
(brn-3c) transcription factor in the inner ear - UCL Discovery
250
IDENTIFICATION AND CHARACTERISATION OF GENE REGULATION BY THE POU4F3 (BRN-3C) TRANSCRIPTION FACTOR IN THE INNER EAR Chrysostomos Tornari Submitted for the degree of PhD University College London 2009
-
Upload
khangminh22 -
Category
Documents
-
view
4 -
download
0
Transcript of (brn-3c) transcription factor in the inner ear - UCL Discovery

IDENTIFICATION AND CHARACTERISATION
OF GENE REGULATION BY THE POU4F3
(BRN-3C) TRANSCRIPTION FACTOR IN THE
INNER EAR
Chrysostomos Tornari
Submitted for the degree of PhD
University College London
2009

Declaration 2
DECLARATION
I, Chrysostomos Tornari, confirm that the work presented in this thesis is my own. Where
information has been derived from other sources, I confirm that this has been indicated in
the thesis. Where work has been conducted by other members of our laboratory, this has
been indicated by their initials or an appropriate reference:
SD Dr Sally Dawson
ET Dr Emily Towers
VG Dr Valentina Gburcik Lazovic
JK Mr John Kelly

Abstract 3
ABSTRACT
Hair cells are the mechanosensory cells of the inner ear whose loss causes irreversible
hearing loss in mammals. POU4F3, a POU-domain transcription factor, is only expressed
in hair cells in the inner ear and is essential for hair cell terminal maturation in mice. In
humans, it is essential for hair cell survival as all three identified families with a POU4F3
mutation show autosomal dominant adult-onset progressive hearing loss. The pathways by
which POU4F3 has this effect are unknown as little is known about its target genes (only
four such genes are known: Bdnf, Ntf3, Gfi1 and Lhx3). Therefore, identification of
unknown POU4F3 target genes would aid the understanding of hair cell maturation and
survival.
Prior to starting my doctoral work, a subtractive hybridization was carried out in an inner
ear cell line (UB/OC-2) which was manipulated to either over- or under-express POU4F3 to
identify unknown POU4F3 target genes. The clones produced by this screen were first
matched to their corresponding gene; the presence of these genes in POU4F3-expressing
UB/OC-2 cells was then confirmed by western blot and/or reverse transcriptase PCR.
Where possible, expression was also confirmed in cochlear hair cells by immunofluorescence
microscopy.
Subsequently, the interaction of POU4F3 with these genes was characterised.
Bioinformatics software was used to identify putative POU4F3 recognition elements in
target gene promoters, and these sequences were then synthesised and used in a DNA
binding assay (EMSA) to assess POU4F3 binding. The ability of POU4F3 to regulate
putative gene promoters was also tested using luciferase assays.
By these methods, one gene (Nr2f2) was shown to be a direct target of POU4F3 in vitro and
two other genes were shown to be likely POU4F3 targets. The identification of these genes
improves our understanding of the mechanism of POU4F3 function and further
investigation of these networks may yield therapies for deafness caused by hair cell loss.

Table of contents 4
TABLE OF CONTENTS
ABBREVIATIONS 11
NOTES TO READER 13
1 GENERAL INTRODUCTION 14
1.1 Normal hearing and balance 15
1.2 Inner ear development 26
1.3 Hair cells 34
1.4 Abnormal hearing 46
1.5 Transcription factors and regulation of gene expression by POU4F3 61
1.6 Investigation of inner ear biology 77
1.7 Project aims 78
2 MATERIALS AND METHODS 80
2.1 Safety 80
2.2 General equipment 80
2.3 Stock solutions 81
2.4 BLAST analysis of subtractive hybridization clones 81
2.5 Cell culture 82
2.6 General DNA manipulation 83
2.7 Reverse Transcriptase Polymerase Chain Reaction (RT-PCR) 85
2.8 Western blotting 86
2.9 Immunofluorescence immunohistochemistry 89
2.10 Electrophoretic Mobility Shift Assay (EMSA) 91
2.11 Cell transfection and reporter gene assay 95
2.12 Site-directed mutagenesis (SDM) of the Nr2f2 promoter 100
2.13 Allele specific hybridization of plasmid DNA with EMSA oligonucleotides 104
2.14 Sequencing of NR2F2p4kbmut-BS1&2 clones 105

Table of contents 5
3 CANDIDATE POU4F3 TARGET GENE IDENTIFICATION AND PRIORITISATION 106
3.1 Previous work in the identification of POU4F3 target genes 107
3.2 Subtractive hybridization in UB/OC-2 cells 108
3.3 Follow-up of subtractive hybridization screen results 109
3.4 Reverse transcriptase PCR in UB/OC-2 cells 113
3.5 Prediction of POU4F3 transcription factor binding sites 114
3.6 Candidate gene expression in the inner ear 118
3.7 Refinement of candidate genes for further investigation 119
3.8 Summary 121
4 CHARACTERISATION OF THE INTERACTION OF POU4F3 WITH THE NR2F2 PROMOTER 122
4.1 Identification of Nr2f2 as a potential POU4F3 target gene 122
4.2 Introduction to Nr2f2 125
4.3 Steroid/thyroid hormone nuclear receptors 125
4.4 NR2F2 function and expression 128
4.5 Initial selection of Nr2f2 as a candidate gene for investigation 131
4.6 Verification of NR2F2 expression in UB/OC-2 cells 134
4.7 Immunohistochemistry for NR2F2 in rat and mouse inner ear tissue 137
4.8 Does POU4F3 directly activate the Nr2f2 promoter? 143
4.9 Transcriptional regulation of the Nr2f2 5’ flanking region by POU4F3 152
4.10 Site-directed mutagenesis of POU4F3 binding sites in the Nr2f2 promoter 161
4.11 Discussion of Nr2f2 activation by POU4F3 173
5 INVESTIGATION OF PUTATIVE LUZP1, RBMS1 AND ZRANB2 REGULATION BY POU4F3 176
5.1 Introduction to Luzp1, Rbms1 and Zranb2 176
5.2 Identification of Luzp1, Rbms1 and Zranb2 as potential POU4F3 targets 182
5.3 Initial prioritisation of Luzp1, Rbms1 and Zranb2 for investigation 186
5.4 Investigation of the inner ear expression patterns of selected genes 188
5.5 Design of oligonucleotides for EMSA analysis of Luzp1, Rbms1 and Zranb2 193
5.6 EMSA analysis of POU4F3 binding sites in candidate gene 5’ flanking regions 201
5.7 Activation of candidate gene 5’ flanking regions by POU4F3 210
5.8 Summary and discussion of candidate gene activation by POU4F3 217
6 GENERAL DISCUSSION 220
6.1 Conclusions 225
APPENDIX: REVERSE TRANSCRIPTASE PCR PRIMERS 227
BIBLIOGRAPHY 229

Table of figures 6
TABLE OF FIGURES
Figure 1.1. Gross anatomy of the ear. 16 Figure 1.2. Cochlear anatomy. 21 Figure 1.3. Anatomy of the membranous labyrinth. 25 Figure 1.4. Inner ear morphogenesis. 28 Figure 1.5. Development of the organ of Corti. 35 Figure 1.6. Stereocilial links and structure. 40 Figure 1.7. Cochlear expression of factors involved in hereditary hearing loss. 51 Figure 1.8. Interaction of transcription factors to initiate transcription. 62 Figure 1.9. The role of POU4F3 in hair cell development. 66 Figure 1.10. DFNA15 caused by POU4F3 mutation. 69 Figure 1.11. POU4F3 protein composition. 74 Figure 2.1. pDrive cloning vector. 95 Figure 2.2. pGL4.10[luc2] vector. 96 Figure 2.3. pGL4.23[luc2/minP] vector. 97 Figure 2.4. pSi mammalian expression vector. 98 Figure 3.1. Candidate gene mRNA in UB/OC-2 cells. 114 Figure 4.1. Clone D8 of the subtractive hybridization screen matches the Nr2f2 gene. 123 Figure 4.2. Expression of NR2F2 in UB/OC-1 and UB/OC-2 cells. 135 Figure 4.3. NR2F2 expression in undifferentiated (proliferating) UB/OC-2 cells. 136 Figure 4.4. NR2F2 expression in the E18 rat cochlea. 138 Figure 4.5. NR2F2 expression in the postnatal rat cochlea. 139 Figure 4.6. NR2F2 expression in the postnatal mouse cochlear apex. 140 Figure 4.7. NR2F2 expression in the P0 mouse crista. 141 Figure 4.8. Schematic representation of Nr2f2 regulation. 143 Figure 4.9. Identification of putative POU4F3 binding sites in the Nr2f2 promoter. 145 Figure 4.10. Binding of in vitro translated POU4F3 to transcription factor binding sites. 148 Figure 4.11. Binding of POU4F3 to Nr2f2 promoter binding sites. 150 Figure 4.12. Schematic of Nr2f2 5’ flanking region reporter constructs. 153 Figure 4.13. Nr2f2 promoter regulation by POU4F3 in BHK and ND7 cells. 154 Figure 4.14. NR2F2p4kb dose response to cotransfected POU4F3 expression construct. 156 Figure 4.15. Upregulation of pGL4.23-NR2F2BS1 by POU4F3 in ND7 cells. 158 Figure 4.16. Upregulation of pGL4.23-NR2F2BS2 by POU4F3 in ND7 cells. 159 Figure 4.17. Design of mutant POU4F3 binding sites. 162 Figure 4.18. Effect of binding site mutation on transcription factor binding. 164 Figure 4.19. Site-directed mutagenesis (SDM) of NR2F2p4kb by overlapping PCR. 166 Figure 4.20. Screening of SDM colonies for incorporation of mutation. 167 Figure 4.21. POU4F3 binding site mutation reduces Nr2f2 promoter upregulation. 170 Figure 4.22. Alignment of mouse NR2F2BS1 with equivalent human and rat sequences. 172 Figure 4.23. Alignment of mouse NR2F2BS2 with equivalent human and rat sequences. 172 Figure 5.1. Clone D3 of the subtractive hybridization screen matches Luzp1. 183 Figure 5.2. Clone FB5 of the subtractive hybridization screen matches Rbms1. 184 Figure 5.3. Clone FA8 of the subtractive hybridization screen matches Zranb2. 185 Figure 5.4. RBMS1 and ZRANB2 expression in UB/OC-1 and UB/OC-2 cells. 190 Figure 5.5. ZRANB2 expression in the P0 rat cochlea. 192 Figure 5.6. Prediction of potential POU4F3 binding sites in the Luzp1 promoter. 194 Figure 5.7. Prediction of potential POU4F3 binding sites in the RBMS1 promoter. 196 Figure 5.8. Prediction of potential POU4F3 binding sites in the Zranb2 promoter. 199

Table of figures 7
Figure 5.9. Binding of in vitro translated POU4F3 to predicted binding sites. 202 Figure 5.10. Binding of in vitro translated POU4F3 to RBMS1BS1-3. 203 Figure 5.11. Binding of UB/OC-2 cell nuclear protein extract to LUZP1BS1 & 2. 207 Figure 5.12. Binding of UB/OC-2 cell nuclear protein extract to RBMS1BS1-3. 208 Figure 5.13. Binding of UB/OC-2 cell nuclear protein extract to ZRANB2BS1 & 2. 209 Figure 5.14. Response of LUZP1p2.8kb to POU4F3. 212 Figure 5.15. Regulation of RBMS1p1.3kb by POU4F3. 214 Figure 5.16. Regulation of RBMS1p5.1kb by POU4F3. 215 Figure 5.17. ZRANB2p3.2kb is not regulated by POU4F3. 216

Table of tables 8
TABLE OF TABLES
Table 1.1. Sensory organs of the inner ear. 19 Table 1.2. Classification of hearing loss. 47 Table 1.3. Types and onset of SNHL. 49 Table 1.4. Causes of hereditary hearing loss. 53 Table 1.5. Global prevention strategies for SNHL. 56 Table 1.6. Functions of the original POU family genes. 64 Table 2.1. PCR primer oligonucleotide design parameters. 85 Table 2.2. Primers for attempted QuikChange® II XL kit site-directed mutagenesis. 100 Table 2.3. NR2F2BS1 and NR2F2BS2 mutagenesis primers. 102 Table 3.1. Genes corresponding to clones produced by subtractive hybridization screen. 111 Table 3.2. Categorisation of POU4F3 candidate target genes for follow up. 112 Table 3.3. MatInspector and ModelInspector analysis of candidate genes. 116 Table 4.1. Nr2f2 GO units. 132 Table 4.2. Oligonucleotides for Nr2f2 EMSA analysis. 145 Table 5.1. Luzp1 GO units. 186 Table 5.2. Rbms1 GO units. 187 Table 5.3. Zranb2 GO units. 188 Table 5.4. Luzp1 EMSA oligonucleotides. 195 Table 5.5. RBMS1 EMSA oligonucleotides. 198 Table 5.6. Zranb2 EMSA oligonucleotides. 201 Table 5.7. Consensus sequence oligonucleotides for competition assays. 206

Dedication 9
DEDICATION
In loving memory of
Dr Kyriacos Chrysostomou Tornari
1935 - 2003

Acknowledgements 10
ACKNOWLEDGEMENTS
I would like to thank the people who provided the opportunity for me to carry out the work
reported in this thesis and who supported me throughout. Firstly, I would like to thank
Stefano for giving me the opportunity to explore my interest in hearing and later
supervising my BSc project. I would also like to thank the UCL MB PhD programme for
funding this research; Professor Gordon Stewart for his willingness to sign anything and
Sue Beesley for being a rock of good sense and organisation in a sea of confusion.
The support that I have received at the UCL Ear Institute has been outstanding and I
would like to thank the staff and students that have influenced my development over the
time I have spent in the department. Many thanks to Nico, Elena and Andy for the patient
hours of teaching and discussion that were beyond their responsibilities and, most
importantly, the members of the Dawson-Gale laboratory: Jonathan (B), Manuela, Zoë,
John (K), Valentina, Lisa and, especially, Emily. This work would truly not have been
possible without their help and their friendship has been a great source of strength and
happiness through some testing times. Outside of UCL I would like to thank my friends
who have put up with me over the last few years and who I have not been able to see as
much of as I would have liked. To my former housemates, Doug and Bhairavi, thanks for
putting up with me the many nights I would be locked in my room working and not being
much fun! Thanks to Nicola, Theo and Sofronis for their help and advice and many thanks
to Chad for his endless technical expertise, assistance and even equipment!
To Sally, thank you for your endless patience and professionalism, sorry for not being able
find the words with which to fully express my gratitude. To Jonathan (G), thank you for
your insight that always gives me a new angle on a problem.
Most importantly, I would like to thank my mother Maria, my sister Katerina and my
partner Natalia for helping me keep my perspective over the last few years.
Nat, thank you for not letting me forget the things that are most important to me and
always challenging me.

Abbreviations 11
ABBREVIATIONS
ABR auditory brainstem response
AF activation function
ARHL age-related hearing loss
BLAST basic local alignment search tool
BM basilar membrane
bp base-pair(s)
cDNA complementary DNA
CVG cochleovestibular ganglion
DTT dithiothreitol
EMSA electrophoretic mobility shift assay
ENU N-ethyl-N-nitrosourea
GER greater epithelial ridge
GO gene ontology
HAT histone acetyl-transferase
HBS Hank’s buffered saline
HDAC histone deacetylase
IHC inner hair cell
kb kilobase(s)
LBD ligand binding domain
LER lesser epithelial ridge
LTLD lower tip-link density
MET mechanoelectrical transduction
MGI Mouse Genome Informatics
NHS National Health Service
NIHL noise-induced hearing loss
NLS nuclear localization signal
OHC outer hair cell
PAGE polyacrylamide gel electrophoresis
PBS phosphate buffered saline
PCR polymerase chain reaction
PVDF polyvinylidene fluoride
Abbreviations 12
RNA ribonucleic acid
ROS reactive oxygen species
RT-PCR reverse transcriptase polymerase chain reaction
SDM site-directed mutagenesis
SDS sodium dodecyl sulphate
Shh sonic hedgehog
SNHL sensorineural hearing loss
TEMED tetramethylethylenediamine
TM tectorial membrane
TSS transcriptional start site
UTLD upper tip-link density
UTR untranslated region
WHO World Health Organization
λ wavelength

Notes to reader 13
NOTES TO READER
• Human gene names are in upper case and italicised
• Non-human gene names are italicised with capitalised first letters only
• Non-human gene names are used if referring to both human and non-human genes
• All protein names are fully upper case and not italicised.

1 General introduction 14
1
GENERAL INTRODUCTION
Being able to perceive, interpret and appreciate sound is an important part of human life.
Our sense of hearing is essential to our ability to respond to changes in our environment,
communicate with others and appreciate music. Though the loss of this ability can be
compensated for through various means (sign languages, hearing dogs, appliances with
visual alerts etc.), such methods are often only used by people who lose their hearing early
in life (RNID 2009). For the increasing number of people who have to manage hearing loss
later in life, the adjustment can pose a very different and difficult challenge (Van Laer et al.
2007). Across the age range, hearing loss can have a wide personal and social effect. In
children, it has been shown to adversely affect confidence, behaviour and acceptance by
peers (Moeller 2007), whilst quality of life is reported to be significantly affected in older
people with age-related hearing loss (ARHL) (Howarth et al. 2006).
Worldwide, approximately 278 million people have a moderate to profound hearing loss in
both ears (World Health Organization 2006). Though more is being done to identify
children with hearing loss and reduce risk factors for hearing loss at all ages, ARHL –
which affects approximately 40% of people by age 65 – will become an increasing problem
due to our ageing society (Ohlemiller 2004). Furthermore, greater voluntary noise exposure
– e.g. due to increased use of personal music players – is predicted to contribute to the
incidence of noise-related hearing loss despite reductions in occupational noise exposure
(Daniel 2007). Therefore, research into the anatomically and molecularly complex systems
that underlie hearing is required to improve our understanding of this process and to
identify new strategies by which to prevent and treat hearing loss.
This thesis addresses the lack of knowledge regarding gene regulatory networks in hair
cells, the primary sensory cells of the inner ear. The POU4F3 transcription factor is
uniquely expressed in these mechanosensory cells in the inner ear (Erkman et al.
1996;Xiang et al. 1998) where it has been shown to be essential for their terminal
differentiation in mice (Xiang et al. 1998) and for their survival in humans (Collin et al.
2008;Vahava et al. 1998). However, the mechanism of its function is poorly understood.
Therefore, we attempted to identify POU4F3 target genes to explain how this transcription

1 General introduction 15
factor generates and maintains the hair cell phenotype and, thereby, identify proteins that
are involved in the terminal differentiation and survival of hair cells.
1.1 Normal hearing and balance Sound is mechanical energy travelling through a medium in a longitudinal wave at
frequencies audible to humans (i.e. in the range of approximately 20Hz to 20kHz) (Kingsley
1999b). Prior to its transduction into electrical energy by the ear, it undergoes multiple
complex steps of modification in order to optimise the useful information that can be
extracted from the original signal.
The first step in this modification occurs prior to sound reaching the ear. The torso, neck
and head give a modest boost to sound below 1kHz (less than 5dB) (Ballachanda 1997). The
head is also an important factor in the determination of sound localization on the horizontal
axis as the difference in sound pressure and timing between ears is influenced by head size
and shape (Pickles 1988).
1.1.1 The outer ear
The ear itself is divided into three sections: the outer, middle and inner ear. Sound first
arrives at the outer ear which, in turn, is divided into the pinna and the ear canal (see
Figure 1.1). These structures do not simply pass sound into the skull unmodified. They are
designed to gather sound, aid in its localization and boost its pressure in the speech
frequencies.
The first two of these functions are carried out by the pinna (also called the auricle). Due to
its larger surface area, more sound arrives here than would arrive at the ear canal alone
and the folds of the pinna direct this additional sound into the ear canal. As well as
directing the sound, the pinna modifies sounds that do not enter the ear canal directly in
order to aid in localization. Sound therefore takes two paths to the ear canal: the direct
path (into the ear canal) and the reflected path (via the pinna). Sound from the reflected
path undergoes spectral modification that is variable depending on its horizontal and
vertical localization i.e. the location of a sound source determines which part of the pinna
the sound arrives at first which determines its spectral modification. This modified sound
combines with sound from the direct path, and the signature of the combined signal allows
identification of the sound’s location following transduction and neural processing
(Middlebrooks et al. 1991). This processing takes place in the brainstem where the timing,
phase, pressure and spectral differences between sounds arriving at each ear are compared.
This large area of hearing research is beyond the scope of this thesis and is not discussed
further. Though the pinna is essential for vertical localization, its role in horizontal
localization is not essential and its most important role in this task is in distinguishing
front/back ambiguity (Pickles 1988).

1 General introduction 16
Figure 1.1. Gross anatomy of the ear. The ear is divided into the outer ear, middle ear and inner ear. The outer ear comprises the pinna and external auditory meatus and is divided from the middle ear by the tympanic membrane. The middle ear transmits movement of the tympanic membrane to the inner ear via the three ossicles: the malleus, the incus and the stapes. The movements of the stapes are transduced to electrical energy in the hair cells of the cochlea and transmitted to the brain via the cochlear division of the vestibulocochlear nerve. The remaining sensory organs of the inner ear transduce head acceleration and position information which is passed to the higher brain centres via the vestibular portion of the vestibulocochlear nerve (adapted from Kelley 2006).
The final role of the external ear – amplification of speech frequencies – is primarily
performed by the ear canal. This canal starts in the pinna and ends at the tympanic
membrane (also called the eardrum) i.e. it is a cylinder that is closed at one end (see Figure
1.1). The length of such a cylinder is ¼λ of its resonant frequency and, as the adult ear
canal is approximately 25mm long, its resonant frequency is approximately 3.4kHz.
Frequencies at and around this frequency are therefore amplified and the ear canal
provides most of the 15 to 20dB amplification that is applied to sounds from 1.5 to 7.0kHz
(see Ballachanda 1997 for review). The range of this amplification and the fundamental
frequency of the canal therefore lie within the important frequency range for speech (250Hz
to 4kHz) (Sataloff et al. 1993).
1.1.2 The middle ear
The middle ear translates vibration of the tympanic membrane into vibration of the liquid
that fills the cochlea. It not only passes sound from the outer ear to the inner ear but also
matches the impedance from air to liquid – to optimise the efficiency of energy transfer –
and alters the spectral response of the incoming sound to enhance important frequencies
(Pickles 1988). Encased in the temporal bone, it is a space that contains small bones, nerves
and muscles that either aid in the above functions or, in the case of the facial and
glossopharyngeal nerves, pass through the middle ear (Dean et al. 1996).
Picture removed for copyright purposes

1 General introduction 17
Sound that has passed through the ear canal reaches the tympanic membrane, which
separates the outer and middle ear. This sound causes variation in pressure in the ear
canal, creating a pressure difference between the outer ear and the middle ear (which
contains air at atmospheric pressure). High pressure on the lateral tympanic membrane –
caused by compression of air particles during a sound wave – causes it to move medially i.e.
towards the middle ear. Conversely, rarefactions create low pressure, causing the tympanic
membrane to move laterally, towards its resting position. The maintenance of atmospheric
pressure in the middle ear is necessary for this to occur and it is achieved by the connection
of the middle ear to the pharynx via the Eustachian tube which, though closed at rest, is
easily opened by pharyngeal muscle movements (see Figure 1.1) (Vander et al. 2001).
The functions of the middle ear are primarily achieved by the ossicles – the smallest bones
in the human body – without which only a small proportion of sound that is transmitted by
the tympanic membrane would reach the inner ear (Kurokawa et al. 1995). In each middle
ear, there are three ossicles. The first of this chain is the malleus (hammer) which has a
long arm that is attached to the tympanic membrane, a neck, and a head which articulates
with the second ossicle, the incus (anvil), via a synovial joint. The incus is also divisible into
three parts: the head, which is attached to the malleus; the short process which connects
this bone to the posterior wall of the middle ear; and the long process which articulates, via
another synovial joint, to the stapes (stirrup). This final ossicle is divided into the head,
which articulates with the incus, followed by two processes which join the head to the
footplate. It is the footplate that delivers the vibration of the ossicles to the cochlea via an
opening in the bony capsule of the inner ear called the oval window (fenestra vestibuli). In
reptiles, the tympanic membrane is joined directly to the oval window by the stapes.
However, bones from the reptilian jaw evolved to form the malleus and incus which
improve the impedance matching and spectral response of the middle ear, allowing more
accuracy in hearing (Clack et al. 2004).
The middle ear transfer function
Impedance matching by the middle ear is achieved as follows:
1) A greater pressure is applied at the oval window than at the tympanic
membrane because the surface area of the footplate of the stapes is smaller than
that of the tympanic membrane (see Equation 1.1).

1 General introduction 18
Equation 1.1. Pressure-area relationship between tympanic membrane and oval window. TympM = tympanic membrane, OW = oval window, P = pressure, A = area.
OWOWTympMTympM APAP ×=×
2) The lever action of the middle ear bones modify the movement of the stapes,
increasing its force and decreasing its velocity to provide a small benefit in
impedance matching.
3) The conical shape of the tympanic membrane allows it to buckle so that the
malleus moves less than the surface of the membrane providing another small
benefit to the impedance match (Pickles 1988).
These factors contribute to what is known as the transfer function of the middle ear which
increases the pressure at the footplate of the stapes whilst decreasing velocity. Differences
in the efficiency of this function at different frequencies are the result of the physical
properties of the middle ear which optimise transmission of the most important frequencies.
In humans, the greatest pressure gain peaks near 0.9kHz (26.6dB) with fairly flat gain at
low frequencies and steadily falls off above 0.9kHz to zero pressure gain at 7.0kHz.
Therefore, the middle ear can be described as a bandpass filter as it transmits sounds at
different frequencies with differing efficiency (Kurokawa et al. 1995). Consequently, middle
ear dysfunction, e.g. due to abnormal bone remodelling in the middle ear (otosclerosis),
causes hearing loss as sound is no longer efficiently transmitted to the cochlea (Cureoglu et
al. 2009).
Middle ear muscles
Ossicular function is determined both by the constant effect of their anatomy and also by
the variable effect of two muscles – tensor tympani and stapedius – which attach to the
malleus and stapes respectively to control their stiffness. Contraction of these muscles
influences both the amount and spectrum of sound that is transmitted from the outer ear to
the inner ear. The tensor tympani arises from a bony canal in the middle ear wall and
attaches to the long arm of the malleus. Similarly, the stapedius muscle arises from a bony
canal and attaches to the neck of the stapes (Moore et al. 1999). Tensor tympani has a
modest function, contracting in response to high intensity sound and in response to head
and pharyngeal muscle movement and causing almost no attenuation in sound
transmission (Kingsley 1999b). The stapedius muscle has a larger effect, causing an
approximately 10dB attenuation in response to the sound of more than approximately 70dB
or muscle movements (Kingsley 1999b;Sataloff et al. 1993). The combined effect of these
muscles protect the inner ear from damage by sustained sound of high intensity. However,
the latency of this reaction renders it insufficient to protect the inner ear from sudden loud
noises (Vander et al. 2001).

1 General introduction 19
1.1.3 The anatomy and function of the inner ear
The inner ear is responsible for the detection of sound, head acceleration and head position.
Encased in the petrosal temporal bone – the hardest bone in the human body – it is a
liquid-filled cavity (the bony labyrinth) with extremely complex anatomy that can be
divided into the bulla, three semicircular canals (with their associated ampullae) and the
cochlea. The bony labyrinth contains the membranous labyrinth and its six sensory organs
that convert sensory information to action potentials via their sensory epithelia (see Table
1.1). The ampullae of the semicircular canals house their respective cristae, the bulla
contains the utricle and saccule (each of which contains a sensory macula) and the cochlea
houses the cochlear duct, within which the organ of Corti transduces sound. Action
potentials generated by the sensory hair cells in these epithelia travel through afferent
neurons in the vestibulocochlear nerve to the brain where the signal is processed and
perceived (Vander et al. 2001).
Table 1.1. Sensory organs of the inner ear. (adapted from Kingsley 1999b).
Organ Sensory Epithelium Function
Cochlea Organ of Corti Sound transduction
Saccule Saccular macula Linear vertical head acceleration
and orientation
Utricle Utricular macula Linear horizontal head acceleration
and orientation
Superior
semicircular canal Superior crista ampullaris
Head rotation around rostro-caudal
axis
Posterior
semicircular canal Posterior crista ampullaris
Head rotation around horizontal
axis
Horizontal
semicircular canal Horizontal crista ampullaris Head rotation around vertical axis
Cochlear anatomy
Sound is delivered to the inner ear either by the movements of the footplate of the stapes in
the oval window due to sound that has passed through the outer and middle ear, or by
conduction through bone. The cochlea extracts frequency and amplitude information from
this sound and passes this information to higher centres via the vestibulocochlear nerve.
Both cellular and acellular cochlear components are required for this process.
The cochlea – which is, perhaps, the most anatomically complex sensory organ – is
composed of three liquid-filled spaces which spiral around a central bony projection called
the modiolus for little under 2.75 turns in humans to give the organ its characteristic shape

1 General introduction 20
(Kingsley 1999b). These three spaces are named the scala vestibuli, scala media and scala
tympani. The superior edge of the scala vestibuli and the inferior edge of the scala tympani
are bordered by the bony labyrinth. The scala vestibuli starts near the oval window and
coils up the cochlea on top of the other two compartments to the apex of the cochlea where
it is continuous with the scala tympani at an opening called the helicotrema. The scala
tympani then coils down the cochlea to end at a membrane called the secondary tympanic
membrane that covers the round window of the bony labyrinth. The scala tympani and
scala vestibuli are filled with extracellular fluid known as perilymph – a sodium-rich liquid
with similar composition to cerebro-spinal fluid that is continuous with the cerebro-spinal
fluid via the cochlear duct (see Figure 1.2a) (Kingsley 1999b).
Sandwiched in-between these two compartments lies the roughly-triangular scala media.
This is separated from the scala vestibuli at its superior border by the Reissner’s membrane,
which is composed of mesothelial cells superiorly and epithelial cells inferiorly with a
basement membrane in between these two layers (see Figure 1.2b). The epithelial cells are
connected by tight junctions and adherens junctions to maintain fluid separation between
the scala media and scala vestibuli (Slepecky 1996;Wangemann et al. 1996). The lateral
border is formed by the lateral wall which comprises the stria vascularis and spiral limbus;
regions important in setting up and maintaining potassium concentration of the liquid that
fills the scala media, the endolymph. This liquid also fills the remainder of the membranous
labyrinth via the ductus reuniens. On the inner aspect of the inferior border of the scala
media lies the organ of Corti and associated support cells. This is the sensory epithelium of
the cochlea that contains the hair cells – the sensory transductory cells of the cochlea. Hair
cells are organised into one row of inner hair cells (IHCs) and – in humans – three to four
rows of outer hair cells (OHCs). The IHCs are the ‘true’ sensory cells of the inner ear and
are mainly innervated by afferent neurons that transmit transduced signals to the brain.
OHCs, on the other hand, have a mainly efferent innervation and act to sensitize and
modulate IHC function (see below). The nerve fibres travel medially to the spiral lamina,
through the habenula perforata and into Rosenthal’s canal in the modiolus where their cell
bodies form the spiral ganglion. Axons of both bipolar and pseudounipolar neurons continue
from here to the vestibulocochlear nerve (Kingsley 1999b). Pillar cells separate IHCs from
OHCs, forming the perilymph-filled tunnel of Corti and, along with the other supporting
cells of the organ of Corti (Deiters and Hensen cells) contribute to a reticular lamina at the
surface of the sensory epithelium. The remaining cells of the floor of the scala media (inner
sulcus cells, inner phalangeal cells, Claudius cells and Boettcher cells) have less well-
characterised function and are involved in processes such as ion transport rather than
mechanical support. The organ of Corti and the cells that populate the distance between the
Hensen cells and lateral wall lie on the basilar membrane (BM) which is a specialised
basement membrane that is mainly composed of homogeneous ground substance with fibres
embedded in its matrix (see Figure 1.2b) (Slepecky 1996).

1 G
en
era
l in
trod
uct
ion
2
1
Fig
ure
1.2
. C
och
lea
r an
ato
my.
a)
mid
-modio
lar
section
of
the m
atu
re c
och
lea s
how
ing
the
path
ways u
p t
he
scala
vestibu
li (r
ed
arr
ow
s)
an
d
dow
n
the
scala
ty
mp
ani
(blu
e
arr
ow
s).
G
reen
, perily
mph;
ye
llow
, end
oly
mph;
red,
str
uctu
res
req
uired
fo
r tr
ansd
uctio
n
an
d
esta
blis
hm
ent
of
endo
lym
phatic p
ote
ntia
l (a
dap
ted
fro
m B
ole
y 2
008).
b)
de
taile
d
anato
my o
f th
e c
ochle
ar
duct
(taken f
rom
Fig
ure
1 i
n G
ate
s e
t al. 2
005).
c)
Flu
id
boun
dari
es
in
the
cochle
a.
Gre
en,
peri
lym
ph;
yello
w,
end
oly
mph;
SL,
spir
al
ligam
ent; B
M,
basila
r m
em
bra
ne (
adap
ted f
rom
Sle
pe
cky 1
996).
a)
c)
b)
Pic
ture
rem
oved
for
cop
yri
gh
t p
urp
ose
s
Pic
ture
rem
oved
for
cop
yri
gh
t p
urp
ose
s
Pic
ture
rem
oved
for
cop
yri
gh
t p
urp
ose
s
1 General introduction 22
Morphologically the BM forms the inferior border of the scala media. However, liquid
separation between the scala media and scala tympani is achieved by the reticular lamina
which connects hair cell and support cell apices across the sensory epithelium, maintaining
cell apices in the potassium-rich endolymph and cell bodies in the sodium-rich perilymph
(Slepecky 1996). The location of this boundary is important because the differential ion
concentrations across the reticular lamina set up an electrical potential (the endocochlear
potential) of +80mV (Wangemann 2006). This potential difference, combined with basal
conductances in hair cells, establishes the hair cell resting membrane potential which is
required for transduction (see Figure 1.2c) (Housley et al. 2006;Kros 1996).
Highly organised finger-like projections called stereocilia arise from the hair cell apices into
the endolymph of the scala media towards a structure called the tectorial membrane (TM)
which overlies the organ of Corti and arises from a bony prominence of the modiolus called
the spiral lamina. The TM is composed of gel-like connective tissue and the tips of the OHC
stereocilia are known to be embedded in this matrix. There is still some debate as to
whether IHC stereocilia are also embedded in the TM, though it is widely agreed that they
are not and that a groove in the TM that overlies the IHC stereocilia (Hensen’s stripe)
interacts with the inner hair cell stereocilia indirectly (Raphael et al. 2003). The mass and
movement of the TM are required for normal hair cell mechano-electrical transduction (see
below) and mutations in the genes that encode TM proteins are known to cause deafness
(see Richardson et al. 2008 for review).
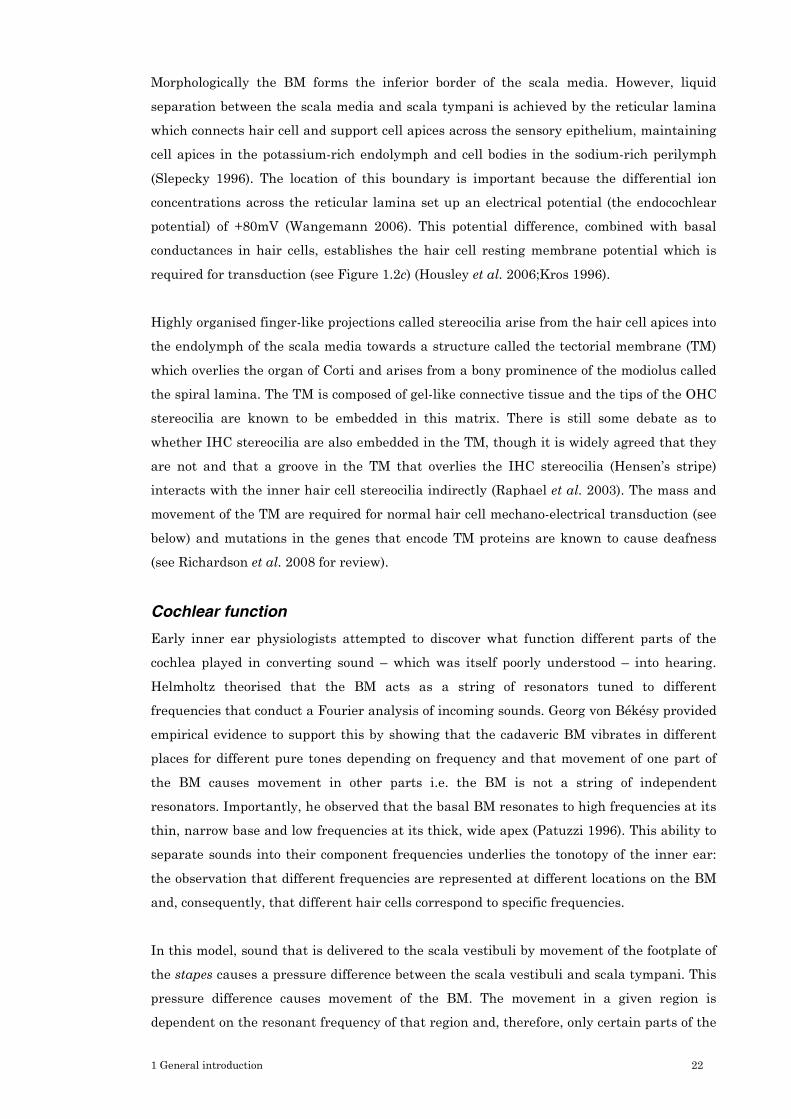
Cochlear function
Early inner ear physiologists attempted to discover what function different parts of the
cochlea played in converting sound – which was itself poorly understood – into hearing.
Helmholtz theorised that the BM acts as a string of resonators tuned to different
frequencies that conduct a Fourier analysis of incoming sounds. Georg von Békésy provided
empirical evidence to support this by showing that the cadaveric BM vibrates in different
places for different pure tones depending on frequency and that movement of one part of
the BM causes movement in other parts i.e. the BM is not a string of independent
resonators. Importantly, he observed that the basal BM resonates to high frequencies at its
thin, narrow base and low frequencies at its thick, wide apex (Patuzzi 1996). This ability to
separate sounds into their component frequencies underlies the tonotopy of the inner ear:
the observation that different frequencies are represented at different locations on the BM
and, consequently, that different hair cells correspond to specific frequencies.
In this model, sound that is delivered to the scala vestibuli by movement of the footplate of
the stapes causes a pressure difference between the scala vestibuli and scala tympani. This
pressure difference causes movement of the BM. The movement in a given region is
dependent on the resonant frequency of that region and, therefore, only certain parts of the

1 General introduction 23
BM resonate in response to a given frequency with the amplitude of the movement being
proportional to the amplitude of the incoming sound. When the organ of Corti moves
upwards, towards the TM, hair cell stereocilia are bent in the direction of the longest row,
causing a mechanoelectrical transduction (MET) channel to be opened and allowing the
non-selective influx of sufficiently small positively charged ions – primarily potassium due
to the high endolymphatic potassium concentration – causing transduction currents within
the cells. Conversely, when the BM is pushed downwards, hair cell stereocilia are bent
towards the shortest row, causing MET channels to close and reducing the likelihood of
transduction currents in the cell (Hudspeth 2000). Transduction currents are transmitted
to afferent neurons by the release of neurotransmitters from the hair cell base and these
signals are then received and processed by higher brain centres (Kingsley 1999b).
However, the observed frequency selectivity of the cadaveric BM described by von Békésy is
not sufficient to explain the observed frequency selectivity of the human ear. Applying
concepts from radio engineering to this problem, Gold used a mathematical model to show
that the input of an appropriate amount of energy to the BM would counteract the viscous
damping by the liquid in the cochlea and would sharpen its frequency tuning to better
explain observed frequency selectivity (Gold 1948). Gold was not able to identify the site of
the required sensation and feedback of signal, though it has since been found that this
function is carried out by OHCs. The required sharpening of the BM response is achieved
by the opposite process of mechanoelectrical transduction: electromechanical transduction.
In this process, OHCs, having converted kinetic energy into depolarising electrical energy
(in the form of a transduction current) convert the electrical energy back into mechanical
energy by the ‘motor protein’ called prestin (Slc26a5) that causes the OHCs to contract
(Zheng et al. 2002). The energy provided by this movement is sufficient to overcome much of
the viscous damping of BM movement by the cochlear liquids and allows sharpening of the
frequency response of the BM to allow more frequency-specific activation of IHCs,
accounting for the observed frequency-selectivity of hearing (Gold 1948;Robles et al. 2001).
Furthermore, loss of prestin function due to its mutation, such as that seen in two human
families, results in a recessive non-syndromic hearing loss (Liu et al. 2003).
Though the precise biomechanical mechanism through which OHC electromechanical
transduction sharpens frequency selection is still being debated, the effect of BM movement
induced by cellular movement in the inner ear has been exploited for diagnostic purposes.
The sound created by this BM movement is detectable in the ear canal and is known as an
otoacoustic emission (OAE), as predicted by Gold and proven by Kemp in his 1978 paper
which first identified evoked OAEs (Kemp 1978). OAEs now serve as a clinical measure of
cochlear function that does not require the cooperation of the subject. This method is now
widely used to detect hearing loss e.g. in the UK National Health Service’s neonatal
hearing screening programme (MRC Hearing & Communication Group 2008).

1 General introduction 24
Vestibular anatomy and function
As for cochlear hair cells, vestibular hair cells in all five vestibular sensory epithelia
transduce sound by the movement of stereocilia that lead to transduction currents. The
differences in vestibular stimuli transduced by the different epithelia are due to the
location and overlying structures of each sensory epithelium (see Figure 1.3).
The saccule and utricle transduce the same type of stimuli as they have the same overlying
otoconia which provide the necessary mass for the underlying hair cells to respond to
gravity. When the head is moved, the inertia of the heavy otoconia causes them to slide
back over the underlying sensory epithelium. This causes displacement of the stereocilia
which results in depolarisation or hyperpolarisation of the hair cells depending on the
direction of the displacement. Though both the saccule and utricle interpret linear
acceleration and head position, the differences in the direction of travel sensed is dependent
on the placement of the epithelium i.e. the saccular macula lies in the vertical plane
whereas the utricular macula is horizontal (see Figure 1.3a&b) (Kingsley 1999b).
Similarly, the three cristae of each inner ear transduce rotational acceleration by the
movement of endolymph against a gelatinous matrix (the cupula) which overlies the hair
cells in the sensory epithelia. The relative movement of the cupula against the sensory
epithelium causes displacement of the hair cell stereocilia, resulting in transduction
currents. The type of rotation detected by the different cristae is dependent on the
orientation of the semicircular canal to which it is attached (see Figure 1.3c). Higher
centres compare contralateral inputs and integrate the signals from the different cristae to
determine the net rotation of the head in three dimensions. Signals from the vestibular
organs are also integrated with ocular cues in brainstem nuclei to maintain balance. As in
the cochlea, vestibular epithelia are connected to their higher brain centres by both afferent
and efferent neurons which travel in the vestibulocochlear nerve (Kingsley 1999b).

1 G
en
era
l in
trod
uct
ion
2
5
Fig
ure
1.3
. A
nato
my o
f th
e m
em
bra
no
us lab
yri
nth
. a)
The positio
n of
the m
em
bra
nous la
byrin
th in
th
e
tem
pora
l bo
ne
an
d
the
locatio
ns
of
the
vestibu
lar
sensory
epith
elia
w
ith
in
it.
T
he
utr
icu
lar
macu
la
is
oriente
d
horizon
tally
and
th
e
saccula
r m
acula
is
positio
ned v
ert
ically
(ad
apte
d f
rom
Kin
gsle
y 1
999a).
b)
cellu
lar
an
ato
my o
f th
e u
tric
ula
r and s
accula
r m
acu
lae
show
ing t
he
tw
o typ
es o
f h
air c
ell
with
in these
epithe
lia
that
transduce
lin
ear
accele
ratio
n a
nd
head
positio
n.
The
ha
ir
cells
are
overla
id
with
a
ge
latin
ous
layer
(adapte
d
fro
m
Kin
gsle
y
1999a).
c)
an
ato
my
of
the
crista
, show
ing
the
sen
sory
epith
eliu
m
with
the
overlyin
g c
up
ula
wh
ich i
s d
ispla
ced b
y e
ndo
lym
phatic
movem
ents
in
th
e
se
mic
ircula
r cana
ls
causin
g
movem
ent
of
the
hair
cell
ste
reocili
a
(taken
fro
m
Kin
gsle
y 1
99
9a).
a)
b)
c)
Pic
ture
rem
oved
for
cop
yri
gh
t p
urp
ose
s
Pic
ture
rem
oved
for
cop
yri
gh
t p
urp
ose
s
Pic
ture
rem
oved
for
cop
yri
gh
t p
urp
ose
s

1 General introduction 26
1.2 Inner ear development With the advent of molecular biological techniques that are sufficiently sensitive to allow
the study of inner ear development, there has been an explosion in the understanding of
this process in the last decade (Kelley et al. 2005). From a patch of thickened ectoderm
through to the elaborate structure of the labyrinth, many signalling networks have been
shown to be involved in inner ear morphogenesis. These signals direct a combination of
proliferation, differentiation, growth, migration and programmed cell death which result in
the formation of the mature inner ear (Bok et al. 2007).
In brief, the inner ear is formed as follows: a patch of thickened ectoderm called the otic
placode is formed on the anterolateral surface of the embryo and invaginates to form the
otic cup. The cup then deepens and the surface epithelium begins to close off its roof. Once
the cup has pinched off from the surface of the embryo, it is known as the otocyst (also
known as otic cyst / otic vesicle). The otocyst undergoes a series of complex remodelling
processes which lead to the mature anatomy of the labyrinth. This section describes the
above processes in the order in which they occur and the signalling mechanisms on which
they are known to rely.
1.2.1 Early inner ear morphogenesis
The first sign of inner ear development is the thickening of the surface ectoderm adjacent to
the developing hindbrain to form the otic placode. Though it is known that cells from a wide
area converge to form this structure, little is known of the mechanisms by which this is
achieved. Therefore, much work is being done to identify the important factors in this
process from the bewildering array of signalling molecules – primarily of the FGF family –
that are likely to be involved (Groves 2005) and recent work is beginning to unravel this
extremely complicated signalling network (Zelarayan et al. 2007).
Subsequently, the cup invaginates and a large number of apoptotic cells are detectable at
its edges. As the cup begins to close off from the surface epithelium, the diminishing
opening between the developing otic cup and the surface becomes known as the otic pore.
Apoptotic cells continue to line this pore and are thought to be required to break down its
lumen, the obliteration of which results in the otic cup pinching off from the surface
ectoderm. The developing inner ear is now known as the otocyst, which is a roughly
spherical space that is lined by a pseudo-stratified epithelium (Kelley 2007;Leon et al. 2004).
Throughout otic cup and otocyst development, specific proteins demarcate different
functional domains which are anatomically indistinguishable. These protein domains define
the axes of the developing labyrinth and some proteins are required to establish the axes
whilst others are expressed as a result of axis specification. The three axes that are

1 General introduction 27
established by this process are the anteroposterior axis, dorsoventral axis and mediolateral
axis (see Figure 1.4a) (Bok et al. 2007).
Protein expression at this stage and beyond is better understood than that of placode
induction. The anteroposterior axis is the first to be established and is first identifiable in
the invaginating otic cup though cells in the anterior and posterior domains are unlikely to
have become committed to their fate until the cup is half-closed. The signals responsible for
the establishment of this axis are unknown; it was thought that signals from the hindbrain
were responsible though recent experiments in the chick have cast doubt on this hypothesis.
The axis itself, however, is quite clear with multiple genes being selectively expressed in
the anterior region (Fgf10, Lfng, Delta1, Ngn1 and NeuroD) from which neuroblasts
delaminate soon after otic cup closure to form the cochleovestibular ganglion (CVG, initially
known as the statoacoustic ganglion (Fritzsch et al. 1998)) (Bok et al. 2007;Kelley 2006).
These neuroblasts migrate into the mesenchymal space ventromedial to the otocyst. They
subsequently return axons to innervate the sensory epithelia that develop near to where
they were generated (Abello et al. 2007). The expression of a different group of genes (Tbx1,
Otx1, Otx2 and Goosecoid) becomes detectable in the posterior otic cup at the same time as
the known anterior markers. Tbx1 – which is among the best studied of these markers – is
thought to be responsible for maintaining the posterior domain by preventing anteriorly
expressed genes from extending their expression into more posterior regions (see section
1.2.2 for Tbx1 function in the developing sensory epithelium) (Bok et al. 2007;Mansour et al.
2005). Consistent with a role in limiting the anterior neurosensory fate, Tbx1 deletion
results in a 1.83-fold increase in the size of the CVG (Raft et al. 2004).
Like the anteroposterior axis, markers of the dorsoventral axis are identifiable at the otic
cup stage though the cells in these domains are thought to commit to their fate later than
those in the anteroposterior axis. It has been shown that the dorsoventral axis is required
for the specification of the cochlea and saccule from the ventral otocyst (pars inferior), and
of the semicircular canals and utricle from the dorsal otocyst (pars superior) (Bok et al.
2007;Leon et al. 2004). Unlike the anteroposterior and mediolateral axes, the inductive
signals for the dorsoventral axis are known. The developing hindbrain secretes Wnt factors
that induce the dorsal otic markers (Dlx5, Dlx6, Hmx2, Hmx3 and Gbx2) and sonic
hedgehog (Shh)/Gli signals that define the ventral domain (marked by Lfng, Ngn1,
NeuroD1, Sox2 and Six1). Furthermore, Shh signalling restricts Wnt expression to the
dorsal region though it is unknown how Shh signalling is regulated. Other ventrally
expressed proteins (Six1 and Eya1) have also been shown to be involved in this process as
Wnt and Shh knockout animals do not completely lose their dorsoventral patterning.
However, it is unclear how these signals are regulated and, as their function does not fully
explain the observed morphogenesis, it is thought that at least one other hindbrain signal is
required for ventral patterning (Bok et al. 2007;Mansour et al. 2005).

1 G
en
era
l in
trod
uct
ion
2
8
Fig
ure
1.4
. In
ne
r e
ar
mo
rph
og
en
esis
. a)
Sch
em
atic
repre
senta
tion
of
the
thre
e-
dim
ensio
na
l axes o
f th
e in
ner
ear.
b)
Sche
matic
repre
senta
tio
n o
f th
e o
tocyst
with its
rela
tions t
o
the
spatia
l orig
ins
of
the
sensory
epith
elia
, endo
lym
phatic
duct
an
d
cochle
ovestib
ula
r gang
lion
in
dic
ate
d.
ED
, e
ndoly
mpha
tic d
uct; C
S,
crista
superi
oris;
MS
, m
acula
saccu
li;
MU
, m
acula
utr
iculi;
CP
, crista
poste
riori
s;
CL,
crista
la
tera
lis;
OC
, org
an
of
Cort
i;
CV
G,
cochle
ovestibu
lar
ga
nglio
n (
based
on F
igure
6
in
Rin
kw
itz
et
al.
200
1).
c)
la
tera
l vie
ws
of
pain
t-fille
d
mem
bra
nous
labyrinth
s
from
develo
pin
g
mouse
in
ner
ears
. S
ca
le
bar,
200µ
m.
ed,
endo
lym
phatic duct; co,
cochle
ar
duct;
aa,
ante
rior
am
pulla
; asc,
ante
rior
sem
icircula
r can
al;
cc,
com
mo
n
cru
s;
es,
endo
lym
phatic
sac;
la,
late
ral
am
pu
lla;
lsc,
late
ral sem
icircula
r cana
l; p
a,
poste
rior
am
pu
lla;
psc,
poste
rior
sem
icircula
r canal; s
, saccule
; u
, utr
icle
(a
dapte
d
from
F
igure
1
in
Bok
et
al.
2007).
c)
the
deve
lop
men
t of
the
pro
sensory
patc
hes of
the m
em
bra
no
us la
byrinth
an
d th
e
mark
ers
th
at
div
ide
these
dom
ain
s.
Th
e
poste
rior
pro
sensory
p
atc
h
(whic
h
form
s
the
poste
rior
crista
) and
th
e
dors
al
part
of
the
ante
rove
ntr
al str
ipe (
whic
h f
orm
s t
he late
ral and
ante
rior
crista
e)
expre
ss S
ox2 a
nd B
mp4
. T
he
ventr
al
part
of
the
ante
roventr
al
str
ipe (w
hic
h
form
s th
e u
tric
ula
r m
acu
la,
saccula
r m
acula
and
org
an of
Cort
i) expre
sses S
ox2 a
nd L
fng.
pc,
poste
rior
crista
; lc
, la
tera
l crista
; ac,
ante
rior
crista
; m
u,
macula
utr
icu
li; m
s,
macula
sacculi;
oc,
org
an o
f C
ort
i (a
da
pte
d f
rom
Fig
ure
3 in B
ok
et a
l. 2
007).
Pic
ture
rem
oved
for
cop
yri
gh
t p
urp
ose
s P
ictu
re r
em
oved
for
cop
yri
gh
t p
urp
ose
s
Pic
ture
rem
oved
for
cop
yri
gh
t p
urp
ose
s
Pic
ture
rem
oved
for
cop
yri
gh
t p
urp
ose
s

1 General introduction 29
The final axis to become identifiable – though it is likely to be specified much earlier than it
becomes visible – is the mediolateral axis. Current evidence suggests that medial domain
identity is acquired due to Wnt and Fgf signals from the hindbrain and that the
specification of the lateral domain is also guided by signals from the hindbrain. However,
the latter process is poorly understood and the roles of midline structures (i.e. the
notochord and floorplate) require further characterisation, as does the role of hedgehog
signalling (Whitfield et al. 2007).
Shortly after its appearance, and following the establishment of its axes, the otocyst is
largely capable of completing its development independent of signals from its surrounding
mesenchyme (approximately E11.5 in mice) (Fritzsch et al. 1998). From this point on,
cellular proliferation, differentiation and survival – both in the otocyst and CVG – are
essential for otocyst growth and development. These processes are initially dependent on
insulin-related growth factor signalling that is balanced by apoptotic hotspots (Leon et al.
2004).
1.2.2 Late inner ear and sensory epithelial development
The first structures to emerge from the ellipsoid otocyst are the endolymphatic and cochlear
ducts. The endolymphatic duct arises from the dorsomedial aspect of the otocyst (Kelley
2006;Rinkwitz et al. 2001) and a group of apoptotic cells are visible at the junction of the
developing endolymphatic duct with the otocyst; this process may aid duct formation by
limiting epithelial proliferation (Fekete et al. 1997;Leon et al. 2004). Similarly – both
temporally and morphologically – the cochlear duct extends from the ventral otocyst and an
apoptotic hotspot is visible on the ventromedial otocyst. This spot is located where the
cochlear duct joins the saccule and persists for much of cochlear duct extension where it
may direct differentiation between these two regions (see Figure 1.4c) (Leon et al. 2004). As
these structures extend, the prosensory regions of the developing otic vesicle (regions that
will give rise to the three cristae, utricular macula, saccular macula and organ of Corti)
become identifiable as thickened epithelial plaques containing nascent CVG neurites
(Kelley 2006).
Prosensory domain development
Initially, two prosensory domains are identifiable: a posterior spot that goes on to form the
posterior crista and the anteroventral stripe that forms the rest of the sensory epithelia (see
Figure 1.4d) (Bok et al. 2007). It is currently unclear whether the posterior region separates
from the remainder of the developing prosensory domain or if the two regions arise
separately (Kelley 2006). These prosensory regions are marked by SRY-box containing gene
2 (Sox2) which is expressed in both of the initial prosensory domains and, in mice, has been

1 General introduction 30
shown to be required for the normal development of the sensory epithelia (Dabdoub et al.
2008;Kiernan et al. 2005b).
The earliest known network that is involved in the specification of these regions is the
Notch signalling network. Experiments in chicks, zebrafish and mice have shown that the
Notch receptor (Notch1) is expressed early in development, before the development of the
otic placode. Its expression is maintained throughout the remaining development of the
otocyst and inner ear and its function is thought to be in the regulation of the size of the
initial sensory patch through regulation of the placement of sensory/non-sensory
boundaries. However, it is not thought to be required for sensory patch specification
(Daudet et al. 2007;Kelley 2006).
Consistent with a role for Notch receptors in prosensory domain patterning, the Notch-
related genes lunatic fringe (Lfng) and jagged 1 (Jag1) are expressed in patterns consistent
with the development of the prosensory domain. LFNG is a modulator of Notch
glycosylation (Panin et al. 2002) that is expressed in the anteroventral prosensory domain;
the region that gives rise to the utricular macula, saccular macula and organ of Corti. In
non-mammalian vertebrates, the modification of Notch glycosylation by LFNG has been
shown to inhibit the sensitivity of Notch 1 to one of its ligands: serrate. The mammalian
homologue of serrate is Jag1, which is expressed in a pattern that abuts the prosensory
domain during its specification. Though it has been suggested that Jag1 and Notch
signalling are involved in the specification of sensory patches, experiments in chick and
zebrafish seem to contradict this hypothesis. However, redundancy in mammalian Notch
signalling may explain the conflicting data in this field. Therefore, elucidating the role of
each of the above genes in prosensory specification and development is likely to determine
which factors are necessary for prosensory domain specification (Daudet et al. 2007;Kelley
2006).
Another gene that is implicated in prosensory domain development is Tbx1 As previously
mentioned Tbx1 is expressed posteroventrally and is responsible for restricting neuroblast
development from the anterior (CVG-forming) domain (Bok et al. 2007). It is therefore
protective of the cells of the posterior domain which overlaps with the prosensory domain
from which the non-neuronal sensory cells arise (Bok et al. 2007;Kelley 2006). Consistent
with this model, over-expression of Tbx1 leads to an enlarged sensory epithelium and Tbx1
mutation in humans results in a syndrome which includes sensorineural hearing loss
amongst its signs (Di George syndrome) (Bok et al. 2007;Kelley 2006).
Tbx1 expression overlaps with that of bone morphogenetic protein 4 (Bmp4) – a member of
the transforming growth factor beta superfamily – in the posteroventral region of the
otocyst. Though expression of Bmp4 is initially diffuse and located in the posteroventral otic

1 General introduction 31
cup, its expression is later refined to the nascent cristae i.e. the non-Lfng-expressing
prosensory regions (see Figure 1.4d) (Cole et al. 2000;Pujades et al. 2006). As for Notch,
BMP4 signalling was thought to be involved in specification of prosensory patches and
experiments designed to test this hypothesis yielded unclear results. However, a consistent
theme has emerged from these experiments suggesting that BMP4 is involved in cellular
patterning of the developing sensory domains; consequently, manipulation of BMP4
signalling results in abnormal hair cell numbers in a chick model (Pujades et al. 2006).
A number of other markers, e.g. Islet1, prospero-related homeobox 1 (Prox1) and fibroblast
growth factor 16 (Fgf16), have also been shown to be expressed in patterns that are
consistent with that of the developing prosensory region and their function is currently
being studied (Bermingham-McDonogh et al. 2006;Radde-Gallwitz et al. 2004;Wright et al.
2003). The characterisation of these factors, along with the factors described above, has
significantly improved our understanding of prosensory domain establishment and
development. This is allowing a shift in focus in this research area from the identification of
regional markers to the full understanding of the mechanisms of prosensory specification
and development.
Semicircular canal development
The semicircular canals are required for delivering rotational acceleration forces to the
cristae for transduction. These canals develop alongside their respective cristae though they
arise from the dorsolateral otocyst rather than the posterior or anteroventral otocyst from
which the cristae originate (Rinkwitz et al. 2001). The nascent semicircular canals
evaginate from the otocyst to form the anterior and posterior canal genesis zones prior to
that of the lateral semicircular canal. In higher vertebrates, the epithelia of the opposing
walls of the pouch come into contact during pouch extension to form a ‘fusion plate’ at the
centre of the pouch. Apoptotic cells appear within these fusion plates at the time of
epithelial contact which occurs in the order of semicircular canal development (anterior
first, then posterior and, finally, lateral). The clearance of epithelial cells from the centre of
the canal that results from these apoptotic foci gives rise to the anatomy of the mature
semicircular canal. Consequently, inhibition of apoptosis leads to defects in the clearing of
the centres of the semicircular canals in chick experiments (Fekete et al. 1997). Alongside
central clearing, each canal develops an ampulla at one end that houses its respective crista
(i.e. the anterior end of the anterior canal, the posterior end of the posterior canal and the
anterior end of the lateral canal) (see Figure 1.4c & d) (Bok et al. 2007;Leon et al. 2004).
Utricle and saccule formation
As the Lfng-expressing region of the anteroventral prosensory domain develops, it
eventually segregates into the utricular macula, saccular macula and organ of Corti. The
first of these three to separate is the utricular macula, which is known to become

1 General introduction 32
independent of the anteroventral stripe by E12 in the mouse. The Ngn1 and Notch
pathways are then thought to regulate the maturation of this epithelium by guiding cell
fate determination i.e. differentiating hair cells, support cells and neural cells. The saccular
macula separates from the anteroventral stripe in a similar manner to the utricular macula
at E13. As with the utricular macula, members of the Ngn1 and Notch signalling pathways
are thought to be involved in guiding its terminal development (see Figure 1.4d) (Bok et al.
2007).
The processes before and after separation of these epithelia are being elucidated and little
is known about the process by which these epithelia become distinct from the anteroventral
stripe and each other. A number of genes (Hmx2, Hmx3, Otx1, and Otx2) are thought to be
active in influencing this process from the non-sensory tissues that surround the
prosensory domain and only one protein, GATA3, is known to be differentially expressed
between the utricle and saccule at this stage (Bok et al. 2007;Karis et al. 2001). Also, a
conserved region of apoptotic cells is consistently observed at the junction of the cochlea
and saccule in a site that goes on to form the ductus reuniens (the duct that joins the scala
media to the saccule) which is likely to be required for the separation of these organs
(Fekete et al. 1997;Leon et al. 2004;Nishikori et al. 1999).
As prosensory development proceeds, additional apoptotic hotspots are observed within and
around the sensory epithelia and within the CVG (including the cristae and organ of Corti).
These are thought to be required to allow axons that have been extended from the CVG to
penetrate the sensory epithelium and contact sensory cells, as well as aiding in CVG
maturation (Bok et al. 2007;Fekete et al. 1997;Leon et al. 2004).
Cochlear extension and maturation
As the cochlear duct extends from the otocyst, it begins to take on its mature (coiled)
appearance at around E12 in the mouse (Kelley 2007). The prosensory domain continues to
be marked by SOX2 and LFNG whilst a non-sensory stripe of BMP4 expression becomes
visible on the opposite wall of the extending cochlear duct after prosensory plaque
specification (see Figure 1.4) (Bok et al. 2007).
Between E12 and E14, cells in the nascent organ of Corti exit the cell cycle in an apical to
basal wave and, from this point on, there is minimal cell proliferation and apoptosis in this
developing sensory epithelium (Jones et al. 2007;Ruben 1967). The cochlear duct continues
to transform after this terminal mitosis in a basal to apical direction and does not complete
its coiling until approximately E19-P0 (see Figure 1.4d) (Jones et al. 2007;Kelley 2007).
This elongation process changes the cochlear duct from a short, thick structure (the dorsal
cochlear floor is four to six cells deep when the cochlear duct first appears) to a much longer

1 General introduction 33
and thinner structure that is only two cell layers deep in the mature organ of Corti (see
Figure 1.5) (Kelley 2007).
The proposed model by which cochlear growth is achieved in the absence of cellular
proliferation is known as convergent extension. This model is based on the process by which
many axial structures develop across phyla (Zajac et al. 2000) and by which the body axis is
elongated in vertebrate gastrulation and neurulation (Jenny et al. 2006). In this model,
cells in the developing epithelium elongate and subsequently intercalate as they move
towards the lumen of the cochlear duct, causing growth along the basal-apical axis. As cells
no longer proliferate at this stage, the cochlear duct epithelium becomes thinner as
epithelial cells intercalate and as the cochlear duct elongates (Jones et al. 2007;Wang et al.
2005). This cochlear extension occurs at the same time as the organisation of planar cell
polarity (PCP) in the nascent organ of Corti (see section 1.3.3).
Once the inner ear has completed its morphogenesis, the elaborate structures that have
been created become encased in bone (the otic capsule). Correct formation of the otic
capsule is dependent on signaling between the epithelium of the cochlear duct and the
surrounding mesenchyme e.g. the Shh-Tbx1-Pou3f4 axis in the periotic mesenchyme is
required for normal duct patterning (Bok et al. 2007;Rinkwitz et al. 2001). Once the capsule
ossifies around the membranous labyrinth, there is no further growth in the inner ear – a
fact that is exploited in paediatric cochlear implantation, as implants do not need to be
changed as children grow.
1.2.3 Summary of inner ear development
A large number of dynamically expressed factors are now known to be required to
transform the flat otic placode into the complicated three-dimensional labyrinth. The high
resolution that is being achieved in the identification and characterisation of expressed
factors in this process is aiding in the emerging understanding of the precise contribution of
each of these factors. Apart from explaining the causes of a number of human deafnesses –
e.g. X-linked deafness seen in DFN3 (Pou3f4 mutation) (de Kok et al. 1995) – these
processes precede or coincide with hair cell development (see next section) and, therefore,
signalling networks involved in morphogenesis may influence future therapies to prevent or
reverse hearing loss.

1 General introduction 34
1.3 Hair cells There are four different types of hair cell in the mammalian inner ear. Inner hair cells
(IHCs) and outer hair cells (OHCs) of the cochlea are required for auditory transduction
whilst Type I and Type II vestibular hair cells are found in the remaining inner ear sensory
epithelia and are required for balance sensation (Kingsley 1999b;Kingsley 1999a). These
functions depend on the specialised anatomy and physiology of the sensory epithelia and
require functional hair cells. Consequently, hair cell loss causes loss of hearing and
vestibular function that is irreversible in mammals, where hair cells do not regenerate.
1.3.1 Hair cell and support cell specification
Cochlear hair cells arise from a group of mitotically quiescent cells of the prosensory patch
in the elongating cochlear duct. In many neuronal systems, excessive progenitor cells are
produced and subsequently eliminated to produce mature patterning. However, the
cochlear prosensory domain does not follow this model as it appears to have the required
number of cells for full development at the time of terminal mitosis as supported by the
lack of apoptosis in this region (Kelley 2007). Therefore, the timing of the terminal mitosis
requires precise control to ensure correct development. Though the signals that control the
timing of terminal mitosis are unknown, one of the first identifiable effectors of this timing
mechanism is the cyclin kinase inhibitor p27Kip1 (Kelley 2007).
Most progenitor cells in the nascent organ of Corti of the mouse cochlear duct have long
been known to exit the cell cycle between E13 and E14 beginning in the apex and
progressing to the base (Ruben 1967). This wave of terminal mitosis creates an apical-to-
basal line of mitotically quiescent cells along the middle of the developing sensory
epithelium that encompasses the full thickness of the epithelium and is called the zone of
non-proliferation (ZNP) (Chen et al. 1999;Chen et al. 2002). Consistent with its known role
in cell cycle regulation, p27Kip1 expression begins abruptly at the cochlear apex at E12 and
extends basally, to become strongly expressed throughout the ZNP by E14 (Chen et al.
1999). The temporal and spatial correlation of p27Kip1 expression with mitotic quiescence, as
shown by BrdU studies, provides evidence for its requirement in preventing mitosis in this
region (see Figure 1.5a) (Chen et al. 2002). Results from p27Kip1 knockout mice support this
result as they show a delay in terminal mitosis that is associated with supernumerary hair
cells and severe hearing loss (Chen et al. 1999;Lowenheim et al. 1999).
Though mitosing cells are identifiable in the organ of Corti of p27Kip1 knockout mice as late
as postnatal day six (the latest date investigated) (Chen et al. 1999), both hair cells and
support cells are able to stop mitosing and differentiate. This indicates that another factor
or other factors are involved in halting mitosis in the developing organ of Corti and
retinoblastoma (Rb) has been shown to be one such factor.

1 G
en
era
l in
trod
uct
ion
3
5
Fig
ure
1.5
. D
evelo
pm
en
t o
f th
e o
rgan
of
Co
rti.
a)
cells
exit t
he c
ell
cycle
in
the m
iddle
of
the d
eve
lopin
g m
ouse c
och
lear
duct
flo
or
in s
ection
. M
ito
tic q
uie
scence is d
em
onstr
ate
d b
y a
lack o
f B
rdU
sta
inin
g a
nd b
y
expre
ssio
n o
f p2
7K
ip1 in t
he Z
NP
(ta
ken f
rom
Fig
ure
2 in C
he
n e
t a
l. 2
002).
Ato
h1 is e
xpre
ssed in h
air c
ells
sh
ort
ly a
fter
term
ina
l m
itosis
as s
een in a
cochle
ar
culture
(t
aken f
rom
Fig
ure
1 in
Ch
en e
t al. 2
002).
b)
a n
ew
mode
l of
ce
llula
r d
evelo
pm
en
t in
the
org
an o
f C
ort
i in
the
rat.
Red
, in
ner
pill
ar
cell;
purp
le,
inn
er
hair
cell;
bro
wn
, support
cells
. G
ER
, gre
ate
r epith
elia
l ridg
e;
LE
R,
lesser
epithelia
l ridg
e (
taken f
rom
Fig
ure
11 in T
he
len e
t al. 2
009).
c)
Ato
h1 e
xpre
ssio
n in a
n a
pic
al section o
f th
e
E15.5
mo
use c
ochle
ar
duct. A
TO
H1-e
xpre
ssin
g n
ascent
ha
ir c
ells
initia
lly f
orm
a p
illar
and a
re t
hen t
houg
ht
to i
nte
rcala
te i
n a
basa
l-to
-apic
al
directio
n r
esultin
g i
n
converg
ent
exte
nsio
n (
CE
) of th
e c
och
lea
(ta
ke
n fro
m F
igure
5 in
Ch
en e
t al. 2
00
2).
d)
mod
el of
mo
use o
rga
n o
f C
ort
i a
nd
ha
ir c
ell
deve
lop
ment
(take
n fro
m F
igure
8
in C
hen e
t a
l. 2
00
2).
a)
b)
c)
d)
Pic
ture
rem
oved
for
cop
yri
gh
t p
urp
ose
s P
ictu
re r
em
oved
for
cop
yri
gh
t p
urp
ose
s
Pic
ture
rem
oved
for
cop
yri
gh
t p
urp
ose
s P
ictu
re r
em
oved
for
cop
yri
gh
t p
urp
ose
s

1 General introduction 36
Rb is upregulated at E15.5 in basal hair cells (i.e. during early hair cell differentiation) and
its expression extends from the base to the apex following the wave of hair cell
differentiation (see section 1.3.2). It is subsequently expressed throughout the ZNP, and is
weakly expressed in other cochlear cells (Liu et al. 2008;Mantela et al. 2005;Sage et al.
2005). Current evidence shows that Rb protein is required for the maintenance of mitotic
quiescence in the organ of Corti and in the terminal maturation of outer hair cells through
an unknown mechanism (Mantela et al. 2005;Sage et al. 2005;Sage et al. 2006). Given its
role in prevention of proliferation, Rb inhibition is thought to be a potential strategy for
hair cell regeneration as hair cells re-enter the cell cycle when Rb is inhibited. However, the
hair cells produced by this method subsequently die by apoptosis. Therefore, further work
on short-term inhibition of Rb function is required to clarify whether hair cells can be made
to minimally mitose without proceeding to apoptosis or oncogenesis (Sage et al. 2006).
Following the induction of mitotic quiescence in the ZNP by p27Kip1 and Rb, it is thought
that the cyclin kinase inhibitors p19Ink4d and p21Cip1 are required to prevent hair cells re-
entering the cell cycle. Codeletion of these factors results in a sudden loss of cell cycle
control at P3 (in mice) and inappropriate S phase entry of hair cells with the production of
supernumerary hair cells. This dysregulation leads to p53-mediated apoptosis of mitosing
hair cells resulting in a phenotype similar to that of Rb knockout mice and supporting the
hypothesis that maintenance of hair cells in the postmitotic state is dependent on a
network of interacting cyclin kinase inhibitors (Laine et al. 2007).
At the time that the ZNP is established, it is thought that its constituent cells have equal
potential to become hair cells or support cells and that only cells of the ZNP contribute to
the organ of Corti (Kelley 2007). Within the ZNP hair cells and support cells are born
simultaneously, suggesting that they share a common lineage, with viral tracing studies in
the chick confirming that hair cells and support cells share a common progenitor (Fekete et
al. 1998). Though it is thought that IHCs are the first cells to become identifiable in the
maturing organ of Corti, recent work in developing rats has cast doubt on this as high
resolution electron microscopy techniques have revealed cells whose morphology is
consistent with that of inner pillar cells prior to IHC detection (Thelen et al. 2009).
If inner pillar cells are indeed the first cells to differentiate following terminal mitosis in
the ZNP, IHCs are the next cell type to become identifiable, followed by the OHCs and
support cells (see Figure 1.5b) (Thelen et al. 2009). The IHCs are located on the modiolar
side of the border between the greater and lesser epithelial ridges where inner pillar cells
develop. The earliest marker of hair cells is the basic helix-loop-helix (bHLH) transcription
factor Atoh1 (formerly known as Math1) which marks a column of nascent inner hair cells
that span the distance from the BM to the lumen of the cochlear duct (see Figure 1.5c)
(Chen et al. 2002). Many conflicting results are available regarding when Atoh1 is first

1 General introduction 37
detectable, though it is accepted that this transcription factor is initially expressed basally
in a diffuse group of cells at E12.5 and later refined to be expressed more specifically in
nascent HCs once they have adopted their fate (see Figure 1.5a) (Kelley 2007). However, it
has not been proven whether all of the cells of the Atoh1-positive column become hair cells
or if only the luminal cells adopt the hair cell fate and it is therefore unclear whether all
Atoh1-positive cells at this stage are committed to the hair cell fate (Chen et al.
2002;Goodyear et al. 2006).
Atoh1 is thought to be initially maintained at low levels by the HLH proteins Ids1, Ids2 and
Ids3 until, through an unknown mechanism, Atoh1 expression is able to rise above a
threshold in nascent hair cells. This allows it to regulate its target genes and may allow it
to positively autoregulate. Two of the genes that are upregulated in Atoh1-expressing cells
are the Notch ligands Jag2 and Delta-like 1 (Dll1). These factors mediate a process of
lateral inhibition by acting on the Notch1 receptor of adjacent cells, thereby initiating the
expression of Notch target genes in these cells (Hes1 and Hes5), causing them to
differentiate as support cells (Kelley 2007;Kiernan et al. 2005a). Consistent with this model,
dysregulation of Notch signalling – e.g. by deletion of the Nr2f1 nuclear receptor – disrupts
normal patterning of the sensory epithelial mosaic (Kelley 2007;Tang et al. 2006) and alters
the expression of the prosensory marker Sox2, which is downregulated in Atoh1-expressing
cells through an unknown mechanism. However, Sox2 expression is maintained in support
cells – most likely due to Notch-mediated upregulation – where it is able to induce the
homeodomain transcription factor Prox1 to suppress the hair cell fate, thereby preventing
overproduction of inner hair cells (Dabdoub et al. 2008;Kelley 2007).
1.3.2 Hair cell differentiation
Soon after the onset of Atoh1 expression, a number of hair cell-specific proteins become
identifiable. The cells that express these markers subsequently develop morphologically,
acquiring the specialised structures required for MET and electromechanical transduction
(in OHCs), and gaining functional maturity. Hair cell differentiation proceeds in a basal-to-
apical direction (Lim et al. 1985).
One of the first known steps in hair cell differentiation is the downregulation of the
connexin genes that leads to a loss of gap junctions. In chick studies, this downregulation
has been shown to precede morphological changes in hair cells and occurs with a decoupling
of developing hair cells from much of the basal extracellular matrix so that only the most
basilar of the column of nascent hair cells has contact with the underlying extracellular
matrix (similar to the developing mouse organ of Corti) (Bryant et al. 2005;Chen et al. 2002).
Unlike gap junctions, tight junctions and adherens junctions are retained by developing
hair cells (Bryant et al. 2005). At the hair cell apices, tight junctions become more complex

1 General introduction 38
as development proceeds with adherens junctions developing beneath them. These apical
junctions become mature as the endocochlear potential is generated at P6 in mice. They
also define the junction between apical and lateral membranes in the hair cells and this
distinction is thought to allow trafficking of different proteins to these different sites
(Bryant et al. 2005).
Almost immediately after hair cell specification and onset of Atoh1 expression, hair cells
begin to express an array of marker genes. These include the calcium-binding proteins
calmodulin, calretinin and parvalbumin; the unconventional myosins VI, VIIa and XVa (see
section 1.3.3); and the POU-domain transcription factor, POU4F3 (see section 1.5.3)
(Bryant et al. 2005;Xiang et al. 1998). Calretinin and parvalbumin are also expressed in
sensory ganglion neurons making them less specific markers for early differentiating hair
cells (Xiang et al. 1998). In contrast to this, other factors are downregulated as hair cells
differentiate, e.g. the gap junctions and GATA3, the latter of which is first downregulated
in hair cells and subsequently downregulated in support cells (Rivolta et al. 1998b).
As well as the signalling proteins described, retinoic acid signalling is known to be involved
in hair cell development. In the embryonic organ of Corti, it is known to promote
differentiation of epithelial cells to hair cells and accompanying support cells. It normally
acts through hetero-dimers of its receptors (Goodyear et al. 2006) of which retinoic acid
receptor (RAR) α, retinoid X receptor (RXR) α and RXRβ are expressed by E13 in the
cochlear epithelium, becoming more strongly expressed as hair cells develop (though RAR α
expression is rapidly suppressed between E17 and P3) (Raz et al. 1999). Treatment of
cochlear cultures with a retinoic acid antagonist causes changes in the expression of Pou4f3
and myosin VIIa but does not affect myosin VI expression, suggesting that retinoic acid
signalling is not required for hair cell specification but is responsible for hair cell
maturation. The fact that not all markers are eliminated when retinoic acid signalling is
suppressed suggests that there is more than one differentiation pathway at work in nascent
hair cells (Raz et al. 1999).
1.3.3 Morphological maturation of hair cells
As described in section 1.1.3, hair cells display highly specialised apical structures called
stereocilia that are grouped together to form a hair bundle that is required for
mechanoelectrical transduction (MET). Stereocilia are identifiable early in hair cell
differentiation with scanning electron microscopy studies in the developing mouse showing
that they are first observable at E12.5 in the utricle and E13.5 in the cristae and saccule
(Bryant et al. 2005;Goodyear et al. 2006). In the cochlea they have been tentatively
identified at E15 by transmission electron microscopy (E18 in rat as shown by scanning
electron microscopy) (Bryant et al. 2005;Goodyear et al. 2006;Siemens et al. 2004;Zine et al.
1996).

1 General introduction 39
A striking feature of the mature organ of Corti is the high regularity and identical
orientation of its cells and cellular organelles including hair bundles. This regularity arises
because cells must be correctly oriented in the organ of Corti if they are to respond
appropriately to movements of the BM. A similarly strict regulation of orientation is
exhibited in the vestibular sensory epithelia (Kelly et al. 2007). At the hair cell apices, this
process of polarisation can be seen in the development of the hair bundles.
Around the time that they are born, hair cells have polygonal apices with many microvilli
and a kinocilium (a true cilium) at the centre (Zine et al. 1996). Lateralisation of the
kinocilium is one of the earliest events in hair bundle development, and this initiates
asymmetry in the hair cell apex. The bundle develops centrally in a circular shape but is
refined to its adult shape as development proceeds. Mature OHC hair bundles are W-
shaped and IHC hair bundles are characteristically straight or slightly curved (see Figure
1.6a) (Kelly et al. 2007). Consistent with the wave of hair cell differentiation, stereocilia
first appear in the basal region of the cochlea and are later detectable apically (Zine et al.
1996). As they grow, they undergo extensive remodelling to achieve their mature
morphology e.g. tapering at the base and repositioning on the apex. The regular rows of
both IHC and OHC hair bundles mature to form a ‘staircase’ pattern in which adjacent
rows of stereocilia increase in height in the modiolar to striolar direction (Bryant et al.
2005;Goodyear et al. 2006). The staircase arrangement of stereocilia becomes more
apparent throughout the P0-P4 age range and, by P4-P6, hair bundles attain their adult
shape (Lelli et al. 2009;Nishida et al. 1998); the kinocilia are also lost at P6 (Lelli et al.
2009). By the time of functional hair cell maturation (P10-12), apical hair cell stereocilia are
longer than those in the base due to their faster growth rate and due to shortening of basal
hair cell stereocilia (see Figure 1.6b) (Bryant et al. 2005;Goodyear et al. 2006;Lelli et al.
2009).
Though the kinocilium is initially moved in the same direction in all hair cells, apical cell
polarity is not as strictly aligned as it will become as the organ of Corti matures. A
microfilament network that runs parallel to the apical membrane – which is associated
between hair cells and support cells through adherens junctions – may be involved in
signalling this polarization and striated rootlets parallel to the hair cell apices may be
involved in positioning the kinocilia. Though the orientation of the bundles is slightly
variable early in hair bundle development (e.g. at E17 in the mouse cochlea), by P10, there
is very little difference in bundle orientation between hair cells (Goodyear et al. 2006). This
orientation process is thought to be mediated by a group of genes that control similar cell
polarity processes in Drosophila development (Celsr1, Vangl2, Frizzled and members of the
Wnt signalling pathway) (Kelly et al. 2007).

1 General introduction 40
Figure 1.6. Stereocilial links and structure. a) Scanning electron micrograph of the mid-basal guinea pig organ of Corti showing mature stereocilial morphology. Red arrow, IHCs; blue arrows, OHCs; asterisk, tunnel of Corti; green arrows, neurons (adapted from Lenoir 1999). b) electron micrographs of the five different types of link seen in the hair bundle (centre) (taken from Figure 1 in Nayak et al. 2007). c) a recent model of MET at the stereocilial apex. In this model, stereocilial movement in the excitatory direction puts tension on the tip-links (composed of CDH23 apically and PCD15 basally), physically opening the MET channel (mc), thus allowing small cations to enter. The upper portion of the tip-link is attached by a harmonin isoform and the tip-link is maintained at optimum tensions by a process of adaptation that requires MYO1C (taken from Figure 7 in Grillet et al. 2009).
The stereocilia – which more closely resemble enlarged microvilli than true cilia like the
kinocilium – are known to be composed of a large number of proteins. Cytoskeletal core
proteins Actin, Fimbrin, and Espin form much of the stereocilial structure whilst the
unconventional hair cell myosins are required for correct stereocilial development and
function. In mice, a myosin VI mutation leads to a circling and deaf phenotype (Snell’s
waltzer); a myosin VIIa mutation causes vestibular dysfunction and deafness (Shaker1);
and a myosin XVa mutation causes deafness and circling behaviour (Shaker2) (Goodyear et
al. 2006;Liang et al. 1998). Though the precise functions of these molecular motors are
unknown, the above mutations are known to cause auditory and vestibular defects by
disruption of the hair bundle (Bryant et al. 2005;Goodyear et al. 2006).
As the stereocilia mature, links between them become apparent. These links have been best
characterised in the chick basilar papilla where, from hair bundle apex to base, tip-links,
horizontal top connectors, shaft connectors and ankle links have been identified (Bryant et
al. 2005;Goodyear et al. 2006). If the kinocilium is still present (i.e. before P6 in the mouse
cochlea), then there are also abundant kinocilial links present which join the kinocilium to
the immediately adjacent stereocilia in the tallest row of the hair bundle (see Figure 1.6b)
(Nayak et al. 2007). The tip-links grow radially between the stereocilia and are later refined
a) b)
c)
Picture removed for copyright
purposes
Picture removed for copyright
purposes
Picture removed for copyright purposes

1 General introduction 41
to remove extraneous links, leaving only those that are in line with the direction of hair
bundle displacement (Waguespack et al. 2007). These are thought to be involved in the
gating of the MET channel (see section 1.3.4) and are formed by an asymmetric complex of
the cell adhesion molecules cadherin 23 and protocadherin 15 (Kazmierczak et al. 2007). A
large and heterogeneous group of mutations in these genes are known to cause deaf-
blindness in humans (Reiners et al. 2006) but only cause inner ear dysfunction in Ames
Waltzer mice due to abnormal stereocilial development; the difference between mice and
humans most likely being due to functional redundancy between different isoforms of these
cadherins in mice (Ahmed et al. 2008). The remaining links are thought to play a purely
structural role in co-ordinating hair bundles so that they move as a functional unit, though
their precise roles are uncharacterised (Bryant et al. 2005). Furthermore, the function of an
increasing array of cell membrane proteins (Integrins and Ptprq), PDZ-binding domain
proteins (Harmonin b, Whirlin and Sans) and downstream target genes of PCP genes and
integrins (Rho-GTPases) are being characterised in developing hair cells (Bryant et al.
2005;Goodyear et al. 2006) where they are also thought to be involved in hair bundle
maturation and function.
As well as the array of proteins described above, microRNAs have also been implicated in
normal hair cell development. These molecules bind to target mRNA and repress its
translation to produce subtle changes in protein expression (Weston et al. 2009). miR-96,
which is expressed from a primary transcript that also encodes miR-182 and miR-183, has
been shown to be required for normal hair cell development. Mutation in the seed region of
this microRNA (the part of the molecule that interacts with target mRNAs) causes hair
bundle deformity in heterozygous mice and very few recognisable hair cells in four to six
week old homozygotes. Heterozygotes consequently display highly raised hearing
thresholds and homozygotes have no detectable hearing at 4 weeks of age (Lewis et al.
2009). Furthermore, miR-96 mutation in humans causes a progressive autosomal dominant
hearing loss (Mencia et al. 2009). These effects are thought to be due to the dysregulation of
translation of 96 transcripts identified by microarray analysis (particularly Slc26a5, Ocm,
Gfi1, Ptprq and Pitpnm1 which are involved in hair cell development and function) (Lewis
et al. 2009).
At the hair cell apices, stereocilial roots insert into a dense body of cytoskeletal proteins
called the cuticular plate. This structure contains α-actin, spectrin, tropomyosin, myosin Ie
and myosin VI and is first identifiable at E14-15 in the mouse cochlea using an antibody
that recognises one of its unidentified components i.e. before stereocilia become detectable.
During its generation, many uncoated vesicles are present in the apical hair cell cytoplasm,
and coated pits suggest extensive endocytotic activity and high membrane turnover at the
apical membrane. As this subsides, the cuticular plate thickens and joins the hair cell apex
and neck by the formation of a junctional complex (Forge et al. 1993; Nishida et al. 1998).

1 General introduction 42
1.3.4 Functional maturation of hair cells
To perform their specialised functions properly, hair cells require a hair bundle with MET
channels; ion channels in the basolateral membrane (for K+ and Ca2+) with fast enough
kinetics to produce sufficiently sensitive receptor potentials; and adequately developed
synapses for the informative release of neurotransmitter. Mice start to hear at about P10-
12, at which point all of the above factors are in place. Electromechanical transduction is
also in place in OHCs at this stage (see below) (Kros 1996;Marcotti et al. 1999;Meyer et al.
2009). The development and mature function of these processes is described in this section.
Mechanoelectrical transduction
When hair cell stereocilial bundles are deflected away from the modiolus, it is thought that
tip-links are stretched due to the relative rotational movement of stereocilia in
neighbouring rows. The tension generated in the tip-links is transmitted to the as-yet
unidentified MET channel by an unknown coupling mechanism causing the influx of small
cations from the endolymph that results in hair cell depolarisation (Xu et al. 2009). These
tip-links are maintained at optimal tension by an adaptation process (Holt et al. 2000).
Gradually, more aspects of these processes are being identified and their development is
being characterised (see Figure 1.6c).
Morphologically, the transduction apparatus can be divided into the upper tip-link density
(UTLD), the tip-link, the lower tip-link density (LTLD) and the MET channel. It is thought
that the MET channel is located at the tips of the stereocilia though it is uncertain whether
it is located on taller or shorter stereocilia (though it is unlikely to be present at both ends
of the tip-link) (Fettiplace et al. 2006). The most recent model at the time of writing places
the MET channel at the top of the shorter stereocilia in the LTLD where force is
transmitted to it by the lower (PCD15) portion of the tip-link via an unknown mechanism
(Grillet et al. 2009). The upper part of the tip-link is composed of CDH23 and this part
inserts into the UTLD. A protein called harmonin has recently been shown to form part of
the UTLD and it is thought that harmonin couples CHD23 to the F-actin in the taller
stereocilium (see Figure 1.6c) (Grillet et al. 2009). Though harmonin a and/or b is known to
be primarily expressed at the UTLD in adult mice, different isoforms of harmonin are
expressed in different parts of the stereocilia and at different levels throughout
development (Boeda et al. 2002;Grillet et al. 2009).
The MET channel is known to be expressed as early as E18.5 in mice as its transducer
current (IT) develops in the basal cochlea at this date. It is thought that this early MET
channel expression (well before the onset of hearing) might be required to regulate hair
bundle maturation and to facilitate spontaneous action potentials that are generated by
developing hair cells (Kros 1996). Though the MET channel current is identifiable from

1 General introduction 43
E18.5 (in inner hair cells), cochlear IHCs and OHCs do not become mechanosensitive until
between P0 and P2 (Lelli et al. 2009). These hair cells are identifiable in the basal P0
cochlea with the developmental gradient of mechanotransduction moving from base to apex
to encompass all cochlear hair cells at P7 as demonstrated by FM1-43 staining (a styryl dye
that permeates the open MET channel (Gale et al. 2001)) (Lelli et al. 2009). Functional, but
closed, MET channels have been identified at earlier dates in these regions by deflecting
hair bundles and measuring evoked currents. By this method, >80% of OHCs in the mid
apical and apical turns are identified as being mechanosensitive at P2. Furthermore, there
is a systematic increase in the amplitude of maximal transduction currents (between P0
and P2 in the base and between P2 and P6 in the apex) with similar maturation of the
operating range (stabilising at P2-3 basally and P5-6 apically) and adaptation (stabilising
at P4 basally and P6 apically) (Lelli et al. 2009). It is thought that harmonin is required for
maturation of these MET transducer currents as the currents produced by mature
harmonin mutant cochlear hair cells resemble those of immature wild type hair cells
(Grillet et al. 2009).
Hair cell ion channels, currents, innervation and synaptic maturation
A full discussion of the variety of currents that are seen in developing and mature hair cells
(including the MET current) is beyond the scope of this work. However, these currents will
be briefly discussed along with synaptic maturation due to the requirement of these
processes for normal hair cell development.
Following specification, the IHC has a resting potential of approximately -50mV due to the
IK,emb current. This resting potential becomes more negative by E16.5 due to the additional
K+ current, IK1. At this stage, Ca2+ and Na+ currents with fast activation kinetics become
identifiable and IHCs are therefore likely to be able to release synaptic vesicles by this
point (Housley et al. 2006). All of these currents rapidly increase in size in the base by
E17.5 (E18.5 in the apex) where ICa is necessary for calcium action potentials and INa and
IK1 modulate the frequency and shape of these action potentials which are quite small and
slow (Goodyear et al. 2006;Kros 1996).
These action potentials are spontaneous and are thought to be important for the correct
maturation of synaptic connections i.e. they are necessary for the development and survival
of neural connections as well as the development and survival of IHCs themselves. Afferent
neurons begin to form synapses with IHCs at about E18 when, in the basal cochlea, the
MET transducer current (IT) is also present (though probably not yet mechanosensitive)
(Goodyear et al. 2006;Housley et al. 2006;Kros 1996;Lelli et al. 2009). Therefore, as well as
potentially regulating hair bundle maturation, IT might be required with ICa to facilitate
spontaneous action potentials (Goodyear et al. 2006;Kros 1996).

1 General introduction 44
Spontaneous action potentials, both due to intrinsically generated Ca2+ spikes and
purinergic signalling, continue into the second postnatal week by which time in vitro
studies have shown that large changes are completed in hair cell innervation and ion
channel expression (Housley et al. 2006;Tritsch et al. 2007). From P3 to P10, temporary
efferent synaptic connections are formed with the IHCs that are thought to inhibit afferent
firing via the ISK2 current, thereby setting up rhythmic firing patterns in immature afferent
neurons that are required for coding functional hair cell output. Also in the early postnatal
period, the delayed-rectifier K+ current IK,neo develops (P0), efferent synapses at the OHCs
express SK2 currents and OHCs become electromotile (from about P8) (Goodyear et al.
2006;Kros 1996).
Final maturation of IHCs occurs towards the end of the second postnatal week when there
is a sudden expression – at the onset of hearing – of the fast, non-inactivating outward K+
current IK,f which allows IHCs to respond to hair bundle movement with the fast, graded
receptor potentials required for appropriately detailed encoding of sound intensity. A
potassium current (IK(Ca)) is also found and thought to regulate neurotransmitter release.
Finally, IK,f (IBK), a KCNQ4 current (IK,n) and IK,s are expressed. IK,f and IK,n take over from
IK1 in setting the resting potential in the mature IHC and IK,s (a delayed-rectifier K+
current with slow action kinetics) may contribute to the adaptation of IHC receptor
potentials to long-duration tone bursts (Goodyear et al. 2006;Kros 1996).
Once signals are transmitted from the MET channel to the remainder of the IHC, the signal
has to be transmitted to the nervous system. This is accomplished by release of the
excitatory amino acid neurotransmitter glutamate from IHCs that acts on AMPA receptors
on postsynaptic afferent neurons. Glutamate release is dependent on maturation of IHC
presynaptic function and, to facilitate this, there is an increase in ICa and synaptic vesicle
exocytosis in the first postnatal week. Though ICa subsequently declines, exocytosis remains
constant and these changes are accompanied by a large-scale remodelling of the
presynaptic IHC that is associated with the development of plates of presynaptic ‘ribbons’
around the onset of hearing. These changes are thought to be essential for precise control of
neurotransmitter release (reviewed in Kros 1996;Meyer et al. 2009). In mice, ribbon
synapses have been shown to be tuned so that their morphology at mature IHCs is similar
throughout the cochlea but with a tonotopic variation in synaptic density (Meyer et al.
2009).
Effect of thyroid hormone signalling on inner ear development
The thyroid hormone receptors TRα1 and TRα2 (encoded by Thra) are expressed in most of
the sensory epithelia of the inner ear whereas TRβ1 and TRβ2 (encoded by Thrb) are only
expressed in the cochlear epithelium in both the greater epithelial ridge (GER) and lesser
epithelial ridge (LER). Induced hypothyroidism influences the activity of the T3-responsive

1 General introduction 45
thyroid hormone receptors (TRα1, TRβ1 and TRβ2) and causes a delay in organ of Corti
development with additional defects in TM development. Furthermore, knockout of all
thyroid receptors leads to defects and delay in hair cell functional maturation as measured
by the disruption of normal hair cell ion currents (Goodyear et al. 2006).
Outer hair cell mechanoelectrical transduction
The lateral membranes of IHCs and OHCs appear similar at birth. However, the OHC
lateral membrane becomes specialised by P8 (when OHCs become electromotile) i.e. prior to
the onset of hearing at P10-12 in mice (P15 in the rat) (Bryant et al. 2005;Goodyear et al.
2006;Jensen-Smith et al. 2007;Kros 1996). The support cells disconnect from the lateral
membrane, leaving a liquid-filled gap, and endoplasmic cisternae develop parallel to the
OHC lateral membrane where prestin (Slc26a5), Glut-5, actin and Ca2+-ATPase become
localised. The organisation of these proteins and the cisternae continues to develop in a
time frame consistent with functional maturation of OHCs (as measured by OAEs) and,
therefore, the onset of electromotility at P8 in mouse OHCs (Bryant et al. 2005;Marcotti et
al. 1999).
Following the described processes of prosensory domain specification, hair cell specification
and differentiation, mature hair cells are able to detect subatomic deflections of hair
bundles (Dallos 1992). This ability underlies the exquisite sensitivity of human hearing and
small perturbations of the above processes – including genetic mutations – are sufficient to
abolish the function of this sensitive system.

1 General introduction 46
1.4 Abnormal hearing
1.4.1 Epidemiology and classification of hearing loss
278 million people worldwide are estimated to have a moderate to profound hearing loss in
both ears (World Health Organization 2006) which can arise from damage at any level of
the auditory pathway from the outer ear to higher brain centres. Hearing loss often
presents in childhood and 68 million people are thought to have hearing loss that originated
in childhood with about 62 million of this population aged less than 15 years. This is due to
an estimated neonatal incidence of about 720 000 cases per year worldwide which doubles
by age 9 in developed countries such as the UK (Fortnum et al. 2001;Olusanya et al. 2007).
According to current measures, two thirds of the burden of hearing loss is borne by
developing countries. However, it has been argued that the World Health Organization’s
thresholds for disabling hearing loss are set too high and, therefore, do not take into
account less severe hearing losses that can be disabling in noisy environments. Therefore
the number of people in both the developed and developing world that are living with a
disabling hearing loss is likely to be higher than the above figure (Olusanya et al.
2007;Smith et al. 2006).
Traditionally, hearing loss is described as being either conductive, sensorineural or mixed
in origin. Conductive hearing loss is hearing loss due to abnormality of the outer or middle
ear that causes reduced sound conduction to sensory hair cells of the inner ear and
sensorineural hearing loss (SNHL) refers to damage to the cochlea, sensory neurons or
higher auditory centres (Bull et al. 2007) (see Table 1.2).
SNHL is the most common sensory deficit in more developed societies and, based on years
of healthy life lost, adult-onset hearing loss from all causes is the third largest cause of
disability after depressive disorders and unintentional injuries (Olusanya et al. 2007).
However, some authors argue that permanent childhood hearing impairment is likely to
cause a greater loss of healthy life if properly accounted for (Olusanya et al. 2007).
Due to differences in healthcare, living conditions and culture, the causes of hearing loss
vary greatly between developed and developing countries. The largest causes of hearing loss
in developing countries (infection and medication) now account for only a small amount of
hearing loss in the developed world where genetic deafness and age-related hearing loss
(ARHL) are responsible for most hearing loss (see Olusanya et al. 2007 for review). The
problem of ARHL – which is growing due to the ageing population in developed countries
such as the UK – is further complicated by increasing rates of dual sensory loss as vision
impairment is also associated with age (Heine et al. 2002). In recent studies, ARHL has

1 General introduction 47
been shown to have a prevalence of 29-43% in men and 17-20% in women of 60-69 years of
age (Agrawal et al. 2008;Gopinath et al. 2009).
Table 1.2. Classification of hearing loss. Causes of hearing loss categorised by location of lesion and in approximate order of incidence in the developed world (adapted from Bull et al. 2007).
Conductive Sensorineural
Wax Age-related hearing loss (ARHL)
Otitis media Noise-induced hearing loss (NIHL)
Barotrauma Genetic (Congenital, early- or late-onset)
Otosclerosis Drug- / Poison-induced (including solvents)
Injury of tympanic membrane Menière’s disease
Traumatic ossicular dislocation Late otosclerosis
Congenital ear canal atresia Inner ear infections and meningitis
Middle ear agenesis Hypoxia
Middle ear tumours Jaundice
Vestibular Schwannoma
Head Injury
CNS disease
Metabolic
1.4.2 Testing and characterisation of hearing loss
Worldwide, there is a trend towards early detection of childhood hearing impairment. The
importance of early identification and characterisation of hearing loss in achieving better
outcomes in auditory habilitation has been established, especially regarding childhood
development; late (>1 year) detection and management of hearing impairment is associated
with substantial developmental deficits in communication and cognition (Olusanya et al.
2007). Adequate assessment of adult hearing loss is, likewise, important in determining the
cause and, therefore, the appropriate treatment for hearing loss.
Simple clinical tests can be used to identify and categorise hearing loss. The tuning fork
tests devised by Weber (to identify unilateral hearing loss) and Rinne (to differentiate
conductive and sensorineural hearing losses) still form part of hearing examination though
they provide little information on the frequency distribution of hearing losses (Ludman et al.
1998). Audiometric tests can also perform the function of identifying hearing loss and aid in
the differentiation between conductive and sensorineural hearing loss. However, they serve
the further purpose of characterising the frequency distribution and quantifying hearing
loss which makes it possible to track its progression (Ludman et al. 1998;Prosser et al.
2007). Finally, imaging techniques such as MRI and CT are employed to identify gross
anatomical causes of hearing loss (Phelps 1998).

1 General introduction 48
Focussing on SNHL, commonly available quantitative tests are pure tone audiometry,
speech audiometry, auditory brainstem responses (ABRs) and otoacoustic emissions. In the
first two tests, a subject’s ability to detect sounds of differing frequency and intensity is
tested. Pure tone audiometry presents sinusoidal waveforms for this task whereas speech
audiometry uses speech sounds. Subjects report their ability to detect a pure tone or repeat
speech sounds to the examiner as appropriate. This results in the production of an
audiogram whereby the lowest intensity at which sound of a given frequency can be
detected is plotted relative to the expected threshold for a number of frequencies (see
Figure 1.10b for an example) (Ludman et al. 1998;Prosser et al. 2007). Of the two tests,
speech audiometry is thought to be more relevant to communication and is therefore more
useful in monitoring the results of rehabilitative interventions (Prosser et al. 2007).
However, both pure tone and speech audiometry are restricted by the requirement of
communication from the subject. Though most adults and children aged five years and
above can undergo pure tone audiometry, younger children require special conditioning
procedures and it is difficult and time-consuming to test these children (Prosser et al. 2007).
Such co-operation is not required for ABRs and OAEs. ABRs measure the response of the
auditory brainstem to auditory stimuli by detecting action potentials at six to seven points
between the cochlear nerve and subthalamic nuclei. This test looks for neural abnormalities
and is able to localise auditory brainstem deficits as well as detecting cochlear hearing loss.
OAEs, on the other hand, look solely at OHC function. Different stimuli are used to
measure the cochlear response at different frequencies and intensities (Ludman et al. 1998)
to identify cochlear causes of hearing loss. Given the ease with which OAEs can be
measured (usually in 3-5 minutes per subject), they have become the screening method of
choice for the UK NHS neonatal hearing screening programme (MRC Hearing &
Communication Group 2008).
The above tests, allied with more specialised tests and a battery of vestibular function tests,
currently aid in the assessment and management of patients with hearing loss (Ludman et
al. 1998;Omahoney et al. 1998;Prosser et al. 2007). Once an audiogram is obtained, the
severity of hearing loss can be quantified, and the type of hearing loss can be categorised
(i.e. low-frequency, middle-frequency, high-frequency or flat).
The above tests currently aid in tailoring treatment for hearing loss (see section 1.4.6),
though they are likely to play a greater diagnostic role as the audiogram phenotype of
different hearing losses becomes better-characterised, as the temporal progression of
different hearing losses are better understood and as the audiogram-histological
relationship of hair cell-mediated and non-hair cell-mediated hearing loss is elucidated
(Prosser et al. 2007). Perhaps most importantly, future improvement in the sensitivity of
these assessment tools may guide genetic investigations for hearing loss in order to identify

1 General introduction 49
which of the hundreds of chromosomal loci that cause hearing loss are at fault in a given
patient with a suspected genetic cause of hearing loss (see sections 1.4.4 and 1.5.4) (Prosser
et al. 2007).
1.4.3 Sensorineural hearing loss (SNHL)
SNHL can be caused by a diverse group of factors that either cause direct damage to the
organ of Corti (e.g. infection and trauma) or cause hair cell dysfunction through other
mechanisms which can underlie the differences in onset of different hearing losses (e.g.
genetic hearing loss and aminoglycoside antibiotics) (see Table 1.3). Fortunately, in the
developed world, the incidence of hearing loss due to preventable causes has been greatly
reduced. This change is due to improvements in prenatal and perinatal care (including
maternal vaccination against rubella), careful use of aminoglycoside antibiotics (see section
1.4.6), appropriate treatment of infection, reduced exposure to solvents and genetic
counselling (Olusanya et al. 2007).
Unfortunately, although NIHL caused by occupational exposure to noise is thought to be on
the decline, NIHL from other causes seems set to rise. This is thought to be due to
increased voluntary exposure to high intensity noise though personal music players and
loud concerts as well as the failure to implement a variety of lifestyle factors (of various
levels of evidence) which can be preventative, i.e. using hearing protection, smoking
cessation, increasing exercise, improving nutrition and reducing other risk factors for
diabetes or heart disease. (Daniel 2007).
Table 1.3. Types and onset of SNHL. The different types of SNHL categorised by onset (data from Bull et al. 2007;Daniel 2007;Howarth et al. 2006;Olusanya et al. 2007;Smith et al. 2005).
Onset Prenatal Perinatal Postnatal Early-onset Late-onset
Genetic / Chromosomal
Infectious
Drugs (e.g. Aminoglycoside antibiotics) / Poisons (e.g. solvents)
Noise
Trauma
Birth
Asphyxia
Neonatal
Jaundice
Prematurity
Low
Birthweight
Type
Age

1 General introduction 50
1.4.4 Genetic causes of hearing loss
Many of the critical factors for physiological hearing have been identified as their mutation
results in hearing loss (in both humans and mouse models) (Robin et al. 2005;Van Camp &
Smith 2008). Less than 15 years ago, few genetic causes of hearing loss were known.
However, since the advent of new molecular biological experimental techniques, mutations
at over 100 loci have been shown to be responsible for hereditary hearing loss and the
majority of the mutations at these loci cause SNHL (Prosser et al. 2007;Robin et al.
2005;Van Camp & Smith 2008). Though mutations causing hearing loss eventually result
in similar pathology (i.e. hair cell loss and organ of Corti degeneration), the factors which
they affect are active in a range of sites as shown in Figure 1.7 (Friedman et al. 2007); this
diversity of function and localization is representative of the complexity of the inner ear.
The level of disability caused by these hereditary hearing losses is dependent on the
severity (mild, moderate or profound) and time of onset (typically described as congenital,
prelingual, postlingual or adult) of hearing loss, though these factors can vary greatly
(summarised in Table 1.4).
More than half of neonates with SNHL have hereditary hearing loss. Of this number, 30%
are syndromic (most commonly due to SLC26A4 mutation that causes Pendred’s syndrome)
and approximately 50% are attributed to non-syndromic gap junction mutation (GJB2 and
GJB6), with the remainder being attributable to other non-syndromic causes, such as
POU4F3 mutation (Robin et al. 2005;Smith et al. 2005) (see Table 1.4 and sections 1.5.3
and 1.5.4 ). Consequently, clinical investigation of suspected hereditary hearing loss is
usually restricted to GJB2 and SLC26A4 analysis (Prosser et al. 2007).
Such hearing losses can be inherited by a number of different modes (autosomal dominant,
autosomal recessive, X-linked or mitochondrial). Furthermore, both the mode of inheritance
and type of hearing loss caused by different mutations in the same gene can vary greatly
(see Table 1.4). This is illustrated by GJB2 mutation that can result in either autosomal
recessive nonsyndromic hearing loss or autosomal dominant syndromic hearing loss
depending on the mutation present. Looking more closely at these GJB2 mutant
phenotypes, the time of onset of hearing loss is also highly variable, causing either
prelingual or postlingual deafness, which will result in a large difference in language
acquisition in affected individuals (see Table 1.4).
Although the largest cause of hearing loss (GJB2 mutation) does not cause hearing loss by
a direct effect on hair cells (mature hair cells do not express gap junctions), a large amount
of genetic deafness is due to hair cell loss (Smith et al. 2005;Van Camp & Smith 2008). This
is either due to mutation of genes that are selectively expressed in hair cells (as in Figure
1.7d,e & f) or by hair cell death secondary to other cochlear disorders (Friedman et al. 2007).

1 General introduction 51
Attempts are currently underway to identify more genes that are required for normal inner
ear function through large forward genetics (phenotype-driven) mutagenesis programs. In
such programs, random mutations are generated in mice (e.g. by ENU mutagenesis) and
the progeny are tested for hearing loss, initially with a simple test (e.g. response to a click)
and later by more detailed investigation (e.g. ABR hearing testing) (Acevedo-Arozena et al.
2008). It is hoped that these new mutant mice will give us a better understanding of the
mechanisms of hearing and deafness.
Figure 1.7. Cochlear expression of factors involved in hereditary hearing loss. Schematic of factors required for normal hearing which are expressed in different parts of the cochlea and whose mutation results in SNHL: a) cochlear section (RM, Reissner’s membrane); b) tectorial membrane; c) stria vascularis; d) hair cell and support cells; e) hair cell apex and hair bundle links; f) stereocilium (taken from Friedman et al. 2007).
Though there is a strong focus on the identification of mutations that cause SNHL in
animal models, this sometimes overlooks the complex interaction between genetic and
environmental factors that confound human SNHL study. As environmental factors can
greatly influence hearing loss, it is difficult to identify genetic factors that can underlie
sensitivity to these environmental causes of hearing loss, making it hard to attribute the
correct share of causality to each factor. An example of this is the mitochondrial mutation
Picture removed for copyright purposes

1 General introduction 52
(A1555G) that underlies a non-syndromic hearing loss and increased sensitivity to
aminoglycoside ototoxicity (Zhang et al. 2005). However, using novel resources, genetic
modifiers of susceptibility to late-onset hearing loss are being identified. Using a large
sample of patients with hearing loss, Friedman et al. were recently able to identify GRM7
(a gene that encodes a type of metabotropic glutamate receptor), the mutation of which is
thought to underlie susceptibility to ARHL (Friedman et al. 2009b). Furthermore, using a
different approach (i.e. candidate gene SNPs and the HapMap project), van Laer et al. were
able to identify a gene that is associated with ARHL (GRHL2) due to a mutation in an
intronic region that is likely to affect its regulation and, therefore, expression (Van Laer et
al. 2008).
Given that more deafness-causing genes are now known, it has been suggested that genetic
testing is likely to become a more integral part of the evaluation of hearing impairment,
particularly in children. This is important for prognosis in terms of disease progression and
response to treatment, as well as being valuable for genetic counselling of parents. It is also
an appealing prospect for healthcare services as it can be cheaper than the battery of tests
that many patients are subjected to, assuming that a mutation is found (Robin et al. 2005).
However, given the considerable heterogeneity in the genetic causes of hearing loss, the
poor genotype-phenotype correlation seen for most forms of deafness (see Table 1.4), and
the number of environmental factors that can greatly affect phenotype, the challenges
facing the design and implementation of such diagnostic tests are considerable.

1 G
en
era
l in
trod
uct
ion
5
3
Tab
le 1
.4. C
au
ses
of
here
dit
ary
he
ari
ng
lo
ss.
A n
um
ber
of
gen
es t
hat
are
know
n t
o c
ause h
eari
ng
loss w
hen
muta
ted
are
sho
wn b
elo
w.
DF
N,
X-l
inke
d;
DF
NA
, auto
som
al do
min
an
t; D
FN
B,
auto
som
al re
cessiv
e
(Khark
ovets
et
al. 2
006;O
MIM
20
09;P
etit
et a
l. 2
001
;Van C
am
p &
Sm
ith 2
00
8).
Gene
Protein
Human deafness
Mouse Model
Type
Onset
MYO7A
Myosi
n V
IIA
D
FN
B2 ±
reti
nop
ath
y (
Ush
er
1B
); D
FN
A1
1
Shaker-1
Both
V
ari
ab
le
MYO15
Myosi
n X
V
DF
NB
3
Shaker-2
Non
-syn
dro
mic
C
on
gen
ital
MYO6
Myosi
n V
I D
FN
A22
Snell’s waltzer
Non
-syn
dro
mic
P
ost
lin
gu
al-
late
USH1C
Harm
on
in
DF
NB
18 ±
reti
nop
ath
y (
Ush
er
1C
) Deaf circler
Syn
dro
mic
C
on
gen
ital
CHD23
Cad
heri
n-2
3
DF
NB
12 ±
reti
nop
ath
y (
Ush
er
1D
) Waltzer
Syn
dro
mic
C
on
gen
ital
Espn
Esp
in
DF
NB
36
Jerker
Non
-syn
dro
mic
P
reli
ngu
al
KCNQ4
KC
NQ
4
DF
NA
2A
Kcnq4-/- ; Kcnq4dn/dn
Non
-syn
dro
mic
P
ost
lin
gu
al
–
late
20s
Atp2b2/Pmca2
Ca
2+-A
TP
ase
2
Un
kn
ow
n
Deafwaddler
Un
kn
ow
n
Un
kn
ow
n
OTOF
Oto
ferl
in
DF
NB
9
Otof-/-
Non
-syn
dro
mic
C
on
gen
ital
–
<2 y
ears
POU4F3
PO
U4F
3
DF
NA
15
Pou4f3
-/- ; Pou4f3
ddl/ddl
Non
-syn
dro
mic
C
hil
dh
ood
on
ward
s
CX26/GJB2
Con
nexin
26
DF
NB
1; D
FN
A3 ±
kera
tod
erm
ia
Cx26-/-
Both
P
reli
ngu
al
–
Post
lin
gu
al
CX30/GJB6
Con
nexin
30
DF
NA
3’ ± k
era
tod
erm
ia;
DF
NB
1
Cx30-/-
Syn
dro
mic
P
reli
ngu
al
CX31/GJB3
Con
nexin
31
DF
NA
2’; D
FN
Bi
± p
eri
ph
era
l n
eu
rop
ath
y
Gjb3-/-
Non
-syn
dro
mic
E
arl
y
–
late
chil
dh
ood

1 G
en
era
l in
trod
uct
ion
5
4
Gene
Protein
Human deafness
Mouse Model
Type
Onset
Slc12a2/ Nkcc1
NK
CC
1
Un
kn
ow
n
syns ; Nkcc1-/-
Un
kn
ow
n
Un
kn
ow
n
PDS
Pen
dri
n
DF
NB
4 ±
th
yro
id g
oit
re
Pds-/-
Syn
dro
mic
C
on
gen
ital
CLDN14
Cla
ud
in-1
4
DF
NB
29
Cldn14-/-
Non
-syn
dro
mic
C
on
gen
ital
COCH
Coch
lin
D
FN
A9
Coch
-/-
Non
-syn
dro
mic
P
ost
lin
gu
al
EYA4
EY
A4
DF
NA
10
Eya4-/-
Non
-syn
dro
mic
L
ate
-on
set
POU3F4
PO
U3F
4
DF
N3
Pou3f4
-/-
Non
-syn
dro
mic
U
nk
now
n
COL11A2
Coll
agen
XI
(α2 c
hain
) D
FN
A13 ±
ost
eoch
on
dro
dysp
lasia
Col11a2-/-
Syn
dro
mic
P
ost
lin
gu
al
TECTA
α-t
ect
ori
n
DF
NA
8/1
2; D
FN
B21
Tecta
-/-
Non
-syn
dro
mic
P
reli
ngu
al
–
post
lin
gu
al
Otog
Oto
geli
n
Un
kn
ow
n
Twister; Otog-/-
Non
-syn
dro
mic
U
nk
now
n
TMPRSS3
TM
PR
SS
3
DF
NB
8/1
0
Tmprss1
-/-
Non
-syn
dro
mic
C
on
gen
ital
PCDH15
Pro
toca
dh
eri
n-1
5
DF
NB
23 ±
reti
nop
ath
y
Ames waltzer
Syn
dro
mic
P
reli
ngu
al
HDIA1
Dia
ph
an
ou
s-1
DF
NA
1
Unknown
Non
-syn
dro
mic
P
ost
lin
gu
al
DFNA5
DF
NA
5
DF
NA
5
Dfna5-/-
Non
-syn
dro
mic
P
ost
lin
gu
al
MYH9
Myosi
n I
IA
DF
NA
17 ±
gia
nt
pla
tele
ts
None
Syn
dro
mic
S
eco
nd
deca
de

1 General introduction 55
1.4.5 Hair cell death
Hair cell loss in humans leads to permanent SNHL and loss of vestibular function because
there is no hair cell regeneration in the mammalian cochlea and little regeneration in the
vestibular epithelia (Matsui et al. 2005). As well as gene mutation, noise, medications (such
as aminoglycoside antibiotics and the cytotoxic agent cisplatin), age and other factors can
also cause hearing loss via hair cell death (Holley 2005).
Although the mechanisms that trigger hair cell death have not been elucidated, the
signalling pathways involved in this process are becoming increasingly well characterised.
For example, apoptosis (type 1 programmed cell death), necrosis and necrosis-like
programmed cell death (type 2 programmed cell death) have all been implicated in hair cell
loss due to noise and cochlear implantation trauma (Eshraghi et al. 2006). In noise-induced
hearing loss (NIHL), basal cochlear OHCs have been shown to be the most susceptible to
damage as these are the first hair cells to be lost following noise exposure (Henderson et al.
2006). This may be due to reactive oxygen species (ROS) and toxic free radicals that are
known to be produced in the stria vascularis and later appear in OHCs. ROS are also
associated with aminoglycoside-induced hair cell loss, cisplatin-induced hair cell loss and,
along with reactive nitrogen species, hair cell loss in pneumococcal labyrinthitis (secondary
to meningitis) (Cheng et al. 2005;Klein et al. 2008;Matsui et al. 2004a;Rizzi et al.
2007;Rybak et al. 2007). However, it is not understood whether ROS cause cochlear damage
or if they are the products of dying cells (Henderson et al. 2006). In NIHL, hair cell death
occurs via a mixture of necrosis and apoptosis in the initial phase which later progresses
due to apoptosis alone (Henderson et al. 2006). Hair cell death is thought to be triggered by
JNK and c-jun activation which leads to Bax translocation to the mitochondria and
cytochrome c release with associated caspase activation (Cheng et al. 2005).
The mechanism of hair cell death due to aminoglycoside antibiotics is thought to share the
same upstream component as NIHL (Cheng et al. 2005). Approximately 4 hours after
neomycin application, the intracellular Ca2+ concentration undergoes a sustained increase
which is temporally linked to phosphorylation of JNKs (and, subsequently, c-Jun) which, in
turn, leads to apoptosis (Cheng et al. 2005;Gale et al. 2004;Matsui et al. 2004b). Though
cisplatin-induced apoptosis acts through the same end-effectors as aminoglycosides and
produces a similar pattern of hair cell loss, it does not seem to be controlled by the JNK /
MAPK pathway, suggesting the presence of more than one apoptotic trigger in hair cells
(Cheng et al. 2005). One such trigger may be p53, which is upregulated in hair cells in
response to cisplatin treatment suggesting that it is an upstream regulator of cisplatin-
induced hair cell death (Cheng et al. 2005;Rybak et al. 2007).

1 General introduction 56
The deeper insight into hair cell death that has been gained in recent years has clarified
the disease mechanisms of many different types of hearing loss. This knowledge is now
being turned into potential preventative measures against hearing loss (see section 1.4.7).
1.4.6 Current SNHL management strategies
Though a variety of medical and surgical interventions are available for the treatment of
conductive hearing losses, there is still only a limited range of treatment options for SNHL
(Kulkarni et al. 2008). However, for many causes of SNHL, effective preventative measures
can be taken from the governmental to the personal level (see Table 1.5).
Table 1.5. Global prevention strategies for SNHL. (based on Daniel 2007;Fransen et al. 2008;Olusanya et al. 2007).
Cause Interventions
ARHL
Risk factor reduction e.g. smoking cessation and weight loss for
overweight individuals
NIHL
Public health education to avoid exposure to excessive noise.
Legislation to reduce noise exposure
Genetic Genetic counselling and avoidance of consanguineous marriages
Drug- / Poison-
induced (including
solvents)
Medical and public health education to avoid exposure to ototoxic
drugs and solvents
Infection
Immunisation, improved obstetric and neonatal care and prompt
treatment
Hypoxia Improved obstetric and neonatal care
Jaundice Improved obstetric and neonatal care
SNHL has fallen in developed countries due to the implementation of some of these
prevention strategies, especially improvements in neonatal care and vaccination. However,
children in less developed countries have not benefited from these advances as they cannot
access this care and rates of both acquired and genetic hearing loss (often due to
consanguinity) are higher. Vaccination, better healthcare and genetic counselling is
required to overcome these problems and, more importantly, prevent serious and
potentially fatal infections (Smith et al. 2005).

1 General introduction 57
Due to the irreplaceable nature of hair cells, however, such measures provide no benefit
once SNHL is established. Therefore, treatment focuses on the development of management
strategies such as lip-reading and signing along with amplification of incoming sounds to
optimise input to remaining hair cells. Amplification is currently possible through three
strategies: increasing the volume of sound reaching the inner ear, electrical stimulation of
the cochlea and electrical stimulation of the brainstem (Kulkarni et al. 2008).
Amplification of sound to the inner ear is achieved through wearable hearing aids, bone-
anchored hearing aids and middle ear implants. These interventions are aimed at patients
with mild to severe hearing loss and rely on residual hearing to detect incoming sound. An
increasing array of devices are becoming available for this and more digital hearing aids
are being produced as these devices are able to perform signal processing to optimise
signals in different auditory environments (Kulkarni et al. 2008).
Direct electrical stimulation of the cochlea in the form of cochlear implants has become
increasingly refined over the last two decades and has greatly improved the treatment of
severe to profound hearing loss that was previously treated by high-powered hearing aids
(Ramsden et al. 2007). Cochlear implants work through an array of electrodes (usually 22)
that are inserted into the scala tympani of the affected cochlea and present incoming
sounds (received by an external microphone and transmitted transdermally to a speech
processor) to the spiral ganglion cells and surviving dendrites by direct, tonotpic electrical
stimulation (Kulkarni et al. 2008;Ramsden et al. 2007). Though originally used in adults,
there has been a rapid move to early implantation because of improved neonatal hearing
screening. Though it is unclear what the effect of early implantation will be, it is thought
that the improvement in hearing provided by cochlear implants will cause hearing-
impaired children’s development to more closely match that of their peers and that this will
not adversely affect family relationships (Moeller 2007;Smith et al. 2005). Unfortunately,
due to their cost, cochlear implantation only remains a viable therapeutic option for
patients in developed countries (Tarabichi et al. 2008).
The most recent intervention for the treatment of SNHL is the implantation of the
electrode arrays that either stimulate the surface of the brainstem or use penetrating
electrodes to stimulate brainstem nuclei. Such implants are used when the normal neural
pathway from the cochlea is absent and, though they do not provide the same performance
as cochlear implants, they aid in patients’ ability to lip-read and recognise sentences
(Kulkarni et al. 2008;Ramsden et al. 2007).
1.4.7 Future strategies in hearing loss
Future strategies will focus on reducing the incidence of hearing loss and on the creation of
new treatments for SNHL. The former task will rely, for the most part, on making existing

1 General introduction 58
preventative strategies more widely available whilst the latter is the focus of a large
amount of scientific research.
Prevention and treatment of hearing loss in the developing world
Given that the largest cause of acquired SNHL in the developing world is infection,
increased vaccination against rubella, haemophilus influenzae and streptococcus
pneumoniae – most likely through the World Health Organization’s global programme for
vaccines – has the potential to greatly reduce the burden of hearing loss in these countries
(Smith et al. 2005).
However, existing therapies for infection can also cause SNHL, particularly aminoglycoside
antibiotics. Though these effective bactericidal drugs are the mainstay for the treatment of
serious (usually gram-negative) infections due to their affordability and efficacy, the
morbidity caused by aminoglycoside-induced SNHL is significant, particularly in China. As
cheap alternatives for these antibiotics are not available, pharmaceutical hair cell
protection by aspirin co-administration is being investigated. This strategy appears
promising and the use of aspirin with other ototoxic drugs, such as cisplatin, is also being
studied. However, it is uncertain whether the gastric side-effects of aspirin will outweigh
any benefit and whether hair cell protection comes at the cost of drug efficacy (Rizzi et al.
2007;Rybak et al. 2007).
Other prominent causes of hearing loss in industrialised developing countries are noise and
solvents. In developed countries, legislation to reduce exposure to noise and solvents in the
workplace has shown a marked reduction in occupational hearing loss and the
implementation of similar laws in developing countries is likely to have a similar effect
(Tarabichi et al. 2008). Finally, increased provision of existing SNHL treatments in
developing countries through global health strategies will provide benefit to a large
population, the main impediment being cost.
New therapies for SNHL
Much work is going into identifying new methods to prevent hair cell loss and regenerate
lost hair cells. As well as using existing drugs to protect hair cells from programmed cell
death following an insult, new molecules are being trialled for their protective properties.
For example, inhibitors of the JNK pathway, such as D-JNKI-1, have shown promise in
protecting hair cells against damage due to noise and cochlear implant insertion in animal
models (Eshraghi et al. 2006). Similarly, infusion of caspase inhibitors has shown promise
in protecting against cisplatin ototoxicity (Rybak et al. 2007). Finally, antioxidants and free
radical scavengers, which are presumed to work by reducing ROS in the cochlea following
an insult such as cisplatin administration, have also shown promise in the prevention of
SNHL in animal models. These molecules are thought to assist endogenous otoprotective
1 General introduction 59
mechanisms and free radical scavengers to protect hair cells against damage from noise,
drugs and age (Darrat et al. 2007;Rybak et al. 2007).
Though these strategies provide hope for a great reduction in hearing loss in the future,
they cannot provide any benefit to those who already have SNHL due to hair cell loss. As
avians and lower vertebrates are able to regenerate their hair cells following trauma such
as aminoglycoside administration or noise (unlike mammals), there has been a drive to
understand the mechanisms that mediate regeneration with a view to manipulating these
pathways in mammalian support cells to induce hair cell regeneration (Cotanche 2008).
Following hair cell loss in the chick basilar papilla (the chicken equivalent of the cochlea),
hair cells are regenerated by two distinct pathways: transdifferentiation and proliferation.
Initially transdifferentiation predominates. In this process, support cells upregulate genes
involved in hair cell development and become hair cells. Later, support cells re-enter the
cell cycle and mitose to form either two new hair cells, one hair cell and one support cell or,
later, two support cells (Cotanche 2008;Matsui et al. 2005). Though the understanding of
this process is progressing, the signals that initiate transdifferentiation and proliferation in
the chick basilar papilla have yet to be identified and, therefore, it has not been possible to
determine whether these signals can induce regeneration in the mammalian cochlea
(Cotanche 2008). Furthermore, attempts to induce support cell differentiation using growth
factors (e.g. FGF, IGF, BDNF, EGF and TGF) have had only limited success (Matsui et al.
2004a).
Therefore, current efforts to induce hair cell regeneration are focusing on more recent
techniques such as gene therapy and transplantation (e.g. of stem cells). Gene therapy
relies on the manipulation of gene expression in cochlear cells to correct genetic hearing
loss, prevent hair cell loss or replace lost hair cells from residual cochlear cells. The
correction of genetic hearing loss would most likely require an understanding of the
mechanism of hair cell loss and, potentially, the creation of a specific therapy for each form
of genetic deafness. Otoprotection would require the upregulation of protective genes such
as Ntf3 and Bdnf (which enhance spiral ganglion cell survival) and antioxidant enzymes
such as Mn superoxide dismutase (Kesser et al. 2008;Pfister et al. 2007). Finally, strategies
for regeneration, without knowledge of factors that trigger regeneration in avian and other
systems, rely on upregulation of factors involved in hair cell specification such as ATOH1
(Cotanche 2008;Kesser et al. 2008;Pfister et al. 2007).
As well as there being limited knowledge of which factors to target, gene therapy faces
challenges in terms of routes of application and gene transfer vectors. Much progress has
been made in solving these problems in recent years. Many routes have been tested for the
delivery of reagents to the inner ear (e.g. diffusion through the round window and injection
at different sites), with detectable expression of transgenes being identified using many of

1 General introduction 60
these techniques. However, the trauma caused by some of these delivery techniques may
mean that they are not viable routes for the treatment of human hearing loss. Different
gene transfer methods have also been intensely investigated, with adenovirus and adeno-
associated virus showing the most promise. Furthermore, recent experiments have shown
that adenoviral vectors are capable of transfecting human vestibular epithelia in vitro.
However, initially promising in vivo results in non-primate laboratory animals have shown
that there are still many obstacles to overcome in this field. For example, Atoh1
overexpression by a viral transfection strategy is capable of inducing hair cell regeneration
in the deafened cochlea (Izumikawa et al. 2005), however, trauma during delivery,
cytotoxicity of transfection, misplacement of regenerated hair cells and degeneration of
regenerated hair cells mean that such therapy still appears far from clinical applicability
(Edge et al. 2008;Izumikawa et al. 2005).
The final novel and promising method proposed for the regeneration of hair cells is centred
around the transplantation of stem cells to the cochlea. This method has both the potential
to replace hair cells and to reform the cochlear microarchitecture which is eventually lost
when hair cells die. Ideally, cells for transplantation would come from the patient in order
to avoid host-versus-graft disease and the need for immunosuppression. However,
xenografting (e.g. using porcine cells) or allografting (e.g. with stem cells derived from
human foetal tissue) currently seem more realistic strategies as cells are more readily
available for these purposes. The challenges faced in this field are similar to those in gene
therapy (e.g. potential oncogenesis). Furthermore, the triggers that can induce full hair cell
differentiation have yet to be identified and the targeting of stem cell delivery to desired
sites is currently impossible (Chen et al. 2007;Rivolta 2007;Ulfendahl 2007).
Though much work remains to be done in order for the above methods to benefit SNHL
patients, they remain viable strategies. Recent advances in retinal regeneration aid in the
proof of many principals of sensory epithelial regeneration and lessons learned from this,
and similar systems should aid the advancement of hair cell regeneration whilst protecting
against some of the pitfalls of regenerative therapy (Enzmann et al. 2009).

1 General introduction 61
1.5 Transcription factors and regulation of gene
expression by POU4F3 The ability of cells to selectively express different genes from an identical genome underlies
the large differences in cell type seen in individual organisms and allows cells to respond to
external signals at the transcriptional level. This ability is primarily achieved through the
interaction of gene regulatory proteins with DNA binding sites and non-DNA binding
cofactors (Alberts et al. 2002). Both gene regulatory proteins and non-DNA binding
cofactors are known as transcription factors as they both influence the rate of gene
transcription though this term is usually used with reference to gene regulatory proteins
and will be used as such with non-DNA binding proteins referred to as cofactors,
coactivators or corepressors as appropriate.
In some cases, the relationship between the binding of transcription factors to DNA binding
sites and the initiation of transcription is simple, acting as an on/off switch. However, this
is rarely the case in eukaryotic gene promoters, which are DNA regions that are responsible
for the control of transcription of a given gene. Promoters act as processors; integrating
multiple inputs from regulatory transcription factors to determine the level of expression of
the gene they control (Alberts et al. 2002). They can be present at a number of locations,
though they are usually located 5’ to the transcriptional start site (TSS) of the gene they
control. Such promoters are classically composed of a core promoter (the minimum part of
the promoter that is required for transcriptional initiation), proximal promoter and a distal
promoter. These different regions contain binding sites that are recognised and bound by
different transcription factors, which recognise them due to their sequence. Such binding
sites vary in length though they are usually less than 20bp long (Alberts et al.
2002;Heintzman et al. 2007).
Epigenetic regulatory mechanisms also influence whether a transcription factor is able to
bind the DNA. Various forms of DNA methylation prevent transcription factor binding
whilst modification of chromatin packing, e.g. due to the modification of histones, can also
inhibit or favour transcription factor binding (Alberts et al. 2002;Heintzman et al. 2007).
1.5.1 Transcription factor structure and function
Transcription factors typically contain a DNA binding domain and protein-protein
interaction domains through which they mediate the regulation of their target genes.
Through different forms of DNA binding domain, transcription factors are able to recognise
diverse binding sites, usually by binding the major groove of the double helix and reading
the outside of the nucleotides in this groove. As well as the individual code of the bases, the
overall geometry of the helix can be recognised and other features of the DNA, e.g. the
energy required to bend it, can also influence TF binding (Alberts et al. 2002).
1 General introduction 62
Figure 1.8. Interaction of transcription factors to initiate transcription. The assembly of the RNApol II preinitiation complex on eukaryotic promoters. Transcription factors act on distal enhancers to increase the probability of assembly of the RNApol II complex on the core promoter via their interaction with general transcription factors (Krishnamurthy et al. 2009).
A number of different structures have evolved in order for transcription factors to bind
DNA. These are the helix-turn helix, zinc finger, leucine zipper and helix-loop-helix
domains. One of the most commonly occurring of these is the helix-turn-helix domain in
which there are typically two alpha helices joined by a short amino acid chain (the turn). It
is usually the helix nearer the C-terminal which binds DNA in the major groove (Alberts et
al. 2002).
Once bound to the DNA, transcription factors can upregulate target gene transcription by
recruiting cofactors to aid in the assembly of the RNA polymerase II (RNApol II) complex
(e.g. coactivators and general transcription factors that form part of the RNApol II
preinitiation complex). Transcription factors can also repress the transcription of target
genes. In its most simple form, gene transcription can be downregulated by the binding of a
transcription factor to a region that causes the binding site of an upregulatory transcription
factor to become blocked. However, transcriptional repression is often more complicated
and requires the recruitment of corepressors which downregulate target gene transcription
by modifying chromatin or inhibiting RNApol II formation. The complexes formed between
transcription factors, cofactors and transcriptional protein complexes are extremely large
and, due to the ability of DNA to be remodelled to bring distant regions into close contact,
enhancer elements can be located far from the core promoter that they influence (Figure
1.8) (Alberts et al. 2002;Krishnamurthy et al. 2009).
Picture removed for copyright purposes
1 General introduction 63
Typically, a group of transcription factors, acting proximal to the TSS, will be responsible
for basal gene expression with this transcriptional control being modulated by numerous
other transcription factors, acting distally. The effect of distally acting transcription factors
may be weaker and these factors might only be expressed in special circumstances e.g.
during oxidative stress (Heintzman et al. 2007).
1.5.2 The POU family
The POU family is named after the first members of the class to be identified: Pit-1, Oct-1
and Oct-2 (mammalian); and Unc-86 (C. elegans) (Verrijzer et al. 1993). These transcription
factors are members of the larger homeodomain family that is defined by the presence of a
characteristic 60 amino acid helix-turn-helix DNA-binding domain – the homeodomain
(Scott et al. 1989). The homeodomain contained in POU transcription factors is called the
POU-homeodomain (POUH) and comprises three alpha helices of which the second and
third form a helix-turn-helix motif, and the third contacts the major groove (Verrijzer et al.
1993).
The POUH is preceded by another DNA-binding domain that is 74-82 amino acids long and,
as it is unique to POU factors, is called the POU specific (POUS) domain (Verrijzer et al.
1993). The POUS, which comprises four alpha helices, contacts the DNA with an extended
form of the helix-turn-helix motif formed between helices two and three with helix three
making contact with the major groove (Assa-Munt 1993). These two domains are joined by
a linker that is poorly-conserved between family members and the three components
described (POUS, linker and POUH) together form a region named the POU-domain
(Verrijzer et al. 1993). It is thought that the complicated structure of this bipartite DNA-
binding domain allows for fine control of DNA binding at binding sites in target gene
promoters – typically octamers – which are asymmetrical due to the structure of the POU
domain (Alberts et al. 2002;Aurora et al. 1992;Verrijzer et al. 1993). In support of this
explanation, it has been shown that all three components of the POU domain contribute to
the sequence-specificity of DNA binding (Aurora et al. 1992;Verrijzer et al. 1993).
Though POU family members tend to exist as monomers in solution, they have been shown
to bind DNA both as monomers and dimers. Dimerisation, where it occurs, is thought to
take place on the DNA, i.e. once a monomer has bound to a DNA binding site in a target
gene promoter, and such interactions are mediated through the POU domain (Andersen et
al. 2001;Aurora et al. 1992;Verrijzer et al. 1993). Once bound, POU family transcription
factors are able to either upregulate or downregulate target genes. The type of regulation at
a particular site is dependent on coregulators which interact with N- and C-terminally
located transactivation domains in the POU protein as well as interacting with the
homeodomain (Andersen et al. 2001).

1 General introduction 64
The functional role of these transcription factors has since been investigated and they have
been shown to be important in a variety of developmental and homeostatic functions. The
main action of POU domain transcription factors is seen in neural cells of various kinds e.g.
pituitary, neocortical and retinal with particular attention being given to their actions in
embryonic development (He et al. 1989;Robertson 1988;Veenstra et al. 1997). In these cells,
they regulate terminal cell proliferation, differentiation, migration and survival (Table 1.6)
(Andersen et al. 2001).
Table 1.6. Functions of the original POU family genes. (Andersen et al. 2001;McGhee et al. 1997;Robertson 1988).
Organism Transcription
Factor Localization Function
Pit-1 Pituitary Cells GH, PRL, TSHβ, GHRHR and
other pituitary marker activation
Oct-1 Ubiquitous Activates small nuclear RNA
(snRNA) and histone H2B genes Mammalian
Oct-2 B-Lymphocytes,
glia & neurons Activates immunoglobulin genes
C. elegans Unc-86 Neuroblast Cells Fate specification of neural cells
A large array of POU family genes have now been identified and divided into subfamilies
(POU1 to POU6) based on their homology in the POU domain (Andersen et al. 2001;He et al.
1989;Verrijzer et al. 1993). The POU4 family (POU4F) is one of these subfamilies and the
first member of this group to be identified was Pou4f1 (also known as Brn-3a and Brn-3.0)
which is involved in gene regulation in sensory neurons and is required for differentiation
and survival of certain sensory and autonomic neurons (Andersen et al. 2001;He et al. 1989).
Pou4f2 (also known as Brn-3b and Brn-3.2) was identified soon after and shown to be
expressed in the central nervous system and retina (Lillycrop et al. 1992;Xiang et al. 1993).
Finally, Pou4f3 (also known as Brn-3c or Brn-3.1) was identified from a cDNA library and
localised to mouse chromosome 18 (Gerrero et al. 1993;Ninkina et al. 1993;Xia et al. 1993).
The POU4F factors are highly conserved and the human POU4F proteins share 98% amino
acid similarity to their corresponding murine genes (Xiang et al. 1995).
Pou4f3 was found to have limited expression in the rat central and peripheral nervous
system beginning at around E13. By adulthood, its expression had reduced to undetectable
levels in the mouse brain (Gerrero et al. 1993;Ninkina et al. 1993;Theil et al. 1993). In the
spinal cord, it was inferred that POU4F3 was present in mechanosensitive sensory neurons
due to labelling of cells in lamina 4/5 of rat spinal cord by in situ hybridization (the authors
could not identify exactly which cell types had been stained). It was also present in the
trigeminal and dorsal root ganglia (Erkman et al. 1996;Ninkina et al. 1993). Finally, it was
found to be expressed in retinal ganglion cells and in the inner ear (Erkman et al.
1996;Xiang et al. 1995). Though the role of Pou4f3 in the nervous system and retina has
received little attention, its expression pattern in the inner ear has prompted much work.
1 General introduction 65
POU4F3 was shown to be uniquely expressed in hair cells of the inner ear, beginning in the
basal cochlea and extending to include all the hair cells of both the cochlear and vestibular
sensory epithelia (see Figure 1.9a) (Erkman et al. 1996;Raz et al. 1999;Xiang et al. 1997).
The onset of this expression, in mice, was found to be as early as E12.5 in postmitotic
nascent hair cells (Xiang et al. 1998) and no other POU4F members are expressed in hair
cells (Erkman et al. 1996;Ryan 1997). Two knockout mice, one spontaneous Pou4f3 mutant
mouse and three human families with POU4F3 mutations have since revealed that Pou4f3
is required for the terminal maturation and survival of hair cells (sections 1.5.3 and 1.5.4
respectively) (Collin et al. 2008;de Heer et al. 2009;Erkman et al. 1996;Hertzano et al.
2004;Vahava et al. 1998;Xiang et al. 1998;Xiang et al. 1997).
1.5.3 The role of Pou4f3 in hair cell development in rodents
The expression of POU4F3 in the inner ears of mice and rats has been investigated from
embryonic to adult ages. Its expression begins at E12.5 in the otic vesicle, soon after Atoh1
and before the hair cell specific myosins VI and VIIa at E13.5. It is accepted to be restricted
to postmitotic cells. However, interpretation of results showing this and similar results for
other proteins is complicated by a lack of consistency and information in reporting the
region of the developing inner ear analysed (e.g. Chen et al. 2002;Xiang et al. 1998).
In the developing cochlea, Pou4f3 expression begins in the base (see Figure 1.9a) (Erkman
et al. 1996;Raz et al. 1999) and extends to include all hair cells of the inner ear by birth,
following the wave of hair cell differentiation. Once present, POU4F3 expression is thought
to be maintained at a high level in the hair cells of the inner ear throughout adulthood,
though direct evidence of this is lacking (Erkman et al. 1996;Raz et al. 1999;Ryan
1997;Xiang et al. 1998;Xiang et al. 1997). There has been no report of a basal-to-apical
gradient of POU4F3 expression in the late postnatal or adult organ of Corti.
The role of Pou4f3 in hair cell development and maintenance has been clarified by three
Pou4f3 mutant mice (a fourth mouse was created to investigate the role of Pou4f3 in retinal
ganglion cell axon outgrowth and is therefore beyond the scope of this thesis (Wang et al.
2002)). Erkman et al. produced the first reported Pou4f3 knockout mouse by creating a null
mutation at the gene locus which removed the entire protein coding region. Heterozygous
animals were normal, but homozygous knockout mice (Pou4f3-/-) had severe deficits in
balance, coordination and autonomic response to vestibular stimuli, with hyperactivity (by
5-6) weeks and complete deafness (Erkman et al. 1996;Murakami et al. 2002). This was
shown to be due to a lack of differentiated hair cells in the early postnatal period and was
followed by deterioration of the morphology of the organ of Corti and spiral ganglion
neurons (Erkman et al. 1996).
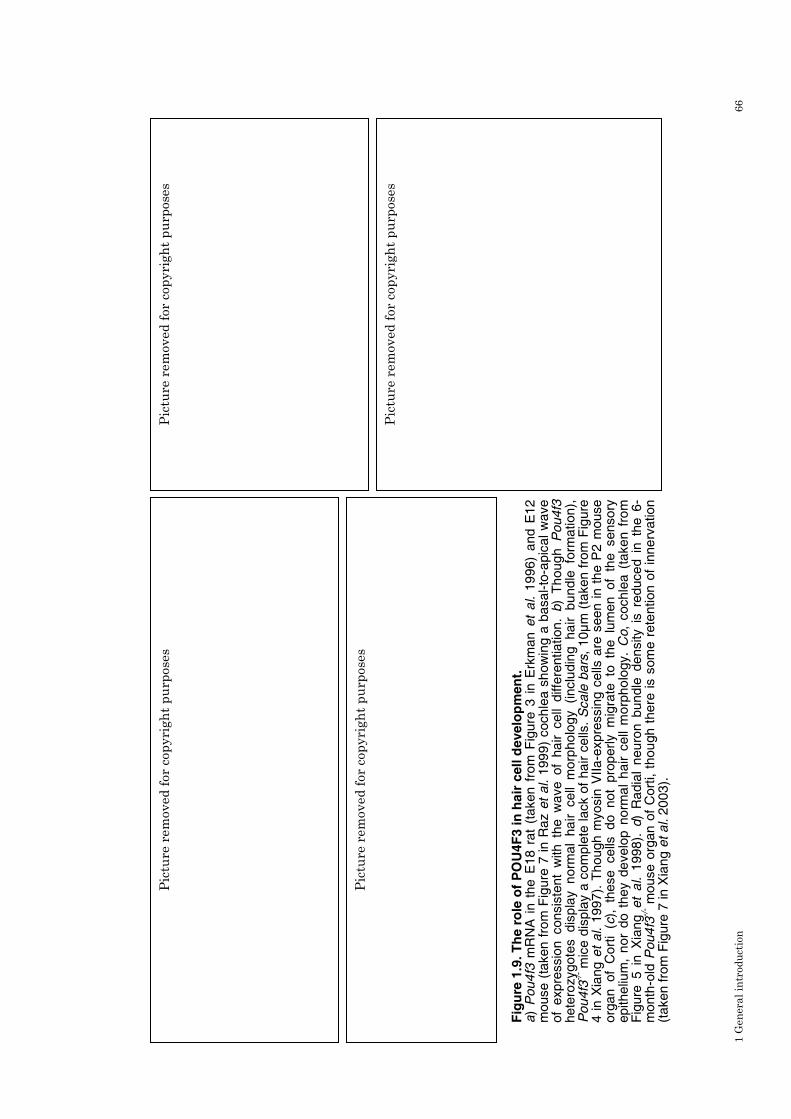
1 G
en
era
l in
trod
uct
ion
6
6
Fig
ure
1.9
. T
he r
ole
of
PO
U4F
3 in
ha
ir c
ell d
evelo
pm
en
t.
a)
Pou4
f3 m
RN
A i
n t
he E
18 r
at
(taken f
rom
Fig
ure
3 i
n E
rkm
an e
t a
l. 1
996)
and E
12
m
ouse
(ta
ken
fro
m F
igure
7 in
Raz e
t al. 1
99
9)
coch
lea s
how
ing
a b
asa
l-to
-apic
al w
ave
of
expre
ssio
n consis
tent
with th
e w
ave of
ha
ir cell
diffe
rentiation
. b)
Th
oug
h P
ou
4f3
hete
rozygote
s dis
pla
y n
orm
al
ha
ir cell
morp
ho
logy (i
nclu
din
g ha
ir bu
nd
le fo
rmation),
P
ou
4f3
-/- m
ice d
isp
lay a
co
mple
te lack o
f ha
ir c
ells
. S
cale
bars
, 10µ
m (
taken f
rom
Fig
ure
4 i
n X
iang e
t al. 1
99
7).
Th
ough m
yosin
VIIa-e
xpre
ssin
g c
ells
are
see
n i
n t
he P
2 m
ouse
org
an
of
Cort
i (c
), th
ese
cells
d
o not
pro
perly m
igra
te to
th
e lu
men
of
the sensory
epithe
lium
, n
or
do t
hey d
evelo
p n
orm
al
hair c
ell
mo
rpho
logy.
Co,
cochle
a (
take
n f
rom
F
igure
5 i
n X
iang et
al. 1
998).
d)
Ra
dia
l n
euro
n b
undle
de
nsity i
s r
educe
d i
n t
he 6
-m
onth
-old
Pou4
f3-/
- mouse o
rgan o
f C
ort
i, t
hou
gh t
here
is s
om
e r
ete
ntion o
f in
ne
rvatio
n
(taken fro
m F
igure
7 in
Xia
ng e
t al. 2
003).
a)
b)
c)
d)
Pic
ture
rem
oved
for
cop
yri
gh
t p
urp
ose
s
Pic
ture
rem
oved
for
cop
yri
gh
t p
urp
ose
s
Pic
ture
rem
oved
for
cop
yri
gh
t p
urp
ose
s
Pic
ture
rem
oved
for
cop
yri
gh
t p
urp
ose
s

1 General introduction 67
A knockout mouse was also created by Xiang et al. in which all of exon one and most of exon
two of the Pou4f3 gene were deleted by homologous recombination. Again, heterozygous
mice showed a normal phenotype. Knockout mice, however, showed circling behaviour with
reduced weight and fertility when compared to wild type mice. The deficits seen were
thought to be due to the increased energy expenditure that arises due to circling behaviour.
These knockout mice were also completely deaf and showed a marked balance deficit (Xiang
et al. 1997). Histological investigation again revealed that the deafness and balance deficits
seen are caused by a severe loss of hair cells (see Figure 1.9b). Though mature hair cells are
not seen, nascent hair cells are produced in the developing organ of Corti of knockout mice
(see Figure 1.9c). However, these cells (which express the hair cell markers myosin VI and
VIIa, calretinin and parvalbumin) never develop mature hair cell morphology and undergo
apoptosis in the late embryonic and early postnatal inner ear resulting in near complete
loss by P5, supporting a role for POU4F3 in hair cell survival (Xiang et al. 2003;Xiang et al.
1998;Xiang et al. 1997). At P7/8, only 1% of nascent hair cells remain in the cochlea and
20% remain in the vestibular sensory epithelia (Xiang et al. 2003). These results support
the suggestion of Raz et al. that more than one pathway may be involved in hair cell
differentiation (Raz et al. 1999).
The final Pou4f3 mutant mouse to be reported is the dreidel mouse (Hertzano et al. 2004).
This mouse has a spontaneous dinucleotide deletion in the Pou4f3 coding sequence,
upstream of the POU domain (reported as c.388_389delTG). This mutation was predicted to
result in a truncated, non-functional protein. Dreidel homozygous mice display a similar
phenotype to other Pou4f3 mutant mice with vertical head tossing, circling and hyper-
reactivity combined with a hearing loss (ABR threshold >100dB SPL). As in the other
mouse mutants, the phenotype observed is a result of hair cell degeneration and, though
hair cell loss in dreidel homozygous mice is severe, it appears less severe than that of the
other two Pou4f3 knockout mice whose inner ear morphology has been reported (Erkman et
al. 1996;Hertzano et al. 2004;Xiang et al. 1998;Xiang et al. 1997).
As well as hair cell degeneration, neuronal loss has been noted in the inner ears of Pou4f3
knockout mice. The spiral ganglia of Pou4f3-/- mice show minimal neuronal loss at E17.5
and appear normal up to P0. From P1-4 onwards, however, there is a clear reduction in the
number of spiral ganglion neurons and, by P14, most spiral ganglion and vestibular
ganglion neurons have degenerated with synapses on type I hair cells being markedly
reduced (Erkman et al. 1996;Xiang et al. 2003;Xiang et al. 1997). In fact, vestibular
ganglion neuron degeneration appears to begin earlier than spiral ganglion neuron
degeneration with a significant reduction in vestibular ganglion size by E16.5. The
deterioration of spiral and vestibular ganglia was shown to be due to an increased rate of
apoptosis in the late embryonic and early postnatal periods (Xiang et al. 1998). In the
cochlea, there is a consequent disruption in both afferent and efferent innervation with

1 General introduction 68
particular disruption in the outer hair cell region. By six months, very little innervation
remains in the inner ear apart from in the cochlear apex where it appears that some fibres
can remain despite the lack of mature hair cells (see Figure 1.9d) (Xiang et al. 2003).
As support cells and neurons do not express Pou4f3, it is most likely that their deterioration
is secondary to a lack of trophic support from mature hair cells (Erkman et al. 1996;Xiang
et al. 2003;Xiang et al. 1998;Xiang et al. 1997). However, the pattern of neuronal loss in
Pou4f3-/- mice does not match that of any single neurotrophic factor knockout mouse (Xiang
et al. 2003). Nonetheless, POU4F3 has been shown to upregulate the expression of the
neurotrophic factors brain-derived neurotrophic factor (Bdnf) and neurotrophin 3 (Ntf3 also
known as NT-3 ) and it is possible that the combined reduction of expression of these two
factors contributes to the phenotype seen (Clough et al. 2004;Xiang et al. 2003) (See section
1.5.5).
1.5.4 The role of POU4F3 in hair cell maintenance
Given that Pou4f3 was found to be expressed in adult rodent hair cells, it was suggested
that it might play a role in maintaining hair cells and promoting their survival (Ryan 1997).
Furthermore, given that POU4F3 is able to upregulate the neurotrophins BDNF and NT-3
(Clough et al. 2004), it may be required for the maintenance of innervation of hair cells or
for the trophic support of neighbouring cells.
Evidence for such a role has been provided by three human families. In these families,
individuals who are heterozygous for one of three disease-causing POU4F3 mutations
display a late onset, dominant and progressive non-syndromic hearing loss (DFNA15) (see
Figure 1.10a) (Collin et al. 2008;Vahava et al. 1998). The first family to be identified was an
Israeli Jewish family (family H) in which hearing loss begins the ages of 18 and 30 years
and progresses to a moderate to severe hearing loss by age 50 with complete penetrance in
affected individuals by the age of 40. Following linkage analysis, precise identification of
the genomic location of Pou4f3 and sequencing, the investigators identified an eight base-
pair deletion in the protein coding region. This deletion causes a frameshift that was shown
(in vitro) to cause a truncation of the resulting protein due to a premature stop codon. Prior
to the stop codon, four amino acid residues are also mutated (Collin et al. 2008;Vahava et al.
1998).
A detailed audiological evaluation of members of family H revealed bilateral, sensorineural
and progressive deafness with variable audiogram configuration (see Figure 1.10b).
Furthermore, OAE testing of affected individuals confirmed OHC dysfunction and ABR
testing revealed a normal central auditory pathway, supporting the hypothesis that hearing
loss in this family is due to hair cell loss and that POU4F3 is required for hair cell
maintenance (Frydman et al. 2000).

1 General introduction 69
Figure 1.10. DFNA15 caused by POU4F3 mutation. POU4F3 mutation has been shown to be the cause of DFNA15 in three human families. The mode of inheritance has been shown to be autosomal dominant (a) (taken from Figure 1 in Pauw et al. 2008). Though audiograms in affected individuals are not sufficiently characteristic to aid diagnosis, affected individuals typically demonstrate flat or gently downsloping audiograms (b) (taken from Figure 1 in Vahava et al. 1998).
For a decade, family H was the only known family with hearing loss due to POU4F3
mutation. However, two Dutch families have recently been identified to have missense
POU4F3 mutations which, like in family H, result in non-syndromic autosomal dominant
hearing impairment. In the first of these two families (family W05-549), investigators
identified c.865C>T which is predicted to result in L289F (where 1 is the initiator
methionine) (Collin et al. 2008). Hearing loss in family W05-549 is self-reported to begin
from childhood to the age of 60 years (mean age of onset was 35 years) with most patients
exhibiting an early adult to midlife onset. Again, the mutation was fully penetrant with
most individuals showing flat or gently downsloping audiogram configurations (however,
other configurations were also observed). These audiograms were comparable to those seen
for family H (see Figure 1.10b), though the rate of progression and severity of hearing loss
a)
b)
Picture removed for copyright purposes
Picture removed for copyright purposes

1 General introduction 70
at different ages was shown to vary between family H and family W05-549 (Pauw 2008).
Interestingly, the authors comment that speech recognition in family W05-059 is relatively
preserved compared to audiogram severity. This may be due to loss of OHCs with relatively
preserved IHC function as is the case for other deafnesses, which show preservation of
speech recognition scores compared to pure-tone audiometry (Pauw et al. 2008).
Furthermore, nearly all members of this family (28 of the 30 living family W05-059
members) display vestibular deficits. These deficits are highly variable and do not correlate
to gender, tinnitus or degree of hearing impairment. Vestibular involvement cannot be
excluded from family H as it was not tested (van Drunen et al. 2009).
Most recently, the audiometric and vestibular characterisation of a family with a c.668T>C
mutation in the POU4F3 POUS domain, resulting in L223P, has been carried out (Collin et
al. 2008;de Heer et al. 2009). This family again displays an autosomal dominant late onset
hearing loss with onset most often in early adulthood and with a flat or gently downsloping
audiogram. Good speech recognition scores were again reported (though these results were
not subjected to statistical analysis) (de Heer et al. 2009) and the phenotype of this family
was reported to be milder than that of the other two families reported (de Heer et al.
2009;Frydman et al. 2000;Pauw et al. 2008). This is likely to correlate with milder
impairment of L223P mutant POU4F3 function compared to L289F as reported in
molecular studies of the DNA binding and transactivation capability of these mutants
(Collin et al. 2008).
One of the challenges faced by clinicians in this field is the identification of the cause of
hearing loss in their patients. As more therapies become available, this will become
increasingly important. Unfortunately, according to the evidence above, there is no clear
phenotype-genotype correlation for DFNA15. Though many patients display flat or gently
downsloping audiograms with good speech recognition scores relative to pure tone
audiometry scores, there are also affected individuals with very different results and
vestibular dysfunction appears to vary greatly depending on the disease causing mutation
(Collin et al. 2008;de Heer et al. 2009;Frydman et al. 2000;Pauw et al. 2008;Vahava et al.
1998;van Drunen et al. 2009). It is possible that this variation is due to confounding factors,
however, no such factors have yet been identified, making the future identification of
affected individuals and families difficult. As Collin et al. suggest, the recent identification
of the two Dutch families with POU4F3 mutations may reflect a higher prevalence of
DFNA15 than previously thought. Therefore, they suggest routine screening of the small
POU4F3 gene as part of a battery of diagnostic tests for deafness in certain populations
appears reasonable (Collin et al. 2008). However, a more comprehensive study of the
prevalence of DFNA15 in different populations would be required before the cost-
effectiveness of such a strategy could be determined.

1 General introduction 71
As well as the genotypes and phenotypes of DFNA15 patients, the likely mechanisms of the
three disease-causing POU4F3 mutations have also been investigated. All three mutations
are predicted to cause amino acid substitution or peptide truncation in the POU domain of
POU4F3 (Collin et al. 2008;Vahava et al. 1998). In family H, the four residue mutation and
truncation is found in the POUH (at the end of the first of three alpha helices that form this
subdomain), as is the L289F mutation of family W05-059 (which is in the third alpha helix)
(Collin et al. 2008;Vahava et al. 1998;Weiss et al. 2003). L223P, on the other hand, causes
its substitution in the POUS (adjacent to the start of the third of four alpha helices in this
subdomain) (Collin et al. 2008). The effect of these mutations on DNA binding,
transactivation and nuclear localization have since been investigated. As expected for
mutations in the POU domain, all three mutations cause deficits in DNA binding and
transactivation with L223P appearing to cause the smallest deficit (Collin et al. 2008;Weiss
et al. 2003). Weiss et al. investigated the effect of the original mutation on protein
localization and identified one bipartite nuclear localization signal (NLS) which is disrupted
in the truncated protein and one monopartite NLS. Protein localization has since been
investigated for L223P and L289F. Though neither of these mutations are predicted to
affect either NLS (as the eight base-pair deletion in family H does), they both cause
transfected cells to show a degree of cytoplasmic POU4F3 expression (Collin et al.
2008;Vahava et al. 1998;Weiss et al. 2003), suggesting that they may interfere with the
known NLSs or that they disrupt/interfere with unknown NLSs in POU4F3.
Given the impediments to obtaining and manipulating human inner ear tissue (see section
1.6.1), alternative methods have been used to try to elucidate the mechanism by which
POU4F3 heterozygosity causes hearing loss. Four hypotheses may explain deafness in
human heterozygous individuals with a mutation in the POU domain of POU4F3. The first
of these is a dominant negative effect whereby mutant POU4F3 dimerises with wild type
POU4F3 or other proteins to inhibit or otherwise alter their function; the second is that the
mutation causes a gain of function which results in mutant POU4F3 binding to new DNA
sequences; the third is that mutant POU4F3 might somehow trigger cell death; and the
fourth is haploinsufficiency.
Following the identification of family H, Pou4f3+/- mice (Erkman et al. 1996) were aged to
24 months in order to identify which of the above mechanisms might explain DFNA15
(Keithley et al. 1999). However, these mice did not show a greater ARHL than wild type
controls. Given that the mouse strain used may not be a suitable model for investigating
this form of hearing loss – one of the strains of the mixed background mouse used displays
ARHL due to hair cell loss which may mask Pou4f3-related hearing loss despite wild type
controls (Spongr et al. 1997), and many humans with POU4F3 mutations do not display
hearing loss until mid-life (Vahava et al. 1998) – in vitro models have provided more
evidence of the mechanisms through which POU4F3 mutations cause hearing loss. Firstly,

1 General introduction 72
in vitro experiments show that a dominant negative effect is unlikely to underlie DFNA15.
Without binding to DNA, the N-terminal domain of POU4F3 does not appear to bind
cofactors and, if POU4F3 is capable of dimerisation, this is likely to be through the POU
domain which is mutated in all three identified DFNA15-causing mutations (Collin et al.
2008;Sud et al. 2005;Vahava et al. 1998). Furthermore, mutant POU4F3 does not interfere
with wild type POU4F3 transactivation in vitro (Weiss et al. 2003). The second hypothesis
described (gain of function) is also unlikely to be correct as it is unlikely that the three
different mutations identified could all cause such a similar gain of function (Collin et al.
2008;Vahava et al. 1998). Thirdly, Weiss et al. proposed that cytoplasmic accumulation of
mutant POU4F3 may lead to hair cell death, though a potential mechanism by which this
might occur has not been suggested (Weiss et al. 2003). Therefore, the most probable
explanation of deafness due to POU4F3 mutation currently appears to be haploinsufficiency,
though it is difficult to prove this mechanism as Pou4f3+/- mice do not appear to be an
appropriate model for DFNA15 (Keithley et al. 1999).
In summary, the three human families identified with mutations in the POU4F3 coding
sequence causing DFNA15 have suggested that POU4F3 mutation causing deafness may
not be as rare as first thought (Collin et al. 2008;Vahava et al. 1998). Furthermore, they
support a life-long role for POU4F3 in maintaining hair cells and promoting their survival.
Therefore, a greater understanding of the mechanism of POU4F3 function can not only
provide potential strategies for prevention of DFNA15, but can also identify hair cell
survival mechanisms which could be manipulated to prevent acquired hearing loss.
1.5.5 POU4F3 regulation, structure and function
The function of POU4F3 in hair cell development and maintenance is dependent on its
regulation, structure and transcriptional environment. Regulation of Pou4f3 is important
for highly cell-specific expression whilst its structure and environment dictate its
subcellular localization, DNA binding capability and target gene regulation. Pou4f3 has
been localized to chromosome 18 in the mouse (Xia et al. 1993) and rat and chromosome five
in humans (Xiang et al. 1995). It is composed of two exons, with a similar structure to
Pou4f1, and gives rise to only one transcript, which produces a 37kDa protein (Gerrero et al.
1993;Xiang et al. 1995). This is in contrast to its two family members, each of which has
been shown to produce a long and short transcript with different functions (Theil et al.
1995;Theil et al. 1993).
Little is known of the factors that regulate Pou4f3 in order to produce hair cell-specific
expression in the inner ear. In an in vivo preparation of the chicken retina, the products of
a number of genes have been associated with increased cBrn3c (Chicken Pou4f3) expression
(Cath5 (Chicken Ath5), Math5 (Mouse Ath5 / Atoh7), Pou4f1, Pou4f2 and Pou4f3) though a
direct mechanism of cBrn3c of upregulation has not been shown for these genes (Liu et al.

1 General introduction 73
2001). Similarly, in cochlear cultures, POU4F3 expression has been shown to be dependent
on retinoic acid signalling, without evidence for the mechanism of regulation, which may be
indirect (Raz et al. 1999). Conversely, an NFAT-C/EBP composite element is able to
regulate a recognition element in the POU4F3 promoter (Yang et al. 2003) and an analysis
of sequence variants at the POU4F3 locus identified an SP family binding cis-regulatory
element in the POU4F3 5’ flanking region which may affect its regulation in vitro (Nolan et
al. 2007). However, the significance of these relationships have not been studied in vivo.
Further characterisation of these interactions is likely to help clarify the requirement of
POU4F3 for hair cell survival and may identify polymorphisms associated with late onset
hearing loss, particularly presbyacusis (Nolan et al. 2007).
The POU4F3 protein can be separated into two main domains. The first domain is the N-
terminal activation domain, which encompasses the POU-IV box – a region of high
homology between POU4F members (Gerrero et al. 1993). Similar to the N-terminal of
POU4F1 (Budhram-Mahadeo et al. 1995;Theil et al. 1993), this N-terminal domain is
involved in transactivation and appears to function following binding of POU4F3 to DNA,
presumably through protein-protein interactions (Smith et al. 1998;Sud et al. 2005). The
second domain in POU4F3 is the POU domain described above (see section 1.5.2) which is
present in POU4F3 in its normal POUS-linker-POUH conformation (see Figure 1.11)
(Gerrero et al. 1993;Ninkina et al. 1993).
The POU domain is highly conserved between POU4F members, showing approximately
95% sequence similarity with the greatest number of mismatches present in the linker
region (see Figure 1.11a). The third helix of the POUH (i.e. the helix that makes contact
with the major groove (Verrijzer et al. 1993)) is fully conserved between mammalian
POU4F members (Xiang et al. 1995). It was therefore predicted that POU4F members
compete for the same DNA sequences when coexpressed (Xiang et al. 1995) and this is
supported by experiments which show that POU4F3 can upregulate POU4F1 target genes
(Budhram-Mahadeo et al. 1995;Smith et al. 1998). However, this is not the case in the
organ of Corti as only POU4F3 is expressed in hair cells and, though POU4F DNA binding
sites have been shown to be similar, there are subtle differences in sequence specificity
between POU4F members (see Figure 1.11c) (Gruber et al. 1997;Xiang et al. 1995).

1 G
en
era
l in
trod
uct
ion
7
4
Fig
ure
1.1
1.
PO
U4F
3 p
rote
in c
om
po
sit
ion
. a)
Alig
nm
ent
of
PO
U4F
1 a
nd P
OU
4F
3.
The
am
ino a
cid
sequ
ences o
f P
OU
4F
1 a
nd P
OU
4F
3 a
re s
how
n w
ith h
om
olo
gous r
esid
ues s
haded
. T
he P
OU
-IV
box,
PO
US
and
PO
UH a
re o
ver
lined,
indic
atin
g t
he
conserv
ation
of
these
functio
nally
im
port
ant
do
main
s.
The
arr
ow
in
dic
ate
s t
he
splic
e ju
nctio
n t
hat
diffe
rentiate
s t
he lo
ng
an
d
short
PO
U4F
1 t
ranscripts
and is locate
d b
etw
een e
xo
ns o
ne
and t
wo in
PO
U4F
1 (
ada
pte
d f
rom
Gerr
ero
et
al. 1
99
3).
b)
PO
U4F
3 p
rote
in d
om
ain
s (
taken
fro
m S
ud
2005).
c)
gra
phic
re
pre
se
nta
tion of
PO
U4F
1 an
d P
OU
4F
2 conse
nsus seq
ue
nces fr
om
positio
na
l w
eig
ht
matr
ices and a com
bin
atio
n of
the tw
o consensus
sequences w
ith p
ositio
n o
ne o
f th
e c
om
bin
ed s
eq
ue
nce b
ein
g e
qu
ivale
nt
to p
ositio
n -
1 o
f th
e P
OU
4F
1 c
on
sensus a
nd p
ositio
n 1
of
the
PO
U4F
2 c
onsensu
s
(adapte
d fro
m G
rub
er
et
al. 1
99
7;X
iang e
t a
l. 1
995).
Seque
nces v
isua
lise
d u
sin
g W
eb
Log
o (
Cro
oks e
t al. 2
004).
________________POU-IV BOX________________
POU4F1 MMSMNSKQPH FAMHPTLPEH KYPSLHSSSE AIRRACLPTP PLQSNLFASL DETLLARAEA LAAVDIAVSQ GKSHPFKPDA
POU4F3 MMAMNAKQP- FGMHPVLQEP KFSSLHSGSE AMRRVCLPAP QLQGNIFGSF DESLLARAEA LAAVDI-VSH GKNHPFKPDA
POU4F1 TYHTMNSVPC TSTS-TVPLA H-----HHHH HHHHQALEPG DLLDHISSPS LALMAGAGGA GAAGGGGGAH DGPGGGGGPG
POU4F3 TYHTMSSVPC TSTSPTVPIS HPAALTSHPH HAVHQGLE-G DLLEHIS-PT LSV------- ---------- ----------
POU4F1 GGGGPGGGGP GGGGGGGGPG GGGGGPGGGL LGGSAHPHPH MHGLGHLSHP AAAAAMNMPS GLPHP-GLVA AAAHHGAAAA
POU4F3 ---------- ---------- ---------- ---------- ---------- ---------S GLGAPEHSVM PAQIHPHHLG
_____________________________POU-SPECIFIC DOMAIN_____
POU4F1 AAAAAAGQV- AAASAAAAVV GAAGLASICD SDTDPRELEA FAERFKQRRI KLGVTQADVG SALANLKIPG VGSLSQSTIC
POU4F3 AMGHLH-QAM GMSHPHAVAP HSAMPACLSD VESDPRELEA FAERFKQRRI KLGVTQADVG AALANLKIPG VGSLSQSTIC
_____________________________ ________________________POU-HOMEODOMAIN_
POU4F1 RFESLTLSHN NMIALKPILQ AWLEEAEGAQ REKMNKPELF NGGEKKRKRT SIAAPEKRSL EAYFAVQPRP SSEKIAAIAE
POU4F3 RFESLTLSHN NMIALKPVLQ AWLEEAEAAY REKNSKPELF NGSERKRKRT SIAAPEKRSL EAYFAIQPRP SSEKIAAIAE
________________________
POU4F1 KLDLKKNVVR VWFCNQRQKQ KRMKFSATY
POU4F3 KLDLKKNVVR VWFCNQRQKQ KRMKYSAVH
a)
b)
c)
Pic
ture
rem
oved
for
cop
yri
gh
t p
urp
ose
s
Pic
ture
rem
oved
for
cop
yri
gh
t p
urp
ose
s

1 General introduction 75
Although transactivation by POU factors, including POU4F1, can be mediated through the
POU domain (Andersen et al. 2001;Budhram-Mahadeo et al. 1995), the isolated POU4F3
POU domain was not able to mediate transactivation when tested in an inner ear cell line
(Sud et al. 2005) in contrast to its ability to upregulate a herpes simplex virus promoter in
neuronal cells (ND7) (Liu et al. 2000). It was also thought that POU4F members, unlike
other POU factors, were unable to dimerise through their POU domain (Andersen et al.
2001;Gruber et al. 1997), however, POU4F members are likely to form dimers on
appropriate recognition elements as demonstrated by the dimerisation of the POU4F1 POU
domain on a Brn-2 (POU3F2) consensus oligonucleotide; though they may also function as
monomers (Rhee et al. 1998). No structural data are available for POU4F members and it is
therefore unknown whether the POUS and POUH bind opposite DNA strands like Oct1
(Klemm et al. 1994) or the same strand, like Pit-1 (Jacobson et al. 1997).
As POU4F3 is only likely to affect target gene transcription when bound to DNA (Sud et al.
2005), its regulatory function is dependent on the presence of POU4F3 binding sites in
target gene promoters. Furthermore, as shown by experiments with POU4F1 and POU4F2,
the structure of the promoter, including the context and spacing of binding sites, can have
an effect on transcriptional regulation (Dawson et al. 1996;Morris et al. 1996). Though no
consensus sequence has been independently derived for POU4F3, consensus sequences for
both POU4F2 (Xiang et al. 1995) and POU4F1 (Gruber et al. 1997) have been determined
(see Figure 1.11c) and shown to be similar to those of Brn-2 (POU3F2) and Brn-5 (POU6F1)
(Rhee et al. 1998). POU4F3 has been shown to have affinity for similar binding sites to its
family members (Xiang et al. 1995), however, the affinity and transcriptional activity of
POU4F3 at these sites has not been reported (binding affinity being a strong predictor of
transcriptional activation for POU4F1 (Trieu et al. 1999)). Given the large amount of
genomic sequence currently available (in stark contrast to the time that the above work
was published), a greater understanding of POU4F3 affinity for these sites and the factors
that determine its transcriptional function once bound will greatly aid in the identification
and characterisation of POU4F3 target genes. However, targets discovered in silico may be
biased to the existing consensus sequences. Therefore, unbiased identification of POU4F3
binding sites, e.g. by random oligonucleotide selection or chromatin immunoprecipitation,
will greatly aid the accuracy of such experiments, as will feed back on the transcriptional
effect of POU4F3 at predicted binding sites.
Though POU4F3 is known to be a transcription factor, few of its targets have been
identified. Initially its regulatory function was investigated for known targets of POU4F1
in neuronal cells. POU4F3 was able to transactivate a number of POU4F1 target gene
promoters (SNAP-25, α-internexin, synapsin three neurofilament subunits) (Budhram-
Mahadeo et al. 1995;Morris et al. 1996;Smith et al. 1998). It was also shown to be capable of
repressing one promoter (the α3 nicotinic acetylcholine receptor subunit gene promoter)

1 General introduction 76
(Milton et al. 1996). However, the relevance of these interactions to hair cells is unclear as
POU4F3 is able to regulate different promoters in different cell types (e.g. neuronal versus
non-neuronal) (Clough et al. 2004;Smith et al. 1998;Sud et al. 2005). Though it was
suggested that differences in regulation are due to the POU4F3 N-terminal activation
domain only being active in neuronal cells (Smith et al. 1998), contradictory results were
obtained using a more sensitive assay system (Sud et al. 2005). Furthermore, regulation by
POU4F3, like regulation by other POU4F members, is likely to be influenced by the context
of its binding sites (Budhram-Mahadeo et al. 1995;Dawson et al. 1996).
Since the demonstration of the requirement for POU4F3 in hair cell development and
survival (Erkman et al. 1996;Vahava et al. 1998;Xiang et al. 1998;Xiang et al. 1997), the
identification of POU4F3 target genes has focused on these cells. To date, the only proven
directly upregulated targets of POU4F3 are the neurotrophins BDNF and NT-3, as
demonstrated by DNAse footprinting, EMSA and luciferase assay (Clough et al. 2004) and,
for BDNF, supported by microarray results in POU4F3 mutant mice (Hertzano et al. 2007).
These genes are known to be required for maintenance of normal hair cell innervation by
providing trophic support to neurons, and a role for POU4F3 in their expression in vivo is
supported by the reduced expression of BDNF in immature hair cells in Pou4f3-/- mice
(NT-3 expression does not appear to be markedly reduced) (Xiang et al. 2003). However, it
is likely that BDNF expression in the developing inner ear is also influenced by additional
factors, e.g. miR15a (Friedman et al. 2009a), as its expression does not closely match that of
POU4F3 (Hertzano et al. 2007).
In addition to the above targets Gfi and Lhx3 are strongly associated with POU4F3
expression. Calbindin2 may also be associated with POU4F3 expression though very little
evidence exists for this possible interaction (Hertzano et al. 2004;Hertzano et al. 2007).
Both Gfi1 and Lhx3 were identified based on the microarray comparison of cDNAs present
in wild type and Pou4f3ddl/ddl (homozygous dreidel mutant) whole inner ears and the
expression of both genes seems to mirror that of Pou4f3, though Lhx3 expression declines
postnatally despite increased Pou4f3 transcription (Hertzano et al. 2007). Subsequent RNA
in situ hybridization and immunohistochemistry has revealed that both genes have hair
cell-specific expression patterns in the inner ear. Though Lhx knockout does not affect hair
cell development (Hertzano et al. 2007), Gfi1 knockout results in OHC loss, which proceeds
to total disruption of the organ of Corti by P14, demonstrating an important role for this
presumed target of POU4F3 in hair cell development and maintenance (Wallis et al. 2003).
However, the mechanism by which POU4F3 may upregulate these genes has not been
reported, and there is, therefore, a lack of evidence to support direct regulation of Gfi1 or
Lhx3 expression by POU4F3.

1 General introduction 77
In summary, POU4F3 expression in the inner ear is essential for hair cell terminal
differentiation and survival (Erkman et al. 1996;Xiang et al. 1998;Xiang et al. 1997) and
little is known of the target genes through which it is able to generate and maintain the
mature hair cell phenotype. In order to understand the mechanism of POU4F3 function,
unknown targets must be identified and characterised. Furthermore, the mechanism
through which POU4F3 regulates these genes is likely to be important in the identification
of strategies to prevent hair cell loss in patients with POU4F3 mutations as well as
identifying new strategies in preventing hair cell loss in the general population due
acquired hearing loss. However, such investigations face unique challenges posed by the
complicated biology of the inner ear.
1.6 Investigation of inner ear biology
1.6.1 Difficulties of analysing inner ear biology
The inner ear is one of the most inaccessible organs in the mammalian body and the
irreplaceable hair cells are surrounded by a complex and delicate microarchitecture that
necessitates removal of the whole inner ear in order to use them for molecular biological
investigation. As mammalian hair cells are mitotically quiescent and cannot be cultured,
experiments rely on hair cells obtained from inner ears of laboratory animals; commonly
mouse, rat or guinea pig. Many inner ears would be required to provide enough tissue for
biochemical analyses given the low number of hair cells available per inner ear
(approximately 20 000 depending on species (Slepecky 1996)) and many research
techniques require the separation of hair cells from other cell types in order to yield
meaningful results. Though the latter has been attempted with success (e.g. Zheng et al.
2000) in studies similar to the present one (see section 3.1), such techniques present
differing challenges which could interfere with the identification of transcription factor
target genes. The traditional techniques of enzymatic-, microdissection- and trituration-
based hair cell isolation (see references in He et al. 2000) can cause damage to hair cells
which may alter gene expression (this may be due to direct effects of enzymes, or
mechanical damage). The main limitation, however, is the length of time required between
sacrificing the animal and using the cells (e.g. the trypsinisation step in He et al. 2000
alone takes 15 minutes) which can affect gene expression. The more recent technique of
laser capture microdissection for the isolation of inner ear hair cells (Anderson et al.
2007;Cristobal et al. 2004;Cristobal et al. 2005;Gao et al. 2007;Wu et al. 2008) circumvents
the above problems and allows a reduction in the time between animal sacrifice and cell
fixation by intracardial PFA infusion (Wu et al. 2008). However, as stated by De Preter et al.
(De Preter et al. 2003), only small amounts of nucleic acids are obtained by LCM and the
required staining protocols are not beneficial for RNA quality.

1 General introduction 78
1.6.2 Utility of cell lines in inner ear research
Cell lines provide a method with which to circumvent many of the problems outlined above.
Many cells can be rapidly generated and their contents are rapidly accessible for use in
molecular biological experimentation. However, according to the desired application, the
cell line used can be of pivotal importance and cell lines are often not suitable for the study
of protein function as they do not express required proteins or are not in their required
niche.
In investigating transcriptional regulation, the choice of cell type is particularly important
given that the transcriptional environment can vary greatly and is a major determinant of
cell phenotype. For example, POU4F3 is able to upregulate the SNAP-25 promoter in a
neuronal cell line (ND7), but not in non-neuronal and inner ear sensory epithelial cell lines
(BHK, UB/OC-1 and UB/OC-2) (Smith et al. 1998;Sud et al. 2005). Conversely, it is able to
upregulate Bdnf and Ntf3 promoters in UB/OC and BHK cell lines but not in ND7 cells
(Clough et al. 2004). As these differences are likely to be due to differences present in the
native tissue that these cells were derived from, the use of an inner ear cell line is likely to
yield more physiologically relevant results in investigations of inner ear transcriptional
regulation than other cell types (see section 3.1). However, as cultured cells do not precisely
represent the cells of interest, it is possible that artefactual interactions will be discovered
in these cells. Therefore, regulatory relationships identified in cell lines require supporting
evidence from native tissue, where possible, to confirm and strengthen evidence for any
interactions discovered.
1.7 Project aims Hair cell loss due to different causes remains the principal cause of deafness. In turn,
deafness is the most common sensory disability in the western world (Olusanya et al. 2007).
Therefore, a method to replace hair cells, or prevent their loss, would benefit a large
population. Unfortunately, no such methods exist and we remain reliant on prostheses such
as hearing aids and cochlear implants to ameliorate hearing without improving and, in
some cases, further damaging residual hearing (Kulkarni et al. 2008).
Though an increasing number of proteins are being shown to be expressed in hair cells,
signalling networks within these cells remain poorly characterised and, until recently, very
difficult to investigate. A greater understanding of these networks could potentially aid in a
variety of therapeutic measures e.g. gene therapy, drug therapy, stem cell programming
and growth factor therapy.
In my project, I took the POU4F3 transcription factor as a start-point from which to
investigate the networks that it is likely to control given its essential role in hair cell
differentiation and survival (Collin et al. 2008;Erkman et al. 1996;Vahava et al. 1998;Xiang

1 General introduction 79
et al. 1998;Xiang et al. 1997). I investigated a pool of potential POU4F3 target genes,
previously generated in our laboratory by a subtractive hybridization screen in UB/OC-2
cells, in order to determine whether these genes alter their expression in response to
POU4F3 and whether they are directly regulated by POU4F3. I also aimed to investigate
the physiological significance of any regulatory relationships in vivo by determining the
expression patterns of selected newly identified POU4F3 target genes. Particular priority
was given to genes that might be important in hair cell survival and might therefore be
useful in preventing hair cell loss or promoting hair cell regeneration.

2 Materials and methods 80
2
MATERIALS AND METHODS
NB All water used is type III purified water unless otherwise stated.
All chemicals were supplied by BDH, Invitrogen, Promega or Sigma-Aldrich unless
otherwise stated.
Restriction endonucleases were purchased from Promega unless otherwise stated.
Where work has been carried out by other members of the laboratory, it is made clear
in the text
2.1 Safety
2.1.1 Unsealed radioactive sources
All procedures using unsealed radioactive sources were conducted according to local
regulations. Where possible, radioactive sources were used in a room designated for work
with radioactive reagents and appropriate monitoring and personal dosimetry was carried
out.
2.1.2 Genetically modified bacteria
Bacteria were manipulated and disposed of according to local regulations.
2.1.3 General
All procedures were carried out according to UCL safety regulations.
2.2 General equipment
Eppendorf
Centrifuges: 5417C, 5417R, 5804R,
MiniSpin; Concentrator: 5301; Thermal
cyclers: Mastercycler gradient,
Mastercycler personal
Jenway
6305 UV/Vis Spectrophotometer

2 Materials and methods 81
Luckham
R100 rotatest shaker
Millipore
Elix and Milli-Q® water purification
system
Nanodrop®
ND-1000 spectrophotometer
New Brunswick Scientific
C2 incubator shaker
Sorvall
RC 5C plus centrifuge
Stuart Scientific
STR6 platform shaker
Techne
Dri-Block® DB-2D heat block
UVP
3UV™ Transilluminator; GelDoc-it
imaging system
2.3 Stock solutions Luria-Bertani broth (LB)
• 1% Tryptone
(DUCHEFA)
• 0.5% Yeast extract
(DUCHEFA)
• 0.17M NaCl
LB-Agar
• 98.5% LB
• 1.5% Micro Agar
(DUCHEFA)
PBS pH 7.4 at 25°C (Sigma-
Aldrich)
• 0.01M phosphate buffer
• 0.0027M potassium
chloride
• 0.137M sodium chloride
50x TAE
• 2M Tris
• 1M Glacial acetic
acid
• 50mM EDTA pH 8.0
2.4 BLAST analysis of subtractive hybridization
clones cDNA clones that had been produced by the subtractive hybridization screen were sent for
sequencing by members of the laboratory. The sequences generated from this analysis
contained adaptor sequences that had been used to amplify and clone differentially
expressed transcripts from the subtractive hybridization screen into the pGEM-T® Easy
vector. The sequences of these adaptors were therefore aligned with the sequenced data
from the subtractive hybridization clones using the ‘pairwise alignment’ function of the
BioEdit software package (a modified Smith-Waterman alignment algorithm) or manually
and then deleted from the sequence data if present (Hall 2007;Hall 1999). This edited
sequence data was copied to a text file and annotated in FASTA format for each gene. In
order to identify genes corresponding to the cDNA sequences, these files were used to query
the Ensembl mouse cDNA database by nucleotide-nucleotide BLASTN analysis using the
WU BLAST 2.0 software package through the Ensembl website (Ensembl 2008a;Gish 2004).
The algorithm for near-exact matches was used to identify genes that corresponded to the

2 Materials and methods 82
cDNA sequences in order to minimise type 2 error. If significant alignments were found for
a given sequence, the most significantly aligned gene was taken to be the corresponding
gene for that sequence. Sequences that had no significant matches (p < 0.05) were re-
analysed using mouse genomic database and discarded if no significant matches were
identified. Subsequent analysis of these matches is described in section 3.2.
2.5 Cell culture
2.5.1 Equipment for cell culture
ALC
PK10 centrifuge
Binder
WTC tissue culture incubator
Kendro
Heraeus HeraSafe KS safety cabinet;
Heraeus HeraCell 150 tissue culture
incubator
Nikon
Eclipse TS100 microscope
2.5.2 University of Bristol organ of Corti-1 (UB/OC-1) and UB/OC-2 cells
UB/OC-1 and UB/OC-2 cells — developmental inner ear sensory epithelial cell lines — were
cultured in Eagle minimum essential medium supplemented with L-Glutamine, 10% heat-
inactivated foetal bovine serum and 50U/ml γ-interferon in a 33ºC incubator with 5%
carbon dioxide (Rivolta et al. 1998a). Cells were passaged by trypsinisation with 1% trypsin
in 5mM HEPES-buffered Hanks’ balanced salt solution followed by centrifugation at
1000rpm for 3 minutes, resuspension in culture medium (described above) and seeding at
approximately 1-2 x 10⁵ cells per 75cm2 flask.
2.5.3 Baby hamster kidney -21 (BHK-21) cells
BHK-21 cells were cultured in Dulbecco’s modified Eagle medium supplemented with 10%
heat-inactivated foetal bovine serum in a 37ºC incubator with 5% carbon dioxide. Cells were
seeded and passaged as for UB/OC-1 & -2 cells.
2.5.4 ND7 cells
ND7 cells — a sensory-neuronal / neuroblastoma hybrid cell line (Wood et al. 1990) — were
cultured in L-glutamine-containing L-15 media supplemented with 10% heat-inactivated
foetal bovine serum, 0.32% sodium bicarbonate, 0.25% glucose and 0.85% penicillin-
streptomycin. Cells were incubated at 37ºC, 5% carbon dioxide, seeded at approximately 1-2
x 105 cells per 75cm2 flask and passaged by mechanical dissociation.

2 Materials and methods 83
2.6 General DNA manipulation
2.6.1 Plasmid DNA purification
Where plasmid DNA has been used, it has been purified using the MiniPrep kit (Qiagen)
spin method or the MidiPrep kit (Qiagen) spin method:
MiniPrep
Bacteria (typically XL1-Blue cells (Stratagene) or JM109 cells (Promega)) were cultured in
2ml LB containing 1x ampicillin (100µg/ml) for 8 hours or in 5ml LB + 1x ampicillin
(100µg/ml) for 16 hours. 1.5ml of broth was centrifuged in a 1.5ml microcentrifuge tube at
3000rpm for 2 minutes at 4°C. The bacterial pellet was resuspended and DNA was purified
according to the manufacturer’s instructions. Typically, the column (used to bind and wash
the DNA) was dried on a heat block for two minutes at 50°C following the final ethanol
(‘Buffer PE’) wash and DNA was eluted in 50µl water.
MidiPrep
Bacteria (typically XL1-Blue (Stratagene) or JM109 (Promega) cells) were cultured in 50ml
LB containing 1x ampicillin (100µg/ml) for 16 hours. The full culture was typically
centrifuged at 4000rpm for 20 minutes at 4°C and the pellet was processed according to the
manufacturer’s protocol apart from the second centrifugation step which was replaced by
the filtration of the supernatant from the first centrifugation step through a cloth filter.
DNA was typically resuspended in 200µl water and its concentration was determined as
explained in section 2.11.4 or using a Nanodrop® ND-1000 spectrophotometer.
2.6.2 Digestion of DNA by restriction endonucleases
Typically, 1µg plasmid DNA was digested with 10 units of restriction endonuclease with the
appropriate buffer at 1x concentration in a final volume of 30µl made up with water. 1 hour
at 37°C was sufficient to ensure complete digestion.
2.6.3 Agarose gel electrophoresis
Typically, 0.5-1µg DNA was electrophoresed on a 1-1.5% agarose gel containing 0.01%
ethidium bromide at approximately 80mA for 45 minutes. The gel was then visualised and
electrophoresed further if necessary. Exposure to the ultra-violet light of the visualiser was
minimised if the integrity of the DNA sequence needed to be maintained as the UV light is
mutagenic.
2.6.4 Extraction of DNA from agarose gel
DNA for extraction was electrophoresed in a low melting point agarose gel of appropriate
percentage (typically 1%). The required band was cut out using a scalpel under UV
illumination and the DNA from the band was extracted using the MinElute kit (Qiagen)

2 Materials and methods 84
(for bands of >70bp and <4kb) or using the Gel Extraction kit (Qiagen) according to the
manufacturer’s instructions.
2.6.5 DNA ligations
DNA ligation was carried out either by the TA method or using T4 DNA ligase.
TA method
PCR amplicons which had been amplified using a polymerase that leaves un-paired adenine
residues at the 3’ ends (typically GoTaq (Promega)) were ligated into the pDrive cloning
vector according to the manufacturer’s instructions (PCR Cloning kit (Qiagen)). The
ligation typically proceeded for 3 hours at room temperature or 16 hours at 16°C.
T4 DNA ligase method
The following mixture was typically used for DNA ligations for both blunt- and sticky-ended
inserts though blunt-ended ligations were usually attempted at more than one vector:insert
ratio:
• 1µl T4 DNA ligase (Promega)
• 1µl Linearised Vector
• 3µl Insert
• 5µl 2x T4 DNA ligase buffer (Promega)
Ligations were typically incubated for 16 hours at 16°C.
2.6.6 Transformation of competent bacteria
Chemically competent XL1-Blue (Stratagene) bacteria of transformation efficiency of >1 x
105 cfu/µg DNA/100µl competent cells (for subcloning applications) or >1 x 10⁵ cfu/µg
DNA/100µl (for transformation of purified circular DNA) were thawed on ice and aliquoted
into 1.5mL microcentrifuge tubes on ice. To each aliquot, no more than 5µl of ligation
mixture was added (typically the maximum amount was used). The reaction was incubated
on ice for a minimum of 45 minutes followed by a two minute heat shock at 42°C. 500µl LB
was then added and the cells were incubated for 30 minutes in a shaking incubator at 230
rotations per minute prior to being spread onto LB-Agar plates and incubated upside-down
at 37°C for 16 hours in an oven. Colonies were picked either the following morning (for
MiniPreps from 2mL cultures) or stored at 4°C and picked in the evening (for MiniPreps
from 5mL cultures or MidiPreps from 50mL cultures) using a 1-200µl pipette tip and
incubated for 8 or 16 hours respectively prior to DNA purification.

2 Materials and methods 85
2.7 Reverse Transcriptase Polymerase Chain
Reaction (RT-PCR)
2.7.1 Equipment for RT-PCR agarose gel electrophoresis
Jencons
Mini-Plus horizontal electrophoresis unit
2.7.2 RT-PCR primer oligonucleotide design.
Table 2.1. PCR primer oligonucleotide design parameters.
Parameter Range
Length 20-35bp
GC content 40-60%
Terminal nucleotide C or G
Salt-adjusted melting temperature (Tm) >60ºC
Single nucleotide repetitions <3bp at 3’ end of oligonucleotide
Hairpins None with Oligocalc
Complementarity None with Oligocalc
Self-annnealing None with Oligocalc
Primer Dimers <5bp match between primers
Amplicon length >800bp, <1.5kb
Exon specificity cDNA specific
BLAST results against appropriate genome Ensured that Tm of non-specific interaction was at
least 5ºC below that of the specific reaction
Primers were designed to be as sequence-specific as possible whilst maintaining optimal
melting temperatures for PCR to minimise non-specific amplification (Table 2.1). This was
done by ensuring that primers were of optimum length and GC content (for optimal melting
temperature), checking for secondary structure potential within primer pairs and, finally,
checking that the sequences to which the primers were designed were genomically unique.
Furthermore, where possible, primer pairs were designed to differing exons in order
differentiate – by size – between sequences amplified from cDNA and those amplified due
to genomic DNA contamination. The amplicon was designed to be large enough to easily
size-separate by agarose gel electrophoresis though small enough to not exceed the
optimum range for the GoTaq polymerase (Promega) that was used. Furthermore, where
possible, primers were designed to amplify target gene exons whose transcription in
UB/OC-2 cells had been suggested by the results of the subtractive hybridization screen
and subsequent BLAST analysis (for full details of individual primer sequences and
properties, see Appendix).
2 Materials and methods 86
2.7.3 RNA extraction and reverse transcription from UB/OC-2 cells
The RNeasy Mini kit (Qiagen) was used to extract RNA from a 75cm2 tissue culture flask of
approximately 90% confluent UB/OC-2 cells. The RNA was then reverse transcribed into
cDNA using the Omniscript RT kit (Qiagen) according to the manufacturer’s instructions.
2.7.4 PCR design and parameters
The following recipe was used for each reaction:
• 13.875µl water
• 5µl GoTaq Green Master Mix, 2X
• 2µl 25mM MgCl2
• 1µl dNTPs (5mM each)
• 1µl sense primer
• 1µl antisense primer
• 1µl UB/OC-2 cell reverse transcribed cDNA (diluted to approx. 5ng/µl)
• 0.125µl GoTaq polymerase
The above samples were used in PCR with the following thermal cycler program:
1. 95°C 1 minute
2. 95°C 30 seconds
3. 64°C 30 seconds
4. 72°C 1 minute 20 seconds
5. REPEAT STEPS 2 TO 4 FOR 34 CYCLES
6. 72°C 10 minutes
Samples were then electrophoresed on a 1.5% agarose gel and visualised (see section 2.6.3).
2.8 Western blotting
2.8.1 Equipment for western blotting
Bio-Rad
Protean IIxI cell for PAGE
2.8.2 Reagents for whole cell protein extraction and western blotting
Lysis buffer
• 50mM Tris-HCl pH 7.9
• 50mM KCl
• 1mM EDTA
• 2mM DTT
• 1 tablet/10ml cOmplete mini
protease inhibitor cocktail (Roche)
• 25% glycerol
Lysis buffer was filter sterilised prior to
use.
10x TBS
• 1.5M NaCl
• 0.2M Tris (24.2g Tris)
TBS-T
• 1x TBS
• 0.1% Tween

2 Materials and methods 87
1L 10x SDS PAGE Gel Running
Buffer
• 144.2g Glycine
• 100ml 10% SDS
• 30.3g Tris
1L 10x Western Blotting Buffer
• 144g Glycine
• 30.3g Tris
1x Western Blotting Buffer
• 10% 10x Blotting
Buffer
• 30% methanol
• 60% H20
1x SDS Gel Loading Buffer
• 50mM Tris-HCl pH6.8
• 2% SDS
• 10% glycerol
• 0.1% bromophenol
blue
• 100mM DTT
2.8.3 Gels for western blotting
Western resolving gel
• 10% acrylamide /
bis-acrylamide (37.5:1)
• 375mM Tris pH8.8
• 0.1% SDS
• 0.1% ammonium persulfate
• 0.04% TEMED
Western stacking gel
• 5% acrylamide /
bis-acrylamide (37.5:1)
• 0.125M Tris pH6.8
• 0.1% SDS
• 0.1% ammonium
persulfate
• 0.1% TEMED
2.8.4 Whole cell protein extraction
UB/OC-1, UB/OC-2, ND7, BHK and HeLa cells (the latter of which were cultured by ET)
were grown in 4-6 175cm2 tissue culture flasks until approximately 90% confluent —
generating 8-12 x 106 cells respectively. The growth media were then replaced with 12ml
PBS and cells were harvested using a cell scraper. The PBS, containing the dissociated cells,
was pooled to a 50ml Falcon tube and centrifuged at 1000rpm at 4ºC for 5 minutes. The
supernatant was removed from the tube and the pellet was resuspended in 50µl lysis buffer
per 106 cells. Lysis was carried out using a 100µl homogeniser and the lysate was pelleted
by centrifugation at 14000rpm at 4ºC for 10 minutes. The protein concentration was
estimated by measurement of the optical density of the solution at A280 and A260 by
spectrophotometry and using the values obtained in Equation 2.1:
Equation 2.1. Protein Concentration.
))Density(A Optical (0.76 - ))Density(A Optical (1.55 )g/(ion ConcentratProtein 260280 ××=lµµ
100µg aliquots were then snap frozen with liquid nitrogen. Tubes were stored at
-80ºC.

2 Materials and methods 88
2.8.5 SDS PAGE of protein
A 10% polyacrylamide western resolving gel was poured in a Protean IIxI cell for PAGE
(Bio-Rad), overlaid with water saturated isobutanol and allowed to set. The isobutanol was
then removed with paper towel. A 5% western stacking gel was poured, an appropriately
sized well comb was inserted and the gel was allowed to set. Once set, the comb was
removed and the wells were rinsed with 1x SDS PAGE gel running buffer. Protein samples
were made up to 20µl in SDS gel loading buffer (to a final concentration of 1x SDS gel
loading buffer), denatured by heating to 95ºC for 2 minutes and loaded into the wells; 15µl
of Rainbow™ coloured molecular weight marker (Amersham Biosciences) was run alongside
the protein extract for later sizing. The gel was run at 25mA/gel until the dye front entered
the resolving gel, the current was then turned up to 35mA/gel until the molecular weight
marker of relevant weight had been adequately resolved.
2.8.6 Western blotting
An Immobilon-P (PVDF) transfer membrane (Millipore) which had been cut to the
dimensions of the gel was equilibrated in 100% methanol for 15 seconds, followed by
equilibration in water for 2 minutes and then 1x blotting buffer for 5 minutes. The glass
plates of the gel assembly were carefully separated and the stacking gel was trimmed from
the resolving gel. The gel was then transferred onto a dry piece of Whatmann 3MM paper
and a sandwich was assembled comprising, from bottom to top: back plate of western
blotting tray; sponge; Whatmann 3MM paper sheet; gel (Whatmann 3MM paper side
down); equilibrated PVDF membrane; two more pieces of Whatmann 3MM paper; upper
sponge; upper plate of western blotting tray. The blot was run at 215mA for 3-4 hours in a
Trans-blot™ cell (Bio-Rad). The sandwich was then separated and the membrane carefully
removed and inspected to ensure adequate transfer of the molecular marker. The
membrane was dried by immersion in 100% methanol for 10 seconds followed by air-drying
at room temperature for 15 minutes or until thoroughly dry. It was then cut into
appropriate size strips and either stored at -20ºC or immediately used for immunodetection.
2.8.7 Ponceau S staining of PVDF membranes
In order to visualise lanes on a blotted membrane to assist in cutting the membrane into
strips prior to immunodetection, the protein on the membranes was stained by 5 minute
incubation with Ponceau S solution (Sigma-Aldrich) at room temperature under gentle
agitation. Once the strips had been cut, staining was reversed with water washes until
protein bands were no longer visible in order to facilitate immunodetection.
2.8.8 Immunolabelling of proteins on Immobilon P membranes
Membranes were either used directly after blotting or removed from storage at -20ºC and
allowed to warm to room temperature prior to manipulation. Blocking of non-specific
antigenicity was conducted by incubation of the membrane for 1 hour at room temperature

2 Materials and methods 89
in TBS-T containing 10% Marvel. Following a 5 minute wash in TBS-T, the membrane was
incubated for 1 hour in a solution of 1x TBS-T and 5% Marvel which contained an
appropriate dilution of primary antibody (1:1000 for anti-NR2F2; 1:2000 for anti-RBMS1;
1:250 for anti-ZRANB2).
The membrane was then twice rinsed with 1x TBS-T and two 5 minute incubations in
TBS-T with 5% Marvel were carried out followed by incubation for 1 hour in a solution of 1x
TBS-T and 5% Marvel containing an appropriate dilution of a secondary HRP-conjugated
antibody raised against the IgG of the animal that the primary antibody was raised in
(1:5000 swine anti-rabbit immunoglobulins for anti-NR2F2 and anti-RBMS1; 1:1000 goat
anti-mouse immunoglobulins for anti-ZRANB2). Finally, one 15 minute and two 5 minute
washes were carried out in TBS-T.
2.8.9 Detection of chemoluminescence
The membrane was removed from the TBS-T wash and any remaining TBS-T was poured
off. 5ml Immobilon™ Western chemiluminescent HRP substrate was added to the
membrane for 5 minutes. The reagent mix was then poured off and any excess was drained
onto paper towel. The blot was covered with plastic wrap, a piece of Hyperfilm™ ECL™
film was placed on top and was left to expose for 5 minutes in an X-ray film cassette.
2.8.10 Equalisation
Equalisation of protein expression by comparison of detected bands with a housekeeping
protein was not carried as this was not required in the present study i.e. the experiment
was conducted to identify the presence or absence of protein expression in a given cell line,
not to compare the levels of expression between cell lines. However, Ponceau staining of the
PVDF membrane was carried out to ensure that sufficient protein had been transferred to
the membrane for detection. Coomassie staining (a more sensitive assessment of protein
loading) of identically loaded gels was also carried out.
2.9 Immunofluorescence immunohistochemistry
2.9.1 Equipment for immunofluorescence immunohistochemistry
Carl Zeiss
LSM 510 META inverted laser scanning confocal microscope and laser module.
Leica
Dissecting microscopes: MZ 125 & MZ 75 ; CM1850 cryostat

2 Materials and methods 90
2.9.2 Reagents for immunofluorescence on UB/OC-2 cells
Blocking solution
• 10% Goat serum (Invitrogen)
• 0.2% Triton X solution (Sigma-Aldrich)
• 89.8% PBS solution
2.9.3 UB/OC-2 cell culture and immunohistochemistry
UB/OC-2 cells were seeded at approximately 1 x 10⁵ cells/ well in a six-well plate which
contained 0 or 1.5 thickness 13mm diameter uncoated glass coverslips (VWR). Cells were
grown to approximately 80% confluency and fixed for 20 minutes in 4% PFA in PBS at room
temperature. Three 5 minute PBS washes were carried out and coverslips were stored at
4ºC in PBS. Non-specific antibody binding was prevented by the addition of blocking
solution to each coverslip for 1 hour at room temperature prior to the addition of optimally
diluted primary antibody in blocking solution for a 1 hour incubation at room temperature
(1:1000 for anti-NR2F2; 1:500-2000 for anti-RBMS1). The coverslips were then rinsed with
PBS three times followed by the application of a 1-5µM DAPI, 1:200 (i.e. 1Unit/ml) Alexa
633-conjugted phalloidin and 2µg/ml Alexa 488-conjugated goat anti-rabbit IgG secondary
antibody mix diluted in blocking serum which was incubated for 2 hours at room
temperature. Slides were then rinsed with water three times and finally mounted on glass
slides using Fluromount G solution (Southern Biotech). Cells were visualised using a Zeiss
LSM 510 Meta microscope.
2.9.4 Reagents for immunofluorescence on cryosections
Blocking solution
• 10% Goat serum
(Invitrogen)
• 0.1-0.5% Triton X solution
(Sigma-Aldrich)
• 89.8% PBS solution
1% low gelling agarose gel
• 1% low gelling
agarose
• 18% sucrose
• 0.05% sodium azide
• 80.95% PBS
2.9.5 Preparation of cryosections
Tissue for cryosectioning (from Sprague Dawley rats or CBA/ca mice) was fixed in 4% PFA
solution (in PBS) for 1-2hours at room temperature or overnight at 4ºC. Samples were
cryoprotected by incubation in 30% sucrose in PBS overnight at 4ºC. The tissue was then
mounted in a 1% low gelling agarose gel which had been heated to 140ºC and allowed to
cool to 37ºC. Once the agarose had set (typically by incubation at 4ºC overnight) a block was

2 Materials and methods 91
cut from the agarose, attached to a cryostat chuck with OCT compound and rapidly frozen
by immersion in liquid nitrogen prior to cryosectioning at -20 to -25 ºC.
2.9.6 Blocking of non-specific antibody binding sites, immunolabelling and mounting
Slides were allowed to equilibrate to room temperature and the sections were drawn
around using a hydrophobic pen. Blocking solution with 0.1-0.5% Triton-X was then added
and incubated for 1 hour at room temperature. Slides were drained and optimally diluted
primary antibody, diluted in blocking solution, was added to the slides (1:1000 for anti-
NR2F2 and 1:250/500 for anti-ZRANB2) which were left to incubate overnight at 4ºC. The
following morning, three 5 minute washes were carried out with PBS and, typically, a
solution of blocking solution, 2µg/ml secondary antibody (conjugated to Alexa 488 or 633)
and 1Unit/ml phalloidin (conjugated to Alexa 488 or 633) was added for 2 hours at room
temperature. Slides were again washed for three 5 minute washes with PBS prior to the
addition of DAPI at 5µM (in PBS or blocking solution) for 20 minutes. Finally, the tissue
was washed for three 5 minute periods in PBS and mounted in Fluromount G (Southern
Biotech) under a 0 or 1.5 thickness 22mmx22mm or 22mmx50mm coverslip (VWR) which
was sealed with nail varnish (Boots). Slides were visualised using a Zeiss LSM 510 Meta
Microscope.
2.10 Electrophoretic Mobility Shift Assay (EMSA) NB The design of oligonucleotides used in EMSA analysis is described in section 3.5,
4.8.1 and 5.5.
2.10.1 Equipment for EMSA
Bio-Rad
Protean IIxI cell for PAGE (20cm glass plates, 3mm spacers)
Epson
Perfection 1650 scanner
MSE
Centaur 1 centrifuge
Rietschle Thomas
Welch Gel Master™ gel dryer vacuum system
Scie-Plas
Gel Dryer
UMAX
Astra 1200S scanner

2 Materials and methods 92
2.10.2 Reagents for EMSA
Cytoplasmic Lysis Buffer
• 10mM HEPES pH7.6
• 1mM EDTA
• 0.1mM EGTA
• 10mM KCl
• 1mM DTT
• 1mM sodium
pyrophosphate
• 1mg/ml SP1
• 1mM vanidate
Nuclear Lysis Buffer
• 20mM HEPES pH 7.6
• 0.2mM EDTA
• 0.1mM EGTA
• 25% Glycerol
• 0.42M NaCl2
• 1mM DTT
• 1mM sodium
pyrophosphate
• 1mg/ml SP1
• 1mM vanidate
3µg/µl Poly(dI-dC)
• 10Units poly(deoxyinosinic-
deoxycytidylic) acid sodium salt
(15Units/mg)
• 222.2µl H2O
10x Medium salt buffer
• 0.5M NaCl
• 0.1M Tris-HCl pH7.5
• 0.1M MgCl2
• 0.01M DTT
2x Parker buffer
• 16% Ficoll
• 40mM HEPES pH7.9
• 100mM KCl
• 2mM EDTA pH8.0
• 1mM DTT
10x TBE
• 0.89M Tris-borate
• 20mM EDTA pH 8.0
2.10.3 In vitro protein translation
cDNA for mouse Pou4f3 and Barhl1 was cloned into the pGEM®-T Easy vector under the
control of the T7 or SP6 promoter in our laboratory. Protein was synthesised according to
the manufacturer’s instructions using either the TNT®T7 Coupled Reticulocyte Lysate
System (Promega) or the TNT®SP6 Quick Coupled Transcription/Translation System
(Promega) using the provided SP6/T7 luciferase control DNA vector to synthesise luciferase
protein which was used as a negative control in EMSA experiments.
2.10.4 Nuclear protein extraction
UB/OC-2 cells were grown in four 175cm2 tissue culture flasks to 90% confluency. The cells
were washed once with PBS and placed on ice. 3ml of cytoplasmic lysis buffer was added to
each flask and left to incubate on ice for 5 minutes prior to scraping of the cells with a cell
scraper. The contents of each flask were then transferred to microcentrifuge tubes on ice
(1ml per tube). 60µl of 10% NP-40 was added to the top side of each tube and the tubes
were briefly vortexed and spun at 14000rpm at 4ºC for 30 seconds. The supernatant, which
contains cytoplasmic proteins, was removed and stored at 4ºC. All traces of supernatant

2 Materials and methods 93
were removed from the pellet and 60µl nuclear lysis buffer was added. The tube was flicked
gently to dislodge the pellet and was then subjected to three freeze thaw cycles between an
ethanol-dry ice bath and a 37ºC water bath. The tubes were then centrifuged at 14000rpm
at 4ºC for 10 minutes. The supernatants from this step were pooled, their protein
concentration estimated as for whole cell protein extracts (Equation 2.1) and the protein
aliquoted into 20µg aliquots and snap frozen in liquid nitrogen prior to storage at -80ºC.
2.10.5 EMSA oligonucleotide design and synthesis
Double stranded oligonucleotides were designed as described in section 3.5 (general design)
and synthesised by Operon Biotechnologies Inc.
2.10.6 Probe preparation
10µg of sense and antisense oligonucleotide were combined with 1x medium salt buffer in a
total volume of 22.2µl. This mixture was heated to 95ºC for 10 minutes and left to slowly
cool to room temperature to anneal the single-stranded oligonucleotides to form double
stranded EMSA probe. Probe annealing was checked by electrophoresis of annealed probe
alongside single-stranded probe on a 3% Agarose gel. Following confirmation of annealing,
probes were stored at -20ºC.
2.10.7 Probe labelling
Probes were diluted to 25ng/µl and 50ng of each probe was labelled in a standard T4 kinase
reaction:
• 50ng probe
• 2µl 10x Kinase buffer
• 3µl γ32P γ-ATP (10µCi/µl) (GE Healthcare)
• 1µl T4 Kinase (5-10U/µl)
• to 20µl H2O
The reaction was incubated at 37ºC for 30 minutes. 80µl H2O was then added and the
diluted reaction mixture was loaded onto a Sephadex-G25 column and spun at 1500 rpm for
2 minutes to separate labelled oligonucleotides from free γ32P γ-ATP (GE Healthcare).
Radiolabelled probes were stored at -20ºC.

2 Materials and methods 94
2.10.8 Assay reaction
Assay reactions were set up and incubated on ice for 10 minutes:
• 10µl 2x Parker buffer
• 3µg polydI/dC
• 2-4µl UB/OC-2 Nuclear Protein Extract or in vitro translated protein
• 0-1000ng Non-radiolabelled competition probe
• to 20µl H2O
1ng of labelled probe was then added to each tube and the tubes were incubated at room
temperature for 15-30 minutes.
2.10.9 Non-denaturing polyacrylamide gel electrophoresis
A 4% polyacrylamide (29:1), 0.25x TBE gel was poured (dimensions: 200 x 200 x 3mm) and
polymerisation was initiated and catalysed by 0.05% ammonium persulfate and 0.2%
TEMED respectively. Once set, the wells were washed with 0.25x TBE and the gel was run
in this buffer at 200 volts at 4ºC in the Protean IIxI cell until the current had fallen to
below 30 mA per gel (typically 30 minutes). The samples were then loaded onto the gel and
electrophoresed at 200 volts for 1 to 3 hours at 4ºC.
2.10.10 Gel drying and autoradiography
After electrophoresis, the gel was removed from its cast to a piece of Whatmann 3MM paper,
covered with cling film (Terinex) and placed in a gel dryer at 80ºC under vacuum until dry
(typically 1-2 hours). Autoradiography was carried out in an X-ray film cassette with X-ray
film (SLS) that was exposed at -80ºC for between 1 hour to 5 days. Once exposed, the film
was removed from the cassette in a dark room, developed and fixed using Kodak processing
chemicals for autoradiography films (GBX developer/replenisher and GBX
fixer/replenisher) (Sigma-Aldrich) according to the manufacturer’s instructions. Once dry,
autoradiographs were scanned using an Epson or Umax scanner.

2 Materials and methods 95
2.11 Cell transfection and reporter gene assay
2.11.1 Equipment for luciferase assay
Turner
TD-20e luminometer
2.11.2 Reagents for luciferase Assay
10x HEPES-Buffered Saline (HBS)
• 8.18% NaCl (w/v)
• 5.94% HEPES (w/v)
• 0.2% Na2HPO4 (w/v)
Filter sterilised with a 0.22µm filter and
stored at 4ºC.
2x HBS
• 10ml 10x HBS
• 40ml water
The solution was pH adjusted to 7.12 and
filter sterilized with a 0.22µm filter.
2.11.3 Plasmid constructs for luciferase assay
The pGL3-basic-NR2F2 4kb promoter (NR2F2p4kb) luciferase reporter construct was
kindly provided by Dr M Vasseur-Cognet. pGL-3-basic-NR2F2 1.6kb promoter
(NR2F2p1.6kb) was kindly provided by Dr S Tsai. pGV-Basic-Rbms1 1.3kb promoter
(RBMS1p1.3kb) luciferase reporter construct was kindly provided by Dr H Ariga.
pGL4.10[luc2] was purchased from Promega UK Ltd. pSi-Pou4f3 was cloned in our lab
(Nolan et al. 2007).
Figure 2.1. pDrive cloning vector. Schematic diagram of the pDrive cloning vector which was used in order to clone gene promoters which had been amplified from genomic DNA by PCR. Purified PCR product was ligated into the pDrive vector by TA ligation i.e. by ligation of the Adenine bases at the 3’ ends of the amplified promoter to the free uracil bases of the linearised pDrive vector. © Qiagen.
Picture removed for copyright purposes

2 Materials and methods 96
Figure 2.2. pGL4.10[luc2] vector. Schematic diagram of the pGL4.10[luc2] luciferase reporter vector which contains a synthetic luciferase gene that has been codon optimised for expression in mammalian cells. Promoters from putative POU4F3 target genes were cloned into this vector for investigation of their regulation by POU4F3. © Promega.
pGL4.10-LUZP1p-2.8kb
The pGL4.10[luc2]-LUZP1 2.8kb promoter (LUZP1p2.8kb) luciferase reporter construct was
produced as follows: The forward primer 5’-TTCCAGTGTGGTCTTGAACTCCTGTGG-3’
and reverse primer 5’-GAGGATCCGGCGCTCCGCTC-3’ were used to amplify a 2.8kb
fragment of the LUZP1 promoter from mouse genomic DNA (Promega) with GoTaq
(Promega) and Pfu (Stratagene) polymerases which was inserted, by TA-based ligation, into
the pDrive cloning vector (Qiagen) (see Figure 2.1) according to the manufacturer’s
instructions. The promoter orientation was checked by restriction digestion with XhoI and
the KpnI-ΝheI fragment of this construct was inserted into the KpnI-NheI site of
pGL4.10[luc2] (see Figure 2.2). Promoter integrity was checked by DNA sequencing.
pGL4.10-Rbms1p-5.1kb
This construct (abbreviated to RBMS1p5.1kb) was cloned by SD. The BsgI fragment of a
plasmid containing 21kb of the RBMS1 5’ flanking region (kindly provided by Dr H Ariga)
was incubated with the DNA polymerase large (Klenow) fragment (Promega) according to
the manufacturer’s instructions to produce a blunt-ended fragment. This was inserted into
the EcoRV site of pGL4.10[luc2] (see Figure 2.2). Correct orientation of the insert in
pGL4.10[luc2] was verified by digestion with PstI.
pGV-B
An empty pGV-B vector (PicaGene) was created by excising the RBMS1 5’ flanking
sequence from RBMS1p1.3kb with XbaI and HindIII. The sticky ends produced were
blunted by incubation with Klenow (as above) and re-ligated to produce the final vector.
Picture removed for copyright purposes

2 Materials and methods 97
Figure 2.3. pGL4.23[luc2/minP] vector. Schematic of the pGL4.23[luc2/minP] luciferase reporter vector which contains the synthetic, codon-optimised luc2 gene as well as a minimal TATA promoter downstream of POU4F3 binding sites that were inserted into the EcoRV site of the vector. © Promega.
pGL4.10-ZRANB2p-3.2kb
The pGL4.10[luc2] 3kb Zranb2 5’ flanking region luciferase reporter construct
(ZRANB2p3.2kb) was produced as follows: The forward primer: 5’-
GGTCCTTCACCCTCATGATAGCTCACTG-3’ and reverse primer 5’-
CGTCACTGACTCGGAAATTCTTGGTCG-3’ were used to amplify a 3.2kb fragment of the
LUZP1 promoter from mouse genomic DNA (Promega) with long-range enzyme mix
(Qiagen) which was inserted, by TA-based ligation, into the pDrive cloning vector (Qiagen)
(see Figure 2.1) according to the manufacturer’s instructions; the orientation of the
promoter was checked by restriction digestion with SacI and the KpnI-XbaI fragment of
this construct was inserted into the KpnI-NheI site of pGL4.10[luc2] (see Figure 2.2).
Promoter integrity was checked by DNA sequencing.
pGL4.23-NR2F2BS1-1,2,3&5x
The minimal promoter constructs pGL4.23-NR2F2BS1-1x, pGL4.23-NR2F2BS1-2x,
pGL4.23-NR2F2BS1-3x and pGL4.23-NR2F2BS1-5x were constructed by blunt-ended
ligation of T4 kinase-phosphorylated EMSA probe NR2F2BS1 with EcoRV-linearised
pGL4.23[luc2/minP] (see Figure 2.3). The number of repeats of NR2F2BS1 that had been
incorporated into the vector were assessed by NheI-PvuII restriction digestion and size
assessment by agarose gel electrophoresis. The “–nx” suffix of the construct name refers to
the number of repeats of NR2F2BS1 contained in that construct.
pGL4.23-NR2F2BS2-1-4x
The minimal promoter constructs pGL4.23-NR2F2BS2-1x, pGL4.23-NR2F2BS2-2x,
pGL4.23-NR2F2BS2-3x and pGL4.23-NR2F2BS2-4x were constructed as for pGL4.23-
NR2F2BS2-1,2,3&5 using NR2F2BS2 instead of NR2F2BS1 (see Figure 2.3).
Picture removed for copyright purposes

2 Materials and methods 98
Figure 2.4. pSi mammalian expression vector. The pSi expression vector, whose SV40 enhancer region induces constitutive expression of inserted DNA in mammalian cells, was used for the expression of proteins. © Promega.
pSi-Dreidel
pHM6-Dreidel, an expression construct for a 2bp missense mutated form of mouse POU4F3,
was kindly provided by Prof. Karen Avraham. For compatibility with other expression
constructs used in luciferase assays, the dreidel coding sequence was cloned into the pSi
expression vector by insertion of the EcoRV-NotI fragment of pHM6-Dreidel into the
EcoRV-NotI site of pSi.
2.11.4 Purification of DNA from bacterial culture for transfection
Bacteria were streaked out on an LB-Agar-ampicillin (100µg/ml) plate from glycerol stocks
and incubated at 37ºC overnight. The following morning, single colonies were picked using
a 200µl pipettor tip into 2ml LB-ampicillin (100µg/ml) and incubated at 37ºC at 220rpm in
a shaking incubator for 8 hours. The culture was then decanted into 50ml of LB-ampicillin
(100µg/ml) and cultured overnight. The next morning, bacteria were pelleted by
centrifugation at 4000rpm for 20 minutes at 4ºC, plasmid DNA was extracted using the
MidiPrep kit (Qiagen) and resuspended in 200µl of water. The DNA concentration was
estimated by measuring the optical density of the resuspended DNA at A260 using a
spectrophotometer and using the resultant value in Equation 2.2:
Equation 2.2. DNA Concentration.
1000
50) Factor Dilution )(ADensity (Optical )/(ion concentratDNA 260 ××=lg µµ
DNA was diluted to desired concentrations in water and checked by diagnostic restriction
enzyme digest followed by electrophoresis on an agarose gel of appropriate concentration.
Picture removed for copyright purposes

2 Materials and methods 99
2.11.5 Preparation of UB/OC-2, BHK and ND7 cells for transfection
Cells were transfected based on a standard calcium precipitation protocol (e.g. Kingston et
al. 2001). UB/OC-2, BHK or ND7 cells were plated at approximately 2 x 10⁵ cells/well in a
six-well plate (BD Falcon). The next morning, the culture media were changed to DMEM +
10% FBS and the cells were incubated at 37ºC, 5% CO2 for at least one hour prior to
transfection.
2.11.6 Preparation of precipitate
400µl 2 x HBS was aliquoted into 1.5ml microcentrifuge tubes designated tubes B (one per
condition being tested) and allowed to warm to room temperature. In separate tubes,
designated tubes A, the following mixture was prepared (one per condition being tested):
• 0.25M CaCl2
• 100-200µg/well Luciferase reporter vector
• 1-3µg/well pSi / pSi-Pou4f3 expression vector
• 10ng/well pRL-null vector
• to 400µl water
The contents of each A tube were added to its corresponding B tube dropwise (total volume
800µl). The precipitate was then allowed to form for 20 minutes at room temperature.
2.11.7 Transfection
Following precipitation, 200µl of precipitate was added to each well and mixed by pipetting
up and down three times; experiments were conducted in triplicate. Following addition of
precipitate, ND7 cells were incubated at 37ºC, 5% CO2 for a minimum of 6 hours and
UB/OC-2 or BHK cells were incubated under identical conditions for a minimum of 16
hours. After this incubation: The precipitate was removed from UB/OC-2 cells, the cells
were shocked with DMEM + 15% glycerol for 2 minutes 30 seconds, washed with HBSS +
10% FBS and then incubated in UB/OC-2 cell culture media; the precipitate was removed
from BHK and ND7 cells and replaced with appropriate culture media. All cell types were
further incubated for a minimum of 24 hours prior to luciferase assay.
2.11.8 Dual Luciferase assay and analysis
Luciferase assays were carried out with the Dual-Luciferase® kit (Promega) according to
the manufacturer’s instructions, which were modified by the use of 50µl of LARII reagent
instead of 100µl. Samples were assessed in a single-point luminometer (Turner). A reporter
construct was deemed to be regulated if significantly activated by pSi-Pou4f3 compared to
pSi, promoterless reporter construct, mutant POU4F3 expression construct or a mutant
reporter construct (p<0.05) as determined by a two-sample two-tailed student’s t test i.e.
Nr2f2 and Rbms1 reporter constructs, but not Luzp1 or Zranb2 reporter constructs.
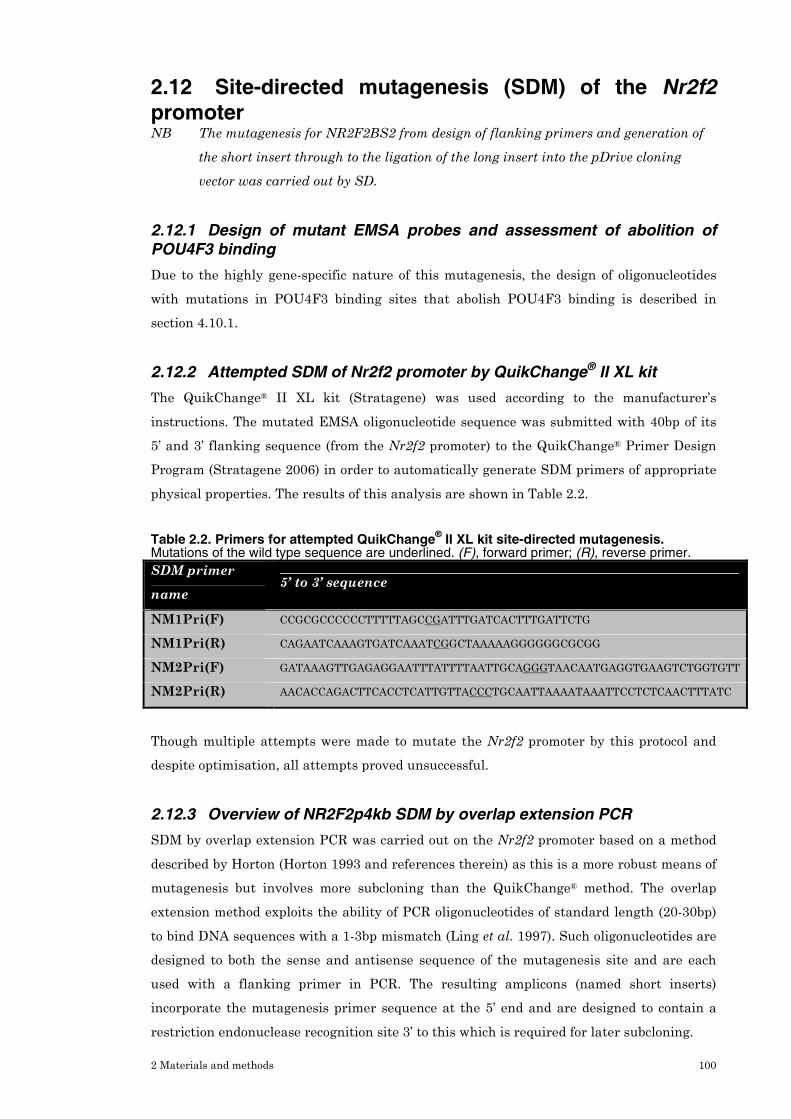
2 Materials and methods 100
2.12 Site-directed mutagenesis (SDM) of the Nr2f2
promoter NB The mutagenesis for NR2F2BS2 from design of flanking primers and generation of
the short insert through to the ligation of the long insert into the pDrive cloning
vector was carried out by SD.
2.12.1 Design of mutant EMSA probes and assessment of abolition of POU4F3 binding
Due to the highly gene-specific nature of this mutagenesis, the design of oligonucleotides
with mutations in POU4F3 binding sites that abolish POU4F3 binding is described in
section 4.10.1.
2.12.2 Attempted SDM of Nr2f2 promoter by QuikChange® II XL kit
The QuikChange® II XL kit (Stratagene) was used according to the manufacturer’s
instructions. The mutated EMSA oligonucleotide sequence was submitted with 40bp of its
5’ and 3’ flanking sequence (from the Nr2f2 promoter) to the QuikChange® Primer Design
Program (Stratagene 2006) in order to automatically generate SDM primers of appropriate
physical properties. The results of this analysis are shown in Table 2.2.
Table 2.2. Primers for attempted QuikChange® II XL kit site-directed mutagenesis.
Mutations of the wild type sequence are underlined. (F), forward primer; (R), reverse primer.
SDM primer
name 5’ to 3’ sequence
NM1Pri(F) CCGCGCCCCCCTTTTTAGCCGATTTGATCACTTTGATTCTG
NM1Pri(R) CAGAATCAAAGTGATCAAATCGGCTAAAAAGGGGGGCGCGG
NM2Pri(F) GATAAAGTTGAGAGGAATTTATTTTAATTGCAGGGTAACAATGAGGTGAAGTCTGGTGTT
NM2Pri(R) AACACCAGACTTCACCTCATTGTTACCCTGCAATTAAAATAAATTCCTCTCAACTTTATC
Though multiple attempts were made to mutate the Nr2f2 promoter by this protocol and
despite optimisation, all attempts proved unsuccessful.
2.12.3 Overview of NR2F2p4kb SDM by overlap extension PCR
SDM by overlap extension PCR was carried out on the Nr2f2 promoter based on a method
described by Horton (Horton 1993 and references therein) as this is a more robust means of
mutagenesis but involves more subcloning than the QuikChange® method. The overlap
extension method exploits the ability of PCR oligonucleotides of standard length (20-30bp)
to bind DNA sequences with a 1-3bp mismatch (Ling et al. 1997). Such oligonucleotides are
designed to both the sense and antisense sequence of the mutagenesis site and are each
used with a flanking primer in PCR. The resulting amplicons (named short inserts)
incorporate the mutagenesis primer sequence at the 5’ end and are designed to contain a
restriction endonuclease recognition site 3’ to this which is required for later subcloning.

2 Materials and methods 101
In the second stage of the mutagenesis process, the flanking primers used for both the
sense and antisense mutagenesis are used in a PCR with the sense and antisense short
inserts as template sequence. In initial cycles of the PCR, the overlapping region of the
short inserts (which is equivalent to the mutagenesis primers used in the first PCR) primes
polymerisation of a long amplicon (named the long insert) which comprises the two short
inserts joined by their overlapping region. Therefore, the long insert contains the
mutagenesis site flanked by the desired restriction endonuclease recognition sites. In
subsequent cycles of the PCR, the flanking primers prime amplification of the long insert.
This long insert can then be ligated directly into the pDrive cloning vector by TA cloning
(when an appropriate polymerase is used) for amplification and subsequent cloning into the
wild type NR2F2p4kb vector in order to produce a reporter vector which incorporates the
desired mutations. Alternatively, the long insert can be digested by the appropriate
restriction endonuclease for direct ligation (by T4 DNA ligase) into wild type NR2F2p4kb
which has been similarly digested, phosphatased and purified.
2.12.4 Reagents and methods used for the NR2F2p4kb SDM
The mutant EMSA probes that had been used to verify abolition of POU4F3 binding by
EMSA, and the SDM primers that had been used in the attempted QuikChange® SDM were
used to introduce the desired mutations into the Nr2f2 promoter (see Figure 4.19 for
schematic of the SDM process).
This strategy minimises the length of amplicons required for the mutagenesis PCR and
therefore makes the PCR conditions more favourable. This was particularly important due
to the length and high GC content of the Nr2f2 promoter which were the most likely factors
that caused the QuikChange® strategy to be unsuccessful.
Mutagenesis PCR reactions
Primers used for generation of the short fragments are shown in Table 2.3. The primers
that had been used for the attempted QuikChange® mutagenesis were used for the
mutation of NR2F2BS2 (Table 2.2 & Table 2.3) whilst the mutant oligonucleotides that
were used for EMSA analysis of mutations in NR2F2BS1 were used to mutate NR2F2BS1
(Figure 4.17 & Table 2.3). These primers were used in a standard PCR reaction with a
mixture of GoTaq (Promega) and Pfu (Roche) polymerases in a 2:1 ratio (see section 2.7.4)
and the products of these reactions were electrophoresed on a low melting-point agarose gel
of appropriate concentration (typically 1.5%). The band of correct size (see Short Insert
Length, Table 2.3) was then excised and purified from the gel (see section 2.6.4 for DNA
purification method).

2 M
ate
rials
an
d m
eth
od
s 102
Tab
le 2
.3. N
R2F
2B
S1 a
nd
NR
2F
2B
S2 m
uta
gen
es
is p
rim
ers
.
Prim
ers
used f
or
overla
pp
ing e
xte
nsio
n P
CR
muta
gene
sis
. M
uta
ted b
ases o
f m
uta
gen
ic p
rim
ers
are
underl
ine
d.
Insert
Name
Primer
Description
Primer
Name
Sequence
Short
Insert
Length
Long
Insert
Length
5’m
uta
gen
ic
pri
mer
NR
2F
2B
S1
mu
t C
TT
TT
TA
GC
CG
AT
TT
GA
TC
AC
TT
TG
AT
T
NR2F2BS1
mut5’
3’ fl
an
kin
g
pri
mer
N1A
paI5
'P
AA
GC
CT
CC
GG
GT
CG
GG
CC
CG
GA
G
407 b
p
5’m
uta
gen
ic
pri
mer
NR
2F
2B
S1
mu
tRC
A
AT
CA
AA
GT
GA
TC
AA
AT
CG
GC
TA
AA
AA
G
NR2F2BS1
mut3’
3’ fl
an
kin
g
pri
mer
MV
CA
paI3
' T
CC
GC
GC
TC
CG
GG
GT
CC
AC
407 b
p
786 b
p
5’m
uta
gen
ic
pri
mer
NM
2P
riF
G
AT
AA
AG
TT
GA
GA
GG
AA
TT
TA
TT
TT
AA
TT
GC
AG
GG
TA
AC
AA
TG
AG
GT
GA
AG
TC
TG
GT
GT
T
NR2F2BS2
mut5’
3’ fl
an
kin
g
pri
mer
MV
CE
R3’
GC
TT
AA
TG
AA
TT
CC
CA
TC
AC
TT
GC
231 b
p
5’m
uta
gen
ic
pri
mer
NM
2P
riR
A
AC
AC
CA
GA
CT
TC
AC
CT
CA
TT
GT
TA
CC
CT
GC
AA
TT
AA
AA
TA
AA
TT
CC
TC
TC
AA
CT
TT
AT
C
NR2F2BS2
mut3’
3’ fl
an
kin
g
pri
mer
MV
CE
R5’
GG
AA
TT
CT
CA
CA
AT
CA
AC
TA
GC
GG
633 b
p
804 b
p

2 Materials and methods 103
Purified short insert DNA was then used as template DNA for generation of the long
inserts. Flanking primers that had been used to generate the short inserts for each site
were used to amplify the long insert i.e. N1ApaI5'P was used with MVCApaI3' to amplify
the long insert containing NR2F2BS1mut and MVCER3’ was used with MVCER5’ to
amplify the long insert containing NR2F2BS2mut (Table 2.3). The same GoTaq (Promega)
– Pfu (Roche) mix was used to amplify the long NR2F2BS2mut insert as was used in the
short insert PCR whereas Herculase (Stratagene) polymerase was used for NR2F2BS1mut
long insert amplification as this insert was GC rich. The NR2F2BS1mut long insert
contained the potentially mutated POU4F3 binding site flanked by EcoRI restriction sites
and NR2F2BS2mut long insert contained the mutated POU4F3 binding site flanked by
ApaI restriction sites. PCR products were electrophoresed on a 1% low melting-point
agarose gel and the long insert was extracted from the gel (sections 2.6.3 and 2.6.4).
2.12.5 Cloning of NR2F2BS2mut long insert into the NR2F2p4kb plasmid
Purified insert was ligated into the pDrive cloning vector (section 2.6.5, TA method).
Colonies incorporating the insert (assessed by blue/white selection) were cultured and
plasmid DNA was purified (Miniprep, section 2.6.1) and sequenced. NR2F2BS2mut pDrive
clones containing the desired insert were digested with EcoRI and electrophoresed on a low
melting-point agarose gel. DNA was extracted from the gel as described above. The
NR2F2p4kb construct (which contains 4kb of Nr2f2 5’ flanking region) was similarly
digested, electrophoresed and purified prior to being phosphatased using Calf Alkaline
Phosphatase (Promega) according to the manufacturer’s instructions. The mutant insert
was ligated into the prepared vector using T4 DNA ligase (section 2.6.5). The colonies
produced were digested with the NheI and PstI restriction endonucleases and subjected to
agarose gel electrophoresis (2.6.3) to determine insert orientation within the vector. Clones
containing the insert in the correct orientation were subsequently sequenced to verify
incorporation of the mutant insert and this vector was named NR2F2p4kb-BS2mut.
2.12.6 Cloning of NR2F2BS1mut long insert into NR2F2p4kb and NR2F2p4kb-BS2mut
NR2F2BS1mut long insert was extracted from pDrive colonies as for NR2F2BS2mut except
the ApaI restriction endonuclease was used instead of EcoRI. This insert was ligated into
NR2F2p4kb and NR2F2p4kb-BS2mut which had been prepared as NR2F2p4kb was in
section 2.12.5 (with ApaI instead of EcoRI) to produce NR2F2p4kb-BS2mut and
NR2F2p4kb-BS1&2mut. This ligation mixture was transformed and cultured as above and
the purified plasmid DNA of the resultant clones was digested with SacI and
electrophoresed in order to identify the orientation of the long insert. As well as selecting
clones which incorporated the insert in the desired orientation, incorporation of the desired
mutation was verified by allele specific hybridization.

2 Materials and methods 104
2.13 Allele specific hybridization of plasmid DNA with
EMSA oligonucleotides Prior to costly sequencing of multiple clones, the incorporation of the desired 2bp
NR2F2BS1 mutation into pDrive or NR2F2p4kb-BS2mut (to make NR2F2p4kb-
BS1&2mut) was verified by allele specific hybridization.
2.13.1 Equipment used for allele specific hybridization
Techne
HB-1D hybridizer
2.13.2 Reagents for allele specific hybridization
Alkali denaturation buffer
• 3.8M NaCl
• 0.5M NaOH
Hybridization solution
• 30ml 20x SSPE
• 5ml SDS
• 5ml 100x Denhardt’s
solution
• 60ml distilled water
Wash buffer (3x SSPE, 0.1%SDS)
• 15ml 20xSSPE
• 100µl SDS
• 84.9ml distilled water
20x SSPE
• 3M NaCl
• 0.2M NaH2PO4
• 20mM EDTA
The solution pH was corrected to 7.4
Denhardt’s solution
• 0.1% Ficoll
• 0.1% Bovine serum
albumin
• 0.1% polyvinyl-
pyrrolidone
2.13.3 Preparation of membrane for hybridization
Amersham Hybond™-N+ membrane (GE Healthcare) was cut to an approximate size of
20cm x 10cm and boxes of approximately 1.5cm x 2.5cm were marked on the membrane in
pencil. 1-2µl of Miniprep (Qiagen) DNA from potentially mutated clones was spotted onto
individual cells of the membrane with NR2F2p4kb DNA included in one corner cell as a
control for estimation of background radioactivity (see section 2.13.5). The DNA spotting
pattern was duplicated on another membrane for each experiment and DNA was fixed to
the membrane by incubation with alkali denaturation buffer for 20 minutes at room
temperature.
2.13.4 Pre-hybridization
The duplicate membranes were placed in separate hybridization tubes (tube A and tube B),
and briefly washed in wash buffer (3xSSPE, 0.1%SDS). They were then pre-hybridized by
replacement of the denaturation buffer with approximately 50ml hybridization solution
2 Materials and methods 105
followed by incubation at 58°C (the salt adjusted melting temperature of the wild type
NR2F2BS1 EMSA oligonucleotide minus two degrees) for 15 minutes.
2.13.5 Hybridization and washing of membranes
10µg of single stranded sense probes for NR2F2BS1 and NR2F2BS1mut (Figure 4.17) were
radiolabelled as described in section 2.10.6 with the volume of the antisense strand omitted
and the volume of 1x medium salt buffer reduced to 1.1µl accordingly. The entire volume of
each labelled probe (11.1µl) was added to the hybridization solution in a hybridization tube:
NR2F2BS1mut was added to tube A and NR2F2BS1 to tube B. Hybridizations were
incubated at 58°C for one hour.
The membranes were then washed for 15 minutes periods in pre-warmed wash buffer
(3xSSPE, 0.1%SDS) at hybridization temperature and the radioactivity of the control cell
(NR2F2p4kb) was estimated using a Geiger counter. Once the control cell had fallen to
near-background levels, excess wash buffer was removed from the membrane using paper
towel. The membrane was covered in plastic wrap and autoradiographed at -80°C for 16
hours with X-ray film (SLS). Autoradiographs were developed, fixed and scanned as for
EMSAs (section 2.10.10).
2.14 Sequencing of NR2F2p4kbmut-BS1&2 clones Plasmids were sequenced by Geneservice Ltd. Chromatogram and sequence files were
returned and the chromatogram was inspected to determine the signal to noise ration of the
sequencing reaction. Sequence was aligned against sequenced NR2F2p4kb and the
Ensembl Nr2f2 5’ flanking region. This method was used to identify unintended mutations
in clones from the NR2F2p4kb mutagenesis.

3 Candidate Pou4f3 target gene identification and prioritisation 106
3
CANDIDATE POU4F3 TARGET GENE
IDENTIFICATION AND PRIORITISATION
POU4F3 is a transcription factor that is essential to hair cell development and survival.
Pou4f3 knockout and mutant mice have demonstrated that it is required for hair cell
terminal maturation (Erkman et al. 1996;Hertzano et al. 2004;Xiang et al. 1998;Xiang et al.
1997) and three human families with different POU4F3 mutations show that it is involved
in the maintenance of hearing (Collin et al. 2008;Pauw et al. 2008;Vahava et al. 1998). As a
transcription factor, POU4F3 produces the wild-type hair cell phenotype by binding to
specific recognition elements in the promoter regions of target genes and recruiting or
blocking other transcription factors in order to produce a positive or negative effect on
target gene transcription. The phenotype seen in Pou4f3 knockout hair cells cannot
therefore be explained directly by POU4F3 loss e.g. POU4F3 itself is not a component of the
stereocilia and therefore cannot be structurally responsible for stereocilial deficits in Pou4f3
mutant mice. Therefore, the transcriptomal effect produced by the up- or down-regulation
of target genes and their subsequent functions in hair cell development and maintenance
must be responsible for the production of the hair cell phenotype. Hence, the phenotypes
produced by Pou4f3 mutation in mice and humans are likely to be due to dysregulation of
these target genes.
In order to understand how Pou4f3 produces hair cell terminal differentiation and survival,
the regulatory networks from Pou4f3 through to the hair cell phenotype would have to be
traced. A full understanding of these pathways could provide strategies to reverse Pou4f3-
related hearing loss, prevent hair cell loss from other causes and aid in hair cell
regeneration.

3 Candidate Pou4f3 target gene identification and prioritisation 107
In this chapter I report the process by which the candidate target genes of POU4F3 were
identified and the difficult – sometimes subjective – process by which a subset of these
genes were prioritised for further investigation. Comparative bioinformatic analyses of
candidate target genes and preliminary experiments which were used to compare targets in
this selection process are reported herein. Detailed bioinformatic investigation of prioritised
candidate genes and characterisation of the regulation of individual genes by POU4F3 is
reported in subsequent chapters (see chapters 4 & 5).
3.1 Previous work in the identification of POU4F3
target genes Prior to the start of my doctoral work, experiments were conducted in our laboratory to
identify unknown POU4F3 target genes at the transcriptional level using a genetic screen.
Historically, hair cell genetic networks have been difficult to investigate by traditional
molecular biological methods. This difficulty arises because of challenges in obtaining tissue
of appropriate type and sufficient quantity and purity to employ such techniques (see
section 1.6.1 for further detail).
In addition to the known difficulties of analysing genetic pathways in the inner ear,
analysis of the transcriptional effect of POU4F3 by the common strategy of comparing wild
type to mutant tissue could be confounded by secondary abnormalities and deterioration of
nascent hair cells in Pou4f3 mutants. For example, apoptotic genes that are upregulated in
cell death in Pou4f3 mutant mice (Xiang et al. 1998) would be more likely to be identified by
a genetic screen even if these genes aren’t directly regulated by POU4F3. Although
investigators have attempted to identify POU4F3 target genes by comparing gene
expression in wild type and dreidel Pou4f3 mutant whole E16.5 cochleas by microarray
analysis (Hertzano et al. 2004;Hertzano et al. 2007), the level of apoptosis in the inner ears
of Pou4f3 mutant mice at this age has not been reliably assessed (Xiang et al. 1998).
Therefore, though the expression of two genes (Gfi1 and Lhx3) has been shown to be
affected by the dreidel Pou4f3 mutation by this method (Hertzano et al. 2004;Hertzano et al.
2007), the mechanism by which POU4F3 might regulate these genes is currently unknown.
Hence, these genes may be dysregulated due to hair cell death rather than the direct effects
of POU4F3 loss.
Identification of target genes by conducting a genetic screen in vitro in cell lines
circumvents the difficulties in obtaining sufficient tissue of sufficient quality and minimises
confounding by abnormal and apoptosing cells. However, a problem posed by cell lines is
that the transcriptional environment in which the screen is conducted is potentially
different from that in the developing inner ear. As POU4F3 expression is initiated as early
as E12.5 in the inner ear (Xiang et al. 1998), the UB/OC-2 cell line – which is derived from
E13 immortomouse sensory epithelium and constitutively expresses POU4F3, myosin VI

3 Candidate Pou4f3 target gene identification and prioritisation 108
and myosin VIIa – was selected for use in the screen as it is likely to provide as suitable a
transcriptional environment as possible compared to other cell lines (Rivolta et al. 1998a).
3.1.1 Methods for identification of differential gene regulation
At the time that the subtractive hybridization screen was carried out, many methods were
available to identify mRNAs that are differentially expressed between two sources
(summarised in Munir et al. 2004). Broadly, these techniques can be categorised as
differential display, subtractive hybridization and microarray. A subtractive hybridization
method was chosen as it is unbiased in its identification of transcripts – unlike non-tiling
cDNA microarrays (reviewed in Mockler et al. 2005) – it is able to identify lowly expressed
transcripts – unlike differential display (Ledakis et al. 1998) – and it was cost-effective.
Furthermore, at the time of the analysis no microarray chip was available that was tailored
to the inner ear transcriptome.
The major limitation of the subtractive hybridization screen is that it is biased towards
reporting transcripts that display large differences in mRNA level though slight changes in
the expression of some genes can have potent effects on phenotype and such changes are
identifiable using oligonucleotide microarrays. It consequently also leaves out the
possibility of investigating complex and subtle multi-gene interactions as only the most
differentially expressed of the directly regulated genes in a network may be identified.
Despite its limitations, this method was appropriate for the identification of POU4F3 target
genes.
3.2 Subtractive hybridization in UB/OC-2 cells In our laboratory, the PCR-Select™ cDNA Subtraction kit (Clontech) was used to identify
POU4F3 target genes. UB/OC-2 cells were manipulated to over- or under-express POU4F3
by stable transfection with sense Pou4f3 cDNA or anti-sense Pou4f3 N-terminus cDNA
respectively. mRNA was extracted from the two cell populations and converted to cDNA
which was then separately digested to produce shorter, blunt-ended cDNA molecules to
which adaptor oligonucleotides were ligated. These samples were subjected to two rounds of
hybridization (to enrich differentially expressed transcripts) and two rounds of PCR
amplification (to amplify differentially expressed sequences and reduce background). The
above steps were carried out in order to identify both upregulated and downregulated
POU4F3 targets that were then subcloned into the pGEM-T Easy vector (Promega). Virtual
Northern analysis was carried out (with both upregulated and downregulated transcript
pools) in order to confirm the expression pattern of individual clones to minimise the risk of
false positives prior to sequencing of differentially expressed clones (Clontech Laboratories
2008).

3 Candidate Pou4f3 target gene identification and prioritisation 109
3.3 Follow-up of subtractive hybridization screen
results As with other methods of identification of differential gene expression, subtractive
hybridization screens present the problem of making sense of the substantial amount of
data produced. Though not as statistically complicated as the interpretation of microarray
data, subtractive hybridization screen results still require thorough verification and further
investigation to confirm specific effects of manipulations on target genes. The differentially
expressed transcripts produced by the screen were reduced in our laboratory to those that
are most differentially expressed based on a series of virtual Northern blots.
From this reduced pool, I began my project with 20 potentially upregulated and one
potentially downregulated transcript to investigate. These were provided in 26 sequencing
files from 21 cDNA clones that had been generated in our laboratory from the subtractive
hybridization screen. All bar one of the clones that I was allocated were from the ‘forward’
subtractive hybridization screen i.e. these potential targets of POU4F3 were upregulated in
the presence of POU4F3 in the subtractive hybridization screen.
3.3.1 Matching cDNA clones from the subtractive hybridization screen to mouse genes
The first step in the analysis of these differentially expressed clones was to identify to
which genes they correspond. As the primers used in sequencing these clones flanked the
cloned sequence, adaptor oligonucleotides that were used in the subtractive hybridization
prior to cloning of differentially expressed cDNAs into the pGEM-T Easy vector (Promega)
were included in the sequence returned. These unwanted sequences were identified by
alignment of the known adaptor sequence with the sequencing data and manually deleted
to leave cDNA sequence alone. The trimmed sequences were then used to identify genes
that correspond to the clones from the screen. Each trimmed sequence was individually
submitted to the Ensembl nucleotide-nucleotide BLASTN software through the Ensembl
website in order to find near-exact matches (Ensembl 2008a;Gish 2004) and the most
significant match to a given clone was selected as the corresponding gene. If no statistically
significant match was found (i.e. p-value < 0.05), the clone was not followed up.
The BLASTN analysis provides a low false positive rate (it is unlikely to incorrectly report
non-matching sequences as matches) however, certain regions of a query sequence will not
be aligned with a homologous sequence if that sequence has characteristics that increase
the risk of an alignment being due to chance e.g. highly repetitive regions. Therefore, for
genes that were selected for further investigation, the trimmed clone sequence was aligned
with the Ensembl sequence for its corresponding gene to identify whether intervening
regions were false negatives. This analysis also helped to identify which transcripts of a
gene (if any) best matched the submitted cDNA sequence.

3 Candidate Pou4f3 target gene identification and prioritisation 110
Of the 21 clones submitted, four did not produce any significant matches – this may have
been due to factors such as sequencing error of the clone, short query sequence length, low
sequence complexity or deficits in the Ensembl database. The remaining 17 clones matched
14 genes in the mouse genome (see Table 3.1).
3.3.2 Prioritising candidates for further study
The genes identified in Table 3.1 – referred to as candidate genes – perform various
functions, are of differing levels of characterisation and consequently had differing numbers
of experimental reagents available (e.g. antibody, purified protein etc.). Given the large
amount of time and resources required to investigate each interaction, candidates were
prioritised for further study based on their known functions in other systems and their
potential role in hair cell maturation and maintenance. Gene function data were required
to inform this process and formulate hypotheses of candidate gene function which could
guide future work.
A rapid method of assessing the available information on the function of a gene product is
to examine its Gene Ontology (GO) units. GO units are descriptions of the known functions
of wild type gene products. These descriptions are drawn from structured vocabularies that
classify the cellular components (i.e. subcellular localization), molecular functions and
biological processes in which gene products are involved. Furthermore, the type of evidence
on which such functions are based can be identified as the GO database assigns an evidence
code to each unit (Gene Ontology Consortium 2008). Therefore, candidate genes’ GO units
were downloaded from the Ensembl genome browser and compared, with reference to the
literature, to assist prioritisation of suitable candidates for further investigation.
As mentioned in section 3.1.1, one of the benefits of the subtractive hybridization screen
technique is its potential to identify novel and unknown genes. However – by definition –
the literature on such genes is sparse and they have few experimentally verified data.
Therefore, the GO units for these genes are few and predominantly computationally
predicted (i.e. without experimental verification) making it difficult to hypothesise what
their functions could be in the inner ear though these functions could be interesting.
Furthermore, there are often few experimental reagents available for the study of novel
genes and generation of the required reagents is a lengthy and costly process. These factors
make such genes challenging candidates for further study and they were therefore less
likely to be prioritised for further investigation when found, as they were much more
difficult to pursue immediately despite their potential novelty. Candidate genes whose
expression is known to be essential to the function of all mammalian cells were also less
likely to be pursued as dysregulation of such genes in hair cells is unlikely to be due to a
different mechanism than in other cells.

3 C
an
did
ate
Pou4f3
targ
et
gen
e i
den
tifi
cati
on
an
d p
riori
tisa
tion
111
Tab
le 3
.1. G
en
es c
orr
esp
on
din
g t
o c
lon
es p
rod
uc
ed
by s
ub
tra
cti
ve h
yb
rid
izati
on
scre
en
.
The E
-valu
e is a
measure
of
the p
-va
lue w
hic
h t
akes into
accou
nt
the s
ize o
f th
e d
ata
base b
ein
g s
earc
hed a
nd,
the
refo
re,
corr
ects
for
the incre
ased lik
elih
ood o
f a
m
atc
h b
ein
g i
de
ntified b
y c
hance i
n a
larg
e d
ata
base.
E-v
alu
es o
f <
5 i
nd
icate
seque
nces t
ha
t are
lik
ely
to b
e h
om
olo
gous.
Th
e l
ow
er
the E
-va
lue
, th
e m
ore
sig
nific
an
t th
e s
core
. +
, p
ote
ntially
upre
gu
late
d targ
et
of P
OU
4F
3;
-, p
ote
ntially
dow
nre
gula
ted
targ
et of
PO
U4F
3.
Clone Designation
Potential POU4F3 Effect
Mouse Gene Informatics
Symbol
E-value
%ID to matched
transcript cDNA
FA
4,
B12,
C7
+
Rcn1
7x10
-109,
7x10
-109, 5
.3x10
-10
9
89.1
7, 8
9.1
7, 89
.17
FA
8
+
Zranb2
6.6
x10
-51
88.8
9
FA
10
, F
B3, E
4, E
12
+
No S
ign
ific
an
t M
atc
h
N/A
N
/A
FB
5
+
Rbms1
6.7
x10
-99
91.3
7
B9
+
Hnrnpa2b1
7.8
x10
-162
94.0
7
B12R
-
Actb
3.5
x10
-13
90.5
7
FC
2
+
Metap2
3.8
x10
-114
90.8
3
FC
6
+
Amd1
2.1
x10
-67
93.2
2
FC
10
+
Sertad2
1.3
x10
-39
93.9
8
C12,
FD
1
+
BC010304
1.1
x10
-208
95.1
6
D3
+
Luzp1
3.6
x10
-96
87.8
4
D8
+
Nr2f2
2.7
x10
-224
95.0
7
D10
+
Anxa5
5.4
x10
-44
85.3
7
D12
+
Slc16a1
6.2
x10
-47
91.8
2
E1
+
Exosc9
2.6
x10
-147
86.3
4

3 Candidate Pou4f3 target gene identification and prioritisation 112
Based on these criteria, the genes identified were separated into two groups:
• Genes with known functions which could be relevant to hair cell terminal
maturation and maintenance
• Genes with a potentially novel role in the inner ear
Within these groups, genes were ranked according to their potential relevance to hair cell
development and maintenance. Though GO units provide an indicator of this, the ranking
was also based on scientific judgement of the literature and supporting evidence for those
GO units as there is no quantitative method for the analysis of such a small sample of
genes’ GO units i.e. it was not possible to analyse the GO units common to differentially
expressed transcripts as the existing software requires much larger sample sizes to produce
significant results. Candidate genes from each group which were judged to have the highest
potential relevance to hair cell development and maintenance were then selected for further
study. Only Slc16a1 was not included in this ranking as it was followed up by another
member of the laboratory (ET) who had also identified it as a potential target of POU4F3
from a different clone of the subtractive hybridization screen. The results of this analysis
are presented in Table 3.2.
Having completed this analysis of the known functions of each gene, I compared the
biological processes in which candidate genes are involved to identify whether they function
in the same processes. This comparison did not identify a common theme in the functions of
the candidate Pou4f3 target genes identified. I therefore continued to investigate high
priority genes (Table 3.2) on an individual basis.
Table 3.2. Categorisation of POU4F3 candidate target genes for follow up. NB: Slc16a1 is not included as it was investigated by ET.
High priority
due to
existing evidence
High priority
due to
potential novelty
Low priority
due to
existing evidence
Low priority
due to
lack of evidence
Nr2f2 Luzp1 Actb Amd1
Metap2 Sertad2 Anxa5 BC010304
Rbms1 Exosc9 Hnrnpa2b1
Rcn1
Zranb2

3 Candidate Pou4f3 target gene identification and prioritisation 113
3.4 Reverse transcriptase PCR in UB/OC-2 cells Having narrowed down the list of candidate genes, the process of comparing, verifying and
characterising POU4F3-candidate gene interactions began. As an initial verification, the
correlation of candidate gene expression with POU4F3 expression was investigated. All
seven of the high priority candidates for follow-up were from the forward subtractive
hybridization screen (i.e. potentially upregulated targets of POU4F3), and may therefore be
expressed in POU4F3-expressing cells. A sensitive, rapid and cost-effective way of checking
their transcription in such cells is by reverse transcriptase PCR (RT-PCR), which identifies
if the candidate gene is being transcribed by detection of mRNA signal.
Ideally, hair cells would be used to identify candidate gene expression as these are the
POU4F3-expressing cells of interest and therefore have the most relevant transcriptome.
However, as for the subtractive hybridization, this was not practical due to difficulties in
isolating sufficient hair cells to obtain RNA for reverse transcription and subsequent PCR.
Therefore, in order to verify that the candidate genes are expressed in POU4F3-expressing
cells, unmanipulated UB/OC-2 cells, which constitutively express POU4F3, were used as
the source of RNA for reverse transcription. As previously explained (section 3.1), these
cells provide a transcriptional environment that is more similar to that of the inner ear
than many other cell lines (Rivolta et al. 1998a).
The UB/OC-2 cDNA was used as the template for PCR reactions to detect candidate gene
expression. Genomic DNA (gDNA) was digested using DNAse prior to reverse transcription
of UB/OC-2 cell RNA to cDNA and any DNA fragments amplified from gDNA could be size-
separated from cDNA bands by agarose gel electrophoresis due to the exon-specificity of the
primers designed (see Appendix). Where possible, the primers were designed to amplify the
exons that had been detected in the subtractive hybridization screen to ensure
identification of relevant transcripts. The BLAST analysis described in section 3.3.1
provided a guide as to which transcripts to design primers against. The exons identified by
the BLAST analysis were likely to be at the known 3’ end of their gene as transcripts from
the subtractive hybridization were amplified using a poly dT primer which primes the
amplification of cDNA from the poly(A) tail of an RNA molecule.
Figure 3.1 shows that bands were amplified for all seven of the genes investigated. Though
non-specific bands were present for three genes (Rbms1, Sertad2 and Zranb2), each gene
yielded a band of predicted size without genomic DNA contamination (as determined by
size). This result supports subtractive hybridization screen results and is compatible with
the potential upregulation of these genes by POU4F3.

3 Candidate Pou4f3 target gene identification and prioritisation 114
Figure 3.1. Candidate gene mRNA in UB/OC-2 cells. UB/OC-2 cell cDNA was used as a template in PCR reactions with exon-specific primers against candidate genes identified in the subtractive hybridization screen and prioritised for further study. The most intense band for each gene corresponded to the predicted amplicon length as measured by comparison to the molecular weight marker (see Appendix). NB, the specific production of the above bands from UB/OC-2 cDNA was confirmed by negative controls that did not include cDNA and showed no detectable DNA on agarose gel electrophoresis.
3.5 Prediction of POU4F3 transcription factor
binding sites A bioinformatic analysis was carried out on the promoter regions of the seven candidate
genes prioritised for further study (Table 3.2) to identify potential POU4F3 binding sites.
The first step in this process is the identification of the promoter regions of candidate genes.
3.5.1 Promoter identification and selection
The Genomatix Gene2Promoter software was the promoter prediction program selected to
identify candidate gene promoters. Many programs execute this task with varying success
using different methods (Bajic et al. 2004), however, the promoter prediction program on
which Gene2Promoter is based (PromoterInspector) provides the highest sensitivity
available (43%, i.e. 43% of positives can be expected to be true positives) (Scherf et al. 2000).
This improvement is supplemented with oligo-capping and comparative genomics to verify
predictions (Bajic et al. 2004;Genomatix 2008;Scherf et al. 2000).
In this analysis, more than one promoter per gene was predicted. This selection was
narrowed down to the most appropriate promoter prior to transcription factor binding site
identification. I based my choice of promoter on the RNA transcript to which it
corresponded. The transcript is essential as the transcriptional start site (TSS) of a gene is
a useful landmark in promoter prediction by this method (Bajic et al. 2004;Heintzman et al.
2007). Each transcript is scored by Genomatix based on the completeness of its 5’
sequencing by the identification of the known sequence of the oligonucleotide that capped
the 5’ end of the transcript. If a transcript has experimentally verified full 5’ sequencing, it
is assigned a gold score; if the 5’ end of the transcript was confirmed by PromoterInspector
1.6Kb-
Marker Luzp1 Metap2 Nr2f2 Rbms1 Rcn1 Sertad2 Zranb2

3 Candidate Pou4f3 target gene identification and prioritisation 115
prediction, its score is silver and a bronze score is assigned if the transcript has no
confirmation of 5’ completeness. Only promoters with gold transcripts were further
analysed. These Genomatix transcripts were compared to the Ensembl transcripts from the
BLAST analysis and the promoter of the best-matching transcript was chosen for further
analysis. Detailed results for this analysis for genes that were followed-up further are
presented in chapters 4 & 5.
3.5.2 Transcription factor binding site identification
The Genomatix MatInspector and ModelInspector programs provided the largest number of
publicly available matrices for transcription factor binding sites (including the POU4
family) to assess candidate gene promoters. Therefore, these programs were used to
identify binding sites in candidate gene promoters.
MatInspector originally did this by matching promoter sequence to positional weight
matrices for transcription factor binding sites based on the TRANSFAC database with
positive weighting for experimentally verified sites (Quandt et al. 1995). This was
improved for the version of the software used in this analysis. The weight matrix library
was generated with a new program which extended the original algorithm; multiple
positional weight matrices for a transcription factor are grouped into families to reduce
redundant matches and matrix thresholds were optimized for each matrix in the library on
the basis of length and conservation (Cartharius et al. 2005). Unpublished experimental
evidence in our laboratory suggest that this version of the MatInspector software has much
greater accuracy in predicting transcription factor binding sites than its predecessors.
Though the binding of a transcription factor like POU4F3 to a promoter is essential for its
function, the existence of the binding site alone is not sufficient for regulation. Instead, the
context of the binding site influences transcriptional regulation subsequent to transcription
factor binding. The ModelInspector software takes this into account by adding contextual
information (e.g. number of binding site repeats and structural DNA information such as
hairpins) to predict binding modules and searches a pre-defined module database for
regulatory regions with a similar signature (Frech & Werner 1997). These modules are
therefore more likely to be functional than transcription factor binding sites identified in
MatInspector and genes with such modules would be more promising candidates for further
study than those with transcription factor binding sites alone.
The promoter selected for each gene was subjected to both MatInspector and
ModelInspector analysis. ModelInspector modules were selected for further analysis along
with the most significant MatInspector predictions. These results were collated (Table 3.3)
and the predicted binding sites were compared between candidate genes in order to aid
selection of candidate genes for further investigation (see section 3.7).

3 C
an
did
ate
Pou4f3
targ
et
gen
e i
den
tifi
cati
on
an
d p
riori
tisa
tion
116
Tab
le 3
.3. M
atI
nsp
ecto
r a
nd
Mo
delIn
sp
ecto
r an
aly
sis
of
can
did
ate
gen
es.
The L
ocation
re
fers
to
th
e d
ista
nce
of
the
M
atInsp
ecto
r b
ind
ing
site or
Mo
delInsp
ecto
r m
od
ule
fr
om
th
e ca
ndid
ate
g
ene
’s T
SS
. M
atr
ix S
imila
rity
re
fers
to
M
atInsp
ecto
r pre
dic
tions o
nly
. F
or
Soft
ware
: A
, M
atIn
specto
r; a
nd B
, M
ode
lInsp
ecto
r. F
or
Location:
+,
sen
se s
trand;
an
d -
, antisense
str
and.
All
bin
din
g s
ites w
ere
id
entifie
d in th
e 5
’ flankin
g r
egio
n o
f ta
rget g
ene
s.
Gene
Promoter
Sites identified (sense sequence)
Location
Family
Software
Matrix
Similarity Comment
CA
CA
TT
TA
AT
TA
AT
CA
AC
T
+ 4
23-4
41
- 4
23-4
41
V$B
RN
4.0
1
A
+ =
0.9
42
- =
0.9
40
On
both
str
an
ds.
Luzp1
GX
P_28
78
87
TA
TT
TA
TT
AA
TT
TT
TT
CA
T
+ 9
75-9
93
V$B
RN
3.0
2
A
0.9
40
GA
TT
TA
TT
TA
TT
AT
AT
GT
A
+ 1
025-1
043
V$B
RN
3.0
1
A
0.7
86
Metap2
GX
P_40
82
41
AA
TC
TA
TT
TA
TT
AT
AT
GT
A
+ 2
557-2
575
V$B
RN
3.0
1
A
0.8
24
In a
clu
ste
r of
bin
din
g
site
s.
TT
AG
CA
TA
TT
TG
AT
CA
CT
T
+ 1
814-1
832
V$B
RN
5.0
1
A
0.8
36
Nr2f2
GX
P_15
86
16
GG
AA
TT
TA
TT
TT
AA
TT
GC
AT
CA
TA
AC
AA
TG
AG
GT
GA
-
919-8
95
OC
T1
B
N/A
Hig
h s
trin
gen
cy
MatI
nsp
ect
or
Brn
-2
site
s overl
ap
.
Rbms1
GX
P_14
95
94
GA
TT
TT
AT
AT
CG
AT
GA
AT
GA
GC
AT
GA
GC
TG
-
1600-1
553
BR
NF
B
N
/A
Mou
se s
ite p
rese
nte
d.
Late
r re
an
aly
sed
for
hu
man
. S
ee C
hap
ter
5.
CT
CG
AT
TT
GT
AT
CC
C
+ 6
12-6
93/7
05
BR
NF
B
N
/A
Tw
o o
verl
ap
pin
g
mod
ule
s.
Rcn1
GX
P_28
62
71
TG
AC
AA
GT
TT
AT
TA
GT
CA
GG
A
+ 6
64-7
05
BR
NF
B
N
/A

3 C
an
did
ate
Pou4f3
targ
et
gen
e i
den
tifi
cati
on
an
d p
riori
tisa
tion
117
Gene
Promoter
Sites identified (sense sequence)
Location
Family
Software
Matrix
Similarity Comment
TT
AT
TA
TA
AT
TA
TT
AG
AG
A
- 1565-1
583
V$B
RN
3.0
2
A
0.9
21
Op
posi
te h
igh
er
stri
ngen
cy V
$B
RN
2.0
1
site
. Sertad2
GX
P_40
91
10
GC
TA
TT
AT
AA
TG
AC
TT
GC
CA
GA
GA
G
AT
AT
AC
AA
TT
AG
+
13
68-1
446
BR
NF
B
N
/A
GT
TT
TA
TA
CA
TT
AT
GG
TT
T
+ 2
81-3
16
OC
T-P
IT1
B
N/A
Pro
be d
esi
gn
ed
again
st
hig
h-s
trin
gen
cy
V$B
RN
3.0
1 s
ite w
ith
in
mod
ule
. Zranb2
GX
P_43
09
71
AC
AG
CA
CA
AT
TA
AT
AA
TA
A
- 568-5
86
V$B
RN
3.0
1
A
0.8
11
Op
posi
te h
igh
stri
ngen
cy V
$B
RN
5.0
1
site
.
3 Candidate Pou4f3 target gene identification and prioritisation 118
3.6 Candidate gene expression in the inner ear The decision to continue studying a gene came under iterative review during this
investigation. One of the first of these iterations was the identification of the cellular and
subcellular expression of candidate genes in the inner ear prior to conducting investigations
into potential interactions between these genes’ promoters and POU4F3. The literature and
a developmental gene expression database (the GENSAT database (Gong et al. 2003)) were
searched to identify reported expression of candidate genes in the inner ear. The GENSAT
database is an online database of the neural expression profiles of a large number of genes.
The gene expression profile is made visible by the introduction of a bacterial artificial
chromosome containing the Egfp gene in place of the gene of interest, the product of which
is detectable by fluorescence or immunohistochemical methods (Gong et al. 2003). As well
as the GENSAT database, the NCBI UniGene database was searched to identify whether
target gene mRNA transcripts had been detected in the inner ear (Boguski et al.
1995;Wheeler et al. 2003). However, the GENSAT and UniGene analyses were found to be
poor discriminators of candidate gene inner ear expression at this stage – no inner ear
expression of candidate genes was found in GENSAT and the UniGene analysis was
positive for all candidate genes. Therefore, only the results of the literature search aided in
the further refinement of candidate genes for investigation.
3.6.1 Genes with identified cellular and subcellular inner ear expression profiles
The analysis yielded inner ear expression data for Nr2f2 only (Tang et al. 2005). Tang et al.
identified Nr2f2 mRNA expression at E8.75 and demonstrated the cellular and subcellular
localization of NR2F2 protein at E15.5 (Tang et al. 2005). This evidence is further discussed
in section 4.5.2. In brief, the onset of NR2F2 expression in the developing inner ear
precedes that of POU4F3. However, at E15.5, NR2F2 was shown to be expressed in regions
that were likely to include hair cells which are known to express POU4F3 (Tang et al. 2005;
Xiang et al. 1998). This likely temporospatial colocalisation made NR2F2 a very strong
candidate for further study and it was therefore selected for continued investigation.
Expression data found in the above searches yielded two candidate genes – Rbms1 and
Zranb2 – that are ‘ubiquitously’ expressed in examined tissues, but whose cellular
localization within those tissues is largely unknown (Adams et al. 2000;Fujimoto et al.
2000;Karginova et al. 1997;Nakano et al. 1998). Luzp1, by contrast, is expressed only in
certain organs (Sun et al. 1996). The need to understand a gene’s cellular localization is
highlighted by Nr2f2 which is known to be expressed in many tissues (e.g. Jonk et al. 1994)
but shows marked cellular restriction within organs (e.g. Tang et al. 2005;Tripodi et al.
2004).

3 Candidate Pou4f3 target gene identification and prioritisation 119
3.6.2 Obtaining existing reagents for investigation of candidate genes
With the exception of Nr2f2, none of these genes’ inner ear expression patterns had been
characterised. If these candidate genes are upregulated by POU4F3, they would be
predicted to be expressed in hair cells. Furthermore, knowing the timing of the onset of
changes in candidate gene expression compared with that of POU4F3 could clarify the
putative mechanism of regulation. Identification of expression of these genes in hair cells
would therefore confirm the relevance of the potential interactions identified in the
subtractive hybridization screen to hair cell development and may provide further clues as
to the role of POU4F3 candidate genes in hair cells.
I planned to investigate cochlear expression using antibodies to candidate genes for
immunohistochemistry due to the relative rapidity and ease of this method compared to
RNA in situ hybridization. A search of the literature and company websites was conducted
to identify custom made and commercial antibodies respectively. This search identified
antibodies for all candidate genes except Sertad2. The antibodies identified were verified
for differing applications (i.e. not all had been used for immunohistochemistry which was
their primary intended use in this study) and were of varying specificities (i.e. some
antibodies identified had cross-reactivity to genes homologous to candidate genes).
As this initial screen did not seek to perform a comprehensive characterisation of gene
expression or use an antibody-intensive protocol, only a small amount of an antibody that
was suitable for immunohistochemistry was required. Therefore, if no suitable commercial
antibody was available, I identified and requested a small amount of custom made antibody
from the laboratory that had made or commissioned it. If a suitable antibody was available
commercially, I contacted a company that would provide a sample of the antibody for
assessment.
By this method, I was able to obtain antibodies for RBMS1 (Takai et al. 1994) and ZRANB2
(Abnova 2008a) for the identification of their inner ear expression. I was also able to obtain
an anti-NR2F2 antibody for further characterisation of NR2F2 expression (Tripodi et al.
2004).
3.7 Refinement of candidate genes for further investigation At this stage of analysis, two genes had been chosen for early study. Nr2f2 was chosen
because it encodes a well-investigated transcription factor which is known to be involved in
processes relevant to hair cell development and maintenance (see chapter 4); there are
many reagents available for its study; its transcription in UB/OC-2 cells was verified; and it
is reported to be expressed in a region of the developing inner ear that gives rise to hair
cells. Furthermore, a promoter module for Oct1 – a member of the POU family which,

3 Candidate Pou4f3 target gene identification and prioritisation 120
therefore, binds DNA in a similar way to POU4F3 (e.g. Li et al. 1993) – was identified in
the Nr2f2 promoter as well as a high-stringency predicted transcription factor binding site
which provided potential sites for direct regulation of Nr2f2 by POU4F3.
The other gene selected for early study was Zranb2. This is a ubiquitously expressed
(Adams et al. 2000;Nakano et al. 1998) regulator of alternative splicing (Adams et al. 2001)
and therefore, despite being less well characterised than Nr2f2, has the potential to
regulate developmental and maintenance pathways in the inner ear. An antibody was
obtained against ZRANB2, making it easy to rapidly verify its expression profile in the
inner ear, provided that the antibody was suitable for immunohistochemistry. It is
transcribed in UB/OC-2 cells and, as for Nr2f2, one promoter module and one transcription
factor binding site were identified in its 5’ flanking region making Zranb2 a good candidate
gene for regulation by POU4F3.
Rbms1 encodes a transcription factor which has been implicated in processes relevant to
hair cell development and maintenance (e.g. cell cycle (c-myc) (Negishi et al. 1994) and
apoptosis (mitochondrial) (Iida et al. 1997)). Like Nr2f2 and Zranb2, it was shown to be
transcribed in UB/OC-2 cells by RT-PCR. Furthermore, a BRNF module (i.e. a ‘Brn’ POU
domain factor module (see Andersen et al. 2001)) was initially identified in the mus
musculus Rbms1 gene promoter that may have been sufficient for POU4F3 regulation,
though the promoter analysis was later redone for the human sequence for compatibility
with reagents obtained (see section 5.5.2). Rbms1 was preferred for follow-up given that we
were able to obtain an antibody that was potentially useful for future experiments and
promoter reporter and expression constructs were available from collaborators.
Metap2 was not prioritised for further study as the transcription factor binding sites
identified in its promoter were of lower quality and stringency than any other candidate
gene being followed up at this stage. Although high stringency potential POU4F3 binding
sites were identified in the Rcn1 and Sertad2 5’ flanking regions, I was unable to obtain an
antibody or other reagents for RCN1 and SERTAD2 had no antibody available.
Furthermore, very little was known about the functions of either of these genes, making it
difficult to assess their potential relevance to hair cell development and maintenance. As
there was less reason to continue the investigation of these genes at this stage, they were
not prioritised for investigation. However, the decision to continue investigation of
prioritised genes came under iterative review throughout this study. Therefore, the
literature and online databases of gene expression were monitored for Metap2, Rcn1 and
Sertad2 throughout this investigation, with ongoing attempts being made to identify and
obtain reagents for the investigation of these putative POU4F3 target genes.

3 Candidate Pou4f3 target gene identification and prioritisation 121
The final gene selected for follow-up was Luzp1. This candidate gene had predicted
transcription factor binding sites of comparable quality to those of other genes selected for
follow up. Its known expression profile is amongst the most restricted of the candidate
genes and it is likely to act as a transcription factor (Lee et al. 2001;Sun et al. 1996).
Therefore, like RBMS1, LUZP1 could potentially regulate a variety of processes in the inner
ear. An antibody was available and I attempted (unsuccessfully) to obtain a sample of this
whilst I continued to investigate this candidate gene.
3.8 Summary Having identified candidate POU4F3 target genes from a subtractive hybridization carried
out in our laboratory, a small number of candidate genes were selected for further
investigation based on measures that indicated the likelihood of POU4F3 regulation i.e.
prediction of putative POU4F3 binding sites in predicted candidate gene promoters; the
potential role of candidate genes in auditory hair cell maintenance and survival; and the
reagents available for experimentation.
The expression patterns of candidate genes in the inner ear and the upregulation of
candidate genes by POU4F3 suggested by the subtractive hybridization was subsequently
tested to verify any interaction and to elucidate the mechanism by which POU4F3 might
affect target gene transcription. Results from these experiments guided the ongoing
prioritisation of genes and the allocation of resources for further investigation in order to
allow greater focus on genes that were most likely to be involved in the guidance of hair cell
terminal differentiation and survival that is mediated by POU4F3.

4 Characterisation of the interaction of POU4F3 with the Nr2f2 promoter 122
4
CHARACTERISATION OF THE
INTERACTION OF POU4F3 WITH THE
NR2F2 PROMOTER
All candidate genes reported herein were identified as putative targets of the POU4F3
transcription factor from a subtractive hybridization screen that was conducted by
members of our laboratory. This screen identified mRNA transcripts that were
differentially expressed between cells that had been manipulated to either over- or under-
express Pou4f3. The transcripts were output from the subtractive hybridization screen in
the form of cDNA sequences that had been cloned into the pGEM-T® Easy vector and
subsequently sequenced. In order to identify which gene in the mouse genome the
transcripts had been produced from (i.e. which gene may be transcriptionally regulated by
POU4F3), I used these sequencing files in BLAST analysis against the Ensembl mouse
cDNA database.
4.1 Identification of Nr2f2 as a potential POU4F3 target gene Nr2f2 was identified as a potential target of POU4F3 from a clone (clone D8) that was
produced from the forward (upregulated) subtractive hybridization screen as follows: The
sequencing file for clone D8 was analysed to verify full sequencing of the cloned cDNA as a
longer, higher quality sequence would provide higher quality matches on BLAST analysis.
Sequencing of the whole insert was verified by identification of adaptor oligonucleotide
sequences at both the 5’ and 3’ ends of the sequence. These adaptors had been used to
amplify and subsequently clone the differentially expressed Nr2f2 cDNA from the
subtractive hybridization screen into the pGEM-T® Easy vector (Figure 4.1.a). Adaptor
oligonucleotide sequences were manually trimmed from the cDNA sequence prior to BLAST
analysis and this analysis was conducted using the trimmed cDNA sequence against the
annotated genes in the Ensembl mouse ‘gene build’ database (see section 3.3.1) i.e.

4 Characterisation of the interaction of POU4F3 with the Nr2f2 promoter 123
sequences that had been annotated as being transcribed from the mouse genome (Curwen
et al. 2004).
Five significant matches to the Nr2f2 sequence in the Ensembl database were identified by
this method with the most significant match being 343bp long and of 100% sequence
identity to Nr2f2 (p = 8.6 x 10-273) (Figure 4.1.boxes 1&2, b). However, as an alternative
transcript (NP_899084.2) was found to overlap with Nr2f2 in this region, a match of equal
significance to the Nr2f2 match was identified to this transcript. Therefore, the initial
strategy of selecting the most significant match to a given clone as its corresponding gene
(section 3.3.1) was not appropriate for clone D8.
In order to verify the match of clone D8 to Nr2f2, the genomic locations of all significant
matches (p < 0.05) that were produced by the BLAST analysis were checked. Though one of
these matches was to the other member of the NR2F family (Nr2f1) (p = 3.3 x 10⁻²⁵), this
match was much shorter than the other significant matches (116bp, 87% sequence identity),
less significant, and near the 3’ terminal of the transcript which is the most homologous to
Nr2f2 (Tripodi et al. 2004). Therefore, this match to Nr2f1 was excluded as a match to clone
D8.
Figure 4.1. Clone D8 of the subtractive hybridization screen matches the Nr2f2 gene. (Legend on page 124)
a)
GGGGNGGNNTTCNNNTCCCNNNNNNAAAAAGNGANNANCTTNCCCCGCGGCCGAGGTACAT
AGACACAGGACAATTAATAATTTGGAAAAAAATGACTTACNTTGTCCATTCTGCTAATTTTCT
CCCAATCTCCTTAAATGCACTTTTAGCAATATTTTTCAAAAATTTACCAAAAAGAAAAAAAGA
CTAATTTCCTTTTTATACAAAAATGATAAGTAGCAGGTTGTTCTGCCCAACACAGGAGTTGTTT
TCTTTCTTTTTTTTTAATGCATTCTGTAAAAGTTCATTTGGCAATCTCTCTCTTTCTCTCTCTCCT
TTTTGAAATTCACAGTCCATTAAATTCTTCCCCTCTCTTCTTTTTAGCAAACTTGTAACATCCTT
TCTTAACAGAAGGAAATTAAGCAAACAAAACCAGTCTTTTGCCTTTTCTTTCTCTGTTTCACTC
CCCCTTATTTTGATTGATTTATTTATTGAATTGCCATATATGGCCAGTTAAAACTGCTGCCGGA
CAGTAACATATCCCGGATGAGGGTTTCGATGGGGGTTTTACCTACCAAACGGACGAAAAACAATTGCTCTATGACTGAGGAGGAGACCGTGCGGAGGGAAGGGAGACGAAGCAAGAGCTTTCCG
AACCGTGTTGGCTGGTTGGGGTACCTGCCCGGGCGGCCGCTCGA
b)

4 C
hara
cteri
sati
on
of
the i
nte
ract
ion
of
PO
U4F
3 w
ith
th
e Nr2f2
pro
mote
r 124
Fig
ure
4.1
. C
lon
e D
8 o
f th
e s
ub
tra
cti
ve h
yb
rid
izati
on
scre
en
matc
hes t
he N
r2f2
gen
e (
co
nti
nu
ed
).
a)
Adapto
r o
ligon
ucle
otide s
equences f
rom
th
e s
ub
tra
ctive h
ybri
diz
atio
n s
cre
en
(re
d t
ype)
were
identified
in
the
clo
ne s
equ
ence i
n o
rder
to v
erify
full
seq
ue
ncin
g.
These s
equ
ences w
ere
th
en d
ele
ted p
rior
to B
LA
ST
an
aly
sis
, le
avin
g a
tri
mm
ed s
equ
ence (
bla
ck t
ype).
b)
Gra
phic
al
repre
sen
tatio
n o
f th
e s
eque
nce m
atc
h b
y
BL
AS
T a
na
lysis
fro
m t
he E
nsem
bl
‘Co
ntigV
iew
.’ T
he
red b
oxes r
epre
sent
clo
ne
sequences t
hat
matc
h t
o t
he t
wo
cD
NA
tra
nscripts
re
pre
sente
d b
elo
w i
n m
aro
on.
These t
ranscripts
are
on
the r
evers
e s
tra
nd o
f th
e c
ontig r
epre
sente
d a
bove
in b
lue.
c)
The
alig
nm
ent
of
the t
rim
med
forw
ard
(c.f
) and
revers
e (
c.h
) clo
ne
D8
sequence
to t
he N
r2f2
gen
e w
as v
erifie
d b
y a
lignin
g a
ll of th
e r
ele
va
nt
BL
AS
T m
atc
hes (
c.a
-e)
to th
e E
nsem
bl seque
nce for
Nr2
f2 (
c.g
).
c)
4 Characterisation of the interaction of POU4F3 with the Nr2f2 promoter 125
The remaining matches were found to be in the same genomic region as the most
significant match (Figure 4.1.b, red boxes) and three matched Nr2f2 but not the overlapping
transcript in that region (NP_899084.2). This suggested that Nr2f2 was the true match to
clone D8. However, the BLAST analysis did not report the alignment of regions between
matches; as discussed in section 3.3.1, the BLAST software used can fail to identify true
homology in low complexity (i.e. repetitive) regions as these regions are filtered out or
masked by programs included in the WU-BLAST 2 software package that the Ensembl
BLAST tool uses (Gish 2004). Therefore, as a further verification of the match of Nr2f2 to
clone D8, the trimmed clone D8 insert sequence was aligned with the last exon of Nr2f2 to
identify whether the regions between BLAST matches also matched this sequence (Figure
4.1.c.f&h). All significant BLAST matches to Nr2f2 were included in the alignment (Figure
4.1.c.a-e).
This alignment showed that the whole of the clone D8 insert matched the Nr2f2 transcript
in the Ensembl database with high sequence similarity (>99%). Furthermore, homologous
regions not identified by BLAST analysis were shown to be of low complexity, as expected.
This verified that the clone D8 sequence used in the BLAST analysis matched Nr2f2 and
not NP_899084.2 as the alignment extended beyond the 3’ terminal of the latter transcript.
Therefore, the clone D8 insert sequence that was reverse transcribed and cloned from an
mRNA transcript in the subtractive hybridization screen unequivocally matches the Nr2f2
transcript in the Ensembl database. As clone D8 was produced from the forwards
(upregulated) POU4F3 subtractive hybridization screen, the above match to Nr2f2
indicates that POU4F3 upregulates Nr2f2 in UB/OC-2 cells. Therefore, POU4F3 may
upregulate Nr2f2 expression in hair cells.
4.2 Introduction to Nr2f2 Nr2f2 was the first gene identified by the POU4F3 subtractive hybridization screen to be
investigated. It is a well-characterised member of the steroid/thyroid hormone nuclear
receptor superfamily that has commonly been referred to as apoAI regulatory protein-1
(ARP-1) (Ladias et al. 1991), COUP-TFII (Ritchie et al. 1990) and COUP-TF2 (Wang et al.
1991). In this document it is referred to as Nr2f2 as recommended by the Nuclear Receptors
Nomenclature Committee in order to place it in a systematic framework of nuclear
receptors based on its phylogeny (Nuclear Receptors Nomenclature Committee. 1999).
4.3 Steroid/thyroid hormone nuclear receptors The steroid/thyroid hormone nuclear receptor superfamily is a large and well-characterised
group of nuclear receptor transcription factors that classically bind steroid/thyroid/vitamin-
derived hormone ligands that regulate their function. The binding of the ligand to the
nuclear receptor can take place outside the nucleus and induce translocation of the nuclear
receptor to the nucleus (reviewed in Benoit et al. 2004;DeFranco et al. 1998) or, the

4 Characterisation of the interaction of POU4F3 with the Nr2f2 promoter 126
typically lipophilic ligand can be transported to the nucleus prior to binding to a nuclearly
expressed receptor (e.g. reviewed in Kishimoto et al. 2006). Ligand binding classically acts
to alter the transcriptional effect of nuclear receptors on their target genes. As the sources
of ligands can be systemic, local or exogenous (including xenobiotic compounds), nuclear
receptors are involved in both systemic/endocrine signalling (e.g. by steroid hormones) and
local/paracrine regulation (e.g. by retinoids), thereby influencing processes from embryonic
development to adult homeostasis (reviewed in Beato et al. 1995;Benoit et al. 2004;Weigel
1996).
4.3.1 Molecular function of steroid/thyroid hormone nuclear receptors
For classical nuclear receptors, ligand binding induces a conformational change in the
receptor’s ligand-binding domain (LBD) which, in turn, alters the binding of coactivators
and corepressors, thus influencing target gene regulation (Beato et al. 1995;Weigel 1996).
This transcriptional activity is mediated by the two ‘activation function’ (AF) helices of the
nuclear receptor. AF-1 mediates ligand-independent transcriptional activation whilst AF-2
– which is part of the LBD – has ligand-dependent function (Kishimoto et al. 2006;Noy
2007;Weigel 1996). When not bound to ligand, the conformation of the AF-2 helix typically
facilitates binding of corepressors to the LBD (e.g. HDAC); conversely, the binding of ligand
to the LBD induces a conformational change in this protein region that allows binding of
coactivators (e.g. HAT) (Gronemeyer et al. 2004;Kishimoto et al. 2006;Xu et al. 1999).
Though co-factors are required for transcriptional regulation of nuclear receptor target
genes, their action is often secondary to DNA binding by the nuclear receptor. This DNA-
binding function is dependent on the DNA binding domain (DBD) of the protein, which
recognises specific response elements in target gene promoters. The canonical hormone
response element RGGTCA – in which R is a purine – is modified, extended and duplicated
to yield specific response elements for different classes of nuclear receptor (Gronemeyer et
al. 2004). DNA binding is further modulated by competition for binding sites with other
nuclear receptors and by protein-protein interactions. For example, homo- or hetero-
dimerisation of nuclear receptors can have both an up and downregulatory effect on
transcription and is sometimes required for DNA-binding to palindromic hormone response
element half-sites in vivo (reviewed in Beato et al. 1995;Park et al. 2003). Other important
protein-protein interactions mediate the shuttling of nuclear receptors between the
cytoplasm and nucleus. For example, a 90kDa heat-shock protein (hsp90) is associated with
unliganded cytoplasmically-expressed nuclear receptors in order to maintain cytoplasmic
expression and dissociates from liganded nuclear receptor, allowing nuclear translocation
(DeFranco et al. 1998). Though the majority of nuclear receptors are constitutively
expressed in nuclei, most steroid-hormone receptors which bind systemically acting ligands
shuttle between the cytoplasm and nucleus and this translocation is dependent on
associated proteins (reviewed in Benoit et al. 2004;Kishimoto et al. 2006). Such proteins

4 Characterisation of the interaction of POU4F3 with the Nr2f2 promoter 127
might therefore be involved in the controlling the subcellular localization of NR2F2 which
is primarily expressed nuclearly, though it has been reported to be expressed
cytoplasmically in the rat anterior pituitary gland (Raccurt et al. 2006). The final major
area of nuclear receptor protein regulation is that of post-translational modification. For
example, phosphorylation, ubiquitination and sumoylation of PPARγ (a nuclear receptor
involved in development and metabolism) can all affect its function (Burgermeister et al.
2007). Therefore, the regulation of nuclear receptor target genes can be controlled at the
DNA level (at target gene promoter response elements), by protein-protein interaction (by
dimerisation/tetramerisation and nucleo-cytoplasmic shuttling) and by post-translational
modification, resulting in complex regulation and function of these genes.
4.3.2 Orphan nuclear receptors
A distinction is drawn between nuclear receptors based on their ligand binding
characteristics. Nuclear receptors that display non-classical ligand binding can be described
as orphan or promiscuous. Promiscuous nuclear receptors, have affinity for multiple ligands
e.g. members of the NR1 receptor subfamily are activated by a number of xenobiotic
compounds (reviewed in Noy 2007). At the opposite end of the spectrum, orphan nuclear
receptors are those that do or did not have identified ligands; naturally occurring ligands
have now been identified for more than half of the human nuclear receptors that were
originally termed ‘orphan’ (reviewed in Willson et al. 2002).
Though ligands have now been identified for many ‘orphan’ nuclear receptors, it has been
shown that a number of the remaining orphan receptors are unlikely to utilize ligand
signaling. This can be for one of two reasons. Firstly, the ligand binding pocket (LBP) of the
receptor can be occupied by a tightly-bound cofactor which is more likely to act as an
essential structural component rather than a signaling ligand (e.g. HNF4). Secondly, the
LBP of the protein can be blocked by its own bulky amino acid side chains though the
receptor can still regulate transcription as the AF-2 helix is folded in an active
conformation (e.g. Nurr1) (Benoit et al. 2004).
NR2F2 was, until very recently, an orphan steroid/thyroid hormone nuclear receptor that
had been categorised as such on the basis of its sequence similarity to Ear-3 (v-erbA-related
human receptor-3, also known as COUP-TFI or NR2F1), Ear-2 (NR2F6) and the Drosophila
gene, Seven-up (Ladias et al. 1991;Nuclear Receptors Nomenclature Committee. 1999).
Though retinoid acids have now been found to upregulate NR2F2 activity in vitro, the
ligand for such regulation in vivo is unclear as no ligand that is able to bind NR2F2 at
physiological concentrations had been identified (Kruse et al. 2008). Due to this delay in
ligand identification, little is known about NR2F2’s endogenous ligand-binding properties
whereas its other biological functions are well investigated.

4 Characterisation of the interaction of POU4F3 with the Nr2f2 promoter 128
4.4 NR2F2 function and expression In development, NR2F2 is expressed in a wide range of tissues in a pattern that overlaps
with, but is distinct from that of its family member NR2F1 (COUP-TFI) (reviewed in
Pereira et al. 2000). Its expression was first identified in whole organs by Northern blot (e.g.
Ladias et al. 1991;Lutz et al. 1994), and its localization within organs has since been
visualised in skin, brain, spinal cord, salivary gland, oesophagus, thyroid, lung, stomach,
intestine, liver, pancreas, kidney, bladder, prostate, testis and ovary primarily by RNA in
situ hybridization (Lutz et al. 1994;Pereira et al. 1995;Qiu et al. 1994a;Zhang et al. 2002). In
development, NR2F factors are initially expressed in all three germ layers though their
expression becomes more restricted as development progresses. Their level of expression is
also modulated throughout organogenesis – NR2F factors are downregulated as organs
complete their development (Pereira et al. 1995). More recently, knockout and protein
expression studies have elucidated many of the suggested roles of NR2F2 and it has been
found to be commonly involved in organogenesis.
NR2F2’s well-described expression and requirement in organ development is of particular
relevance to the present study, as it is known to be expressed in the inner ear in
development (see section 4.5.2). Its expression is seen in the otic placode at E8.75 (Tang et
al. 2005) and subsequently follows a pattern that is comparable to that seen in other organs
where it has been shown to be essential for normal patterning (see below). Furthermore,
NR2F2 is known to be involved in sensory organ development as its expression in the
dorsal retina is thought to mediate dorsal-ventral patterning of this sensory epithelium by
interaction with retinoic acid signalling (McCaffery et al. 1999) – a signalling pathway that
is also important for inner ear development (reviewed in Romand et al. 2006).
The most vital developmental function of NR2F2 – in terms of embryonic viability – is in
cardiovascular development (Pereira et al. 1999). This was demonstrated by Nr2f2 mutant
mice which were generated by disruption of most of exon 1 and the entire exon 2 of the
three-exon Nr2f2 gene. Two-thirds of heterozygous Nr2f2 mutant mice generated by this
method die before weaning and homozygous mutant mice show embryonic lethality at E10
(Pereira et al. 1999). This Nr2f2-/- phenotype is thought to be due to haemorrhage and
oedema in the brain and heart, which is due to defects in angiogenesis, heart development
and capillary plexus formation associated with a reduction in Ang1 expression (a gene that
is also involved in heart and vascular development) (Pereira et al. 1999). Homozygous
mutation of Nr2f2 also caused malformation of the cardinal veins (Pereira et al. 1999). This
is consistent with observations from a subsequent study in which NR2F2 expression in
endothelial cells was ablated, showing that NR2F2 is required for specification of venous
identity and is associated with suppression of Notch signalling (You et al. 2005a). Like
retinoic acid signalling, Notch signalling is required for inner ear development (Fekete et al.
2002).

4 Characterisation of the interaction of POU4F3 with the Nr2f2 promoter 129
Neurally, NR2F2 is required for normal central nervous system development. It is
expressed in the murine telencephalon and tectum at day 10.5 p.c. and later shows
expression in parts of all three brain compartments (forebrain, midbrain and hindbrain)
(Qiu et al. 1994a) as is the case in chick development (reviewed in Qiu et al. 1994b). In late
mouse development, NR2F2 shows highly organised, stripe-like expression in the
cerebellum (Yamamoto et al. 1999). Functionally, it has been shown to be important for the
control of neurogenesis (Park et al. 2003), for the guidance of migrating neurons (Tripodi et
al. 2004) and, with NR2F1, is important in the acquisition of gliogenic competency (the
ability to differentiate into glial cells) (Naka et al. 2008). Caudally, NR2F2 has been
implicated in the development of spinal motor neurons by studies in the developing chick
which showed its transient expression in the ventral spinal cord in a region where motor
neurons are known to develop (Lutz et al. 1994). Furthermore, it is expressed in the
substancia gelatinosa of the spinal cord in the chick and mouse, a region known to give rise
to sensory neurons. However, by 18.5 days p.c. NR2F2 is expressed in the whole of the
mouse spinal cord, suggesting a differing maintenance role following cord development (Qiu
et al. 1994a;Qiu et al. 1994b).
These observations are consistent with NR2F2’s developmental theme of organ patterning
and cell fate determination, a theme that is continued in other systems. In the stomach,
NR2F2 has been shown to be important for radial and anteroposterior patterning by a
conditional knockout that showed defects consistent with a model of Nr2f2 regulation by
Hedgehog signalling in this system (Takamoto et al. 2005b). Conditional Nr2f2 knockout
mice also demonstrated that NR2F2 expression in the developing foregut is required for
normal diaphragmatic development: homozygous conditional knockout mice had reduced
survival compared to heterozygous littermates due to lung hypoplasia secondary to
herniation by the liver and stomach through the diaphragm. This defect is consistent with a
human form of congenital diaphragmatic hernia which is likely to be due to heterozygous
Nr2f2 deletion (You et al. 2005b).
More peripherally, NR2F2 has been implicated in limb and skeletal muscle development.
Chimera analysis and conditional knockout of Nr2f2 in embryos showed that NR2F2 is
required for normal limb bud outgrowth and myogenesis in the developing mouse (Lee et al.
2004). Finally, NR2F2 is predicted to be required for lung, liver and pancreatic
organogenesis (Kimura et al. 2002;Zhang et al. 2002). Its role in the latter organ has been
investigated by conditional Nr2f2 knockout in pancreatic beta-cells which resulted in
glucose intolerance in heterozygotes and embryonic lethality of unknown mechanism in
homozygotes (Bardoux et al. 2005). This metabolic involvement is continued postnatally
(see below).

4 Characterisation of the interaction of POU4F3 with the Nr2f2 promoter 130
The above roles of NR2F2 in organogenesis illustrate that this nuclear receptor is essential
for the normal development of a number of systems via differing processes i.e. cell fate
determination, regulation of cell cycle and maintenance of cell survival, as supported by
data from species other than mouse and chicken, namely Drosophila, Xenopus and C.
elegans. Furthermore, NR2F2 has been suggested to play a role in mesenchymal-
endothelial/epithelial signalling (reviewed in Pereira et al. 2000). These functions are
consistent with a potential role for NR2F2 in inner ear development.
Though NR2F2 expression displays its greatest variability in development and is reduced
on completion of organogenesis (Pereira et al. 2000), it is still widely expressed postnatally
(see below). In the inner ear, POU4F3 is also expressed postnatally (Erkman et al. 1996). If
Nr2f2 is, indeed, upregulated by POU4F3, then its known postnatal functions may aid
understanding of POU4F3-dependent postnatal maintenance of hair cell survival (Vahava
et al. 1998).
NR2F2 is expressed in all postnatal adult human organs examined (primarily in
mesenchymal cells) and particular note was taken of its expression in the lung, kidney,
gastrointestinal tract, liver, spleen and in the reproductive and endocrine systems (Suzuki
et al. 2000). This study did not investigate the postnatal expression of NR2F2 in human
neuronal tissues though, in the mouse brain, NR2F2 was found to be predominantly
expressed in the middle part of the brain, amygdaloid nucleus and arachnoid membranes
with lower expression seen in regions neighbouring the hypothalamus and in the choroid
plexus (da Silva et al. 1995). Subsequent study of NR2F2 in the rat showed that it is also
expressed in the pituitary, where it was found to be primarily expressed in lactotropes
(prolactin-producing cells) in both the cytoplasm and the nucleus. This study also
demonstrated that postnatal NR2F2 expression can be dynamic as both its cytoplasmic and
nuclear expression was upregulated in pregnancy (Raccurt et al. 2006).
Outside the brain, NR2F2 has been implicated in menstruation (Sato et al. 2003),
steroidogenesis in the ovary (Murayama et al. 2008) and embryo implantation (Takamoto et
al. 2005a). Its expression varies with the Hedgehog family genes Indian Hedgehog and
Desert Hedgehog (Katayama et al. 2006), probably due to regulation by Sonic Hedgehog
(Shh), which has been shown to directly upregulate transcription at a response element in
the Nr2f2 promoter (Krishnan et al. 1997) though a direct interaction has not been shown.
As Shh signalling has been shown to be important in inner ear patterning, its interaction
with Nr2f2 provides a potential avenue by which NR2F2 might be involved in inner ear
development and function (reviewed in Bok et al. 2007).
NR2F2 is also thought to play a role in mesenchymal-epithelial signalling e.g. by mediating
epithelial oestrogen receptor expression (Kurihara et al. 2007) and this may suggest a
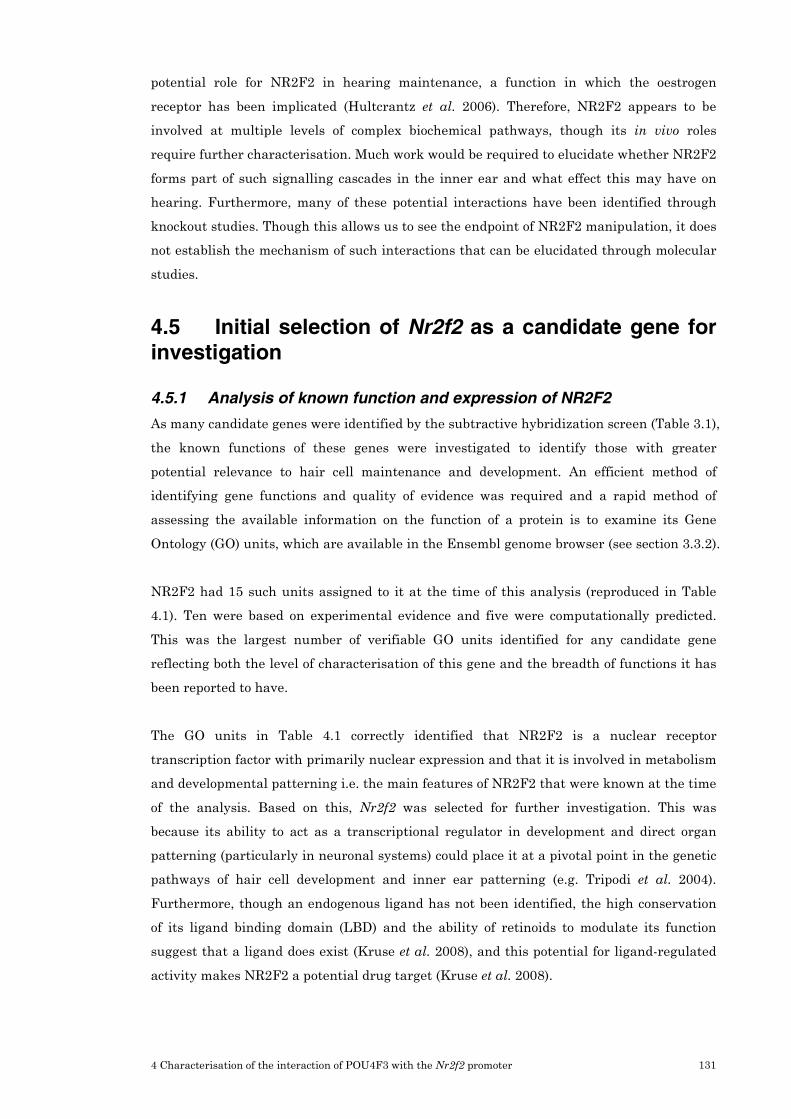
4 Characterisation of the interaction of POU4F3 with the Nr2f2 promoter 131
potential role for NR2F2 in hearing maintenance, a function in which the oestrogen
receptor has been implicated (Hultcrantz et al. 2006). Therefore, NR2F2 appears to be
involved at multiple levels of complex biochemical pathways, though its in vivo roles
require further characterisation. Much work would be required to elucidate whether NR2F2
forms part of such signalling cascades in the inner ear and what effect this may have on
hearing. Furthermore, many of these potential interactions have been identified through
knockout studies. Though this allows us to see the endpoint of NR2F2 manipulation, it does
not establish the mechanism of such interactions that can be elucidated through molecular
studies.
4.5 Initial selection of Nr2f2 as a candidate gene for
investigation
4.5.1 Analysis of known function and expression of NR2F2
As many candidate genes were identified by the subtractive hybridization screen (Table 3.1),
the known functions of these genes were investigated to identify those with greater
potential relevance to hair cell maintenance and development. An efficient method of
identifying gene functions and quality of evidence was required and a rapid method of
assessing the available information on the function of a protein is to examine its Gene
Ontology (GO) units, which are available in the Ensembl genome browser (see section 3.3.2).
NR2F2 had 15 such units assigned to it at the time of this analysis (reproduced in Table
4.1). Ten were based on experimental evidence and five were computationally predicted.
This was the largest number of verifiable GO units identified for any candidate gene
reflecting both the level of characterisation of this gene and the breadth of functions it has
been reported to have.
The GO units in Table 4.1 correctly identified that NR2F2 is a nuclear receptor
transcription factor with primarily nuclear expression and that it is involved in metabolism
and developmental patterning i.e. the main features of NR2F2 that were known at the time
of the analysis. Based on this, Nr2f2 was selected for further investigation. This was
because its ability to act as a transcriptional regulator in development and direct organ
patterning (particularly in neuronal systems) could place it at a pivotal point in the genetic
pathways of hair cell development and inner ear patterning (e.g. Tripodi et al. 2004).
Furthermore, though an endogenous ligand has not been identified, the high conservation
of its ligand binding domain (LBD) and the ability of retinoids to modulate its function
suggest that a ligand does exist (Kruse et al. 2008), and this potential for ligand-regulated
activity makes NR2F2 a potential drug target (Kruse et al. 2008).

4 Characterisation of the interaction of POU4F3 with the Nr2f2 promoter 132
Table 4.1. Nr2f2 GO units. IDA, inferred from direct assay; IEA, inferred from electronic annotation; TAS, traceable author statement; IMP, inferred from mutant phenotype.
GO ID GO Term Evidence Code
Cellular
component GO:0005634 Nucleus TAS
GO:0003700 Transcription factor activity IEA
GO:0003706 Ligand-regulated transcription factor
activity TAS
GO:0003707 Steroid hormone receptor activity IEA
GO:0003714 Transcription corepressor activity TAS
GO:0008270 Zinc ion binding IEA
Molecular
function
GO:0046872 Metal ion binding IEA
GO:0001764 Neuronal migration IDA, IEA
GO:0006350 Transcription IEA
GO:0006357 Regulation of transcription from Pol II
promoter TAS
GO:0006629 Lipid metabolism TAS
GO:0007165 Signal transduction TAS
GO:0009952 Anterior/posterior pattern formation IEA, IMP
GO:0009956 Radial pattern specification IEA, IMP
Biological
process
GO:0030900 Forebrain development IDA, IEA

4 Characterisation of the interaction of POU4F3 with the Nr2f2 promoter 133
4.5.2 Reported expression pattern of NR2F2 in the inner ear
Following initial selection of candidate genes for further study, their known expression and
function in the inner ear was investigated in order to help judge their potential relevance to
hair cell development and survival. The literature and online databases of gene expression
were searched to determine candidate gene expression patterns. Nr2f2 was the only
prioritised gene from the pool described (see Table 3.2) with histologically verified
expression in the inner ear. Its expression pattern was described in a single report where
RNA in situ hybridization and immunohistochemistry were used to identify Nr2f2 mRNA
and protein in the developing mouse cochlea (Tang et al. 2005).
Nr2f2 expression has been detected as early as E8.75 in the otic placode by RNA in situ
hybridization (Tang et al. 2005). It is expressed in the ventral-anterior domain and its
expression extends posteriorly by E9.75 to include the ventral-posterior domain. Between
E10 to E13.5 it was only detected in the distal tip of the extending cochlear duct floor. This
changes by E15.5, a stage at which hair cells are maturing at the junction of the greater
and lesser epithelial ridges (see Figure 1.5d). At this stage NR2F2 expression spanned the
greater and lesser epithelial ridges and supero-medial wall of the apical cochlear duct; it is
more restricted to the lesser epithelial ridge in the middle turn and only shows faint
expression in the lesser epithelial ridge basally (Tang et al. 2005). This expression in the
organ of Corti is reported to reduce to undetectable levels postnatally, as examined by
immunohistochemistry (Tang et al. 2005).
Expression of NR2F2 in the developing sensory epithelium at E15.5 in the mouse is
consistent with a potential role in hair cell development. Furthermore, its expression is
likely to overlap with that of POU4F3, supporting a possible regulatory relationship in
developing hair cells and making Nr2f2 a suitable gene for further investigation. However,
a lack of postnatal NR2F2 expression would mean that it is not involved in hair cell
survival. Given that the NR2F2 inner ear expression pattern is described in a single report
and that the inability to detect its expression postnatally may be due to antibody sensitivity,
I investigated NR2F2 expression at late developmental and early postnatal stages. In order
to do this, an affinity-purified anti-NR2F2 rabbit polyclonal antibody was obtained from a
collaborator (Dr Michelè Studer (Tripodi et al. 2004)). This antibody was different to the
antibody previously used to investigate the NR2F2 expression pattern in the inner ear
though it was raised against the same region in NR2F2 (the N terminal of the protein that
is most divergent from NR2F1). The specificity of the antibody had previously been checked
by our collaborators by western blotting and immunohistochemistry with immunogen
blocking and was found to recognise NR2F2 without cross-reactivity to NR2F1, though the
data for this analysis were not shown in the reporting paper (Tripodi et al. 2004).

4 Characterisation of the interaction of POU4F3 with the Nr2f2 promoter 134
4.6 Verification of NR2F2 expression in UB/OC-2
cells
4.6.1 Immunoblot to examine NR2F2 expression in cell lines
Prior to investigating NR2F2 expression in the inner ear, its expression in UB/OC-2 cells
was assessed in order to test antibody specificity and verify translation of Nr2f2 mRNA
detected in UB/OC-2 cells by RT-PCR (see Figure 3.1). Protein expression was first assessed
by western immunoblotting to assess antibody specificity by determining the molecular
weight of any protein recognised. This method has the additional benefit of being able to
identify any alternative NR2F2 isoforms that might be present in this inner ear cell line
(though only one Nr2f2 transcript is known in the mouse (Ensembl 2008b)). Non-POU4F3-
expressing undifferentiated UB/OC-1 cells (derived from E13 immortomouse sensory
epithelium like UB/OC-2 cells (Rivolta et al. 1998a)) were included for comparison.
Undifferentiated UB/OC-1 and UB/OC-2 whole cell protein extract was electrophoresed on
a denaturing 10% polyacrylamide gel prior to electroblotting onto a PVDF membrane and
immunodetection. The results of this analysis are shown in Figure 4.2. A strong band of
approximately 50kDa and a weaker band of approximately 55kDa is seen for both UB/OC-1
and UB/OC-2 protein extract. The predicted size of the NR2F2 protein is 46kDa and two
antibody catalogues show the protein size to be reported as 46kDa (Abcam) and 50kDa
(Abnova). In these catalogues, both antibodies were tested against human NR2F2 (from
HepG2 and 293T cells) which is identical in its peptide sequence to mouse NR2F2. The
difference in sizing between the 50kDa band in Figure 4.2, the Abnova data and the Abcam
data may be due to differential post-translational modification of the protein, but its
molecular weight is within the sensitivity range of the western immunoblot protocol.
The less dense band of approximately 55kDa in Figure 4.2 appears similar to an extra band
found in the Abcam western immunoblot and, though the immunogen is unknown, it
probably represents a modified protein isoform rather than a non-specific target of the anti-
NR2F2 antibody used as it has been identified by two different antibodies (our
collaborator’s and Abcam’s). It is unlikely to be the product of an alternative transcript as
only one Nr2f2 transcript is known (Ensembl 2008b) and it is unlikely to represent cross-
reactivity to NR2F1 as any such band would be expected to be of slightly lower molecular
weight (45kDa) (Raccurt et al. 2006). Furthermore, the antibody used was raised against a
divergent NR2F region and has previously been reported not to recognise NR2F1 (Tripodi et
al. 2004). As this experiment was carried out to determine antibody specificity rather than
relative expression levels between cell types, equality of protein loading between lanes was
not checked by equalisation with a housekeeping gene. Therefore, though the density of the
55kDa band appears different in UB/OC-1 and UB/OC-2 cells, it is not possible to
determine if the antigen is differentially expressed between these two cell types.

4 Characterisation of the interaction of POU4F3 with the Nr2f2 promoter 135
Figure 4.2. Expression of NR2F2 in UB/OC-1 and UB/OC-2 cells. NR2F2 is detectable in UB/OC1 and UB/OC-2 cells as a strong band of 50kDa and a weaker band of 55kDa (arrows). According to two reports, the molecular weight of NR2F2 is 46kDa (Abcam 2008) or 50kDa (Abnova 2008b). A difference of 4kDa is not beyond the limits of error in such an experiment and this immunoblot is therefore consistent with both of these reports.
This western immunoblot therefore shows that the antibody used is able to detect NR2F2
which is expressed in UB/OC-1 and UB/OC-2 cells. Its expression in UB/OC-1 cells is
consistent with its reported inner ear expression pattern where NR2F2 is expressed in the
developing sensory epithelium from which these cells are derived prior to the onset of
POU4F3 expression (Tang et al. 2005), demonstrating that POU4F3 is unlikely to be
required for its expression. The latter conclusion is not surprising given that NR2F2 is
known to be expressed in many non-POU4F3 expressing cells (e.g. Tripodi et al. 2004).
These possibilities, coupled with the reported work demonstrating the sensitivity of the
antibody (Tripodi et al. 2004) demonstrate that it specifically recognises NR2F2 and is
therefore suitable for the investigation of NR2F2 expression in the inner ear.
4.6.2 Immunohistochemistry to detect NR2F2 in UB/OC-2 cells
Having shown the specificity of the antibody obtained for NR2F2, it was used for
immunofluorescence immunohistochemistry in UB/OC-2 cells. This was done to identify if
NR2F2 is expressed in all cells in the monolayer and whether its subcellular localization in
these cells is nuclear, as is expected – it has only been found to be expressed
cytoplasmically in the rat pituitary gland (Raccurt et al. 2006). Though the suitability of the
antibody for immunofluorescence microscopy had been previously demonstrated (Tripodi et
al. 2004), this experiment provided the opportunity to optimise the immunofluorescence
protocol for later use in the study of rodent inner ear tissue which is harder to obtain and
prepare.
97.4 kDa
30 kDa
46 kDa
OC-2
OC-1
14.3 kDa 21.5 kDa
66 kDa
220 kDa

4 Characterisation of the interaction of POU4F3 with the Nr2f2 promoter 136
Figure 4.3. NR2F2 expression in undifferentiated (proliferating) UB/OC-2 cells. NR2F2 is expressed in cell nuclei visualised by immunofluorescence microscopy (green, ii.b & ii.d). Anti-rabbit IgG alone (i.b) does not show any signal showing that staining in ii.b is specific to the anti-NR2F2 antibody. i.a & ii.a) DAPI, a fluorescent stain that binds to DNA and therefore labels cell nuclei; i.b) Alexa 488-conjugated anti-rabbit IgG; ii.b) anti-NR2F2 (primary antibody) and Alexa 488-conjugated anti-rabbit IgG (secondary antibody); i.c & ii.c) Alexa 633-conjugated Phalloidin, a toxin that binds to filamentous actin; i.d & ii.d) Merge. Images were taken using identical settings through a 20x objective. Arrowhead, mitosing or apoptosing cell.
UB/OC-2 cells were grown to 80% confluence on glass coverslips, fixed and immunolabelled
prior to visualisation by fluorescence microscopy with a Zeiss LSM 510 Meta microscope
(see Figure 4.3.ii). The non-specific (background) labelling pattern of the secondary
antibody used (Alexa 488-conjugated anti-rabbit IgG) was also ascertained in these cells in
order to verify its specificity and the efficacy of the blocking solution used by omission of
anti-NR2F2 antibody from these slides (Figure 4.3.i).
Figure 4.3 shows that fluorescent signal is detected for NR2F2 in a pattern that overlaps
with that of DAPI and not phalloidin in all but one cell (Figure 4.3.arrowhead). These
results indicate that NR2F2’s subcellular localization in undifferentiated (proliferating)
UB/OC-2 cells is nuclear and that NR2F2 is expressed uniformly in UB/OC-2 cells. They
also confirm that the antibody used is suitable for immunohistochemistry and that the
antibody concentration and blocking solution used are appropriate for this application. I
therefore proceeded to use the anti-NR2F2 antibody at the dilution described to investigate
NR2F2 expression in the rodent inner ear.
i) ii)

4 Characterisation of the interaction of POU4F3 with the Nr2f2 promoter 137
4.7 Immunohistochemistry for NR2F2 in rat and
mouse inner ear tissue As previously described (see section 4.5.2), there is only one report of NR2F2 expression in
the inner ear which showed expression in the developing mouse and did not identify
postnatal NR2F2 expression in the organ of Corti (Tang et al. 2005). I therefore re-
examined its expression at late developmental and early postnatal stages in the rat
(sections 4.7.1 and 4.7.2) and mouse (section 4.7.3). Particular attention was paid to NR2F2
expression in relation to POU4F3 expression in order to identify any correlation in the
expression of the two genes that might indicate whether POU4F3 could modulate Nr2f2
activation in the inner ear. However, the known expression of NR2F2 in cells that do not
express POU4F3 (e.g. Figure 4.2) suggests that such a modulation may be subtle as
POU4F3 is unlikely to be required for Nr2f2 expression.
4.7.1 NR2F2 expression in the embryonic rat inner ear
POU4F3 is known to be expressed in the inner ear at E18.5 in the rat with stronger
expression in the base than in the apex (Erkman et al. 1996). Therefore, this age was
chosen for the investigation of embryonic NR2F2 expression as it provides a gradient of
POU4F3 expression to which NR2F2 expression could be compared.
Cryosections were prepared from E18 rat cochleas and immunofluorescence
immunohistochemistry was carried out with the antibody described (see section 4.6). Figure
4.4 shows that NR2F2 expression was seen in many cell types in the developing cochlea.
Though it was diffusely expressed, strong expression was seen in the cells of the cochlear
duct. However, this expression was not uniform throughout the turns of the developing
cochlea. In the apical and middle turns, expression is seen in the supero-medial wall,
greater epithelial ridge (GER) and lesser epithelial ridge (LER). The supero-medial wall
gives rise to the cells of Reissner’s membrane whereas the GER and LER both contribute to
hair cell development and other cell types of the sensory epithelium (see section 1.3.1). In
contrast to widespread NR2F2 expression in the apical and middle turns, basal expression
was primarily restricted to the LER.
This expression pattern is consistent with that of the developing mouse (Tang et al. 2005).
Expression of NR2F2 in the basal E18 cochlea (Figure 4.4a, j-m) is likely to overlap with
that of POU4F3 (see Figure 1.9a) (Erkman et al. 1996), supporting the hypothesis that
modulation of Nr2f2 expression by POU4F3 in hair cells may occur and be relevant to hair
cell development. Colocalisation of the two proteins would provide stronger evidence for
this; however, I was not able to establish this due to the lack of a suitable anti-POU4F3
antibody. Furthermore, apical cochlear duct NR2F2 expression (Figure 4.4a-e) and NR2F2
expression outside the developing sensory epithelium suggests a separate (POU4F3-
independent) role for NR2F2 in the developing rat cochlea.

4 Characterisation of the interaction of POU4F3 with the Nr2f2 promoter 138
Figure 4.4. NR2F2 expression in the E18 rat cochlea. a) NR2F2 labelling in E18 rat cochlea is strongest in the apical cochlear duct in the lesser epithelial ridge (LER), greater epithelial ridge (GER) and supero-medial wall (S-MW), where NR2F2 labelling (green) overlaps with the nuclear marker, DAPI (blue) consistent with nuclear expression (b-e). Phalloidin, a marker of filamentous actin, is labelled in red. In the middle cochlear turn (f-i), NR2F2 labelling is similar to that in the apex whereas in the basal turn (j-m), it is restricted to the LER (arrowhead).
4.7.2 NR2F2 expression in the postnatal rat inner ear
NR2F2 expression was further characterised by looking at its expression in postnatal rat
inner ears. POU4F3 expression has been reported to be maintained into adulthood in rats
(Erkman et al. 1996) and, therefore, any regulatory relationship between POU4F3 and
Nr2f2 may be relevant beyond the gestational period. P0, P4 and P8 rat cochleas were
prepared similarly to E18 tissue and examined. The same antibody was used to
immunolabel this tissue as was used for embryonic rat tissue.
This analysis, summarised in Figure 4.5, showed that NR2F2 is expressed postnatally in
many cell types of the postnatal rat cochlea up to and including P8 (the latest age
examined) with consistent expression in the Hensen cell nuclei. At P0 and P4, NR2F2 is
expressed in the nuclei of all cells examined including the POU4F3-expressing hair cells
(Erkman et al. 1996). This is also true of the P8 apical cochlea though, in the basal turn at
P8, there is a shift from nuclear to cytoplasmic NR2F2 expression in hair cells.
This expression pattern suggests that NR2F2 continues to function in the organ of Corti
postnatally. As it is expressed in hair cells, which are known to express POU4F3, the
suggested modulation of Nr2f2 expression by POU4F3 could continue beyond gestation.
Also, the cytoplasmic expression of NR2F2 in the basal P8 rat cochlear hair cells (Figure
4.5) suggests that NR2F2 may be subject to regulation at the protein level in hair cells.
Cytoplasmic NR2F2 expression has only been reported in the rat pituitary, though the
significance and mechanism of this change in subcellular localization has not yet been

4 Characterisation of the interaction of POU4F3 with the Nr2f2 promoter 139
investigated (Raccurt et al. 2006). NR2F2 expression would have to be investigated from P8
to adulthood to identify the duration of its expression in rat hair cells and, therefore, its
potential regulation by POU4F3. Such experiments would clarify the timing of the nuclear
to cytoplasmic transition in NR2F2 expression, and whether this transition is dynamic or
transient.
Figure 4.5. NR2F2 expression in the postnatal rat cochlea. The basal and apical expression profiles of NR2F2 in the organ of Corti were examined at P0, P4 and P8 with two cochleas examined at each age. Representative images of this analysis are shown. Green, anti-NR2F2 IgG; red, phalloidin. NR2F2 is seen to be expressed in the nuclei of both inner and outer hair cells which are identified by Phalloidin labelling of their stereocilia. Nuclear NR2F2 expression is seen in all areas examined except for the P8 basal region where NR2F2 appears to be expressed in the hair cell cytoplasm (arrowhead). Many cells that line the scala media maintain NR2F2 expression, particularly the Hensen cells (HSC). RM, Reissner’s membrane; IHC, inner hair cell; OHC, outer hair cell; SC, support cell; BM, basilar membrane.
4.7.3 NR2F2 expression in the postnatal mouse inner ear
The identified postnatal expression of NR2F2 in the rat cochlea, coupled with its known
postnatal functions in other organs (see section 4.4), give NR2F2 the potential to be
involved in maintenance functions in the postnatal inner ear. However, it has previously
been reported that NR2F2 expression reduces to undetectable levels in the postnatal mouse
organ of Corti (Tang et al. 2005). Therefore, NR2F2 expression in the postnatal mouse inner
ear was examined using the same antibody that was used in the postnatal rat to investigate
whether the observed difference in NR2F2 expression was due to variation between species,
different antibody/protocol sensitivity or dynamic variation in expression. P0 mouse
cochleas were dissected and fixed as for previous immunofluorescence experiments.
HSC

4 Characterisation of the interaction of POU4F3 with the Nr2f2 promoter 140
However, the organ of Corti and crista ampullaris were immunolabelled as whole mount
preparations instead of cryosections. In the organ of Corti, NR2F2 expression was found in
the apex (Figure 4.6) where it was most clearly seen in the Hensen cell nuclei. In contrast
to the organ of Corti, NR2F2 expression was seen in hair cells in the P0 mouse crista
ampullaris as well as other cells in the ampulla (Figure 4.7). This is the first report of
NR2F2 expression in vestibular hair cells.
Figure 4.6. NR2F2 expression in the postnatal mouse cochlear apex. i) An optical section of the whole-mount apical P0 mouse organ of Corti at the level of the hair cell nuclei. NR2F2 was very weakly expressed in the hair cell nuclei, but clearly expressed in the adjacent Hensen cell nuclei in the two animals examined. a) Phalloidin, b) anti-NR2F2 rabbit IgG, c) DAPI, d) Merge. ii) Orthogonal view. IHC, inner hair cell; OHC, outer hair cell. Red, phalloidin; green, anti-NR2F2 rabbit IgG; blue, DAPI. NB, hair bundles are flattened due to the coverslip placed on the tissue.
i)
ii)
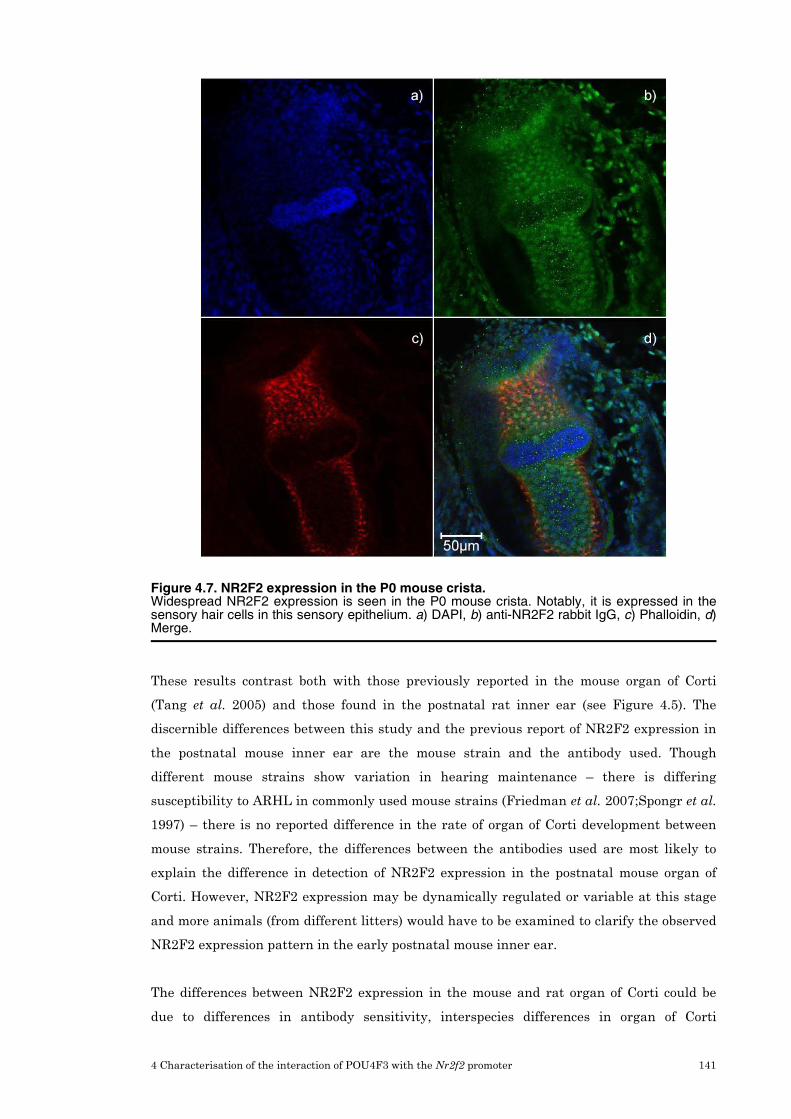
4 Characterisation of the interaction of POU4F3 with the Nr2f2 promoter 141
Figure 4.7. NR2F2 expression in the P0 mouse crista. Widespread NR2F2 expression is seen in the P0 mouse crista. Notably, it is expressed in the sensory hair cells in this sensory epithelium. a) DAPI, b) anti-NR2F2 rabbit IgG, c) Phalloidin, d) Merge.
These results contrast both with those previously reported in the mouse organ of Corti
(Tang et al. 2005) and those found in the postnatal rat inner ear (see Figure 4.5). The
discernible differences between this study and the previous report of NR2F2 expression in
the postnatal mouse inner ear are the mouse strain and the antibody used. Though
different mouse strains show variation in hearing maintenance – there is differing
susceptibility to ARHL in commonly used mouse strains (Friedman et al. 2007;Spongr et al.
1997) – there is no reported difference in the rate of organ of Corti development between
mouse strains. Therefore, the differences between the antibodies used are most likely to
explain the difference in detection of NR2F2 expression in the postnatal mouse organ of
Corti. However, NR2F2 expression may be dynamically regulated or variable at this stage
and more animals (from different litters) would have to be examined to clarify the observed
NR2F2 expression pattern in the early postnatal mouse inner ear.
The differences between NR2F2 expression in the mouse and rat organ of Corti could be
due to differences in antibody sensitivity, interspecies differences in organ of Corti

4 Characterisation of the interaction of POU4F3 with the Nr2f2 promoter 142
development or true differences in NR2F2 expression between the two species. Though rat
and mouse NR2F2 differ by a single residue that is within the region to which the antibody
was raised, this is unlikely to explain the difference in rat and mouse expression patterns
(Tang et al. 2005). This is because labelling of NR2F2 expression in the developing rat
cochlea matches that previously reported in the mouse. Furthermore, the antibody used
recognises a single band of identical molecular weight to that found in UB/OC-2 cells when
used in western blot analysis of a neuronal cell line which is a hybrid of rat and mouse cells,
ND7 (data not shown).
Rat and mouse gestation periods vary (approximately 21 days for mice and up to 24 days
for rats), and the inner ears of mice and rats consequently mature at different rates. The
difference seen between the mice and rats investigated may therefore be explicable by this
developmental difference and NR2F2 expression would have to be investigated with
markers of hair cell development (e.g. prestin) to account for these differences (Bryant et al.
2005). Also, investigations of rat inner ears at later stages than those reported may help
explain if the differences seen are due to slower rat development. Such analyses would help
identify whether the differences seen are due to a true difference in the expression of
NR2F2 in the developmental organ of Corti between mice and rats.
In summary, it appears that NR2F2 is expressed in developing hair cells and that its
expression in hair cell nuclei falls as hair cells mature from base to apex in the late
embryonic (mouse) or early postnatal (rat) organ of Corti. NR2F2 expression therefore
declines despite reported rises and maintenance of POU4F3 expression in hair cells in the
same period (Hertzano et al. 2007;Ryan 1997). Furthermore, NR2F2 expression in the hair
cells of the crista ampullaris (which also express POU4F3) appears to be maintained to
later stages than in cochlear hair cells (Xiang et al. 1998). It is, therefore, possible that
POU4F3 influences activation of the Nr2f2 promoter in developing hair cells (when their
expression overlaps), as suggested by the subtractive hybridization screen. POU4F3 may be
one of a number of transcription factors acting at the Nr2f2 promoter in developing hair
cells whose combined action and interaction determine the rate of Nr2f2 transcription.
Furthermore, the embryonic NR2F2 expression pattern seen combined with the known
functions of NR2F2 (see section 4.4) suggest a potential role for NR2F2 in cochlear
organogenesis. Therefore, Nr2f2 was further pursued as a candidate target of POU4F3 and
the effect of POU4F3 on the Nr2f2 promoter was investigated in order to identify whether
POU4F3 has a direct effect on Nr2f2 transcription and in order to verify that Nr2f2 is
upregulated by POU4F3, as suggested by the subtractive hybridization results.

4 Characterisation of the interaction of POU4F3 with the Nr2f2 promoter 143
4.8 Does POU4F3 directly activate the Nr2f2
promoter? Several Nr2f2 regulatory elements have been identified, ranging from distal enhancer
regions to proximal transcription factor binding sites. Of these sites, a number are
responsive to members of signalling cascades with which NR2F2 has been shown to interact
i.e. the retinoic acid, notch and hedgehog pathways (see sections 4.4). The schematic
diagram in Figure 4.8 shows the regions and factors that have been shown to affect Nr2f2
regulation. Of these, four have been shown to interact with the Nr2f2 promoter – Notch
(Diez et al. 2007), retinoic acid (RA) (Qiu et al. 1996), sonic hedgehog (Shh) (Krishnan et al.
1997) and the E26 transformation-specific family member, Ets-1 (Petit et al. 2004) – though
the interaction of POU4F3 with this promoter has not previously been assessed.
As the subtractive hybridization screen suggests that Nr2f2 is upregulated by POU4F3, the
mechanism of this potential interaction was investigated to identify if POU4F3 might
produce an increase in Nr2f2 expression by a direct or indirect mechanism. A direct
interaction would require POU4F3 binding to transcription factor binding sites in the Nr2f2
promoter and mediating an increase in the rate of Nr2f2 transcription. An indirect
mechanism would require POU4F3 to regulate a different target gene that would
subsequently interact directly with the Nr2f2 gene promoter.
Figure 4.8. Schematic representation of Nr2f2 regulation. Schematic of the factors that influence human and mouse Nr2f2 transcription and the sites at which they act. RA, retinoic acid; pink box, 571bp liver enhancer region at -66kb to the Nr2f2 transcriptional start site (TSS); blue box, Shh response element (TACATAATGCGCCG) at -1661bp to -1648bp which confers upregulation by Shh on the Nr2f2 promoter; yellow boxes, two inverted Ets protein consensus sequences (TTCC) which confer upregulation by Ets-1; purple box, Nr2f2 5’ UTR; orange box, Nr2f2 exon 1. Inhibition of the MAP kinase pathway represses NR2F2 expression (and vice-versa) whilst treatment with EGF or TGFα increases NR2F2 expression, though the sites of these regulatory actions are unknown (not shown) (Baroukh et al. 2005;Diez et al. 2007;Krishnan et al. 1997;More et al. 2003;Petit et al. 2004;Qiu et al. 1996).
RA(9cis) upregulatory region
ATG
-66kb -10kb -1.5kb +1bp +264bp
Notch signalling downregulatory region

4 Characterisation of the interaction of POU4F3 with the Nr2f2 promoter 144
4.8.1 EMSA Oligonucleotide Design
In order to identify whether POU4F3’s putative activation of the Nr2f2 promoter is direct,
possible POU4F3 binding sites in this promoter would need to be identified and POU4F3’s
ability to bind these sites and activate transcription would have to be tested. Bioinformatic
software was therefore used to predict potential POU4F3 binding sites in the Nr2f2
5’flanking region.
Nr2f2 promoter prediction
Prior to using software to identify potential POU4F3 binding sites, the Nr2f2 gene
promoter region first had to be predicted. The Genomatix Gene2Promoter software was
selected for this purpose as explained in section 3.5.1. This analysis was carried out using
the mouse database as promoter reporter constructs that I intended to use in subsequent
experiments were cloned from this species (see section 4.9 for these experiments).
The software revealed six putative promoters for Nr2f2. All six of these promoters
corresponded to one or more than one transcript whose 5’ region had been fully sequenced
i.e. oligo-capping had been used in order to clone the 5’ end of transcript, thereby
identifying the transcriptional start site and improving the promoter prediction. I selected
the most appropriate Nr2f2 promoter by identifying which Genomatix transcript best
corresponded to the Nr2f2 transcript identified by the BLAST analysis (Figure 4.9a). The
transcript identified in the BLAST analysis comprised three exons and this gene structure
is supported by data in the UniProtKB/Swiss-Prot or RefSeq databases (Ensembl 2009).
Figure 4.9b shows that two promoters (GXP_158557 and GXP_158616) correspond to a
three-exon transcript, however, only the transcript corresponding to GXP_158616 has full 5’
region sequencing (i.e. its transcriptional start site had been verified experimentally). This
promoter was therefore selected as the most appropriate promoter for further analysis (see
section 3.5.1 for more detail on promoter selection criteria).
Prediction of POU4F3 binding sites in the predicted Nr2f2 promoter
The selected predicted Nr2f2 promoter was analysed using the MatInspector and
ModelInspector programs to identify putative POU4F3 binding sites and modules
respectively. As the DNA recognition of POU proteins has been shown to be similar (Rhee et
al. 1998), all predicted binding sites of the ‘Brn’ sub-class of POU domain factors in the
Genomatix software were considered for further analysis (see Andersen et al. 2001).
Putative binding sites with the highest stringency predictions, i.e. the greatest similarity to
known binding sites, were selected for in vitro assay of POU4F3’s ability to bind them by
electrophoretic mobility shift assay (EMSA).
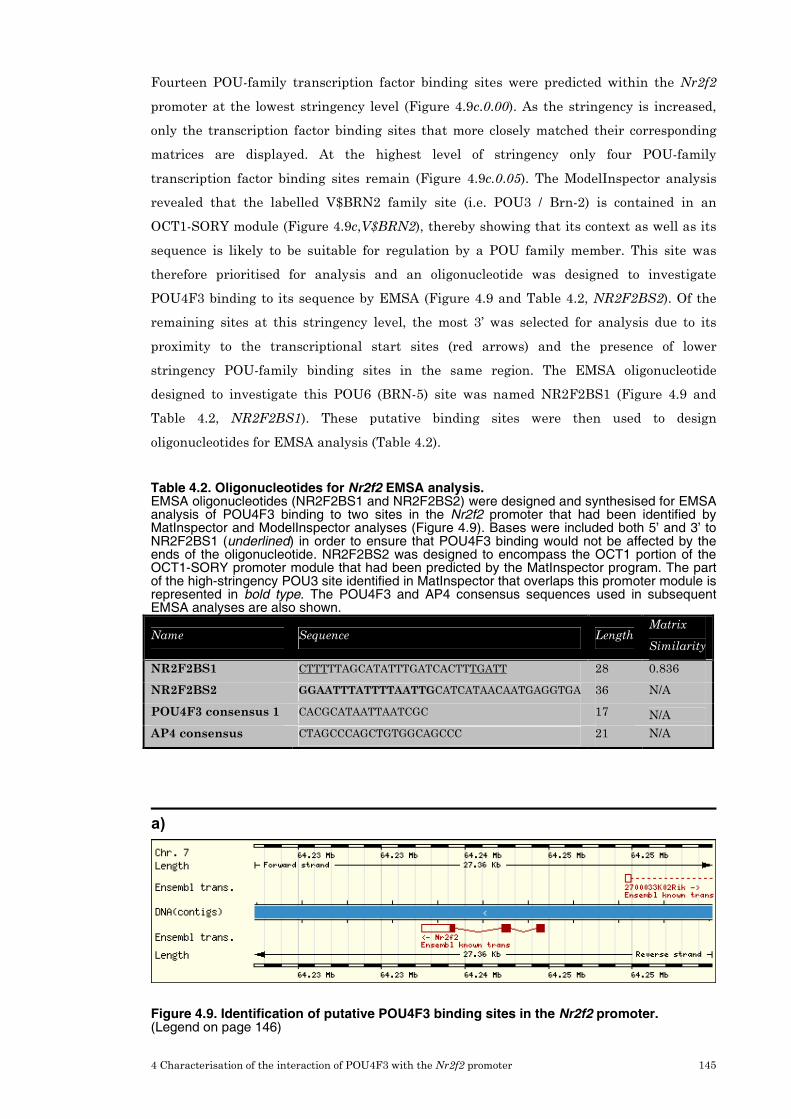
4 Characterisation of the interaction of POU4F3 with the Nr2f2 promoter 145
Fourteen POU-family transcription factor binding sites were predicted within the Nr2f2
promoter at the lowest stringency level (Figure 4.9c.0.00). As the stringency is increased,
only the transcription factor binding sites that more closely matched their corresponding
matrices are displayed. At the highest level of stringency only four POU-family
transcription factor binding sites remain (Figure 4.9c.0.05). The ModelInspector analysis
revealed that the labelled V$BRN2 family site (i.e. POU3 / Brn-2) is contained in an
OCT1-SORY module (Figure 4.9c,V$BRN2), thereby showing that its context as well as its
sequence is likely to be suitable for regulation by a POU family member. This site was
therefore prioritised for analysis and an oligonucleotide was designed to investigate
POU4F3 binding to its sequence by EMSA (Figure 4.9 and Table 4.2, NR2F2BS2). Of the
remaining sites at this stringency level, the most 3’ was selected for analysis due to its
proximity to the transcriptional start sites (red arrows) and the presence of lower
stringency POU-family binding sites in the same region. The EMSA oligonucleotide
designed to investigate this POU6 (BRN-5) site was named NR2F2BS1 (Figure 4.9 and
Table 4.2, NR2F2BS1). These putative binding sites were then used to design
oligonucleotides for EMSA analysis (Table 4.2).
Table 4.2. Oligonucleotides for Nr2f2 EMSA analysis. EMSA oligonucleotides (NR2F2BS1 and NR2F2BS2) were designed and synthesised for EMSA analysis of POU4F3 binding to two sites in the Nr2f2 promoter that had been identified by MatInspector and ModelInspector analyses (Figure 4.9). Bases were included both 5’ and 3’ to NR2F2BS1 (underlined) in order to ensure that POU4F3 binding would not be affected by the ends of the oligonucleotide. NR2F2BS2 was designed to encompass the OCT1 portion of the OCT1-SORY promoter module that had been predicted by the MatInspector program. The part of the high-stringency POU3 site identified in MatInspector that overlaps this promoter module is represented in bold type. The POU4F3 and AP4 consensus sequences used in subsequent EMSA analyses are also shown.
Name Sequence Length Matrix
Similarity
NR2F2BS1 CTTTTTAGCATATTTGATCACTTTGATT 28 0.836
NR2F2BS2 GGAATTTATTTTAATTGCATCATAACAATGAGGTGA 36 N/A
POU4F3 consensus 1 CACGCATAATTAATCGC 17 N/A
AP4 consensus CTAGCCCAGCTGTGGCAGCCC 21 N/A
Figure 4.9. Identification of putative POU4F3 binding sites in the Nr2f2 promoter. (Legend on page 146)
a)

4 C
hara
cteri
sati
on
of
the i
nte
ract
ion
of
PO
U4F
3 w
ith
th
e Nr2f2
pro
mote
r 146
b)
c)
Fig
ure
4.9
. Id
en
tifi
cati
on
of
pu
tati
ve P
OU
4F
3
bin
din
g s
ites in
th
e N
r2f2
pro
mo
ter.
a)
Gra
phic
al re
pre
senta
tio
n o
f th
e N
r2f2
ge
ne in
th
e E
nsem
bl
gen
om
e bro
wser.
T
his
tr
anscrip
t w
as i
de
ntifie
d b
ase
d o
n e
xperim
enta
l d
ata
an
d
was t
here
fore
use
d t
o v
eri
fyin
g t
he a
ccura
cy o
f tr
anscripts
ann
ota
ted
in
the
corr
espon
din
g
Genom
atix
da
tab
ase.
b)
The
pre
dic
ted
Nr2
f2
pro
mote
r th
at
corr
espo
nd
ed
to
the
tra
nscript
that
best-
matc
hed t
he
Ensem
bl N
r2f2
tra
nscript
was s
ele
cte
d (
arr
ow
head)
based
on
both
exon
num
ber
(thre
e)
an
d q
ualit
y of
pre
dic
tion (g
old
colo
ur)
. c)
PO
U-f
am
ily
transcription
facto
r bin
din
g s
ites w
ere
pre
dic
ted in t
he M
atInsp
ecto
r pro
gra
m.
Red
box,
SO
RY
-OC
T1
mo
du
le
ide
ntifie
d
by
Mod
elInspe
cto
r softw
are
. B
lue
boxes,
PO
U4 b
indin
g s
ites p
rioritised
for
EM
SA
ana
lysis
based o
n m
atr
ix s
imila
rity
, pro
xim
ity t
o
the
transcription
al
sta
rt
site
and
supp
ort
ing
evid
ence
from
M
atInspecto
r and
M
ode
lInspecto
r (s
ee
section
4.8
.1).

4 Characterisation of the interaction of POU4F3 with the Nr2f2 promoter 147
4.8.2 In vitro translated POU4F3 is able to bind to two sites in the Nr2f2 promoter
In the EMSA, the ability of POU4F3 to bind the two oligonucleotides designed against two
sites in a predicted Nr2f2 promoter was tested. As binding to target gene promoters
appears to be a prerequisite step for their activation by POU4F3 (Sud et al. 2005), binding
of NR2F2BS1 and NR2F2BS2 by POU4F3 would support the hypothesis that POU4F3
directly activates the Nr2f2 promoter.
1ng of radiolabelled NR2F2BS1 (Figure 4.10a) or NR2F2BS2 (Figure 4.10b) was either
incubated alone or with 5µl in vitro translated protein (POU4F3 or luciferase) at room
temperature for 30 minutes. The proteins had been in vitro translated using the TNT®T7
Coupled Reticulocyte Lysate System (Promega). Samples were then electrophoresed on a
4% non-denaturing polyacrylamide gel at 200 volts at 4ºC for two hours. The gel was dried
and autoradiographed at -80ºC for varying exposures (typically 16-24 hours). Protein
binding is identifiable as shifted bands (bandshifts) in protein-containing sample lanes.
This is due to the protein-oligonucleotide complex having higher molecular weight than
oligonucleotide alone and therefore having slowed migration through the gel on
electrophoresis.
Figure 4.10 shows binding of in vitro translated mouse POU4F3 protein to the putative
Nr2f2 promoter binding sites (NR2F2BS1 and NR2F2BS2). Bandshifts present in both
protein-containing lanes were due to non-specific oligonucleotide binding of translated
proteins or proteins present in the reticulocyte lysate. However, for both putative binding
sites, a bandshift was identified in the in vitro translated POU4F3 lane that was not
present in the control lanes (arrowheads, Figure 4.10). This demonstrates that in vitro
translated POU4F3 is able to bind to both of the sites identified from the Nr2f2 promoter.
Though these results suggest that POU4F3 is capable of binding the oligonucleotides, the
assay does not show whether the binding is sequence-specific and the in vitro translated
protein (that was produced using a rabbit reticulocyte lysate system) may demonstrate
different binding from POU4F3 translated in UB/OC-2 cells due to different post-
translational modifications. Therefore, the sequence-specificity of this interaction was
further investigated using protein that had been extracted from UB/OC-2 cells.

4 Characterisation of the interaction of POU4F3 with the Nr2f2 promoter 148
Figure 4.10. Binding of in vitro translated POU4F3 to transcription factor binding sites. EMSAs were carried out using [γ-32P]ATP labelled DNA oligonucleotides which corresponded to two predicted POU-family binding sites in the Nr2f2 gene promoter: NR2F2BS1 (a) and NR2F2BS2 (b). The binding sites were incubated without protein, with in vitro translated POU4F3 or with in vitro translated luciferase protein. Arrowheads indicate a POU4F3-specific binding pattern.
a) b)
POU4F
3
No
prot
ein
Lucife
rase
POU4F
3
No
prot
ein
Lucife
rase

4 Characterisation of the interaction of POU4F3 with the Nr2f2 promoter 149
4.8.3 POU4F3 protein from UB/OC-2 cell nuclear protein extract demonstrates sequence-specific binding to NR2F2BS1 & 2
Nuclear protein extract prepared from UB/OC-2 cells was used to determine whether
POU4F3 binding to NR2F2BS1 & 2 is sequence-specific. UB/OC-2 cells were chosen as they
express POU4F3 but do not express POU4F1 or POU4F2 (Rivolta et al. 1998a).
Furthermore, the DNA-binding properties of POU4F3 extracted from these cells should
better reflect its physiological function than in vitro translated POU4F3 as it is more likely
to have appropriate post-translational modifications that may be required for physiological
DNA binding. As the nuclear protein extract contains proteins other than POU4F3, some of
which will bind DNA, POU4F3-specific bandshifts must be identified amongst bandshifts
produced by other proteins. Two methods are commonly used to identify protein-specific
bandshifts: supershift analysis and competition analysis. As no suitable anti-POU4F3
antibody is available for supershift analysis, competition analysis was the most appropriate
of the available methods for this analysis. Therefore, a competition analysis was conducted
in order to identify if any of the bandshifts that are produced by UB/OC-2 cell nuclear
extract are due to POU4F3.
In this analysis, an increasing amount of a non-radiolabelled oligonucleotide that is known
to be bound by POU4F3 (cold POU4F3 consensus, Figure 4.11a&b) was added to EMSA
reactions. As the unlabelled DNA will compete with the radiolabelled putative Nr2f2
promoter binding sites for POU4F3 binding, an excess of non-radiolabelled consensus
oligonucleotide will ensure that POU4F3 will not bind enough radiolabelled DNA to be
visible on autoradiography. Therefore, bandshifts produced by POU4F3 are abolished by
sufficient non-radiolabelled consensus oligonucleotide. This also abolishes bandshifts
produced by non-sequence-specific DNA-binding proteins; therefore, a negative control was
conducted for the competition analysis to identify sequence-specificity of POU4F3 binding.
For this control, a 1000-fold excess of unlabelled consensus oligonucleotide for a different
transcription factor (AP4) was added to a separate EMSA reaction. Bandshifts caused by
non-specific DNA-binding proteins become invisible to autoradiography in this condition as
an excess of non-radiolabelled AP4 consensus sequence displaces the radiolabelled
oligonucleotides from the non-specific DNA-binding protein. POU4F3, however, does not
bind to the AP4 consensus oligonucleotide (as shown by previous experiments in our
laboratory), resulting in a persistent bandshift (cold AP4 consensus lane, Figure 4.11).

4 Characterisation of the interaction of POU4F3 with the Nr2f2 promoter 150
Figure 4.11. Binding of POU4F3 to Nr2f2 promoter binding sites. EMSAs were carried out using [γ-32P]ATP labelled NR2F2BS1 and NR2F2BS2. a) NR2F2BS1 was incubated with or without UB/OC-2 cell nuclear extract and with varying amounts of non-radiolabelled POU4F3 or AP4 consensus binding site. The same assay was conducted for the second putative binding site, NR2F2BS2 (b). For both oligonucleotides, POU4F3-specific banding patterns (i.e. bandshifts that are competed for by specific POU4F3 consensus sequence but not by non-specific AP4 consensus sequence) were identified (B1 in both cases) along with non-specific bands and complexes. B, bandshift; C, complex.
a) b)
C1
C2
B1
C1
B1
B2
B3

4 Characterisation of the interaction of POU4F3 with the Nr2f2 promoter 151
On autoradiography, bandshifts were seen for NR2F2BS1 with UB/OC-2 cell nuclear
protein extract (Figure 4.11a). The banding pattern shows a slow-migrating band (Figure
4.11a.B1) and two complexes of faster migration (Figure 4.11a.C1&C2). On competition
with unlabelled POU4F3 consensus oligonucleotide, B1 was abolished by 100-fold excess of
unlabelled POU4F3 consensus sequence and a 1000-fold excess of this oligonucleotide
attenuated C1 and C2 density (cold POU4F3 consensus, Figure 4.11a). In competition with
1000-fold unlabelled AP4 consensus sequence (cold AP4 consensus, Figure 4.11a), B1, C1
and C2 are restored. This pattern shows that the B1 bandshift is specifically produced by
POU4F3 as it is only eliminated by specific competition. It also shows that C1 and C2 are
likely to be produced by POU4F3 binding, however their competition by unlabelled
POU4F3 consensus oligonucleotide is not as clear as that of B1 (Figure 4.11a).
As with NR2F2BS1, bandshifts were seen for NR2F2BS2 on EMSA analysis with UB/OC2
cell nuclear protein extract (Figure 4.11b). A slow-migrating band (Figure 4.11b.B1), a
doublet (Figure 4.11b.B2&B3) and a fast-migrating complex were visible on the
autoradiograph (Figure 4.11b.C1). Of these bandshifts, B2 and B3 and were only slightly
reduced by maximum unlabelled POU4F3 consensus competition (cold POU4F3 consensus,
Figure 4.11b.B2,B3&C1), indicating that these bandshifts are unlikely to be due to
POU4F3. B1, however, was markedly reduced by 500-fold POU4F3 consensus competition,
abolished by 1000-fold POU4F3 consensus competition and fully restored on 1000-fold AP4
consensus competition. Similarly, C1 appears to be reduced by 1000-fold POU4F3
consensus competition and restored on 100-fold AP4 consensus competition. This pattern
indicates that B1 and C1 are produced by POU4F3 (Figure 4.11b). On comparison of Figure
4.11a and Figure 4.11b, POU4F3 appears to have a higher affinity for NR2F2BS2 than
NR2F2BS1 as more competition is required to abolish visible binding to this site (1000-fold
cold consensus sequence for NR2F2BS2 compared to 500-fold for NR2F2BS1). This is
consistent with the similarity of the binding sites to their respective matrices in the
bioinformatic analysis (0.980 matrix similarity for NR2F2BS2 to a POU3 matrix and 0.836
matrix similarity for NR2F2BS1 to a POU6 matrix, see section 4.8.1).
The above competition assay shows that murine POU4F3 extracted from UB/OC-2 cells is
able to bind NR2F2BS1 and NR2F2BS2 oligonucleotides in vitro. When considered with the
binding of in vitro translated POU4F3 to these oligonucleotides (Figure 4.10), this evidence
suggests that POU4F3 may be able to bind these sites in the context of the full Nr2f2 gene
promoter in vivo. Given this evidence of a direct interaction between POU4F3 and Nr2f2,
the transcriptional regulation of the Nr2f2 gene promoter by POU4F3 was investigated to
identify whether POU4F3 is able to directly upregulate the Nr2f2 gene as the subtractive
hybridization suggests.

4 Characterisation of the interaction of POU4F3 with the Nr2f2 promoter 152
4.9 Transcriptional regulation of the Nr2f2 5’ flanking
region by POU4F3 The ability of POU4F3 to activate the Nr2f2 promoter was investigated to verify the
upregulation suggested by the subtractive hybridization and, if verified, provide evidence
for direct interaction between POU4F3 and the Nr2f2 promoter.
4.9.1 Investigation of Nr2f2 5’ flanking sequence response to POU4F3
Plasmids containing Nr2f2 5’ flanking sequences upstream of the firefly (photinus pyralis)
luciferase gene were used in cotransfections with varying amounts of Pou4f3 expression
construct (in the pSi expression vector). Empty pSi vector was used to keep the total
amount of transfected DNA constant and pRL-null, a promoter-less luciferase construct
which produces sea pansy (renilla reniformis) luciferase, was included in cotransfections to
correct for differing transfection efficiencies between replicates. The Promega Dual
Luciferase and DualGlo kits were used to assay firefly and sea pansy luciferase production.
Two Nr2f2 5’ flanking region constructs were obtained from collaborators. A 4kb luciferase
reporter construct containing the sequence from approximately -180bp to the Nr2f2
transcriptional start site to approximately -4.2kb was received from Dr M Vasseur-Cognet
and designated NR2F2p4kb (Figure 4.12a). The other construct, designated NR2F2p1.6kb
(Figure 4.12b), was received from Dr S Tsai and contained 1.6kb of sequence from
approximately -234bp to approximately -1.8kb. These constructs are occasionally referred to
as promoters for convenience though they have not been shown to act as full length Nr2f2
promoters. Both constructs were investigated by cotransfections with POU4F3 expression
constructs in UB/OC-2, ND7 and BHK cells. Calcium phosphate precipitation was used for
these and subsequent transfections as it provided sufficient luciferase expression for this
assay and was more cost-effective than liposome-based and related systems (e.g.
Lipofectamine (Invitrogen) and FuGENE (Roche)). Though an approximately two-fold
activation was seen in UB/OC-2 cells, the presence and magnitude of this response varied
between experiments (data not shown). This may have been due to endogenous UB/OC-2
cell POU4F3 expression which leads to increased baseline promoter construct upregulation
that masks the effect of the cotransfected POU4F3 expression construct. Alternatively,
dynamic POU4F3 expression and post-translational modification or cofactors that regulate
the NR2F2p4kb construct in response to different cell states could produce this variability.
Of the three cell types tested, UB/OC-2 cells should, in theory, provide the most appropriate
transcriptional environment in which to examine POU4F3 regulation of target genes due to
their expression of hair cell markers (Rivolta et al. 1998a). However, the variability of
NR2F2p4kb response to POU4F3 seen in these cells would make it hard to obtain
meaningful results without accounting for this variability, thereby making UB/OC-2 cells
unsuitable for further study of this relationship.

4 Characterisation of the interaction of POU4F3 with the Nr2f2 promoter 153
In both BHK and ND7 cells, both NR2F2p1.6kb and NR2F2p4kb are activated by POU4F3
(Figure 4.13). In BHK cells (Figure 4.13a), NR2F2p1.6kb showed a greater response than
NR2F2p4kb: 5.2-fold and 3.2-fold respectively. In ND7 cells, the response was more even,
with both promoters responding approximately equally: NR2F2p4kb 3.6-fold and
NR2F2p1.6kb 3.3-fold. These results support the hypothesis that POU4F3 activates Nr2f2
and that this activation is produced by a direct mechanism.
The difference in responses between promoters is attributable to their different lengths and,
therefore, the transcription factor binding sites present i.e. the difference in response seen
in BHK cells (Figure 4.13a) is likely to be due to negative regulatory elements that are
present in NR2F2p4kb and not in NR2F2p1.6kb. Differential response between cell types,
however, is due to the complex integration of the multiple cell-specific factors that influence
POU4F3 transcription, Nr2f2 promoter upregulation and luciferase translation in the assay.
Though NR2F2p1.6kb showed a greater response than NR2F2p4kb in BHK cells, the latter
promoter was selected for further investigation. This was because NR2F2p1.6kb only
included NR2F2BS1 in its sequence whereas NR2F2p4kb contained both NR2F2BS1 and
NR2F2BS2 (see Figure 4.12), thereby allowing further investigation of these sites.
Subsequent transfections used ND7 cells as the selected promoter showed a greater
response in these cells than in BHK cells and as variability of the response seen in
UB/OC-2 cells could confound future results.
Figure 4.12. Schematic of Nr2f2 5’ flanking region reporter constructs. Schematics of NR2F2p4kb (a) and NR2F2p1.6kb (b) showing the location of NR2F2BS1 and NR2F2BS2. All values are given relative to the Nr2f2 transcriptional start site in the Ensembl database (Ensembl 2008b).

4 Characterisation of the interaction of POU4F3 with the Nr2f2 promoter 154
Figure 4.13. Nr2f2 promoter regulation by POU4F3 in BHK and ND7 cells. a) In BHK cells NR2F2p4kb shows an approximately three-fold upregulation when cotransfected with a POU4F3 expression construct whereas NR2F2p1.6kb shows an approximately five-fold upregulation. b) In ND7 cells, the two promoter constructs show a similar upregulation of greater than three-fold. Luc, firefly (photinus pyralis) luciferase cDNA.
a)
b)

4 Characterisation of the interaction of POU4F3 with the Nr2f2 promoter 155
4.9.2 Characterisation of the POU4F3 activation of NR2F2p4kb
The activation of NR2F2p4kb by POU4F3 was further characterised in order to identify
whether this response is dose-dependant (a characteristic of direct interactions between
transcription factors and promoters). A control experiment was also carried out to ensure
that the POU4F3 response seen was not artefactual and previous experiments in our
laboratory showed that the pGl-3 Basic vector into which NR2F2p4kb was cloned does not
respond to pSi-Pou4f3.
ND7 cells were transfected with NR2F2p4kb as in previous experiments (section 4.9.1),
however, the amount of POU4F3 expression construct was varied (Figure 4.14a). In order to
verify that any observed upregulation of luciferase production was due to POU4F3 acting
through its normal regulatory mechanisms and not due to a non-specific upregulation of
NR2F2p4kb caused by increased protein production, a control was performed using a
version of the POU4F3 cDNA (named dreidel) that contains a dinucleotide TG deletion
(Courtesy of Dr Karen Avraham). The deletion is reported at 388del2 (Hertzano et al. 2004),
though I located it at c.390_391delTG in the Ensembl sequence. This mutation arose
spontaneously in mice and renders the transcription factor non-functional, causing
deafness (Hertzano et al. 2004). Dreidel cDNA was first cloned from the pHM6 vector in
which it was received into the pSi vector for comparability with the pSi-Pou4f3 construct.
Subsequently, it was used in transfections as for pSi-Pou4f3 (Figure 4.14b).
Figure 4.14a shows that increasing the amount of pSi-Pou4f3 that was included in each
transfection resulted in an increase in the averaged adjusted relative luciferase values
measured, presumably due to the increasing amount of POU4F3 protein acting directly on
the Nr2f2 promoter to increase the rate of luciferase transcription. In the condition
containing the largest amount of pSi-Pou4f3 expression construct (Figure 4.14a 3000ng pSi-
Pou4f3) an upregulation of greater than five-fold was seen. The dreidel protein did not
produce such an upregulation (Figure 4.14b) as it was only able to produce an
approximately 1.5-fold increase in measured relative luciferase values in the condition
containing the largest amount of pSi-Dreidel (Figure 4.14b 3000ng pSi-Dreidel). These
results demonstrate that functional POU4F3 is required in these experiments to upregulate
the Nr2f2 promoter in a dose-dependent fashion, presumably via a direct interaction with
the Nr2f2 promoter, potentially at the binding sites identified in previous EMSA assays
(section 4.8).

4 Characterisation of the interaction of POU4F3 with the Nr2f2 promoter 156
Figure 4.14. NR2F2p4kb dose response to cotransfected POU4F3 expression construct. ND7 cells were transfected with NR2F2p4kb and increasing amounts of expression construct. 10ng pRL-null was included in all conditions and the total amount of DNA was regulated with pSi mammalian expression vector (Promega) (see Figure 2.4). a) Increasing amounts of POU4F3 correlate with a dose-dependent increase in luciferase production. POU4F3 expression construct that contains the dreidel dinucleotide deletion (b) does not produce such an upregulation. SV40e, SV40 enhancer / early promoter; and SV40l, SV40 late poly(A) in the pSi mammalian expression vector.

4 Characterisation of the interaction of POU4F3 with the Nr2f2 promoter 157
4.9.3 Investigation of the transcriptional effect of POU4F3 on two experimentally verified binding sites in the Nr2f2 promoter
In order to confirm that NR2F2p4kb is directly regulated by POU4F3, the sites at which
POU4F3 produces its activation would need to be identified. NR2F2BS1&2 were found to
be bound by POU4F3 by EMSA and were, therefore, the most likely sites of POU4F3
regulation of NR2F2p4kb (section 4.8.1). In order to investigate if NR2F2p4kb is regulated
by POU4F3 at NR2F2BS1&2, I first investigated the potential of POU4F3 to regulate the
EMSA oligonucleotides in isolation i.e. out of the context of their promoter. Regulation of
these isolated binding sites by POU4F3 would support the hypothesis that they are the
sites of POU4F3 regulation in NR2F2p4kb.
NR2F2BS1 and NR2F2BS2 were cloned upstream of a minimal TATA promoter in the
pGL4.23 vector 5’ to the sequence for the synthetic photinus pyralis luciferase gene, luc2.
This luciferase coding sequence has been codon-optimised for mammalian expression and,
as for the rest of the plasmid, consensus mammalian transcription factor binding sites had
been removed where possible in order to reduce background regulation. The number of
copies of the binding sites that had been inserted into different clones were assessed by
restriction endonuclease digestion followed by size separation of inserts by agarose gel
electrophoresis. Plasmids that contained different copy numbers were obtained. NR2F2BS1
clones that contained one, two, three and five copies of the EMSA oligonucleotide were
identified. One, two, three and four copy-number plasmids were obtained for NR2F2BS2.
Each site was assayed in cotransfections with pSi or pSi-Pou4f3 and pRL-null in order to
assess whether NR2F2BS1&2 confer POU4F3 regulation onto the luciferase gene in the
reporter constructs used. This would show whether POU4F3 can upregulate luciferase
expression via these sites (as expected based on its action on the Nr2f2 promoter in
NR2F2p4kb (section 4.9.2)) and, if no regulation was seen, might suggest that other sites or
non-protein-DNA interactions might produce the observed upregulation of the Nr2f2
promoter. pSi-Dreidel transfections were also carried out for each plasmid that contained
one copy of the binding site in order to demonstrate whether any identified regulatory effect
required functional POU4F3. Previous experiments in our laboratory had demonstrated
that luc2 production from the native pGL-4.23 vector is not influenced by POU4F3, thereby
ruling out regulation of the base vector.

4 Characterisation of the interaction of POU4F3 with the Nr2f2 promoter 158
Figure 4.15. Upregulation of pGL4.23-NR2F2BS1 by POU4F3 in ND7 cells. Reporter constructs were cloned that contained varying copy numbers of NR2F2BS1 or NR2F2BS2 upstream of a synthetic luciferase coding sequence with a minimal TATA promoter. 100ng of each reporter construct was cotransfected with 10ng pRL-null and 3µg of a POU4F3 expression construct in ND7 cells. The plasmid that contained a single copy of the binding site (a) was also assayed with dreidel mutant POU4F3 expression construct. All four constructs (a-d) showed a 1.6- to 1.8-fold upregulation in the presence of POU4F3. The effect was dependent on functional POU4F3 protein as dreidel mutant POU4F3 did not upregulate luciferase production in pGL4.23-NR2F2BS1-1x. a, pGL4.23-NR2F2BS1-1x; b, pGL4.23-NR2F2BS1-2x; c, pGL4.23-NR2F2BS1-3x; d, pGL4.23-NR2F2BS1-5x.
a) b)
c) d)
pGL4.23-NR2F2BS1-1x pGL4.23-NR2F2BS1-2x
pGL4.23-NR2F2BS1-3x pGL4.23-NR2F2BS1-5x

4 Characterisation of the interaction of POU4F3 with the Nr2f2 promoter 159
Figure 4.16. Upregulation of pGL4.23-NR2F2BS2 by POU4F3 in ND7 cells. As for NR2F2BS1, 100ng of plasmid constructs containing a synthetic luciferase coding sequence under the transcriptional regulation of a minimal TATA promoter and a varying copy number of NR2F2BS2 was cotransfected with 10ng pRL-null and a POU4F3 expression construct. All four constructs showed a 1.4- to 2-fold upregulation in the presence of POU4F3. The plasmid that contained a single copy of the binding site was also assayed with dreidel mutant POU4F3 expression construct and this showed that the effect of POU4F3 on this binding site was dependent on functional protein as the mutant POU4F3 did not upregulate luciferase production in pGL4.23-NR2F2BS2-1x (a). a, pGL4.23-NR2F2BS2-1x; b, pGL4.23-NR2F2BS2-2x; c, pGL4.23-NR2F2BS2-3x; d, pGL4.23-NR2F2BS2-4x.
a) b)
c) d)
pGL4.23-NR2F2BS2-1x pGL4.23-NR2F2BS2-2x
pGL4.23-NR2F2BS2-3x pGL4.23-NR2F2BS2-4x

4 Characterisation of the interaction of POU4F3 with the Nr2f2 promoter 160
pGL4.23-NR2F2BS1-1x demonstrated a 1.8-fold upregulation in luc2 luciferase expression
in the presence of POU4F3 protein (Figure 4.15a). This effect required functional POU4F3
as dreidel mutant POU4F3 did not demonstrate such an upregulation. Promoter constructs
that contained multiple copies of the binding site showed an approximately 1.6-fold
upregulation in the presence of POU4F3 (Figure 4.15b-d). This demonstrates that POU4F3
is not only able to bind to NR2F2BS1, but is also able to confer regulation on a heterologous
promoter once bound to this site. The effect is not increased by multiple repeats of the
binding site (Figure 4.15b-d), suggesting either: (i) the spacing or orientation of these sites
does not allow more than one copy of POU4F3 to bind; (ii) once bound, multiple POU4F3
copies are not all able to access cofactors to influence transcription or; (iii) that the context
of the binding sites limit the activation that POU4F3 is able to produce e.g. due to a limited
availability of cofactors.
The NR2F2BS2-containing promoters were also activated by POU4F3 (approximately 1.5-
to 2-fold), though they showed a more varied response. As for pGL4.23-NR2F2BS1-1x, the
effect of POU4F3 on pGL4.23-NR2F2BS2-1x was found to require functional POU4F3
protein (Figure 4.16). Though increasing copies of the binding site appear to result in a
small increase in response for one to three copies, the plasmid that contained four copies of
the binding site showed a reduced response (Figure 4.16b-d). This difference between
NR2F2BS1 copy number variants may be due to the orientation of the sites in this plasmid
or secondary regulatory factors discussed above. Furthermore, the difference in response for
promoters containing different copy numbers of NR2F2BS2 may be sequence-specific or due
to the spacing between binding sites in these different constructs (NR2F2BS2 is longer
than NR2F2BS1).
As these results show that POU4F3 is capable of binding and upregulating the identified
binding sites in the Nr2f2 promoter, they suggest that the upregulation of NR2F2p4kb seen
in luciferase assays (Figure 4.14) occurs at these two binding sites. These results also
suggest that POU4F3 may be able to upregulate Nr2f2 in genomic DNA at these binding
sites. Given that these sites were selected as the two most likely sites to be bound by
POU4F3 in bioinformatic analysis (section 4.8.1), it is likely that a significant proportion of
the upregulation of NR2F2p4kb by POU4F3 is due to upregulation at these sites. Though
the above results demonstrate the ability of POU4F3 to bind to and upregulate the two
binding sites, they do so in conditions that are quite different to those found in the normal
cell. The cloned binding sites are removed from the transcriptional influence of other
binding sites that surround them in the full Nr2f2 promoter and a heterologous promoter
confers a basal upregulation of reporter gene expression that is not present in the full
promoter. This is also likely to be the reason that the activation of the binding sites in the
above experiments is not as large as that of NR2F2p4kb (1.5-fold compared to 5-fold).
Furthermore, experimental factors such as the amount of DNA transfected can affect the

4 Characterisation of the interaction of POU4F3 with the Nr2f2 promoter 161
assay and confound results e.g. by causing cytotoxicity. I therefore proceeded to identify
whether the upregulation of NR2F2p4kb by POU4F3 required NR2F2BS1 and NR2F2BS2
in order to verify the function of these sites in the more physiological context of the Nr2f2 5’
flanking region.
4.10 Site-directed mutagenesis of POU4F3 binding sites in the Nr2f2 promoter In order to identify the contribution of NR2F2BS1 and NR2F2BS2 to the upregulation of
NR2F2p4kb, I attempted to mutate these sites in order to abolish POU4F3 binding. The
purpose of this site-directed mutagenesis (SDM) was to demonstrate whether the isolated
abolition of the two binding sites was sufficient to affect the observed upregulation of the
Nr2f2 promoter in NR2F2p4kb seen in section 4.9.2, thus clarifying their action in the more
physiological context of their promoter. The ability of POU4F3 to bind to the mutated sites
designed was first assessed by EMSA analysis and these mutations were subsequently
introduced to the NR2F2p4kb plasmid in order to quantify their effect on POU4F3
upregulation of this Nr2f2 promoter construct.
4.10.1 Design of NR2F2BS1 and NR2F2BS2 mutations to abolish POU4F3 binding
The sequences of NR2F2BS1 and NR2F2BS2 were compared to published POU4F3 binding
sites to predict: (i) where exactly POU4F3 might bind within these oligonucleotides; (ii)
which bases are expected to be essential for binding; and (iii) what changes could be made
to these sites to abolish POU4F3 binding (Figure 4.17). Five studies that report binding
sites (Gruber et al. 1997;Li et al. 1993;Trieu et al. 1999;Xiang et al. 1995), effects of binding
site organisation (Gruber et al. 1997;Li et al. 1993;Rhee et al. 1998) and effects of sequence
variation (Gruber et al. 1997;Trieu et al. 1999;Xiang et al. 1995) on POU4F DNA-binding
were used to identify the regions within NR2F2BS1 and NR2F2BS2 that are likely to be
required for POU4F3 binding. This information also aided the choice of mutations to apply
to NR2F2BS1 and NR2F2BS2 in order to abolish POU4F3 binding (Figure 4.17). After
having predicted POU4F3 binding sites within EMSA oligonucleotides based on the original
Genomatix analysis (section 4.8.1) and their sequence similarity to published POU4F3
consensus sequences (particularly the CATAATTAAT sequence identified in Gruber et al.
1997), reported effective mutations of POU4F3 binding sites were used to aid in the
prediction of mutations of the Nr2f2 promoter binding sites that would abolish their
binding and upregulation by POU4F3 (Xiang et al. 1995). In particular, the CAT sequence
identified as being important for upregulation by Xiang et al. was targeted and AT was
replaced with CG to maximise any effect on POU4F3 binding (Xiang et al. 1995). For
NR2F2BS1 (Figure 4.17a) a two base-pair mutation was sufficient however, for NR2F2BS2
(Figure 4.17b) a three base-pair was required to disrupt two neighbouring CAT motifs.

4 Characterisation of the interaction of POU4F3 with the Nr2f2 promoter 162
Figure 4.17. Design of mutant POU4F3 binding sites. The EMSA oligonucleotide sequences are shown with the identified regions of likely POU4F3 binding highlighted in blue. These sites were mutated in order to abolish POU4F3 binding (mutations highlighted in pink). The reverse complement (RC) sequences of unmutated and mutated (mut) NR2F2BS1 (a) and NR2F2BS2 (b) are shown for easy identification of antisense putative POU4F3 binding sites compared to a POU4F binding site consensus sequence (c) (Gruber et al. 1997).
a)
10 20
....|....|....|....|....|...
NR2F2BS1 CTTTTTAGCATATTTGATCACTTTGATT NR2F2BS1RC AATCAAAGTGATCAAATATGCTAAAAAG
10 20
....|....|....|....|....|...
NR2F2BS1mut CTTTTTAGCCGATTTGATCACTTTGATT NR2F2BS1mutRC AATCAAAGTGATCAAATCGGCTAAAAAG
b)
10 20 30
....|....|....|....|....|....|....|.
NR2F2BS2 GGAATTTATTTTAATTGCATCATAACAATGAGGTGA NR2F2BS2RC TCACCTCATTGTTATGATGCAATTAAAATAAATTCC
10 20 30
....|....|....|....|....|....|....|.
NR2F2BS2mut GGAATTTATTTTAATTGCAGGGTAACAATGAGGTGA NR2F2BS2mutRC TCACCTCATTGTTACCCTGCAATTAAAATAAATTCC
c)
10
....|....|
POU4F3 consensus 2 CATAATTAAT

4 Characterisation of the interaction of POU4F3 with the Nr2f2 promoter 163
4.10.2 Effect of mutated EMSA oligonucleotides on in vitro translated POU4F3 binding
Prior to assessing the effect of the mutations shown in Figure 4.17 on POU4F3 regulation
in luciferase assays (in the context of the Nr2f2 promoter), the mutant sequences were
synthesised and the oligonucleotides were used in EMSA analysis with in vitro translated
POU4F3 in order to assess the effect of the mutations on POU4F3 binding. The analysis
was carried out as described in section 4.8.2, except that the protein was translated using a
new wheat germ quick-coupled transcription/translation system rather than rabbit
reticulocyte lysate, and in vitro translated Barhl1 transcription factor was used instead of
luciferase protein to test non-specific binding background.
Figure 4.18a&b shows that the two base-pair mutation of NR2F2BS1 resulted in a
substantial decrease in POU4F3 binding (indicated by opaque arrowheads). Unexpectedly,
the mutation also resulted in an increase in Barhl1 binding to the sequence. Barhl1 and
POU4F3 binding sites have since been observed to overlap at some loci in our laboratory (by
VG). Mutation of NR2F2BS2 (Figure 4.18c&d) resulted in a reduction in the amount of
oligonucleotide bound by POU4F3 (Figure 4.18, hollow arrowhead). In contrast to
NR2F2BS1, the Barhl1 binding pattern was similar for both the wild type and mutant
oligonucleotide.
These results demonstrate that the mutations designed for the two POU4F3 binding sites
in the Nr2f2 promoter reduce POU4F3 binding to these sites. In the context of a promoter,
this reduction in POU4F3 binding should result in a reduction of POU4F3-mediated
upregulation of these promoters if these sites are required for POU4F3 regulation. In order
to verify that these binding sites are necessary for POU4F3 regulation of Nr2f2, I
attempted to reproduce the above mutations in the NR2F2p4kb reporter construct. A
reduction in upregulation of this promoter due to these mutations would demonstrate
whether the changes in POU4F3 binding shown in Figure 4.18 have an effect on
transcriptional activation in the context of the NR2F2p4kb promoter and how much the two
binding sites contribute to the upregulation of the Nr2f2 promoter seen in Figure 4.14.
4 Characterisation of the interaction of POU4F3 with the Nr2f2 promoter 164
Figure 4.18. Effect of binding site mutation on transcription factor binding. a) NR2F2BS1 is bound by POU4F3 but not by Barhl1. b) The mutated base-pairs in NR2F2BS1mut strongly reduce POU4F3 binding (filled arrowheads) and facilitate Barhl1 binding. In contrast, both wild type (c) and mutant (d) NR2F2BS2 are bound by Barhl1, but POU4F3 binding is reduced by mutation of NR2F2BS2 (hollow arrowheads).
a)
No
prot
ein
PO
U4F
3Bar
hl1
No
prot
ein
PO
U4F
3Bar
hl1
b)
No
prot
ein
PO
U4F
3Bar
hl1
c)
No
prot
ein
PO
U4F
3Bar
hl1
d)
NR2F2BS1 NR2F2BS1mut NR2F2BS2 NR2F2BS2mut

4 Characterisation of the interaction of POU4F3 with the Nr2f2 promoter 165
4.10.3 Site-directed mutagenesis using the QuikChangeII XL kit
In order to introduce the desired mutations into the POU4F3 binding sites in NR2F2p4kb,
site-directed mutagenesis (SDM) was attempted for both binding sites using the Stratagene
QuikChangeII XL kit. This kit offers rapid SDM by hybridization of mutant primer to the
target site, polymerisation of the remaining plasmid sequence and subsequent digestion of
parent DNA to yield mutant plasmid alone. The QuikChange XL kit was selected as it is
designed to work for large and difficult plasmids (>8kb) and NR2F2p4kb is approximately
9kb long. Primers were designed using the QuikChange primer design program (Stratagene
2006) and subsequently manufactured and purified commercially.
Though multiple attempts were made using this technique, and the troubleshooting
optimisations suggested in the manufacturer’s manual were implemented, this strategy
was unsuccessful. The Nr2f2 promoter contains GC-rich regions that are likely to have
interfered with polymerase activity even though the QuikSolution™ reagent contained in
the kit was used in an attempt to overcome this problem. I therefore used an overlapping
PCR method in order to produce the required mutations in NR2F2p4kb.
4.10.4 SDM of NR2F2p4kb by overlapping PCR for NR2F2BS2
NR2F2BS2 lies in a less GC rich and repetitive region of the Nr2f2 promoter than
NR2F2BS1 and therefore presented less challenges in its mutagenesis. This site was
mutated by an overlapping PCR strategy that is summarised in Figure 4.19 (initial SDM
PCR conducted by SD). Briefly, NR2F2p4kb was used as template DNA in two initial PCR
reactions. In the first reaction, (5’ reaction) MVCER5’ and NR2F2BS2RC or its equivalent
SDM primer were used to amplify a region from -621 to the most 3’ nucleotide of
NR2F2BS2 to produce fragment a. The second reaction (3’ reaction) used NR2F2BS2 and
MVCER3’ and amplified up to +182bp from the most 3’ nucleotide of NR2F2BS2 to produce
fragment b (Figure 4.19). The DNA amplified in these two reactions was then used as the
template for the ‘overlap extension’ reaction. In the initial cycles of this PCR, the two
fragments are denatured and annealed to each other in their overlapping regions. The
sense strand of fragment a binds to the antisense strand of fragment b and the overlapping
region primes polymerisation of missing 5’ to 3’ sequence at both ends of parent fragments.
The primers included in the reaction (MVCER5’ and 3’) are then able to prime
polymerisation of this long fragment in subsequent cycles. The long fragment of the
reactions that initially used the EMSA oligonucleotides as primers was then cloned in to
the pDrive cloning vector by TA cloning and the insert was verified by sequencing. The
flanking primers used (MVCER5’ and 3’) had been designed to overlap EcoRI restriction
endonuclease recognition elements that were used to subclone the digested mutant PCR
fragment of approximately 790bp back into NR2F2p4kb. The orientation of the fragment
was checked by restriction digest and verified by sequencing yielding NR2F2p4kb-BS2mut.

4 Characterisation of the interaction of POU4F3 with the Nr2f2 promoter 166
Figure 4.19. Site-directed mutagenesis (SDM) of NR2F2p4kb by overlapping PCR. a) structure of the NR2F2p4kb promoter construct; b) NR2F2BS2 mutagenesis PCR; c) full-length insert generation by overlapping PCR; d) ligation of full-length insert into the pDrive PCR cloning vector by TA ligation; e) restriction digestion of template and full-length insert; f) ligation of full-length insert into NR2F2p4kb.

4 Characterisation of the interaction of POU4F3 with the Nr2f2 promoter 167
4.10.5 SDM of NR2F2p4kb by overlapping PCR for NR2F2BS1
Having mutated one of the two sites in the Nr2f2 promoter that bioinformatic prediction
and our experiments suggest are responsible for the upregulation of NR2F2p4kb by
POU4F3, I attempted to produce a construct in which both POU4F3 binding sites were
mutated in order to determine the combined effect of these sites on POU4F3 regulation.
Figure 4.20. Screening of SDM colonies for incorporation of mutation. a) the orientation of inserts that had been subcloned into the pDrive vector were screened for incorporation of insert and orientation by restriction endonuclease digestion and subsequent electrophoresis. An example of the pattern seen on gel visualisation under UV light is shown. Correctly incorporated and oriented inserts were identified by the presence of a predicted band of 683bp in the absence of any other bands smaller than 1.6Kb (i.e. lanes 2, 5, 6 & 10). b) Miniprep DNA from pDrive clones that had incorporated the insert in the correct orientation were subsequently screened to identify if the desired mutation (NR2F2BS1mut) had been produced by DNA hybridization with radiolabelled EMSA oligonucleotides. Colonies which had incorporated the mutation are identifiable by stronger hybridization with radiolabelled NM1 than with radiolabelled N1. A negative control (NR2F2p4kbBS2mut) that was known to contain wild type NR2F2BS1 was included as a negative control (box 12). All clones screened contained the desired mutation apart from 10 (which contained wild type NR2F2BS1) and 11 (which contains an unknown sequence or was of low concentration). NB, box 2 has been edited for presentation purposes as this clone was spotted out of sequence at the bottom of the NM1 membrane (cropped). c) inserts that had been directly subcloned into NR2F2p4kb-BS2 mut were screened for incorporation of the desired mutation in the same way as those cloned into pDrive prior to checking of insert orientation. Box 22 contains the negative control DNA (NR2F2p4kb-BS2mut). Boxes 1-10, 12 and 15-20 are consistent with mutated clones whilst the clone in box 14 appears unmutated and the remaining boxes appear to contain an unknown sequence or an inadequate amount of DNA.
a)
b)
c)
0.5Kb -
1.0Kb -

4 Characterisation of the interaction of POU4F3 with the Nr2f2 promoter 168
The strategy used to mutate NR2F2BS2 was also used for NR2F2BS1 with some
modification in order to produce a version of NR2F2p4kb in which both NR2F2BS1 and
NR2F2BS2 were mutated (named NR2F2p4kb-BS1&2mut). Once the full length mutated
PCR fragment had been made (i.e. Figure 4.19c), an aliquot of the purified fragment was
digested and ligated directly into the NR2F2p4kb-BS2mut construct using the ApaI
restriction endonuclease as well as cloning the remainder of the undigested purified
fragment into the pDrive vector by TA cloning. pDrive colonies were screened by Miniprep
(Qiagen) and restriction endonuclease digestion in to identify whether the full-length
mutant PCR fragment had been incorporated and to determine its orientation (Figure
4.20a). pDrive colonies that had been shown to contain the desired insert in the correct
orientation were then screened by DNA hybridization to determine whether the mutation
had been incorporated or whether the colonies had arisen from wild type NR2F2p4kb i.e.
due to incomplete digestion or phosphorylation of this plasmid during earlier cloning stages
(Figure 4.20b). Colonies yielded by direct ligation of the full-length mutated fragment into
NR2F2p4kb-BS2mut were also screened, though their orientation was not determined
(Figure 4.20c). Having identified colonies that had incorporated the mutation, these clones
were sent for sequencing in order to verify that NR2F2BS1 had been mutated and, in the
case of colonies that had been directly ligated into NR2F2p4kb-BS2mut, that the insert was
in the correct orientation.
4.10.6 Correction of unintended mutations in NR2F2p4kbmut
On sequencing, unintended mutations were noticed to have arisen in the mutated clones,
presumably due to PCR errors (different mutations were identified between colonies). A
strategy was therefore designed to correct unwanted mutations. The BclI restriction
endonuclease was used to excise a region from a clone with a mutation 5’ to NR2F2BS1 and
replace it with the equivalent region in another clone that did not contain the 5’ mutation
but did have a mutation within the excised region. Orientation of this fragment was
checked by restriction endonuclease digestion and the correction was verified by sequencing
of this plasmid (NR2F2p4kb-BS1&2mut). This plasmid had a c to t missense mutation -
288bp from the intended mutagenesis site that could not be repaired, however, a c to t
missense mutation at +74bp and a three base-pair deletion starting at +301 to the intended
mutation were repaired. The remaining mutation is unlikely to have an effect on POU4F3-
specific interactions with this promoter due to its distance from POU4F3 binding sites.
However, as the remaining mutation might interfere with the binding of other transcription
factors to the Nr2f2 promoter sequence, basal expression of this promoter construct
(NR2F2p4kb-BS1&2mut) was not compared to the wild-type construct (NR2F2p4kb) as any
difference in luciferase production could not be assigned to POU4F3 alone.

4 Characterisation of the interaction of POU4F3 with the Nr2f2 promoter 169
4.10.7 Luciferase assay shows reduced response of NR2F2p4kb-BS1&2mut to POU4F3 compared to wild type NR2F2p4kb
NR2F2p4kb-BS1&2mut was used in cotransfection assays and compared to NR2F2p4kb
which was assayed as previously described (see section 4.9.2) in order to assess the
contribution of the two binding sites to the upregulation of the Nr2f2 promoter by POU4F3.
However, a lower total amount of DNA (1210ng instead of 3110ng) was used in order to
reduce the possibility of cytotoxicity from the transfection confounding the results. If the
upregulation is produced by the action of POU4F3 at the identified sites, the mutations
should reduce POU4F3 binding and therefore reduce, or abolish the upregulation of
luciferase protein production in response to increasing amounts of POU4F3 seen with
NR2F2p4kb (Figure 4.14).

4 C
hara
cteri
sati
on
of
the i
nte
ract
ion
of
PO
U4F
3 w
ith
th
e Nr2f2
pro
mote
r 170
Fig
ure
4.2
1.
PO
U4F
3 b
ind
ing
sit
e m
uta
tio
n r
ed
uce
s N
r2f2
pro
mo
ter
up
reg
ula
tio
n.
NR
2F
2p
4kb o
r N
R2F
2p
4kb-B
S1&
2m
ut
were
cotr
ansfe
cte
d w
ith i
ncre
asin
g a
mo
unts
of
pS
i-P
ou4f3
and
a c
onsta
nt
am
ou
nt
of
pR
L-n
ull.
Lucifera
se
pro
duction
fro
m
NR
2F
2p
4kb w
as incre
ased
by p
Si-
Pou
4f3
. In
contr
ast,
NR
2F
2p4kb-B
S1
&2
mut
de
monstr
ate
d a
much-r
ed
uce
d r
espo
nse,
dem
onstr
ating
the r
ole
of
NR
2F
2B
S1
an
d
NR
2F
2B
S2 in N
R2F
2p4kb
activation b
y P
OU
4F
3.

4 Characterisation of the interaction of POU4F3 with the Nr2f2 promoter 171
Figure 4.21 shows that the mutation of the two POU4F3 binding sites (NR2F2BS1 and
NR2F2BS2) reduces the upregulatory effect of POU4F3 on NR2F2p4kb. In this experiment,
wild type NR2F2p4kb demonstrated a two-fold upregulation in response to 1000ng of
cotransfected pSi-Pou4f3 and the mutated promoter (NR2F2p4kb-BS1&2mut) shows a 1.3-
fold upregulation. The response of the wild type promoter (NR2F2p4kb) to POU4F3 in this
experiment is lower than the previously identified five-fold upregulation (see Figure 4.14),
though this is likely to be due to less POU4F3 expression construct being cotransfected in
this experiment to avoid cytotoxicity. Furthermore, the response of NR2F2p4kb to POU4F3
in ND7 cells may vary between passages. This evidence provides further proof that the two
POU-family binding sites identified and investigated in the Nr2f2 promoter are essential
for the observed upregulation of this promoter by POU4F3 in this context i.e. NR2F2BS1
and NR2F2BS2 must be intact in order for POU4F3 to be able to upregulate the Nr2f2
promoter in ND7 cells.
The data in this chapter demonstrate that NR2F2BS1&2 are bound by POU4F3 in
NR2F2p4kb and, therefore, are likely to be bound in the Nr2f2 promoter; POU4F3 is
capable of binding these sites in EMSA assay and a reduction in POU4F3 binding to
mutant binding sites in EMSA assay is reflected in the reduced response of the mutated
Nr2f2 5’ flanking region (NRF2p4kb-BS1&2mut). These results confirm and extend those of
the subtractive hybridization which produced Nr2f2 as a putative target of POU4F3 as it is
also likely that upregulation of Nr2f2 by POU4F3 is via a direct mechanism with POU4F3
binding the Nr2f2 promoter at the sites identified (NR2F2BS1 and NR2F2BS2).
4.10.8 Conservation of POU4F3 binding sites in the Nr2f2 promoter
As with coding sequence, regulatory elements are conserved through evolution if their
sequence is required for the production of a given phenotype and depending on redundancy
i.e. whether a base-pair can be exchanged or deleted without affecting protein binding and
upregulation at a cis-regulatory element. I therefore investigated the conservation of the
identified POU4F3 cis-regulatory elements in order to estimate the importance of the
interaction that had been identified in the mouse.
The chromosomal locations of the verified mouse cis-regulatory elements NR2F2BS1 and
NR2F2BS2 were identified and compared with the equivalent regions of the human and rat
genomes using precomputed genomic alignments from the Vista project (Loots et al. 2004).
Once obtained, the sites’ conservation was quantified using the BioEdit software package
which calculated the percentage sequence similarity between these species.

4 Characterisation of the interaction of POU4F3 with the Nr2f2 promoter 172
Nr2f2 promoter POU4F3 binding site 1
Figure 4.22. Alignment of mouse NR2F2BS1 with equivalent human and rat sequences. Both the human and rat sequences had 100% sequence similarity to the mouse sequence, showing a strong conservation of this site. This figure is modified from the precomputed Vista genomic alignment (Loots et al. 2004). + and - indicate sense or antisense strand respectively for each species.
NR2F2BS1 showed 100% conservation between the three species investigated (Figure 4.23).
This indicates that this POU4F3 binding site, along with its flanking sequence is well
conserved and is therefore likely to play an important role in the regulation of Nr2f2
expression.
Nr2f2 promoter POU4F3 binding site 2
Figure 4.23. Alignment of mouse NR2F2BS2 with equivalent human and rat sequences. Though this sequence was less well-conserved than NR2F2BS1, the region previously predicted to be the POU4F3 binding site (Figure 4.17), which is shaded in red, has only a single mismatch between mouse and rat sequences (91.7% sequence similarity), showing that this binding site is well-conserved. Figure modified from precomputed Vista genomic alignment (Loots et al. 2004). + and - indicate sense or antisense strand respectively for each species.
NR2F2BS2 was less well-conserved than NR2F2BS1. Across the whole sequence, the
sequence similarity between species was as follows: mouse:human = 80.5%, mouse:rat =
97.2% and human:rat = 77.7% (Hall 2007). However, in the region that had previously been
predicted to be the POU4F3 binding site (Figure 4.17b), the conservation was high:
mouse:human = 100%, mouse/human:rat = 91.7%. Given the small sample size, it is
difficult to compare the conservation of this site to its surrounding sequence, however, it is
possible to say that this site, as for NR2F2BS1, is well-conserved. This high level of binding
site conservation again indicates that the POU4F3-Nr2f2 interaction that takes place at
NR2F2BS2 is likely to take place in vivo.

4 Characterisation of the interaction of POU4F3 with the Nr2f2 promoter 173
4.11 Discussion of Nr2f2 activation by POU4F3 NR2F2 was identified as a putative target of the POU4F3 transcription factor by a
subtractive hybridization screen in UB/OC-2 cells. It was selected for further investigation
based on its known functions: NR2F2 is known to be required for organogenesis in a range
of organs where it has been shown to interact with a number of signalling networks that
are known to be involved in inner ear development (sections 4.4 and 4.8). Furthermore, it is
expressed in the inner ear where it has been suggested to play a role in inner ear
development (section 4.5.2) and many reagents were available for its investigation.
NR2F2 expression in the inner ear was investigated to identify whether it is expressed in
hair cells that express POU4F3. The results of these expression studies showed that NR2F2
is widely expressed in the apex of the E18 rat cochlear duct with its expression becoming
increasingly restricted to the lesser epithelial ridge towards the base of the cochlear duct
(see Figure 4.4). Its expression in the E18 rat inner ear is, therefore, likely to overlap with
that of POU4F3 in hair cells (Erkman et al. 1996) and is similar to the pattern seen in the
developing mouse inner ear at E15.5 (Tang et al. 2005;Xiang et al. 1998).
Immunofluorescence experiments also showed, for the first time, that NR2F2 is expressed
in the cochlear hair cells of the postnatal rat inner ear (see Figure 4.5) and the hair cells of
the crista in the postnatal mouse inner ear; NR2F2 was only detected in the Hensen cells of
the apical organ of Corti in postnatal mice (see Figure 4.6 and Figure 4.7). Furthermore,
cytoplasmic NR2F2 expression was detected in basal P8 rat cochlear hair cells (similar to
that seen in the rat pituitary gland (Raccurt et al. 2006)), suggesting that the function of
NR2F2 in hair cells may be controlled by modulation of its subcellular localization. This
expression pattern supports the possibility of a physiologically relevant regulatory
relationship between POU4F3 and Nr2f2 in hair cells. Therefore, the putative activation of
the Nr2f2 5’ flanking region by POU4F3 was investigated to verify activation and, if
activation was confirmed, to identify the mechanism of regulation.
Two well-conserved POU4F3 binding sites were identified in the Nr2f2 5’ flanking region by
bioinformatic analysis and POU4F3 binding to these sites was verified by EMSA (sections
4.8 and 4.10.8). Having verified that POU4F3 is able to bind to these sites, POU4F3 was
shown to activate two reporter constructs containing differing lengths of the Nr2f2 5’
flanking region by luciferase assay (section 4.9). Furthermore, the POU4F3 binding sites
that had previously been identified in the Nr2f2 5’ flanking region were found to be
required for the activation of an Nr2f2 5’ flanking region reporter construct (NR2F2p4kb)
as mutation of these sites reduced its activation from two-fold to 1.3-fold (section 4.10).
Collectively, the data presented provide strong evidence that POU4F3 activates Nr2f2 and
that this may be relevant to hair cell development, though evidence of this regulation would
be strengthened by additional experimentation. Firstly, to better-characterise the timing

4 Characterisation of the interaction of POU4F3 with the Nr2f2 promoter 174
and variation of NR2F2 expression, a larger number of animals require investigation and
investigation of older animals will help explain differences in postnatal NR2F2 expression
between mice and rats. Study of NR2F2 expression in relation to markers of hair cell
development may aid in this comparison and help determine whether the differences seen
are due to the slower development of the rat or true interspecies differences.
To better characterise the effect of POU4F3 on NR2F2p4kb, independent mutations of
NR2F2BS1 and NR2F2BS2 require investigation. Though the reduction in the activation of
NR2F2pBS1&2mut compared to NR2F2p4kb shows the requirement of these sites for
NR2F2p4kb activation, individual mutations of these sites will determine their contribution
to this activation. Furthermore, the ability of POU4F3 to bind to these sites in genomic
DNA could be investigated by chromatin immunoprecipitation. At a late stage of this
investigation, preliminary attempts were made to identify POU4F3 binding to NR2F2BS1
and NR2F2BS2 by this method using a POU4F3 fusion protein (to overcome the lack of a
suitable anti-POU4F3 antibody). Though this assay did not identify NR2F2BS1 or
NR2F2BS2, the protocol used requires optimization (this was not carried out due to time
constraints) and the possibility that the fusion protein used interferes with DNA binding by
POU4F3 needs to be excluded.
Finally, the interaction of POU4F3 with the Nr2f2 promoter in hair cells requires
investigation in order to clarify the relevance of this interaction to their development and, if
NR2F2 expression in hair cells is maintained throughout life, survival. In order to
investigate the effect of POU4F3 expression on Nr2f2 in hair cells, two models could be
used: cochlear cultures and Pou4f3 mutant mice. Though we intended to manipulate
POU4F3 levels in hair cells in culture, we were unable to do so due to extremely low hair
cell transfection efficiency despite a number of methods being attempted in our laboratory.
Furthermore, we were unable to obtain Pou4f3 mutant mouse inner ear tissue for
investigation of the effect of Pou4f3 mutation on NR2F2 levels. However, an adenovirus-
based transfection protocol is currently being developed in our laboratory for use in cochlear
cultures in order to overcome previous transfection problems.
In summary, future work will focus on the in vivo relevance of the regulatory relationship
identified and clarification of the role of NR2F2 in the developing organ of Corti will aid in
our understanding of its role in hair cell development and, potentially, maintenance. As
NR2F2 has been shown to be essential for organogenesis and maintenance of a number of
organs through signalling networks that are known to be active in the inner ear, future
work on the role of NR2F2 in the inner ear is likely to focus on understanding how it
interacts with these signalling cascades in this system. Given that its family member,
NR2F1, has been shown to be essential for normal inner ear morphogenesis, NR2F2’s
potentially important role could be investigated using a conditional inner ear knockout to

4 Characterisation of the interaction of POU4F3 with the Nr2f2 promoter 175
circumvent the problems of the embryonic lethality of the homozygous Nr2f2 knockout
mouse. Such investigations would shed much light on the role of this multi-faceted
transcription factor in the development of hearing and balance.
5 Investigation of putative Luzp1, Rbms1 and Zranb2 regulation by POU4F3 176
5
INVESTIGATION OF PUTATIVE LUZP1,
RBMS1 AND ZRANB2 REGULATION
BY POU4F3
Having identified putative POU4F3 target genes from a subtractive hybridization screen in
UB/OC-2 cells, four candidate genes were prioritised for investigation: Nr2f2 (chapter 4),
Luzp1, Rbms1 and Zranb2. These genes were selected based on their potential roles in hair
cell development, likelihood of regulation by POU4F3 (estimated by the presence of
predicted POU4F binding sites in their 5’ flanking regions), and availability of reagents (see
section 3.7). The identification and investigation of Luzp1, Rbms1 and Zranb2 is reported in
this chapter.
As for Nr2f2, investigation of these genes focused on verification of the ability of POU4F3 to
bind sites in their predicted promoter regions and to activate transcription in reporter
constructs containing these regions. Furthermore, as an antibody was available for
ZRANB2 which was suitable for immunohistochemistry, its inner ear expression profile
was characterised to identify whether it is expressed in hair cells and thereby assess the
likelihood of its being regulated by POU4F3 in vivo.
5.1 Introduction to Luzp1, Rbms1 and Zranb2
5.1.1 Luzp1
The Luzp1 gene is located on mouse chromosome 4 (human chromosome 1) and encodes an
mRNA with a long (3940bp) 3’ UTR that is suggested to be subject to rapid degeneration
due to its AU-rich content. The protein encoded by Luzp1 (LUZP1, also known as LUZP)
was predicted to contain three leucine zipper motifs, numerous putative phosphorylation
sites, eight potential glycosylation sites and three putative nuclear localization signals (Sun
et al. 1996).

5 Investigation of putative Luzp1, Rbms1 and Zranb2 regulation by POU4F3 177
Of the predicted protein domains, the three leucine zipper motifs have been the focus of
speculation over LUZP function. These domains are commonly seen in transcription factors
where they mediate protein-protein interactions. They are often preceded by an adjacent
basic region that is involved in sequence-specific DNA binding. Where this basic region is
lacking, as is the case for LUZP1, leucine zipper containing proteins can interact with a
wide variety of proteins of varying function and subcellular localization. Such proteins are
less likely to be involved in transcriptional regulation. However, the predominantly nuclear
localization of LUZP1 expression identified by immunohistochemistry in neural tissue
suggests that it may have a transcription factor function despite not containing this basic
region (Lee et al. 2001;Sun et al. 1996).
Expression of LUZP1 is strongest in the brain with lower expression levels in the kidney
and lung (Sun et al. 1996). Immunohistochemical analysis of the perirhinal cortex showed
LUZP1 expression in the nuclei of neurons with weaker expression in dendrites (Sun et al.
1996). Its expression in neural tissue was further investigated by Lee et al. who
demonstrated expression in pyramidal neurons in the cerebral cortex and hippocampus as
well as neural tissue in teratomas (Lee et al. 2001). Luzp1 knockout mice die perinatally
due to cardiac and neural tube defects. Some homozygotes display exencephaly and less
severely affected animals show hypomorphic development of the brain and adjacent
structures. These defects are due to neural tube closure defects that have been shown to be
associated with ectopic sonic hedgehog signalling and elevated apoptosis in the dorso-
lateral hindbrain neuroepithelium (Hsu et al. 2008).
Based on these data, a working model of LUZP1 function proposes that it acts as a negative
transcriptional regulator by binding to transcription factors via its leucine zipper motifs
(e.g. bHLH transcription factors which have been shown to be inhibited by leucine zipper
containing proteins) and inhibiting their function. Furthermore, phosphorylation of
predicted sites in LUZP1 may acts as a means of modulating its function (Sun et al. 1996).
However, the above model is almost entirely based on computational predictions and the
ability of LUZP1 to dimerise and be phosphorylated has not been tested experimentally.
The expression and function of LUZP1 in the inner ear has also not been investigated.
5.1.2 Rbms1
RBMS1 (also known as MSSP gene 2) is a 16-exon gene with a coding sequence of over 60kb.
This sequence gives rise to alternative transcripts to produce the proteins MSSP-1, MSSP-2,
SCR2 and human YC1 (Haigermoser et al. 1996;Kanaoka et al. 1994). MSSP (i.e. either
MSSP-1 or MSSP-2) and SCR2 expression was found in all tissues examined though short
MSSP transcripts were found to be abundantly expressed in testis tissue (Fujimoto et al.
2000).

5 Investigation of putative Luzp1, Rbms1 and Zranb2 regulation by POU4F3 178
MSSP has been shown to have versatile functions that are, for the most part, relevant to its
interaction with the proto-oncogene c-Myc. The first of its functions to be identified were
those of DNA binding and replication. MSSP was found to bind to both the single- and
double-stranded forms of a putative DNA replication origin / transcriptional enhancer in
the human c-Myc gene (myc21) (Negishi et al. 1994). The DNA binding properties of MSSP-
1 and MSSP-2 were shown to be identical and mediated through two ribonucleoprotein
binding domains (RNP-1A and RNP-1B) which are both contained in all MSSP family
proteins and are required for DNA binding to an MSSP recognition sequence (TCTCTTA).
Furthermore, these proteins were found to promote DNA replication, resulting in G1 to S
phase cell cycle progression and this function was shown to require the integrity of almost
the whole MSSP protein (Takai et al. 1994). The mechanism by which MSSP produces this
effect has been investigated by GST ‘pull-down’ assays and it was found to bind to the N-
terminus of the DNA polymerase alpha catalytic subunit both in vitro and in human cells.
Furthermore, MSSP was able to stimulate DNA polymerase activity in vitro, suggesting
that it forms part of the origin of DNA replication complex (tested at the DNA replication
origin of the c-myc gene) and demonstrating a mechanism through which it can promote G1
to S phase progression (Niki et al. 2000a).
As well as DNA replication, MSSP has been shown to play a role in transcriptional
regulation. It is able to bind to cMyc protein (which acts as a transcription factor as well as
performing other functions (for review see Eilers et al. 2008)) in order to affect its DNA
binding ability. cMyc is able to bind to a DNA consensus sequence (the E-box) as a
heterodimer with a transcription factor called Max. This heterodimerisation takes place at
the cMyc leucine zipper motif which, unlike in LUZP1, has a basic region on its N-proximal
side. MSSP-2 was shown to be able to bind to this basic region to form a cMyc/Max/MSSP-2
ternary complex that abrogates the ability of cMyc/Max to bind, and therefore regulate, the
E-box DNA sequence (Niki et al. 2000b). Therefore, MSSP may be able to modulate
transcriptional regulation at other cMyc target genes such as those that promote cellular
growth e.g. eIF-2α (Rosenwald 1993). Furthermore, MSSP has been shown to be able to
regulate transcription directly e.g. there is strong evidence that it is able to directly
transrepress the chicken alpha-smooth actin gene at a site (TATCTTA) in the 5’ flanking
region of this gene (Kimura et al. 1998).
The final experimentally verified functions of Rbms1 gene products are induction of
apoptosis and cell transformation (i.e. induction of neoplasia). Overexpression of MSSP-1 or
MSSP-2 in HeLa cells was shown to result in apoptosis in a dose-dependent manner
through a Fas-dependent mechanism (Iida et al. 1997;Nomura et al. 2005) and MSSP was
shown to promote cell transformation by ras/myc in a manner dependent on its RNP
domains which have been shown to be necessary for all of its functions (Niki et al. 2000b).

5 Investigation of putative Luzp1, Rbms1 and Zranb2 regulation by POU4F3 179
Unlike Luzp1 and Zranb2, the regulation of RBMS1 has been investigated in some detail
by investigation of transcriptional activity at its 5’ flanking region. Haigermoser et al.
investigated the basal regulation of RBMS1 5’ flanking region constructs of differing length.
A region from –1709 to +61 (relative to the identified transcriptional start site) was shown
to be basally expressed in HeLa cells by luciferase assay. Deletion of the 5’ sequence of this
construct to as far as -1283 resulted in an approximately two-fold increase in the
transcription of the sequence and further deletions resulted in a reduction in
transcriptional activation to levels near or below that of the longest sequence tested. This
analysis identified that the region from -1709 to -1283 is likely to contain negative
regulatory elements with positive regulatory elements present from -1283 to -196 and a
region from -488 to -196 being responsible for an approximately four-fold reduction in
luciferase production when deleted (Haigermoser et al. 1996). This GC rich region was
thought to be regulated by SP1 or AP2 due to consensus sequences for these binding sites
being present in this region from which the -474 to -440 fragment was shown to be
protected from DNAseI by two proteins – one of 38kDa one of 62kDa – that are activated in
the G1 stage of the cell cycle. However, neither SP1 nor AP2 was able to bind this region in
a DNA binding assay, and neither of the proteins that bind this region have been identified
(Fujimoto et al. 1998;Haigermoser et al. 1996).
The apparently wide-reaching functions of Rbms1 are reflected by homozygous knockout
mice that demonstrate an approximately 50% embryonic lethality rate, though surviving
animals do not display any overt phenotype. This may be due to a similar protein, SCR3 –
an MSSP family protein that is produced by a distinct gene – compensating for the lack of
Rbms1 gene products. On closer examination, homozygous knockout mice were shown to
have retarded testicular, uterine and ovarian development, with adult females showing
disrupted serum progesterone levels in pregnancy (Fujimoto et al. 2001). As for Luzp1 and
Zranb2, the function, expression and regulation of Rbms1 and its products has not been
studied in the inner ear and the inner ears of Rbms1 knockout mice have not been
investigated. However, given the versatility of its function and potential relevance to inner
ear development, the actions of MSSP-1, MSSP-2 and Scr2 in the inner ear could be of
particular interest.
5.1.3 Zranb2
Zranb2 (formerly known as Zis and Znf265) is the most recently discovered of the four
genes prioritised in this investigation and encodes ZRANB2, which has been shown to be
able to induce alternate splicing of RNA transcripts (Adams et al. 2001;Karginova et al.
1997). ZRANB2 is an extremely well conserved protein with human and rat ZRANB2
having identical protein sequences and the mouse protein differing by a single residue
(Karginova et al. 1997). There are two splice variants of human and mouse ZRANB2 which

5 Investigation of putative Luzp1, Rbms1 and Zranb2 regulation by POU4F3 180
differ by ten amino acids with ZRANB2-1 (the longer form that contains exon 11 instead of
exon 10) appearing to be more predominantly expressed than ZRANB2-2 (the shorter form
that contains exons one to ten) (Li et al. 2008;Mangs et al. 2006;Nakano et al. 1998).
The expression of Zranb2 mRNA has been widely investigated by Northern blot analysis
which has shown it to be expressed in the brain, heart, liver, kidney, lung, testis, skin,
placenta, muscle and pancreas (Adams et al. 2000;Karginova et al. 1997;Nakano et al. 1998).
Its expression appears consistently lower in the lung and liver than in other tissues and the
level of expression and detectable transcripts in all organs appears to vary between
organisms and ages tested (Adams et al. 2000;Karginova et al. 1997;Nakano et al. 1998).
Generally, its expression is stronger and more consistent between organs in foetal tissues,
becoming reduced and more specific in adult tissues (Adams et al. 2000;Karginova et al.
1997;Nakano et al. 1998). This pattern of expression suggests that ZRANB2 is widely
required for development, progressing to more restricted functions in adult tissues (Adams
et al. 2000;Karginova et al. 1997;Nakano et al. 1998). The subcellular localization of
ZRANB2 has been investigated in cell lines by western blot and immunofluorescence,
showing expression throughout the nucleus or slightly more restricted to nuclear speckles
(structures that contain pre-mRNA) (Adams et al. 2001;Mangs et al. 2006).
The ZRANB2 protein is composed (from N-terminal to C-terminal) of two zinc fingers
followed by a predicted nuclear localization signal and an Argine/Serine-rich (RS) domain.
The zinc finger motifs are separated by a 24-residue flexible linker (characteristic of an
RNA recognition motif) and have been classified as Ran-binding domains based on their
homology to this motif (reviewed in Mangs et al. 2008). Though the nuclear localization
signal was predicted to lie between the zinc finger and RS region, deletion assays with
EGFP fusion proteins revealed that this region is not required or sufficient for nuclear
ZRANB2 expression in transfected cultured cells and that it is the RS domain that is
responsible for nuclear localization in this system. However, the exact location of the
nuclear localization signal within the RS region of ZRANB2 remains unknown (Adams et al.
2001).
The zinc fingers of ZRANB2 underlie its ability to induce alternative splicing (Adams et al.
2001). ZRANB2 is thought to be active at the early spliceosome where it binds to single-
stranded RNA containing AGGUAA repeats with micromolar affinity. Through this binding,
it is thought to influence splice site selection as it may be able to contact both splice donor
and splice acceptor sites to influence splicing (Loughlin et al. 2009). Supporting evidence for
the role of Zranb2 in alternative splicing is provided by its ability to interact with the
spliceosomal constituents SFRS17A, U1-70K and U2AF35 in yeast two-hybrid assays and its
colocalisation with these proteins in the nucleus (Adams et al. 2001;Mangs et al. 2006).

5 Investigation of putative Luzp1, Rbms1 and Zranb2 regulation by POU4F3 181
More recently, ZRANB2 has been suggested to play a role in immune responses as its
expression changes in response to Ureaplasma Urealyticum infection in Sertoli cells (both
in cultured cells and in vivo) (Li et al. 2009) and viral infection (Finsterbusch et al. 2009)
though the mechanisms of these observations have not been characterised. The regulation
of Zranb2 has also not been characterised (Mangs et al. 2008). Though its function and
expression are poorly understood, characterisation of the potential role of ZRANB2 in the
inner ear through its involvement in alternative splicing may aid in the understanding of
alternative splicing in hair cells, which is also poorly understood.

5 Investigation of putative Luzp1, Rbms1 and Zranb2 regulation by POU4F3 182
5.2 Identification of Luzp1, Rbms1 and Zranb2 as
potential POU4F3 targets In the subtractive hybridization screen, Luzp1, Rbms1 and Zranb2 were identified as
putatively upregulated POU4F3 targets from three clones (D3, FB5 and FA8). As
previously described (sections 3.3.1), these clones were sequenced and adaptor
oligonucleotides from the subtractive hybridization screen were identified and deleted from
the resulting sequencing files (Figure 5.1a, Figure 5.2a and Figure 5.3a). The trimmed
sequences were submitted to the Ensembl BLASTN software to identify alignments to the
Ensembl mouse cDNA library (Figure 5.1b, Figure 5.2 b and Figure 5.3 b) with the most
significant match from the BLAST analysis being investigated as the corresponding gene
for each clone. Furthermore, for prioritised genes, all matches of a given clone to its
corresponding gene were aligned with the corresponding gene sequence as the BLAST
software does not return matches that are likely to have arisen due to chance e.g. due to
single base-pair repeats (Figure 5.1c, Figure 5.2c and Figure 5.3c).
5.2.1 Clone D3 of the subtractive hybridization screen matches Luzp1
On BLAST analysis, the trimmed 727bp sequence of clone D3 of the subtractive
hybridization screen (Figure 5.1a) most significantly matched a 727bp region of the Luzp1
3’UTR with 99.7% sequence identity (Figure 5.1b). The next match was of 23bp with 95.7%
sequence identity to another gene and was therefore likely to have arisen by chance. The
best match was confirmed by alignment of the trimmed sequence with the Ensembl Luzp1
sequence which revealed a full alignment apart from a 1bp mismatch and a 1bp insertion
(Figure 5.1c). Luzp1 was therefore selected as the corresponding gene for clone D3.
5.2.2 Clone FB5 of the subtractive hybridization matches Rbms1
Similarly, the trimmed 286bp sequence of clone FB5 (Figure 5.2a) was found to most
significantly match a region in the Rbms1 gene of 132bp with 100% sequence identity
(Figure 5.2b). All other matches were also to Rbms1. Alignment of the trimmed clone FB5
sequence with the Ensembl Rbms1 sequence showed a full-length match between clone FB5
and Rbms1 of 99.7% sequence identity i.e. a 286bp match with a 1bp mismatch (Figure
5.2c). Furthermore, the position of this alignment to Rbms1 (Figure 5.2b) suggested that
clone FB5 corresponded to the shortest Rbms1 transcript in the Ensembl library.
5.2.3 Clone FA8 of the subtractive hybridization matches Zranb2
Finally, clone FA8 fully matched 108bp of the Zranb2 3’ UTR (Figure 5.3b), the next best
match being 19bp long (100% sequence identity) and therefore likely to be due to chance.
Alignment of the trimmed clone sequence (Figure 5.3a) with Zranb2 revealed that all 548bp
of this sequence fully matched the corresponding region in the Zranb2 3’ UTR (Figure 5.3c).
Zranb2 was therefore selected as the corresponding gene for clone FA8.

5 Investigation of putative Luzp1, Rbms1 and Zranb2 regulation by POU4F3 183
Figure 5.1. Clone D3 of the subtractive hybridization screen matches Luzp1. a) adaptor sequences from the subtractive hybridization screen (red type) and non-specified bases (N) were deleted from the clone D3 sequence. (b) the full length of the trimmed clone matched a region in the Luzp1 3’ UTR with 99.7% sequence identity. This alignment is shown at the nucleotide level in (c). c.a, Ensembl sequence; c.b, trimmed clone D3.
TCGAGCGGCCGCCCGGGCAGGTACCAATTGGCAGCCCTGAGAGTTAAAAGGAAACAGGCCCC
CTGTGGTGGTCCACTGAAGAGTATAGGAAATTAAGTCTGTGGCTCTTCTCTGCTGATAAAAAC
AGAGGGGCACCAAGCCCTGCCTCAAAATATCTCGTCAATAATTTTTGTCTTTGGGTGTTGAGC
CCTGGATTCTTCTGGTGCTGTAGCTCCTGGTGCCAAAGTCTGGATCTTTCCACATTTTAGCAGC
ACCAACACCTGCTGCTATTTGAAATGTTCTGTGGAAAAGGGACAGCTGTGGGATGCCATTTTG
AAAATCTGAGTGCAATAGCATTTGATTGTAACAATTATTTCAGGATATTTTGTTTCTTTAGTCT
GCACACTTTGTAGTCCTGCCATAAAGTAGATTTTATTTTTAAATACCTTCAGCATTGCAAATGT
TTATACCAAGCAAATGGAGGCTAGAGGGTTCAAGTCCCCTTGGGCCTCATATGGATGGCTAGA
CTGACTCTGATTTCAAGGTCGAAAGACATATCACTTCTGAAAACACCAAGATGTAACCTTTGG
GCCCAAGCCAGAAGCTGCAGGAAGCCTCCACATAGAAGGGAGACTGGTATTCAAACCATTGT
CTAATCAAGCCAAATATTCCCCACTAAAAGACCCACTTTCCTGACAGTGCTTCTCTAAAGTTTG
GGTAGGTGGCTAAATTGAGCCAGCAGGTCAGGAGTCTATGAGAGTTCTGAGTNCCTCGGCCG
CGAGCACGCT
a)
b)
c)
a)

5 Investigation of putative Luzp1, Rbms1 and Zranb2 regulation by POU4F3 184
Figure 5.2. Clone FB5 of the subtractive hybridization screen matches Rbms1. a) Full sequencing of clone FB5 was verified by identification of adaptor sequences and non-specified bases (red type) from the subtractive hybridization screen. These were deleted from the sequence prior to BLAST analysis, leaving insert sequence alone (black type). b) Ensembl ‘ContigView’ of the match of the trimmed insert sequence to the Rbms1 gene. Red boxes on the ‘Blast hits’ row represent matches to the Rbms1 transcripts below. c) the trimmed clone FB5 sequence (c.b) matches the Ensembl Rbms1 sequence (c.a) with a one base-pair mismatch.
NNNNNNNNNNANGCTGCAGACGCGTTACGTATCGGATCCAGAATTCGTGATT
AGCGTGGTCGCGGCCGAGGTACTTGTTTGGGTTCTGTCTCTTTTTCTGTCCTCC
ATCCGCAAACTTGCACAGTAAAGGTTCTGTAGGAGCAGAAACTCCTGGTGGG
GTCTTGATGAATTTTCCATTAAAATGACCAATTACAGCTTCGCATTTTTCCGTT
GATTCCATCCTGGCAAAGCCAACACCACGGCTGGCACCACTGGAATCACGTA
GGACCCTTGTAGAAATAACTTGTCCAAAGGGTTTGAGCATATTTTCAAGTTCC
TGCTCATCCATGGACAGCGGCAGGTTAGAAATGTACCTGCCCGGGCGGCCGC
TCGAAATCTGA
a)
b)
c)
a)

5 Investigation of putative Luzp1, Rbms1 and Zranb2 regulation by POU4F3 185
Figure 5.3. Clone FA8 of the subtractive hybridization screen matches Zranb2. a) Adapter oligonucleotide sequences and non-specified bases (red type) were trimmed from the clone FA8 sequence prior to BLAST analysis. This analysis (b) revealed that part of the clone FA8 sequence (red) matched Zranb2 known protein coding sequence (maroon). c) shows the alignment of the trimmed FD8 sequence (c.a) with the matching region in the Ensembl Zranb2 sequence (c.b).
NNNNNNNANNNNNANGCNGCAGACGCGTTACGTATCGGATCCAGAATTCGT
GATTAGCGTGGTCGCGGCCGAGGTACGATACTTTGTTTTCATCTTTAGATCAG
TTGAGAAGAGAAACACTCACTTTAAAATAAAAACATTTTGTTTGATCTGTCTA
CTAAACATCTTAGAAGGCTTTACTTATTTAAACTGCAGCAGACAAATACTAA
AGGAGAAACAGGAAAAATAATTCCCTCACAAGGAGCCCCAGCACAACTGTT
GTCCCTTATATACTTACCTTGCTTTTGCTGCTGAAGAGACTGTTAAAGAGAAA
CCTTTTAACTTTTAAACCAGAGAACAAAATGGATCTCAAGTGACCAGATTTTA
ATTTGAGAAATAAAACTCCAAAAGCATTTTAAGCCATATGGTTTTCTTTTTCA
GATGTGGAGAAAAATGATTTTGCTTAAATTGTGCAGAAATAAGAATTCTTCT
GTTACTTAGGTATCTGCAATGTTCAAAATCAGACATCACAAGGCAAATGTTC
ACTTAAATTCATGTCCCTGTCAGCCTGCCACTGAGAAACAGGTTTCAAAAGCT
TTCTTCAATTTGCTCATTAACTATGATTTAGCCTTTTTTAAAAATCCACCTGCC
CGGGCGGCCGCTCGAATCTG
a)
b)
c)
a)

5 Investigation of putative Luzp1, Rbms1 and Zranb2 regulation by POU4F3 186
5.3 Initial prioritisation of Luzp1, Rbms1 and Zranb2
for investigation As previously described (section 3.8), Luzp1, Rbms1 and Zranb2 were prioritised for
investigation over other putative POU4F3 target genes in part due to their known function
and availability of reagents for their study. The investigation of the known function of
candidate genes was based on the GO units identified for these genes (see section 3.3.2)
that were judged with additional information on their supporting evidence from the
literature. The availability of reagents was also investigated in the literature and in
company catalogues. These analyses are reported here in detail.
5.3.1 Selection of Luzp1 for investigation
Unlike Nr2f2, Luzp1 was (and remains) an uncharacterised gene with only three GO units
reported through the Ensembl genome browser (Table 5.1). The lack of GO units reflected
the lack of published data for Luzp1 at the time of the analysis (2006) with only two papers
reporting the predominantly nuclear expression of LUZP1 in neural tissue (some expression
was seen in dendritic profiles) (Lee et al. 2001;Sun et al. 1996). Of the GO units identified,
GO:0005634 refers to the nuclear LUZP1 expression pattern that is found in neurons and
neural tissue in teratomas (Lee et al. 2001;Sun et al. 1996). The two other GO units
(GO:0003674 and GO:0008150) refer to the predicted leucine zipper motifs in LUZP1 that
may mediate protein-protein interactions and allow it to act as a transcription factor (Sun
et al. 1996).
Though the expression pattern of LUZP1 in the inner ear has not been investigated and its
expression in the inner ear was not identified in the online databases investigated (see
section 3.6), the predominantly nuclear expression of this protein coupled with its predicted
transcription factor function suggest that it may play an interesting role in hair cell
development and maintenance if expressed in these cells (Lee et al. 2001;Sun et al. 1996).
Furthermore, the presence of two binding sites in the Luzp1 5’ flanking region with high
similarity to known POU family binding sites (see sections 3.5 and 5.5.1), supported the
possibility that Luzp1 is a directly regulated POU4F3 target. Therefore, despite not being
able to obtain an anti-LUZP1 antibody at the time of these analyses, Luzp1 was selected for
further investigation due to its potentially interesting role in the inner ear.
Table 5.1. Luzp1 GO units. ND, no biological data available, IDA, inferred from direct assay.
GO ID GO Term Evidence Code
GO:0003674 Molecular function ND
GO:0005634 Nucleus IDA
GO:0008150 Biological process ND

5 Investigation of putative Luzp1, Rbms1 and Zranb2 regulation by POU4F3 187
5.3.2 Selection of Rbms1 for investigation
NB For clarity, Rbms1 gene products are collectively referred to as RBMS1
though, in the literature, different isoforms are often referred to as MSSP
(for MSSP-1 and/or MSSP-2) and Scr2.
In contrast to Luzp1, RBMS1 has experimentally verified DNA binding ability and is
known to play a role in DNA replication (Negishi et al. 1994). The GO units identified for
this gene reflected this as well as proposed, unproven roles in RNA processing and
translation (Table 5.2). However, they fail to identify the ability of RBMS1 to act as a
transcription factor (e.g. Kimura et al. 1998). These results demonstrate that, though this
method provides a useful means by which to rapidly assess gene function, a literature
search is required for more sensitive and specific identification of target gene functions.
As for Luzp1, the inner ear expression pattern for RBMS1 is unknown, though it has been
found to be expressed in all organs examined by Northern blot (Fujimoto et al. 2000). Given
that the processes in which RBMS1 has been implicated are relevant to hair cell
development and maintenance, and as reagents were available for its study (an antibody,
expression construct and 5’ flanking region luciferase reporter construct), Rbms1 was
selected for further investigation.
Table 5.2. Rbms1 GO units. IEA, inferred from electronic annotation; TAS, traceable author statement; NAS, Non-traceable author statement; ND, no biological data available.
GO ID GO Term Evidence Code
GO:0000166 Nucleotide binding IEA
GO:0003690 Double-stranded DNA binding TAS
GO:0003697 Single-stranded DNA binding TAS
GO:0003723 RNA binding NAS
GO:0005634 Nucleus IEA
GO:0006260 DNA replication TAS
GO:0006396 RNA processing TAS
GO:0006445 Regulation of translation TAS
GO:0008372 Cellular component unknown ND
5.3.3 Selection of Zranb2 for investigation
As for other candidate genes, Zranb2 GO units were obtained, examined and compared to
those of other candidate genes in order to decide whether to pursue its putative regulation
by POU4F3 in hair cells. Zranb2 had six identified GO units, four of which were supported
by author statements and two of which were predicted based on a zinc finger domain in its
sequence (Table 5.3). It was thought to be capable of binding DNA or RNA with the two zinc
fingers in this domain (Karginova et al. 1997), though subsequent analysis of this region in
ZRANB2 showed it to be an RNA-binding protein (Plambeck et al. 2003).

5 Investigation of putative Luzp1, Rbms1 and Zranb2 regulation by POU4F3 188
Though this candidate gene was not as thoroughly characterised as others, its ability to
influence splicing made it an interesting candidate for further investigation (Morris et al.
2001), i.e. if ZRANB2 is expressed in hair cells, it might contribute to the hair cell
phenotype through this process. Furthermore, it was possible to obtain a sample of an anti-
ZRANB2 antibody from a company, making it possible to rapidly assess its expression in
the inner ear if found to be suitable for immunohistochemistry (as for LUZP1 and RBMS1,
the inner ear expression pattern of ZRANB2 was unknown). Therefore, Zranb2 was
selected for further investigation.
Table 5.3. Zranb2 GO units. TAS, traceable author statement; IEA, inferred from electronic annotation.
5.4 Investigation of the inner ear expression patterns
of selected genes Following candidate gene prioritisation, I aimed to identify whether the selected genes are
expressed in the POU4F3-expressing hair cells of the inner ear. Such coexpression of
POU4F3 with candidate genes would aid in the decision to continue the investigation of
these genes as it would support the putative upregulatory relationships between POU4F3
and these genes suggested by the subtractive hybridization screen. Two methods, RNA in
situ hybridization and immunohistochemistry, are best suited to the assessment of target
gene expression in situ. If a suitable antibody is available for the target gene of interest,
immunohistochemistry is the most rapid and robust of these methods. Therefore, I searched
the literature and antibody company catalogues to identify suitable reagents for the
intended analysis.
Antibodies were found to be available for LUZP1, RBMS1 and ZRANB2. Therefore, I
attempted to obtain gifts or samples of these antibodies with which to investigate the inner
ear expression patterns of these proteins. By this method, I was able to obtain an anti-
RBMS1 antibody from a collaborator (Dr H Ariga) which has been shown to recognise two
Rbms1 alternative transcripts (MSSP-1 and MSSP-2). An anti-ZRANB2 antibody sample
was also obtained from a company (Abnova 2008a). I was, however, unable to obtain an
anti-LUZP1 antibody at this stage.
GO ID GO Term Evidence Code
GO:0003700 Transcription factor activity TAS
GO:0003723 RNA binding TAS
GO:0005634 Nucleus TAS
GO:0008270 Zinc ion binding IEA
GO:0008380 RNA splicing TAS
GO:0046872 Metal ion binding IEA

5 Investigation of putative Luzp1, Rbms1 and Zranb2 regulation by POU4F3 189
5.4.1 Western immunoblot to investigate RBMS1 and ZRANB2 expression in UB/OC-1 and UB/OC-2 cells
Prior to use in immunohistochemistry, the anti-RBMS1 and anti-ZRANB2 antibodies were
used in western immunoblots. Though both of these antibodies had previously been shown
to be suitable for use in western immunoblotting (see Abnova 2008a for anti ZRANB2;Takai
et al. 1994 for anti-RBMS1) this analysis was conducted to verify the specificity of these
antibodies and to identify which RBMS1 and ZRANB2 isoforms might be expressed in the
cells investigated. UB/OC-2 cells were selected for this analysis as they were shown to
express Rbms1 and Zranb2 mRNAs and were therefore likely to express the corresponding
proteins (Figure 3.1). As for a similar investigation of the anti-NR2F2 antibody (section
4.6.1), UB/OC-1 cell protein extract was included for comparison. UB/OC-1 and UB/OC-2
whole cell protein extract was electrophoresed with a molecular weight marker on a 10%
polyacrylamide gel and electroblotted onto a PVDF membrane for immunodetection. The
transfer of sufficient protein to the membrane for immunodetection was confirmed by
Ponceau S staining.
Figure 5.4 shows the results of immunoblots with the anti-RBMS1 (Figure 5.4a) and anti-
ZRANB2 (Figure 5.4b) antibodies. For anti-RBMS1, a single band of approximately 45kDa
was identified which was consistent with its previously reported molecular weight of
approximately 50kDa (Figure 5.4a) (Kimura et al. 1998). This demonstrated the specificity
of the anti-RBMS1 antibody, though it was not possible to identify to which RBMS1 isoform
this band might correspond based on the available literature. Having verified its specificity,
this antibody was used in immunohistochemical investigations of the inner ear expression
pattern of RBMS1.
In the anti-ZRANB2 immunoblot (Figure 5.4b), three bands were identifiable in the UB/OC-
1 cell lane and two bands were seen in the UB/OC-2 cell lane. The most dense of these
bands is approximately 55kDa and matches the previously reported size of human ZRANB2
identified by polyclonal rabbit antibodies (Adams et al. 2001;Li et al. 2008), though this is
heavier than the predicted 38kDa of both the predicted protein size and the recombinant
protein against which it was raised (Abnova 2008a). Two less dense bands were also seen
in UB/OC-1 whole cell protein extract. One was lighter and one was heavier than the most
dense (55kDa) band. Only the 55kDa band and the lighter band were identified in UB/OC-2
cell protein extract, though both of these bands were less dense in these cells. The latter
difference may have been due to unevenness of protein loading onto the SDS-PAGE gel or
uneven transfer to the PVDF membrane as Ponceau staining of the membrane revealed
that the protein concentration in the UB/OC-2 cell lane was slightly less dense than that in
the UB/OC-1 cell lane (data not shown). However, as the assessment of relative levels of
protein expression between cell types was not the focus of this experiment, the equality of
protein concentration between cell types was not compared by equalising the membrane

5 Investigation of putative Luzp1, Rbms1 and Zranb2 regulation by POU4F3 190
with an antibody to a housekeeping gene. This pattern raises the possibility that the
expression of different Zranb2 isoforms may be influenced by differential POU4F3
expression between these two cell types, though the western blot would have to be repeated
with confirmation of equal protein loading in order to confirm that the difference seen was
not due to a lack of sufficient protein for detection in the UB/OC-2 lane.
Two transcripts of Zranb2 are known to exist in humans and mice and many alternative
transcripts have been identified by Northern blot (Adams et al. 2001;Li et al. 2008;Mangs et
al. 2008;Nakano et al. 1998). Furthermore, the characterisation of regulation and potential
autoregulation of Zranb2 is poor (Mangs et al. 2008). Therefore, these bands were assumed
to have arisen due to alternate transcripts of Zranb2 though it is possible that the antibody
used displays some non-specific binding or that different ZRANB2 isoforms exist due to
post-translational modification. Given its affinity to a band of equivalent molecular weight
to a known ZRANB2 isoform (55kDa), the antibody was judged to be sufficiently specific for
immunohistochemical investigation of the ZRANB2 expression.
Figure 5.4. RBMS1 and ZRANB2 expression in UB/OC-1 and UB/OC-2 cells. a) immunoblot analysis of UB/OC-1 and UB/OC-2 whole cell protein extract was carried out with an anti-RBMS1 antibody. This analysis revealed a single band of approximately 45kDa in both UB/OC-1 and UB/OC-2 protein extract lanes. b) the same analysis was carried out with an anti-ZRANB2 antibody. This identified a band of approximately 55kDa for both UB/OC-1 and UB/OC-2 cells. A heavier, less dense band of approximately 60kDa was also identified in these two cell types though a lighter band of approximately 46kDa was only identified in UB/OC-1 cell protein extract.
OC-1 OC-2

5 Investigation of putative Luzp1, Rbms1 and Zranb2 regulation by POU4F3 191
5.4.2 Investigation of RBMS1 expression in the inner ear
Having confirmed the sensitivity of the anti-RBMS1 antibody by western blot, this antibody
was used with cryosections of early postnatal rat cochleas, as for NR2F2 (see section 4.7), to
characterise RBMS1 expression in this tissue. Several antibody dilutions were attempted
and an alternative detection method was used to enhance any signal (ABCelite with
DAB/Nickel enhancement (Vector)). However, no specific signal was identified. Therefore,
immunofluorescence experiments were attempted in UB/OC-2 cells in which RBMS1
expression had been confirmed by western blot. Again, no specific signal was detected (data
not shown) and the antibody was therefore determined not to be suitable for use in
immunohistochemistry.
5.4.3 Investigation of ZRANB2 expression in the inner ear
The mouse monoclonal anti-ZRANB2 antibody was also used in immunofluorescence
experiments with cryosections of rat inner ears at P0, P4 and P8 to identify any ZRANB2
expression in this tissue and, particularly in hair cells. ZRANB2 expression was detected at
P0 (Figure 5.5), though it was not detected at P4 or P8 (data not shown). At P0, all labelling
appeared predominantly nuclear with stronger expression noted in cells of the cochlear duct
compared to surrounding cells. Its subcellular localization in hair cells was also nuclear
(arrows Figure 5.5) with no base-to-apex gradient of expression noted within sections.
Furthermore, no difference in signal intensity was noted between hair cells and other cells
of the cochlear duct (Figure 5.5). These results represent the first description of the cellular
and subcellular localization of ZRANB2 in the inner ear and require verification by
replication, though they support the hypothesis that POU4F3 may regulate Zranb2 in hair
cells. Given that no ZRANB2 expression was identified by P4 in the rat cochlea, the
apparently rapid downregulation of its expression could be further investigated by
examining the inner ears of rats at intervening ages to determine the pattern of this
downregulation.
5.4.4 Immunohistochemistry as a means of investigating the expression patterns of candidate genes
The results of attempts to characterise the expression of candidate POU4F3 target genes
presented in this section illustrate the strengths and weaknesses of the strategy used. The
dependence of this strategy on the availability of a suitable antibody for
immunohistochemical investigation of candidate gene expression resulted in it not being
possible to investigate LUZP1 and RBMS1 expression in the inner ear. However, the
specificity of the anti-RBMS1 antibody seen in western blot suggested that it could be
valuable for future investigations e.g. supershift or chromatin immunoprecipitation
(Nomura et al. 2005). In contrast, this strategy was suitable for investigation of ZRANB2
expression (as it had been for NR2F2). Furthermore, the cost and duration of this
investigation was much lower and shorter than that of alternative strategies.

5 I
nvest
igati
on
of
pu
tati
ve Luzp1, Rbms1
an
d Zranb2 r
egu
lati
on
by P
OU
4F
3
192
Fig
ure
5.5
. Z
RA
NB
2 e
xp
ressio
n in
th
e P
0 r
at
co
ch
lea.
a)
Ap
ica
l tu
rn o
f P
0 r
at
cochle
a lab
elle
d w
ith a
nti-Z
RA
NB
2 a
ntib
ody,
DA
PI
and
Phallo
idin
. b)
Mid
dle
turn
of
P0 r
at
coch
lea
labe
lled w
ith
anti-Z
RA
NB
2 a
ntib
ody,
DA
PI
and P
ha
lloid
in.
ZR
AN
B2 e
xpre
ssio
n i
s s
een i
n t
he n
ucle
i of
cells
thro
ug
hou
t th
e c
ochle
ar
duct
with w
ea
ker
expre
ssio
n s
een o
uts
ide t
he c
ochle
ar
duct
(a).
Its
subcellu
lar
loca
lization w
as n
ucle
ar
and n
o b
ase-t
o-a
pex e
xpre
ssio
n g
radie
nt
was s
een b
etw
een t
urn
s o
f th
e c
ochle
ar
duct. A
rrow
s,
hair c
ells
. T
hese r
esults a
re
repre
senta
tive o
f th
ree e
xa
min
ed c
och
leas.
a)
b)

5 Investigation of putative Luzp1, Rbms1 and Zranb2 regulation by POU4F3 193
5.5 Design of oligonucleotides for EMSA analysis of
Luzp1, Rbms1 and Zranb2 Having selected candidate genes for investigation and attempted to characterise their inner
ear expression patterns, the putative activation of all three remaining candidate genes by
POU4F3 was investigated. As previously described in section 1.5.5, it is thought that
POU4F3 is only able to transactivate target gene promoters once bound to DNA (Sud et al.
2005) i.e. POU4F3 binding to target gene promoters is likely to be required if these genes
are POU4F3 targets. Therefore, the identification of POU4F3 binding sites in target gene
promoters would support the possibility that these genes are direct POU4F3 targets.
As for Nr2f2 (section 4.8.1), remaining candidate gene promoters were predicted using the
Genomatix Gene2Promoter software (see section 3.5.1) and binding sites were predicted
within these regions using the Genomatix MatInspector and ModelInspector programs (see
section 3.5.2). Oligonucleotides were designed against these putative binding sites and used
in EMSA analyses to determine whether POU4F3 is able to bind these regions in candidate
gene 5’ flanking regions.
5.5.1 Luzp1 promoter prediction, binding site identification and EMSA oligonucleotide design
In the original BLAST analysis that identified Luzp1 as the corresponding gene for clone
D3 of the subtractive hybridization screen (section 5.2.1), the clone sequence matched that
of the Luzp 3’ UTR (Figure 5.1b). On subsequent analysis of the Luzp1 locus in the Ensembl
genome browser, only two of the annotated Luzp1 transcripts contained the 3’ UTR to
which the original BLAST match for LUZP1 was found (Figure 5.6a). Of these two
transcripts, one was a Havana protein coding transcript and one was an Ensembl protein
coding transcript (Figure 5.6a). As Havana protein coding transcripts are manually
annotated and therefore based on greater evidence than automatically annotated Ensembl
protein coding transcripts, the Havana protein coding transcript was selected as the
transcript that most likely corresponded to that identified by the subtractive hybridization
screen (Figure 5.6a, arrowhead) (Ensembl 2009).
This transcript comprised four exons, and two promoters corresponding to four-exon
transcripts were identified by the Gene2Promoter promoter prediction program (Figure
5.6a, GXP_287887 and GXP_287889). Only one of these transcripts had confirmed 5’
sequencing and was, therefore, selected as the best-matching promoter for MatInspector
and ModelInspector analysis (Figure 5.6b, GXP_287887 (arrowhead)).

5 I
nvest
igati
on
of
pu
tati
ve Luzp1, Rbms1
an
d Zranb2 r
egu
lati
on
by P
OU
4F
3
194
Fig
ure
5.6
. P
red
icti
on
of
po
ten
tial P
OU
4F
3 b
ind
ing
sit
es in
th
e L
uzp
1 p
rom
ote
r.
a)
the L
uzp1
gene
locus v
iew
ed i
n t
he E
nsem
bl
genom
e b
row
ser.
A V
ega-H
avana
tra
nscript
(arr
ow
head)
corr
esp
ond
ed t
o t
he
Luzp1
tra
nscript
identified
by
subtr
active
hybri
diz
ation
. b
) T
he G
eno
matix p
rom
ote
r (G
XP
_28
788
7,
arr
ow
head
) th
at
best
matc
he
d t
his
tra
nscript
was s
ele
cte
d f
or
furt
her
ana
lysis
. c)
PO
U4
F
bin
din
g s
ites o
f h
ighest str
ingency th
at w
ere
iden
tified
by M
atI
nspecto
r a
na
lysis
were
sele
cte
d f
or
EM
SA
analy
sis
.
a)
b)
c)

5 Investigation of putative Luzp1, Rbms1 and Zranb2 regulation by POU4F3 195
The selected promoter was submitted for both MatInspector and ModelInspector analysis.
Though an OCT1-PBXC module was identified by the ModelInspector program (data not
shown), this was more distal to the TSS than two predicted high stringency POU4F3
binding sites (V$3.02 in Figure 5.6c). These two sites were selected for EMSA analysis and
another site was not selected for analysis because of its lower matrix similarity to its
corresponding POU binding site.
LUZP1BS1 was designed against a region that, on the sense strand, contained a predicted
Brn-4 (POU3F) binding site of 0.942 matrix similarity and, on the antisense strand,
contained a POU4F3 binding site of 0.940 matrix similarity. To this sequence, additional
bases were included in the 5’ region so that the end of the oligonucleotide did not interfere
with POU4F3 binding and to the 3’ region to include POUHD binding motifs (TAAT) and to
ensure that this end of the oligonucleotide did not interfere with POU4F3 binding either
(Table 5.4).
LUZP1BS2 was designed against a predicted POU4 (Brn-3) binding site of 0.940 matrix
similarity. This was the second highest stringency match identified and was more proximal
to the TSS than LUZP1BS1. As for LUZP1BS1, additional sequence was included both 5’
and 3’ to the predicted binding site in order to avoid interference with POU4F3 binding in
EMSA analysis (Table 5.4).
Table 5.4. Luzp1 EMSA oligonucleotides. Two EMSA oligonucleotides were designed using the MatInspector software to identify putative POU4F3 binding sites in a predicted Luzp1 promoter region (GXP_287887). Bases were included both 3’ and 5’ to the sites identified (underlined) to ensure that the ends of the oligonucleotides would not interfere with POU4F3 binding.
Name Sequence
LUZP1BS1 GGATTATCACATTTAATTAATCAACTAATTAACTAATTAAC
LUZP1BS1RC GTTAATTAGTTAATTAGTTGATTAATTAAATGTGATAATCC
LUZP1BS2 ATTTTTATTTATTAATTTTTTCATGTGGATG
LUZP1BS2RC CATCCACATGAAAAAATTAATAAATAAAAAT
5.5.2 Rbms1 promoter prediction, binding site identification and EMSA oligonucleotide design
Though putative mouse Rbms1 5’ flanking region POU4F3 binding sites were originally
predicted by the same method used for Nr2f2 (section 4.8.1), Luzp1 (section 5.5.1) and
Zranb2 (section 5.5.3), this analysis was repeated for the human RBMS1 gene as the
luciferase reporter constructs obtained and cloned for this gene contained segments of the
human RBMS1 5’ flanking region (see section 5.7.1).

5 I
nvest
igati
on
of
pu
tati
ve Luzp1, Rbms1
an
d Zranb2 r
egu
lati
on
by P
OU
4F
3
196
Fig
ure
5.7
. P
red
icti
on
of
po
ten
tial P
OU
4F
3 b
ind
ing
sit
es in
th
e R
BM
S1 p
rom
ote
r.
a)
The
Rb
ms1 t
ranscripts
corr
espond
ing
to
the p
red
icte
d p
rom
ote
r G
XP
_14
959
4 w
ere
co
mpare
d t
o h
um
an
tra
nscripts
. T
he h
um
an t
ran
scripts
that
best-
matc
he
d t
he
m
ouse t
ranscripts
sele
cte
d c
orr
esponde
d t
o t
he h
um
an p
redic
ted R
BM
S1 pro
mote
r G
XP
_28
678
0 a
nd t
his
pro
mote
r w
as,
there
fore
, sele
cte
d f
or
pre
dic
tion of
PO
U4F
3 b
ind
ing s
ites.
b)
PO
U4 b
indin
g s
ites id
entified
by M
atInspecto
r an
aly
sis
were
sele
cte
d f
or
EM
SA
an
aly
sis
. T
hre
e s
ites w
ere
sele
cte
d f
or
the d
esig
n o
f th
ree
EM
SA
olig
onucle
otides (
RB
MS
1B
S1
, R
BM
S1
BS
2 a
nd R
BM
S1B
S3).
These s
ite
s w
ere
sele
cte
d d
ue
to t
here
be
ing c
luste
rs o
f p
uta
tive P
OU
4F
3 b
ind
ing
sites a
t th
ese loci and d
ue
to t
he
ir p
roxim
ity to t
he R
BM
S1
tra
nscriptio
na
l sta
rt s
ite.
a)
b)

5 Investigation of putative Luzp1, Rbms1 and Zranb2 regulation by POU4F3 197
In the original Rbms1 (mouse) promoter prediction, the Genomatix promoter GXP_149594
(Figure 5.7a) was found to best match a 14 exon Rbms1 transcript in the Ensembl database.
Comparative genomic analysis between the transcripts corresponding to this promoter
(Figure 5.7a, green boxes) and human transcripts in the Genomatix transcript database
revealed that the human transcripts (Figure 5.7a, salmon boxes) that most closely matched
the GXP_149594 transcripts corresponded to the human promoter GXP_286780.
This promoter was subjected to MatInspector and ModelInspector analysis in order to
identify putative POU4F3 binding sites and modules. As for Luzp1, suitable modules were
identified in the RBMS1 5’ flanking region by the ModelInspector software, though these
were further 5’ than predicted (MatInspector) POU binding sites and were therefore
thought to not be contained in an available RBMS1 5’ flanking region reporter construct.
Though many MatInspector predicted POU binding sites were later shown to not be
contained in this reporter construct either, they were thought to be included at the time of
this analysis. Therefore, EMSA probes were designed against the binding sites identified by
the MatInspector software.
RBMS1BS1 was designed against a cluster of POU factor binding sites which contained a
V$BRN5.03 binding site of 0.791 matrix similarity (Brn-5 (POU6) binding sites have been
shown to be similar to POU4F binding sites (Rhee et al. 1998)) and two V$BRNF binding
sites of 0.898 and 0.910 matrix similarity (Figure 5.7b). As before, additional bases were
included both 5’ and 3’ to these predicted binding sites in EMSA oligonucleotides to prevent
the ends of the oligonucleotide from interfering with POU4F3 binding (Table 5.5).
RBMS1BS2 was designed against a cluster of predicted POU4F binding sites which
contained a high stringency (0.909 matrix similarity) predicted POU4F3 binding site
(Figure 5.7b) and a lower stringency (0.793) POU4F binding site, plus additional flanking
bases (Table 5.5). As a third cluster of POU family binding sites of comparable stringency to
the two described was identified in GXP_286780, a third EMSA probe (RBMS1BS3) was
designed for RBMS1. This probe encompassed a V$BRN5.04 binding site of 0.907 matrix
similarity (i.e. of higher stringency than the V$BRN5 binding site in RBMS1BS1) (Figure
5.7b) as well as two POU4F3 binding sites of high stringency (0.923 and 0.927) plus
flanking bases (Table 5.5).

5 Investigation of putative Luzp1, Rbms1 and Zranb2 regulation by POU4F3 198
Table 5.5. RBMS1 EMSA oligonucleotides. Three EMSA oligonucleotides were designed using the MatInspector software to identify putative POU4F3 binding sites in a predicted RBMS1 promoter region (GXP_286780). As for other EMSA oligonucleotides, bases were included both 3’ and 5’ to the sites identified (underlined) to ensure that the ends of the oligonucleotides would not interfere with POU4F3 binding.
Name Sequence
RBMS1BS1 TTATCATATAAAAATAATAACTGTTTAACAAAATAATGCATTCCAG
RBMS1BS1RC CTGGAATGCATTATTTTGTTAAACAGTTATTATTTTTATATGATAA
RBMS1BS2 CGGGGACCAATTAATTCCATTAAATTATATCTAGTTA
RBMS1BS2RC TAACTAGATATAATTTAATGGAATTAATTGGTCCCCG
RBMS1BS3 TTGTGAAAAAAAATTACTGGGCGGTGGGAAGTGAACGATTAATCAGATTTCCTCT
RBMS1BS3RC AGAGGAAATCTGATTAATCGTTCACTTCCCACCGCCCAGTAATTTTTTTTCACAA
5.5.3 Zranb2 promoter prediction, binding site identification and EMSA oligonucleotide design
The mechanism of the putative upregulation of Zranb2 by POU4F3 was first investigated,
as for other candidate genes, by the identification of putative POU4F3 binding sites in its
promoter. On searching the Gene2Promoter software for predicted Zranb2 promoters, five
options were returned. Of these, three were eliminated as they were solely based on
computational prediction (Figure 5.8a) and two promoters remained in the analysis:
GXP_132934 and GXP_430971. The supporting evidence for the former was a single one-
exon transcript of gold standard (i.e. this transcript had verified full 5’ sequencing, showing
that its transcriptional start site had been identified), whereas the latter had 14 gold
standard transcripts of ten exons i.e. the same exon number as the Ensembl transcript
identified by the BLAST analysis (Figure 5.3a and Figure 5.8b). Therefore, GXP_430971
was selected for further analysis.
The MatInspector and ModelInspector programs were used to analyse the Zranb2 promoter
in order to identify putative POU4F3 transcription factor binding sites. The ModelInspector
analysis yielded an OCT1-PIT1 module, a HOXF-HOXF-OCT1 module and a PIT1 GATA
module within the region examined. Of these, the OCT1-PIT1 module was selected for
further investigation as, unlike the other modules identified, both of the transcription
factors that relate to this module are POU domain transcription factors. Therefore, an
EMSA oligonucleotide, ZRANB2BS1 (Table 5.6), was designed to a region within this
module that had a POU4F (Brn-3) binding site on the sense strand and a POU6 (Brn-5)
binding site on the opposite strand (Figure 5.8c). Furthermore, the POU4F binding site had
the second highest matrix similarity of the sites identified by the MatInspector software for
this promoter.

5 Investigation of putative Luzp1, Rbms1 and Zranb2 regulation by POU4F3 199
Of the three remaining putative binding sites at the highest level of stringency,
ZRANB2BS2 was designed against the middle site (Table 5.6). This site was selected as it
had a higher matrix similarity to its corresponding (POU6/Brn-5) sequence than the most 3’
site (0.818 compared to 0.807) and was closer to the Zranb2 transcriptional start site than
the most 5’ site, though it had slightly lower matrix similarity to its corresponding
transcription factor’s DNA sequence matrix (0.818 compared to 0.832) (Figure 5.8c).
As for other EMSA oligonucleotides, additional sequence was included at both ends of both
Zranb2 EMSA oligonucleotides to ensure that the ends of the oligonucleotide did not
interfere with POU4F3 binding. Furthermore, the 3’ region of both oligonucleotides was
extended to encompass a additional homeodomain binding motifs (TAAT) (Table 5.6).
Figure 5.8. Prediction of potential POU4F3 binding sites in the Zranb2 promoter. (Legend on page 200)
a)

5 I
nvest
igati
on
of
pu
tati
ve Luzp1, Rbms1
an
d Zranb2 r
egu
lati
on
by P
OU
4F
3
200
Fig
ure
5.8
. P
red
icti
on
of
po
ten
tial P
OU
4F
3 b
ind
ing
sit
es in
th
e Z
ran
b2 p
rom
ote
r (c
on
tin
ued
).
a)
The
pro
mote
r corr
espo
ndin
g t
o g
old
sta
nd
ard
tra
nscripts
in t
he G
en
om
atix d
ata
base t
hat
had t
en e
xons w
as s
ele
cte
d f
or
furt
her
an
aly
sis
(arr
ow
hea
d)
as t
his
best
matc
he
d t
he t
ranscript
ide
ntified
in E
nsem
bl
(b).
b)
Gra
phic
al
repre
senta
tio
n o
f th
e Z
ranb2
ge
ne i
n t
he
Ensem
bl
geno
me b
row
ser
(the M
GI
na
me f
or
Zra
nb2 w
as
ZF
P265 a
t th
e t
ime o
f th
is a
na
lysis
). c
) P
OU
-fam
ily t
ranscription f
acto
r b
ind
ing s
ites w
ere
ide
ntifie
d in M
atIn
specto
r fo
r Z
ranb2.
The t
wo s
ites t
hat
were
se
lecte
d f
or
EM
SA
ana
lysis
are
sh
ow
n in b
lue.
b)
c)

5 Investigation of putative Luzp1, Rbms1 and Zranb2 regulation by POU4F3 201
Table 5.6. Zranb2 EMSA oligonucleotides. Zranb2 EMSA oligonucleotides designed against the Genomatix predicted promoter GXP_430971. Additional bases included at both ends are underlined.
Name Sequence
ZRANB2BS1 TCATAGTTTTATACATTATGGTTTTAATTTTAC
ZRANB2BS1RC GTAAAATTAAAACCATAATGTATAAAACTATGA
ZRANB2BS2 TAGTAACAGCACAATTAATAATAATTGAATTAA
ZRANB2BS2RC TTAATTCAATTATTATTAATTGTGCTGTTACTA
5.6 EMSA analysis of POU4F3 binding sites in
candidate gene 5’ flanking regions Having designed EMSA oligonucleotides to predicted POU4F3 binding sites in the Luzp1,
Rbms1 and Zranb2 5’ flanking regions, these oligonucleotides were used in EMSA analysis
to identify whether in vitro translated POU4F3 and POU4F3 from UB/OC-2 cell nuclear
protein extract is able to bind to them.
5.6.1 In vitro translated POU4F3 is able to bind sites in the Luzp1 and Zranb2 promoter
The ability of POU4F3 to bind LUZP1BS1, LUZP1BS2, ZRANB2BS1 and ZRANB2BS2 was
tested by EMSA analysis with in vitro translated protein. As for Nr2f2 (section 4.8.2), the
radiolabelled EMSA oligonucleotides were incubated either alone, with in vitro translated
POU4F3 or with in vitro translated luciferase protein that had been produced using a
rabbit reticulocyte lysate in vitro transcription / translation system. Samples were
electrophoresed on a 4% polyacrylamide gel that was then dried and autoradiographed. If
the oligonucleotide is bound by the in vitro translated POU4F3, then a bandshift is seen in
the in vitro translated POU4F3 lane that is of higher molecular weight than bands seen in
the lane containing probe alone. If this bandshift is not due to non-specific binding by other
proteins in the in vitro translation mixture, it should not be present in the lane containing
in vitro translated luciferase protein.
On EMSA analysis (see Figure 5.9), LUZP1BS1 (Figure 5.9a), LUZP1BS2 (Figure 5.9b),
ZRANB2BS1 (Figure 5.9c) and ZRANB2BS2 (Figure 5.9d) all show bandshifts produced by
in vitro translated POU4F3. These bandshifts are shown to be due to POU4F3 by their
absence or marked reduction in in vitro translated luciferase protein-containing lanes and
lanes that do not contain in vitro translated protein (Figure 5.9, arrowheads). These results
show that in vitro translated POU4F3 is able to bind to the four EMSA oligonucleotides
tested in this analysis, though they do not show whether this binding is sequence-specific.
Therefore, the sequence-specificity of these interactions was tested by competition with a
POU4F3 consensus sequence (see section 5.6.3). As for Nr2f2 binding sites previously tested,
this analysis was carried out with UB/OC-2 cell nuclear protein extract as POU4F3 in
UB/OC-2 cells is more likely to have the post-translational modifications required for native
DNA binding that in vitro translated protein may lack (see section 4.8.3).

5 I
nvest
igati
on
of
pu
tati
ve Luzp1, Rbms1
an
d Zranb2 r
egu
lati
on
by P
OU
4F
3
202
Fig
ure
5.9
. B
ind
ing
of
in v
itro
tra
nsla
ted
PO
U4F
3 t
o p
red
icte
d b
ind
ing
sit
es
.
The ab
ility
of
in vitro
tr
an
sla
ted P
OU
4F
3 to
bin
d to
pre
dic
ted bin
din
g sites in
th
e Luzp1 a
nd Z
ranb
2 g
ene 5
’ fla
nkin
g re
gio
ns w
as te
ste
d by E
MS
A a
na
lysis
. O
ligonucle
otid
es t
hat
had b
een d
esig
ned a
ga
inst
pre
dic
ted P
OU
4F
3 b
ind
ing s
ites w
ere
rad
iola
be
lled w
ith
[γ-3
2P
]AT
P a
nd incu
bate
d w
ith in v
itro
tra
nsla
ted P
OU
4F
3
or
lucifera
se p
rote
in.
LU
ZP
1B
S1 (
a),
LU
ZP
1B
S2 (
b),
ZR
AN
B2B
S1 (
c)
and Z
RA
NB
2B
S2 (
d)
all
show
in v
itro
tra
nsla
ted P
OU
4F
3-s
pecific
ban
dshifts
(arr
ow
hea
ds),
i.e
. bands t
ha
t are
pre
se
nt
in P
OU
4F
3-c
onta
inin
g lanes a
nd a
bsent
or
mark
edly
att
en
uate
d in in
vitro
tra
nsla
ted lucifera
se
pro
tein
conta
inin
g lane
s.
This
in
dic
ate
s t
hat
in
vitro
tra
nsla
ted
PO
U4F
3 is a
ble
to b
ind t
o a
ll fo
ur
of
the o
ligon
ucle
otides t
este
d.
NB
, th
e a
uto
radio
gra
ph im
ages p
resente
d in
th
is f
igure
are
cro
pp
ed
for
pre
senta
tion
purp
oses.
a)
b)
POU4F
3
No
prot
ein
Lucife
rase
POU4F3
No pro
tein
Lucife
rase
c)
POU4F
3
No
prot
ein
Lucife
rase
d)
POU4F
3
No
prot
ein
Lucife
rase
LUZP1BS1 LUZP1BS2 ZRANB2BS1 ZRANB2BS2

5 Investigation of putative Luzp1, Rbms1 and Zranb2 regulation by POU4F3 203
Figure 5.10. Binding of in vitro translated POU4F3 to RBMS1BS1-3. EMSA analysis of in vitro translated POU4F3 binding to oligonucleotides designed against predicted binding sites in the RBMS1 5’ flanking region. This analysis revealed POU4F3-specific bandshifts for RBMS1BS1 (a, arrowheads). However, a streaky appearance was noted in protein-containing lanes in the analysis of RBMS1BS2 (b) and RBMS1BS3 (c), most likely due to protein-DNA complex degradation. During attempts to improve the resolution of bands for RBMS1BS2 and RBMS1BS3, POU4F3 binding to these oligonucleotides was identified by an alternative method and this method was, therefore, not pursued further.
a)
No
prot
ein
PO
U4F
3Bar
hl1
No
prot
ein
PO
U4F
3Bar
hl1
b)
No
prot
ein
PO
U4F
3Bar
hl1
c)
RBMS1BS1 RBMS1BS2 RBMS1BS3

5 Investigation of putative Luzp1, Rbms1 and Zranb2 regulation by POU4F3 204
5.6.2 EMSA analysis of in vitro translated POU4F3 binding to predicted binding sites in the RBMS1 promoter
The ability of in vitro translated POU4F3 to bind RBMS1 EMSA oligonucleotides was
investigated in the same way as for other candidate genes. Though POU4F3-specific
binding to RBMS1BS1 was seen (Figure 5.10a), autoradiographs for RBMS1BS2 (Figure
5.10b) and RBMS1BS3 (Figure 5.10c) appeared streaky in protein-containing lanes. This
appearance can be caused by protein-DNA complex dissociation or inappropriate salt
concentrations (Hellman et al. 2007). It was not thought to be due to the in vitro translated
Barhl1 or POU4F3 used, as these proteins were able to bind to RBMS1BS1 (Figure 5.10a).
Another abnormality noted in these experiments was the appearance of RBMS1BS3 on
autoradiography in the absence of protein (Figure 5.10c). This oligonucleotide appears have
migrated much slower than RBMS1BS1 or RBMS1BS2 through the polyacrylamide gel in
similar conditions, though this difference may have been due to its greater length (55bp)
compared to RBMS1BS1 (46bp) and RBMS1BS2 (37bp) or concatamerisation of the probe.
As attempts were being made to optimise EMSA conditions to improve the resolution of
bandshifts and thereby determine whether POU4F3 is able to bind to RBMS1BS2 and
RBMS1BS3, POU4F3 binding to these oligonucleotides was identified using UB/OC-2 cell
nuclear protein extract (see section 5.6.3). Given that the question posed in the in vitro
translate experiment had been answered by this alternative method, it was not pursued
further. The limitations of not having identified POU4F3 binding to RBMS1BS1 and
RBMS1BS2 by this method are discussed below.
5.6.3 POU4F3 extracted from UB/OC-2 cell nuclei is able to bind to all oligonucleotides tested
The EMSAs conducted with in vitro translated proteins demonstrated that POU4F3 is able
to bind to LUZP1BS1 & 2, RBMSBS1 and ZRANB2BS1 & 2. However, they do not show
whether this binding is sequence-specific i.e. that POU4F3 is binding to these binding sites
because of their sequence and not through an abnormal protein-DNA interaction produced
by the conditions of the assay despite these conditions being kept as physiological as
possible. Therefore, to verify that the binding seen is sequence-specific, a competition
gradient experiment was carried out (as for NR2F2BS1 & 2; reported in section 4.8.3).
In this experiment an increasing amount of non-radiolabelled POU4F3 consensus
oligonucleotide was added to EMSA reactions. An oligonucleotide that is known to be bound
by POU4F3 (POU4F3 consensus) was used for LUZP1BS1 & 2 and ZRANB2BS1 & 2 with
an oligonucleotide called ‘Prox6 consensus’ – a new POU4F3 consensus sequence designed
by SD – used for RBMS1BS1-3. In separate EMSA reactions, a non-radiolabelled non-
POU4F3-binding sequence (‘AP4 consensus’ for LUZP1BS1&2 and ZRANB2BS1&2; ‘Prox6
mutant’ for RBMS1BS1-2) was included (see Table 5.7). Sequence-specific binding was

5 Investigation of putative Luzp1, Rbms1 and Zranb2 regulation by POU4F3 205
identifiable on autoradiographs as a bandshift that that was attenuated or abolished by
sufficient POU4F3 consensus sequence competition but not as strongly attenuated by an
equivalent amount of non-specific competitor. Though the non-specific competitor should
not attenuate POU4F3 bandshifts as much as specific competition, any competing
oligonucleotide can reduce specific binding when present at great excess, causing some
attenuation of these bandshifts (Hellman et al. 2007). The competitor oligonucleotides also
serve to identify which of the bandshifts produced by the UB/OC-2 cell nuclear extract is
due to POU4F3 and (within experiments) demonstrates the relative POU4F3-binding
affinity of test oligonucleotides.
Autoradiographs of experiments with LUZP1BS1 & 2 (Figure 5.11), RBMS1BS1-3 (Figure
5.12) and ZRANB2BS1 & 2 (Figure 5.13) revealed POU4F3 sequence-specific banding
patterns for all oligonucleotides tested (arrowheads in Figure 5.11, Figure 5.12 and Figure
5.13). For LUZP1BS1 (Figure 5.11a), three such bandshifts were seen with the highest
affinity bandshift being greatly attenuated by 1000x POU4F3 consensus competition and
restored by AP4 consensus competition. Similar bandshifts were seen for LUZP1BS2
(Figure 5.11b), with four POU4F3-specific bandshifts seen, the highest affinity of which was
abolished by 1000x POU4F3 consensus competition. In contrast, only one POU4F3-specific
bandshift was identified for RBMS1BS1 (Figure 5.12a), RBMS1BS2 (Figure 5.12b),
RBMS1BS3 (Figure 5.12c), ZRANB2BS1 (Figure 5.13a) and ZRANB2BS2 (Figure 5.13b).
For the RBMS1 5’ flanking region binding sites, RBMS1BS2 and RBMS1BS3 appeared to
be of approximately equal affinity, requiring 1000x Prox 6 consensus competition to greatly
attenuate the POU4F3-specific bandshift; RBMS1BS1 required only 500x Prox 6 consensus
competition to abolish its equivalent bandshift suggesting a lower POU4F3 binding affinity
for this site. Of the Zranb2 5’ flanking region binding sites, ZRANB2BS1 appeared to have
slightly higher affinity for POU4F3 than ZRANB2BS2, requiring 500x POU4F3 consensus
competition instead of 100x POU4F3 consensus competition to abolish its POU4F3-specific
bandshift. Therefore, the relative affinity of the binding sites tested correlates with the
Genomatix predictions of their matrix similarity to known binding sites (see section 5.5).
These bandshifts can be attributed to POU4F3 as it is expressed in UB/OC-2 cells (where
POU4F1 and POU4F2 are not expressed); all oligonucleotides except RBMS1BS2 and
RBMS1BS3 were shown to be bound by in vitro translated POU4F3; and POU4F3
sequence-specific bandshift patterns were seen for all oligonucleotides tested. Further
evidence of these bands being produced by POU4F3 would be provided by a ‘supershift’
analysis, though no suitable antibody exists for this analysis. For RBMS1BS2 and
RBMS1BS3, greater evidence of POU4F3 binding could be obtained by optimisation of the
EMSA with in vitro translated POU4F3 to reduce the streakiness seen in previous attempts
of this assay as, in the absence of a supershift analysis, this would support the evidence
that the POU4F3 sequence-specific bands identified in Figure 5.12b and c are produced by
POU4F3.

5 Investigation of putative Luzp1, Rbms1 and Zranb2 regulation by POU4F3 206
The evidence provided by the EMSA analyses described above shows that POU4F3 is able
to bind sites in the Luzp1, RBMS1 and Zranb2 5’ flanking regions. As POU4F3 sequence-
specific binding was seen at all the binding sites identified by analysis of predicted
candidate gene promoters (nine binding sites in total), the strategy used to identify these
sites appears highly sensitive (see section 5.5). If POU4F3 is able to bind these sites in vivo,
and if candidate gene upregulation is verified, it may be able to transactivate the candidate
genes identified by the subtractive hybridization at the sites identified. Such binding could
be investigated by chromatin immunoprecipitation experiments. However, despite
preliminary attempts to investigate the binding of a POU4F3 fusion protein to these sites
by this method (in cell lines) at a very late stage of this investigation, such binding was not
seen. Furthermore, the practical limitations of antibody and tissue availability made the
investigation of native POU4F3 binding to these sites in hair cells impractical at this stage
(see Chapter 6).
Table 5.7. Consensus sequence oligonucleotides for competition assays. POU4F3 consensus 1 and AP4 are reproduced from Table 4.2 for ease of reference. Prox 6 consensus and Prox 6 mutant oligonucleotides were designed by SD. Mutant bases in Prox 6 mutant are underlined.
Name Sequence
POU4F3 consensus 1 CACGCATAATTAATCGC
AP4 consensus CTAGCCCAGCTGTGGCAGCCC
Prox 6 consensus TCGATCTCCTGCATAATTAATTACGCCG
Prox 6 mutant TCGATCTCCTGCATAAGCAAGCACGCCG

5 Investigation of putative Luzp1, Rbms1 and Zranb2 regulation by POU4F3 207
Figure 5.11. Binding of UB/OC-2 cell nuclear protein extract to LUZP1BS1 & 2. EMSAs were performed using [γ-32P]ATP labelled DNA oligonucleotides which corresponded to two predicted high-stringency POU binding sites in the Luzp1 gene promoter (LUZP1BS1 and LUZP1BS2). Oligonucleotides were incubated with non-radiolabelled POU4F3 or AP4 consensus binding site to determine bandshifts due to sequence-specific POU4F3 binding. This analysis revealed POU4F3-specific banding patterns for both LUZP1BS1 (a, arrowheads) and LUZP1BS2 (b, arrowheads), indicating that POU4F3 from UB/OC-2 cell nuclear extract is able to bind both oligonucleotides.
a) b)

5 I
nvest
igati
on
of
pu
tati
ve Luzp1, Rbms1
an
d Zranb2 r
egu
lati
on
by P
OU
4F
3
208
Fig
ure
5.1
2.
Bin
din
g o
f U
B/O
C-2
cell
nu
cle
ar
pro
tein
extr
act
to R
BM
S1B
S1-3
. E
MS
As w
ere
carr
ied o
ut
as f
or
RB
MS
1 E
MS
A o
ligonu
cle
otides.
How
ever,
non-r
adio
lab
elle
d P
rox6 c
onsensu
s a
nd P
rox6 m
uta
nt
olig
on
ucle
otides w
as u
se
d inste
ad o
f non-r
ad
iola
belle
d
PO
U4F
3
and
AP
4
conse
nsus
olig
onucle
otid
es
to
dete
rmin
e
sequ
ence-s
pecific
P
OU
4F
3
bin
din
g
to
RB
MS
1-3
. P
OU
4F
3-s
pecific
b
andsh
ifts
(a
rrow
hea
ds)
were
iden
tified f
or
RB
MS
1B
S1 (
a),
RB
MS
1B
S2
(b)
an
d R
BM
S1B
S3 (
c).
NB
, th
e a
uto
rad
iogra
ph im
ages p
rese
nte
d i
n t
his
fig
ure
are
cro
pped
for
pre
senta
tio
n p
urp
oses.
a)
b)
c)

5 Investigation of putative Luzp1, Rbms1 and Zranb2 regulation by POU4F3 209
Figure 5.13. Binding of UB/OC-2 cell nuclear protein extract to ZRANB2BS1 & 2. a) radiolabelled binding site one (ZRANB2BS1) was incubated with / without UB/OC-2 cell nuclear extract and with varying amounts of non-radiolabelled POU4F3 or AP4 consensus binding site. The same assay was conducted using ZRANB2BS2 (b). Both experiments demonstrate a banding pattern that is likely to be due to POU4F3 contained in the UB/OC-2 cell nuclear protein extract used (arrowheads).
a) b)

5 Investigation of putative Luzp1, Rbms1 and Zranb2 regulation by POU4F3 210
5.7 Activation of candidate gene 5’ flanking regions
by POU4F3
The results of the subtractive hybridization suggest that all three of the remaining
prioritised candidate genes (Luzp1, Rbms1 and Zranb2) are activated by POU4F3 (Table
3.1). In order to verify and characterise this regulation, the ability of POU4F3 to activate
the 5’ flanking regions of candidate genes (which are likely to form part of the gene
promoter) was tested by luciferase reporter gene assays. In order to carry out these
experiments, plasmid constructs containing the 5’ flanking region of a candidate gene
upstream of luciferase cDNA were obtained from collaborators or cloned. Such constructs
are occasionally referred to as promoter constructs for convenience though the ability of the
candidate gene 5’ flanking regions used to act as full length promoters has not been
demonstrated. These constructs were cotransfected with a POU4F3 expression construct in
ND7 cells and their response was assessed by luminometry. ND7 cells were selected for
these assays as they had been shown to be suitable for this application in previous
experiments with Nr2f2 promoter reporter constructs.
5.7.1 Cloning of candidate gene 5’flanking region reporter constructs
Luzp1
As no luciferase reporter promoter construct existed for Luzp1, a construct containing 2.8kb
of the Luzp1 5’ flanking region was cloned and named LUZP1p2.8kb. Primers were
designed to amplify the 2.8kb sequence from mouse genomic DNA and this was cloned into
the pDrive cloning vector prior to subcloning into the pGL4.10 luciferase reporter construct
(which contains a luciferase gene that is codon optimised for expression in mammalian
cells) and sequencing to verify insert orientation. The sequence cloned encompassed both
LUZP1BS1 and LUZP1BS2.
RBMS1
A vector containing 1.3kb of the RBMS1 5’ flanking region was kindly provided by Dr H
Ariga (RBMS1p1.3kb). In this reporter construct, the RBMS1 5’ flanking region had been
cloned into the promoterless pGV-B luciferase reporter vector (Haigermoser et al. 1996).
The regulation of this vector by POU4F3 had not been assessed. Therefore, an empty pGV-
B vector (i.e. pGV-B without the RBMS1 5’ flanking region) was created by excision of the
RBMS1 5’ flanking region to assess regulation of the vector by POU4F3 in luciferase assay.
Notably, RBMS1p1.3kb only contains RBMS1BS3 and does not contain RBMS1BS1 or
RBMS1BS2 which lie upstream of this RBMS1 5’ flanking sequence. Therefore, to
encompass these binding sites, an RBMS1 5’ flanking region reporter construct was cloned

5 Investigation of putative Luzp1, Rbms1 and Zranb2 regulation by POU4F3 211
in our laboratory (by SD) by excising 5.1kb of the RBMS1 5’ flanking sequence from a
plasmid containing 21kb of the RBMS1 5’ flanking sequence in the pUC19 vector (also
kindly provided by Dr H Ariga) and inserting the 5.1kb sequence into the pGL4.10 vector.
Zranb2
As for Luzp1, no luciferase reporter constructs existed for the Zranb2 promoter. Therefore,
a 3.2kb region of the Zranb2 5’ flanking region that includes ZRANB2BS1 & 2 was
amplified from mouse genomic DNA and cloned into the pDrive cloning vector prior to
subcloning into the pGL4.10 vector. As the GC content of the region immediately 5’ to the
Zranb2 transcriptional start site (TSS) was too high for suitable primer design and, given
that designing a primer 5’ to this region might exclude the core promoter from the cloned
sequence, I designed the 3’ PCR primer to a region immediately downstream of the TSS. As
the cloned promoter would contain the Zranb2 TSS, the primer was designed to be in frame
with the luc2 TSS in the pGL-4.10 vector to avoid interference with luciferase transcription.
The fragment amplified with these primers was ligated into pDrive and the KpnI-XbaI
fragment of this construct was subsequently inserted into the KpnI-NheI site of
pGL4.10[luc2]. Correct insertion of the amplified sequence was verified by sequencing. This
reporter construct was named ZRANB2p3.2kb.
5.7.2 Regulation of LUZP1p2.8kb by POU4F3
The ability of POU4F3 to regulate a Luzp1 promoter construct (LUZP1p2.8kb) was
investigated by luciferase assay. LUZP1p2.8kb was cotransfected with increasing amounts
of a POU4F3 expression construct (pSi-Pou4f3) and pRL-null for normalization of luciferase
values to transfection efficiency. The total amount of DNA transfected was maintained at a
constant level with empty pSi vector. An identical assay was carried out with the dreidel
expression construct (pSi-Dreidel) in place of pSi-Pou4f3 to ensure that any response seen
was due to the specific action of POU4F3. The empty pGL4.10 vector has previously been
show to show modest (1.4-fold) regulation by POU4F3 in ND7 cells in experiments in our
laboratory (by JK).
The results of this experiment show that the LUZP1p2.8kb responds to 1µg of cotransfected
pSi-Pou4f3 with a two-fold upregulation (Figure 5.14). This response is likely to be due to
specific regulation by POU4F3 as the response of the promoter construct to the same
amount of pSi-Dreidel revealed a smaller (1.4-fold) upregulation. However, the difference in
regulation by POU4F3 and dreidel mutant protein is modest. The results presented in
Figure 5.14 represent the results of two separate experiments with each condition assayed
in triplicate i.e. six samples per data point. In order to verify the small difference in
regulation between POU4F3 and dreidel mutant POU4F3, a greater number of repeats
would be required to ensure that the difference seen is not due to chance and thereby
provide stronger evidence that the LUZP1p2.8kb regulation seen is POU4F3-specific.

5 I
nvest
igati
on
of
pu
tati
ve Luzp1, Rbms1
an
d Zranb2 r
egu
lati
on
by P
OU
4F
3
212
Fig
ure
5.1
4.
Resp
on
se o
f L
UZ
P1p
2.8
kb
to
PO
U4F
3.
ND
7 c
ells
were
cotr
ansfe
cte
d w
ith 2
00n
g L
UZ
P1p
2.8
kb
, 10
ng p
RL-n
ull
and i
ncre
asin
g a
mou
nts
of
expre
ssio
n c
onstr
uct
(pS
i-P
ou
4f3
or
pS
i-D
reid
el).
Th
e t
ota
l am
ou
nt
of
DN
A in
each cotr
ansfe
ction w
as m
ain
tain
ed
at
1210
ng usin
g th
e em
pty
pS
i vecto
r. In
cre
asin
g th
e a
mou
nt
of
PO
U4F
3 re
sults in
an in
cre
ase in
LU
ZP
1p2.8
kb a
ctiva
tio
n o
f tw
o-f
old
at
the m
axim
al
level
transfe
cte
d (
10
00n
g p
Si-P
ou4
f3)
an
d c
otr
ansfe
ctions o
f LU
ZP
1p
2.8
kb w
ith a
n e
quiv
ale
nt
am
ou
nt
of
the
muta
nt
Pou
4f3
expre
ssio
n v
ecto
r pS
i-D
reid
el re
sults in
a s
ma
ller
upre
gula
tion (
1.4
-fold
). S
V40e
, S
V4
0 e
nhan
cer
/ early p
rom
ote
r; S
V4
0l, S
V40 late
po
ly(A
).

5 Investigation of putative Luzp1, Rbms1 and Zranb2 regulation by POU4F3 213
5.7.3 Regulation of RBMS1p1.3kb and RBMS1p5.1kb by POU4F3
The ability of POU4F3 to regulate the RBMS1p1.3kb promoter construct was tested
similarly to LUZP1p2.8kb (section 5.7.2) though assays were repeated a different number of
times. Furthermore, due to problems with low transfection efficiency, the amount of pRL-
null included in experiments where RBMS1p1.3kb and pSi-Dreidel or pGV-B and pSi-
Pou4f3 were cotransfected was increased to 50ng to ensure sufficient sea pansy luciferase
production for detection on luminometry.
These experiments showed that RBMS1p1.3kb is activated by increasing amounts of
POU4F3. At the largest amount of pSi-Pou4f3 (1µg) RBMS1p1.3kb is activated 2.7-fold
compared to transfections with an equivalent amount of empty pSi vector. This effect was
shown to be POU4F3-specific and not caused by regulation of the pGV-B plasmid into
which the 1.3kb Rbms1 promoter is cloned as control experiments demonstrated that
RBMS1p1.3kb activity is repressed by 1µg pSi-Dreidel and pGV-B is repressed by 1µg pSi-
Pou4f3 (Figure 5.15).
Given that POU4F3 has been shown to bind the RBMS1BS3 binding site contained in
RBMS1p1.3kb by EMSA analysis (Figure 5.12c), it is likely that the upregulation of this
reporter construct by POU4F3 is produced at this site. As well as RBMS1BS3, two other
sites (RBMS1BS1 and RBMSBS2) were shown to be bound by POU4F3 in EMSA analysis.
A construct containing a longer fragment (5.1kb) of the RBMS1 5’ flanking sequence that
encompassed these sites as well as RBMS1BS1 was cloned in order to identify whether
their inclusion affected RBMS1 5’ flanking region activation by POU4F3 (see section 5.7.1).
The activation of 200ng RBMS1p5.1kb cotransfected with 0ng or 1µg pSi-Pou4f3 and 50ng
pRL-null was compared to RBMS1p5.1kb cotransfected with 0ng or 1µg pSi-Dreidel and
10ng pRL-null. Figure 5.16 shows that RBMS1p5.1kb is upregulated 2.6-fold by 1µg pSi-
Pou4f3 – an activation which is similar to that of RBMS1p1.3kb when cotransfected with
equivalent amounts of pSi-Pou4f3. As for RBMS1p1.3kb, this response was shown to be
POU4F3-specific as pSi-Dreidel is unable to activate RBMS1p5.1kb. Furthermore, the
response seen is not due to regulation of the pGL4.10 vector which only shows a 1.4-fold
response to POU4F3 in these conditions as determined by JK in our laboratory.

5 I
nvest
igati
on
of
pu
tati
ve Luzp1, Rbms1
an
d Zranb2 r
egu
lati
on
by P
OU
4F
3
214
Fig
ure
5.1
5.
Reg
ula
tio
n o
f R
BM
S1p
1.3
kb
by P
OU
4F
3.
ND
7 c
ells
were
cotr
ansfe
cte
d w
ith 2
00ng R
BM
S1
p1.3
kb
or
pG
V-B
and incre
asin
g a
mo
unts
of
expre
ssio
n c
onstr
uct
(pS
i-P
ou4f3
or
pS
i-D
reid
el).T
he a
mo
unt
of
pR
L-
null
used
w
as 10
ng
fo
r R
BM
S1p
1.3
kb
cotr
ansfe
ctio
ns w
ith pS
i-P
ou4f3
an
d 5
0ng
fo
r all
oth
er
assays.
The to
tal
am
ount
of
DN
A in
e
ach cotr
ansfe
ction
w
as
main
tain
ed a
t a
consta
nt
level
usin
g th
e em
pty
p
Si
vecto
r. In
cre
asin
g P
OU
4F
3 expre
ssio
n in
cre
ases R
BM
S1p
1.3
kb
activa
tio
n 2
.7-f
old
at
the m
axim
al
level
transfe
cte
d (
100
0ng p
Si-P
ou4f3
). T
his
re
gu
lation i
s n
ot
due t
o r
eg
ula
tion o
f th
e p
GV
-B v
ecto
r in
to w
hic
h t
he R
bm
s1 p
rom
ote
r w
as c
lone
d a
s t
his
vecto
r is
not
activate
d b
y P
OU
4F
3. F
urt
herm
ore
, th
is a
ctivatio
n is P
OU
4F
3-s
pecific
as a
n e
qu
ivale
nt a
mo
unt
of p
Si-D
reid
el re
su
lts in a
re
duction in R
BM
S1p
1.3
kb
activatio
n.

5 Investigation of putative Luzp1, Rbms1 and Zranb2 regulation by POU4F3 215
Figure 5.16. Regulation of RBMS1p5.1kb by POU4F3. 200ng RBMS1p5.1kb was cotransfected with either pSi-Pou4f3 and 50ng pRL-null or pSi-Dreidel with 10ng pRL-null in ND7 cells. The total amount of DNA transfected was kept constant using the empty pSi expression vector. RBMS1p5.1kb showed a 2.6-fold response to 1µg pSi-Pou4f3 and this response was shown to be POU4F3-specific as dreidel mutant POU4F3 did not activate RBMS1p5.1kb. SV40e, SV40 enhancer / early promoter; SV40l, SV40 late poly(A).
Taken together, the POU4F3-specific activation of two different RBMS1 promoter
constructs in two different reporter vectors (pGV-B for RBMS1p1.3kb and pGL4.10 for
RBMS1p5.1kb) clearly demonstrates the ability of POU4F3 to activate the RBMS1 5’
flanking region in vitro. Furthermore, these results and EMSA data that demonstrate
POU4F3 binding to three sites in the RBMS1 5’ flanking region strongly suggest that this
activation is produced by a direct mechanism i.e. that POU4F3 binds to the RBMS1 5’
flanking region to produce this activation in this cellular context.
Though it is tempting to speculate that RBMS1BS1 and RBMS1BS2 are unlikely to
influence POU4F3 regulation of the RBMS1 promoter because RBMS1p5.1kb does not show
a larger response than the construct that only contains RBMS1BS3 (RBMS1p1.3kb), this is
not necessarily the case as RBMS1p5.1kb may contain binding sites for transcription
factors that mediate repression of RBMS1. Furthermore, it is known to contain the -1283 to
-1709 region (which contains RBMSBS1 and RBMS1BS2) that reduces basal RBMS1 5’
flanking region activation in HeLa cells (Haigermoser et al. 1996). Therefore, the preferred
method for assessment of the putative contribution of each binding to site to POU4F3
activation of RBMS1 promoter reporter constructs remains site-directed mutagenesis.

5 Investigation of putative Luzp1, Rbms1 and Zranb2 regulation by POU4F3 216
5.7.4 Assessment of ZRANB2p3.2kb regulation by POU4F3
A luciferase assay was carried out with the ZRANB2p3.2kb luciferase reporter construct as
for RBMS1p5.1kb. As before, the reporter construct was cotransfected with pRL-null (to
control for variation in transfection efficiency and cell number) and either pSi-Pou4f3 or
pSi-Dreidel. The results of this assay (Figure 5.17) show that ZRANB2p3.2kb is
upregulated 1.6-fold by 1µg pSi-Pou4f3 and 2.1-fold by 1µg pSi-Dreidel. This shows that the
Zranb2 5’ flanking region cloned is not specifically activated by POU3F3.
The unusually large response of ZRANB2p3.2kb to dreidel mutant POU4F3 and high levels
of basal luciferase production seen with this construct suggest that any protein-specific
activation may be masked in the conditions used to investigate its regulation. Due to the
inclusion of the Zranb2 transcriptional start site in ZRANB2p3.2kb, basal regulation of this
promoter in ND7 cells, which have been shown to express ZRANB2 (data not shown), may
be sufficient to mask any POU4F3-specific effect. This hypothesis could be tested by
subcloning a promoter construct that does not include the Zranb2 transcriptional start site
or by assaying ZRANB2p3.2kb activation in cells that do not constitutively express
ZRANB2 to reduce the suggested background regulation, though the transcriptional
environment in such cells may not be suitable for the assessment of POU4F3 function.
However, based on current evidence (Figure 5.17), ZRANB2p3.2kb does not appear to be
activated by POU4F3 and, therefore, Zranb2 is unlikely to be a true target of POU4F3.
Figure 5.17. ZRANB2p3.2kb is not regulated by POU4F3. Cotransfections were carried out for ZRANB2p3.2kb as for other promoter constructs tested. In this experiment 200ng of the reporter construct was cotransfected with differing amounts of pSi-Pou4f3 (with 50ng pRL-null) or pSi-Dreidel (with 10ng pRL-null) in ND7 cells. Though the promoter demonstrated a 1.6-fold increase in luciferase production in the presence of 1000ng pSi-Pou4f3, a 2.1-fold response was seen with an equivalent amount of pSi-Dreidel. Therefore, ZRANB2p3.2 does not appear to be specifically activated by POU4F3. SV40e, SV40 enhancer / early promoter; SV40l, SV40 late poly(A).

5 Investigation of putative Luzp1, Rbms1 and Zranb2 regulation by POU4F3 217
5.8 Summary and discussion of candidate gene
activation by POU4F3 Luzp1, Rbms1 and Zranb2 were suggested to be POU4F3 target genes by a subtractive
hybridization screen in UB/OC-2 cells. These genes were prioritised for further
investigation on the basis of their potential roles in hair cell development and survival; the
availability of reagents for their study; and the identification of putative POU4F3 binding
sites in their predicted promoter regions.
I first attempted to determine the inner ear expression patterns of these candidate genes by
immunohistochemistry. As Zranb2 was the only candidate gene (apart from Nr2f2) for
which I was able to obtain an antibody that was suitable for immunohistochemistry, its
inner ear expression pattern was characterised. This revealed widespread ZRANB2
expression in the P0 cochlea that declined to undetectable levels by P4. It was noted to be
expressed in hair cells at P0, suggesting that it is coexpressed with POU4F3, which is
known to be expressed in hair cells at this stage. This coexpression supported the
possibility that POU4F3 might regulate Zranb2 in hair cells. Given that it was not possible
to obtain suitable antibodies to investigate LUZP1 and RBMS1 expression in the inner ear,
RNA in situ hybridization could be used in future work to investigate their expression.
Following the investigation of candidate gene inner ear expression, putative regulation of
target genes by POU4F3 was investigated at the transcriptional level. Bioinformatic
software was used to identify POU4F3 binding sites in predicted target gene promoters and
putative POU4F3 binding sites were identified in these regions. The identification of high
stringency predicted POU4F3 binding sites aided in the selection of these candidate genes
for further investigation and oligonucleotides designed against predicted binding sites were
used in a protein-DNA binding assay (EMSA) to determine whether POU4F3 can bind
oligonucleotides that correspond to these sites in candidate gene promoters.
This analysis revealed that POU4F3 is able to bind to two sites in the Luzp1 5’ flanking
region, three sites in the RBMS1 5’ flanking region and two sites in the Zranb2 5’ flanking
region. These binding sites therefore represent potential locations for POU4F3 regulation of
candidate target genes. Having demonstrated that POU4F3 is able to bind sites in
candidate gene 5’ flanking regions, its ability to activate candidate gene 5’ flanking region
luciferase reporter constructs that contain these binding sites was assessed.
Candidate gene 5’ flanking regions were cloned for Luzp1, Rbms1 and Zranb2 and a
luciferase reporter construct was obtained for Rbms1. The Luzp1 promoter construct
(LUZP1p2.8kb) and two RBMS1 promoter constructs (RBMS1p1.3kb and RBMS1p5.1kb)
were shown to be activated by POU4F3, supporting the hypothesis that POU4F3 is able to

5 Investigation of putative Luzp1, Rbms1 and Zranb2 regulation by POU4F3 218
regulate the 5’ flanking regions of these genes in the context of genomic DNA. However,
POU4F3 was shown not to be able to specifically upregulate the Zranb2 promoter construct
ZRANB2p3.2kb.
Based on the above evidence, Luzp1 is suggested to be modestly regulated by POU4F3.
Therefore, the upregulation of LUZP1p2.8kb should be confirmed by repetition of luciferase
assays (section Figure 5.14) and putative sites at which POU4F3 might produce
upregulation of this reporter construct (i.e. LUZP1BS1 and LUZP1BS2) should by mutated
(as for NR2F2BS1 and NR2F2BS2) in order to identify whether these are the sites of
activation and, therefore, whether POU4F3 is likely to directly activate LUZP1p2.8kb.
Results from these experiments will, furthermore, provide stronger evidence that POU4F3
might upregulate Luzp1 in vivo. In order to investigate the relevance of any interaction in
the inner ear, LUZP1 expression requires investigation. Since the conclusion of the studies
reported in this chapter, an anti-LUZP1 antibody has been obtained and is currently being
used to attempt to identify whether LUZP1 is expressed in the inner ear.
Unlike Luzp1, the evidence for POU4F3 upregulation of the Rbms1 5’ flanking region
reporter constructs, RBMS1p1.3kb and RBMS1p5.1kb is strong. Therefore, RBMS1BS1-3
should be mutated in these constructs to identify which, if any, of these is responsible for
the activations seen at these promoters. As for LUZP1, the expression pattern of RBMS1 in
the inner ear remains to be characterised and would require an antibody that is suitable for
immunohistochemistry to be obtained or RNA in situ hybridizations to be conducted. Such
experiments would identify whether Rbms1 is expressed in hair cells and, therefore,
whether Rbms1 activation by POU4F3 is likely to be relevant to hair cell development and
maintenance. Alternatively, reverse transcriptase PCR strategies or investigation of Rbms1
knockout mouse inner ears may identify whether it plays a role in hair cell development or
survival.
ZRANB2 has been shown to be expressed in the inner ear and two sites in its promoter
have been shown to be bound by POU43 by EMSA analysis. However, the ability of
POU4F3 to activate the Zranb2 5’ flanking region has not been characterised as the
reporter construct cloned (ZRANB2p3.2kb) displays strong basal regulation in ND7 cells
that may mask any transcriptional effect of POU4F3. Therefore, a Zranb2 promoter
construct should be cloned that omits the transcriptional start site to attempt to abolish
this basal regulation. Alternatively the response of ZRANB2p3.2kb to POU4F3 could be
assayed in a cell type that does not exhibit high basal regulation of this construct. However,
given that POU4F3 has been shown to activate some target gene promoters in a cell-specific
manner, attempts should be made to ensure that the transcriptional environment in the
cell type chosen is likely to reflect that of neuronal or sensory epithelial cells.

5 Investigation of putative Luzp1, Rbms1 and Zranb2 regulation by POU4F3 219
The varying levels of evidence for the expression and POU4F3 regulation of candidate
genes reported above demonstrates the difficulty of investigating a large number of genes
following a screen such as a subtractive hybridization (discussed further in Chapter 6).
However, they also demonstrate the value of obtaining clear evidence of candidate gene
expression and regulation in order to prioritise these genes for further investigation,
thereby allowing more effective allocation of limited resources. Therefore, based on the
current evidence available for Luzp1, Rbms1 and Zranb2, the interaction between POU4F3
and Rbms1 appears to be the best candidate for further investigation. This is because, the
RBMS1 5’ flanking region reporter constructs tested demonstrate the most robust
activation in response to POU4F3 and RBMS1 is known to be involved in many roles
relevant to hair cell maintenance and survival (see section 5.1.2). However, a priority in
such an investigation would be to identify whether RBMS1 is expressed in hair cells in
order to determine whether the regulatory relationship seen in ND7 cells and the known
functions of RBMS1 are relevant to the development and maintenance of these cells.

6 General discussion 220
6
GENERAL DISCUSSION
The investigation reported in this thesis represents an attempt to better understand the
mechanism by which POU4F3 mediates hair cell differentiation and survival. We aimed to
clarify why hair cells fail to terminally differentiate and survive in homozygous Pou4f3
knockout mice and how the human deafness caused by POU4F3 mutation (DFNA15) occurs
(Collin et al. 2008;Vahava et al. 1998;Xiang et al. 1998). As POU4F3 is a transcription
factor with no other identified function, these phenotypes are almost certainly caused by
dysregulation of POU4F3 target genes.
At the time that this investigation was commenced in our laboratory, subtractive
hybridization was selected to identify POU4F3 target genes, as it was the most appropriate
strategy available. The selection of this strategy, as well as other methodologies applied in
this investigation, reflects ongoing difficulties in the analysis of inner ear biology. In
particular, the investigation of hair cells presents unique challenges as these cells are
relatively inaccessible, making it difficult to obtain sufficient material for molecular
analysis. Furthermore, these cells are mitotically quiescent and must therefore be isolated
from primary tissue prior to investigation. Finally, it is difficult to use standard
methodologies and reagents to investigate gene regulation in these cells, requiring time-
consuming and potentially costly methods to be used for their investigation e.g. viral
transfection.
As previously discussed (section 3.3), the subtractive hybridization itself presented the
challenge of managing, prioritising and investigating a large number of candidate genes. In
contrast to a similar experiment conducted in our laboratory for another inner ear
transcription factor that only revealed four differentially expressed clones (unpublished
data, VG), the present study yielded a large number of differentially expressed clones. This
is likely to not only reflect differences in the methodology used (i.e. the stringency by which
differentially expressed transcripts were identified) but also the nature of POU4F3 function
i.e. POU4F3 is likely to produce its effects by the subtle modulation of a large number of
genes which, in turn, mediate hair cell survival and maintenance by a summative action
rather than it simply activating the expression of known hair cell structural components to

6 General discussion 221
produce the hair cell phenotype. The results of this subtractive hybridization therefore
represented a difficult middle-ground whereby the potentially differentially expressed
genes identified are too numerous to all be investigated but too few to submit to
bioinformatic software, developed for microarray studies, that might be able to provide
information on the systems-level effect of POU4F3 e.g. by extracting common pathways
that candidate target genes are involved in by literature mining (Munir et al. 2004).
The method by which target genes were prioritised for investigation was, therefore, a
difficult and sometimes subjective process, with ongoing experiments revealing potentially
interesting results for genes that were not originally prioritised for investigation by this
method. Thus, the outcomes seen identify the strengths and weaknesses of the strategy
employed. For example, the identification of genes with available (and obtainable) reagents
allowed for the rapid verification and characterisation of NR2F2 and ZRANB2 expression in
the early postnatal inner ear. However, the lack of available reagents for other candidate
genes led to their investigation not being pursued despite subsequent work demonstrating
potentially interesting roles for these genes e.g. recent work with RCN1 has shown that it
is expressed in hair cells in the P1 mouse inner ear (unpublished data).
The case of Rcn1 and other genes investigated herein also illustrate a general problem
reaffirmed by the present study: that many of the large online databases of gene
information, expression etc. are still incomplete and sometimes misleading. For example,
clones that were originally not found to significantly match genomic DNA in the mouse
genome (through BLAST analysis) can now be seen to match genes in this database.
Therefore, such resources cannot be used as a reliable replacement for appropriately
reported information in the scientific literature, though they may eventually incorporate
this information.
Turning now to the evidence identified for candidate gene expression in the ear and
potential regulation by POU4F3. Immunohistochemistry proved to be a rapid and cost-
efficient method by which to investigate candidate gene expression in the inner ear. In this
study, it was effective for characterising NR2F2 expression (section 4.7) and identifying
ZRANB2 expression (section 5.4.3).
Future work for NR2F2 will focus on verifying and explaining differences in its expression
in the mouse and rat inner ears; characterising the suggested nuclear to cytoplasmic shift
in its expression seen in the basal P8 rat cochlea; and verifying that POU4F3 is able to
regulate its expression in this system (see below). Future work for ZRANB2 will focus on
verifying and characterising its apparently rapid downregulation between P0 and P4 rat
inner ears. It would also be interesting to examine its expression in development i.e. around
the time of onset of POU4F3 expression, in order to see what relationship the expression

6 General discussion 222
patterns of the two genes bear (if any). Furthermore, the investigation of the potential for
ZRANB2 to induce alternative splicing in the inner ear could be of particular interest.
As previously mentioned, LUZP1 expression is currently being investigated in the inner ear
and investigation of Rbms1 expression is dependant on obtaining a suitable antibody for
immunohistochemistry or pursuing RNA in situ hybridization (which has been attempted
without success) to characterise its expression. Though RNA in situ hybridization may be
required for future work, its use at earlier stages of the investigation would have been less
efficient than immunohistochemistry which was shown to be an efficient means of assessing
candidate gene expression in the inner ear in this study. For all of the genes that were
found to be expressed in the inner ear, greater information on the potential effect of
POU4F3 on their regulation could be provided by quantification of their level of expression
(e.g. by quantitative PCR), though the technical impediments to this may be substantial,
depending on their expression pattern.
In terms of the investigation of transcriptional regulation reported here, the strategy used
(identification of POU4F3 binding to sites in target gene 5’ flanking regions and luciferase
assay of target gene reporter promoter constructs) appeared to be highly sensitive. The
binding sites predicted by the Genomatix programs used (MatInspector and
ModelInspector) were all shown to be bound by POU4F3 which, in comparison to previous
experiments in our laboratory, is a substantial improvement compared to older versions of
this software. Therefore, the existing positional weight matrix and contextual information
for POU-factor binding contained in the Genomatix database appears to be extremely
accurate though, as the TransFac database is no longer being maintained, it is a shame
that no freely available resource for the collation of transcriptional regulatory information
now exists. This deficit hindered attempts to investigate the basic mechanisms by which
POU4F3 binds and activates target gene promoters.
Luciferase assays of reporter constructs with the luciferase gene under the regulation of
candidate gene 5’ flanking regions demonstrated that POU4F3 is able to activate these
regions for Nr2f2, Luzp1 (pending verification) and RBMS1 with further work required to
identify whether it is able to activate the Zranb2 5’ flanking region. Furthermore,
activation of the Nr2f2 5’ flanking region tested was shown to occur at identified binding
sites by site-directed mutagenesis, though the individual contribution of each of these sites
remains to be determined. Future experiments will focus on determining whether the
binding sites identified in the Luzp1 and RBMS1 5’ flanking regions are the loci for
regulation of their reporter constructs. This can be investigated by site-directed
mutagenesis, as for Nr2f2. Furthermore, demonstration of the ability of POU4F3 to bind
these sites in a more physiological context than that of the EMSA analysis will provide
evidence as to whether these sites are likely to be bound by POU4F3 in vivo. At a very late

6 General discussion 223
stage of this work preliminary attempts were made to investigate POU4F3 binding to these
sites by chromatin immunoprecipitation using a fusion protein to overcome the lack of a
suitable anti-POU4F3 antibody. However, none of the binding sites were identified by this
method. Furthermore, this protocol requires further optimisation and the possibility that
the fusion protein affects POU4F3 binding ability has not been excluded.
Taken together, the results of the DNA-binding and promoter regulation experiments
conducted (EMSAs and luciferase assays respectively) verify and extend the results of the
subtractive hybridization. These results support the hypothesis that the candidate genes
investigated (Nr2f2, Luzp1, Rbms1 and Zranb2) may be targets of POU4F3 regulation in
hair cells (though the ability of POU4F3 to regulate the Zranb2 and Luzp1 5’ flanking
regions particularly requires further investigation).
In order to investigate candidate gene responses to POU4F3 in hair cells, we intended to
manipulate Pou4f3 expression in these cells in cochlear cultures and assay target gene
response (to the single cell level) using a cell collection and quantitative (real time) reverse
transcriptase PCR strategy devised in our laboratory (unpublished data). As previously
discussed, inner ear biology is difficult to investigate by such methods as the required
tissue is difficult to obtain and manipulate; hence the use of UB/OC-2 cells to identify
POU4F3 target genes by subtractive hybridization. Accordingly, despite many transfection
methods being attempted (e.g. cationic agents, electroporation and gene gun), it was not
possible to transfect hair cells in cochlear cultures and, thereby, investigate the response
and function of POU4F3 target genes in this system. Current attempts to manipulate
target gene expression in these cells using viral vectors appear more promising and may
therefore aid in the elucidation of the physiological regulation of POU4F3 target genes.
An alternative method to examine candidate gene regulation in response to POU4F3 would
be to examine the inner ears of Pou4f3 mutant mice. However, the abnormalities seen in
these mutants (i.e. disruption of the elaborate mosaic structure of the organ of Corti,
impaired nascent hair cell terminal differentiation and degeneration of hair cells by
apoptosis) may mask the effect of POU4F3 on their regulation (Erkman et al.
1996;Hertzano et al. 2004;Xiang et al. 1998;Xiang et al. 1997). Furthermore, the expression
patterns of investigated genes show that they are not only expressed in hair cells in the
inner ear, demonstrating that POU4F3 is unlikely to be required for their expression and
might therefore play a subtle role in their regulation. Therefore, the controlled
manipulation of Pou4f3 expression in cochlear cultures appears to be a more sensitive and
versatile means of investigating the proposed regulation of target genes in hair cells and,
potentially, elucidating their function in hair cells.

6 General discussion 224
The clones investigated in this study represent approximately half of those obtained from
the subtractive hybridization screen. The remainder of these clones were investigated by
ET and a discussion of the understanding of POU4F3 function gained from this
investigation is, therefore, not complete without the inclusion of these genes. Though some
of the candidate genes identified share common functions (e.g. transcription factor activity),
the putative POU4F3 target genes identified by the subtractive hybridization appear to
have varied function, ranging from transcription factors to ion channels. As some of these
putative POU4F3 targets are extremely undercharacterised and others have not been
characterised in the inner ear, it has been difficult to relate the regulation of verified
POU4F3 target genes to the production of the hair cell phenotype and any such relation
remains speculative. However, recent investigations by ET suggest that at least three
POU4F3 target genes identified by the subtractive hybridization may be involved in
cellular responses to stressful stimuli (e.g. heat shock or, aminoglycoside antibiotics)
(unpublished data), thus illustrating how POU4F3 may mediate hair cell responses to
stress and suggesting roles for these factors in ensuring hair cell survival in development.
One notable observation of the subtractive hybridization was that it did not identify known
direct targets of POU4F3 (Bdnf and Ntf3) and transcription factors that have been strongly
associated with POU4F3 expression and shown to be involved in hair cell development
(Gfi1 and Lhx3). Though POU4F3 regulation in hair cells has only been investigated for
Bdnf, its regulation of Bdnf and Ntf3 was identified in UB/OC-2 cells and they would,
therefore, be expected to have been identified by the subtractive hybridization.
There are three likely explanations for this. Firstly, the subtractive hybridization strategy
used is biased towards identifying the most differentially regulated transcripts between
populations tested. Though the genes linked (Bdnf and Ntf3) or associated (Gfi1 and Lhx3)
with POU4F3 regulation may have been differentially expressed in UB/OC-2 cells in which
POU4F3 expression had been manipulated, they would not necessarily have been more
differentially expressed than candidate genes identified. In fact, clones that appeared less
differentially regulated than those sequenced following the qualitative virtual Northern
blot analysis of the subtractive hybridization screen may have corresponded to these genes.
The second explanation is that the above candidate genes were identified to be putative
POU4F3 target genes by different methods. Bdnf and Ntf3 were identified as POU4F3
target genes by CAT assay and DNAse I footprinting of their 5’ flanking regions (Clough et
al. 2004) and Gfi1 and Lhx3 were identified by cDNA microarray that compared whole
homozygous dreidel Pou4f3 mutant mouse inner ears to those of wild type animals
(Hertzano et al. 2004;Hertzano et al. 2007). These differences in methodology may be
sufficient to explain the differences seen between these quite different experiments,
especially where the effects seen might be transient (Fortunel et al. 2003).

6 General discussion 225
The third explanation for this observation centres on the transcriptional environment in
UB/OC-2 cells. It would not be possible to carry out a subtractive hybridization in hair cells,
and the transcriptional effects of POU4F3 have been shown to be cell type specific (Smith et
al. 1998;Sud et al. 2005). Therefore, these cells were selected for the present study as they
were the best available model of the hair cell transcriptional environment that could be
manipulated as required and would provide sufficient material for analysis. However, there
are clear differences between UB/OC-2 cells and hair cells, i.e. though they express hair cell
marker genes, they do not resemble hair cells morphologically and they are not mitotically
quiescent in their undifferentiated state (Rivolta et al. 1998a). Therefore, the difference in
the transcriptional environment between hair cells and UB/OC-2 cells may explain why
previously described likely POU4F3 target genes were not identified by the method used in
this study.
6.1 Conclusions Transcriptional regulation in hair cells of the inner ear is poorly understood and this deficit
is an impediment to the creation of therapies for hearing loss e.g. gene or stem cell therapy.
Therefore, in this project I to aimed identify POU4F3 target genes to aid in the explanation
of the mechanism by which this transcription factor appears to produce and maintain hair
cells and, therefore, hearing.
14 candidate POU4F3 target genes were identified from 21 clones of transcripts that were
shown to be differentially regulated by POU4F3 in a subtractive hybridization screen in
UB/OC-2 cells. Seven putative POU4F3 target genes were initially investigated based on
their potential role in hair cell development and survival and, of these, four were selected
for detailed analysis based on their known expression, potential function, potential for
POU4F3 regulation (as determined by the presence of predicted POU4F3 binding sites in
their 5’ flanking regions) and availability of reagents for their investigation.
Nr2f2 was shown to be a likely direct target of POU4F3; two 5’ flanking region reporter
constructs for Rbms1 were shown to be regulated by POU4F3 with potential sites of
regulation identified; and POU4F3 was shown to be able to bind to two sites in the Zranb2
and Luzp1 5’ flanking regions with a likely activation of the Luzp1 5’ flanking region that
requires verification. This represents a substantial contribution to the understanding of the
network that POU4F3 regulates. Furthermore, the identification and characterisation of
NR2F2 and ZRANB2 expression in the hair cells of the inner ear supports the possibility
that POU4F3 is able to regulate Nr2f2 and Zranb2 expression in these cells and that these
factors, in turn, might play a role in generating and maintaining the hair cell phenotype.

6 General discussion 226
It is hoped that this contribution to the understanding of transcriptional regulation by
POU4F3 might aid in future work to elucidate its function in hair cell development and
maintenance, thereby contributing to the development of new therapies for the increasing
number of people affected by hearing loss.
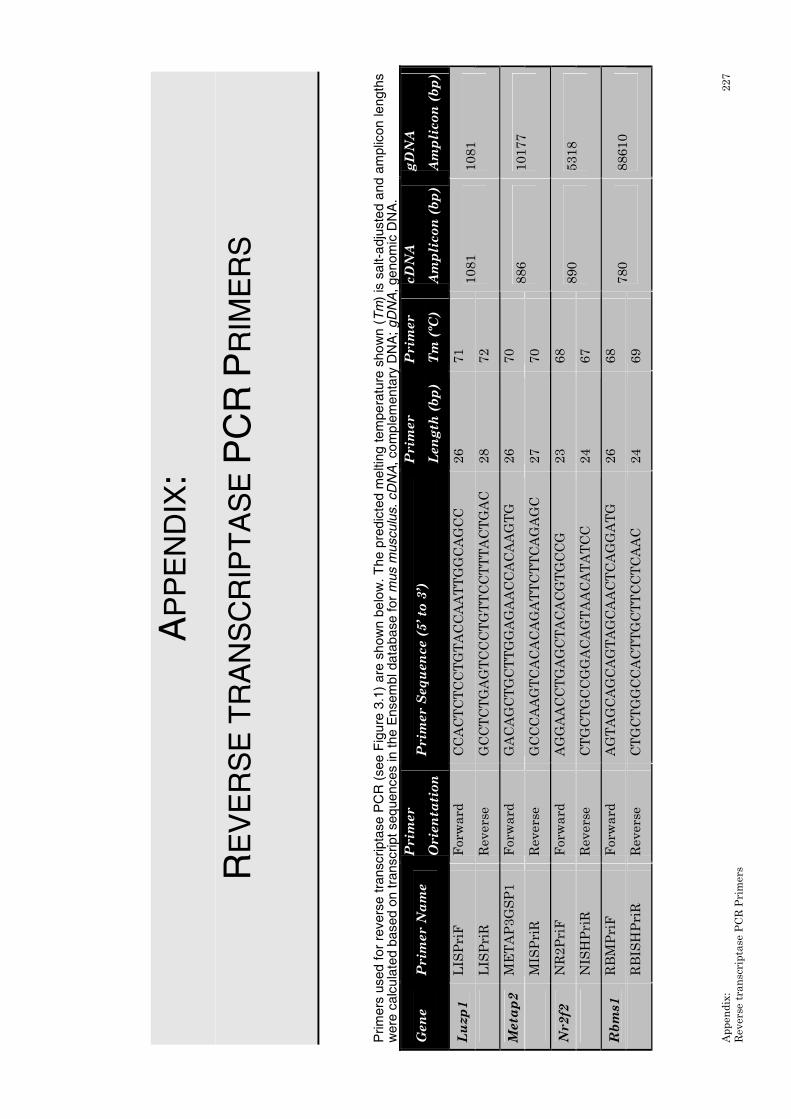
Ap
pen
dix
:
Revers
e t
ran
scri
pta
se P
CR
Pri
mers
227
AP
PE
ND
IX:
RE
VE
RS
E T
RA
NS
CR
IPT
AS
E P
CR
PR
IME
RS
Prim
ers
used
for
revers
e t
ranscripta
se
PC
R (
see F
igu
re 3
.1)
are
sh
ow
n b
elo
w.
The p
redic
ted m
eltin
g t
em
pe
ratu
re s
ho
wn (
Tm
) is
sa
lt-a
dju
ste
d a
nd
am
plic
on
le
ngth
s
were
calc
ula
ted b
ased o
n tra
nscript seq
uences in t
he E
nsem
bl data
base f
or
mus m
usculu
s. cD
NA
, co
mp
lem
enta
ry D
NA
; g
DN
A, ge
nom
ic D
NA
.
Gene
Primer Name
Primer
Orientation
Primer Sequence (5’ to 3’)
Primer
Length (bp)
Primer
Tm (ºC)
cDNA
Amplicon (bp)
gDNA
Amplicon (bp)
Luzp1
L
ISP
riF
F
orw
ard
C
CA
CT
CT
CC
TG
TA
CC
AA
TT
GG
CA
GC
C
26
71
L
ISP
riR
R
evers
e
GC
CT
CT
GA
GT
CC
CT
GT
TC
CT
TT
AC
TG
AC
28
72
1081
1081
Metap2
M
ET
AP
3G
SP
1
Forw
ard
G
AC
AG
CT
GC
TT
GG
AG
AA
CC
AC
AA
GT
G
26
70
M
ISP
riR
R
evers
e
GC
CC
AA
GT
CA
CA
CA
GA
TT
CT
TC
AG
AG
C
27
70
886
1017
7
Nr2f2
N
R2P
riF
F
orw
ard
A
GG
AA
CC
TG
AG
CT
AC
AC
GT
GC
CG
23
68
N
ISH
Pri
R
Revers
e
CT
GC
TG
CC
GG
AC
AG
TA
AC
AT
AT
CC
24
67
890
5318
Rbms1
R
BM
Pri
F
Forw
ard
A
GT
AG
CA
GC
AG
TA
GC
AA
CT
CA
GG
AT
G
26
68
R
BIS
HP
riR
R
evers
e
CT
GC
TG
GC
CA
CT
TG
CT
TC
CT
CA
AC
24
69
780
8861
0

Ap
pen
dix
:
Revers
e t
ran
scri
pta
se P
CR
Pri
mers
228
Gene
Primer Name
Primer
Orientation
Primer Sequence (5’ to 3’)
Primer
Length (bp)
Primer
Tm (ºC)
cDNA
Amplicon (bp)
gDNA
Amplicon (bp)
Rcn1
R
CN
Pri
F
Forw
ard
C
AA
GC
AG
GC
CA
CC
TA
TG
GC
TA
CT
AC
C
26
71
R
cIS
HP
riR
R
evers
e
GT
GG
GT
TT
AT
TG
TG
CA
CA
TT
AG
CA
GG
TC
28
68
1143
7355
Sertad2
S
ER
Pri
F
Forw
ard
C
TA
TC
CA
TG
GC
TG
GC
TG
GC
TG
TA
TT
CC
27
71
S
ISH
Pri
R
Revers
e
GG
AC
AC
TG
GA
CT
CA
CT
GG
AG
GT
TC
C
25
71
1034
1050
75
Zranb2
Z
NF
Pri
F
Forw
ard
A
AG
AC
AC
TG
GC
AG
AG
AA
GA
GC
C
22
64
Z
ISP
riR
R
evers
e
CC
AT
GT
GT
CT
GA
AG
TC
CA
GG
CA
AG
CC
26
71
1195
1057
6

Bibliography 229
BIBLIOGRAPHY
Abcam. NR2F2 antibody (ab66662) datasheet | Abcam.
http://www.abcam.com/index.html?datasheet=66662 . 2008.
Ref Type: Internet Communication
Abello, G. & Alsina, B. 2007, "Establishment of a proneural field in the inner ear",
Int.J.Dev.Biol, vol. 51, no. 6-7, pp. 483-493.
Abnova. NR2F2 MaxPab polyclonal antibody (B01) - H00007026-B01 - Abnova.
http://www.abnova.com/Products/products_detail.asp?Catalog_id=H00007026-B01#p00 .
2008b.
Ref Type: Internet Communication
Abnova. ZNF265 monoclonal antibody (M01), clone 1D10 - H00009406-M01 - Abnova.
http://www.abnova.com/Products/products_detail.asp?Catalog_id=H00009406-M01 . 2008a.
Ref Type: Internet Communication
Acevedo-Arozena, A., Wells, S., Potter, P., Kelly, M., Cox, R. D., & Brown, S. D. 2008, "ENU
mutagenesis, a way forward to understand gene function", Annu.Rev Genomics Hum.Genet.,
vol. 9, pp. 49-69.
Adams, D. J., van der, W. L., Kovacic, A., Lovicu, F. J., Copeland, N. G., Gilbert, D. J.,
Jenkins, N. A., Ioannou, P. A., & Morris, B. J. 2000, "Chromosome localization and
characterization of the mouse and human zinc finger protein 265 gene", Cytogenet.Cell
Genet, vol. 88, no. 1-2, pp. 68-73.
Adams, D. J., van der, W. L., Mayeda, A., Stamm, S., Morris, B. J., & Rasko, J. E. 2001,
"ZNF265--a novel spliceosomal protein able to induce alternative splicing", J.Cell Biol., vol.
154, no. 1, pp. 25-32.
Agrawal, Y., Platz, E. A., & Niparko, J. K. 2008, "Prevalence of hearing loss and differences
by demographic characteristics among US adults: data from the National Health and
Nutrition Examination Survey, 1999-2004", Arch Intern.Med., vol. 168, no. 14, pp. 1522-
1530.
Ahmed, Z. M., Kjellstrom, S., Haywood-Watson, R. J., Bush, R. A., Hampton, L. L., Battey,
J. F., Riazuddin, S., Frolenkov, G., Sieving, P. A., & Friedman, T. B. 2008, "Double
homozygous waltzer and Ames waltzer mice provide no evidence of retinal degeneration",
Mol Vis., vol. 14, pp. 2227-2236.
Alberts, B., Johnson, A., Lewis, J., Raff, M., Roberts, K., & Walter, P. 2002, "Control of
Gene Expression," in Molecular Biology of the Cell, 4 edn, S. Gibbs, ed., Garland Science,
New York, pp. 375-466.
Andersen, B. & Rosenfeld, M. G. 2001, "POU Domain Factors in the Neuroendocrine
System: Lessons from Developmental Biology Provide Insights into Human Disease",
Endocrine Reviews, vol. 22, no. 1, pp. 2-35.
Anderson, C. T. & Zheng, J. 2007, "Isolation of outer hair cells from the cochlear sensory
epithelium in whole-mount preparation using laser capture microdissection", Journal of
Neuroscience Methods, vol. 162, no. 1-2, pp. 229-236.

Bibliography 230
Aurora, R. & Herr, W. 1992, "Segments of the POU domain influence one another's DNA-
binding specificity", Molecular and Cellular Biology, vol. 12, no. 2, pp. 455-467.
Bajic, V. B., Tan, S. L., Suzuki, Y., & Sugano, S. 2004, "Promoter prediction analysis on the
whole human genome", Nat Biotechnol., vol. 22, no. 11, pp. 1467-1473.
Ballachanda, B. B. 1997, "Theoretical and applied external ear acoustics",
J.Am.Acad.Audiol., vol. 8, no. 6, pp. 411-420.
Bardoux, P., Zhang, P., Flamez, D., Perilhou, A., Lavin, T. A., Tanti, J. F., Hellemans, K.,
Gomas, E., Godard, C., Andreelli, F., Buccheri, M. A., Kahn, A., Le Marchand-Brustel, Y.,
Burcelin, R., Schuit, F., & Vasseur-Cognet, M. 2005, "Essential role of chicken ovalbumin
upstream promoter-transcription factor II in insulin secretion and insulin sensitivity
revealed by conditional gene knockout", Diabetes, vol. 54, no. 5, pp. 1357-1363.
Baroukh, N., Ahituv, N., Chang, J., Shoukry, M., Afzal, V., Rubin, E. M., & Pennacchio, L.
A. 2005, "Comparative genomic analysis reveals a distant liver enhancer upstream of the
COUP-TFII gene", Mamm.Genome, vol. 16, no. 2, pp. 91-95.
Beato, M., Herrlich, P., & Schutz, G. 1995, "Steroid hormone receptors: many actors in
search of a plot", Cell, vol. 83, no. 6, pp. 851-857.
Benoit, G., Malewicz, M., & Perlmann, T. 2004, "Digging deep into the pockets of orphan
nuclear receptors: insights from structural studies", Trends Cell Biol., vol. 14, no. 7, pp.
369-376.
Bermingham-McDonogh, O., Oesterle, E. C., Stone, J. S., Hume, C. R., Huynh, H. M., &
Hayashi, T. 2006, "Expression of Prox1 during mouse cochlear development", J Comp
Neurol., vol. 496, no. 2, pp. 172-186.
Boeda, B., El-Amraoui, A., Bahloul, A., Goodyear, R., Daviet, L., Blanchard, S., Perfettini, I.,
Fath, K. R., Shorte, S., Reiners, J., Houdusse, A., Legrain, P., Wolfrum, U., Richardson, G.,
& Petit, C. 2002, "Myosin VIIa, harmonin and cadherin 23, three Usher I gene products
that cooperate to shape the sensory hair cell bundle", EMBO J, vol. 21, no. 24, pp. 6689-
6699.
Boguski, M. S. & Schuler, G. D. 1995, "ESTablishing a human transcript map", Nat Genet,
vol. 10, no. 4, pp. 369-371.
Bok, J., Chang, W., & Wu, D. K. 2007, "Patterning and morphogenesis of the vertebrate
inner ear", Int J Dev.Biol., vol. 51, no. 6-7, pp. 521-533.
Boley, J. Auditory System.
http://www.perceptualentropy.com/wiki/index.php?title=Auditory_system . 2008.
Ref Type: Internet Communication
Bryant, J. E., Forge, A., & Richardson, G. P. 2005, "The Differentiation of Hair Cells," in
Development of the Inner Ear, M. K. Kelley et al., eds., Springer, New York, pp. 158-203.
Budhram-Mahadeo, V., Morris, P. J., Lakin, N. D., Theil, T., Ching, G. Y., Lillycrop, K. A.,
Moroy, T., Liem, R. K., & Latchman, D. S. 1995, "Activation of the alpha-internexin
promoter by the Brn-3a transcription factor is dependent on the N-terminal region of the
protein", J Biol.Chem., vol. 270, no. 6, pp. 2853-2858.
Bull, P. & Clarke, R. 2007, "Deafness," in Diseases of the Ear, Nose and Throat, 10 edn, V.
Noyes, ed., Blackwell Publishing, Oxford, pp. 17-22.
Burgermeister, E. & Seger, R. 2007, "MAPK kinases as nucleo-cytoplasmic shuttles for
PPARgamma", Cell Cycle, vol. 6, no. 13, pp. 1539-1548.

Bibliography 231
Cartharius, K., Frech, K., Grote, K., Klocke, B., Haltmeier, M., Klingenhoff, A., Frisch, M.,
Bayerlein, M., & Werner, T. 2005, "MatInspector and beyond: promoter analysis based on
transcription factor binding sites", Bioinformatics, vol. 21, no. 13, pp. 2933-2942.
Chen, P., Johnson, J. E., Zoghbi, H. Y., & Segil, N. 2002, "The role of Math1 in inner ear
development: Uncoupling the establishment of the sensory primordium from hair cell fate
determination", Development, vol. 129, no. 10, pp. 2495-2505.
Chen, P. & Segil, N. 1999, "p27(Kip1) links cell proliferation to morphogenesis in the
developing organ of Corti", Development, vol. 126, no. 8, pp. 1581-1590.
Chen, W., Cacciabue-Rivolta, D. I., Moore, H. D., & Rivolta, M. N. 2007, "The human fetal
cochlea can be a source for auditory progenitors/stem cells isolation", Hear.Res., vol. 233, no.
1-2, pp. 23-29.
Cheng, A. G., Cunningham, L. L., & Rubel, E. W. 2005, "Mechanisms of hair cell death and
protection", Curr.Opin.Otolaryngol.Head Neck Surg., vol. 13, no. 6, pp. 343-348.
Clack, J. A. & Allin, E. 2004, "The Evolution of Single- and Multiple-Ossicle Ears in Fishes
and Tetrapods," in Evolution of the Vertebrate Auditory System, G. A. Manley, A. N. Popper,
& R. R. Fay, eds., Springer-Verlag, New York, pp. 128-163.
Clontech Laboratories, I. 2008, "PCR-Select™ cDNA Subtraction Kit User Manual",
http://www.clontech.com/images/pt/PT1117-1.pdf.
Clough, R. L., Sud, R., vis-Silberman, N., Hertzano, R., Avraham, K. B., Holley, M., &
Dawson, S. J. 2004, "Brn-3c (POU4F3) regulates BDNF and NT-3 promoter activity",
Biochem.Biophys.Res.Commun., vol. 324, no. 1, pp. 372-381.
Cole, L. K., Le, R., I, Nunes, F., Laufer, E., Lewis, J., & Wu, D. K. 2000, "Sensory organ
generation in the chicken inner ear: contributions of bone morphogenetic protein 4, serrate1,
and lunatic fringe", J Comp Neurol., vol. 424, no. 3, pp. 509-520.
Collin, R. W., Chellappa, R., Pauw, R. J., Vriend, G., Oostrik, J., van, D. W., Huygen, P. L.,
Admiraal, R., Hoefsloot, L. H., Cremers, F. P., Xiang, M., Cremers, C. W., & Kremer, H.
2008, "Missense mutations in POU4F3 cause autosomal dominant hearing impairment
DFNA15 and affect subcellular localization and DNA binding", Hum.Mutat., vol. 29, no. 4,
pp. 545-554.
Cotanche, D. A. 2008, "Genetic and pharmacological intervention for treatment/prevention
of hearing loss", J Commun.Disord., vol. 41, no. 5, pp. 421-443.
Cristobal, R., Wackym, P. A., Cioffi, J. A., Erbe, C. B., & Popper, P. 2004, "Selective
acquisition of individual cell types in the vestibular periphery for molecular biology studies",
Otolaryngology - Head and Neck Surgery, vol. 131, no. 5, pp. 590-595.
Cristobal, R., Wackym, P. A., Cioffi, J. A., Erbe, C. B., Roche, J. P., & Popper, P. 2005,
"Assessment of differential gene expression in vestibular epithelial cell types using
microarray analysis", Molecular Brain Research, vol. 133, no. 1, pp. 19-36.
Crooks, G. E., Hon, G., Chandonia, J. M., & Brenner, S. E. 2004, "WebLogo: a sequence logo
generator", Genome Research, vol. 14, no. 6, pp. 1188-1190.
Cureoglu, S., Schachern, P. A., Ferlito, A., Rinaldo, A., Tsuprun, V., & Paparella, M. M.
2009, "Otosclerosis: etiopathogenesis and histopathology", American Journal of
Otolaryngology, vol. 27, no. 5, pp. 334-340.
Curwen, V., Eyras, E., Andrews, T. D., Clarke, L., Mongin, E., Searle, S. M. J., & Clamp, M.
2004, "The Ensembl Automatic Gene Annotation System", Genome Research, vol. 14, no. 5,
pp. 942-950.

Bibliography 232
da Silva, S. L., Cox, J. J., Jonk, L. J. C., Kruijer, W., & Burbach, J. P. 1995, "Localization of
transcripts of the related nuclear orphan receptors COUP-TF I and ARP-1 in the adult
mouse brain", Molecular Brain Research, vol. 30, no. 1, pp. 131-136.
Dabdoub, A., Puligilla, C., Jones, J. M., Fritzsch, B., Cheah, K. S. E., Pevny, L. H., & Kelley,
M. W. 2008, "Sox2 signaling in prosensory domain specification and subsequent hair cell
differentiation in the developing cochlea", Proceedings of the National Academy of Sciences,
vol. 105, no. 47, pp. 18396-18401.
Dallos, P. 1992, "The active cochlea", J Neurosci., vol. 12, no. 12, pp. 4575-4585.
Daniel, E. 2007, "Noise and hearing loss: a review", J.Sch Health, vol. 77, no. 5, pp. 225-231.
Darrat, I., Ahmad, N., Seidman, K., & Seidman, M. D. 2007, "Auditory research involving
antioxidants", Curr.Opin.Otolaryngol.Head Neck Surg., vol. 15, no. 5, pp. 358-363.
Daudet, N., Ariza-McNaughton, L., & Lewis, J. 2007, "Notch signalling is needed to
maintain, but not to initiate, the formation of prosensory patches in the chick inner ear",
Development, vol. 134, no. 12, pp. 2369-2378.
Dawson, S. J., Liu, Y. Z., Rodel, B., Moroy, T., & Latchman, D. S. 1996, "The ability of POU
family transcription factors to activate or repress gene expression is dependent on the
spacing and context of their specific response elements", Biochem.J, vol. 314 ( Pt 2), pp.
439-443.
de Heer, A. M., Huygen, P. L., Collin, R. W., Kremer, H., & Cremers, C. W. 2009, "Mild and
variable audiometric and vestibular features in a third DFNA15 family with a novel
mutation in POU4F3", Ann.Otol.Rhinol.Laryngol., vol. 118, no. 4, pp. 313-320.
de Kok, Y. J., van der Maarel, S. M., Bitner-Glindzicz, M., Huber, I., Monaco, A. P.,
Malcolm, S., Pembrey, M. E., Ropers, H. H., & Cremers, F. P. 1995, "Association between X-
linked mixed deafness and mutations in the POU domain gene POU3F4", Science, vol. 267,
no. 5198, pp. 685-688.
De Preter, K., Vandesompele, J., Heimann, P., Kockx, M. M., Van Gele, M., Hoebeeck, J.,
De Smet, E., Demarche, M., Laureys, G., Van Roy, N., De Paepe, A., & Speleman, F. 2003,
"Application of laser capture microdissection in genetic analysis of neuroblastoma and
neuroblastoma precursor cells", Cancer Letters, vol. 197, no. 1-2, pp. 53-61.
Dean, C. & Pegington, J. 1996, "The Ear," in The Head and Neck, W.B. Saunders Company
Ltd., London, pp. 27-35.
DeFranco, D. B., Ramakrishnan, C., & Tang, Y. 1998, "Molecular chaperones and
subcellular trafficking of steroid receptors", J.Steroid Biochem.Mol.Biol., vol. 65, no. 1-6, pp.
51-58.
Diez, H., Fischer, A., Winkler, A., Hu, C. J., Hatzopoulos, A. K., Breier, G., & Gessler, M.
2007, "Hypoxia-mediated activation of Dll4-Notch-Hey2 signaling in endothelial progenitor
cells and adoption of arterial cell fate", Exp.Cell Res., vol. 313, no. 1, pp. 1-9.
Edge, A. S. & Chen, Z. Y. 2008, "Hair cell regeneration", Curr.Opin.Neurobiol., vol. 18, no. 4,
pp. 377-382.
Eilers, M. & Eisenman, R. N. 2008, "Myc's broad reach", Genes and Development, vol. 22, no.
20, pp. 2755-2766.
Ensembl. M.musculus - Gene summary - Gene: Nr2f2 (ENSMUSG00000030551).
http://www.ensembl.org/Mus_musculus/Gene/Summary?g=ENSMUSG00000030551 . 2008b.
Ref Type: Internet Communication

Bibliography 233
Ensembl. Frequently asked questions.
http://www.ensembl.org/Help/Results?_referer=;result=faq_152;result=glossary_85;result=f
aq_129;result=glossary_78;result=view_143;result=view_162;result=view_144;result=view_
151;result=view_140 . 2009.
Ref Type: Internet Communication
Ensembl. BlastView. http://www.ensembl.org/Multi/blastview . 2008a.
Ref Type: Electronic Citation
Enzmann, V., Yolcu, E., Kaplan, H. J., & Ildstad, S. T. 2009, "Stem cells as tools in
regenerative therapy for retinal degeneration", Arch Ophthalmol., vol. 127, no. 4, pp. 563-
571.
Erkman, L., McEvilly, R. J., Luo, L., Ryan, A. K., Hooshmand, F., O'Connell, S. M.,
Keithley, E. M., Rapaport, D. H., Ryan, A. F., & Rosenfeld, M. G. 1996, "Role of
transcription factors a Brn-3.1 and Brn-3.2 in auditory and visual system development",
Nature, vol. 381, no. 6583, pp. 603-606.
Eshraghi, A. A. & Van de Water, T. R. 2006, "Cochlear implantation trauma and noise-
induced hearing loss: Apoptosis and therapeutic strategies", Anat.Rec.A Discov.Mol Cell
Evol.Biol., vol. 288, no. 4, pp. 473-481.
Fekete, D. M., Homburger, S. A., Waring, M. T., Riedl, A. E., & Garcia, L. F. 1997,
"Involvement of programmed cell death in morphogenesis of the vertebrate inner ear",
Development, vol. 124, no. 12, pp. 2451-2461.
Fekete, D. M., Muthukumar, S., & Karagogeos, D. 1998, "Hair cells and supporting cells
share a common progenitor in the avian inner ear", J Neurosci., vol. 18, no. 19, pp. 7811-
7821.
Fekete, D. M. & Wu, D. K. 2002, "Revisiting cell fate specification in the inner ear", Current
Opinion in Neurobiology, vol. 12, no. 1, pp. 35-42.
Fettiplace, R. & Ricci, A. J. 2006, "Mechanoelectrical Transduction in Auditory Hair Cells,"
in Vertebrate Hair Cells, R. A. Eatock, R. R. Fay, & A. N. Popper, eds., Springer, New York,
pp. 154-203.
Finsterbusch, T., Steinfeldt, T., Doberstein, K., Rodner, C., & Mankertz, A. 2009,
"Interaction of the replication proteins and the capsid protein of porcine circovirus type 1
and 2 with host proteins", Virology, vol. 386, no. 1, pp. 122-131.
Forge, A. & Richardson, G. 1993, "Freeze fracture analysis of apical membranes in cochlear
cultures: differences between basal and apical-coil outer hair cells and effects of neomycin",
J Neurocytol., vol. 22, no. 10, pp. 854-867.
Fortnum, H. M., Summerfield, A. Q., Marshall, D. H., Davis, A. C., Bamford, J. M., Davis,
A., Yoshinaga-Itano, C., & Hind, S. 2001, "Prevalence of permanent childhood hearing
impairment in the United Kingdom and implications for universal neonatal hearing
screening: questionnaire based ascertainment study Commentary: Universal newborn
hearing screening: implications for coordinating and developing services for deaf and
hearing impaired children", BMJ, vol. 323, no. 7312, p. 536.
Fortunel, N. O., Otu, H. H., Ng, H. H., Chen, J., Mu, X., Chevassut, T., Li, X., Joseph, M.,
Bailey, C., Hatzfeld, J. A., Hatzfeld, A., Usta, F., Vega, V. B., Long, P. M., Libermann, T. A.,
& Lim, B. 2003, "Comment on " 'Stemness': Transcriptional Profiling of Embryonic and
Adult Stem Cells" and "A Stem Cell Molecular Signature" (I)", Science, vol. 302, no. 5644, p.
393b.
Fransen, E., Topsakal, V., Hendrickx, J. J., Van, L. L., Huyghe, J. R., Van, E. E., Lemkens,
N., Hannula, S., Maki-Torkko, E., Jensen, M., Demeester, K., Tropitzsch, A., Bonaconsa, A.,
Bibliography 234
Mazzoli, M., Espeso, A., Verbruggen, K., Huyghe, J., Huygen, P. L., Kunst, S., Manninen,
M., az-Lacava, A., Steffens, M., Wienker, T. F., Pyykko, I., Cremers, C. W., Kremer, H.,
Dhooge, I., Stephens, D., Orzan, E., Pfister, M., Bille, M., Parving, A., Sorri, M., Van de, H.
P., & Van, C. G. 2008, "Occupational noise, smoking, and a high body mass index are risk
factors for age-related hearing impairment and moderate alcohol consumption is protective:
a European population-based multicenter study", J Assoc.Res.Otolaryngol., vol. 9, no. 3, pp.
264-276.
Frech, K. & Werner, T. "Specific modelling of regulatory units in DNA sequences", in
Pacific Symposium on Biocomputing 1997, R. B. Altman et al., eds., World Scientific, pp.
151-162.
Friedman, L. M., Dror, A. A., & Avraham, K. B. 2007, "Mouse models to study inner ear
development and hereditary hearing loss", Int J Dev.Biol., vol. 51, no. 6-7, pp. 609-631.
Friedman, L. M., Dror, A. A., Mor, E., Tenne, T., Toren, G., Satoh, T., Biesemeier, D. J.,
Shomron, N., Fekete, D. M., Hornstein, E., & Avraham, K. B. 2009a, "MicroRNAs are
essential for development and function of inner ear hair cells in vertebrates",
Proc.Natl.Acad.Sci U.S.A, vol. 106, no. 19, pp. 7915-7920.
Friedman, R. A., Van, L. L., Huentelman, M. J., Sheth, S. S., Van, E. E., Corneveaux, J. J.,
Tembe, W. D., Halperin, R. F., Thorburn, A. Q., Thys, S., Bonneux, S., Fransen, E., Huyghe,
J., Pyykko, I., Cremers, C. W., Kremer, H., Dhooge, I., Stephens, D., Orzan, E., Pfister, M.,
Bille, M., Parving, A., Sorri, M., Van de Heyning, P. H., Makmura, L., Ohmen, J. D.,
Linthicum, F. H., Jr., Fayad, J. N., Pearson, J. V., Craig, D. W., Stephan, D. A., & Van, C. G.
2009b, "GRM7 variants confer susceptibility to age-related hearing impairment", Hum.Mol
Genet., vol. 18, no. 4, pp. 785-796.
Fritzsch, B., Barald, K. F., & Lomax, M. I. 1998, "Early Embryology of the Vertebrate Ear,"
in Development of the Auditory System, E. W. Rubel, A. N. Popper, & R. R. Fay, eds.,
Springer-Verlag, New York, pp. 80-145.
Frydman, M., Vreugde, S., Nageris, B. I., Weiss, S., Vahava, O., & Avraham, K. B. 2000,
"Clinical characterization of genetic hearing loss caused by a mutation in the POU4F3
transcription factor", Arch Otolaryngol.Head Neck Surg., vol. 126, no. 5, pp. 633-637.
Fujimoto, M., Iguchi-Ariga, S. M., & Ariga, H. 1998, "Characterization of an element
positively regulating the transcription of MSSP gene-2 which encodes C-MYC binding
proteins", Gene, vol. 214, no. 1-2, pp. 113-120.
Fujimoto, M., Matsumoto, K., Iguchi-Ariga, S. M., & Ariga, H. 2001, "Disruption of MSSP,
c-myc single-strand binding protein, leads to embryonic lethality in some homozygous mice",
Genes Cells, vol. 6, no. 12, pp. 1067-1075.
Fujimoto, M., Matsumoto, K. I., Iguchi-Ariga, S. M., & Ariga, H. 2000, "Structures and
comparison of genomic and complementary DNAs of mouse MSSP, a c-Myc binding protein",
Int.J.Oncol., vol. 16, no. 2, pp. 245-251.
Gale, J. E., Marcotti, W., Kennedy, H. J., Kros, C. J., & Richardson, G. P. 2001, "FM1-43
dye behaves as a permeant blocker of the hair-cell mechanotransducer channel", J
Neurosci., vol. 21, no. 18, pp. 7013-7025.
Gale, J. E., Piazza, V., Ciubotaru, C. D., & Mammano, F. 2004, "A mechanism for sensing
noise damage in the inner ear", Curr.Biol., vol. 14, no. 6, pp. 526-529.
Gao, J., Maison, S. F., Wu, X., Hirose, K., Jones, S. M., Bayazitov, I., Tian, Y., Mittleman,
G., Matthews, D. B., Zakharenko, S. S., Liberman, M. C., & Zuo, J. 2007, "Orphan
Glutamate Receptor {delta}1 Subunit Required for High-Frequency Hearing", Molecular
and Cellular Biology, vol. 27, no. 12, pp. 4500-4512.

Bibliography 235
Gates, G. A. & Mills, J. H. 2005, "Presbycusis", Lancet, vol. 366, no. 9491, pp. 1111-1120.
Gene Ontology Consortium, T. 2008, "The Gene Ontology project in 2008", Nucleic Acids
Res., vol. 36, no. Database issue, p. D440-D444.
Genomatix. Gene2Promoter.
http://www.genomatix.de/online_help/help_eldorado/Gene2Promoter_Intro.html . 2008.
Ref Type: Internet Communication
Gerrero, M. R., McEvilly, R. J., Turner, E., Lin, C. R., O'Connell, S., Jenne, K. J., Hobbs, M.
V., & Rosenfeld, M. G. 1993, "Brn-3.0: a POU-domain protein expressed in the sensory,
immune, and endocrine systems that functions on elements distinct from known octamer
motifs", Proc.Natl.Acad.Sci U.S.A, vol. 90, no. 22, pp. 10841-10845.
Gish, W. WU BLAST 2.0. http://blast.wustl.edu . 2004.
Ref Type: Internet Communication
Gold, T. 1948, "Hearing. II. The Physical Basis of the Action of the Cochlea",
Proc.R.Soc.Lond.B., vol. 135, no. 881, pp. 492-498.
Gong, S., Zheng, C., Doughty, M. L., Losos, K., Didkovsky, N., Schambra, U. B., Nowak, N.
J., Joyner, A., Leblanc, G., Hatten, M. E., & Heintz, N. 2003, "A gene expression atlas of the
central nervous system based on bacterial artificial chromosomes", Nature, vol. 425, no.
6961, pp. 917-925.
Goodyear, R. J., Kros, C. J., & Richardson, G. P. 2006, "The Development of Hair Cells in
the Inner Ear," in Vertebrate Hair Cells, R. A. Eatock, R. R. Fay, & A. N. Popper, eds.,
Springer, New York, pp. 20-94.
Gopinath, B., Rochtchina, E., Wang, J. J., Schneider, J., Leeder, S. R., & Mitchell, P. 2009,
"Prevalence of age-related hearing loss in older adults: Blue Mountains Study", Arch
Intern.Med., vol. 169, no. 4, pp. 415-416.
Grillet, N., Xiong, W., Reynolds, A., Kazmierczak, P., Sato, T., Lillo, C., Dumont, R. A.,
Hintermann, E., Sczaniecka, A., Schwander, M., Williams, D., Kachar, B., Gillespie, P. G.,
& Müller, U. 2009, "Harmonin Mutations Cause Mechanotransduction Defects in Cochlear
Hair Cells", Neuron, vol. 62, no. 3, pp. 375-387.
Gronemeyer, H., Gustafsson, J. A., & Laudet, V. 2004, "Principles for modulation of the
nuclear receptor superfamily", Nat Rev.Drug Discov., vol. 3, no. 11, pp. 950-964.
Groves, A. K. 2005, "The Induction of the Otic Placode," in Development of the Inner Ear, M.
K. Kelley et al., eds., Springer, New York, pp. 10-42.
Gruber, C. A., Rhee, J. M., Gleiberman, A., & Turner, E. E. 1997, "POU domain factors of
the Brn-3 class recognize functional DNA elements which are distinctive, symmetrical, and
highly conserved in evolution", Molecular and Cellular Biology, vol. 17, no. 5, pp. 2391-2400.
Haigermoser, C., Fujimoto, M., Iguchi-Ariga, S. M., & Ariga, H. 1996, "Cloning and
characterization of the genomic DNA of the human MSSP genes", Nucleic Acids Res., vol.
24, no. 19, pp. 3846-3857.
Hall, T. A. BioEdit sequence alignment editor for Windows 95/98/NT/XP.
http://www.mbio.ncsu.edu/BioEdit/BioEdit.html . 27-6-2007.
Ref Type: Internet Communication
Hall, T. A. 1999, "BioEdit: a user-friendly biological sequence alignment editor and analysis
program for Windows 95/98/NT", Nucl.Acids.Symp.Ser., vol. 41, pp. 95-98.

Bibliography 236
He, D. Z., Zheng, J., Edge, R., & Dallos, P. 2000, "Isolation of cochlear inner hair cells",
Hear.Res., vol. 145, no. 1-2, pp. 156-160.
He, X., Treacy, M. N., Simmons, D. M., Ingraham, H. A., Swanson, L. W., & Rosenfeld, M.
G. 1989, "Expression of a large family of POU-domain regulatory genes in mammalian
brain development", Nature, vol. 340, no. 6228, pp. 35-41.
Heine, C. & Browning, C. J. 2002, "Communication and psychosocial consequences of
sensory loss in older adults: overview and rehabilitation directions", Disabil.Rehabil., vol.
24, no. 15, pp. 763-773.
Heintzman, N. D. & Ren, B. 2007, "The gateway to transcription: identifying,
characterizing and understanding promoters in the eukaryotic genome", Cell Mol Life Sci,
vol. 64, no. 4, pp. 386-400.
Hellman, L. M. & Fried, M. G. 2007, "Electrophoretic mobility shift assay (EMSA) for
detecting protein-nucleic acid interactions", Nat.Protoc., vol. 2, no. 8, pp. 1849-1861.
Henderson, D., Bielefeld, E. C., Harris, K. C., & Hu, B. H. 2006, "The role of oxidative stress
in noise-induced hearing loss", Ear Hear., vol. 27, no. 1, pp. 1-19.
Hertzano, R., Dror, A. A., Montcouquiol, M., Ahmed, Z. M., Ellsworth, B., Camper, S.,
Friedman, T. B., Kelley, M. W., & Avraham, K. B. 2007, "Lhx3, a LIM domain transcription
factor, is regulated by Pou4f3 in the auditory but not in the vestibular system",
Eur.J.Neurosci., vol. 25, no. 4, pp. 999-1005.
Hertzano, R., Montcouquiol, M., Rashi-Elkeles, S., Elkon, R., Yucel, R., Frankel, W. N.,
Rechavi, G., Moroy, T., Friedman, T. B., Kelley, M. W., & Avraham, K. B. 2004,
"Transcription profiling of inner ears from Pou4f3(ddl/ddl) identifies Gfi1 as a target of the
Pou4f3 deafness gene", Hum.Mol.Genet, vol. 13, no. 18, pp. 2143-2153.
Holley, M. C. 2005, "Keynote review: The auditory system, hearing loss and potential
targets for drug development", Drug Discov.Today, vol. 10, no. 19, pp. 1269-1282.
Holt, J. R. & Corey, D. P. 2000, "Two mechanisms for transducer adaptation in vertebrate
hair cells", Proc.Natl.Acad.Sci U.S.A, vol. 97, no. 22, pp. 11730-11735.
Horton, R. M. 1993, "In Vitro Recombination and Mutagenesis of DNA," in Methods in
Molecular Biology, vol. 15 PCR Protocols: Current Methods and Applications. B. A. White,
ed., Humana Press Inc., Totowa, NJ, USA, pp. 251-261.
Housley, G. D., Marcotti, W., Navaratnam, D., & Yamoah, E. N. 2006, "Hair cells--beyond
the transducer", J Membr.Biol., vol. 209, no. 2-3, pp. 89-118.
Howarth, A. & Shone, G. R. 2006, "Ageing and the auditory system", Postgrad.Med.J., vol.
82, no. 965, pp. 166-171.
Hsu, C. Y., Chang, N. C., Lee, M. W., Lee, K. H., Sun, D. S., Lai, C., & Chang, A. C. 2008,
"LUZP deficiency affects neural tube closure during brain development",
Biochem.Biophys.Res.Commun., vol. 376, no. 3, pp. 466-471.
Hudspeth, A. J. 2000, "Hearing," in Principles of Neural Science, 4 edn, E. R. Kandel, J. H.
Schwartz, & T. M. Jessell, eds., McGraw-Hill, New York, pp. 590-613.
Hultcrantz, M., Simonoska, R., & Stenberg, A. E. 2006, "Estrogen and hearing: a summary
of recent investigations", Acta Otolaryngol., vol. 126, no. 1, pp. 10-14.
Iida, M., Taira, T., Ariga, H., & Iguchi-Ariga, S. M. 1997, "Induction of apoptosis in HeLa
cells by MSSP, c-myc binding proteins", Biol.Pharm.Bull., vol. 20, no. 1, pp. 10-14.

Bibliography 237
Izumikawa, M., Minoda, R., Kawamoto, K., Abrashkin, K. A., Swiderski, D. L., Dolan, D. F.,
Brough, D. E., & Raphael, Y. 2005, "Auditory hair cell replacement and hearing
improvement by Atoh1 gene therapy in deaf mammals", Nat.Med., vol. 11, no. 3, pp. 271-
276.
Jacobson, E. M., Li, P., Leon-del-Rio, A., Rosenfeld, M. G., & Aggarwal, A. K. 1997,
"Structure of Pit-1 POU domain bound to DNA as a dimer: unexpected arrangement and
flexibility", Genes and Development, vol. 11, no. 2, pp. 198-212.
Jenny, A. & Mlodzik, M. 2006, "Planar cell polarity signaling: a common mechanism for
cellular polarization", Mt.Sinai J.Med., vol. 73, no. 5, pp. 738-750.
Jensen-Smith, H. & Hallworth, R. 2007, "Lateral wall protein content mediates alterations
in cochlear outer hair cell mechanics before and after hearing onset", Cell
Motil.Cytoskeleton, vol. 64, no. 9, pp. 705-717.
Jones, C. & Chen, P. 2007, "Planar cell polarity signaling in vertebrates", Bioessays, vol. 29,
no. 2, pp. 120-132.
Jonk, L. J., de Jonge, M. E., Pals, C. E., Wissink, S., Vervaart, J. M., Schoorlemmer, J., &
Kruijer, W. 1994, "Cloning and expression during development of three murine members of
the COUP family of nuclear orphan receptors", Mech.Dev., vol. 47, no. 1, pp. 81-97.
Kanaoka, Y. & Nojima, H. 1994, "SCR: novel human suppressors of cdc2/cdc13 mutants of
Schizosaccharomyces pombe harbour motifs for RNA binding proteins", Nucleic Acids Res.,
vol. 22, no. 13, pp. 2687-2693.
Karginova, E. A., Pentz, E. S., Kazakova, I. G., Norwood, V. F., Carey, R. M., & Gomez, R. A.
1997, "Zis: a developmentally regulated gene expressed in juxtaglomerular cells",
Am.J.Physiol, vol. 273, no. 5 Pt 2, p. F731-F738.
Karis, A., Pata, I., van Doorninck, J. H., Grosveld, F., de Zeeuw, C. I., de, C. D., & Fritzsch,
B. 2001, "Transcription factor GATA-3 alters pathway selection of olivocochlear neurons
and affects morphogenesis of the ear", J Comp Neurol., vol. 429, no. 4, pp. 615-630.
Katayama, S., Ashizawa, K., Gohma, H., Fukuhara, T., Narumi, K., Tsuzuki, Y., Tatemoto,
H., Nakada, T., & Nagai, K. 2006, "The expression of Hedgehog genes (Ihh, Dhh) and
Hedgehog target genes (Ptc1, Gli1, Coup-TfII) is affected by estrogenic stimuli in the uterus
of immature female rats", Toxicol.Appl.Pharmacol., vol. 217, no. 3, pp. 375-383.
Kazmierczak, P., Sakaguchi, H., Tokita, J., Wilson-Kubalek, E. M., Milligan, R. A., Muller,
U., & Kachar, B. 2007, "Cadherin 23 and protocadherin 15 interact to form tip-link
filaments in sensory hair cells", Nature, vol. 449, no. 7158, pp. 87-91.
Keithley, E. M., Erkman, L., Bennett, T., Lou, L., & Ryan, A. F. 1999, "Effects of a hair cell
transcription factor, Brn-3.1, gene deletion on homozygous and heterozygous mouse
cochleas in adulthood and aging", Hear.Res., vol. 134, no. 1-2, pp. 71-76.
Kelley, M. W. 2006, "Regulation of cell fate in the sensory epithelia of the inner ear", Nat
Rev Neurosci., vol. 7, no. 11, pp. 837-849.
Kelley, M. W. 2007, "Cellular commitment and differentiation in the organ of Corti",
Int.J.Dev.Biol, vol. 51, no. 6-7, pp. 571-583.
Kelley, M. W. & Wu, D. K. 2005, "Developmental Neurobiology of the Ear: Current Status
and Future Directions," in Development of the Inner Ear, M. K. Kelley et al., eds., Springer,
New York, pp. 1-9.
Kelly, M. & Chen, P. 2007, "Shaping the mammalian auditory sensory organ by the planar
cell polarity pathway", Int J Dev.Biol., vol. 51, no. 6-7, pp. 535-547.

Bibliography 238
Kemp, D. T. 1978, "Stimulated acoustic emissions from within the human auditory system",
J Acoust.Soc.Am., vol. 64, no. 5, pp. 1386-1391.
Kesser, B. W., Hashisaki, G. T., & Holt, J. R. 2008, "Gene transfer in human vestibular
epithelia and the prospects for inner ear gene therapy", Laryngoscope, vol. 118, no. 5, pp.
821-831.
Kharkovets, T., Dedek, K., Maier, H., Schweizer, M., Khimich, D., Nouvian, R., Vardanyan,
V., Leuwer, R., Moser, T., & Jentsch, T. J. 2006, "Mice with altered KCNQ4 K+ channels
implicate sensory outer hair cells in human progressive deafness", EMBO J, vol. 25, no. 3,
pp. 642-652.
Kiernan, A. E., Cordes, R., Kopan, R., Gossler, A., & Gridley, T. 2005a, "The Notch ligands
DLL1 and JAG2 act synergistically to regulate hair cell development in the mammalian
inner ear", Development, vol. 132, no. 19, pp. 4353-4362.
Kiernan, A. E., Pelling, A. L., Leung, K. K., Tang, A. S., Bell, D. M., Tease, C., Lovell-Badge,
R., Steel, K. P., & Cheah, K. S. 2005b, "Sox2 is required for sensory organ development in
the mammalian inner ear", Nature, vol. 434, no. 7036, pp. 1031-1035.
Kimura, K., Saga, H., Hayashi, K., Obata, H., Chimori, Y., Ariga, H., & Sobue, K. 1998, "c-
Myc gene single-strand binding protein-1, MSSP-1, suppresses transcription of alpha-
smooth muscle actin gene in chicken visceral smooth muscle cells", Nucleic Acids Res., vol.
26, no. 10, pp. 2420-2425.
Kimura, Y., Suzuki, T., Kaneko, C., Darnel, A. D., Moriya, T., Suzuki, S., Handa, M., Ebina,
M., Nukiwa, T., & Sasano, H. 2002, "Retinoid receptors in the developing human lung",
Clin.Sci.(Lond), vol. 103, no. 6, pp. 613-621.
Kingsley, R. E. 1999b, "The Auditory System," in Concise Text of Neuroscience, 2 edn,
Lippincott Williams & Wilkins, Baltimore, pp. 393-432.
Kingsley, R. E. 1999a, "The Cranial Nerves," in Concise Text of Neuroscience, 2 edn,
Lippincott Williams & Wilkins, Baltimore, pp. 337-392.
Kingston, R. E., Chen, C. A., & Okayama, H. 2001, "Calcium phosphate transfection",
Curr.Protoc.Immunol., vol. Chapter 10, p. Unit 10.13.
Kishimoto, M., Fujiki, R., Takezawa, S., Sasaki, Y., Nakamura, T., Yamaoka, K., Kitagawa,
H., & Kato, S. 2006, "Nuclear receptor mediated gene regulation through chromatin
remodeling and histone modifications", Endocr.J., vol. 53, no. 2, pp. 157-172.
Klein, M., Koedel, U., Kastenbauer, S., & Pfister, H. W. 2008, "Nitrogen and oxygen
molecules in meningitis-associated labyrinthitis and hearing impairment", Infection, vol. 36,
no. 1, pp. 2-14.
Klemm, J. D., Rould, M. A., Aurora, R., Herr, W., & Pabo, C. O. 1994, "Crystal structure of
the Oct-1 POU domain bound to an octamer site: DNA recognition with tethered DNA-
binding modules", Cell, vol. 77, no. 1, pp. 21-32.
Krishnamurthy, S. & Hampsey, M. 2009, "Eukaryotic transcription initiation", Curr.Biol.,
vol. 19, no. 4, p. R153-R156.
Krishnan, V., Elberg, G., Tsai, M. J., & Tsai, S. Y. 1997, "Identification of a Novel Sonic
Hedgehog Response Element in the Chicken Ovalbumin Upstream Promoter-Transcription
Factor II Promoter", Molecular Endocrinology, vol. 11, no. 10, pp. 1458-1466.
Kros, C. J. 1996, "Hair Cell Physiology," in The Cochlea, P. Dallos, A. N. Popper, & R. R.
Fay, eds., Springer-Verlag, New York, pp. 318-385.

Bibliography 239
Kruse, S. W., Suino-Powell, K., Zhou, X. E., Kretschman, J. E., Reynolds, R., Vonrhein, C.,
Xu, Y., Wang, L., Tsai, S. Y., Tsai, M. J., & Xu, H. E. 2008, "Identification of COUP-TFII
orphan nuclear receptor as a retinoic acid-activated receptor", PLoS.Biol., vol. 6, no. 9, p.
e227.
Kulkarni, K. & Hartley, D. E. 2008, "Recent advances in hearing restoration", J R.Soc.Med.,
vol. 101, no. 3, pp. 116-124.
Kurihara, I., Lee, D. K., Petit, F. G., Jeong, J., Lee, K., Lydon, J. P., DeMayo, F. J., Tsai, M.
J., & Tsai, S. Y. 2007, "COUP-TFII mediates progesterone regulation of uterine
implantation by controlling ER activity", PLoS.Genet., vol. 3, no. 6, p. e102.
Kurokawa, H. & Goode, R. L. 1995, "Sound pressure gain produced by the human middle
ear", Otolaryngol Head Neck Surg, vol. 113, no. 4, pp. 349-355.
Ladias, J. A. & Karathanasis, S. K. 1991, "Regulation of the apolipoprotein AI gene by
ARP-1, a novel member of the steroid receptor superfamily", Science, vol. 251, no. 4993, pp.
561-565.
Laine, H., Doetzlhofer, A., Mantela, J., Ylikoski, J., Laiho, M., Roussel, M. F., Segil, N., &
Pirvola, U. 2007, "p19Ink4d and p21Cip1 Collaborate to Maintain the Postmitotic State of
Auditory Hair Cells, Their Codeletion Leading to DNA Damage and p53-Mediated
Apoptosis", Journal of Neuroscience, vol. 27, no. 6, pp. 1434-1444.
Ledakis, P., Tanimura, H., & Fojo, T. 1998, "Limitations of differential display",
Biochem.Biophys.Res.Commun., vol. 251, no. 2, pp. 653-656.
Lee, C. T., Li, L., Takamoto, N., Martin, J. F., DeMayo, F. J., Tsai, M. J., & Tsai, S. Y. 2004,
"The nuclear orphan receptor COUP-TFII is required for limb and skeletal muscle
development", Mol Cell Biol., vol. 24, no. 24, pp. 10835-10843.
Lee, M. W., Chang, A. C., Sun, D. S., Hsu, C. Y., & Chang, N. C. 2001, "Restricted
expression of LUZP in neural lineage cells: a study in embryonic stem cells", J.Biomed.Sci.,
vol. 8, no. 6, pp. 504-511.
Lelli, A., Asai, Y., Forge, A., Holt, J. R., & Geleoc, G. S. G. 2009, "Tonotopic Gradient in the
Developmental Acquisition of Sensory Transduction in Outer Hair Cells of the Mouse
Cochlea", Journal of Neurophysiology, vol. 101, no. 6, pp. 2961-2973.
Lenoir, M. Organ of Corti. http://www.cochlea.org . 1999.
Ref Type: Internet Communication
Leon, Y., Sanchez-Galiano, S., & Gorospe, I. 2004, "Programmed cell death in the
development of the vertebrate inner ear", Apoptosis., vol. 9, no. 3, pp. 255-264.
Lewis, M. A., Quint, E., Glazier, A. M., Fuchs, H., De Angelis, M. H., Langford, C., van, D.
S., breu-Goodger, C., Piipari, M., Redshaw, N., Dalmay, T., Moreno-Pelayo, M. A., Enright,
A. J., & Steel, K. P. 2009, "An ENU-induced mutation of miR-96 associated with
progressive hearing loss in mice", Nat.Genet., vol. 41, no. 5, pp. 614-618.
Li, J., Chen, X. H., Xiao, P. J., Li, L., Lin, W. M., Huang, J., & Xu, P. 2008, "Expression
pattern and splicing function of mouse ZNF265", Neurochem.Res., vol. 33, no. 3, pp. 483-489.
Li, P., He, X., Gerrero, M. R., Mok, M., Aggarwal, A., & Rosenfeld, M. G. 1993, "Spacing and
orientation of bipartite DNA-binding motifs as potential functional determinants for POU
domain factors", Genes and Development, vol. 7, no. 12b, pp. 2483-2496.
Li, R., Xi, Y., Liu, X., Chen, G., Wang, B., Jiang, L., & Li, W. 2009, "Expression of IL-1alpha,
IL-6, TGF-beta, FasL and ZNF265 during sertoli cell infection by ureaplasma urealyticum",
Cell Mol Immunol., vol. 6, no. 3, pp. 215-221.

Bibliography 240
Liang, Y., Wang, A., Probst, F. J., Arhya, I. N., Barber, T. D., Chen, K. S., Deshmukh, D.,
Dolan, D. F., Hinnant, J. T., Carter, L. E., Jain, P. K., Lalwani, A. K., Li, X. C., Lupski, J.
R., Moeljopawiro, S., Morell, R., Negrini, C., Wilcox, E. R., Winata, S., Camper, S. A., &
Friedman, T. B. 1998, "Genetic Mapping Refines DFNB3 to 17p11.2, Suggests Multiple
Alleles of DFNB3, and Supports Homology to the Mouse Model shaker-2", The American
Journal of Human Genetics, vol. 62, no. 4, pp. 904-915.
Lillycrop, K. A., Budrahan, V. S., Lakin, N. D., Terrenghi, G., Wood, J. N., Polak, J. M., &
Latchman, D. S. 1992, "A novel POU family transcription factor is closely related to Brn-3
but has a distinct expression pattern in neuronal cells", Nucleic Acids Res., vol. 20, no. 19,
pp. 5093-5096.
Lim, D. J. & Anniko, M. 1985, "Developmental morphology of the mouse inner ear. A
scanning electron microscopic observation", Acta Otolaryngol.Suppl, vol. 422, pp. 1-69.
Ling, M. M. & Robinson, B. H. 1997, "Approaches to DNA Mutagenesis: An Overview",
Analytical Biochemistry, vol. 254, no. 2, pp. 157-178.
Liu, W., Khare, S. L., Liang, X., Peters, M. A., Liu, X., Cepko, C. L., & Xiang, M. 2000, "All
Brn3 genes can promote retinal ganglion cell differentiation in the chick", Development, vol.
127, no. 15, pp. 3237-3247.
Liu, W., Mo, Z., & Xiang, M. 2001, "The Ath5 proneural genes function upstream of Brn3
POU domain transcription factor genes to promote retinal ganglion cell development",
Proc.Natl.Acad.Sci U.S.A, vol. 98, no. 4, pp. 1649-1654.
Liu, X. Z., Ouyang, X. M., Xia, X. J., Zheng, J., Pandya, A., Li, F., Du, L. L., Welch, K. O.,
Petit, C., Smith, R. J. H., Webb, B. T., Yan, D., Arnos, K. S., Corey, D., Dallos, P., Nance, W.
E., & Chen, Z. Y. 2003, "Prestin, a cochlear motor protein, is defective in non-syndromic
hearing loss", Human Molecular Genetics, vol. 12, no. 10, pp. 1155-1162.
Liu, Z. & Zuo, J. 2008, "Cell cycle regulation in hair cell development and regeneration in
the mouse cochlea", Cell Cycle, vol. 7, no. 14, pp. 2129-2133.
Loots, G. G. & Ovcharenko, I. 2004, "rVISTA 2.0: evolutionary analysis of transcription
factor binding sites", Nucleic Acids Res., vol. 32, no. Web Server issue, p. W217-W221.
Loughlin, F. E., Mansfield, R. E., Vaz, P. M., McGrath, A. P., Setiyaputra, S., Gamsjaeger,
R., Chen, E. S., Morris, B. J., Guss, J. M., & Mackay, J. P. 2009, "The zinc fingers of the SR-
like protein ZRANB2 are single-stranded RNA-binding domains that recognize 5' splice
site-like sequences", Proc.Natl.Acad.Sci U.S.A, vol. 106, no. 14, pp. 5581-5586.
Lowenheim, H., Furness, D. N., Kil, J., Zinn, C., Gultig, K., Fero, M. L., Frost, D., Gummer,
A. W., Roberts, J. M., Rubel, E. W., Hackney, C. M., & Zenner, H. P. 1999, "Gene disruption
of p27(Kip1) allows cell proliferation in the postnatal and adult organ of corti",
Proc.Natl.Acad.Sci U.S.A, vol. 96, no. 7, pp. 4084-4088.
Ludman, H. & Kemp, D. T. 1998, "Basic Acoustics and Hearing Tests," in Diseases of the
Ear, 6 edn, H. Ludman & T. Wright, eds., Arnold, London, pp. 58-86.
Lutz, B., Kuratani, S., Cooney, A. J., Wawersik, S., Tsai, S. Y., Eichele, G., & Tsai, M. J.
1994, "Developmental regulation of the orphan receptor COUP-TF II gene in spinal motor
neurons", Development, vol. 120, no. 1, pp. 25-36.
Mangs, A. H. & Morris, B. J. 2008, "ZRANB2: structural and functional insights into a
novel splicing protein", Int.J.Biochem.Cell Biol., vol. 40, no. 11, pp. 2353-2357.
Mangs, A. H., Speirs, H. J., Goy, C., Adams, D. J., Markus, M. A., & Morris, B. J. 2006,
"XE7: a novel splicing factor that interacts with ASF/SF2 and ZNF265", Nucleic Acids Res.,
vol. 34, no. 17, pp. 4976-4986.
Bibliography 241
Mansour, S. L. & Schoenwolf, G. C. 2005, "Morphogenesis of the Inner Ear," in Development
of the Inner Ear, M. K. Kelley et al., eds., Springer, New York, pp. 43-84.
Mantela, J., Jiang, Z., Ylikoski, J., Fritzsch, B., Zacksenhaus, E., & Pirvola, U. 2005, "The
retinoblastoma gene pathway regulates the postmitotic state of hair cells of the mouse
inner ear", Development, vol. 132, no. 10, pp. 2377-2388.
Marcotti, W. & Kros, C. J. 1999, "Developmental expression of the potassium current IK,n
contributes to maturation of mouse outer hair cells", J Physiol, vol. 520 Pt 3, pp. 653-660.
Matsui, J. I. & Cotanche, D. A. 2004a, "Sensory hair cell death and regeneration: two
halves of the same equation", Curr.Opin.Otolaryngol.Head Neck Surg., vol. 12, no. 5, pp.
418-425.
Matsui, J. I., Gale, J. E., & Warchol, M. E. 2004b, "Critical signaling events during the
aminoglycoside-induced death of sensory hair cells in vitro", J Neurobiol., vol. 61, no. 2, pp.
250-266.
Matsui, J. I., Parker, M. A., Ryals, B. M., & Cotanche, D. A. 2005, "Regeneration and
replacement in the vertebrate inner ear", Drug Discovery Today, vol. 10, no. 19, pp. 1307-
1312.
McCaffery, P., Wagner, E., O'Neil, J., Petkovich, M., & Drager, U. C. 1999, "Dorsal and
ventral retinal territories defined by retinoic acid synthesis, break-down and nuclear
receptor expression", Mech.Dev., vol. 82, no. 1-2, pp. 119-130.
McGhee, J. D. & Krause, M. W. 1997, "Transcription Factors and Transcriptional
Regulation," in C.Elegans II Online Edition, 2nd edn, D. L. Riddle et al., eds., COLD
SPRING HARBOR LABORATORY PRESS, New York.
Mencia, A., Modamio-Hoybjor, S., Redshaw, N., Morin, M., Mayo-Merino, F., Olavarrieta, L.,
Aguirre, L. A., del, C., I, Steel, K. P., Dalmay, T., Moreno, F., & Moreno-Pelayo, M. A. 2009,
"Mutations in the seed region of human miR-96 are responsible for nonsyndromic
progressive hearing loss", Nat.Genet., vol. 41, no. 5, pp. 609-613.
Meyer, A. C., Frank, T., Khimich, D., Hoch, G., Riedel, D., Chapochnikov, N. M., Yarin, Y.
M., Harke, B., Hell, S. W., Egner, A., & Moser, T. 2009, "Tuning of synapse number,
structure and function in the cochlea", Nat.Neurosci., vol. 12, no. 4, pp. 444-453.
Middlebrooks, J. C. & Green, D. M. 1991, "Sound localization by human listeners",
Annu.Rev Psychol., vol. 42, pp. 135-159.
Milton, N. G., Bessis, A., Changeux, J. P., & Latchman, D. S. 1996, "Differential regulation
of neuronal nicotinic acetylcholine receptor subunit gene promoters by Brn-3 POU family
transcription factors", Biochem.J, vol. 317 ( Pt 2), pp. 419-423.
Mockler, T. C., Chan, S., Sundaresan, A., Chen, H., Jacobsen, S. E., & Ecker, J. R. 2005,
"Applications of DNA tiling arrays for whole-genome analysis", Genomics, vol. 85, no. 1, pp.
1-15.
Moeller, M. P. 2007, "Current state of knowledge: psychosocial development in children
with hearing impairment", Ear Hear., vol. 28, no. 6, pp. 729-739.
Moore, K. L. & Dalley, A. F. 1999, "Head," in Clinically Oriented Anatomy, 4 edn, P. J.
Kelly, ed., Lippincott Williams & Wilkins, Baltimore, pp. 831-993.
More, E., Fellner, T., Doppelmayr, H., Hauser-Kronberger, C., Dandachi, N., Obrist, P.,
Sandhofer, F., & Paulweber, B. 2003, "Activation of the MAP kinase pathway induces
chicken ovalbumin upstream promoter-transcription factor II (COUP-TFII) expression in
human breast cancer cell lines", J Endocrinol, vol. 176, no. 1, pp. 83-94.

Bibliography 242
Morris, B. J., Adams, D. J., & van der, W. L. 2001, "Renin gene expression: the switch and
the fingers", Clin.Exp.Pharmacol.Physiol, vol. 28, no. 12, pp. 1044-1047.
Morris, P. J., Lakin, N. D., Dawson, S. J., Ryabinin, A. E., Kilimann, M. W., Wilson, M. C.,
& Latchman, D. S. 1996, "Differential regulation of genes encoding synaptic proteins by
members of the Brn-3 subfamily of POU transcription factors", Brain Res.Mol Brain Res.,
vol. 43, no. 1-2, pp. 279-285.
MRC Hearing & Communication Group. NHS Newborn Hearing Screening Programme.
http://hearing.screening.nhs.uk/ . 2008.
Ref Type: Internet Communication
Munir, S., Singh, S., Kaur, K., & Kapur, V. 2004, "Suppression subtractive hybridization
coupled with microarray analysis to examine differential expression of genes in virus
infected cells", Biol.Proced.Online., vol. 6, pp. 94-104.
Murakami, D. M., Erkman, L., Hermanson, O., Rosenfeld, M. G., & Fuller, C. A. 2002,
"Evidence for vestibular regulation of autonomic functions in a mouse genetic model",
Proc.Natl.Acad.Sci U.S.A, vol. 99, no. 26, pp. 17078-17082.
Murayama, C., Miyazaki, H., Miyamoto, A., & Shimizu, T. 2008, "Involvement of
Ad4BP/SF-1, DAX-1, and COUP-TFII transcription factor on steroid production and
luteinization in ovarian theca cells", Mol Cell Biochem., vol. 314, no. 1-2, pp. 51-58.
Naka, H., Nakamura, S., Shimazaki, T., & Okano, H. 2008, "Requirement for COUP-TFI
and II in the temporal specification of neural stem cells in CNS development", Nat Neurosci.
Nakano, M., Yoshiura, K. i., Oikawa, M., Miyoshi, O., Yamada, K., Kondo, S., Miwa, N.,
Soeda, E., Jinno, Y., Fujii, T., & Niikawa, N. 1998, "Identification, characterization and
mapping of the human ZIS (zinc-finger, splicing) gene", Gene, vol. 225, no. 1-2, pp. 59-65.
Nayak, G. D., Ratnayaka, H. S., Goodyear, R. J., & Richardson, G. P. 2007, "Development of
the hair bundle and mechanotransduction", Int J Dev.Biol., vol. 51, no. 6-7, pp. 597-608.
Negishi, Y., Nishita, Y., Saegusa, Y., Kakizaki, I., Galli, I., Kihara, F., Tamai, K., Miyajima,
N., Iguchi-Ariga, S. M., & Ariga, H. 1994, "Identification and cDNA cloning of single-
stranded DNA binding proteins that interact with the region upstream of the human c-myc
gene", Oncogene, vol. 9, no. 4, pp. 1133-1143.
Niki, T., Galli, I., Ariga, H., & Iguchi-Ariga, S. M. 2000a, "MSSP, a protein binding to an
origin of replication in the c-myc gene, interacts with a catalytic subunit of DNA
polymerase alpha and stimulates its polymerase activity", FEBS Lett., vol. 475, no. 3, pp.
209-212.
Niki, T., Izumi, S., Saegusa, Y., Taira, T., Takai, T., Iguchi-Ariga, S. M., & Ariga, H. 2000b,
"MSSP promotes ras/myc cooperative cell transforming activity by binding to c-Myc", Genes
Cells, vol. 5, no. 2, pp. 127-141.
Ninkina, N. N., Stevens, G. E. M., Wood, J. N., & Richardson, W. D. 1993, "A novel Brn3-
Iike POU transcription factor expressed in subsets of rat sensory and spinal cord neurons",
Nucleic Acids Research, vol. 21, no. 14, pp. 3175-3182.
Nishida, Y., Rivolta, M. N., & Holley, M. C. 1998, "Timed markers for the differentiation of
the cuticular plate and stereocilia in hair cells from the mouse inner ear", J Comp Neurol.,
vol. 395, no. 1, pp. 18-28.
Nishikori, T., Hatta, T., Kawauchi, H., & Otani, H. 1999, "Apoptosis during inner ear
development in human and mouse embryos: an analysis by computer-assisted three-
dimensional reconstruction", Anat.Embryol.(Berl), vol. 200, no. 1, pp. 19-26.

Bibliography 243
Nolan, L. S., Jagutpal, S. S., Cadge, B. A., Woo, P., & Dawson, S. J. 2007, "Identification
and functional analysis of common sequence variants in the DFNA15 gene, Brn-3c", Gene,
vol. 400, no. 1-2, pp. 89-97.
Nomura, J., Matsumoto, K., Iguchi-Ariga, S. M., & Ariga, H. 2005, "Positive regulation of
Fas gene expression by MSSP and abrogation of Fas-mediated apoptosis induction in
MSSP-deficient mice", Exp.Cell Res., vol. 305, no. 2, pp. 324-332.
Noy, N. 2007, "Ligand specificity of nuclear hormone receptors: sifting through promiscuity",
Biochemistry, vol. 46, no. 47, pp. 13461-13467.
Nuclear Receptors Nomenclature Committee. 1999, "A unified nomenclature system for the
nuclear receptor superfamily", Cell, vol. 97, no. 2, pp. 161-163.
Ohlemiller, K. K. 2004, "Age-related hearing loss: the status of Schuknecht's typology",
Curr.Opin.Otolaryngol Head Neck Surg, vol. 12, no. 5, pp. 439-443.
Olusanya, B. O. & Newton, V. E. 2007, "Global burden of childhood hearing impairment
and disease control priorities for developing countries", Lancet, vol. 369, no. 9569, pp. 1314-
1317.
Omahoney, C. F. & Davies, R. A. 1998, "Vestibular Investigations," in Diseases of the Ear, 6
edn, H. Ludman & T. Wright, eds., Arnold, London, pp. 87-104.
OMIM. OMIM Home. www.ncbi.nlm.nih.gov/sites/entrez?db=omim . 2009.
Ref Type: Internet Communication
Panin, V. M., Shao, L., Lei, L., Moloney, D. J., Irvine, K. D., & Haltiwanger, R. S. 2002,
"Notch ligands are substrates for protein O-fucosyltransferase-1 and Fringe", J Biol.Chem.,
vol. 277, no. 33, pp. 29945-29952.
Park, J. I., Tsai, S. Y., & Tsai, M. J. 2003, "Molecular mechanism of chicken ovalbumin
upstream promoter-transcription factor (COUP-TF) actions", Keio J.Med., vol. 52, no. 3, pp.
174-181.
Patuzzi, R. 1996, "Cochlear Micromechanics and Macromechanics," in The Cochlea, P.
Dallos, A. N. Popper, & R. R. Fay, eds., Springer-Verlag, New York, pp. 186-257.
Pauw, R. J., van Drunen, F. J., Collin, R. W., Huygen, P. L., Kremer, H., & Cremers, C. W.
2008, "Audiometric characteristics of a Dutch family linked to DFNA15 with a novel
mutation (p.L289F) in POU4F3", Arch.Otolaryngol.Head Neck Surg., vol. 134, no. 3, pp.
294-300.
Pereira, F. A., Qiu, Y., Tsai, M. J., & Tsai, S. Y. 1995, "Chicken ovalbumin upstream
promoter transcription factor (COUP-TF): expression during mouse embryogenesis",
J.Steroid Biochem.Mol Biol., vol. 53, no. 1-6, pp. 503-508.
Pereira, F. A., Qiu, Y., Zhou, G., Tsai, M. J., & Tsai, S. Y. 1999, "The orphan nuclear
receptor COUP-TFII is required for angiogenesis and heart development", Genes and
Development, vol. 13, no. 8, pp. 1037-1049.
Pereira, F. A., Tsai, M. J., & Tsai, S. Y. 2000, "COUP-TF orphan nuclear receptors in
development and differentiation", Cell Mol Life Sci., vol. 57, no. 10, pp. 1388-1398.
Petit, C., Levilliers, J., & Hardelin, J. P. 2001, "Molecular genetics of hearing loss",
Annu.Rev Genet., vol. 35, pp. 589-646.
Petit, F. G., Salas, R., Tsai, M. J., & Tsai, S. Y. 2004, "The regulation of COUP-TFII gene
expression by Ets-1 is enhanced by the steroid receptor co-activators", Mech.Ageing Dev.,
vol. 125, no. 10-11, pp. 719-732.

Bibliography 244
Pfister, M. & Lalwani, A. K. 2007, "Gene Therapy of the Inner Ear," in Genes, Hearing and
Deafness, A. Martini, D. Stephens, & A. P. Read, eds., Informa UK Ltd., London, pp. 299-
304.
Phelps, P. D. 1998, "Diagnostic Imaging of the Ear (Normal and Congenital)," in Diseases of
the Ear, 6 edn, H. Ludman & T. Wright, eds., Arnold, London, pp. 105-124.
Pickles, J. O. 1988, "The Outer and Middle Ears," in An Introduction to the Physiology of
Hearing, 2 edn, Academic Press Limited, London, pp. 12-25.
Plambeck, C. A., Kwan, A. H., Adams, D. J., Westman, B. J., van der, W. L., Medcalf, R. L.,
Morris, B. J., & Mackay, J. P. 2003, "The structure of the zinc finger domain from human
splicing factor ZNF265 fold", Journal of Biological Chemistry, vol. 278, no. 25, pp. 22805-
22811.
Prosser, S. & Martini, A. 2007, "Understanding the Phenotype: Basic Concepts in
Audiology," in Genes, Hearing and Deafness, A. Martini, D. Stephens, & A. P. Read, eds.,
Informa UK Ltd., London, pp. 19-38.
Pujades, C., Kamaid, A., Alsina, B., & Giraldez, F. 2006, "BMP-signaling regulates the
generation of hair-cells", Dev.Biol., vol. 292, no. 1, pp. 55-67.
Qiu, Y., Cooney, A. J., Kuratani, S., DeMayo, F. J., Tsai, S. Y., & Tsai, M. J. 1994a,
"Spatiotemporal expression patterns of chicken ovalbumin upstream promoter-
transcription factors in the developing mouse central nervous system: evidence for a role in
segmental patterning of the diencephalon", Proc.Natl.Acad.Sci.U.S.A, vol. 91, no. 10, pp.
4451-4455.
Qiu, Y., Krishnan, V., Pereira, F. A., Tsai, S. Y., & Tsai, M.-J. 1996, "Chicken ovalbumin
upstream promoter-transcription factors and their regulation", The Journal of Steroid
Biochemistry and Molecular Biology, vol. 56, no. 1-6, pp. 81-85.
Qiu, Y., Tsai, S. Y., & Tsai, M. J. 1994b, "COUP-TF an orphan member of the
steroid/thyroid hormone receptor superfamily", Trends in Endocrinology and Metabolism,
vol. 5, no. 6, pp. 234-239.
Quandt, K., Frech, K., Karas, H., Wingender, E., & Werner, T. 1995, "MatInd and
MatInspector: new fast and versatile tools for detection of consensus matches in nucleotide
sequence data", Nucleic Acids Res., vol. 23, no. 23, pp. 4878-4884.
Raccurt, M., Smallwood, S., Mertani, H. C., Devost, D., Abbaci, K., Boutin, J. M., & Morel,
G. 2006, "Cloning, Expression and Regulation of Chicken Ovalbumin Upstream Promoter
Transcription Factors (COUP-TFII and EAR-2) in the Rat Anterior Pituitary Gland",
Neuroendocrinology, vol. 82, no. 5-6, pp. 233-244.
Radde-Gallwitz, K., Pan, L., Gan, L., Lin, X., Segil, N., & Chen, P. 2004, "Expression of
Islet1 marks the sensory and neuronal lineages in the mammalian inner ear", J Comp
Neurol., vol. 477, no. 4, pp. 412-421.
Raft, S., Nowotschin, S., Liao, J., & Morrow, B. E. 2004, "Suppression of neural fate and
control of inner ear morphogenesis by Tbx1", Development, vol. 131, no. 8, pp. 1801-1812.
Ramsden, R., Saeed, S., & Aggarwal, R. 2007, "Cochlear Implantation in Genetic Deafness,"
in Genes, Hearing and Deafness, A. Martini, D. Stephens, & A. P. Read, eds., Informa UK
Ltd., London, pp. 253-262.
Raphael, Y. & Altschuler, R. A. 2003, "Structure and innervation of the cochlea", Brain
Res.Bull., vol. 60, no. 5-6, pp. 397-422.

Bibliography 245
Raz, Y. & Kelley, M. W. 1999, "Retinoic Acid Signaling Is Necessary for the Development of
the Organ of Corti", Developmental Biology, vol. 213, no. 1, pp. 180-193.
Reiners, J., Nagel-Wolfrum, K., Jurgens, K., Marker, T., & Wolfrum, U. 2006, "Molecular
basis of human Usher syndrome: Deciphering the meshes of the Usher protein network
provides insights into the pathomechanisms of the Usher disease", Experimental Eye
Research, vol. 83, no. 1, pp. 97-119.
Rhee, J. M., Gruber, C. A., Brodie, T. B., Trieu, M., & Turner, E. E. 1998, "Highly
Cooperative Homodimerization Is a Conserved Property of Neural POU Proteins", Journal
of Biological Chemistry, vol. 273, no. 51, pp. 34196-34205.
Richardson, G. P., Lukashkin, A. N., & Russell, I. J. 2008, "The tectorial membrane: one
slice of a complex cochlear sandwich", Curr.Opin.Otolaryngol Head Neck Surg, vol. 16, no. 5,
pp. 458-464.
Rinkwitz, S., Bober, E., & Baker, R. 2001, "Development of the vertebrate inner ear",
Ann.N.Y.Acad.Sci., vol. 942, pp. 1-14.
Ritchie, H. H., Wang, L. H., Tsai, S., O'Malley, B. W., & Tsai, M. J. 1990, "COUP-TF gene: a
structure unique for the steroid/thyroid receptor superfamily", Nucleic Acids Res., vol. 18,
no. 23, pp. 6857-6862.
Rivolta, M. N. 2007, "Stem Cells in the Inner Ear: Advancing Towards a New Therapy for
Hearing Impairment," in Genes, Hearing and Deafness, A. Martini, D. Stephens, & A. P.
Read, eds., Informa UK Ltd., London, pp. 279-288.
Rivolta, M. N., Grix, N., Lawlor, P., Ashmore, J. F., Jagger, D. J., & Holley, M. C. 1998a,
"Auditory hair cell precursors immortalized from the mammalian inner ear", Proc.Biol.Sci.,
vol. 265, no. 1406, pp. 1595-1603.
Rivolta, M. N. & Holley, M. C. 1998b, "GATA3 is downregulated during hair cell
differentiation in the mouse cochlea", J Neurocytol., vol. 27, no. 9, pp. 637-647.
Rizzi, M. D. & Hirose, K. 2007, "Aminoglycoside ototoxicity", Curr.Opin.Otolaryngol.Head
Neck Surg., vol. 15, no. 5, pp. 352-357.
RNID. Royal National Institute for Deaf People. www.rnid.org.uk . 2009.
Ref Type: Internet Communication
Robertson, M. 1988, "Homoeo boxes, POU proteins and the limits to promiscuity", Nature,
vol. 336, no. 6199, pp. 522-524.
Robin, N. H., Prucka, S. K., Woolley, A. L., & Smith, R. J. 2005, "The use of genetic testing
in the evaluation of hearing impairment in a child", Curr.Opin.Pediatr., vol. 17, no. 6, pp.
709-712.
Robles, L. & Ruggero, M. A. 2001, "Mechanics of the mammalian cochlea", Physiol Rev, vol.
81, no. 3, pp. 1305-1352.
Romand, R., Dolle, P., & Hashino, E. 2006, "Retinoid signaling in inner ear development",
J.Neurobiol., vol. 66, no. 7, pp. 687-704.
Ruben, R. J. 1967, "Development of the inner ear of the mouse: a radioautographic study of
terminal mitoses", Acta Otolaryngol. p. Suppl-44.
Ryan, A. F. 1997, "Transcription factors and the control of inner ear development",
Semin.Cell Dev.Biol., vol. 8, no. 3, pp. 249-256.
Rybak, L. P. & Ramkumar, V. 2007, "Ototoxicity", Kidney Int, vol. 72, no. 8, pp. 931-935.

Bibliography 246
Sage, C., Huang, M., Karimi, K., Gutierrez, G., Vollrath, M. A., Zhang, D. S., Garcia-
Anoveros, J., Hinds, P. W., Corwin, J. T., Corey, D. P., & Chen, Z. Y. 2005, "Proliferation of
functional hair cells in vivo in the absence of the retinoblastoma protein", Science, vol. 307,
no. 5712, pp. 1114-1118.
Sage, C., Huang, M., Vollrath, M. A., Brown, M. C., Hinds, P. W., Corey, D. P., Vetter, D. E.,
& Chen, Z. Y. 2006, "Essential role of retinoblastoma protein in mammalian hair cell
development and hearing", vol. 103, no. 19, pp. 7345-7350.
Sataloff, R. T. & Sataloff, J. 1993, "Classification and Measurement of Hearing Loss," in
Occupational Hearing Loss, 2 edn, Marcel Dekker, New York, pp. 49-72.
Sato, Y., Suzuki, T., Hidaka, K., Sato, H., Ito, K., Ito, S., & Sasano, H. 2003,
"Immunolocalization of nuclear transcription factors, DAX-1 and COUP-TF II, in the
normal human ovary: correlation with adrenal 4 binding protein/steroidogenic factor-1
immunolocalization during the menstrual cycle", J.Clin.Endocrinol Metab, vol. 88, no. 7, pp.
3415-3420.
Scherf, M., Klingenhoff, A., & Werner, T. 2000, "Highly specific localization of promoter
regions in large genomic sequences by PromoterInspector: a novel context analysis
approach", J.Mol.Biol., vol. 297, no. 3, pp. 599-606.
Scott, M. P., Tamkun, J. W., & Hartzell, G. W., III 1989, "The structure and function of the
homeodomain", Biochim.Biophys.Acta, vol. 989, no. 1, pp. 25-48.
Siemens, J., Lillo, C., Dumont, R. A., Reynolds, A., Williams, D. S., Gillespie, P. G., &
Muller, U. 2004, "Cadherin 23 is a component of the tip link in hair-cell stereocilia", Nature,
vol. 428, no. 6986, pp. 950-955.
Slepecky, N. B. 1996, "Cochlear Structure," in The Cochlea, P. Dallos, A. N. Popper, & R. R.
Fay, eds., Springer-Verlag, New York, pp. 44-129.
Smith, A. & Mathers, C. 2006, "Epidemiology of Infection as a Cause of Hearing Loss," in
Infection and Hearing Impairment, V. E. Newton & P. J. Vallely, eds., Whurr Publishers
Limited (a subsidiary of John Wiley & Sons Ltd), Chichester, pp. 31-66.
Smith, M. D., Morris, P. J., & Latchman, D. S. 1998, "The Brn-3c transcription factor
contains a neuronal-specific activation domain", Neuroreport, vol. 9, no. 5, pp. 851-856.
Smith, R. J., Bale, J. F., Jr., & White, K. R. 2005, "Sensorineural hearing loss in children",
Lancet, vol. 365, no. 9462, pp. 879-890.
Spongr, V. P., Flood, D. G., Frisina, R. D., & Salvi, R. J. 1997, "Quantitative measures of
hair cell loss in CBA and C57BL/6 mice throughout their life spans", J Acoust.Soc.Am., vol.
101, no. 6, pp. 3546-3553.
Stratagene. QuikChange® Primer Design Program.
http://www.stratagene.com/sdmdesigner/default.aspx . 2006.
Ref Type: Internet Communication
Sud, R., Jones, C. M., Banfi, S., & Dawson, S. J. 2005, "Transcriptional regulation by
Barhl1 and Brn-3c in organ-of-Corti-derived cell lines", Brain Res.Mol Brain Res., vol. 141,
no. 2, pp. 174-180.
Sun, D. S., Chang, A. C., Jenkins, N. A., Gilbert, D. J., Copeland, N. G., & Chang, N. C.
1996, "Identification, molecular characterization, and chromosomal localization of the
cDNA encoding a novel leucine zipper motif-containing protein", Genomics, vol. 36, no. 1, pp.
54-62.

Bibliography 247
Suzuki, T., Moriya, T., Darnel, A. D., Takeyama, J., & Sasano, H. 2000,
"Immunohistochemical distribution of chicken ovalbumin upstream promoter transcription
factor II in human tissues", Mol.Cell Endocrinol., vol. 164, no. 1-2, pp. 69-75.
Takai, T., Nishita, Y., Iguchi-Ariga, S. M., & Ariga, H. 1994, "Molecular cloning of MSSP-2,
a c-myc gene single-strand binding protein: characterization of binding specificity and DNA
replication activity", Nucleic Acids Res., vol. 22, no. 25, pp. 5576-5581.
Takamoto, N., Kurihara, I., Lee, K., Demayo, F. J., Tsai, M. J., & Tsai, S. Y. 2005a,
"Haploinsufficiency of chicken ovalbumin upstream promoter transcription factor II in
female reproduction", Molecular Endocrinology, vol. 19, no. 9, pp. 2299-2308.
Takamoto, N., You, L. R., Moses, K., Chiang, C., Zimmer, W. E., Schwartz, R. J., DeMayo, F.
J., Tsai, M. J., & Tsai, S. Y. 2005b, "COUP-TFII is essential for radial and anteroposterior
patterning of the stomach", Development, vol. 132, no. 9, pp. 2179-2189.
Tang, L. S., Alger, H. M., Lin, F., & Pereira, F. A. 2005, "Dynamic expression of COUP-TFI
and COUP-TFII during development and functional maturation of the mouse inner ear",
Gene Expr.Patterns., vol. 5, no. 5, pp. 587-592.
Tang, L. S., Alger, H. M., & Pereira, F. A. 2006, "COUP-TFI controls Notch regulation of
hair cell and support cell differentiation", Development, vol. 133, no. 18, pp. 3683-3693.
Tarabichi, M. B., Todd, C., Khan, Z., Yang, X., Shehzad, B., & Tarabichi, M. M. 2008,
"Deafness in the developing world: the place of cochlear implantation", J Laryngol.Otol., vol.
122, no. 9, pp. 877-880.
Theil, T., Lean-Hunter, S., Zornig, M., & Moroy, T. 1993, "Mouse Brn-3 family of POU
transcription factors: a new aminoterminal domain is crucial for the oncogenic activity of
Brn-3a", Nucleic Acids Res., vol. 21, no. 25, pp. 5921-5929.
Theil, T., Rodel, B., Spiegelhalter, F., & Moroy, T. 1995, "Short isoform of POU factor Brn-
3b can form a heterodimer with Brn-3a that is inactive for octamer motif binding", J
Biol.Chem., vol. 270, no. 52, pp. 30958-30964.
Thelen, N., Breuskin, I., Malgrange, B., & Thiry, M. 2009, "Early identification of inner
pillar cells during rat cochlear development", Cell Tissue Res.
Trieu, M., Rhee, J. M., Fedtsova, N., & Turner, E. E. 1999, "Autoregulatory Sequences are
Revealed by Complex Stability Screening of the Mouse brn-3.0 Locus", Journal of
Neuroscience, vol. 19, no. 15, pp. 6549-6558.
Tripodi, M., Filosa, A., Armentano, M., & Studer, M. 2004, "The COUP-TF nuclear
receptors regulate cell migration in the mammalian basal forebrain", Development, vol. 131,
no. 24, pp. 6119-6129.
Tritsch, N. X., Yi, E., Gale, J. E., Glowatzki, E., & Bergles, D. E. 2007, "The origin of
spontaneous activity in the developing auditory system", Nature, vol. 450, no. 7166, pp. 50-
55.
Ulfendahl, M. 2007, "Tissue Transplantation into the Inner Ear," in Genes, Hearing and
Deafness, A. Martini, D. Stephens, & A. P. Read, eds., Informa UK Ltd., London, pp. 289-
298.
Vahava, O., Morell, R., Lynch, E. D., Weiss, S., Kagan, M. E., Ahituv, N., Morrow, J. E., Lee,
M. K., Skvorak, A. B., Morton, C. C., Blumenfeld, A., Frydman, M., Friedman, T. B., King,
M. C., & Avraham, K. B. 1998, "Mutation in Transcription Factor POU4F3 Associated with
Inherited Progressive Hearing Loss in Humans", Science, vol. 279, no. 5358, pp. 1950-1954.

Bibliography 248
Van Camp, G. & Smith, R. Hereditary Hearing Loss Homepage.
http://webh01.ua.ac.be/hhh . 2008.
Ref Type: Internet Communication
van Drunen, F. J., Pauw, R. J., Collin, R. W., Kremer, H., Huygen, P. L., & Cremers, C. W.
2009, "Vestibular impairment in a Dutch DFNA15 family with an L289F mutation in
POU4F3", Audiol Neurootol, vol. 14, no. 5, pp. 303-307.
Van Laer, L. & Van Camp, G. 2007, "Age-related hearing impairment: ensemble playing of
environmental and genetic factors," in Genes, Hearing, and Deafness, A. Martini, D.
Stephens, & A. P. Read, eds., Informa Healthcare, London, pp. 79-90.
Van Laer, L., Van Eyken, E., Fransen, E., Huyghe, J. R., Topsakal, V., Hendrickx, J. J.,
Hannula, S., Maki-Torkko, E., Jensen, M., Demeester, K., Baur, M., Bonaconsa, A., Mazzoli,
M., Espeso, A., Verbruggen, K., Huyghe, J., Huygen, P., Kunst, S., Manninen, M., Konings,
A., az-Lacava, A. N., Steffens, M., Wienker, T. F., Pyykko, I., Cremers, C. W., Kremer, H.,
Dhooge, I., Stephens, D., Orzan, E., Pfister, M., Bille, M., Parving, A., Sorri, M., Van de
Heyning, P. H., & Van, C. G. 2008, "The grainyhead like 2 gene (GRHL2), alias TFCP2L3,
is associated with age-related hearing impairment", Hum.Mol Genet., vol. 17, no. 2, pp. 159-
169.
Vander, A., Sherman, J., & Luciano, D. 2001, "The Sensory Systems," in Human Physiology,
8 edn, McGraw-Hill, New York, pp. 227-262.
Veenstra, G. J., van, d., V, & Destree, O. H. 1997, "POU domain transcription factors in
embryonic development", Mol Biol.Rep., vol. 24, no. 3, pp. 139-155.
Verrijzer, C. P. & van, d., V 1993, "POU domain transcription factors",
Biochim.Biophys.Acta, vol. 1173, no. 1, pp. 1-21.
Waguespack, J., Salles, F. T., Kachar, B., & Ricci, A. J. 2007, "Stepwise morphological and
functional maturation of mechanotransduction in rat outer hair cells", J Neurosci., vol. 27,
no. 50, pp. 13890-13902.
Wallis, D., Hamblen, M., Zhou, Y., Venken, K. J., Schumacher, A., Grimes, H. L., Zoghbi, H.
Y., Orkin, S. H., & Bellen, H. J. 2003, "The zinc finger transcription factor Gfi1, implicated
in lymphomagenesis, is required for inner ear hair cell differentiation and survival",
Development, vol. 130, no. 1, pp. 221-232.
Wang, J., Mark, S., Zhang, X., Qian, D., Yoo, S. J., Radde-Gallwitz, K., Zhang, Y., Lin, X.,
Collazo, A., Wynshaw-Boris, A., & Chen, P. 2005, "Regulation of polarized extension and
planar cell polarity in the cochlea by the vertebrate PCP pathway", Nat Genet, vol. 37, no. 9,
pp. 980-985.
Wang, L. H., Ing, N. H., Tsai, S. Y., O'Malley, B. W., & Tsai, M. J. 1991, "The COUP-TFs
compose a family of functionally related transcription factors", Gene Expr., vol. 1, no. 3, pp.
207-216.
Wang, S. W., Mu, X., Bowers, W. J., Kim, D. S., Plas, D. J., Crair, M. C., Federoff, H. J.,
Gan, L., & Klein, W. H. 2002, "Brn3b/Brn3c double knockout mice reveal an unsuspected
role for Brn3c in retinal ganglion cell axon outgrowth", Development, vol. 129, no. 2, pp.
467-477.
Wangemann, P. 2006, "Supporting sensory transduction: cochlear fluid homeostasis and the
endocochlear potential", J Physiol, vol. 576, no. Pt 1, pp. 11-21.
Wangemann, P. & Schacht, J. 1996, "Homeostatic Mechanisms in the Cochlea," in The
Cochlea, P. Dallos, A. N. Popper, & R. R. Fay, eds., Springer-Verlag, New York, pp. 130-185.

Bibliography 249
Weigel, N. L. 1996, "Steroid hormone receptors and their regulation by phosphorylation",
Biochem.J., vol. 319 ( Pt 3), pp. 657-667.
Weiss, S., Gottfried, I., Mayrose, I., Khare, S. L., Xiang, M., Dawson, S. J., & Avraham, K. B.
2003, "The DFNA15 deafness mutation affects POU4F3 protein stability, localization, and
transcriptional activity", Mol Cell Biol., vol. 23, no. 22, pp. 7957-7964.
Weston, M. D. & Soukup, G. A. 2009, "MicroRNAs sound off", Genome Med., vol. 1, no. 6, p.
59.
Wheeler, D. L., Church, D. M., Federhen, S., Lash, A. E., Madden, T. L., Pontius, J. U.,
Schuler, G. D., Schriml, L. M., Sequeira, E., Tatusova, T. A., & Wagner, L. 2003, "Database
resources of the National Center for Biotechnology", Nucleic Acids Research, vol. 31, no. 1,
pp. 28-33.
Whitfield, T. T. & Hammond, K. L. 2007, "Axial patterning in the developing vertebrate
inner ear", Int J Dev.Biol., vol. 51, no. 6-7, pp. 507-520.
Willson, T. M. & Moore, J. T. 2002, "Minireview: Genomics Versus Orphan Nuclear
Receptors--A Half-Time Report", Molecular Endocrinology, vol. 16, no. 6, pp. 1135-1144.
Wood, J. N., Bevan, S. J., Coote, P. R., Dunn, P. M., Harmar, A., Hogan, P., Latchman, D. S.,
Morrison, C., Rougon, G., Theveniau, M., & . 1990, "Novel cell lines display properties of
nociceptive sensory neurons", Proc.Biol.Sci., vol. 241, no. 1302, pp. 187-194.
World Health Organization. Fact sheet N°300.
http://www.who.int/mediacentre/factsheets/fs300/en/print.html . 2006.
Ref Type: Internet Communication
Wright, T. J., Hatch, E. P., Karabagli, H., Karabagli, P., Schoenwolf, G. C., & Mansour, S. L.
2003, "Expression of mouse fibroblast growth factor and fibroblast growth factor receptor
genes during early inner ear development", Dev.Dyn., vol. 228, no. 2, pp. 267-272.
Wu, X., Wang, X., Gao, J., Yu, Y., Jia, S., Zheng, J., Dallos, P., He, D. Z. Z., Cheatham, M.,
& Zuo, J. 2008, "Glucose transporter 5 is undetectable in outer hair cells and does not
contribute to cochlear amplification", Brain Research, vol. 1210, pp. 20-28.
Xia, Y. R., Andersen, B., Mehrabian, M., Diep, A. T., Warden, C. H., Mohandas, T.,
McEvilly, R. J., Rosenfeld, M. G., & Lusis, A. J. 1993, "Chromosomal organization of
mammalian POU domain factors", Genomics, vol. 18, no. 1, pp. 126-130.
Xiang, M., Gao, W. Q., Hasson, T., & Shin, J. J. 1998, "Requirement for Brn-3c in
maturation and survival, but not in fate determination of inner ear hair cells", Development,
vol. 125, no. 20, pp. 3935-3946.
Xiang, M., Maklad, A., Pirvola, U., & Fritzsch, B. 2003, "Brn3c null mutant mice show long-
term, incomplete retention of some afferent inner ear innervation", BMC.Neurosci., vol. 4, p.
2.
Xiang, M., Zhou, L., Macke, J. P., Yoshioka, T., Hendry, S. H., Eddy, R. L., Shows, T. B., &
Nathans, J. 1995, "The Brn-3 family of POU-domain factors: primary structure, binding
specificity, and expression in subsets of retinal ganglion cells and somatosensory neurons",
Journal of Neuroscience, vol. 15, no. 7, pp. 4762-4785.
Xiang, M., Zhou, L., Peng, Y. W., Eddy, R. L., Shows, T. B., & Nathans, J. 1993, "Brn-3b: a
POU domain gene expressed in a subset of retinal ganglion cells", Neuron, vol. 11, no. 4, pp.
689-701.
Xiang, M., Gan, L., Li, D., Chen, Z. Y., Zhou, L., O'Malley, B. W., Klein, W., & Nathans, J.
1997, "Essential role of POU-domain factor Brn-3c in auditory and vestibular hair cell

Bibliography 250
development", Proceedings of the National Academy of Sciences of the United States of
America, vol. 94, no. 17, pp. 9445-9450.
Xu, L., Glass, C. K., & Rosenfeld, M. G. 1999, "Coactivator and corepressor complexes in
nuclear receptor function", Curr.Opin.Genet Dev., vol. 9, no. 2, pp. 140-147.
Xu, Z., Ricci, A. J., & Heller, S. 2009, "Rethinking how hearing happens", Neuron, vol. 62,
no. 3, pp. 305-307.
Yamamoto, M., Fujinuma, M., Tanaka, M., Drager, U. C., & McCaffery, P. 1999, "Sagittal
band expression of COUP-TF2 gene in the developing cerebellum", Mech.Dev., vol. 84, no. 1-
2, pp. 143-146.
Yang, T. T. & Chow, C. W. 2003, "Transcription cooperation by NFAT.C/EBP composite
enhancer complex", J Biol.Chem., vol. 278, no. 18, pp. 15874-15885.
You, L. R., Lin, F. J., Lee, C. T., DeMayo, F. J., Tsai, M. J., & Tsai, S. Y. 2005a,
"Suppression of Notch signalling by the COUP-TFII transcription factor regulates vein
identity", Nature, vol. 435, no. 7038, pp. 98-104.
You, L. R., Takamoto, N., Yu, C. T., Tanaka, T., Kodama, T., DeMayo, F. J., Tsai, S. Y., &
Tsai, M. J. 2005b, "Mouse lacking COUP-TFII as an animal model of Bochdalek-type
congenital diaphragmatic hernia", Proc.Natl.Acad.Sci.U.S.A, vol. 102, no. 45, pp. 16351-
16356.
Zajac, M., Jones, G. L., & Glazier, J. A. 2000, "Model of convergent extension in animal
morphogenesis", Phys.Rev Lett., vol. 85, no. 9, pp. 2022-2025.
Zelarayan, L. C., Vendrell, V., Alvarez, Y., Dominguez-Frutos, E., Theil, T., Alonso, M. T.,
Maconochie, M., & Schimmang, T. 2007, "Differential requirements for FGF3, FGF8 and
FGF10 during inner ear development", Dev.Biol., vol. 308, no. 2, pp. 379-391.
Zhang, H. J., Xu, C. H., Zhan, Y. J., Zhao, S. Y., Shan, Y. F., Geng, X. X., & Shan, X. N.
2005, "Sequence analysis of the mitochondrial genome from a large family with maternally
inherited nonsyndromic deafness", Zhonghua Yi.Xue.Yi.Chuan Xue.Za Zhi., vol. 22, no. 4,
pp. 368-371.
Zhang, P., Bennoun, M., Gogard, C., Bossard, P., Leclerc, I., Kahn, A., & Vasseur-Cognet, M.
2002, "Expression of COUP-TFII in metabolic tissues during development", Mech.Dev., vol.
119, no. 1, pp. 109-114.
Zheng, J., Madison, L. D., Oliver, D., Fakler, B., & Dallos, P. 2002, "Prestin, the motor
protein of outer hair cells", Audiol.Neurootol., vol. 7, no. 1, pp. 9-12.
Zheng, J., Shen, W., He, D. Z., Long, K. B., Madison, L. D., & Dallos, P. 2000, "Prestin is the
motor protein of cochlear outer hair cells", Nature, vol. 405, no. 6783, pp. 149-155.
Zine, A. & Romand, R. 1996, "Development of the auditory receptors of the rat: a SEM
study", Brain Res., vol. 721, no. 1-2, pp. 49-58.


![2W ^fde_¶e SV cVXZ`_R] eYcVRe+ 3C:4D - Daily Pioneer](https://static.fdokumen.com/doc/165x107/631aa8d85d5809cabd0f7e42/2w-fdee-sv-cvxzr-eycvre-3c4d-daily-pioneer.jpg)