MOLECULAR ANALYSIS OF INNER EAR BY USING ...
141
MOLECULAR ANALYSIS OF INNER EAR BY USING FORWARD GENETIC APPROACH A THESIS SUBMITTED to UNIVERSITY OF THE PUNJAB in complete fulfillment of the requirement for the degree of DOCTOR OF PHILOSOPHY in MOLECULAR BIOLOGY by ZIL-E-HUMA BASHIR Centre of Excellence in Molecular Biology University of the Punjab, Lahore Supervisors: DR. SHEIKH RIAZUDDIN & DR. SHAHEEN N. KHAN Centre of Excellence in Molecular Biology University of the Punjab, Lahore (2009)
-
Upload
khangminh22 -
Category
Documents
-
view
0 -
download
0
Transcript of MOLECULAR ANALYSIS OF INNER EAR BY USING ...

MOLECULAR ANALYSIS OF INNER EAR BY
USING FORWARD GENETIC APPROACH
A THESIS SUBMITTED
to
UNIVERSITY OF THE PUNJAB
in complete fulfillment of the requirement for the degree of
DOCTOR OF PHILOSOPHY
in
MOLECULAR BIOLOGY
by
ZIL-E-HUMA BASHIR Centre of Excellence in Molecular Biology
University of the Punjab, Lahore
Supervisors:
DR. SHEIKH RIAZUDDIN &
DR. SHAHEEN N. KHAN
Centre of Excellence in Molecular Biology University of the Punjab, Lahore
(2009)

In the name of
ALLAH
the most merciful,
the most beneficent.

CERTIFICATE
It is certified that the research work described in this thesis is the original work of the
author ZIL-E-HUMA BASHIR and has been carried out under our direct supervision.
We have personally gone through all the data reported in the manuscript and certify their
correctness/authenticity. It is further certified that the material included in this thesis have
not been used in part or full in a manuscript already submitted or in the process of
submission in partial/complete fulfillment of the award of any other degree from any
other institution. It is also certified that the thesis has been prepared under our supervision
according to the prescribed format and we endorse its evaluation for the award of Ph.D.
degree through the official procedures of the University.
In accordance with the rules of the Centre, data books # 620 and M-59 are declared as
unexpendable document that will be kept in the registry of the Centre for a minimum of
three years from the date of the thesis defense examination.
Signature of the Supervisor: __________________
Name: Dr. Sheikh Riazuddin
Designation: National Distinguished Professor
Signature of the Supervisor: __________________
Name: Dr. Shaheen N. Khan
Designation: National Distinguished Professor
DEDICATED TO:
MMMYYY PPPAAARRREEENNNTTTSSS
MMMYYY LLLOOOVVVIIINNNGGG HHHUUUSSSBBBAAANNNDDD
&&&
MMMYYY FFFRRRIIIEEENNNDDD SSSAAAIIIMMMAAA
LIST OF CONTENTS
Page #
LIST OF FIGURES .................................................................................................I LIST OF TABLES ...................................................................................................II SUMMARY ..............................................................................................................III-IV ACKNOWLEDGMENTS .......................................................................................V LIST OF ABBREVIATIONS & SYMBOLS ........................................................VI-VII INTRODUCTION ................................................................................ 1-3
SECTION: 1
REVIEW OF LITERATURE .............................................. 4-31
CHAPTER I
AUDITORY SYSTEM............................................................... 4-19 ANATOMY OF HUMAN EAR .......................................................................4-16 EXTERNAL EAR ....................................................................................................4 Pinna .....................................................................................................................4 External Auditory Canal .......................................................................................4 Tympanic Membrane ............................................................................................4 MIDDLE EAR..........................................................................................................5 Tympanic Cavity...................................................................................................5 Auditory Ossicles..................................................................................................5 Eustachian Tube....................................................................................................5 Oval and Round Windows....................................................................................5 INNER EAR .............................................................................................................7-16 Osseous Labyrinth ................................................................................................7 Membranous Labyrinth.........................................................................................8-14 Sensory Epithelia ..............................................................................................8 Organ of Corti ...............................................................................................9 Sensory Cells ............................................................................................11 Inner Hair Cells.....................................................................................11 Outer Hair Cells ....................................................................................11 Ion Transport Epithelia .....................................................................................13 Interciliary Links of Stereocilia and Mechanotransduction..................................14
PHYSIOLOGY OF HEARING ........................................................................17-19 EVENTS IN SOUND TRANSDUCTION PATHWAY..........................................17

CHAPTER II
MOLECULAR BASIS OF DEAFNESS ...............................20-28
PREVALENCE.........................................................................................................20 CLASSIFICATION ..................................................................................................20-22 HISTORY OF GENETIC DEAFNESS....................................................................22 MOLECULAR BASIS OF HEREDITRY DEAFNESS ..........................................22 NONSYNDROMIC AUTOSOMAL RECESSIVE DEAFNESS ............................25 CHAPTER III
LINKAGE ANALYSIS” A KEY TOOL FOR HUNTING DISEASE GENES ...................................................................... 29-31
LINKAGE ANALYSIS............................................................................................29 RECOMBINATION FRACTION............................................................................29 LOD SCORE ...........................................................................................................30 MULTIPOINT MAPPING .......................................................................................31 DNA POLYMORPHISMS - A TOOL FOR LINKAGE ANALYSIS.....................31
SECTION: 2
MATERIALS & METHODS .............................................. 32-59
FIELD WORK.......................................................................................................32-39 IDENTIFICATION AND ENROLLMENT OF FAMILIES ...................................32 CLINICAL EVALUATION.....................................................................................33-39 Clinical Assessment of Hearing Loss ...................................................................33-36 Clinical Assessment of Vestibular Function.........................................................37 Clinical Assessment of Retinitis Pigmentosa (RP)...............................................37-39 LAB WORK...........................................................................................................39-59 DNA EXTRACTION ...............................................................................................39-41 From Blood Samples............................................................................................39 From Buccal Swabs .............................................................................................40 QUANTIFICATION OF DNA.................................................................................41-42 PREPARATION OF REPLICA DNA PLATES......................................................42 LINKAGE ANALYSIS FOR REPORTED DFNB LOCI........................................42-47 Genotyping STR Markers by Polymerase Chain Reaction...................................43 GENOME WIDE SCAN ..........................................................................................48-51 Multiplex PCR Protocol........................................................................................48 SAMPLE PREPARATION FOR ABI PRISM® 3100 GENETIC ANALYZER......52

PRINCIPLE OF AUTOMATED FLUORESCENT GENOTYPING......................52 HAPLOTYPE ANALYSIS ......................................................................................53 DATA ORGANIZATION AND LOD SCORE CALCULATION..........................53-56 Data Sheet .............................................................................................................53 Ranges Sheet.........................................................................................................54 The Macros of the Software..................................................................................54 LOD Score Calculation by FASTLINK ...............................................................55 LOD Score Calculation by EASYLINKAGE.......................................................56 DNA SEQUENCING ...............................................................................................56-59 Amplification of PCR Fragments .........................................................................56 Purification of PCR Product .................................................................................57 Sequencing Reaction.............................................................................................57 Preparation of Product for Sequencing .................................................................58 Analysis of DNA Sequences ................................................................................58
SECTION: 3
RESULTS................................................................................. 60-93 CHAPTER I
LINKAGE ANALYSIS FOR REPORTED DFNB LOCI...... 60-79 PREFACE...............................................................................................................60 LINKAGE TO DFNB1/GJB2...................................................................................61-65 PKDF131 ..............................................................................................................61 PKDF1103 ............................................................................................................61 PKDF1094 ............................................................................................................61 LINKAGE TO DFNB4/SLC26A4 ............................................................................66-67 PKSR14A..............................................................................................................66 LINKAGE TO DFNB9/OTOF .................................................................................68-70 PKDF339 ..............................................................................................................68 PKDF1088 ............................................................................................................69 LINKAGE TO DFNB29/CLDN14 ..........................................................................71-77 PKDF315 ..............................................................................................................71 PKDF361 ..............................................................................................................71 PKDF1092 ............................................................................................................75 PKDF797 ..............................................................................................................75 Haplotype Analysis of Recurrent Mutations of CLDN14.....................................78

CHAPTER II
MAPPING OF A NEW AUTOSOMAL RECESSIVE NONSYNDROMIC DEAFNESS LOCUS DFNB88 AT CHROMOSOME 2p11.2……………………………………...79-93
PREFACE..............................................................................................................79 PKDF468 .................................................................................................................80-87 Clinical Evaluation................................................................................................80 Linkage Analysis for Reported Loci.....................................................................80 Genome-Wide Linkage Analysis for Mapping new Locus .................................81 LOD Score Calculations .......................................................................................84 Haplotype Analysis of PKDF468 .........................................................................84 Further Evidence of DFNB88 LINKAGE................................................................88-89 PKSR11b..................................................................................................................88 Haplotype Analysis of PKSR11b..........................................................................88 REFINED LINKAGE INTERVAL OF DFNB88....................................................90 CANDIDATE GENES IN DFNB88 REGION ........................................................91
SECTION: 4
DISCUSSION.......................................................................... 94-102 SECTION: 5
REFERENCES....................................................................... 103-116

I
LIST OF FIGURES Page #
Fig 1.1 Human Ear Anatomy ..............................................................................6 Fig 1.2 The Cochlea ............................................................................................10 Fig 1.3 Mechanosensory Transduction Unit .......................................................12 Fig 1.4 Structure and Protein Composition of the Stereociliary Bundle ............16 Fig 1.5 Sound Conduction Pathway ...................................................................19 Fig 1.6 Cytogenetic Map Positions of Human Nonsyndromic Deafness Loci ..24 Fig 1.7 Recombination Event..............................................................................30 Fig 2.1 Chart Representing Degree of Severity of Hearing Loss........................35 Fig 2.2 Sample Audiograms for Hearing Loss on the Basis of Ear Defect.........36 Fig 2.3 Picture of Normal Human Retina and with Retinitis Pigmentosa ..........38 Fig 2.4 Thermocycling Profiles for Amplification of Microsatellite Markers....47 Fig 2.5 Thermocycling Profiles for Amplification of Panel Markers .................47 Fig 2.6 Thermocycling Profile for Sequencing Reaction....................................58 Fig 3.1 Family PKDF131, Linked to DFNB1/GJB2...........................................63 Fig 3.2 Family PKDF1103, Linked to DFNB1/GJB2.........................................64 Fig 3.3 Family PKDF1094, Linked to DFNB1/GJB2and DFNB4/SLC26A4 .....65 Fig 3.4 Family PKSR14A, Linked to DFNB4/SLC26A4 ....................................67 Fig 3.5 Family PKDF339, Linked to DFNB9/OTOF .........................................68 Fig 3.6 Family PKDF1088, Linked to DFNB9/OTOF .......................................70 Fig 3.7 Family PKDF315, Linked to DFNB29/CLDN14 ...................................73 Fig 3.8 Family PKDF361, Linked to DFNB29/CLDN14 ...................................74 Fig 3.9 Family PKDF1092, Linked to DFNB29/CLDN14 .................................76 Fig 3.10 Family PKDF797, Linked to DFNB29/CLDN14 ...................................77 Fig 3.11 Transmembrane Topology of CLDN14 ..................................................77 Fig 3.12 Schematic representation of ABI PRISM® Linkage Mapping set ..........82 Fig 3.13 Two-point Lod scores of Genome-Wide Markers..................................85 Fig 3.14 DFNB88 Linked Haplotype in PKDF468...............................................86 Fig 3.15 Pure Tone Air and Bone Conduction Audiograms of PKDF468............87 Fig 3.16 DFNB88 Linked Haplotype in PKSR11b...............................................89 Fig 3.17 DFNB88 Linkage Interval on Human Chromosome 2p11.2 ..................90 Fig 3.18 Candidate Genes in the Refined Linkage Interval of DFNB88 ..............91

II
LIST OF TABLES Page #
Table 1.1 Loci for Nonsyndromic Autosomal Recessive Deafness........................26 Table 2.1 Categories of Hearing Impairment on the Basis of Severity .................35 Table 2.2 Quantification of Genomic DNA ...........................................................42 Table 2.3 STR Markers Used for Linkage Analysis of Reported Loci/Genes........44 Table 2.4 Reaction Mixture for Genotyping of STR Markers ................................43 Table 2.5 Sets of Multiplex PCR for HD10 Genome Wide Panel..........................49 Table 2.6 Reaction Mixture for Amplification of PCR Fragments.........................57 Table 2.7 Reaction Mixture for EXO-SAP Treatment............................................57 Table 2.8 Reaction Mixture for Sequencing Reaction ............................................58 Table 3.1 Correlation of Haplotype with Mutations in DFNB29 linked families ..78 Table 3.2 Two-Point LOD Scores for PKDF468....................................................86 Table 3.3 Two-Point LOD Scores for PKSR11b....................................................89 Table 3.4 DFNB88 Candidate Genes along with their Putative Functions.............92 Table 4.1 Calculation of Lod Score at Different Penetrance Values ......................99
III
SUMMARY
Deafness, the inability to hear, is the most prevalent sensory deficit manifested by genetic
as well as environmental etiologies (McKusick, 1992). Hereditary hearing impairment
can be categorized into two groups on the basis of their phenotype, non syndromic (70%)
and syndromic (30%). The predominant mode of inheritance of non syndromic deafness
is autosomal recessive and exhibits enormous genetic as well as allelic heterogeneity.
Presently 88 autosomal recessive non syndromic deafness (DFNB) loci have been
mapped and 30 of the corresponding genes have been cloned. The expression of 1% of
total human genes in the inner ear indicates the association of a large repertoire of genes
with deafness. Large consanguineous families with three or more affected siblings,
provide a very useful genetic resource for the identification of mutated genes associated
with hearing loss (Friedman and Griffith, 2003). The Pakistani population due to high rate
of consanguinity (Hussain and Beatles., 1998) thus provides a valuable genetic resource
for the identification of novel deafness loci.
The present study was intended to elucidate the molecular basis of autosomal recessive
hearing impairment in Pakistani population. For this purpose, 50 families segregating
prelingual profound hearing loss were enrolled from special education schools in
Pakistan. Written informed consent was obtained from participants; blood samples were
collected and processed for DNA extraction. Twenty five families were selected for
exclusion studies for reported autosomal recessive deafness loci (Hereditary Hearing Loss
Homepage). Among these, the deafness phenotype of 8 families (PKDF131, PKDF1103,
PKDF1094, PKSR14a, PKDF339, PKDF1088, PKDF315 and PKDF1092) was linked to
reported loci DFNB1/GJB2, DFNB4/PDS, DFNB9/OTOF and DFNB29/CLDN14
respectively. Mutational analysis revealed five reported variants of three genes including
GJB2 (p.W24X in PKDF131 and PKDF1103, and p.W77X in PKDF1094), SLC26A4
(p.S90L in PKSR14A), and CLDN14 (p.V85D in PKDF797 and 398delT in PKDF1092).
This study also revealed one novel mutation of SLC26A4 (IVS13+9C>T in PKSR14A)
and two novel pathogenic variants of CLDN14 (p.A94V in PKDF315 and p.I86V+p.S87I
in PKDF361).
Four selected unlinked consanguineous families were subjected to genome-wide linkage
analysis by using ABI PRISM® Linkage Mapping Set version 2.5 having 388 fluorescent

IV
dye-labeled microsatellite markers spaced at an average distance of 10 cM. The results of
genome wide scan mapped a novel autosomal recessive non syndromic deafness locus on
chromosome 2p11.2 in a family, PKDF468. The critical linkage interval of this locus
spans a genetic interval of ~4.3 cM (0.9 Mb) enclosed by of D2S1387 (103.2 cM) at
proximal end and D2S2232 (107.5 cM) at distal end. This locus was designated as
DFNB88 by Human Genome Organization (HUGO) committee. Genotyping of 500
unlinked families from CEMB DNA data bank identified one additional family PKSR11b
linked to DFNB88. Although this family was not helpful to further refine the linkage
interval but it strengthened the finding of a new disease gene on chromosome 2p11.2.
The critical region of DFNB88 (~4.3 cM) overlaps with the reported interval of an
autosomal dominant nonsyndromic deafness locus (DFNA43), of which the
corresponding gene is not known. KCMF1, TCF7L1, TMSB10, LOC129293, RNF181,
SH2D6, RETSAT, MAT2A, VAMP8, VAMP5, TMEM150, USP39 and ATOH8 are among
the plausible candidates in the refined linkage interval on the basis of their structural as
well functional homology to the already reported deafness loci and expression in mouse
inner ear. Sequence analysis of four of these candidate genes, KCMF1, TCF7L1, TMSB10
and LOC129293 did not reveal any pathogenic mutations. Localization of DFNB88 is the
first step towards the identification of novel gene that will provide further insight in the
molecular basis of deafness.

V
ACKNOWLEDGMENTS
All praises and thanks to ALLAH Almighty, Who is the ultimate source of knowledge to
mankind, Who bestowed man intellectual power and understanding to discover his “Self”
and to know his “Creator” by discovering His signs extended throughout the universe,
Who blessed me with the ability and opportunity to get knowledge with quality of doing
something adventurous, novel, thrilling, sensational, and path bearing. Next to His
Messenger Hazrat Muhammad (Peace Be Upon Him) who is a perpetual glow of
awareness and spring of guidance for humanity.
A profound sense of gratitude is owed to Dr. Sheikh Riazuddin and Dr. Shaheen N.
Khan for their array of guidance, assistance, encouragement and providing necessary
laboratory facilities during the whole span of this research work.
My sincere thanks are due to Dr. Zubair M. Ahmad and Dr. Shahid Yar Khan for
thoughtful discussions, sound advices, encouragement, and for the valuable suggestions
during the progress of my studies and research and in preparation of this manuscript.
No words of acknowledgements can be adequate to sublime love and benevolent
cooperation of my Parents and my Husband. So far whatever I have achieved is due to
God’s blessings and my parent’s prayers and sincere cooperation of my husband and my
mother in law. Their prayers and love are the assets of my life. I must not forget to
thank my best friend Saima Anwar for her love, patience and support. It was perhaps
very difficult for me to complete this task without her help. I am also thankful to my
Brothers and Sisters, for their prayers and best wishes, which have inspired me with a
new spirit.
To everybody that has been a part of my life but I failed to mention, thank you
very much. There won’t be enough space if I will mention you all.
ZIL-E-HUMA BASH

VI
LIST OF ABBREVIATIONS & SYMBOLS
A Adenine
ABR Auditory Brain Response
aBS Atypical Bartter Syndrome
ASR Allele Size Range
ATP Adenosine Tri Phosphate
bp Base Pair
C Cytosine
Ca2+ Calcium ions
CaCl2 Calcium Chloride
Cen Centromere
Cl- Chloride ions
cM Centi-Morgan
CFP Cyan Flourescent Protein
Cx Connexin
dB Decibels
del Deletion
DFN Deafness, X-linked
DFNA Deafness, Autosomal Dominant
DFNB Deafness, Autosomal Recessive
DFNM Deafness, Modifier
DNA Deoxyribonucleic Acid
DTT Dithiothreitol
dNTP Deoxynucleotide Tri- Phosphate
EDTA Ethylene Diamine TetraAcetic
Acid
EGTA Ethylene Glycol TetraAcetic Acid
ER Endoplasmic Reticulum
EtBr Ethidium Bromide
ext External
FAM 5-Carboxy Fluorescein
G Guanine
g Gram(s)
HCO3- Bicarbonate ions
HEK Human Embryonic Kidney
HEPES N-2-Hydroxyethylpiperazine-N'-
2-Ethanesulfonic Acid
HL Hearing Loss
Hld. Hold (in PCR Cycle)
Hrs. Hours
Hz Hertz
IHCs Inner Hair Cells
ins Insertion
int Internal
K+ Potassium ions
Kb Kilobase
KCl Potassium Chloride
LOD Likelihood of Odds
M Mole
Mb Megabase
MDCK Madin Darby Canine Kidney
MgCl2 Magnesium Chloride
min. Minute
ml Millilitre
mm Millimeter
mM Millimole
ms Millisecond
mV Millivolt
Na+ Sodium ions
NaCl Sodium Chloride
NaOH Sodium Hydroxide
ng Nanogram

VIII
NSHL Non-syndromic Hearing Loss
nt Nucleotide
nX n Times
OHCs Outer Hair Cells
OMIM Online Mendelian Inheritance in
Man
p Short Arm of Chromosome
PAGE Polyacrylamide Gel Electrophoresis
PCR Polymerase Chain Reaction
PDS Pendred Syndrome
pH Negative Logarithm of H+ ion
concentration
pS Pico Siemens
q Long arm of Chromosome
RP Retinitis Pigmentosa
rpm Revolutions Per Minute
SDS Sodium Dodecyl Sulfate
SEM Standard Error of Mean
SHL Syndromic Hearing Loss
T Thymidine
T.E. Tris-EDTA
Taq Thermus Aquaticus
TBE Tris-Borate-EDTA
td Touch Down
Tm Melting Temperature
Tmp Temperatures (in PCR Cycle)
TNE Tris-NaCl-EDTA
Tris [Tris-hydroxymethyl]
aminomethane
USH Usher Syndrome
UV Ultra Violet
WT Wild Type
YFP Yellow Flourescent Protein
θ Recombination Fraction
∝ Infinity
Consanguineous Marriage
Nonconsanguineous Marriage
Affected Female
Affected Male
∅ Deceased Female
Deceased Male
Female
Male
Sex Unknown
Symbol used to record a point on
audiogram for left ear (Air
Conduction)
°C Degree Centigrade
MΩ Mega Ohm
μl Microlitre
μM Micromole
ρmol Picomole
> Symbol used to record a point on
audiogram (Bone Conduction)
○ Symbol used to record a point on
an audiogram for right ear (Air
Conduction)

1
INTRODUCTION
Hearing is one of the key signals among the five senses for accomplishing the basic
activities of daily life. Hearing impairment, the partial or complete inability to hear is one
of the most frequent neurosensory anomalies in humans (Marazita et al., 1993).
Etiologically, it is a multifactorial disorder caused by environmental as well as genetic
factors. The worldwide prevalence of hearing impairment is estimated to be 1 in 1000
(Parving et al., 2003; Fortnum et al., 2001) with over 50% contribution of genetic factors
(Kochhar et al., 2007; Morton & Nance, 2006).
Prelingual hearing impairment can be categorized into two groups on the basis of
phenotypic spectrum: major nonsyndromic hearing loss (70%), where hearing impairment
is not associated with any other anomaly and syndromic deafness (30%), associated with
other anomalies besides hearing impairment (Friedman et al., 2003; Petit et al., 2001). In
non syndromic deafness, the major prevalence of inheritance is autosomal recessive (70-
80%) characterized by prelingual, profound sensorineral hearing loss followed by milder,
post-lingual, and progressive autosomal dominant (20%) (Petersen and Willems, 2006;
Tranebaerg, 2008).
Sensorineural deafness exhibits tremendous genetic heterogeneity, which is not surprising
due to the involvement of ~1% of human protein coding genes in sound conduction
pathways (Friedman and Griffith, 2003). To date, 148 non-syndromic deafness loci have
been mapped on different chromosomes; 88 of these loci are inherited in autosomal
recessive mode (DFNB) of which 30 of the corresponding nuclear genes have been
identified (Van Camp, & Smith, www.uia.ac.be/dnalab/hhh). The disruption of different
classes of proteins, ion channels involved in ion homeostasis, cytoskeletal and
extracellular matrix components, transcription factors, cellular trafficking proteins and
molecules belonging to the cadherin superfamily have been reported as causes of hearing
loss (Gillespie and Walker, 2001; Steel and Kros, 2001; Bitner-Glindzicz, 2002).
Despite tremendous progress in molecular and cellular approaches, very little is known
about biochemical and physiological basis of mechanoeletrical transducer mainly due to

2
relative inaccessibility. Mapping of deafness causing genes is challenging due to extreme
genetic heterogeneity, high tendency of deaf people to marry among themselves, small
family sizes and involvement of phenocopies (Petit et al., 2001). Therefore, forward
genetic approach is useful for identifying the key components of auditory transduction.
Forward genetic approach begins with a well defined phenotype and moving toward the
gene that contributes to phenotype (Takahashi et al., 1994). Mapping of deafness genes
by forward genetics is difficult because of extreme genetic and clinical heterogeneity,
small family size and involvement of environmental factors. These problems can be
overcome by linkage analysis of large inbred families segregating hereditary hearing loss
(Woods et al., 2006). Due to unique sociocultural practices in Pakistan, approximately
60% marriages are consanguineous of which more than 80% are between 1st cousins
(Hussain and Bittles, 1998). The prevalence of hereditary hearing loss is 1.6 in 1000 in
Pakistan (Elahi et al., 1998; Jaber et al., 1992). Therefore, highly inbred families
manifesting profound hearing loss offer a useful genetic material to study and understand
the molecular and physiological basis of hearing process (Schwander et al., 2007).
The present study was designed to elucidate the molecular basis of autosomal recessive
hearing impairment in Pakistani population. For this purpose, 50 families segregating
prelingual profound deafness were enrolled from different cities of Punjab, Sindh and
Balochistan provinces of Pakistan. Written informed consent was obtained from study
participants: blood samples were collected and processed for DNA isolation. Twenty five
selected families underwent exclusion analyses for the reported autosomal recessive
deafness loci and eight families were found linked to known loci; PKDF131-
DFNB1/GJB2, PKDF1103-DFNB1/GJB2, PKDF1094-DFNB1/GJB2 and
DFNB4/SLC26A4, PKSR14A-DFNB4/SLC26A4, PKDF339-DFNB9/OTOF, PKDF1088-
DFNB9/OTOF, PKDF315-DFNB29/CLDN14 and PKDF1092-DFNB29/CLDN14.
Mutational analysis of GJB2, SLC26A4 and CLDN14 revealed two reported variants
p.W24X and p.W77X of GJB2 in PKDF131, PKDF1103 and PKDF1094, one reported
variant p.S90L and one novel splice site mutation IVS13+9 C>T of SLC26A4 in
PKSR14A and two reported p.V85D and 398delT and two novel p.A94V and
p.I86V+S87I mutations of CLDN14 in PKDF797, PKDF1092, PKDF315 and PKDF361
respectively. p.V85D of CLDN14 is the most frequent cause of DFNB29 linked deafness
in Pakistan and haplotype analysis demonstrated it a founder mutation.

3
Seventeen families which remain unlinked to the reported deafness loci suggested the
existence of novel deafness loci in these families. In an effort to identify novel deafness
locus, four unlinked consanguineous families were subjected to genome-wide linkage
analysis and deafness segregating in a consanguineous family PKDF468 was found
linked to 2p11.2 showing a 4.3 cM interval of homozygosity delimited by markers
D2S1387 (103.16 cM) and D2S2232 (107.46 cM). This novel locus was designated as
“DFNB88” by Human Genome Organization (HUGO) committee. DFNB88 linked STR
markers were used to screen 500 Pakistani families in CEMB DNA data bank segregating
recessive deafness. One additional family PKSR11b was found segregating DFNB88
linked deafness. The linkage interval of PKSR11b is of approximately 50 cM enclosed by
D2S2259 (64.29 cM) (2p21) and D2S2264 (114.42 cM) (2q11.2). Meiotic recombination
events in these two families define a critical interval of 4.3 cM (0.9 Mb) bounded by
markers D2S1387 (103.16 cM) and D2S2232 (107.46 cM), overlapping with the reported
interval of one autosomal dominant nonsyndromic deafness locus DFNA43, of which the
corresponding gene is not known. KCMF1, TCF7L1, TMSB10, LOC129293, RNF181,
SH2D6, RETSAT, MAT2A, VAMP8, VAMP5, TMEM150, USP39 and ATOH8 are the
potential candidates in the refined linkage interval on the basis of their structural as well
functional homology to the already reported deafness loci and expression in mouse inner
ear. Combine linkage interval of DFNA43 and DFNB88 harbaur four candidate genes
KCMF1, TCF7L1, TMSB10 and LOC129293. So, on the hypothesis that DFNA43 and
DFNB88 are allelic variants of the same gene these genes were selected for sequencing.
Mutational analysis of coding exons along with the splice site of these genes did not
reveal any pathogenic mutation.
In summary, this thesis reports two mutations of GJB2, two mutations of SLC26A4 and
four pathogenic variants of CLDN14. Further implication of a novel locus DFNB88 in the
etiology of autosomal recessive non syndromic deafness is identified. Positional cloning
of DFNB88 locus will shed further light into the unknown mechanism of hearing
impairment. This study will also be helpful for decreasing socio-economic burden of
Pakistan by employing carrier testing to lessen the number of at-risk unions. More
specifically, the continuing elucidation of the molecular basis of inner ear function will
lay the foundation for developing new approaches for diagnosis, management and
treatment of auditory and vestibular disorders.

0
SECTION: 1
REVIEW OF LITERATURE
1
CHAPTER: I
AUDITORY SYSTEM

4
ANATOMY OF HUMAN EAR
The human ear is one of the most composite, integrated, efficient, and an ingenious
system of the body. It has been engineered so to percept the waves of compression and
rarefaction (sound) from the environment through the brain in a proficient. A human ear
can perceive sounds over a dynamic range of six orders of magnitude and discriminate
different frequencies with 0.2% precision in the range from 50 to 20,000 cycles per sound
(Hz) (Dallos, 1996). In order to enable us to hear and interpret these sounds, there are
enormous numbers of tasks that the auditory system must perform. To date, no artificial
intelligence based system is built that can interpret sounds with the accuracy that the
auditory system can.
The auditory system is a highly intricate functional group, assembled of three functional
compartments: the outer, middle and inner ear.
THE EXTERNAL EAR: The external ear is made up of the Pinna (also known as the auricle), the external
auditory canal (meatus) and the eardrum (or tympanic membrane).
The Pinna: A visible portion of ear which is attached by ligaments and muscles to the skull. It is
made up of a cartilaginous framework of elastic connective tissue and serves to funnel
sound waves to the auditory meatus (Fig. 1.1).
The External Auditory Canal: The external auditory canal is a short tube (approx. one inch in length) extending from the
pinna to the tympanic membrane (tympanum) (Fig. 1.1). Deeper within the meatus are
cerumen-excreting glands (ceruminous glands). Cerumen (ear wax) is thought to be an
insect repellant and keeps the tympanum soft and waterproof.
Tympanic Membrane: A thin double-layered epithelial partition (~1 cm in diameter) between the meatus and the
middle ear. It protects the delicate organs of the inner parts of the auditory system from
bacterial infections and foreign matter, which could block the system (Fig. 1.1). However,
it is designed for efficient transmission of sound.

5
THE MIDDLE EAR: Tympanic Cavity: The middle ear is an air-filled cavity separated from the auditory meatus by the tympanic
membrane and from the inner ear by a bony partition assembled of the oval window and
the round window (Fig. 1.1). It acts as bridge between the external ear and the inner ear.
Auditory Ossicles: The auditory ossicles are three smallest bones of the body (the smallest bone weighs
0.0001 ounces (0.3 cg), which act like a lever system. These can never grow larger than
that at the time of birth. The malleus (hammer), the lateral most bone is attached at its
base to the tympanum, the stapes (stirrup) is attached at its broad base (footplate) to the
oval window that acts as an opening between the air filled middle ear and the fluid filled
vestibule of the inner ear. The incus (anvil) is positioned between maleus and stapes and
articulates with both (Fig. 1.1). When the tympanum begins to vibrate as a result of
sound, it pushes on the malleus, which then begins to vibrate. These vibrations are then
propagated through piston like movement of these ossicles from air filled middle ear to
fluid within inner ear through oval window.
Eustachian Tube: Eustachian tube is a small tube that serves to connect middle ear to nasopharynx of the
throat and equalizes air pressure on both sides of the tympanic membrane. It allows fresh
air to be filled in the middle ear space periodically (Fig. 1.1).
Oval and Round Windows: These windows separate air filled tympanic cavity from fluid filled membranous
labyrinth. Oval window (Fenestra vestibuli) displacement occurs via movement of
tympanic membrane via ossicles, and causing fluid displacement in inner ear. Round
window (Fenestra cochlea) displacement is opposite to that of oval window because of
incompressible nature of inner ear fluid.

6
Fig. 1.1: Structure of human ear showing Outer, Middle and inner ear. (Adapted from www.web-books.com/.../Physiology/Ear/Ear. jpg).

7
THE INNER EAR: The inner ear is a mechano-receptive organ within temporal bone, the hardest bone of the
body. It houses two sensory systems: the auditory system for perception of sound and the
vestibular system for spatial orientation and equilibrium. Vestibular system includes three
semicircular canals, utricle, saccule and auditory system includes cochlea. It consists of
the bony labyrinth and within it a membranous labyrinth made up of series of
interconnected sacs and tubes. The term labyrinth refers to series of convoluted
compartments of the inner ear within the bone.
Osseous Labyrinth: The osseous labyrinth consists of three functional units: Vestibule, Semicircular canals
and cochlea. The osseous (bony) labyrinth is filled with the perilymph, a fluid secreted by
the cells lining the bony canals. Chemical composition of perilymph resembles with
cerebrospinal fluid (CSF) and normal extracellular fluids as it contains low K+ (4.2 mM)
and high Na+ (148 mM) concentration.
Vestibule: The central part of the bony labyrinth. The lateral wall of vestibule contains the oval
window, a bean shaped white blotch between the utricle and saccule.
Semicircular Canals: The three bony semicircular canals (superior, posterior, and lateral) are oriented at right
angle to each other and are positioned posteriorly (dorsally) to the vestibule. At one end
of each is a dilatation called ampulla, which connects to the vestibule.
Cochlea: The cochlea is a 35 mm long spiral tube of snail shell shape (Fig. 1.1). It winds two and
half turns around a central bony axis, the modiolus. Projecting outward from the modiolus
is a thin bony plate, the spiral lamina that partially divides the cochlear canal into an
upper passageway called the scala vestibuli, which originates at the oval window and is
continuous with the vestibule and a lower one called the scala tympani, which terminates
at the round window (Fig. 1.2). Both of these are filled with perilymph and are separate
except at the very narrow apex of the cochlea, named as helicotrema. In between these
canals, there is the triangular passageway called the cochlear duct (Scala media). The
cochlear duct is separated from scala vestibuli by Reissner’s membrane and from scala
tympani by basilar membrane. The cochlear duct is filled with endolymph and terminates

8
at the helicotrema. It houses the Organ of Corti with its two types of sensory cells (Fig.
1.2).
Membranous Labyrinth: A second series of tubes made up of delicate cellular structures called the membranous
labyrinth lies within the bony labyrinth. Structures of the membranous labyrinth include:
Utricle and Saccule (within the vestibule), three semicircular ducts and their ampulla
(within semicircular canals), and Cochlear duct (within the cochlea). The tubular
chambers of the membranous labyrinth are filled with endolymph, a fluid having an
unusual composition than perilymph i.e. High K+ concentration (~157 mM) and a very
low Na+ (1.3 mm). The difference in ionic composition of endolymph and perilymph
generates a potential difference of ~+80 mV, the largest potential in the body. The
remarkable potential difference (+150 mV) across hair cell apex serves as tremendous
driving force for mechanoeletrical transduction process (Eisen and Ryugo, 2007).
The endolymph is enclosed by highly diverse epithelia including:
Sensory Epithelia: The sensory epithelium of cochlea is organ of corti, which houses sensory hair cells
and supporting cells. The hair cells are polarized epithelial cells of placodal origin that
derive their name from an array of actin filled microvilli arranged like staircase in rank of
increasing height at their apex. The human cochlea houses two morphologically distinct
types of sensory hair cells i.e. one row of innner hair cells (IHCs) (~3500) and three rows
of outer hair cells (OHCs) (~12000). This number is extremely low as compared to
millions of photoreceptors in retina and chemoreceptors in the nose. The IHCs are actual
sensory cells responsible for transmission of auditory signals to eighth cranial nerve and
the auditory cortex while OHCs have electromotile elements and serve as mechanical
amplifiers of the sound stimuli (Raphael and Altschuler, 2003). The deflection of the
stereocilia is the first step in mechano-electrical transduction. Sound waves or changes in
head position lead to deflection of the hair bundle towards its taller edge which ultimately
leads to opening of mechanoeletrical transduction (MET) channels by bending the
stereocilia at their tapered base and deflection in the opposite direction closes theses
channels. The vestibular system of mammals contains five sensory epithelial sheets: the
maculae of the utricle and saccule, and the three cristae, one in each of the semi-circular
canals.

9
ORGAN OF CORTI: The amazing ability of the mammalian cochlea to transduce sounds over a wide range of
frequencies depends on the highly specialized sensorineural end organ known as organ of
Corti. It rests on the top of basilar membrane and covered by gelatinous ribbon of
extracellular matrix known as tectorial membrane, final component of cochlear functional
apparatus (Fig. 1.2). The stiffness gradient of basilar membrane along the length of
cochlea is one of the fundamental mechanisms of tonotopic arrangement of cochlea. As a
result of more stiffness, the high frequency sounds are detected at the base while low
frequency sounds are detected at the apex. The organ of corti houses polarized sensory
cells, called hair cells, the neurons, and several types of support cells. Organ of corti is an
unusual type of epithelium in that it does not have undifferentiated cells that accounts for
inability of hair cells to be replaced (Raphael and Altschuler, 2003).

10
Fig. 1.2: The Cochlea (Adapted From Willems P. J., 2000). The cochlear duct is filled with endolymph and houses the organ of Corti enclosed between the tectorial and the basilar membranes. The relative movement of the two membranes leads to deflection of the stereocilia of the inner hair cells and the outer hair cells, which generates the influx of potassium ions through channels at the tip links of the stereocilia. The hair cell is the mechanoelectrical transducer that produces an electrical signal that is transmitted through nerve fibers and the spinal ganglion to the cochlear nerve and the auditory cortex of the brain. The potassium ions probably leave the hair cells at their basolateral side through potassium channels and enter the supporting cells. The potassium ions then flow through these cells and the cochlear fibrocytes to the stria vascularis and are then secreted back into the endolymph to maintain endocochlear potential.

11
SENSORY CELLS: The human ear houses two morphologically as well as physiologically distinct classes of
sensory cells known as OHCs and IHCs. Hair cells derive their name from tuft of actin
filled sterelocilia at their apex. Stereocilia are plasma membrane bound projections
enclosing filaments of actin, the cytoskeletal protein that are cross-linked by fimbrin and
espin (Flock et al., 1977; Zheng et al., 2000). The apical tips of stereocilia are connected
by tip links to their neighboring stereocilia (Pickles et al., 1984). Deflection of the
stereocilia towards the longest one opens ion channels (the transducer channels), K+
enters and the hair cell becomes depolarized. Deflection in the opposite direction closes
the transducer channels and the hair cell becomes hyperpolarized. The transducer
channels are located towards the top of the stereocilia (Hudspeth, 1989).
Inner Hair Cells: (IHCs) IHCs, actual sensory elements of sound transduction system are pear shaped cells with a
round centrally located nucleus (Fig. 1.3). There is only one row of approximately 3,500
IHCs, having ~20-50 straight line or wide ‘U’-shape stereocilia (Raphael and Altschuler,
2003). The stereocilia of the IHCs do not appear to contact with the overlying tectorial
membrane. These cells account for most of the cochlear nerve influx sent to the auditory
centre by receiving about 95% of the afferent innervations from the nerve endings of the
VIII cranial nerve. When lost or damaged, irreversible severe to profound hearing loss
usually occurs.
Outer Hair Cells: (OHCs) They are mainly innervated by efferent terminals (80%) and are known to enhance and
modulate the function of inner hair cells. There are 12,000 OHCs in most mammals that
are regularly arranged within three or sometimes four rows. They are cylindrical in shape
with a nucleus at the bottom. OHCs harbors 100 stereocilia at the top of the cell which
form a characteristic ‘W’-shape and contact the underside of the overlying tectorial
membrane with visible impression of the longest stereocilia from the OHCs. Stereocilia
of the OHCs have same molecular organization as of IHCs and range in length from 20
µM to 70 µM (Raphael and Altschuler, 2003). The main task of outer OHCs is to boost
the stimulus by electromechanical feedback and act as a “cochlear amplifier”, a
mechanism that increases both the amplitude and frequency selectivity of basilar
membrane vibration for low-level sounds (Fettipalce and Hackney, 2006).

12
Fig. 1.3: Mechanosensory Transduction Unit. (Adapted from www.hearingcentral.com)

13
Ion Transporting Epithelia: The function of ion transport epithelium is to maintain high K+ concentration and
endocochlear potential (EP), the main driving force for mechanosensory transduction.
Stria vascularis is the ion transporting epithelia of the cochlea (Fig. 1.2) and the dark cells
constitute the ion transporting epithelium of the vestibular system. Stria vascularis is
highly vascularized epithelium in lateral wall of cochlear duct and serve as metabolic
control center of cochlea. The advantage of this spatial isolation of stria vascularis and
sensory transducer (organ of Corti) is that its high degree of vascularization to maintain
endocochlear potential cannot interfere with cochlear micromechanics. Stria vascularis is
highly unusual multilayered epithelium displaying two diffusion barriers formed by tight
junctions between the apex of marginal cells and between the basal cells (Wangemann,
2006; Nin et al., 2008). The inner membrane of the basal cells is connected to strial
intermediate cells while outer membrane is in contact with fibrocytes via gap junctions.
Potassium ions are actively taken up from the intrastrial space into the marginal cells
through the Na,K-ATPase and the NaK2Cl cotransporter NKCC1 and are then secreted
into the endolymph through apical KCNQ1/KCNE1 K+ channels.
The recycling of Na+ and Cl- ions taken up by marginal cells of stria vascularis via the
NKCC1 cotransporter is essential for the maintenance of endocochlear potential. This
recycling occurs in the basolateral membrane through Na+ /K+-ATPase and the Cl-
channels ClC-Ka/barttin (CLCNKA/BSND) and ClC-Kb/barttin (CLCNKB/BSND).This
role has been demonstrated by Bsnd-/- mice that displayed drastic decrease in
endocochlear potential (Rickheit et al., 2008). The influx of K+ back into endolymph
results in an unusually low K+ concentration in the intrastrial space (Salt et al., 1987;
Ikeda and Morizono, 1989; Nin et al., 2008), creating a large K+ diffusion potential across
the apical membrane of intermediate cells that prominently express the K+ channel Kir4.1
(Kcnj10) (Salt et al., 1987; Takeuchi et al., 2000; Marcus et al., 2002; Nin et al., 2008).
Mice lacking Kir4.1 displayed complete breakdown of the EP ultimately leading to
collapse of reissner’s membrane (Marcus et al., 2002).

14
Relatively Unspecialized Epithelia: The less specialized epithelia form permeability barriers between fluid spaces. These are
reissner’s membrane in the cochlear system and the epithelium of the roof of the saccule,
utricle, ampullae of the semicircular canals and the semi-circular canals in vestibular
apparatus. Any damage to these membranes would be expected to result in fluid mixing
and physiological dysfunction.
Intercilliary Links of Stereocilia and Mechanoeletrical Transduction: The hair bundle, accessory structure of sensory transduction constitutes rows of
stereocilia that increase in height in one particular direction across the bundle, and a
single kinocilium positioned behind the row of longest stereocilia (Forge and Wright,
2002). Stereocilia are plasma membrane bound projections enclosing filaments of the
cytoskeletal protein, actin, while the kinocilium is a true cilium. In the hair cells of the
organ of corti, the kinocilium is present only during development, becoming reduced as
the cochlea matures to remain only as the basal body in the apical cytoplasm at one side
of the stereociliary bundle. The position of the basal body and the longest row of
stereocilia define the polarity of the asymmetric hair bundle. The stereocilia are supported
on the cuticular plate, a rigid platform formed of a meshwork of actin filaments in the
apical cytoplasm of the hair cells at the level of the junction between the hair and
supporting cells (Slepecky, 1996). The stereocilia within hair bundle are interconnected
by a variety of extracellular filaments (Pickles, 1993). In mature mammalian cochlea,
adjacent stereocilia are connected along with their shafts by lateral links whereas tip links
extend from the apex of each stereocilium to the side of adjacent taller stereocilium
(Pickles, 1984; Goodyear et al., 2005). There are thought to be at least three different
types of lateral links between stereocilia (Richardson et al., 1990). Ankle links connect
stereocilia at their proximal ends whereas shaft links are present along the mid-region of
the stereociliary shaft (Fig. 1.4). Top-connectors run laterally between stereocilia just
below the level of the tip-links. Ankle links are absent from the hair cells of the organ of
corti, but present in the hair bundles of mammalian vestibular organs.
The tip-link is thought to have special role as gating element that acts as spring and
controls the opening of the transduction channel located towards the top of sterecilium
(Hudspeth 1989; Markin and Hudspeth, 1995). As the bundle moves in the excitatory
direction, tension on the link opens the MET channel in ~100ms; k+ enters and the hair

15
cell becomes depolarized. Deflection in the opposite direction closes the transducer
channels and the hair cell becomes hyperpolarized. The probability of channel opening is
modulated between fully closed and fully opened by submicron displacements of the tip
of the hair bundle (Fettiplace and Hackney, 2006). Even with the loudest sound pressures,
the hair bundles rock to and from with amplitude not greater than the diameter of a single
stereocilium, and at auditory threshold, the bundles may move of the order of 1 nm, a
stimulus approaching atomic dimensions. The minimum auditory threshold in mammals
occurs at a sound pressure of 20 μpa and, at this sound level, the displacement of the
basilar membrane is ~1 nm (Robles and Ruggero, 2001).

16
Fig. 1.4: Stereocilia displaying interciliary links along with some protein components. (Adapted From Fettipalce and Hackney, 2006). MET, Mechanoelectrical Transduction; PMCA2a, Plasma Membrane CaATPase Pump; TRPA1, Transient Receptor Potential Channel A1.

17
PHYSIOLOGY OF EAR
Sensory transduction involves a complex series of reactions within the ear. It begins with
collection of sound energy by external ear that is propagated in the form of mechanical
vibrations just like rippling waves through middle ear to fluid filled inner ear where it
finally causes the opening of transduction channels leading to conversion of
hydromechanical stimulus into equivalent electrical stimulus i.e.mechanoeletrical
transduction.
EVENTS IN SOUND TRANSDUCTION PATHWAY: The external ear (pinna) collects sound waves and funnels them down the auditory canal,
where they vibrate the tympanic membrane. The central area of the tympanic membrane
is connected to the malleus, which also starts to vibrate ultimately leading to articulation
of incus and stapes in piston like fashion. The articulation of stapes results in back and
forth movement of oval window.
The movement of the oval window sets up waves in the perilymph of the scala vestibuli,
which result in the production of pressure waves in perilymph. As the pressure moves
through the perilymph of the scala vestibuli, it pushes the vestibular membrane inward
and increases the pressure of the endolymph inside the cochlear duct. As a result, the
basilar membrane bulges out and moves slightly into the scala tympani. As the pressure
moves through the scala tympani, perilymph moves toward the round window, causing it
to bulge outward into the middle ear or tympanic cavity. Following the compression that
resulted in the above actions is a decompression that causes the stapes to move toward the
tympanic membrane and the above actions are reversed. That is, the fluid moves in the
opposite direction along the same pathway, and the basilar membrane bulges into the
cochlear duct (Fig. 1.5).
Vibration of basilar membrane creates a shearing force between the basilar membrane and
the tectorial membrane, thus causes the stereocilia of the outer hair cells of the organ of
Corti to bend. This shearing action causes deflection of a few nanometers of a stereocilia
bundle towards the tallest stereocilia, and through an angle that can be less than 1°, opens
(within a few microseconds) mechanically gated ion channels located on the top of each
stereocilia. The tip links allow a quick opening synchronized for all stereocilia when they
are displaced toward the stria vascularis. This opening results in rapid influx of K+ into

18
hair cells down electrochemical gradient. (High concentration of K+ in endolymph and
~150 mV electric garadient between endolymph and hair cells.). This tends to neutralize
some of the negative charge, and depolarize the membrane of hair cells. Excited
(depolarized) OHCs, react by contracting (electromotility), this is an active mechanism.
Due to the tight coupling of OHCs with the basilar membrane and reticular lamina, this
active mechanism feeds energy back to the organ of corti and the IHCs are excited
probably due to tectorial membrane activation of stereocilia.
Voltage sensitive calcium channels are activated in IHCs and calcium triggers the release
of neurotransmitters mainly glutamate at synapses with afferent auditory nerve endings at
the basal end of the cell. The impulses are passed via the cochlear branch of the eighth
cranial nerve to the medulla. Within the medulla, most impulses cross to the opposite side
and then travel to the midbrain, to the thalamus, and finally to the auditory area of the
temporal lobe of the cerebral cortex. Sounds of different frequencies excite different areas
of the primary auditory complex of the brain.
It is clear from the complexity of auditory sensation that a large assembly of proteins acts
in concert to orchestrate its function. Defect in any one of these proteins results deafness.
High proportions of reported hearing loss cases are attributed to OHCs abnormalities
(Avarham, 1998; Kossal, 1997).

19
Fig. 1.5: The Sound Conduction Pathway. (Adapted From Fettipalce and Hackney, 2006).Vibrations of the eardrum or tympanum (t) are propagated via osssicles, the malleus (m), incus (i) and stapes (s), and create pressure into the cochlear fluids, which is being relieved at the round window (rw). The pressure waves set in motion the basilar membrane, ultimetly leading to mechanosensory transduction by sensory organ, the organ of Corti which houses sensory hair cells. The cochlea is shown as straight to illustrate its division into three different chambers filled with fluids of different ionic composition. Different regions of the cochlea respond differently to different sound frequencies. High frequency sounds are detected at the base while low frequency sounds at the apex.

20
CHAPTER: II
MOLECULAR BASIS OF DEAFNESS

20
PREVALENCE: Deafness is one of the most prevalent sensory deficits with striking effects on speech
acquisition and literacy. It is estimated that 1 in 1,000 births are affected with serious
permanent hearing impairment (Morton, 1991), of which about 60% are attributed to
genetic factors (Marazita et al., 1993). In addition, a further 1/1000 children becomes
deaf before adulthood (Fortnum et al., 2001). Finally, 10% and 50% of the population
manifest a hearing loss by the age of 60 and 80 years, respectively, which impairs their
ability to communicate easily, leading to increase social isolation and a severe
compromisation of the quality of life (Davis, 1989). Presbycusis (Age related hearing
loss) results in progressive but less severe hearing loss, and is thought to be a result of life
long interactions of unknown genetic and non-genetic factors, noise being the most
common one (Gates et al., 1999).
CLASSIFICATION: Hearing impairment can be categorized on the basis of
Cause
Type
Onset
Severity of Hearing Loss
Frequency
Association
Cause: Hearing loss is multifactorial disorder caused by both genetic as well as environmental
factors or by combination of both. Environmental factors include prenatal infections
from “TORCH” organisms (i.e., toxoplasmosis, rubella, cytomegalic virus, and herpes),
or postnatal infections, particularly bacterial meningitis caused by Neisseria meningitidis,
Haemophilus influenzae, or Streptococcus pneumoniae. Acquired hearing loss in adults is
most often attributed to environmental factors, especially noise exposure, but
susceptibility probably reflects an environmental-genetic interaction. For example,
aminoglycoside-induced hearing loss is more likely in persons with an A-to-G transition
at nucleotide position 1555 in the mitochondrial genome (mtDNA).
Most forms of Genetic hearing impairment are monogenic diseases, with few
exceptions (Adato et al., 1999; Balciuniene et al., 1998; Morell et al., 1998). Hereditary

21
deafness can be categorized on the basis of mode of transmission as predominant
autosomal recessive (DFNB) (75-80%) followed by autosomal dominant (20%), X-linked
(1%) and mitochondrial (<1%) (Morton, 1991; Morton and Nancy, 2006).
Type of Ear Defect: On the basis of type of ear defect, deafness may be Conductive, Sensorineural or Mixed
depending on the anomalies of the external ear and/or the ossicles of the middle ear, inner
ear and cortical auditory centres or combination of both respectively.
Onset: On the bases of onset, deafness may be: Prelingual i.e. present before development of
speech; or Post lingual, hearing loss develops after the development of normal speech.
All congenital (present at birth) hearing loss is prelingual, but not all-prelingual hearing
loss is congenital.
Severity of Hearing Loss: Hearing is measured in decibels (dB). Hearing is considered normal if an individual's
thresholds are within 15 dB of normal thresholds. On the basis of severity, hearing loss
can be graded as:
• Mild (26-40 dB)
• Moderate (41-55 dB)
• Moderately severe (56-70 dB)
• Severe (71-90 dB)
• Profound (>90 dB)
Frequency: On the basis of frequency, hearing loss may be:
• Low frequency hearing loss (< 500 Hz)
• Middle (501- 2000 Hz)
• High (> 2000 Hz)
Association: On the basis of association, deafness can be categorized as:

22
Syndromic Deafness: Hearing loss is accompanied by involvement of one or several other organ systems e.g.
Pendred syndrome. The significant cause of deafness (~10%) is characterized by
segregation of goiter with hearing impairment. Similarly, Usher syndrome is
characterized by segregation of Retinitis Pigmentosum (RP) with hearing loss. More than
400 syndromes associated with hearing loss have been reported. The syndromic hearing
loss can be conductive, sensorineural or mixed and accounts for 30% of the total hearing
impairment (Gorlin et al., 1995).
Nonsyndromic Deafness: Nonsyndromic deafness in which inner ear abnormalities are the sole clinical feature and
there is no other recognizable symptom associated with deafness. It is more prevalent
mode of hearing loss than syndromic deafness, as it account for 70% of all the genetically
determined cases of deafness and is almost absolutely sensorineural (Morton, 1991;
Reardon, 1992; Marazita et al., 1993).
HISTORY OF GENETIC DEAFNESSS: Comprehensive history of genetic hearing loss has been documented by Stephens (1985),
Ruben (1991), and Reardon (1992). According to Goldstein (1933), Johannes Schenck
was the earliest known author who has recognized that some forms of deafness may be
hereditary. Stephens (1985) includes a pedigree drawing of a sixteenth century family of
the Spanish aristocracy in which members in three generations were documented as deaf.
In 1621, the papal physician Paolus Zacchias recommended that the deaf abstain from
marriage because of evidence that their children will also be deaf (Cranefield and Federn,
1970), indicating his conviction that heredity is important in deafness.
MOLECULAR BASIS OF HEREDITARY DEAFNESS: Hereditary hearing loss is genetically heterogeneous as expected from the structural and
functional complexities of the inner ear. Classical biochemical and molecular genetic
approaches to characterize unknown molecules involved in the adaptation process of
auditory mechanotransduction and the causative deafness genes had not been practical
owing to the paucity of sensory cells (e.g., only around 104 hair cells) in the cochlea and
its location in the hardest bone of the body. A genetic approach to the molecular basis of

23
inner ear function therefore seemed especially promising (Petit, 1996; Friedman and
Griffith, 2003).
Even though hearing loss is common worldwide, nevertheless identification of causative
genes has been a daunting challenge, mainly due to extreme genetic heterogeneity and
limited clinical differentiation (Petit et al., 2001). However families with multiple
affected individuals showing clear segregation are excellent resource for such type of
studies (Guilford et al., 1994a). Such families can be enrolled from geographically,
culturally or religiously isolated populations like Pakistan. Genetic linkage analysis of
such highly inbred families is a useful method not only for mapping new locations, but
also for refining intervals where deafness-causing loci have been previously mapped.
This strategy has helped in gene identification studies for many recessive loci.
By using molecular genetic technology, the genes for many syndromic as well as
nonsyndromic hearing losses have been precisely located. It has been estimated that at
least 1% of human protein-coding genes (30,000 genes) are involved in the hearing
process, so over 300 genes are predicted to cause this disorder in humans (Friedman and
Griffith, 2003).
Rapid advancement in understanding hereditary deafness in humans has paralleled the
availability of families segregating hearing loss, comprehensive clinical data, highly
polymorphic genetic markers, genetic maps, physical maps, genomic DNA sequence for
humans and mice, transcriptome databases, and mouse and zebra fish models for human
hearing. It seems reasonable that by the next decades many more dozen disorders and
genes of hearing loss will be genetically mapped (Fig. 1.6).

24
Fig. 1.6: Cytogenetic map positions of human nonsyndromic deafness loci (Modified from Friedman and Griffith, 2003). A deafness locus is underlined when the gene is known. Loci with published, statistically significant support for linkage are shown with a solid black font. Shown with a gray font are loci for which there are reserved symbols but no published data, or published loci lacking statistically significant support for linkage. DFN is the root of the locus symbol for deafness. An A or B suffix indicates that the mutant allele is segregating as an autosomal dominant or autosomal recessive, respectively. Sex-linked nonsyndromic hearing loss is designated with a DFN symbol and a numerical suffix. DFNM1 on chromosome 1q24 is a dominant modifier of DFNB26 on chromosome 4q31.

25
NONSYNDROMIC AUTOSOMAL RECESSIVE DEAFNESS: Nonsyndromic autosomal recessive deafness (NSRD) is a major category of hereditary
hearing loss accounting for ~70% of it. To date, 77 loci causing autosomal recessive
nonsyndromic deafness have been mapped and 28 of the corresponding genes have been
identified (Hereditary Hearing Loss Homepage; HUGO committee) (Table 1.1). Those
loci mapped for nonsyndromic autosomal recessive hearing impairment, have been
designated as DFNB1, DFNB2…… in the same order in which they are reported or
reserved.
Many of these deafness loci have been mapped either in endogamous populations or in
families with children of consanguineous reunions (Friedman and Griffith, 2003). Nearly
all recessive loci are associated with congenital, prelingual, severe to profound hearing
impairment. However, most studies of recessive hearing loss have been targeted toward
populations with profound hearing impairment, and in many cases only one kindred is
described, so the range of phenotypic expression may be unknown. Also, many of the loci
have been described in kindreds from areas in which full diagnostic evaluations are not
possible, so details of audiological progression, vestibular function, and other clinical
parameters may not be available.

26
Table 1.1: List of Autosomal Recessive Nonsyndromic Deafness Loci Along With Their Corresponding Genes.
Locus Location Gene Origin of Families Most Important References
DFNB1 13q12 GJB2 Tunisia, Israel
(Bedouin), Pakistan, Australian
Guilford et al., 1994a Kelsell et al., 1997
DFNB2 11q13.5 MYO7A Tunisia Guilford et al., 1994b
Liu et al., 1997 Weil et al., 1997
DFNB3 17p11.2 MYO15 Bali, India, Pakistan Friedman et al., 1995 Wang et al., 1998
DFNB4 7q31 SLC26A4 Israel (Druze) Baldwin et al., 1995 Li et al., 1998
DFNB5 14q12 Unknown India Fukushima et al., 1995a
DFNB6 3p14-p21 TMIE India, Pakistan Fukushima et al., 1995b Naz et al., 2002
DFNB7/11 9q13-q21 TMC1 India
Israel (Bedouin), Pakistan
Jain et al., 1995 Scott et al., 1996,
Kurima et al., 2002
DFNB8/10 21q22 TMPRSS3 Pakistan Israel (Palestinian)
Veske et al., 1996 Bonne-Tamir et al., 1996
Scott et al., 2001
DFNB9 2p22-p23 OTOF Lebanon, Turkey Chaib et al., 1996a Yasunaga et al., 1999
DFNB12 10q21-q22 CDH23 Syrian, Pakistan Chaib et al., 1996b Bork et al., 2001
DFNB13 7q34-36 Unknown Lebanon Mustapha et al., 1998a DFNB14 7q31 Unknown Lebanon Mustapha et al., 1998b
DFNB15 3q21-q25 19p13 Unknown India Chen et al., 1997
DFNB16 15q21-q22 STRC Pakistan, Palestine, Syria, France
Campbell et al., 1997 Verpy et al., 2001
DFNB17 7q31 Unknown India, Middle Eastern Druze Greinwald et al., 1998
DFNB18 11p14-15.1 USH1C India, Pakistan Jain et al., 1998
Ouyang et al., 2002 Ahmed et al., 2002
DFNB19 18p11 Unknown Deafness meeting Bethesda, October 8-11, 1998 (Green et al., abstract 108)
DFNB20 11q25-qter Unknown Pakistan Moynihan et al., 1999 DFNB21 11q TECTA Lebanon Mustapha et al., 1999 DFNB22 16p12.2 OTOA Palestine Zwaenepoel et al., 2002 DFNB23 10p11.2-q21 PCDH15 Pakistan Ahmed et al., 2003b DFNB24 11q23 RDX Pakistan, India Khan et al., 2007a DFNB25 4p15.3-q12 Unknown Richard Smith, unpublished DFNB26 4q31 Unknown Pakistan Riazuddin et al., 2000 DFNB27 2q23-q31 Unknown United Arab Emirate Pulleyn et al., 2000
DFNB28 22q13 TRIOBP Palestine Walsh et al., 2000
Riazuddin et al., 2006a Shahin et al., 2006
DFNB29 21q22 CLDN14 Pakistan Wilcox et al., 2001

27
DFNB30 10p12.1 MYO3A Israel Walsh et al., 2002
DFNB31 9q32-q34 WHRN Palestine Mustapha et al., 2002 Mburu et al., 2003
DFNB32 1p13.3-22.1 Unknown Tunisian Masmoudi et al., 2003 DFNB33 9q34.3 Unknown Jordan Medlej-Hashim et al., 2002 DFNB34 Reserved
DFNB35 14q24.1-24.3 ESRRB Pakistan, Turkey
Ansar et al., 2003a Collin et al., 2008
DFNB36 1p36.3 ESPN Pakistan Naz et al., 2004 DFNB37 6q13 MYO6 Pakistan Ahmed et al., 2003a DFNB38 6q26-q27 Unknown Pakistan Ansar et al., 2003b
DFNB39 7q11.22-q21.12 HGF Pakistan Wajid et al., 2003 Schultz et al., 2009
DFNB40 22q11.21-12.1 Unknown Iran Delmaghani et al., 2003 DFNB41 Reserved DFNB42 3p13.31-q22.3 Unknown Pakistan Aslam et al., 2005 DFNB43 Reserved DFNB44 7p14.1-q11.22 Unknown Pakistan Ansar et al., 2004 DFNB45 1q43-q44 Unknown Pakistan Bhatti et al., 2008
DFNB46 18p11.32-p11.31 Unknown Pakistan Mir et al., 2005
DFNB47 2p25.1-p24.3 Unknown Pakistan Hassan et al, 2005 DFNB48 15q23-q25.1 Unknown Pakistan Ahmad et al., 2005
DFNB49 5q12.3-q14.1 MARVEL2D Pakistan Ramzan et al., 2005 Riazuddin et al., 2006b
DFNB50 12q23 Unknown DFNB51 11p13-p12 Unknown Pakistan Shaikh et al., 2005 DFNB52 Reserved DFNB53 6p21.3 COL11A2 Iranian Chen et al., 2005 DFNB54 Reserved DFNB55 4q12-q13.2 Unknown Pakistan Irshad et al., 2005 DFNB56 Reserved DFNB57 10q23.1-q26.11 Unknown DFNB58 2q14.1-q21.2 Unknown Richard Smith, unpublished DFNB59 2q31.1-q31.3 PJVK Iran Delmaghani et al., 2006 DFNB60 5q22-q31 Unknown Richard Smith, unpublished DFNB61 Reserved DFNB62 12p13.2-p11.23 Unknown Pakistan Ali et al., 2006
DFNB63 11q13.2-q13.3 LRTOMT Pakistan, Turkey Tunisia
Khan et al., 2007b Tlili et al., 2007
Kalay et al., 2007 Ahmed et al., 2008
DFNB64 Reserved DFNB65 20q13.2-q13.32 Unknown Pakistan Tariq et al., 2006
DFNB66/67 6p21.2-22.3 LHFPL5 Pakistan, Turkey Tlili et al., 2005
Shabbir et al., 2006 Kalay et al., 2006
DFNB68 19p13.2 Unknown Pakistan Santos et al., 2006 DFNB69 Reserved DFNB70 Reserved DFNB71 8p22-21.3. Unknown Pakistan Chishti et al., 2009

28
DFNB72 19p13.3 Unknown Pakistan Ain et al., 2007 DFNB73 1p32.3 BSND Pakistan Riazuddin et al., 2009 DFNB74 12q14.2-q15 Pakistan Waryah et al., 2009 DFNB75 Reserved DFNB76 Reserved DFNB77 Reserved DFNB78 Reserved DFNB79 9q34.3 Unknown Pakistan Khan et al., 2009 Adapted from Hereditary Hearing Loss Homepage (http://dnalab-www.uia.ac.be/dnalab/hhh/)

29
CHAPTER: III
LINKAGE ANALYSIS, A KEY TOOL FOR MAPPING DISEASE GENES

29
LINKAGE ANALYSIS: Linkage analysis a powerful, family-based approach is used to map the disease genes in
human pedigrees. Two loci on the same chromosome are said to be linked if the process
of crossing over can not separate them. If the two loci are physically close to each other
on the same chromosome then there are rare chances that process of crossing over can
separate them. The segregation of specific neighboring genetic markers with the disease
within a family reflects lack of recombination between the disease mutation and genetic
markers. Individuals within a family who share a disease causing mutation will typically
share alleles at markers near the disease gene. The particular alleles co-inherited with the
disease often differ between families, reflecting allelic heterogeneity. Results of linkage
analysis are statistically evaluated by calculating LOD score which represents the relative
likelihood that a disease locus and a genetic marker are genetically linked (with a
recombination fraction theta), rather than that they are genetically unlinked. A LOD score
of at least +3.0 is typically considered evidence of linkage and LOD score of −2 or below
excludes disease linkage to a region (Ott, 1991).
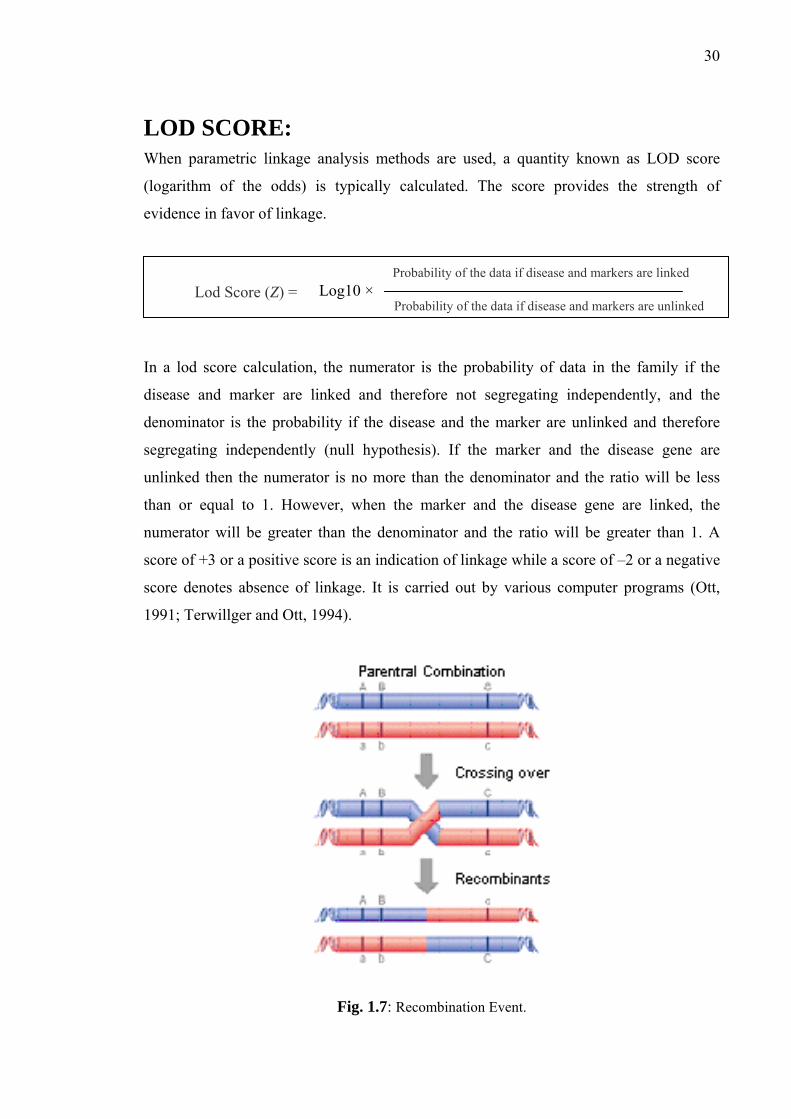
RECOMBINATION FRACTION: Alleles at loci on same chromosome co-segregate at a rate that is directly proportional to
the physical distance between them on the chromosome. This rate is the probability or
recombination fraction (θ), of a recombination event (Fig. 1.7) occurring between two
loci. Two loci are said to be genetically linked when recombination fraction is less than
0.5. One of these loci is the disease locus while the other is a polymorphic marker like
microsatellite repeats. The recombination fraction ranges from θ=0 for loci right next to
each other through θ = 0.5 for loci apart (or on different chromosomes). It means it can be
taken as a measure of the genetic distance or map distance between gene loci. Two loci
that show 1% recombination are defined as being 1 cM apart on the genetic map, and a
genetic distance of 1 cM represents ~0.9 Mb on the sex averaged physical map (Foroud,
1997).
30
LOD SCORE: When parametric linkage analysis methods are used, a quantity known as LOD score
(logarithm of the odds) is typically calculated. The score provides the strength of
evidence in favor of linkage.
In a lod score calculation, the numerator is the probability of data in the family if the
disease and marker are linked and therefore not segregating independently, and the
denominator is the probability if the disease and the marker are unlinked and therefore
segregating independently (null hypothesis). If the marker and the disease gene are
unlinked then the numerator is no more than the denominator and the ratio will be less
than or equal to 1. However, when the marker and the disease gene are linked, the
numerator will be greater than the denominator and the ratio will be greater than 1. A
score of +3 or a positive score is an indication of linkage while a score of –2 or a negative
score denotes absence of linkage. It is carried out by various computer programs (Ott,
1991; Terwillger and Ott, 1994).
Fig. 1.7: Recombination Event.
Lod Score (Z) = Probability of the data if disease and markers are linked
Probability of the data if disease and markers are unlinked Log10 ×
31
MULTIPOINT MAPPING: Linkage analysis can be more efficient if the data for more than two loci are analyzed
simultaneously. Multipoint mapping is particularly useful for finding the chromosomal
order of a set of linked markers. Usually the starting point in mapping a disease locus is to
find a two point score which gives linkage between a specific marker and a disease locus.
A multipoint score is calculated to find the location of disease gene between two or more
markers.
DNA POLYMORPHISM—A TOOL FOR LINKAGE ANALYSIS: It is necessary to have polymorphic markers, which can be checked for inheritance with
the disease locus in question for linkage analysis. Genotyping is carried out by a genetic
marker defined as an observable polymorphism within the population.
The simple sequence repeats also known as microsatellite, have revolutionized the world
of genotyping. STRs are hyper variable tandem sequence repeats which consist of di-tri-
or tetra-nucleotide repeats. The most widely used STRs to be developed for genotyping
are the simple (CA)n and (GT)n repeats. The (CA)n repeats are extremely abundant and
can be found, on average, once every 30-60 kb. (CA)n repeats are generally polymorphic
if the repeat length is greater than 10. By isolating and sequencing DNA fragments
containing the microsatellite, PCR primers that flanked the STRs can be created and used
to amplify it.

32
SECTION: 2
MATERIALS & METHODS

32
A two-phase strategy was employed to map a novel deafness causing gene:
PHASE I: Phase I is the Field Work which involved identification of families
segregating hereditary hearing impairment through special education schools, their
enrollment by collecting blood samples and clinical evaluation of selected and available
individuals of these families.
PHASE II: phase II includes extensive Lab work including DNA extraction, exclusion
studies of the known DFNB loci/genes, genome wide scan for mapping of a novel
deafness causing gene in the unlinked families and sequencing of the known genes in
linked families to identify novel pathogenic variants.
FIELD WORK
IDENTIFICATION AND ENROLLMENT OF FAMILIES: After approval of the institutional Review Board at National Centre of Excellence in
Molecular Biology, Lahore, Pakistan (FWA00001758) and the NIDCD at the National
Institutes of Health, USA (OH-93-N-016), families segregating deafness in three or more
individuals were ascertained through the special education schools from different cities of
Punjab province of Pakistan. A questionnaire was developed to collect information
regarding the history of deafness in the family of a student, phone number, address and
the number of affected individuals in the family other than student. Principals/Incharges
were contacted and after briefing about the research program, they were requested to
collect information about the history of deafness in the family of each student by
providing them a specified questionnaire. After receiving feedback, the families having
three or more affected individuals were visited to collect complete disease history and
detailed pedigree drawing by interviewing the multiple family members. Detailed history
was taken from each family to minimize the environmental causes of deafness as well as
presence of other abnormalities. Families were specially questioned about skin
pigmentation, hair pigmentation, and problems relating to balance, vision, night
blindness, thyroid, kidneys, diabetes, heart, and infectious diseases like meningitis,
antibiotic usage, injury, and typhoid. Once the recessive mode of inheritance of deafness
is evident from the family structure, blood samples were collected from all participants
33
after written informed consent. If a family had other affected relatives with hearing loss,
they were also included in the study depending upon their willingness and availability.
Pedigree structures of the enrolled families were drawn using Cyrillic® program (Cyrillic
for Windows 3.1) and Macromedia® FreeHand® software.
CLINICAL EVALUATION: Families were clinically evaluated by performing different tests. Hearing was evaluated
by performing pure tone audiometry tests for air and bone conduction at frequencies 250
to 8,000 Hz on affected and unaffected members of these families. Vestibular function
was evaluated by tandem gait and Romberg test. Ocular fundoscopy and
electroretinography (ERG) was performed to detect the presence of retinopathy.
Clinical Assessment of Hearing Loss: Evaluation of the patient’s hearing problems begins with simple observation. Observation
of manner, voice and his hearing for conversation at the first consultation may provide a
rough indication of the nature and degree of hearing disability. The patient who watches a
speaker closely may be proficient at lip reading. The voice is often soft in conductive
disability and flat and toneless with sensorineural loss.
Audiological Testing: Audiometry was performed to test a person’s ability to hear various sound frequencies
and to ascertain the type and severity of the impairment. The AMBCO Audiometer model
650 AB (AC) and Siemens SD 70 (AC and BC) audiometers were used for audiological
testing of affected and normal individuals.
Sound is measured in terms of its frequency, caused by the rate of vibration of the sound
wave and also by its loudness or intensity. The frequency of sound is measured in cycles
per second or Hertz (Hz) and the intensity of sound in decibels (dB). Audiometric testing
normally includes a measurement of hearing sensitivity using air borne pure tones and
bone conducted pure tones and involves the determination of the lowest intensity at which
an individual perceives a pure tone of threshold increase thus provides a means of
classifying deafness according to the degree of severity as shown in Fig. 2.1 (Mazeas &
Bourguet 1975).
Threshold sensitivity is measured by using right and left earphones of the audiometer,
allowing each ear to be examined independently. Headphones are fitted with RED
marked earphones on the Right ear and the BLUE on the Left ear, adjusting the headband

34
as necessary. Tones are reduced in intensity (dB) until a just detectable threshold of
hearing is determined. This is repeated at frequencies from 250 to 8,000 Hz within the
audible range covering the auditory spectrum. The threshold of hearing is the quietist
level at which the subject can identify the tone and the results are plotted as an
audiogram. The dB reading is plotted on the audiogram chart showing the frequencies in
Hz on horizontal axis and intensity in db on vertical axis. The symbols used for right and
left ear measurements on audiogram are “O” and “X” respectively. The shape of the
curve is a measure of the frequency sensitivity of both the middle ear and the inner ear.
In Pure tone air conduction audiometry, sounds are presented through earphones;
thresholds depend on the condition of the external ear canal, middle ear, and inner ear.
Bone conduction audiometry is done to determine whether the loss is caused by a
sensory problem (sensorineural hearing loss) or a mechanical problem (conductive
hearing loss). This distinction is made by presenting sounds through a vibrator which is
placed somewhere on the skull, usually the mastoid bone or forehead. Sound at various
frequencies and sound pressure leads directly to the cochlea via bone conduction thus
bypassing the external ear and the mechanical parts of the middle ear. If hearing is better
using bone than air, this suggests a conductive hearing loss (Fig. 2.2).
SEVERITY OF HEARING LOSS: Hearing is measured in decibels (dB). The threshold or 0 dB mark for each frequency
refers to the level at which normal young adults perceive a tone burst 50% of the time.
Hearing is considered normal if an individual’s thresholds are < 25 dB (adults) and <15
dB (children). On the basis of severity, hearing impairment can be categorized as: (Table
2.1).

35
Table 2.1: Categories of Hearing Impairment on Basis of Severity.
Fig. 2.1: Chart Representing Degree of Severity of Hearing Loss.
Sr. # Type Degree of Hearing Loss
1 Mild 21-45dB
2 Moderate 46-60 dB
3 Moderately severe 61-75 dB
4 Severe 76-90 dB
5 Profound = >90 dB

36
Normal Hearing Profound Hearing Loss
Conductive Hearing Loss Mixed Hearing Loss
Fig. 2.2: Sample Audiograms for Hearing Loss on the Basis of Type of Ear Defect.

37
Clinical Assessment of Vestibular Function: The purpose of vestibular testing is to determine the functioning and integrity of the
vestibular apparatus of the inner ear. Body orientation is controlled by the vestibular
system, which consists of three semi-circular canals, the utricle and saccule. Each of these
semi-circular canals lies at a right angle to each other and deals with different
movements, up and down, side-to-side and tilting from one side to the other. As the head
moves, hair cells in the semicircular canals send nerve impulses to the brain by way of the
vestibular portion of the acoustic nerve.
Vestibular function is usually evaluated by using Romberg, tandem gait and ENG of the
affected individuals.
Romberg and Tandem Gait Test: The Romberg test is a physical examination in which the patient is asked to stand with
their feet together (touching each other) and to close their eyes. An observer remains
close at hand in case the patient begins to sway or fall. With eyes open, three sensory
systems provide input to the cerebellum to maintain truncal stability. These are vision,
proprioception, and vestibular. If there is a mild lesion in the vestibular or proprioception
systems, the patient is usually able to compensate by visual input. With closed eyes,
however, visual input is removed and instability can be apparent. If there is a more severe
proprioceptive or vestibular lesion, or if there is a midline cerebellar lesion causing
truncal instability, the patient will be unable to maintain this position even with their eyes
open and may fall (Blumenfeld, 2001).
In case of tandem gait test, the patient is asked to walk with their hand attached with the
body, each foot has to place adjacent with the other foot and have to walk. If there is any
problem with the vestibular system, then the person may not walk properly.
Clinical Assessment of Retinitis Pigmentosa: (RP) Retinitis pigmentosa (RP) is a progressive retinal degeneration that begins with loss of
peripheral vision and night blindness, and often leads to total blindness in later life. Two
tests were performed on the affected individuals of each family for the diagnosis of RP.
Fundoscopy: Fundoscopy is an examination of the sensory portion of the eyeball (fundus), which
includes the retina, optic disc, choroid and blood vessels.
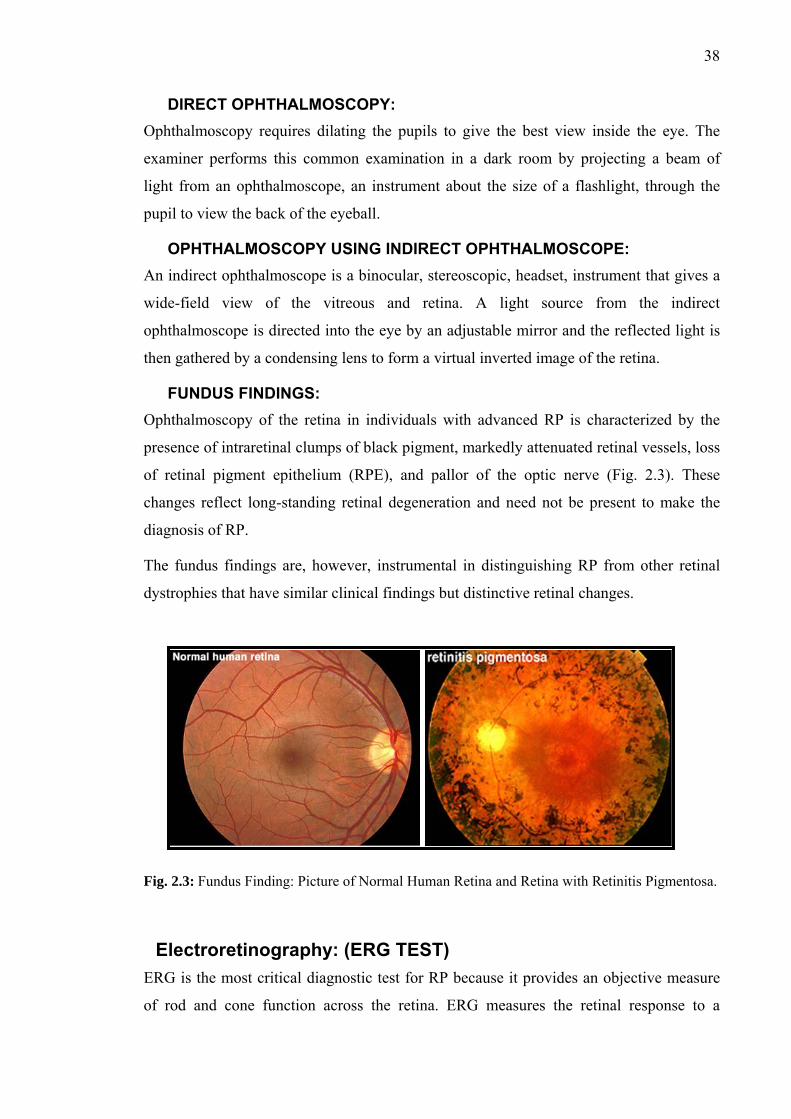
38
DIRECT OPHTHALMOSCOPY: Ophthalmoscopy requires dilating the pupils to give the best view inside the eye. The
examiner performs this common examination in a dark room by projecting a beam of
light from an ophthalmoscope, an instrument about the size of a flashlight, through the
pupil to view the back of the eyeball.
OPHTHALMOSCOPY USING INDIRECT OPHTHALMOSCOPE: An indirect ophthalmoscope is a binocular, stereoscopic, headset, instrument that gives a
wide-field view of the vitreous and retina. A light source from the indirect
ophthalmoscope is directed into the eye by an adjustable mirror and the reflected light is
then gathered by a condensing lens to form a virtual inverted image of the retina.
FUNDUS FINDINGS: Ophthalmoscopy of the retina in individuals with advanced RP is characterized by the
presence of intraretinal clumps of black pigment, markedly attenuated retinal vessels, loss
of retinal pigment epithelium (RPE), and pallor of the optic nerve (Fig. 2.3). These
changes reflect long-standing retinal degeneration and need not be present to make the
diagnosis of RP.
The fundus findings are, however, instrumental in distinguishing RP from other retinal
dystrophies that have similar clinical findings but distinctive retinal changes.
Fig. 2.3: Fundus Finding: Picture of Normal Human Retina and Retina with Retinitis Pigmentosa.
Electroretinography: (ERG TEST) ERG is the most critical diagnostic test for RP because it provides an objective measure
of rod and cone function across the retina. ERG measures the retinal response to a
39
stimulus of light using a corneal electrode and neutral electrodes placed on the skin
around the eye. The corneal electrode is placed gently behind the lower eyelid and
contacts the cornea. A flash of light is shown to the patient and the electrodes record the
retinal potentials, which develop as a response to the flash. This diagnostic procedure is
useful in distinguishing between a variety of retinal disorders such as cone or rod
dystrophy and retinitis pigmentosa.
LAB WORK
DNA EXTRACTION:
From Blood Samples: 10 ml of venous blood samples were collected in properly labeled 50 ml Sterilin® falcon
tubes containing 400 μl of 0.5 M EDTA as an anticoagulant. Blood samples were kept
frozen either at -70°C for 20-30 min or at -20°C for long term storage. Genomic DNA
was extracted from the blood samples following a non-organic method (Grimberg et al.,
1989) and modified organic method.
1. Blood samples were thawn for the Red Blood Cells (RBC) lysis.
2. 35 ml of TE buffer (10 mM Tris HCl, 2 mM EDTA, pH 8.0) was added for
washing of blood samples. Samples were centrifuged at 3000 rpm for 20 min and
supernatant was discarded. Washing was repeated for three to four times till the
White Blood Cells (WBC) pellet is free of hemoglobin.
3. Proteins in the pellets of WBC were digested by adding 0.5 mg of proteinase K
along with 200 μl of 10% SDS in the presence of 6 ml TNE buffer (10 mM Tris
HCl, 2 mM EDTA, 400 mM NaCl).
4. The samples were left overnight in an incubating shaker at 37oC at a speed of 250
rpm.
5. Digested proteins were precipitated by adding 1 ml of super saturated NaCl (6M),
followed by vigorous shaking and chilling on ice for 15 min before centrifugation.
After centrifugation the supernatant containing DNA was transferred to the newly
labeled falcon tube.

40
6. DNA was precipitated in the form of threads from the supernatant by adding equal
volume of isopropanol and was pellet down by centrifugation at 3000 rpm for 15
min.
7. After washing with 70% ethanol, DNA pellet was dried and resuspended in TE
buffer (10 mM Tris, 0.2 mM EDTA) and heat shock was given at 70oC in a water
bath for 1 hr to inactivate any remaining nucleases.
Organic method of DNA extraction differs from non organic method only at step 5
where proteins are precipitated out by salting out in non organic method while in case of
organic method proteins were digested by Phenol:Chloroform and Isoamyl alcohol as
follows:
5. Phenol:Chloroform:Isoamyl alcohol solution (25:24:1) was added in ratio of One-
third volume of the initial blood sample (3ml for 10ml of blood) to the tubes and
emulsified, and then tubes were centrifuged at 3000 rpm for 20 minutes. The
aqueous layer containg DNA was transferred carefully to the new labeled falcon
tube.
6. Step 6 and 7 were same for both methods.
From Buccal Swabs: In case of elderly people or very young children where it was not feasible to obtain blood
sample, buccal swabs were collected, as it is simple and noninvasive technique for
obtaining buccal cell DNA. Cheek cells were obtained by means of sterile MasterAmpTM
Buccal Swab Brush (Epicentre® Technologies WI, Medical Package Co-operation, CA,
USA). Subjects were asked to refrain from smoking, drinking, or eating for 1 hr before
sample collection to reduce the possibility that food particle or other exogenous materials
would compromise the sample and they were instructed to thoroughly rinse their mouth
with water. Two swabs were taken from an individual by swirling each brush firmly on
the oral mucosa for 30 seconds, air dried and then stored in the original packaging at
room temperature. DNA was extracted from these cells using MasterAmpTM Buccal Swab
DNA Extraction Buffer from Epicentre (Walker et al., 1999).
1. 500 μl of Aliquot buffer was added in an eppendorf placed on ice.

41
2. Buccal brush was rotated for a minimum of 5 times in the buffer and pressed
against the side walls while removing it from the eppendorf to retain the most of
the liquid in the eppendorf.
3. The cap of the eppendorf was closed firmly and vortex mixed for 10 sec.
4. The eppendorf was incubated at 60°C for 30 min and vortex mixed for 15 sec.
5. The eppendorf was transferred to 98°C, incubated for 8 min and vortex mixed for
15 sec.
6. The eppendorf was incubated again at 98°C for 8 min and vortex mixed for 15
sec.
7. The eppendorf was chilled briefly on ice to reduce the temperature.
8. Cellular debris was pellet down by centrifugation at 4°C for 5 min.
9. The supernatant containing the DNA was carefully transferred to a sterilized tube
without including any of the beads.
The yield of the DNA is usually 2-8 ng/μl. The DNA was kept at -20°C, or at -
70°C for long term storage.
QUANTIFICATION OF DNA: DNA was quantified by two methods:
Optical Density Measurements: DNA concentrations were deliberated by measuring the optical density (OD) at 260 nm
using 1/100 dilution in quartz cuvette and the spectrophotometer with the UV lamp turned
on. The ratio of readings taken at 260 nm and 280 nm wavelengths indicates the purity of
the nucleic acid. DNA quality measurement is based on the fact that OD at 260 nm is
twice than that of at 280 nm if the solution contains pure DNA. If there is a contaminant
like protein, there is some additional OD, which decreases the OD ratio between 260 and
280 nm. For pure DNA, OD260:OD280 = 1.8. Ratios less than these indicate
contamination of protein and estimation of concentration would be inaccurate (Table 2.2).

42
Agarose Gel Electrophoresis Estimation with a Known Standard DNA Dilution: This method uses the UV-induced fluorescence of ethidium bromide dye intercalated into
the nucleic acids. The amount of fluorescence is proportional to the amount of nucleic
acid present. Fluorescence from the test DNA and from a known amount of a DNA
standard was compared visually. It also allowed the simultaneous assessment of the
integrity of the nucleic acid. The DNA was stored at -20°C.
Table 2.2: Calculation of Concentration of DNA.
A B C D E F G H
Amount to be taken to prepare
100 ml dilution of 25ng/μl 1
OD
A°2
60
OD
A°2
80
Rat
io
Dilu
tion
Fact
or
Con
c. o
f Sto
ck
μg/m
l Stock DNA (µl) Buffer
2 Formula B3/C3 100 = B3*E3*50 = (25/F3)*100 = 100-G3
3 Example 0.130 0.07 1.86 100 650 3.85 96.15
PREPARATION OF REPLICA DNA PLATES: DNA was diluted in low TE Buffer (10 mM Tris HCl pH 8.0, 0.1 mM EDTA). Working
DNA concentrations were kept at 25 ng/μl and 75 ng/µl for single marker and multiplex
PCR amplification, respectively. 96 well master plate was designed and DNA samples of
set of particular families were assigned to each of the wells. Plate map was designed that
consists of at least 3 affected individuals with a parent and normal sibling from each
family. Replicates of the designed master plate were prepared with 50 ng of DNA for
exclusion studies and 150 ng for genome wide scan into each well overlaid with a 12 μl
mineral oil.
LINKAGE ANALYSIS FOR REPORTED DFNB LOCI: At the time of study, 67 loci have so far been reported for nonsyndromic autosomal
recessive deafness. Linkage to known DFNB loci was done for the enrolled families using
at least three microsatellite markers for each of the reported deafness loci (Hereditary

43
Hearing Loss Homepage) (Table 2.3). The selected markers were checked for
heterozygosity in the range of 0.7-0.8 from Marshfield maps. The primers have been such
designed and selected to ensure robust PCR amplification and to produce PCR products
covering a wide range of molecular weights. Fluorescently labeled primers (forward
primers labeled with one of the fluorescent dyes, FAM, NED and VIC) were used for
genotyping. They were obtained commercially from Applied Biosystems (ABI). The
labeling dyes of the primers were assigned in a manner that a single locus could be pooled
at one time.
Genotyping STR Markers by Polymerase Chain Reaction: PCR fragments were amplified from 50 ng of genomic DNA in 5 μl reaction using replica
plates.
Table 2.4: Reaction Mixture for Amplification of STR Markers for Genotyping.
Ingredients Final Conc. Stock Required Volume
Genomic DNA 50 ng 25 ng/μl 2 μl
Primer Forward 0.8-1.2 pM 8.0 pM 0.1-0.15 μl
Reverse 0.8-1.2 pM 8.0 pM 0.1-0.15 μl
dNTPs (dATP,dTTP,dCTP, dGTP) 125 μM 1.25 mM 0.5 μl
PCR Buffer* 1x 10x 0.5μl
Taq Polymerase 1 units 2 units/μl 0.5 μl
dH2O q.s to 5μl
* 10X PCR buffer (100 mM Tris Cl-pH 8.4, 500 mM KCl, 15-25 mM MgCl2 and 1% Triton)
PCR Cycle: The microsatellite markers were amplified by the polymerase chain reaction (PCR) on
GeneAmp® PCR system ABI 2700 or 9700 (Applied Biosystems). The thermocycler
programs used for amplification of single markers were either touch down programs
(either 64°C→54°C or 67°C→57°C) or annealing 54-58°C with extension of 45 sec in
program in which denaturation temperature was 94°C for first fourteen cycles and 89°C
for last 27 cycles or annealing 54-58°C along with extension of two min for 30 cycles
(Fig. 2.4 and Fig. 2.5).
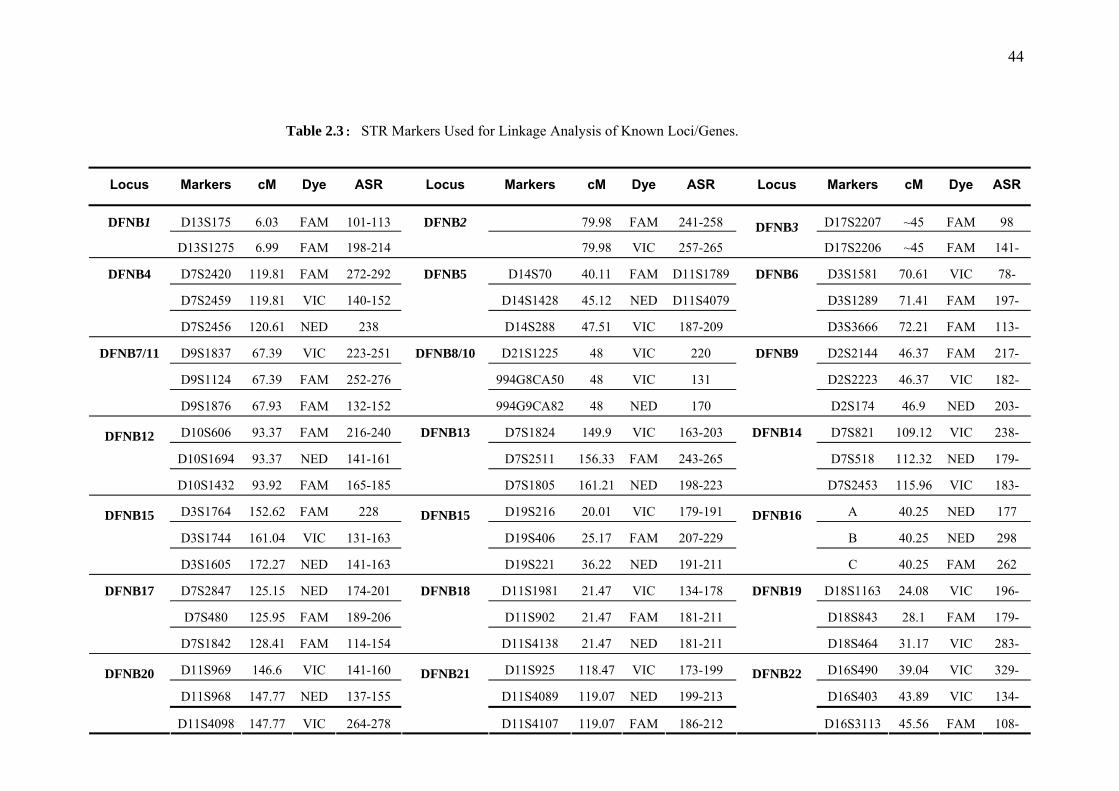
44
Table 2.3: STR Markers Used for Linkage Analysis of Known Loci/Genes.
Locus Markers cM Dye ASR Locus Markers cM Dye ASR Locus Markers cM Dye ASR
D13S175 6.03 FAM 101-113 79.98 FAM 241-258 D17S2207 ~45 FAM 98 DFNB1
D13S1275 6.99 FAM 198-214
DFNB2
79.98 VIC 257-265 DFNB3
D17S2206 ~45 FAM 141-
D7S2420 119.81 FAM 272-292 D14S70 40.11 FAM D11S1789 D3S1581 70.61 VIC 78-
D7S2459 119.81 VIC 140-152 D14S1428 45.12 NED D11S4079 D3S1289 71.41 FAM 197-
DFNB4
D7S2456 120.61 NED 238
DFNB5
D14S288 47.51 VIC 187-209
DFNB6
D3S3666 72.21 FAM 113-
D9S1837 67.39 VIC 223-251 D21S1225 48 VIC 220 D2S2144 46.37 FAM 217-
D9S1124 67.39 FAM 252-276 994G8CA50 48 VIC 131 D2S2223 46.37 VIC 182-
DFNB7/11
D9S1876 67.93 FAM 132-152
DFNB8/10
994G9CA82 48 NED 170
DFNB9
D2S174 46.9 NED 203-
D10S606 93.37 FAM 216-240 D7S1824 149.9 VIC 163-203 D7S821 109.12 VIC 238-
D10S1694 93.37 NED 141-161 D7S2511 156.33 FAM 243-265 D7S518 112.32 NED 179-
DFNB12
D10S1432 93.92 FAM 165-185
DFNB13
D7S1805 161.21 NED 198-223
DFNB14
D7S2453 115.96 VIC 183-
D3S1764 152.62 FAM 228 D19S216 20.01 VIC 179-191 A 40.25 NED 177
D3S1744 161.04 VIC 131-163 D19S406 25.17 FAM 207-229 B 40.25 NED 298
DFNB15
D3S1605 172.27 NED 141-163
DFNB15
D19S221 36.22 NED 191-211
DFNB16
C 40.25 FAM 262
D7S2847 125.15 NED 174-201 D11S1981 21.47 VIC 134-178 D18S1163 24.08 VIC 196-
D7S480 125.95 FAM 189-206 D11S902 21.47 FAM 181-211 D18S843 28.1 FAM 179-
DFNB17
D7S1842 128.41 FAM 114-154
DFNB18
D11S4138 21.47 NED 181-211
DFNB19
D18S464 31.17 VIC 283-
D11S969 146.6 VIC 141-160 D11S925 118.47 VIC 173-199 D16S490 39.04 VIC 329-
D11S968 147.77 NED 137-155 D11S4089 119.07 NED 199-213 D16S403 43.89 VIC 134-
DFNB20
D11S4098 147.77 VIC 264-278
DFNB21
D11S4107 119.07 FAM 186-212
DFNB22
D16S3113 45.56 FAM 108-

45
D10S2529 74.5 FAM 200 D11S2017 101.75 FAM 109-133 D4S1632 44.66 VIC 277
D10S2536 74.5 VIC 203 D11S1986 105.74 VIC 176-252 D4S3001 49.47 VIC 214-228
DFNB23
D10S546 75.57 FAM 148-160
DFNB24
D11S4111 108.59 NED 203-222
DFNB25
D4S1627 60.16 NED 177-201
D4S2981 145.98 NED 141-155 D2S382 169.41 VIC 156-170 D22S692 41.42 VIC 155-171
D4S1625 145.98 FAM 182-210 D2S294 174.3 NED 184-216 D22S1045
42.81 NED 140-158 DFNB26
D4S1604 145.98 NED 254-260
DFNB27
D2S326 177.53 FAM 156-174
DFNB28
D22S115 44.32 FAM 150-162
D21S2078 35.45 NED 144-178 D10S2481 52.1 VIC 186-226 31A 123.33 FAM 155-195
D21S2079 35.45 NED 305-347 D10S1775 52.1 FAM 218-226 31B 123.33 FAM 195-230
DFNB29
D21S1252 35.45 VIC 231-251
DFNB30
D10S197 52.1 FAM 161-173
DFNB31
31C 123.33 FAM 195-235
D1S2739 130.73 FAM 130-150 D9S1826 159.61 VIC 133-147 D14S76 84.69 FAM 167-207
D1S206 134.2 FAM 206-218 D9S158 161.71 TET 213-233 D14S983 87.39 FAM 240-270
DFNB32
D1S248 139.02 FAM 191-211
DFNB33
D9S1838 163.84 FAM 159-175
DFNB35
D14S61 86.29 FAM 197-227
D1S2870 14.04 FAM 190-210 D6S1031 88.63 NED 260 D6S1599 169.95 VIC 131-155
D1S3774 14.04 FAM 250-270 D6S1589 89.23 NED 180 D6S1277 173.31 NED 292
DFNB36
D1S214 14.04 VIC 117-147
DFNB37
D6S286 89.83 FAM 206
DFNB38
D6S1273 173.31 VIC 145-165
D7S2204 90.95 FAM 200-270 D22S446 14.4 FAM 198-232 D3S4523 138.00 FAM 228-249
D7S660 93.63 VIC 180-200 D22S310 23.37 FAM 181 D3S1303 136.32 FAM 198-218 DFNB39
D7S820 98.44 NED 195-225
DFNB40
D22S1167 24.74 FAM 266-278
DFNB42
D3S1589 141.79 FAM 149-169
D7S2846 VIC 57.79 172-196 D1S304 267.51 VIC 168-174 D18S476 2.84 VIC 263-275
D7S691 NED 63.67 128-146 D1S2842 273.46 FAM 217-231
DFNB46 D18S115
48.3 FAM 230-277
DFNB44
D7S1818 FAM 69.56 183-199
DFNB45
D1S2836 285.75 FAM 268-281 D18S52 9.26 FAM 116-132
45

46
D7S2552 NED 74.38 232-282 D18S976 12.81 FAM 171-198
D2S2952 FAM 17.88 177-209 D15S973 73.52 FAM 242-254 D5S629 75.89 FAM 233-253
D2S2207 VIC 20.57 194-238 D15S1027 74.69 FAM 184-204 GATA-141B10
75.89 FAM 104-116
D2S168 NED 27.06 196-216 D15S1023 74.69 FAM 238-302 D5S637 75.89 FAM 246-254 DNB47
D2S131 FAM 31.2 229-247
DFNB48
D15S1005 75.27 FAM 104-122
DFNB49
D11S907 FAM 42.55 162-173 D6S1665 36.37 VIC 210-226 D6S276 44.40 VIC 198-230
D11S4203 FAM 45.94 218-278 D6S1660 40.14 NED 203-217 D6S1568 47.71 FAM 84-110 DFNB51
D11S4102 FAM 47.61 142-172
DFNB53/66/
67 D6S2439 42.27 NED 218-258
DFNB53/66/
67 D6S1610 53.81 NED 117-143
D4S1569 71.77 NED 279-291 D2S2341 129.22 FAM 229-247 D5S404 127.93 NED 180-198
D4S3248 72.52 FAM 233-257 D2S2215 134.45 FAM 139-161 D5S2110 135.25 FAM 248-272 DFNB55
D4S1645 72.52 VIC 225-257
DFNB58
D2S112 141.62 VIC 136-150
DFNB60
D5S1979 144.06 FAM 157-179
D12S358 26.23 FAM 238-270 D11S4136 FAM 160-200 D20S840 79.91 FAM 123-165
D12S320 30.6 NED 196-216 D11S4139 FAM 135-200 D20S120 83.51 NED 213-241 DFNB62
D12S1042 48.7 FAM 118-136
DFNB63
D11S1337 VIC 279-295
DFNB65
D20S102 86.98 NED 169-177

47
Fig. 2.4: Thermocycling Profiles for the Amplification of STR markers A. Thermocycler programme Touch Down 67°C→57°C B. Thermocycler programme, Touch Down 64°C→54°C C. Thermocycler programme, with annealing 54°C.
Fig. 2.5: Thermocycling Profiles for Amplification of Panel Markers in Multiplex PCR.
A
B
C
∝
∝
∝

48
GENOME WIDE SCAN: Genome Wide Scan linkage analysis was performed on the four selected families, which
remained unlinked to known DFNB loci to map novel deafness causing gene in these
families. The ABI PRISM® Linkage Mapping Set, Version 2.5 (Applied Biosystems),
consisting of 811 fluorescent dye-labeled microsatellite markers, organized in 86 panels is
available in two configurations:
• Linakge Mapping Set v2.5 HD5, defines a ~5 cM resolution human index
map
• Linakge Mapping Set v2.5 HD10, defines a ~10 cM resolution human index
map
In this study, genome wide scan was performed by using MD10 linkage mapping set,
which consists of 388 microsatellite markers. The Linkage mapping set consists of 28
panels. Out of 28 panels, 27 are for autosomes and 1 for X chromosome. The markers had
been selected from the 1996 Genethon Human genetic map based on chromosomal
location and heterozygosity. Marker heterozygosity values and allele size range is based
on CEPH genotype databases used for the 1996 Genethon map and may vary slightly in
other populations.
Standard PCR usually uses one pair of primers to amplify a specific sequence, while
multiplex PCR uses multiple pairs of primers to amplify many sequences simultaneously.
Sequences for all the primers had been such optimized that only one set of PCR
conditions: annealing 54°C with extension of two minutes for 30 cycles are required for
the entire set (Fig. 2.5). Multiplex PCR were standardized and streamlined for the
markers of each panel by dividing them into appropriate sets. Each panel consists of a
group of markers that can be loaded into one capillary or into one lane of the gel. PCR
conditions are given in Table 2.5.
Multiplex PCR Protocol: PCR fragments were amplified from 150 ng of genomic DNA in 5 μl reaction containing
0.04-0.08 μM of each primer, 250 μM of dATP, dTTP, dCTP and dGTP, 1 unit of Taq
polymerase, 0.5 μl of 10XPCR reaction buffer (750 mM KCl; 100 mM Tris HCl pH:8.3.
25 mM MgCl2) and 10 μl overlay of mineral oil.
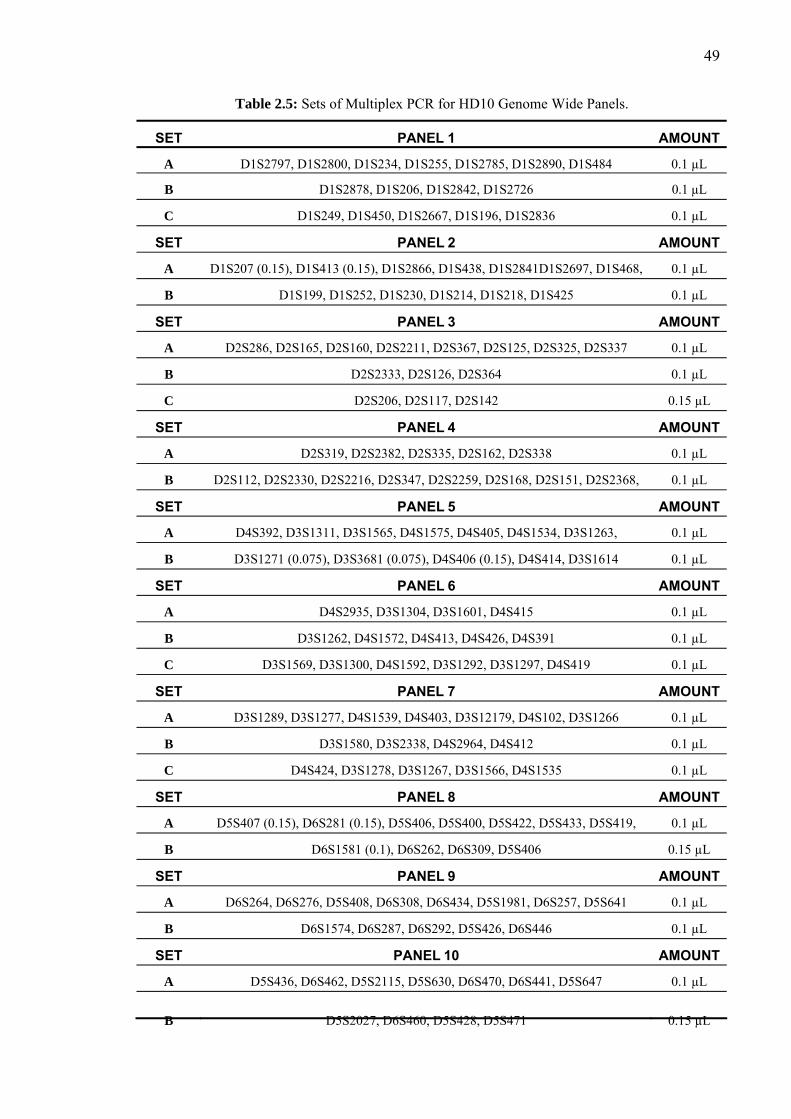
49
Table 2.5: Sets of Multiplex PCR for HD10 Genome Wide Panels.
SET PANEL 1 AMOUNT
A D1S2797, D1S2800, D1S234, D1S255, D1S2785, D1S2890, D1S484 0.1 µL
B D1S2878, D1S206, D1S2842, D1S2726 0.1 µL
C D1S249, D1S450, D1S2667, D1S196, D1S2836 0.1 µL
SET PANEL 2 AMOUNT
A D1S207 (0.15), D1S413 (0.15), D1S2866, D1S438, D1S2841D1S2697, D1S468, 0.1 µL
B D1S199, D1S252, D1S230, D1S214, D1S218, D1S425 0.1 µL
SET PANEL 3 AMOUNT
A D2S286, D2S165, D2S160, D2S2211, D2S367, D2S125, D2S325, D2S337 0.1 µL
B D2S2333, D2S126, D2S364 0.1 µL
C D2S206, D2S117, D2S142 0.15 µL
SET PANEL 4 AMOUNT
A D2S319, D2S2382, D2S335, D2S162, D2S338 0.1 µL
B D2S112, D2S2330, D2S2216, D2S347, D2S2259, D2S168, D2S151, D2S2368, 0.1 µL
SET PANEL 5 AMOUNT
A D4S392, D3S1311, D3S1565, D4S1575, D4S405, D4S1534, D3S1263, 0.1 µL
B D3S1271 (0.075), D3S3681 (0.075), D4S406 (0.15), D4S414, D3S1614 0.1 µL
SET PANEL 6 AMOUNT
A D4S2935, D3S1304, D3S1601, D4S415 0.1 µL
B D3S1262, D4S1572, D4S413, D4S426, D4S391 0.1 µL
C D3S1569, D3S1300, D4S1592, D3S1292, D3S1297, D4S419 0.1 µL
SET PANEL 7 AMOUNT
A D3S1289, D3S1277, D4S1539, D4S403, D3S12179, D4S102, D3S1266 0.1 µL
B D3S1580, D3S2338, D4S2964, D4S412 0.1 µL
C D4S424, D3S1278, D3S1267, D3S1566, D4S1535 0.1 µL
SET PANEL 8 AMOUNT
A D5S407 (0.15), D6S281 (0.15), D5S406, D5S400, D5S422, D5S433, D5S419, 0.1 µL
B D6S1581 (0.1), D6S262, D6S309, D5S406 0.15 µL
SET PANEL 9 AMOUNT
A D6S264, D6S276, D5S408, D6S308, D6S434, D5S1981, D6S257, D5S641 0.1 µL
B D6S1574, D6S287, D6S292, D5S426, D6S446 0.1 µL
SET PANEL 10 AMOUNT
A D5S436, D6S462, D5S2115, D5S630, D6S470, D6S441, D5S647 0.1 µL
B D5S2027, D6S460, D5S428, D5S471 0.15 µL

50
C D5S410, D5S418, D5S416 0.15 µL
SET PANEL 11 AMOUNT
A D7S530 (0.15), D7S517 (0.15), D7S484, D8S264, D8S549, D8S258, D7S669 0.1 µL
B D7S516 (0.15), D7S510 (0.15), D8S272, D7S502, D7S630, D7S640, D7S513, 0.1 µL
C D8S260, D8S1784, D7S2465, D8S1771 0.15 µL
SET PANEL 12 AMOUNT
A D7S507, D7S515, D7S486, D7S519, D7S661, D8S277 0.1 µL
B D8S284, D7S684, D8S270 0.1 µL
C D7S798, D8S505, D7S636 0.1 µL
D D7S493, D8S550, D7S531, D8S285 0.1 µL
SET PANEL 13 AMOUNT
A D11S937, D11S935, D9S1677, D11S902, D11S904, D10S547, D11S905, 0.1 µL
B D11S4175, D9S285, D11S987, D11S1314 0.1 µL
SET PANEL 14 AMOUNT
A D10S197, D10S1653, D9S161, D11S901, D10S1686 0.15 µL
B D10S185, D9S175, D10S212, D9S287, D9S1597, D9S167, D9S288 0.15 µL
SET PANEL 15 AMOUNT
A D9S286, D9S1690, D11S1320, D11S968, D9S1776, D11S1338, D10S591, 0.1 µL
B D9S164, D11S4151, D11S4191, D10S537, D11S925 0.1 µL
SET PANEL 16 AMOUNT
A D10S548, D9S1826, D9S1682, D11S908, D10S1693, D9S290 (0.2), D10S597 0.15 µL
B D11S898, D10S196, D10S217, D9S283 (0.15), D10S165 (0.15) 0.1 µL
C D9S1817, D9S158 0.15 µL
SET PANEL 17 AMOUNT
A D13S218, D12S78, D13S217, D12S1659, D12S1723, D13S175, D12S346, 0.1 µL
B D12S83, D13S285, D13S170, D13S263 0.1 µL
SET PANEL 18 AMOUNT
A D12S85, D12S351, D12S368, D13S1265, D12S79 0.1 µL
B D12S345, D12S99, D12S87, D13S156, D12S336 0.1 µL
SET PANEL 19 AMOUNT
A D13S158, D13S173, D12S364, D12S352, D12S326, D13S171, D12S324 0.1 µL
B D13S159, D13S265, D12S310, D13S153 0.1 µL
SET PANEL 20 AMOUNT
A D14S475, D14S280, D14S65, D14S258, D14S70, D14S283, D14S985, D14S276 0.1 µL
B D14S292, D14S74, D14S288, D14S261, D14S68, D14S63 0.15 µL

51
SET PANEL 21 AMOUNT
A D16S3075, D16S3136, D16S3068, D15S130, D15S165, D16S503, D15S127, 0.1 µL
B D16S515, D15S1002, D16S520, D15S131, D15S117 0.1 µL
SET PANEL 22 AMOUNT
A D16S3046, D16S415, D15S978, D16S3103, D15S120 0.1 µL
B D15S205, D16S404, D15S128, D16S516 0.1 µL
C D15S1007, D15S994, D15S1012, D16S423 0.1 µL
SET PANEL 23 AMOUNT
A D18S462, D18S70, D17S1857, D17S1852, D17S799, D18S1102, D17S849 0.1 µL
B D17S949, D18S478, D17S831, D17S1868, D17S798, D17S787, D18S61 0.1 µL
SET PANEL 24 AMOUNT
A D17S944, D17S784, D18S464, D18S63, D18S64, D18S474 0.1 µL
B D18S53, D17S938, D18S59, D17S921, D17S928, D18S452, D17S785, 0.1 µL
SET PANEL 25 AMOUNT
A D20S889, D20S117, D20S112, D19S220, D20S171, D19S420, D19S414, 0.1 µL
B D19S221, D19S210, D20S100, 0.1 µL
SET PANEL 26 AMOUNT
A D20S119, D21S266, D20S107, D19S902, D20S186, D22S420, D22S280, 0.1 µL
B D19S884, D12S1252, D22S539 0.1 µL
C D22S274 0.1 µL
SET PANEL 27 AMOUNT
A D22S283, D20S195, D22S315, D19S209, D19S418, D20S173, D21S263, 0.1 µL

52
SAMPLE PREPARATION FOR ABI PRISM® 3100 GENETIC ANALYZER: 1 μl of the PCR products labeled with one of the fluorescent dyes, FAM, VIC, and NED
together with 11.8 μl Hi-DiTM Formamide (Applied Biosystems) and 0.2 μl of one of the
internal size standard ROX® or LIZ® (Applied Biosystems) were combined in a 96 well
pooling plate using 12 capillary Hamilton® Syringe. Multiplexing of samples was
performed in the pooling plates in a manner that avoids mixing of PCR amplified
products of the same size labeled with the same dye. Products of different sizes were
pooled together by maintaining the difference of 25 nucleotides in case the products are
labeled with similar dye thus avoiding overlapping products during the analysis of data.
The samples were denatured at 95°C for 5 min followed by quick chilling by keeping on
ice for 5 min.
PRINCIPLE OF AUTOMATED FLUORESCENT GENOTYPING: PCR products labeled with three different fluorescent dyes are combined (pooled) and
loaded in a single capillary injection for automated genotyping in ABI PRISM® 3100
Genetic Analyzer according to the manufacture’s instructions using POP-4™ polymer
given in technical manuals. Sample sheets in the Genescan are made to identify the lane
number and contents of each sample like file name, sample name, dye and internal
standard used.
When the fluorescent-labeled DNA fragments electrophorese through the acrylamide gel,
they are separated according to their size and at the lower portion of the gel they pass
through a region where a laser beam continuously scans across the gel. The laser excites
the fluorescent dyes attached to the fragments and they emit light at a specific wavelength
for each dye. A spectrograph collects and separates the lights according to wavelength,
thus all four types of fluorescent emissions can be detected with one pass of the laser.
With the help of data collection software, light intensities are stored as electrical signals
(Lee et al., 1997). Automated allele assignment was performed using the Genescan
analysis and Genotyper 3.7 NT software (Applied Biosystem). The Genescan analysis
software uses the automated fluorescent detection capability of the ABI genetic analysis
instrument to size and quantitate DNA fragments and displays the result of the
experiment as a reconstructed gel image, electropherogram or tabular data or a

53
combination of electropherogram and corresponding tabular data. The Genotyper import
Genescan sample files and converts data from Genescan files into user application results.
Genotypic results include dye color, sample fragments with identifying labels,
quantitative data, sample information and comments. The Genotyper software also
screens out peaks resulting from PCR related artifacts fragments detected during
electrophoresis. The stringency of this filtering process is user defined by selecting filter
parameters that will remove labels from artifact peaks. The Genotyper results are
transferred to data spread sheets for haplotype and statistical analysis.
HAPLOTYPE ANALYSIS: A haplotype is the block of genotyped alleles arranged according to the cM distance along
a chromosome, which represents an individual’s chromosomal segment. Alleles were
arranged in ways that confirm the inheritance pattern of segregating disease. If three
polymorphic (fully informative) markers located in the linkage interval of a DFNB locus
did not show homozygosity among the affected of a family, the locus was considered
unlinked. Linkage to a particular locus was confirmed when homozygous data of affected
members correlates with the disease pattern in the family tree.
DATA ORGANIZATION AND LOD SCORE CALCULATIONS: The Microsoft Excel based macros was specially developed by Bioinformatics Lab,
CEMB. ‘Macro’ is a series of commands and instructions that are grouped together as a
single command to perform various tasks repeatedly in an automated way. The macros
consist of different modules. Different excel sheets are named: Data Sheet, Ranges Sheet,
Basic Information Sheet, and Code Sheet and help in integrating different excel sheets to
analyze data.
Data Sheet: The Data sheet is the primary sheet in which the records of size of alleles after genotyping were entered. It contained the following information: Panel ID, Marker’s name, cM distance, Labeling dye, ASR, Person name and its ID from the pedigree, Disease status/relation. Markers were listed column wise while individuals were arranged horizontally and per individual 2 columns were assigned for the set of alleles as shown below.

54
Ranges Sheet: The data entered in the data sheet was subjected to different analysis parameters by using
different modules of the macro, like Parentage, Coloring, Coding, and Filing. To run a
specific module, ranges i.e. specific number of column and rows were given in the ranges
sheet.
The Macros of the Software: Data sheet and the Ranges sheet were act as a backbone to run different modules of
software. To run the macros, click “Tools” on the Menubar, select Macro, and then
Macros (Alt+F8). A window with the list of modules was opened; the relevant module
was selected and Run command was given.
Modules:
They provide a computerized format for the enhanced management of data and related
information. The macro package is provided with five dynamic modules. Descriptions of
different modules are as follows:
COLORING (Coloring of Homozygous Alleles): This module highlights all the
homozygous alleles by changing their background color. For a single marker, if there
were more than one homozygous pairs of alleles, different colors were assigned to
different set of values and same color to same set of values.
CODING: This module analyzed all the alleles appeared against a marker and
assigned them a numeric codes. Finally it generates a new version of data sheet having all
information of original data sheet except that alleles are replaced by its numeric code.
FILING: This module compiles the allelic data for a given set of markers in the form
of concatenated alleles. The out put of the module is to populate the column labeled
“alleles” on a different data sheet named Basic Info which is further used to make pre file
for LOD score calculation. Other columns of this sheet were filled manually according to
the information of subjected pedigree.
CREATION OF PRE FILE: This module picks the data from “Basic Info” sheet;
arrange it in a specific pattern recommended by Linkage software and saves in a text-
formatted file with a “pre” extension. This pre file is used as starting point for calculation
of LOD Scores.

55
LOD Score Calculations by Fast Link: Morton (1996) demonstrated that LOD scores represent the most efficient statistical proof
of evaluating pedigrees for linkage. LOD scores were calculated using FASTLINK
(v4.1p), a DOS based software package (Schaffer et al., 1996). Two point and multipoint
LOD scores were calculated with MLINK and LINKMAP programs respectively
(Terwillger and Ott, 1994). Deafness was assumed to be inherited in an autosomal
recessive manner with complete penetrance. Recombination frequencies were assumed to
be equal in both males and females. Genetic distances were based on Marshfield human
genetic map.
PRE FILE: A simple notepad file containing information regarding family structure,
affection status and sex of individuals along with their genotypic data for one marker or
more than one.
PED FILE: A file in which the information about the consanguineous marriages/loops in
the family is entered. The loops are broken with the help of a program named
MAKEPED so that the program doesn’t revolve in enclosed circle. As a result, the
program makes double entry of those individuals from where the loops were broken and
make a .Ped file.
DAT FILE: This file is made with a help of program named PREPLINK, and contains
the population data (allele frequency) of each of the marker for which LOD score is to be
calculated. The frequency of deafness alleles were estimated by genotyping the genomic
DNA from 90 unrelated Pakistani subjects. Sometimes, the allele frequencies were
considered equal, according to the data of family or 10 alleles with equal frequency of 0.1
were assumed to make total sum equals to 1.0.
LCP: A linkage control program which takes .ped and .dat files as input files and
generates pedin batch file which is then executed and resulted in a file named as
Final.out.
FAM2PD PROGRAM: This program reads the Final.out file and gives us a readable file
of LOD score in notepad file format.
56
LOD Score Calculations by Easylinkage: Three macros were recorded for working with EasyLinkage GUI software package.
The details of recorded macros are as under:
Create_pro: This macro converts the Microsoft Excel raw family data into *.pro file that contains the
necessary information about the pedigree. This file contains five data columns containing
pedigree ID, individual ID, father ID, mother ID, sex, and disease status respectively.
Such *.pro file is used as input pedigree information file for EasyLinkage software.
Create_Abi_Singal_Marker: This macro converts the genotype data against a single STR marker to make marker
information file (*.abi).
Create_Abi_Multiple_Markers: This macro converts the genotype data against multiple STR markers to make multiple
marker information files (*.abi) accordingly.
EasyLinkage require two types of input files:
1. Pedigree information file [*.pro]
2. Marker information file(s) [*.abi]
These two files act as backbone for calculation of two point LOD score by using
SuperLink V1.5 and multipoint LOD scores by GeneHunter of Easy Linkage. LOD scores
were calculated as notepad file named as Results and in the form of graphs.
DNA SEQUENCING: The sequencing reactions were performed on an automated ABI PRISM® 3100 Genetic
Analyzer using Big Dye Terminator Chemistry (Heiner et al., 1998). The Genetic
Analyzer functions the same way for both sequencing and genescan analysis. It performs
electrophoretic separation and spectral detection of dye labeled DNA fragments. There
are four different dyes used to identify A, C, G, and T extension reactions.
Amplification of PCR Fragments: The fragment of interest was amplified in a PCR reaction as follows: PCR reactions were
performed with 75 ng of template DNA in 25 μl reaction mixture.

57
Table 2.6: Reaction Mixture for Amplification of PCR Fragments.
Ingredients Final Conc. Stock Required Volume
Genomic DNA 75 ng 25 ng/μl 3.0 μl
Primer Forward 0.24 pM 8.0 pM 0.5 μl
Reverse 0.24 pM 8.0 pM 0.5 μl
dNTPs (dATP,dTTP,dCTP, 200μM 1.25 mM 2.5 μl
PCR Buffer* 1x 10x 2.5 μl
Taq Polymerase 1-2 units 2 units/μl 1.25 μl
dH2O q.s to 25 μl
* 10X PCR buffer (100 mM Tris-Cl, pH 8.4, 500mM KCl, 15-20mM MgCl2 and 1% Triton)
Purification of PCR Product: 3 μl of the PCR product was analyzed on a 1.5% agarose gel to confirm the amplification and to check the purity of the PCR product before sequence analysis. The DNA was then treated to remove unincorporated nucleotides and oligonucleotides with a mixture containing exonuclease 1 and shrimp alkaline phosphatase (SAP).
Table 2.7: Reaction Mixture for EXO-SAP Treatment.
Ingredients Required Volume
Amplified DNA 20 μl
Shrimp alkaline phosphatase 0.2 μl
Exonuclease 1 0.2 μl
10X SAP Buffer 1.5 μl
dH2O q.s to 25 μl
Incubated at 37oC for 1 hr, followed by 80oC for 15 min to inactivate the enzymes and
lastly at 25°C for 30 min.
Sequencing Reaction: To the above 25 μl reaction, equal volume of dH2O was added to dilute the salt
concentration in the samples which otherwise could affect the sequencing results.
Sequencing PCR either with forward or reverse primer was performed using the
following reaction mixture. PCR program used for sequencing is shown in Fig. 2.6.

58
Table 2.8: Reaction Mixture for Sequencing Reaction.
Ingredients Required Volume
Diluted DNA template 6 μl
Big dye sequencing mix 1 μl
Primer (3.2 pM) 1 μl
5x sequencing buffer* 1 μl
dH2O q.s to 10 μl
5x sequencing buffer* (Tris HCl 400 mM-pH 8.7, MgCl2 10 mM)
Fig. 2.6: Thermocycling Profile for Sequencing Reaction.
Preparing a Product for Sequencing on ABI PRISM® 3100 Genetic Analyzer: Sequencing reaction was set up in 96 well MicroAmp PCR plate (ABI) and precipitated
using ethanol. 18.9 μl of 95% ethanol and 1.1 μl of dH2O was added to the 10 μl
sequencing reaction to make the final concentration of ethanol upto 60± 3%. Plate was
inverted a few times to mix after sealing with 3M Scotch® aluminum foil tape and was
kept at room temperature for 15 min to precipitate the extended products. The tray was
centrifuged at 3250 rpm for 30 minutes and adhesive tape was carefully removed and
supernatant was discarded by inverting the plate on a paper towel. 150 μl of 70% ethanol
was added to each well to rinse the pellet, and plate was again centrifuged at 3250 rpm for
20 min after covering with adhesive tape. Finally ethanol was discarded similarly as
above, pellets were air dried and dissolved in 13 μl of deionized Hi-DiTM Formamide
(ABI). Samples were denatured at 95°C for 5 min and quick chilled by placing in ice
before loading on the ABI PRISM® 3100 Genetic Analyzer.
Analysis of DNA Sequences: Data was analyzed using ABI Sequencing Analysis software (v. 3.4.1). After each run,
the samples were analyzed using the ABI PRISM sequencing analysis software version

59
3.7. Sequence was analyzed manually by using Chromas software version (v. 1.45). The
sequence was also blast against normal sequence by using either Nucleotide-nucleotide
BLAST (blastn) or BLAST 2 Sequences (2.2.10) on the NCBI web. BLAST (Basic Local
Alignments Search Tool), a family of search programs is designed to explore all the
available databases against a query protein or DNA sequence. The scores are assigned in
a BLAST search based on a statistical interpretation, thus differentiating real matches
from random background hits (Altschul et al., 1990).
'BLAST 2 Sequences', a new BLAST-based tool for aligning two protein or nucleotide
sequences, is used to compare only two sequences that are already known to be
homologous, unlike the standard BLAST program which is used to search for
homologous sequences in all the available nucleotide and protein databases, thus making
it less time-consuming (Tatusova and Madden, 1999). 'BLAST 2 Sequences' utilizes the
BLAST algorithm for pair wise DNA-DNA or protein-protein sequence comparison. A
World Wide Web version of the program can be used interactively at the NCBI website
(http://www.ncbi.nlm.nih.gov/blast/bl2seq/wblast2.cgi). The resulting alignments are
presented in both graphical and text form. Any change in the DNA sequence was
confirmed by sequencing both sense and antisense strands.

0
SECTION: 3
RESULTS

1
CHAPTER: I
LINKAGE ANALYSIS FOR REPORTED AUTOSOMAL RECESSIVE DEAFNESS
(DFNB) LOCI

60
PREFACE
Linkage analysis is the most common approach in family-based studies for mapping
disease causing genes (Morton and Nance, 2006), especially in case of genetically
heterogeneous populations this approach is extremely useful (Friedman and Griffith,
2003). Thirty autosomal recessive deafness loci (DFNB) and nineteen deafness genes
have been identified in Pakistani population through the use of linkage analysis of highly
inbred pedigrees. The first deafness modifier locus, DFNM1 was also mapped in a large
consanguineous Pakistani family (Riazuddin et al., 2000). Moreover it has been observed
that prevalence of different recessive deafness loci/genes are population specific. DFNB1,
DFNB2/USH1B, DFNB3, DFNB4/PDS, DFNB7/11, DFNB12/USH1D,
DFNB18/USH1C, DFNB21, DFNB23/USH1F, DFNB28, DFNB29, DFNB37, DFNB39,
DFNB48 and DFNB49 are the common cause of hearing impairment in Pakistani
population.
This approach is not only beneficial in mapping the disease phenotype to particular locus
but also helpful in hunting the disease gene by refinement of the linkage interval. This
will further enhance our understanding about the role of deafness genes and better insight
in the physiology of the hearing process.
As an initial effort to elucidate the molecular basis of hearing, fifty families with three or
more affected individuals were enrolled through schools for deaf children from different
cities of Punjab, Sindh, and Balochistan, out of them twenty five families were selected
for further studies. Secrening of these families for linkage to the known loci identified
eight families linked with reported loci including PKDF131 and PKDF1103 linked with
DFNB1/GJB2, PKSR14A linked with DFNB4/SLC26A4, PKDF339 and PKDF1088
linked with DFNB9/OTOF, PKDF315 and PKDF1092 linked with DFNB29/CLDN14,
and a digenic family PKDF1094 linked with DFNB1/GJB2 and DFNB4/PDS. Mutational
analysis of GJB2 in PKDF131, PKDF1103 and PKDF1094 revealed two reported variants
(p.W24X and p.W77X), PKSR14A harbor one reported (p.S90L) and one novel mutation
(IVS13+9 C>T) of SLC26A4. While mutational analysis of CLDN14 in PKDF315,
PKDF361, PKDF1092 and PKDF797, identified two novel (p.A94V and p.I86V+S87I)
and 2 reported (398delT and p.V85D) mutations respectively. Two-point LOD score was
calculated for each of the family by using SuperLink programme.

61
LINKAGE TO DFNB1/GJB2:
PKDF131: A large consanguineous pedigree enrolled from “Lahore” (Punjab) belongs to Punjabi
ethnic group. It is a five generation family with eighteen affected individuals (Fig.3.1A).
Congenital, severe to profound sensorineural hearing loss was segregating in affected
individuals in a recessive mode of inheritance. There was no evidence of any other
associated clinical problem like night blindness, balance problem, goiter, etc. which
indicates that the deafness segregating in the family is non-syndromic. Homozygosity
mapping of deafness segregating in PKDF131, revealed linkage with microsatellite
markers D13S175 and D13S1275 used for screening of DFNB1.
Nonsense Mutation (p.W24X) in GJB2 Causes Deafness: Sequence analysis of coding exon of GJB2 gene revealed homozygous transistion
mutation c.71G>A, which results in a premature stop codon at tryptophan 24 (p.W24X) in
affected individuals of PKDF131 (Fig.3.1C). p.W24X is positioned in first
transmembrane domain of connexin26 (Cx26).
PKDF1103: PKDF1103, a six generation consanguineous family with four affected individuals was
enrolled from Lodrahan (Fig. 3.2A). This family belongs to the caste “Rajput” and the
ethnic group “Punjabi”. Audiometric evaluations of the available affected individuals
showed bilateral profound hearing impairment. In the affected individuals of PKDF1103,
no other apparent extra auditory phenotypes were segregating with deafness. Haplotype
analysis showed linkage to DFNB1 markers on chromosome 13 (Fig. 3.2A).
Nonsense Mutation (p. W24X) in GJB2 Causes Deafness: DNA sequence analysis of coding exons of GJB2 in affected individuals uncovered a
homozygous substitution c.71G>A, leading to a premature stop codon at tryptophan 24
(p.W24X) in all the three affected individuals of this family (Fig. 3.2C).
PKDF1094: A consanguineous family, PKDF1094, of Jutt origin was ascertained from Wahari
(Multan). This family consists of nine affected individuals in three sibships (Fig. 3.3A).
Audiometric profile of affected individuals showed profound bilateral hearing loss.

62
Physical evaluation of affected individuals revealed the absence of any other anomaly co-
segregating along with hearing loss.
During linkage analysis, affected individual III:5, III:7, V:1, V:2 and V:3 were linked
with DFNB1 and IV:1, IV:7 and IV:9 showed linkage with DFNB4 (Fig. 3.3A). The
markers used for the linkage analysis of DFNB1 are D13S175 and D13S1275. While
D7S2420, D7S2459 (intragenic marker) and D7S2456 were used for linkage analysis of
DFNB4/PDS. These results showed that this large highly consanguinous family harbor
two genes GJB2 and SLC26A4. For lod score calculation the family was split into two
parts, Maximum two-point lod score of 3.13 was obtained for markers D13S175 for the
individuals linked with DFNB1.
Nonsense Mutation (p. W77X) in GJB2 Causes Deafness: DNA sequence analysis of coding exon of GJB2 in affected individuals III:5, III:7, V:1,
V:2 and V:3 uncovered a homozygous substitution (c.231G>A) leading to a premature
truncation of connexin26 at tryptophan 77 (p.W77X) (Fig. 3.3 C). This nonsense mutation
resides in the 2nd transmembrane domain of connexion 26.

63
Fig. 3.1: (A). Pedigree drawing of PKDF131 along with c.71G>A linked genotypes of GJB2 (+: wild type allele and -: mutant allele) (B-C). The sequence chromatograms of Exon2 of GJB2 showing homozygosity for the wild type and mutant allele (c.71G>A) respectively.

64
Fig. 3.2: (A). Pedigree drawing of PKDF1103 along with DFNB1 linked haplotype at chromosome 13q12. The linked haplotypes are boxed in yellow color in all generations. The STR markers and their relative positions in centimorgans (cM) are shown on the left side of the pedigree. (B-C). The sequence chromatograms of Exon2 of GJB2 showing homozygosity for the wild type and mutant allele (c.71G>A) respectively.

65
Fig. 3.3: (A). Pedigree drawing of PKDF1094 along with DFNB1 and DFNB4 linked haplotypes at chromosome 13 and chromosome 7 respectively. The DFNB1 linked haplotypes are boxed in yellow and DFNB4 in purple color. The STR markers and their relative positions in centimorgans (cM) according to the Marshfield map are shown. (B-C) The sequence chromatograms of Exon2 of GJB2 showing homozygosity for the wild type and mutant allele (c.231G>A) respectively.

66
LINKAGE TO DFNB4/SLC26A4:
PKSR14A: A large consanguineous family comprised of six affected individuals in two sibships
belongs to Faisalabad in Punjab Province of Pakistan but only four affected individuals
were avalible at the time of enrolment. Audiometric profiles of the affected individuals
revealed severe to profound level of hearing loss. Autozygosity mapping showed
statistically significant linkage to DFNB4 at chromosome 7q31 as all the affected
individuals were homozygous for markers D7S2420, D7S2459 and D7S2456 flanking
causative gene of DFNB4 (SLC26A4) (Fig. 3.4A). Zmax of 2.55 was observed for
D7S2459, D7S2420 at recombination fraction θ = 0.
IVS13+9C>T and p.S90L in SLC26A4 Causes Deafness: Mutational analysis of SLC26A4 in PKSR14A revealed two mutations, c.269C>T in
exon-3 which results in replacement of Serine with Leucine at position 90 (p.S90L) and a
novel splice site mutation IVS13+9C>T (Fig. 3.4 C, E). p.S90L is the third most frequent
mutation of SLC26A4 in Pakistan (Anwar et al., 2009).

67
Fig. 3.4: (A). Pedigree drawing of PKSR14A along with DFNB4 linked haplotype at chromosome 7q31. The linked haplotypes are boxed. The genetic linkage markers and their relative positions in centimorgans (cM) according to the Marshfield map are shown on the left side of the pedigree. (B-C). The sequence chromatograms of exon3 of SLC26A4 showing homozygosity for the wild type and mutant allele (c.269C>T). (D-E). The sequence chromatograms of exon13 of SLC26A4 showing homozygosity for the wild type and mutant allele (IVS13+9C>T).
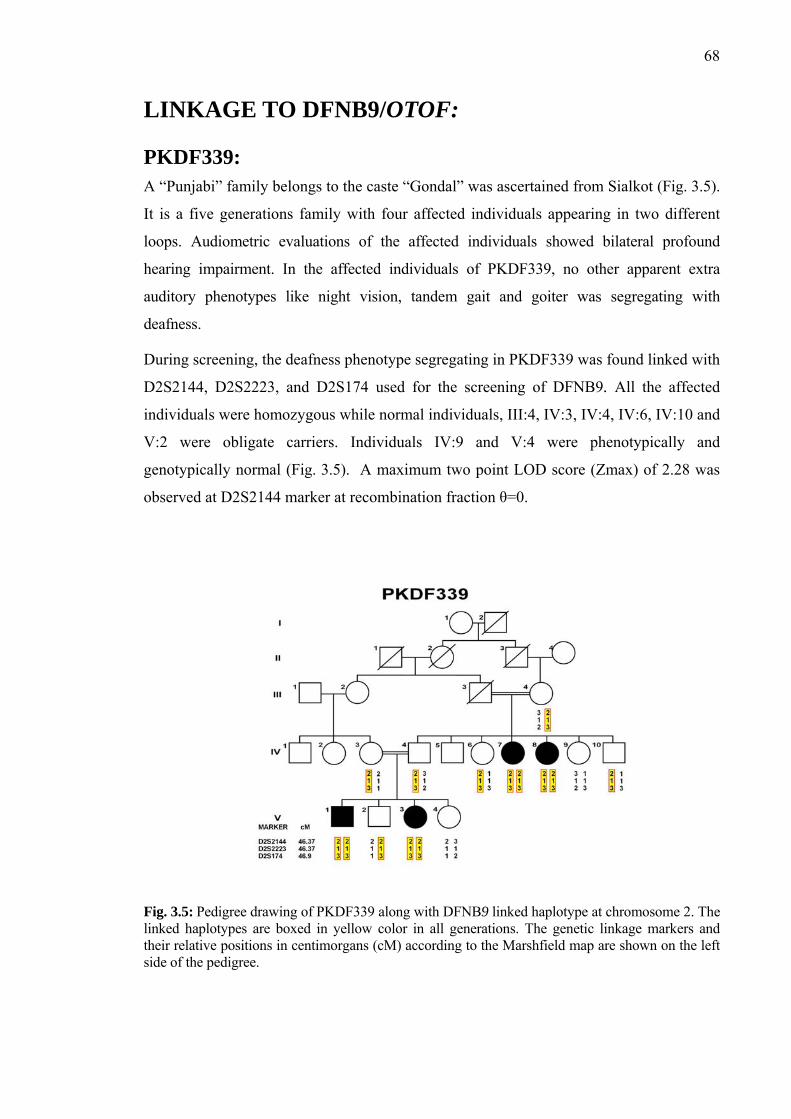
68
LINKAGE TO DFNB9/OTOF:
PKDF339: A “Punjabi” family belongs to the caste “Gondal” was ascertained from Sialkot (Fig. 3.5).
It is a five generations family with four affected individuals appearing in two different
loops. Audiometric evaluations of the affected individuals showed bilateral profound
hearing impairment. In the affected individuals of PKDF339, no other apparent extra
auditory phenotypes like night vision, tandem gait and goiter was segregating with
deafness.
During screening, the deafness phenotype segregating in PKDF339 was found linked with
D2S2144, D2S2223, and D2S174 used for the screening of DFNB9. All the affected
individuals were homozygous while normal individuals, III:4, IV:3, IV:4, IV:6, IV:10 and
V:2 were obligate carriers. Individuals IV:9 and V:4 were phenotypically and
genotypically normal (Fig. 3.5). A maximum two point LOD score (Zmax) of 2.28 was
observed at D2S2144 marker at recombination fraction θ=0.
Fig. 3.5: Pedigree drawing of PKDF339 along with DFNB9 linked haplotype at chromosome 2. The linked haplotypes are boxed in yellow color in all generations. The genetic linkage markers and their relative positions in centimorgans (cM) according to the Marshfield map are shown on the left side of the pedigree.

69
PKDF1088: Seven-generation family belonging to caste “Dhara” was enrolled from Bhukar. This
highly inbred family consists of thirteen affected individuals but only seven affected
individuals were available for research work (Fig. 3.6). All affected individuals showed
bilateral profound sensorineural hearing loss. There was no history of night blindness,
goiter, kidney problem, balance problem or any other clinical abnormalities segregating
with deafness in this pedigree.
During screening for reported DFNB loci, all affected individuals displayed
homozygosity for markers D2S2144, D2S2223, and D2S174 used for the screening of
DFNB9. Maximum two-point lod score of 2.56 was obtained at recombination fraction θ
= 0 for the marker D2S2144.

70
Fig. 3.6: Pedigree drawing of PKDF1088 along with DFNB9 linked haplotype at chromosome 2. The linked haplotypes are boxed in yellow color in all generations. The genetic linkage markers and their relative positions in centimorgans (cM) are shown on the left side of the pedigree. Black symbols represent affected individuals.

71
LINKAGE TO DFNB29/CLDN14:
PKDF315: This is a large consanguineous family of Punjabi ethnic group and belongs to the Lohaar
caste (Fig. 3.7A). This was ascertained from Sialkot. PKDF315 comprised of five hearing
impaired members in two sibships. Affected individuals displayed bilateral prelingual
profound hearing loss. There were no signs of night blindness, goiter, balance problems
or other clinical abnormalities co-segregating with deafness. Haplotype analysis
established linkage to DFNB29/CLDN14 (Fig. 3.7A). Maximum two-point lod scores of
1.93 at recombination fraction θ = 0 for microsatellite marker D21S2078 and D21S2080
was obtained.
Missense Mutation (p. A94V) in CLDN14 Causes Deafness: All the affected individuals of PKDF315 were homozygous and obligate carriers were
heterozygous for a novel transistion mutation, c.281C>T (p. A94V) in exon 3 of CLDN14
(Fig. 3.7 B-D). The transition of C to T at position 281 results in substitution of alanine
with valine at position 94 (p.A94V). This change is localized in the second
transmembrane domain of CLDN14 (Fig. 3.11). Alanine 94 is not only conserved among
different orthologs (Fig. 3.7E) but also conserved among 10 of the 21 claudins, while the
remaining 11 claudins have glycine at this position. p. A94V is not detected in 96 DNA
samples from geographically matched normal hearing individuals.
PKDF361: PKDF361 is a large “Talka Lakhi” family that was ascertained from Shikarpur. This
family had six affected individuals in three-loops, while spouse I:1 was said to be a
distantly related cousin (Fig. 3.8A). This family was previously linked with
DFNB29/CLDN14. For mutational analysis DNA samples were provided from CEMB
DNA bank.
Missense Mutations (p.I86V+S87I) in CLDN14 Causes Deafness: The deafness phenotype of PKDF361 cosegregate with novel mutation involving
homozygous substitution of three bases c.256A>G, 259T>A and 260C>T (Fig. 3.8C).
This was further confirmed by sequencing CLDN14 in all family members of PKDF361
and by sequencing 96 DNA samples from geographically matched normal hearing
individuals. These three point mutations resulted in replacement of Isoleucine86 with

72
Valine and Serine 87 with Isoleucine. The affected residues I86 and S87 are in the second
transmembrane domain and are conserved in different orthologs (Fig. 3.8E).

73
Fig. 3.7: (A). Pedigree drawing of PKDF315 along with DFNB29 linked haplotype at chromosome 21. The linked haplotypes are boxed. The STR markers and their relative positions in centimorgans (cM) are shown on the left side of the pedigree. (B-D). The sequence chromatograms of Exon3 of CLDN14 showing homozygosity for the wild type, mutant allele (c.281C>T) and carrier of family PKDF315. (E).Multiple sequence alignment of CLDN14 showing conservation of p.A94.

74
Fig. 3.8: (A). Pedigree drawing of PKDF361 along with (c.256A>G, c.259T>A and c.260C>T) linked genotypes of CLDN14 (+: wild type allele and -: mutant allele) (B-D). Chromatograms of CLDN14 (Exon 3) illustrating homozygosity for the wild type, mutant (c.256A>G, c.259T>A and c.260C>T) and carrier of PKDF361. (E). Multiple sequence alignment of CLDN14 showing conservation of p.I86V+S87I.
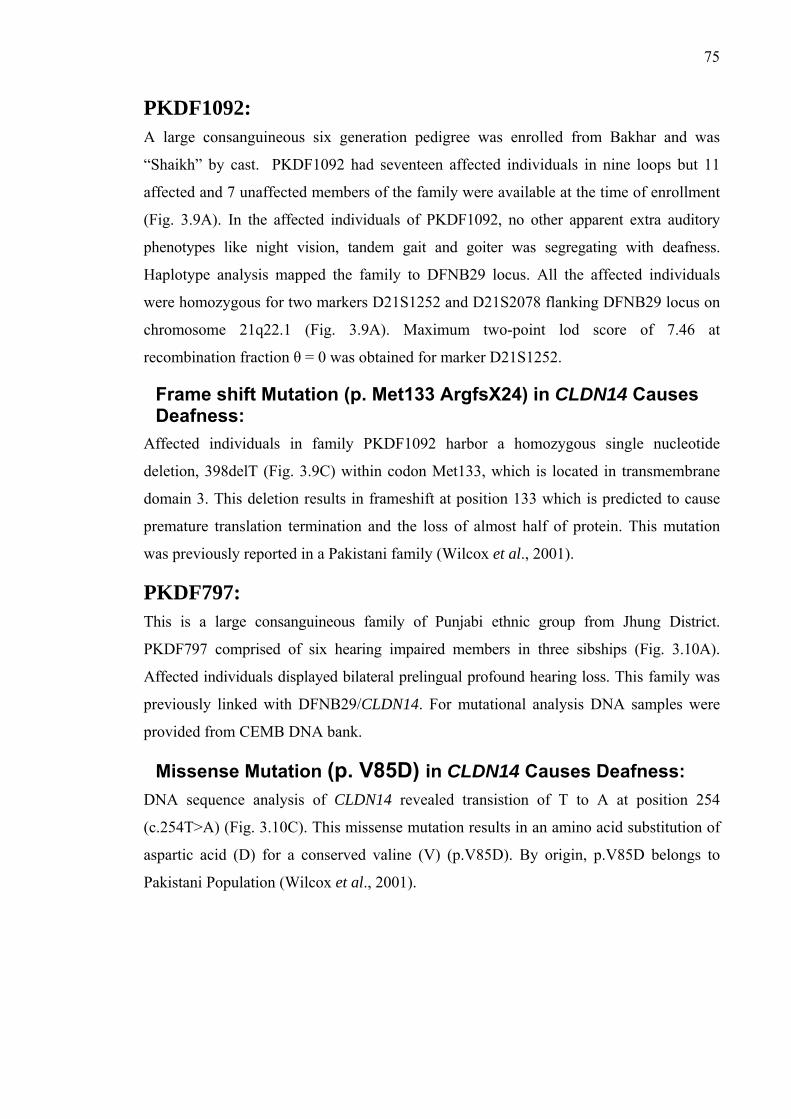
75
PKDF1092: A large consanguineous six generation pedigree was enrolled from Bakhar and was
“Shaikh” by cast. PKDF1092 had seventeen affected individuals in nine loops but 11
affected and 7 unaffected members of the family were available at the time of enrollment
(Fig. 3.9A). In the affected individuals of PKDF1092, no other apparent extra auditory
phenotypes like night vision, tandem gait and goiter was segregating with deafness.
Haplotype analysis mapped the family to DFNB29 locus. All the affected individuals
were homozygous for two markers D21S1252 and D21S2078 flanking DFNB29 locus on
chromosome 21q22.1 (Fig. 3.9A). Maximum two-point lod score of 7.46 at
recombination fraction θ = 0 was obtained for marker D21S1252.
Frame shift Mutation (p. Met133 ArgfsX24) in CLDN14 Causes Deafness:
Affected individuals in family PKDF1092 harbor a homozygous single nucleotide
deletion, 398delT (Fig. 3.9C) within codon Met133, which is located in transmembrane
domain 3. This deletion results in frameshift at position 133 which is predicted to cause
premature translation termination and the loss of almost half of protein. This mutation
was previously reported in a Pakistani family (Wilcox et al., 2001).
PKDF797: This is a large consanguineous family of Punjabi ethnic group from Jhung District.
PKDF797 comprised of six hearing impaired members in three sibships (Fig. 3.10A).
Affected individuals displayed bilateral prelingual profound hearing loss. This family was
previously linked with DFNB29/CLDN14. For mutational analysis DNA samples were
provided from CEMB DNA bank.
Missense Mutation (p. V85D) in CLDN14 Causes Deafness: DNA sequence analysis of CLDN14 revealed transistion of T to A at position 254
(c.254T>A) (Fig. 3.10C). This missense mutation results in an amino acid substitution of
aspartic acid (D) for a conserved valine (V) (p.V85D). By origin, p.V85D belongs to
Pakistani Population (Wilcox et al., 2001).

76
Fig. 3.9: (A). Pedigree drawing of PKDF1092 along with DFNB29 linked haplotype at chromosome 21. The linked haplotypes are boxed in yellow color. The genetic linkage markers and their relative positions in centimorgans (cM) are shown on the left side of the pedigree. (B-C). The sequence chromatograms of Exon3 of CLDN14 showing homozygosity for the wild type and mutant allele (c.398delT).

77
Fig. 3.10: (A). Pedigree drawing of PKDF797 linked with DFNB29. (B). The sequence chromatograms of Exon3 of CLDN14 showing homozygosity for the wild type and mutant allele (c.254T>A).
Fig. 3.11: Mapping of pathogenic variants detected in this study in Pakistani population on transmembrane topological structure of CLDN14. Novel mutations are indicted in blue circles while red circle represent previously reported mutation.

78
HAPLOTYPE ANALYSIS OF RECURRENT MUTATIONS OF CLDN14: p.V85D and p.A94V are the recurrent mutations of CLDN14 in Pakistani population.
Among thirteen DFNB29 linked families nine families have p.V85D mutation indicating
that this mutation is the most common mutation of CLDN14. In order to identify the origin
of the recurrent mutations of DFNB29, disease associated haplotypes across the CLDN14
gene at chromosome 21q22.1 were determined by typing three microsatellite markers.
Two affected individuals from each family were amplified for these three STR markers
and were genotyped simultaneously by loading on the ABI PRISM® Genetic Analyzer
3100 to find the exact alleles and haplotypes of the families linked to CLDN14/DFNB29.
The segregation of p.V85D on same haplotypes in six out of eight families suggested that
either it is because of common founder (Table 3.1). The occurrence of p.A94V on distinct
but common haplotypes supports the opinion of common founder. CLDN14 mutations
account for 1.73% (13 of 750) of deafness in the NCEMB Pakistani families segregating
recessive deafness.
Table 3.1: Correlation of Haplotype with Mutations in DFNB29 linked Families.
Screening markers for CLDN14/DFNB29
PKDF
D21S2078 D21S1252 D21S2080
MUTATION
PKDF048 152 244 174 p.V85D
PKDF050 152 244 174 p.V85D
PKDF108 152 244 174 p.V85D
PKDF242 152 244 174 p.V85D PKDF307 152 244 174 p.V85D
PKDF704 152 244 174 p.V85D
PKDF797 152 244 174 p.V85D
PKDF505 156 244 164 p.V85D
PKDF001 152 242 166 p.V85D
PKDF1092 154 246 166 c.398delT
PKDF315 154 228 172 p.A94V
PKDF488 154 228 172 p.A94V
PKDF361 156 246 166 p.I86V&S87I
79
CHAPTER: II
MAPPING OF A NEW AUTOSOMAL
RECESSIVE NONSYNDROMIC DEAFNESS
LOCUS DFNB88 AT CHROMOSOME 2p11.2

79
PREFACE
Hereditary hearing impairment exhibits enormous genetic heterogeneity which is not
amazing due to involvement of approximately 1% of human protein coding genes in
hearing (Friedman and Griffith 2003). Presently, 88 autosomal recessive deafness loci
(DFNB) have been mapped and 29 of the corresponding genes have been identified (Van
Camp G, Smith RJH. Hereditary Hearing Loss Homepage.
http://www.uia.ac.be/dnalab/hhh) but still a large repertoire of human genes associated
with hearing impairment remains to be mapped and these genes can be useful to depict
the molecular mechanisms of hearing impairment. Genetic heterogeneity of deafness is
the major obstacle in mapping the disease gene (Morton and Nance, 2006), which can be
circumvented by using large consanguineous families, in which there is likely to be single
genetic factor responsible for deafness (Yan and Liu, 2008). Homozygosity mapping
involves searching for genetic markers identical by descent (IBD) in affected members of
population isolates or large consanguineous families (Friedman et al., 1995). This
strategy has been used to map deafness genes inherited as a recessive trait (Petersen and
Willems, 2006). As a consequence of the unique socio-cultural practices in the Pakistani
population, approximately 60% of marriages are consanguineous, of which more than
80% are between first cousins (Hussain and Bittles, 1998). Consanguineous families have
already contributed significantly to the identification of mutated genes associated with
hearing loss (Friedman and Griffith 2003). This extreme nature of intermarriages in
Pakistani population provides an excellent genetic source to explore the molecular and
genetic basis of inherited disorders like hearing impairment by identification of novel
deafness loci/genes.
Hitherto, 31 autosomal recessive linkages on different chromosomes have been mapped
using the genetic resources of Pakistani population; DFNB8, DFNB16, DFNB20,
DFNB23, DFNB24, DFNB26, DFNB29, DFNB35, DFNB36, DFNB37, DFNB38,
DFNB39, DFNB42, DFNB44, DFNB45, DFNB46, DFNB47, DFNB48, DFNB49,
DFNB51, DFNB55, DFNB62, DFNB63, DFNB65, DFNB67, DFNB68, DFNB71,
DFNB72, DFNB73 and DFNB74 (Veske et al., 1996; Campbell et al., 1997; Moynihan
et al., 1999; Ahmed et al., 2003b; Khan et al., 2007; Riazuddin et al., 2000; Wilcox et al.,
2001; Ansar et al., 2003a; Naz et al., 2004; Ahmed et al., 2003a; Ansar et al., 2003b;
Wajid et al., 2003; Aslam et al., 2005; Ansar et al., 2004; Bhatti et al., 2008; Mir et al.,
2005; Hassan, et al., 2005; Ahmad et al., 2005; Ramzan et al., 2005; Shaikh et al., 2005;

80
Irshad, et al., 2005; Ali et al., 2006; Tariq, et al., 2006; Khan et al., 2007b; Shabbir et al.,
2006; Santos et al., 2006; Chishti et al., 2009 ; Ain et al., 2007; Riazuddin et al.,2009
and Waryah et al.,2009 ). Many other issues regarding genotype phenotype correlation in
nonsyndromic loci and overlapping usher loci, and an intricate range of mutations in
many deafness genes segregating in genetically diverse Pakistani population has further
enhanced our understanding about the role of deafness genes and better insight in the
pathophysiology of the hearing process.
Large consanguineous families segregating hearing loss were enrolled in order to map
new loci/genes. These families underwent linkage analysis to screen reported deafness
loci. Ultimately genome-wide scans of four unlinked families were performed to map
new loci/genes responsible for hearing loss. Further efforts were made to narrow down
the critical linkage interval by genotyping closely spaced STR markers in linked family or
by searching additional families linked to newly mapped locus.
PKDF468: A multigeneration family segregating autosomal recessive non-syndromic hearing was
recruited from Kila Didar Singh (Punjab). It is a consanguineous pedigree with four
affected individuals in two sibships. The affected individuals (V:4, V:5, V:6 and V:11)
appeared in the 5th generation (Fig. 3.14). Multiple family members were interviewed to
clear relations of consanguineous marriages and for pedigree drawing.
Clinical Evaluation:
Clinical histories were obtained from participating family members to rule out obvious
environmental causes of hearing loss and physical evaluations were undertaken to verify
that deafness was non-syndromic. Pure tone audiometry for air and bone conduction were
performed at frequencies ranging from 250 to 8,000 Hz. Regardless of age, affected
individuals in family PKDF468 displayed congenital, bilateral, and severe to profound,
sensorineural hearing loss (Fig. 3.15).
Linkage Analysis for Reported Loci:
Genomic DNA was isolated from peripheral venous blood samples of fifteen participating
indiviuals by a standard protocol (materials and methods). Linkage analyses to known
loci was performed by genotyping at least three microsatellite markers for each of the
reported deafness loci (Table 2.3). The deafness phenotype segregating in family

81
PKDF468 was not observed to be linked with any of reported DFNB loci (Hereditary
Hearing Loss Homepage). LOD scores were calculated in order to statistically evaluate
the data, however, no significance was observed for any of the known loci.
Genome-wide Linkage Analysis for Mapping New Locus:
For genome-wide scan, eight individuals (IV:2, IV:3, V:4, V:5, V:6 V:7, V:11 and V:12)
including four normal and four affected members (Fig. 3.14) were selected. The genome-
wide scan was performed using 388 fluorescent dye-labeled microsatellite markers from
ABI Prism Linkage Mapping Set, Version 2.5 (Applied Biosystems) that are spaced at an
average of 10cM across the human genome (Fig. 3.12). As pedigree shows autosomal
recessive inheritance, only autosomal markers were included in the study. The intervals in
which a single informative marker is homozygous in affected individuals and
heterozygous in normal individuals, the entire family is retyped adding additional normal
individuals to confirm or exclude the linkage. Also additional available markers were
typed to confirm the linkage or no linkage. Once the linkage has been observed, proximal
and distal boundaries were acknowledged by genotyping all family members and all
available markers in that particular region. Efforts were made to collect additional
samples in order to refine the linkage interval.

82
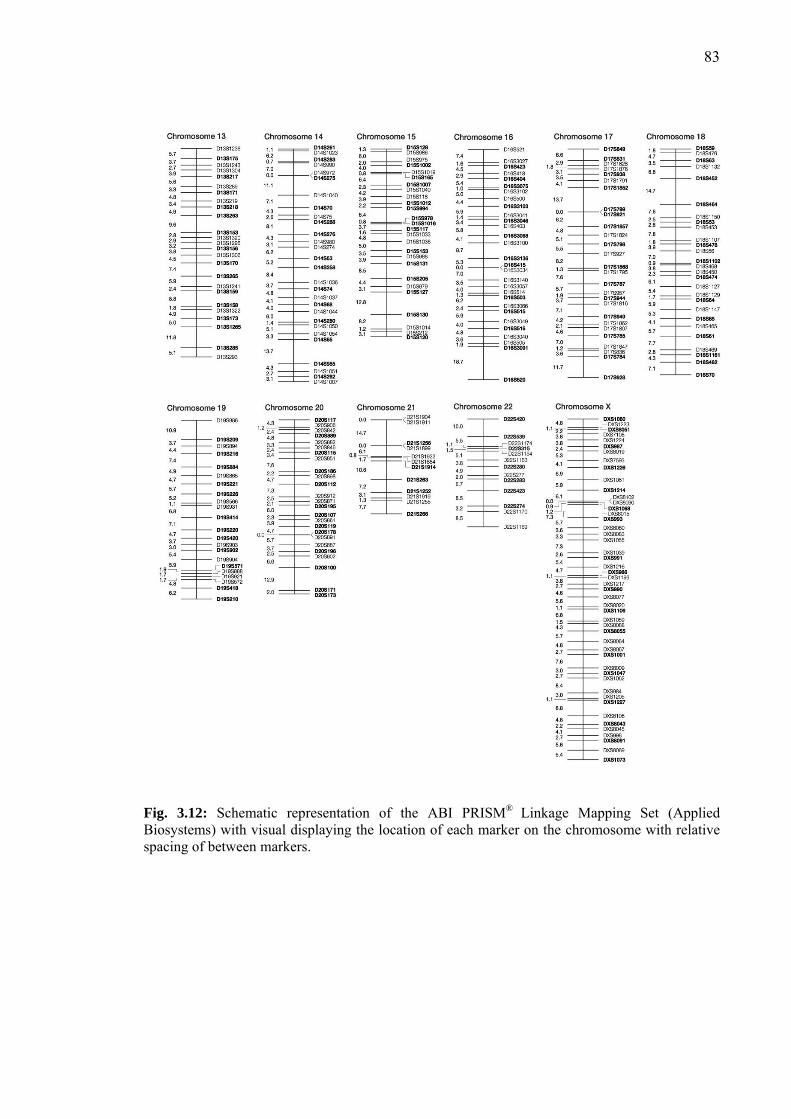
83
Fig. 3.12: Schematic representation of the ABI PRISM® Linkage Mapping Set (Applied Biosystems) with visual displaying the location of each marker on the chromosome with relative spacing of between markers.

84
LOD Score Calculations:
Two-point parametric linkage analysis of whole genome-wide markers were performed
by the SuperLink v1.4 programs of easyLINKAGE Plus v5.00 program package (Lindner
and Hoffmann, 2005). A fully penetrant recessive model with no phenocopies and a
disease allele frequency of 0.001 was assumed. Microsatellite markers positions and map
distances were derived from the Marshfield genetic map
(http://www.research.marshfieldclinic.org/). Meiotic recombination frequencies were
considered to be equal for males and females. Two-point linkage analysis of genome-
wide scan revealed significant lod score at chromosome 2, 5 and 9 (Fig. 3.13). A
maximum two-point lod score of 3.16 at recombination fraction θ = 0 was obtained for
PKDF468 at marker D2S2333 (103.17 cM). Genotyping of additional closely spaced
microsatellite markers in this family confirmed linkage at chromosome 2 and exclude the
other chromosomal positions.
Haplotype Analysis of PKDF468:
PKDF468 showed initial evidence of linkage to chromosome 2p11.2. Genotyping of
closely spaced STR markers and haplotype analysis revealed linkage interval of 4.3 cM
(0.9 Mb) delimited by markers D2S1387 (103.16 cM, 84.93 Mb) and D2S2232 (107.46
cM, 85.84 Mb). Affected individual V: 6 defined the centromeric breakpoint at
microsatellite marker D2S1387 (103.16 cM, 84.93 Mb). The telomeric boundary was
determined by recombination event at D2S2232 (107.46 cM, 85.84 Mb) in affected
individual V: 11 (Fig. 3.14). The two unaffected individuals (V:2 and V:9) are also
homozygous for at risk haplotype thus are non penetrant (Riazuddin et al., 2000).
Two point Lod Score (Zmax) was calculated for complete family of PKDF468 excluding
two non penetrant individuals. This revealed a maximum Lod Score of 2.64 at
recombination fraction θ = 0 for the marker D2S2333 (103.16cM) (Table 3.2). The
Human Genome Organization (HUGO) (http://www.gene.ucl.ac.uk/hugo) Nomenclature
Committee (HGNC) assigned DFNB88 as the designation for this locus for non-
syndromic autosomal recessive deafness.

85
Fig. 3.13: Two-point parametric linkage analysis of whole genome-wide markers of PKDF468. Black circles represents highest multipoint lod scores obtained for microsatellite markers at chromosome 2, 5 and 9 respectively. Genotyping of additional dense mapped STR markers excluded linkage at chromosome 5 and 9 and revealed a novel locus DFNB88 at chromosome 2.

86
Fig. 3.14: Chromosome 2 markers co-segregating with deafness in family PKDF468 define DFNB88. Haplotypes showing a ~4.3 cM region of homozygosity flanked by markers D2S1387 (103.16 cM) and D2S2232 (107.46 cM). The diseased haplotypes are boxed.
Table 3.2: Two-point LOD scores for family PKDF468.
Recombination
Fraction θ = 0
Markers Marshfield Map Position
(cM)
PKDF468
D2S329 101.02 -inf
D2S2180 102.62 -inf
D2S289 103.16 -inf
D2S2162 103.16 -inf
D2S440 103.16 -inf
D2S1387 103.16 -inf
D2S2333 103.16 2.64
D2S2232 107.46 0.21
D2S388 107.46 0.21
D2S2216 111.21 0.19

87
Fig. 3.15: Pure tone air and bone conduction audiograms (right and left ear) of two affected and two normal individuals of PKDF468. The hearing profile of affected individuals displayed severe to profound hearing loss. “O”, “X”,” >” and “<” symbols correspond to the right and left ear, respectively.

88
FURTHER EVIDENCE OF DFNB88 LINKAGE:
Five hundred consanguineous families segregating profound, bilateral, congenital deafness
were screened for evidence of linkage to chromosome 2p11.2 to further confirm the linkage
region. This exhaustive search was supported by CEMB DNA bank, which has a large
reservoir of DNA families from the four provinces of Pakistan collected by continual efforts
of more than 10 years and had been maintained in the CEMB DNA repository. During this
extensive search, one additional family PKSR11b was found linked to this region.
PKSR11b:
This family PKSR11b was enrolled from Faisalabad (Punjab). This consanguineous family
belongs to the Syed caste and Punjabi ethnic group. All affected individuals appeared in the
fifth generation (V:1, V:2 and V:3) (Fig. 3.16). All affected individuals of this pedigree had
congenital, bilateral, profound, sensorineural hearing loss while unaffected individuals
showed normal auditory phenotype, regardless of age. Vestibular function was normal in
affected individuals and there was no extra-auditory phenotype present in the family.
Haplotype Analysis of PKSR11b:
During screening, the family PKSR11b showed linkage with DFNB88. After initial
evedience of linkage additional STR markers were typed to define boundaries. As a result of
haplotype analysis the disease causing gene of PKSR11b was localized to a region of
approximately 50cM distal to D2S2259 (64.29 cM) (2p21) and proximal to D2S2264 (114.42
cM) (2q11.2). The proximal recombination was defined by all of the affected individuals and
distal breakpoint was refined by V:1 (Fig. 3.16).
A maximum two-point lod score Zmax of 1.73 was obtained for the markers D2S337
(80.69cM) at recombination fraction θ = 0 (Table 3.3).

89
Fig. 3.16: Pedigree drawing of family PKSR11b linked to chromosome2p21-2q11.2 markers. The ‘at risk’ haplotypes are boxed in different generations. Haplotypes showing a region of homozygosity flanked by D2S2259 (64.29cM) and D2S2264 (114.42cM).
Table 3.3: Two-point lod scores for family PKSR11B.
Recombination Fraction θ = 0
Markers Marshfield Map Position
(cM)
PKSR11B
D2S165 47.13 -2.07
D2S352 50.65 -2.19
D2S2259 64.29 -1.97
D2S391 70.31 0.90
D2S337 80.69 1.73
D2S2333 103.16 0.68
D2S2232 107.46 0.91
D2S388 107.46 1.71
D2S2264 114.42 -3.24
D2S293 118.16 -3.10
D2S160 122.96 -3.55

90
REFINED LINKAGE INTERVAL OF DFNB88:
Recombination analysis of PKDF468 and PKSR11b refined the linkage interval of DFNB88 to
4.3 cM (0.9 Mb) delimited by D2S1387 (103.2cM) and D2S2232 (107.5cM) (Fig. 3.17).
According to UCSC genome browser the refined linkage interval spans 0.9 Mb region and
consists of ~24 annotated genes (Table 3.4).
Fig. 3.17: DFNB88 linkage interval of hearing loss on human chromosome 2p11.2. STR markers are represented by filled circles along with sex averaged recombination distances in cM and physical distances in Mb. Candidate genes in this interval are listed. The genetic distances are from the Marshfield genetic map while Mb positions of markers and genes are from the May 2006 NCBI build 36 at hhtp://www.genome.cse.ucsc.edu/cgi-bin/hgGateway.

91
CANDIDATE GENES IN THE DFNB88 REGION:
Candidate genes in the DFNB88 interval on chromosome 2p11.2 were sort out using UCSC
Genome Bioinformatics web browser (UCSC Genome Bioinformatics: http//:
www.genome.ucsc.edu/), NCBI, and Ensembl databases (Fig. 3.18). The overlapping region
of DFNB88 with DFNA43 is only 0.4 Mb (Fig. 3.17), having four candidate genes KCMF1,
TCF7L1, TMSB10 and LOC129293. Since allelic variants of many genes are reported as
cause of autosomal recessive as well as dominant deafness so, on the hypothesis that
DFNA43 and DFNB88 are allelic variants of the same gene, these four candidate genes were
selected for sequencing. Mutational analysis of the coding exons, along with splice site of
these genes did not reveal any pathogenic mutation.
Fig. 3.18:
Candidate genes in the refined linkage interval of DFNB88. Approximately 24 candidate genes are presnt in the refined linkage interval of DFNB88 identified by UCSC genome browser (MARCH 2006 Assembly).

92
Table 3.4: The DFNB88 Potential candidate genes along with their Functions.
Genes Putative Functions TMSB10 This protein plays an important role in the organization of the
cytoskeleton and inhibits actin polymerization. It is located in
Cytoplasm and cytoskeleton and belongs to the thymosin beta
family.
KCMF1 It belongs to the KCMF1 family and has intrinsic E3 ubiquitin
ligase activity and promotes ubiquitination. The encoded protein is
expressed in Spleen, small intestine, ovary, peripheral blood, lung,
kidney, pancreas, thymus, prostate, testis, colon, heart, brain and
liver.
TCF7L1 This protein belongs to the TCF/LEF family and participates in the
Wnt signaling pathway. Binds to DNA and acts as a repressor in the
absence of CTNNB1, and as an activator in its presence. Necessary
for the terminal differentiation of epidermal cells, the formation of
keratohyalin granules and the development of the barrier function
of the epidermis.
CAPG It belongs to the villin/gelsolin family. This is a Calcium-sensitive
protein which reversibly blocks the barbed ends of actin filaments.
May play an important role in macrophage function and in
regulating cytoplasmic and/or nuclear structures through potential
interactions with actin.
MAT2A Homo sapiens cDNA FLJ78446 complete cds, highly similar to
Homo sapiens methionine adenosyltransferase II, alpha (MAT2A).
It has expression in mouse inner ear (Peters et al., 2007).
GGCX It belongs to the vitamin K-dependent gamma-carboxylase family.
This protein mediates the vitamin K-dependent carboxylation of
glutamate residues to calcium binding gamma-carboxyglutamate
(Gla) residues with the concomitant conversion of the reduced
hydroquinone form of vitamin K to vitamin K epoxide.

93
Defects in GGCX are reported as a cause of combined deficiency
of vitamin K-dependent clotting factors 1 (VKCFD1)
[MIM:277450] and also cause PXE-like disorder with multiple
coagulation factor deficiency [MIM:610842]. GGCX is an
interesting candidate on the basis of its expression in mouse inner
ear (Peters et al., 2007).
VAMP8 This protein belongs to the synaptobrevin family. It involved in the
targeting and/or fusion of transport vesicles to their target
membrane, dense-granule secretion in platelets, abscission of the
midbody during cell division, homotypic fusion of early and late
endosomes and also plays a role in regulated enzyme secretion in
pancreatic acinar cells (By similarity). It is also considered as
potential candidate on the basis of its expression in mouse inner ear
(Peters et al., 2007).
VAMP5 It belongs to the synaptobrevin family and contains 1 v-SNARE
coiled-coil homology domain. This protein may participate in
trafficking events that are associated with myogenesis, such as
myoblast fusion and/or GLUT4 trafficking. It protein also
expressed in mouse inner ear (Peters et al., 2007).
RNF181 This protein belongs to the RNF181 family, contains 1 RING-type
zinc finger. E3 ubiquitin-protein ligase which accepts ubiquitin
from an E2 ubiquitin-conjugating enzyme in the form of a thioester
and then directly transfers the ubiquitin to targeted substrates. This
protein considered as potential candidate on the basis of its
expression in mouse inner ear (Peters et al., 2007).
SFTPB This protein contains 1 saposin A-type domain and
3 saposin B-type domains. Its allelic variants are genetic basis of
pulmonary surfactant metabolism dysfunction type 1 (SMDP1)
[MIM:265120]; also called pulmonary alveolar proteinosis due to
surfactant protein B deficiency.

94
SECTION: 4
DISCUSSION

94
DISCUSSION
Deafness, the inability to hear, is a common neurosensory disorder manifested by genetic as
well as environmental causes (McKusick, 1992). It is estimated that approximately 1/1000
children suffer from severe or profound hearing loss at birth or during childhood, at pre-
lingual stage and one half of these cases have genetic manifestations (Kochhar et al., 2007).
Nonsyndromic autosomal recessive deafness is usually clinically homogeneous and is
nonprogressive in nature (Van Camp et al., 1997). Tremendous progress has been made in
identifying genes involved in deafness since 1994 when research on causative deafness genes
began to bear fruit (Guilford et al., 1994a). Recessively inherited disorders are more
prevalent in endogamous populations (Jaber et al., 1998). So far, 88 recessive deafness loci
(DFNB) have been reported and 30 of the corresponding nuclear genes have been cloned
(Van Camp & Smith, www.uia.ac.be/dnalab/hhh; Yan and Liu, 2008). Pakistani families
helped in the identification of following disease causing genes; GJB2-DFNB1, TMIE-
DFNB6, TMC1- DFNB7/11, TMPRSS3-DFNB8/10, CDH23-DFNB12, USH1C-DFNB18,
PCDH15-DFNB23, CLDN14-DFNB29, ESRRB-DFNB35, ESPN-DFNB36, MYO6-
DFNB37, RDX-DFNB24, TRIOBP-DFNB28, MARVELD2-DFNB49, TMHS-DFNB66/67
and BSND-DFNB73 (Naz et al., 2002; Kurima et al., 2002; Bork et al., 2001; Ahmed et al.,
2002; Ahmed et al., 2003b; Wilcox et al., 2001; Collin et al., 2008, Naz et al., 2004; Ahmed
et al., 2003a; Khan et al., 2007a; Riazuddin et al., 2006a; Riazuddin et al., 2006b; Shabbir et
al., 2006, Riazuddin et al., 2009). These results suggest that Pakistani population offers a
useful genetic resource material to identify and characterize a large number of deafness genes
critical to understand disease phenotypes.
This study was designed to characterize the genetic basis of hereditary hearing impairment in
Pakistani population. Fifty families having three or more deaf individuals were ascertained
from different provinces/cities of Pakistan. Twenty five of these consanguineous families
were subjected to linkage studies using highly polymorphic microsatellite markers for
reported recessive (DFNB) loci and eight families were linked with following reported loci:
DFNB1/GJB2, DFNB4/SLC26A4, DFNB9/OTOF and DFNB29/CLDN14.

95
DFNB1 is the first reported autosomal recessive non-syndromic deafness locus at
chromosome 13q11 (Guilford et al., 1994a). The disease-causing gene of DFNB1 is GJB2
(Kelsell et al., 1997), which encodes gap junction’s protein connexin 26 (Cx26). Gap
Junctions play important role in recycling of K+ ions necessary for mechanosensory
transduction (Yan and Liu, 2008). DFNB1 is a major contributor (30-50%) of autosomal
recessive non-syndromic deafness in various populations (Denoyelle et al., 1999;
Najamabadi et al., 2005; Petersen and Willems, 2006). Sequence analysis of GJB2, in
affected individuals of PKDF131 and PKDF1103 revealed transition of G to A at position 71
(c.71G>A) leading to truncation of protein at position 24 (p.W24X). W24 is present in first
transmembrane (TM1) domain of Cx26. This mutation was first reported in Pakistani family
(Kelsell et al., 1997) and is most common mutation in Indo-Pakistan subcontinent
(Maheshwari et al., 2003; Ramshankar et al., 2003; Santos et al., 2005). p.W24X is the most
frequent cause of DFNB1 deafness in Pakistan (51%) and is more prevalent in Urdu speaking
ethnic group (Unpublished Lab data).
PKDF1094 is a digenic family with deafness phenotype linked to two different genes
DFNB1/GJB2 in two loops of the family (shown in yellow color in Fig. 3.3A ) and
DFNB4/SLC26A4 in other two sibships (shown in purple color in Fig. 3.3A ) Digenic
inheritance is not a common phenomenon. This family is an example of genetic
heterogeneity in deafness. Sequence analysis of GJB2 revealed a nonsense mutation
(c.231G>A), which results in a premature stop codon at tryptophan 77 (p.W77X). This
mutation was first reported in Pakistani family (Kelsell et al., 1997) and is common mutation
in Indian subcontinent (Maheshwari et al., 2003; Santos et al., 2005). This mutation is
second most frequent GJB2 variant and is more prevalent in Punjabi ethnic group than in
other ethnic groups in Pakistan (Unpublished Lab data).
During homozygosity mapping, PKSR14A was found linked to DFNB4/SLC26A4, the
leading cause of genetic deafness in Pakistani population (~7.2%) (Anwar et al., 2009).
Pendred Syndrome (PDS) is an autosomal recessive phenotype characterized by co-existence
of sensorineural hearing loss and goiter and accounts for approximately 10% of all hereditary
hearing loss (Reardon et al., 1999; Cremer et al., 1998). In this family deafness is non
syndromic (DFNB4). The affected individuals of PKSR14A harbor third most frequent
mutation p.S90L positioned in amino terminal loop of pendrin (Anwar et al., 2009) and a

96
novel splice site mutation IVS13+9C>T. Functional characterization of these two variants
will identify either the disease phenotype of this family is the result of additive effect of these
two variants or one of these is just a rare polymorphism.
During screening deafness phenotype of the two families PKDF339 and PKDF1088 was
found linked with DFNB9, an autosomal recessive non syndromic deafness locus has been
mapped to chromosome 2p22-23 in a consanguineous Lebanon family (Chaib et al., 1996a).
OTOF, the causative gene of DFNB9 has been identified through candidate gene approach
(Yasunaga et al., 1999). The expression pattern of otoferlin in the mouse sensory hair cells is
evident with its role in synaptic vesicles. DFNB9 is a significant contributor of deafness in
Pakistan with an estimated prevalence of 2.3% which is not significantly different from other
populations (Varga et al., 2006; Rodrıguez-Ballesteros et al., 2008).
LINKAGE TO DFNB29/CLDN14:
DFNB29 an autosomal recessive non syndromic deafness locus was mapped to chromosome
21q22.1 in two inbred Pakistani kindred and allelic variants of CLDN14, are the genetic basis
of DFNB29 linked deafness (Wilcox et al., 2001). The phenotype of CLDN14–null mice is
similar to the human phenotype having profound hearing loss with normal vestibular function
(Ben Yousef et al., 2003). During this study two families, PKDF315 and PKDF1092 showed
linkage with DFNB29. Mutational analysis of these two families along with PKDF361 and
PKDF797 (which were kindly provided by CEMB Data bank) was carried out by sequencing
coding exons, along with splice sites of CLDN14 gene.
Sequence analysis of CLDN14 in PKDF797 revealed a homozygous transition of T>A at
position 254 (c.254T>A), leading to the substitution of highly conserved valine with aspartic
acid at position 85 (p.V85D). p.V85D is the most frequent mutation and its high frequency is
attributed to either the mutational hotspot or the most ancient founder mutation which has
undergone ancestral recombination events within flanking STR markers (Table 3.1).
Affected individuals in family PKDF1092 were found to have a homozygous single
nucleotide deletion, 398delT within codon Met133, which is located in transmembrane
domain3. This frameshift is predicted to cause premature translation termination and the loss

97
of almost half of the protein (Wilcox et al., 2001). This mutation of CLDN14 was also
reported previously in a Pakistani family (Wilcox et al., 2001).
Mutational analysis of PKDF315 identified a novel transistion mutation c.281C>T which
results in substitution of alanine with valine at position 94 (p.A94V). Alanine 94 positioned
in second transmembrane domain of CLDN14 is higly conserved among different orthologs.
This mutation was also found in another family and the recurrent occurrence of it may be due
to founder effect (Table 3.1).
PKDF361 harbours a homozygous missense mutation in which there is a change of three
nucleotides c.256A>G, 259T>A and 260C>T which result in substitution of two highly
conserved amino acids (p.I86V+S87I). The substitution of conserved Isoleucine with Valine
at position 86 and a polar hydrophilic amino acid Serine at position 87 with a non polar and
hydrophobic isoleucine are predicted to be pathogenic because these were detected in
homozygous state in all affected individuals of the family and in heterozygous state in
parents consistent with autosomal recessive pattern of inheritance. Although the precise
effect of these two novel variants is not known but they are predicted to cause deafness by
structural alteration of the transmembrane domain. The NCEMB data has shown that
CLDN14 mutations account for 1.73% (13/750) of deafness in Pakistani population
(unpublished data).
MAPPING OF A NEW LOCUS DFNB88:
Subsequent to mapping of the first recessive deafness locus DFNB1 (Guilfold et al., 1994a),
the list of genetic loci/genes for deafness has grown rapidly. The involvement of 1% of
human protein coding genes in deafness signifies that there is still a long way to go. Extreme
genetic heterogeneity of Pakistani population provides a unique genetic resource material to
study and characterize novel population specific alleles and genes critical to understand
deafness phenotype. In an effort to map a new locus/gene, genome wide linkage analysis was
performed on four unlinked families. Co-segregation of deafness phenotype of PKDF468
with microsatellite markers on chromosome 2p11.2 revealed a new locus, DFNB88.
Haplotype analysis revealed the segregation of at risk haplotypes in homozygous state in two
unaffected members (V:2 and V:9) of the family. This finding raised the possibility of

98
phenotype misinterpretation. In order to rule out this aspect, clinical histories were obtained
from each family member and pure tone audiometric profile of these two unaffected
members revealed normal hearing. These two phenotypic escapies are 18 and 13 years old
respectively. Both are living normal life without any speech or communication deficiencies.
Air conduction audiometry of the two normal individuals (V:1 & V:2) revealed mild to
moderate degree of hearing loss at low and high frequencies (Fig. 3.15). But the bone
conduction of these two individuals revealed normal hearing profile. The mild degree of
hearing loss in these two individuals is due to middle ear infection (otitis media). All of the
family members which were evaluated clinically have history of otitis media.
Second postulate about this atypical case is false positive or spurious results and the actual
disease gene is located elsewhere in the genome. Multipoint and Two point Parametric Lod
Scores of the whole genome was calculated. Genotyping of the additional STR markers for
the region with significant values of Lod score revealed no linkage except at chromosome 02.
The third and more convincing postulate is the existence of a modifier gene suppressing the
deafness phenotype in these two unaffected individuals (V:2 and V:9) of PKDF468. This
hypothesis is further strengthen by a previous report of genetic modifier locus (DFNM1) in a
large inbred Pakistani family which suppress DFNB26 linked deafness in seven affected
individuals (Riazuddin et al.,2000). In another case hypomorphic allele of Plasma Membrane
Calcium Pump (PMCA2) modulates the severity of hearing loss caused by homozygous
mutations of CDH23 (Julie et al., 2005).
There are well documented examples of variable expressivity for human deafness which is
usually attributed to environmental or genetic modifiers (Friedman et al., 2000). The 35delG
mutation is the most frequent cause of deafness in some populations. The variation of the
hearing profile associated with 35delG is attributed to genetic or environmental factors
(Cohen et al., 1999). The mouse also provides several examples of interaction of the gentic
modifiers with deafness genes. The mdfw locus modifies the hearing phenotype in dfw/+
heterozygotes whereas a dominant allele of Moth1 protects tubby mice from hearing loss
(Noben-Trauth et al., 1997; Ikeda et al., 1999). Modifier genes can therefore act to suppress
or enhance the mutant phenotype (Bejjani et al., 2000).

99
Two-point parametric LOD Score calculation was performed in three different situations for
extended pedigree PKDF468. In the first case lod score was calculated by excluding the two
non penetrant individuals and maximum two point lod score (Zmax)of 2.64 for marker
D2S2333 (103.16 cM) at recombination fraction θ=0 was obtained. In the second case when
lodscore was calculated by taking non penetrant individuals as affected, the maximum two
point lodscore of 3.76 at θ=0 was obtained for D2S2333. In the 3rd case lod score was
calculated at different penetrance values as shown in Table 4.1.
Screening of 500 Pakistani families segregating profound, bilateral recessive hearing loss by
using DFNB88 linked STR markers lead to the identification of one additional family
PKSR11b segregating DFNB88 linked deafness. Haplotype analysis revealed a
homozygosity region of approximately 50cM flanked by marker D2S2259 (64.29 cM) and
D2S2264 (114.42 cM) giving a physical distance of about 58.9 Mb on human chromosome
2p21-2q11.2. Although this family is not helpful for refinement of linkage interval of
DFNB88 but strengthen the possibility of the location of disease gene here.
Table 4.1: Calculation of Lod Score at different penetrance values.
RECOMBINATION FRACTION θ=0 MARKER cM 100%
95% 90% 85% 80% 75% 70% 60% 50%
D2S329 101.02 -inf -4.37 -3.84 -3.33 -2.97 -2.69 -2.47 -2.13 -1.88 D2S2180 102.62 -inf -4.56 -4.17 -3.91 -3.71 -3.54 -3.39 -3.15 -2.94 D2S289 103.16 -inf -5.60 -4.70 -4.16 -3.77 -3.47 -3.22 -2.84 -2.55
D2S2162 103.16 -inf -4.91 -4.02 -3.50 -3.14 -2.68 -2.64 -2.29 -2.03 D2S440 103.16 -inf -4.87 -3.97 -3.45 -3.08 -2.79 -2.56 -2.21 -1.94
D2S1387 103.16 -inf -4.05 -3.18 -2.68 -2.34 -2.09 -1.89 -1.59 -1.39 D2S2333 103.16 -inf 0.15 0.17 1.01 1.22 1.36 1.47 1.63 1.72 D2S2232 107.46 -inf -0.92 -0.65 -0.51 -0.43 -0.37 -0.33 -0.27 -0.25 D2S388 107.46 -inf -0.92 -0.65 -0.51 -0.43 -0.37 -0.33 -0.27 -0.25
D2S2216 111.21 -inf -0.93 -0.67 -0.53 -0.45 -0.39 -0.34 -0.29 -0.27
Additional STR markers were genotyped in all members of these two families (PKDF468
and PKSR11b) in order to refine the DFNB88 linkage interval. Refined linked region for
DFNB88 is of 4.3 cM (~0.9 Mb), has the proximal boundary at D2S1387 (103.16 cM) as
provided by V: 6 and the distal boundary at marker D2S2232 (107.46 cM) by V: 11 of

100
PKDF468 (Fig. 3.12). According to physical map available on the UCSC Genome Browser
(May 2006 assembly) refined boundaries for DFNB88 span 915425 base pairs.
To date, five autosomal recessive nonsyndromic deafness loci (DFNB9, DFNB27 DFNB47,
DFNB58 and DFNB59) and two autosomal dominant loci (DFNA16 and DFNA43) have
been mapped on chromosome 2 (Hereditary Hearing Loss Homepage). The refined linkage
interval of DFNB88 does not overlap with any of these autosomal recessive nonsyndromic
deafness loci. However, the linkage interval of DFNB88 overlaps with an autosomal
dominant deafness locus DFNA43 (2p12-p11.1). This locus was reported in an Italian family
in which 15 members were affected with autosomal dominant nonsyndromic sensorineural
deafness (Flex et al., 2003). Disease gene interval of DFNA43 is of 9.6 cM but the
overlapping region of DFNB88 with DFNA43 is only 0.4 Mb (Fig. 3.17). Which harbour
four candidate genes KCMF1, TCF7L1, TMSB10 and LOC129293. Since allelic variants of
many genes are reported as cause of autosomal recessive as well as dominant deafness e.g.
mutations of MYO7A and TMC1 are reported as cause of DFNB2/DFNA11 and
DFNB7/11/DFNA36 respectively (Tamagawa et al., 1996; Liu et al., 1997; Kurima et al.,
2002). So, on the hypothesis that DFNA43 and DFNB88 are allelic variants of the same
gene, these four candidate genes were selected for sequencing. Mutational analysis of the
coding exons, along with splice site of these genes did not reveal any pathogenic mutation.
The results indicate that either genetic bases of DFNA43 and DFNB88 are different or
mutation in regulatory elements of any of these genes is responsible for deafness.
To facilitate gene identification of DFNB88, it was important to construct a genetic and
physical map of the candidate region and to list down all the genes and EST's mapped to this
region using databases of UCSC Genome Browser (May 2006 assembly), NCBI, and
Ensembl. Approximately 24 genes reside in the refined linkage interval of DFNB88 (Fig.
3.15). If the function of a gene suggested a relationship to hearing, it was considered as a
good candidate for mutational screening to the underlying causative gene at this locus.
Among the 24 candidate genes of DFNB88, Zinc finger protein RNF181 is one of the strong
candidates which may be involved in transcription regulation. Many transcription factors
EYA4, POU3F4, POU4F3 and TFCP2L3 are reported to be mutated in DFNA10 (Wayne et
al., 2001), DFN3 (De Kok et al., 1995), DFNA15 (Vahava et al., 1998) and DFNA28 (Peters

101
et al., 2002), respectively. So, on the basis of functional homology to already reported
deafness genes it can be considered as potential candidate.
The SH2D6 is also an interesting candidate on the basis of the domain structure of the
encoded protein and its expression in the mouse inner ear. (Peters et al., 2007).The protein
consists of 1 Src-homology 2 domain (SH2) domain, a module of ~100 amino acids that bind
to specific phospho (pY)-containing peptide motifs. The SH2 domain is found embedded in a
wide variety of proteins including enzymes, in adaptor proteins that lack catalytic sequences
and in cytoskeletal proteins, such as fodrin and myosin VIIA. The function of the SH2
domain is not well understood but they may mediate many diverse processes such as
increasing local concentration of proteins, altering their subcellular location and mediating
the assembly of large multiprotein complexes.Autosomal recessive non syndromic deafness
DFNB2, Usher Syndrome type1B (USH1B) and autosomal dominant neursensory disorder
DFNA11 are caused by allelic variants of myosin VIIA (Riazuddin et al., 2008; Weil et al.,
1995; Liu et al. 1997), the structural homology of SH2D6 with MYO7A (a reported deafness
causing gene) makes it an excellent candidate for mutational analysis.
RETSAT, MAT2A, VAMP8, VAMP5, TMEM150, USP39 and ATOH8 are also considered as
potential candidate genes for DFNB88 linked deafness on the basis of their expression in the
mouse inner ear. (Peters et al., 2007).TMEM150 is a transmembrane protein and many
transmembrane proteins e.g. SLC26A4, TMHS are reported as a cause of deafness.( Li et al.,
1998; Everett et al., 1997; Shabbir et al., 2006). Sequece analysis of these genes will identify
which one of these is disease causing gene in DFNB88 linked pedigree. The identification of
the diseased gene will resolve some unsettled aspects of hearing physiology.
The efforts made towards the discovery of DFNB88, its refinement, and characterization of
the genes present within the DFNB88 region is a first step which will greatly contribute to
the identification of a novel gene that is necessary for the development and/or maintenance of
normal hearing and a better understanding of molecular events involved in the process of
hearing. Once the mutation in the gene that is consistent with DFNB88 is found, elucidation
of the function of that gene will reveal the effect of a modifier gene and the association of a
particular haplotype with mutation may provide insight and clues to the associated clinical
findings.

102
The application of molecular genetic techniques to the study of hereditary hearing
impairment has contributed significantly to our understanding of the genetics of deafness. In
addition some of the complex genetic mechanisms, such as role of modifier genes, involved
in rescuing or causing various forms of hearing loss has been a bit clearly understood. Still,
there remains much to learn about theses mechanisms? This study is a small input to the great
strides that have been made in our understanding of the genetic causes of hearing loss.
Discovery of DFNB88 like every new discovery is another advance in putting together a
piece of the whole puzzle. Such discoveries bring scientists closer to understanding the
intricate choreography of genes and proteins involved in the normal development of human
hearing. This knowledge in turn facilitates the development of intervention strategies to
prevent and treat hearing loss.
The carrier screening within the families with multiple affected individuals seems to be
important as it can identify the persons at a high risk. Marriages within the family are quite
common in Pakistan, therefore identification of carriers, increasing awarness about the
possible effects of consanguineous families, offering the genetic counseling and prenatal
diagnosis to the families can help to reduce the incidence of hereditary deafness in our
population. For obtaining this objective, the need is to further characterize the deafness at
molecular level and identify the particular loci contributing most to hearing loss in the
concerned country and this study being a small part of that investigation.

103
SECTION: 5
REFERENCES

103
REFERENCES Adato, A., Kalinski, H., Weil, D., Chaib, H., Korostishevsky, M., Bonne-Tamir, B.(1999) Possible
interaction between USH1B and USH3 gene products as implied by apparent digenic deafness inheritance. Am J Hum Genet 65(1): 261-265.
Ahmad, J., Khan, S. N., Khan, S. Y., Ramzan, K., Riazuddin, S., Ahmed, Z. M., Wilcox, E. R., Friedman, T. B., Riazuddin, S. (2005) DFNB48, a new nonsyndromic recessive deafness locus, maps to chromosome 15q23-q25.1. Hum Genet 116: 407-412.
Ahmed, Z. M., Masmoudi, S., Kalay, E., Belyantseva, I. A., Mosrati, M. A., Collin, R. W., Riazuddin, S., Hmani-Aifa, M., Venselaar, H., Kawar, M. N., Tlili, A., van der Zwaag, B., Khan, S. Y., Ayadi, L., Riazuddin, S. A., Morell, R. J., Griffith, A. J., Charfedine, I., Caylan, R., Oostrik, J., Karaguzel, A., Ghorbel, A., Riazuddin, S., Friedman, T. B., Ayadi, H., Kremer, H. (2008) Mutations of LRTOMT, a fusion gene with alternative reading frames, cause nonsyndromic deafness in humans. Nat Genet. 40(11):1335-1340.
Ahmed, Z. M., Morell, R. J., Riazuddin, S., Gropman, A., Shaukat, S., Ahmad, M. M., Mohiddin, S. A., Fananapazir, L., Caruso, R. C., Husnain, T., Khan, S. N., Riazuddin, S., Griffith, A. J., Friedman, T. B., Wilcox, E. R. (2003a) Mutations of MYO6 are associated with recessive deafness, DFNB37. Am J Hum Genet 72: 1315-1322.
Ahmed, Z. M., Riazuddin, S., Ahmad, J., Bernstein, S. L., Guo, Y., Sabar, M. F., Sieving, P., Riazuddin, S., Griffith, A. J., Friedman, T. B., Belyantseva, I. A., Wilcox, E. R. (2003b) PCDH15 is expressed in the neurosensory epithelium of the eye and ear and mutant alleles are responsible for both USH1F and DFNB23. Hum Mol Genet 12: 3215-3223.
Ahmed, Z. M., Smith, T. N., Riazuddin, S., Makishima, T., Ghosh, M., Bokhari, S., Menon, P. S. N., Deshmukh, D., Griffith, A. J., Riazuddin, S., Friedman, T. B., Wilcox, E. R. (2002) Nonsyndromic recessive deafness DFNB18 and Usher syndrome type IC are allelic mutations of USHIC. Hum Genet 110: 527-531.
Ain, Q., Nazli, S., Riazuddin, S., Jaleel, A. U., Riazuddin, S. A., Zafar, A. U., Khan, S. N., Husnain, T., Griffith, A. J., Ahmed, Z. M., Friedman, T. B., Riazuddin, S. (2007) The autosomal recessive nonsyndromic deafness locus DFNB72 is located on chromosome 19p13.3. Hum Genet 122(5): 445-450.
Ali, G., Santos, R L., John, P., Wambangco, M A., Lee K., Ahmad, W., Leal, S. (2006) The mapping of DFNB62, a new locus for autosomal recessive non-syndromic hearing impairment, to chromosome 12p13.2-p11.23. Clin Genet 69(5): 429-433.
Altschul, S. F., Gish, W., Miller, W., Myers, E. W., Lipman, D. J. (1990) Basic local alignment search tool. J Mol Biol 215: 403-410.
Ansar, A., Aminudin, M., Arshad, M., Sohail, M., Faiyaz-ul-Haq, M., Haque, S., Ahmed, W., Leal, S. M. (2003a) A Novel Autosomal Recessive Non-Syndromic Deafness Locus (DFNB35) Maps to 14q24.1–14q24.3 in Large Consanguineous Kindred from Pakistan. Euro J Hum Genet 11: 77-80.
Ansar, A., Ramzan, M., Pham, T. L., Yan, K., Jamal, S. M., Haque, S., Ahmad, W., Leal, S. M. (2003b) Localization of A Novel Autosomal Recessive Non-Syndromic Hearing Impairment Locus (DFNB38) to 6q26-q27 in a Consanguineous Kindred from Pakistan. Hum Hered 55: 71-74.
Ansar, M., Chahrour, M. H., Amin ud Din, M., Arshad, M., Haque, S., Pham, T. L., Yan, K., Ahmad, W., Leal, S. M. (2004) DFNB44, a novel autosomal recessive non-syndromic hearing impairment locus, maps to chromosome 7p14.1-q11.22. Hum Hered 57: 195-199.
Anwar S., Riazuddin, S., Ahmed, Z.M., Tasneem, S., Jaleel, A.U., Khan, S. Y., Griffith, A. J., Friedman T.B., Riazuddin, S. (2009) SLC26A4 mutation spectrum associated with DFNB4 deafness and Pendred syndrome in Pakistanis. J Hum Genet 54: 266-270.
Aslam, M., Wajid, M., Chahrour, M. H., Ansar, M, Haque, S., Pham, T. L., Santos, R. P., Yan, K., Ahmad, W., Leal, S. M. (2005) A Novel Autosomal Recessive Nonsyndromic Hearing Impairment Locus

104
(DFNB42) Maps to Chromosome 3q13.31-q22.3. Am J Med Genet 133: 18-22.
Avraham, K. B. (1998) Hear come more genes! Nat Med 4: 1238-1239.
Balciuniene, J., Dahl, N., Borg, E., Samuelsson, E., Koisti, M. J., Petterersson, U. and Jazin, E. E. (1998) Evidence for digenic inheritance of nonsyndromic hereditary hearing loss in a Swedish family. Am J Hum Genet 63: 786-793.
Baldwin, C. T., Weiss, S., Farrer, L. A., De Stefano, A. L., Adair, R., Franklyn, B., Kidd, K. K., Korostishevsky, M., Bonne-Tamir, B. (1995) Linkage of congenital, recessive deafness (DFNB4) to chromosome 7q31 and evidence for genetic heterogeneity in the Middle Eastern Druze population. Hum Mol Genet 4: 1637-1642.
Bejjani, B. A., Stockton, D. W., Lewis, R. A., Tomey, K.F., Dueker, D. K., Jabak, M., Astle, W. F., Lupski, J. R. (2000) Multiple CYP1B1 mutations and incomplete penetrance in an inbred population segregating primary congenital glaucoma suggest frequent de novo events and a dominant modifier locus. Hum Mol Genet. 12;9(3):367-74.
Ben-Yosef, T., Belyantseva, I. A., Saunders, T. L., Hughes, E. D., Kawamoto, K., Van Itallie, C. M., Beyer, L. A., Halsey, K., Gardner, D. J., Wilcox, E. R,, Rasmussen, J., Anderson, J. M., Dolan, D. F., Forge, A., Raphael, Y., Camper, S. A., Friedman, T. B. (2003) Claudin 14 knockout mice, a model for autosomal recessive deafness DFNB29, are deaf due to cochlear hair cell degeneration. Hum Mol Genet. 12: 2049–2061.
Bhatti, A., Lee, K., McDonald, M. L., Hassan, M. J., Gutala, R., Ansar, M., Ahmad. W., Leal, S. M. (2008) Mapping of new autosomal recessive non-syndromic hearing impairment locus (DFNB45) to chromosome 1q43-q44. Clin Genet 73(4): 395-398.
Bhatti, A., Lee, K., McDonald, M. L., Hassan, M. J., Gutala, R., Ansar, M., Ahmad, W., Leal, S. M. (2008) Mapping of a new autosomal recessive non-syndromic hearing impairment locus (DFNB45) to chromosome 1q43-q44. Clin Genet.: 73(4):395-8.
Bitner-Glindzicz, M. (2002) Hereditary deafness and phenotyping in humans. Br Med Bull. 63: 73-94.
Blumenfeld, H. (2001) Neuroanatomy through Clinical Cases. Yale University School of Medicine, New York.
Bonne-Tamir, B., DeStefano, A. L., Briggs, C. E., Adair, R., Franklyn, B., Weiss, S., Korostishevsky, M., Frydman, M., Baldwin, C. T., Farrer, L. A. (1996) Linkage of congenital recessive deafness (gene DFNB10) to chromosome 21q22.3. Am J Hum Genet 58: 1254-1259.
Bork, J. M., Peters, L. M., Riazuddin, S., Bernstein, S. L., Ahmed, Z. M., Ness, S. L., Polomeno, R., Ramesh, A., Schloss, M., Srisailpathy, C. R., Wayne, S., Bellman, S., Desmukh, D., Ahmed, Z., Khan, S. N., Kaloustian, V. M., Li, X. C., Lalwani, A., Riazuddin, S., Bitner-Glindzicz, M., Nance W. E., Liu, X. Z., Wistow, G., Smith, R. J H., Griffith, A. J., Wilcox, E. R., Friedman, T. B., Morell, R. J. (2001) Usher syndrome 1D and nonsyndromic autosomal recessive deafness DFNB12 are caused by allelic mutations of the novel cadherin-like gene CDH23. Am J Hum Genet 68: 26-37.
Campbell, D. A., McHale, D. P., Brown, K. A., Moynihan, L. M., Houseman, M., Karbani, G., Parry, G., Janjva, A. H., Newton, V., al-Gazali, L., Markham, A. F., Lench, N. J., Mueller, R. F. (1997) A new locus for non-syndromal, autosomal recessive, sensorineural hearing loss (DFNB16) maps to human chromosome 15q21-q22. J Med Genet 34: 1015-1017.
Chaib, H., Place, C., Salem, N., Chardenoux, S., Vincent, C., Weissenbach, J., El-Zir, E., Loiselet, J., Petit, C. (1996a) A gene responsible for a sensorineural nonsyndromic recessive deafness maps to chromosome 2p22-23. Hum Mol Genet 5: 155-158.
Chaib, H., Place, C., Salem, N., Dode, C., Chardenoux, S., Weissenbach, J., El-Zir, E., Loiselet, J. Petit, C. (1996b) Mapping of DFNB12, a gene for a non- syndromal autosomal recessive deafness, to chromosome 10q21-22. Hum Mol Genet 5: 1061-1064.
Chen, A., Wayne, S., Bell, A., Ramesh, A., Srisailapathy, C. R., Scott, D. A., Sheffield, V. C., Van Hauwe, P., Zbar, R. I., Ashley, J., Lovett, M., Van Camp, G., Smith, R. J. H. (1997) New gene for autosomal

105
recessive non-syndromic hearing loss maps to either chromosome 3q or 19p. Am J Med Genet 71: 467-471.
Chen, W., Kahrizi, K., Meyer, N. C., Riazulhosseini, Y., Van Camp, G., Najamabadi, H., Smith, R. J. H. (2005) Mutation of COL11A2 causes autosomal recessive non-syndromic hearing loss at DFNB53 locus. J Med Genet 42:e61.
Chishti, M. S., Lee K, McDonald M. L., Hassan M. J., Ansar M., Ahmad W., Leal S. M. (2009) Novel autosomal recessive non-syndromic hearing impairment locus (DFNB71) maps to chromosome 8p22-21.3. J Hum Genet 54(3): 141-144.
Choi, B. Y., Ahmed, Z. M., Riazuddin, S., Bhinder, M. A., Shahzad, M., Husnain, T., Riazuddin, S., Griffith, A. J., Friedman, T. B. (2009) Identities and frequencies of mutations of the otoferlin gene (OTOF) causing DFNB9 deafness in Pakistan. Clin Genet. 75:237-243.
Cohn, E. S., Kelley, P. M., Fowler, T. W., Gerga, M. P., Lefkowitz, D. M., Kuchn, H. J., Schaefer, G. B., Gobar, L. S., Hahn, F. J., Harris, D. J. and Kumbuling, W. J. (1999 ). Clinical studies of families with hearing loss attributed to mutations in the connexin 26 gene (GJB2/ DFNB1). Pediatries 103: 546-550.
Collin, R. W. J, Kalay, E, Tariq, M, Peters, T, van der, Zwaag. B, Venselaar, H, Oostrik, J, Lee, K, Ahmed, Z. M, Çaylan, R, Li, Y, Spierenburg, H. A, Eyupoglu, E, Heister, A, Riazuddin, S, Bahat, E, Arslan, S, Wollnik, B, Brunner, H. G, Cremers, C. W. R. J, Karaguzel, A, Ahmad, W, Cremers, F. P. M, Vriend, G, Friedman, T. G, Riazuddin, S, Leal, S. M, Kremer, H (2008) Mutations of ESRRB encoding estrogen-related receptor beta cause autosomal recessive nonsyndromic hearing impairment DFNB35. Am J Hum Genet 82(1): 125-138.
Cranefield, P. F., Federn, W. (1970) Paulus Zacchias on mental deficiency and on deafness. Bull. NY Acad Med 46: 3-21.
Cremers, C. W., Admiraal, R. J, Huygen, P. L., Bolder, C., Everett, L. A., Joosten, F. B., Green, E. D., Van Camp, G., Otten, B. J.(1998) Progressive hearing loss, hypoplasia of the cochlea and widened vestibular aqueducts are very common features in Pendred's syndrome. Int J Pediatr Otorhinolaryngol 45(2): 113-123.
Dallos, P. (1992) The active cochlea.J.Neurosci.12: 4575 –4585.
Davis, A. C. (1989) The prevalence of hearing impairment and reported hearing disability among adults in Great Britain. Int J Epidemiol 18: 911-917.
De Kok, Y. J., Van der Maarel, S. M., Bitner-Glindzicz, M., Huber, I., Monaco, A. P., Malcolm, S., Pembrey, M. E., Ropers, H. H., Cremers, F. P. (1995) Association between X-linked mixed deafness and mutations in the POU domain gene POU3F4. Science 267: 685-668.
Delmaghani, S., Aghaie, A., Compain-Nouaille, S., Ataie, A., Lemainque, A., Zeinali, S., Lathrop, M., Weil, D., Petit, C. (2003) DFNB40, a recessive form of sensorineural hearing loss, maps to chromosome 22q11.21-12.1. Eur J Hum Genet 11: 816-818.
Delmaghani, S., del Castillo, F. J., Michel, V., Leibovici, M., Aghaie, A., Ron, U., Van Laer, L., Ben-Tal, N., Van Camp, G., Weil, D., Langa, F., Lathrop, M., Avan, P., and Petit, C. (2006) Mutations in the gene encoding pejvakin, a newly identified protein of the afferent auditory pathway, cause DFNB59 auditory neuropathy. Nat Genet 38: 770–778.
Denoyelle, F., Marlin, S., Weil, D., Moatti, L., Chauvin, P., Garabédian, E. N., and Petit, C. (1999) Clinical features of the prevalent form of childhood deafness, DFNB1, due to a connexin-26 gene defect: implications for genetic counselling. Lancet 353(9161):1298-1303.
Eisen, M. D., and Ryugo, D. K. (2007) Hearing molecules: contributions from genetic deafness Cell.Mol.Life Sci. DOI 10.1007/s00018-007-6417-32007.
Elahi, M., Elahi, F., Elahi, A., Elahi, S. B. (1998) Paediatric hearing loss in rural Pakistan. J Otolaryngol 27: 348-353.
Everett, L. A., Glaser, B., Beck, J. C., Idol, J. R., Buchs, A., Heyman, M., Adawi, F., Hazani, E., Nassir, E.,
106
Baxevanis, A. D., Sheffield, V. C., Green, E. D. (1997) Pendred syndrome is caused by mutations in a putative sulphate transporter gene (PDS). Nat Genet 17: 411-422.
Fettiplace, R., and Hackney, C. M. (2006) The sensory and motor roles of auditory hair cells. Nat. Rev. Neurosci 7:.19-29.
Flex, E., Mangino, M., Mazzoli, M., Martini, A., Migliosi, V., Colosimo, A., Mingarelli, R., Pizzuti, A., Dallapiccola, B. (2003) Mapping of a new autosomal dominant non-syndromic hearing loss locus (DFNA43) to chromosome 2p12. J. Med. Genet. 40: 278-282.
Flock, A., Flock, B., and Murray, E. (1977) Studies on the sensory hairs of receptor cells in the inner ear.Acta Otolaryngol 83: 85-91.
Forge, A., Wright, T. (2002) The molecular architecture of the inner ear. Br Med Bull 63: 5-24.
Foroud, T. (1997) Introduction to genetic linkage analysis. Cancer Invest 15: 548-552.
Fortnum, H. M., Summerfield, A. Q., Marshall, D. H., Davis, A. C., Bamford, J. M. (2001). Prevalence of permanent childhood hearing impairment in the United Kingdom and implications for universal neonatal hearing screening: questionnaire based ascertainment study. Brit Med J 323: 1-6.
Friedman*, T., Battey*, J., Kachar, B., Riazuddin, S., Noben-Trauth*, K., Griffith*, A. and Wilcox*, E. (2000) Modifier genes of hereditary hearing loss. Current Opinion in Neurobiology 10:487–493.
Friedman, T. B., Griffith, A. J. (2003) Human nonsyndromic sensorineural deafness. Annu Rev Genomics Hum Genet 4: 341-402.
Friedman, T. B., Liang, Y., Weber, J. L., Hinnant, J. T., Barber, T. D., Winata, S., Arhya, I. N., Asher, J. H Jr. (1995) A gene for congenital, recessive deafness DFNB3 maps to the pericentromeric region of chromosome 17. Nat Genet 9: 86-91.
Fukushima, K., Ramesh, A., Srisailapathy, C. R. S., Ni, L., Wayne, S., O'Neill, M. E., Van Camp, G., Coucke, P., Jain, P., Wilcox, E. R., Smith, S. D., Kenyon, J. B., Zbar, R. I. S., Smith, R. J. H. (1995b) An autosomal recessive nonsyndromic form of sensorineural hearing loss maps to 3p-DFNB6. Genome Res 5: 305-308.
Fukushima, K., Ramesh, A., Srisailapathy, C. R., Ni, L., Chen, A., O’Neill, M., Van Camp, G., Coucke, P., Smith, S. D., Kenyon, J. B., Jain, P., Wilcox, E. R., Zbar, R. I. S., Smith, R. J. H. (1995a) Consanguineous nuclear families used to identify a new locus for recessive non-syndromic hearing loss on 14q. Hum Mol Genet 4: 1643-1648.
Gates, G. A., Couropmitree, N. N., Myers, R. H. (1999) Genetic associations in age-related hearing thresholds. Arch Otolaryngol 125: 654-659.
Gillespie, P. G., Walker, R. G. (2001) Molecular basis of mechanosensory transduction. Nature 413: 194-202.
Goldstein, M. A. (1933) Problems of the deaf. The Laryngoscope Press, St. Louis, MO.
Goodyear, R. J., Marcotti, W., Kros, C. J. and Richardson, G. P. (2005) Development and properties of stereociliary link types in hair cells of the mouse cochlea.J.Comp.Neurol 485:75-85.
Gorlin, R. J., Toriello, H. V., Cohen, M. M. (1995) Hereditary Hearing Loss and Its Syndromes. Oxford University Press, New York/Oxford.
Greinwald, J. H. Jr., Wayne, S., Chen, A. H., Scott, D. A., Zbar, R. I., Kraft, M. L., Prasad, S., Ramesh, A., Coucke, P., Srisailapathy, C. R., Lovett, M., Van Camp, G., Smith, R. J. H. (1998) Localization of a novel gene for nonsyndromic hearing loss (DFNB17) to chromosome region 7q31. Am J Med Genet 78: 107-113.
Grimberg, J., Nawoschik, S., Belluscio, L., McKee, R., Turck, A., Eisenberg, A. (1989) A simple and efficient non-organic procedure for the isolation of genomic DNA from blood. Nucleic Acids Res 17: 8390.
Guilford, P., Arab, S. B., Blanchard, S., Levilliers, J., Weissenbach, J., Belkahia, A., Petit, C. (1994a) A

107
non-syndromic form of neurosensory, recessive deafness maps to the pericentromeric region of chromosome 13q. Nat Genet 6:24-28.
Guilford, P., Ayadi, H., Blanchard, S., Chaib, H., Le Paslier, D., Weissenbach, J., Drira, M., Petit, C. (1994b) A human gene responsible for neurosensory, non-syndromic recessive deafness is a candidate homologue of the mouse sh-1 gene. Hum Mol Genet 3: 989-993.
Hassan, M. J., Santos, R. L., Rafiq, M. A., Chahrour, M. H., Pham, T. L., Wajid, M., Hijab, N., Wambangco, M., Lee, K., Ansar, M., Yan, K., Ahmad, W., Leal, S. M.(2005) A novel autosomal recessive non-syndromic hearing impairment locus (DFNB47) maps to chromosome 2p25.1-p24.3. Hum Genet 118 (5): 605-610.
Heiner, C. R., Hunkapiller, K. L., Chen, S. M., Glass, J. I., Chen, E. Y. (1998) Sequencing multimegabase-template DNA with BigDye terminator chemistry. Genome Res 8: 557-561.
Hudspeth, A.J. (1989) How the ear’s works work. Nature 341: 397-404.
Hussain, R., and Bittles A. H. (1998) The prevalence and demographic characteristics of consanguineous marriages in Pakistan. J Biosoc Sci 30: 261-275.
Hussain, R., and Bittles A. H. (1998) The prevalence and demographic characteristics of consanguineous marriages in Pakistan. J Biosoc Sci 30:261-275.
Ikeda, A., Zheng, Q. Y., Rosenstiel, P., Maddatu, T., Zuberi, A. R., Roopenian, D. C., North, M. A., Naggert, J. K., Johnson, K. R., Nishina, P. M. (1999) Genetic modification of hearing in tubby mice: evidence for the existence of a major gene (moth1) which protects tubby mice from hearing loss. Hum Mol Genet. 8(9):1761-7.
Ikeda, K., Morizono, T. (1989) Electrochemical profiles for monovalent ions in the stria vascularis: cellular model of ion transport mechanisms. Hear Res 39: 279-286.
Irshad, S., Santos, R. L., Muhammad, D., Lee, K., McArthur, N., Haque, S., Ahmad, W., Leal, S. M. (2005) Localization of a novel autosomal recessive non-syndromic hearing impairment locus DFNB55 to chromosome 4q12-q13.2. Clin Genet 68: 262-267.
Jaber, L., Merlob, P., Bu, X., Rotter, J. I., Shohat, M. (1992) Marked parental consanguinity as a cause for increased major malformations in an Israeli Arab community. Am. J Med Genet 44: 1-6.
Jaber, L., Merlobp, P., Bu, X., Rotter, J. I., Shohat, M. (1992) Marked parental consanguinity as a cause for increased major malformations in an Israeli Arab community. Am. J Med Genet 44: 1-6.
Jain, P. K., Fukushima, K., Deshmukh, D., Ramesh, A., Thomas, E., Lalwani, A. K., Kumar, S., Plopis, B., Skarka, H., Srisailapathy, C. R. (1995) A human recessive neurosensory nonsyndromic hearing impairment locus is potential homologue of murine deafness (dn) locus. Hum Mol Genet 4: 2391-2394.
Jain, P. K., Lalwani, A. K., Li, X. C., Singleton, T. L., Smith, T. N., Chen, A., Deshmukh, D., Verma, I. C., Smith, R. J. H., Wilcox, E. R. (1998) A gene for recessive nonsyndromic sensorineural deafness (DFNB18) maps to the chromosomal region 11p14-p15.1 containing the Usher syndrome type 1C gene. Genomics 50: 290-292.
Kalay, E., Caylan, R., Kiroglu, A. F., Yasar, T., Collin, R. W., Heister, J. G., Oostrik, J., Cremers, C. W., Brunner, H. G., Karaguzel, A., Kremer, H. (2007) A novel locus for autosomal recessive nonsyndromic hearing impairment, DFNB63, maps to chromosome 11q13.2-q13.4. J Mol Med 85(4): 397-404.
Kalay, E., Li, Y., Uzumcu, A., Uyguner, O., Collin, R. W., Caylan, R., Ulubil-Emiroglu, M., Kersten, F. F., Hafiz, G., van Wijk, E., Kayserili, H., Rohmann, E., Wagenstaller, J., Hoefsloot, L. H., Strom, T. M., Nürnberg, G., Baserer, N., Den Hollander, A. I., Cremers, F. P., Cremers, C. W., Becker, C., Brunner, H. G., Nürnberg, P., Karaguzel, A., Basaran, S., Kubisch, C., Kremer, H., Wollnik, B. (2006) Mutations in the lipoma HMGIC fusion partner-like 5 (LHFPL5) gene cause autosomal recessive nonsyndromic hearing loss. Hum Mutat 27(7): 633-639.
Kelsell, D. P., Dunlop, J., Stevens, H. P., Lench, N. J., Liang, J. N., Parry, G., Mueller, R. F., Leigh, I. M.

108
(1997) Connexin 26 mutations in hereditary non-syndromic sensorineural deafness. Nature 387: 80-83.
Khan, S. Y., Ahmed, Z. M., Shabbir, M. I., Kitajiri, S., Kalsoom, S., Tasneem, S., Shayiq, S., Ramesh, A., Srisailpathy S., Khan, S. N., Smith, R. J H., Riazuddin, S., Friedman, T. B., Riazuddin, S. (2007a) Mutations of the RDX gene cause nonsyndromic hearing loss at the DFNB24 locus . Human Mutation 28 (5): 417-423.
Khan, S. Y., Riazuddin, S., Tariq, M., Anwar, S., Shabbir, M. I., Riazuddin, S. A., Khan, S. N., Husnain, T., Ahmed, Z. M., Friedman, T. B., Riazuddin, S. (2007b). Autosomal recessive nonsyndromic deafness locus DFNB63 at chromosome 11q13.2-q13.3. Hum Genet 120(6): 789-793.
Khan, S.Y., Riazuddin, S., Shahzad, M., Ahmed, N., Zafar, A.U., Griffith, A. J., Ahmed, Z.M., Riazuddin, S., Friedman, T.B., (2009). DFNB79: reincarnation of a nonsyndromic deafness locus on chromosome 9q34.3. Eur J Hum Genet (Epub ahead of print).
Kochhar, A., Hildebrand, M. S., Smith, R. J.(2007) Clinical aspects of hereditary hearing loss. Genet Med 9(7): 393- 408.
Kossal, M. (1997) Sound emissions from cochlear filters and foveae-Does the auditory sense organ makes sense? Naturwissenchaften 84: 9-16.
Kurima, K., Peters, L. M., Yang, Y., Riazuddin, S., Ahmed, Z. M., Naz, S., Arnaud, D., Drury, S., Mo, J., Makishima, T. Ghosh, M., Menon, P. S. N., Deshmukh, D., Oddoux, C., Oster, H., Khan, N., Riazuddin, S., Deininger, L. P., Hampton, L. L., Sullivan, L. S., Battey, F. J., Keats, B. J. B., Wilcox, E. R., Friedman, T. B., Griffith, A. J. (2002) Dominant and recessive deafness caused by mutations of a novel gene, TMC1, required for cochlear hair-cell function. Nat Genet 30: 277-284.
Lee, L. G., Spurgeon, S. L., Heiner, C. R., Benson, S. C., Rosenblum, B. B., Menchen, S. M., Graham, R. J., Constantinescu, A., Upadhya, K. G., Cassel, J. M. (1997) New energy transfer dyes for DNA sequencing. Nucleic Acids Res 25: 2816-2822.
Li, X. C., Everett, L. A., Lalwani, A. K., Desmukh D., Friedman, T. B., Green, E. D., Wilcox, E. R. (1998) A mutation in PDS causes non-syndromic recessive deafness. Nat Genet 18: 215-217.
Linder, T. H., Hoffmann, K. (2005) easyLINKAGE: A PERL script for easy and automated two-/multipoint linkage analyses. Bioinformatics 21:405-407.
Liu, X. Z., Walsh, J., Mburu, P., Kendrick-Jones, J., Cope, M. J. T. V., Steel, K. P., Brown, S. D. M. (1997) Mutations in the myosin VIIA gene cause non- syndromic recessive deafness. Nat Genet 16:188-190.
Maheshwari, M., Vijaya, R., Ghosh, M., Shastri, S., Kabra, M., Menon P. S. N. (2003). screening of families with autosomal recessive nonsyndromic hearing impairment (ARNSHI) for mutations in GJB2 gene: Indian scenario. Am J Med Genet A 120(2): 180-184.
Marazita, M. L., Ploughman, L. M., Rawlings, B., Remington, E., Arons, K. S., Nance, W. E. (1993) Genetic epidemiological studies of early onset deafness in U. S. school-age population. Am J Med Genet 46: 486-491.
Marcus, D. C., Wu, T., Wangemann, P., Kofuji, P. (2002) KCNJ10 (Kir4.1) potassium channel knockout abolishes endocochlear potential. Am. J. Physiol. Cell Physiol 282: 403-407.
Markin, V. S., Hudspeth, A. J.(1995) Gating-spring models of mechanoelectrical transduction by hair cells of the internal ear. Annu Rev Biophys Biomol Struct 24: 59-83.
Masmoudi, S., Tlili, A., Majava, M., Ghorbel, A. M., Chardenoux, S., Lemainque, A., Zina, Z. B., Moala, J., Mannikko, M., Weil, D., Lathrop, M., Ala-Kokko, L., Drira, M., Petit, C., Ayadi, H. (2003) Mapping of a new autosomal recessive nonsyndromic hearing loss locus (DFNB32) to chromosome 1p13.3-22.1. Eur J Hum Genet 11: 185-188.
Mazeas, R., and Bourguet, J. (1975) New method of deafness classification. Ann Otolaryngol Chir Cervicofac. 92: 567-572.

109
Mburu, P., Mustapha, M., Varela, A., Weil, D., El-Amraoui, A., Holme, R. H., Rump, A., Hardisty, R. E., Blanchard, S., Coimbra, R. S., Perfettini, I., Parkinson, N., Mallon, A. M., Glenister, P., Rogers, M. J., Paige, A. J., Moir, L., Clay, J., Rosenthal, A., Liu, X. Z., Blanco, G., Steel, K. P., Petit, C., Brown, S. D. (2003) Defects in whirlin, a PDZ domain molecule involved in stereocilia elongation, cause deafness in the whirler mouse and families with DFNB31. Nature Genet 34: 421-428.
McKusick, V. A. (1992) Mendelian Inheritance in Man. Johns Hopkins University Press, Baltimore.
Medlej-Hashim, M., Mustapha, M., Chouery, E., Weil, D., Parronaud, J., Salem, N., Delague, V., Loiselet, J., Lathrop, M., Petit, C., Megarbane, A. (2002) Non-syndromic recessive deafness in Jordan: mapping of a new locus to chromosome 9q34.3 and prevalence of DFNB1 mutations. Eur J Hum Genet 10: 391-394.
Mir, A., Ansar, M., Chahrour, M. H., Pham, T. L., Wajid, M., Haque, S., Yan, K., Ahmad, W., Leal, S. M. (2005) Mapping of a novel autosomal recessive nonsyndromic deafness locus (DFNB46) to chromosome 18p11.32-p11.31. Am J Med Genet A 133: 23-26.
Morell, R. J., Kim, H. J., Hood, L. J., Goforth, L., Friderici, K., Fisher, R., Van Camp, G., Berlin, C. I., Oddoux, C., Ostrer, H., Keats, B., Friedman,T. B. (1998) Mutations in the connexin 26 gene (GJB2) among Ashkenazi Jews with nonsyndromic recessive deafness. N Engl J Med 339: 1500-1505.
Morton, C. C., and Nance, W. E. (2006) Newborn Hearing Screening — A Silent Revolution N Engl J Med 354: 2151-2164.
Morton, N. E. (1991) Genetic epidemiology of hearing impairment. Ann N Y Acad Sci 630:16-31.
Moynihan, L., Houseman, M., Newton, V., Mueller, R., Lench, N. (1999) DFNB20: a novel locus for autosomal recessive, non-syndromal sensorineural hearing loss maps to chromosome 11q25-qter. Europ J Hum Genet 7: 243-246.
Mustapha, M., Chardenoux, S., Nieder, A., Salem, N., Weissenbach, J., el-Zir, E., Loiselet, J., Petit, C. (1998a) A sensorineural progressive autosomal recessive form of isolated deafness, DFNB13, maps to chromosome 7q34-q36. Eur J Hum Genet 6: 245-250.
Mustapha, M., Chouery, E., Chardenoux, S., Naboulsi, M., Paronnaud, J., Lemainque, A., Megarbane, A., Loiselet, J., Weil, D., Lathrop, M., Petit, C. (2002) DFNB31, a recessive form of sensorineural hearing loss, maps to chromosome 9q32–34. Eur J Hum Genet 10: 210-212.
Mustapha, M., Salem, N., Weil, D., el-Zir, E., Loiselet, J., Petit, C. (1998b) Identification of a locus on chromosome 7q31, DFNB14, responsible for prelingual sensorineural non-syndromic deafness. Eur J Hum Genet 6: 548-551.
Mustapha, M., Weil, D., Chardenoux, S., Elias, S., El-Zir, E., Beckmann, J. S., Loiselet, J., Petit, C. (1999) An alpha-tectorin gene defect causes a newly identified autosomal recessive form of sensorineural pre-lingual non-syndromic deafness, DFNB21. Hum Mol Genet 8 :409-412.
Najmabadi, H., Nishimura, C., Kahrizi, K., Riazalhosseini, Y., Malekpour, M., Daneshi, A., Farhadi, M., Mohseni, M., Mahdieh, N., Ebrahimi, A., Bazazzadegan, N., Naghavi, A., Avenarius, M., Arzhangi, S., Smith, R. J. H. (2005) GJB2 mutations: passage through Iran. Am J Med Genet. 133:132-137.
Naz, S., Giguere, C. M., Kohrman, D. C., Mitchem, K. L., Riazuddin, S., Morell, R. J., Ramesh, A., Srisailpathy, S., Deshmukh, D., Riazuddin, S., Griffth, A. J., Friedman T. B., Smith, R. J. H., Wilcox, E. R. (2002) Mutations in a novel gene, TMIE, are associated with hearing loss linked to DFNB6 locus. Am J Hum Genet 71: 632-636.
Naz, S., Griffith, A. J., Riazuddin, S., Hampton, L. L., Battey, J. F. Jr., Khan, S. N., Riazuddin, S., Wilcox, E. R., Friedman, T. B. (2004) Mutations of ESPN cause autosomal recessive deafness and vestibular dysfunction. J Med Genet 41: 591-595.
Nin, F., Hibino, H., Doi, K., Suzuki, T., Hisa, Y., Kurachi, Y. (2008) The endocochlear potential depends on two K+ diffusion potentials and an electrical barrier in the stria vascularis of the inner ear. Proc Natl Acad Sci USA 105: 1751-1756.
Noben-Trauth, K., Zheng, Q.Y., Johnson, K.R. & Nishina, P.M. (1997) mdfw: deafness susceptibility locus

110
that interacts with deaf waddler (dfw). Genomics 44: 266–272.
Ott, J. (1991) Analysis of human linkage (Baltimore and London, John Hopkinís University Press).
Ouyang, X. M., Xia, X. J., Verpy, E., Du, L. L., Pandya, A., Petit, C., Balkany, T., Nance, W. E., Liu, X. Z. (2002) Mutations in the alternatively spliced exons of USH1C cause non-syndromic recessive deafness. Hum Genet 111: 26-30.
Parving, A., Hauch, A. M., Christensen, B. (2003) Hearing loss in children epidemiology, age at identification and causes through 30 years. Ugeskr Laeger 2003 165(6):574-579.
Peters, L. M., Anderson, D. W., Griffith, A. J., Grundfast, K. M., San Agustin, T. B., Madeo, A. C., Friedman, T. B., Morell, R. J. (2002) Mutation of a transcription factor, TFCP2L3, causes progressive autosomal dominant hearing loss, DFNA28. Hum Mol Genet 11: 2877-2885.
Peters, L. M., Belyantseva, I. A., Lagziel, A., Battey, J. F., Friedman, T. B., Morell, R. J. (2007) Signatures from tissue-specific MPSS libraries identify transcripts preferentially expressed in the mouse inner ear.Genomics 89: 197-206.
Petersen, M. B., and Willems, P. J. (2006) Non-syndromic, autosomal-recessive deafness. Clin Genet 69:371-392.
Petit, C. (1996) Genes responsible for Human Hereditary Deafness: Sympony of a thousand. Nat Genet 14: 385-391.
Petit, C., Levilliers, J., Hardelin, J. P. (2001) Molecular genetics of hearing loss. Annu Rev Genet 35: 589-646.
Pickles, J. O., Comis, S. D., Osborne, M. P. (1984) Cross-links between stereocilia in the guinea pig organ of Corti, and their possible relation to sensory transduction. Hear. Res 15:103-112.
Pickles, J.O.(1993) Early events in auditory processing. Curr Opin Neurobiol 3: 558-562.
Pulleyn, L. J., Jackson, A. P., Roberts, E., Carridice, A., Muxworthy, C., Houseman, M., Al-Gazali, L. I., Lench, N. J., Markham, A. F., Mueller, R. F. (2000) A new locus for autosomal recessive non-syndromal sensorineural hearing impairment (DFNB27) on chromosome 2q23-q31. Eur J Hum Genet 8: 991-993.
RamShankar, M., Girirajan, S., Dagan, O., Ravi Shankar, H. M., Jalvi, R., Rangasayee, R., Avraham, K. B., Anand, A. (2003) Contribution of connexin26 (GJB2) mutations and founder effect to non-syndromic hearing loss in India. J Med Genet 40(5):e68.
Ramzan, K., Shaikh, R. S., Ahmad, J., Khan, S. N., Riazuddin, S., Ahmed, Z. M., Friedman, T. B., Wilcox, E. R., Riazuddin, S. (2005) A new locus for nonsyndromic deafness DFNB49 maps to chromosome 5q12.3-q14.1. Hum Genet 116: 17-22.
Raphael, Y., Altschuler, R. A. (2003) Structure and innervation of the cochlea. Brain Research Bulletin 60: 397-422.
Reardon, W. (1992) Genetic deafness. J Med Genet 29: 521-526.
Reardon, W. (1992) Genetic deafness. J Med Genet 29:521-526.
Reardon, W., Coffey, R., Chowdhury, T., Grossman, A., Jan, H., Britton, K., Kendall-Taylor, P., Trembath, R.(1999) Prevalence, age of onset, and natural history of thyroid disease in Pendred syndrome. J Med Genet 36(8): 595-598.
Riazuddin, S., Ahmed, Z. M., Fanning, A. S., Lagziel, A., Kitajiri, S., Ramzan, K., Khan, S. N., Chattaraj, P., Friedman, P. L., Anderson, J. M., Belyantseva, I. A., Forge, A., Riazuddin, S., Friedman, T. B. (2006b) Tricellulin is a tight-junction protein necessary for hearing. Am J Hum Genet 79(6): 1040-1051.
Riazuddin, S., Anwar, S., Fischer, M., Ahmed, Z. M., Khan, S. Y., Janssen, A. G. H., Zafar, A. U., Scholl, U., Husnain, T., Belyantseva, I. A., Friedman, P. L., Riazuddin, S., Friedman, T. B., Fahlke, C.(2009) Molecular Basis of DFNB73: Mutations of BSND Can Cause Nonsyndromic Deafness or

111
Bartter Syndrome, Am J Hum Genet. 85(2): 273-280.
Riazuddin, S., Castelein, C. M., Ahmed, Z. M., Lalwani, A. K., Mastroianni, M. A., Naz, S., Smith, T. N., Liburd, N. A., Friedman, T. B., Griffith, A. J., Riazuddin, S., Wilcox, E. R. (2000) Dominant modifier DFNM1 suppresses recessive deafness DFNB26 Nat Genet 26(4): 431-434.
Riazuddin, S., Khan, S. N., Ahmed, Z. M., Ghosh, M., Caution, K., Nazli, S., Kabra, M., Zafar, A. U., Chen, K., Naz, S., Antonellis, A., Pavan, W. J., Green, E. D., Wilcox, E. R., Friedman, P. L., Morell, R. J., Riazuddin, S., Friedman, T. B. (2006a) Mutations in TRIOBP, which encodes a putative cytoskeletal-organizing protein, are associated with nonsyndromic recessive deafness. Am J Hum Genet 78: 137-143.
Riazuddin, S., Nazli, S., Ahmed, Z. M., Yi Yang, Zulfiqar, F., Shaikh, R. S.,Zafar, A.U., Khan, S.N., Sabar, F., Javid, F. T., Wilcox, E. R., Tsilou, E., Erich T. Boger, E. T., James R. Sellers, J. R., Belyantseva, I. A., Riazuddin, S. and Friedman T. B.(2008) Mutation Spectrum of MYO7A and Evaluation of a Novel Nonsyndromic Deafness DFNB2 Allele with Residual Function. Hum Mutation 0: 1-10.
Richardson, G. P., Bartolami, S., Russell, I. J. (1990) Identification of a 275-kD protein associated with the apical surfaces of sensory hair cells in the avian inner ear. J. Cell Biol 110: 1055-1066.
Rickheit, G., Maier, H., Strenzke, N., Andreescu, C. E., De Zeeuw, C. I., Muenscher, A., Zdebik, A. A., Jentsch, T. J. (2008). Endocochlear potential depends on Cl- channels: mechanism underlying deafness in Bartter syndrome IV. EMBO J 27: 2907-2917.
Robles, L., and Ruggero, M. A. (2001) Mechanics of the mammalian cochlea.Physiol.Rev.81: 1305-1352.
Rodriguez-Ballesteros, M., Reynoso, R., Olarte, M., Villamar, M., Morera, C., Santarelli, R., Arslan, E., Meda, C., Curet, C., Volter, C., Sainz-Quevedo, M., Castorina, P., Ambrosetti, U., Berrettini, S., Frei, K., Tedin, S., Smith, J., Cruz Tapia, M., Cavalle, L., Gelvez, N., Primignani, P., Gomez-Rosas, E., Martín, M., Moreno-Pelayo, M. A., Tamayo, M., Moreno-Barral, J., Moreno, F., del Castillo, I.(2008). A multicenter study on the prevalence and spectrum of mutations in the otoferlin gene (OTOF) in subjects with nonsyndromic hearing impairment and auditory neuropathy. Hum Mutat 29(6):823-831.
Ruben R. J. (1991) The history of the genetics of hearing impairment Ann NY Acad Sci 630: 6-15.
Salt, A. N., Melichar, I., Thalmann, R. (1987) Mechanisms of endocochlear potential generation by stria vascularis. Laryngoscope 97: 984-991.
Santos, R. L., Hassan, M. J., Sikandar, S., Lee, K., Ali, G., Martin, P. E. Jr., Wambangco, M. A., Ahmad, W., Leal, S. M. (2006) DFNB68, a novel autosomal recessive non-syndromic hearing impairment locus at chromosomal region 19p13.2. Hum Genet 120: 85-92.
Santos, R. L., Wajid, M., Pham, T. L., Hussan, J., Ali, G., Ahmad, W., Leal, S. M. (2005) Low prevalence of Connexin 26 (GJB2) variants in Pakistani families with autosomal recessive non-syndromic hearing impairment. Clin Genet 67: 61-68.
Schaffer, A. A. (1996) Faster linkage analysis computations for pedigrees with loops or unused alleles. Hum Hered 46: 226-235.
Schultz, J. M., Khan, S. N., Ahmed, Z. M., Riazuddin, S., Waryah, A. M., Chhatre, D., Starost, M. F., Ploplis, B., Buckley, S., Velasquez, D., Kabra, M., Lee, K., Hassan, M. J., Ali, G. Ansar, M., Ghosh, M., Wilcox, E. R ., Ahmad, W., Merlino, G., Leal, S. M., Riazuddin, S., Friedman, T. B., Morell, R. J.(2009) Mutations affecting regulation of the HGF gene are the cause of nonsyndromic hearing loss DFNB39. Am J Hum Genet 85(1):25-39.
Schultz, J. M., Yang, Y., Caride, A. J., Filoteo, A. G., Penheiter, A. R., Lagziel, A., Morell, R. J., Mohiddin, S. A., Fananapazir, L., Madeo, A. C., Penniston, J. T., Griffith, A. J. (2005) Modification of human hearing loss by plasma-membrane calcium pump PMCA2. N Engl J Med. 352(15):1557-64.
Schwander, M., Sczaniecka, A., Grillet, N., Bailey, J. S., Avenarius, M., Najmabadi, H., Steffy, B. M., Federe, G. C., Lagler, E. A., Banan, R., Hice, R., Grabowski-Boase, L., Keithley, E. M., Ryan, A. F.,

112
Housley, G. D., Wiltshire, T., Smith, R. J., Tarantino, L. M., Müller, U.(2007) A forward genetics screen in mice identifies recessive deafness traits and reveals that pejvakin is essential for outer hair cell function.J Neurosci 27(9): 2163-2175.
Scott, D. A., Carmi, R., Elbedour, K., Yosefsberg, S., Stone, E. M., Sheffield, V. C. (1996) An autosomal recessive nonsyndromic-hearing-loss locus identified by DNA pooling using two inbred Bedouin kindreds. Am J Hum Genet 59: 385-391.
Scott, H. S., Kudoh, J., Wattenhofer, M., Shibuya, K., Berry, A., Chrast, R., Guipponi, M., Wang, J., Kawasaki, K., Asakawa, S., Minoshima, S., Younus, F., Mehdi, S. Q., Radhakrishna, U., Papasavvas, M. P., Gehrig, C., Rossier, C., Korostishevsky, M., Gal, A., Shimizu, N., Bonne-Tamir, B., Antonarakis, S. E. (2001) Insertion of betasatellite repeats identifies a transmembrane protease causing both congenital and childhood onset autosomal recessive deafness. Nat Genet 27(1): 59-63.
Shabbir, M. I., Ahmad, Z. M., Khan, S. Y., Riazuddin, S., Khan, S. N., Camps, R. D., Gosh, M., Kabra, M., Belyantseva, I. A., Friedman, T. B., Riazuddin, S. (2006) Mutations of human TMHS cause recessively inherited nonsyndromic hearing loss. J Med Genet 43(8): 634-640.
Shahin, H., Walsh, T., Sobe, T., Abu, Saeed, J., Abu Rayan, A., Lynch, E. D., Lee, M. K., Avraham, K. B., King, M. C., Kanaan, M. (2006) Mutations in a novel isoform of TRIOBP that encodes a filamentous-actin binding protein are responsible for DFNB28 recessive nonsyndromic hearing loss. Am J Hum Genet 78: 144-152.
Shaikh, R. S., Ramzan, K., Nazli, S., Sattar, S., Khan, S. N., Riazuddin, S., Ahmed, Z. M., Friedman, T. B., Riazuddin, S. (2005) A New Locus for Nonsyndromic Deafness DFNB51 Maps to Chromosome 11p13-p12. Am J Med Genet A 138(4): 392-395.
Slepecky, N.B. (1996) Structure of the mammalian cochlea. In: Dallos P, Popper AN, Fay RR. (eds) The Cochlea. New York: Springer; 44-129.
Steel, K.P., Kros, C.J. (2001) A genetic approach to understanding auditory function. Nat Genet 27: 143-149.
Stephens, S. D. G. (1985) Genetic hearing loss: A historical overview. Adv Audiol 3: 3-17.
Takahashi, J. S., Pinto, L. H., Vitaterna, M. H. (1994) Forward and reverse genetic approaches to behavior in the mouse. Science 264(5166): 1724-33.
Takeuchi, S., Ando, M., Kakigi, A. (2000) Mechanism generating endocochlear potential: role played by intermediate cells in stria vascularis. Biophys J. 79: 2572-2582.
Tariq, A., Santos, R. L., Khan, M. N., Lee, K., Hassan, M. J., Ahmad, W., Leal, S. M. (2006) Localization of a novel autosomal recessive nonsyndromic hearing impairment locus DFNB65 to chromosome 20q13.2-q13.32. J Mol Med 84(6): 484-490.
Tatusova, T., Madden, T. (1999) BLAST 2 Sequences, a new tool for comparing protein and nucleotide sequences. FEMS Microbiol Lett 174: 247-250.
Terwillger, J. D., Ott, J. (1994) Handbook of human genetic linkage (Baltimore, John Hopkins University Press).
Tlili, A., Männikkö, M., Charfedine, I., Lahmar, I., Benzina, Z., Ben Amor, M., Driss, N., Ala-Kokko, L., Drira, M., Masmoudi, S., Ayadi, H. A. (2005) Novel autosomal recessive non-syndromic deafness locus, DFNB66, maps to chromosome 6p21.2-22.3 in a large Tunisian consanguineous family. Hum Hered. 60(3): 123-128.
Tlili, A., Masmoudi, S., Dhouib, H., Bouaziz, S., Rebeh, I. B., Chouchen, J., Turki, K., Benzina, Z., Charfedine, I., Drira, M., Ayadi, H. (2007) Localization of a novel autosomal recessive non-syndromic hearing impairment locus DFNB63 to chromosome 11q13.3-q13.4.Ann Hum Genet 71: 271-275.
Tranebaerg, L. (2008) Genetics of congenital hearing impairment: a clinical approach. Int J Audiol. 47(9): 535-545.

113
Vahava, O., Morell, R., Lynch, E. D., Weiss, S., Kagan, M. E., Ahituv, N., Morrow, J. E., Lee, M. K., Skvorak, A. B., Morton, C. C., Blumenfeld, A., Frydman, M., Friedman, T. B., King, M. C., Avraham, K. B.(1998) Mutation in transcription factor POU4F3 associated with inherited progressive hearing loss in humans. Science. 279(5358):1870-1871.
Van Camp, G., Willems, P. J. and Smith, R. J. H. (1997) Nonsyndromic hearing impairment unparalleled heterogeneity. Am J Hum Genet 60:758-764.
Verpy, E., Masmoudi, S., Zwaenepoel, I., Leibovici, M., Hutchin, T. P., Del Castillo, I., Nouaille, S., Blanchard, S., Laine, S., Popot, J. L., Moreno, F., Mueller, R. F., Petit, C. (2001) Mutations in a new gene encoding a protein of the hair bundle cause non-syndromic deafness at the DFNB16 locus. Nat Genet 29: 345-349.
Veske, A., Oehlmann, R., Younus, F., Mohyuddin, A., Muller-Myhsok, B., Mehdi, S. Q., Gal, A. (1996) Autosomal recessive non-syndromic deafness locus (DFNB8) maps on chromosome 21q22 in a large consanguineous kindred from Pakistan. Hum Mol Genet 5: 165-168.
Wajid, M., Abbasi, A. A., Ansar, M., Pham, T. L., Yan, K., Haque, S., Ahmad, W. Leal, S. M. (2003) DFNB39, a recessive form of sensorineural hearing impairment, maps to chromosome 7q11.22-q21.12. Eur J Hum Genet 11: 812-815.
Walker, A. H., Najarian, D., White, D. L., Jaffe, J. F., Kanetsky, P. A, Rebbeck, T. R. (1999) Collection of genomic DNA by buccal swabs for polymerase chain reaction-based biomarker assays. Environ Health Perspect 107: 517-520.
Walsh, T. D., Shahin, H., Morrow, J., King, M. C., Lynch, E., Avraham, K., Kanaan M. (2000) DFNB28, a novel locus for prelingual nonsyndromic autosomal recessive hearing loss maps to 22q13 in a large consanguineous Palestinian kindred. Abstracts (Hereditary hearing loss homepage)
Walsh, T., Walsh, V., Vreugde, S., Hertzano, R., Shahin, H., Haika, S., Lee, M. K., Kanaan, M., King, M. C., Avraham, K. B. (2002) From flies' eyes to our ears: mutations in a human class III myosin cause progressive nonsyndromic hearing loss DFNB30. Proc Natl Acad Sci U S A 99: 7518-7523
Wang, A., Liang, Y., Fridell, R. A., Probst, F. J., Wilcox, E. R., Touchman, J. W., Morton, C. C., Morell, R. J., Noben-Trauth, K., Camper, S. A., Friedman, T. B. (1998) Association of unconventional myosin MYO15 mutations with human nonsyndromic deafness DFNB3. Science 280: 1447-1451.
Wangemann P (2006) Supporting sensory transduction: cochlear fluid homeostasis and the endocochlear potential. J Physiol 576: 11–21.
Waryah, A.M., Rehman, A.U., Ahmed, Z.M., Bashir, Z.H., Khan, S.Y., Zafar, A.U., Riazuddin, S., Friedman, T.B., Riazuddin, S. (2009) DFNB74, a novel autosomal recessive nonsyndromic hearing impairment locus on chromosome 12q14.2-q15.Clin Genet [Epub ahead of print].
Wayne, S., Robertson, N. G., DeClau, F., Chen, N., Verhoeven, K., Prasad, S., Tranebjarg, L., Morton, C. C., Ryan, A. F., Van Camp, G., Smith, R. J. H. (2001) Mutations in the transcriptional activator EYA4 cause late-onset deafness at the DFNA10 locus. Hum Mol Genet 10: 195-200.
Weil, D., Blanchard, S., Kaplan, J., Guilford, P., Gibson, F., Walsh, J., Mburu, P., Varela, A., Levilliers, J., Weston, M. D., Kelley, P. M., Kimberling, W. J., Wagenaar, M., Levi-Acobas, F., Larget-Piet, D., Munnich, A., Steel, K. P., Brown, S. D. M., Petit, C. (1995) Defective myosin VIIA gene responsible for Usher syndrome type IB. Nature 374: 60-61.
Weil, D., Kussel, P., Blanchard, S., Levy, G., Levi-Acobas, F., Drira, M., Ayadi, H. andPetit, C. (1997) The autosornal recessive isolated deafness, DFNB2, and the Usher 1B syndrome are allelic defects of the myosin-VIIA gene. Nat Genet 16: 191-193.
Wilcox, E. R., Burton, Q. L., Naz, S., Riazuddin, S., Smith, T. N., Ploplis, B., Belyantseva, I., Ben-Yosef, T., Liburd, N. A., Morell, R. J., Kachar, B., Wu, D. K., Griffith, A. J., Riazuddin, S., Friedman, T. B. (2001). Mutations in the Gene Encoding Tight Junction Claudin-14 Cause Autosomal Recessive Deafness DFNB29. Cell 104:165-172.
Woods, C. G., Cox, J., Springell, K., Hampshire, D. J., Mohamed, M. D., McKibbin, M., Stern, R.,

114
Raymond, F. L., Sandford, R., Malik, Sharif, S., Karbani, G., Ahmed, M., Bond, J., Clayton, D., Inglehearn, C. F. (2006) Quantification of homozygosity in consanguineous individuals with autosomal recessive disease. Am J Hum Genet 78(5): 889-896.
Yan, D., Liu, X.Z. (2008) Cochlear molecules and hereditary deafness. Front Biosci 13: 4972-4983.
Yasunaga, S., Grati, M., Cohen-Salmon, M., El-Amraoui, A., Mustapha, M., Salem, N., El-Zir, E., Loiselet, J., Petit, C. (1999) A mutation in OTOF, encoding otoferlin, a FER-1-like protein, causes DFNB9, a nonsyndromic form of deafness. Nat Genet 21: 363-369.
Zheng, L., Sekerkova, G., Vranich, K., Tilney, L. G., Mugnaini, E., Bartles, J. R. (2000) The deaf jerker mouse has a mutation in the gene encoding the espin actin-bundling proteins of hair cell stereocilia and lacks espins. Cell 102: 377-385.
Zwaenepoel, I., Mustapha, M., Leibovici, M., Verpy, E., Goodyear, R., Liu, X. Z., Nouaille, S., Nance, W. E., Kanaan, M., Avraham, K. B., Tekaia, F., Loiselet, J., Lathrop, M., Richardson, G., Petit, C. (2002) Otoancorin, an inner ear protein restricted to the interface between the apical surface of sensory epithelia and their overlying acellular gels, is defective in autosomal recessive deafness DFNB22. Proc Natl Acad Sci USA 99: 6240-6245.

115
ELECTRONIC DATABASE INFORMATION URL’s mostly used are: Applied Biosystems:
www.appliedbiosystems.com
Center for Medical Genetics, Marshfield Medical Research Foundation:
http://research.marshfieldclinic.org/genetics/
CEPH Database World Wide Web server:
http://www.cephb.fr/
Connexins and deafness Homepage:
http://www.crg.es/deafness/
Ensembl Genome Browser:
http://www.ensembl.org/
Gene Cards:
http://www.genecards.org/
GeneTests Web site:
http://www.genetests.org/
The GDB Human Genome Database:
http://www.gdb.org/
Hereditary Hearing Impairment in Mice:
http://www.jax.org/hmr/
Hereditary Hearing Loss Homepage:
http://dnalab-www.uia.ac.be/dnalab/hhh/
Mouse Genome Informatics:
http://www.informatics.jax.org/
National Center for Biotechnology Information (NCBI):
http://www.ncbi.nlm.nih.gov/
National Institutes of Health (NIH):
http://www.nih.gov/
Online Mendelian Inheritance in Man (OMIM):
http://www.ncbi.nlm.nih.gov/entrez/OMIM/
Primer3 Web-Based Server:
http://frodo.wi.mit.edu/cgi-bin/primer3/primer3_www.cgi/
PubMed (NCBI):
http://www.ncbi.nlm.nih.gov/entrez/query.fcgi/
The 1993-1994 Genethon human genetic linkage map:
http://www.cephb.fr/genetic/

116
The Human Genome Organization (HUGO):
http://www.gene.ucl.ac.uk/hugo/
The Wellcome Trust Sanger Institute:
http://www.sanger.ac.uk/
UCSC Genome Browser (May 2004 assembly):
http://genome.ucsc.edu/