MORE THAN MEETS THE EAR
73
MASTER THESIS SUBMITTED IN PARTIAL FULFILLMENT OF THE REQUIREMENTS FOR THE DEGREE OF MASTER OF SCIENCE IN COMMUNICATION STUDIES AT THE FACULTY OF BEHAVIOURAL, MANAGEMENT AND SOCIAL SCIENCES AT THE UNIVERSITY OF TWENTE, ENSCHEDE, THE NETHERLANDS. MORE THAN MEETS THE EAR THE EFFECT OF NON-LINGUISTIC SIGNALING ON TRUST IN TELE- AND VOICE MARKETING Philipp Dengler S2206927 FACULTY OF BEHAVIOURAL, MANAGEMENT AND SOCIAL SCIENCES COMMUNICATION STUDIES SPECIALIZATION: DIGITAL MARKETING EXAMINATION COMMITTEE Dr. A.D. Beldad Drs. M. H. Tempelman SEPTEMBER 2019
-
Upload
khangminh22 -
Category
Documents
-
view
1 -
download
0
Transcript of MORE THAN MEETS THE EAR

MASTER THESIS SUBMITTED IN PARTIAL FULFILLMENT OF THE REQUIREMENTS FOR THE DEGREE OF MASTER OF SCIENCE IN COMMUNICATION STUDIES AT THE FACULTY OF BEHAVIOURAL, MANAGEMENT AND SOCIAL SCIENCES AT THE UNIVERSITY OF TWENTE, ENSCHEDE, THE NETHERLANDS.
MORE THAN MEETS THE EAR THE EFFECT OF NON-LINGUISTIC SIGNALING ON TRUST IN TELE- AND VOICE MARKETING
Philipp Dengler S2206927
FACULTY OF BEHAVIOURAL, MANAGEMENT AND SOCIAL
SCIENCES
COMMUNICATION STUDIES SPECIALIZATION: DIGITAL MARKETING
EXAMINATION COMMITTEE
Dr. A.D. Beldad Drs. M. H. Tempelman
SEPTEMBER 2019

Dengler, P. (2019) MORE THAN MEETS THE EAR
ABSTRACT
In telemarketing refusal rates are often very high and research with the focus on the field of
non-linguistic expressions is limited. By manipulating speech rate, fluency and intonation,
the proposed study investigated the effect of non-linguistic speech variables, on the
conversion intention in persuasive approaches, mediated by trust in the speaker based on
perceived warmth and competence. A scenario-based 2 (high versus low speech rate) × 2
(high amounts versus low amounts of fluency) × 2 (weak versus strong intonation) factorial
design was employed to examine the effect of these vocal characteristics on the mediator's
warmth and competence and the intent to convert. The between-subjects experiment was
executed with 209 German participants (Mean age = 31.06). 8 manipulated stimuli exhibiting
the researched characteristics were employed simulating the opening approach of a telephone
survey. The study resulted in significant effects of speech rate for both mediators, fluency on
competence and intonation on warmth, with full and partly mediations occurring displaying
strong indirect mediation effects. Furthermore, a significant interaction effect for fluency and
intonation on conversion intention was found. In conclusion vocal variables such as speech
rate, fluency and intonation are strong indicators for the perception of warmth and
competence. Furthermore, enthusiastic intonation can be seen as a strong indicator for high
perceived warmth, while a fluent way of speaking predicts a highly perceived competence.
As a consequence, these results imply several applications for enhancing persuasiveness in
persuasive calls and the creation of interactive voice marketing.
Keywords:
telemarketing, voice marketing, non-linguistic, signaling, warmth and competence,
conversion intention

Dengler, P. (2019) MORE THAN MEETS THE EAR
3
TABLE OF CONTENTS
INTRODUCTION .................................................................................................................................6
THEORETICAL FRAMEWORK .....................................................................................................11
PERSUASION AND BEHAVIORAL INTENTION ......................................................................................11
NON-LINGUISTIC SIGNALING ...............................................................................................................12
TRUST BASED ON WARMTH AND COMPETENCE ..................................................................................13
MEASUREMENT OF NON-LINGUISTIC SIGNALING...............................................................................14
THE IMPACT OF SPEECH RATE (HIGH SPEECH RATE VERSUS LOW SPEECH RATE) ........................16
THE IMPACT OF FLUENCY OF SPEECH (FLUENT VERSUS INTERRUPTED BEHAVIOR) ......................18
THE IMPACT OF VARYING INTONATION (EMPHATIC INTONATION VERSUS MONOTONOUS
INTONATION).........................................................................................................................................19
HYPOTHESES PERTAINING TO THE INTERACTION EFFECTS OF SPEECH RATE, FLUENCY, AND
INTONATION ..........................................................................................................................................22
MEDIATION EFFECTS OF WARMTH AND COMPETENCE .....................................................................23
CONCEPTUAL RESEARCH MODEL ........................................................................................................24
METHODOLOGY ..............................................................................................................................25
RESEARCH DESIGN ...............................................................................................................................25
STIMULUS MATERIALS .........................................................................................................................25
PRELIMINARY STUDY ...........................................................................................................................27
ACOUSTIC PROPERTIES .......................................................................................................................28
MAIN STUDY .........................................................................................................................................31
SAMPLE AND DATA COLLECTION ........................................................................................................32
SCALE CONSTRUCTION ........................................................................................................................34
FACTOR AND RELIABILITY ANALYSIS. ...................................................................................................35

Dengler, P. (2019) MORE THAN MEETS THE EAR
4
RESULTS .............................................................................................................................................37
MANIPULATION CHECKS .....................................................................................................................37
HYPOTHESES PERTAINING TO THE MAIN EFFECTS OF SPEECH RATE, FLUENCY, AND
INTONATION ..........................................................................................................................................38
SPEECH RATE. ........................................................................................................................................39
FLUENCY. ...............................................................................................................................................40
INTONATION. ..........................................................................................................................................41
HYPOTHESES PERTAINING TO INTERACTION EFFECTS ....................................................................43
HYPOTHESES PERTAINING TO MEDIATING EFFECTS OF TRUST (COMPETENCE AND WARMTH) .44
SPEECH RATE MEDIATED THROUGH WARMTH AND COMPETENCE. .......................................................45
FLUENCY MEDIATED THROUGH COMPETENCE.......................................................................................46
INTONATION MEDIATED THROUGH WARMTH. .......................................................................................47
OVERVIEW OF THE TESTED HYPOTHESES .........................................................................................49
DISCUSSION .......................................................................................................................................50
DISCUSSION OF MAIN EFFECTS AND INTERACTION EFFECTS ..........................................................50
DISCUSSION OF MEDIATING EFFECTS ................................................................................................52
IMPLICATIONS AND FUTURE RESEARCH RECOMMENDATIONS ........................................................53
SCIENTIFIC IMPLICATIONS. ....................................................................................................................53
PRACTICAL IMPLICATIONS. ....................................................................................................................54
LIMITATIONS AND RECOMMENDATIONS FOR FUTURE RESEARCH. ........................................................56
CONCLUSION .........................................................................................................................................58
REFERENCES ....................................................................................................................................60
APPENDICES ......................................................................................................................................70

Dengler, P. (2019) MORE THAN MEETS THE EAR
5
APPENDIX 1 ...........................................................................................................................................70
APPENDIX 2 ...........................................................................................................................................71
APPENDIX 3 ...........................................................................................................................................72
APPENDIX 4 ...........................................................................................................................................72

Dengler, P. (2019) MORE THAN MEETS THE EAR
6
Introduction
First impressions when meeting people, be it in person or mediated, are quickly formed even
when very limited information is available (Baus, McAleer, Marcoux, Belin, & Costa, 2019).
While measuring facial expressions is often the most common object of study, the focus on
vocal expression is less common (Laukka, Juslin, & Bresin, 2005). Speech is an important
communicator of social signals in our day to day life, ranging from face-to-face
conversations to phone calls and human-computer interaction. According to Mehrabian and
Ferris (1967) 38% of the perceived communication is based on the tone of voice. While the
generalization of this study has been criticized (Knapp, Hall & Horgan, 2013; Yaffe, 2011),
the use of language in verbal communication, carries with it several non-linguistic features
that determine considerable amounts of the social phenomena (Stoltzman, 2006). This study
will focus on the universal non-linguistic signals speech rate, fluency and intonation, firstly
explaining the specific characteristics and secondly researching their effect on perceived first
impressions. In contrast to cultural and individual factors such as gender, these three vocal
characteristics are found to be predominately significant (Frick, 1985; Gélinas-Chebat,
Chebat, & Boivin,1999; Belin, Boehme & Mc Aleer, 2017).
In telemarketing first impressions formed by social signals impact the success rate, especially
in cold calls (Stoltzman, 2006). A cold call is defined by directly approaching a target (e.g.
potential customers) with a telephone call without prior contact (Merriam-Webster’s
Collegiate Dictionary, 2019). These calls might be aimed at persuading the listener into an
intriguing conversation, participating in a survey, fixing an appointment or closing a sale. In
the business and marketing realm the success rate is usually measured by conversion
(Nielsen, 2013). Conversion studies analyze whether recipients of marketing activities
convert into further engagement with a brand as result of successful persuasion (Pratt,
McCabe, Cortes-Jimenez, & Blake, 2010). In conclusion this conversion intention is the

Dengler, P. (2019) MORE THAN MEETS THE EAR
7
outcome metric to indicate successful persuasion. Success in telemarketing is still a field that
needs exploration, due to contradicting findings of successful persuasion (Oksenberg,
Coleman, & Cannell, 1986; Gélinas-Chebat et al., 1999; Knapp et al., 2013) Especially in
telemarketing refusal rates are very high, due to the reduced signaling channel, the anonymity
and the non-committal nature of phone calls (Gélinas-Chebat et al., 1999). The non-linguistic
components of interpersonal communication often determine the outcome of employee-
customer interactions (Sundaram & Webster, 2000). Hence, this study focusses on how
characteristics of non-linguistic signals, may relate to the acceptance or rejection of the
persuasive approach, measured by the conversion intention.
According to Levitan, Maredia and Hirschberg (2018) the success of a persuasion attempt
depends on the establishment of trust in an interaction. In relation to the conversion intention,
this implies that higher trust leads to a higher success rate. The social phenomena of trust can
be described along the two spectrums of warmth and competence (Fiske, Cuddy, & Glick,
2007), which determine the development of first impressions (Broome, 2015). While the
dimension of warmth explains the intentions, perceived competence relates to the ability to
carry them out. In current telemarketing research the model proposed by Fiske et al. is
commonly used to explain the impact of non-linguistic characteristics on trust regarding the
development of first impressions (Broome, 2015, 2017; Ponsot, Burred, Belin, &
Aucouturier, 2018). Understanding what signals and cues activate behavioral patterns of trust
is crucial for further understanding of how the conversion intention can be increased. If
characteristics of trustworthy speech are understood, people in communication positions or
social robots can leverage their trustworthieness. Understanding the non-linguistic
characteristics that impact trust in a speaker, can further strengthen existing research in the
field (Broome, 2017).

Dengler, P. (2019) MORE THAN MEETS THE EAR
8
Findings on the effects of non-linguistic signals tend to be contradicting (Gélinas-Chebat et
al., 1999), requiring further research and improved research methods.
Currently two main streams of research can be identified. One relies on experimental studies,
experimenting with several recordings of different speakers that are being judged by
respondents according to wide ranges of attributes (Broome, 2015; Ketrow, 1990). The other,
more current stream focuses on the impact of single words (Belin et al., 2017; Schröder,
Stone, & Birkholz, 2017; Ponsot et al., 2018). Since the words are digitally manipulated, high
comparability of the results can be achieved. This study proposes a combined research model
to close the gap between these two streams.
Regarding the practical relevance of the study, the common method to analyze the
effectiveness of conversations in call-centers is executed in the conversion of speech to text,
which often returns poor accuracies especially in noisy or fast-paced conversations
(Kopparapu, 2015). A focus on non-linguistic features comes with the advantage of analyzing
the success factors for persuasion without regarding the actual content of speech. Findings of
this study may give insights for the development of a tool that analyzes non-linguistic cues.
This can serve as feedback and instruction for agents on how to improve their interaction
with customers or nudge them in the right direction during the call.
Novel findings on non-linguistic signaling can also be useful to human-computer interaction.
Lately, research on the design and modulation of voice has gained lots of traction due to the
popularity of Voice UX and chatbots. These channels primarily work with the intent to
interact only through verbal dialog and demand intricate knowledge of how people
communicate while only using language and non-linguistic signals (Salah, Pantic, &
Vinciarelli, 2011). As computers become new interaction partners for humans, social signals
become increasingly valuable in the transmission of messages. In addition to semantic
understanding, a machine has to be able to receive and send affective signals. These social

Dengler, P. (2019) MORE THAN MEETS THE EAR
9
signaling elements require many improvements in the fields of computer, social, and
communication sciences, to provide useful concepts and models. As voice marketing
becomes an emerging and promising field in the digital marketing environment (Sotolongo &
Copulsky, 2018), parallels between the fields of telemarketing and voice marketing could
lead to new conclusions on how to design conversational interfaces based on non-linguistic
signals examined in this study.
The study aims to show how non-linguistic signals impact the success of the conversion rate
in persuasive phone calls. This should result in conclusions that indicate concrete
implications on how to act in calling situations, verbal interaction and dialogue design to
increase persuasiveness. In consequence, this leads us to the following research questions:
Research Question 1: How do the non-linguistic variables (speech rate, fluency,
intonation) impact the conversion intention in persuasive cold calls?
Research Question 2: How do the non-linguistic variables (speech rate, fluency,
intonation) impact the mediators of perceived warmth and competence of the speaker?
Research Question 3: How are the perceptions of warmth and competence mediating
the impact on the conversion rate?
The research design for this thesis analyzes the non-linguistic cues and their impact on the
conversion intention of participants. Based on current research the three non-linguistic
independent variables speech rate, fluency and intonation were deducted, measuring their
effect on the dependent variable conversion intention. Furthermore, the assumed mediating
effects of the variables of warmth and competence were examined. To test the hypotheses

Dengler, P. (2019) MORE THAN MEETS THE EAR
10
proposed for this research, an experimental study using a telephone survey context was
conducted, employing a between-subjects 2 (high versus low speech rate) × 2 (high amounts
versus low amounts of fluency) × 2 (weak versus strong intonation) factorial design with 209
German respondents.

Dengler, P. (2019) MORE THAN MEETS THE EAR
11
Theoretical Framework
Persuasion and Behavioral Intention
The delivery of speech has been stressed as important in many public speaking and sales
textbooks. Delivery of speech, rather than the content, have been the focus of rhetoric
research dating back to the ancient Greek philosophers. Studies showing that delivery as
variable had an impact were almost always proven (Knapp et al., 2013). This also holds true
in the environment of tele- and voice marketing in which the persuasion attempt is directed at
marketing goods or services with the restriction to the audio communication channel
(Merriam-Webster’s Collegiate Dictionary, 2019). Aims of those activities are for instance,
convincing people to schedule a meeting or persuading target to part take in a research study
(Stoltzman, 2006; Broome, 2017).
Broome considers the introduction of the interview as the most crucial aspect in the
procedure of telemarketing persuasion. According to the Theory of Planned Behavior (Ajzen,
1991), the perception of the introduction, in interplay with an individual’s attitude, normative
beliefs, and perceived behavioral control, leads to behavioral intention, which then relates to
the actual performance of that behavior. Attitudes are formed on the basis of the perceptions
of a caller's persuasive attempts, which in turn, influence the respondents intention to further
engage with the caller, leading to conversion. Focusing on the behavioral intention to convert
instead of the actual behavior is particularly useful to rule out distorting factors such as time
constraints and situational barriers (e.g. wrong time and place to call) (Broome, 2015). The
customer intention is a crucial requirement for participation in further engagement during a
cold call by an unknown researcher or salesperson.

Dengler, P. (2019) MORE THAN MEETS THE EAR
12
Non-linguistic Signaling
Broome (2017) divides the elements of persuasion in telemarketing into the groups of speech
(what is being said) and vocal characteristics (how it is being said). The way in which
something is communicated, often holds as much importance as its content (Stoltzman,
2006). These vocal characteristics function as social signals, that directly or indirectly convey
information about social action, interactions, emotions, attitudes and relationships (Poggi &
D'Errico, 2010). Even without semantic understanding of words, prototypical signals display
differences of gender, dominance, emotions and so forth communicated through the variation
of pitch, speech rate, intensity and tone of voice as well as facial expressions (Salah et al.,
2011; Knapp et al., 2013). The voice can be considered as an ‘auditory face’ containing
linguistic information (e.g. phonemes) but also cues of personal biological characteristics
(e.g. gender, age, size) (Belin, Bestelmeyer, Latinus, & Watson, 2011). Even though Scherer
(1979) found that cultural differences in the perception of these signals exist, Frick (1985)
suggests that prosodic signals, such as speech rate, fluency or intonation are evolved patterns
of communicating, which appear to be largely similar across different individuals and
cultures. This is supported by Gélinas-Chebat et al. (1999), who found no significant impact
in regard to the gender's source or the respondents' gender when exposed to a telemarketing
activity. These gender-independent mechanisms were also suggested in a current study by
Belin, Boehme and Mc Aleer (2017).
Especially Pentland (2010) and Stoltzman’s (2006) research on non-linguistic signals as
predictors for the perception of trust and conversion intention, coined the term of honest
signaling. Honest signals act as strong early predictors of sales call closings, salary
negotiation outcomes and success of pitching business ideas (Pentland, 2010). Since these
non-linguistic signals are more difficult to control, they provide a sounder source of
information regarding the internal states and dispositions of the sender (Lepri et al., 2010).

Dengler, P. (2019) MORE THAN MEETS THE EAR
13
While perceiving messages, these cues form more reliable indicators of emotions expressed,
than the content itself (Sundaram & Webster, 2000). Attempts to intentionally manipulate
and fake honest signals are usually unsuccessful since social signaling can be tested through
interaction (Lepri et al., 2010). DePaulo (1992) also suggests that these signals are more
difficult to suppress or fake and emphasizes their accessibility to external observers.
Trust based on warmth and competence
The signaling of trustworthy cues is a crucial element for developing and improving
telemarketing activities (Levitan et al., 2018). During the first research experiments lists of
adjectives were used to characterize trustworthy traits, which were consequently clustered
into groupings along the lines of ‘social good-bad’ and ‘intellectual good-bad’ (Ash, 1946;
Rosenberg, Nelson, & Vivekananthan, 1968). Apple, Streeter and Krauss (1979) correlated
them to the major personality dimensions of "competence" and "benevolence". While similar
models for understanding persuasiveness based on trust were developed (cf. Fogg, 2002;
McAleer, Todorov, & Belin, 2014), Fiske et al. (2007) proposed a model that appears to be
the most common and reliable when analyzing non-linguistic signals (Broome, 2015, 2017;
Ponsot et al., 2018). Fiske et al. further developed the model proposed by Apple et al.,
differentiating people by their warmth (likability, honesty, friendliness) on the social
dimension and by competence (respecting, agency, efficiency) on the intellectual dimension.
The combination of these two dimensions form the perceived trust in the sender and impact
the effectiveness of the persuasion (Broome, 2017).
According to Fiske et al. (2007), the perception of warmth relates to first assessing people's
intentions, before determining their ability to carry them out. It is argued that these
dimensions reflect survival value, based on the assessment of the perceived potential threat.
As an evolved aspect of social perception, this can be connected to the social signaling

Dengler, P. (2019) MORE THAN MEETS THE EAR
14
theory, in which cues are assessed in a similar way (Koenig & Stephens, 2014). Especially in
credence-based services, when quality and competence is difficult to assess, customers rely
heavily on nonverbal signals that significantly impact their perception of trust (Sundaram &
Webster, 2000).
Regarding the importance of the variables research results differ. According to Solomon and
Flores (2003), the most important condition of trust is the competence of the person trusted.
In a complex world that is too complicated to exhibit expertise in every discipline, trust in the
competence of specialists is inevitable. Especially the own assessment of competence can not
be stressed enough, to establish trustful relationships and minimize disappointment.
Contradicting this notion is the fact that information about warmth is cognitively easier to
perceive than cues of competence, with moral-social judgments occurring first. Warmth
judgments seem prioritized for the establishment of trust. Chaiken and Eagly (1983) found
that especially the trait of likability is an indicator of effective persuasion. According to Baus
et al. (2019), the individual importance of warmth and competence remains unclear,
especially due to opposing research results.
Measurement of non-linguistic signaling
Since measuring paralanguage is a complex procedure, many different techniques and
methods for studying the role of non-linguistic cues have been developed (Scherer, 2003).
Currently two main streams of research can be identified. One relies on experimental studies,
experimenting with several recordings of different speakers that are being judged by
respondents according to wide ranges of attributes based on their previous experiences,
attitudes and beliefs (Broome, 2015; Ketrow, 1990). This research stream is more common
for earlier studies, since the necessary computing power to manipulate the recordings was not
available to researches at the time (Brown, Strong and Rencher, 1973). Even though this

Dengler, P. (2019) MORE THAN MEETS THE EAR
15
research approach reduces the impact of cultural and gender differences by incorporating a
variety of different speakers, it leads to less comparable and reliable results.
More current research focuses on the impact of specific characteristics. Since the words are
digitally manipulated high comparability of the results can be achieved. On the downside
these manipulations lead to artificial sounding stimuli, which might have led to distorted
research results (cf. Belin et al., 2017; Schröder et al., 2017; Ponsot et al., 2018).
Measuring specific characteristics can give insights about the effect of acoustic properties,
like speech rate, fundamental frequency (f0) and intensity perceived as loudness (Knapp et
al., 2013). These can subsequently be described dynamically in terms of range, variation, and
contour. Laukka et al. (2005) divided their studied vocal expressions into (a) f0, (b)voice
intensity, (c) voice quality, and (d) temporal aspects of speech. Oksenberg et al. (1986) also
added pronunciation and speaking skill, researching personal attributes signaled by voices.
The aforementioned study by Stoltzman (2006) assigned vocal characteristics according to
their developed behavioral model of activity and emphasis. Activity, on the one hand, is
described as a combination of speaking time, length of phrases and speed rate that indicates
the outward projection in a state of social offering. The emphasis, on the other hand, is
defined as a combination of variation in loudness, pitch, and spectral entropy, that can be
seen as a state of social invitation, signaling openness to comment or requesting new
information (Stoltzman, 2006). Since this study focuses especially on first impressions,
activity and emphasis as seen from a conversational perspective are not adequate independent
variables. Other research focused on first impressions suggests that fluent, non-hesitant
speech, higher pitch variation, louder voice and faster speech rate in general function as
variables for persuasion (Burgoon, Birk, & Pfau, 1990; Leigh & Summers, 2002; Broome,
2017). Therefore, a different clustering of non-linguistic characteristics was chosen,

Dengler, P. (2019) MORE THAN MEETS THE EAR
16
combining and adapting the established elements of existing research on first impressions.
Namely, the variables of speech rate, fluency, and intonation.
The impact of Speech Rate (High Speech rate versus low speech rate)
Speech rate can be defined as a number of words or syllables uttered in a specific period, e.g.
second or minute (Tusing, 2005). It indicates the rate and the length of a spoken segment and
is a fundamental variable in all emotional expressions (Eyben, et al., 2015). Although the
judgment of speech rate is biased by the comparison with the listeners to their speed of
speech (Buller, 2005), the literature corpus defines approximate speech rates. According to
Broome (2017), an ideal speech rate for obtaining cooperation lies around 200 words per
minute, while a slow speech rate can be considered from around 140 words per minutes
downwards. Ketrow (1990) indicates a similar, though somewhat slower range for high
speech rate of approximately 150-200 words per minute. Important to note is that overly high
or low speech rates are perceived as less credible (Schröder et al., 2017) and tend to be less
successful in persuasion (Broome, 2017).
Scherer (2003) found that judgments of percipients were highly influenced by variations of
pitch and speed: Fast tempo was attributed to highly active and potent emotions like interest,
anger, and happiness, while slow speed was associated with sadness, disgust, and boredom.
Regarding competence, a tendency of relatively fast fluent speech can be seen as being
perceived as competent (Apple et al., 1979; Ketrow, 1990; Knapp et al., 2013; André, Petr,
André, Hausberger, & Lemasson, 2016), credible, dominant (Ketrow, 1990) and more
persuasive (Gélinas-Chebat et al., 1999). Oksenberg et al. (1986) found that faster speakers
are also rated more intelligent, knowledgeable and objective than slow speakers. This leads
us to conclude the following hypothesis:

Dengler, P. (2019) MORE THAN MEETS THE EAR
17
Hypothesis 1: The perception of competence is (a) higher when respondents are
exposed to a high speech rate and (b) lower when respondents are exposed to low
speech rate.
In contrast, slow-talking men are judged less truthful, less fluent, less emphatic, less serious
and also less persuasive, with the only upside of being seen as more potent (Brown et al.,
1973; Apple et al., 1979). Even though Brown et al., describe a higher speech rated to be
rated less ‘benevolent’ (cf. Fiske et al. 2007), Apple et al. (1979) refuted this argument by
demonstrating that their measurements relied on extreme values, while the benevolence
dimension yields an inverted-U relationship, tending to be perceived less warm towards the
extremes of speech rate. According to Levitan et al. (2018) truthfulness displays a rather high
speaking rate. It signals the speaker's familiarity and eases with the topic, which inspires trust
in the listener, leading us to the following hypothesis:
Hypothesis 2: The perception of warmth is (a) higher when respondents are exposed to
a high speech rate and (b) lower when respondents are exposed to low speech rate.
Regarding the conversion intention previous research indicates clearly that increased speech
rate is linked to persuasiveness (Oksenberg et al., 1986; Stoltzman, 2006; Knapp et al., 2013;
André et al., 2016), while slow-talking speech is judged as less persuasive (Apple et al.,
1979). Knapp et al. (2013) argue that this persuasive effect might be due to the increased
cognitive processing or distraction by the faster speech rate, which hinders the development
of counter arguments in our heads. Oksenberg et al. (1986) found that increased speech rate
led to lower refusal rates of interviewers. Consequently, it is hypothesized that the differences
of speech rate impact the dependent variable conversion intention in the following ways:
Dengler, P. (2019) MORE THAN MEETS THE EAR
18
Hypothesis 3: The conversion intention (a) increases when respondents are exposed to
a high speech rate and (b) decreases when respondents are exposed to low speech rate.
The impact of fluency of speech (Fluent versus interrupted behavior)
Fluency as a variable is less discussed in existing research, but according to Schröder et al.
(2017) it has a significant impact on the perception of the speaker. The variable can be
described as the uninterrupted flow of speech, that apart from conscious grammatical pauses,
is mainly focused on precise and coherent expression (Knapp et al., 2013). Levitan et al.
(2018) argue that fluent speech signals the speaker's familiarity and ease with the topic and
inspires trust in the listener. In contrast to the variable of speech rate the vocal characteristics
do not rely on speed in which an utterance occurs, but rather on how uninterrupted it is
expressed. Especially filled pauses with phonations such as "um" or "uh", are associated with
undesirable characteristics (Apple et al., 1979; Knapp et al., 2013). Hesitance in spoken text
and interruptive pauses between sentences and words stutters mainly lead to a decrease in
credibility and competence (Knapp et al., 2013). According to Ketrow (1990) fluent speech,
precise articulation, and pronunciation, as well as the absence of unnatural hesitations,
disfluencies or multiple pauses are a salient factor for judgments on competence. More fluid,
certain and assertive manners of speaking function as predictors for higher perceived
competence (Leigh & Summers, 2002; Anderson & Kilduff, 2009). Therefore, the following
hypothesis is derived:
Hypothesis 4: The perception of competence is (a) higher when respondents are
exposed to a high fluency and (b) lower when respondents are exposed to low fluency.

Dengler, P. (2019) MORE THAN MEETS THE EAR
19
Regarding the effect of fluency on warmth, little is said in existing research. Knapp et al.
(2013) state that too many unfilled pauses cause listeners to be perceived as anxious or bored,
displaying characteristics of low likability and warmth. In general, highly hesitant or
disfluent speakers are assigned relatively undesirable personality traits and perceived less
credible (Apple et al., 1979). According to André et al. (2016) these speakers are considered
less benevolent. One hypothesis can be that, decreased fluency signals forms of difficulty and
general less perceived warmth. Hence, the following hypothesis is developed:
Hypothesis 5: The perception of warmth is (a) higher when respondents are exposed to
high fluency and (b) lower when respondents are exposed to low fluency.
Concerning the impact of fluency conversion intention, less halting and more fluent speech is
usually considered to be more persuasive (Oksenberg et al., 1986; Leigh & Summers, 2002;
Knapp et al., 2013) and leading to higher conversion intention (Knapp et al., 2013). On the
contrary many pauses may receive negative evaluations from listeners, decreasing the
conversion intention (Apple et al., 1979; Knapp et al., 2013). Following impact of the
variations of fluency is hypothesized:
Hypothesis 6: The conversion intention (a) increases when respondents are exposed to
high fluency and (b) decreases when respondents are exposed to low fluency.
The impact of varying intonation (Emphatic intonation versus monotonous intonation)
Intonation is described as a combination of f0 fundamental frequency of the voice, the f0
variations and levels of intensity, measured in dB, in which the speech is uttered. (Scherer,
Banse, Wallbott & Goldbeck, 1991; Tusing, 2005). Listeners perceive the f0 fundamental

Dengler, P. (2019) MORE THAN MEETS THE EAR
20
frequency as the general pitch in which a person speaks e.g. a deep voice versus a high-
pitched voice, while the f0 variations describe the dynamics of the pitch and levels of
intensity the loudness.
The effects of intonation are discussed controversially in the current research corpus. In
general, a direct and enthusiastic approach with a friendly manner, positive mood and
genuine interest is expressed by higher amounts of intonation and has positive effects on the
conversion intention (Hüfken & Schäfer, 2003). Firstly, the f0 fundamental frequency is a
strong predictor for the attribution of positive and negative personality traits. Men with high-
pitched voices are perceived as less truthful, less persuasive, weaker and more nervous
(Apple et al., 1979; Schröder et al., 2017). This is due to the signaling of emotions like worry
and anxiety, who display an increased number of f0 (Scherer, 1986). Messages that were
judged deceptive are generally displaying a greater pitch and intensity. (Levitan et al., 2018).
Even though stating that lower pitch tends to be perceived as more competent Broome (2017)
debates the universality of this. In the article successful persuasion in phone surveys is
correlated also with a higher perceived pitch.
Second, a high intensity of the uttered words displays a powerful speaking style often
associated with competence, status, and success. Remland and Jones (1994) suggest that a
moderately loud tone of voice leads to more compliance and trust. Especially soft vocal-
intensity showed low levels of compliances, assumingly due to signaling of less potency,
salience, and dominance. Gélinas-Chebat et al. (1999) found that speakers who talk more
loudly are perceived as being more able to articulate their arguments and are consequently
perceived as more credible and trustworthy leading to higher degrees of persuasiveness (also
see Broome, 2017; Hüfken & Schäfer, 2003).In the context of telemarketing loudness has a
diminished role, since the mediation through the microphone or telephone usually produces
equally distributed amounts of loudness (Scherer et al., 1991). While Ketrow (1990) and

Dengler, P. (2019) MORE THAN MEETS THE EAR
21
Knapp et al. (2013) also see moderately loud speech as a predictor for higher perceived
competence, both stress the point of dynamic delivery. Higher amounts of pitch variation lead
to an increased perception of dynamism, confidence, intelligence, and status. On the contrary,
Hüfken and Schäfer (2003) revealed that variations in pitch should be minimized to increase
effective persuasion. This was also suggested by Stoltzman (2006) proposing that the
behavioral signal of emphasis, namely variation in loudness, pitch and spectral entropy,
should be low for successful persuasion. Since variations of pitch underline emphasis and
invite people conversationally, the contradictory results might hold for the presentation of
pitches. They need to be reconsidered in the context of telemarketing. Hence, the following
hypothesis is derived:
Hypothesis 7: The perception of competence is (a) higher when respondents are
exposed to high variations of intonation and (b) lower when respondents are exposed to
low variations of intonation.
Scherer et al. (1991) describe positive emotions such as joy with moderate increases in f0
pitch, while emotions such as sadness are usually expressed with decreases in the pitch
variations. Belin et al. (2017) and Ketrow (1990) also indicate that traits of attractiveness and
trustworthiness are attributed to higher f0 variation. Andrè et al. (2016) found that less
monotonous voices with frequent frequency changes are associated with more positive and
warm personalities. These results are similar to findings demonstrating that increased
intonation leads to higher perceived benevolence (Brown et al., 1973).

Dengler, P. (2019) MORE THAN MEETS THE EAR
22
Hypothesis 8: The perception of warmth is (a) higher when respondents are exposed to
high variations of intonation and (b) lower when respondents are exposed to low
variations of intonation.
Regarding the effect of intonation on conversion intention, the findings are somewhat
contradictory. While Stoltzman (2006) indicates that persuasive speakers employ well-
regulated volume dynamics, most researchers found a variety in volume, pitch and
articulation leads to higher conversion intentions (Oksenberg et al., 1986; Leigh & Summers,
2002; Knapp et al., 2013). Especially speakers with very high amounts of intensity and a
greater pitch are judged as deceptive, and negatively impacted persuasion attempt of the
speaker (Apple et al., 1979; Levitan et al., 2018). As a consequence of the assumed
persuasive effect of intonation variations on the perception of listeners, the following
hypothesis is made regarding the dependent variable conversion intention:
Hypothesis 9: The conversion intention (a) increases when respondents are exposed to
a large amount of intonation and (b) decreases when respondents are exposed to low
amounts of intonation.
Hypotheses pertaining to the interaction effects of speech rate, fluency, and intonation
In research often a combination of the previously mentioned variables leads to the strongest
effects on conversion intention (Weiss, 2013; Ketrow, 1990; Hüfken & Schäfer, 2003;
Gélinas-Chebat et al., 1999). Drawing from the hypothesis stated above, it is expected that
combinations of characteristics that increase the perception of competence or warmth and
positively influence the conversion intention, lead to strong interaction effects.

Dengler, P. (2019) MORE THAN MEETS THE EAR
23
To name one example, Oksenberg et al. (1986) focused on the acceptance and refusal of
unknown callers. In their study callers with higher-pitched voices, greater ranges of pitch
variations, louder and faster rates of speaking and with more distinct pronunciation were
most successful. These traits were all associated with attractiveness and with higher
perceived social class. Confirming the signaling theory, respondents reacted to the cues
communicated by the caller rather than to the content of the introduction (Oksenberg et al.,
1986). Hence, following hypotheses regarding interaction effects arise:
Given the weak theoretical basis for the interaction effects among the three non-linguistic
variables, generating hypothesis deemed invalid and an additional research question was
formulated.
Research Question 4: To what extend do the independent variables interact with each
other, regarding the dimensions of warmth, competence and conversion intention?
Mediation effects of warmth and competence
Both warmth and competence of the previously mentioned model by Cuddy, Fiske, & Glick,
(2008) can act as mediators between vocal characteristics and the conversion intention. It is
assumed that perceptions of dimension will influence the intention of a participant to convert
into a qualified lead, a new participant for a telephone survey, or more generally speaking to
further deepen engagement. This is due to the affected expectations regarding the perceived
risk of the interaction (Broome, 2017; Cuddy et. al, 2008). In the previous paragraphs, the
impact of speech rate, fluency, and intonation on warmth and competence were already
discussed, turning them into suitable mediators in the research model (see Figure 1). This
leads to the following hypotheses:

Dengler, P. (2019) MORE THAN MEETS THE EAR
24
Hypothesis 10: The effect of speech rate on conversion intention is mediated by (a)
competence and (b) warmth.
Hypothesis 11: The effect of fluency on conversion intention is mediated by (a)
competence and (b) warmth.
Hypothesis 12: The effect of intonation on conversion intention is mediated by (a)
competence and (b) warmth.
Conceptual research model
Based on the hypothesized relationships between the variables the conceptual research model
is presented visually in Figure 1 below.
Figure 1. Conceptual research model

Dengler, P. (2019) MORE THAN MEETS THE EAR
25
Methodology
Research design
To test the hypotheses a 2 (low versus high speech rate) × 2 (low versus high fluency) × 2
(low versus high intonation) factorial design was implemented. In combination, those factors
consequently lead to 8 conditions displayed in Figure 2. To avoid carryover effects and
minimize time and effort for the participants a between-subjects design was chosen.
Figure 2. Research design displaying each condition
Stimulus materials
The 8 different conditions were tested through sound files that exhibit the vocal
characteristics researched. Multiple recordings of a native German speaker with a standard

Dengler, P. (2019) MORE THAN MEETS THE EAR
26
accent and previous call-center working experience were created in a soundproof
environment. According to existing research (Broome, 2017; Apple et al., 1979), lower-
pitched voices signal higher amounts of competence. Furthermore, (Gélinas-Chebat et al.,
1999) found that a male voice was usually perceived better by recipients, while not
significantly impacting their results. Hence, a male speaker was chosen, since it should have
slightly positive effects on the conversion rate. The speaker was instructed to act out a short-
modified opening script (see Appendix 1) for a telephone survey retrieved by the official
guidebook for introductions to phone surveys (Gabler, Häder, & Hoffmeyer-Zlotnik, 2016).
The decision of conducting this experiment based on the participation for a telephone survey
had several reasons. First, the opening introduction for a telephone survey contains several
parallels to sales or marketing calls. Secondly, the results gathered from this research can also
be used for academic purposes in future telephone surveys. The final introduction script
included the name of the established German research Institute "Infratest DIMAP", as well as
a relevant and important topic, namely the political sentiment after the European elections.
The intention was to avoid missing trust in an institution or organization and direct the
attention to the speaker rather than the organization. Also, issues about the perceived risk of
privacy and distracting elements were avoided. In his delivery, the speaker was free to
express and include a variety of information, which were based on his previous work
experience and discussed previous to the recording. According to Houtkoop and Van den
Bergh (1995) in this way an authentic delivery is ensured, due to the intuitive behavior of the
speaker. The script of the recordings was recorded in several takes using three distinctive
styles. This is because otherwise, it would have been difficult to recreate them digitally
without affecting the authenticity of the sound. Namely, the individual recordings were
defined by an intonated energetic tone of voice, a monotone moderate way of speaking and
different versions of paused and influent ways of speech. For the manipulation of the

Dengler, P. (2019) MORE THAN MEETS THE EAR
27
recordings the digital software tool Version 2.3.2 of Audacity ® (Audacity Team, 2019) was
used.
Preliminary Study
A pre-test was performed to validate the perceived effect of different voice variables on
participants, test the inter-item reliability and to identify potential problems with
comprehension of those items. The aim was to prove the coherent perception of voice
variables by participants according to the intended effect of each condition.
The non-probability sample of German participants (N = 16) had to rate their perception of
speech rate, tonality, fluency, and authenticity. The sample consisted of 8 male (𝑛 = 8) and 8
female (𝑛 = 8) respondents with the mean age of 30.38 (𝑆𝐷 = 11.83). The answers were
given considering several vocal attributions on a 7-point Likert scale. For instance, an item to
measure the speech rate was rated from slow (1) to fast (7), or authenticity as artificial (1) to
lifelike (7). The entire translated pre-test survey can be found in Appendix 2. To digitally
distribute the questionnaire, SAP Qualtrics was used.
The scales used were partly derived from Hüfken and Schäfer (2003), more specifically their
scale on vocal characteristics. With these items, the respondent’s perception of non-linguistic
characteristics could be measured. An example item is "The fluency of the speaker feels:
Interrupted (1) – Continuous (7)". A full overview of all items present within the pre-test can
be found in Appendix 1.
To test the internal consistency the Cronbach alpha values for each scale were measured. In
result, speech rate (α = .92), fluency (α = .86), intonation (α = .88) and authenticity (α =
.84) were altogether above the common bottom line coefficient of .7 (DeVellis, 2016). This
indicated sufficient reliability of the scales to be used in the main study.

Dengler, P. (2019) MORE THAN MEETS THE EAR
28
An independent samples t-test was conducted to ensure that significant differences between
the independent variables are recognized. The results show that all items measured significant
differences, except for two items, (Q2_Fluency) Mumbling-Precise (𝑡(14) = −1,67, 𝑝 =
.11) and (Q3_Intonation) Static-Excited (𝑡(15) = −1,80, 𝑝 = .08). This is suspected to be
due to the relatively low number of participants since the overall reliability of the scales is
given.
To validate the perception of the stimuli as authentic and not manipulated a measurement
construct regarding authenticity was implemented. In a close inspection of several studies
examining the perception of paralinguistic variables, the conditions are often produced in a
digital and nonorganic way (Belin et al., 2017). Based on the work of Bartneck, Kulic, Croft,
and Zoghbi (2008) on anthropomorphism and animacy items for measuring the authenticity
of the displayed stimuli were adapted (α = .86). One example item is "The voice of the
speaker sounds: Mechanical (1) – Organic (7)". Concluding the different variables were
identified accurately by the participants and were considered reliable and valid for the main
study.
Acoustic Properties
The final conditions were eventually peer-reviewed, pre-tested and finally included in the
main study. An overview of the most important acoustic parameters can be found in Table 1.
The parameters were analyzed with Version 6.1.02 of the phonetic analysis software Praat
(Boersma & Weenink, 2019).

Dengler, P. (2019) MORE THAN MEETS THE EAR
29
Table 1
Overview of acoustic parameters
C1 C2 C3 C4 C5 C6 C7 C8
H-Sr
H-Fl
H-Int
H-Sr
H-Fl
L-Int
H-Sr
L-Fl
H-Int
H-Sr
L-Fl
L-Int
L-Sr
H-Fl
H-Int
L-Sr
H-Fl
L-Int
L-Sr
L-Fl
H-Int
L-Sr
L-Fl
L-Int
Duration (s) 20.90 23.10 25.19 24.02 26.14 27.08 29.53 28.24
Words per Minute 178.01 161.05 147.70 154.90 142.32 137.37 125.96 131.71
f0 mean 179.52 157.86 177.74 161.63 175.28 159.48 173.52 160.66
f0 Min 75.36 55.22 55.75 54.45 76.97 52.94 50.00 55.20
f0 Max 349.43 383.74 381.98 366.26 349.20 359.49 381.78 388.96
f0 variability 50.04 45.18 47.59 45.00 43.26 41.64 42.73 42.65
Intensity Energy Mean (dB) 68.51 65.38 68.42 66.95 68.68 65.73 68.85 66.24
Intensity Min (dB) 9.29 7.79 8.58 7.89 8.30 7.61 8.63 5.99
Intensity Max (dB) 77.81 77.40 78.88 78.51 79.07 78.41 79.49 79.50
Note. f0 = fundamental frequency of the voice; dB = Decibel; C* = Condition. H-Sr = High Speech rate; L-Sr =
Low Speech rate; H-Fl = High Fluency; L-Fl = Low Fluency; H-Int = High Intonation; L-Int = Low Intonation
Firstly, the speech rate was modified according to indicated values found in the existing
literature. According to Broome (2017), an ideal speech rate for obtaining cooperation lies
around 200 words per minute, while a slow speech rate can be considered from around 140
words per minutes downwards. Ketrow (1990) indicates a similar, though somewhat slower
range for high speech rate of approximately 150-200 words per minute. Consequently, the
recordings were slowed down and speeded up to modify the speech rate. In table 1 it is
indicated that high speech varied from 178.01 words per minute to 147.70 words per minute.
On the contrary, slow speech rates ranged from 142.32 words per minute down to 131.71
words per minutes. During the manipulations, the values were manipulated according to the
determined words per minute, while still maintaining authenticity and therefore do not range
in extremes (cf. Pre-Test and Main Study results).
Second, the fluency of the recordings was manipulated by inserting speech patterns of
interruption, such as breaks, stutters and short utterances, into the fluently spoken recordings.
Five different sound snippets were extracted and inserted into the fluent recordings, which
had a direct impact on the count of words per minute (see conditions 3,4,7 and 8 in Table 1).
Dengler, P. (2019) MORE THAN MEETS THE EAR
30
Third, the multiple variations of intonation recorded were cut down into smaller speech
fragments to synthesize versions that best display the characteristics of the variable intonation
due to variations in f0. Table one states clearly, that the fundamental mean frequency f0
differs between high intonated conditions (𝑀𝑓0 = 176.51, 𝑆𝐷𝑓0 = 2.65) and low intonated
conditions (𝑀𝑓0 = 159.91, 𝑆𝐷𝑓0 = 1.63). In contrast, the intensity energy mean of each
condition does not diverge as much. Scherer et al. (1991) claim it as a difficult variable to
measure since it depends on the distance and direction of the speaker towards the
microphone. Therefore, it was disregarded as an indicator of intonation manipulation. In
Figure 3 the comparison of the f0 fundamental frequency contour is displayed for the same
segment of speech spoken with different intonation. In the back, the mean intensity is colored
grey, which is an indicator for overall volume present in the sound snippet. It can be seen,
that for the recording with high amounts of intonation the average volume is slightly higher.
To better display the audible variation of the pitch a range between 50 and 400 Hz was
chosen for the analysis. On the left, a high level of intonation is depicted (C1), which is
indicated by a more variated f0 contour with higher peaks. On the contrary, the f0contour of
condition 5 (C5) shows a smaller f0 mean and less variation overall. The different final
stimuli can be found via the download link in Appendix 3.

Dengler, P. (2019) MORE THAN MEETS THE EAR
31
Figure 3. f0 contour comparison of high versus low intonation. f0 = fundamental frequency
of the voice
Main Study
The online survey experiment was distributed through the SAP Qualtrics Experience
Management Platform. Participants were first briefed about the main topic, the approximate
duration of the survey and privacy regulations. After obtaining consent, demographic
information about gender, age, and employment situation was collected. Secondly, the
respondents were instructed to listen carefully to the randomly assigned condition. All
respondents were required to complete the survey in a calm environment and advoked to use
headphones for better listening comprehension. After the exposure, participants were
requested to indicate their perceptions regarding items measuring the mediating and
dependent variables of the study (warmth and competence of the speaker as well as their
conversion intention). Fourthly, participants were asked to fill out several manipulation check
questions (speech rate, fluency, intonation, and authenticity). Finally, the respondents were
debriefed and thanked for their participation. The full translated survey can be found in
Appendix 4.

Dengler, P. (2019) MORE THAN MEETS THE EAR
32
Sample and data collection
The targeted sample was German-speaking adults because non-native English speakers
display a higher probability of distorting test results. A translation and back-translation
procedure were employed to survey in the German language. A non-probability snowball
sampling technique was used to recruit participants. The respondents were approached by
reaching out to the personal network of the researcher, utilizing social media and messaging
platforms. Furthermore, participants were recruited by actively approaching adults in the
center of Gronau, Germany. Eventually, 75% of the approached population completed the
survey. The respondents all have been recruited from July 28, 2019, up until August 11,
2019.
Out of 279 started survey participations, a total of 209 German, Austrian and Swiss citizens
filled out the complete survey questionnaire (N = 209), with a mean completion time of
approximately six and a half minutes. Hence, a sample to item ratio of 6.5:1 was reached,
therefore having an adequate sample size (Gorsuch, 1983). Furthermore, Tabachnik and
Fidell (2013) argue that a sample size of 20 or more respondents for each condition ensures
the robustness of the results.
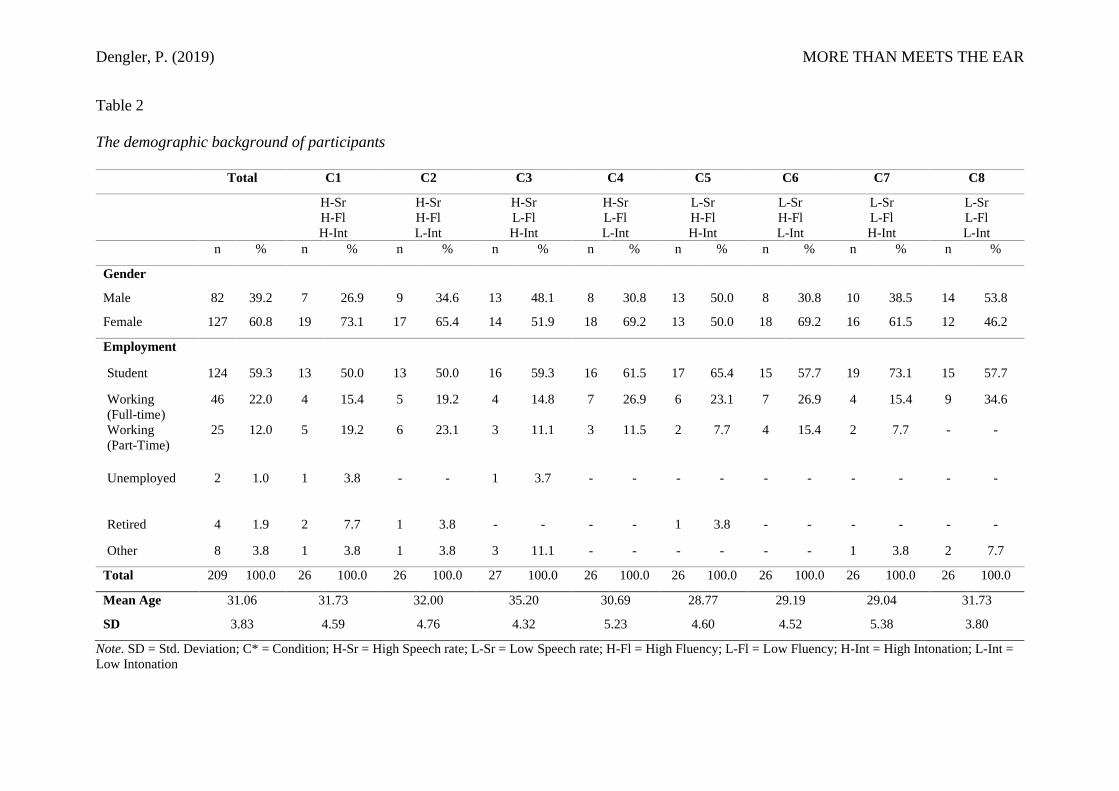
127 respondents were females (𝑛 = 127) and 82 males (𝑛 = 82). Predominantly the
participants were between 18-35 years old (cumulative percentage of 78.95%) with a Mean
age of 31.06 years. An overview of the demographics of the research participants can be
found in Table 2.
Dengler, P. (2019) MORE THAN MEETS THE EAR
Table 2
The demographic background of participants
Total C1 C2 C3 C4 C5 C6 C7 C8
H-Sr
H-Fl
H-Int
H-Sr
H-Fl
L-Int
H-Sr
L-Fl
H-Int
H-Sr
L-Fl
L-Int
L-Sr
H-Fl
H-Int
L-Sr
H-Fl
L-Int
L-Sr
L-Fl
H-Int
L-Sr
L-Fl
L-Int
n % n % n % n % n % n % n % n % n %
Gender
Male 82 39.2 7 26.9 9 34.6 13 48.1 8 30.8 13 50.0 8 30.8 10 38.5 14 53.8
Female 127 60.8 19 73.1 17 65.4 14 51.9 18 69.2 13 50.0 18 69.2 16 61.5 12 46.2
Employment
Student 124 59.3 13 50.0 13 50.0 16 59.3 16 61.5 17 65.4 15 57.7 19 73.1 15 57.7
Working
(Full-time)
46 22.0 4 15.4 5 19.2 4 14.8 7 26.9 6 23.1 7 26.9 4 15.4 9 34.6
Working
(Part-Time)
25 12.0 5 19.2 6 23.1 3 11.1 3 11.5 2 7.7 4 15.4 2 7.7 - -
Unemployed 2 1.0 1 3.8 - - 1 3.7 - - - - - - - - - -
Retired 4 1.9 2 7.7 1 3.8 - - - - 1 3.8 - - - - - -
Other 8 3.8 1 3.8 1 3.8 3 11.1 - - - - - - 1 3.8 2 7.7
Total 209 100.0 26 100.0 26 100.0 27 100.0 26 100.0 26 100.0 26 100.0 26 100.0 26 100.0
Mean Age 31.06 31.73 32.00 35.20 30.69 28.77 29.19 29.04 31.73
SD 3.83 4.59 4.76 4.32 5.23 4.60 4.52 5.38 3.80
Note. SD = Std. Deviation; C* = Condition; H-Sr = High Speech rate; L-Sr = Low Speech rate; H-Fl = High Fluency; L-Fl = Low Fluency; H-Int = High Intonation; L-Int =
Low Intonation

Dengler, P. (2019) MORE THAN MEETS THE EAR
Next, the normality of distribution was controlled investigating outliers. Hence tests to
calculate Mahalanobis' distance, Cook's distance, and Leverage were performed. 6 degrees of
freedom were chosen, namely the independent variables (speech rate, fluency, and
intonation), two dependent mediators (competence and warmth), and one dependent variable
(conversion intention). For Mahalanobis’ distance, the cut-off score was 𝑀𝑎ℎ𝑙𝑎𝑛𝑜𝑏𝑖𝑠 =
18.95, 𝐷𝐹 = 6, 𝑝 < .001. The Cook’s distance bottom-line score was .019 and the Leverage
score was cut off at .077 (according to UCLA, 2019). One case appeared to be an outlier,
exceeding the cook's distance and the leverage cutoffs. After careful investigation, the
response was still considered as valid, due to its relatively reasonable distribution.
Furthermore, Van den Broeck, Cunningham, Eeckels, and Herbst (2005) argue that Likert-
scales usually do not exhibit outliers and are often rather excluded due to their non-
conformity with prior expectations of the investigator.
Scale construction
The questionnaire uses semantic differentiation 7-point scales and 7-point Likert scales in a
consistent form, testing altogether 34 items.
To measure the respondent's impressions, several constructs were considered. First, the
measurement of trust was separated into the previously mentioned concepts of warmth and
competence. The items to assess these dimensions were taken from the works of Fiske et al.
(2007) and Wojciszke (2005) as well as from the research of Rosenberg et al. (1968) who
arranged their items according to the two dimensions of social and intellectual desirability.
Further items of Ohanian’s (1990) scale for source credibility and Broome’s (2015) scale for
speaker characteristics were considered.

Dengler, P. (2019) MORE THAN MEETS THE EAR
35
Secondly, established scale items to measure purchase intention served as a guideline to
measure the participant’s intent of taking part in the telephone survey. Spear & Singh (2004)
describe intentions as personal action tendencies, representing a person’s conscious plan to
carry out a behavior. Consequently, their purchase intention scale was adapted measuring the
three items interest, motivation and certainty with a 7-point Likert scale.
Factor and reliability analysis.
An Exploratory factor analysis, using principal component analysis, was performed to
determine whether the 15 items selected for the 3 constructs of the study measured
adequately. The eigenvalues above one indicated that six different factors could be
distinguished. The Kaiser-Meyer-Olkin measures .91 (>.5) and Bartlett’s Test of Sphericity is
significant at 𝑋2 = 2416.76, 𝑝 < .001; Therefore, revealing that the correlations between the
15 items are suitable for principal component analysis. A principal component analysis was
employed and showed that all items loaded on the proposed constructs except for the items of
warmth and competence, which loaded on a common factor and can therefore not be
considered as valid. Overall, the 3 factors explain 73.15% cumulative variance. None of the
15 items had significant cross-loadings (>.50).
Since the constructs warmth and competence loaded into one construct a second factor
analysis was performed, excluding the items that loaded into the competence construct The
items 2 (likable), 3 (honest) and 5 (friendly) do show cross-loads with the competence
construct, but those fall beneath the threshold of .50 and can be considered insignificant.
Concluding, these three remaining items amount to the construct of warmth in the results
section. The results for the second-factor analysis suggest that all scale items loaded above
𝑝 > .5 into the correct factor. Therefore, the scales can be considered valid (KMO =
.88; 𝑋2 = 1795.01, 𝑝 < .001). Table 5 presents the factor loadings after rotation of the items
measuring perceived competence and warmth and conversion intention. To ensure the

Dengler, P. (2019) MORE THAN MEETS THE EAR
36
reliability of each construct the Cronbach alpha scores were measured. All scales fulfill
Nunally's (1978) recommendation of the minimum level of .7 Cronbach Alpha. Table 3 also
provides an overview of the reliability scores. The Cronbach Alpha scores of the measured
scales range from α = .79 and α = .93, which indicates that sufficient reliability for the
constructs in this study is given.
Table 3
Principal Component Analysis
Component
1 2 3
Competence - The speaker appeared to be competent. .87
Competence - The speaker appeared to be intelligent. .74
Competence - The speaker appeared to be qualified. .84
Competence - The speaker appeared to be confident. .79
Competence - The speaker appeared to be energetic. .61
Competence - The speaker appeared to be professional. .86
Warmth - I perceived the speaker as likable. .74
Warmth - I perceived the speaker as honest. .59
Warmth - I perceived the speaker as friendly. .90
Conversion Intention - I'm interested in participating. .89
Conversion Intention - I'm motivated to participate. .93
Conversion Intention - I will definitely participate. .89
Explained Variance 49.63 16.68 9.21
Eigenvalue 5.96 2.00 1.11
Cronbach Alpha .91 .79 .93
Note. Small coefficients under .50 were suppressed; The items were measured utilizing 7-point scales
(N = 209). Extraction Method: Principal Component Analysis; Rotation Method: Varimax with Kaiser
Normalization.

Dengler, P. (2019) MORE THAN MEETS THE EAR
37
Results
Manipulation Checks
To ensure that the manipulations of speech rate, fluency and intonation measured the
expected outcome of high and low, whith the conditions still perceived as authentic, several
tests were performed. Firstly, independent samples t-test revealed that there were statistically
significant differences between the perception of speech rate (𝑡(207) = 2.15, 𝑝 < .001),
fluency (𝑡(207) = .002, 𝑝 < .001) and intonation (𝑡(207) = 2.57, 𝑝 < .001).Table 4
presents as to which extent the respondents perceived the manipulations according to the
stimuli displayed in the experiment. The mean and standard deviation scores can also be
found in Table 4. The data shows that all attributes were observed with significant differences
(𝑝 < .001). As mentioned in the chapter before, the manipulated conditions were not
designed at their full extremes to maintain authenticity. The difference and ratings on a 7-
point Likert scale, are not as polarized as expected but do measure significant differences.
Table 4
Mean perception and standard deviation of manipulations
n Mean SD Sig.
Speech Rate Low 104 3.53 .90 .000
High 105 4.55 1.03 .000
Fluency Low 105 3.57 1. 20 .000 High 104 5.02 1.15 .000
Intonation Low 104 3.51 1.22 .000
High 105 4.51 1.13 .000
Note. The items were measured utilizing 7-point scales (N = 209)
Additionally, an Exploratory factor analysis, using principal component analysis, was
conducted. In Table 5 it can be seen, that the manipulation check scales speech rate,
intonation, and fluency and the construct authenticity all loaded into their corresponding

Dengler, P. (2019) MORE THAN MEETS THE EAR
38
factors and are therefore valid (KMO = .84; 𝑋2 = 2340.61, 𝑝 < .001) and reliable with
Cronbach's alpha values ranging from .85 to .90.
Table 5
Principal Component Analysis
Component
1 2 3 4
Speech Rate 1 .80
Speech Rate 2 .76
Speech Rate 3 .87
SpeechRate 4 .84
Fluency 1 .88
Fluency 2 .64
Fluency 3 .88
Fluency 4 .90
Intonation 1 .80
Intonation 2 .82
Intonation 3 .86
Intonation 4 .80
Authenticity 1 .84
Authenticity 2 .89
Authenticity 3 .81
Authenticity 4 .81
Authenticity 5 .60
Explained Variance 35.47 15.35 13.72 8.78
Eigenvalue 6.03 2.61 2.33 1.50
Cronbach's Alpha .88 .90 .87 .85
Note. Small coefficients under .50 were suppressed; Extraction Method: Principal Component Analysis.
Rotation Method: Varimax with Kaiser Normalization.
Hypotheses Pertaining to the Main Effects of Speech Rate, Fluency, and Intonation
A one-way between-groups multivariate analysis of variance (MANOVA) was performed, to
indicate significant differences regarding means of the conditions and dependent variables.
The two dependent Mediator variables competence and warmth and the dependent variable
conversion intention were used. The independent variables were speech rate, fluency, and
intonation. Preliminary assumption testing was conducted according to Tabachnick and Fidell
(2007).
First, a Wilk’s Lambda test was conducted measuring the general effect between independent
and dependent variables, which is depicted in Table 6. The Analysis of the main effects of

Dengler, P. (2019) MORE THAN MEETS THE EAR
39
speech rate (Λ = 0.95; 𝐹(3,209) = 3.81; 𝑝 < .05), fluency (Λ = 0.95; F = 3.81; 𝑝 < .05)
and intonation (Λ = 0.95; F = 3.81; 𝑝 < .05) resulted in a significant differences at a .05
level. The results of the MANOVA are further discussed in the following sections.
Table 6
Multivariate Test; Descriptive statistics of the independent variables
Λ F Sig. Partial 𝜂2
SpeechRate .95 3.81 .011 .054
Fluency .81 15.86 .000 .193
Intonation .92 5.48 .001 .076
SpeechRate * Fluency 1.00 .23 .873 .004
SpeechRate * Intonation .98 1.38 .250 .020
Fluency * Intonation .95 3.69 .013 .053
SpeechRate * Fluency *
Intonation
.967 2.256 .083 .033
Note. Degrees of freedom of 3.0; Significant values < .05 are in boldface. The multivariate test was performed
on the variables warmth, competence, and conversion intention
Speech rate.
There was a statistically significant difference between low and high speech rate on the
dependent variables, 𝐹(3, 199) = 3.81, 𝑝 = .011; Λ = .95; 𝑃𝑎𝑟𝑡𝑖𝑎𝑙 η2 = .054. When the
results for the dependent variables were considered separately, the differences to reach
statistical significance were competence (𝐹(1, 201) = 9.74, 𝑝 = .002; 𝑃𝑎𝑟𝑡𝑖𝑎𝑙 η2 = .046)
and warmth 𝐹(1, 201) = 8.40, 𝑝 = .004; 𝑃𝑎𝑟𝑡𝑖𝑎𝑙 η2 = .040) (Table 7).
Table 7
Tests of Between-Subjects Effects
Source DV F Sig. Partial η2
SpeechRate Competence 9.74 .002 .046
Warmth 8.40 .004 .040
Conversion
Intention
1.76 .187 .009
Note. DV = Dependent Variable;

Dengler, P. (2019) MORE THAN MEETS THE EAR
40
An inspection of the mean scores indicated that low speech rate was perceived as slightly less
competent (𝑀 = 4.29, 𝑆𝐷 = 1.23) than a high speech rate (𝑀 = 4.79, 𝑆𝐷 = 1.30).
Regarding warmth, lower speech rate was also perceived lesser (𝑀 = 4.72, 𝑆𝐷 = 1.16) than
a high speech rate (𝑀 = 5.15, 𝑆𝐷 = 1.01). No significant main effect was measured for the
dependable variable of conversion intention 𝐹(1, 201) = 1.76, 𝑝 = .187; 𝑃𝑎𝑟𝑡𝑖𝑎𝑙 η2 =
.009). Based on these results, H1a&b and H2a&b are supported, while H3a&b are not. For an
overview of the observed mean and standard deviation values refer to Table 8.
Table 8
Descriptive Statistics Speech Rate
SpeechRate M SD n
Competence Low 4.29 1.23 104
High 4.79 1.28 105
Warmth Low 4.72 1.16 104
High 5.15 1.01 105
Conversion Intention Low 3.55 1.66 104
High 3.83 1.50 105
Note. M = Mean; SD = Std. Deviation;
Fluency.
There was a statistically significant difference between low and high fluency on the
dependent variables, 𝐹(3, 199) = 15.86, 𝑝 = .000; Λ = .81; 𝑃𝑎𝑟𝑡𝑖𝑎𝑙 η2 = .193. When the
results for the dependent variables were considered separately, the only difference to reach
statistical significance, was competence (𝐹(1, 201) = 40.25, 𝑝 = .000; 𝑃𝑎𝑟𝑡𝑖𝑎𝑙 η2 = .167).
An overview of the between-subjects effects is indicated in Table 9.

Dengler, P. (2019) MORE THAN MEETS THE EAR
41
Table 9
Tests of Between-Subjects Effects
Source DV F Sig. Partial η2
Fluency Competence 40.25 .000 .167
Warmth 2.03 .156 .010
Conversion
Intention
1.78 .185 .009
Note. DV = Dependent Variable;
An inspection of the mean scores indicated that low fluency was perceived significantly less
competent (𝑀 = 4.04, 𝑆𝐷 = 1.36) than high fluency (𝑀 = 5.04, 𝑆𝐷 = .96).
No significant main effect was measured for the dependable variables of warmth
𝐹(1, 201) = 2.03, 𝑝 = .156; 𝑃𝑎𝑟𝑡𝑖𝑎𝑙 η2 = .010) and conversion intention 𝐹(1, 201) =
1.77, 𝑝 = .185; 𝑃𝑎𝑟𝑡𝑖𝑎𝑙 η2 = .009). This means that fluency significantly predicts if a
speaker is perceived as competent. These results support H4a&b, while H5a&b and H6a&b
are not supported. The overview of the observed mean and standard deviation of the effects
on mediating and dependent variables can be found in Table 10.
Table 10
Descriptive Statistics Fluency
Fluency M SD n
Competence Low 4.04 1.36 105
High 5.04 .96 104
Warmth Low 4.83 1.14 105
High 5.04 1.07 104
Conversion Intention Low 3.55 1.68 105
High 3.84 1.47 104
Note. M = Mean; SD = Std. Deviation;
Intonation.
There was a statistically significant difference between low and high intonation on the
dependent variables 𝐹(3, 199) = 5.48, 𝑝 = .001; Λ = .92; 𝑃𝑎𝑟𝑡𝑖𝑎𝑙 η2 = .076. When the

Dengler, P. (2019) MORE THAN MEETS THE EAR
42
results for the dependent variables were considered separately, the difference to reach
statistical significance, was warmth 𝐹(1, 201) = 15.66, 𝑝 = .004; 𝑃𝑎𝑟𝑡𝑖𝑎𝑙 η2 = .072). For
an overview of the between-subject effects refer to Table 11.
Table 11
Tests of Between-Subjects Effects
Source DV F Sig. Partial η2
Intonation Competence 3.12 .079 .015
Warmth 15.66 .000 .072
Conversion Intention 1.18 .279 .006
Note. DV = Dependent Variable;
An inspection of the mean scores indicated that low intonation was perceived as slightly less
warm (𝑀 = 4.65, 𝑆𝐷 = 1.17) than high intonation (𝑀 = 5.22, 𝑆𝐷 = .96). No significant
main effect was measured for the dependable variables of competence 𝐹(1, 201) = 3.12, 𝑝 =
.079; 𝑃𝑎𝑟𝑡𝑖𝑎𝑙 η2 = .015) and conversion intention 𝐹(1, 201) = 1.18, 𝑝 =
.279; 𝑃𝑎𝑟𝑡𝑖𝑎𝑙 η2 = .006). This means that fluency significantly predicts if a speaker is
perceived as warm and friendly. Therefore, the hypotheses H7a&b are not supported, while
H8&b measure significant effects and are supported. The hypotheses H9a&b are also not
supported. The overview of the observed mean and standard deviation of the effects on
mediating and dependent variables are given in Table 12.

Dengler, P. (2019) MORE THAN MEETS THE EAR
43
Table 12
Descriptive Statistics
Intonation M SD n
Competence Low 4.40 1.29 104
High 4.68 1.25 105
Warmth Low 4.65 1.17 104
High 5.22 .96 105
Conversion Intention Low 3.58 1.53 104
High 3.81 1.63 105
Note. M = Mean; SD = Std. Deviation;
Hypotheses Pertaining to Interaction Effects
The interaction effects of the independent variables speech rate, fluency, and intonation on
the dependent variables (competence, warmth and conversion intention) were also measured
using a multivariate analysis of variance (MANOVA). The interactions between the main
effects showed that there are no significant interaction effects, except for Fluency*Intonation
𝐹(3, 199) = 3.69, 𝑝 = .013; Λ = .95; 𝑃𝑎𝑟𝑡𝑖𝑎𝑙 η2 = .053. On closer inspections, the result
appearing to be significant for conversion intention (𝐹(1, 201) = 6.08, 𝑝 =
.015; 𝑃𝑎𝑟𝑡𝑖𝑎𝑙 η2 = .029). This means that the combination of fluency and intonation
significantly predicts if a participant has the intention to part take in the study. The between-
subjects effects are referred to in Table 13 below.
Table 13
Tests of Between-Subjects Effects
Source DV F Sig. Partial η2
Fluency * Intonation Competence .02 .893 .000
Warmth .76 .385 .004
Conversion
Intention
6.08 .015 .029
Note. DV = Depdendent Variable;

Dengler, P. (2019) MORE THAN MEETS THE EAR
44
A visual reference displaying the interaction effect can be seen in Figure 4. While low
intonation and fluency resulted in small ratings for conversion intention, high fluency and
intonation significantly increased the amount of conversion intention. Consequently, these
findings should offer sufficient empirical support to answer Research Question 4.
Figure 4. Interaction effects of fluency and intonation; X & Y coordinates indicate the
estimated marginal means of fluency and intonation.
Hypotheses Pertaining to Mediating Effects of Trust (Competence and Warmth)
As seen in the proposed research model (Figure 1) the effects of speech rate, fluency, and
intonation on the conversion intention are hypothesized to be mediated by warmth and
competence. To carry out testings for mediation, multiple linear regressions based on the
PROCESS macro for SPSS by Preacher and Hayes (2004) were conducted. The approach by
Baron and Kenny was disregarded due to its inferiority (Preacher & Hayes, 2004; Zhao,
Lynch, & Chen, 2010). To investigate the hypotheses of mediating effects by competence
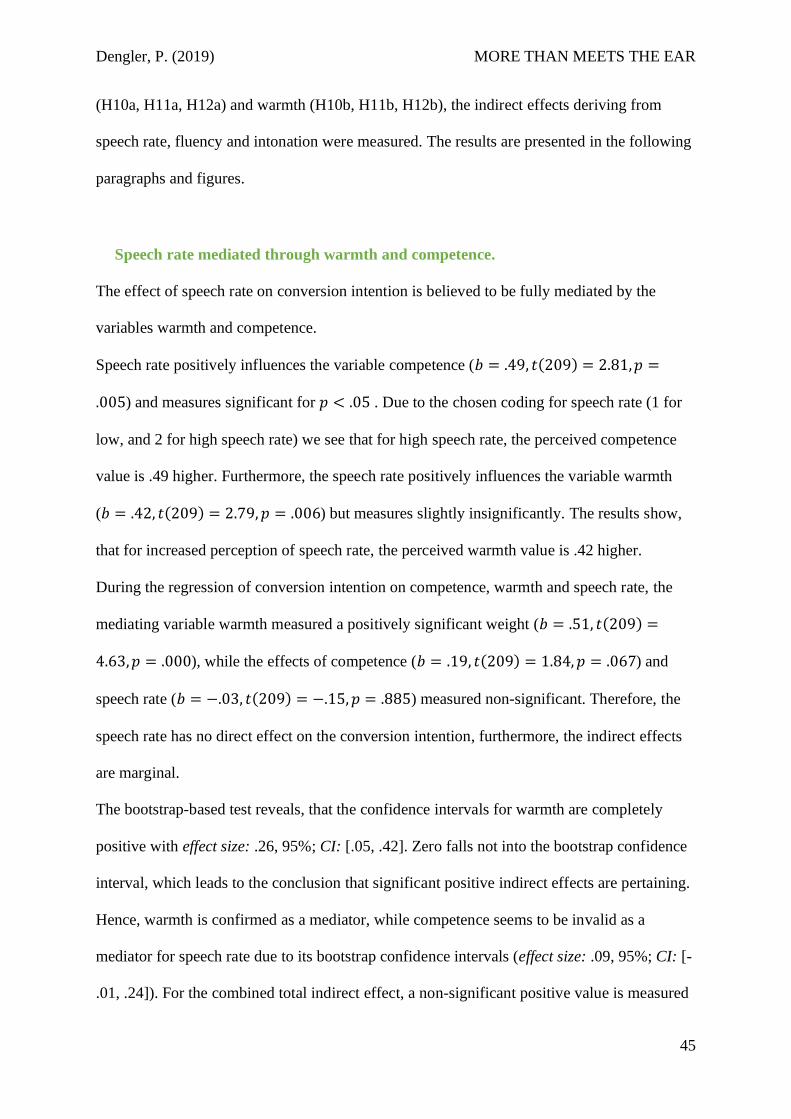
Dengler, P. (2019) MORE THAN MEETS THE EAR
45
(H10a, H11a, H12a) and warmth (H10b, H11b, H12b), the indirect effects deriving from
speech rate, fluency and intonation were measured. The results are presented in the following
paragraphs and figures.
Speech rate mediated through warmth and competence.
The effect of speech rate on conversion intention is believed to be fully mediated by the
variables warmth and competence.
Speech rate positively influences the variable competence (𝑏 = .49, 𝑡(209) = 2.81, 𝑝 =
.005) and measures significant for 𝑝 < .05 . Due to the chosen coding for speech rate (1 for
low, and 2 for high speech rate) we see that for high speech rate, the perceived competence
value is .49 higher. Furthermore, the speech rate positively influences the variable warmth
(𝑏 = .42, 𝑡(209) = 2.79, 𝑝 = .006) but measures slightly insignificantly. The results show,
that for increased perception of speech rate, the perceived warmth value is .42 higher.
During the regression of conversion intention on competence, warmth and speech rate, the
mediating variable warmth measured a positively significant weight (𝑏 = .51, 𝑡(209) =
4.63, 𝑝 = .000), while the effects of competence (𝑏 = .19, 𝑡(209) = 1.84, 𝑝 = .067) and
speech rate (𝑏 = −.03, 𝑡(209) = −.15, 𝑝 = .885) measured non-significant. Therefore, the
speech rate has no direct effect on the conversion intention, furthermore, the indirect effects
are marginal.
The bootstrap-based test reveals, that the confidence intervals for warmth are completely
positive with effect size: .26, 95%; CI: [.05, .42]. Zero falls not into the bootstrap confidence
interval, which leads to the conclusion that significant positive indirect effects are pertaining.
Hence, warmth is confirmed as a mediator, while competence seems to be invalid as a
mediator for speech rate due to its bootstrap confidence intervals (effect size: .09, 95%; CI: [-
.01, .24]). For the combined total indirect effect, a non-significant positive value is measured

Dengler, P. (2019) MORE THAN MEETS THE EAR
46
(𝑏 = .28, 𝑡(209) = 1.27, 𝑝 = .204). A visual reference to the mediation model can be
consulted in Figure 5.
Therefore, the positive association between speech rate and conversion intention is fully
mediated by warmth at α = .05 and partly by competence at α = .05. The results do not
support hypothesis 10a, while 10b is supported.
Figure 5. Mediation model for speech rate
* Significant effect with 𝑝 < .05
** Significant effect with 𝑝 < .001
Fluency mediated through competence.
Fluency positively influences the Variable competence (𝑏 = 1.00, 𝑡(209) = 6.15, 𝑝 = .000)
and measures clearly significant. The perceived competence value is higher by 1.00.
During the regression of conversion intention on competence and fluency, the mediating
variable competence measured a positively significant weight (𝑏 = .48, 𝑡(209) = 5.20, 𝑝 =
.000), while the effects of fluency (𝑏 = −.19, 𝑡(209) = −.85, 𝑝 = .396) measured clearly
non-significant.

Dengler, P. (2019) MORE THAN MEETS THE EAR
47
The bootstrap-based test reveals, that the confidence intervals for competence (effect size:
.48, 95%; CI: [.25, .77]) are only in a positive range excluding zero, which means that
significant indirect effects are pertaining. Hence, competence seems to be valid as a mediator
for fluency. For the combined total indirect effect, a non-significant positive value is
measured (𝑏 = .29, 𝑡(209) = 1.31, 𝑝 = .192). A visual reference to the mediation model can
be consulted in Figure 6. Therefore, the positive association between fluency and conversion
intention is also fully mediated by competence at α = .05. The results support hypothesis
11a, while hypothesis 11b is not supported.
Figure 6. Mediation model for fluency
** Significant effect with 𝑝 < .001
Intonation mediated through warmth.
Intonation positively influences the Variable warmth (𝑏 = .57, 𝑡(209) = 3.86, 𝑝 = .000) and
measures significantly. During the regression of conversion intention on warmth and
intonation, the mediating variable warmth measured a positively significant weight (𝑏 =
.66, 𝑡(209) = 7.31, 𝑝 = .000), while the effects of intonation (𝑏 = −.15, 𝑡(209) =
−.72, 𝑝 = .473) measured clearly non-significant. Therefore, intonation has no direct effect
on the conversion intention but instead measures high indirect effects.
The bootstrap-based test reveals, that the confidence intervals for warmth are completely
positive with effect size: .38, 95%; CI: [.17, .61], which leads to the conclusion that

Dengler, P. (2019) MORE THAN MEETS THE EAR
48
significant positive indirect effects are pertaining. Hence, warmth is confirmed as a mediator.
For the combined total indirect effect, a non-significant positive value is measured (𝑏 =
.23, 𝑡(209) = 1.04, 𝑝 = .298). A visual reference to the mediation model can be consulted in
Figure 7. Therefore, the positive association between intonation and conversion intention is
fully mediated by warmth at α = .05. The results do not support hypothesis 12a but do
support 12b.
Figure 7. Mediation model for intonation
** Significant effect with 𝑝 < .001

Dengler, P. (2019) MORE THAN MEETS THE EAR
49
Overview of the Tested Hypotheses
An overview of the results is provided in Table 14, indicating if the initial hypotheses were
supported or not.
Table 14
Summary of Results of the tested Hypotheses
No. Hypotheses Result
H1 The perception of competence is (a) higher when respondents are exposed to a
high speech rate and (b) lower when respondents are exposed to low speech
rate.
Supported
H2 The perception of warmth is (a) higher when respondents are exposed to a high
speech rate and (b) lower when respondents are exposed to low speech rate.
Supported
H3 The conversion intention (a) increases when respondents are exposed to a high
speech rate and (b) decreases when respondents are exposed to low speech
rate.
Not supported
H4 The perception of competence is (a) higher when respondents are exposed to a
high fluency and (b) lower when respondents are exposed to low fluency.
Supported
H5 The perception of warmth is (a) higher when respondents are exposed to high fluency and (b) lower when respondents are exposed to low fluency.
Not supported
H6 The conversion intention (a) increases when respondents are exposed to high
fluency and (b) decreases when respondents are exposed to low fluency.
Not supported
H7 The perception of competence is (a) higher when respondents are exposed to
high variations of intonation and (b) lower when respondents are exposed to
low variations of intonation.
Not supported
H8 The perception of warmth is (a) higher when respondents are exposed to high
variations of intonation and (b) lower when respondents are exposed to low
variations of intonation.
Supported
H9 The conversion intention (a) increases when respondents are exposed to a large
amount of intonation and (b) decreases when respondents are exposed to low
amounts of intonation.
Not supported
H10 The effect of speech rate on conversion intention is mediated by (a)
competence and (b) warmth.
(a) Not supported
(b) Supported
H11 The effect of fluency on conversion intention is mediated by (a) competence
and (b) warmth.
(a) Supported
(b) Not supported
H12 The effect of intonation on conversion intention is mediated by (a) competence
and (b) warmth.
(a) Not supported
(b) Supported
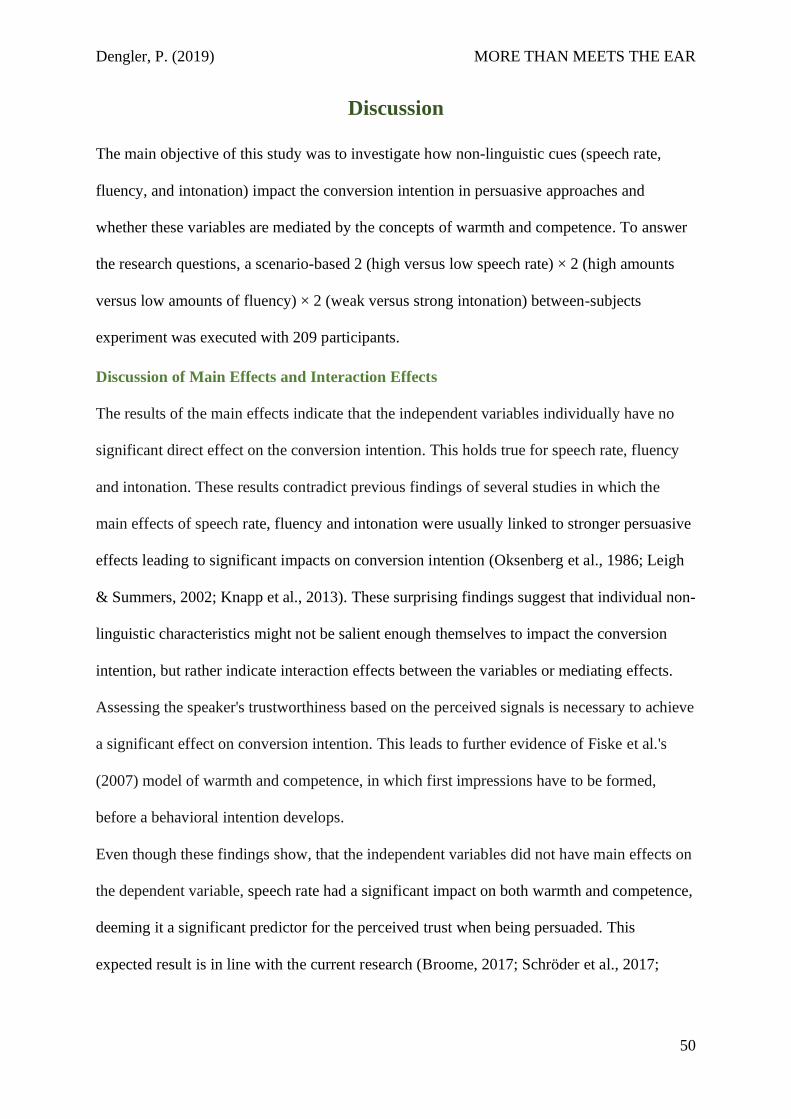
Dengler, P. (2019) MORE THAN MEETS THE EAR
50
Discussion
The main objective of this study was to investigate how non-linguistic cues (speech rate,
fluency, and intonation) impact the conversion intention in persuasive approaches and
whether these variables are mediated by the concepts of warmth and competence. To answer
the research questions, a scenario-based 2 (high versus low speech rate) × 2 (high amounts
versus low amounts of fluency) × 2 (weak versus strong intonation) between-subjects
experiment was executed with 209 participants.
Discussion of Main Effects and Interaction Effects
The results of the main effects indicate that the independent variables individually have no
significant direct effect on the conversion intention. This holds true for speech rate, fluency
and intonation. These results contradict previous findings of several studies in which the
main effects of speech rate, fluency and intonation were usually linked to stronger persuasive
effects leading to significant impacts on conversion intention (Oksenberg et al., 1986; Leigh
& Summers, 2002; Knapp et al., 2013). These surprising findings suggest that individual non-
linguistic characteristics might not be salient enough themselves to impact the conversion
intention, but rather indicate interaction effects between the variables or mediating effects.
Assessing the speaker's trustworthiness based on the perceived signals is necessary to achieve
a significant effect on conversion intention. This leads to further evidence of Fiske et al.'s
(2007) model of warmth and competence, in which first impressions have to be formed,
before a behavioral intention develops.
Even though these findings show, that the independent variables did not have main effects on
the dependent variable, speech rate had a significant impact on both warmth and competence,
deeming it a significant predictor for the perceived trust when being persuaded. This
expected result is in line with the current research (Broome, 2017; Schröder et al., 2017;
Dengler, P. (2019) MORE THAN MEETS THE EAR
51
Scherer, 2003; André et al., 2016; Levitan et al., 2018), judging the conditions with slow
speech rate as less warm and competent.
Fluency did measure a significant effect on competence, which resonates with previous
research (Anderson & Kilduff, 2009; Knapp et al., 2013; Schröder et al., 2017; Levitan et al.,
2018), but did not appear to be affecting the perception of warmth. In previous research this
was indicated that fluency signals difficulty (André et al., 2016), which rather addresses the
dimension of competence. Taking Fiske, Cuddy and Glick's (2007) theory into consideration,
the dimension of warmth is explained as the evaluation of the intention of a person. Fluency
as variable might not indicate whether these intentions are benevolent or unfriendly.
The opposite was the case for the intonation variable. Not measuring a significant effect on
competence is contrary to the findings of Stoltzman (2006) which state that low intonation
should result in a higher perception of competence and consequently stronger persuasion.
Instead, the mediating variable warmth was significantly affected. Therefore, intonation
displays a higher amount of social offering (Stoltzman, 2006), which implies a state of
collaboration and companionship. In consequence, trust can be established, and positive
engagement will increase. This also resonates with the findings of Belin et al. (2017), as well
as Ketrow (1990), who indicate that traits of attractiveness and trustworthiness are attributed
to higher variation in intonation.
While speech rate did not seem to have significant interaction effects, fluency and intonation
combined led to significant impact on the conversion intention. High fluency and intonation
affected the conversion intention positively, while the opposite was the case for low levels of
the variables. This is expected to be the case because of the salient effects of the combination
of those two variables as seen in previous research (Weiss, 2013; Ketrow, 1990; Hüfken &
Schäfer, 2003; Gélinas-Chebat et al., 1999). Speech rate, on the contrary, did not seem to
have any interaction effect. Respondents that were exposed to more fluent and highly

Dengler, P. (2019) MORE THAN MEETS THE EAR
52
intonated speech scored significantly higher on conversion intention than those exposed to
hesitant and monotonous speech. As interaction effects represent matching of principles,
intonation and fluency might share similar attributes that increase the salience of their
perception. These effects seem to be in line with Pentland's (2010) and Stoltzman's (2006)
findings, explaining the impact of non-linguistic characteristics increasing with the
combination of congruent signals. Lastly, warmth and competence have not been
significantly impacted by the interaction effect of fluency and intonation. This poses the
question if other variables that were not regarded in the original research model affect the
dependent variable.
Concluding and answering the first research question, it can be said that the main effects
regarding the dependent variable persist, when the salience is strong enough, while other
variables could still be identified.
Discussion of Mediating Effects
Regarding the mediating effect of the perceived warmth and competence, the results
indicated several indirect effects occurring. This is congruent with the research of Poggi and
D'Errico (2010) who argue that social signals are often transmitted indirectly.
The variable warmth measured significant mediation. Interestingly this coincides with the
missing interaction effects of speech rate, supporting the idea that the variable was not salient
enough. As a consequence, one can say, that speech rate in comparison to the other also
moderately designed variables seems to play a lesser role regarding the effect of conversion
intention.
Fluency was mediated by competence with a statistically significant value. As hypothesized
fluency is an especially salient indicator for competence, which goes along with the findings
of Ketrow (1990) and Anderson and Kilduff (2009).

Dengler, P. (2019) MORE THAN MEETS THE EAR
53
Intonation was mediated by warmth. It significantly showed that the perception of warmth
mediates the effect of intonated speech on conversion intention. This resonates well with
Broome's (2017) research, highlighting the importance of intonation regarding warmth and
likability and its effect on judge's willingness to participate in a study.
Lastly, it is important to note that the indirect effect of the mediators was surprisingly strong.
This leads to the conclusion that warmth and competence are significant mediators, that can
predict the social signaling of vocal characteristics, and based upon these signals a decision to
convert is made. Bliege Bird et al. (2005) found that evaluations of such signals are crucial
elements of our decision-making process.
Therefore, the hypotheses align with the expectations. It does impact the mediation variables
significantly, and these mediate it to the conversion intention. In conclusion, the effects on
the mediating variables were significant and lead to new insights into the impact of warmth
and competence on
Implications and Future Research Recommendations
Scientific implications.
The results of the study suggest that the effect of trust, namely warmth and competence, is
stronger than previously believed. While previous studies implied that the direct effect of
vocal characteristics is determining the outcome of a persuasive telemarketing attempt, this
study suggests that researchers should consider the first impressions mediated by the
perceptions of warmth and competence.
Although previous research has discussed the impact and moderating role of cultural and
individual factors on non-linguistic variables, it was shown that these characteristics lead to
strong effects perceived by the respondents. Even if cultural and individual factors can not be
ruled out, but that their effect is limited. Furthermore, the interaction effect of intonation and

Dengler, P. (2019) MORE THAN MEETS THE EAR
54
fluency indicates that these non-linguistic signals might share similar characteristics, that are
perceived as congruent.
Practical implications.
One field for practical application is the education on prosody for salespeople, call centers,
speech therapy and other environments that require signaling especially focused on the voice.
The results imply that the speech rate is a crucial element regarding the perception of warmth
and competence since it significantly affects both dimensions. Since the interaction effect is
not significant, it is advisable to focus on this variable first to increase the perceived
trustworthiness towards the listener. Secondly, a fluent and concise speech can enhance
persuasiveness by incrementally raising the perceived competence. For instance, when posing
an argument to convince someone, one should make clear to use a fluent way of speaking
with little hesitance and interruptions. Lastly, intonation should be expressed strongly when
the aim is to be perceived as more likable, friendly and honest. Especially at the beginning of
a conversation, when trust is not established, highly intonated speech signals openness and
possible interactivity. It is important to note, that trustworthy cues do not necessary imply
that a person is perceived as such in further engagement. Attempts to intentionally
manipulate or fake honest signals are usually unsuccessful since social signaling can be tested
throughout interactions (Lepri et al., 2010).
According to Broome (2017), such a training could be implemented with the use of software
measuring the speaker's prosody. In other contexts, such as presentations and negotiations,
these results might indicate advisable behavior but should be considered with care, since
other non-verbal signals such as body-language and sociodemographic signals come into
play.
Another application for telemarketing might be the automatization of introductions including
trustworthy signals. After the persuasive message is sent, a positive response by the

Dengler, P. (2019) MORE THAN MEETS THE EAR
55
respondent can indicate the software to further engage with the customer, connecting the call
to a human. Therefore, saving costs for human resources by only connecting to interested
targets.
Another practical application can be found in the realms of chatbots and voice UX. Creating
a chatbot for voice interaction usually focusses on understanding the intent and content of the
answers rather than the design of the voice. Instead, the modulation of the tone-of-voice can
improve the interaction, since the way of speaking would be connected to the intended
meaning, thus solving semantic problems such as irony, giving a more layered approach on
how to respond. The recently developed programming language for voice interaction SMML
(Baggia et al., 2010) is capable of adjusting variables such as speech rate, emphasis, and
fluency. Therefore, an application of the research results for creating voice-controlled user
experiences seems plausible. According to Brandtzaeg and Følstad (2017), the main driver
for the use of chatbots is the intention to increase productivity. In light of the research results,
signaling especially the trait of competence in the chatbots vocal characteristics could
improve customer satisfaction, while traits of warmth should facilitate further engagement.
Even though these suggestions seem plausible, it should be kept in mind that this research
focused on first impressions and how perceived signals influence a listener's conversion
intention. It is important to note, that these characteristics might change over time and
prolonged interaction and can be affected by interfering signals. Nevertheless, companies that
plan to employ persuasive chatbots, should consider the non-verbal characteristics.
Lastly, ethical implications are considered. Persuasion uses rhetoric elements to enhance
convincing arguments. Social engineering, for instance, relies heavily on Cialdini's (1993) 6
principles of influence, which include principles such as authority and liking. Sharing
similarities with the definitions of warmth and competence, the knowledge on persuasion can
be abused in the means of social hacking, exploiting weaknesses in human psychology

Dengler, P. (2019) MORE THAN MEETS THE EAR
56
(Hadnagy, 2010). Fraudsters might use their knowledge of vocal characteristics to signal a
false sense of trustworthiness, warmth or competence. According to Pentland's (2010) theory
of honest signals, which implies that features such as displaying activity, emphasis are hard
to fake, especially interactional behaviors such as mirroring and engagement can be
indicators for deceptive communication. Interacting with someone can disrupt and reveal
fake signaling of warmth and trustworthiness (Lepri et al., 2010). Nevertheless, social
engineering has emerged as a serious threat to security systems, which needs further
investigation by the scientific and security research community (Krombholz, Hobel, Huber,
& Weippl, 2015).
Limitations and recommendations for future research.
The conditions exposed to the participant were still in quite moderate speeds, frequencies and
fluencies leaning towards common and realistic ways of speaking, which also lead to
significant results but did not measure in strongly polarized ratings on the 7-point Likert
scale. Hence, one recommendation for further research is to assess, whether extremer
manipulations of the conditions would result in more significant results and different effects
on the perceptions of the listeners. A more comprehensive research design with additional
variables, extending the employed factorial design with more manipulations, could uncover
potential thresholds of the listener's perception and give more detailed feedback regarding the
different variables. In addition to added vocal characteristics, studies on interactivity
according to Pentland (2010) and Stoltzman (2006) could produce promising results
regarding the coherence of the honest signals over time and situations.
Another limitation of the current study was the diminished measurement of warmth, due to
unsuccessfully loading into one factor during factor analysis. In consequence, the results are
expected to have less validity and reliability. An explanation for this occurrence might be the
broad range of attributes that were incorporated into the scale suggested by Fiske et al. (2007)

Dengler, P. (2019) MORE THAN MEETS THE EAR
57
and Wojciszke (2005). Regarding further research into the topic, it is suggested to reevaluate
the dimensions of warmth and competence and subdividing them into smaller constructs such
as perceived dominance and competence on the one hand, and likability, trustworthiness on
the other.
Aside from the prosodic elements of speech rate, fluency and intonation further elements can
be considered when analyzing vocal characteristics. Firstly, gender is assumed being
attributed with certain stereotypical signals. According to Belin et al. (2017), the effects of
the speaker's gender on average trustworthiness ratings, had similar effects on male and
female listeners, indicating gender-independent mechanisms. Further research on the first
impressions moderated by gender could be conducted according to the researched mediators.
Furthermore, measures of trustworthiness strongly depend on the situation and the context in
which they are executed. Especially the variable of loudness might have more importance in
settings outside the realm of telemarketing. Scherer (1979) for instance, found the influence
of certain speech styles are highly dependent on cultural variables. Scherer's study (1979)
conducted the same survey in the united states of America and Germany, which lead to
significantly different preferences in influential speaking style. While American respondents
were persuaded by a determined, confident and even aggressive style of speech, German
respondents were more compelled by fluent and faster speakers. Therefore, the influence of
culture and surrounding should be considered, when choosing a vocal style. Further research
is recommended to reconsider these cultural factors and deem them relevant for each case
study. Also, combinations with other research models investigating mood, attribution models
or personality research are fields that create new opportunities for scientific research.
In the current study, conversion intention could have been impacted by factors that did not
directly relate to vocal characteristics. Drawing a conclusion that fully explains the impact of
prosodic features on conversion intention, is not convincing. Prosodic features inhibit a great

Dengler, P. (2019) MORE THAN MEETS THE EAR
58
variety of possible measurements, such as individual personal vocal characteristics and
preferences. On an individual level, rhetorical argumentation might be affected by the
personal preferences of the voice. With the development of consumer-based personalization
and increasing processing power, a designed voice could be taking variables such as gender,
dialects, and interaction into account. This empathetic understanding of consumers and
authentic delivery of voice interaction creates a promising and exciting field for future
research and product development. Understanding a wider variety of characteristics that
impact on warmth and competence can lead to more persuasive and empathetic technology.
Lastly, it is recommended to extend this study by applying other research designs to verify
the findings. For instance, field experiments, measuring the success rate of sales calls or call
centers expressing the researched vocal characteristics, would provide empiric evidence
regarding the actual conversion rates. Furthermore, qualitative interviews could extend the
knowledge about the perception of signals and detect potential moderating or mediating
variables, distorting the main effects.
Conclusion
In conclusion non-linguistic variables such as speech rate, fluency and intonation are strong
indicators for the perception of warmth and competence. The results of the study suggest that
the effect of trust, namely warmth and competence, is stronger than previously believed.
While previous studies implied that the direct effect of vocal characteristics is determining
the outcome of a persuasive telemarketing attempt, this study suggests that researchers should
consider the first impressions mediated by the perceptions of warmth and competence.
Furthermore, enthusiastic intonation can be seen as a strong indicator for high perceived
warmth, while a fluent way of speaking predicts a highly perceived competence. As a

Dengler, P. (2019) MORE THAN MEETS THE EAR
59
consequence, these results imply several applications for enhancing persuasiveness in
persuasive calls and the creation of interactive voice marketing.
Although previous research has discussed the impact and moderating role of cultural and
individual factors on non-linguistic variables, it was shown that these characteristics lead to
strong effects perceived by the respondents. Even if cultural and individual factors can not be
ruled out, their effect is limited.

Dengler, P. (2019) MORE THAN MEETS THE EAR
60
References
Ajzen, I. (1991). The theory of planned behavior. Organizational behavior and human
decision processes, 50(2), 179-211.
Anderson, C., & Kilduff, G. J. (2009). Why do dominant personalities attain influence in
face-to-face groups? The competence-signaling effects of trait dominance. Journal of
personality and social psychology, 96(2), 491.
André, V., Petr, C., André, N., Hausberger, M., & Lemasson, A. (2016). Voice features of
telephone operators predict auditory preferences of consumers. Interaction Studies, 17(1),
70-90.
Apple, W., Streeter, L. A., & Krauss, R. M. (1979). Effects of pitch and speech rate on
personal attributions. Journal of personality and social psychology, 37(5), 715.
Audacity Team (2019). Audacity ®: Free Audio Editor and Recorder [Computer application].
Retrieved May 20th, 2019 from https://audacityteam.org.
Baggia, P., Bagshaw, P., Bodell, M., Huang, D. Z., Xiaoyan, L., McGlashan, S., … Wu, Z.
(2010, September 7). Speech Synthesis Markup Language (SSML) Version 1.1. Retrieved
from https://www.w3.org/TR/speech-synthesis11.
Bartneck, C., Kulić, D., Croft, E., & Zoghbi, S. (2009). Measurement instruments for the
anthropomorphism, animacy, likeability, perceived intelligence, and perceived safety of
robots. International journal of social robotics, 1(1), 71-81.
Dengler, P. (2019) MORE THAN MEETS THE EAR
61
Baus, C., McAleer, P., Marcoux, K., Belin, P., & Costa, A. (2019). Forming social
impressions from voices in native and foreign languages. Scientific reports, 9(1), 414.
Belin, P., Bestelmeyer, P. E., Latinus, M., & Watson, R. (2011). Understanding voice
perception. British Journal of Psychology, 102(4), 711-725.
Belin, P., Boehme, B., & McAleer, P. (2017). The sound of trustworthiness: Acoustic-based
modulation of perceived voice personality. PloS one, 12(10).
Bliege Bird, R., Smith, E., Alvard, M., Chibnik, M., Cronk, L., Giordani, L., ... & Smith, E.
(2005). Signaling theory, strategic interaction, and symbolic capital. Current
Anthropology, 46(2), 221-248.
Boersma, P. & Weenink, D. (2019). Praat: Doing phonetics by computer [Computer
program]. Version 6.1.03, retrieved 1 September 2019 from http://www.praat.org.
Brandtzaeg, P. B., & Følstad, A. (2017). Why people use chatbots. Lecture Notes in
Computer Science, Vol. 10673 LNCS, 377-392.
Broome, J. (2015). First Impressions of Telephone Survey Interviewers. Journal of Official
Statistics, 31(4), 611-625.
Broome, J. (2017). Phone Surveys: Introductions and Response Rates. Handbook of Research
Methods in Health Social Sciences, 1-14.

Dengler, P. (2019) MORE THAN MEETS THE EAR
62
Brown, B. L., Strong, W. J., & Rencher, A. C. (1973). Perceptions of personality from
speech: Effects of manipulations of acoustical parameters. The Journal of the Acoustical
Society of America, 54(1), 29-35.
Buller, D. B. (2005). Methods for measuring speech rate. The sourcebook of nonverbal
measures: Going beyond words, 317-324.
Burgoon, J. K., Birk, T., & Pfau, M. (1990). Nonverbal behaviors, persuasion, and
credibility. Human communication research, 17(1), 140-169.
Chaiken, S., & Eagly, A. H. (1983). Communication modality as a determinant of persuasion:
The role of communicator salience. Journal of personality and social psychology, 45(2),
241.
Cuddy, A. J., Fiske, S. T., & Glick, P. (2008). Warmth and competence as universal
dimensions of social perception: The stereotype content model and the BIAS map.
Advances in experimental social psychology, 40, 61-149.
DePaulo, B. M. (1992). Nonverbal behavior and self-presentation. Psychological
Bulletin, 111(2), 203.
DeVellis, R. F. (2016). Scale development: Theory and applications (Vol. 26). Sage
publications.

Dengler, P. (2019) MORE THAN MEETS THE EAR
63
Eyben, F., Scherer, K. R., Schuller, B. W., Sundberg, J., André, E., Busso, C., & Truong, K.
P. (2015). The Geneva minimalistic acoustic parameter set (GeMAPS) for voice research
and affective computing. IEEE Transactions on Affective Computing, 7(2), 190-202.
Fiske, S. T., Cuddy, A. J., & Glick, P. (2007). Universal dimensions of social cognition:
Warmth and competence. Trends in cognitive sciences, 11(2), 77-83.
Frick (1985). Communicating emotion: The role of prosodic features. Psychological Bulletin,
97(3), 412.
Fogg, B. J. (2002). Persuasive technology: using computers to change what we think and do.
Ubiquity, 2002(December), 5.
Gabler S., Häder S., & Hoffmeyer-Zlotnik J.H.P. (2016). Richtlinie für telefonische
Befragungen. VS Verlag für Sozialwissenschaften.
Gélinas-Chebat, C., Chebat, J. C., & Boivin, R. (1999, August). Impact of male and female
voice cues on consumers' attitudes in telemarketing. In Conference proceedings of 14.
International Conference of Phonetic Science (pp. 1577-1580).
Gorsuch, R. L. (1983). Factor Analysis (2nd ed.). Hillsdale, NJ: Lawrence Erlbaum
Associates.
Hadnagy, C. (2010). Social engineering: The art of human hacking. John Wiley & Sons.

Dengler, P. (2019) MORE THAN MEETS THE EAR
64
Houtkoop, H., & Van den Bergh, H. (1995). Effects of Introductions in Large Scale
Telephone Interview. Unpublished manuscript, Free University, the Netherlands.
Hüfken, V., & Schäfer, A. (2003). Zum Einfluss stimmlicher Merkmale und
Überzeugungsstrategien der Interviewer auf die Teilnahme in Telefonumfragen. KZfSS
Kölner Zeitschrift für Soziologie und Sozialpsychologie, 55(2), 321-339.
Ketrow, S. M. (1990). Attributes of a telemarketer's voice and persuasiveness. A review and
synthesis of the literature. Journal of Direct Marketing, 4(3), 7-21.
Knapp, M. L., Hall, J. A., & Horgan, T. G. (2013). Nonverbal communication in human
interaction. Cengage Learning.
Koenig, M., & Stephens, E. (2014). Characterizing children’s responsiveness to cues of
speaker trustworthiness. Trust and skepticism: Children’s selective learning from
testimony, 13-27.
Kopparapu, S. K. (2015). Non-Linguistic Analysis of Call Center Conversations. Springer
International Publishing.
Krombholz, K., Hobel, H., Huber, M., & Weippl, E. (2015). Advanced social engineering
attacks. Journal of Information Security and applications, 22, 113-122.

Dengler, P. (2019) MORE THAN MEETS THE EAR
65
Laukka, P., Juslin, P., & Bresin, R. (2005). A dimensional approach to vocal expression of
emotion. Cognition & Emotion, 19(5), 633-653.
Leigh, T. W., & Summers, J. O. (2002). An initial evaluation of industrial buyers'
impressions of salespersons' nonverbal cues. Journal of Personal Selling & Sales
Management, 22(1), 41-53.
Lepri, B., Kalimeri, K., & Pianesi, F. (2010, August). Honest signals and their contribution to
the automatic analysis of personality traits–a comparative study. In International
Workshop on Human Behavior Understanding (pp. 140-150). Springer, Berlin,
Heidelberg.
Levitan, S. I., Maredia, A., & Hirschberg, J. (2018). Acoustic-prosodic indicators of
deception and trust in interview dialogues. Proc. Interspeech 2018, 416-420.
Nielsen, J. (2013). Conversion Rate: Definition as used in UX and web analytics. Retrieved
September 21, 2019, from https://www.nngroup.com/articles/conversion-rates.
McAleer, P., Todorov, A., & Belin, P. (2014). How do you say ‘Hello’? Personality
impressions from brief novel voices. PloS one, 9(3).
Mehrabian, A. & Ferris, S. R. (1967). Inference of attitudes from nonverbal communication
in two channels. Journal of Consulting Psychology, 31, 248-252.

Dengler, P. (2019) MORE THAN MEETS THE EAR
66
Merriam-Webster’s Collegiate Dictionary. (2019). Cold Call. Retrieved September 21, 2019,
from https://www.merriam-webster.com/dictionary/coldcall.
Merriam-Webster’s Collegiate Dictionary. (2019). Telemarketing. Retrieved September 21,
2019, https://www.merriam-webster.com/dictionary/telemarketing.
Oksenberg, L., Coleman, L., & Cannell, C. F. (1986). Interviewers' voices and refusal rates in
telephone surveys. Public Opinion Quarterly, 50(1), 97-111.
Pentland, A. (2010). Honest signals: how they shape our world. MIT press.
Poggi, I., & D'Errico, F. (2010, October). Cognitive modeling of human social signals. In
SSPW@ MM (pp. 21-26).
Ponsot, E., Burred, J. J., Belin, P., & Aucouturier, J. J. (2018). Cracking the social code of
speech prosody using reverse correlation. Proceedings of the National Academy of
Sciences, 115(15), 3972-3977.
Pratt, S., McCabe, S., Cortes-Jimenez, I., & Blake, A. (2010). Measuring the effectiveness of
destination marketing campaigns: Comparative analysis of conversion studies. Journal of
Travel Research, 49(2), 179-190.
Preacher, K. J., & Hayes, A. F. (2004). SPSS and SAS procedures for estimating indirect
effects in simple mediation models. Behavior research methods, instruments, &
computers, 36(4), 717-731.
Dengler, P. (2019) MORE THAN MEETS THE EAR
67
Remland, M. S., & Jones, T. S. (1994). The influence of vocal intensity and touch on
compliance gaining. The Journal of social psychology, 134(1), 89-97.
Rosenberg, S., Nelson, C., & Vivekananthan, P. S. (1968). A multidimensional approach to
the structure of personality impressions. Journal of personality and social
psychology, 9(4), 283.
Salah, A. A., Pantic, M., & Vinciarelli, A. (2011, October). Recent developments in social
signal processing. In 2011 IEEE International Conference on Systems, Man, and
Cybernetics (pp. 380-385). IEEE.
Scherer, K. R. (1979). Voice and speech correlates of perceived social influence in simulated
juries. Language and social psychology, 88-120.
Scherer, K. R. (1986). Vocal affect expression: A review and a model for future
research. Psychological Bulletin, 99(2), 143.
Scherer, K. R. (2003). Vocal communication of emotion: A review of research
paradigms. Speech communication, 40(1-2), 227-256.
Scherer, K. R., Banse, R., Wallbott, H. G., & Goldbeck, T. (1991). Vocal cues in emotion
encoding and decoding. Motivation and Emotion, 15(2), 123-148.

Dengler, P. (2019) MORE THAN MEETS THE EAR
68
Schröder, A., Stone, S., & Birkholz, P. (2017). The Sound of Deception-What Makes a
Speaker Credible?. Interspeech, 1467-1471.
Solomon, R. C., & Flores, F. (2003). Building trust: In business, politics, relationships, and
life. Oxford University Press.
Sotolongo, N., & Copulsky, J. (2018). Conversational marketing: Creating compelling
customer connections. Applied Marketing Analytics, 4(1), 6-21.
Stoltzman, W. T. (2006). Toward a social signaling framework: Activity and emphasis in
speech (Doctoral dissertation). MIT press.
Sundaram, D. S., & Webster, C. (2000). The role of nonverbal communication in service
encounters. Journal of Services Marketing, 14(5), 378-391.
Tabachnick, B. G., & Fidell, L. S. (2013). Using multivariate statistics, 6th edn Boston. Ma:
Pearson.
Tusing, K. J. (2005). Objective measurement of vocal signals. The sourcebook of nonverbal
measures: Going beyond words, 393.
UCLA. (2019). Introduction to Regression with SPSS Lesson 2: SPSS Regression
Diagnostics. Retrieved from https://stats.idre.ucla.edu/spss/seminars/introduction-to-
regression-with-spss/introreg-lesson2.
Dengler, P. (2019) MORE THAN MEETS THE EAR
69
Van den Broeck, J., Cunningham, S. A., Eeckels, R., & Herbst, K. (2005). Data cleaning:
detecting, diagnosing, and editing data abnormalities. PLoS medicine, 2(10), e267.
Weiss, B. (2013). Prosodische Elemente vokaler Sympathie. Studientexte zur
Sprachkommunikation. TUD Press, Dresden, 65, 212-217.
Yaffe, P. (2011). The 7% rule: fact, fiction, or misunderstanding. Ubiquity, 2011(October), 1.
Zhao, X., Lynch Jr, J. G., & Chen, Q. (2010). Reconsidering Baron and Kenny: Myths and
truths about mediation analysis. Journal of consumer research, 37(2), 197-206.

Dengler, P. (2019) MORE THAN MEETS THE EAR
70
Appendices
Appendix 1
German:
Skript für Surveyumfrage
Guten Tag. Mein Name ist __Max Mensing__ vom Markforschungsinstitut Infratest Dimap
in Berlin. Wir führen momentan eine wissenschaftliche Befragung zum politischen
Stimmungsbild in Deutschland nach den Europawahlen durch. Die Befragung dauert in etwa
10 Minuten. Ihre Teilnahme ist natürlich freiwillig und die Auswertung der Daten erfolgt
anonym. Voraussetzung ist, dass Sie volljährig sind. Wären Sie oder jemand in Ihrem
Haushalt denn verfügbar?
English:
Script for telephone survey
Hello. My name is _____Max Mensing______ from the market research institute Infratest
Dimap in Berlin. We are currently conducting a scientific survey on the political mood in
Germany. The interview takes about 10 minutes. Your participation is of course voluntary
and the evaluation of the data is anonymous. The prerequisite is that you are of legal age.
Would you or someone in your household be available?

Dengler, P. (2019) MORE THAN MEETS THE EAR
71
Appendix 2
Pre-Test: Survey of non-linguistic Signals
As part of my graduation thesis for the MSc Communication Studies I examine.
The survey takes approximately 5 minutes of your time. Your data is handled confidentially
and responsible. The results are processed completely anonymously.
You will now hear a segment of speech from a telemarketing institute asking for your
collaboration for a survey about the political sentiment in Europe. After hearing the message,
please fill out the questionary.
The tempo of the speaker is:
Slow 1 2 3 4 5 Fast
Relaxed1 2 3 4 5 Stressed
Dragged 1 2 3 4 5 Rushed
Sluggish 1 2 3 4 5 Hastened
The fluency of the speaker feels:
Interrupted 1 2 3 4 5 Continuous
Mumbling 1 2 3 4 5 Precise
Faltering 1 2 3 4 5 Certain
Hesitant 1 2 3 4 5 Decisive
The intonation of the speaker is:
Static 1 2 3 4 5 Excited
Passive 1 2 3 4 5 Inviting
Monotone 1 2 3 4 5 Energetic
Detached1 2 3 4 5 Enthusiastic
The Voice of the speaker sounds:
Fake 1 2 3 4 5 Natural
Artificially 1 2 3 4 5 Lifelike
Mechanical 1 2 3 4 5 Organic
Altered 1 2 3 4 5 Original
Scripted 1 2 3 4 5 Improvised
My overall Impression of the speaker is:
Positive1 2 3 4 5 Negative
Thanks for participating in this study.

Dengler, P. (2019) MORE THAN MEETS THE EAR
72
Appendix 3
https://drive.google.com/file/d/1ecU5aS35yAfTHl6fehUzgl2JtJSSb0AI/view?usp=sharing
Appendix 4
Main Study: Survey of non-linguistic Signals
Dear Participant,
My master thesis examines the effect of telephone surveys on target groups. The survey takes
about 6-10 minutes. Your data will be anonymized and treated confidentially.
Click Next to join the study and accept the privacy terms and conditions.
Please fill in the general information first:
Gender
Male – Female - Other
Age
Indicate your age:
Employment:
Employed full time
Employed part time
Unemployed
Retired
Student
Disabled
On the next page you will hear a section of a telephone call from the German market research
institute "Infratest Dimap". The segment is spoken by a professional actor, and is intended in
the way it sounds.
After you have heard the clip, you will be asked to complete the following questionnaire to
the best of your knowledge and belief.
Before playing, make sure that you are in a quiet room. It is recommended to use headphones
for better listening.
Please evaluate the just mentioned section based on the following criteria:
COMPETENCE: The speaker appeared to be…
Competent
Intelligent
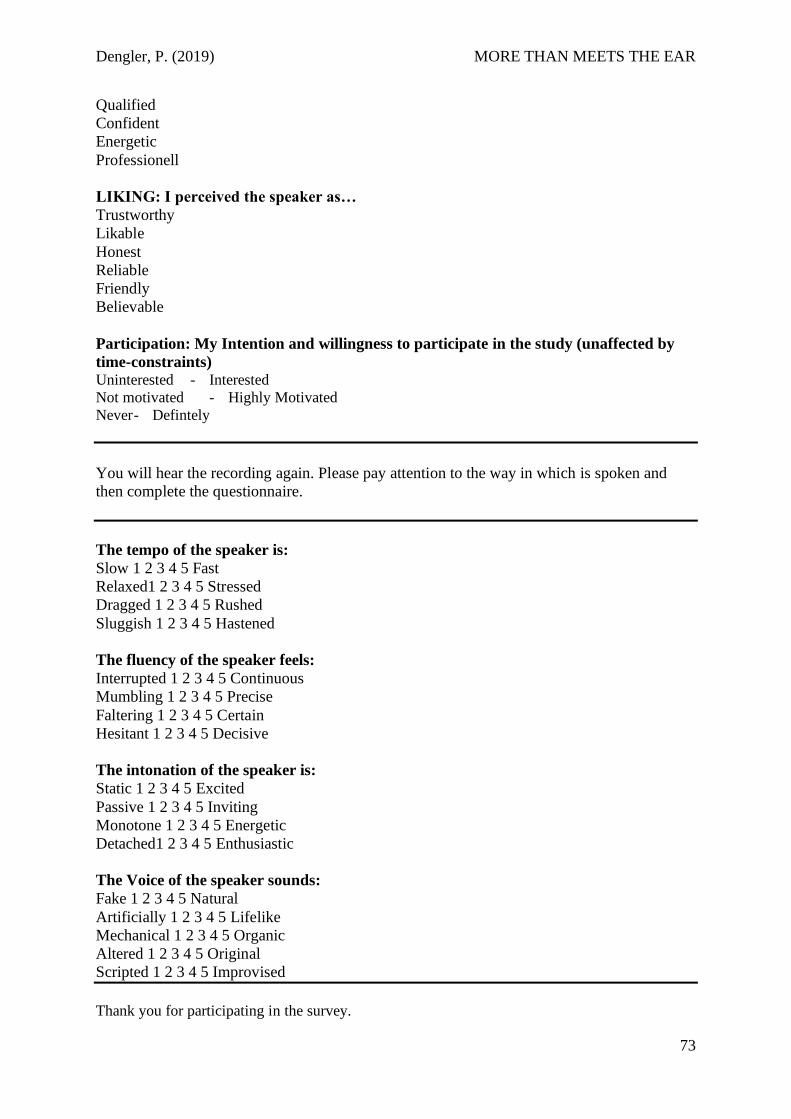
Dengler, P. (2019) MORE THAN MEETS THE EAR
73
Qualified
Confident
Energetic
Professionell
LIKING: I perceived the speaker as…
Trustworthy
Likable
Honest
Reliable
Friendly
Believable
Participation: My Intention and willingness to participate in the study (unaffected by
time-constraints) Uninterested - Interested
Not motivated - Highly Motivated
Never - Defintely
You will hear the recording again. Please pay attention to the way in which is spoken and
then complete the questionnaire.
The tempo of the speaker is:
Slow 1 2 3 4 5 Fast
Relaxed1 2 3 4 5 Stressed
Dragged 1 2 3 4 5 Rushed
Sluggish 1 2 3 4 5 Hastened
The fluency of the speaker feels:
Interrupted 1 2 3 4 5 Continuous
Mumbling 1 2 3 4 5 Precise
Faltering 1 2 3 4 5 Certain
Hesitant 1 2 3 4 5 Decisive
The intonation of the speaker is:
Static 1 2 3 4 5 Excited
Passive 1 2 3 4 5 Inviting
Monotone 1 2 3 4 5 Energetic
Detached1 2 3 4 5 Enthusiastic
The Voice of the speaker sounds:
Fake 1 2 3 4 5 Natural
Artificially 1 2 3 4 5 Lifelike
Mechanical 1 2 3 4 5 Organic
Altered 1 2 3 4 5 Original
Scripted 1 2 3 4 5 Improvised
Thank you for participating in the survey.