Disk-Jet Connection in the Radio Galaxy 3C 120
28
arXiv:0909.2051v1 [astro-ph.HE] 10 Sep 2009 Draft version September 10, 2009 Preprint typeset using L A T E X style emulateapj v. 08/22/09 DISK-JET CONNECTION IN THE RADIO GALAXY 3C 120 Ritaban Chatterjee 1 , Alan P. Marscher 1 , Svetlana G. Jorstad 1,2 , Alice R. Olmstead 1 , Ian M. McHardy 3 , Margo F. Aller 4 , Hugh D. Aller 4 , Anne L¨ ahteenm¨ aki 5 , Merja Tornikoski 5 , Talvikki Hovatta 5 , Kevin Marshall 6,7 , H. Richard Miller 6 , Wesley T. Ryle 6 , Benjamin Chicka 1 , A. J. Benker 8,9 , Mark C. Bottorff 10 , David Brokofsky 8,11 , Jeffrey S. Campbell 8 , Taylor S. Chonis 8,12,17 , C. Martin Gaskell 8,12 , Evelina R. Gaynullina 13 , Konstantin N. Grankin 13,14 , Cecelia H. Hedrick 8,15 , Mansur A. Ibrahimov 13 , Elizabeth S. Klimek 8,16 , Amanda K. Kruse 8 , Shoji Masatoshi 8,12 , Thomas R. Miller 17 , Hong-Jian Pan 18 , Eric A. Petersen 8 , Bradley W. Peterson 8,19 , Zhiqiang Shen 18 , Dmitriy V. Strel’nikov 13,20 , Jun Tao 18 , Aaron E. Watkins 8 , Kathleen Wheeler 8 Draft version September 10, 2009 ABSTRACT We present the results of extensive multi-frequency monitoring of the radio galaxy 3C 120 between 2002 and 2007 at X-ray (2-10 keV), optical (R and V band), and radio (14.5 and 37 GHz) wave bands, as well as imaging with the Very Long Baseline Array (VLBA) at 43 GHz. Over the 5 yr of observation, significant dips in the X-ray light curve are followed by ejections of bright superluminal knots in the VLBA images. Consistent with this, the X-ray flux and 37 GHz flux are anti-correlated with X-ray leading the radio variations. Furthermore, the total radiative output of a radio flare is related to the equivalent width of the corresponding X-ray dip. This implies that, in this radio galaxy, the radiative state of accretion disk plus corona system, where the X-rays are produced, has a direct effect on the events in the jet, where the radio emission originates. The X-ray power spectral density of 3C 120 shows a break, with steeper slope at shorter timescale and the break timescale is commensurate with the mass of the central black hole based on observations of Seyfert galaxies and black hole X-ray binaries. These findings provide support for the paradigm that black hole X-ray binaries and both radio-loud and radio-quiet active galactic nuclei are fundamentally similar systems, with characteristic time and size scales linearly proportional to the mass of the central black hole. The X-ray and optical variations are strongly correlated in 3C 120, which implies that the optical emission in this object arises from the same general region as the X-rays, i.e., in the accretion disk- corona system. We numerically model multi-wavelength light curves of 3C 120 from such a system with the optical-UV emission produced in the disk and the X-rays generated by scattering of thermal photons by hot electrons in the corona. From the comparison of the temporal properties of the model light curves to that of the observed variability, we constrain the physical size of the corona and the distances of the emitting regions from the central BH. In addition, we discus physical scenarios for the disk-jet connection that are consistent with our observations. Subject headings: galaxies: active — galaxies: individual (3C 120) — galaxies: jets — physical data and processes—X-rays: galaxies — radio continuum: galaxies 1 Institute for Astrophysical Research, Boston University, 725 Commonwealth Avenue, Boston, MA 02215 2 Astronomical Institute of St. Petersburg State University, Uni- versitetskij Pr. 28, Petrodvorets, 198504 St. Petersburg, Russia 3 Department of Physics and Astronomy, University of Southampton, Southampton, SO17 1BJ, United Kingdom 4 Astronomy Department, University of Michigan, 830 Denni- son, 501 East University Street, Ann Arbor, Michigan 48109-1042 5 Mets¨ ahovi Radio Observatory, Helsinki University of Technol- ogy TKK, Mets¨ ahovintie 114, FIN-02540 Kylm¨ al¨ a, Finland 6 Department of Physics and Astronomy, Georgia State Univer- sity, Atlanta, GA 30303 7 Department of Physics, Bucknell University, Lewisburg PA 17837 8 Department of Physics and Astronomy, University of Nebraska, Lincoln, NE 68588-0111 9 Department of Physics & Astronomy, University of California, Irvine, CA 92697-4575 10 Physics Department, Southwestern University, Georgetown, TX 78627-0770 11 Deceased, Sept. 13, 2008 12 Department of Astronomy, University of Texas, Austin, TX 78712-0259 13 Ulugh Beg Astronomical Institute of the Uzbek Academy of Sciences Astronomicheskaya St. 33, Tashkent, 100052, Uzbekistan 14 Present address: Crimean Astrophysical Observatory, 1. INTRODUCTION Stellar-mass black hole X-ray binaries (BHXRBs) and active galactic nuclei (AGNs) are both powered by accre- tion onto a black hole (BH). In many cases these systems emit radiation over several decades of frequency and pos- sess relativistic jets (Mirabel & Rodriguez 1999). The above similarities in the basic generation of energy and observational properties have led to the paradigm that Nauchny, Crimea, 98409 Ukraine 15 Present address: Astronomy and Astrophysics Department, Pennsylvania State University, 525 Davey Laboratory, University Park, PA 16802 16 Present address: Astronomy Department, MSC 4500, New Mexico State University, PO BOX 30001, La Cruces, NM 88003- 8001 17 Miller Observatory, 3400 N. 102nd St., Lincoln, NE. 68527 18 Key Laboratory for Research in Galaxies and Cosmology, Shanghai Astronomical Observatory, Chinese Academy of Sciences, 80 Nandan Rd., Shanghai, 200030 China 19 Present Address: Department of Physics and Astronomy, Iowa State University, Ames, IA, 50011-3160 20 Department of Astronomy, National University of Uzbekistan, Tashkent 700095, Uzbekistan
-
Upload
independent -
Category
Documents
-
view
2 -
download
0
Transcript of Disk-Jet Connection in the Radio Galaxy 3C 120
arX
iv:0
909.
2051
v1 [
astr
o-ph
.HE
] 1
0 Se
p 20
09Draft version September 10, 2009Preprint typeset using LATEX style emulateapj v. 08/22/09
DISK-JET CONNECTION IN THE RADIO GALAXY 3C 120
Ritaban Chatterjee1, Alan P. Marscher1, Svetlana G. Jorstad1,2, Alice R. Olmstead1, Ian M. McHardy3,Margo F. Aller 4, Hugh D. Aller4, Anne Lahteenmaki5, Merja Tornikoski5, Talvikki Hovatta5, Kevin
Marshall6,7, H. Richard Miller6, Wesley T. Ryle6, Benjamin Chicka1, A. J. Benker8,9, Mark C. Bottorff10,David Brokofsky8,11, Jeffrey S. Campbell8, Taylor S. Chonis8,12,17, C. Martin Gaskell8,12, Evelina R.
Gaynullina13, Konstantin N. Grankin13,14, Cecelia H. Hedrick8,15, Mansur A. Ibrahimov13, Elizabeth S.Klimek8,16, Amanda K. Kruse8, Shoji Masatoshi8,12, Thomas R. Miller17, Hong-Jian Pan18, Eric A. Petersen8,
Bradley W. Peterson8,19, Zhiqiang Shen18, Dmitriy V. Strel’nikov13,20, Jun Tao18, Aaron E. Watkins8, KathleenWheeler8
Draft version September 10, 2009
ABSTRACT
We present the results of extensive multi-frequency monitoring of the radio galaxy 3C 120 between2002 and 2007 at X-ray (2-10 keV), optical (R and V band), and radio (14.5 and 37 GHz) wavebands, as well as imaging with the Very Long Baseline Array (VLBA) at 43 GHz. Over the 5 yr ofobservation, significant dips in the X-ray light curve are followed by ejections of bright superluminalknots in the VLBA images. Consistent with this, the X-ray flux and 37 GHz flux are anti-correlatedwith X-ray leading the radio variations. Furthermore, the total radiative output of a radio flareis related to the equivalent width of the corresponding X-ray dip. This implies that, in this radiogalaxy, the radiative state of accretion disk plus corona system, where the X-rays are produced, hasa direct effect on the events in the jet, where the radio emission originates. The X-ray power spectraldensity of 3C 120 shows a break, with steeper slope at shorter timescale and the break timescale iscommensurate with the mass of the central black hole based on observations of Seyfert galaxies andblack hole X-ray binaries. These findings provide support for the paradigm that black hole X-raybinaries and both radio-loud and radio-quiet active galactic nuclei are fundamentally similar systems,with characteristic time and size scales linearly proportional to the mass of the central black hole.The X-ray and optical variations are strongly correlated in 3C 120, which implies that the opticalemission in this object arises from the same general region as the X-rays, i.e., in the accretion disk-corona system. We numerically model multi-wavelength light curves of 3C 120 from such a systemwith the optical-UV emission produced in the disk and the X-rays generated by scattering of thermalphotons by hot electrons in the corona. From the comparison of the temporal properties of the modellight curves to that of the observed variability, we constrain the physical size of the corona and thedistances of the emitting regions from the central BH. In addition, we discus physical scenarios forthe disk-jet connection that are consistent with our observations.
Subject headings: galaxies: active — galaxies: individual (3C 120) — galaxies: jets — physical dataand processes—X-rays: galaxies — radio continuum: galaxies
1 Institute for Astrophysical Research, Boston University, 725Commonwealth Avenue, Boston, MA 02215
2 Astronomical Institute of St. Petersburg State University, Uni-versitetskij Pr. 28, Petrodvorets, 198504 St. Petersburg, Russia
3 Department of Physics and Astronomy, University ofSouthampton, Southampton, SO17 1BJ, United Kingdom
4 Astronomy Department, University of Michigan, 830 Denni-son, 501 East University Street, Ann Arbor, Michigan 48109-1042
5 Metsahovi Radio Observatory, Helsinki University of Technol-ogy TKK, Metsahovintie 114, FIN-02540 Kylmala, Finland
6 Department of Physics and Astronomy, Georgia State Univer-sity, Atlanta, GA 30303
7 Department of Physics, Bucknell University, Lewisburg PA17837
8 Department of Physics and Astronomy, University of Nebraska,Lincoln, NE 68588-0111
9 Department of Physics & Astronomy, University of California,Irvine, CA 92697-4575
10 Physics Department, Southwestern University, Georgetown,TX 78627-0770
11 Deceased, Sept. 13, 200812 Department of Astronomy, University of Texas, Austin, TX
78712-025913 Ulugh Beg Astronomical Institute of the Uzbek Academy of
Sciences Astronomicheskaya St. 33, Tashkent, 100052, Uzbekistan14 Present address: Crimean Astrophysical Observatory,
1. INTRODUCTION
Stellar-mass black hole X-ray binaries (BHXRBs) andactive galactic nuclei (AGNs) are both powered by accre-tion onto a black hole (BH). In many cases these systemsemit radiation over several decades of frequency and pos-sess relativistic jets (Mirabel & Rodriguez 1999). Theabove similarities in the basic generation of energy andobservational properties have led to the paradigm that
Nauchny, Crimea, 98409 Ukraine15 Present address: Astronomy and Astrophysics Department,
Pennsylvania State University, 525 Davey Laboratory, UniversityPark, PA 16802
16 Present address: Astronomy Department, MSC 4500, NewMexico State University, PO BOX 30001, La Cruces, NM 88003-8001
17 Miller Observatory, 3400 N. 102nd St., Lincoln, NE. 6852718 Key Laboratory for Research in Galaxies and Cosmology,
Shanghai Astronomical Observatory, Chinese Academy of Sciences,80 Nandan Rd., Shanghai, 200030 China
19 Present Address: Department of Physics and Astronomy, IowaState University, Ames, IA, 50011-3160
20 Department of Astronomy, National University of Uzbekistan,Tashkent 700095, Uzbekistan
2
these two systems are fundamentally similar, with char-acteristic time and size scales linearly proportional tothe mass of the central BH (∼10 M⊙ for BHXRBs and106 to 109 M⊙ for AGNs). Although this paradigm hasgiven rise to the expectation that we might test mod-els of AGNs with observations of BHXRBs, such an ap-proach is unjustified until detailed, possibly quantitativeconnections between BHXRB systems and AGNs becomewell-established. The comparison of BHXRBs and AGNsis complicated by the fact that a single AGN usuallydoes not show the entire range of properties that wewish to compare. For example, Seyfert galaxies are theAGNs that most resemble BHXRBs, but their radio jetstend to be weak and non-relativistic (e.g. Ulvestad et al.1999). On the other hand, in radio-loud AGNs withstrong, highly variable nonthermal radiation (blazars),the Doppler beamed emission from the jet at most wave-lengths masks the thermal emission from the accretiondisk and its nearby regions.
One well-established property of BHXRBs is theconnection between accretion state and events inthe jet. In these objects, transitions to high-soft X-ray states are associated with the emergenceof very bright features that proceed to propagatedown the radio jet (Fender, Belloni, & Gallo 2004;Fender, Homan, & Belloni 2009). Similarly, an accre-tion disk-jet connection was established in AGNs byMarscher et al. (2002), who reported a relationship be-tween X-ray and radio events in the radio galaxy 3C 120(redshift of 0.033). During ∼ 3 yr of monitoring of thisobject, four dips in the X-ray flux, accompanied by spec-tral hardening, preceded the appearance of bright super-luminal knots in the radio jet. This Fanaroff-Riley classI radio galaxy has a prominent radio jet that displaysstrong variability in flux and jet structure (Gomez et al.2001; Walker et al. 2001). The jet lies at an angle ∼ 20◦
to our line of sight, significantly wider than is typicallythe case for blazars (Jorstad et al. 2005). At optical andX-ray frequencies, 3C 120 possesses properties similarto Seyfert galaxies and BHXRBs, e.g., a prominent ironemission line at a rest energy of 6.4 keV (Grandi et al.1997; Zdziarski & Grandi 2001). Hence, most of the X-rays are produced in the immediate environs of the ac-cretion disk: the corona, a hot wind, or the base of thejet. Since the superluminal knots are disturbances prop-agating down the jet, a link between decreases in X-rayproduction and the emergence of new superluminal com-ponents demonstrates the existence of a strong disk-jetconnection.
In this paper we present the results of extensive multi-frequency monitoring of 3C 120 between 2002 and 2007at X-ray energies (2.4-10 keV), optical R and V bands,and radio frequencies 37 and 14.5 GHz, as well as imag-ing with the Very Long Baseline Array (VLBA) at 43GHz. We use these data to obtain quantitative supportfor the disk-jet connection claimed by Marscher et al.(2002). Times of “ejections” are defined as the extrap-olated time of coincidence of a moving knot with theposition of the (presumed quasi-stationary) core in theVLBA images. Savolainen et al. (2002) have found thatejection times are generally associated with an increasein flux at 37 GHz. Therefore, the 37 GHz flux should beanti-correlated with the X-ray flux if decreases in X-ray
production are linked to ejections. Here, we confirm theexistence of this anti-correlation and test for a relationbetween the amplitude of the X-ray dips and that of theassociated 37 GHz flares.
Another similarity between BHXRBs and Seyfertgalaxies lies in their X-ray power spectral densi-ties (PSDs). The PSD corresponds to the power inthe variability of flux on different timescales. TheX-ray PSDs of Seyfert galaxies can be fit by piece-wise power laws with a break (Nowak et al. 1999;Uttley, McHardy, & Papadakis 2002; McHardy et al.2004; Markowitz et al. 2003; Pounds et al. 2001;Edelson & Nandra 1999). This is generally similar tothat of BHXRBs although in many cases the latterhave more than one break and sharp peaks due toquasi-periodic oscillations. We use our data set to verifythat the X-ray PSD of 3C 120 also has a break, asinferred by Marshall et al. (2009), who calculated thePSD from somewhat less extensive observations thatpartially overlap with ours.
The bulk of the optical continuum from non-blazarAGNs is thought to emanate from the accretion disk(Malkan 1983). In order to test this, we cross-correlatethe optical flux variations of 3C 120 with those at X-ray energies. However, the coefficients of raw correla-tions may be artificially low due to the uneven sam-pling present in the data. In light of this, we use simu-lated light curves, based on the underlying PSD, to esti-mate the significance of the derived coefficients of boththe X-ray/optical correlation and X-ray/37 GHz anti-correlation found in the 3C 120 data.
In §2 we present the observations and data reductionprocedures, while in §3 we describe the power spectralanalysis and its results. In §4 we cross-correlate the X-ray and 37 GHz light curves and quantitatively inves-tigate the relation between the X-ray dips, radio flaresand ejections, as well as discuss the X-ray/optical corre-lation. In §5 we discuss and interpret the results, focusingon the implications regarding the accretion disk-jet con-nection and the source of the optical emission in 3C 120.§6 presents conclusions, including comparison of 3C 120with BHXRBs
2. OBSERVATIONS AND DATA ANALYSIS
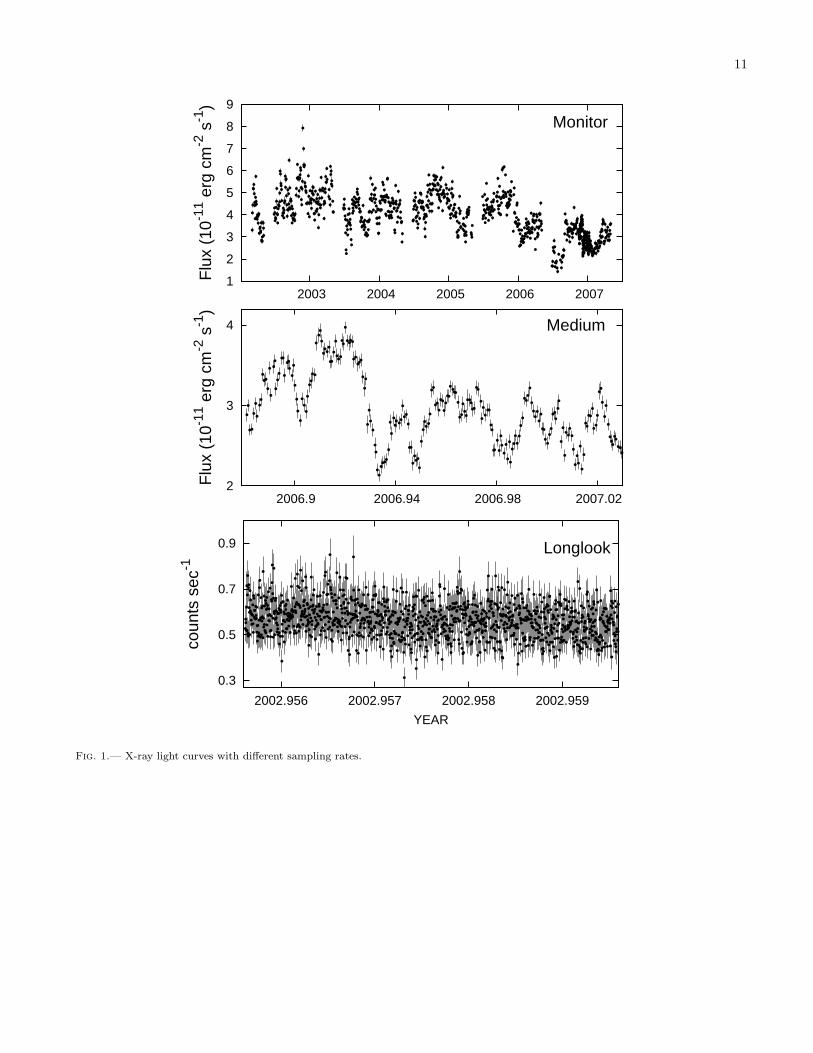
Table 1 summarizes the intervals of monitoring at dif-ferent frequencies for each of the three wave bands inour data set. We term the entire light curve “monitordata”; shorter segments of more intense monitoring aredescribed below.
The X-ray light curves are based on observations of3C 120 with the Rossi X-ray Timing Explorer (RXTE)from 2002 March to 2007 May. We observed 3C 120 withthe RXTE PCA instrument with typical exposure timesof 1-2 ks. For each exposure, we used routines from theX-ray data analysis software FTOOLS and the programXSPEC to calculate and subtract an X-ray backgroundmodel from the data and to fit the X-ray spectrum from2.4 to 10 keV as a power law with low-energy photoelec-tric absorption by intervening gas in our Galaxy. For thelatter, we used a hydrogen column density of 1.23× 10²¹
atoms cm−2 (Elvis, Lockman, & Wilkes 1989).The sampling of the X-ray flux varied. Normally, ob-
servations were made 2-3 times per week except during8-week intervals each year when the radio galaxy is too

3
close to the Sun’s celestial position to observe safely. Inorder to sample shorter-term variations, between 2006November and 2007 January we obtained, on average,four measurements per day for almost two months. Werefer to these observations as the “medium” data. XMM-Newton observed 3C 120 quasi-continuously for about130 ks on 2002 December 13 and 14, during which allinstruments were operating normally. The data wereprocessed with the latest software (SAS version 5.3.3).Light curves were extracted in two energy bands, 0.3-10keV and 4-10 keV, and were background-subtracted andbinned to 100 s time intervals. The 4-10 keV light curve,re-binned to an interval of 0.01 day, were used as the“longlook” data. We use the 4-10 keV data since the en-ergy range is similar to that of our RXTE data (2.4-10keV). Figure 1 presents these three data sets.
We also monitored 3C 120 in the optical R and Vbands over a portion of the time span of the X-rayobservations. The majority of the measurements in Rband are from the 2 m Liverpool Telescope (LT) at LaPalma, Canary Islands, Spain, supplemented by obser-vations at the 1.8 m Perkins Telescope of Lowell Ob-servatory, Flagstaff, Arizona. The V-band photometrywas obtained with the 0.4-m telescope of the Univer-sity of Nebraska. On each night a large number of one-minute images (∼ 20) were taken and measured sep-arately. Details of the observing and reduction pro-cedure are as described in Klimek, Gaskell, & Hendrick(2004). Comparison star magnitudes were calibrated us-ing Doroshenko et al. (2006). To minimize the effectsof variations in the image quality, fluxes were measuredthrough an aperture of 8 arcseconds radius. The errorsgiven for each night are the uncertainties in the means.The Miller Observatory observations were taken witha 0.4-m telescope in Nebraska and reduced in similarmanner as were the University of Nebraska observations.Observations at the Shanghai Astronomical Observatorywere obtained with the 1.56-m telescope at Sheshan Sta-tion with standard Johnson-Cousins V, R, and I filters,and all the magnitudes were scaled to the V passband.The reductions were as for the Nebraska observations.Early observations (2002 to 2004) carried out at thePerkins Telescope were in V-band. For these measure-ments, we used stars D, E, and G from Angione (1971)to calculate the V-magnitudes. We use three comparisonstars in the field of 3C 120 to calculate the R-magnitude.We determined the R-magnitudes of these three starsbased on ∼20 frames obtained within 2 yr. We use theflux-magnitude calibration of Mead et al. (1990) and cor-rect for Galactic extinction for both R and V bands.
Since the optical sampling in R or V band individuallyis not as frequent as the X-ray sampling, we constructa better-sampled optical light curve by combining thesetwo bands. We find that the R and V band light curveshave 38 data points that were measured within 0.5 dayof each other. These data are shown in Figure 2. Theequation of the best-fit line is FR = 0.96FV +1.96, whereFV and FR are the fluxes in V and R band, respectively.We convert the V band fluxes into R band using thisequation. We also add some data from Lowell Observa-tory while constructing the combined light curve, whichwe present in Figure 3.
We have compiled a 37 GHz light curve with data fromthe 13.7 m telescope at Metsahovi Radio Observatory,
Finland. The flux density scale is set by observations ofDR 21. Sources 3C 84 and 3C 274 are used as secondarycalibrators. A detailed description on the data reductionand analysis is given in Terasranta et al. (1998). We alsomonitored 3C 120 at 14.5 GHz with the 26 m antenna ofthe University of Michigan Radio Astronomy Observa-tory. Details of the calibration and analysis techniquesare described in Aller et al. (1985). At both frequenciesthe flux scale was set by observations of Cassiopeia A(Baars et al. 1977).
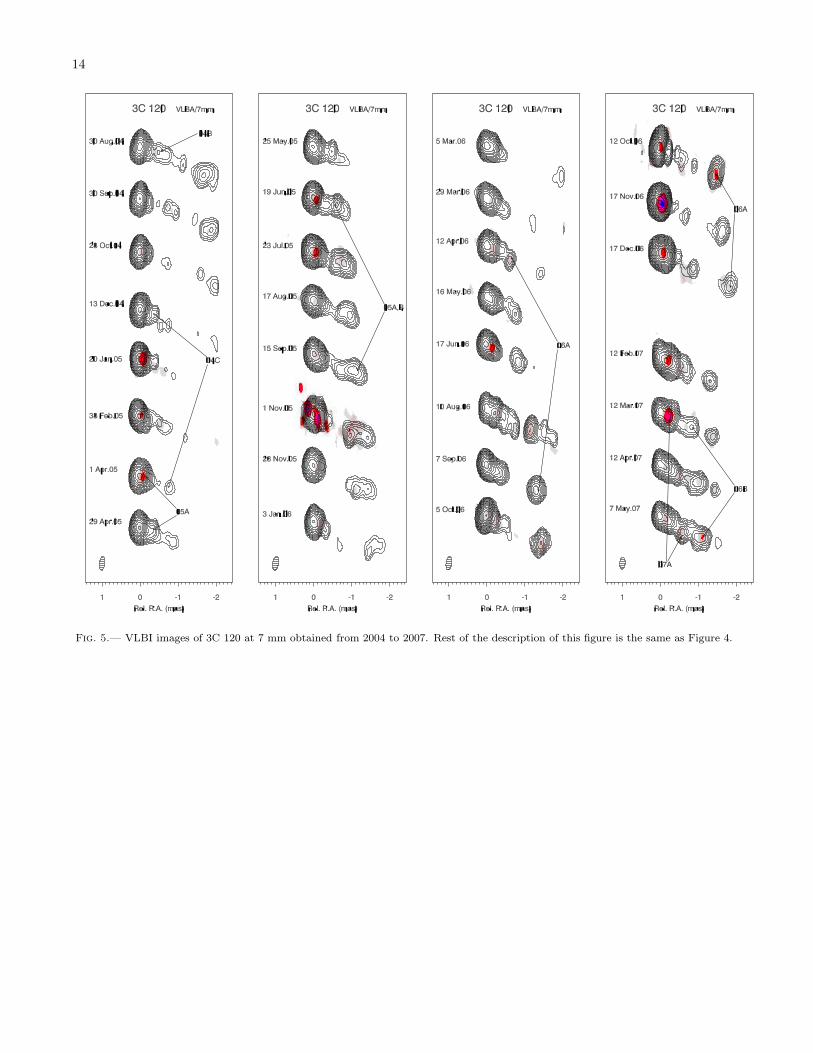
Starting in 2001 May, we observed 3C 120 with theVery Long Baseline Array (VLBA) at 43 GHz at roughlymonthly intervals, with some gaps of 2-4 months. Thesequence of images from these data provide a dynamicview of the jet at an angular resolution ∼0.1 milliarcsec-onds (mas) in the direction of the jet, corresponding to0.064 pc for Hubble constant H0 = 70 km s−1 Mpc−1.We processed the data in the same manner as describedin Jorstad et al. (2005). We modeled the brightness dis-tribution at each epoch with multiple circular Gaussiancomponents using the task MODELFIT of the softwarepackage DIFMAP (Shepherd et al. 1997). This repre-sents the jet emission downstream of the core by a se-quence of knots (also referred to as “components”), eachcharacterized by its flux density, FWHM diameter, andposition relative to the core. The apparent speeds of themoving components with well-determined motions are allwithin, 4.0c ± 0.2c. The ejection time T0 is the extrap-olated time of coincidence of a moving knot with theposition of the (presumed stationary) core in the VLBAimages. Table 2 lists the ejection times and Figure 4 and5 display the VLBA images. Fig. 6 presents the X-ray,optical and radio light curves. In the top panel of thefigure, the arrows represent the times of superluminalejections, while the line segments perpendicular to thearrows show the uncertainties in the values of T0. Fig-ure 7 displays the X-ray and optical light curves in theinterval between 2006 October and 2007 April. It showsthe best-sampled pair of dips in the X-ray and opticalfluxes.
3. POWER SPECTRAL ANALYSIS AND RESULTS
We use a variant of the Power Spectrum Responsemethod (PSRESP Uttley, McHardy, & Papadakis 2002)to determine the intrinsic PSD of the X-ray lightcurve. Our realization of PSRESP is described inChatterjee et al. (2008). PSRESP gives both the best-fit PSD model and a “success fraction” Fsucc (fractionof simulated light curves that successfully represent theobserved light curve) that indicates the goodness of fit ofthe model.
At first we fit a simple power-law model to the X-rayPSD, but found that the value of Fsucc was unacceptablylow. This implies that a simple power-law is not the bestmodel for this PSD. Then we fit a bending power-lawmodel (broken power law with a smooth break) to theX-ray PSD,
P (ν) = AναL [1 + (ν
νB)(αL−αH)]−1. (1)
Here, A is a normalization constant, νB is the break fre-quency, and αH and αL are the slopes of the power-laws above and below the break frequency, respectively(McHardy et al. 2004). During the fitting, we varied νB
4
from 10−9 to 10−5 Hz in steps of 100.05, αH from −1.5to −3.0 in steps of 0.1, and αL from −1.0 to −1.5 insteps of 0.1. These ranges include the values of α foundin the light curves of BHXRBs in the high-soft state,for which αL ≈ −1 and αH between −2 and −3 (e.g.Remillard, & McClintock 2006). This procedure yieldsa much higher success fraction than the simple power-law model. Based on the model with the highest successfraction, we obtain a best fit with the parameters αL =−1.3+0.2
−0.1, αH = −2.5+0.3−0.5, and log10(νB) = −5.05+0.2
−0.6 Hz.The success fraction for this fit is high, 0.9. The intrin-sic scatter of power is very high for slopes below −2 dueto red noise leak. As a result, trial PSD models witha high frequency slope of any value between −2 and −3give very similar success fractions. This causes the largeruncertainty in the value of the high frequency slope rel-ative to that at lower frequencies. Figure 8 presents thisbest-fit model and the corresponding PSD. As seen inthe figure, the high frequency part of the PSD is dom-inated by Poisson noise. That is because this part ofthe PSD is generated from the longlook light curve, andfluxes in the longlook light curve have larger uncertain-ties owing to shorter exposure times than those in theother light curves. The figure shows that when the esti-mated Poisson noise is added to the best-fit model PSD,it matches the observed PSD quite well. The nature ofthe X-ray PSDs and the values of break frequencies foundpreviously in Seyfert galaxies are consistent with thoseof BHXRBs in high-soft state (McHardy et al. 2005).This is consistent with accretion rates in all these ob-jects which are above 10%, more than the typical valueof 2% indicating the transition from low to high statein galactic BHXRBs (Maccarone 2003). In 3C 120, theaccretion rate ∼30% which implies that it is also a highstate system.
The PSD break frequency in BHXRBs and Seyfertgalaxies scales inversely with the mass of the blackhole while being proportional to the accretion rate(Uttley, McHardy, & Papadakis 2002; McHardy et al.2004, 2006; Edelson & Nandra 1999; Markowitz et al.2003). Using the best-fit values and uncertainties in therelation between break timescale, BH mass, and accre-tion rate obtained by McHardy et al. (2006), we estimatethe expected value of the break frequency in the X-rayPSD of 3C 120 to be 10−5.0±0.7 Hz. Hence, our derivedbreak frequency lies within the expected range. Herewe adopt a BH mass of 5.5× 10⁷ M⊙ from emission-linereverberation mapping (Peterson et al. 2004) and a bolo-metric luminosity of the big blue bump of 2.2×1045 ergss−1 (Woo & Urry 2002).
We note that the high and low frequency slopes, aswell as the break frequency calculated by Marshall et al.(2009) (−2.1±0.4, −1.2, 10−5.75±0.43 Hz), are consistentwith the best-fit values in this paper within the uncer-tainties. The difference in the central values probablyresults from our use of a different longlook light curve,which is from the EPIC instrument onboard XMM-Newton. The sensitivity of this detector is higher thanthe PCA of RXTE, allowing our light curve to have amuch better sampling rate. This is useful for extendingthe lower end of the frequency range of the PSD, leadingto a more accurate measurement of the high frequencyslope and break frequency.
4. CROSS-CORRELATION ANALYSIS AND RESULTS
We employ the discrete cross-correlation function(DCCF Edelson & Krolik 1988) method to search forconnections between variations at pairs of wave bands.We determine the significance of the correlations byperforming the analysis on 100 simulated light curvesgenerated randomly with a PSD matching that of thereal data. Details of this procedure are described inChatterjee et al. (2008). In the present case, we corre-late simulated X-ray light curves with the observed op-tical/radio light curves to calculate the significance.
4.1. X-ray/Radio Correlation
The 37 GHz light curve has an average sampling fre-quency of about once per week. We bin the X-ray and the37 GHz light curves in 7-day intervals before performingthe cross-correlation so that the light curves being com-pared have similar sampling frequency. As determinedby the DCCF (top panel of Figure 9), the X-ray fluxvariations are anti-correlated with those at 37 GHz in3C 120. The highest amplitude of the X-ray versus 37GHz DCCF is at a value of −0.68 ± 0.11, which corre-sponds to a 90% significance level. The time lag of thepeak indicates that the X-ray lead the radio variationsby 120 ± 30 days. We have used the FR-RSS techniqueproposed by Peterson et al. (1998) to calculate the meanvalue and uncertainty of the cross-correlation time lag.This procedure gives quantitative support to the trendthat is apparent by inspection of the light curve, i.e., X-ray dips are followed by appearance of new superluminalknots and hence enhancement in the 37 GHz flux.
The bottom panel of Figure 9 shows the X-ray/37 GHzDCCF but without the data after 2006 April, in order toexclude the two deepest X-ray dips and highest ampli-tude flare at 37 GHz toward the end of our monitoringprogram. The X-ray/37 GHz anti-correlation remains,although the minimum of the DCCF is smaller, −0.4,with a significance level of 72%. The X-ray variationslead the radio by 80± 30 days. Thus, the X-ray/37 GHzanti-correlation is not just the consequence of a singularevent. The longer time delay of the major event in late2006 was caused by the longer time between the start ofthe outburst and the peak relative to other radio flares,especially the one at 2003.7. This is naturally explainedas a consequence of higher optical depth of stronger radiooutbursts.
4.2. X-ray Dips and Radio Flares
In order to determine the physical link between theaccretion disk and jet, we check whether the amplitudesof the X-ray dips and associated radio flares are related.To test this, we calculate the equivalent width of eachX-ray dip and the area under the curve of each 37 GHzflare to measure the total energy involved in the events.We approximate that the radio light curve is a super-position of a constant baseline of 1.5 Jy from the moreextended jet and long-term flares. The baseline is cho-sen as approximately the lowest level of the 37 GHz lightcurve. We then follow Valtaoja et al. (1999) by decom-posing the baseline-subtracted light curve into individualflares, each with exponential rise and decay. We use fourparameters to describe each flare: the rise and decaytimescales, and the height and epoch of the peak. Be-

5
fore the decomposition, we smooth the light curve usinga Gaussian function with a 10-day FWHM smoothingtime. The details of the decomposition procedure aredescribed in Chatterjee et al. (2008).
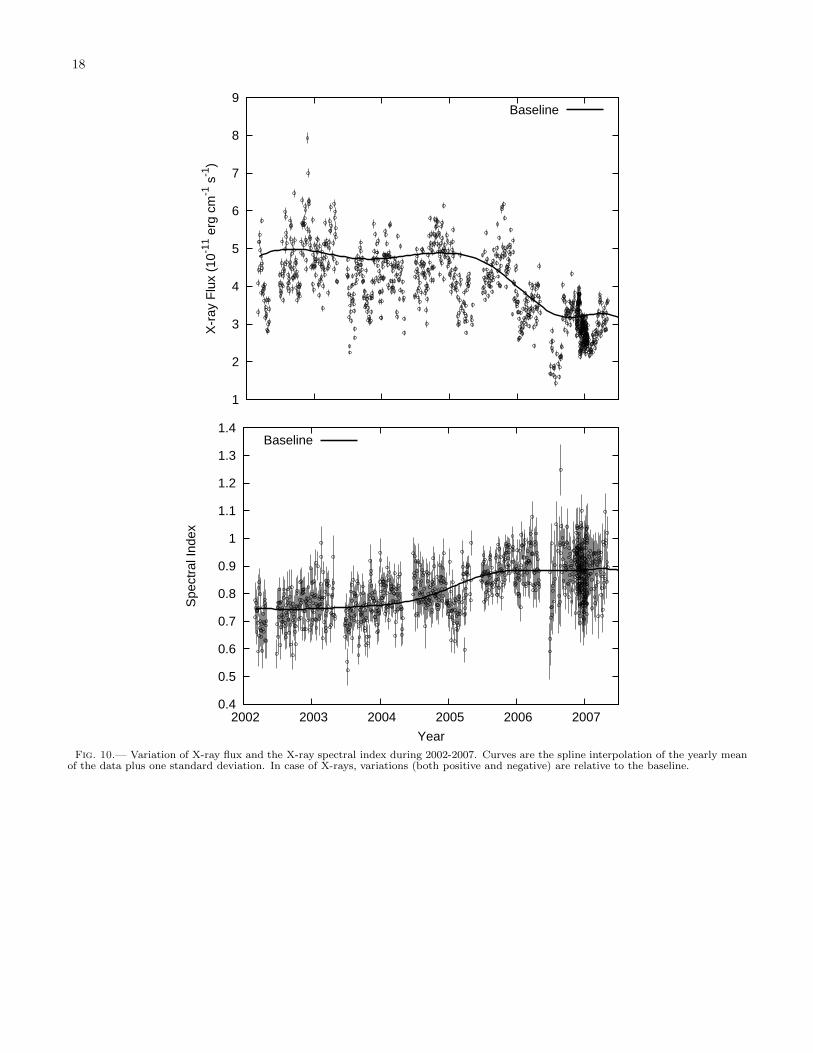
The X-ray light curve has a long-term trend, i.e., thebaseline is not constant. We define the baseline X-rayflux as a cubic-spline fit of the annual mean plus onestandard deviation. Although this is an arbitrary defini-tion, this baseline reproduces reasonably well the meanflux level in between obvious dips and flares. There is along-term trend in the spectral index variations as well.The X-ray spectral index αx, defined by fx ∝ ναx , wherefx is the X-ray flux density and ν is the frequency, variedbetween −0.5 and −1.1, with an average value of −0.83and a standard deviation of 0.10 over the 5.2 yr of obser-vation. In addition to the short term fluctuations, thereis a long-term trend of increasing values of αx during thisinterval. We calculate a baseline in the same manner asfor the X-ray flux variations to highlight the change inspectral index during the dips (see Figure 10). Before weperform the above analysis to calculate the baseline, wesmooth the X-ray light curve using a Gaussian functionwith a 10-day FWHM smoothing time.
We proceed by subtracting the baseline and then mod-eling the dips as inverted exponential flares. Figure 11shows the model fits to both the X-ray and 37 GHz lightcurves. Table 2 lists the parameters of the X-ray dips andthe corresponding 37 GHz flares along with the times ofsuperluminal ejections. Since the correlation functionswith and without the data in 2007 (during the large am-plitude 37 GHz flare) show that the X-ray dips lead the37 GHz flares by 120 ± 30 and 80 ± 30 days, respec-tively, and we have identified 15 significant dips duringthe 5.2 yr of monitoring, we assume that a radio flarethat peaks between 20 and 180 days after an X-ray min-imum is physically related to it. Using the results ofthis analysis, we plot the equivalent width of X-ray dipsversus the energy output of the corresponding 37 GHzflares in Figure 12. The 37 GHz flare at 2003.72 hasa wide decaying wing and there are two X-ray dips (at2003.58 and 2003.82) that may be related to this flareas well as another smaller 37 GHz flare (at 2003.92) ontop of that wing. Similarly, there are two X-ray dips at2005.12 and 2005.39, and there are four corresponding 37GHz flares very close to each other in time at 2005.23,2005.36, 2005.57, 2005.80. In the above cases, we plot-ted the total energy output of the group of 37 GHz flaresagainst the total equivalent width of the correspondinggroup of X-ray dips. The energy output of the flares andthe dips were corrected by adding the residuals shown inFigure 11. The plot in Figure 12 reveals a positive corre-lation between the flare and dip strengths. The level ofchange in the accretion disk and/or corona is thereforeclosely related to the amount of excess energy injectedinto the jet.
It can be seen from Table 2 that 14 out of 15 sig-nificant X-ray dips are followed by a superluminal ejec-tion. The time delay between the start of the X-ray dipsand the time of “ejection” of the corresponding super-luminal knot varies between 0.03 yr to 0.46 yr, with amean value of 0.18 ± 0.14 yr. We plot the times of ejec-tion of new knots along with the corresponding times ofstart of the X-ray dips in Figure 13. The uncertaintiesin the start time are proportional to the widths of the
dips and those in the ejection times are as given in Ta-ble 2. A straight line fits the data extremely well withsmall scatter, which indicates that there is a clear asso-ciation between X-ray dips and superluminal ejections.The best-fit line through the points has a slope of 1 andy-intercept of 0.19, which is consistent with the meandelay of 0.18 ± 0.14 yr given above. This strongly sup-ports the proposition (Marscher et al. 2002) that in 3C120, a decrease in the X-ray production is linked withincreased speed in the jet flow, causing a shock front tosubsequently move downstream. Generally, there is aclose correspondence of superluminal ejections with 37GHz flares, but sometimes the decrease in flux fartherout in the jet offsets much of the flux increase from theappearance of a new knot. In such cases, the correspond-ing increase of flux was not large enough to be detectedin our decomposition of the smoothed light curve. Thiscauses the minimum in the X-ray DCCF to be less sig-nificant than it would if old knots were to completelyfade before new ones appear. Despite this complication,the X-ray/37 GHz cross-correlation (§4.1) verifies withan objective statistical method that radio events in thejet are indeed associated with X-ray dips. The apparentspeeds of the moving components with well-determinedmotions are all similar, 4.0c ± 0.2c. Therefore, a knotmoves a distance of 0.22 pc in 0.18 yr, projected on theplane of the sky. Since the angle of the jet axis of 3C 120to the line of sight ∼20◦, the actual distance traveled bythe knot ∼ 0.5 pc. Hence, we derive a distance ∼ 0.5pc from the corona (where the X-rays are produced) tothe VLBA 43 GHz core region. This confirms that thecore is offset from the position of the BH. This is one ofthe few cases where we are able to probe the upstreamregion of the core using the time variable emission at acombination of wave bands.
4.3. X-ray/Optical Correlation
We bin the X-ray and the combined optical light curvesin 2-day intervals before performing the cross-correlation,so that the light curves being compared have similarsampling frequency. As determined by the DCCF (Fig-ure 14), we find that the X-ray variations are verystrongly correlated with those at optical wavelengthsin 3C 120. The peak X-ray versus optical DCCF is0.80±0.07, which corresponds to a 99% significance level.The position of the peak of the correlation function in-dicates the relative time delay between the variations atthe two wavelengths. In this case, the peak is very wide,so that the value of the relative time delay can not beeasily estimated from the DCCF plot. We used the FR-RSS technique proposed by Peterson et al. (1998) to cal-culate the mean value and the uncertainty of the cross-correlation time lag. This method indicates that the X-ray variations lead the optical by 0.5±4 days. The highlysignificant correlation and short time delay between theX-ray and optical variations indicates that emission atthese wave bands is at least partially co-spatial. Theasymmetry in the correlation function at time delaysabove ∼100 days indicate that the X-ray variations leadthose in the optical at these longer timescales.
To characterize the variation of the X-ray/optical timelag over the years, we divide both light curves into twointervals, 2004 July to 2005 May and 2005 June to 2007May, and repeat the DCCF analysis on each segment.

6
The result (Figure 15) indicates that in the first segment,the X-ray variations lead those in the optical by ∼25 dayswhile in the second segment the correlation function issimilar to what we obtained for the entire time interval,with similar non-zero time delay (Figure 14). This vari-ation of the time lag over the years may be the cause ofthe observed wide peak in the correlation function.
Between 2006 November and 2007 January, the X-raylight curve (“medium” light curve described in §2) wassampled 4 times per day and the combined optical lightcurve has a sampling rate of twice per day, on average.We bin these light curves in 0.5 day intervals. We cross-correlate the binned light curves in order to comparethe correlation function with that of the long-term lightcurves. The correlation function, shown in Figure 16, hasa similarly significant correlation coefficient and time de-lay. The similar values of correlation coefficient and timedelay using very well-sampled light curves illustrates therobustness of the correlation result.
The X-ray to optical time delay calculated byMarshall et al. (2009) has the same sign as determinedin this paper, although the magnitude is significantly dif-ferent (28.73+6.19
−5.87 days). We note that (1) This workincludes more data points in the R band light curve, in-cluding the period 2007.0−2007.36, and 2) We constructa combined light curve using the R band data as well asscaled V band data. We use this more completely sam-pled light curve for the correlation analysis. This, in ad-dition to the longer time lag from 2004.5 to 2005.5, canaccount for the difference between our result and thatobtained by Marshall et al. (2009).
The interpolated cross-correlation function (ICCF) isanother method to calculate the cross-correlation of un-evenly sampled discrete data (Gaskell & Peterson 1987).We have repeated all the above correlation analysis us-ing the ICCF and have found that the DCCF and ICCFresults are consistent with each other for the data pre-sented in this work.
We have cross-correlated the hard (4-10 keV) and soft(0.2-4 keV) longlook X-ray light curves, finding an ex-cellent correlation with nearly zero time lag (Figure 17).This indicates that in 3C 120, variations in soft and hardX-rays follow each other very closely.
5. DISCUSSION
5.1. Disk-Jet Connection
The physical cause of the connection between eventsin the central engine and the jet of BHXRBs and AGNsis currently a matter of considerable speculation. Ifthe jet is magnetically launched from the accretion disk(Blandford & Payne 1982), then there must be a linkbetween the magnetic state at the base of the jet andthe accretion state in the inner disk. One scenario, pro-posed for BHXRBs by Livio, Pringle, & King (2003) andKing et al. (2004), involves a change in the magneticfield configuration in the inner disk from a turbulentcondition in the high-soft state (when the X-ray flux isrelatively higher and softer) to mainly poloidal in thelow-hard X-ray state. The turbulence is needed for vis-cous heating, which in the BHXRB case leads directly tobright X-ray emission with a soft spectrum. In an AGNit causes strong ultraviolet emission, which is Comptonscattered in the corona to a hard X-ray spectrum. If
the field switches from chaotic to mainly poloidal, whichLivio, Pringle, & King (2003) suggest can occur by ran-dom episodes of near-alignment of the field in the rela-tively small number of turbulent cells in the inner disk,then the radiation in the inner disk will be quenchedat the same time as energy flow into the jet is promoted.The transition back to the turbulent, radiative inner diskof the high-soft state would need to involve a surge of en-ergy injected into the jet in order to send a shock wave(Miller-Jones et al. 2005) down the jet. Perhaps globalmagnetic reconnection could cause this, but no detailedMHD model has been published to date.
Alternatively, it is possible that the “corona,” wherethe X-ray emission seen in AGN supposedly arises fromCompton up-scattering of softer accretion-disk photons,might be the base of the jet (Markoff, Nowak, & Wilms2005). If this is the case, then the X-ray flux will be re-lated to the number of electrons residing there and avail-able for scattering to create X-rays. The mass loading ofthe jet should also affect the asymptotic Lorentz factor ofthe flow downstream if the jet is magnetically driven (e.g.Vlahakis & Konigl 2004). The same decrease in electronnumber that causes a drop in scattered X-ray emissionnear the disk would lead to a time-delayed increase in thespeed of the jet downstream. The flatter-spectrum non-thermal X-ray emission from the downstream jet wouldthen play a larger relative role in the X-ray emission,causing the observed hardening of the spectrum duringthe dips. The increase in flow speed of the jet could forma shock wave, seen as a superluminal radio knot. It is dif-ficult to speculate why the mass loading should change,since we do not understand the processes by which ma-terial from the disk and/or ergosphere are injected intothe base of the jet. However, observations of the mi-croquasar GRS 1915+105 suggest that outflow of matterfrom the disk switches from mainly a wind to the jets(Neilsen & Lee 2009). In an AGN with a magneticallydriven jet, it may be the case that lower mass injectioninto the jet actually enhances the jet emission owing toan increase in the flow speed driving a shock wave downthe jet, as described above.
5.2. Source of Optical Emission
The strong correlation between the X-ray and opti-cal variations in 3C 120 implies that the emission atboth wave bands arises from the same general region.Since the X-rays originate in the corona, the opticalemission is probably thermal emission from the accre-tion disk (Malkan 1983). We can reject the alternativehypothesis that the main component of optical emissionis synchrotron radiation from the jet. In that case, theemission should be significantly polarized, contrary toobservations showing the optical linear polarization tobe < 0.3% (Jorstad et al. 2007). Furthermore, the anti-correlation of the X-ray and 37 GHz emission (the latterof which is produced in the jet) implies that any opti-cal synchrotron emission from the jet should also anti-correlate with the X-ray flux, contrary to the strong ob-served correlation.
Although the X-rays are predominantly produced byinverse Compton (IC) scattering of the thermal opti-cal/UV seed photons from the accretion disk by hot,but non-relativistic, electrons in the corona, the opti-cal/UV emission and the X-rays are tied together by

7
another mechanism: some of the optical/UV radiationis produced by heating of the accretion disk by X-raysproduced in the above process (“feedback” mechanism).The amplitude of the short timescale (∼days) variationsin the X-ray light curve is larger than that in the optical.This can happen if a significant fraction of the opticalemission is due to heating of the disk by X-rays, sincethis reprocessing may smooth out the short timescalevariations. Feedback can make the time delay more diffi-cult to define by producing a fraction of the optical/UVphotons with different temporal properties from that ofthe direct emission.
There is a weak correlation between the X-ray spectralindex and the X-ray flux, indicating that the spectrumbecomes harder during a decrease in the production of X-rays (Fig 10). This kind of “pivoting” has been seen be-fore (Ogle et al. 2005; Maraschi et al. 1991). The X-raysmay be produced mainly by up-scattering of UV photonsand not optical photons, consistent with the correlationfound by Ogle et al. (2005) between the X-ray and UVvariations in 3C 120. This could occur if the flux of op-tical photons reaching the corona is much smaller thanthat of UV photons. Such a scenario is likely if the coronais small such that the region where the UV photons aregenerated is much closer to the corona than the regionwhere the majority of the optical photons are produced.Any disturbance propagating outwards in the accretiondisk will cause a change in the UV flux (and a resultantnearly immediate change in the X-ray emission) followedby a similar change in the optical flux. The sign of thetime delay will switch if the disturbance propagates in-wards. The observed mean time delay between X-ray andoptical variations may be due to such propagation timedelays. If we adopt typical parameters such as ∼ 0.1 foraccretion efficiency, L/Led ∼ 0.3 Ogle et al. (2005), andLbol ∼ 2× 1045 ergs/sec (Woo & Urry 2002) and neglectGeneral Relativistic effects, the region in the accretiondisk where the emission peaks in the extreme UV/softX-ray range (λ = 10 nm) should be very close to the in-nermost stable orbit (∼ 5 rg, where rg is the gravitationalradius of the black hole). The region where the emissionpeaks in the optical (λ = 600 nm) lies at ∼ 1000rg. For3C 120, with a BH mass of ∼ 5×10⁷ M⊙, 1000 rg isequivalent to ∼4 light days. We consider a model thatincludes both time delays and coupling of emission fromthe corona and disk.
We have performed a theoretical calculation to pro-duce multi-wavelength light curves from a disk-coronasystem. We assume that (1) the temperature of the diskchanges with its radial distance from the center accord-ing to T∼ r−3/4 (Shakura & Sunyaev 1973), (2) eachannulus radiates as a perfect black-body, (3) the X-raysare produced in a spherical region (corona) close to thecenter of the disk by inverse-Compton scattering of thedisk photons that reach the corona, and (4) lower energyradiation (UV-optical) is produced both by blackbodyradiation in the disk and reheating of the disk by theX-rays from the corona. For simplicity, we assume thatthe energy distribution of electrons is uniform through-out the volume of the corona. The fraction of the UV-optical photons that reach the corona are up-scatteredto X-rays and a part of the X-rays re-heat the disk toproduce additional thermal photons. We treat the X-ray
production in the corona as a reflection that increases theenergy of the radiation. The computer code that we usefor the model also follows the travel time of photons fromdifferent radii of the disk to the corona and vice versa.The temporal nature of the emission from the corona andthe part of the disk close to it are very similar owing tothe small light travel time. Figure 18 shows the varia-tion of the total UV and optical intensity emitted by anannulus at radius r of thickness ∆r ∝ r, i.e., Bνr ver-sus r. This shows that the annulus that produces thelargest amount of UV radiation (“region UV”) lies ∼5 rg
from the center, and for optical emission (‘region Op”)it is at ∼75 rg. This distance is much smaller than whatwould be expected if most of the optical radiation were tocome from radii near where the Planck curve Bν peaksat R band. These latter radii lie ∼4 light-days (1000rg) from the center, while regions close to the center areat higher temperature, and therefore emit at a higherblackbody intensity at all wavelengths. Although Bν in-creases monotonically with decreasing radii, Bνr peaksat a radius ∼75 rg at R band.
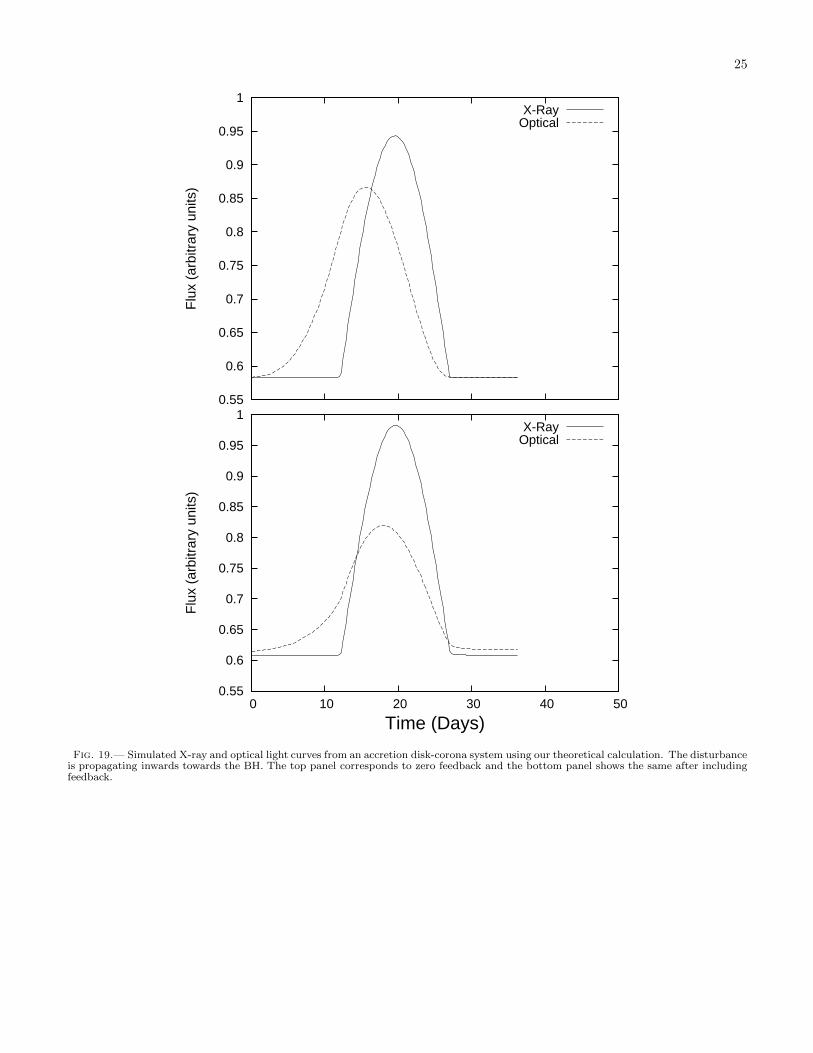
We use a computer code to model this disk-corona sys-tem and then introduce a disturbance in the temperatureof the accretion disk that propagates at a speed ∼0.1cfrom the center toward the outside or vice versa. Dueto the disturbance, the temperature at a given annulusvaries with time according to a Gaussian profile. Thiscauses a flare in the emission of the entire system at allwavelengths, although the flare starts and peaks at dif-ferent times at different wavelengths. We produce theselight curves at X-ray, UV, and optical bands, includ-ing delays from internal light-travel time. The natureof the flare and relation between flares at multiple wavebands depend on the speed and direction of propagationof the disturbance since emission from different annuliof the disk have different wavelength dependence. Thetop panel of Figure 19 shows the X-ray and optical lightcurves from the above calculation when the disturbancepropagates toward smaller radii. As a result, the emis-sion from the outer disk flares before that closer to theBH. Therefore, the optical variation leads that in theX-rays. In this simulation, the time delay between thepeaks of the X-ray and optical light curves ∼4 days.
In 3C 120, the time delay is centered on 0.5 day with anuncertainty of ±4 days, hence the direction of the timedelay cannot be specified with certainty. The correlationfunction in Figure 16 also shows a relatively broad peakcentered on zero, with a similar uncertainty in the timedelay. The cross-correlation function for longterm lightcurves sometimes show a broad peak due to changes inthe direction and magnitude of the time delay over thetimespan of the light curves. If the broad peak in thesecorrelation functions is due to the above-mentioned rea-son, it may indicate a dichotomy in the speed of propa-gation of the disturbances and their directions, i.e., theuncertainty corresponds to an actual range of time de-lays. This also constrains the size of the corona. Forexample, if the corona were spread such that the regionsOp and UV were at the same distance from the corona,then these regions would contribute equally to the fluxof seed photons that are up-scattered to X-rays. In thatcase, the X-ray flares would be much broader than ob-served and no optical/X-ray time delay would be present.This is contrary to the observation of relatively sharp X-

8
ray flares. In addition, although overall we find a shortmean time delay of 0.5 day (i.e., if the uncertainty doesnot correspond to an actual range of time delays butrather is consistent with zero), in some of the individ-ual flares the time delay is longer (∼25 days; see toppanel of Figure 15). Also, if optical and UV photonswere up-scattered to soft and hard X-rays, respectively,a significant “soft-hard” time delay would be expected.But from Figure 17, it is clear that the soft-hard timelag cannot be more than 0.25 day, which is essentiallyunobservable with the longterm light curves. From theabove discussion, we conclude that the corona is situatedclose to the center of the accretion disk, and its size issuch that the flux of photons reaching the corona fromregion Op is negligible with respect to that from regionUV. Based on the solid angle subtended, the coronal ra-dius should be less than 40rg for the flux from region Opto be less than 10% of that from region UV.
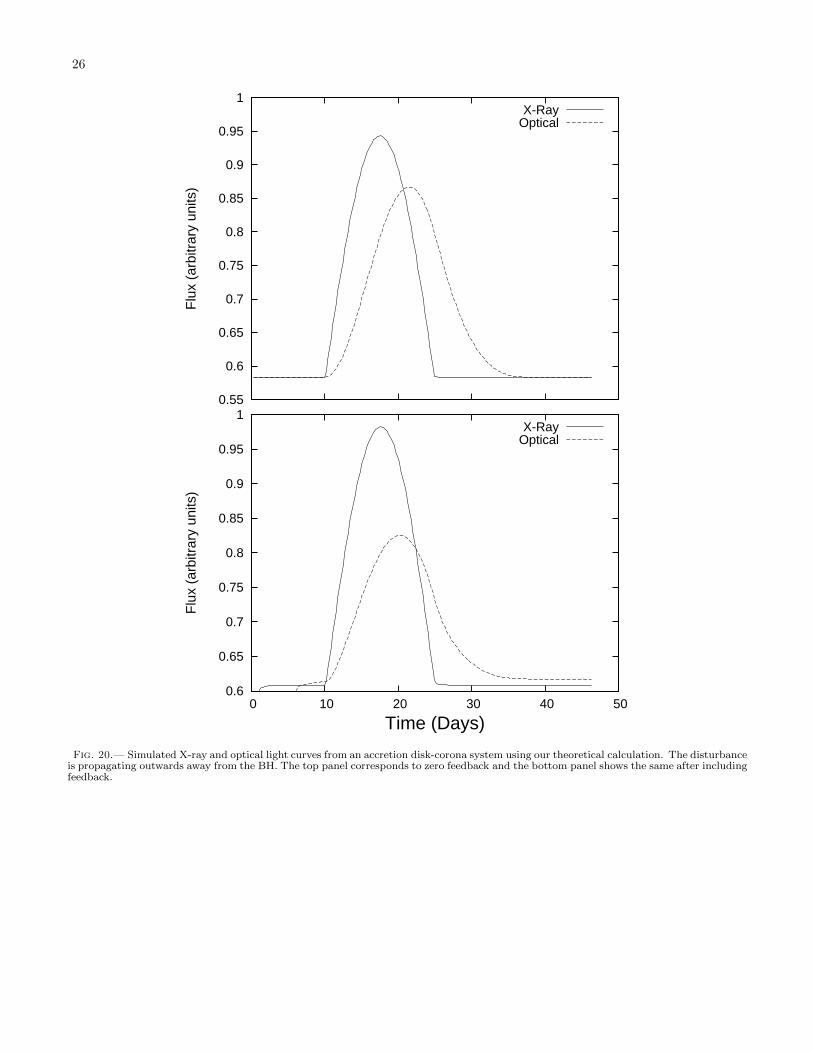
In Figure 19, the two panels show results for differentlevels of feedback (the fraction of the X-rays producedin the corona that reflect toward and re-heat the disk).The top panel has feedback fraction equal to zero, i.e.,none of the X-rays re-heat the disk. We can see from thefigure that, as feedback is introduced, the resulting timedelay becomes smaller and less precise. Figure 20 showsthe light curves when the disturbance is propagating out-wards from the BH. In this case, as expected, the X-rayvariations lead those in the optical (by similar amount asin Figure 19) for the same propagation speed. The panelsshow, as above, that including feedback makes the timedelay shorter. Hence, feedback from the corona may alsocontribute to the range of time delays that we see in thedata.
In another possible scenario, the X-ray variability iscaused by intrinsic changes in the hot electrons in thecorona and the UV-optical changes are due to feedback,i.e., there is no intrinsic variability in the accretion disk.In this case, the X-ray/optical time delay will solely bedue to light travel time from the corona to the accretiondisk. This will produce time lags of a small fraction ofa day (Kazanas & Nayakshin 2001), which is too smallto observe with the sampling of the data used in thiswork. The observed essentially zero time lag between thelong-term X-ray and optical light curves (0.5 ± 4 days)and smaller variability amplitude in the short-term op-tical light curve than that in the X-rays are consistentwith the above scenario. In fact the steepening of the X-ray spectrum and decrease in the mean X-ray flux levelafter 2006.0 (see Fig. 10) suggest a long-term steepen-ing of the energy distribution of electrons in the corona.But the longer X-ray/optical time delay over a signifi-cant portion of the dataset (Figure 15) and comparableX-ray/optical B-band variability amplitude in the long-term light curves (Doroshenko et al. 2009) with B-bandvariations sometimes leading, indicate that propagationof disturbances in the accretion disk must produce atleast part of the X-ray/optical variability in this radiogalaxy.
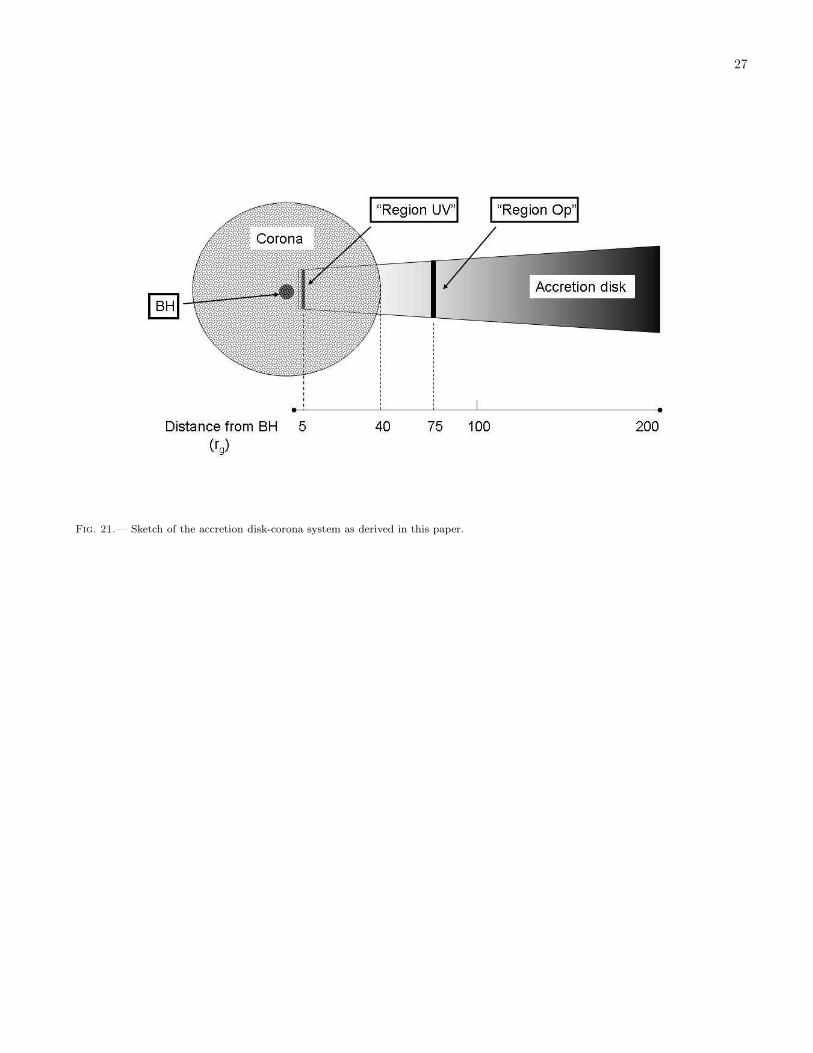
Figure 21 shows a sketch of the accretion disk-coronasystem as derived in this paper. The black filled cir-cle is the position of the BH, the temperature of theaccretion disk is shown by gray scale with lighter colormeaning higher temperature, and the larger circular areafilled with dots is the corona. “Region UV” and “Region
Op” are shown as thick solid lines on the accretion disk.The radius of the corona and the distance of the relevantemission regions from the BH are shown in units of rg .
From the above model and the correlation results, weconclude that most, if not all, of the optical emission in3C 120 is produced in the accretion disk. The X-raysare produced by scattering of (mostly) UV radiation inthe corona. Optical/UV emission due to re-heating ofthe disk by the X-rays is also a possible ongoing mecha-nism that may cause the spread of the time delay. Thepresence of sharp X-ray flares and the X-ray/optical timedelay of weeks in some individual flares indicate that thecorona must lie sufficiently close to the BH that the fluxof seed photons reaching the corona is dominated by UVlight.
The light curve during the dip at X-ray and opticalwave bands between 2006 October and 2007 April, dis-played in Figure 7, is very well-sampled. It is evident thatthe optical flux starts to decrease after ∼MJD 4025, ∼ 40days earlier than the decrease starts in the X-rays. Theminimum in optical occurs ∼40 days earlier than that inthe X-rays as well. This indicates that the decrease wascaused by a disturbance propagating from the outer radiiof the accretion disk toward the BH. If this disturbance isa thermal fluctuation propagating inward, then it shouldhave an effective speed . 0.01c to cause a time delay of∼40 days. This is one order of magnitude higher than thesound speed for a gas pressure dominated disk of temper-ature ≤ 105 K. Therefore, the above disturbance cannotbe transmitted by sound waves (Krolik et al. 1991) un-less the relevant regions of the disk are dominated byradiation pressure, which cannot be ruled out in 3C 120given its high accretion rate, nearly the Eddington value(0.3 LE). On the other hand, this scenario is consis-tent with the model proposed by King et al. (2004), inwhich large scale alignment of poloidal magnetic fieldin the inner accretion disk from random fluctuationscauses the decrease in the X-ray flux. Such alignmentoccurs at a timescale 2R/Hk(R3/GM)1/2, where R/His the radius to thickness ratio of the disk, k is a con-stant ∼10 (Tout & Pringle 1992; Stone et al. 1996), and(R3/GM)1/2 is the disk dynamical timescale at radius R.This alignment timescale, for a 10M⊙ BH, is few seconds,which translates to ∼50 days for a ∼ 5×10⁷M⊙ BH in 3C120. Model light curves of King et al. (2004) also containshort timescale, small amplitude fluctuations on top ofthe big flares and dips caused by small-scale alignmentof the poloidal magnetic field, similar to that observed inthe light curves of 3C 120 presented in this paper.
6. SUMMARY AND CONCLUSIONS
This paper presents well-sampled, 5-yr-long lightcurves of 3C 120 between 2002 and 2007 at X-ray, op-tical, and radio wavebands, as well as monthly imagesobtained with the VLBA at 43 GHz. We have calculatedthe broad-band X-ray power spectral density (PSD) of3C 120. The X-ray and radio light curves were decom-posed into individual dips and flares, respectively, andthe properties of the contemporaneous dips and flareswere compared. That comparison, as well as, the X-ray/radio correlation analysis were used to find a con-nection between events in the jet and the accretion disk.We have also cross-correlated the X-ray and optical lightcurves and have determined the significance of the cor-

9
relations with simulated light curves based on the PSD.Using a numerical model, we have produced X-ray andoptical light curves from the accretion disk-corona sys-tem. From the comparison of the temporal properties ofthe simulated light curves to that of the observed vari-ability, we infer the physical size of the corona and thedistances of the emitting regions from the central BH.
Our main conclusions are as follows:(1) The X-ray PSD of 3C 120 is best fit by a bendingpower-law model where there is a smooth change in theslope above a break frequency. The best fit value of breakfrequency for 3C 120 is 10−5.05 Hz, which agrees very wellwith the relation between break timescale, BH mass andaccretion rate obtained by McHardy et al. (2006) span-ning a range of BH mass from 10 M⊙ to 109 M⊙. Thisindicates that the accretion process in 3C 120 is similarto that of the BHXRBs.(2) The X-ray and 37 GHz variations are anti-correlatedwith the X-ray leading the radio by ∼120 days. Theanti-correlation remains even if the large X-ray dips andradio flares after 2006 are excluded.(3) Almost all X-ray dips are followed by the ejectionof a new knot in the VLBA images. This and the anti-correlation mentioned in (2) imply that decrease in theX-ray production is linked with increased speed in thejet flow, causing a shock front to form and move down-stream. This property of 3C 120 is also similar to thegalactic black hole systems where transitions to high-softX-ray states are associated with the emergence of verybright features that proceed to propagate down the radiojet.(4) We derive a distance ∼0.5 pc from the corona (wherethe X-rays are produced) to the VLBA 43 GHz core re-gion using the average time delay between the start ofthe X-ray dips and the time of “ejection” of the corre-sponding superluminal knots.(5) The X-ray and optical variations in 3C 120 arevery strongly correlated (see also Marshall et al. (2009);Doroshenko et al. (2009)). This correlation, absence ofsignificant optical polarization, and anti-correlation of X-
ray and 37 GHz variations (the latter of which are pro-duced in the jet), together imply that the optical emis-sion is blackbody radiation from the accretion disk.(6) The X-rays are produced by scattering of (mostly)UV radiation in the corona. Comparison of simulatedlight curves from a disk-corona system and the observedvariation imply that the corona must lie sufficiently closeto the BH that the flux of seed photons reaching thecorona is dominated by UV light.
7. ACKNOWLEDGMENTS
We thank the anonymous referee for many usefulcomments which helped to improve the quality of themanuscript. We would also like to thank P. Utt-ley for many valuable discussions. The research atBoston University was funded in part by the NationalScience Foundation (NSF) through grant AST-0406865and by NASA through several RXTE Guest Investi-gator Program grants, most recently NNG05GM33G,NNG05GM64G, and most recently Astrophysical DataAnalysis Program grant NNX08AJ64G. The Metsahoviteam acknowledges the support from the Academy ofFinland. The University of Michigan Radio Astron-omy Observatory was supported by funds from the NSF,NASA, and the University of Michigan. The VLBA isan instrument of the National Radio Astronomy Obser-vatory, a facility of the National Science Foundation op-erated under cooperative agreement by Associated Uni-versities, Inc. The Liverpool Telescope is operated on theisland of La Palma by Liverpool John Moores Universityin the Spanish Observatorio del Roque de los Mucha-chos of the Instituto de Astrofisica de Canarias, withfinancial support from the UK Science and TechnologyFacilities Council. MG thanks the US National ScienceFoundation for support through grants AST 03-07912and AST 08-03883. HP, JT, and ZS thank the Labora-tory for the Optical Astronomy of the Chinese Academyof Sciences for partial support and the National NaturalScience Foundation of China for support through grants10633010 and 10625314.
REFERENCES
Aller, H. D., Aller, M. F., Latimer, G. E., & Hodge, P. E. 1985,ApJS, 59, 513
Angione, R. J. 1971, AJ, 76, 412Baars, J. W. M., Genzel, R., Pauliny-Toth, I. I. K., & Witzel, A.
1977, A&A, 61, 99Blandford, R. D., & Payne, D. G. 1982, MNRAS, 199, 883Chatterjee, R., et al. 2008, ApJ, 689, 79Doroshenko, V. T., Sergeev, S. G., Merkulova, N. I., Sergeeva,
E. A., Golubinsky, Y. V., & Pronik, V. I. 2006, AstronomicalSociety of the Pacific Conference Series, 360, 69
Doroshenko, V. T., Sergeev, S. G., Efimov, Y. S., Klimanov, S.A., Nazarov, S. V. 2009, Astronomy Letters, 2009, Vol. 35, No.6, 361 (Original Russian text published in Pis’ma vAstronomicheski Zhurnal, 2009, Vol. 35, No. 6,403
Edelson, R. A., & Krolik, J. H. 1988, ApJ, 333, 646Edelson, R. A., & Nandra K. 1999, ApJ, 514, 682Elvis, M., Lockman, F. J., & Wilkes, B. J. 1989, AJ, 97, 777Fender, R. P., Belloni, T. M. & Gallo, E. 2004, MNRAS, 355, 1105Fender, R. P., Homan, J. & Belloni, T. M. 2009, MNRAS, 396,
1370Gaskell, C. M., & Peterson, B. M. 1987, ApJS, 65, 1Gomez, J. L., Marscher, A. P., Alberdi, A., Jorstad, S. G. &
Agudo, I. 2001, ApJ, 561, L161Grandi, P. et al. 1997, ApJ, 487, 636
Greiner, J., Cuby, J. G., & McCaughrean, M. J., 2001, Nature,414, 522
Jorstad, S. G., Marscher, A. P., Lister, M. L., Stirling, A. M.,Cawthorne, T. V., Gomez, J.-L., & Gear, W. K. 2004, AJ, 127,3115
Jorstad, S. G., et al. 2005, AJ, 130, 1418Jorstad, S. G., et al. 2007, AJ, 134, 799Kazanas, D. & Nayakshin, S. 2001, ApJ, 550, 655King, A. R., Pringle, J. E., West, R. G., & Livio, M. 2004,
MNRAS, 348, 111Klimek, E. S., Gaskell, C. M., & Hedrick, C. H. 2004, ApJ, 609, 69Krolik, J. H., Horne, K., Kallman, T. R., Malkan, M. A., Edelson,
R. A., & Kriss, G. A. 1991, ApJ, 371, 541Livio, M., Pringle, J. E., & King, A. R., 2003, ApJ, 593 184Maccarone, T. J. 2003, A&A, 409, 697Malkan, M. A. 1983, ApJ, 268, 582Maraschi, L., Chiapetti, L., Falomo, R., Garilli, B., Malkan, M.,
Tagliaferri, G., Tanzi, E. G., & Treves, A. 1991, ApJ, 368, 138Markoff, S., Nowak, M. A., & Wilms, J. 2005, ApJ, 635, 1203Markowitz, A., et al. 2003, ApJ, 593, 96Marscher et al. 2002, Nature, 417, 625, 2002Marshall, K., Ryle, W. T., Miller, H. R., Marscher, A. P., Jorstad,
S. G., Chicka, B., & McHardy, I. M. 2009, ApJ, 696, 601McHardy, I. M., Koerding, E., Knigge, C., Uttley, P., & Fender,
R. P. 2006, Nature, 444, 730

10
McHardy I. M., Papadakis I. E., Uttley P., Page M. J., & MasonK. O. 2004, MNRAS, 348, 783
McHardy, I. M., Gunn, K. F., Uttley, P. & Goad, M. R. 2005,MNRAS, 359, 1469
Meier, D. L., Koide, S., & Uchida, Y., 2000, Science, 291, 84Mead, A. R. G., Ballard, K. R., Brand, P. W. J. L., Hough, J. H.,
Brindle, C., & Bailey, J. A. 1990, A&AS, 83, 183Miller-Jones, J. C. A., McCormick, D. G., Fender, R. P., Spencer,
R. E., Muxlow, T. W. B., & Pooley, G. G. 2005, MNRAS, 363,867
Mirabel, I. F. and Rodrıguez, L. F., 1999, ARA&A, 37, 409Neilsen, J. & Lee, J. C., 2009, Nature, 458, 481Nowak, M. A., et al. 1999, ApJ, 510, 874Ogle, P. M., Davis, S. W., Antonucci, R. R. J., Colbert, J. W.,
Malkan, M. A., Page, M. J., Sasseen, T. P., & Tornikoski, M.2005, ApJ, 618, 139
Peterson, B. M., Wanders, I., Horne, K., Collier, S., Alexander,T., Kaspi, S., & Maoz, D. 1998, PASP, 110, 660
Peterson, B. M., et al. 2004, ApJ, 613, 682Pounds, K. A., Edelson, R. A., Markowitz, A., & Vaughan, S.
2001, ApJ, 550, L15Remillard, R. A., & McClintock, J. E. 2006, ARA&A, 44, 49Sasseen, T. P., & Tornikoski, M. 2005, ApJ, 618, 139
Sambruna, R. M., Eracleous, M., & Mushotzky, R. F. 1999, ApJ,526, 60S
Shakura, N. F. & Sunyaev, R. A. 1973, A&AS, 24, 337Shepherd, M. C. 1997, in ASP Conf. Proc. 125, Astronomical
Data Analysis Software and Systems VI, ed. G. Hunt & H. E.Payne (San Francisco: ASP), 77
Savolainen, T., Wiik, K., Valtaoja, E., Jorstad, S. G., &Marscher, A. P. 2002, A&A, 394, 851
Stone, J. M., Hawley, J. F., Gammie, C. F., & Balbus, S. A. 1996,ApJ, 463, 656
Terasranta, H. et al. 1998, A&AS, 132, 305Tout, C. A., & Pringle, J. E. 1992, MNRAS, 259, 604Ulvestad, J. S., et al. 1999, ApJL, 517, L81Uttley, P., McHardy, I. M., & Papadakis, I. E. 2002, MNRAS,
332, 231Valtaoja E., et al. 1999, ApJS, 120, 95Vlahakis, N. & Konigl, A. 2004, ApJ, 605, 656Walker, R. C., Benson, J. M., Unwin, S. C., Lystrup, M. B.,
Hunter, T. R., Pilbratt, G., & Hardee, P. E. 2001, ApJ, 556, 756Woo, J. H., & Urry, C. M. 2002, ApJ, 579, 530Zdziarski, A. & Grandi, P. 2001, ApJ, 551, 186
11
1
2
3
4
5
6
7
8
9
2003 2004 2005 2006 2007
Flu
x (1
0-11 e
rg c
m-2
s-1
)
Monitor
2
3
4
2006.9 2006.94 2006.98 2007.02
Flu
x (1
0-11 e
rg c
m-2
s-1
)
Medium
0.3
0.5
0.7
0.9
2002.9592002.9582002.9572002.956
coun
ts s
ec-1
YEAR
Longlook
Fig. 1.— X-ray light curves with different sampling rates.

12
5.5
6
6.5
7
7.5
8
8.5
9
9.5
10
3.5 4 4.5 5 5.5 6 6.5 7 7.5 8
R-B
and
Flu
x (m
Jy)
V-Band Flux (mJy)Fig. 2.— Filled circles show the 38 data points that are measured within 0.5 day of each other in V and R band, along with the respective
uncertainties. The dashed line represents the best fit straight line through these points, which is used for the V band to R band fluxconversion.
5
6
7
8
9
10
11
2003 2004 2005 2006 2007 2008
Flu
x D
ensi
ty (
mJy
)
YearFig. 3.— Light curve of 3C 120 constructed by combining the V and R band light curves.

13
Fig. 4.— VLBI images of 3C 120 at 7 mm obtained from 2002 to 2004. The contours and color show the total and polarized intensity,respectively. The images are convolved with an elliptical Gaussian beam of size 0.36×0.15 mas at PA = −6◦. The global peak over allmaps is 1.52 Jy/Beam. The contour levels are 0.25, 0.5, 1.0, ..., 64.0, 90.0% of the global peak. Individual moving knots are marked atselected epochs.
14
Fig. 5.— VLBI images of 3C 120 at 7 mm obtained from 2004 to 2007. Rest of the description of this figure is the same as Figure 4.

15
2
3
4
5
6
7
8
9
Flu
x (1
0-11 e
rg c
m-2
s-1
)
X-ray (2.4-10 keV)
4
6
8
Flu
x D
ensi
ty (
mJy
)
R BandV Band
0
2
4
6
2003 2004 2005 2006 2007
Flu
x D
ensi
ty (
Jy)
Year
37 GHz15 GHz
Fig. 6.— Variation of X-ray flux, optical flux density and radio flux density of 3C 120 from 2002 to 2007. In the top panel, the arrowsshow the times of superluminal ejections and the line segments perpendicular to the arrows indicate the uncertainties in the times.

16
4
5
6
7
8
9
3950 4000 4050 4100 4150 4200
X-r
ay (
10-1
1 erg
cm
-2 s
ec-1
)/O
ptic
al (
mJy
) F
lux
MJD
OpticalX-ray
Fig. 7.— Points represent the X-ray and optical light curves between MJD 3950 and 4200 (2006 October and 2007 April) when the timesampling was dense during a minimum in the light curves. The curves represent the same data smoothed with a Gaussian function with a3 day FWHM smoothing time.
-6
-5
-4
-3
-2
-1
-8 -7 -6 -5 -4 -3
log
[Pow
er X
Fre
quen
cy] (
rms2 )
log Frequency (Hz)Fig. 8.— Result of application of the PSRESP method to the light curves. The PSD of the observed data at high, medium and low
frequencies is given by the solid, dashed and dotted jagged lines, respectively, while the underlying power-law model is given by the thickersolid bent line. Points with error bars (open squares, solid circles and asterisks for high, medium and low frequency range, respectively)correspond to the mean value of the PSD simulated from the underlying power-law model (see text). The errorbars are the standarddeviation of the distribution of simulated PSDs. The broadband power spectral density is best described by a bending power law with lowfrequency slope −1.3, high frequency slope −2.5 and break frequency 10−5.05 Hz.

17
-0.8
-0.6
-0.4
-0.2
0
0.2
0.4
Cor
rela
tion
Coe
ffici
ent
-0.8
-0.6
-0.4
-0.2
0
0.2
0.4
-300 -200 -100 0 100 200 300
Cor
rela
tion
Coe
ffici
ent
Time Delay (Days)
Fig. 9.— Discrete cross-correlation function (DCCF) of the X-ray and radio monitor data. The time delay is defined as positive if theX-ray variations lag those at radio frequency. Top panel shows the correlation function for the entire data set and the bottom panel showsthe same excluding the data during the major flare at 37 GHz in 2006-07 and the corresponding deep dip at X-ray energies.
18
1
2
3
4
5
6
7
8
9
X-r
ay F
lux
(10-1
1 erg
cm
-1 s
-1)
Baseline
0.4
0.5
0.6
0.7
0.8
0.9
1
1.1
1.2
1.3
1.4
2002 2003 2004 2005 2006 2007
Spe
ctra
l Ind
ex
Year
Baseline
Fig. 10.— Variation of X-ray flux and the X-ray spectral index during 2002-2007. Curves are the spline interpolation of the yearly meanof the data plus one standard deviation. In case of X-rays, variations (both positive and negative) are relative to the baseline.

19
0
1
2
3
4
5
6
Flu
x (1
0-11 er
g cm
-2 s
-1)
Baseline subtracted X-ray light curveResidual flux
Sum of Flares Plus Baseline
0
1
2
3
4
5
6
7
2002 2003 2004 2005 2006 2007 2008
Flu
x D
ensi
ty (
Jy)
Year
37 GHz light curveResidual flux
Sum of Flares Plus Baseline
Fig. 11.— X-ray and 37 GHz light curves. Curves correspond to summed flux after modeling the light curve as a superposition of manyindividual X-ray dips or radio flares and a baseline as shown in Figure 10.

20
0
100
200
300
400
500
600
700
0 100 200 300 400 500 600 700 800
Ene
rgy
Out
put o
f 37
GH
z F
lare
s (1
0-6 e
rg c
m-2
)
Equivalent Widths of X-ray Dips (10-6 erg cm-2)
Fig. 12.— Total energy output of the 37 GHz flares versus equivalent width of the corresponding X-ray dips.
2002
2003
2004
2005
2006
2007
2008
2002 2003 2004 2005 2006 2007 2008
Tim
es o
f Eje
ctio
n
Start Times of X-ray Dips
x+0.19
Fig. 13.— Times of ejection of new VLBA knots versus times of start of X-ray dips from Table 2. The dashed line is the best-fit straightline through the points. The y-intercept of this line indicates the value of mean time delay between the start of dips and times of ejections.

21
-0.4
-0.2
0
0.2
0.4
0.6
0.8
1
-300 -200 -100 0 100 200 300
Cor
rela
tion
Coe
ffici
ent
Time Delay (Days)Fig. 14.— Discrete cross-correlation function (DCCF) of the optical and X-ray monitor data for the entire 5 yr interval. The time delay
is defined as positive if the variations at the higher frequency waveband lag those at the lower frequency.

22
-0.8
-0.6
-0.4
-0.2
0
0.2
0.4
0.6
0.8
1
Cor
rela
tion
Coe
ffici
ent
July 04 to May 05
0
0.1
0.2
0.3
0.4
0.5
0.6
0.7
0.8
0.9
-150 -100 -50 0 50 100 150
Cor
rela
tion
Coe
ffici
ent
Time Delay (Days)
June 05 to May 07
Fig. 15.— Variation of the X-ray/optical correlation function across two intervals. The X-ray variations lead those in the optical by 25days during the first interval and the two variations are almost simultaneous during the second interval.

23
-1.5
-1
-0.5
0
0.5
1
-40 -20 0 20 40
Cor
rela
tion
Coe
ffici
ent
Time Delay (Days)Fig. 16.— Discrete cross-correlation function (DCCF) of the optical and X-ray data between 2006 November and 2007 January, binned
to an interval of 0.5 day.
-0.1
0
0.1
0.2
0.3
0.4
0.5
-40000 -30000 -20000 -10000 0 10000 20000 30000 40000
Cor
rela
tion
Coe
ffici
ent
Time Delay (Seconds)Fig. 17.— Discrete cross-correlation function (DCCF) of the soft and hard longlook X-ray data. The time delay is defined as positive if
the variations at the hard wave band lag those at the soft wave band.

24
0
0.2
0.4
0.6
0.8
1
0 200 400 600 800 1000
Bνr
(ar
bitr
ary
unit)
Radius (rg)
Fig. 18.— Total intensity of radiation coming from different annuli of an accretion disk versus the annular radii. The solid and dashedcurves correspond to UV and optical wavelengths, respectively.
25
0.55
0.6
0.65
0.7
0.75
0.8
0.85
0.9
0.95
1
Flu
x (a
rbitr
ary
units
)
X-RayOptical
0.55
0.6
0.65
0.7
0.75
0.8
0.85
0.9
0.95
1
0 10 20 30 40 50
Flu
x (a
rbitr
ary
units
)
Time (Days)
X-RayOptical
Fig. 19.— Simulated X-ray and optical light curves from an accretion disk-corona system using our theoretical calculation. The disturbanceis propagating inwards towards the BH. The top panel corresponds to zero feedback and the bottom panel shows the same after includingfeedback.
26
0.55
0.6
0.65
0.7
0.75
0.8
0.85
0.9
0.95
1
Flu
x (a
rbitr
ary
units
)
X-RayOptical
0.6
0.65
0.7
0.75
0.8
0.85
0.9
0.95
1
0 10 20 30 40 50
Flu
x (a
rbitr
ary
units
)
Time (Days)
X-RayOptical
Fig. 20.— Simulated X-ray and optical light curves from an accretion disk-corona system using our theoretical calculation. The disturbanceis propagating outwards away from the BH. The top panel corresponds to zero feedback and the bottom panel shows the same after includingfeedback.
27
Fig. 21.— Sketch of the accretion disk-corona system as derived in this paper.

28
TABLE 1Parameters of the Light Curves.
Data set Start End T (days)1 ∆T (days) 2 Npoints
Longlook 2002 December 13 2002 December 14 1.5 0.01 150X-ray Medium 2006 November 2007 January 60.0 0.25 240
Monitor 2002 March 2007 May 1910.0 15.0 1050Optical Monitor 2004 August 2008 January 1250.0 - 154Radio Monitor 2002 March 2008 January 2167.0 - 329
aTotal length of light curvesbBin size
TABLE 2Time, Area and Width of the X-ray Dips and 37 GHz Flares, and Times of Superluminal Ejections.
Parameters of X-ray Dips Ejection Times Knot ID Parameters of 37 GHz FlaresTime (start) Time (min.) Area 1 Width2
T0 Time (peak) Area3 Width2
−4 2002.15 −
4−
4 2002.23 ± 0.03 02A 2002.39 195 952002.19 2002.30 657 120. 2002.65 ± 0.04 02B 2002.58 404 752002.75 2002.76 12 5.2003.02 2003.12 29 22.5 2003.35 ± 0.15 03A 2003.35 17 172003.32 2003.58 172 52.5 2003.67 ± 0.02 03B 2003.72 441 852003.66 2003.82 184 40. 2003.81 ± 0.03 03C 2003.92 24 202003.95 2003.98 44 15. 2003.98 ± 0.03 03D2004.12 2004.17 20 15. 2004.16 ± 0.05 04A2004.21 2004.37 364 65. 2004.37 ± 0.03 04B 2004.38 126 52
2004.49 60 252004.62 2004.66 30 12.5 2004.82 ± 0.05 04C 2005.05 61 272005.09 2005.12 33 17.5 2005.14 ± 0.03 05A 2005.23 21 152005.19 2005.39 351 65. 2005.34 ± 0.02 05B 2005.36 10 10
2005.57 92 572005.80 127 57
2005.94 2006.04 287 70. 2006.00 ± 0.03 06A 2006.43 126 1052006.38 2006.44 382 72.5 2006.72 ± 0.05 06B 2006.88 598 622006.96 2007.09 193 62.5 2007.05 ± 0.02 07A 2007.43 132 72
−4 2007.87 122 60
aEquivalent width of dips. Units: 10−6 erg cm−2
bUnits: dayscArea under the flare light curves. Units: 10−6 erg cm−2
dInsufficient data