Quality- Disk 2 - Schlumberger
14
If a date has to be put on it, then 1912 could be the year when quality became offi- cial. That year, Henry Ford began selling the world’s first mass-produced automobile. Ford did more than organize a series of manufacturing processes under the same roof, although that in itself was a revolution. He appreciated that reliability in a complex, mass-produced product required organized quality control. There had to be a formal inspection of parts used for the cars and periodic inspections of the product during its manufacture. 1 Ford launched the science of quality, but quality itself is as old as the hills. Since time immemorial, artisans have been crafting fur- Oilfield Review Quality is a word that has entered industry vocabulary with increasing vigor since the turn of the century. In the Now the quality movement is gaining ground. This article reviews current ideas about quality and shows how they Neil Burnett Jon Jeffries Aberdeen, Scotland John Harrigan Tom Lebsack Rosharon, Texas, USA Joe Mach Mike Robson Sugar Land, Texas, USA David Mullen Bogota, Colombia Dominique Pajot Stavanger, Norway Fernand Rat Philippe Theys Montrouge, France Quality niture, firearms and everything else required by man to satisfactory and often extraordi- nary levels of quality—many would say to higher levels than can ever be achieved by mass production. In the days of less sophisti- cated technology, quality was guaranteed by both artisan and client knowing the product and also knowing each other. Such a close relationship has been hard to preserve in the twentieth century. Pigeon-holed in a more specialized world, vendor and client have drifted apart while the increasing technologi- cal content of products and services inhibits the client’s ability to gauge product quality. Independent guarantees of quality have become essential to bridge this gap. These two factors, mass production and technology, have been shaping the quality issue since the beginning of the century. A third force, global competitiveness, came into play only after World War II. Before this, manufacturers enjoyed markets pro- tected by local or national boundaries— Americans bought American cars, the French bought French cars, etc. As trade barriers fell, through regulatory change or client willingness to shop around, a new era of competitiveness was launched. Pushing European and American industry even further from the 1960s on was the dramatic maturing of Japan’s postwar industrialization. For help in preparation of this article, thanks to Bill Dig- gons, Wireline, Testing & Anadrill, Sugar Land, Texas, USA; Steve Englehardt, Mobil Oil Co., Fairfax, Virginia, USA; Ed Williamson, Amoco Production Company, Chicago, Illinois, USA; John Oldenburg, BPX, Bogotá, Colombia; Ken Arnold, Dowell, Tulsa, Oklahoma, USA; Tom Osten, Anadrill, Sugar Land, Texas, USA. In this article, CoilLIFE, CoilLIMIT and TIM (Tubing Integrity Monitor) are marks of Dowell, TRILOGY QC (onboard data management quality control system) is a mark of Geco-Prakla, and ClientLink is a mark of Schlum- berger. 1. For a good overview on quality: Teboul J: Managing Quality Dynamics. Hemel Hemp- stead, England: Prentice Hall International (UK) Ltd, 1991. Eight Dimensions of Quality Few would disagree that quality is achieving what the customer wants in a cost-effective, responsi- ble manner. But the question remains: what does the customer want? Some criteria may be easy to define and easily specified, but wishes and whims are subjective and hard to pin down. Professor David Garvin of the Harvard Business School has suggested this eight-fold way of gaug- ing quality from the client perspective: 1 1) Performance: How does the product/service perform according to quantifiable specifica- tions and compared to other similar products? Examples: automobile acceleration, color clar- ity on a television set. 2) Features: What bells and whistles does the product/service have that others do not? Exam- ples: free drink on a plane, automatic tuner on a television set. EFFICIENCY DRIVERS 46
-
Upload
khangminh22 -
Category
Documents
-
view
2 -
download
0
Transcript of Quality- Disk 2 - Schlumberger

Neil BurnettJon JeffriesAberdeen, Scotland
John HarriganTom LebsackRosharon, Texas, USA
Joe MachMike RobsonSugar Land, Texas, USA
David MullenBogota, Colombia
Dominique PajotStavanger, Norway
Fernand RatPhilippe TheysMontrouge, France
Quality
EFFICIENCY DRIVERS
Quality is a word that has entered industry vocabulary with increasing vigor since the turn of the century. In the
Now the quality movement is gaining ground. This article reviews current ideas about quality and shows how they
If a date has to be put on it, then 1912could be the year when quality became offi-cial. That year, Henry Ford began selling theworld’s first mass-produced automobile.Ford did more than organize a series ofmanufacturing processes under the sameroof, although that in itself was a revolution.He appreciated that reliability in a complex,mass-produced product required organizedquality control. There had to be a formalinspection of parts used for the cars andperiodic inspections of the product duringits manufacture.1
Ford launched the science of quality, butquality itself is as old as the hills. Since timeimmemorial, artisans have been crafting fur-
For help in preparation of this article, thanks to Bill Dig-gons, Wireline, Testing & Anadrill, Sugar Land, Texas,USA; Steve Englehardt, Mobil Oil Co., Fairfax, Virginia,USA; Ed Williamson, Amoco Production Company,Chicago, Illinois, USA; John Oldenburg, BPX, Bogotá,Colombia; Ken Arnold, Dowell, Tulsa, Oklahoma, USA;Tom Osten, Anadrill, Sugar Land, Texas, USA.In this article, CoilLIFE, CoilLIMIT and TIM (TubingIntegrity Monitor) are marks of Dowell, TRILOGY QC(onboard data management quality control system) is amark of Geco-Prakla, and ClientLink is a mark of Schlum-berger.1. For a good overview on quality:
Teboul J: Managing Quality Dynamics. Hemel Hemp-stead, England: Prentice Hall International (UK) Ltd,1991.
46
niture, firearms and everything else requiredby man to satisfactory and often extraordi-nary levels of quality—many would say tohigher levels than can ever be achieved bymass production. In the days of less sophisti-cated technology, quality was guaranteed byboth artisan and client knowing the productand also knowing each other. Such a closerelationship has been hard to preserve in thetwentieth century. Pigeon-holed in a morespecialized world, vendor and client havedrifted apart while the increasing technologi-cal content of products and services inhibitsthe client’s ability to gauge product quality.Independent guarantees of quality havebecome essential to bridge this gap.
These two factors, mass production andtechnology, have been shaping the qualityissue since the beginning of the century. Athird force, global competitiveness, cameinto play only after World War II. Beforethis, manufacturers enjoyed markets pro-tected by local or national boundaries—Americans bought American cars, theFrench bought French cars, etc. As tradebarriers fell, through regulatory change orclient willingness to shop around, a newera of competitiveness was launched.Pushing European and American industryeven further from the 1960s on was thedramatic maturing of Japan’s postwarindustrialization.
Eight Dimensions of Quality
Few would disagree that quality is achieving what
the customer wants in a cost-effective, responsi-
ble manner. But the question remains: what does
the customer want? Some criteria may be easy
to define and easily specified, but wishes and
whims are subjective and hard to pin down.
Professor David Garvin of the Harvard Business
School has suggested this eight-fold way of gaug-
ing quality from the client perspective:1
1) Performance: How does the product/service
perform according to quantifiable specifica-
tions and compared to other similar products?
Examples: automobile acceleration, color clar-
ity on a television set.
2) Features: What bells and whistles does the
product/service have that others do not? Exam-
ples: free drink on a plane, automatic tuner on
a television set.
Oilfield Review

oilfield, the concept of quality has been around for years even if it has eluded precise definition.
are being applied in the oil patch.
nTwo cars of equalquality. Both satisfycustomers, even ifone seems more lux-urious. (Adapted fromTeboul, reference 1.)
Style and prestige
Air-conditioned
Spacious
Luxurious interior withfitted carpet and leatherupholstery
Electronic seatadjustment
Starts easily andruns silently
Reliable
Solid and durable
Silent and comfortableEasy to park
Solid and durable
Easy tomaintain
Reliable
Starts easily
Inexpensive
Quality is therefore crucial in today’sindustrial world. To avoid remaining anabstraction, however, the word needs care-ful definition. Today, most manufacturersand service providers agree that qualityamounts to this:
“Conformance to specified requirements agreed with the client.”
This phrase categorically links the quality ofa product or service with client needs. It sug-gests that quality is achieved through twoprocesses, one external to the vendor andone internal. The external process is the ven-dor reaching out to the client and the twoparties agreeing on product or service speci-fications. Specifying requirements is a cru-cial step and often the stumbling block to
improving quality—see “Eight Dimensions ofQuality,“ (below and previous page). Theinternal process is whatever it takes for thevendor to make the product or service matchthe agreed-upon specifications.
The definition does not equate qualitywith some perceived excellence of theproduct or service. For example, the luxuri-ousness of a Rolls Royce would convincemost people of its excellence, but Fords,Renaults and other less expensive makes ofcar must be considered of equal qualitywhen judged by client expectation (above).
The definition also reveals that quality isnot fixed, but evolves as client needschange. In the world of consumer products,manufacturers attempt to influence client
needs through advertising. In the explorationand production industry, events move moreconservatively but move nevertheless. Forexample, the trend toward integrated ser-vices is dramatically changing the “specifiedrequirements” agreed to between oil compa-nies and the service industry. The quality ofthe service companies’ operations mustevolve to meet these new expectations.
In the end, quality is more than a measureof how well something is done. Quality isabout increasing profitability over the longterm, about maintaining a lead over thecompetition, and ultimately—the case, forexample, of numerous corporations whohad to struggle against the Japanese indus-trial miracle—about staying in business.
47
3) Reliability: What are the chances of the prod-
uct/service failing within a specified period of
time?
4) Conformance: Is the product/service manufac-
tured or delivered to accepted standards? This
is the heart of traditional quality assurance.
5) Durability: Does a product wear out and need
to be rebuilt or replaced more or less often
than expected? Durability has economic impli-
cations since it introduces repair or replace-
ment cost.
6) Serviceability: Is the product easy to maintain
or fix? How does a company’s service response
rate with respect to speed, courtesy and com-
petence?
7) Aesthetics: Does the product/service look
classy? This dimension is highly subjective
and is a primary cause for establishing niche
markets. You cannot please everyone, so
instead please a fraction.
8) Perceived quality: How does the half-informed
customer perceive the quality of the product/
service? Also highly subjective, perceived
quality depends on reputation, word of mouth
and advertising.
1. Garvin DA: “Competing on the Eight Dimensions of Qual-ity,” Harvard Business Review 65 no. 6 (November-December 1987): 101-109.

nCoiled-tubing qual-ity control. On thejob, a TIM TubingIntegrity Monitor(device encirclingtubing on left of photograph) tracksrunning speed andinspects tubing forovality, cuts anddents as it entersand leaves the well.Over 400 diametermeasurements aremade every secondwith an accuracy of0.001 in. [0.025 mm].Audible alarms aresounded if tubingdeviates from norms.
nLog example showing the Stripes log quality control system. The three coloredlines at the left of the left-hand track indicate possible anomalies in tool function(magenta line), environmental problems (green line) and other factors (blue line).Anomalies are indicated by a narrow hatched band and listed with detailedexplanation at the end of the job.
Log Quality Monitoring System
Output DLIS FileDITE .006 28-AUG-1992 09:44
DITE-LDTD-CNTH-SGTL-
Filters applied:Severity: Informative warning errorVerbosity: Suppressed dominantTools: LDTD misc.
Tool Class Severity Depth ObservationBottom Top
LDTD Uncl. Warning 359.5 352.0 RHOB is reading very lowLDTD Uncl. Warning 429.0 419.0 RHOB is reading very lowMisc. None Info. 437.5 342.0 Tool in CasingMisc. Envr. Info. 440.5 431.5 Large WashoutMisc. Envr. Info. 440.5 440.5 Caliper Large StepMisc. Envr. Info. 529.5 520.5 Large WashoutMisc. Envr. Info. 3729.0 3726.5 Caliper Large StepLDTD Uncl. Warning 3730.0 3721.5 RHOB is unusually activeMisc. Envr. Info. 3731.0 3724.0 Rugose holeMisc. Envr. Info. 3942.5 3942.0 Caliper Large StepMisc. Envr. Info. 3944.5 3942.0 Rugose holeMisc. Envr. Info. 3961.5 3961.0 Caliper Large StepMisc. Envr. Info. 3962.0 3958.5 Rugose holeMisc. Envr. Warning 4006.0 4004.0 Tension IncreasingLDTD Uncl. Warning 4022.5 4011.0 Caliper reading is very inactiveLDTD Uncl. Warning 4022.5 4011.0 RHOB is unusually inactiveMisc. None Info. 4028.0 4006.5 Tool at TD
Quality ControlHow do you achieve quality and helpensure business prosperity? Typically, qual-ity is perceived and implemented in threeprogressively complex ways—quality con-trol, quality assurance and total qualitymanagement. The simplest is quality con-trol. This comprises methods to measuredeviations from some agreed-upon normand rejection of large deviations. For exam-ple, the worker at the end of a productionline removing dolls with only one leg per-forms quality control. Although the manu-facturing industry has always led the qualitymovement and continues to do so, qualitycontrol in the oilfield service industry fol-lows the same procedure.
In the logging business, quality control isperformed on every log by running a short,repeat section at the bottom of the holebefore logging and by attaching to the logall the required pre- and postjob calibrationdata.2 Any deviation from accepted normsin any of these controls invalidates theentire log. Recently, Schlumberger intro-
48
2. Theys PP: Log Data Acquisition and Quality Control.Paris, France: Editions Technip, 1991.Log Quality Control Reference Manual. Paris, France:Services Techniques Schlumberger, 1991.
3. Closure describes the tracking of one seismic horizonaround to itself in a loop, a necessary condition forproving the integrity of a reservoir or caprock.
duced the Stripes log monitoring system thatuses a simple color-coding system to displayadditional pertinent quality indicators onthe log as it is recorded (top).
Another example of quality control in theoilfield service industry is coiled-tubingmonitoring. Coiled tubing is used increas-ingly to perform efficient remedial opera-tions in workover, to deliver logging tools tothe end of horizontal wells, and mostrecently to drill small-diameter hole. Coiledtubing is not fragile, but it requires care.Damage can occur on the surface as thetubing flexes around the gooseneck and iswrapped on and off the reel. These actions
push the tubing into plasticity and promoterisk of fatigue collapse. More fatigue arisesdue to the combination of tension and pres-sure the coiled tubing experiences. Theanswer to these problems is a package ofcontrols that ensure the tubing neverreaches unacceptable levels of fatigue.Dowell achieves this by tracking the spool-ing history of each coiled tubing and usingits CoilLIFE model to estimate fatigue lifehistory, tracking acceptable levels of tensionand pressure with its CoilLIMIT model, and
Oilfield Review

Cos
ts
Percentage of defects
Failurecost
Appraisalcost
Total cost
nFinding the right compromise betweenappraisal cost, spent on quality control;and failure cost, spent on disposal of poorfinished product.
finally an inspection device that monitors inreal time the physical state of the tubing(previous page, middle).
One of the most ambitious quality controlundertakings in the oilfield service industryis the TRILOGY QC system, being imple-mented by Geco-Prakla. This integrated sys-tem seeks to improve the quality of marine3D seismic data, a crucial issue since poordata quality seriously prolongs data process-ing. Used onboard the survey vessel and inreal time throughout the survey, the TRIL-OGY QC system simultaneously monitorsthe quality of individual hydrophone traces,the quality of source signatures, and theintegrity of navigation data. Furthermore,the system permits immediate onboard pro-cessing such as brute stacking, near-tracecubes and areal displays, results that con-firm for the oil company geophysicistwhether the survey is proceeding satisfacto-rily (below). In a 3D marine survey recentlyaccomplished for Elf Gabon, the TRILOGYQC system permitted Elf geophysicists toextend the survey after onboard processingsuggested the initial survey would miss clo-sure on an interesting prospect.3
October 1993
nTwo real-time on-board products of the TRimmediate resurveying and correction of pr
Left: A screen dump showing vertical sectfew traces are clearly displaced by some 30caused by incorrect navigation data. Right:tom is gently sloping toward the right. The bhas not yet reached this area. But the area care missing because the hydrophone stream
Vertical section Time slice
Quality AssuranceIf quality control was what manufacturersinitially used to maintain product reliability,they soon discovered that increasingly com-plex manufacturing processes demanded ahigher-level approach. When thousands ofcomponents were being assembled in multi-ple processes, not only did checking everyone of them become prohibitively expen-sive, but the failure rate of the finished prod-ucts if quality control was relaxed couldbecome alarmingly high. Pre-war, theacceptable rejection rate for componentswas 1%—in other words, 99 out of every100 components passed. Suppose a productwas built from 50 components. Then, theacceptance rate of the product could be aslow as (.99)50 or just 60%. A fortune couldbe spent checking every component, calledappraisal cost, or an equal fortune rejectinga large proportion of the finished product,called failure cost (above, right).
One solution to this dilemma appearedduring the intense phase of manufacturingduring World War II. This was statisticalprocess control, in which systematic qualitycontrol of each component was abandoned
ILOGY QC marine seismic quality control systoblems. ion of data near seabed corrected for normal milliseconds due to incorrect NMO correction A horizontal slice of raw data, also near the srown swath at the bottom is empty of data, bovered by the thinner swath higher up has beers drifted and coverage was missed.
and substituted by a few checks that couldyield the norm and variance of the compo-nent’s quality. The real breakthrough, how-ever, occurred in the 1960s when manufac-turing complexity reached new heights andquality control even with the aid of statisticswas breaking down.
49
em that permits
moveout (NMO). As. These errors areeabed—the sea bot-ecause the surveyen surveyed. Data
moved a group of major oil companies toinitiate a program to evaluate the reliabilityof gun systems, known as PEGS. The cleargoal was to ensure that gun systems wouldreliably perform to their ratings. As part ofPEGS, extensive testing at high temperatureand pressure was carried out at the Perforat-ing & Testing Center. The tests confirmed amarginal performance, and precipitated asubstantial review and codification of theprocedures used to design and manufacturegun systems. It was the beginning of aproper quality assurance program for theperforating service industry.
Briefly, the recommended sequence ofaction was as follows: Analyze the pro-cesses behind designing and manufacturinga gun system, write them down, and thenperform them as closely as possible to whatwas written. Then observe the results andrevise the processes. The last steps turn the
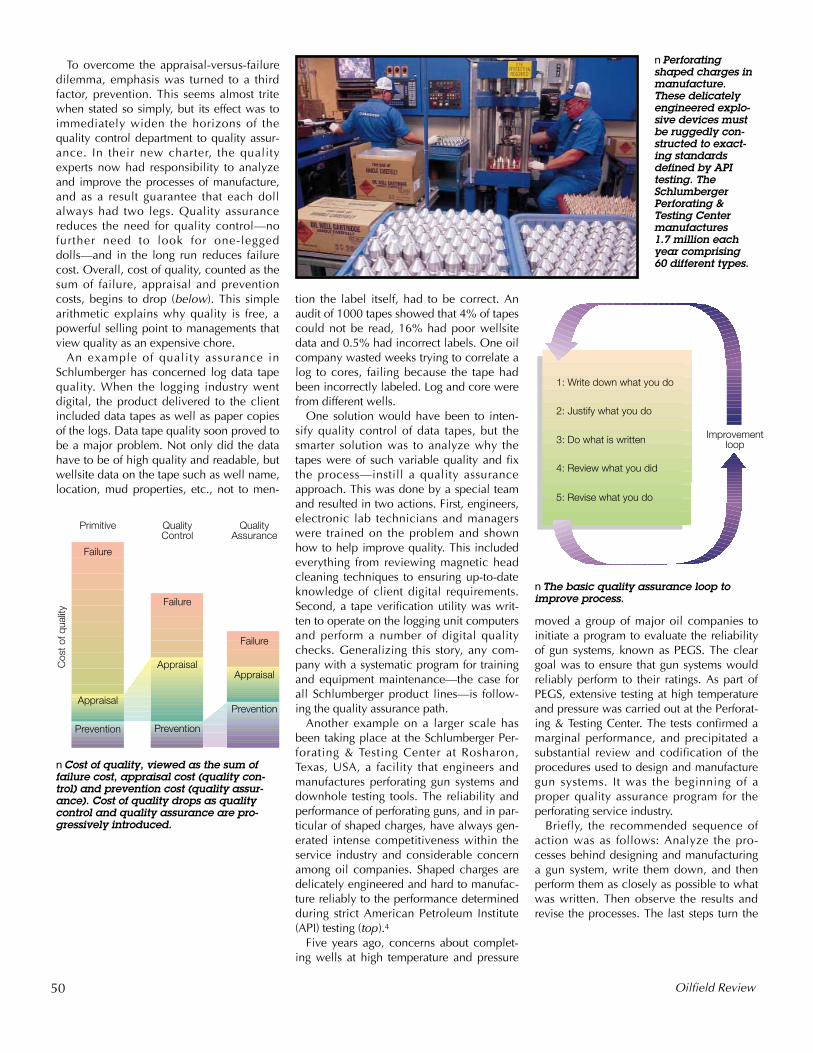
To overcome the appraisal-versus-failuredilemma, emphasis was turned to a thirdfactor, prevention. This seems almost tritewhen stated so simply, but its effect was toimmediately widen the horizons of thequality control department to quality assur-ance. In their new charter, the qualityexperts now had responsibility to analyzeand improve the processes of manufacture,and as a result guarantee that each dollalways had two legs. Quality assurancereduces the need for quality control—nofurther need to look for one-leggeddolls—and in the long run reduces failurecost. Overall, cost of quality, counted as thesum of failure, appraisal and preventioncosts, begins to drop (below). This simplearithmetic explains why quality is free, apowerful selling point to managements thatview quality as an expensive chore.
An example of quality assurance inSchlumberger has concerned log data tapequality. When the logging industry wentdigital, the product delivered to the clientincluded data tapes as well as paper copiesof the logs. Data tape quality soon proved tobe a major problem. Not only did the datahave to be of high quality and readable, butwellsite data on the tape such as well name,location, mud properties, etc., not to men-
tion the label itself, had to be correct. Anaudit of 1000 tapes showed that 4% of tapescould not be read, 16% had poor wellsitedata and 0.5% had incorrect labels. One oilcompany wasted weeks trying to correlate alog to cores, failing because the tape hadbeen incorrectly labeled. Log and core werefrom different wells.
One solution would have been to inten-sify quality control of data tapes, but thesmarter solution was to analyze why thetapes were of such variable quality and fixthe process—instill a quality assuranceapproach. This was done by a special teamand resulted in two actions. First, engineers,electronic lab technicians and managerswere trained on the problem and shownhow to help improve quality. This includedeverything from reviewing magnetic headcleaning techniques to ensuring up-to-dateknowledge of client digital requirements.Second, a tape verification utility was writ-ten to operate on the logging unit computersand perform a number of digital qualitychecks. Generalizing this story, any com-pany with a systematic program for trainingand equipment maintenance—the case forall Schlumberger product lines—is follow-ing the quality assurance path.
Another example on a larger scale hasbeen taking place at the Schlumberger Per-forating & Testing Center at Rosharon,Texas, USA, a facility that engineers andmanufactures perforating gun systems anddownhole testing tools. The reliability andperformance of perforating guns, and in par-ticular of shaped charges, have always gen-erated intense competitiveness within theservice industry and considerable concernamong oil companies. Shaped charges aredelicately engineered and hard to manufac-ture reliably to the performance determinedduring strict American Petroleum Institute(API) testing (top).4
Five years ago, concerns about complet-ing wells at high temperature and pressure
nPerforatingshaped charges inmanufacture.These delicatelyengineered explo-sive devices mustbe ruggedly con-structed to exact-ing standardsdefined by APItesting. TheSchlumberger Perforating & Testing Centermanufactures 1.7 million eachyear comprising 60 different types.
nThe basic quality assurance loop toimprove process.
50 Oilfield Review
Failure
Failure
Failure
Appraisal
AppraisalAppraisal
Prevention Prevention
Prevention
Cos
t of q
ualit
y
Primitive QualityControl
QualityAssurance
nCost of quality, viewed as the sum offailure cost, appraisal cost (quality con-trol) and prevention cost (quality assur-ance). Cost of quality drops as qualitycontrol and quality assurance are pro-gressively introduced.
Improvement loop
1: Write down what you do
2: Justify what you do
3: Do what is written
4: Review what you did
5: Revise what you do

The Twenty ISO Quality Assurance Processes
1. Management Responsibility2. Quality System3. Contract Review4. Design Control5. Document Control6. Purchasing7. Purchaser Supplied Product8. Product Identification and Traceability9. Process Control10. Inspection and Testing11. Inspection, Measuring and Test Equipment12. Inspection and Test Status13. Control of Nonconforming Product14. Corrective Action15. Handling, Storage, Packaging and Delivery16. Quality Records17. Internal Quality Audits18. Training19. Servicing20. Statistical Techniques
4. For an overview on perforating technology and manufacture:Schlumberger Perforating Services. Houston, Texas,USA: Schlumberger Wireline & Testing, 1993.
5. International Standard, ISO 9000, “Quality Manage-ment and Quality Assurance Standards—Guidelinesfor Selection and Use.” Geneva, Switzerland: Interna-tional Organization for Standardization, 1987.International Standard, ISO 9001, “Quality Sys-tems—Model for Quality Assurance in Design/Devel-opment, Production, Installation and Servicing.”Geneva, Switzerland: International Organization forStandardization, 1987.
International Standard, ISO 9002, “Quality Sys-tems—Model for Quality Assurance in Production andInstallation.” Geneva, Switzerland: International Orga-nization for Standardization, 1987.International Standard, ISO 9003, “Quality Sys-tems—Model for Quality Assurance in Final Inspec-tion and Test.” Geneva, Switzerland: InternationalOrganization for Standardization, 1987.
sequence into a feedback loop that enablesconstant refining of each process (previouspage, middle). The result for the Perforating& Testing Center was a dramatic improve-ment of gun systems in tough conditions anda reduction in scrap rate during the manu-facturing of shaped charges from about 3%to less than 1%. Most important, it con-vinced management to apply the codifica-tion procedure to the entire plant. Guide-lines for achieving this were widely availablefrom numerous standards organizations.
A driving force in quality assurance hasbeen the International Organization of Stan-dardization (IOS), based in Geneva,Switzerland. Its work is based on earlierstandards developed by the British Stan-dards Institute. IOS has written quality assur-ance standards for all kinds of business situ-ations from manufacturing to the serviceindustry. The complete set is called the ISO-9000 series, ISO being simultaneously arearrangement of the IOS acronym and aGreek-based prefix meaning uniform orhomogeneous.5 The Perforating & TestingCenter chose to apply ISO 9001, the mostrigorous of the standards since it applies todesign as well as manufacturing.
Each ISO quality assurance standard com-prises relatively few pages—seven for ISO9001—of which the first few cover only thescope of the document, definitions and ref-erences. The meat of ISO 9001 comesexclusively in section 4 that describes qual-ity assurance controls for 20 key processesin any engineering/manufacturing plant (see“The Twenty ISO Quality Assurance Pro-cesses,” above, right). The list ranges fromdefining the management function and howdesign is performed to handling of purchas-ing and training. These guidelines representa blueprint for writing a plant’s own QualitySystem Manual, the first of a hierarchy ofdocumentation essential to implementingthe ISO quality assurance system (right).
The Quality System Manual remainsgeneric, that is nonproduct specific, andoutlines the quality system of the plant andhow quality is to be assured in any of the 20categories. Referenced in it are variousProcedures Manuals that comprise the nextlevel of documentation. These contain adetailed description of specific functions inthe plant, such as Product Development,Quality Management, Customer Service,Explosive Products, Sustaining Engineeringand more. The discourse while moredetailed still falls short of discussing individ-
Quality system manual
Procedures
Work instructions
Forms and records
SustainingPurchasingQuality management
Customer service
Production and
assembly
Product development
51October 1993
nThe pyramid ofquality assurance,as required by ISO9001 regulations.The SchlumbergerPerforating & Test-ing Center spent ayear preparing forits ISO 9001 auditby the certificationauthority, DetNorske Veritas.

ual products. Much of the process descrip-tion is in flowchart form (below).
The next level called Work Instructionsgets product specific. Here, we find detailson individual shaped charges, guns andother equipment. The fourth and last level,called Forms and Records, comprises all thepaper and electronic records that prove pro-cedures and work instructions as defined inthe previous two levels have been followed.In its entirety, this hierarchy provides aframework for a planned, systematicapproach to product design and manufac-ture. It also ensures that the plant has ade-quate resources to deliver an agreed-uponquality product.
It took the Schlumberger Perforating &Testing Center one year and almost $250,000
to fulfill the ISO 9001 requirements. Alongthe way, all personnel had to be trained inthe methodology, and the mere act of defin-ing processes caused many to be revised. Anecessary part of the ISO process, however,is certification. This involves an initial auditfrom a certification authority followed byperiodic six-month audits, proving that thestandards have been properly described andthat they are being adhered to. The periodicaudits oblige the plant to keep the documen-tation in line with changing practices.
The audits are tough, particularly the initi-ating one. The Perforating & Testing Centerchose to be audited by Det Norske Veritas(DNV). To date, three Schlumberger oilfieldservice engineering/manufacturing plants—the Wireline & Testing engineering and
manufacturing plant at Melun, France andthe Dowell manufacturing plant at Tulsa,Oklahoma, USA in addition to the Perforat-ing & Testing Center—have succeeded inobtaining and keeping ISO certification.Two more plants, Wireline & Testing’s prod-uct center at Houston and the Sugar Landengineering and manufacturing plant ofSchlumberger’s drilling services companyAnadrill, are currently preparing for theirfirst ISO audits.
Quality assurance is also moving to thefield. In 1989, Anadrill’s Aberdeen officebegan implementing ISO 9001 at its supportbases for directional drilling services in theNorth Sea. The results were encouragingenough to extend the certification to its sup-port bases for all types of drilling service.Finally in July 1993, the ISO 9001 certifica-tion was extended to the wellsite, both off-shore and on land. Almost concurrently,Dowell’s Aberdeen operations gained itsISO 9001 certification. These two groupsare among the first service organizations toimplement a comprehensive quality assur-ance program in the field.
Total Quality ManagementInterestingly, the ISO philosophy generatesheated debate. Its adherents point to thebenefits from committing to and obtainingISO certification: It forces proper review ofhow work gets done, a systematic monitor-ing of subcontractors and suppliers, andcontinuity in the event of a change in per-sonnel. Its detractors point to a bureaucraticmentality that generates too much paper,inflexibility once the procedures are estab-lished—despite the six-month review—andno proof that the final product is what theclient wants.
One explanation for this difference ofopinion is that the detractors are expectingtoo much from ISO, in particular the ISO9001 and 9002 guidelines that are con-cerned with only quality assurance—in thedesign, manufacture and test environments.The detractors may also be suspicious thatthose holding ISO certifications feel morehas been achieved than just quality assur-ance. Whatever the case, the debate is asmuch about the next level of quality, calledby a variety of terms but most commonlyTotal Quality Management (TQM), than it isabout ISO itself.
The aim of TQM is to release the fullpotential of an organization to achieve thatagreed-upon quality definition—“confor-mance to specified requirements agreedwith the client.” TQM is customer oriented
52 Oilfield Review
Refer tononconforming
material procedure QM-008
Continue production
Paint, package and seal boosters
Transfer to customer service
Fill out material transfer
Adjust parameters
Fill out data sheet
Perform transfer and drop tests
Weigh and press initial booster
Dry powder
Procure raw material
Receive order from Customer Service
Manufacture 50 boosters per procedure
End
End
Fail
Fail Pass
Pass
Perform transfer and drop tests
nFlow diagram from a procedures manual, in the second level ofISO documentation. This one describes how to “modify, completeinspection and package boosters to fill customer service requests.”Boosters ensure propagation of explosive shock from detonator todetonating cord.

and employee oriented, but above all, itrequires total management commitment,which explains the word Total.
TQM is almost defined by the phraseol-ogy it has spawned over the years. A corner-stone of TQM is continuous improvement,which means never resting on your laurelsbut always striving for a better way (right)—see “Continuous-Improvement Strategy forSoftware Development,” next page. Zero-defect, zero-hassle describes the ideal clientperception of product or service. Empower-ment refers to increasing employee freedomto act, facilitating improvement. Processreengineering describes the act of rethinkinga process from scratch, generally at thegrassroots level, to find that better way.
The TQM movement started when itsoriginator, Dr. W. Edwards Deming, was
invited to Japan in 1950.6 Deming hadalready concluded that quality was every-one’s concern, especially management’s,but could not convince US industrial lead-ers. The Japanese had nothing to lose intheir immediate postwar condition andquickly embraced Deming’s message. Therest is history. Initially lagging far behind theWest’s level of quality, they caught up 25years later and for many consumer productsare now way ahead (right).
Deming was joined in the crusade byother experts, notably Philip Crosby, JosephJuran, Tom Peters and Kaoru Ishikawa.Although they all had their own privateagenda—whether it was Deming’s 14 man-
agement points, Crosby’s 14 steps or Juran’sseven-stage sequence—in the essentials, theprogram was always the same. Managementhad to relax from a control-and-directmode, and instill in its place employeeempowerment, more client awareness and acontinuous improvement philosophy.Whether this constitutes a revolution or justgood management remains open to individ-ual interpretation.
Out of dire necessity, TQM finallyreached the shores of the US. Motorola wasone of the first converts, starting its programin the early 1980s (left). In a well-publicizedturnaround, Xerox Corporation which hadhitherto been almost eclipsed by Japanesecompetition, managed to completely reori-ent its 100,000 employees to TQM princi-ples and build up a competitive positionagain.7 TQM became such a hot issue in theUS that when former US President Reagan’scommerce secretary, Malcolm Baldrige, waskilled in a rodeo accident, the US govern-ment instituted in his memory the MalcolmBaldrige National Quality Award—see“Baldrige TQM Categories,” next page. For
53October 1993
nTrack record on TQM for major nonoilfield corporations in Japan, the US and Europe.
nThe hare and the tortoise. US manufac-turing quality started way ahead of theJapanese after World War II, but Dem-ing’s TQM principles helped theJapanese catch up—by the mid-1970s.Western industry then had to learn TQMto remain competitive.
6. Deming WE: Out of the Crisis: Quality, Productivityand Competitive Position. Cambridge, England: Cam-bridge University Press, 1986.
7. Kearns DT and Nadler DA: Prophets in the Dark:How Xerox Reinvented Itself and Beat Back theJapanese. New York, New York, USA: HarperCollinsPublishers, Inc., 1992.
Time
Qua
lity
Perception of needs
Identification of improvements
Execution of improvements
Feedback
Quality Assurance
P
I
E
F
QA
Japa
n
Ciba-GeigyRenault
XeroxHewlett-PackardHarley-DavidsonTexas Instrument
Florida Power & LightMotorola
MatsushitaToyotaNissanHonda
Nippondenso
US
Eur
ope
0 5 10 15 20 25 30 35Years of TQM
Qua
lity
West
Japan
1950 1960 1970 19801975 Time
nTQM basics: the wheel of continuous improvementbeing pushed up the hill of quality by the wedge ofquality assurance.

some, this serves as a kind of supreme auditon TQM for US industry, a complement toquality assurance certification. Meanwhile,the International Organization for Standard-ization is reviewing its guidelines with theaim of accommodating more TQM ideas, agoal already achieved in its guidelines forservice providers in the ISO 9004 series.8
TQM took time to reach the oil industry,but at least in the US it has now taken firmhold. Most major oil companies boast pro-grams several years old and achievement ofcost cuttings in the hundreds of millions ofdollars. Amoco Production Company beganinstilling TQM principles in all its 13,000employees worldwide in 1988—TQM train-ing manuals are translated into four lan-guages. In 1991, it was decided to concen-trate on continuous improvement throughemployee involvement. Under continuousimprovement director Ed Williamson, eightfacilitators support as many as 90 coacheswho conduct the detailed implementationof the TQM programs. Emphasis is on team-work, rethinking processes and when neces-sary changing organizational structure.
In Mobil Oil Co., quality management iscoordinated by an ad-hoc committee calledthe Total Quality Advisory Council (TQAC),
comprising senior-management qualityexperts. TQAC has been meeting monthlyfor almost three years, has the responsibilityof spreading TQM ideas throughout Mobil,and each year sponsors a two-day QualityForum attended by over 100 quality practi-tioners. There is special emphasis at Mobilon vetting suppliers, not only for TQM butalso related aspects of performance—inhealth, safety and environmental mattersand in litigation. Especially important toMobil is a supplier’s ability to measure andreduce the cost of poor quality. A recent tar-get was the North American operations ofSchlumberger’s pumping company Dowell.Mobil surveyed Dowell’s operations alongthe guidelines used for the MalcolmBaldrige award.
Ten years ago, software comprised only a small
percentage of Schlumberger investment in new
products. Today, software consumes between 50
and 100% of the expenditure of new product
development. This revolution in software’s domi-
nance is common to the entire industrialized
world and demands special care in management
and development efficiency.
Four years ago, the Schlumberger Laboratory
for Computer Science, based in Austin, Texas,
USA, set up a special group to attack the problem
of software development efficiency. Their man-
date was vast. Review how software was devel-
oped in as many as 80 distinct company organi-
zations located around the globe—numbering
from 5 to 180 personnel each and using hardware
ranging from 4-bit microprocessors to massively
parallel supercomputers—suggest ways to
increase development efficiency and then help
the groups achieve the improvements.1
Since its inception, the group has used process
improvement guidelines originating at the Soft-
ware Engineering Institute (SEI) at Carnegie Mel-
lon University, Pittsburgh, Pennsylvania, USA.
The SEI guidelines are tailored especially for
software development and were deemed more
suitable than generic standards such as the ISO
9000 series. The SEI view of process and process
management encompasses five levels of matu-
rity, each level having its particular set of prob-
lem areas (next page). The object is to progres-
sively move to higher levels. Today, most
software development, throughout industry, is
stuck at level 2 or below.
For a given software development center, the
group uses the SEI guidelines to identify maturity
level and likely problem areas, and then offer
solutions for improvements. The actual procedure
54 Oilfield Review
8. International Standard, ISO 9004, “Quality Manage-ment and Quality System Elements—Guidelines.”Geneva, Switzerland: International Organization forStandardization, 1987.International Standard, ISO 9004-2, “Quality Manage-ment and Quality System Elements—Part 2: Guide-lines for Services.” Geneva, Switzerland: InternationalOrganization for Standardization, 1990.See also:Durand IG, Marquardt RW, Peach RW and Pyle JC:“Updating the ISO 9000 Quality Standards: Respond-ing to Marketplace Needs,” Quality Progress 26, no. 7(July 1993): 23-28.
Baldrige TQM Categories Percentage Importance
1. Leadership and management system 12
2. Information and analysis of data and facts 6
3. Strategic quality planning 8
4. Human resource utilization 15• Management• Quality education and training• Employee recognition• Quality of work life
5. Quality assurance 14• Introduction of new products• Process control• Measurements and standards• Audits• Documentation• Quality assurance, internal and external
6. Quality results 15• Quality of products and services• Quality improvement
7. Customer satisfaction 30• Knowledge of customer requirements
and expectations• Customer relationship management• Customer satisfaction methods of
measurement and results

Optimizing: Continuous process improvement is enabled through quantitative feedback and from piloting innovative ideas and technologies.
Initial: Ad-hoc, even chaotic, software process. Few processes defined. Success depends on individual effort.
Repeatable: Basic project management tracks cost, schedule and functionality. Enough process discipline to repeat earlier successes on similar projects.
Defined: Management and engineering activities are documented, standardized and integrated into a standard software process for the organization.
Managed: Detailed measures of the software process and product quality are available. Both the software process and products are quantitatively understood and controlled.
3
1
5
2
4
nFive levels of software-development maturity, as defined by the Software Engineering Institute of Carnegie Mellon University.
Harvey Wohlwend
Austin, Texas, USA
1. Wohlwend H and Rosenbaum S: “Software Improvements inan International Company,” presented at the 15th InternationalConference on Software Engineering, Baltimore, Maryland,USA, May 17-21, 1993.
Continuous-Improvement Strategy for Software Development
is to form a four-person team per product devel-
opment center. Two of the four come from the
Austin group, while the remaining two are picked
from the product center and another center that
produces similar software products, respectively.
The team visits the center for three days to
assess maturity level and problems. Then it
makes recommendations. Later, it revisits the
center to monitor progress.
At the beginning of the program, the Austin
group found most product centers to be at matu-
rity level 1. Since then, many have progressed to
level 2 and are aspiring to level 3. The current
thrust is therefore at level 2, for which the key
problems areas with suggested solutions are:
55October 1993
• Requirements management:The requirements of complex software projects
often evolve as the project matures. By giving
each project a core team responsible for moni-
toring the project from beginning to end,
requirements management improved dramati-
cally. Before the introduction of the core team
concept, one product took 34 validation cycles
before meeting requirements—validation is a
checking of the entire developed software sys-
tem. With a core team in place, the next simi-
lar system took just 15 validation cycles.
• Software project planning and management:The Austin group helped many development
teams formalize an otherwise ad-hoc approach
to project planning and management. In 1990,
one engineering center had 51% of its software
developments completed on time. In 1991,
after improvement methods were applied,
this figure had climbed to 89%. In 1992, it
was 94%.
• Software subcontractor management:The SEI guidelines used by the Austin group to
improve internal software development can also
be applied to judge the performance of software
subcontractors. The days when a subcontractor
delivered one million lines of noncommented,
nonworking code have thus been consigned to the
history books.
• Software quality assurance:Quality assurance has been as much a problem
in software development as in any other engi-
neering enterprise. In one product center, 25% of
software product defects were discovered by the
customer after product release. After a quality
assurance team was set up, this figure dropped to
18% a year later. Now it stands at 10%.
• Software configuration management:The issue of configuration management—the cor-
rect handling of different code versions and asso-
ciated manuals, etc.— becomes more crucial as
a software organization grows. Schlumberger’s
software community has grown to 2000, so this is
a central issue for the Austin group as it visits
each product center.
The Austin group sees improvements generally
12 to 18 months after contacting a center. It also
runs software improvement team workshops
attended by team leaders from product centers
attempting improvements. The bottom line,
though, as with all continuous improvement ini-
tiatives, is local management backing. With it,
improvement at the product center moves ahead.
Without it, there is little progress.
Dow
ell i
ncid
ents
repo
rted,
N. A
mer
ica
Per crew
Per job
1991 1992 1993
0
16
12
8
4
5
4
3
2
1
0
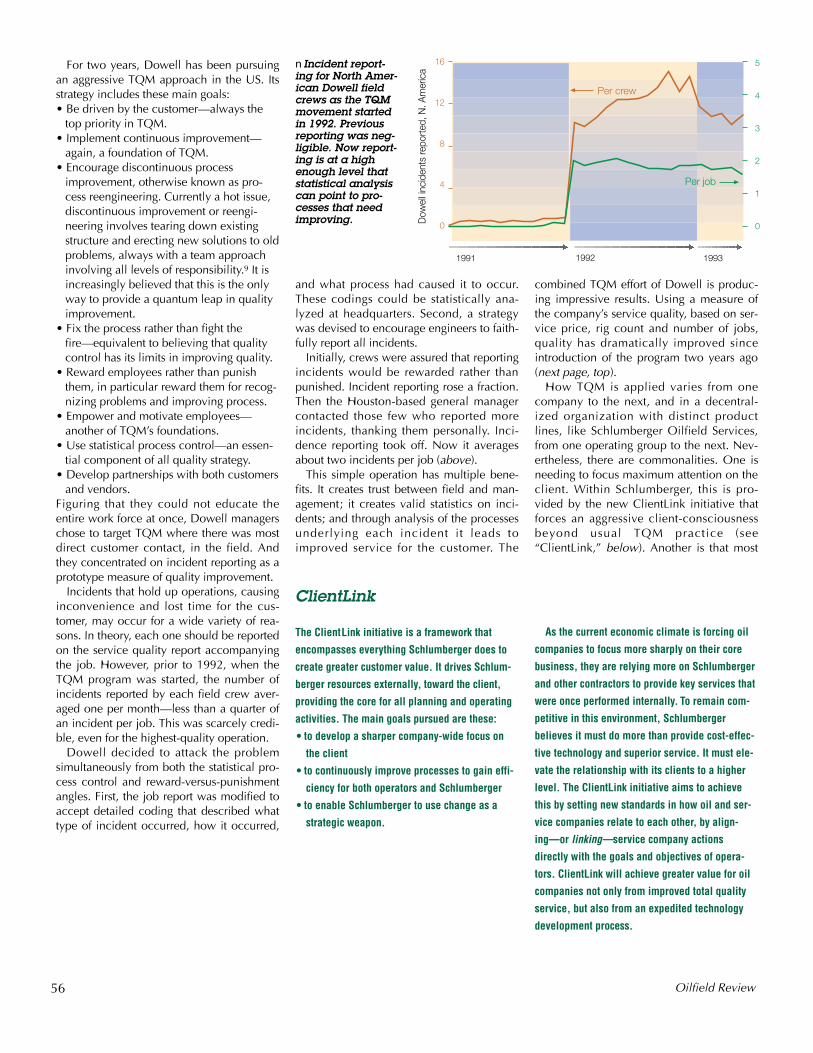
nIncident report-ing for North Amer-ican Dowell fieldcrews as the TQMmovement startedin 1992. Previousreporting was neg-ligible. Now report-ing is at a highenough level thatstatistical analysiscan point to pro-cesses that needimproving.
For two years, Dowell has been pursuingan aggressive TQM approach in the US. Itsstrategy includes these main goals:• Be driven by the customer—always the
top priority in TQM. • Implement continuous improvement—
again, a foundation of TQM.• Encourage discontinuous process
improvement, otherwise known as pro-cess reengineering. Currently a hot issue,discontinuous improvement or reengi-neering involves tearing down existingstructure and erecting new solutions to oldproblems, always with a team approachinvolving all levels of responsibility.9 It isincreasingly believed that this is the onlyway to provide a quantum leap in qualityimprovement.
• Fix the process rather than fight thefire—equivalent to believing that qualitycontrol has its limits in improving quality.
• Reward employees rather than punishthem, in particular reward them for recog-nizing problems and improving process.
• Empower and motivate employees—another of TQM’s foundations.
• Use statistical process control—an essen-tial component of all quality strategy.
• Develop partnerships with both customersand vendors.
Figuring that they could not educate theentire work force at once, Dowell managerschose to target TQM where there was mostdirect customer contact, in the field. Andthey concentrated on incident reporting as aprototype measure of quality improvement.
Incidents that hold up operations, causinginconvenience and lost time for the cus-tomer, may occur for a wide variety of rea-sons. In theory, each one should be reportedon the service quality report accompanyingthe job. However, prior to 1992, when theTQM program was started, the number ofincidents reported by each field crew aver-aged one per month—less than a quarter ofan incident per job. This was scarcely credi-ble, even for the highest-quality operation.
Dowell decided to attack the problemsimultaneously from both the statistical pro-cess control and reward-versus-punishmentangles. First, the job report was modified toaccept detailed coding that described whattype of incident occurred, how it occurred,
56
and what process had caused it to occur.These codings could be statistically ana-lyzed at headquarters. Second, a strategywas devised to encourage engineers to faith-fully report all incidents.
Initially, crews were assured that reportingincidents would be rewarded rather thanpunished. Incident reporting rose a fraction.Then the Houston-based general managercontacted those few who reported moreincidents, thanking them personally. Inci-dence reporting took off. Now it averagesabout two incidents per job (above).
This simple operation has multiple bene-fits. It creates trust between field and man-agement; it creates valid statistics on inci-dents; and through analysis of the processesunderlying each incident it leads toimproved service for the customer. The
combined TQM effort of Dowell is produc-ing impressive results. Using a measure ofthe company’s service quality, based on ser-vice price, rig count and number of jobs,quality has dramatically improved sinceintroduction of the program two years ago(next page, top).
How TQM is applied varies from onecompany to the next, and in a decentral-ized organization with distinct productlines, like Schlumberger Oilfield Services,from one operating group to the next. Nev-ertheless, there are commonalities. One isneeding to focus maximum attention on theclient. Within Schlumberger, this is pro-vided by the new ClientLink initiative thatforces an aggressive client-consciousnessbeyond usual TQM practice (see“ClientLink,” below). Another is that most
ClientLink
The ClientLink initiative is a framework that
encompasses everything Schlumberger does to
create greater customer value. It drives Schlum-
berger resources externally, toward the client,
providing the core for all planning and operating
activities. The main goals pursued are these:
• to develop a sharper company-wide focus on
the client
• to continuously improve processes to gain effi-
ciency for both operators and Schlumberger
• to enable Schlumberger to use change as a
strategic weapon.
As the current economic climate is forcing oil
companies to focus more sharply on their core
business, they are relying more on Schlumberger
and other contractors to provide key services that
were once performed internally. To remain com-
petitive in this environment, Schlumberger
believes it must do more than provide cost-effec-
tive technology and superior service. It must ele-
vate the relationship with its clients to a higher
level. The ClientLink initiative aims to achieve
this by setting new standards in how oil and ser-
vice companies relate to each other, by align-
ing—or linking—service company actions
directly with the goals and objectives of opera-
tors. ClientLink will achieve greater value for oil
companies not only from improved total quality
service, but also from an expedited technology
development process.
Oilfield Review

Dow
ell q
ualit
y in
dex,
N. A
mer
ica
1.12
1.08
1.04
1.00
1991 1992 1993
nQuality index ofDowell’s service inNorth America,showing increasesafter TQM drivewas started in 1992.The index is basedon price of services,rig count and num-ber of jobs.
TQM implementations follow the samebasic steps.
First, there must be two key assessments,an internal one that gauges employee per-ceptions and an external one that gaugesclient perception of the product or service.From these assessments comes a list ofproblems that must be prioritized. Fortu-nately, most of the headaches come fromjust a few problems, so prioritization is gen-erally not contentious. Once a list of prob-lems emerges, plans can be made to takecorrective action.
In early 1993, the Schlumberger Wireline& Testing group in the US started along thistrack. A questionnaire asking more than 60questions on perception of service qualitywas dispatched to 1800 employees in allparts of the company—the field, headquar-
October 1993
ters, sales and computing interpretation cen-ters. A survey of major clients in 1991 wasdeemed still relevant. The results of bothsurveys were reviewed by a group of 30middle managers picked from all over theorganization and from all disciplines—tech-nical managers, sales personnel, controllers,trainers, etc. as well as line managers.
The group identified twelve itemsdemanding immediate attention. Theseincluded improving communicationbetween sales and operations, identifyingbetter customer needs, improving equip-ment maintenance, and improving customerinvoicing. Teams have now been set up toattack each of these problems, with clientinput when relevant. Each team comprisesmembers of the original group of 30, plusmore employees at all levels coming from
across the organization. As processes areanalyzed, the tougher problems are beingsplit into two or more subprocesses, andprocesses particular to a given locality arealso beginning to be identified. The entireTQM effort is monitored by a Quality Coun-cil of eight middle-to-senior managers whomeet monthly.
In Wireline & Testing’s operations outsidethe US, the TQM initiative is more dispersedwith distinct TQM cells distributed world-wide. Five were started in 1992 and eightmore added in 1993. Each cell correspondsto an organizational district comprisingbetween five and ten field crews and tailorsits TQM approach to the clients it serves.
In the Colombia cell in South America,the TQM effort addresses all the major oper-ators—BP Colombia Limited, Occidental,Elf and Chevron and the Colombiannational oil company, Ecopetrol. Results sofar have been impressive, ranging from clearservice improvements in borehole seismicsand well testing to a streamlining in invoic-ing that has halved the time between billingand payment—an efficiency benefit to bothoperator and service contractor. The nextsteps in the Colombian cell will stress con-tinuous improvement.
Success in Colombia combined applyingthe dual foundations of TQM—communica-tion with the client and improved internalprocess—with total management commit-ment. In developing this TQM program, per-haps the most exciting trend has been inclient communication. This has becomemore open and honest on both sides, lend-ing truth to the meaning of partnership. InColombia, client feedback comes from visitsby Wireline & Testing personnel, from clientsatisfaction ratings after each job, and mostimportantly from service quality meetingsheld each month or at completion of a well.
At the service quality meeting, personnelrepresenting both operator and contractorsit down and review recent problems. Tradi-tionally, these meetings are adversarial withboth parties tending to hold their cardsclose to the chest. The TQM initiative in
9. Hammer M and Champy J: Reengineering the Corpo-ration. New York, New York, USA: HarperBusiness,1993.
In short, the ClientLink initiative creates a new
way of thinking and behaving that infuses the
client perspective in all activities, a general phi-
losophy of service that Schlumberger is commit-
ted to instilling in all of its 34,000 oilfield
employees. It comprises a range of specific pro-
grams. Some are particular to a product line like
the TQM movement in Dowell. Others are com-
mon to the entire range of Schlumberger oilfield
services, including:
• The Integrated Services and Strategic AlliancesProgram, in which Schlumberger packages
varying services and products into one contract
to satisfy a client need for greater efficiency
• The ClientLink Solutions and Database Pro-gram—a systematic process for understanding,
anticipating and solving client needs through
relevant technology development
• Joint R & E Programs that encourage technical
cooperation between operators and Schlum-
berger to maximize resources and avoid dupli-
cation of effort
• Joint HSE and Quality Standards, established
by regularly sharing concerns, experiences and
performance standards
• Client Training Programs—for improving
efficiency of technology transfer. Under the
ClientLink initiative, these programs will
place a greater emphasis on two-way
communication.
57

nChange in failure reporting for Wireline & Testing. Both systems use the concept ofmajor operational failure. For minor failures, however, the old system counted tool failureand lost time as the sole criterion for judging service quality. The new system introducesthe concept of client-affecting failure (CAF) that can result from several additional fac-tors. Reported CAFs now greatly exceed the previous non-lost-time failures.
Criteria for Client Affecting Failure
• Late arrival at wellsite• Tool failure requiring re-run• Lost time—more than 15 minutes; includes software problems• Loss of information• Incorrect data, but recoverable• Depth error less than 10 feet—temporary tool sticking excluded• Late delivery of wellsite product• Nonavailability of required format• Failed or delayed data transmission• Additional logistics required by client• Lack of required equipment test certificates
Old reporting system
Wel
l site
New reporting system
Failures during maintenance and
prejob checks
Lost time
No lost time
Failures during maintenance and
prejob checks
Major operational
failure
Client affecting failure
Major operational
failure
Colombia, however, has persuaded bothparties that cooperation rather than a stand-off is more constructive. Meetings now dis-play a degree of honesty on both sides thatwas previously unimaginable.
This more open relationship, a key toimproving service quality, can also be seenin recent changes in how the Wireline &Testing group internally analyzes equipmentfailure and lost time on the job. Failure usedto be divided into three main categories.First was failure that occurred during regularmaintenance and prejob tool checks, ideallywhen any failure should occur inconve-niencing neither client nor field crew. Then,there was failure at the wellsite causing nolost time (NLTF), and, least frequently, fail-ure at the wellsite incurring lost time (LTF).In addition, a failure that grossly inconve-nienced the client was termed a major oper-ational failure (MOF), whether it involvedlost time or not (right).
For reporting MOFs, this system was fine.Its drawback for reporting less serious prob-lems was to equate just two parameters—equipment failure and lost time—with ser-vice quality. Plenty of other potential annoy-ances on the job should by rights also havebeen in the equation. This has been cor-rected in a new reporting system, wherewellsite failures are divided into just twotypes, MOFs and the less serious clientaffecting failure (CAF). Client affecting fail-ures are defined by eleven criteria and intro-duce many parameters besides lost time (see“Criteria for Client Affecting Failure,” right).Reporting of CAFs now greatly exceeds thelevel of previous NLTF reporting andenables management to remain in bettertouch with client perception of Schlum-berger’s field operations.
Reporting is also changing in Schlum-berger’s drilling company, Sedco Forex. Itsnew computerized daily drilling report con-tains more detail than previous reports, farmore than the standard report approved bythe International Association of Drilling Con-tractors (IADC) (next page). The new reportlists every action with start and stop time andrequires each action to be categorized in
58 Oilfield Review

nNew dailydrilling reportused by SedcoForex. Thereport itemizesevery actiontaken on the rig,with start andstop times,allowing statisti-cal analysis ofrig usage.
RIG NAME : RIG 65 SEDCO FOREX DAILY OPERATIONS REPORT DATE : 17 Mar 93
CUSTOMER : DAYS ON WELL : 28 Date of LLTI : 01 Mar 91WELL NAME : DAYS SINCE SPUD : 2 LLTI (days) : 747FIELD : LAST BOP TEST : Total Rig Personnel : 32Rig Superintendent : DAY SINCE BOP TEST : 3 Sedco Forex Personnel : 27
TIME ANALYSIS WELL DATA MUD PRODUCTS
From To Operation From To Run Day Progress : 98.00 m Item Qty Stock Unithh:mm hh:mm m m Rotating Hours : 18.50 Code Used Left
00:00 04:30 DRILLING: MAKING HOLE 50.00 68.00 3 Last Casing Shoe : 146.00 m 32 0 0 kgf04:30 04:45 CIRCULATING: FOR MUD CONDITION 68.00 68.00 3 Open Hole : 26" mm 21 0 0 kgf04:45 07:00 DEVIATION SURVEY: WELL PROFILE 68.00 68.00 3 Last Depth : 148.00 m 61 0 0 m307:00 07:45 MAKE UP STANDS: DRILLING OPERATION 68.00 68.00 3 Last TVD : 17.00 m 41 0 0 kgf07:45 11:30 DRILLING: MAKING HOLE 68.00 94.00 3 11:30 11:45 REPAIR CLIENT EQPMT: 94.00 94.00 3 RKB Wellhead : 10.00 m11:45 15:30 DRILLING: MAKING HOLE 94.00 115.00 3 Water Depth : 0.00 m15:30 16:45 DEVIATION SURVEY: WELL PROFILE 115.00 115.00 316:45 22:00 DRILLING: MAKING HOLE 115.00 135.00 322:00 23:15 DRILLING: MAKING HOLE 135.00 148.00 323:15 23:30 CIRCULATING: FOR MUD CONDITION 148.00 148.00 323:30 24:00 DEVIATION SURVEY: WELL PROFILE 148.00 148.00 3
Run RR Diameter (mm) IADC Make Type S/N Jet T/B/G Pull Out Reason C.Foot (m) C. Hours
3 Y 26" XIII SMITH KR9608 0.-0.-0. / / 121.00 29.00
Run WOB RPM Torque Flow Press. Mud Den in Den out MV PV Gel YP Temp WL Sol pHkgf kgf.m L/min kgf/c Type kg/L kg/L s/L cP 0 10 kgf/m2 degC ml/30 %
3 13000 3500 400 90 55 0.00 0.00 0 0 0 0 0 0.0 0.0 0 0
Run No: 3 DEVIATION SURVEY LITHOLOGY
BHA OD Length Depth Inclin. Azimuth From To Main Sub FormationCode mm mm m deg deg m m Lith Lith Name
BIT 660.400 0.61 11.00 0.20 260.70 0.00 148.00 CLY OR MOLASSEBS 280.000 1.10 17.00 0.50 284.80SPDC 286.000 18.86STB 285.000 2.25SPDC 241.300 26.37XO 228.000 0.92HW 127.000 9.00
0.00 OTHER PRODUCTS0.000.00 Item Qty Used Stock Left Units0.000.00 FUEL 0 0 m30.000.000.000.000.000.000.000.000.00
COMMENTS AND PROGNOSISDRILLING FROM 50M TO 68M, CIR, GYRO, DRILLING FROM 68M TO 94M, REPAIR CONVEYOR BELT (0H25), DRILLING FROM 94M TO 115M, GYRO, 1H25DRILLING FROM 115M TO 148M, CIRCULATION & GYRO SAFETY : ROUTINE SAFETY MEETINGS, INSTALL LIFE LINE IN MASTPREPARE BILK SITUATION AT 07H00: POOH & WELD BLADES ON STABILOWAREHOUSE PARAMETERS : Daily Issues : USD Daily Receipts : USD Stock Balance : USD
Line Work SLOW CIRCULATING RATE Rate 1 2 3 4 5 6 7 Total
Day Work : 40.00 1000 Pump #1 Pump #2 Pump #3 Hour 1.50 18.25 4.25 0.00 0.00 0.00 0.00 24.00Cumm Work : 73430.00 1000 Press : 0 0 0 kgf/cmCumm Slip : 1331.00 m SPM : 0 0 0Balance : 0.00 m Liner : 0.00 0.00 0.00 mm
TIME ANALYSIS
From To Operation From To Runhh:mm hh:mm m m
00:00 04:30 DRILLING: MAKING HOLE 50.00 68.00 304:30 04:45 CIRCULATING: FOR MUD CONDITION 68.00 68.00 304:45 07:00 DEVIATION SURVEY: WELL PROFILE 68.00 68.0 307:00 07:45 MAKE UP STANDS: DRILLING OPEATION 68.00 68.00 307:45 11:30 DRILLING: MAKING HOLE 68.00 94.00 311:30 11:45 REPAIR CLIENT EQPMT: 94.00 94.00 311:45 15:30 DRILLING: MAKING HOLE 94.00 115.00 315:30 16:45 DEVIATION SURVEY: WELL PROFILE 115.00 115.00 316:45 22:00 DRILLING: MAKING HOLE 115.00 135.00 322:00 23:15 DRILLING: MAKING HOLE 135.00 148.00 323:15 23:30 CIRCULATING: FOR MUD CONDITION 148.00 148.00 323:30 24:00 DEVIATION SURVEY: WELL PROFILE 148.00 148.00 3
two ways: what the action was and why itwas performed. This allows a simple analysisof rig time by main activities—making hole,setting casing, remedial work, evaluationand downtime—with a detailed breakdownof each activity to monitor performance,identify problems and create and test newprocedures. It also provides a tool for help-ing implement incentive contracts in whichthe drilling company is rewarded for quality.
In a pioneering contract with Mobil Pro-ducing Nigeria Ultd, Sedco Forex earns amonthly bonus for drilling with quality.Quality is assessed by summing the contrac-tor’s performance in 11 safety and environ-mental categories, in 13 operational effi-ciency categories, in two personnelcategories and in one solids-control equip-ment category. As an example, one opera-tional efficiency category is the time neededto make a connection. Performance is ratedA, B, C or D. Lowest rating A is for averag-ing more than 180 seconds to make a con-nection; highest is D for taking less than 120
October 1993
seconds—the average is taken from 30 con-nections chosen randomly over one month.Once all the performances have beenassessed, a simple scoring system permitscomputing overall quality and the size ofthe bonus.
Incentive payments based on qualityprove that both oil companies and the ser-vice industry have traveled far along thequality road. Propelled by a tough, competi-tive business environment, they see thequality movement as something real, asapplicable to the exploration and produc-tion industry as any other industry. Thequality movement is showing results andcausing greater collaboration and under-standing between all parties. It seems des-tined to grow. —HE
59