Pyrolysis of waste polypropylene plastics for energy recovery
138
Pyrolysis of waste polypropylene plastics for energy recovery: Investigation of operating parameters and process development at pilot scale by George Kofi Parku Thesis presented in partial fulfilment of the requirements for the Degree of MASTER OF ENGINEERING (CHEMICAL ENGINEERING) in the Faculty of Engineering at Stellenbosch University Supervisor Prof. Johann F. Görgens Co-Supervisor Dr. François-Xavier Collard April 2019
-
Upload
khangminh22 -
Category
Documents
-
view
3 -
download
0
Transcript of Pyrolysis of waste polypropylene plastics for energy recovery

Pyrolysis of waste polypropylene plastics for
energy recovery: Investigation of operating
parameters and process development at pilot
scale
by
George Kofi Parku
Thesis presented in partial fulfilment of the requirements for the Degree
of
MASTER OF ENGINEERING (CHEMICAL ENGINEERING)
in the Faculty of Engineering at Stellenbosch University
Supervisor
Prof. Johann F. Görgens
Co-Supervisor Dr. François-Xavier Collard
April 2019

i
DECLARATION
By submitting this thesis electronically, I declare that the entirety of the work contained therein is my own, original work, that I am the sole author thereof (save to the extent explicitly otherwise stated), that reproduction and publication thereof by Stellenbosch University will not infringe any third party rights and that I have not previously in its entirety or in part submitted it for obtaining any qualification.
Date: April 2019
Copyright © 2019 Stellenbosch University All rights reserved
Stellenbosch University https://scholar.sun.ac.za

ii
PLAGIARISM DECLARATION
1. Plagiarism is the use of ideas, material and other intellectual property of another’swork and to present is as my own.
2. I agree that plagiarism is a punishable offence because it constitutes theft.
3. I also understand that direct translations are plagiarism.
4. Accordingly, all quotations and contributions from any source whatsoever (includingthe internet) have been cited fully. I understand that the reproduction of text withoutquotation marks (even when the source is cited) is plagiarism.
5. I declare that the work contained in this assignment, except where otherwise stated,is my original work and that I have not previously (in its entirety or in part) submitted itfor grading in this module/assignment or another module/assignment.
Initials and surname: G.K. PARKU
Date: April 2019
Stellenbosch University https://scholar.sun.ac.za

iii
Abstract
Polypropylene (PP) has been identified as the second most abundant plastic waste in landfills
globally and the fastest growing plastic waste in South Africa. The increasing numbers have
been attributed to the limitation of conventional mechanical recycling not being able to
handle plastic wastes contaminated with other organic wastes. Recycling via pyrolysis has
been identified as a promising option to managing these plastic wastes due to its ability to
handle significant levels of contamination and also yielding products with huge fuel prospects
from plastics. Pyrolysis under vacuum conditions for other organic wastes such as biomass
has demonstrated promising yields of condensable products. Unfortunately, pyrolysis of
plastics under vacuum has received very little attention. Also, transition from bench to
industrial scale applications of pyrolysis processes could be complicated and pilot scale
processes to mediate between both levels are very helpful towards attaining the sustainable
commercialisation of plastics pyrolysis into fuels.
The aim of the study was to investigate the effects of key process parameters (that include
temperature and heating rate) on products yield distribution and quality of condensable
products from the pyrolysis of waste PP plastics at bench scale under atmospheric and
vacuum conditions. Four temperatures (450, 488, 525 and 600 ᵒC) were investigated at two
distinct heating rates of 15 ᵒC/min (slow), 175 ᵒC/min (fast). As part of the aims of the study,
a 5 kg/h pyrolysis pilot plant was also designed and commissioned after which tests obtained
from atmospheric fast heating rates were scaled-up to the commissioned pilot.
Pyrolysis of PP under atmospheric slow and fast heating rates revealed maximum
condensable products (oil and wax) yields of 85.6 and 84.5 wt.% respectively all attained at
488 ᵒC after which further increase of temperature resulted in secondary cracking reactions
which promoted yields of permanent gases against condensables. Cracking was however
more severe under fast heating rates due to the combined effects of higher temperature and
faster heating rate. Gas Chromatography/ Mass Spectrometry (GC/MS) analysis of
condensable products obtained under these conditions also revealed that production of
gasoline range compounds was favoured mostly under reactions where some cracking
reactions occur. Also, Higher Heating Values (HHVs) of condensable products recovered under
atmospheric conditions ranged between 41 - 45 MJ/kg. HHVs were however seen to decrease
Stellenbosch University https://scholar.sun.ac.za

iv
at severe temperature and heating rate conditions due to the increased production of
aromatics.
Maximum yields of condensable products for slow and fast heating rates under vacuum
conditions were reported to be 92.7 wt.% (at 525 ᵒC) and 91.8 wt.% (at 488 ᵒC) respectively.
Total yields of condensable products under vacuum were observed to be higher than the
corresponding yields under atmospheric conditions. Unlike atmospheric conditions, diesel
range compounds predominated all condensable products recovered under vacuum
pyrolysis. In addition, HHVs of condensable products retrieved under vacuum ranged
between 42 - 46 MJ/kg and were seen to remain high even at severe conditions of
temperature and heating rate.
Lastly, tests under atmospheric fast heating rates at bench were mimicked on the
commissioned pilot plant (because they both employ a pre-heated reactor). Compared to the
bench scale test, temperature at which maximum yield of condensable products were
retrieved on the pilot decreased by 28 ᵒC with the maximum condensable products yield also
decreasing by 6%. These differences were blamed on different reactor length configurations.
Physico-chemical properties of oils recovered from the pilot when compared to commercial
diesel and gasoline fuels disclosed that PP derived oils contained compositions of both diesel
and gasoline range compounds.
Stellenbosch University https://scholar.sun.ac.za

v
Opsomming
Polipropolien (PP) is uitgeken as die plastiek wat wêreldwyd die tweede meeste voorkom in
vullisterreine en dit is die vinnigste groeiende plastiekmateriaalafval in Suid Afrika. Die
groeiende syfers word toegeken aan die die feit dat konvensionele meganiese herwinning
beperkte kapasiteit het om afvalplastiekmateriaal wat met organiese afval gekontamineer is,
the hanteer. Herwinning via pirolise is geïdentifiseer as ʼn belowende opsie om plastiekafval
te bestuur, as gevolg van pirolise se vermoë om beduidende vlakke van kontaminasie te
hanteer, asook die oplewering van produkte met belowende brandstof eienskappe. Pirolise
onder vakuumkondisies van ander organiese afvalmateriaal, soos biomass, toon belowende
opbrengste van kondenseerbare produkte. Ongelukkig, vind pirolise van plastiek onder
vakuumkondisies baie min aandag. Verder, kan dit ingewikkeld wees om van banktoetsskaal
na industriële skaal oor te gaan en lootsskaal prosesse kan hulpvaardig wees om tussen die
twee vlakke te bemiddel om volhoubare kommersialisering van plastiekpirolise om brandstof
the maak, te bekom.
Die doelwit van die studie was om die effekte van sluetel-proses-parameters (insluitend
temperatuur en verhittingstempo) op die verspreiding en kwaliteit van kondenseerbare
produkte vanaf die pirolise van afval PP-plastiek by banktoetsskaal onder atmosferiese en
vakuumdruk kondisies te ondersoek. Vier temperature (450, 488, 525 en 600 ᵒC) was
onderoek by twee duidelike verhittingstempo’s van 15 ᵒC /min (stadig) en 175 ᵒC /min
(vining). As deel van die doelwitte van die studie, is ‘n 5 kg/h pirolise lootsaanleg ook ontwerp
en opgedra, waarna toetse verkry vanaf atmosferiese vinnige verhittingstempo’s,
opgeskaleer is na die lootsaanleg.
Pirolise van PP onder atmosferiese stadige en vinnige verhittingstempo’s het maksimale
kondenseerbare produkte (olie en was) opbrengste gelewer van 85.6 wt.% en 84.5 wt.%
onderskeidelik, als verkry by 488 °C, waarna ʼn verdere toename in temperatuur sekondêre
kraking reaksies tot gevolg gehad het wat opbrengste van permanente gasse teenoor
kondenseerbare produkte bevorder. Kraking was egter hewiger onder vinnige
verhittingstempo as gevolg van die gekombineerde gevolge van hoër temperatuur en vinniger
verhittingstempo. GC/MS-analise van kondenseerbare produkte wat onder hierdie toestande
verkry is het ook gewys dat produksie van petrol bestek samestellings is meestal bevoordeel
waar sekondêre kraking reaksies voorkom. Verder, was die hoërverhittingswaarde (HHV) van
Stellenbosch University https://scholar.sun.ac.za

vi
herwinde kondenseerbare produkte onder atmosferiese kondisies in bestek van 41 - 45
MJ/kg. HHVs het egter verminder by geweldige temperature en verhittingstempo kondisies
a.g.v die toenemende vervaardiging van aromatiese verbindings.
Maksimale kondenseerbare produkte opbrengste vir stadige en vinnige verhittingstempo’s
onder vakuum is gerapporteer as 92.7 wt.% (by 525 °C) en 91.8 wt.% (by 488 °C)
onderskeidelik. Totale opbrengste van kondenseerbare produkte onder vakuum was hoër as
die ooreenstemmende opbrengste van olies onder atmosferiese toestande. Anders as
atmosferiese toestande, het diesel bestek verbindings alle kondenseerbare produkte wat
onder vakuum pirolise herwin is oorheers. Verder, het kondenseerbare produkte wat onder
vakuum herwin is, HHV’s wat in die bestek van tussen 42 - 46 MJ/kg geval het en dit was
gevind om hoog te bly selfs onder geweldige kondisies van temperatuur en verhittingstempo.
Laastens, is toetse onder atmosferiese vinnige verhittingstempo’s op banktoetsskaal
nageboots op die lootsaanleg (want hulle altwee benut ‘n voorverhitte reaktor). In
vergelyking met die banktoetsskaal toetse, het die temperatuur waarby maksimum opbrengs
van kondenseerbare produkte herwin is, met 28 °C verminder. Die maksimum opbrengs van
kondenseerbare produkte het ook met 6% verminder. Hierde verskille is toegeken aan die
verskil in lengte konfigurasies van die reaktore. Physico-chemiese eienskappe van olies
herwin uit die lootsaanleg, as vergelyk word met kommersiële diesel en petrol brandstowwe,
het gewys dat die samestelling van PP afgeleide olies in die bestek van beide diesel en petrol
samestellings val.
Stellenbosch University https://scholar.sun.ac.za

vii
Acknowledgements
I would like to express my sincere gratitude to my supervisor, Prof. Johann Görgens for his
invaluable guidance throughout my master’s studies. I also thank him for giving me the
platform and financial support.
I am grateful to Dr. François-Xavier Collard, my co-supervisor for his critical reviews on my
writeups and making excellent contributions. I also thank him for his academic and moral
support that have brought the work to a successful end.
I would like to express my heartfelt gratitude to my family, especially parents and siblings
for their love and moral support throughout my studies.
Special thanks to Ms. Hanlie Botha, Mr. Jaco Van Rooyen and Ms. Levine Simmers at the
Process Engineering Analytical Laboratory for their assistance with GC/MS analysis.
Thanks to the workshop team, Mr. Jos Weerdenburg, Mr. Anton Cordier, Mr. Brent Gideons
and Mr. Bevan Koopman for their immense support in installing and maintaining the pyrolysis
setups.
I would also like to thank Dr. JP Barnard and Mr. George Whitehead for their assistance with
software and IT related issues.
I am highly indebted to the Analytical Staff of Intertek, Cape Town for their huge support in
conducting Fuel Tests.
To all my friends at the Department of Process Engineering and to all the other colleagues
in Thermochemical Process Research Group, I would like to say thank you for your support.
Council for Scientific and Industrial Research (CSIR) and Plastics SA for their financial support
without which this study would not have materialised.
Mr. Alvin Petersen (Dept of Process Engineering), Mr. Sithandile Ngxangxa (Department of
Organic Chemistry) and Mr. Henry Solomons (Department of Wood Science), I would like to
say thank you for your support.
Above all, I thank God for the gifts of life, love and good health.
Stellenbosch University https://scholar.sun.ac.za
viii
Table of Contents
DECLARATION .......................................................................................................................... i
Abstract ..................................................................................................................................... iii
Opsomming ................................................................................................................................ v
Acknowledgements .................................................................................................................. vii
Table of Contents .................................................................................................................... viii
List of Tables ............................................................................................................................ xii
List of Figures .......................................................................................................................... xiii
Nomenclature ......................................................................................................................... xvi
Definition of Key terms .......................................................................................................... xvii
Introduction .............................................................................................................. 1
1.1 Background ....................................................................................................................... 1
1.2 Motivation for the research ............................................................................................. 3
1.3 Research Aims and Objectives ......................................................................................... 5
1.3.1 Aim ............................................................................................................................. 5
1.3.2 Objectives .................................................................................................................. 5
1.4 Research Questions .......................................................................................................... 6
1.5 Thesis Overview ............................................................................................................... 6
Literature review ....................................................................................................... 7
2.1 Introduction ...................................................................................................................... 7
2.2 Flow of Polypropylene in South Africa ............................................................................. 7
2.3 Plastic Waste Management ............................................................................................. 8
2.4 Pyrolysis and factors influencing plastics pyrolysis .......................................................... 9
2.4.1 Chemical composition of plastic material ............................................................... 10
2.4.2 Temperature and Heating rate ................................................................................ 10
2.4.3 Heating rate ............................................................................................................. 11
Stellenbosch University https://scholar.sun.ac.za
ix
2.4.4 Residence Time ........................................................................................................ 11
2.4.5 Pressure ................................................................................................................... 12
2.5 Types of Pyrolysis ........................................................................................................... 12
2.5.1 Slow Pyrolysis .......................................................................................................... 12
2.5.2 Fast Pyrolysis ........................................................................................................... 12
2.5.3 Intermediate Pyrolysis ............................................................................................. 13
2.5.4 Vacuum Pyrolysis ..................................................................................................... 13
2.6 Review on PP pyrolysis ................................................................................................... 13
2.6.1 Physical Properties of Polypropylene (PP) .............................................................. 14
2.6.2 Pyrolysis of Polypropylene (PP) ............................................................................... 14
Thermogravimetric degradation of PP ............................................................ 14
Effects of temperature and heating rate on PP pyrolysis products ................ 17
Vacuum pyrolysis of PP .................................................................................... 21
2.6.3 Condensable products of PP pyrolysis .................................................................... 25
2.7 Chemical composition and distillation behaviour of conventional liquid fuels ............. 29
2.7.1 Chemical composition of commercial diesel fuels .................................................. 30
2.7.2 Chemical composition of commercial gasoline fuels .............................................. 31
2.7.3 Fuel properties of commercial liquid fuels .............................................................. 32
2.8 Pilot scale and commercial plastic pyrolysis plants ....................................................... 35
2.8.1 Feeding System ........................................................................................................ 36
Screw feeders ................................................................................................... 36
Piston Feeders .................................................................................................. 38
Lock Hopper feeding systems .......................................................................... 39
2.8.2 Reactors ................................................................................................................... 41
2.8.3 Condensers .............................................................................................................. 47
2.8.4 Some Pilot and Commercial Scale Plastic Pyrolysis Plants ...................................... 48
Stellenbosch University https://scholar.sun.ac.za

x
2.9 Key Conclusions drawn from literature ......................................................................... 50
Materials and methods ........................................................................................... 52
3.1 Introduction .................................................................................................................... 52
3.2 Feedstock supply and preparation ................................................................................. 52
3.3 Feedstock characterisation ............................................................................................ 53
3.4 Pyrolysis conversion ....................................................................................................... 53
3.4.1 Bench scale pyrolysis ............................................................................................... 53
Bench-scale setup description ......................................................................... 53
Bench-scale experimental procedure .............................................................. 55
3.4.2 Pilot conversion ....................................................................................................... 55
Pilot plant setup description ............................................................................ 55
Pilot experimental procedure .......................................................................... 57
3.5 Products characterisation .............................................................................................. 58
3.5.1 Gas Chromatography/Mass Spectrometry (GC/MS) ............................................... 58
3.5.2 Gas Analysis ............................................................................................................. 59
3.5.3 Fuel Tests ................................................................................................................. 60
Results and discussion............................................................................................. 63
4.1 Introduction .................................................................................................................... 63
4.2 Thermodegradation behaviour and Compositional Characterisation of PP .................. 63
4.2.1 Thermal degradation and Proximate analysis of waste PP ..................................... 63
4.2.2 Elemental analysis of waste PP ............................................................................... 64
4.3 Atmospheric pyrolysis of PP at bench-scale .................................................................. 65
4.3.1 Product yield distribution (Atmospheric conditions) .............................................. 65
4.3.2 Condensable products characterisation (Atmospheric conditions) ........................ 68
GC/MS analysis (Atmospheric Conditions) ...................................................... 68
Higher Heating Value (HHV) analysis (Atmospheric conditions) ..................... 70
Stellenbosch University https://scholar.sun.ac.za

xi
4.3.3 Gas analysis (Atmospheric Conditions) ................................................................... 71
4.4 Vacuum pyrolysis of PP at bench-scale .......................................................................... 73
4.4.1 Product yield distribution (Vacuum pyrolysis) ........................................................ 73
4.4.2 Condensable products characterisation (vacuum conditions) ................................ 76
GC/MS Analysis (Vacuum conditions).............................................................. 76
HHV Analysis (Vacuum) .................................................................................... 77
4.4.3 Gas Analysis (Vacuum conditions) ........................................................................... 78
4.5 Process Development at Pilot Scale ............................................................................... 80
4.5.1 Product yield distribution (Pilot scale pyrolysis) ..................................................... 80
4.5.2 Liquid product analysis (Pilot scale process) ........................................................... 85
GC/MS Analysis (Pilot scale process) ............................................................... 85
HHV of condensable products oils (pilot study) .............................................. 87
4.5.3 Gas Analysis (Pilot scale process) ............................................................................ 88
4.5.4 Comparing fuel properties of PP pyrolysis oils with commercial fuels ................... 90
Conclusions and recommendations ........................................................................ 94
5.1 Conclusions ..................................................................................................................... 94
5.2 Recommendations ......................................................................................................... 95
References ............................................................................................................................... 97
: Uses and flow of plastics .................................................................................. 112
: Standard Deviation ........................................................................................... 114
: Simulated distillation used for GC/MS characterisation of oils ....................... 117
: Images of condensable products and char obtained from bench ................... 118
Stellenbosch University https://scholar.sun.ac.za

xii
List of Tables
Table 2.1. Plastics waste distribution in South Africa as at 2012 reported by Plastics SA ........ 7
Table 2.2. Thermal decomposition of PP in TGA experiments ................................................ 14
Table 2.3. Summary on the effects of temperature, heating rate and other key parameters
on product distribution in the thermal pyrolysis of PP (batch reactors) ................................. 23
Table 2.4. Influence of temperature and other key parameters in product distribution of fast
PP pyrolysis in Fluidised bed reactors ...................................................................................... 24
Table 2.5. Distribution of hydrocarbon types obtained from PP pyrolysis oil......................... 28
Table 2.6. Carbon number distribution and boiling points of oils recovered from PP pyrolysis
.................................................................................................................................................. 28
Table 2.7. Paraffins, Olefins and Aromatic fractions in different grades of diesel fuel ........... 30
Table 2.8. Paraffinic, Olefinic and Aromatic constituents of different grades of gasoline fuel
.................................................................................................................................................. 31
Table 2.9. Comparing different types of reactors .................................................................... 45
Table 4.1. Proximate Analysis of PP ......................................................................................... 64
Table 4.2. Elemental Composition of PP .................................................................................. 65
Table 4.3. HHV of PP derived oils under atmospheric pyrolysis of PP .................................... 71
Table 4.4. HHV of PP derived oils (Vacuum conditions) .......................................................... 77
Table 4.5. Summarised description of oil labels ...................................................................... 81
Table 4.7. HHV of PP oils recovered from pilot pyrolysis of PP ............................................... 88
Table 4.8. Fuel properties of PP pyrolysis oils ......................................................................... 92
Table 4.9. Specifications for commercial diesel and gasoline fuels ........................................ 93
Table A.1. Some useful applications of commonly used plastic materials………………………… 112
Table B.1. Raw data showing standard deviations of products yields (Atmospheric slow) 114
Table B.2. Raw data showing standard deviations of products yields (Atmospheric fast-
insertion)………………………………………………………………………………………………………………………… 114
Table B.3. Raw data showing standard deviations of products yields (Vacuum slow) 115
Table B.4. Raw data showing standard deviations of products yields (Vacuum fast
insertion)…………………………………………………………………………………………………………………………. 115
Table B.5. Raw data showing standard deviations of products yields (Pilot tests)……………. 116
Stellenbosch University https://scholar.sun.ac.za

xiii
List of Figures
Figure 2.1. Mechanism of Pyrolysis of a solid fuel ..................................................................... 9
Figure 2.2. Formation of polypropylene polymer from propylene monomer ....................... 13
Figure 2.3. TGA curves for PP degradation at heating rates of 5, 10 and 20 °C/min .............. 16
Figure 2.4. DTG curves for PP degradation at heating rates of 5, 10 and 20 °C/min .............. 17
Figure 2.5. Empirical model depicting the effects of temperature on condensable product
(oil/wax) yield for slow pyrolysis of PP – Data points from; [Williams & Williams, (1997b),
Hájeková & Bajus, (2005), Takuma et al., (2001), Yan et al., (2015), Zhou et al., (2004), Ciliz et
al., (2004), Miandad et al., (2016), Uçar, et al., (2016), Heydariaraghi et al., (2016), Kodera
et al., (2006), Miskolczi et al., (2009), Ahmad et al., (2015), Lu et al., (2015), Kaminsky &
Zorriqueta, (2007) and Demirbas, (2004)] ............................................................................... 18
Figure 2.6. Empirical model depicting the effects of temperature on condensable product
(oil/wax) yield for fast pyrolysis of PP – Data retrieved from; [Jung et al., (2010), Predel &
Kaminsky, (2000) Aguado et al., (2002) and Arabiourrutia et al., (2012)] .............................. 19
Figure 2.7. Empirical model depicting the effects of heating rate on condensable product
(oil/wax) yield for batch scale pyrolysis of PP – Data retrieved from [Hájeková & Bajus,
(2005) Yan et al., (2015), (Ciliz et al., 2004), Miandad et al., (2016), Uçar, et al., (2016),
Heydariaraghi et al., (2016), (Fakhrhoseini & Dastanian, 2013), Encinar & González, (2008)
Demirbas, (2004) and (Miranda et al., 2001)] ......................................................................... 21
Figure 2.8. Screw feeder .......................................................................................................... 36
Figure 2.9. The principle of operation of a piston feeder ........................................................ 38
Figure 2.10. Lock-hopper feeding system coupled with a screw feeder ................................. 40
Figure 2.11. Schematic representation of a lock-hopper coupled with a piston feeder. ........ 41
Figure 2.12. Scheme of a fluidised bed reactor ....................................................................... 42
Figure 2.13. Schematic representation of a screw kiln pyrolysis reacting system showing the
screw kiln reactor ..................................................................................................................... 43
Figure 2.14. Schematic representation of a rotary kiln reactor .............................................. 44
Figure 2.15. Schematic representation of the shell and tube heat exchanger ....................... 48
Figure 3.1. Representation of the bench-scale pyrolysis setup ............................................... 54
Figure 3.2. Schematic representation of the pilot plant.......................................................... 57
Figure 4.1. TGA/DTG curve for PP degradation at 20 °C/min .................................................. 63
Stellenbosch University https://scholar.sun.ac.za

xiv
Figure 4.2. Effects of Temperature and heating rate on product yield distribution
(Atmospheric conditions)......................................................................................................... 66
Figure 4.3. Proportions of Diesel and Gasoline present in oils obtained from atmospheric
pyrolysis of PP (Diesel and Gasoline proportions in each product was based on GC/MS
surface area and yields of oil) .................................................................................................. 69
Figure 4.4. Effects of temperature on gaseous product distribution (Atmospheric slow
condition) ................................................................................................................................. 72
Figure 4.5. Effects of temperature on gaseous product distribution (Atmospheric fast
insertion condition) .................................................................................................................. 73
Figure 4.6. Effects of temperature and heating rate on product yield distribution (Vacuum
conditions) ............................................................................................................................... 74
Figure 4.7. Proportions of diesel and gasoline in condensable products (oil and wax)
recovered under the vacuum pyrolysis of PP (Diesel and gasoline proportions in each
product was based on GC/MS surface area and yields of oil) ................................................. 76
Figure 4.8. Effects of temperature on gaseous product distribution (Vacuum slow conditions)
.................................................................................................................................................. 78
Figure 4.9. Effects of temperature on gaseous product distribution (Vacuum fast insertion
conditions) ............................................................................................................................... 79
Figure 4.10. Sample of product recovered from char collection box showing layers of char (in
black) and wax (in gold). (A) View showing both layers of char and wax, (B) View showing
mainly char, (C) view showing mainly wax .............................................................................. 82
Figure 4.11. Oil samples obtained in condenser 1 at 460 ᵒC. (A) Top light fraction, (B) Bottom
waxy fraction. Samples physical appearances are similar to those recovered at 450 ᵒC. ...... 82
Figure 4.12. Oil samples recovered in condenser 1 at 488 ᵒC. (A) Top dark waxy oil fraction,
(B) Bottom brownish waxy oil fraction. Physical appearance of samples is similar to those
obtained at temperatures, 507 and 525 ᵒC. ............................................................................ 83
Figure 4.13. Effects of temperature on product yield distribution (Pilot scale pyrolysis of PP)
.................................................................................................................................................. 85
Figure 4.14. Yields of Diesel present in all oil products from pilot scale pyrolysis of PP
(Proportions in each product was based on GC/MS surface area and yield of oil) ................. 86
Figure 4.15. Yields of Gasoline present in all oil fractions from pilot scale pyrolysis of PP
(Proportions in each product was based on GC/MS surface area and oil yield) ..................... 87
Stellenbosch University https://scholar.sun.ac.za

xv
Figure 4.16. Effects of temperature on gaseous product distribution (Pilot scale pyrolysis of
PP) ............................................................................................................................................ 89
Figure C.1. GC/MS Chromatogram of Alkane standard used in simulated distillation showing
the retention time ranges for gasoline, diesel and wax range compounds used to
characterise oils. .................................................................................................................... 117
Figure D.1.Heavy condensable products obtained from ambient condition condenser. (A)
Oils recovered at 600 °C under atmospheric conditions showing its viscous nature (wax-
containing), (B) Oils recovered at 450 °C under atmospheric conditions showing its less
viscous wax nature, (C) Condensable product obtained in ambient condition condenser
under vacuum showing its completely solid wax nature. ..................................................... 118
Figure D.2. Light condensable products obtained under dry ice condensers showing their
clear, free-flowing and wax-free nature. (A) From ambient, (B) From vacuum. ................... 118
Figure D.3. Images of char showing complete and incomplete conversions of PP. (A) Sample
boat showing char remains after complete conversion of PP at 600 °C under atmospheric
condition, (B) Char sample obtained from the pyrolysis of PP at 600 °C, (C) Sample boat
showing incomplete conversion of PP at 400 °C. .................................................................. 119
Stellenbosch University https://scholar.sun.ac.za

xvi
Nomenclature
ASTM – American Society for Testing and Materials (ASTM)
BTX – Benzene, Toluene and Xylene
FBP – Final Boiling Point
GC/MS – Gas chromatography/Mass spectrometry
HDPE – High Density Polyethylene
HHV – Higher Heating Value
IBP – Initial Boiling Point
IP – Institute of Petroleum
LDPE – Low Density Polyethylene
MSW – Municipal Solid Waste
PE – Polyethylene
PP – Polypropylene
PS – Polystyrene
PUR – Polyurethanes
PVC – Polyvinyl chloride
RON – Research Octane Number
TGA – Thermogravimetric Analysis
Stellenbosch University https://scholar.sun.ac.za

xvii
Definition of Key terms
Aliphatics- A class of saturated or unsaturated carbon compounds, in which the carbon atoms
are joined in open or cyclic chains, but the cyclic compounds are not aromatic
Aromatics- They are compounds that consist of one or more rings containing alternating
single and double bonds in its chemical stricture. In this study, this term will more particularly
refer to group of hydrocarbons with benzene as the parent
Aromatisation- It is the formation of aromatic compounds, observed during pyrolysis at high
temperatures due to secondary reactions.
Condensation polymers- They are polymers formed through condensation reactions where
molecules fuse together, producing much smaller molecules such as water and ethanol as by-
products.
Condensable products- Condensable gases which were recovered as both oil and wax
Cyclisation- It is the formation of cyclic/closed ring and aromatic hydrocarbons also caused by
secondary reactions
Naphthenes- Any group of cyclic aliphatic hydrocarbons
Olefins- Class of unsaturated hydrocarbons
Paraffins- Saturated hydrocarbons
Recombination reactions- Also a form of secondary reaction but it involves the reaction of
two different primary radicals/products into one single final product.
Secondary reactions- The further reaction of primary pyrolysis products into much more
stable compounds.
Simulated distillation- It is a chromatographic technique which correlates retention times of
hydrocarbons from a GC/MS spectrum with boiling points of the same compounds.
Stellenbosch University https://scholar.sun.ac.za

1
Introduction
1.1 Background
In today’s modern society, plastics provide a basic contribution to many daily activities,
ranging from agriculture to packaging (Pinto et al., 1999; Lopez, et al., 2017). However, the
build-up of extensive amounts of plastic waste worldwide has raised environment concerns
(Siddiqui & Redhwi, 2009; Pinto et al., 2013; Abbas-Abadi et al., 2014; Ahmad et al., 2015). A
survey conducted on the flow of plastic materials in 2007 revealed that 260 million tons of
plastics were produced worldwide with this figure increasing at a rate of 4 to 5% annually (Al-
Salem et al., 2010; Kunwar et al., 2016; Lopez et al., 2017). Also, in 2013, plastic production
worldwide has increased to a little below 300 million tonnes (Sharuddin et al., 2016). It is also
estimated that about 60% of these generated plastic wastes end up at landfills globally
(Valavanidis et al., 2008; Al-Salem et al., 2010). In South Africa, a total of about 1.3 million
tonnes of plastic are manufactured out of which only about 20% are recycled with the
remaining being landfilled. This is according to a survey conducted by Plastics SA, a
representative organisation for all sectors of the South African plastic industry in 2012.
Although more innovative technologies have been used over the past couple of years to
recover plastics, there still remains a substantial fraction of plastic wastes which is difficult to
recycle mechanically as a result of impurities, lack of markets or the failure to sort and remove
the plastics that make recovery unattainable (Panda & Singh, 2013; Heydariaraghi et al.,
2016). Most of these non-recycled plastics then become landfilled or incinerated (which is not
very prevalent in South Africa) (Williams & Williams, 1997; Demirbas & Taylan, 2015;
Heydariaraghi et al., 2016).
Landfilling is not an ideal remedy for plastic waste management because sites for building
suitable landfills have been increasingly scarce mainly due to opposition executed by nearby
inhabitants and pressures from law-making bodies (Adewole & Wolkowicz, 1999; Achilias et
al., 2008; Panda et al., 2010). Secondly, is the poor biodegradability of plastics which
promotes soil leaching and impregnation as well as consequent pollution of underground
waters. Besides, the lifelong effects of degradation of these plastics have still not been
Stellenbosch University https://scholar.sun.ac.za

2
validated (Pinto et al., 1999; Achilias et al., 2008; Lu et al., 2015) Also, the increasing cost of
transport and disposal has caused landfilling of plastic wastes an unpleasant option (Williams
& Williams, 1997; Achilias et al., 2008; Al-Salem et al., 2009; Miskolczi et al., 2009; Panda et
al., 2010). Lastly, a substantial amount of plastic waste have also ended up in the ocean, and
should the current usage and disposal of plastics continue, there will be more plastics than
fish in the ocean by 2050 (Geyer et al., 2017; World Economic Forum, 2016).
Presently, plastic recycling can be grouped into four categories; primary or closed-loop,
secondary, tertiary and quaternary (Wong et al., 2000; Abbas & Shubar, 2008; Al-Salem et al.,
2009; Siddiqui & Redhwi, 2009; Hopewell et al., 2009; Wong et al., 2015). Primary and
secondary recycling falls under mechanical recycling processes. Primary recycling involves the
conversion of plastics to products with identical properties as virgin plastics (Hopewell et al.,
2009; Wong et al., 2000; Achilias et al., 2008). Secondary recycling also known as downgrading
is the conversion of plastic wastes into new products of depreciated value (Ali & Siddiqui,
2001; Low, et al., 2001; Lu et al., 2015). Downgrading also refers to a recycling technique
where waste plastic material is used to build an object that will usually not be made with
virgin plastics. A typical example is plastic lumber that can be used in place of a much more
expensive timber (Hopewell et al., 2009). Tertiary recycling is defined as the processing of
plastics back into their monomer structures, petrochemicals and/or fuel compounds (Ali &
Siddiqui, 2001; Wong et al., 2000). Quaternary recycling employs incineration with or without
energy recovery from plastic products (Ali & Siddiqui, 2001; Hopewell et al., 2009; Wong et
al., 2000). Primary and secondary recycling have helped in managing waste plastic materials,
but they have limitations on properties and uses of final products (Low et al., 2001; Wong et
al., 2000; Lu et al., 2015). Quaternary recycling minimizes amount of plastic wastes deposited
in landfills and substantial amount of energy can be retrieved on combustion. It nonetheless
comes with the release of substantial amount of toxic gases and dusts which are not
environmentally friendly. (Pinto et al., 1999; Wong et al., 2000; Larraín et al., 2017). Also, it is
very inefficient since considerable cost is incurred in managing the large volumes of flue gases
generated.
Since management of plastic wastes via landfill and incineration pose serious threats to the
environmental with mechanical recycling techniques being limited in terms of feedstock
purity and product quality, pyrolysis as a type of tertiary recycling has been acknowledged as
Stellenbosch University https://scholar.sun.ac.za

3
a promising route to managing waste plastics (Lin & Yen, 2005; Lee & Shin, 2007; Miskolczi et
al., 2009; Jung et al., 2010; Panda & Singh, 2013). Pyrolysis, a major type of thermochemical
conversion, is the degradation of polymers at elevated temperatures in the absence of oxygen
to produce valuable products such as char and volatiles, which can be separated into a
condensable fraction and permanent gases. Pyrolysis leads to the breakdown of long chain
polymers of plastics into shorter chain compounds and monomers, from which the plastics
are initially made, and other useful fuels and chemicals (Wong et al., 2015; Miskolczi et al.,
2009). It also has the advantage of processing to some extent unwashed and unsorted plastics
and multilayer films that are difficult to recycle mechanically thus both clean and
contaminated plastics have the potential to be recycled in this fashion (Scheirs, 2006). This
implies that polymer mixtures as well as highly contaminated plastics such as mulch film could
be processed to yield products with high rate of returns. However, change in composition of
feedstock and proportion of contaminants influences product yield and properties (Scheirs,
2006).
Pyrolysis of polypropylene plastics is the focus of this study because, Plastics SA has reported
that plastic tubs, punnets, trays, iced cream and yoghurt containers have increased
considerably in the South African plastic waste stream. These materials made up of
polypropylene (PP) happens to be one of the least recycled post-consumer plastics with only
about 18% recycled as at 2012. This is due to the high level of contamination with other non-
plastic materials such as food and other organics wastes from domestic streams (Plastics SA,
2015). Also, polypropylene (PP) is the second most manufactured and utilised plastic product
worldwide behind Polyethylene (PE) (Al-Salem et al., 2010; Wong et al., 2015). Closed-loop
recycling of plastic materials requires that the feed material is free of contaminants, which in
real life is often unrealistic (Hopewell et al., 2009; Al-Salem et al., 2010). Therefore,
valorisation of waste PP plastics into useful fuels via pyrolysis, has been identified as a
promising alternative.
1.2 Motivation for the research
When considering plastics pyrolysis to produce condensable fuel products, several factors
affect the yield and quality of products generated from the process. These include
temperature, heating rate, residence time of volatiles and solids, among others. A number of
works on PP plastics pyrolysis employed only a single condition of heating rate (Heydariaraghi
Stellenbosch University https://scholar.sun.ac.za

4
et al., 2016; Yan et al., 2015; Hájeková and Bajus, 2005) with others (Miskolczi et al., 2009;
Zhou et al., 2004; Takuma et al., 2001) not even reporting the heating rate used. This resulted
in a wide range of condensable product yields (49 - 83 wt.%) reported for similar heating rate
conditions. Also, different reactor configurations employed by the various researchers made
the comparison of these studies challenging. The number of studies investigating the
influence of heating rate (Encinar & González, 2008; Fakhrhoseini & Dastanian, 2013) are also
limited. For a clearer picture of the influence of heating rate and potential interactions with
temperature on conversion mechanisms and yields, there is a need to vary both factors.
Moreover, condensable products recovered from PP pyrolysis are sometimes reported as wax
(Aguado et al., 2002; Arabiourrutia et al., 2012), liquid (Lu et al., 2015; Owusu et al., 2018) or
a mixture of the two (Yan et al., 2015; Hájeková & Bajus, 2005) and in most cases, these are
not highlighted. As these properties influence the potential application of the products, it is
vital to understand the effects of the process conditions on the physical properties of the
condensed product.
Additionally, most pyrolysis experiments reported in literature on PP pyrolysis were
conducted under atmospheric conditions (Al-Salem et al., 2017). However, pyrolysis
processes can also be conducted under vacuum (below atmospheric) (Miranda et al., 2001).
Pyrolysis under vacuum conditions limit secondary cracking reactions since primary products
generated are quickly extracted from the hot part of the reactor by the vacuum suction. This
process in effect increases the yield of condensable products (oil/wax) and minimises the
production of permanent gases. Unlike biomass, pyrolysis of plastics under vacuum
conditions received very little attention. From literature, only Miranda et al., (2001) was
found to report the vacuum pyrolysis of PP. Their investigation was however conducted at
only a single condition of temperature. The effects of how the variation of temperature and
heating rate affect the product yield distribution and quality of condensable products under
vacuum pyrolysis of PP has been identified as gap.
Also, the scale-up of bench-scale processes to pilot scale on the pyrolysis PP and other plastics
is hardly covered in literature. Most scale-ups covered were rather from milligram scale (TGA)
to bench scale (Bradfield, 2014; Chomba, 2018). Scale-up to pilot is important because, when
laboratory scale pyrolysis experiments look promising and there is the tendency for
commercialisation, scaling up helps to further investigate its viability for commercialisation
Stellenbosch University https://scholar.sun.ac.za

5
and also ascertain the validity of bench-scale experiments (Arena & Mastellone, 2006). This
will therefore contribute significantly to efforts being made towards the sustainable
commercialisation of plastics pyrolysis into fuels since pilot plants bridge the gap between
laboratory and industrial scale processes.
This study therefore seeks to investigate the pyrolysis conversion of PP into liquid fuels, with
attention given to the effects of key operating parameters, including temperature and heating
rate on the yield and quality of obtained fuel oils. Also, to be examined are the effects of
vacuum pyrolysis at bench scale on oil yield and quality and how they compare with PP
pyrolysis under atmospheric conditions also at bench. Lastly, the design, installation and
commissioning of a 5 kg/h pyrolysis pilot plant will also be conducted as part of the study.
Bench scale atmospheric tests will then be scaled up to the installed pilot plant.
1.3 Research Aims and Objectives
1.3.1 Aim
The aim of the research was to investigate the effects of key parameters that include
temperature and heating rate on the pyrolysis of waste polypropylene (PP) plastics into liquid
fuels, at both bench and pilot scale on a pilot plant that will be built as part of the study.
1.3.2 Objectives
To realise this aim, the following objectives need to be performed:
1. To design, install and commission a 5 kg/h pyrolysis pilot plant that converts plastics
and non-plastic materials into pyrolysis products.
2. To investigate the effects of temperature and heating rate on yield and quality of PP
derived oils under vacuum and atmospheric pyrolysis conditions at bench scale.
3. To scale up atmospheric bench scale processes to the commissioned pilot plant.
4. To characterise oils recovered from the pilot for Physico-chemical properties that
include density, viscosity, pour point, cetane index and compare with commercial
diesel and gasoline fuels.
Stellenbosch University https://scholar.sun.ac.za
6
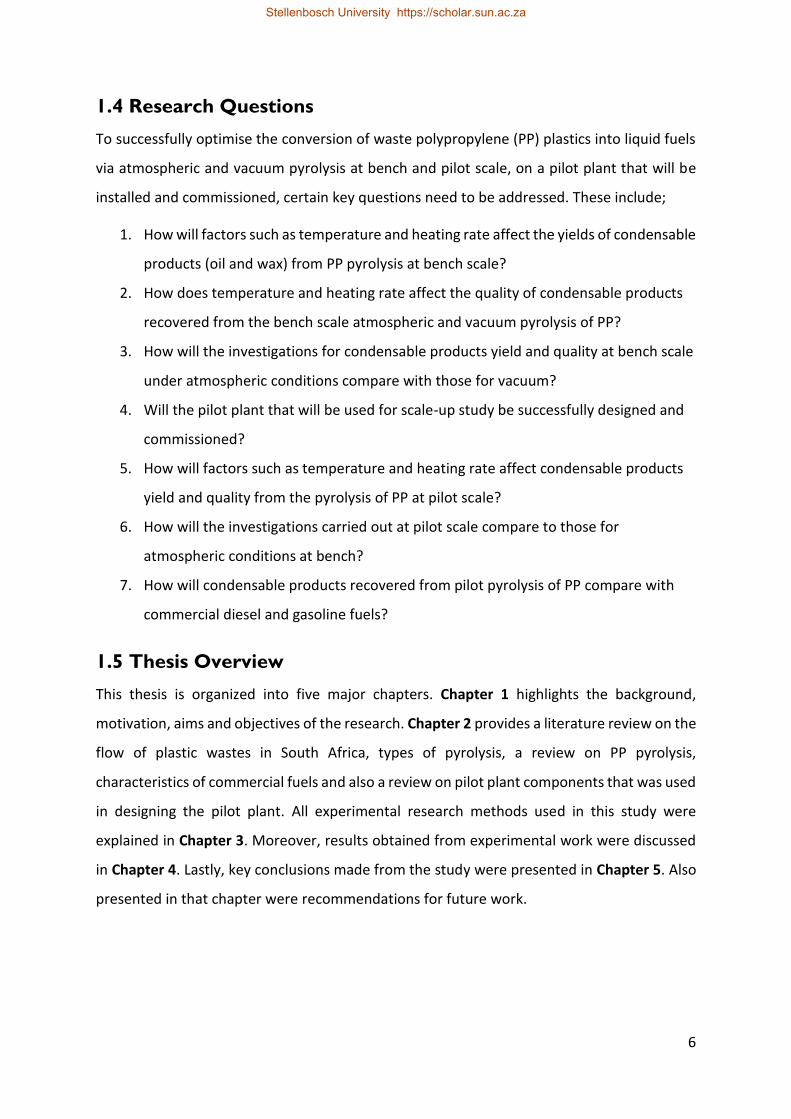
1.4 Research Questions
To successfully optimise the conversion of waste polypropylene (PP) plastics into liquid fuels
via atmospheric and vacuum pyrolysis at bench and pilot scale, on a pilot plant that will be
installed and commissioned, certain key questions need to be addressed. These include;
1. How will factors such as temperature and heating rate affect the yields of condensable
products (oil and wax) from PP pyrolysis at bench scale?
2. How does temperature and heating rate affect the quality of condensable products
recovered from the bench scale atmospheric and vacuum pyrolysis of PP?
3. How will the investigations for condensable products yield and quality at bench scale
under atmospheric conditions compare with those for vacuum?
4. Will the pilot plant that will be used for scale-up study be successfully designed and
commissioned?
5. How will factors such as temperature and heating rate affect condensable products
yield and quality from the pyrolysis of PP at pilot scale?
6. How will the investigations carried out at pilot scale compare to those for
atmospheric conditions at bench?
7. How will condensable products recovered from pilot pyrolysis of PP compare with
commercial diesel and gasoline fuels?
1.5 Thesis Overview
This thesis is organized into five major chapters. Chapter 1 highlights the background,
motivation, aims and objectives of the research. Chapter 2 provides a literature review on the
flow of plastic wastes in South Africa, types of pyrolysis, a review on PP pyrolysis,
characteristics of commercial fuels and also a review on pilot plant components that was used
in designing the pilot plant. All experimental research methods used in this study were
explained in Chapter 3. Moreover, results obtained from experimental work were discussed
in Chapter 4. Lastly, key conclusions made from the study were presented in Chapter 5. Also
presented in that chapter were recommendations for future work.
Stellenbosch University https://scholar.sun.ac.za

7
Literature review
2.1 Introduction
This chapter considers the various types of plastic waste management, their advantages and
disadvantages. Also, the most interesting waste management route was highlighted. The
chapter also covers the physical and chemical properties of polypropylene (PP) and why PP is
the focus of this research work. Also considered in this chapter is the comparison of the
chemical and physicochemical properties of commercial liquid fuels to oils derived from PP
pyrolysis. In addition, major factors affecting plastics pyrolysis as well as the types of pyrolysis
were highlighted. Finally, overview of the various components associated with typical pilot
and commercial scale pyrolysis plants as well as some brief descriptions of some existing pilot
pyrolysis plants were also mentioned.
2.2 Flow of Polypropylene in South Africa
Table 2.1. Plastics waste distribution in South Africa as at 2012 reported by Plastics SA
Plastic type
Amount manufactured (tonnes)
Amount recycled (tonnes)
Amount landfilled (tonnes)
percentage recovered (%)
percentage landfilled (%)
PE-LD/LLD 345000 98971 246029 28.69 71.31
PE-HD 200000 45950 154050 22.98 77.03
PP 260000 47080 212920 18.11 81.89
PET 160000 54424 105576 34.02 65.99
PS 63000 3394 59606 5.39 94.61
PVC 159000 16812 142188 10.57 89.43
OTHER 183000 6060 176940 3.31 96.69
Total 1370000 272691 1097309
Stellenbosch University https://scholar.sun.ac.za

8
PP has been identified as one of the least primary recycled plastic wastes in South Africa by
Plastics SA, (2013). As of 2012, out of about 260,000 tonnes of PP manufactured, only about
18% were recycled in a closed-loop (primary) fashion (Chomba, 2018; Plastics SA, 2013). This
means that close to 82% of waste PP plastics end up at landfill sites. It was assumed that
incinerated plastic tonnages were negligible since very little information is available on the
amount of incinerated plastics in South Africa. Based on the HHV of PP (45 MJ/kg), the
estimated amount of PP ending up at landfills could generate about 10 Terajoules of energy
equivalent to 1,250 barrels of liquid fuel. More detailed flow of PP and other plastics in South
Africa have been presented in Table 2.1.
2.3 Plastic Waste Management
Usage and discarding of plastic materials recently nonetheless has given rise to serious
environmental concerns since they are not easily biodegradable (Marcilla et al., 2003; Lin et
al., 2010; Papuga et al., 2016). Also, a large percentage of plastics produced per annum are
used in the manufacture of mainly disposable packaging materials and/or other transitory
products which are rejected within about 12 months of their production (see Appendix A)
(Hopewell et al., 2009). Due to the durability of the constituents of plastic materials, a huge
amount of disposed plastic materials are accumulating in landfills and eventually in the ocean
(Panda et al., 2010; Hopewell et al., 2009). Plastics SA reported that, primary recycling (a
commonly used recycling technique) of plastics more specifically PP, is problematic since
plastic wastes are mostly contaminated with other non-plastic wastes which makes recycling
challenging. Pyrolysis, a tertiary recycling technique, tends to be a promising route for
recycling plastic materials which are not compatible with primary recycling (Siddiqui &
Redhwi, 2009; Rashid & Sarker, 2013). Plastic pyrolysis, yields products composed of mainly
hydrocarbon mixtures which can be used as alternate heating/energy sources or as
petrochemical feedstock (Low et al., 2001; Wang et al., 2015). Pyrolysis has the following
advantages over conventional primary recycling techniques (Low et al., 2001; Miranda, et al.,
2001; Scheirs, 2006; Almeida & Marques, 2016);
i. Its ability to recycle waste commingled plastics which are difficult to be recycled
mechanically.
ii. It can handle to some extent the recycling of unwashed and dirty plastics such as
agricultural plastic wastes.
Stellenbosch University https://scholar.sun.ac.za

9
iii. It allows to a degree, the recycling of plastic laminates, coextrusions as well as
multilayer packaging films especially aluminium foil layers which are not easily
recycled via the conventional mechanical recycling methods.
2.4 Pyrolysis and factors influencing plastics pyrolysis
Products obtained from the pyrolysis of plastics are mainly composed of volatiles with
relatively little amount of char (Walendziewski, 2006; Xingzhong, 2006). The volatile
composition is made up of a condensable fraction and a non-condensable gaseous stream
(Scheirs, 2006; Williams, 2006). The condensable fraction can be either in the form of oil or
wax depending on the reaction conditions and type of plastic material (Hajekova & Bajus,
2005; Scheirs, 2006; Williams, 2006; Gao, 2010). The relative proportion of each product
(char, oil and gases) depends on the chemical composition of polymer fed, as well as operating
conditions of the pyrolysis process (Buekens, 2006; Jung & Fontana, 2006; Thorat et al., 2013).
The mechanism of the degradation of a solid fuel via pyrolysis is shown in Figure 2.1. The solid
residue at the end of the conversion is referred as char. As observed from the figure, applying
heat in an inert environment to a solid fuel (plastic in this case) sparks the devolatilization of
the fuel accompanied with the release of volatiles. Solid residue that remain at the end of the
reaction is referred to as the char (negligible amounts are usually obtained from plastics
pyrolysis).
Figure 2.1. Mechanism of Pyrolysis of a solid fuel (Redrawn from Zajec, 2009)
Stellenbosch University https://scholar.sun.ac.za
10
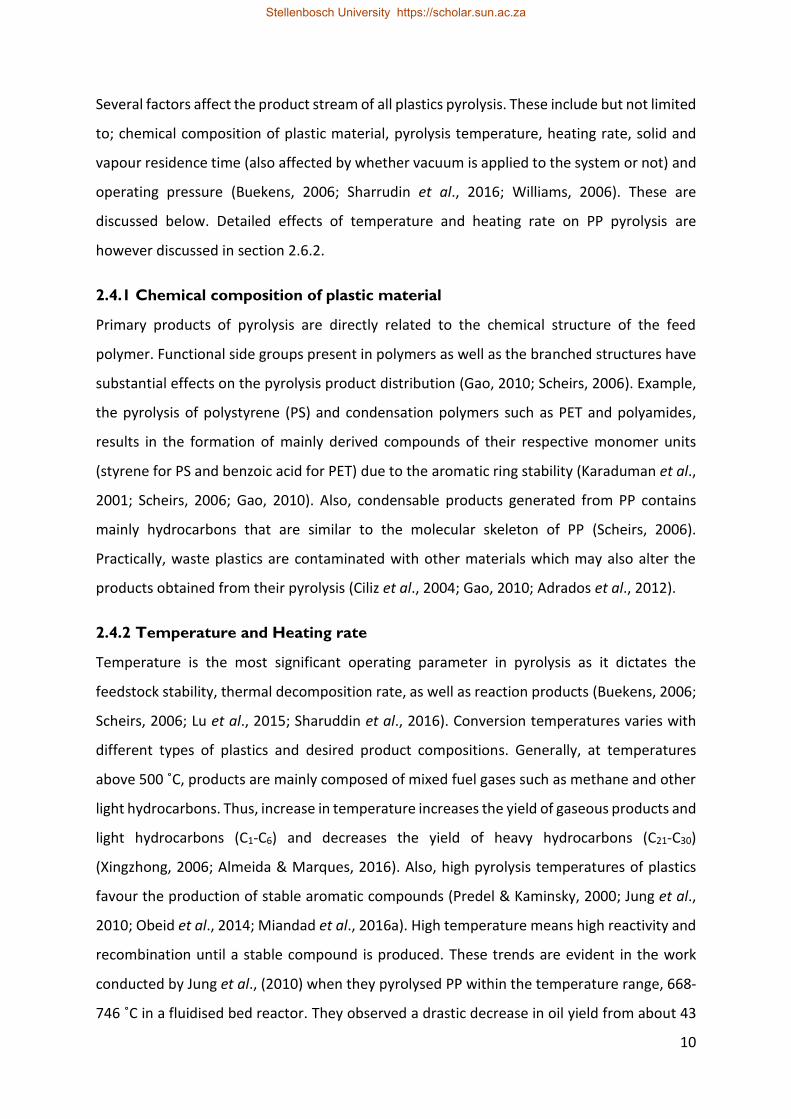
Several factors affect the product stream of all plastics pyrolysis. These include but not limited
to; chemical composition of plastic material, pyrolysis temperature, heating rate, solid and
vapour residence time (also affected by whether vacuum is applied to the system or not) and
operating pressure (Buekens, 2006; Sharrudin et al., 2016; Williams, 2006). These are
discussed below. Detailed effects of temperature and heating rate on PP pyrolysis are
however discussed in section 2.6.2.
2.4.1 Chemical composition of plastic material
Primary products of pyrolysis are directly related to the chemical structure of the feed
polymer. Functional side groups present in polymers as well as the branched structures have
substantial effects on the pyrolysis product distribution (Gao, 2010; Scheirs, 2006). Example,
the pyrolysis of polystyrene (PS) and condensation polymers such as PET and polyamides,
results in the formation of mainly derived compounds of their respective monomer units
(styrene for PS and benzoic acid for PET) due to the aromatic ring stability (Karaduman et al.,
2001; Scheirs, 2006; Gao, 2010). Also, condensable products generated from PP contains
mainly hydrocarbons that are similar to the molecular skeleton of PP (Scheirs, 2006).
Practically, waste plastics are contaminated with other materials which may also alter the
products obtained from their pyrolysis (Ciliz et al., 2004; Gao, 2010; Adrados et al., 2012).
2.4.2 Temperature and Heating rate
Temperature is the most significant operating parameter in pyrolysis as it dictates the
feedstock stability, thermal decomposition rate, as well as reaction products (Buekens, 2006;
Scheirs, 2006; Lu et al., 2015; Sharuddin et al., 2016). Conversion temperatures varies with
different types of plastics and desired product compositions. Generally, at temperatures
above 500 ˚C, products are mainly composed of mixed fuel gases such as methane and other
light hydrocarbons. Thus, increase in temperature increases the yield of gaseous products and
light hydrocarbons (C1-C6) and decreases the yield of heavy hydrocarbons (C21-C30)
(Xingzhong, 2006; Almeida & Marques, 2016). Also, high pyrolysis temperatures of plastics
favour the production of stable aromatic compounds (Predel & Kaminsky, 2000; Jung et al.,
2010; Obeid et al., 2014; Miandad et al., 2016a). High temperature means high reactivity and
recombination until a stable compound is produced. These trends are evident in the work
conducted by Jung et al., (2010) when they pyrolysed PP within the temperature range, 668-
746 ˚C in a fluidised bed reactor. They observed a drastic decrease in oil yield from about 43
Stellenbosch University https://scholar.sun.ac.za

11
wt.% to 30 wt.% and a corresponding increase in the yield of permanent gases from about 50
wt.% to 66 wt.% when temperature advanced from 668 to 746 ᵒC. Also, aromatic fractions in
the oils recovered increased sharply from about 22 wt.% to 97 wt.% for the same temperature
range. They also experienced equivalent trends when PE was pyrolysed under the same set
of conditions. Similar conclusion was also drawn by Demirbas, (2004) when he pyrolysed a
mixture of PE, PP and PS in a stainless steel batch reactor. For all plastic materials,
temperature range for optimising the production of liquid products was reported to be in the
range 300 - 500 ᵒC whereas temperatures above 500 ˚C favoured the production of
permanent gases (Buekens, 2006; Xingzhong, 2006; Sharuddin, 2016).
2.4.3 Heating rate
Heating rate is also another thermodynamic variable that influences pyrolysis. It is defined in
this context of study as the increase in sample temperature per unit of time. Generally, high
heating rates augment bond cleavage which facilitates the production of light molecular
weight products (Buekens, 2006). In continuous pyrolysis processes, heating rate can be high
up to 10,000 ˚C/min (Gao, 2010; Jung & Fontana, 2006). In slow pyrolysis systems, sample is
heated from ambient temperature to the final pyrolysis temperature at a fixed heating rate
usually controlled by a programmable temperature controller (Williams & Williams, 1999a;
Gao, 2010). Heating rate for such processes is relatively low and ranges between 10 – 100
˚C/min (Miranda et al., 2001; Jung & Fontana, 2006; Williams & Williams, 1997b).
2.4.4 Residence Time
Residence time can be found in literature, to describe either vapour residence time or solid
residence time in the hot part of the reactor. Solid residence time is defined as the amount of
time that solid particles spend in the reactor until they are removed (Gao, 2010; Sharuddin et
al., 2016). Vapour residence time is the time spent by vapour products from the time they are
produced till the time they exit the reactor. Longer vapour residence time, especially at higher
pyrolysis temperatures above 500 ˚C, favours the cracking of primary products into much
more thermally stable light molecular mass hydrocarbons, non-condensable gases and
aromatics (Gao, 2010; Arena & Mastellone, 2006; Buekens, 2006; Encinar & González, 2008;
Sharuddin et al., 2016; Al-Salem et al., 2017).
Stellenbosch University https://scholar.sun.ac.za

12
2.4.5 Pressure
Most pyrolysis experiments reported in literature were conducted under atmospheric
conditions (Al-Salem et al., 2017). Pyrolysis processes can however be conducted under
vacuum (below atmospheric pressure), atmospheric or above atmospheric pressure
conditions (Pinto et al., 1999; Bilgesü et al., 2006; Williams & Slaney, 2007). Low pressure
pyrolysis takes place under vacuum (below atmospheric pressure). Vacuum pyrolysis favours
the production of primary products because primary products are quickly removed from the
reactor once they are formed, preventing secondary reactions (Miranda et al., 2001a;
Karaduman et al., 2003; Li et al., 2004).
2.5 Types of Pyrolysis
Based on the residence time and heating rate in the course of a pyrolysis process, pyrolysis
may be categorised as slow, intermediate, fast and vacuum (Gao, 2010). The difference
between these processes can be ambiguous and technologies must be defined based on the
operating conditions. General definitions of these processes are highlighted below.
2.5.1 Slow Pyrolysis
Slow pyrolysis is characterised by relatively low heating rates, which can be up to but normally
below 100 ̊ C/min (Mašek et al., 2016; Williams, 2006; Gao, 2010). In slow pyrolysis processes,
feedstock materials are heated progressively from ambient temperature to the desired final
temperature (Williams & Williams, 1999; Gao, 2010). Slow pyrolysis usually occurs at
temperatures up to 600˚C (Williams, 2006) with relatively a longer vapour residence time of
few minutes.
2.5.2 Fast Pyrolysis
It usually occurs at temperatures between 500 - 950 ˚C with rapid heating rate, up to 10,000
˚C/min (about 167 ˚C/s) (Zajec, 2009; Gao, 2010). It also operates under a very short hot
volatile residence time, usually less than 1 second with rapid quenching or cooling which leads
to the formation of mainly condensable products (Williams, 2006). To sustain the high heating
rates in fast pyrolysis, the feedstock needs to be reduced to very small particle sizes normally
lower than a few millimetres (Mašek et al., 2016). Keeping the vapour residence time below
a few seconds is a key feature of fast pyrolysis, aided by the rapid cooling hence preventing
secondary vapour phase decomposition reactions (Jung & Fontana, 2006).
Stellenbosch University https://scholar.sun.ac.za

13
2.5.3 Intermediate Pyrolysis
Intermediate pyrolysis fits between slow and fast pyrolysis. It therefore has a product yield
distribution between those typical for fast and slow pyrolysis (Mašek et al., 2016).
Intermediate pyrolysis can combine some of the advantages of fast (high yield of liquid
products) and slow pyrolysis (ability to use larger particles of feedstock) (Mašek et al., 2016).
It happens to be the most recent development in pyrolysis and a number of different
technologies have been implemented (Hornung and Seifert, 2006; Henrich et al., 2007; Mašek
et al., 2016).
2.5.4 Vacuum Pyrolysis
Vacuum pyrolysis is a comparatively new technique of pyrolysis suitable for biomass, waste
plastics, waste tyres and sewage sludge conversion (Rabe, 2005; Lopez et al., 2010). In
vacuum pyrolysis, feedstock is thermally disintegrated below atmospheric pressure as low as
2 kPa, absolute (Miranda et al., 2001). The vacuum suction quickly removes vapour products
from the reaction chamber reducing the vapour residence time in the process and also
minimising secondary reactions (Rabe, 2005; Encinar & González, 2008). This is believed to
limit the formation of carbon residue and promotes oil yield.
2.6 Review on PP pyrolysis
Figure 2.2. Formation of polypropylene polymer from propylene monomer (Adapted from; Polymer Science Learning Centre, 2016)
Polypropylene (PP) is generated by the polymerization of propylene monomers into lengthy
chain polymer molecules. Several routes exist towards the polymerization of propylene
monomers into PP. However, majority of commercially used PP are manufactured with
Stellenbosch University https://scholar.sun.ac.za

14
catalysts which gives them their semi crystalline characteristic (Kissel et al., 1999; Zorriqueta,
2006). Formation of PP from its monomers is illustrated in Figure 2.2.
2.6.1 Physical Properties of Polypropylene (PP)
Polypropylene is one of the lightest thermoplastic materials with a density ranging between
0.85 - 1.3 g/cm3 (Lin & Yen, 2005; Kaminsky & Zorriqueta, 2007; Gao, 2010; Arabiourrutia et
al., 2012; Lu et al., 2015; Wang et al., 2015) and melting point ranging between 150 - 170 ˚C
(Beyler & Hirschler, 2001; Kaminsky & Zorriqueta, 2007; Achilias et al., 2008; Gao, 2010; Lu et
al., 2015; Wang et al., 2015; Das & Tiwari, 2018). Higher Heating Value of PP has also been
reported to be around 45 MJ/kg (Sorum et al., 2001; Arabiourrutia et al., 2012). The different
values of the physical properties reported in literature could be attributed to the different
types of PP that might have been used and also the degree of additives or contamination (Lin
& Yen, 2005; Yan et al., 2015). Polypropylene has become a significant component of mixed
plastic waste stream in recent years due to the exponential increase in the quantity of
municipal solid waste (MSW) and with pyrolysis identified as a promising option to managing
waste plastic mixtures, the pyrolysis of PP into useful fuel oil is considered in this study.
2.6.2 Pyrolysis of Polypropylene (PP)
Thermogravimetric degradation of PP
Table 2.2. Thermal decomposition of PP in TGA experiments
Heating
Rate
(˚C/min)
Degradation
temperature
Range (˚C)
Maximum
decomposition
temperature (˚C)
Carrier gas References
5 337 - 450 434 Argon (Chan &
Balke, 1997)
5 300 - 500 440 Nitrogen (Jung et al.,
2010)
5 340 - 481 456 Argon (Gersten et
al., 2000)
Stellenbosch University https://scholar.sun.ac.za

15
Heating
Rate
(˚C/min)
Degradation
temperature
Range (˚C)
Maximum
decomposition
temperature (˚C)
Carrier gas References
10 354 - 489 469 Argon (Gersten et
al., 2000)
10 350 - 500 440 Vacuum (Miranda et
al., 2001b)
10 400 - 450 500 Nitrogen (Jung et al.,
2010)
10 400 - 500 455 Nitrogen (Lee & Shin,
2007)
10* 407 - 458 427 Nitrogen (Ciliz et al.,
2004)
10** 423 - 472 458 Nitrogen (Ciliz et al.,
2004)
15 371 - 394 477 Argon (Gersten et
al., 2000)
20 387- 497 472 Argon (Chan &
Balke, 1997)
20 400 - 525 500 Nitrogen (Jung et al.,
2010)
*Waste PP **Pure PP
The mechanism of thermal degradation of plastic materials is quite complex (Encinar &
González, 2008). Thermogravimetric analysis (TGA) is extensively considered as a very
important technique in studying the decomposition processes of solid materials. It can be
defined as the measurement of the weight change of a material with the increase of time and
temperature. A lot of TGA experiments have been performed on PP under various conditions
to assess its thermal behaviour.
Stellenbosch University https://scholar.sun.ac.za

16
Table 2.2 shows some thermal degradation behaviour of PP at various conditions. From the
table, it was observed that generally, degradation of PP can begin at temperatures as low as
300 ˚C and end at about 525 ˚C. Temperature at which maximum decomposition occurs, also
ranged from about 430 - 500 ˚C. It was also detected that, high heating rates increased the
maximum degradation temperature, as can been seen with the experiments performed by
Gersten et al., (1997) and Jung et al., (2010). An indication that higher heating rates enhances
faster degradation of PP. Single peak temperatures recorded for all data generated signifies
that PP degradation is a single-step process. Ciliz et al., (2004), also studied the thermal
behaviour of waste and pure PP. They observed that thermogravimetric onset temperature
for waste PP was lower than for uncontaminated/pure which could be as a result of impurities
interfering with the thermal degradation of PP.
The varying temperature degradation behaviour observed by the various studies was
corroborated to the different grades of PP utilised. For instance, Jung et al., (2010) used waste
PP for their studies whereas Gersten et al., (1997) and Ciliz et al., (2004) used different grades
of virgin PP (E-50-E and MH418 respectively) with obviously varying proportions of additives.
Figure 2.3. TGA curves for PP degradation at heating rates of 5, 10 and 20 °C/min (Reproduced from Jung et al., 2010 with permission from Elsevier)
Stellenbosch University https://scholar.sun.ac.za

17
Typical TGA and DTG curves of PP as obtained by Jung et al., (2010) were represented in Figure
2.3 and Figure 2.4. Tests were conducted at three different heating rates (5, 10 and 20 °C/min)
and a final temperature of 800 °C. As highlighted earlier, it was observed from both figures
that degradation of PP at all heating rates started at around 400 °C and was virtually complete
at 500 °C. It was also noticed that degradation experiments conducted at higher heating rates
resulted in slightly higher maximum degradation temperatures (as clearly observed in DTG
curves) which is an indication of enhanced thermal degradation of PP at higher heating rates.
Figure 2.4. DTG curves for PP degradation at heating rates of 5, 10 and 20 °C/min (Reproduced from Jung et al., 2010 with permission from Elsevier)
Effects of temperature and heating rate on PP pyrolysis products
Pyrolysis of PP plastics is usually aimed at yielding maximum oil fraction, which preferably
should exhibit properties of conventional liquid fuels. The major influencing factors identified
from literature are temperature, heating rate and pressure (atmospheric and vacuum). A
review on the effects of temperature, heating rate and other key process parameters on
product distribution for PP pyrolysis in various process systems have been presented in Table
2.3 and Table 2.4 respectively with focus on condensable fractions (oil and wax). Also, a
statitical model was fitted on data gathered from literature to ascertain the effects of
Stellenbosch University https://scholar.sun.ac.za

18
temperature and heating rate on the distribution of condensable products (oil/wax). This
followed similar analysis performed on literature data by Neves et al., (2011).
Temperature
Figure 2.5. Empirical model depicting the effects of temperature on condensable product (oil/wax) yield for slow pyrolysis of PP – Data points from; [Williams & Williams, (1997b), Hájeková & Bajus, (2005), Takuma et al., (2001), Yan et al., (2015), Zhou et al., (2004), Ciliz et al., (2004), Miandad et al., (2016), Uçar, et al., (2016), Heydariaraghi et al., (2016), Kodera et al., (2006), Miskolczi et al., (2009), Ahmad et al., (2015), Lu et al., (2015), Kaminsky & Zorriqueta, (2007) and Demirbas, (2004)]
From the literature data presented in Table 2.3, an emprical model was generated to predict
the effects of temperature on condensable products (oil/wax) yield from the slow pyrolysis
of PP in batch reactors. The model, represented in Figure 2.5 was generated according to
results gatherthered from the following authors; Williams & Williams, (1997b), Hájeková &
Bajus, (2005), Takuma et al., (2001), Yan et al., (2015), Zhou et al., (2004), Ciliz et al., (2004),
Miandad et al., (2016), Uçar, et al., (2016), Heydariaraghi et al., (2016), Kodera et al., (2006),
Miskolczi et al., (2009), Ahmad et al., (2015), Lu et al., (2015), Kaminsky & Zorriqueta, (2007)
and Demirbas, (2004). From the figure, it was observed that correlation between temperature
0
10
20
30
40
50
60
70
80
90
100
0 100 200 300 400 500 600 700 800
Co
nd
ensa
ble
pro
du
cts
(Oil/
wax
) yi
eld
(w
t.%
)
Temperature (ᵒC)
Stellenbosch University https://scholar.sun.ac.za

19
and yields of condensable products was weak and did not follow any specific trend. This was
blamed on the different reactor configrations and process systems used by the various
authors. It was however observed that minimum condensable products yield of about 58 - 60
wt.% was obtained in the temperature region of 250 - 300 ˚C. Peak yields then spanned
between 88 - 95 wt.%, obtained in the temperature range of 450 - 500 ˚C. Temperatures
beyond 500 ˚C saw a general decrease in yields. From the trends, maximum condensable
products yield temperature was deduced to be in the region of around 400 - 500 ˚C. It was
also inferred that temperatures beyond 500 ˚C promoted secondary cracking reactions which
lead to the decrease in yields of condensable products.
Figure 2.6. Empirical model depicting the effects of temperature on condensable product (oil/wax) yield for fast pyrolysis of PP – Data retrieved from; [Jung et al., (2010), Predel & Kaminsky, (2000) Aguado et al., (2002) and Arabiourrutia et al., (2012)]
Another model was generated to establish the effects of temperature on condensable
products (oil/wax) yield for fast pyrolysis of PP (in fluidised bed reactors). The data for this
model were retreived from Jung et al., (2010), Predel & Kaminsky, (2000) Aguado et al., (2002)
and Arabiourrutia et al., (2012) all in Table 2.4 and presented in Figure 2.6. From the figure,
it was observed that condensable products yield decreased sharply from about 95 to 25 wt.%
as temperature progressed from around 450 to 750 ˚C. This observation showed that at
comparatively higher temperatures and faster heating rates, rigorous secondary cracking
0
10
20
30
40
50
60
70
80
90
100
0 200 400 600 800
Co
nd
ensa
ble
pro
du
cts
(oil/
wax
) yi
eld
(w
t.%
)
Temperature (ᵒC)
Stellenbosch University https://scholar.sun.ac.za

20
reactions occur. The cracking reactions then favour the production of permanent gases and
suppresses condensable products yield. The correlation between temperature and oil yield in
this instance was very strong as a trend could be observed. The strong correlation is attributed
to majority of the data coming from same reactor.
In conclusion, it was observed that condensable products yield for batch pyrolysis of PP under
atmospheric pressure conditions generally rose as temperature increased to a point in the
region of 450 - 500 ˚C, after which a further increase of temperature initiates secondary
reactions which results in the decrease of condensable products yield and production of more
permanent gases. It was also deduced that higher pyrolysis temperatures (above 500 ˚C) at
faster heating rates (above 100 ˚C) enhances secondary cracking reactions which supresses
the production of condensable products.
Heating rate
Information on heating rate of PP pyrolysis in literature is quite ambiguous. For instance,
under batch scale pyrolysis, most of the information on heating rate available were reported
in different reactor configurations which made comparison difficult. It was also observed that
almost all of these tests were performed under slow heating rates ranging between 5 - 25
˚C/min. Moreover, those who varied the heating rate in batch reactors investigated narrow
ranges of heating rates which resulted in insignificant trends. Most fast heating rates reported
were carried out in fluidised bed reactors which is covered in the previous section under
temperature. Therefore, to establish a trend on the effects of heating rate on condensable
products yield for batch reactors, all the heating rates reported were collected and fitted to
a model. These data points were retrieved from results reported by; Hájeková & Bajus, (2005),
Yan et al., (2015), Ciliz et al., (2004), Miandad et al., (2016), Uçar, et al., (2016), Heydariaraghi
et al., (2016), (Fakhrhoseini & Dastanian, 2013), Encinar & González, (2008), Demirbas, (2004)
and Miranda et al., (2001) all available in Table 2.3. From the model represented in Figure 2.7,
it was observed that as heating rate progressed from 5 to 25 ˚C, yield of condensable products
remained virtually constant and did not vary significantly which was corroborated to the
rather narrow range of heating rate gathered. However, Lu et al., (2015) who performed their
tests in a pre-heated batch reactor however observed a drastic decrease in oil yield from
Stellenbosch University https://scholar.sun.ac.za

21
about 63 to 33 wt.% with the rise of temperature (heating rate in effect). They however did
not report the value of the heating rate used.
It was therefore concluded that, narrow ranges of slow heating rate for batch scale pyrolysis
of PP had no significant effect on condensable products yield. However, pre-heated batch
scale reactors promoted the rapid degradation of PP with this becoming more pronouced at
higher temperatures. Similar observations were also made for fluidised bed reactors which
substantiates the fact that for pre-heated reactor systems, increase of temperature also
means increase in heating rate. Since the effects of wider range of heating rate for batch scale
pyrolysis of PP is not entirely addressed in literature, it is worth investigating.
Figure 2.7. Empirical model depicting the effects of heating rate on condensable product
(oil/wax) yield for batch scale pyrolysis of PP – Data retrieved from [Hájeková & Bajus, (2005)
Yan et al., (2015), (Ciliz et al., 2004), Miandad et al., (2016), Uçar, et al., (2016), Heydariaraghi et
al., (2016), (Fakhrhoseini & Dastanian, 2013), Encinar & González, (2008) Demirbas, (2004) and
(Miranda et al., 2001)]
Vacuum pyrolysis of PP
As mentioned in section 1.2, plastics pyrolysis under vacuum received very little attention as
compared to biomass, with virtually nothing reported on how the variation of temperature
0
10
20
30
40
50
60
70
80
90
100
0 5 10 15 20 25
Co
nd
ensa
ble
pro
du
cts
(oil/
wax
) yi
eld
(w
t.%
)
Heating rate (ᵒC/min)
Stellenbosch University https://scholar.sun.ac.za

22
and heating rate affects products yield and quality from PP pyrolysis under vacuum
conditions. Following literature survey, only Miranda et al., (2001) was found to investigate
PP pyrolysis under vacuum. Their test was however conducted at only a single condition of
temperature and heating rate. Parameters surronding their tests are presented in Table 2.3.
From the data, they pyrolysed PP at 500 ˚C temperature and a heating rate of 10 ˚C/min in a
batch reactor under a vacuum pressure of 2 kPa, absolute. Following this, they obtained a
combined condensable fraction yield of 95 wt.% of which 70 wt.% was recovered as wax and
the remaining 20 wt.% as free-flowing oil. A permanent gas yield of about 3.5 wt.% was
recovered with the remaining fraction being char. Comparing the results they obtained to
similar conditions under atmospheric pyrolysis as observed with Uçar et al., (2016) and
Fakhrhoseini & Dastanian (2013), it was noticed that vacuum conditions generated higher
yields of condensable products (oil/wax) with additional yield of up to about 15% observed.
This was attributed to the short vapour residence time as a result of quick extraction of
volatiles from the hot reactor zone by the vacuum pump, which minimised secondary cracking
reactions known to favour the production of permanent gases over condensable products.
Following the interesting trend observed for vacuum and the fact that investigation of how
process parameters affect products yield and quality for PP pyrolysis is hardly covered in
literature, it warrants attention.
Stellenbosch University https://scholar.sun.ac.za

23
Table 2.3. Summary on the effects of temperature, heating rate and other key parameters on product distribution in the thermal pyrolysis of PP (batch reactors)
Yields (wt.%)
References Reactor type Temperature (ᵒC)
Heating Rate (ᵒC/min)
Vapour residence time
(s)
Pressure Gas Oil Wax Residue
Williams & Williams, (1997b)
Fixed bed, batch 700 N/A 25 Atm. 13.6 84.4 N/A 0.15
Hájeková & Bajus, (2005)
Stainless steel batch
450 15 N/A 11 87.8 (oil + wax)
N/A 1.2
Takuma et al., (2001)
Fixed bed, tubular flow
525 N/A N/A 10.5 29.5 60 0.1
(Yan et al., 2015) Fixed bed, batch 460 15 16 13.7 84.8 (oil + wax)
N/A 1.5
Zhou, et al., (2004) Fixed bed, batch 430 N/A 13 9.3 87.2 N/A 3.5
Ciliz et al., (2004) Fixed bed, batch 600 5 N/A 11 76 N/A 13
Miandad et al., (2016)
Fixed bed, batch 450 10 N/A 54.5 42 0 3.5
Uçar et al., (2016) Fixed bed, batch 500 5 N/A 13 56 30 1
Heydariaraghi et al., (2016)
Stirred reactor, batch
450 8 N/A 11 88 N/A 1
Kodera et al., (2006) Screw kiln, continuous
500 N/A N/A 6.1 46.5 N/A 2
600 N/A N/A 22.5 35.5 N/A 3
700 N/A N/A 78 22 N/A 1
Miskolczi et al., (2009)
Horizontal tube, continuous
520 N/A N/A 5 95 (oil + wax)
N/A N/A
(Fakhrhoseini & Dastanian, 2013)
Batch 500 6 N/A 17.76 82.12 N/A 0.12
8 18.68 81.32 0.09
10 19.28 80.65 0.07
12 20.55 79.41 0.04
14 21.74 78.26 0.00
Encinar & González, (2008)
Cylindrical Stainless-steel
800 5 N/A 16.55 83.34 (oil + wax)
N/A 0.11
10 17.2 82.67 (oil + wax)
0.13
15 17.88 82.02 (oil + wax)
0.1
20 31.84 68.06 (oil + wax)
0.1
Ahmad et al., (2015)
Batch 250 N/A N/A 29.05 57.27 N/A 13.68
300 28.04 69.82 1.34
350 30 67.74 1.56
400 31.07 63.23 5.7
Lu et al., (2015) Ceramic batch 300 Pre-heated reactor
N/A 19 63 N/A 18
320 19 71.4 9.6
350 52.4 43.6 4
400 56.1 38.2 5.7
450 66.7 33.1 0.2
(Kaminsky & Zorriqueta, 2007)
Batch 500 N/A N/A 20 62 18 1
Demirbas, (2004) Batch 740 10 N/A 49.6 48.8 N/A 1.6
Miranda et al., (2001)
Batch 500 10 N/A Vacuum (2 kPa, abs.)
3.5 25 70 0.01
Stellenbosch University https://scholar.sun.ac.za
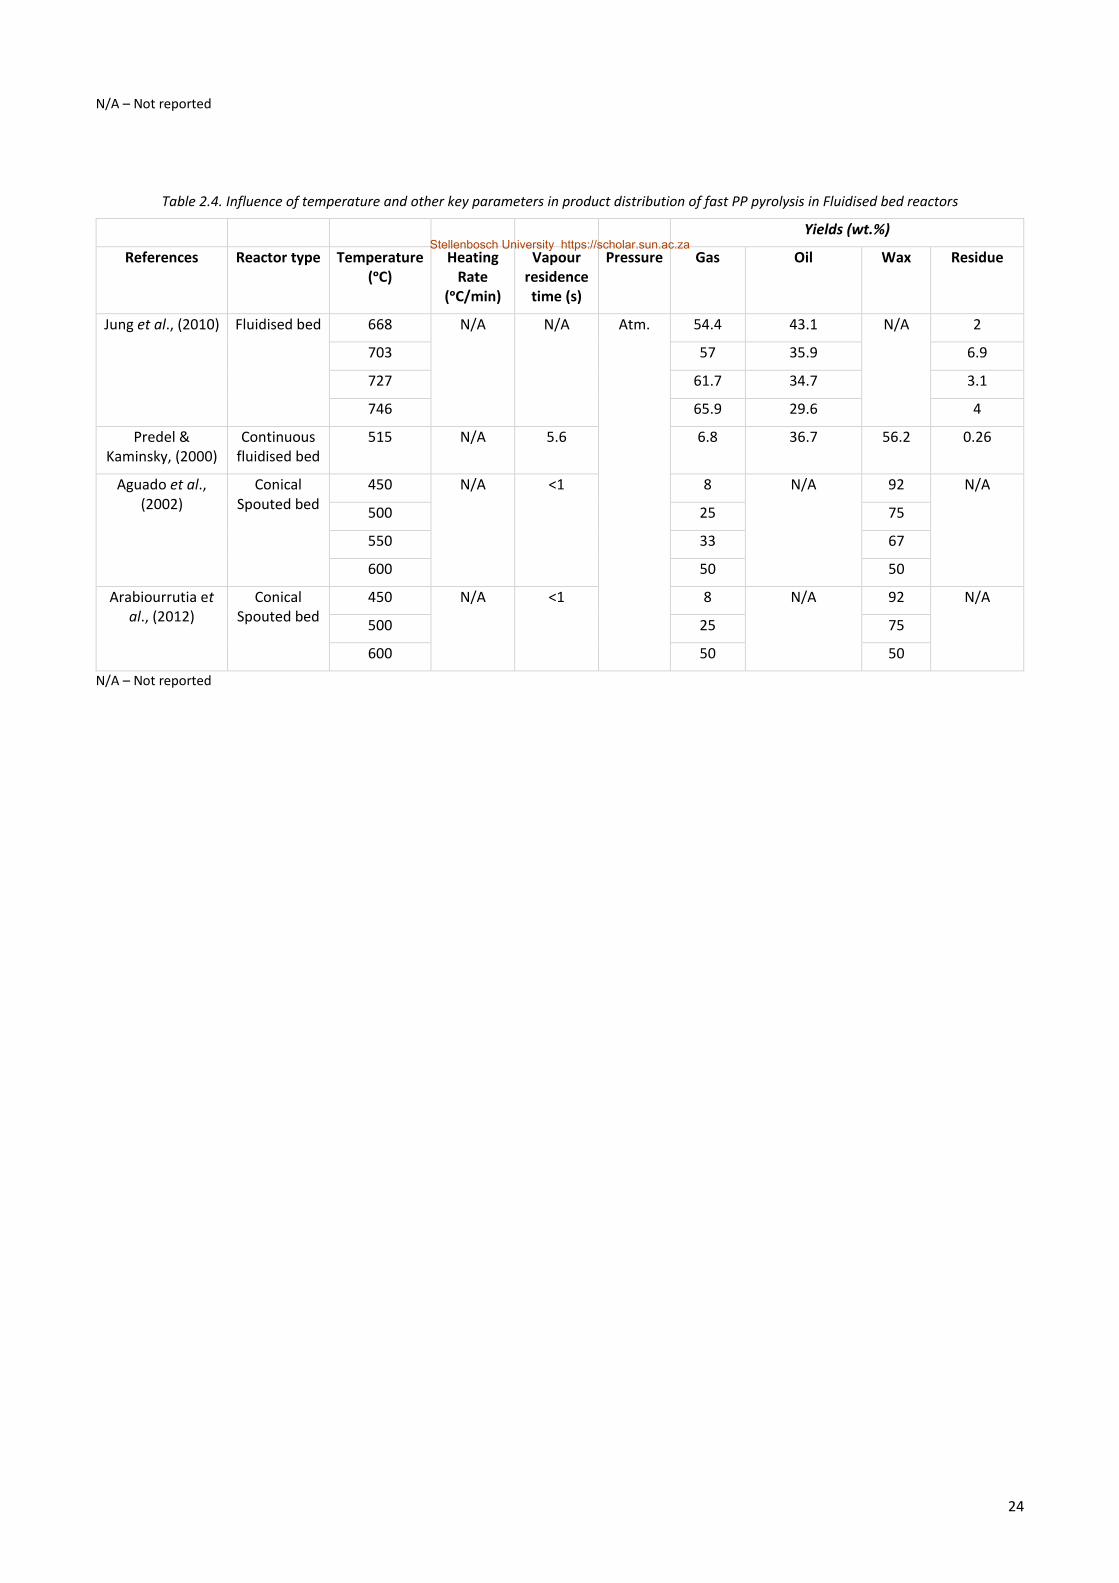
24
N/A – Not reported
Table 2.4. Influence of temperature and other key parameters in product distribution of fast PP pyrolysis in Fluidised bed reactors
Yields (wt.%)
References Reactor type Temperature (ᵒC)
Heating Rate
(ᵒC/min)
Vapour residence time (s)
Pressure Gas Oil Wax Residue
Jung et al., (2010) Fluidised bed 668 N/A N/A Atm. 54.4 43.1 N/A 2
703 57 35.9 6.9
727 61.7 34.7 3.1
746 65.9 29.6 4
Predel & Kaminsky, (2000)
Continuous fluidised bed
515 N/A 5.6 6.8 36.7 56.2 0.26
Aguado et al., (2002)
Conical Spouted bed
450 N/A <1 8 N/A 92 N/A
500 25 75
550 33 67
600 50 50
Arabiourrutia et al., (2012)
Conical Spouted bed
450 N/A <1 8 N/A 92 N/A
500 25 75
600 50 50
N/A – Not reported
Stellenbosch University https://scholar.sun.ac.za

25
2.6.3 Condensable products of PP pyrolysis
Production of fuels and chemicals via the pyrolysis of polyolefins appears to be a promising
way of plastics recycling (Wang et al., 2015). The calorific value of polypropylene is around 45
MJ/kg which is greater than that of fuel oil (41 MJ/kg) and high-quality coal, 29 MJ/kg
(Miskolczi, et al., 2009). Production of liquid fuels via PP pyrolysis can therefore be seen as
having a very significant potential.
Condensable products from PP pyrolysis either come in the form of oil or wax. The oil products
are chiefly hydrocarbons with carbon number distributions falling in the range, C5-C20 whereas
waxes are composed with higher amounts of long chain hydrocarbons with carbon number
distribution greater than C20 (Lopez et al., 2017). The product distribution of these
condensable fractions however depends on process parameters; reactor design,
temperature, heating rate, residence time and pressure (vacuum). Oils and waxes obtained
from PP pyrolysis are essentially made up of aliphatics (paraffins, naphthenes and olefins) and
aromatics (Pinto et al., 1999; Demirbas, 2004; Miskolczi et al., 2006; Lee & Shin, 2007). Oil
and waxes are mostly reported in literature as one fraction because liquid hydrocarbons are
usually dissolved in waxes or the other way around where waxes are dissolved in liquid
hydrocarbons. This sometimes brings some ambiguity when comparing literature results
(Lopez et al., 2017). Distribution of aliphatic & aromatic hydrocarbons and boiling points of
oils obtained from PP pyrolysis have been summarised in Table 2.5 and Table 2.6 respectively.
Ahmad et al., (2015) characterised the oils generated at optimum oil yield temperature of 300
˚C of PP pyrolysis. Paraffins, olefins and naphthenic yields observed, were 66, 25 and 7%
respectively. No aromatic compounds were produced. Also, the oil obtained was enriched in
diesel range hydrocarbons, forming about 46% of the oil fraction, with gasoline range
hydrocarbons being 15%. The remaining fractions fell in the wax range. Sakata et al., (1999)
also analysed the oils generated from the batch pyrolysis of PP at 380 ˚C but did not analyse
the hydrocarbon types present. They however performed a simulated distillation to group the
hydrocarbons present into diesel and gasoline. Simulated distillation is a chromatographic
technique which correlates retention times of hydrocarbons from a GC/MS spectrum with
boiling points of the same compounds. They concluded that, diesel fractions (56 wt.%)
dominated the oil products. The remaining 43 wt.% was found to be gasoline range
compounds. From the simulated distillation conducted, they also concluded that boiling point
Stellenbosch University https://scholar.sun.ac.za

26
of oil fell in the range, 36 to 405 ˚C. Demirbas, (2004) studied the composition of products
obtained from PP pyrolysis at different temperatures. It was observed that with an increase
in the pyrolysis temperature from 402 to 602 ˚C, naphthenic and aromatic products increased
from 21.5 to 23.5 wt.% and 1.4 to 10.2 wt.% respectively. The increase in aromatic yield was
attributed to secondary reactions such as cyclisation and aromatisation of primary products
(olefins and paraffins). This is evident in the corresponding decrease in paraffinic and olefinic
yields as temperature increased. Bockhorn et al., (1999), studied the pyrolysis of PP in a
special type of continuous stirred batch reactor, named the gradient free reactor, at a
temperature of 460 ˚C and recorded an oil composed of 7.6 wt.% and 92.5 wt.% of paraffins
and olefins respectively. Furthermore, Pinto et al., (1999), investigated the oil products
generated from the thermal pyrolysis of PP in an autoclave at 450 ˚C. The liquid products
comprised of 58 wt.% paraffins, 33 wt.% olefins and 8 wt.% aromatics. Yan et al., (2015)
neither reported fractions of hydrocarbons present in their oils however, they grouped the
carbon numbers into diesel and gasoline and reported the fractions to be 36 and 58%
respectively. Uçar et al., (2016) also reported 50 wt.% paraffins, 45 wt.% olefins and 5 wt.%
aromatics as the fractions of hydrocarbons present in their oil when they pyrolysed PP at 500
˚C. Predel & Kaminsky, (2000) reported fractions of paraffins, olefins, naphthenes and
aromatics in their oil as 12.28, 63.02, 1.95 and 0.06 wt.% respectively when they pyrolysed PP
at 515 ˚C in a fluidised bed reactor. They further reported the boiling point ranges of the oils
as 25 to 300 ˚C. Ciliz, et al., (2004) characterised oils recovered from waste PP pyrolysed at
600 ˚C and reported aliphatics (paraffins, naphthenes and alkenes) present in the oil to be 17
wt.% with aromatics being 83 wt.%. Miskolczi et al., (2009), pyrolysed PP plastics in a pilot
scale horizontal tube continuous reactor, at 520 ˚C temperature after which the hydrocarbon
products obtained where separated via distillation into products, they called gasoline and
light oils. Paraffin content contained in the light oil was 61.5 wt.%. Olefins detected was 38.1
wt.% with the remaining 0.4 wt.% being aromatics. The gasoline fraction also contained 59.9,
39.6 and 0.5 wt.% of paraffins, olefins and aromatics respectively. The concluded that the
light oils had a boiling point range of 115 to 353 ˚C and gasoline, 23 to 216 ˚C. Finally, Kim &
Kim, (2004) investigated the effects of heating rate on oil compositions at 500 ˚C in a stirred
batch autoclave and reported that gasoline range hydrocarbons increased significantly as
heating rate progressed from 0.5 to 1-2 ˚C/min. Although the heating rate range examined
was narrow, slight decrease in diesel range compounds was observed for the same trend of
Stellenbosch University https://scholar.sun.ac.za

27
heating rate. These trends are evident because increase in heating rate together with
temperature promotes cracking and hence increases the yields of light molecular weight
compounds.
From the trends presented, it is observed that except for results reported by Bockhorn et al.,
(1999) and Predel & Kaminsky, (2000), paraffins and naphthenes (alkanes) mostly dominate
the oil/wax fractions generated from PP pyrolysis, followed closely by olefins, with aromatics
being the least. It is also deduced that, very high pyrolysis temperatures of PP, 600 ˚C and
above promoted the formation of aromatics. Similar conclusions were drawn by Jung et al.,
(2010) and Westerhout et al., 1998) when they examined PP pyrolysis at very high pyrolysis
temperatures (600 to 800 ˚C). This has been explained as the secondary reactions of paraffins
and olefins at elevated temperatures, forming aromatics in the process. The dominant olefinic
fractions reported by Bockhorn et al., (1999) and Predel & Kaminsky, (2000) could be
corroborated to interaction effects of faster heating rates and fast vapour residence times
which might have enhanced beta-scission reactions/intramolecular hydrogen transfer and
the swift removal of the resulting alkenes from the reactor.
Furthermore, the carbon number distributions and boiling point ranges, presented in Table
2.6 for almost all the oils reported appear to fall within the ranges defined for both
commercial diesel (180 - 380 ᵒC) and gasoline (69 - 180 ᵒC) from literature. The ranges
reported stretch from naphtha to fuel oil which stipulates that oils derived from PP pyrolysis
might contain compounds belonging to each of these fuels and hence need to be distilled or
processed further to obtain pure diesel or gasoline. The boiling point ranges presented by
Miskolczi et al., (2009) is a clear indication that PP derived oils contain both diesel and
gasoline range compounds, because they obtained two different products similar to diesel
and gasoline following distillation of the PP oil. The oil they labelled gasoline had its boiling
point range very similar to commercial gasoline and the oil they named light oil had very
comparable characteristics in terms of boiling point to commercial diesel.
Stellenbosch University https://scholar.sun.ac.za

28
Table 2.5. Distribution of hydrocarbon types obtained from PP pyrolysis oil
References Reactor type Temperature (ᵒC)
Heating rate (ᵒC/min)
Vapour residence time
(s)
Pressure Hydrocarbon fractions (wt.%/% area of oil)
Paraffins Naphthenes Olefins Aromatics Others
Demirbas, (2004) batch 402 10 N/A Atm. 30.40 21.50 44.70 1.40 2
452 28.20 22.80 42.10 4.50 2.4
527 24.90 24.40 39.50 2.60 2.6
602 29.60 23.50 35.50 10.20 1.2
(Predel & Kaminsky, 2000)
Continuous fluidized bed
515 N/A 5.6 12.28 1.95 63.02 0.06 22.70
(Ahmad et al., 2015)* batch 300 N/A N/A 66.00 7.00 25.00 0.00 2.00
Pinto et al., (1999) Stirred batch autoclave
450 N/A >20mins 58.00 N/A 33.00 8.00 1.00
Bockhorn et al., (1999)
Gradient free reactor
460 Pre-heated reactor
N/A 7.60 N/A 92.5 0.00 N/A
Yan et al., (2015)* batch 460 15 16 N/A N/A N/A N/A N/A
Heydariaraghi et al., (2016)
Stirred batch 450 5 N/A N/A N/A N/A N/A N/A
Ciliz, et al., (2004)* Fixed bed batch 600 5 N/A 17 83.0 N/A
Kodera et al., (2006) Screw kiln, continuous
500 N/A N/A N/A N/A N/A N/A N/A
Uçar et al., (2016) Fixed bed, batch 500 5 N/A 50.00 N/A 45 5.00 N/A
Sakata et al., (1999)* batch 380 3 N/A N/A N/A N/A N/A N/A
Miskolczi et al., (2009), light oil *
Horizontal tube, continuous
520 N/A N/A 61.50 N/A 38.10 0.40 N/A
Miskolczi et al., (2009), gasoline *
59.90 N/A 39.60 0.50 N/A
(Kim & Kim, 2004) Stirred batch autoclave
500 0.5 N/A N/A N/A N/A N/A N/A
1.0 N/A N/A N/A N/A N/A N/A
2.0 N/A N/A N/A N/A N/A N/A
N/A – Not reported; * fractions that were reported in %area
Table 2.6. Carbon number distribution and boiling points of oils recovered from PP pyrolysis
References Carbon number distribution (wt.%/%area of oil)
C6-C10 (Gasoline) C11-C23 (Diesel) C23+ (Wax) Boiling point range (ᵒC)
Ciliz, et al., (2004)* 33.00 48.00 18 N/A
(Ahmad et al., 2015)* 15.16 46.03 24.97 N/A
Yan et al., (2015)* 58.00 36.00 N/A N/A
Pinto et al., (1999) N/A N/A N/A 35 -265
Heydariaraghi et al., (2016) N/A N/A N/A 50 - 300
Kodera et al., (2006) N/A N/A N/A 55 - 300
Predel & Kaminsky, (2000) 65.41 34.59 N/A 25 - 300
Sakata et al., (1999)* 43.00 56.00 N/A 36 - 405
Miskolczi et al., (2009), light oil *
N/A 95.50 N/A 115 - 353
Miskolczi et al., (2009), gasoline *
95.50 5.00 N/A 23 - 216
Kim & Kim, (2004)
0.5 ᵒC/min 28.00 59.50 N/A N/A
1.0 ᵒC/min 42.00 54.00 N/A N/A
2.0 ᵒC/min 42.00 56.50 N/A N/A
N/A-not reported; *fractions that were reported based on %area
Stellenbosch University https://scholar.sun.ac.za

29
2.7 Chemical composition and distillation behaviour of
conventional liquid fuels
Chemical composition of diesel is not definite because over billions of different chemical
compounds may be present (Bacha et al., 2007). As a result, it is virtually impossible to
characterise diesel for individual compounds (Speight, 2015). However, the large number of
compounds present could be easily categorised into paraffins (alkanes), cycloparaffins
(cycloalkanes/naphthenes), aromatics and olefins (unsaturated hydrocarbons) (Bacha et al.,
2007; Speight, 2015). A key variable which defines diesel is the boiling point range. Boiling
point/Distillation range for a mixture of close boiling liquids can be defined as the
temperature range over which this mixture exists in vapour liquid equilibrium at atmospheric
pressure. Pure liquids have a single boiling point at a given pressure. For a multicomponent
liquid mixture, there is no single boiling point to vaporize the complete mixture. Such mixtures
have boiling points occurring over a range of temperature, which depends on the components
involved, system pressure as well as affinity among the compounds. For such mixtures, the
initial boiling point (IBP) at a given pressure is defined as the temperature value when the first
bubble of vapour is formed from the liquid mixture. It depends on the mixture composition
and pressure (Meks, 2015). Final boiling point (FBP) is defined as the temperature at which
the first liquid drop appears in a vaporised mixture (Meks, 2015).
The boiling point range of diesel could be expressed in terms of its distillation temperature
range or the corresponding hydrocarbons that get distilled in this temperature range.
Distillation range is considered an important property for petroleum crude and its resultant
fuel components, since it determines whether fuels possess suitable volatility (Hsu, 2000).
Distillation of diesel which defines its boiling point typically falls within but not limited to the
temperature range 180 - 380 ᵒC. These temperature limits correspond to the boiling point of
the C10 (Decane) and C23 (Tricosane) hydrocarbons respectively. Similarly, boiling point range
of gasoline can be defined to be in the range 69 to 180 ºC since the limits of the range
correspond to C6 (Hexane) and C10 (Decane) respectively. These ranges are however not
limited to the figures stated above and may overlap due to the different grades of diesel and
gasoline fuels available. (Pinto et al., 1999; Miskolczi et al., 2006; Li et al., 2004; Laresgoiti et
al., 2004; Bacha et al., 2007; Heydariaraghi et al., 2016).
Stellenbosch University https://scholar.sun.ac.za

30
2.7.1 Chemical composition of commercial diesel fuels
Todd et al., (1999), reported the composition of a type of diesel as having mixtures of C10-C19
hydrocarbons with 64% being paraffinic hydrocarbons (straight chain alkanes and
cycloalkanes), 1-2% unsaturated hydrocarbons (olefins) and 35% aromatic hydrocarbons.
Liang et al., (2005), studied the composition of conventional diesel fuel using Gas
Chromatography/Mass Spectrometer (GC/MS). They concluded that diesel fuel contained
90% paraffinic hydrocarbons which included n-alkanes, iso-alkanes and cycloalkanes, no
olefins, with the remaining 10% being aromatic hydrocarbons (alkylbenzenes, polyaromatic
hydrocarbons and aromatic acids). They also inferred that branched and cyclic alkanes
contained in the diesel fuel ranged between C10-C25. Pál et al., (1998) analysed the
hydrocarbon groups in diesel range petroleum fractions and concluded that diesel fuel ranged
between C11-C23 hydrocarbons with n-alkanes being the prevailing fraction of the
hydrocarbon groups. Similar range was also defined by Almeida & Marques, (2016), Yan et
al., (2015) and Syamsiro et al., (2014).
Table 2.7. Paraffins, Olefins and Aromatic fractions in different grades of diesel fuel (Adapted from Sjogren et al., 1995)
Type of
hydrocarbon
Diesel Fuel Grades
D1 D2 D4 D5 D7 D8 D9 D10 D14 D15 Avg.
Paraffins 95.9 83.3 75.4 72.4 79.6 80.4 83.3 77.5 n. a n. a 64.8
Olefins 1.4 2.0 2.2 1.6 0.9 0.2 0.7 1.8 n. a n. a 1.1
Aromatics 2.7 14.7 22.5 26 19.8 19.4 16.0 20.7 7.7 3.7 15.3
n. a - not reported; D-diesel grade
Lastly, Sjörgen et al., (1995) performed principal component analysis using the composition
of ten different grades of diesel fuel as shown in Table 2.7. It was found that the dominating
hydrocarbons were paraffins with volume fractions ranging between 72 and 96% (average of
64.8), followed by aromatic hydrocarbons with volume fractions ranging between 2.5 and
26% (average being 15.3%). Very little fraction of olefins was present with the maximum
fraction detected being 2.2% and an average fraction of just about 1.1%. From the trends
described above, it was evident that paraffins form the majority fraction of diesel fuels
followed by aromatics with olefins forming the least. In some cases, olefins were completely
Stellenbosch University https://scholar.sun.ac.za
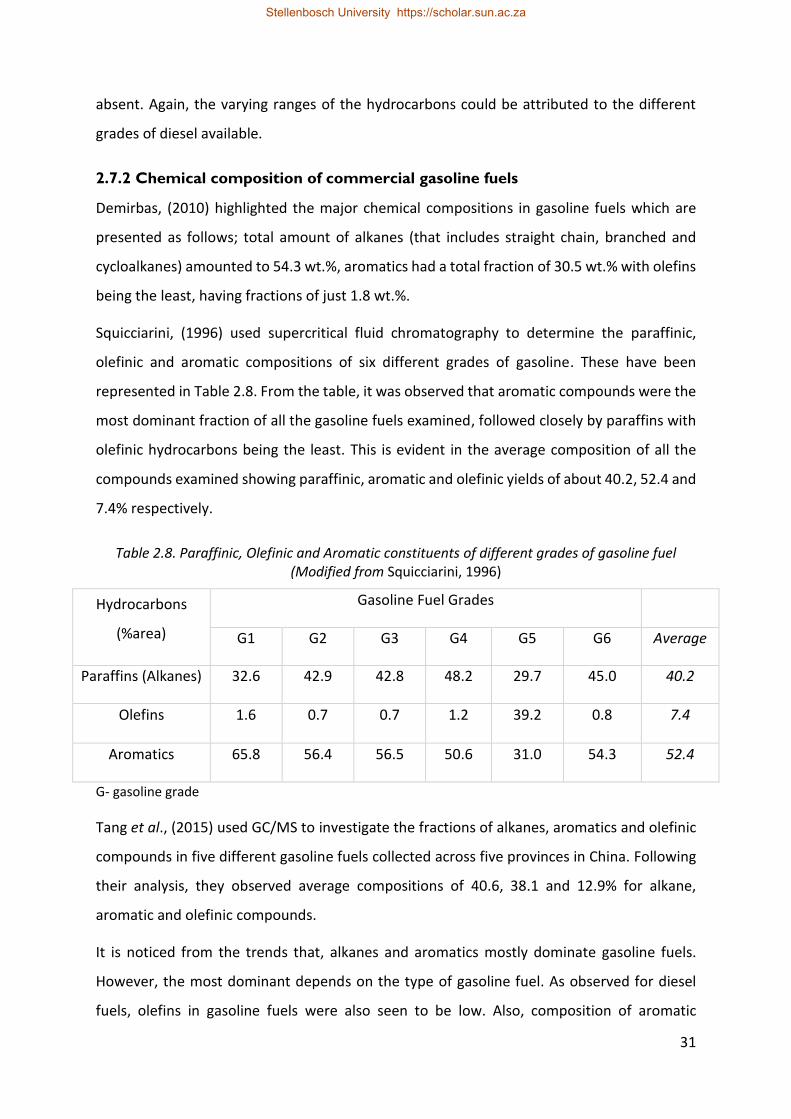
31
absent. Again, the varying ranges of the hydrocarbons could be attributed to the different
grades of diesel available.
2.7.2 Chemical composition of commercial gasoline fuels
Demirbas, (2010) highlighted the major chemical compositions in gasoline fuels which are
presented as follows; total amount of alkanes (that includes straight chain, branched and
cycloalkanes) amounted to 54.3 wt.%, aromatics had a total fraction of 30.5 wt.% with olefins
being the least, having fractions of just 1.8 wt.%.
Squicciarini, (1996) used supercritical fluid chromatography to determine the paraffinic,
olefinic and aromatic compositions of six different grades of gasoline. These have been
represented in Table 2.8. From the table, it was observed that aromatic compounds were the
most dominant fraction of all the gasoline fuels examined, followed closely by paraffins with
olefinic hydrocarbons being the least. This is evident in the average composition of all the
compounds examined showing paraffinic, aromatic and olefinic yields of about 40.2, 52.4 and
7.4% respectively.
Table 2.8. Paraffinic, Olefinic and Aromatic constituents of different grades of gasoline fuel (Modified from Squicciarini, 1996)
Hydrocarbons
(%area)
Gasoline Fuel Grades
G1 G2 G3 G4 G5 G6 Average
Paraffins (Alkanes) 32.6 42.9 42.8 48.2 29.7 45.0 40.2
Olefins 1.6 0.7 0.7 1.2 39.2 0.8 7.4
Aromatics 65.8 56.4 56.5 50.6 31.0 54.3 52.4
G- gasoline grade
Tang et al., (2015) used GC/MS to investigate the fractions of alkanes, aromatics and olefinic
compounds in five different gasoline fuels collected across five provinces in China. Following
their analysis, they observed average compositions of 40.6, 38.1 and 12.9% for alkane,
aromatic and olefinic compounds.
It is noticed from the trends that, alkanes and aromatics mostly dominate gasoline fuels.
However, the most dominant depends on the type of gasoline fuel. As observed for diesel
fuels, olefins in gasoline fuels were also seen to be low. Also, composition of aromatic
Stellenbosch University https://scholar.sun.ac.za

32
compounds in gasoline fuels were seen to be significantly higher than aromatic compounds
present in diesel.
2.7.3 Fuel properties of commercial liquid fuels
Based on the mode of application, diesel fuels are usually classified into three main types.
These include, land diesel fuels, used in trucks, buses, trains or other land transportation
vehicles; marine diesel, used in ships; and plant diesel fuels, used in electric power generation
plants, boilers and combustors (Hsu, 2000). The quality of diesel fuels used therefore depends
on the performance requirements of the system/engine since land transportation vehicles,
ships and power plants have variations in speed and load (Hsu, 2000). Also, commercial fuels
and heavy fuel oils, used in compression combustion engines and boilers/combustors
respectively, are required to meet certain specifications to ensure acceptable performance
(Syamsiro et al., 2014; Ahmad et al., 2015). Standard fuel specifications have been established
by Institute of Petroleum (IP) and American Society for Testing and Materials (ASTM)
(Sharuddin et al., 2016), and these specifications establish the characteristic ranges for
diverse grades of fuels available for different specialised applications (Ahmad et al., 2015;
Hsu, 2000). Several ASTM and IP test methods are used to determine fuel properties. The
major physico-chemical properties considered when testing fuel properties include, the
density/specific gravity, viscosity, calorific/heating values, ash content, boiling point range,
octane number (gasoline)/cetane number (diesel), pour point, flashpoint and aniline point
(Islam et al., 2010; Miskolczi et al., 2009; Ahmad et al., 2015; Hsu, 2000; Blazso, 2006). These
properties are explained below.
Density
Density of a liquid is defined as the mass of liquid per unit of volume at a specific temperature
(Kandola et al., 1995). Diesel fuels have much higher density compared to gasoline and other
lighter petroleum derived fuels which is an indication of the presence of high molecular
weight compounds. Also, it has been established that organic compounds with longer chain
lengths have higher density compared to branched organic compounds (Gao, 2010). Density
is also correlated to the heating value such that increase in density results in the decrease in
heating value. This is because, as the density of a fuel increases, the Carbon to Hydrogen (C/H)
ratio increases because the olefinic and aromatic contents tend to do dominate which means
a lesser amount of C-H will be available per mass of the hydrocarbon hence lower heating
Stellenbosch University https://scholar.sun.ac.za

33
value (American Bureau of Shipping, 2001). The standard density of diesel fuel ranges
between 800 - 860 kg/m3 (Li et al., 2005; Miskolczi et al., 2009; Gao, 2010; Islam et al., 2010;
Ahmad et al., 2015) whereas that for gasoline ranged between 720 - 780 kg/m3 (Owusu et al.,
2018; Faussone, 2017).
Viscosity
Viscosity of a fuel is a degree of its resistance to flow. It is inversely proportional to
temperature; that is, the viscosity of a fuel will decrease when fuel temperature increases
hence viscosity values are always reported together with the temperature of fuel at which
the test was done (American Bureau of Shipping, 2001; Bacha et al., 2007). Also, higher
viscosity of liquid fuels implies higher density (American Bureau of Shipping, 2001). Viscosity
of fuels is normally measured by the kinematic viscosity since it has proven to be more
accurate (American Bureau of Shipping, 2001). Its unit of measurement is mm2/s or
centiStokes (cSt). The kinematic viscosity for diesel fuel oils used in heavy-duty low-speed
engines ranges from 2.4 to 24 mm2/s at 40 ˚C (Bacha et al., 2007; Hsu, 2000) whereas that of
transportation diesel fuels ranges between 1.3 - 4.5 mm2/s at the same temperature (Bacha
et al., 2007; Islam et al., 2010; Hsu, 2000) that for commercial gasoline at the same
temperature is around 1.17 mm2/s (Sharuddin et al., 2016; Ahmad et al., 2015).
Pour point
Pour point of a liquid fuel is defined as the minimum temperature at which the liquid stops
flowing. Pour point therefore defines the fluidity of liquid fuels at relatively low temperatures
(Ahmad et al., 2015). Increase in viscosity and crystallization of waxy compounds are the main
parameters that enhance the loss of fluidity of liquid fuels (American Bureau of Shipping,
2001; Ahmad et al., 2015). Although the standard acceptable pour point for fuel oils varies,
the pour point for diesel fuel occurs around 6 ˚C.
Heating Value
Heating value is the amount of energy released on combustion of a fuel. Heating value can be
classified as gross (high) or net (lower) (Patel et al., 2000; Bacha et al., 2007). Gross or higher
heating value is the quantity of energy generated by absolute combustion of a unit amount
of liquid fuel. For higher heating value, the water produced by combustion is condensed to
Stellenbosch University https://scholar.sun.ac.za
34
liquid, whereas for net heating value, the water remains in the gaseous form (Bacha et al.,
2007; Kunwar et al., 2016). The standard higher heating value for diesel fuels ranges between
43 - 50 MJ/kg (Ahmad et al., 2015; Islam et al., 2010; Hsu, 2000).
Paraffinic hydrocarbons on combustion releases more energy than their corresponding
naphthenic, olefinic and aromatic hydrocarbons (American Bureau of Shipping, 2001; Ahmad
et al., 2015). This is because heating value is basically influenced by the carbon/hydrogen ratio
present in oil; as the carbon/hydrogen ratio decrease, the heating value increases (American
Bureau of Shipping, 2001). More hydrogen per carbon decreases the oxidation state of a
hydrocarbon and hence more energy will be released on combustion.
Ash Content
Ash is the residue left after carbonaceous material has been combusted. Higher ash content
reduces the combustion efficiency of fuels (Hsu, 2000). It also damages fuel injection system
and can cause deposits in combustion chambers. Due to this, ash contents in liquid fuels must
be kept to traces. The maximum ash content required in commercial diesel and other liquid
fuels is 0.01 wt.% (Syamsiro et al., 2014; Bacha et al., 2007).
Cetane number
Cetane number describes how spontaneously a fuel begins to combust in a diesel engine. High
cetane number fuels combust, moments after they have been introduced in a combustion
chamber of an engine. Such fuels can be classified as having a short ignition delay period.
Contrary, a fuel with low cetane number struggles to auto-ignite resulting in longer ignition
delay period.
Two hydrocarbons (n-hexadecane and 1-methylnapthalene) are used to represent the cetane
number scale (Hsu, 2000; Bacha et al., 2007), with 1-methylnapthalene representing a cetane
number of 0 and n-hexadecane representing a cetane number of 100 (Bacha et al., 2007).
Cetane number should be at least 40 according to the ASTM requirement for diesel fuel oils
(Ahmad et al., 2015; Bacha et al., 2007). Paraffinic hydrocarbons, especially normal paraffins
present in diesel fuels improve the cetane number and hence the ignition quality of the fuel
(Gao, 2010).
Stellenbosch University https://scholar.sun.ac.za

35
Octane number
Octane number is the measure of the tendency for gasoline fuels to ignite spontaneously. It
is used to characterise the anti-knock quality (Sharuddin et al., 2016). High octane number
indicates that a fuel possesses a better anti-knock quality (Sharuddin et al., 2016).
Flash Point
The flash point of a liquid fuel is described as the least temperature at which the vapours
above the liquid kindle when an external spark is applied (Li et al., 2005; Ahmad et al., 2015).
It is considered an important factor in fuel handling to avoid risks of fire during storage. Flash
points of transportation diesel fuels are mostly above 40 ˚C (Ahmad et al., 2015; Hsu, 2000),
and that of fuel oils used in boilers and low speed engines are 55 ˚C (Islam et al., 2010; Hsu,
2010).
Aniline Point
Aniline point is defined as the temperature at which the aniline compound (C6H5NH2) forms a
single phase with the liquid fuel oil (Sharuddin et al., 2016). Aniline point is used to gauge the
content of aromatics present in fuels. Lower aniline point specifies a higher proportion of
aromatic compounds whereas higher aniline point indicates the higher amounts of paraffinic
compounds present in the oil. Olefins and naphthenes have aniline points between the two
extremes of aromatic and paraffin values (Hsu, 2000; Sharuddin et al., 2016). Commercial
diesel and gasoline have estimated aniline points of 77.5 and 71 ᵒC respectively (Ahmad et
al., 2015; Sharuddin et al., 2016).
2.8 Pilot scale and commercial plastic pyrolysis plants
This section reviews the major components of pilot and commercial pyrolysis plants with
discussion on the advantages and disadvantages of the different types available. Most
commercial and pilot scale pyrolysis plants operate under continuous processes. The main
components of a pyrolysis plant comprise the feeding system, the reactor and the
condensers. These are discussed in the sections below. This exercise was conducted to assist
in the design of the semi-continuous, kilogram-scale pyrolysis pilot plant that was installed
and used in this study.
Stellenbosch University https://scholar.sun.ac.za

36
2.8.1 Feeding System
Feeding of materials into continuous pyrolysis reactors is a common critical challenge.
Feeding system has two major functions, i.e. preventing air flowing into the reactor and also
controlling the feed-rate (Gao, 2010). They are very susceptible to blockage which prevents
smooth flow of feedstock. Smooth and continuous delivery should be the benchmark of an
ideal feeding system for a continuous reactor, and be suitable for wide range of materials (Dai
et al., 2012). Therefore, for effective operation of continuous pyrolysis processes, it is vital to
choose the precise type of feeder. Feeding plays a key role in enhancing continuous, reliable
and efficient operation of the process. Varieties of feeding systems exist because of different
feedstock properties and process requirements. Common setbacks normally faced in feeding
systems include; bridging or blocking, seal failures, fuel specific feeders, noise, high cost, early
breakdown service as well as reaction of feedstock occurring in the feeder before entering
the reactor. For various thermochemical processes, several feeders have been used. These
include; the hopper and lock hopper systems, screw feeders and piston feeders (Wilen &
Rautalin, 1993; Dai et al., 2012). Details of these feeders have been discussed below.
Screw feeders
Feedstock Replaceable screw section
Screw shaft
Screw flight
Figure 2.8. Screw feeder (Modified from; Wilen & Rautalin, 1993)
Screw feeders are common feeding equipment capable of delivering bulk solids over
extensive feed rate ranges (Bates, 2000; Dai et al., 2012). The commonly used ones include,
the single and the twin screw. As shown in Figure 2.8, the screw feeder consists of a shaft on
which a helicoidal surface is fitted. This arrangement rotates inside a fixed tube to propel feed
materials across the feeder (Bortolamasi & Fottner, 2001). Frictional interaction between
Stellenbosch University https://scholar.sun.ac.za

37
screw flight and adjacent casing, material properties and screw configurations are the factors
used to estimate the efficiency of a screw feeder (Dai et al., 2012).
Screw feeders are volumetric devices, which mean they meter a consistent volume of material
controlled by the speed or revolution of the discharge device (Bates, 2000; Dai et al., 2012).
The volume of feedstock conveyed in a given period of time is dependent on the following;
screw flight, diameters of the shaft, pitch and the roundness of the screw (Dai et al., 2012).
Some advantages and disadvantages of the screw feeder include (Wilen & Rautalin, 1993;
Bortolamasi & Fottner, 2001; Dai et al., 2012;)
Advantages
• Volumetric feeding. That is their ability to feed in a fixed volume of feedstock into the
reactor
• It handles both cohesive and adhesive materials
• It has a flexible arrangement
• Low energy consumption and
• cost effective
Disadvantages
• Limitations in the mass flow rate of feeding for feedstock with low bulk densities
• Blockage which is caused by overload or difficult feed properties such as dense particles.
• Lack of flow which is instigated by bridge or ‘rathole’ in the case where the screw feeder
is preceded by a load hopper
• Feed rate fluctuations which may be caused by screw flight rotation, sporadic bridging in
the hopper as well as solid build up in the screw.
• Pressure seal failure
• Particle attrition
• Sticking of materials on flights, shafts and internal casing of the screw.
Screw feeders can be operated single screw or twin screw (positive displacement feeders).
Both are equally efficient to use however the single screw is simpler and economical whereas
the twin screw can better handle sticky materials (Dai et al., 2012; Rospen Industries Limited).
Stellenbosch University https://scholar.sun.ac.za

38
Piston Feeders
Piston feeders normally compress feedstock into an impermeable plug before being
transported into the reacting vessel. The plug which usually should be substantially
compacted averts the backward flow of gases and reacting feedstock back into the feeding
system (Dai et al., 2012). Piston feeders are very good choices for high pressured reactors
(Rautalin & Wilen, 1992; Dai et al., 2012).
The mode of operation of a simple piston feeder includes; the charging of their feeding tank
with feedstock usually under atmospheric pressure, after which the volume is reduced
following the forward movement of the piston. As a result, the pressure within the cylinder
increases and the materials moves forward into the reacting vessel (Rautalin & Wilen, 1992).
The principle of operation of a simple piston feeder is illustrated in Figure 2.9.
Compaction begins
Compaction ends and extrusion starts
Extrusion ends and plug is released into
reactor
Figure 2.9. The principle of operation of a piston feeder (Adapted from Rautalin & Wilen, 1992)
Some advantages and disadvantages of the piston feeder are listed below (Dai et al., 2012;
Rautalin & Wilen, 1992);
Advantages
• They are also positive displacement feeders, i.e. they trap a fixed volume of sample and
discharge it into the reactor.
• They can handle sticky and stringy feedstock
Stellenbosch University https://scholar.sun.ac.za

39
• They facilitate short cycling operation and hence a continuous operation is possible with
piston feeders
• They enhance uniform moisture content in feedstock materials as a result of the
compression
• They have very good pressure sealing due to the compact plug formed
• They handle wide range of materials (plastics, biomass, waste tyres, fibre).
Disadvantages
• Design and operation are quite complicated as compared to other feeding systems
• Wear of piston ring and cylinder since they continuously slide against each other which
leads to severe wear (this effect can be reduced by ring coatings and cylinder liners)
• Gas leakage (can be minimised by combining with other feeding systems such as the lock
hopper)
• Feeding fluctuations due to intermittent delivery.
Lock Hopper feeding systems
Lock hopper systems operate on the principle of intermittent feeding across into reactors,
typically by the stepwise opening and closing of valves on the top and bottom of the feed
vessel (Swanson et al., 2003).
Mode of operation
The upper valve is opened to receive material into the lock hopper while the lower valve is
closed. After the upper valve is closed, a non-reactive gas is used to raise the pressure within
the lock-hopper system to or beyond system pressure after which the bottom valve is opened,
and the feed material is discharged into the reactor. After the lock-hopper is emptied, the
lower valve is closed, and the vessel is depressurized to permit another cycle (Swanson et al.,
2003; van der Drift, et al., 2004). Dual and parallel lock hoppers may also be employed, which
allows one lock hopper to discharge pressure to the process, while the other lock hopper
takes care of filling and pressurizing (Swanson et al., 2003). A lock-hopper feeding system is
usually coupled with a piston feeder or a screw feeder to improve sealing and also facilitate
smooth and efficient feeding of feedstock into the reactor (Rautalin & Wilen, 1992; Wilen &
Stellenbosch University https://scholar.sun.ac.za

40
Rautalin, 1993). A lock-hopper coupled with a screw feeding system is shown in Figure 2.10.
A lock-hopper coupled with a piston feeder is also presented in Figure 2.11. Advantages and
disadvantages of the lock hopper system are listed below (Rautalin & Wilen, 1992; Van der
Drift et al., 2004);
Advantages
• It is a simple design device with few moving parts
• It handles wide range of feedstock
• It consumes low amount of energy
• It is compatible with other feeding systems such as the screw and piston feeder
Figure 2.10. Lock-hopper feeding system coupled with a screw feeder (Adapted from Rautalin & Wilen, 1992)
Disadvantages
• It is a complex control strategy which involves valve cycling, pressurization and
depressurization.
Stellenbosch University https://scholar.sun.ac.za
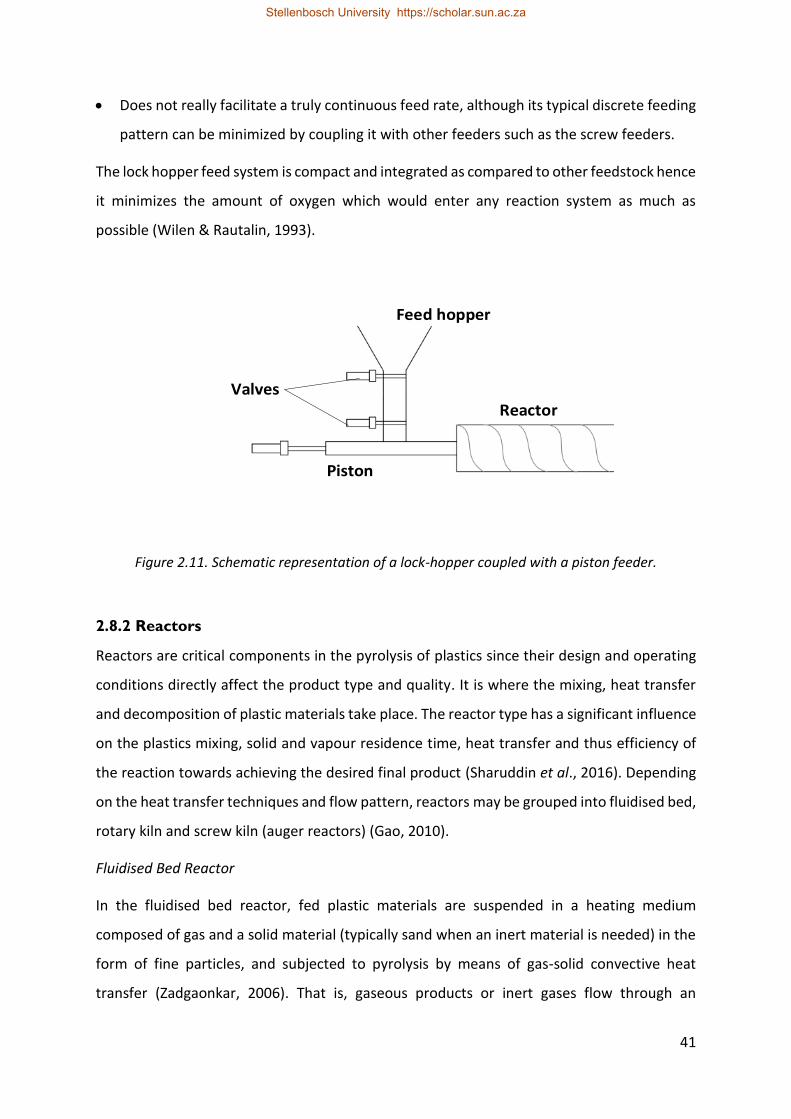
41
• Does not really facilitate a truly continuous feed rate, although its typical discrete feeding
pattern can be minimized by coupling it with other feeders such as the screw feeders.
The lock hopper feed system is compact and integrated as compared to other feedstock hence
it minimizes the amount of oxygen which would enter any reaction system as much as
possible (Wilen & Rautalin, 1993).
Valves
Piston
Reactor
Feed hopper
Figure 2.11. Schematic representation of a lock-hopper coupled with a piston feeder.
2.8.2 Reactors
Reactors are critical components in the pyrolysis of plastics since their design and operating
conditions directly affect the product type and quality. It is where the mixing, heat transfer
and decomposition of plastic materials take place. The reactor type has a significant influence
on the plastics mixing, solid and vapour residence time, heat transfer and thus efficiency of
the reaction towards achieving the desired final product (Sharuddin et al., 2016). Depending
on the heat transfer techniques and flow pattern, reactors may be grouped into fluidised bed,
rotary kiln and screw kiln (auger reactors) (Gao, 2010).
Fluidised Bed Reactor
In the fluidised bed reactor, fed plastic materials are suspended in a heating medium
composed of gas and a solid material (typically sand when an inert material is needed) in the
form of fine particles, and subjected to pyrolysis by means of gas-solid convective heat
transfer (Zadgaonkar, 2006). That is, gaseous products or inert gases flow through an
Stellenbosch University https://scholar.sun.ac.za

42
expanded bed of plastic feedstock and other bed materials which is usually sand (Gao, 2010).
Its advantages include less temperature gradient and effective heat transfer due to the even
turbulent mixage of gases and bed materials (Gao, 2010). It also has excellent heat and mass
transfer characteristics hence high thermal conductivity and it is widely accepted and utilised
especially in commercial processes (Low et al., 2001; Gao, 2010). Extra advantages of the
fluidized bed reactor include its flexibility with catalysts since they mix up very well with the
reacting medium (Gao, 2010; Sharuddin et al., 2016). Fast or flash pyrolysis is usually
performed with this type of reactor (Jung & Fontana, 2006). The main disadvantage of the
fluidised bed reactor is; it requires uniform particles in terms of size and density to allow
control of fluidisation, making it suitable for only homogenous feeds and not different kinds
of plastic mixtures (Gao, 2010). A schematic representation of a fluidised bed reactor is
depicted in Figure 2.12.
Figure 2.12. Scheme of a fluidised bed reactor (Adapted from Williams & Williams, 1999b)
Screw kiln reactors
The screw kiln reactor is a reaction system that has also been widely used for plastic
processing (Serrano et al., 2003; Jung & Fontana, 2006; Kodera et al., 2006; Aguado et al.,
Stellenbosch University https://scholar.sun.ac.za

43
2008; Gao, 2010). It comprises of an externally heated extruder that conveys plastic feedstock
from the feeding system to the other end of the extruder, and in the process converts
feedstock materials into volatiles and residues which are separated and collected (Aguado et
al., 2006; Gao, 2010). The screw kiln reactor is driven by an external motor, therefore plastic
melts easily flow irrespective of their high viscosity, which is a noteworthy advantage (Aguado
et al., 2006). Both melted plastics and plastic solid particles are compatible with the screw
kiln reactor. The radial temperature gradient of the extruder is minimised due to its small
diameter as well and highly efficient blending of materials (Aguado et al., 2006; Gao, 2010).
Residence time is controlled by adjusting the rotation speed of the extruder. A screw kiln
reactor system is shown in Figure 2.13.
Carrier gas feedFeedstock inlet
Zone 1 Zone 2
Reactor
Condenser
Figure 2.13. Schematic representation of a screw kiln pyrolysis reacting system showing the screw kiln reactor (Adapted from Serrano et al., 2003)
Rotary kiln reactors
The rotary kiln reactor is usually made from steel and normally with an inclination to facilitate
the movement of feed materials downstream. Its internal surface is usually sheltered with
refractory material to cushion the metal surfaces from extremely high temperatures (Zajec,
2009). In special cases, specific dampers are attached to the inlet section to prevent the entry
of oxygen into the reaction chamber or exit of gaseous product into the feeding system during
material feeding (Zajec, 2009). Baffles inside the reactor aid with mixing and flow of materials.
The main advantage of the rotary kiln reactor is that rotation ensures continuous turning and
Stellenbosch University https://scholar.sun.ac.za

44
blending of plastic materials as the reaction proceeds, such that the mixture is persistently
homogenised and mixed with the inert gas, thereby forming uniform pyrolytic products (Li et
al., 2004; Zadgaonkar, 2006). Also, it has easily adjustable residence time of solids, which
facilitates the control of pyrolysis reactions, and it can process solid waste of varying shapes
sizes (Li et al., 2004; Zadgaonkar, 2006). They are relatively cheaper compared to fluidised
bed and screw kiln reactors. Due to high degree of mixing that allows efficient heat exchange
and considerable flexibility pertaining to the size and type of materials that the rotary kiln
reactor can accomodate, it is very much suitable for slow pyrolysis (Zajec, 2009) and possibly,
intermediate pyrolysis. Various commercial and pilot scale pyrolysis plants for waste tyres and
plastics have been successfully employed, using rotary kiln reactors in their processes. They
include the Kobe Steel commercial plant and the Italian ENEA Research Centre Trisaia pilot-
scale plant (Li et al., 2004). A schematic representation of a rotary kiln reacting system is
shown in Figure 2.14.
Feedstock
Reaction
Volatiles
Char
Rotation
Figure 2.14. Schematic representation of a rotary kiln reactor (Adapted from Zajec, 2009)
Table 2.9 (Arena & Mastellone, 2006) compares some key parameters, features and
advantages of the different types of reactors discussed above. These include; operating
temperature ranges, suitable particle size, process flexibility, costs and scale-up problems.
From the table, all reactors can all operate at temperatures of up to 800 ᵒC. Also, fluidised
Baffles
Stellenbosch University https://scholar.sun.ac.za

45
bed and screw kiln reactors have more substantial process flexibilities compared to rotary kiln
reactors. The process flexibilities include easily adjustable vapour residence time, pressure
and temperature. In terms of scale-up complications, the rotary kiln reactor appears to be the
best as compared to the other three reactors, giving the least problems when it comes to
scale-up issues. The fluidised bed reactor is cheaper and easy to maintain as compared to the
rotary kiln and screw kiln reactors. However, it is more difficult to get it into stable operation,
especially with heterogeneous waste materials.
Table 2.9. Comparing different types of reactors (Adapted from Arena & Mastellone, 2006)
Bubbling fluidized bed
Rotary kiln Extruder/Screw
Temperature profile
Temperature is almost constant in vertical direction but limited variation in radial direction
Longitudinal as well as transversal gradient may be large and not easy to control
Two zones are recommended: one at ˂ 150˚C to remove volatile fractions and one ˃ 250˚C to extract HCl gas in case of PVC pyrolysis
Temperature range (˚C)
500 - 850 450 - 800 200 - 520
Heat exchange and transfer
Very efficient exchange. Large heat transfer activated by solids circulation
Relatively poor exchange. Then there is often the necessity of long cylinder kilns
Degradation occurs by exposure to thermal and mechanical work (shear forces)
Particle size Narrow size distribution. Mean particle diameter between 0.008 and 3 mm. bed particles attrition and consequent entrainment may be severe
No problem for size. Any size can be treated from fines to large lumps
Plastic feedstock needs to be shredded to the size of side-plates
Stellenbosch University https://scholar.sun.ac.za

46
Bubbling fluidized bed
Rotary kiln Extruder/Screw
Residence time of the feed
Particles spend substantial time (mins or hours) in the bed. Gas residence time depends on gas velocity that is below 2 m/s
Very long (1-2 h)
As long as required for full conversion
Conversion Mixing of solids and gas bypassing can determine performance poorer than other reactors
Conversion can be high
Preferably used as a pre-treatment before feedstock recycling process
Process flexibility
Excellent. Can be used for low- and high-temperature pyrolysis with or without catalyst. Can treat different plastic wastes
Limited. Operating parameters (residence time, temperature, etc.) can be varied in a narrow range.
Permits highly diverse mixed-plastics to be effectively and efficiently converted into a liquid form
Products quality and value
Likely to be high especially in processes for monomer recovery and high temperature situations
The difficulty in temperature control leads to a wide range of products
Either homogeneous liquid or granules are formed depending on the conditions. In very high temperature conditions however, volatiles are produced
Scale-up problems
Must be cautiously considered. Pilot plant is usually important
Generally, not significant
Suitable screw diameter
Stellenbosch University https://scholar.sun.ac.za

47
Bubbling fluidized bed
Rotary kiln Extruder/Screw
Costs Moderate. Low maintenance cost
Moderate cost of investment. Large maintenance cost because of rotating parts and the fouling and erosion of the inner surface
Single screw is less expensive, Double screw are more expensive with counter rotating twin screws being an intermediate in terms of cost
Depending on feeding and product withdrawal technique, reactors can be categorised into
batch, semi-batch and continuous. In batch processes, reactor is charged with feedstock, prior
to the commencement of the process or after a cycle is complete. In the continuous reactor
configuration, feedstock continuously enter and exit the system. In the semi-batch reactor
configuration, the feed materials are added continuously but products accumulate and are
discharged all at once (Felder & Rousseau, 2005). Batch and semi-batch reactors are used
purposely for research because they have simple design and their control parameters are
much easier to regulate whereas continuous processes are much suited for commercial
operations because feedstock recharging is much cheaper compared to batch processes and
also, they increase productivity due to their high efficiency (Williams & Williams, 1997 cited
in Gao, 2010; Sharuddin et al., 2016).
2.8.3 Condensers
Pyrolysis hot vapours consist of compounds with different chemical and physical properties.
The condensation process therefore helps in collection and segregating the various
compounds in the hot volatiles into several fractions. It involves the process where the
pyrolysis vapours from the reactor are passed through series of condensers operating at
different temperatures and this facilitates the collection of condensed fractions based on
their physical and chemical properties. Different types of condensers are employed in
pyrolysis processes. These include; the shell and tube heat exchanger and ASTM D86 type
(comprises of a tube immersed in a water bath), etc. The most commonly used is the shell
Stellenbosch University https://scholar.sun.ac.za

48
and tube heat exchangers due to their advantages of efficient heat transfer and ease of
cleaning/ maintenance (Stonecypher, 2009).
Shell and tube heat exchanger
The shell and tube heat exchanger/condenser for pyrolysis vapours is made up of many tubes,
placed within a steel shell as shown in Figure 2.15, with water flowing in the tubes and hot
vapours flowing around the tubes. Upon contact with the tube surface, the vapours condense
and drop down the condenser. The shell and tube heat exchanger have a very large surface
area for heat transfer although in a relatively small confinement, which makes it portable to
use (Stonecypher, 2009).
Figure 2.15. Schematic representation of the shell and tube heat exchanger (South west thermal technology, 2016)
2.8.4 Some Pilot and Commercial Scale Plastic Pyrolysis Plants
When experiments performed at laboratory scale looks promising, they are subsequently
scaled up to commercial standards. Nevertheless, scale up directly from bench scale to
commercial scale is difficult to attain and hence pilot plants are very vital in confirming the
validity of laboratory-scale tests and also simulating industrial stage processes (Arena and
Mastellone, 2006). A number of pilot plastics pyrolysis plants have been in operation
worldwide. Some pilot and commercial plastics pyrolysis plants have been described below.
Stellenbosch University https://scholar.sun.ac.za

49
Hamburg ABB
This plant was established by the University of Hamburg, Germany, as a pilot scale plant
operating at 40 kg/h. Their main feedstock was shredded plastic waste with very minimal PVC
content (Kaminsky, 2006). They employed a bubbling fluidized bed in converting the plastic
materials into high yields of olefins, rather than paraffins and naphthenes, as well as oils rich
in benzene, toluene and xylene (BTX) aromatics (Kaminsky, 2006). The reactor operated in
the temperature range of 600 to 800 ˚C, as was purged with steam and nitrogen gas (Arena
& Mastellone, 2006).
Veba Oel
Established by Veba Oel AG in Gelsenkirchen, also in Germany, operates at 500 kg/h, using an
indirectly heated rotary kiln reactor, preceded by a screw feeder. Operating temperatures
were in the range of 650 - 850 ˚C. The plant converts waste plastic materials and vulcanized
elastomers into mainly gas, oil and char. Char produced by this process contains close to 80%
elemental carbon, and it is further treated in gasification and hydrogenation plants (Behzadi
& Farid, 2006; Ali and Siddiqui, 2006). They also have another plant which operates at 12.5
tons/h in Ruhr area, Germany (Arena & Mastellone, 2006).
Fuji
Fuji Recycle Industries, in collaboration with Mobil Oil, Nippon Steel Corp., and Shinagawa
Fuel Corp. operate the Fuji pyrolysis plant. Their technology includes an extruder followed by
a fixed bed reactor. Extrusion of feed materials mixed with recycled liquid stream from the
reactor takes place at 300 ˚C, followed by the thermal decomposition in the first chamber of
the reactor and then catalytic cracking in the second part of the fixed bed reactor at 400˚C
(Walendziewski, 2006). Their main feedstock is polyolefin from industrial waste stream with
final products being gasoline, kerosene and diesel (Yanik & Karayildirim, 2006). A pilot plant
operating at 400 tonnes/year was initially established, which was later scaled up to a
demonstration plant operating at 5000 tonnes/year in Okegawa City and Aioi City respectively
all in Japan (Arena and Mastellone, 2006).
From the review, the following segments were considered during the design of the pyrolysis
pilot plant;
Stellenbosch University https://scholar.sun.ac.za

50
1. Lock hopper coupled with a piston feeder.
2. A rotary kiln reactor and
3. Glass condenser tubes immersed in water
A lock hopper coupled with a piston feeder was chosen because from the mode of operation
of the lock-hopper, minimal amount of oxygen enters the system during feeding which is key
in every pyrolysis process. Also, the lock-hopper was selected because it can handle a wide
variety of feedstock that includes biomass, waste tires, fibres just to mention a few.
Moreover, a piston feeder was preferred as an attachment to the lock-hopper because it
consumes less amount of energy compared to other feeders such as the screw feeder. It can
also handle sticky and stringy feedstock materials. Just like the hopper, the piston feeder is
also compatible with wide range of feedstock materials. Unlike the screw feeder, blockage
hardly occurs in the piston feeder.
Furthermore, a rotary kiln reactor was selected because compared to the screw kiln and the
fluidised bed reactor, it comes with minimal complications resulting from scale-up from bench
to pilot scale processes. Also, in terms of slow and intermediate pyrolysis mechanisms, the
rotary kiln reactor is very similar to the bench scale reactor that will be used in the study and
hence will make results easily comparable. In terms of costs, it is cheaper than screw kiln and
fluidised bed reactors. Unlike screw kiln and fluidised bed reactors, the rotary kiln reactor can
accommodate wide range of feedstock sizes from fine materials to larger lumps.
Glass condenser tubes immersed in water was preferred because of it is cheaper as compared
to the shell and tube heat exchanger. Also, it is easier to operate and maintain.
2.9 Key Conclusions drawn from literature
1. Pyrolysis conversion of polypropylene (PP) begins around 300 ˚C and ends at about
520 ˚C. However, 450 - 500 ˚C was deduced as the temperature range within which
optimum condensable products (oil and wax) yield from PP pyrolysis is likely to be
attained.
2. For batch processes, secondary cracking reactions tend to dominate PP pyrolysis at
temperatures beyond 500 ˚C which leads to the production of more permanent gases
over condensable products. Therefore, to promote yield of condensable products,
higher temperatures should be avoided.
Stellenbosch University https://scholar.sun.ac.za

51
3. For fluidised bed processes, it was inferred that heating rate of the process increases
with increase of temperature hence compared to batch, secondary cracking reactions
begin to occur at a much lower temperature (just after 450 ˚C).
4. The heating rate trend observed for fluidised bed reactors is similar to batch scale pre-
heated reactors where increase in temperature also increases the heating rate, which
in effect enhances rapid degradation of PP. It was also infered that slow heating rates
in the range of 5 - 25 ˚C for batch scale pyrolysis of PP have no significant effect on
condensable products yield.
5. Vacuum pyrolysis of PP exhibited promising yield of condensable products when
compared to atmospheric pyrolysis. However, the effects of varying temperature and
heating rate on condensable products yield and quality under vacuum is barely
reported in literature. Therefore, it warrants investigation.
6. At temperatures below 600 ˚C, paraffins and naphthenes dominated condensable
products recovered from PP pyrolysis followed by olefins with aromatics being the
least. Nevertheless, at temperatures beyond 600 ˚C, secondary cracking reactions
convert paraffins and olefins into more aromatic products.
7. Boiling point range of oils/waxes recovered from PP pyrolysis revealed that they
contain compounds that fall in both diesel and gasoline range.
Stellenbosch University https://scholar.sun.ac.za

52
Materials and methods
3.1 Introduction
This chapter entails the stepwise approach employed in performing various experiments
conducted as part the study, together with a description of all equipment used. Outline
includes; feedstock preparation and characterisation, pyrolysis conversion processes (which
also entails the description of pyrolysis setups) and products characterisation.
3.2 Feedstock supply and preparation
Industrial waste polypropylene (PP) was obtained from Zibo containers, manufacturers of
plastic bowls, punnets and other plastic containers located in Blackheath, Kuils River, South
Africa. These plastics were virtually free of other non-plastic contaminants except for
additives added during manufacturing. Feedstock was a mixture of chipped black and white
pigments of PP with particle size ranging between 4 - 6 mm. The feedstock was mixed up
thoroughly followed by sub-sampling using cone and quarter procedure described by Gerlach
et al., (2002). In this method, a pile of the thoroughly mixed PP sample was placed on a thin
film of plastic spread out on the floor. The pile was then flattened after which a thin, flat piece
of cardboard was driven through the middle of the pile perpendicularly, to separate the pile
into nearly two equal halves. The cardboard was lifted from the sample and rotated 90 ° from
the position that was used to divide the pile initially and driven through the sample once more
in the new position resulting in the pile being divided into four separate, nearly equal
segments. Piles collected from two diagonal segments were combined (second and fourth
quadrants, starting from the upper right in this case) and coned and quartered further in the
same manner described above, each time discarding the piles from the other two diagonals
and saving them for subsequent quartering. Following sub-sampling, about 10 g of sampled
PP was fed into a Retsch mill (ZM 200) which generated much smaller particles with sizes
about 2 mm. The milled products were used for characterisation experiments carried out on
milligram scale. All samples were kept in air-tight plastic bags to avoid contamination.
Stellenbosch University https://scholar.sun.ac.za

53
3.3 Feedstock characterisation
Proximate analysis of feedstock to determine the moisture, volatiles, fixed carbon and ash,
was performed using a Mettler Toledo TGA/DSC 1 Star System Thermogravimetric Analyser
in accordance with ASTM E1131. The thermal degradation behaviour of the feedstock was
also studied using the Mettler Toledo TGA/DSC 1 Star System where 44 mg of the sample was
heated from 30 ºC at a ramp rate of 20 ºC/min to a final temperature of 600 ºC under nitrogen
gas running at a flowrate of 80 mL/min.
HHV of the feedstock and condensable products were determined based on ASTM standard
D5865-11a using a bomb calorimeter (Cal2K Eco Calorimeter, model 2013) calibrated using
benzoic acid.
Elemental analysis was performed using Vario EL Cube Elemental Analyser based on ASTM D
4239 and ASTM D5373. In this method, plastic samples were combusted in a column filled
and enriched with Tungsten Trioxide (WO3) and oxygen at a temperature of 1050 ᵒC. The
combustion generated CO2, H2O, NOX, SO2 and SO3 from which the amounts of the various
elements were deduced.
3.4 Pyrolysis conversion
3.4.1 Bench scale pyrolysis
The bench scale setup is a gram scale unit and considered as a scale-up version of milligram
scale experiments in the TGA.
Bench-scale setup description
Figure 3.1 is a graphical representation of the pyrolysis setup used for all bench-scale
experiments. The various units of the setup are described below; a nitrogen cylinder from
which technical grade nitrogen (99.99% purity, Afrox, South Africa) was supplied, a nitrogen
flow controller which regulates the flow of nitrogen gas into the reactor, a well-insulated
electric furnace which houses a stainless-steel tubular reactor within which a quartz boat
where samples are fed, is placed. The tubular reactor is 1 m long with internal diameter of 60
mm. For fast-insertion tests, the tubular reactor has a feeding chamber attached, where
samples are kept while reactor is pre-heated, and samples are introduced into the centre of
the reactor only when the final setpoint temperature has been attained. This feeding chamber
Stellenbosch University https://scholar.sun.ac.za

54
is joined to the tubular reactor by a tri-clover fitting. The sample is pushed to the centre of
the reactor with the help of a sliding handle. Two K-type thermocouples are placed at the
middle of the reactor to monitor the reactor wall and sample temperature (close to the
centre).
Next is a set of condensation train where hot volatiles exiting the reactor were condensed.
The condensation train consists of an ambient condition condenser made of stainless-steel,
positioned at the exit of the reactor. Most heavy molecular weight condensable products (oils
containing some wax) were recovered in this condenser (see Appendix D). Following the
ambient condenser is a set of four (4) glass condensers connected by thick-walled rubber
tubing. These condensers were cooled using dry ice (Afrox, South Africa) which facilitated the
capture of most light fractions of condensable products (wax-free oils) (also presented in
Appendix D). An auxiliary part of the setup is a vacuum pump which is connected to the exit
point of the last condenser in case experiments are to be performed under vacuum
conditions.
N2
P
968 mm
Ø ID 59.5 mm
2
1 34
56
8
7
Dry ice condensers
Dry ice condensers
Ø OD 63.5 mm 9
475 mm
1. Tubular Reactor2. Sample boat containing sample3. Tri-clover fitting4. Sliding handle5. Sample thermocouple6. Reactor thermocouple7. Ambient condenser8. Vacuum pump9. Electric Furnace
Figure 3.1. Representation of the bench-scale pyrolysis setup
Stellenbosch University https://scholar.sun.ac.za

55
Bench-scale experimental procedure
Based on the thermal degradation behaviour of PP studied and described in Section 3.3, four
different temperatures were examined at each of the four types of pyrolysis conditions
devised. These are; 450 ºC, 488 o C, 525 ᵒC and 600 o C. For slow pyrolysis experiments, samples
were placed at the centre of the reactor and heated gradually at a rate of 15 ᵒC/min from
ambient to the final temperature. For fast-insertion experiments, reactor was pre-heated to
the final temperature before samples were introduced to the middle of the reactor hence
sample was heated rapidly at estimated heating rates (based on sample thermocouple)
ranging between 170 - 180 ᵒC/min. For experiments under ambient conditions, a nitrogen
flow of 0.5 L/min was used throughout the course of the experiment to remove any oxygen
from the system during reactor purge and to sweep generated volatiles from the hot part of
the reactor to condensers. For both heating rates, samples were kept for 60 mins after the
maximum temperature has been reached to ensure complete conversion.
For experiments under vacuum, nitrogen supply was disconnected and a two-stage vacuum
pump (Instruvac) was connected at the exit point of the last condenser to aid in sweeping
volatiles from the hot part of the reactor and to keep the system inert. Vacuum pressure used
for all experiments ranged between 90 to 95 kPa below atmospheric.
Permanent gases generated under both atmospheric and vacuum conditions were collected
in tedlar bags and analysed using a compact GC described in Section 3.5.2. Char products
(usually in small quantities) remain in the sample boat after the conversion. Prior to each
experiment, a leak test was performed with the vacuum pump to ensure that no oxygen was
present in the system during the tests. For all experiments, 20 g of sample was fed. All
experiments were conducted in replicates to ensure consistency of the results.
3.4.2 Pilot conversion
Pilot plant setup description
A 5 kg/h pyrolysis pilot plant was installed in the context of this study with the objective to
mimic the tests from bench scale experiments at pilot scale. This was necessary because of
the different reactor configurations of bench and pilot scale reactors.
With the help of our suppliers, Technotherm Superior Thermal Technologies, the system was
designed. It was assembled by Technotherm in Johannesburg, South Africa and commissioned
Stellenbosch University https://scholar.sun.ac.za

56
at Stellenbosch University. As shown in Figure 3.2, the pilot plant comprises the feeding
section, the reactor, residue box, a set of condensation train, gas towers, oxygen analyser and
a PLC where process parameters such as temperature, and retort rotation speed are
controlled.
The feeding system consists of a lock hopper where samples are fed and two pneumatic valves
which open and close in a step-wise fashion after samples have been fed. That is, the first
valve opens and closes to receive samples after which the second also follows the same
mechanism so that the sample is introduced in the piston chamber. This is to minimise the
amount of oxygen entering the unit during feeding. The piston, which is the second part of
the feeding system, then pushes samples deposited from the hopper into the reactor. This
design was based on the lock-hopper and piston feeding system presented by Wilen &
Rautalin, (1993) and Dai et al., (2012) respectively.
The reactor is where conversion of materials occurs. It is a rotary kiln within which a spiral
screw (baffle) is fitted. The rotation of the reactor enhances efficient heat transfer. Also, the
baffle helps in propelling samples across the reactor till the residues are deposited in the
residue box. Generated hot volatiles then progress to the condensation train.
The condensers are four glass jars immersed in chilled water. The heaviest oil fractions (oils
containing some wax) were recovered in the first with the lightest oil fractions (wax-free oils)
recovered in the last. Incondensable gases were sampled after the 4th condenser in regular
time intervals using tedlar bags and analysed with the help of the CompactGC 4.0 (Global
Analyser Solutions) described in section 3.5.2. The gases were also captured in the gas towers
filled with water, after which their volumes were recorded. The towers operate such that,
gases displace the water. Volumes of gases together with the concentrations of the main
compounds measured by GC, aided in the estimation of the mass of gases generated and
subsequently, the mass balance of the process. A vacuum pump with vacuum suction just
about 2 kPa, abs (below atmospheric) was connected before the towers to help in the quick
extraction of volatiles from the reactor and the gas towers. Nitrogen gas flow of 5 L/min was
used to purge the system for 15 minutes before samples were fed. In addition, an average
nitrogen gas flow of about 1.5 L/min was used to sweep volatiles from the reactor during
conversion.
Stellenbosch University https://scholar.sun.ac.za

57
N2
1
2
4
5
6
3
7
91.Electric furnace2. Rotary kiln pyrolyser3. PLC4. Lock Feed Hopper5. Piston6. Char collection box7. Condensers8. Vacuum pump9. Gas towers10. Reactor thermocouples11,12. Pneumatic valves13. Oxygen Analyser
10
11
12
13
8
750 mm
Ø200 mm
Figure 3.2. Schematic representation of the pilot plant
Pilot experimental procedure
Five temperatures were examined at the pilot level. These include, 450, 460, 488, 507 and
525 ºC. Modifications to the temperatures examined on the bench were made on the pilot
because the pilot’s configuration promoted severe cracking reactions when compared to
bench scale reactor and hence more permanent gases were likely to be produced at severe
temperatures. Since the target was condensable products, attention was given to much lower
temperatures on the pilot and hence the inclusion of temperatures, 460 and 507 ºC and the
exclusion of 600 ºC. For each experiment, reactor was pre-heated to the selected
temperatures before samples were fed. A total of about 3.6 kg of sample was fed for each
run. The pneumatic valves on the lock hopper open every 72 s, and about 50 g of sample is
fed per cycle after which the piston moves in the forward direction to convey the samples
into the reactor. Following complete feeding, conversion is allowed to progress until there
are no more volatiles coming out of the reactor, which is an indication of complete
conversion. This is determined based on the results from GC analysis of gases, showing
negligible concentrations of gases characteristic of PP conversion. For temperatures 488 to
525 ºC, complete conversion took about 2 hours after feeding whereas complete conversion
could take up to 4 hours for temperatures, 450 and 460 ºC after feeding. The rotation speed
of the retort was 25 Hz for all tests, which corresponds to 50% of the maximum retort rotation
speed.
Stellenbosch University https://scholar.sun.ac.za

58
Char and solid wax products were recovered in the residue box as two separate layers with
char collected at the bottom. These solid products fell upon opening the residue box from
bottom after which the char was gently scrapped off and weighed separately. Oils were
mostly recovered in the condensers with oils in condenser 1 containing high amounts of wax
at the pyrolysis temperatures, 488 - 525 ᵒC. However, oils recovered in the same condenser
at temperatures 450 and 460 ᵒC contained relatively low wax fractions. Detailed description
of the distribution and appearance of these condensable products have been made at section
4.5.1. Permanent gases were sampled in tedlar bags only when the piston moves forward.
This is because, the forward movement of the piston generates some pressure build up that
enables efficient movement of volatiles into the tedlar bags. Reverse movement of the piston
creates a negative pressure which inhibited gas sampling. Gas towers were switched from one
to the other when the gases occupied about three-quarters the total volume of the tower.
Volume of gases were then recorded before refilling the towers with water. Like bench scale
tests, all tests at different temperatures were conducted in replicates to confirm reliability.
3.5 Products characterisation
The techniques under this section are relevant for oil and gaseous products coming from both
bench and pilot tests. Except that for pilot tests, Physico-chemical properties of condensable
products (oil and wax) were performed in addition.
3.5.1 Gas Chromatography/Mass Spectrometry (GC/MS)
Simulated distillation (see Appendix C) was used to group the compounds present in oil/wax
products into diesel and gasoline fractions. Simulated distillation is a chromatographic
technique which correlates retention times with boiling points of compounds (Das & Tiwari,
2018). A standard of known composition was injected and used as a benchmark for grouping
compounds into different fractions (Arabiourrutia et al., 2012). A C7 - C40 mixture of saturated
alkane standard (Supelco, USA) was used for grouping detected compounds into gasoline and
diesel fractions. Peaks eluting with retention times between those of C6 and C10 alkanes were
grouped as gasoline while C11 and C23 alkanes were grouped as diesel. Chloroform (99% purity,
BDH Analytical Chemicals) was used as solvent for all samples. Samples containing mixtures
of oil and wax were thoroughly stirred to mix up before analysis to ensure a uniform
Stellenbosch University https://scholar.sun.ac.za

59
representative sample was used. For all tests, peak area was assumed to be the mass of
compound detected.
An Agilent Technologies 7890A gas chromatograph coupled with an Agilent Technologies
5975C mass spectrometer (mass-selective detector) was used for the analysis. A Zebron ZB-
1701:002 column (length – 60 m; internal diameter – 0.25 mm and film thickness – 0.25 μm)
was used for separation. Helium was used as the carrier gas with a steady flowrate of 1.3
mL/min. The process was started by heating the oven at 45 ºC and held for 10 minutes, then
increased to 100 ºC at a heating rate of 2 ᵒC/min. It was finally heated from 100 ᵒC to 260 ᵒC
at a heating rate of 7 ᵒC/min and held there for 20 minutes. Injected volume of samples per
run was 1 μL and a split ratio of 20:1 was employed.
3.5.2 Gas Analysis
Analysis of the permanent gases for both bench and pilot scale tests, followed the same
method used in previous studies by Mundike et al., (2017) and Brown et al., (2019) where a
CompactGC (Global Analyser Solutions) was calibrated to quantify concentrations of nitrogen,
C1 - C5 linear hydrocarbon gases, hydrogen, carbon monoxide and carbon dioxide. Mixtures of
known concentrations of these gases (Afrox, South Africa) were used for the calibration. N2
was employed as an internal standard to determine the yield of each gas compound. The
CompactGC was made up of three channels. The first channel consisted of a Molsieve 5A
column heated at 65 °C and a TCD detector used for the analysis of N2, H2, CO and CH4. The
second channel comprised of a PP-Q-bond column at 50 °C and a TCD detector that was used
for the analysis of CO2, C2H4 and C2H6. The third channel was equipped with a Rtx-1 column
at 45 °C coupled with an FID detector used for the analysis of C2 - C4 hydrocarbons.
For pilot and atmospheric experiments at bench scale, permanent gases were collected at the
end of the 4th condenser in tedlar bags at regular time intervals and fed immediately into the
CompactGC 4.0 gas chromatograph. For vacuum conditions at bench-scale, gas sampling was
done at the exit point of the vacuum pump. The maximum volume of the bag (5 L) and the
time it takes to completely fill the bag (77 sec) were used to estimate the volume of gas that
was sampled per minute (about 3.9 L). This volume coupled with volume fractions obtained
from the CompactGC were used to calculate the total mass of gases produced and to
complete the mass balance of the process.
Stellenbosch University https://scholar.sun.ac.za

60
3.5.3 Fuel Tests
Oil products derived from pilot experiments were subjected to the following fuel tests to
verify how they compare with commercial diesel and gasoline fuels.
i. Density @ 20 ᵒC, in accordance with ASTM D4052. For the procedure, a small
volume of about 1 - 2 mL of condensable product (sample) was introduced into an
oscillating sample tube and the changes in oscillating frequency (caused by the
change in the mass of the tube) in conjunction with calibrated data were used to
determine the density.
ii. Kinematic Viscosity @ 40 ᵒC, in accordance with ASTM D445. This employed the
reverse or straight flow viscosity tubes that were immersed in a water bath. About
10 mL of condensable product (sample) was introduced into the viscosity tubes
which was clean, dried and already calibrated. The viscosity tube was then
immersed in a water bath at a stable temperature of 40 ± 0.02 ᵒC after which a
vacuum pump was used to draw samples until it reached the upper meniscus of
the viscosity tube. A stopwatch was then used to count the flow time between the
upper and lower meniscus. This was repeated for each test sample and Equation
3.1 was used to estimate the kinematic viscosity for each sample.
Where,
𝑣 - kinematic viscosity (mm2/s)
C - viscosity calibration constant (mm2/s)/s
t - flow time (s)
iii. Distillation to determine boiling point range, in accordance with ASTM D86. This
was performed using atmospheric distillation at ambient pressure. For the
process, 100 mL of condensable product was transferred into a flat bottom flask
equipped with a thermocouple used for the distillation. The flask was heated to
keep a distillation ratio of 4 mL/min and 5 mL/min. The distilled sample was
condensed and collected in a measuring cylinder at room temperature. The
distillation volume recovered at 250, 350 and 365 ᵒC together with the initial and
final boiling point temperatures were recorded. The temperature at which the first
𝑣 = 𝐶𝑡 3.1
Stellenbosch University https://scholar.sun.ac.za

61
drop of distillate was recovered was identified as the initial boiling point (IBP)
whereas the temperature at which all samples in the distillation flask evaporated
was recorded as the final boiling (FBP). The temperatures at which the following
volumes of condensates were recovered were also recorded. Volumes include
10%, 50%, 90% and 95%.
iv. Pour point, in accordance with ASTM D97. This test employed cooling samples in
a specified glass tube in a bath containing Isopropyl alcohol and Dry ice. The
sample was cooled at specific rates and examined at intervals of 3 ᵒC for flow
characteristics. The lowest temperature at which sample stops flowing was then
recorded to be the pour point.
v. Aniline point, in accordance with ASTM D611. This was performed by mixing equal
proportions of aniline with condensable products after the which the resultant
mixture was heated till a complete mixage was obtained. Thereafter, a
thermometer was used to check the temperature at which the mixture separated
or got hazy and was recorded as the aniline point.
vi. Cetane Index was estimated by calculation using parameters from density of
samples at 15 °C and temperatures at which 10%, 50% and 90% distillation
condensates were obtained. Equation 3.2 was used for the estimation and is
known as the four variable equation in accordance with ASTM D4737 (Drews,
1998; Owusu et al., 2018).
𝐶1 = 45.2 + 0.0892𝑇10𝑁 + (0.131 + 0.901𝐵)𝑇50𝑁 + (0.0523 − 0.420𝐵)𝑇90𝑁
+ 0.00049(𝑇10𝑁2 − 𝑇90𝑁
2 ) + 107𝐵 + 60𝐵2
3.2
Where,
CI- Calculated Cetane Index
𝑇10𝑁 = 𝑇10 − 215
𝑇50𝑁 = 𝑇50 − 260
𝑇90𝑁 = 𝑇90 − 310
𝐵 = [𝑒𝑥𝑝−3.5(𝜌−0.85)] − 1
ρ- Density of sample
Stellenbosch University https://scholar.sun.ac.za

62
A set of tests required about 250 ml of oil sample hence only oils from condensers 1 and 2
have been characterised for fuel. Oils from condensers 3 and 4 were not enough for fuel tests.
Also, waxy oils obtained at higher pyrolysis temperatures (488 - 525 ᵒC) could not be
characterised for distillation, flash point, cetane index and aniline point due to their high
viscosity. All fuel test experiments were performed by Intertek, Cape Town except aniline
point, which was performed by Intertek, Durban, all in South Africa.
Stellenbosch University https://scholar.sun.ac.za

63
Results and discussion
4.1 Introduction
This chapter tackles the effects of temperature and heating rate on condensable products (oil
and wax) yield and quality under atmospheric and vacuum pyrolysis of polypropylene (PP) at
bench scale. Furthermore, experiments performed at atmospheric conditions at bench level
were scaled up to a pilot plant and results obtained were compared. The pilot plant was
designed and commissioned as part of the study. Moreover, condensable products recovered
from the pilot experiment were subjected to fuel tests that include density, viscosity, flash
point and pour point to ascertain how these properties vary with the process parameters
examined and also, how they compare with commercial diesel and gasoline fuels.
4.2 Thermodegradation behaviour and Compositional
Characterisation of PP
4.2.1 Thermal degradation and Proximate analysis of waste PP
Figure 4.1. TGA/DTG curve for PP degradation at 20 °C/min
PP sample was subjected to Thermogravimetric Analysis (TGA) to determine its degradation
with respect to temperature. As shown in Figure 4.1, it was observed that degradation of PP
began and was completed at temperatures of about, 400 ᵒC and 500 ᵒC respectively with
maximum degradation occurring at 475 ᵒC. The single peak detected indicates that
-0.8
-0.7
-0.6
-0.5
-0.4
-0.3
-0.2
-0.1
0.00
10
20
30
40
50
60
70
80
90
100
100 200 300 400 500 600
Sam
ple
weig
ht
(%)
Derivative w
t. loss
(w
t.%
/s)
Temperature (˚C)
TG DTG
Stellenbosch University https://scholar.sun.ac.za

64
degradation of PP is a single-step mechanism. Similar observations were reported by Chan &
Balke, (1997), Lee & Shin, (2007), Jung et al., (2010) and Yan et al., (2015) which possibly
suggests that PP used in this study had identical chemical composition to most PP used in
literature. The degradation temperature range was used as a basis to define temperature
range for bench-scale experiments.
Table 4.1. Proximate Analysis of PP
Compound wt.% (average)
Moisture 0.05 ± 0.01 Volatiles 97.49 ± 0.14 Fixed Carbon 2.00 ± 0.25 Ash 0.46 ± 0.1
TGA was used to conduct proximate analysis on PP samples. As shown in Table 4.1, it was
deduced that the volatile matter was the major component of PP with fraction of about 97.5
wt.% followed by the fixed carbon content with traces of ash and moisture. Volatile matter
represents the possibility of how much volatiles (condensable and permanent gases) can be
harnessed when a material is subjected to pyrolysis. The relatively small amount of fixed
carbon signifies that for conversion under optimal conditions, very little amount of char is
expected. The figures obtained were pretty consistent with those reported by Uçar et al.,
(2016) and Jung et al., (2010) suggesting that chemical composition of PP examined in this
study was similar to those reported in literature. The relatively low content of ash of about
0.5 wt.% obtained as compared to those reported by Uçar et al., (2016) (2.2 wt.%) and Jung
et al., (2010) (3.55 wt.%) signifies that PP examined in this study contained minimal amounts
of additives/contaminants.
4.2.2 Elemental analysis of waste PP
Elemental analysis of PP in Table 4.2 revealed that PP is mainly composed of carbon and
hydrogen with traces of nitrogen, sulphur and oxygen. Fraction of Carbon present was
recorded to be 85.07 wt.% with Hydrogen being 14.16 wt.%. Nitrogen, Sulphur and Oxygen
were present in trace amounts with fractions of 0.05, 0.10 and 0.16 wt.% respectively present.
The C/H ratio of PP waste used in this study (6.0) was very close to those reported by
Stellenbosch University https://scholar.sun.ac.za

65
Heydariaraghi et al., (2016) and Miranda et al., (2001) who all reported C/H ratios of about
6.1 and 5.6 respectively. Since these studies employed pure PP, it implies that PP waste used
in this study is consistent in elemental composition with pure PP. HHV of PP waste used in the
study was recorded to be 45.3 MJ/kg. Sorum et al., (2001) reported very close figure of HHV
(46.4 MJ/kg) for pure PP.
Table 4.2. Elemental Composition of PP
Element wt.% C 85.07 ± 0.41 H 14.16 ± 0.18 N 0.05 ± 0.00 S 0.10 ± 0.00 O (by difference) 0.16 ± 0.23
HHV (MJ/kg) 45.30 ± 0.12
4.3 Atmospheric pyrolysis of PP at bench-scale
Tests under atmospheric pyrolysis of PP at bench scale were performed at four temperatures
(450, 488, 525 and 600 ºC) at slow and fast heating rates under atmospheric conditions. This
followed PP characterisation discussed under section 4.2.1. 400 ºC was not included in the
temperatures to be investigated because initial screening tests showed highly incomplete
conversion of PP waste at this temperature (see Appendix D). Condensable products derived
were characterised for Higher Heating Value (HHV) and Gas Chromatography/Mass
Spectrometry (GC/MS) to determine their energy contents and compositions respectively.
Finally, analysis of permanent gases using a CompactGC was conducted at all conditions to
ascertain gaseous composition and also complete the mass balance of the processes.
4.3.1 Product yield distribution (Atmospheric conditions)
The condensable products recovered in the first condenser at room temperature were waxier
than those recovered under dry ice (next set of condensers) (Appendix D). This could possibly
suggest that condensables recovered in the first condenser, under ambient conditions
contained heavier molecular weight compounds compared to those recovered under dry ice.
Stellenbosch University https://scholar.sun.ac.za
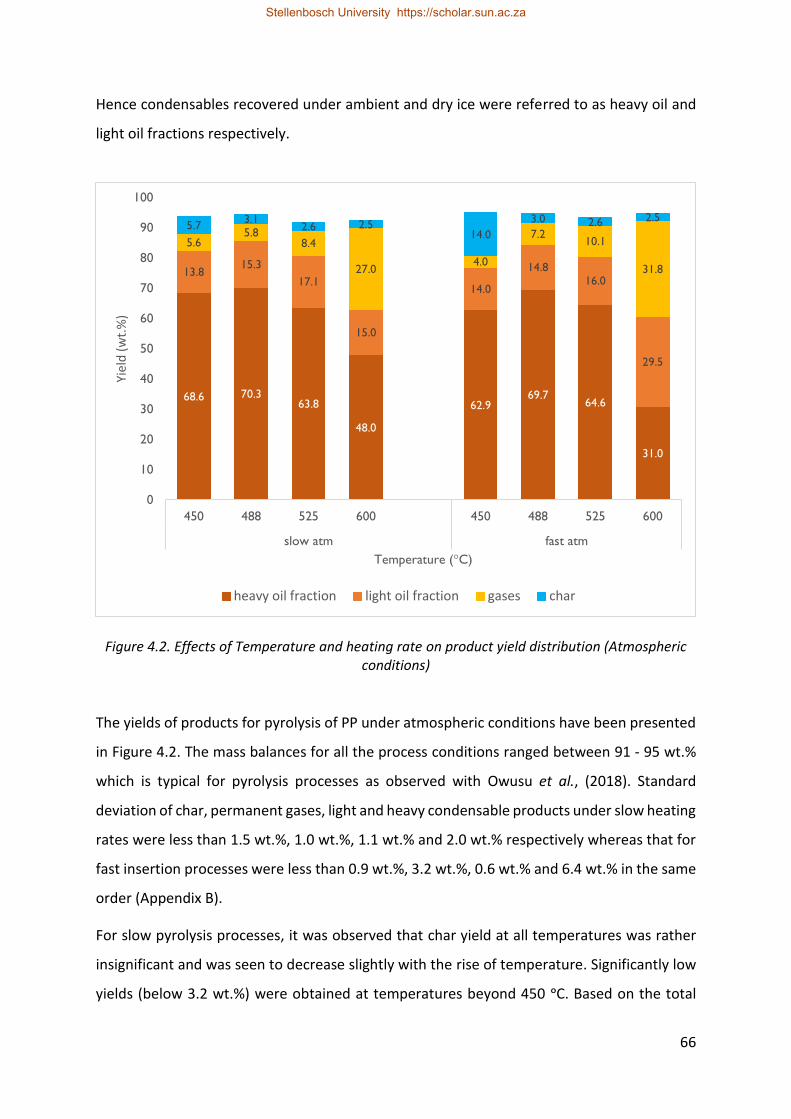
66
Hence condensables recovered under ambient and dry ice were referred to as heavy oil and
light oil fractions respectively.
Figure 4.2. Effects of Temperature and heating rate on product yield distribution (Atmospheric conditions)
The yields of products for pyrolysis of PP under atmospheric conditions have been presented
in Figure 4.2. The mass balances for all the process conditions ranged between 91 - 95 wt.%
which is typical for pyrolysis processes as observed with Owusu et al., (2018). Standard
deviation of char, permanent gases, light and heavy condensable products under slow heating
rates were less than 1.5 wt.%, 1.0 wt.%, 1.1 wt.% and 2.0 wt.% respectively whereas that for
fast insertion processes were less than 0.9 wt.%, 3.2 wt.%, 0.6 wt.% and 6.4 wt.% in the same
order (Appendix B).
For slow pyrolysis processes, it was observed that char yield at all temperatures was rather
insignificant and was seen to decrease slightly with the rise of temperature. Significantly low
yields (below 3.2 wt.%) were obtained at temperatures beyond 450 ᵒC. Based on the total
68.6 70.363.8
48.0
62.969.7
64.6
31.0
13.815.3
17.1
15.0
14.0
14.816.0
29.5
5.65.8
8.4
27.04.0
7.210.1
31.8
5.73.1
2.6 2.514.0
3.0 2.6 2.5
0
10
20
30
40
50
60
70
80
90
100
450 488 525 600 450 488 525 600
slow atm fast atm
Yiel
d (
wt.
%)
Temperature (°C)
heavy oil fraction light oil fraction gases char
Stellenbosch University https://scholar.sun.ac.za

67
content of fixed carbon and ash (2.5 wt.%, Table 4.1), it can be deduced that sample
conversion was almost complete. Total yield of condensable products (heavy and light)
increased slightly from about 82 wt.% to a maximum of 86 wt.% as temperature progressed
from 450 to 488 ᵒC. It however dropped to 80 wt.% when temperature augmented to 525 ᵒC
and further decreased drastically to 63 wt.% when temperature reached 600 ᵒC. From the
trends, 488 ᵒC was deduced to be the temperature at which maximum condensable products
yield of 86 wt.% was recovered, after which further increase of temperature resulted in a
corresponding decrease in condensable products yield. The decrease in yield of condensables
observed after the optimum temperature was blamed on the occurrences of secondary
cracking reactions to produce much lighter products to the detriment of oils. This is evident
in the corresponding increase in the yields of permanent gases detected. Permanent gas
yields were observed to increase sharply from about 6 to 27 wt.% as temperature rose from
450 to 600 ᵒC with the latter temperature producing the highest yield of permanent gases.
This shows that secondary cracking reactions become more pronounced at the higher
temperatures. Ahmad et al., (2015) reported similar trends when they pyrolysed PP in a batch
reactor in the temperature range 250 - 400 ᵒC. They reported maximum condensable
products yield of about 70 wt.% after which a further rise in temperature resulted in a
decrease in yield of oil to about 63 wt.% with a corresponding increase in gas yield.
Mechanism of secondary cracking reactions occur when two or more unstable primary
volatile products generated from the devolatilization of PP further react to produce much
more stable compounds. This mechanism is facilitated at severe temperatures and heating
rates.
Results for experiments under fast-insertion pyrolysis followed almost the same trend
observed for slow pyrolysis. Yield of char was also observed to decreased with the increase
of temperature. Considerable amount of char was however generated at 450 ᵒC. While
increasing heating rate usually results in reduced char yield, the reverse trend was observed
in this case. This was blamed on the incomplete conversion of PP due to the relatively shorter
solid residence time when compared to slow pyrolysis conditions. Trends observed for
condensable products yield followed similar path as slow pyrolysis with maximum
condensable products yield of about 85 wt.% attained at 488 ᵒC. A further increase of
temperature resulted in reduced condensable products yield and promoted the formation of
Stellenbosch University https://scholar.sun.ac.za

68
permanent gases which again was attributed to secondary cracking reactions. Similar
observations to these trends were made by Lu et al., (2015) who also investigated the
pyrolysis of PP in a pre-heated batch reactor where they recorded a maximum condensable
products yield of about 72 wt.% after which a further increase of temperature resulted in the
increase of permanent gas yield at the expense of oil. A permanent gas yield of about 67 wt.%
was generated as against an oil yield of 33 wt.% at their highest temperature investigated. At
600 o C, compared to slow pyrolysis, it was seen that yields of light oil fractions and permanent
gases became more pronounced to the detriment of heavy oil fractions, with light oil fraction
shooting by about 15 wt.% and permanent gases by close to 5 wt.%. It was then inferred that
when comparing slow and fast heating rates, significant difference in the distribution of yields
of volatiles (oil and gas) was only observed at the highest temperature examined, 600 ᵒC. This
observation was interpreted as consequence of interaction between temperature and
heating rate. At slow heating rate, most of the volatiles were released before the reactor
temperature reached 500 ᵒC (with respect to TGA curve in Figure 4.1). At fast heating rate,
the volatiles were released in a reactor already at 600 ᵒC, which facilitated severe cracking
reactions to produce lighter compounds.
In conclusion, for both slow and fast pyrolysis of PP under atmospheric conditions, secondary
reactions known to suppress oil yield occurred beyond the temperature at which maximum
condensable products were obtained, 488 ᵒC. However, interaction between temperature
and heating rate at 600 ᵒC led to significant secondary cracking reactions at this temperature
which promoted the formation of lighter products.
4.3.2 Condensable products characterisation (Atmospheric conditions)
GC/MS analysis (Atmospheric Conditions)
Each product recovered under atmospheric pyrolysis of PP was analysed by GC/MS which
gave the proportions of compounds found in diesel and gasoline fractions based on surface
area. As a first approach, assuming similar response factors of the compounds as generated
by the GC/MS, the proportions of diesel (respectively gasoline) was multiplied by the yield
(wt.%) of the product to estimate the yield of diesel (respectively gasoline) in each product.
Figure 4.3, illustrates how the process parameters (temperature and heating rate), affected
the proportions of diesel (C11-C23) and gasoline (C6-C10) range compounds under atmospheric
Stellenbosch University https://scholar.sun.ac.za
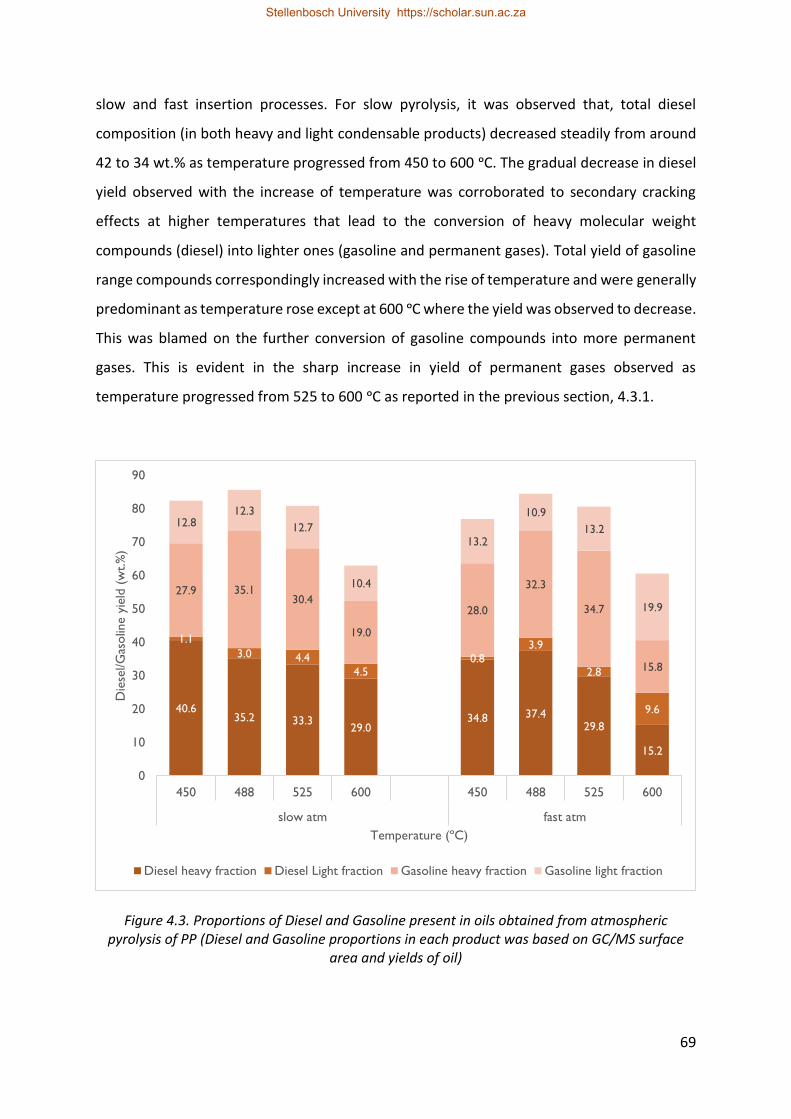
69
slow and fast insertion processes. For slow pyrolysis, it was observed that, total diesel
composition (in both heavy and light condensable products) decreased steadily from around
42 to 34 wt.% as temperature progressed from 450 to 600 ᵒC. The gradual decrease in diesel
yield observed with the increase of temperature was corroborated to secondary cracking
effects at higher temperatures that lead to the conversion of heavy molecular weight
compounds (diesel) into lighter ones (gasoline and permanent gases). Total yield of gasoline
range compounds correspondingly increased with the rise of temperature and were generally
predominant as temperature rose except at 600 ᵒC where the yield was observed to decrease.
This was blamed on the further conversion of gasoline compounds into more permanent
gases. This is evident in the sharp increase in yield of permanent gases observed as
temperature progressed from 525 to 600 ᵒC as reported in the previous section, 4.3.1.
Figure 4.3. Proportions of Diesel and Gasoline present in oils obtained from atmospheric pyrolysis of PP (Diesel and Gasoline proportions in each product was based on GC/MS surface
area and yields of oil)
40.635.2 33.3
29.034.8 37.4
29.8
15.2
1.1
3.0 4.4
4.50.8
3.9
2.8
9.6
27.9 35.130.4
19.0
28.0
32.3
34.7
15.8
12.812.3
12.7
10.4
13.2
10.9
13.2
19.9
0
10
20
30
40
50
60
70
80
90
450 488 525 600 450 488 525 600
slow atm fast atm
Die
sel/G
asolin
e y
ield
(w
t.%
)
Temperature (ºC)
Diesel heavy fraction Diesel Light fraction Gasoline heavy fraction Gasoline light fraction
Stellenbosch University https://scholar.sun.ac.za

70
For fast-insertion pyrolysis, also depicted in Figure 4.3, it was observed that, the total diesel
fraction (in both heavy and light oil) increased somewhat from about 36 to 41 wt.% when
temperature rose from 450 to 488 ᵒC. It then decreased to around 33 wt.% at 525 ᵒC and
further to 25 wt.% when temperature reached 600 ᵒC. Compared to slow pyrolysis, it was
noticed that yields of diesel compounds were mostly lower especially at the highest
temperature tested (600 ᵒC), which further ascertains the fact that secondary cracking
reactions became more severe at higher temperatures and faster heating rates. This is evident
in the comparatively improved yield of gasoline compounds under fast heating rate
conditions compared to slow heating rate. It was also observed that gasoline range
compounds were prevalent over diesel range compounds at all temperatures under fast
heating rates.
These observations were enough to conclude that, production of gasoline range compounds
from PP pyrolysis is favoured mostly under reaction conditions where some secondary
cracking occurs.
Surprisingly, physical observation of condensable products revealed that heavy condensable
product recovered under ambient conditions (condenser 1) tended to become waxier or more
viscous in nature with the rise of temperature (high temperature is known to decrease the
number of carbon atoms of the compounds through cracking reactions) (Appendix D). This
unforeseen phenomenon was explained as; - at relatively lower pyrolysis temperatures,
although both lower molecular weight (MW)/lower boiling points and heavy MW/higher
boiling point compounds were produced, the heavier compounds were not released because
pyrolysis temperature was lower than their boiling points. Heavy MW/Higher boiling point
compounds were only released at elevated pyrolysis temperatures and hence the formation
of waxy compounds at these temperatures. This observation was also identified to be novel
with respect to what has been currently reported in literature. Physical observations for light
condensable products (recovered from condensers 2-5) however did not change with the
variation of temperature. These products were clear, free-flowing and did not contain wax.
They were stable and never solidified even after months of storage.
Higher Heating Value (HHV) analysis (Atmospheric conditions)
The HHV of condensable products (oil and wax) obtained from the atmospheric pyrolysis of
PP have been presented in Table 4.3. From the table, it was observed that HHV of all heavy
Stellenbosch University https://scholar.sun.ac.za

71
condensable products were greater than corresponding HHVs of light condensables which is
expected because heavy condensable products contained higher number of carbon atoms.
Moreover, it was noticed that HHV for each type of oil generally decreased with the upsurge
of temperature which was corroborated to the increased production of aromatic compounds.
Aromatics were found to be present in higher amounts in gasoline compounds than diesel
(refer to section 2.7.2) hence increased production of gasoline compounds at higher
temperatures (from GC/MS results in the previous section) implies higher aromatic contents
and therefore the lower HHVs recorded at higher temperatures. Lastly, the range of HHV for
all the condensable products (41 - 46 MJ/kg) were consistent with the HHVs of commercial
heavy fuel oil, diesel and gasoline having HHVs ranging between 41 - 46 MJ/kg.
Table 4.3. HHV of PP derived oils under atmospheric pyrolysis of PP
Temperature (ᵒC)
HHV(MJ/kg)
Slow Fast insertion
Heavy oil fraction
Light oil fraction Heavy oil fraction
Light oil fraction
450 45.28 43.79 45.67 45.24
488 45.46 43.13 45.45 44.46
525 44.15 42.42 45.82 45.67
600 41.56 41.60 44.45 42.97
4.3.3 Gas analysis (Atmospheric Conditions)
The gaseous product yield distributions with reference to the feedstock for atmospheric
pyrolysis of PP have been presented in Figure 4.4 and Figure 4.5. The description focussed on
the hydrocarbon gases and hydrogen because of their promising energy potential. CO and
CO2 detected were attributed to the presence of trace amounts of oxygen gas in the reactor.
Their yields were seen to increase with the upsurge of temperature since reactivity of oxygen
gas increased with increasing temperature. As depicted in the figures, it was observed that C3
gases were the most dominant produced at all process conditions. This is expected because
polypropylene is made from propylene monomer units and pyrolysis is known to breaking
down polymer structures back into their monomers hence the dominating amounts of C3
(polypropylene monomers) in the gas stream. Similar observations were made by Yan et al.,
Stellenbosch University https://scholar.sun.ac.za

72
(2015) and Das & Tiwari, (2018) who all reported C3 (propane, propadiene and propylene) to
be the most dominant of all the gases generated with yields representing around 45 and 35
wt.% of the total gas yield respectively. Hydrogen gas (H2) production largely increased with
increase of temperature, but its production remained relatively low at all process conditions.
Under slow heating rates, yields of gases C1-C5, generally increased with the rise of
temperature, with 600 ᵒC observed to be the temperature at which maximum yield of all
gases were produced. This showed that increase in temperature under slow heating rates
generally enhanced some level of cracking reactions that promoted yields of the permanent
gases with the rise of temperature.
Under fast-insertion pyrolysis, yields of all the gases, C1 - C4 were seen to increase sharply with
the upsurge of temperature while for C5, yield increased from 0.70 to 1.27 wt.% when
temperature rose from 450 to 488 ᵒC after which the yields were seen to decrease at the
subsequent higher temperatures (525 - 600 ᵒC). The increase in yield of the comparatively
lighter hydrocarbon gases (C1 - C4) to the detriment of the heavier hydrocarbon C5 gas with
temperature rise also confirms the higher intensity of cracking reactions at higher
temperatures under faster heating rates.
Figure 4.4. Effects of temperature on gaseous product distribution (Atmospheric slow condition)
0.71 0.17 0.34 2.520.560.36
1.22
3.20
2.19 3.05
4.03
6.15
0.49 0.64
0.80
2.32
0.96 0.87
1.00
1.90
0.04 0.01
0.02
0.03
0.69 0.67
1.16
1.78
0
2
4
6
8
10
12
14
16
18
20
450 488 525 600
Gas
yie
ld (
wt.%
)
Temperature (ᵒC)
C₁ C₂ C₃ C₄ C₅ H₂ CO & CO₂
Stellenbosch University https://scholar.sun.ac.za

73
Figure 4.5. Effects of temperature on gaseous product distribution (Atmospheric fast insertion condition)
4.4 Vacuum pyrolysis of PP at bench-scale
Tests under vacuum pyrolysis of PP followed similar approach as atmospheric conditions.
Experiments at bench scale were also performed at same temperatures (450, 488, 525 and
600 ºC) used for atmospheric pyrolysis at slow and fast heating rates. Condensable products
obtained were also characterised for HHV and GC/MS. Permanent gases were characterised
using a CompactGC that aided in closing the mass balance. All results obtained under vacuum
pyrolysis were compared to atmospheric conditions.
4.4.1 Product yield distribution (Vacuum pyrolysis)
For tests under vacuum conditions, all condensable fractions recovered in the ambient
condition condenser were recovered in the form of solid wax (Appendix D). Compared to the
waxes recovered in the same condenser under atmospheric conditions, these waxes
appeared relatively dry and sticky. These waxes were also referred to as heavy oil products.
Condensable products recovered from dry ice condensers, however, were free-flowing liquids
0.12 0.21 0.52 4.92
0.38 0.70 1.45
5.99
2.033.39
4.81
15.27
0.410.76
1.17
3.04
0.70
1.27
1.11
0.89
0.01
0.01
0.14
0.360.83
1.02
1.55
0
5
10
15
20
25
30
35
450 488 525 600
Gas
yie
ld (
wt.%
)
Temperature (ᵒC)
C₁ C₂ C₃ C₄ C₅ H₂ CO & CO₂
Stellenbosch University https://scholar.sun.ac.za

74
and had similar appearances to those retrieved from same condensers under atmospheric
pyrolysis, hence the name light oil fraction was still maintained in this context.
Mass balance at all process conditions ranged between 89 - 98 wt.%. Maximum standard
deviation for char, permanent gases, light and heavy condensable products under slow
heating rates were 0.6 wt.%, 1.2 wt.%, 3.8 wt.% and 4.6 wt.% respectively whereas that for
fast insertion heating rates were 0.5 wt.%, 1.2 wt.%, 2.5 wt.% and 2.4 wt.% respectively
(Appendix B).
Figure 4.6. Effects of temperature and heating rate on product yield distribution (Vacuum conditions)
Product yield distribution depicted in Figure 4.6 showed that char yields under vacuum slow
conditions were lower than 5 wt.%, demonstrating that PP conversion was also nearly
complete. It further substantiates the negligible amount of fixed carbon obtained from the
proximate analysis of PP. Yield of total condensable products (oil and wax) increased
progressively from about 89 wt.% and peaked at 93 wt.% when temperature rose from 450
to 525 ᵒC. It then decreased to 86 wt.% when temperature reached 600 ᵒC, the highest
62.9 60.5 64.5 61.1 64.7 66.5 65.7
51.4
26.1 30.328.2
25.225.5 25.3 25.6
27.8
1.72.3
3.4
4.11.8 2.2 5.1
7.4
4.4 2.51.9
2.44.6 3.1
2.4
2.4
0
10
20
30
40
50
60
70
80
90
100
450 488 525 600 450 488 525 600
slow vacuum fast vacuum
Yie
ld (
wt.%
)
Temperature (°C)
heavy oil fraction light oil fraction gases char
Stellenbosch University https://scholar.sun.ac.za

75
temperature examined. The decrease in yield of total condensable products after the
temperature where peak amounts of condensables were recovered was blamed on cracking
reactions. When comparing with experiments under atmospheric conditions, total
condensable products under vacuum were higher at similar temperature and at optimal
temperature. This was corroborated to the limited cracking effects under vacuum conditions
since volatiles generated were quickly removed from the hot part of the reactor. This is
consistent with the relatively lower yields of permanent gases generated under vacuum.
Between the temperature range, 450 - 525 ᵒC, permanent gas yields under vacuum were at
least twice lesser than their corresponding yields under atmospheric conditions. At 600 ᵒC,
the highest temperature examined, permanent gas yield recovered under vacuum conditions
was about four times even lesser than corresponding yields under atmospheric pyrolysis.
For vacuum fast pyrolysis of PP, insignificant yields of char were also observed. Total yield of
condensable products (oil and wax) remained virtually constant (increasing from 90 - 91 wt.%)
as temperature progressed from 450 to 525 ᵒC but decreased sharply to about 79 wt.% at 600
ᵒC. Total condensable products yield under vacuum conditions were again observed to be
higher than corresponding yields under atmospheric conditions. As observed for atmospheric
conditions, significant difference in condensable products yield distribution between slow
and fast heating rates under vacuum pyrolysis was also observed only at 600 ᵒC. These
differences were however not as pronounced as atmospheric conditions.
In conclusion, at all the process conditions examined, vacuum pyrolysis of PP generated
higher yields of condensable products compared to the pyrolysis of PP under atmospheric
conditions. This ascertains the promising potential of vacuum pyrolysis in harnessing higher
yields of condensable products. Compared to atmospheric pyrolysis, secondary cracking
reactions were minimal under vacuum conditions because volatiles were quickly extracted
from the reactor by the vacuum suction. This led to the production of significantly high yields
(about 80 wt.% at least) of condensable products even at severe temperature and heating
rate conditions under vacuum. Only limitation with vacuum pyrolysis of PP is that, majority of
the condensable fractions were recovered in the form of wax with over 60% of total
condensable fractions recovered as wax at all process conditions.
Stellenbosch University https://scholar.sun.ac.za

76
4.4.2 Condensable products characterisation (vacuum conditions)
GC/MS Analysis (Vacuum conditions)
Figure 4.7 illustrates how temperature and heating rate affected the proportions of diesel and
gasoline range compounds present in the heavy and light condensable products. Estimation
of the proportions followed same procedure as used for atmospheric conditions described in
section 4.3.2.1.
It was observed that diesel range compounds predominated at all process conditions which
is corroborated to the majority of condensable products being recovered as wax.
Figure 4.7. Proportions of diesel and gasoline in condensable products (oil and wax) recovered under the vacuum pyrolysis of PP (Diesel and gasoline proportions in each product was based on
GC/MS surface area and yields of oil)
For slow heating rate conditions, it was observed that total diesel composition rose from
around 69 to 77 wt.% as temperature increased from 450 to 488 ᵒC after which a further
increase of temperature resulted in decreases in yields of diesel range compounds. It appears
that production of diesel and gasoline range compounds did not follow any definite trend,
61.8 60.555.6
59.9
43.9
64.458.3
38.5
7.316.5
4.5
7.6
6.9
5.5
5.2
5.6
1.0
8.91.3
20.7
2.07.4
12.9
18.913.8
23.817.6
18.6 19.8 20.4
22.1
0
10
20
30
40
50
60
70
80
90
100
450 488 525 600 450 488 525 600
slow vacuum fast vacuum
Die
sel/G
aso
line fra
ctio
ns
(wt.%
)
Temperature (ºC)
Diesel heavy fraction Diesel LF Gasoline heavy fraction Gasoline LF
Stellenbosch University https://scholar.sun.ac.za
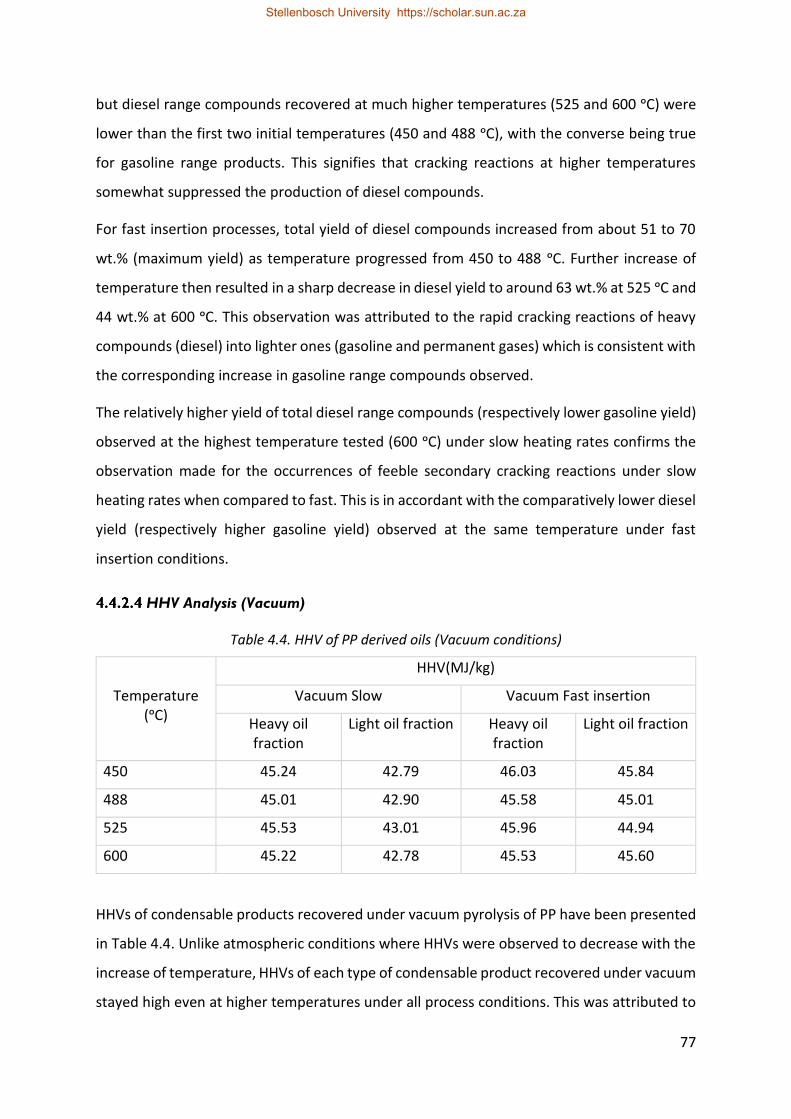
77
but diesel range compounds recovered at much higher temperatures (525 and 600 ᵒC) were
lower than the first two initial temperatures (450 and 488 ᵒC), with the converse being true
for gasoline range products. This signifies that cracking reactions at higher temperatures
somewhat suppressed the production of diesel compounds.
For fast insertion processes, total yield of diesel compounds increased from about 51 to 70
wt.% (maximum yield) as temperature progressed from 450 to 488 ᵒC. Further increase of
temperature then resulted in a sharp decrease in diesel yield to around 63 wt.% at 525 ᵒC and
44 wt.% at 600 ᵒC. This observation was attributed to the rapid cracking reactions of heavy
compounds (diesel) into lighter ones (gasoline and permanent gases) which is consistent with
the corresponding increase in gasoline range compounds observed.
The relatively higher yield of total diesel range compounds (respectively lower gasoline yield)
observed at the highest temperature tested (600 ᵒC) under slow heating rates confirms the
observation made for the occurrences of feeble secondary cracking reactions under slow
heating rates when compared to fast. This is in accordant with the comparatively lower diesel
yield (respectively higher gasoline yield) observed at the same temperature under fast
insertion conditions.
HHV Analysis (Vacuum)
Table 4.4. HHV of PP derived oils (Vacuum conditions)
Temperature (ᵒC)
HHV(MJ/kg)
Vacuum Slow Vacuum Fast insertion
Heavy oil fraction
Light oil fraction Heavy oil fraction
Light oil fraction
450 45.24 42.79 46.03 45.84
488 45.01 42.90 45.58 45.01
525 45.53 43.01 45.96 44.94
600 45.22 42.78 45.53 45.60
HHVs of condensable products recovered under vacuum pyrolysis of PP have been presented
in Table 4.4. Unlike atmospheric conditions where HHVs were observed to decrease with the
increase of temperature, HHVs of each type of condensable product recovered under vacuum
stayed high even at higher temperatures under all process conditions. This was attributed to
Stellenbosch University https://scholar.sun.ac.za

78
the limited formation of aromatics under vacuum pyrolysis, which is consistent with the
predominant yield of diesel range compounds observed at all process conditions (from GC/MS
tests presented in previous section, diesel compounds were identified to contain lower
amounts of aromatic compounds compared to gasoline). Similar to what was observed under
atmospheric conditions, it was also noticed that under vacuum conditions, HHVs of heavy
condensable products were greater than HHVs of corresponding light condensables, which
was attributed to the higher number of carbon compounds present in the heavy products.
HHVs of all condensables reported under vacuum were consistent with the HHVs of
commercial liquid fuels. HHVs obtained ranged between 42 - 46 MJ/kg and were comparable
with commercial diesel and gasoline fuels.
4.4.3 Gas Analysis (Vacuum conditions)
Figure 4.8. Effects of temperature on gaseous product distribution (Vacuum slow conditions)
Figure 4.8 and Figure 4.9 illustrate the yields of permanent gases generated from the pyrolysis
of PP under vacuum conditions. Unlike the spectrum of gases generated under atmospheric
conditions, total amount of CO and CO2 detected under vacuum pyrolysis were comparatively
low, demonstrating that, very little amount of oxygen was present in the reactor under
vacuum. Similar to atmospheric conditions, C3 gases were the most prevalent at all the
0.010.12 0.21 0.34
0.630.63
1.04
1.641.32
0.11
0.20
0.270.71
0.66
0.61
0.75
1.12
0.10
0.07
0.03
0.20
0.11
0.16
0.32
0.17
0.0
0.5
1.0
1.5
2.0
2.5
3.0
3.5
4.0
4.5
450 488 525 600
Gas
yie
ld (
wt.%
)
Temperature (ᵒC)
C₁ C₂ C₃ C₄ C₅ H₂ CO & CO₂
Stellenbosch University https://scholar.sun.ac.za

79
process conditions showing that significant amounts of depolymerisation of PP back into its
monomer compounds also occurs in PP conversion under vacuum. Also, a combined C1 yield
of only 0.02 wt.% was produced under both slow and fast heating rates, confirming that
minimal cracking reactions occurred under vacuum conditions. Yields of hydrogen gas (H2)
retrieved under vacuum were also noticed to be comparatively higher than corresponding
yields recovered under atmospheric conditions.
Figure 4.9. Effects of temperature on gaseous product distribution (Vacuum fast insertion conditions)
Under both slow and fast insertion processes, it was observed that the yields of the gases C2-
C5 generally increased with the upsurge of temperature with none of the heavier gases
cracking further to produce lighter ones at higher temperatures. This ascertains the fact that
pyrolysis under vacuum conditions (even at severe conditions of temperature and heating
rate) significantly suppressed cracking reactions. Compared to atmospheric conditions, it was
observed that total gas yields under vacuum conditions were significantly lower. At all process
conditions, total gas yields under atmospheric conditions were at least twice that of the
corresponding yields obtained under vacuum. This further validated the reduced degree of
cracking reactions under vacuum.
0.010.16 0.19
0.631.150.72 0.93
2.52
3.42
0.110.18
0.51
1.19
0.690.66
0.98
1.01
0.05
0.07
0.04
0.110.15
0.32
0.16
0
1
2
3
4
5
6
7
8
450 488 525 600
Gas
yie
ld (
wt.%
)
Temperature (ᵒC)
C₁ C₂ C₃ C₄ C₅ H₂ CO & CO₂
Stellenbosch University https://scholar.sun.ac.za

80
4.5 Process Development at Pilot Scale
This section tackles the pilot scale pyrolysis of PP. As stated in section 3.4.2.1, the objective
of the pilot scale study was to mimic bench-scale atmospheric pyrolysis tests to ascertain how
they both compare (since they have different configurations). Pilot study was also performed
to address any industrial scale prospects. As fast insertion and slow pyrolysis gave similar
yields, it was decided to mimic fast insertion, due to the similarity of the two processes.
Indeed, with the pilot, sample is introduced in a pre-heated reactor just like for fast insertion
processes. While as in the case of fast insertion test at bench scale, the heating rate could not
be set, the heating rate was influenced by the reactor temperature on the pilot: An increase
in temperature automatically resulted in an increase in the heating rate of the sample
particles.
This section therefore encompasses, the effects of temperature on product yield distribution
and quality of condensable products. Effects of the process parameters on composition of
permanent gases were also investigated. Also addressed are the Physico-chemical properties
(density, viscosity, pour point, boiling point range etc.) of condensable products recovered
and how they compare with commercial diesel and gasoline fuels.
4.5.1 Product yield distribution (Pilot scale pyrolysis)
A 5 kg/h pyrolysis pilot plant was designed and commissioned after which bench-scale
experiments were projected to the pilot plant. Pilot scale tests were performed at five
different temperatures (450, 460, 488, 507 and 525 ᵒC). The selection was based on
temperatures used for bench-scale tests but saw the inclusion of temperatures, 460 and 507
ᵒC and exclusion of 600 ᵒC. As mentioned at section 3.4.2.2, the latter temperature was
excluded from pilot tests because, conversion was quite severe as observed with bench scale
tests and promoted the formation of significant amount of permanent gases which is not of
interest in this study. The former temperatures were included to increase the chances of
easily identifying the most suitable temperature at which maximum condensable products
were attained. The vacuum pump on the pilot had a maximum suction capacity of about 2
kPa below atmospheric pressure which is relatively close to ambient pressure compared to
the vacuum pressure on bench (90 - 95 kPa below atmospheric). Standard deviations of char,
oils, waxes and permanent gases were less than 0.3, 2.6, 2.6 and 2.2 wt.% respectively
(Appendix B).
Stellenbosch University https://scholar.sun.ac.za

81
Table 4.5. Summarised description of oil labels
Oil label Description
C1A Top oil fraction of condenser 1
C1B Bottom oil fraction of condenser 1
C2 Oil recovered from condenser 2
C3 Oil recovered from condenser 3
C4 Oil recovered from condenser 4
CF Oil collected at reactor and feeder joint
CW Wax recovered from char collection box
Based on the pilot design, contrary to what was expected, significant amount of wax was
collected in the char collection box as can be seen in Figure 4.10. As highlighted earlier under
section 3.4.2.2, the wax was recovered together with char samples as two separate layers
with the char at the bottom. The char was then carefully scraped off the wax and weighed
separately. For each temperature, oils were recovered in all four condensers with the first
condenser recovering the most. Two different types of oil based on physical observations
were recovered from Condenser 1 at all temperatures. At relatively lower temperatures, 450
and 460 ºC, a more viscous and opaque oil was recovered at the bottom whereas a clear, less
viscous oil was recovered on top. At relatively higher temperatures (488 - 525 ºC), oil fractions
recovered in Condenser 1 were both highly waxy in nature but differed in colour. These are
depicted in Figure 4.11 & Figure 4.12 respectively. The lighter oil fractions which were always
recovered on top of condenser 1 were labelled C1A while those recovered at the bottom were
labelled C1B. Furthermore, at temperatures 450 and 460 ºC, an extra dark coloured oil was
collected at the joint of the reactor inlet duct and the piston feeding system due to the release
of volatiles during the back and forth movement of the piston feeder. This oil was labelled as
CF. Oils from condensers 2, 3 and 4 were labelled as C2, C3 and C4 respectively. Unlike
condenser 1, these oils were all single-phase in nature. Waxes recovered from char collection
box were labelled as CW. Devised labels of oil and wax products have been summarised in
Table 4.5. Waxy oils recovered in condensers 1 were categorised as oil together with all other
Stellenbosch University https://scholar.sun.ac.za

82
oils retrieved from the condensers. Waxes recovered from the char collection box were
tagged as wax.
Figure 4.10. Sample of product recovered from char collection box showing layers of char (in black) and wax (in gold). (A) View showing both layers of char and wax, (B) View showing mainly
char, (C) view showing mainly wax
Figure 4.11. Oil samples obtained in condenser 1 at 460 ᵒC. (A) Top light fraction, (B) Bottom waxy fraction. Samples physical appearances are similar to those recovered at 450 ᵒC.
Stellenbosch University https://scholar.sun.ac.za

83
Figure 4.12. Oil samples recovered in condenser 1 at 488 ᵒC. (A) Top dark waxy oil fraction, (B) Bottom brownish waxy oil fraction. Physical appearance of samples is similar to those obtained
at temperatures, 507 and 525 ᵒC.
Figure 4.13 represents the effects of temperature on products distribution at pilot scale
pyrolysis of PP. Mass balance at all temperatures ranged between 83 to about 88 wt.% which
is quite promising considering how challenging it was to completely keep the system air tight.
For instance, during the continuous closing and opening of pneumatic valves in the feeder,
some smoke released evidenced the loss of volatiles.
Product distribution revealed that, char yield was relatively negligible, with the highest and
lowest yields (1.29 and 0.55 wt.%) obtained at the lowest and highest temperatures
respectively. Total condensable products (oil and wax) yield of about 77 wt.% was recovered
at 450 ᵒC which rose gently to about 80 wt.% when temperature reached 460 ᵒC. This
temperature was observed to be the temperature where maximum yield of condensable
products were recovered. A further increase of temperature to 488 ᵒC, resulted in a sharp
decrease in condensable products yield to about 70 wt.%, which is attributed to the incidence
of secondary cracking reactions. This is consistent with the increase in the yield of permanent
gases from around 6.8 to 10.6 wt.% for the same temperature rise. This suggests that,
conversion at 488 ᵒC on the pilot is already high enough temperature for significant
Stellenbosch University https://scholar.sun.ac.za

84
occurrence of cracking reactions. Condensable products yield was found to remain virtually
constant (at about 70 wt.%) as temperature progressed from 488 to 525 ᵒC. The trend infers
that the degree of secondary cracking reactions remained unchanged for the temperature
range 488 to 525 ᵒC, which was not expected when compared to bench scale tests.
The evolution of permanent gas yield was observed to increase steadily from about 5.6 to
15.5 wt.% as temperature rose from 450 to 525 ᵒC. As observed for bench scale tests, the
gradual increase in permanent gas yield to the detriment of oil yield observed, could be
attributed to the occurrence of more cracking reactions of the partially converted plastics and
volatiles in the hot part of the reactor. It is likely that oil at 488 ᵒC was slightly underestimated
(consistent with its lowest mass balance), probably due to more volatile loss, which means
that oil yield at 488 should probably intermediate between yields obtained at 460 ᵒC and 507
ᵒC. Though oil yield at 488 ᵒC was probably underestimated, the optimum at temperature
around 460 ᵒC appears reliable based on the lower gas yield, when compared to 488 ᵒC.
Comparing the optimum yield of oil (about 85 wt.%) attained at 488 ᵒC under atmospheric
fast insertion at bench scale (similar to the pilot process since reactor is pre-heated in both
cases) to the pilot’s 80 wt.% obtained at 460 ᵒC, it was detected that maximum yield on the
pilot decreased by about 6% with optimum temperature decreasing by 28 ᵒC. Part of the
difference could be due to lower mass balance due to more product loss on the pilot. The fact
that lower temperature was required for the conversion at pilot scale was probably due to
more extensive cracking in the pilot reactor. The reason for a lower maximum condensable
products yield obtained at a lesser temperature on the pilot level is ascribed to the following;
1. It was assumed that, the much more elongated length of the pilot reactor compared
to the bench scale reactor increased the residence time of the volatiles in the pilot
reactor which promoted secondary cracking reactions that reduced the oil yield in
effect. Conversion of PP on the pilot occurred across the whole length (750 mm) of
the reactor whereas conversion on bench took place only at a segment of the reactor
(heated segment) with length of around 475 mm. Also, the volume of the pilot far
supersedes that of the bench scale reactor hence the higher residence time of the
volatiles.
Stellenbosch University https://scholar.sun.ac.za

85
Figure 4.13. Effects of temperature on product yield distribution (Pilot scale pyrolysis of PP)
4.5.2 Liquid product analysis (Pilot scale process)
GC/MS Analysis (Pilot scale process)
GC/MS characterisation and analysis of condensable products recovered from pilot runs
followed similar process as described for bench scale, where the proportions of diesel
(respectively gasoline) was multiplied by the yield (wt.%) of the condensable products to
estimate the yield of diesel (respectively gasoline) in each product fraction. The yields of
diesel (C11-C23) and gasoline (C6-C10) are presented in Figure 4.14 and Figure 4.15 respectively.
From the figures, it was observed that diesel range product dominated in oils recovered in
the first condenser which is expected because the heavier molecular weight compounds
(diesel) get condensed ahead of the light compounds (gasoline). That is, the higher boiling
point molecules will condense at a higher temperature, which is the first condenser
(beginning of the condensation system). These trends are consistent with those obtained for
bench scale tests (atmospheric fast insertion) where diesel range compounds dominated oils
recovered in the first condenser. Diesel range compounds were also the most prevalent at all
11.6 10.2 6.8 8.7 5.0
65.3 69.9
62.7 62.165.3
5.66.8
10.613.7 15.5
1.31.1
0.81.0 0.6
0
10
20
30
40
50
60
70
80
90
100
450 460 488 507 525
Yie
ld (
wt.%
)
Temperature (ᵒC)
wax oil gas char
Stellenbosch University https://scholar.sun.ac.za

86
temperatures examined. This is contrary to what was observed at bench (atmospheric fast
insertion) where gasoline range compounds were the most prevalent. This differing
phenomenon was attributed to the presence of slight vacuum conditions on the pilot, which
might have aided in somewhat extracting volatiles faster from the hot reactor zone, thereby
limiting cracking which has been established to favouring the production of gasoline.
Figure 4.14. Yields of Diesel present in all oil products from pilot scale pyrolysis of PP (Proportions in each product was based on GC/MS surface area and yield of oil)
As represented in Figure 4.14, it was observed that total diesel yield increased somewhat
from about 43 wt.% to 47 wt.% when temperature rose from 450 to 460 ᵒC after which a
steady decrease in yield (from 38 to 33 wt.%) was observed with the subsequent increase of
temperature (488 - 525 ᵒC). Maximum yield of diesel was obtained at 460 ᵒC. On the other
hand, 525 ᵒC was the temperature at which minimum yield of diesel was recovered. Decrease
in diesel yield at higher temperatures was expected because higher temperatures promoted
cracking of heavy compounds (diesel) into lighter ones (gasoline and permanent gases). From
Figure 4.15 total gasoline range compounds rose slightly from about 21 to 23 wt.% as
temperature progressed from 450 to 460 ᵒC. Yield then dropped to about 17 wt.% at
29.68 28.65
18.2516.15 15.63
6.87 8.07
15.99
14.4311.38
3.03 3.953.43
3.755.35
0.20 0.19
0.43
0.450.63
0.08 0.110.14
0.110.09
3.495.89
0
5
10
15
20
25
30
35
40
45
50
450 460 488 507 525
Die
sel yi
eld
(w
t.%
)
Temperature (ºC)
Diesel C1A Diesel C1B Diesel C2 Diesel C3 Diesel C4 Diesel CF
Stellenbosch University https://scholar.sun.ac.za

87
temperatures, 488 and 507 ᵒC and was seen to rise slightly again to 18 wt.% at the final
temperature tested, 525 ᵒC. Gasoline compounds had comparatively higher yields at the first
two initial temperatures (450 and 460 ᵒC) when cracking reactions were still minimal. Their
yields however reduced substantially at the subsequent higher temperatures investigated
(488 - 525 ᵒC). This was blamed on the further loss of gasoline compounds into more
permanent gases arising from the much more severe cracking on the pilot. This is in
agreement with the sudden increase in yields of permanent gases observed for the same
temperature range.
Figure 4.15. Yields of Gasoline present in all oil fractions from pilot scale pyrolysis of PP (Proportions in each product was based on GC/MS surface area and oil yield)
HHV of condensable products oils (pilot study)
The HHV for all oil samples are presented in Table 4.6. It can be seen that all oil samples had
HHV ranging between 44 to 46 MJ/kg which is equivalent with commercial diesel and gasoline
fuels. Unlike bench scale atmospheric fast insertion process where HHVs for each type of oil
were observed to generally decrease with the upsurge of temperature, HHVs on pilot stayed
high at higher temperatures and did not change with the rise of temperature. This difference
14.0011.99
6.49 6.427.57
3.36
3.42
6.28 6.866.37
3.18
4.38
3.24 2.713.60
0.18 0.24
0.77 0.48
0.82
0.030.04
0.19 0.06
0.10
0.69 2.41
0
5
10
15
20
25
450 460 488 507 525
Gas
olin
e y
ield
(w
t.%
)
Temperature (ºC)
Gasoline C1A Gasoline C1B Gasoline C2 Gasoline C3 Gasoline C4 Gasoline CF
Stellenbosch University https://scholar.sun.ac.za

88
observed is consistent with the diesel and gasoline proportions obtained for each set of tests.
Pilot scale products had diesel range compounds dominating at all temperatures, which
means comparatively lower aromatics were present and hence the higher HHVs of
condensables even at higher temperatures. For bench scale tests, gasoline range compounds
predominated and that means increased aromatics with temperature rise and hence the
lower HHVs observed with the upsurge of temperature.
Table 4.6. HHV of PP oils recovered from pilot pyrolysis of PP
Temperature
(ºC)
HHV (MJ/kg)
C1A
(liquid)
C1B
(liquid +
wax)
C2
(liquid)
C3
(liquid)
C4
(liquid)
CF
(liquid)
CW
(wax)
450 45.75 45.37 45.49 45.42 45.36 45.83 46.33
460 45.94 44.91 45.16 46.24 45.86 45.91 45.55
488 45.92 45.38 45.56 45.12 45.41 N/A 45.24
507 44.59 44.45 44.98 45.75 45.79 N/A 46.78
525 44.25 44.61 45.11 45.00 44.54 N/A 45.79
N/A- No sample available at that condition; C1A- Top oil fraction from condenser 1; C1B; Bottom oil
fraction from condenser 1; C2- Oil from condenser 1; C3- Oil from condenser 2; C4- Oil from condenser
4; CF- Oil from feeder/reactor inlet joint; CW- Wax from char pot
4.5.3 Gas Analysis (Pilot scale process)
Distribution of yields of gaseous products generated from the pyrolysis of PP at pilot scale is
presented in Figure 4.16. Like bench scale processes, the description played emphasis on the
hydrocarbon gases and hydrogen because of their huge energy potential. As observed from
the plot, C3 was the predominant fraction at all temperatures which is consistent with what
was reported from bench scale in section 4.3.3. Also, like bench scale processes, presence of
CO and CO2 was blamed on traces of oxygen present in the reactor. Reactivity of oxygen
increases with the increase of temperature which could explain the increasing yield of CO and
CO2 with the rise of temperature.
Stellenbosch University https://scholar.sun.ac.za

89
From the graph, C3 yield rose slightly from 2.07 to 2.59 wt.% when temperature progressed
from 450 to 460 ᵒC. Yield further increased appreciably at subsequent temperatures (488 -
525 ᵒC) and peaked at 525 ᵒC, where a yield of 8.30 wt.% was attained for C3. Just as observed
at bench scale, the domination of C3 in the gas stream, is an indication that cracking of PP
back to its monomer structure also happens during conversion on the pilot. This trend is
consistent with what was reported by Das and Tiwari, (2018) and Ciliz et al., (2004) who all
reported C3 as the predominant product in their gas stream.
Figure 4.16. Effects of temperature on gaseous product distribution (Pilot scale pyrolysis of PP)
Moreover, C1 and C2 gases followed similar trend observed for C3 but their yields were
comparatively lower. They were also seen to increase steadily with the rise of temperature
with their highest yields (0.83 and 0.73 wt.% respectively) obtained at 525 ᵒC. Also, C4 and C5
gases increased steadily as temperature progressed from 450 to 507 ᵒC but decreased
abruptly when temperature reached 525 ᵒC. The increase in yield of the lower molecular
weight gases (C1 - C3) to the detriment of the heavier molecular ones (C4 and C5) as
0.13 0.160.26
0.48 0.83
0.07 0.08 0.23 0.42
0.732.07 2.59
4.22
6.25
8.30
0.951.11
1.55
1.79
1.20
1.66
2.03
2.85
2.76
2.03
0.01
0.01
0.01
0.02
0.03
0.76
0.87
1.46
2.00
2.41
0
2
4
6
8
10
12
14
16
18
450 460 488 507 525
Gas
yie
ld (
wt.)
Temperature (ᵒC)
C₁ C₂ C₃ C₄ C₅ H₂ CO & CO₂
Stellenbosch University https://scholar.sun.ac.za

90
temperature intensified further validates the occurrences of s cracking reactions at higher
temperatures. Like bench scale tests, yield of hydrogen gas was relatively negligible and was
seen to increase with the rise of temperature.
4.5.4 Comparing fuel properties of PP pyrolysis oils with commercial fuels
Oil products derived from pilot scale experiments were subjected to the following fuel tests
and compared to commercial diesel and gasoline fuel specifications; Density @ 20 ᵒC,
Kinematic Viscosity @ 40 ᵒC, Pour Point, Distillation to determine boiling point range and
Cetane index. The methods followed to performing these tests have been highlighted in
section 3.5.3. Flash point was not examined because initial boiling point of all oils were quite
low which implies that their flash points could be around ambient temperature, 20 ᵒC. Also,
only oils obtained from condenser 1 (C1A and C1B), C2 and CF were characterised for fuel
tests. C3 and C4 could not be tested because their volumes were not enough for the tests. A
set of tests required a minimum of 250 ml of sample. Moreover, waxy oils especially for those
obtained from 488 to 525 ᵒC could not be characterised for distillation, flash point and cetane
index because they could not be distilled. All these tests require that samples can be distilled.
Also, CF oil obtained at 450 ᵒC could not be characterised for these tests for similar reason.
Fuel tests for the oils characterised have been presented in Table 4.7. with specifications for
commercial diesel and gasoline fuels also depicted in Table 4.8.
At 450 ᵒC, Density @ 20 ᵒC for all oils remained virtually constant. Density for oils C1A, C1B
and C2 ranged between 0.77 to 0.78 kg/L with CF having the highest density of 0.79 kg/L. Also,
compared to the other oil fractions, CF had the highest viscosity of 2.53 mm2/s with C2 being
possessing the least, 0.96 mm2/s. These observations ascertain the dominance of heavier
molecular weight compounds (diesel) in CF and light molecular weight compounds (gasoline)
in C2 as observed with GC/MS tests. Similar observations were made for oils recovered at 460
ᵒC. CF had the highest density (0.80 kg/L) and viscosity (1.95 mm2/s) whereas C2 had the
lowest density and viscosity of 0.76 kg/L and 1.71 mm2/s respectively. Also, at subsequent
temperatures (488 - 525 ᵒC) it was observed that C1A and C1B had higher densities than C2
which is also as a result of the presence of different molecular weight compounds. It was
however noticed that for all the oil fractions, pyrolysis temperature had no substantial effect
on their density. Moreover, compared to commercial diesel and gasoline fuels, only CF (460
ᵒC) and C1A (at 488 ᵒC) had density comparable with diesel. All the other oils had density
Stellenbosch University https://scholar.sun.ac.za

91
values between diesel and gasoline which is consistent with the fact that compounds
belonging to both ranges of diesel and gasoline are present in oils. Except for oils CF (at 450
ᵒC) and C1A (at 488 ᵒC) which have viscosities falling in the diesel range, all other oils had
viscosities falling between that for diesel and gasoline range. Pour point, the minimum
temperature at which the oil ceases to flow, for all oils were less than 18 ᵒC which implies that
all the oils obtained have pour point consistent with the specification required for commercial
liquid fuels. Furthermore, it was noticed that the initial boiling points for all oil products were
in the range of the initial boiling point for commercial gasoline fuels whereas their final boiling
points lied in the region of the final boiling point for commercial diesel. This buttresses the
fact that all oil products that could be analysed from the pilot pyrolysis of PP contained both
compounds in the diesel and gasoline range. Also, except for oil C2 (at 450 ᵒC), all oils
characterized for cetane index, had cetane indices above 40 (which is the minimum
requirement according to ASTM). This implies that majority of the oils recovered will readily
combust in a diesel engine (Bacha et al., 2007). Lastly, aniline point is a measure of the
proportions of aromatic compounds present in the oil. Compared to the commercial
standards of aniline point, it appears that for the oils tested, CF (at 460 ᵒC) had the highest
aniline point which implies that the oil contained lower amounts of aromatics and higher
amounts of paraffinic compounds. C1A (at 450 ᵒC), C2 (at 450 ᵒC) and C1A, C2 (at 460 ᵒC)
however had comparatively lower aniline points which indicates that they contained higher
amounts of aromatic compounds.
Stellenbosch University https://scholar.sun.ac.za
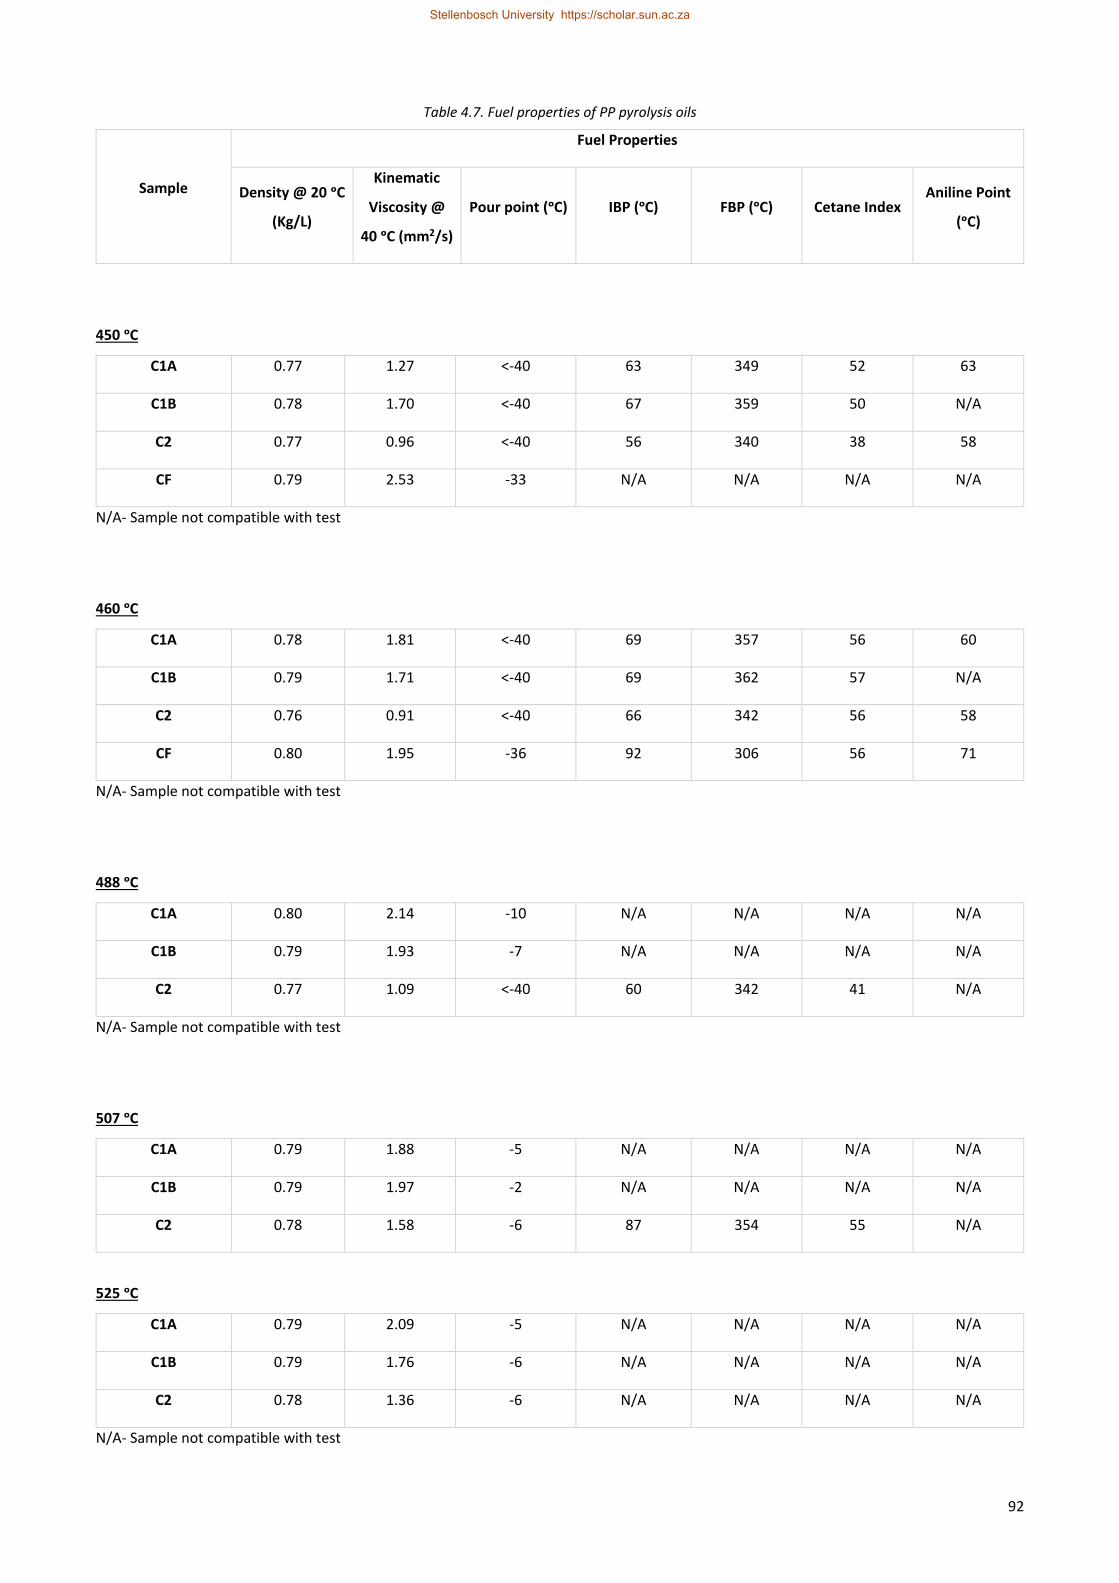
92
Table 4.7. Fuel properties of PP pyrolysis oils
Sample
Fuel Properties
Density @ 20 ᵒC
(Kg/L)
Kinematic
Viscosity @
40 ᵒC (mm2/s)
Pour point (ᵒC) IBP (ᵒC) FBP (ᵒC) Cetane Index Aniline Point
(ᵒC)
450 ᵒC
C1A 0.77 1.27 <-40 63 349 52 63
C1B 0.78 1.70 <-40 67 359 50 N/A
C2 0.77 0.96 <-40 56 340 38 58
CF 0.79 2.53 -33 N/A N/A N/A N/A
N/A- Sample not compatible with test
460 ᵒC
C1A 0.78 1.81 <-40 69 357 56 60
C1B 0.79 1.71 <-40 69 362 57 N/A
C2 0.76 0.91 <-40 66 342 56 58
CF 0.80 1.95 -36 92 306 56 71
N/A- Sample not compatible with test
488 ᵒC
C1A 0.80 2.14 -10 N/A N/A N/A N/A
C1B 0.79 1.93 -7 N/A N/A N/A N/A
C2 0.77 1.09 <-40 60 342 41 N/A
N/A- Sample not compatible with test
507 ᵒC
C1A 0.79 1.88 -5 N/A N/A N/A N/A
C1B 0.79 1.97 -2 N/A N/A N/A N/A
C2 0.78 1.58 -6 87 354 55 N/A
525 ᵒC
C1A 0.79 2.09 -5 N/A N/A N/A N/A
C1B 0.79 1.76 -6 N/A N/A N/A N/A
C2 0.78 1.36 -6 N/A N/A N/A N/A
N/A- Sample not compatible with test
Stellenbosch University https://scholar.sun.ac.za

93
Table 4.8. Specifications for commercial diesel and gasoline fuels
Fuel
Fuel Properties
Density @ 20
ᵒC (Kg/l)
Kinematic
Viscosity
(m2/s)
Pour point (ᵒC) IBP (ᵒC) FBP (ᵒC) Cetane
Index
Aniline Point
(ᵒC)
Diesel 0.8 [1] 2.2 - 5.3 [1] ≤ 18 [4] 172 - 196 [2] [5] 350 - 362 [1] [2] min, 40 [3] 77.5 [3]
Gasoline 0.71 - 0.79 [1] [8] 1.17 [1] [9] N/A 27 -40 [2] [6] [7] 215 - 225 [1] [2] [8] N/A 71 [3]
N/A -Not applicable
Sources: [1]SANS, 2014a; [2]Owusu et al., (2018); [3]Ahmad et al., (2015); [4]Miandad et al., (2016); [5]Kalargaris et al., (2018); [6]Heydariaraghi et al., (2016); [7]Pinto et al., (1999); [8]SANS 2014b; [9]Sharuddin et al., 2016
Stellenbosch University https://scholar.sun.ac.za
94
Conclusions and recommendations
5.1 Conclusions
This study focused on the bench-scale optimisation of temperature and heating rate which
appeared to be the key process parameters that affect PP pyrolysis, with the aim of improving
oil yield and fuel properties. Also, pyrolysis processes at bench-scale were conducted under
atmospheric and vacuum conditions and compared to ascertain which of the two scenarios
yielded the most condensable products with most promising fuel characteristics. Finally,
optimum conditions from bench-scale experiments were scaled up to a 5 kg/h pilot plant (that
was designed and commissioned as part of the study) to simulate industrial processes and
also validate the results from bench.
Following bench scale experimental work, the following conclusions can be drawn:
1. Under atmospheric pyrolysis of PP (both slow and fast insertion), optimum
condensable fractions (oil/wax) were attained at 488 ᵒC after which a subsequent
increase of temperature initiated secondary cracking reactions known to promote the
yields of permanent gases over condensable products. Therefore, to maximise oil yield
under atmospheric pyrolysis of PP, higher temperatures above 488 ᵒC need to be
avoided.
2. Yields of condensable products under vacuum pyrolysis of PP were higher than their
corresponding yields recovered under atmospheric conditions. This is due to the short
residence time of volatiles under vacuum conditions limiting cracking. Limitation of
vacuum is the recovery of high amounts of wax from the condensable products.
3. Higher Heating Values (HHVs) of all condensable products (oil/wax) recovered from
the atmospheric and vacuum pyrolysis of PP ranged between 41 - 46 MJ/kg and were
comparable with commercial liquid fuels. Severe secondary cracking reactions were
found to decrease HHVs of condensable products due to the increased production of
aromatics.
Stellenbosch University https://scholar.sun.ac.za

95
4. Production of more gasoline range compounds in condensable products retrieved
from the pyrolysis of PP was favored mostly under reaction conditions where some
secondary cracking occur with the converse being true for diesel range compounds.
From the process development at pilot scale, the following conclusions were drawn:
1. The 5 kg/h pyrolysis pilot plant was successfully designed and commissioned. The
plant operated successfully in converting both plastics and non-plastic wastes into
final pyrolysis products.
2. Compared to the results obtained from bench scale, optimum oil yield temperature of
460 ᵒC obtained on the pilot decreased by 28 ᵒC with the optimum yield decreasing by
6%. This was attributed to the elongated length of the reactor which increased the
volatile residence time thereby enhancing more secondary cracking reactions.
3. HHVs of oils retrieved from the pilot scale tests were consistent with those recovered
from bench scale tests. The HHVs were also similar to commercial diesel and gasoline
fuels.
4. Production of more diesel range compounds was preferred at lower pyrolysis
temperatures whereas that for gasoline range compounds is favored at higher
pyrolysis temperatures. This conclusion is consistent with what was observed at bench
scale.
5. Gases generated from PP pyrolysis are composed primarily of the hydrocarbon gases
ranging from C1 to C5 with traces of hydrogen which is an indication that gases
generated from the process have promising energy content that can be used to sustain
the pyrolysis process or channeled for other energy activities.
6. Physico-chemical properties showed that compositions of all oil products tested fell in
both diesel and gasoline range. Cetane indices of the wax-free oils also proved that
they can readily burn in a diesel engine.
5.2 Recommendations
Despite the presence of the vacuum pump, working under pressures significantly lower than
ambient was not possible without major modifications of the pilot setup. It is therefore
recommended that modification on the pilot to improve the level of vacuum should be
considered since vacuum pyrolysis on bench scale provided promising yields of oil.
Stellenbosch University https://scholar.sun.ac.za

96
Moreover, most of the condensable products generated under vacuum were recovered as
wax. Also, some of the products retrieved on the pilot were waxy in nature and could not be
distilled to help ascertain their boiling point range, meaning a fraction of the wax is possibly
made up of hydrocarbons with molecular weight greater than diesel. Further cracking of these
waxes into saleable oils is recommended.
It was concluded that, oils and waxes recovered under the pyrolysis of PP at both bench and
pilot scale comprised of compounds that fall in both diesel and gasoline range. To obtain pure
diesel or gasoline product, it is recommended that the oils should be distilled to obtain pure
compositions.
Also, the reaction kinetics behind all the process conditions especially vacuum pyrolysis,
should be investigated to better understand the mechanisms.
Finally, a techno-economic study should be considered to help ascertain the economic
viability of the pyrolysis of PP into liquid fuels at commercial scale.
Stellenbosch University https://scholar.sun.ac.za

97
References
Abbas-Abadi, M. S., Haghighi, M. N., Yeganeh, H., & McDonald, A. G. (2014). Evaluation of
pyrolysis process parameters on polypropylene degradation products. Journal of
Analytical and Applied Pyrolysis, 109, 272–277.
Abbas, A. S., & Shubar, S. D. A. (2008). Pyrolysis of High-density Polyethylene for the
Production of Fuel-like Liquid Hydrocarbon. IJCPE Iraqi Journal of Chemical and
Petroleum Engineering, 99(231), 23–29.
Achilias, D. S., Antonakou, E., Roupakias, C., Megalokonomos, P., & Lappas, A. (2008).
Recycling techniques of polyolefins from plastic wastes. Global NEST Journal, 10(1),
114–122.
Adewole, A. A., & Wolkowicz, M. D. (1999). Recycling of Polypropylene and Its
Blends: Economic and Technology Aspects. Maryland: Montell USA, Inc., Elkton. In
H.G. Karian (Ed.). Handbook of Polypropylene and Polypropylene Composites. (pp. 115-
156). New York: Marcel Dekker, Inc.
Adrados, A., Marco, I. De, Caballero, B. M., López, A., Laresgoiti, M. F., & Torres, A. (2012).
Pyrolysis of plastic packaging waste : A comparison of plastic residuals from material
recovery facilities with simulated plastic waste. Waste Management, 32(5), 826–832.
Aguado, R.; Olazar, M.; Gaisan, B.; Prieto, R.; Bilbao, J. (2002). Kinetic Study of Polyolefins
Pyrolysis in a Conical Spouted Bed Reactor. Ind. Eng. Chem. Res., 41(23), 4559–4566.
Aguado, J., Serrano, D. P., & Escola, J. M. (2006). Catalytic upgrading of plastic wastes. In J.
Scheirs & W. Kaminsky (Eds.). Feedstock Recycling and Pyrolysis of Waste Plastics:
Converting Waste Plastics into Diesel and Other Fuels. (pp. 73-110). Chichester, UK:
John Wiley & Sons.
Aguado, J., Serrano, D. P., & Escola, J. M. (2008). Fuels from Waste Plastics by Thermal and
Catalytic Processes : A Review, 7982–7992.
Ahmad, I., Khan, M. I., Khan, H., Ishaq, M., Tariq, R., Gul, K., & Ahmad, W. (2015). Pyrolysis
Study of Polypropylene and Polyethylene Into Premium Oil Products. International
Journal of Green Energy, 12(7), 663–671.
Stellenbosch University https://scholar.sun.ac.za

98
Ali, M.F., & Siddiqui, M.N. (2006). The Conversion of Waste Plastics/Petroleum Residue
Mixtures to Transportation Fuels, In J. Scheirs & W. Kaminsky (Eds.). Feedstock
Recycling and Pyrolysis of Waste Plastics: Converting Waste Plastics into Diesel and
Other Fuels. (pp. 363-380). Chichester, UK: John Wiley & Sons.
Al-Salem, S. M., Antelava, A., Constantinou, A., Manos, G., & Dutta, A. (2017). A review on
thermal and catalytic pyrolysis of plastic solid waste (PSW). Journal of Environmental
Management, 197(1408), 177–198.
Al-Salem, S. M., Lettieri, P., & Baeyens, J. (2009). Recycling and recovery routes of plastic
solid waste (PSW): A review. Waste Management, 29(10), 2625–2643.
Al-Salem, S. M., Lettieri, P., & Baeyens, J. (2010). The valorization of plastic solid waste
(PSW) by primary to quaternary routes: From re-use to energy and chemicals. Progress
in Energy and Combustion Science, 36(1), 103–129.
Almeida, D., & Marques, M. D. F. (2016). Thermal and catalytic pyrolysis of plastic
waste. Polímeros, 26(1), 44-51.
American Bureau of Shipping. (2001). Notes on Heavy Fuel Oil. Technical Paper.
Retrieved from: http://ww2.eagle.org/content/dam/eagle/rules-and-
guides/current/other/31_heavyfueloil/pub31_heavyfueloil.pdf; 2016 [Accessed:
13th May 2017]
Arabiourrutia, M., Elordi, G., Lopez, G., Borsella, E., Bilbao, J., & Olazar, M. (2012).
Characterization of the waxes obtained by the pyrolysis of polyolefin plastics in a
conical spouted bed reactor. Journal of Analytical and Applied Pyrolysis, 94, 230–237.
Arena, U., & Mastellone, M. L. (2006). Fluidized bed pyrolysis of plastic wastes. In J. Scheirs
& W. Kaminsky (Eds.). Feedstock Recycling and Pyrolysis of Waste Plastics: Converting
Waste Plastics into Diesel and Other Fuels. (pp. 435-474). Chichester, UK: John Wiley &
Sons.
Bacha, J., Freel, J., Gibbs, A., Gibbs, L., Hemighaus, G., Hoekman, K., … Mills, J. (2007). Diesel
Fuels Technical Review. Chevron Global Marketing, 1–116. Bates, L. (British M. H. B.
(2000). Guide to the Design, Selection, and Application of Screw Feeders.
Stellenbosch University https://scholar.sun.ac.za

99
Bates, L. (2000). Guide to the design, selection, and application of screw feeders.
Professional Engineering Pub. London and Bury St Edmunds, UK: Professional
Engineering Publishing Limited. (pp. 1-168)
Behzadi, S., & Farid, M. (2006). Liquid Fuel from Plastic Wastes Using Extrusion–Rotary Kiln
Reactors. In J. Scheirs & W. Kaminsky (Eds.). Feedstock Recycling and Pyrolysis of Waste
Plastics: Converting Waste Plastics into Diesel and Other Fuels. (pp. 531-548).
Chichester, UK: John Wiley & Sons.
Beyler, C. L., & Hirschler, M. M. (2002). Thermal Decomposition of Polymers. SPE Handbook
of Fire Protection Engineering, 110–131.
Bilgesü, A. Y., Kocak, M. C., & Karaduman, A. (2006). Waste Plastic Pyrolysis in Free‐Fall
Reactors. In J. Scheirs & W. Kaminsky (Eds.). Feedstock Recycling and Pyrolysis of Waste
Plastics: Converting Waste Plastics into Diesel and Other Fuels. (pp. 605-623).
Chichester, UK: John Wiley & Sons.
Blazso, M. (2006). Composition of Liquid Fuels Derived from the Pyrolysis of Plastics. In J.
Scheirs & W. Kaminsky (Eds.). Feedstock Recycling and Pyrolysis of Waste Plastics:
Converting Waste Plastics into Diesel and Other Fuels. (pp. 315-343). Chichester, UK:
John Wiley & Sons.
Bockhorn, H., Hornung, A., Hornung, U., & Schawaller, D. (1999). Kinetic study on the
thermal degradation of polypropylene and polyethylene, Journal of Analytical and
Applied Pyrolysis, 48, 93–109.
Bortolamasi, M., & Fottner, J. (2001). Design and sizing of screw feeders. In International
Congress for Particle Technology (PARTEC) (pp. 27–29).
Bradfield, F. L. (2014). Examination of the thermal properties of municipal solid waste and
the scalability of its pyrolysis(Master's dissertation, Stellenbosch: Stellenbosch
University).
Brown, L. J., Collard, F. X., & Görgens, J. (2019). Fast pyrolysis of fibre waste contaminated
with plastic for use as fuel products. Journal of Analytical and Applied Pyrolysis, 138,
261-269.
Stellenbosch University https://scholar.sun.ac.za

100
Buekens, A. (2006). Introduction to feedstock recycling of plastics. In J. Scheirs & W.
Kaminsky (Eds.) Feedstock Recycling and Pyrolysis of Waste Plastics: Converting Waste
Plastics into Diesel and Other Fuels. (pp. 1-41). Chichester, UK: John Wiley & Sons.
Chan, J. H., & Balke, S. T. (1997). The thermal degradation kinetics of polypropylene: Part III.
Thermogravimetric analyses. Polymer Degradation and Stability, 57(2), 135–149.
Chomba, E. M. (2018). Pyrolysis of waste plastics into chemicals as an alternative to
landfilling or incineration(Master's dissertation, Stellenbosch: Stellenbosch University).
Ciliz, N. K., Ekinci, E., & Snape, C. E. (2004). Pyrolysis of virgin and waste polypropylene and
its mixtures with waste polyethylene and polystyrene. Waste Management, 24(2),
173–181.
Dai, J., Cui, H., & Grace, J. R. (2012). Biomass feeding for thermochemical reactors. Progress
in Energy and Combustion Science, 38(5), 716–736.
Das, P., & Tiwari, P. (2018). Valorization of packaging plastic waste by slow pyrolysis.
Resources, Conservation & Recycling, 128(June 2017), 69–77.
Demirbas, A. (2004). Pyrolysis of municipal plastic wastes for recovery of gasoline-range
hydrocarbons, Journal of Analytical and Applied Pyrolysis, 72, 97–102.
Demirbas, A. (2010). Biorefineries: For biomass upgrading facilities. (p. 96). Springer: New
York
Demirbas, A., & Taylan, O. (2015). Recovery of Gasoline-Range Hydrocarbons From
Petroleum Basic Plastic Wastes. Petroleum Science and Technology, 33(23–24), 1883–
1889.
Drews, A. W. (1998). Manual on Hydrocarbon Analysis (6th ed.).(p. 720) West
Conshohocken: The American Society For Testing and Materials.
Encinar, J. M., & González, J. F. (2008). Pyrolysis of synthetic polymers and plastic wastes.
Kinetic study. Fuel Processing Technology, 89(7), 678–686.
Fakhrhoseini, S. M., & Dastanian, M. (2013). Predicting Pyrolysis Products of PE , PP , and
PET Using NRTL Activity Coefficient Model, Journal of Chemistry 2013, 7–9.
Stellenbosch University https://scholar.sun.ac.za
101
Faussone, G. C. (2017). Transportation fuel from plastic: Two cases of study. Waste
Management, 73, 416–423.
Felder, R.M. & R.W., Rousseau. (2005). Elementary Principles of Chemical Processes. Third
Edition. (p. 84). New Jersey: John Wiley & Sons, Inc.
Gao, F. (2010). Pyrolysis of Waste Plastics into Fuels. (Doctoral dissertation, Canterbury:
University of Canterbury).
Gerlach, R. W., Dobb, D. E., Raab, G. A., & Nocerino, J. M. (2002). Gy sampling theory in
environmental studies . 1 . Assessing soil splitting protocols §, Journal of Chemometrics:
A Journal of the Chemometrics Society 16, 321–328.
Gersten, J., Fainberg, V., Hetsroni, G., & Shindler, Y. (2000). Kinetic study of the thermal
decomposition of polypropylene , oil shale , and their mixture, Fuel 79, 2–8.
Geyer, R., Jambeck, J. R., & Law, K. L. (2017). Production, uses, and fate of all plastics ever
made. Science Advances, 3(7), 5.
Gimleo Heat Exchanger Company Ltd.
http://www.gimleo.com/en/ProductView_tsid_97_0_115.html [Accessed 24th
November, 2016]
Hájeková, E., & Bajus, M. (2005). Recycling of low-density polyethylene and polypropylene
via copyrolysis of polyalkene oil / waxes with naphtha : product distribution and coke
formation, Journal of Analytical and Applied Pyrolysis 74, 270–281.
Henrich, E., Dahmen, N., Raffelt, K., Stahl, R. & Weirich, E. (2007). The Karlsruhe ‘Bioliq’
process for biomass gasification. In 2nd European Summer School on Renewable Motor
Fuels. Warsaw. Available at
http://citeseerx.ist.psu.edu/viewdoc/download?doi=10.1.1.453.4591&rep=rep1&type=
Heydariaraghi, M., Ghorbanian, S., Hallajisani, A., & Salehpour, A. (2016). Fuel properties of
the oils produced from the pyrolysis of commonly-used polymers: Effect of
fractionating column. Journal of Analytical and Applied Pyrolysis, 121, 307–317.
Stellenbosch University https://scholar.sun.ac.za
102
Hopewell, J., Dvorak, R., & Kosior, E. (2009). Plastics recycling: challenges and opportunities.
Philosophical Transactions of the Royal Society B: Biological Sciences, 364(1526), 2115–
2126.
Hornung, A., & Seifert, H. (2006). Rotary Kiln Pyrolysis of Polymers Containing Heteroatoms.
In J. Scheirs & W. Kaminsky (Eds.). Feedstock Recycling and Pyrolysis of Waste Plastics:
Converting Waste Plastics into Diesel and Other Fuels. (pp. 549-567). Chichester, UK:
John Wiley & Sons.
Hsu, C.S. (2000). Diesel Fuels Analysis. In Meyers, R.A. (Ed.). Encyclopedia of Analytical
Chemistry: Applications, Theory and Instrumentation. (pp. 7212-7220). New York, USA:
John Wiley & Sons Ltd.
Islam, M. R., Parveen, M., Haniu, H., & Sarker, M. R. I. (2010). Innovation in pyrolysis
technology for management of scrap tire :A solution of energy and environment.
International Journal of Environmental Science and Development, 1(1), 89–96.
Jung, S. H., Cho, M. H., Kang, B. S., & Kim, J. S. (2010). Pyrolysis of a fraction of waste
polypropylene and polyethylene for the recovery of BTX aromatics using a fluidized bed
reactor. Fuel Processing Technology, 91(3), 277–284.
Jung, C. G., Fontana, A. (2006). Production of Gaseous and Liquid Fuels by Pyrolysis and
Gasification of Plastics: Technological Approach. In J. Scheirs & W. Kaminsky (Eds.).
Feedstock Recycling and Pyrolysis of Waste Plastics: Converting Waste Plastics into
Diesel and Other Fuels. (pp. 251-283). Chichester, UK: John Wiley & Sons.
Kalargaris, I., Tian, G., & Gu, S. (2018). Experimental characterisation of a diesel engine
running on polypropylene oils produced at di ff erent pyrolysis temperatures. Fuel,
211(September 2017), 797–803.
Kaminsky, W. (2006). The Hamburg Fluidized‐bed Pyrolysis Process to Recycle Polymer
Wastes and Tires. In J. Scheirs & W. Kaminsky (Eds.). Feedstock Recycling and Pyrolysis
of Waste Plastics: Converting Waste Plastics into Diesel and Other Fuels. (pp. 475-491).
Chichester, UK: John Wiley & Sons.
Kaminsky, W., & Zorriqueta, I. J. N. (2007). Catalytical and thermal pyrolysis of polyolefins.
Journal of Analytical and Applied Pyrolysis, 79(1–2 SPEC. ISS.), 368–374.
Stellenbosch University https://scholar.sun.ac.za

103
Kandola, B. S. (1995). Introduction to mechanics of fluids. In D.J. Philip et al., (Eds.). SFPE
Handbook of Fire Protection Engineering. Third Edition. (pp. 1-26). Massachusetts:
National Fire Protection Association, Inc.
Karaduman, A., Koçak, M. Ç., & Bilgesü, A. Y. (2003). Flash Vacuum Pyrolysis of Low Density
Polyethylene in a Free-Fall Reactor. Polymer-Plastics Technology and Engineering,
42(2), 181–191.
Karaduman, A., Şimşek, E. H., Çiçek, B., & Bilgesü, A. Y. (2001). Flash pyrolysis of polystyrene
wastes in a free-fall reactor under vacuum. Journal of Analytical and Applied Pyrolysis,
60(2), 179–186.
Kim, S. S., & Kim, S. (2004). Pyrolysis characteristics of polystyrene and polypropylene in a
stirred batch reactor. Chemical Engineering Journal, 98(1–2), 53–60.
Kissel, W.J., Han, H.H., Meyer J.A. (1999). Polypropylene: Structure, Properties,
Manufacturing Processes, and Applications. In H.G. Karian (Ed.). Handbook of
Polypropylene and Polypropylene Composites. (pp. 15-37). New York: Marcel Dekker,
Inc.
Kodera, Y., Ishihara, Y., & Kuroki, T. (2006). Novel Process for Recycling Waste Plastics To
Fuel Gas Using a Moving-Bed Reactor. Energy & Fuels, 20(1), 155–158.
Kunwar, B., Cheng, H. N., Chandrashekaran, S. R., & Sharma, B. K. (2016). Plastics to fuel: a
review. Renewable and Sustainable Energy Reviews, 54, 421–428.
Laresgoiti, M. F., Caballero, B. M., De Marco, I., Torres, A., Cabrero, M. A., & Chomón, M. J.
(2004). Characterization of the liquid products obtained in tyre pyrolysis. Journal of
Analytical and Applied Pyrolysis, 71(2), 917–934.
Larraín, T., Carrier, M., & Radovic, L. (2017). Structure-reactivity relationship in pyrolysis of
plastics. A comparison with natural polymers. J. Anal. Appl. Pyrolysis, (January), 0–1.
Lee, K. H., & Shin, D. H. (2007). Characteristics of liquid product from the pyrolysis of waste
plastic mixture at low and high temperatures: Influence of lapse time of reaction.
Waste Management, 27(2), 168–176.
Stellenbosch University https://scholar.sun.ac.za

104
Li, D., Wu-gao, Z., Zhen, H., & Jian-guang, Y. (2005). Physico-chemical properties of ethanol –
diesel blend fuel and its effect on performance and emissions of diesel engines, 30,
967–976.
Li, S.-Q., Yao, Q., Chi, Y., Yan, J.-H., & Cen, K.-F. (2004). Pilot-Scale Pyrolysis of Scrap Tires in a
Continuous Rotary Kiln Reactor. Industrial & Engineering Chemistry Research,
43(AUGUST 2004), 5133–5145.
Liang, F., Lu, M., Keener, T. C., Liu, Z., & Khang, S.-J. (2005). The organic composition of
diesel particulate matter, diesel fuel and engine oil of a non-road diesel generator.
Journal of Environmental Monitoring : JEM, 7(10), 983–988.
Lin, H., Huang, M., Luo, J., Lin, L., Lee, C., & Ou, K. (2010). Hydrocarbon fuels produced by
catalytic pyrolysis of hospital plastic wastes in a fl uidizing cracking process. Fuel
Processing Technology, 91(11), 1355–1363.
Lin, Y. H., & Yen, H. Y. (2005). Fluidised bed pyrolysis of polypropylene over cracking
catalysts for producing hydrocarbons. Polymer Degradation and Stability, 89(1), 101–
108.
Lopez, G., Artetxe, M., Amutio, M., Bilbao, J., & Olazar, M. (2017). Thermochemical routes
for the valorization of waste polyolefinic plastics to produce fuels and chemicals. A
review. Renewable and Sustainable Energy Reviews, 73(November 2016), 346–368.
Lopez, G., Olazar, M., Aguado, R., Elordi, G., Amutio, M., & Artetxe, M. (2010). Vacuum
Pyrolysis of Waste Tires by Continuously Feeding into a Conical Spouted Bed
Reactor, Industrial & Engineering Chemistry Research, 49(19) 8990–8997.
Low, S. L., Connor, M. a, & Covey, G. H. (2001). Turning mixed plastic wastes into a useable
liquid fuel. 6th World Congress of Chemical Engineering, 6.
Lu, C., Chen, Y., Hu, X., Lin, S., & Pan, Q. (2015). Highly selective pyrolysis of polypropylene.
In Advances in Energy Equipment Science and Engineering: Proceedings of the
International Conference on Energy Equipment Science and Engineering, (ICEESE 2015),
May 30-31, 2015, Guangzhou, China (pp. 437-440). CRC Press.
Marcilla, A., Giner, A., & Go, A. (2003). Catalytic pyrolysis of polypropylene using MCM-41 :
kinetic model, Polymer degradation and stability, 80(2), 233–240.
Stellenbosch University https://scholar.sun.ac.za

105
Mašek, O., Ronsse, F., & Dickinson, D. (2016). Biochar production and feedstock. In S.
Schackley et al., (Ed.). Biochar in European Soils and Agriculture: Science and Practice.
(pp. 17-40). UK: Routledge.
McMurry, J., (2000) Organic Chemistry. Fifth edition ed. Vol. 5. Pacific Grove: Brooks/Cole.
(pp. 1-172).
Meks (2015). “Distillation Range”. http://www.enggcyclopedia.com/2011/01/distillation-
range/ [Accessed 22nd Oct. 2016]
Miandad, R., Barakat, M. A., Aburiazaiza, A. S., Rehan, M., Ismail, I. M. I., & Nizami, A. S.
(2016). Effect of plastic waste types on pyrolysis liquid oil Kingdom of Saudi Arabia.
International Biodeterioration & Biodegradation.
Miandad, R., Barakat, M. A., Aburiazaiza, A. S., Rehan, M., & Nizami, A. S. (2016). Catalytic
pyrolysis of plastic waste: A review. Process Safety and Environmental Protection, 102,
822–838.
Miranda, R., Yang, J., Roy, C., & Vasile, C. (2001). Vacuum pyrolysis of commingled plastics
containing PVC. II. Product analysis. Polymer Degradation and Stability, 72(3), 469–491.
Miranda, R., Jin, Y., Roy, C., & Vasile, C. (2001b). Vacuum pyrolysis of commingled plastics
containing PVC I. Kinetic study. Polymer Degradation and Stability, 66(1), 107–125.
Miskolczi, N., Angyal, A., Bartha, L., & Valkai, I. (2009). Fuels by pyrolysis of waste plastics
from agricultural and packaging sectors in a pilot scale reactor. Fuel Processing
Technology, 90(7–8), 1032–1040.
Miskolczi, N., Bartha, L., & Deak, G. (2006). Thermal degradation of polyethylene and
polystyrene from the packaging industry over different catalysts into fuel-like feed
stocks. Polymer Degradation and Stability, 91(3), 517–526.
Mundike, J., Collard, F. X., & Görgens, J. F. (2017). Pyrolysis of Lantana camara and Mimosa
pigra: Influences of temperature, other process parameters and incondensable gas
evolution on char yield and higher heating value. Bioresource Technology, 243, 284–
293.
Stellenbosch University https://scholar.sun.ac.za

106
Neves, D., Thunman, H., Matos, A., Tarelho, L., & Gómez-barea, A. (2011). Characterization
and prediction of biomass pyrolysis products. Progress in Energy and Combustion
Science, 37(5), 611–630.
Obeid, F., Zeaiter, J., Al-muhtaseb, A. H., & Bouhadir, K. (2014). Thermo-catalytic pyrolysis of
waste polyethylene bottles in a packed bed reactor with different bed materials and
catalysts. Energy Conversion and Management, 85, 1–6.
Owusu, P. A., Banadda, N., Zziwa, A., Seay, J., & Kiggundu, N. (2018). Reverse engineering of
plastic waste into useful fuel products. Journal of Analytical and Applied Pyrolysis,
130(January), 249–255.
Pál, R., Juhász, M., & Stumpf, Á. (1998). Detailed analysis of hydrocarbon groups in diesel
range petroleum fractions with on-line coupled supercritical fluid chromatography-gas
chromatography-mass spectrometry. Journal of Chromatography A, 819(1–2), 249–
257.
Panda, A. K., & Singh, R. K. (2013). Experimental Optimization of Process for the Thermo-
catalytic Degradation of Waste Polypropylene to Liquid Fuel. Advances in Energy
Engineering, 1(3). Retrieved from www.seipub.org/aee
Panda, A. K., Singh, R. K., & Mishra, D. K. (2010). Thermolysis of waste plastics to liquid fuel.
A suitable method for plastic waste management and manufacture of value added
products-A world prospective. Renewable and Sustainable Energy Reviews, 14(1), 233–
248.
Patel, M., Thienen, N. Von, & Jochem, E. (2000). Recycling of plastics in
Germany, Resources, Conservation and Recycling, 29(1-2), 65–90.
Papuga, S., Gvero, P., & Vukic, L. (2016). Temperature and time influence on the waste
plastics pyrolysis in the fixed bed reactor. Thermal Science, 20(2), 731–741.
https://doi.org/10.2298/TSCI141113154P
Pinto, F., Costa, P., Gulyurtlu, I., & Cabrita, I. (1999). Pyrolysis of plastic wastes . 1 . Effect of
plastic waste composition on product yield, Journal of Analytical and Applied
Pyrolysis, 51(1-2), 39–55.
Stellenbosch University https://scholar.sun.ac.za

107
Pinto, F., Paradela, F., Gulyurtlu, I., & Ramos, A. M. (2013). Prediction of liquid yields from
the pyrolysis of waste mixtures using response surface methodology. Fuel Processing
Technology, 116, 271–283.
Plastics SA. (2013). Plastics Recycling Survey — 2012. Plastics SA. Retrieved from
http://www.plasticsinfo.co.za/wp-content/uploads/2014/10/4725.pdf
Polymer Science Learning Centre (2016). “Polypropylene”.
http://www.pslc.ws/macrog/pp.htm [Accessed: 17th Sept. 2016]
Predel, M., & Kaminsky, W. (2000). Pyrolysis of mixed polyolefins in a fluidised-bed reactor
and on a pyro-GC/MS to yield aliphatic waxes, Polymer Degradation and
Stability, 70(3), 373-385.
Rabe, R. C. (2005). A model for the vacuum pyrolysis of biomass (Master's dissertation,
Stellenbosch: University of Stellenbosch).
Rashid, M. M., & Sarker, M. (2013). Polypropylene and Polystyrene Waste Plastics Mixture
to Diesel Fuel for Truck / Bus Engines, 2(10), 62–68.
Rautalin, A., & Wilen, C. (1992). Feeding biomass into pressure and related safety
engineering. Technical Paper. Espoo, Finland: Technical Research Centre of Finland,
Laboratory of Fuel and Process Technology. (pp. 7-60)
Rospen Industries. (n.d.). Metering Feeders: Designs for continuous metering. Technical
Paper. Retrieved from: http://www.rospen.com/downloads/Metering_Feeders.pdf
[Accessed: 19th May 2016]
Sakata, Y., Uddin, M. A., & Muto, A. (1999). Degradation of polyethylene and polypropylene
into fuel oil by using solid acid and non-acid catalysts. Journal of Analytical and Applied
Pyrolysis, 51(1–2), 135–155.
SANS, 2014a (SANS) South African National Standards
Automotive Diesel Fuel, SANS 342
South African Bureau of Standards (2014)
Stellenbosch University https://scholar.sun.ac.za

108
SANS, 2014b (SANS) South African National Standards
Unleaded Petrol, SANS 1598
South African Bureau of Standards (2014)
Scheirs, J. (2006). Overview of commercial pyrolysis processes for waste plastics. In J. Scheirs
& W. Kaminsky (Eds.). Feedstock Recycling and Pyrolysis of Waste Plastics: Converting
Waste Plastics into Diesel and Other Fuels. (pp. 381-433). Chichester, UK: John Wiley &
Sons.
Serrano, D. P., Aguado, J., Escola, J. M., & Garagorri, E. (2003). Performance of a continuous
screw kiln reactor for the thermal and catalytic conversion of polyethylene-lubricating
oil base mixtures. Applied Catalysis B: Environmental, 44(2), 95–105.
Sharuddin, A. S. D., Abnisa, F., Wan Daud, W. M. A., & Aroua, M. K. (2016). A review on
pyrolysis of plastic wastes. Energy Conversion and Management, 115, 308–326.
Siddiqui, M. N., & Redhwi, H. H. (2009). Pyrolysis of mixed plastics for the recovery of useful
products. Fuel Processing Technology, 90(4), 545–552.
Sjörgen, M., Li, H., Rannug, U., & Westerholm, R. (1995). A multivariate statistical analysis of
chemical composition and physical characteristics of ten diesel fuels. Fuel, 74(7), 983–
989.
Sorum, L., Gronli, M. G., & Hustad, J. E. (2001). Pyrolysis characteristics and kinetics of
municipal solid wastes. Fuel, 80(9), 1217–1227.
South West Thermal Technology Inc. Shell and tube heat exchangers
Retrieved from: http://www.southwestthermal.com/shell-tube-exchanger.html
[Accessed: 20th July, 2016]
Speight, J. G. (2015). Handbook of petroleum product analysis. Second Edition. (pp. 18, 88-
201). Hoboken, New Jersey: John Wiley & Sons.
Squicciarini, M. P. (1996). Paraffin, olefin, naphthene, and aromatic determination of
gasoline and JP-4 jet fuel with supercritical fluid chromatography. Journal of
chromatographic science, 34(1), 7-12.
Stellenbosch University https://scholar.sun.ac.za

109
Stonecypher, L. (2009). “The Purpose and types of Condensers in Air Conditioning Systems”.
Retrieved from: http://www.brighthubengineering.com/hvac/33283-the-purpose-and-
types-of-condensers-in-air-conditioning-systems/ [Accessed: 18th July, 2016]
Swanson, M. L., Musich, M. A., Schmidt, D. D., & Schultz, J. K. (2003). Feed system innovation
for gasification of locally economical alternative fuels (FIGLEAF). Pittsburgh: US
Department of Energy, National Energy Technology Laboratory. (pp. 77-86).
Retrieved from:
https://www.netl.doe.gov/File%20Library/research/coal/energy%20systems/gasifica
tion/mm-fig1.pdf [Accessed: 20th May, 2016]
Syamsiro, M., Saptoadi, H., Norsujianto, T., Noviasri, P., Cheng, S., Alimuddin, Z., &
Yoshikawa, K. (2014). Fuel oil production from municipal plastic wastes in sequential
pyrolysis and catalytic reforming reactors. Energy Procedia, 47, 180–188.
Takuma, K., Uemichi, Y., Sugioka, M., & Ayame, A. (2001). Production of aromatic
hydrocarbons by catalytic degradation of polyolefins over H-gallosilicate. Industrial and
Engineering Chemistry Research, 40(4), 1076–1082.
Tang, G., Sun, J., Wu, F., Sun, Y., & Zhu, X. (2015). Organic composition of gasoline and its
potential effects on air pollution in North China, (January 2019).
Thorat, P. V., Warulkar, S., & Sathone, H. (2013). Thermofurl–“Pyrolysis of waste plastic to
produce liquid hydrocarbons”. Adv. Polym. Sci. Technol. An International Journal., 3.
Todd, G. D., Chessin, R. L., & Colman, J. (1999). Toxicological profile for total petroleum
hydrocarbons (TPH). Retrieved from:
http://www.atsdr.cdc.gov/ToxProfiles/tp.asp?id=424&tid=75 [Accessed: 10th May
2017]
Uçar, S., Özkan, A. R., & Karagöz, S. (2016). Co-pyrolysis of waste polyolefins with waste
motor oil. Journal of Analytical and Applied Pyrolysis, 119, 233–241.
Valavanidis, A., Iliopoulos, N., Gotsis, G., & Fiotakis, K. (2008). Persistent free radicals, heavy
metals and PAHs generated in particulate soot emissions and residue ash from
controlled combustion of common types of plastic. Journal of Hazardous Materials,
156(1–3), 277–284.
Stellenbosch University https://scholar.sun.ac.za

110
van der Drift, A., Boerrigter, H., Coda, B., Cieplik, M. K., Hemmes, K., Van Ree, R., & Veringa,
H. J. (2004). Entrained flow gasification of biomass: Ash behaviour, feeding issues, and
system analyses. The Netherlands: ECN, Petten, ECN-C--04-039. (pp 1-58)
Walendziewski, J. (2006). Thermal and catalytic conversion of polyolefins. In J. Scheirs & W.
Kaminsky (Eds.). Feedstock Recycling and Pyrolysis of Waste Plastics: Converting Waste
Plastics into Diesel and Other Fuels. (pp. 111-127). Chichester, UK: John Wiley & Sons.
Wang, Y., Huang, Q., Zhou, Z., Yang, J., Qi, F., & Pan, Y. (2015). Online Study on the Pyrolysis
of Polypropylene over the HZSM ‑ 5 Zeolite with Photoionization Time-of-Flight Mass
Spectrometry.
Westerhout, R. W. J., Waanders, J., Kuipers, J. A. M., & van Swaaij, W. P. M. (1998).
Recycling of Polyethene and Polypropene in a Novel Bench-Scale Rotating Cone Reactor
by High-Temperature Pyrolysis. Industrial & Engineering Chemistry Research, 37(6),
2293–2300.
Wilen, C., & Rautalin, A. (1993). Handling and feeding of biomass to pressurized reactors:
safety engineering. Bioresource technology, 46(1-2), 77-85.
Williams, E. A., & Williams, P. T. (1997a). Analysis of products derived from the fast pyrolysis
of plastic waste, 41, 347–363.
Williams, E. A., & Williams, P. T. (1997b). The Pyrolysis of Individual Plastics and a Plastic
Mixture in a Fixed Bed Reactor. Journal of Chemical Technology & Biotechnology:
International Research in Process, Environmental AND Clean Technology, 70(1), 9-20.
Williams, P. T., & Slaney, E. (2007). Analysis of products from the pyrolysis and liquefaction
of single plastics and waste plastic mixtures, 51, 754–769.
Williams, P. T., & Williams, E. A. (1999a). Interaction of plastics in mixed-plastics pyrolysis.
Energy & Fuels, 13(12), 188–196.
Williams, P. T., & Williams, E. A. (1999b). Fluidised bed pyrolysis of low density polyethylene
to produce petrochemical feedstock, Journal of Analytical and Applied Pyrolysis 51,
107–126.
Stellenbosch University https://scholar.sun.ac.za

111
Wong, H. W., Kruse, T. M., Woo, O. S., & Broadbelt, L. J. (2000). Tertiary resource recovery
from waste polymers via pyrolysis: polypropylene. In Prepr Symp-Am Chem Soc, Div
Fuel Chem (Vol. 45, pp. 480-484).
Wong, S. L., Ngadi, N., Abdullah, T. A. T., & Inuwa, I. M. (2015). Current state and future
prospects of plastic waste as source of fuel: A review. Renewable and sustainable
energy reviews, 50, 1167-1180.
World Economic Forum, Ellen MacArthur Foundation and McKinsey & Company, The New
Plastics Economy — Rethinking the future of plastics (2016,
http://www.ellenmacarthurfoundation.org/publications).
Xingzhong, Y. (2006). Converting Waste Plastics into Liquid Fuel by Pyrolysis: Developments
in China. In J. Scheirs & W. Kaminsky (Eds.). Feedstock Recycling and Pyrolysis of Waste
Plastics: Converting Waste Plastics into Diesel and Other Fuels. (pp. 729-755).
Chichester, UK: John Wiley & Sons.
Yan, G., Jing, X., Wen, H., & Xiang, S. (2015). Thermal cracking of virgin and waste plastics of
PP and LDPE in a semibatch reactor under atmospheric pressure. Energy & Fuels, 29(4),
2289-2298.
Yanik, J., & Karayildirim, T. (2006). Liquefaction of municipal waste plastics over acidic and
nonacidic catalysts. In J. Scheirs & W. Kaminsky (Eds.). Feedstock Recycling and
Pyrolysis of Waste Plastics: Converting Waste Plastics into Diesel and Other Fuels. (pp.
209-224). Chichester, UK: John Wiley & Sons.
Zadgaonkar, A. (2006). Process and equipment for conversions of waste plastics into fuels.
In J. Scheirs & W. Kaminsky (Eds.). Feedstock Recycling and Pyrolysis of Waste Plastics:
Converting Waste Plastics into Diesel and Other Fuels. (pp. 709-728). Chichester, UK:
John Wiley & Sons.
Zajec, L. (2009). Slow pyrolysis in a rotary kiln reactor : Optimization and experiment. A
Master’s Thesis. Retrieved from:
http://skemman.is/stream/get/1946/7005/17751/1/Luka_Zajec.pdf [Accessed: 10th
February 2017]
Stellenbosch University https://scholar.sun.ac.za

112
Zhou, Q., Zheng, L., Wang, Y. Z., Zhao, G. M., & Wang, B. (2004). Catalytic degradation of
low-density polyethylene and polypropylene using modified ZSM-5 zeolites. Polymer
Degradation and Stability, 84(3), 493–497.
Zorriqueta, N. I. J. (2006). Pyrolysis of polypropylene by ziegler-natta catalysts. Doctor
thesis. Universität Hamburg. Retrieved from: https://www.chemie.uni-
hamburg.de/bibliothek/2006/DissertationNunez.pdf [Accessed: 11th October 2016]
Stellenbosch University https://scholar.sun.ac.za

113
Appendices
: Uses and flow of plastics
Table A.1. Some useful applications of commonly used plastic materials
Material
Applications
Packaging Non-packaging
PET
Carbonated drink bottles, mineral water bottles, clear bottles used for dishwashing liquids and edible oils, Jars, Biscuit trays, Punnets, Salad domes
Carpeting, fibres for apparel and industrial applications. Engineering components such as sewing machine parts
HDPE
Milk bottles, fruit juice bottles, drums, packaging films, carrier type shopping bags, tubs, closures, cosmetic bottles, crates, pallets, bins
Irrigation pipes, water reticulation, shade-cloth, netting, shopping trolleys, refuse bins, toys, medical implants such as hip replacement components
PVC-P (Flexible)
Industrial cling film, pouches
Cable insulation, gum boots, shoe soles, flooring, matting, medical cloth and tubing, tarpaulins, hoses, safety gloves, soft toys, rain wear, erasers, banners, see-through ‘vinyl curtains, tents and upholstery etc.
PVC-U
(Rigid)
Clear bottles and jars (limited use)
Blister packaging, food packaging, inserts such as chocolate trays
Pipes for water reticulation and sewage, conduit profiles, cladding, stationery foils, plumbing etc.
LDPE
Packaging films, domestic cling film, stretch wrap, shrink wrap, bags, shrouds, dust covers, peel-able lids, cosmetic tubes, boutique shopping bags
Irrigation pipes, cable insulation, agricultural films, rational moulded products such as tanks
PP Yoghurt tubs, margarine tubs, ice cream containers, wrappers, packaging films, bottles, caps and
Coat hangers, battery cases, reels, automotive components such as bumpers, furniture, bowls, buckets, carpeting, hair extensions,
Stellenbosch University https://scholar.sun.ac.za

114
Material
Applications
Packaging Non-packaging
closures, canisters, strapping tape, woven bags, crates
appliances including toasters and kettles, toilet seats, ropes, fishing nets
PS-HI
(High impact)
Yoghurt and other dairy product tubs, display boxes, cake domes, punnets
Coat hangers, take away cutlery, take away crockery, toys, cups, plates, audio and video cassette housings, CD and DVD covers, cell phone covers, stationery items including pens and rulers, toys, watch glasses, shower doors, office drawers, stationery trays etc.
PS-E
(Expanded)
Protective packaging, take-away food containers, clamshell packaging, meat and vegetable trays, punnets
Vending cups, insulation panels, suspended ceiling panels
Others, Polycarbonate
(PC)
Baby bottle, housings for cameras, video equipment, light covers, traffic light covers, safety glasses, visors, crash helmets
Stellenbosch University https://scholar.sun.ac.za

115
: Standard Deviation
Table B.1. Raw data showing standard deviations of products yields (Atmospheric slow)
Temperature
(ºC)
Product yields and standard deviations (wt.%)
Heavy oil Light oil gas char
450 68.6 ± 0.2 13.8 ± 0.5 5.6 ± 0.4 5.7 ± 1.5
488 70.3 ± 0.2 15.3 ± 0.8 5.8 ± 0.3 3.1 ± 0.4
525 63.8 ± 1.7 17.1 ± 1.1 8.4 ± 0.2 2.6 ± 0.2
600 48.0 ± 2.0 15.0 ± 1.0 27.0 ± 1.3 2.5 ± 0.1
Table B.2. Raw data showing standard deviations of products yields (Atmospheric fast-insertion)
Temperature
(ºC)
Product yields and standard deviations (wt.%)
Heavy oil Light oil gas char
450 62.9 ± 2.0 14.0 ± 0.4 4.0 ± 1.0 14.0 ± 0.9
488 69.7 ± 0.8 14.8 ± 0.0 7.2 ± 0.5 3.0 ± 0.1
525 64.6 ± 0.5 16.0 ± 0.2 10.1 ± 1.9 2.6 ± 0.1
600 31.0 ± 6.4 29.5 ± 0.6 31.8 ± 3.2 2.5 ± 0.1
Stellenbosch University https://scholar.sun.ac.za

116
Table B.3. Raw data showing standard deviations of products yields (Vacuum slow)
Temperature
(ºC)
Product yields and standard deviations (wt.%)
Heavy oil Light oil gas char
450 62.9 ± 1.9 26.1 ± 3.3 1.7 ± 0.1 4.4 ± 0.6
488 60.5 ± 4.6 30.3 ± 3.8 2.3 ± 0.6 2.5 ± 0.2
525 64.5 ± 3.0 28.2 ± 3.6 3.4 ± 0.1 1.9 ± 0.4
600 61.1 ± 0.8 25.2 ± 1.5 2.9 ± 1.2 2.4 ± 0.0
Table B.4. Raw data showing standard deviations of products yields (Vacuum fast insertion)
Temperature
(ºC)
Product yields and standard deviations (wt.%)
Heavy oil Light oil gas char
450 64.7 ± 0.9 25.5 ± 1.0 1.8 ± 1.0 4.6 ± 0.2
488 66.5 ± 1.8 25.3 ± 0.0 2.2 ± 0.5 3.1 ± 0.5
525 64.5 ± 3.0 28.2 ± 3.6 5.11 ± 1.2 1.9 ± 0.4
600 61.1 ± 0.8 25.2 ± 1.5 7.36 ± 0.5 2.4 ± 0.0
Stellenbosch University https://scholar.sun.ac.za

117
Table B.5. Raw data showing standard deviations of products yields (Pilot tests)
Temperature
(ºC)
Product yields and standard deviations (wt.%)
Oil from
condensers
Wax from char
box
gas char
450 76.90 ± 0.5 11.57 ± 0.9 5.63 ± 0.5 1.29 ± 0.1
460 80.14 ± 0.2 10.21 ± 2.6 6.83 ± 0.9 1.13 ± 0.3
488 69.49 ± 0.9 6.80 ± 0.4 10.57 ± 1.4 0.78 ± 0.0
507 70.81 ± 2.2 8.68 ± 1.0 13.71 ± 0.1 0.96 ± 0.1
525 70.22 ± 2.6 4.98 ± 1.1 15.52 ± 2.2 0.55 ± 0.1
Stellenbosch University https://scholar.sun.ac.za

118
: Simulated distillation used for GC/MS characterisation of
oils
Figure C.1. GC/MS Chromatogram of Alkane standard used in simulated distillation showing the retention time ranges for gasoline, diesel and wax range compounds used to characterise oils.
Decane
Tricosane
Gasoline range
(C6-c12) Diesel range
(C11-C23)
Wax (C23+)
Stellenbosch University https://scholar.sun.ac.za

119
: Images of condensable products and char obtained from bench
Figure D.1.Heavy condensable products obtained from ambient condition condenser. (A) Oils
recovered at 600 °C under atmospheric conditions showing its viscous nature (wax-containing), (B)
Oils recovered at 450 °C under atmospheric conditions showing its less viscous wax nature, (C)
Condensable product obtained in ambient condition condenser under vacuum showing its completely
solid wax nature.
Figure D.2. Light condensable products obtained under dry ice condensers showing their clear, free-
flowing and wax-free nature. (A) From ambient, (B) From vacuum.
Stellenbosch University https://scholar.sun.ac.za

120
Figure D.3. Images of char showing complete and incomplete conversions of PP. (A) Sample boat
showing char remains after complete conversion of PP at 600 °C under atmospheric condition, (B)
Char sample obtained from the pyrolysis of PP at 600 °C, (C) Sample boat showing incomplete
conversion of PP at 400 °C.
Stellenbosch University https://scholar.sun.ac.za