Analysis of fracture toughness in the transition-temperature region of an Mn-Mo-Ni low-alloy steel
7
I. INTRODUCTION MN-MO-NI low-alloy steels are key materials used for nuclear reactor facilities such as pressure vessels, compres- sors, and steam generators. [1,2] The most critical properties required for these low-alloy steels are suf cient strength to withstand the inner pressure and a high fracture toughness that can ensure safety against momentary impact due to unexpected accidents. [3–8] Considering the occurrence of neutron irradiation embrittlement, which causes an increase in the ductile-brittle transition temperature, the use of steels with high fracture toughness in the transition-temperature region is highly required in order to ensure a suf cient safety margin in nuclear reactor operation. [9] The fracture toughness of steels at the lower-shelf region can be evaluated by measuring plane-strain fracture tough- ness (K Ic ) in accordance with the ASTM E399 standard test method. [10] In measuring the resistance to the ductile-crack propagation in the upper shelf or upper transition region, J Ic can be used as de ned by the ASTM E1737 standard test method. [11] However, these two methods have some limitations in measuring fracture toughness in the transition region. [12] Since the plastic-zone size at a crack tip should be very small compared to the specimen dimensions, very thick specimens are required to measure K Ic in the transition- temperature region where some level of plastic deformation occurs; thus, K Ic tests are valid mostly in the lower-shelf region for most structural steels. Although the size re- quirement in J Ic is more lenient than it is in K Ic , its applica- tion to the transition region is hardly possible, because a suf cient level of ductile-crack growth is not ensured. The ASTM E1290 crack-tip opening displacement (CTOD) measurement method, [13] which has been widely used to Analysis of Fracture Toughness in the Transition-Temperature Region of an Mn-Mo-Ni Low-Alloy Steel SANGHO KIM, BYOUNGCHUL HWANG, and SUNGHAK LEE This study is concerned with the analysis of fracture toughness in the transition region of an Mn-Mo-Ni low-alloy steel, in accordance with the ASTM E1921 standard test method. Elastic-plastic cleavage fracture toughness (K Jc ) was determined by three-point bend tests, using precracked Charpy V-notch (PCVN) specimens, and relationships between K Jc , the critical component of J (J c ), critical distance (X c ), stretch-zone width (SZW), local fracture stress, and plane-strain fracture toughness (K Ic were discussed on the basis of the cleavage fracture behavior in the transition region. The master curve and the 95 pct con dence curves well explained the variation in the measured K Jc , and the Weibull slope measured on the Weibull plots was consistent with the theoretical slope of 4. Fractographic ob- servation indicated that X c linearly increased with increasing J c , and that the SZW had a good correla- tion with K Jc , irrespective of the test temperature. In addition, the local fracture stress was independent of the test temperature, because the tempered bainitic steel used in this study showed a propagation- controlled cleavage fracture behavior. measure fracture toughness in the transition region, also has a shortcoming in that the critical CTOD values are depen- dent on the specimen size or geometric shape. The ASTM E1921 standard test method, [14] in which the variation of fracture toughness in the transition region is considered as a property of ferritic steels, can quantitatively evaluate the fracture toughness from the probabilistic and statistical point of view. According to this test method, vari- ations in fracture toughness as a function of temperature can be described using a master curve characterized by a refer- ence temperature. In the present study, fracture toughness in the transition-temperature region of an Mn-Mo-Ni low-alloy steel was analyzed in accordance with the ASTM E1921 standard test method. Based on the reference temperature that characterizes fracture toughness in the transition region, investigations were made into microstructural factors affect- ing the fracture toughness. II. EXPERIMENTAL The Mn-Mo-Ni low-alloy steel used in this study has the composition corresponding to an ASME SA508 Grade 3 steel used for nuclear reactor pressure vessels. Its chemical composition is 0.198C-1.36Mn-0.484Mo-0.928Ni-0.127Cr- 0.201Si-0.019A1-0.015N-Fe (wt pct). A vacuum induction melting furnace of 30 kgf capacity was used to produce a cast ingot. The ingot was hot rolled to the thickness of 35 mm and was homogenized at 1200 ± C for 12 hours. It was austenitized at 900 ± C for 1 hour, water quenched, austeni- tized at 900 ± C for 1 hour again, and continuously cooled at a rate of 20 ± C/min in order to obtain a bainitic structure. Tempering was then conducted at 660 ± C for 10 hours. Specimens were polished and etched in a 2 pct nital solu- tion. Microstructures were analyzed using an optical micro- scope and a transmission electron microscope (TEM). Carbon thin- lm extraction replicas were prepared and observed by a TEM at an acceleration voltage of 200 kV. Tensile bars with a gage diameter of 4 mm and a gage length of 12.5 mm were prepared in the transverse direction and were tested at room temperature at a strain rate of 4 £ 10 ¡4 /s using a 10-ton METALLURGICAL AND MATERIALS TRANSACTIONS A VOLUME 34A, JUNE 2003—1275 SANGHO KIM, Postdoctoral Research Associate, BYOUNGCHUL HWANG, Research Assistant, and SUNGHAK LEE, Professor, are with the Center for Advanced Aerospace Materials, Pohang University of Science and Technology, Pohang, 790-784 Korea. SUNGHAK LEE is jointly ap- pointed with the Materials Science and Engineering Department, Pohang University of Science and Technology. Contact e-mail: [email protected] Manuscript submitted April 22, 2002.
-
Upload
independent -
Category
Documents
-
view
1 -
download
0
Transcript of Analysis of fracture toughness in the transition-temperature region of an Mn-Mo-Ni low-alloy steel

I INTRODUCTION
MN-MO-NI low-alloy steels are key materials used fornuclear reactor facilities such as pressure vessels compres-sors and steam generators[12] The most critical propertiesrequired for these low-alloy steels are suf cient strength towithstand the inner pressure and a high fracture toughnessthat can ensure safety against momentary impact due tounexpected accidents[3ndash8] Considering the occurrence ofneutron irradiation embrittlement which causes an increasein the ductile-brittle transition temperature the use of steelswith high fracture toughness in the transition-temperatureregion is highly required in order to ensure a suf cient safetymargin in nuclear reactor operation[9]
The fracture toughness of steels at the lower-shelf regioncan be evaluated by measuring plane-strain fracture tough-ness (KIc) in accordance with the ASTM E399 standard testmethod[10] In measuring the resistance to the ductile-crackpropagation in the upper shelf or upper transition region JIc
can be used as de ned by the ASTM E1737 standardtest method[11] However these two methods have somelimitations in measuring fracture toughness in the transitionregion[12] Since the plastic-zone size at a crack tip shouldbe very small compared to the specimen dimensions verythick specimens are required to measure KIc in the transition-temperature region where some level of plastic deformationoccurs thus KIc tests are valid mostly in the lower-shelfregion for most structural steels Although the size re-quirement in JIc is more lenient than it is in KIc its applica-tion to the transition region is hardly possible because asuf cient level of ductile-crack growth is not ensuredThe ASTM E1290 crack-tip opening displacement (CTOD)measurement method[13] which has been widely used to
Analysis of Fracture Toughness in the Transition-Temperature Region of an Mn-Mo-Ni Low-Alloy Steel
SANGHO KIM BYOUNGCHUL HWANG and SUNGHAK LEE
This study is concerned with the analysis of fracture toughness in the transition region of an Mn-Mo-Ni low-alloy steel in accordance with the ASTM E1921 standard test method Elastic-plasticcleavage fracture toughness (KJc) was determined by three-point bend tests using precracked CharpyV-notch (PCVN) specimens and relationships between KJc the critical component of J (Jc) criticaldistance (Xc) stretch-zone width (SZW) local fracture stress and plane-strain fracture toughness (KIc
were discussed on the basis of the cleavage fracture behavior in the transition region The master curveand the 95 pct con dence curves well explained the variation in the measured KJc and the Weibullslope measured on the Weibull plots was consistent with the theoretical slope of 4 Fractographic ob-servation indicated that Xc linearly increased with increasing Jc and that the SZW had a good correla-tion with KJc irrespective of the test temperature In addition the local fracture stress was independentof the test temperature because the tempered bainitic steel used in this study showed a propagation-controlled cleavage fracture behavior
measure fracture toughness in the transition region also hasa shortcoming in that the critical CTOD values are depen-dent on the specimen size or geometric shape
The ASTM E1921 standard test method[14] in which thevariation of fracture toughness in the transition region isconsidered as a property of ferritic steels can quantitativelyevaluate the fracture toughness from the probabilistic andstatistical point of view According to this test method vari-ations in fracture toughness as a function of temperature canbe described using a master curve characterized by a refer-ence temperature In the present study fracture toughness inthe transition-temperature region of an Mn-Mo-Ni low-alloysteel was analyzed in accordance with the ASTM E1921standard test method Based on the reference temperaturethat characterizes fracture toughness in the transition regioninvestigations were made into microstructural factors affect-ing the fracture toughness
II EXPERIMENTAL
The Mn-Mo-Ni low-alloy steel used in this study has thecomposition corresponding to an ASME SA508 Grade 3steel used for nuclear reactor pressure vessels Its chemicalcomposition is 0198C-136Mn-0484Mo-0928Ni-0127Cr-0201Si-0019A1-0015N-Fe (wt pct) A vacuum inductionmelting furnace of 30 kgf capacity was used to produce acast ingot The ingot was hot rolled to the thickness of35 mm and was homogenized at 1200 plusmnC for 12 hours It wasaustenitized at 900 plusmnC for 1 hour water quenched austeni-tized at 900 plusmnC for 1 hour again and continuously cooled ata rate of 20 plusmnCmin in order to obtain a bainitic structureTempering was then conducted at 660 plusmnC for 10 hours
Specimens were polished and etched in a 2 pct nital solu-tion Microstructures were analyzed using an optical micro-scope and a transmission electron microscope (TEM) Carbonthin- lm extraction replicas were prepared and observed by aTEM at an acceleration voltage of 200 kV Tensile bars witha gage diameter of 4 mm and a gage length of 125 mm wereprepared in the transverse direction and were tested at roomtemperature at a strain rate of 4 pound 10iexcl4s using a 10-ton
METALLURGICAL AND MATERIALS TRANSACTIONS A VOLUME 34A JUNE 2003mdash1275
SANGHO KIM Postdoctoral Research Associate BYOUNGCHULHWANG Research Assistant and SUNGHAK LEE Professor are with theCenter for Advanced Aerospace Materials Pohang University of Scienceand Technology Pohang 790-784 Korea SUNGHAK LEE is jointly ap-pointed with the Materials Science and Engineering Department PohangUniversity of Science and TechnologyContact e-mail shleepostechackr
Manuscript submitted April 22 2002
Instron machine Low-temperature tensile tests were con-ducted after the tensile bars were kept for 15 minutes insidea low-temperature chamber in which the test temperaturewas controlled by spraying liquid nitrogen Charpy impacttests were performed on Charpy V-notch (CVN) bars whichwere machined in the transverse-longitudinal (T-L) orienta-tion in the temperature range from iexcl150 plusmnC to 100 plusmnC
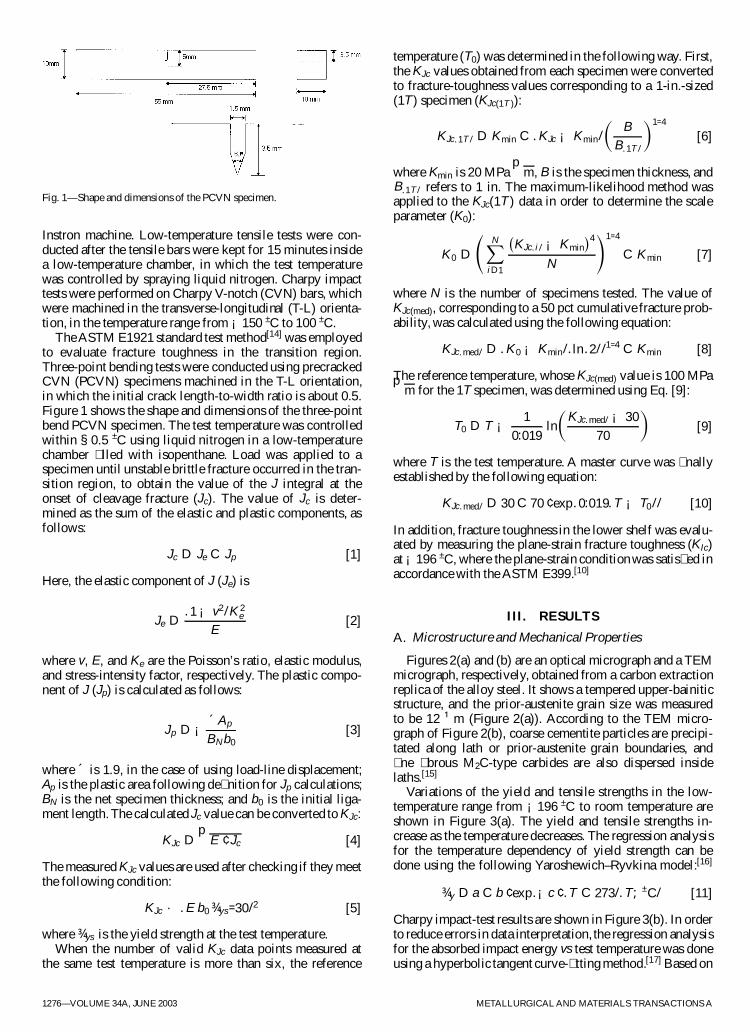
The ASTM E1921 standard test method[14] was employedto evaluate fracture toughness in the transition regionThree-point bending tests were conducted using precrackedCVN (PCVN) specimens machined in the T-L orientationin which the initial crack length-to-width ratio is about 05Figure 1 shows the shape and dimensions of the three-pointbend PCVN specimen The test temperature was controlledwithin sect05 plusmnC using liquid nitrogen in a low-temperaturechamber lled with isopenthane Load was applied to aspecimen until unstable brittle fracture occurred in the tran-sition region to obtain the value of the J integral at theonset of cleavage fracture (Jc) The value of Jc is deter-mined as the sum of the elastic and plastic components asfollows
Jc D Je C Jp [1]
Here the elastic component of J (Je) is
Je D1 iexcl v2K 2
e
E[2]
where v E and Ke are the Poissonrsquos ratio elastic modulusand stress-intensity factor respectively The plastic compo-nent of J (Jp) is calculated as follows
Jp D iexclacute Ap
BN b0[3]
where acute is 19 in the case of using load-line displacementAp is the plastic area following de nition for Jp calculationsBN is the net specimen thickness and b0 is the initial liga-ment length The calculated Jc value can be converted to KJc
KJc Dp
E cent Jc [4]
The measured KJc values are used after checking if they meetthe following condition
KJc middot E b0 frac34ys=302 [5]
where frac34ys is the yield strength at the test temperature When the number of valid KJc data points measured at
the same test temperature is more than six the reference
temperature (T0) was determined in the following way Firstthe KJc values obtained from each specimen were convertedto fracture-toughness values corresponding to a 1-in-sized(1T ) specimen (KJc(1T ))
KJc1T D Kmin C KJc iexcl Kmin
sup3B
B1T
acute1=4
[6]
where Kmin is 20 MPa p
m B is the specimen thickness andB1T refers to 1 in The maximum-likelihood method wasapplied to the KJc(1T ) data in order to determine the scaleparameter (K0)
K0 D
AacuteNX
iD1
iexclKJci iexcl Kmin
cent4
N
1=4
C Kmin [7]
where N is the number of specimens tested The value ofKJc(med) corresponding to a 50 pct cumulative fracture prob-ability was calculated using the following equation
KJcmed D K0 iexcl Kminln21=4 C Kmin [8]
The reference temperature whose KJc(med) value is 100 MPapm for the 1T specimen was determined using Eq [9]
T0 D T iexcl 1
0019ln
sup3KJcmed iexcl 30
70
acute[9]
where T is the test temperature A master curve was nallyestablished by the following equation
KJcmed D 30 C 70 cent exp0019T iexcl T0 [10]
In addition fracture toughness in the lower shelf was evalu-ated by measuring the plane-strain fracture toughness (KIc)at iexcl196 plusmnC where the plane-strain condition was satis ed inaccordance with the ASTM E399[10]
III RESULTS
A Microstructure and Mechanical Properties
Figures 2(a) and (b) are an optical micrograph and a TEMmicrograph respectively obtained from a carbon extractionreplica of the alloy steel It shows a tempered upper-bainiticstructure and the prior-austenite grain size was measuredto be 12 sup1m (Figure 2(a)) According to the TEM micro-graph of Figure 2(b) coarse cementite particles are precipi-tated along lath or prior-austenite grain boundaries and ne brous M2C-type carbides are also dispersed insidelaths[15]
Variations of the yield and tensile strengths in the low-temperature range from iexcl196 plusmnC to room temperature areshown in Figure 3(a) The yield and tensile strengths in-crease as the temperature decreases The regression analysisfor the temperature dependency of yield strength can bedone using the following YaroshewichndashRyvkina model[16]
frac34y D a C b cent expiexclc cent T C 273T plusmnC [11]
Charpy impact-test results are shown in Figure 3(b) In orderto reduce errors in data interpretation the regression analysisfor the absorbed impact energy vs test temperature was doneusing a hyperbolic tangent curve- tting method[17] Based on
1276mdashVOLUME 34A JUNE 2003 METALLURGICAL AND MATERIALS TRANSACTIONS A
Fig 1mdashShape and dimensions of the PCVN specimen
the data from the regression analysis various index temper-atures such as T50ft-lb T30ft-lb and T28 J were measured to beiexcl61 plusmnC iexcl72 plusmnC and iexcl79 plusmnC respectively The uppershelfenergy was 211 J
B Fracture Toughness in the Transition Region
The fracture-toughness test results in the transition regionreveal cleavage fracture in the test-temperature range subse-quent to some plastic deformation at the fatigued crack tipwithout further ductile crack growth The reference temper-ature of ferritic steels whose KJc(med) value is 100 MPa m12
for the 1-in-sized specimen was calculated to be iexcl89 plusmnCThe calculation was done with a set of actual fracture-toughness results at iexcl100 plusmnC as shown in Table I andKJc(med) at this temperature was calculated to be 87 MPa
pm
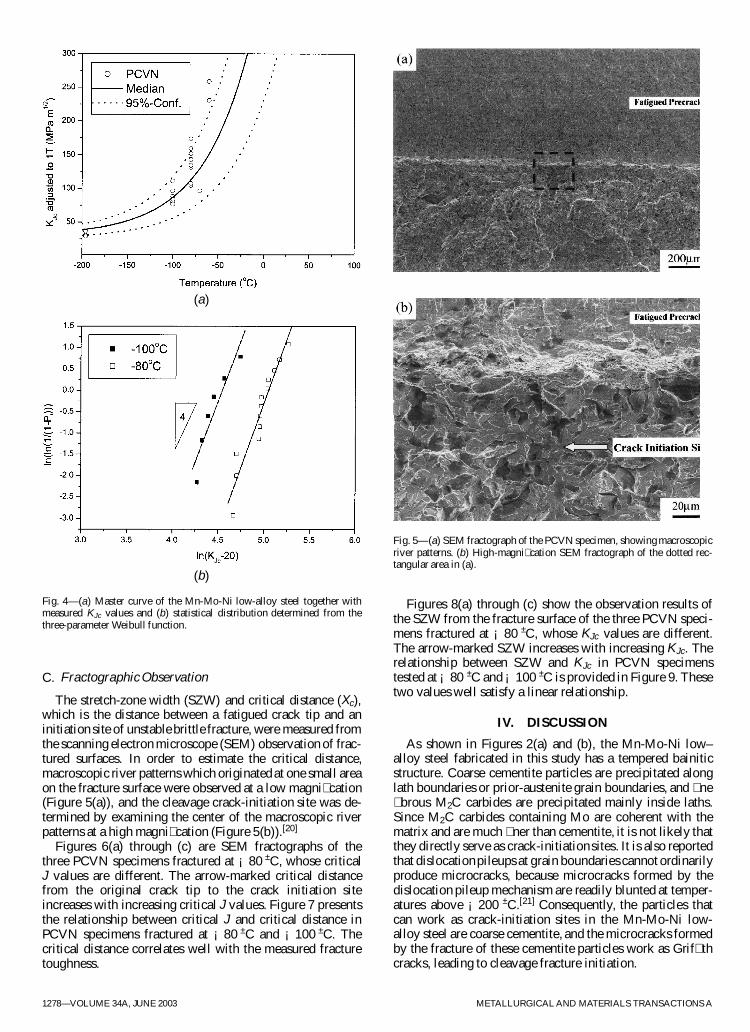
The master curve determined from the measured referencetemperature together with the measured values of elastic-plastic cleavage fracture toughness is presented in Figure4(a) The solid line indicates the fracture toughness of 50 pctcumulative fracture probability while the dotted lines showthe region of 95 pct con dence for the presented mastercurve It is known from this gure that the scatters of thefracture-toughness data are well explained by the mastercurve and the 95 pct con dence curves
To con rm whether the measured test data well satisfy theWeibull probability distribution Weibull plots are shown inFigure 4(b) The Weibull slope (m) determined by thelinear-regression analysis de nes the scatter of the test dataon the Weibull distribution According to Wallin[18] andAnderson and Stienstra[19] the theoretical Weibull slopecalculated from the crack-tip stress distribution is about 4The Weibull slopes measured on the Weibull plots are nearlyconsistent with the theoretical slope of 4
METALLURGICAL AND MATERIALS TRANSACTIONS A VOLUME 34A JUNE 2003mdash1277
Table I Fracture Toughness Test Results Measuredat Various Temperatures
Test Temperature (plusmnC) KJc Adjusted to 1T (MPa p
m)
iexcl60 2307 2588iexcl70 965iexcl80 1045 1075 1075 1315 1328
1331 1345 1348 1429 14381519 1597 1738
iexcl100 766 799 841 880 964 1112iexcl196 291 302
Fig 2mdash(a) Optical and (b) TEM micrographs of the Mn-Mo-Ni low-alloysteel showing an upper bainitic structure containing cementite and M2Ccarbides
Fig 3mdashVariation of (a) yield and tensile stresses and (b) Charpy impact en-ergy as a function of test temperature for the Mn-Mo-Ni low-alloy steel
(a)
(b)
C Fractographic Observation
The stretch-zone width (SZW) and critical distance (Xc)which is the distance between a fatigued crack tip and aninitiation site of unstable brittle fracture were measured fromthe scanning electron microscope (SEM) observation of frac-tured surfaces In order to estimate the critical distancemacroscopic river patterns which originated at one small areaon the fracture surface were observed at a low magni cation(Figure 5(a)) and the cleavage crack-initiation site was de-termined by examining the center of the macroscopic riverpatterns at a high magni cation (Figure 5(b))[20]
Figures 6(a) through (c) are SEM fractographs of thethree PCVN specimens fractured at iexcl80 plusmnC whose criticalJ values are different The arrow-marked critical distancefrom the original crack tip to the crack initiation siteincreases with increasing critical J values Figure 7 presentsthe relationship between critical J and critical distance inPCVN specimens fractured at iexcl80 plusmnC and iexcl100 plusmnC Thecritical distance correlates well with the measured fracturetoughness
Figures 8(a) through (c) show the observation results ofthe SZW from the fracture surface of the three PCVN speci-mens fractured at iexcl80 plusmnC whose KJc values are differentThe arrow-marked SZW increases with increasing KJc Therelationship between SZW and KJc in PCVN specimenstested at iexcl80 plusmnC and iexcl100 plusmnC is provided in Figure 9 Thesetwo values well satisfy a linear relationship
IV DISCUSSION
As shown in Figures 2(a) and (b) the Mn-Mo-Ni lowndashalloy steel fabricated in this study has a tempered bainiticstructure Coarse cementite particles are precipitated alonglath boundaries or prior-austenite grain boundaries and ne brous M2C carbides are precipitated mainly inside lathsSince M2C carbides containing Mo are coherent with thematrix and are much ner than cementite it is not likely thatthey directly serve as crack-initiation sites It is also reportedthat dislocation pileups at grain boundaries cannot ordinarilyproduce microcracks because microcracks formed by thedislocation pileup mechanism are readily blunted at temper-atures above iexcl200 plusmnC[21] Consequently the particles thatcan work as crack-initiation sites in the Mn-Mo-Ni low-alloy steel are coarse cementite and the microcracks formedby the fracture of these cementite particles work as Grif thcracks leading to cleavage fracture initiation
1278mdashVOLUME 34A JUNE 2003 METALLURGICAL AND MATERIALS TRANSACTIONS A
Fig 4mdash(a) Master curve of the Mn-Mo-Ni low-alloy steel together withmeasured KJc values and (b) statistical distribution determined from thethree-parameter Weibull function
Fig 5mdash(a) SEM fractograph of the PCVN specimen showing macroscopicriver patterns (b) High-magni cation SEM fractograph of the dotted rec-tangular area in (a)
(a)
(b)
Figure 10 is an SEM micrograph of the cross-sectionalarea beneath the fracture surface of the PCVN specimentested at iexcl100 plusmnC Cementite particles having a large sizeand aspect ratio are preferentially cracked under the highstrain near the crack tip The effects of carbide size and car-bide aspect ratio on fracture toughness in the transitionregion can be explained by the weakest-link theory and the ber-loading model respectively[22] Since the KIc transitiontemperature of cementite particles is above 300 plusmnC[21] they
show brittle fracture at all temperatures below 300 plusmnC Thefracture probability of brittle cementite (Pfr) can be repre-sented from the perspective of the weakest-link theory as[22]
Pf r D 1 iexcl exp
sup3iexcl
sup3d
dN
acute3sup3 frac34 iexcl frac34min
frac340 iexcl frac34min
acutemacute[12]
Here d refers to the carbide size frac34 to the tensile stressacting on carbides frac34min to the minimum fracture stress ofcarbides m to the Weibull inhomogeneity factor and frac340 anddN refer to normalizing parameters Equation [12] indicatesthat the fracture probability of carbides increases with in-creasing carbide size (d ) The in uence of the carbide aspectratio together with carbide size on the fracture probabilityof carbides can be interpreted on the basis of the following ber-loading model[23]
frac34 particlemax raquo
l
dcent frac34 matrix
ow [13]
where frac34 particlemax refers to the maximum stress acting on car-
bides frac34 matrix ow refers to the ow stress of the matrix and l and
d refer to the carbide length and diameter in the direction offrac34 matrix
ow In Eq [13] the fracture probability of carbides in-creases with increasing aspect ratio (ld ) because the in-crease in aspect ratio leads to an increasing maximum stressacting within the carbides
Figure 7 shows that the critical J value increases as thecritical distance increases Fractographic observation re-veals that all the cleavagendashinitiation sites are found to be at alocation where the stress levels are higher than 98 pct of themaximum tensile stress frac34 max
yy based on the theoreticalcrack-tip stress distribution calculated by McMeeking[24]
This indicates that the location of fracture-initiation sitesis almost matched with that of maximum tensile stressThe maximum tensile stress is typically shown at the loca-tions corresponding to double the CTOD (plusmnt ) from thecrack tip Based on Hutchinson-Rice-Rosengren (HRR)singularity[2526] Shih[27] showed that J and the CTODsatisfy a unique solution as follows
plusmnt D dnJ
frac340[14]
METALLURGICAL AND MATERIALS TRANSACTIONS A VOLUME 34A JUNE 2003mdash1279
Fig 6mdash(a) through (c) SEM fractographs of the three PCVN specimenstested at iexcl80 plusmnC whose critical J (Jc) values are different Note that arrow-marked critical distances (Xc) increase with increasing Jc
Fig 7mdashRelationship between Xc and Jc in the PCVN specimens fractured atiexcl80 plusmnC and iexcl100 plusmnC
where dn refers to a nondimensional constant and frac340 refersto a reference stress corresponding to the yield stress ThusXc and Jc meet the following relationship
Xc frac14 2 plusmnc D 2 dnJc
frac340[15]
Since dn and frac340 are constant at the same temperature Xc andJc have a linear relation as shown in Figure 7 This impliesthat toughness is low when the critical nucleus for cleavageinitiation is located near a crack tip In specimens having
higher toughness the critical distance increases because thecrack has to pass through many regions until it discovers thecritical nucleus Many researchers including Heerens andRead[20] and Watanabe et al[28] have reported results similarto this
Local fracture stress was calculated by substituting thecritical distance and the measured values of the fracturetoughness yield strength and strain-hardening exponentinto McMeekingrsquos theoretical crack-tip stress distribution[24]
the calculated stress values are 2854 2774 and 2788 MParespectively at iexcl100 plusmnC iexcl80 plusmnC and iexcl60 plusmnC Knott[29]
measured local fracture stresses using bend specimens withdifferent notch angles in order to evaluate the effect of tensilestress on the cleavage fracture of mild steels It was foundthat the local fracture stress was independent of variations inthe test temperature and notch angle Research results byBrown et al[30] showed that the local fracture stress was irrel-evant to temperature in the range from iexcl196 plusmnC to iexcl100 plusmnCAlthough the temperature range is narrow in this study it isalso observed that the local fracture stress is nearly inde-pendent of the test temperature This is because the cleavagefracture of steels typically shows a propagationndashcontrolled
1280mdashVOLUME 34A JUNE 2003 METALLURGICAL AND MATERIALS TRANSACTIONS A
Fig 8mdash(a) through (c) SEM fractographs of the three PCVN specimenstested at iexcl80 plusmnC whose KJc values are different Note that arrow-markedSZW increases with increasing KJc
Fig 10mdashSEM micrograph of the cross-sectioned area beneath the fracturesurface of the PCVN specimen tested at iexcl100 plusmnC showing the cracking ofcarbides
Fig 9mdashRelationship between SZW and KJc in the PCVN specimens testedat iexcl80 plusmnC and iexcl100 plusmnC
cleavagendashfracture behavior which means that fracture occursunder a certain tensile stress
The plane-strain fracture toughness (KIc) was measured3 times at the test temperature of iexcl196 plusmnC which satis edtheASTM E399 KIc regulationsand the measured values are32 33 and 41 MPa
pm The average KIc value is 35 MPap
m and the variation is large at about 9 MPap
m Thisindicates that a statistical distribution of the measured KIcexists in the lower shelf although it is not so severe as in thetransition region Consequently it is risky to evaluate thefracture property of the lower shelf with a single measure-ment of KIc thus it is necessary to conduct a suf cientnumber of experiments in order to understand the statisticaltendency
V CONCLUSIONS
1 The fracture-toughness test results in the transition re-gion in accordance with the ASTM E1921 standard testmethod showed that the master curve and the 95 pct con- dence curves well explained the variation in the mea-sured fracture-toughness values Also the Weibull slopemeasured on the Weibull plots was consistent with thetheoretical slope of 4
2 Fractographic analysis revealed that the critical distancefrom the original crack tip to the crack-initiation siteand the critical J value were in a linear relationship andthat the SZW and the elastic-plastic KJc also showed a rel-atively good correlation irrespective of test temperatureThe measured local fracture stress was nearly indepen-dent of test temperature because the tempered bainiticsteel used in the present study showed a propagation-controlled cleavage-fracture behavior
3 A large variation was present in the KIc values measuredin the lower shelf satisfying ASTM E399 conditionsThis indicated that the statistical distribution of KIc in thelower shelf should also be considered just as in the tran-sition region
ACKNOWLEDGMENTS
This work was supported by the Korea Atomic EnergyResearch Institute and by the Ministry of Science and Tech-nology of Korea The authors thank Professor Hu-Chul Lee
and Dr Young-Roc Im Seoul National University and DrsJun Hwa Hong and Bong Sang Lee Korea Atomic EnergyResearch Institute for their helpful discussion on fracturetoughness analysis
REFERENCES
1 SG Druce and BC Edwards Nucl Energy 1980 vol 19pp 347ndash60
2 K Suzuki J Nucl Mater 1982 vols 108ndash109 pp 443ndash50 3 N Ohashi T Enami H Wanaka and K Aso Nucl Eng Design 1984
vol 81 pp 193ndash205 4 M Frve F Papouschek K Fischer and C Maidorn Nucl Eng
Design 1988 vol 108 pp 485ndash95 5 B Chapelle Nucl Energy 1992 vol 31 pp 417ndash25 6 P Bocquet A Cheviet and R Dumont Nucl Eng Design 1994
vol 151 pp 503ndash11 7 K Suzuki I Sato and H Tsukada Nucl Eng Design 1994 vol 151
pp 513ndash22 8 RM Boothby CA Hippsley OK Gorton and SJ Garwood Nucl
Energy 1995 vol 34 pp 229ndash38 9 JR Hawthorne Nucl Eng Design 1985 vol 89 pp 223ndash32
10 ASTM Standard E399-90 ASTM Philadelphia PA 1990 11 ASTM Standard E1737-96 ASTM Philadelphia PA 1996 12 TL Anderson and RH Dodds J Testing Evaluation 1991 vol 19
pp 123ndash34 13 British Standard 57621979 BSI London UK 1979 14 ASTM Standard E1921-97 ASTM Philadelphia PA 1997 15 S Kim Y Im S Lee H Lee YJ Oh and JH Hong Metall Mater
Trans A 2001 vol 32A pp 903ndash11 16 H Kotilainen Metals Laboratory Report No 41 Technical Research
Center of Finland Helsinki Finland 1979 17 YS Ahn YJ Oh HD Kim GM Kim and JH Hong J Kor Inst
Metall Mater 2000 vol 38 pp 466ndash73 18 K Wallin Eng Fract Mech 1984 vol 19 pp 1085ndash93 19 TL Anderson and D Stienstra J Testing Evaluation 1989 vol 17
pp 46ndash53 20 J Heerens and DT Read NISTIR 88-3099 NIST Boulder CO 1988 21 GT Hahn Metall Trans A 1984 vol 15A pp 947ndash59 22 K Wallin T Saario and K Toumlrroumlnen Int J Fract 1987 vol 32
pp 201ndash09 23 A Kelly and BE Davies Metall Rev 1965 vol 10 pp 1ndash77 24 RM McMeeking J Mech Phys Solids 1977 vol 25 pp 357ndash81 25 JW Hutchinson J Mech Phys Solids 1968 vol 16 pp 13ndash31 26 JR Rice and GF Rosengren J Mech Phys Solids 1968 vol 16
pp 1ndash12 27 CF Shih J Mech Phys Solids 1981 vol 29 pp 305ndash26 28 J Watanabe T Iwadate Y Tanaka T Yokobori and K Ando Eng
Fract Mech 1987 vol 28 pp 589ndash600 29 JF Knott J Iron Steel Inst 1966 vol 204 pp 104ndash11 30 P Bowen SG Druce and JF Knott Acta Metall 1986 vol 34
pp 1121ndash31
METALLURGICAL AND MATERIALS TRANSACTIONS A VOLUME 34A JUNE 2003mdash1281
Instron machine Low-temperature tensile tests were con-ducted after the tensile bars were kept for 15 minutes insidea low-temperature chamber in which the test temperaturewas controlled by spraying liquid nitrogen Charpy impacttests were performed on Charpy V-notch (CVN) bars whichwere machined in the transverse-longitudinal (T-L) orienta-tion in the temperature range from iexcl150 plusmnC to 100 plusmnC
The ASTM E1921 standard test method[14] was employedto evaluate fracture toughness in the transition regionThree-point bending tests were conducted using precrackedCVN (PCVN) specimens machined in the T-L orientationin which the initial crack length-to-width ratio is about 05Figure 1 shows the shape and dimensions of the three-pointbend PCVN specimen The test temperature was controlledwithin sect05 plusmnC using liquid nitrogen in a low-temperaturechamber lled with isopenthane Load was applied to aspecimen until unstable brittle fracture occurred in the tran-sition region to obtain the value of the J integral at theonset of cleavage fracture (Jc) The value of Jc is deter-mined as the sum of the elastic and plastic components asfollows
Jc D Je C Jp [1]
Here the elastic component of J (Je) is
Je D1 iexcl v2K 2
e
E[2]
where v E and Ke are the Poissonrsquos ratio elastic modulusand stress-intensity factor respectively The plastic compo-nent of J (Jp) is calculated as follows
Jp D iexclacute Ap
BN b0[3]
where acute is 19 in the case of using load-line displacementAp is the plastic area following de nition for Jp calculationsBN is the net specimen thickness and b0 is the initial liga-ment length The calculated Jc value can be converted to KJc
KJc Dp
E cent Jc [4]
The measured KJc values are used after checking if they meetthe following condition
KJc middot E b0 frac34ys=302 [5]
where frac34ys is the yield strength at the test temperature When the number of valid KJc data points measured at
the same test temperature is more than six the reference
temperature (T0) was determined in the following way Firstthe KJc values obtained from each specimen were convertedto fracture-toughness values corresponding to a 1-in-sized(1T ) specimen (KJc(1T ))
KJc1T D Kmin C KJc iexcl Kmin
sup3B
B1T
acute1=4
[6]
where Kmin is 20 MPa p
m B is the specimen thickness andB1T refers to 1 in The maximum-likelihood method wasapplied to the KJc(1T ) data in order to determine the scaleparameter (K0)
K0 D
AacuteNX
iD1
iexclKJci iexcl Kmin
cent4
N
1=4
C Kmin [7]
where N is the number of specimens tested The value ofKJc(med) corresponding to a 50 pct cumulative fracture prob-ability was calculated using the following equation
KJcmed D K0 iexcl Kminln21=4 C Kmin [8]
The reference temperature whose KJc(med) value is 100 MPapm for the 1T specimen was determined using Eq [9]
T0 D T iexcl 1
0019ln
sup3KJcmed iexcl 30
70
acute[9]
where T is the test temperature A master curve was nallyestablished by the following equation
KJcmed D 30 C 70 cent exp0019T iexcl T0 [10]
In addition fracture toughness in the lower shelf was evalu-ated by measuring the plane-strain fracture toughness (KIc)at iexcl196 plusmnC where the plane-strain condition was satis ed inaccordance with the ASTM E399[10]
III RESULTS
A Microstructure and Mechanical Properties
Figures 2(a) and (b) are an optical micrograph and a TEMmicrograph respectively obtained from a carbon extractionreplica of the alloy steel It shows a tempered upper-bainiticstructure and the prior-austenite grain size was measuredto be 12 sup1m (Figure 2(a)) According to the TEM micro-graph of Figure 2(b) coarse cementite particles are precipi-tated along lath or prior-austenite grain boundaries and ne brous M2C-type carbides are also dispersed insidelaths[15]
Variations of the yield and tensile strengths in the low-temperature range from iexcl196 plusmnC to room temperature areshown in Figure 3(a) The yield and tensile strengths in-crease as the temperature decreases The regression analysisfor the temperature dependency of yield strength can bedone using the following YaroshewichndashRyvkina model[16]
frac34y D a C b cent expiexclc cent T C 273T plusmnC [11]
Charpy impact-test results are shown in Figure 3(b) In orderto reduce errors in data interpretation the regression analysisfor the absorbed impact energy vs test temperature was doneusing a hyperbolic tangent curve- tting method[17] Based on
1276mdashVOLUME 34A JUNE 2003 METALLURGICAL AND MATERIALS TRANSACTIONS A
Fig 1mdashShape and dimensions of the PCVN specimen
the data from the regression analysis various index temper-atures such as T50ft-lb T30ft-lb and T28 J were measured to beiexcl61 plusmnC iexcl72 plusmnC and iexcl79 plusmnC respectively The uppershelfenergy was 211 J
B Fracture Toughness in the Transition Region
The fracture-toughness test results in the transition regionreveal cleavage fracture in the test-temperature range subse-quent to some plastic deformation at the fatigued crack tipwithout further ductile crack growth The reference temper-ature of ferritic steels whose KJc(med) value is 100 MPa m12
for the 1-in-sized specimen was calculated to be iexcl89 plusmnCThe calculation was done with a set of actual fracture-toughness results at iexcl100 plusmnC as shown in Table I andKJc(med) at this temperature was calculated to be 87 MPa
pm
The master curve determined from the measured referencetemperature together with the measured values of elastic-plastic cleavage fracture toughness is presented in Figure4(a) The solid line indicates the fracture toughness of 50 pctcumulative fracture probability while the dotted lines showthe region of 95 pct con dence for the presented mastercurve It is known from this gure that the scatters of thefracture-toughness data are well explained by the mastercurve and the 95 pct con dence curves
To con rm whether the measured test data well satisfy theWeibull probability distribution Weibull plots are shown inFigure 4(b) The Weibull slope (m) determined by thelinear-regression analysis de nes the scatter of the test dataon the Weibull distribution According to Wallin[18] andAnderson and Stienstra[19] the theoretical Weibull slopecalculated from the crack-tip stress distribution is about 4The Weibull slopes measured on the Weibull plots are nearlyconsistent with the theoretical slope of 4
METALLURGICAL AND MATERIALS TRANSACTIONS A VOLUME 34A JUNE 2003mdash1277
Table I Fracture Toughness Test Results Measuredat Various Temperatures
Test Temperature (plusmnC) KJc Adjusted to 1T (MPa p
m)
iexcl60 2307 2588iexcl70 965iexcl80 1045 1075 1075 1315 1328
1331 1345 1348 1429 14381519 1597 1738
iexcl100 766 799 841 880 964 1112iexcl196 291 302
Fig 2mdash(a) Optical and (b) TEM micrographs of the Mn-Mo-Ni low-alloysteel showing an upper bainitic structure containing cementite and M2Ccarbides
Fig 3mdashVariation of (a) yield and tensile stresses and (b) Charpy impact en-ergy as a function of test temperature for the Mn-Mo-Ni low-alloy steel
(a)
(b)
C Fractographic Observation
The stretch-zone width (SZW) and critical distance (Xc)which is the distance between a fatigued crack tip and aninitiation site of unstable brittle fracture were measured fromthe scanning electron microscope (SEM) observation of frac-tured surfaces In order to estimate the critical distancemacroscopic river patterns which originated at one small areaon the fracture surface were observed at a low magni cation(Figure 5(a)) and the cleavage crack-initiation site was de-termined by examining the center of the macroscopic riverpatterns at a high magni cation (Figure 5(b))[20]
Figures 6(a) through (c) are SEM fractographs of thethree PCVN specimens fractured at iexcl80 plusmnC whose criticalJ values are different The arrow-marked critical distancefrom the original crack tip to the crack initiation siteincreases with increasing critical J values Figure 7 presentsthe relationship between critical J and critical distance inPCVN specimens fractured at iexcl80 plusmnC and iexcl100 plusmnC Thecritical distance correlates well with the measured fracturetoughness
Figures 8(a) through (c) show the observation results ofthe SZW from the fracture surface of the three PCVN speci-mens fractured at iexcl80 plusmnC whose KJc values are differentThe arrow-marked SZW increases with increasing KJc Therelationship between SZW and KJc in PCVN specimenstested at iexcl80 plusmnC and iexcl100 plusmnC is provided in Figure 9 Thesetwo values well satisfy a linear relationship
IV DISCUSSION
As shown in Figures 2(a) and (b) the Mn-Mo-Ni lowndashalloy steel fabricated in this study has a tempered bainiticstructure Coarse cementite particles are precipitated alonglath boundaries or prior-austenite grain boundaries and ne brous M2C carbides are precipitated mainly inside lathsSince M2C carbides containing Mo are coherent with thematrix and are much ner than cementite it is not likely thatthey directly serve as crack-initiation sites It is also reportedthat dislocation pileups at grain boundaries cannot ordinarilyproduce microcracks because microcracks formed by thedislocation pileup mechanism are readily blunted at temper-atures above iexcl200 plusmnC[21] Consequently the particles thatcan work as crack-initiation sites in the Mn-Mo-Ni low-alloy steel are coarse cementite and the microcracks formedby the fracture of these cementite particles work as Grif thcracks leading to cleavage fracture initiation
1278mdashVOLUME 34A JUNE 2003 METALLURGICAL AND MATERIALS TRANSACTIONS A
Fig 4mdash(a) Master curve of the Mn-Mo-Ni low-alloy steel together withmeasured KJc values and (b) statistical distribution determined from thethree-parameter Weibull function
Fig 5mdash(a) SEM fractograph of the PCVN specimen showing macroscopicriver patterns (b) High-magni cation SEM fractograph of the dotted rec-tangular area in (a)
(a)
(b)
Figure 10 is an SEM micrograph of the cross-sectionalarea beneath the fracture surface of the PCVN specimentested at iexcl100 plusmnC Cementite particles having a large sizeand aspect ratio are preferentially cracked under the highstrain near the crack tip The effects of carbide size and car-bide aspect ratio on fracture toughness in the transitionregion can be explained by the weakest-link theory and the ber-loading model respectively[22] Since the KIc transitiontemperature of cementite particles is above 300 plusmnC[21] they
show brittle fracture at all temperatures below 300 plusmnC Thefracture probability of brittle cementite (Pfr) can be repre-sented from the perspective of the weakest-link theory as[22]
Pf r D 1 iexcl exp
sup3iexcl
sup3d
dN
acute3sup3 frac34 iexcl frac34min
frac340 iexcl frac34min
acutemacute[12]
Here d refers to the carbide size frac34 to the tensile stressacting on carbides frac34min to the minimum fracture stress ofcarbides m to the Weibull inhomogeneity factor and frac340 anddN refer to normalizing parameters Equation [12] indicatesthat the fracture probability of carbides increases with in-creasing carbide size (d ) The in uence of the carbide aspectratio together with carbide size on the fracture probabilityof carbides can be interpreted on the basis of the following ber-loading model[23]
frac34 particlemax raquo
l
dcent frac34 matrix
ow [13]
where frac34 particlemax refers to the maximum stress acting on car-
bides frac34 matrix ow refers to the ow stress of the matrix and l and
d refer to the carbide length and diameter in the direction offrac34 matrix
ow In Eq [13] the fracture probability of carbides in-creases with increasing aspect ratio (ld ) because the in-crease in aspect ratio leads to an increasing maximum stressacting within the carbides
Figure 7 shows that the critical J value increases as thecritical distance increases Fractographic observation re-veals that all the cleavagendashinitiation sites are found to be at alocation where the stress levels are higher than 98 pct of themaximum tensile stress frac34 max
yy based on the theoreticalcrack-tip stress distribution calculated by McMeeking[24]
This indicates that the location of fracture-initiation sitesis almost matched with that of maximum tensile stressThe maximum tensile stress is typically shown at the loca-tions corresponding to double the CTOD (plusmnt ) from thecrack tip Based on Hutchinson-Rice-Rosengren (HRR)singularity[2526] Shih[27] showed that J and the CTODsatisfy a unique solution as follows
plusmnt D dnJ
frac340[14]
METALLURGICAL AND MATERIALS TRANSACTIONS A VOLUME 34A JUNE 2003mdash1279
Fig 6mdash(a) through (c) SEM fractographs of the three PCVN specimenstested at iexcl80 plusmnC whose critical J (Jc) values are different Note that arrow-marked critical distances (Xc) increase with increasing Jc
Fig 7mdashRelationship between Xc and Jc in the PCVN specimens fractured atiexcl80 plusmnC and iexcl100 plusmnC
where dn refers to a nondimensional constant and frac340 refersto a reference stress corresponding to the yield stress ThusXc and Jc meet the following relationship
Xc frac14 2 plusmnc D 2 dnJc
frac340[15]
Since dn and frac340 are constant at the same temperature Xc andJc have a linear relation as shown in Figure 7 This impliesthat toughness is low when the critical nucleus for cleavageinitiation is located near a crack tip In specimens having
higher toughness the critical distance increases because thecrack has to pass through many regions until it discovers thecritical nucleus Many researchers including Heerens andRead[20] and Watanabe et al[28] have reported results similarto this
Local fracture stress was calculated by substituting thecritical distance and the measured values of the fracturetoughness yield strength and strain-hardening exponentinto McMeekingrsquos theoretical crack-tip stress distribution[24]
the calculated stress values are 2854 2774 and 2788 MParespectively at iexcl100 plusmnC iexcl80 plusmnC and iexcl60 plusmnC Knott[29]
measured local fracture stresses using bend specimens withdifferent notch angles in order to evaluate the effect of tensilestress on the cleavage fracture of mild steels It was foundthat the local fracture stress was independent of variations inthe test temperature and notch angle Research results byBrown et al[30] showed that the local fracture stress was irrel-evant to temperature in the range from iexcl196 plusmnC to iexcl100 plusmnCAlthough the temperature range is narrow in this study it isalso observed that the local fracture stress is nearly inde-pendent of the test temperature This is because the cleavagefracture of steels typically shows a propagationndashcontrolled
1280mdashVOLUME 34A JUNE 2003 METALLURGICAL AND MATERIALS TRANSACTIONS A
Fig 8mdash(a) through (c) SEM fractographs of the three PCVN specimenstested at iexcl80 plusmnC whose KJc values are different Note that arrow-markedSZW increases with increasing KJc
Fig 10mdashSEM micrograph of the cross-sectioned area beneath the fracturesurface of the PCVN specimen tested at iexcl100 plusmnC showing the cracking ofcarbides
Fig 9mdashRelationship between SZW and KJc in the PCVN specimens testedat iexcl80 plusmnC and iexcl100 plusmnC
cleavagendashfracture behavior which means that fracture occursunder a certain tensile stress
The plane-strain fracture toughness (KIc) was measured3 times at the test temperature of iexcl196 plusmnC which satis edtheASTM E399 KIc regulationsand the measured values are32 33 and 41 MPa
pm The average KIc value is 35 MPap
m and the variation is large at about 9 MPap
m Thisindicates that a statistical distribution of the measured KIcexists in the lower shelf although it is not so severe as in thetransition region Consequently it is risky to evaluate thefracture property of the lower shelf with a single measure-ment of KIc thus it is necessary to conduct a suf cientnumber of experiments in order to understand the statisticaltendency
V CONCLUSIONS
1 The fracture-toughness test results in the transition re-gion in accordance with the ASTM E1921 standard testmethod showed that the master curve and the 95 pct con- dence curves well explained the variation in the mea-sured fracture-toughness values Also the Weibull slopemeasured on the Weibull plots was consistent with thetheoretical slope of 4
2 Fractographic analysis revealed that the critical distancefrom the original crack tip to the crack-initiation siteand the critical J value were in a linear relationship andthat the SZW and the elastic-plastic KJc also showed a rel-atively good correlation irrespective of test temperatureThe measured local fracture stress was nearly indepen-dent of test temperature because the tempered bainiticsteel used in the present study showed a propagation-controlled cleavage-fracture behavior
3 A large variation was present in the KIc values measuredin the lower shelf satisfying ASTM E399 conditionsThis indicated that the statistical distribution of KIc in thelower shelf should also be considered just as in the tran-sition region
ACKNOWLEDGMENTS
This work was supported by the Korea Atomic EnergyResearch Institute and by the Ministry of Science and Tech-nology of Korea The authors thank Professor Hu-Chul Lee
and Dr Young-Roc Im Seoul National University and DrsJun Hwa Hong and Bong Sang Lee Korea Atomic EnergyResearch Institute for their helpful discussion on fracturetoughness analysis
REFERENCES
1 SG Druce and BC Edwards Nucl Energy 1980 vol 19pp 347ndash60
2 K Suzuki J Nucl Mater 1982 vols 108ndash109 pp 443ndash50 3 N Ohashi T Enami H Wanaka and K Aso Nucl Eng Design 1984
vol 81 pp 193ndash205 4 M Frve F Papouschek K Fischer and C Maidorn Nucl Eng
Design 1988 vol 108 pp 485ndash95 5 B Chapelle Nucl Energy 1992 vol 31 pp 417ndash25 6 P Bocquet A Cheviet and R Dumont Nucl Eng Design 1994
vol 151 pp 503ndash11 7 K Suzuki I Sato and H Tsukada Nucl Eng Design 1994 vol 151
pp 513ndash22 8 RM Boothby CA Hippsley OK Gorton and SJ Garwood Nucl
Energy 1995 vol 34 pp 229ndash38 9 JR Hawthorne Nucl Eng Design 1985 vol 89 pp 223ndash32
10 ASTM Standard E399-90 ASTM Philadelphia PA 1990 11 ASTM Standard E1737-96 ASTM Philadelphia PA 1996 12 TL Anderson and RH Dodds J Testing Evaluation 1991 vol 19
pp 123ndash34 13 British Standard 57621979 BSI London UK 1979 14 ASTM Standard E1921-97 ASTM Philadelphia PA 1997 15 S Kim Y Im S Lee H Lee YJ Oh and JH Hong Metall Mater
Trans A 2001 vol 32A pp 903ndash11 16 H Kotilainen Metals Laboratory Report No 41 Technical Research
Center of Finland Helsinki Finland 1979 17 YS Ahn YJ Oh HD Kim GM Kim and JH Hong J Kor Inst
Metall Mater 2000 vol 38 pp 466ndash73 18 K Wallin Eng Fract Mech 1984 vol 19 pp 1085ndash93 19 TL Anderson and D Stienstra J Testing Evaluation 1989 vol 17
pp 46ndash53 20 J Heerens and DT Read NISTIR 88-3099 NIST Boulder CO 1988 21 GT Hahn Metall Trans A 1984 vol 15A pp 947ndash59 22 K Wallin T Saario and K Toumlrroumlnen Int J Fract 1987 vol 32
pp 201ndash09 23 A Kelly and BE Davies Metall Rev 1965 vol 10 pp 1ndash77 24 RM McMeeking J Mech Phys Solids 1977 vol 25 pp 357ndash81 25 JW Hutchinson J Mech Phys Solids 1968 vol 16 pp 13ndash31 26 JR Rice and GF Rosengren J Mech Phys Solids 1968 vol 16
pp 1ndash12 27 CF Shih J Mech Phys Solids 1981 vol 29 pp 305ndash26 28 J Watanabe T Iwadate Y Tanaka T Yokobori and K Ando Eng
Fract Mech 1987 vol 28 pp 589ndash600 29 JF Knott J Iron Steel Inst 1966 vol 204 pp 104ndash11 30 P Bowen SG Druce and JF Knott Acta Metall 1986 vol 34
pp 1121ndash31
METALLURGICAL AND MATERIALS TRANSACTIONS A VOLUME 34A JUNE 2003mdash1281
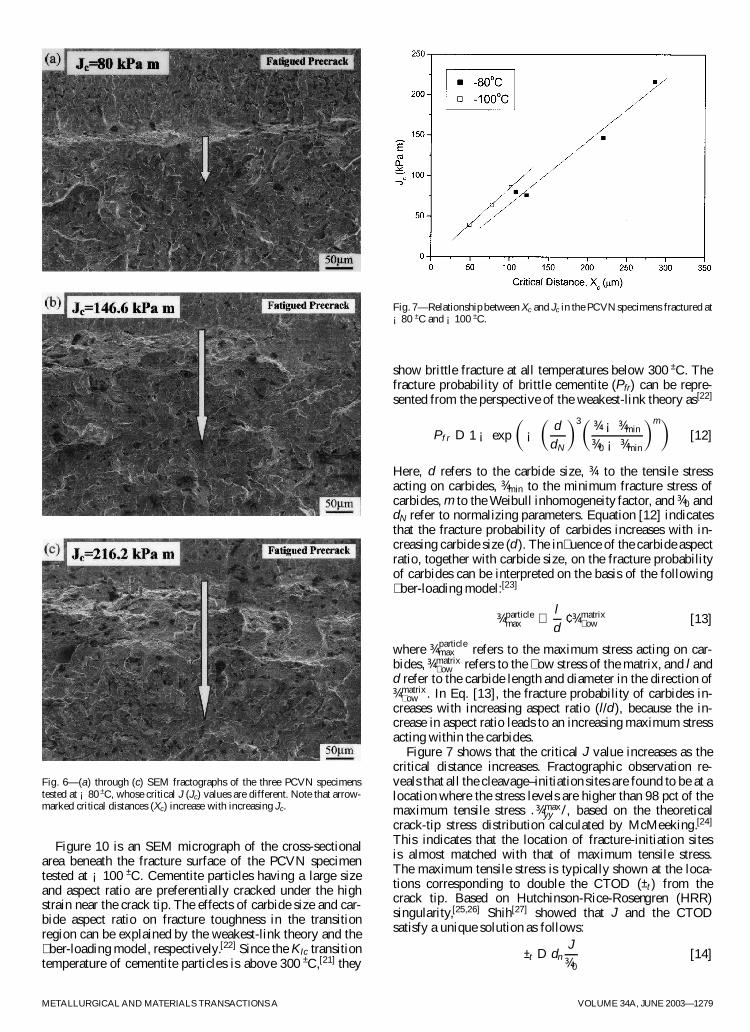