Nordic Mining Engebø Rutile and Garnet Project Prefeasibility ...
Published on Ceramics International 32 (2006) 393-405 Copyright © 2009 Elsevier Ltd. All rights reserved. doi:10.1016/j.ceramint.2005.03.015
1
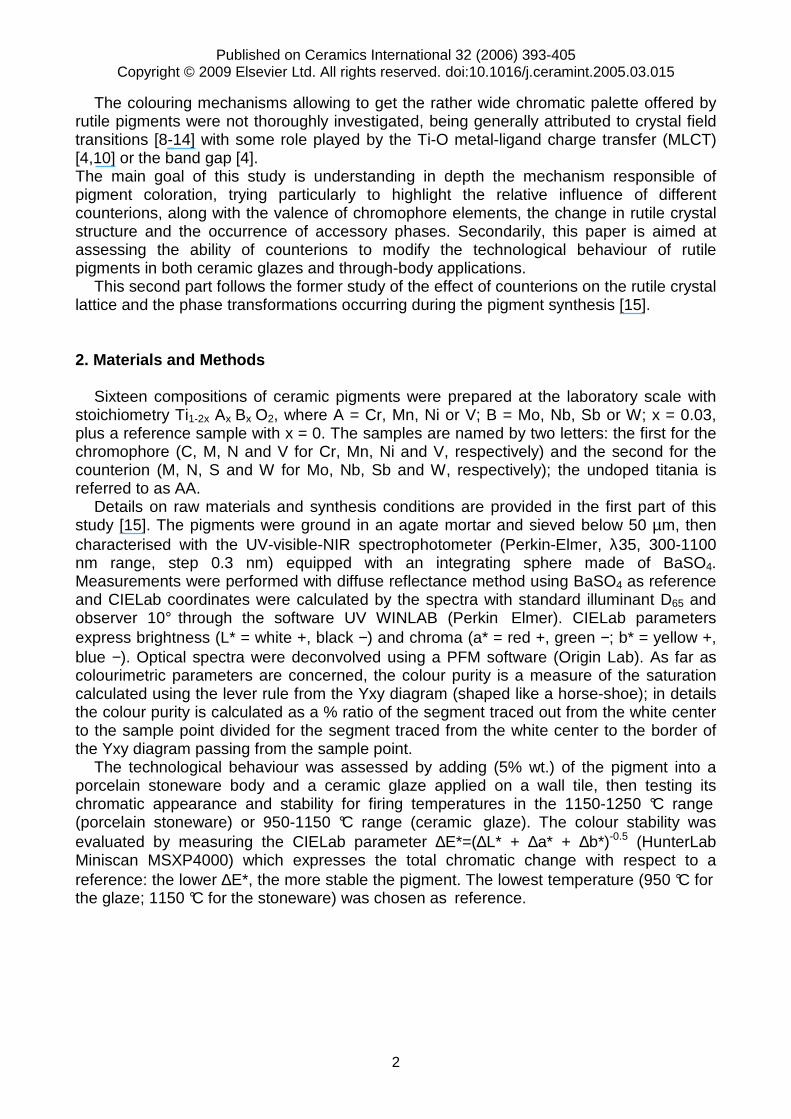
The Role of Counterions (Mo, Nb, Sb, W) in Cr-, Mn-, Ni- and V-doped Rutile Ceramic Pigments Part 2. Colour and Technological Properties.
M. Dondi1, G. Cruciani2, G. Guarini1, F. Matteucci, M. Raimondo1
1 Institute of Science and Technology for Ceramics (ISTEC), Via Granarolo 64, 48018 Faenza (Italy) 2 Earth Science Department, University of Ferrara, Corso Ercole I d’Este 32, 44100 Ferrara (Italy)
Abstract Industrial rutile pigments are manufactured using several chromophores: Cr (giving an orange hue), Mn (tan), Ni (yellow) and V (gray); a second element, the so-called counterion (i.e. Mo, Sb, Nb or W) is always added in order to achieve the desired coloration and/or improve the technological properties (e.g. chemico-physical resistance in ceramic bodies and glazes). The colour of these pigments is determined by both metal-ligand charge transfer (Ti4+↔O2-) and crystal field effects (transition metals substituting Ti4+ in octahedral coordination). Though the absorbance bands are broad and frequently overlapped, the UV-vis-NIR spectra suggest the occurrence of Cr3+, Mn2+, Mn3+, Ni2+, V3+, and V4+ as chromophores. Rutile pigments are suitable for through-body (up to 1250 °C) and glaze applications (up to 1100 °C). The best coloration of porcelain stoneware bodies is achieved with Sb or W as counterions, though the higher stability is ensured by Sb, but in the Ti-Ni-W system. The best glaze colours are accomplished by W-bearing pigments, which however are less stable than Nb- or Sb-containing ones, except than for the V+W coupling. This latter represents a new and very interesting Co-free and Cr-free black pigment for low temperature applications. Key-words: B. Spectroscopy, C. Colour, C. Optical properties, D. TiO2, D. Traditional Ceramics, Ceramic Pigments. 1. Introduction
Several rutile-based ceramic pigments are industrially manufactured using different chromophore elements: chromium (to get orange hues), manganese (brown), nickel (yellow), and vanadium (gray). A second element with high field strength (the so-called counterion, i.e. Sb, Nb or W) is always added in order to fulfil the electroneutrality of the structure, so achieving the desired coloration and/or improving the technological properties of pigments (e.g. chemico-physical resistance in contact at high temperature with the liquid phase present in ceramic bodies and glazes) [1,2]. In some cases, even molybdenum is utilised as counterion, though not considered in the DCMA list [2-4].
Despite their intense and brilliant colours, rutile pigments have been progressively confined to low temperature ceramic applications, because of their partial solubility into the glazes over 1,000 °C. This drawback can be minimise d using special, Ti-rich glaze formulations, that unfortunately exhibit both technological (very high thermal expansion coefficient) and aesthetical limitations (high refractive index, strong brilliance) [5-6]. However, a renewed industrial interest has been growing in the last decade, due to the large request of pigments for through-body colouring of porcelain stoneware tiles, whose requirements are fulfilled by rutile pigments [2,7].
Published on Ceramics International 32 (2006) 393-405 Copyright © 2009 Elsevier Ltd. All rights reserved. doi:10.1016/j.ceramint.2005.03.015
2
The colouring mechanisms allowing to get the rather wide chromatic palette offered by rutile pigments were not thoroughly investigated, being generally attributed to crystal field transitions [8-14] with some role played by the Ti-O metal-ligand charge transfer (MLCT) [4,10] or the band gap [4]. The main goal of this study is understanding in depth the mechanism responsible of pigment coloration, trying particularly to highlight the relative influence of different counterions, along with the valence of chromophore elements, the change in rutile crystal structure and the occurrence of accessory phases. Secondarily, this paper is aimed at assessing the ability of counterions to modify the technological behaviour of rutile pigments in both ceramic glazes and through-body applications.
This second part follows the former study of the effect of counterions on the rutile crystal lattice and the phase transformations occurring during the pigment synthesis [15].
2. Materials and Methods
Sixteen compositions of ceramic pigments were prepared at the laboratory scale with stoichiometry Ti1-2x Ax Bx O2, where A = Cr, Mn, Ni or V; B = Mo, Nb, Sb or W; x = 0.03, plus a reference sample with x = 0. The samples are named by two letters: the first for the chromophore (C, M, N and V for Cr, Mn, Ni and V, respectively) and the second for the counterion (M, N, S and W for Mo, Nb, Sb and W, respectively); the undoped titania is referred to as AA.
Details on raw materials and synthesis conditions are provided in the first part of this study [15]. The pigments were ground in an agate mortar and sieved below 50 µm, then characterised with the UV-visible-NIR spectrophotometer (Perkin-Elmer, λ35, 300-1100 nm range, step 0.3 nm) equipped with an integrating sphere made of BaSO4. Measurements were performed with diffuse reflectance method using BaSO4 as reference and CIELab coordinates were calculated by the spectra with standard illuminant D65 and observer 10° through the software UV WINLAB (Perkin Elmer). CIELab parameters express brightness (L* = white +, black −) and chroma (a* = red +, green −; b* = yellow +, blue −). Optical spectra were deconvolved using a PFM software (Origin Lab). As far as colourimetric parameters are concerned, the colour purity is a measure of the saturation calculated using the lever rule from the Yxy diagram (shaped like a horse-shoe); in details the colour purity is calculated as a % ratio of the segment traced out from the white center to the sample point divided for the segment traced from the white center to the border of the Yxy diagram passing from the sample point.
The technological behaviour was assessed by adding (5% wt.) of the pigment into a porcelain stoneware body and a ceramic glaze applied on a wall tile, then testing its chromatic appearance and stability for firing temperatures in the 1150-1250 °C range (porcelain stoneware) or 950-1150 °C range (ceramic glaze). The colour stability was evaluated by measuring the CIELab parameter ∆E*=(∆L* + ∆a* + ∆b*)-0.5 (HunterLab Miniscan MSXP4000) which expresses the total chromatic change with respect to a reference: the lower ∆E*, the more stable the pigment. The lowest temperature (950 °C for the glaze; 1150 °C for the stoneware) was chosen as reference.
Published on Ceramics International 32 (2006) 393-405 Copyright © 2009 Elsevier Ltd. All rights reserved. doi:10.1016/j.ceramint.2005.03.015
3
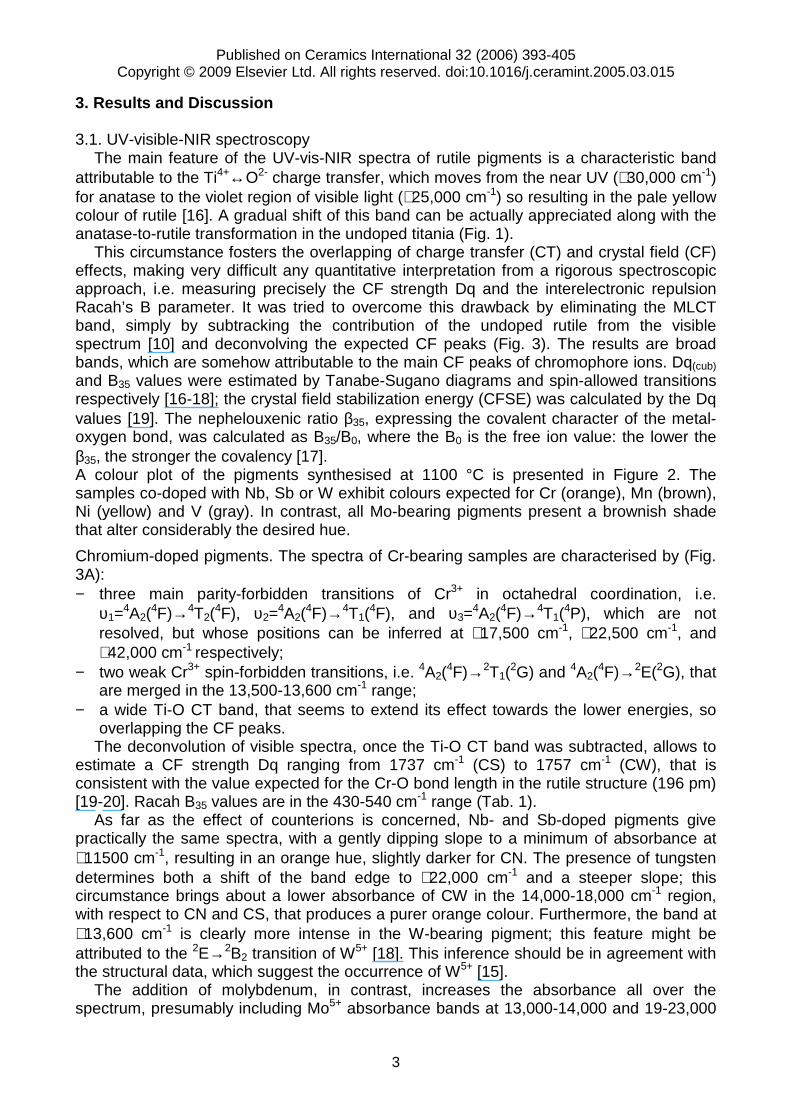
3. Results and Discussion 3.1. UV-visible-NIR spectroscopy
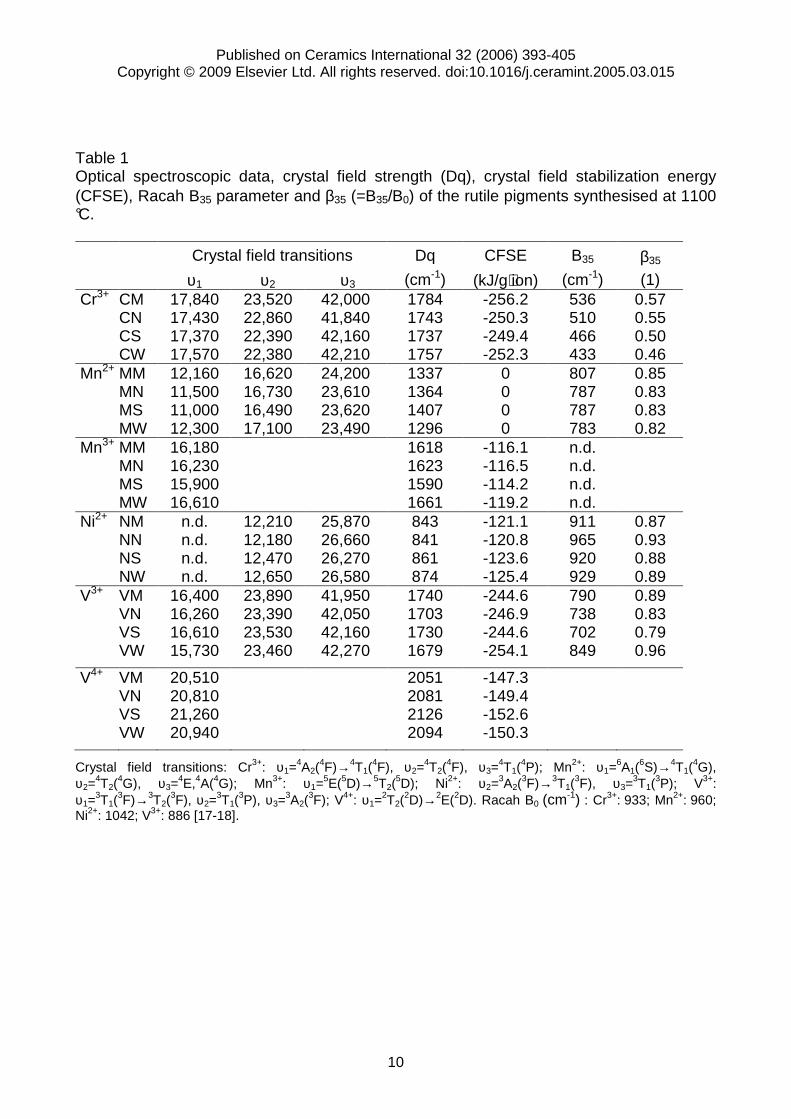
The main feature of the UV-vis-NIR spectra of rutile pigments is a characteristic band attributable to the Ti4+↔O2- charge transfer, which moves from the near UV (∼30,000 cm-1) for anatase to the violet region of visible light (∼25,000 cm-1) so resulting in the pale yellow colour of rutile [16]. A gradual shift of this band can be actually appreciated along with the anatase-to-rutile transformation in the undoped titania (Fig. 1).
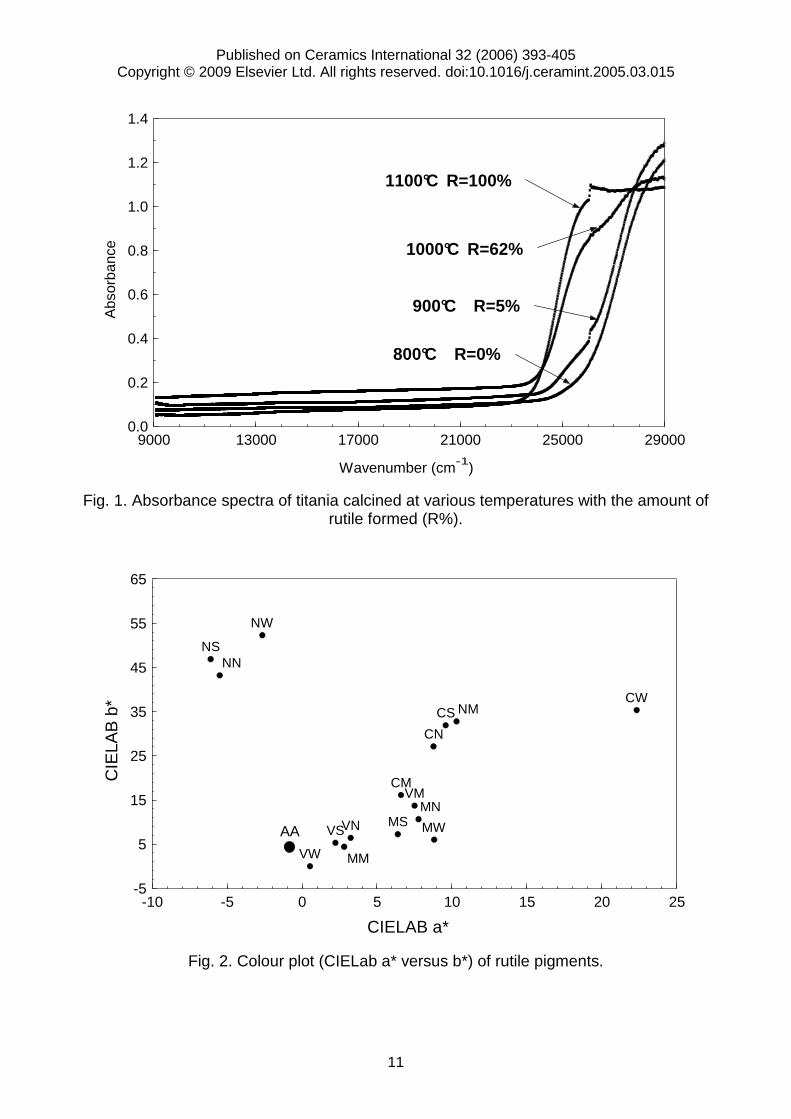
This circumstance fosters the overlapping of charge transfer (CT) and crystal field (CF) effects, making very difficult any quantitative interpretation from a rigorous spectroscopic approach, i.e. measuring precisely the CF strength Dq and the interelectronic repulsion Racah’s B parameter. It was tried to overcome this drawback by eliminating the MLCT band, simply by subtracking the contribution of the undoped rutile from the visible spectrum [10] and deconvolving the expected CF peaks (Fig. 3). The results are broad bands, which are somehow attributable to the main CF peaks of chromophore ions. Dq(cub) and B35 values were estimated by Tanabe-Sugano diagrams and spin-allowed transitions respectively [16-18]; the crystal field stabilization energy (CFSE) was calculated by the Dq values [19]. The nephelouxenic ratio β35, expressing the covalent character of the metal-oxygen bond, was calculated as B35/B0, where the B0 is the free ion value: the lower the β35, the stronger the covalency [17]. A colour plot of the pigments synthesised at 1100 °C is presented in Figure 2. The samples co-doped with Nb, Sb or W exhibit colours expected for Cr (orange), Mn (brown), Ni (yellow) and V (gray). In contrast, all Mo-bearing pigments present a brownish shade that alter considerably the desired hue.
Chromium-doped pigments. The spectra of Cr-bearing samples are characterised by (Fig. 3A): − three main parity-forbidden transitions of Cr3+ in octahedral coordination, i.e.
υ1=4A2(
4F)→4T2(4F), υ2=
4A2(4F)→4T1(
4F), and υ3=4A2(
4F)→4T1(4P), which are not
resolved, but whose positions can be inferred at ∼17,500 cm-1, ∼22,500 cm-1, and ∼42,000 cm-1 respectively;
− two weak Cr3+ spin-forbidden transitions, i.e. 4A2(4F)→2T1(
2G) and 4A2(4F)→2E(2G), that
are merged in the 13,500-13,600 cm-1 range; − a wide Ti-O CT band, that seems to extend its effect towards the lower energies, so
overlapping the CF peaks. The deconvolution of visible spectra, once the Ti-O CT band was subtracted, allows to
estimate a CF strength Dq ranging from 1737 cm-1 (CS) to 1757 cm-1 (CW), that is consistent with the value expected for the Cr-O bond length in the rutile structure (196 pm) [19-20]. Racah B35 values are in the 430-540 cm-1 range (Tab. 1).
As far as the effect of counterions is concerned, Nb- and Sb-doped pigments give practically the same spectra, with a gently dipping slope to a minimum of absorbance at ∼11500 cm-1, resulting in an orange hue, slightly darker for CN. The presence of tungsten determines both a shift of the band edge to ∼22,000 cm-1 and a steeper slope; this circumstance brings about a lower absorbance of CW in the 14,000-18,000 cm-1 region, with respect to CN and CS, that produces a purer orange colour. Furthermore, the band at ∼13,600 cm-1 is clearly more intense in the W-bearing pigment; this feature might be attributed to the 2E→2B2 transition of W5+ [18]. This inference should be in agreement with the structural data, which suggest the occurrence of W5+ [15].
The addition of molybdenum, in contrast, increases the absorbance all over the spectrum, presumably including Mo5+ absorbance bands at 13,000-14,000 and 19-23,000
Published on Ceramics International 32 (2006) 393-405 Copyright © 2009 Elsevier Ltd. All rights reserved. doi:10.1016/j.ceramint.2005.03.015
4
cm-1 [18], so producing a dark colour, far from the orange hue of the other Cr-bearing rutiles.
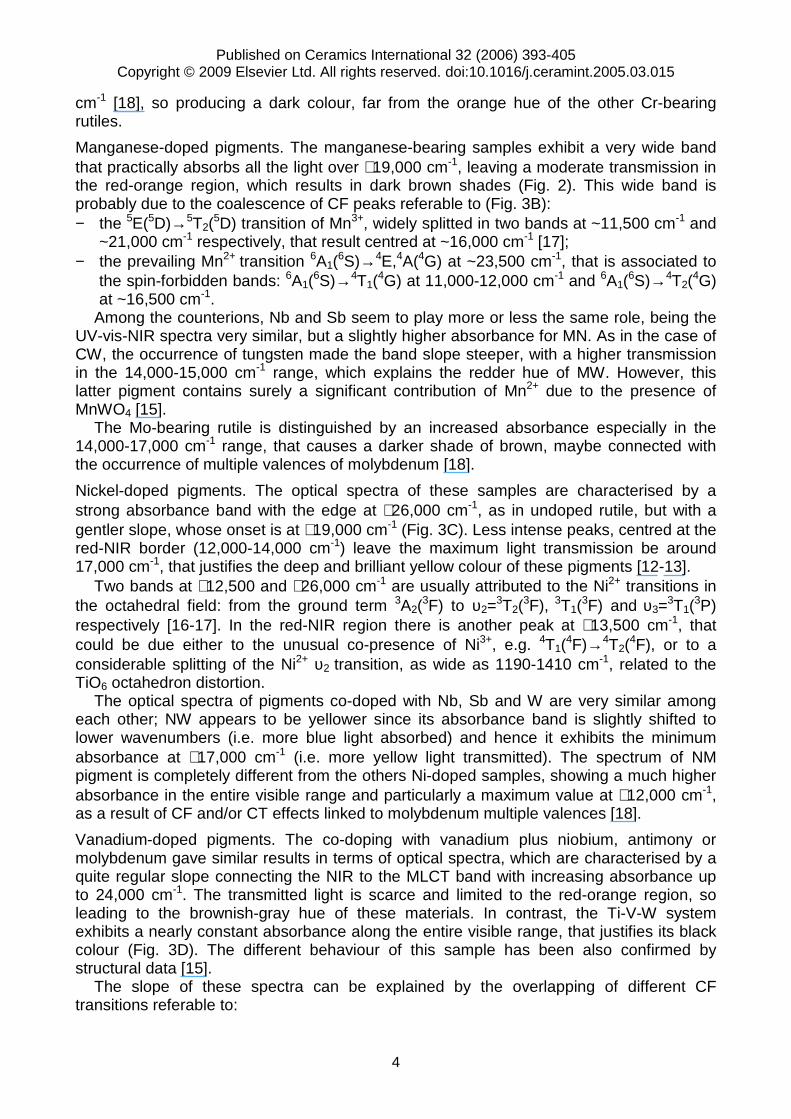
Manganese-doped pigments. The manganese-bearing samples exhibit a very wide band that practically absorbs all the light over ∼19,000 cm-1, leaving a moderate transmission in the red-orange region, which results in dark brown shades (Fig. 2). This wide band is probably due to the coalescence of CF peaks referable to (Fig. 3B): − the 5E(5D)→5T2(
5D) transition of Mn3+, widely splitted in two bands at ~11,500 cm-1 and ~21,000 cm-1 respectively, that result centred at ~16,000 cm-1 [17];
− the prevailing Mn2+ transition 6A1(6S)→4E,4A(4G) at ~23,500 cm-1, that is associated to
the spin-forbidden bands: 6A1(6S)→4T1(
4G) at 11,000-12,000 cm-1 and 6A1(6S)→4T2(
4G) at ~16,500 cm-1.
Among the counterions, Nb and Sb seem to play more or less the same role, being the UV-vis-NIR spectra very similar, but a slightly higher absorbance for MN. As in the case of CW, the occurrence of tungsten made the band slope steeper, with a higher transmission in the 14,000-15,000 cm-1 range, which explains the redder hue of MW. However, this latter pigment contains surely a significant contribution of Mn2+ due to the presence of MnWO4 [15].
The Mo-bearing rutile is distinguished by an increased absorbance especially in the 14,000-17,000 cm-1 range, that causes a darker shade of brown, maybe connected with the occurrence of multiple valences of molybdenum [18].
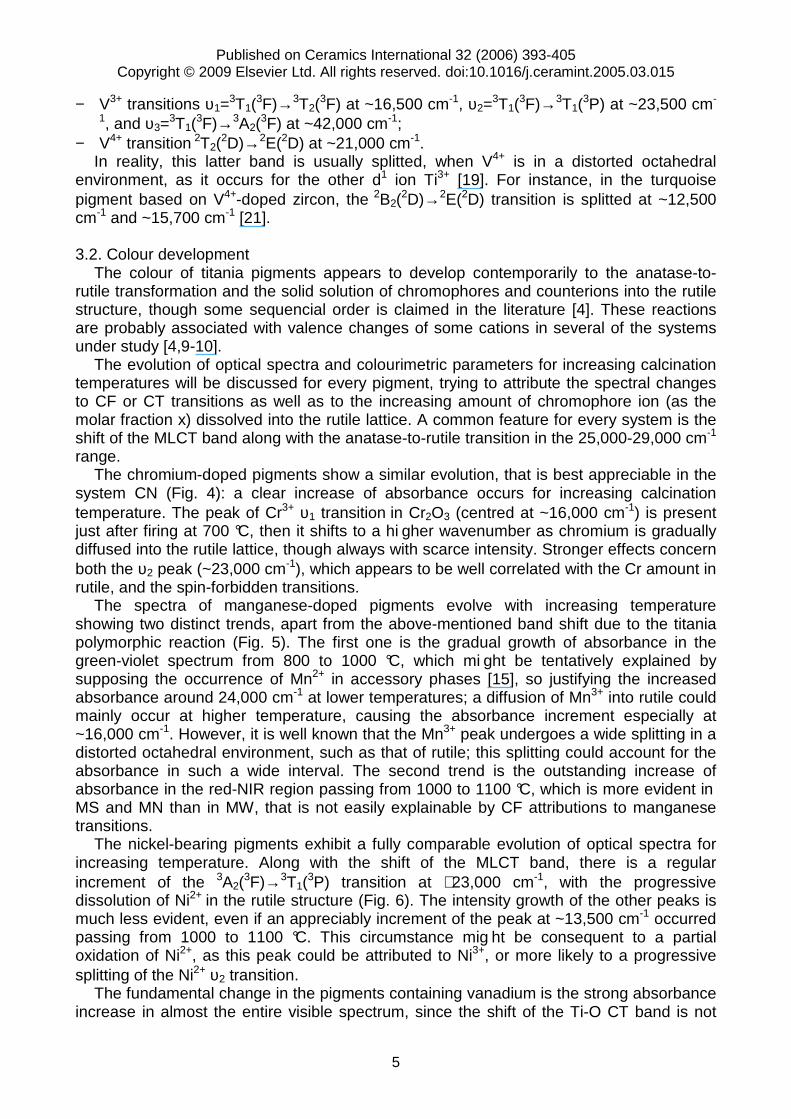
Nickel-doped pigments. The optical spectra of these samples are characterised by a strong absorbance band with the edge at ∼26,000 cm-1, as in undoped rutile, but with a gentler slope, whose onset is at ∼19,000 cm-1 (Fig. 3C). Less intense peaks, centred at the red-NIR border (12,000-14,000 cm-1) leave the maximum light transmission be around 17,000 cm-1, that justifies the deep and brilliant yellow colour of these pigments [12-13].
Two bands at ∼12,500 and ∼26,000 cm-1 are usually attributed to the Ni2+ transitions in the octahedral field: from the ground term 3A2(
3F) to υ2=3T2(
3F), 3T1(3F) and υ3=
3T1(3P)
respectively [16-17]. In the red-NIR region there is another peak at ∼13,500 cm-1, that could be due either to the unusual co-presence of Ni3+, e.g. 4T1(
4F)→4T2(4F), or to a
considerable splitting of the Ni2+ υ2 transition, as wide as 1190-1410 cm-1, related to the TiO6 octahedron distortion.
The optical spectra of pigments co-doped with Nb, Sb and W are very similar among each other; NW appears to be yellower since its absorbance band is slightly shifted to lower wavenumbers (i.e. more blue light absorbed) and hence it exhibits the minimum absorbance at ∼17,000 cm-1 (i.e. more yellow light transmitted). The spectrum of NM pigment is completely different from the others Ni-doped samples, showing a much higher absorbance in the entire visible range and particularly a maximum value at ∼12,000 cm-1, as a result of CF and/or CT effects linked to molybdenum multiple valences [18].
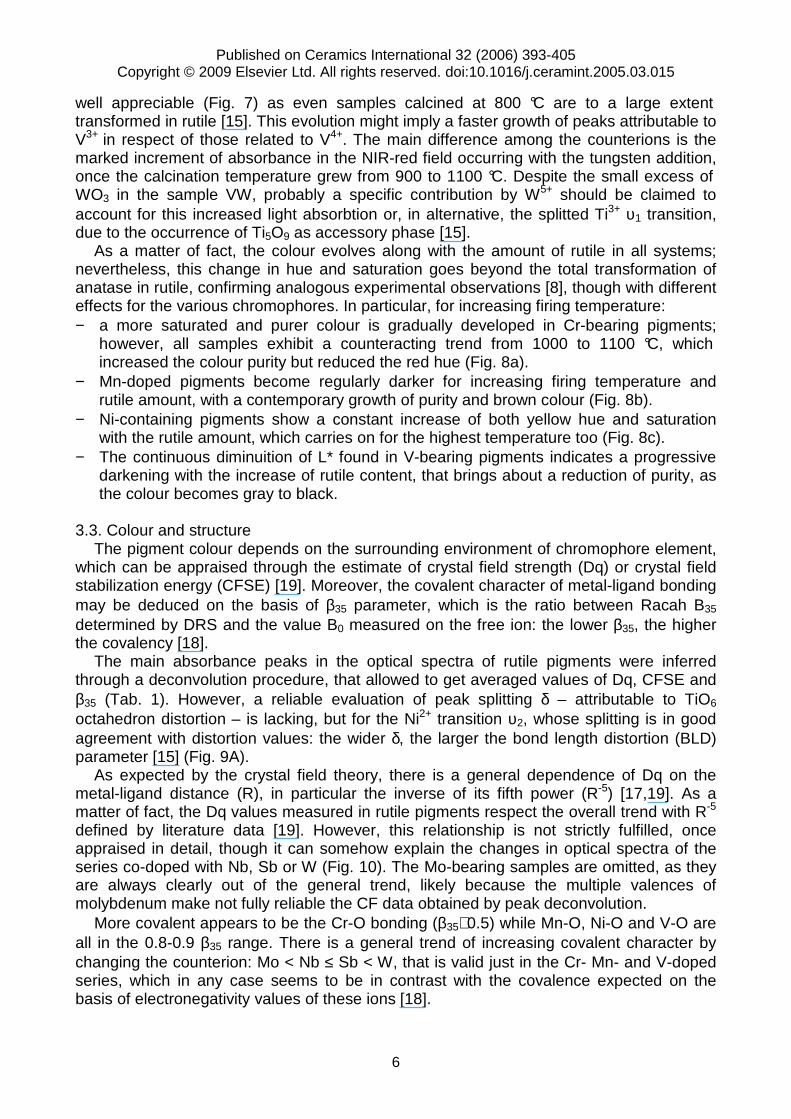
Vanadium-doped pigments. The co-doping with vanadium plus niobium, antimony or molybdenum gave similar results in terms of optical spectra, which are characterised by a quite regular slope connecting the NIR to the MLCT band with increasing absorbance up to 24,000 cm-1. The transmitted light is scarce and limited to the red-orange region, so leading to the brownish-gray hue of these materials. In contrast, the Ti-V-W system exhibits a nearly constant absorbance along the entire visible range, that justifies its black colour (Fig. 3D). The different behaviour of this sample has been also confirmed by structural data [15].
The slope of these spectra can be explained by the overlapping of different CF transitions referable to:
Published on Ceramics International 32 (2006) 393-405 Copyright © 2009 Elsevier Ltd. All rights reserved. doi:10.1016/j.ceramint.2005.03.015
5
− V3+ transitions υ1=3T1(
3F)→3T2(3F) at ~16,500 cm-1, υ2=
3T1(3F)→3T1(
3P) at ~23,500 cm-
1, and υ3=3T1(
3F)→3A2(3F) at ~42,000 cm-1;
− V4+ transition 2T2(2D)→2E(2D) at ~21,000 cm-1.
In reality, this latter band is usually splitted, when V4+ is in a distorted octahedral environment, as it occurs for the other d1 ion Ti3+ [19]. For instance, in the turquoise pigment based on V4+-doped zircon, the 2B2(
2D)→2E(2D) transition is splitted at ~12,500 cm-1 and ~15,700 cm-1 [21]. 3.2. Colour development
The colour of titania pigments appears to develop contemporarily to the anatase-to-rutile transformation and the solid solution of chromophores and counterions into the rutile structure, though some sequencial order is claimed in the literature [4]. These reactions are probably associated with valence changes of some cations in several of the systems under study [4,9-10].
The evolution of optical spectra and colourimetric parameters for increasing calcination temperatures will be discussed for every pigment, trying to attribute the spectral changes to CF or CT transitions as well as to the increasing amount of chromophore ion (as the molar fraction x) dissolved into the rutile lattice. A common feature for every system is the shift of the MLCT band along with the anatase-to-rutile transition in the 25,000-29,000 cm-1 range.
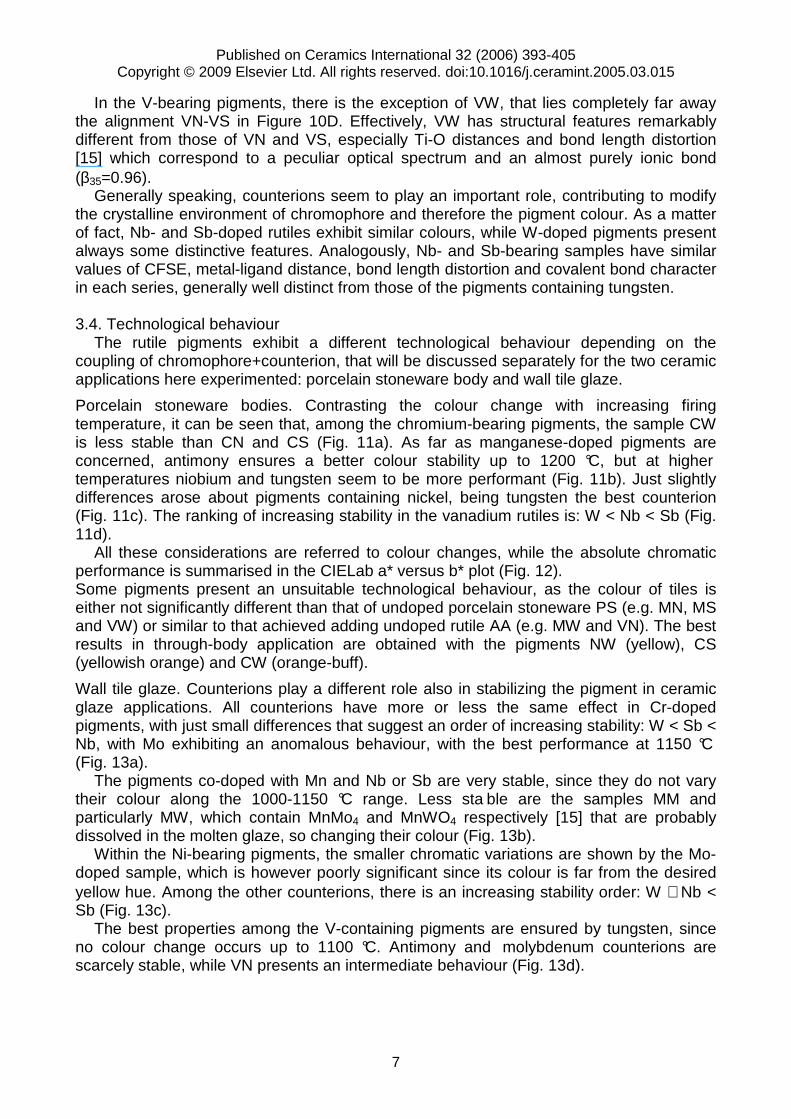
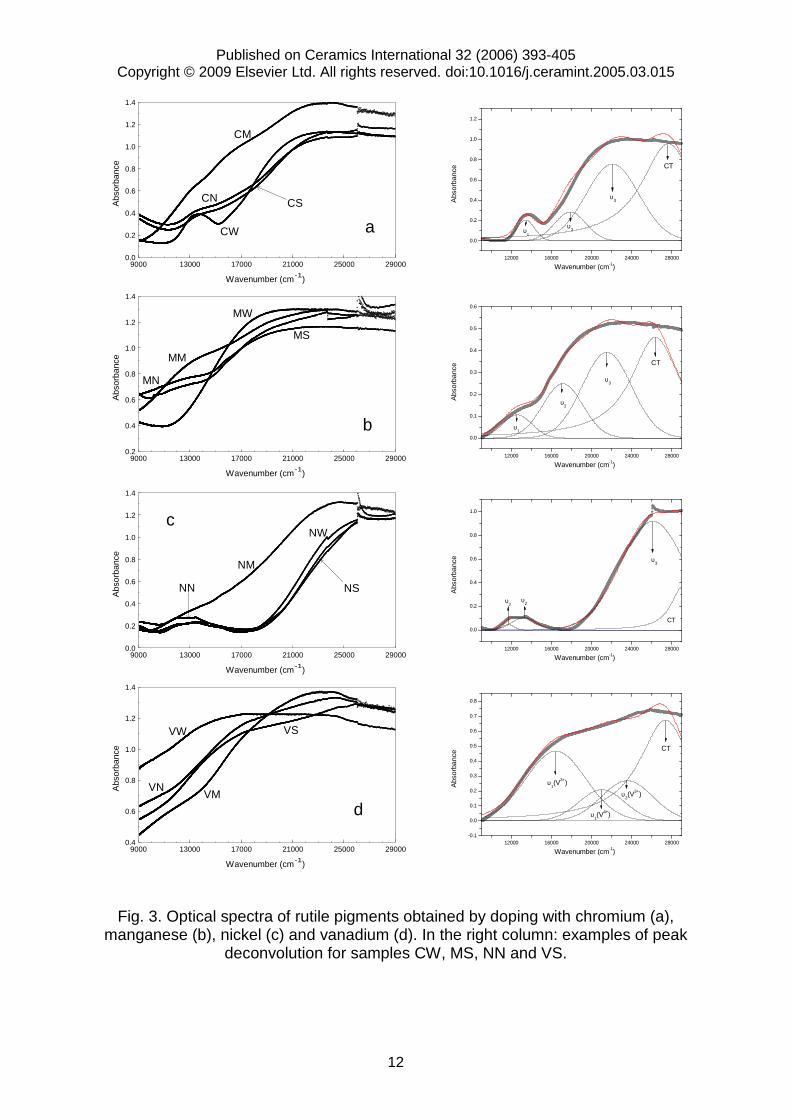
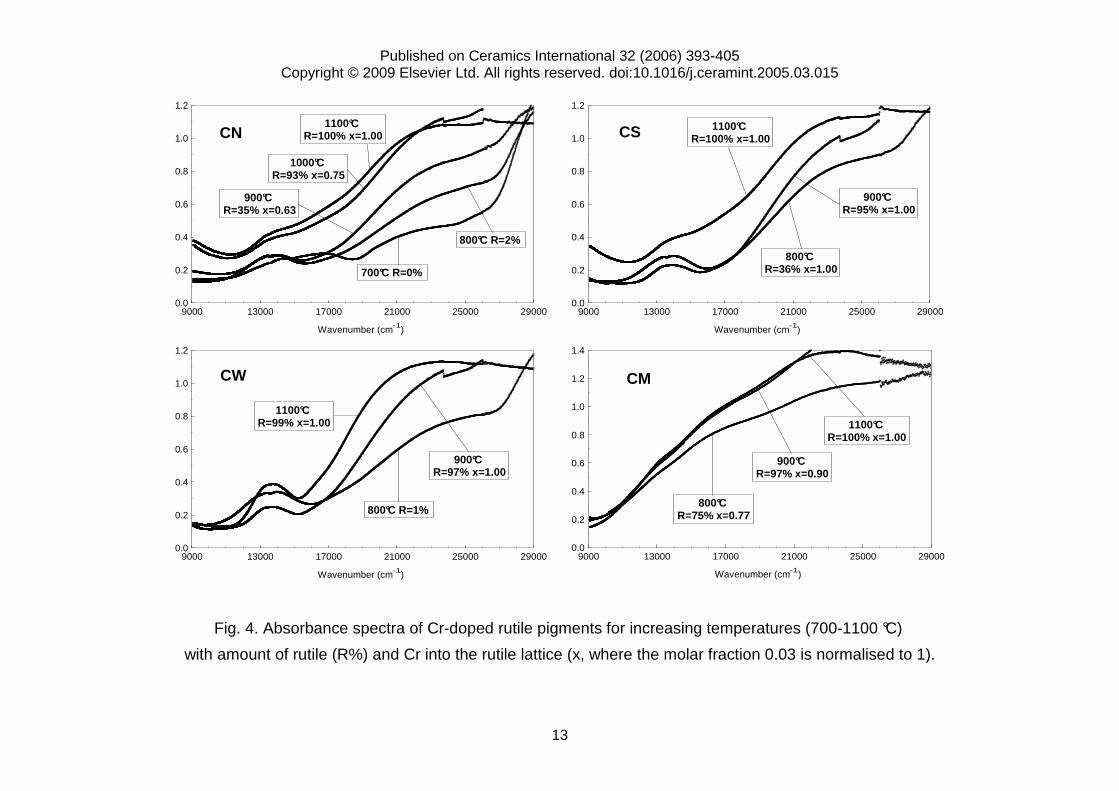
The chromium-doped pigments show a similar evolution, that is best appreciable in the system CN (Fig. 4): a clear increase of absorbance occurs for increasing calcination temperature. The peak of Cr3+ υ1 transition in Cr2O3 (centred at ~16,000 cm-1) is present just after firing at 700 °C, then it shifts to a hi gher wavenumber as chromium is gradually diffused into the rutile lattice, though always with scarce intensity. Stronger effects concern both the υ2 peak (~23,000 cm-1), which appears to be well correlated with the Cr amount in rutile, and the spin-forbidden transitions.
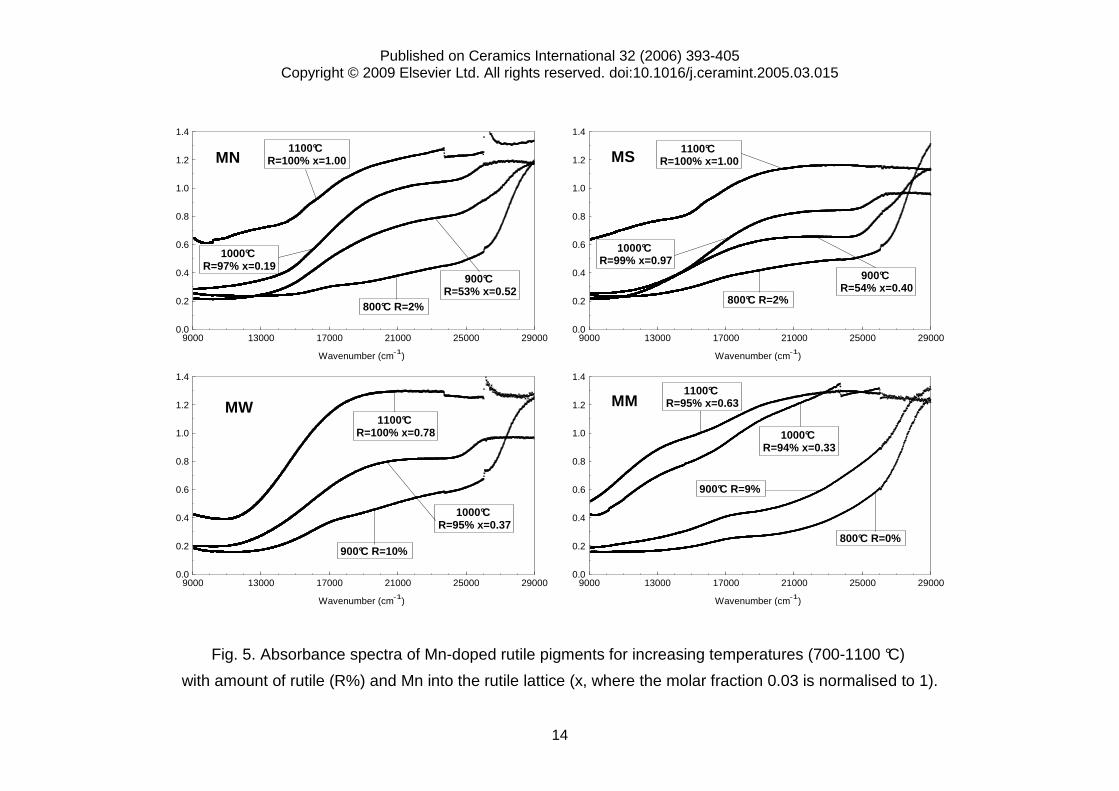
The spectra of manganese-doped pigments evolve with increasing temperature showing two distinct trends, apart from the above-mentioned band shift due to the titania polymorphic reaction (Fig. 5). The first one is the gradual growth of absorbance in the green-violet spectrum from 800 to 1000 °C, which mi ght be tentatively explained by supposing the occurrence of Mn2+ in accessory phases [15], so justifying the increased absorbance around 24,000 cm-1 at lower temperatures; a diffusion of Mn3+ into rutile could mainly occur at higher temperature, causing the absorbance increment especially at ~16,000 cm-1. However, it is well known that the Mn3+ peak undergoes a wide splitting in a distorted octahedral environment, such as that of rutile; this splitting could account for the absorbance in such a wide interval. The second trend is the outstanding increase of absorbance in the red-NIR region passing from 1000 to 1100 °C, which is more evident in MS and MN than in MW, that is not easily explainable by CF attributions to manganese transitions.
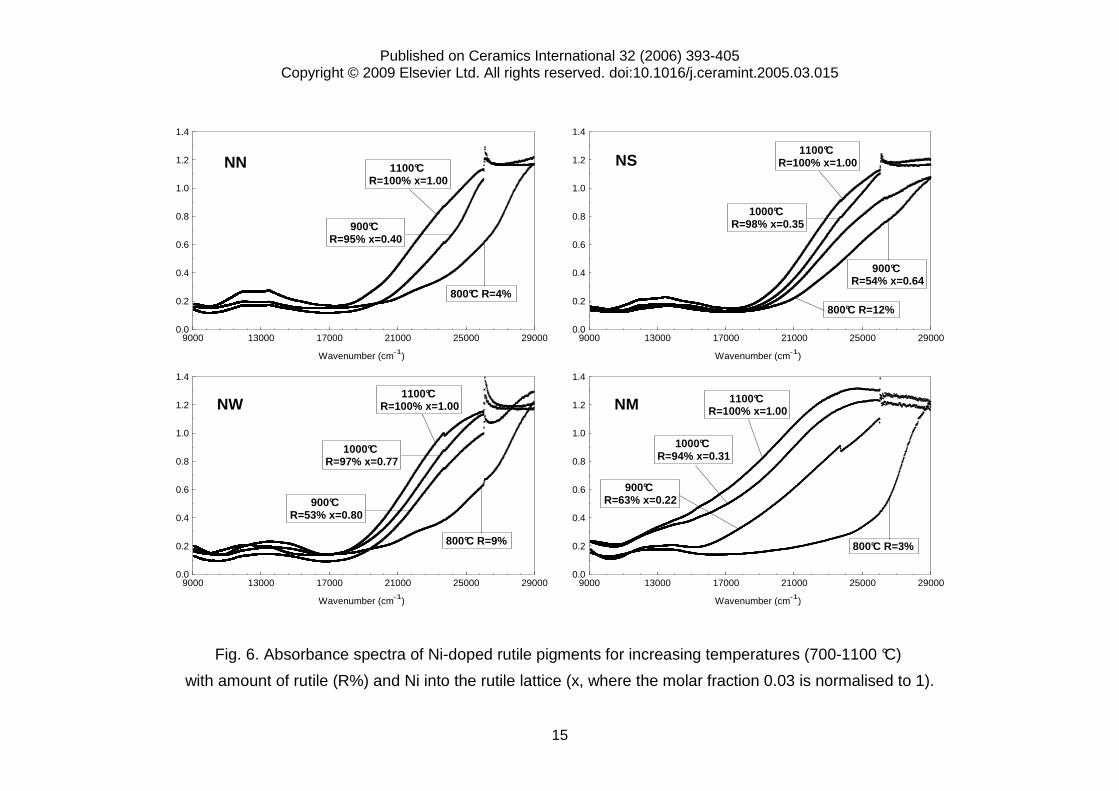
The nickel-bearing pigments exhibit a fully comparable evolution of optical spectra for increasing temperature. Along with the shift of the MLCT band, there is a regular increment of the 3A2(
3F)→3T1(3P) transition at ∼23,000 cm-1, with the progressive
dissolution of Ni2+ in the rutile structure (Fig. 6). The intensity growth of the other peaks is much less evident, even if an appreciably increment of the peak at ~13,500 cm-1 occurred passing from 1000 to 1100 °C. This circumstance mig ht be consequent to a partial oxidation of Ni2+, as this peak could be attributed to Ni3+, or more likely to a progressive splitting of the Ni2+ υ2 transition.
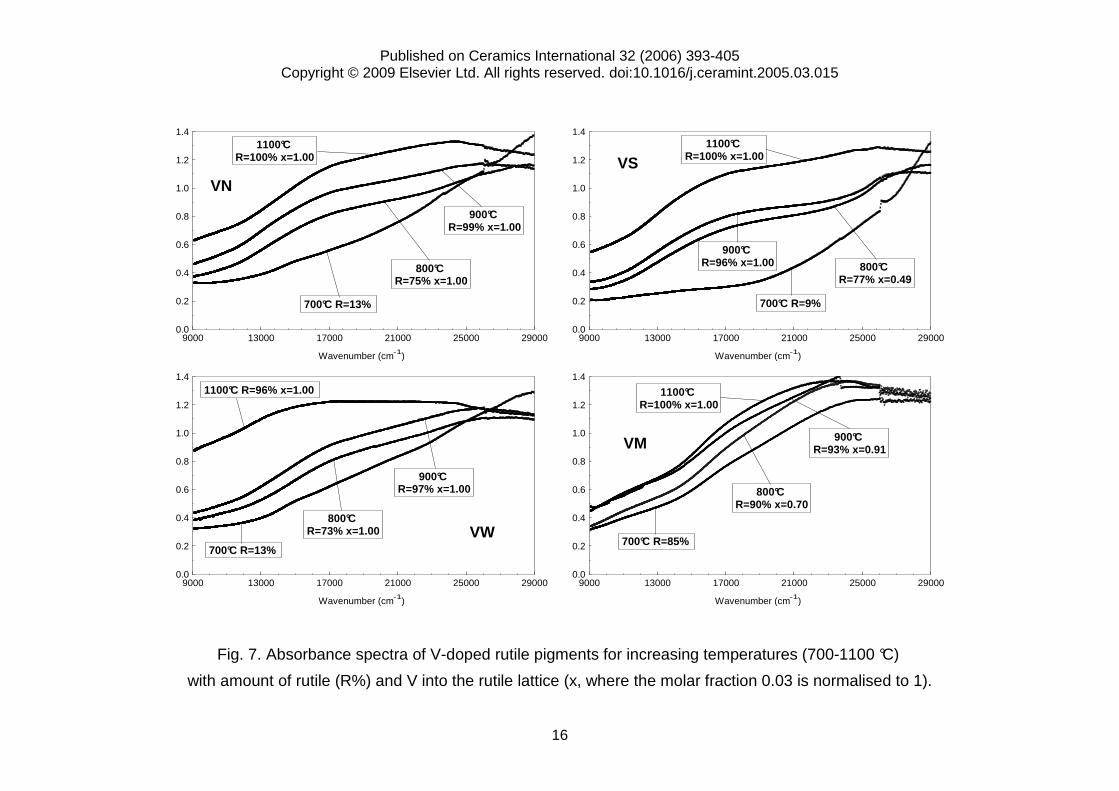
The fundamental change in the pigments containing vanadium is the strong absorbance increase in almost the entire visible spectrum, since the shift of the Ti-O CT band is not
Published on Ceramics International 32 (2006) 393-405 Copyright © 2009 Elsevier Ltd. All rights reserved. doi:10.1016/j.ceramint.2005.03.015
6
well appreciable (Fig. 7) as even samples calcined at 800 °C are to a large extent transformed in rutile [15]. This evolution might imply a faster growth of peaks attributable to V3+ in respect of those related to V4+. The main difference among the counterions is the marked increment of absorbance in the NIR-red field occurring with the tungsten addition, once the calcination temperature grew from 900 to 1100 °C. Despite the small excess of WO3 in the sample VW, probably a specific contribution by W5+ should be claimed to account for this increased light absorbtion or, in alternative, the splitted Ti3+ υ1 transition, due to the occurrence of Ti5O9 as accessory phase [15].
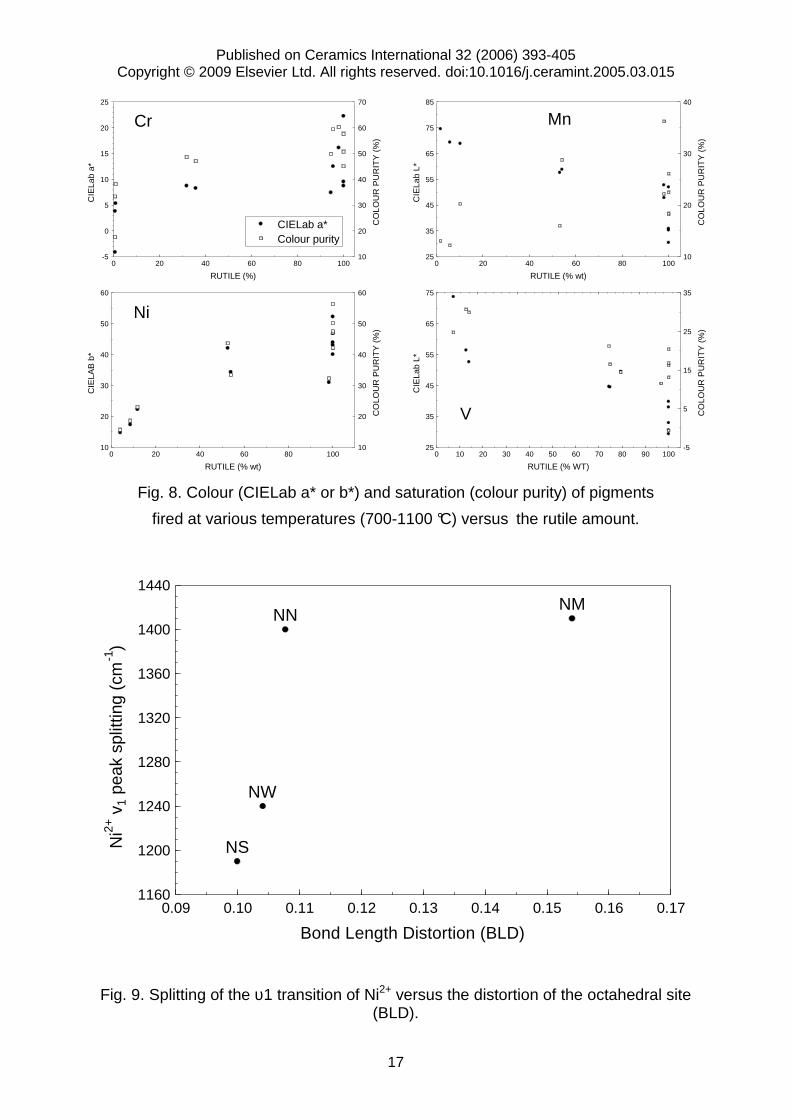
As a matter of fact, the colour evolves along with the amount of rutile in all systems; nevertheless, this change in hue and saturation goes beyond the total transformation of anatase in rutile, confirming analogous experimental observations [8], though with different effects for the various chromophores. In particular, for increasing firing temperature: − a more saturated and purer colour is gradually developed in Cr-bearing pigments;
however, all samples exhibit a counteracting trend from 1000 to 1100 °C, which increased the colour purity but reduced the red hue (Fig. 8a).
− Mn-doped pigments become regularly darker for increasing firing temperature and rutile amount, with a contemporary growth of purity and brown colour (Fig. 8b).
− Ni-containing pigments show a constant increase of both yellow hue and saturation with the rutile amount, which carries on for the highest temperature too (Fig. 8c).
− The continuous diminuition of L* found in V-bearing pigments indicates a progressive darkening with the increase of rutile content, that brings about a reduction of purity, as the colour becomes gray to black.
3.3. Colour and structure
The pigment colour depends on the surrounding environment of chromophore element, which can be appraised through the estimate of crystal field strength (Dq) or crystal field stabilization energy (CFSE) [19]. Moreover, the covalent character of metal-ligand bonding may be deduced on the basis of β35 parameter, which is the ratio between Racah B35 determined by DRS and the value B0 measured on the free ion: the lower β35, the higher the covalency [18].
The main absorbance peaks in the optical spectra of rutile pigments were inferred through a deconvolution procedure, that allowed to get averaged values of Dq, CFSE and β35 (Tab. 1). However, a reliable evaluation of peak splitting δ – attributable to TiO6 octahedron distortion – is lacking, but for the Ni2+ transition υ2, whose splitting is in good agreement with distortion values: the wider δ, the larger the bond length distortion (BLD) parameter [15] (Fig. 9A).
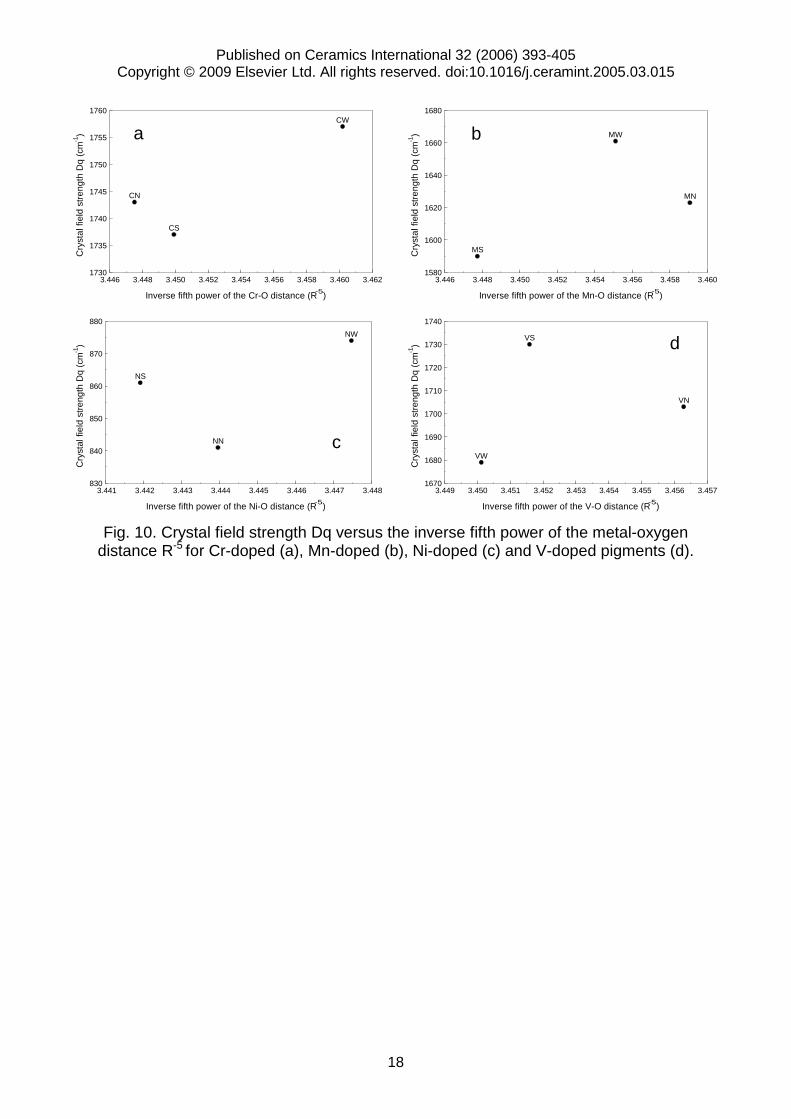
As expected by the crystal field theory, there is a general dependence of Dq on the metal-ligand distance (R), in particular the inverse of its fifth power (R-5) [17,19]. As a matter of fact, the Dq values measured in rutile pigments respect the overall trend with R-5 defined by literature data [19]. However, this relationship is not strictly fulfilled, once appraised in detail, though it can somehow explain the changes in optical spectra of the series co-doped with Nb, Sb or W (Fig. 10). The Mo-bearing samples are omitted, as they are always clearly out of the general trend, likely because the multiple valences of molybdenum make not fully reliable the CF data obtained by peak deconvolution.
More covalent appears to be the Cr-O bonding (β35∼0.5) while Mn-O, Ni-O and V-O are all in the 0.8-0.9 β35 range. There is a general trend of increasing covalent character by changing the counterion: Mo < Nb ≤ Sb < W, that is valid just in the Cr- Mn- and V-doped series, which in any case seems to be in contrast with the covalence expected on the basis of electronegativity values of these ions [18].
Published on Ceramics International 32 (2006) 393-405 Copyright © 2009 Elsevier Ltd. All rights reserved. doi:10.1016/j.ceramint.2005.03.015
7
In the V-bearing pigments, there is the exception of VW, that lies completely far away the alignment VN-VS in Figure 10D. Effectively, VW has structural features remarkably different from those of VN and VS, especially Ti-O distances and bond length distortion [15] which correspond to a peculiar optical spectrum and an almost purely ionic bond (β35=0.96).
Generally speaking, counterions seem to play an important role, contributing to modify the crystalline environment of chromophore and therefore the pigment colour. As a matter of fact, Nb- and Sb-doped rutiles exhibit similar colours, while W-doped pigments present always some distinctive features. Analogously, Nb- and Sb-bearing samples have similar values of CFSE, metal-ligand distance, bond length distortion and covalent bond character in each series, generally well distinct from those of the pigments containing tungsten. 3.4. Technological behaviour
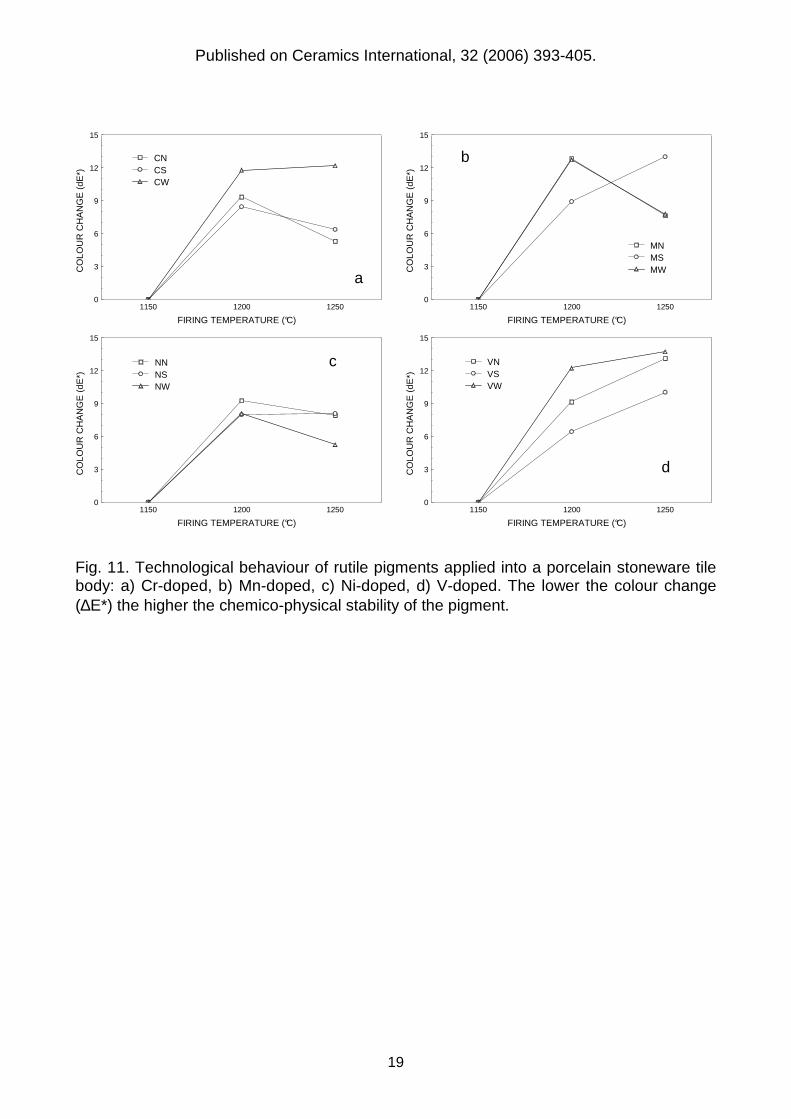
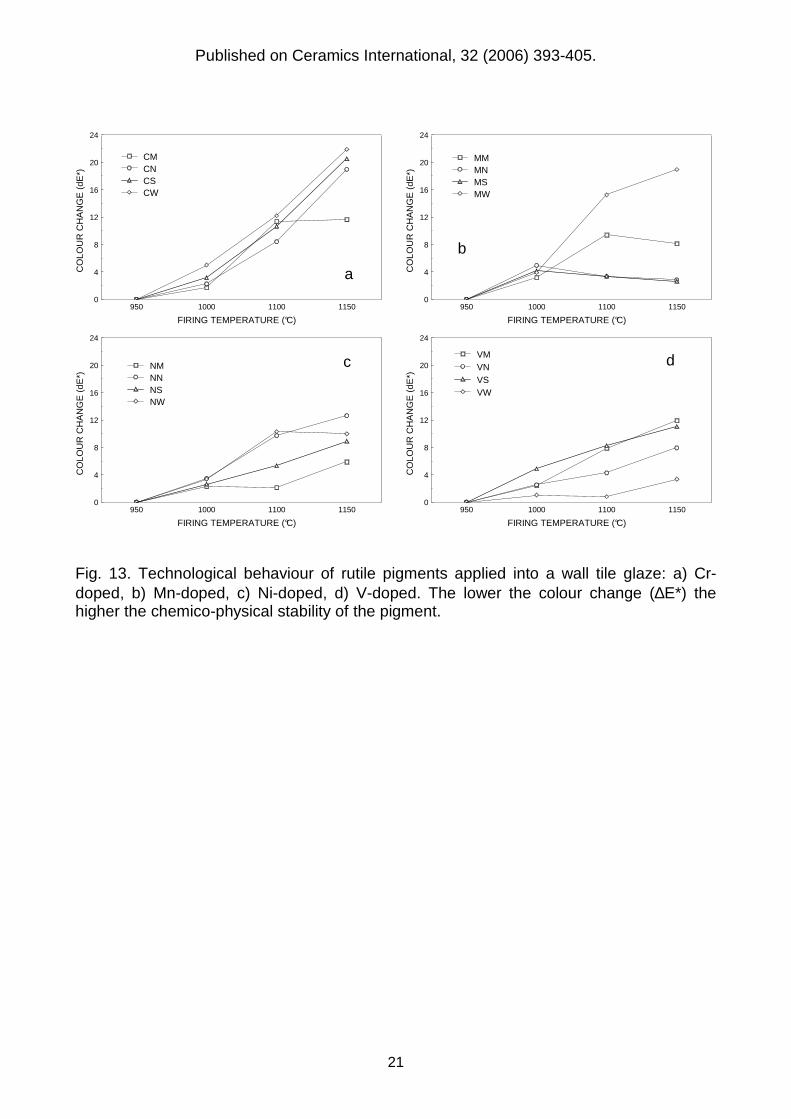
The rutile pigments exhibit a different technological behaviour depending on the coupling of chromophore+counterion, that will be discussed separately for the two ceramic applications here experimented: porcelain stoneware body and wall tile glaze.
Porcelain stoneware bodies. Contrasting the colour change with increasing firing temperature, it can be seen that, among the chromium-bearing pigments, the sample CW is less stable than CN and CS (Fig. 11a). As far as manganese-doped pigments are concerned, antimony ensures a better colour stability up to 1200 °C, but at higher temperatures niobium and tungsten seem to be more performant (Fig. 11b). Just slightly differences arose about pigments containing nickel, being tungsten the best counterion (Fig. 11c). The ranking of increasing stability in the vanadium rutiles is: W < Nb < Sb (Fig. 11d).
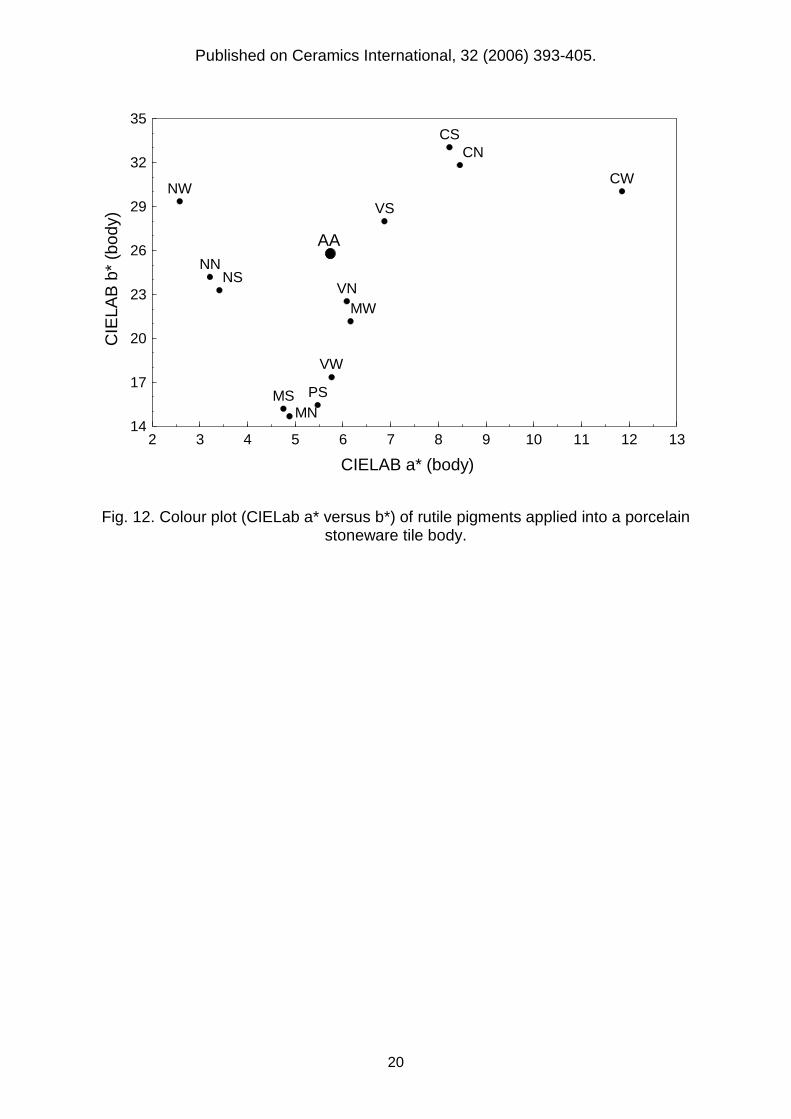
All these considerations are referred to colour changes, while the absolute chromatic performance is summarised in the CIELab a* versus b* plot (Fig. 12). Some pigments present an unsuitable technological behaviour, as the colour of tiles is either not significantly different than that of undoped porcelain stoneware PS (e.g. MN, MS and VW) or similar to that achieved adding undoped rutile AA (e.g. MW and VN). The best results in through-body application are obtained with the pigments NW (yellow), CS (yellowish orange) and CW (orange-buff).
Wall tile glaze. Counterions play a different role also in stabilizing the pigment in ceramic glaze applications. All counterions have more or less the same effect in Cr-doped pigments, with just small differences that suggest an order of increasing stability: W < Sb < Nb, with Mo exhibiting an anomalous behaviour, with the best performance at 1150 °C (Fig. 13a).
The pigments co-doped with Mn and Nb or Sb are very stable, since they do not vary their colour along the 1000-1150 °C range. Less sta ble are the samples MM and particularly MW, which contain MnMo4 and MnWO4 respectively [15] that are probably dissolved in the molten glaze, so changing their colour (Fig. 13b).
Within the Ni-bearing pigments, the smaller chromatic variations are shown by the Mo-doped sample, which is however poorly significant since its colour is far from the desired yellow hue. Among the other counterions, there is an increasing stability order: W ∼ Nb < Sb (Fig. 13c).
The best properties among the V-containing pigments are ensured by tungsten, since no colour change occurs up to 1100 °C. Antimony and molybdenum counterions are scarcely stable, while VN presents an intermediate behaviour (Fig. 13d).

Published on Ceramics International 32 (2006) 393-405 Copyright © 2009 Elsevier Ltd. All rights reserved. doi:10.1016/j.ceramint.2005.03.015
8
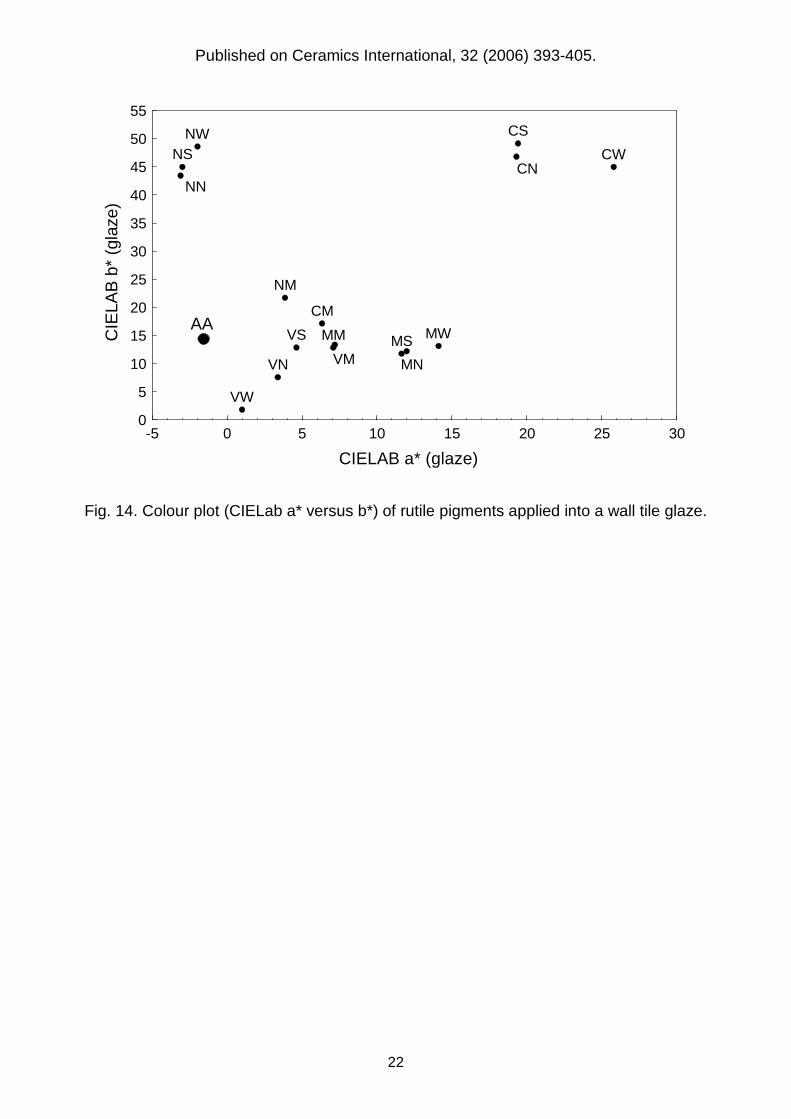
According to the absolute chromatic performance displayed in the CIELab a* versus b* plot (Fig. 14) the most suitable counterion is tungsten, being the best pigments for glaze applications: CW (orange), MW (tan), NW (yellow) and VW (black). However, the colour performance could be also influenced by a different solubility of rutile in glazes depending on its particle size that, though not systematically analysed, was controlled by sieving during sample preparation. Nevertheless, the technological tests indicated W as the best counterions for all the chromophores, hence the influence of particle size appear not to be pivotal.
4. Conclusions
The colour of rutile pigments is determined by both metal-ligand charge transfer (Ti4+↔O2-) and crystal field effects (chromophore elements substituting Ti4+ in octahedral coordination). The absorbance bands in the UV-visible-NIR spectra are broad and frequently overlapped, so resulting poorly resolved and making difficult any accurate quantitative spectroscopic interpretation.
Optical spectroscopic data suggest the occurrence of the following ions: Cr3+, Mn2+, Mn3+, Ni2+, V3+, and V4+. These results confirm to a large extent the hypotheses advanced during the structural study of the same pigments [15].
The colour takes place during the pigment calcination in a multistage process, involving: − shift of the Ti-O charge transfer band towards the visible range, consequent to the
anatase-to-rutile transformation; − development of crystal field peaks of chromophores due to progressive incorporation
into the rutile lattice after decomposition of accessory phases; − overlapping of absorbance peaks, due to valence change of chromophore ions
(particularly manganese and vanadium, but probably molybdenum, antimony and tungsten too).
The counterions contribute to change the rutile colour by affecting somehow the crystalline environment of chromophore. In fact, the Nb- and Sb-doped pigments have close values of CFSE, metal-ligand distance, bond length distortion and bond covalency, resulting in very similar colours, while W-doped pigments present always some structural and colourimetric differences.
Rutile pigments proved to be suitable for through-body (up to 1250 °C) and glaze applications (approximately up to 1100 °C). The bes t glaze coloration is exhibited by W-bearing pigments, which however are less stable than Nb- or Sb-containing ones, except than for the V+W coupling, which represents a new, interesting Co-free and Cr-free black pigment for low temperature applications. Into the porcelain stoneware bodies, the best coloration is achieved with Sb or W as counterions, though the best stability is ensured by Sb, but in the Ti-Ni-W system.
References [1] P. Escribano Lòpez, J.B. Carda Castellò, C.E. Cordoncillo, Esmaltes y pigmentos ceràmicos, Faenza
Editrice Iberica, 2001, p.1-300. [2] Italian Ceramic Society, Colour, pigments and colouring in ceramics, SALA, Modena, 2003, p. 1-295. [3] DCMA, Classification and chemical description of the complex inorganic color pigments, Dry Color
Manufacturers’ Association, Alexandria VA, 1991, 3rd ed. [4] J. Maloney, Titanate pigments: colored rutile, priderite, and pseudobrookite structured pigments. In:
High Performance Pigments, H.M. Smith (ed.), Wiley-VCH, 2002, p. 53-73.
Published on Ceramics International 32 (2006) 393-405 Copyright © 2009 Elsevier Ltd. All rights reserved. doi:10.1016/j.ceramint.2005.03.015
9
[5] R.A. Eppler, Reflectance of titania opacified porcelain enamels, J. Am. Ceram. Soc. 48 (5) (1969) 549-554.
[6] R.A. Eppler, Crystallization and phase transformation in TiO2-opacified porcelain enamels: I, Theory; II, Comparison of theory with experiment, J. Am. Ceram. Soc. 52 (2) (1969) 89-99.
[7] F. Bondioli, T. Manfredini, G.C. Pellacani, Inorganic pigments for ceramic tiles: characteristics and industrial applications, Interceram 48 (6) (1999) 414-422.
[8] N. Tozzi, R. Bindi, G. Ionescu, Ciclo produttivo e metodiche di controllo dei principali pigmenti ceramici in funzione del loro meccanismo di formazione, Ceramurgia 11 (5) (1981) 192-199.
[9] R.A. Eppler, Effect of antimony oxide on the anatase-rutile transformation in titanium dioxide, J. Am. Ceram. Soc. 70 (4) (1987) C64-C66.
[10] S. Ishida, M. Hayashi, Y. Fujimura, K. Fujiyoshi, Spectroscopic study of the chemical state and coloration of chromium in rutile, J. Am. Ceram. Soc. 73 (11) (1990) 3351-3355.
[11] M.A. Tena, M. Llusar, J.A. Badenes, J.B. Vicent, M.C. Granana, G. Monrós, Synthesis and structural characterisation of solid solutions CrxTi1-2x-yVx+yO2 at atmospheric pressure, Br. Ceram. Trans. 98 (5) (1999) 230-233.
[12] M.A. Tena, M. Llusar, J.A. Badenes, M. Vicente, G. Monrós, Influence of precursors on formation of TiO2-CrTaO4 rutile solid solutions, Br. Ceram. Trans. 99 (5) (2000) 219-224.
[13] M.A. Tena, A. Mestre, A. García, S. Sorlí, G. Monrós, Synthesis of gray ceramic pigments with rutile structure from alkoxides, J. Sol-Gel Sci. Technol. 26 (2003) 813-816.
[14] S. Sorlí, M.A. Tena, J.A. Badenes, J. Calbo, M. Llusar, G. Monrós, Structure and color of NixA1-3xB2xO2 (A=Ti,Sn; B=Sb,Nb) solid solutions, J. Eur. Ceram. Soc. 24 (8) (2004) 2425-2432.
[15] G. Cruciani, M. Dondi, F. Matteucci, M. Raimondo, The Role of Counterions (Mo, Nb, Sb, W) in Cr-, Mn-, Ni- and V-doped Rutile Ceramic Pigments. Part 1. Crystal Structure and Phase Transformation, Ceramics Int. ... (..) (2005) ...-... .
[16] A.S. Marfunin, Physics of minerals and inorganic materials. An introduction, Springer-Verlag, 1979, p.1-340.
[17] M. Wildner, M. Andrut, C.Z. Rudowicz, Optical absorption spectroscopy in geosciences. Part I: Basic concepts of crystal field theory, EMU Notes in Mineralogy - 6, 2004, 93-143.
[18] A.B.P. Lever, Inorganic electronic spectroscopy, Elsevier, 2nd edition, 1984, p.1-863. [19] R.G. Burns, Mineralogical applications of crystal field theory, Cambridge University Press, 2nd edition,
1993, p.1-551. [20] M. Andrut, M. Wildner, C.Z. Rudowicz, Optical absorption spectroscopy in geosciences. Part II:
Quantitative aspects of crystal fields, EMU Notes in Mineralogy - 6, 2004, 145-188. [21] S. Di Gregorio, M. Greenblatt, J.H. Pifer, M.D. Sturge, ESR and optical study of V4+ in zircon-type
crystals. J. Chem. Phys. 76 (6) (1982) 2931-2937.
Published on Ceramics International 32 (2006) 393-405 Copyright © 2009 Elsevier Ltd. All rights reserved. doi:10.1016/j.ceramint.2005.03.015
10
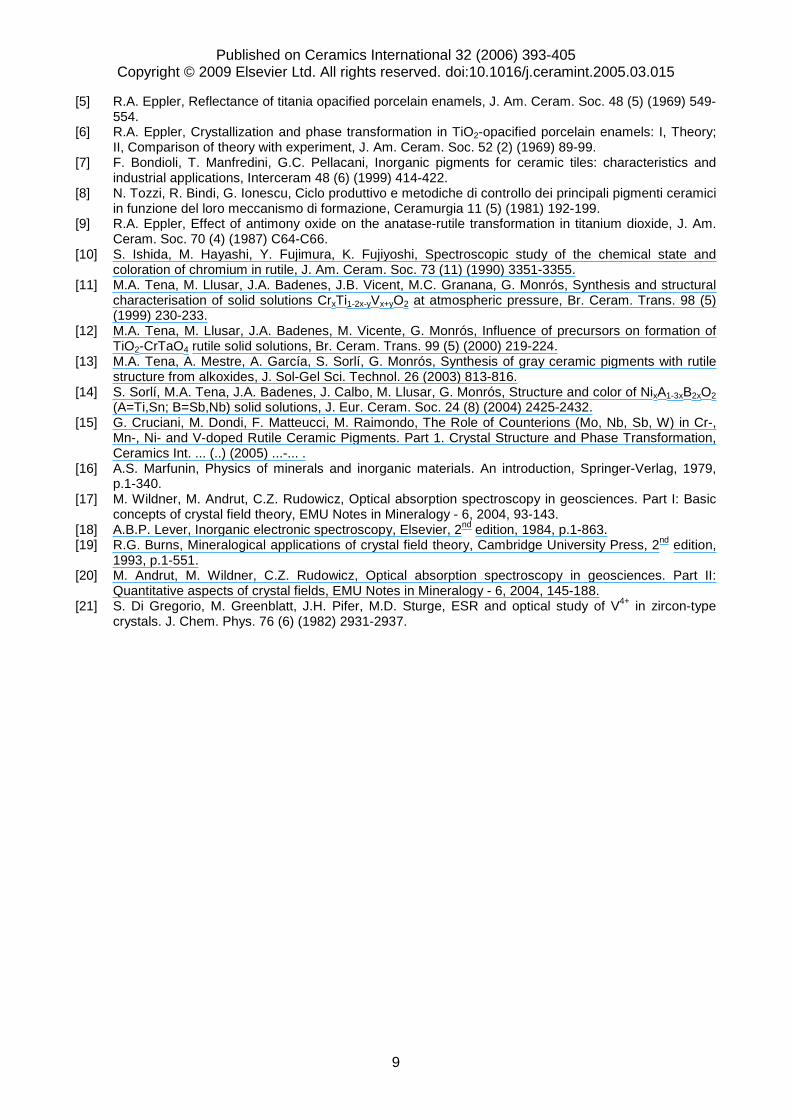
Table 1 Optical spectroscopic data, crystal field strength (Dq), crystal field stabilization energy (CFSE), Racah B35 parameter and β35 (=B35/B0) of the rutile pigments synthesised at 1100 °C. Crystal field transitions Dq CFSE B35 β35 υ1 υ2 υ3 (cm-1) (kJ/g⋅ion) (cm-1) (1) Cr3+ CM 17,840 23,520 42,000 1784 -256.2 536 0.57 CN 17,430 22,860 41,840 1743 -250.3 510 0.55 CS 17,370 22,390 42,160 1737 -249.4 466 0.50 CW 17,570 22,380 42,210 1757 -252.3 433 0.46 Mn2+ MM 12,160 16,620 24,200 1337 0 807 0.85 MN 11,500 16,730 23,610 1364 0 787 0.83 MS 11,000 16,490 23,620 1407 0 787 0.83 MW 12,300 17,100 23,490 1296 0 783 0.82 Mn3+ MM 16,180 1618 -116.1 n.d. MN 16,230 1623 -116.5 n.d. MS 15,900 1590 -114.2 n.d. MW 16,610 1661 -119.2 n.d. Ni2+ NM n.d. 12,210 25,870 843 -121.1 911 0.87 NN n.d. 12,180 26,660 841 -120.8 965 0.93 NS n.d. 12,470 26,270 861 -123.6 920 0.88 NW n.d. 12,650 26,580 874 -125.4 929 0.89 V3+ VM 16,400 23,890 41,950 1740 -244.6 790 0.89 VN 16,260 23,390 42,050 1703 -246.9 738 0.83 VS 16,610 23,530 42,160 1730 -244.6 702 0.79 VW 15,730 23,460 42,270 1679 -254.1 849 0.96
V4+ VM 20,510 2051 -147.3 VN 20,810 2081 -149.4 VS 21,260 2126 -152.6 VW 20,940 2094 -150.3
Crystal field transitions: Cr3+: υ1=4A2(
4F)→4T1(4F), υ2=
4T2(4F), υ3=
4T1(4P); Mn2+: υ1=
6A1(6S)→4T1(
4G), υ2=
4T2(4G), υ3=
4E,4A(4G); Mn3+: υ1=5E(5D)→5T2(
5D); Ni2+: υ2=3A2(
3F)→3T1(3F), υ3=
3T1(3P); V3+:
υ1=3T1(
3F)→3T2(3F), υ2=
3T1(3P), υ3=
3A2(3F); V4+: υ1=
2T2(2D)→2E(2D). Racah B0 (cm-1) : Cr3+: 933; Mn2+: 960;
Ni2+: 1042; V3+: 886 [17-18].
Published on Ceramics International 32 (2006) 393-405 Copyright © 2009 Elsevier Ltd. All rights reserved. doi:10.1016/j.ceramint.2005.03.015
11
Wavenumber (cm-1)
Abs
orba
nce
0.0
0.2
0.4
0.6
0.8
1.0
1.2
1.4
9000 13000 17000 21000 25000 29000
1100°C R=100%
1000°C R=62%
900°C R=5%
800°C R=0%
Fig. 1. Absorbance spectra of titania calcined at various temperatures with the amount of
rutile formed (R%).
CIELAB a*
CIE
LAB
b*
CN
CSCW
MNMS MW
NNNS
NW
VNVS
VW
CM
NM
VM
-5
5
15
25
35
45
55
65
-10 -5 0 5 10 15 20 25
MM
AA
Fig. 2. Colour plot (CIELab a* versus b*) of rutile pigments.
Published on Ceramics International 32 (2006) 393-405 Copyright © 2009 Elsevier Ltd. All rights reserved. doi:10.1016/j.ceramint.2005.03.015
12
Wavenumber (cm-1)
Abs
orba
nce
0.0
0.2
0.4
0.6
0.8
1.0
1.2
1.4
9000 13000 17000 21000 25000 29000
CN CS
CM
CW a
12000 16000 20000 24000 28000
0.0
0.2
0.4
0.6
0.8
1.0
1.2
Abs
orba
nce
Wavenumber (cm-1)
CT
υ1
υ2
υ3
Wavenumber (cm-1)
Abs
orba
nce
0.2
0.4
0.6
0.8
1.0
1.2
1.4
9000 13000 17000 21000 25000 29000
MS
MN
MW
MM
b
12000 16000 20000 24000 28000
0.0
0.1
0.2
0.3
0.4
0.5
0.6
υ3
υ2
Abs
orba
nce
Wavenumber (cm-1)
υ1
CT
Wavenumber (cm-1)
Abs
orba
nce
0.0
0.2
0.4
0.6
0.8
1.0
1.2
1.4
9000 13000 17000 21000 25000 29000
NM
NN NS
NWc
12000 16000 20000 24000 28000
0.0
0.2
0.4
0.6
0.8
1.0
υ2
Abs
orba
nce
Wavenumber (cm-1)
CT
υ3
υ2
Wavenumber (cm-1)
Abs
orba
nce
0.4
0.6
0.8
1.0
1.2
1.4
9000 13000 17000 21000 25000 29000
VS
VM
VW
VN
d
12000 16000 20000 24000 28000-0.1
0.0
0.1
0.2
0.3
0.4
0.5
0.6
0.7
0.8
υ2(V3+)
υ1(V4+)
Abs
orba
nce
Wavenumber (cm-1)
CT
υ1(V3+)
Fig. 3. Optical spectra of rutile pigments obtained by doping with chromium (a), manganese (b), nickel (c) and vanadium (d). In the right column: examples of peak
deconvolution for samples CW, MS, NN and VS.
Published on Ceramics International 32 (2006) 393-405 Copyright © 2009 Elsevier Ltd. All rights reserved. doi:10.1016/j.ceramint.2005.03.015
13
Wavenumber (cm-1)
0.0
0.2
0.4
0.6
0.8
1.0
1.2
9000 13000 17000 21000 25000 29000
CN1100°C
R=100% x=1.00
1000°CR=93% x=0.75
900°CR=35% x=0.63
800°C R=2%
700°C R=0%
Wavenumber (cm-1)
0.0
0.2
0.4
0.6
0.8
1.0
1.2
9000 13000 17000 21000 25000 29000
1100°CR=100% x=1.00CS
900°CR=95% x=1.00
800°CR=36% x=1.00
Wavenumber (cm-1)
0.0
0.2
0.4
0.6
0.8
1.0
1.2
9000 13000 17000 21000 25000 29000
1100°CR=99% x=1.00
CW
900°CR=97% x=1.00
800°C R=1%
Wavenumber (cm-1)
0.0
0.2
0.4
0.6
0.8
1.0
1.2
1.4
9000 13000 17000 21000 25000 29000
CM
1100°CR=100% x=1.00
800°CR=75% x=0.77
900°CR=97% x=0.90
Fig. 4. Absorbance spectra of Cr-doped rutile pigments for increasing temperatures (700-1100 °C)
with amount of rutile (R%) and Cr into the rutile lattice (x, where the molar fraction 0.03 is normalised to 1).
Published on Ceramics International 32 (2006) 393-405 Copyright © 2009 Elsevier Ltd. All rights reserved. doi:10.1016/j.ceramint.2005.03.015
14
Wavenumber (cm-1)
0.0
0.2
0.4
0.6
0.8
1.0
1.2
1.4
9000 13000 17000 21000 25000 29000
1100°CR=100% x=1.00MN
800°C R=2%
900°CR=53% x=0.52
1000°CR=97% x=0.19
Wavenumber (cm-1)
0.0
0.2
0.4
0.6
0.8
1.0
1.2
1.4
9000 13000 17000 21000 25000 29000
1100°CR=100% x=1.00MS
900°CR=54% x=0.40
1000°CR=99% x=0.97
800°C R=2%
Wavenumber (cm-1)
0.0
0.2
0.4
0.6
0.8
1.0
1.2
1.4
9000 13000 17000 21000 25000 29000
MW1100°C
R=100% x=0.78
1000°CR=95% x=0.37
900°C R=10%
Wavenumber (cm-1)
0.0
0.2
0.4
0.6
0.8
1.0
1.2
1.4
9000 13000 17000 21000 25000 29000
800°C R=0%
MM
900°C R=9%
1000°CR=94% x=0.33
1100°CR=95% x=0.63
Fig. 5. Absorbance spectra of Mn-doped rutile pigments for increasing temperatures (700-1100 °C)
with amount of rutile (R%) and Mn into the rutile lattice (x, where the molar fraction 0.03 is normalised to 1).
Published on Ceramics International 32 (2006) 393-405 Copyright © 2009 Elsevier Ltd. All rights reserved. doi:10.1016/j.ceramint.2005.03.015
15
Wavenumber (cm-1)
0.0
0.2
0.4
0.6
0.8
1.0
1.2
1.4
9000 13000 17000 21000 25000 29000
NN
800°C R=4%
900°CR=95% x=0.40
1100°CR=100% x=1.00
Wavenumber (cm-1)
0.0
0.2
0.4
0.6
0.8
1.0
1.2
1.4
9000 13000 17000 21000 25000 29000
NS
1000°CR=98% x=0.35
900°CR=54% x=0.64
1100°CR=100% x=1.00
800°C R=12%
Wavenumber (cm-1)
0.0
0.2
0.4
0.6
0.8
1.0
1.2
1.4
9000 13000 17000 21000 25000 29000
1100°CR=100% x=1.00NW
900°CR=53% x=0.80
800°C R=9%
1000°CR=97% x=0.77
Wavenumber (cm-1)
0.0
0.2
0.4
0.6
0.8
1.0
1.2
1.4
9000 13000 17000 21000 25000 29000
NM 1100°CR=100% x=1.00
1000°CR=94% x=0.31
900°CR=63% x=0.22
800°C R=3%
Fig. 6. Absorbance spectra of Ni-doped rutile pigments for increasing temperatures (700-1100 °C)
with amount of rutile (R%) and Ni into the rutile lattice (x, where the molar fraction 0.03 is normalised to 1).
Published on Ceramics International 32 (2006) 393-405 Copyright © 2009 Elsevier Ltd. All rights reserved. doi:10.1016/j.ceramint.2005.03.015
16
Wavenumber (cm-1)
0.0
0.2
0.4
0.6
0.8
1.0
1.2
1.4
9000 13000 17000 21000 25000 29000
VN
1100°CR=100% x=1.00
900°CR=99% x=1.00
800°CR=75% x=1.00
700°C R=13%
Wavenumber (cm-1)
0.0
0.2
0.4
0.6
0.8
1.0
1.2
1.4
9000 13000 17000 21000 25000 29000
VS1100°C
R=100% x=1.00
900°CR=96% x=1.00 800°C
R=77% x=0.49
700°C R=9%
Wavenumber (cm-1)
0.0
0.2
0.4
0.6
0.8
1.0
1.2
1.4
9000 13000 17000 21000 25000 29000
VW800°C
R=73% x=1.00
700°C R=13%
900°CR=97% x=1.00
1100°C R=96% x=1.00
Wavenumber (cm-1)
0.0
0.2
0.4
0.6
0.8
1.0
1.2
1.4
9000 13000 17000 21000 25000 29000
1100°CR=100% x=1.00
VM
700°C R=85%
800°CR=90% x=0.70
900°CR=93% x=0.91
Fig. 7. Absorbance spectra of V-doped rutile pigments for increasing temperatures (700-1100 °C)
with amount of rutile (R%) and V into the rutile lattice (x, where the molar fraction 0.03 is normalised to 1).
Published on Ceramics International 32 (2006) 393-405 Copyright © 2009 Elsevier Ltd. All rights reserved. doi:10.1016/j.ceramint.2005.03.015
17
RUTILE (%)
CIE
Lab
a*
CO
LOU
R P
UR
ITY
(%
)
10
20
30
40
50
60
70
-5
0
5
10
15
20
25
0 20 40 60 80 100
CIELab a*Colour purity
Cr
RUTILE (% wt)
CIE
Lab
L*
CO
LOU
R P
UR
ITY
(%
)
10
20
30
40
25
35
45
55
65
75
85
0 20 40 60 80 100
Mn
RUTILE (% wt)
CIE
LAB
b*
CO
LOU
R P
UR
ITY
(%
)
10
20
30
40
50
60
10
20
30
40
50
60
0 20 40 60 80 100
Ni
RUTILE (% WT)
CIE
Lab
L*
CO
LOU
R P
UR
ITY
(%
)
-5
5
15
25
35
25
35
45
55
65
75
0 10 20 30 40 50 60 70 80 90 100
V
Fig. 8. Colour (CIELab a* or b*) and saturation (colour purity) of pigments
fired at various temperatures (700-1100 °C) versus the rutile amount.
Bond Length Distortion (BLD)
Ni2+
v1
peak
spl
ittin
g (c
m-1
)
NMNN
NS
NW
1160
1200
1240
1280
1320
1360
1400
1440
0.09 0.10 0.11 0.12 0.13 0.14 0.15 0.16 0.17
Fig. 9. Splitting of the υ1 transition of Ni2+ versus the distortion of the octahedral site (BLD).
Published on Ceramics International 32 (2006) 393-405 Copyright © 2009 Elsevier Ltd. All rights reserved. doi:10.1016/j.ceramint.2005.03.015
18
Inverse fifth power of the Cr-O distance (R-5)
Cry
stal
fiel
d st
reng
th D
q (c
m-1
)
CN
CS
CW
1730
1735
1740
1745
1750
1755
1760
3.446 3.448 3.450 3.452 3.454 3.456 3.458 3.460 3.462
a
Inverse fifth power of the Mn-O distance (R-5)
Cry
stal
fiel
d st
reng
th D
q (c
m-1
)
MN
MS
MW
1580
1600
1620
1640
1660
1680
3.446 3.448 3.450 3.452 3.454 3.456 3.458 3.460
b
Inverse fifth power of the Ni-O distance (R-5)
Cry
stal
fiel
d st
reng
th D
q (c
m-1
)
NN
NS
NW
830
840
850
860
870
880
3.441 3.442 3.443 3.444 3.445 3.446 3.447 3.448
c
Inverse fifth power of the V-O distance (R-5)
Cry
stal
fiel
d st
reng
th D
q (c
m-1
)
VN
VS
VW
1670
1680
1690
1700
1710
1720
1730
1740
3.449 3.450 3.451 3.452 3.453 3.454 3.455 3.456 3.457
d
Fig. 10. Crystal field strength Dq versus the inverse fifth power of the metal-oxygen
distance R-5 for Cr-doped (a), Mn-doped (b), Ni-doped (c) and V-doped pigments (d).
Published on Ceramics International, 32 (2006) 393-405.
19
FIRING TEMPERATURE (°C)
CO
LOU
R C
HA
NG
E (
dE*)
0
3
6
9
12
15
1150 1200 1250
CNCSCW
a
FIRING TEMPERATURE (°C)
CO
LOU
R C
HA
NG
E (
dE*)
0
3
6
9
12
15
1150 1200 1250
MNMSMW
b
FIRING TEMPERATURE (°C)
CO
LOU
R C
HA
NG
E (
dE*)
0
3
6
9
12
15
1150 1200 1250
NNNSNW
c
FIRING TEMPERATURE (°C)
CO
LOU
R C
HA
NG
E (
dE*)
0
3
6
9
12
15
1150 1200 1250
VNVSVW
d
Fig. 11. Technological behaviour of rutile pigments applied into a porcelain stoneware tile body: a) Cr-doped, b) Mn-doped, c) Ni-doped, d) V-doped. The lower the colour change (∆E*) the higher the chemico-physical stability of the pigment.
Published on Ceramics International, 32 (2006) 393-405.
20
CIELAB a* (body)
CIE
LAB
b*
(bod
y)
PS
CNCS
CW
MS
MW
NNNS
NW
VN
VS
VW
14
17
20
23
26
29
32
35
2 3 4 5 6 7 8 9 10 11 12 13
MN
AA
Fig. 12. Colour plot (CIELab a* versus b*) of rutile pigments applied into a porcelain stoneware tile body.
Published on Ceramics International, 32 (2006) 393-405.
21
FIRING TEMPERATURE (°C)
CO
LOU
R C
HA
NG
E (
dE*)
0
4
8
12
16
20
24
950 1000 1100 1150
CMCNCSCW
a
FIRING TEMPERATURE (°C)
CO
LOU
R C
HA
NG
E (
dE*)
0
4
8
12
16
20
24
950 1000 1100 1150
MMMNMSMW
b
FIRING TEMPERATURE (°C)
CO
LOU
R C
HA
NG
E (
dE*)
0
4
8
12
16
20
24
950 1000 1100 1150
NMNNNSNW
c
FIRING TEMPERATURE (°C)
CO
LOU
R C
HA
NG
E (
dE*)
0
4
8
12
16
20
24
950 1000 1100 1150
VMVNVSVW
d
Fig. 13. Technological behaviour of rutile pigments applied into a wall tile glaze: a) Cr-doped, b) Mn-doped, c) Ni-doped, d) V-doped. The lower the colour change (∆E*) the higher the chemico-physical stability of the pigment.
Published on Ceramics International, 32 (2006) 393-405.
22
CIELAB a* (glaze)
CIE
LAB
b*
(gla
ze)
CM
CS
CW
MM MS MW
NM
NSNW
VN
VS
VW
0
5
10
15
20
25
30
35
40
45
50
55
-5 0 5 10 15 20 25 30
NN
MNVM
CN
AA
Fig. 14. Colour plot (CIELab a* versus b*) of rutile pigments applied into a wall tile glaze.
Copyright © 2022 FDOKUMEN