Laboratory Measurements and T-Matrix Calculations of the Scattering Matrix of Rutile Particles in...
9
Laboratory measurements and T-matrix calculations of the scattering matrix of rutile particles in water Hester Volten, Juho-Pertti Jalava, Kari Lumme, Johan F. de Haan, Wim Vassen, and Joop W. Hovenier We present experimentally determined scattering matrix elements of birefringent rutile particles in water as a function of the scattering angle for a wavelength of 633 nm ~in air!. These elements are compared with the results of T-matrix calculations for prolate spheroids. For the diagonal matrix elements the results of the T-matrix calculations are in good agreement with those of the measurements. A good fit for the whole matrix, including the off-diagonal elements, is obtained when we compensate for the birefringence of the rutile particles by performing the computations for spheroids with a slightly larger lengthywidth ratio than measured. © 1999 Optical Society of America OCIS codes: 290.0290, 120.5410. 1. Introduction The optical behavior of rutile ~titanium dioxide! par- ticles is of considerable interest for two reasons. First, rutile pigments, consisting of small rutile par- ticles, are widely employed in industry as constitu- ents of paints, plastics, printing inks, and papers. These pigments are used for their extreme whiteness, high opacity, and high tinting strength. 1 Second, the large birefringence of the rutile particles is of particular interest from a theoretical point of view. 2,3 The optical properties of rutile pigments depend on the light-scattering and the absorption behavior of constituent rutile particles. Since pure rutile parti- cles are transparent at visible wavelengths, absorp- tion by the sample particles is due to trace elements such as chromium 4 and will generally be small. In contrast, scattering by rutile particles is very strong in the visible part of the spectrum because of the large real parts of the refractive index for their ordi- nary and extraordinary axes. Other properties that determine the scattering behavior are the particle shape and orientation, the size distribution of the particles, the distances between the particles, and the wavelength of the light used. To determine theoretically the optical properties of rutile pigments, it is necessary to know the single- scattering behavior of the particles in the pigments, specifically their scattering matrix. It is not trivial to obtain accurately the scattering matrix of an en- semble of rutile particles in random orientation, ei- ther experimentally or numerically. These particles have a strong tendency to form aggregates in air, but their optical properties can be measured when these particles are suspended in water. However, the air– glass–water interface of, for example, a glass cuvette filled with such a suspension produces unwanted re- flections that complicate the measurements as well as the data reduction. 5,6 This makes it difficult, time-consuming, and costly to do these measure- ments on a regular basis, e.g., during the manufac- turing process. On the other hand, numerical calculations of scattering matrices of ensembles of rutile particles tend to be rather difficult and com- puter time-consuming because of the birefringence and the complex crystal shape of the particles whereas simplification of the calculation method re- quires validation. In this paper we present results of laboratory mea- surements of the scattering matrix elements as a function of the scattering angle for rutile particles in water for a wavelength of 633 nm ~in air!. To cali- H. Volten, J. F. de Haan, W. Vassen, and J. W. Hovenier are with the Department of Physics and Astronomy, Free University, De Boelelaan 1081, NL-1081 HV Amsterdam, The Netherlands. J. W. Hovenier is also with the Astronomical Institute “Anton Pannekoek,” University of Amsterdam, Kruislaan 403, NL-1098 SJ Amsterdam, The Netherlands. J.-P. Jalava is with Kemira Pigments Oy, FIN-28840 Pori, Finland. K. Lumme is with the Observatory, P.O. Box 14, University of Helsinki, FIN-00014 Hel- sinki, Finland. The e-mail address for H. Volten is hester@nat. vu.nl. Received 10 March 1999; revised manuscript received 26 May 1999. 0003-6935y99y245232-09$15.00y0 © 1999 Optical Society of America 5232 APPLIED OPTICS y Vol. 38, No. 24 y 20 August 1999
-
Upload
independent -
Category
Documents
-
view
0 -
download
0
Transcript of Laboratory Measurements and T-Matrix Calculations of the Scattering Matrix of Rutile Particles in...

tp
Laboratory measurements and T-matrix calculations ofthe scattering matrix of rutile particles in water
Hester Volten, Juho-Pertti Jalava, Kari Lumme, Johan F. de Haan, Wim Vassen, andJoop W. Hovenier
We present experimentally determined scattering matrix elements of birefringent rutile particles inwater as a function of the scattering angle for a wavelength of 633 nm ~in air!. These elements arecompared with the results of T-matrix calculations for prolate spheroids. For the diagonal matrixelements the results of the T-matrix calculations are in good agreement with those of the measurements.A good fit for the whole matrix, including the off-diagonal elements, is obtained when we compensate forthe birefringence of the rutile particles by performing the computations for spheroids with a slightlylarger lengthywidth ratio than measured. © 1999 Optical Society of America
OCIS codes: 290.0290, 120.5410.
1. Introduction
The optical behavior of rutile ~titanium dioxide! par-ticles is of considerable interest for two reasons.First, rutile pigments, consisting of small rutile par-ticles, are widely employed in industry as constitu-ents of paints, plastics, printing inks, and papers.These pigments are used for their extreme whiteness,high opacity, and high tinting strength.1 Second,he large birefringence of the rutile particles is ofarticular interest from a theoretical point of view.2,3
The optical properties of rutile pigments depend onthe light-scattering and the absorption behavior ofconstituent rutile particles. Since pure rutile parti-cles are transparent at visible wavelengths, absorp-tion by the sample particles is due to trace elementssuch as chromium4 and will generally be small. Incontrast, scattering by rutile particles is very strongin the visible part of the spectrum because of the
H. Volten, J. F. de Haan, W. Vassen, and J. W. Hovenier are withthe Department of Physics and Astronomy, Free University, DeBoelelaan 1081, NL-1081 HV Amsterdam, The Netherlands.J. W. Hovenier is also with the Astronomical Institute “AntonPannekoek,” University of Amsterdam, Kruislaan 403, NL-1098SJ Amsterdam, The Netherlands. J.-P. Jalava is with KemiraPigments Oy, FIN-28840 Pori, Finland. K. Lumme is with theObservatory, P.O. Box 14, University of Helsinki, FIN-00014 Hel-sinki, Finland. The e-mail address for H. Volten is [email protected].
Received 10 March 1999; revised manuscript received 26 May1999.
0003-6935y99y245232-09$15.00y0© 1999 Optical Society of America
5232 APPLIED OPTICS y Vol. 38, No. 24 y 20 August 1999
large real parts of the refractive index for their ordi-nary and extraordinary axes. Other properties thatdetermine the scattering behavior are the particleshape and orientation, the size distribution of theparticles, the distances between the particles, and thewavelength of the light used.
To determine theoretically the optical properties ofrutile pigments, it is necessary to know the single-scattering behavior of the particles in the pigments,specifically their scattering matrix. It is not trivialto obtain accurately the scattering matrix of an en-semble of rutile particles in random orientation, ei-ther experimentally or numerically. These particleshave a strong tendency to form aggregates in air, buttheir optical properties can be measured when theseparticles are suspended in water. However, the air–glass–water interface of, for example, a glass cuvettefilled with such a suspension produces unwanted re-flections that complicate the measurements as wellas the data reduction.5,6 This makes it difficult,time-consuming, and costly to do these measure-ments on a regular basis, e.g., during the manufac-turing process. On the other hand, numericalcalculations of scattering matrices of ensembles ofrutile particles tend to be rather difficult and com-puter time-consuming because of the birefringenceand the complex crystal shape of the particleswhereas simplification of the calculation method re-quires validation.
In this paper we present results of laboratory mea-surements of the scattering matrix elements as afunction of the scattering angle for rutile particles inwater for a wavelength of 633 nm ~in air!. To cali-
t
NtCv
wt
dpmedctrcttle
brate our setup, we use the results of measurementson latex spheres, because they can be compared withthe results of ~exact! Mie calculations. We investi-gate the extent to which results of relatively fast andeasily implemented T-matrix calculations7 can beused to describe the scattering behavior of the rutileparticles. For these T-matrix calculations the some-what prolate rutile particles are approximated byprolate spheroids and the birefringence of the parti-cles is neglected. Comparison of the results of therutile particles measurements, on the one hand, andresults of these T-matrix calculations, on the otherhand, reveals the accuracy of these approximationsfor a theoretical determination of optical scatteringproperties of rutile particles.
2. Some Concepts from Light-Scattering Theory
We briefly summarize some concepts of light-scattering theory. The energy flux and polarizationof a beam of light can be represented by a columnvector I 5 $I, Q, U, V%, the Stokes vector.2,8 TheStokes parameter I is proportional to the total energyflux of the beam. Stokes parameters Q and U rep-resent the differences between two components of theflux for which the electric-field vectors oscillate inorthogonal directions. The Stokes parameter V isthe difference between two oppositely circularly po-larized components of the flux.
If, as in our experiment, light is scattered by anensemble of randomly oriented particles and reci-procity applies, the Stokes vectors of the incidentbeam and the scattered beam are, for each scatteringangle u, related by a ~4 3 4! scattering matrix2:
1Is
Qs
Us
Vs
2 5l2
4p2D2 1F11 F12 F13 F14
F12 F22 F23 F24
2F13 2F23 F33 F34
F14 F24 2F34 F44
21Ii
Qi
Ui
Vi
2 . (1)
Here subscript s is the scattered beam, subscript i ishe incident beam, l is the wavelength, and D is the
distance from the scatterers to the detector. In thiscase the scattering matrix elements are independentof the azimuthal angle. The plane through the di-rection of propagation of the incident and the scat-tered light beams is chosen as a plane of reference,the scattering plane.
The elements of the scattering matrix contain in-formation about the size, shape, and refractive indexof the scatterers. It contains 10 independent matrixelements that have to be determined. For conve-nience we normalize all matrix elements to F11; i.e.,we present results for F11 and FijyF11 with i, j 5 1–4.
ote that uFijyF11u # 1.9 A stricter test for the rela-ionships between matrix elements is formed by theloude coherency test as described by Hovenier andan der Mee.10 For all the measurements reported
in this paper, we have investigated the reliability ofthe measured angular distributions by applying thisCloude coherency test; i.e., we checked to determinewhether each measured matrix can be a sum of pure
scattering matrices. In all cases this test was satis-fied within the limits of the error bars.
3. Properties of the Rutile Particles
Rutile particles are birefringent, the real part of therefractive index n at 633 nm is 2.872 ~2.156 relative to
ater! for the extraordinary and 2.584 ~1.940 relativeo water! for the ordinary axis.11 The refractive in-
dex of water at 633 nm is 1.332.12 The sample thatwe used consisted of a water suspension of pure, un-coated rutile particles with a small ~0.2%! amount of
ispersing agent. The rutile particles were pre-ared by the so-called sulfate process at Kemira Pig-ents Oy, Pori, Finland. In Fig. 1 a transmission-
lectron-microscope image of rutile particles isisplayed. From mineralogy it is known that rutilerystals have two axes of the same length, while thehird axis is generally the longest. Therefore mostutile particles tend to have a prolate shape. This isonsistent with the shapes in Fig. 1, if we assumehat the particles are randomly orientated. The par-icle size and the shape were measured as width andengthywidth distributions by using transmissionlectron microscopy13 ~TEM! ~Jeol Jem 1200 EX, cal-
ibrated with latex spheres! and are shown by solidcurves in Fig. 2. The dashed curves in Fig. 2 arediscussed in Section 7. Expressed as a volume-equivalent sphere value, the diameter dTEM of therutile particles becomes 221~3! nm with a standarddeviation sTEM of 57~3! nm. The digits within pa-rentheses represent the uncertainty in the last digitsof the given values.
4. Experimental Setup
The scattering matrix of the rutile particles has beenmeasured with the experimental setup developed at
Fig. 1. TEM image of rutile particles. The white bar at thebottom of the image denotes 500 nm.
20 August 1999 y Vol. 38, No. 24 y APPLIED OPTICS 5233

u
o
Qm
5
the Department of Physics and Astronomy of the FreeUniversity in Amsterdam.14 This setup was origi-nally designed to determine the scattering matrix ofaerosol particles.15–17 However, the setup wasadapted for measuring particles in water.6
A schematic of the experimental setup is shown inFig. 3. Light with a wavelength of 633 nm from acontinuous-wave He–Ne laser passes through a po-larizer oriented at an angle gP and an electro-opticmodulator oriented at an angle gM. The orientationangles of optical elements are measured counter-clockwise from the scattering plane when one is look-ing in the direction of propagation of the light. Themodulated light is subsequently scattered by thesample of rutile particles. The scattered lightpasses through a quarter-wave plate oriented at an
Fig. 2. Two-dimensional distribution of the width and the lengthf all values for 180 combinations of width and lengthywidth equ
estimated values obtained by fitting results of the T-matrix calcula~see Section 7!.
Fig. 3. Schematic of the experimental setup: P, polarizer; S,rutile sample in water; PM, photomultiplier; A, ~optional! analyzer;
, ~optional! quarter-wave plate. The photomultipliers areounted on a goniometer ring with an outer diameter of 1 m.
234 APPLIED OPTICS y Vol. 38, No. 24 y 20 August 1999
angle gQ and an analyzer oriented at an angle gA~both optional! and is detected by a photomultipliertube that moves along a ring. The detector covers ascattering angle range from 15 deg ~nearly forwardscattering! to 165 deg ~nearly backward scattering!.
The modulator in the setup in combination withlock-in detection increases the accuracy of the mea-surements and makes it possible to deduce severalelements of the scattering matrix from one detectedsignal. A voltage varying sinusoidally in time is ap-plied to the modulator crystal. The phase shiftcaused by the crystal is also sinusoidal, so that theresulting phase shift can be described by Bessel func-tions of the first kind Jk~x!. If the amplitude f0 ofthe varying phase shift is chosen appropriately, theflux reaching the detector is14
Idet~u! 5 c@DC~u! 1 2J1~f0!S~u!sin vt
1 2J2~f0!C~u!cos 2vt 1 . . .#, (2)
where J1~f0! and J2~f0! are known constants and c isa constant for a certain optical arrangement. Themodulation frequency v is 1 kHz. The coefficientsDC~u!, S~u!, and C~u! contain elements of the scatter-ing matrix ~see Table 1; e.g., Refs. 14 and 17!. By
sing lock-in detection the dc, sin vt, and cos 2vtterms containing, respectively, DC~u!, S~u!, and C~u!are separated. The sin vt and cos 2vt parts aresubsequently divided by the dc part of the signalbelonging to the same configuration, which for theseratios eliminates the constant c. Note that F11~u! isobtained only on a relative scale in our experiments.Finally, when F12yF11, F13yF11, and F14yF11 mea-sured with combinations 1 and 5 in Table 1 are used,other element ratios FijyF11 are extracted from the
th of the rutile sample. The normalization is such that the sumnity. Solid curves, values determined by TEM; dashed curves,to measured angular distributions of scattering matrix elements
ywidals utions

dtrseladfstso
tedsr
a
tfltctsit
mbmpioitrrtda1u
Table 1. Matrix Elements Measured for Eight Combinations of the Orientation Angles gg , gg , gg , and gg of the Polarizer, the Modulator, the
ratios measured with combinations 2, 3, 4, 6, 7, and 8.For example, we find F24yF11 from
F14 1 F24
F11 1 F125
F14yF11 1 F24yF11
1 1 F12yF11, (3)
since it is the only unknown ratio in Eq. ~3!. Otherelement ratios are extracted in a similar way.
The rutile sample is contained in a cylindricallyshaped cuvette, 30 mm in diameter, made of Pyrexglass. A magnetic stirrer continuously homogenizesthe sample. To reduce reflections of the incidentlight from the glass cuvette, one places the cuvette inthe center of a cylindrical Pyrex glass basin ~22 cm in
iameter! filled with glycerin. Since glycerin hashe same refractive index as glass ~n 5 1.5!, strongeflections take place farther from the scatteringample. Also, the glass basin has flat entrance andxit windows to prevent reflections of the incidentaser beam on the basin from reaching the detectorss well as to avoid spherical aberrations of the inci-ent beam. In spite of these precautions a smallraction of the light scattered by rutile particles istill reflected either by the wall of the cuvette or byhe basin. In addition, a small fraction of the un-cattered light is reflected by the wall of the cuvetter basin and can thereafter be partly scattered.5,18
When reflections of the light on the wall of the cuvetteor basin are assumed to be perpendicular and we takeinto account multiple reflections, we find the follow-ing exact equation for the true scattering matrix ofthe rutile particles ~see also Ref. 6!:
F~u! 5 Func~u! 2 @rRFunc~180° 2 u!
1 Func~180° 2 u!rR#, (4)
where Func represents the uncorrected measured ma-trix, r is a ~constant! reflection coefficient, and R ishe Fresnel matrix for perpendicular reflection. Anmpirical value for r of 0.012 6 0.001 has been de-uced by minimizing the difference between the re-ults of measurements on latex spheres with theesults of Mie calculations.
In single-scattering experiments it is essential tovoid multiple scattering.19,20 Therefore the sample
concentration must be low enough. On the otherhand, the signal-to-noise ratio decreases for low con-centrations. To determine the highest sample con-
Quarter-Wave Pla
Combination gP ~deg! gM ~deg! gQ ~deg!
1 0 245 –2 0 245 23 0 245 –4 0 245 05 45 0 –6 45 0 –7 45 0 –8 45 0 0
aS~u! and C~u! are subsequently divided by the DC~u! output be
centration to which single scattering applies, thefollowing method has been adopted. The detector isplaced at a fixed position at 15 deg. Subsequently, aseries of measurements is made with increasing sam-ple concentration. As long as the scattered flux isproportional to the hydrosol concentration, multiplescattering is assumed to be negligible. In this man-ner the optimal concentration has been determined.We verified that at this concentration the averagedistance between the particles is sufficiently large tomake the particles independent scatterers and near-field effects negligible.21
The medium in which the rutile particles were sus-pended consisted of Baker analyzed high-performanceliquid chromatography ~HPLC! reagent ~HPLC wa-er! with a small amount of dispersing agent. Theux of light scattered by the cuvette filled with onlyhis background medium has been measured for eachombination in Table 1 and has been subtracted fromhe corresponding results of the rutile particles mea-urements. The effect of the background corrections maximal for the forward and backward direc-ions.6,22
The scattering volume seen by the detector is de-termined by the scattering angle, by the geometry ofthe scattering volume inside the cuvette ~length, 30
m, width, 1 mm; i.e., twice the waist of the laseream!, by the distance to the photomultiplier ~300m!, and by the circular pinholes in front of the
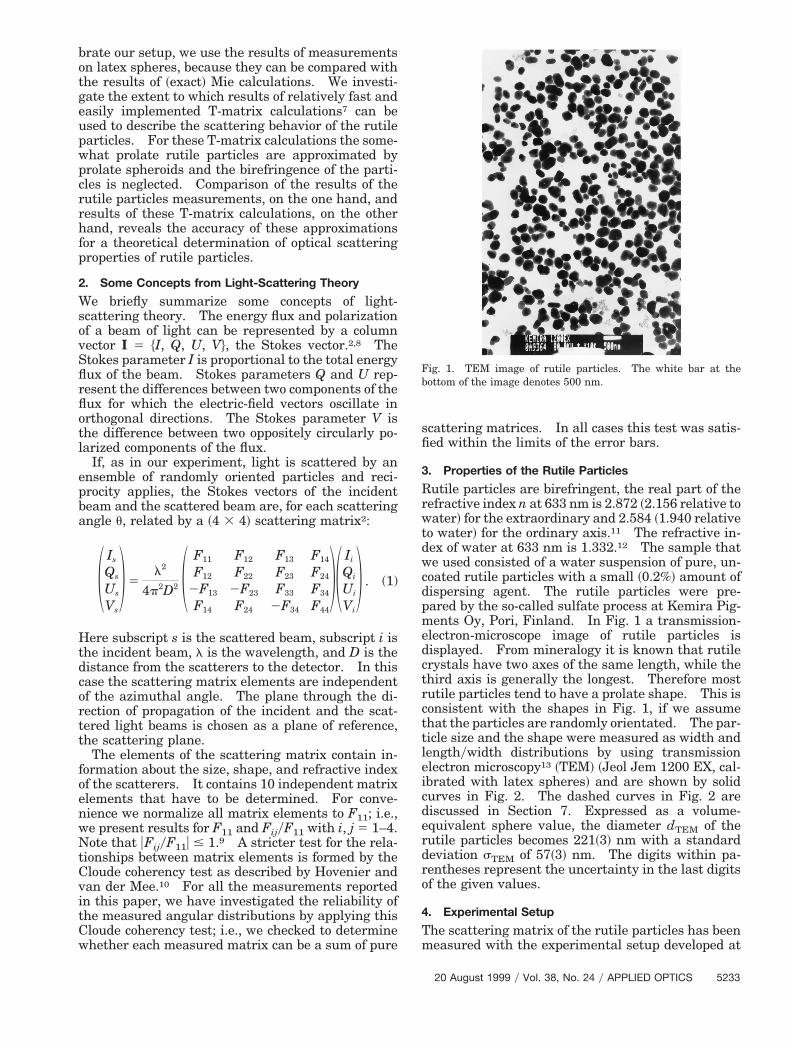
hotomultiplier ~one with a diameter of 5 mm directlyn front and one with a diameter of 2 mm at a distancef 100 mm from the photomultiplier tube!. By tak-ng this geometry into account and by assuming thathe width of the laser beam can be neglected, a cor-ection function of the scattering angle has been de-ived by which the measured flux has to be multipliedo correct for the scattering volume as seen by theetector. This function equals sin u for most of thengle range ~see Fig. 4!, i.e., roughly between 25 and55 deg ~e.g., Ref. 3, Section 13.2.1! and has beensed to correct the measurements.
5. Measurements on Latex Spheres
We have validated the results obtained with the ex-perimental setup by comparing the measurements onlatex spheres with the Mie calculations23 for spheri-cal particles with a log-normal size distribution24
P M Q A
nd the Analyzera
A ~deg! DC~u! S~u! C~u!
– F11 2F14 F12
0 F11 1 F12 2~F14 1 F24! F12 1 F22
45 F11 2 F13 2~F14 1 F34! F12 2 F23
45 F11 1 F14 2~F14 1 F44! F12 1 F24
– F11 2F14 F13
0 F11 1 F12 2~F14 1 F24! F13 1 F23
45 F11 2 F13 2~F14 1 F34! F13 1 F33
45 F11 1 F14 2~F14 1 F44! F13 2 F34
ng to the same configuration.
te, a
g
longi
20 August 1999 y Vol. 38, No. 24 y APPLIED OPTICS 5235
mC
a
n
5F
rb
a
F
5
with reff 5 0.2595 mm, neff 5 0.0057, and refractiveindex n 1 in9 5 1.194 1 i00 relative to HPLC water.The values for reff and n 1 in9 were specified by the
anufacturer of the latex spheres ~Duke Scientificorporation!. The value for neff was not specified
and was therefore chosen so that the difference be-tween the Mie calculations and the measurementswas minimized by using a x2 method that took intoconsideration all the matrix elements. During thisfitting procedure the normalization of the calculated
Fig. 4. Correction function of scattering angle ~solid line! to cor-ect the measured flux for the changing scattering volume as seeny the detector. This function equals sin u ~dashed curve! for most
of the scattering angle range.
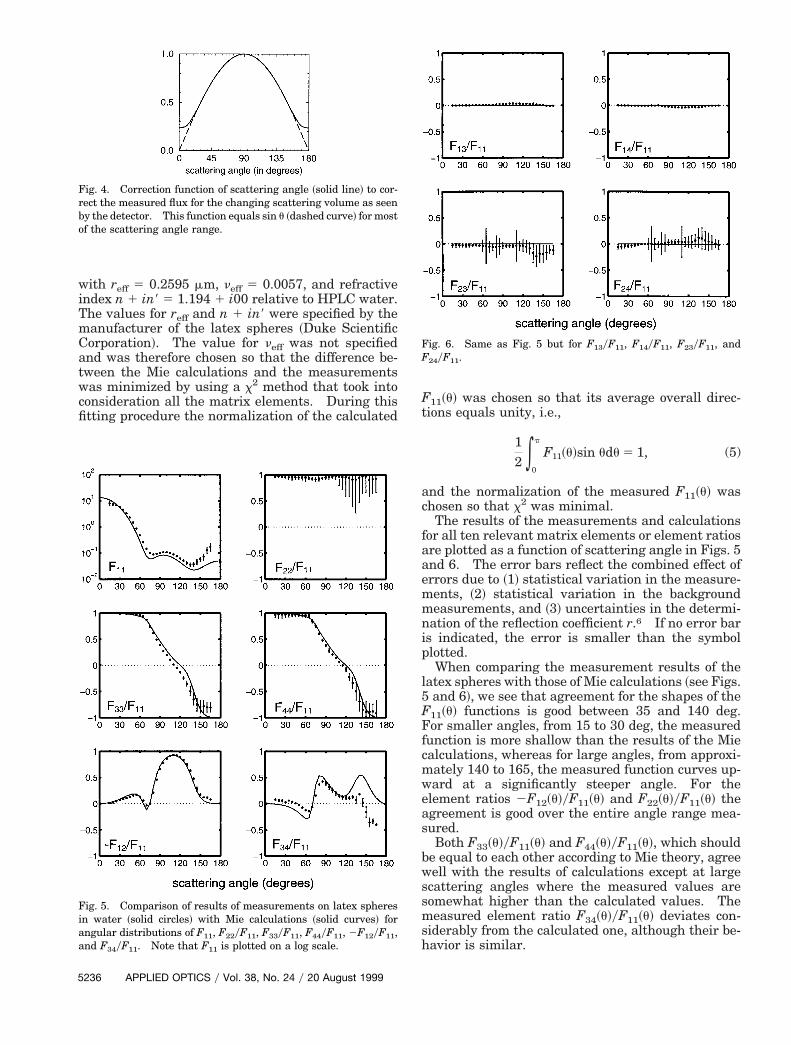
Fig. 5. Comparison of results of measurements on latex spheresin water ~solid circles! with Mie calculations ~solid curves! forangular distributions of F11, F22yF11, F33yF11, F44yF11, 2F12yF11,nd F34yF11. Note that F11 is plotted on a log scale.
236 APPLIED OPTICS y Vol. 38, No. 24 y 20 August 1999
F11~u! was chosen so that its average overall direc-tions equals unity, i.e.,
12 *
0
p
F11~u!sin udu 5 1, (5)
nd the normalization of the measured F11~u! waschosen so that x2 was minimal.
The results of the measurements and calculationsfor all ten relevant matrix elements or element ratiosare plotted as a function of scattering angle in Figs. 5and 6. The error bars reflect the combined effect oferrors due to ~1! statistical variation in the measure-ments, ~2! statistical variation in the backgroundmeasurements, and ~3! uncertainties in the determi-
ation of the reflection coefficient r.6 If no error baris indicated, the error is smaller than the symbolplotted.
When comparing the measurement results of thelatex spheres with those of Mie calculations ~see Figs.
and 6!, we see that agreement for the shapes of the11~u! functions is good between 35 and 140 deg.
For smaller angles, from 15 to 30 deg, the measuredfunction is more shallow than the results of the Miecalculations, whereas for large angles, from approxi-mately 140 to 165, the measured function curves up-ward at a significantly steeper angle. For theelement ratios 2F12~u!yF11~u! and F22~u!yF11~u! theagreement is good over the entire angle range mea-sured.
Both F33~u!yF11~u! and F44~u!yF11~u!, which shouldbe equal to each other according to Mie theory, agreewell with the results of calculations except at largescattering angles where the measured values aresomewhat higher than the calculated values. Themeasured element ratio F34~u!yF11~u! deviates con-siderably from the calculated one, although their be-havior is similar.
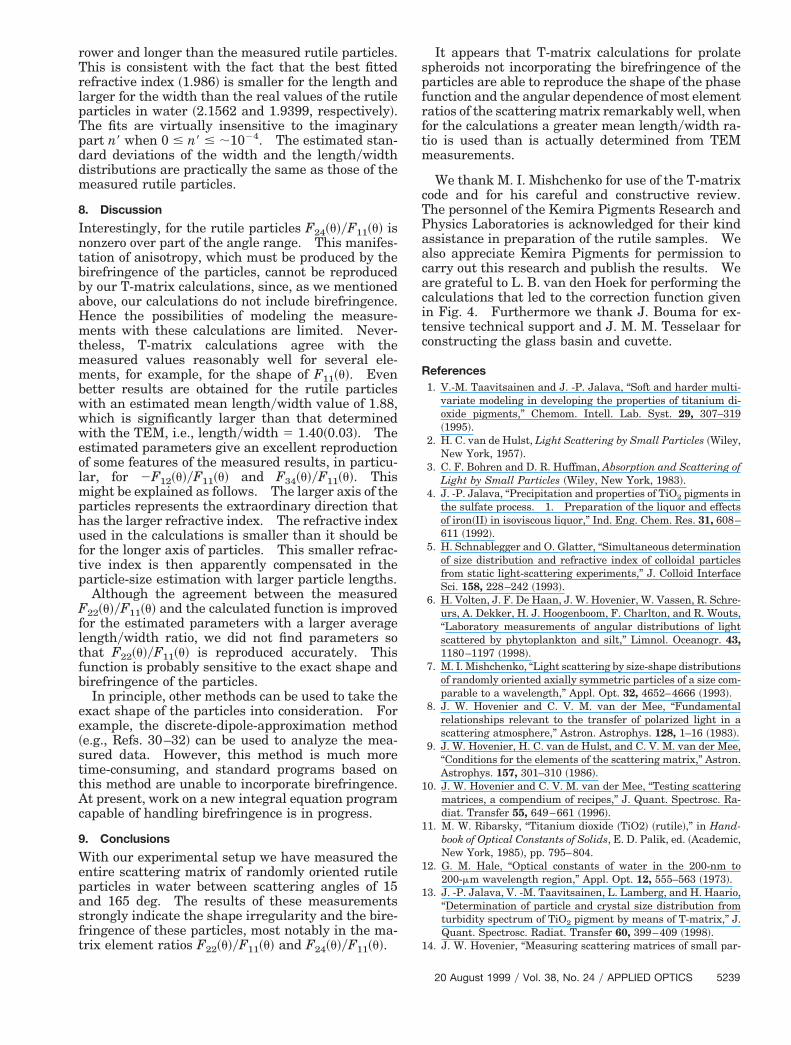
Fig. 6. Same as Fig. 5 but for F13yF11, F14yF11, F23yF11, and24yF11.

25
asm
~d
F
oi
Fca
Fpad
F
Interestingly, Miller et al. reported similar devi-tions for their calibration measurements on latexpheres of the same size obtained from the sameanufacturer ~Duke Scientific Corporation!, in par-
ticular for F34~u!yF11~u!. This seems to indicate thateither the particles do not completely obey Mie scat-tering or the specifications of the manufacturer arenot accurate enough ~see also Ref. 26!. The mea-sured element ratios F13~u!yF11~u!, F14~u!yF11~u!,F23~u!yF11~u!, and F24~u!yF11~u! do not differ fromzero by more than the error bars.
6. Measurements on Rutile Particles in Water
The complete scattering matrix of rutile particles inwater measured as a function of scattering angle isshown by filled circles in Figs. 7 and 8. The phasefunction F11~u! has been normalized according to Eq.5! where we used a Legendre series expansion toefine F11~u! for angles not covered by measure-
ments. The scales for Fij~u!yF11~u! range from 11 to21. Error bars are determined in the same way asfor the latex spheres. The error bars are smallerthan for the latex spheres, especially for F22~u!y
11~u!, because rutile particles are much strongerscatterers than latex spheres particularly at side-scattering and backscattering angles. For example,the measured F11~u! varies by no more than a factorf 17 over the covered angles. For the latex spherest is a factor of 226.
As is clear from Fig. 7, the angular distribution of22~u!yF11~u! of the rutile particles deviates signifi-antly from one, ranging between approximately 0.6nd 1.0. The shapes of F33~u!yF11~u! and F44~u!y
F11~u! are similar except at small angles whereF44~u!yF11~u! is approximately 0.1 lower than F33~u!y
11~u! and at large angles where F44~u!yF11~u! is ap-roximately 0.15 higher. Both ratios vanish atpproximately the same angle ~between 120 and 125eg!, as does F34~u!yF11~u!. The 2F12~u!yF11~u! ratio
peaks at ;75 deg with a maximum value of 0.18 andis positive for most angles but becomes slightly neg-ative beyond 140 deg.
The scattering-element ratio F24~u!yF11~u! in Fig. 8deserves special attention because it deviates fromzero by more than the error bars. This particularbehavior is probably the result of the strong birefrin-gence of the rutile particles, since for randomly ori-ented isotropic particles having a plane of symmetryF24~u!yF11~u! is identical to zero, just like F13~u!yF11~u!, F14~u!yF11~u!, and F23~u!yF11~u!. For F23~u!y
11~u! we find no significant deviations from zero, andF13~u!yF11~u! as well as F14~u!yF11~u! is clearly zero atall angles within the experimental errors.
7. T-Matrix Calculations
The theoretical interpretation of light-scatteringmeasurements of rutile particles is complicated for atleast two reasons. First, rutile is a highly anisotro-pic, birefringent substance. Second, the shape of atypical rutile particle cannot be described precisely bya simple geometric figure.
We have chosen to apply the T-matrix method to
our measurements because it is fast and easy to im-plement. In doing this we adopt a prolate ellipsoidmodel for the shapes and ignore the large birefrin-gence of the rutile particles. The scattering matrixof rutile particles has been calculated with theT-matrix algorithm developed by Mishchenko.7,27
According to past experience the gamma distributionis a suitable distribution for describing both thewidth and the lengthywidth distributions of the rutileparticles.13 Actually we found that the results of thecalculations are not sensitive to the precise shape ofthe distributions, as is consistent with other obser-vations.28
The parameters for applying the T-matrix methodto the measurements by using gamma distributionsare as follows:
the mean width dw of the particles,the standard deviation sw of the width distribution,the mean lengthywidth ratio lyw of the prolate ellip-
soids,
Fig. 7. Comparison of results of measurements on rutile particlesin water with the results of T-matrix calculations for the angulardistributions of F11, F22yF11, F33yF11, F44yF11, 2F12yF11, and F34yF11. The normalization of F11~u! is such that its average overthree-dimensional space equals unity. Solid circles, measuredvalues, dash–dot curves, functions calculated with the T-matrixmethod by using the width and the lengthywidth distributionsdetermined by TEM ~see Fig. 2 and Table 2!; solid curves, the samebut for estimated values obtained by fitting the results of T-matrixcalculations to measured angular distributions of scattering ma-trix elements ~see Fig. 2 and Table 2!.
20 August 1999 y Vol. 38, No. 24 y APPLIED OPTICS 5237

tc
dp
mtp
w
et
smtaco
F
5
the standard deviation slyw of the lengthywidth dis-tribution, and
the refractive index m 5 n 1 in9.
We performed a T-matrix calculation by using thevalues for the parameters measured with the TEMand an arithmetic mean of the literature values forthe refractive indices ~see Table 2!. The results ofhis calculation are plotted in Fig. 7 as dash–doturves where F11~u! obeys Eq. ~5!. The agreement
between the measured results and the results of thecalculation is excellent for the shape of F11~u!. Forthe other diagonal elements we find that the calcu-lations provide a good reproduction of the trends seenfor the measured results. However, a totally differ-ent behavior is found for two off-diagonal elementratios, namely, 2F12~u!yF11~u! and F34~u!yF11~u!.
We have performed a least-squares fitting proce-ure to determine whether we can improve the com-arison between measurements and calculations by
Fig. 8. Same as Fig. 7 but for F13yF11, F14yF11, F23yF11, and24yF11. Results of calculations have been omitted for these ele-
ment ratios since they are identically zero at all scattering angles.
Table 2. Parameters Used in the T-Matrix Calculations Presented inFigs. 7 and 8a
Parameters Measured Estimated
dw 198~4! nm 179 nmsw 50~3! nm 45 nmlyw 1.40~0.03! 1.88slyw 0.25~0.02! 0.23n 1 in9 2.048b 1 i 0.00 1.986 1 i 0.00
aThe measured particle size and shape distributions of the rutileparticles have been determined with TEM. Estimated valueswere obtained by fitting the results of T-matrix calculations tomeasured angular distributions of scattering matrix elements.The digits within parentheses represent the uncertainties ~onesigma standard deviations! of the given values.
bAverage of the values 2.1562 and 1.9399 for the extraordinaryand the ordinary axes, respectively.11
238 APPLIED OPTICS y Vol. 38, No. 24 y 20 August 1999
odifying the parameters slightly. We minimizehe following sum of squares ~SS! with respect to thearameters mentioned above:
SS 5 SS1 1 SS2 (6)
ith
SS1 51N (
i51
N H@F11~ui!measyF11~ui!calc 2 1#2
1 (j
wj@Fj, meas~ui!yF11, meas~ui!
2 Fj, calc~ui!yF11,calc~ui!#2J , (7)
SS2 5 ~dTEM 2 dcalc!2 1 ~sTEM 2 scalc!
2, (8)
where j 5 22, 33, 44, 12, 34 and where meas and calcrefer to the measured and the calculated values, re-spectively, N is the number of scattering angles, andwj are the weights. F11~ui!meas and F11~ui!calc arenormalized according to Eq. ~5!. The SS2 term con-tains the volume-equivalent sphere diameters dTEMand dcalc as well as the standard deviations sTEM andscalc derived from the TEM measurements andT-matrix calculations, respectively, expressed innanometers. This term was added to constrain thecombination of parameters dw and lyw as well as swand slyw. In this way we ensured that the estimatedwidth and the lengthywidth distributions did not de-viate too much from physical reality. We did theestimation by iterative least-squares minimizationby using the Nelder Mead minimization algorithmthat was implemented with Matlab and the DataAnalysis Toolbox.29 To obtain a solution in whichthe behavior of 2F12~u!yF11~u! and F34~u!yF11~u! ismphasized, these terms were given a weight of 10;he other weights were one.
The results of the fit produced in this manner arehown in Fig. 7 by solid curves. The resulting esti-ated parameters are listed in Table 2. In addition
he estimated width and lengthywidth distributionsre shown in a two-dimensional plot in Fig. 2 ~dashedurves! to facilitate comparison with the measurednes. The volume-equivalent sphere diameter dcalc
and the standard deviation scalc are equal to thosedetermined with the TEM, i.e., dcalc 5 221 nm andscalc 5 57 nm.
It is not entirely unexpected, because of theweights given to these functions, that the agreementbetween measured results and calculated functionshas improved dramatically for 2F12~u!yF11~u! andF34~u!yF11~u!. For the diagonal element ratios theagreement has also improved considerably, especiallyfor F33~u!yF11~u! and F44~u!yF11~u! at side-scatteringangles. A great difference is still present for F22~u!yF11~u!. It is likely that this element ratio is mostsensitive to the actual shapes and birefringence of therutile particles.
As can be seen in Table 2 and Fig. 2, the spheroidsthat produce the best fitted result are slightly nar-
Tp
t
tm
cTPaacacitc
rower and longer than the measured rutile particles.This is consistent with the fact that the best fittedrefractive index ~1.986! is smaller for the length andlarger for the width than the real values of the rutileparticles in water ~2.1562 and 1.9399, respectively!.
he fits are virtually insensitive to the imaginaryart n9 when 0 # n9 # ;1024. The estimated stan-
dard deviations of the width and the lengthywidthdistributions are practically the same as those of themeasured rutile particles.
8. Discussion
Interestingly, for the rutile particles F24~u!yF11~u! isnonzero over part of the angle range. This manifes-tation of anisotropy, which must be produced by thebirefringence of the particles, cannot be reproducedby our T-matrix calculations, since, as we mentionedabove, our calculations do not include birefringence.Hence the possibilities of modeling the measure-ments with these calculations are limited. Never-theless, T-matrix calculations agree with themeasured values reasonably well for several ele-ments, for example, for the shape of F11~u!. Evenbetter results are obtained for the rutile particleswith an estimated mean lengthywidth value of 1.88,which is significantly larger than that determinedwith the TEM, i.e., lengthywidth 5 1.40~0.03!. Theestimated parameters give an excellent reproductionof some features of the measured results, in particu-lar, for 2F12~u!yF11~u! and F34~u!yF11~u!. Thismight be explained as follows. The larger axis of theparticles represents the extraordinary direction thathas the larger refractive index. The refractive indexused in the calculations is smaller than it should befor the longer axis of particles. This smaller refrac-tive index is then apparently compensated in theparticle-size estimation with larger particle lengths.
Although the agreement between the measuredF22~u!yF11~u! and the calculated function is improvedfor the estimated parameters with a larger averagelengthywidth ratio, we did not find parameters sohat F22~u!yF11~u! is reproduced accurately. This
function is probably sensitive to the exact shape andbirefringence of the particles.
In principle, other methods can be used to take theexact shape of the particles into consideration. Forexample, the discrete-dipole-approximation method~e.g., Refs. 30–32! can be used to analyze the mea-sured data. However, this method is much moretime-consuming, and standard programs based onthis method are unable to incorporate birefringence.At present, work on a new integral equation programcapable of handling birefringence is in progress.
9. Conclusions
With our experimental setup we have measured theentire scattering matrix of randomly oriented rutileparticles in water between scattering angles of 15and 165 deg. The results of these measurementsstrongly indicate the shape irregularity and the bire-fringence of these particles, most notably in the ma-trix element ratios F22~u!yF11~u! and F24~u!yF11~u!.
It appears that T-matrix calculations for prolatespheroids not incorporating the birefringence of theparticles are able to reproduce the shape of the phasefunction and the angular dependence of most elementratios of the scattering matrix remarkably well, whenfor the calculations a greater mean lengthywidth ra-io is used than is actually determined from TEMeasurements.
We thank M. I. Mishchenko for use of the T-matrixode and for his careful and constructive review.he personnel of the Kemira Pigments Research andhysics Laboratories is acknowledged for their kindssistance in preparation of the rutile samples. Welso appreciate Kemira Pigments for permission toarry out this research and publish the results. Were grateful to L. B. van den Hoek for performing thealculations that led to the correction function givenn Fig. 4. Furthermore we thank J. Bouma for ex-ensive technical support and J. M. M. Tesselaar foronstructing the glass basin and cuvette.
References1. V.-M. Taavitsainen and J. -P. Jalava, “Soft and harder multi-
variate modeling in developing the properties of titanium di-oxide pigments,” Chemom. Intell. Lab. Syst. 29, 307–319~1995!.
2. H. C. van de Hulst, Light Scattering by Small Particles ~Wiley,New York, 1957!.
3. C. F. Bohren and D. R. Huffman, Absorption and Scattering ofLight by Small Particles ~Wiley, New York, 1983!.
4. J. -P. Jalava, “Precipitation and properties of TiO2 pigments inthe sulfate process. 1. Preparation of the liquor and effectsof iron~II! in isoviscous liquor,” Ind. Eng. Chem. Res. 31, 608–611 ~1992!.
5. H. Schnablegger and O. Glatter, “Simultaneous determinationof size distribution and refractive index of colloidal particlesfrom static light-scattering experiments,” J. Colloid InterfaceSci. 158, 228–242 ~1993!.
6. H. Volten, J. F. De Haan, J. W. Hovenier, W. Vassen, R. Schre-urs, A. Dekker, H. J. Hoogenboom, F. Charlton, and R. Wouts,“Laboratory measurements of angular distributions of lightscattered by phytoplankton and silt,” Limnol. Oceanogr. 43,1180–1197 ~1998!.
7. M. I. Mishchenko, “Light scattering by size-shape distributionsof randomly oriented axially symmetric particles of a size com-parable to a wavelength,” Appl. Opt. 32, 4652–4666 ~1993!.
8. J. W. Hovenier and C. V. M. van der Mee, “Fundamentalrelationships relevant to the transfer of polarized light in ascattering atmosphere,” Astron. Astrophys. 128, 1–16 ~1983!.
9. J. W. Hovenier, H. C. van de Hulst, and C. V. M. van der Mee,“Conditions for the elements of the scattering matrix,” Astron.Astrophys. 157, 301–310 ~1986!.
10. J. W. Hovenier and C. V. M. van der Mee, “Testing scatteringmatrices, a compendium of recipes,” J. Quant. Spectrosc. Ra-diat. Transfer 55, 649–661 ~1996!.
11. M. W. Ribarsky, “Titanium dioxide ~TiO2! ~rutile!,” in Hand-book of Optical Constants of Solids, E. D. Palik, ed. ~Academic,New York, 1985!, pp. 795–804.
12. G. M. Hale, “Optical constants of water in the 200-nm to200-mm wavelength region,” Appl. Opt. 12, 555–563 ~1973!.
13. J. -P. Jalava, V. -M. Taavitsainen, L. Lamberg, and H. Haario,“Determination of particle and crystal size distribution fromturbidity spectrum of TiO2 pigment by means of T-matrix,” J.Quant. Spectrosc. Radiat. Transfer 60, 399–409 ~1998!.
14. J. W. Hovenier, “Measuring scattering matrices of small par-
20 August 1999 y Vol. 38, No. 24 y APPLIED OPTICS 5239
ticles at optical wavelengths,” in Light Scattering by Non- 24. J. E. Hansen and L. D. Travis, “Light scattering in planetary
5
spherical Particles, M. I. Mishchenko, J. W. Hovenier, andL. D. Travis, eds. ~Academic, San Diego, Calif., 1999!, pp.355–365.
15. P. Stammes, “Light scattering properties of aerosols and theradiation inside a planetary atmosphere,” Ph.D. dissertation~Free University, Amsterdam, The Netherlands, 1989!.
16. F. Kuik, P. Stammes, and J. W. Hovenier, “Experimental de-termination of scattering matrices of water droplets andquartz particles,” Appl. Opt. 30, 4872–4881 ~1991!.
17. F. Kuik, “Single scattering of light by ensembles of particleswith various shapes,” Ph.D. dissertation ~Free University, Am-sterdam, The Netherlands, 1992!.
18. S. Sugihara, M. Kishino, and N. Okami, “Backscattering oflight by particles suspended in water,” Phys. Chem. Res. 76,1–8 ~1982!.
19. E. S. Fry and K. J. Voss, “Measurements of the Mueller matrixfor phytoplankton,” Limnol. Oceanogr. 30, 1322–1326 ~1985!.
20. D. A. Cross and P. Latimer, “Angular dependence of scatteringfrom Escherichia Coli cells,” Appl. Opt. 11, 1225–1228 ~1972!.
21. M. I. Mishchenko, D. W. Mackowski, and L. D. Travis, “Scat-tering of light by bispheres with touching and separated com-ponents,” Appl. Opt. 34, 4589–4599 ~1995!.
22. K. D. Lofftus, M. S. Quinby-Hunt, A. J. Hunt, F. Livolant, andM. Maestre, “Light scattering by Prorocentrum micans: anew method and results,” Appl. Opt. 31, 2924–2931 ~1992!.
23. G. Mie, “Beitrage zur Optik truber Medien speziell kolloidalerMetallosungen,” Ann. Phys. ~Leipzig! 25, 377–445 ~1908!.
240 APPLIED OPTICS y Vol. 38, No. 24 y 20 August 1999
atmospheres,” Space Sci. Rev. 16, 527–610 ~1974!.25. D. Miller, M. S. Quinby-Hunt, and A. J. Hunt, “Laboratory
studies of angle- and polarization-dependent light scatteringin sea ice,” Appl. Opt. 36, 1278–1288 ~1997!.
26. M. I. Mishchenko and D. W. Mackowski, “Electromagneticscattering by randomly oriented bispheres: comparison oftheory and experiment and benchmark calculations,” J.Quant. Spectrosc. Radiat. Transfer 55, 683–694 ~1996!.
27. M. I. Mishchenko and L. D. Travis, “Capabilities and limita-tions of a current FORTRAN implementation of the T-matrixmethod for randomly oriented, rotationally symmetric scatter-ers,” J. Quant. Spectrosc. Radiat. Transfer 60, 309–324 ~1998!.
28. M. I. Mishchenko and L. D. Travis, “Light scattering by poly-dispersions of randomly oriented spheroids with sizes compa-rable to wavelengths of observation,” Appl. Opt. 33, 7206–7225 ~1994!.
29. H. Haario and V. -M. Taavitsainen, Data Analysis Toolbox foruse with Matlab ~ProfMat Oy, Helsinki, Finland, 1997!.
30. E. M. Purcell and C. R. Pennypacker, “Scattering and absorp-tion of light by nonspherical dielectric grains,” Astrophys. J.186, 705–714 ~1973!.
31. B. T. Draine, “The discrete-dipole approximation and its ap-plication to interstellar graphite grains,” Astrophys. J. 333,848–872 ~1988!.
32. K. Lumme, J. Rahola, and J. W. Hovenier, “Light scattering bydense clusters of spheres,” Icarus 126, 455–469 ~1997!.