Social Accounting matrix
38
Welcome
-
Upload
abuportal-ng -
Category
Documents
-
view
1 -
download
0
Transcript of Social Accounting matrix

Welcome

Social Accounting Matrix:
General equilibrium analysis
Isah Musa Ahmad
Advanced Macroeconomics Analysis

Outline
• General equilibrium analysis• What is SAM?• Construction of SAM• Advantage & Disadvantage SAM
• Strengths and limitations of SAM in brief

Neoclassical Macroeconomics?
approaches to economics focusing on the determination of prices, outputs, and income distributions in markets through supply and demand, often mediated through a hypothesized maximization of utility by income-constrained individuals and of profits by cost-constrained firms employing available information and factors of production, in accordance with rational choice theory. Present day dominant school of economic thought built on the foundation laid by the 18th century (classical) theories of Adam Smith (1723-1790) David Ricardo (1772-1823) which were refined by;
19th and 20th century theories of Alfred Marshall (1842-1924), Vilfredo Pareto (1848-1923), John Clark (1847-1938), and Irving Fisher (1867-1947).

Economic Equilibrium: Overview
• State of balance or equal magnitude.
• In economics, economic equilibrium is a state where economic forces such as supply and demand are balanced and in the absence of external influences the (equilibrium) values of economic variables will not change.
• Equilibrium occurs at the point at which quantity demanded and quantity supplied are equal.
• Market equilibrium in this case refers to a condition where a market price is established through competition such that the amount of goods or services sought by buyers is equal to the amount of goods or services produced by sellers.

Types of equilibrium • Partial equilibrium is a condition of economic equilibrium which takes into consideration only a part of the market, ceteris paribus, to attain equilibrium.
• As defined by George Stigler, "A partial equilibrium is one which is based on only a restricted range of data, a standard example is price of a single product, the prices of all other products being held fixed during the analysis.

Cont`
Partial equilibrium analysis examines the effects of policy action in creating equilibrium only in that particular sector or market which is directly affected, ignoring its effect in any other market or industry assuming that they being small will have little impact if any.
Is a single sectoral analysis on a short run scenario.
Hence this analysis is considered to be useful in constricted markets.

Assumptions• Commodity price is given and constant for the
consumers.
• Consumers' taste and preferences, habits, incomes are also considered to be constant.
• Prices of prolific resources of a commodity and that of other related goods are known as well as constant.
• Industry is easily availed with factors of production at a known and constant price compliant with the methods of production in use.
• Prices of the products that the factor of production helps in producing and the price and quantity of other factors are known and constant.
• There is perfect mobility of factors of production between occupation and places.
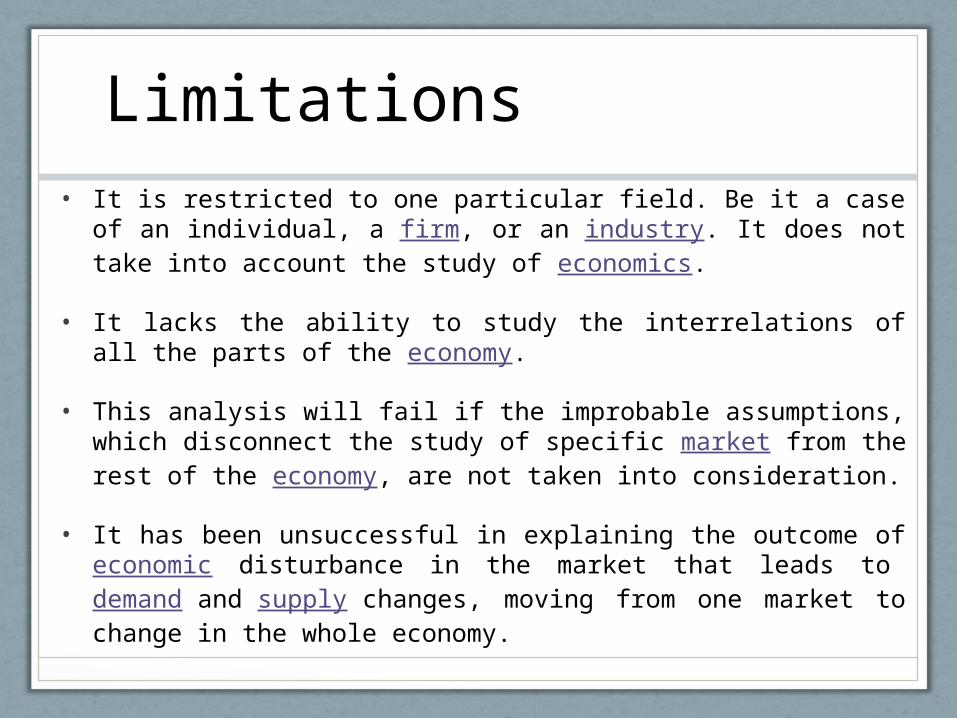
Limitations• It is restricted to one particular field. Be it a case
of an individual, a firm, or an industry. It does not take into account the study of economics.
• It lacks the ability to study the interrelations of all the parts of the economy.
• This analysis will fail if the improbable assumptions, which disconnect the study of specific market from the rest of the economy, are not taken into consideration.
• It has been unsuccessful in explaining the outcome of economic disturbance in the market that leads to demand and supply changes, moving from one market to change in the whole economy.

Strengths
• Specifies the behavior of all the economic agents using widely-accepted principles of optimization and choice.
• Possibility of deriving better measures of the welfare gain or loss associated with a new policy.
• Flexibility
• Attractiveness
• Simple to compute and interpret
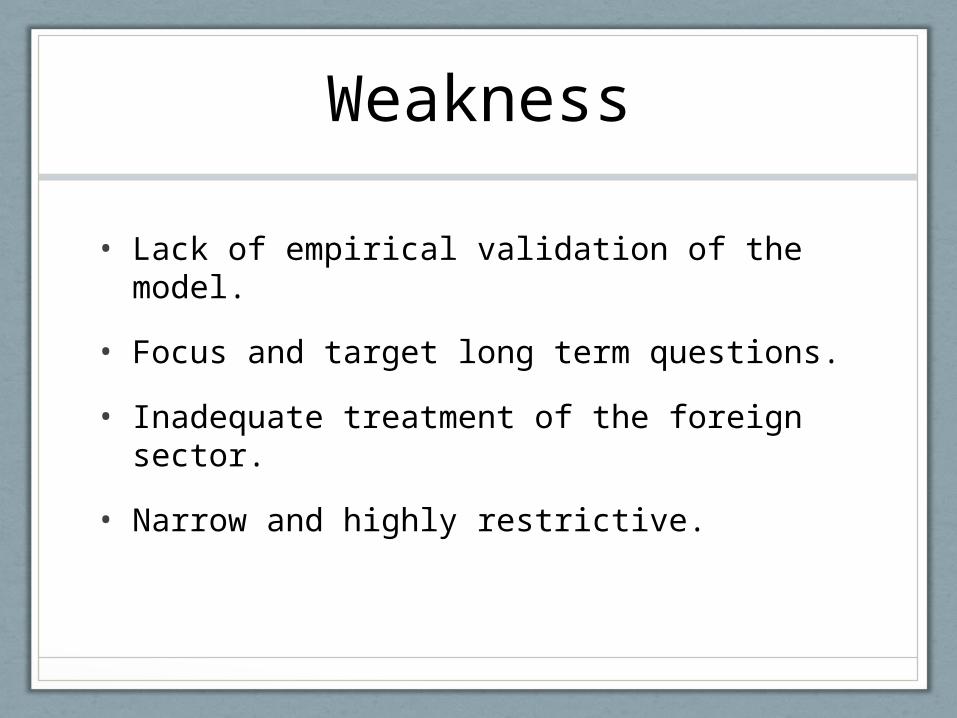
Weakness
• Lack of empirical validation of the model.
• Focus and target long term questions.• Inadequate treatment of the foreign sector.
• Narrow and highly restrictive.

General equilibrium
• In economics, general equilibrium theory attempts to explain the behavior of supply, demand, and prices in a whole economy with several or many interacting markets, by seeking to prove that a set of prices exists that will result in an overall (or "general") equilibrium.
• Based on the Walrasian tradition, general equilibrium models describe the allocation of resources in a market economy as the result of the interaction of supply and demand, leading to equilibrium prices.

Broadly speaking, general equilibrium tries to give an understanding of the whole economy using a "bottom-up" approach, starting with individual markets and agents. Macroeconomics, as developed by the Keynesian economists, focused on a "top-down" approach, where the analysis starts with larger aggregates, the "big picture". Therefore, general equilibrium theory has traditionally been classified as part of microeconomics.
General equilibrium macroeconomic models usually have a simplified structure that only incorporates a few markets, like a "goods market" and a "financial market". In contrast, general equilibrium models in the microeconomic tradition typically involve a multitude of different goods markets. They are usually complex and require computers to help with numerical solutions.

• The first attempt in neoclassical economics to model prices for a whole economy was made by Léon Walras.
• Was the first to lay down a research program much followed by 20th-century economists. In particular, the Walrasian agenda included the investigation of when equilibria are unique and stable.
• Walras also proposed a dynamic process by which general equilibrium might be reached, the process is a model for investigating stability of equilibria. Prices are announced (perhaps by an "auctioneer"), and agents state how much of each good they would like to offer (supply) or purchase (demand).
• Some think Walras was unsuccessful and that the later models in this series are inconsistent

Operational constraints
• Substantial investment in data gathering, analysis and adjustment.
• Subjectivity due to simplification, manipulation & adaptation.
• Difficulty to develop a model for the whole country.
• Simulation model not forecasting or econometric model.

Difference between Partial and General Equilibrium Partial Equilibrium General Equilibrium
• Developed by Alfred M arshall • Léon W alras was first to develop it.
• Related to single variable • M ore than one variable or economy as a whole is taken into consideration
• Based on two assumptions:
1. Ceteris Paribus 2. Other sectors are not affected due to
change in one sector.
• It is based on the assumption that various sectors are mutually interdependent. There is an effect on other sectors due to change in one.
• Other things remaining constant, price of a good is determined
•Prices of goods are determined simultaneously and mutually. Hence all product and factor markets are simultaneously in equilibrium.

What is a SAM?• A square matrix accounting framework that represents an
economy’s flows of income
• A SAM is a money-matrix. Every entry represents a monetary value
• More specifically: it captures transactions and transfers among all economic agents in an economy (production sectors, households, government, foreign actors)
• A square matrix has equal number of rows and columns
• Each row and column in a SAM is called an account
• Each cell in a SAM represents a payment from the column account to the corresponding row account.

A cell in a SAM
• Each cell in a SAM, thus, represents expenditure and receipt.
• A SAM is thus follows a double-accounting entry system• The sum of rows must be equal to the sum of columns for each account!!!

SAM Is regarded as an extension of input output table in the form of a matrix representing all transactions and transfers between different production activities, factors of production and institutions within the economy and with respect to the rest of the world.A comprehensive accounting framework within which full circular flow of income from production to factors incomes, household income to household consumption and back to production is captured.Transactions in economy is presented in matrix. Row gives receipt of an account and column gives expenditure.Total of each row is supposed to be equal to total of each corresponding column.

Come about of SAM developed at the “Cambridge Growth Project” in Cambridge, UK,
in 1962 by Stone and Brown.
Used for National Account for World Bank.
Graham Pyatt & Erik Thorbecke, the leading proponents and developers of SAMs.
By the early 1980s, models were heavily used by World Bank for development analysis. SAMs were similarly a mainstay of Bank analysis.
Presently, adopted by many private & public institutions across the world.

Basic structure of SAM

Basic Structure of SAM … Cont’d

Basic structure of SAM …Cont’d
• Activities produce commodities • Commodities are goods and services produced by activities
Why do we separate Activities and Commodities?
• Two reasons:• An activity may produce more than one commodity
• A commodity may be produced by more than one Activity. E.g. coffee could be produced by large-scale farmers or by small-scale farmers.

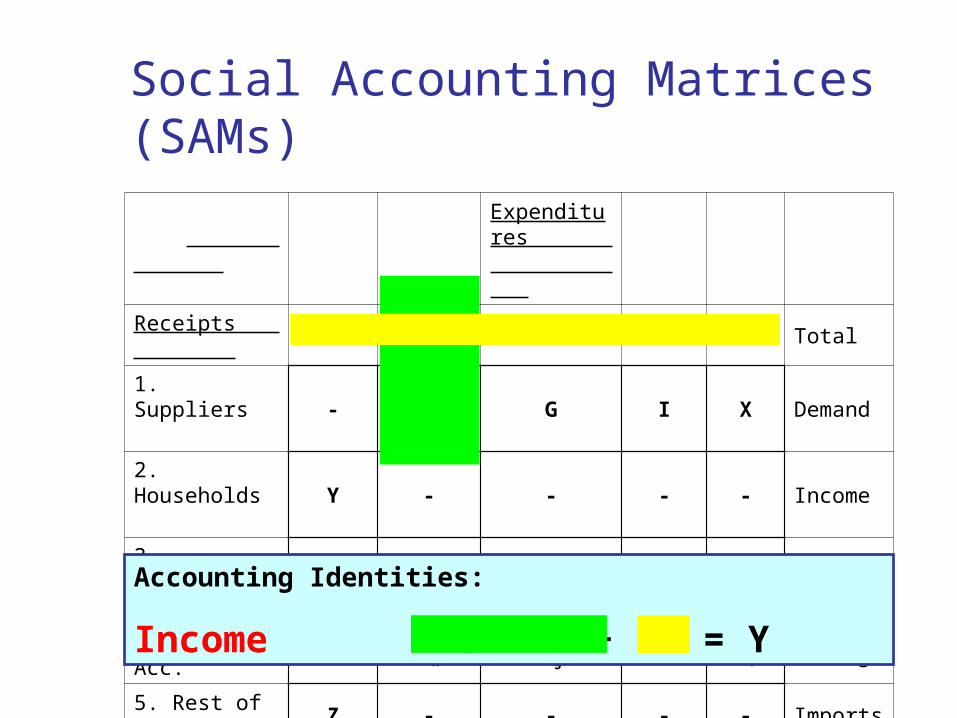
Social Accounting Matrices (SAMs)
Expenditures
Receipts 1 2 3 4 5 Total
1. Suppliers
- C G I X Demand
2. Households
Y - - - - Income
3. Government
- T - - - Receipts
4. Capital Accnt. - Sh Sg - Sf Savings
5. Rest of World Z - - - - Imports
Total Supply
Expendi-ture
Expenditure
Invest-
mentROW
Additional variablesSh = Private Savings

Social Accounting Matrices (SAMs)
Expenditures
Receipts 1 2 3 4 5 Total
1. Suppliers
- C G I X Demand
2. Households
Y - - - - Income
3. Government
- T - - - Receipts
4. Capital Accnt. - Sh Sg - Sf Savings
5. Rest of World Z - - - - Imports
Total Supply
Expendi-ture
Expenditure
Invest-
mentROW
Additional variablesSg = Government Savings

Social Accounting Matrices (SAMs)
Expenditures
Receipts 1 2 3 4 5 Total
1. Suppliers
- C G I X Demand
2. Households
Y - - - - Income
3. Government
- T - - - Receipts
4. Capital Accnt. - Sh Sg - Sf Savings
5. Rest of World Z - - - - Imports
Total Supply
Expendi-ture
Expenditure
Invest-
mentROW
Additional variablesT = Tax Payments

Social Accounting Matrices (SAMs)
Expenditures
Receipts 1 2 3 4 5 Total
1. Suppliers
- C G I X Demand
2. Households
Y - - - - Income
3. Government
- T - - - Receipts
4. Capital Accnt. - Sh Sg - Sf Savings
5. Rest of World Z - - - - Imports
Total Supply
Expendi-ture
Expenditure
Invest-
mentROW
Additional variablesSf = Foreign Savings

Social Accounting Matrices (SAMs)
Expenditures
Receipts 1 2 3 4 5 Total
1. Suppliers
- C G I X Demand
2. Households
Y - - - - Income
3. Government
- T - - - Receipts
4. Capital Acc. - Sh Sg - Sf Savings
5. Rest of World Z - - - - Imports
Total Supply
Expendi-ture
Expenditure
Invest-
mentROW
Additional variablesG = Government Spending

Social Accounting Matrices (SAMs)
Expenditures
Receipts 1 2 3 4 5 Total
1. Suppliers
- C G I X Demand
2. Households
Y - - - - Income
3. Government
- T - - - Receipts
4. Capital Acc. - Sh Sg - Sf Savings
5. Rest of World Z - - - - Imports
Total Supply
Expendi-ture
Expenditure
Invest-
mentROW
Accounting Identities:
Mat. Bal. Y + Z = C + G + I + X
Social Accounting Matrices (SAMs)
Expenditures
Receipts 1 2 3 4 5 Total
1. Suppliers
- C G I X Demand
2. Households
Y - - - - Income
3. Government
- T - - - Receipts
4. Capital Acc. - Sh Sg - Sf Savings
5. Rest of World Z - - - - Imports
Total Supply
Expendi-ture
Expenditure
Invest-
mentROW
Accounting Identities:
Income C + T + Sh = Y

Social Accounting Matrices (SAMs)
Expenditures
Receipts 1 2 3 4 5 Total
1. Suppliers
- C G I X Demand
2. Households
Y - - - - Income
3. Government
- T - - - Receipts
4. Capital Acc. - Sh Sg - Sf Savings
5. Rest of World Z - - - - Imports
Total Supply
Expendi-ture
Expenditure
Invest-
mentROW
Accounting Identities:
Govt. Budget G + Sg = T

Social Accounting Matrices (SAMs)
Expenditures
Receipts 1 2 3 4 5 Total
1. Suppliers
- C G I X Demand
2. Households
Y - - - - Income
3. Government
- T - - - Receipts
4. Capital Acc. - Sh Sg - Sf Savings
5. Rest of World Z - - - - Imports
Total Supply
Expendi-ture
Expenditure
Invest-
mentROW
Accounting Identities:
Saving-Investment I = Sh + Sg + Sf

Social Accounting Matrices (SAMs)
Expenditures
Receipts 1 2 3 4 5 Total
1. Suppliers
- C G I X Demand
2. Households
Y - - - - Income
3. Government
- T - - - Receipts
4. Capital Acc. - Sh Sg - Sf Savings
5. Rest of World Z - - - - Imports
Total Supply
Expendi-ture
Expenditure
Invest-
mentROW
Accounting Identities:
Trade Balance X + Sf = Z
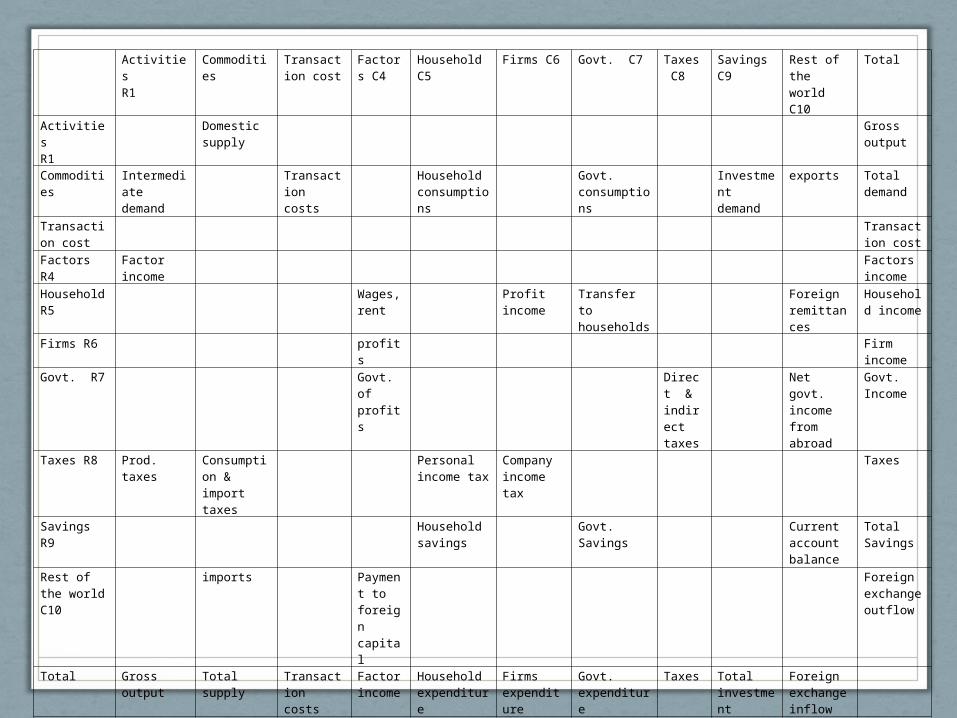
ActivitiesR1
Commodities
Transaction cost
Factors C4
Household C5
Firms C6 Govt. C7 Taxes C8
Savings C9
Rest of the world C10
Total
ActivitiesR1
Domestic supply
Gross output
Commodities
Intermediate demand
Transaction costs
Household consumptions
Govt. consumptions
Investment demand
exports Total demand
Transaction cost
Transaction cost
Factors R4
Factor income
Factors income
Household R5
Wages, rent
Profit income
Transfer to households
Foreign remittances
Household income
Firms R6 profits
Firm income
Govt. R7 Govt. of profits
Direct & indirect taxes
Net govt. income from abroad
Govt. Income
Taxes R8 Prod. taxes
Consumption & import taxes
Personal income tax
Company income tax
Taxes
Savings R9
Household savings
Govt. Savings
Current account balance
Total Savings
Rest of the world C10
imports Payment to foreign capital
Foreign exchange outflow
Total Gross output
Total supply
Transaction costs
Factor income
Household expenditure
Firms expenditure
Govt. expenditure
Taxes Total investment
Foreign exchange inflow

Advantages of SAM• ability to capture a wide variety of developments
in a (macro-) economy, as it links production, factor and income accounts
• disaggregates large share of economic activities to smaller groups to show the effect of each group.
• it is a relatively efficient way of presenting data.
• useful tool to reconcile different data sources and fill in the gaps. This enables the reliability of existing data to be improved and inconsistencies in data sets of different nature be adjusted.

Limitations of SAM• restrictive, assumptions made, that all firms in a
given industry employ a constant production average of input, output, labour, technology and produce identical products.
• model assumes that there are no economies or diseconomies of scale in production or factor substitution.
• The statistical estimation of a new matrix is very labour-intensive and expensive. This is mainly because much of the information is gathered with help of micro-survey questionnaires.
• A related problem with this method is that interviewees, firms, or households, are not able to give perfect answers.


•Thank You for Listening!