MANAGERIAL ACCOUNTING - LibreTexts
348
MANAGERIAL ACCOUNTING
-
Upload
khangminh22 -
Category
Documents
-
view
0 -
download
0
Transcript of MANAGERIAL ACCOUNTING - LibreTexts
MANAGERIAL ACCOUNTING
Managerial Accounting

This text is disseminated via the Open Education Resource (OER) LibreTexts Project (https://LibreTexts.org) and like thehundreds of other texts available within this powerful platform, it is freely available for reading, printing and"consuming." Most, but not all, pages in the library have licenses that may allow individuals to make changes, save, andprint this book. Carefully consult the applicable license(s) before pursuing such effects.
Instructors can adopt existing LibreTexts texts or Remix them to quickly build course-specific resources to meet the needsof their students. Unlike traditional textbooks, LibreTexts’ web based origins allow powerful integration of advancedfeatures and new technologies to support learning.
The LibreTexts mission is to unite students, faculty and scholars in a cooperative effort to develop an easy-to-use onlineplatform for the construction, customization, and dissemination of OER content to reduce the burdens of unreasonabletextbook costs to our students and society. The LibreTexts project is a multi-institutional collaborative venture to developthe next generation of open-access texts to improve postsecondary education at all levels of higher learning by developingan Open Access Resource environment. The project currently consists of 14 independently operating and interconnectedlibraries that are constantly being optimized by students, faculty, and outside experts to supplant conventional paper-basedbooks. These free textbook alternatives are organized within a central environment that is both vertically (from advance tobasic level) and horizontally (across different fields) integrated.
The LibreTexts libraries are Powered by MindTouch and are supported by the Department of Education Open TextbookPilot Project, the UC Davis Office of the Provost, the UC Davis Library, the California State University AffordableLearning Solutions Program, and Merlot. This material is based upon work supported by the National Science Foundationunder Grant No. 1246120, 1525057, and 1413739. Unless otherwise noted, LibreTexts content is licensed by CC BY-NC-SA 3.0.
Any opinions, findings, and conclusions or recommendations expressed in this material are those of the author(s) and donot necessarily reflect the views of the National Science Foundation nor the US Department of Education.
Have questions or comments? For information about adoptions or adaptions contact [email protected]. Moreinformation on our activities can be found via Facebook (https://facebook.com/Libretexts), Twitter(https://twitter.com/libretexts), or our blog (http://Blog.Libretexts.org).
This text was compiled on 01/08/2022
®
1 1/8/2022
TABLE OF CONTENTS
1: NATURE OF MANAGERIAL ACCOUNTING AND COSTS1.1: CHAPTER 1 STUDY PLAN1.2: THE ROLE OF ACCOUNTING IN THE BASIC MANAGEMENT PROCESS1.3: CHARACTERISTICS OF MANAGERIAL ACCOUNTING REPORTS1.4: COSTS AND EXPENSES1.5: COST CLASSIFICATIONS USED FOR PLANNING AND CONTROL1.6: THE STATEMENT OF COST OF GOODS MANUFACTURED1.7: CHAPTER 1 KEY POINTS1.8: GLOSSARY1.9: CHAPTER 1- EXERCISES
2: JOB ORDER COST SYSTEM2.1: CHAPTER 2 STUDY PLAN2.2: CHARACTERISTICS OF JOB ORDER COSTING2.3: SUBSIDIARY LEDGERS NEEDED FOR JOB ORDER COSTING2.4: JOB COSTING PROCESS WITH JOURNAL ENTRIES2.5: ACTUAL VS. APPLIED FACTORY OVERHEAD2.6: UNDER- OR OVER-APPLIED OVERHEAD2.7: ACCOUNTING IN THE HEADLINES2.8: CHAPTER 2 KEY POINTS2.9: GLOSSARY2.10: CHAPTER 2- EXERCISES
3: PROCESS COST SYSTEM3.1: CHAPTER 3 STUDY PLAN3.2: PROCESS COSTING VS. JOB ORDER COSTING3.3: EQUIVALENT UNITS (WEIGHTED AVERAGE)3.4: PROCESS COSTING (WEIGHTED AVERAGE)3.5: JOURNAL ENTRIES FOR THE FLOW OF PRODUCTION COSTS3.6: PROCESS COSTING (FIFO METHOD)3.7: PROCESS COST DEMONSTRATION (FIFO METHOD)3.8: ACCOUNTING IN THE HEADLINES3.9: CHAPTER 3 KEY POINTS3.10: GLOSSARY3.11: CHAPTER 3- EXERCISES
4: ACTIVITY-BASED COSTING4.1: ACTIVITY-BASED COSTING AND MANAGEMENT4.2: CHAPTER 4 STUDY PLAN4.3: ACTIVITY BASED-COSTING METHOD4.4: ACCOUNTING IN THE HEADLINES4.5: CHAPTER 4 KEY POINTS4.6: GLOSSARY4.7: CHAPTER 4- EXERCISES
5: COST BEHAVIOR AND COST-VOLUME-PROFIT ANALYSIS5.1: CHAPTER 5 STUDY PLAN5.2: COST BEHAVIOR VS. COST ESTIMATION5.3: FIXED AND VARIABLE COSTS5.4: MIXED COSTS5.5: ACCOUNTING IN THE HEADLINES- COSTS5.6: COST-VOLUME-PROFIT ANALYSIS IN PLANNING5.7: BREAK – EVEN POINT FOR A SINGLE PRODUCT
2 1/8/2022
5.8: BREAK EVEN POINT FOR MULTIPLE PRODUCTS5.9: COST-VOLUME-PROFIT ANALYSIS SUMMARY5.10: ACCOUNTING IN THE HEADLINES- BREAKEVEN5.11: CHAPTER 5 KEY POINTS5.12: GLOSSARY5.13: CHAPTER 5- EXERCISES
6: VARIABLE AND ABSORPTION COSTING6.1: ABSORPTION COSTING6.2: CHAPTER 6 STUDY PLAN6.3: VARIABLE COSTING6.4: COMPARING ABSORPTION AND VARIABLE COSTING6.5: CHAPTER 6 KEY POINTS6.6: CHAPTER 6- EXERCISES
7: BUDGETING7.1: THE PERFORMANCE REPORT7.2: CHAPTER 7 STUDY PLAN7.3: INTRODUCTION TO BUDGETING AND BUDGETING PROCESSES7.4: MASTER BUDGETS7.5: OPERATING BUDGETS7.6: MANUFACTURING BUDGETS7.7: CASH BUDGETS7.8: BUDGETED BALANCE SHEET7.9: BUDGETING IN A MERCHANDISING COMPANY7.10: OTHER BUDGETING METHODS7.11: FLEXIBLE BUDGETS7.12: GLOSSARY7.13: CHAPTER 7- EXERCISES
8: STANDARD COST SYSTEMS8.1: CHAPTER 8 STUDY PLAN8.2: THE ROLE OF STANDARD COSTS IN MANAGEMENT8.3: CALCULATIONS FOR DIRECT MATERIALS AND LABOR8.4: CALCULATIONS FOR OVERHEAD8.5: ADVANTAGES AND DISADVANTAGES OF STANDARD COSTING8.6: VARIANCE SUMMARY8.7: ACCOUNTING IN THE HEADLINES8.8: GLOSSARY8.9: CHAPTER 8- EXERCISES
9: RESPONSIBILITY ACCOUNTING FOR COST, PROFIT AND INVESTMENTCENTERS
9.1: CHAPTER 9 STUDY PLAN9.2: TYPES OF COSTS9.3: RESPONSIBILITY ACCOUNTING IN MANAGEMENT9.4: RESPONSIBILITY REPORTS9.5: RESPONSIBILITY CENTERS9.6: INVESTMENT CENTER ANALYSIS9.7: SEGMENTED INCOME STATEMENTS9.8: ACCOUNTING IN THE HEADLINES9.9: TRANSFER PRICING9.10: BALANCED SCORECARD9.11: CHAPTER 9 KEY POINTS9.12: GLOSSARY9.13: CHAPTER 9- EXERCISES
10: DIFFERENTIAL ANALYSIS (OR RELEVANT COSTS)

3 1/8/2022
10.1: CHAPTER 10 STUDY PLAN10.2: DIFFERENTIAL ANALYSIS10.3: APPLYING DIFFERENTIAL ANALYSIS IN MANAGERIAL DECISION MAKING10.4: APPLYING DIFFERENTIAL ANALYSIS TO QUALITY DECISIONS10.5: ACCOUNTING IN THE HEADLINES10.6: GLOSSARY10.7: CHAPTER 10- EXERCISES
11: CAPITAL INVESTMENT ANALYSIS11.1: CAPITAL INVESTMENT ANALYSIS11.2: CHAPTER 11 STUDY PLAN11.3: SHORT TERM BUSINESS DECISIONS11.4: ACCOUNTING IN THE HEADLINES – PAYBACK11.5: THE CAPITAL RATIONING PROCESS11.6: CONTROLLING CAPITAL INVESTMENT EXPENDITURES11.7: CHAPTER 11 KEY POINTS11.8: GLOSSARY11.9: CHAPTER 11- EXERCISES
12: FINANCIAL STATEMENT ANALYSIS12.1: ANALYZING COMPARATIVE FINANCIAL STATEMENTS12.2: CHAPTER 12 STUDY PLAN12.3: CALCULATING TREND PERCENTAGES12.4: COMMON-SIZE FINANCIAL STATEMENTS12.5: ACCOUNTING IN THE HEADLINES12.6: CALCULATE RATIOS THAT ANALYZE A COMPANY’S SHORT-TERM DEBT-PAYING ABILITY12.7: RATIOS THAT ANALYZE A COMPANY’S LONG-TERM DEBT PAYING ABILITY12.8: RATIOS THAT ANALYZE A COMPANY’S EARNINGS PERFORMANCE12.9: RATIO SUMMARY12.10: CHAPTER 12- EXERCISES
13: APPENDIX- SERVICE DEPARTMENT ALLOCATION13.1: ALLOCATION OF SERVICE DEPARTMENT COSTS13.2: DIRECT METHOD OF ALLOCATION13.3: STEP METHOD OF ALLOCATION13.4: RECIPROCAL METHOD OF ALLOCATION
BACK MATTERINDEXGLOSSARY
1 1/8/2022
CHAPTER OVERVIEW1: NATURE OF MANAGERIAL ACCOUNTING AND COSTS
Learning Objectives
By the end of this section, the students should be able to
Compare and contrast financial vs. managerial accounting.Apply accounting procedures for manufacturing businesses.
After you complete the required assignments you will be able to:
Compare/Contrast Financial vs. Managerial Accounting.Define product and period costsCompute cost of goods sold for a manufacturerPrepare a manufacturing statement
1.1: CHAPTER 1 STUDY PLAN1.2: THE ROLE OF ACCOUNTING IN THE BASIC MANAGEMENT PROCESS1.3: CHARACTERISTICS OF MANAGERIAL ACCOUNTING REPORTS1.4: COSTS AND EXPENSES1.5: COST CLASSIFICATIONS USED FOR PLANNING AND CONTROL1.6: THE STATEMENT OF COST OF GOODS MANUFACTURED1.7: CHAPTER 1 KEY POINTS1.8: GLOSSARY1.9: CHAPTER 1- EXERCISES
1.1.1 1/1/2022 https://biz.libretexts.org/@go/page/26025
1.1: Chapter 1 Study PlanKnowledge Targets
I can define the following terms as they relate to our unit:
Direct Cost Indirect Cost Prime Cost Conversion Cost
Product Cost Period Cost Direct Material Direct Labor
Overhead Raw Materials Indirect Materials Indirect Labor
Cost of Goods Sold Variable Cost Fixed Cost Cost of Goods Manufactured
Financial Accounting Managerial Accounting Goods in Process Finished Goods
Reasoning Targets
I can identify differences between financial and managerial accounting.I can classify costs as direct or indirect, fixed or variable, prime or conversion, and product or period.I can identify product costs as direct materials, direct labor or overhead.I can understand the flow of goods from raw materials inventory to goods in process inventory to finished goodsinventory.I can understand the difference between cost of goods manufactured and cost of goods sold in a manufacturingenvironment.I can prepare a manufacturing statement with cost of goods manufactured calculated.
Skill Targets
I can calculate direct materials used from raw materials inventory data.I can calculate cost of goods manufactured for a manufacturer.I can calculate cost of goods sold for a merchandiser and a manufacturer.I can prepare a manufacturing statement with cost of goods manufactured calculated.
Click Chapter 1 Plan for a printable copy.
1.2.1 1/8/2022 https://biz.libretexts.org/@go/page/26024
1.2: The Role of Accounting in the Basic Management ProcessManagerial accounting helps managers make good decisions. Managerial accounting provides information about the costof goods and services, whether a product is profitable, whether to invest in a new business venture, and how to budget. Itcompares actual performance to planned performance and facilitates many other important decisions critical to the successof organizations.
The remaining chapters in this book focus on managerial accounting. This chapter provides an overview of managerialaccounting and shows how to determine the cost of a particular type of product known as a job.
A YouTube element has been excluded from this version of the text. You can view it online here:pb.libretexts.org/llmanagerialaccounting/?p=28
Compare managerial accounting with financial accountingWhereas financial accounting provides financial information primarily for external use, managerial accountinginformation is for internal use. By reporting on the financial activities of the organization, financial accounting providesinformation needed by investors and creditors.
Most managerial decisions require more detailed information than that provided by external financial reports. For instance,in their external financial statements, large corporations such as General Electric Company show single amounts on theirbalance sheets for inventory. However, managers need more detailed information about the cost of each of several hundredproducts.
We show the fundamental differences between managerial and financial accounting in the chart and video.
Financial accounting Managerial accounting
Users External users of information – usuallyshareholders, financial analysts, and creditors
Internal users of information – usuallymanagers.
GAAP Must comply with generally acceptedaccounting principles.
NO generally accepted accounting principlerequirements
Time Period Uses historical (or past) data. May use estimates of the future for budgetingand decision making.
Detail presented Presents summary data, costs, revenues, andprofits.
More detailed data are presented aboutproduct.
1.2.2 1/8/2022 https://biz.libretexts.org/@go/page/26024
A YouTube element has been excluded from this version of the text. You can view it online here:pb.libretexts.org/llmanagerialaccounting/?p=28
Accountants currently face a big challenge: designing information systems that provide information for multiple purposes.Some people at lower levels in the organization need detailed information, but not the big picture provided by a company’sincome statement. However, managers at top levels need to see the big picture.
All of you will use accounting information in your careers. Therefore, you need to know enough about accounting to getthe information you need for decision making.
Managerial accountants face many choices involving ethics. For example, managers are responsible for achieving financialtargets such as net income. Managers who fail to achieve these targets may lose their jobs. If a division or company ishaving trouble achieving financial performance targets, managers may be tempted to manipulate the accounting numbers.
In its Standards of Ethical Conduct for Management Accountants, the Institute of Management Accountants (IMA) statesthat management accountants have an obligation to maintain the highest levels of ethical conduct by maintainingprofessional competency, refraining from disclosing confidential information, and maintaining integrity and objectivity intheir work.[1]
The standards recommend that people faced with ethical conflicts follow the company’s established policies that deal withsuch conflicts. If the policies do not resolve the conflict, accountants should consider discussing the matter with theirsuperiors, potentially going as high as the audit committee of the board of directors. In extreme cases, the accountants mayhave no alternative but to resign.
CC licensed content, Shared previouslyAccounting Principles: A Business Perspective. . Authored by: James Don Edwards, University of Georgia & RogerH. Hermanson, Georgia State University.. Provided by: Endeavour International Corporation. Project: The GlobalText Project. License: CC BY: Attribution
All rights reserved contentIntroduction to Managerial Accounting. Authored by: Education Unlocked. Located at: youtu.be/KCyg8-zM9bA.License: All Rights Reserved. License Terms: Standard YouTube LicenseFinancial Accounting vs Managerial Accounting. Authored by: Education Unlocked. Located at:youtu.be/Ep7DqVxFHaY. License: All Rights Reserved. License Terms: Standard YouTube License
1.3.1 12/11/2021 https://biz.libretexts.org/@go/page/26026
1.3: Characteristics of Managerial Accounting Reports
Financial reporting by manufacturing companies
Many of you will work in manufacturing companies or provide services for them. Others will work in retail or serviceorganizations that do business with manufacturers. This section will help you understand how manufacturing companieswork and how to read both their internal and external financial statements.
Assume you own a bicycle store and purchase bicycles and accessories to sell to customers. To determine yourprofitability, you would subtract the cost of bicycles and accessories from your gross sales as cost of goods sold. However,if you owned the manufacturing company that made the bicycles, you would base your cost of goods sold on the cost ofmanufacturing those bicycles. Accounting for manufacturing costs is more complex than accounting for costs ofmerchandise purchased that is ready for sale.
Perhaps the most important accounting difference between merchandisers and manufacturers relates to the differences inthe nature of their activities. A merchandiser purchases finished goods ready to be sold. On the other hand, a manufacturermust purchase raw materials and use production equipment and employee labor to transform the raw materials intofinished products.
Thus, while a merchandiser has only one type of inventory—merchandise available for sale—a manufacturer has threetypes—unprocessed materials, partially complete work in process, and ready-for-sale finished goods. Instead of oneinventory account, three different inventory accounts are necessary to show the cost of inventory in various stages ofproduction. Looking at Exhibit 2, you can see how the inventory cost flows differ between manufacturing andmerchandising companies.
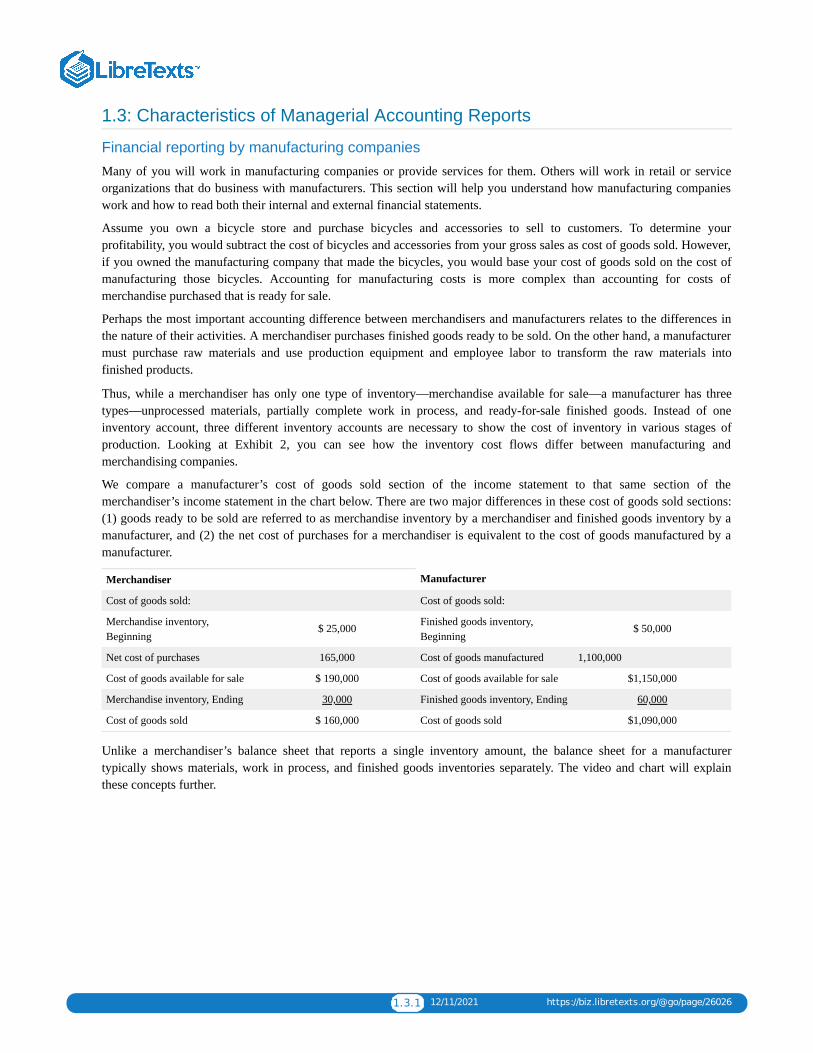
We compare a manufacturer’s cost of goods sold section of the income statement to that same section of themerchandiser’s income statement in the chart below. There are two major differences in these cost of goods sold sections:(1) goods ready to be sold are referred to as merchandise inventory by a merchandiser and finished goods inventory by amanufacturer, and (2) the net cost of purchases for a merchandiser is equivalent to the cost of goods manufactured by amanufacturer.
Merchandiser Manufacturer
Cost of goods sold: Cost of goods sold:
Merchandise inventory,Beginning
$ 25,000 Finished goods inventory,Beginning
$ 50,000
Net cost of purchases 165,000 Cost of goods manufactured 1,100,000
Cost of goods available for sale $ 190,000 Cost of goods available for sale $1,150,000
Merchandise inventory, Ending 30,000 Finished goods inventory, Ending 60,000
Cost of goods sold $ 160,000 Cost of goods sold $1,090,000
Unlike a merchandiser’s balance sheet that reports a single inventory amount, the balance sheet for a manufacturertypically shows materials, work in process, and finished goods inventories separately. The video and chart will explainthese concepts further.
1.3.2 12/11/2021 https://biz.libretexts.org/@go/page/26026
A YouTube element has been excluded from this version of the text. You can view it online here:pb.libretexts.org/llmanagerialaccounting/?p=30
Account Account Type Description
Raw Materials Inventory Current Asset all materials to be used in production(including direct and indirect materials)
Work in Process Inventory Current Asset Direct Material + Direct Labor + Overheadapplied to items started but not completed
Finished Goods Inventory Current Asset Direct Material + Direct Labor + Overheadapplied to items completed BUT not sold
Cost of goods sold Expense Direct Material + Direct Labor + Overheadapplied to items completed AND sold
The next section will explain the different cost types of direct materials, direct labor and overhead.
CC licensed content, Shared previouslyAccounting Principles: A Business Perspective.. Authored by: James Don Edwards, University of Georgia & Roger H.Hermanson, Georgia State University.. Provided by: Endeavour International Corporation. Project: The Global TextProject.. License: CC BY: Attribution
All rights reserved contentRaw Materials, Work in Process, and Finished Goods Inventory (Managerial Accounting Tutorial #23) . Authored by:Note Pirate. Located at: youtu.be/78_uE_b896U. License: All Rights Reserved. License Terms: Standard YouTubeLicense
1.4.1 1/8/2022 https://biz.libretexts.org/@go/page/26027
1.4: Costs and Expenses
Merchandiser and manufacturer accounting: Differences in cost concepts
Cost is a financial measure of the resources used or given up to achieve a stated purpose. Product costs are the costs acompany assigns to units produced. Product costs are the costs of making a product, such as an automobile; the cost ofmaking and serving a meal in a restaurant; or the cost of teaching a class in a university.
Manufacturing companies use the most complex product costing methods. To ensure that you understand how and whyproduct costing is done in manufacturing companies, we use many manufacturing company examples. However, sincemany of you could have careers in service or merchandising companies, we also use nonmanufacturing examples.
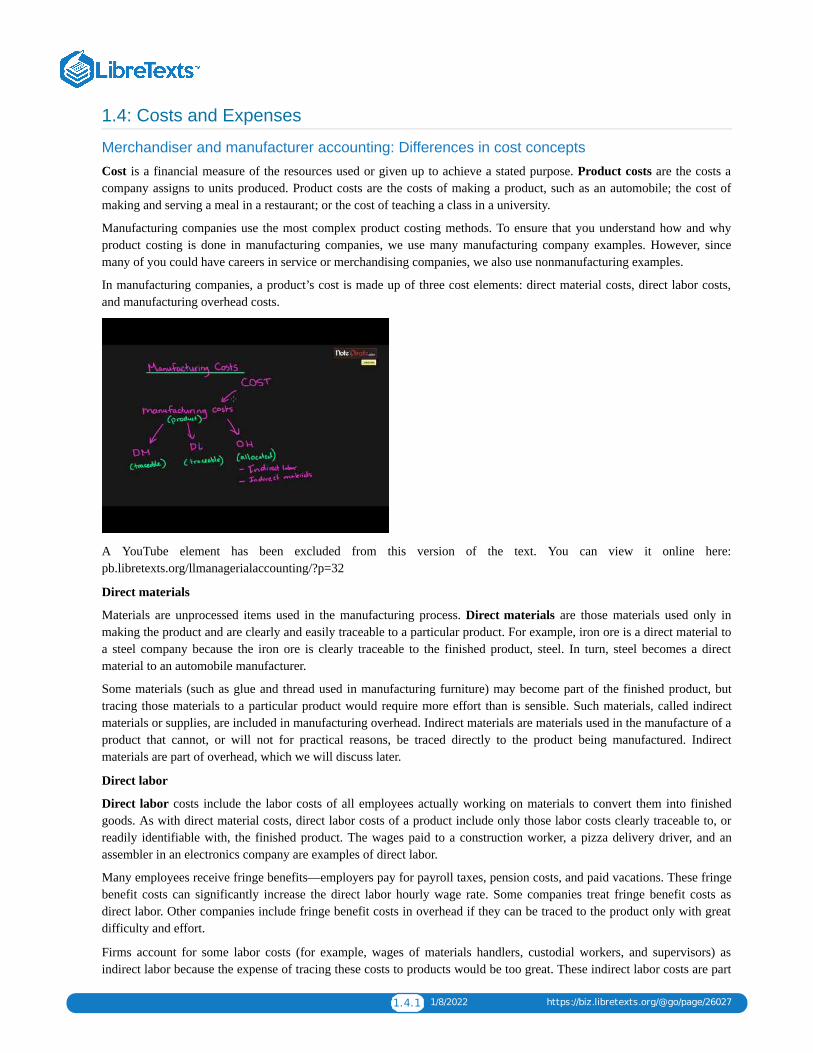
In manufacturing companies, a product’s cost is made up of three cost elements: direct material costs, direct labor costs,and manufacturing overhead costs.
A YouTube element has been excluded from this version of the text. You can view it online here:pb.libretexts.org/llmanagerialaccounting/?p=32
Direct materials
Materials are unprocessed items used in the manufacturing process. Direct materials are those materials used only inmaking the product and are clearly and easily traceable to a particular product. For example, iron ore is a direct material toa steel company because the iron ore is clearly traceable to the finished product, steel. In turn, steel becomes a directmaterial to an automobile manufacturer.
Some materials (such as glue and thread used in manufacturing furniture) may become part of the finished product, buttracing those materials to a particular product would require more effort than is sensible. Such materials, called indirectmaterials or supplies, are included in manufacturing overhead. Indirect materials are materials used in the manufacture of aproduct that cannot, or will not for practical reasons, be traced directly to the product being manufactured. Indirectmaterials are part of overhead, which we will discuss later.
Direct labor
Direct labor costs include the labor costs of all employees actually working on materials to convert them into finishedgoods. As with direct material costs, direct labor costs of a product include only those labor costs clearly traceable to, orreadily identifiable with, the finished product. The wages paid to a construction worker, a pizza delivery driver, and anassembler in an electronics company are examples of direct labor.
Many employees receive fringe benefits—employers pay for payroll taxes, pension costs, and paid vacations. These fringebenefit costs can significantly increase the direct labor hourly wage rate. Some companies treat fringe benefit costs asdirect labor. Other companies include fringe benefit costs in overhead if they can be traced to the product only with greatdifficulty and effort.
Firms account for some labor costs (for example, wages of materials handlers, custodial workers, and supervisors) asindirect labor because the expense of tracing these costs to products would be too great. These indirect labor costs are part

1.4.2 1/8/2022 https://biz.libretexts.org/@go/page/26027
of overhead. Indirect labor consists of the cost of labor that cannot, or will not for practical reasons, be traced to theproducts being manufactured.
Overhead
In a manufacturing company, overhead is generally called manufacturing overhead. (You may also see other names formanufacturing overhead, such as factory overhead, factory indirect costs, or factory burden.) Service companies useservice overhead, and construction companies use construction overhead. Any of these companies may just use the termoverhead rather than specifying it as manufacturing overhead, service overhead, or construction overhead. Some peopleconfuse overhead with selling and administrative costs. Overhead is part of making the good or providing the service,whereas selling costs result from sales activity and administrative costs result from running the business.
In general, overhead refers to all costs of making the product or providing the service except those classified as directmaterials or direct labor. (Some service organizations have direct labor but not direct materials.) In manufacturingcompanies, manufacturing overhead includes all manufacturing costs except those accounted for as direct materials anddirect labor. Manufacturing overhead costs are manufacturing costs that must be incurred but that cannot or will not betraced directly to specific units produced. In addition to indirect materials and indirect labor, manufacturing overheadincludes depreciation and maintenance on machines and factory utility costs. Look at the following for more examples ofmanufacturing overhead costs.
Indirect labor including: Repairs and maintenance on factory buildings and equipment
Janitors in factory buildings Payroll taxes and fringe benefits for manufacturing employees
Supervisors in factory buildings Depreciation on factory buildings and equipment
Materials storeroom personnel Insurance and taxes on factory property and inventories
Cost accountant salary Utilities for factory buildings
Indirect materials including:
Oil
Nails
Selling expenses
Selling expenses are costs incurred to obtain customer orders and get the finished product in the customers’ possession.Advertising, market research, sales salaries and commissions, and delivery and storage of finished goods are selling costs.The costs of delivery and storage of finished goods are selling costs because they are incurred after production has beencompleted. Therefore, the costs of storing materials are part of manufacturing overhead, whereas the costs of storingfinished goods are a part of selling costs. Remember that retailers, wholesalers, manufacturers, and service organizationsall have selling costs.
Administrative expenses
Administrative expenses are nonmanufacturing costs that include the costs of top administrative functions and variousstaff departments such as accounting, data processing, and personnel. Executive salaries, clerical salaries, office expenses,office rent, donations, research and development costs, and legal costs are administrative costs. As with selling costs, allorganizations have administrative costs.
Product Costs vs Period Expenses
Companies also classify costs as product costs and period costs. Product costs are the costs incurred in making products.These costs include the costs of direct materials, direct labor, and manufacturing overhead.
Period expenses are closely related to periods of time rather than units of products. For this reason, firms expense (deductfrom revenues) period costs in the period in which they are incurred. Accountants treat all selling and administrativeexpenses as period costs for external financial reporting.
To illustrate, assume a company pays its sales manager a fixed salary. Even though the manager may be working onprojects to benefit the company in future accounting periods, it expenses the sales manager’s salary in the period incurredbecause the expense cannot be traced to the production of a specific product.

1.4.3 1/8/2022 https://biz.libretexts.org/@go/page/26027
A YouTube element has been excluded from this version of the text. You can view it online here:pb.libretexts.org/llmanagerialaccounting/?p=32
In summary, product costs (direct materials, direct labor and overhead) are not expensed until the item is sold when theproduct costs are recorded as cost of goods sold. Period costs are selling and administrative expenses, not related tocreating a product, that are shown in the income statement along with cost of goods sold.
CC licensed content, Shared previouslyAccounting Principles: A Business Perspective.. Authored by: James Don Edwards, University of Georgia & Roger H.Hermanson, Georgia State University.. Provided by: Endeavour International Corporation. Project: The Global TextProject.. License: CC BY: Attribution
All rights reserved contentManufacturing Costs (Direct Materials, Labor, Manufacturing Overhead) and Product and Period Costs. . Authoredby: Note Pirate. Located at: youtu.be/4eUdwWNNkYU. License: All Rights Reserved. License Terms: StandardYouTube License17 -- Product Costs Versus Period Costs . Authored by: Larry Walther. Located at: youtu.be/sfKgR0uuMaM. License:All Rights Reserved. License Terms: Standard YouTube License

1.5.1 1/1/2022 https://biz.libretexts.org/@go/page/26028
1.5: Cost Classifications Used for Planning and Control
In this course, we will cover many cost classifications useful for planning and control. We will introduce the basicconcepts behind these classifications but you will use them (and get in greater depth) in other chapters.
Fixed vs Variable CostsA fixed cost remains the same in total but changes per unit. Fixed costs examples include your monthly rent, salariedemployees, straight-line depreciation as these amounts do not change based on volume. A variable cost remains the sameper unit but changes in total. Variable cost examples include sales commissions, hourly workers, units-of-productionmethod depreciation as these amounts will change based on total volume but the amount charged per unit does not change.
A YouTube element has been excluded from this version of the text. You can view it online here:pb.libretexts.org/llmanagerialaccounting/?p=34
Direct vs Indirect Costs
A direct cost is an amount that can be traced to a specific department, process or job. Direct costs can be product costs likedirect materials or direct labor or they can be period costs like an accountant’s salary would be traced to the accountingdepartment. Indirect costs is an amount that cannot be traced to a specific department, process or job. These costs aretypically allocated (or estimated) to the departments, processes or jobs using those items. Indirect costs can be productcosts like overhead or period costs like an IT employee’s salary to the sales department. The sales department needs theservices provided by IT and the IT employee’s time would be an indirect expense to the sales department.
Here is a video that provides a real world example of the differences between direct and indirect costs (focus on the first 2minutes of the video):
1.5.2 1/1/2022 https://biz.libretexts.org/@go/page/26028
A YouTube element has been excluded from this version of the text. You can view it online here:pb.libretexts.org/llmanagerialaccounting/?p=34
Controllable vs Non-controllable CostsWhen evaluating the performance of an executive or manager under managerial accounting, it is helpful to recognize thatsome costs and expenses may be out of the control of that manager or executive. One example is the the manager’s salary.The manager has no control over his own salary and has no power to change or stay within the budget for the salary.Controllable costs are things the executive, manager, or department even can control or change. If the executive, manageror department cannot change or control the cost, it is an uncontrollable cost. An example of an uncontrollable cost wouldbe an allocation of administrative expenses to each job or department.
A YouTube element has been excluded from this version of the text. You can view it online here:pb.libretexts.org/llmanagerialaccounting/?p=34
Differential Costs including Sunk and Opportunity Costs
Differential Costs represent the difference between two alternatives. We will analyze what is relevant to our decisionmaking including any opportunity costs. Opportunity costs are what you give up by choosing one alternative over another(think about what you are giving up by taking this course — what else could you be doing?). Sunk costs are not relevantfor decision making as the cost cannot be recovered at a later date. Watch this video to get a better idea of these concepts.
A YouTube element has been excluded from this version of the text. You can view it online here:pb.libretexts.org/llmanagerialaccounting/?p=34
All rights reserved contentFixed and Variable Costs (Managerial Accounting Tutorial #3) NotePirate NotePirate . Authored by: Note Pirate.Located at: youtu.be/RIYN2F6fW2Y. License: All Rights Reserved. License Terms: Standard YouTube License

1.5.3 1/1/2022 https://biz.libretexts.org/@go/page/26028
Direct & Indirect Costs. Authored by: Andromedia Productions. Located at: youtu.be/NTEwMcXZ-0o. License: AllRights Reserved. License Terms: Standard YouTube LicenseControllable and Uncontrollable costs . Authored by: Rutgers Accounting Web. Located at: youtu.be/HKJjov8i3RU.License: All Rights Reserved. License Terms: Standard YouTube LicenseDifferential Analysis - Concepts. Authored by: Christy Lynch Chauvin. Located at: youtu.be/ZtATVI1Oeyo. License:Public Domain: No Known Copyright
1.6.1 1/8/2022 https://biz.libretexts.org/@go/page/26029
1.6: The Statement of Cost of Goods Manufactured
The statement of cost of goods manufactured supports the cost of goods sold figure on the income statement. The twomost important numbers on this statement are the total manufacturing cost and the cost of goods manufactured. Be carefulnot to confuse the terms total manufacturing cost and cost of goods manufactured with each other or with the cost of goodssold.
Total Manufacturing Cost includes the costs of all resources put into production during the period (meaning, the directmaterials, direct labor and overhead applied). Cost of goods manufactured consists of the cost of all goods completedduring the period. It includes total manufacturing costs plus the beginning work in process inventory minus the endingwork in process inventory. Cost of goods sold are the costs of all goods SOLD during the period and includes the cost ofgoods manufactured plus the beginning finished goods inventory minus the ending finished goods inventory. Cost of goodssold is reported as an expense on the income statements and is the only time product costs are expensed. This chart willsummarize the formulas you will need:
Direct Materials UsedBeginning Raw Materials Inventory + Raw Material Purchases –Ending Raw Materials Inventory – Indirect Materials Used
Total Manufacturing Cost Direct Materials + Direct Labor + Overhead applied
Cost of Goods ManufacturedTotal Manufacturing Cost (Direct Materials + Direct Labor +Overhead applied) + Beginning Work In Process Inventory – EndingWork in Process Inventory
Cost of Goods Sold Beginning Finished Goods Inventory + Cost of Goods Manufactured– Ending Finished Goods Inventory
A YouTube element has been excluded from this version of the text. You can view it online here:pb.libretexts.org/llmanagerialaccounting/?p=36
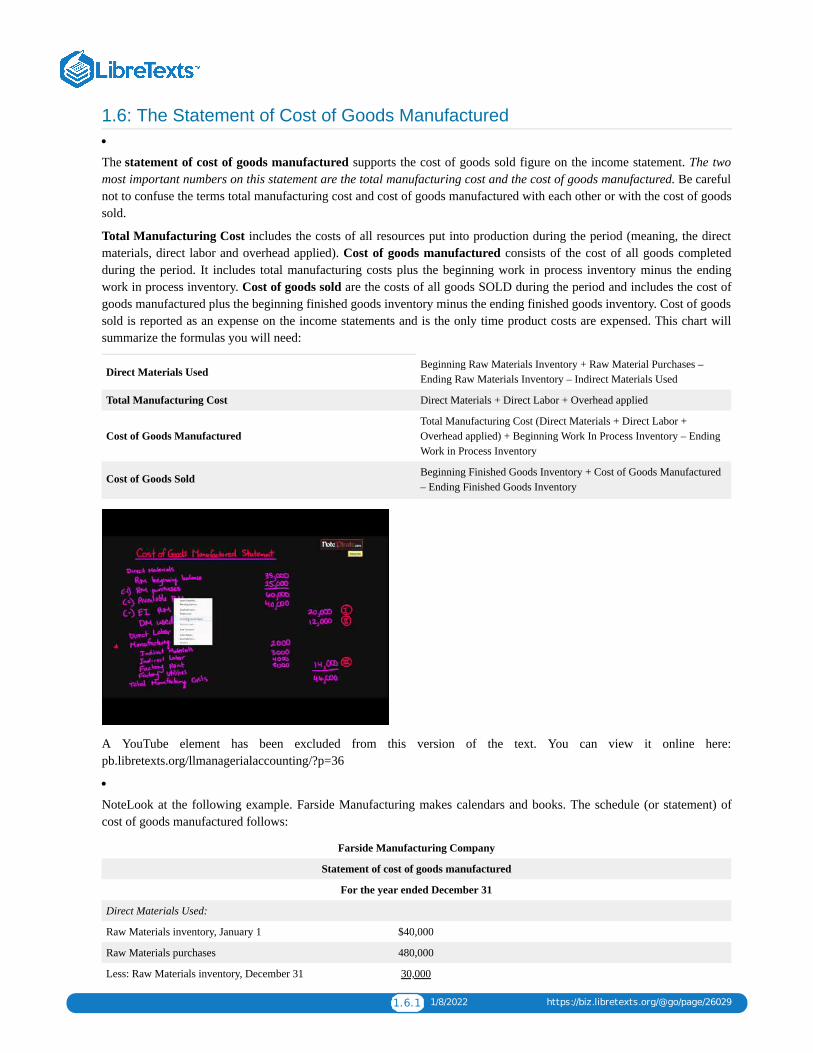
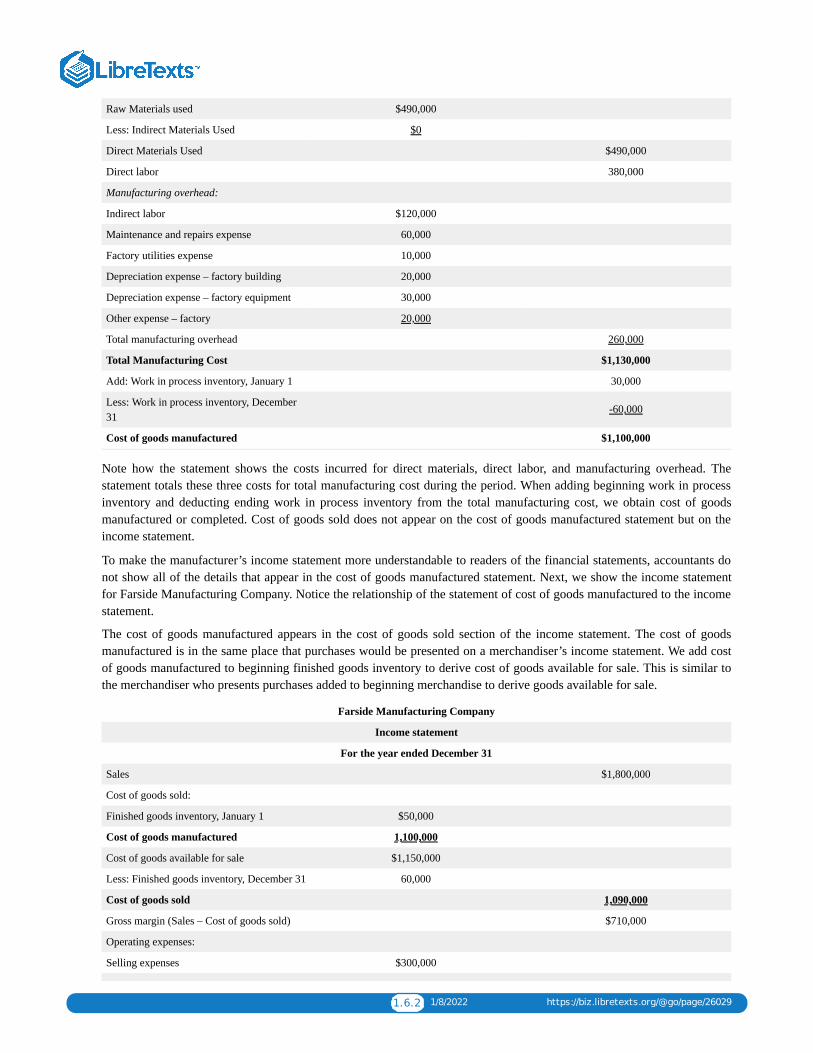
NoteLook at the following example. Farside Manufacturing makes calendars and books. The schedule (or statement) ofcost of goods manufactured follows:
Farside Manufacturing Company
Statement of cost of goods manufactured
For the year ended December 31
Direct Materials Used:
Raw Materials inventory, January 1 $40,000
Raw Materials purchases 480,000
Less: Raw Materials inventory, December 31 30,000
1.6.2 1/8/2022 https://biz.libretexts.org/@go/page/26029
Raw Materials used $490,000
Less: Indirect Materials Used $0
Direct Materials Used $490,000
Direct labor 380,000
Manufacturing overhead:
Indirect labor $120,000
Maintenance and repairs expense 60,000
Factory utilities expense 10,000
Depreciation expense – factory building 20,000
Depreciation expense – factory equipment 30,000
Other expense – factory 20,000
Total manufacturing overhead 260,000
Total Manufacturing Cost $1,130,000
Add: Work in process inventory, January 1 30,000
Less: Work in process inventory, December31
-60,000
Cost of goods manufactured $1,100,000
Note how the statement shows the costs incurred for direct materials, direct labor, and manufacturing overhead. Thestatement totals these three costs for total manufacturing cost during the period. When adding beginning work in processinventory and deducting ending work in process inventory from the total manufacturing cost, we obtain cost of goodsmanufactured or completed. Cost of goods sold does not appear on the cost of goods manufactured statement but on theincome statement.
To make the manufacturer’s income statement more understandable to readers of the financial statements, accountants donot show all of the details that appear in the cost of goods manufactured statement. Next, we show the income statementfor Farside Manufacturing Company. Notice the relationship of the statement of cost of goods manufactured to the incomestatement.
The cost of goods manufactured appears in the cost of goods sold section of the income statement. The cost of goodsmanufactured is in the same place that purchases would be presented on a merchandiser’s income statement. We add costof goods manufactured to beginning finished goods inventory to derive cost of goods available for sale. This is similar tothe merchandiser who presents purchases added to beginning merchandise to derive goods available for sale.
Farside Manufacturing Company
Income statement
For the year ended December 31
Sales $1,800,000
Cost of goods sold:
Finished goods inventory, January 1 $50,000
Cost of goods manufactured 1,100,000
Cost of goods available for sale $1,150,000
Less: Finished goods inventory, December 31 60,000
Cost of goods sold 1,090,000
Gross margin (Sales – Cost of goods sold) $710,000
Operating expenses:
Selling expenses $300,000
1.6.3 1/8/2022 https://biz.libretexts.org/@go/page/26029
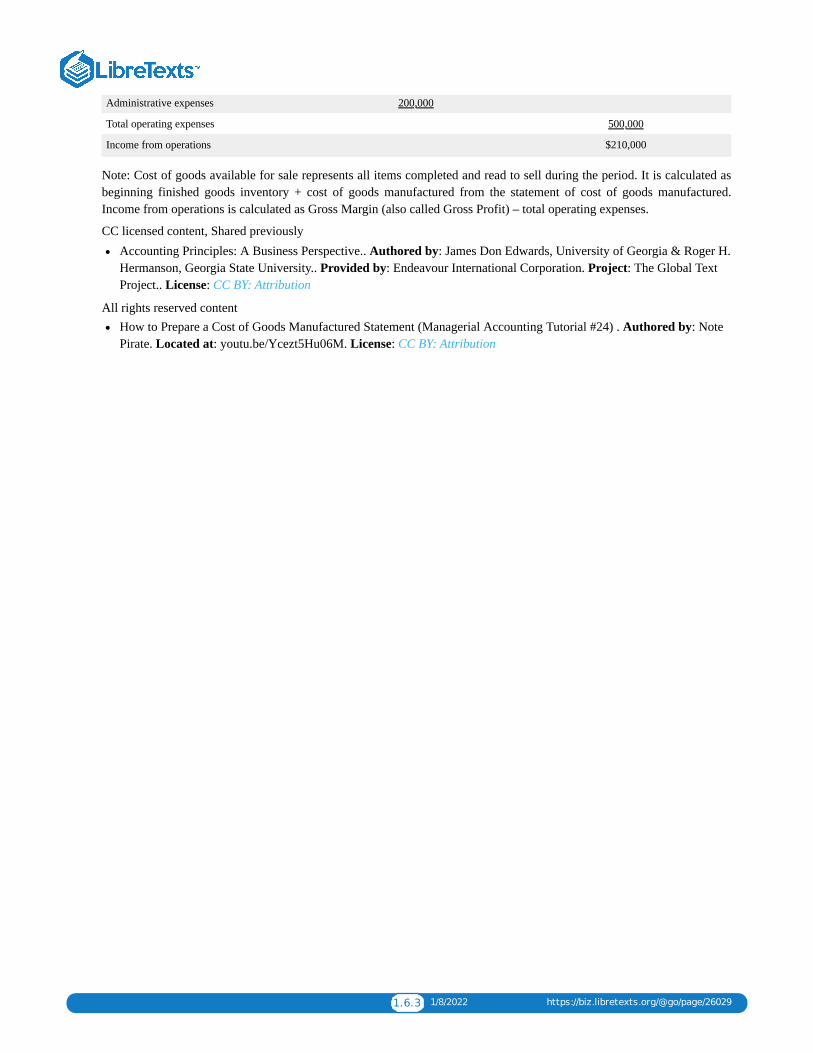
Administrative expenses 200,000
Total operating expenses 500,000
Income from operations $210,000
Note: Cost of goods available for sale represents all items completed and read to sell during the period. It is calculated asbeginning finished goods inventory + cost of goods manufactured from the statement of cost of goods manufactured.Income from operations is calculated as Gross Margin (also called Gross Profit) – total operating expenses.
CC licensed content, Shared previouslyAccounting Principles: A Business Perspective.. Authored by: James Don Edwards, University of Georgia & Roger H.Hermanson, Georgia State University.. Provided by: Endeavour International Corporation. Project: The Global TextProject.. License: CC BY: Attribution
All rights reserved contentHow to Prepare a Cost of Goods Manufactured Statement (Managerial Accounting Tutorial #24) . Authored by: NotePirate. Located at: youtu.be/Ycezt5Hu06M. License: CC BY: Attribution
1.7.1 1/1/2022 https://biz.libretexts.org/@go/page/26030
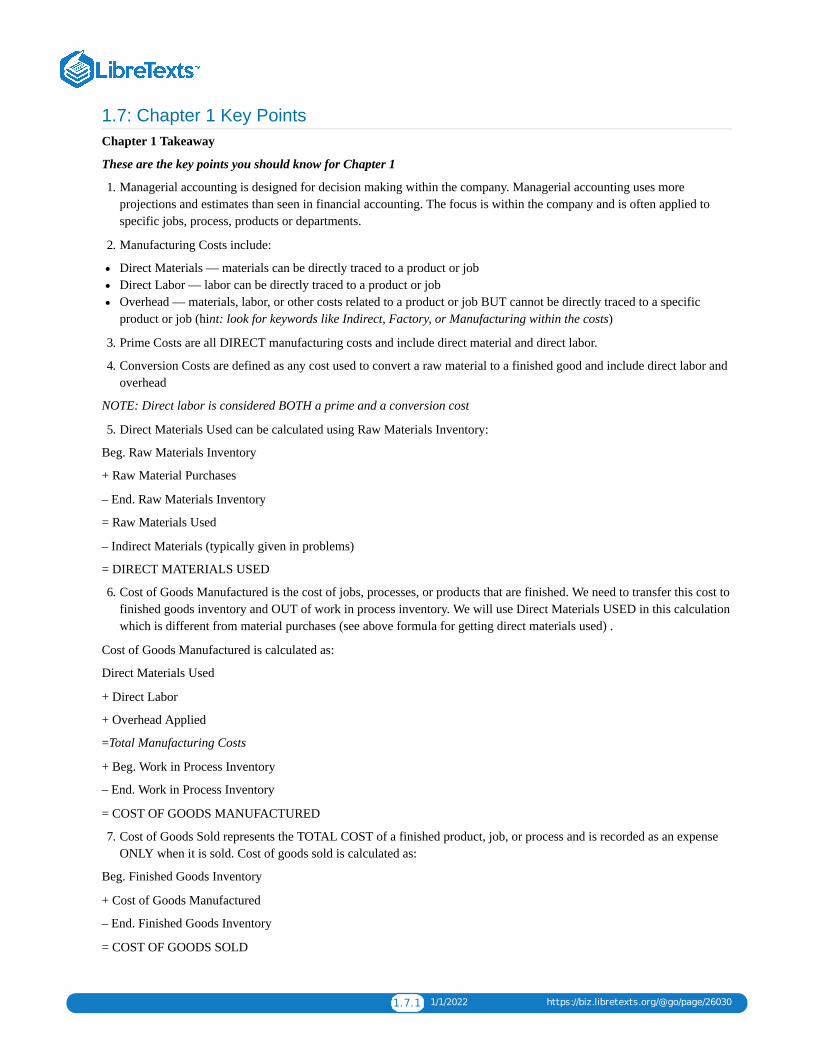
1.7: Chapter 1 Key PointsChapter 1 Takeaway
These are the key points you should know for Chapter 1
1. Managerial accounting is designed for decision making within the company. Managerial accounting uses moreprojections and estimates than seen in financial accounting. The focus is within the company and is often applied tospecific jobs, process, products or departments.
2. Manufacturing Costs include:
Direct Materials — materials can be directly traced to a product or jobDirect Labor — labor can be directly traced to a product or jobOverhead — materials, labor, or other costs related to a product or job BUT cannot be directly traced to a specificproduct or job (hint: look for keywords like Indirect, Factory, or Manufacturing within the costs)
3. Prime Costs are all DIRECT manufacturing costs and include direct material and direct labor.
4. Conversion Costs are defined as any cost used to convert a raw material to a finished good and include direct labor andoverhead
NOTE: Direct labor is considered BOTH a prime and a conversion cost
5. Direct Materials Used can be calculated using Raw Materials Inventory:
Beg. Raw Materials Inventory
+ Raw Material Purchases
– End. Raw Materials Inventory
= Raw Materials Used
– Indirect Materials (typically given in problems)
= DIRECT MATERIALS USED
6. Cost of Goods Manufactured is the cost of jobs, processes, or products that are finished. We need to transfer this cost tofinished goods inventory and OUT of work in process inventory. We will use Direct Materials USED in this calculationwhich is different from material purchases (see above formula for getting direct materials used) .
Cost of Goods Manufactured is calculated as:
Direct Materials Used
+ Direct Labor
+ Overhead Applied
=Total Manufacturing Costs
+ Beg. Work in Process Inventory
– End. Work in Process Inventory
= COST OF GOODS MANUFACTURED
7. Cost of Goods Sold represents the TOTAL COST of a finished product, job, or process and is recorded as an expenseONLY when it is sold. Cost of goods sold is calculated as:
Beg. Finished Goods Inventory
+ Cost of Goods Manufactured
– End. Finished Goods Inventory
= COST OF GOODS SOLD

1.7.2 1/1/2022 https://biz.libretexts.org/@go/page/26030
8. Gross Profit (or Gross Margin) is calculated as Sales – Cost of Goods Sold and does not include any selling, general oradministrative costs. Net Income includes ALL expenses and is calculated as Sales – cost of goods sold, selling,general and administrative costs.
Click Chapter 1 Key points for a printable copy.

1.8.1 12/25/2021 https://biz.libretexts.org/@go/page/26031
1.8: Glossary
GLOSSARY
Administrative costs Costs of managing the organization, including the costs of top administrative functions and variousstaff departments such as accounting, data processing, and personnel.
Cost A financial measure of the resources used or given up to achieve a stated purpose.
Cost driver Activity or transaction that causes costs to be incurred. Machine-hours can be a cost driver for costs of energyto run machines, for example.
Cost of goods manufactured Consists of the total costs of all goods completed during the period; includes cost tomanufacture plus beginning work in process inventory minus ending work in process inventory
Cost of goods sold Cost of goods manufactured plus the beginning finished goods inventory minus the ending finishedgoods inventory.
Cost to manufacture (or manufacturing costs) Includes the direct materials, direct labor, and manufacturing overheadincurred during the period.
Direct labor Labor costs of all employees actually working on materials to convert them to finished goods. Direct laborcosts are directly traced to particular products in contrast to indirect labor costs.
Direct materials Materials that are used only in making the product and are clearly and easily traceable to a particularproduct.
Finished goods Completed manufactured products ready to be sold. Finished Goods Inventory is the title of an inventoryaccount maintained for such products.
Indirect labor The cost of labor that cannot, or will not for practical reasons, be traced to the goods being produced or theservices being provided.
Indirect materials Materials used in making a product that cannot, or will not for practical reasons, be traced directly toparticular products.
Managerial accounting Managerial accounting information is intended for internal use. The purpose is to generateinformation managers can use to make good decisions.
Manufacturing overhead All manufacturing costs except for those costs accounted for as direct materials and directlabor.
Materials Unprocessed items used in the manufacturing process typically stored in Raw Materials Inventory.
Overhead All costs of making goods or providing services except for those costs classified as direct materials and directlabor. See manufacturing overhead for overhead in manufacturing companies.
Period costs Costs related more closely to periods of time than to products produced. Period costs cannot be traceddirectly to the manufacture of a specific product; they are expensed in the period in which they are incurred.
Predetermined overhead rate Calculated by dividing estimated total overhead costs for a period by the expected level ofactivity, such as total expected machine-hours or total expected direct labor-hours for the period.
Product costs Costs a company assigns to units produced. In manufacturing companies, these costs are direct materials,direct labor, and manufacturing overhead. In service companies that have no materials, these costs are direct labor andoverhead.
Selling costs Costs incurred to obtain customer orders and distribute the finished product to the customer.
Statement of cost of goods manufactured An accounting report showing the cost to manufacture and the cost of goodsmanufactured.
Work in process Partially manufactured products; a Work in Process Inventory account is maintained for such products.
1.9.1 1/1/2022 https://biz.libretexts.org/@go/page/26032
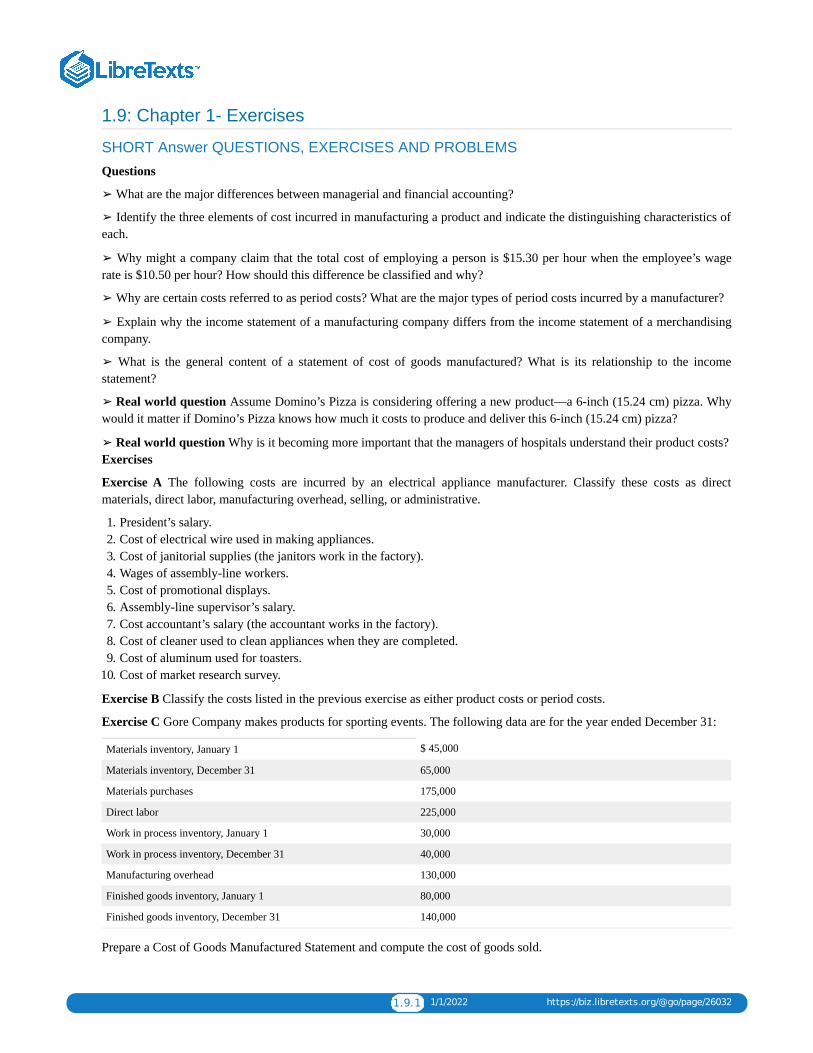
1.9: Chapter 1- Exercises
SHORT Answer QUESTIONS, EXERCISES AND PROBLEMS
Questions
➢ What are the major differences between managerial and financial accounting?
➢ Identify the three elements of cost incurred in manufacturing a product and indicate the distinguishing characteristics ofeach.
➢ Why might a company claim that the total cost of employing a person is $15.30 per hour when the employee’s wagerate is $10.50 per hour? How should this difference be classified and why?
➢ Why are certain costs referred to as period costs? What are the major types of period costs incurred by a manufacturer?
➢ Explain why the income statement of a manufacturing company differs from the income statement of a merchandisingcompany.
➢ What is the general content of a statement of cost of goods manufactured? What is its relationship to the incomestatement?
➢ Real world question Assume Domino’s Pizza is considering offering a new product—a 6-inch (15.24 cm) pizza. Whywould it matter if Domino’s Pizza knows how much it costs to produce and deliver this 6-inch (15.24 cm) pizza?
➢ Real world question Why is it becoming more important that the managers of hospitals understand their product costs? Exercises
Exercise A The following costs are incurred by an electrical appliance manufacturer. Classify these costs as directmaterials, direct labor, manufacturing overhead, selling, or administrative.
1. President’s salary.2. Cost of electrical wire used in making appliances.3. Cost of janitorial supplies (the janitors work in the factory).4. Wages of assembly-line workers.5. Cost of promotional displays.6. Assembly-line supervisor’s salary.7. Cost accountant’s salary (the accountant works in the factory).8. Cost of cleaner used to clean appliances when they are completed.9. Cost of aluminum used for toasters.
10. Cost of market research survey.
Exercise B Classify the costs listed in the previous exercise as either product costs or period costs.
Exercise C Gore Company makes products for sporting events. The following data are for the year ended December 31:
Materials inventory, January 1 $ 45,000
Materials inventory, December 31 65,000
Materials purchases 175,000
Direct labor 225,000
Work in process inventory, January 1 30,000
Work in process inventory, December 31 40,000
Manufacturing overhead 130,000
Finished goods inventory, January 1 80,000
Finished goods inventory, December 31 140,000
Prepare a Cost of Goods Manufactured Statement and compute the cost of goods sold.
1.9.2 1/1/2022 https://biz.libretexts.org/@go/page/26032
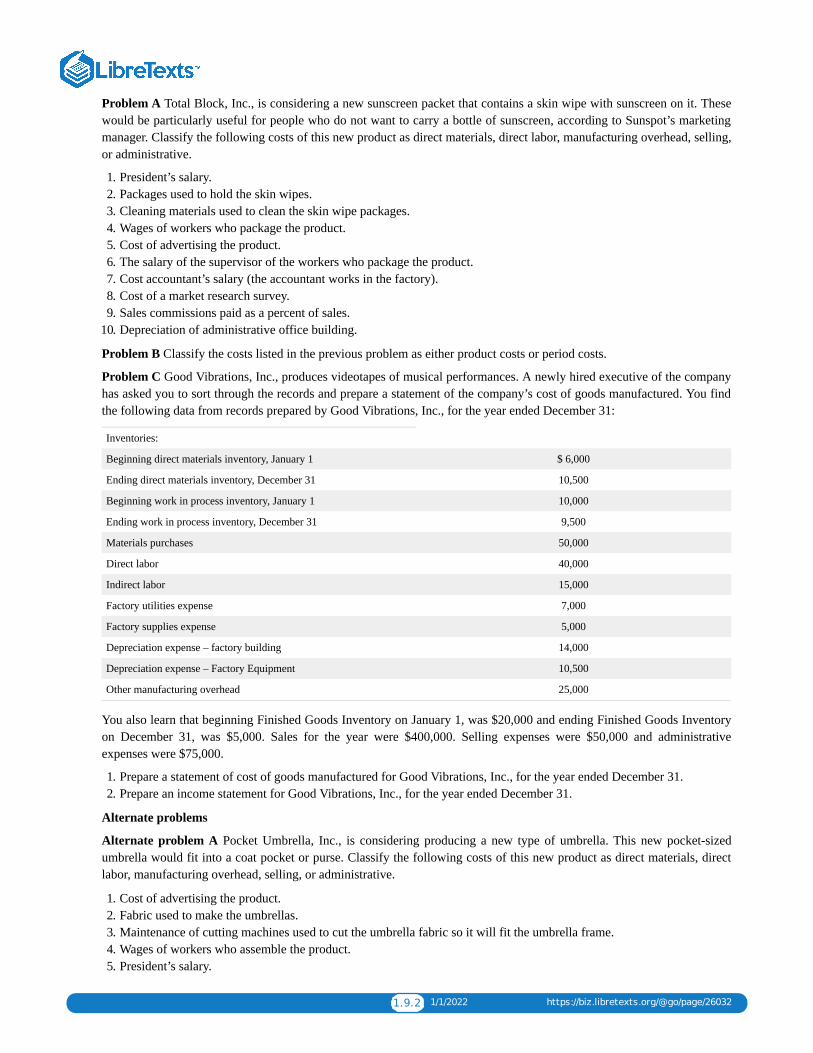
Problem A Total Block, Inc., is considering a new sunscreen packet that contains a skin wipe with sunscreen on it. Thesewould be particularly useful for people who do not want to carry a bottle of sunscreen, according to Sunspot’s marketingmanager. Classify the following costs of this new product as direct materials, direct labor, manufacturing overhead, selling,or administrative.
1. President’s salary.2. Packages used to hold the skin wipes.3. Cleaning materials used to clean the skin wipe packages.4. Wages of workers who package the product.5. Cost of advertising the product.6. The salary of the supervisor of the workers who package the product.7. Cost accountant’s salary (the accountant works in the factory).8. Cost of a market research survey.9. Sales commissions paid as a percent of sales.
10. Depreciation of administrative office building.
Problem B Classify the costs listed in the previous problem as either product costs or period costs.
Problem C Good Vibrations, Inc., produces videotapes of musical performances. A newly hired executive of the companyhas asked you to sort through the records and prepare a statement of the company’s cost of goods manufactured. You findthe following data from records prepared by Good Vibrations, Inc., for the year ended December 31:
Inventories:
Beginning direct materials inventory, January 1 $ 6,000
Ending direct materials inventory, December 31 10,500
Beginning work in process inventory, January 1 10,000
Ending work in process inventory, December 31 9,500
Materials purchases 50,000
Direct labor 40,000
Indirect labor 15,000
Factory utilities expense 7,000
Factory supplies expense 5,000
Depreciation expense – factory building 14,000
Depreciation expense – Factory Equipment 10,500
Other manufacturing overhead 25,000
You also learn that beginning Finished Goods Inventory on January 1, was $20,000 and ending Finished Goods Inventoryon December 31, was $5,000. Sales for the year were $400,000. Selling expenses were $50,000 and administrativeexpenses were $75,000.
1. Prepare a statement of cost of goods manufactured for Good Vibrations, Inc., for the year ended December 31.2. Prepare an income statement for Good Vibrations, Inc., for the year ended December 31.
Alternate problems
Alternate problem A Pocket Umbrella, Inc., is considering producing a new type of umbrella. This new pocket-sizedumbrella would fit into a coat pocket or purse. Classify the following costs of this new product as direct materials, directlabor, manufacturing overhead, selling, or administrative.
1. Cost of advertising the product.2. Fabric used to make the umbrellas.3. Maintenance of cutting machines used to cut the umbrella fabric so it will fit the umbrella frame.4. Wages of workers who assemble the product.5. President’s salary.

1.9.3 1/1/2022 https://biz.libretexts.org/@go/page/26032
6. The salary of the supervisor of the people who assemble the product.7. Wages of the product tester who stands in a shower to make sure the umbrellas do not leak.8. Cost of market research survey.9. Salary of the company’s sales managers.
10. Depreciation of administrative office building.
Alternate problem B Classify the costs listed in Alternate problem A as either product costs or period costs.
Alternate problem C Presley Manufacturing Company is a producer of music compact discs (CDs) and tapes. Thefollowing account balances are for the year ended December 31
Administrative expenses $ 60,000
Depreciation expense – Manufacturing equipment 50,000
Direct labor 468,000
Manufacturing supplies expense 40,000
Indirect labor 36,000
Beginning inventories, January 1:
Direct materials 14,000
Work in process 20,000
Finished goods 128,000
Ending inventories, December 31
Direct materials 44,000
Work in process 56,000
Finished goods 92,000
Direct materials purchases 216,000
Rent expense – Factory 28,000
Sales 1,400,000
Selling expense 72,000
Other manufacturing overhead 126,000
1. Prepare a statement of cost of goods manufactured for Presley Manufacturing Company for the year.2. Prepare an income statement for the year ended December 31.
Beyond the numbers—Critical thinking
Business decision case A Companies often do work on a cost-reimbursement basis. That is, Company B reimbursesCompany A for the cost of doing work for Company B. Suppose your company has a contract that calls for reimbursementof direct materials and direct labor, but not overhead. Following are costs that various organizations incur; they fall intothree categories: direct materials (DM), direct labor (DL), or overhead (OH).
Glue used to attach labels to bottles containing a patented medicine.
Compressed air used in operating paint sprayers for Student Painters, a company that paints houses and apartments.
Insurance on a factory building and equipment.
A production department supervisor’s salary.
Rent on factory machinery.
Iron ore in a steel mill.
Oil, gasoline, and grease for forklift trucks in a manufacturing company’s warehouse.
Services of painters in building construction.

1.9.4 1/1/2022 https://biz.libretexts.org/@go/page/26032
Cutting oils used in machining operations.
Cost of paper towels in a factory employees’ washroom.
Payroll taxes and fringe benefits related to direct labor.
The plant electricians’ salaries.
Crude oil to an oil refinery.
Copy editor’s salary in a book publishing company.
1. Classify each of these items as direct materials, direct labor, or overhead.2. Assume your classifications could be challenged in a court case. Indicate to your attorneys which of your answers for
part a might be successfully disputed by the opposing attorneys. In which answers are you completely confident?
Writing assignment B Refer to Presley Manufacturing company, Alt Problem C. Assume the newly hired executive is awhiz at marketing, but a person whose eyes glaze over at the sight of a number. The executive wants you to explain thefinancial results for the year in words. Essentially, assume the executive has not seen the financial statements prepared.What would you say to convey the message in the financial statements? Keep it short—less than 100 words.Using theInternet—A view of the real world
Visit the website for a high technology company, such as HP, Intel Corporation, or IBM, and locate its annual report.Review the annual report to gain a general understanding of the company’s primary business segments and products. Writea report addressing the following questions based on your research. What products or services are provided by thecompany? How does the financial information provided in the annual report (focus on the income statement) differ fromfinancial information used for managerial accounting purposes? As a manager making business decisions within thecompany, what additional information would you need? (Remember that the income statement may be referred to usingdifferent terminology such as statement of earnings or statement of operations.)
Company Website
Hewlett Packard Http://www.hp.com
Intel Corporation Http://www.intel.com
IBM Http://www.ibm.com
Visit the following website for Wells Fargo (a financial institution) and locate its annual report:
http://www.wellsfargo.com
Review the annual report to gain a general understanding of the company’s primary business segments and products. Writea report addressing the following questions based on your research. What products or services are provided by thecompany? How does the financial information provided in the annual report (focus on the income statement) differ fromfinancial information used for managerial accounting purposes? As a manager making business decisions within thecompany, what additional information would you need? (Remember that the income statement may be referred to usingdifferent terminology such as statement of earnings or statement of operations.)
Visit the following website for Home Depot (a retail organization) and locate its annual report:
http://www.homedepot.com
Review the annual report to gain a general understanding of the company’s primary business segments and products. Writea report addressing the following questions based on your research. What products or services are provided by thecompany? How does the financial information provided in the annual report (focus on the income statement) differ fromfinancial information used for managerial accounting purposes? As a manager making business decisions within thecompany, what additional information would you need? (Remember that the income statement may be referred to usingdifferent terminology such as statement of earnings or statement of operations.)
1. [1]See Standards of Ethical Conduct for Management Accountants (Montvale, N.J.: Institute of ManagementAccountants, June 1, 1983.)
CC licensed content, Shared previously

1.9.5 1/1/2022 https://biz.libretexts.org/@go/page/26032
Accounting Principles: A Business Perspective. Authored by: James Don Edwards, University of Georgia & Roger H.Hermanson, Georgia State University. Provided by: Endeavour International Corporation. Project: The Global TextProject. License: CC BY: Attribution

1 1/8/2022
CHAPTER OVERVIEW2: JOB ORDER COST SYSTEM
2.1: CHAPTER 2 STUDY PLAN2.2: CHARACTERISTICS OF JOB ORDER COSTING2.3: SUBSIDIARY LEDGERS NEEDED FOR JOB ORDER COSTING2.4: JOB COSTING PROCESS WITH JOURNAL ENTRIES2.5: ACTUAL VS. APPLIED FACTORY OVERHEAD2.6: UNDER- OR OVER-APPLIED OVERHEAD2.7: ACCOUNTING IN THE HEADLINES2.8: CHAPTER 2 KEY POINTS2.9: GLOSSARY2.10: CHAPTER 2- EXERCISES

2.1.1 1/8/2022 https://biz.libretexts.org/@go/page/26033
2.1: Chapter 2 Study Plan
Study Plan: Job Costing
Knowledge Targets
I can define the following terms as they relate to our unit:
Applied Overhead Goods (or work) in process Finished Goods Job Costing
Allocation Base Cost driver Cost of goods sold Under-applied Overhead
Predetermined overhead rate Cost of Goods Sold Cost of Goods Manufactured Over-applied Overhead
Gross Margin (or Profit) Direct materials Direct Labor Actual Overhead
Reasoning Targets
I can identify job costs as direct materials, direct labor and overhead.I can track job costs from raw materials to goods in process to finished goods and cost of goods sold.I can identify accounts to use in recording the flow of job costs.I can identify the allocation base used in calculating predetermined overhead rate.I can identify the difference between actual overhead and applied overhead.I can determine under- or over-applied overhead.I can understand a manufacturing statement with cost of goods manufactured calculated.
Skill Targets
I can prepare and post journal entries for job costing from raw materials to cost of goods sold.I can calculate the predetermined overhead rate for a company.I can calculate the amount of appliedoverhead using the predetermined overhead rate.I can calculate the amount of under- or over-applied overhead using applied overhead and actual overhead.I can compute the total cost of a job and determine the job’s gross margin.I can prepare a manufacturing statement, schedule of cost of goods sold, and income statement for job costing.
Click Job Cost Study Plan for a printable copy.

2.2.1 1/1/2022 https://biz.libretexts.org/@go/page/26034
2.2: Characteristics of Job Order Costing
The general cost accumulation model
In general, companies match the flow of costs to the physical flow of products through the production process. They placematerials received from suppliers in the materials storeroom and record the cost of those materials when purchasing themto raw materials inventory. As they are needed for production, the materials move from the materials storeroom (rawmaterials inventory) to the production departments with their cost as shown below.
During production, the materials processed by workers and machines become partially manufactured products. At any timeduring production, these partially manufactured products are collectively known as work in process (or goods in process).For example, if accountants compute the inventory when the company has partially finished products at the end of theyear, this inventory is work in process inventory.
Completed products are finished goods. When the products are completed and transferred to the finished goods storeroom,the company removes their costs from Work in Process Inventory and assigns them to Finished Goods Inventory. As thegoods are sold, the company transfers related costs from Finished Goods Inventory to Cost of Goods Sold.
The accounting flow of costs follows the physical flow of the manufacturing process in most companies. In this chapterand the next, we assume costs follow the physical flow of products.In discussing product costing, we described howaccountants and managers assign costs to products. Recall that products can be either goods or services, so this discussionapplies to service and merchandising companies as well as to manufacturing companies.
This video explains what job order costing is in the context of managerial accounting. An example is provided to illustratehow a job cost sheet is completed to account for the cost of a job under the job order costing method.
What kinds of companies would use job costing? The chart below shows how various companies choose differentaccounting systems, depending on their products. First, companies producing individual, unique products known as jobs
Job Order CostingJob Order Costing
2.2.2 1/1/2022 https://biz.libretexts.org/@go/page/26034
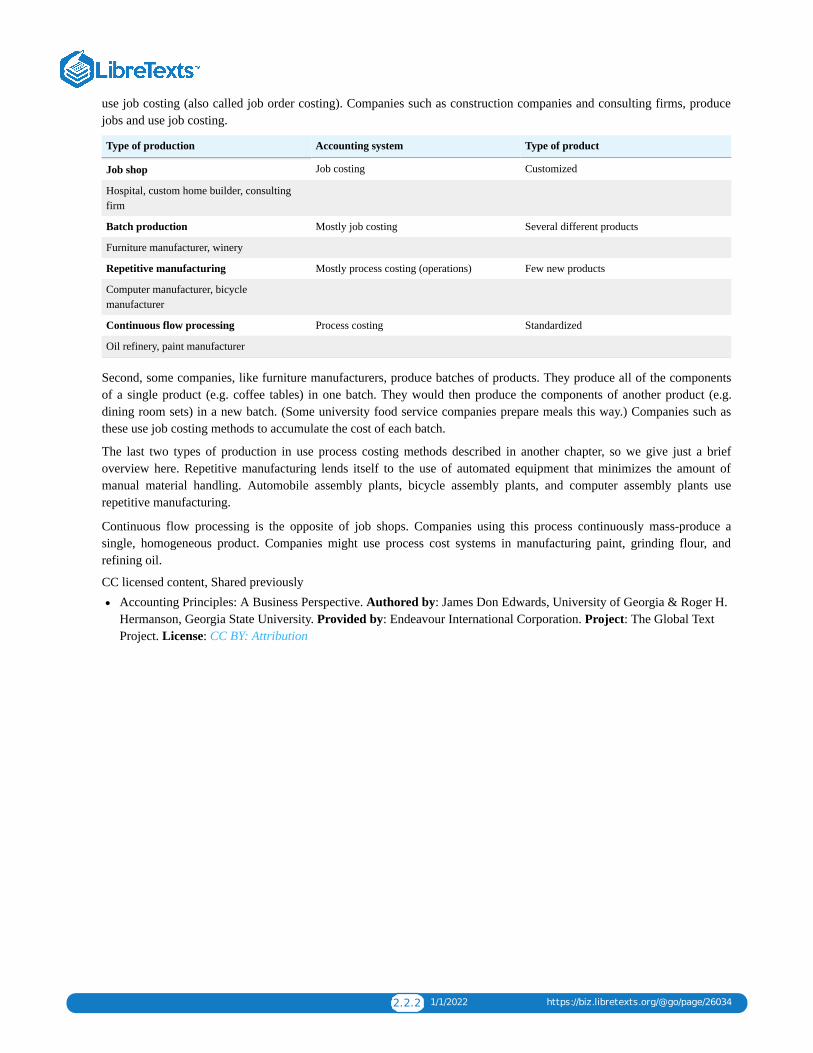
use job costing (also called job order costing). Companies such as construction companies and consulting firms, producejobs and use job costing.
Type of production Accounting system Type of product
Job shop Job costing Customized
Hospital, custom home builder, consultingfirm
Batch production Mostly job costing Several different products
Furniture manufacturer, winery
Repetitive manufacturing Mostly process costing (operations) Few new products
Computer manufacturer, bicyclemanufacturer
Continuous flow processing Process costing Standardized
Oil refinery, paint manufacturer
Second, some companies, like furniture manufacturers, produce batches of products. They produce all of the componentsof a single product (e.g. coffee tables) in one batch. They would then produce the components of another product (e.g.dining room sets) in a new batch. (Some university food service companies prepare meals this way.) Companies such asthese use job costing methods to accumulate the cost of each batch.
The last two types of production in use process costing methods described in another chapter, so we give just a briefoverview here. Repetitive manufacturing lends itself to the use of automated equipment that minimizes the amount ofmanual material handling. Automobile assembly plants, bicycle assembly plants, and computer assembly plants userepetitive manufacturing.
Continuous flow processing is the opposite of job shops. Companies using this process continuously mass-produce asingle, homogeneous product. Companies might use process cost systems in manufacturing paint, grinding flour, andrefining oil.
CC licensed content, Shared previouslyAccounting Principles: A Business Perspective. Authored by: James Don Edwards, University of Georgia & Roger H.Hermanson, Georgia State University. Provided by: Endeavour International Corporation. Project: The Global TextProject. License: CC BY: Attribution
2.3.1 1/4/2022 https://biz.libretexts.org/@go/page/26035
2.3: Subsidiary Ledgers Needed for Job Order Costing
If you remember from your financial accounting class, a subsidiary ledger is a secondary ledger that provides the details ofa control account. A control account is a summarized account balance to make viewing financial statements easier.Accounts Receivable is an example of a control account. We show the amount owed to use by customers in total on thebalance sheet and do not list an accounts receivable for each customer on the balance sheet (could you imagine the lengthof that report?). We have a subsidiary ledger for each customer so we can determine who owes us money and who haspaid. The total of the items in the subsidiary ledger must match the balance reported in the control account.
This concept relates to job costing because we have 3 main inventory accounts control accounts: Raw Materials Inventory,Work in Process Inventory, and Finished Goods Inventory. Raw Materials inventory is used to store the costs of materialspurchased but not yet used in production. The subsidiary ledger would contain details of the individual raw materialcomponents.
Work in Process Inventory is used when we have started but not completed a job and include all job costs including anycosts from the previous period and costs added this period include direct materials, direct labor and applied overhead. Thesubsidiary ledger consists of the job cost sheet (remember the video from the previous page?) showing all the directmaterials, direct labor, and overhead costs applied to a job. The total of all jobs still in process will equal the balance ofWork in Process Inventory.
Finished Goods Inventory is used when we finish a job and before we sell it. We move the total job cost of the job fromWork in Process Inventory to Finished Goods Inventory. The subsidiary ledger will the be for each job showing its full jobcost until the item is sold.
2.4.1 1/1/2022 https://biz.libretexts.org/@go/page/26036
2.4: Job Costing Process with Journal EntriesJob costing
A job cost system (job costing) accumulates costs incurred according to the individual jobs. Companies generally use jobcost systems when they can identify separate products or when they produce goods to meet a customer’s particular needs.
Who uses job costing? Examples include home builders who design specific houses for each customer and accumulate thecosts separately for each job, and caterers who accumulate the costs of each banquet separately. Consulting, law, andpublic accounting firms use job costing to measure the costs of serving each client. Motion pictures, printing, and otherindustries where unique jobs are produced use job costing. Hospitals also use job costing to determine the cost of eachpatient’s care.
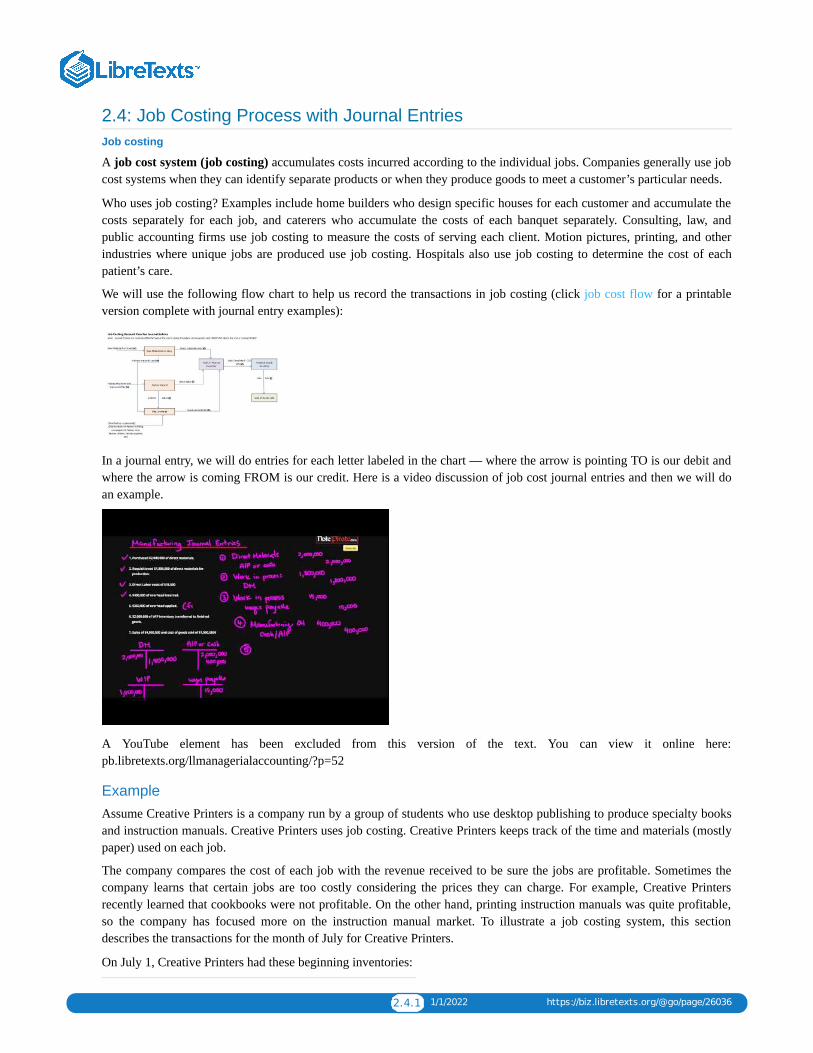
We will use the following flow chart to help us record the transactions in job costing (click job cost flow for a printableversion complete with journal entry examples):
In a journal entry, we will do entries for each letter labeled in the chart — where the arrow is pointing TO is our debit andwhere the arrow is coming FROM is our credit. Here is a video discussion of job cost journal entries and then we will doan example.
A YouTube element has been excluded from this version of the text. You can view it online here:pb.libretexts.org/llmanagerialaccounting/?p=52
ExampleAssume Creative Printers is a company run by a group of students who use desktop publishing to produce specialty booksand instruction manuals. Creative Printers uses job costing. Creative Printers keeps track of the time and materials (mostlypaper) used on each job.
The company compares the cost of each job with the revenue received to be sure the jobs are profitable. Sometimes thecompany learns that certain jobs are too costly considering the prices they can charge. For example, Creative Printersrecently learned that cookbooks were not profitable. On the other hand, printing instruction manuals was quite profitable,so the company has focused more on the instruction manual market. To illustrate a job costing system, this sectiondescribes the transactions for the month of July for Creative Printers.
On July 1, Creative Printers had these beginning inventories:
2.4.2 1/1/2022 https://biz.libretexts.org/@go/page/26036
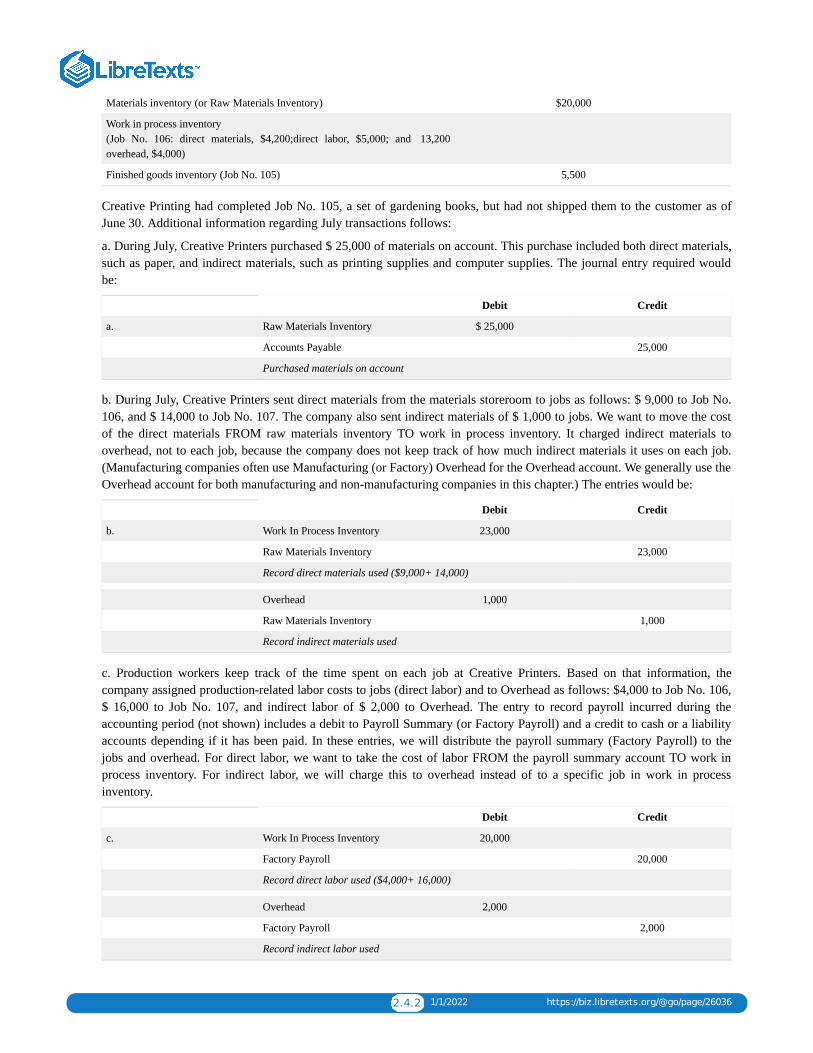
Materials inventory (or Raw Materials Inventory) $20,000
Work in process inventory(Job No. 106: direct materials, $4,200;direct labor, $5,000; andoverhead, $4,000)
13,200
Finished goods inventory (Job No. 105) 5,500
Creative Printing had completed Job No. 105, a set of gardening books, but had not shipped them to the customer as ofJune 30. Additional information regarding July transactions follows:
a. During July, Creative Printers purchased $ 25,000 of materials on account. This purchase included both direct materials,such as paper, and indirect materials, such as printing supplies and computer supplies. The journal entry required wouldbe:
Debit Credit
a. Raw Materials Inventory $ 25,000
Accounts Payable 25,000
Purchased materials on account
b. During July, Creative Printers sent direct materials from the materials storeroom to jobs as follows: $ 9,000 to Job No.106, and $ 14,000 to Job No. 107. The company also sent indirect materials of $ 1,000 to jobs. We want to move the costof the direct materials FROM raw materials inventory TO work in process inventory. It charged indirect materials tooverhead, not to each job, because the company does not keep track of how much indirect materials it uses on each job.(Manufacturing companies often use Manufacturing (or Factory) Overhead for the Overhead account. We generally use theOverhead account for both manufacturing and non-manufacturing companies in this chapter.) The entries would be:
Debit Credit
b. Work In Process Inventory 23,000
Raw Materials Inventory 23,000
Record direct materials used ($9,000+ 14,000)
Overhead 1,000
Raw Materials Inventory 1,000
Record indirect materials used
c. Production workers keep track of the time spent on each job at Creative Printers. Based on that information, thecompany assigned production-related labor costs to jobs (direct labor) and to Overhead as follows: $4,000 to Job No. 106,$ 16,000 to Job No. 107, and indirect labor of $ 2,000 to Overhead. The entry to record payroll incurred during theaccounting period (not shown) includes a debit to Payroll Summary (or Factory Payroll) and a credit to cash or a liabilityaccounts depending if it has been paid. In these entries, we will distribute the payroll summary (Factory Payroll) to thejobs and overhead. For direct labor, we want to take the cost of labor FROM the payroll summary account TO work inprocess inventory. For indirect labor, we will charge this to overhead instead of to a specific job in work in processinventory.
Debit Credit
c. Work In Process Inventory 20,000
Factory Payroll 20,000
Record direct labor used ($4,000+ 16,000)
Overhead 2,000
Factory Payroll 2,000
Record indirect labor used
2.4.3 1/1/2022 https://biz.libretexts.org/@go/page/26036
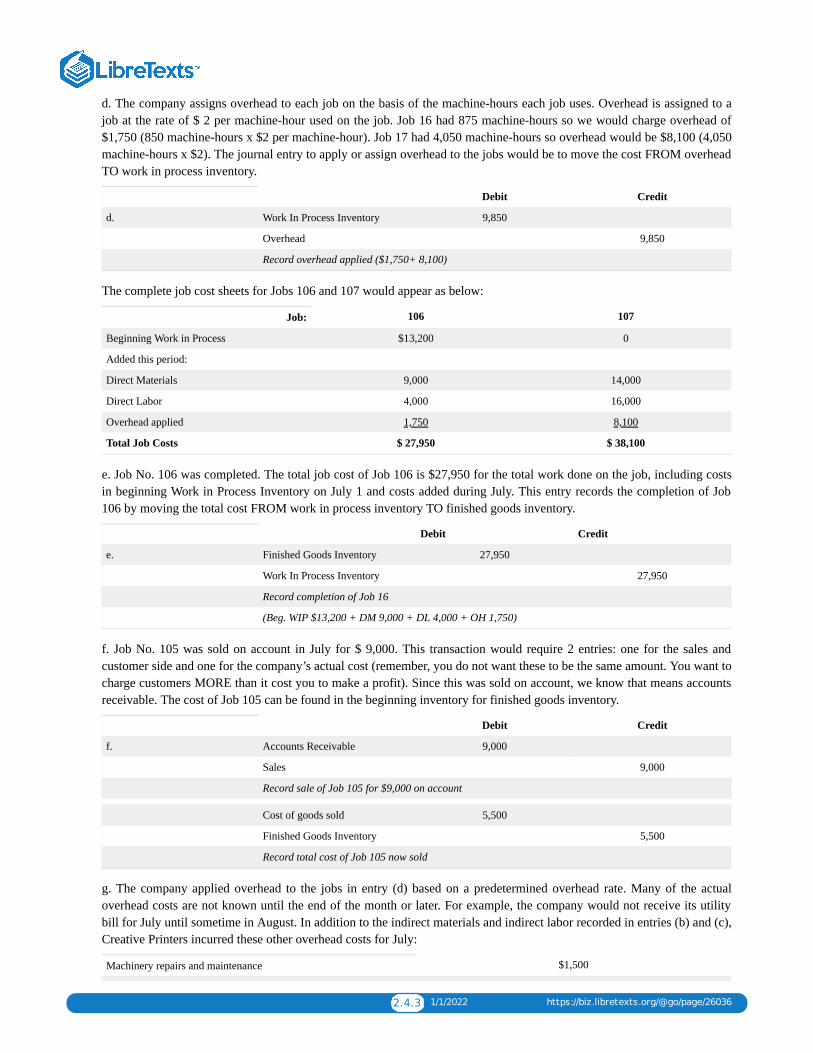
d. The company assigns overhead to each job on the basis of the machine-hours each job uses. Overhead is assigned to ajob at the rate of $ 2 per machine-hour used on the job. Job 16 had 875 machine-hours so we would charge overhead of$1,750 (850 machine-hours x $2 per machine-hour). Job 17 had 4,050 machine-hours so overhead would be $8,100 (4,050machine-hours x $2). The journal entry to apply or assign overhead to the jobs would be to move the cost FROM overheadTO work in process inventory.
Debit Credit
d. Work In Process Inventory 9,850
Overhead 9,850
Record overhead applied ($1,750+ 8,100)
The complete job cost sheets for Jobs 106 and 107 would appear as below:
Job: 106 107
Beginning Work in Process $13,200 0
Added this period:
Direct Materials 9,000 14,000
Direct Labor 4,000 16,000
Overhead applied 1,750 8,100
Total Job Costs $ 27,950 $ 38,100
e. Job No. 106 was completed. The total job cost of Job 106 is $27,950 for the total work done on the job, including costsin beginning Work in Process Inventory on July 1 and costs added during July. This entry records the completion of Job106 by moving the total cost FROM work in process inventory TO finished goods inventory.
Debit Credit
e. Finished Goods Inventory 27,950
Work In Process Inventory 27,950
Record completion of Job 16
(Beg. WIP $13,200 + DM 9,000 + DL 4,000 + OH 1,750)
f. Job No. 105 was sold on account in July for $ 9,000. This transaction would require 2 entries: one for the sales andcustomer side and one for the company’s actual cost (remember, you do not want these to be the same amount. You want tocharge customers MORE than it cost you to make a profit). Since this was sold on account, we know that means accountsreceivable. The cost of Job 105 can be found in the beginning inventory for finished goods inventory.
Debit Credit
f. Accounts Receivable 9,000
Sales 9,000
Record sale of Job 105 for $9,000 on account
Cost of goods sold 5,500
Finished Goods Inventory 5,500
Record total cost of Job 105 now sold
g. The company applied overhead to the jobs in entry (d) based on a predetermined overhead rate. Many of the actualoverhead costs are not known until the end of the month or later. For example, the company would not receive its utilitybill for July until sometime in August. In addition to the indirect materials and indirect labor recorded in entries (b) and (c),Creative Printers incurred these other overhead costs for July:
Machinery repairs and maintenance $1,500
2.4.4 1/1/2022 https://biz.libretexts.org/@go/page/26036
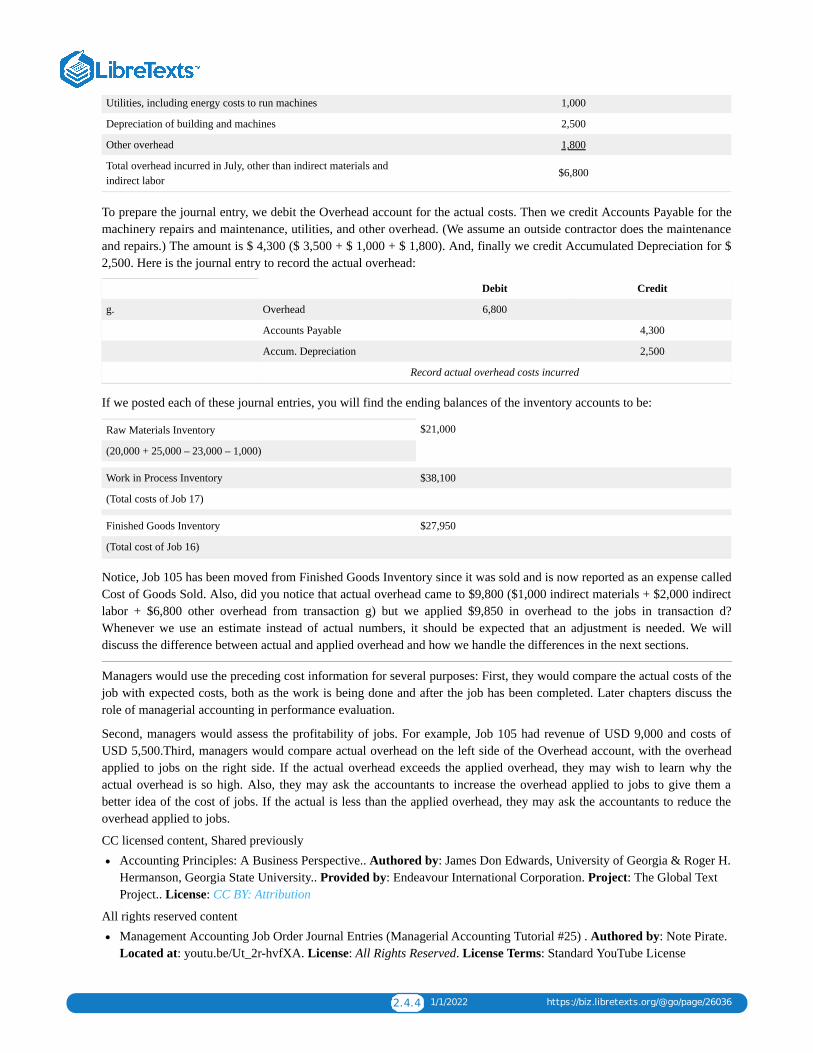
Utilities, including energy costs to run machines 1,000
Depreciation of building and machines 2,500
Other overhead 1,800
Total overhead incurred in July, other than indirect materials andindirect labor
$6,800
To prepare the journal entry, we debit the Overhead account for the actual costs. Then we credit Accounts Payable for themachinery repairs and maintenance, utilities, and other overhead. (We assume an outside contractor does the maintenanceand repairs.) The amount is $ 4,300 ($ 3,500 + $ 1,000 + $ 1,800). And, finally we credit Accumulated Depreciation for $2,500. Here is the journal entry to record the actual overhead:
Debit Credit
g. Overhead 6,800
Accounts Payable 4,300
Accum. Depreciation 2,500
Record actual overhead costs incurred
If we posted each of these journal entries, you will find the ending balances of the inventory accounts to be:
Raw Materials Inventory $21,000
(20,000 + 25,000 – 23,000 – 1,000)
Work in Process Inventory $38,100
(Total costs of Job 17)
Finished Goods Inventory $27,950
(Total cost of Job 16)
Notice, Job 105 has been moved from Finished Goods Inventory since it was sold and is now reported as an expense calledCost of Goods Sold. Also, did you notice that actual overhead came to $9,800 ($1,000 indirect materials + $2,000 indirectlabor + $6,800 other overhead from transaction g) but we applied $9,850 in overhead to the jobs in transaction d?Whenever we use an estimate instead of actual numbers, it should be expected that an adjustment is needed. We willdiscuss the difference between actual and applied overhead and how we handle the differences in the next sections.
Managers would use the preceding cost information for several purposes: First, they would compare the actual costs of thejob with expected costs, both as the work is being done and after the job has been completed. Later chapters discuss therole of managerial accounting in performance evaluation.
Second, managers would assess the profitability of jobs. For example, Job 105 had revenue of USD 9,000 and costs ofUSD 5,500.Third, managers would compare actual overhead on the left side of the Overhead account, with the overheadapplied to jobs on the right side. If the actual overhead exceeds the applied overhead, they may wish to learn why theactual overhead is so high. Also, they may ask the accountants to increase the overhead applied to jobs to give them abetter idea of the cost of jobs. If the actual is less than the applied overhead, they may ask the accountants to reduce theoverhead applied to jobs.
CC licensed content, Shared previouslyAccounting Principles: A Business Perspective.. Authored by: James Don Edwards, University of Georgia & Roger H.Hermanson, Georgia State University.. Provided by: Endeavour International Corporation. Project: The Global TextProject.. License: CC BY: Attribution
All rights reserved contentManagement Accounting Job Order Journal Entries (Managerial Accounting Tutorial #25) . Authored by: Note Pirate.Located at: youtu.be/Ut_2r-hvfXA. License: All Rights Reserved. License Terms: Standard YouTube License
2.5.1 12/18/2021 https://biz.libretexts.org/@go/page/26037
2.5: Actual Vs. Applied Factory Overhead
By definition, overhead cannot be traced directly to jobs. Most company use a predetermined overhead rate (or estimatedrate) instead of actual overhead for the following reasons:
•A company usually does not incur overhead costs uniformly throughout the year. For example, heating costs are greaterduring winter months. However, allocating more overhead costs to a job produced in the winter compared to one producedin the summer may serve no useful purpose.
•Some overhead costs, like factory building depreciation, are fixed costs. If the volume of goods produced varies frommonth to month, the actual rate varies from month to month, even though the total cost is constant from month to month.The predetermined rate, on the other hand, is constant from month to month.
•Predetermined rates make it possible for companies to estimate job costs sooner. Using a predetermined rate, companiescan assign overhead costs to production when they assign direct materials and direct labor costs. Without a predeterminedrate, companies do not know the costs of production until the end of the month or even later when bills arrive. Forexample, the electric bill for July will probably not arrive until August. If Creative Printers had used actual overhead, thecompany would not have determined the costs of its July work until August. It is better to have a good estimate of costswhen doing the work instead of waiting a long time for only a slightly more accurate number.
Predetermined overhead ratesPredetermined overhead rates are used to apply overhead to jobs until we have all the actual costs available. To create therate, we use cost drivers to assign overhead to jobs. A cost driver is a measure of activities, such as machine-hours, that isthe cause of costs. To assign overhead to jobs, the cost driver should be the cause of the overhead costs, or at least bereasonably associated with the overhead costs. Just as automobile mileage is a good cost driver for measuring the cause ofgasoline consumption, machine-hours is a measure of what causes energy costs. By assigning energy costs to jobs based onthe number of machine-minutes or hours the job uses, we have a pretty good idea of the energy costs required to producethe job.
A YouTube element has been excluded from this version of the text. You can view it online here:pb.libretexts.org/llmanagerialaccounting/?p=54
Most manufacturing and service organizations use predetermined rates.
To calculate a predetermined overhead rate, a company divides the estimated total overhead costs for a period by anestimated base (or expected level of activity). This activity could be total expected machine-hours, total expected directlabor-hours, or total expected direct labor cost for the period. Companies set predetermined overhead rates at the beginningof the year in which they will use them. This formula computes a predetermined rate:
Predetermined Overhead Rate (POHR) =Estimated Overhead
Estimated Base

2.5.2 12/18/2021 https://biz.libretexts.org/@go/page/26037
Notice how the predetermined rate is based on ESTIMATED overhead and the ESTIMATED base or level of activity. Toapply overhead, we will use the actual amount of the base or level of activity x the predetermined overhead rate. Again, toapply overhead use this formula:
Applied Overhead = Actual amount of base x POHR
To demonstrate, assume the accountants at Creative Printers estimated overhead related to machine usage to be $ 120,000for the year and estimated the machine usage for the year to be 60,000 machine-hours. Thus, the predetermined overheadrate would be calculated as follows:
Predetermined Overhead Rate(POHR) =
Estimated Overhead = $120,000 = $2 per machine hour
Estimated Base 60,000 machine hours
If we want to apply overhead to jobs. Job 106 had 875 machine hours and Job 107 had 4,050 machine hours. Thecalculation for actual overhead for each job would be:
Job ACTUAL machine hours POHR Overhead applied
106 875 x $2 $ 1,750
107 4050 x $2 8,100
Total Overhead applied $ 9,850
Actual Overhead
Actual Overhead costs are the true costs incurred and typically include things like indirect materials, indirect labor, factorysupplies used, factory insurance, factory depreciation, factory maintenance and repairs, factory taxes, etc. Actual overheadcosts are any indirect costs related to completing the job or making a product. Next, we look at how we correct our recordswhen the actual and our applied (or estimated) overhead do not match (which they almost never match!).
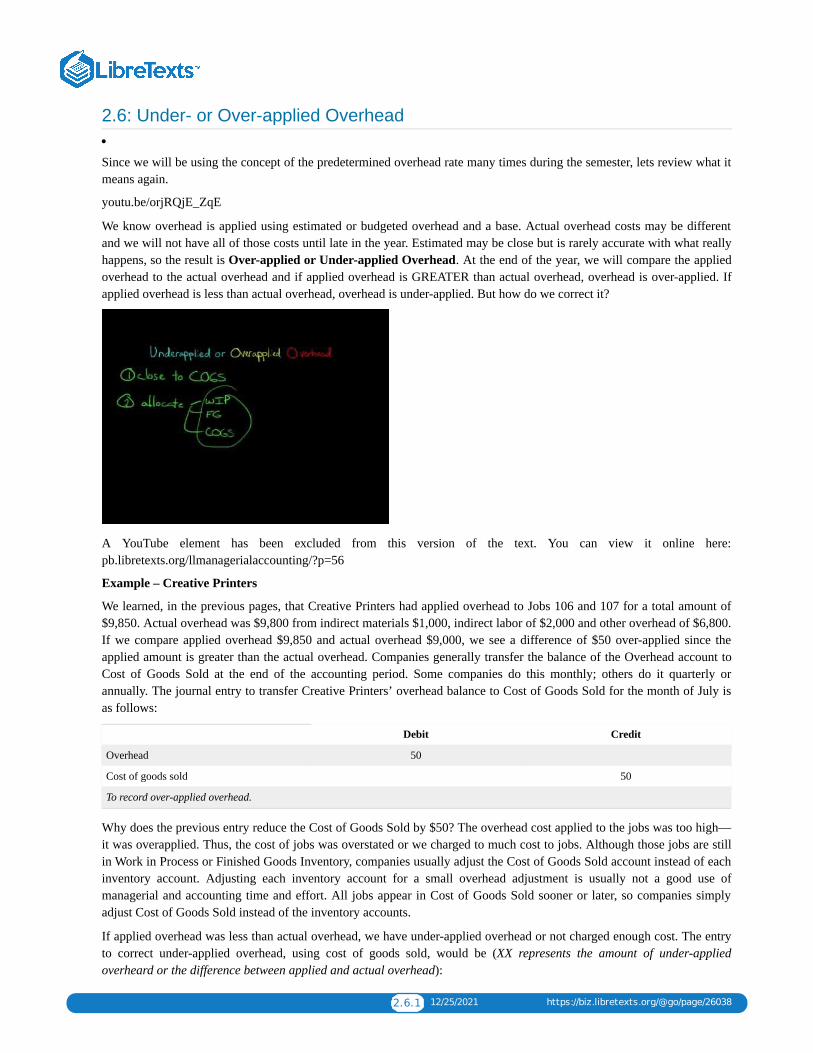
2.6.1 12/25/2021 https://biz.libretexts.org/@go/page/26038
2.6: Under- or Over-applied Overhead
Since we will be using the concept of the predetermined overhead rate many times during the semester, lets review what itmeans again.
youtu.be/orjRQjE_ZqE
We know overhead is applied using estimated or budgeted overhead and a base. Actual overhead costs may be differentand we will not have all of those costs until late in the year. Estimated may be close but is rarely accurate with what reallyhappens, so the result is Over-applied or Under-applied Overhead. At the end of the year, we will compare the appliedoverhead to the actual overhead and if applied overhead is GREATER than actual overhead, overhead is over-applied. Ifapplied overhead is less than actual overhead, overhead is under-applied. But how do we correct it?
A YouTube element has been excluded from this version of the text. You can view it online here:pb.libretexts.org/llmanagerialaccounting/?p=56
Example – Creative Printers
We learned, in the previous pages, that Creative Printers had applied overhead to Jobs 106 and 107 for a total amount of$9,850. Actual overhead was $9,800 from indirect materials $1,000, indirect labor of $2,000 and other overhead of $6,800.If we compare applied overhead $9,850 and actual overhead $9,000, we see a difference of $50 over-applied since theapplied amount is greater than the actual overhead. Companies generally transfer the balance of the Overhead account toCost of Goods Sold at the end of the accounting period. Some companies do this monthly; others do it quarterly orannually. The journal entry to transfer Creative Printers’ overhead balance to Cost of Goods Sold for the month of July isas follows:
Debit Credit
Overhead 50
Cost of goods sold 50
To record over-applied overhead.
Why does the previous entry reduce the Cost of Goods Sold by $50? The overhead cost applied to the jobs was too high—it was overapplied. Thus, the cost of jobs was overstated or we charged to much cost to jobs. Although those jobs are stillin Work in Process or Finished Goods Inventory, companies usually adjust the Cost of Goods Sold account instead of eachinventory account. Adjusting each inventory account for a small overhead adjustment is usually not a good use ofmanagerial and accounting time and effort. All jobs appear in Cost of Goods Sold sooner or later, so companies simplyadjust Cost of Goods Sold instead of the inventory accounts.
If applied overhead was less than actual overhead, we have under-applied overhead or not charged enough cost. The entryto correct under-applied overhead, using cost of goods sold, would be (XX represents the amount of under-appliedoverheard or the difference between applied and actual overhead):
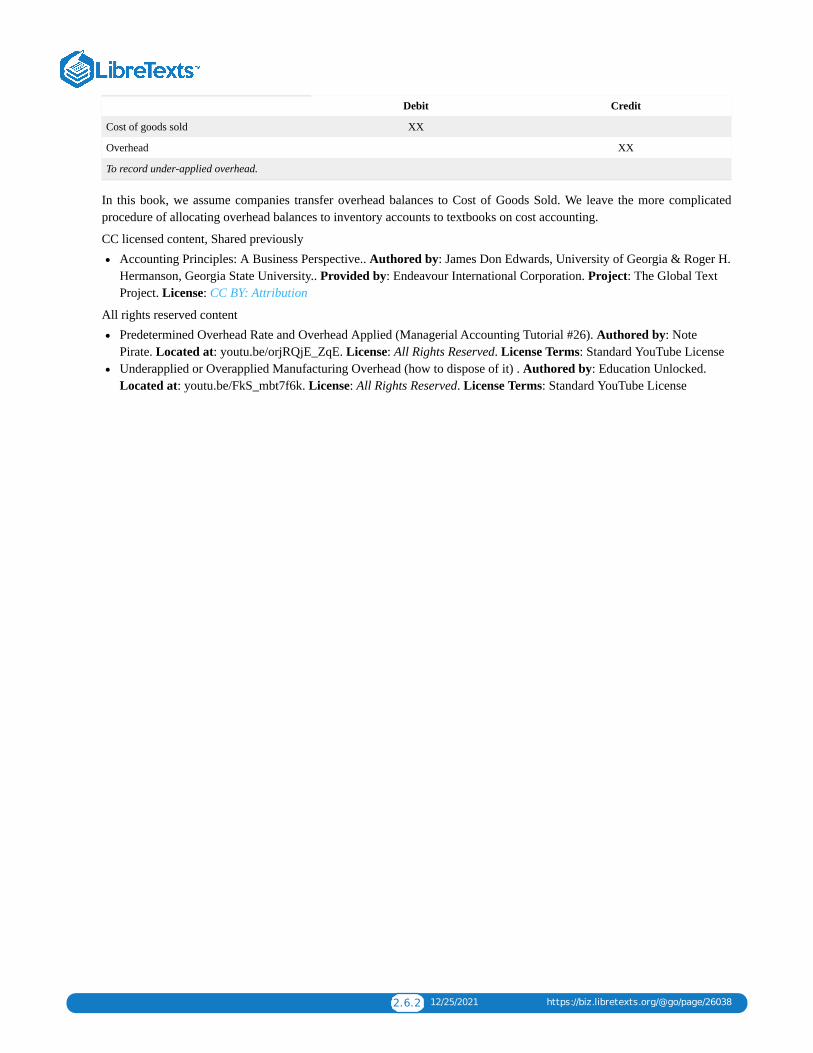
2.6.2 12/25/2021 https://biz.libretexts.org/@go/page/26038
Debit Credit
Cost of goods sold XX
Overhead XX
To record under-applied overhead.
In this book, we assume companies transfer overhead balances to Cost of Goods Sold. We leave the more complicatedprocedure of allocating overhead balances to inventory accounts to textbooks on cost accounting.
CC licensed content, Shared previouslyAccounting Principles: A Business Perspective.. Authored by: James Don Edwards, University of Georgia & Roger H.Hermanson, Georgia State University.. Provided by: Endeavour International Corporation. Project: The Global TextProject. License: CC BY: Attribution
All rights reserved contentPredetermined Overhead Rate and Overhead Applied (Managerial Accounting Tutorial #26). Authored by: NotePirate. Located at: youtu.be/orjRQjE_ZqE. License: All Rights Reserved. License Terms: Standard YouTube LicenseUnderapplied or Overapplied Manufacturing Overhead (how to dispose of it) . Authored by: Education Unlocked.Located at: youtu.be/FkS_mbt7f6k. License: All Rights Reserved. License Terms: Standard YouTube License

2.7.1 12/25/2021 https://biz.libretexts.org/@go/page/26039
2.7: Accounting in the Headlines
Would a Pizza Studio franchisee need to use job-costing or process costing for its made-to-order pizzas?
Pizza Studio is a relatively new pizza chain that takes the made-to-order model used by Chipotle and Subway and appliesit to pizzas. At a counter, customers order their pizzas with exactly the crust, sauce, cheese, and toppings they want – andthen watch as the pizza travels through a conveyor-belt oven, being blasted with 150 degree heat, and then see it emergetwo minutes later, hot and bubbling.
Pizza Studio has many choices for pizzas. In addition to traditional, crust choices include whole grain & flax seed,rosemary herb, and firecracker. Sauces include tomato blend, basil pesto, tangy BBQ, spicy buffalo, and others. Cheeseselections include mozzarella, feta and goat cheese. Pizza Studio offers a wide variety of unlimited toppings: mincedgarlic, artichoke hearts, Kalamata olives, zucchini, Jamaican jerk seasoning, and caramelized onions are a sampling of thetoppings available. Describe Pizza Studio process here.
The price of each pizza is $7.99.
Pizza Studio was founded in 2012 and has nearly 25 locations, with additional locations planned to be added throughout2015. It has several franchise operators; most of Pizza Studio’s growth is projected to be through the opening of newfranchise locations.
Questions
1. Does an individual Pizza Studio franchise operator need to decide whether to use a job-costing system or a processcosting system for the pizzas it sells? Why or why not?
2. Assume that Pizza Studio pizzas are extremely popular and Pizza Studio decides to expand into local grocery storeswith frozen Pizza Studio pizzas. Do you think Pizza Studios would use more of a job-costing system or a process-costing system for the pizzas it produces for grocery stores? Explain.
CC licensed content, Specific attributionWould a Pizza Studio franchisee need to use job-costing or process costing for its made-to-order pizzas?. Authored by:Dr. Wendy Tietz, CPA, CMA, CGMA. Located at: http://www.accountingintheheadlines.com. License: CC BY-NC:Attribution-NonCommercial

2.8.1 12/18/2021 https://biz.libretexts.org/@go/page/26040
2.8: Chapter 2 Key Points
Job Costing Key Points
Here is some basic information you need to know about these accounts:
Account Account Type Financial Statement Increases with Decreases with
Raw Materials Inventory Asset Balance Sheet Debit Credit
Work in Process (or goodsin process) Inventory
Asset Balance Sheet Debit Credit
Finished Goods Inventory Asset Balance Sheet Debit Credit
Cost of Goods Sold Expense Income Statement Debit Credit
Sales Revenue Income Statement Credit Debit
Factory Payroll and Factory Overhead are temporary accounts that act like assets/expenses meaning Debit will increaseand Credit will decrease. Both accounts are zeroed out at the end of the period so they will not appear on a financialstatement.
Job costs include the TOTAL costs incurred for direct materials, direct labor and overhead. Direct materials can be tracedto a specific job. Direct labor hours and dollars can be traced to a specific job. Overhead are indirect costs that cannot betraced to a specific job and include things like indirect materials, indirect labor, factory utilities, factory depreciation,factory rent, etc.
When a job is started, the costs (direct materials, direct labor, and applied overhead) go into Work in Process or Goods inProcess Inventory. When the job is finished, the job cost gets transferred to Finished Goods Inventory and is removed fromWork in process inventory.
A predetermined overhead rate can be established to budget overhead expenses to jobs. The predetermined overhead rate isused to APPLY overhead costs to jobs in Work in Process Inventory. The predetermined overhead rate (POHR) can bebased on anything the company chooses – direct labor dollars, direct labor hours, machine hours, jobs finished, etc. Themost common we will see is direct labor.
The formula for calculating the predetermined overhead rate is:
ESTIMATED OVERHEAD
ESTIMATED BASE
with the base being whatever is decided upon (again, examples include direct labor, machine hours, etc.).
Actual overhead costs are recorded in the Factory overhead account. Applied overhead uses the Predetermined OverheadRate and applies the overhead to jobs in Work in Process Inventory by taking the ACTUAL amount of the BASE x thePredetermined Overhead Rate. At the end of the period, the actual overhead costs (debits to factory overhead) arecompared to the applied overhead costs (credits to factory overhead) to make sure they agree – which they won’t sinceapplied is an estimate. You will need to do an adjusting entry to Cost of Goods Sold to make the Factory Overhead accountzero. If applied overhead (credits) are more than the actual overhead (debits), overhead is OVER-applied. If appliedoverhead is less than actual overhead, overhead is UNDER-applied.
Click Job Costing Key Points for a printable copy.
2.9.1 12/18/2021 https://biz.libretexts.org/@go/page/26041
2.9: Glossary
GLOSSARY
Actual overhead rate Total actual manufacturingoverhead divided by total actual manufacturing activity.
Cost A financial measure of the resources used or given up to achieve a stated purpose.
Cost driver Activity or transaction that causes costs to be incurred. Machine-hours can be a cost driver for costs of energyto run machines, for example.
Cost of goods manufactured Consists of the total costs of all goods completed during the period; includes cost tomanufacture plus beginning work in process inventory minus ending work in process inventory
Cost of goods sold Cost of goods manufactured plus the beginning finished goods inventory minus the ending finishedgoods inventory.
Cost to manufacture (or total manufacturing cost) Includes the direct materials, direct labor, and manufacturingoverhead incurred during the period.
Direct labor Labor costs of all employees actually working on materials to convert them to finished goods. Direct laborcosts are directly traced to particular products in contrast to indirect labor costs.
Direct materials Materials that are used only in making the product and are clearly and easily traceable to a particularproduct.
Finished goods Completed manufactured products ready to be sold. Finished Goods Inventory is the title of an inventoryaccount maintained for such products.
Indirect labor The cost of labor that cannot, or will not for practical reasons, be traced to the goods being produced or theservices being provided.
Indirect materials Materials used in making a product that cannot, or will not for practical reasons, be traced directly toparticular products.
Job cost system (job costing) A manufacturing cost system that accumulates costs incurred to produce a productaccording to individual jobs, such as a building, a consulting job, or a batch of 100 computer desks.
Manufacturing overhead All manufacturing costs except for those costs accounted for as direct materials and directlabor.
Materials Unprocessed items used in the manufacturing process.
Overapplied (overabsorbed) overhead The amount by which the overhead applied to production exceeds the actualoverhead costs incurred in that same period.
Overhead All costs of making goods or providing services except for those costs classified as direct materials and directlabor. See manufacturing overhead for overhead in manufacturing companies.
Period costs Costs related more closely to periods of time than to products produced. Period costs cannot be traceddirectly to the manufacture of a specific product; they are expensed in the period in which they are incurred.
Predetermined overhead rate Calculated by dividing estimated total overhead costs for a period by the expected level ofactivity, such as total expected machine-hours or total expected direct labor-hours for the period.
Product costs Costs a company assigns to units produced. In manufacturing companies, these costs are direct materials,direct labor, and manufacturing overhead. In service companies that have no materials, these costs are direct labor andoverhead.
Statement of cost of goods manufactured An accounting report showing the cost to manufacture and the cost of goodsmanufactured.
Underapplied (underabsorbed) overhead The amount by which actual overhead costs incurred in a period exceed theoverhead applied to production in that period.

2.9.2 12/18/2021 https://biz.libretexts.org/@go/page/26041
Work in process Partially manufactured products; a Work in Process Inventory account is maintained for such products.
CC licensed content, Shared previouslyAccounting Principles: A Business Perspective. Authored by: James Don Edwards, University of Georgia & Roger H.Hermanson, Georgia State University. Provided by: Endeavour International Corporation. Project: The Global TextProject. License: CC BY: Attribution

2.10.1 11/20/2021 https://biz.libretexts.org/@go/page/26042
2.10: Chapter 2- Exercises
SHORT Answer QUESTIONS, EXERCISES AND PROBLEMS
Questions
➢ What are the major differences between managerial and financial accounting?
➢ Identify the three elements of cost incurred in manufacturing a product and indicate the distinguishing characteristics ofeach.
➢ Why might a company claim that the total cost of employing a person is $15.30 per hour when the employee’s wagerate is $10.50 per hour? How should this difference be classified and why?
➢ Why are certain costs referred to as period costs? What are the major types of period costs incurred by a manufacturer?
➢ Explain why the income statement of a manufacturing company differs from the income statement of a merchandisingcompany.
➢ What is the general content of a statement of cost of goods manufactured? What is its relationship to the incomestatement?
➢ What is the relationship between cost flows in the accounts and the flow of physical products through a factory?
➢ Define a job cost system and give an example of a situation in which it can be used.
➢ What are the major reasons for using predetermined manufacturing overhead rates?
➢ What is the formula for computing a predetermined overhead rate? If the expected level of activity in a productioncenter is 50,000 machine-hours and the estimated overhead costs are $750,000, what is the predetermined overhead rate?Show the calculation.
➢ What is underapplied and overapplied overhead? What type of balance does each have in the Overhead account?
➢ Direct materials were issued to the following jobs: Material A was issued to Job No. 101, $2,000; Job No. 102, $1,000;and Job No. 103, $5,000. Material B was issued to Job No. 101, $5,000; Job No. 102, $2,000; and Job No. 103, $3,000. Atotal of $3,000 in indirect materials was issued to all jobs.
➢ Record the direct and indirect materials issued in journal entry form.
➢ Real world question Assume Domino’s Pizza is considering offering a new product—a 6-inch (15.24 cm) pizza. Whywould it matter if Domino’s Pizza knows how much it costs to produce and deliver this 6-inch (15.24 cm) pizza?
➢ Real world question Why is it becoming more important that the managers of hospitals understand their product costs?
➢ Real world question Besides law firms and public accounting firms, name three service organizations that produceindividual jobs and would use job costing.
Exercises
Exercise A The following costs are incurred by an electrical appliance manufacturer. Classify these costs as directmaterials, direct labor, manufacturing overhead, selling, or administrative.
1. President’s salary.2. Cost of electrical wire used in making appliances.3. Cost of janitorial supplies (the janitors work in the factory).4. Wages of assembly-line workers.5. Cost of promotional displays.6. Assembly-line supervisor’s salary.7. Cost accountant’s salary (the accountant works in the factory).8. Cost of cleaner used to clean appliances when they are completed.9. Cost of aluminum used for toasters.
10. Cost of market research survey.
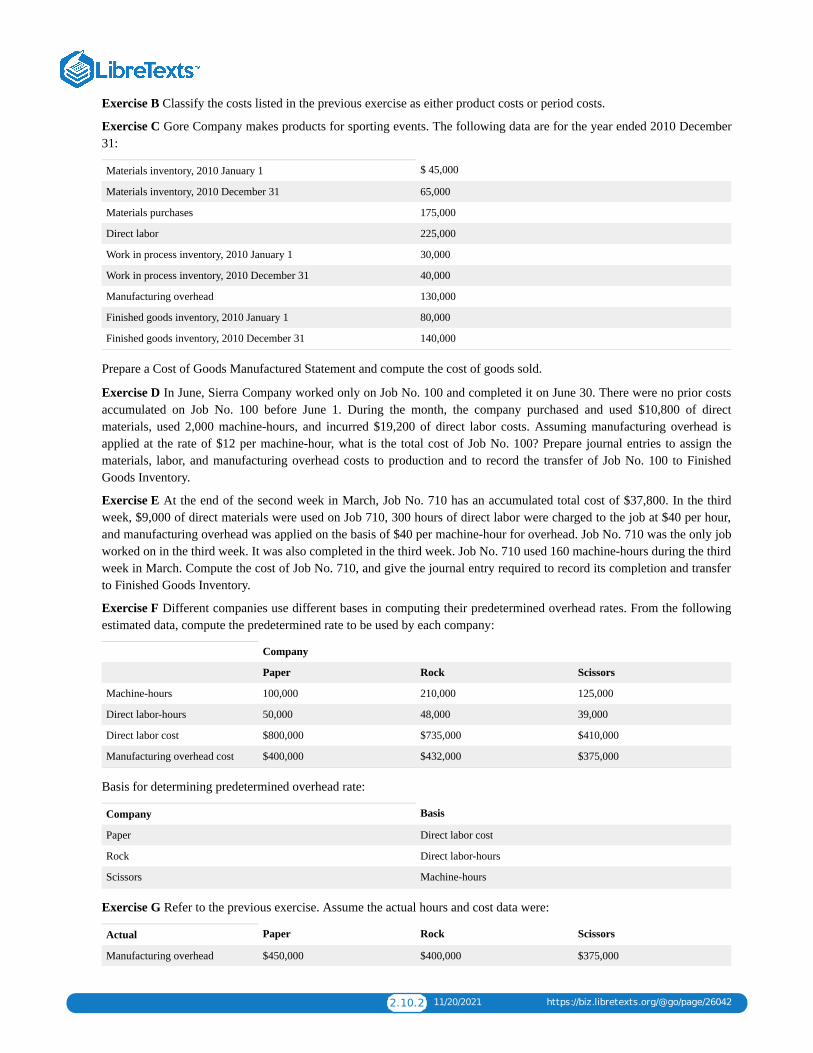
2.10.2 11/20/2021 https://biz.libretexts.org/@go/page/26042
Exercise B Classify the costs listed in the previous exercise as either product costs or period costs.
Exercise C Gore Company makes products for sporting events. The following data are for the year ended 2010 December31:
Materials inventory, 2010 January 1 $ 45,000
Materials inventory, 2010 December 31 65,000
Materials purchases 175,000
Direct labor 225,000
Work in process inventory, 2010 January 1 30,000
Work in process inventory, 2010 December 31 40,000
Manufacturing overhead 130,000
Finished goods inventory, 2010 January 1 80,000
Finished goods inventory, 2010 December 31 140,000
Prepare a Cost of Goods Manufactured Statement and compute the cost of goods sold.
Exercise D In June, Sierra Company worked only on Job No. 100 and completed it on June 30. There were no prior costsaccumulated on Job No. 100 before June 1. During the month, the company purchased and used $10,800 of directmaterials, used 2,000 machine-hours, and incurred $19,200 of direct labor costs. Assuming manufacturing overhead isapplied at the rate of $12 per machine-hour, what is the total cost of Job No. 100? Prepare journal entries to assign thematerials, labor, and manufacturing overhead costs to production and to record the transfer of Job No. 100 to FinishedGoods Inventory.
Exercise E At the end of the second week in March, Job No. 710 has an accumulated total cost of $37,800. In the thirdweek, $9,000 of direct materials were used on Job 710, 300 hours of direct labor were charged to the job at $40 per hour,and manufacturing overhead was applied on the basis of $40 per machine-hour for overhead. Job No. 710 was the only jobworked on in the third week. It was also completed in the third week. Job No. 710 used 160 machine-hours during the thirdweek in March. Compute the cost of Job No. 710, and give the journal entry required to record its completion and transferto Finished Goods Inventory.
Exercise F Different companies use different bases in computing their predetermined overhead rates. From the followingestimated data, compute the predetermined rate to be used by each company:
Company
Paper Rock Scissors
Machine-hours 100,000 210,000 125,000
Direct labor-hours 50,000 48,000 39,000
Direct labor cost $800,000 $735,000 $410,000
Manufacturing overhead cost $400,000 $432,000 $375,000
Basis for determining predetermined overhead rate:
Company Basis
Paper Direct labor cost
Rock Direct labor-hours
Scissors Machine-hours
Exercise G Refer to the previous exercise. Assume the actual hours and cost data were:
Actual Paper Rock Scissors
Manufacturing overhead $450,000 $400,000 $375,000

2.10.3 11/20/2021 https://biz.libretexts.org/@go/page/26042
Direct labor cost $850,000 $700,000 $400,000
Direct labor-hours 45,000 46,000 38,000
Machine-hours 105,000 200,000 130,000
1. Compute overapplied or underapplied overhead for each company.2. Prepare journal entries to transfer overapplied or underapplied overhead to Cost of Goods Sold for each company.
Exercise H Ernest Peat Consultants uses a job cost system and had the following activity during December:
There were no jobs in beginning Work in Process or Finished Goods Inventory.
Three jobs were started: No. 222, 223, and 224. Job No. 222 was completed and the customer was billed for $10,000 onaccount. Job No. 223 was completed and in Finished Goods Inventory awaiting billing to the client at the end of themonth. Job No. 224 was still in process at month-end.
Direct labor costs incurred for:
Job No. 222 200 hours @ $21/hour
Job No. 223 300 hours @ $18/hour
Job No. 224 120 hours @ $17/hour
Assume overhead is applied at the rate of $10 per labor-hour.
Actual overhead was $6,400. (The credit part of the journal entry is to Accounts Payable.
Prepare journal entries to record the preceding data, as well as the transfer of underapplied or overapplied overhead to Costof Goods Sold.
Problem A Total Block, Inc., is considering a new sunscreen packet that contains a skin wipe with sunscreen on it. Thesewould be particularly useful for people who do not want to carry a bottle of sunscreen, according to Sunspot’s marketingmanager. Classify the following costs of this new product as direct materials, direct labor, manufacturing overhead, selling,or administrative.
1. President’s salary.2. Packages used to hold the skin wipes.3. Cleaning materials used to clean the skin wipe packages.4. Wages of workers who package the product.5. Cost of advertising the product.6. The salary of the supervisor of the workers who package the product.7. Cost accountant’s salary (the accountant works in the factory).8. Cost of a market research survey.9. Sales commissions paid as a percent of sales.
10. Depreciation of administrative office building.
Problem B Classify the costs listed in the previous problem as either product costs or period costs.
Problem C Good Vibrations, Inc., produces videotapes of musical performances. A newly hired executive of the companyhas asked you to sort through the records and prepare a statement of the company’s cost of goods manufactured. You findthe following data from records prepared by Good Vibrations, Inc., for the year ended 2009 December 31:
Inventories:
Beginning direct materials inventory, 2009 January 1 $ 6,000
Ending direct materials inventory, 2009 December 31 10,500
Beginning work in process inventory, 2009 January 1 10,000
Ending work in process inventory, 2009 December 31 9,500
Materials purchases 50,000
Direct labor 40,000

2.10.4 11/20/2021 https://biz.libretexts.org/@go/page/26042
Indirect labor 15,000
Factory utilities expense 7,000
Factory supplies expense 5,000
Depreciation expense – factory building 14,000
Depreciation expense – Factory Equipment 10,500
Other manufacturing overhead 25,000
You also learn that beginning Finished Goods Inventory on 2009 January 1, was $20,000 and ending Finished GoodsInventory on 2009 December 31, was $5,000. Sales for the year were $400,000. Selling expenses were $50,000 andadministrative expenses were $75,000.
1. Prepare a statement of cost of goods manufactured for Good Vibrations, Inc., for the year ended 2009 December 31.2. Prepare an income statement for Good Vibrations, Inc., for the year ended 2009 December 31.
Problem D Log Cabin Homes, Inc., uses a job cost system to account for its jobs, which are prefabricated houses. As ofJanuary 1, its records showed inventories as follows:
Materials and supplies $100,000
Work in process (Job Nos. 22 and 23) 180,000
Finished goods (Job No. 21) 140,000
The work in process inventory consisted of two jobs:
Job No.Directmaterials
Directlabor
Manufacturingoverhead
Total
22 $36,000 $40,000 $20,000 $ 96,000
23 40,000 28,000 16,000 84,000
$180,000
Cost and sales data:
a. Materials purchased on account, $400,000.
b. Direct materials used: Job No. 22, $60,000; Job No. 23, $120,000; Job No. 24, $180,000.
c. Indirect materials used, $10,000.
d. Direct labor costs: Job No. 22, $100,000; Job No. 23, $200,000; and Job No. 24, $80,000.
e. Indirect labor costs, $80,000.
f. Overhead is assigned to jobs at $100 per machine-hour. Job No. 22 used 500 machine-hours, Job No. 23 used 1,000machine-hours, and Job No. 24 used 300 machine-hours in January.
g. Job No. 22 and 23 were completed and transferred to Finished Goods Inventory.
h. Job No. 21 and 22 were sold on account for $1,200,000, total.
i. Manufacturing overhead costs incurred, other than indirect materials and indirect labor, were depreciation, $60,000, andheat, light, power, miscellaneous, $30,000 (to be paid next month).
Required:
1. Calculate the Job Cost for each job.2. Prepare journal entries to assign each cost for each cost and sales data item.3. Calculate the ending balance in Raw Materials Inventory, Work in Process Inventory, Finished Goods Inventory, and
Cost of Goods Sold.4. Assuming selling and administrative expenses were $100,000, prepare a multi-step income statement.
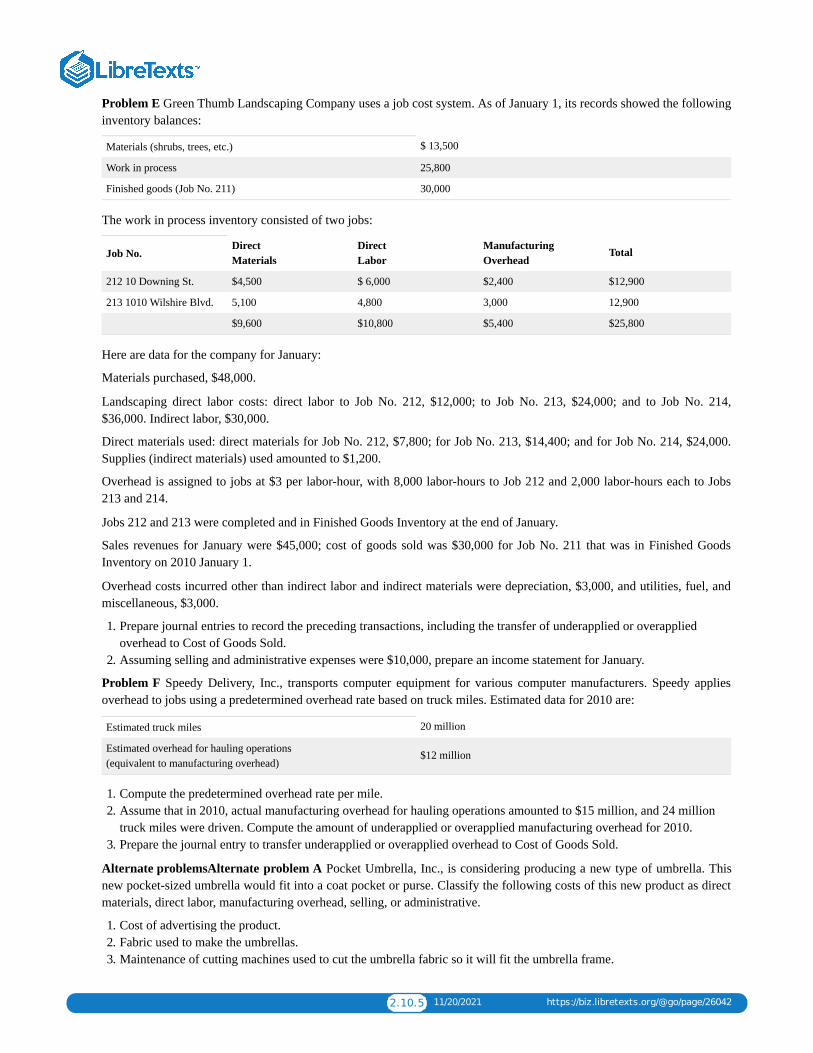
2.10.5 11/20/2021 https://biz.libretexts.org/@go/page/26042
Problem E Green Thumb Landscaping Company uses a job cost system. As of January 1, its records showed the followinginventory balances:
Materials (shrubs, trees, etc.) $ 13,500
Work in process 25,800
Finished goods (Job No. 211) 30,000
The work in process inventory consisted of two jobs:
Job No.DirectMaterials
DirectLabor
ManufacturingOverhead
Total
212 10 Downing St. $4,500 $ 6,000 $2,400 $12,900
213 1010 Wilshire Blvd. 5,100 4,800 3,000 12,900
$9,600 $10,800 $5,400 $25,800
Here are data for the company for January:
Materials purchased, $48,000.
Landscaping direct labor costs: direct labor to Job No. 212, $12,000; to Job No. 213, $24,000; and to Job No. 214,$36,000. Indirect labor, $30,000.
Direct materials used: direct materials for Job No. 212, $7,800; for Job No. 213, $14,400; and for Job No. 214, $24,000.Supplies (indirect materials) used amounted to $1,200.
Overhead is assigned to jobs at $3 per labor-hour, with 8,000 labor-hours to Job 212 and 2,000 labor-hours each to Jobs213 and 214.
Jobs 212 and 213 were completed and in Finished Goods Inventory at the end of January.
Sales revenues for January were $45,000; cost of goods sold was $30,000 for Job No. 211 that was in Finished GoodsInventory on 2010 January 1.
Overhead costs incurred other than indirect labor and indirect materials were depreciation, $3,000, and utilities, fuel, andmiscellaneous, $3,000.
1. Prepare journal entries to record the preceding transactions, including the transfer of underapplied or overappliedoverhead to Cost of Goods Sold.
2. Assuming selling and administrative expenses were $10,000, prepare an income statement for January.
Problem F Speedy Delivery, Inc., transports computer equipment for various computer manufacturers. Speedy appliesoverhead to jobs using a predetermined overhead rate based on truck miles. Estimated data for 2010 are:
Estimated truck miles 20 million
Estimated overhead for hauling operations(equivalent to manufacturing overhead)
$12 million
1. Compute the predetermined overhead rate per mile.2. Assume that in 2010, actual manufacturing overhead for hauling operations amounted to $15 million, and 24 million
truck miles were driven. Compute the amount of underapplied or overapplied manufacturing overhead for 2010.3. Prepare the journal entry to transfer underapplied or overapplied overhead to Cost of Goods Sold.
Alternate problemsAlternate problem A Pocket Umbrella, Inc., is considering producing a new type of umbrella. Thisnew pocket-sized umbrella would fit into a coat pocket or purse. Classify the following costs of this new product as directmaterials, direct labor, manufacturing overhead, selling, or administrative.
1. Cost of advertising the product.2. Fabric used to make the umbrellas.3. Maintenance of cutting machines used to cut the umbrella fabric so it will fit the umbrella frame.
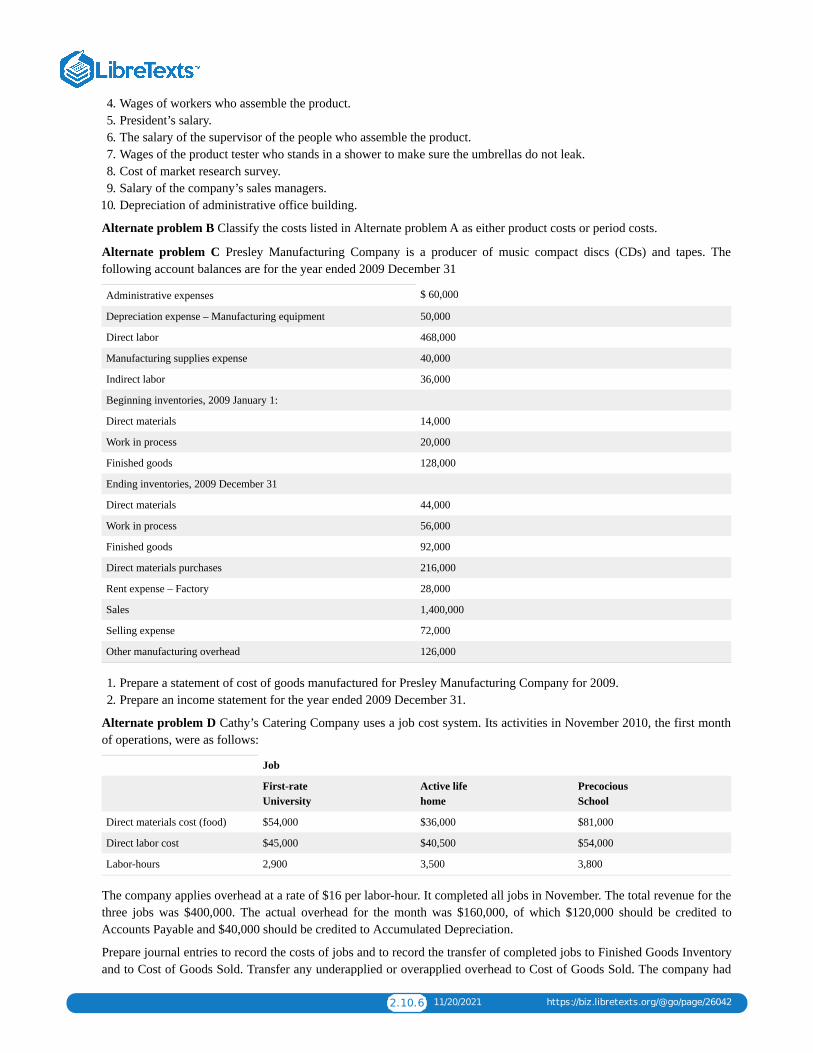
2.10.6 11/20/2021 https://biz.libretexts.org/@go/page/26042
4. Wages of workers who assemble the product.5. President’s salary.6. The salary of the supervisor of the people who assemble the product.7. Wages of the product tester who stands in a shower to make sure the umbrellas do not leak.8. Cost of market research survey.9. Salary of the company’s sales managers.
10. Depreciation of administrative office building.
Alternate problem B Classify the costs listed in Alternate problem A as either product costs or period costs.
Alternate problem C Presley Manufacturing Company is a producer of music compact discs (CDs) and tapes. Thefollowing account balances are for the year ended 2009 December 31
Administrative expenses $ 60,000
Depreciation expense – Manufacturing equipment 50,000
Direct labor 468,000
Manufacturing supplies expense 40,000
Indirect labor 36,000
Beginning inventories, 2009 January 1:
Direct materials 14,000
Work in process 20,000
Finished goods 128,000
Ending inventories, 2009 December 31
Direct materials 44,000
Work in process 56,000
Finished goods 92,000
Direct materials purchases 216,000
Rent expense – Factory 28,000
Sales 1,400,000
Selling expense 72,000
Other manufacturing overhead 126,000
1. Prepare a statement of cost of goods manufactured for Presley Manufacturing Company for 2009.2. Prepare an income statement for the year ended 2009 December 31.
Alternate problem D Cathy’s Catering Company uses a job cost system. Its activities in November 2010, the first monthof operations, were as follows:
Job
First-rateUniversity
Active lifehome
PrecociousSchool
Direct materials cost (food) $54,000 $36,000 $81,000
Direct labor cost $45,000 $40,500 $54,000
Labor-hours 2,900 3,500 3,800
The company applies overhead at a rate of $16 per labor-hour. It completed all jobs in November. The total revenue for thethree jobs was $400,000. The actual overhead for the month was $160,000, of which $120,000 should be credited toAccounts Payable and $40,000 should be credited to Accumulated Depreciation.
Prepare journal entries to record the costs of jobs and to record the transfer of completed jobs to Finished Goods Inventoryand to Cost of Goods Sold. Transfer any underapplied or overapplied overhead to Cost of Goods Sold. The company had
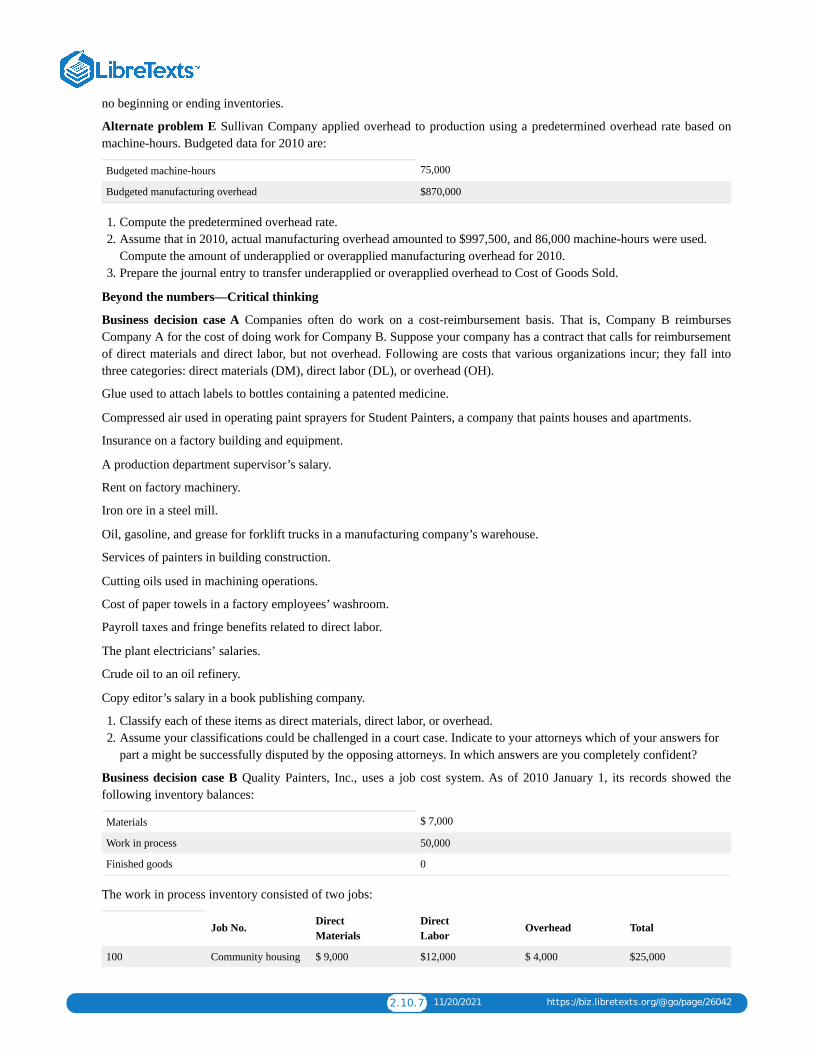
2.10.7 11/20/2021 https://biz.libretexts.org/@go/page/26042
no beginning or ending inventories.
Alternate problem E Sullivan Company applied overhead to production using a predetermined overhead rate based onmachine-hours. Budgeted data for 2010 are:
Budgeted machine-hours 75,000
Budgeted manufacturing overhead $870,000
1. Compute the predetermined overhead rate.2. Assume that in 2010, actual manufacturing overhead amounted to $997,500, and 86,000 machine-hours were used.
Compute the amount of underapplied or overapplied manufacturing overhead for 2010.3. Prepare the journal entry to transfer underapplied or overapplied overhead to Cost of Goods Sold.
Beyond the numbers—Critical thinking
Business decision case A Companies often do work on a cost-reimbursement basis. That is, Company B reimbursesCompany A for the cost of doing work for Company B. Suppose your company has a contract that calls for reimbursementof direct materials and direct labor, but not overhead. Following are costs that various organizations incur; they fall intothree categories: direct materials (DM), direct labor (DL), or overhead (OH).
Glue used to attach labels to bottles containing a patented medicine.
Compressed air used in operating paint sprayers for Student Painters, a company that paints houses and apartments.
Insurance on a factory building and equipment.
A production department supervisor’s salary.
Rent on factory machinery.
Iron ore in a steel mill.
Oil, gasoline, and grease for forklift trucks in a manufacturing company’s warehouse.
Services of painters in building construction.
Cutting oils used in machining operations.
Cost of paper towels in a factory employees’ washroom.
Payroll taxes and fringe benefits related to direct labor.
The plant electricians’ salaries.
Crude oil to an oil refinery.
Copy editor’s salary in a book publishing company.
1. Classify each of these items as direct materials, direct labor, or overhead.2. Assume your classifications could be challenged in a court case. Indicate to your attorneys which of your answers for
part a might be successfully disputed by the opposing attorneys. In which answers are you completely confident?
Business decision case B Quality Painters, Inc., uses a job cost system. As of 2010 January 1, its records showed thefollowing inventory balances:
Materials $ 7,000
Work in process 50,000
Finished goods 0
The work in process inventory consisted of two jobs:
Job No. DirectMaterials
DirectLabor
Overhead Total
100 Community housing $ 9,000 $12,000 $ 4,000 $25,000
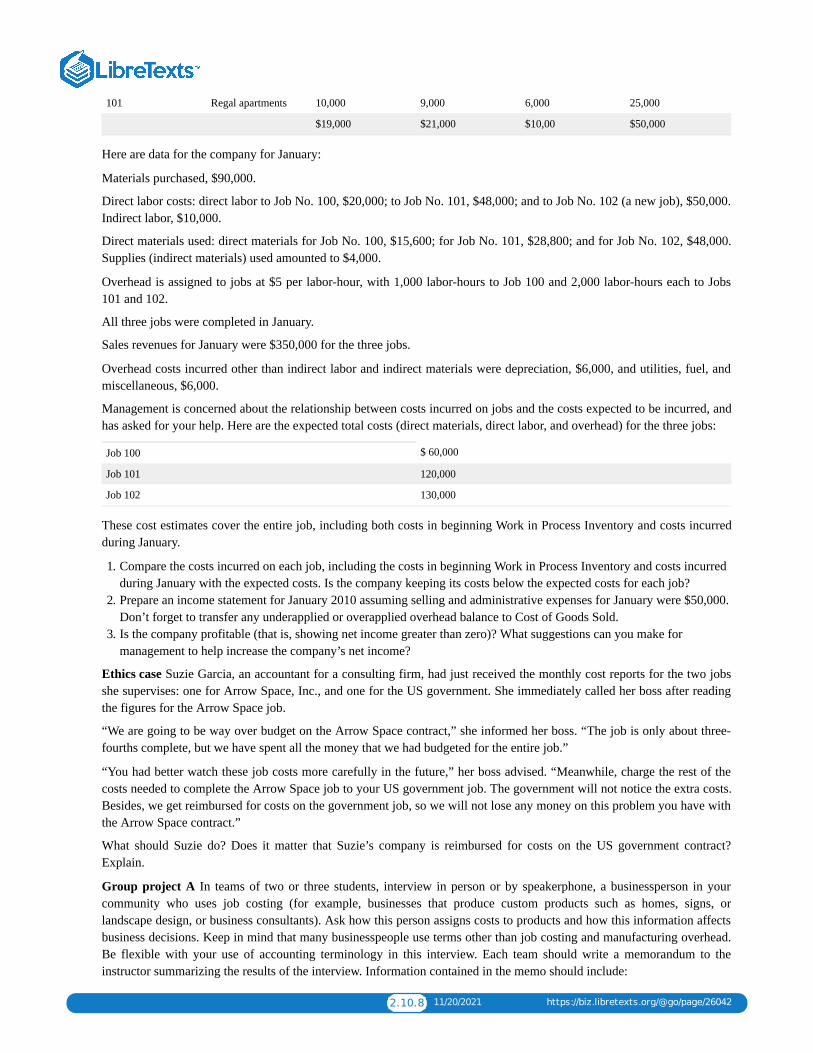
2.10.8 11/20/2021 https://biz.libretexts.org/@go/page/26042
101 Regal apartments 10,000 9,000 6,000 25,000
$19,000 $21,000 $10,00 $50,000
Here are data for the company for January:
Materials purchased, $90,000.
Direct labor costs: direct labor to Job No. 100, $20,000; to Job No. 101, $48,000; and to Job No. 102 (a new job), $50,000.Indirect labor, $10,000.
Direct materials used: direct materials for Job No. 100, $15,600; for Job No. 101, $28,800; and for Job No. 102, $48,000.Supplies (indirect materials) used amounted to $4,000.
Overhead is assigned to jobs at $5 per labor-hour, with 1,000 labor-hours to Job 100 and 2,000 labor-hours each to Jobs101 and 102.
All three jobs were completed in January.
Sales revenues for January were $350,000 for the three jobs.
Overhead costs incurred other than indirect labor and indirect materials were depreciation, $6,000, and utilities, fuel, andmiscellaneous, $6,000.
Management is concerned about the relationship between costs incurred on jobs and the costs expected to be incurred, andhas asked for your help. Here are the expected total costs (direct materials, direct labor, and overhead) for the three jobs:
Job 100 $ 60,000
Job 101 120,000
Job 102 130,000
These cost estimates cover the entire job, including both costs in beginning Work in Process Inventory and costs incurredduring January.
1. Compare the costs incurred on each job, including the costs in beginning Work in Process Inventory and costs incurredduring January with the expected costs. Is the company keeping its costs below the expected costs for each job?
2. Prepare an income statement for January 2010 assuming selling and administrative expenses for January were $50,000.Don’t forget to transfer any underapplied or overapplied overhead balance to Cost of Goods Sold.
3. Is the company profitable (that is, showing net income greater than zero)? What suggestions can you make formanagement to help increase the company’s net income?
Ethics case Suzie Garcia, an accountant for a consulting firm, had just received the monthly cost reports for the two jobsshe supervises: one for Arrow Space, Inc., and one for the US government. She immediately called her boss after readingthe figures for the Arrow Space job.
“We are going to be way over budget on the Arrow Space contract,” she informed her boss. “The job is only about three-fourths complete, but we have spent all the money that we had budgeted for the entire job.”
“You had better watch these job costs more carefully in the future,” her boss advised. “Meanwhile, charge the rest of thecosts needed to complete the Arrow Space job to your US government job. The government will not notice the extra costs.Besides, we get reimbursed for costs on the government job, so we will not lose any money on this problem you have withthe Arrow Space contract.”
What should Suzie do? Does it matter that Suzie’s company is reimbursed for costs on the US government contract?Explain.
Group project A In teams of two or three students, interview in person or by speakerphone, a businessperson in yourcommunity who uses job costing (for example, businesses that produce custom products such as homes, signs, orlandscape design, or business consultants). Ask how this person assigns costs to products and how this information affectsbusiness decisions. Keep in mind that many businesspeople use terms other than job costing and manufacturing overhead.Be flexible with your use of accounting terminology in this interview. Each team should write a memorandum to theinstructor summarizing the results of the interview. Information contained in the memo should include:

2.10.9 11/20/2021 https://biz.libretexts.org/@go/page/26042
Date:
To:
From:
Subject:
Content of the memo must include the name and title of the person interviewed, name of the company, date of theinterview, examples of the use of accounting information for decision making, and any other pertinent information.
Group project B In teams of two or three students, interview the manager of a campus print shop or a print shop in thearea about how the company bids on prospective jobs. Does it use cost information from former jobs that are similar toprospective ones, for example? Does it have a specialist in cost estimation who estimates the costs of prospective jobs?Each team should write a memorandum to the instructor summarizing the results of the interview. Information contained inthe memo should include:
Date:
To:
From:
Subject:
Content of the memo must include the name and title of the person interviewed, name of the company, date of theinterview, and information responding to the questions above.
Using the Internet—A view of the real world
Visit the website for a high technology company, such as HP, Intel Corporation, or IBM, and locate its annual report.Review the annual report to gain a general understanding of the company’s primary business segments and products. Writea report addressing the following questions based on your research. What products or services are provided by thecompany? How does the financial information provided in the annual report (focus on the income statement) differ fromfinancial information used for managerial accounting purposes? As a manager making business decisions within thecompany, what additional information would you need? (Remember that the income statement may be referred to usingdifferent terminology such as statement of earnings or statement of operations.)
Company Website
Hewlett Packard Http://www.hp.com
Intel Corporation Http://www.intel.com
IBM Http://www.ibm.com
Visit the following website for Wells Fargo (a financial institution) and locate its annual report:
http://www.wellsfargo.com
Review the annual report to gain a general understanding of the company’s primary business segments and products. Writea report addressing the following questions based on your research. What products or services are provided by thecompany? How does the financial information provided in the annual report (focus on the income statement) differ fromfinancial information used for managerial accounting purposes? As a manager making business decisions within thecompany, what additional information would you need? (Remember that the income statement may be referred to usingdifferent terminology such as statement of earnings or statement of operations.)
Visit the following website for Home Depot (a retail organization) and locate its annual report:
http://www.homedepot.com
Review the annual report to gain a general understanding of the company’s primary business segments and products. Writea report addressing the following questions based on your research. What products or services are provided by thecompany? How does the financial information provided in the annual report (focus on the income statement) differ fromfinancial information used for managerial accounting purposes? As a manager making business decisions within the
2.10.10 11/20/2021 https://biz.libretexts.org/@go/page/26042
company, what additional information would you need? (Remember that the income statement may be referred to usingdifferent terminology such as statement of earnings or statement of operations.)
1. [1]See Standards of Ethical Conduct for Management Accountants (Montvale, N.J.: Institute of ManagementAccountants, June 1, 1983.)
CC licensed content, Shared previouslyAccounting Principles: A Business Perspective. Authored by: James Don Edwards, University of Georgia & Roger H.Hermanson, Georgia State University. Provided by: Endeavour International Corporation. Project: The Global TextProject. License: CC BY: Attribution
1 1/8/2022
CHAPTER OVERVIEW3: PROCESS COST SYSTEM
3.1: CHAPTER 3 STUDY PLAN3.2: PROCESS COSTING VS. JOB ORDER COSTING3.3: EQUIVALENT UNITS (WEIGHTED AVERAGE)3.4: PROCESS COSTING (WEIGHTED AVERAGE)3.5: JOURNAL ENTRIES FOR THE FLOW OF PRODUCTION COSTS3.6: PROCESS COSTING (FIFO METHOD)3.7: PROCESS COST DEMONSTRATION (FIFO METHOD)3.8: ACCOUNTING IN THE HEADLINES3.9: CHAPTER 3 KEY POINTS3.10: GLOSSARY3.11: CHAPTER 3- EXERCISES

3.1.1 12/18/2021 https://biz.libretexts.org/@go/page/26043
3.1: Chapter 3 Study Plan
Study Plan: Process Costing
Knowledge Targets
I can define the following terms as they relate to our unit:
Process Costing Equivalent Units Conversion Cost Predetermined overhead rate
Weighted Average method Cost of Goods Manufactured Cost per Equivalent Unit Goods completed andtransferred out
Ending goods (or work) inprocess
Process cost summary Percent Complete Goods started
Reasoning Targets
I can identify the difference between process costing and job costing.I can identify costs in process costing as direct materials, direct labor, and overhead.I can understand the difference between beginning and ending balances in work inprocess inventory.I can track process costs from raw materials to goods in process to finished goods and cost of goods sold.I can identify accounts to use in recording the flow of process costing.I can determine the percent complete for direct materials and conversion costs.I can understand equivalent units of production and how it is used in process costing.I can determine the ending balance in goods in process inventory.I can understand a process cost summary report.
Skill Targets
I can prepare and post journal entries for process costing from raw materials to cost of goods sold.I can calculate the equivalent units for direct materials, direct labor and overhead using the weighted averagemethod.I can calculate the cost per equivalent unit using the weighted average method.I can calculate the amount of cost to assign to goods completed and transferred out (also known as cost of goodsmanufactured) using equivalent units and cost per equivalent unit.I can calculate the amount of cost to assign to ending goods in process inventory using equivalent units and cost perequivalent unit.I can prepare a process cost summary report under the weighted average method.
Click Process Cost Study Plan for a printable copy.

3.2.1 12/11/2021 https://biz.libretexts.org/@go/page/26044
3.2: Process Costing Vs. Job Order Costing
Nature of a process cost systemMany businesses produce large quantities of a single product or similar products. Pepsi-Cola makes soft drinks, ExxonMobil produces oil, and Kellogg Company produces breakfast cereals on a continuous basis over long periods. For thesekinds of products, companies do not have separate jobs. Instead, production is an ongoing process.
A YouTube element has been excluded from this version of the text. You can view it online here:pb.libretexts.org/llmanagerialaccounting/?p=70
Job costing and process costing have important similarities:
Both job and process cost systems have the same goal: to determine the cost of products.Both job and process cost systems have the same cost flows. Accountants record production in separate accounts formaterials inventory, labor, and overhead. Then, they transfer the costs to a Work in Process Inventory account.Both job and process cost systems use predetermined overhead rates to apply overhead.
Job costing and process costing systems also have their significant differences:
Types of products produced. Companies that use job costing work on many different jobs with different productionrequirements during each period. Companies that use process costing produce a single product, either on a continuousbasis or for long periods. All the products that the company produces under process costing are the same.Cost accumulation procedures. Job costing accumulates costs by individual jobs. Process costing accumulates costs byprocess or department.Work in Process Inventory accounts. Job cost systems have one Work in Process Inventory account for each job.Process cost systems have a Work in Process Inventory account for each department or process.
Aprocess cost system (process costing) accumulates costs incurred to produce a product according to the processes ordepartments a product goes through on its way to completion. Companies making paint, gasoline, steel, rubber, plastic, andsimilar products using process costing. In these types of operations, accountants must accumulate costs for each process ordepartment involved in making the product. As an example, view this How’s It Made video.
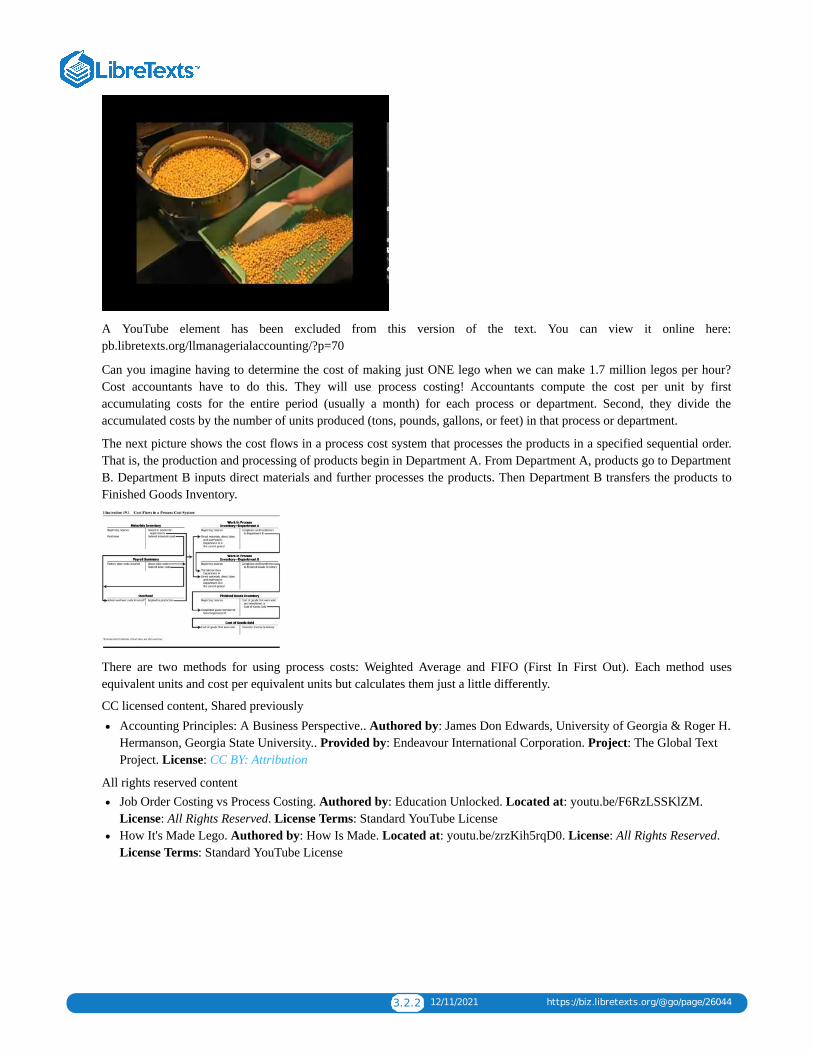
3.2.2 12/11/2021 https://biz.libretexts.org/@go/page/26044
A YouTube element has been excluded from this version of the text. You can view it online here:pb.libretexts.org/llmanagerialaccounting/?p=70
Can you imagine having to determine the cost of making just ONE lego when we can make 1.7 million legos per hour?Cost accountants have to do this. They will use process costing! Accountants compute the cost per unit by firstaccumulating costs for the entire period (usually a month) for each process or department. Second, they divide theaccumulated costs by the number of units produced (tons, pounds, gallons, or feet) in that process or department.
The next picture shows the cost flows in a process cost system that processes the products in a specified sequential order.That is, the production and processing of products begin in Department A. From Department A, products go to DepartmentB. Department B inputs direct materials and further processes the products. Then Department B transfers the products toFinished Goods Inventory.
There are two methods for using process costs: Weighted Average and FIFO (First In First Out). Each method usesequivalent units and cost per equivalent units but calculates them just a little differently.
CC licensed content, Shared previouslyAccounting Principles: A Business Perspective.. Authored by: James Don Edwards, University of Georgia & Roger H.Hermanson, Georgia State University.. Provided by: Endeavour International Corporation. Project: The Global TextProject. License: CC BY: Attribution
All rights reserved contentJob Order Costing vs Process Costing. Authored by: Education Unlocked. Located at: youtu.be/F6RzLSSKlZM.License: All Rights Reserved. License Terms: Standard YouTube LicenseHow It's Made Lego. Authored by: How Is Made. Located at: youtu.be/zrzKih5rqD0. License: All Rights Reserved.License Terms: Standard YouTube License
3.3.1 1/4/2022 https://biz.libretexts.org/@go/page/26045
3.3: Equivalent Units (Weighted Average)
Essentially, the concept of equivalent units involves expressing a given number of partially completed units as a smallernumber of fully completed units. We do this because it is easier to account for whole units then parts of a unit. We areadding together partially completed units to make a whole unit. For example, if we have 3 units 1/3 of the way complete,we can add them together to make 1 equivalent unit (1/3 + 1/3 + 1/3). We can make this calculation easier by multiplyingthe units by a percentage of complete.
For example, if we bring 1,000 units to a 40 % state of completion, this is equivalent to 400 units (1,000 x 40%) that are100% complete. Accountants base this concept on the supposition that a company must incur approximately the sameamount of costs to bring 1,000 units to a 40% level of completion as it would to complete 400 units.
Here is a diagram of the concept of equivalent units. As you examine the diagram, think of the amount of water in theglasses as costs that the company has already incurred.
Now, watch the video for another example.
A YouTube element has been excluded from this version of the text. You can view it online here:pb.libretexts.org/llmanagerialaccounting/?p=72
Units in Beg. Work in Process Units Completed and Transferred
+ Units Started this period + Units in End. Work in Process
= Total Units = Total Units
The total units in each column must agree with one another. This formula explains how many units we had to work with(including units in beginning work in process + units started this period) and what happened to those units (unitscompleted or units remain in work in process inventory since there are not complete).
Under the weighted average method, equivalent units are calculated based on 2 things: units completed andtransferred out and units in ending work in process inventory.
Units completed and transferred are finished units and will always be 100% complete for equivalent unit calculations fordirect materials, direct labor and overhead. For units in ending work in process, we would take the units unfinished x apercent complete. The percent complete can be different for direct materials, direct labor or overhead.
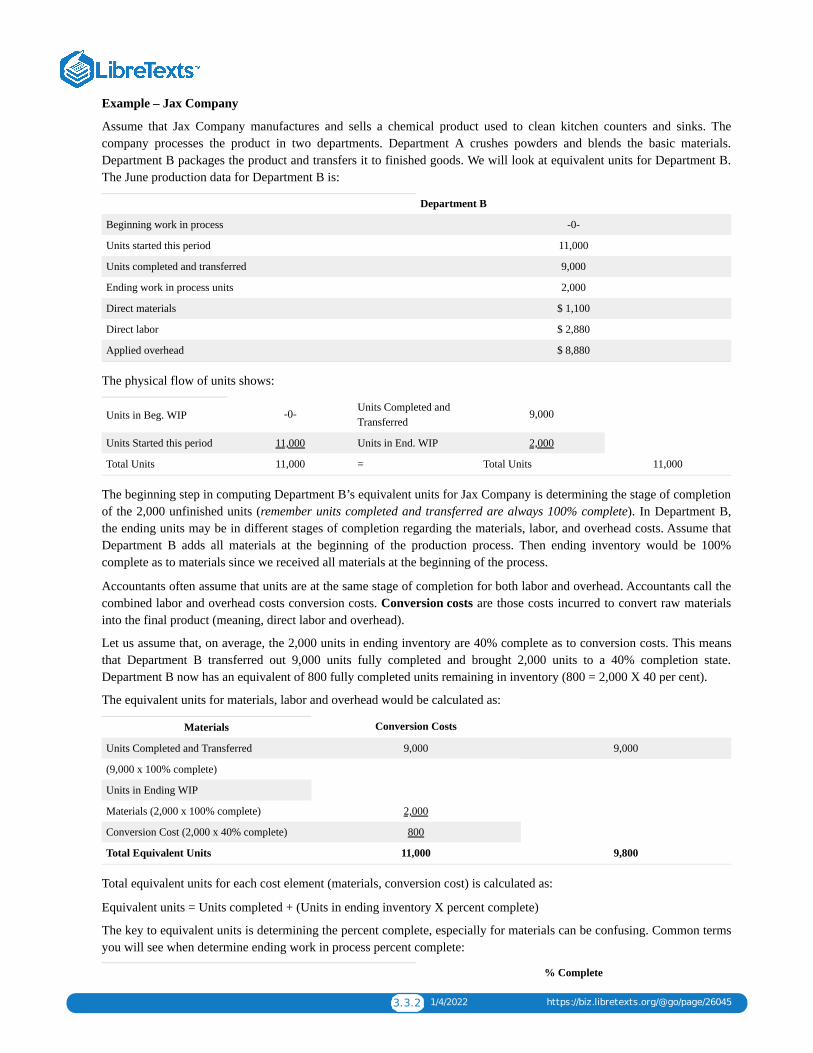
3.3.2 1/4/2022 https://biz.libretexts.org/@go/page/26045
Example – Jax Company
Assume that Jax Company manufactures and sells a chemical product used to clean kitchen counters and sinks. Thecompany processes the product in two departments. Department A crushes powders and blends the basic materials.Department B packages the product and transfers it to finished goods. We will look at equivalent units for Department B.The June production data for Department B is:
Department B
Beginning work in process -0-
Units started this period 11,000
Units completed and transferred 9,000
Ending work in process units 2,000
Direct materials $ 1,100
Direct labor $ 2,880
Applied overhead $ 8,880
The physical flow of units shows:
Units in Beg. WIP -0- Units Completed andTransferred
9,000
Units Started this period 11,000 Units in End. WIP 2,000
Total Units 11,000 = Total Units 11,000
The beginning step in computing Department B’s equivalent units for Jax Company is determining the stage of completionof the 2,000 unfinished units (remember units completed and transferred are always 100% complete). In Department B,the ending units may be in different stages of completion regarding the materials, labor, and overhead costs. Assume thatDepartment B adds all materials at the beginning of the production process. Then ending inventory would be 100%complete as to materials since we received all materials at the beginning of the process.
Accountants often assume that units are at the same stage of completion for both labor and overhead. Accountants call thecombined labor and overhead costs conversion costs. Conversion costs are those costs incurred to convert raw materialsinto the final product (meaning, direct labor and overhead).
Let us assume that, on average, the 2,000 units in ending inventory are 40% complete as to conversion costs. This meansthat Department B transferred out 9,000 units fully completed and brought 2,000 units to a 40% completion state.Department B now has an equivalent of 800 fully completed units remaining in inventory (800 = 2,000 X 40 per cent).
The equivalent units for materials, labor and overhead would be calculated as:
Materials Conversion Costs
Units Completed and Transferred 9,000 9,000
(9,000 x 100% complete)
Units in Ending WIP
Materials (2,000 x 100% complete) 2,000
Conversion Cost (2,000 x 40% complete) 800
Total Equivalent Units 11,000 9,800
Total equivalent units for each cost element (materials, conversion cost) is calculated as:
Equivalent units = Units completed + (Units in ending inventory X percent complete)
The key to equivalent units is determining the percent complete, especially for materials can be confusing. Common termsyou will see when determine ending work in process percent complete:
% Complete
3.3.3 1/4/2022 https://biz.libretexts.org/@go/page/26045
Description
Materials added at the beginning of the process 100% complete for materials
Materials added evenly through out the process Use % complete for ending WIP
Materials added at the end of the process 0% complete for materials
CC licensed content, Shared previouslyAccounting Principles: A Business Perspective.. Authored by: James Don Edwards, University of Georgia & Roger H.Hermanson, Georgia State University.. Provided by: Endeavour International Corporation. Project: The Global TextProject.. License: CC BY: Attribution
All rights reserved content20-- The Concept of Equivalent Units of Production. Authored by: Larry Walther. Located at:youtu.be/IMhBXeb0IsY. License: All Rights Reserved. License Terms: Standard YouTube License
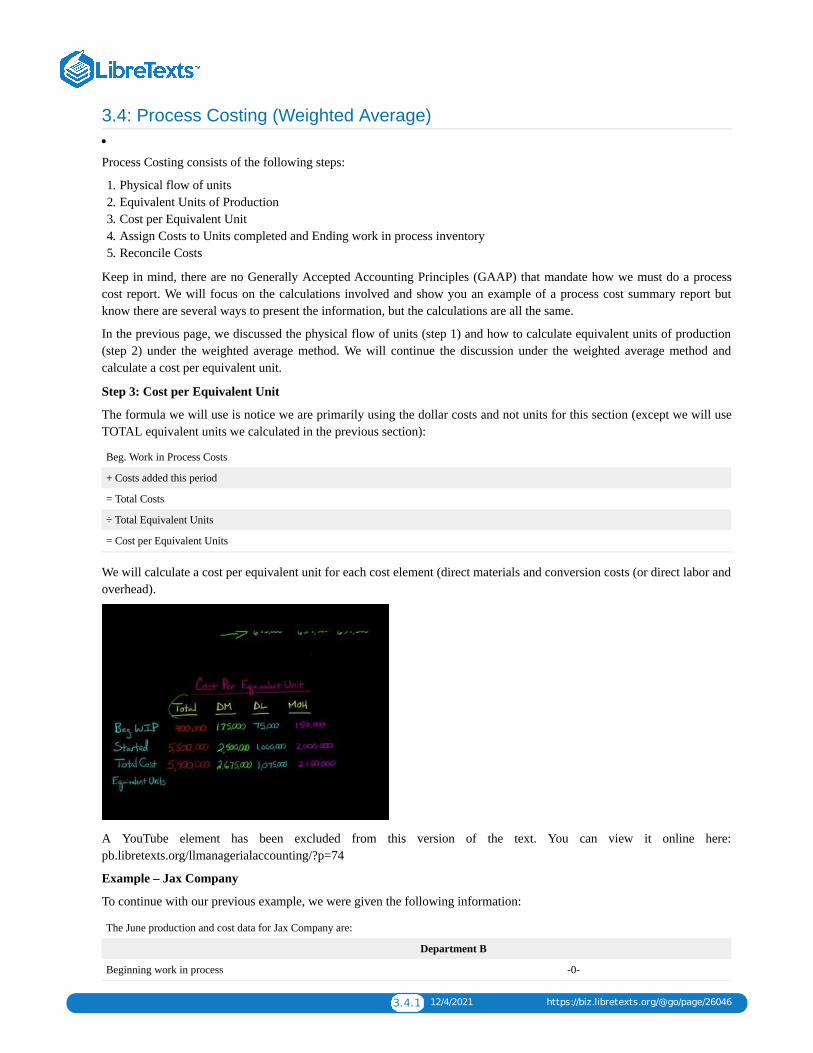
3.4.1 12/4/2021 https://biz.libretexts.org/@go/page/26046
3.4: Process Costing (Weighted Average)
Process Costing consists of the following steps:
1. Physical flow of units2. Equivalent Units of Production3. Cost per Equivalent Unit4. Assign Costs to Units completed and Ending work in process inventory5. Reconcile Costs
Keep in mind, there are no Generally Accepted Accounting Principles (GAAP) that mandate how we must do a processcost report. We will focus on the calculations involved and show you an example of a process cost summary report butknow there are several ways to present the information, but the calculations are all the same.
In the previous page, we discussed the physical flow of units (step 1) and how to calculate equivalent units of production(step 2) under the weighted average method. We will continue the discussion under the weighted average method andcalculate a cost per equivalent unit.
Step 3: Cost per Equivalent Unit
The formula we will use is notice we are primarily using the dollar costs and not units for this section (except we will useTOTAL equivalent units we calculated in the previous section):
Beg. Work in Process Costs
+ Costs added this period
= Total Costs
÷ Total Equivalent Units
= Cost per Equivalent Units
We will calculate a cost per equivalent unit for each cost element (direct materials and conversion costs (or direct labor andoverhead).
A YouTube element has been excluded from this version of the text. You can view it online here:pb.libretexts.org/llmanagerialaccounting/?p=74
Example – Jax Company
To continue with our previous example, we were given the following information:
The June production and cost data for Jax Company are:
Department B
Beginning work in process -0-
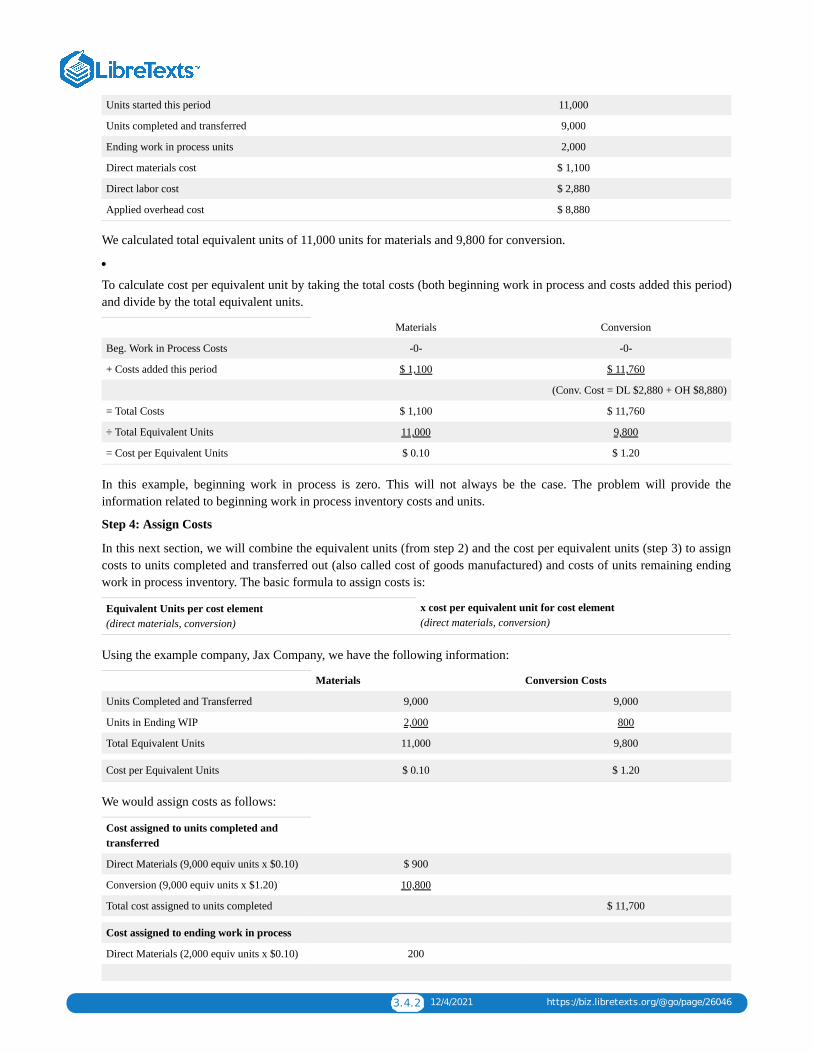
3.4.2 12/4/2021 https://biz.libretexts.org/@go/page/26046
Units started this period 11,000
Units completed and transferred 9,000
Ending work in process units 2,000
Direct materials cost $ 1,100
Direct labor cost $ 2,880
Applied overhead cost $ 8,880
We calculated total equivalent units of 11,000 units for materials and 9,800 for conversion.
To calculate cost per equivalent unit by taking the total costs (both beginning work in process and costs added this period)and divide by the total equivalent units.
Materials Conversion
Beg. Work in Process Costs -0- -0-
+ Costs added this period $ 1,100 $ 11,760
(Conv. Cost = DL $2,880 + OH $8,880)
= Total Costs $ 1,100 $ 11,760
÷ Total Equivalent Units 11,000 9,800
= Cost per Equivalent Units $ 0.10 $ 1.20
In this example, beginning work in process is zero. This will not always be the case. The problem will provide theinformation related to beginning work in process inventory costs and units.
Step 4: Assign Costs
In this next section, we will combine the equivalent units (from step 2) and the cost per equivalent units (step 3) to assigncosts to units completed and transferred out (also called cost of goods manufactured) and costs of units remaining endingwork in process inventory. The basic formula to assign costs is:
Equivalent Units per cost element(direct materials, conversion)
x cost per equivalent unit for cost element(direct materials, conversion)
Using the example company, Jax Company, we have the following information:
Materials Conversion Costs
Units Completed and Transferred 9,000 9,000
Units in Ending WIP 2,000 800
Total Equivalent Units 11,000 9,800
Cost per Equivalent Units $ 0.10 $ 1.20
We would assign costs as follows:
Cost assigned to units completed andtransferred
Direct Materials (9,000 equiv units x $0.10) $ 900
Conversion (9,000 equiv units x $1.20) 10,800
Total cost assigned to units completed $ 11,700
Cost assigned to ending work in process
Direct Materials (2,000 equiv units x $0.10) 200
3.4.3 12/4/2021 https://biz.libretexts.org/@go/page/26046
Conversion (800 equiv units x $1.20) 960
Total cost assigned to ending work in processinventory
$ 1,160
For costs of units completed and transferred, we take the equivalent units for units completed x cost per equivalent unit.We do the same of ending work in process but using the equivalent units for ending work in process.
Step 5: Cost Reconciliation
Finally, we can check our work. We want to make sure that we have assigned all the costs from beginning work in processand costs incurred or added this period to units completed and transferred and ending work in process inventory.
First, we need to know our total costs for the period (or total costs to account for) by adding beginning work in processcosts to the costs incurred or added this period. Then, we compare the total to the cost assignment in step 4 for unitscompleted and transferred and ending work in process to get total units accounted for. Both totals should agree.
For Jax Company, the cost reconciliation would be:
Beg. Work in Process Cost -0-
+ Costs added this period $ 12,860
($1,100 DM + $2,880 DL + $8,880 OH)
= Total costs to account for $ 12,860
Cost assigned to units completed and transferred (from step 4 above) $ 11,700
+ Cost assigned to ending work in process inventory (from step 4above)
1,160
= Total costs accounted for $ 12,860
The full process cost report can be found by clicking Jax_process cost).
CC licensed content, Shared previouslyAccounting Principles: A Business Perspective.. Authored by: James Don Edwards, University of Georgia & Roger H.Hermanson, Georgia State University.. Provided by: Endeavour International Corporation. Project: The Global TextProject.. License: CC BY: Attribution
All rights reserved contentCost Per Equivalent Unit (weighted average method) . Authored by: Education Unlocked. Located at:youtu.be/Txv05196CWs. License: All Rights Reserved. License Terms: Standard YouTube License
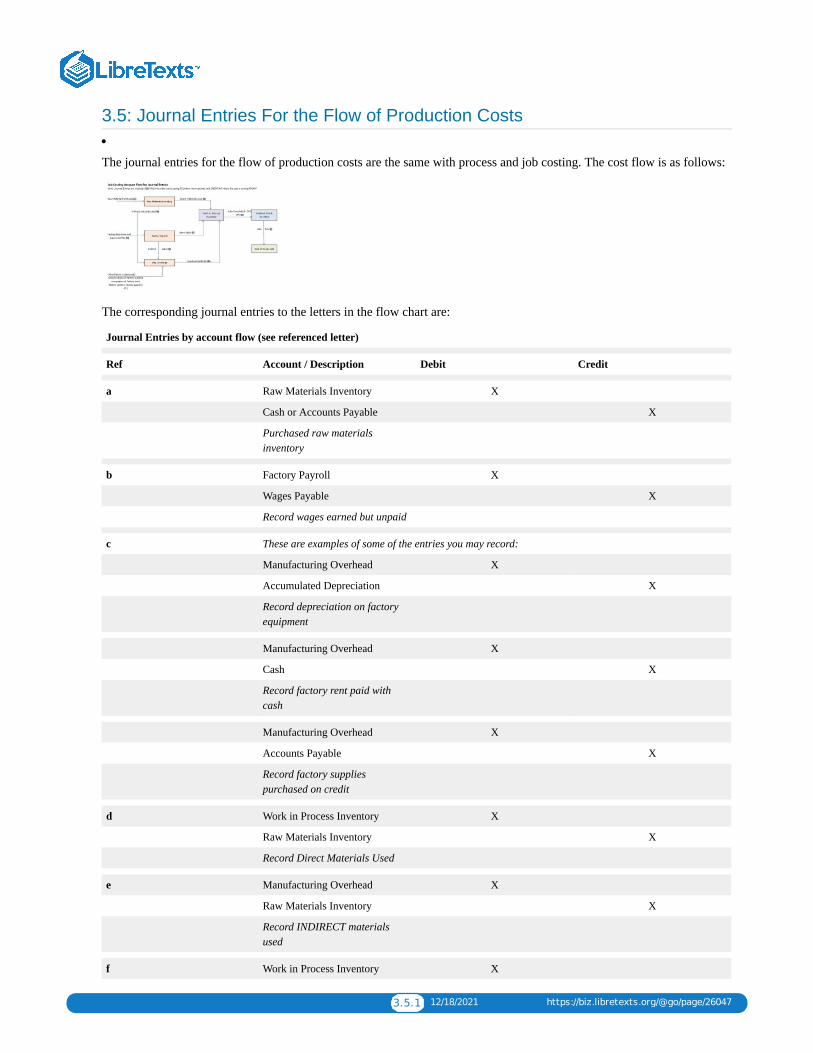
3.5.1 12/18/2021 https://biz.libretexts.org/@go/page/26047
3.5: Journal Entries For the Flow of Production Costs
The journal entries for the flow of production costs are the same with process and job costing. The cost flow is as follows:
The corresponding journal entries to the letters in the flow chart are:
Journal Entries by account flow (see referenced letter)
Ref Account / Description Debit Credit
a Raw Materials Inventory X
Cash or Accounts Payable X
Purchased raw materialsinventory
b Factory Payroll X
Wages Payable X
Record wages earned but unpaid
c These are examples of some of the entries you may record:
Manufacturing Overhead X
Accumulated Depreciation X
Record depreciation on factoryequipment
Manufacturing Overhead X
Cash X
Record factory rent paid withcash
Manufacturing Overhead X
Accounts Payable X
Record factory suppliespurchased on credit
d Work in Process Inventory X
Raw Materials Inventory X
Record Direct Materials Used
e Manufacturing Overhead X
Raw Materials Inventory X
Record INDIRECT materialsused
f Work in Process Inventory X

3.5.2 12/18/2021 https://biz.libretexts.org/@go/page/26047
Factory Payroll X
Record Direct Labor
g Manufacturing Overhead X
Factory Payroll X
Record INDIRECT labor
h Work in Process Inventory X
Manufacturing Overhead X
Record Overhead APPLIED toproduction
i Finished Goods Inventory X
Work in Process Inventory X
Record jobs or goods completed (cost of goods manufactured)
j Cost of goods sold X
Finished Goods Inventory X
Record cost of jobs or goodscompleted AND sold
For a printable view click job cost flow.
3.6.1 12/11/2021 https://biz.libretexts.org/@go/page/26048
3.6: Process Costing (FIFO Method)Another acceptable method for determining unit cost under process costing is the first-in, first-out (FIFO) cost method.Under the FIFO method, we assume any units that were not completed last period (beginning work in process) are finishedbefore anything else is started. The following table shows the differences between the weighted average method and theFIFO cost method:
Weighted Average FIFO
Units Completed and transferred out: Total units completed this periodTotal units finished from beginning work inprocess + units started and completed thisperiod
Equivalent Units based on:Units completed this period + Units inEnding Work in Process
Units from Beg. Work in Process completed +units started and completed + units in EndingWork in Process
Cost per Equivalent Unit based on: Beg. Work in Process Costs + Costs addedthis period
Costs added this period only
Assign costs using:Equivalent Units x Cost per Equivalent Unitsfor Units completed and units in ending Workin Process
Beg. Work in Process Costs + EquivalentUnits x cost per equivalent unit for unitsfinished from Beg. Work In Process, Unitsstarted and completed and units in End. WorkIn Process
We will look at each item individually as we discuss the steps of process costing. Under either method, weighted averageor FIFO, process costing consists of 5 steps:
1. Physical Flow of Units2. Equivalent Units3. Cost per Equivalent Unit4. Assign Costs to Units Completed and Ending Work in Process Inventory5. Reconcile Costs
Physical Flow of Units
The physical flow of units is as follows under the weighted average method:
Units in Beg. WIP Units Completed and Transferred
+ Units Started this period + Units in End. WIP
= Total Units = Total Units
This is altered just slightly under the FIFO method as we must separate the items in units completed into Units Completedfrom beginning work in process and Units started and completed this period since under FIFO, we must finish anythingfrom beginning work in process before we start something new. Under the FIFO, we the physical flow of units would bedocumented as:
Units in Beg. WIP Units Completed and Transferred:
+ Units Started this period Beg. Work in Process Units Completed
= Total Units + Units started and Completed this period
= Units completed and transferred
+ Units in End. WIP
= Total Units
Just as in the weighted average method, the 2 Total Units figures must agree!
Equivalent Units of Production
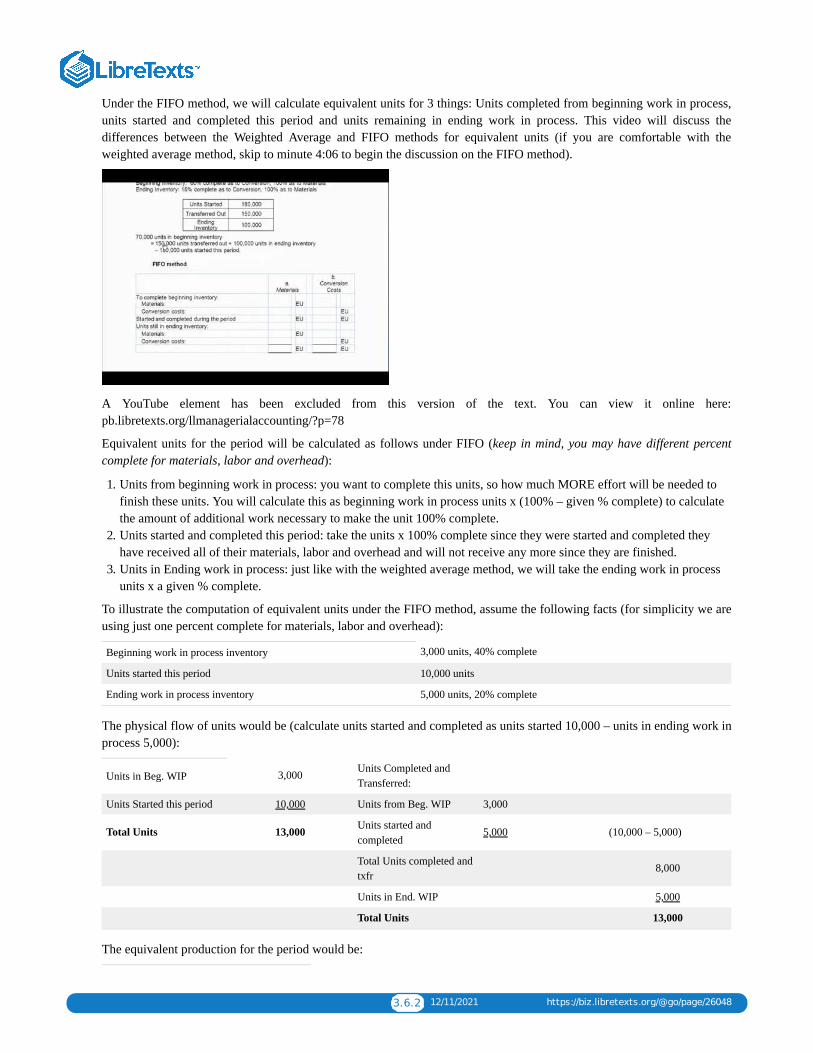
3.6.2 12/11/2021 https://biz.libretexts.org/@go/page/26048
Under the FIFO method, we will calculate equivalent units for 3 things: Units completed from beginning work in process,units started and completed this period and units remaining in ending work in process. This video will discuss thedifferences between the Weighted Average and FIFO methods for equivalent units (if you are comfortable with theweighted average method, skip to minute 4:06 to begin the discussion on the FIFO method).
A YouTube element has been excluded from this version of the text. You can view it online here:pb.libretexts.org/llmanagerialaccounting/?p=78
Equivalent units for the period will be calculated as follows under FIFO (keep in mind, you may have different percentcomplete for materials, labor and overhead):
1. Units from beginning work in process: you want to complete this units, so how much MORE effort will be needed tofinish these units. You will calculate this as beginning work in process units x (100% – given % complete) to calculatethe amount of additional work necessary to make the unit 100% complete.
2. Units started and completed this period: take the units x 100% complete since they were started and completed theyhave received all of their materials, labor and overhead and will not receive any more since they are finished.
3. Units in Ending work in process: just like with the weighted average method, we will take the ending work in processunits x a given % complete.
To illustrate the computation of equivalent units under the FIFO method, assume the following facts (for simplicity we areusing just one percent complete for materials, labor and overhead):
Beginning work in process inventory 3,000 units, 40% complete
Units started this period 10,000 units
Ending work in process inventory 5,000 units, 20% complete
The physical flow of units would be (calculate units started and completed as units started 10,000 – units in ending work inprocess 5,000):
Units in Beg. WIP 3,000 Units Completed andTransferred:
Units Started this period 10,000 Units from Beg. WIP 3,000
Total Units 13,000 Units started andcompleted
5,000 (10,000 – 5,000)
Total Units completed andtxfr
8,000
Units in End. WIP 5,000
Total Units 13,000
The equivalent production for the period would be:
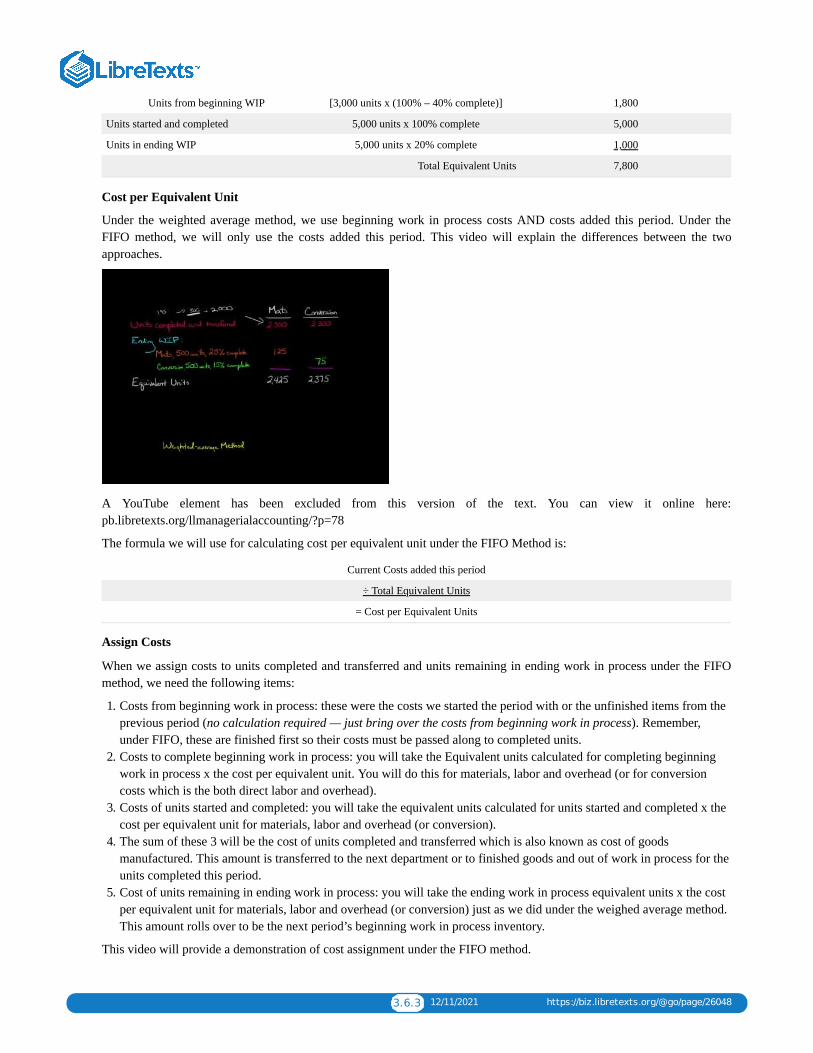
3.6.3 12/11/2021 https://biz.libretexts.org/@go/page/26048
Units from beginning WIP [3,000 units x (100% – 40% complete)] 1,800
Units started and completed 5,000 units x 100% complete 5,000
Units in ending WIP 5,000 units x 20% complete 1,000
Total Equivalent Units 7,800
Cost per Equivalent Unit
Under the weighted average method, we use beginning work in process costs AND costs added this period. Under theFIFO method, we will only use the costs added this period. This video will explain the differences between the twoapproaches.
A YouTube element has been excluded from this version of the text. You can view it online here:pb.libretexts.org/llmanagerialaccounting/?p=78
The formula we will use for calculating cost per equivalent unit under the FIFO Method is:
Current Costs added this period
÷ Total Equivalent Units
= Cost per Equivalent Units
Assign Costs
When we assign costs to units completed and transferred and units remaining in ending work in process under the FIFOmethod, we need the following items:
1. Costs from beginning work in process: these were the costs we started the period with or the unfinished items from theprevious period (no calculation required — just bring over the costs from beginning work in process). Remember,under FIFO, these are finished first so their costs must be passed along to completed units.
2. Costs to complete beginning work in process: you will take the Equivalent units calculated for completing beginningwork in process x the cost per equivalent unit. You will do this for materials, labor and overhead (or for conversioncosts which is the both direct labor and overhead).
3. Costs of units started and completed: you will take the equivalent units calculated for units started and completed x thecost per equivalent unit for materials, labor and overhead (or conversion).
4. The sum of these 3 will be the cost of units completed and transferred which is also known as cost of goodsmanufactured. This amount is transferred to the next department or to finished goods and out of work in process for theunits completed this period.
5. Cost of units remaining in ending work in process: you will take the ending work in process equivalent units x the costper equivalent unit for materials, labor and overhead (or conversion) just as we did under the weighed average method.This amount rolls over to be the next period’s beginning work in process inventory.
This video will provide a demonstration of cost assignment under the FIFO method.

3.6.4 12/11/2021 https://biz.libretexts.org/@go/page/26048
A YouTube element has been excluded from this version of the text. You can view it online here:pb.libretexts.org/llmanagerialaccounting/?p=78
Reconcile Costs
Finally, something is the same under FIFO and Weighted Average.
We want to make sure that we have assigned all the costs from beginning work in process and costs incurred or added thisperiod to units completed and transferred and ending work in process inventory.
First, we need to know our total costs for the period (or total costs to account for) by adding beginning work in processcosts to the costs incurred or added this period. Then, we compare the total to the cost assignment in step 4 for unitscompleted and transferred and ending work in process to get total units accounted for. Both totals should agree.
The cost reconciliation would be:
Beg. Work in Process Cost
+ Costs added this period
= Total costs to account for
Cost assigned to units completed and transferred
+ Cost assigned to ending work in process inventory
= Total costs accounted for
In the next page, we will do a demonstration problem of the FIFO method for process costing.
All rights reserved contentEquivalent Units. Authored by: Linda Williams. License: All Rights Reserved. License Terms: Standard YouTubeLicenseCost Per Equivalent Unit-- FIFO Method vs. Weighted-average Method . Authored by: Education Unlocked. Locatedat: youtu.be/P_Nwchc_pcs. License: All Rights Reserved. License Terms: Standard YouTube LicenseCost Per Equivalent Unit, FIFO Method, Part 2 (Applying Costs) . Authored by: Education Unlocked. Located at:youtu.be/y1TLRSL9Yjo. License: All Rights Reserved. License Terms: Standard YouTube License
3.7.1 1/8/2022 https://biz.libretexts.org/@go/page/26049
3.7: Process Cost Demonstration (FIFO Method)To illustrate more completely the operation of the FIFO process cost method, we use an example of the month of Juneproduction costs for a company’s Department B. Department B adds materials only at the beginning of processing. TheMay 31 inventory in Department B (June’s beginning work in process) consists of 2,000 units that are fully complete as tomaterials and 60% complete as to conversion. Beginning work in process inventory has accumulated costs of $6,180.
The following costs were added in June: Direct materials issued $ 1,300; direct labor $ 7,200; and manufacturing overheadapplied $ 6,000. The units for the period were:
Beginning work in process inventory 2,000 units
Units started this period 10,000 units
Ending work in process inventory 3,000 units
Ending work in process inventory was 1/3 complete as to conversion costs.
Step 1: Physical Flow of UnitsFor the physical flow of units, we calculate units started AND completed this period as Units started 10,000 – unitsremaining in ending work in process 3,000 = 7,000 units.
Units in Beg. WIP 2,000 Units Completed andTransferred:
Units Started this period 10,000 Units from Beg. WIP 2,000
Total Units 12,000 Units started andcompleted
7,000 (10,000 – 3,000)
Total Units completed andtxfr 9,000
Units in End. WIP 3,000
Total Units 12,000
Step 2: Equivalent Units of ProductionWe are concerned with the right side of our physical flow of units. We must first FINISH beginning work in process, addunits started and completed and units remaining in ending work in process. Beginning work in process is fully completefor materials (or 100% complete) and 60% complete for conversion so to complete these units we will need NO (or 0%)materials and 40% of conversion (100% – 60%). Units started and completed are always 100% complete for materials,labor and overhead! Ending work in process is 1/3 complete for conversion costs, but what about materials? The probleminformation reads “Department B adds materials only at the beginning of processing” which means we receive all (or100%) of the materials at the beginning of the process and ending work in process will be fully complete for materials.
Materials Conversion Costs
Units from beginning WIP 0 800
[ 2,000 units x (100% – 100% complete)] [ 2,000 units x (100% – 60% complete)]
Units started and completed 7,000 7,000
(7,000 units x 100% complete)
Units in ending WIP 3,000 1,000
(3,000 units x 100% complete) (3,000 units x 1/3 complete)
Total Equivalent Units 10,000 8,800

3.7.2 1/8/2022 https://biz.libretexts.org/@go/page/26049
Step 3: Cost per Equivalent UnitsUnder FIFO, we are only interested in the current period costs which is June for this example. Conversion costs are directlabor $7,200 + overhead $6,000.
Materials Conversion Costs
Current Costs added this period $ 1,300 $ 13,200 (7,200 + 6,000)
÷ Total Equivalent Units 10,000 8,800
= Cost per Equivalent Unit $ 0.13 $ 1.50
Step 4: Assign Costs to Units Completed and Ending Work in Process InventoryUnder FIFO, remember to bring over the costs of beginning work in process first, then multiply the individual equivalentunits calculated in step 2 (not the total equivalent units) by the cost per equivalent unit from step 3.
Cost assigned to units completed andtransferred out:
Cost of beginning work in process inventory $6,180
Cost to complete beginning work in processinventory
Materials (0 equivalent units) $0
Conversion (800 equiv units x $1.50) $1,200
$1,200
Cost of units started and completed
Materials (7,000 equiv units x $0.13) $910
Conversion (7,000 equiv units x $1.50) $10,500
$11,410
Total cost of units completed andtransferred $18,790
Cost assigned to ending work in processinventory:
Materials (3,000 equiv units x $0.13) $390
Conversion (1,000 equiv units x $1.50) $1,500
Total cost of units remaining in endingwork in process inventory $1,890
Step 5: Reconcile CostsHere is our chance to check our work. Total costs to account for should always equal what was assigned in total costsaccounted for.
Cost of beginning work in process $6,180
Costs added in June $14,500 (1,300 DM + 7,200 DL + 6,000 OH)
Total costs to account for $20,680
Costs assigned to units completed $18,790 (from step 4 above)
Costs assigned to ending work in process $1,890 (from step 4 above)
Total costs accounted for $20,680

3.7.3 1/8/2022 https://biz.libretexts.org/@go/page/26049
CC licensed content, Shared previouslyAccounting Principles: A Business Perspective. Authored by: James Don Edwards, University of Georgia & Roger H.Hermanson, Georgia State University. Provided by: Endeavour International Corporation. Project: The Global TextProject. License: CC BY: Attribution
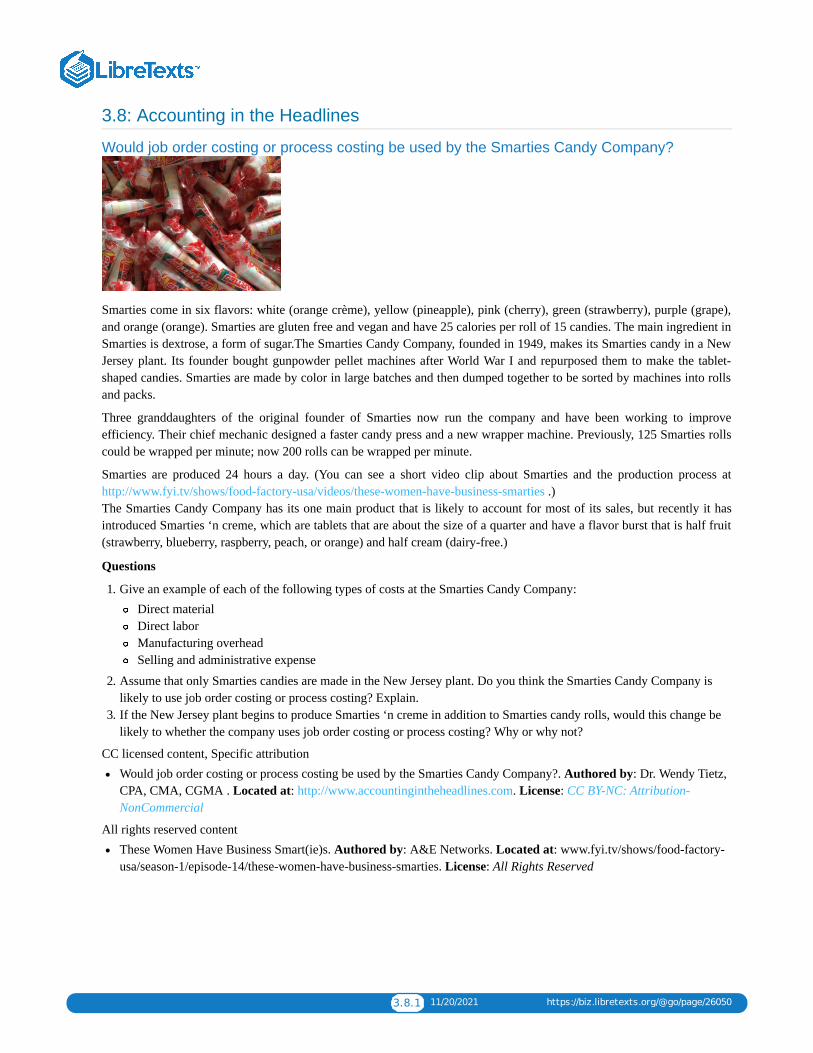
3.8.1 11/20/2021 https://biz.libretexts.org/@go/page/26050
3.8: Accounting in the Headlines
Would job order costing or process costing be used by the Smarties Candy Company?
Smarties come in six flavors: white (orange crème), yellow (pineapple), pink (cherry), green (strawberry), purple (grape),and orange (orange). Smarties are gluten free and vegan and have 25 calories per roll of 15 candies. The main ingredient inSmarties is dextrose, a form of sugar.The Smarties Candy Company, founded in 1949, makes its Smarties candy in a NewJersey plant. Its founder bought gunpowder pellet machines after World War I and repurposed them to make the tablet-shaped candies. Smarties are made by color in large batches and then dumped together to be sorted by machines into rollsand packs.
Three granddaughters of the original founder of Smarties now run the company and have been working to improveefficiency. Their chief mechanic designed a faster candy press and a new wrapper machine. Previously, 125 Smarties rollscould be wrapped per minute; now 200 rolls can be wrapped per minute.
Smarties are produced 24 hours a day. (You can see a short video clip about Smarties and the production process athttp://www.fyi.tv/shows/food-factory-usa/videos/these-women-have-business-smarties .) The Smarties Candy Company has its one main product that is likely to account for most of its sales, but recently it hasintroduced Smarties ‘n creme, which are tablets that are about the size of a quarter and have a flavor burst that is half fruit(strawberry, blueberry, raspberry, peach, or orange) and half cream (dairy-free.)
Questions
1. Give an example of each of the following types of costs at the Smarties Candy Company:Direct materialDirect laborManufacturing overheadSelling and administrative expense
2. Assume that only Smarties candies are made in the New Jersey plant. Do you think the Smarties Candy Company islikely to use job order costing or process costing? Explain.
3. If the New Jersey plant begins to produce Smarties ‘n creme in addition to Smarties candy rolls, would this change belikely to whether the company uses job order costing or process costing? Why or why not?
CC licensed content, Specific attributionWould job order costing or process costing be used by the Smarties Candy Company?. Authored by: Dr. Wendy Tietz,CPA, CMA, CGMA . Located at: http://www.accountingintheheadlines.com. License: CC BY-NC: Attribution-NonCommercial
All rights reserved contentThese Women Have Business Smart(ie)s. Authored by: A&E Networks. Located at: www.fyi.tv/shows/food-factory-usa/season-1/episode-14/these-women-have-business-smarties. License: All Rights Reserved
3.9.1 12/25/2021 https://biz.libretexts.org/@go/page/26051
3.9: Chapter 3 Key Points
Process Costing Key Points
Process costing is used for mass production – high volumes of standardized product. This makes costing difficult due tothe sheer volume of product we are producing and the fact that each product uses a small amount of materials, labor andoverhead. Process costing is done in a 5-step Process.
Step 1: Cost accumulation
This section lists all dollar costs in Beginning work in process and adds the costs added during the period to get your TotalCosts to Account For.
Step 2: Physical Flow of Units
In this section, we document how many units we had to work on and then disclose what happened to those units – werethey finished or not. The calculation is:
Beginning work in process units + units started this period = Units completed and transferred + Ending work in processunits
Step 3: Equivalent Units – Weighted Average
Equivalent units is the process of adding partially completed units together to make whole units since it is easier tocalculate with whole numbers. Under the weighted average method, we use only the Units completed and transferred andEnding work in process units from Step 2. You will calculated equivalent units for direct materials, direct labor andoverhead. The calculation for equivalent units is:
Units completed and transferred x 100% percent complete
Plus Ending work in process units x percent complete
= Total Equivalent Units
Note: Ending work in process percent complete can be different for direct materials, direct labor, or overhead. Materialsadded at the beginning means 100% complete since it has received all its materials. Materials or conversion costs addedevenly means use the percent complete given. Remember, conversion costs means direct labor and overhead.
Step 4: Cost per Equivalent Unit – Weighted Average
We add the total costs incurred during the process including beginning work in process and divide by the Total EquivalentUnits calculated in Step 3. The formula is applied to direct materials, direct labor and overhead individually (or sometimesjust direct materials and conversion costs). The calculation is:
Cost of Beginning work in process inventory + costs added this period
Total Equivalent Units
Step 5: Assign and Reconcile Costs
In this section, you will use the equivalent units calculated in Step 3 and multiply by the cost per equivalent unit calculatedin Step 4. You will do this beginning with units completed and transferred and apply the costs to direct material first, thenconversion costs. The result of this step is Cost of Goods Manufactured. The calculations look like this:
Cost assigned to units completed
Direct Materials (equivalent units for direct materials units completed in step 3 x direct material cost per equivalent unit instep 4)
+ Conversion Costs (equivalent units for conversion cost units completed in step 3 x conversion cost per equivalent unit instep 4).
= Total Costs transferred out (or Cost of Goods Manufactured)
Now, repeat the process using your equivalent units calculated based on Ending Work in Process.

3.9.2 12/25/2021 https://biz.libretexts.org/@go/page/26051
Cost assigned to ending work in process
Direct Materials (equivalent units for direct materials for ending work in process in step 3 x direct material cost perequivalent unit in step 4)
+ Conversion Costs (equivalent units for conversion cost for ending work in process in step 3 x conversion cost perequivalent unit in step 4).
= Total Costs assigned to Ending Work in Process
Finally, you complete the reconciliation by adding your Total Costs Transferred Out and Total costs assigned to EndingWork in Process to get your Total Costs Accounted For. This should match the cost totals in Step 1.
Click Process Costing Key Points for a printable copy.
3.10.1 12/11/2021 https://biz.libretexts.org/@go/page/26052
3.10: Glossary
GLOSSARY
Average cost (or weighted average) method A method of computing equivalent units where the number of equivalentunits for each cost element equals the number of units transferred out plus the number of equivalent units of that costelement in the ending inventory.
Conversion costs Costs of converting raw materials into the final product. Direct labor plus overhead.
Equivalent units A method of expressing a given number of partially completed units as a smaller number of fullycompleted units; for example, bringing 1,000 units to a 75 per cent level of completion is the equivalent of bringing 750units to a 100 per cent level of completion.
First-in, first-out (FIFO) method A method of determining unit cost. This method computes equivalent units by addingequivalent units of work needed to complete the units in beginning inventory, work done on units started and completedduring the period, and work done on partially completed units in ending inventory.
Job cost system (job costing) A manufacturing cost system that accumulates costs incurred to produce a productaccording to individual jobs.
Process cost system (process costing) A manufacturing cost system that accumulates costs incurred to produce a productaccording to the processes or departments a product goes through on its way to completion.
Production cost report A report that shows both the flow of units and the flow of costs through a processing center. Italso shows how accountants divide these costs between the cost of units completed and transferred out and the cost of unitsstill in the processing center’s ending inventory.
Transferred-in costs Costs associated with physical units that were accumulated in previous processing centers.
CC licensed content, Shared previouslyAccounting Principles: A Business Perspective. Authored by: James Don Edwards, University of Georgia & Roger H.Hermanson, Georgia State University. Provided by: Endeavour International Corporation. Project: The Global TextProject. License: CC BY: Attribution
3.11.1 1/8/2022 https://biz.libretexts.org/@go/page/26054
3.11: Chapter 3- Exercises
Short Answer Questions, Exercises, and ProblemsShort-Answer Questions➢ Define process costing and describe the types of companies that use process costing.➢ How does a process cost system differ from a job costing system?➢ Would a lumber mill use process or job costing?➢ What is meant by the term equivalent units? Of what use is thecomputation of the numbers of equivalent units of production?➢ Distinguish between the number of units completed and transferred during a period and the equivalent units for thesame period.➢ Under what circumstances would the number of equivalent units of materials differ from the number ofequivalent units of labor and overhead in the same department in the same period? Under what circumstances would theybe the same?➢ When transferring goods from one department to another, which accounts require journal entries?➢ Unitsare usually assumed to be at the same stage of completion for both labor and overhead. What is the reason for thisassumption?
➢ What is the basic information conveyed by a production cost report?
➢ What are the four steps in preparing a production cost report?
➢ What is meant by average cost procedure? What other two cost flow assumptions could be used?
➢ Would an automobile plant that makes specialty race cars use job costing or process costing? Would an automobile plantthat makes all terrain vehicles use job costing or process costing? Explain your answer.
➢ Show the differences between computing equivalent units of production using the average cost method and FIFO costmethod (Appendix 19A).
➢ Real world question Does The Coca-Cola Company use a process cost system or a job costing system in its bottlingplants? Why?
➢ Real world question Name five companies that probably use process costing.
Exercises
Exercise A Using the average cost method, compute the equivalent units of production in each of the following cases:
1. Units started in production during the month, 72,000; units completed and transferred, 52,800; and units in process atthe end of the month (100% complete as to materials; 60% complete as to conversion), 19,200. (There was nobeginning inventory.)
2. Units in process at the beginning of the month (100% complete as to materials; 30% complete as to conversion),12,000; units started during the month, 48,000; and units in process at the end of the month (100% complete as tomaterials; 40% complete as to conversion), 24,000.
Exercise B In Department C, materials are added at the beginning of the process. There were 1,000 units in beginninginventory, 10,000 units were started during the month, and 7,000 units were completed and transferred to finished goodsinventory. The ending inventory in Department C in June was 40% complete as to conversion costs. Under the averagecost method, what are the equivalent units of production for materials and conversion?
Exercise C In Department D, materials are added uniformly throughout processing. The beginning inventory wasconsidered 80% complete, as was the ending inventory. Assume that there were 6,000 units in the beginning inventory and20,000 in the ending inventory, and that 80,000 units were completed and transferred out of Department D. What are theequivalent units for the period using the average cost method?
Exercise D If in the previous exercise the total costs charged to the department amounted to $960,000, including the$48,000 cost of the beginning inventory, what is the cost of the units completed and transferred out?
Exercise E The following data relate to Work in Process—Department C, in which all materials are added at the start ofprocessing:
Work in process – Department C: Inventory, March 1:
Materials cost (1,200 pounds; 100% complete) $7,020
3.11.2 1/8/2022 https://biz.libretexts.org/@go/page/26054
Conversion cost (20% complete) 1,804
Costs incurred this period:
Direct materials used (9,000 pounds) $36,330
Direct labor 10,880
Overhead 17,820
Inventory, March 31
Materials cost (1,800 pounds, 100% complete) ?
Conversion cost (1,800 pounds, 80% complete) ?
Pounds of product transferred out: 8,400
Using these data, compute:
1. The unit cost per equivalent unit for materials and conversion (use the average cost method).2. The cost of the product transferred out.
Problems
Problem A The following data refer to a production center of Sipp-Fizz, a soft drink bottler:
Work in process inventory, August 1, 4,000 units (units equal 12-bottle cases):
Direct materials $12,000
Direct labor 6,120
Manufacturing overhead applied 8,000
$26,120
Units started in August 12,000
Costs incurred in August:
Direct materials $36,000
Direct labor 48,000
Manufacturing overhead applied 60,000
The beginning inventory was 100% complete for materials and 50% complete for conversion costs.
The ending inventory on August 31 consisted of 6,000 units (100% complete for materials, 70% complete for conversioncosts).
Compute the following:
1. Number of units completed and transferred to finished goods inventory.2. The equivalent units of production for materials and conversion costs using the average cost method.3. Cost per equivalent unit for materials and conversion costs.4. Cost of units completed and transferred.5. Cost of ending inventory.
Problem B The following information relates to Aromatic Company for its line of perfume products for the month endedMarch 31:
Units in beginning inventory (units equal cases of product) 2,700
Cost of units in beginning inventory:
Materials $40,500
Conversion $ 18,900
Units placed in production 54,000

3.11.3 1/8/2022 https://biz.libretexts.org/@go/page/26054
Cost incurred during current period:
Materials $239,598
Conversion $215,310
Units remaining in ending inventory(100% complete as to materials, 60% complete as to conversion)
3,000
Prepare a production cost report for the month ended March 31, using the average cost method.
Problem C Shine Company uses a process cost system to account for the costs incurred in making its single product, ahair conditioner. This product is processed in Department A and then in Department B. Materials are added in bothdepartments. Production for May was as follows:
Department A Department B
Units started or transferred in 200,000 160,000
Units completed and transferred out 160,000 120,000
Stage of completion of May 31 inventory:
Materials 100% 80%
Conversion 50% 40%
Costs incurred this month:
Direct materials costs $200,000 $304,000
Conversion costs $540,000 $272,000
There was no May 1 inventory in either department.
1. Prepare a production cost report for Department A in May.2. Prepare a production cost report for Department B in May.
Problem D A bottling company bottles soft drinks using a process cost system. Following are cost and production data forthe mixing department for June:
Units Materialscosts
Conversioncosts
Inventory, June 1 56,000 $11,620 $16,240
Placed in production in June 133,000 29,960 41,720
Inventory, June 30 63,000 ? ?
The June 30 inventory was 100% complete as to materials and 30% complete as to conversion.
Prepare a production cost report for the month ended June 30 using the average cost method.
Problem E Refer to the facts given in the previous problem. Assume the beginning inventory on June 1 was 100%complete as to materials and 25% complete as to conversion.
1. Prepare a production cost report for the month ended June 30, using FIFO. Round unit costs to the nearest cent.2. Why are ending inventory amounts different than those for the previous problem?
Alternate problems
Alternate problem A Pure Aqua Company is a producer of flavored mineral water. These data are for its Marchproduction:
Work in process inventory, March 1, 3,000 (units equal cases):
Direct materials $12,600
Direct labor 6,000
Manufacturing overhead (1,500 machine-hours at $6 per machine- 9,000

3.11.4 1/8/2022 https://biz.libretexts.org/@go/page/26054
hours)
$27,600
Units started in March 9,000
Costs incurred in March:
Direct materials $36,360
Direct labor 55,200
Manufacturing overhead applied (13,800 machine-hours) ?
The ending inventory consisted of 4,500 units (100% complete as to materials, 60% complete as to conversion).
Compute the following:
1. Number of units completed and transferred to finished goods inventory.2. The equivalent units of production for materials and conversion costs using the average cost method.3. Cost per equivalent unit for materials and conversion costs.4. Cost of units completed and transferred.5. Cost of ending inventory.
Alternate problem B The following data pertain to a production center of Sunbelt Company, a maker of sunscreenproducts:
Units Materialscosts
Conversioncosts
Inventory, October 1 70,000 $12,000 $16,000
Placed in production in October 200,000 20,400 18,200
Inventory, October 31 100,000 ? ?
The October 31 inventory was 100% complete as to materials and 20% complete as to conversion costs.
Prepare a production cost report for the month ended October 31, using the average cost method.
Alternate problem C Healthbar Company produces a health food and determines product costs using a process costsystem. The product is moved through two departments, mixing and bottling. Production and cost data for the bottlingdepartment in August follow.
Work in process, August 1 (30,000 pints):
Costs transferred in $30,000
Materials costs 15,000
Conversion costs 9,000
Costs incurred in August:
Transferred in (100,000 pints) $100,000
Materials costs 50,000
Conversion costs 39,300
All materials are added at the beginning of the bottling process. Ending inventory consists of 25,000 pints, 100% completeas to materials and 40% complete as to conversion.
Prepare a production cost report for August using the average cost method.
Beyond the numbers—Critical thinking
Business decision case A Bicycles Plus, Inc., produces bicycles. While the company has developed a per unit cost, it hasnot been able to break down its costs in each of its three departments: frames, assembling, and finishing. Karol Ring, theproduction manager, has been concerned with cost overruns during July in the frames department, which produces thebicycle frames.
3.11.5 1/8/2022 https://biz.libretexts.org/@go/page/26054
On July 1, the frames department had 6,000 units in its work in process inventory. These units were 100% complete as tomaterials and 40% complete as to conversion. The department had incurred $12,000 in materials costs and $90,000 inconversion costs in processing these 6,000 units.
The department handled 30,000 units during the month, including the 6,000 units in beginning inventory on July 1. At theend of the month, the department’s work in process included 3,600 units that were 100% complete as to materials and 30%complete as to conversion. The month’s costs were allocated on the number of units processed during the month asfollows:
Materials Conversion
Costs $60,000 $300,216
Units handled during month 30,000 30,000
Cost per unit $ 2 $ 10
The $12 per unit cost was assigned in a way that resulted in the following costs:
Beginning workin process
Work startedand completed
Ending workin process
Cost per unit incurred during themonth:
Units 6,000 20,400 3,600
Cost per unit $12 $12 $12
Ring realized that this per unit cost is incorrect and asks you to develop a better method of computing these costs for themonth ended July 31.
1. How would you recommend that July’s costs be assigned to the units produced?How would this differ from the presentmethod?
2. To justify your recommendation, recalculate July’s costs using your recommendation. Present your analysis in aproduction cost report.
Ethics case – Writing experience B Steve Yung works in the inventory control group at a company that produces stone-washed jeans. A good friend manages the Stitching Department at the same company. At the end of a recent month, Yungreviewed the Stitching Department’s production cost report and found the department had no beginning Work in ProcessInventory, had started 27,000 pairs of jeans, and had produced only 24,000 pairs. That leaves 3,000 pairs in endinginventory, Yung thought, that is a lot of jeans they did not finish.
Later, Yung visited his friend who managed the Stitching Department. “Why all the ending inventory?” he asked.
“One of the new workers set several machines wrong, and the stitching was bad on 2,400 pairs,” the manager replied. “Weset those aside, and we will fix them when we have some free time. The other 600 pairs are complete now, and have beentransferred out. Our entire operation was slower because of the machine problem.”
“Company policy is to send all defective products to the Rework Department. They can fix the jeans. That is their job,”Yung said.
“No way!” exclaimed the Stitching Department manager. “We would all be in trouble if plant management finds out. Theworker who messed up would probably be fired. I do not want that. This is our little problem, and we will take care of it.”
1. What should Yung do?2. Would your answer change if Yung learned that the Stitching Department had fixed the jeans and sent them on to the
next department?
Financial analysis C Suppose a bottling company made an error in estimating the stage of completion of its work inprocess inventory. Suppose the costs in beginning inventory and the costs transferred in were correct, but the companyoverstated the stage of completion for both materials and conversion costs in ending Work in Process Inventory causing
3.11.6 1/8/2022 https://biz.libretexts.org/@go/page/26054
ending Work in Process Inventory to be $100,000 too high. The beginning and ending Finished Goods Inventory amountsare correct. What effect would this error have on the company’s last year’s financial statements?
Group project D In groups of 3 or 4 students, write a paper on the topic, “How scientific is the allocation of joint costs toproducts?” Prepare the paper on a computer and prepare and edit several drafts before turning in the final paper. Useexamples to demonstrate your points.
Group project E In teams of two or three students, interview the manager of a grocery store. What is the cost of spoilagein the vegetable and fruit section as a percentage of the total cost of goods sold? Does the manager differentiate betweennormal and abnormal spoilage? If so, provide some examples. Each team should write a memorandum to the instructorsummarizing the results of the interview. Information contained in the memo should include:
Date:
To:
From:
Subject:
Content of the memo must include the name and title of the person interviewed, name of the company, and informationresponding to the questions above.
Group project F In teams of two or three students, interview the manager of a fast food restaurant such as McDonald’s.What is the cost of spoilage as a percentage of the total cost of goods sold? Does the manager differentiate between normaland abnormal spoilage? If so, provide some examples. Each team should write a memorandum to the instructorsummarizing the results of the interview. Information contained in the memo should include:
Date:
To:
From:
Subject:
Content of the memo must include the name and title of the person interviewed, name of the company, and informationresponding to the questions above.
Using the Internet—A view of the real world
Using the Internet as a research tool, describe the conversion activities (or processes) involved in producing oil or oil-related products. Your description should include examples of raw materials used as inputs, production activities requiredto convert inputs into products, and resulting outputs (finished goods). Write your report in the form of a memorandum.The heading of the memorandum should contain the date, to whom it is written, from whom, and the subject matter. Besure to attach your research materials obtained from the Internet to the memorandum.
Using the Internet as a research tool, describe the conversion activities (or processes) involved in producing milk or milk-related products. Your description should include examples of raw materials used as inputs, production activities requiredto convert inputs into products, and resulting outputs (finished goods). Write your report in the form of a memorandum.The heading of the memorandum should contain the date, to whom it is written, from whom, and the subject matter. Besure to attach your research materials obtained from the Internet to the memorandum.
Comprehensive review problem
The Compack Company assembles personal computers. Personal computers go through several departments where subassemblies are unpacked and checked, the circuit board is attached, the product is tested and repaired if defective, and thecomputers are packed carefully for shipping. Each order is treated as a job, and the entire job is shipped at once. Thecompany keeps track of costs by job and calculates the equivalent stage of completion for each job based on machine-hours.
Although the company has grown rapidly, it has yet to show a profit. You have been called in as a consultant. Managementbelieves some jobs are profitable and others are not, but it is not clear which are profitable. The accounting system isalmost nonexistent; however, you piece together the following information for April:
3.11.7 1/8/2022 https://biz.libretexts.org/@go/page/26054
Production:
1. Completed Job No. 101.2. Started and completed Job No. 102.3. Started Job No. 103.
Inventory values:
1. Work in process inventory:
March 31: Job No. 101
Direct materials $60,000
Direct labor 9,600
Overhead 14,400
April 30: Job No. 103
Direct materials $45,000
Direct labor 10,400
Overhead 15,600
1. Job No. 101 was exactly one-half finished in direct labor-hours and machine-hours at the beginning of April, and JobNo. 103 was exactly one-half complete in direct labor-hours and machine-hours at the end of April. However, all of thedirect materials necessary to do the entire job were charged to each job as soon as the job was started.
2. There were no direct materials inventories or finished goods inventories at either March 31 or April 30.
Manufacturing overhead is applied at $30 per machine-hour. The company used 1,600 machine-hours during April, 480machine-hours on Job 101 and 600 machine-hours on Job 102. The actual overhead for the month of April was$50,000.Cost of goods sold (before adjustment for over applied or under applied overhead):
Job No. 101:
Materials $60,000
Labor ?
Overhead ?
Total ?
Job No. 102:
Materials ?
Labor ?
Overhead ?
Total ?
Overhead was applied to jobs using the predetermined rate of $30 per machine-hour. The same rate had been used sincethe company began operations. Over- or under applied overhead is debited or credited to Cost of Goods Sold.All direct materials were purchased on account. Direct materials purchased in April amounted to $150,000.Direct labor costs charged to jobs in April were $32,000. All labor costs were the same rate per hour for April for alllaborers.
1. Compute the cost of each job, whether in inventory or sold.2. Show the transactions in journal entry form. Use a separate Work in Process Inventory account for each job.3. Prepare an income statement for April assuming revenue was $250,000 and selling and administrative expenses were
$60,000.4. [1]For example, a survey of oil refineries indicated that seven of the nine companies did not allocate joint costs. See K.
Slater and C. Wooton, A Study of Joint and By-Product Costing in the U.K. (Reprint, London: Chartered Institute of

3.11.8 1/8/2022 https://biz.libretexts.org/@go/page/26054
Management Accountants, 1988), p. 110.
CC licensed content, Shared previouslyAccounting Principles: A Business Perspective. Authored by: James Don Edwards, University of Georgia & Roger H.Hermanson, Georgia State University. Provided by: Endeavour International Corporation. Project: The Global TextProject. License: CC BY: Attribution
1 1/8/2022
CHAPTER OVERVIEW4: ACTIVITY-BASED COSTING
4.1: ACTIVITY-BASED COSTING AND MANAGEMENT4.2: CHAPTER 4 STUDY PLAN4.3: ACTIVITY BASED-COSTING METHOD4.4: ACCOUNTING IN THE HEADLINES4.5: CHAPTER 4 KEY POINTS4.6: GLOSSARY4.7: CHAPTER 4- EXERCISES
4.1.1 1/8/2022 https://biz.libretexts.org/@go/page/26055
4.1: Activity-Based Costing and Management
Activity-based costing and managementSuppose you go to a movie theater that has five screens showing five different movies. Jerome Justin works for the movietheater selling tickets for all five movies. Suppose management wants to know the cost of selling tickets per movie andasks you to assign Justin’s wages to each of the five movies. How would you assign his wages?
You could simply divide Justin’s wages by the number of movies and allocate 20% (1/5 = 20%) of his salary to eachmovie. Or you could figure out how many tickets he sold to each movie, and allocate his wages on the basis of ticket sales.For example, if 50% of the ticket sales were for Avatar, you might allocate 50% of Justin’s wages to Avatar. You probablyalso could think of additional ways to allocate Justin’s wages. No matter how we allocate Justin’s wages, his wages wouldnot be directly traceable to one of the movies if he sold tickets for all five movies. In short, the allocation of Justin’s wagesto a particular movie is at least somewhat arbitrary because alternative methods could allocate different amounts of Justin’swages to each movie. Justin’s wages would be indirect costs to the different movies because his wages could not bedirectly assigned to any one of the movies.
By definition, the allocation of indirect costs is at least somewhat arbitrary. Nevertheless, accountants have discovered thatthey can improve the ways costs are assigned, such as to movies in this case, by using activity-based costing.
Activity-based costing is a costing method that assigns indirect costs to activities and to the products based on eachproduct’s use of activities. Activity-based costing is based on the premise: Products consume activities; activities consumeresources.
Activity-based costing identifies the activities generating costs and assigns costs to those activities. Take the earlier Justinexample. By focusing on Justin’s activities, management could learn what caused costs and find ways to improve Justin’sefficiency. Suppose that by studying Justin’s activities, management learns he spends 40% of his time answering questionsabout movies, 40% of his time selling tickets, and 20% doing nothing. Based on this information, management could thinkabout better ways to use Justin’s time. By improving their signs and posting information about the movies, managementcould reassign Justin to other tasks.
Closely related to activity-based costing is the notion of activity-based management (ABM). Using activity-basedmanagement, managers identify which activities consume resources. The focus is then to effectively manage costlyactivities with the goal of reducing costs and improving quality. Consider Justin and the movie theater again. Usingactivity-based management, managers would identify what Justin did with his time and perhaps find ways to help himbecome more efficient.
Let’s look at a company that makes clothing. The product does not cost less under one system or another. Our problem isthat no cost system measures costs perfectly. We are able to trace some costs directly to the product. For example, we arepretty accurate in measuring the cost of denim, which is a direct material, in each of our shirts, pants, jackets, and so forth.
Activity-based costing and managementSuppose you go to a movie theater that has five screens showing five different movies. Jerome Justin works for the movietheater selling tickets for all five movies. Suppose management wants to know the cost of selling tickets per movie andasks you to assign Justin’s wages to each of the five movies. How would you assign his wages?
You could simply divide Justin’s wages by the number of movies and allocate 20 per cent of his salary to each movie. Oryou could figure out how many tickets he sold to each movie, and allocate his wages on the basis of ticket sales. Forexample, if 50 per cent ofthe ticket sales were for Avatar, you might allocate 50 per cent of Justin’s wages to Avatar. Youprobably also could think of additional ways to allocate Justin’s wages. No matter how we allocate Justin’s wages, hiswages would not be directly traceable to one of the movies if he sold tickets for all five movies. In short, the allocation ofJustin’s wages to a particular movie is at least somewhat arbitrary because alternative methods could allocate differentamounts of Justin’s wages to each movie. Justin’s wages would be indirect costs to the different movies because his wagescould not be directly assigned to any one of the movies.
By definition, the allocation of indirect costs is at least somewhat arbitrary. Nevertheless, accountants have discovered thatthey can improve the ways costs are assigned, such as to movies in this case, by using activity-based costing.
4.1.2 1/8/2022 https://biz.libretexts.org/@go/page/26055
Activity-based costing is a costing method that assigns indirect costs to activities and to the products based on eachproduct’s use of activities. Activity-based costing is based on the premise: Products consume activities; activities consumeresources.
Numerous companies, such as HP, Caterpillar, and IBM, have implemented activity-based costing. Activity-based costing(ABC) has revealed startling information in these companies. For example, after installing new costing methods, one well-known company found that one of its products, a printed circuit board, was generating negative margins of 46 per cent.
Activity-based costing identifies the activities generating costs and assigns costs to those activities. Take the earlier Justinexample. By focusing on Justin’s activities, management could learn what caused costs and find ways to improve Justin’sefficiency. Suppose that by studying Justin’s activities, management learns he spends 40 per cent of his time answeringquestions about movies, 40 per cent of his time selling tickets, and 20 per cent doing nothing. Based on this information,management could think about better ways to use Justin’s time. By improving their signs and posting information about themovies, management could reassign Justin to other tasks.
Closely related to activity-based costing is the notion of activity-based management (ABM). Using activity-basedmanagement, managers identify which activities consume resources. The focus is then to effectively manage costlyactivities with the goal of reducing costs and improving quality. Consider Justin and the movie theater again. Usingactivity-based management, managers would identify what Justin did with his time and perhaps find ways to help himbecome more efficient.
Let’s illustrate by looking at a textile company that makes jeans. We will use this company as a basis to demonstratesimportant issues about the difficulty with traditional cost allocation methods and the advantages of activity-based costing.
The product does not cost less under one system or another. Our problem is that no cost system measures costs perfectly.We are able to trace some costs directly to the product. For example, we are pretty accurate in measuring the cost of denim,which is a direct material, in each of our shirts, pants, jackets, and so forth.
Overhead costs are another matter. Overhead includes costs like electricity to run machines and salaries of productdesigners and inspectors. All these costs are allocated to products. We know quality control inspectors cost money, but wedo not know how much of that cost is caused by a particular jacket or pair of pants. So we make some assumptions aboutthe relation between products and overhead costs. For example, we typically allocate overhead based on machine-hoursrequired to stitch and fasten snaps. While that is probably a reasonable way to allocate the costs of electricity to runmachines, its not a desirable way to allocate the cost of quality control inspectors.
overhead allocation is somewhat arbitrary (it is based on an estimate only), how will activity-based costing help?
Activity-based costing provides more accurate information because we can identify which activities cause costs, and wecan determine the cost of the activity. Activity-based costing identifies and measures the costs of performing the activitiesthat go into a product much better than traditional cost methods. For example, if a particular jacket requires 10 inspectionsfor a production run of 1,000 jackets, we figure out the cost of those inspections and assign that cost to the production runfor this particular jacket.
But exactly how would activity-based costing help us cut production costs?
Once we identify activities that cause costs, we can eliminate or modify costly activities. For example, if we find that ajacket requires too many costly inspections, we could redesign the jacket to reduce the need for inspections. Our currentcost system allocates all overhead costs, including inspection costs, to products based on machine-hours. We really do notknow how much it costs to make an inspection and how much inspection cost is required by each product.
Because activity-based costing provides more information, it takes more time than traditional cost systems. Newaccounting methods sound great in theory, but there must be enough benefit from improved management decisions tojustify the additional work required to provide numbers.
Key points about activity-based costing:
1. The allocation of indirect costs is at least somewhat arbitrary, even using sophisticated accounting methods.2. Activity-based costing provides more detailed measures of costs than traditional allocation methods.3. Activity-based costing can help marketing people by providing more accurate product cost numbers for decisions about
pricing and which unprofitable products the company should eliminate.
4.1.3 1/8/2022 https://biz.libretexts.org/@go/page/26055
4. Production also benefits because activity-based costing provides better information about the cost of each activity. Inpractice, ABC helps managers identify cost-causing activities. To manage costs, production managers learn to managethe activities that cause costs.
5. Activity-based costing provides more information about product costs than traditional methods but requires morerecord-keeping. Managers must decide whether the benefits or improved decisions justify the additional record-keepingcost.
6. Installing activity-based costing requires teamwork among accountants, production managers, marketing managers, andother nonaccounting people.
Next, we discuss the methods used for activity-based costing and illustrate them with an example.

4.2.1 12/18/2021 https://biz.libretexts.org/@go/page/26053
4.2: Chapter 4 Study Plan
Study Plan: Activity Based Costing
Knowledge Targets
I can define the following terms as they relate to our unit:
Cost Driver Cost Pool Product Margin Activity Based Costing
Customer Margin Activity Rate Plantwide rate Departmental rate
Allocation Base Cost per Unit
Reasoning Targets
I can explain the use of cost pools in activity based costing.I can analyze the product margin of a product when using activity based costing and plantwide allocation.I can understand the difference between plantwide rate, departmental rate, and activity based costing activity rate.I can analyze the customer margin of a product using activity based costing.
Skill Targets
I can calculate activity rates for activity cost pools.I can calculate the product margin using a traditional costing system and activity based costing.I can allocate overhead using activity based costing activity rates.I can allocate overhead using plantwide rates and departmental rates.I can calculate the total cost of a department, job, product, or process using activity based costing.
Click ABC Costing study plan for a printable copy.
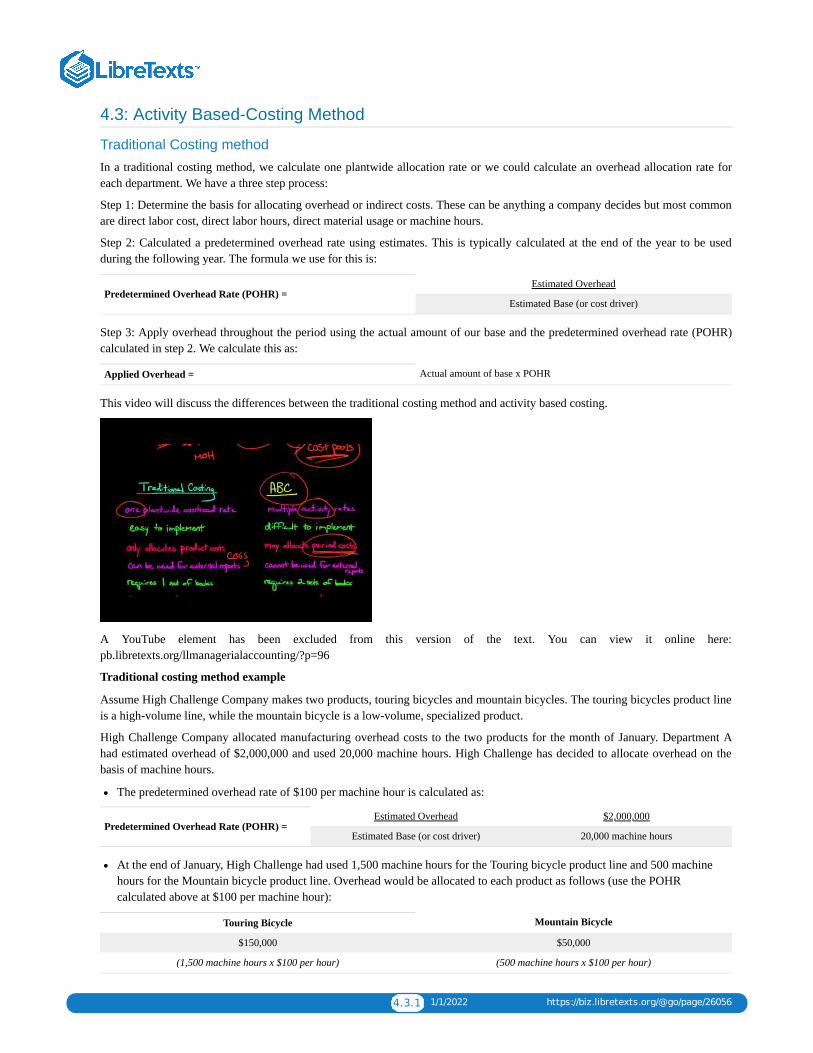
4.3.1 1/1/2022 https://biz.libretexts.org/@go/page/26056
4.3: Activity Based-Costing Method
Traditional Costing method
In a traditional costing method, we calculate one plantwide allocation rate or we could calculate an overhead allocation rate foreach department. We have a three step process:
Step 1: Determine the basis for allocating overhead or indirect costs. These can be anything a company decides but most commonare direct labor cost, direct labor hours, direct material usage or machine hours.
Step 2: Calculated a predetermined overhead rate using estimates. This is typically calculated at the end of the year to be usedduring the following year. The formula we use for this is:
Predetermined Overhead Rate (POHR) =Estimated Overhead
Estimated Base (or cost driver)
Step 3: Apply overhead throughout the period using the actual amount of our base and the predetermined overhead rate (POHR)calculated in step 2. We calculate this as:
Applied Overhead = Actual amount of base x POHR
This video will discuss the differences between the traditional costing method and activity based costing.
A YouTube element has been excluded from this version of the text. You can view it online here:pb.libretexts.org/llmanagerialaccounting/?p=96
Traditional costing method example
Assume High Challenge Company makes two products, touring bicycles and mountain bicycles. The touring bicycles product lineis a high-volume line, while the mountain bicycle is a low-volume, specialized product.
High Challenge Company allocated manufacturing overhead costs to the two products for the month of January. Department Ahad estimated overhead of $2,000,000 and used 20,000 machine hours. High Challenge has decided to allocate overhead on thebasis of machine hours.
The predetermined overhead rate of $100 per machine hour is calculated as:
Predetermined Overhead Rate (POHR) =Estimated Overhead $2,000,000
Estimated Base (or cost driver) 20,000 machine hours
At the end of January, High Challenge had used 1,500 machine hours for the Touring bicycle product line and 500 machinehours for the Mountain bicycle product line. Overhead would be allocated to each product as follows (use the POHRcalculated above at $100 per machine hour):
Touring Bicycle Mountain Bicycle
$150,000 $50,000
(1,500 machine hours x $100 per hour) (500 machine hours x $100 per hour)

4.3.2 1/1/2022 https://biz.libretexts.org/@go/page/26056
Methods used for activity-based costingActivity-based costing requires accountants to use the following four steps:
1. Identify the activities that consume resources and assign costs to those activities. Purchasing materials would be an activity, forexample.
2. Identify the cost drivers associated with each activity. A cost driver is an activity or transaction that causes costs to be incurred.For the purchasing materials activity, the cost drivers could be the number of orders placed or the number of items ordered.Each activity could have multiple cost drivers.
3. Compute a cost rate per cost driver unit. The cost driver rate could be the cost per purchase order, for example.4. Assign costs to products by multiplying the cost driver rate times the volume of cost driver units consumed by the product. For
example, the cost per purchase order times the number of orders required for Product A for the month of December wouldmeasure the cost of the purchasing activity for Product A for December.
The next section describes these four steps.
Step 1 is often the most interesting and challenging part of the exercise. This step requires people to understand all of the activitiesrequired to make the product. Imagine the activities involved in making a simple product like a pizza—ordering, receiving andinspecting materials, making the dough, putting on the ingredients, baking, and so forth. Or imagine the activities involved inmaking a complex product such as an automobile or computer.
One of the lessons of activity-based costing has been that the more complex the business, the higher the indirect costs. Imaginethat each month you produce 100,000 gallons of vanilla ice cream and your friend produces 100,000 gallons of 39 differentflavors of ice cream. Further, assume your ice cream is sold only in one liter containers, while your friend sells ice cream invarious containers. Your friend has more complicated ordering, storage, product testing (one of the more desirable jobs,nevertheless), and packing in containers. Your friend has more machine setups, too. Presumably, you can set the machinery to onesetting to obtain the desired product quality and taste. Your friend has to set the machines each time a new flavor is produced.Although both of you produce the same total volume of ice cream, it is not hard to imagine that your friend’s overhead costswould be considerably higher.
In Step 2, we identify the cost drivers. In the table below, we present several examples of the cost drivers companies use. Mostcost drivers are related to either the volume of production or to the complexity of the production or marketing process.
Cost driver Cost of assigned cost driver
Miles driven Automobile costs
Machine-hours Electricity to run machines
Customers served Overhead in a bank
Flight hours Airplane maintenance costs
Number of customers Selling costs
In deciding which cost drivers to use, managers consider these three factors:
Causal relation. Choosing a cost driver that causes the cost is ideal. For example, suppose students in biology classes aremessier than students in history classes. As a result, the university does more maintenance per square foot in biologyclassrooms and labs than in history classrooms. Further, it is possible to keep track of the time maintenance people spendcleaning classrooms and labs. The university could assign maintenance costs based on the time spent in history classrooms andin biology classrooms and labs, respectively, to the history and biology departments.Benefits received. Choose a cost driver so costs are assigned in proportion to benefits received. For example, if the physicsdepartment in a university benefits more from the university’s supercomputer than the German department does, the universityshould select a cost driver that recognizes such differences in benefits. The cost driver could be the number of faculty and/orstudents in each department who use the computer.Reasonableness. Some costs that cannot be linked to products based on causality or benefits received are assigned on the basisof reasonableness.
For step 3, we need to calculate the activity rates. These are calculated using the same formula for predetermined overhead rate(POHR) that we used for traditional costing. In general, predetermined rates for allocating indirect costs to products are computedas follows:
Predetermined Overhead Rate (POHR) = Estimated Overhead
4.3.3 1/1/2022 https://biz.libretexts.org/@go/page/26056
Estimated Base (or cost driver)
This formula applies to all indirect costs, whether manufacturing overhead, administrative costs, distribution costs, selling costs,or any other indirect cost.
In Step 4, we first define the notion of an activity center. An activity center is a unit of the organization that performs someactivity. For example, the costs of setting up machines would be assigned to the activity center that sets up machines. This meansthat each activity has associated costs. When the cost driver is the number of inspections, for example, the company must keeptrack of the cost of inspections.
Workers and machines perform activities on each product as it is produced. Accountants allocate costs to products by multiplyingeach activity’s indirect cost rate by the volume of activity used in making the product. The formula we will use for each activity is:
Applied Overhead = Actual amount of activity cost driver x activity POHR
Activity-based costing example
Assume High Challenge Company makes two products, touring bicycles and mountain bicycles. The touring bicycles product lineis a high-volume line, while the mountain bicycle is a low-volume, specialized product.
In using activity-based costing, the company identified four activities that were important cost drivers and a cost driver used toallocate overhead. These activities were (1) purchasing materials, (2) setting up machines when a new product was started, (3)inspecting products, and (4) operating machines.
Accountants estimated the overhead and the volume of events for each activity. For example, management estimated the companywould purchase 100,000 pieces of materials that would require overhead costs of $200,000 for the year. These overhead costsincluded salaries of people to purchase, inspect, and store materials. Setting up machines for a new product would need 400 setupsand overhead of $800,000. The company would have 4,000 inspections and overhead of $400,000. Finally, running machineswould cost $600,000 for 20,000 machine hours.
These estimates were made last year and will be used during all of the current year. In practice, companies most frequently setrates for the entire year, although some set rates for shorter periods, such as a quarter.
Look at the overhead rates computed for the four activities in the table below. Note that the total overhead for current year is$2,000,000 using activity-based costing, just as it was using a traditional costing method. The total amount of overhead should bethe same whether using activity-based costing or traditional methods of cost allocation to products. The primary differencebetween activity-based costing and the traditional allocation methods is the amount of detail; particularly, the number of activitiesused to assign overhead costs to products. Traditional allocation uses just one activity, such as machine-hours. Activity-basedcosting used four activities in this case. In practice, companies using activity-based costing generally use more than four activitiesbecause more than four activities are important. We used four to keep the illustration as simple as possible.
The activity cost rates (predetermined overhead rates) are calculated as follows:
Activity Cost Driver (activity) Overhead Cost Estimated Units Rate
Purchasing Materials Pieces of materials $ 200,000 100,000 pieces $ 2 per piece
Machine Setups Machine setups 800,000 400 setups 2,000 per setup
Inspections Inspection hours 400,000 4,000 inspect. hours 100 per inspect. hour
Running Machine Machine hours 600,000 20,000 mach. Hours 30 per machine hour
Total Overhead $ 2,000,000
For January, the High Challenge Company has the following information about the actual number of cost driver units for each ofthe two products:
Touring Mountain
Purchasing Materials 6,000 pieces 4,000 pieces
Machine Setups 10 setups 30 setups
Inspections 200 hours 200 hours
Running Machine 1,500 hours 1,500 hours

4.3.4 1/1/2022 https://biz.libretexts.org/@go/page/26056
Multiplying the actual activity events for each product times the predetermined rates computed earlier resulted in the overheadallocated to the two products:
Touring Mountain
Purchasing Materials $ 12,000 (6,000 pieces x $2 perpiece)
$ 8,000 (4,000 pieces x $2 perpiece)
Machine Setups 20,000 (10 setups x $2,000 persetup)
60,000 (30 setups x $2,000 persetup)
Inspections 20,000 (200 hours x $100 per hour) 20,000 (200 hours x $100 per hour)
Running Machine 45,000 (1,500 hours x $30 perhour)
15,000 (500 hours x $30 per hour)
Total Overhead $ 97,000 $ 103,000
Now we can compare the overhead allocated to the two product lines using the traditional method and activity-based costing, asfollows:
Touring bicycles Mountain bicycles
Traditional method $150,000 $50,000
Activity-based costing 97,000 103,000
Notice how the total overhead for the month of January is the same at $200,000 but the amount allocated to each product isdifferent.
Analysis More overhead is allocated to the lower volume mountain bicycles using activity-based costing. The mountain bicyclesare allocated more overhead per unit primarily because activity-based costing recognizes the need for more setups for mountainbicycles and for as many inspection hours for the more specialized mountain bicycles as for the higher volume touring bicycles.By failing to assign costs to all of the activities, touring bicycles were subsidizing mountain bicycles. Many companies have foundthemselves in similar situations. Activity-based costing has revealed that low-volume, specialized products have been the cause ofgreater costs than managers had realized.
Here is a video example of activity based costing:
A YouTube element has been excluded from this version of the text. You can view it online here:pb.libretexts.org/llmanagerialaccounting/?p=96
All rights reserved contentActivity Based Costing vs. Traditional Costing. Authored by: Education Unlocked. Located at: youtu.be/aDycx2hJ6tg.License: All Rights Reserved. License Terms: Standard YouTube LicenseActivity Based Costing Systems for Overhead (Managerial Accounting Tutorial #28) . Authored by: Note Pirate. Located at:youtu.be/0m0Ob81nd9g. License: All Rights Reserved. License Terms: Standard YouTube License

4.4.1 11/13/2021 https://biz.libretexts.org/@go/page/26057
4.4: Accounting in the Headlines
What are potential cost drivers for an ABC system at Virgin America?
After several years of losses, Virgin America recently announced that it anticipates a profit for 2013. Although thecompany is expecting a profit for 2013, it still is not out of the woods. Critics have called for greater cost control at VirginAmerica.
The following table contains selected financial and other data for Virgin America for 2012.
Virgin America
Selected financial data
For Twelve Months Ended December 31, 2012
Partial income statement: (000s omitted)
Operating revenues $ 1,332,837
Other expenses:
Aircraft fuel 537,501
Aircraft rent 221,275
Wages and salaries 176,216
Aircraft maintenance 74,459
Landing fees 110,165
Sales and marketing 107,136
Guest services 50,448
Depreciation 11,260
Other 76,110
Total operating expenses $ 1,364,570
Operating income/loss $ (31,733)
Selected data:
Available seat miles (millions) 12,545
Departures 56,362
Aircraft in service 51
Guests (thousands) 6,219
Load factor (% of seats filled) 79.0%
Fuel gallons consumed (thousands) 161,404
Financial data source here.
Questions
1. For each of the expenses listed in the income statement, select a cost driver from the drivers listed under “Selecteddata.” Provide rationale for your choice of each of the drivers.
2. Are there any expenses you would group together into a single pool? Why or why not?3. How could Virgin America use these cost pools and activity-based costing information internally?
CC licensed content, Specific attributionWhat are potential cost drivers for an ABC system at Virgin America?. Authored by: Dr. Wendy Tietz, CPA, CMA,CGMA. Located at: http://www.accountingintheheadlines.com. License: CC BY-NC: Attribution-NonCommercial

4.5.1 12/18/2021 https://biz.libretexts.org/@go/page/26058
4.5: Chapter 4 Key Points
Activity-Based Costing Takeaways
In this chapter we reviewed/learned 3 ways of allocating overhead. We will use the formula for Predetermined OverheadRate (POHR) you have already learned.
Plantwide Overhead
Plantwide Overhead allocation means the company uses just one allocation rate (POHR) for the entire company. The rateis calculated as:
Total Overhead for company
Total Base for company
The base is typically direct labor but it doesn’t have to be – it can be anything the company decides. To apply overhead,you will take the ACTUAL amount of whatever base was selected for a department, product, job, etc. and multiply by thePlantwide POHR.
Departmental Overhead
Departmental Overhead allocation means the each department selects a different BASE to be used to allocate overhead.The rate is calculated as:
Total Departmental Overhead
Total Departmental Base chosen by Department
The base can be anything the department decides but it will use the DEPARTMENT costs only and not total costs. You canhave different rates for every department you choose.
To apply overhead, you will take the ACTUAL amount of whatever base was selected for a department and multiply bythe Department POHR for that department.
Activity Based Overhead
In Activity-Based Overhead allocation, the company’s overhead is divided into cost activities. These costs have a costdriver which is the object that causes the cost to increase or decrease. A cost pool is where costs that have the same costdrivers are added together to make on activity. Each activity will have its own overhead allocation rate (POHR). The rate iscalculated as:
TOTAL Overhead for the cost pool or activity
TOTAL cost driver quantity (or base)
The base or cost driver can be anything but the rate is based on TOTAL amounts for that activity. You will have differentrates for every activity or cost pool.
To apply overhead, you will take the ACTUAL amount of whatever base or cost driver for the job, product or departmentyou are assigning overhead to (not TOTAL here just the specific amount for the overhead you are applying) and multiplyby the Activity–based POHR for that activity.
Click ABC Takeways for a printable copy.
4.6.1 11/27/2021 https://biz.libretexts.org/@go/page/26059
4.6: Glossary
GLOSSARY
Activity-based costing A costing method that first assigns costs to activities, then assigns costs to products based on theirconsumption of activities.
Activity center An activity center is a unit of the organization that performs some activity.
Cost driver A cost driver is an activity or transaction that causes costs to be incurred.

4.7.1 11/13/2021 https://biz.libretexts.org/@go/page/26060
4.7: Chapter 4- Exercises
Questions
➢ A company’s performance measure is the number of customer complaints. Why would the company measure thenumber of customer complaints?
➢ A company’s performance measure is the percentage of time that machines are not working. Why would the companymeasure the percentage of time that the machines are not working?
➢ What is the difference between activity-based costing and activity-based management?
➢ Activity-based costing methods use four steps in computing a product’s cost. What are these steps?
➢ “Activity-based costing is great for manufacturing plants, but does not really address the needs of the service sector.”Do you agree with this statement? Explain.
➢ What is a cost driver? Give three examples.
➢ The vice president of marketing wonders how products can cost less under one cost system than under another. Howwould you respond to her question “Are not costs cut-and-dried?”
➢ A drawback to activity-based costing is that it requires more record-keeping and extensive teamwork between alldepartments. What are the potential benefits of a more detailed product cost system?
➢ Give three criteria for choosing cost drivers for allocating costs to products.
➢ “Activity-based costing is for accountants and production managers. I plan to be a marketing specialist so ABC will nothelp me.” Do you agree with this statement? Explain.
➢ Observe the workings of a food service or coffee house. What activities are being performed? Give examples of somecost drivers that cause the cost of those activities. (For example, cooking food is an activity; the number of meals could bea cost driver for the cooking activity.)
➢ Observe the workings of a bank, credit union, or savings and loan institution. What activities are being performed? Giveexamples of some cost drivers that cause the cost of those activities. (For example, opening checking accounts is anactivity; the number of accounts opened could be a cost driver for the opening accounts activity.)
➢ Activity-based costing assigns costs to activities that consume resources and to the products based on each product’s useof activities. What is a benefit of this approach compared to a traditional approach that allocates costs to products based onthe machine-hours used to produce the product?
Exercises
Exercise A Quality Sound Corporation produces two types of compact discs (CDs), one is to install on touring bicyclesand the other is a high-grade product for home and car use. The touring bicycles’ CDs are designed for durability ratherthan accurate sound reproduction. The company only recently began producing the high-grade disc. Management believesthe accounting system may not be accurately allocating costs to products.
Management asked you to investigate the cost allocation problem. You found that manufacturing overhead is currentlyassigned based on the direct labor costs in the products. For your investigation, you are using data from last year. Lastyear’s manufacturing overhead was $440,000 based on production of 320,000 touring bicycle CDs and 100,000 high-gradeCDs. Direct labor and direct materials costs were as follows:
Touringbicycle
Highgrade
Total
Direct labor $180,000 $60,000 $240,000
Materials 120,000 112,000 232,000
Management believes three activities cause overhead costs. The cost drivers and related costs for your analysis are asfollows:
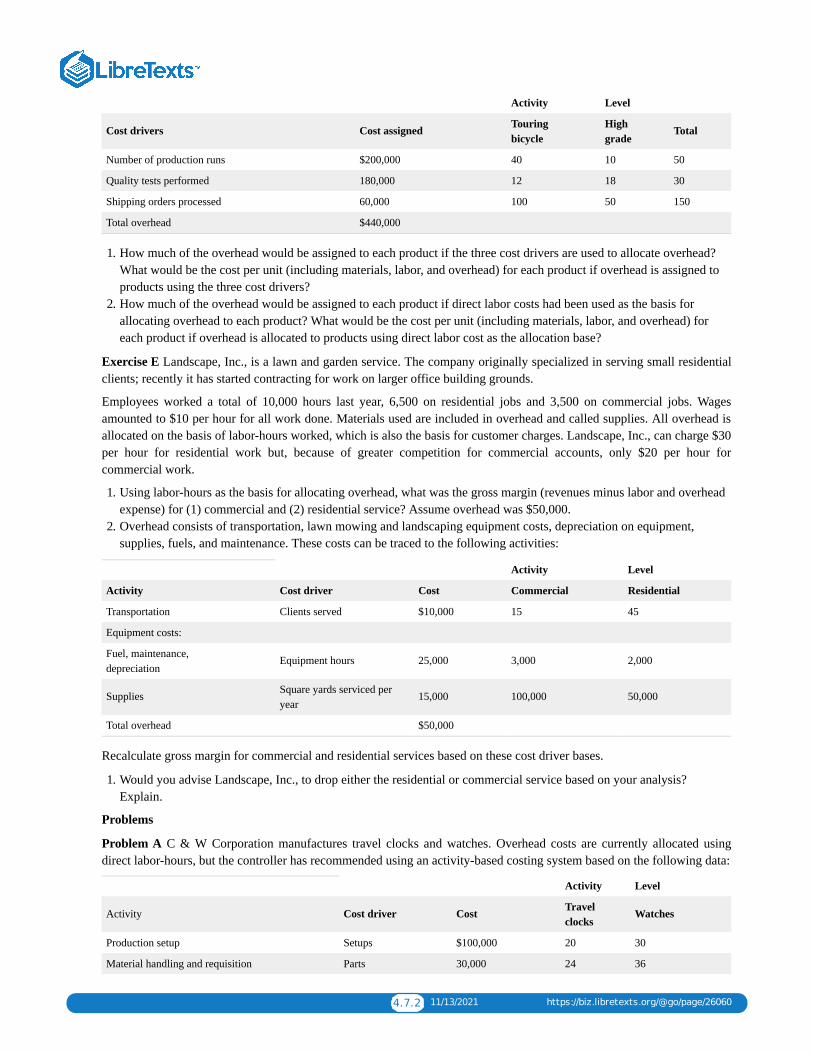
4.7.2 11/13/2021 https://biz.libretexts.org/@go/page/26060
Activity Level
Cost drivers Cost assigned Touringbicycle
Highgrade
Total
Number of production runs $200,000 40 10 50
Quality tests performed 180,000 12 18 30
Shipping orders processed 60,000 100 50 150
Total overhead $440,000
1. How much of the overhead would be assigned to each product if the three cost drivers are used to allocate overhead?What would be the cost per unit (including materials, labor, and overhead) for each product if overhead is assigned toproducts using the three cost drivers?
2. How much of the overhead would be assigned to each product if direct labor costs had been used as the basis forallocating overhead to each product? What would be the cost per unit (including materials, labor, and overhead) foreach product if overhead is allocated to products using direct labor cost as the allocation base?
Exercise E Landscape, Inc., is a lawn and garden service. The company originally specialized in serving small residentialclients; recently it has started contracting for work on larger office building grounds.
Employees worked a total of 10,000 hours last year, 6,500 on residential jobs and 3,500 on commercial jobs. Wagesamounted to $10 per hour for all work done. Materials used are included in overhead and called supplies. All overhead isallocated on the basis of labor-hours worked, which is also the basis for customer charges. Landscape, Inc., can charge $30per hour for residential work but, because of greater competition for commercial accounts, only $20 per hour forcommercial work.
1. Using labor-hours as the basis for allocating overhead, what was the gross margin (revenues minus labor and overheadexpense) for (1) commercial and (2) residential service? Assume overhead was $50,000.
2. Overhead consists of transportation, lawn mowing and landscaping equipment costs, depreciation on equipment,supplies, fuels, and maintenance. These costs can be traced to the following activities:
Activity Level
Activity Cost driver Cost Commercial Residential
Transportation Clients served $10,000 15 45
Equipment costs:
Fuel, maintenance,depreciation
Equipment hours 25,000 3,000 2,000
Supplies Square yards serviced peryear
15,000 100,000 50,000
Total overhead $50,000
Recalculate gross margin for commercial and residential services based on these cost driver bases.
1. Would you advise Landscape, Inc., to drop either the residential or commercial service based on your analysis?Explain.
Problems
Problem A C & W Corporation manufactures travel clocks and watches. Overhead costs are currently allocated usingdirect labor-hours, but the controller has recommended using an activity-based costing system based on the following data:
Activity Level
Activity Cost driver Cost Travelclocks
Watches
Production setup Setups $100,000 20 30
Material handling and requisition Parts 30,000 24 36
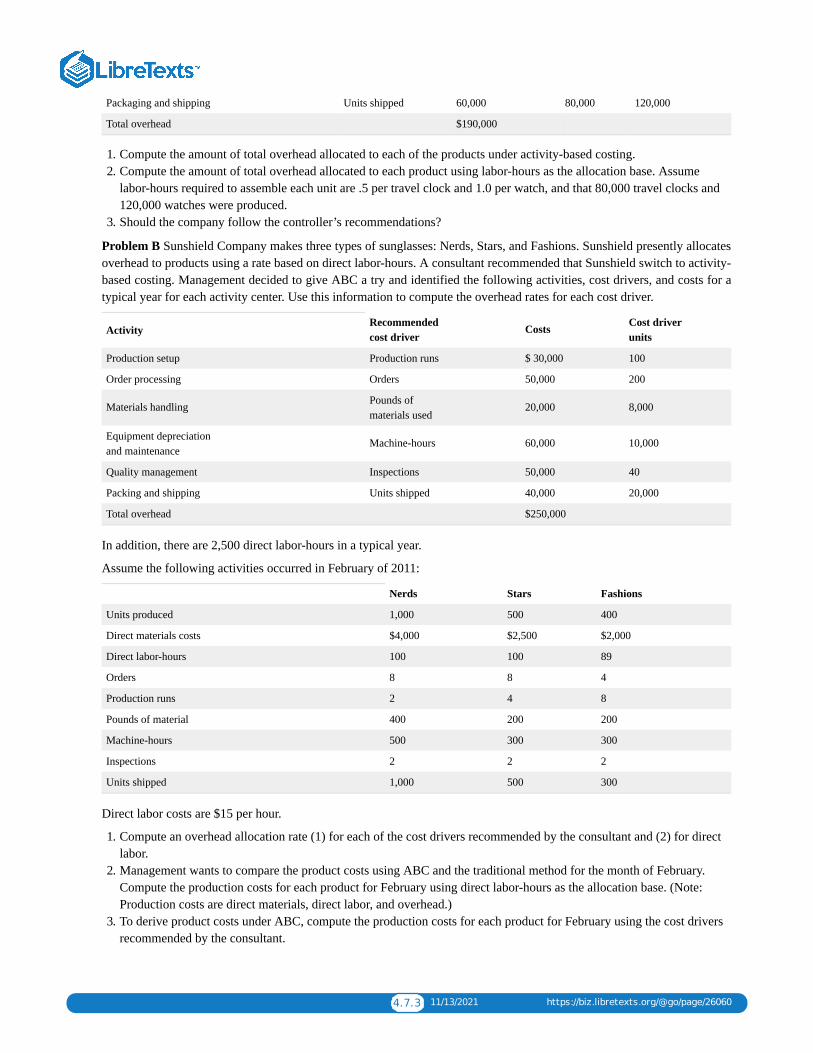
4.7.3 11/13/2021 https://biz.libretexts.org/@go/page/26060
Packaging and shipping Units shipped 60,000 80,000 120,000
Total overhead $190,000
1. Compute the amount of total overhead allocated to each of the products under activity-based costing.2. Compute the amount of total overhead allocated to each product using labor-hours as the allocation base. Assume
labor-hours required to assemble each unit are .5 per travel clock and 1.0 per watch, and that 80,000 travel clocks and120,000 watches were produced.
3. Should the company follow the controller’s recommendations?
Problem B Sunshield Company makes three types of sunglasses: Nerds, Stars, and Fashions. Sunshield presently allocatesoverhead to products using a rate based on direct labor-hours. A consultant recommended that Sunshield switch to activity-based costing. Management decided to give ABC a try and identified the following activities, cost drivers, and costs for atypical year for each activity center. Use this information to compute the overhead rates for each cost driver.
ActivityRecommendedcost driver
Costs Cost driverunits
Production setup Production runs $ 30,000 100
Order processing Orders 50,000 200
Materials handling Pounds ofmaterials used
20,000 8,000
Equipment depreciationand maintenance
Machine-hours 60,000 10,000
Quality management Inspections 50,000 40
Packing and shipping Units shipped 40,000 20,000
Total overhead $250,000
In addition, there are 2,500 direct labor-hours in a typical year.
Assume the following activities occurred in February of 2011:
Nerds Stars Fashions
Units produced 1,000 500 400
Direct materials costs $4,000 $2,500 $2,000
Direct labor-hours 100 100 89
Orders 8 8 4
Production runs 2 4 8
Pounds of material 400 200 200
Machine-hours 500 300 300
Inspections 2 2 2
Units shipped 1,000 500 300
Direct labor costs are $15 per hour.
1. Compute an overhead allocation rate (1) for each of the cost drivers recommended by the consultant and (2) for directlabor.
2. Management wants to compare the product costs using ABC and the traditional method for the month of February.Compute the production costs for each product for February using direct labor-hours as the allocation base. (Note:Production costs are direct materials, direct labor, and overhead.)
3. To derive product costs under ABC, compute the production costs for each product for February using the cost driversrecommended by the consultant.

4.7.4 11/13/2021 https://biz.libretexts.org/@go/page/26060
4. Management has seen your numbers and wants to know how you account for the discrepancy between the productcosts using direct labor-hours as the allocation base and using activity-based costing. Write a brief response tomanagement.
Problem C Filmworks Photography offers two types of services, student portraits and family portraits. Last year,Filmworks had the following costs and revenues:
FilmworksPhotography
Income statement
Deluxe Family Total
Revenue $180,000 $200,000 $380,000
Direct materials 25,000 25,000 50,000
Direct labor 90,000 60,000 150,000
Indirect costs:
Administration ——- ———- 25,000
Production setup ——- ———- 50,000
Quality control ——- ———- 25,000
Marketing ——- ———- 20,000
Operating profit $60,000
Filmworks Photography currently uses labor costs to allocate all overhead, but management is considering implementingan activity-based costing system. After interviewing the sales and production staff, management decides to allocateadministrative costs on the basis of direct labor costs and to use the following bases to allocate the remaining overhead:
Cost driver Units
Activity Cost driver Student Family
Production setup Photo sessions 150 250
Quality control Customer inspections 300 200
Marketing Advertisements 60 40
1. Complete the income statement using these activity bases.2. Write a report describing how management might use activity-based costing to reduce costs.3. Restate the income statement for Filmworks Photography using direct labor costs as the only overhead allocation base.4. Write a report to management stating why product line profits differ using activity-based costing compared to the
traditional approach. Indicate whether the activity-based costing method provides more accurate information and why(if you believe it does provide more accurate information). Indicate in your report how the use of labor-based overheadallocation could result in Filmworks Photography management making suboptimal decisions.
Alternate problems
Alternate problem A The manager of Rafting Excursions uses activity-based costing to compute the costs of her raft trips.Each raft holds six paying customers and a guide. She offers two types of raft trips, a three-day float trip for beginners, anda three-day white-water trip for seasoned rafters. The breakdown of costs is as follows:
Activities (with cost drivers) Costs per float trip Costs per white-water trip
Advertising (trips) $430 $430
Permit to use the river (trips) 60 100
Equipment use (trips, people) 40 + 10 per person 80 + $16 per person
Insurance (trips) 150 300
Paying guide (trips, guides) 600 per guide 800 per guide

4.7.5 11/13/2021 https://biz.libretexts.org/@go/page/26060
Food (people) 120 per person 120 per person
1. Compute the cost of a 28-person (including guides) float trip with four rafts and four guides.2. Compute the cost of a 28-person (including guides) white-water trip with four rafts and four guides.3. How much should the manager charge each customer if she wants to cover her costs?
Alternate problem B Shoe Express, Inc., manufactures two types of shoes, B-Ball and Marathon. The B-Ball shoe has acomplex design that uses gel-filled compartments to provide support. The Marathon shoe is simpler to manufacture anduses conventional foam padding. Last year, Shoe Express had the following revenues and costs:
Shoe Express, Inc.
Income Statement
B-Ball Marathon Total
Revenue $390,000 $368,000 $758,000
Direct materials 110,000 100,000 210,000
Direct labor 80,000 40,000 120,000
Indirect costs:
Administration ——– ——— 40,000
Production setup ——— ——— 90,000
——— ———
Quality control ——— ——— 60,000
Advertising ———- ——— 120,000
Net income before taxes $118,000
Shoe Express currently uses labor costs to allocate all overhead, but management is considering implementing an activity-based costing system. After interviewing the sales and production staff, management decides to allocate administrativecosts on the basis of direct labor costs, but to use the following bases to allocate the remaining overhead:
Activity Level
Activity Cost drivers B-ball Marathon
Production setup Production runs 20 20
Quality control Inspections 40 20
Advertising Advertisements 12 48
1. Complete the income statement using these activity bases.2. Write a brief report indicating how management could use activity-based costing to reduce costs.3. Restate the income statement for Shoe Express, Inc., using direct labor costs as the only overhead allocation base.4. Write a report to management stating why product line profits differ using activity-based costing compared to the
traditional approach. Indicate whether the activity-based costing method provides more accurate information and why(if you believe it does provide more accurate information). Indicate in your report how the use of labor-based overheadallocation could result in Shoe Express management making suboptimal decisions.
Beyond the numbers—Critical thinking
Business decision case A Many companies recognize that their cost systems are inadequate for today’s global market.Managers in companies selling multiple products are making important product decisions based on distorted costinformation.
Write a short paper describing the benefits management should expect from implementing activity-based costing.
Business decision case B A company that makes Halloween costumes is considering using just-in-time purchasing andproduction methods. Write a short paper describing the problems this company might face in using just-in-time.
4.7.6 11/13/2021 https://biz.libretexts.org/@go/page/26060
Business decision case C Managers at Texas Instruments developed these four cost-of-quality categories: preventioncosts, appraisal costs, internal failure costs, and external failure costs. Give an example of a cost for each of these fourcategories. Would minimizing the sum of these four costs assure high-quality products? Why or why not? Write a shortpaper summarizing your analysis.
Group project D The chapter listed the following six important points to remember about activity-based costing.Following each point are the comments of a cynic in italics. After forming six groups, discuss one of these points in eachgroup. How would you respond to the cynic’s comments? (It is okay to agree; even cynics have good points to make.)Choose one group member to report your group’s response to the class.
The allocation of indirect costs is at least somewhat arbitrary, even using sophisticated accounting methods. (“Thismeans no method gives you a true cost; all are arbitrary. So why go to the trouble of implementing ABC?”)Activity-based costing provides more detailed measures of costs than traditional allocation methods. (“Who needs moredetail? Life is already too complicated“.)Activity-based costing can help marketing people by providing more accurate product cost numbers for decisions aboutpricing and which unprofitable products the company should eliminate. (“Why should accountants want to helpmarketing people?”)Production also benefits because activity-based costing provides better information about the cost of each activity. Inpractice, ABC helps managers identify cost causing activities. To manage costs, production managers learn to managethe activities that cause costs. (“If production people know their jobs, they do not need help from accountants“.)Activity-based costing provides more information about product costs than traditional methods but requires morerecord-keeping. Managers must decide whether the benefits of improved decisions justify the additional record-keepingcost. (“ABC sounds like a lot of work. Why bother?“)Installing activity-based costing requires teamwork among accountants, production managers, marketing managers, andother nonaccounting people. (“You will never get these people to work together. Accountants and marketing people?You have got to be kidding!”)
Group project E Form a group of three or four students and assume you are hired as business consultants for each of thecases below. Respond to each of the comments made in case 1 and case 2. Your response should assume you are talkingdirectly to the CEO. State whether you agree or disagree with the statement and justify your response. (Hint: Consider thepotential costs and benefits associated with each case.)
Case 1 Your group is meeting with the CEO of a relatively small company that produces one model of bicycles. Afterlengthy discussion regarding the company’s costing system, the CEO makes the following statement: “From what I haveseen at other companies lately, activity-based costing is the wave of the future. Everyone, including us, should dropexisting cost systems and adopt ABC!”
Case 2 Your group is meeting with the CEO of a relatively large company that produces hundreds of expensive customcomputers. After lengthy discussion regarding the company’s costing system, the CEO makes the following statement:“From what I have seen at other companies lately, activity-based costing is the wave of the future. Everyone, including us,should drop existing cost systems and adopt ABC!”
Group project F In teams of two or three, interview the manager of a retail (or wholesale) store such as a music store, anautomobile parts store, or the parts department of an appliance dealership. Ask the manager how items are ordered toreplace those sold. For example, does he or she order based on observing inventory levels or place an order each time acustomer buys an item? Does he or she appear to use just-in-time inventory? Write a memorandum to the instructorsummarizing the results of the interview. Information contained in the memo should include:
Date:
To:
From:
Subject:
Content of the memo must include the name and title of the person interviewed, name of the company, date of theinterview, and the results of the interview.

4.7.7 11/13/2021 https://biz.libretexts.org/@go/page/26060
Group project G In teams of two or three, observe an organization of your choice—wholesale, retail, or service. Giveexamples of warning and diagnostic signals the organization uses. How could it use control charts, Pareto charts, andcause-and-effect analysis?
Using the Internet—A view of the real world
The Malcolm Baldrige National Quality Award is awarded to companies meeting certain quality standards and criteria.This award is issued annually by the National Institute of Standards and Technology (NIST). Visit the following website:
http://www.baldrige.nist.gov
Click on “Criteria and their Impact”. What criteria are used as a basis for making awards to applicants? Click on “WinnersShowcase”. Who were the most recent winners of the Baldrige Award? What products or services do these companiesprovide?
Based on the results of the previous Internet project, perform an Internet search to find at least one recent Baldrige Awardwinning company. Does the company provide information on the Internet about being the recipient of the award? If so,write a report summarizing this information. If not, search for a recent award winner that does provide this information,and write a report summarizing the information provided.
1. [1]“Texas Instruments: Cost of Quality (A)” (Boston: Harvard Business School, Case 9-189-029).
1. [2]Based on R. S. Kaplan and D. P. Norton, “Using the Balanced Scorecard as a Strategic Management System,”Harvard Business Review, January-February 1996.
1 1/8/2022
CHAPTER OVERVIEW5: COST BEHAVIOR AND COST-VOLUME-PROFIT ANALYSIS
5.1: CHAPTER 5 STUDY PLAN5.2: COST BEHAVIOR VS. COST ESTIMATION5.3: FIXED AND VARIABLE COSTS5.4: MIXED COSTS5.5: ACCOUNTING IN THE HEADLINES- COSTS5.6: COST-VOLUME-PROFIT ANALYSIS IN PLANNING5.7: BREAK – EVEN POINT FOR A SINGLE PRODUCT5.8: BREAK EVEN POINT FOR MULTIPLE PRODUCTS5.9: COST-VOLUME-PROFIT ANALYSIS SUMMARY5.10: ACCOUNTING IN THE HEADLINES- BREAKEVEN5.11: CHAPTER 5 KEY POINTS5.12: GLOSSARY5.13: CHAPTER 5- EXERCISES
5.1.1 1/8/2022 https://biz.libretexts.org/@go/page/26061
5.1: Chapter 5 Study Plan
Study Plan: Cost-Volume-Profit (CVP) Analysis
Knowledge Targets
I can define the following terms as they relate to our unit:
Contribution margin Fixed Costs Variable Costs Profit
Break even point Margin of safety Targeted Income Contribution margin ratio
Reasoning Targets
I can identify costs as fixed or variable.I can explain how changes in volume affect contribution margin.I can explain the significance of margin of safety.I can explain the importance of calculating break even point.
Skill Targets
I can calculate contribution margin and contribution margin ratio.I can determine the break even point in units and dollars.I can calculate the level of sales necessary to achieve a targeted income or profit.
Click CVP Study Plan for a printable copy.
5.2.1 11/27/2021 https://biz.libretexts.org/@go/page/26062
5.2: Cost Behavior Vs. Cost EstimationCost behavior patterns
There are four basic cost behavior patterns: fixed, variable, mixed (semivariable), and step which graphically would appearas below.
The relevant range is the range of production or sales volume over which the assumptions about cost behavior are valid.Often, we describe them as time-related costs.
A YouTube element has been excluded from this version of the text. You can view it online here:pb.libretexts.org/llmanagerialaccounting/?p=110
A graph depicting the relevant range would look like this:
Fixed costs remain constant (in total) over some relevant range of output. Depreciation, insurance, property taxes, andadministrative salaries are examples of fixed costs. Recall that so-called fixed costs are fixed in the short run but notnecessarily in the long run.
For example, a local high-tech company did not lay off employees during a recent decrease in business volume because themanagement did not want to hire and train new people when business picked up again. Management treated direct labor asa fixed cost in this situation. Although volume decreased, direct labor costs remained fixed.
In contrast to fixed costs, variable costs vary (in total) directly with changes in volume of production or sales. In particular,total variable costs change as total volume changes. If pizza production increases from 100 10-inch pizzas to 200 10-inchpizzas per day, the amount of dough required per day to make 10-inch pizzas would double. The dough is a variable cost ofpizza production. Direct materials and sales commissions are variable costs.
Direct labor is a variable cost in many cases. If the total direct labor cost increases as the volume of output increases anddecreases as volume decreases, direct labor is a variable cost. Piecework pay is an excellent example of direct labor as avariable cost. In addition, direct labor is frequently a variable cost for workers paid on an hourly basis, as the volume ofoutput increases, more workers are hired. However, sometimes the nature of the work or management policy does notallow direct labor to change as volume changes and direct labor can be a fixed cost.

5.2.2 11/27/2021 https://biz.libretexts.org/@go/page/26062
Mixed costs have both fixed and variable characteristics. A mixed cost contains a fixed portion of cost incurred even whenthe facility is idle, and a variable portion that increases directly with volume. Electricity is an example of a mixed cost. Acompany must incur a certain cost for basic electrical service. As the company increases its volume of activity, it runsmore machines and runs them longer. The firm also may extend its hours of operation. As activity increases, so does thecost of electricity.
Managers usually separate mixed costs into their fixed and variable components for decision-making purposes. Theyinclude the fixed portion of mixed costs with other fixed costs, while assuming the variable part changes with volume. Wewill look at ways to separate fixed and variable components of a mixed cost later in the chapter.
A step cost remains constant at a certain fixed amount over a range of output (or sales). Then, at certain points, the stepcosts increase to higher amounts. Visually, step costs appear like stair steps.
A YouTube element has been excluded from this version of the text. You can view it online here:pb.libretexts.org/llmanagerialaccounting/?p=110
Supervisors’ salaries are an example of a step cost when companies hire additional supervisors as production increases.For instance, the local McDonald’s restaurant has one supervisor until sales exceed 100 meals during the lunch hour. Ifsales regularly exceed 100 meals during that hour, the company adds a second supervisor. The supervisor costs will remainthe same for between 0 – 100 meals served that hour. When meals served are between 101 – 200, the supervisor cost goesup to reflect 2 supervisors. Step costs will increase by the same amount for each new cost or step. Step costs are sometimeslabeled as step variable costs (many small steps) or step fixed costs (only a few large steps). In graph form, a step costwould appear as:
Although we have described four different cost patterns (fixed, variable, mixed, and step), we simplify our discussions inthis chapter by assuming managers can separate mixed and step costs into fixed and variable components using costestimation techniques.
Many costs do not vary in a strictly linear relationship with volume. Rather, costs may vary in a curvilinear pattern—a10% increase in volume may yield an 8% change in total variable costs at lower output levels and an 11% change in totalvariable costs at higher output levels. We show a curvilinear cost pattern below.
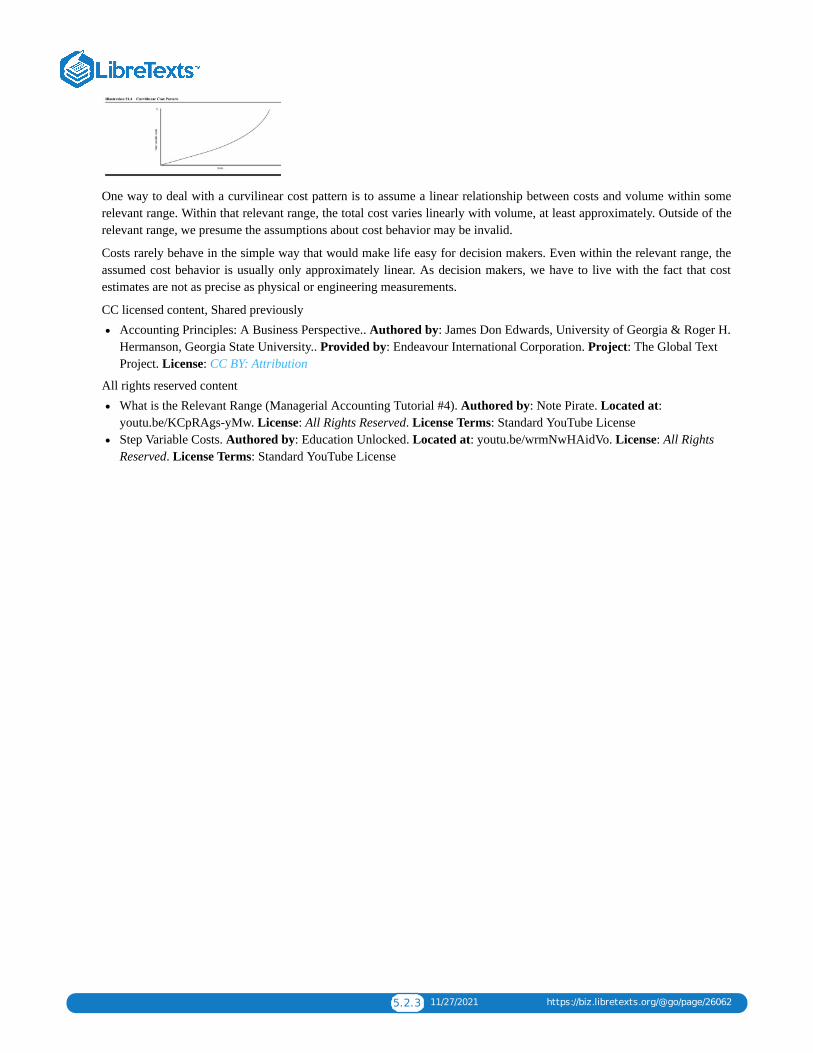
5.2.3 11/27/2021 https://biz.libretexts.org/@go/page/26062
One way to deal with a curvilinear cost pattern is to assume a linear relationship between costs and volume within somerelevant range. Within that relevant range, the total cost varies linearly with volume, at least approximately. Outside of therelevant range, we presume the assumptions about cost behavior may be invalid.
Costs rarely behave in the simple way that would make life easy for decision makers. Even within the relevant range, theassumed cost behavior is usually only approximately linear. As decision makers, we have to live with the fact that costestimates are not as precise as physical or engineering measurements.
CC licensed content, Shared previouslyAccounting Principles: A Business Perspective.. Authored by: James Don Edwards, University of Georgia & Roger H.Hermanson, Georgia State University.. Provided by: Endeavour International Corporation. Project: The Global TextProject. License: CC BY: Attribution
All rights reserved contentWhat is the Relevant Range (Managerial Accounting Tutorial #4). Authored by: Note Pirate. Located at:youtu.be/KCpRAgs-yMw. License: All Rights Reserved. License Terms: Standard YouTube LicenseStep Variable Costs. Authored by: Education Unlocked. Located at: youtu.be/wrmNwHAidVo. License: All RightsReserved. License Terms: Standard YouTube License
5.3.1 10/30/2021 https://biz.libretexts.org/@go/page/26063
5.3: Fixed and Variable Costs
Fixed CostsFixed costs remain in TOTAL but change per unit based on the actual amount of production. Here is a video to discussthese concepts.
A YouTube element has been excluded from this version of the text. You can view it online here:pb.libretexts.org/llmanagerialaccounting/?p=112
Examples of fixed costs include monthly rent, mortgage or car payments, employee salary, depreciation calculated understraight-line method, and insurance.
Variable Costs
Variable Costs remain the same PER UNIT but CHANGE in total. Watch this video for another explanation:
A YouTube element has been excluded from this version of the text. You can view it online here:pb.libretexts.org/llmanagerialaccounting/?p=112
Variable costs for a manufacturer would include things like direct labor of hourly workers, other wage employees, directmaterials, applied overhead, sales commissions, and depreciation under units of production method.
All rights reserved contentVariable Costs. Authored by: Education Unlocked. Located at: youtu.be/0Nmvjvhdex8. License: All Rights Reserved.License Terms: Standard YouTube LicenseFixed Costs. Authored by: Education Unlocked. Located at: youtu.be/Ah7EggKApHY. License: All Rights Reserved.License Terms: Standard YouTube License

5.4.1 1/1/2022 https://biz.libretexts.org/@go/page/26064
5.4: Mixed CostsMixed costs are costs that contain a portion of both fixed and variable costs. Common examples include utilities and evenyour cell phone! You may be charged a fixed amount each month for data usage or text messages allowed but when youexceed your limit, you are charged a set amount (variable cost) based on each text message or gigabyte of data you useover your limit.
youtu.be/mRi01CYooDA
A mixed cost would look like this in a graph:
Next, we will look at how we can estimate the fixed and variable portions of a mixed cost for accounting analysis.
All rights reserved contentWhat are Mixed Costs? (Managerial Accounting Tutorial #5). Authored by: Note Pirate. Located at:youtu.be/mRi01CYooDA. License: All Rights Reserved. License Terms: Standard YouTube License
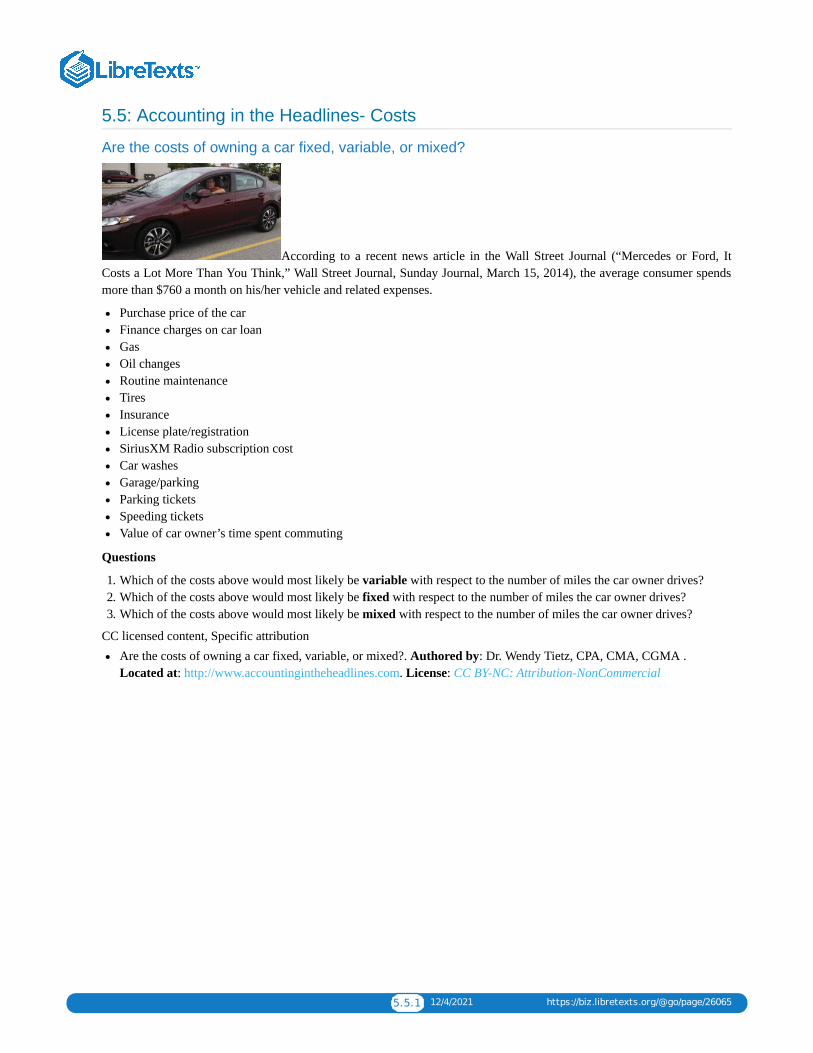
5.5.1 12/4/2021 https://biz.libretexts.org/@go/page/26065
5.5: Accounting in the Headlines- Costs
Are the costs of owning a car fixed, variable, or mixed?
According to a recent news article in the Wall Street Journal (“Mercedes or Ford, ItCosts a Lot More Than You Think,” Wall Street Journal, Sunday Journal, March 15, 2014), the average consumer spendsmore than $760 a month on his/her vehicle and related expenses.
Purchase price of the carFinance charges on car loanGasOil changesRoutine maintenanceTiresInsuranceLicense plate/registrationSiriusXM Radio subscription costCar washesGarage/parkingParking ticketsSpeeding ticketsValue of car owner’s time spent commuting
Questions
1. Which of the costs above would most likely be variable with respect to the number of miles the car owner drives?2. Which of the costs above would most likely be fixed with respect to the number of miles the car owner drives?3. Which of the costs above would most likely be mixed with respect to the number of miles the car owner drives?
CC licensed content, Specific attributionAre the costs of owning a car fixed, variable, or mixed?. Authored by: Dr. Wendy Tietz, CPA, CMA, CGMA .Located at: http://www.accountingintheheadlines.com. License: CC BY-NC: Attribution-NonCommercial
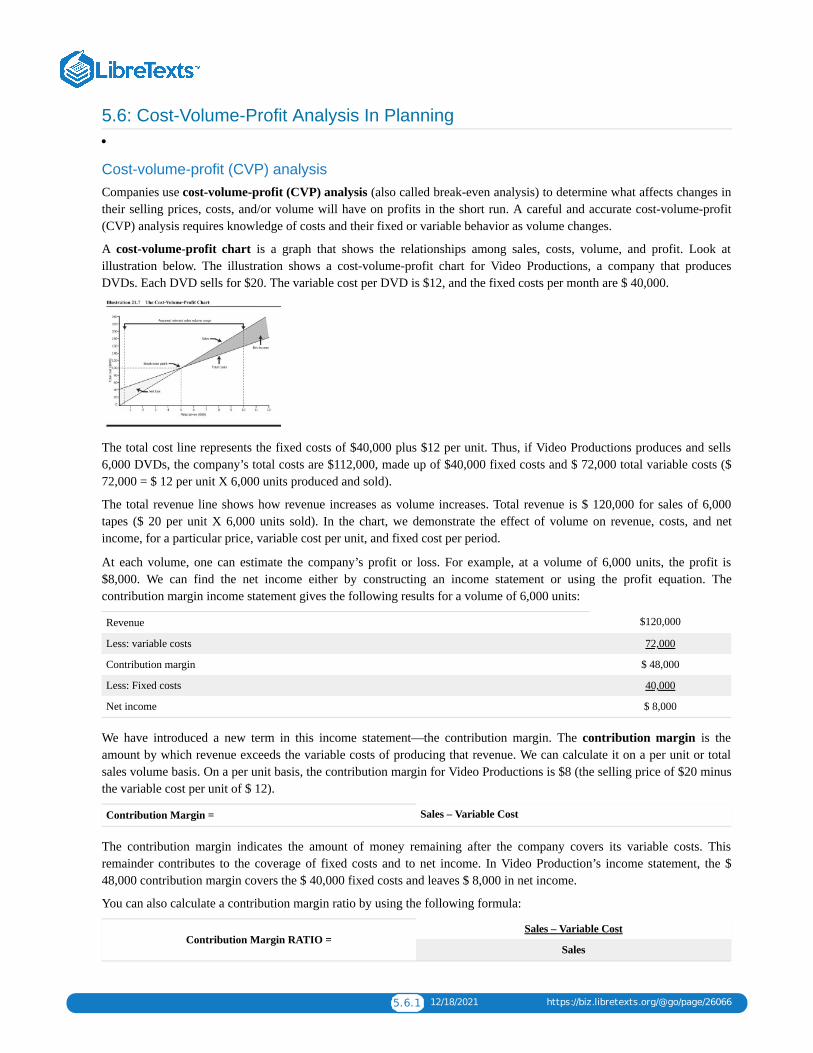
5.6.1 12/18/2021 https://biz.libretexts.org/@go/page/26066
5.6: Cost-Volume-Profit Analysis In Planning
Cost-volume-profit (CVP) analysisCompanies use cost-volume-profit (CVP) analysis (also called break-even analysis) to determine what affects changes intheir selling prices, costs, and/or volume will have on profits in the short run. A careful and accurate cost-volume-profit(CVP) analysis requires knowledge of costs and their fixed or variable behavior as volume changes.
A cost-volume-profit chart is a graph that shows the relationships among sales, costs, volume, and profit. Look atillustration below. The illustration shows a cost-volume-profit chart for Video Productions, a company that producesDVDs. Each DVD sells for $20. The variable cost per DVD is $12, and the fixed costs per month are $ 40,000.
The total cost line represents the fixed costs of $40,000 plus $12 per unit. Thus, if Video Productions produces and sells6,000 DVDs, the company’s total costs are $112,000, made up of $40,000 fixed costs and $ 72,000 total variable costs ($72,000 = $ 12 per unit X 6,000 units produced and sold).
The total revenue line shows how revenue increases as volume increases. Total revenue is $ 120,000 for sales of 6,000tapes ($ 20 per unit X 6,000 units sold). In the chart, we demonstrate the effect of volume on revenue, costs, and netincome, for a particular price, variable cost per unit, and fixed cost per period.
At each volume, one can estimate the company’s profit or loss. For example, at a volume of 6,000 units, the profit is$8,000. We can find the net income either by constructing an income statement or using the profit equation. Thecontribution margin income statement gives the following results for a volume of 6,000 units:
Revenue $120,000
Less: variable costs 72,000
Contribution margin $ 48,000
Less: Fixed costs 40,000
Net income $ 8,000
We have introduced a new term in this income statement—the contribution margin. The contribution margin is theamount by which revenue exceeds the variable costs of producing that revenue. We can calculate it on a per unit or totalsales volume basis. On a per unit basis, the contribution margin for Video Productions is $8 (the selling price of $20 minusthe variable cost per unit of $ 12).
Contribution Margin = Sales – Variable Cost
The contribution margin indicates the amount of money remaining after the company covers its variable costs. Thisremainder contributes to the coverage of fixed costs and to net income. In Video Production’s income statement, the $48,000 contribution margin covers the $ 40,000 fixed costs and leaves $ 8,000 in net income.
You can also calculate a contribution margin ratio by using the following formula:
Contribution Margin RATIO =Sales – Variable Cost
Sales
5.6.2 12/18/2021 https://biz.libretexts.org/@go/page/26066
Watch this video to see more about contribution margin and how it can be used in business.
A YouTube element has been excluded from this version of the text. You can view it online here:pb.libretexts.org/llmanagerialaccounting/?p=118
Profit equation The profit equation is just like the income statement, except it presents the analysis in a slightly differentform. According to the profit equation:
Net income = Revenue – Total variable costs – Fixed costs
For Video Productions, the profit equation looks like this:
Net income = $ 120,000 − $ 72,000 − $ 40,000 Net income = $ 8,000
The CVP chart above shows cost data for Video Productions in a relevant range of output from 500 to 10,000 units. Recallthe relevant range is the range of production or sales volume over which the basic cost behavior assumptions hold true. Forvolumes outside these ranges, costs behave differently and alter the assumed relationships. For example, if VideoProductions produced and sold more than 10,000 units per month, it might be necessary to increase plant capacity (thusincurring additional fixed costs) or to work extra shifts (thus incurring overtime charges and other inefficiencies). In eithercase, the assumed cost relationships would no longer be valid.
The contribution margin income statement is used quite frequently since it separates fixed and variable costs to allow acompany to see what it can directly change and what it cannot change. This video will give you an example of the why andhow to do a contribution margin income statement.
A YouTube element has been excluded from this version of the text. You can view it online here:pb.libretexts.org/llmanagerialaccounting/?p=118
CC licensed content, Shared previously
5.6.3 12/18/2021 https://biz.libretexts.org/@go/page/26066
Accounting Principles: A Business Perspective.. Authored by: James Don Edwards, University of Georgia & Roger H.Hermanson, Georgia State University.. Provided by: Endeavour International Corporation. Project: The Global TextProject. License: CC BY: Attribution
All rights reserved contentInvestopedia Video: Contribution Margin . Authored by: Investopedia. Located at: youtu.be/pm6Eo9qiUIY. License:All Rights Reserved. License Terms: Standard YouTube LicenseContribution Margin Income Statement. Authored by: Krisitin Ingram. Located at: youtu.be/fyAEVKCSjcI. License:All Rights Reserved. License Terms: Standard YouTube License
5.7.1 12/4/2021 https://biz.libretexts.org/@go/page/26067
5.7: Break – Even Point for a single product
Finding the break-even pointA company breaks even for a given period when sales revenue and costs charged to that period are equal. Thus, the break-even point is that level of operations at which a company realizes no net income or loss.
A company may express a break-even point in dollars of sales revenue or number of units produced or sold. No matterhow a company expresses its break-even point, it is still the point of zero income or loss. To illustrate the calculation of abreak-even point watch the following video and then we will work with the previous company, Video Productions.
A YouTube element has been excluded from this version of the text. You can view it online here:pb.libretexts.org/llmanagerialaccounting/?p=120
Before we can begin, we need two things from the previous page: Contribution Margin per unit and Contribution MarginRATIO. These formulas are:
Contribution Margin per unit = Sales Price – Variable Cost per Unit
Contribution Margin Ratio =Contribution margin (Sales – Variable Cost)
Sales
Break-even in units
Recall that Video Productions produces DVDs selling for $20 per unit. Fixed costs per period total $40,000, while variablecost is $12 per unit. We compute the break-even point in units as:
BE Units = Fixed Costs
Contribution Margin per unit
Video Productions contribution margin per unit is $ 8 ($ 20 selling price per unit – $ 12 variable cost per unit). The breakeven point in units would be calculated as:
BE Units =Fixed Costs $40,000
= 5,000 unitsContribution Margin per unit $8
The result tells us that Video Productions breaks even at a volume of 5,000 units per month. We can prove that to be trueby computing the revenue and total costs at a volume of 5,000 units. Revenue = (5,000 units X $20 sales price per unit)$100,000. Total costs = $100,000 ($40,000 fixed costs + $60,000 variable costs calculated as $12 per unit X 5,000 units).
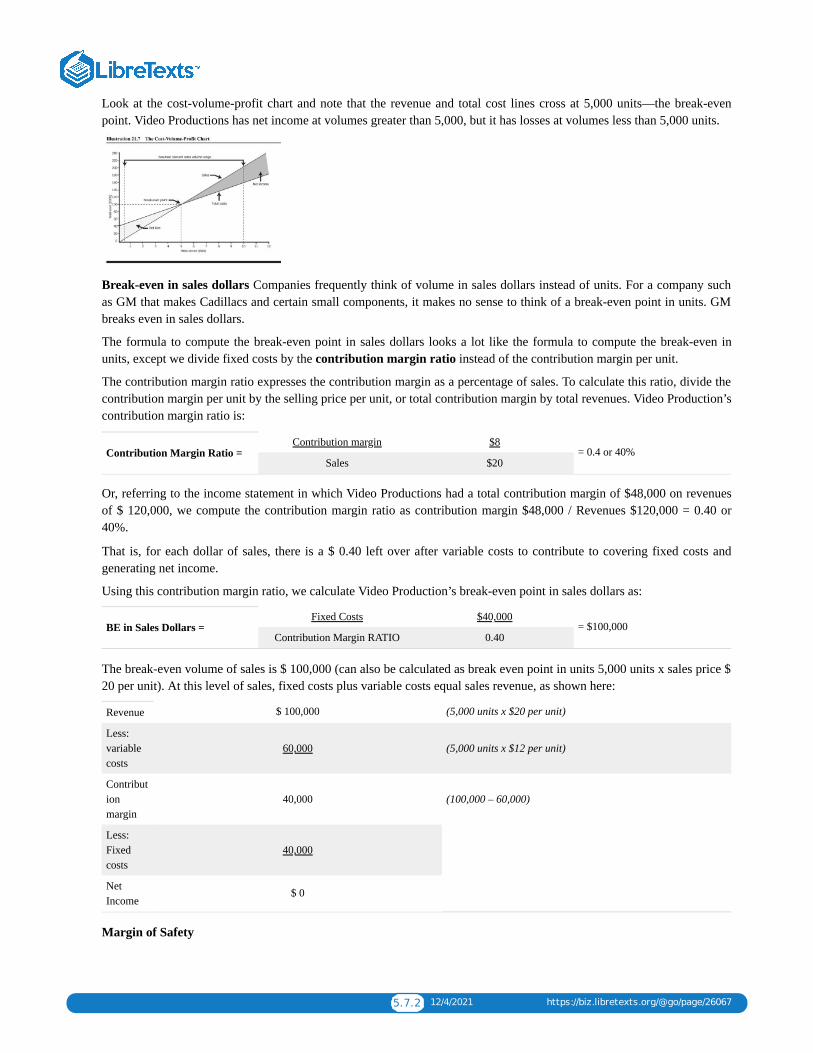
5.7.2 12/4/2021 https://biz.libretexts.org/@go/page/26067
Look at the cost-volume-profit chart and note that the revenue and total cost lines cross at 5,000 units—the break-evenpoint. Video Productions has net income at volumes greater than 5,000, but it has losses at volumes less than 5,000 units.
Break-even in sales dollars Companies frequently think of volume in sales dollars instead of units. For a company suchas GM that makes Cadillacs and certain small components, it makes no sense to think of a break-even point in units. GMbreaks even in sales dollars.
The formula to compute the break-even point in sales dollars looks a lot like the formula to compute the break-even inunits, except we divide fixed costs by the contribution margin ratio instead of the contribution margin per unit.
The contribution margin ratio expresses the contribution margin as a percentage of sales. To calculate this ratio, divide thecontribution margin per unit by the selling price per unit, or total contribution margin by total revenues. Video Production’scontribution margin ratio is:
Contribution Margin Ratio =Contribution margin $8
= 0.4 or 40%Sales $20
Or, referring to the income statement in which Video Productions had a total contribution margin of $48,000 on revenuesof $ 120,000, we compute the contribution margin ratio as contribution margin $48,000 / Revenues $120,000 = 0.40 or40%.
That is, for each dollar of sales, there is a $ 0.40 left over after variable costs to contribute to covering fixed costs andgenerating net income.
Using this contribution margin ratio, we calculate Video Production’s break-even point in sales dollars as:
BE in Sales Dollars =Fixed Costs $40,000
= $100,000Contribution Margin RATIO 0.40
The break-even volume of sales is $ 100,000 (can also be calculated as break even point in units 5,000 units x sales price $20 per unit). At this level of sales, fixed costs plus variable costs equal sales revenue, as shown here:
Revenue $ 100,000 (5,000 units x $20 per unit)
Less:variablecosts
60,000 (5,000 units x $12 per unit)
Contributionmargin
40,000 (100,000 – 60,000)
Less:Fixedcosts
40,000
NetIncome
$ 0
Margin of Safety
5.7.3 12/4/2021 https://biz.libretexts.org/@go/page/26067
If a company’s current sales are more than its break-even point, it has a margin of safety equal to current sales minusbreak-even sales. The margin of safety is the amount by which sales can decrease before the company incurs a loss. Forexample, assume Video Productions currently has sales of $120,000 and its break-even sales are $ 100,000. The margin ofsafety is $ 20,000, computed as follows:
Margin of safety = Current sales – Break even sales
Margin of safety = $ 120,000 – $ 100,000 = $ 20,000
Sometimes people express the margin of safety as a percentage, called the margin of safety rate or just margin of safetypercentage. The margin of safety rate is equal to
Marginof SafetyPercent =
Current Sales – Break even Sales
Current Sales
Using the data just presented, we compute the margin of safety rate is $20,000 / 120,000 = 16.67 %
This means that sales volume could drop by 16.67 percent before the company would incur a loss.
Targeted Profit or Income
You can also use this same type of analysis to determine how many sales units or sales dollars you would need to make aspecific profit (very helpful!). The good news is you have already learned the basic formula, we are just changing itslightly. The formulas we will need are:
Units at Target Profit =Fixed Costs + Target Income
Contribution Margin per unit
Sales Dollars for Target Profit =Fixed Costs + Target Income
Contribution Margin RATIO
These look familiar (or they should!). These are the same formulas we used for break even analysis but this time we haveadded target income. If you think about it, it IS the same formula because at break even our target income is ZERO.
A YouTube element has been excluded from this version of the text. You can view it online here:pb.libretexts.org/llmanagerialaccounting/?p=120
Let’s look at another example. The management of a major airline wishes to know how many seats must be sold on Flight529 to make $8,000 in profit. To solve this problem, management must identify and separate costs into fixed and variablecategories.
The fixed costs of Flight 529 are the same regardless of the number of seats filled. Fixed costs include the fuel required tofly the plane and crew (with no passengers) to its destination; depreciation on the plane used on the flight; and salaries ofrequired crew members, gate attendants, and maintenance and refueling personnel. Fixed costs are $12,000.
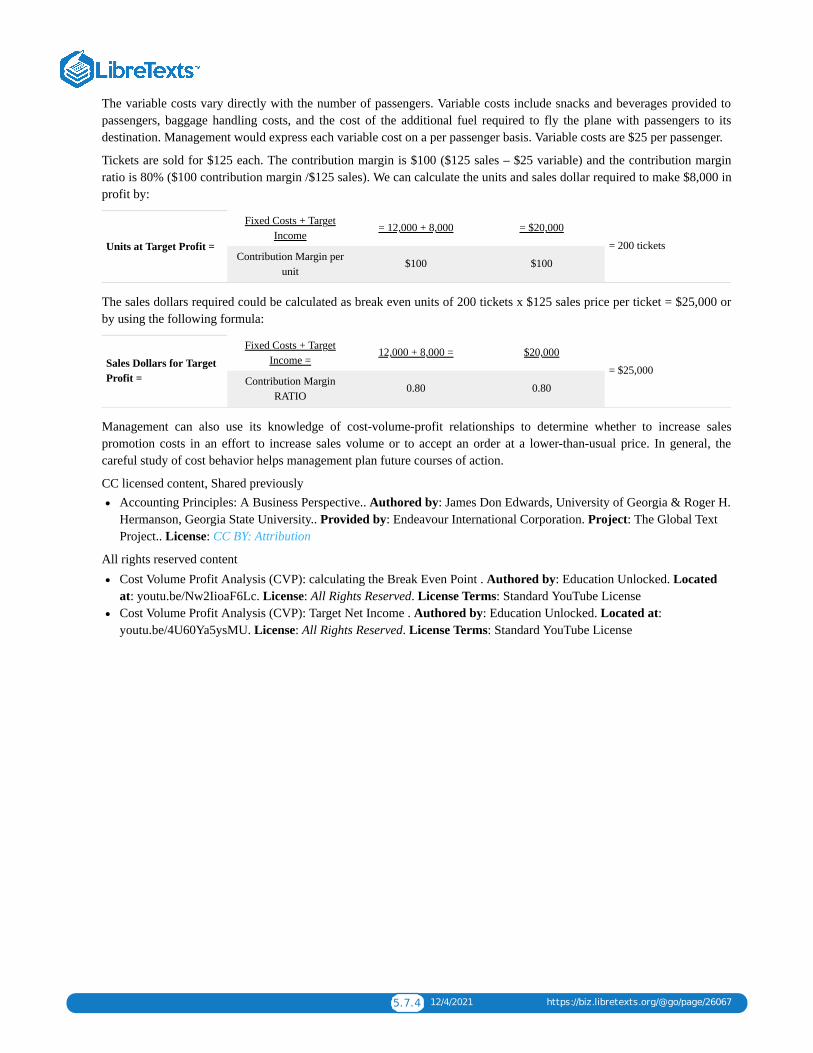
5.7.4 12/4/2021 https://biz.libretexts.org/@go/page/26067
The variable costs vary directly with the number of passengers. Variable costs include snacks and beverages provided topassengers, baggage handling costs, and the cost of the additional fuel required to fly the plane with passengers to itsdestination. Management would express each variable cost on a per passenger basis. Variable costs are $25 per passenger.
Tickets are sold for $125 each. The contribution margin is $100 ($125 sales – $25 variable) and the contribution marginratio is 80% ($100 contribution margin /$125 sales). We can calculate the units and sales dollar required to make $8,000 inprofit by:
Units at Target Profit =
Fixed Costs + TargetIncome
= 12,000 + 8,000 = $20,000
= 200 ticketsContribution Margin per
unit$100 $100
The sales dollars required could be calculated as break even units of 200 tickets x $125 sales price per ticket = $25,000 orby using the following formula:
Sales Dollars for TargetProfit =
Fixed Costs + TargetIncome =
12,000 + 8,000 = $20,000
= $25,000Contribution Margin
RATIO0.80 0.80
Management can also use its knowledge of cost-volume-profit relationships to determine whether to increase salespromotion costs in an effort to increase sales volume or to accept an order at a lower-than-usual price. In general, thecareful study of cost behavior helps management plan future courses of action.
CC licensed content, Shared previouslyAccounting Principles: A Business Perspective.. Authored by: James Don Edwards, University of Georgia & Roger H.Hermanson, Georgia State University.. Provided by: Endeavour International Corporation. Project: The Global TextProject.. License: CC BY: Attribution
All rights reserved contentCost Volume Profit Analysis (CVP): calculating the Break Even Point . Authored by: Education Unlocked. Locatedat: youtu.be/Nw2IioaF6Lc. License: All Rights Reserved. License Terms: Standard YouTube LicenseCost Volume Profit Analysis (CVP): Target Net Income . Authored by: Education Unlocked. Located at:youtu.be/4U60Ya5ysMU. License: All Rights Reserved. License Terms: Standard YouTube License

5.8.1 12/11/2021 https://biz.libretexts.org/@go/page/26068
5.8: Break Even Point for Multiple Products
Although you are likely to use cost-volume-profit analysis for a single product, you will more frequently use it in multi-product situations. The easiest way to use cost-volume-profit analysis for a multi-product company is to use dollars ofsales as the volume measure. For CVP purposes, a multi-product company must assume a given product mix or sales mix.Product (or sales) mix refers to the proportion of the company’s total sales for each type of product sold.
To illustrate the computation of the break-even point for Wonderfood, a multi-product company that makes three types ofcereal, assume the following historical data (percent is a percentage of sale, for each product, take the amount / sales andmultiply by 100 to get the percentage):
Product 1 Product 2 Product 3 Total
Amount Percent Amount Percent Amount Percent Amount Percent
Sales 60,000 100% 30,000 100% 10,000 100% 100,000 100%
Less:variablecosts
40,000 67% 16,000 53% 4,000 40% 60,000 60%
Contributionmargin
20,000 33% 14,000 47% 6,000 60% 40,000 40%
We use the data in the total columns to compute the break-even point. The contribution margin ratio is 40% (totalcontribution margin $40,000/total sales $ 100,000). Assuming the product mix remains constant and fixed costs for thecompany are $50,000, break-even sales are $125,000, computed as follows:
BE in Sales Dollars =Fixed Costs $50,000
= $ 125,000Contribution Margin RATIO 0.40
[To check our answer: ($ 125,000 break even sales X 0.40 contribution margin ratio) – $ 50,000 fixed costs = $ 0 netincome.]
Here is a video example:
A YouTube element has been excluded from this version of the text. You can view it online here:pb.libretexts.org/llmanagerialaccounting/?p=122
Since what we found in our example for Wonderfood is a total, we need to determine how much sales would be needed byeach product to break even. To find the three product sales totals, we multiply total sales dollars by the percent of product(or sales) mix for each of the three products. The product mix for products 1, 2, and 3 is 60:30:10, respectively. That is, out
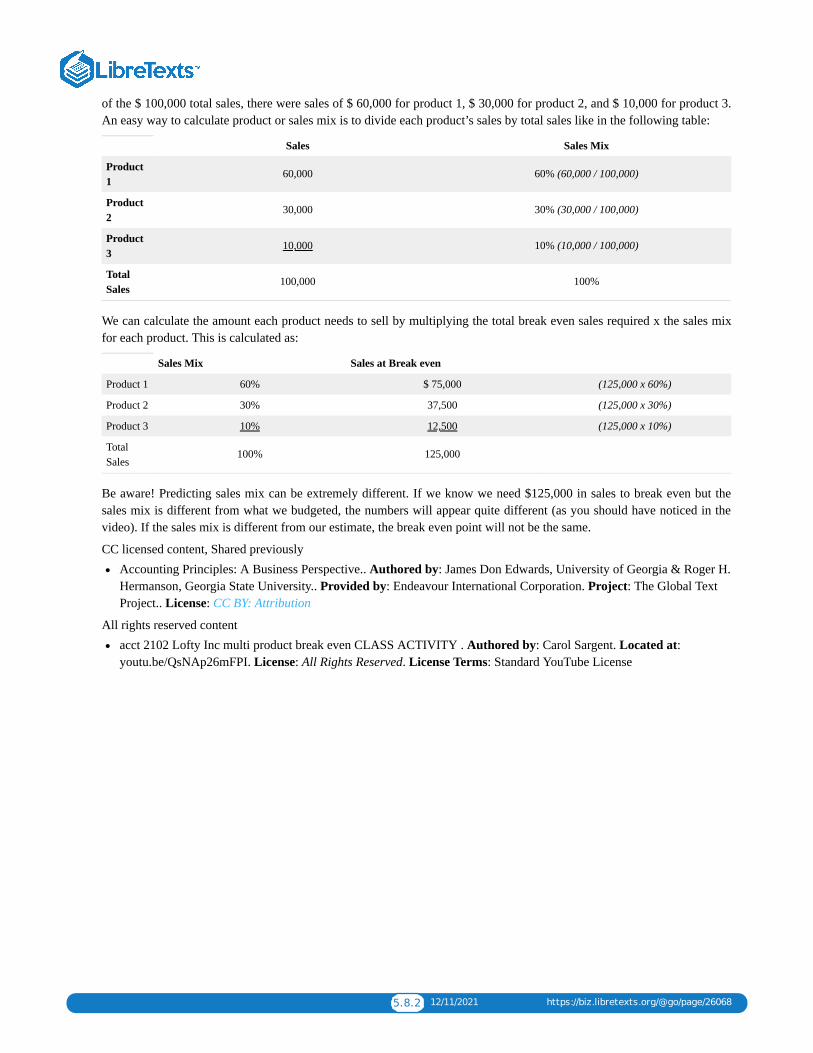
5.8.2 12/11/2021 https://biz.libretexts.org/@go/page/26068
of the $ 100,000 total sales, there were sales of $ 60,000 for product 1, $ 30,000 for product 2, and $ 10,000 for product 3.An easy way to calculate product or sales mix is to divide each product’s sales by total sales like in the following table:
Sales Sales Mix
Product1
60,000 60% (60,000 / 100,000)
Product2
30,000 30% (30,000 / 100,000)
Product3
10,000 10% (10,000 / 100,000)
TotalSales
100,000 100%
We can calculate the amount each product needs to sell by multiplying the total break even sales required x the sales mixfor each product. This is calculated as:
Sales Mix Sales at Break even
Product 1 60% $ 75,000 (125,000 x 60%)
Product 2 30% 37,500 (125,000 x 30%)
Product 3 10% 12,500 (125,000 x 10%)
TotalSales
100% 125,000
Be aware! Predicting sales mix can be extremely different. If we know we need $125,000 in sales to break even but thesales mix is different from what we budgeted, the numbers will appear quite different (as you should have noticed in thevideo). If the sales mix is different from our estimate, the break even point will not be the same.
CC licensed content, Shared previouslyAccounting Principles: A Business Perspective.. Authored by: James Don Edwards, University of Georgia & Roger H.Hermanson, Georgia State University.. Provided by: Endeavour International Corporation. Project: The Global TextProject.. License: CC BY: Attribution
All rights reserved contentacct 2102 Lofty Inc multi product break even CLASS ACTIVITY . Authored by: Carol Sargent. Located at:youtu.be/QsNAp26mFPI. License: All Rights Reserved. License Terms: Standard YouTube License

5.9.1 1/4/2022 https://biz.libretexts.org/@go/page/26069
5.9: Cost-Volume-Profit Analysis Summary
Assumptions made in cost-volume-profit analysisTo summarize, the most important assumptions underlying CVP analysis are:
•Selling price, variable cost per unit, and total fixed costs remain constant through the relevant range. This means that acompany can sell more or fewer units at the same price and that the company has no change in technical efficiency asvolume changes.
•In multi-product situations, the product mix is known in advance.
•Costs can be accurately classified into their fixed and variable portions.
Critics may call these assumptions unrealistic in many situations, but they greatly simplify the analysis.
CVP Graph
This video review the components of the CVP Chart or graph.
youtu.be/Ei8SFrqZiag
CC licensed content, Shared previouslyAccounting Principles: A Business Perspective.. Authored by: James Don Edwards, University of Georgia & Roger H.Hermanson, Georgia State University.. Provided by: Endeavour International Corporation. Project: The Global TextProject.. License: CC BY: Attribution
All rights reserved contentLesson FA-20-050 - Clip 12 - CVP Graph - Part 2 - Breakeven, Profits, Losses, and MoS - 3:10 . Authored by:evideolearner. Located at: youtu.be/Ei8SFrqZiag. License: All Rights Reserved. License Terms: Standard YouTubeLicense
5.10.1 12/25/2021 https://biz.libretexts.org/@go/page/26070
5.10: Accounting in the Headlines- Breakeven
What happens to the breakeven point when Sports Illustrated lays off all six staffphotographers and uses freelancers instead?
Sports Illustrated announced in late January 2015 that it would be laying off all sixof its staff photographers. Instead, it will be using freelance photographers around the world. Sports Illustrated is one of 90magazines owned by Time Inc. (TIME). Published 56 times a year, Sports Illustrated is read by over 23 million peopleeach week.
Questions
1. What type of cost would staff photographers be for Sports Illustrated (fixed, variable, or mixed)?2. What type of cost would the freelance photographers be for Sports Illustrated?3. What is likely to happen to the breakeven point for Sports Illustrated due to the switch to using freelance
photographers?4. What are some disadvantages to Sports Illustrated’s decision to outsource its photography?
CC licensed content, Specific attributionWhat happens to the breakeven point when Sports Illustrated lays off all six staff photographers and uses freelancersinstead?. Authored by: Dr. Wendy Tietz, CPA, CMA, CGMA. Located at: http://www.accountingintheheadlines.com.License: CC BY: Attribution

5.11.1 1/4/2022 https://biz.libretexts.org/@go/page/26071
5.11: Chapter 5 Key Points
CVP Key Takeaways
Fixed Cost stays the same in total but varies per unit.
Variable Costs stay the same per unit but vary in total.
To calculate cost per unit (this works for any type of cost per unit):
Cost (make sure to use the correct cost)
Units produced
Contribution Margin is Sales – Variable Cost (contribution margin per unit is Sales price per unit – Variable cost per unit).
Contribution Margin RATIO is: Contribution Margin per unit / Sales Price per unit
You can find the breakeven point IN UNITS or the units necessary at any income level using the same formula:
Fixed Costs + Target Income
Contribution Margin per unit
Note: At breakeven, your target income is ZERO.
You can calculate breakeven point in SALES DOLLARS or Sales necessary to achieve a specific amount of income in 2ways:
1. Fixed Costs + Target Income
Contribution Margin RATIO
Note: At breakeven, your target income is ZERO.
2. OR, an alternative method is to take your breakeven point in UNITS x sales price per unit.
Contribution Margin Income Statement assumes all costs can be classified as either Fixed or Variable Costs. The basicstructure is:
Sales
– Variable Costs
= Contribution Margin (Sales – Variable Costs)
– Fixed Costs
=Net Income (Contribution Margin – Fixed Costs)
Click CVP Key Takeaways for a printable copy.

5.12.1 12/4/2021 https://biz.libretexts.org/@go/page/26072
5.12: Glossary
GLOSSARY
Break-even point That level of operations at which revenues for a period are equal to the costs assigned to that period sothere is no net income or loss.
Contribution margin The amount by which revenue exceeds the variable costs of producing that revenue. Thecontribution margin per unit is the selling price minus the variable cost per unit.
Contribution margin ratio Contribution margin per unit divided by selling price per unit, or total contribution margindivided by total revenues.
Cost-volume-profit (CVP) analysis An analysis of the effect that any changes in a company’s selling prices, costs, and/orvolume will have on income (profits) in the short run. Also called break-even analysis.
Cost-volume-profit (CVP) chart A graph that shows the relationships among sales, volume, costs, and net income orloss.
Fixed costs Costs that remain constant (in total) over some relevant range of output.
High-low method A method used in dividing mixed costs into their fixed and variable portions. The high plot and low plotof actual costs are used to draw a line representing a total mixed cost.
Margin of safety Amount by which sales can decrease before a loss is incurred.
Margin of safety rate Margin of safety expressed as a percentage, which equals (Current sales – Break-evensales)/Current sales.
Mixed cost Contains a fixed portion of cost incurred even when the plant is completely idle and a variable portion thatincreases directly with production volume.
Product mix The proportion of the company’s total sales attributable to each type of product sold.
Profit equation The equation is Net income = Revenue – Total variable costs – Fixed costs.
Relevant range The range of production or sales volume over which the assumptions about cost behavior are valid.
Scatter diagram A diagram that shows plots of actual costs incurred for various levels of activity; it is used in dividingmixed costs into their fixed and variable portions.
Short run The time during which a company’s management cannot change the effects of certain past decisions; oftendetermined to be one year or less. In the short run, many costs are assumed to be fixed and unchangeable.
Step cost A cost that remains constant at a certain fixed amount over a range of output (or sales) but then keeps increasingto a higher amount at certain points.
Variable costs Costs that vary (in total) directly with changes in the volume of production or sales.
*Some terms listed in earlier chapters are repeated here for your convenience.
CC licensed content, Shared previouslyAccounting Principles: A Business Perspective. Authored by: James Don Edwards, University of Georgia & Roger H.Hermanson, Georgia State University. Provided by: Endeavour International Corporation. Project: The Global TextProject. License: CC BY: Attribution

5.13.1 1/1/2022 https://biz.libretexts.org/@go/page/26073
5.13: Chapter 5- Exercises
Short-Answer Questions, Exercises, and ProblemsShort-Answer Questions➢ Name and describe four cost behavior patterns.➢ Describe two methods of determining the fixed and variable components of mixed costs.➢ What is meant by the term break-even point?➢ What are two ways in which the break-even point can be expressed?➢ What is the relevant range?➢ What is the formula for calculating the break-even point in sales revenue?➢ What formula is used to solve for the break-even point in units?➢ How can the break-even formula be altered to calculate the number of units that must be sold to achieve a desired levelof income?➢ Why might a business wish to lower its break-even point? How would it go about lowering the break-even point?➢ What effect would you expect the mechanization and automation of production processes to have on the break-evenpoint?➢ Real world question Assume your college is considering hiring a lecturer to teach a special class in communicationskills. Identify at least two costs that college administrators might consider in deciding whether to hire the lecturer and addthe class.➢ Real world question Two enterprising students are considering renting space and opening a class video recordingservice. They would hire camera operators to record large introductory classes. The students taking the classes would becharged a fee to rent and view the video on their laptops or smart phones. Identify as many costs of this business as youcan and indicate which would be variable and which would be fixed.ExercisesExercise A Name and match the types of cost behavior with the appropriate diagram below:Exercise B Research Inc.,performs laboratory tests. Use the high-low method to determine the fixed and variable components of a mixed cost, giventhe following observations:
Volume (number of tests) Total cost
4,800 $6,000
19,200 9,600
Exercise C Compute the break-even point in sales dollars if fixed costs are $200,000 and the total contribution margin is20% of revenue.
Exercise D Barney Company makes and sells stuffed animals. One product, Michael Bears, sells for $28 per bear. MichaelBears have fixed costs of $100,000 per month and a variable cost of $12 per bear. How many Michael Bears must beproduced and sold each month to break even?
Exercise E Peter Garcia Meza is considering buying a company if it will break even or earn net income on revenues of$80,000 per month. The company that Peter is considering sells each unit it produces for $5. Use the following cost data tocompute the variable cost per unit and the fixed cost for the period. Calculate the break-even point in sales dollars. ShouldPeter buy this company?
Volume (units) Cost
8,000 $70,000
68,000 190,000
Exercise F Never Late Delivery currently delivers packages for $9 each. The variable cost is $3 per package, and fixedcosts are $60,000 per month. Compute the break-even point in both sales dollars and units under each of the followingindependent assumptions. Comment on why the break-even points are different.
1. The costs and selling price are as just given.2. Fixed costs are increased to $75,000.3. Selling price is increased by 10%. (Fixed costs are $60,000.)4. Variable cost is increased to $4.50 per unit. (Fixed costs are $60,000 and selling price is $9.)
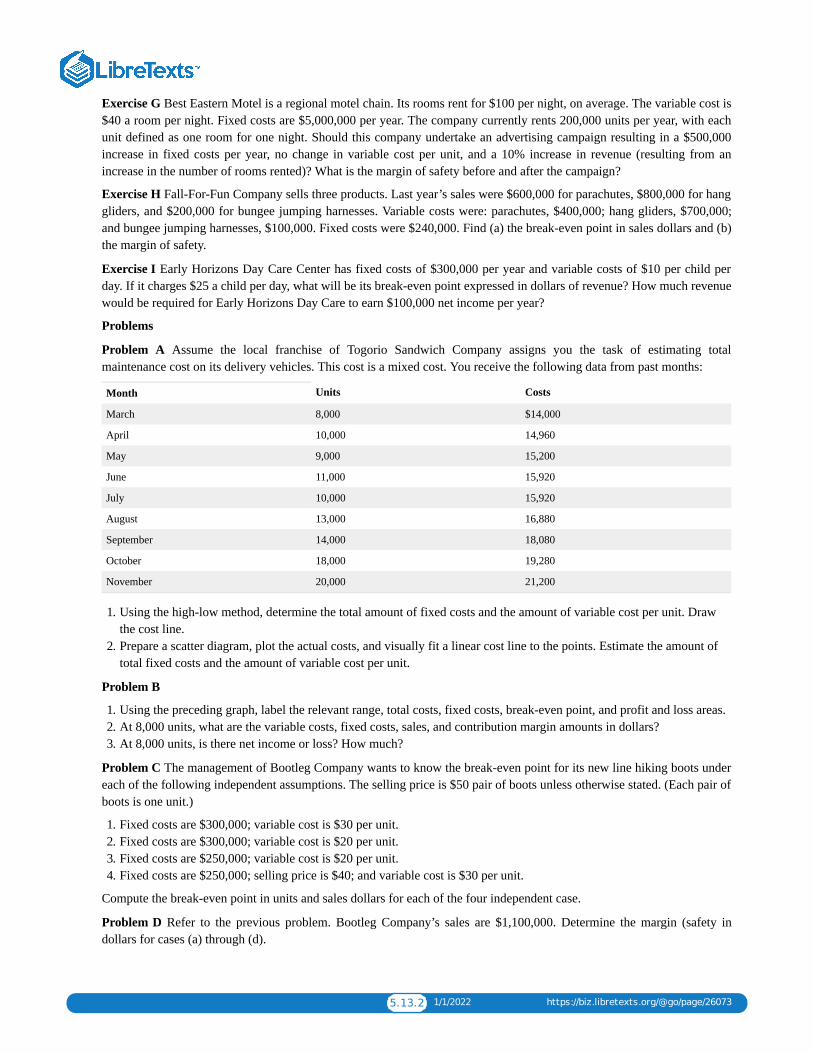
5.13.2 1/1/2022 https://biz.libretexts.org/@go/page/26073
Exercise G Best Eastern Motel is a regional motel chain. Its rooms rent for $100 per night, on average. The variable cost is$40 a room per night. Fixed costs are $5,000,000 per year. The company currently rents 200,000 units per year, with eachunit defined as one room for one night. Should this company undertake an advertising campaign resulting in a $500,000increase in fixed costs per year, no change in variable cost per unit, and a 10% increase in revenue (resulting from anincrease in the number of rooms rented)? What is the margin of safety before and after the campaign?
Exercise H Fall-For-Fun Company sells three products. Last year’s sales were $600,000 for parachutes, $800,000 for hanggliders, and $200,000 for bungee jumping harnesses. Variable costs were: parachutes, $400,000; hang gliders, $700,000;and bungee jumping harnesses, $100,000. Fixed costs were $240,000. Find (a) the break-even point in sales dollars and (b)the margin of safety.
Exercise I Early Horizons Day Care Center has fixed costs of $300,000 per year and variable costs of $10 per child perday. If it charges $25 a child per day, what will be its break-even point expressed in dollars of revenue? How much revenuewould be required for Early Horizons Day Care to earn $100,000 net income per year?
Problems
Problem A Assume the local franchise of Togorio Sandwich Company assigns you the task of estimating totalmaintenance cost on its delivery vehicles. This cost is a mixed cost. You receive the following data from past months:
Month Units Costs
March 8,000 $14,000
April 10,000 14,960
May 9,000 15,200
June 11,000 15,920
July 10,000 15,920
August 13,000 16,880
September 14,000 18,080
October 18,000 19,280
November 20,000 21,200
1. Using the high-low method, determine the total amount of fixed costs and the amount of variable cost per unit. Drawthe cost line.
2. Prepare a scatter diagram, plot the actual costs, and visually fit a linear cost line to the points. Estimate the amount oftotal fixed costs and the amount of variable cost per unit.
Problem B
1. Using the preceding graph, label the relevant range, total costs, fixed costs, break-even point, and profit and loss areas.2. At 8,000 units, what are the variable costs, fixed costs, sales, and contribution margin amounts in dollars?3. At 8,000 units, is there net income or loss? How much?
Problem C The management of Bootleg Company wants to know the break-even point for its new line hiking boots undereach of the following independent assumptions. The selling price is $50 pair of boots unless otherwise stated. (Each pair ofboots is one unit.)
1. Fixed costs are $300,000; variable cost is $30 per unit.2. Fixed costs are $300,000; variable cost is $20 per unit.3. Fixed costs are $250,000; variable cost is $20 per unit.4. Fixed costs are $250,000; selling price is $40; and variable cost is $30 per unit.
Compute the break-even point in units and sales dollars for each of the four independent case.
Problem D Refer to the previous problem. Bootleg Company’s sales are $1,100,000. Determine the margin (safety indollars for cases (a) through (d).
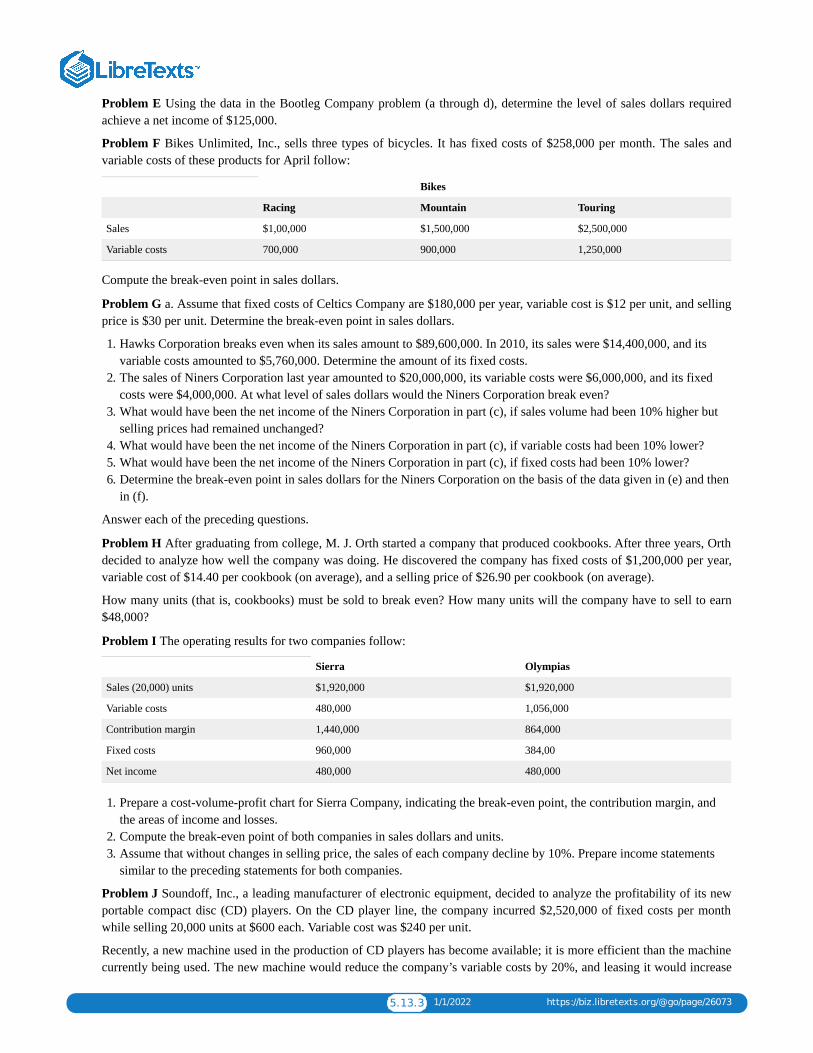
5.13.3 1/1/2022 https://biz.libretexts.org/@go/page/26073
Problem E Using the data in the Bootleg Company problem (a through d), determine the level of sales dollars requiredachieve a net income of $125,000.
Problem F Bikes Unlimited, Inc., sells three types of bicycles. It has fixed costs of $258,000 per month. The sales andvariable costs of these products for April follow:
Bikes
Racing Mountain Touring
Sales $1,00,000 $1,500,000 $2,500,000
Variable costs 700,000 900,000 1,250,000
Compute the break-even point in sales dollars.
Problem G a. Assume that fixed costs of Celtics Company are $180,000 per year, variable cost is $12 per unit, and sellingprice is $30 per unit. Determine the break-even point in sales dollars.
1. Hawks Corporation breaks even when its sales amount to $89,600,000. In 2010, its sales were $14,400,000, and itsvariable costs amounted to $5,760,000. Determine the amount of its fixed costs.
2. The sales of Niners Corporation last year amounted to $20,000,000, its variable costs were $6,000,000, and its fixedcosts were $4,000,000. At what level of sales dollars would the Niners Corporation break even?
3. What would have been the net income of the Niners Corporation in part (c), if sales volume had been 10% higher butselling prices had remained unchanged?
4. What would have been the net income of the Niners Corporation in part (c), if variable costs had been 10% lower?5. What would have been the net income of the Niners Corporation in part (c), if fixed costs had been 10% lower?6. Determine the break-even point in sales dollars for the Niners Corporation on the basis of the data given in (e) and then
in (f).
Answer each of the preceding questions.
Problem H After graduating from college, M. J. Orth started a company that produced cookbooks. After three years, Orthdecided to analyze how well the company was doing. He discovered the company has fixed costs of $1,200,000 per year,variable cost of $14.40 per cookbook (on average), and a selling price of $26.90 per cookbook (on average).
How many units (that is, cookbooks) must be sold to break even? How many units will the company have to sell to earn$48,000?
Problem I The operating results for two companies follow:
Sierra Olympias
Sales (20,000) units $1,920,000 $1,920,000
Variable costs 480,000 1,056,000
Contribution margin 1,440,000 864,000
Fixed costs 960,000 384,00
Net income 480,000 480,000
1. Prepare a cost-volume-profit chart for Sierra Company, indicating the break-even point, the contribution margin, andthe areas of income and losses.
2. Compute the break-even point of both companies in sales dollars and units.3. Assume that without changes in selling price, the sales of each company decline by 10%. Prepare income statements
similar to the preceding statements for both companies.
Problem J Soundoff, Inc., a leading manufacturer of electronic equipment, decided to analyze the profitability of its newportable compact disc (CD) players. On the CD player line, the company incurred $2,520,000 of fixed costs per monthwhile selling 20,000 units at $600 each. Variable cost was $240 per unit.
Recently, a new machine used in the production of CD players has become available; it is more efficient than the machinecurrently being used. The new machine would reduce the company’s variable costs by 20%, and leasing it would increase

5.13.4 1/1/2022 https://biz.libretexts.org/@go/page/26073
fixed costs by $96,000 per year.
1. Compute the break-even point in units assuming use of the old machine.2. Compute the break-even point in units assuming use of the new machine.3. Assuming that total sales remain at $12,000,000 and that the new machine is leased, compute the expected net income.4. Should the new machine be leased? Why?
Problem K Surething CD Company reports sales of $720,000, variable costs of $432,000, and fixed costs of $108,000. Ifthe company spends $72,000 on a sales promotion campaign, it estimates that sales will be increased by $270,000.
Determine whether the sales promotion campaign should be undertaken. Provide calculations.
Alternate problems
Alternate problem A Hear Right Company has identified certain variable and fixed costs in its production of hearing aids.Management wants you to divide one of its mixed costs into its fixed and variable portions. Here are the data for this cost:
Month Units Costs
January 20,800 $57,600
February 20,000 54,000
March 22,000 58,500
April 25,600 57,600
May 28,400 58,500
June 30,000 62,100
July 32,800 63,900
August 35,600 68,400
September 37,600 72,000
October 40,000 77,400
1. Using the high-low method, determine the total amount of fixed costs and the amount of variable cost per unit. Drawthe cost line.
2. Prepare a scatter diagram, plot the actual costs, and visually fit a linear cost line to the points. Estimate the amount oftotal fixed costs and the variable cost per unit.
Alternate problem B
1. Using the preceding graph, label the relevant range, total costs, fixed costs, break-even point, and profit and loss areas.2. At 18,000 units, what would sales revenue, total costs, fixed and variable costs be?3. At 18,000 units, would there be a profit or loss? How much?
Alternate problem C Jefferson Company has a plant capacity of 100,000 units, at which level variable costs are $720,000.Fixed costs are expected to be $432,000. Each unit of product sells for $12.
1. Determine the company’s break-even point in sales dollars and units.2. At what level of sales dollars would the company earn net income of $144,000?3. If the selling price were raised to $14.40 per unit, at what level of sales dollars would the company earn $144,000?
Alternate problem D a. Determine the break-even point in sales dollars and units for Cowboys Company that has fixedcosts of $63,000, variable cost of $24.50 per unit, and a selling price of $35.00 per unit.
1. Wildcats Company breaks even when sales are $280,000. In March, sales were $670,000, and variable costs were$536,000. Compute the amount of fixed costs.
2. Hoosiers Company had sales in June of $84,000; variable costs of $46,200; and fixed costs of $50,400. At what level ofsales, in dollars, would the company break even?
3. What would the break-even point in sales dollars have been in (c) if variable costs had been 10% higher?4. What would the break-even point in sales dollars have been in (c) if fixed costs had been 10% higher?

5.13.5 1/1/2022 https://biz.libretexts.org/@go/page/26073
5. Compute the break-even point in sales dollars for Hoosiers Company in (c) under the assumptions of (d) and (e)together.
Answer each of the preceding questions.
Alternate problem E See Right Company makes contact lenses. The company has a plant capacity of 200,000 units.Variable costs are $4,000,000 at 100% capacity. Fixed costs are $2,000,000 per year, but this is true only between 50,000and 200,000 units.
1. Prepare a cost-volume-profit chart for See Right Company assuming it sells its product for $40 each. Indicate on thechart the relevant range, break-even point, and the areas of net income and losses.
2. Compute the break-even point in units.3. How many units would have to be sold to earn $200,000 per year?
Alternate problem F Mr Feelds Cookies has fixed costs of $360,000 per year. It sells three types of cookies. The cost andrevenue data for these products follow:
Cookies
Cream cake Goo fill Sweet tooth
Sales $64,000 $95,0000 $131,000
Variable costs 38,400 55,100 66,000
Compute the break-even point in sales dollars.
Beyond the numbers—Critical thinking
Business decision case A Quality Furniture Company is operating at almost 100% of capacity. The company expects salesto increase by 25% in 2011. To satisfy the demand for its product, the company is considering two alternatives: The firstalternative would increase fixed costs by 15% but not affect variable costs. The second alternative would not affect fixedcosts but increase variable costs to 60% of the selling price of the company’s product.
This is Quality Furniture Company’s condensed income statement for 2010:
Sales $3,600,000
Costs:
Variable $1,620,000
Fixed 330,000 1,950,000
Income before taxes $1,650,000
1. Determine the break-even point in sales dollars for 2011 under each of the alternatives.2. Determine projected income for 2011 under each of the alternatives.3. Which alternative would you recommend? Why?
Business decision case B When the Weidkamp Company’s plant is completely idle, fixed costs amount to $720,000. Whenthe plant operates at levels of 50% of capacity or less, its fixed costs are $840,000; at levels more than 50% of capacity, itsfixed costs are $1,200,000. The company’s variable costs at full capacity (100,000 units) amount to $1,800,000.
1. Assuming that the company’s product sells for $60 per unit, what is the company’s break-even point in sales dollars?2. Using only the data given, at what level of sales would it be more economical to close the factory than to operate it? In
other words, at what level would operating losses approximate the losses incurred if the factory closed downcompletely?
3. Assume that Weidkamp Company is operating at 50% of its capacity and decides to reduce the selling price from $60per unit to $36 per unit to increase sales. At what percentage of capacity must the company operate to break even at thereduced sales price?
Business decision case C Monroe Company has recently been awarded a contract to sell 25,000 units of its product to thefederal government. Monroe manufactures the components of the product rather than purchasing them. When the news ofthe contract was released to the public, President Mary Monroe, received a call from the president of the McLean
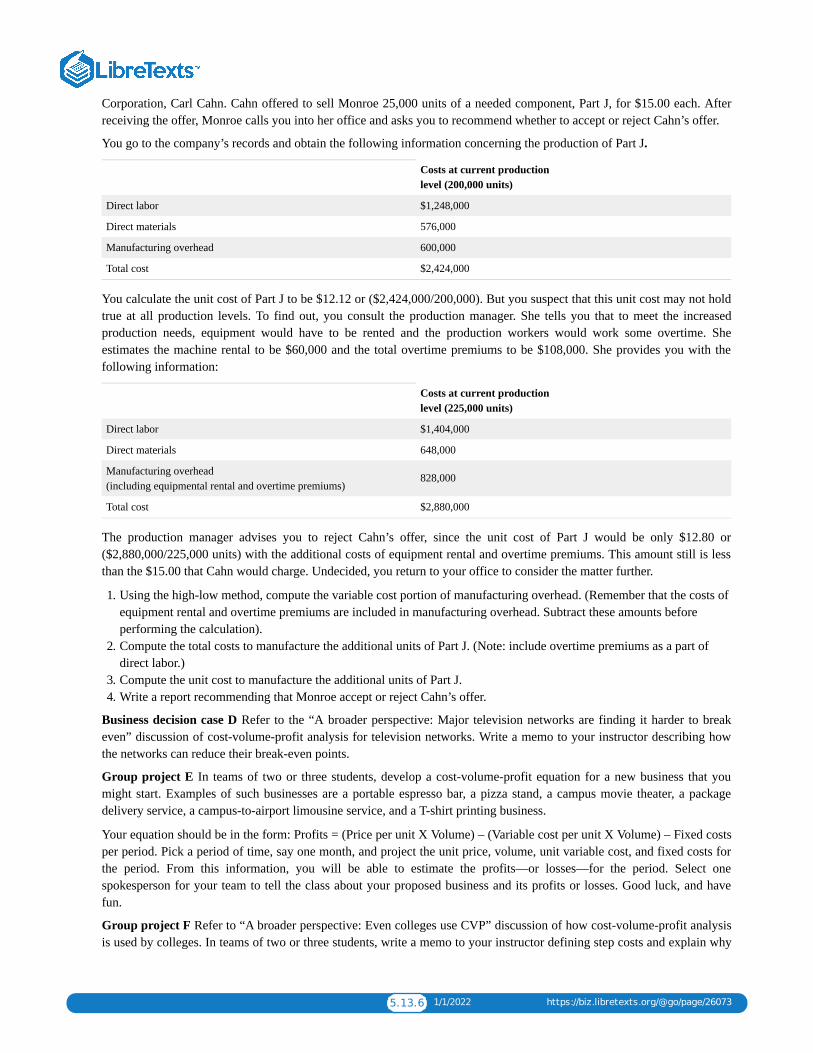
5.13.6 1/1/2022 https://biz.libretexts.org/@go/page/26073
Corporation, Carl Cahn. Cahn offered to sell Monroe 25,000 units of a needed component, Part J, for $15.00 each. Afterreceiving the offer, Monroe calls you into her office and asks you to recommend whether to accept or reject Cahn’s offer.
You go to the company’s records and obtain the following information concerning the production of Part J.
Costs at current productionlevel (200,000 units)
Direct labor $1,248,000
Direct materials 576,000
Manufacturing overhead 600,000
Total cost $2,424,000
You calculate the unit cost of Part J to be $12.12 or ($2,424,000/200,000). But you suspect that this unit cost may not holdtrue at all production levels. To find out, you consult the production manager. She tells you that to meet the increasedproduction needs, equipment would have to be rented and the production workers would work some overtime. Sheestimates the machine rental to be $60,000 and the total overtime premiums to be $108,000. She provides you with thefollowing information:
Costs at current productionlevel (225,000 units)
Direct labor $1,404,000
Direct materials 648,000
Manufacturing overhead(including equipmental rental and overtime premiums)
828,000
Total cost $2,880,000
The production manager advises you to reject Cahn’s offer, since the unit cost of Part J would be only $12.80 or($2,880,000/225,000 units) with the additional costs of equipment rental and overtime premiums. This amount still is lessthan the $15.00 that Cahn would charge. Undecided, you return to your office to consider the matter further.
1. Using the high-low method, compute the variable cost portion of manufacturing overhead. (Remember that the costs ofequipment rental and overtime premiums are included in manufacturing overhead. Subtract these amounts beforeperforming the calculation).
2. Compute the total costs to manufacture the additional units of Part J. (Note: include overtime premiums as a part ofdirect labor.)
3. Compute the unit cost to manufacture the additional units of Part J.4. Write a report recommending that Monroe accept or reject Cahn’s offer.
Business decision case D Refer to the “A broader perspective: Major television networks are finding it harder to breakeven” discussion of cost-volume-profit analysis for television networks. Write a memo to your instructor describing howthe networks can reduce their break-even points.
Group project E In teams of two or three students, develop a cost-volume-profit equation for a new business that youmight start. Examples of such businesses are a portable espresso bar, a pizza stand, a campus movie theater, a packagedelivery service, a campus-to-airport limousine service, and a T-shirt printing business.
Your equation should be in the form: Profits = (Price per unit X Volume) – (Variable cost per unit X Volume) – Fixed costsper period. Pick a period of time, say one month, and project the unit price, volume, unit variable cost, and fixed costs forthe period. From this information, you will be able to estimate the profits—or losses—for the period. Select onespokesperson for your team to tell the class about your proposed business and its profits or losses. Good luck, and havefun.
Group project F Refer to “A broader perspective: Even colleges use CVP” discussion of how cost-volume-profit analysisis used by colleges. In teams of two or three students, write a memo to your instructor defining step costs and explain why

5.13.7 1/1/2022 https://biz.libretexts.org/@go/page/26073
the step costs identified in the case are classified as such. Also include in your memo how the school might lower itsbreak-even point.
Group project G In teams of two or three students, address the following questions:
Why would a company consider increasing automation and decreasing the use of labor if the result would be anincrease in the break-even point?Would an increase in automation increase fixed costs over the short-run, long-run, or both?
Write a memo to your instructor that addresses both questions. Be sure to explain your answers.
Using the Internet—A view of the real world
Visit the website for Intel Corporation, a high technology manufacturing company.
http://www.intel.com
Go to the company’s most recent financial statements and review the consolidated statement of income. What additionalinformation, if any, would you need to perform cost-volume-profit analysis? Why is this information excluded from Intel’sincome statement?
Visit the website for Wal-Mart Corporation, a retail company.
www.walmart.com
Go to the company’s most recent financial statements and review the statement of income. What additional information, ifany, would you need to perform cost-volume-profit analysis? Why is this information excluded from Wal-MartCorporation’s income statement?
level (225,000 units)Direct labor$1,404,000Direct materials648,000
Manufacturing overhead
(including equipmental rental and overtime premiums)
828,000Total cost$2,880,000
The production manager advises you to reject Cahn’s offer, since the unit cost of Part J would be only $12.80 or($2,880,000/225,000 units) with the additional costs of equipment rental and overtime premiums. This amount still is lessthan the $15.00 that Cahn would charge. Undecided, you return to your office to consider the matter further.
1. Using the high-low method, compute the variable cost portion of manufacturing overhead. (Remember that the costs ofequipment rental and overtime premiums are included in manufacturing overhead. Subtract these amounts beforeperforming the calculation).
2. Compute the total costs to manufacture the additional units of Part J. (Note: include overtime premiums as a part ofdirect labor.)
3. Compute the unit cost to manufacture the additional units of Part J.4. Write a report recommending that Monroe accept or reject Cahn’s offer.
CC licensed content, Shared previouslyAccounting Principles: A Business Perspective. Authored by: James Don Edwards, University of Georgia & Roger H.Hermanson, Georgia State University. Provided by: Endeavour International Corporation. Project: The Global TextProject. License: CC BY: Attribution

1 1/8/2022
CHAPTER OVERVIEW6: VARIABLE AND ABSORPTION COSTING
6.1: ABSORPTION COSTING6.2: CHAPTER 6 STUDY PLAN6.3: VARIABLE COSTING6.4: COMPARING ABSORPTION AND VARIABLE COSTING6.5: CHAPTER 6 KEY POINTS6.6: CHAPTER 6- EXERCISES
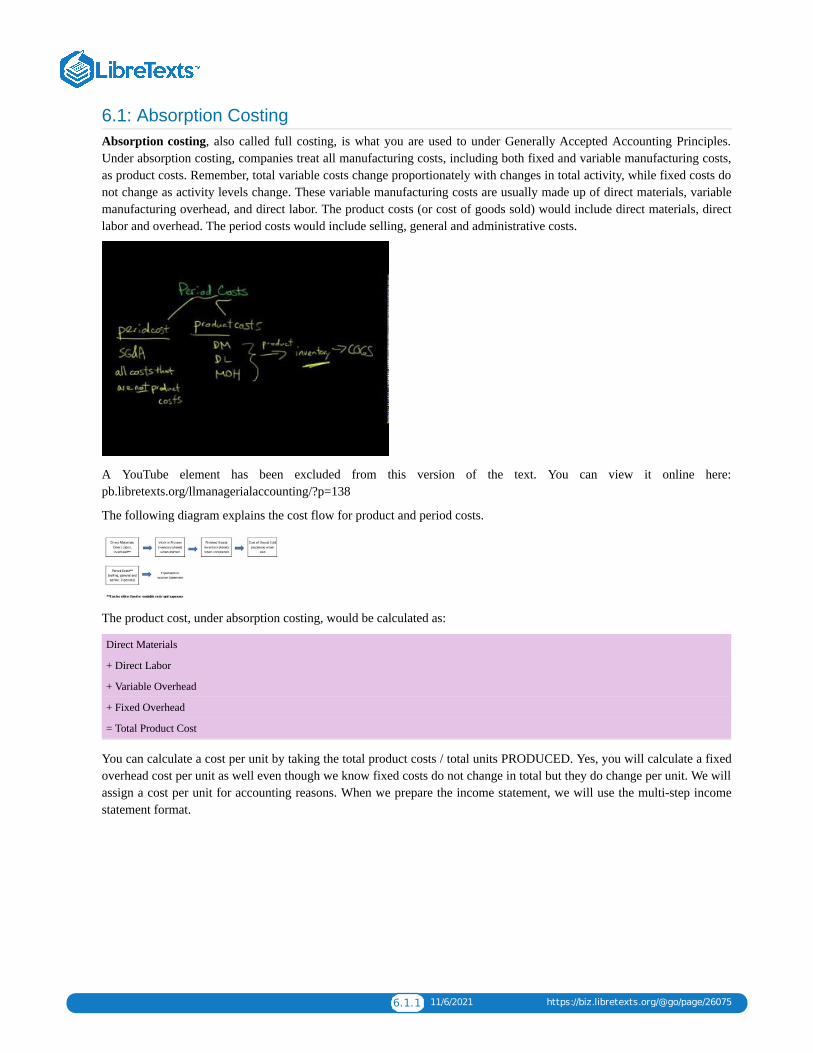
6.1.1 11/6/2021 https://biz.libretexts.org/@go/page/26075
6.1: Absorption CostingAbsorption costing, also called full costing, is what you are used to under Generally Accepted Accounting Principles.Under absorption costing, companies treat all manufacturing costs, including both fixed and variable manufacturing costs,as product costs. Remember, total variable costs change proportionately with changes in total activity, while fixed costs donot change as activity levels change. These variable manufacturing costs are usually made up of direct materials, variablemanufacturing overhead, and direct labor. The product costs (or cost of goods sold) would include direct materials, directlabor and overhead. The period costs would include selling, general and administrative costs.
A YouTube element has been excluded from this version of the text. You can view it online here:pb.libretexts.org/llmanagerialaccounting/?p=138
The following diagram explains the cost flow for product and period costs.
The product cost, under absorption costing, would be calculated as:
Direct Materials
+ Direct Labor
+ Variable Overhead
+ Fixed Overhead
= Total Product Cost
You can calculate a cost per unit by taking the total product costs / total units PRODUCED. Yes, you will calculate a fixedoverhead cost per unit as well even though we know fixed costs do not change in total but they do change per unit. We willassign a cost per unit for accounting reasons. When we prepare the income statement, we will use the multi-step incomestatement format.
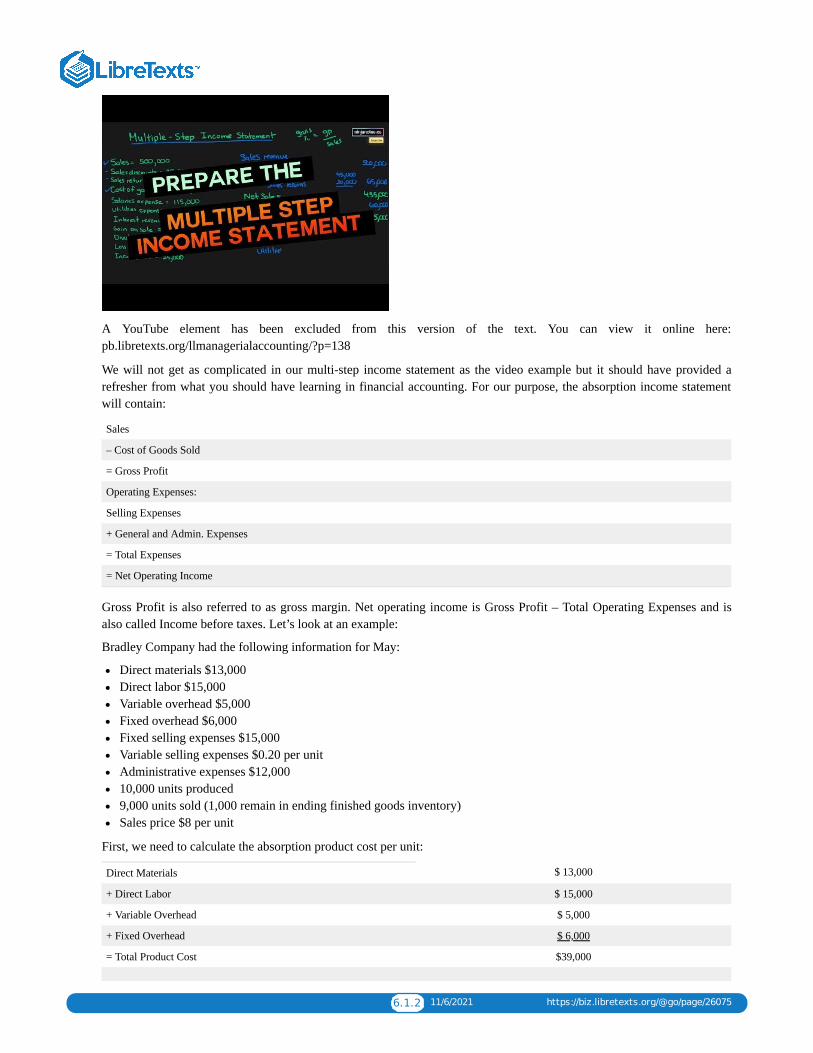
6.1.2 11/6/2021 https://biz.libretexts.org/@go/page/26075
A YouTube element has been excluded from this version of the text. You can view it online here:pb.libretexts.org/llmanagerialaccounting/?p=138
We will not get as complicated in our multi-step income statement as the video example but it should have provided arefresher from what you should have learning in financial accounting. For our purpose, the absorption income statementwill contain:
Sales
– Cost of Goods Sold
= Gross Profit
Operating Expenses:
Selling Expenses
+ General and Admin. Expenses
= Total Expenses
= Net Operating Income
Gross Profit is also referred to as gross margin. Net operating income is Gross Profit – Total Operating Expenses and isalso called Income before taxes. Let’s look at an example:
Bradley Company had the following information for May:
Direct materials $13,000Direct labor $15,000Variable overhead $5,000Fixed overhead $6,000Fixed selling expenses $15,000Variable selling expenses $0.20 per unitAdministrative expenses $12,00010,000 units produced9,000 units sold (1,000 remain in ending finished goods inventory)Sales price $8 per unit
First, we need to calculate the absorption product cost per unit:
Direct Materials $ 13,000
+ Direct Labor $ 15,000
+ Variable Overhead $ 5,000
+ Fixed Overhead $ 6,000
= Total Product Cost $39,000
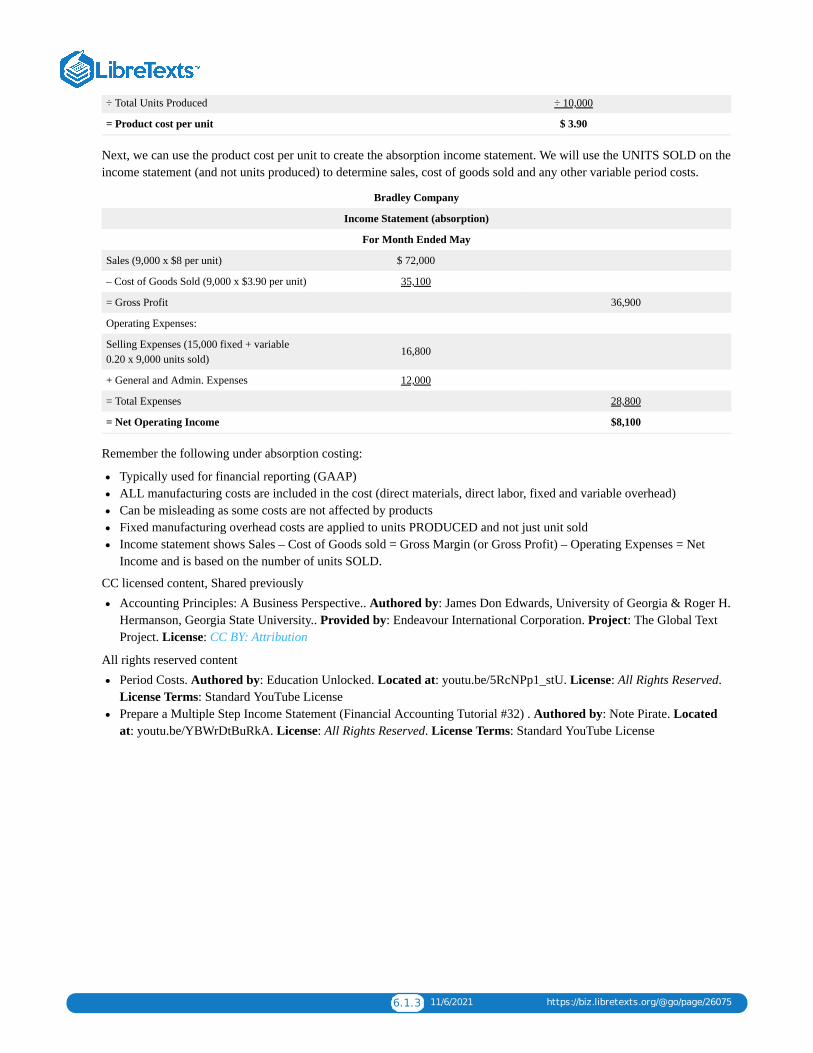
6.1.3 11/6/2021 https://biz.libretexts.org/@go/page/26075
÷ Total Units Produced ÷ 10,000
= Product cost per unit $ 3.90
Next, we can use the product cost per unit to create the absorption income statement. We will use the UNITS SOLD on theincome statement (and not units produced) to determine sales, cost of goods sold and any other variable period costs.
Bradley Company
Income Statement (absorption)
For Month Ended May
Sales (9,000 x $8 per unit) $ 72,000
– Cost of Goods Sold (9,000 x $3.90 per unit) 35,100
= Gross Profit 36,900
Operating Expenses:
Selling Expenses (15,000 fixed + variable0.20 x 9,000 units sold)
16,800
+ General and Admin. Expenses 12,000
= Total Expenses 28,800
= Net Operating Income $8,100
Remember the following under absorption costing:
Typically used for financial reporting (GAAP)ALL manufacturing costs are included in the cost (direct materials, direct labor, fixed and variable overhead)Can be misleading as some costs are not affected by productsFixed manufacturing overhead costs are applied to units PRODUCED and not just unit soldIncome statement shows Sales – Cost of Goods sold = Gross Margin (or Gross Profit) – Operating Expenses = NetIncome and is based on the number of units SOLD.
CC licensed content, Shared previouslyAccounting Principles: A Business Perspective.. Authored by: James Don Edwards, University of Georgia & Roger H.Hermanson, Georgia State University.. Provided by: Endeavour International Corporation. Project: The Global TextProject. License: CC BY: Attribution
All rights reserved contentPeriod Costs. Authored by: Education Unlocked. Located at: youtu.be/5RcNPp1_stU. License: All Rights Reserved.License Terms: Standard YouTube LicensePrepare a Multiple Step Income Statement (Financial Accounting Tutorial #32) . Authored by: Note Pirate. Locatedat: youtu.be/YBWrDtBuRkA. License: All Rights Reserved. License Terms: Standard YouTube License
6.2.1 12/25/2021 https://biz.libretexts.org/@go/page/26074
6.2: Chapter 6 Study Plan
Study Plan: Variable Costing & Performance Reporting
Knowledge Targets
I can define the following terms as they relate to our unit:
Absorption costing Variable costing Fixed Costs Variable Costs
Segment Segment Margin Segmented Income Statement Contribution Margin IncomeStatement
Traceable Cost Common cost Cost per unit Net Income
Reasoning Targets
I can identify costs as fixed or variable.I can explain the difference between variable costing and absorption costing.I can analyze and explain the difference in net income under variable costing and absorption costing.I can determine the profitability of each segment in a segmented income statement.
Skill Targets
I can calculate cost per unit under variable costing.I can calculate cost per unit under absorption costing.I can prepare income statements using variable costing and absorption costing.I can prepare a segmented income statement.
Click Variable Costing for a printable copy.
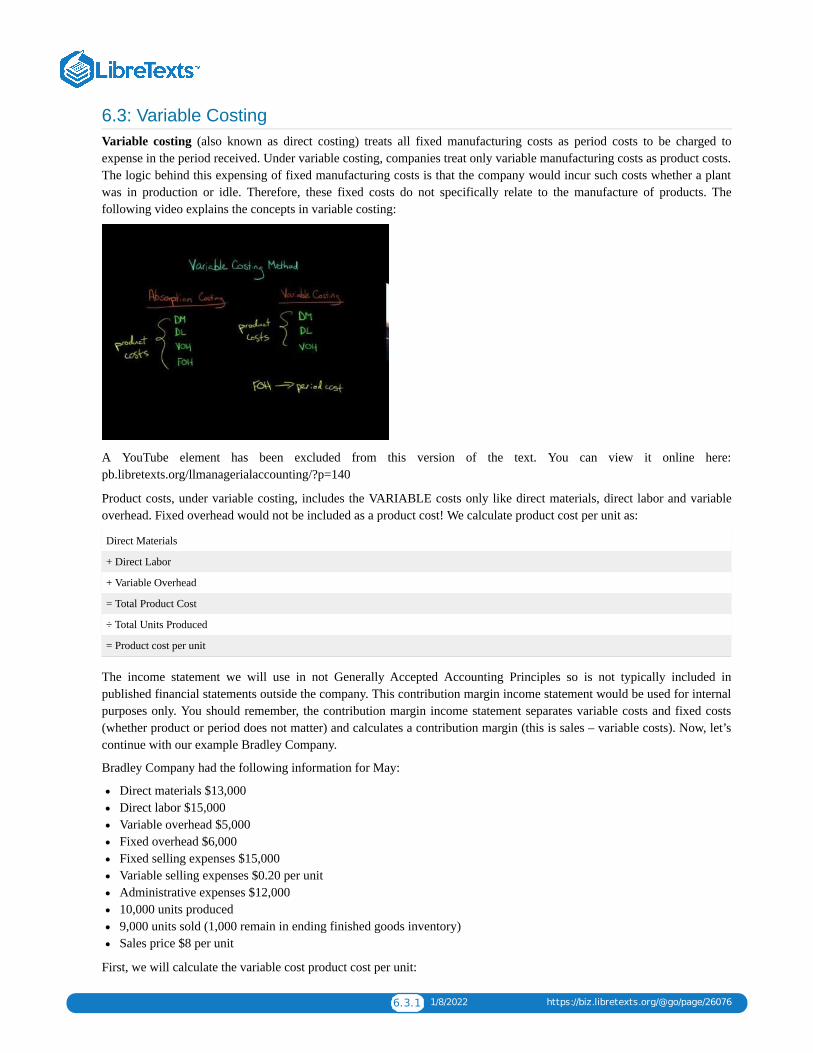
6.3.1 1/8/2022 https://biz.libretexts.org/@go/page/26076
6.3: Variable CostingVariable costing (also known as direct costing) treats all fixed manufacturing costs as period costs to be charged toexpense in the period received. Under variable costing, companies treat only variable manufacturing costs as product costs.The logic behind this expensing of fixed manufacturing costs is that the company would incur such costs whether a plantwas in production or idle. Therefore, these fixed costs do not specifically relate to the manufacture of products. Thefollowing video explains the concepts in variable costing:
A YouTube element has been excluded from this version of the text. You can view it online here:pb.libretexts.org/llmanagerialaccounting/?p=140
Product costs, under variable costing, includes the VARIABLE costs only like direct materials, direct labor and variableoverhead. Fixed overhead would not be included as a product cost! We calculate product cost per unit as:
Direct Materials
+ Direct Labor
+ Variable Overhead
= Total Product Cost
÷ Total Units Produced
= Product cost per unit
The income statement we will use in not Generally Accepted Accounting Principles so is not typically included inpublished financial statements outside the company. This contribution margin income statement would be used for internalpurposes only. You should remember, the contribution margin income statement separates variable costs and fixed costs(whether product or period does not matter) and calculates a contribution margin (this is sales – variable costs). Now, let’scontinue with our example Bradley Company.
Bradley Company had the following information for May:
Direct materials $13,000Direct labor $15,000Variable overhead $5,000Fixed overhead $6,000Fixed selling expenses $15,000Variable selling expenses $0.20 per unitAdministrative expenses $12,00010,000 units produced9,000 units sold (1,000 remain in ending finished goods inventory)Sales price $8 per unit
First, we will calculate the variable cost product cost per unit:
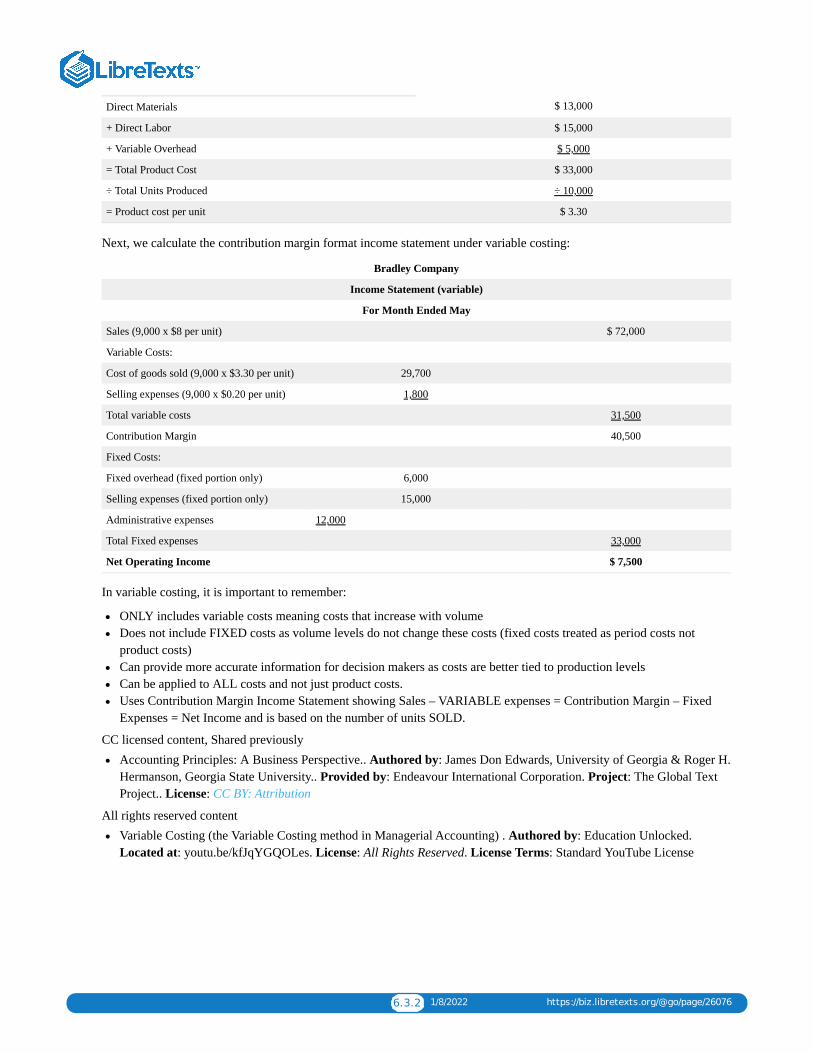
6.3.2 1/8/2022 https://biz.libretexts.org/@go/page/26076
Direct Materials $ 13,000
+ Direct Labor $ 15,000
+ Variable Overhead $ 5,000
= Total Product Cost $ 33,000
÷ Total Units Produced ÷ 10,000
= Product cost per unit $ 3.30
Next, we calculate the contribution margin format income statement under variable costing:
Bradley Company
Income Statement (variable)
For Month Ended May
Sales (9,000 x $8 per unit) $ 72,000
Variable Costs:
Cost of goods sold (9,000 x $3.30 per unit) 29,700
Selling expenses (9,000 x $0.20 per unit) 1,800
Total variable costs 31,500
Contribution Margin 40,500
Fixed Costs:
Fixed overhead (fixed portion only) 6,000
Selling expenses (fixed portion only) 15,000
Administrative expenses 12,000
Total Fixed expenses 33,000
Net Operating Income $ 7,500
In variable costing, it is important to remember:
ONLY includes variable costs meaning costs that increase with volumeDoes not include FIXED costs as volume levels do not change these costs (fixed costs treated as period costs notproduct costs)Can provide more accurate information for decision makers as costs are better tied to production levelsCan be applied to ALL costs and not just product costs.Uses Contribution Margin Income Statement showing Sales – VARIABLE expenses = Contribution Margin – FixedExpenses = Net Income and is based on the number of units SOLD.
CC licensed content, Shared previouslyAccounting Principles: A Business Perspective.. Authored by: James Don Edwards, University of Georgia & Roger H.Hermanson, Georgia State University.. Provided by: Endeavour International Corporation. Project: The Global TextProject.. License: CC BY: Attribution
All rights reserved contentVariable Costing (the Variable Costing method in Managerial Accounting) . Authored by: Education Unlocked.Located at: youtu.be/kfJqYGQOLes. License: All Rights Reserved. License Terms: Standard YouTube License

6.4.1 11/20/2021 https://biz.libretexts.org/@go/page/26077
6.4: Comparing Absorption and Variable CostingIn comparing the two income statements for Bradley, we notice that the cost of goods sold under absorption is $3.90 perunit and $3.30 per unit under variable costing. The income reported under each statement is off by $600 because of thisdifference ($8,100 under absorption and $7,500 under variable). Let’s review how these costs were calculated:
Absorption Variable
Direct Materials $13,000 $13,000
+ Direct Labor $15,000 $15,000
+ Variable Overhead $5,000 $5,000
+ Fixed Overhead $6,000 do not include
= Total Product Cost $39,000 $33,000
÷ Total Units Produced ÷ 10,000 ÷ 10,000
= Product cost per unit $3.90 $3.30
Since fixed overhead cost is given to each unit produced under the absorption costing method, the 1,000 units remaining ininventory carry forward some of May’s fixed costs into the next period. The variable costing method treats the fixedoverhead as relating to May only and not to any specific units. Ending inventory would be calculated as:
Absorption Variable
$3,900 (1,000 units x $3.90 cost) $3,300 (1,000 units x $3.30 cost)
These differences are due to the treatment of fixed manufacturing costs. Under absorption costing, each unit in endinginventory carries $0.60 of fixed overhead cost as part of product cost. At the end of the month, Bradley has 1,000 units ininventory. Therefore, ending inventory under absorption costing includes $600 of fixed manufacturing overhead costs($0.60 X 1,000 units) and is valued at $600 more than under variable costing.
Under variable costing, companies charge off, or expense, all the fixed manufacturing costs during the period rather thandeferring their expense and carrying them forward to the next period as part of inventory cost. Therefore, $6,000 of fixedmanufacturing costs appear on the variable costing income statement as an expense, rather than $5,400 ($6,000 fixedoverhead costs – $600 fixed manufacturing included in inventory) under absorption costing. Consequently, income beforeincome taxes under variable costing is $600 less than under absorption costing because more costs are expensed during theperiod.
Finally, remember that the difference between the absorption costing and variable costing methods is solely in thetreatment of fixed manufacturing overhead costs and income statement presentation. Both methods treat selling andadministrative expenses as period costs. Regarding selling and administrative expenses, the only difference is theirplacement on the income statement and the segregation of variable and fixed selling and administrative expenses. Variableselling and administrative expenses are not part of product cost under either method.
As a general rule, relate the difference in net income under absorption costing and variable costing to the change ininventories. Assuming a relatively constant level of production, if inventories increase during the year, productionexceeded sales and reported income before federal income taxes is less under variable costing than under absorptioncosting. Conversely, if inventories decreased, then sales exceeded production, and income before income taxes is largerunder variable costing than under absorption costing.
6.4.2 11/20/2021 https://biz.libretexts.org/@go/page/26077
Variable costing is not currently acceptable for income measurement or inventory valuation in external financial statementsthat must comply with generally accepted accounting principles (GAAP) in the United States. However, managers oftenuse variable costing for internal company reports. Here is a video comparing the two methods:
A YouTube element has been excluded from this version of the text. You can view it online here:pb.libretexts.org/llmanagerialaccounting/?p=142
SUMMARY
1. Product costs are calculated differently under each method:
Absorption Variable
Direct Materials Include Include
Direct Labor Include Include
Overhead:
Variable Overhead Include Include
Fixed Overhead Include DO NOT include
Total Product Costs Sum sum
÷ Total Units Produced ÷ Total Units Produced ÷ Total Units Produced
Product Cost per Unit = Cost per unit = Cost per unit
2. Income statement formats are different under each method (both use units sold for variable expenses):
Absorption uses standard GAAP income statement of Sales – Cost of Goods Sold = Gross Profit – Operating Expenses= Net Operating IncomeVariable uses a contribution margin income statement of Sales – Variable Costs = Contribution Margin – FixedExpenses = Net Operating Income
3. Net income on the two reports can be different if units produced do not equal units sold.
CC licensed content, Shared previouslyAccounting Principles: A Business Perspective.. Authored by: James Don Edwards, University of Georgia & Roger H.Hermanson, Georgia State University.. Provided by: Endeavour International Corporation. Project: The Global TextProject.. License: CC BY: Attribution
All rights reserved contentAbsorption vs. Contribution Approach using Income Statements (Managerial Tutorial #30) . Authored by: Note Pirate.Located at: youtu.be/oSH77AHIYQc. License: Public Domain: No Known Copyright. License Terms: StandardYouTube License

6.5.1 12/4/2021 https://biz.libretexts.org/@go/page/26078
6.5: Chapter 6 Key Points
Absorption vs. Variable Costing
Product cost includes Direct Materials, direct labor and overhead. Period costs are selling, general and administrativecosts.
Contribution Margin is Sales – Variable Costs.
Absorption Costing (or full costing):
Typically used for financial reporting (GAAP)ALL manufacturing costs are included in the cost (direct materials, direct labor, fixed and variable overhead)Can be misleading as some costs are not affected by productsFixed manufacturing overhead costs are applied to units PRODUCED and not just unit soldFixed manufacturing overhead per unit calculated as Fixed manufacturing costs divided by units PRODUCED.Cost of goods sold = units sold x absorption cost per unit (including direct materials, direct labor, fixed and variableoverhead)
Variable Costing:
ONLY includes product variable costs meaning costs that increase with volume (DM, DL & Variable OH)Does not include FIXED costs as volume levels do not change these costs (fixed costs treated as period costs notproduct costs)Can provide more accurate information for decision makers as costs are better tied to production levelsCan be applied to ALL costs and not just product costs.
Comparing Absorption and Variable Cost per unit:
Absorption Variable
Direct Materials Include Include
Direct Labor Include Include
Overhead:
Variable Overhead Include Include
Fixed Overhead Include DO NOT include
Total Product Costs Sum sum
÷ Total Units ÷ Total Units ÷ Total Units
Product Cost per Unit = Cost per unit = Cost per unit
Note: Same formula can be applied for each product cost (Cost ÷ Units produced) to get direct material cost per unit,direct labor per unit, etc.
Income Statement Formats:
Absorption Costing – this is your standard income statement showing Sales – Cost of Goods sold = Gross Margin (orGross Profit) – Operating Expenses = Net Income and cost of goods sold is based on the number of units SOLD xabsorption cost per unit.Variable Costing – this is a Contribution Margin Income Statement showing Sales – VARIABLE expenses =Contribution Margin – Fixed Expenses = Net Income and variable expenses are based on number of units sold xvariable cost per unit.Net income on the two reports can be different if units produced do not equal units sold.
Click Absorption Variable Key Takeaway for a printable copy.
6.6.1 12/4/2021 https://biz.libretexts.org/@go/page/26079
6.6: Chapter 6- ExercisesQuestions
➢ Explain the absorption costing method.
➢ Explain the variable costing method.
➢ Discuss the differences between variable and absorption costing.
➢ When is it appropriate to use variable or absorption costing in financial reporting?
➢ Under what specific circumstances would you expect net income to be larger under variable costing than underabsorption costing? What is the reason for this difference?
Exercise I The following data relate to Socks Company for the year ended 2013 December 31:
Cost of production:
Direct materials (variable) $360,000
Direct labor (variable) 504,000
Manufacturing overhead:
Variable 180,000
Fixed 360,000
Sales commissions (variable) 108,000
Sales salaries (fixed) 72,000
Administrative expenses (fixed) 144,000
Units produced 150,000
Units sold (at $18 each) 120,000
Beginning inventory, 2013 January 1 -0
There were no beginning inventories. Assume direct materials and direct labor are variable costs. Prepare two incomestatements—a variable costing income statement and an absorption costing income statement.
Problem G Costner Company uses an absorption costing system in accounting for the single product it manufactures. Thefollowing selected data are for the year
The company produced 12,000 units and sold 10,000 units. Direct materials and direct labor are variable costs. One unit ofdirect material goes into each unit of finished goods. Overhead rates are based on a volume of 12,000 units and are $1.08and $1.44 per unit for variable and fixed overhead, respectively. The ending inventory is the 2,000 units of finished goodson hand at the end of 2013. There was no inventory at the beginning of 2013.
1. Calculate production cost per unit under variable and absorption costing.2. Prepare an income statement for 2013 under variable costing.3. Prepare an income statement for 2013 under absorption costing.4. Explain the reason for the difference in net income between b and c.
CC licensed content, Shared previouslyAccounting Principles: A Business Perspective. Authored by: James Don Edwards, University of Georgia & Roger H.Hermanson, Georgia State University. Provided by: Endeavour International Corporation. Project: The Global TextProject. License: CC BY: Attribution

1 1/8/2022
CHAPTER OVERVIEW7: BUDGETING
7.1: THE PERFORMANCE REPORT7.2: CHAPTER 7 STUDY PLAN7.3: INTRODUCTION TO BUDGETING AND BUDGETING PROCESSES7.4: MASTER BUDGETS7.5: OPERATING BUDGETS7.6: MANUFACTURING BUDGETS7.7: CASH BUDGETS7.8: BUDGETED BALANCE SHEET7.9: BUDGETING IN A MERCHANDISING COMPANY7.10: OTHER BUDGETING METHODS7.11: FLEXIBLE BUDGETS7.12: GLOSSARY7.13: CHAPTER 7- EXERCISES

7.1.1 12/11/2021 https://biz.libretexts.org/@go/page/26090
7.1: The Performance Report
Flexible Budget A flexible budget is a budget prepared using the ACTUAL level of production instead of the budgetedactivity. The difference between actual costs incurred and the flexible budget amount for that same level of operations iscalled a budget variance. Budget variances can indicate a department’s or company’s degree of efficiency, since theyemerge from a comparison of what was with what should have been. The performance report shows the budget variancefor each line item.
A flexible budget allows volume differences to be removed from the analysis since we are using the same actual level ofactivity for both budget and actual. How can we do this? We will need to determine the budgeted variable cost per unit foreach variable cost. Budgeted fixed costs would remain the same because they do not change based on volume.
A YouTube element has been excluded from this version of the text. You can view it online here:pb.libretexts.org/llmanagerialaccounting/?p=170
To illustrate the computation of budget variances, assume that Leed’s management prepared an overhead budget based onan expected volume of 100% capacity, or 25,000 units. At this level of production, the budgeted amount for supplies is avariable cost at $0.08 per unit for a total of $2,000 (25,000 units x $0.08). By the end of the period, Leed has used $1,900of supplies. Our first impression is that a favorable variance of $100 exists ($1,900 actual amount is less than the $2,000budget amount).
However, if Leed’s actual production for the period was only 22,500 units (90% of capacity), the company would have anunfavorable variance of $100. Why? Because at 90% capacity of 22,500 units, the flexible operating budget for supplieswould be $1,800 (22,500 units x $0.08). The $1900 actual supplies used is $100 more than the flexible budget amount of$1,800. Consequently, it appears that Leed used supplies inefficiently.
To give another example using the data in Exhibit 6, Leed’s management may have budgeted maintenance at USD 5,600for a given period assuming the company planned to produce 20,000 units (80 per cent of operating capacity). However,Leed’s actual maintenance costs may have been USD 6,200 for the period. This result does not necessarily mean that Leedhad an unfavorable variance of USD 600. The variance depends on actual production volume.
Assume once again that Leed actually produced 22,500 units during the period. The company had budgeted maintenancecosts at USD 6,300 for that level of production. Therefore, there would actually be a favorable variance of USD 100 (USD6,300 – USD 6,200).
Flexible budgets often show budgeted amounts for every 10 per cent change in the level of operations, such as at the 70 percent, 80 per cent, 90 per cent, and 100 per cent levels of capacity. However, actual production may fall between the levelsshown in the flexible budget. If so, the company can find the budgeted amounts at that level of operations using thefollowing formula:
Budgeted amount = Budgeted fixed portion of costs + [Budgeted variable portion of cost per unit X Actual units of output]
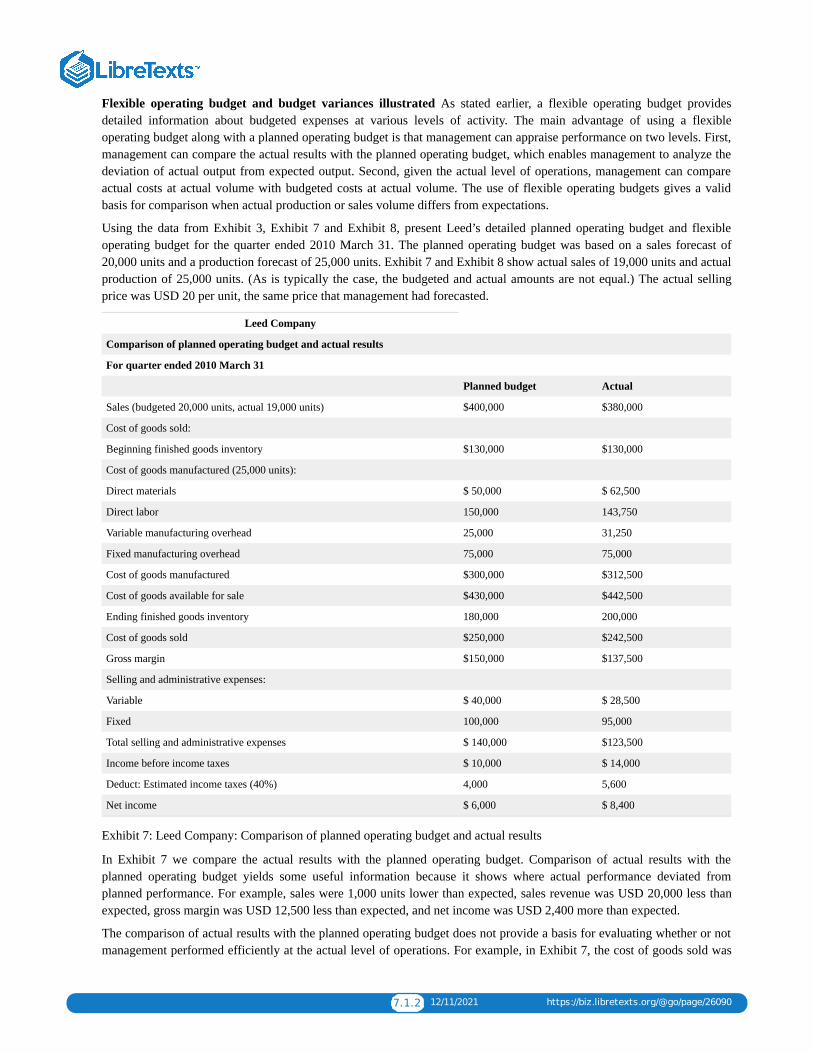
7.1.2 12/11/2021 https://biz.libretexts.org/@go/page/26090
Flexible operating budget and budget variances illustrated As stated earlier, a flexible operating budget providesdetailed information about budgeted expenses at various levels of activity. The main advantage of using a flexibleoperating budget along with a planned operating budget is that management can appraise performance on two levels. First,management can compare the actual results with the planned operating budget, which enables management to analyze thedeviation of actual output from expected output. Second, given the actual level of operations, management can compareactual costs at actual volume with budgeted costs at actual volume. The use of flexible operating budgets gives a validbasis for comparison when actual production or sales volume differs from expectations.
Using the data from Exhibit 3, Exhibit 7 and Exhibit 8, present Leed’s detailed planned operating budget and flexibleoperating budget for the quarter ended 2010 March 31. The planned operating budget was based on a sales forecast of20,000 units and a production forecast of 25,000 units. Exhibit 7 and Exhibit 8 show actual sales of 19,000 units and actualproduction of 25,000 units. (As is typically the case, the budgeted and actual amounts are not equal.) The actual sellingprice was USD 20 per unit, the same price that management had forecasted.
Leed Company
Comparison of planned operating budget and actual results
For quarter ended 2010 March 31
Planned budget Actual
Sales (budgeted 20,000 units, actual 19,000 units) $400,000 $380,000
Cost of goods sold:
Beginning finished goods inventory $130,000 $130,000
Cost of goods manufactured (25,000 units):
Direct materials $ 50,000 $ 62,500
Direct labor 150,000 143,750
Variable manufacturing overhead 25,000 31,250
Fixed manufacturing overhead 75,000 75,000
Cost of goods manufactured $300,000 $312,500
Cost of goods available for sale $430,000 $442,500
Ending finished goods inventory 180,000 200,000
Cost of goods sold $250,000 $242,500
Gross margin $150,000 $137,500
Selling and administrative expenses:
Variable $ 40,000 $ 28,500
Fixed 100,000 95,000
Total selling and administrative expenses $ 140,000 $123,500
Income before income taxes $ 10,000 $ 14,000
Deduct: Estimated income taxes (40%) 4,000 5,600
Net income $ 6,000 $ 8,400
Exhibit 7: Leed Company: Comparison of planned operating budget and actual results
In Exhibit 7 we compare the actual results with the planned operating budget. Comparison of actual results with theplanned operating budget yields some useful information because it shows where actual performance deviated fromplanned performance. For example, sales were 1,000 units lower than expected, sales revenue was USD 20,000 less thanexpected, gross margin was USD 12,500 less than expected, and net income was USD 2,400 more than expected.
The comparison of actual results with the planned operating budget does not provide a basis for evaluating whether or notmanagement performed efficiently at the actual level of operations. For example, in Exhibit 7, the cost of goods sold was
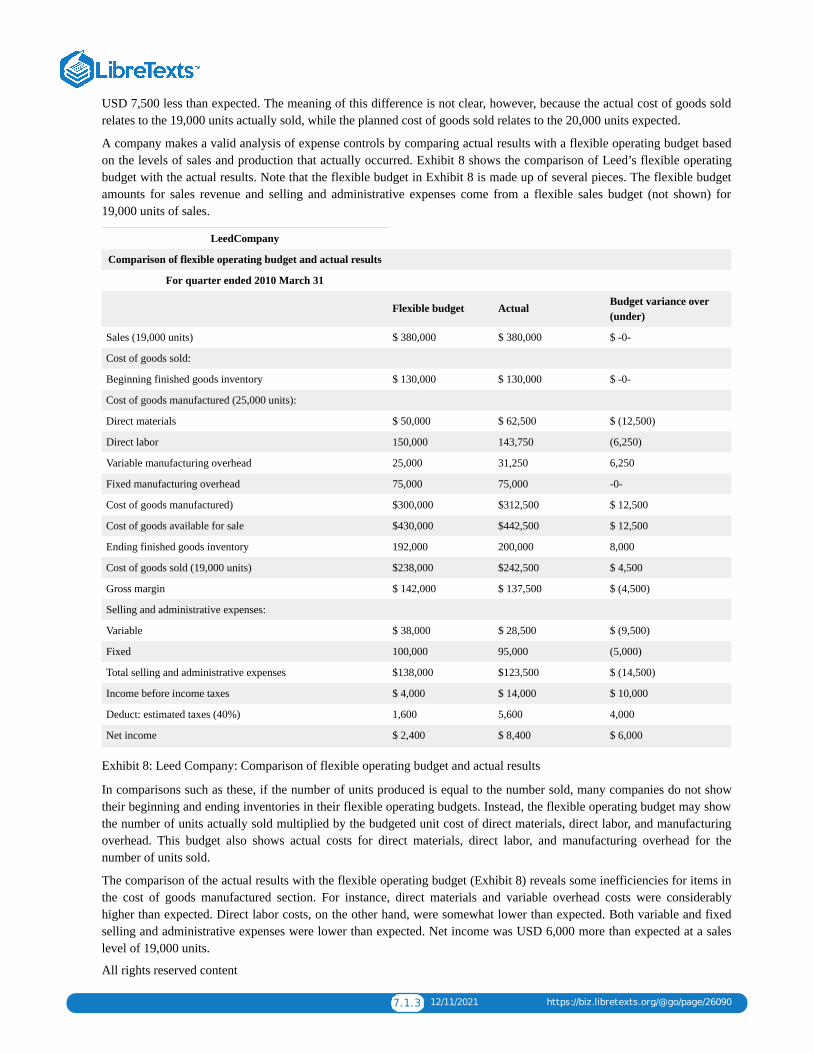
7.1.3 12/11/2021 https://biz.libretexts.org/@go/page/26090
USD 7,500 less than expected. The meaning of this difference is not clear, however, because the actual cost of goods soldrelates to the 19,000 units actually sold, while the planned cost of goods sold relates to the 20,000 units expected.
A company makes a valid analysis of expense controls by comparing actual results with a flexible operating budget basedon the levels of sales and production that actually occurred. Exhibit 8 shows the comparison of Leed’s flexible operatingbudget with the actual results. Note that the flexible budget in Exhibit 8 is made up of several pieces. The flexible budgetamounts for sales revenue and selling and administrative expenses come from a flexible sales budget (not shown) for19,000 units of sales.
LeedCompany
Comparison of flexible operating budget and actual results
For quarter ended 2010 March 31
Flexible budget Actual Budget variance over(under)
Sales (19,000 units) $ 380,000 $ 380,000 $ -0-
Cost of goods sold:
Beginning finished goods inventory $ 130,000 $ 130,000 $ -0-
Cost of goods manufactured (25,000 units):
Direct materials $ 50,000 $ 62,500 $ (12,500)
Direct labor 150,000 143,750 (6,250)
Variable manufacturing overhead 25,000 31,250 6,250
Fixed manufacturing overhead 75,000 75,000 -0-
Cost of goods manufactured) $300,000 $312,500 $ 12,500
Cost of goods available for sale $430,000 $442,500 $ 12,500
Ending finished goods inventory 192,000 200,000 8,000
Cost of goods sold (19,000 units) $238,000 $242,500 $ 4,500
Gross margin $ 142,000 $ 137,500 $ (4,500)
Selling and administrative expenses:
Variable $ 38,000 $ 28,500 $ (9,500)
Fixed 100,000 95,000 (5,000)
Total selling and administrative expenses $138,000 $123,500 $ (14,500)
Income before income taxes $ 4,000 $ 14,000 $ 10,000
Deduct: estimated taxes (40%) 1,600 5,600 4,000
Net income $ 2,400 $ 8,400 $ 6,000
Exhibit 8: Leed Company: Comparison of flexible operating budget and actual results
In comparisons such as these, if the number of units produced is equal to the number sold, many companies do not showtheir beginning and ending inventories in their flexible operating budgets. Instead, the flexible operating budget may showthe number of units actually sold multiplied by the budgeted unit cost of direct materials, direct labor, and manufacturingoverhead. This budget also shows actual costs for direct materials, direct labor, and manufacturing overhead for thenumber of units sold.
The comparison of the actual results with the flexible operating budget (Exhibit 8) reveals some inefficiencies for items inthe cost of goods manufactured section. For instance, direct materials and variable overhead costs were considerablyhigher than expected. Direct labor costs, on the other hand, were somewhat lower than expected. Both variable and fixedselling and administrative expenses were lower than expected. Net income was USD 6,000 more than expected at a saleslevel of 19,000 units.
All rights reserved content

7.1.4 12/11/2021 https://biz.libretexts.org/@go/page/26090
Variance Analysis, Master (Static), Flexible and Actual Budgets (Managerial Accounting Tutorial #43) . Authored by:Note Pirate. Located at: youtu.be/DFD2E5sO6k0. License: All Rights Reserved. License Terms: Standard YouTubeLicense
7.2.1 12/4/2021 https://biz.libretexts.org/@go/page/26080
7.2: Chapter 7 Study PlanKnowledge Targets
I can define the following terms as they relate to our unit:
Budget Planning Budget Flexible Budget Cash Budget
Master Budget Activity Variance Revenue Variance Spending Variance
Fixed Cost Variable Cost Standard Cost Standard Hours
Standard Price Variance Quantity Variance Efficiency Variance
Rate Variance Price Variance Materials Labor
Variable Overhead Fixed Overhead Selling expense Administrative expense
Reasoning Targets
I can understand the difference between a planning budget and a flexible budget.I can identify costs as fixed cost or variable cost.I can understand the purpose of using a budget for businesses.I can analyze differences between budget and actual and explain possible reasons for the variances.I can analyze and explain laborrate and efficiency variances.I can analyze and explain material price and quantity variances.I can understand the use of standards (including cost, hours or price) for budgeting and analysis.
Skill Targets
I can prepare a sales and production budget (or purchases budget for merchandiser).I can prepare a selling and administrative expense budget.I can prepare a cash budget including schedules of receivables and payables.I can prepare a budgeted income statement and budgeted balance sheet.I can prepare a master budget including budgets for sales, purchases, selling and administrative expenses, cash,income statement and balance sheet.I can prepare a flexible budget based on the actual level of production.I can prepare a flexible budget performance report analyzing difference between budget and actual.I can calculate variances for materials and labor.
Click Budgeting Study Plan for a printable copy.
7.3.1 1/1/2022 https://biz.libretexts.org/@go/page/26081
7.3: Introduction to Budgeting and Budgeting Processes
The budget—For planning and controlTime and money are scarce resources to all individuals and organizations; the efficient and effective use of these resourcesrequires planning. Planning alone, however, is insufficient. Control is also necessary to ensure that plans actually arecarried out. A budget is a tool that managers use to plan and control the use of scarce resources. A budget is a planshowing the company’s objectives and how management intends to acquire and use resources to attain those objectives.
A YouTube element has been excluded from this version of the text. You can view it online here:pb.libretexts.org/llmanagerialaccounting/?p=152
Companies, nonprofit organizations, and governmental units use many different types of budgets. Responsibility budgetsare designed to judge the performance of an individual segment or manager. Capital budgets evaluate long-term capitalprojects such as the addition of equipment or the relocation of a plant. This chapter examines the master budget, whichconsists of a planned operating budget and a financial budget. The planned operating budget helps to plan futureearnings and results in a projected income statement. The financial budget helps management plan the financing of assetsand results in a projected balance sheet.
The budgeting process involves planning for future profitability because earning a reasonable return on resources used is aprimary company objective. A company must devise some method to deal with the uncertainty of the future. A companythat does no planning whatsoever chooses to deal with the future by default and can react to events only as they occur.Most businesses, however, devise a blueprint for the actions they will take given the foreseeable events that may occur.
A budget: (1) shows management’s operating plans for the coming periods; (2) formalizes management’s plans inquantitative terms; (3) forces all levels of management to think ahead, anticipate results, and take action to remedypossible poor results; and (4) may motivate individuals to strive to achieve stated goals.
Companies can use budget-to-actual comparisons to evaluate individual performance. For instance, the standard variablecost of producing a personal computer at IBM is a budget figure. This figure can be compared with the actual cost ofproducing personal computers to help evaluate the performance of the personal computer production managers andemployees who produce personal computers. We will do this type of comparison in a later chapter.
Many other benefits result from the preparation and use of budgets. For example: (1) businesses can better coordinate theiractivities; (2) managers become aware of other managers’ plans; (3) employees become more cost conscious and try toconserve resources; (4) the company reviews its organization plan and changes it when necessary; and (5) managers fostera vision that otherwise might not be developed.
The planning process that results in a formal budget provides an opportunity for various levels of management to thinkthrough and commit future plans to writing. In addition, a properly prepared budget allows management to follow themanagement-by-exception principle by devoting attention to results that deviate significantly from planned levels. For allthese reasons, a budget must clearly reflect the expected results.
7.3.2 1/1/2022 https://biz.libretexts.org/@go/page/26081
Failing to budget because of the uncertainty of the future is a poor excuse for not budgeting. In fact, the less stable theconditions, the more necessary and desirable is budgeting, although the process becomes more difficult. Obviously, stableoperating conditions permit greater reliance on past experience as a basis for budgeting. Remember, however, that budgetsinvolve more than a company’s past results. Budgets also consider a company’s future plans and express expectedactivities. As a result, budgeted performance is more useful than past performance as a basis for judging actual results.
A budget should describe management’s assumptions relating to: (1) the state of the economy over the planning horizon;(2) plans for adding, deleting, or changing product lines; (3) the nature of the industry’s competition; and (4) the effects ofexisting or possible government regulations. If these assumptions change during the budget period, management shouldanalyze the effects of the changes and include this in an evaluation of performance based on actual results.
Budgets are quantitative plans for the future. However, they are based mainly on past experience adjusted for futureexpectations. Thus, accounting data related to the past play an important part in budget preparation. The accounting systemand the budget are closely related. The details of the budget must agree with the company’s ledger accounts. In turn, theaccounts must be designed to provide the appropriate information for preparing the budget, financial statements, andinterim financial reports to facilitate operational control.
Management should frequently compare accounting data with budgeted projections during the budget period andinvestigate any differences. Budgeting, however, is not a substitute for good management. Instead, the budget is animportant tool of managerial control. Managers make decisions in budget preparation that serve as a plan of action.
The period covered by a budget varies according to the nature of the specific activity involved. Cash budgets may cover aweek or a month; sales and production budgets may cover a month, a quarter, or a year; and the general operating budgetmay cover a quarter or a year.
Budgeting involves the coordination of financial and nonfinancial planning to satisfy organizational goals and objectives.No foolproof method exists for preparing an effective budget. However, budget makers should carefully consider theconditions that follow:
Top management support All management levels must be aware of the budget’s importance to the company and mustknow that the budget has top management’s support. Top management, then, must clearly state long-range goals andbroad objectives. These goals and objectives must be communicated throughout the organization. Long-range goalsinclude the expected quality of products or services, growth rates in sales and earnings, and percentage-of-markettargets. Overemphasis on the mechanics of the budgeting process should be avoided.Participation in goal setting Management uses budgets to show how it intends to acquire and use resources to achievethe company’s long-range goals. Employees are more likely to strive toward organizational goals if they participate insetting them and in preparing budgets. Often, employees have significant information that could help in preparing ameaningful budget. Also, employees may be motivated to perform their own functions within budget constraints if theyare committed to achieving organizational goals.Communicating results People should be promptly and clearly informed of their progress. Effective communicationimplies (1) timeliness, (2) reasonable accuracy, and (3) improved understanding. Managers should effectivelycommunicate results so employees can make any necessary adjustments in their performance.Flexibility If significant basic assumptions underlying the budget change during the year, the planned operating budgetshould be restated. For control purposes, after the actual level of operations is known, the actual revenues and expensescan be compared to expected performance at that level of operations.Follow-up Budget follow-up and data feedback are part of the control aspect of budgetary control. Since the budgetsare dealing with projections and estimates for future operating results and financial positions, managers mustcontinuously check their budgets and correct them if necessary. Often management uses performance reports as afollow-up tool to compare actual results with budgeted results.
The term budget has negative connotations for many employees. Often in the past, management has imposed a budgetfrom the top without considering the opinions and feelings of the personnel affected. Such a dictatorial process may resultin resistance to the budget. A number of reasons may underlie such resistance, including lack of understanding of theprocess, concern for status, and an expectation of increased pressure to perform. Employees may believe that theperformance evaluation method is unfair or that the goals are unrealistic and unattainable. They may lack confidence in theway accounting figures are generated or may prefer a less formal communication and evaluation system. Often these fears
7.3.3 1/1/2022 https://biz.libretexts.org/@go/page/26081
are completely unfounded, but if employees believe these problems exist, it is difficult to accomplish the objectives ofbudgeting.
Problems encountered with such imposed budgets have led accountants and management to adopt participatory budgeting.Participatory budgeting means that all levels of management responsible for actual performance actively participate insetting operating goals for the coming period. Managers and other employees are more likely to understand, accept, andpursue goals when they are involved in formulating them.
Within a participatory budgeting process, accountants should be compilers or coordinators of the budget, not preparers.They should be on hand during the preparation process to present and explain significant financial data. Accountants mustidentify the relevant cost data that enables management’s objectives to be quantified in dollars. Accountants areresponsible for designing meaningful budget reports. Also, accountants must continually strive to make the accountingsystem more responsive to managerial needs. That responsiveness, in turn, increases confidence in the accounting system.
Although many companies have used participatory budgeting successfully, it does not always work. Studies have shownthat in many organizations, participation in the budget formulation failed to make employees more motivated to achievebudgeted goals. Whether or not participation works depends on management’s leadership style, the attitudes of employees,and the organization’s size and structure. Participation is not the answer to all the problems of budget preparation.However, it is one way to achieve better results in organizations that are receptive to the philosophy of participation.
CC licensed content, Shared previouslyAccounting Principles: A Business Perspective. Authored by: James Don Edwards, University of Georgia & Roger H.Hermanson, Georgia State University. Provided by: Endeavour International Corporation. Project: The Global TextProject. License: CC BY: Attribution
All rights reserved contentIntroduction to Budgeting (Managerial Accounting) . Authored by: Education Unlocked. Located at:youtu.be/pCwLhz0ltlE. License: All Rights Reserved. License Terms: Standard YouTube License
7.4.1 1/1/2022 https://biz.libretexts.org/@go/page/26082
7.4: Master BudgetsA master budget consists of a projected income statement (planned operating budget) and a projected balance sheet(financial budget) showing the organization’s objectives and proposed ways of attaining them. In diagram below, we depicta flowchart of the financial planning process that you can use as an overview of the elements in a master budget. Theremainder of this chapter describes how a company prepares a master budget. We emphasize the master budget because ofits prime importance to financial planning and control in a business entity.
The budgeting process starts with management’s plans and objectives for the next period. These plans take intoconsideration various policy decisions concerning selling price, distribution network, advertising expenditures, andenvironmental influences from which the company forecasts its sales for the period (in units by product or product line).Managers arrive at the sales budget in dollars by multiplying sales units times sales price per unit. They use expectedproduction, sales volume, and inventory policy to project cost of goods sold. Next, managers project operating expensessuch as selling and administrative expenses.
This chapter cannot cover all areas of budgeting in detail—entire books have been written on budgeting. However, thefollowing video provides an overview of a budgeting procedure that many successful companies have used.
A YouTube element has been excluded from this version of the text. You can view it online here:pb.libretexts.org/llmanagerialaccounting/?p=154
We begin the budget process by discussing the planned operating budget or projected income statement.
The projected balance sheet, or financial budget, depends on many items in the projected income statement. Thus, thelogical starting point in preparing a master budget is the projected income statement, or planned operating budget.However, since the planned operating budget shows the net effect of many interrelated activities, management mustprepare several supporting budgets (sales, production, and purchases, to name a few) before preparing the plannedoperating budget. The process begins with the sales budget.
CC licensed content, Shared previouslyAccounting Principles: A Business Perspective. Authored by: James Don Edwards, University of Georgia & Roger H.Hermanson, Georgia State University. Provided by: Endeavour International Corporation. Project: The Global TextProject. License: CC BY: Attribution
All rights reserved contentThe Master Budget (Managerial Accounting Tutorial #38) . Authored by: Note Pirate. Located at:youtu.be/n0iddr99fD4. License: All Rights Reserved. License Terms: Standard YouTube License
7.5.1 11/27/2021 https://biz.libretexts.org/@go/page/26083
7.5: Operating BudgetsIn this Operating Budget section, we will discuss the following budgets:
1. Sales Budget2. Production Budget3. Cost of Goods Sold Budget4. Selling and Administrative Expense Budget5. Income Statement
Sales budget The cornerstone of the budgeting process is the sales budget because the usefulness of the entire operatingbudget depends on it. The sales budget involves estimating or forecasting how much demand exists for a company’s goodsand then determining if a realistic, attainable profit can be achieved based on this demand. Sales forecasting can involveeither formal or informal techniques, or both. The video below illustrates a sales budget (watch the first 4 minutes of thevideo only for the sales budget).
A YouTube element has been excluded from this version of the text. You can view it online here:pb.libretexts.org/llmanagerialaccounting/?p=156
Formal sales forecasting techniques often involve the use of statistical tools. For example, to predict sales for the comingperiod, management may use economic indicators (or variables) such as the gross national product or gross nationalpersonal income, and other variables such as population growth, per capita income, new construction, and populationmigration.
To use economic indicators to forecast sales, a relationship must exist between the indicators (called independentvariables) and the sales that are being forecast (called the dependent variable). Then management can use statisticaltechniques to predict sales based on the economic indicators.
Management often supplements formal techniques with informal sales forecasting techniques such as intuition orjudgment. In some instances, management modifies sales projections using formal techniques based on other changes inthe environment. Examples include the effect on sales of any changes in the expected level of advertising expenditures, theentry of new competitors, and/or the addition or elimination of products or sales territories. In other instances, companiesdo not use any formal techniques. Instead, sales managers and salespersons estimate how much they can sell. Managersthen add up the estimates to arrive at total estimated sales for the period.
Usually, the sales manager is responsible for the sales budget and prepares it in units and then in dollars by multiplying theunits by their selling price. The sales budget in units is the basis of the remaining budgets that support the operatingbudget.
We will be illustrating the step-by-step preparation of a master budget for Leed Company, which manufactures low-pricedrunning shoes. Most companies develop the sales budget in units and sales dollars because the remaining budgets will useboth sales units and sales dollars.
7.5.2 11/27/2021 https://biz.libretexts.org/@go/page/26083
To illustrate this step, assume that Leed’s management forecasts sales for the year at 100,000 units (each pair of shoes isone unit). Quarterly sales are expected to be 15,000, 40,000, 20,000, and 25,000 units, reflecting higher demand for shoesin the late spring and again around Christmas. The selling price for each pair of shoes forecasted at $40. Leed’s salesbudget would be prepared as by showing the sales unit for each quarter x budgeted sales price to get the sales in dollars.The totals for the year are added from each quarter.
Leed Company
Sales Budget
Qtr 1 Qtr 2 Qtr 3 Qtr 4 YEAR
Sales in Units 15,000 40,000 20,000 25,000 100,000
Budgeted price x $40 x $40 x $40 x $40
Sales in Dollars $600,000 $1,600,000 $800,000 $1,000,000 $4,000,000
Production budget The production budget considers the units in the sales budget and the company’s inventory policy.Managers develop the production budget in units and then in dollars. Determining production volume is an important task.Companies should schedule production carefully to maintain certain minimum quantities of inventory while avoidingexcessive inventory accumulation. The principal objective of the production budget is to coordinate the production andsale of goods in terms of time and quantity.
Companies using a just-in-time inventory system need to closely coordinate purchasing, sales, and production. In general,maintaining high inventory levels allows for more flexibility in coordinating purchases, sales, and production. However,businesses must compare the convenience of carrying inventory with the cost of carrying inventory; for example, theymust consider storage costs and the opportunity cost of funds tied up in inventory. Watch this video for an example of howto create a production budget.
A YouTube element has been excluded from this version of the text. You can view it online here:pb.libretexts.org/llmanagerialaccounting/?p=156
Firms often subdivide the production budget into budgets for materials, labor, and manufacturing overhead, which we willdiscuss in the manufacturing budgets. Usually materials, labor, and some elements of manufacturing overhead varydirectly with production within a given relevant range of production. Fixed manufacturing overhead costs do not varydirectly with production but are constant in total within a relevant range of production. To determine fixed manufacturingoverhead costs accurately, management must determine the relevant range for the expected level of operations.
For our example company, Leed Company, we assume the company’s policy is to maintain 40% of next quarters sales inending inventory. Finished goods inventory on January 1 is 10,000 units (Note: You should be given this information but ifyou do not have the beginning inventory, you can assume the company followed the same ending inventory policy. Thismeans, you can calculate beginning finished goods inventory as Quarter 1 sales x 40% since we can assume the companyfollowed this policy and the ending inventory of 4th quarter last year is the beginning inventory of this year). We anticipate
7.5.3 11/27/2021 https://biz.libretexts.org/@go/page/26083
the December 31 ending inventory to be 6,000 units. From these data, we can prepare the schedule of planned productionusing the Sales budget as our starting place.
Leed Company
Production Budget
Qtr 1 Qtr 2 Qtr 3 Qtr 4 YEAR
Sales in Units 15,000 40,000 20,000 25,000 100,000
Add: Desired EndingInventory
16,000 8,000 10,000 6,000 6,000
(Next Qtr Sales x40%)
(40,000 x 40%) (20,000 x 40%) (25,000 x 40%) (given)
Total Units Needed 31,000 48,000 30,000 31,000 106,000
Less: BeginningInventory
10,000 16,000 8,000 10,000 10,000
Units to be Produced 21,000 32,000 22,000 21,000 96,000
Important things to note:
1. Desired ending inventory is calculated as next quarter sales units x 40% in Leed’s case since the company policy is tomaintain 40% of next quarters sales in ending inventory.
2. Quarter 4 ending inventory is the same number used for ending inventory for the year.3. Quarter 1 beginning inventory is the same number used for beginning inventory for the year.4. Quarter 2 beginning inventory is quarter 1’s ending inventory since the balance rolls over the to next period. This
means, quarter 3 beginning inventory is quarter 2’s ending inventory and quarter 4 beginning inventory is quarter 3’sending inventory.
5. Inventory refers to Finished Goods Inventory for a manufacturer.
For a merchandiser, this budget would be called a Purchases Budget and would show how many units we would need topurchase for each quarter. The inventory in this case would refer to merchandise inventory. You can see an example of apurchases budget in the Budgets for a Merchandiser section later in this chapter.
Cost of Goods Sold budget The cost of goods sold budget establishes the forecast for the inventory expense and is usuallyon of the largest expenses on an income statement. A cost of goods sold budget would not be necessary for a servicecompany since they do not sell a product. Management must now prepare a schedule to forecast cost of goods sold, thenext major amount in the planned operating budget. We need to understand the costs for making the product. LeedCompany has the following costs:
Direct Materials $ 10 per unit
Direct Labor $ 6 per unit
Variable Overhead $ 0.75 per unit
Fixed Overhead $75,000 per quarter
The cost of goods sold budget would use the sales budget in units. We will take each of our variable costs (direct materials,direct labor and variable overhead) x budgeted sales units. The cost of goods sold budget would look like:
Leed Company
Cost of Goods Sold Budget
Qtr 1 Qtr 2 Qtr 3 Qtr 4 YEAR
Sales in Units 15,000 40,000 20,000 25,000 100,000
Direct Materials ($10per unit)
$150,000 $400,000 $200,000 $250,000 $1,000,000
Direct Labor ($6 per 90,000 240,000 120,000 150,000 600,000

7.5.4 11/27/2021 https://biz.libretexts.org/@go/page/26083
unit)
Variable Overhead($0.75 per unit)
11,250 30,000 15,000 18,750 75,000
Fixed Overhead 75,000 75,000 75,000 75,000 300,000
Cost of Goods Sold $326,250 $745,000 $410,000 $493,740 $1,975,000
After managers forecast cost of goods sold, they prepare a separate budget for all selling and administrative expenses.
Selling and administrative expense budget The costs of selling a product are closely related to the sales forecast.Generally, the higher the forecast, the higher the selling expenses. Administrative expenses are likely to be less dependenton the sales forecast because many of the items are fixed costs (e.g. salaries of administrative personnel and depreciationof administrative buildings and office equipment). Managers must also estimate other expenses such as interest expense,income tax expense, and research and development expenses.
A YouTube element has been excluded from this version of the text. You can view it online here:pb.libretexts.org/llmanagerialaccounting/?p=156
For Leed Company, we need to know the following information:
Selling expenses are $2 per unit soldAdministrative expenses are $100,000 per quarter
We can calculate Leed Company’s Selling and Administrative Expense Budget using the information above and the salesbudget. For selling expenses, we will take the sales in units x $2 variable selling expense per unit. Administrative expensesare fixed so they will not change based on volume. Fixed expenses include depreciation on the office building of $20,000per quarter.
Leed Company
Selling and Administrative Budget
Qtr 1 Qtr 2 Qtr 3 Qtr 4 YEAR
Selling Expenses 30,000 80,000 40,000 50,000 200,000
(Current qtr unitssold x $2 per unit)
(15,000 units x $2) (40,000 units x $2) (20,000 units x $2) (25,000 units x $2)
AdministrativeExpenses
100,000 100,000 100,000 100,000 400,000
Total Selling andAdmin Expenses
$130,000 $180,000 $140,000 $150,000 $600,000
Less: Office BldgDepreciation
(20,000) (20,000) (20,000) (20,000) (80,000)
Total Cash payments $110,000 $160,000 $120,000 $130,000 $520,000
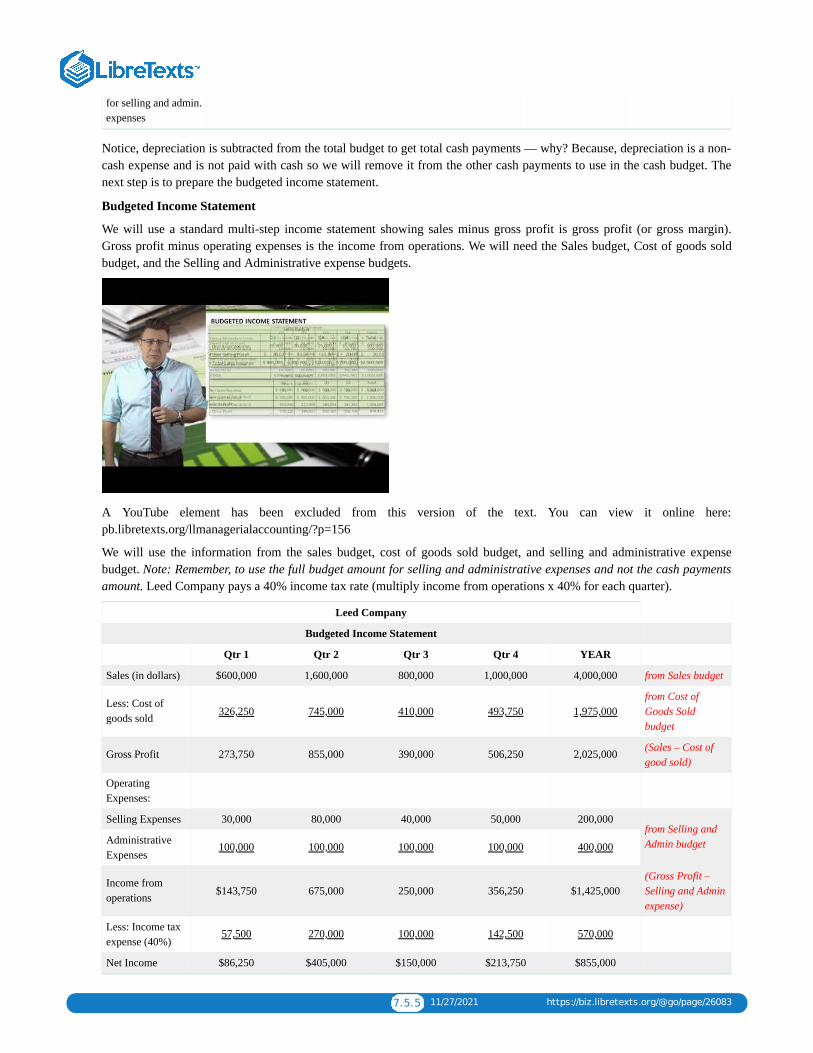
7.5.5 11/27/2021 https://biz.libretexts.org/@go/page/26083
for selling and admin.expenses
Notice, depreciation is subtracted from the total budget to get total cash payments — why? Because, depreciation is a non-cash expense and is not paid with cash so we will remove it from the other cash payments to use in the cash budget. Thenext step is to prepare the budgeted income statement.
Budgeted Income Statement
We will use a standard multi-step income statement showing sales minus gross profit is gross profit (or gross margin).Gross profit minus operating expenses is the income from operations. We will need the Sales budget, Cost of goods soldbudget, and the Selling and Administrative expense budgets.
A YouTube element has been excluded from this version of the text. You can view it online here:pb.libretexts.org/llmanagerialaccounting/?p=156
We will use the information from the sales budget, cost of goods sold budget, and selling and administrative expensebudget. Note: Remember, to use the full budget amount for selling and administrative expenses and not the cash paymentsamount. Leed Company pays a 40% income tax rate (multiply income from operations x 40% for each quarter).
Leed Company
Budgeted Income Statement
Qtr 1 Qtr 2 Qtr 3 Qtr 4 YEAR
Sales (in dollars) $600,000 1,600,000 800,000 1,000,000 4,000,000 from Sales budget
Less: Cost ofgoods sold 326,250 745,000 410,000 493,750 1,975,000
from Cost ofGoods Soldbudget
Gross Profit 273,750 855,000 390,000 506,250 2,025,000 (Sales – Cost ofgood sold)
OperatingExpenses:
Selling Expenses 30,000 80,000 40,000 50,000 200,000from Selling andAdmin budgetAdministrative
Expenses100,000 100,000 100,000 100,000 400,000
Income fromoperations $143,750 675,000 250,000 356,250 $1,425,000
(Gross Profit –Selling and Adminexpense)
Less: Income taxexpense (40%)
57,500 270,000 100,000 142,500 570,000
Net Income $86,250 $405,000 $150,000 $213,750 $855,000

7.5.6 11/27/2021 https://biz.libretexts.org/@go/page/26083
We look look at the manufacturing budgets and cash budget next.
CC licensed content, Shared previouslyAccounting Principles: A Business Perspective. Authored by: James Don Edwards, University of Georgia & Roger H.Hermanson, Georgia State University. Provided by: Endeavour International Corporation. Project: The Global TextProject. License: CC BY: Attribution
All rights reserved contentThe Production Budget. Authored by: Education Unlocked. Located at: youtu.be/YwIUeaFkOS8. License: All RightsReserved. License Terms: Standard YouTube LicenseThe Sales Budget. Authored by: Education Unlocked. Located at: youtu.be/frCX_bsFsao. License: All RightsReserved. License Terms: Standard YouTube LicenseOperating Expenses (Selling and Administrative) Budget . Authored by: Kristin Ingram. Located at:youtu.be/kKlfC8iv-xY. License: All Rights Reserved. License Terms: Standard YouTube LicenseManagerial Accounting: Budgeted Income Statement . Authored by: Prof Alldredge. Located at:youtu.be/l5BBOZHhfjM. License: CC BY: Attribution
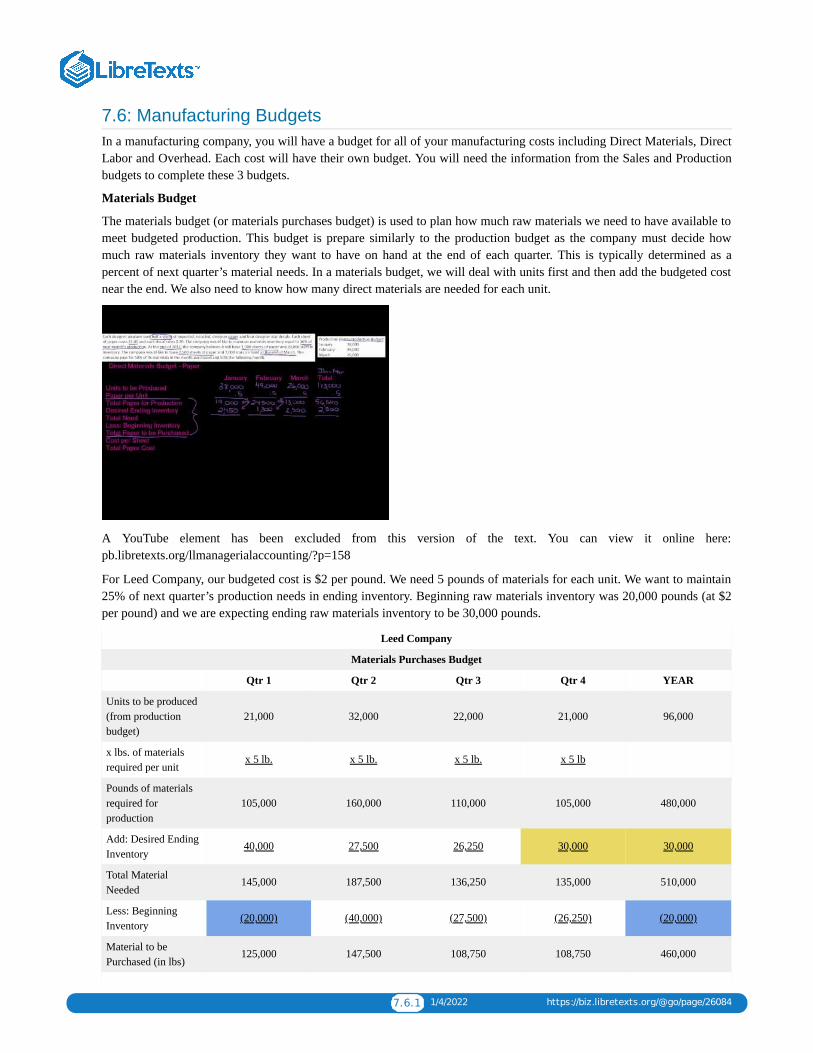
7.6.1 1/4/2022 https://biz.libretexts.org/@go/page/26084
7.6: Manufacturing BudgetsIn a manufacturing company, you will have a budget for all of your manufacturing costs including Direct Materials, DirectLabor and Overhead. Each cost will have their own budget. You will need the information from the Sales and Productionbudgets to complete these 3 budgets.
Materials Budget
The materials budget (or materials purchases budget) is used to plan how much raw materials we need to have available tomeet budgeted production. This budget is prepare similarly to the production budget as the company must decide howmuch raw materials inventory they want to have on hand at the end of each quarter. This is typically determined as apercent of next quarter’s material needs. In a materials budget, we will deal with units first and then add the budgeted costnear the end. We also need to know how many direct materials are needed for each unit.
A YouTube element has been excluded from this version of the text. You can view it online here:pb.libretexts.org/llmanagerialaccounting/?p=158
For Leed Company, our budgeted cost is $2 per pound. We need 5 pounds of materials for each unit. We want to maintain25% of next quarter’s production needs in ending inventory. Beginning raw materials inventory was 20,000 pounds (at $2per pound) and we are expecting ending raw materials inventory to be 30,000 pounds.
Leed Company
Materials Purchases Budget
Qtr 1 Qtr 2 Qtr 3 Qtr 4 YEAR
Units to be produced(from productionbudget)
21,000 32,000 22,000 21,000 96,000
x lbs. of materialsrequired per unit
x 5 lb. x 5 lb. x 5 lb. x 5 lb
Pounds of materialsrequired forproduction
105,000 160,000 110,000 105,000 480,000
Add: Desired EndingInventory
40,000 27,500 26,250 30,000 30,000
Total MaterialNeeded
145,000 187,500 136,250 135,000 510,000
Less: BeginningInventory
(20,000) (40,000) (27,500) (26,250) (20,000)
Material to bePurchased (in lbs)
125,000 147,500 108,750 108,750 460,000

7.6.2 1/4/2022 https://biz.libretexts.org/@go/page/26084
x $2 cost per pound x $ 2 x $ 2 x $ 2 x $ 2
Total Material to bePurchased (in $)
$250,000 $295,000 $217,500 $217,500 $980,000
Just like with the production budget, please note the following items:
Ending inventory is calculated as NEXT quarter’s production needs x 25% for all but quarter 4.Quarter 4 ending inventory is the same as the ending inventory for the year and was given in the example.Beginning inventory refers to the previous quarters ending inventory for all quarters except quarter 1. For quarter 1,beginning raw materials was given in the problem and should also be the beginning inventory for the YEAR. Ifbeginning inventory is not provided, assume the company followed the same inventory policy last year and multiplyQuarter 1 pounds of materials needed x percent provided for ending inventory.Quarter 2 beginning is quarter 1 ending inventory. Quarter 3 beginning is quarter 2 ending inventory and quarter 4beginning is quarter 3 ending inventory.
The total material to be purchased will be used later in the cash disbursement section of the CASH budget.
Direct Labor Budget
The direct labor budget is a very easy one. We need to know the units required from the production budget. Next, we needto know how many direct labor hours it takes to complete one unit and the cost per labor hour. Using this information, wecan determine how many direct labor hours are required to meet the budgeted level of production. We will take theproduction units x direct labor per unit to get the number of direct labor hours. Finally, we will take the direct labor hours xthe rate per hour.
A YouTube element has been excluded from this version of the text. You can view it online here:pb.libretexts.org/llmanagerialaccounting/?p=158
For Leed Company, each unit requires 0.5 hours of direct labor and the hourly rate is $12 per hour. The direct labor budgetwould be:
Leed Company
Direct Labor Budget
Qtr 1 Qtr 2 Qtr 3 Qtr 4 YEAR
Units to be produced 21,000 32,000 22,000 21,000 96,000
x 0.5 DL hour perunit
x 0.5 hr x 0.5 hr x 0.5 hr x 0.5 hr
Direct Labor HoursRequired
10,500 16,000 11,000 10,500 48,000
x $12 per hour x $12 x $12 x $12 x $12
Budgeted direct labordollars
$126,000 $192,000 $132,000 $126,000 $576,000

7.6.3 1/4/2022 https://biz.libretexts.org/@go/page/26084
The budgeted direct labor dollar amount will be used later in the cash disbursement section of the CASH budget.
Manufacturing Overhead Budget
The final budget for manufacturing is the manufacturing overhead budget. The manufacturing overhead budget is preparedepending on how the company allocates overhead. The company can choose to allocate overhead using onepredetermined overhead rate, departmental rates or using activity-based costing. Further, the company can choose toseparate the fixed and variable overhead costs and assign costs to overhead using only the variable overhead.
A YouTube element has been excluded from this version of the text. You can view it online here:pb.libretexts.org/llmanagerialaccounting/?p=158
Leed Company has decided to allocate variable overhead on the basis of $1.50 per direct labor hour and fixed overhead is$75,000 per quarter. Depreciation on the factory machinery of $10,000 per quarter is included in the fixed overhead.
Leed Company
Mfg. Overhead Budget
Qtr 1 Qtr 2 Qtr 3 Qtr 4 YEAR
Budgeted direct laborhours (from directlabor budget)
10,500 16,000 11,000 10,500 48,000
x Variable OH perunit
x $1.50 x $1.50 x $1.50 x $1.50
Variable OverheadCost
$15,750 $24,000 $16,500 $15,750 $72,000
Fixed Overhead Cost 75,000 75,000 75,000 75,000 300,000
Total OverheadCost
$90,750 $99,000 $91,500 $90,750 $372,000
Less: Depreciation onFactory Machinery
(10,000) (10,000) (10,000) (10,000) (40,000)
Total Cash paymentsfor mfg overhead
$80,750 $89,000 $81,500 $80,750 $332,000
We will use the information from the overhead budget in the cash disbursement section of the cash budget.
All rights reserved contentDirect Materials Budget, Part 1. Authored by: Kristin Ingram. Located at: youtu.be/jgN_E4qlkI4. License: All RightsReserved. License Terms: Standard YouTube LicenseDirect labor Budget. Authored by: Kristin Ingram. Located at: youtu.be/sqUuV_Y5TYM. License: All RightsReserved. License Terms: Standard YouTube License

7.6.4 1/4/2022 https://biz.libretexts.org/@go/page/26084
Overhead budget. Authored by: Kristin Ingram. Located at: youtu.be/nb9SoL8M5AU. License: All Rights Reserved.License Terms: Standard YouTube License

7.7.1 12/25/2021 https://biz.libretexts.org/@go/page/26085
7.7: Cash BudgetsCash budget After the preceding analyses have been prepared, sufficient information is available to prepare the cashbudget and compute the balance in the Cash account for each quarter. Preparing a cash budget requires information aboutcash receipts and cash disbursements from all the other operating budget schedules.
A YouTube element has been excluded from this version of the text. You can view it online here:pb.libretexts.org/llmanagerialaccounting/?p=160
Cash receipts We can prepare the cash receipts schedule based on how the company expects to collect on sales. We know,from past experience, how much of our sales are cash sales and how much are credit sales. We also can analyze pastaccounts receivable to determine when credit sales are typically paid.
A YouTube element has been excluded from this version of the text. You can view it online here:pb.libretexts.org/llmanagerialaccounting/?p=160
Leed Company has determined that all sales are on credit and they do not have any cash sales. For the credit sales,experience tells Leed they will collect 60% of sales in the quarter of the sale and the remaining 40% is collected thequarter after the sale (yes, we understand collecting 100% is unlikely but Leed chooses to budget for 100% collection).Accounts Receivable at the beginning of the year is $200,000 and is expected to be collected in the 1st Quarter. LeedCompany prepares the following schedule of planned cash receipts:
Leed Company
Schedule of Cash Receipts
Qtr 1 Qtr 2 Qtr 3 Qtr 4
Budgeted Sales $600,000 $1,600,000 $800,000 $1,000,000
Cash receipts, current 360,000 960,000 480,000 600,000
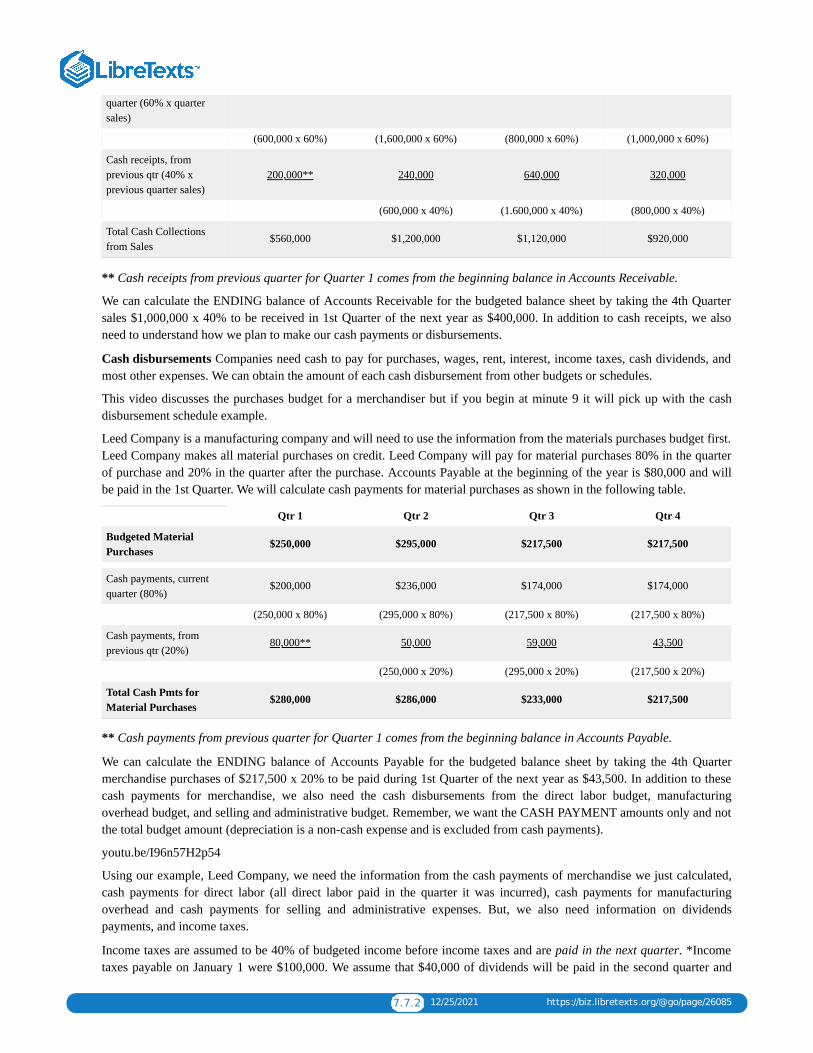
7.7.2 12/25/2021 https://biz.libretexts.org/@go/page/26085
quarter (60% x quartersales)
(600,000 x 60%) (1,600,000 x 60%) (800,000 x 60%) (1,000,000 x 60%)
Cash receipts, fromprevious qtr (40% xprevious quarter sales)
200,000** 240,000 640,000 320,000
(600,000 x 40%) (1.600,000 x 40%) (800,000 x 40%)
Total Cash Collectionsfrom Sales
$560,000 $1,200,000 $1,120,000 $920,000
** Cash receipts from previous quarter for Quarter 1 comes from the beginning balance in Accounts Receivable.
We can calculate the ENDING balance of Accounts Receivable for the budgeted balance sheet by taking the 4th Quartersales $1,000,000 x 40% to be received in 1st Quarter of the next year as $400,000. In addition to cash receipts, we alsoneed to understand how we plan to make our cash payments or disbursements.
Cash disbursements Companies need cash to pay for purchases, wages, rent, interest, income taxes, cash dividends, andmost other expenses. We can obtain the amount of each cash disbursement from other budgets or schedules.
This video discusses the purchases budget for a merchandiser but if you begin at minute 9 it will pick up with the cashdisbursement schedule example.
Leed Company is a manufacturing company and will need to use the information from the materials purchases budget first.Leed Company makes all material purchases on credit. Leed Company will pay for material purchases 80% in the quarterof purchase and 20% in the quarter after the purchase. Accounts Payable at the beginning of the year is $80,000 and willbe paid in the 1st Quarter. We will calculate cash payments for material purchases as shown in the following table.
Qtr 1 Qtr 2 Qtr 3 Qtr 4
Budgeted MaterialPurchases
$250,000 $295,000 $217,500 $217,500
Cash payments, currentquarter (80%)
$200,000 $236,000 $174,000 $174,000
(250,000 x 80%) (295,000 x 80%) (217,500 x 80%) (217,500 x 80%)
Cash payments, fromprevious qtr (20%)
80,000** 50,000 59,000 43,500
(250,000 x 20%) (295,000 x 20%) (217,500 x 20%)
Total Cash Pmts forMaterial Purchases
$280,000 $286,000 $233,000 $217,500
** Cash payments from previous quarter for Quarter 1 comes from the beginning balance in Accounts Payable.
We can calculate the ENDING balance of Accounts Payable for the budgeted balance sheet by taking the 4th Quartermerchandise purchases of $217,500 x 20% to be paid during 1st Quarter of the next year as $43,500. In addition to thesecash payments for merchandise, we also need the cash disbursements from the direct labor budget, manufacturingoverhead budget, and selling and administrative budget. Remember, we want the CASH PAYMENT amounts only and notthe total budget amount (depreciation is a non-cash expense and is excluded from cash payments).
youtu.be/I96n57H2p54
Using our example, Leed Company, we need the information from the cash payments of merchandise we just calculated,cash payments for direct labor (all direct labor paid in the quarter it was incurred), cash payments for manufacturingoverhead and cash payments for selling and administrative expenses. But, we also need information on dividendspayments, and income taxes.
Income taxes are assumed to be 40% of budgeted income before income taxes and are paid in the next quarter. *Incometaxes payable on January 1 were $100,000. We assume that $40,000 of dividends will be paid in the second quarter and
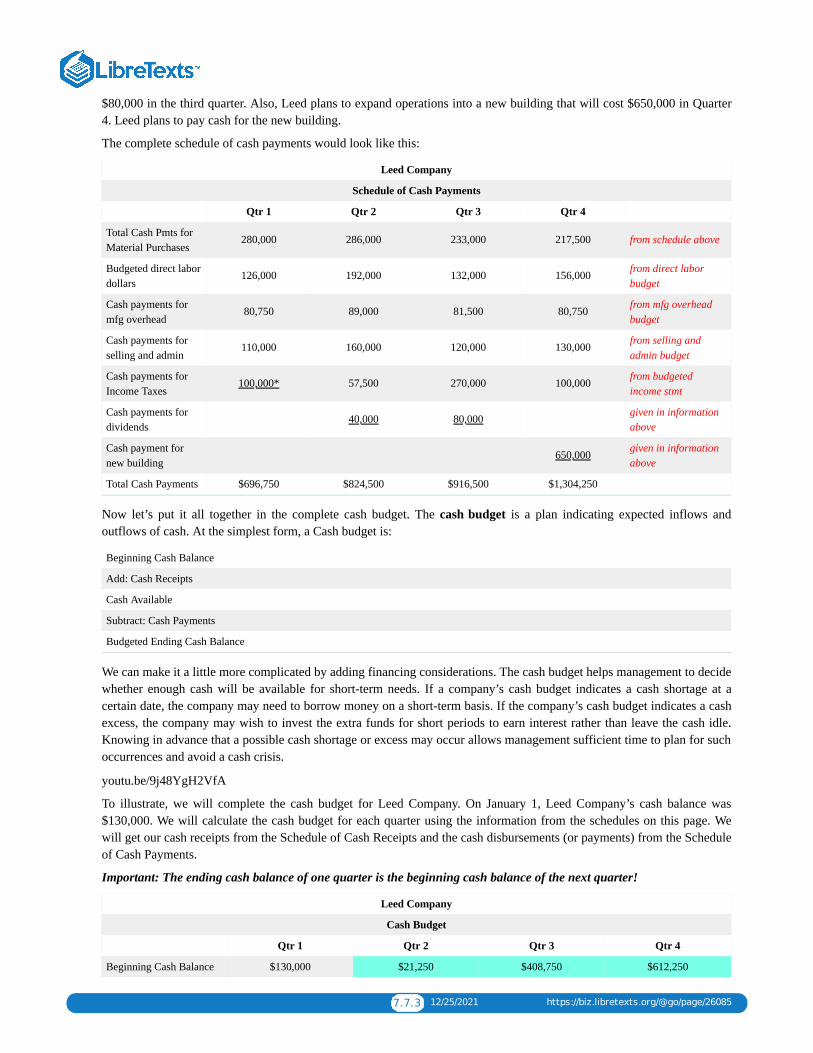
7.7.3 12/25/2021 https://biz.libretexts.org/@go/page/26085
$80,000 in the third quarter. Also, Leed plans to expand operations into a new building that will cost $650,000 in Quarter4. Leed plans to pay cash for the new building.
The complete schedule of cash payments would look like this:
Leed Company
Schedule of Cash Payments
Qtr 1 Qtr 2 Qtr 3 Qtr 4
Total Cash Pmts forMaterial Purchases
280,000 286,000 233,000 217,500 from schedule above
Budgeted direct labordollars
126,000 192,000 132,000 156,000 from direct laborbudget
Cash payments formfg overhead
80,750 89,000 81,500 80,750 from mfg overheadbudget
Cash payments forselling and admin
110,000 160,000 120,000 130,000 from selling andadmin budget
Cash payments forIncome Taxes
100,000* 57,500 270,000 100,000 from budgetedincome stmt
Cash payments fordividends
40,000 80,000 given in informationabove
Cash payment fornew building
650,000 given in informationabove
Total Cash Payments $696,750 $824,500 $916,500 $1,304,250
Now let’s put it all together in the complete cash budget. The cash budget is a plan indicating expected inflows andoutflows of cash. At the simplest form, a Cash budget is:
Beginning Cash Balance
Add: Cash Receipts
Cash Available
Subtract: Cash Payments
Budgeted Ending Cash Balance
We can make it a little more complicated by adding financing considerations. The cash budget helps management to decidewhether enough cash will be available for short-term needs. If a company’s cash budget indicates a cash shortage at acertain date, the company may need to borrow money on a short-term basis. If the company’s cash budget indicates a cashexcess, the company may wish to invest the extra funds for short periods to earn interest rather than leave the cash idle.Knowing in advance that a possible cash shortage or excess may occur allows management sufficient time to plan for suchoccurrences and avoid a cash crisis.
youtu.be/9j48YgH2VfA
To illustrate, we will complete the cash budget for Leed Company. On January 1, Leed Company’s cash balance was$130,000. We will calculate the cash budget for each quarter using the information from the schedules on this page. Wewill get our cash receipts from the Schedule of Cash Receipts and the cash disbursements (or payments) from the Scheduleof Cash Payments.
Important: The ending cash balance of one quarter is the beginning cash balance of the next quarter!
Leed Company
Cash Budget
Qtr 1 Qtr 2 Qtr 3 Qtr 4
Beginning Cash Balance $130,000 $21,250 $408,750 $612,250
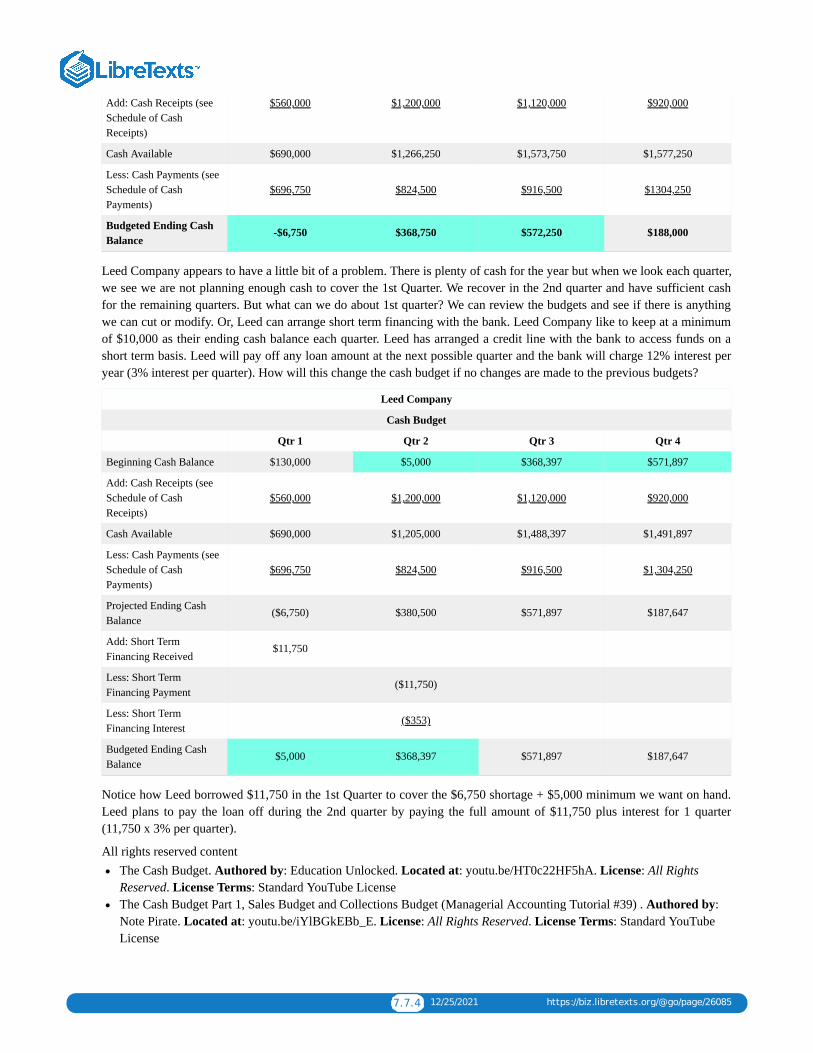
7.7.4 12/25/2021 https://biz.libretexts.org/@go/page/26085
Add: Cash Receipts (seeSchedule of CashReceipts)
$560,000 $1,200,000 $1,120,000 $920,000
Cash Available $690,000 $1,266,250 $1,573,750 $1,577,250
Less: Cash Payments (seeSchedule of CashPayments)
$696,750 $824,500 $916,500 $1304,250
Budgeted Ending CashBalance
-$6,750 $368,750 $572,250 $188,000
Leed Company appears to have a little bit of a problem. There is plenty of cash for the year but when we look each quarter,we see we are not planning enough cash to cover the 1st Quarter. We recover in the 2nd quarter and have sufficient cashfor the remaining quarters. But what can we do about 1st quarter? We can review the budgets and see if there is anythingwe can cut or modify. Or, Leed can arrange short term financing with the bank. Leed Company like to keep at a minimumof $10,000 as their ending cash balance each quarter. Leed has arranged a credit line with the bank to access funds on ashort term basis. Leed will pay off any loan amount at the next possible quarter and the bank will charge 12% interest peryear (3% interest per quarter). How will this change the cash budget if no changes are made to the previous budgets?
Leed Company
Cash Budget
Qtr 1 Qtr 2 Qtr 3 Qtr 4
Beginning Cash Balance $130,000 $5,000 $368,397 $571,897
Add: Cash Receipts (seeSchedule of CashReceipts)
$560,000 $1,200,000 $1,120,000 $920,000
Cash Available $690,000 $1,205,000 $1,488,397 $1,491,897
Less: Cash Payments (seeSchedule of CashPayments)
$696,750 $824,500 $916,500 $1,304,250
Projected Ending CashBalance
($6,750) $380,500 $571,897 $187,647
Add: Short TermFinancing Received
$11,750
Less: Short TermFinancing Payment
($11,750)
Less: Short TermFinancing Interest
($353)
Budgeted Ending CashBalance
$5,000 $368,397 $571,897 $187,647
Notice how Leed borrowed $11,750 in the 1st Quarter to cover the $6,750 shortage + $5,000 minimum we want on hand.Leed plans to pay the loan off during the 2nd quarter by paying the full amount of $11,750 plus interest for 1 quarter(11,750 x 3% per quarter).
All rights reserved contentThe Cash Budget. Authored by: Education Unlocked. Located at: youtu.be/HT0c22HF5hA. License: All RightsReserved. License Terms: Standard YouTube LicenseThe Cash Budget Part 1, Sales Budget and Collections Budget (Managerial Accounting Tutorial #39) . Authored by:Note Pirate. Located at: youtu.be/iYlBGkEBb_E. License: All Rights Reserved. License Terms: Standard YouTubeLicense

7.7.5 12/25/2021 https://biz.libretexts.org/@go/page/26085
The Cash Budget Part 2, Inventory Purchases Budget (Managerial Accounting Tutorial #40) . Authored by: NotePirate. Located at: youtu.be/tn1atrXrwn8. License: All Rights Reserved. License Terms: Standard YouTube LicenseThe Cash Budget Part 3, Operating Expenses Budget (Managerial Accounting Tutorial #41) . Authored by: NotePirate. Located at: youtu.be/I96n57H2p54. License: All Rights Reserved. License Terms: Standard YouTube License
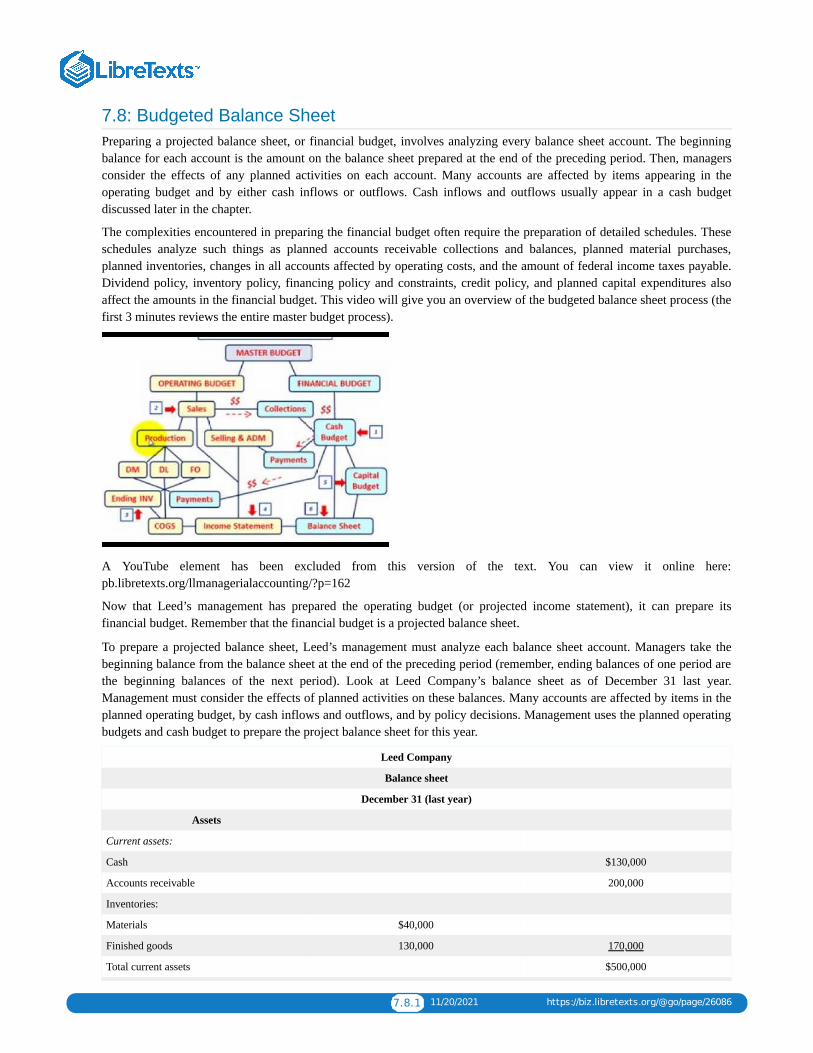
7.8.1 11/20/2021 https://biz.libretexts.org/@go/page/26086
7.8: Budgeted Balance SheetPreparing a projected balance sheet, or financial budget, involves analyzing every balance sheet account. The beginningbalance for each account is the amount on the balance sheet prepared at the end of the preceding period. Then, managersconsider the effects of any planned activities on each account. Many accounts are affected by items appearing in theoperating budget and by either cash inflows or outflows. Cash inflows and outflows usually appear in a cash budgetdiscussed later in the chapter.
The complexities encountered in preparing the financial budget often require the preparation of detailed schedules. Theseschedules analyze such things as planned accounts receivable collections and balances, planned material purchases,planned inventories, changes in all accounts affected by operating costs, and the amount of federal income taxes payable.Dividend policy, inventory policy, financing policy and constraints, credit policy, and planned capital expenditures alsoaffect the amounts in the financial budget. This video will give you an overview of the budgeted balance sheet process (thefirst 3 minutes reviews the entire master budget process).
A YouTube element has been excluded from this version of the text. You can view it online here:pb.libretexts.org/llmanagerialaccounting/?p=162
Now that Leed’s management has prepared the operating budget (or projected income statement), it can prepare itsfinancial budget. Remember that the financial budget is a projected balance sheet.
To prepare a projected balance sheet, Leed’s management must analyze each balance sheet account. Managers take thebeginning balance from the balance sheet at the end of the preceding period (remember, ending balances of one period arethe beginning balances of the next period). Look at Leed Company’s balance sheet as of December 31 last year.Management must consider the effects of planned activities on these balances. Many accounts are affected by items in theplanned operating budget, by cash inflows and outflows, and by policy decisions. Management uses the planned operatingbudgets and cash budget to prepare the project balance sheet for this year.
Leed Company
Balance sheet
December 31 (last year)
Assets
Current assets:
Cash $130,000
Accounts receivable 200,000
Inventories:
Materials $40,000
Finished goods 130,000 170,000
Total current assets $500,000
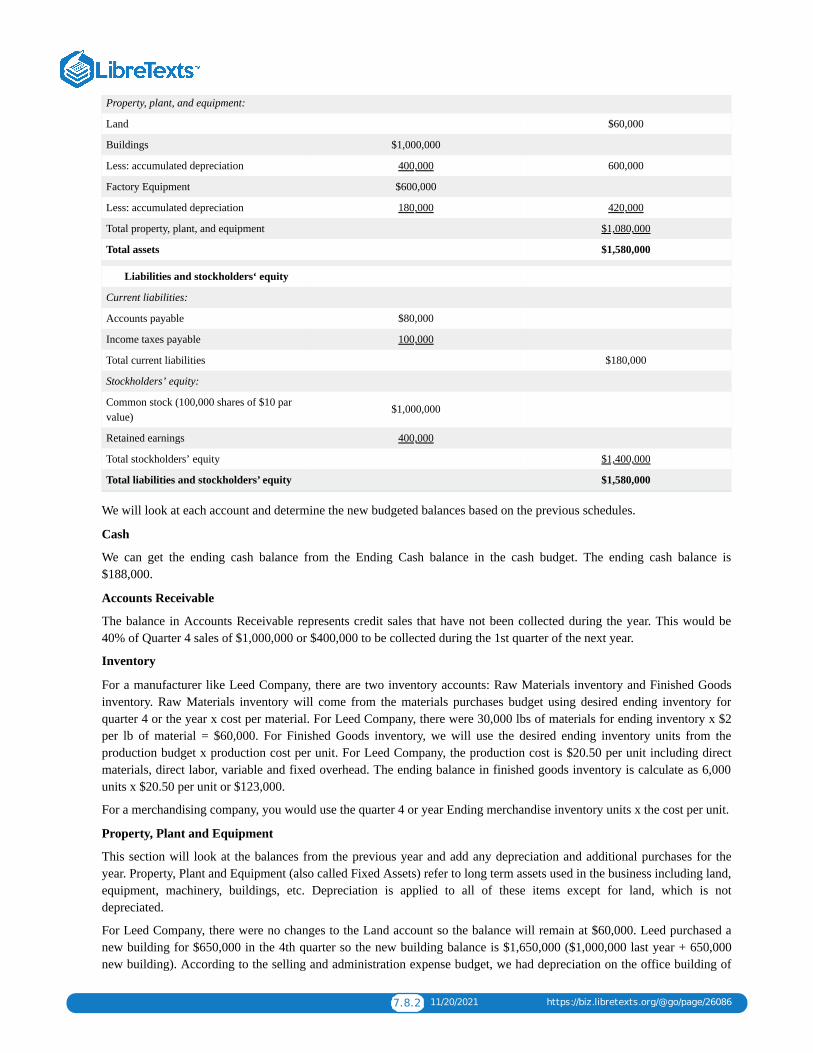
7.8.2 11/20/2021 https://biz.libretexts.org/@go/page/26086
Property, plant, and equipment:
Land $60,000
Buildings $1,000,000
Less: accumulated depreciation 400,000 600,000
Factory Equipment $600,000
Less: accumulated depreciation 180,000 420,000
Total property, plant, and equipment $1,080,000
Total assets $1,580,000
Liabilities and stockholders‘ equity
Current liabilities:
Accounts payable $80,000
Income taxes payable 100,000
Total current liabilities $180,000
Stockholders’ equity:
Common stock (100,000 shares of $10 parvalue)
$1,000,000
Retained earnings 400,000
Total stockholders’ equity $1,400,000
Total liabilities and stockholders’ equity $1,580,000
We will look at each account and determine the new budgeted balances based on the previous schedules.
Cash
We can get the ending cash balance from the Ending Cash balance in the cash budget. The ending cash balance is$188,000.
Accounts Receivable
The balance in Accounts Receivable represents credit sales that have not been collected during the year. This would be40% of Quarter 4 sales of $1,000,000 or $400,000 to be collected during the 1st quarter of the next year.
Inventory
For a manufacturer like Leed Company, there are two inventory accounts: Raw Materials inventory and Finished Goodsinventory. Raw Materials inventory will come from the materials purchases budget using desired ending inventory forquarter 4 or the year x cost per material. For Leed Company, there were 30,000 lbs of materials for ending inventory x $2per lb of material = $60,000. For Finished Goods inventory, we will use the desired ending inventory units from theproduction budget x production cost per unit. For Leed Company, the production cost is $20.50 per unit including directmaterials, direct labor, variable and fixed overhead. The ending balance in finished goods inventory is calculate as 6,000units x $20.50 per unit or $123,000.
For a merchandising company, you would use the quarter 4 or year Ending merchandise inventory units x the cost per unit.
Property, Plant and Equipment
This section will look at the balances from the previous year and add any depreciation and additional purchases for theyear. Property, Plant and Equipment (also called Fixed Assets) refer to long term assets used in the business including land,equipment, machinery, buildings, etc. Depreciation is applied to all of these items except for land, which is notdepreciated.
For Leed Company, there were no changes to the Land account so the balance will remain at $60,000. Leed purchased anew building for $650,000 in the 4th quarter so the new building balance is $1,650,000 ($1,000,000 last year + 650,000new building). According to the selling and administration expense budget, we had depreciation on the office building of

7.8.3 11/20/2021 https://biz.libretexts.org/@go/page/26086
$80,000 so we will add this to the existing balance from the previous year to get a new balance of $480,000 ($400,000prior year + $80,000 current year depreciation). We are not planning on buying any new equipment this year. Theequipment balance will remain the same at $600,000. According to the manufacturing overhead budget, we planned$40,000 of factory equipment depreciation this year. The new balance for equipment accumulated depreciation is $220,000($180,000 prior year + $40,000 current year depreciation).
Current Liabilities
Current Liabilities are liabilities we expect to pay in the next year. Accounts Payable is determined using the purchasesbudget (material purchases for a manufacturer or inventory purchase budget for a merchandiser) and the schedule of cashpayments.
Leed Company budgets purchase payments as 80% in the quarter of purchase and 20% in the quarter after the purchase.We can calculate Leed’s ending accounts payable by looking at the Quarter 4 material purchases of $217,500 x 20% to bepaid in the first quarter of next year for $43,500.
Income taxes are typically paid in the quarter after they were calculated or during the first quarter of the next year. ForLeed Company, income taxes are paid in the quarter after they were calculated. We can determine the budgeted income taxamount from the budgeted income statement. In quarter 4, Leed Company plans income taxes of $142,500 to be paid in thefirst quarter of the following year making this the ending balance for Income Taxes Payable.
Stockholder’s Equity
Stockholder’s Equity is comprised of common stock and retained earnings. Common stock represents ownership in thecompany. Retained Earnings is the earnings of the company over time minus any dividends paid.
Leed Company did not have any new issues of common stock so the ending common stock balance will remain the sameas $1,000,000. For retained earnings, we will need to calculate the ending balance using the following formula:
Beginning Retained Earnings + Net Income – Dividends = Ending Retained Earnings
Beginning retained earnings comes from the balance of last year’s balance sheet of $400,000. Net Income comes from thebudgeted income statement for the year of $855,000. Dividends can be determined from the schedule of cash paymentswhich shows $120,000 paid this year. Ending Retained Earnings is $1,135,000 ($400,000 + 855,000 – 120,000).
The full budgeted balance sheet will look like this:
Leed Company
Budgeted Balance sheet
December 31
Assets
Current assets:
Cash 188,000
Accounts receivable 400,000
Inventories:
Materials 60,000
Finished goods 123,000 183,000
Total current assets 771,000
Property, plant, and equipment:
Land 60,000
Buildings 1,650,000
Less: accumulated depreciation 480,000 1,170,000
Factory Equipment 600,000
Less: accumulated depreciation 220,000 380,000
Total property, plant, and equipment 1,550,000

7.8.4 11/20/2021 https://biz.libretexts.org/@go/page/26086
Total assets 2,321,000
Liabilities and stockholders‘ equity
Current liabilities:
Accounts payable 43,500
Income taxes payable 142,500
Total current liabilities 186,000
Stockholders’ equity:
Common stock (100,000 shares of $10 parvalue)
1,000,000
Retained earnings 1,135,000
Total stockholders’ equity 2,135,000
Total liabilities and stockholders’ equity 2,321,000
The preparation of Leed’s financial budgeted balance sheet completes the master budget. Management now hasinformation to help appraise the policies it has adopted before implementing them. If the master budget shows the resultsof these policies to be unsatisfactory, the company can change its policies before serious problems arise.
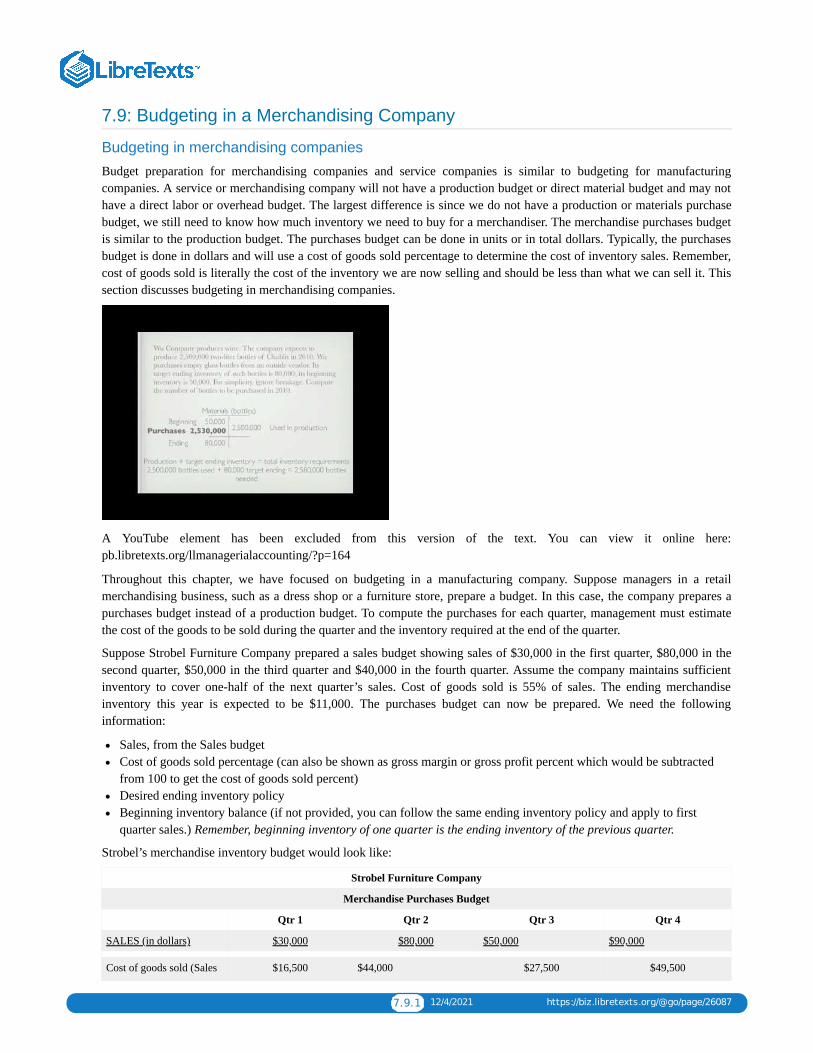
7.9.1 12/4/2021 https://biz.libretexts.org/@go/page/26087
7.9: Budgeting in a Merchandising Company
Budgeting in merchandising companies
Budget preparation for merchandising companies and service companies is similar to budgeting for manufacturingcompanies. A service or merchandising company will not have a production budget or direct material budget and may nothave a direct labor or overhead budget. The largest difference is since we do not have a production or materials purchasebudget, we still need to know how much inventory we need to buy for a merchandiser. The merchandise purchases budgetis similar to the production budget. The purchases budget can be done in units or in total dollars. Typically, the purchasesbudget is done in dollars and will use a cost of goods sold percentage to determine the cost of inventory sales. Remember,cost of goods sold is literally the cost of the inventory we are now selling and should be less than what we can sell it. Thissection discusses budgeting in merchandising companies.
A YouTube element has been excluded from this version of the text. You can view it online here:pb.libretexts.org/llmanagerialaccounting/?p=164
Throughout this chapter, we have focused on budgeting in a manufacturing company. Suppose managers in a retailmerchandising business, such as a dress shop or a furniture store, prepare a budget. In this case, the company prepares apurchases budget instead of a production budget. To compute the purchases for each quarter, management must estimatethe cost of the goods to be sold during the quarter and the inventory required at the end of the quarter.
Suppose Strobel Furniture Company prepared a sales budget showing sales of $30,000 in the first quarter, $80,000 in thesecond quarter, $50,000 in the third quarter and $40,000 in the fourth quarter. Assume the company maintains sufficientinventory to cover one-half of the next quarter’s sales. Cost of goods sold is 55% of sales. The ending merchandiseinventory this year is expected to be $11,000. The purchases budget can now be prepared. We need the followinginformation:
Sales, from the Sales budgetCost of goods sold percentage (can also be shown as gross margin or gross profit percent which would be subtractedfrom 100 to get the cost of goods sold percent)Desired ending inventory policyBeginning inventory balance (if not provided, you can follow the same ending inventory policy and apply to firstquarter sales.) Remember, beginning inventory of one quarter is the ending inventory of the previous quarter.
Strobel’s merchandise inventory budget would look like:
Strobel Furniture Company
Merchandise Purchases Budget
Qtr 1 Qtr 2 Qtr 3 Qtr 4
SALES (in dollars) $30,000 $80,000 $50,000 $90,000
Cost of goods sold (Sales $16,500 $44,000 $27,500 $49,500
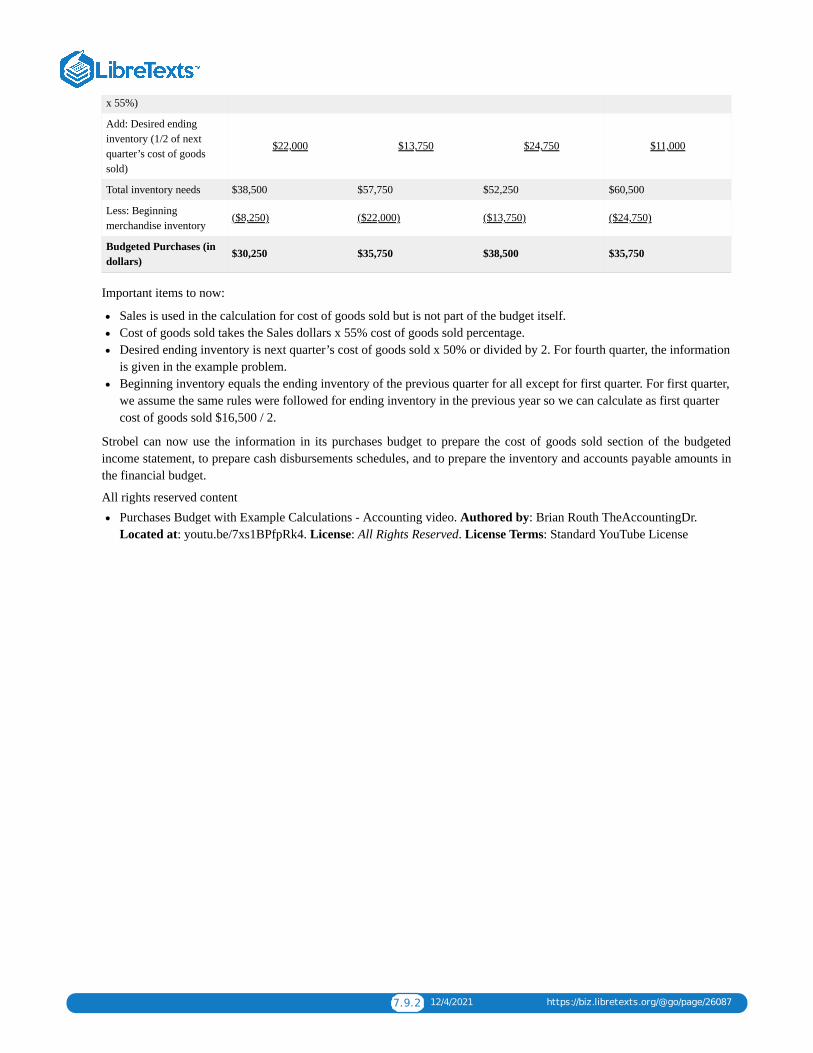
7.9.2 12/4/2021 https://biz.libretexts.org/@go/page/26087
x 55%)
Add: Desired endinginventory (1/2 of nextquarter’s cost of goodssold)
$22,000 $13,750 $24,750 $11,000
Total inventory needs $38,500 $57,750 $52,250 $60,500
Less: Beginningmerchandise inventory
($8,250) ($22,000) ($13,750) ($24,750)
Budgeted Purchases (indollars)
$30,250 $35,750 $38,500 $35,750
Important items to now:
Sales is used in the calculation for cost of goods sold but is not part of the budget itself.Cost of goods sold takes the Sales dollars x 55% cost of goods sold percentage.Desired ending inventory is next quarter’s cost of goods sold x 50% or divided by 2. For fourth quarter, the informationis given in the example problem.Beginning inventory equals the ending inventory of the previous quarter for all except for first quarter. For first quarter,we assume the same rules were followed for ending inventory in the previous year so we can calculate as first quartercost of goods sold $16,500 / 2.
Strobel can now use the information in its purchases budget to prepare the cost of goods sold section of the budgetedincome statement, to prepare cash disbursements schedules, and to prepare the inventory and accounts payable amounts inthe financial budget.
All rights reserved contentPurchases Budget with Example Calculations - Accounting video. Authored by: Brian Routh TheAccountingDr.Located at: youtu.be/7xs1BPfpRk4. License: All Rights Reserved. License Terms: Standard YouTube License
7.10.1 11/13/2021 https://biz.libretexts.org/@go/page/26088
7.10: Other Budgeting MethodsBudgeting in service companies
The concepts discussed in this chapter are equally applicable to service companies. Service firms have service revenuesand operating expenses that must be budgeted. Projected income statements and balance sheets can be prepared for servicecompanies and are typically based on past performance.
A YouTube element has been excluded from this version of the text. You can view it online here:pb.libretexts.org/llmanagerialaccounting/?p=166
To illustrate, assume Windy Weather Company wants to make the following changes this year to last year’s results:
1. Sales will increase 5%2. Sales commissions will remain the same at 10% of sales3. Sales and administrative salaries will increase 3%4. Supplies, rent and miscellaneous expenses will remain the same.5. Income taxes will be 30% of net income.
The budgeted income statement for this year would be:
Windy Weather Company
Budgeted Income Statement
Last Year BUDGET Calculation
Sales $450,000 $472,500 450,000 + (450,000 x 5%)
Less Expenses: heading only – no entry
Sales Commissions $45,000 $49,500 472,500 x 10%
Sales Salaries $50,000 $51,500 $50,000 + (50,000 x 3%)
Administrative Salaries $75,000 $77,250 $75,000 + (75,000 x 3%)
Supplies Expense $5,000 $5,000 no change
Rent Expense $120,000 $120,000 no change
Miscellaneous Expense $15,000 $15,000 no change
Total Expenses $310,000 $318,250 sum of all expenses
Income from operations $140,000 $154,250 Sales 450,000 – Expenses318,250
Less: Income Tax (30%) ($42,000) ($46,275) Inc. from operations x 30%
Net Income $98,000 $107,975 Inc. from operations – income tax
Zero-Based Budgeting

7.10.2 11/13/2021 https://biz.libretexts.org/@go/page/26088
An alternative to the traditional budget is zero-based budgeting.
A YouTube element has been excluded from this version of the text. You can view it online here:pb.libretexts.org/llmanagerialaccounting/?p=166
Zero-base budgeting became popular in the 1970s, particularly when President Jimmy Carter supported it for state andfederal governmental units. It has received less attention since then.
Under zero-base budgeting, managers in a company start each year with zero budget levels and must justify every dollarthat appears in the budget. Managers do not assume any costs incurred in previous years should be incurred this year. Eachmanager prepares decision packages that describe the nature and cost of tasks that can be performed by that unit and theconsequences of not performing each task. Top organization officials rank the decision packages and approve those thatthey believe are most worthy. A major drawback to the use of this concept is the massive amounts of paperwork and timeneeded to prepare and rank decision packages, especially in large organizations.
Accounting in the Headlines
Why is Campbell Soup Company using zero-based budgeting?
Consumers are increasingly distrusting “Big Food,” and CampbellSoup Company (CPB) is working to counter the effects of that trend by offering more healthy or natural alternatives. Forexample, Campbell’s recently introduced a new line of organic soups, Campbell’s® Organics, and acquired both BolthouseFarms juices and Plum Organics baby food.
In addition to expanding its healthier and more natural product lines, Campbell’s has also announced it will beimplementing zero-based budgeting. It expects to save $200 million off its expected annual costs of close to $7 billion.
Questions
1. What is “zero-based budgeting”?2. How does Campbell’s expect that it will save $200 million by using zero-based budgeting?3. What are some potential drawbacks to Campbell’s from its use of zero-based budgeting?
Final Thoughts
For the final thoughts on budgeting, it might be helpful to rethink about how we create budgets, who creates them andwhat motivation the person might have for the budget figures. This video discusses the difference between participating
7.10.3 11/13/2021 https://biz.libretexts.org/@go/page/26088
and traditional budgeting.
A YouTube element has been excluded from this version of the text. You can view it online here:pb.libretexts.org/llmanagerialaccounting/?p=166
CC licensed content, Specific attributionWhy is Campbell Soup Company using zero-based budgeting?. Authored by: Dr. Wendy Tietz, CPA, CMA, CGMA .Located at: http://www.accountingintheheadlines.com. License: CC BY-NC: Attribution-NonCommercial
All rights reserved contentWhat is Zero-Based Budgeting (ZBB)?. Authored by: Stroud International. Located at: youtu.be/t0KLvsvShsk.License: All Rights Reserved. License Terms: Standard YouTube LicenseParticipative Budgeting vs. Traditional Budgeting . Authored by: Education Unlocked. Located at: youtu.be/m-uWeIy-whQ. License: All Rights Reserved. License Terms: Standard YouTube LicenseHow to Build a Basic Financial Projection - Business Finance . Authored by: Gateway CFO Solutions. Located at:youtu.be/IuL0dWfd7Jk. License: All Rights Reserved. License Terms: Standard YouTube License
7.11.1 1/1/2022 https://biz.libretexts.org/@go/page/26089
7.11: Flexible BudgetsEarly in the chapter, you learned that a budget should be adjusted for changes in assumptions or variations in the level ofoperations. Managers use a technique known as flexible budgeting to deal with budgetary adjustments. A flexibleoperating budget is a special kind of budget that provides detailed information about budgeted expenses (and revenues) atvarious levels of output.
A YouTube element has been excluded from this version of the text. You can view it online here:pb.libretexts.org/llmanagerialaccounting/?p=168
Leed Company’s manufacturing overhead cost budget at 70% capacity is shown below. Leed can produce 25,000 units in a3 month period or a quarter, which represents 100% of capacity.
Leed Company
Manufacturing Overhead Cost
3-month Budget
Supplies $1,400
Power 7,000
Insurance 4,200
Maintenance 4,900
Depreciation 18,000
Supervision 57,000
Total Overhead Costs $92,500
Units Produced (70% capacity) 17,500
To keep the example simple, we assume that the first four costs are strictly variable and we will calculate a budget per unitfor these costs. On the other hand, the last two costs, depreciation and supervision, are fixed costs and are assumed to beconstant over the entire relevant range of activity meaning they do not change based on volume. The table below shows thecalculations for units produced at 70% capacity and calculates the variable cost per unit for all variable costs.
Variable Fixed Calculation
Units produced 17,500 units (25,00 units x 70%capacity)
Supplies $1,400 $0.08 ($1,400 / 17,500 units)
Power 7,000 $0.40 ($7,000 / 17,500 units)
Insurance 4,200 $0.24 ($4,200 / 17,500 units)
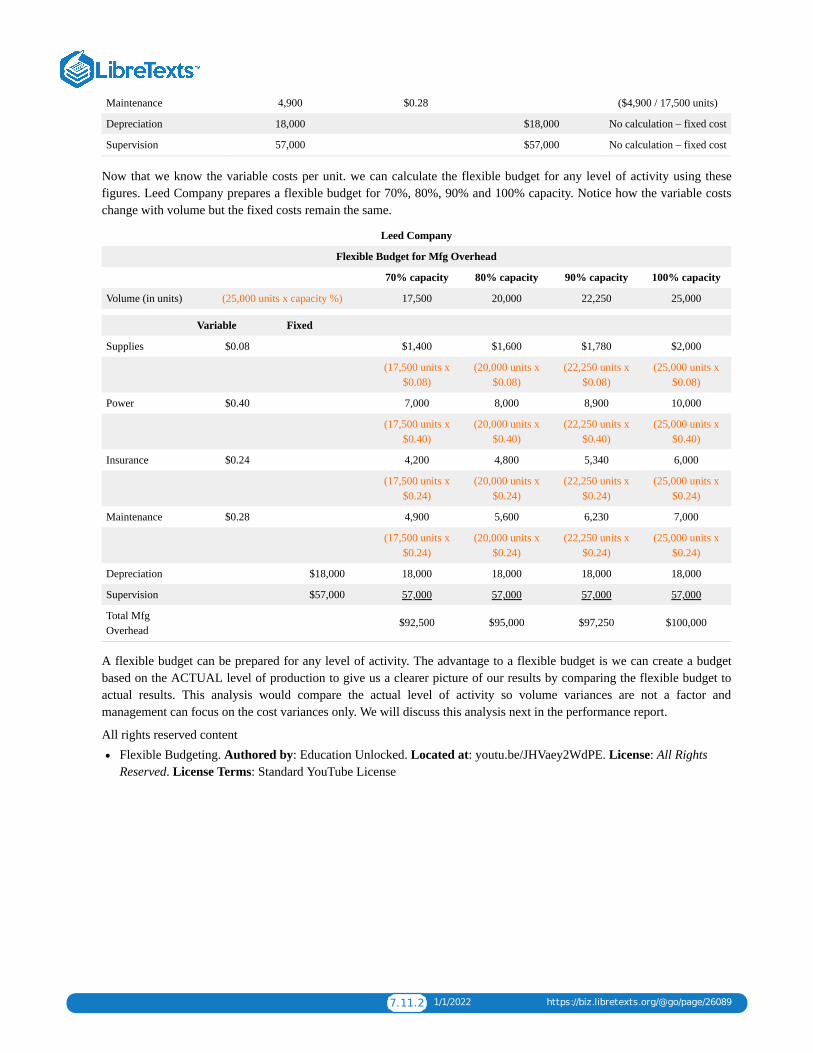
7.11.2 1/1/2022 https://biz.libretexts.org/@go/page/26089
Maintenance 4,900 $0.28 ($4,900 / 17,500 units)
Depreciation 18,000 $18,000 No calculation – fixed cost
Supervision 57,000 $57,000 No calculation – fixed cost
Now that we know the variable costs per unit. we can calculate the flexible budget for any level of activity using thesefigures. Leed Company prepares a flexible budget for 70%, 80%, 90% and 100% capacity. Notice how the variable costschange with volume but the fixed costs remain the same.
Leed Company
Flexible Budget for Mfg Overhead
70% capacity 80% capacity 90% capacity 100% capacity
Volume (in units) (25,000 units x capacity %) 17,500 20,000 22,250 25,000
Variable Fixed
Supplies $0.08 $1,400 $1,600 $1,780 $2,000
(17,500 units x$0.08)
(20,000 units x$0.08)
(22,250 units x$0.08)
(25,000 units x$0.08)
Power $0.40 7,000 8,000 8,900 10,000
(17,500 units x$0.40)
(20,000 units x$0.40)
(22,250 units x$0.40)
(25,000 units x$0.40)
Insurance $0.24 4,200 4,800 5,340 6,000
(17,500 units x$0.24)
(20,000 units x$0.24)
(22,250 units x$0.24)
(25,000 units x$0.24)
Maintenance $0.28 4,900 5,600 6,230 7,000
(17,500 units x$0.24)
(20,000 units x$0.24)
(22,250 units x$0.24)
(25,000 units x$0.24)
Depreciation $18,000 18,000 18,000 18,000 18,000
Supervision $57,000 57,000 57,000 57,000 57,000
Total MfgOverhead
$92,500 $95,000 $97,250 $100,000
A flexible budget can be prepared for any level of activity. The advantage to a flexible budget is we can create a budgetbased on the ACTUAL level of production to give us a clearer picture of our results by comparing the flexible budget toactual results. This analysis would compare the actual level of activity so volume variances are not a factor andmanagement can focus on the cost variances only. We will discuss this analysis next in the performance report.
All rights reserved contentFlexible Budgeting. Authored by: Education Unlocked. Located at: youtu.be/JHVaey2WdPE. License: All RightsReserved. License Terms: Standard YouTube License

7.12.1 1/4/2022 https://biz.libretexts.org/@go/page/26091
7.12: Glossary
GLOSSARY
Budget A plan showing a company’s objectives and proposed ways of attaining the objectives. Major types of budgets are(1) master budget, (2) responsibility budget, and (3) capital budget.
Budgeting The coordination of financial and nonfinancial planning to satisfy an organization’s goals.
Budget variance The difference between an actual cost incurred (or revenue earned) at a certain level of operations andthe budgeted amount for the same level of operations.
Cash budget A plan indicating expected inflows (receipts) and outflows (disbursements) of cash; it helps managementdecide whether enough cash will be available for short-term needs.
Financial budget The projected balance sheet portion of a master budget.
Fixed costs Costs that are unaffected in total by the relative level of production or sales.
Flexible operating budget A special budget that provides detailed information about budgeted expenses (and revenues) atvarious levels of output.
Just-in-time inventory system Provides that goods are produced and delivered just in time to be sold.
Master budget The projected income statement (planned operating budget) and projected balance sheet (financial budget)showing the organization’s objectives and proposed ways of attaining them; includes supporting budgets for various itemsin the master budget; also called master profit plan. The master budget is the overall plan of the enterprise and ideallyconsists of all of the various segmental budgets.
Participatory budgeting A method of preparing the budget that includes the participation of all levels of managementresponsible for actual performance.
Planned operating budget The projected income statement portion of a master budget.
Production budget A budget that takes into account the units in the sales budget and the company’s inventory policy.
Variable costs Costs that vary in total directly with production or sales and are a constant dollar amount per unit of outputover different levels of output or sales.
Zero-base budgeting Managers in a company start each year with zero budget levels and must justify every dollar thatwill appear in the budget.
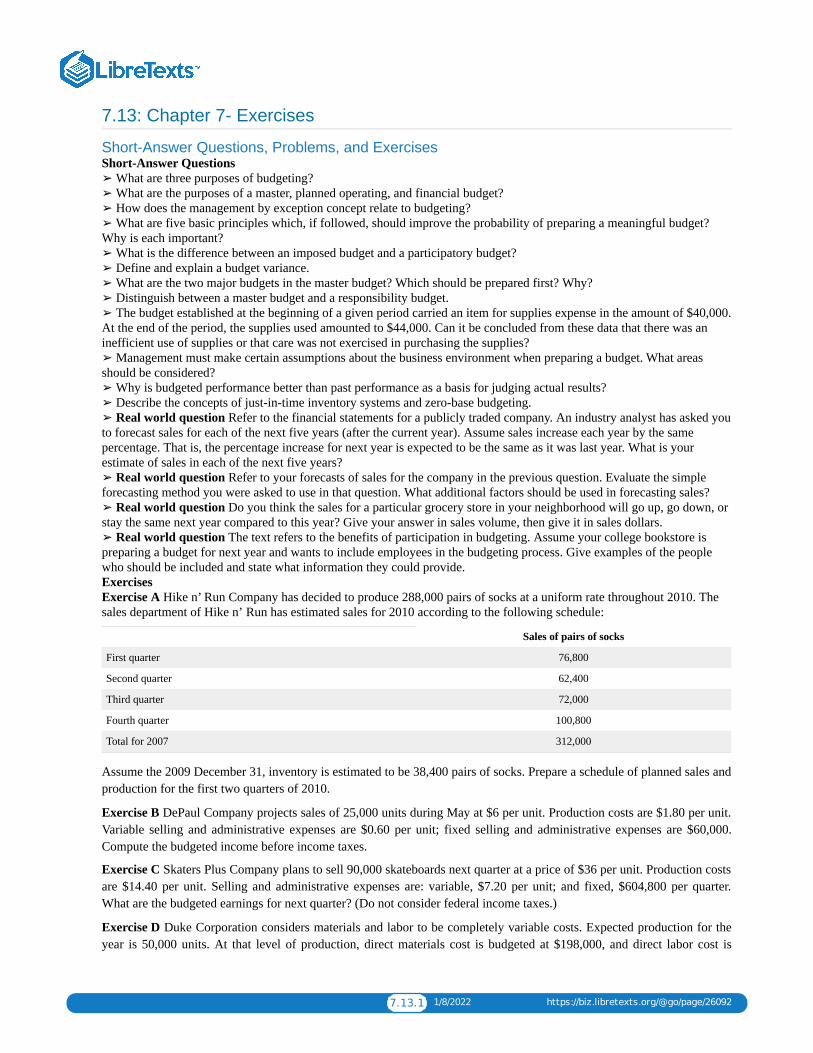
7.13.1 1/8/2022 https://biz.libretexts.org/@go/page/26092
7.13: Chapter 7- Exercises
Short-Answer Questions, Problems, and ExercisesShort-Answer Questions➢ What are three purposes of budgeting?➢ What are the purposes of a master, planned operating, and financial budget?➢ How does the management by exception concept relate to budgeting?➢ What are five basic principles which, if followed, should improve the probability of preparing a meaningful budget?Why is each important?➢ What is the difference between an imposed budget and a participatory budget?➢ Define and explain a budget variance.➢ What are the two major budgets in the master budget? Which should be prepared first? Why?➢ Distinguish between a master budget and a responsibility budget.➢ The budget established at the beginning of a given period carried an item for supplies expense in the amount of $40,000.At the end of the period, the supplies used amounted to $44,000. Can it be concluded from these data that there was aninefficient use of supplies or that care was not exercised in purchasing the supplies?➢ Management must make certain assumptions about the business environment when preparing a budget. What areasshould be considered?➢ Why is budgeted performance better than past performance as a basis for judging actual results?➢ Describe the concepts of just-in-time inventory systems and zero-base budgeting.➢ Real world question Refer to the financial statements for a publicly traded company. An industry analyst has asked youto forecast sales for each of the next five years (after the current year). Assume sales increase each year by the samepercentage. That is, the percentage increase for next year is expected to be the same as it was last year. What is yourestimate of sales in each of the next five years?➢ Real world question Refer to your forecasts of sales for the company in the previous question. Evaluate the simpleforecasting method you were asked to use in that question. What additional factors should be used in forecasting sales?➢ Real world question Do you think the sales for a particular grocery store in your neighborhood will go up, go down, orstay the same next year compared to this year? Give your answer in sales volume, then give it in sales dollars.➢ Real world question The text refers to the benefits of participation in budgeting. Assume your college bookstore ispreparing a budget for next year and wants to include employees in the budgeting process. Give examples of the peoplewho should be included and state what information they could provide.ExercisesExercise A Hike n’ Run Company has decided to produce 288,000 pairs of socks at a uniform rate throughout 2010. Thesales department of Hike n’ Run has estimated sales for 2010 according to the following schedule:
Sales of pairs of socks
First quarter 76,800
Second quarter 62,400
Third quarter 72,000
Fourth quarter 100,800
Total for 2007 312,000
Assume the 2009 December 31, inventory is estimated to be 38,400 pairs of socks. Prepare a schedule of planned sales andproduction for the first two quarters of 2010.
Exercise B DePaul Company projects sales of 25,000 units during May at $6 per unit. Production costs are $1.80 per unit.Variable selling and administrative expenses are $0.60 per unit; fixed selling and administrative expenses are $60,000.Compute the budgeted income before income taxes.
Exercise C Skaters Plus Company plans to sell 90,000 skateboards next quarter at a price of $36 per unit. Production costsare $14.40 per unit. Selling and administrative expenses are: variable, $7.20 per unit; and fixed, $604,800 per quarter.What are the budgeted earnings for next quarter? (Do not consider federal income taxes.)
Exercise D Duke Corporation considers materials and labor to be completely variable costs. Expected production for theyear is 50,000 units. At that level of production, direct materials cost is budgeted at $198,000, and direct labor cost is
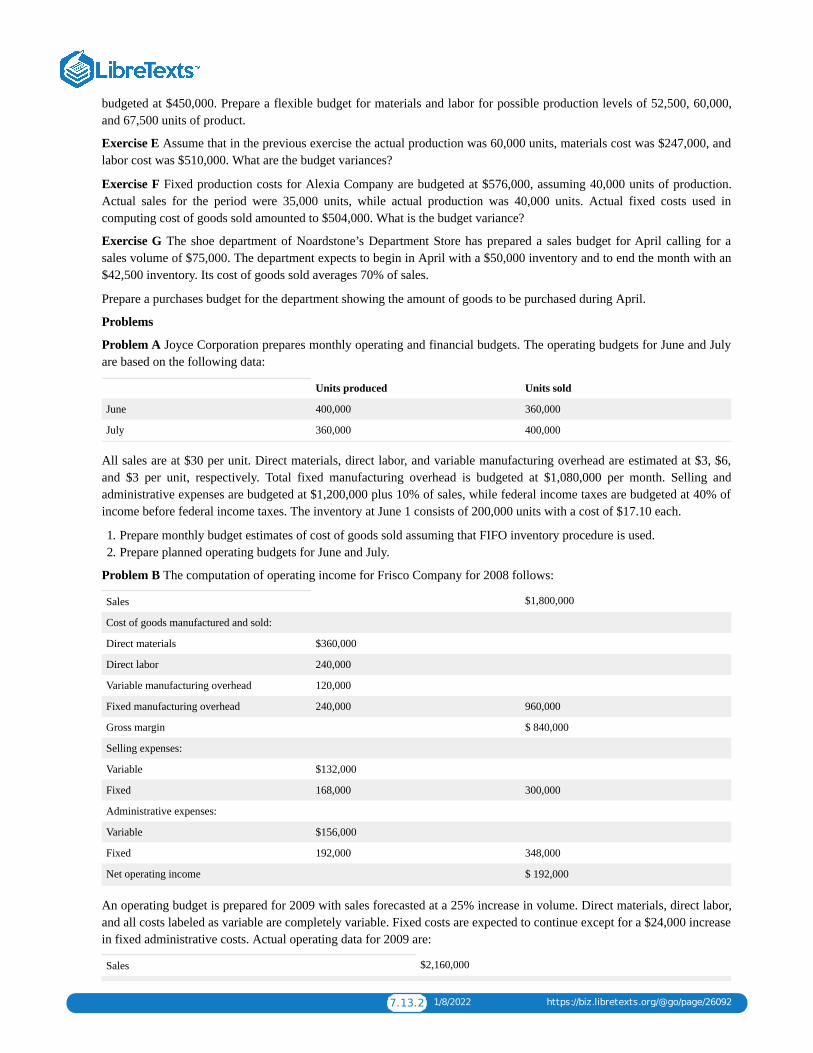
7.13.2 1/8/2022 https://biz.libretexts.org/@go/page/26092
budgeted at $450,000. Prepare a flexible budget for materials and labor for possible production levels of 52,500, 60,000,and 67,500 units of product.
Exercise E Assume that in the previous exercise the actual production was 60,000 units, materials cost was $247,000, andlabor cost was $510,000. What are the budget variances?
Exercise F Fixed production costs for Alexia Company are budgeted at $576,000, assuming 40,000 units of production.Actual sales for the period were 35,000 units, while actual production was 40,000 units. Actual fixed costs used incomputing cost of goods sold amounted to $504,000. What is the budget variance?
Exercise G The shoe department of Noardstone’s Department Store has prepared a sales budget for April calling for asales volume of $75,000. The department expects to begin in April with a $50,000 inventory and to end the month with an$42,500 inventory. Its cost of goods sold averages 70% of sales.
Prepare a purchases budget for the department showing the amount of goods to be purchased during April.
Problems
Problem A Joyce Corporation prepares monthly operating and financial budgets. The operating budgets for June and Julyare based on the following data:
Units produced Units sold
June 400,000 360,000
July 360,000 400,000
All sales are at $30 per unit. Direct materials, direct labor, and variable manufacturing overhead are estimated at $3, $6,and $3 per unit, respectively. Total fixed manufacturing overhead is budgeted at $1,080,000 per month. Selling andadministrative expenses are budgeted at $1,200,000 plus 10% of sales, while federal income taxes are budgeted at 40% ofincome before federal income taxes. The inventory at June 1 consists of 200,000 units with a cost of $17.10 each.
1. Prepare monthly budget estimates of cost of goods sold assuming that FIFO inventory procedure is used.2. Prepare planned operating budgets for June and July.
Problem B The computation of operating income for Frisco Company for 2008 follows:
Sales $1,800,000
Cost of goods manufactured and sold:
Direct materials $360,000
Direct labor 240,000
Variable manufacturing overhead 120,000
Fixed manufacturing overhead 240,000 960,000
Gross margin $ 840,000
Selling expenses:
Variable $132,000
Fixed 168,000 300,000
Administrative expenses:
Variable $156,000
Fixed 192,000 348,000
Net operating income $ 192,000
An operating budget is prepared for 2009 with sales forecasted at a 25% increase in volume. Direct materials, direct labor,and all costs labeled as variable are completely variable. Fixed costs are expected to continue except for a $24,000 increasein fixed administrative costs. Actual operating data for 2009 are:
Sales $2,160,000

7.13.3 1/8/2022 https://biz.libretexts.org/@go/page/26092
Direct materials 444,000
Direct labor 288,000
Variable manufacturing overhead 148,800
Fixed manufacturing overhead 246,000
Variable selling expenses 186,000
Fixed selling expenses 157,200
Variable administrative expenses 198,000
Fixed administrative expenses 218,200
1. Prepare a budget report comparing the 2009 planned operating budget with actual 2009 data.2. Prepare a budget report that would be useful in appraising the performance of the various persons charged with
responsibility to provide satisfactory income. (Hint: Prepare budget data on a flexible basis and use the percentage bywhich sales were actually experienced.)
3. Comment on the differences revealed by the two reports.
Problem C Use the following data to prepare a planned operating budget for Hi-Lo Company for the year ending 2009December 31:
Plant capacity 100,000 units
Expected sales volume 90,000 units
Expected production 90,000 units
Actual production 90,000 units
Forecasted selling price $ 12,00 per unit
Actual selling price $ 13,50 per unit
Manufacturing costs:
Variable (per unit):
Direct materials $3.60
Direct labor $1.50
Manufacturing overhead $2.25
Fixed manufacturing overhead $108,000
Selling and administrative expenses:
Variable (per unit) $1.20
Fixed $60,000
Assume no beginning or ending inventory. Federal income taxes are budgeted at 40% of income before federal incometaxes.
The actual operating data for the year ending 2009 December 31, follow:
Sales $1,080,000
Cost of goods sold:
Direct materials $337,500
Direct labor 135,000
Variable manufacturing overhead 202,500
Fixed manufacturing overhead 108,000
Total $783,000
Less: Ending inventory ($783,000 x 10/90) 87,000 696,000
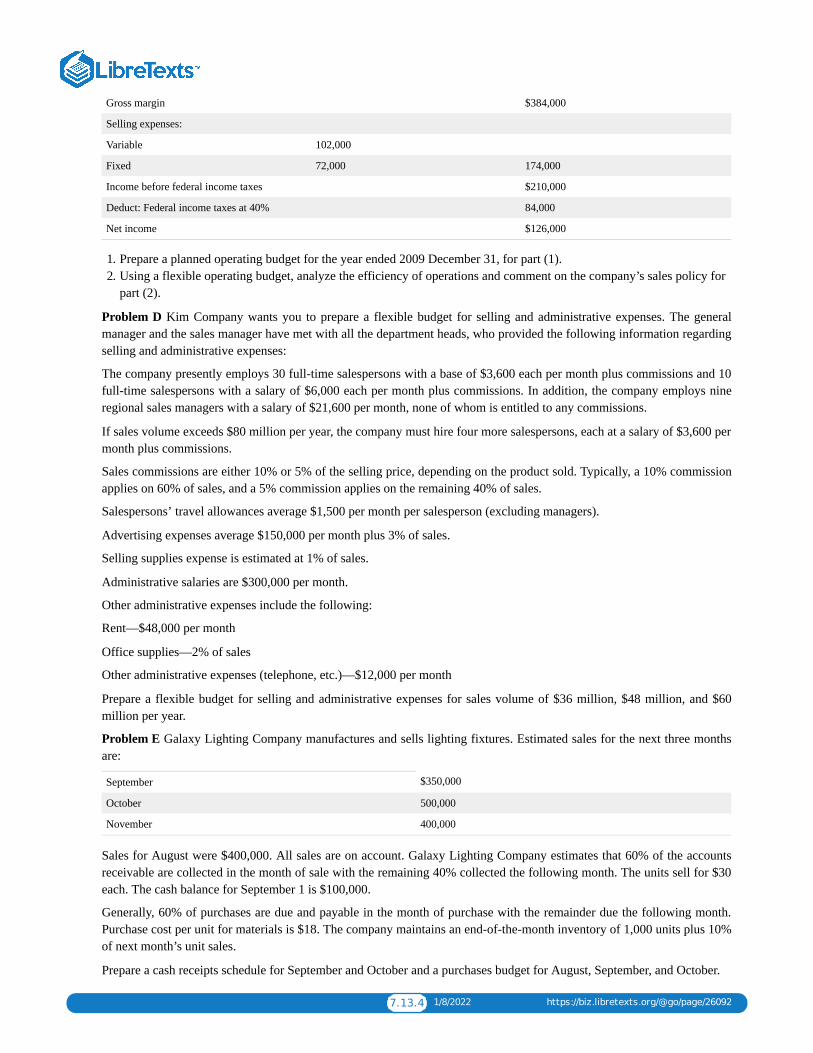
7.13.4 1/8/2022 https://biz.libretexts.org/@go/page/26092
Gross margin $384,000
Selling expenses:
Variable 102,000
Fixed 72,000 174,000
Income before federal income taxes $210,000
Deduct: Federal income taxes at 40% 84,000
Net income $126,000
1. Prepare a planned operating budget for the year ended 2009 December 31, for part (1).2. Using a flexible operating budget, analyze the efficiency of operations and comment on the company’s sales policy for
part (2).
Problem D Kim Company wants you to prepare a flexible budget for selling and administrative expenses. The generalmanager and the sales manager have met with all the department heads, who provided the following information regardingselling and administrative expenses:
The company presently employs 30 full-time salespersons with a base of $3,600 each per month plus commissions and 10full-time salespersons with a salary of $6,000 each per month plus commissions. In addition, the company employs nineregional sales managers with a salary of $21,600 per month, none of whom is entitled to any commissions.
If sales volume exceeds $80 million per year, the company must hire four more salespersons, each at a salary of $3,600 permonth plus commissions.
Sales commissions are either 10% or 5% of the selling price, depending on the product sold. Typically, a 10% commissionapplies on 60% of sales, and a 5% commission applies on the remaining 40% of sales.
Salespersons’ travel allowances average $1,500 per month per salesperson (excluding managers).
Advertising expenses average $150,000 per month plus 3% of sales.
Selling supplies expense is estimated at 1% of sales.
Administrative salaries are $300,000 per month.
Other administrative expenses include the following:
Rent—$48,000 per month
Office supplies—2% of sales
Other administrative expenses (telephone, etc.)—$12,000 per month
Prepare a flexible budget for selling and administrative expenses for sales volume of $36 million, $48 million, and $60million per year.
Problem E Galaxy Lighting Company manufactures and sells lighting fixtures. Estimated sales for the next three monthsare:
September $350,000
October 500,000
November 400,000
Sales for August were $400,000. All sales are on account. Galaxy Lighting Company estimates that 60% of the accountsreceivable are collected in the month of sale with the remaining 40% collected the following month. The units sell for $30each. The cash balance for September 1 is $100,000.
Generally, 60% of purchases are due and payable in the month of purchase with the remainder due the following month.Purchase cost per unit for materials is $18. The company maintains an end-of-the-month inventory of 1,000 units plus 10%of next month’s unit sales.
Prepare a cash receipts schedule for September and October and a purchases budget for August, September, and October.

7.13.5 1/8/2022 https://biz.libretexts.org/@go/page/26092
Problem F Refer to the previous problem. In addition to the information given, selling and administrative expenses paid incash are $120,000 per month.
Prepare a monthly cash budget for September and October for Galaxy Lighting Company.
Alternate problems
Alternate problem A Cougars Company prepares monthly operating and financial budgets. Estimates of sales in units aremade for each month. Production is scheduled at a level high enough to take care of current needs and to carry into eachmonth one-half of the next month’s unit sales. Direct materials, direct labor, and variable manufacturing overhead areestimated at $12, $6, and $4 per unit, respectively. Total fixed manufacturing overhead is budgeted at $480,000 per month.Sales for April, May, June, and July 2009 are estimated at 100,000, 120,000, 160,000, and 120,000 units. The inventory at2009 April 1, consists of 50,000 units with a cost of $28.80 per unit.
9. Prepare a schedule showing the budgeted production in units for April, May, and June 2009.10. Prepare a schedule showing the budgeted cost of goods sold for the same three months assuming that the FIFO method
is used for inventories.
Alternate problem B Following is a summary of operating data of Bugs Company for the year 2008:
Sales $ 7,00,000
Cost of goods manufactured and sold:
Direct materials $1,200,000
Direct labor 1,100,000
Variable manufacturing overhead 300,000
Fixed manufacturing overhead 800,000 3,400,000
Gross margin $ 3,600,000
Selling expenses:
Variable $ 300,000
Fixed 400,000 700,000
2,900,000
General and administrative expenses:
Variable $ 100,000
Fixed 1,200,000 1,300,000
Net operating income $ 1,600,000
Sales volume for 2009 is budgeted at 90% of 2008 sales volume. Prices are not expected to change. The 2009 budgetamounts for the various other costs and expenses differ from those reported in 2008 only for the expected volume changein the variable items. Actual operating data for 2009 follow:
Sales $5,800,000
Direct materials 1,300,000
Direct labor 1,100,000
Variable manufacturing overhead 300,000
Fixed manufacturing overhead 780,000
Variable selling expenses 270,000
Fixed selling expenses 290,000
Variable administrative expenses 110,000
Fixed administrative expenses 1,100,000
1. Prepare a budget report comparing the planned operating budget for 2009 with the actual results for that year.
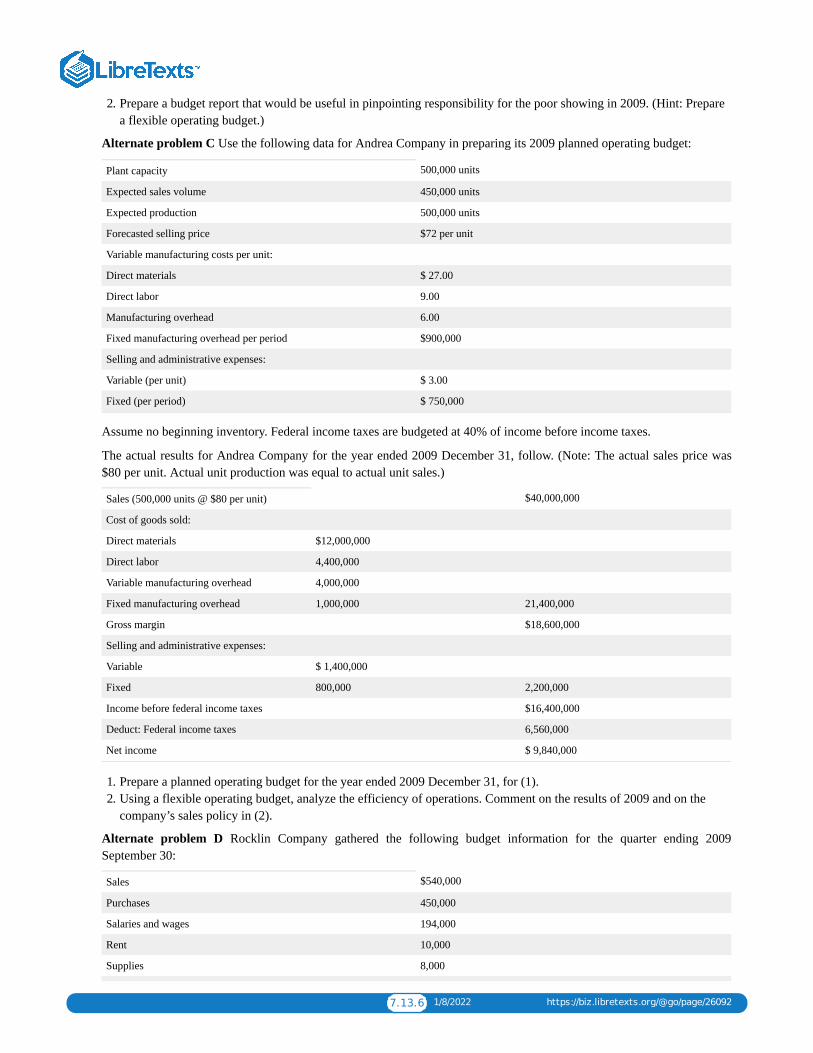
7.13.6 1/8/2022 https://biz.libretexts.org/@go/page/26092
2. Prepare a budget report that would be useful in pinpointing responsibility for the poor showing in 2009. (Hint: Preparea flexible operating budget.)
Alternate problem C Use the following data for Andrea Company in preparing its 2009 planned operating budget:
Plant capacity 500,000 units
Expected sales volume 450,000 units
Expected production 500,000 units
Forecasted selling price $72 per unit
Variable manufacturing costs per unit:
Direct materials $ 27.00
Direct labor 9.00
Manufacturing overhead 6.00
Fixed manufacturing overhead per period $900,000
Selling and administrative expenses:
Variable (per unit) $ 3.00
Fixed (per period) $ 750,000
Assume no beginning inventory. Federal income taxes are budgeted at 40% of income before income taxes.
The actual results for Andrea Company for the year ended 2009 December 31, follow. (Note: The actual sales price was$80 per unit. Actual unit production was equal to actual unit sales.)
Sales (500,000 units @ $80 per unit) $40,000,000
Cost of goods sold:
Direct materials $12,000,000
Direct labor 4,400,000
Variable manufacturing overhead 4,000,000
Fixed manufacturing overhead 1,000,000 21,400,000
Gross margin $18,600,000
Selling and administrative expenses:
Variable $ 1,400,000
Fixed 800,000 2,200,000
Income before federal income taxes $16,400,000
Deduct: Federal income taxes 6,560,000
Net income $ 9,840,000
1. Prepare a planned operating budget for the year ended 2009 December 31, for (1).2. Using a flexible operating budget, analyze the efficiency of operations. Comment on the results of 2009 and on the
company’s sales policy in (2).
Alternate problem D Rocklin Company gathered the following budget information for the quarter ending 2009September 30:
Sales $540,000
Purchases 450,000
Salaries and wages 194,000
Rent 10,000
Supplies 8,000
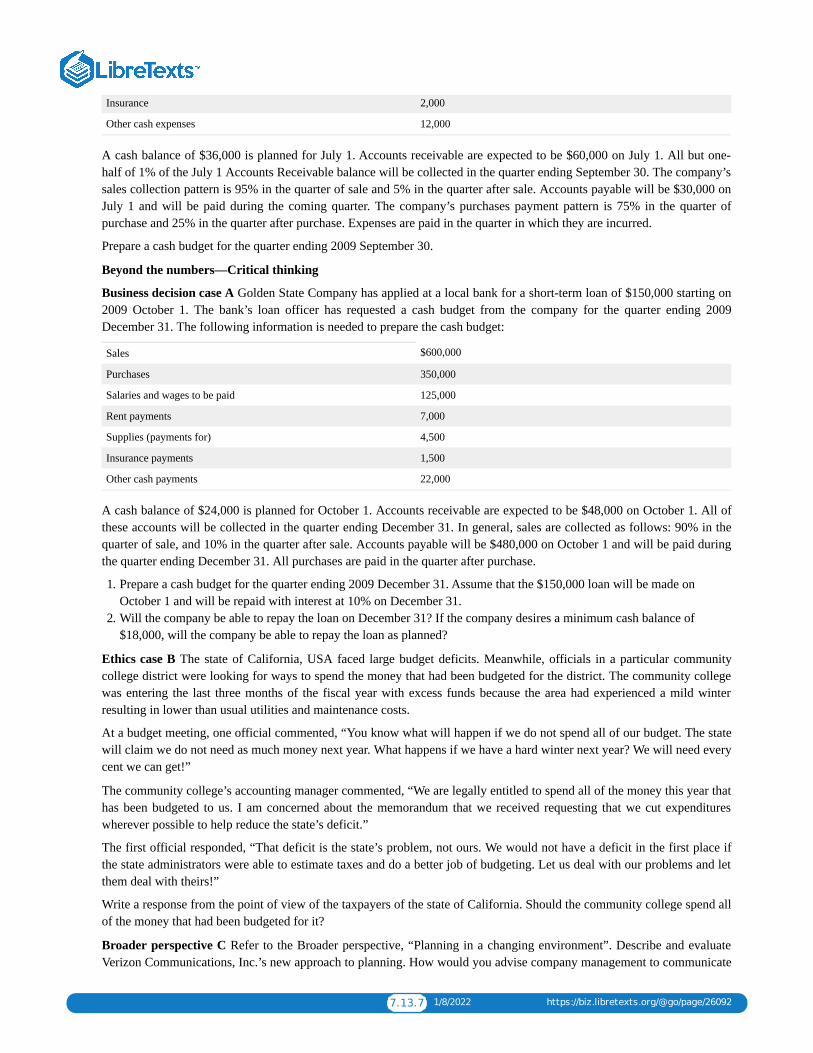
7.13.7 1/8/2022 https://biz.libretexts.org/@go/page/26092
Insurance 2,000
Other cash expenses 12,000
A cash balance of $36,000 is planned for July 1. Accounts receivable are expected to be $60,000 on July 1. All but one-half of 1% of the July 1 Accounts Receivable balance will be collected in the quarter ending September 30. The company’ssales collection pattern is 95% in the quarter of sale and 5% in the quarter after sale. Accounts payable will be $30,000 onJuly 1 and will be paid during the coming quarter. The company’s purchases payment pattern is 75% in the quarter ofpurchase and 25% in the quarter after purchase. Expenses are paid in the quarter in which they are incurred.
Prepare a cash budget for the quarter ending 2009 September 30.
Beyond the numbers—Critical thinking
Business decision case A Golden State Company has applied at a local bank for a short-term loan of $150,000 starting on2009 October 1. The bank’s loan officer has requested a cash budget from the company for the quarter ending 2009December 31. The following information is needed to prepare the cash budget:
Sales $600,000
Purchases 350,000
Salaries and wages to be paid 125,000
Rent payments 7,000
Supplies (payments for) 4,500
Insurance payments 1,500
Other cash payments 22,000
A cash balance of $24,000 is planned for October 1. Accounts receivable are expected to be $48,000 on October 1. All ofthese accounts will be collected in the quarter ending December 31. In general, sales are collected as follows: 90% in thequarter of sale, and 10% in the quarter after sale. Accounts payable will be $480,000 on October 1 and will be paid duringthe quarter ending December 31. All purchases are paid in the quarter after purchase.
1. Prepare a cash budget for the quarter ending 2009 December 31. Assume that the $150,000 loan will be made onOctober 1 and will be repaid with interest at 10% on December 31.
2. Will the company be able to repay the loan on December 31? If the company desires a minimum cash balance of$18,000, will the company be able to repay the loan as planned?
Ethics case B The state of California, USA faced large budget deficits. Meanwhile, officials in a particular communitycollege district were looking for ways to spend the money that had been budgeted for the district. The community collegewas entering the last three months of the fiscal year with excess funds because the area had experienced a mild winterresulting in lower than usual utilities and maintenance costs.
At a budget meeting, one official commented, “You know what will happen if we do not spend all of our budget. The statewill claim we do not need as much money next year. What happens if we have a hard winter next year? We will need everycent we can get!”
The community college’s accounting manager commented, “We are legally entitled to spend all of the money this year thathas been budgeted to us. I am concerned about the memorandum that we received requesting that we cut expenditureswherever possible to help reduce the state’s deficit.”
The first official responded, “That deficit is the state’s problem, not ours. We would not have a deficit in the first place ifthe state administrators were able to estimate taxes and do a better job of budgeting. Let us deal with our problems and letthem deal with theirs!”
Write a response from the point of view of the taxpayers of the state of California. Should the community college spend allof the money that had been budgeted for it?
Broader perspective C Refer to the Broader perspective, “Planning in a changing environment”. Describe and evaluateVerizon Communications, Inc.’s new approach to planning. How would you advise company management to communicate
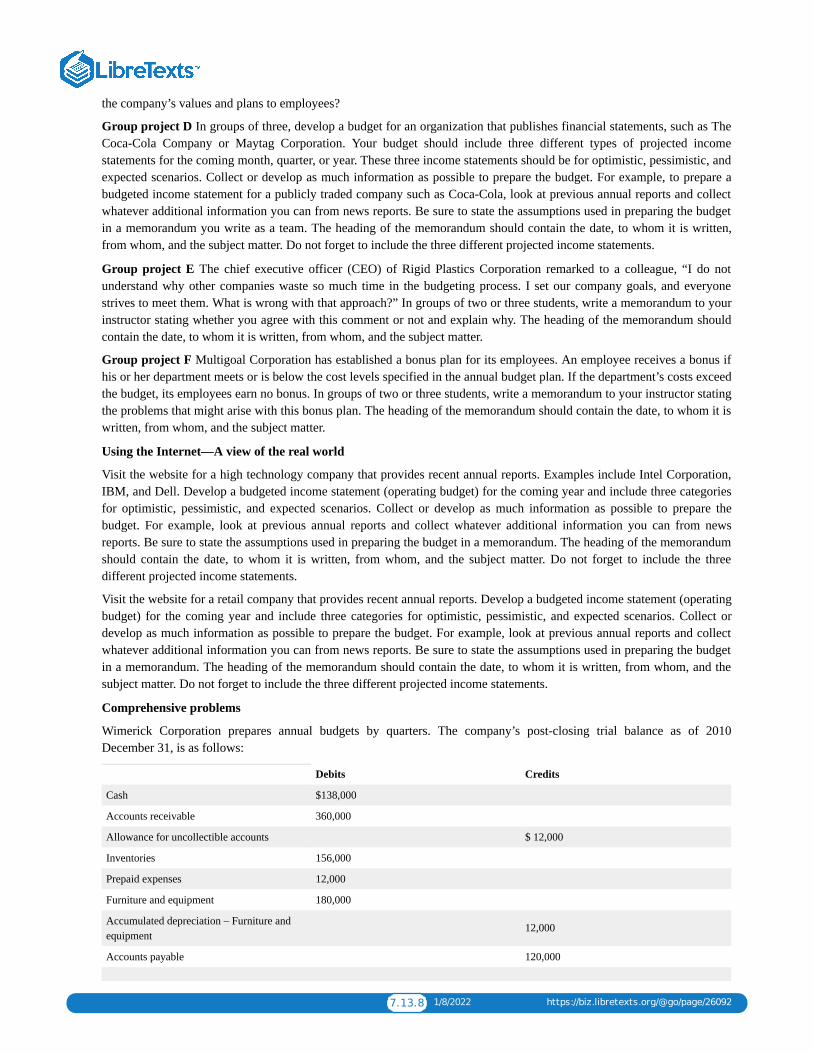
7.13.8 1/8/2022 https://biz.libretexts.org/@go/page/26092
the company’s values and plans to employees?
Group project D In groups of three, develop a budget for an organization that publishes financial statements, such as TheCoca-Cola Company or Maytag Corporation. Your budget should include three different types of projected incomestatements for the coming month, quarter, or year. These three income statements should be for optimistic, pessimistic, andexpected scenarios. Collect or develop as much information as possible to prepare the budget. For example, to prepare abudgeted income statement for a publicly traded company such as Coca-Cola, look at previous annual reports and collectwhatever additional information you can from news reports. Be sure to state the assumptions used in preparing the budgetin a memorandum you write as a team. The heading of the memorandum should contain the date, to whom it is written,from whom, and the subject matter. Do not forget to include the three different projected income statements.
Group project E The chief executive officer (CEO) of Rigid Plastics Corporation remarked to a colleague, “I do notunderstand why other companies waste so much time in the budgeting process. I set our company goals, and everyonestrives to meet them. What is wrong with that approach?” In groups of two or three students, write a memorandum to yourinstructor stating whether you agree with this comment or not and explain why. The heading of the memorandum shouldcontain the date, to whom it is written, from whom, and the subject matter.
Group project F Multigoal Corporation has established a bonus plan for its employees. An employee receives a bonus ifhis or her department meets or is below the cost levels specified in the annual budget plan. If the department’s costs exceedthe budget, its employees earn no bonus. In groups of two or three students, write a memorandum to your instructor statingthe problems that might arise with this bonus plan. The heading of the memorandum should contain the date, to whom it iswritten, from whom, and the subject matter.
Using the Internet—A view of the real world
Visit the website for a high technology company that provides recent annual reports. Examples include Intel Corporation,IBM, and Dell. Develop a budgeted income statement (operating budget) for the coming year and include three categoriesfor optimistic, pessimistic, and expected scenarios. Collect or develop as much information as possible to prepare thebudget. For example, look at previous annual reports and collect whatever additional information you can from newsreports. Be sure to state the assumptions used in preparing the budget in a memorandum. The heading of the memorandumshould contain the date, to whom it is written, from whom, and the subject matter. Do not forget to include the threedifferent projected income statements.
Visit the website for a retail company that provides recent annual reports. Develop a budgeted income statement (operatingbudget) for the coming year and include three categories for optimistic, pessimistic, and expected scenarios. Collect ordevelop as much information as possible to prepare the budget. For example, look at previous annual reports and collectwhatever additional information you can from news reports. Be sure to state the assumptions used in preparing the budgetin a memorandum. The heading of the memorandum should contain the date, to whom it is written, from whom, and thesubject matter. Do not forget to include the three different projected income statements.
Comprehensive problems
Wimerick Corporation prepares annual budgets by quarters. The company’s post-closing trial balance as of 2010December 31, is as follows:
Debits Credits
Cash $138,000
Accounts receivable 360,000
Allowance for uncollectible accounts $ 12,000
Inventories 156,000
Prepaid expenses 12,000
Furniture and equipment 180,000
Accumulated depreciation – Furniture andequipment
12,000
Accounts payable 120,000

7.13.9 1/8/2022 https://biz.libretexts.org/@go/page/26092
Accrued liabilities payable 36,000
Notes payable, 5% (due 2008) 480,000
Capital stock 300,000
Retained earnings (deficit) 114,000
$960,000 $960,000
All of the capital stock of the company was recently acquired by Juan Jackson. After the purchase, Jackson loanedsubstantial sums of money to the corporation, which still owes him $480,000 on a 5% note. There are no accrued federalincome taxes payable, but future earnings will be subject to income taxation.
Jackson is anxious to withdraw $120,000 from the corporation (as a payment on the note payable to him) but will not do soif it reduces the corporation’s cash balance below $120,000. Thus, he is quite interested in the budgets for the quarterending 2011 March 31.
Sales for the coming quarter ending 2011 March 31, are forecasted at $1,200,000; for the following quarter they areforecasted at $1,500,000. All sales are priced to yield a gross margin of 40%. Inventory is to be maintained on hand at theend of any quarter in an amount equal to 20% of the goods to be sold in the next quarter. All sales are on account, and 95%of the 2010 December 31, receivables plus 70% of the current quarter’s sales will be collected during the quarter ending2011 March 31.
Selling expenses are budgeted at $48,000 plus 6% of sales; $24,000 will be incurred on account, $66,000 accrued, $27,000from expiration of prepaid rent and prepaid insurance, and $3,000 from allocated depreciation.
Purchasing expenses are budgeted at $34,800 plus 5% of purchases for the quarter; $9,000 will be incurred on account,$48,000 accrued, $13,800 from expired prepaid expenses, and $1,200 from allocated depreciation.
Administrative expenses are budgeted at $42,000 plus 2% of sales; $3,000 will be incurred on account, $36,000 accrued,$13,200 from expired prepayments, and $1,800 from allocated depreciation. Uncollectible accounts are estimated at 1% ofsales.
Interest accrues at 5% annually on the notes payable and is credited to Accrued Liabilities Payable.
All of the beginning balances in Accounts Payable and Accrued Liabilities Payable, plus 80% of the current credits toAccounts Payable, and all but $30,000 of the current accrued liabilities will be paid during the quarter. An $18,000insurance premium is to be paid prior to March 31, and a full year’s rent of $144,000 is due on January 2.
Federal income taxes are budgeted at 40% of the income before federal income taxes. The taxes should be accrued, and nopayments are due in the first quarter.
1. Prepare a planned operating budget for the quarter ending 2011 March 31, including supporting schedules for plannedpurchases and operating expenses.
2. Prepare a financial budget for 2011 March 31. Supporting schedules should be included that (1) analyze accountscredited for purchases and operating expenses, (2) show planned accounts receivable collections and balance, and (3)show planned cash flows and cash balance.
3. Will Jackson be able to collect the $120,000 on his note?
Davis Corporation is a rapidly expanding company. The company’s post-closing balance as of 2010 December 31, is asfollows:
Davis corporation
Post-closing trial balance
2010 December 31
Debits Credits
Cash $240,000
Accounts receivable 480,000
Allowance for uncollectible accounts $ 36,000
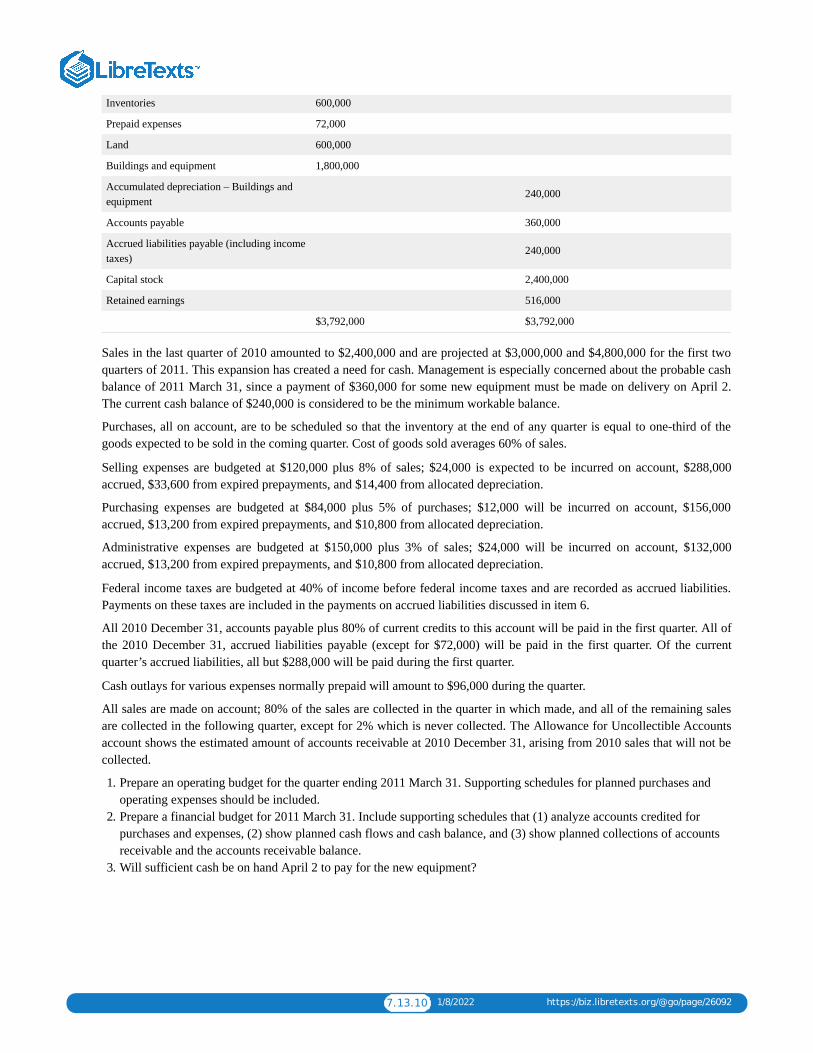
7.13.10 1/8/2022 https://biz.libretexts.org/@go/page/26092
Inventories 600,000
Prepaid expenses 72,000
Land 600,000
Buildings and equipment 1,800,000
Accumulated depreciation – Buildings andequipment
240,000
Accounts payable 360,000
Accrued liabilities payable (including incometaxes)
240,000
Capital stock 2,400,000
Retained earnings 516,000
$3,792,000 $3,792,000
Sales in the last quarter of 2010 amounted to $2,400,000 and are projected at $3,000,000 and $4,800,000 for the first twoquarters of 2011. This expansion has created a need for cash. Management is especially concerned about the probable cashbalance of 2011 March 31, since a payment of $360,000 for some new equipment must be made on delivery on April 2.The current cash balance of $240,000 is considered to be the minimum workable balance.
Purchases, all on account, are to be scheduled so that the inventory at the end of any quarter is equal to one-third of thegoods expected to be sold in the coming quarter. Cost of goods sold averages 60% of sales.
Selling expenses are budgeted at $120,000 plus 8% of sales; $24,000 is expected to be incurred on account, $288,000accrued, $33,600 from expired prepayments, and $14,400 from allocated depreciation.
Purchasing expenses are budgeted at $84,000 plus 5% of purchases; $12,000 will be incurred on account, $156,000accrued, $13,200 from expired prepayments, and $10,800 from allocated depreciation.
Administrative expenses are budgeted at $150,000 plus 3% of sales; $24,000 will be incurred on account, $132,000accrued, $13,200 from expired prepayments, and $10,800 from allocated depreciation.
Federal income taxes are budgeted at 40% of income before federal income taxes and are recorded as accrued liabilities.Payments on these taxes are included in the payments on accrued liabilities discussed in item 6.
All 2010 December 31, accounts payable plus 80% of current credits to this account will be paid in the first quarter. All ofthe 2010 December 31, accrued liabilities payable (except for $72,000) will be paid in the first quarter. Of the currentquarter’s accrued liabilities, all but $288,000 will be paid during the first quarter.
Cash outlays for various expenses normally prepaid will amount to $96,000 during the quarter.
All sales are made on account; 80% of the sales are collected in the quarter in which made, and all of the remaining salesare collected in the following quarter, except for 2% which is never collected. The Allowance for Uncollectible Accountsaccount shows the estimated amount of accounts receivable at 2010 December 31, arising from 2010 sales that will not becollected.
1. Prepare an operating budget for the quarter ending 2011 March 31. Supporting schedules for planned purchases andoperating expenses should be included.
2. Prepare a financial budget for 2011 March 31. Include supporting schedules that (1) analyze accounts credited forpurchases and expenses, (2) show planned cash flows and cash balance, and (3) show planned collections of accountsreceivable and the accounts receivable balance.
3. Will sufficient cash be on hand April 2 to pay for the new equipment?

1 1/8/2022
CHAPTER OVERVIEW8: STANDARD COST SYSTEMS
8.1: CHAPTER 8 STUDY PLAN8.2: THE ROLE OF STANDARD COSTS IN MANAGEMENT8.3: CALCULATIONS FOR DIRECT MATERIALS AND LABOR8.4: CALCULATIONS FOR OVERHEAD8.5: ADVANTAGES AND DISADVANTAGES OF STANDARD COSTING8.6: VARIANCE SUMMARY8.7: ACCOUNTING IN THE HEADLINES8.8: GLOSSARY8.9: CHAPTER 8- EXERCISES
8.1.1 1/1/2022 https://biz.libretexts.org/@go/page/26093
8.1: Chapter 8 Study PlanKnowledge Targets
I can define the following terms as they relate to our unit:
Budget Planning Budget Flexible Budget Cash Budget
Master Budget Activity Variance Revenue Variance Spending Variance
Fixed Cost Variable Cost Standard Cost Standard Hours
Standard Price Variance Quantity Variance Efficiency Variance
Rate Variance Price Variance Materials Labor
Variable Overhead Fixed Overhead Selling expense Administrative expense
Reasoning Targets
I can understand the difference between a planning budget and a flexible budget.I can identify costs as fixed cost or variable cost.I can understand the purpose of using a budget for businesses.I can analyze differences between budget and actual and explain possible reasons for the variances.I can analyze and explain laborrate and efficiency variances.I can analyze and explain material price and quantity variances.I can understand the use of standards (including cost, hours or price) for budgeting and analysis.
Skill Targets
I can prepare a sales and production budget (or purchases budget for merchandiser).I can prepare a selling and administrative expense budget.I can prepare a cash budget including schedules of receivables and payables.I can prepare a budgeted income statement and budgeted balance sheet.I can prepare a master budget including budgets for sales, purchases, selling and administrative expenses, cash,income statement and balance sheet.I can prepare a flexible budget based on the actual level of production.I can prepare a flexible budget performance report analyzing difference between budget and actual.I can calculate variances for materials and labor.
Click Budgeting Study Plan for a printable copy.
8.2.1 1/1/2022 https://biz.libretexts.org/@go/page/26094
8.2: The Role of Standard Costs in Management
Uses of standard costsWhenever you have set goals that you have sought to achieve, these goals could have been called standards. Periodically,you might measure your actual performance against these standards and analyze the differences to see how close you are toyour goal. Similarly, management sets goals, such as standard costs, and compares actual costs with these goals to identifypossible problems.
This section begins with a discussion of the nature of standard costs. Next, we explain how managers use standard costs toestablish budgets. Then we describe how management uses the concept of management by exception to investigatevariances from standards. We also explain setting standards and how management decides whether to use ideal or practicalstandards. The section closes with a discussion of the other uses of standard costs.
A YouTube element has been excluded from this version of the text. You can view it online here:pb.libretexts.org/llmanagerialaccounting/?p=180
Nature of standard costsA standard cost is a carefully predetermined measure of what a cost should be under stated conditions. Standard costs arenot only estimates of what costs will be but also goals to be achieved. When standards are properly set, their achievementrepresents a reasonably efficient level of performance.
Usually, effective standards are the result of engineering studies and of time and motion studies undertaken to determinethe amounts of materials, labor, and other services required to produce a product. Also considered in setting standards aregeneral economic conditions because these conditions affect the cost of materials and other services that must bepurchased by a manufacturing company.
8.2.2 1/1/2022 https://biz.libretexts.org/@go/page/26094
A YouTube element has been excluded from this version of the text. You can view it online here:pb.libretexts.org/llmanagerialaccounting/?p=180
Manufacturing companies determine the standard cost of each unit of product by establishing the standard cost of directmaterials, direct labor, and manufacturing overhead necessary to produce that unit. Determining the standard cost of directmaterials and direct labor is less complicated than determining the standard cost of manufacturing overhead.
The standard direct materials cost per unit of a product consists of the standard amount of material required to produce theunit multiplied by the standard price of the material. You must distinguish between the terms standard price and standardcost. Standard price usually refers to the price per unit of inputs into the production process, such as the price per pound ofraw materials.
Standard cost, however, is the standard quantity of an input required per unit of output times the standard price per unit ofthat input. For example, if the standard price of cloth is $ 3 per yard and the standard quantity of material required toproduce a dress is 3 yards, the standard direct materials cost of the dress is 3 yards x $ 3 per yard = $ 9. Similarly, acompany computes the standard direct labor cost per unit for a product as the standard number of hours needed to produceone unit multiplied by the standard labor or wage rate per hour.
Standard manufacturing overhead cost To find the standard manufacturing overhead cost of a unit, use the followingsteps. First, determine the expected level of output for the year. This level of output is called the standard level of output.Second, determine the total budgeted manufacturing overhead cost at the standard level of output. The total budgetedoverhead cost includes both fixed and variable components. Total fixed cost is the same at every level of output within arelevant range. Total variable overhead varies in direct proportion to the number of units produced. Third, compute thestandard manufacturing overhead cost per unit by dividing the total budgeted manufacturing overhead cost at the standardlevel of output by the standard level of output. The result is standard overhead cost (or rate) per unit of output.
The formula to compute the standard overhead cost per unit is:
Total Budgeted Manufacturing OH at standard level / standard level of output
Sometimes accountants find the standard overhead rate per unit of input, such as direct labor-hour instead of per unit. Tofind the standard overhead cost per unit, multiply the direct labor-hours per unit times the standard overhead cost per directlabor-hour. For instance, if the standard overhead costs per direct labor-hour is $ 5 and the standard number of direct labor-hours is two hours per unit, the standard overhead cost per unit is $ 5 x 2 hours = $ 10.
As discussed in the previously, budgets are formal written plans that represent management’s planned actions in the futureand the impacts of these actions on the business. As a business incurs actual expenses and revenues, managementcompares them with the budgeted amounts. To control operations, management investigates any differences between theactual and budgeted amounts and takes corrective action.
When management compares actual expenses and revenues with budgeted expenses and revenues, differences—calledvariances—are likely to occur. The responsibility of management is to investigate significant variances. Obviously,management must determine when a variance is significant. This process of focusing on only the most significantvariances is known as management by exception. The process of management by exception enables management toconcentrate its efforts on those variances that could have a big effect on the company, ignoring those variances that are notsignificant.
In developing standards, management must consider the assumed conditions under which these standards can be met.Standards generally fall into two groups—ideal and practical.
A company attains ideal standards under the best circumstances—with no machinery problems or worker problems. Thecompany can attain these unrealistic standards only when it has highly efficient, skilled workers who are working at theirbest effort throughout the entire period needed to complete the job.
Practical standards are strict but attainable standards that have allowances made for machinery problems and rest periodsfor workers. Companies can meet these standards if average workers are efficient at their work. These standards aregenerally used in planning.
Generally, management does not use ideal standards because ideal standards do not allow for normal repairs to machineryor rest periods for workers. A company rarely runs its operations under ideal conditions. Since planning under ideal
8.2.3 1/1/2022 https://biz.libretexts.org/@go/page/26094
standards is unrealistic, managers rarely use ideal standards in budgeting. Instead, management uses practical standards inplanning because these standards are more realistic, allowing for machinery repairs and rest periods for workers. Anyvariances that result when practical standards are used indicate abnormal or unusual problems.
In addition to developing budgets, companies use standard costs in evaluating management’s performance, evaluatingworkers’ performance, and setting appropriate selling prices.
Firms evaluate management’s and workers’ performances through the use of a budget. When management compares actualresults with budgeted amounts, it can see how well it is performing its own duties and managing its employees.Management also can evaluate workers based on how well they performed relative to the budgeted amounts pertaining tothe activities they performed.
Standard costs are useful in setting selling prices. The budget shows the expected expenses incurred by the business. Byconsidering these expenses, management can determine how much to charge for a product so that it can produce thedesired net income. As the business actually incurs these expenses, management determines if the selling prices set are stillreasonable and, when necessary, considers some price adjustments after taking competition into account.
CC licensed content, Shared previouslyAccounting Principles: A Business Perspective.. Authored by: James Don Edwards, University of Georgia & Roger H.Hermanson, Georgia State University.. Provided by: Endeavour International Corporation. Project: The Global TextProject. License: CC BY: Attribution
All rights reserved contentStandard Cost versus Actual Cost: Which is Best?. Authored by: Cost Matters. Located at: youtu.be/KTeY4TBh5nA.License: All Rights Reserved. License Terms: Standard YouTube LicenseStandard Cost: Which Costs To Use As A Standard? . Authored by: Cost Matters. Located at:youtu.be/QDKP7u1VVqE. License: All Rights Reserved. License Terms: Standard YouTube License
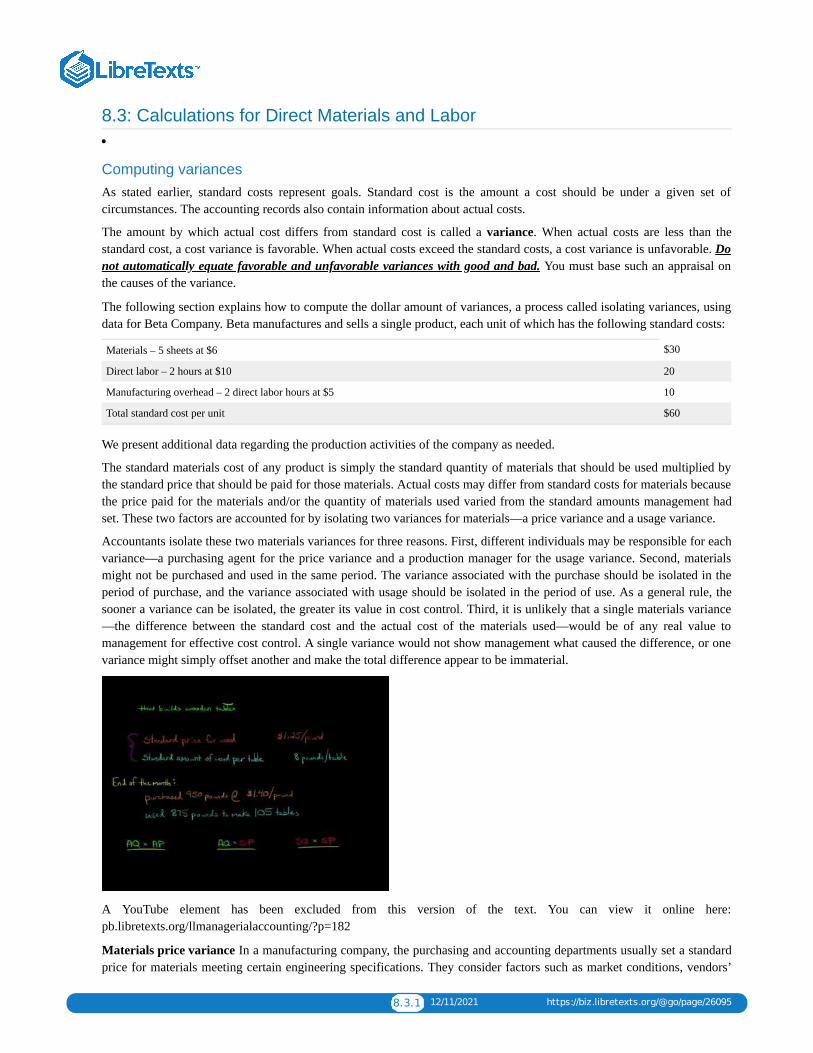
8.3.1 12/11/2021 https://biz.libretexts.org/@go/page/26095
8.3: Calculations for Direct Materials and Labor
Computing variancesAs stated earlier, standard costs represent goals. Standard cost is the amount a cost should be under a given set ofcircumstances. The accounting records also contain information about actual costs.
The amount by which actual cost differs from standard cost is called a variance. When actual costs are less than thestandard cost, a cost variance is favorable. When actual costs exceed the standard costs, a cost variance is unfavorable. Donot automatically equate favorable and unfavorable variances with good and bad. You must base such an appraisal onthe causes of the variance.
The following section explains how to compute the dollar amount of variances, a process called isolating variances, usingdata for Beta Company. Beta manufactures and sells a single product, each unit of which has the following standard costs:
Materials – 5 sheets at $6 $30
Direct labor – 2 hours at $10 20
Manufacturing overhead – 2 direct labor hours at $5 10
Total standard cost per unit $60
We present additional data regarding the production activities of the company as needed.
The standard materials cost of any product is simply the standard quantity of materials that should be used multiplied bythe standard price that should be paid for those materials. Actual costs may differ from standard costs for materials becausethe price paid for the materials and/or the quantity of materials used varied from the standard amounts management hadset. These two factors are accounted for by isolating two variances for materials—a price variance and a usage variance.
Accountants isolate these two materials variances for three reasons. First, different individuals may be responsible for eachvariance—a purchasing agent for the price variance and a production manager for the usage variance. Second, materialsmight not be purchased and used in the same period. The variance associated with the purchase should be isolated in theperiod of purchase, and the variance associated with usage should be isolated in the period of use. As a general rule, thesooner a variance can be isolated, the greater its value in cost control. Third, it is unlikely that a single materials variance—the difference between the standard cost and the actual cost of the materials used—would be of any real value tomanagement for effective cost control. A single variance would not show management what caused the difference, or onevariance might simply offset another and make the total difference appear to be immaterial.
A YouTube element has been excluded from this version of the text. You can view it online here:pb.libretexts.org/llmanagerialaccounting/?p=182
Materials price variance In a manufacturing company, the purchasing and accounting departments usually set a standardprice for materials meeting certain engineering specifications. They consider factors such as market conditions, vendors’

8.3.2 12/11/2021 https://biz.libretexts.org/@go/page/26095
quoted prices, and the optimum size of a purchase order when setting a standard price. A materials price variance (MPV)occurs when a company pays a higher or lower price than the standard price set for materials. Materials price variance isthe difference between actual price paid (AP) and standard price allowed (SP) multiplied by the actual quantity ofmaterials purchased (AQ). In equation form, the materials price variance can be done in two ways:
Materials price variance = (Actual price – Standard price) x Actual quantity purchased
OR
Materials price variance = (Actual price x Actual quantity purchased) – (Standard price x Actual quantitypurchased)
To illustrate, assume that a new supplier entered the market enabling Beta Company to purchase 60,000 sheets of materialat a price of $ 5.90 each. Since the standard price set by management is $ 6 per sheet, the materials price variance iscomputed as:
Materials price variance= (Actual price – Standard price) x Actual quantity purchased
= ($5.90 – $6.00) x 60,000 sheets of material
= (-0.10) x 60,000 sheets = -6,000 which means $6,000 favorable
OR
Materials price variance = (Actual price x Actual quantity purchased) – (Standard price x Actual quantity purchased)
= ($5.90 x 60,000) – ($6.00 x 60,000 sheets of material)
= $345,000 – $360,000 = -6,000 which means $6,000 favorable
The materials price variance of $ 6,000 is considered favorable since the materials were acquired for a price less than thestandard price. If the actual price had exceeded the standard price, the variance would be unfavorable because the costsincurred would have exceeded the standard price. We do not show variances with a negative or positive but at theabsolute value with favorable or unfavorable specified.
Materials usage variance Because the standard quantity of materials used in making a product is largely a matter ofphysical requirements or product specifications, usually the engineering department sets it. But if the quality of materialsused varies with price, the accounting and purchasing departments may perform special studies to find the right quality.
The materials usage variance occurs when more or less than the standard amount of materials is used to produce a productor complete a process. The variance shows only differences from the standard quantity caused by the quantity of materialsused; it does not include any effect of variances in price. Thus, the materials usage variance is :
Materials usage variance = (Actual qty – Standard qty allowed) x Standard price
OR
Materials price variance = (Actual Qty x Standard price) – (Standard Qty x Standard price)
To illustrate, assume that Beta Company used 55,500 sheets of material to produce 11,000 units of a product for which thestandard quantity allowed is 55,000 sheets (5 sheets per unit allowed x 11,000 units actually produced). Since the standardprice of the material is $ 6 per sheet, the materials usage variance of $ 3,000 would be computed as follows:
Materials usage variance = (Actual qty – Standard qty allowed) x Standard price
= (55,500 actual sheets – 55,000 allowed sheets) x $6 per sheet
= 500 sheets x $6 per sheet
= $ 3,000 which means $3,000 unfavorable variance
OR
Materials price variance = (Actual Qty x Standard price) – (Standard Qty x Standard price)
= (55,500 actual sheets x $6) – (55,000 allowed sheets x $6 per sheet)
= $333,000 – 330,000

8.3.3 12/11/2021 https://biz.libretexts.org/@go/page/26095
= $ 3,000 which means $3,000 unfavorable variance
The variance is unfavorable because more materials were used than the standard quantity allowed to complete the job. Ifthe standard quantity allowed had exceeded the quantity actually used, the materials usage variance would have beenfavorable.
Determine whether a variance is favorable or unfavorable by reliance on reason or logic. If more materials were used thanthe standard quantity, or if a price greater than the standard price was paid, the variance is unfavorable. If the reverse istrue, the variance is favorable.
The standard labor cost of any product is equal to the standard quantity of labor time allowed multiplied by the wage ratethat should be paid for this time. Here again, it follows that the actual labor cost may differ from standard labor costbecause of the wages paid for labor, the quantity of labor used, or both. Thus, two labor variances exist—a rate varianceand an efficiency variance.
A YouTube element has been excluded from this version of the text. You can view it online here:pb.libretexts.org/llmanagerialaccounting/?p=182
Labor rate variance The labor rate variance occurs when the average rate of pay is higher or lower than the standardcost to produce a product or complete a process. The labor rate variance is similar to the materials price variance.
To compute the labor rate variance, we use the actual direct labor-hour rate paid (AR), the standard direct labor-hour rateallowed (SR) and the actual hours of direct labor services worked (AH). It can also be calculated in either of the followingways:
Labor rate variance= (Actual rate – Standard rate) x Actual hours worked
OR
Labor rate variance = (Actual rate x actual hours worked) – (Standard rate x actual hours worked)
To continue the Beta example, assume that the direct labor payroll of the company consisted of 22,200 hours at a total costof $ 233,100 (an average actual hourly rate of $ 10.50). Because management has set a standard direct labor-hour rate of $10 per hour, the labor rate variance is:
Labor rate variance = (Actual rate – Standard rate) x Actual hours worked
= ($10.50 actual rate – $10 per hour standard) x 22,200 actual hours
= $ 0.50 x 22,200
= $ 11,100 or $11,100 unfavorable variance
OR
Labor rate variance = (Actual rate x actual hours worked) – (Standard rate x actual hours worked)
= ($10.50 actual rate x 22,200 hours) – ($10 per hour standard x 22,200 actual hours)
= $ 233,100 – $ 222,000

8.3.4 12/11/2021 https://biz.libretexts.org/@go/page/26095
= $ 11,100 or $11,100 unfavorable variance
The variance is positive and unfavorable because the actual rate paid exceeded the standard rate allowed. If the reversewere true, the variance would be favorable.
Labor efficiency variance Usually, the company’s engineering department sets the standard amount of direct labor-hoursneeded to complete a product. Engineers may base the direct labor-hours standard on time and motion studies or onbargaining with the employees’ union. The labor efficiency variance occurs when employees use more or less than thestandard amount of direct labor-hours to produce a product or complete a process. The labor efficiency variance is similarto the materials usage variance.
To compute the labor efficiency variance, we will use the actual direct labor-hours worked (AH), the standard direct labor-hours allowed (SH), and the standard direct labor-hour rate per hour (SR) in either of the following ways:
Labor efficiency variance= (Actual DL hours – Standard DL hours) x Standard DL rate per hour
OR
Labor efficiency variance = (Actual DL hours x Std Rate) – (Std DL hours x Std Rate)
To illustrate, assume that the 22,200 hours of direct labor-hours worked by Beta Company employees resulted in 11,000units of production. Assume these units have a standard direct labor-hours of 22,000 hours (11,000 units at 2 hour unit).Since the standard direct labor rate is $ 10 per hour, the labor efficiency variance is $ 2,000, computed as follows:
Labor efficiency variance= (Actual hours worked – Standard hours allowed) x Standard rate
= (22,200 actual DL hours x 22,000 standard DL hours) x $10 per hour
= 200 hours x $10
= $ 2,000 unfavorable variance
OR
Labor efficiency variance= (Actual DL hours x Std Rate) – (Std DL hours x Std Rate)
= (22,200 actual DL hours x $10 per hour) – x (22,000 standard DL hours x $10 per hour)
= $222,000 – 220,000
= $ 2,000 unfavorable variance
The variance is unfavorable since more hours than the standard number of hours were required to complete the period’sproduction. If the reverse were true, the variance would be favorable.
The unfavorable labor rate variance is not necessarily caused by paying employees more wages than they are entitled toreceive. More probable reasons are either that more highly skilled employees with higher wage rates worked on productionthan originally anticipated, or that employee wage rates increased after the standard was developed and the standard wasnot revised. Favorable rate variances, on the other hand, could be caused by using less-skilled, cheaper labor in theproduction process. Typically, the hours of labor employed are more likely to be under management’s control than the ratesthat are paid. For this reason, labor efficiency variances are generally watched more closely than labor rate variances.
Summary of labor variances The accuracy of the two labor variances can be checked by comparing their sum with thedifference between actual and standard labor cost for a period. In the Beta Company illustration, this difference was:
Actual labor cost incurred (22,200 hours x $10.50) $233,100
Standard labor cost allowed (22,000 hours x $10) 220,000
Total labor variance (unfavorable) $ 13,100
This $13,100 unfavorable variance is made up of two labor variances:
Labor rate variance (22,200 x $0.50) $11,100 unfavorable
Labor efficiency variance (200 x $10) 2,000 unfavorable
Total labor variance (11,100 U + 2,000 U) $ 13,100 Unfavorable

8.3.5 12/11/2021 https://biz.libretexts.org/@go/page/26095
Since both the rate and efficiency variances are unfavorable, we would add them together to get the TOTAL laborvariance. If we had one favorable and one unfavorable variance, we would subtract the numbers.
Still unsure about material and labor variances, watch this Note Pirate video to help.
A YouTube element has been excluded from this version of the text. You can view it online here:pb.libretexts.org/llmanagerialaccounting/?p=182
CC licensed content, Shared previouslyAccounting Principles: A Business Perspective. Authored by: James Don Edwards, University of Georgia & Roger H.Hermanson, Georgia State University. Provided by: Endeavour International Corporation. Project: The Global TextProject . License: CC BY: Attribution
All rights reserved contentDirect Materials Variances. Authored by: Education Unlocked. Located at: youtu.be/-e32TQdCjDg. License: AllRights Reserved. License Terms: Standard YouTube LicenseDirect Labor Variance. Authored by: Education Unlocked. Located at: youtu.be/zNriZz-zCec. License: All RightsReserved. License Terms: Standard YouTube LicenseVariance Analysis, Master (Static), Flexible and Actual Budgets (Managerial Accounting Tutorial #43) . Authored by:Note Pirate. Located at: youtu.be/DFD2E5sO6k0. License: All Rights Reserved. License Terms: Standard YouTubeLicense
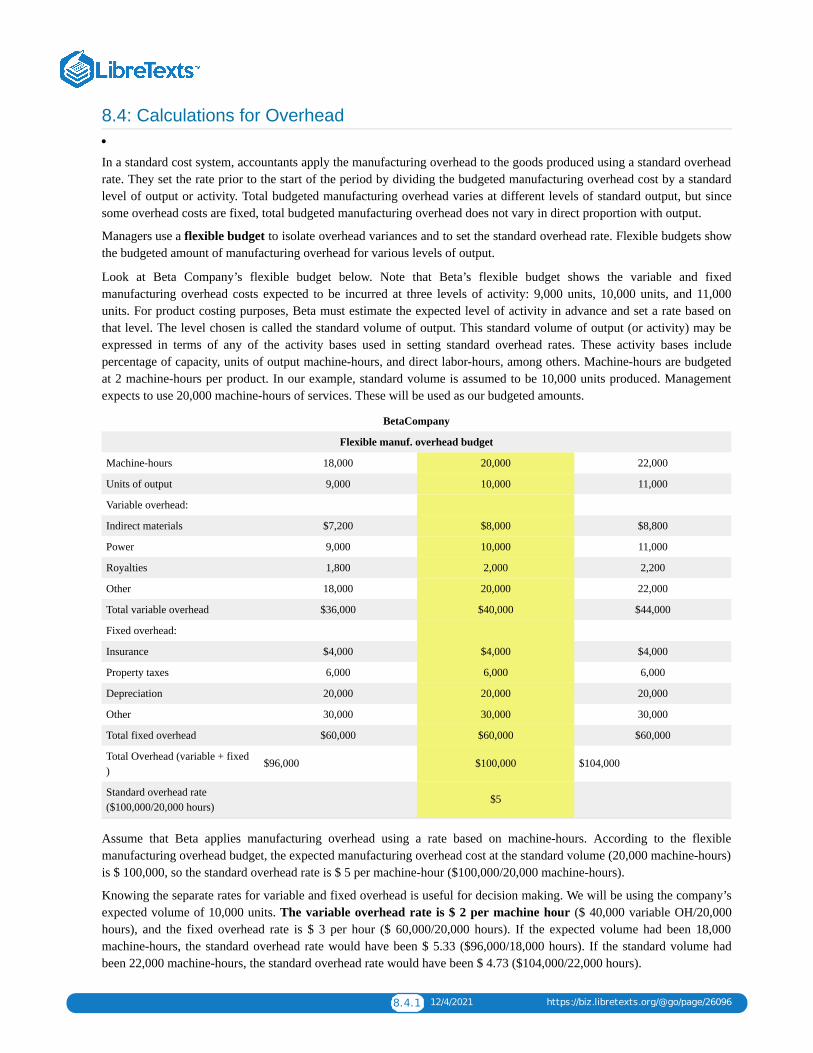
8.4.1 12/4/2021 https://biz.libretexts.org/@go/page/26096
8.4: Calculations for Overhead
In a standard cost system, accountants apply the manufacturing overhead to the goods produced using a standard overheadrate. They set the rate prior to the start of the period by dividing the budgeted manufacturing overhead cost by a standardlevel of output or activity. Total budgeted manufacturing overhead varies at different levels of standard output, but sincesome overhead costs are fixed, total budgeted manufacturing overhead does not vary in direct proportion with output.
Managers use a flexible budget to isolate overhead variances and to set the standard overhead rate. Flexible budgets showthe budgeted amount of manufacturing overhead for various levels of output.
Look at Beta Company’s flexible budget below. Note that Beta’s flexible budget shows the variable and fixedmanufacturing overhead costs expected to be incurred at three levels of activity: 9,000 units, 10,000 units, and 11,000units. For product costing purposes, Beta must estimate the expected level of activity in advance and set a rate based onthat level. The level chosen is called the standard volume of output. This standard volume of output (or activity) may beexpressed in terms of any of the activity bases used in setting standard overhead rates. These activity bases includepercentage of capacity, units of output machine-hours, and direct labor-hours, among others. Machine-hours are budgetedat 2 machine-hours per product. In our example, standard volume is assumed to be 10,000 units produced. Managementexpects to use 20,000 machine-hours of services. These will be used as our budgeted amounts.
BetaCompany
Flexible manuf. overhead budget
Machine-hours 18,000 20,000 22,000
Units of output 9,000 10,000 11,000
Variable overhead:
Indirect materials $7,200 $8,000 $8,800
Power 9,000 10,000 11,000
Royalties 1,800 2,000 2,200
Other 18,000 20,000 22,000
Total variable overhead $36,000 $40,000 $44,000
Fixed overhead:
Insurance $4,000 $4,000 $4,000
Property taxes 6,000 6,000 6,000
Depreciation 20,000 20,000 20,000
Other 30,000 30,000 30,000
Total fixed overhead $60,000 $60,000 $60,000
Total Overhead (variable + fixed)
$96,000 $100,000 $104,000
Standard overhead rate($100,000/20,000 hours)
$5
Assume that Beta applies manufacturing overhead using a rate based on machine-hours. According to the flexiblemanufacturing overhead budget, the expected manufacturing overhead cost at the standard volume (20,000 machine-hours)is $ 100,000, so the standard overhead rate is $ 5 per machine-hour ($100,000/20,000 machine-hours).
Knowing the separate rates for variable and fixed overhead is useful for decision making. We will be using the company’sexpected volume of 10,000 units. The variable overhead rate is $ 2 per machine hour ($ 40,000 variable OH/20,000hours), and the fixed overhead rate is $ 3 per hour ($ 60,000/20,000 hours). If the expected volume had been 18,000machine-hours, the standard overhead rate would have been $ 5.33 ($96,000/18,000 hours). If the standard volume hadbeen 22,000 machine-hours, the standard overhead rate would have been $ 4.73 ($104,000/22,000 hours).
8.4.2 12/4/2021 https://biz.libretexts.org/@go/page/26096
Note that the difference in rates is due solely to dividing fixed overhead by a different number of machine-hours. That is,the variable overhead cost per unit stays constant ($ 2 per machine-hour) regardless of the number of units expected to beproduced, and only the fixed overhead cost per unit changes. Since fixed overhead does not change per unit, we willseparate the fixed and variable overhead for variance analysis.
Continuing with the Beta Company illustration, assume that the company incurred $ 108,000 of actual manufacturingoverhead costs ($46,000 in variable OH and $62,000 in fixed OH) in a period during which 11,000 units of product wereproduced. The actual costs would be debited to Manufacturing Overhead and credited to a variety of accounts such asAccounts Payable, Accumulated Depreciation, Prepaid Insurance, Property Taxes Payable, and so on. According to theflexible budget, the standard number of machine-hours allowed for 11,000 units of production is 22,000 hours. Therefore,$ 110,000 of manufacturing overhead is applied to production ($ 5 per machine-hour times 22,000 hours) by debitingWork in Process Inventory and crediting Manufacturing Overhead for $ 110,000.
These show that manufacturing overhead has been overapplied to production by the $ 2,000 ($110,000 applied OH –$108,000 actual OH). Because of its fixed component, manufacturing overhead tends to be over applied when actualproduction is greater than standard production. Now, we will separate the variable and fixed components for analysis.
Variable Overhead VariancesAlthough various complex computations can be made for overhead variances, we use a simple approach in this text. In thisapproach, known as the two-variance approach to variable overhead variances, we calculate only two variances—avariable overhead spending variance and a variable overhead efficiency variance.
A YouTube element has been excluded from this version of the text. You can view it online here:pb.libretexts.org/llmanagerialaccounting/?p=184
Variable Overhead Spending Variance The variable overhead spending variance shows in one amount howeconomically overhead services were purchased and how efficiently they were used. This overhead spending variance issimilar to a price variance for materials or labor. We compare the Variable OH rate for budget and actual using the actualamount of our variable overhead base (machine-hours, direct labor dollars, direct labor hours, etc.)
Variable OH Spending Variance = (Actual Variable OH per base – Std Variable OH per base) x Actual OH base
OR
Variable OH Spending Variance = (Actual OH base x Actual Variable OH per base) – (Actual OH base x StdVariable OH per base)
For Beta Company, overhead is applied based on machine hours. The Variable OH rate per machine hour is $2 (calculatedabove) and actual variable overhead was $46,000 for 22,000 actual machine hours giving an actual rate of $2.0909rounded ($46,000 / 22,000 actual machine hours). We can calculate the variable OH spending variance using either ofthese two methods below:
Variable OH Spending Variance = (Actual Variable OH per base – Std Variable OH per base) x Actual OH base
= ($2.0909 per machine hour – $2.00 per machine hour) x 22,000 actual machine hours

8.4.3 12/4/2021 https://biz.libretexts.org/@go/page/26096
= $0.0909 x 22,000 machine hours
= $2,000 (rounded) Unfavorable
OR
Variable OH Spending Variance = (Actual OH base x Actual Variable OH per base) – (Actual OH base x Std Variable OHper base)
= $46,000 actual variable OH – (22,000 actual machine hours x $2 standard OH per machine hour)
= $46,000 – 44,000
= $2,000 unfavorable
The variance is unfavorable because actual variable overhead costs were $46,000, while according to the flexible budgetfor 11,000 units, they should have been $44,000 meaning Beta spent more on variable overhead than they hadplanned.Variable Overhead Efficiency Variance The variable efficiency overhead variance is caused by producing at alevel other than that used in setting the standard overhead application rate. The variable OH efficiency variance showswhether plant assets produced more or fewer units than expected.
Variable OH Efficiency Variance = (Actual OH base – Std OH base) x Standard Variable OH per base
OR
Variable OH Efficiency Variance = (Actual OH base x Std Variable OH per base) – (Std OH base x Std Variable OHper base)
For Beta Company, the Variable OH rate per machine hour is $2 (calculated above) and actual variable overhead was$46,000 for 22,000 actual machine hours. Management expected to use 20,000 hours for 10,000 units produced. We cancalculate the variable OH spending variance using either of these two methods below:
Variable OH Efficiency Variance = (Actual OH base – Std OH base) x Standard Variable OH per base
= (22,000 actual machine hours – 20,000 standard machine hours ) x $2 per machine hour
= 2,000 machine hours x $2 per machine hour
= $4,000 unfavorable
OR
Variable OH Efficiency Variance = (Actual OH base x Std Variable OH per base) – (Std OH base x Std Variable OH perbase)
= (22,000 actual hours x $2 per machine hour) – (20,000 standard hours x $2 per machine hour)
= $44,000 – 40,000
= $4,000 unfavorable
The efficiency variance is unfavorable because we used more machine hours than we had budgeted. Of course, this isbecause we produced 11,000 units when the budget planned for 10,000 units.
Fixed Overhead Variance
Because fixed overhead is not constant on a per unit basis, any deviation from planned production causes the overheadapplication rate to be incorrect. We can calculate a fixed overhead variance by comparing:
Fixed Overhead variance = Actual fixed overhead – Budgeted fixed overhead
In the Beta Company illustration, the budgeted fixed overhead was $60,000 (notice the level of production does not mattersince fixed costs remain the same regardless of volume) and the actual fixed costs were $62,000.
Fixed Overhead variance = Actual fixed overhead – Budgeted fixed overhead
= $62,000 actual fixed – $60,000 budgeted fixed
= $2,000 unfavorable variance
8.4.4 12/4/2021 https://biz.libretexts.org/@go/page/26096
This variance is unfavorable since we spent more on fixed costs than we had planned.
Summary of overhead variances To easily determine the accuracy of the overhead variances, Beta would compare thesum of the variances with the difference between the costs of actual manufacturing overhead and budgeted manufacturingoverhead. For Beta Company, the difference between actual and budgeted overhead (budget is based on the expected levelof volume of 10,000 units) was:
Actual manufacturing overhead incurred $ 108,000
Budgeted overhead (at 10,000 units) 100,000
Total overhead variance (unfavorable) $ 8,000
This difference is made up of the following overhead variances:
Variable OH Spending Variance $ 2,000 U
Variable OH Efficiency Variance $ 4,000 U
Fixed OH Variance $ 2,000 U
Total overhead variance (2,000 U + 4,000 U + 2,000 U) $8,000Unfavorable
The unfavorable spending variance is because we had more variable cost per unit than budgeted. The efficiency variance isunfavorable because we spent more machine hours than budgeted because we produced more units. We spent more onfixed costs than we had anticipated.
CC licensed content, Shared previouslyAccounting Principles: A Business Perspective.. Authored by: James Don Edwards, University of Georgia & Roger H.Hermanson, Georgia State University.. Provided by: Endeavour International Corporation. Project: The Global TextProject.. License: CC BY: Attribution
All rights reserved contentCost Accounting 15: Overhead Variance Analysis . Authored by: AccountingED. Located at:youtu.be/fKPDFk69Hrk. License: All Rights Reserved. License Terms: Standard YouTube License
8.5.1 1/4/2022 https://biz.libretexts.org/@go/page/26098
8.5: Advantages and Disadvantages of Standard Costing
Advantages and disadvantages of using standard costsFive of the benefits that result from a business using a standard cost system are:
Improved cost control.More useful information for managerial planning and decision making.More reasonable and easier inventory measurements.Cost savings in record-keeping.Possible reductions in production costs.
Improved cost control Companies can gain greater cost control by setting standards for each type of cost incurred andthen highlighting exceptions or variances—instances where things did not go as planned. Variances provide a starting pointfor judging the effectiveness of managers in controlling the costs for which they are held responsible.
Assume, for example, that in a production center, actual direct materials costs of $ 52,015 exceeded standard costs by $6,015. Knowing that actual direct materials costs exceeded standard costs by $ 6,015 is more useful than merely knowingthe actual direct materials costs amounted to $ 52,015. Now the firm can investigate the cause of the excess of actual costsover standard costs and take action.
Further investigation should reveal whether the exception or variance was caused by the inefficient use of materials orresulted from higher prices due to inflation or inefficient purchasing. In either case, the standard cost system acts as anearly warning system by highlighting a potential hazard for management.
More useful information for managerial planning and decision making When management develops appropriate coststandards and succeeds in controlling production costs, future actual costs should be close to the standard. As a result,management can use standard costs in preparing more accurate budgets and in estimating costs for bidding on jobs. Astandard cost system can be valuable for top management in planning and decision making.
More reasonable and easier inventory measurements A standard cost system provides easier inventory valuation thanan actual cost system. Under an actual cost system, unit costs for batches of identical products may differ widely. Forexample, this variation can occur because of a machine malfunction during the production of a given batch that increasesthe labor and overhead charged to that batch. Under a standard cost system, the company would not include such unusualcosts in inventory. Rather, it would charge these excess costs to variance accounts after comparing actual costs to standardcosts.
Thus, in a standard cost system, a company assumes that all units of a given product produced during a particular timeperiod have the same unit cost. Logically, identical physical units produced in a given time period should be recorded atthe same cost.
Cost savings in record-keeping Although a standard cost system may seem to require more detailed record-keepingduring the accounting period than an actual cost system, the reverse is true. For example, a system that accumulates onlyactual costs shows cost flows between inventory accounts and eventually into cost of goods sold. It records these varyingamounts of actual unit costs that must be calculated during the period. In a standard cost system, a company shows the costflows between inventory accounts and into cost of goods sold at consistent standard amounts during the period. It needs nospecial calculations to determine actual unit costs during the period. Instead, companies may print standard cost sheets inadvance showing standard quantities and standard unit costs for the materials, labor, and overhead needed to produce acertain product.
Possible reductions in production costs A standard cost system may lead to cost savings. The use of standard costs maycause employees to become more cost conscious and to seek improved methods of completing their tasks. Only whenemployees become active in reducing costs can companies really become successful in cost control.
Three of the disadvantages that result from a business using standard costs are:
Controversial materiality limits for variances.Nonreporting of certain variances.Low morale for some workers.
8.5.2 1/4/2022 https://biz.libretexts.org/@go/page/26098
Controversial materiality limits for variances Determining the materiality limits of the variances may be controversial.The management of each business has the responsibility for determining what constitutes a material or unusual variance.Because materiality involves individual judgment, many problems or conflicts may arise in setting materiality limits.
Nonreporting of certain variances Workers do not always report all exceptions or variances. If management onlyinvestigates unusual variances, workers may not report negative exceptions to the budget or may try to minimize theseexceptions to conceal inefficiency. Workers who succeed in hiding variances diminish the effectiveness of budgeting.
Low morale for some workers The management by exception approach focuses on the unusual variances. Managementoften focuses on unfavorable variances while ignoring favorable variances. Workers might believe that poor performancegets attention while good performance is ignored. As a result, the morale of these workers may suffer.
CC licensed content, Shared previouslyAccounting Principles: A Business Perspective. Authored by: James Don Edwards, University of Georgia & Roger H.Hermanson, Georgia State University. Provided by: Endeavour International Corporation. Project: The Global TextProject. License: CC BY: Attribution
8.6.1 12/25/2021 https://biz.libretexts.org/@go/page/26097
8.6: Variance SummarySee below for a summary of the six variances from standard discussed in this chapter.
Materials price variance =(Actual price – Standard price) x Actual quantity purchased OR(Actual Price x Actual Qty purch) – (Standard Price x ActualQuantity purchased)
Materials usage variance =
(Actual quantity used – Standard quantity allowed) x Standard priceOR(Actual qty used x Standard price) – (Standard Qty allowed xStandard price)
Labor rate variance =(Actual rate – standard rate) x Actual hours worked OR(Actual rate x Actual hours worked) – (Standard rate x Actual hoursworked)
Labor efficiency variance =(Actual hours worked – standard hours allowed) x Standard rate OR(Actual hours worked x Standard Rate) – (Standard hours allowed xStandard Rate)
Variable OH Spending variance =
(Actual variable OH rate – standard variable OH rate) x Actual OHbase OR(Actual variable OH rate x Actual OH base) – (Std variable OH rate xActual OH base)
Variable OH Efficiency variance =
(Actual OH base – standard OH base) x Standard variable OH rateOR(Actual OH base x Standard variable OH rate) – (Std OH base x Stdvariable OH rate)
Fixed OH variance = Actual fixed overhead – Budgeted fixed overhead
Remember, variances are expressed at the absolute values meaning we do not show negative or positive numbers. Weexpress variances in terms of FAVORABLE or UNFAVORABLE and negative is not always bad or unfavorable andpositive is not always good or favorable.
Keep these in mind:
When actual materials are more than standard (or budgeted), we have an UNFAVORABLE variance.When actual materials are less than the standard, we have a FAVORABLE variance.Same rule applies for direct labor. If actual direct labor (either hours or dollars) is more than the standard, we have anUNFAVORABLE variance. A FAVORABLE variance occurs when actual direct labor is less than the standard.
Accounting in the Headlines
How will the increasing cost of chocolate impact Hershey’s variances?
The price of chocolate had been predicted to increase rapidly beginning in late 2013 and continue into 2014, according tothe Wall Street Journal. The price increase is due to multiple factors, including a shortage of cocoa beans and an increase indemand by consumers.
Although the demand for all chocolate has been increasing, consumer tastes have been gradually shifting towards darkchocolate because of its purported health benefits. Dark chocolate uses more cocoa beans per ounce than milk chocolate.
So what does the predicted price increase mean for companies that use chocolate and/or cocoa beans?
Questions
1. The Hershey Company produces several products that use chocolate and/or cocoa beans. Which of the followingvariances for Hershey’s chocolate products are likely to be impacted by the projected price increase in the cost ofchocolate? Explain your answer.
a. Direct material price variance
8.6.2 12/25/2021 https://biz.libretexts.org/@go/page/26097
b. Direct material quantity variancec. Direct labor rate varianced. Direct labor efficiency variance
2. Hershey’s Special Dark Mildly Sweet Chocolate Bar and Hershey’s Milk Chocolate with Almonds Bar both weigh 1.45ounces. Which bar’s variances are more likely to be impacted by the increase in the cost of chocolate? Explain yourreasoning.
3. Since The Hershey Company’s management knows that the price of chocolate is likely to increase, it might revise one ormore of its standards. Which standard(s) would be impacted? What would be the benefit of revising the standard(s) beforethe end of the reporting period?
CC licensed content, Shared previouslyAccounting Principles: A Business Perspective.. Authored by: James Don Edwards, University of Georgia & Roger H.Hermanson, Georgia State University.. Provided by: Endeavour International Corporation. Project: The Global TextProject.. License: CC BY: Attribution
CC licensed content, Specific attributionHow will the increasing cost of chocolate impact Hersheyu2019s variances?. Authored by: Dr. Wendy Tietz, CPA,CMA, CGMA. Located at: http://www.accountingintheheadlines.com. License: CC BY-NC: Attribution-NonCommercial
8.7.1 12/25/2021 https://biz.libretexts.org/@go/page/26099
8.7: Accounting in the Headlines
How will cost standards be impacted at PEZ Candy Inc. by the rising cost of sugar and labor?
PEZ Candy Inc. produces the popular small candy that is dispensed in collectible flip-top dispensers. PEZ candy was invented as a breath mint in Vienna, Austria, in 1927. The name PEZ is derived from“pfefferminz” which is the word for peppermint in German.
In the United States, PEZ candies are produced in a factory in Connecticut since 1973. The PEZ candies are made fromabout 95% sugar, which makes the PEZ product cost particularly sensitive to changes in the cost of sugar. The cost ofsugar in the United States has been significantly increasing over the past year, due in least at part, to preliminary tariffsimposed by the U.S. government on Mexican sugar. In addition, the cost of labor has been increasing due to increases inthe minimum wage in the U.S. For these reasons, PEZ expects to raise its prices in 2015.
Questions
1. What cost standards will most likely be adjusted at PEZ for the rising costs? When do you think these standardadjustments will be made?
2. If the related cost standard is not adjusted, what variance(s) will be impacted by the rising cost of sugar? Whatdepartment would typically be responsible for explaining this variance(s)?
3. If the related cost standard is not adjusted, what variance(s) will be impacted by the rising cost of labor? Whatdepartment would typically be responsible for explaining this variance(s)?
CC licensed content, Specific attributionHow will cost standards be impacted at PEZ Candy Inc. by the rising cost of sugar and labor?. Authored by: Dr.Wendy Tietz, CPA, CMA, CGMA . Located at: http://www.accountingintheheadlines.com. License: CC BY:Attribution
8.8.1 12/11/2021 https://biz.libretexts.org/@go/page/26100
8.8: Glossary
GLOSSARY
Budgets Formal written plans that represent management’s planned actions in the future and the impacts of these actionson the business.
Flexible budget A budget that shows the budgeted amount of manufacturing overhead for various levels of output; used inisolating overhead variances and setting standard overhead rates.
Ideal standards Standards that can be attained under the best circumstances—that is, with no machinery problems orworker problems. These unrealistic standards can only be met when the company has highly efficient, skilled workers whoare working at their best effort throughout the entire period needed to complete the job.
Fixed overhead variance A variance from standard caused by using more or less than the standard amount of fixedoverhead costs to produce a product or complete a process; computed as Actual fixed overhead – Budgeted fixed overhead.
Labor efficiency variance (LEV) A variance from standard caused by using more or less than the standard amount ofdirect labor-hours to produce a product or complete a process; computed as (Actual hours worked – Standard hoursallowed) x Standard rate per hour.
Labor rate variance (LRV) A variance from standard caused by paying a higher or lower average rate of pay than thestandard cost to produce a product or complete a process; computed as (Actual rate -Standard rate) x Actual hours worked.
Management by exception The process where management only investigates those variances that are unusually favorableor unfavorable or that have a material effect on the company.
Materials price variance (MPV) A variance from standard caused by paying a higher or lower price than the standard formaterials purchased; computed as (Actual price – Standard price) x Actual quantity purchased.
Materials usage variance (MUV) A variance from standard caused by using more or less than the standard amount ofmaterials to produce a product or complete a process; computed as (Actual quantity used – Standard quantity allowed) xStandard price.
Overhead Base The overhead base is how overhead is applied to a product and is typically based on direct labor hours,direct labor dollars or machine hours. Practical standards Standards that are strict but attainable. Allowances are made formachinery problems and rest periods for workers. These standards are generally used in planning.
Standard cost A carefully predetermined measure of what a cost should be under stated conditions.
Standard level of output A carefully predetermined measure of what the expected level of output should be for aspecified period of time, usually one year.
Variance A deviation of actual costs from standard costs; may be favorable or unfavorable. That is, actual costs may beless than or more than standard costs. Variances may relate to materials, labor, or manufacturing overhead.
Variable Overhead Spending variance (VOHSV) A variance from standard caused by incurring more actual variableoverhead than the standard variable overhead cost to produce a product or complete a process; computed as (Actualvariable OH rate -Standard variable OH rate) x Actual amount of base.
Variable Overhead Efficiency variance (VOHEV) A variance from standard caused by using more or less than thestandard amount of overhead application base to produce a product or complete a process; computed as (Actual OH base –Standard OH base) x Standard variable OH rate per base.
CC licensed content, Shared previouslyAccounting Principles: A Business Perspective. Authored by: James Don Edwards, University of Georgia & Roger H.Hermanson, Georgia State University. Provided by: Endeavour International Corporation. Project: The Global TextProject. License: CC BY: Attribution

8.9.1 12/4/2021 https://biz.libretexts.org/@go/page/26101
8.9: Chapter 8- ExercisesShort-Answer Questions
➢ Is a standard cost an estimated cost? What is the primary objective of employing standard costs in a cost system?
➢ What is a budget?
➢ What is the difference between ideal and practical standards? Which standard generally is used in planning?
➢ What is meant by the term management by exception?
➢ What are some advantages of using standard costs? What are some disadvantages?
➢ Describe how the materials price and usage variances would be computed from the following data:
➢ Standard—1 unit of material at $20 per unit. Purchased—1,200 units of material at $20.30; used—990 units. Production—1,000 units of finished goods.
➢ When might a given company have a substantial favorable materials price variance and a substantial unfavorablematerials usage variance?
➢ What is the usual cause of a favorable or unfavorable labor rate variance? What other labor variance is isolated in astandard cost system? Of the two variances, which is more likely to be under the control of management? Explain.
➢ Identify the type of variance indicated by each of the following situations and indicate whether it is favorable orunfavorable:
The cutting department of a company during the week ending July 15 cut 12 size-S cogged wheels out ofthree sheets of 12-inch high-tempered steel. Usually three wheels of such size are cut out of each sheet.A company purchased and installed an expensive new cutting machine to handle expanding orders. Thispurchase and the related depreciation had not been anticipated when the overhead was budgeted.Edwards, the band saw operator, was on vacation last week. Lands took her place for the normal 40-hourweek. Edwards’ wage rate is $12 per hour, while Lands’ is $10 per hour. Production was at capacity lastweek and the week before.
➢ Theoretically, how would an accountant dispose of variances from standard? How does an accountant typically disposeof variances?
➢ Why are variances typically isolated as soon as possible?
➢ Is it correct to consider favorable variances as always being desirable? Explain.
➢ How does the use of standard costs permit the application of the principle of management by exception?
➢ How do standards help in controlling production costs?
➢ Real world question Imagine you are making and selling pizzas for Domino’s Pizza. How would you set standards forone pizza to be made and delivered?
Exercises
Exercise A During July, the cutting department completed 8,000 units of a product that had a standard materials cost of 2square feet per unit at $2.40 per square foot. The actual materials purchased consisted of 16,400 square feet at $2.20 persquare foot, for a total cost of $36,080. The actual material used this period was 16,160 square feet. Compute the materialsprice and usage variances. Indicate whether each is favorable or unfavorable.
Direct materials – 4 pounds at $5 per pound $20
Direct labor – 3 hours at $6 per hour 18
Manufacturing overhead – 150% of direct labor 27
$65
8.9.2 12/4/2021 https://biz.libretexts.org/@go/page/26101
Exercise B Whitewater’s purchasing agent took advantage of a special offer from one of its suppliers to purchase 44,000pounds of material at $4.10 per pound. Assume 5,500 units were produced and 34,100 pounds of material were used.Compute the variances for materials. Comment on the purchasing agent’s decision to take the special offer.
Exercise C Compute the labor variances in the following situation:
Actual direct labor payroll (51,600 hours at $18) $928,800
Standard direct labor allowed per unit, 4.20 hours at $19.20 80.64
Production for month (in units) 10,000
Exercise D Blackman Company manufactures a product that has a standard direct labor cost of four hours per unit at $24per hour. In producing 6,000 units, the foreman used a different crew than usual, which resulted in a total labor cost of $26per hour for 22,000 hours. Compute the labor variances and comment on the foreman’s decision to use a different crew.
Exercise E The following data relates to the manufacturing activities of Strauss Company for the first quarter of thecurrent year:
Standard activity (in units) 30,000
Actual production (units) 24,000
Budgeted fixed manufacturing overhead $36,000
Variable overhead rate (per unit) $ 4.00
Actual fixed manufacturing overhead $37,200
Actual variable manufacturing overhead $88,800
Compute the variable overhead spending variance, variable overhead efficiency variance and the fixed overhead variance.(Assume overhead is applied based on units produced.)
Exercise F Assume that the actual production in the previous exercise was 26,000 units rather than 24,000. What was thevariable overhead efficiency variance?
Problems
Problem A A product has a standard materials usage and cost of 4 pounds per unit at $7.00 per pound. During the month,2,400 pounds of materials were purchased at $7.30 per pound. Production for the month totaled 550 units requiring 2,100pounds of materials.
Compute the materials variances.
Problem B During December, a department completed 2,500 units of a product that has a standard materials usage andcost of 1.2 square feet per unit at $0.48 per square foot. The actual material used consisted of 3,050 square feet at an actualcost of $2,664.48. The actual purchase of this material amounted to 4,500 square feet at a total cost of $3,931.20.
Prepare journal entries (a) for the purchase of the materials and (b) for the issuance of materials to production.
Problem C Martin Company makes plastic garbage bags. One box of bags requires one hour of direct labor at an hourlyrate of $6. The company produced 200,000 boxes of bags using 208,000 hours of direct labor at a total cost of $1,144,000.
Compute the labor variances.
Problem D The finishing department of Mozart Company produced 25,000 units during November. The standard numberof direct labor-hours per unit is two hours. The standard rate per hour is $37.80. During the month, 51,250 direct labor-hours were worked at a cost of $1,742,500.
Compute labor variances.
Problem E The standard amount of output for the Chicago plant of Worldworth Company is 50,000 units per month.Overhead is applied based on units produced. The flexible budget of the month for manufacturing overhead allows$180,000 for fixed overhead and $4.80 per unit of output for variable overhead. Actual overhead for the month consistedof $181,440 of fixed overhead; the actual variable overhead follows.

8.9.3 12/4/2021 https://biz.libretexts.org/@go/page/26101
Compute the overhead variances variance assuming the following actual production in units and actual variable overheadin dollars:
400. 37,500 and $182,400.401. 55,000 and $270,480.
Problem F Based on a standard volume of output of 96,000 units per month, the standard cost of the productmanufactured by Tahoe Company consists of:
Direct materials (0.25 pounds x $8 per pound) $2.00
Direct labor (0.5 hours x $7.60 per hour) 3.80
Variable manufacturing overhead 2.50
Fixed manufacturing overhead ($144,000 in total) 1.50
Total $9.80
A total of 25,200 pounds of materials was purchased at $8.40 per pound. During May, 98,400 units were produced with thefollowing costs:
Direct materials used (24,000 pounds at $8.40) $201,600
Direct labor (50,000 hours at $7.80) 390,000
Variable manufacturing overhead 249,000
Fixed manufacturing overhead 145,000
Compute the materials price and usage variances, the labor rate and efficiency variances, and the overhead budget andvolume variances. (Overhead is applied based on units produced.)
Alternate problems
Alternate problem A The following data apply to Roseanne Company for August, when 2,500 units were produced:
Materials used: 16,000 pounds
standard materials per unit: 6 pounds at 5 per pound
Materials purchased: 24,000 pounds at$4.80 per pound
Direct labor: 5,800 hours at a total cost of $69,600
Standard labor per unit: 2 hours at $11 per hour.
1. Compute the materials and labor variances.2. Prepare journal entries to record the transactions involving these variances.
Alternate problem B During April, Shakespeare Company produced 15,000 units of a product called Creative. Creativehas a standard materials cost of two pieces per unit at $8 per piece. The actual materials used consisted of 30,000 pieces ata cost of $230,000. Actual purchases of the materials amounted to 40,000 pieces at a cost of $300,000.
Compute the two materials variances.
Alternate problem C Some of the records of Gonzaga Company’s repair and maintenance division were accidentallyshredded. Salvaged records indicate that actual direct labor-hours for the period were 2,000 hours. The total labor variancewas $6,000, favorable. The standard labor rate was $7 per direct labor-hour, and the labor rate variance was $2,000,unfavorable.
Compute the actual direct labor rate per hour and prepare the journal entry to record the labor rate and the labor efficiencyvariances.
Alternate problem D All Fixed Overhead Company computes its overhead rate based on a standard level of output of20,000 units. Fixed manufacturing overhead for the current year is budgeted at $30,000. Actual fixed manufacturingoverhead for the current year was $31,000. Overhead is applied based on units produced.
8.9.4 12/4/2021 https://biz.libretexts.org/@go/page/26101
Compute the amount of overhead volume variance for the year under each of the following assumptions regarding actualoutput:
1. 12,500 units.2. 22,500 units.
Beyond the numbers—Critical thinking
Business decision case A Turn to the Sun City Company exercise in this chapter. For each of the variances listed, give apossible reason for its existence.
Business decision case B Diane La Hoya, the president of the Rebokk Company, has a problem that does not involvesubstantial dollar amounts but does involve the important question of responsibility for variances from standard costs. Shehas just received the following report:
Standard materials at standard price for the actual production in May $9,000
Unfavorable materials price variance
($3.60 – $3.00) x 3,450 pounds 2,070
Unfavorable materials usage variance
(3,450 – 3,000 pounds) x $3 1,350
Total actual materials cost for the month of May
(3,450 pounds at $3.60 per pound) $12,420
La Hoya has discussed the unfavorable price variance with Jim Montel, the purchasing officer. Montel agrees that underthe circumstances he should be held responsible for most of the materials price variance. But he objects to the inclusion of$270 (450 pounds of excess materials used at $0.60 per pound). This, he argues, is the responsibility of the productiondepartment. If the production department had not been so inefficient in the use of materials, he would not have had topurchase the extra 450 pounds.
On the other hand, Ken Kechum, the production manager, agrees that he is basically responsible for the excess quantity ofmaterials used. But, he does not agree that the materials usage variance should be revised to include the $270 ofunfavorable price variance on the excess materials used. “That is Jim’s responsibility,” he says.
La Hoya now turns to you for help. Specifically, she wants you to tell her:
1. Who is responsible for the $270 in dispute?2. If responsibility cannot be clearly assigned, how should the accounting department categorize the variance (price or
usage)? Why?3. Are there likely to be other circumstances where materials variances cannot be considered the responsibility of the
manager most closely involved with them? Explain.
Prepare written answers to the three questions La Hoya asked.
A broader perspective C Refer to “A broader perspective: Quality management and Balridge award”. The BaldrigeAward has been criticized for fostering a winner-versus-loser mentality, instead of encouraging every organization toimprove its quality. Further, the award has been criticized for grading on the curve by awarding companies that are the bestin US industry but still do not compete well against foreign competition.
Write a response to each of these criticisms of the Baldrige Award.
Group project D Many workers hate standards. Some people claim standards reduce morale and productivity. Othersbelieve standards are necessary to motivate people. Based on your own experience in school or on a job, what do youthink?
In groups of three, choose an organization or business to use as an example. List all the possible standards you could setfor this organization or business. Then decide whether your group favors setting standards. If the group does, decide whoshould set each of the standards on your list. If the group does not favor standards, discuss your reasons. Choose onemember to report for your group to the class.
8.9.5 12/4/2021 https://biz.libretexts.org/@go/page/26101
Group project E The chief executive officer (CEO) of Tax Preparation Services, Incorporated, remarked to a colleague,“Establishing standard costs and performing variance analysis is only useful for companies with inventories. As a serviceorganization, how could we possibly benefit from implementing such a system?” In groups of two or three students, writea memorandum to your instructor stating whether you agree with this comment or not and explain why. The heading of thememorandum should contain the date, to whom it is written, from whom, and the subject matter.
Group project F The controller of Plastics Manufacturing, Incorporated, states: “Let us figure the materials pricevariances when the materials are used rather than at the time of purchase. This way we can prepare the price and usagevariances at the same time and directly link the price variance to production.” In groups of two or three students, write amemorandum to your instructor stating whether you agree with this suggestion or not and explain why. The heading of thememorandum should contain the date, to whom it is written, from whom, and the subject matter.
Using the Internet—A view of the real world
Using any Internet search engine enter “standard costs” (be sure to include the quotation marks). Select an article thatdirectly discusses standard costs and print a copy of the article. You are encouraged (but not required) to find an article thatanswers some of the following questions: When is the use of standard costing appropriate? How do certain industries usestandard costing? How are standard costs established? How do standard costs help management in production?
Write a memorandum to your instructor summarizing the key points of the article. The heading of the memorandum shouldcontain the date, to whom it is written, from whom, and the subject matter. Be sure to include a copy of the article used forthis assignment.
Using any Internet search engine select one of the new terms at the end of the chapter and perform a key word search. Besure to include quotation marks (for example: “Management by exception”). Select an article that directly discusses thenew term used and print a copy of the article. Write a memorandum to your instructor summarizing the key points of thearticle. The heading of the memorandum should contain the date, to whom it is written, from whom, and the subject matter.Be sure to include a copy of the article used for this assignment.
CC licensed content, Shared previouslyAccounting Principles: A Business Perspective. Authored by: James Don Edwards, University of Georgia & Roger H.Hermanson, Georgia State University. Provided by: Endeavour International Corporation. Project: The Global TextProject. License: CC BY: Attribution
1 1/8/2022
CHAPTER OVERVIEW9: RESPONSIBILITY ACCOUNTING FOR COST, PROFIT AND INVESTMENTCENTERS
9.1: CHAPTER 9 STUDY PLAN9.2: TYPES OF COSTS9.3: RESPONSIBILITY ACCOUNTING IN MANAGEMENT9.4: RESPONSIBILITY REPORTS9.5: RESPONSIBILITY CENTERS9.6: INVESTMENT CENTER ANALYSIS9.7: SEGMENTED INCOME STATEMENTS9.8: ACCOUNTING IN THE HEADLINES9.9: TRANSFER PRICING9.10: BALANCED SCORECARD9.11: CHAPTER 9 KEY POINTS9.12: GLOSSARY9.13: CHAPTER 9- EXERCISES
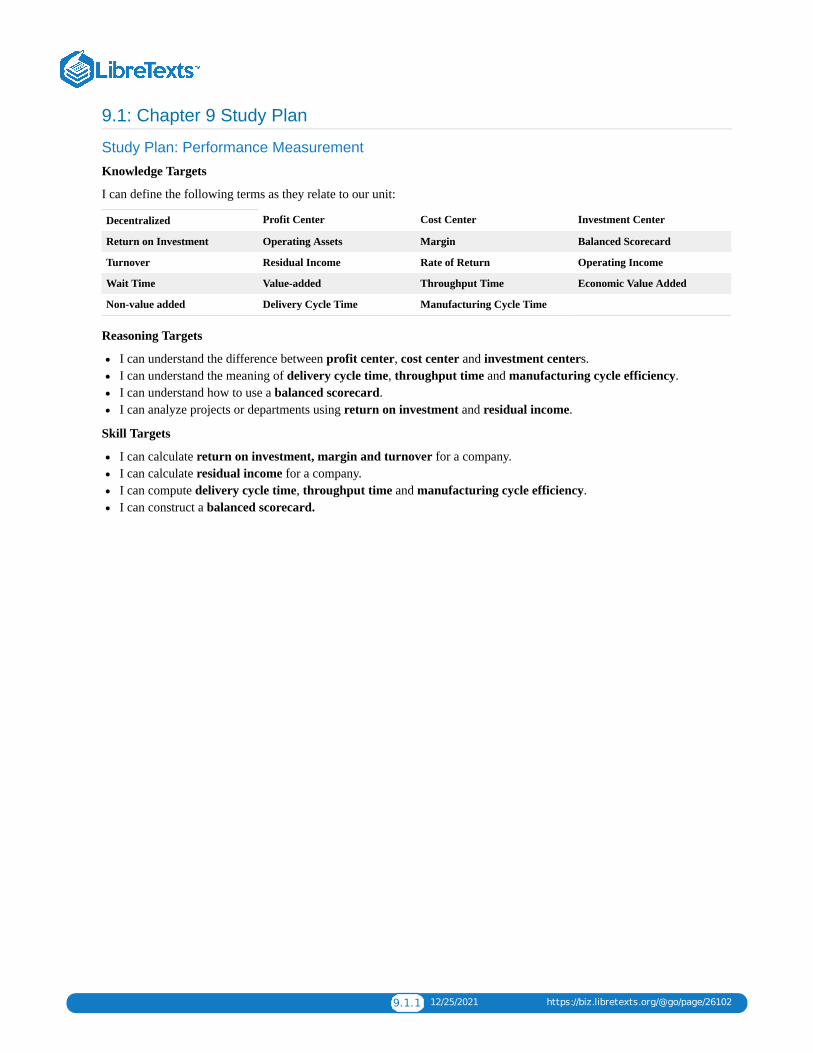
9.1.1 12/25/2021 https://biz.libretexts.org/@go/page/26102
9.1: Chapter 9 Study Plan
Study Plan: Performance Measurement
Knowledge Targets
I can define the following terms as they relate to our unit:
Decentralized Profit Center Cost Center Investment Center
Return on Investment Operating Assets Margin Balanced Scorecard
Turnover Residual Income Rate of Return Operating Income
Wait Time Value-added Throughput Time Economic Value Added
Non-value added Delivery Cycle Time Manufacturing Cycle Time
Reasoning Targets
I can understand the difference between profit center, cost center and investment centers.I can understand the meaning of delivery cycle time, throughput time and manufacturing cycle efficiency.I can understand how to use a balanced scorecard.I can analyze projects or departments using return on investment and residual income.
Skill Targets
I can calculate return on investment, margin and turnover for a company.I can calculate residual income for a company.I can compute delivery cycle time, throughput time and manufacturing cycle efficiency.I can construct a balanced scorecard.
9.2.1 12/25/2021 https://biz.libretexts.org/@go/page/26103
9.2: Types of Costs
Product vs. Period Cost
A product cost is any cost related to creating a product and can be a direct or indirect cost. The key word is CREATING aproduct. Product costs are typically direct materials, direct labor and manufacturing overhead. These costs are notexpensed until the product is actually sold, then it is reported as cost of goods sold on the income statement.
A period cost is NOT related to creating the product. These are costs necessary for the product to be sold or accounted forbut not for actually making the product. A period cost is typically selling, general and administrative costs expensed on theincome statement when it is incurred.
A YouTube element has been excluded from this version of the text. You can view it online here:pb.libretexts.org/llmanagerialaccounting/?p=200
Direct vs. Indirect CostA direct cost is a cost that can be directly tied or traced to a specific unit, department or process. Examples of a direct costinclude direct materials, direct labor, sales salaries to the sales department, accounting dept salaries to the accountingdepartment, etc.
An indirect cost is a cost that cannot be directly traced to a specific unit, department or process. Examples includemanufacturing overhead, executive staff salaries, and even the Information Technology department salaries to all otherdepartments.
A YouTube element has been excluded from this version of the text. You can view it online here:pb.libretexts.org/llmanagerialaccounting/?p=200
All rights reserved content

9.2.2 12/25/2021 https://biz.libretexts.org/@go/page/26103
Authored by: Education Unlocked. Provided by: Direct vs. Indirect Costs . Located at: youtu.be/3SEv1_dl86I.License: All Rights Reserved. License Terms: Standard YouTube LicenseManagerial Accounting: Product vs Period Costs. Authored by: Prof Alldredge. Located at:youtu.be/rbSABuSKVpQ. License: All Rights Reserved. License Terms: Standard YouTube License
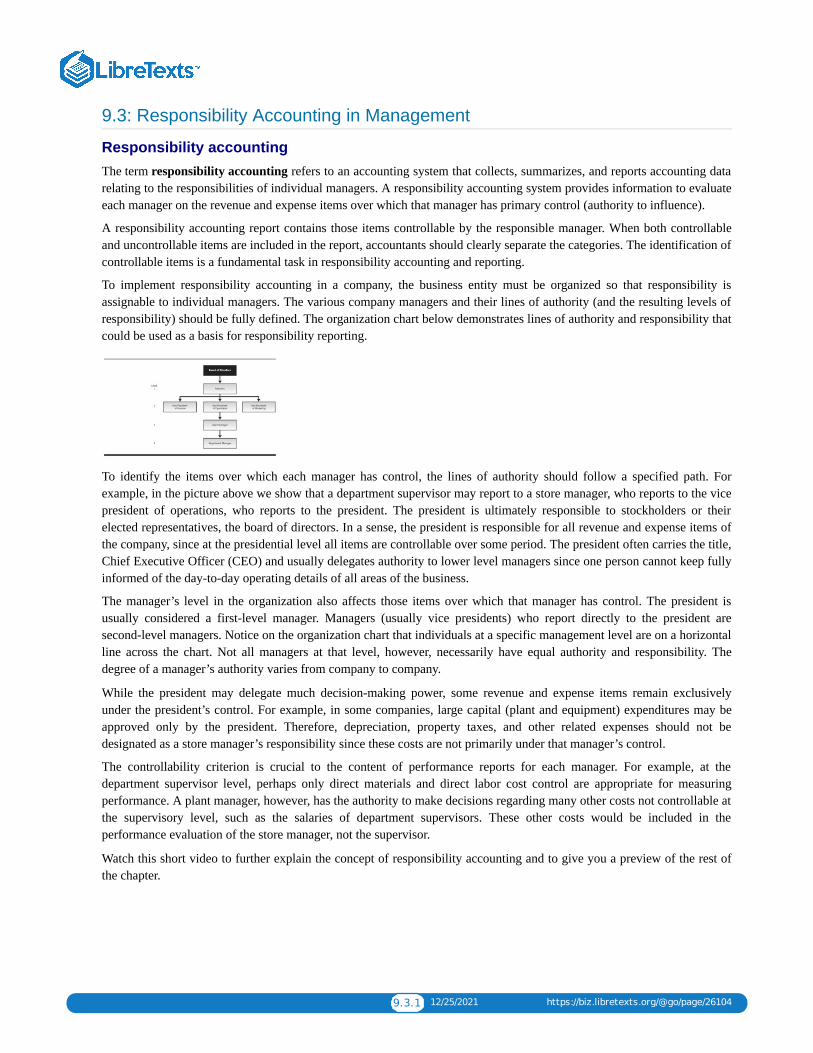
9.3.1 12/25/2021 https://biz.libretexts.org/@go/page/26104
9.3: Responsibility Accounting in Management
Responsibility accountingThe term responsibility accounting refers to an accounting system that collects, summarizes, and reports accounting datarelating to the responsibilities of individual managers. A responsibility accounting system provides information to evaluateeach manager on the revenue and expense items over which that manager has primary control (authority to influence).
A responsibility accounting report contains those items controllable by the responsible manager. When both controllableand uncontrollable items are included in the report, accountants should clearly separate the categories. The identification ofcontrollable items is a fundamental task in responsibility accounting and reporting.
To implement responsibility accounting in a company, the business entity must be organized so that responsibility isassignable to individual managers. The various company managers and their lines of authority (and the resulting levels ofresponsibility) should be fully defined. The organization chart below demonstrates lines of authority and responsibility thatcould be used as a basis for responsibility reporting.
To identify the items over which each manager has control, the lines of authority should follow a specified path. Forexample, in the picture above we show that a department supervisor may report to a store manager, who reports to the vicepresident of operations, who reports to the president. The president is ultimately responsible to stockholders or theirelected representatives, the board of directors. In a sense, the president is responsible for all revenue and expense items ofthe company, since at the presidential level all items are controllable over some period. The president often carries the title,Chief Executive Officer (CEO) and usually delegates authority to lower level managers since one person cannot keep fullyinformed of the day-to-day operating details of all areas of the business.
The manager’s level in the organization also affects those items over which that manager has control. The president isusually considered a first-level manager. Managers (usually vice presidents) who report directly to the president aresecond-level managers. Notice on the organization chart that individuals at a specific management level are on a horizontalline across the chart. Not all managers at that level, however, necessarily have equal authority and responsibility. Thedegree of a manager’s authority varies from company to company.
While the president may delegate much decision-making power, some revenue and expense items remain exclusivelyunder the president’s control. For example, in some companies, large capital (plant and equipment) expenditures may beapproved only by the president. Therefore, depreciation, property taxes, and other related expenses should not bedesignated as a store manager’s responsibility since these costs are not primarily under that manager’s control.
The controllability criterion is crucial to the content of performance reports for each manager. For example, at thedepartment supervisor level, perhaps only direct materials and direct labor cost control are appropriate for measuringperformance. A plant manager, however, has the authority to make decisions regarding many other costs not controllable atthe supervisory level, such as the salaries of department supervisors. These other costs would be included in theperformance evaluation of the store manager, not the supervisor.
Watch this short video to further explain the concept of responsibility accounting and to give you a preview of the rest ofthe chapter.

9.3.2 12/25/2021 https://biz.libretexts.org/@go/page/26104
A YouTube element has been excluded from this version of the text. You can view it online here:pb.libretexts.org/llmanagerialaccounting/?p=202
Decentralization is the dispersion of decision-making authority among individuals at lower levels of the organization. Inother words, the extent of decentralization refers to the degree of control that segment managers have over the revenues,expenses, and assets of their segments. When a segment manager has control over these elements, the investment centerconcept can be applied to the segment. Thus, the more decentralized the decision making is in an organization, the moreapplicable is the investment center concept to the segments of the company. The more centralized the decision making is,the more likely responsibility centers are to be established as expense centers.
Some advantages of decentralized decision making are:
Managing segments trains managers for high-level positions in the company. The added authority and responsibilityalso represent job enlargement and often increase job satisfaction and motivation.Top management can be more removed from day-to-day decision making at lower levels of the company and canmanage by exception. When top management is not involved with routine problem solving, it can devote more time tolong-range planning and to the company’s most significant problem areas.Decisions can be made at the point where problems arise. It is often difficult for top managers to make appropriatedecisions on a timely basis when they are not intimately involved with the problem they are trying to solve.Since decentralization permits the use of the investment center concept, performance evaluation criteria such as ROIand residual income (to be explained later) can be used.
All rights reserved contentPart 1 of Responsibility Accounting, Operational Performance Measures, and the Balanced Scorecard . Authored by:Maxwell Katzman . Located at: youtu.be/EsS0socI3I4. License: All Rights Reserved. License Terms: StandardYouTube License
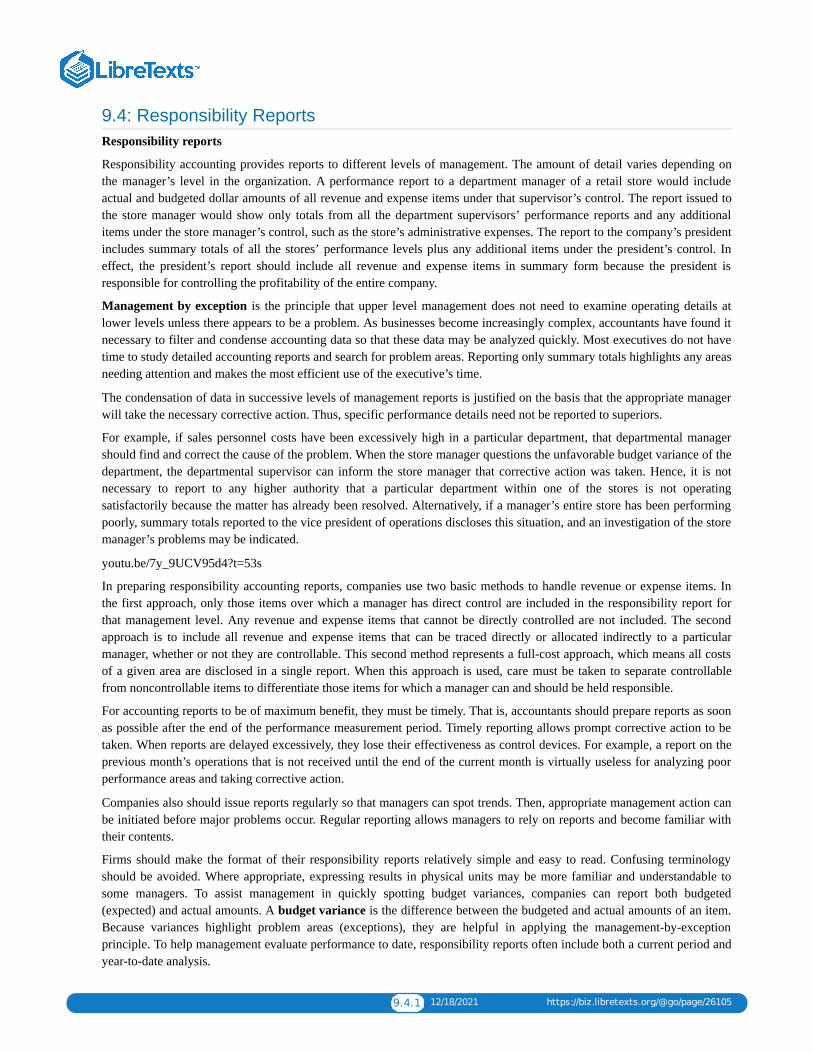
9.4.1 12/18/2021 https://biz.libretexts.org/@go/page/26105
9.4: Responsibility ReportsResponsibility reports
Responsibility accounting provides reports to different levels of management. The amount of detail varies depending onthe manager’s level in the organization. A performance report to a department manager of a retail store would includeactual and budgeted dollar amounts of all revenue and expense items under that supervisor’s control. The report issued tothe store manager would show only totals from all the department supervisors’ performance reports and any additionalitems under the store manager’s control, such as the store’s administrative expenses. The report to the company’s presidentincludes summary totals of all the stores’ performance levels plus any additional items under the president’s control. Ineffect, the president’s report should include all revenue and expense items in summary form because the president isresponsible for controlling the profitability of the entire company.
Management by exception is the principle that upper level management does not need to examine operating details atlower levels unless there appears to be a problem. As businesses become increasingly complex, accountants have found itnecessary to filter and condense accounting data so that these data may be analyzed quickly. Most executives do not havetime to study detailed accounting reports and search for problem areas. Reporting only summary totals highlights any areasneeding attention and makes the most efficient use of the executive’s time.
The condensation of data in successive levels of management reports is justified on the basis that the appropriate managerwill take the necessary corrective action. Thus, specific performance details need not be reported to superiors.
For example, if sales personnel costs have been excessively high in a particular department, that departmental managershould find and correct the cause of the problem. When the store manager questions the unfavorable budget variance of thedepartment, the departmental supervisor can inform the store manager that corrective action was taken. Hence, it is notnecessary to report to any higher authority that a particular department within one of the stores is not operatingsatisfactorily because the matter has already been resolved. Alternatively, if a manager’s entire store has been performingpoorly, summary totals reported to the vice president of operations discloses this situation, and an investigation of the storemanager’s problems may be indicated.
youtu.be/7y_9UCV95d4?t=53s
In preparing responsibility accounting reports, companies use two basic methods to handle revenue or expense items. Inthe first approach, only those items over which a manager has direct control are included in the responsibility report forthat management level. Any revenue and expense items that cannot be directly controlled are not included. The secondapproach is to include all revenue and expense items that can be traced directly or allocated indirectly to a particularmanager, whether or not they are controllable. This second method represents a full-cost approach, which means all costsof a given area are disclosed in a single report. When this approach is used, care must be taken to separate controllablefrom noncontrollable items to differentiate those items for which a manager can and should be held responsible.
For accounting reports to be of maximum benefit, they must be timely. That is, accountants should prepare reports as soonas possible after the end of the performance measurement period. Timely reporting allows prompt corrective action to betaken. When reports are delayed excessively, they lose their effectiveness as control devices. For example, a report on theprevious month’s operations that is not received until the end of the current month is virtually useless for analyzing poorperformance areas and taking corrective action.
Companies also should issue reports regularly so that managers can spot trends. Then, appropriate management action canbe initiated before major problems occur. Regular reporting allows managers to rely on reports and become familiar withtheir contents.
Firms should make the format of their responsibility reports relatively simple and easy to read. Confusing terminologyshould be avoided. Where appropriate, expressing results in physical units may be more familiar and understandable tosome managers. To assist management in quickly spotting budget variances, companies can report both budgeted(expected) and actual amounts. A budget variance is the difference between the budgeted and actual amounts of an item.Because variances highlight problem areas (exceptions), they are helpful in applying the management-by-exceptionprinciple. To help management evaluate performance to date, responsibility reports often include both a current period andyear-to-date analysis.
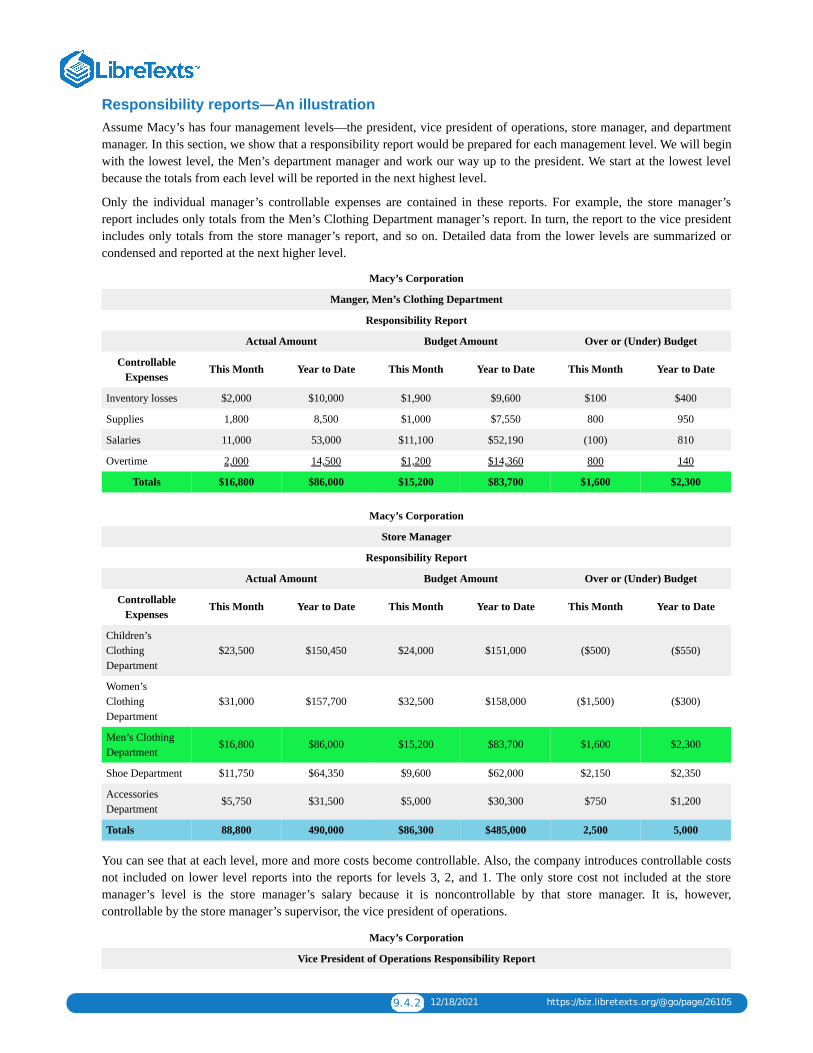
9.4.2 12/18/2021 https://biz.libretexts.org/@go/page/26105
Responsibility reports—An illustrationAssume Macy’s has four management levels—the president, vice president of operations, store manager, and departmentmanager. In this section, we show that a responsibility report would be prepared for each management level. We will beginwith the lowest level, the Men’s department manager and work our way up to the president. We start at the lowest levelbecause the totals from each level will be reported in the next highest level.
Only the individual manager’s controllable expenses are contained in these reports. For example, the store manager’sreport includes only totals from the Men’s Clothing Department manager’s report. In turn, the report to the vice presidentincludes only totals from the store manager’s report, and so on. Detailed data from the lower levels are summarized orcondensed and reported at the next higher level.
Macy’s Corporation
Manger, Men’s Clothing Department
Responsibility Report
Actual Amount Budget Amount Over or (Under) Budget
ControllableExpenses
This Month Year to Date This Month Year to Date This Month Year to Date
Inventory losses $2,000 $10,000 $1,900 $9,600 $100 $400
Supplies 1,800 8,500 $1,000 $7,550 800 950
Salaries 11,000 53,000 $11,100 $52,190 (100) 810
Overtime 2,000 14,500 $1,200 $14,360 800 140
Totals $16,800 $86,000 $15,200 $83,700 $1,600 $2,300
Macy’s Corporation
Store Manager
Responsibility Report
Actual Amount Budget Amount Over or (Under) Budget
ControllableExpenses
This Month Year to Date This Month Year to Date This Month Year to Date
Children’sClothingDepartment
$23,500 $150,450 $24,000 $151,000 ($500) ($550)
Women’sClothingDepartment
$31,000 $157,700 $32,500 $158,000 ($1,500) ($300)
Men’s ClothingDepartment
$16,800 $86,000 $15,200 $83,700 $1,600 $2,300
Shoe Department $11,750 $64,350 $9,600 $62,000 $2,150 $2,350
AccessoriesDepartment
$5,750 $31,500 $5,000 $30,300 $750 $1,200
Totals 88,800 490,000 $86,300 $485,000 2,500 5,000
You can see that at each level, more and more costs become controllable. Also, the company introduces controllable costsnot included on lower level reports into the reports for levels 3, 2, and 1. The only store cost not included at the storemanager’s level is the store manager’s salary because it is noncontrollable by that store manager. It is, however,controllable by the store manager’s supervisor, the vice president of operations.
Macy’s Corporation
Vice President of Operations Responsibility Report
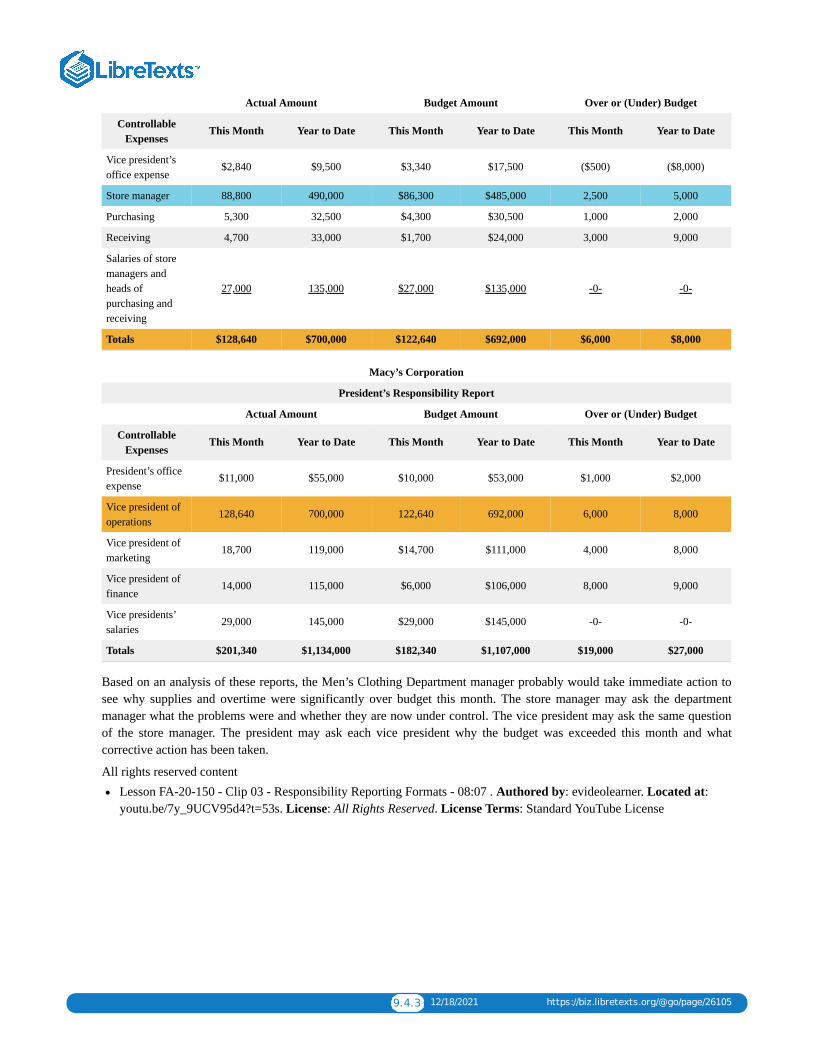
9.4.3 12/18/2021 https://biz.libretexts.org/@go/page/26105
Actual Amount Budget Amount Over or (Under) Budget
ControllableExpenses
This Month Year to Date This Month Year to Date This Month Year to Date
Vice president’soffice expense
$2,840 $9,500 $3,340 $17,500 ($500) ($8,000)
Store manager 88,800 490,000 $86,300 $485,000 2,500 5,000
Purchasing 5,300 32,500 $4,300 $30,500 1,000 2,000
Receiving 4,700 33,000 $1,700 $24,000 3,000 9,000
Salaries of storemanagers andheads ofpurchasing andreceiving
27,000 135,000 $27,000 $135,000 -0- -0-
Totals $128,640 $700,000 $122,640 $692,000 $6,000 $8,000
Macy’s Corporation
President’s Responsibility Report
Actual Amount Budget Amount Over or (Under) Budget
ControllableExpenses
This Month Year to Date This Month Year to Date This Month Year to Date
President’s officeexpense
$11,000 $55,000 $10,000 $53,000 $1,000 $2,000
Vice president ofoperations
128,640 700,000 122,640 692,000 6,000 8,000
Vice president ofmarketing
18,700 119,000 $14,700 $111,000 4,000 8,000
Vice president offinance
14,000 115,000 $6,000 $106,000 8,000 9,000
Vice presidents’salaries
29,000 145,000 $29,000 $145,000 -0- -0-
Totals $201,340 $1,134,000 $182,340 $1,107,000 $19,000 $27,000
Based on an analysis of these reports, the Men’s Clothing Department manager probably would take immediate action tosee why supplies and overtime were significantly over budget this month. The store manager may ask the departmentmanager what the problems were and whether they are now under control. The vice president may ask the same questionof the store manager. The president may ask each vice president why the budget was exceeded this month and whatcorrective action has been taken.
All rights reserved contentLesson FA-20-150 - Clip 03 - Responsibility Reporting Formats - 08:07 . Authored by: evideolearner. Located at:youtu.be/7y_9UCV95d4?t=53s. License: All Rights Reserved. License Terms: Standard YouTube License
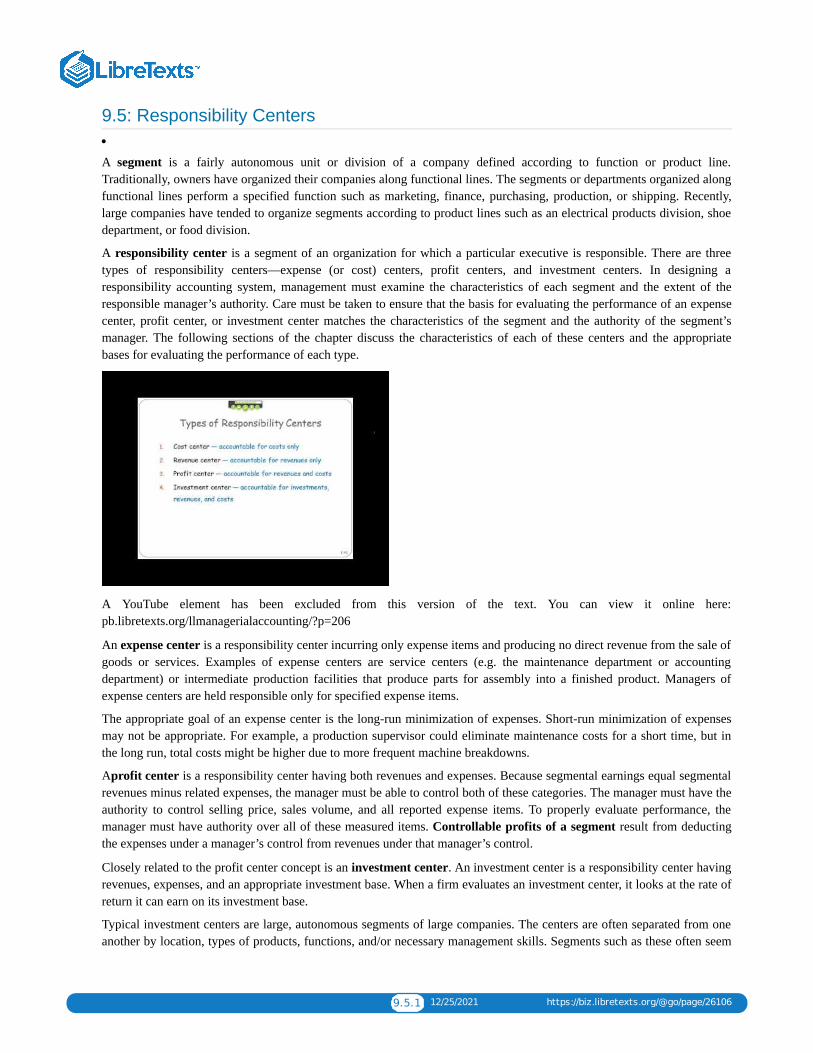
9.5.1 12/25/2021 https://biz.libretexts.org/@go/page/26106
9.5: Responsibility Centers
A segment is a fairly autonomous unit or division of a company defined according to function or product line.Traditionally, owners have organized their companies along functional lines. The segments or departments organized alongfunctional lines perform a specified function such as marketing, finance, purchasing, production, or shipping. Recently,large companies have tended to organize segments according to product lines such as an electrical products division, shoedepartment, or food division.
A responsibility center is a segment of an organization for which a particular executive is responsible. There are threetypes of responsibility centers—expense (or cost) centers, profit centers, and investment centers. In designing aresponsibility accounting system, management must examine the characteristics of each segment and the extent of theresponsible manager’s authority. Care must be taken to ensure that the basis for evaluating the performance of an expensecenter, profit center, or investment center matches the characteristics of the segment and the authority of the segment’smanager. The following sections of the chapter discuss the characteristics of each of these centers and the appropriatebases for evaluating the performance of each type.
A YouTube element has been excluded from this version of the text. You can view it online here:pb.libretexts.org/llmanagerialaccounting/?p=206
An expense center is a responsibility center incurring only expense items and producing no direct revenue from the sale ofgoods or services. Examples of expense centers are service centers (e.g. the maintenance department or accountingdepartment) or intermediate production facilities that produce parts for assembly into a finished product. Managers ofexpense centers are held responsible only for specified expense items.
The appropriate goal of an expense center is the long-run minimization of expenses. Short-run minimization of expensesmay not be appropriate. For example, a production supervisor could eliminate maintenance costs for a short time, but inthe long run, total costs might be higher due to more frequent machine breakdowns.
Aprofit center is a responsibility center having both revenues and expenses. Because segmental earnings equal segmentalrevenues minus related expenses, the manager must be able to control both of these categories. The manager must have theauthority to control selling price, sales volume, and all reported expense items. To properly evaluate performance, themanager must have authority over all of these measured items. Controllable profits of a segment result from deductingthe expenses under a manager’s control from revenues under that manager’s control.
Closely related to the profit center concept is an investment center. An investment center is a responsibility center havingrevenues, expenses, and an appropriate investment base. When a firm evaluates an investment center, it looks at the rate ofreturn it can earn on its investment base.
Typical investment centers are large, autonomous segments of large companies. The centers are often separated from oneanother by location, types of products, functions, and/or necessary management skills. Segments such as these often seem

9.5.2 12/25/2021 https://biz.libretexts.org/@go/page/26106
to be separate companies to an outside observer. But the investment center concept can be applied even in relatively smallcompanies in which the segment managers have control over the revenues, expenses, and assets of their segments.
All rights reserved contentTypes of Responsibility Centers. Authored by: Rutgers Accounting Web. Located at: youtu.be/N84VVslVctU.License: All Rights Reserved. License Terms: Standard YouTube License
9.6.1 11/27/2021 https://biz.libretexts.org/@go/page/26107
9.6: Investment Center Analysis
Two evaluation bases that include the concept of investment base in the analysis are ROI (return on investment) and RI(residual income).
Return on Investment (ROI)
A segment that has a large amount of assets usually earns more in an absolute sense than a segment that has a smallamount of assets. Therefore, a firm cannot use absolute amounts of segmental income to compare the performance ofdifferent segments. To measure the relative effectiveness of segments, a company might use return on investment (ROI),which calculates the return (income) as a percentage of the assets employed (investment). The formula for ROI is:
ROI =Segment Income
Investment Base
For example, a segment that earns $500,000 on an investment base of $5,000,000 has an ROI of 10% ($500,000/$5,000,000). Return on investment is reported as a percentage. The return on investments means how much income do wegenerate for every dollar of investment. In this example, ROI was 10% which means the company earns 10 cents on every$1 of investment. To illustrate the difference between using absolute amounts and using percentages in evaluating asegment’s performance, consider the data in the table below for a company with three segments.
When using absolute dollars of income to evaluate performance, Segment B appears to be doing twice as well as SegmentC. However, using ROI to evaluate the segments indicates that Segment C is really performing the best (25%), Segment Bis next (20%), and Segment A is performing the worst (10%). Therefore, ROI is a more useful indicator of the relativeperformance of segments than absolute income.
This video will summarize the return on investment concept. Focus on the first 3 steps listed in the video.
A YouTube element has been excluded from this version of the text. You can view it online here:pb.libretexts.org/llmanagerialaccounting/?p=208
Determining the investment base to be used in the ROI calculation is a tricky matter. Normally, the assets available for useby the division make up its investment base. But accountants disagree on whether depreciable assets should be included inthe ROI calculation at original cost, original cost less accumulated depreciation, or current replacement cost. Original costis the price paid to acquire the assets. Original cost less accumulated depreciation is the book value of the assets—theamount paid less total depreciation taken. Current replacement cost is the cost of replacing the present assets with similarassets in the same condition as those now in use. A different rate of return results from each of these measures. Therefore,management must select and agree on an appropriate measure of investment base prior to making ROI calculations orinterdivision comparisons.
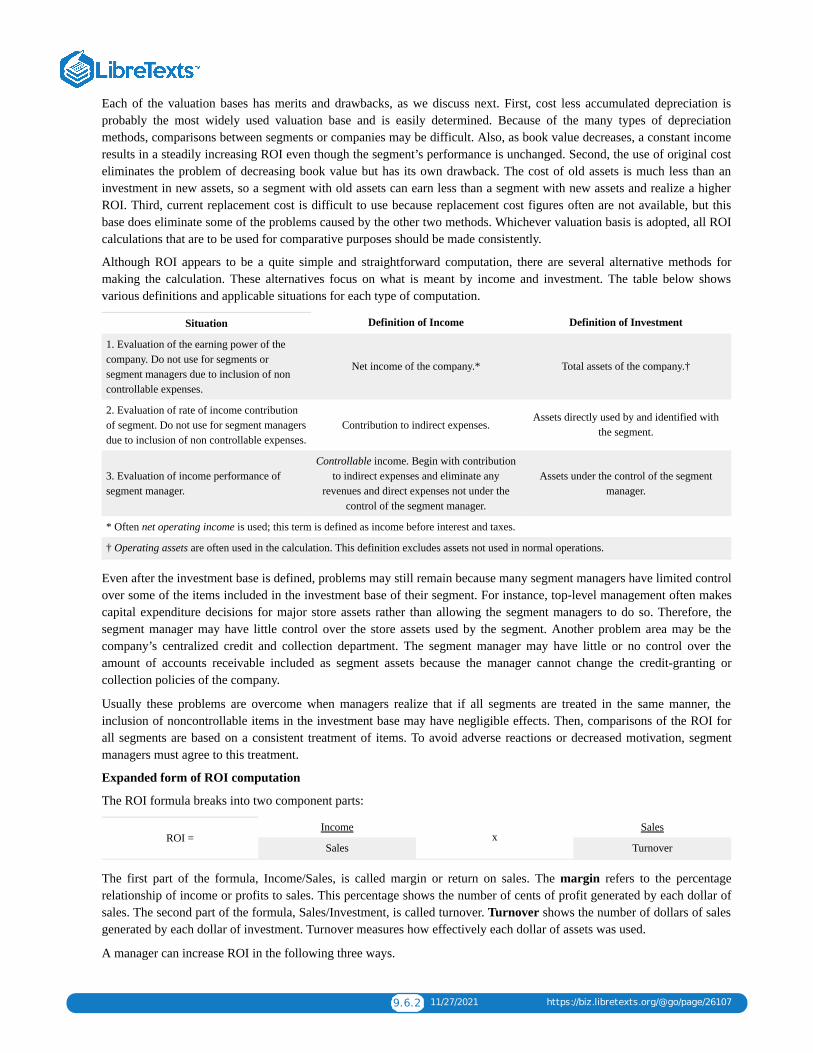
9.6.2 11/27/2021 https://biz.libretexts.org/@go/page/26107
Each of the valuation bases has merits and drawbacks, as we discuss next. First, cost less accumulated depreciation isprobably the most widely used valuation base and is easily determined. Because of the many types of depreciationmethods, comparisons between segments or companies may be difficult. Also, as book value decreases, a constant incomeresults in a steadily increasing ROI even though the segment’s performance is unchanged. Second, the use of original costeliminates the problem of decreasing book value but has its own drawback. The cost of old assets is much less than aninvestment in new assets, so a segment with old assets can earn less than a segment with new assets and realize a higherROI. Third, current replacement cost is difficult to use because replacement cost figures often are not available, but thisbase does eliminate some of the problems caused by the other two methods. Whichever valuation basis is adopted, all ROIcalculations that are to be used for comparative purposes should be made consistently.
Although ROI appears to be a quite simple and straightforward computation, there are several alternative methods formaking the calculation. These alternatives focus on what is meant by income and investment. The table below showsvarious definitions and applicable situations for each type of computation.
Situation Definition of Income Definition of Investment
1. Evaluation of the earning power of thecompany. Do not use for segments orsegment managers due to inclusion of noncontrollable expenses.
Net income of the company.* Total assets of the company.†
2. Evaluation of rate of income contributionof segment. Do not use for segment managersdue to inclusion of non controllable expenses.
Contribution to indirect expenses.Assets directly used by and identified with
the segment.
3. Evaluation of income performance ofsegment manager.
Controllable income. Begin with contributionto indirect expenses and eliminate any
revenues and direct expenses not under thecontrol of the segment manager.
Assets under the control of the segmentmanager.
* Often net operating income is used; this term is defined as income before interest and taxes.
† Operating assets are often used in the calculation. This definition excludes assets not used in normal operations.
Even after the investment base is defined, problems may still remain because many segment managers have limited controlover some of the items included in the investment base of their segment. For instance, top-level management often makescapital expenditure decisions for major store assets rather than allowing the segment managers to do so. Therefore, thesegment manager may have little control over the store assets used by the segment. Another problem area may be thecompany’s centralized credit and collection department. The segment manager may have little or no control over theamount of accounts receivable included as segment assets because the manager cannot change the credit-granting orcollection policies of the company.
Usually these problems are overcome when managers realize that if all segments are treated in the same manner, theinclusion of noncontrollable items in the investment base may have negligible effects. Then, comparisons of the ROI forall segments are based on a consistent treatment of items. To avoid adverse reactions or decreased motivation, segmentmanagers must agree to this treatment.
Expanded form of ROI computation
The ROI formula breaks into two component parts:
ROI =Income
xSales
Sales Turnover
The first part of the formula, Income/Sales, is called margin or return on sales. The margin refers to the percentagerelationship of income or profits to sales. This percentage shows the number of cents of profit generated by each dollar ofsales. The second part of the formula, Sales/Investment, is called turnover. Turnover shows the number of dollars of salesgenerated by each dollar of investment. Turnover measures how effectively each dollar of assets was used.
A manager can increase ROI in the following three ways.
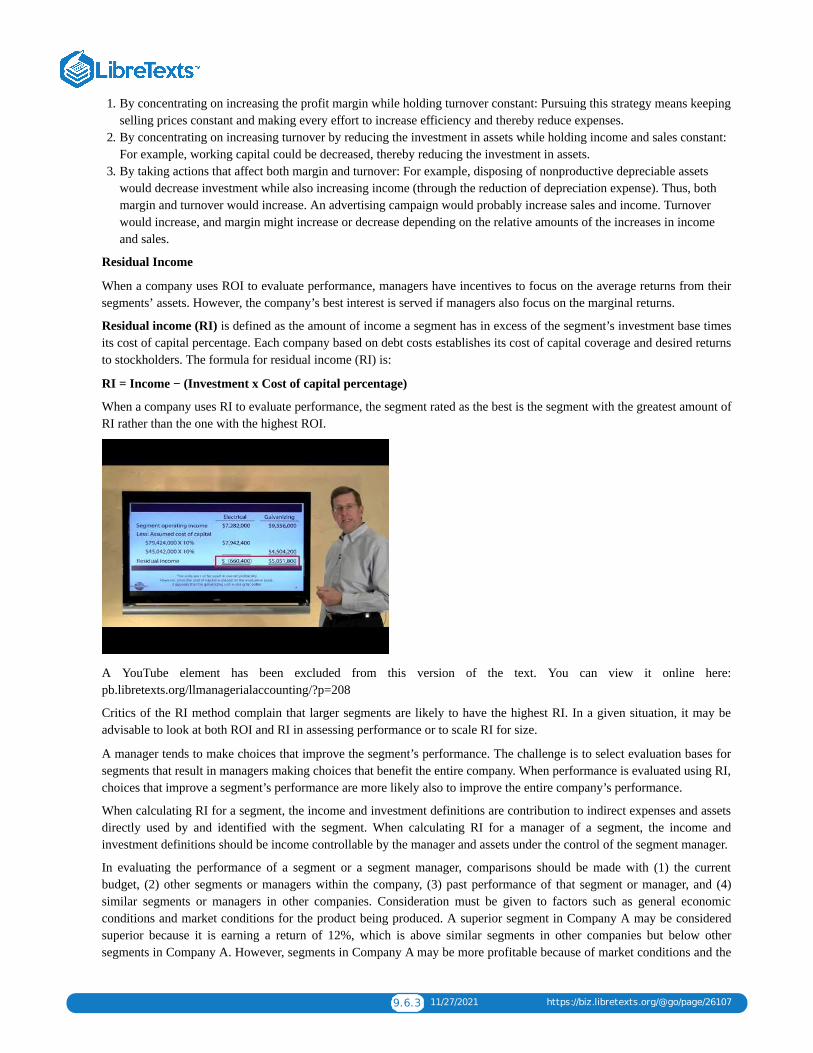
9.6.3 11/27/2021 https://biz.libretexts.org/@go/page/26107
1. By concentrating on increasing the profit margin while holding turnover constant: Pursuing this strategy means keepingselling prices constant and making every effort to increase efficiency and thereby reduce expenses.
2. By concentrating on increasing turnover by reducing the investment in assets while holding income and sales constant:For example, working capital could be decreased, thereby reducing the investment in assets.
3. By taking actions that affect both margin and turnover: For example, disposing of nonproductive depreciable assetswould decrease investment while also increasing income (through the reduction of depreciation expense). Thus, bothmargin and turnover would increase. An advertising campaign would probably increase sales and income. Turnoverwould increase, and margin might increase or decrease depending on the relative amounts of the increases in incomeand sales.
Residual Income
When a company uses ROI to evaluate performance, managers have incentives to focus on the average returns from theirsegments’ assets. However, the company’s best interest is served if managers also focus on the marginal returns.
Residual income (RI) is defined as the amount of income a segment has in excess of the segment’s investment base timesits cost of capital percentage. Each company based on debt costs establishes its cost of capital coverage and desired returnsto stockholders. The formula for residual income (RI) is:
RI = Income − (Investment x Cost of capital percentage)
When a company uses RI to evaluate performance, the segment rated as the best is the segment with the greatest amount ofRI rather than the one with the highest ROI.
A YouTube element has been excluded from this version of the text. You can view it online here:pb.libretexts.org/llmanagerialaccounting/?p=208
Critics of the RI method complain that larger segments are likely to have the highest RI. In a given situation, it may beadvisable to look at both ROI and RI in assessing performance or to scale RI for size.
A manager tends to make choices that improve the segment’s performance. The challenge is to select evaluation bases forsegments that result in managers making choices that benefit the entire company. When performance is evaluated using RI,choices that improve a segment’s performance are more likely also to improve the entire company’s performance.
When calculating RI for a segment, the income and investment definitions are contribution to indirect expenses and assetsdirectly used by and identified with the segment. When calculating RI for a manager of a segment, the income andinvestment definitions should be income controllable by the manager and assets under the control of the segment manager.
In evaluating the performance of a segment or a segment manager, comparisons should be made with (1) the currentbudget, (2) other segments or managers within the company, (3) past performance of that segment or manager, and (4)similar segments or managers in other companies. Consideration must be given to factors such as general economicconditions and market conditions for the product being produced. A superior segment in Company A may be consideredsuperior because it is earning a return of 12%, which is above similar segments in other companies but below othersegments in Company A. However, segments in Company A may be more profitable because of market conditions and the
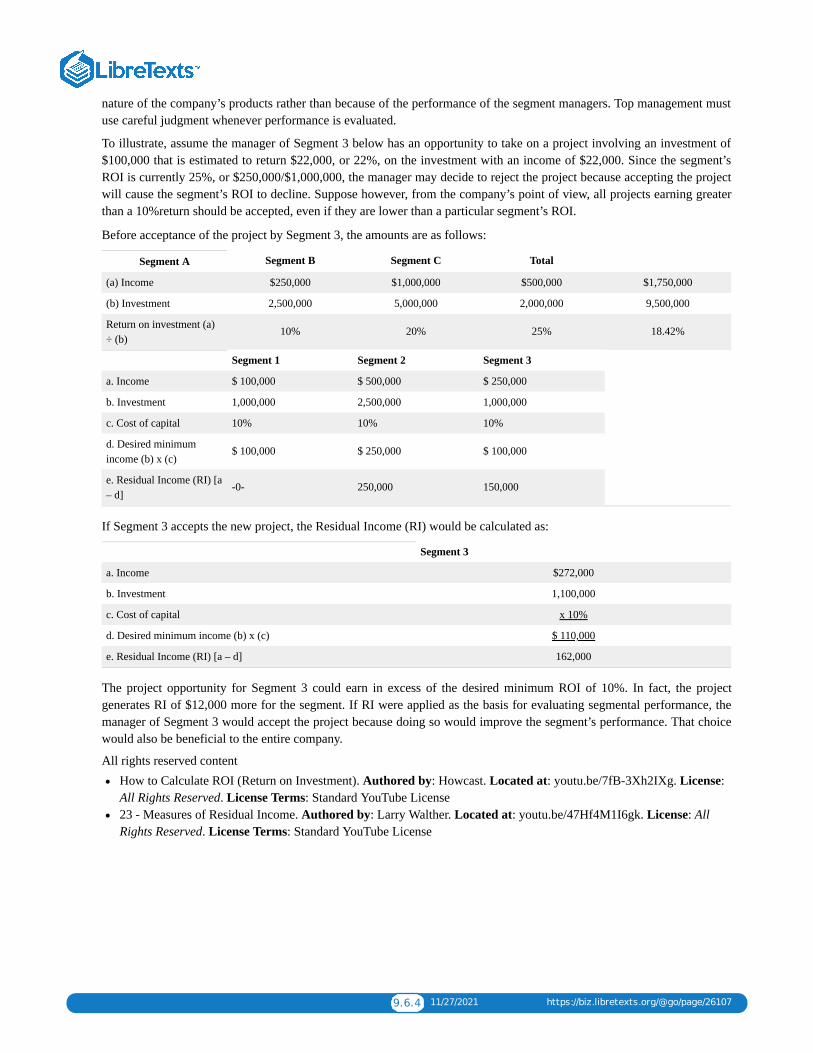
9.6.4 11/27/2021 https://biz.libretexts.org/@go/page/26107
nature of the company’s products rather than because of the performance of the segment managers. Top management mustuse careful judgment whenever performance is evaluated.
To illustrate, assume the manager of Segment 3 below has an opportunity to take on a project involving an investment of$100,000 that is estimated to return $22,000, or 22%, on the investment with an income of $22,000. Since the segment’sROI is currently 25%, or $250,000/$1,000,000, the manager may decide to reject the project because accepting the projectwill cause the segment’s ROI to decline. Suppose however, from the company’s point of view, all projects earning greaterthan a 10%return should be accepted, even if they are lower than a particular segment’s ROI.
Before acceptance of the project by Segment 3, the amounts are as follows:
Segment A Segment B Segment C Total
(a) Income $250,000 $1,000,000 $500,000 $1,750,000
(b) Investment 2,500,000 5,000,000 2,000,000 9,500,000
Return on investment (a)÷ (b)
10% 20% 25% 18.42%
Segment 1 Segment 2 Segment 3
a. Income $ 100,000 $ 500,000 $ 250,000
b. Investment 1,000,000 2,500,000 1,000,000
c. Cost of capital 10% 10% 10%
d. Desired minimumincome (b) x (c)
$ 100,000 $ 250,000 $ 100,000
e. Residual Income (RI) [a– d]
-0- 250,000 150,000
If Segment 3 accepts the new project, the Residual Income (RI) would be calculated as:
Segment 3
a. Income $272,000
b. Investment 1,100,000
c. Cost of capital x 10%
d. Desired minimum income (b) x (c) $ 110,000
e. Residual Income (RI) [a – d] 162,000
The project opportunity for Segment 3 could earn in excess of the desired minimum ROI of 10%. In fact, the projectgenerates RI of $12,000 more for the segment. If RI were applied as the basis for evaluating segmental performance, themanager of Segment 3 would accept the project because doing so would improve the segment’s performance. That choicewould also be beneficial to the entire company.
All rights reserved contentHow to Calculate ROI (Return on Investment). Authored by: Howcast. Located at: youtu.be/7fB-3Xh2IXg. License:All Rights Reserved. License Terms: Standard YouTube License23 - Measures of Residual Income. Authored by: Larry Walther. Located at: youtu.be/47Hf4M1I6gk. License: AllRights Reserved. License Terms: Standard YouTube License
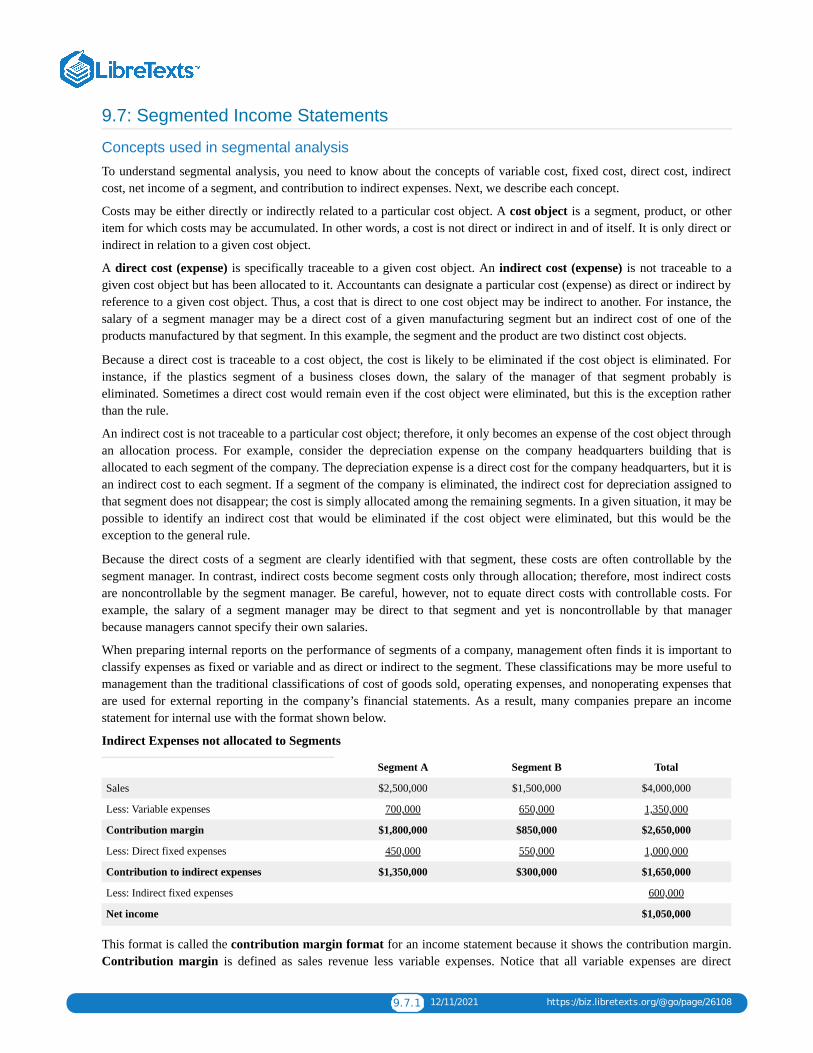
9.7.1 12/11/2021 https://biz.libretexts.org/@go/page/26108
9.7: Segmented Income Statements
Concepts used in segmental analysis
To understand segmental analysis, you need to know about the concepts of variable cost, fixed cost, direct cost, indirectcost, net income of a segment, and contribution to indirect expenses. Next, we describe each concept.
Costs may be either directly or indirectly related to a particular cost object. A cost object is a segment, product, or otheritem for which costs may be accumulated. In other words, a cost is not direct or indirect in and of itself. It is only direct orindirect in relation to a given cost object.
A direct cost (expense) is specifically traceable to a given cost object. An indirect cost (expense) is not traceable to agiven cost object but has been allocated to it. Accountants can designate a particular cost (expense) as direct or indirect byreference to a given cost object. Thus, a cost that is direct to one cost object may be indirect to another. For instance, thesalary of a segment manager may be a direct cost of a given manufacturing segment but an indirect cost of one of theproducts manufactured by that segment. In this example, the segment and the product are two distinct cost objects.
Because a direct cost is traceable to a cost object, the cost is likely to be eliminated if the cost object is eliminated. Forinstance, if the plastics segment of a business closes down, the salary of the manager of that segment probably iseliminated. Sometimes a direct cost would remain even if the cost object were eliminated, but this is the exception ratherthan the rule.
An indirect cost is not traceable to a particular cost object; therefore, it only becomes an expense of the cost object throughan allocation process. For example, consider the depreciation expense on the company headquarters building that isallocated to each segment of the company. The depreciation expense is a direct cost for the company headquarters, but it isan indirect cost to each segment. If a segment of the company is eliminated, the indirect cost for depreciation assigned tothat segment does not disappear; the cost is simply allocated among the remaining segments. In a given situation, it may bepossible to identify an indirect cost that would be eliminated if the cost object were eliminated, but this would be theexception to the general rule.
Because the direct costs of a segment are clearly identified with that segment, these costs are often controllable by thesegment manager. In contrast, indirect costs become segment costs only through allocation; therefore, most indirect costsare noncontrollable by the segment manager. Be careful, however, not to equate direct costs with controllable costs. Forexample, the salary of a segment manager may be direct to that segment and yet is noncontrollable by that managerbecause managers cannot specify their own salaries.
When preparing internal reports on the performance of segments of a company, management often finds it is important toclassify expenses as fixed or variable and as direct or indirect to the segment. These classifications may be more useful tomanagement than the traditional classifications of cost of goods sold, operating expenses, and nonoperating expenses thatare used for external reporting in the company’s financial statements. As a result, many companies prepare an incomestatement for internal use with the format shown below.
Indirect Expenses not allocated to Segments
Segment A Segment B Total
Sales $2,500,000 $1,500,000 $4,000,000
Less: Variable expenses 700,000 650,000 1,350,000
Contribution margin $1,800,000 $850,000 $2,650,000
Less: Direct fixed expenses 450,000 550,000 1,000,000
Contribution to indirect expenses $1,350,000 $300,000 $1,650,000
Less: Indirect fixed expenses 600,000
Net income $1,050,000
This format is called the contribution margin format for an income statement because it shows the contribution margin.Contribution margin is defined as sales revenue less variable expenses. Notice that all variable expenses are direct
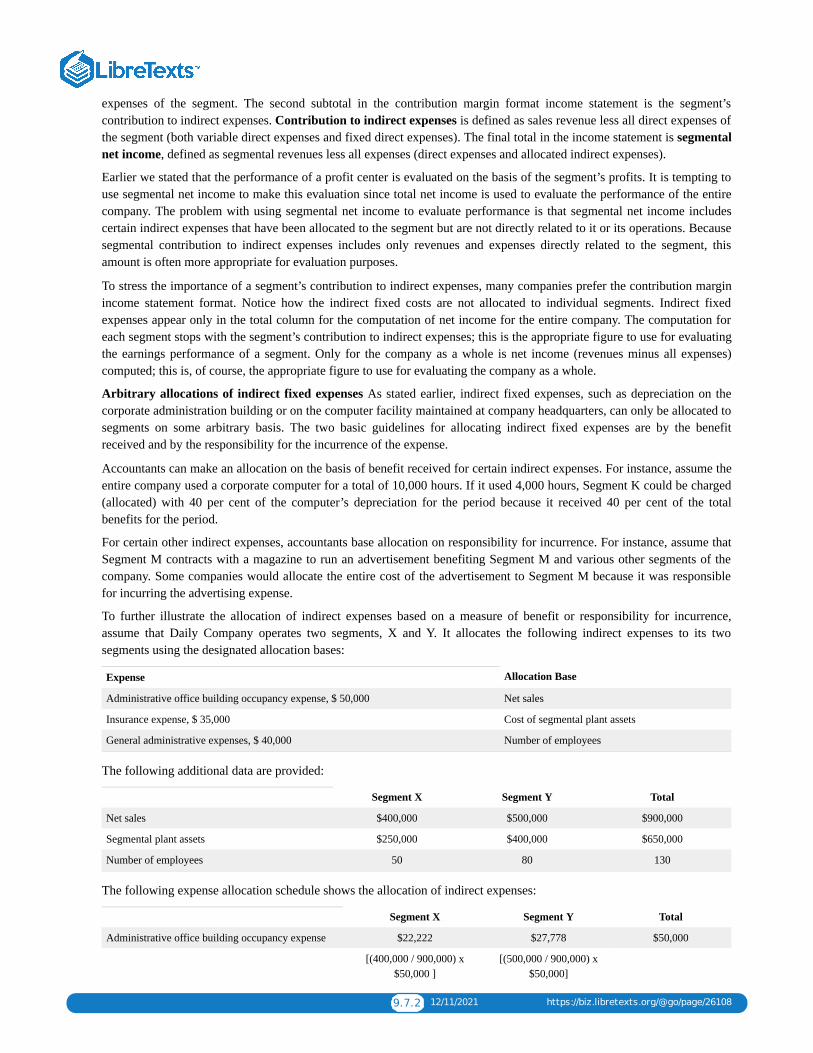
9.7.2 12/11/2021 https://biz.libretexts.org/@go/page/26108
expenses of the segment. The second subtotal in the contribution margin format income statement is the segment’scontribution to indirect expenses. Contribution to indirect expenses is defined as sales revenue less all direct expenses ofthe segment (both variable direct expenses and fixed direct expenses). The final total in the income statement is segmentalnet income, defined as segmental revenues less all expenses (direct expenses and allocated indirect expenses).
Earlier we stated that the performance of a profit center is evaluated on the basis of the segment’s profits. It is tempting touse segmental net income to make this evaluation since total net income is used to evaluate the performance of the entirecompany. The problem with using segmental net income to evaluate performance is that segmental net income includescertain indirect expenses that have been allocated to the segment but are not directly related to it or its operations. Becausesegmental contribution to indirect expenses includes only revenues and expenses directly related to the segment, thisamount is often more appropriate for evaluation purposes.
To stress the importance of a segment’s contribution to indirect expenses, many companies prefer the contribution marginincome statement format. Notice how the indirect fixed costs are not allocated to individual segments. Indirect fixedexpenses appear only in the total column for the computation of net income for the entire company. The computation foreach segment stops with the segment’s contribution to indirect expenses; this is the appropriate figure to use for evaluatingthe earnings performance of a segment. Only for the company as a whole is net income (revenues minus all expenses)computed; this is, of course, the appropriate figure to use for evaluating the company as a whole.
Arbitrary allocations of indirect fixed expenses As stated earlier, indirect fixed expenses, such as depreciation on thecorporate administration building or on the computer facility maintained at company headquarters, can only be allocated tosegments on some arbitrary basis. The two basic guidelines for allocating indirect fixed expenses are by the benefitreceived and by the responsibility for the incurrence of the expense.
Accountants can make an allocation on the basis of benefit received for certain indirect expenses. For instance, assume theentire company used a corporate computer for a total of 10,000 hours. If it used 4,000 hours, Segment K could be charged(allocated) with 40 per cent of the computer’s depreciation for the period because it received 40 per cent of the totalbenefits for the period.
For certain other indirect expenses, accountants base allocation on responsibility for incurrence. For instance, assume thatSegment M contracts with a magazine to run an advertisement benefiting Segment M and various other segments of thecompany. Some companies would allocate the entire cost of the advertisement to Segment M because it was responsiblefor incurring the advertising expense.
To further illustrate the allocation of indirect expenses based on a measure of benefit or responsibility for incurrence,assume that Daily Company operates two segments, X and Y. It allocates the following indirect expenses to its twosegments using the designated allocation bases:
Expense Allocation Base
Administrative office building occupancy expense, $ 50,000 Net sales
Insurance expense, $ 35,000 Cost of segmental plant assets
General administrative expenses, $ 40,000 Number of employees
The following additional data are provided:
Segment X Segment Y Total
Net sales $400,000 $500,000 $900,000
Segmental plant assets $250,000 $400,000 $650,000
Number of employees 50 80 130
The following expense allocation schedule shows the allocation of indirect expenses:
Segment X Segment Y Total
Administrative office building occupancy expense $22,222 $27,778 $50,000
[(400,000 / 900,000) x$50,000 ]
[(500,000 / 900,000) x$50,000]
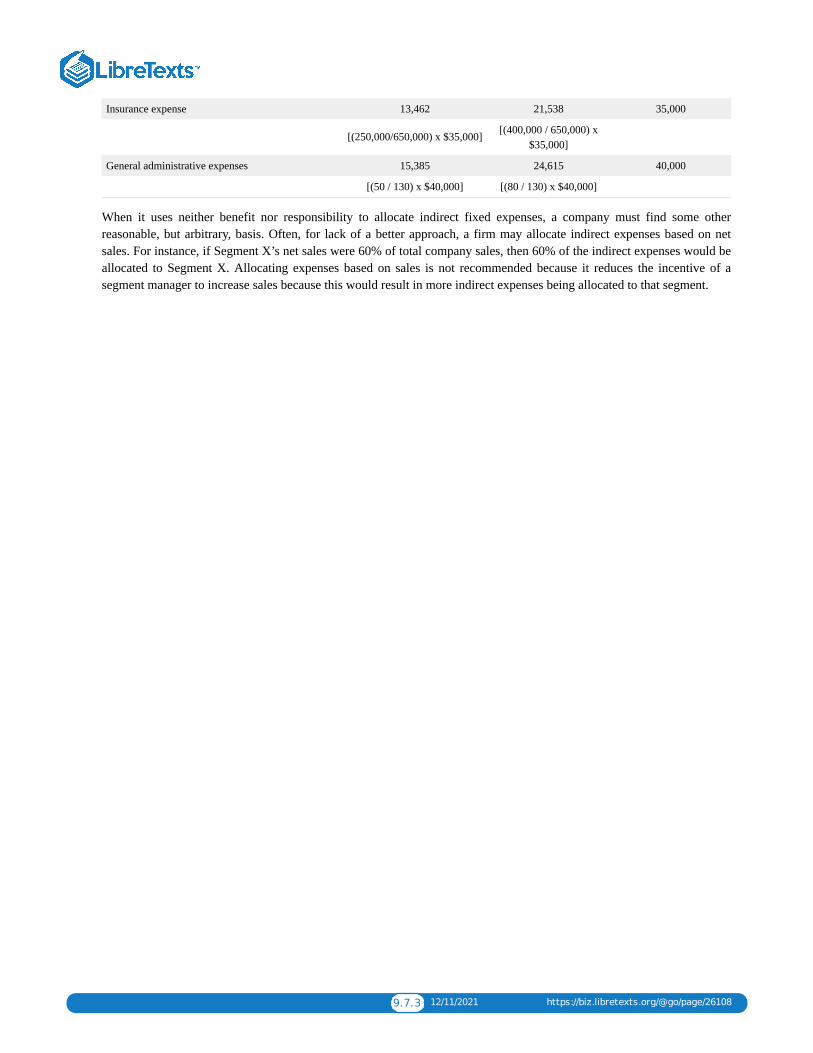
9.7.3 12/11/2021 https://biz.libretexts.org/@go/page/26108
Insurance expense 13,462 21,538 35,000
[(250,000/650,000) x $35,000] [(400,000 / 650,000) x$35,000]
General administrative expenses 15,385 24,615 40,000
[(50 / 130) x $40,000] [(80 / 130) x $40,000]
When it uses neither benefit nor responsibility to allocate indirect fixed expenses, a company must find some otherreasonable, but arbitrary, basis. Often, for lack of a better approach, a firm may allocate indirect expenses based on netsales. For instance, if Segment X’s net sales were 60% of total company sales, then 60% of the indirect expenses would beallocated to Segment X. Allocating expenses based on sales is not recommended because it reduces the incentive of asegment manager to increase sales because this would result in more indirect expenses being allocated to that segment.
9.8.1 12/18/2021 https://biz.libretexts.org/@go/page/26109
9.8: Accounting in the Headlines
How should the cost of national advertising by Whole Foods impact the performance report(and segment margin) for each store?
Whole Foods Market, Inc., is a supermarket chain based in Austin, Texas, with 381 stores in the US (italso has stores in the UK and Canada.) Whole Foods specializes in natural and organic food and has annual sales of $13billion.
In October 2014, Whole Foods rolled out its first national advertising campaign in the United States. This advertisingcampaign is centered on the slogan “Values matter,” and is estimated to have a cost of $20 million. The advertising will beon TV, in print, and online.
Questions
1. Would each of Whole Foods’ stores be considered to be a cost center, a revenue center, a profit center, or an investmentcenter?
2. Assume that Whole Foods prepares performance reports for each of its stores. Would you expect to see a portion of thenational advertising campaign cost in each store’s segment margin? Why or why not?
3. Assume now that the advertising campaign turns out to be quite successful because it increases Whole Foods’ visibilityand results in increased sales across all stores in the U.S. Should the U.S. store managers be evaluated on the variancebetween the budgeted national advertising costs and the actual national advertising costs? Why or why not?
CC licensed content, Specific attributionHow should the cost of national advertising by Whole Foods impact the performance report (and segment margin) foreach store?. Authored by: Dr. Wendy Tietz, CPA, CMA, CGMA. Located at:http://www.accountingintheheadlines.com. License: CC BY: Attribution

9.9.1 12/4/2021 https://biz.libretexts.org/@go/page/26110
9.9: Transfer Pricing
Transfer pricesProfit centers and investment centers inside companies often exchange products with each other. The Pontiac, Buick, andother divisions of General Motors buy and sell automobile parts from each other, for example. No market exchange takesplace, so the company sets transfer prices that represent revenue to the selling division and costs to the buying division.
A transfer price is an artificial price used when goods or services are transferred from one segment to another segmentwithin the same company. Accountants record the transfer price as a revenue of the producing segment and as a cost, orexpense, of the receiving segment. Usually no cash actually changes hands between the segments. Instead, the transferprice is an internal accounting transaction.
A YouTube element has been excluded from this version of the text. You can view it online here:pb.libretexts.org/llmanagerialaccounting/?p=214
Segments are generally evaluated based on some measure of profitability. The transfer price is important because it affectsthe profitability of the buying and selling segments. The higher the transfer price, the better for the seller. The lower thetransfer price, the better for the buyer.
Ideally, a transfer price provides incentives for segment managers to make decisions not only in their best interests but alsoin the interests of the entire company. For example, if the selling segment can sell everything it produces for $100 per unit,the buying segment should pay the market price of $100 per unit. A seller with excess capacity, however, should be willingto transfer a product to the buying segment for any price at or above the differential cost of producing and transferring theproduct to the buying segment (typically all variable costs).
In practice, companies mostly base transfer prices on (1) the market price of the product, (2) the cost of the product, or (3)some amount negotiated by the buying and selling segment managers.
All rights reserved contentPricing - 6 Transfer Pricing. Authored by: Susan Crosson. Located at: youtu.be/0aB6L6kajCY. License: All RightsReserved. License Terms: Standard YouTube License
9.10.1 1/1/2022 https://biz.libretexts.org/@go/page/26111
9.10: Balanced ScorecardThe balanced scorecard is a set of performance targets and results that show an organization’s performance in meeting itsobjectives to its stakeholders. It is a management tool that recognizes organizational responsibility to different stakeholdergroups, such as employees, suppliers, customers, business partners, the community, and shareholders. Often differentstakeholders have different needs or desires that the managers of the organization must balance. The concept of a balancedscorecard is to measure how well the organization is doing in view of those competing stakeholder concerns.
A YouTube element has been excluded from this version of the text. You can view it online here:pb.libretexts.org/llmanagerialaccounting/?p=216
An example of a balanced scorecard is shown in below. As you can see, the focus is to balance the efforts of theorganization between the financial, customer, process, and innovative responsibilities.
Traditionally, business organizations have focused on financial results, which mainly have reflected the shareholders’interests. In recent years, organizations have shifted attention to customer issues, such as quality and service, to employees,and to the community. For example, Ben & Jerry’s Ice Cream measures its social performance along with financialperformance and presents a social audit in its annual report next to its financial audit (click SEAR to see the 2014 report).Johnson & Johnson’s code of conduct (click CODE to see it) makes it clear that the company has a responsibility to severalcompeting stakeholders.
The balanced scorecard has been developed and used in many companies. It primarily has been used at the topmanagement level to support the organization’s development of strategies. For example, Kaplan and Norton describe thedevelopment of the balanced scorecard at an insurance company as follows:
Step 1: Ten of the company’s top executives formed a team to clarify the company’s strategy and objectives to meetresponsibilities.Step 2: The top three layers of the company’s management (100 people) were brought together to discuss the newstrategy and to develop performance measures for each part of the company. These performance measures became thescorecards for each part of the business and reflected the company’s desired balance in satisfying differentstakeholders.Step 3: Managers began eliminating programs that were not contributing to the company’s objectives.Step 4: Top management reviewed the scorecards for each part of the organization.
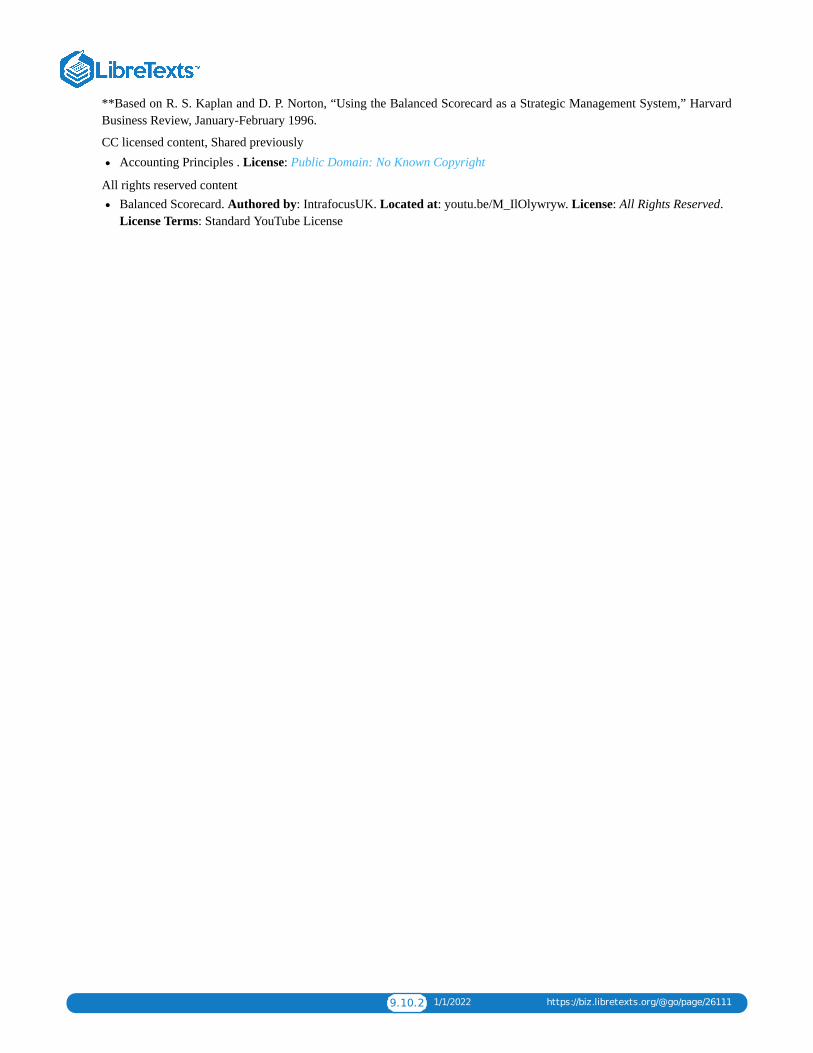
9.10.2 1/1/2022 https://biz.libretexts.org/@go/page/26111
**Based on R. S. Kaplan and D. P. Norton, “Using the Balanced Scorecard as a Strategic Management System,” HarvardBusiness Review, January-February 1996.
CC licensed content, Shared previouslyAccounting Principles . License: Public Domain: No Known Copyright
All rights reserved contentBalanced Scorecard. Authored by: IntrafocusUK. Located at: youtu.be/M_IlOlywryw. License: All Rights Reserved.License Terms: Standard YouTube License

9.11.1 1/1/2022 https://biz.libretexts.org/@go/page/26112
9.11: Chapter 9 Key Points
Key Takeaways – Performance MeasurementManagers and Department heads should be evaluated based on CONTROLLABLE costs or things that they can alter.Indirect costs from other departments can be allocated using whatever base the company had decided upon. The basicformula is Indirect Department Cost / Total Base to get our allocation rate. Then take the number of actual base used bythe current department x allocation rate.Direct costs are costs that can be directly traced to a segment, department or product and can be either fixed or variable.Contribution to Indirect expenses by a segment is used to determine the amount of money the segments gives towardsindirect (and often uncontrollable) expenses. It is calculated as Contribution Margin (Sales – Variable expenses) –direct fixed expenses.Return on Investment is calculated as Income / Investment Base. Return on investment tells you how many cents areearned in income for every dollar of investment base.Return on Investment can also be calculated as Margin (Income / Sales) x Turnover (Sales / Investment)
Click Key Takeaways for a printable copy.
9.12.1 1/1/2022 https://biz.libretexts.org/@go/page/26113
9.12: Glossary
GLOSSARY
Budget variance The difference between the budgeted and actual amounts of an item.
Contribution margin Sales revenues less variable expenses.
Contribution margin format An income statement format that shows the contribution margin (Sales -Variable expenses)for a segment.
Contribution to indirect expenses Sales revenue less all direct expenses of the segment.
Controllable profits of a segment Profit of a segment when expenses under a manager’s control are deducted fromrevenues under that manager’s control.
Cost object A segment, product, or other item for which costs may be accumulated.
Current replacement cost The cost of replacing the present assets with similar assets in the same condition as those nowin use.
Decentralization The dispersion of decision-making authority among individuals at lower levels of the organization.
Direct cost (expense) A cost that is specifically traceable to a given cost object.
Expense center A responsibility center incurring only expense items and producing no direct revenue from the sale ofgoods or services. Examples include the accounting department and the maintenance department.
Indirect cost (expense) A cost that is not traceable to a given cost object but has been allocated to it.
Investment center A responsibility center having revenues, expenses, and an appropriate investment base.
Management by exception The principle that upper level management does not need to examine operating details atlower levels unless there appears to be a problem (an exception).
Margin (as used in ROI) The percentage relationship of income (or profits) to sales.
\text{Margin}=\frac{\text{Income}}{\text{Sales}}\\
Original cost The price paid to acquire an asset.
Original cost less accumulated depreciation The book value of an asset—the amount paid less total depreciation taken.
Profit center A responsibility center having both revenues and expenses.
Residual income (RI), Economic Value Added The amount of income a segment has in excess of the investment basetimes the cost of capital percentage. Residual income is equal to \text{Income}-(\text{Investment}\times\text{Cost of capital percentage})\\.
Responsibility accounting Refers to an accounting system that collects, summarizes, and reports accounting data relatingto the responsibility of the individual managers. A responsibility accounting system provides information to evaluate eachmanager on revenue and expense items over which that manager has primary control.
Responsibility center A segment of an organization for which a particular executive is responsible.
Return on investment (ROI) Calculates the return (income) as a percentage of the assets employed (investment).
\text{Return on investment}=\frac{\text{Income}}{\text{Investment}}\text{or}\frac{\text{Income}}{\text{Sales}}\times\frac{\text{Sales}}{\text{Investment}}\\
Segment A fairly autonomous unit or division of a company defined according to function or product line.
Segmental net income The final total in the income statement; segmental revenues less all expenses (direct expenses andallocated indirect expenses).
Transfer price An artificial price used when goods or services are transferred from one segment to another segment withinthe same company.
Turnover (as used in ROI) The number of dollars of sales generated by each dollar of investment.
\text{Turnover}=\frac{\text{Sales}}{\text{Investment}}\\
9.13.1 1/4/2022 https://biz.libretexts.org/@go/page/26115
9.13: Chapter 9- Exercises
Short-Answer Questions, Exercises, and Problems
Short-Answer Questions
What is the fundamental principle of responsibility accounting?List five important factors that should be considered in designing reports for a responsibility accounting system.How soon should accounting reports be prepared after the end of the performance measurement period? Explain.Name and describe three types of responsibility centers.Describe a segment of a business enterprise that is best treated as an expense center. List four indirect expenses thatmay be allocated to such an expense center.Compare and contrast an expense center and an investment center.What purpose is served by setting transfer prices?What is the advantage of using investment centers as a basis for performance evaluation?Which categories of items must a segment manager have control over for the investment center concept to beapplicable?What is the connection between the extent of decentralization and the investment center concept?Give some of the advantages of decentralization.Differentiate between a direct cost and an indirect cost of a segment. What happens to these categories if the segment towhich they are related is eliminated?Is it possible for a cost to be direct to one cost object and indirect to another cost object? Explain.Describe some of the methods by which indirect expenses are allocated to a segment.Give the general formula for return on investment (ROI). What are its two components?Give the three sets of definitions for income and investment that can be used in ROI calculations, and explain wheneach set is applicable.Give the various valuation bases that can be used for plant assets in investment center calculations. Discuss some of theadvantages and disadvantages of these methods.In what way is the use of the residual income (RI) concept superior to the use of ROI?How is residual income (RI) determined?If the RI for segment manager A is $50,000 while the RI for segment manager B is $100,000, does this necessarilymean that B is a better manager than A? Explain.Real world question Refer to the annual report of a publicly traded company. Which of the company’s geographicregions performed better? Explain.(Based on Appendix) Briefly discuss the two methods of allocating service department costs.
ExercisesExercise A The following information refers to the inspection department of a chemical packaging plant for September:
Amount Over or (Under) Budget
Supplies $ 54,000 $ (10,800)
Repairs and maintenance 270,000 21,600
Overtime paid to inspectors 108,000 10,800
Salary of inspection department manager 32,400 (5,400)
Salary of plant manager 43,200 -0-
Allocation of company accounting costs 32,400 10,800
Allocation of building depreciation to theinspection department
21,600 (5,400)
Using this information, prepare a responsibility report for the manager of the inspection department for September. Includethose items for which you think the inspection department manager would be held responsible.
9.13.2 1/4/2022 https://biz.libretexts.org/@go/page/26115
Exercise B Present the following information for the Hardware Division of ABC Computer Company,
Sales $ 1,400,000
Variable selling and administrative expenses 100,000
Fixed direct manufacturing expenses 35,000
Fixed indirect manufacturing expenses 56,000
Variable manufacturing expenses 400,000
Fixed direct selling and administrative expenses 175,000
Fixed indirect selling and administrative expenses 28,000
Exercise C Given the following data, prepare a schedule that shows contribution margin, contribution to indirect expenses,and net income of the Sharks Division of Hockey, Inc.:
Direct fixed expenses $ 324,000
Indirect fixed expenses 259,200
Sales 2,100,000
Variable expenses 1,500,000
What would be the effect on the company income if the segment were eliminated?
Exercise D Three segments (A, B, and C) of Trump Enterprises have net sales of $300,000, $150,000, and $50,000,respectively. A decision is made to allocate the pool of $25,000 of administrative overhead expenses of the home office tothe segments, using net sales as the basis for allocation.
a. How much of the $25,000 should be allocated to each segment?
b. If Segment C is eliminated, how much of the $25,000 will be allocated to A and B?
Exercise E Two segments (Mountain Bike and Road Bike) showed the following data for the most recent year:
Mountain bike Road bike
Contribution to indirect expenses $ 840,000 $ 504,000
Assets directly used by and identified withthe segment
2,520,000 2,184,000
Sales 3,360,000 6,720,000
a. Calculate return on investment for each segment in the most direct manner.
b. Calculate return on investment using the margin and turnover components.
Exercise F Calculate the new margin, turnover, and return on investment of the Mountain Bike segment for each of thefollowing changes. Consider each change independently of the others.
a. Direct variable expenses were reduced by $33,600. Sales and assets were unaffected.
b. Assets used by the segment were reduced by $540,000, while income and sales were unaffected.
c. An advertising campaign increased sales by $336,000 and income by $50,000. Assets directly used by the segment wereunaffected.
Exercise G The following data are available for Segment A of ABC Company:
Net income of the segment $ 50,000
Contribution to indirect expenses 40,000
Controllable income by manager 48,000
Assets directly used by the manager 360,000
Assets under the control of the segment manager 240,000
9.13.3 1/4/2022 https://biz.libretexts.org/@go/page/26115
Determine the return on investment for evaluating (a) the income performance of the manager of Segment A and (b) therate of income contribution of the segment.
Exercise H Travel Company has three segments: Air, Land, and Sea. Data concerning income and investment follow:
Air Land Sea
Contribution to indirect expenses $ 43,200 $ 86,400 $ 115,200
Assets directly used by andidentified with the segment
288,000 576,000 1,296,000
Assuming that the cost of capital on investment is 12%, calculate the residual income of each of the segments. Do theresults indicate that any of the segments should be eliminated?
Problems
Problem A You are given the following information for Farflung Company for the year ended 2009 December 31. Thecompany is organized according to functions:
Plant Manager Vice President Of Manufacturing President
Controllableexpenses
Budget Actual Budget Actual Budget Actual
Office expense $ 7,200 $ 9,600 $ 12,000 $ 16,800 $ 24,000 $ 16,800
Printing 19,200 16,800
Paging 2,400 2,160
Binding 4,800 4,800
Purchasing 24,000 26,400
Receiving 12,000 14,400
Inspection 19,200 16,800
Vice president ofmarketing
192,000 168,000
Controller 144,000 120,000
Treasurer 96,000 72,000
Vice president ofpersonnel
48,000 72,000
Prepare the responsibility accounting reports for the three levels of management—plant manager, vice president ofmanufacturing, and president.
Problem B Joey Bauer Corporation has production plants in Sacramento, Dallas, and Seattle. Following is a summary ofthe results for past year:
Plant Revenues Expenses Investment base (gross assets)
Sacramento $ 450,000 $ 225,000 $ 4,500,000
Dallas 450,000 180,000 3,375,000
Seattle 675,000 247,500 7,200,000
a. If the plants are treated as profit centers, which plant manager appears to have done the best job?
b. If the plants are treated as investment centers, which plant manager appears to have done the best job? (Assume theplant managers are evaluated by return on investment on gross assets.)
c. Do the results of profit center analysis and investment center analysis give different findings? If so, why?

9.13.4 1/4/2022 https://biz.libretexts.org/@go/page/26115
Problem C Quinn Company allocates all of its home office expenses to its two segments, A and B. Allocations are basedon the following selected expense account balances and additional data:
Expenses (allocation bases)
Home office building expense (net sales) $ 76,800
Buying expense (net purchases) 67,200
Uncollectible accounts (net sales) 8,000
Depreciation of home office equipment (net sales) 21,120
Advertising expense (indirect, allocated on basis of relative amountsof direct advertising)
86,400
Insurance expense (relative amounts of equipment plus averageinventory in department)
23,040
Segment A Segment B Total
Purchases (net) $ 243,200 $ 76,800 $ 320,000
Sales (net) 512,000 128,000 640,000
Equipment (cost) 96,000 64,000 160,000
Advertising (cost) 25,600 12,800 38,400
Average inventory 160,000 64,000 224,000
a. Prepare a schedule showing the amounts of each type of expense allocable to Segments X and Y using these data andbases of allocation.
b. Evaluate and criticize these allocation bases.
Problem D Allentown, Inc., is a company with two segments, X and Y. Its revenues and expenses for 2009 follow:
Segment X Segment Y Total
Net sales $ 96,000 $ 144,000 $ 240,000
Direct expenses:*
Cost of goods sold 45,000 99,000 144,000
Selling 13,680 7,200 20,880
Administrative:
Uncollectible accounts 3,000 1,800 4,800
Insurance 2,400 1,200 3,600
Interest 480 240 720
Indirect expenses (all fixed):
Selling 18,000
Administrative 25,200
* All the direct expenses are variable except insurance and interest, which are fixed.
a. Prepare a schedule showing the contribution margin, the contribution to indirect expenses of each segment, and netincome for the company as a whole. Do not allocate indirect expenses to the segments.
b. Assume that indirect selling expenses are to be allocated on the basis of net sales and that indirect administrativeexpenses are to be allocated on the basis of direct administrative expenses. Prepare a statement (starting with thecontribution to indirect expenses) that shows the net income of each segment.
c. Comment on the appropriateness of the income amounts shown in parts (a) and (b) for determining the incomecontribution of the segments.
9.13.5 1/4/2022 https://biz.libretexts.org/@go/page/26115
Problem E The following data pertain to the operating revenues and expenses for Golden State Company for 2009:
Los Angeles(LA) Segment
San Francisco(SF) Segment
Total
Sales $ 180,000 $ 360,000 $ 540,000
Variable expenses 96,000 240,000 336,000
Direct fixed expenses 24,000 30,000 54,000
Indirect fixed expenses 72,000
Regarding the company’s total operating assets of $900,000, the following facts exist:
Los AngelesSegment
San FranciscoSegment
Assets directly used by and identified withthe segment
$ 180,000 $ 360,000
a. Prepare a statement showing the contribution margin of each segment, the contribution to indirect expenses of eachsegment, and the total income of Golden State Company.
b. Determine the return on investment for evaluating (1) the earning power of the entire company and (2) the performanceof each segment.
c. Comment on the results of part (b).
Problem F Shaq Company operates with three segments, Louisiana, Orlando, and LA. Data regarding these segmentsfollow:
Louisianasegment
Orlandosegment
LAsegment
Contribution to indirect expenses $ 324,000 $ 180,000 $ 144,000
Assets directly used andidentified with the segment
1,800,000 1,440,000 720,000
a. Calculate the return on investment for each segment. Rank them from highest to lowest.
b. Assume the cost of capital is 12% for a segment. Calculate residual income for each segment. Rank them from highestto lowest.
c. Repeat (b), but assume the cost of capital is 17% for a segment. Rank them from highest to lowest.
d. Comment on the rankings achieved.
Problem G The manager of the Winston Company faced the following data for the year 2009:
Contribution to indirect expenses $ 1,800,000
Assets directly used by and identified with the segment 22,500,000
Sales 36,000,000
a. Determine the margin, turnover, and return on investment for the segment in 2009.
b. Determine the effect on margin, turnover, and return on investment of the segment in 2010 if each of the followingchanges were to occur. Consider each change separately and assume that any items not specifically mentioned remain thesame as in 2009:
A campaign to control costs resulted in $180,000 of reduced expenses.
Certain nonproductive assets were eliminated. As a result, investment decreased by $900,000, and expenses decreased by$72,000.
9.13.6 1/4/2022 https://biz.libretexts.org/@go/page/26115
An advertising campaign resulted in increasing sales by $3,600,000, cost of goods sold by $2,700,000, and advertisingexpense by $540,000.
An investment was made in productive assets costing $900,000. As a result, sales increased by $360,000, and expensesincreased by $54,000.
Problem H For the year ended 2009 December 31, Fore Company reported the following information for the company asa whole and for the sports segment of Fore Corporation:
Sports Segment
Forecompany
WoodsProject
IronsProject
Total
Sales $12,000,000 $1,350,000 $600,000 $1,950,000
Income 1,125,000 300,000 37,500 337,500
Investment 4,500,000 900,000 105,000 1,005,000
Fore Company anticipates that these relationships (return on investment, margin, and turnover) will hold true for theupcoming year. The sports segment is faced with the possibility of adding a new project in 2010, with the followingprojected data:
PuttersProject
Sales $450,000
Income 52,500
Investment 187,500
a. Determine the return on investment for Fore Company, for the sports segment, and for the Woods and Irons projectsseparately for the year ended 2009 December 31.
b. Using this information, determine the effect of adding the Putters project on the sports segment’s return on investment.What problem may be encountered?
Using the data provided in the previous problem, determine the residual income (1) for all three projects and (2) for thesports segment with and without the Putters project, if the cost of capital is 25%. What is the effect on the sport segment’sresidual income if the Putter project is added? How does this result compare with your answer to the previous problem?
Alternate problems
Alternate problem A Swiss Corporation has three production plants (X, Y, and Z). Following is a summary of the resultsfor January 2009:
Plant Revenues ExpensesInvestmentBase(gross assets)
X $ 720,000 $ 300,000 $ 1,440,000
Y 960,000 180,000 1,920,000
Z 5,040,000 1,920,000 13,200,000
a. If the plants are treated as profit centers, which plant manager appears to have done the best job?
b. If the plants are treated as investment centers, which plant manager appears to have done the best job? (Assume theplant managers are evaluated by return on investment.)
c. Do the results of profit center analysis and investment center analysis give different findings? If so, why?
Alternate problem B Easy Loans, Inc., allocates expenses and revenues to the two segments that it operates. Easy Loansextends credit to customers under a revolving charge plan whereby all account balances not paid within 30 days are
9.13.7 1/4/2022 https://biz.libretexts.org/@go/page/26115
charged interest at the rate of 11/2% per month.
Following are selected revenue and expense accounts and some additional data needed to complete the allocation of theone revenue amount and the expenses.
Revenue and Expenses (allocation bases)
Revolving charge service revenue (net sales) $600,000
Home office building occupancy expense (net sales) 45,000
Buying expenses (net purchases) 150,000
General administrative expenses (number of employees indepartment)
75,000
Insurance expense (relative average inventory plus costof equipment and fixtures in each department)
18,000
Depreciation expense on home office equipment (net sales) 30,000
High RiskSegment
Low RiskSegment
Total
Number of employees 3 7 10
Net sales $ 300,000 $ 600,000 $ 900,000
Net purchases 240,000 360,000 600,000
Averaging inventory 60,000 120,000 180,000
Cost of equipment fixtures 90,000 180,000 270,000
a. Prepare a schedule showing allocation of these items to the High and Low Risk segments.
b. Do you think these are good allocation bases? Why or why not?
Alternate problem C Student Painters, Inc., operates two segments, interior and exterior. The revenue and expense datafor 2009 follow:
Interior Exterior Total
Net sales $ 335,700 553,800 $ 889,500
Direct expenses:*
Cost of goods sold 186,000 282,000 468,000
Selling 31,800 27,000 58,800
Administrative 9,000 6,000 15,000
Uncollectible accounts 2,400 6,600 9,000
Indirect expenses (all fixed):
Selling 126,000
Administrative 156,000
*All the direct expenses are variable except administrative expense, which is fixed.
a. Prepare a schedule showing the contribution margin, the contribution to indirect expenses of each segment, and netincome for the company as a whole. Do not allocate indirect expenses to the segments.
b. Assume that indirect selling expenses are to be allocated to segments on the basis of net sales (round to the nearest%)and that indirect administrative expenses are to be allocated on the basis of direct administrative expenses. Prepare astatement (starting with the contribution to indirect expenses) which shows the net income of each segment.
c. Comment on the appropriateness of the income amounts shown in parts (a) and (b) for determining the incomecontribution of the segments.
9.13.8 1/4/2022 https://biz.libretexts.org/@go/page/26115
Alternate problem D Elliott Corporation has three segments. Following are the results of operations for 2009:
Segment A Segment B Segment C Total
Sales $36,000,000 $ 21,600,000 $ 14,400,000 $ 72,000,000
Variable expenses 25,920,000 12,240,000 9,720,000 47,880,000
Fixed expenses:
Direct 5,040,000 1,800,000 720,000 7,560,000
Indirect 3,600,000
For the company’s total operating assets of $100,800,000, the following facts exist:
Segment A Segment B Segment C
Assets directly used by andidentified with the segment
$ 50,400,000 $ 28,800,000 $ 14,400,000
a. Prepare a statement (in thousands of dollars) showing the contribution margin, the contribution to indirect expenses foreach segment, and the total income of the Elliott Corporation.
b. Determine the return on investment for evaluating (1) the performance of the entire company and (2) performance ofeach segment.
c. Comment on the results of part (a).
Alternative problem E Goodwin Company has three segments, 1,2, and 3. Data regarding these segments follow:
Segment 1 Segment 2 Segment 3
Contribution to indirect expenses $ 432,000 $ 208,800 $ 72,000
Assets directly used by andidentifiedwith the segment
3,600,000 1,440,000 360,000
a. Calculate the return on investment for each segment. Rank them from highest to lowest.
b. Assume the cost of capital is 10% for a segment. Calculate the residual income for each segment. Rank them fromhighest to lowest.
c. Repeat (b), but assume the desired cost of capital is 14%. Rank the segments from highest to lowest.
d. Comment on the rankings achieved.
Beyond the numbers—Critical thinking
Business decision case A Texas Company manufactures skateboards. Because the company’s business is seasonal,between August and December skilled manufacturing employees are laid off. To improve morale, the financial vicepresident suggested that 10 employees not be laid off in the future. Instead, she suggested that they work in general laborfrom August to December but still be paid their manufacturing wages of $10 per hour. General labor personnel earn $6.60per hour. What are the implications of this plan for the assignment of costs to the various segments of the business?
Business decision case B Piero Company builds new homes. Sarah Richards is in charge of the construction department.Among other responsibilities, Sarah hires and supervises the carpenters and other workers who build the homes. PieroCompany does not do its own foundation work. The construction of foundations is done by subcontractors hired by LeslieLarue of the procurement department.
To start the development of a 500-home community, Larue hired Dire Company to build the foundations for the homes. Onthe day construction was to begin, Dire Company went out of business. Consequently, construction was delayed six weekswhile Larue hired a new subcontractor. Which department should be charged with the cost of the delay in construction?Why?

9.13.9 1/4/2022 https://biz.libretexts.org/@go/page/26115
Business decision case C Ken Silva is the supervisor of Department 103 of Laguna Company. The annual budget forSilva’s department is as follows:
Annual budget for Department 103
Small tools $ 6,750
Set up 7,500
Direct labor 8,250
Direct materials 15,000
Supplies 3,750
Supervision 22,500
Property taxes 3,750
Property insurance 750
Depreciation, machinery 1,500
Depreciation, building 1,500
Total $ 71,250
Silva’s salary of $15,000 is included in supervision. The remaining $7,500 in supervision is the salary of the assistantsupervisor directly responsible to Silva. Identify the budget items that Silva controls.
Broader perspective – Writing experience D Refer to “A broader perspective: Employee buyouts”. Write a brief reportexplaining the effects of employee buyouts on employee motivation.
Group project E Macrofast Software, Inc., faces stiff competition in selling its products. Macrofast’s top managementfeels considerable pressure from the company’s stockholders to increase earnings.
Mac Washington, the vice president of marketing at the company’s Production Software Division, received a memorandumfrom top management that said, in effect, “Increase your division’s earnings or look for a new job”.
Washington could think of only one way to increase earnings by the end of the year. The Production Software Division hadseveral installations that should be completed early the following year, probably in February or March. For each of thosejobs, he asked the customers to sign a Completed Installation document stating the job was completed to the customer’ssatisfaction. He did this because Macrofast’s accounting department would record the revenue from the job when itreceived the Completed Installation document.
Several customers signed Completed Installation documents even though the jobs were not complete because Washingtongave them a personally signed letter stating the Completion Installation document was not legally binding.
The scheme initially worked. Revenues were prematurely recorded for these jobs, sales and earnings for the year were up,Macrofast’s top management was delighted with the results, and Washington was rewarded with a large bonus and apromotion to a vice presidency at corporate headquarters.
The following June, a staff accountant discovered the scheme when a customer called to complain that he was being billedfor a job that was not yet completed. When the accountant produced the customer’s Completed Installation document, thecustomer produced Washington’s letter saying the document was not binding. The accountant did some detective work andunearthed the scheme. When she presented the results to her supervisor, the supervisor said, “This practice is unfortunateand is against company policy. But what is done is done. Do not worry about last year’s financial statements. Just be sure itdoes not happen again.”
a. In teams of four, discuss what the staff accountant should do.
b. Then, decide how your solution would change if all jobs had been completed to the customers’ satisfaction.
c. As a team, write a memorandum to your instructor describing your solutions. The heading of the memo should containthe date, to whom it is written, from whom, and the subject matter.
Group project F Bleak Prospects, Inc., found that its market share was slipping. Division managers were encouraged tomaximize ROI and made decisions consistent with that goal. Nonetheless, there were frequent customer complaints, with
9.13.10 1/4/2022 https://biz.libretexts.org/@go/page/26115
resulting loss of business. Moreover, Bleak depended on an established product line and was unable to find new productsfor expansion while its competitors seemed to be able to generate new products almost yearly. What would you suggestBleak Prospects’ management do to improve the situation? In groups of two or three students, write a memorandum toyour instructor addressing this question. The heading of the memorandum should contain the date, to whom it is written,from whom, and the subject matter.
Group project G Management of Division A is evaluated based on residual income measures. The division can either rentor buy a certain asset. Will the performance evaluation technique have an impact on the rent-or-buy decision? Why or whynot? In groups or three students, write a memorandum to your instructor addressing this question. The heading of thememorandum should contain the date, to whom it is written, from whom, and the subject matter.
Using the Internet—A view of the real world
Visit the website for PepsiCo, Incorporated.
http://www.pepsico.com
Go to the company’s most recent annual report. Compare the performance of PepsiCo’s three business segments: (1)beverages, (2) snack foods, and (3) restaurants. (You will find business segment information in the notes to the financialstatements.) Which business segment had the most operating profits? Which business performed better using ROI, profitmargin, and asset turnover as the performance measures? Use end-of-year “identifiable assets” to measure investment,“operating profits” to measure income, and “net sales” to measure sales. Be sure to submit a copy of PepsiCo’s businesssegment information from the annual report.
Visit the website for PepsiCo, Incorporated.
http://www.pepsico.com
Go to the company’s most recent annual report. Using financial information for the most recent year, which of thecompany’s geographic areas had the highest ROI? (You will find business segment information in the notes to the financialstatements, including geographic segments.) Use end-of-year “identifiable assets” to measure investment, “operatingprofits” to measure income, and “net sales” to measure sales. Be sure to submit a copy of PepsiCo’s business segmentinformation from the annual report.
1 1/8/2022
CHAPTER OVERVIEW10: DIFFERENTIAL ANALYSIS (OR RELEVANT COSTS)
10.1: CHAPTER 10 STUDY PLAN10.2: DIFFERENTIAL ANALYSIS10.3: APPLYING DIFFERENTIAL ANALYSIS IN MANAGERIAL DECISION MAKING10.4: APPLYING DIFFERENTIAL ANALYSIS TO QUALITY DECISIONS10.5: ACCOUNTING IN THE HEADLINES10.6: GLOSSARY10.7: CHAPTER 10- EXERCISES

10.1.1 1/8/2022 https://biz.libretexts.org/@go/page/26114
10.1: Chapter 10 Study Plan
Study Plan: Relevant Costing for Managers
Knowledge Targets
I can define the following terms as they relate to our unit:
Avoidable Cost Constraint Make or Buy Differential Cost
Differential Revenue Joint Product Joint Cost Opportunity Cost
Sunk Cost Relevant Benefit Relevant Cost Sells or Process further
Special Order Split Off Point Constrained Resource
Reasoning Targets
I can identify costs as relevant, avoidable, opportunity or sunk cost.I can classify costs as relevant or not relevant.I can determine value and use of a constrained resource.
Skill Targets
I can prepare an analysis showing if a product line or business segment should be dropped or added.I can prepare make or buy analysis.I can prepare analysis showing whether a special order should be accepted or rejected.I can prepare an analysis showing whether a joint product should be sold at the split off point or processed further.
Click Relevant Costs for a printable copy.
10.2.1 11/20/2021 https://biz.libretexts.org/@go/page/26116
10.2: Differential Analysis
Differential analysisDifferential analysis involves analyzing the different costs and benefits that would arise from alternative solutions to aparticular problem. Relevant revenues or costs in a given situation are future revenues or costs that differ depending onthe alternative course of action selected. Differential revenue is the difference in revenues between two alternatives.Differential cost or expense is the difference between the amounts of relevant costs for two alternatives.[1]
Future costs that do not differ between alternatives are irrelevant and may be ignored since they affect both alternativessimilarly. Past costs, also known as sunk costs, are not relevant in decision making because they have already beenincurred; therefore, these costs cannot be changed no matter which alternative is selected.
For certain decisions, revenues do not differ between alternatives. Under those circumstances, management should selectthe alternative with the least cost. In other situations, costs do not differ between alternatives. Accordingly, managementshould select the alternative that results in the largest revenue. Many times both future costs and revenues differ betweenalternatives. In these situations, the management should select the alternative that results in the greatest positive differencebetween future revenues and expenses (costs).
To illustrate relevant, differential, and sunk costs, assume that Joanna Bennett invested $400 in a tiller so she could tillgardens to earn $1,500 during the summer. Not long afterward, Bennett was offered a job at a horse stable feeding horsesand cleaning stalls for $1,200 for the summer. The costs that she would incur in tilling are $100 for transportation and $150for supplies. The costs she would incur at the horse stable are $100 for transportation and $50 for supplies. If Bennettworks at the stable, she would still have the tiller, which she could loan to her parents and friends at no charge.
The tiller cost of $400 is not relevant to the decision because it is a sunk cost. The transportation cost of $100 is also notrelevant because it is the same for both alternatives. These costs and revenues are relevant (note: differential meansdifference):
Performing tilling service Working at horse stable Differential
Revenues $1,500 $1,200 $300
Costs 150 50 100
Net benefit in favor of tillingservice
$200
Based on this differential analysis, Joanna Bennett should perform her tilling service rather than work at the stable. Ofcourse, this analysis considers only cash flows; nonmonetary considerations, such as her love for horses, could sway thedecision.

10.2.2 11/20/2021 https://biz.libretexts.org/@go/page/26116
A YouTube element has been excluded from this version of the text. You can view it online here:pb.libretexts.org/llmanagerialaccounting/?p=228
In many situations, total variable costs differ between alternatives while total fixed costs do not. For example, suppose youare deciding between taking the bus to work or driving your car on a particular day. The differential costs of driving a carto work or taking the bus would involve only the variable costs of driving the car versus the variable costs of taking thebus.
Suppose the decision is whether to drive your car to work every day for a year versus taking the bus for a year. If youbought a second car for commuting, certain costs such as insurance and an auto license that are fixed costs of owning a carwould be differential costs for this particular decision.
Before studying the applications of differential analysis, you must realize that opportunity costs are also relevant inchoosing between alternatives. An opportunity cost is the potential benefit that is forgone by not following the next bestalternative course of action. For example, assume that the two best uses of a plot of land are as a mobile home park (annualincome of $100,000) and as a golf driving range (annual income of $60,000). The opportunity cost of using the land as amobile home park is $60,000, while the opportunity cost of using the land as a driving range is $100,000.
Companies do not record opportunity costs in the accounting records because they are the costs of not following a certainalternative. Thus, opportunity costs are not transactions that occurred but that did not occur. However, opportunity cost is arelevant cost in many decisions because it represents a real sacrifice when one alternative is chosen instead of another.
In the next section, we will look at examples of differential analysis.
All rights reserved contentDifferential Analysis - Concepts. Authored by: Christy Lynch Chauvin. Located at: youtu.be/ZtATVI1Oeyo. License:All Rights Reserved. License Terms: Standard YouTube License

10.3.1 1/4/2022 https://biz.libretexts.org/@go/page/26117
10.3: Applying Differential Analysis in Managerial Decision MakingApplications of differential analysis
To illustrate the application of differential analysis to specific decision problems, we consider five decisions:
1. setting prices of products;2. accepting or rejecting special orders;3. adding or eliminating products, segments, or customers;4. processing or selling joint products; and5. deciding whether to make products or buy them.
Although these five decisions are not the only applications of differential analysis, they represent typical short-termbusiness decisions using differential analysis. Our discussion ignores income taxes.
Pricing Decisions
When applying differential analysis to pricing decisions, each possible price for a given product represents an alternativecourse of action. The sales revenues for each alternative and the costs that differ between alternatives are the relevantamounts in these decisions. Total fixed costs often remain the same between pricing alternatives and, if so, may be ignored.In selecting a price for a product, the goal is to select the price at which total future revenues exceed total future costs bythe greatest amount, thus maximizing income.
A high price is not necessarily the price that maximizes income. The product may have many substitutes. If a company setsa high price, the number of units sold may decline substantially as customers switch to lower-priced competitive products.Thus, in the maximization of income, the expected volume of sales at each price is as important as the contribution marginper unit of product sold. In making any pricing decision, management should seek the combination of price and volumethat produces the largest total contribution margin. This combination is often difficult to identify in an actual situationbecause management may have to estimate the number of units that can be sold at each price.
For example, assume that a company selling fried chicken in the New York market estimates product demand for its largebucket of chicken for a particular period to be:
Choice Demand
1 15,000 units at $6 per unit
2 12,000 units at $7 per unit
3 10,000 units at $8 per unit
4 7,000 units at $9 per unit
The company’s fixed costs of $20,000 per year are not affected by the different volume alternatives. Variable costs are $5per unit. What price should be set for the product? Based on the calculations shown in the table below, the company shouldselect a price of $8 per unit because choice (3) results in the greatest total contribution margin and net income. In the shortrun, maximizing total contribution margin maximizes profits.
Choice Sales Price – Var. Cost =Contributionmargin perunit x
Numberof units =
Totalmargin
Fixedcosts
Netincome (loss)
1 $6 $5 $1 15,000 $15,000 $20,000 $(5,000)
2 $7 $5 2 12,000 24,000 20,000 4,000
3 $8 $5 3 10,000 30,000 20,000 10,000
4 $9 $5 4 7,000 28,000 20,000 8,000
Accept or Reject Special Orders
Sometimes management has an opportunity to sell its product in two or more markets at two or more different prices.Movie theaters, for example, sell tickets at discount prices to particular groups of people—children, students, and senior
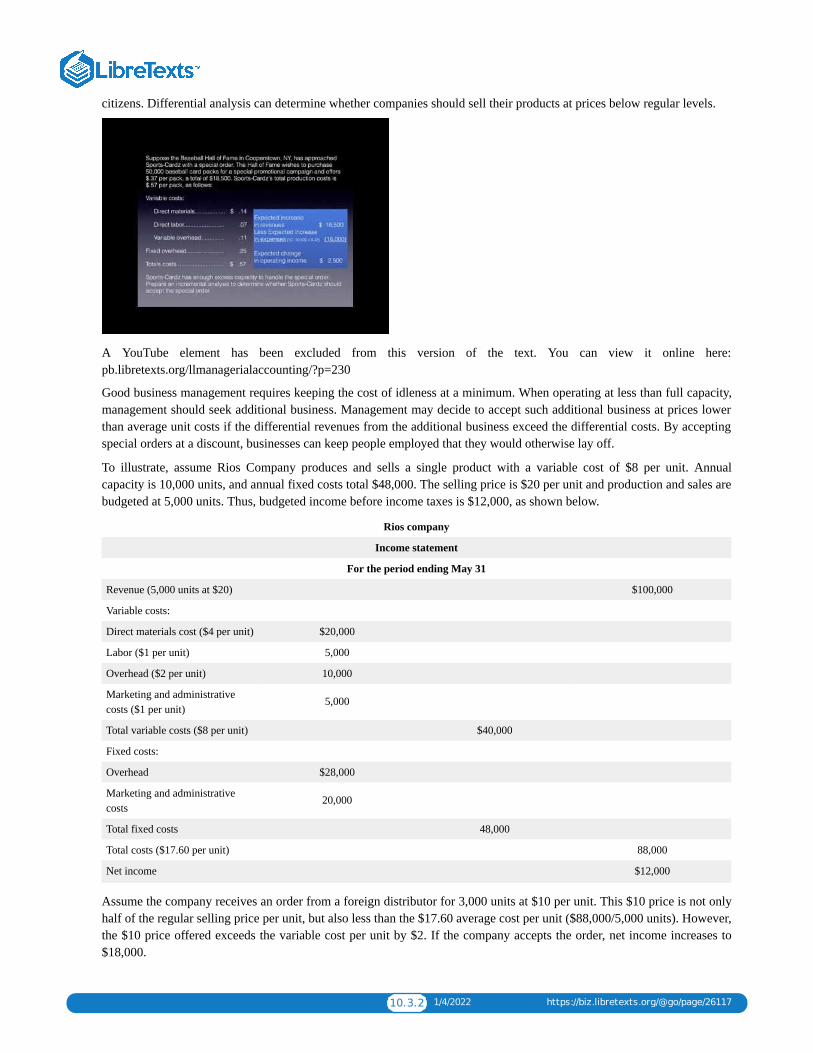
10.3.2 1/4/2022 https://biz.libretexts.org/@go/page/26117
citizens. Differential analysis can determine whether companies should sell their products at prices below regular levels.
A YouTube element has been excluded from this version of the text. You can view it online here:pb.libretexts.org/llmanagerialaccounting/?p=230
Good business management requires keeping the cost of idleness at a minimum. When operating at less than full capacity,management should seek additional business. Management may decide to accept such additional business at prices lowerthan average unit costs if the differential revenues from the additional business exceed the differential costs. By acceptingspecial orders at a discount, businesses can keep people employed that they would otherwise lay off.
To illustrate, assume Rios Company produces and sells a single product with a variable cost of $8 per unit. Annualcapacity is 10,000 units, and annual fixed costs total $48,000. The selling price is $20 per unit and production and sales arebudgeted at 5,000 units. Thus, budgeted income before income taxes is $12,000, as shown below.
Rios company
Income statement
For the period ending May 31
Revenue (5,000 units at $20) $100,000
Variable costs:
Direct materials cost ($4 per unit) $20,000
Labor ($1 per unit) 5,000
Overhead ($2 per unit) 10,000
Marketing and administrativecosts ($1 per unit)
5,000
Total variable costs ($8 per unit) $40,000
Fixed costs:
Overhead $28,000
Marketing and administrativecosts
20,000
Total fixed costs 48,000
Total costs ($17.60 per unit) 88,000
Net income $12,000
Assume the company receives an order from a foreign distributor for 3,000 units at $10 per unit. This $10 price is not onlyhalf of the regular selling price per unit, but also less than the $17.60 average cost per unit ($88,000/5,000 units). However,the $10 price offered exceeds the variable cost per unit by $2. If the company accepts the order, net income increases to$18,000.

10.3.3 1/4/2022 https://biz.libretexts.org/@go/page/26117
Revenue would increase to $130,000 with the special order. Each of the variable costs increases in total by 60% becausetotal volume increases by 60% (3,000 units in the special order/5,000 units regularly produced). The revised incomestatement would appear as follows:
Rios company
Income statement (with Special Order)
For the period ending May 31
Revenue (5,000 units at $20 +3,000 units at $10)
$130,000
Variable costs:
Direct materials cost ($4) $32,000
Labor ($1) 8,000
Overhead ($2) 16,000
Marketing and administrativecosts ($1)
8,000
Total variable costs ($8 per unit) $64,000
Fixed costs:
Manufacturing overhead $28,000
Marketing and administrativecosts
20,000
Total fixed costs 48,000
Total costs ($14 per unit) 112,000
Net income $18,000
Note that the fixed costs do not increase with the special order. Because the special order does not increase the fixed costs,the special order’s revenues need only cover its variable costs.
If Rios Company continues to operate at 50% capacity (producing 5,000 units without the special order) it would generateincome of only $12,000. By accepting the special order, net income increases by $6,000 ($18,000 net income with specialorder – $12,000 net income without special order).
Differential analysis would provide the following calculations:
Acceptorder
Rejectorder
Differential
Revenues $130,000 $100,000 $30,000
Costs 112,000 88,000 24,000
Net benefit of accepting order $6,000
Variable costs set a floor for the selling price in special-order situations. Even if the price exceeds variable costs onlyslightly, the additional business increases net income, assuming fixed costs do not change. However, pricing just abovevariable costs of special-order business often brings only short-term increases in net income. In the long run, companiesmust cover all of their costs, not just the variable costs.
Adding or Eliminating
Periodically, management has to decide whether to add or eliminate certain products, segments, or customers. If you havewatched a store or a plant open or close in your area, you have seen the results of these decisions. Differential analysis isuseful in this decision making because a company’s income statement does not automatically associate costs with certainproducts, segments, or customers. Thus, companies must reclassify costs as those that the action would change and thosethat it would not change.
10.3.4 1/4/2022 https://biz.libretexts.org/@go/page/26117
youtu.be/w7Ve8__NtPY
If companies add or eliminate products, they usually increase or decrease variable costs. The fixed costs may change, butnot in many cases. Management bases decisions to add or eliminate products only on the differential items; that is, thecosts and revenues that change.
To illustrate, assume that the Campus Bookstore is considering eliminating its art supplies department. If the bookstoredropped the art supplies department, it would lose revenues of $100,000 annually. The bookstore’s management assignscosts of $110,000 ($80,000 variable and $30,000 fixed) to the art supplies department. Therefore, art supplies has anapparent annual loss of $10,000 ($100,000 revenue minus $110,000 costs). But careful cost analysis reveals that if the artsupplies department were dropped, the reduction in costs would be only $80,000 variable costs directly related to the artsupplies department and the $30,000 fixed costs are general bookstore fixed costs allocated to the art supplies department.These fixed costs would continue to be incurred and would not be saved by closing the art supplies department. Look atthe differential analysis below.
Art Supplies Department
Keep Close Differential
Revenues $100,000 $-0- $100,000
Variable costs 80,000 -0- 80,000
Fixed costs 30,000 30,000 -0-
Net benefit of keeping artsupplies department
$ 20,000
Note that the art supplies department has been contributing $20,000 ($100,000 revenues – $80,000 variable costs) annuallytoward covering the fixed costs of the business. Consequently, its elimination could be a costly mistake unless there is amore profitable use for the vacated facilities.
If the company has a profitable alternative use for the vacated facilities, the potential income from that alternativerepresents an opportunity cost of retaining the product, segment, or customer. Assume, for example, that the bookstorecould use the facilities currently occupied by the art supplies department to open a new department to display and sellpersonal computers, printers, and software. This new department would contribute $35,000 to the bookstore’s income.
The relevant costs in the decision to retain the art supplies department are $115,000 ($80,000 of variable manufacturingcosts and $35,000 of opportunity cost of not opening a new department), while the relevant revenues are still $100,000.Therefore, the bookstore has a net disadvantage in keeping the art supplies department because it loses $15,000 comparedto the computer department.
Art Supplies PCs Differential
Revenues $100,000
Variable costs -80,000
Additional Income $20,000 35,000 $15,000
Sell or Process Further
Sometimes two or more products result from a common raw material or production process; these products are called jointproducts. Companies can process these products further or sell them in their current condition. For instance, whenChevron refines crude oil, it produces a wide variety of fuels, solvents, lubricants, and residual petrochemicals.
Management can use differential analysis to decide whether to process a joint product further or to sell it in its presentcondition. Joint costs are those costs incurred up to the point where the joint products split off from each other. Thesecosts are sunk costs and are not considered when deciding whether to process a joint product further before selling it or tosell it in its condition at the split-off point.
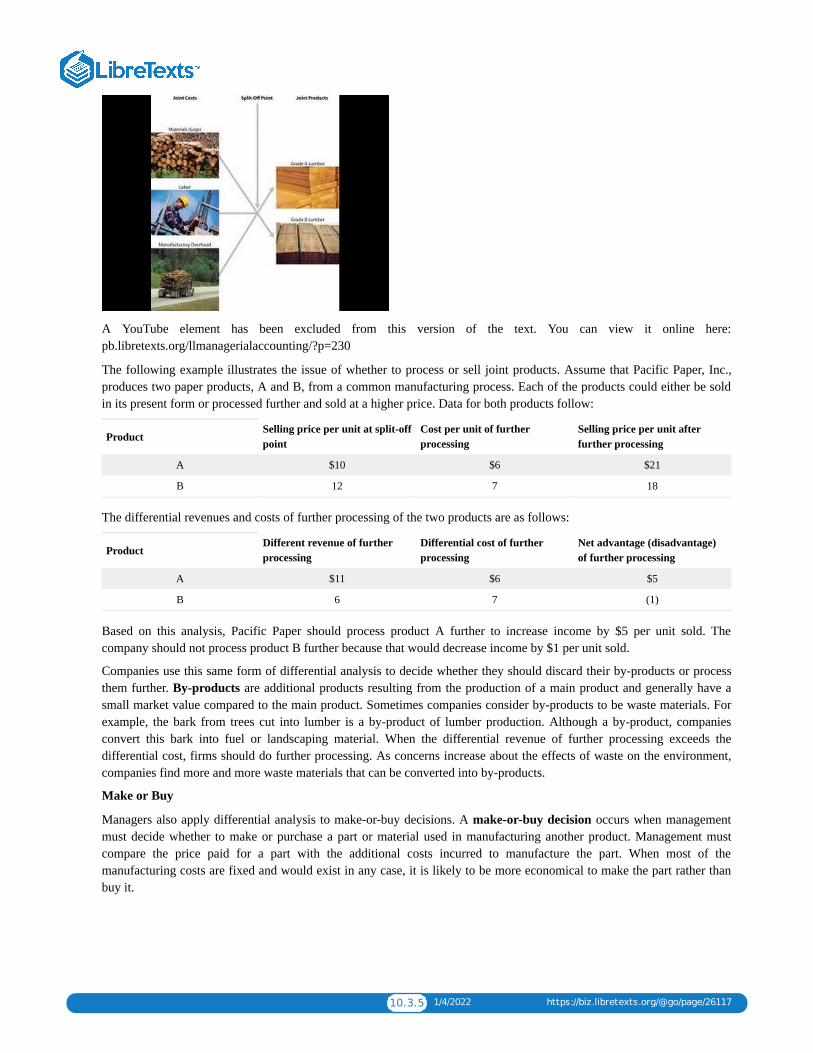
10.3.5 1/4/2022 https://biz.libretexts.org/@go/page/26117
A YouTube element has been excluded from this version of the text. You can view it online here:pb.libretexts.org/llmanagerialaccounting/?p=230
The following example illustrates the issue of whether to process or sell joint products. Assume that Pacific Paper, Inc.,produces two paper products, A and B, from a common manufacturing process. Each of the products could either be soldin its present form or processed further and sold at a higher price. Data for both products follow:
ProductSelling price per unit at split-offpoint
Cost per unit of furtherprocessing
Selling price per unit afterfurther processing
A $10 $6 $21
B 12 7 18
The differential revenues and costs of further processing of the two products are as follows:
ProductDifferent revenue of furtherprocessing
Differential cost of furtherprocessing
Net advantage (disadvantage)of further processing
A $11 $6 $5
B 6 7 (1)
Based on this analysis, Pacific Paper should process product A further to increase income by $5 per unit sold. Thecompany should not process product B further because that would decrease income by $1 per unit sold.
Companies use this same form of differential analysis to decide whether they should discard their by-products or processthem further. By-products are additional products resulting from the production of a main product and generally have asmall market value compared to the main product. Sometimes companies consider by-products to be waste materials. Forexample, the bark from trees cut into lumber is a by-product of lumber production. Although a by-product, companiesconvert this bark into fuel or landscaping material. When the differential revenue of further processing exceeds thedifferential cost, firms should do further processing. As concerns increase about the effects of waste on the environment,companies find more and more waste materials that can be converted into by-products.
Make or Buy
Managers also apply differential analysis to make-or-buy decisions. A make-or-buy decision occurs when managementmust decide whether to make or purchase a part or material used in manufacturing another product. Management mustcompare the price paid for a part with the additional costs incurred to manufacture the part. When most of themanufacturing costs are fixed and would exist in any case, it is likely to be more economical to make the part rather thanbuy it.

10.3.6 1/4/2022 https://biz.libretexts.org/@go/page/26117
A YouTube element has been excluded from this version of the text. You can view it online here:pb.libretexts.org/llmanagerialaccounting/?p=230
To illustrate the application of differential analysis to make-or-buy decisions, assume that Small Motor Companymanufactures a part costing $6 for use in its toy automobile engines. Cost components are: materials, $3.00; labor, $1.50;fixed overhead costs, $1.05; and variable overhead costs, $0.45. Small could purchase the part for $5.25. Fixed overheadwould presumably continue even if the part were purchased. The added costs (variable costs only) of manufacturingamount to $4.95 ($3.00 DM + $1.50 DL + $0.45 Variable OH). This amount is 30 cents per unit less than the purchaseprice of the part. Therefore, manufacturing the part should be continued as shown in the following analysis:
Make Buy Differential
Variable Costs $4.95 $5.25 $0.30
Net advantage of making $0.30
In make-or-buy decisions, management also should consider the opportunity cost of not utilizing the space for some otherpurpose. In the previous example, if the opportunity costs of not using this space in its best alternative use is more than 30cents per unit times the number of units produced, the part should be purchased.
In some manufacturing situations, firms avoid a portion of fixed costs by buying from an outside source. For example,suppose eliminating a part would reduce production so that a supervisor’s salary could be saved. In such a situation, firmsshould treat these fixed costs the same as variable costs in the analysis because they would be relevant costs.
Sometimes the cost to manufacture may be only slightly less than the cost of purchasing the part or material. Thenmanagement should place considerable weight on other factors such as the competency of existing personnel to undertakemanufacturing the part or material, the availability of working capital, and the cost of any loans that may be necessary.
All rights reserved contentManagement Product & Pricing Decisions: Special Order; Incremental Analysis - Accounting video. Authored by:Brian Routh TheAccountingDr. Located at: youtu.be/0vDqSCMXoa0. License: All Rights Reserved. License Terms:Standard YouTube License72 Management Accounting Decision Making Add or Delete Product Line . Authored by: MLI247. Located at:youtu.be/w7Ve8__NtPY. License: All Rights Reserved. License Terms: Standard YouTube LicenseDifferential Analysis - Joint Products Sell or Process Further. Authored by: Christy Lynch Chauvin. Located at:youtu.be/dcRj7cb3FVo. License: All Rights Reserved. License Terms: Standard YouTube LicenseManagement Accounting 17: Make or Buy Decisions . Authored by: AccountingED. Located at:youtu.be/FWWvPPx4rTQ. License: All Rights Reserved. License Terms: Standard YouTube License
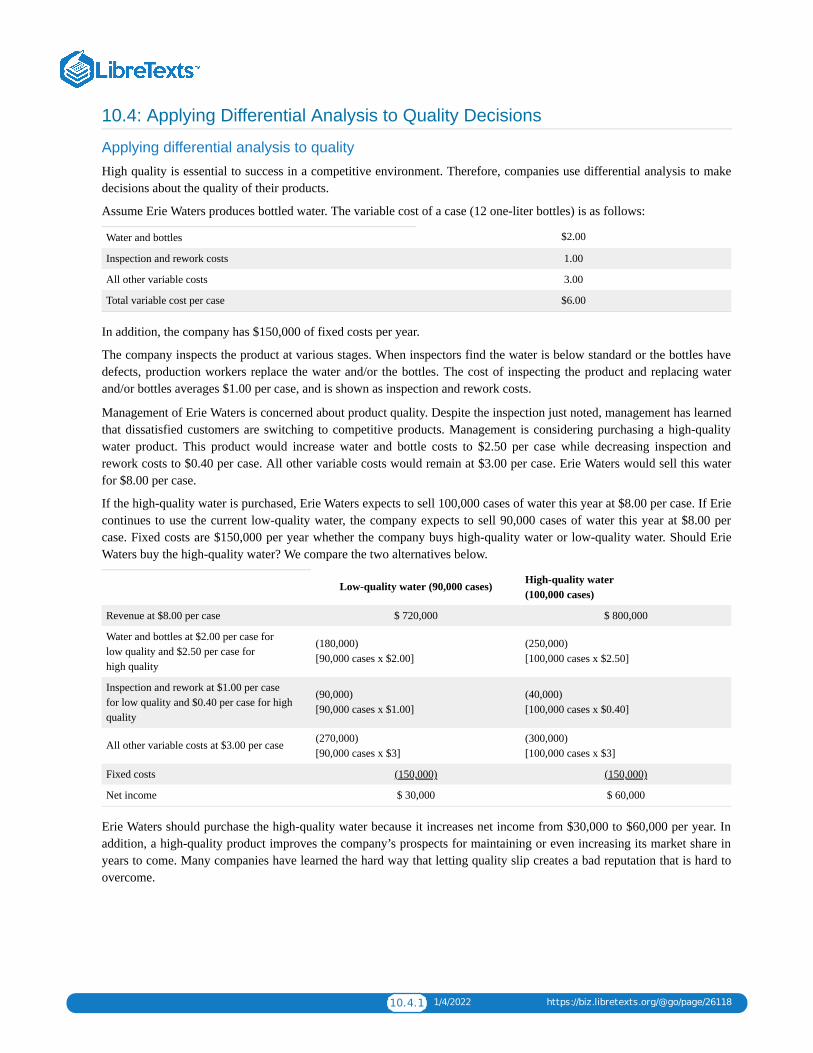
10.4.1 1/4/2022 https://biz.libretexts.org/@go/page/26118
10.4: Applying Differential Analysis to Quality Decisions
Applying differential analysis to quality
High quality is essential to success in a competitive environment. Therefore, companies use differential analysis to makedecisions about the quality of their products.
Assume Erie Waters produces bottled water. The variable cost of a case (12 one-liter bottles) is as follows:
Water and bottles $2.00
Inspection and rework costs 1.00
All other variable costs 3.00
Total variable cost per case $6.00
In addition, the company has $150,000 of fixed costs per year.
The company inspects the product at various stages. When inspectors find the water is below standard or the bottles havedefects, production workers replace the water and/or the bottles. The cost of inspecting the product and replacing waterand/or bottles averages $1.00 per case, and is shown as inspection and rework costs.
Management of Erie Waters is concerned about product quality. Despite the inspection just noted, management has learnedthat dissatisfied customers are switching to competitive products. Management is considering purchasing a high-qualitywater product. This product would increase water and bottle costs to $2.50 per case while decreasing inspection andrework costs to $0.40 per case. All other variable costs would remain at $3.00 per case. Erie Waters would sell this waterfor $8.00 per case.
If the high-quality water is purchased, Erie Waters expects to sell 100,000 cases of water this year at $8.00 per case. If Eriecontinues to use the current low-quality water, the company expects to sell 90,000 cases of water this year at $8.00 percase. Fixed costs are $150,000 per year whether the company buys high-quality water or low-quality water. Should ErieWaters buy the high-quality water? We compare the two alternatives below.
Low-quality water (90,000 cases) High-quality water(100,000 cases)
Revenue at $8.00 per case $ 720,000 $ 800,000
Water and bottles at $2.00 per case forlow quality and $2.50 per case forhigh quality
(180,000)[90,000 cases x $2.00]
(250,000)[100,000 cases x $2.50]
Inspection and rework at $1.00 per casefor low quality and $0.40 per case for highquality
(90,000)[90,000 cases x $1.00]
(40,000)[100,000 cases x $0.40]
All other variable costs at $3.00 per case (270,000)[90,000 cases x $3]
(300,000)[100,000 cases x $3]
Fixed costs (150,000) (150,000)
Net income $ 30,000 $ 60,000
Erie Waters should purchase the high-quality water because it increases net income from $30,000 to $60,000 per year. Inaddition, a high-quality product improves the company’s prospects for maintaining or even increasing its market share inyears to come. Many companies have learned the hard way that letting quality slip creates a bad reputation that is hard toovercome.

10.5.1 1/8/2022 https://biz.libretexts.org/@go/page/26119
10.5: Accounting in the Headlines
Should Apple Country Orchards sell Granny Smith apples or make cider from those apples?
Apple Country Orchards in Idalou, Texas, has 6,000 apple trees and offers 30 varietiesof apples. The orchard is 29 years old and allows customers to pick their own apples or to purchase pre-picked apples. Inaddition to apples and apple picking, the orchard offers hayrides, lunch, pumpkins, and a variety of other items.
Apple Country Orchards makes cider from several different apple varieties. One of the varieties used to make cider is theGranny Smith apple, which is known for its ability to be easily preserved in storage for up to a year and for its highantioxidant activity.
Assume that Apple Country Orchards sells Granny Smith apples for $0.90 per pound. One gallon of fresh-pressed cider atApple Country Orchards sells for $8. (On average, ten pounds of Granny Smith apples yield one gallon of fresh-pressedcider.)
Questions
1. Do you need to know the cost per pound that Apple Country Orchards uses for its Granny Smith apples to be able todecide if the Granny Smith apples should be sold as is (as raw apples) or processed further into cider, pie, turnovers, orany other apple product? Why or why not?
2. From a purely quantitative standpoint, should Apple Country Orchards sell raw Granny Smith apples or process thoseapples further into apple cider? Support your answer with calculations.
3. Assume that it is financially advantageous to sell raw apples rather than process them further into cider. Whatqualitative factors might influence Apple Country Orchards’ decision to offer fresh-pressed cider?
CC licensed content, Specific attributionShould Apple Country Orchards sell Granny Smith apples or make cider from those apples?. Authored by: Dr. WendyTietz, CPA, CMA, CGMA. Located at: http://www.accountingintheheadlines.com. License: CC BY: Attribution

10.6.1 12/18/2021 https://biz.libretexts.org/@go/page/26120
10.6: Glossary
GLOSSARY
By-products Additional products resulting from the production of a main product. By-products generally have a smallmarket value compared to the main product.
Committed fixed costs Costs relating to the basic facilities and organizational structure that a company must have tocontinue operations.
Differential analysis An analysis of the different costs and benefits that would arise from alternative solutions to aparticular problem.
Differential cost or expense The difference between the amounts of relevant costs for two alternatives.
Differential revenue The difference between the amounts of relevant revenues for two alternatives.
Discretionary fixed costs Fixed costs subject to management control from year to year; an example is advertisingexpense.
Joint costs Those production costs incurred up to the point where the joint products split off from each other.
Joint products Two or more products resulting from a common raw material or production process.
Make-or-buy decision A decision concerning whether to manufacture or purchase a part or material used inmanufacturing another product.
Opportunity cost The potential benefit that is forgone from not following the next best alternative course of action.
Relevant revenues or costs Revenues or costs that will differ in the future depending on which alternative course ofaction is selected.
Sunk costs Past costs that are not relevant in decision making because they have already been incurred.

10.7.1 1/4/2022 https://biz.libretexts.org/@go/page/26121
10.7: Chapter 10- Exercises
Short-Answer Questions, Exercises, and ProblemsQuestions➢ Identify types of decisions that can be made using differential analysis.➢ What is a committed fixed cost? Give some examples.➢ What is a discretionary fixed cost? Give some examples.➢ Give an example of a fixed cost that might be considered committed for one company and discretionary for another.➢ What is the disadvantage of a company having all committed fixed costs? Explain.➢ What is an opportunity cost? Give some examples.➢ What essential feature distinguishes the contribution margin income statement from the traditional income statement?➢ Real world question Give an example of a make-or-buy decision that you have made or someone you know has made.➢ Real world question Give an example in which your campus bookstore replaces one of its departments with another itcurrently does not have. (For example, it stops selling magazines and starts selling cameras.) What revenues and costswould be differential?➢ Real world question Assume that McDonald’s, of McDonald’s fast-food restaurants, currently buys its french friesfrom agricultural growers and food processors. In doing so, McDonald’s has decided to buy the materials for its frenchfries instead of “make” them. (Assume that making french fries includes growing the potatoes.) What factors would go intoMcDonald’s decision to buy instead of make french fries?➢ Real world question Suppose that Wal-Mart, one of thefastest growing companies in the world, were to close one of its stores. Which differential revenues and costs would beaffected by that decision?ExercisesExercise A The following data are for Paso Robles Company for the year ended 2009December 31:
Costs:
Direct material $ 90,000
Direct labor 130,000
Manufacturing overhead:
Variable 45,000
Fixed 90,000
Sales commissions (variable) 25,000
Sales salaries (fixed) 20,000
Administrative expenses (fixed) 35,000
Selling price per unit $ 10
Units produced and sold 60,000
Assume direct materials and direct labor are variable costs. Prepare a contribution margin income statement and atraditional income statement.
Exercise B Assume you had invested $1,000 in a lawn mower to set up a lawn mowing business for the summer. Duringthe first week, you could choose either to mow the grounds at a housing development for $1,400 or to help paint a garagefor $1,360. Each job would take one week. You cannot do both. You would incur additional costs of $160 for lawnmowing and $80 for garage painting. These costs include $60 under each alternative for transportation to the job. Prepare aschedule showing the net benefit or advantage of selecting one alternative over the other.
Exercise C The marketing department of Specialty Coffees estimates the following monthly demand for espresso in thesefour price-quantity relationships:
Demand
1 9,000 cups at $1.00 per cup
2 8,000 cups at $1.25 per cup
3 6,000 cups at $1.50 per cup
4 4,000 cups at $1.75 per cup
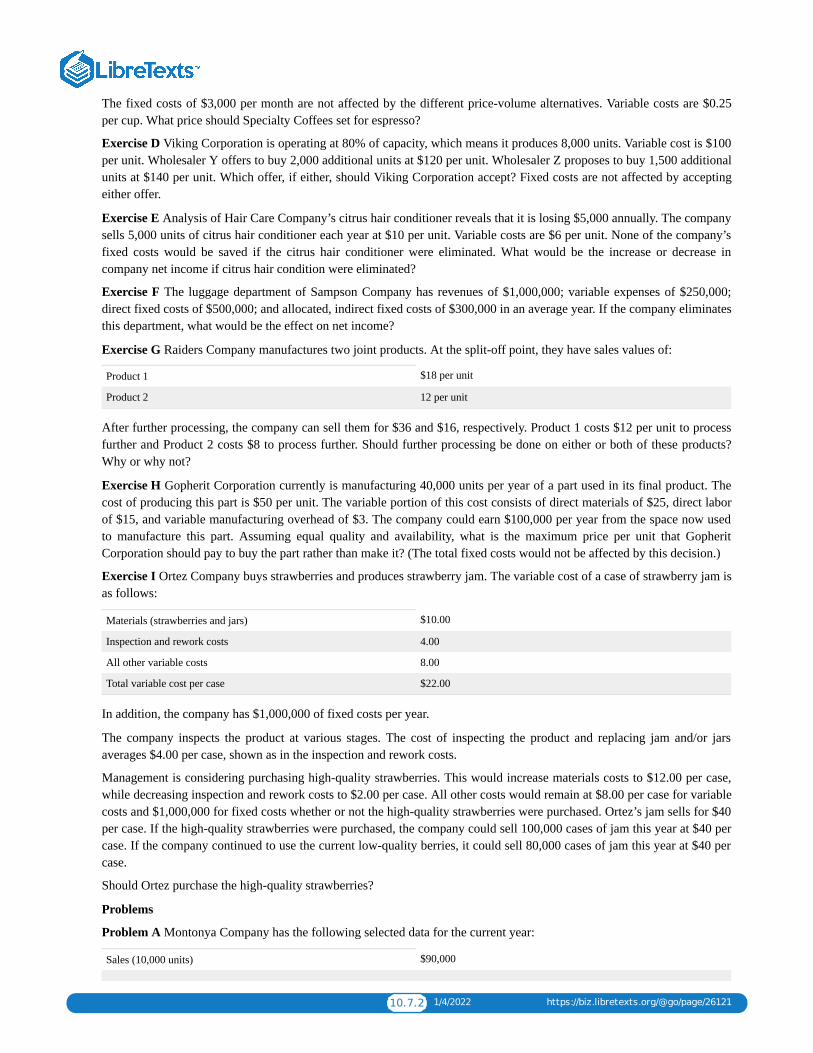
10.7.2 1/4/2022 https://biz.libretexts.org/@go/page/26121
The fixed costs of $3,000 per month are not affected by the different price-volume alternatives. Variable costs are $0.25per cup. What price should Specialty Coffees set for espresso?
Exercise D Viking Corporation is operating at 80% of capacity, which means it produces 8,000 units. Variable cost is $100per unit. Wholesaler Y offers to buy 2,000 additional units at $120 per unit. Wholesaler Z proposes to buy 1,500 additionalunits at $140 per unit. Which offer, if either, should Viking Corporation accept? Fixed costs are not affected by acceptingeither offer.
Exercise E Analysis of Hair Care Company’s citrus hair conditioner reveals that it is losing $5,000 annually. The companysells 5,000 units of citrus hair conditioner each year at $10 per unit. Variable costs are $6 per unit. None of the company’sfixed costs would be saved if the citrus hair conditioner were eliminated. What would be the increase or decrease incompany net income if citrus hair condition were eliminated?
Exercise F The luggage department of Sampson Company has revenues of $1,000,000; variable expenses of $250,000;direct fixed costs of $500,000; and allocated, indirect fixed costs of $300,000 in an average year. If the company eliminatesthis department, what would be the effect on net income?
Exercise G Raiders Company manufactures two joint products. At the split-off point, they have sales values of:
Product 1 $18 per unit
Product 2 12 per unit
After further processing, the company can sell them for $36 and $16, respectively. Product 1 costs $12 per unit to processfurther and Product 2 costs $8 to process further. Should further processing be done on either or both of these products?Why or why not?
Exercise H Gopherit Corporation currently is manufacturing 40,000 units per year of a part used in its final product. Thecost of producing this part is $50 per unit. The variable portion of this cost consists of direct materials of $25, direct laborof $15, and variable manufacturing overhead of $3. The company could earn $100,000 per year from the space now usedto manufacture this part. Assuming equal quality and availability, what is the maximum price per unit that GopheritCorporation should pay to buy the part rather than make it? (The total fixed costs would not be affected by this decision.)
Exercise I Ortez Company buys strawberries and produces strawberry jam. The variable cost of a case of strawberry jam isas follows:
Materials (strawberries and jars) $10.00
Inspection and rework costs 4.00
All other variable costs 8.00
Total variable cost per case $22.00
In addition, the company has $1,000,000 of fixed costs per year.
The company inspects the product at various stages. The cost of inspecting the product and replacing jam and/or jarsaverages $4.00 per case, shown as in the inspection and rework costs.
Management is considering purchasing high-quality strawberries. This would increase materials costs to $12.00 per case,while decreasing inspection and rework costs to $2.00 per case. All other costs would remain at $8.00 per case for variablecosts and $1,000,000 for fixed costs whether or not the high-quality strawberries were purchased. Ortez’s jam sells for $40per case. If the high-quality strawberries were purchased, the company could sell 100,000 cases of jam this year at $40 percase. If the company continued to use the current low-quality berries, it could sell 80,000 cases of jam this year at $40 percase.
Should Ortez purchase the high-quality strawberries?
Problems
Problem A Montonya Company has the following selected data for the current year:
Sales (10,000 units) $90,000
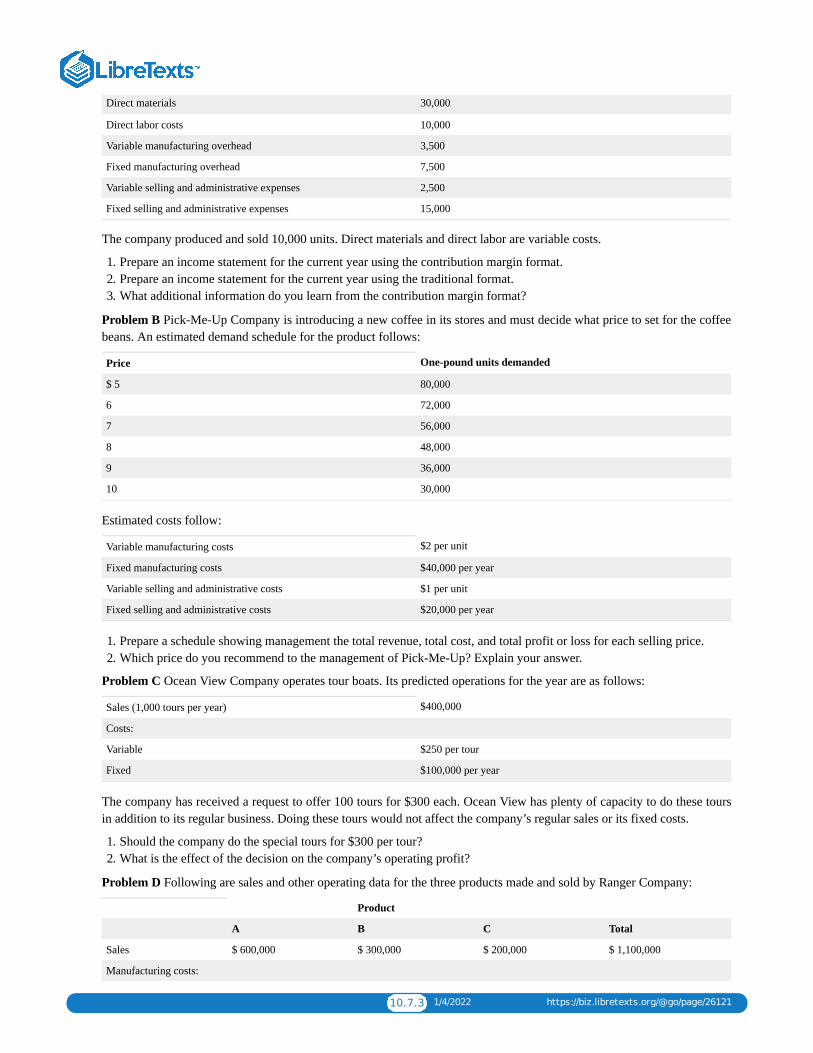
10.7.3 1/4/2022 https://biz.libretexts.org/@go/page/26121
Direct materials 30,000
Direct labor costs 10,000
Variable manufacturing overhead 3,500
Fixed manufacturing overhead 7,500
Variable selling and administrative expenses 2,500
Fixed selling and administrative expenses 15,000
The company produced and sold 10,000 units. Direct materials and direct labor are variable costs.
1. Prepare an income statement for the current year using the contribution margin format.2. Prepare an income statement for the current year using the traditional format.3. What additional information do you learn from the contribution margin format?
Problem B Pick-Me-Up Company is introducing a new coffee in its stores and must decide what price to set for the coffeebeans. An estimated demand schedule for the product follows:
Price One-pound units demanded
$ 5 80,000
6 72,000
7 56,000
8 48,000
9 36,000
10 30,000
Estimated costs follow:
Variable manufacturing costs $2 per unit
Fixed manufacturing costs $40,000 per year
Variable selling and administrative costs $1 per unit
Fixed selling and administrative costs $20,000 per year
1. Prepare a schedule showing management the total revenue, total cost, and total profit or loss for each selling price.2. Which price do you recommend to the management of Pick-Me-Up? Explain your answer.
Problem C Ocean View Company operates tour boats. Its predicted operations for the year are as follows:
Sales (1,000 tours per year) $400,000
Costs:
Variable $250 per tour
Fixed $100,000 per year
The company has received a request to offer 100 tours for $300 each. Ocean View has plenty of capacity to do these toursin addition to its regular business. Doing these tours would not affect the company’s regular sales or its fixed costs.
1. Should the company do the special tours for $300 per tour?2. What is the effect of the decision on the company’s operating profit?
Problem D Following are sales and other operating data for the three products made and sold by Ranger Company:
Product
A B C Total
Sales $ 600,000 $ 300,000 $ 200,000 $ 1,100,000
Manufacturing costs:
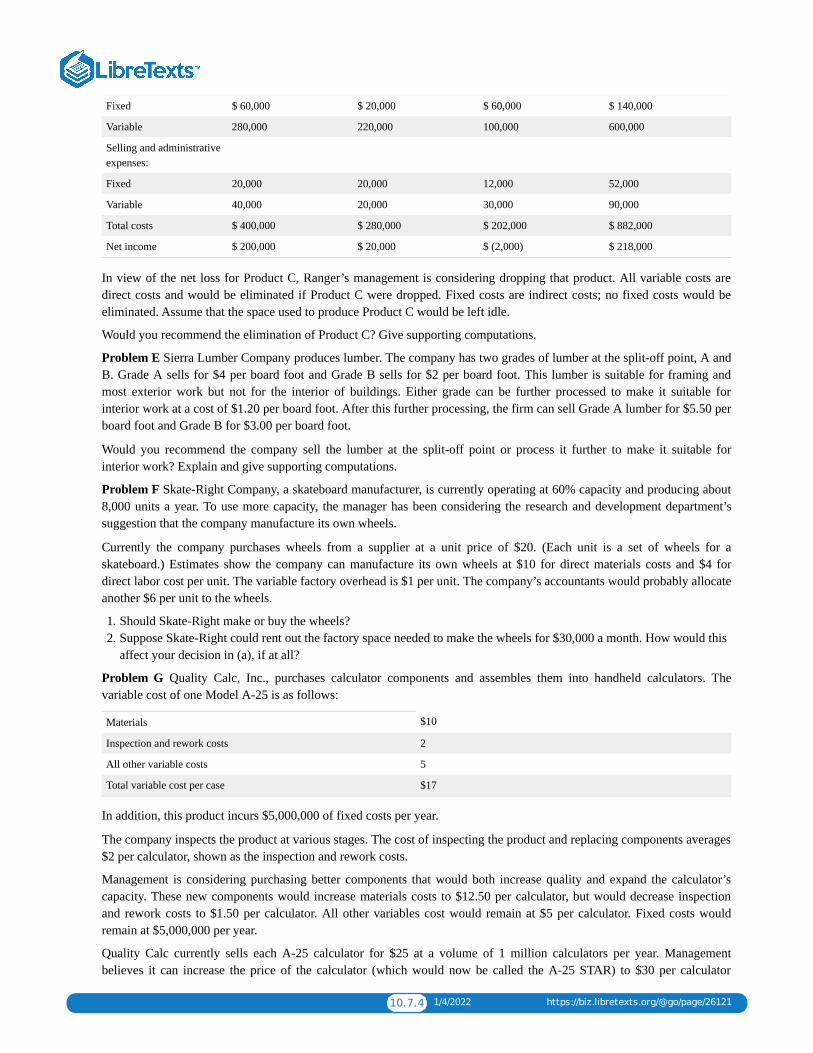
10.7.4 1/4/2022 https://biz.libretexts.org/@go/page/26121
Fixed $ 60,000 $ 20,000 $ 60,000 $ 140,000
Variable 280,000 220,000 100,000 600,000
Selling and administrativeexpenses:
Fixed 20,000 20,000 12,000 52,000
Variable 40,000 20,000 30,000 90,000
Total costs $ 400,000 $ 280,000 $ 202,000 $ 882,000
Net income $ 200,000 $ 20,000 $ (2,000) $ 218,000
In view of the net loss for Product C, Ranger’s management is considering dropping that product. All variable costs aredirect costs and would be eliminated if Product C were dropped. Fixed costs are indirect costs; no fixed costs would beeliminated. Assume that the space used to produce Product C would be left idle.
Would you recommend the elimination of Product C? Give supporting computations.
Problem E Sierra Lumber Company produces lumber. The company has two grades of lumber at the split-off point, A andB. Grade A sells for $4 per board foot and Grade B sells for $2 per board foot. This lumber is suitable for framing andmost exterior work but not for the interior of buildings. Either grade can be further processed to make it suitable forinterior work at a cost of $1.20 per board foot. After this further processing, the firm can sell Grade A lumber for $5.50 perboard foot and Grade B for $3.00 per board foot.
Would you recommend the company sell the lumber at the split-off point or process it further to make it suitable forinterior work? Explain and give supporting computations.
Problem F Skate-Right Company, a skateboard manufacturer, is currently operating at 60% capacity and producing about8,000 units a year. To use more capacity, the manager has been considering the research and development department’ssuggestion that the company manufacture its own wheels.
Currently the company purchases wheels from a supplier at a unit price of $20. (Each unit is a set of wheels for askateboard.) Estimates show the company can manufacture its own wheels at $10 for direct materials costs and $4 fordirect labor cost per unit. The variable factory overhead is $1 per unit. The company’s accountants would probably allocateanother $6 per unit to the wheels.
1. Should Skate-Right make or buy the wheels?2. Suppose Skate-Right could rent out the factory space needed to make the wheels for $30,000 a month. How would this
affect your decision in (a), if at all?
Problem G Quality Calc, Inc., purchases calculator components and assembles them into handheld calculators. Thevariable cost of one Model A-25 is as follows:
Materials $10
Inspection and rework costs 2
All other variable costs 5
Total variable cost per case $17
In addition, this product incurs $5,000,000 of fixed costs per year.
The company inspects the product at various stages. The cost of inspecting the product and replacing components averages$2 per calculator, shown as the inspection and rework costs.
Management is considering purchasing better components that would both increase quality and expand the calculator’scapacity. These new components would increase materials costs to $12.50 per calculator, but would decrease inspectionand rework costs to $1.50 per calculator. All other variables cost would remain at $5 per calculator. Fixed costs wouldremain at $5,000,000 per year.
Quality Calc currently sells each A-25 calculator for $25 at a volume of 1 million calculators per year. Managementbelieves it can increase the price of the calculator (which would now be called the A-25 STAR) to $30 per calculator
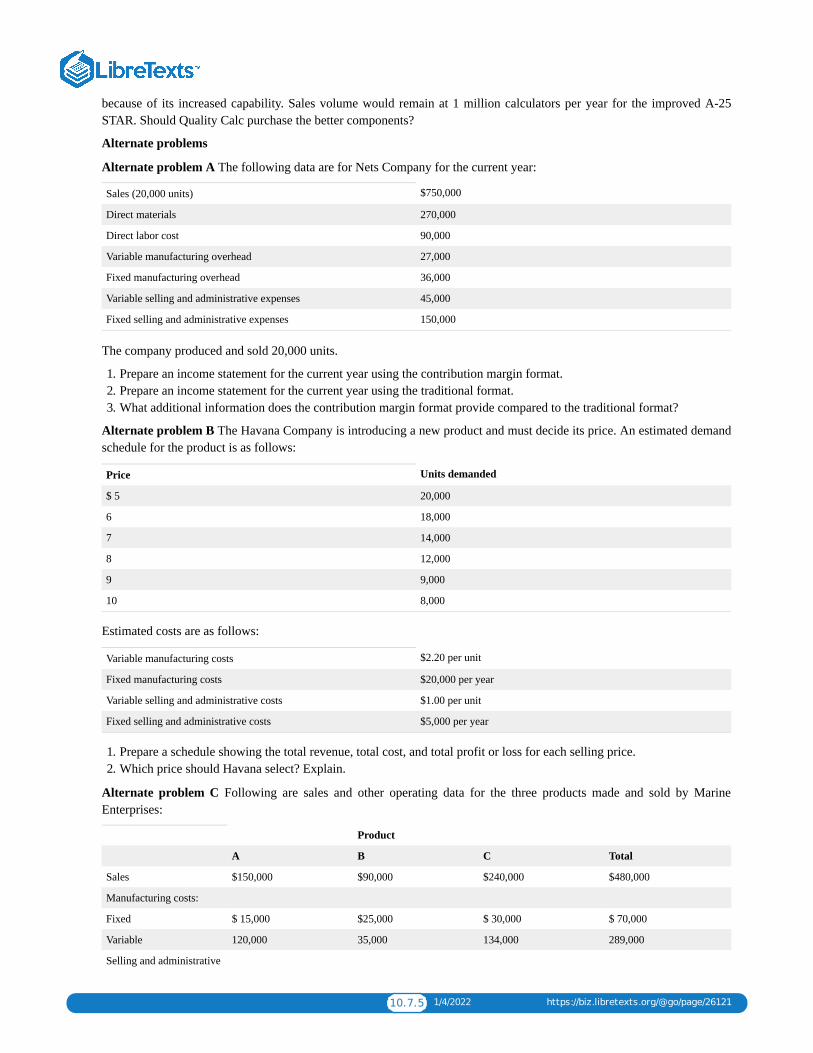
10.7.5 1/4/2022 https://biz.libretexts.org/@go/page/26121
because of its increased capability. Sales volume would remain at 1 million calculators per year for the improved A-25STAR. Should Quality Calc purchase the better components?
Alternate problems
Alternate problem A The following data are for Nets Company for the current year:
Sales (20,000 units) $750,000
Direct materials 270,000
Direct labor cost 90,000
Variable manufacturing overhead 27,000
Fixed manufacturing overhead 36,000
Variable selling and administrative expenses 45,000
Fixed selling and administrative expenses 150,000
The company produced and sold 20,000 units.
1. Prepare an income statement for the current year using the contribution margin format.2. Prepare an income statement for the current year using the traditional format.3. What additional information does the contribution margin format provide compared to the traditional format?
Alternate problem B The Havana Company is introducing a new product and must decide its price. An estimated demandschedule for the product is as follows:
Price Units demanded
$ 5 20,000
6 18,000
7 14,000
8 12,000
9 9,000
10 8,000
Estimated costs are as follows:
Variable manufacturing costs $2.20 per unit
Fixed manufacturing costs $20,000 per year
Variable selling and administrative costs $1.00 per unit
Fixed selling and administrative costs $5,000 per year
1. Prepare a schedule showing the total revenue, total cost, and total profit or loss for each selling price.2. Which price should Havana select? Explain.
Alternate problem C Following are sales and other operating data for the three products made and sold by MarineEnterprises:
Product
A B C Total
Sales $150,000 $90,000 $240,000 $480,000
Manufacturing costs:
Fixed $ 15,000 $25,000 $ 30,000 $ 70,000
Variable 120,000 35,000 134,000 289,000
Selling and administrative
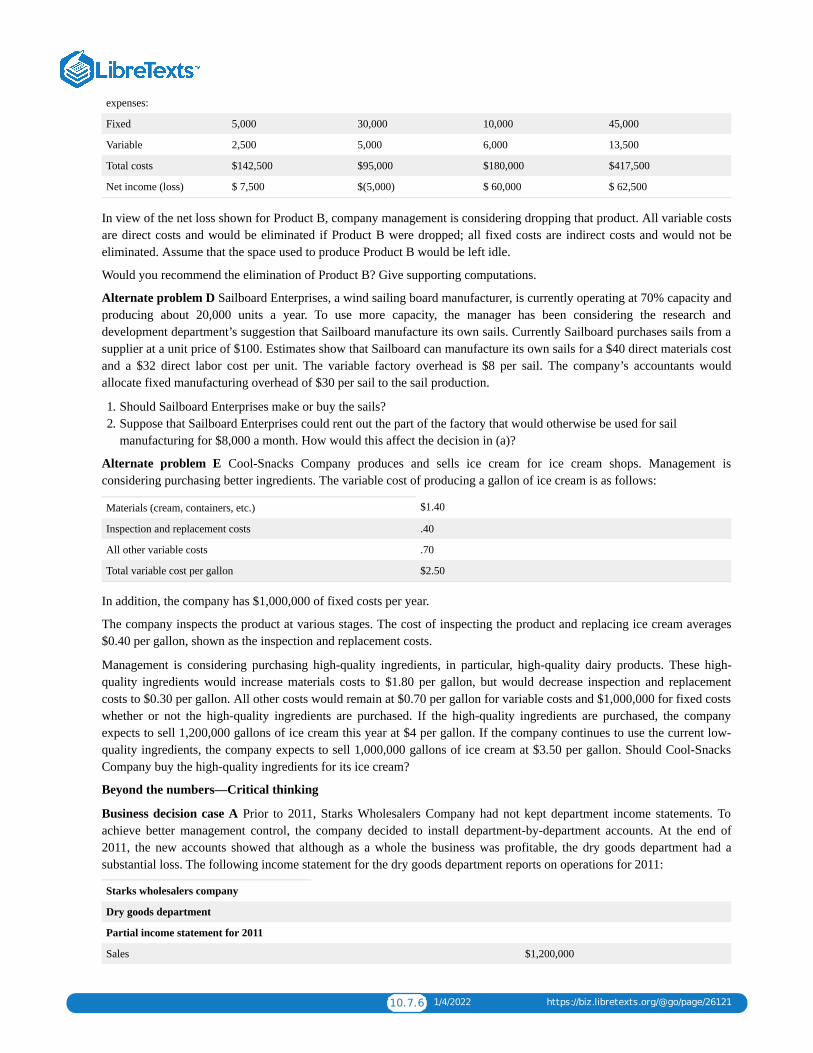
10.7.6 1/4/2022 https://biz.libretexts.org/@go/page/26121
expenses:
Fixed 5,000 30,000 10,000 45,000
Variable 2,500 5,000 6,000 13,500
Total costs $142,500 $95,000 $180,000 $417,500
Net income (loss) $ 7,500 $(5,000) $ 60,000 $ 62,500
In view of the net loss shown for Product B, company management is considering dropping that product. All variable costsare direct costs and would be eliminated if Product B were dropped; all fixed costs are indirect costs and would not beeliminated. Assume that the space used to produce Product B would be left idle.
Would you recommend the elimination of Product B? Give supporting computations.
Alternate problem D Sailboard Enterprises, a wind sailing board manufacturer, is currently operating at 70% capacity andproducing about 20,000 units a year. To use more capacity, the manager has been considering the research anddevelopment department’s suggestion that Sailboard manufacture its own sails. Currently Sailboard purchases sails from asupplier at a unit price of $100. Estimates show that Sailboard can manufacture its own sails for a $40 direct materials costand a $32 direct labor cost per unit. The variable factory overhead is $8 per sail. The company’s accountants wouldallocate fixed manufacturing overhead of $30 per sail to the sail production.
1. Should Sailboard Enterprises make or buy the sails?2. Suppose that Sailboard Enterprises could rent out the part of the factory that would otherwise be used for sail
manufacturing for $8,000 a month. How would this affect the decision in (a)?
Alternate problem E Cool-Snacks Company produces and sells ice cream for ice cream shops. Management isconsidering purchasing better ingredients. The variable cost of producing a gallon of ice cream is as follows:
Materials (cream, containers, etc.) $1.40
Inspection and replacement costs .40
All other variable costs .70
Total variable cost per gallon $2.50
In addition, the company has $1,000,000 of fixed costs per year.
The company inspects the product at various stages. The cost of inspecting the product and replacing ice cream averages$0.40 per gallon, shown as the inspection and replacement costs.
Management is considering purchasing high-quality ingredients, in particular, high-quality dairy products. These high-quality ingredients would increase materials costs to $1.80 per gallon, but would decrease inspection and replacementcosts to $0.30 per gallon. All other costs would remain at $0.70 per gallon for variable costs and $1,000,000 for fixed costswhether or not the high-quality ingredients are purchased. If the high-quality ingredients are purchased, the companyexpects to sell 1,200,000 gallons of ice cream this year at $4 per gallon. If the company continues to use the current low-quality ingredients, the company expects to sell 1,000,000 gallons of ice cream at $3.50 per gallon. Should Cool-SnacksCompany buy the high-quality ingredients for its ice cream?
Beyond the numbers—Critical thinking
Business decision case A Prior to 2011, Starks Wholesalers Company had not kept department income statements. Toachieve better management control, the company decided to install department-by-department accounts. At the end of2011, the new accounts showed that although as a whole the business was profitable, the dry goods department had asubstantial loss. The following income statement for the dry goods department reports on operations for 2011:
Starks wholesalers company
Dry goods department
Partial income statement for 2011
Sales $1,200,000
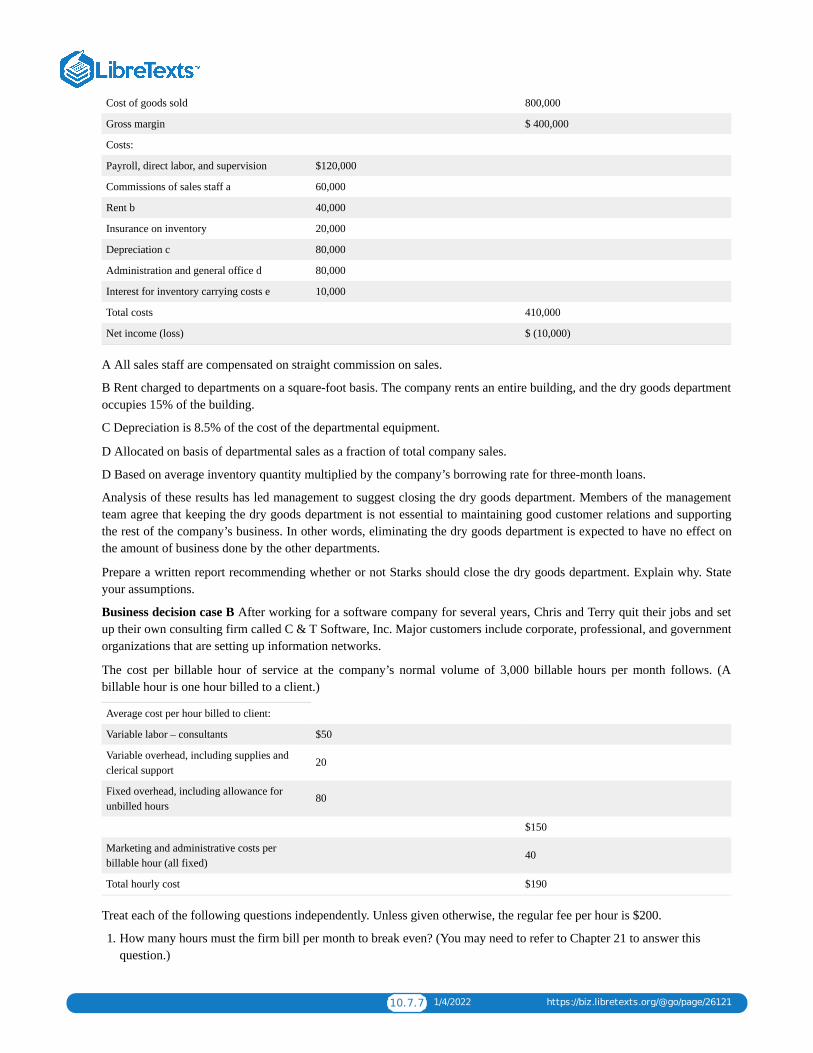
10.7.7 1/4/2022 https://biz.libretexts.org/@go/page/26121
Cost of goods sold 800,000
Gross margin $ 400,000
Costs:
Payroll, direct labor, and supervision $120,000
Commissions of sales staff a 60,000
Rent b 40,000
Insurance on inventory 20,000
Depreciation c 80,000
Administration and general office d 80,000
Interest for inventory carrying costs e 10,000
Total costs 410,000
Net income (loss) $ (10,000)
A All sales staff are compensated on straight commission on sales.
B Rent charged to departments on a square-foot basis. The company rents an entire building, and the dry goods departmentoccupies 15% of the building.
C Depreciation is 8.5% of the cost of the departmental equipment.
D Allocated on basis of departmental sales as a fraction of total company sales.
D Based on average inventory quantity multiplied by the company’s borrowing rate for three-month loans.
Analysis of these results has led management to suggest closing the dry goods department. Members of the managementteam agree that keeping the dry goods department is not essential to maintaining good customer relations and supportingthe rest of the company’s business. In other words, eliminating the dry goods department is expected to have no effect onthe amount of business done by the other departments.
Prepare a written report recommending whether or not Starks should close the dry goods department. Explain why. Stateyour assumptions.
Business decision case B After working for a software company for several years, Chris and Terry quit their jobs and setup their own consulting firm called C & T Software, Inc. Major customers include corporate, professional, and governmentorganizations that are setting up information networks.
The cost per billable hour of service at the company’s normal volume of 3,000 billable hours per month follows. (Abillable hour is one hour billed to a client.)
Average cost per hour billed to client:
Variable labor – consultants $50
Variable overhead, including supplies andclerical support
20
Fixed overhead, including allowance forunbilled hours
80
$150
Marketing and administrative costs perbillable hour (all fixed)
40
Total hourly cost $190
Treat each of the following questions independently. Unless given otherwise, the regular fee per hour is $200.
1. How many hours must the firm bill per month to break even? (You may need to refer to Chapter 21 to answer thisquestion.)
10.7.8 1/4/2022 https://biz.libretexts.org/@go/page/26121
2. Market research estimates that a fee increase to $250 per hour would decrease monthly volume to 2,000 hours. Theaccounting department estimates that fixed overhead costs would be $120 per hour, while variable cost per hour wouldremain unchanged. What effect would a fee increase have on profits?
3. Assume C & T Software is operating at its normal volume of 3,000 hours per month. It has received a special requestfrom one of its long-time customers to provide services on a special-order basis. Because of the long-term nature of thecontract (four months) and the magnitude (1,000 hours per month), the customer believes a fee reduction is in order. C& T Software has a capacity limitation of 4,000 hours per month. Fixed costs would not change if the firm accepts thespecial order. What is the lowest fee C & T Software would be willing to charge?
Business decision case C Refer to “A broader perspective: Differential analysis in sports”. In a memorandum to yourinstructor identify which costs and revenues you think would be differential for a sports team acquiring a major star likeBonds. The heading of the memorandum should contain the date, to whom it is written, from whom, and the subjectmatter.
Group project D In teams of two or three students, visit a local department store and imagine the types of costs that itwould save if it closed a significant department (for example, the housewares department). List the types of costs thatwould be saved, but do not attempt to assign numbers to those costs. For example, would rent be saved? Would security besaved? What about taxes on inventories? Consider the effects of closing the department on the people who work there. Asa team, write a memorandum describing the costs saved and the effects of closing a department in a local department store.The heading of the memorandum should contain the date, to whom it is written, from whom, and the subject matter.
Group project E A manager in your organization just received a special order at a price that is “below cost”. The managerpoints to the document and says, “These are the kinds of orders that will get you in trouble. Every sale must bear its shareof the full costs of running the business. If we sell below our full cost, we will be out of business in no time.” In groups oftwo or three students, write a memorandum to your instructor stating whether you agree with this comment or not andexplain why. The heading of the memorandum should contain the date, to whom it is written, from whom, and the subjectmatter.
Group project F Form a group of two or three students. Assume you are considering driving to a weekend resort for aquick break from school. What are the differential costs of operating your car for the drive? Write a memorandum to yourinstructor addressing this question. The heading of the memorandum should contain the date, to whom it is written, fromwhom, and the subject matter.
Using the Internet—A view of the real world
Visit the website for Intel Corporation, a high technology manufacturing company.
http:/www.intel.com
Go to the company’s most recent financial statements and review the consolidated statement of income. Looking at themost recent year on the statement of income, assume 70% of the cost of sales are variable costs and the remaining 30% arefixed costs. Furthermore, assume all other costs and expenses (research and development, marketing, general andadministrative, interest, taxes, etc.) are 60% variable and 40% fixed. Prepare an income statement using the contributionmargin format. Be sure to submit a copy of Intel’s consolidated statement of income with the contribution margin incomestatement.
Visit the following website for Wal-Mart, a retail company.
http:/www.walmart.com
Go to the company’s most recent financial statements and review the statement of income. Looking at the most recent yearon the statement of income, assume 45% of the cost of sales are variable costs and the remaining 55% are fixed costs.Furthermore, assume all other costs and expenses (research and development, marketing, general and administrative,interest, taxes, etc.) are 30% variable and 70% fixed. Prepare an income statement using the contribution margin format.Be sure to submit acopy of Wal-Mart’s income statement with the contribution margin income statement.

1 1/8/2022
CHAPTER OVERVIEW11: CAPITAL INVESTMENT ANALYSIS
11.1: CAPITAL INVESTMENT ANALYSIS11.2: CHAPTER 11 STUDY PLAN11.3: SHORT TERM BUSINESS DECISIONS11.4: ACCOUNTING IN THE HEADLINES – PAYBACK11.5: THE CAPITAL RATIONING PROCESS11.6: CONTROLLING CAPITAL INVESTMENT EXPENDITURES11.7: CHAPTER 11 KEY POINTS11.8: GLOSSARY11.9: CHAPTER 11- EXERCISES

11.1.1 12/25/2021 https://biz.libretexts.org/@go/page/26123
11.1: Capital Investment Analysis
Capital budgetingCapital budgeting is the process of considering alternative capital projects and selecting those alternatives that providethe most profitable return on available funds, within the framework of company goals and objectives. A capital project isany available alternative to purchase, build, lease, or renovate buildings, equipment, or other long-range major items ofproperty. The alternative selected usually involves large sums of money and brings about a large increase in fixed costs fora number of years in the future. Once a company builds a plant or undertakes some other capital expenditure, its futureplans are less flexible.
A YouTube element has been excluded from this version of the text. You can view it online here:pb.libretexts.org/llmanagerialaccounting/?p=244
Poor capital-budgeting decisions can be costly because of the large sums of money and relatively long periods involved. Ifa poor capital budgeting decision is implemented, the company can lose all or part of the funds originally invested in theproject and not realize the expected benefits. In addition, other actions taken within the company regarding the project,such as finding suppliers of raw materials, are wasted if the capital-budgeting decision must be revoked. Poor capital-budgeting decisions may also harm the company’s competitive position because the company does not have the mostefficient productive assets needed to compete in world markets.
Investment of funds in a poor alternative can create other problems as well. Workers hired for the project might be laid offif the project fails, creating morale and unemployment problems. Many of the fixed costs still remain even if a plant isclosed or not producing. For instance, advertising efforts would be wasted, and stock prices could be affected by thedecline in income.
On the other hand, failure to invest enough funds in a good project also can be costly. Ford’s Mustang is an excellentexample of this problem. At the time of the original capital-budgeting decision, if Ford had correctly estimated theMustang’s popularity, the company would have expended more funds on the project. Because of an undercommitment offunds, Ford found itself short on production capacity, which caused lost and postponed sales of the automobile.
Finally, the amount of funds available for investment is limited. Thus, once a company makes a capital investmentdecision, alternative investment opportunities are normally lost. The benefits or returns lost by rejecting the best alternativeinvestment are the opportunity cost of a given project.
For all these reasons, companies must be very careful in their analysis of capital projects. Capital expenditures do notoccur as often as ordinary expenditures such as payroll or inventory purchases but involve substantial sums of money thatare then committed for a long period. Therefore, the means by which companies evaluate capital expenditure decisionsshould be much more formal and detailed than would be necessary for ordinary purchase decisions.
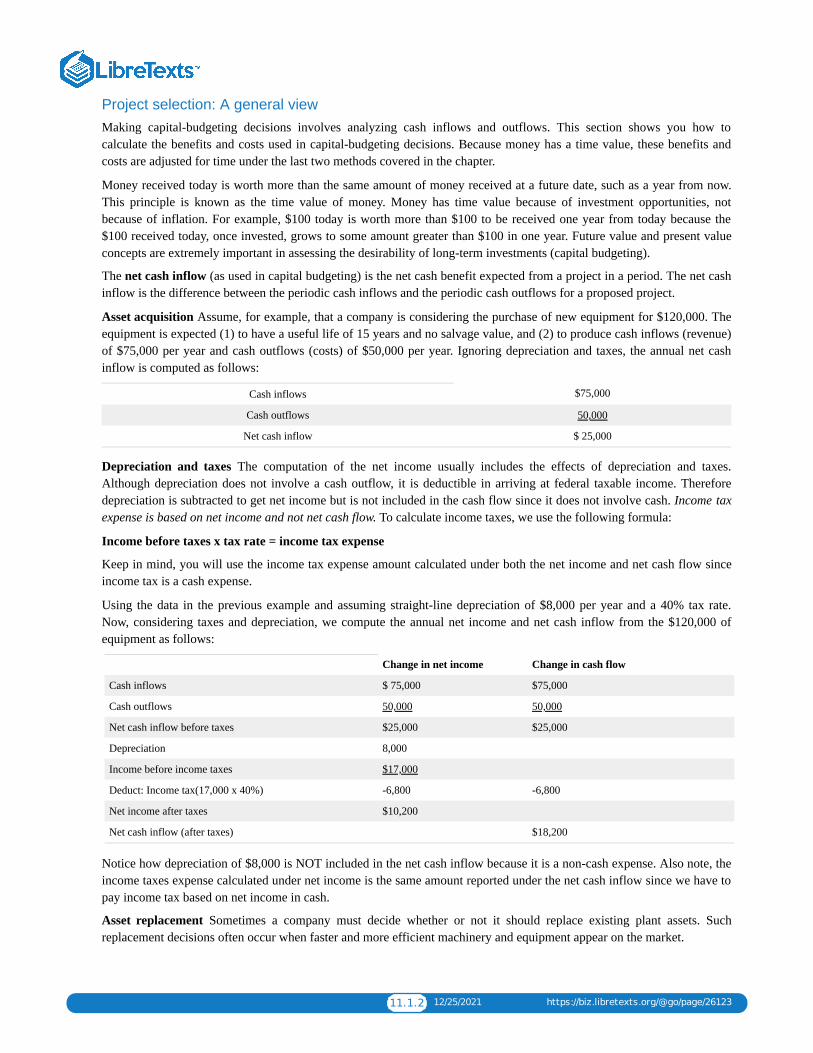
11.1.2 12/25/2021 https://biz.libretexts.org/@go/page/26123
Project selection: A general viewMaking capital-budgeting decisions involves analyzing cash inflows and outflows. This section shows you how tocalculate the benefits and costs used in capital-budgeting decisions. Because money has a time value, these benefits andcosts are adjusted for time under the last two methods covered in the chapter.
Money received today is worth more than the same amount of money received at a future date, such as a year from now.This principle is known as the time value of money. Money has time value because of investment opportunities, notbecause of inflation. For example, $100 today is worth more than $100 to be received one year from today because the$100 received today, once invested, grows to some amount greater than $100 in one year. Future value and present valueconcepts are extremely important in assessing the desirability of long-term investments (capital budgeting).
The net cash inflow (as used in capital budgeting) is the net cash benefit expected from a project in a period. The net cashinflow is the difference between the periodic cash inflows and the periodic cash outflows for a proposed project.
Asset acquisition Assume, for example, that a company is considering the purchase of new equipment for $120,000. Theequipment is expected (1) to have a useful life of 15 years and no salvage value, and (2) to produce cash inflows (revenue)of $75,000 per year and cash outflows (costs) of $50,000 per year. Ignoring depreciation and taxes, the annual net cashinflow is computed as follows:
Cash inflows $75,000
Cash outflows 50,000
Net cash inflow $ 25,000
Depreciation and taxes The computation of the net income usually includes the effects of depreciation and taxes.Although depreciation does not involve a cash outflow, it is deductible in arriving at federal taxable income. Thereforedepreciation is subtracted to get net income but is not included in the cash flow since it does not involve cash. Income taxexpense is based on net income and not net cash flow. To calculate income taxes, we use the following formula:
Income before taxes x tax rate = income tax expense
Keep in mind, you will use the income tax expense amount calculated under both the net income and net cash flow sinceincome tax is a cash expense.
Using the data in the previous example and assuming straight-line depreciation of $8,000 per year and a 40% tax rate.Now, considering taxes and depreciation, we compute the annual net income and net cash inflow from the $120,000 ofequipment as follows:
Change in net income Change in cash flow
Cash inflows $ 75,000 $75,000
Cash outflows 50,000 50,000
Net cash inflow before taxes $25,000 $25,000
Depreciation 8,000
Income before income taxes $17,000
Deduct: Income tax(17,000 x 40%) -6,800 -6,800
Net income after taxes $10,200
Net cash inflow (after taxes) $18,200
Notice how depreciation of $8,000 is NOT included in the net cash inflow because it is a non-cash expense. Also note, theincome taxes expense calculated under net income is the same amount reported under the net cash inflow since we have topay income tax based on net income in cash.
Asset replacement Sometimes a company must decide whether or not it should replace existing plant assets. Suchreplacement decisions often occur when faster and more efficient machinery and equipment appear on the market.

11.1.3 12/25/2021 https://biz.libretexts.org/@go/page/26123
The computation of the net cash inflow is more complex for a replacement decision than for an acquisition decisionbecause cash inflows and outflows for two items (the asset being replaced and the new asset) must be considered. Toillustrate, assume that a company operates two machines purchased four years ago at a cost of $18,000 each. The estimateduseful life of each machine is 12 years (with no salvage value). Each machine will produce 40,000 units of product peryear. The annual cash operating expenses (labor, repairs, etc.) for the two machines together total $14,000. After the oldmachines have been used for four years, a new machine becomes available. The new machine can be acquired for $28,000and has an estimated useful life of eight years (with no salvage value). The new machine produces 60,000 units annuallyand entails annual cash operating expenses of $10,000. The $4,000 reduction in operating expenses ($14,000 for oldmachines – $10,000 for the new machine) is a $4,000 increase in net cash inflow (savings) before taxes.
The firm would pay $28,000 in the first year to acquire the new machine. In addition to this initial outlay, the annual netcash inflow from replacement is computed as follows:
Using these data, the following display shows how you can use this formula to find the net cash flow after taxes:
Change in Annual Cash Expenses: Net Cash Flow
Old Machines 14,000
New Machine 10,000
Annual net cash savings before taxes 4,000
x 40% income tax EXPENSE – 1,600
(4,000 x 40%)
Annual net cash inflow after tax 2,400 2,400
Annual Depreciation:
Old Machines 3,000
New Machine 3,500
Additional Annual Depreciation Expense 500
x 40% income tax expense SAVED + 200 + 200
(500 x 40%)
Annual net cash inflow after tax 2,600
(2,400 annual net cash inflow + 200 tax savings from depreciation)
Remember, depreciation is a non-cash expense so it will not change net cash BUT it will change income tax expense as itis reported for net income.
Notice that these figures concentrated only on the differences in costs for each of the two alternatives. Two other items alsoare relevant to the decision. First, the purchase of the new machine creates a $28,000 cash outflow immediately afteracquisition. Second, the two old machines can probably be sold, and the selling price or salvage value of the old machinescreates a cash inflow in the period of disposal. Also, the previous example used straight-line depreciation. Out-of-pocket and sunk costs A distinction between out-of-pocket costs and sunk costs needs to be made for capitalbudgeting decisions. An out-of-pocket cost is a cost requiring a future outlay of resources, usually cash. Out-of-pocketcosts can be avoided or changed in amount. Future labor and repair costs are examples of out-of-pocket costs.
Sunk costs are costs already incurred. Nothing can be done about sunk costs at the present time; they cannot be avoided orchanged in amount. The price paid for a machine becomes a sunk cost the minute the purchase has been made (before thatmoment it was an out-of-pocket cost). The amount of that past outlay cannot be changed, regardless of whether themachine is scrapped or used. Thus, depreciation is a sunk cost because it represents a past cash outlay. Depletion andamortization of assets, such as ore deposits and patents, are also sunk costs.
A sunk cost is a past cost, while an out-of-pocket cost is a future cost. Only the out-of-pocket costs (the future cashoutlays) are relevant to capital budgeting decisions. Sunk costs are not relevant, except for any effect they have on the cashoutflow for taxes.

11.1.4 12/25/2021 https://biz.libretexts.org/@go/page/26123
Initial cost and salvage value Any cash outflows necessary to acquire an asset and place it in a position and condition forits intended use are part of the initial cost of the asset. If an investment has a salvage value, that value is a cash inflow inthe year of the asset’s disposal.
The cost of capital The cost of capital is important in project selection. Certainly, any acceptable proposal should offer areturn that exceeds the cost of the funds used to finance it. Cost of capital, usually expressed as a rate, is the cost of allsources of capital (debt and equity) employed by a company. For convenience, most current liabilities, such as accountspayable and federal income taxes payable, are treated as being without cost. Every other item on the right (equity) side ofthe balance sheet has a cost. The subject of determining the cost of capital is a controversial topic in the literature ofaccounting and finance and is not discussed here. We give the assumed rates for the cost of capital in this book. Next, wedescribe several techniques for deciding whether to invest in capital projects.
CC licensed content, Shared previouslyAccounting Principles: A Business Perspective.. Authored by: James Don Edwards, University of Georgia & Roger H.Hermanson, Georgia State University.. Provided by: Endeavour International Corporation. Project: The Global TextProject.. License: CC BY: Attribution
All rights reserved contentWhat is Capital Budgeting: Introduction - Managerial Accounting video . Authored by: Brian Routh The AccountingDr. Located at: youtu.be/kFyZkXHit_A. License: All Rights Reserved. License Terms: Standard YouTube License
11.2.1 1/1/2022 https://biz.libretexts.org/@go/page/26122
11.2: Chapter 11 Study PlanKnowledge Targets
I can define the following terms as they relate to our unit:
Payback period Investment Cash Flows Net Cash Flow
Capital Budgeting Cost of Capital Rate of return Time value of money
Reasoning Targets
I can determine the payback period for an investment.I can rank investment projects in order of preference using payback period and rate of return.I can understand the time value of money.
Skill Targets
I can calculate the payback period for an investment.I can evaluate investments using payback period and rate of return.I can compute the rate of return for an investment.I can evaluate investment projects with uncertain cash flows.
Click Capital Budget for a printable copy.

11.3.1 1/8/2022 https://biz.libretexts.org/@go/page/26124
11.3: Short Term Business Decisions
Project selection: Payback periodThe payback period is the time it takes for the cumulative sum of the annual net cash inflows from a project to equal theinitial net cash outlay. In effect, the payback period answers the question: How long will it take the capital project torecover, or pay back, the initial investment?
A YouTube element has been excluded from this version of the text. You can view it online here:pb.libretexts.org/llmanagerialaccounting/?p=246
If the net cash inflows each year are a constant amount, the formula for the payback period is:
Payback period =Initial cash outlay
Annual net cash inflow (benefit)
For the two assets discussed in the previous section, you can compute the payback period as follows. The purchase of the$120,000 equipment creates an annual net cash inflow after taxes of $18,200, so the payback period is 6.6 years, computedas follows:
Payback period =Initial cash outlay = 120,000
= 6.6 years (rounded)Annual net cash inflow (benefit) 18,200
The payback period for the replacement machine with a $28,000 cash outflow in the first year and an annual net cashinflow of $2,600, is 10.8 years, computed as follows:
Payback period =Initial cash outlay = 28,000
= 10.8 years (rounded)Annual net cash inflow (benefit) 2,600
Remember that the payback period indicates how long it will take the machine to pay for itself. The replacement machinebeing considered has a payback period of 10.8 years but a useful life of only 8 years. Therefore, because the investmentcannot pay for itself within its useful life, the company should not purchase a new machine to replace the two oldmachines.
In each of the previous examples, the projected net cash inflow per year was uniform. When the annual returns are uneven,companies use a cumulative calculation to determine the payback period, as shown in the following situation.
Neil Company is considering a capital investment project that costs $40,000 and is expected to last 10 years. The projectedannual net cash inflows are:
Year Investment Annual net cash inflow Cumulative net cash inflows
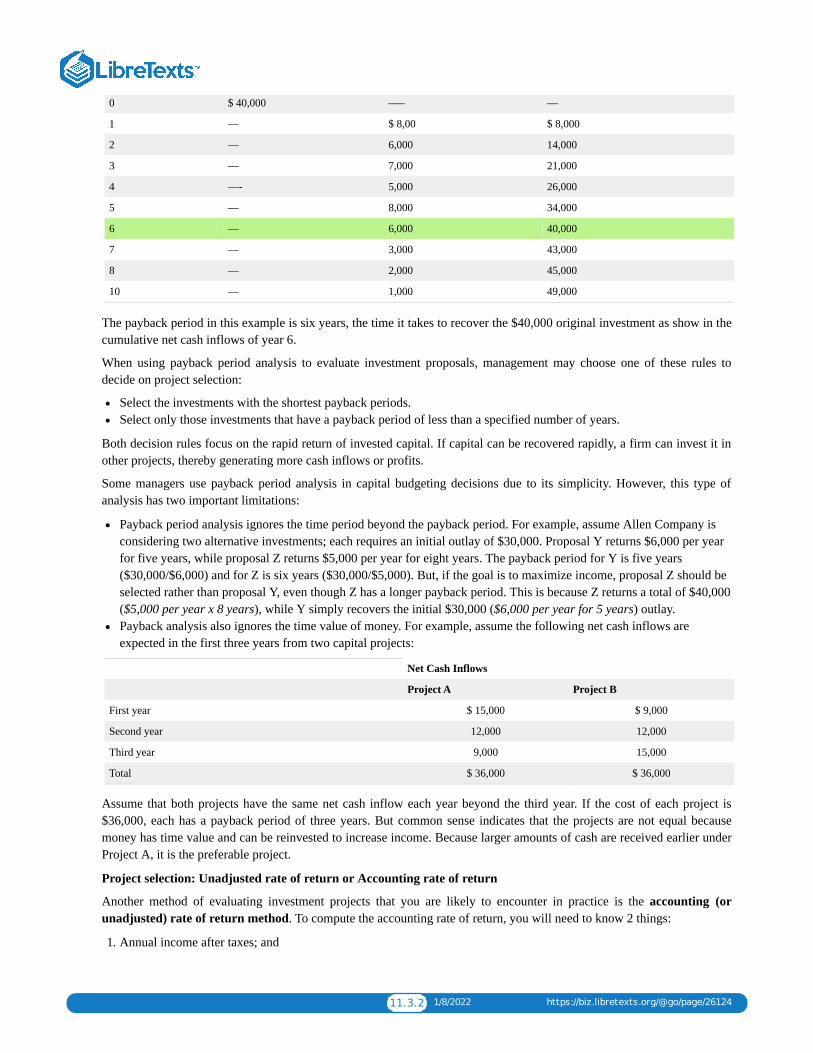
11.3.2 1/8/2022 https://biz.libretexts.org/@go/page/26124
0 $ 40,000 —– —
1 — $ 8,00 $ 8,000
2 — 6,000 14,000
3 — 7,000 21,000
4 —- 5,000 26,000
5 — 8,000 34,000
6 — 6,000 40,000
7 — 3,000 43,000
8 — 2,000 45,000
10 — 1,000 49,000
The payback period in this example is six years, the time it takes to recover the $40,000 original investment as show in thecumulative net cash inflows of year 6.
When using payback period analysis to evaluate investment proposals, management may choose one of these rules todecide on project selection:
Select the investments with the shortest payback periods.Select only those investments that have a payback period of less than a specified number of years.
Both decision rules focus on the rapid return of invested capital. If capital can be recovered rapidly, a firm can invest it inother projects, thereby generating more cash inflows or profits.
Some managers use payback period analysis in capital budgeting decisions due to its simplicity. However, this type ofanalysis has two important limitations:
Payback period analysis ignores the time period beyond the payback period. For example, assume Allen Company isconsidering two alternative investments; each requires an initial outlay of $30,000. Proposal Y returns $6,000 per yearfor five years, while proposal Z returns $5,000 per year for eight years. The payback period for Y is five years($30,000/$6,000) and for Z is six years ($30,000/$5,000). But, if the goal is to maximize income, proposal Z should beselected rather than proposal Y, even though Z has a longer payback period. This is because Z returns a total of $40,000($5,000 per year x 8 years), while Y simply recovers the initial $30,000 ($6,000 per year for 5 years) outlay.Payback analysis also ignores the time value of money. For example, assume the following net cash inflows areexpected in the first three years from two capital projects:
Net Cash Inflows
Project A Project B
First year $ 15,000 $ 9,000
Second year 12,000 12,000
Third year 9,000 15,000
Total $ 36,000 $ 36,000
Assume that both projects have the same net cash inflow each year beyond the third year. If the cost of each project is$36,000, each has a payback period of three years. But common sense indicates that the projects are not equal becausemoney has time value and can be reinvested to increase income. Because larger amounts of cash are received earlier underProject A, it is the preferable project.
Project selection: Unadjusted rate of return or Accounting rate of return
Another method of evaluating investment projects that you are likely to encounter in practice is the accounting (orunadjusted) rate of return method. To compute the accounting rate of return, you will need to know 2 things:
1. Annual income after taxes; and
11.3.3 1/8/2022 https://biz.libretexts.org/@go/page/26124
2. Average amount of the investment in the project. The average investment is the (Beginning balance + Endingbalance)/2. If the ending balance is zero (as we assume), the average investment equals the original cash investmentdivided by 2.
The formula for the unadjusted (or Accounting) rate of return is:
Rate of Return =Average annual income after taxes
Average amount of investment
Notice that this calculation uses annual income rather than net cash inflow.[1]
A YouTube element has been excluded from this version of the text. You can view it online here:pb.libretexts.org/llmanagerialaccounting/?p=246
To illustrate the use of the unadjusted rate of return, assume Thomas Company is considering two capital projectproposals, each having a useful life of three years. The company does not have enough funds to undertake both projects.Information relating to the projects follows:
Average annual Before-tax Average
Proposal Initial cost Salvage Value Net cash inflow Annual depreciation
1 $ 76,000 $ 4,000 $ 45,000 $ 24,000
2 95,000 5,000 55,000 30,000
Assuming a 40% tax rate, Thomas Company can determine the unadjusted rate of return for each project as follows:
Proposal 1 Proposal 2
Average investment: (original outlay + Salvage value)/2 (1) $ 40,000 $ 50,000
(76,000 + 4,000) /2
(95,000 + 5,000) / 2
Annual net cash inflow (before income taxes) $ 45,000 $ 55,000
Less: Annual depreciation – 24,000 – 30,000
Annual income (before income taxes) $ 21,000 $ 25,000
Deduct: Income taxes at 40% – 8,400 – 10,000
Average annual net income from investment (2) $ 12,600 $ 15,000
Rate of return (2)/(1) 31.5% 30%
(12,600 / 40,000) (15,000 / 50,000)
11.3.4 1/8/2022 https://biz.libretexts.org/@go/page/26124
From these calculations, if Thomas Company makes an investment decision solely on the basis of the unadjusted rate ofreturn, it would select Proposal 1 since it has a higher rate.
Sometimes companies receive information on the average annual after-tax net cash inflow. Average annual after-tax netcash inflow is equal to annual before-tax cash inflow minus taxes. Given this information, the firms could deduct thedepreciation to arrive at average net income. For instance, for Proposal 2, Thomas Company would compute average netincome as follows:
After-tax net cash inflow ($55,000-$10,000) $ 45,000
Less: Depreciation – 30,000
Average net income $ 15,000
The unadjusted rate of return, like payback period analysis, has several limitations:
The length of time over which the return is earned is not considered.The rate allows a sunk cost, depreciation, to enter into the calculation. Since depreciation can be calculated in so manydifferent ways, the rate of return can be manipulated by simply changing the method of depreciation used for theproject.The timing of cash flows is not considered. Thus, the time value of money is ignored.
Unlike the two project selection methods just illustrated, the remaining two methods—net present value and time-adjustedrate of return—take into account the time value of money in the analysis. In both of these methods, we assume that all netcash inflows occur at the end of the year. Often used in capital budgeting analysis, this assumption makes the calculationof present values less complicated than if we assume the cash flows occurred at some other time.
CC licensed content, Shared previouslyAccounting Principles: A Business Perspective.. Authored by: James Don Edwards, University of Georgia & Roger H.Hermanson, Georgia State University.. Provided by: Endeavour International Corporation. Project: The Global TextProject. License: CC BY: Attribution
All rights reserved contentThe Payback Method. Authored by: Education Unlocked. Located at: youtu.be/YX4NoZN8YWU. License: AllRights Reserved. License Terms: Stanard YouTube LicenseAverage Accounting Rate of Return CFA-Course.com . Authored by: cfa-course.com. Located at: youtu.be/-E5Z1-0NUmk. License: All Rights Reserved. License Terms: Standard YouTube License
11.4.1 12/18/2021 https://biz.libretexts.org/@go/page/26125
11.4: Accounting in the Headlines – Payback
Should you rent a cable modem from Time Warner Cable or buy one?
When you have internet service from Time Warner Cable, you will need a cablemodem. Time Warner will rent you a modem for $5.99 per month. Alternatively, you could purchase your own cablemodem. For example, you could purchase the Motorola Surfboard SB6121 cable modem from Amazon for $79.99.
Questions
1. What is the payback period (in months) if you decide to purchase the Motorola Surfboard SB6121 cable modem?2. What are the advantages to renting a cable modem from Time Warner?3. What are the advantages to buying a cable model from Time Warner?
CC licensed content, Specific attributionShould you rent a cable modem from Time Warner Cable or buy one?. Authored by: Dr. Wendy Tietz, CPA, CMA,CGMA. Located at: http://www.accountingintheheadlines.com. License: CC BY-NC: Attribution-NonCommercial
11.5.1 12/25/2021 https://biz.libretexts.org/@go/page/26126
11.5: The Capital Rationing Process
Investments in working capitalAn investment in a capital asset usually must be supported by an investment in working capital, such as accountsreceivable and inventory. For example, companies often invest in a capital project expecting to increase sales. Increasedsales usually bring about an increase in accounts receivable from customers and an increase in inventory to support thehigher sales level. The increases in current assets—accounts receivable and inventory—are investments in working capitalthat usually are recovered in full at the end of a capital project’s life. Such working capital investments should beconsidered in capital-budgeting decisions.
To illustrate, assume that a company is considering a capital project involving a $50,000 investment in machinery and a$40,000 investment in working capital. The machine, which will produce a new product, has an estimated useful life ofeight years and no salvage value. The annual cash inflows (before taxes) are estimated at $25,000, with annual cashoutflows (before taxes) of $5,000. The annual net cash inflow from the project is computed as follows (assuming straight-line depreciation and a 40% tax rate):
Cash inflows $ 25,000
Cash outflows 5,000
Net cash inflow before taxes $ 20,000
Less: 40% Income Tax Expense (20,000 x 40%) – 8,000
Net cash inflow after taxes (ignoring depreciation) (1) $ 12,000
Depreciation expense ($ 50,000/8 years) $ 6,250
Income tax rate x 40%
Depreciation tax savings (2) $ 2,500
Annual net cash inflow, years 1-8 (1) + (2) $ 14,500
The annual net cash inflow from the machine is $14,500 each year for eight years. However, the working capitalinvestment must be considered. The investment of $40,000 in working capital at the start of the project is an additionaloutlay that must be made when the project is started. The $40,000 would be tied up every year until the project is finished,or in this case, until the end of the life of the machine. At that point, the working capital would be released, and the$40,000 could be used for other investments. Therefore, the $40,000 is a cash outlay at the start of the project and a cashinflow at the end of the project.
The net present value of the project is computed as follows (assuming a 14% minimum desired rate of return):
Net cash inflow, years 1-8 ($14,500 x 4.63886) $67,263
Recovery of investment in working capital ($40,000 x 0.35056) 14,022
Present value of net cash inflows $81,285
Initial cash outlay ($50,000 + $40,000) 90,000
Net present value $(8,715)
The discount factor for the cash inflows, 4.63886, comes from Table 2 in the Appendix at the end of the book, because thecash inflows in this example are a series of equal payments—an annuity. The recovery of the investment in working capitalis assumed to represent a single lump sum received at the end of the project’s life. As such, it is discounted using a factor(0.35056) that comes from Table 1 in the Appendix.
The investment is not acceptable because it has a negative net present value. If the working capital investment had beenignored, the proposal would have had a rather large positive net present value of $17,263 ($67,263 net cash inflow –

11.5.2 12/25/2021 https://biz.libretexts.org/@go/page/26126
$50,000 initial cost). Thus, it should be obvious that investments in working capital must be considered if correct capital-budgeting decisions are to be made.
CC licensed content, Shared previouslyAccounting Principles: A Business Perspective. Authored by: James Don Edwards, University of Georgia & Roger H.Hermanson, Georgia State University. Provided by: Endeavour International Corporation. Project: The Global TextProject. License: CC BY: Attribution
11.6.1 12/18/2021 https://biz.libretexts.org/@go/page/26127
11.6: Controlling Capital Investment ExpendituresDuring the budget process, a company should prepare a capital expenditures budget. This budget may affect the cashbudget, the budgeted income statement and the budgeted balance sheet so it should be prepared before these final budgetsare prepared.
A YouTube element has been excluded from this version of the text. You can view it online here:pb.libretexts.org/llmanagerialaccounting/?p=252
The capital expenditure budget should not if the capital projects will be paid with cash or with a liability. We will need thisinformation to budget for depreciation on the capital projects as well as the cash payments in the cash budget.
CC licensed content, Shared previouslyAccounting Principles: A Business Perspective.. Authored by: James Don Edwards, University of Georgia & Roger H.Hermanson, Georgia State University.. Provided by: Endeavour International Corporation. Project: The Global TextProject.. License: CC BY: Attribution
All rights reserved contentManagerial Accounting: Capital Expenditure Budget. Authored by: Prof Alldredge. Located at: youtu.be/0wWEJ-x-R2g. License: All Rights Reserved. License Terms: Standard YouTube License

11.7.1 1/4/2022 https://biz.libretexts.org/@go/page/26128
11.7: Chapter 11 Key Points
Key Takeaways – Capital BudgetingClick capital budget key points for a printable copy.
11.8.1 12/25/2021 https://biz.libretexts.org/@go/page/26129
11.8: Glossary
GLOSSARY
Annuity A series of equal cash inflows.
Capital budgeting The process of considering alternative capital projects and selecting those alternatives that provide themost profitable return on available funds, within the framework of company goals and objectives.
Capital project Any available alternative to purchase, build, lease, or renovate equipment, buildings, property, or otherlong-term assets.
Cost of capital The cost of all sources of capital (debt and equity) employed by a company.
Initial cost of an asset Any cash outflows necessary to acquire an asset and place it in a position and condition for itsintended use.
Net cash inflow The periodic cash inflows from a project less the periodic cash outflows related to the project.
Net present value A project selection technique that discounts all expected after-tax cash inflows and outflows from theproposed investment to their present values using the company’s minimum rate of return as a discount rate. If the amountobtained by this process exceeds or equals the investment amount, the proposal is considered acceptable for furtherconsideration.
Opportunity cost The benefits or returns lost by rejecting the best alternative investment.
Out-of-pocket cost A cost requiring a future outlay of resources, usually cash.
Payback period The period of time it takes for the cumulative sum of the annual net cash inflows from a project to equalthe initial net cash outlay.
Profitability index The ratio of the present value of the expected net cash inflows (after taxes) divided by the initial cashoutlay (or present value of cash outlays if future outlays are required).
Sunk costs Costs that have already been incurred. Nothing can be done about sunk costs at the present time; they cannotbe avoided or changed in amount.
Time-adjusted rate of return A project selection technique that finds a rate of return that will equate the present value offuture expected net cash inflows (after taxes) from an investment with the cost of the investment; also called internal rateof return.
Unadjusted (or accounting) rate of return The rate of return computed by dividing average annual income after taxesfrom a project by the average amount of the investment.

11.9.1 12/25/2021 https://biz.libretexts.org/@go/page/26130
11.9: Chapter 11- Exercises
Short-Answer Questions, Exercises, and Problems
Short-Answer Questions
How do capital expenditures differ from ordinary expenditures?What effects can capital-budgeting decisions have on a company?What effect does depreciation have on cash flow?Give an example of an out-of-pocket cost and a sunk cost by describing a situation in which both are encountered.A machine is being considered for purchase. The salesperson attempting to sell the machine says that it will pay foritself in five years. What is meant by this statement?Discuss the limitations of the payback period method.What is the profitability index, and of what value is it?What is the time-adjusted rate of return on a capital investment?What role does the cost of capital play in the time-adjusted rate of return method and in the net present value method?What is the purpose of a postaudit? When should a postaudit be performed?A friend who knows nothing about the concepts in this chapter is considering purchasing a house for rental to students.In just a few words, what would you tell your friend to think about in making this decision?
Exercises
Exercise A Diane Manufacturing Company is considering investing $600,000 in new equipment with an estimated usefullife of 10 years and no salvage value. The equipment is expected to produce $240,000 in cash inflows and $160,000 incash outflows annually. The company uses straight-line depreciation, and has a 40% tax rate. Determine the annualestimated net income and net cash inflow.
Exercise B Zen Manufacturing Company is considering replacing a four-year-old machine with a new, advanced model.The old machine was purchased for $60,000, has an estimated useful life of 10 years with no salvage value, and has annualmaintenance costs of $15,000. The new machine would cost $45,000, but annual maintenance costs would be only $6,000.The new machine would have an estimated useful life of 10 years with no salvage value. Using straight-line depreciationand an assumed 40% tax rate, compute the additional annual cash inflow if the old machine is replaced.
Exercise C Given the following annual costs, compute the payback period for the new machine if its initial cost is$420,000.
Old machine New machine
Depreciation $ 18,000 $ 42,000
Labor 72,000 63,000
Repairs 21,000 4,500
Other costs 12,000 3,600
$ 123,000 $ 113,100
Exercise D Jefferson Company is considering investing $33,000 in a new machine. The machine is expected to last fiveyears and to have a salvage value of $8,000. Annual before-tax net cash inflow from the machine is expected to be $7,000.Calculate the unadjusted rate of return. The income tax rate is 40%.
Exercise E Compute the profitability index for each of the following two proposals assuming the desired minimum rate ofreturn is 20%. Based on the profitability indexes, which proposal is better?
Proposal 1 Proposal 2
Initial cash outlay $ 16,000 $ 10,300
Net cash inflow (after taxes):
First year 10,000 6,000
Second year 9,000 6,000
11.9.2 12/25/2021 https://biz.libretexts.org/@go/page/26130
Third year 6,000 4,000
Fourth year -0- 2,500
Exercise F Ross Company is considering three alternative investment proposals. Using the following information, rank theproposals in order of desirability using the payback period method.
Proposal
A B C
Initial outlay $ 360,000 $ 360,000 $ 360,000
Net cash inflow (after taxes):
First year $ -0- $ 90,000 $ 90,000
Second year 180,000 270,000 180,000
Third year 180,000 90,000 270,000
Fourth year 90,000 180,000 450,000
$ 450,000 $ 630,000 $ 990,000
Exercise G Simone Company is considering the purchase of a new machine costing $50,000. It is expected to save $9,000cash per year for 10 years, has an estimated useful life of 10 years, and no salvage value. Management will not make anyinvestment unless at least an 18% rate of return can be earned. Using the net present value method, determine if theproposal is acceptable. Assume all tax effects are included in these numbers.
Exercise H Refer to the data in previous exercise. Calculate the time-adjusted rate of return.
Exercise I Rank the following investments for Renate Company in order of their desirability using the (a) payback periodmethod, (b) net present value method, and (c) time-adjusted rate of return method. Management requires a minimum rateof return of 14%.
Initial Expected after-tax net cash Expected life of proposal
Investment Cash outlay Inflow per year (years)
A $ 120,000 $ 15,000 8
B 150,000 26,000 20
C 240,000 48,000 10
Problems
Problem A Hamlet Company is considering the purchase of a new machine that would cost $300,000 and would have anestimated useful life of 10 years with no salvage value. The new machine is expected to have annual before-tax cashinflows of $100,000 and annual before-tax cash outflows of $40,000. The company will depreciate the machine usingstraight-line depreciation, and the assumed tax rate is 40%.
a. Determine the net after-tax cash inflow for the new machine.
b. Determine the payback period for the new machine.
Problem B Graham Company currently uses four machines to produce 400,000 units annually. The machines were boughtthree years ago for $50,000 each and have an expected useful life of 10 years with no salvage value. These machines cost atotal of $30,000 per year to repair and maintain.
The company is considering replacing the four machines with one technologically superior machine capable of producing400,000 units annually by itself. The machine would cost $140,000 and have an estimated useful life of seven years withno salvage value. Annual repair and maintenance costs are estimated at $14,000.
Assuming straight-line depreciation and a 40% tax rate, determine the annual additional after-tax net cash inflow if thenew machine is acquired.
11.9.3 12/25/2021 https://biz.libretexts.org/@go/page/26130
Problem C Macro Company owns five machines that it uses in its manufacturing operations. Each of the machines waspurchased four years ago at a cost of $120,000. Each machine has an estimated life of 10 years with no expected salvagevalue. A new machine has become available. One new machine has the same productive capacity as the five old machinescombined; it can produce 800,000 units each year. The new machine will cost $648,000, is estimated to last six years, andwill have a salvage value of $72,000. A trade-in allowance of $24,000 is available for each of the old machines. These arethe operating costs per unit:
Five old Machines New Machines
Repairs $ 0.6796 $ 0.0856
Depreciation 0.1500 0.2400
Power 0.1890 0.1036
Other operating costs 0.1620 0.0496
$ 1.1806 $ 0.4788
Ignore federal income taxes. Use the payback period method for (a) and (b).
a. Do you recommend replacing the old machines? Support your answer with computations. Disregard all factors exceptthose reflected in the data just given.
b. If the old machines were already fully depreciated, would your answer be different? Why?
c. Using the net present value method with a discount rate of 20%, present a schedule showing whether or not the newmachine should be acquired.
Problem D Span Fruit Company has used a particular canning machine for several years. The machine has a zero salvagevalue. The company is considering buying a technologically improved machine at a cost of $232,000. The new machinewill save $50,000 per year after taxes in cash operating costs. If the company decides not to buy the new machine, it canuse the old machine for an indefinite time by incurring heavy repair costs. The new machine would have an estimateduseful life of eight years.
a. Compute the time-adjusted rate of return for the new machine.
b. Management thinks the estimated useful life of the new machine may be more or less than eight years. Compute thetime-adjusted rate of return for the new machine if its useful life is (1) 5 years and (2) 12 years, instead of 8 years.
c. Suppose the new machine’s useful life is eight years, but the annual after-tax cost savings are only $45,000. Compute thetime-adjusted rate of return.
d. Assume the annual after-tax cost savings from the new machine will be $35,000 and its useful life will be 10 years.Compute the time-adjusted rate of return.
Problem E Merryll, Inc., is considering three different investments involving depreciable assets with no salvage value.The following data relate to these investments:
Initial cash Expected before-tax net Expected after-tax net Life of proposal
Investment Outlay Cash inflow per year Cash inflow per year (years)
1 $ 140,000 $ 37,333 $ 28,000 10
2 240,000 72,000 48,000 20
3 360,000 89,333 68,000 10
The income tax rate is 40%. Management requires a minimum return on investment of 12%.
Rank these proposals using the following selection techniques:
a. Payback period.
b. Unadjusted rate of return.
c. Profitability index.
11.9.4 12/25/2021 https://biz.libretexts.org/@go/page/26130
d. Time-adjusted rate of return.
Problem F Slow to Change Company has decided to computerize its accounting system. The company has twoalternatives—it can lease a computer under a three-year contract or purchase a computer outright.
If the computer is leased, the lease payment will be $5,000 each year. The first lease payment will be due on the day thelease contract is signed. The other two payments will be due at the end of the first and second years. The lessor willprovide all repairs and maintenance.
If the company purchases the computer outright, it will incur the following costs:
Acquisition cost $ 10,500
Repairs and maintenance:
First year 300
Second year 250
Third year 350
The computer is expected to have only a three-year useful life because of obsolescence and technological advancements.The computer will have no salvage value and be depreciated on a double-declining-balance basis. Slow to ChangeCompany’s cost of capital is 16%.
a. Calculate the net present value of out-of-pocket costs for the lease alternative.
b. Calculate the net present value of out-of-pocket costs for the purchase alternative.
c. Do you recommend that the company purchase or lease the machine?
Problem G Van Gogh Sports Company is trying to decide whether to add tennis equipment to its existing line of football,baseball, and basketball equipment. Market research studies and cost analyses have provided the following information:
Van Gogh will need additional machinery and equipment to manufacture the tennis equipment. The machines andequipment will cost $450,000, have an estimated 10-year useful life, and have a $10,000 salvage value.
Sales of tennis equipment for the next 10 years have been projected as follows:
Years Sales in dollars
1 $ 75,000
2 112,500
3 168,750
4 187,500
5 206,250
6 – 10 (each year) 225,000
Variable costs are 60% of selling price, and fixed costs (including straight-line depreciation) will total $88,500 per year.
The company must advertise its new product line to gain rapid entry into the market. Its advertising campaign costs willbe:
Years Annual advertising cost
1 – 3 $ 75,000
4 – 10 37,500
The company requires a 14% minimum rate of return on investments.
Using the net present value method, decide whether or not Van Gogh Sports Company should add the tennis equipment toits line of products. (Ignore federal income taxes.) Round to the nearest dollar.
11.9.5 12/25/2021 https://biz.libretexts.org/@go/page/26130
Problem H Jordan Company is considering purchasing new equipment costing $2,400,000. Jordan estimates that theuseful life of the equipment will be five years and that it will have a salvage value of $600,000. The company usesstraight-line depreciation. The new equipment is expected to have a net cash inflow (before taxes) of $258,000 annually.Assume that the tax rate is 40% and that management requires a minimum return of 14%.
Using the net present value method, determine whether the equipment is an acceptable investment.
Problem I Penny Company has an opportunity to sell some equipment for $40,000. Such a sale will result in a tax-deductible loss of $4,000. If the equipment is not sold, it is expected to produce net cash inflows after taxes of $8,000 forthe next 10 years. After 10 years, the equipment can be sold for its book value of $4,000. Assume a 40% federal incometax rate.
Management currently has other opportunities that will yield 18%. Using the net present value method, show whether thecompany should sell the equipment. Prepare a schedule to support your conclusion.
Alternate problems
Alternate problem A Mark’s Manufacturing Company is currently using three machines that it bought seven years ago tomanufacture its product. Each machine produces 10,000 units annually. Each machine originally cost $25,500 and has anestimated useful life of 17 years with no salvage value.
The new assistant manager of Mark’s Manufacturing Company suggests that the company replace the three old machineswith two technically superior machines for $22,500 each. Each new machine would produce 15,000 units annually andwould have an estimated useful life of 10 years with no salvage value.
The new assistant manager points out that the cost of maintaining the new machines would be much lower. Each oldmachine costs $2,500 per year to maintain; each new machine would cost only $1,500 a year to maintain.
Compute the increase in after-tax annual net cash inflow that would result from replacing the old machines; use straight-line depreciation and an assumed tax rate of 40%.
Alternate problem B Fed Extra Company is considering replacing 10 of its delivery vans that originally cost $30,000each; depreciation of $18,750 has already been taken on each van. The vans were originally estimated to have useful livesof eight years and no salvage value. Each van travels an average of 150,000 miles per year. The 10 new vans, if purchased,will cost $36,000 each. Each van will be driven 150,000 miles per year and will have no salvage value at the end of itsthree-year estimated useful life. A trade-in allowance of $3,000 is available for each of the old vans. Following is acomparison of costs of operation per mile:
Old vans New vans
Fuel, lubricants, etc. $ 0.152 $ 0.119
Tires 0.067 0.067
Repairs 0.110 0.087
Depreciation 0.025 0.080
Other operating costs 0.051 0.043
Operating costs per mile $ 0.405 $ 0.396
Use the payback period method for (a) and (b).
a. Do you recommend replacing the old vans? Support your answer with computations and disregard all factors not relatedto the preceding data.
b. If the old vans were already fully depreciated, would your answer be different? Why?
c. Assume that all cost flows for operating costs fall at the end of each year and that 18% is an appropriate rate fordiscounting purposes. Using the net present value method, present a schedule showing whether or not the new vans shouldbe acquired.
Alternate problem C Mesa Company has been using an old-fashioned computer for many years. The computer has nosalvage value. The company is considering buying a computer system at a cost of $35,000. The new computer system will
11.9.6 12/25/2021 https://biz.libretexts.org/@go/page/26130
save $7,000 per year after taxes in cash (including tax effects of depreciation). If the company decides not to buy the newcomputer system, it can use the old one for an indefinite time. The new computer system will have an estimated useful lifeof 10 years.
a. Compute the time-adjusted rate of return for the new computer system.
b. The company is uncertain about the new computer system’s 10-year useful life. Compute the time-adjusted rate of returnfor the new computer system if its useful life is (1) 6 years and (2) 15 years, instead of 10 years.
c. Suppose the computer system has a useful life of 10 years, but the annual after-tax cost savings are only $4,500.Compute the time-adjusted rate of return.
d. Assume the annual after-tax cost savings will be $7,500 and the useful life will be eight years. Compute the time-adjusted rate of return.
Alternate problem D Ott’s Fresh Produce Company has always purchased its trucks outright and sold them after threeyears. The company is ready to sell its present fleet of trucks and is trying to decide whether it should continue to purchasetrucks or whether it should lease trucks. If the trucks are purchased, the company will incur the following costs:
Costs per fleet
Acquisition cost $ 312,000
Repairs:
First year 3,600
Second year 6,600
Third year 9,000
Other annual costs 9,600
At the end of three years, the trucks could be sold for a total of $96,000. Another fleet of trucks would then be purchased.The costs just listed, including the same acquisition cost, also would be incurred with respect to the second fleet of trucks.The second fleet also could be sold for $96,000 at the end of three years.
If the company leases the trucks, the lease contract will run for six years. One fleet of trucks will be provided immediately,and a second fleet of trucks will be provided at the end of three years. The company will pay $126,000 per year under thelease contract. The first lease payment will be due on the day the lease contract is signed. The lessor bears the cost of allrepairs.
Using the net present value method, determine if the company should buy or lease the trucks. Assume the company’s costof capital is 18%. (Ignore federal income taxes.)
Beyond the numbers—Critical thinking
Business decision case A Lloyd’s Company wishes to invest $750,000 in capital projects that have a minimum expectedrate of return of 14%. The company is evaluating five proposals. Acceptance of one proposal does not preclude acceptanceof any of the other proposals. The company’s criterion is to select proposals that meet its 14% minimum required rate ofreturn. The relevant information related to the five proposals is as follows:
Initial cash Expected after-tax net Expected life of
Investment Outlay Cash inflow per year Proposal (years)
A $ 150,000 $ 45,000 5
B 300,000 60,000 8
C 375,000 82,500 10
D 450,000 78,000 12
E 150,000 31,500 10
a. Compute the net present value of each of the five proposals.

11.9.7 12/25/2021 https://biz.libretexts.org/@go/page/26130
b. Which projects should be undertaken? Why? Rank them in order of desirability.
Business decision case B Slick Company is considering a capital project involving a $225,000 investment in machineryand a $45,000 investment in working capital. The machine has an expected useful life of 10 years and no salvage value.The annual cash inflows (before taxes) are estimated at $90,000 with annual cash outflows (before taxes) of $30,000. Thecompany uses straight-line depreciation. Assume the federal income tax rate is 40%.
The company’s new accountant computed the net present value of the project using a minimum required rate of return of16% (the company’s cost of capital). The accountant’s computations follow:
Cash inflows $ 90,000
Cash outflows 30,000
Net cash inflow $ 60,000
Present value of net cash at 16% X 4.833
Present value of net cash inflow $283,980
Initial cash outlay 225,000
Net present value $ 64,980
a. Are the accountant’s computations correct? If not, compute the correct net present value.
b. Is this capital project acceptable to the company? Why or why not?
An accounting perspective – Writing experience C Refer to “An accounting perspective: Business insight”. Write a briefpaper explaining why managers in Japan might use lower measures of the cost of capital than US managers.
Ethics case – Writing experience D Rebecca Peters just learned that First Bank’s investment review committee rejectedher pet project, a new computerized method of storing data that would enable customers to have instant access to theirbank records. Peters’ software consulting firm specializes in working with financial institutions. This project for First Bankwas her first as project manager.
Following up, Peters learned that First Bank’s investment review committee liked the idea but were not convinced that thenew software’s financial benefits would justify the cost of the software. When she told a colleague about the rejection atFirst Bank, the colleague said, “Why not tell the committee this software will increase the bank’s profits? After weinstalled the software in the bank in Indianapolis, Indiana, USA their profits increased substantially. We even have datafrom that bank that you could present.”
Peters thought about the suggestion. She knew First Bank would be pleased with the software if they installed it, and shewanted to make the sale. She also knew that the situation in Indianapolis, Indiana, USA was different; profits there hadincreased primarily because of other software that had reduced the bank’s operating costs.
What should Rebecca Peters do? Write her a letter telling what you would do.
Group assignment E For summer employment, a friend is considering investing in a coffee stand on a busy street nearoffice buildings. Being unfamiliar with the concepts in this chapter, your friend does not know how to make the decision.In teams of four, help your friend get started by providing a framework and questions that your friend should answer. (Forexample, how much will the investment be? How much are the estimated cash flows from sales?) Prepare a memorandumfrom the group to your instructor; list your questions and suggestions for your friend. In the heading, include the date, towhom it is written, from whom, and the subject matter.
Group project F You have the option of choosing between two projects with equal total cash flows over five years butdifferent annual cash flows. In groups of two or three students, determine which project should be selected for investment.Write a memorandum to your instructor addressing this issue. Be sure to provide examples to reinforce your answer. Theheading of the memorandum should contain the date, to whom it is written, from whom, and the subject matter.
Group project G A manager comments to her superior, “There is no need to perform a postaudit. The project was justifiedbased on our initial projections and we were given the green light to proceed. It has been a year since we started theproject, a postaudit would be a waste of time.” In groups of two or three students, respond to this comment. Do you agree?Do you disagree? If this manager is right, why bother with a postaudit? Write a memorandum to your instructor addressing
11.9.8 12/25/2021 https://biz.libretexts.org/@go/page/26130
these questions. The heading of the memorandum should contain the date, to whom it is written, from whom, and thesubject matter.
Using the Internet—A view of the real world
Using any Internet search engine enter “budgeting” . Select an article that directly discusses budgeting in an organizationor industry and print a copy of the article. You are encouraged (but not required) to find an article that answers some of thefollowing questions: What is the purpose of budgeting? How are budgets developed? How is budgeting used to motivateemployees? How might budgeting create ethical dilemmas?
Write a memorandum to your instructor summarizing the key points of the article. The heading of the memorandum shouldcontain the date, to whom it is written, from whom, and the subject matter. Be sure to include a copy of the article used forthis assignment.
Using any Internet search engine select one of the new terms at the end of the chapter and perform a key word search. Besure to include quotation marks (for example: “Payback period”). Select an article that directly discusses the new termused, and print a copy of the article. Write a memorandum to your instructor summarizing the key points of the article. Theheading of the memorandum should contain the date, to whom it is written, from whom, and the subject matter. Be sure toinclude a copy of the article used for this assignment.
1 1/8/2022
CHAPTER OVERVIEW12: FINANCIAL STATEMENT ANALYSIS
12.1: ANALYZING COMPARATIVE FINANCIAL STATEMENTS12.2: CHAPTER 12 STUDY PLAN12.3: CALCULATING TREND PERCENTAGES12.4: COMMON-SIZE FINANCIAL STATEMENTS12.5: ACCOUNTING IN THE HEADLINES12.6: CALCULATE RATIOS THAT ANALYZE A COMPANY’S SHORT-TERM DEBT-PAYING ABILITY12.7: RATIOS THAT ANALYZE A COMPANY’S LONG-TERM DEBT PAYING ABILITY12.8: RATIOS THAT ANALYZE A COMPANY’S EARNINGS PERFORMANCE12.9: RATIO SUMMARY12.10: CHAPTER 12- EXERCISES
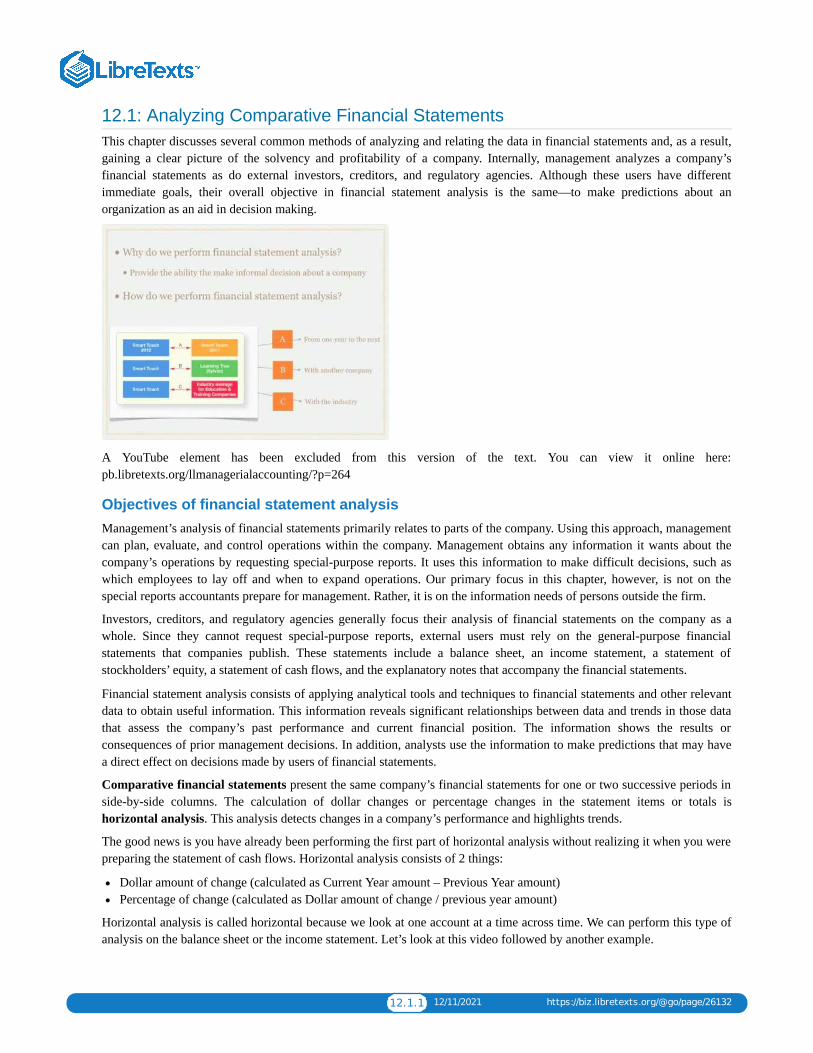
12.1.1 12/11/2021 https://biz.libretexts.org/@go/page/26132
12.1: Analyzing Comparative Financial StatementsThis chapter discusses several common methods of analyzing and relating the data in financial statements and, as a result,gaining a clear picture of the solvency and profitability of a company. Internally, management analyzes a company’sfinancial statements as do external investors, creditors, and regulatory agencies. Although these users have differentimmediate goals, their overall objective in financial statement analysis is the same—to make predictions about anorganization as an aid in decision making.
A YouTube element has been excluded from this version of the text. You can view it online here:pb.libretexts.org/llmanagerialaccounting/?p=264
Objectives of financial statement analysisManagement’s analysis of financial statements primarily relates to parts of the company. Using this approach, managementcan plan, evaluate, and control operations within the company. Management obtains any information it wants about thecompany’s operations by requesting special-purpose reports. It uses this information to make difficult decisions, such aswhich employees to lay off and when to expand operations. Our primary focus in this chapter, however, is not on thespecial reports accountants prepare for management. Rather, it is on the information needs of persons outside the firm.
Investors, creditors, and regulatory agencies generally focus their analysis of financial statements on the company as awhole. Since they cannot request special-purpose reports, external users must rely on the general-purpose financialstatements that companies publish. These statements include a balance sheet, an income statement, a statement ofstockholders’ equity, a statement of cash flows, and the explanatory notes that accompany the financial statements.
Financial statement analysis consists of applying analytical tools and techniques to financial statements and other relevantdata to obtain useful information. This information reveals significant relationships between data and trends in those datathat assess the company’s past performance and current financial position. The information shows the results orconsequences of prior management decisions. In addition, analysts use the information to make predictions that may havea direct effect on decisions made by users of financial statements.
Comparative financial statements present the same company’s financial statements for one or two successive periods inside-by-side columns. The calculation of dollar changes or percentage changes in the statement items or totals ishorizontal analysis. This analysis detects changes in a company’s performance and highlights trends.
The good news is you have already been performing the first part of horizontal analysis without realizing it when you werepreparing the statement of cash flows. Horizontal analysis consists of 2 things:
Dollar amount of change (calculated as Current Year amount – Previous Year amount)Percentage of change (calculated as Dollar amount of change / previous year amount)
Horizontal analysis is called horizontal because we look at one account at a time across time. We can perform this type ofanalysis on the balance sheet or the income statement. Let’s look at this video followed by another example.
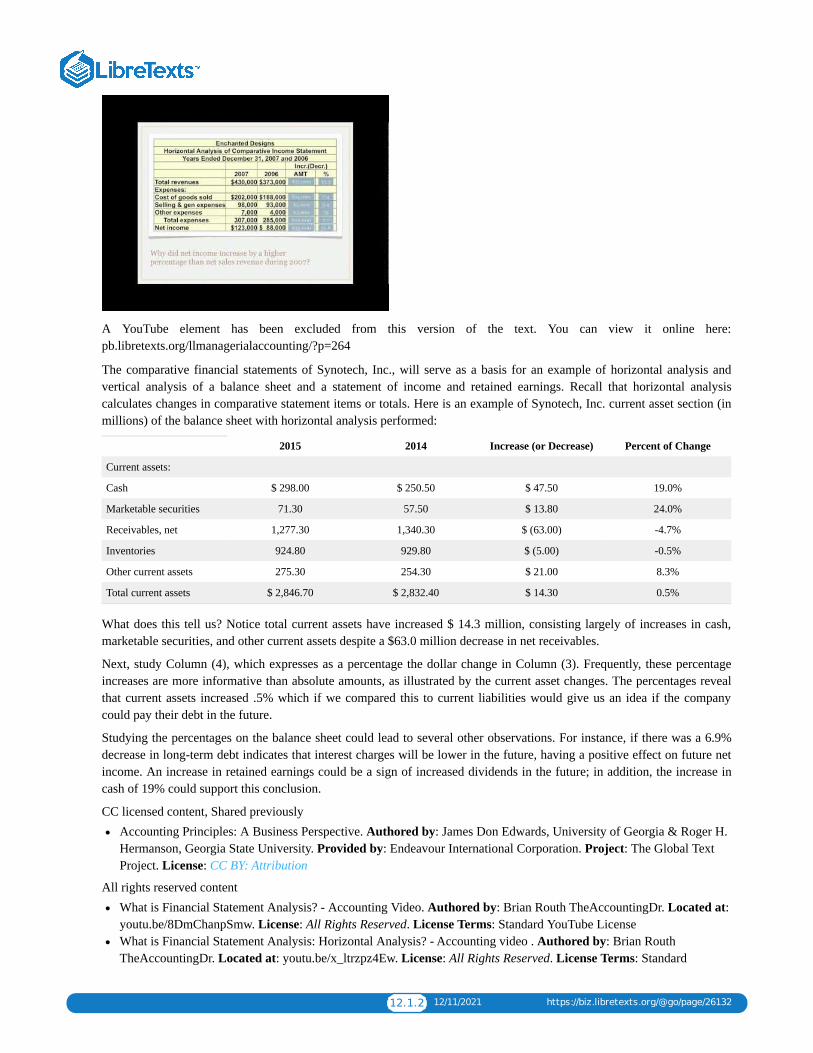
12.1.2 12/11/2021 https://biz.libretexts.org/@go/page/26132
A YouTube element has been excluded from this version of the text. You can view it online here:pb.libretexts.org/llmanagerialaccounting/?p=264
The comparative financial statements of Synotech, Inc., will serve as a basis for an example of horizontal analysis andvertical analysis of a balance sheet and a statement of income and retained earnings. Recall that horizontal analysiscalculates changes in comparative statement items or totals. Here is an example of Synotech, Inc. current asset section (inmillions) of the balance sheet with horizontal analysis performed:
2015 2014 Increase (or Decrease) Percent of Change
Current assets:
Cash $ 298.00 $ 250.50 $ 47.50 19.0%
Marketable securities 71.30 57.50 $ 13.80 24.0%
Receivables, net 1,277.30 1,340.30 $ (63.00) -4.7%
Inventories 924.80 929.80 $ (5.00) -0.5%
Other current assets 275.30 254.30 $ 21.00 8.3%
Total current assets $ 2,846.70 $ 2,832.40 $ 14.30 0.5%
What does this tell us? Notice total current assets have increased $ 14.3 million, consisting largely of increases in cash,marketable securities, and other current assets despite a $63.0 million decrease in net receivables.
Next, study Column (4), which expresses as a percentage the dollar change in Column (3). Frequently, these percentageincreases are more informative than absolute amounts, as illustrated by the current asset changes. The percentages revealthat current assets increased .5% which if we compared this to current liabilities would give us an idea if the companycould pay their debt in the future.
Studying the percentages on the balance sheet could lead to several other observations. For instance, if there was a 6.9%decrease in long-term debt indicates that interest charges will be lower in the future, having a positive effect on future netincome. An increase in retained earnings could be a sign of increased dividends in the future; in addition, the increase incash of 19% could support this conclusion.
CC licensed content, Shared previouslyAccounting Principles: A Business Perspective. Authored by: James Don Edwards, University of Georgia & Roger H.Hermanson, Georgia State University. Provided by: Endeavour International Corporation. Project: The Global TextProject. License: CC BY: Attribution
All rights reserved contentWhat is Financial Statement Analysis? - Accounting Video. Authored by: Brian Routh TheAccountingDr. Located at:youtu.be/8DmChanpSmw. License: All Rights Reserved. License Terms: Standard YouTube LicenseWhat is Financial Statement Analysis: Horizontal Analysis? - Accounting video . Authored by: Brian RouthTheAccountingDr. Located at: youtu.be/x_ltrzpz4Ew. License: All Rights Reserved. License Terms: Standard

12.1.3 12/11/2021 https://biz.libretexts.org/@go/page/26132
YouTube License
12.2.1 12/11/2021 https://biz.libretexts.org/@go/page/26131
12.2: Chapter 12 Study Plan
Study Plan: Financial Statement Analysis
Knowledge Targets
I can define the following terms as they relate to our unit:
Net Income Retained Earnings Horizontal Analysis
Vertical Analysis Ratio Analysis Trend Percents
Current Assets Current Liabilities Average Inventory
Average Accounts Receivable Percent of change Dollar amount of change
Reasoning Targets
• I can understand the use of horizontal analysis, vertical analysis and ratio analysis
to evaluate company performance.
• I can analyze and explain the trends of a company using horizontal analysis.
• I can analyze and explain a company’s financial statements using vertical analysis.
• I can analyze and explain a company’s financial performance using ratio analysis.
Skill Targets
• I can calculate dollar amount of change and percentage of change for accounts on the financial statements usinghorizontal analysis.
• I can calculate trend percentages for horizontal analysis.
• I can calculate the common-size percentages using vertical analysis.
• I can calculate ratios used in ratio analysis.
Click Fin Stmt Analysis for a printable copy.
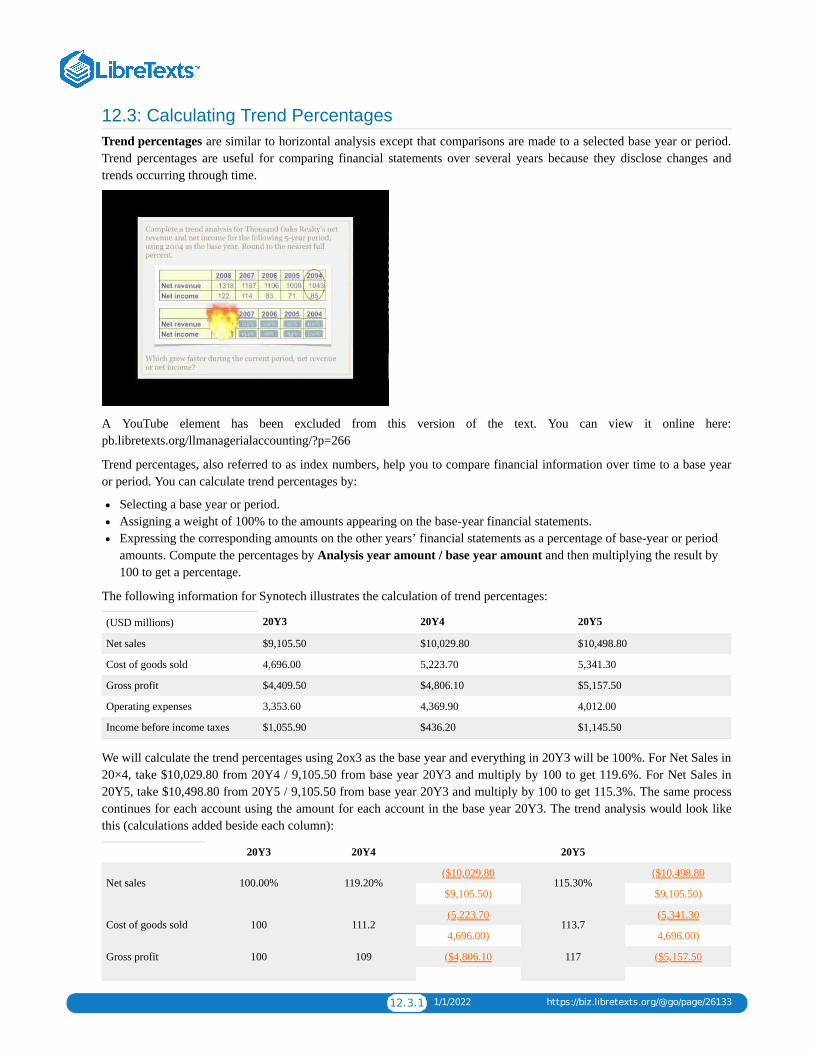
12.3.1 1/1/2022 https://biz.libretexts.org/@go/page/26133
12.3: Calculating Trend PercentagesTrend percentages are similar to horizontal analysis except that comparisons are made to a selected base year or period.Trend percentages are useful for comparing financial statements over several years because they disclose changes andtrends occurring through time.
A YouTube element has been excluded from this version of the text. You can view it online here:pb.libretexts.org/llmanagerialaccounting/?p=266
Trend percentages, also referred to as index numbers, help you to compare financial information over time to a base yearor period. You can calculate trend percentages by:
Selecting a base year or period.Assigning a weight of 100% to the amounts appearing on the base-year financial statements.Expressing the corresponding amounts on the other years’ financial statements as a percentage of base-year or periodamounts. Compute the percentages by Analysis year amount / base year amount and then multiplying the result by100 to get a percentage.
The following information for Synotech illustrates the calculation of trend percentages:
(USD millions) 20Y3 20Y4 20Y5
Net sales $9,105.50 $10,029.80 $10,498.80
Cost of goods sold 4,696.00 5,223.70 5,341.30
Gross profit $4,409.50 $4,806.10 $5,157.50
Operating expenses 3,353.60 4,369.90 4,012.00
Income before income taxes $1,055.90 $436.20 $1,145.50
We will calculate the trend percentages using 2ox3 as the base year and everything in 20Y3 will be 100%. For Net Sales in20×4, take $10,029.80 from 20Y4 / 9,105.50 from base year 20Y3 and multiply by 100 to get 119.6%. For Net Sales in20Y5, take $10,498.80 from 20Y5 / 9,105.50 from base year 20Y3 and multiply by 100 to get 115.3%. The same processcontinues for each account using the amount for each account in the base year 20Y3. The trend analysis would look likethis (calculations added beside each column):
20Y3 20Y4 20Y5
Net sales 100.00% 119.20%($10,029.80
115.30%($10,498.80
$9,105.50) $9,105.50)
Cost of goods sold 100 111.2(5,223.70
113.7(5,341.30
4,696.00) 4,696.00)
Gross profit 100 109 ($4,806.10 117 ($5,157.50

12.3.2 1/1/2022 https://biz.libretexts.org/@go/page/26133
$4,409.50) $4,409.50)
Operating expenses 100 130.3(4,369.90
119.6(4,012.00
3,353.60) 3,353.60)
Income beforeincome taxes
100 41.3($436.20
108.5($1,145.50
$1,055.90) $1,055.90)
These trend percentages indicate the changes taking place in the organization and highlight the direction of these changes.For instance, the percentage of sales is increasing each year compared to the base year. Cost of goods sold increased at alower rate than net sales in 20Y3 and 20Y5, causing gross profit to increase at a higher rate than net sales. Operatingexpenses in 20Y4 increased due to the provision for restructured operations, causing a significant decrease in incomebefore income taxes. Percentages provide clues to an analyst about which items need further investigation or analysis. Inreviewing trend percentages, a financial statement user should pay close attention to the trends in related items, such as thecost of goods sold in relation to sales. Trend analysis that shows a constantly declining gross margin (profit) rate may be asignal that future net income will decrease.
As useful as trend percentages are, they have one drawback. Expressing changes as percentages is usually straightforwardas long as the amount in the base year or period is positive—that is, not zero or negative. Analysts cannot express a$30,000 increase in notes receivable as a percentage if the increase is from zero last year to $30,000 this year (remember,you cannot divide by zero). Nor can they express an increase from a loss last year of – $10,000 to income this year of$20,000 in a realistic percentage term.
Proper analysis does not stop with the calculation of increases and decreases in amounts or percentages over several years.Such changes generally indicate areas worthy of further investigation and are merely clues that may lead to significantfindings. Accurate predictions depend on many factors, including economic and political conditions; management’s plansregarding new products, plant expansion, and promotional outlays; and the expected activities of competitors. Consideringthese factors along with horizontal analysis, vertical analysis, and trend analysis should provide a reasonable basis forpredicting future performance.
CC licensed content, Shared previouslyAccounting Principles: A Business Perspective. Authored by: James Don Edwards, University of Georgia & Roger H.Hermanson, Georgia State University. Provided by: Endeavour International Corporation. Project: The Global TextProject. License: CC BY: Attribution
All rights reserved contentWhat is Financial Statement Analysis: Trend Analysis? - Accounting video . Authored by: Brian RouthTheAccountingDr. Located at: youtu.be/SUr-ZzFBGcQ. License: All Rights Reserved. License Terms: StandardYouTube License
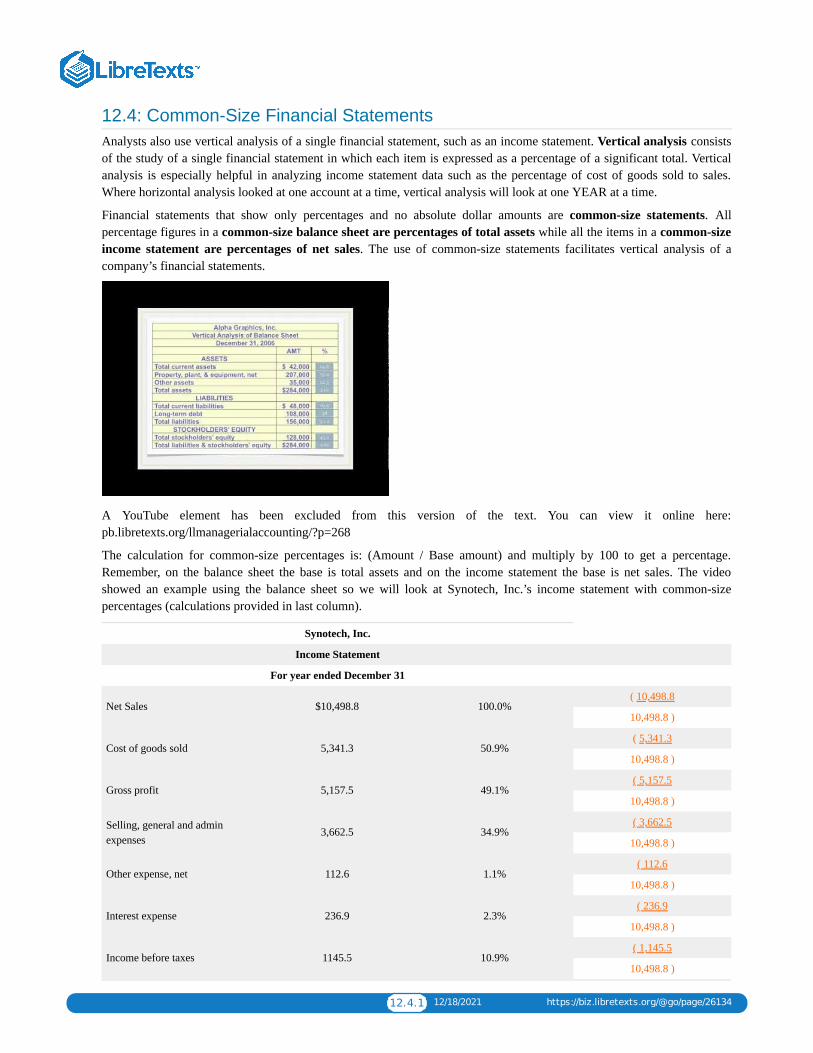
12.4.1 12/18/2021 https://biz.libretexts.org/@go/page/26134
12.4: Common-Size Financial StatementsAnalysts also use vertical analysis of a single financial statement, such as an income statement. Vertical analysis consistsof the study of a single financial statement in which each item is expressed as a percentage of a significant total. Verticalanalysis is especially helpful in analyzing income statement data such as the percentage of cost of goods sold to sales.Where horizontal analysis looked at one account at a time, vertical analysis will look at one YEAR at a time.
Financial statements that show only percentages and no absolute dollar amounts are common-size statements. Allpercentage figures in a common-size balance sheet are percentages of total assets while all the items in a common-sizeincome statement are percentages of net sales. The use of common-size statements facilitates vertical analysis of acompany’s financial statements.
A YouTube element has been excluded from this version of the text. You can view it online here:pb.libretexts.org/llmanagerialaccounting/?p=268
The calculation for common-size percentages is: (Amount / Base amount) and multiply by 100 to get a percentage.Remember, on the balance sheet the base is total assets and on the income statement the base is net sales. The videoshowed an example using the balance sheet so we will look at Synotech, Inc.’s income statement with common-sizepercentages (calculations provided in last column).
Synotech, Inc.
Income Statement
For year ended December 31
Net Sales $10,498.8 100.0%( 10,498.8
10,498.8 )
Cost of goods sold 5,341.3 50.9%( 5,341.3
10,498.8 )
Gross profit 5,157.5 49.1%( 5,157.5
10,498.8 )
Selling, general and adminexpenses
3,662.5 34.9%( 3,662.5
10,498.8 )
Other expense, net 112.6 1.1%( 112.6
10,498.8 )
Interest expense 236.9 2.3%( 236.9
10,498.8 )
Income before taxes 1145.5 10.9%( 1,145.5
10,498.8 )
12.4.2 12/18/2021 https://biz.libretexts.org/@go/page/26134
Income tax expense 383.5 3.7% ( 383.5
10,498.8 )
Net Income 762 7.3%( 762
10,498.8 )
What does this common-size percentage tell you about the company? Since we use net sales as the base on the incomestatement, it tells us how every dollar of net sales is spent by the company. For Synotech, Inc., approximately 51 cents ofevery sales dollar is used by cost of goods sold and 49 cents of every sales dollar is left in gross profit to cover remainingexpenses. Of the 49 cents remaining, almost 35 cents is used by operating expenses (selling, general and administrative), 1cent by other and 2 cents in interest. We earn almost 11 cents of net income before taxes and over 7 cents in net incomeafter taxes on every sales dollar. This is a little easier to understand than the larger numbers showing Synotech earned $762million dollars.
The same process would apply on the balance sheet but the base is total assets. The common-size percentages on thebalance sheet explain how our assets are allocated OR how much of every dollar in assets we owe to others (liabilities) andto owners (equity). Many computerized accounting systems automatically calculate common-size percentages on financialstatements.
CC licensed content, Shared previouslyAccounting Principles: A Business Perspective. Authored by: James Don Edwards, University of Georgia & Roger H.Hermanson, Georgia State University. Provided by: Endeavour International Corporation. Project: The Global TextProject. License: CC BY: Attribution
All rights reserved contentFinancial Statement Analysis: Vertical Analysis - Financial Accounting video . Authored by: Brian RouthTheAccountingDr. Located at: youtu.be/OT1BVZPNfks. License: All Rights Reserved. License Terms: StandardYouTube License

12.5.1 1/1/2022 https://biz.libretexts.org/@go/page/26135
12.5: Accounting in the Headlines
How can a common-size income statement help analysis of Pandora’s results of operations in2015 compared to 2014?
Pandora Internet Radio by Pandora Media (P) is a streaming music service. Its free advertising-supported radio service wasfirst launched in 2005. Pandora users streamed 20.03 billion hours of internet radio during 2014. In December 2014, therewere 81.5 million active users of Pandora, making it the largest streaming music service currently. Pandora has a databaseof over 1,000,000 songs from over 125,000 artists.
Pandora offers its streaming music through two services:
1. Free Service: This option allows the listener access to the music by including advertisements.2. Pandora One: This option is a paid subscription model without any advertisements; it also allows users to have more
daily skips and longer listening times.
While Pandora currently has plenty of cash from its investors, it has yet to generate a profit since its inception. Pandora isfacing increasing competition from sources such as Apple Music (approximately 6.5 million subscribers in 2015), Spotify(approximately 20 million paid subscribers in 2015), and other streaming services. In addition, Pandora’s costs in someareas are increasing.
Pandora recently released its earnings for the third quarter of 2015. Earnings were less than expected by investors andPandora’s stock price fell sharply. At the end of this posting, excerpts from Pandora’s statement of operations is provided,both in dollars and in common-size formats. Use those excerpts to answer the questions.
Questions
1. Using the statement of operations excerpt in dollars, what can you say about how Pandora is doing in the third quarterof 2015 compared to the third quarter of 2014? What can you say about how Pandora is doing for the nine monthsended September 2015 compared to September 2014? Can you tell if the rate of increase is greater for revenues orexpenses from 2014 to 2015? Why or why not?
2. Using the statement of operations excerpt in dollars again, why is the loss from operations larger in 2015 than in 2014?3. Using the common-size statement of operations excerpt, what can you say about how Pandora is doing in the third
quarter of 2015 compared to the third quarter of 2014? What can you say about how Pandora is doing for the ninemonths ended September 2015 compared to September 2014? Is the rate of increase is greater for revenues or expensesfrom 2014 to 2015?
4. Using the common-size statement of operations excerpt again, why is the loss from operations larger in 2015 than in2014? Also, what can you say about the mix of advertising revenue versus subscription revenue?
5. Which statement (dollars versus common-size) is more useful for analyzing the financial performance of Pandora inthis case? Explain.
CC licensed content, Specific attributionHow can a common-size income statement help analysis of Pandorau2019s results of operations in 2015 compared to2014?. Authored by: Dr. Wendy Tietz, CPA, CMA, CGMA . Located at: http://www.accountingintheheadlines.com.License: CC BY-NC: Attribution-NonCommercial

12.6.1 12/25/2021 https://biz.libretexts.org/@go/page/26136
12.6: Calculate Ratios That Analyze a Company’s Short-Term Debt-PayingAbilityRatios are expressions of logical relationships between items in the financial statements of a single period. Analysts cancompute many ratios from the same set of financial statements. A ratio can show a relationship between two items on thesame financial statement or between two items on different financial statements (e.g. balance sheet and income statement).The only limiting factor in choosing ratios is the requirement that the items used to construct a ratio have a logicalrelationship to one another.
Ratio analysisLogical relationships exist between certain accounts or items in a company’s financial statements. These accounts mayappear on the same statement or on two different statements. We set up the dollar amounts of the related accounts or itemsin fraction form called ratios. These ratios include: (1) liquidity ratios; (2) equity, or long-term solvency, ratios; (3)profitability tests; and (4) market tests.
Liquidity ratios indicate a company’s short-term debt-paying ability. Thus, these ratios show interested parties thecompany’s capacity to meet maturing current liabilities.
A YouTube element has been excluded from this version of the text. You can view it online here:pb.libretexts.org/llmanagerialaccounting/?p=272
Current (or working capital) ratio Working capital is the excess of current assets over current liabilities. The ratio thatrelates current assets to current liabilities is the current (or working capital) ratio. The current ratio indicates the abilityof a company to pay its current liabilities from current assets and, thus, shows the strength of the company’s workingcapital position. You calculate the current ratio by:
Current Assets
Current Liabilities
The ratio is usually stated as a number of dollars of current assets available to pay every dollar of current liabilities(although the dollar signs usually are omitted). Thus, for Synotech, when current assets totaled $2,846.7 million andcurrent liabilities totaled $2,285.2 million, the ratio is 1.25:1 (or 1.25 to 1), meaning that the company has $1.25 of currentassets available to pay every $1.00 of current liabilities.
Short-term creditors are particularly interested in the current ratio since the conversion of inventories and accountsreceivable into cash is the primary source from which the company obtains the cash to pay short-term creditors. Long-termcreditors are also interested in the current ratio because a company that is unable to pay short-term debts may be forcedinto bankruptcy. For this reason, many bond indentures, or contracts, contain a provision requiring that the borrowermaintain at least a certain minimum current ratio. A company can increase its current ratio by issuing long-term debt orcapital stock or by selling noncurrent assets.

12.6.2 12/25/2021 https://biz.libretexts.org/@go/page/26136
A company must guard against a current ratio that is too high, especially if caused by idle cash, slow-paying customers,and/or slow-moving inventory. Decreased net income can result when too much capital that could be used profitablyelsewhere is tied up in current assets.
Acid-test (quick) ratio The current ratio is not the only measure of a company’s short-term debt-paying ability. Anothermeasure, called the acid-test (quick) ratio, is the ratio of quick assets (cash, marketable securities, and net receivables) tocurrent liabilities. Analysts exclude inventories and prepaid expenses from current assets to compute quick assets becausethey might not be readily convertible into cash. The formula for the acid-test ratio is:
Cash + Short-term investments + net current receivables
Current Liabilities
Short-term creditors are particularly interested in this ratio, which relates the pool of cash and immediate cash inflows toimmediate cash outflows. In deciding whether the acid-test ratio is satisfactory, investors consider the quality of themarketable securities and receivables. An accumulation of poor-quality marketable securities or receivables, or both, couldcause an acid-test ratio to appear deceptively favorable. When referring to marketable securities, poor quality meanssecurities likely to generate losses when sold. Poor-quality receivables may be uncollectible or not collectible until longpast due.
Since inventory and accounts receivable are a large part of a company’s current assets, it is important to understand thecompany’s ability to collect from their customers and the company’s efficiency in buying and selling inventory.
A YouTube element has been excluded from this version of the text. You can view it online here:pb.libretexts.org/llmanagerialaccounting/?p=272
Accounts receivable turnoverTurnover is the relationship between the amount of an asset and some measure of its use.Accounts receivable turnover is the number of times per year that the average amount of receivables is collected. Tocalculate this ratio:
Net Sales
AVERAGE Accounts receivable, net
Net accounts receivable is accounts receivable after deducting the allowance for uncollectible accounts. Calculate averageaccounts receivable by taking the beginning balance in accounts receivable (or ending amount from the previous year) +the ending balance of the current year and divide by 2.
The accounts receivable turnover ratio provides an indication of how quickly the company collects receivables. ForSynotech, Inc., we have the following information:
Net Sales $ 10,498.80
Accounts Receivable, Net
January 1 $ 1,340.30

12.6.3 12/25/2021 https://biz.libretexts.org/@go/page/26136
December 31 1,277.30
We first need to calculate average accounts receivable. Jan 1 accounts receivable $1,340.30 + Dec 31 Accounts receivable$1,277.30 = $2,617.60 / 2 gives us average accounts receivable of $1,308.80. We calculate the AR Turnover of 8.02 times:
Net Sales $10,498.80
Avg. Accts Receivable = $1,308.80
The accounts receivable turnover ratio indicates Synotech collected, or turned over, its accounts receivable slightly morethan eight times. The ratio is better understood and more easily compared with a company’s credit terms if we convert itinto a number of days, as is illustrated in the next ratio.
Number of days’ sales in accounts receivable The number of days’ sales in accounts receivable ratio is also called theaverage collection period for accounts receivable. Calculate it as follows:
Avg Accounts Receivable x 365 days
Net Sales
We use a 365 days in a year for this calculation. Notice we are using Average accounts receivable here as well, but it canalso be calculated with ending accounts receivable instead. Still using Synotech, Inc.’s information from above, wecalculate 45.5 or 46 days from:
Avg. Accts Receivable = $1,308.80 x 365 Days
Net Sales $10,498.80
It can also be calculated as (365 days / AR Turnover). This ratio tells us it takes 46 days to collect on accounts receivable.Standard credit terms are 30 days but 46 days is not too bad.
What about how a company handles inventory? We can prepare similar ratios for inventory turnover and number of days’sales in inventory.
Inventory turnover A company’s inventory turnover ratio shows the number of times its average inventory is sold duringa period. You can calculateinventory turnover as follows:
Cost of Goods Sold
Average Inventory
When comparing an income statement item and a balance sheet item, measure both in comparable dollars. Notice that wemeasure the numerator and denominator in cost rather than sales dollars. (Earlier, when calculating accounts receivableturnover, we measured both numerator and denominator in sales dollars.) We will calculate average inventory by taking thebeginning inventory + ending inventory and divide by 2. Let’s look at the following information for Synotech, Inc.:
Cost of goods sold $ 5,341.30
Inventory
January 1 $ 929.80
December 31 924.80
We first calculate average inventory as Jan 1 inventory $929.80 + Dec 31 inventory $924.80 = total inventory of $1,854.60and divide by 2 for average inventory of $927.30. Next, we calculate inventory turnover:
Cost of Goods Sold = $5,341.30
Average Inventory $927.30
Synotech was able to sell average inventory 5.76 times during the year. This ratio can better be understood by looking atthe number of days’ sales in inventory. Calculated as 365 days / inventory turnover or by this formula:
12.6.4 12/25/2021 https://biz.libretexts.org/@go/page/26136
Average Inventory x 365 days
Cost of goods sold
We will calculate Synotech’s number of days in inventory using average inventory (but can also be calculated using endinginventory) of 63.4 or just 63 days as follows:
Average Inventory $1,854.60 x 365 Days
Cost of Goods Sold $5,341.30
This means it takes 63 days to sell our inventory. This is a very useful ratio to determine how quickly a company’sinventory moves through the company.
Other things being equal, a manager who maintains the highest inventory turnover ratio (and lowest number of days) is themost efficient. Yet, other things are not always equal. For example, a company that achieves a high inventory turnoverratio by keeping extremely small inventories on hand may incur larger ordering costs, lose quantity discounts, and losesales due to lack of adequate inventory. In attempting to earn satisfactory income, management must balance the costs ofinventory storage and obsolescence and the cost of tying up funds in inventory against possible losses of sales and othercosts associated with keeping too little inventory on hand.
CC licensed content, Shared previouslyAccounting Principles: A Business Perspective. Authored by: James Don Edwards, University of Georgia & Roger H.Hermanson, Georgia State University. Provided by: Endeavour International Corporation. Project: The Global TextProject. License: CC BY: Attribution
All rights reserved contentFinancial Statement Analysis: Ability to Pay Current Liabilities - Accounting video . Authored by: Brian RouthTheAccountingDr. Located at: youtu.be/AD2VPUacKTM. License: All Rights Reserved. License Terms: StandardYouTube LicenseFinancial Statement Analysis: Ability to Sell Inventory and Collect Receivables - Accounting video . Authored by:Brian Routh TheAccountingDr. Located at: youtu.be/g432Yyb8-aw. License: All Rights Reserved. License Terms:Standard YouTube License
12.7.1 12/11/2021 https://biz.libretexts.org/@go/page/26137
12.7: Ratios That Analyze a Company’s Long-Term Debt Paying AbilityCreditors are interested to know if a company can pay its long-term debts. There are several ratios we use for this asdemonstrated in the video:
A YouTube element has been excluded from this version of the text. You can view it online here:pb.libretexts.org/llmanagerialaccounting/?p=274
Debt ratio The debt ratio measures how much we owe in total liabilities for every dollar in total assets we have. This is agood overall ratio to tell creditors or investors if we have enough assets to cover our debt. The ratio is calculated as:
Total Liabilities
Total Assets
Total Liabilities $7,041.00
Total Assets $9,481.80
Times interest earned ratio Creditors, especially long-term creditors, want to know whether a borrower can meet itsrequired interest payments when these payments come due. The times interest earned ratio, or interest coverage ratio, isan indication of such an ability. It is computed as follows:
Income from operations (IBIT)
Interest expense
The ratio is a rough comparison of cash inflows from operations with cash outflows for interest expense. Income beforeinterest and taxes (IBIT) is the numerator because there would be no income taxes if interest expense is equal to or greaterthan IBIT. (To find income before interest and taxes, take net income from continuing operations and add back the netinterest expense and taxes.) Analysts disagree on whether the denominator should be (1) only interest expense on long-term debt, (2) total interest expense, or (3) net interest expense. We will use net interest expense in the Synotechillustration.
For Synotech, the net interest expense is $236.9 million. With an IBIT of $1,382.4 million, the times interest earned ratio is5.84, calculated as:
Income from operations $1,382.40
Interest expense $236.90
The company earned enough during the period to pay its interest expense almost 6 times over.
Low or negative interest coverage ratios suggest that the borrower could default on required interest payments. A companyis not likely to continue interest payments over many periods if it fails to earn enough income to cover them. On the otherhand, interest coverage of 5 to 10 times or more suggests that the company is not likely to default on interest payments.

12.7.2 12/11/2021 https://biz.libretexts.org/@go/page/26137
CC licensed content, Shared previouslyAccounting Principles: A Business Perspective. Authored by: James Don Edwards, University of Georgia & Roger H.Hermanson, Georgia State University. Provided by: Endeavour International Corporation. Project: The Global TextProject . License: CC BY: Attribution
All rights reserved contentFinancial Statement Analysis: Ability to Pay Long-Term Debt - Accounting video. Authored by: Brian RouthTheAccountingDr. Located at: youtu.be/OZEK8uPQuqI. License: All Rights Reserved. License Terms: StandardYouTube License
12.8.1 12/25/2021 https://biz.libretexts.org/@go/page/26138
12.8: Ratios That Analyze a Company’s Earnings PerformanceEquity, or long-term solvency, ratios show the relationship between debt and equity financing in a company.
Equity (stockholders’ equity) ratio The two basic sources of assets in a business are owners (stockholders) and creditors;the combined interests of the two groups are total equities. In ratio analysis, however, the term equity generally refers onlyto stockholders’ equity. Thus, the equity (stockholders’ equity) ratio indicates the proportion of total assets (or totalliabilities and equity) provided by stockholders (owners) on any given date. The formula for the equity ratio is:
Total Stockholder’s Equity
Total Assets (or Total Liabilities & Equity)
Notice how we can use either Total Assests or Total Liabilities and Equity as the denominator, why? Because of theaccounting equation — Assets = Liabilities + Equity. This calculation should look familiar as this is the same calculationwe would have done in a vertical analysis (common-size percentages). Synotech’s liabilities and stockholders’ equityfollow. The company’s equity ratio increased from 22.0% in 20Y4 to 25.7% in 20Y5. The information below shows thatstockholders increased their proportionate equity in the company’s assets due largely to the retention of earnings (whichincreases retained earnings).
20Y5 December 31 20Y4 December 31
(USD millions) Amount % Amount %
Current liabilities $2,285.2 24.1% $2,103.8 22.9%
Long-term liabilities 4,755.8 50.2 5,051.3 55.1
Total liabilities $7,041.0 74.3 $7,155.1 78.0
Total stockholders’ equity 2,440.8 25.7 2,015.7 22.0
Total liabilities & equity(equal to total assets)
$9,481.8 100% $9,170.8 100.0%
The equity ratio must be interpreted carefully. From a creditor’s point of view, a high proportion of stockholders’ equity isdesirable. A high equity ratio indicates the existence of a large protective buffer for creditors in the event a companysuffers a loss. However, from an owner’s point of view, a high proportion of stockholders’ equity may or may not bedesirable. If the business can use borrowed funds to generate income in excess of the net after-tax cost of the interest onsuch funds, a lower percentage of stockholders’ equity may be desirable.
We should point out, however, that too low a percentage of stockholders’ equity (too much debt) has its dangers. Financialleverage magnifies losses per share as well as Earnings Per Share (EPS) since there are fewer shares of stock over which tospread the losses. A period of business recession may result in operating losses and shrinkage in the value of assets, suchas receivables and inventory, which in turn may lead to an inability to meet fixed payments for interest and principal on thedebt. As a result, the company may be forced into liquidation, and the stockholders could lose their entire investments.
Stockholders’ equity to debt (debt to equity) ratio Analysts express the relative equities of owners and creditors inseveral ways. To say that creditors held a 74.3% interest in the assets of Synotech (remember the debt ratio from theprevious section?) on 20Y5 December 31, is equivalent to saying stockholders held a 25.7% interest. Another way ofexpressing this relationship is the stockholders’ equity to debt ratio:
Total Stockholder’s Equity
Total Liabilities
Such a ratio for Synotech would be 0.28:1 (or $2,015.7 million/$7,155.1 million) on 20Y4 December 31, and 0.35:1 (or$2,440.8 million/$7,041.0 million) on 20Y5 December 31. This ratio is often inverted and called the debt to equity ratio.Some analysts use only long-term debt rather than total debt in calculating these ratios. These analysts do not considershort-term debt to be part of the capital structure since it is paid within one year.
12.8.2 12/25/2021 https://biz.libretexts.org/@go/page/26138
Profitability is an important measure of a company’s operating success. Generally, we are concerned with two areas whenjudging profitability: (1) relationships on the income statement that indicate a company’s ability to recover costs andexpenses, and (2) relationships of income to various balance sheet measures that indicate the company’s relative ability toearn income on assets employed. Each of the following ratios utilizes one of these relationships.
A YouTube element has been excluded from this version of the text. You can view it online here:pb.libretexts.org/llmanagerialaccounting/?p=276
Return on average common stockholders’ equity From the stockholders’ point of view, an important measure of theincome-producing ability of a company is the relationship of return on average common stockholders’ equity, also calledrate of return on average common stockholders’ equity, or simply the return on equity (ROE). Although stockholdersare interested in the ratio of operating income to operating assets as a measure of management’s efficient use of assets,they are even more interested in the return the company earns on each dollar of stockholders’ equity. The formula forreturn on average common stockholders’ equity if no preferred stock is outstanding is:
Net Income – preferred dividends
AVERAGE common stockholder’s equity
When a company has preferred stock outstanding, the numerator of this ratio becomes net income minus the annualpreferred dividends. Synotech has preferred stock outstanding. The ratios for the company follow. Total commonstockholders’ equity on January 1 was $ 1,531.5 million and on December 31 $1,969.6. Net income for the year was $762million and preferred dividends were $25.7 million. NOTE: Common stockholder’s equity is Total stockholder’s equity –par value of preferred stock. We calculate average common stockholders equity by taking Jan 1 $1,531.50 + Dec 31$1,969.60 and dividing by 2 to get $1,750.55 million. The return on average stockholder’s equity calculation would be:
Net Income – preferred dividends = $ 762 – $25.7
AVERAGE common stockholder’s equity $1,750.55
The ratio would be 42.06% which indicates that for each dollar of capital invested by a common stockholder, the companyearned approximately 42 cents.
Earnings per share of common stock Probably the measure used most widely to appraise a company’s operations isearnings per share (EPS) of common stock. The formula for EPS is:
Earnings available to common stockholders
weighted average common shares outstanding
The financial press regularly publishes actual and forecasted EPS amounts for publicly traded corporations, together withperiod-to-period comparisons. The Accounting Principles Board noted the significance attached to EPS by requiring thatsuch amounts be reported on the face of the income statement.[2] (Unit 14 illustrated how earnings per share should bepresented on the income statement.)
12.8.3 12/25/2021 https://biz.libretexts.org/@go/page/26138
The calculation of EPS may be fairly simple or highly complex depending on a corporation’s capital structure. A companyhas a simple capital structure if it has no outstanding securities (e.g. convertible bonds, convertible preferred stocks,warrants, or options) that can be exchanged for common stock. If a company has such securities outstanding, it has acomplex capital structure. Discussion of EPS for a corporation with a complex capital structure is beyond the scope of thistext.
The amount of earnings available to common stockholders is equal to net income minus the current year’s preferreddividends, whether such dividends have been declared or not.
Determining the weighted-average number of common shares The denominator in the EPS fraction is the weighted-average number of common shares outstanding for the period. If the number of common shares outstanding did not changeduring the period, the weighted-average number of common shares outstanding would, of course, be the number ofcommon shares outstanding at the end of the period.
To illustrate, the balance in the Common Stock account of Synotech is $219.9 million on December 31. The common stockhad a $1.20 par value. Assuming no common shares were issued or redeemed during the year, the weighted-averagenumber of common shares outstanding would be 183.2 million (or $219.9 million common stock account balance /$1.20par value per share). (Normally, common treasury stock reacquired and reissued are also included in the calculation of theweighted-average number of common shares outstanding. We ignore treasury stock transactions to simplify theillustrations.) The EPS in this example would be $4.02 per share calculated as:
Earnings available to commonstockholders =
Net Income – preferred dividends= $762 – $25.7 = 736.3
weighted average common sharesoutstanding
Common stock account balance /par value
$219.9 / $1.20 183.25 shares
If the number of common shares changed during the period, such a change increases or decreases the capital invested inthe company and should affect earnings available to stockholders. To compute the weighted-average number of commonshares outstanding, we weight the change in the number of common shares by the portion of the year that those shareswere outstanding. Shares are outstanding only during those periods that the related capital investment is available toproduce income.
To illustrate, assume that during Synotech’s began the year with 171.5 million shares outstanding. Assume that thecompany issued 9.5 million shares on April 1, and 2.2 million shares on October 1. The computation of the weighted-average number of common shares outstanding would be:
171.5 million shares x 1 year 171.500 million
9.5 million shares x ¾ year (April – December or 9/12) 7.125 million
2.2 million shares x ¼ year (October – December or 3/12) 0.550
Weighted-average number of common shares outstanding 179.175 million
The EPS in this example would be $4.11 per share calculated as:
Earnings available to commonstockholders =
Net Income – preferred dividends= $ 762 – $25.7 = 736.3
weighted average common sharesoutstanding
171.5 + 7.125 + 0.55 179.175 shares 179.18
EPS and stock dividends or splits Increases in shares outstanding as a result of a stock dividend or stock split do notrequire weighting for fractional periods. Such shares do not increase the capital invested in the business and, therefore, donot affect income. All that is required is to restate all prior calculations of EPS using the increased number of shares. Forexample, assume a company reported EPS for the year as $1.20 (or $120,000/100,000 shares) and earned $120,000 of netincome during the year. The only change in common stock was a two-for-one stock split on December 1, which doubledthe shares outstanding to 200,000. The firm would restate EPS as $0.60 (or $120,000/200,000 shares).
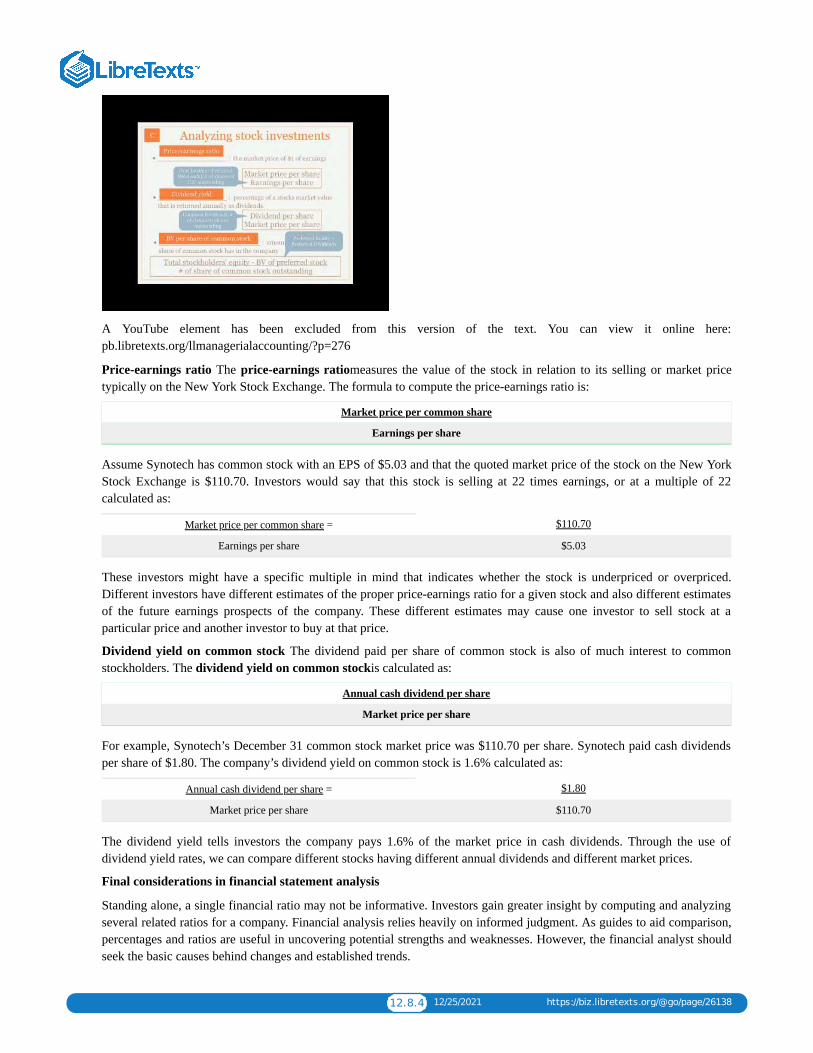
12.8.4 12/25/2021 https://biz.libretexts.org/@go/page/26138
A YouTube element has been excluded from this version of the text. You can view it online here:pb.libretexts.org/llmanagerialaccounting/?p=276
Price-earnings ratio The price-earnings ratiomeasures the value of the stock in relation to its selling or market pricetypically on the New York Stock Exchange. The formula to compute the price-earnings ratio is:
Market price per common share
Earnings per share
Assume Synotech has common stock with an EPS of $5.03 and that the quoted market price of the stock on the New YorkStock Exchange is $110.70. Investors would say that this stock is selling at 22 times earnings, or at a multiple of 22calculated as:
Market price per common share = $110.70
Earnings per share $5.03
These investors might have a specific multiple in mind that indicates whether the stock is underpriced or overpriced.Different investors have different estimates of the proper price-earnings ratio for a given stock and also different estimatesof the future earnings prospects of the company. These different estimates may cause one investor to sell stock at aparticular price and another investor to buy at that price.
Dividend yield on common stock The dividend paid per share of common stock is also of much interest to commonstockholders. The dividend yield on common stockis calculated as:
Annual cash dividend per share
Market price per share
For example, Synotech’s December 31 common stock market price was $110.70 per share. Synotech paid cash dividendsper share of $1.80. The company’s dividend yield on common stock is 1.6% calculated as:
Annual cash dividend per share = $1.80
Market price per share $110.70
The dividend yield tells investors the company pays 1.6% of the market price in cash dividends. Through the use ofdividend yield rates, we can compare different stocks having different annual dividends and different market prices.
Final considerations in financial statement analysis
Standing alone, a single financial ratio may not be informative. Investors gain greater insight by computing and analyzingseveral related ratios for a company. Financial analysis relies heavily on informed judgment. As guides to aid comparison,percentages and ratios are useful in uncovering potential strengths and weaknesses. However, the financial analyst shouldseek the basic causes behind changes and established trends.

12.8.5 12/25/2021 https://biz.libretexts.org/@go/page/26138
Analysts must be sure that their comparisons are valid—especially when the comparisons are of items for different periodsor different companies. They must follow consistent accounting practices if valid interperiod comparisons are to be made.Comparable intercompany comparisons are more difficult to secure. Accountants cannot do much more than disclose thefact that one company is using FIFO and another is using LIFO for inventory and cost of goods sold computations. Such adisclosure alerts analysts that intercompany comparisons of inventory turnover ratios, for example, may not becomparable.
Also, when comparing a company’s ratios to industry averages provided by an external source such as Dun & Bradstreet,the analyst should calculate the company’s ratios in the same manner as the reporting service. Thus, if Dun & Bradstreetuses net sales (rather than cost of goods sold) to compute inventory turnover, so should the analyst. Net sales is sometimespreferable because all companies do not compute and report cost of goods sold amounts in the same manner.
Facts and conditions not disclosed by the financial statements may, however, affect their interpretation. A single importantevent may have been largely responsible for a given relationship. For example, competitors may put a new product on themarket, making it necessary for the company under study to reduce the selling price of a product suddenly renderedobsolete. Such an event would severely affect the percentage of gross margin to net sales. Yet there may be little chancethat such an event will happen again.
Analysts must consider general business conditions within the industry of the company under study. A corporation’sdownward trend in earnings, for example, is less alarming if the industry trend or the general economic trend is alsodownward.
Investors also need to consider the seasonal nature of some businesses. If the balance sheet date represents the seasonalpeak in the volume of business, for example, the ratio of current assets to current liabilities may be much lower than if thebalance sheet date is in a season of low activity.
Potential investors should consider the market risk associated with the prospective investment. They can determine marketrisk by comparing the changes in the price of a stock in relation to the changes in the average price of all stocks.
Potential investors should realize that acquiring the ability to make informed judgments is a long process and does notoccur overnight. Using ratios and percentages without considering the underlying causes may lead to incorrectconclusions.
Relationships between financial statement items also become more meaningful when standards are available forcomparison. Comparisons with standards provide a starting point for the analyst’s thinking and lead to further investigationand, ultimately, to conclusions and business decisions. Such standards consist of (1) those in the analyst’s own mind as aresult of experience and observations, (2) those provided by the records of past performance and financial position of thebusiness under study, and (3) those provided about other enterprises. Examples of the third standard are data availablethrough trade associations, universities, research organizations (such as Dun & Bradstreet and Robert Morris Associates),and governmental units (such as the Federal Trade Commission).
In financial statement analysis, remember that standards for comparison vary by industry, and financial analysis must becarried out with knowledge of specific industry characteristics. For example, a wholesale grocery company would havelarge inventories available to be shipped to retailers and a relatively small investment in property, plant, and equipment,while an electric utility company would have no merchandise inventory (except for repair parts) and a large investment inproperty, plant, and equipment.
Even within an industry, variations may exist. Acceptable current ratios, gross margin percentages, debt to equity ratios,and other relationships vary widely depending on unique conditions within an industry. Therefore, it is important to knowthe industry to make comparisons that have real meaning.
CC licensed content, Shared previouslyAccounting Principles: A Business Perspective. Authored by: James Don Edwards, University of Georgia & Roger H.Hermanson, Georgia State University. Provided by: Endeavour International Corporation. Project: The Global TextProject . License: CC BY: Attribution
All rights reserved content

12.8.6 12/25/2021 https://biz.libretexts.org/@go/page/26138
Financial Statement Analysis: Measuring Profitability, cont'd - Accounting video . Authored by: BrianRouthTheAccountingDr. Located at: youtu.be/aEZWbQznr_U. License: All Rights Reserved. License Terms: StandardYouTube LicenseFinancial Statement Analysis: Analyzing Stock Investments - Accounting video . Authored by: Brian RouthTheAccountingDr. Located at: youtu.be/hDR7fRKwXu8. License: All Rights Reserved. License Terms: StandardYouTube License
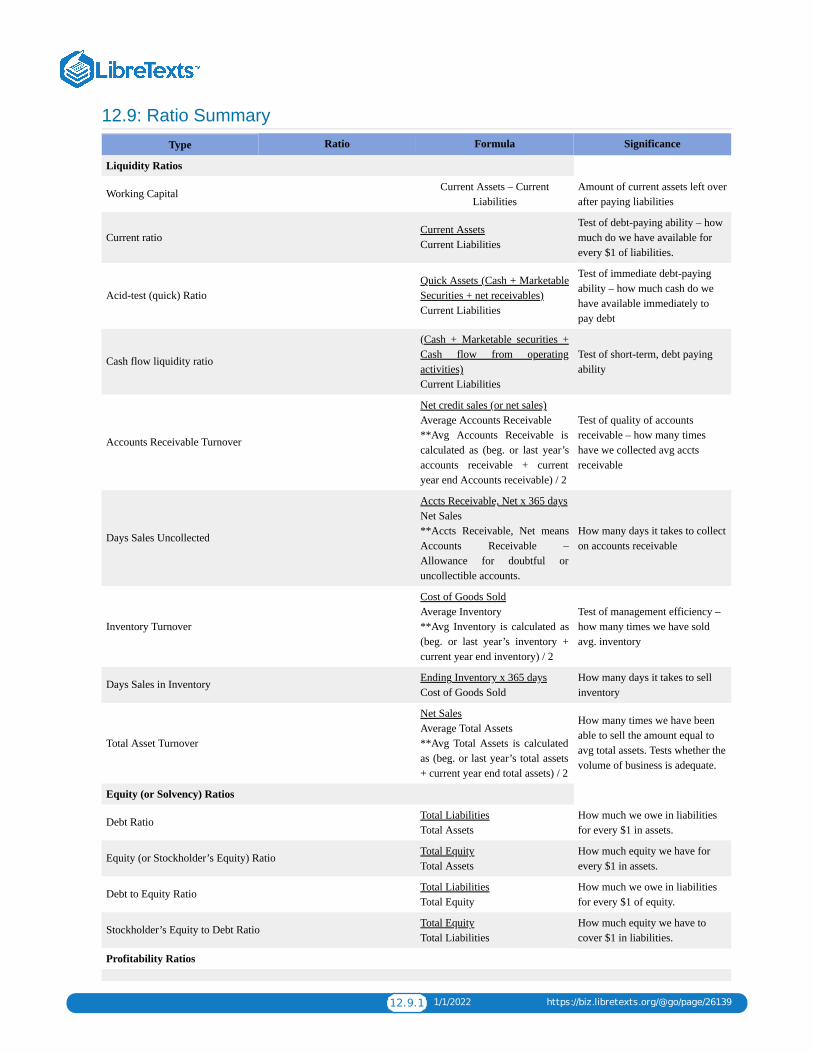
12.9.1 1/1/2022 https://biz.libretexts.org/@go/page/26139
12.9: Ratio SummaryType Ratio Formula Significance
Liquidity Ratios
Working Capital Current Assets – CurrentLiabilities
Amount of current assets left overafter paying liabilities
Current ratioCurrent AssetsCurrent Liabilities
Test of debt-paying ability – howmuch do we have available forevery $1 of liabilities.
Acid-test (quick) RatioQuick Assets (Cash + MarketableSecurities + net receivables)Current Liabilities
Test of immediate debt-payingability – how much cash do wehave available immediately topay debt
Cash flow liquidity ratio
(Cash + Marketable securities +Cash flow from operatingactivities)Current Liabilities
Test of short-term, debt payingability
Accounts Receivable Turnover
Net credit sales (or net sales)Average Accounts Receivable**Avg Accounts Receivable iscalculated as (beg. or last year’saccounts receivable + currentyear end Accounts receivable) / 2
Test of quality of accountsreceivable – how many timeshave we collected avg acctsreceivable
Days Sales Uncollected
Accts Receivable, Net x 365 daysNet Sales**Accts Receivable, Net meansAccounts Receivable –Allowance for doubtful oruncollectible accounts.
How many days it takes to collecton accounts receivable
Inventory Turnover
Cost of Goods SoldAverage Inventory**Avg Inventory is calculated as(beg. or last year’s inventory +current year end inventory) / 2
Test of management efficiency –how many times we have soldavg. inventory
Days Sales in Inventory Ending Inventory x 365 daysCost of Goods Sold
How many days it takes to sellinventory
Total Asset Turnover
Net SalesAverage Total Assets**Avg Total Assets is calculatedas (beg. or last year’s total assets+ current year end total assets) / 2
How many times we have beenable to sell the amount equal toavg total assets. Tests whether thevolume of business is adequate.
Equity (or Solvency) Ratios
Debt Ratio Total LiabilitiesTotal Assets
How much we owe in liabilitiesfor every $1 in assets.
Equity (or Stockholder’s Equity) Ratio Total EquityTotal Assets
How much equity we have forevery $1 in assets.
Debt to Equity Ratio Total LiabilitiesTotal Equity
How much we owe in liabilitiesfor every $1 of equity.
Stockholder’s Equity to Debt Ratio Total EquityTotal Liabilities
How much equity we have tocover $1 in liabilities.
Profitability Ratios

12.9.2 1/1/2022 https://biz.libretexts.org/@go/page/26139
Profit Margin Ratio Net IncomeNet Sales
How much NET income wegenerate from every dollar ofsales.
Gross Margin RatioNet sales – Cost of goods soldNet Sales
How much gross profit is earnedon every dollar of sales (alsoknown as markup)
Return on total assets
Net IncomeAverage Total Assets**Avg Total Assets is calculatedas (beg. or last year’s total assets+ current year end total assets) / 2
How many times we have earnedback average total assets from netincome.
Return on common stockholder’s equityNet Income – Preferred dividendsAverage common stockholder’sequity
How much net income wasgenerated from every dollar ofcommon stock invested.
Basic Earnings per Share (EPS)
Net Income – PreferredDividendsWeighted Avg common sharesoutstanding
How much net income generateon every share of common stock
Market Prospects
Price-earnings ratio Market price per common shareEarnings per share
How much the market price is forevery dollar of earnings per share
Dividend yieldAnnual cash dividends per shareMarket price per share
How much dividends you receivebased on every dollar of marketprice per share.
Click ratio summary for a printable copy.
CC licensed content, Shared previouslyAccounting Principles: A Business Perspective. Authored by: James Don Edwards, University of Georgia & Roger H.Hermanson, Georgia State University. Provided by: Endeavour International Corporation. Project: The Global TextProjectt. License: CC BY: Attribution
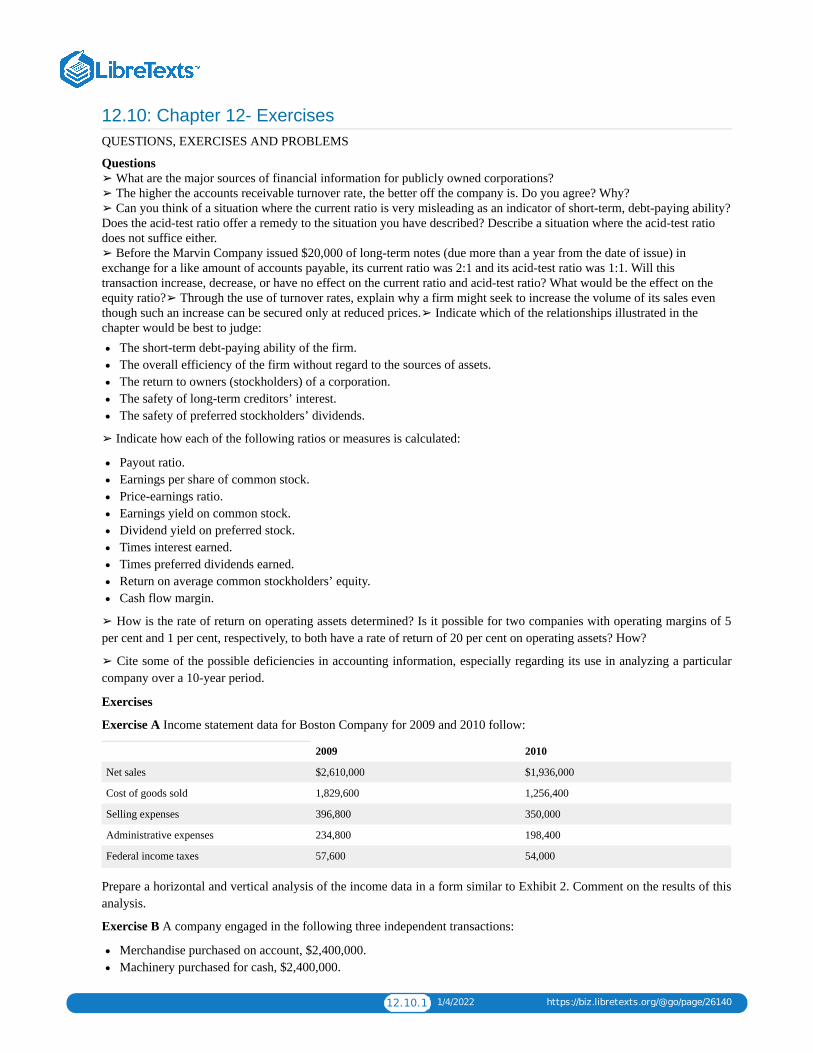
12.10.1 1/4/2022 https://biz.libretexts.org/@go/page/26140
12.10: Chapter 12- ExercisesQUESTIONS, EXERCISES AND PROBLEMS
Questions➢ What are the major sources of financial information for publicly owned corporations?➢ The higher the accounts receivable turnover rate, the better off the company is. Do you agree? Why?➢ Can you think of a situation where the current ratio is very misleading as an indicator of short-term, debt-paying ability?Does the acid-test ratio offer a remedy to the situation you have described? Describe a situation where the acid-test ratiodoes not suffice either.➢ Before the Marvin Company issued $20,000 of long-term notes (due more than a year from the date of issue) inexchange for a like amount of accounts payable, its current ratio was 2:1 and its acid-test ratio was 1:1. Will thistransaction increase, decrease, or have no effect on the current ratio and acid-test ratio? What would be the effect on theequity ratio?➢ Through the use of turnover rates, explain why a firm might seek to increase the volume of its sales eventhough such an increase can be secured only at reduced prices.➢ Indicate which of the relationships illustrated in thechapter would be best to judge:
The short-term debt-paying ability of the firm.The overall efficiency of the firm without regard to the sources of assets.The return to owners (stockholders) of a corporation.The safety of long-term creditors’ interest.The safety of preferred stockholders’ dividends.
➢ Indicate how each of the following ratios or measures is calculated:
Payout ratio.Earnings per share of common stock.Price-earnings ratio.Earnings yield on common stock.Dividend yield on preferred stock.Times interest earned.Times preferred dividends earned.Return on average common stockholders’ equity.Cash flow margin.
➢ How is the rate of return on operating assets determined? Is it possible for two companies with operating margins of 5per cent and 1 per cent, respectively, to both have a rate of return of 20 per cent on operating assets? How?
➢ Cite some of the possible deficiencies in accounting information, especially regarding its use in analyzing a particularcompany over a 10-year period.
Exercises
Exercise A Income statement data for Boston Company for 2009 and 2010 follow:
2009 2010
Net sales $2,610,000 $1,936,000
Cost of goods sold 1,829,600 1,256,400
Selling expenses 396,800 350,000
Administrative expenses 234,800 198,400
Federal income taxes 57,600 54,000
Prepare a horizontal and vertical analysis of the income data in a form similar to Exhibit 2. Comment on the results of thisanalysis.
Exercise B A company engaged in the following three independent transactions:
Merchandise purchased on account, $2,400,000.Machinery purchased for cash, $2,400,000.
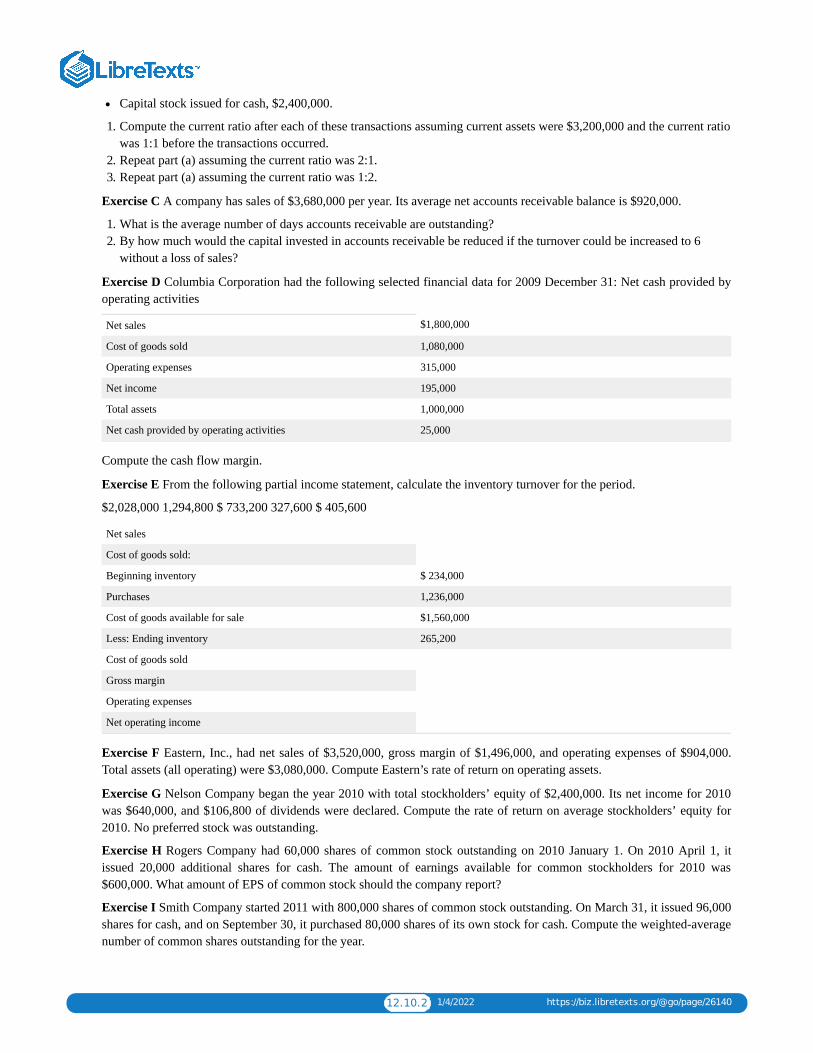
12.10.2 1/4/2022 https://biz.libretexts.org/@go/page/26140
Capital stock issued for cash, $2,400,000.
1. Compute the current ratio after each of these transactions assuming current assets were $3,200,000 and the current ratiowas 1:1 before the transactions occurred.
2. Repeat part (a) assuming the current ratio was 2:1.3. Repeat part (a) assuming the current ratio was 1:2.
Exercise C A company has sales of $3,680,000 per year. Its average net accounts receivable balance is $920,000.
1. What is the average number of days accounts receivable are outstanding?2. By how much would the capital invested in accounts receivable be reduced if the turnover could be increased to 6
without a loss of sales?
Exercise D Columbia Corporation had the following selected financial data for 2009 December 31: Net cash provided byoperating activities
Net sales $1,800,000
Cost of goods sold 1,080,000
Operating expenses 315,000
Net income 195,000
Total assets 1,000,000
Net cash provided by operating activities 25,000
Compute the cash flow margin.
Exercise E From the following partial income statement, calculate the inventory turnover for the period.
$2,028,000 1,294,800 $ 733,200 327,600 $ 405,600
Net sales
Cost of goods sold:
Beginning inventory $ 234,000
Purchases 1,236,000
Cost of goods available for sale $1,560,000
Less: Ending inventory 265,200
Cost of goods sold
Gross margin
Operating expenses
Net operating income
Exercise F Eastern, Inc., had net sales of $3,520,000, gross margin of $1,496,000, and operating expenses of $904,000.Total assets (all operating) were $3,080,000. Compute Eastern’s rate of return on operating assets.
Exercise G Nelson Company began the year 2010 with total stockholders’ equity of $2,400,000. Its net income for 2010was $640,000, and $106,800 of dividends were declared. Compute the rate of return on average stockholders’ equity for2010. No preferred stock was outstanding.
Exercise H Rogers Company had 60,000 shares of common stock outstanding on 2010 January 1. On 2010 April 1, itissued 20,000 additional shares for cash. The amount of earnings available for common stockholders for 2010 was$600,000. What amount of EPS of common stock should the company report?
Exercise I Smith Company started 2011 with 800,000 shares of common stock outstanding. On March 31, it issued 96,000shares for cash, and on September 30, it purchased 80,000 shares of its own stock for cash. Compute the weighted-averagenumber of common shares outstanding for the year.
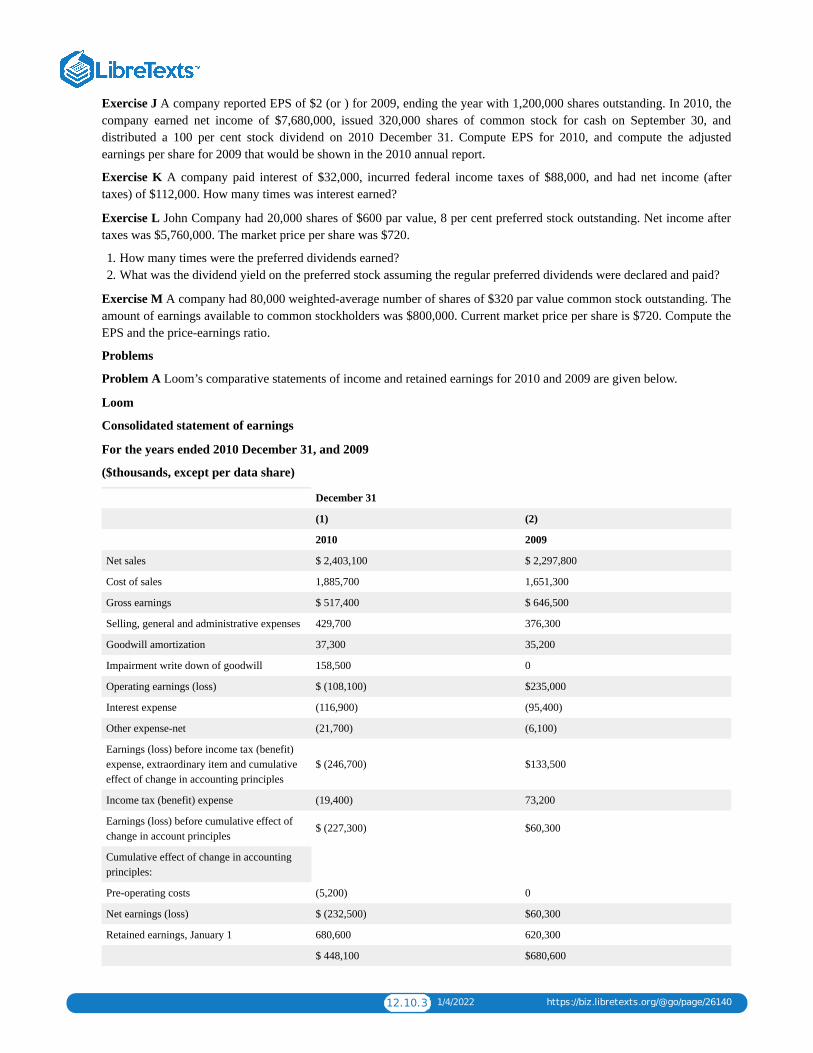
12.10.3 1/4/2022 https://biz.libretexts.org/@go/page/26140
Exercise J A company reported EPS of $2 (or ) for 2009, ending the year with 1,200,000 shares outstanding. In 2010, thecompany earned net income of $7,680,000, issued 320,000 shares of common stock for cash on September 30, anddistributed a 100 per cent stock dividend on 2010 December 31. Compute EPS for 2010, and compute the adjustedearnings per share for 2009 that would be shown in the 2010 annual report.
Exercise K A company paid interest of $32,000, incurred federal income taxes of $88,000, and had net income (aftertaxes) of $112,000. How many times was interest earned?
Exercise L John Company had 20,000 shares of $600 par value, 8 per cent preferred stock outstanding. Net income aftertaxes was $5,760,000. The market price per share was $720.
1. How many times were the preferred dividends earned?2. What was the dividend yield on the preferred stock assuming the regular preferred dividends were declared and paid?
Exercise M A company had 80,000 weighted-average number of shares of $320 par value common stock outstanding. Theamount of earnings available to common stockholders was $800,000. Current market price per share is $720. Compute theEPS and the price-earnings ratio.
Problems
Problem A Loom’s comparative statements of income and retained earnings for 2010 and 2009 are given below.
Loom
Consolidated statement of earnings
For the years ended 2010 December 31, and 2009
($thousands, except per data share)
December 31
(1) (2)
2010 2009
Net sales $ 2,403,100 $ 2,297,800
Cost of sales 1,885,700 1,651,300
Gross earnings $ 517,400 $ 646,500
Selling, general and administrative expenses 429,700 376,300
Goodwill amortization 37,300 35,200
Impairment write down of goodwill 158,500 0
Operating earnings (loss) $ (108,100) $235,000
Interest expense (116,900) (95,400)
Other expense-net (21,700) (6,100)
Earnings (loss) before income tax (benefit)expense, extraordinary item and cumulativeeffect of change in accounting principles
$ (246,700) $133,500
Income tax (benefit) expense (19,400) 73,200
Earnings (loss) before cumulative effect ofchange in account principles
$ (227,300) $60,300
Cumulative effect of change in accountingprinciples:
Pre-operating costs (5,200) 0
Net earnings (loss) $ (232,500) $60,300
Retained earnings, January 1 680,600 620,300
$ 448,100 $680,600
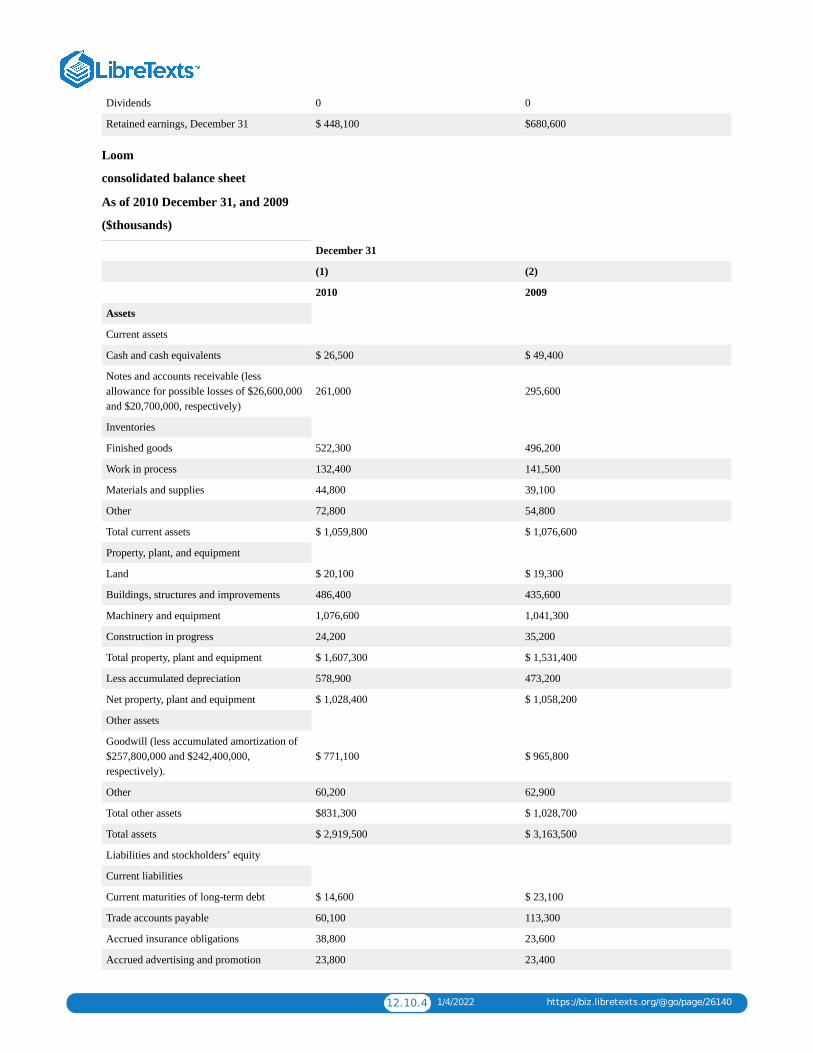
12.10.4 1/4/2022 https://biz.libretexts.org/@go/page/26140
Dividends 0 0
Retained earnings, December 31 $ 448,100 $680,600
Loom
consolidated balance sheet
As of 2010 December 31, and 2009
($thousands)
December 31
(1) (2)
2010 2009
Assets
Current assets
Cash and cash equivalents $ 26,500 $ 49,400
Notes and accounts receivable (lessallowance for possible losses of $26,600,000and $20,700,000, respectively)
261,000 295,600
Inventories
Finished goods 522,300 496,200
Work in process 132,400 141,500
Materials and supplies 44,800 39,100
Other 72,800 54,800
Total current assets $ 1,059,800 $ 1,076,600
Property, plant, and equipment
Land $ 20,100 $ 19,300
Buildings, structures and improvements 486,400 435,600
Machinery and equipment 1,076,600 1,041,300
Construction in progress 24,200 35,200
Total property, plant and equipment $ 1,607,300 $ 1,531,400
Less accumulated depreciation 578,900 473,200
Net property, plant and equipment $ 1,028,400 $ 1,058,200
Other assets
Goodwill (less accumulated amortization of$257,800,000 and $242,400,000,respectively).
$ 771,100 $ 965,800
Other 60,200 62,900
Total other assets $831,300 $ 1,028,700
Total assets $ 2,919,500 $ 3,163,500
Liabilities and stockholders’ equity
Current liabilities
Current maturities of long-term debt $ 14,600 $ 23,100
Trade accounts payable 60,100 113,300
Accrued insurance obligations 38,800 23,600
Accrued advertising and promotion 23,800 23,400
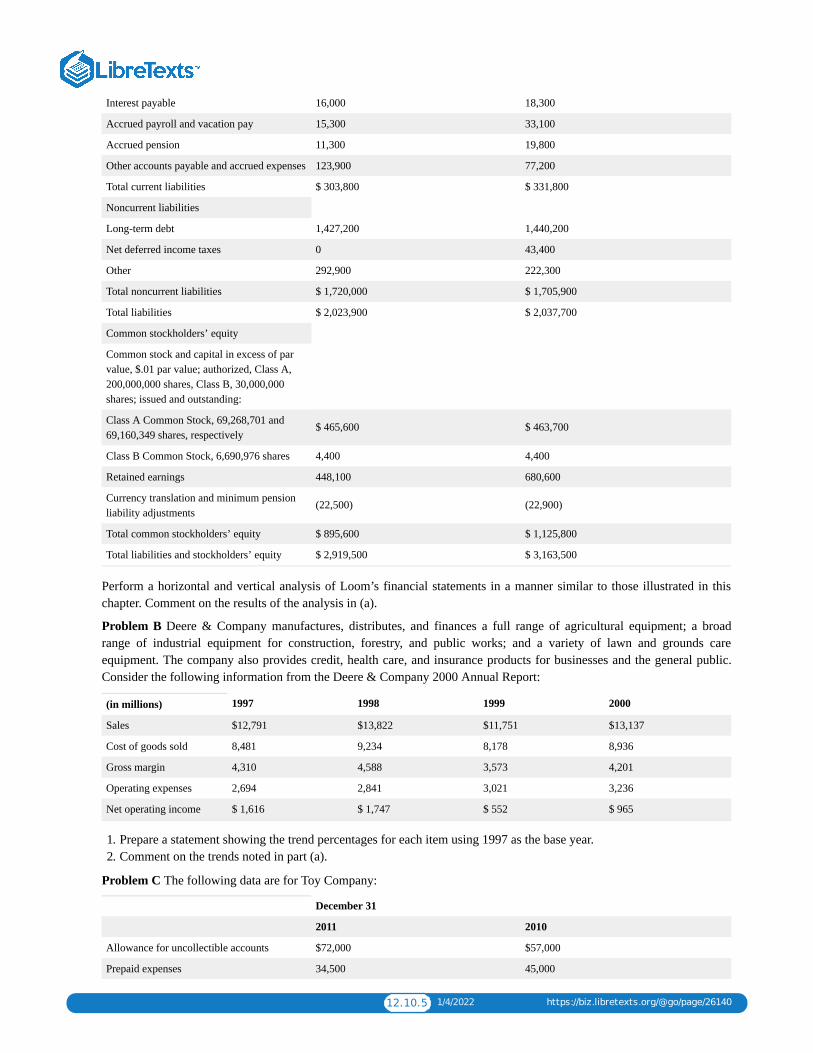
12.10.5 1/4/2022 https://biz.libretexts.org/@go/page/26140
Interest payable 16,000 18,300
Accrued payroll and vacation pay 15,300 33,100
Accrued pension 11,300 19,800
Other accounts payable and accrued expenses 123,900 77,200
Total current liabilities $ 303,800 $ 331,800
Noncurrent liabilities
Long-term debt 1,427,200 1,440,200
Net deferred income taxes 0 43,400
Other 292,900 222,300
Total noncurrent liabilities $ 1,720,000 $ 1,705,900
Total liabilities $ 2,023,900 $ 2,037,700
Common stockholders’ equity
Common stock and capital in excess of parvalue, $.01 par value; authorized, Class A,200,000,000 shares, Class B, 30,000,000shares; issued and outstanding:
Class A Common Stock, 69,268,701 and69,160,349 shares, respectively
$ 465,600 $ 463,700
Class B Common Stock, 6,690,976 shares 4,400 4,400
Retained earnings 448,100 680,600
Currency translation and minimum pensionliability adjustments
(22,500) (22,900)
Total common stockholders’ equity $ 895,600 $ 1,125,800
Total liabilities and stockholders’ equity $ 2,919,500 $ 3,163,500
Perform a horizontal and vertical analysis of Loom’s financial statements in a manner similar to those illustrated in thischapter. Comment on the results of the analysis in (a).
Problem B Deere & Company manufactures, distributes, and finances a full range of agricultural equipment; a broadrange of industrial equipment for construction, forestry, and public works; and a variety of lawn and grounds careequipment. The company also provides credit, health care, and insurance products for businesses and the general public.Consider the following information from the Deere & Company 2000 Annual Report:
(in millions) 1997 1998 1999 2000
Sales $12,791 $13,822 $11,751 $13,137
Cost of goods sold 8,481 9,234 8,178 8,936
Gross margin 4,310 4,588 3,573 4,201
Operating expenses 2,694 2,841 3,021 3,236
Net operating income $ 1,616 $ 1,747 $ 552 $ 965
1. Prepare a statement showing the trend percentages for each item using 1997 as the base year.2. Comment on the trends noted in part (a).
Problem C The following data are for Toy Company:
December 31
2011 2010
Allowance for uncollectible accounts $72,000 $57,000
Prepaid expenses 34,500 45,000

12.10.6 1/4/2022 https://biz.libretexts.org/@go/page/26140
Accrued liabilities 210,000 186,000
Cash in Bank A 1,095,000 975,000
Wages payable -0- 37,500
Accounts payable 714,000 585,000
Merchandise inventory 1,342,500 1,437,000
Bonds payable, due in 2005 615,000 594,000
Marketable securities 217,500 147,000
Notes payable (due in six months) 300,000 195,000
Accounts receivable 907,500 870,000
Cash flow from operating activities 192,000 180,000
1. Compute the amount of working capital at both year-end dates.2. Compute the current ratio at both year-end dates.3. Compute the acid-test ratio at both year-end dates.4. Compute the cash flow liquidity ratio at both year-end dates.5. Comment briefly on the company’s short-term financial position.
Problem D On 2011 December 31, Energy Company’s current ratio was 3:1 before the following transactions werecompleted:
Purchased merchandise on account.Paid a cash dividend declared on 2011 November 15.Sold equipment for cash.Temporarily invested cash in trading securities.Sold obsolete merchandise for cash (at a loss).Issued 10-year bonds for cash.Wrote off goodwill to retained earnings.Paid cash for inventory.Purchased land for cash.Returned merchandise that had not been paid for.Wrote off an account receivable as uncollectible. Uncollectible amount is less than the balance in the Allowance forUncollectible Accounts.Accepted a 90-day note from a customer in settlement of customer’s account receivable.Declared a stock dividend on common stock.
Consider each transaction independently of all the others.
1. Indicate whether the amount of working capital will increase, decrease, or be unaffected by each of the transactions.2. Indicate whether the current ratio will increase, decrease, or be unaffected by each of the transactions.
Problem E Digital Company has net operating income of $500,000 and operating assets of $2,000,000.
Its net sales are $4,000,000.
The accountant for the company computes the rate of return on operating assets after computing the operating margin andthe turnover of operating assets.
1. Show the computations the accountant made.2. Indicate whether the operating margin and turnover increase or decrease after each of the following changes. Then
determine what the actual rate of return on operating assets would be. The events are not interrelated; consider eachseparately, starting from the original earning power position. No other changes occurred.
(a)Sales increased by $160,000. There was no change in the amount of operating income and no change in operatingassets.
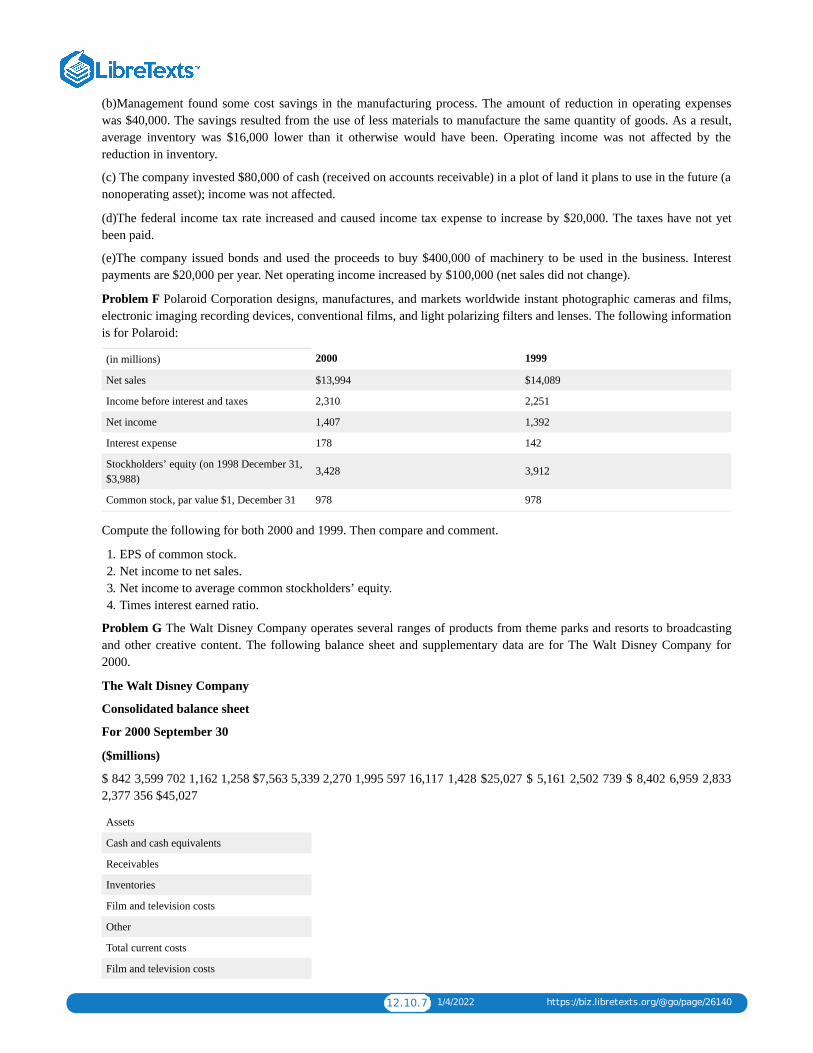
12.10.7 1/4/2022 https://biz.libretexts.org/@go/page/26140
(b)Management found some cost savings in the manufacturing process. The amount of reduction in operating expenseswas $40,000. The savings resulted from the use of less materials to manufacture the same quantity of goods. As a result,average inventory was $16,000 lower than it otherwise would have been. Operating income was not affected by thereduction in inventory.
(c) The company invested $80,000 of cash (received on accounts receivable) in a plot of land it plans to use in the future (anonoperating asset); income was not affected.
(d)The federal income tax rate increased and caused income tax expense to increase by $20,000. The taxes have not yetbeen paid.
(e)The company issued bonds and used the proceeds to buy $400,000 of machinery to be used in the business. Interestpayments are $20,000 per year. Net operating income increased by $100,000 (net sales did not change).
Problem F Polaroid Corporation designs, manufactures, and markets worldwide instant photographic cameras and films,electronic imaging recording devices, conventional films, and light polarizing filters and lenses. The following informationis for Polaroid:
(in millions) 2000 1999
Net sales $13,994 $14,089
Income before interest and taxes 2,310 2,251
Net income 1,407 1,392
Interest expense 178 142
Stockholders’ equity (on 1998 December 31,$3,988)
3,428 3,912
Common stock, par value $1, December 31 978 978
Compute the following for both 2000 and 1999. Then compare and comment.
1. EPS of common stock.2. Net income to net sales.3. Net income to average common stockholders’ equity.4. Times interest earned ratio.
Problem G The Walt Disney Company operates several ranges of products from theme parks and resorts to broadcastingand other creative content. The following balance sheet and supplementary data are for The Walt Disney Company for2000.
The Walt Disney Company
Consolidated balance sheet
For 2000 September 30
($millions)
$ 842 3,599 702 1,162 1,258 $7,563 5,339 2,270 1,995 597 16,117 1,428 $25,027 $ 5,161 2,502 739 $ 8,402 6,959 2,8332,377 356 $45,027
Assets
Cash and cash equivalents
Receivables
Inventories
Film and television costs
Other
Total current costs
Film and television costs
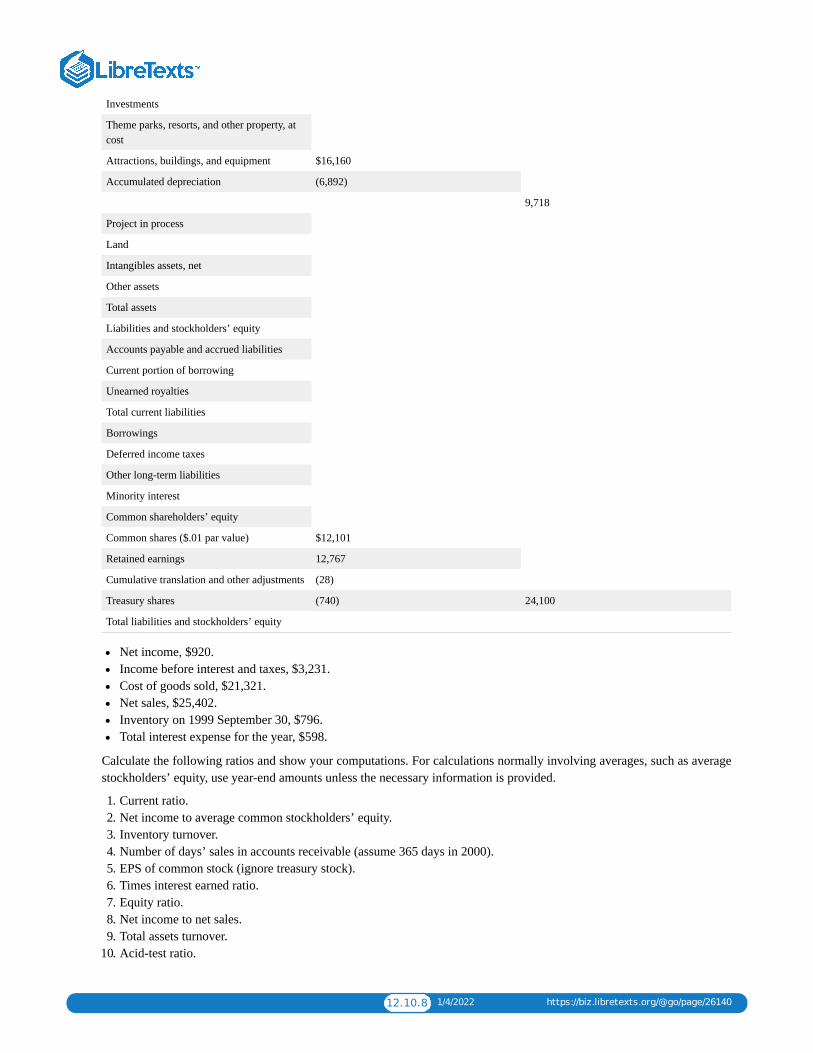
12.10.8 1/4/2022 https://biz.libretexts.org/@go/page/26140
Investments
Theme parks, resorts, and other property, atcost
Attractions, buildings, and equipment $16,160
Accumulated depreciation (6,892)
9,718
Project in process
Land
Intangibles assets, net
Other assets
Total assets
Liabilities and stockholders’ equity
Accounts payable and accrued liabilities
Current portion of borrowing
Unearned royalties
Total current liabilities
Borrowings
Deferred income taxes
Other long-term liabilities
Minority interest
Common shareholders’ equity
Common shares ($.01 par value) $12,101
Retained earnings 12,767
Cumulative translation and other adjustments (28)
Treasury shares (740) 24,100
Total liabilities and stockholders’ equity
Net income, $920.Income before interest and taxes, $3,231.Cost of goods sold, $21,321.Net sales, $25,402.Inventory on 1999 September 30, $796.Total interest expense for the year, $598.
Calculate the following ratios and show your computations. For calculations normally involving averages, such as averagestockholders’ equity, use year-end amounts unless the necessary information is provided.
1. Current ratio.2. Net income to average common stockholders’ equity.3. Inventory turnover.4. Number of days’ sales in accounts receivable (assume 365 days in 2000).5. EPS of common stock (ignore treasury stock).6. Times interest earned ratio.7. Equity ratio.8. Net income to net sales.9. Total assets turnover.
10. Acid-test ratio.
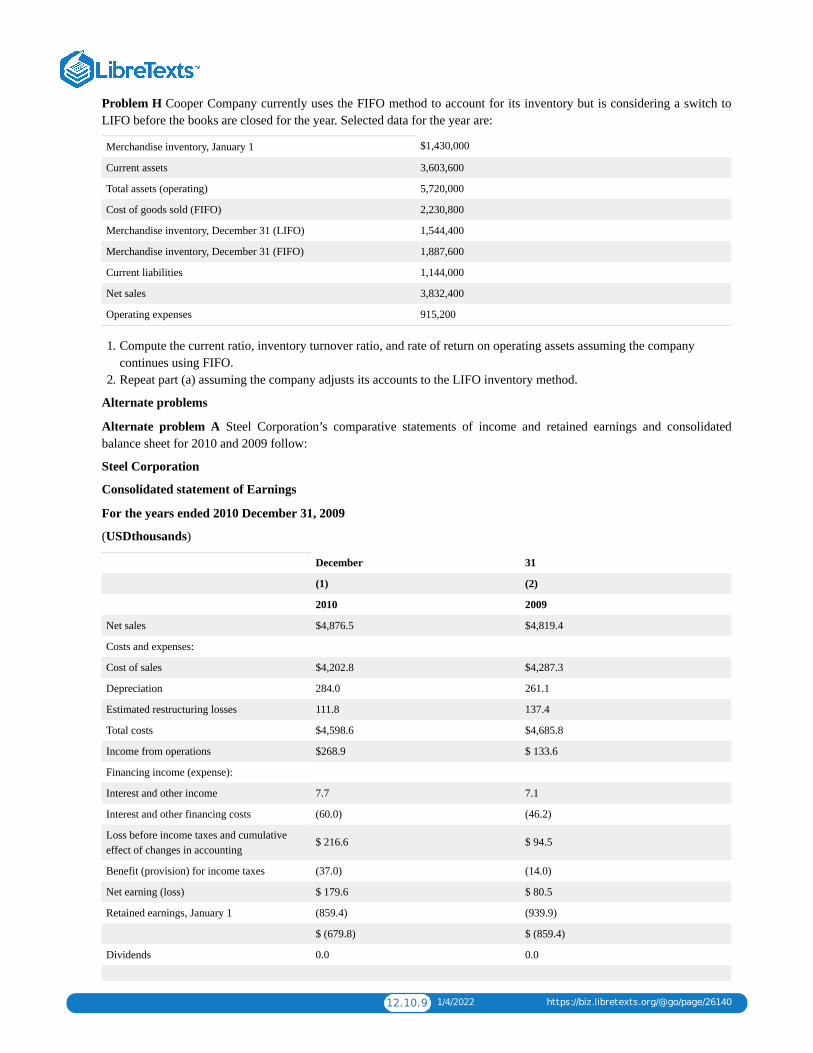
12.10.9 1/4/2022 https://biz.libretexts.org/@go/page/26140
Problem H Cooper Company currently uses the FIFO method to account for its inventory but is considering a switch toLIFO before the books are closed for the year. Selected data for the year are:
Merchandise inventory, January 1 $1,430,000
Current assets 3,603,600
Total assets (operating) 5,720,000
Cost of goods sold (FIFO) 2,230,800
Merchandise inventory, December 31 (LIFO) 1,544,400
Merchandise inventory, December 31 (FIFO) 1,887,600
Current liabilities 1,144,000
Net sales 3,832,400
Operating expenses 915,200
1. Compute the current ratio, inventory turnover ratio, and rate of return on operating assets assuming the companycontinues using FIFO.
2. Repeat part (a) assuming the company adjusts its accounts to the LIFO inventory method.
Alternate problems
Alternate problem A Steel Corporation’s comparative statements of income and retained earnings and consolidatedbalance sheet for 2010 and 2009 follow:
Steel Corporation
Consolidated statement of Earnings
For the years ended 2010 December 31, 2009
(USDthousands)
December 31
(1) (2)
2010 2009
Net sales $4,876.5 $4,819.4
Costs and expenses:
Cost of sales $4,202.8 $4,287.3
Depreciation 284.0 261.1
Estimated restructuring losses 111.8 137.4
Total costs $4,598.6 $4,685.8
Income from operations $268.9 $ 133.6
Financing income (expense):
Interest and other income 7.7 7.1
Interest and other financing costs (60.0) (46.2)
Loss before income taxes and cumulativeeffect of changes in accounting
$ 216.6 $ 94.5
Benefit (provision) for income taxes (37.0) (14.0)
Net earning (loss) $ 179.6 $ 80.5
Retained earnings, January 1 (859.4) (939.9)
$ (679.8) $ (859.4)
Dividends 0.0 0.0

12.10.10 1/4/2022 https://biz.libretexts.org/@go/page/26140
Retained earnings, December 31 $ (679.8) (859.4)
Steel Corporation
Consolidated balance sheet
As of 2010 December 31, and 2009
December 31
(1) (2)
2010 2009
Assets
Current Assets
Cash and cash equivalents $ 180.0 $ 159.5
Receivables 374.6 519.5
Total $ 554.6 $ 679.0
Inventories
Raw materials and supplies $ 335.5 $ 331.9
Finished and semifinished products 604.9 534.9
Contract work in process less billings of$10.9 and $2.3
17.8 16.1
Total inventories $ 958.2 $ 882.9
Other current assets $ 13.0 $ 7.2
Total current assets $ 1,525.8 $ 1,569.1
Property, plant and equipment lessaccumulated depreciation of $4329.5 and$4167.8
$ 2,714.2 $ 2,759.3
Investments and miscellaneous assets 112.3 124.2
Deferred income tax asset – net 885.0 903.2
Intangible asset – Pensions 463.0 426.6
Total assets $ 5,700.3 $ 5,782.4
Liabilities and stockholders’ equity
Current liabilities
Accounts payable $ 381.4 $ 387.0
Accrued employment costs 208.0 165.8
Postretirement benefits other than pensions 150.0 138.0
Accrued taxes 72.4 67.6
Debt and capital lease obligations 91.5 88.9
Other current liabilities 146.3 163.9
Total current liabilities $ 1,049.6 $ 1,011.2
Pension liability $ 1,115.0 $ 1,117.1
Postretirement benefits other than pensions 1,415.0 1,441.4
Long-term debt and capital lease obligations 546.8 668.4
Other 335.6 388.5
Total noncurrent liabilities $ 3,412.4 # 3,615.4
Total liabilities $ 4,462.0 $ 4,626.6

12.10.11 1/4/2022 https://biz.libretexts.org/@go/page/26140
Common stockholders’ equity
Preferred stock – at $1 per share par value(aggregate liquidation preference of $481.2);Authorized 20,000,000 shares
$ 11.6 $ 11.6
Preference stock – at $1 per share par value(aggregate liquidation preference of $88.2);Authorized 20,000,000 shares
2.6 2.6
Common stock – at $1 per share parvalue/Authorized 250,000,000 and150,000,000 shares; Issued 112,699,869 and111,882,276 shares
112.7 111.9
Held in treasury, 1,992,189 and 1,996,715shares at cost
(59.4) (59.5)
Additional paid-in capital 1,850.6 1,948.6
Accumulated deficit (679.8) (859.4)
Total common stockholders’ equity $ 1,238.3 $ 1,155.8
Total liabilities and stockholders’ equity $ 5,700.3 $ 5,782.4
2. Perform a horizontal and vertical analysis of Steel’s financial statements in a manner similar to Exhibit 1 and Exhibit 2.3. Comment on the results obtained in part (a).
Alternate problem B Ford Motor Company is the world’s second-largest producer of cars and trucks and ranks among thelargest providers of financial services in the United States. The following information pertains to Ford: (in millions)
(in millions) 1998 1999 2000
Sales $118.017 $135,073 $141,230
Cost of goods sold 104,616 118,985 126,120
Gross margin $ 13,401 $ 16,088 $ 15,110
Operating expenses 7,834 8,874 9,884
Net operating income $ 5,567 $ 7,214 $ 5,226
1. Prepare a statement showing the trend percentages for each item, using 1998 as the base year.2. Comment on the trends noted in part (a).
Alternate problem C The following data are for Clock Company: Allowance for uncollectible accounts
December 31
2011 2010
Notes payable (due in 90 days) $75,200 $60,000
Merchandise inventory 240,000 208,000
Cash 100,000 128,000
Marketable securities 49,600 30,000
Accrued liabilities 19,200 22,000
Accounts receivable 188,000 184,000
Accounts payable 112,000 72,000
Allowance for uncollectible accounts 24,000 15,200
Bonds payable, due 2008 156,000 160,000
Prepaid expenses 6,400 7,360
Cash flow from operating activities 60,000 40,000
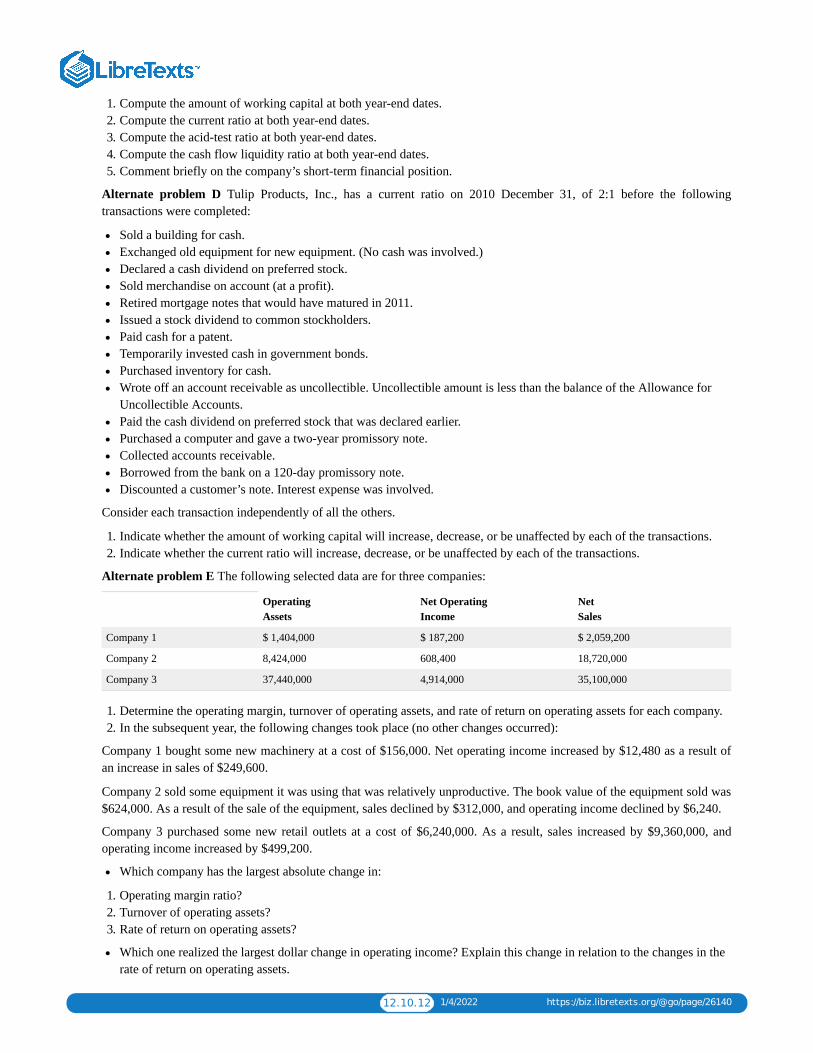
12.10.12 1/4/2022 https://biz.libretexts.org/@go/page/26140
1. Compute the amount of working capital at both year-end dates.2. Compute the current ratio at both year-end dates.3. Compute the acid-test ratio at both year-end dates.4. Compute the cash flow liquidity ratio at both year-end dates.5. Comment briefly on the company’s short-term financial position.
Alternate problem D Tulip Products, Inc., has a current ratio on 2010 December 31, of 2:1 before the followingtransactions were completed:
Sold a building for cash.Exchanged old equipment for new equipment. (No cash was involved.)Declared a cash dividend on preferred stock.Sold merchandise on account (at a profit).Retired mortgage notes that would have matured in 2011.Issued a stock dividend to common stockholders.Paid cash for a patent.Temporarily invested cash in government bonds.Purchased inventory for cash.Wrote off an account receivable as uncollectible. Uncollectible amount is less than the balance of the Allowance forUncollectible Accounts.Paid the cash dividend on preferred stock that was declared earlier.Purchased a computer and gave a two-year promissory note.Collected accounts receivable.Borrowed from the bank on a 120-day promissory note.Discounted a customer’s note. Interest expense was involved.
Consider each transaction independently of all the others.
1. Indicate whether the amount of working capital will increase, decrease, or be unaffected by each of the transactions.2. Indicate whether the current ratio will increase, decrease, or be unaffected by each of the transactions.
Alternate problem E The following selected data are for three companies:
OperatingAssets
Net OperatingIncome
NetSales
Company 1 $ 1,404,000 $ 187,200 $ 2,059,200
Company 2 8,424,000 608,400 18,720,000
Company 3 37,440,000 4,914,000 35,100,000
1. Determine the operating margin, turnover of operating assets, and rate of return on operating assets for each company.2. In the subsequent year, the following changes took place (no other changes occurred):
Company 1 bought some new machinery at a cost of $156,000. Net operating income increased by $12,480 as a result ofan increase in sales of $249,600.
Company 2 sold some equipment it was using that was relatively unproductive. The book value of the equipment sold was$624,000. As a result of the sale of the equipment, sales declined by $312,000, and operating income declined by $6,240.
Company 3 purchased some new retail outlets at a cost of $6,240,000. As a result, sales increased by $9,360,000, andoperating income increased by $499,200.
Which company has the largest absolute change in:
1. Operating margin ratio?2. Turnover of operating assets?3. Rate of return on operating assets?
Which one realized the largest dollar change in operating income? Explain this change in relation to the changes in therate of return on operating assets.
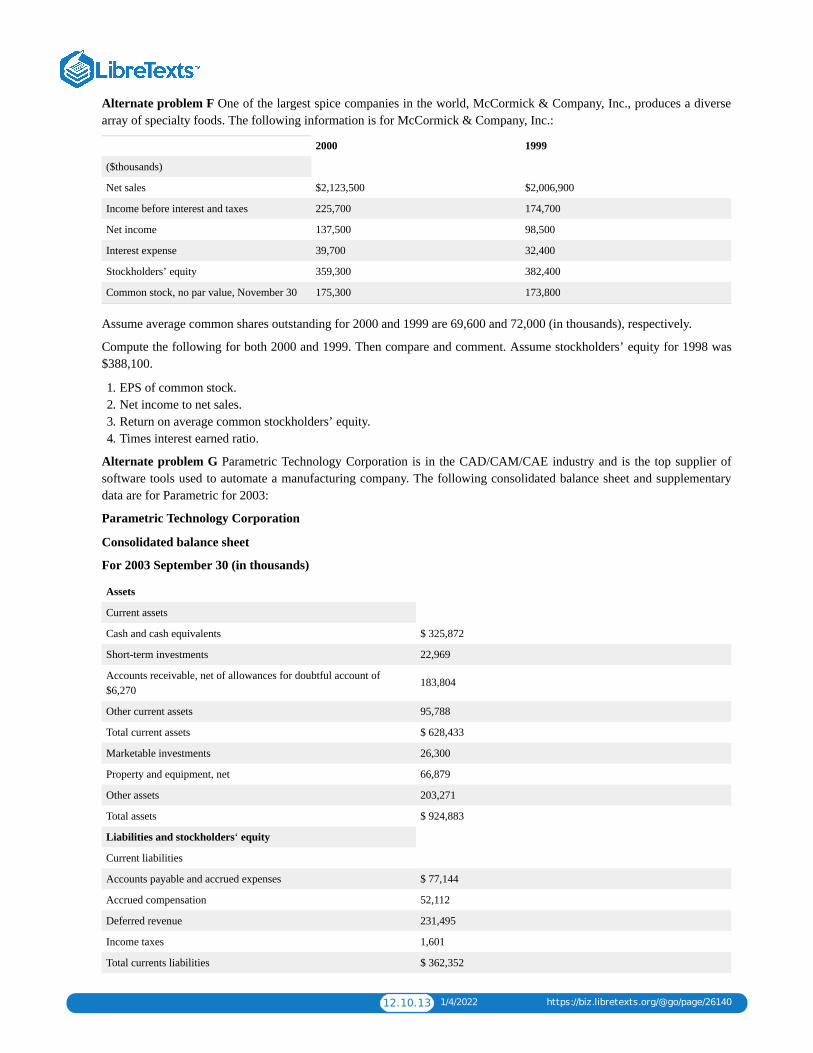
12.10.13 1/4/2022 https://biz.libretexts.org/@go/page/26140
Alternate problem F One of the largest spice companies in the world, McCormick & Company, Inc., produces a diversearray of specialty foods. The following information is for McCormick & Company, Inc.:
2000 1999
($thousands)
Net sales $2,123,500 $2,006,900
Income before interest and taxes 225,700 174,700
Net income 137,500 98,500
Interest expense 39,700 32,400
Stockholders’ equity 359,300 382,400
Common stock, no par value, November 30 175,300 173,800
Assume average common shares outstanding for 2000 and 1999 are 69,600 and 72,000 (in thousands), respectively.
Compute the following for both 2000 and 1999. Then compare and comment. Assume stockholders’ equity for 1998 was$388,100.
1. EPS of common stock.2. Net income to net sales.3. Return on average common stockholders’ equity.4. Times interest earned ratio.
Alternate problem G Parametric Technology Corporation is in the CAD/CAM/CAE industry and is the top supplier ofsoftware tools used to automate a manufacturing company. The following consolidated balance sheet and supplementarydata are for Parametric for 2003:
Parametric Technology Corporation
Consolidated balance sheet
For 2003 September 30 (in thousands)
Assets
Current assets
Cash and cash equivalents $ 325,872
Short-term investments 22,969
Accounts receivable, net of allowances for doubtful account of$6,270
183,804
Other current assets 95,788
Total current assets $ 628,433
Marketable investments 26,300
Property and equipment, net 66,879
Other assets 203,271
Total assets $ 924,883
Liabilities and stockholders‘ equity
Current liabilities
Accounts payable and accrued expenses $ 77,144
Accrued compensation 52,112
Deferred revenue 231,495
Income taxes 1,601
Total currents liabilities $ 362,352
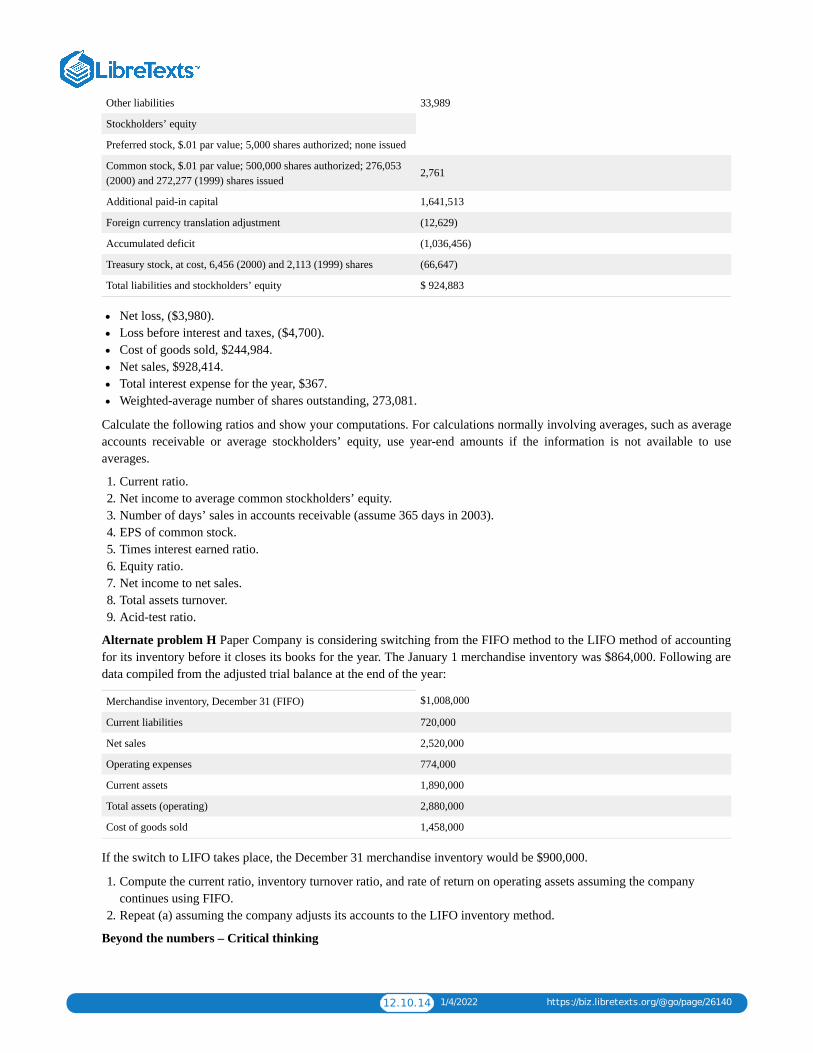
12.10.14 1/4/2022 https://biz.libretexts.org/@go/page/26140
Other liabilities 33,989
Stockholders’ equity
Preferred stock, $.01 par value; 5,000 shares authorized; none issued
Common stock, $.01 par value; 500,000 shares authorized; 276,053(2000) and 272,277 (1999) shares issued
2,761
Additional paid-in capital 1,641,513
Foreign currency translation adjustment (12,629)
Accumulated deficit (1,036,456)
Treasury stock, at cost, 6,456 (2000) and 2,113 (1999) shares (66,647)
Total liabilities and stockholders’ equity $ 924,883
Net loss, ($3,980).Loss before interest and taxes, ($4,700).Cost of goods sold, $244,984.Net sales, $928,414.Total interest expense for the year, $367.Weighted-average number of shares outstanding, 273,081.
Calculate the following ratios and show your computations. For calculations normally involving averages, such as averageaccounts receivable or average stockholders’ equity, use year-end amounts if the information is not available to useaverages.
1. Current ratio.2. Net income to average common stockholders’ equity.3. Number of days’ sales in accounts receivable (assume 365 days in 2003).4. EPS of common stock.5. Times interest earned ratio.6. Equity ratio.7. Net income to net sales.8. Total assets turnover.9. Acid-test ratio.
Alternate problem H Paper Company is considering switching from the FIFO method to the LIFO method of accountingfor its inventory before it closes its books for the year. The January 1 merchandise inventory was $864,000. Following aredata compiled from the adjusted trial balance at the end of the year:
Merchandise inventory, December 31 (FIFO) $1,008,000
Current liabilities 720,000
Net sales 2,520,000
Operating expenses 774,000
Current assets 1,890,000
Total assets (operating) 2,880,000
Cost of goods sold 1,458,000
If the switch to LIFO takes place, the December 31 merchandise inventory would be $900,000.
1. Compute the current ratio, inventory turnover ratio, and rate of return on operating assets assuming the companycontinues using FIFO.
2. Repeat (a) assuming the company adjusts its accounts to the LIFO inventory method.
Beyond the numbers – Critical thinking

12.10.15 1/4/2022 https://biz.libretexts.org/@go/page/26140
Business decision case A The comparative balance sheets of the Darling Corporation for 2011 December 31, and 2010follow:
Darling Corporation
Comparative balance sheets
2011 December 31, and 2010
($millions)
2011 2010
Assets
Cash $ 480,000 $ 96,000
Accounts receivable, net 86,400 115,200
Merchandise inventory 384,000 403,200
Plant and equipment, net 268,800 288,000
Total assets $ 1,219,200 $902,400
Liabilities and stockholders’ equity
Accounts payable $ 96,000 $ 96,000
Common stock 672,000 672,000
Retained earnings 451,200 134,400
Total liabilities and stockholders’ equity $1,219,200 $902,400
Based on your review of the comparative balance sheets, determine the following:
1. What was the net income for 2011 assuming there were no dividend payments?2. What was the primary source of the large increase in the cash balance from 2010 to 2011?3. What are the two main sources of assets for Darling Corporation?4. What other comparisons and procedures would you use to complete the analysis of the balance sheet?
Business decision case B As Miller Manufacturing Company’s internal auditor, you are reviewing the company’s creditpolicy. The following information is from Miller’s annual reports for 2008, 2009, 2010, and 2011:
2008 2009 2010 2011
Nets accounts receivable $ 1,080,000 $ 2,160,000 $ 2,700,000 $ 3,600,000
Net sales 10,800,000 13,950,000 17,100,000 19,800,000
Management has asked you to calculate and analyze the following in your report:
1. If cash sales account for 30 per cent of all sales and credit terms are always 1/10, n/60, determine all turnover ratiospossible and the number of days’ sales in accounts receivable at all possible dates. (The number of days’ sales inaccounts receivable should be based on year-end accounts receivable and net credit sales.)
2. How effective is the company’s credit policy?
Business decision case C Wendy Prince has consulted you about the possibility of investing in one of three companies(Apple, Inc., Baker Company, or Cookie Corp.) by buying its common stock. The companies’ investment shares are sellingat about the same price. The long-term capital structures of the companies alternatives are as follows:
$2,400,000 $2,400,000
Apple,Inc.
BakerCompany
CookieCorp.
Bonds with a 10% interest rate
Preferred stock with an 8%dividend rate

12.10.16 1/4/2022 https://biz.libretexts.org/@go/page/26140
Common stock, $10 par value $4,800,000 2,400,000 2,400,000
Retained earnings 384,000 384,000 384,000
Total long-term equity $5,184,000 $5,184,000 $5,184,000
Number of common sharesoutstanding
480,000 240,000 240,000
Prince has already consulted two investment advisers. One adviser believes that each of the companies will earn $300,000per year before interest and taxes. The other adviser believes that each company will earn about $960,000 per year beforeinterest and taxes. Prince has asked you to write a report covering these points:
1. Compute each of the following, using the estimates made by the first and second advisers.
(a)Earnings available for common stockholders assuming a 40 per cent tax rate.
(b)EPS of common stock.
(c) Rate of return on total stockholders’ equity.
1. Which stock should Prince select if she believes the first adviser?2. Are the stockholders as a group (common and preferred) better off with or without the use of long-term debt in the
companies?
Annual Report analysis D The following selected financial data excerpted from the annual report of ApplianceCorporation represents the summary information which management presented for interested parties to review:
Appliance Corporation
Selected Financial Data
($thousands except per share data)
2010 2009 2008 2007 2006
Net sales $3,049,524 $3,372,515 $2,987,054 $3,041,223 $2,970,626
Cost of sales 2,250,616 2,496,065 2,262,942 2,339,406 2,254,221
Income taxes 74,800 90,200 38,600 15,900 44,400
Income (loss) fromcontinuing operations
(14,996) 151,137 51,270 (8,254) 79,017
Per cent of income(loss) fromcontinuing operationsto net sales
(0.5%) 4.5% 1.7% (0.3%) 2.7%
Income (loss) fromcontinuing operationsper share
$ (0.14) 1.42 0.48 (0.08) $ 0.75
Dividends paid pershare
0.515 0.50 0.50 0.50 0.50
Average sharesoutstanding (inthousands)
107,062 106,795 106,252 106,077 105,761
Working capital $ 543,431 $ 595,703 $ 406,181 $452,626 $ 509,025
Depreciation ofproperty, plant andequipment
102,572 110,044 102,459 94,032 83,352
Additions to property,plant and equipment
152,912 84,136 99,300 129,891 143,372
Total assets 2,125,066 2,504,327 2,469,498 2,501,490 2,535,068
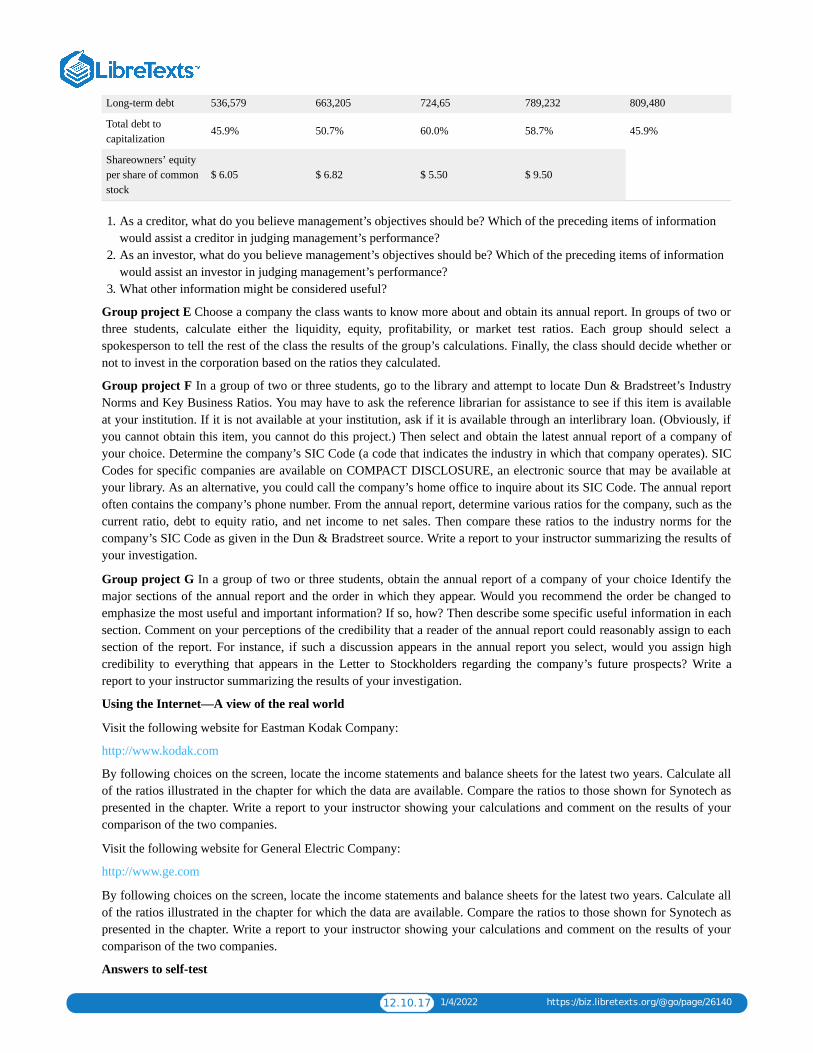
12.10.17 1/4/2022 https://biz.libretexts.org/@go/page/26140
Long-term debt 536,579 663,205 724,65 789,232 809,480
Total debt tocapitalization
45.9% 50.7% 60.0% 58.7% 45.9%
Shareowners’ equityper share of commonstock
$ 6.05 $ 6.82 $ 5.50 $ 9.50
1. As a creditor, what do you believe management’s objectives should be? Which of the preceding items of informationwould assist a creditor in judging management’s performance?
2. As an investor, what do you believe management’s objectives should be? Which of the preceding items of informationwould assist an investor in judging management’s performance?
3. What other information might be considered useful?
Group project E Choose a company the class wants to know more about and obtain its annual report. In groups of two orthree students, calculate either the liquidity, equity, profitability, or market test ratios. Each group should select aspokesperson to tell the rest of the class the results of the group’s calculations. Finally, the class should decide whether ornot to invest in the corporation based on the ratios they calculated.
Group project F In a group of two or three students, go to the library and attempt to locate Dun & Bradstreet’s IndustryNorms and Key Business Ratios. You may have to ask the reference librarian for assistance to see if this item is availableat your institution. If it is not available at your institution, ask if it is available through an interlibrary loan. (Obviously, ifyou cannot obtain this item, you cannot do this project.) Then select and obtain the latest annual report of a company ofyour choice. Determine the company’s SIC Code (a code that indicates the industry in which that company operates). SICCodes for specific companies are available on COMPACT DISCLOSURE, an electronic source that may be available atyour library. As an alternative, you could call the company’s home office to inquire about its SIC Code. The annual reportoften contains the company’s phone number. From the annual report, determine various ratios for the company, such as thecurrent ratio, debt to equity ratio, and net income to net sales. Then compare these ratios to the industry norms for thecompany’s SIC Code as given in the Dun & Bradstreet source. Write a report to your instructor summarizing the results ofyour investigation.
Group project G In a group of two or three students, obtain the annual report of a company of your choice Identify themajor sections of the annual report and the order in which they appear. Would you recommend the order be changed toemphasize the most useful and important information? If so, how? Then describe some specific useful information in eachsection. Comment on your perceptions of the credibility that a reader of the annual report could reasonably assign to eachsection of the report. For instance, if such a discussion appears in the annual report you select, would you assign highcredibility to everything that appears in the Letter to Stockholders regarding the company’s future prospects? Write areport to your instructor summarizing the results of your investigation.
Using the Internet—A view of the real world
Visit the following website for Eastman Kodak Company:
http://www.kodak.com
By following choices on the screen, locate the income statements and balance sheets for the latest two years. Calculate allof the ratios illustrated in the chapter for which the data are available. Compare the ratios to those shown for Synotech aspresented in the chapter. Write a report to your instructor showing your calculations and comment on the results of yourcomparison of the two companies.
Visit the following website for General Electric Company:
http://www.ge.com
By following choices on the screen, locate the income statements and balance sheets for the latest two years. Calculate allof the ratios illustrated in the chapter for which the data are available. Compare the ratios to those shown for Synotech aspresented in the chapter. Write a report to your instructor showing your calculations and comment on the results of yourcomparison of the two companies.
Answers to self-test

12.10.18 1/4/2022 https://biz.libretexts.org/@go/page/26140
True-false
True. Financial statement analysis consists of applying analytical tools and techniques to financial statements and otherrelevant data to obtain useful information.
False. Horizontal analysis provides useful information about the changes in a company’s performance over several periodsby analyzing comparative financial statements of the same company for two or more successive periods.
False. Common-size statements show only percentage figures, such as percentages of total assets and percentages of netsales.
True. Liquidity ratios such as the current ratio and acid-test ratio indicate a company’s short-term debt-paying ability.
True. The accrual net income shown on the income statement is not cash basis income and does not indicate cash flows.
True. Analysts must use comparable data when making comparisons of items for different periods or different companies.
Multiple-choice
1. b. Current assets: $136,000 + $64,000 + $184,000 + $244,000 + $12,000 = $640,000
Current liabilities: $256,000 + $64,000 = $320,000
Current ratio:
1. c. Quick assets:
$136,000 + $64,000 + $184,000 = $384,000
Current liabilities:
256,000 + $64,000 = $320,000
Acid-test ratio:
1. Net sales:
$4,620,000
Average accounts receivable:
Accounts receivable turnover:
1. Cost of goods sold:
$3,360,000
Average inventory:
Inventory turnover:
1. Income before interest and taxes, $720,000
Interest on bonds, 192,000
Times interest earned ratio: $720,000/$192,000 = 3.75 times
CC licensed content, Shared previouslyAccounting Principles: A Business Perspective. Authored by: James Don Edwards, University of Georgia & Roger H.Hermanson, Georgia State University. Provided by: Endeavour International Corporation. Project: The Global TextProject . License: CC BY: Attribution

1 1/8/2022
CHAPTER OVERVIEW13: APPENDIX- SERVICE DEPARTMENT ALLOCATION
13.1: ALLOCATION OF SERVICE DEPARTMENT COSTS13.2: DIRECT METHOD OF ALLOCATION13.3: STEP METHOD OF ALLOCATION13.4: RECIPROCAL METHOD OF ALLOCATION
13.1.1 1/8/2022 https://biz.libretexts.org/@go/page/26141
13.1: Allocation of Service Department CostsThroughout this text, we have emphasized cost allocations only in the operating departments of a company. Theseoperating departments perform the primary purpose of the company—to produce goods and services for consumers.Examples of operating departments are the assembly departments of manufacturing firms and the departments in hotelsthat take and confirm reservations.
The costs of service departments are allocated to the operating departments because they exist to support the operatingdepartments. Examples of service departments are maintenance, administration, cafeterias, laundries, and receiving.Service departments aid multiple production departments at the same time, and accountants must allocate and account forall of these costs. It is crucial that these service department costs be allocated to the operating departments so that the costsof conducting business in the operating departments are clearly and accurately reflected.
Accountants allocate service department costs using some type of base. When the companies’ managers choose bases touse, they consider such criteria as the types of services provided, the benefits received, and the fairness of the allocationmethod. Examples of bases used to allocate service department costs are number of employees, machine-hours, directlabor-hours, square footage, and electricity usage.
There are three methods for allocating service department costs:
The first method, the direct method, is the simplest of the three. The direct method allocates costs of each of the servicedepartments to each operating department based on each department’s share of the allocation base. Services used byother service departments are ignored.The second method of allocating service department costs is the step method. This method allocates service costs to theoperating departments and other service departments in a sequential process. The sequence of allocation generallystarts with the service department that has incurred the greatest costs. After this department’s costs have been allocated,the service department with the next highest costs has its costs allocated, and so forth until the service department with the lowest costs has had its costsallocated. Costs are not allocated back to a department that has already had all of its costs allocated.The third method is the most complicated but also the most accurate. The reciprocal method allocates servicesdepartment costs to operating departments and other service departments. Under the reciprocal cost, the relationshipbetween service departments is recognized and cost is allocated to and from each service department for servicesprovided.
Next, we will look at each method.
CC licensed content, Shared previouslyAccounting Principles: A Business Perspective. Authored by: James Don Edwards, University of Georgia & Roger H.Hermanson, Georgia State University. Provided by: Endeavour International Corporation. Project: The Global TextProject. License: CC BY: Attribution
13.2.1 1/4/2022 https://biz.libretexts.org/@go/page/26142
13.2: Direct Method of AllocationThe direct method allocates costs of each of the service departments to each operating department based on eachdepartment’s share of the allocation base. Services used by other service departments are ignored. This means the directmethod does not recognize service performed by other service departments. For example, if Service Department A usessome of Service Department B’s services, these services would be ignored in the cost allocation process. Because theseservices are not allocated to other service departments, some accountants believe the direct method is not accurate.
A YouTube element has been excluded from this version of the text. You can view it online here:pb.libretexts.org/llmanagerialaccounting/?p=286
Let’s look at another example. A company has 2 service departments, Maintenance and Administration, and 2 operatingdepartments (Department 1 and 2 for simplicity). The costs of the maintenance department are allocated based on themachine-hours used. For the administration department, the cost allocation is based on the number of employees. The following information isprovided:
Service Dept Operating Dept
Maintenance Administration 1 2
Costs $8,000 $4,000 $32,000 $36,000
Machine-hours used 1,000 2,000 1,500 2,500
Number of Employees 100 200 250 150
Remember how we calculate predetermined overhead rates? We will need that same formula again. The formula tocalculate the allocation rate will be slightly modified for service department cost but will be:
Service Dept Cost
TOTAL Cost Driver (operating depts only)
Notice, we use the operating department cost drivers only since we are allocating the service department cost to operatingdepartments only and not to another service department. Maintenance uses machine-hours as the cost driver or basis andAdministration uses number of employees. We can calculate the service department allocation rates as follows:
Maintenance Dept Cost = $8,000 =$8,000
= $2 per machine hourTOTAL Machine Hours(operating depts only)
(1,500 + 2,500) 4,000
Administration Dept Cost = $4,000 =$4,000 = $10 per employee
TOTAL Employees (250 + 150) 400
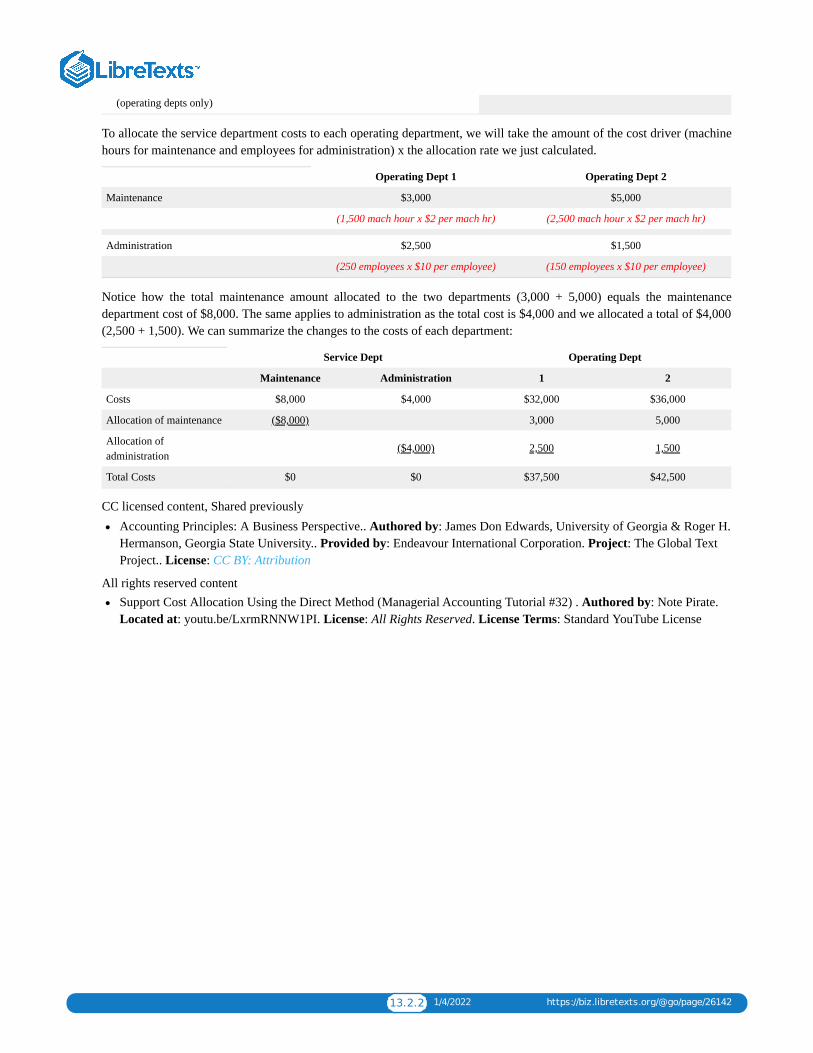
13.2.2 1/4/2022 https://biz.libretexts.org/@go/page/26142
(operating depts only)
To allocate the service department costs to each operating department, we will take the amount of the cost driver (machinehours for maintenance and employees for administration) x the allocation rate we just calculated.
Operating Dept 1 Operating Dept 2
Maintenance $3,000 $5,000
(1,500 mach hour x $2 per mach hr) (2,500 mach hour x $2 per mach hr)
Administration $2,500 $1,500
(250 employees x $10 per employee) (150 employees x $10 per employee)
Notice how the total maintenance amount allocated to the two departments (3,000 + 5,000) equals the maintenancedepartment cost of $8,000. The same applies to administration as the total cost is $4,000 and we allocated a total of $4,000(2,500 + 1,500). We can summarize the changes to the costs of each department:
Service Dept Operating Dept
Maintenance Administration 1 2
Costs $8,000 $4,000 $32,000 $36,000
Allocation of maintenance ($8,000) 3,000 5,000
Allocation ofadministration
($4,000) 2,500 1,500
Total Costs $0 $0 $37,500 $42,500
CC licensed content, Shared previouslyAccounting Principles: A Business Perspective.. Authored by: James Don Edwards, University of Georgia & Roger H.Hermanson, Georgia State University.. Provided by: Endeavour International Corporation. Project: The Global TextProject.. License: CC BY: Attribution
All rights reserved contentSupport Cost Allocation Using the Direct Method (Managerial Accounting Tutorial #32) . Authored by: Note Pirate.Located at: youtu.be/LxrmRNNW1PI. License: All Rights Reserved. License Terms: Standard YouTube License

13.3.1 1/1/2022 https://biz.libretexts.org/@go/page/26143
13.3: Step Method of AllocationThe second method of allocating service department costs is the step method. This method allocates service costs to theoperating departments and other service departments in a sequential process. The sequence of allocation generally startswith the service department that has incurred the greatest costs. After this department’s costs have been allocated, theservice department with the next highest costs has its costs allocated, and so forth until the service department with thelowest costs has had its costs allocated. Costs are not allocated back to a department that has already had all of its costsallocated.
A YouTube element has been excluded from this version of the text. You can view it online here:pb.libretexts.org/llmanagerialaccounting/?p=288
For this example, we will use the same data as before which was:
Service Dept Operating Dept
Maintenance Administration 1 2
Costs $8,000 $4,000 $32,000 $36,000
Machine-hours used 1,000 2,000 1,500 2,500
Number of Employees 100 200 250 150
In the step method, we typically begin with the highest service cost first. We will start with Maintenance and allocate thecost to all remaining operating AND service departments (administration, operating dept 1 and operating dept 2). Whencalculating the allocation rate, we never use the service department cost driver itself (so do not use the maintenancemachine hours used).
Maintenance Cost = $8,000 =$8,000
= $1.3333 per machine hourMachine Hours (all butmaintenance)
(2,000 + 1,500 + 2,500) 6,000
We would allocate maintenance to Administration, Operating Departments 1 and 2 using the machine hours for eachdepartment x the maintenance rate per machine hour (round final answer to nearest dollar).
Admin Oper. Dept 1 Oper. Dept 2
Maintenance 2,667 2,000 3,333
(2,000 MH x 1.333) (1,500 MH x 1.3333) (2,500 MH x 1.3333)
Next, we would allocate the administration department. The total administration cost has changed since we have theoriginal department costs of $4,000 + maintenance cost allocated above of $2,667 making the new administration cost$6,667. Administration will be allocated based on number of employees. We will use the operating departments only sincewe have already allocate all of maintenance costs and there are no other service departments.
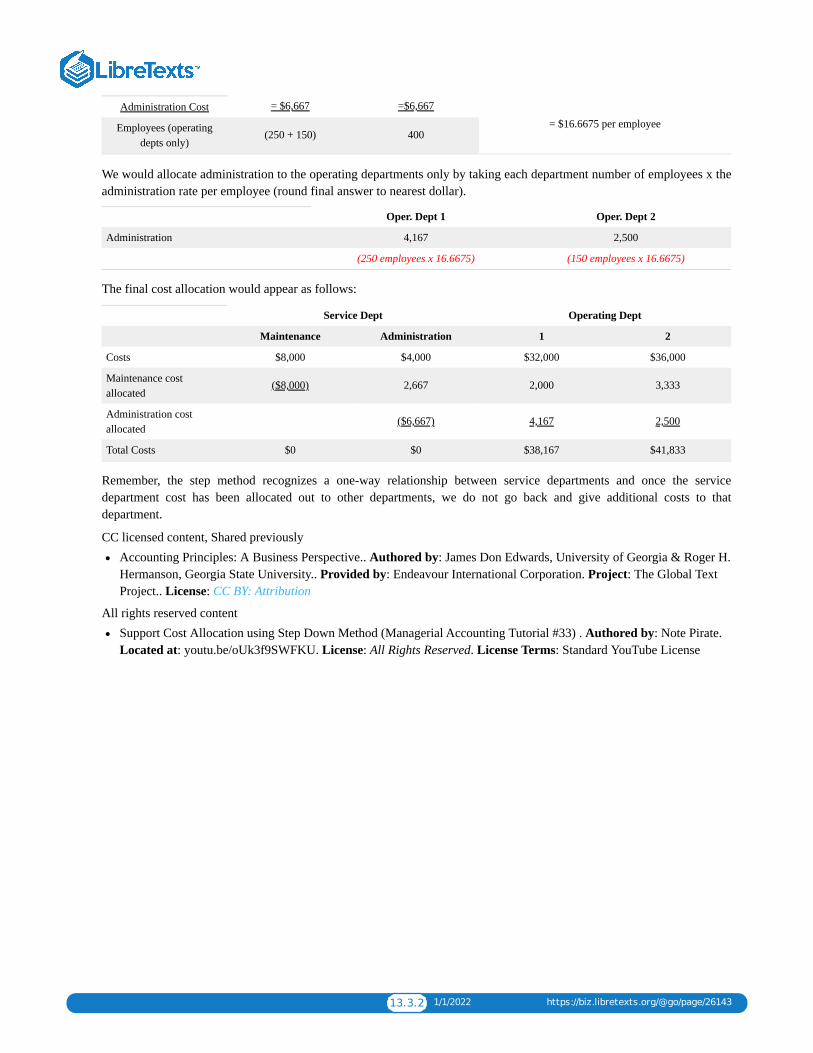
13.3.2 1/1/2022 https://biz.libretexts.org/@go/page/26143
Administration Cost = $6,667 =$6,667
= $16.6675 per employeeEmployees (operatingdepts only)
(250 + 150) 400
We would allocate administration to the operating departments only by taking each department number of employees x theadministration rate per employee (round final answer to nearest dollar).
Oper. Dept 1 Oper. Dept 2
Administration 4,167 2,500
(250 employees x 16.6675) (150 employees x 16.6675)
The final cost allocation would appear as follows:
Service Dept Operating Dept
Maintenance Administration 1 2
Costs $8,000 $4,000 $32,000 $36,000
Maintenance costallocated
($8,000) 2,667 2,000 3,333
Administration costallocated
($6,667) 4,167 2,500
Total Costs $0 $0 $38,167 $41,833
Remember, the step method recognizes a one-way relationship between service departments and once the servicedepartment cost has been allocated out to other departments, we do not go back and give additional costs to thatdepartment.
CC licensed content, Shared previouslyAccounting Principles: A Business Perspective.. Authored by: James Don Edwards, University of Georgia & Roger H.Hermanson, Georgia State University.. Provided by: Endeavour International Corporation. Project: The Global TextProject.. License: CC BY: Attribution
All rights reserved contentSupport Cost Allocation using Step Down Method (Managerial Accounting Tutorial #33) . Authored by: Note Pirate.Located at: youtu.be/oUk3f9SWFKU. License: All Rights Reserved. License Terms: Standard YouTube License
13.4.1 12/4/2021 https://biz.libretexts.org/@go/page/26144
13.4: Reciprocal Method of AllocationThe final method, is the reciprocal method. Although it is the most accurate, it is also the most complicated. In thereciprocal method, the relationship between the service departments is recognized. This means service department costsare allocated to and from the other service departments.
A YouTube element has been excluded from this version of the text. You can view it online here:pb.libretexts.org/llmanagerialaccounting/?p=290
We can break the process up into 3 steps so we can make sense of the process. To demonstrate, we will use the same basicdata:
Service Dept Operating Dept
Maintenance Administration 1 2
Costs $8,000 $4,000 $32,000 $36,000
Machine-hours used 1,000 2,000 1,500 2,500
Number of Employees 100 200 250 150
Step 1: Determine allocation bases
Just like you would for direct or step,we need to calculate the allocation base EXCEPT the only thing you are excluding isthe department cost you are trying to allocate — ALL other departments are included. We can calculate the allocation baseamount for each service department as follows:
Maintenance Dept Administration Dept
Mach Hrs % of Total Employees % of Total
Maintenance – – 100 20.00% (100/500)
Administration 2,000 2/6** (2,000/6,000) – –
Dept 1 1,500 25% (1,500/6,000) 250 50.00% (250/500)
Dept 2 2,500 2.5/6** (2,500/6,000) 150 30.00% (150/500)
Total 6,000 100% 500 100.00%
**since these numbers do not come out evenly, we keep them in the fraction form and only round the final answer to thenearest dollar.
Step 2: Setup the formulas.
Since maintenance costs are allocated to administration and administration cost is allocated to maintenance — things getinteresting. You will need to determine the TOTAL cost being allocated to both the Administration and MaintenanceDepartments first.
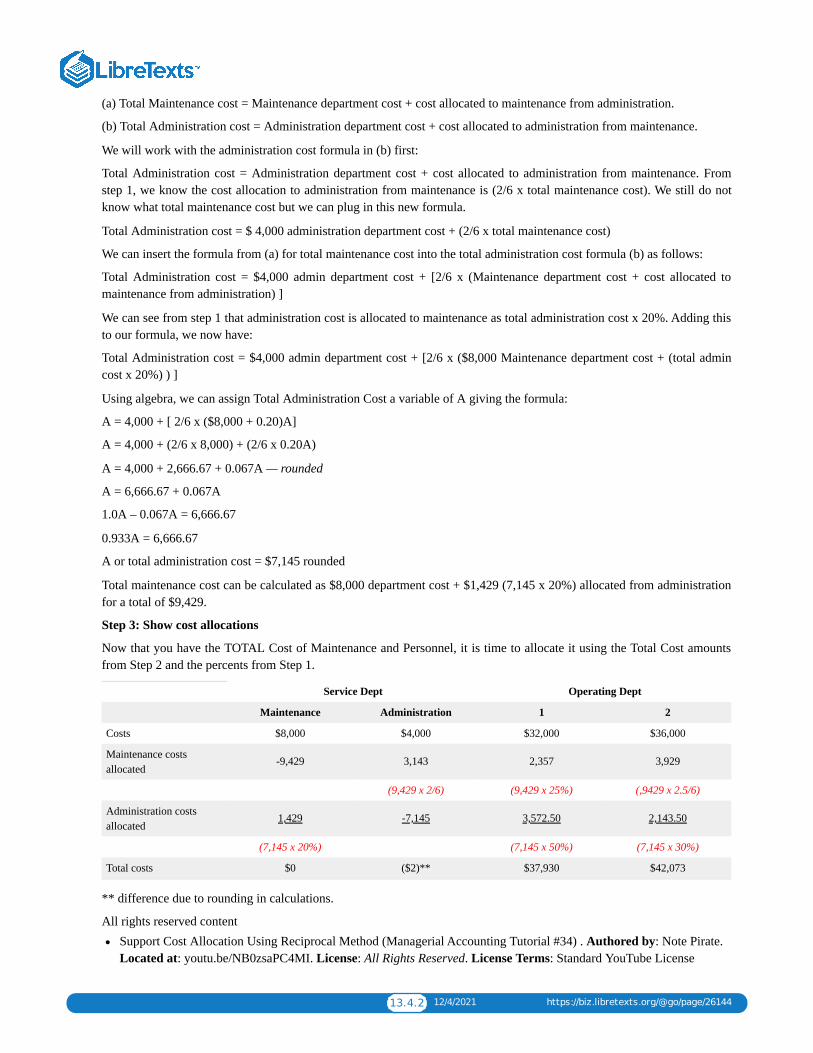
13.4.2 12/4/2021 https://biz.libretexts.org/@go/page/26144
(a) Total Maintenance cost = Maintenance department cost + cost allocated to maintenance from administration.
(b) Total Administration cost = Administration department cost + cost allocated to administration from maintenance.
We will work with the administration cost formula in (b) first:
Total Administration cost = Administration department cost + cost allocated to administration from maintenance. Fromstep 1, we know the cost allocation to administration from maintenance is (2/6 x total maintenance cost). We still do notknow what total maintenance cost but we can plug in this new formula.
Total Administration cost = $ 4,000 administration department cost + (2/6 x total maintenance cost)
We can insert the formula from (a) for total maintenance cost into the total administration cost formula (b) as follows:
Total Administration cost = $4,000 admin department cost + [2/6 x (Maintenance department cost + cost allocated tomaintenance from administration) ]
We can see from step 1 that administration cost is allocated to maintenance as total administration cost x 20%. Adding thisto our formula, we now have:
Total Administration cost = $4,000 admin department cost + [2/6 x ($8,000 Maintenance department cost + (total admincost x 20%) ) ]
Using algebra, we can assign Total Administration Cost a variable of A giving the formula:
A = 4,000 + [ 2/6 x ($8,000 + 0.20)A]
A = 4,000 + (2/6 x 8,000) + (2/6 x 0.20A)
A = 4,000 + 2,666.67 + 0.067A — rounded
A = 6,666.67 + 0.067A
1.0A – 0.067A = 6,666.67
0.933A = 6,666.67
A or total administration cost = $7,145 rounded
Total maintenance cost can be calculated as $8,000 department cost + $1,429 (7,145 x 20%) allocated from administrationfor a total of $9,429.
Step 3: Show cost allocations
Now that you have the TOTAL Cost of Maintenance and Personnel, it is time to allocate it using the Total Cost amountsfrom Step 2 and the percents from Step 1.
Service Dept Operating Dept
Maintenance Administration 1 2
Costs $8,000 $4,000 $32,000 $36,000
Maintenance costsallocated
-9,429 3,143 2,357 3,929
(9,429 x 2/6) (9,429 x 25%) (,9429 x 2.5/6)
Administration costsallocated
1,429 -7,145 3,572.50 2,143.50
(7,145 x 20%) (7,145 x 50%) (7,145 x 30%)
Total costs $0 ($2)** $37,930 $42,073
** difference due to rounding in calculations.
All rights reserved contentSupport Cost Allocation Using Reciprocal Method (Managerial Accounting Tutorial #34) . Authored by: Note Pirate.Located at: youtu.be/NB0zsaPC4MI. License: All Rights Reserved. License Terms: Standard YouTube License

IndexMmaster budget
7.4: Master Budgets

Glossary
Sample Word 1 | Sample Definition 1