MANAGERIAL FINANCE Chapter I Introduction
73
1 MANAGERIAL FINANCE Chapter I Introduction What is Finance? Finance can be defined as the art and science of managing money. Virtually all individuals and organizations earn or raise money and spend or invest money. Finance is concerned with the process, institutions, markets, and instruments involved in the transfer of money among individuals, business, and governments. Most adults will benefit from an understanding of finance, which will enable them to make better personal financial decisions. Those who work in non- financial jobs will benefit by being able to interact effectively with the firm’s financial personnel, process, and procedures. Major areas and opportunities in Finance The major areas of finance can be summarized by reviewing the career opportunities in finance. These opportunities can, for convenience, be divided into two broad areas: Financial services and managerial finance. Financial Services . This is the area of finance concerned with the design and delivery of advice and financial products to individuals, business and government. It involves a variety of interesting career opportunities within the areas of banking and related institutions, personal financial planning, investment, real estate, and insurance. Management Finance . This is concerned with the duties of financial manager in the business firm. Financial manager actively manage the finance affairs of any type of business (financial and nonfinancial, private and public, large and small, profit-seeking and not-for-profit). They perform such varied financial tasks as planning, extending credit to customers, evaluating proposal large expenditures, and raising money to fund the firm’s operations. Legal Forms of Business Organization
Transcript of MANAGERIAL FINANCE Chapter I Introduction

1
MANAGERIAL FINANCE
Chapter I
Introduction
What is Finance?
Finance can be defined as the art and science of managingmoney. Virtually all individuals and organizations earn orraise money and spend or invest money. Finance is concernedwith the process, institutions, markets, and instrumentsinvolved in the transfer of money among individuals, business,and governments. Most adults will benefit from anunderstanding of finance, which will enable them to makebetter personal financial decisions. Those who work in non-financial jobs will benefit by being able to interacteffectively with the firm’s financial personnel, process, andprocedures.
Major areas and opportunities in Finance
The major areas of finance can be summarized by reviewing thecareer opportunities in finance. These opportunities can, forconvenience, be divided into two broad areas: Financialservices and managerial finance.
Financial Services. This is the area of finance concernedwith the design and delivery of advice and financial productsto individuals, business and government. It involves a varietyof interesting career opportunities within the areas ofbanking and related institutions, personal financial planning,investment, real estate, and insurance.
Management Finance. This is concerned with the duties offinancial manager in the business firm. Financial manageractively manage the finance affairs of any type of business(financial and nonfinancial, private and public, large andsmall, profit-seeking and not-for-profit). They perform suchvaried financial tasks as planning, extending credit tocustomers, evaluating proposal large expenditures, and raisingmoney to fund the firm’s operations.
Legal Forms of Business Organization
2
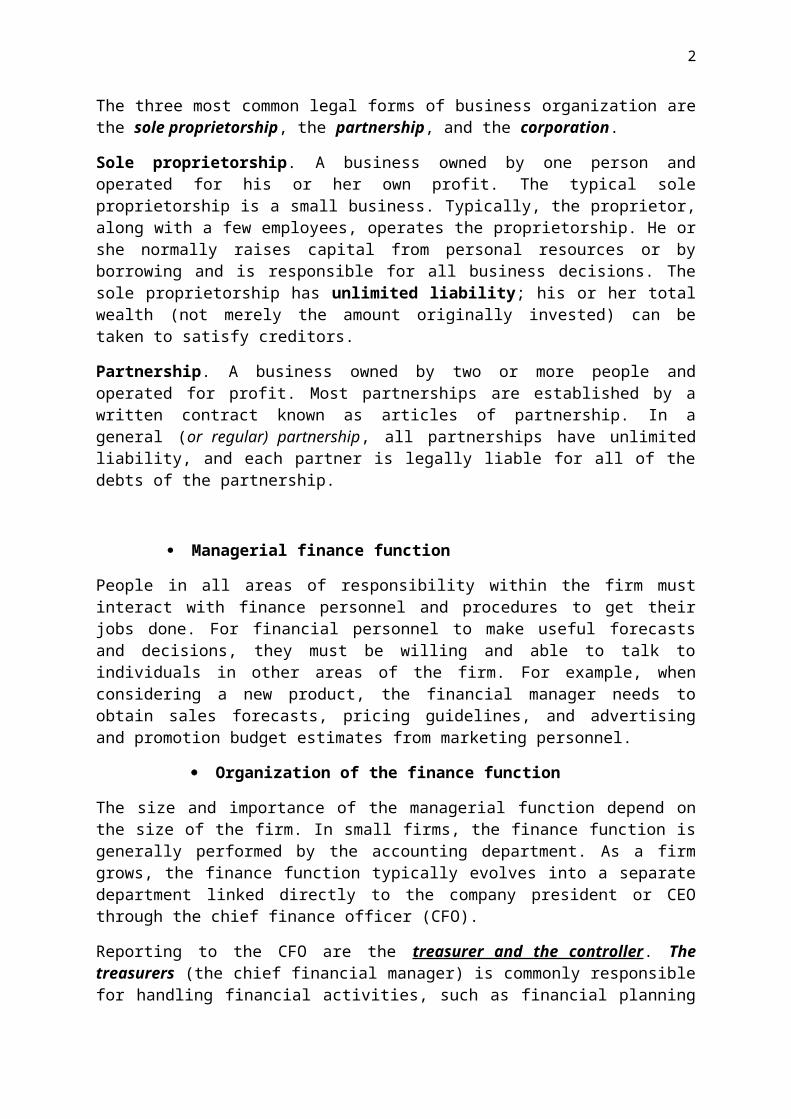
The three most common legal forms of business organization arethe sole proprietorship, the partnership, and the corporation.
Sole proprietorship. A business owned by one person andoperated for his or her own profit. The typical soleproprietorship is a small business. Typically, the proprietor,along with a few employees, operates the proprietorship. He orshe normally raises capital from personal resources or byborrowing and is responsible for all business decisions. Thesole proprietorship has unlimited liability; his or her totalwealth (not merely the amount originally invested) can betaken to satisfy creditors.
Partnership. A business owned by two or more people andoperated for profit. Most partnerships are established by awritten contract known as articles of partnership. In ageneral (or regular) partnership, all partnerships have unlimitedliability, and each partner is legally liable for all of thedebts of the partnership.
Managerial finance function
People in all areas of responsibility within the firm mustinteract with finance personnel and procedures to get theirjobs done. For financial personnel to make useful forecastsand decisions, they must be willing and able to talk toindividuals in other areas of the firm. For example, whenconsidering a new product, the financial manager needs toobtain sales forecasts, pricing guidelines, and advertisingand promotion budget estimates from marketing personnel.
Organization of the finance function
The size and importance of the managerial function depend onthe size of the firm. In small firms, the finance function isgenerally performed by the accounting department. As a firmgrows, the finance function typically evolves into a separatedepartment linked directly to the company president or CEOthrough the chief finance officer (CFO).
Reporting to the CFO are the treasurer and the controller. Thetreasurers (the chief financial manager) is commonly responsiblefor handling financial activities, such as financial planning

3
and fund raising, making capital expenditure decisions,managing cash, managing credit activities, managing thepension fund, and managing foreign exchange. The controller (thechief accountant) typically handles the accounting activities,such as corporate accounting, tax management, financialaccounting, and cost accounting. The treasurer’s focus tendsto be more external, the controller’s focus more internal. Theactivities of the treasurer, or financial manager, are the primary concern of thissubject.
Relationship to Economics
The field of finance is closely related to economics.Financial manager must understand the economic framework andbe alert to the consequences of varying levels of economicactivity and changes in economic policy. They must also beable to use economic theories as guidelines for efficientbusiness operation. Examples include supply-and-demandanalysis, profit-maximizing strategies, and price theory.
Relationship to Accounting
The firm’s finance (treasurer) and accounting (controller)activities are closely related and generally overlap. Indeed,managerial finance and accounting are often not easilydistinguishable. In small firms the controller often carriesout the finance function, and in large firms many accountantsare closely involved in various finance activities. However,there are two basic differences between finance andaccounting; one is related to the emphasis on cash flows andthe other to decision making.
Emphasis on Cash Flows
The accountant’s primary function is to develop and reportdata for measuring the performance of the firm’s assess itsfinancial position, comply with and file reports required bysecurities regulators, and file and pay taxes. Using certainstandardized and generally accepted principles, the accountantprepares financial statements that recognize revenue at thetime of sale (whether payment has been received or not) andrecognize expenses when they are incurred. This approach isreferred to as the accrual basis.

4
The final manager, on the other hand places primary emphasison cash flows, the intake and outgo of cash. He or shemaintains the firm’s solvency by planning the cash flowsnecessary to satisfy its obligations and to acquire assetsneeded to achieve the firm’s goals. The financial manager usesthis cash basis to recognize the revenues and expenses onlywith respect to actual inflows and outflows cash. Regardlessof its profit or loss, a firm must have a sufficient flow of cash to meetits obligations as they come due.
Decision Making
The second major difference between finance and accounting hasto do with decision making. Accountants devote most of theirattention to the collection and presentation of financial data.Financial managers evaluate the accounting statements, developadditional data, and make decisions on the basis of theirassessment of the associated returns and risks. Of course,this does not mean that accountants never make decisions orthat financial manager never gather data. Rather, the primaryfocuses of accounting and finance are distinctively different.
Primary activities of the Financial Manager.
In addition to ongoing involvement in financial analysis andplanning, the financial manager’s primary activities aremaking investment decisions and making financing decisions.Investment decisions determine both the mix and the type ofassets held by the firm. Financing decisions determine boththe mix and the type of financing used by the firm. Thesesorts of decisions can be conveniently viewed in terms of thefirm’s balance sheet, as shown in the following figure.However, the decisions are actually made on the basis of theircash flow effects on the overall value of the firm.
Balance SheetMaking
Investmentdecisions
Current Assets CurrentLiabilities
MakingFinancingDecisions
Fixed Assets Long-termFunds

5
Financial Institutions and markets
Most successful firms have ongoing needs for funds. They canobtain funds from external sources in three ways. The firstsource is through a financial institution that accepts savings andtransfers them to those that need funds. A second source isthrough financial markets, organized forums in which thesuppliers and demanders of various types of funds can maketransactions. A third source is through private placement.Because of the unstructured nature of private placements, herewere focus primarily on the role of financial institutions andfinancial markets in facilitating business financing.
Financial Institutions
Financial institutions serve as intermediaries by channelingthe savings of individuals, business, and governments intoloans or investments. Many financial institutions directly orindirectly pay savers interest on deposited funds; otherprovides services for fee (for example, checking accounts forwhich customers pay service charges). Some financialinstitution accept customers’ savings deposits and lend thismoney to other customers or to firms; others invest customers’savings in earning assets such as real estate or stocks andbonds; and some do both. Financial institutions are requiredby the government to operate within established regulatoryguidelines.
Major Financial institutions
Major Financial Institutions in the U.S. economy arecommercial banks, savings and loans, credits unions, savingbanks, insurance companies, mutual funds, and pension fund.These institutions attract funds from individuals, businesses,and government, combine them, and make loans available toindividuals and businesses.
Financial Markets
Financial markets are forums in which suppliers of funds anddemanders of funds can transact business directly. Whereas theloans and investments of institutions are made without thedirect knowledge of the suppliers of funds (savers), suppliersin the financial markets know where their funds are being lentor invested. The two key financial markets are the money

6
market and the capital market. Transactions in short-term debtinstruments, or marketable securities, take place in the moneymarket. Long-term securities (bonds and stocks) are traded inthe capital market.
To raise money, firms can use either private placements orpublic offerings. Private placement involves the sale of a newsecurity issue, typically bonds or preferred stock, directlyto an investor or group of investors, such as an insurancecompany or pension fund. Most firms, however, raise moneythrough a public offering of securities, which is thenonexclusive sale of either bonds or stocks to the generalpublic.
The relationship between institutions and Markets
Financial institutions actively participate in the financialmarkets as both suppliers and demanders of funds. Theindividuals, businesses, and governments that supply anddemand funds may be domestic or foreign.
The Money Market
The money market is created by a financial relationshipbetween suppliers and demanders of short-term funds (fundswith maturities of one year or less). The money market existsbecause some individuals, businesses, governments, andfinancial institutions have temporarily idle funds that theywish to put to some interest-earnings use. At the same time,other individuals, businesses, governments, and financialinstitutions find themselves in need of seasonal or temporaryfinancing. The money market brings together these suppliersand demanders of short-term funds.
Most money market transactions are made in marketablesecurities (short term debt instrument, such as U.S. treasurybills, commercial paper, and negotiable certificates ofdeposit issued by government, business and financialinstitutions, respectively).
The Capital Market
The capital Market is a market that enables suppliers anddemanders of long-term funds to make transactions. Includedare securities issues of business of business and government.

7
The backbone of the capital market is formed by the broker anddealer markets that provide a forum for bond and stocktransactions.
Key Securities traded: Bonds and Stocks
The Key capital market securities are bonds (long-term debt)and both common stock and preferred stock (equity, or ownership).
Bonds are long-term debt instrument used by business andgovernment to raise large sums of money, generally from adiverse group of lenders. Corporate bonds typically pay interestsemiannually (every 6 months) at a stated coupon interest rate. Theyhave an initial maturity of from 10 to 30 years, and a par orface, value of $1,000 that must be repaid at maturity.
Example
Lakeview Industries, a major microprocessor manufacturing, hasissued a 9 percent coupon interest rate, 20-year bond with a$1,000 par value that pays interest semiannually. Investorswho buy this bond receive the contractual right to $90 annualinterest (9% coupon interest rate x $1,000 par value)distributed as $45 at the end of each 6 month (1/2x$90) for 20years, plus the $1,000 par value at the end of year 20.
As noted earlier, shares of common stock are units ofownership, or equity, in a corporation. Common stockholdersearn a return by receiving dividends (periodic distributionsof earnings) or by realizing increases in share price. Preferredstockholders are promised a fixed periodic dividend that mustbe paid prior to payment of any dividends to commonstockholders. In other words, preferred stock has “preference”over common stock.
Chapter 2
LONG-TERM INVESTMENT DECISIONS: CASH FLOWS IN CAPITALBUDGETING
Capital budgeting decisions

8
Long-term investment represents sizable outlays of funds thatcommit a firm to some course of action. Consequently, the firmneeds procedures to analyze and properly select its long-terminvestments. It must be able to measure cash flows and applyappropriate decision techniques. As time passes, fixed assetsmay become absolute or may require an overhaul; At thesepoints, too, financial decisions may be required. Capitalbudgeting is the process of evaluating and selecting long-terminvestments that are consistent with the firm’s goal ofmaximizing owner wealth. Firms typically make a variety oflong-term investments, but the most common for themanufacturing firm is in fixed assets, which include property(land), plant, and equipment. These assets, often referred toas earning assets, generally provide the basis for the firm’searning power and value.
Motives for Capital Expenditure
A capital Expenditure is an outlay of funds by the firm that isexpected to produce benefits over a period of time greaterthan 1 year. An operating expenditure is an outlay resulting inbenefits received within 1 year. Fixed-asset outlays arecapital expenditures, but not all capital expenditures areclassified as fixed assets. A $60,000 outlays for a newmachine with a usable life of 15 years is a capitalexpenditure that would appear as fixed asset on the firm’sbalance sheet. A $60,000 outlay for an advertising campaignthat is expected to produce benefits over a long period isalso a capital expenditure, but would rarely be shown as afixed asset.
Companies make capital expenditures for many reasons. Thebasic motives for capital expenditures are to expandoperations, replace or renew fixed assets, or to obtain someother, less tangible benefit over a long period.
Basic Terminology
Independent versus mutually exclusive projects

9
The two most common types of projects are (1) independentprojects and (2) mutually exclusive projects. Independentsprojects are those whose cash flows are unrelated orindependent of one another; the acceptance of one does noteliminate the others from further consideration. Mutuallyexclusive projects are those that have the same function andtherefore compete with one another. The acceptance of oneeliminates from further consideration all other projects thatserve a similar function.
Unlimited funds versus Capital rationing
The availability of funds for capital expenditures affects thefirm’s decisions. If a firm has unlimited funds forinvestment, making capital budgeting decisions is quitesimple. All independent projects that will provide anacceptable return can be accepted. Typically, though, firmsoperate under capital rationing instead. This means that theyhave only a fixed number of dollars available for capitalexpenditures and that numerous projects will compete for thesedollars.
Accept-Reject versus Ranking Approaches
Two basic approaches to capital budgeting decisions areavailable. The acceptance-reject approaches involve evaluatingcapital expenditure proposal to determine whether they meetthe firm’s minimum acceptance criterion. This approach can beused when the firm has unlimited funds, as a preliminary stepwhen evaluating mutually exclusive projects, or in a situationin which capital must be rationed. In these cases, onlyacceptable projects should be considered.
The second method, the ranking approach, involves rankingprojects on the basis of some predetermined measure, such asthe rate of return. The project with the highest return isranked first, and the project with the lowest return is rankedlast. Only acceptable projects should be ranked. Ranking isuseful in selecting the “best” of a group of mutually

10
exclusive projects and in evaluating projects with a view tocapital rationing.
Conventional versus nonconventional cash flow patterns
Cash flow patterns associated with capital investment projectscan be classified as conventional or nonconventional. Aconventional cash flow pattern consists of an initial outflowfollowed only by a series of inflows.
A nonconventional cash flow pattern is one in which an initialoutflow is followed by a series of inflows and outflows.
Relevant cash flows
To evaluate capital expenditure alternatives, the firm mustdetermine the relevant cash flows. These are the incremental cashoutflow (investment) and resulting subsequent inflows. The Incrementalcash flows represent the additional cash flows (outflows orinflows) expected to resulting from a proposed capitalexpenditure. Cash flows are used because they affect directlythe firm’s ability to pay bills and purchase assets.
Major Cash Flow Components
The cash flows of any project having the conventional patterncan include three basic components: (1) an initial investment,(2) operating cash inflows, and (3) terminal cash flow. Allprojects whether for expansion, replacement or renewal or someother purpose have the first components. Some, however, lackthe final component, terminal cash flow.
The following table of cash flow components depicts on timeline the cash flows for a project. The initial investment forthe proposed project is $ 50,000. This is the relevant cashoutflow at zero. The operating cash flows, which are theincremental after-tax cash inflows resulting fromimplementation of the project during its life, graduallyincrease from $4,000 in its first year to $10,000 in its tenthand final year. The terminal cash flow is the after-tax no

11
operating cash flow occurring in the final year of theproject. It is usually attributed to liquidation of theproject. In this case it is $25,000, received at the end ofthe project’s 10 years life. Note that the terminal cash flowdoes not include the $10,000 operating cash inflow for years10.
Cash flow components
Initial Investment 50,000
Operating cash inflows 1
4,000
Operating cash inflows 2
5,000
Operating cash inflows 3
6,000
Operating cash inflows 4
7,000
Operating cash inflows 5
7,000
Operating cash inflows 6
8,000
Operating cash inflows 7
8,000
Operating cash inflows 8
8,000
Operating cash inflows 9
9,000
Operating cash inflows 10
10,000
Terminal Cash flow 25,000
Expansion versus replacement Decisions
Developing relevant cash flow estimates is moststraightforward in the case of expansion decisions. In thiscase, the initial investment, operating cash inflows, andterminal cash flow are merely the after-tax cash outflow andinflows associated with the proposed capital expenditure.
Indentifying relevant cash flows for replacement decisions ismore complicated, because the firm must identify theincremental cash outflow and inflows that would result from

12
the proposed replacement. The initial investment in the case ofreplacement is the difference between the initial investment needed to acquirethe new asset and any after-tax cash inflows expected from liquidation of theold asset. The operating cash inflows are the difference betweenthe operating cash inflows from the new asset and those fromthe old asset.
Actually, all capital budgeting decisions can be viewed asreplacement decisions. Expansions decisions are merelyreplacement decisions in which all cash flows from the oldasset are zero. In light of this fact, this chapter focusesprimarily on replacement decisions.
Initial Investment =
Initial Investment to acquire new asset -
After tax cash inflows from liquidation of old asset
OperatingCash Flow =
Operating Cash inflows from new asset -
Operating cash inflows from old asset
Terminal cash flow =
After tax cash flows fromtermination of new asset -
After tax cash flows from termination of old asset
Sunk Cost : Cash outlays that have already been made (pastoutlays) and therefore have no effect on the cash flowsrelevant to a current decision.
Opportunity costs : Cash flows that could be realized fromthe best alternative use of an owned asset.
Example:
Jankwow Equipment is considering renewing its drill press X12,which it purchased 3 years earlier for $237,000, byretrofitting it with the computerized control system from anobsolete piece of equipment it owns. The obsolete equipmentcould be sold today for a high bid of $42,000, but without itscomputerized control system, it would be worth nothing. Jankowis in the process of estimating the labor and materials costsof retrofitting the system to drill press X12 and the benefitsexpected from the retrofit. The $237,000 cost of drill pressX12 is a sunk cost because it represents an earlier cashoutlay. It would not be included as a cash outflow when

13
determining the cash flows relevant to the retrofit decision.Although Jankow owns the obsolete piece of equipment, theproposed use of its computerized control system represents anopportunity cost of $42,000 (the highest it would be soldtoday).
Finding the initial Investment
The term initial investment as used here refers to therelevant cash outflows to be considered when evaluating aprospective capital expenditure.
The basic format for Determining initial investment
Installed cost of new asset (= cost of new assets + Installingcosts) −¿ after-tax proceeds from sale of old asset (=proceeds from sale of old asset ± tax on sale of old asset) ±change in net working capital = Initial investment
Or
Installed cost of new asset −¿ after-tax proceeds from sale ofold asset ± change in net working capital = Initial investment
Book Value
The book value of an asset is its strict accounting value. Itcan be calculated by using the following equation.
Book value = Installed cost of asset – accumulateddepreciation
Example
Hudson industries, a small electrics company, 2years agoacquired a machine tool with an installed cost of $100,000.The asset was being depreciated under Modified Accelerated

14
Cost Recovery system (MACRS) using a 5-years recovery period.If under MACRS for a 5-years recovery period, 20% and 32% ofthe installed cost would be depreciated in years 1 and 2,respectively, In other words, 52% (20% + 32%) of the $100,000cost, or $52,000 (0.52 x $100,000), would represent theaccumulated depreciation at the end of year 2.
Book value = $100,000 - $52,000 = $48,000
Changes in Net Working Capital
Net working capital is the amount by which a firm’s currentassets exceeds its current liabilities. If a firm acquires newmachinery to expand its level of operations, it willexperience an increase in levels of cash, accounts receivable,inventories, account payable, and accruals.
The difference between the change in current assets and thechange in current liabilities is the change in net workingcapitals.
Example
Danson Company, a metal products manufacturer, iscontemplating expanding its operations. Financial analystsexpect that the changes in current accounts summarized in thefollowing table will occur and will be maintained over thelife of the expansion. Current asset are expected to increaseby $22,000, and current liabilities are expected to increaseby $9,000, resulting in a $13,000 increase in net workingcapital. In this case, the change will represent an increasednet working capital investment and will be treated as a cashoutflow in calculating the initial investment
Calculation of change in net Working Capital for DansonCompany
Current Account Change in balanceCash +$4,000Account Receivable +1,000Inventory +

15
17,000
(1) Current assets +22,000
Account Payable +
7,000
Accruals +
2,000
(2) Current Liabilities
+9,000Change in net Working Capital (1) -(2)
+13,000
Calculating the initial Investment
A variety of tax and other considerations enter into theinitial investment calculation.
Powell Corporation, a large, diversified manufacturer ofaircraft components, is trying to determine the initialinvestment required to replace an old machine with a new, moresophisticated model. The proposed machine’s purchase price is$380,000, and an additional $20,000 will be necessary toinstall it. It will be depreciated under MACRS using a 5-yearsrecovery period. The present (old) machine was purchased 3years ago at a cost of $240,000 and was being depreciatedunder MACRS using a 5 years recovery period. The firm hasfound a buyer willing to pay $280,000 for the present machineand to remove it at the buyer’s expense. The firm expects thata $35,000 increase in current assets and an $18,000 increasein current liabilities will accompany the replacement; thesechanges will result in a $17,000 ($35,000-18,000) increase innet working capital. The firm pays taxes at a rate of 40%.
The only component of the initial investment calculation thatis difficult to obtain is taxes. The book value of the presentmachine can be found by using the depreciation percentage(from the table which is shown below) of 20%, 32% and 19% foryears 1, 2, and 3, representatively. The resulting book valueis $69,600 ($240,000 −⦋ (0.20+0.32+0.19 )X$20,000 ⦌¿. a gain of

16
$210, 400 ($280,000 - $69,600) is realized on the sale. Thetotal taxes on the gain are $84,160(0.40 x $210,400). Thesetaxes must be subtracted from the b$280,000 sale price of thepresent machine to calculate the after-tax proceeds from itssale.
Substituting the relevant amounts into the formats inpresented before, results in an initial investment of$221,160, which represents the net cash outflow required attime zero.
Installed cost of proposed machine
Cost of proposed machine380,000
+ installation20,000
Total installed cost -proposed (depreciable Value
400,000
−¿After-tax proceeds from sale of present machine Proceeds from sale of present machine
280,000
−¿Tax on sale of present machine
-84,160
Total after-tax proceeds - present
195,840
+¿Changes in net working capital17,00
0
Initial Investment$221,160
Rounded Depreciation Percentage by Recovery Year Using MACRSfor first four property classes
Percentage by recovery years
Recovery year3 year
5 years
7 years 10 years
1 33% 20% 14% 10%2 45% 32% 25% 18%3 7% 19% 18% 14%4 12% 12% 12%

17
5 12% 9% 9%6 5% 9% 8%7 9% 7%8 4% 6%9 6%10 6%11 4%
Total 100% 100% 100% 100%
ASSIGNMENTS
To determine Book value, taxes and initial investment
Irvin Enterprise is considering the purchase of a new piece ofequipment to replace the current equipment. The new equipmentcosts $75,000 and requires $5,000 in installing costs. It willbe depreciated under MACRS using a 5 years recovery period.The old piece of equipment was purchased 4 years ago for aninstalled cost of $50,000; it was being depreciated underMACRS using a 5-year recovery period. The old equipment can besol today for $55,000 net of any removal or cleanup cost. As aresult of the proposed replacement, the firm’s investment innet working capital is expected to increase by $15,000. Thefirm pays taxes at a rate of 40% (the above table contains theapplicable MACRS depreciation percentage).
a. Calculate the book value of the old piece of equipmentb. Determine the taxes, if any, attributable to the sale of
the old equipment.c. Find the initial investment associated with the proposed
equipment replacement.
Determining Relevant Cash flows
A machine currently in use was originally purchased 2 yearsago for $40,000. The machine is being depreciated under MACRSusing a 5-years recovery period; it has 3 years of usable liferemaining. The current machine can be sold today to net$42,000 after removal and cleanup costs. A new machine, usinga 3 years MACRS recovery period, can be purchased at a price

18
of $140,000. It requires $10,000 to install and has a 3-yearsusable life. If the new machine is acquired, the investment iaaccounts receivable will be expected to rise by $10,000, theinventory investment will increase by $25,000, and accountspayable will increase by $15,000. Earnings beforedepreciation, interest, and taxes are expected to be $70,000for each of the next 3 years with the old machine and to be$120,000 in the first year and $130,000 in the second andthrird years with the new machine. At the end of 3 years, themarket value of the old machine will equal zero, but the newmachine could be sold to net $35,000 before taxes. The firm issubject to a 40% tax rate (the above table contains applicableMCARS depreciation percentage).
a. Determine the initial investment associated with theproposed replacement decision
b. Calculate the incremental operating cash flows c. Calculate the terminal cash flow associated with the
proposed replacement decision. (note this is at the endof year 3)
d. Depict on a time line the relevant cash flows found inparts a, b, and c that are associated with the proposedreplacement decision, assuming that it is terminated atthe end of year 3.
Change in Working Capital
Samuel manufacturing is considering the purchase of a newmachine to replace one it believes is obsolete. The firm hastotal current assets of $920,000 and total current liabilitiesof $640,000. As a result of the proposed replacement, thefollowing changes are anticipated in the levels of the currentasset and current liability accounts noted.
Account Change
Accruals
+$ 40,000Marketable securities
0
Inventories

19
-10,000Account payables
+ 90,000
Note payables 0
Account receivable
+150,000
Cash
+15,000
a. Using the information given, calculated any change in networking capital that is expected to result from theproposed replacement action.
b. Explain why a change in the current accounts would berelevant in determining the initial investment for theproposed capital expenditure.
c. Would the change in net working capital enter into any ofthe other cash flow components that make up the relevantcash flow? Explain.
Chapter 3
TECHNIQUES OF CAPITAL BUDGETING
1. Overview of Capital Budgeting Techniques
When firms have developed relevant cash flows as demonstratedin previous chapter they analyze them to assess whether aproject is acceptable or to rank projects. A number oftechniques are available for performing such analysis. Thepreferred approaches integrate time value procedures, risk andreturn considerations, and valuation concepts to selectcapital expenditures that are consistent with the firm’s goalof maximizing owner’s wealth. This chapter focuses on the useof these techniques in an environment of certainty.
Bennett Company’s Relevant Cash Flows

20
We will use one basic problem to illustrate all the techniquesdescribed in this chapter. The problem concerns BennetCompany, a medium-sized metal fabricator that is currentlycontemplating two projects: Project A requires an initialinvestment of $42,000; Project B requires an initialinvestment of $45,000. The Projected relevant cash flows forthe two projects are presented in the table below and depictedon the time lines in figure below. The projects exhibitconventional cash flow patterns, which are assumed throughout thetext. In addition, we initially assume that all projects’ cashflows have the same level of risk, that projects beingcompared have equal usable lives, and that the firm hasunlimited funds. We begin with a look at the three mostpopular capital budgeting techniques: payback period, netpresent value, and internal rate of return.
Capital Expenditure Data for Bennett Company
Project A Project BInitial
Investment $42,000 $45,000
YearOperating Cash
InflowsOperating Cash
Inflows1 $14,000 $28,0002 $14,000 $12,0003 $14,000 $10,0004 $14,000 $10,0005 $14,000 $10,000
2. Payback Period
Payback periods are commonly used to evaluate proposedinvestment. The payback period is the amount of timerequired for the firm to cover its initial investment in aproject, as calculated from cash inflows. In the case of anannuity, the payback period can be found by dividing theinitial investment by the annual cash inflow. For a mixedstream of cash inflows, the yearly cash inflows must beaccumulated until the initial investment is recovered.

21
Although popular, the pay-back period is generally viewed asan unsophisticated capital budgeting technique, because it does notexplicitly consider the time value of money.
Decision Criteria
When the payback period is used to make accept-rejectdecisions, the following decisions criteria apply.
If the payback period is less than the maximumacceptable payback period, accept the project.
If the payback period is greater than the maximumacceptable payback period, reject the project.
3. Net Present Values (NPV)
Because Net Present Value (NPV) gives explicit consideration tothe time value of money, it is considered a sophisticated capitalbudgeting technique. All such techniques in one way or anotherdiscount the firm’s cash flows at a specified rate. This rateoften called the discount rate, required return, cost of capital, oropportunity cost is the minimum return that must be earned on aproject to leave the firm’s mark value unchanged. In thischapter, we take this rate as a “given”.
The net present value (NPV) is found by subtracting aproject’s initial investment (CF0) From the present value ofits cash inflows (CFt) discounted at a rate equal to thefirm’s cost of capital (r).
NPV = Present Value of Cash inflows – Initial Investment
NPV = ∑t=i
n CFt(1+r)t
−CF0
= ∑t=i
n(CF1xPVIFr,t )−CF0
When NPV is used, both inflows and outflows are measured interms of present dollars. Because we are dealing only with

22
investments that have conventional cash flow patterns, theinitial investment is automatically stated in terms of today’sdollars. If it were not, the present value of a project wouldbe found by subtracting the present value of outflows from thepresent value of inflows.
Decision Criteria
When NPV is used to make accept-reject decisions, the decisioncriteria are as follows:
If the NPV is greater than $0, accept the project. If the NPV is less than $0, reject the project.
If the NPV is greater than $0, the firm will earn a returngreater than its costs of capital. Such action should increasein the market value of the firm, and therefore the wealth ofits owners by an amount equal to the NPV.
We can illustrate the net present value (NPV) approach byusing the Bennett Company data presented in above table. Ifthe firm has a 10% cost of capital, the net present values forprojects A (an annuity) and B (a mixed stream) can becalculated as shown below. These calculations result in netpresent values for a project A and B of $11,071 and $10,924,respectively. Both projects are acceptable, because the netpresent value of each is greater than $0. If the projects werebeing ranked, however, project A would be considered superiorto B, because it has a higher net present value than that of B($11,071 versus $10,924)
Years Project A Project B
0 -42,000 -45,0001 $14,000 $28,0002 $14,000 $12,0003 $14,000 $10,0004 $14,000 $10,0005 $14,000 $10,000
NPV $11,071 10,924

23
MORE EXPLANATION ABOUT NPV
When a business invest in a new plant asset, it expects theinvestment to produce a stream of future net Cash flows.Normally, a business should not invest unless the expectedcash flows are sufficient to return the amount of theinvestment plus a satisfactory return on the investment. Forexample, assume that the cash flows from Murray Company’sinvestment will be received at the end of each year. Will theinvestment in the machine return the amount of the investmentplus a satisfactory return? If Murray Company considers a 12%compounded annual return a satisfactory return on its capitalinvestments, it can answer this question with the calculationsof below illustration.
To purchase the machine, Murray Company must invest $16,000.However, from the sale of the machine’s product the companyexpects to receive net cash flows of $4,100 each year foreight years. The first column of below illustration indicatesthat the net cash flows of the first year are received oneyear hence, and so forth for the years thereafter. This meansthat the net cash flows are received at the end of the year.
Years HenceNet Cash
Flows
PresentValue of $1
at 12%
Present Valueof Net Cash
Flows1 $4,100 0. 8929 $3,6672 $4,100 0.7972 3,2693 $4,100 0.7118 2,9184 $4,100 0.6355 2605.555 $4,100 0.5674 2326.346 $4,100 0.5066 2077.067 $4,100 0.4523 1854.43

24
8 $4,100 0.4039 1655.99Total Present Value $20,373Amount tobe invested 16,000Positive net
present value 4,373
Therefore, if Murray Company considers a 12% compounded returnsatisfactory, this machine will recover its requiredinvestment, plus a 12% compounded return, and $4,367 inaddition.
Shortening the Calculation
Use table of Present Value of an annuity of 1 per period.
Cash Flows Not Uniform
Years Hence
Annual Cash Flow Project A ($)
Annual cash Flow ProjectB ($)
Annual Cash flow Project C ($)
1 5,000 8,000 1,0002 5,000 5,000 5,0003 5,000 2,000 9,000
15,000 15,000 15,000
Comparing net present values of projects when the timing ofcash flows differ.
Years Hence
PV of cash Flows Discounted at10% Project A($)
PV of cash Flows Discounted at10% Project B($)
PV of cash Flows Discounted at 10%Project C ($)
1 4,546 7,273 $9092 4,132 4,132 4,1323 3,756 1,503 6,762
Total Values 11,803

25
Present 12,434 12,908Required
Investment 12,000
12,000 12,000
Net Present
Values +434
+908 -197
Note that all the three projects produce the same total cashflow. However, the flows of Project A are uniform; those ofProject B are greater in the earlier years, while those ofproject C are greater in the later years.
Project B is better than project A. Project C should berejected.
Internal rate of return
The internal rate of Return (IRR) is probably the most widelyused sophisticated capital budgeting technique. However, it isconsiderably more difficult than NPV to calculate by hand. Theinternal rate of return (IRR) is the discount rate thatequates the NPV of an investment opportunity with $0 (becausethe present value of cash inflow equals the initialinvestment) It is the compounded annual rate of return thatthe firm will earn if it invests in the project and receivesthe given cash inflows. Mathematically, thr IRR is the valueof r in equation below that causes NPV to equal $0.
$0 = ∑i=1
n CFt(1+IRR)t
- CF0
∑i=1
n CFt(1+IRR)t
=CF0
Decision Criteria

26
When IRR is used to make accept-reject decisions, the decisioncriteria are as follows:
If the IRR is greater than the cost of capital , acceptthe project
If IRR is less than the cost of capital, reject theproject.
These criteria guarantee that the firm will earn at least itsrequired return. Such an outcome should increase the marketvalues of the firm and therefore the wealth of its owners.
Example is the Bennett Company data presented before asfollows.
Capital Expenditure Data for Bennett Company
Project A Project BInitial
Investment $42,000 $45,000
YearOperating Cash
InflowsOperating Cash
Inflows1 $14,000 $28,0002 $14,000 $12,0003 $14,000 $10,0004 $14,000 $10,0005 $14,000 $10,000
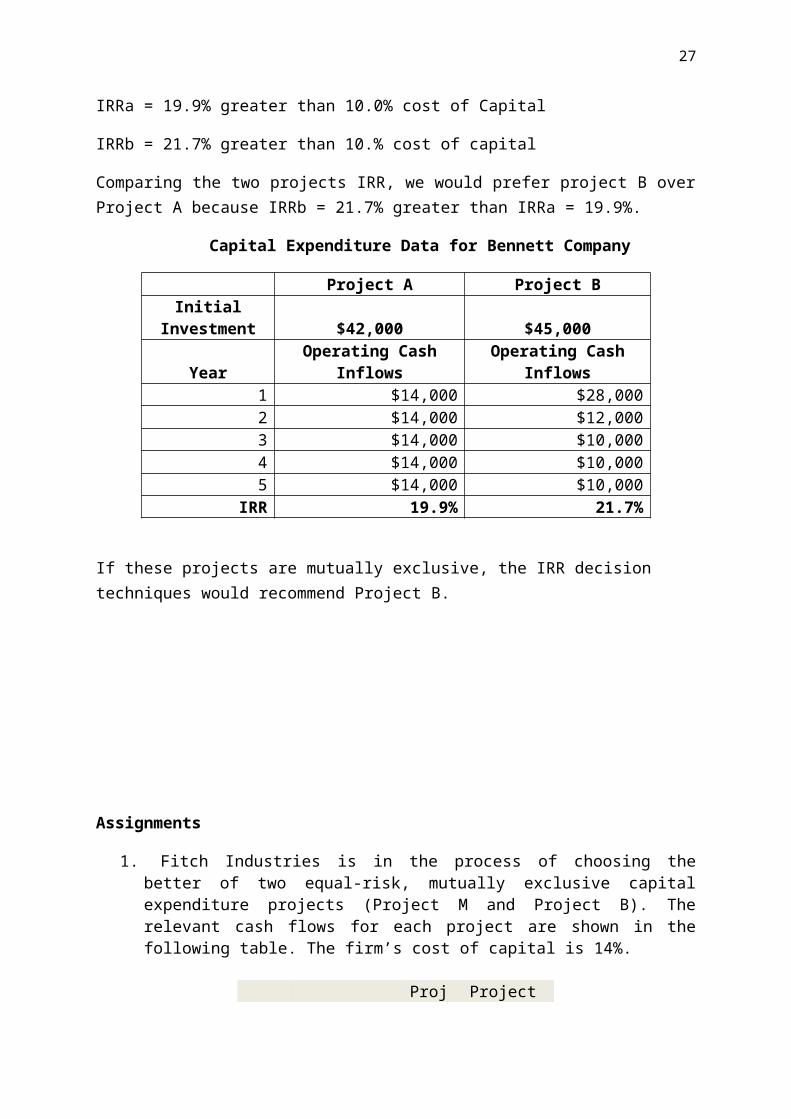
Comparing the IRRs of projects A and B given before to BenettCompany’s 10% cost of Capital, we can see that both projectsare acceptable because:
27
IRRa = 19.9% greater than 10.0% cost of Capital
IRRb = 21.7% greater than 10.% cost of capital
Comparing the two projects IRR, we would prefer project B overProject A because IRRb = 21.7% greater than IRRa = 19.9%.
Capital Expenditure Data for Bennett Company
Project A Project BInitial
Investment $42,000 $45,000
YearOperating Cash
InflowsOperating Cash
Inflows1 $14,000 $28,0002 $14,000 $12,0003 $14,000 $10,0004 $14,000 $10,0005 $14,000 $10,000
IRR 19.9% 21.7%
If these projects are mutually exclusive, the IRR decision techniques would recommend Project B.
Assignments
1. Fitch Industries is in the process of choosing thebetter of two equal-risk, mutually exclusive capitalexpenditure projects (Project M and Project B). Therelevant cash flows for each project are shown in thefollowing table. The firm’s cost of capital is 14%.
Proj Project

28
ect M N
InitialInvestment
$28,500 $27,000
Years (t)Cash inflows
(Cfi)
1$10,000 $11,000
210,000 10,000
310,000 9,000
410,000 8,000
Required
a. Calculate each project’s payback period and indicatethe best performing project.
b. Calculate the net present value (NPV) for each project,and indicate the best performing project.
c. Calculate the internal rate of return (IRR) for eachproject, and indicate the best performing project.
d. Summarize the preferences dictated by each measurer youcalculated, and indicate which project you wouldrecommend. Explain why.
e. Draw the net present value profiles for these projectson the same set of axes, and explain the circumstancesunder which a conflict in rankings might exist.
2. NPV, with ranking Botany Bay, Inc., a maker of casual clothing, is considering four projects, Because of past financial difficulties, the company has a high cost of capital at 15%. Which of these projects would be acceptable under those cost circumstances?
Project A
Project B
Project C
Project D
Initial investment (CF0)
$50,000
$100,000
$80,000
$180,000
Years

29
1
20,000
35,000
20,000
100,00
0
2
20,000
50,000
40,000
80,000
3
20,000
50,000
60,000
60,000
a. Calculate the NPV of each project, using a cost of capital of 15%
b. Rank acceptable projects by NPVc. Calculate the IRR of each project and use it to determine
the highest cost of capital at which all of the projects would be acceptable.
3. Project A and B, of equal risk, are alternatives for expanding Rosa Company’s capacity. The firm’s cost of capital is 13%. The cash flows for each project are shownin the following table
ProjectA Project B
InitialInvestment $80,000 $50,000Years (t) Cash inflows (Cfi)
1 $15,000 $15,0002 20,000 15,0003 25,000 15,0004 30,000 15,0005 35,000 15,000
Required
a. Calculate each project’s payback period and indicatethe best performing project.
b. Calculate the net present value (NPV) for each project,and indicate the best performing project.
c. Calculate the internal rate of return (IRR) for eachproject, and indicate the best performing project.

30
d. Summarize the preferences dictated by each measurer youcalculated, and indicate which project you wouldrecommend. Explain why.
4. Thomas Company is considering two mutually exclusiveprojects. The firm, which has a 12% cost of capital, hasestimated its cash flows as shown in the following table.
ProjectA Project B
InitialInvestment
$130,000 $85,000
Years (t) Cash inflows (Cfi)1 $25,000 $40,0002 35,000 35,0003 45,000 30,0004 50,000 10,0005 55,000 5,000
a. Calculate NPV of each project, and assess itsacceptability.
b. Calculate the IRR for each project, and assess itsacceptability.
c. Evaluate and discuss the rankings of the two projectson the basis of your findings in parts a, b, and c.
d. Explain your findings in part d in light of the patternof each inflow associated with each project.
Chapter 4
LONG-TERM FINANCIAL DECISIONS: THE COST OF CAPITAL
1.1 Overview of the cost of Capital
The cost of capital is the rate of return that a firm mustearn on the projects in which it invest to maintain themarket value of its stock. It can also be thought of as therate of return required by the market suppliers of capitalto attract their fund to the firm. If risk is held constant,projects with a rate of return above the cost of capitalwill increase the value of the firm, and projects with arate of return below the cost of capital will decrease thevalue of the firm.

31
Some Key Assumptions
The cost of capital is a dynamic concept affected by avariety of economic and firm-specific factors. To isolatethe basic structure of the cost of capital, we make some keyassumptions relative to risk and taxes:
Business risk: The risk to the firm of being unable tocover operating costs. It is assumed to be unchanged. Thisassumption means that the firm’s acceptance of a givenproject does not affect its ability to meet operatingcosts.
Financial risk. The risk to the firm of being unableto cover required financial obligations (interest,lease payments, preferred stock dividends). It isassumed to be unchanged. This assumption means thatprojects are financed in such a way that the firm’sability to meet required financing costs is unchanged.For an example of the effect that unexpected legalliabilities can have on the cost of capital.
After-tax costs are considered relevant. In otherwords, the cost of capital is measured on an after-tax basis. Thisassumption is consistent with the after framework usedto make capital budgeting decisions.
The Basic Concept
The cost of capital is estimated at a given point in time. Itreflects the expected average future cost of funds over thelong run. Although firms typically raise money in lumps, thecost of capital should reflect the interrelatedness offinancing activities. For example, if a firm raises fundswithin debt (borrowing) today, it is likely that some form ofequity, such as common stock, will have to be used the nexttime it needs funds. Most firms attempt to maintain a desiredoptimal mix of debt and equity financing. In practice, thismix is commonly a range, such as 40% to 50% debt, rather thana point, such as 55% debt. It is called a target capitalstructure.

32
To capture the interrelatedness of financing assuming thepresence of a target capital structure, we need to look at theoverall cost of capital rather than the cost of the specificsource of funds used to finance a given expenditure.
Example
A Firm is currently faced with an investment opportunity.Assume the following best project available today
Cost = $100,000 Life = 20 years
IRR = 7%
Cost of least-cost financing source available
Debt = 6%
Because it can earn 7% on the investment of funds costing only6%, the firm undertakes the opportunity, imagine that 1 weeklater a new investment opportunity is available:
Best project available 1 week later
Cost = $100,000 Life = 20 years
IRR = 12%
Cost of least-cost financing source available
Debt = 14%
In this instance, the firm rejects the opportunity, becausethe 14% financing cost is greater than the 12% expectedreturn.
Were the firm’s actions in the best interests of its owners?No; it accepted a project yielding a 7% return and rejected

33
one with a 12% return. Clearly, there should be a better way,and there is: The firm can use a combined cost, which over thelong run will yield better decisions. By weighting the cost ofeach source of financing by its target proportion in thefirm’s capital structure, the firm can obtain a weightedaverage cost that reflects the interrelationship of financingdecisions. Assuming that a 50-50 mix of debt and equity istargeted, the weighted average cost here would be 10%:⦋ (0.50x6%debt)+(0.50x14 %equity)⦌.
With this cost, the first opportunity would have been rejected(7% IRR <10% weighted average cost), and the second would havebeen accepted (12% IRR>10% weighted average cost). Such anoutcome would clearly be more desirable.
Specific Sources of Capital
There are four basic sources of long-term funds for thebusiness firm: Long-term debt, preferred stock, common stock,and retained earnings.
BalanceSheet
Current LiabilityLong term debtStockholders ‘equity
Assts Preferred Stock Common stockequity Common stock Retained earnings
N.B: This yellow color indicates the source of long-term funds

34
1.2 Cost of Long-Term Debt
The cost of long-term debt is the after-tax cost today ofraising long-term funds through borrowing. For convenience, wetypically assume that the funds are raised through the sale ofbonds. In addition we assume that the bond pay annualinterest.
Net Proceeds
Most corporate long-term debts are incurred through the saleof bonds. The net proceeds from the sale of bonds or anysecurity are the funds that are actually received from thesale. Flotation costs (the total costs of issuing and sellinga security) reduce the net proceeds from the sale. These costsapply to all public offerings of securities (debt, preferredstock, and common stock). They include two components: (1)underwriting costs (compensation earned by investment bankers forselling the security, and (2) administrative costs (issuerexpenses such as legal, accounting, printing, and otherexpenses.
Example
Duchess Corporation, a major hardware manufacturer, iscontemplating selling $10 million worth of 20-years, 9% coupon
(stated annual interest rate) bonds, each with a par value of$1,000. Because similar-risk bonds earn returns greater than9% the firm must sell the bonds for $980 to compensate for thelower coupon interest rate. The flotation costs are 2% of thepar value of the bond (0.02 x $1,000), or $20. The netprocedure to the firm from the sale of each bond are therefore$960 ($980-$20)
Before-Tax Cost of Debt
The before-tax cost of debt, (rd), for a bond can be obtainedin any of three ways: quotation, calculation, orapproximation.

35
Using Cost Quotations
When the net proceeds from sale of a bond equal its parvalue, the before-tax cost just equals the coupon interestrate. For example, a bond with a 10 percent coupon interestrate that nets proceeds equal to the bond’s $1,000 par valuewould have a before-tax cost, (rd), of 10 percent.
Calculating the cost
This approach finds the before-tax cost of debt by calculatingthe interest rate of return (IRR) on the bond cash flow. Fromthe issuer’s point of view, this value is the cost to maturityof the cash flows associated with the debt.
Example
In the preceding example, the net proceeds of a $1,000, 9%coupon interest rate, 20-year bond were found to be $960. Thecalculation of the annual cost is quite simple. The cash flowpattern is exactly the opposite of a conventional pattern; itconsists of an initial inflow (the net proceeds) followed by aseries of annual outlays (the interest payments). In the finalyear, when the debt is retired, an outlay representing therepayment of the principal also occurs. The cash flowsassociated with Duches Corporation’s bond issue are asfollows:
End of Year (s) Cash Flow
0 $ 9601-20 -$ 9020 -$1,000
The initial $960 inflow is followed by annual interestoutflows of $90(9% coupon interest rate x $1,000 par value)over the 20-year life of the bond. In year 20, an outflow of$1,000 (the repayment of the principal) occurs. We candetermine the cost of debt by finding the IRR, which is the
36
discount rate that equates the present value of the outflowsto the initial inflow.
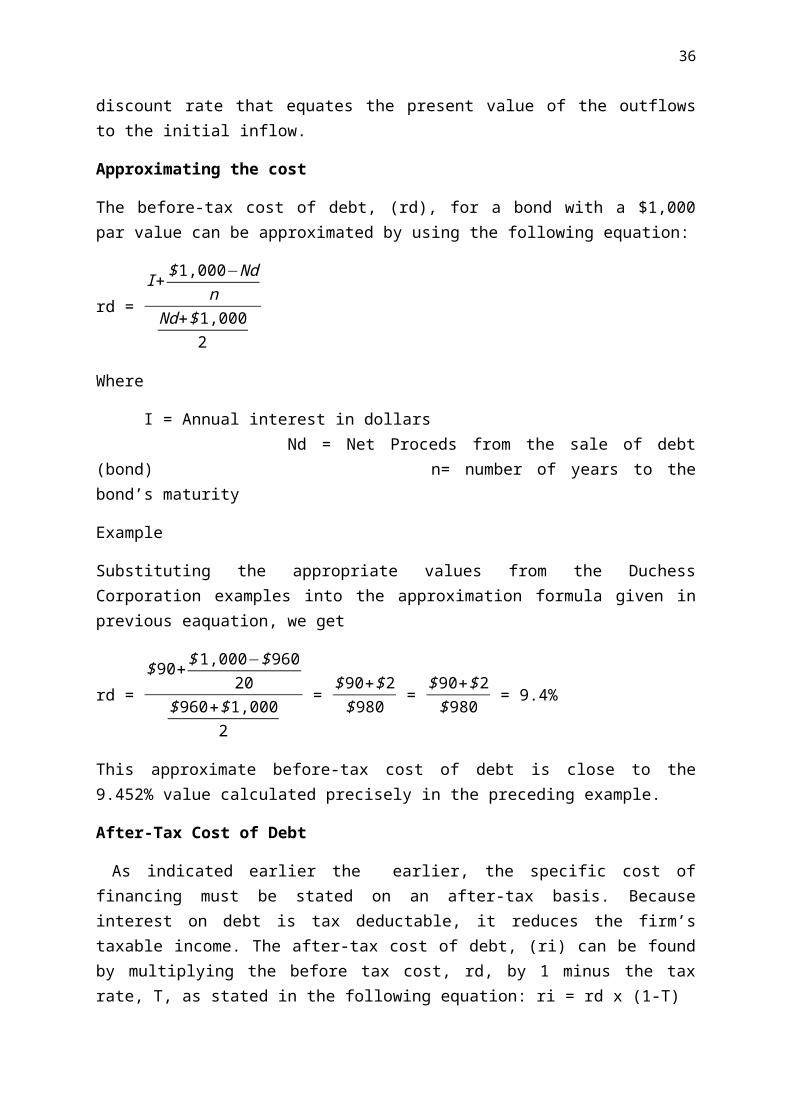
Approximating the cost
The before-tax cost of debt, (rd), for a bond with a $1,000par value can be approximated by using the following equation:
rd = I+
$1,000−Ndn
Nd+$1,0002
Where
I = Annual interest in dollarsNd = Net Proceds from the sale of debt
(bond) n= number of years to thebond’s maturity
Example
Substituting the appropriate values from the DuchessCorporation examples into the approximation formula given inprevious eaquation, we get
rd = $90+$1,000−$960
20$960+$1,000
2
= $90+$2$980 = $90+$2
$980 = 9.4%
This approximate before-tax cost of debt is close to the9.452% value calculated precisely in the preceding example.
After-Tax Cost of Debt
As indicated earlier the earlier, the specific cost offinancing must be stated on an after-tax basis. Becauseinterest on debt is tax deductable, it reduces the firm’staxable income. The after-tax cost of debt, (ri) can be foundby multiplying the before tax cost, rd, by 1 minus the taxrate, T, as stated in the following equation: ri = rd x (1-T)

37
Example
Duchess Corporation has a 40% tax rate. Using the 9.4% before-tax debt cost calculated above, and applying the aboveequation, we find an after-tax cost of debt of 5.6% ⦋(9.4% x(1-0.40)⦌. Typically, the cost of long-term debt is less than agiven firm’s cost of any of the alternative forms of long-termfinancing, primarily because of the tax deductibility ofinterest.
Cost of Preferred Stock
Calculating Cost of Preferred Stock
The cost of preferred stock,(rp), is the ratio of thepreferred stock dividend to the firm’s net proceds from thesale of the preferred stock. The net proceeds represent theamount of money to be received minus any flotation costs. Thefollowing Equation gives the cost of preferred stock, rp, interms of the annual dollar dividend, Dp, the net proceeds fromthe sale of the stock, Np:
Rp = DpNp
Because preferred stock dividends are paid out of the firm’safter-tax cash flows, a tax adjustment is not required.
Example
Duchess Corporation is contemplating issuing of a 10%preferred stock that is expected to sell for its $87-per-sharepar value. The cost of issuing and selling the stock isexpected to be $5 per share. The first step in finding thecost of the stock is to calculate the dollar amount of theannual preferred dividend, which is $8.70 (0.10 x $87). Thenet proceeds per share from the proposed sale of stock equalsdividend, (Dp), of $8.70 and the net proceeds, Np of $82 intoequation gives the cost of preferred stock, 10.6% ($8.7/$82).

38
The cost of Duchess‘s preferred stock (10.6%) is much greaterthan the cost of its long-term debt (5,6%). This differenceexists both because the cost of long-term debt (the interest)is tax deductable and because preferred stock is riskier thanlong-term debt.
Cost of Common Stock
The cost of common stock is the return required on the stockby investing in the marketplace. There are two forms of commonstock financing: (1) retained earnings and (2 ) new issues ofcommon stock. As a first step in finding each of these costs,we must estimate the cost of common stock equity.
Finding the cost of common stock equity
The cost of common stock equity, (rs) is the rate at whichinvestors discount the expected dividends of the firm todetermine its share value. Two techniques are used to measurethe cost of common stock equity. One relies on the constantgrowth valuation model, the other on the capital asset pricingmodel (CAPM).
Using the constant-Growth valuation (Gordon)Model
The model gives the value of shares of stock which is equal tothe present value of all future dividends, which in one modelwere assumed to grow at a constant annual rate over aninfinite time horizon.
This is the constant-growth valuation model, also known as theGordon model.
P0= D1rs−g
Where
P0 = Value of common stockD1 = per-share dividend expected at the end of
year 1 rs = Required return on common

39
stock g = constant rate ofgrowth in dividends
Solving the above equation for rs results in the followingexpression for the cost of common stock equity:
rs = D1P0 +g
This equation indicates that the cost of common stock equitycan be found by dividing the dividend expected at the end ofyear 1 by the current price of the stock (the “dividendyield”) and adding the expected growth rate (the “capital gainyield”). Because common stock dividends are paid from after-tax income no tax adjustment is required.
Example
Duchess Corporation wishes to determine its cost of commonstock equity, rs. The market price, Po, of its common stock is$50 per share. The firm expects to pay a dividend, D1, of $4at the end of the coming year, 2010. The dividends paid on theoutstanding stock over the past 6 years (2004-2009) were asfollows:
Year
Dividends
2009 $3.80
2008 3.62
2007 3.47
2006 3.33
2005 3.12
2004 2.97

40
Using a financial calculator, electronic spreadsheet, or thetable for the present value interest factors, PVIF table, inconjunction with the technique of finding growth rates, wecan calculate the annual growth rate of dividends, g. It turnsout to be approximately 5% (more precisely, it is 5.05%).Substituting D1 = $4, P0 = $50, and g = 5% into equationyields the cost of common stock equity:
Rs = $4$50
+0.05=0.08+0.05=0.130,∨13.0%
The 13% cost of common stock equity represents the returnrequired by existing shareholders on their investment. If theactual return is less than that shareholders are likely tobegin selling their stocks.
Using the capital asset pricing model (CAPM)
Capital asset pricing model (CAPM) describes the relationshipbetween the required return, rs, and the nondiversifiable riskof the firm as measured by the beta coeffificient, “b”. Thebasic CAPM is
rs=RF+ ⦋b×(rm−RF) ⦌
Where
RF = Risk free rate of returnrm = market return, return on market portfolio
of assets
Using CAPM indicates that the cost of common stock equity isthe return required by investors as competition for the firm’snondiversifiable risk, measured by beta.
Example
Duchess Corporation now wishes to calculate its cost of commonstock equity rs, by using the capital asset pricing model. Thefirm’s investment adivisors and its own analyses indicate that

41
the risk-free rate, RF, equals 7%, the firm’s beta b, equals1.5; and the market return, rm, equal 11%, substituting thesevalues into the equation:
rs= 7.0% +⦋1.5 x (11.0% - 7.0%)⦌ = 7.0% +6.0% = 13%
The 13% cost of common stock equity represent therequired return of investors in Duchess Corporationcommon stock. It is the same as that found by usingthe constant-growth valuation model.
Cost of Retained Earnings
As you know, dividends are paid out of a firm’searnings. Their payment, made in cash to commonstockholders, reduces the firm’s retained earnings.Suppose a firm needs common stock equity financing ofa certain amount. It has two choices relative toretained earnings: It can issue additional commonstock in that amount and still pay dividends tostockholders out of retailined earnings, or it canincrease common stock equity by retaining theearnings (not paying the cash dividends) in theneeded amount. In a strict accounting sense, theretention of earnings increases common stock equityin the same way that the sale of additional shares ofcommon stock does. Thus the cost of retainedearnings, rr, to the firm is the same as the cost ofan equivalent fully subscribed issue of additionalcommon stock. Stockholders find the firm’s retentionof earnings acceptable only if they expect that itwill earn at least their required return on thereinvested funds.

42
Viewing retained earnings as a fully subscribed issueof additional common stock, we can set the firm’scost of retained earnings, rr, equal to the cost ofcommon stock equity as given by equation of Gordonand CAPM.
rr=rs
It is not necessary to adjust the cost of retainedearnings for flotation costs, because by retainingearnings, the firm “raises” equity capital withoutincurring theses costs.
Example
The cost of retained earnings for Duchess Corporationwas actually calculated in the preceding examples: Itis equal to the cost of common stock equity. Thus rr
equals 13.0%. As we will show in the next section,the cost of retained earnings is always lower thanthe cost of a new issue of common stock, because itentails no flotation costs.
Assignments
1.Humble Manufacturing is interested inmeasuring its overall cost of capital. Thefirm is the 40% tax bracket. Currentinvestigation has gathered the followingdata.
a.Debt. The firm can raise an unlimited amountof debt by selling $1,000-par value, 10%

43
coupon interest rate, 10-year bonds on whichannual interest payments will be made. Tosell the issue, an average discount of $30per bond must be given. The firm must alsopay flotation costs of $20 per bond.
b.Preferred stock. The firm can sell 11%(annual dividend) preferred stock at its$100-per-share par value. The cost of issuingand selling the preferred stock is expectedto be $4 per share. An unlimited amount ofpreferred stock can be sold under theseterms.
c.Common stock. The firm’s common stock iscurrently selling for $80 per share. The firmexpress to pay cash dividends of $6per sharenext year. The firm’s dividends have beengrowing at an annual rate of 6%, and thisrate is expected to continue in the future.The stock will have to be underpriced by $4per share, and flotation costs are expectedto amount to $4 per share. The firm can sellan unlimited amount of new common stock underthese terms.
d.Retained earnings. The firm expects to have$225,000 of retained earnings available inthe coming year. One these retained earningsare exhausted, the firm will use new commonstock as the form of common stock equityfinancing.
Required:

44
Calculate the specific cost of each source offinancing. (round to the nearest 0.1%)
2.Taylor system has just preferred stock. Thestock has a 12% annual dividend and a $100per value and was sold at $97.50 per share.a.Calculate the cost of preferred stock.b.If the firm sells the preferred stock with
a 10% annual dividend and nets $90.00 afterflotation costs, what is its cost?
3.J&M corporation common stock has a beta, b,of 1.2. The risk-free rate is 6%, and themarket return is 11%.
Your are required Determine J&M’ s costof common stock equity using the CAPM
4.Taylor Systems has just issued preferredstock. The stock has a 12% annual dividendand a $100 par value and was sold at $97.50per share. In addition, flotation costs of$2.50 per share must be paid.
You are required to calculate the costof the preferred stock.
CHAPTER 5
FINANCIAL DIVIDEND POLICY
1.1. Dividend Fundamentals
Expected cash dividends are the key return variable from whichowners and investors determine share value. They represent asource of cash flow to stockholders and provide information

45
about the firm’s current and future performance. Becauseretained earnings, earnings not distributed to owners asdividends, are a form of internal financing, the dividenddecision can significantly affect the firm’s externalfinancing requirements. In other words, if the firm needsfinancing, the large the cash dividend paid, the greater theamount of financing it must raise externally through borrowingor through the sale of common or preferred stock. (Rememberthat although dividends are charged to retained earnings, theyare actually paid out of cash). The first thing to know aboutcash dividends is the procedures for paying them.
Cash Dividends Payment Procedures
At quarterly or semiannual meeting, a firm’s board ofdirectors decides whether and in what amount to pay cashdividends to corporate stockholders. The past period’sfinancial performance and future outlook, as well as recentdividends paid, are key inputs to dividends decisions. Thepayment date of the cash dividend, if one is declared, mustalso be established.
Amount of Dividends
Whether dividends should be paid, and if so, in what amount,are important decisions that depend primarily on the firm’sdividend policy. Most firms have a set policy with respect tothe periodic dividend, but the firm’s directors can changethis amount, largely on the basis of significant increases ordecreases in earnings.
Relevant Dates
If the directors of the firm declare a dividend, they also typically issue a statement indicating the dividend decision, the record date, and the payment date. This statement is generally quoted in the Wall Street Journal and other financial news media.
Record Date. Set by the firm’s directors, the date on which all persons whose names are recorded as stockholders receive a

46
declared dividend at specified future time. These stockholdersare often referred to as holder of record.
Because of the time needed to make bookkeeping entries when astock is traded, the stock begins selling ex dividend 2 businessdays prior to the date of record. Purchasers of a stock sellingex dividends do not receive the current dividend. A simple wayto determine the first days on which the stock sells exdividend is to subtract 2 days from the date of record; if aweekend intervenes, subtract 4 days. Ignoring general marketfluctuations, the stock’s price is expected to drop by theamount of the declared dividend on the ex dividend date.
Payment Date. The payment date, also set by the directors, isthe actual date on which the firm mails the dividend paymentto the holders of record. It is generally a few weeks afterthe recorded date. An example will clarify the various datesand the accounting effects.
Example
At the quarterly dividend meeting of Rudolf Company, adistributor of office products, held on June 10, the directorsdeclared a $0.80-per-share cash dividend for holders of recordon Friday, July 2. The firm had 100,000 shares of common stockoutstanding. The payment date for the dividend was Monday,August 2. Figure 1.1 shows a time line depicting the key datesrelative to the Rudolf Company’s dividend. Before the dividendwas declared, the key accounts of the firm were as follows:
Cash $200,000 Dividends payable $ 0 Retained Earnings 1,000,000
When the dividend was announced by the directors, $80,000 ofthe retained earnings ($0.80 per share x 100,000 shares) was transferred to the dividends payable account. The key accountsthus became
Cash $200,000 Dividends payable $ 80,000Retained Earnings 920, 000

47
Rudolf Company’s stock began selling ex dividend 2 businessdays prior to the date of record, which was Wednesday, June30. This date was found by subtracting 2 days from the July 2date of record. Purchasers of Rudolf’s stock on Tuesday, June29 or earlier received the rights to the dividends; those whopurchased the stock on or after June 30 did not. Assuming astable market, Rudolf’s stock price was expected to drop byapproximately $0.80 per share when it began selling exdividend on June 30. On August 2 the firm mailed dividendchecks to the holders of record as of July 2. This producedthe following balances in the key accounts of the firm:
Cash $120,000 Dividends payable $ 0Retained Earnings 920, 000
The net effect of declaring and paying the dividend was to reduce the firm’s total assets (and stockholders’ equity) by $80,000
Declaration Date Ex Dividend Date Date of RecordPayment Date
Thursday, June 10 Wednesday, June 30 Friday July, 2Monday August 2
________________________________________________________
Board of directors declares $0.80 per share dividend, payable to holders of record on Friday, July 2, payable onMonday, August 2
Stock begins to sell exdividend on Wednesday, June 30, which is 2 business days before the Friday, July 2, date of record
Checks of $0.80 per share are mailed on Monday, August 2, to all holders of record on Friday July 2.

48
TIME
Review Questions
Who are holders of record? When does a stock sell ex dividend?
1.2 Factors Affecting Dividend Policy
The firm’s dividend policy represents a plan of action to befollowed whenever it makes a dividend decision. Firm developpolicies consistent with their goals. Before we review some ofthe popular types of dividend policies, we discuss six factorsthat firms consider in establishing a dividend policy. Theyare legal constraints, Contractual constraints, internalconstraints, the firm’s growth prospects, ownerconsiderations, and market considerations.
Legal Constraints. Most states prohibits corporations frompaying out as cash dividends any portion of the firm’s “legalcapital” which is typically measured by the par value ofcommon stock. Other states define legal capital to include notonly the par value of the common stock, but also any paid-incapital in excess of par. These capital impairmentrestrictions are generally established to provide a sufficientequity base to protect creditors’ claims. An en example willclarify the differing definitions of capital.
ExampleThe stockholders’ equity account of Miller flour Company, alarge grain processor, is presented in the following tables:
Common Stock$100,0
00Paid in Capital in excessof par
200,000
Retained earnings140,00
0Total stockholders' equity
$440,000

49
In states where the firm’s legal capital is defined as the par value of its common stock, the firm could pay out $340,000($200,000 + $140,000) in cash dividends without impairing its capital, In states where the firm’s legal capital include all paid-in capital, the firm could pay out only 140,000 in cash dividend.
Firms sometimes impose an earnings requirement limiting the amount of dividends. With this restriction, the firm cannot pay more in cash dividend than the sum of its most recent and past retained earnings. However, the firm is not prohibited from paying more in dividends than its current earnings.
ExampleAssume that Miller Flour Company, from the preceding example,in the year just ended has $30,000 in earnings available forcommon stock dividends. As the preceding table indicates, thefirm has past retained earnings of $140,000. Thus it canlegally pay dividends of up to $170,000
Contractual Constraints. Often the firm’s ability to pay cashdividend is constrained by restrictive provisions in a loanagreement. Generally, these constraints prohibit the paymentof cash dividends until the firm achieves a certain level ofearnings, or they may limit dividends to certain dollar amountor percentage of earnings. Constraints on dividends help toprotect creditors from losses due to the firm’s insolvency.
Internal Constraints. The firm’s ability to pay cash dividendsis generally constrained by the amount of liquid assets (cashand marketable securities) available. Although it is possiblefor a firm to borrow funds to pay dividends, lenders aregenerally reluctant to make such loans because they produce notangible or operating benefits that will help the firm repaythe loan.
Growth Prospects. The firm’s financial requirements aredirectly related to how much it expects to grow and whatassets it will need to acquire.

50
Owner considerations. The firm must establish a policy thathas a favorable effect on the wealth of the majority ofowners. One consideration is the tax status of a firm’sowners. If a firm has a large percentage of wealthystockholders who have sizable incomes, it may decide to payout a lower percentage of its earnings to allow the owners todelay the payment of taxes until they sell the stock.
Market considerations. Awareness of the marker’s probableresponse to certain type of policies is also helpful informulating dividend policy.
1.3 Types of Dividend Policies
The firm’s dividend policy must be formulated with two basicobjectives in mind: providing for sufficient financing andmaximizing the wealth of the firm’s owners. Three commonlyused dividend policies are described in the followingsections. A particular firm’s cash dividend policy mayincorporate elements of each.
Constant-payout-Ration Divided Policy
One type of dividend policy involves use of a constant payoutratio. The dividend payout ratio indicates the percentage of each dollarearned that the firm distributes to the owners in the form of cash. It iscalculated by dividing the firm’s cash dividend per share by its earnings pershare. With a constant – payout –ratio dividend policy, thefirm establishes that a certain percentage of earnings is paidto owners in each dividend period.
Constant-payout-ratio dividend policy is a dividend policy based on thepayment of a certain percentage of earnings to owners in each dividendperiod.
The problem with this policy is that if the firm’s earningsdrop or if a loss occurs in a given period, the dividends maybe low or even nonexistent. Because dividends are oftenconsidered an indicator of the firm’s future condition andstatus, the firm’s stock price may be adversely affected.
Example

51
Peachtree Industries, a miner of potassium, has a policy ofpaying out 40% earnings in cash dividends. In periods when aloss occurs, the firm’s policy is to pay no cash dividends.Data on Peachtree’s earnings, dividends, and average stockprices for the past 6 years follow.
YearEarnings/Share($)
Dividends/share ($)
Average Price/Share ($)
2009 −¿0.50 0.00 422008 3.00 3.20 522007 1.75 0.70 482006 −¿1.50 0.00 382005 2.00 0.80 462004 4.50 1.80 50
Dividend increased in 2007 and in 2008 but decreased in theother years. In years of decreasing dividends, the firm’sstock price dropped; when dividends increased, the price ofthe stock increased. Peachtree’s sporadic dividend paymentsappear to make its owners uncertain about the return they canexpect.
Although some firms use a constant payout-ratio dividendpolicy, it is not recommended. Regular Dividend Policy
The regular dividend policy is based on the payment of afixed-dollar dividend in each period. This policy provides theowners with generally positive information, thereby minimizingtheir uncertainty. Often, firms that use this policy increasedthe regular dividend once a proven increase in earnings hasoccurred. Under this policy, dividends are almost neverdecreased.
Example

52
The dividend policy of Woodward Laboratories, a producer of apopular artificial sweetener, is to pay annual dividends of$1.00 per share until per-share earnings have exceeded $4.00for 3 consecutive years. At that point, the annual dividend israised to $1.50 per share, and a new earnings plateau isestablished. The firm does not anticipate decreasing itsdividend unless its liquidity is in jeopardy. Data forWoodward’s earnings, dividends, and average stock prices forthe past 12 years follow.
YearEarnings/Share
($)Dividends/share
($)Average
Price/Share ($)2009 4.50 1.50 47.502008 3.90 1.50 46.502007 4.60 1.50 45.002006 4.20 1.00 43.002005 5.00 1.00 42.002004 2.00 1.00 38.502003 6.00 1.00 38.002002 3.00 1.00 36.002001 0.75 1.00 33.002000 0.50 1.00 33.001999 2.70 1.00 33.501998 2.85 1.00 35.00
Whatever the level of earnings, Woodward laboratories paiddividends of $1.00 per share through 2006. In 2007, thedividend increased to $1.50 per share because earnings inexcess of $4.00 per share had been achieved for 3 years. In2007, the firm also had to establish a new earnings plateaufor further dividend increases. Woodward Laboratories’ averageprice per share exhibited a stable, increasing behavior inspite of a somewhat volatile pattern of earnings.
Often a Regular dividend policy is built around a targetdividend-payout ratio. Under this policy, the firm attemptsto pay out a certain percentage of earnings, but rather thanlet dividends fluctuate, it pays a stated dollar dividend andadjusts that dividend toward the target payout as provenearnings increases occur. For instance, Woodward Laboratories

53
appears to have a target payout ratio of around 35%. Thepayout was about 35 percent ($1.00÷$2.85) when the dividendpolicy was set in 1988, and when the dividend was raised to$1.50 in 2007, the payout ratio was about 33% ($1.50÷$4.60).
Low-Regular-and-Extra Dividend Policy
Some firms establish a Low-Regular-and-Extra Dividend Policy,paying a low regular dividend, supplemented by an additional(‘extra”) dividend when earnings are higher than normal; in agiven period. By calling the additional dividend an extradividend, the firm voids giving shareholders false hopes. Thispolicy is especially common among companies that experiencecyclical shifts in earnings.
By establishing a low regular dividend that is paid eachperiod, the firm gives investors the stable income necessaryto build confidence in the firm, and the extra dividendpermits them to share in the earnings from an especially goodperiod. Firms using this policy must raise the level of theregular dividend once proven increases in earnings have beenachieved. The extra dividend should not be a regular event;otherwise, it becomes meaningless. The use of target dividend-payout ratio in establishing the regular dividend level isadvisable.
Review Questions
Describe a constant-payout-ratio dividend policy, a regulardividend policy, and a low-regular-and-extra dividend policy.What are the effects of these policies?
1.4 Other Forms of Dividends
Dividends can be paid in forms other than cash. Here wediscuss two other methods of paying dividends (stock dividendsand stock repurchases) as well as a closely related topic,stock splits.
Stock Dividends

54
A stock dividend is the payment, to existing owners, of adividend in the form of stock. Often firms pay stock dividendsas a replacement for or a supplement to cash dividends.Although stock dividends do not have a real value,stockholders may perceive them to represent something they didnot have before.
Accounting Aspects. In an accounting sense, the payment ofstock dividend is a shifting of funds between stockholders’equity account rather than an outflow of funds. When a firmdeclares a stock dividend, the procedures for announcement anddistribution are the same as those described earlier for acash dividend. The accounting entries associated with thepayment of a stock dividend vary depending on its size. Asmall (ordinary) stock dividend is a stock dividend thatrepresents less than 20% to 25% of the common stockoutstanding when the dividend is declared; small stockdividends are most common.
ExampleThe current stockholders’ equity on the balance sheet ofGarrison Corporation, a distributor of prefabricated cabinets,is as shown in the following accounts.
Preferred stock$300,00
0Common stock (100,000 shares at $ 4 par) 400,000Paid-in capital in excess of par 600,000Retained earnings 700,000
Total stockholders’ equity$2,000,
000
Garrison, which has 100,000 shares of common stockoutstanding, declares a 10% stock dividend when the marketprice of its stock is $15 per share. Because 10,000 new shares(10% of 100,000) are issued at the prevailing market price of$15 per share, $150,000 ($15 per share x 10,000 shares) isshifted from retained earnings to the common stock and paid-incapital accounts. A total of $40,000 ($4 par x 10,000 shares)is added to common stock, and the remaining $110,000 [($15-$4)

55
x 10,000 shares] is added to the paid-in capital in excess ofpar. The resulting account balances are as follows:
Preferred stock$300,00
0Common stock (110,000 shares at $ 4 par) 440,000Paid-in capital in excess of par 710,000Retained earnings 550,000
Total stockholders’ equity$2,000,
000
The firm’s total stockholders’ equity has not changed; fundshave merely been shifted among stockholders’ equity accounts.
Stock Splits
Although not a type of dividend, stock splits have an effecton a firm’s share price similar to that of stock dividends. Astock split is a method commonly used to lower the marketprice of a firm’s stock by increasing the number of sharesbelonging to each shareholder. In a 2-for-1 split. Forexample, two new shares are exchanged for each old share, witheach new share being worth half the value of each old share. Astock split has no effect on the firm’s capital structure andis usually nontaxable.
Quite often, a firm believes that its stock is priced too highand that lowering the market price will enhance tradingactivity, Stock splits are often made prior to issuingadditional stock to enhance that stock’s marketability andstimulate market activity. It is not unusual for a stock splitto cause a slight increase in the market value of the stock,attributable to its informational content and to the fact thattotal dividends paid commonly increase slightly after a split.

56
Example
Delphi Company, a forest product concern, had 200,000 sharesof $2-par-value common stock and no preferred stockoutstanding. Because the stock is selling at a high marketprice, the firm has declared a 2-for-1 stock split. The totalbefore and after-split stockholders’ equity is shown in thefollowing table.
Before Split After 2-for-1 splitCommon stock (200,000 shares at $2 par)
$400,000
Common stock (400,000 sharesat $1 par
$400,000
paid -in capital in excess of par
4,000,000
paid -in capital in excess of par
4,000,000
Retained earnings2,000,00
0 Retained earnings2,000,00
0
Total stockholders’ equity
$6,400,00
0 Total stockholders’ equity$6,400,0
00
The insignificant effect of the stock split on the firm’sbooks is obvious.
Stock can be split in any way desired. Sometimes a reversestock split is made: The firm exchanges a certain number ofoutstanding shares for one new share. For example, in a 1-for-3 split, one new share is exchanged for three old shares.Reverse stock splits are initiated to raise the market priceof a firm’s stock when it is selling at too low a price toappear respectable.
Stock Repurchases viewed as a cash dividend
When firms repurchase common stock for retirement, theunderlying motive is to distribute excess cash to the owners.Generally, as long as earnings remain constant, the repurchasereduces the number of outstanding shares, raising the earningsper share and therefore the market price per share. Inaddition, an owner tax-deferral benefit may result. Therepurchase of common stock results in type of reverse dilution,because the EPS and the market price of stock are increased byreducing the number of shares outstanding. The net effect ofthe repurchase is similar to the payment of a cash dividend.

57
Example Benton Company, a national sportswear chain, has released thefollowing financial data:
Earnings available for common stockholders
$1,000,000
Number of shares of common stock outstanding 400,000Earnings per share ($1,000,000/400,000) $2.50Market price per share $50Price/earnings (P/E) ratio ($50/400) 20
The firm wants to use $800,000 of its earnings either to paycash dividend or to repurchase shares. If the firm paid cashdividends, the amount of the dividend would be $2 per share($800,000/400,000 shares). If the firm paid $52 per share torepurchase stock, it could repurchase approximately 15,385shares ($800,000 /$52 per share). As a result of thisrepurchase, 384,615 shares (400,000 shares – 15,385 shares) ofcommon stock would remain outstanding. Earnings per share(EPS) would rise to $2.60 ($1,000,000/384,615). If the stockstill sold at 20 times earnings (P/E = 20), its market pricecould be estimated by multiplying the new EPS by this P/Eratio (the price/earnings ratio). The price would thereforerise to $52 per share ($2.60 x 20). In both cases, thestockholders would receive $2 per share: a $2 cash dividend inthe dividend case or a $2 increase in shape price ($50 pershare to $52 per share) in the repurchase case.
Repurchase ProcessWhen a company intends to repurchase a block of outstandingshares, it should make shareholders aware of its intentions.Specifically, it should advise them of the purpose of therepurchase (acquisition, stock options, retirement) and thedisposition (if any) planned for the repurchased shares(traded for shares of another firm, distribution toexecutives, or held in the treasury).

58
Three basic methods of repurchase are common. One is topurchase shares on the open market. This places upward pressureon the price of shares if the number of shares beingrepurchased is reasonably large in comparison with the totalnumber outstanding. The second method is through tender offer. Atender offer is a formal offer to purchase a given number ofshares of a firm’s stock at a specific price. The price atwhich a tender offer is made is set above the current marketprice to attract sellers. If the number of shares desiredcannot be repurchased through the tender offer, firms canobtain the additional shares on the open market. Tender offersare preferred when large numbers of shares are repurchased,because the company’s intentions are clearly stated and eachstockholder has an opportunity to sell shares at the tenderedprice. A third method involves the purchase on a negotiated basis,of a large block of shares from one or more majorstockholders. Again, in this case, the firm has to state itsintentions and make certain that the purchase price is fairand equitable in view of the interests and opportunities ofthe remaining shareholders. Review Questions
1. Why do firms issue stock dividends? Comment on thefollowing statement: I have a stock the promises to pay a20% stock dividend every year, and therefore itguarantees that I will break even in 5 years.
2. Compare a Stock split with a stock dividend3. What is the logical behind repurchasing shares of common
stock to distribute excess cash to the firm’s owners?
Self – test Problem (Stock Repurchase)
The off-Shore steel Company has earnings available for commonstockholder of $2 million and has 500,000 shares of commonstock outstanding at $60 per share. The firm is currentlycontemplating the payment of $2 per share in cash dividends.
a. Calculate the firm’s current earnings per share (EPS) andprice/earnings (P?E) ratio.
b. If the firm can repurchase stock at $62 per share, howmany shares can be purchased in lieu of making theproposed cash dividend payment?

59
c. How much will the EPS be after the proposed repurchase?Why?
d. If the stock sells at the old P/E ratio, what will themarket price be after repurchase?
e. Compare and contrast the earnings per share before andafter the proposed repurchase.
f. Compare and contrast the stockholders’ position under thedividend and repurchase alternatives.
Solutiona. Earnings per share (EPS) =
$2,000,000earningsavailable500,000sharesofcommonoutstanding = $4.00/share
Price/Earnings (P/E) ration = $60marketprice$4.00 = 15
b. Proposed dividends = 500,000 shares ×$2pershare =$1,000,000
Shares that can be repurchased = $1,000,000$62=16,129shares
c. After proposed repurchase:Share outstanding = 500,000 – 16,129 = 483,871
EPS = $2,000,000483,871 = $4.13/share
d. Market price = $4.13/share x 15 = $61.95/sharee. The earnings per share (EPS) are higher after the
repurchase, because there are fewer shares of stockoutstanding (483,871) shares versus 500,000 shares) todivide up the firm’s $2,000,000 of available earnings.
f. In both cases, the stockholders would receive $2 pershare (a $2 cash dividend in the dividend case) or anapproximately $2 increase in share price ($60.00 pershare to $61.95 per share) in the repurchase case.
[Note: The difference of $0.05 per share ($2.00 - $1.95) difference is due torounding]
Assignments

60
1. Stephanie’s Cafes, Inc. has declared a dividend of $1.30per share for shareholders of record on Tuesday, May 2.The firm has 200,000 shares outstanding and will pay thedividend on May 24. How much cash will be needed to paythe dividend? When will the stock begin selling exdividend?
2. Ashkenazi Companies has the following stockholder’sequity account:
Common Stock (350,000 shares at $3 par $1,050,000Paid in Capital in excess of par 2,500,000Retained earnings 750,000Total stockholder'equity $4,300,000
Assuming that state laws define legal capital solely asthe par value of common stock, how much of a par-sharedividend can Ashkenewzi pay? If legal capital were morebroadly defined to include all paid-in capital, how muchof a per-share dividend can Ashkenazi pay?
3. The board of Kopi Industry is considered a new dividendpolicy that would set dividend at 60% of earnings. Therecent past has witnessed earnings per share (EPS) anddividend paid per share as follows:
year EPSDividend/share
2006 $1.75 $0.952007 1.95 1.202008 2.05 1.252009 2.25 1.30
Based on Kopi’s historical dividend payout ratio, discusswhether a constant payout ratio of 60% would benefitshareholders.
4. The current stockholders’ equity account for Hilo Farmsis as follows:

61
Common Stock (50,000 shares at $3 par) $150,000Paid in Capital in excess of par 250,000
Retained earnings7,450,00
0Total stockholders’ equity $850,000
Hilo has announced plans to issue an additional 5,000shares of common stock as part of its stock dividendplan. The current market price of Hilo’s common stock is$20 per share. Show how the proposed stock dividend wouldaffect the stockholder’s equity account.
CHAPTER 6
MANAGING WORKING CAPITAL AND CURRENT ASSETS
1. Net Working Capital
Current assets, commonly called working capital, represent theportion of investment that circulates from one form to anotherin the ordinary conduct of business. This idea embraces therecurring transactions from cash to inventories to receivablesand back to cash. As cash substitutes, marketable securities areconsidered part of working capital.
Current liabilities represent the firm’s short-term financing,because they include all debts of the firm that come due (mustbe paid) in 1 year or less. These debts usually includeamounts owed to suppliers (accounts payable), employees andgovernments (accruals), and banks (notes payable), amongothers.
Net Working Capital is commonly defined as the differencebetween the firm’s current assets and its current liabilities.When the current assets exceed the current liabilities, the

62
firm has positive net working capital. When current assets are lessthan current liabilities, the firm has negative net working capital.
The conversion of current assets from inventory to receivablesto cash provides the cash used to pay the current liabilities.The cash outlays for current liabilities are relativelypredictable. When an obligation is incurred, the firmgenerally knows when the corresponding payment will be due.What is difficult to predict are the cash inflows (theconversion of current assets to more liquid forms). The morepredicable its cash inflows, the less net working capital afirm needs. Because most firms are unable to march cashinflows to cash out flows with certainty, they usually needcurrent assets that more than cover outflows for currentliabilities. In general, the greater the margin by which afirm’s current assets cover its current liabilities, thebetter able it will be to pay its bills as they come due.
2. Inventory Management
The first component of the cash conversion cycle is theaverage age of inventory. The objective for managinginventory, as noted earlier, is to turn over inventory asquickly as possible without losing sales from stockouts. Thefinancial manager tends to act as an advisor or “watchdog” inmatters concerning inventory; he or she does not have directcontrol over inventory but does provide input to the inventorymanagement process.
Common Techniques for managing Inventory
Numerous techniques are available for effectively managing thefirm’s inventory. Here we briefly consider four commonly usedtechniques.
1. ABC System
A firm using the ABC inventory system divides its inventoryinto three groups A, B, and C. The A group includes thoseitems with the largest dollar investment. Typically, this

63
group consists of 20 % of the firm’s inventory items but 80 %of its investment in inventory. The B group consists of itemsthat account for the next largest investment in inventory. TheC group consists of a large number of items that require arelatively small investment.
The inventory group of each item determines the item’s levelof monitoring. The A group items receive the most intensemonitoring because of the high dollar investment. Typically, Agroup items are tracked on a perpetual inventory system thatallows daily verification of each item’s inventory level. Bgroup items are frequently controlled through periodic,perhaps weekly, checking of their levels. C group items aremonitored with unsophisticated techniques, such as the two-binmethod. With the two-bin method, the item is stored in twobins . As an item is needed, inventory is removed from thefirst bin. When that bin is empty, an order is placed torefill the first bin while inventory is drawn from the secondbin. The second bin is used until empty, and so on.
The large dollar investment in A and B group items suggeststhe need for a better method of inventory management than theABC system. The EOQ model, discussed next, is an appropriatemodel for the management of A and B group items.
Economic Order Quantity (EOQ) Model
One of the most common techniques for determining the optimalorder size for inventory items is the economic order quantiy(EOQ) model. THE EOQ model considers various costs ofinventory and then determines what order size minimizes totalinventory cost.
According to Praxedes (1990) the word inventory in businessmeans a detailed list of things in stock for a period of time.Proper management of inventory is necessary function of allbusiness operations. Skillful inventory management could meangreat savings for the company, and would maximize the

64
company’s profit. Most problems in inventory fall into one ofthe following categories:
A. The proper quantity (how much to order)B. The proper time to order the quantity. (when to order)
Proper inventory management should be maintained in order tobring down the total annual cost of inventory. There are twocosts involved in annual inventory: Ordering cost and thecarrying cost. Annual cost of inventory is the sum of theannual ordering cost and the annual carrying cost.
The proper quantity and the proper time to order should resultin the lowest annual cost.
Carrying Cost
Carrying Cost or holding cost increases as the size of theinventory increases. If the firm borrows money to finance theinventory, the interest on the money invested in the inventoryis a major contribution to the carrying cost. Storage cost isanother source of carrying cost which includes rent of space,heat, lights, refrigeration and wages of personal needed toprotect and keep records of the inventory. Other sourcesinclude taxes and deterioration of goods. Carrying cost isusually expressed on an annual basis as a percentage of theaverage annual inventory.
If the rate of inventory usage is constant, average inventory will behalf of the amount ordered.
Ordering Cost
Ordering costs include costs associated with getting an iteminto the firm’s inventory. Total ordering cost is composed ofpurchase order, shipping costs, receiving and setting up ofequipment. Ordering cost increases as the number of ordersincreases.
The Economic Order Quantity (EOQ)

65
To minimize the sum of ordering cost and carrying cost, wemust determine the proper quantity to order. The order sizethat minimizes the sum of ordering cost and carrying cost isknown as economic order quantity or EOQ.
There are two ways of finding the economic order quantity:
a. By the use of tables showing various lot sizes ofquantity orders.
b. By the use of the formula: EOQ =
√ 2 (annualinventory) (costperorder)¿
(Percentageofcarrying )(Perunitcost)¿
Example 1:
Margan Furniture requires 576,000 board feet of wood par year.The cost per delivery is $112, no matter how much wood isordered. The company pays $ 0.70 per board foot of wood. It isestimated that the carrying cost is 18% of the inventory. Findthe ordering cost, carrying cost, and the optimum annual costof inventory.
Determining the Ordering Cost and Carrying Cost
a. Ordering Cost = Number of orders per year times cost perorder.If the Margan Furnitures places its order twice a year at$112 per order, annual ordering cost = 2 x 112 = $224
b. Carrying Cost = average inventory cost times percentageof carrying cost. If the company decides to order 3 times a year (that is
567,000/3 = 192,000) Carrying cost = (192,000 )(0.70)
2 x 0.18
= 12,095
Average inventory cost is obtained by multiplying the averageorder quantity by the cost per unit. Since the company decides

66
to order 3 times a year in the above illustration, then
average order quantity is 192,0002
Suppose that the company wants to make a study on the numberof orders to make par year and the proper quantity to order byusing tables of various lot sizes:
Order Qty in bd ft
Number of order/yr
Cost/order ($)
Annual orderingcost (No. of orders × cost/order)
576,000 1 112 112
288,000 2 112 224
192,000 3 112 336
144,000 4 112 448
96,000 6 112 672
64,000 9 112 1008
48,000 12 112 1344
32,000 18 112 2016
24,000 24 112 2688
19,200 30 112 3360
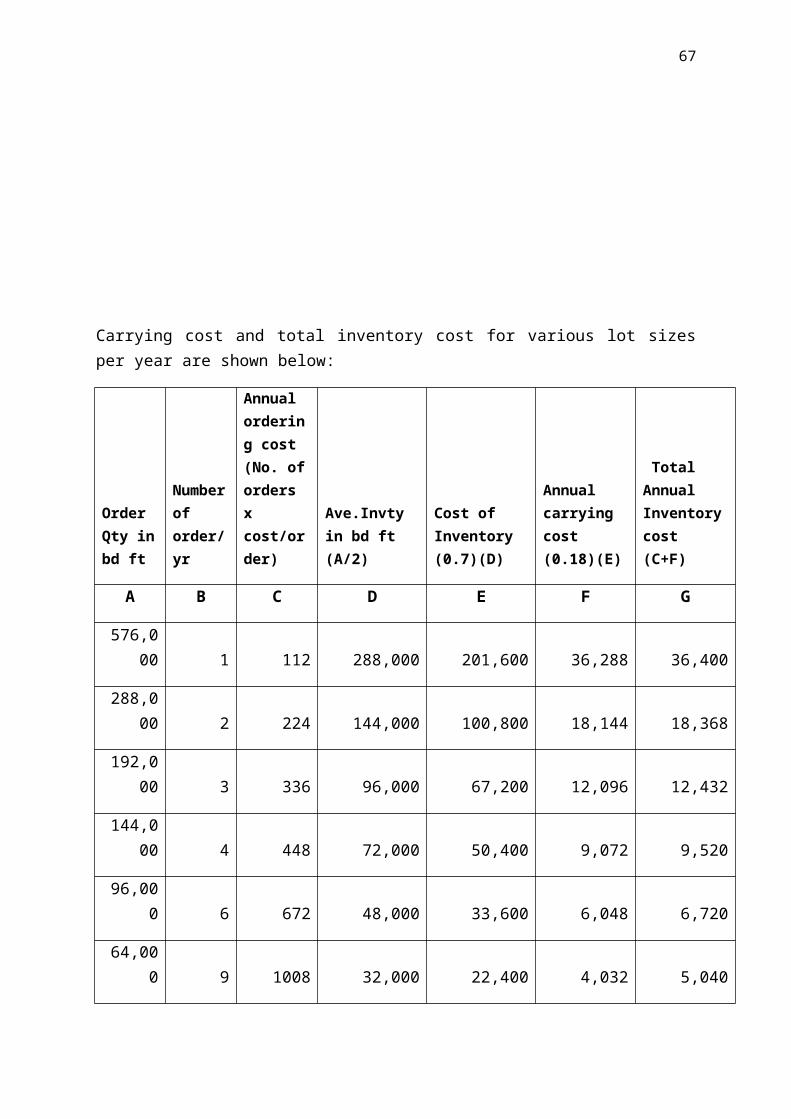
67
Carrying cost and total inventory cost for various lot sizesper year are shown below:
Order Qty inbd ft
Numberof order/yr
Annual ordering cost (No. oforders x cost/order)
Ave.Invty in bd ft (A/2)
Cost of Inventory (0.7)(D)
Annual carrying cost (0.18)(E)
Total Annual Inventorycost (C+F)
A B C D E F G
576,000 1 112
288,000
201,600
36,288
36,400
288,000 2 224
144,000
100,800
18,144
18,368
192,000 3 336
96,000
67,200
12,096
12,432
144,000 4 448
72,000
50,400
9,072
9,520
96,000 6 672
48,000
33,600
6,048
6,720
64,000 9 1008
32,000
22,400
4,032
5,040

68
48,000 12 1344
24,000
16,800
3,024
4,368
32,000 18 2016
16,000
11,200
2,016
4,032
24,000 24 2688
12,000
8,400
1,512
4,200
19,200 30 3360
9,600
6,720
1,210
4,570
Observe that the minimum annual inventory cost $ 4,032.This is obtained at the point when the
annual ordering cost of $2,016 is equal to the annual carryingcost of the same amount. The corresponding order quantity is32,000 board feet which means that the company should order 18times a year (576,000/32,000) = 18 )
Margan Furnitures should therefore be advised to place itsorder 18 times a year or every 20 days, in order to minimizeits annual inventory cost. The proper order quantity is 32,000board feet per order.
USING EOQ FORMULA
Let us first derive the formula
The minimum cost is when carrying cost = ordering cost
Carrying cost = (ave.cost invty) (% of carrying cost)
= (Price/Unit) ¿ ) (%of carrying cost)
Ordering cost = (no.of orders /yr)(cost per order)
No.of orders per year = AnnualInventoryOrderQTY
Ordering cost = AnnualInventoryOrderQTY (cost per order)

69
Hence, since carrying cost = ordering cost
(Price/Unit¿(OrderQty2) (% of carrying) =
AnnualInventoryOrderQTY (cost/order)
Multiplying both members by the commondenominator “2(order qty)”, we obtain(Price/Unit)(order qty)² (% of carrying) =
2(annual invty) (cost/order)
(order qty )² = 2 (anualinvty ) ( costorder
)
(priceunit )(%ofcarrying) 2
EOQ or order qty = √2 (annualinvty )( costorder )
(priceunit )(%ofcarying)
Substituting the data in the formula:
Order qty or EOQ = √2 (576,000)112¿
0.7(0.18)¿ = √142,222 = 32,000 no of
board feet to order
Calculations of EOQ are generally management’s best estimatesof actual values. It may therefore not be exact figure orwhole number. It is often necessary to round off to thenearest unit such as dozen, ton, truckloads and others.
To determine the number of orders to place in a year:
Minimum inventory cost is when ordering cost = carrying cost
Ordering cost = (orders/year)(cost/order)
Carrying cost = (ave. inventory) (%cost)
Ave inventory = Annualrequirement2 x Cost /UnitOrders/year
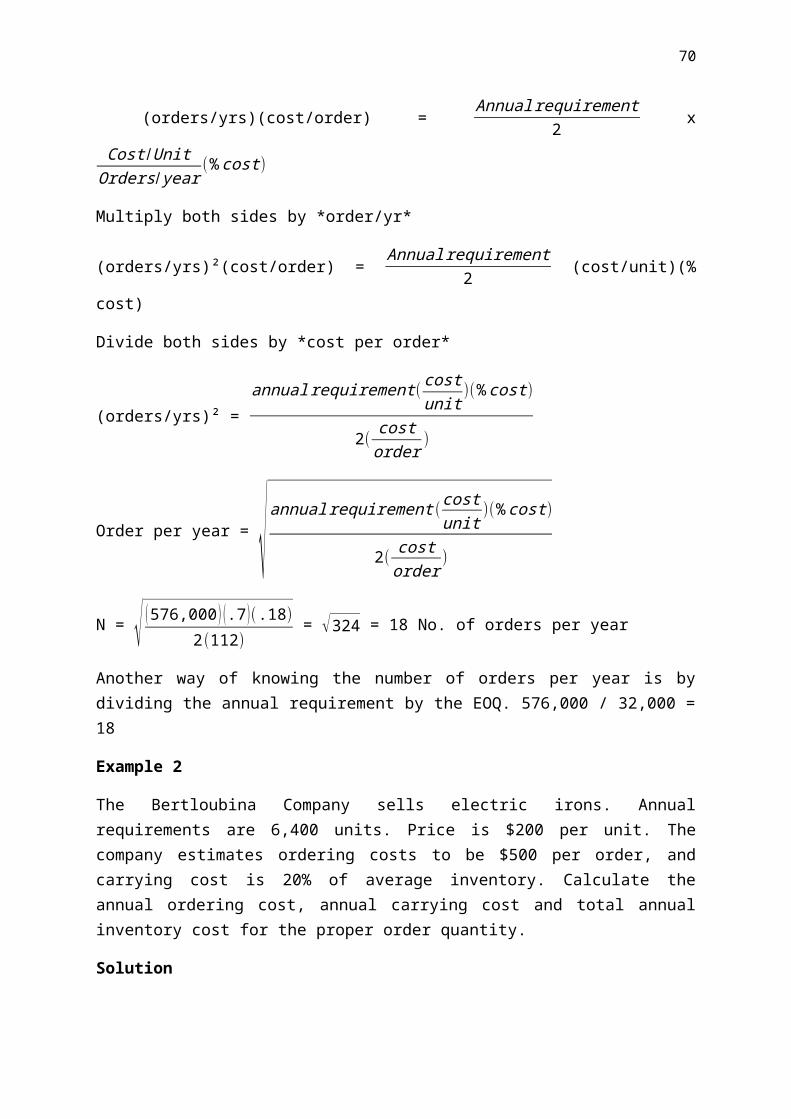
70
(orders/yrs)(cost/order) = Annualrequirement2 x
Cost /UnitOrders/year
(%cost)
Multiply both sides by *order/yr*
(orders/yrs)²(cost/order) = Annualrequirement2 (cost/unit)(%
cost)
Divide both sides by *cost per order*
(orders/yrs)² = annualrequirement(
costunit
)(%cost)
2(costorder )
Order per year = √annualrequirement (costunit
)(%cost)
2(costorder
)
N = √ (576,000) (.7)(.18)
2(112) = √324 = 18 No. of orders per year
Another way of knowing the number of orders per year is bydividing the annual requirement by the EOQ. 576,000 / 32,000 =18
Example 2
The Bertloubina Company sells electric irons. Annualrequirements are 6,400 units. Price is $200 per unit. Thecompany estimates ordering costs to be $500 per order, andcarrying cost is 20% of average inventory. Calculate theannual ordering cost, annual carrying cost and total annualinventory cost for the proper order quantity.
Solution

71
To find annual ordering cost, multiply the number of ordersper year by the cost per order. We must therefore find firstthe proper number of orders per year.
N = √ (Annualinventory) (%ofcost)(CostUnit
)
2¿¿¿ = √ (6400)¿¿¿
Proper order quantity or Q = 6,400/16 = 40 units per order
Therefore ordering cost = 16(500) = $8,000
Annual carrying cost = (%of cost) (ave.invty cost)
Since ave.invty cost = (ave.order qty) (cost/unit)
Annual carrying cost = 0.2 (400/2)(200)
= 0.2 (40,000)
= $8,000
Hence the total inventory cost is $8,000 plus $8,000 = $16,000
Once the annual ordering cost is already obtained, we canassume that the annual carrying cost is approximately of thesame amount. Hence, we can get the total annual cost bymultiplying the order cost by 2.
ASSIGNMENTS
In each of the following problems (1 to 6) find the following:
a. N, the optimal number of orders per yearb. Q, the proper order quantity, or optimal lot sizec. Annual carrying and annual ordering costsd. Optimal total inventory cost per year
1. Winston Company has annual sales of 1,800 noveltyblankets. Each inventory item has a value of $400.Ordering cost is $800 per order. Carrying cost is 15% ofthe average inventory.

72
2. The annual inventory requirements at the CarreraEntreprise are 36,000 units. Price is $20 per unit.Ordering cost is $400 per order. Carrying cost is 10% ofaverage inventory.
3. The PPI Company sells large industrial machines that havean inventory value of $500,000 each. The company expectsto order 5000 machines during the next calendar year.Ordering cost is $1,000 per order and carrying cost is20% of the value of average inventory.
4. The P & P Corporation sells paper punches. Cost is $50per item. Ordering costs is $500 per lot. The company cansell 200,000 units annually. Carrying cost is 10% ofaverage inventory value.
5. The ASV Company manufactures large industrial dryers.Expected annual demand is 100 units. Set up cost is$5,000. The company manufacturers at a cost of $2,000 perunit. Carrying cost is 20% of average inventory.
6. The POV enterprises sells desk lamps. Price is $200 perlamp. Carrying cost is $4 lamp. Ordering cost is $100 perorder. The total annual inventory requirement is 1,800units.
7. Using the symbols given below, derive a formula whichwill solve directly for the optimum number of weeks’supply to purchase at one time. P= Cost per orderC= carrying charges as % of average inventory
A = annual requirement
X= Optimum number of weeks’ supply to purchase at onetime D= Cost per Unit
8. Derive a formula for N if

73
N = number of order placed per yearS = cost per orderH = annual inventory requirement in units of inventoryP = value ($) of a unit of inventory expressed as $ peritemK= cost of carrying inventory expressed as % of averageinventory