REYNA CELL BIOLOGY - LibreTexts
338
REYNA CELL BIOLOGY Nathan Reyna Ouachita Baptist University
-
Upload
khangminh22 -
Category
Documents
-
view
0 -
download
0
Transcript of REYNA CELL BIOLOGY - LibreTexts

REYNA CELL BIOLOGY
Nathan ReynaOuachita Baptist University

Reyna Cell Biology

This text is disseminated via the Open Education Resource (OER) LibreTexts Project (https://LibreTexts.org) and like thehundreds of other texts available within this powerful platform, it is freely available for reading, printing and"consuming." Most, but not all, pages in the library have licenses that may allow individuals to make changes, save, andprint this book. Carefully consult the applicable license(s) before pursuing such effects.
Instructors can adopt existing LibreTexts texts or Remix them to quickly build course-specific resources to meet the needsof their students. Unlike traditional textbooks, LibreTexts’ web based origins allow powerful integration of advancedfeatures and new technologies to support learning.
The LibreTexts mission is to unite students, faculty and scholars in a cooperative effort to develop an easy-to-use onlineplatform for the construction, customization, and dissemination of OER content to reduce the burdens of unreasonabletextbook costs to our students and society. The LibreTexts project is a multi-institutional collaborative venture to developthe next generation of open-access texts to improve postsecondary education at all levels of higher learning by developingan Open Access Resource environment. The project currently consists of 14 independently operating and interconnectedlibraries that are constantly being optimized by students, faculty, and outside experts to supplant conventional paper-basedbooks. These free textbook alternatives are organized within a central environment that is both vertically (from advance tobasic level) and horizontally (across different fields) integrated.
The LibreTexts libraries are Powered by MindTouch and are supported by the Department of Education Open TextbookPilot Project, the UC Davis Office of the Provost, the UC Davis Library, the California State University AffordableLearning Solutions Program, and Merlot. This material is based upon work supported by the National Science Foundationunder Grant No. 1246120, 1525057, and 1413739. Unless otherwise noted, LibreTexts content is licensed by CC BY-NC-SA 3.0.
Any opinions, findings, and conclusions or recommendations expressed in this material are those of the author(s) and donot necessarily reflect the views of the National Science Foundation nor the US Department of Education.
Have questions or comments? For information about adoptions or adaptions contact [email protected]. Moreinformation on our activities can be found via Facebook (https://facebook.com/Libretexts), Twitter(https://twitter.com/libretexts), or our blog (http://Blog.Libretexts.org).
This text was compiled on 01/29/2022
®

1 1/29/2022
TABLE OF CONTENTS
TABLE OF CONTENTS
1: (T1) BASIC CELL CHEMISTRY - CHEMICAL COMPOUNDS AND THEIRINTERACTIONS
1.1: WATER1.2: ACIDS AND BASES1.3: CARBON1.4: SUGARS1.5: NUCLEOTIDES1.6: AMINO ACIDS1.7: FATTY ACIDS
2: 2-(T2-FIRST LECTURE) PROTEIN STRUCTUREProteins are polymers of the bifunctional monomer, amino acids. The twenty common naturally-occurring amino acids each contain anα-carbon, an α-amino group, an α-carboxylic acid group, and an α-side chain or side group. These side chains (or R groups) may beeither nonpolar, polar and uncharged, or charged, depending on the pH and pKa of the ionizable group.
2.1: AMINO ACIDS
2.1.1: A1. AMINO ACID STRUCTURE
2.1.1.1: STRUCTURE AND PROPERTY OF THE NATURALLY-OCCURRING AMINO ACIDS2.1.2: A2. AMINO ACID STEREOCHEMISTRY2.1.3: A3. AMINO ACID CHARGES2.1.4: A4. INTRODUCTION TO AMINO ACID REACTIVITY2.1.5: A5. REACTIONS OF LYSINE2.1.6: A6. REACTIONS OF CYSTEINE2.1.7: A7. CYSTEINE CHEMISTRY
2.1.7.1: REVIEW- OXIDATION/REDUCTION (REDOX) REACTIONS AND OXIDATION NUMBERS2.1.8: A8. REACTIONS OF HISTIDINE2.1.9: A9. IN VIVO POST TRANSLATIONAL MODIFICATION OF AMINO ACIDS2.1.10: A10. GENERAL LINKS AND REFERENCES2.2: COMPOSITION, SEQUENCE AND CONFORMATIONAL ANALYSIS OF PROTEINS
2.2.1: B1. AMINO ACID ANALYSIS AND CHEMICAL SEQUENCING2.2.2: B2. SEQUENCE DETERMINATION USING MASS SPECTROMETRY2.2.3: B3. LEVELS OF PROTEIN STRUCTURE2.2.4: B4. ANALYSIS OF PROTEIN SECONDARY STRUCTURE2.2.5: B5. ANALYSIS OF PROTEIN TERTIARY STRUCTURE2.3: UNDERSTANDING PROTEIN CONFORMATION
2.3.1: C1. MAIN CHAIN CONFORMATIONS2.3.2: C2. SECONDARY STRUCTURE2.3.3: C3. TERTIARY STRUCTURE2.3.4: C4. COMMON MOTIFS IN PROTEINS2.3.5: C5. STRUCTUAL CLASES OF PROTEINS2.3.6: C6. QUARTERNARY STRUCTURE2.3.7: C7. RECENT REFERENCES2.4: PROTEIN FOLDING - IN VIVO AND IN VITRO
2.4.1: D1. INTRODUCTION2.4.2: D2. PROTEIN FOLDING IN VITRO2.4.3: D3. FOLDING OF SINGLE PROTEIN MOLECULES2.4.4: D4. THE DENATURED STATE2.4.5: D5. MULTIPLE CONFORMATIONS FROM THE SAME SEQUENCE2.4.6: D6. PROTEIN FOLDING IN VIVO

2 1/29/2022
2.4.6.1: DO YOU FIND BIOCHEMISTRY AMAZING?2.4.7: D7. REDOX CHEMISTRY AND PROTEIN FOLDING2.4.8: D8. PROTEIN TRANSPORT ACROSS MEMBRANES2.4.9: D9. RECENT REFERENCES2.5: G. PREDICTING PROTEIN PROPERTIES FROM SEQUENCES
2.5.1: G1. INTRODUCTION TO BIOINFORMATICS, COMPUTATIONAL BIOLOGY AND PROTEOMICS2.5.2: G2. PREDICTION OF SECONDARY STRUCTURE2.5.3: G3. PREDICTION OF HYDROPHOBICITY2.5.4: G4. PREDICTION OF MEMBRANE PROTEIN STRUCTURE2.5.5: G5. PREDICTION OF PROTEIN TERTIARY STRUCTURE2.5.6: G6. PROTEOMICS PROBLEM SET 12.5.7: G7. PROTEOMICS PROBLEM SET 22.5.8: G8. GENERAL LINKS AND REFERENCES2.6: H. PROTEIN AGGREGATES AND DISEASE
2.6.1: H1. PROTEIN AGGREGATION2.6.2: H2. PRIONS AND DISEASE2.6.3: H3. MISFOLDING AND AGGREGATION SUMMARY2.6.4: H4. RECENT LINKS AND REFERENCES
3: (T1)ENZYMES -3.1: THE LAWS OF THERMODYNAMICS3.2: ENZYMES3.3: ENZYME KINETICS3.4: REGULATION OF ENZYME ACTIVITY3.5: ENZYME INHIBITION
3.5.1: IRREVERSIBLE COVALENT INHIBITION3.5.2: COMPETITIVE INHIBITION3.5.3: UNCOMPETITIVE INHIBITION3.5.4: NONCOMPETITIVE AND MIXED INHIBITION3.5.5: C5. ENZYME INHIBITION IN VIVO3.5.6: C6. AGONIST AND ANTAGONIST OF LIGAND BINDING TO RECEPTORS - AN EXTENSION3.5.7: C7. INHIBITION BY TEMPERATURE AND PH CHANGES3.5.8: C8. LINKS AND REFERENCES3.6: ENZYME CATALYSIS AND KINETICS3.7: MORE COMPLICATED ENZYMES
3.7.1: D1. MULTI-SUBSTRATE SEQUENTIAL MECHANISMS3.7.2: MULTI-SUBSTRATE PING-PONG MECHANISMS3.7.3: INHIBITORS IN MULTI-SUBSTRATE REACTIONS3.7.4: D4. ALLOSTERIC ENZYMES3.7.5: D5. INTEGRATION OF BINDING, DIFFUSION AND KINETICS3.7.6: D6. LINKS AND REFERENCES3.8: HOMEWORK PROBLEMS - LITERATURE LEARNING MODULES- ENZYME INHIBITION 1 - KCAT
3.8.1: HOMEWORK PROBLEMS - LITERATURE LEARNING MODULE ENZYME INHIBITION - KAT- KEY
4: (T2) MEMBRANE STRUCTUREMembrane Structure and Function- proteins, glycoproteins, glycolipids
4.1: KEY WORDS AND TERMS4.2: OVERVIEW4.3: PLASMA MEMBRANE STRUCTURE4.4: MEMBRANE PROTEINS4.5: HOW MEMBRANE PROTEINS ARE HELD IN MEMBRANES4.6: A DIVERSITY OF MEMBRANE PROTEIN FUNCTIONS4.7: GLYCOPROTEINS4.8: GLYCOLIPIDS4.9: GLYCOPROTEINS AND HUMAN HEALTH
5: (TEST 2)TRANSPORT AND KINETICS

3 1/29/2022
5.1: PASSIVE AND FACILITATED DIFFUSION
5.1.1: A1. SIMPLE DIFFUSION5.1.2: A2. FACILITATED DIFFUSION5.1.3: A3. RECEPTORS IN FACILITATED DIFFUSION5.1.4: A4. MEMBRANE PORES5.1.5: A5. CELL JUNCTIONS - TBA5.1.6: A6. LINKS AND REFERENCES
6: (T2) PROTEIN MODIFICATION AND TRAFFICKINGOnce a polypeptide has been translated and released from the ribosome, it may be ready for use, but often it must undergo post-translational processing in order to become fully functional. While many of these processes are carried out in both prokaryotes andeukaryotes, the presence of organelles provides the need as well as some of the mechanisms for eukaryote-specific modifications suchas glycosylation and targeting.
6.1: PROTEOLYTIC CLEAVAGE6.2: PROTEIN TRAFFICKING6.3: PROTEIN FOLDING IN THE ENDOPLASMIC RETICULUM6.4: N-LINKED PROTEIN GLYCOSYLATION BEGINS IN THE ER6.5: O-LINKED PROTEIN GLYCOSYLATION TAKES PLACE ENTIRELY IN THE GOLGI6.6: VESICULAR TRANSPORT6.7: RECEPTOR-MEDIATED ENDOCYTOSIS
7: (T3) CYTOSKELETONWhen a eukaryotic cell is taken out of its physiological context and placed in a plastic or glass Petri dish, it is generally seen to flattenout to some extent. On a precipice, it would behave like a Salvador Dali watch, oozing over the edge. However, the cell actually has anintricate microstructure within it, framed internally by the components of the cytoskeleton.
7.1: INTRODUCTION TO THE CYTOSKELETON7.2: INTERMEDIATE FILAMENTS7.3: ACTIN MICROFILAMENTS7.4: MICROTUBULES7.5: MICROTUBULE ORGANIZING CENTERS7.6: TRANSPORT ON THE CYTOSKELETON7.7: ACTIN - MYOSIN STRUCTURES IN MUSCLE7.8: CYTOSKELETAL DYNAMICS7.9: CELL MOTILITY7.10: NEW PAGE
8: (T3) SIGNAL TRANSDUCTIONMetazoan organisms are not just conglomerations of cells that happen to stick together. The cells each have specific functions that mustbe coordinated with one another in order to assure the survival of the organism and thus the shared survival of the component cells. Ifcoordination is required, then a method of communication between cells is also required.
8.1: INTRODUCTION TO SIGNAL TRANSDUCTION8.2: RECEPTORS AND LIGANDS8.3: 7-TM RECEPTORS (G-PROTEIN-COUPLED)8.4: RECEPTOR TYROSINE KINASES8.5: CALCIUM ION SIGNALING
9: (T3) CELL CYCLECells, whether prokaryotic or eukaryotic, eventually reproduce or die.
9.1: THE PROKARYOTIC CELL CYCLE9.2: THE EUKARYOTIC CELL CYCLE9.3: CONTROLLING THE CELL CYCLE9.4: ACTIVATION AND INACTIVATION OF THE CYCLIN-CDK COMPLEX9.5: PRE-MITOTIC PHASES9.6: MITOSIS9.7: CELL DEATH

4 1/29/2022
9.8: MEIOSIS
10: CANCER
BACK MATTERINDEXGLOSSARY

1 1/29/2022
CHAPTER OVERVIEW1: (T1) BASIC CELL CHEMISTRY - CHEMICAL COMPOUNDS AND THEIRINTERACTIONS
1.1: WATERThere is no life without water. In this chapter, water will be used to review some very basic ideas in chemistry, particularly as appliesto cell and molecular biology.
1.2: ACIDS AND BASESThe release of H+ and OH— are not limited to water molecules, and many compounds do so in aqueous solutions. These compoundscan be classified as acids (raising the free H+ concentration) or bases (increasing the free hydroxyl concentration]. The extent towhich acids and bases donate or remove protons is measured on the pH scale, which is a logarithmic scale of relative H+concentration.
1.3: CARBONThe major constituent molecules in all living organisms are based on carbon. Carbon has versatility stemming from its four outer shellelectrons, allowing the possibility of four covalent bonds with a variety of partners, including very stable carbon-carbon covalentbonds. Because of this, long carbon chains can form the backbone of more complex molecules and makes possible the great diversityof macromolecules found in the cell.
1.4: SUGARSSugars, and glucose in particular, are important molecules for cells because they are the primary energy source. Sugars have thegeneral chemical formula CH₂O and can be joined together almost infinitely for storage. However, because they are hydrophilic, theyallow water molecules to intercalate between them, and cannot pack as efficiently as fats, which are hydrophobic and thus excludewater. On the other hand, the sugars can be mobilized for use more quickly.
1.5: NUCLEOTIDESNucleotides, the building blocks of RNA and DNA, are themselves composed of a pentose sugar attached to a nitrogenous base onone side and a phosphate group on another. The sugar is either the 5-carbon sugar ribose or its close cousin, deoxyribose (the “deoxy”refers to a “missing” hydroxyl group on the 2-carbon, which has an H instead). The attached nitrogenous base can be a purine, whichis a 6-member ring fused to a 5-member ring, or a pyrimidine, which is a single 6-membered ring.
1.6: AMINO ACIDSMost of the major molecules of the cell - whether structural, like cellular equivalents of a building’s girders and beams, or mechanical,like enzymes that take apart or put together other molecules, are proteins. Proteins interact with a wide variety of other molecules,though any given interaction is usually quite specific. The specificity is determined in part by electrical attraction between themolecules.
1.7: FATTY ACIDSUnlike monosaccharides, nucleotides, and amino acids, fatty acids are not monomers that are linked together to form much largermolecules. Although fatty acids can be linked together, for example, into triacylglycerols or phospholipids, they are not linked directlyto one another, and generally no more than three in a given molecule. The fatty acids themselves are long chains of carbon atomstopped off with a carboxyl group. The length of the chain vary, but most are between 14 and 20 carbons.

E. V. Wong 1.1.1 1/8/2022 https://bio.libretexts.org/@go/page/64185
1.1: WaterThere is no life without water. In this chapter, water will be used to review some very basic ideas in chemistry, particularlyas applies to cell and molecular biology. What is water? H O. Two hydrogen atoms and one oxygen atom (Figure ).Together they form a molecule of water. They are defined as a molecule by the presence of strong chemical bondsconnecting each atom.
Figure . (A) Oxygen and hydrogen (B) water
In this case, each atom is connected to another by a covalent bond. These are the strongest type of chemical bonds, andform when two atoms are sharing electrons in order to fill their outermost (valence) electron shell and increase stability.
The volume of an atom is defined by electrons in a very fast and energetic obit around a nucleus. The electrons arevery small negatively charged particles, and the nucleus is composed of neutrons (electrically neutral) and protons(positively charged), both relatively massive in comparison to electrons. The electrons’ orbits around the nucleus canbe approximated by “shells” or levels. These shells characteristically have limitations on the number of electrons thatcan fit within them: the first shell (closest to nucleus) holds only 2 electrons, while the second shell holds 8, and thethird shell holds 18. The atom is most stable when its outer shell (and by extension, all inner ones also) is filled. Theenergy of the electrons also varies by level - innermost electrons have the least energy while the outermost electronshave the most.
In the case shown here, hydrogen (H) has only one electron, and for maximal stability of that electron shell, it should havetwo. Oxygen, on the other hand, has six electrons in its outer shell, and a filled shell would have eight. Thus, it would“like” to pull in two more electrons for maximal stability. As shown in Figure B, both of those requirements arefulfilled when each of the hydrogen atoms shares an electron with the oxygen, which also shares an electron each with thehydrogen. The water molecule can also be written as H—O—H, in which the single solid line indicates a pair of sharedelectrons, i.e. a single covalent bond. The energy of an average single covalent bond is about 80 kcal/mol. However, asshown below, double and even triple covalent bonds are possible. The strength of those types of bonds is slightly less thandouble (~150 kcal/mol) or triple (~200 kcal/mol) the energy of the single bonds.
Bond energy is a measure of the strength of the bond between two covalently joined atoms, and is proportional to thebond distance, which is determined by the atomic radii. It is not the same thing as bond dissociation energy, which isthe energy released in a homolytic reaction (bond is split with electrons equally distributed) taking place at absolutezero, but they are similar in being measures of bond strength.
Sharing electrons is not the only way to create bonds between atoms. Ionic bonds are created when an atom donates orreceives an electron, rather than sharing one. When an atom gives up an electron, the electrical balance between thenumbers of positively charged protons in its nucleus and negatively charged electrons is upset, and the overall atom nowhas a positive electrical charge. Similarly when an atom receives an extra electron, the balance in a neutral atom is upset,and the atom becomes negatively charged. An ionic bond is formed when one atom donates an electron to an adjacent
2 1.1.1
1.1.1
1.1.1

E. V. Wong 1.1.2 1/8/2022 https://bio.libretexts.org/@go/page/64185
atom, creating an ionic pair, one positively and one negatively charged. The electrical attraction between the oppositelycharged atoms holds them together.
Although salts (such as NaCl) are ionic compounds, not all ionic compounds are salts. The chemical definition of a saltrequires that the compound be formed by the substitution of a hydrogen ion (H+ ) in the original compound. Thisusually occurs in neutralization reactions, such as the neutralization of hydrochloric acid, HCl (or H Cl ) with sodiumhydroxide (Na (OH) ), which yields the salt NaCl, and water (HOH = H O).
Ionic bonds are weaker than covalent bonds, with an average bond energy of ~5.5 kcal/mol. Both covalent and ionic bondsare thermodynamically stable in dry, room temperature conditions (25°C, 298 K, 77°F). The average energy impartedwhen molecules collide at this temperature is only ~0.6 kcal/mol, far less than the energy needed to break a covalent orionic bond.
Figure . (A) Individually, the Na atom and the Cl atom are electrically neutral. However, they are both very reactivechemically because both need only get rid of (Na) or take in (Cl) one electron to have a full outer shell. (B) Because anelectron is completely transferred, the Na becomes Na+ and Cl becomes Cl- , reflecting the new charge imbalance.Although electrically no longer neutral, the thermodynamic enhancement from filling the outer shells makes both of theseions very stable.
Covalent and ionic bonds between atoms are the only way to make molecules, which are stable collections of chemicallybonded atoms. However, other attractive interactions between atoms and molecules exist, but they are significantly weaker,and can be disrupted with relatively small changes in temperature or environmental conditions. These are van der Waal’sforces. They are very short-range interactions, requiring close apposition of the two atoms. As mentioned, an individualhydrogen bond (a specific type of van der Waal’s force described below) or other van der Waal’s interaction can be easilydisrupted, but these types of interactions generally occur en masse. In a sense, they are like molecular Velcro - eachindividual little plastic hook and individual loop of nylon could barely hold two hairs together, but a suit of velcro can holda person on a vertical wall (a la Late Night with David Letterman, 1984).
In the case of hydrogen bonds, these occur when there is permanent asymmetric electron sharing within a covalentlybonded molecule so that the shared electrons spend more time around one nucleus (thus imparting a negative character),than the other (which is therefore somewhat positive in character) to create a permanent electrical dipole. These dipolemoments can interact with oppositely charged moments on other molecules or the same molecule. Van der Waals forcesalso include induced (nonpermanent) dipole-dipole interactions in which a temporary shift in electron density as they orbitthe nucleus forms a minute charge differential, that can induce an opposite and attractive charge differential in a very closeneighboring atom. In fact, some texts define van der Waals forces exclusively as such, leaving hydrogen bonds as aseparate category altogether. One of the arguments for that idea is that the bond length of the average H-bond is smallerthan the sum of the van der Waal’s radii of the two atoms.
+ -
+ -2
1.1.2
®

E. V. Wong 1.1.3 1/8/2022 https://bio.libretexts.org/@go/page/64185
As noted above, hydrogen bonds result from severely uneven sharing of electrons that generate permanent dipoles. Inbiological systems, this generally means that a hydrogen is covalently bound to either an oxygen or a nitrogen atom, whichare both highly electronegative atoms, strongly attracting the shared electrons away from the hydrogen. Commonhydrogen-bonding pairs are OH⋅⋅⋅:O, OH⋅⋅⋅:N, NH⋅⋅⋅:N, and NH⋅⋅⋅:O. Dotted lines are a common method for depictinghydrogen bonds in printed text and diagrams.
Figure . The hydrogen bonding of water molecules to one another is an important determinant of the physicalproperties of water.
Water is a molecule that has a permanent dipole (i.e. it is a polar molecule), with the highly electronegative oxygen nucleustaking the lion’s share of the shared electrons’ time, leaving the hydrogen nuclei stripped bare down to their protons. Thegeometry of the water molecule (Figure B) makes one side of the molecule somewhat negative with two pairs of freeelectrons, and the opposite side positive, because the shared electrons are only rarely near the hydrogen nuclei. This giveswater the ability to hydrogen bond, and is the basis for several of water’s most important qualities. The ability to formmany hydrogen bonds leads to a high specific heat of water, and enables it to act as a generous heat buffer. In order to getenough molecules of water moving faster and increase the temperature of the water, the energy put into the water must firstbe used to break apart the hydrogen bonds without generating heat. This is unlike most other liquids, which do not linkinternally with H-bonding. So the water is able to absorb more heat (energy) without a phase change than many otherliquids.
Another important and unique characteristic of water is that the solid phase (ice) is less dense than the liquid phase. Withmost other liquids, as the temperature drops, the molecules have less energy, so they move less, and they stay closertogether, increasing the density. Only part of that holds true with water. Again, the ability to form hydrogen bonds isdirectly related to this: as the temperature is lowered, the molecules move around less, affording them more opportunitiesto form hydrogen bonds. However, even though they are attractive, the H-bonds also act as spacers separating the watermolecules more than if they were allowed to tumble about together in a liquid without forming H-bonds.
This aspect of water chemistry is actually more important to life in a geologic sense than at the cellular level. At thecellular level, the consequence is that freezing cells causes the water in them to expand and burst, killing them at lowtemperatures unless the cell has chemicals that act as antifreeze and lower the freezing temperature of the cytoplasm.On the other hand, at the geological level, when a pond or lake freezes in winter, the ice is less dense than water, thusstaying on top of the pond, insulating deeper layers, and helping them stay liquid and able to support life (manyorganisms migrate deeper down in the winter). If water became more dense as it froze, as many other molecules, icewould sink, and eventually the entire pond would be completely solid, killing off most life in it once a year!
From a chemical standpoint, the polar nature of water makes it an excellent solvent for ionic and polar molecules. As youcan see in the Figure, the hydrogen side of water interacts with the negatively charged chloride ion, while the oxygen sideof water interacts with the positively charged sodium ion, thus easily dissolving the salt. However, the polarity of wateralso makes it repel nonpolar molecules or by non-polar regions of molecules. This property, known as hydrophobicity, iscrucial to life, since it is the basis for the formation of the biological membranes that define a cell. In general terms, the H-bonding between water molecules is very stable. Non-polar molecules cannot participate in H-bonding, and therefore
1.1.3
1.1.1

E. V. Wong 1.1.4 1/8/2022 https://bio.libretexts.org/@go/page/64185
create areas of instability wherever they are touching aqueous (water-based) solutions. The resolution to this problem is forhydrophobic molecules to aggregate, thus lowering the total surface area in contact with water. In living organisms, manyprotein and lipid molecules are amphipathic, with some portions hydrophobic, while other parts of the molecule arehydrophilic.

E. V. Wong 1.2.1 1/29/2022 https://bio.libretexts.org/@go/page/64186
1.2: Acids and BasesWhile it is easiest to think of water as H O, it is in fact in an equilibrium between the ionized molecules H (which issimply a proton) and OH (the hydroxyl ion). The H itself can be subsequently bound to a water molecule to form ahydronium ion, H O .
Water can dissociate from H O into the ions H and OH , in which the departing hydrogen leaves its electron with theoxygen. However, H is extremely reactive and almost immediately attaches to a nearby water molecule, forming thehydronium ion, H O .
The release of H and OH are not limited to water molecules, and many compounds do so in aqueous solutions. Thesecompounds can be classified as acids (raising the free H concentration) or bases (increasing the free hydroxylconcentration]. The extent to which acids and bases donate or remove protons is measured on the pH scale, which is alogarithmic scale of relative H concentration. Thus the Coca-Cola that I am drinking, and which counts phosphoric,carbonic, and various other acids among its ingredients, has a pH around 3, which means that it liberates 10 times moreH+ than water, which has a pH of 7. Inside cells, the pH range is tightly restricted to slightly above neutral (neutral = pH7), although in eukaryotes, various intracellular organelles (e.g. lysosomes) may have significantly different internalacidity/alkalinity. This is important biologically because changes in acidity or alkalinity can alter hydrogen and ionicbonds, thus potentially changing the shape and activity of enzymes and other biomolecules.
Sometimes, this can be used to an organism’s advantage. For example, cells lining the stomach of an animal such asyourself secrete the enzyme pepsin into the stomach to help digest proteins. Pepsin has a pH optimum close to pH 2, whichis great because stomach pH is also around 2. However, considering that cells themselves contain a lot of proteins, and wedon’t want pepsin-containing cells to digest themselves away, what is the solution? Because the pH inside the cell is closeto 7.2, far above the pH optimum for pepsin, it is inactive inside the cell, and only works after it has been secreted into anacidic environment.
2+
— +
3+
2+ —
+
3+
+ —
+
+ ®
4

E. V. Wong 1.3.1 1/29/2022 https://bio.libretexts.org/@go/page/64187
1.3: CarbonThe major constituent molecules in all living organisms are based on carbon. Carbon has versatility stemming from its fourouter shell electrons, allowing the possibility of four covalent bonds with a variety of partners, including very stablecarbon-carbon covalent bonds. Because of this, long carbon chains can form the backbone of more complex molecules andmakes possible the great diversity of macromolecules found in the cell. The carbon chains themselves are not veryreactive, but they often have reactive chemical groups attached to them.
Common groups are the hydroxyl (—OH), carbonyl (—CO), carboxyl (—COOH), and phosphate (—PO ). Carbon chainsmay even have other carbon chains attached to them. The smaller ones behave and are named as groups also: methyl (—CH ), ethyl, (—C H ), propyl (—C H ), and so forth. Figure B (below) depicts several functional groups that can befound in the simple molecule acetic acid (very dilute acetic acid is the primary component of vinegar).
Figure . (A) The carbon atom has four electrons in its outer shell. (B) Functional groups that can be identified from amolecule of acetic acid.
Carbon is also the basis for the four major classes of biological molecules: sugars, nucleotides, amino acids, and fattyacids. The first three are classes of molecules that can be strung together by covalent bonds to make important largebiomolecules: simple sugars can form large polysaccharides such as starch, cellulose, or glycogen, nucleotides can formRNA (ribonucleic acids) or DNA (deoxyribonucleic acids), and amino acids can form proteins. Fatty acids, on the otherhand, are acid derivatives of long chains of carbons linked to one another, with hydrogens taking up most of the otherbonding positions.
4
3 2 5 3 7 1.3.4
1.3.4

E. V. Wong 1.4.1 12/18/2021 https://bio.libretexts.org/@go/page/64188
1.4: SugarsSugars, and glucose in particular, are important molecules for cells because they are the primary energy source. Sugarshave the general chemical formula CH O and can be joined together almost infinitely for storage. However, because theyare hydrophilic, they allow water molecules to intercalate between them, and cannot pack as efficiently as fats, which arehydrophobic and thus exclude water. On the other hand, the sugars can be mobilized for use more quickly. Therefore,polysaccharides are usually short-term reservoirs of energy for an organism, while fats are used for longer-term storage.
The general chemical formula cannot fully define a particular sugar, because the same set of atoms, e.g. C H O can referto glucose, fructose, mannose, or galactose, and that doesn’t even include the stereoisomers. Isomers are rearrangements ofthe same atoms, such as with glucose and fructose (Figure ), while stereoisomers are much more similar: they aremirror-images of one another. Thus glucose can exist as L-glucose or D-glucose, depending on whether it is a “left-handed” or “right-handed isomer. This may seem like an esoteric distinction, but it becomes important in intermolecularinteractions, because many are based on recognition of specific shapes, so an l-conformation molecule may not berecognized by an enzyme that recognizes its d-isomer.
Another important aspect of sugar chemistry is whether it is an aldose or a ketose, based on the type of carbonyl group itcarries. This is easiest to understand looking at the position of the carbonyl group in the linear structure: put simply, analdehyde is a terminal carbonyl group, while a ketone is an internal carbonyl group. Sugars in aqueous solution exist in anequilibrium between the linear form and the ring form, which is formed by intramolecular attack by a hydroxyl group onthe carbonyl. Technically, the cyclic sugar is a pyranose (6-membered ring) or a furanose (5-membered ring), so that D-glucose cyclizes into D-glucopyranose. However, in most cell biology courses, the cyclic sugar will still be referred to asits non-cyclic alter ego. Note that due to the difference between the C H O aldose glucose, and the C H O ketosefructose, cyclization generates a pyranose in one case, and a furanose in the latter (Figure ), although the number ofcarbons (and other atoms) are the same. These two molecules are therefore recognized differently by the enzymes of thecell, leading to different metabolic pathways.
Figure . Glucose is an aldose (terminal carbonyl) that cyclizes into a pyranose, fructose is a ketose (internal carbonyl)that cyclizes into a furanose.
Simple sugars can be joined together by condensation reactions to form glycosidic bonds. These reactions are calledcondensation reactions because they form water as a byproduct. The glycosidic bond is an —O— linkage between carbonsof two sugars. The bond is usually named with the specific linkages: for example in cellulose, glucoses are linked by β(1,4)linkages, which means in a standard ring diagram, the upward-facing β-hydroxyl on the 1-carbon interacts with the —OHon the 4-carbon of a neighboring glucose (Figure B). [Technically, since only two glucoses are shown here, this is amolecule of cellobiose, not cellulose.] In contrast, the maltose shown in the same Figure (Figure A), while alsoshowing two glucoses linked together, is an α(1,4) linkage, with a downward-facing a-hydroxyl on the 1-carbon.
Figure . (A) the α(1,4) glycosidic bond of maltose, (B) the β(1,4) bond of cellobiose, and (C) the α(1,6) bond inbranching glycogen.
2
6 12 6
1.4.5
6 12 6 6 12 61.4.5
1.4.5
1.4.6
1.4.6
1.4.6

E. V. Wong 1.4.2 12/18/2021 https://bio.libretexts.org/@go/page/64188
Large polysaccharides generally have one of two functions: as a very strong structural component of a cell, and as astorage molecule for readily accessible energy. The two major structural polysaccharides made by cells are cellulose andchitin. Cellulose is primarily synthesized by plants, while chitin is mostly synthesized by invertebrates (think crab shells),though it is also made by many fungi and algae. As we just saw, cellulose is an array of parallel lengths of glucosemonomers joined together by β(1,4) glycosidic bonds (Figure ). These long glucans are stacked closely on oneanother so that many H-bonds can form along their lengths, which are virtually limitless, determined by the needs of theorganism. Interestingly, chitin is also a homopolymer linked by β(1,4) glycosidic bonds, but instead of glucose, themonosaccharide used is N-acetylglucosamine (often abbreviated GlcNAc, see chapter 11). However, the macromolecularstructure is very similar to cellulose, and like cellulose, it is very strong.
Figure . Cellulose is a very strong material due to the many hydrogen bonds (in red) possible when strands of β(1,4)-linked glucoses are aligned.
As with structural polysaccharides, there are also two primary energy-storage polysaccharides: starch, which is synthesizedby plants, and glycogen, which is synthesized by animals. Starch is actually a mixture of two slightly differentpolysaccharides. One is a-amylose, which is a glucose homopolymer like cellulose, but connected by α(1,4) glycosidiclinkages, which makes it completely different structurally. Unlike the linear and highly stackable cellulosepolysaccharides, a-amylose takes on a twisting a-helical shape. The other starch polysaccharide is amylopectin, which islike a-amylose with the addition of branches formed from α(1,6) glycosidic bonds every 24-30 residues (Figure C).The storage polysaccharide for animals, glycogen, is essentially amylopectin with a higher frequency of branching,approximately every 8-14 residues. Whereas the tight packing of the structural polysaccharides renders them waterproof,this is certainly not the case for starch or glycogen, both of which can interact with many water molecules simultaneously,and swell up with the hydration, as any cook who has ever made a pudding (the thickening ingredient is starch from corn)can attest.
1.4.7
1.4.7
1.4.6

E. V. Wong 1.5.1 1/15/2022 https://bio.libretexts.org/@go/page/64189
1.5: NucleotidesNucleotides, the building blocks of RNA and DNA, are themselves composed of a pentose sugar attached to a nitrogenousbase on one side and a phosphate group on another. The sugar is either the 5-carbon sugar ribose or its close cousin,deoxyribose (the “deoxy” refers to a “missing” hydroxyl group on the 2-carbon, which has an H instead). The attachednitrogenous base can be a purine, which is a 6-member ring fused to a 5-member ring, or a pyrimidine, which is a single 6-membered ring. These bases are usually adenine (purine), guanine (purine), thymine (pyrimidine), and cytosine(pyrimidine) for DNA, with a substitution of uracil for thymine in RNA bases. However, there are also someunconventional and modified bases that show up in special situations, such as in tRNAs. In addition to being the monomercomponents of DNA and RNA, nucleotides have other important functions as well. The best known, adenosinetriphosphate, or ATP, is the primary “instant” energy source for the cell by the energy released through hydrolysis of itsterminal phosphate group.
DNA or RNA are built from nucleotides through linkages of the sugars, and the polymerization occurs by condensationreactions, but these bonds are not glycosidic bonds like with polysaccharides. Instead, bonds form between the 5’phosphate group of one nucleotide and the 3’ hydroxyl group of another. These are phosphodiester bonds, and a quickglance at the structure (Figure ) explains the naming: an ester bond is a carbonoxygen linkage, and the phosphodiesterbond is a C-O-P-O-C, so there are two esters with a phosphorus linking them. With the purine or pyrimidine base on the 1-carbon, this arrangement places the bases on the opposite side of the sugar from the polymerizing phosphodiester bonds.This forms a sugar-phosphate backbone to the DNA/RNA, which then has the bases projecting out from it.
Figure . (A) DNA and (B) RNA differ by the presence of —OH on the 2-carbon of ribose but not deoxyribose and theuse of uracil in RNA instead of thymine. Both are constructed from nucleotides like adenosine triphosphate (C).
The bases will then likely interact with the bases of other nucleotides, whether part of another nucleic acid strand or free-floating. Not only do they interact, but they interact with great specificity and consistency: adenines base-pair withthymines (or uracils) through two hydrogen bonds, while guanines interact with cytosine through three H-bonds. Note thatwhile one extra hydrogen bond does not appear to be particularly significant, the attraction between G-C is 50% strongerthan between A-T, and over long stretches of DNA, areas high in G-C content are significantly more difficult to unzip(separate strands) than areas high in A-T pairs. This specific base-pairing, known as Chargaff’s rules, is the basis for life:base-pairing is needed to make DNA double stranded, which gives an organism a built-in backup of genetic informationand it is also the basis for transforming that information into proteins that form the bulk of a cell.
1.5.8
1.5.8

E. V. Wong 1.5.2 1/15/2022 https://bio.libretexts.org/@go/page/64189
Nucleic acids, the long polymers of nucleotides, exist in either single or double stranded forms in vitro. However, in thecell, most RNA is single-stranded, and most DNA is double-stranded. This difference is important to their function: RNAis a temporary information transfer molecule for a particular gene, DNA is the permanent repository of all geneticinformation needed to make an organism. Therefore, RNA needs to be easily read, meaning that the bases need to beaccessible, and not locked to a complementary strand. Its long-term stability is not particularly important because when itis made, usually many copies are made at the time, and it is only needed while the cell needs to make the protein itencodes. Conversely, the same strand of DNA is read over and over to make the RNA, and since there are only two copiesof each chromosome (a chromosome is a single double-stranded DNA molecule) in a cell, the ability to maintain theintegrity of the DNA is crucial. Because of base pairing, each strand of DNA contains all the information necessary tomake a complete exact copy of its complementary strand.
Of course, the point of the genetic information in DNA is to encode the production of proteins that can then carry out thefunctions that define cellular life. Some of those functions, such as DNA replication, gene regulation, transcription, andtranslation, require the proteins to interact with a nucleic acid. Usually, part of the recognition process involves appositionof a positively charged region of the protein to the DNA (or RNA), which is a very negatively charged molecule, asexpected from all the phosphates in the sugar-phosphate backbone. RNA, but not DNA (with some exceptions), can alsointeract with itself by complementary base-pairing. If a stretch of RNA sequence comes into contact with a stretch of RNAwith a complementary sequence on the same molecule, then base-pairing can occur. Depending on the number ofnucleotides between the complementary areas, secondary structures such as stem-and-loops and hairpins can form.

E. V. Wong 1.6.1 1/29/2022 https://bio.libretexts.org/@go/page/64190
1.6: Amino AcidsMost of the major molecules of the cell - whether structural, like cellular equivalents of a building’s girders and beams, ormechanical, like enzymes that take apart or put together other molecules, are proteins. Proteins interact with a wide varietyof other molecules, though any given interaction is usually quite specific. The specificity is determined in part by electricalattraction between the molecules. So, what determines the charge of different regions of a protein?
Figure . The Amino Acids. The backbone is shown in black, while the side chains are colored red. Amino acidscircled in blue can be synthesized by humans, while the uncircled amino acids must be ingested. Amino acids with ayellow background have unique structural considerations: the extremely small side chain of glycine allows it to fit intotight spaces, the sulfhydryl group of cystein allows the formation of disulfide bonds, and the cyclic structure of prolineintroduces a forced bend in the polypeptide chain.
Amino acids (Figure ), which are joined together to make proteins, may be positively charged (basic), negativelycharged (acidic), polar, or nonpolar, based on the characteristics of their side chains. The charge on the amino or carboxylend of each amino acid does not play a role in the overall character of any particular region of the protein, because they areeffectively neutral, having been linked, the amino group of one amino acid to the carboxyl group of another, by a peptidebond. Note the Figure of the amino acid: it is one carbon, called the a carbon, linked to amino and carboxyl groups onopposite sides, and to hydrogen, and a side chain, denoted by R. These side chains, of which there are twenty commonones, can be as simple as a hydrogen atom (glycine), or could be quite complex, involving extended ring structures(histidine, phenylalanine). The variety in their size, shape, and charge all add up to an extremely versatile set of buildingblocks for some of the most important working molecules of the cell.
Almost all amino acids (glycine is the exception) are optically active, which means that they are asymmetric in such away that it is impossible to superimpose the original molecule upon its mirror image. There is a “handed-ness” aboutthem, much as your right hand cannot be superimposed on your left hand if both palms must face the same direction.In fact, in the Figure here, you can also understand why glycine is an exception, since its R-group is a simple hydrogenatom.
1.6.9
1.6.9
chirality

E. V. Wong 1.6.2 1/29/2022 https://bio.libretexts.org/@go/page/64190
Figure released to public domain by NASA
Chiral pairs, or enantiomers, not only have the same atomic components like all isomers, they also have the samebonds and bond order. The term “optically active” comes from the discovery that polarize light is rotated in differentdirections by enantiomers. Amino acids are often labeled as either d- (dextrorotatory) or l- (levorotatory) depending ontheir atomic configuration in relation to the enantiomers of glyceraldehyde. This is a common naming system, but notalways logical, in that almost half of the l-amino acids are in fact dextrorotatory (clockwise rotation of light), but theirmolecular configurations resemble the levorotatory isomer of glyceraldehyde.
Ribosome-created proteins and peptides are all constructed with l-amino acids. However, d-amino acids do exist innature, and can be incorporated into peptides through non-ribosomal means. An excellent example is found in the cellwalls of some bacteria. Because most proteolytic enzymes only act on proteins with lamino acids, the incorporation ofd-amino acids into the cell wall can protect the bacteria from harm. These D-amino acids are incorporated bytranspeptidase. Transpeptidase is also the target of the antibiotic, penicillin, which is an irreversible inhibitor of thatenzyme.
In the cell, a peptide bond is formed between two amino acids with enzymatic help from the ribosome. Like the previoustwo polymerizing reactions, formation of peptide bonds is a condensation reaction in which the carbon of the carboxylgroup and the nitrogen from the amino group of their respective amino acids are bonded together (Figure ). This is avery stable bond due to resonance of the amide group. In the cell, peptide bonds are mostly nonreactive, except whenattacked by proteolytic enzymes.
Figure . Peptide Bond Formation. A condensation reaction between the carboxyl group of alanine and and the aminogroup of valine generates a peptide bond linking the two amino acids, with a molecule of water as a byproduct.
A peptide is an inexact term used for relatively few (usually <30) amino acids joined together. Each amino acid in apolypeptide or protein may also be referred to as a “residue” which can sometimes be confusing because the same term isalso applied to monomers of nucleic acids and of polysaccharides. Larger polymers are known as polypeptides or asproteins, although polypeptide has more of a structural connotation and may be used to indicate an unfinished or not-yet-functional state, whereas protein generally implies some physiological function. On of the key characteristics of proteins isthe ability to form secondary, tertiary, and for proteins, quaternary structure by means of specific folding patterns. If youthink of a long piece of thread, yarn, or rope, you can probably imagine an infinite number of different ways to arrange it,
1.6.10
1.6.10
E. V. Wong 1.6.3 1/29/2022 https://bio.libretexts.org/@go/page/64190
from spirals to loops to random tangles. This is essentially what can happen with a protein with the constraints put upon itby the size and charge of the amino acids that compose it.
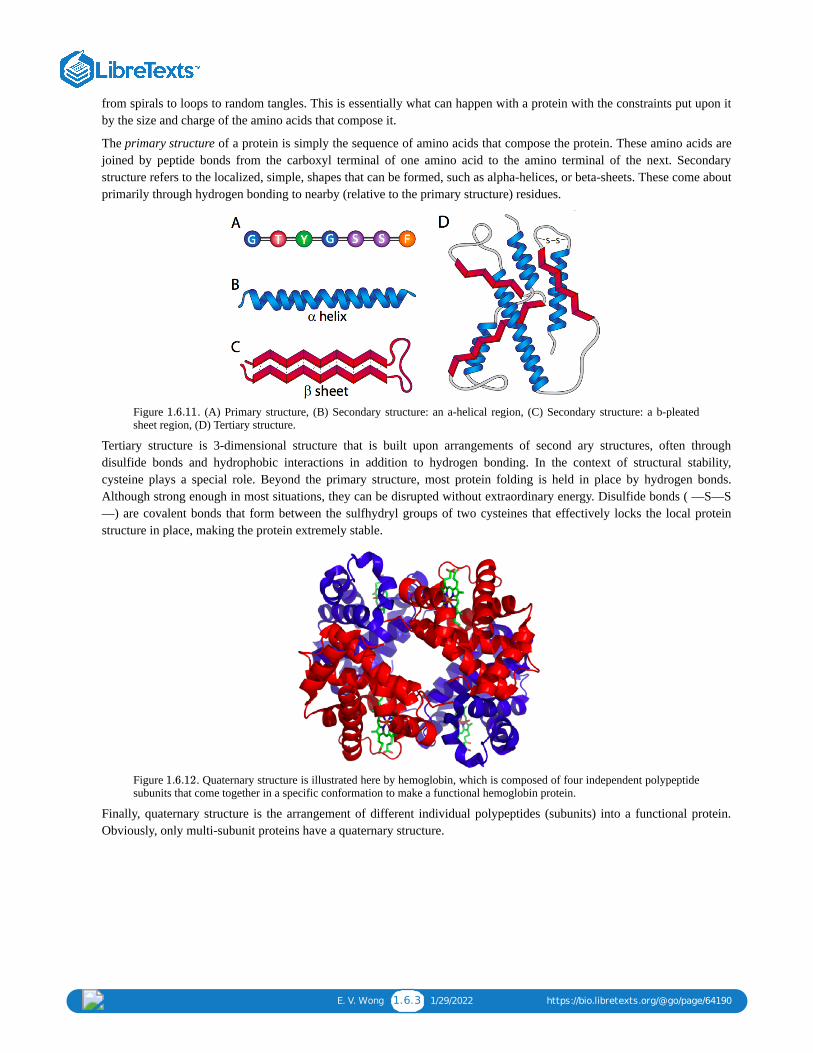
The primary structure of a protein is simply the sequence of amino acids that compose the protein. These amino acids arejoined by peptide bonds from the carboxyl terminal of one amino acid to the amino terminal of the next. Secondarystructure refers to the localized, simple, shapes that can be formed, such as alpha-helices, or beta-sheets. These come aboutprimarily through hydrogen bonding to nearby (relative to the primary structure) residues.
Figure . (A) Primary structure, (B) Secondary structure: an a-helical region, (C) Secondary structure: a b-pleatedsheet region, (D) Tertiary structure.
Tertiary structure is 3-dimensional structure that is built upon arrangements of second ary structures, often throughdisulfide bonds and hydrophobic interactions in addition to hydrogen bonding. In the context of structural stability,cysteine plays a special role. Beyond the primary structure, most protein folding is held in place by hydrogen bonds.Although strong enough in most situations, they can be disrupted without extraordinary energy. Disulfide bonds ( —S—S—) are covalent bonds that form between the sulfhydryl groups of two cysteines that effectively locks the local proteinstructure in place, making the protein extremely stable.
Figure . Quaternary structure is illustrated here by hemoglobin, which is composed of four independent polypeptidesubunits that come together in a specific conformation to make a functional hemoglobin protein.
Finally, quaternary structure is the arrangement of different individual polypeptides (subunits) into a functional protein.Obviously, only multi-subunit proteins have a quaternary structure.
1.6.11
1.6.12

E. V. Wong 1.7.1 12/4/2021 https://bio.libretexts.org/@go/page/64191
1.7: Fatty AcidsUnlike monosaccharides, nucleotides, and amino acids, fatty acids are not monomers that are linked together to form muchlarger molecules. Although fatty acids can be linked together, for example, into triacylglycerols or phospholipids, they arenot linked directly to one another, and generally no more than three in a given molecule. The fatty acids themselves arelong chains of carbon atoms topped off with a carboxyl group. The length of the chain can vary, although most are between14 and 20 carbons, and in higher order plants and animals, fatty acids with 16 and 18 carbons are the major species.
Figure . Fatty acids. (Top) Stearic acid is a fully saturated fatty acid with no carbon-carbon double bonds. (Bottom)Oleic acid is an unsaturated fatty acid.
Due to the mechanism of synthesis, most fatty acids have an even number of carbons, although odd-numbered carbonchains can also be generated. More variety can be generated by double-bonds between the carbons. Fatty acid chains withno double bonds are saturated, because each carbon is saturated with as many bonded hydrogen atoms as possible. Fattyacid chains with double bonds are unsaturated (Figure ). Those with more than one double bond are calledpolyunsaturated. The fatty acids in eukaryotic cells are nearly evenly divided between saturated and unsaturated types, andmany of the latter may be polyunsaturated. In prokaryotes, polyunsaturation is rare, but other modifications such asbranching and cyclization are more common than in eukaryotes. A table of common fatty acids is shown below.
Myristic Acid 14:0 (14 carbons, no double bonds
Palmitic Acid 16:0
Stearic Acid 18:0
Arachidic Acid 20:0
Palmitoleic Acid 16:1
Oleic Acid 18:1
Linoleic Acid 18:2
Arachidonic Acid 2:4
There are significant physical differences between the saturated and unsaturated fatty acids due simply to the geometry ofthe double-bonded carbons. A saturated fatty acid is very flexible with free rotation around all of its C-C bonds. The usuallinear diagrams and formulas depicting saturated fatty acids also serve to explain the ability of saturated fatty acids to packtightly together, with very little intervening space. Unsaturated fatty acids, on the other hand are unable to pack as tightlybecause of the rotational constraint impoarted by the double bond. The carbons cannot rotate around the double bond, sothere is now a “kink” in the chain. Generally, double-bonded carbons in fatty acids are in the cis- configuration,introducing a 30-degree bend in the structure.
1.7.13
1.7.13

E. V. Wong 1.7.2 12/4/2021 https://bio.libretexts.org/@go/page/64191
Figure . Triglycerides. These lipids are formed by conjugation of a glycerol to three fatty acyl chains through esterbonds from each glycerol oxygen.
Fatty acids inside cells are usually parts of larger molecules, rather than free acids. Some of the most common lipidsderived from fatty acids are triacylglycerols, phosphoglycerides, and sphingolipids. Triacylglycerols, as the name implies,is three fatty acid (acyl) chains connected to a glycerol molecule by ester bonds (Figure ). Triacylglycerols, alsoknown as triglycerides, may have fatty acids of the same (simple triacylglycerols) or varying types (mixedtriacylglycerols). Mixtures of these are the primary long-term energy storage molecules for most organisms. Although theymay be referred to colloquially as fats or oils, the only real difference is the degree of saturation of their constituent fattyacids. Mixtures with higher percentages of saturated fatty acids have a higher melting point and if they are solid at roomtemperature, they are referred to as fats. Triacylglycerol mixtures remaining liquid at room temperature are oils.
In human medicine, a common test for heart disease risk factors is measurement of triglyceride levels in the blood.Although various cell types can make and use triglycerides, most of the triglycerides in people are concentrated in theadipose tissue, which is made up of adipocytes, or fat cells, though liver is also a significant fat store. These cells havespecialized to carry fat globules that take up most of the volume of the cell. When triglyceride levels in the blood are high,it means that fat is being produced or ingested faster than it can be taken up by the adipocytes.
Figure . A phospholipid: the glycerol backbone (red) connects to two fatty acids and to a phosphate and polar headgroup.
Phospholipids (also called phosphoglycerides or glycerophospholipids), are also based on attachment of fatty acids toglycerol. However, instead of three fatty acyl tails, there are only two, and in the third position is a phosphate group(Figure ). The phosphate group also attaches to a “head group” . The identity of the head group names the molecule,along with the fatty acyl tails. In the example Figure, 1-stearoyl refers to the stearic acid on the 1-carbon of the glycerolbackbone; 2-palmitoyl refers to the palmitic acid on the 2-carbon of the glycerol, and phosphatidylethanolamine refers tothe phosphate group and its attached ethanolamine, that are linked to the glycerol 3-carbon. Because of the negatively-charge phosphate group, and a head group that is often polar or charged, phospholipids are amphipathic - carrying a stronghydrophobic character in the two fatty acyl tails, and a strong hydrophilic character in the head group. This amphipathicityis crucial in the role of phospholipids as the primary component of cellular membranes.
1.7.14
1.7.14
1.7.15
1.7.15

E. V. Wong 1.7.3 12/4/2021 https://bio.libretexts.org/@go/page/64191
Figure . Sphingolipids are based on the amino alcohol, sphingosine (A). Ceramides have a fatty acid tail attached,and a ceramide with a phosphocholine head group is a sphingomyelin (B). If the head group is a sugar, then the molecule isa cerebroside. (C)
Sphingolipids (Figure ) are also important constituents of membranes, and are based not upon a glycerol backbone,but on the amino alcohol, sphingosine (or dihydrosphingosine). There are four major types of sphingolipids: ceramides,sphingomyelins, cerebrosides, and gangliosides. Ceramides are sphingosine molecules with a fatty acid tail attached to theamino group. Sphingomyelins are ceramides in which a phosphocholine or phosphoethanolamine are attached to the 1-carbon. Cerebrosides and gangliosides are glycolipids - they have a sugar or sugars, respectively, attached to the 1-carbonof a ceramide. The oligosaccharides attached to gangliosides all contain at least one sialic acid residue. In additional tobeing a structural component of the cell membrane, gangliosides are particular important in cell to cell recognition.
Lipids are vaguely defined as biological compounds that are insoluble in water but are soluble in organic solvents such asmethanol or chloroform. This includes the fatty acid derivatives listed above, and it includes the final topic for this chapter,cholesterol. Cholesterol (Figure ) is the major biological derivative of cyclopentanoperhydrophenanthrene, asaturated hydrocarbon consisting of four fused ring formations. It is an important component of plasma membranes inanimal cells, and is also the metabolic precursor to steroid hormones, such as cortisol or b-estradiol. Plant cells have littleif any cholesterol, but other sterols like stigmasterol are present. Similarly, fungi have their particular sterols. However,prokaryotes do not, for the most part, contain any sterol molecules.
Figure . Cholesterol is an important lipid both as a membrane component and as a steroid precursor.
1.7.16
1.7.16
1.7.17
1.7.17

1 1/29/2022
CHAPTER OVERVIEW2: 2-(T2-FIRST LECTURE) PROTEIN STRUCTUREProteins are polymers of the bifunctional monomer, amino acids. The twenty common naturally-occurring amino acids each contain anα-carbon, an α-amino group, an α-carboxylic acid group, and an α-side chain or side group. These side chains (or R groups) may beeither nonpolar, polar and uncharged, or charged, depending on the pH and pKa of the ionizable group.
2.1: AMINO ACIDS
2.1.1: A1. AMINO ACID STRUCTURE
2.1.1.1: STRUCTURE AND PROPERTY OF THE NATURALLY-OCCURRING AMINO ACIDS2.1.2: A2. AMINO ACID STEREOCHEMISTRY2.1.3: A3. AMINO ACID CHARGES2.1.4: A4. INTRODUCTION TO AMINO ACID REACTIVITY2.1.5: A5. REACTIONS OF LYSINE2.1.6: A6. REACTIONS OF CYSTEINE2.1.7: A7. CYSTEINE CHEMISTRYTwo cysteine side chains can covalently interact in a protein to produce a disulfide. Just as HOOH (hydrogen peroxide) is moreoxidized than HOH (O in H2O2 has oxidation number of 1- while the O in H2O has an oxidation number of 2-) , RSSR is theoxidized form (S oxidation number 1-) and RSH is the reduced form (S oxidation number 2-) of thiols. There oxidation number areanalogous since O and S are both in Group 6 of the periodic table and both are more electronegative than C.
2.1.7.1: REVIEW- OXIDATION/REDUCTION (REDOX) REACTIONS AND OXIDATION NUMBERS2.1.8: A8. REACTIONS OF HISTIDINE2.1.9: A9. IN VIVO POST TRANSLATIONAL MODIFICATION OF AMINO ACIDS2.1.10: A10. GENERAL LINKS AND REFERENCES2.2: COMPOSITION, SEQUENCE AND CONFORMATIONAL ANALYSIS OF PROTEINS
2.2.1: B1. AMINO ACID ANALYSIS AND CHEMICAL SEQUENCING2.2.2: B2. SEQUENCE DETERMINATION USING MASS SPECTROMETRYMass spectrometry is supplanting more tradition methods (see above) as the choice to determine the molecular mass and structure of aprotein. Its power comes from its exquisite sensitivity and modern computational methods to determine structure through comparisonsof ion fragment data with computer databases of known protein structures.
2.2.3: B3. LEVELS OF PROTEIN STRUCTURE2.2.4: B4. ANALYSIS OF PROTEIN SECONDARY STRUCTURE2.2.5: B5. ANALYSIS OF PROTEIN TERTIARY STRUCTURE2.3: UNDERSTANDING PROTEIN CONFORMATION
2.3.1: C1. MAIN CHAIN CONFORMATIONSIn contrast to micelles and bilayers, which are aggregates of single and double chain amphiphiles, proteins are covalent polymers of20 different amino acids, which fold, to a first approximation, in a thermodynamically spontaneous process into a single uniqueconformation, theoretically at a global energy minimum. This chapter section will investigate the possible conformations available toproteins, just as we studied the conformations of free fatty acids and acyl chains in lipid aggregates.
2.3.2: C2. SECONDARY STRUCTURESecondary structures are those repetitive structures involving H bond between amide H and carbonyl O in- the main chain. Theseinclude alpha helices, beta strands (sheets) and reverse turns.
2.3.3: C3. TERTIARY STRUCTURETopologically, it is impossible for a protein to fold in an intramolecular fashion in strict analogy to the the intermolecular aggregationof single chain amphiphiles into a micelle. Consider also that the entire backbone is polar. To a first approximation we would expectthe bulk nonpolar groups would be buried surrounded by other nonpolar groups. Likewise we would expect the bulk of polar andcharged would be on the surface.
2.3.4: C4. COMMON MOTIFS IN PROTEINSGiven the number of possible combinations of 1°, 2°, and 3° structures, one might guess that the 3D structure of each protein is quitedistinctive. This is true. However, it has been found that similar substructures are found in proteins. For instance, common secondarystructures are often grouped together to form a motifs called super-secondary structure (SSS).
2 1/29/2022
2.3.5: C5. STRUCTUAL CLASES OF PROTEINS2.3.6: C6. QUARTERNARY STRUCTUREQuaternary structure is the overall structure that arises when tertiary structures aggregate to self to form homodimers, homotrimers, orhomopolymers OR aggregate with different proteins to form heteropolymers.
2.3.7: C7. RECENT REFERENCES2.4: PROTEIN FOLDING - IN VIVO AND IN VITRO
2.4.1: D1. INTRODUCTIONTo think about how proteins fold, we have to think dynamically. Luckily we have the tools of molecular dynamics (MD) at ourfingertips which helps us imagine how these processes take place and concomitantly how to probe protein folding experimentally.View the following two MD simulations and compare the spontaenously formation of a micelle and the folding of a protein before wedelve into the complex topic of protein folding and stability.
2.4.2: D2. PROTEIN FOLDING IN VITRO2.4.3: D3. FOLDING OF SINGLE PROTEIN MOLECULES2.4.4: D4. THE DENATURED STATE2.4.5: D5. MULTIPLE CONFORMATIONS FROM THE SAME SEQUENCE2.4.6: D6. PROTEIN FOLDING IN VIVO
2.4.6.1: DO YOU FIND BIOCHEMISTRY AMAZING?2.4.7: D7. REDOX CHEMISTRY AND PROTEIN FOLDING2.4.8: D8. PROTEIN TRANSPORT ACROSS MEMBRANES2.4.9: D9. RECENT REFERENCES2.5: G. PREDICTING PROTEIN PROPERTIES FROM SEQUENCES
2.5.1: G1. INTRODUCTION TO BIOINFORMATICS, COMPUTATIONAL BIOLOGY AND PROTEOMICS2.5.2: G2. PREDICTION OF SECONDARY STRUCTURE2.5.3: G3. PREDICTION OF HYDROPHOBICITY2.5.4: G4. PREDICTION OF MEMBRANE PROTEIN STRUCTURE2.5.5: G5. PREDICTION OF PROTEIN TERTIARY STRUCTURE2.5.6: G6. PROTEOMICS PROBLEM SET 12.5.7: G7. PROTEOMICS PROBLEM SET 22.5.8: G8. GENERAL LINKS AND REFERENCES2.6: H. PROTEIN AGGREGATES AND DISEASE
2.6.1: H1. PROTEIN AGGREGATIONWe have seen that protein aggregates complicate the lives of people who study protein folding in vitro and who try to express humanproteins in prokaryotes like E. Coli in vivo. Instead of viewing these aggregates as junk, some now study them avidly. It turns out thatthese aggregates are not as non-specific as earlier believed. In addition, an understanding of how and when they form will give usclues into the etiology and treatment of some of the most debilitating and feared diseases.
2.6.2: H2. PRIONS AND DISEASEThe problem in the transmissible spongiform encephalopathies (TSE's) is that amyloid-like protein aggregates form which appear tobe neurotoxic. The protein found in the plaques has the same primary sequence as the PrPc but a different secondary and presumablytertiary structure. The protein found in the plaques, called the PrPsc (the scrapie form of the the normal protein) is insoluble inaqueuous solution, protease resistant.
2.6.3: H3. MISFOLDING AND AGGREGATION SUMMARY2.6.4: H4. RECENT LINKS AND REFERENCES

Henry Jakubowski 2.1.1 1/15/2022 https://bio.libretexts.org/@go/page/64193
2.1: Amino Acids
state the charge on amino acid side chains using the Henderson Hasselbach equation and the approximate charge byinspection at any given pHdraw mechanisms and identify products for the reaction of nucleophilic side chains Lys and Cys with commonchemical modification agents and extend this understanding to reactions of His.draw mechanisms for disulfide exchange reactions for sulfhydryls using them and oxidation numbers to explainredox reactions of cysteine/cystine.
Learning Objectives
2.1.1: A1. Amino Acid Structure
2.1.2: A2. Amino Acid Stereochemistry
2.1.3: A3. Amino Acid Charges
2.1.4: A4. Introduction to Amino Acid Reactivity
2.1.5: A5. Reactions of Lysine
2.1.6: A6. Reactions of Cysteine
2.1.7: A7. Cysteine ChemistryTwo cysteine side chains can covalently interact in a protein to produce a disulfide. Just as HOOH (hydrogenperoxide) is more oxidized than HOH (O in H2O2 has oxidation number of 1- while the O in H2O has an oxidationnumber of 2-) , RSSR is the oxidized form (S oxidation number 1-) and RSH is the reduced form (S oxidation number2-) of thiols. There oxidation number are analogous since O and S are both in Group 6 of the periodic table and bothare more electronegative than C.
2.1.1.1: Structure and Property of the Naturally-Occurring Amino Acids
2.1.7.1: Review- Oxidation/Reduction (Redox) Reactions and Oxidation Numbers
Topic hierarchy

Henry Jakubowski 2.1.2 1/15/2022 https://bio.libretexts.org/@go/page/64193
Thumbnail: Structure of human hemoglobin. The proteins α and β subunits are in red and blue, and the iron-containingheme groups in green. From PDB: 1GZX . (GNU; Proteopedia Hemoglobin).
Contributors and Attributions
Prof. Henry Jakubowski (College of St. Benedict/St. John's University)
2.1.8: A8. Reactions of Histidine
2.1.9: A9. In Vivo Post Translational Modification of Amino Acids
2.1.10: A10. General Links and References

Henry Jakubowski 2.1.1.1 12/4/2021 https://bio.libretexts.org/@go/page/64194
2.1.1: A1. Amino Acid StructureProteins are polymers of a bifunctional monomer, the amino acid. The twenty common naturally-occurring amino acidseach contain an a-carbon, an a-amino group, an a-carboxylic acid group, and an a-side chain or side group. These sidechains (or R groups) may be either nonpolar, polar and uncharged, or charged, depending on the pH and pKa of theionizable group. Two other amino acids occasionally appear in proteins. One is selenocysteine, which is found in Arachea,eubacteria, and animals. Another just recently found is pyrrolysine, found in Arachea. Shultz et al. have gone one stepfurther. They have engineered bacterial to incorporate two new amino acids, O-methyl-tyrosine and p-aminophenylalanine.More recently, they (Chin et al.) have engineered the yeast strain Saccharomyces cerevisiae to incorporate five newunnatural amino acid (using the TAG nonsense codon and new, modified tRNA and tRNA synthetases) with keto groupsthat allow chemical modifications to the protein. We will concentrate only on the 20 abundant, naturally-occurring aminoacids.
Structure and Property of the Naturally-Occurring Amino Acids (Too large to include in text: print separately)Learning Amino Acids Structure: YouTube - Part 1 | Part 2
Amino acids form polymers through a nucleophilic attack by the amino group of an amino acid at the electrophiliccarbonyl carbon of the carboxyl group of another amino acid. The carboxyl group of the amino acid must first be activatedto provide a better leaving group than OH-. (We will discuss this activation by ATP latter in the course.) The resulting linkbetween the amino acids is an amide link which biochemists call a peptide bond. In this reaction, water is released. In areverse reaction, the peptide bond can be cleaved by water (hydrolysis).
When two amino acids link together to form an amide link, the resulting structure is called a dipeptide. Likewise, we canhave tripeptides, tetrapeptides, and other polypeptides. At some point, when the structure is long enough, it is called aprotein. The average molecular weight of proteins in yeast is about 50,000 with about 450 amino acids. The large proteinmight be titin with molecular weight of about 3 million (about 27,0000 amino acids). A new class of very small proteins(30 or fewer amino acids and perhaps better named as polypeptides) called smORFs (small open reading frames) haverecently been discovered to have significant biological activity (Science, doi:10.1126/science.1238802, 2013). These areencoded directly in the genome and are produced by the same processes that produce regular proteins (DNA transcriptionand RNA translation). They are not simply the result of selective cleavage of a larger protein into smaller peptidefragments.
There are many different ways to represent the structure of a polypeptide or protein. each showing differing amounts ofinformation.
Figure: Different Representations of a Polypeptide (heptapeptide)

Henry Jakubowski 2.1.1.2 12/4/2021 https://bio.libretexts.org/@go/page/64194
Figure: Amino Acids React to Form Proteins
(Note: above picture represents the amino acid in an unlikely protonation state with the weak acid protonated and the weakbase deprotonated for simplicity in showing removal of water on peptide bond formation and the hydrolysis reaction.)Proteins are polymers of twenty naturally occurring amino acids. In contrast, nucleic acids are polymers of just 4 differentmonomeric nucleotides. Both the sequence of a protein and it's total length differentiate one protein from another. Just foran octapeptide, there are over 25 billion different possible arrangement of amino acids (820). Compare this to just 65536different oligonucleotides (4 different monomeric deoxynucleotides) of 8 monomeric units, an 8mer (84). Hence thediversity of possible proteins is enormous.
Please consult the Jmol site below dealing with amino acids. Please learn the 3 letter code for the amino acids.
Jsmol: Amino Acids from Charles S. Gasser, UC Davis Jmol: Amino Acids
Contributors and Attributions
Prof. Henry Jakubowski (College of St. Benedict/St. John's University)

Henry Jakubowski 2.1.1.1.1 1/22/2022 https://bio.libretexts.org/@go/page/64195
2.1.1.1: Structure and Property of the Naturally-Occurring Amino Acids
Amino Acid3 Letter
Code1 Letter
CodeStructure
pK (α-carboxyl)
pk (α-amino)
pk (sidechain)
Nonpolar Side Chains
Glycine Gly G 2.35 9.78 .
Alanine Ala A 2.35 9.87 .
Valine Val V 2.29 9.74 .
Leucine Leu L 2.33 9.74 .
Isoleucine Ile I 2.32 9.76 .
Methionine Met M 2.13 9.28 .
Proline Pro P 1.95 10.64 .
Phenylalanine
Phe F 2.20 9.31 .
Tryptophan Trp W 2.46 9.41 .
a1 a2 a3

Henry Jakubowski 2.1.1.1.2 1/22/2022 https://bio.libretexts.org/@go/page/64195
Uncharged Polar Side Chains
Serine Ser S 2.19 9.21 .
Threonine Thr T 2.09 9.10 .
Asparagine Asn N 2.14 8.72 .
Glutamine Gln Q 2.17 9.13 .
Tyrosine Tyr Y 2.20 9.21 10.46
Cysteine Cys C 1.92 10.70 8.37
Charged Polar Side Chains10.54
Lysine Lys K 2.16 9.06 10.54
Arginine Arg R 1.82 8.99 12.48

Henry Jakubowski 2.1.1.1.3 1/22/2022 https://bio.libretexts.org/@go/page/64195
Histidine His H 1.80 9.33 6.04
Aspartic Acid Asp D 1.99 9.90 3.90
Glutamic Acid Glu E 2.10 9.47 4.07
Contributors and AttributionsProf. Henry Jakubowski (College of St. Benedict/St. John's University)

Henry Jakubowski 2.1.2.1 1/15/2022 https://bio.libretexts.org/@go/page/64196
2.1.2: A2. Amino Acid StereochemistryThe amino acids are all chiral, with the exception of glycine, whose side chain is H. As with lipids, biochemists use the Land D nomenclature. All naturally occurring proteins from all living organisms consist of L amino acids. The absolutestereochemistry is related to L-glyceraldehyde, as was the case for triacylglycerides and phospholipids. Most naturallyoccurring chiral amino acids are S, with the exception of cysteine. As the diagram below shows, the absolute configurationof the amino acids can be shown with the H pointed to the rear, the COOH groups pointing out to the left, the R group tothe right, and the NH3 group upwards. You can remember this with the mnemonic CORN.
Figure: Stereochemistry of Amino Acids.
Why does Biochemistry still use D and L for sugars and amino acids? This explanation (taken from the link below) seemsreasonable.
"In addition, however, chemists often need to define a configuration unambiguously in the absence of any referencecompound, and for this purpose the alternative (R,S) system is ideal, as it uses priority rules to specify configurations.These rules sometimes lead to absurd results when they are applied to biochemical molecules. For example, as we haveseen, all of the common amino acids are L, because they all have exactly the same structure, including the position of the Rgroup if we just write the R group as R. However, they do not all have the same configuration in the (R,S) system: L-cysteine is also (R)-cysteine, but all the other L-amino acids are (S), but this just reflects the human decision to give asulphur atom higher priority than an oxygen atom, and does not reflect a real difference in configuration. Worse problemscan sometimes arise in substitution reactions: sometimes inversion of configuration can result in no change in the (R) or(S) prefix; and sometimes retention of configuration can result in a change of prefix.
It follows that it is not just conservatism or failure to understand the (R,S) system that causes biochemists to continue withD and L: it is just that the DL system fulfils their needs much better. As mentioned, chemists also use D and L when theyare appropriate to their needs. The “explanation” given above of why the (R,S) system is little used in biochemistry is thusalmost the exact opposite of reality. This system is actually the only practical way of unambiguously representing thestereochemistry of complicated molecules with several asymmetric centres, but it is inconvenient with regular series ofmolecules like amino acids and simple sugars. "
If I told you to draw the correct stereochemistry of a molecule with 1 chiral C (S isomer for example) and I gave you thesubstituents, you could do so easily following the R, S priority rules. However, how would you draw the correct isomer for

Henry Jakubowski 2.1.2.2 1/15/2022 https://bio.libretexts.org/@go/page/64196
the L isomer of the amino acid alanine? You couldn't do it without prior knowledge of the absolute configuration of therelated molecule, L glyceraldehyde, or unless you remembered the mnemonic CORN. This disadvantage, however, is morethan made up for by the fact that different L amino acids with the same absolute stereochemistry, might be labeled R or S ,which makes this nomenclature unappealing to biochemists.
Contributors and AttributionsProf. Henry Jakubowski (College of St. Benedict/St. John's University)

Henry Jakubowski 2.1.3.1 1/29/2022 https://bio.libretexts.org/@go/page/64197
2.1.3: A3. Amino Acid ChargesMonomeric amino acids have an alpha amino group and a carboxyl group, both of which may be protonated ordeprotonated, and a R group, some of which may be protonated or deprotonated. When protonated, the amino group has a+1 charge, and the carboxyl group a 0 charge. When deprotonated the amino group has no charge, while the carboxylgroup has a -1 charge. The R groups which can be protonated/deprotonated include Lys, Arg and His, which have a + 1charge when protonated, and Glu and Asp (carboxylic acids), Tyr and Ser (alcohols) and Cys (thiol), which have 0 chargewhen protonated. Of course, when the amino acids are linked by peptide bonds (amide link), the alpha N and the carboxylC are in an amide link, and are not charged. However, the amino group of the N -terminal amino acid and the carboxylgroup of the C-terminal amino acid of a protein may be charged. The Henderson Hasselbach equation gives us a way todetermine the charge state of any ionizable group knowing the pKa of the group. Write each functional group capable ofbeing deprotonated as an acid, HA, and the deprotonated form as A. The charge of HA and A will be determined by thefunctional group. The Ka for the reaction is:
or
or
This is the (in)famous Henderson-Hasselbach (HH) equation.
The properties of a protein will be determined partly by whether the side chain functional groups, the N terminal, and the Cterminal are charged or not. The HH equation tells us that this will depend on the pH and the pKa of the functional group.
If the pH is 2 units below the pKa, the HH equation becomes, -2 = log A/HA, or .01 = A/HA. This means that thefunctional group will be about 99% protonated (with either 0 or +1 charge, depending of the functional group).If the pH is 2 units above the pKa, the HH equation becomes 2 = log A/HA, or 100 = A/HA. Therefore the functionalgroup will be 99% deprotonated.If the pH = pka, the HH equation becomes 0 = log A/HA, or 1 = A/HA. Therefore the functional group will be 50%deprotonated
From these simple examples, we have derived the +2 rule. This rule is used to quickly determine protonation, and hencecharge state, and is extremely important to know (and easy to derive). Titration curves for Gly (no ionizable) side chain,Glu (carboxlic acid side chain) and Lys (amine side chain) are shown below. You should be able to associate varioussections of these curves with titration of specific ionizable groups in the amino acids.
Figure: Titration curves for Gly, Glu, and Lys
=Ka[ ][A]H3O+
[HA](2.1.3.1)
[ ] =H3O+ Ka
[HA]
[A](2.1.3.2)
−log[ ] = −log +logH3O+ Ka
[A]
[HA](2.1.3.3)
pH = p +logKa
[A]
[HA](2.1.3.4)

Henry Jakubowski 2.1.3.2 1/29/2022 https://bio.libretexts.org/@go/page/64197
Buffer ReviewThe Henderson-Hasselbach equation is also useful in calculating the composition of buffer solutions. Remember thatbuffer solutions are composed of a weak acid and its conjugate base. Consider the equilibrium for a weak acid, like aceticacid, and its conjugate base, acetate:
If the buffer solution contains equal concentrations of acetic acid and acetate, the pH of the solution is:
A look at the titration curve for the carboxyl group of Gly (see above) shows that when the pH = pKa, the slope of thecurve (i.e. the change in pH with addition of base or acid) is at a minimum. As a general rule of thumb, buffer solution canbe made for a weak acid/base in the range of +/- 1 pH unit from the pKa of the weak acids. At the pH = pKa, the buffersolution best resists addition of either acid and base, and hence has its greatest buffering ability. The weak acid can reactwith added strong base to form the weak conjugate base, and the conjugate base can react with added strong acid to formthe weak acid (as shown below) so pH changes on addition of strong acid and base are minimized.
addition of strong base produces weak conjugate base: addition of strong acid produces weak acid:
There are two simples ways to make a buffered solution. Consider an acetic acid/acetate buffer solution.
make equal molar solution of acetic acid and sodium acetate, and mix them, monitoring pH with a pH meter, until thedesired pH is reached (+/- 1 unit from the pKa).
C C H + O ⇔ +H3 O2 H2 H3O+ C COH3−2 (2.1.3.5)
pH = p +log = 4.7 +log 1 = 4.7Ka
[A]
[HA](2.1.3.6)
C C H +O → + OH3 O2 H− C COH3−2 H2
+ → C C H + OH3O+ C COH3−2 H3 O2 H2

Henry Jakubowski 2.1.3.3 1/29/2022 https://bio.libretexts.org/@go/page/64197
take a solution of acetic acid and add NaOH at substoichiometric amounts until the desired pH is reached (+/- 1 unitfrom the pKa). In this method you are forming the conjugate base, acetate, on addition of the weak base:
Buffers for pH control: Recipes based on pKas for acids, temperature, and ionic strength
Isoelectric PointWhat happens if you have many ionizable groups in a single molecule, as is the case with a polypeptide or protein.Consider a protein. At a pH of 2, all ionizable groups would be protonated, and the overall charge of the protein would bepositive. (Remember, when carboxylic acid side chains are protonated, their net charge is 0.) As the pH is increased, themost acidic groups will start to deprotonate and the net charge will become less positive. At high pH, all the ionizablegroups will become deprotonated in the strong base, and the overall charge of the protein will be negative. At some pH,then, the net charge will be 0. This pH is called the isoelectric point (pI). The pI can be determined by averaging the pKavalues of the two groups which are closest to and straddle the pI. One of the online problems will address this in moredetail
LIst of pI and MW for proteins derived from 2D gels
Remember that pKa is really a measure of the equilibrium constant for the reaction. And of course, you remember thatDGo = -RT ln Keq. Therefore, pKa is independent of concentration, and depends only on the intrinsic stability ofreactants with respect to the products. This is true only AT A GIVEN SET OF CONDITIONS, SUCH AS T, P, ANDSOLVENT CONDITIONS.
Consider, for example acetic acid, which in aqueous solution has a pKa of about 4.7. It is a weak acid, which dissociatesonly slightly to form H+ (in water the hydronium ion, H3O+, is formed) and acetate (Ac-). These ions are moderatelystable in water, but reassociate readily to form the starting product. The pKa of acetic acid in 80% ethanol is 6.87. This canbe accounted for by the decrease in stability of the charged products which are less shielded from each other by the lesspolar ethanol. Ethanol has a lower dielectric constant than does water. The pKa increases to 10.32 in 100% ethanol, and toa whopping 130 in air!
A great interactive web site: Amino Acid Acid/Base Titration CurvespI calculator for any protein sequenceAmino Acid Repository: Properties of Amino Acids
Contributors and AttributionsProf. Henry Jakubowski (College of St. Benedict/St. John's University)
C C H +O → + OH3 O2 H− C COH3−2 H2 (2.1.3.7)

Henry Jakubowski 2.1.4.1 1/15/2022 https://bio.libretexts.org/@go/page/64198
2.1.4: A4. Introduction to Amino Acid ReactivityYou should be able to identify which side chains contain H bond donors and acceptors. Likewise, some are acids andbases. You should be familiar with the approximate pKa's of the side chains, and the N and C terminal groups. Three of theamino acid side chains (Trp, Tyr, and Phe) contribute significantly to the UV absorption of a protein at 280 nm. Thissection will dealing predominantly with the chemical reactivity of the side chains, which is important in understanding theproperties of the proteins. Many of the side chains are nucleophiles. Nucleophilicity is a measure of how rapidly moleculeswith lone pairs of electrons can react in nucleophilic substitution reactions. It correlates with basicity, which measures theextent to which a molecule with lone pairs can react with an acid (Bronsted or Lewis). The properties of the atom whichholds the lone pair are important in determining both nucleophilicity and basicity. In both cases, the atom must be willingto share its unbonded electron pair. If the atoms holding the nonbonded pair is more electronegative, it will be less likely toshare its electrons, and that molecule will be a poorer nucleophile (nu:) and weaker base. Using these ideas, it should beclear that RNH2 is a better nucelophile than ROH, OH- is a better than H2O and RSH is a better than H2O. In the lattercase, S is bigger and its electron cloud is more polarizable - hence it is more reactive. The important side chainnucleophiles (in order from most to least nucleophilic) are Cys (RSH, pKa 8.5-9.5), His (pKa 6-7), Lys (pKa 10.5) and Ser(ROH, pKa 13).
An understanding of the chemical reactivity of the various R group side chains of the amino acids in a protein is importantsince chemical reagents that react specifically with a given amino acid side chain can be used to:
identify the presence of the amino acids in unknown proteins ordetermine if a given amino acid is critical for the structure or function of the protein. For example, if a reagent thatcovalently interacts with only Lys is found to inhibit the function of the protein, a lysine might be considered to beimportant in the catalytic activity of the protein.
Figure: A REVIEW SUMMARY OF THE CHEMISTRY OF ALDEHYDES, KETONES, AND CARBOXYLIC ACIDDERIVATIVES
The side chain of serine is generally no more reactive than ethanol. It is a potent nucleophile in a certain class of proteins(proteases, for example) when it is deprotonated. The amino group of lysine is a potent nucleophile only whendeprotonated.

Henry Jakubowski 2.1.4.2 1/15/2022 https://bio.libretexts.org/@go/page/64198
Contributors and AttributionsProf. Henry Jakubowski (College of St. Benedict/St. John's University)

Henry Jakubowski 2.1.5.1 1/22/2022 https://bio.libretexts.org/@go/page/64199
2.1.5: A5. Reactions of Lysinereacts with anhydride in a nucleophilic substitution reaction (acylation).reacts reversibly with methylmaleic anhydride (also called citraconic anhydride) in a nucleophilic substitution reaction.reacts with high specificity and yield toward ethylacetimidate in a nucleophilic substitution reaction (ethylacetimidateis like ethylacetate only with a imido group replacing the carbonyl oxygen). Ethanol leaves as the amidino group forms.(has two N -i.e. din - attached to the C)
Figure: LYSINE REACTIONS 2
reacts with O-methylisourea in a nucleophilic substitution reaction. with the expulsion of methanol to form a guanidinogroup (has 3 N attached to C, nidi)reacts with fluorodintirobenzene (FDNB or Sanger's reagent) or trinitrobenzenesulfonate (TNBS, as we saw with thereaction with phosphatidylethanolamine) in a nucleophilic aromatic substitution reaction to form 2,4-DNP-lysine orTNB-lysine.reacts with Dimethylaminonapthelenesulfonylchloride (Dansyl Chloride) in a nucleophilic substitution reaction.

Henry Jakubowski 2.1.5.2 1/22/2022 https://bio.libretexts.org/@go/page/64199
Figure: LYSINE REACTIONS 3
reacts with high specificity toward aldehydes to form imines (Schiff bases), which can be reduced with sodiumborohydride or cyanoborohydride to form a secondary amine.

Henry Jakubowski 2.1.5.3 1/22/2022 https://bio.libretexts.org/@go/page/64199
Contributors and AttributionsProf. Henry Jakubowski (College of St. Benedict/St. John's University)

Henry Jakubowski 2.1.6.1 11/27/2021 https://bio.libretexts.org/@go/page/64200
2.1.6: A6. Reactions of CysteineCysteine is a potent nucleophile, which is often linked to another Cys to form a covalent disulfide bond.
Figure: CYSTEINE REACTIONS 1
reacts with iodoacetic acid in an SN2 rx., adding a carboxymethyl group to the S.reacts with iodoacetamide in an SN2 rx, adding a carboxyamidomethyl group to S.reacts with N-ethylmaleimide in an addition rx. to the double bond
Figure: a quick review of sulfur redox chemistry

Henry Jakubowski 2.1.6.2 11/27/2021 https://bio.libretexts.org/@go/page/64200
Figure: CYSTEINE REACTIONS 2
reacts with R'-S-S-R'', a disulfide, in a disulfide interchange reaction, to form R-S-S-R'reacts with oxidizing agents like HCOOOH, performic acid, to form cysteic acid.reacts with 5,5-Dithiobis (2-nitrobenzoic acid) (DTNB or Ellman's reagent) in a RSH displacement reaction in whichDTNB is cleaved and the 2-nitro-5-thiobenzoic acid anion, which absorbs at 412 nm, is released. Used to quantitatetotal RSH in a protein
Contributors and Attributions
Prof. Henry Jakubowski (College of St. Benedict/St. John's University)

Henry Jakubowski 2.1.7.1 1/29/2022 https://bio.libretexts.org/@go/page/64201
2.1.7: A7. Cysteine ChemistryTwo cysteine side chains can covalently interact in a protein to produce a disulfide. Just as HOOH (hydrogen peroxide) ismore oxidized than HOH (O in H2O2 has oxidation number of 1- while the O in H2O has an oxidation number of 2-) ,RSSR is the oxidized form (S oxidation number 1-) and RSH is the reduced form (S oxidation number 2-) of thiols. Thereoxidation number are analogous since O and S are both in Group 6 of the periodic table and both are more electronegativethan C.
A quick review of redox reactions and oxidation numbers.
Figure: DISULFIDE - CYSTINE - REACTIONS
When a protein folds, two Cys side chains might approach each other, and form an intrachain disulfide bond. Likewise,two Cys side chains on separate proteins might approach each other and form an interchain disulfide. Such disulfides mustbe cleaved, and the chains separated before analyzing the sequence of the protein. The disulfide in protein can be cleavedby reducing agents such as beta-mercaptoethanol, dithiothreitol, tris (2-carboxyethyl) phosphine (TCEP) or oxidizingagents which further oxidizes the disulfide to separate cysteic acids.
Figure: TCEP reduction of disulfides

Henry Jakubowski 2.1.7.2 1/29/2022 https://bio.libretexts.org/@go/page/64201
Figure: Disulfide Oxidizing Agents - b-mercaptoethanol, dithiothreitol, and phosphines
The inside of cells are maintained in a reduced environment by the presence of many "reducing" agents, such as thetripeptide g-glu-cys-gly (glutathione). Hence intracellular proteins usually do not contain disulfides, which are abundant inextracellular proteins (such as those found in blood) or in certain organelles such as the endoplasmic reticulum andmitochondrial intermembrane space where disulfides can be introduced.
Figure: Cleaving Disulfide Bonds in Proteins
Cysteine Redox ChemistryThe sulfur in cysteine is redox-active and hence can exist in a wide variety of states, depending on the local redoxenvironment and the presence of oxidzing and reducing agents. A potent oxidizing agent that can be made in cells ishydrogen peroxide, which can lead to more drastic and irreversible chemical modifications to the Cys side chains. If areactive Cys is important to protein function, then the function of the protein can be modulated (sometimes reversibly,sometimes irreversibly) with various oxidizing agents, as shown in the figure below.

Henry Jakubowski 2.1.7.3 1/29/2022 https://bio.libretexts.org/@go/page/64201
Figure: Redox state of Cysteine
Contributors and AttributionsProf. Henry Jakubowski (College of St. Benedict/St. John's University)

Henry Jakubowski 2.1.7.1.1 12/25/2021 https://bio.libretexts.org/@go/page/64202
2.1.7.1: Review- Oxidation/Reduction (Redox) Reactions and OxidationNumbersIn oxidation/reduction reactions, there is a transfer of charge - an electron - from one species to another.Oxidation is the loss of electrons and reduction is a gain in electrons. Use these acronyms to help youremember: Leo Ger - Loss of electrons oxidation; Gain of electrons reduction or Oil Rig - Oxidation involvesloss, Reduction involves gain - of electrons.) These reactions always occur in pair. That is, an oxidation isalways coupled to a reduction. When something gets oxidized, another agent gains those electrons, acting asthe oxidizing agent, and gets reduced in the process. When a substance gets reduced, it gains electrons fromsomething that gave them up, the reducing agent, which in the process gets oxidized. It's just like an acidbase reaction. An acid reacts with a base to form a new acid and base.
Reactions in which a pure metal reacts with a substance to form a salts are clearly oxidation reactions.Consider for example the reaction of sodium metal and chlorine gas.
Na is a pure metal. (Although it really exists as sodium ions surrounded by a sea of electrons), consider it forour purposes to exist as elemental Na, which has a formal charge of 0. Likewise, Cl is a pure element. Todetermine the charge on each Cl atoms, we divide the two bonded electrons equally between the two Cl atoms,hence assigning 7 electrons to each Cl. Hence the formal charge on each Cl is 0.
In a similar fashion we can determine the oxidation number of an atom bonded to another atom. We canassign electrons to a bonded atoms, compare that number to the number in the outer shell of the unbondedatoms, and see if there is an excess or lack. In these cases, the same number of electrons get assigned toeach atoms as when we are calculating formal charge. Hence the oxidation numbers are equal to the formalcharge in these examples. Clearly, Na went from an oxidation number and formal charge of 0 to 1+ and Cl from0 to 1-. Therefore, Na was oxidized by the oxidizing agent Cl , and Cl was reduced by the reducing agent Na.
Let's consider other similar redox reactions:
In the first two reactions, a pure metal (with formal charges and oxidation numbers of 0) lose electrons to formmetal oxides, with positive metal ions. The oxygen goes form a formal charge and oxidation number of 0 to 2-and hence is reduced.
What about the last case? Each atom in both reactants and products has a formal charge of 0. This reaction, acombustion reactions with molecular oxygen, is also a redox reaction. Where are the electrons that are lost orgained?
This can be determined by assigning the electrons in the different molecules in a way slightly different thanwith formal charge. For shared (bonded) electrons, assign both electrons in the bond to the atom in theshared pair that has a higher electronegativity. Next calculate the apparent charge on the atom by comparingthe number of assigned electrons to the usual number of outer shell electrons in an atom (i.e. the groupnumber). This apparent charge is called the oxidation number. When using this method for the reaction of Cto CO , the C in carbon dioxide has an oxidation number of 4+ while the two oxygens have an oxidationnumber of 2- . Clearly, the C has "lost electrons" and has become oxidized by interacting with the oxidizingagent O . as it went from C to CO . If the atoms connected by a bond are identical, we split the electrons andassign one to each atom. In water, the O has an oxidation number of 2- while each H atom has an oxidationnumber of 1+. Notice that the sum of the oxidation numbers of the atoms in a species is equal to the net chargeon that species.
2Na(s) +C → 2NaCl(s)l2 (2.1.7.1.1)
2
2 2
2Mg(s) + (g) → 2MgO(s)O2
Fe(s) + (g) → Fe oxides (s)O2
C(s) + (g) → C (g)O2 O2
2
2 2

Henry Jakubowski 2.1.7.1.2 12/25/2021 https://bio.libretexts.org/@go/page/64202
What we have done is devise another way to count the electrons around an atom and the resulting charges onthe atoms. See the animation below to review electron counting, and the 3 "types of charges" - partial charges,formal charges, and now oxidation numbers.
ANIMATION: Counting electrons and determining "charge" on an atom.
Consider an O-X bond, where X is any element other than F or O. Since O is the second most electronegativeatom, the two electrons in the O-X bond will be assigned to O. In fact all the electrons around O (8) will beassigned to O, giving it always an oxidation number of 2-. This will be true for most molecules containing O wewe encounter except for O and H O (hydrogen peroxide), where the oxidations number for O are 0 and 1-,respectively. Now consider a C-H bond. Since C is nearer to F, O, and N than is H, we could expect C (en 2.5)to be more electronegative than H (en 2.1). Therefore, both electrons in the C-H bond are assigned to C, and Hhas an oxidation number of 1+. This will always be true for the molecules we study, except H-H. A quicksummary of oxidation numbers shows that for the molecules we will study:
O always has an oxidation # of 2- (except when it is bonded to itself or F)H always has an oxidation # of 1+ (except when it is bonded to itself)The sum of the oxidation numbers on a compound must equal the charge on the compound (just like thecase of formal charges)
Notice in each of the reactions above, oxygen is an oxidizing agent. Also notice that in each of these reactions,a pure element is chemically changed into a compound with other elements. All pure, uncharged elementshave formal charges and oxidation numbers of 0. When they appear as compounds in the products, they musthave a different oxidation number. The disappearance or appearance of a pure element in a chemical reactionmakes that reaction a redox reaction.
Now lets consider a more complicated case - the reaction of methane and oxygen to produce carbon dioxideand water:
Since H has an oxidation # of 1+, the oxidation # of C in CH is 4-, while in CO it is 4+. Clearly C has beenoxidized by the oxidizing agent O . O has been reduced to form both products.
Now consider a series of step-wise reactions of CH ultimately leading to CO
.
You should be able to determine that the oxidation numbers for the central C in each molecule are 4-, 2-, 0, 2+,and 4+ as you proceed from left to right, and hence represent step-wise oxidations of the carbon. Stepwiseoxidations of carbon by oxidizing agents different than O are the hallmark of biological oxidation reactions.Each step-wise step releases smaller amounts of energy, which can be handled by the body more readily that ifit occurred in "one step", as indicated in the combustion of methane by O above.
You may have learned in a previous course that in oxidation reactions, there is an increase in the number of X-O bonds, where X is some atom. Alternatively, it also involves the decrease of X-H bonds. Reduction would bethe opposite case - decreasing the number of X-O bonds and/or increasing the number of X-H bonds. This ruleapplies well to the above step-wise example.
Now let's consider sulfur. in sulfhydrls and disulfides.
2 2 2
C + → O+CH4 O2 H2 O2 (2.1.7.1.2)
4 2
2 2
4 2
2
2

Henry Jakubowski 2.1.7.1.3 12/25/2021 https://bio.libretexts.org/@go/page/64202
The oxidation number of S in RSH (2-) and in RSSH (1-) is the same as for O in ROH and ROOR. This must betrue only if S is more electronegative than C. It is but not by much in the Pauling Scale (2.55 for C, 2.58 for S).In some general chemistry textbooks, the values are both given as 2.5. Other scales give different values asshown below.
Scale C S
Pauling 2.55 2.58
Sanderson 2.75 2.96
Allred Rochow 2.5 2.44
Mulliken-Jaffe 2.48 2.69
Allen 2.544 2.589
Avg value for all 2.56 2.65
Hence, S is more electronegative than C (or H) and its oxidation numbers are analogous to oxygen.
Contributors and Attributions
Prof. Henry Jakubowski (College of St. Benedict/St. John's University)

Henry Jakubowski 2.1.8.1 1/8/2022 https://bio.libretexts.org/@go/page/64203
2.1.8: A8. Reactions of HistidineHistidine is one of the strongest bases at physiological pH's. The nitrogen atom in a secondary amine might be expected tobe a stronger nucleophile than a primary amine through electron release to that N in a secondary amine. Opposing thiseffect is the steric hindrance by the two attached Cs of the N on attach on an electrophile . However, in His, this stericeffect is minimized since the 2Cs are restrained by the ring. With a pKa of about 6.5, this amino acid is one of the strongestavailable bases at physiological pH (7.0). Hence, it can often cross-react with many of the reagents used to modify Lys sidechains. His reacts with reasonably high selectivity with diethyl pyrocarbonate.
Figure: REACTIONS OF HISTIDINE
Figure: Where is the H on His? Where is the Charge?

Henry Jakubowski 2.1.8.2 1/8/2022 https://bio.libretexts.org/@go/page/64203
Contributors and AttributionsProf. Henry Jakubowski (College of St. Benedict/St. John's University)

Henry Jakubowski 2.1.9.1 1/5/2022 https://bio.libretexts.org/@go/page/64204
2.1.9: A9. In Vivo Post Translational Modification of Amino AcidsAmino acids in naturally occurring proteins are also subjected to chemical modification within cells. These modificationsalter the properties of the amino acid that is modified, which can alter the structure and function of the protein. Mostchemical modifications made to proteins within cells occur after the protein is synthesized in a process called translation.The resulting chemical changes are termed post-translational modifications.
Figure: Post-translational modification of proteins
Here is a list of post-translational modification from the Swiss Institute of Bioinformatics:
PDOC00001 1 N-glycosylation site
PDOC00004 1 cAMP- and cGMP-dependent protein kinase phosphorylation site
PDOC00005 1 Protein kinase C phosphorylation site
PDOC00006 1 Casein kinase II phosphorylation site
PDOC00007 1 Tyrosine kinase phosphorylation site
PDOC00008 1 N-myristoylation site
PDOC00009 1 Amidation site

Henry Jakubowski 2.1.9.2 1/5/2022 https://bio.libretexts.org/@go/page/64204
PDOC00010 1 Aspartic acid and asparagine hydroxylation site
PDOC00012 1 Phosphopantetheine attachment site
PDOC00013 1 Prokaryotic membrane lipoprotein lipid attachment site
PDOC00342 1 Prokaryotic N-terminal methylation site
PDOC00266 1 Prenyl group binding site (CAAX box)
PDOC00687 2 Intein N- and C-terminal splicing motif profiles
Contributors and AttributionsProf. Henry Jakubowski (College of St. Benedict/St. John's University)
Henry Jakubowski 2.1.10.1 1/1/2022 https://bio.libretexts.org/@go/page/64205
2.1.10: A10. General Links and ReferencesThe Amino Acid Repository from the Image Library of Biological Molecules. Contains a great data base of propertiesabout amino acids.Amino Acid Information form Rockefeller University.
References
1. Chin, J. et al. An expanded eukaryotic genetic code. Science. 301. pg 964 (2003)2. Schultz, P. et al. JACS, last week January, 20033. A New Twist on Chirality (how homochirality in amino acids may have developed). Science. 292, pg 2021 (2001)
Contributors and Attributions
Prof. Henry Jakubowski (College of St. Benedict/St. John's University)

Henry Jakubowski 2.2.1 1/22/2022 https://bio.libretexts.org/@go/page/64206
2.2: Composition, Sequence and Conformational Analysis of Proteins
describe in general terms the procedures and chemical steps in the determinations of the following for proteins:molecular weightpresence of certain specific amino acidsamino acid compositionN and C terminal amino acidspecific amino acid necessary for binding and activityamino acid sequencesecondary structure3D structure
Thumbnail: Structure of human hemoglobin. The proteins α and β subunits are in red and blue, and the iron-containingheme groups in green. From PDB: 1GZX . (GNU; Proteopedia Hemoglobin).
Contributors and Attributions
Prof. Henry Jakubowski (College of St. Benedict/St. John's University)
Learning Objectives
2.2.1: B1. Amino Acid Analysis and Chemical Sequencing
2.2.2: B2. Sequence Determination Using Mass SpectrometryMass spectrometry is supplanting more tradition methods (see above) as the choice to determine the molecular massand structure of a protein. Its power comes from its exquisite sensitivity and modern computational methods todetermine structure through comparisons of ion fragment data with computer databases of known protein structures.
2.2.3: B3. Levels of Protein Structure
2.2.4: B4. Analysis of Protein Secondary Structure
2.2.5: B5. Analysis of Protein Tertiary Structure
Topic hierarchy

Henry Jakubowski 2.2.1.1 11/27/2021 https://bio.libretexts.org/@go/page/64207
2.2.1: B1. Amino Acid Analysis and Chemical SequencingAs described in the Introduction to Proteins, we can understand proteins structure at varying level of complexity.
Figure: Protein Analysis from low to high resolution.
In the last chapter section, we learned about the charge and chemical reactivity properties of isolated amino acids andamino acids in proteins. The analysis of a whole protein is complicated since each different amino acid might berepresented many times in the sequence. Each protein has an N-terminal and C-terminal amino acid and secondarystructure. Some proteins exists biologically as multisubunit proteins, which adds to the complexity of the analyses sincenow the proteins would have multiple N- and C-terminal ends. In addition, isolated proteins might have chemicallymodifications (post-translational) which add to the functionalities of the proteins but also add to the complexities of theanalyses. To illustrate some of these issues, view the structure of the RhoA program below.
Updated RhoA - a cytoplasmic protein - The complexity of protein analysis Jmol14 (Java) | JSMol (HTML5)
Amino Acid CompositionAt a low level of resolution, we can determine the amino acid composition of the protein by hydrolyzing the protein in 6 NHCl, 100oC, under vacuum for various time intervals. After removing the HCl, the hydrolysate is applied to an ion-exchange or hydrophobic interaction column, and the amino acids eluted and quantitated with respect to known standards.A non naturally- occurring amino acid like norleucine is added in known amounts as an internal standard to monitorquantitative recovery during the reactions. The separated amino acids are often derivitized with ninhydrin orphenylisothiocyantate to facilitate their detection. The reaction is usually allowed to procedure for 24, 36, and 48 hours,since amino acids with OH (like ser) are destroyed. A time course allows the concentration of Ser at time t=0 to beextrapolated. Trp is also destroyed during the process. In addition, the amide links in the side chains of Gln and Asn arehydrolyzed to form Glu and Asp, respectively.
AA Analysis: Iowa State University Protein Facility
N- and C-Terminal Amino Acid Analysis
The amino acid composition does not give the sequence of the protein. The N-terminus of the protein can be determined byreacting the protein with fluorodinitrobenzene (FDNB) or dansyl chloride, which reacts with any free amine in the protein,including the epsilon amino group of lysine. The amino group of the protein is linked to the aromatic ring of the DNBthrough an amine and to the dansyl group by a sulfonamide, and are hence stable to hydrolysis. The protein is hydrolyzedin 6 N HCl, and the amino acids separated by TLC or HPLC. Two spots should result if the protein was a single chain,with some Lys residues. The labeled amino acid other than Lys is the N-terminal amino acid. The C-terminal amino acidcan be determined by addition of carboxypeptidases, enzymes which cleave amino acids from the C-terminal. A timecourse must be done to see which amino acid is released first. N-terminal analysis can also be done as part of sequencingthe entire protein as discussed below (Edman degradation reaction).

Henry Jakubowski 2.2.1.2 11/27/2021 https://bio.libretexts.org/@go/page/64207
Analysis for Specific Amino AcidsAromatic amino acids can be detected by their characteristic absorbance profiles. Amino acids with specific functionalgroups can be determined by chemical reactions with specific modifying groups, as shown in section 2A.
Figure: amino acid absorbance profiles
Amino Acid Sequence - Edman DegradationTwo methods exist to determine the entire sequence of a protein. In one, the protein is sequenced; in the other, the DNAencoding the protein is sequenced, from which the amino acid sequence can be derived. The actually protein can besequenced by automated, sequential Edman Degradation.
Figure: Edman Degradation

Henry Jakubowski 2.2.1.3 11/27/2021 https://bio.libretexts.org/@go/page/64207
In this technique, a protein adsorbed to a solid phase reacts with phenylisothiocyanate. An intramolecular cyclization andcleavage of the N-terminal amino acid results, which can be washed from the adsorbed protein and detected by HPLCanalysis. The yields in this technique are close to 100%. However, with time, more chains accumulate in which an N-terminal amino acid has not been removed. If it is removed on the next step, two amino acids will elute, creating increasing"noise" in the elution step - i.e. more than 1 amino acid derivative will be detected. Hence the maximal length of thepeptide which can be sequenced is about 50 amino acids. Most proteins are larger than that. Hence, before the protein canbe sequenced, it must be cleaved with specific enzymes called endoproteases which cleave proteins after specific sidechains. For example, trypsin cleaves proteins within a chain after Lys and Arg, while chymotrypsin cleaves after aromaticamino acids, like Trp, Tyr, and Phe. Chemical cleavage by small molecules can be used as well. Cyanogen bromide, CNBr,cleaves proteins after methionine side chains. The individual proteins must be cleaved using two different methods, andeach peptide fragment isolated and sequenced. Then the order of the cleaved peptides with known sequence can be piecedtogether by comparing the peptide sequences obtained using different cleavage methods. Many proteins also have disulfidebonds connecting Cys side chains distal to each other in the polypeptide chain. Proteolytic or chemical cleavage of theprotein would lead to the formation of a fragment containing two peptides linked by disulfides. Edman degration wouldrelease two amino acids from such fragments. To avoid this problem, the protein is oxidized with performic acid, whichirreversibly oxidizes free Cys, or Cys-Cys disulfides to cysteic acid residues. A summary of the steps involved in proteinsequencing are shown below:

Henry Jakubowski 2.2.1.4 11/27/2021 https://bio.libretexts.org/@go/page/64207
PROTEIN SEQUENCING STRATEGY - 8 STEPS1. If the protein contains more than one polypeptide chain, the chains are separated and purified. If disulfide bonds
connect two different chains, the S-S bond must be cleaved (as described in step 2) and each peptide independentlypurified.
2. Intrachain S-S bonds between Cys side chains are cleaved with performic acid. (See above for interchain S-S bonds).3. The amino acid composition of each chain is determined4. The N-terminal and C-terminal residues are identified.5. Each polypeptide chain is cleaved into smaller fragments, and the amino acid composition and sequence of each
fragment is determined.6. Step 5 is repeated, using a different cleavage procedure to generate a different and overlapping set of peptide
fragments.7. The overall amino acid sequence of the protein is reconstructed from the sequences in overlapping fragments.8. The position of the S-S is located. (See online problem set - Proteins)
Contributors and AttributionsProf. Henry Jakubowski (College of St. Benedict/St. John's University)

Henry Jakubowski 2.2.2.1 12/25/2021 https://bio.libretexts.org/@go/page/64208
2.2.2: B2. Sequence Determination Using Mass SpectrometryMass spectrometry is supplanting more tradition methods (see above) as the choice to determine the molecular mass andstructure of a protein. Its power comes from its exquisite sensitivity and modern computational methods to determinestructure through comparisons of ion fragment data with computer databases of known protein structures. In massspectrometry, a molecule is first ionized in an ion source. The charged particles are then accelerated by an electric fieldinto a mass analyzer where they are subjected to an external magnetic field. The external magnetic field interacts with themagnetic field arising from the movement of the charged particles, causing them to deflect. The deflection is proportionalto the mass to charge ratio, m/z. Ions then enter the detector which is usually a photomultiplier. Sample introduction intothe ion source occurs though simple diffusion of gases and volatile liquids from a reservoir, by injection of a liquid samplecontaining the analyte by spraying a fine mist, or for very large proteins by desorbing a protein from a matrix using a laser.Analysis of complex mixtures is done by coupling HPLC with mass spectrometry in a LCMS.
Ion source: There are many methods to ionize molecules, including atmospheric pressure chemical ionization (APCI),chemical ionization (CI), or electron impact (EI). The most common methods for protein/peptide analyzes are electrosprayionization (ESI) and matrix assisted laser desorption ionization (MALDI).
Electrospray ionization (ESI) - The analyte, dissolved in a volatile solvent like methanol or acetonitrile, is injected througha fine stainless steel capillary at a slow flow rate into the ion source. A high voltage (3-4 kV) is maintained on the capillarygiving it a positive charge with respect to the other oppositely charged electrode. The flowing liquid becomes charged withsame polarity as the polarity of the positively charged capillary. The high field leads to the emergence of the sample as acharged aerosol spray of charged microdrops which reduces electrostatic repulsions in the liquid. This method essentiallyuses electrical energy to produce the aerosol instead of mechanical energy to produce a liquid aerosol, as in the case of aperfume atomizer. Surrounding the capillary is a flowing gas (nitrogen) which helps to move the aerosol towards the massanalyzer. The microdrops become smaller in size as the volatile solvent evaporates, increasing the positive charge densityon the drops. Eventually electrostatic repulsions cause the drops to explode in a series of steps, ultimately producinganalyte devoid of solvent. This gentle method of ionization produces analytes that are not cleaved but ready forintroduction into the mass analyzer. Protein emerge from this process with a roughly Gaussian distribution of positivecharges on basic side chains. In organic chemistry you studied mass spectrums of small molecules induced by electronbombardment. This produces ions of +1 charge as an electron is stripped away from the neutral molecule. The highest m/zpeak in the spectrum is the parent ion or M+ ion. The highest m/z ratio detectable in the mass spectrum is in the thousands.However, large peptides and proteins with large molecular masses can be detected and resolved since the charge on theions are great than +1. In 2002, John Fenn was awarded a Noble Prize in Chemistry for the development and use of ESI tostudy biological molecules.
An example of an ESI spectrum of apo-myoglobin is shown below. Note the roughly Gaussian distribution of the peaks,each of which represents the intact protein with charges differing by +1. Protein have positive charges by virtue of bothprotonation of amino acid side chains as well as charges induced during the electrostray process itself. Based on the aminoacid sequence of myoglobin and the assumption that the pKa of the side chains are the same in the protein as for isolatedamino acids, the calculated average net charges of apoMb would be approximately +30 at pH 3.5, +20 at pH 4.5, +9 at pH6, and 0 at pH 7.8 (the calculated pI). The mass spectrum below was taken by direct injection into the MS of apoMb in0.1% formic acid (pH 2.8). Charges on the peptide are a combined results of charges present on the peptide before theelectrospray and changes in charges induced during the process. www.chm.bris.ac.uk/ms/theory/...onisation.html. .
Figure: ESI Mass Spectrum of Apo-Myoglobin

Henry Jakubowski 2.2.2.2 12/25/2021 https://bio.libretexts.org/@go/page/64208
The molecular mass of the protein can be determined by analyzing two adjacent peaks, as shown in the figure below.
If M is the molecular mass of the analyte protein, and n is the number of positive charges on the protein represented in agiven m/z peak, then the following equations gives the molecular mass M of the protein for each peak:
where 1.008 is the atomic weight of H. Since there is only one value of M, the two equations can be set equal to eachother, giving:
Solving for n gives:
Knowing n, the molecular mass M the protein can be calculated for each m/z peak. The best value of M can then bedetermined by averaging the M values determined from each peak (16,956 from the above figure). For peaks from m/z of893-1542, the calculated values of n ranged from +18 to +10.
Matrix assisted laser desorption ionization (MALDI): In this technique, used for larger biomolecules like proteins andpolysaccharides, the analyte is mixed with an absorbing matrix material. Laser excitation is used to excite the matrix,leading to energy transfer that results in ionization and "launching" of the matrix and analyte in ion form from the solidmixture. Parent ion peaks of (M+H)+ and (M-H)- are formed.
Mass AnalyzerQuadrupole ion trap (used in ESI) - A complex mixture of ions can be contained (or trapped) in this type of mass analyzer.Two common type are linear and 3D quadrupoles.
Figure: Linear and 3D Quadrupoles
Mpeak2 = n(m/z)peak2 −n(1.008) (2.2.2.1)
Mpeak1 = (n +1)(m/z)peak1 −(n +1)(1.008) (2.2.2.2)
n(m/z)peak2 −n(1.008) = (n +1)(m/z)peak1 −(n +1)(1.008) (2.2.2.3)
n = [(m/z)peak1 −1.008]/[(m/z)peak2 −(m/z)peak1]. (2.2.2.4)

Henry Jakubowski 2.2.2.3 12/25/2021 https://bio.libretexts.org/@go/page/64208
As dipoles display positive and negative charge separation on a linear axis, quadrupoles have either opposite electricalcharges or opposite magnetic fields at the opposing ends of a square or cube. In charge separation, the monopole (sum ofthe charges) and dipoles cancel to zero, but the quadrupole moment does not. The quadrupole traps ions using acombination of fixed and alternating electric fields. The trap contains He at 1 mTorr. For the 3D trap, The ring electrodehas a oscillating RF voltage which keeps the ions trapped. The end caps also have an AC voltage. Ions oscillate in the trapwith a "secular" frequency determined by the frequency of the RF voltage, and of course, the m/z ratio. By increasing thethe amplitude of the RF field across the ring electron, ion motion in the trap becomes destabilized and leads to ion ejectioninto the detector. When the secular frequency of ion motion matches the applied AC voltage to the endcap electrodes,resonance occurs and the amplitude of motion of the ions increases, also allowing leakage out of the ion trap into thedetector.
Ion Trap TutorialIon Trap Animation (requires download) from Thermo Scientific
Time of Flight (TOF) tube (used in MALDI) - a long tubes is used and the time required for ion detection is determined.The small molecular mass ions take the shortest time to reach the detector.
Tandem Mass Spectrometry (MS/MS)
Quadrupole mass analyzers which can select ions of varying m/z ratios in the ion traps are commonly used in for tandemmass spectrometry (MS/MS). In this technique, the selected ions are further fragmented into smaller ions by a processcalled collision induced dissociation (CID). When performed on all of the initial ions present in the ion trap, the sequenceof a peptide/protein can be determined. This techniques usually requires two mass analyzers with a collision cell in-between where selected ions are fragmented by collision with an inert gas. It can also be done in a single mass analyzerusing a quadrupole ion trap.
In a typical MS/MS experiment to determine a protein sequence, a protein is cleaved into protein fragments with anenzyme such as trypsin, which cleaves on carboxyl side of positively charge Lys and Arg side chains. The average size ofproteins in the human proteome is approximately 50,000. If the average molecular mass of an amino acid in a protein isaround 110 (18 subtracted since water is released on amide bond formation), the average number of amino acids in theprotein would be around 454. If 10% of the amino acids are Arg and Lys, the on average there would be approximately 50Lys and Arg, and hence 50 tryptic peptides of average molecular mass of 1000. The fragments are introduced in the MSwhere a peptide fragment fingerprint analysis can be performed. The MWs of the fragments can be identified andcompared to known peptide digestion fragments from known proteins to identify the analyte protein.
To get sequence information, a tryptic peptide with a specific m/z ratio (optimally with a single +1 charge) is furtherselected in the ion trap and fragmented on collision with an inert agent (MS/MS). Since the m/e range of massspectrometers is in the thousands, tryptic fragments with a single charge can easily be detected and targeted for MS/MS.The likely and observed cleavages for a tetrapeptide and the resulting ions with a +1 charge are illustrated below. Ions withthe original N terminus are denoted as a, b, and c, while ions with the original C terminus are denoted as x, y, and z. c and

Henry Jakubowski 2.2.2.4 12/25/2021 https://bio.libretexts.org/@go/page/64208
y ions gain an extra proton from the peptide to form positively charged -NH3+ groups. The actual ions observed depend onmany factors including the sequence of the peptide, its original charge, the energy of the collision inducing thefragmentation, etc. Low energy fragmentation of peptides in ion traps usually produce a, b, and y ions, along with peaksresulting from loss of NH3 (a*, b* and y*) or H2O (ao, bo and yo). No peaks resulting from fragmentation of side chainsare observed. Fragmentation at two sites in the peptide (usually at b and y sites in the backbone) form an internal fragment.
Figure: Peptide Fragmentation and Sequencing by MS/MS
The y1 peak represents the C-terminal Lys or Arg (in this example) of the tryptic peptide. Peak y2 has one addition aminoacid compared to y1 and the molecular mass difference identifies the extra amino acid. Peak y3 is likewise one amino acidlarger than y2. All three y fragments peaks have a common Lys/Arg C-terminal and the charged fragment contains the C-terminal end of the original peptide. All b fragment peaks for a given peptide contain a common N terminal amino acidwith b1 the smallest. Note that the subscript represents the number of amino acids in the fragment. By identifying b and ypeaks the actual sequence of small peptide can be determined. Usually spectra are match to databases to identify thestructure of each peptide and ultimately that of the protein. The actual m values for fragments can be calculated as follows,where (N is the molecular mass of the neutral N terminal group, (C) is the molecular mass of the neutral c terminal group,and (M) is the molecule mass of the neutral amino acids.
a: (N)+(M)-CHOb: (N)+(M)y: (C)+(M)+H (note in the figure above that the amino terminus of the y peptides has an extra proton in the +1 chargedpeptides.)
m/z values can be calculated from the calculated m values and by adding the one H mass to the overall z if the overallcharge is +1, etc.
Table: Masses of amino acid residues in a protein. (For N terminal amino acid, add 1 H. for C terminus add OH)Residue Code Monoisotopic Mass Average Mass
Ala A 71.03714 71.0779
Arg R 156.101111 156.1857
Asn N 114.042927 114.1026
Asp D 115.026943 115.0874

Henry Jakubowski 2.2.2.5 12/25/2021 https://bio.libretexts.org/@go/page/64208
Residue Code Monoisotopic Mass Average Mass
Cys C 103.009185 103.1429
Glu E 129.042593 129.114
Gln Q 128.058578 128.1292
Gly G 57.021464 57.0513
His H 137.058912 137.1393
Ile I 113.084064 113.1576
Leu L 113.084064 113.1576
Lys K 128.092963 128.1723
Met M 131.040485 131.1961
Phe F 147.068414 147.1739
Pro P 97.052764 97.1152
Ser S 87.032028 87.0773
Thr T 101.047679 101.1039
Trp W 186.079313 186.2099
Tyr Y 163.06332 163.1733
Val V 99.068414 99.1311
As an example, sing these MW values, the sequence of the human Glu1- fibrinopeptide B can be determined from MS/MSspectra shown in an annotated form below. Note that most of the b peaks are b* resulting from lost of NH3 from the Nterminus.
Figure: Annotated MS/MS spectra of human Glu1- fibrinopeptide B
MS review from Organic ChemistryMass Spectroscopy Educational ResourcesMass Spec ResourcesSequence Determination: AnimationAn Introduction to Mass Spectrometry

Henry Jakubowski 2.2.2.6 12/25/2021 https://bio.libretexts.org/@go/page/64208
Ion TrapsWhat is electrospray?Protein Prospector: Proteomics tools for mining sequence databases in conjunction with Mass Spectrometry
experimentsProteomics Research for Integrative BiologyMascot from Matrix Science: a powerful search engine which uses mass spectrometry data to identify proteins
from primary sequence databasesPeptide Mass Fingerprinting: A tutorial
Contributors and AttributionsProf. Henry Jakubowski (College of St. Benedict/St. John's University)

Henry Jakubowski 2.2.3.1 1/29/2022 https://bio.libretexts.org/@go/page/64209
2.2.3: B3. Levels of Protein StructureA protein can be considered to have primary, secondary, tertiary, and quaternary structures.
primary structure: the linear amino acid sequence of a proteinsecondary structure: regular repeating structures arising when hydrogen bonds between the peptide backbone amidehydrogens and carbonyl oxygens occur at regular intervals within a given linear sequence (strand) of a protein (as in thealpha helix) or between two adjacent strands (as in beta sheets and reverse turns)
Figure: Secondary Structure (purple -alpha helices, yellow - beta strands. Image made with VMD)
tertiary structure: the overall three dimensional shape of a protein, often represented by a backbone trace
Figure: tertiary structure (calmodulin - image made with VMD)
quaternary structure: oligomeric structure of a multisubunit protein in which separate proteins chains associate to formdimers, trimers, tetramers, and other oligomers. The different chains in the oligomers may be the same protein(homooligomers) or a combination of different protein chains (heteroliogomers). The different chains within theoligomer may be held together by noncovalent intermolecular forces or may also contain covalent interchain disulfides.
Figure: Quaternary structure (4 chains of hemoglobin - Image made with VMD)

Henry Jakubowski 2.2.3.2 1/29/2022 https://bio.libretexts.org/@go/page/64209
Contributors and AttributionsProf. Henry Jakubowski (College of St. Benedict/St. John's University)

Henry Jakubowski 2.2.4.1 1/1/2022 https://bio.libretexts.org/@go/page/64210
2.2.4: B4. Analysis of Protein Secondary StructureThe percent and type of secondary structure can be determined using circular dichroism (CD) spectroscopy.(The links below come from an animated tutorial on Electromagnetic Waves and Circular Dichroism by AndrásSzilágyi ) In this method, right and left circularly polarized light illuminates a protein, which, since it is made of allL-amino acids, is chiral. (The mirror image would be a protein of the same sequence made of D-amino acids.)Circularly polarized light can be made when plane polarized light of the same amplitude and wavelength meetout of phase. If R and L circularly polarized light of the same wavelength and amplitude are passed through anoptically inactive medium, the two waves combine (vectorially) to produce plane polarized light. Optical activityis observed only when the environment in which a transition occurs is asymmetric.
The peptide (amide) bond absorbs UV light in the range of 180 to 230 nm (far-UV range) so this region of the spectra giveinformation about the protein backbone, and more specifically, the secondary structure of the protein. The main transitionsare n --> p* at 220 nm and p --> p* at 190 nm. There is a little contribution from aromatic amino acid side chainsbut it is small given the large number of peptide bonds. The lone pair on N adjacent to the pi bond can beconsidered to be rehybrized to sp2 from sp3 allowing for conjugation of the p electrons (which lowers theenergy of the electrons). The Huckel diagram below shows 3 MOs generated form the 3 atomic p orbitals. Themiddle one (with 1 node) has energy similar to the separate atomic p orbtials and is considered a nonbondingMO (consistent with the lone nonbonding pair on the N atom).
Figure: Peptide Bonds - MOs and Huckel Diagram
The peptide bonds in a protein's asymmetric environment will absorb this range of light (promoting electrons to higherenergy levels). In different secondary structures , the peptide bond electrons will absorb right and left circularly polarizedlight differently (for example, they have different molar absorptivities). Hence a, b and random coil structures all havedistinguishable far UV CD spectra.
Stated in another way, if plane polarized light, which is a superposition of right and left circularly polarized light, passesthrough an asymmetric sample which absorbs right and left circularly polarized differently (i.e they display circulardichroism), then the light passing through the sample after vector addition of the right and left hand circularly polarizedlight gives elliptically polarized light. (Great link!) The
If the chiral molecules also have a different index of refraction for R and L circularly polarized light, an added net effect isrotation of the angle of the ellipitically of the polarized light. The far-UV CD spectrum of the protein is sensitive to themain chain conformation. The CD spectra of alpha and beta secondary structure are shown in the figure below.
Figure: The CD Spectra of Alpha-Helix, Beta-Sheet, and Random Coils

Henry Jakubowski 2.2.4.2 1/1/2022 https://bio.libretexts.org/@go/page/64210
Protein side chains also find themselves in such an asymmetric environment. If irradiated with circularly polarized UVlight in the range of 250-300 nm (near UV), differential absorption of right and circularly polarized light by the aromaticamino acids (Tyr, Phe, Trp) and disulfide bonds occur and a near UV CD spectra result. If the near UV CD spectra of aprotein is taken under two different sets of conditions, and the spectra differ, then it can be surmised that the environmentof the side chains is different, and hence the proteins have somewhat different conformations. It will not give informationabout secondary structure of the backbone since that requires lower wavelengths for absorption of occur. Rather it canshow differences in tertiary structure.
CD Spectroscopy - web tutorial
Contributors and AttributionsProf. Henry Jakubowski (College of St. Benedict/St. John's University)

Henry Jakubowski 2.2.5.1 1/15/2022 https://bio.libretexts.org/@go/page/64211
2.2.5: B5. Analysis of Protein Tertiary StructureClearly, the highest resolution understanding of protein structure requires a solution to the 3D structure of theprotein. Once that is determined, it is easy to devise computer programs which will determine what part of thestructure is in secondary structure. Three methods are presently useful to determine the 3D structures ofproteins.
A. X-Ray crystallography
If crystals of the protein can be made, traditional x-ray crystallographic techniques can be used to solve the structure. X-rays irradiate a crystal, which scatters the x-rays, leading to constructive/destructive interference patterns. Usingappropriate math, the interference pattern can be reconverted into the actual structure of the protein. Check out a funexample showing such a reconstruction of the Parthenon from its diffraction pattern!
These structures are not solution structures, but overwhelming evidence suggest that they do represent the solutionstructure. For instance, x-ray structure contain many water molecules which interact with each other and the protein, afinding expected for a structure that represents the solution structure of the protein. In addition, substrates and inhibitorscan be infused into the crystal and bind with the protein, suggesting again a native-like structure for the protein in thecrystal.
x ray crystallography tutorial
B. NMR
There are many protons in proteins which give a proton NMR spectra. The problem is one of assignment, since there are somany. Nuclei in different environments absorb energy at different resonant frequencies. When a proton spin flips, it goes toa higher energy state. It will return to the equilibrium state with some time delay.
Figure: 1D NMR spectra of a protein

Henry Jakubowski 2.2.5.2 1/15/2022 https://bio.libretexts.org/@go/page/64211
If an unexcited proton is proximal in space, the magnetization can be transferred to the unexcited proton. This interactionis inversely proportional to the 6th power of the distance between them and is the basis of the Nuclear Overhauser Effect(NOE). A 2D NOE spectra shows peaks off the diagonal that are correlated, indicated that they are close in 3D space.
Figure: 2D NOSEY spectra of a protein
Multi-dimensional techniques, obtained when isotopes of N(15) and C(13) are present in the protein, can be used toactually obtain a 3D solution of a small protein. NMR and X-ray structure of the protein are almost superimposable.
Figure: NMR Structure of Proteins
Start2Fold: Database of hydrogen/deuterium exchange data on protein folding and stability Great link to visualize D2Ofolding data. TBA
basic NMR reviewprotein NMRStructure Determination of Proteins with NMR Spectroscopy. (including 1, 2, and 3 D)2D NMR

Henry Jakubowski 2.2.5.3 1/15/2022 https://bio.libretexts.org/@go/page/64211
C. Homology Modeling
The structure of unknown proteins can be modeled theoretically if they have extensive sequence homology to anotherprotein whose structure is known.
homology modeling : general descriptionhomology modeling for beginners: a coursean automative comparative protein modeling server - from the The ExPASy (Expert Protein Analysis System)proteomics server of the Swiss Institute of Bioinformatics (SIB)comparative protein modeling from ExPASy.
Of course, to characterize proteins rigorously, they must be purified from a solution containing many proteins. We willcover these techniques in the laboratory. Here is a quick summary of some of them:
Java based Protein Purification fron the University of Leeds (School of Biochemistry and Molecular Biology)
Contributors and AttributionsProf. Henry Jakubowski (College of St. Benedict/St. John's University)
Henry Jakubowski 2.3.1 1/8/2022 https://bio.libretexts.org/@go/page/64212
2.3: Understanding Protein Conformation
describe the differences between primary, secondary, supersecondary, tertiary, quaternary and domain proteinstructureexplain the basis of CD measurements for secondary structuredescribe the similarities between torsion angles and an energy vs torsion angle plot for the rotation of the C2-C3torison angle with phi/psi angles of peptide bonds and the 2D plots off allowed conformations around a givenamino acid in a protein (Ramachandran plot).(from reading give explanation for observed propensities of amino acids for different secondary structure)
Learning Objectives
2.3.1: C1. Main Chain ConformationsIn contrast to micelles and bilayers, which are aggregates of single and double chain amphiphiles, proteins arecovalent polymers of 20 different amino acids, which fold, to a first approximation, in a thermodynamicallyspontaneous process into a single unique conformation, theoretically at a global energy minimum. This chaptersection will investigate the possible conformations available to proteins, just as we studied the conformations of freefatty acids and acyl chains in lipid aggregates.
2.3.2: C2. Secondary StructureSecondary structures are those repetitive structures involving H bond between amide H and carbonyl O in- the mainchain. These include alpha helices, beta strands (sheets) and reverse turns.
2.3.3: C3. Tertiary StructureTopologically, it is impossible for a protein to fold in an intramolecular fashion in strict analogy to the theintermolecular aggregation of single chain amphiphiles into a micelle. Consider also that the entire backbone is polar.To a first approximation we would expect the bulk nonpolar groups would be buried surrounded by other nonpolargroups. Likewise we would expect the bulk of polar and charged would be on the surface.
2.3.4: C4. Common Motifs in ProteinsGiven the number of possible combinations of 1°, 2°, and 3° structures, one might guess that the 3D structure of eachprotein is quite distinctive. This is true. However, it has been found that similar substructures are found in proteins.For instance, common secondary structures are often grouped together to form a motifs called super-secondarystructure (SSS).
2.3.5: C5. Structual Clases of Proteins
2.3.6: C6. Quarternary StructureQuaternary structure is the overall structure that arises when tertiary structures aggregate to self to form homodimers
Topic hierarchy

Henry Jakubowski 2.3.2 1/8/2022 https://bio.libretexts.org/@go/page/64212
Thumbnail: Structure of human hemoglobin. The proteins α and β subunits are in red and blue, and the iron-containingheme groups in green. From PDB: 1GZX . (GNU; Proteopedia Hemoglobin).
Contributors and AttributionsProf. Henry Jakubowski (College of St. Benedict/St. John's University)
Quaternary structure is the overall structure that arises when tertiary structures aggregate to self to form homodimers,homotrimers, or homopolymers OR aggregate with different proteins to form heteropolymers.
2.3.7: C7. Recent References

Henry Jakubowski 2.3.1.1 1/15/2022 https://bio.libretexts.org/@go/page/64213
2.3.1: C1. Main Chain ConformationsIn contrast to micelles and bilayers, which are composed of aggregates of single and double chain amphiphiles, proteinsare covalent polymers of 20 different amino acids, which fold, to a first approximation, in a thermodynamicallyspontaneous process into a single unique conformation, theoretically at a global energy minimum. This chapter section willinvestigate the possible conformations available to proteins, just as we studied the conformations of free fatty acids andacyl chains in lipid aggregates. The next chapter section will discuss the actual processes of folding and of unfolding(denaturation), both in vitro and in vivo. Then we will discuss the thermodynamics and intermolecular forces whichstabilize the folded (or native) shape and the unfolded (or denatured state) of proteins, in a fashion similar to how wediscussed micelle and bilayer stability.
Just as saturated fatty acid chains have preferred conformations (all ttt), peptide chains also have preferred conformations.The complexity is much greater, however. With fatty acid chains, we dealt only with torsion or dihedral angles around themethylene carbons. For proteins, we must consider the covalent links which attach the amino acids together, as well as therotations possible in 20 different amino acids. The peptide bonds connect the carbonyl C of the i th amino acid to the alphaamine N of the i th+1 amino acid. The resulting bond is an amide link. X-ray analysis shows that the the C-N bond hasdouble bond character. This can be accounted for by delocalizing the nonbonding electron pair of the N to the carbonyl Cforming a double bond, with the pi bonded electrons of the carbonyl C-O bond moving to the O. These resonancestructures lead to a planar arrangement of the peptide carbonyl C and amide N and the two other atoms connected to each,since the hybridization of the C and N has sp character, with 120° bond angles. This greatly simplifies the number ofconformations which a protein can adopt since these 6 atoms can be considered to reside and move in a plane. The alpha Cserves as the corner attachment point of two different planes, each which can rotate independently of the other plane. Thetwo planes can twist around the alpha carbon. The rotation angles for the two planes are called phi (f) and psi(y) areanalogous to the torsion angles in the acyl chains of fatty acid. They can vary from -180° to +180°. The R groupsubstituent attached to the alpha C can also rotate around the alpha C and the beta C of the side chain. This angle is definedas chi. Other rotations also occur within the side chain. We will concentrate on phi (f) and psi(y) angles in this section.
Figure: Extended Polypeptide Showing Planes and phi/psi Angles
Another important feature of the peptide bond is that the alpha Cs at opposite ends of the rectangle are usually trans toeach other (on opposite sides of the C-N bond in the peptide bond. This trans arrangement of the alpha Cs is stericallyfavored by a factor of 1000/1 for all peptide bonds except X-Pro. Pro, which is a cyclic amino acid, is sterically restricted.
2

Henry Jakubowski 2.3.1.2 1/15/2022 https://bio.libretexts.org/@go/page/64213
Figure: trans arrangement of the alpha Cs
The figure above, which also shows the X-Pro bond, clearly shows that both the trans and cis forms of the X-Pro bonds arehindered to a similar extent. In X-Pro bonds in proteins, the trans/cis ratio found in proteins is 4/1. The diagram aboveshows rans peptide bonds, and how they could be converted to cis through rotation around the C-N bond.
A protein can now be thought of as a series of linked sequences of rigid, planar peptide units which can rotate aroundphi/psi angles. When the chain is fully extended (as shown in the links above), phi/psi are 180°.
When phi (f) and psi(y) equal 0o, the two peptide bonds flanking the alpha Cs are in the same plane. This conformation isprohibited since the O of the C=O on one plane and the H of the H-N on the other are overlapping - i.e. they approachcloser than their van der Waals radii.
This simple example shows that all conformational space is not accessible for protein folding.
Animation showing phi (f) angle rotation at psi (y)= 0.Animations showing psi (y) angle rotation at phi (f) = 0.Quick time movie (Alpha carbons are red. Move slider to approx. half way point to see "extended chain, analogous tothe zig-zag conformation of the acyl chains in saturated fatty acids)
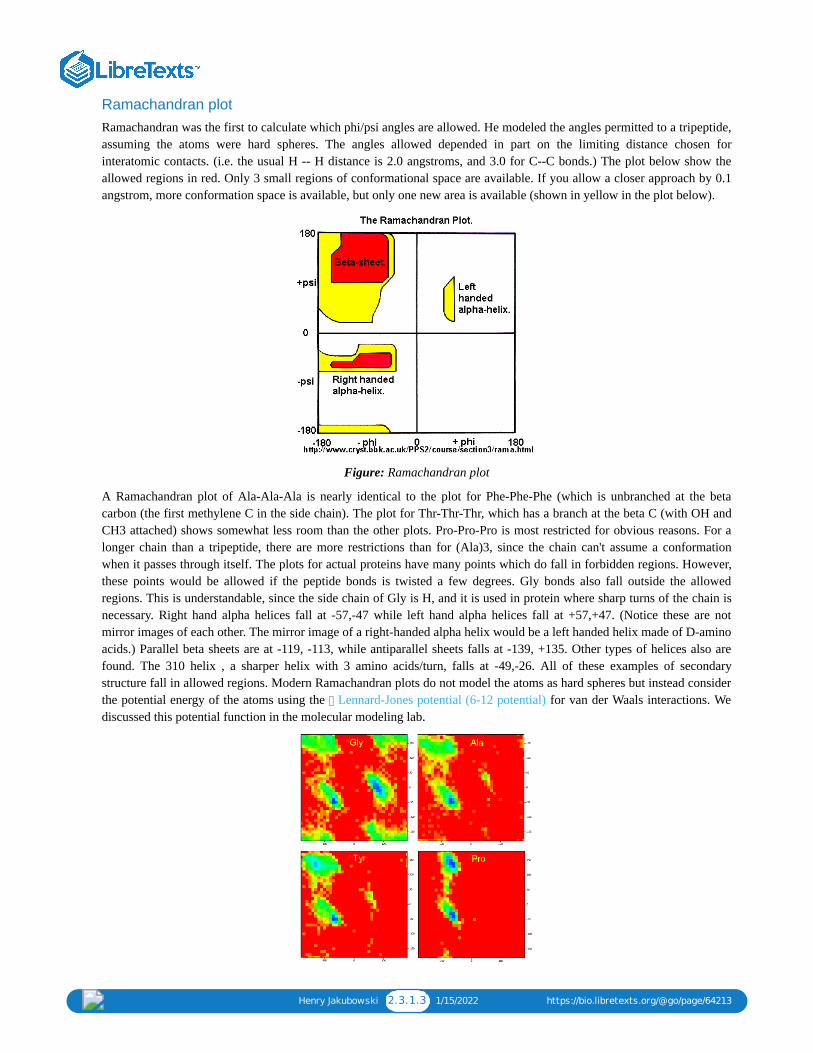
Henry Jakubowski 2.3.1.3 1/15/2022 https://bio.libretexts.org/@go/page/64213
Ramachandran plotRamachandran was the first to calculate which phi/psi angles are allowed. He modeled the angles permitted to a tripeptide,assuming the atoms were hard spheres. The angles allowed depended in part on the limiting distance chosen forinteratomic contacts. (i.e. the usual H -- H distance is 2.0 angstroms, and 3.0 for C--C bonds.) The plot below show theallowed regions in red. Only 3 small regions of conformational space are available. If you allow a closer approach by 0.1angstrom, more conformation space is available, but only one new area is available (shown in yellow in the plot below).
Figure: Ramachandran plot
A Ramachandran plot of Ala-Ala-Ala is nearly identical to the plot for Phe-Phe-Phe (which is unbranched at the betacarbon (the first methylene C in the side chain). The plot for Thr-Thr-Thr, which has a branch at the beta C (with OH andCH3 attached) shows somewhat less room than the other plots. Pro-Pro-Pro is most restricted for obvious reasons. For alonger chain than a tripeptide, there are more restrictions than for (Ala)3, since the chain can't assume a conformationwhen it passes through itself. The plots for actual proteins have many points which do fall in forbidden regions. However,these points would be allowed if the peptide bonds is twisted a few degrees. Gly bonds also fall outside the allowedregions. This is understandable, since the side chain of Gly is H, and it is used in protein where sharp turns of the chain isnecessary. Right hand alpha helices fall at -57,-47 while left hand alpha helices fall at +57,+47. (Notice these are notmirror images of each other. The mirror image of a right-handed alpha helix would be a left handed helix made of D-aminoacids.) Parallel beta sheets are at -119, -113, while antiparallel sheets falls at -139, +135. Other types of helices also arefound. The 310 helix , a sharper helix with 3 amino acids/turn, falls at -49,-26. All of these examples of secondarystructure fall in allowed regions. Modern Ramachandran plots do not model the atoms as hard spheres but instead considerthe potential energy of the atoms using the Lennard-Jones potential (6-12 potential) for van der Waals interactions. Wediscussed this potential function in the molecular modeling lab.

Henry Jakubowski 2.3.1.4 1/15/2022 https://bio.libretexts.org/@go/page/64213
Figure: Ramachandran plots showing phi/psi angles for Gly, Ala, Tyr, and Pro in actual proteins
Ramachandran Plots from ProtopediaQuery of Ramachandran Plots for any selected amino acidRamachandran Plot ServerSecondary Structure and Backbone Conformation from ExPASy. (concentrate on first part on backbone
conformation and Ramachandran plots) (great site)Side Chain Conformations: How are side chain atoms and bond angles designated? A tutorial from ExPASy
Contributors and AttributionsProf. Henry Jakubowski (College of St. Benedict/St. John's University)

Henry Jakubowski 2.3.2.1 1/8/2022 https://bio.libretexts.org/@go/page/64214
2.3.2: C2. Secondary StructureSecondary structures are those repetitive structures involving H bond between amide H and carbonyl O in- the main chain.These include alpha helices, beta strands (sheets) and reverse turns.
Alpha Structure
Figure: Right Handed Alpha helices - image made with VMD
These helices are formed when the carbonyl O of the i th amino acid H bonds to the amide H of the i th +4 aa (4 aminoacids away). The phi/psi angles for those amino acids in the alpha helix are - 57,-47, which emphasizes the regularrepeating nature of the structure. It can also be characterized by n (the number of amino acid units/turn = 3.6) and pitch(the helix rise/turn = 5.4 angstroms). Some facts:
the alpha helix is more compact than the fully extended polypeptide chain with phi/psi angles of 180oin proteins, the average number of amino acids in a helix is 11, which gives 3 turns.the left-handed alpha helix, although allowed from inspections of a Ramachandran plot, is never observed, since theside chains are too close to the backbone.the core of the helix is packed tightly. There are not holes or pores in the helix.All the R-groups extend backward and away from the helix axis.Some amino acids are more commonly found in alpha helices than other. Amino acids can be divided into two kinds,those with branches at the beta C and those with none. Consider first those that aren't branched . Gly is tooconformationally flexible to be found with high frequency in alpha helices, while Pro is too rigid. The amino acids withside chains that can H-bond (Ser, Asp, and Asn) and aren't too long appear to act as competitors of main chain H bonddonor and acceptors, and destabilize alpha helices. The rest with no branches at the beta C can form helices. Those withbranches at the beta carbon (Val, Ile) destabilize the alpha helix due to steric interactions of the bulky side chains withthe helix backbone. (Remember left-handed alpha helices are not found in nature for similar reasons.) Summary ofamino acids propensities for alpha helices (and beta structure as well)alpha keratins, the major component of hair, skin, fur, beaks, and fingernails, are almost all alpha helix.
Jmol: Updated An isolated helix from an Antifreeze Protein Jmol14 (Java) | JSMol (HTML5)

Henry Jakubowski 2.3.2.2 1/8/2022 https://bio.libretexts.org/@go/page/64214
There are other kinds of helices that can occur. These include a 310 helix and a \(\pi\) helix, which are stabilized by H-bonds between the amide NH and carbonyl O of residues (i, i+3) and (i, i+5), respectively. Likewise, they have 3 and4.3 residues/turn, respectively, and a rise per residue of 6 and 4.7 angstrom, respectively. These structures are muchrarer than right handed alpha helices.
Helix Type H bond btw ith and ith+X AA,where X =
Residue/turn Rise (Angstrom)/turn
310 3 3 6
4 3.6 5.4
5 4.3 4.7
Beta Structure
Beta Structure: Parallel and antiparallel beta strands are much more extended than alpha helices (phi/psi of -57,-47) but notas extended as a fully extended polypeptide chain (with phi/psi angles of +/- 180). The beta sheets are not quit so extended(parallel -119, +113 ; antiparallel, -139, +135), and can be envisioned as rippled sheets. They can be visualized by layingthin, pleated strips of paper side by side to make a "pleated sheet" of paper. Each strip of paper can be pictured as a singlepeptide strand in which the peptide backbone makes a zig-zag along the strip, with the alpha carbons lying at the folds ofthe pleats. Each single strand of the beta-sheet can be pictured as a twofold helix, i.e. a helix with 2 residues/turn. Thearrangement of each successive peptide plane is pleated due to the tetrahedral nature of the alpha C. The H bonds areinterstrand, not intrastrand as in the alpha helix.
Figure: Parallel beta strands (image made with Spartan)
helices
α
π

Henry Jakubowski 2.3.2.3 1/8/2022 https://bio.libretexts.org/@go/page/64214
Figure: Antiparallel beta strands (image made with Spartan)
Consider a strand as a continuous and contiguous polypeptide backbone propagating in one direction. Hence, usingthis definition, a helix consist of a single strand, and all the H-bonds are within the strand (or intrastrand). A beta sheetwould then consist of multiple strands, since each "strand" is separated from other "strands" by an interveningcontiguous stretch of amino acid which bends within the protein in a way which allows the next section of the peptidebackbone, the next "strand", to H-bond with the first "strand". But remember, even in this case, all the H-bondsholding the alpha and beta structure together are intramolecular.
In a parallel beta sheet structure, the optimal H bond pattern leads to a less extended structure (phi/psi of -119, +113) thanthe optimal arrangement of the H bonds in the antiparallel structure (phi/psi of -139, +135). Also the H bonds in theparallel sheet are bent significantly. (i.e. the carbonyl O on one strand is not exactly opposite the amide H on the adjacentstrand, as it is in the antiparallel sheet.) Hence antiparallel beta strands are presumably more stable, even though both areabundantly found in nature. Short parallel beta sheets of 4 strands or less are not common, which might reflect their lowerstability.
The side chains in the beta sheet are normal to the plane of the sheet, extending out from the plane on alternating sides.Parallel sheets characteristically distribute hydrophobic side chains on both side of the sheet, while antiparallel sheets areusually arranged with all the hydrophobic residues on one side. This requires an alternation of hydrophilic andhydrophobic side chains in the primary sequence. Antiparallel sheets are found in silk with the sheets running parallel tothe silk fibers. The following repeat is found in the primary sequence: (Ser-Gly-Ala-Gly)n), with Gly pointing out fromone face, and Ser or Ala from the other.
Jmol: Silk
Beta strands have a tendency to twist in the right hand direction. This leads to important consequences in how the betastrands are connected. Parallel strands can form twisted sheets or saddles as well as beta barrels.
Figure: Twisted Beta Sheet/Saddle (image made with VMD)
Note

Henry Jakubowski 2.3.2.4 1/8/2022 https://bio.libretexts.org/@go/page/64214
Figure: Beta Barrel (image made with VMD)
in parallel strands, right handed connectivity is common.in a protein with parallel strand in register, and given the inherent twist in the stands, the strands arrange in a way tohave the H bonds stretched equally at the ends of the chains, giving rise to a twisted saddle shape (top structure above).
Jmol: Updated Twisted beta sheet from Arabinose Binding Protein Jmol14 (Java) | JSMol (HTML5)
in a protein with parallel strand out of register, and given the inherent twist in the stands, the strands arrange in a way tohave the H bonds stretched equally at the ends of the chains, giving rise to a beta barrel (bottom structure above).
Jmol: Beta barrel from triose phosphate isomerase
Reverse TurnsAbout 50% of the amino acids in a globular protein are in regular secondary structure (alpha or beta). The remainingamino acids are not less ordered, just less regular. An additional example of secondary structures is reverse turns (or beta-bends or beta turns). Reverse turns often connect successive antiparallel beta strands and are then called beta hairpins.
Figure: Reverse Turns (image made with VMD)

Henry Jakubowski 2.3.2.5 1/8/2022 https://bio.libretexts.org/@go/page/64214
They are almost always at the surface, and consist of 4 amino acids. There are two types. (I - f2 = -60, y2=-30; f3 = -90, y3= 0; II - f2 = -60, y2=120; f3 = 90, y3 = 0 ) Residue 2 of both is often Pro. (Why?) Both have an H bond between thecarbonyl O of the i th a.a and the amide H of the i th+3 aa (three amino acids away). In the type 2, the O of residue 2crowds the beta C of residue 3, so aa2 is usually Gly. Why? Those amino acids which destabilize alpha helices are oftenfound in beta sheets, since the side chains project out of the plan which holds the main chain.
Figure: Type I and Type II Reverse Turns - from hen egg white lysozyme (image make with VMD)
Jmol: Updated Reverse Turn: Trypsin Inhibitor Jmol14 (Java) | JSMol (HTML5)
(Notice the tightness of the reverse turn and the presence of Pro and Gly.)
Figure: Why do amino acid propensities for secondary structure differ?

Henry Jakubowski 2.3.2.6 1/8/2022 https://bio.libretexts.org/@go/page/64214
Secondary Structure and Backbone Conformation from ExPASy.(concentrate on second part on secondarystructure)
Contributors and AttributionsProf. Henry Jakubowski (College of St. Benedict/St. John's University)

Henry Jakubowski 2.3.3.1 1/8/2022 https://bio.libretexts.org/@go/page/64215
2.3.3: C3. Tertiary StructureTo a first approximation, you may think the a globular protein might fold such thal all the hydrophobic side chains areburied in the interior of the protein, surrounded by other hydrophobic side chains. In a similar fashion, you might expectthe polar and charged side chains could be on the surface, exposed to water. Such a model would be analogous to a micellewhich has an almost "perfect" separation of polar (on the surface) and nonpolar atoms (buried). If it were only that simple!Topologically, it is impossible for a protein to fold in an intramolecular fashion in strict analogy to the the intermolecularaggregation of single chain amphiphiles into a micelle. Consider also that the entire backbone is polar. To a firstapproximation we would expect the bulk nonpolar groups would be buried surrounded by other nonpolar groups. Likewisewe would expect the bulk of polar and charged would be on the surface. The Jmol models below show the similarities inthe formations of a micelle, in which all nonpolars are buried, to that of protein in which most nonpolar side chain areburied and surrounded in a nonpolar environment.
Jmol: Updated A protein with a buried nonpolar amino acid Jmol14 (Java) | JSMol (HTML5)
Jmol: Updated Micelle Jmol14 (Java) | JSMol (HTML5)
What is the preferred disposition of side chains in proteins as evidenced from the crystal structure of thousands ofproteins? Here are some conclusions from a paper by Pace (Biochemistry. 40, pg 310 (2001)
On average, about 50% of the amino acids are in secondary structure. On average, there is about 27% alpha helix, and23% beta structure. Of course, some proteins are almost all alpha-helical, and some are almost all beta structure, butmost are a mixture.The side chain location varies with polarity. Nonpolar side chains, such as Val, Leu, Ile, Met, and Phe arepredominately (83%) in the interior of the protein.Charged polar side chains are almost equally partitioned between being buried or exposed on the surface. (54% - Asp,Glu, His, Arg, Lys are buried away from water, a bit startling)Uncharged polar groups such as Asn, Gln, Ser, Thr, Tyr are mostly (63%) buried, and not on the surface (a bit startling).Globular proteins are quite compact, with water excluded. The packing density (Vvdw/Vtot) is about 0.75, which islike the NaCl crystal and equals the closest packing density of 0.74. This compares to organic liquids, whose density isabout 0.6-0.7.
Tertiary structure and pK sIf a charged size chain is buried in a protein, you would expect that it would be surrounded, in general, by either oppositelycharged side chains, to which it could form an internal salt bridge (ion-ion interaction), or a polar uncharged group withwhich it could interact through dipole-dipole or, more specifically, H bond interactions. You would also expect that if itwere not near an oppositely charged side chain, that it would exist, if buried, in an uncharged state.
Hence the pKa of side chains would be dramatically affected by the nature of its microenvironment (as we have alreadyseen with the pKa of acetic acid in solvents of different polarity). NMR spectroscopy has been used to determine the pKavalues of specific side chains in protein whose crystal structure is known. Pace et al (2009) summarize data on theproperties of ionizable side chains in a series of proteins whose structure has been determined. The intrinsic pKa, pKaint orprototypical pKa value for a side chain exposed to water can be determined using a pentapeptide containing the targetamino acid X surrounded by 2 Ala ion either each side with both the N and C termini of the peptide blocked so they areuncharged.
Table: pKa values of ionizable side chains in a series of protein
Group Content % Buried % pKa int inAAXAA
pKa avg low pKa high pKa #measurements
Asp 5.2 56 3.9 3.5 + 1.2 0.5 9.2 139
Glu 6.5 48 4.3 4.2 + 0.9 2.1 8.8 153
a

Henry Jakubowski 2.3.3.2 1/8/2022 https://bio.libretexts.org/@go/page/64215
Group Content % Buried % pKa int inAAXAA
pKa avg low pKa high pKa #measurements
His 2.2 72 6.5 6.6 + 1.0 2.4 9.2 131
Cys 1.2 90 8.6 6.8 + 2.7 2.5 11.1 25
Tyr 3.2 67 9.8 10.3 + 1.2 6.1 12.1 20
Lys 5.9 34 10.4 10.5 + 1.1 5.7 12.1 35
Arg 5.1 56 12.3
C term 3.7 3.3 + 0.8 2.4 5.9 22
N term 8.0 7.7 + 0.5 6.8 9.1 16
A quick glance a the table shows a huge variation in the pKas of ionizable side chains in proteins with the pKa of Aspvarying over a range of 8.7 pH units, showing that it can act at physiological pH as either a strong acid or a moderate base.Three majors effects can perturb the pKa of ionizable side chains:
1. Dehydration of side chain as it is buried in a protein (Born Effect): The stability of a charged group depends on thepolarity of the medium in which it exists. Ions are more stable in water than in nonpolar solvents as the water moleculescan reorient and interact with the ion through ion-dipole or ion-H bond interactions, which effectively shields the ion fromother counter ion. The shielding effect of water is related to the dielectric constant, e, of the solvent. Coulombs law can bewritten as Fcoul = q1q2/er2 which can be expressed in energy terms as DGcoul = q1q2/er. Epsilon is the dielectric constantof the solvent. Water has a higher dlelectric constant (80) than nonpolar solvents (4-10) and hence shields opposingcharges more, stabilizing them. Hence the pKa of side chains of those amino whose deprotonated state is charged will havetheir pKa values raised (so they are less acidic) in nonpolar environments. The reverse holds for side chains whoseprotonated form is charged. Pace cites as an example two mutant of staphylococcal nuclease in which a buried Val 66 ischanged either to Asp or Lys. The buried Asp has a pKa of 8.9 compared to 5.5 for the buried Lys. These changes were notcompensated for with new charge-charge interactions, so the change can be attributed to the dehydration (or Born) effect.
2. Ion-Ion interactions with another charged side chain through Coulombic forces: This effect can be most readily observedat the surface of the protein. Pace cites a study of RNase Sa that is devoid of Lys and has a pI of 3.5. Five Asp and Gluwere replaced on the surface using site-specific mutagenesis with Lys, which changed the pI of the protein to 10.2. At pH7, the protein without Lys had a charge of -7 while the protein with 5 Lys had a charge of +3. The crystal structures weresimilar so Coulombic interactions would determine the differences in the pKa of the 11 common side chains. On averagethe mutant pKas were higher by 0.75 pH units, which makes sense as the mutant had a high pI. Calculated pKa valueswere similar to those determined by NMR. These data are consistent with the idea that Coulombic interactions are thechief cause of pKa changes in surface side chains.
3. Charge-dipole interactions and H bonds: It should be obvious that charge states of ionizable side chains would beadjusted to optimize H bond (and more generally charge-dipole) interactions in proteins. If the interactions are optimal inthe charged state, pKa values for His and Lys would be increased and for Asp, Glu, Cys, and Tyr they would be decreased.Pace cites the buried Asp 76 in RNase T1 in which the Asp is charged but does not form an internal salt bridge. It has adepressed pKa of 0.6 and has 3 H bonds to the side chains of Asn 9, Tyr 11 and Thr 91. Mutants were made to remove theH bonds to see the effect on the pKa of Asp 76. Removing 1, 2, or 3 H bonds changed the pKa to 3.3, 5.1, and 6.4respectively. The 6.4 value is much higher than the pKint, which can be attributed to the Born effect.
Contributors and AttributionsProf. Henry Jakubowski (College of St. Benedict/St. John's University)

Henry Jakubowski 2.3.4.1 1/1/2022 https://bio.libretexts.org/@go/page/64216
2.3.4: C4. Common Motifs in ProteinsSuper-Secondary Structure - Given the number of possible combinations of 1°, 2°, and 3° structures, one might guess thatthe 3D structure of each protein is quite distinctive. This is true. However, it has been found that similar substructures arefound in proteins. For instance, common secondary structures are often grouped together to form a motifs called super-secondary structure (SSS). See some examples below:
helix-loop-helix : found in DNA binding proteins and also in calcium binding proteins. This motif, which is also ahelix-loop-helix, is often called the EF hand. The loop region in calcium binding proteins are enriched in Asp, Glu, Ser,and Thr. Why? The EF hand shown below is from calmodulin.
Figure: helix-loop-helix (image made with VMD)
Figure: EF Hand
Jmol: Updated helix-loop-helix of the lambda Repressor Jmol14 (Java) | JSMol (HTML5)
Jmol: Updated helix-loop-helix (EF hand) from calmodulin Jmol14 (Java) | JSMol (HTML5)
beta-hairpin or beta-beta: is present in most antiparallel beta structures both as an isolated ribbon and as part of betasheets.
Figure: beta-hairpin, or beta-beta (image made with VMD)
Jmol: Updated beta-hairpin from bovine pancreatic trypsin inhibitor Jmol14 (Java) | JSMol (HTML5)
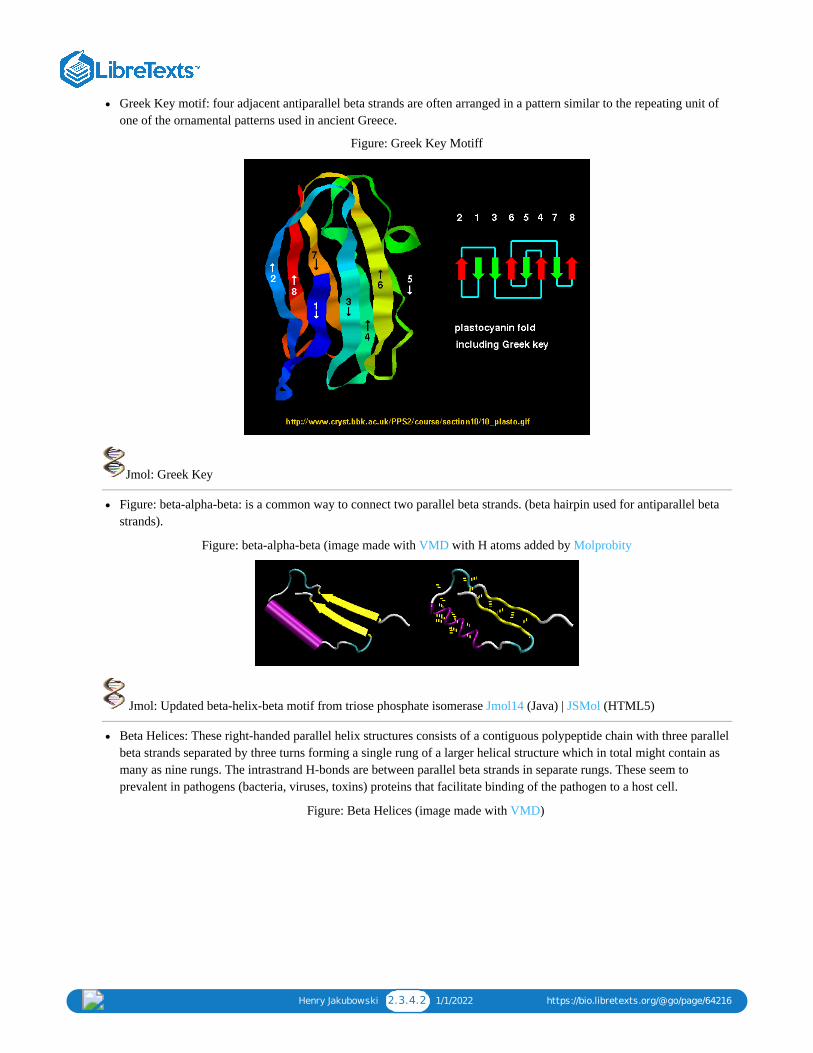
Henry Jakubowski 2.3.4.2 1/1/2022 https://bio.libretexts.org/@go/page/64216
Greek Key motif: four adjacent antiparallel beta strands are often arranged in a pattern similar to the repeating unit ofone of the ornamental patterns used in ancient Greece.
Figure: Greek Key Motiff
Jmol: Greek Key
Figure: beta-alpha-beta: is a common way to connect two parallel beta strands. (beta hairpin used for antiparallel betastrands).
Figure: beta-alpha-beta (image made with VMD with H atoms added by Molprobity
Jmol: Updated beta-helix-beta motif from triose phosphate isomerase Jmol14 (Java) | JSMol (HTML5)
Beta Helices: These right-handed parallel helix structures consists of a contiguous polypeptide chain with three parallelbeta strands separated by three turns forming a single rung of a larger helical structure which in total might contain asmany as nine rungs. The intrastrand H-bonds are between parallel beta strands in separate rungs. These seem toprevalent in pathogens (bacteria, viruses, toxins) proteins that facilitate binding of the pathogen to a host cell.
Figure: Beta Helices (image made with VMD)

Henry Jakubowski 2.3.4.3 1/1/2022 https://bio.libretexts.org/@go/page/64216
Table: Beta HelicesVibrio cholerae cholera
Helicobacter pylori ulcers
Plasmodium falciparum malaria
Chlamyidia trachomatis VD
Chlamydophilia pneumoniae respiratory infection
Trypanosoma brucei sleeping sickness
Borrelia burgdorferi Lymes disease
Bordetella parapertussis whooping cough
Bacillus anthracis anthrax
Neisseria meningitides menigitis
Legionaella pneumophilia Legionaire's disease
Beta Topologies on the Webof the Swiss Institute of Bioinformatics. (SIB) is dedicated to the analysis of protein sequences and structures as
well as 2-D PAGE
Domains -
Domains are the fundamental unit of 3o structure. It can be considered a chain or part of a chain that can independentlyfold into a stable tertiary structure. Domains are units of structure but can also be units of function. Some proteins can becleaved at a single peptide bonds to form two fragments. Often, these can fold independently of each other, and sometimeseach unit retains an activity that was present in the uncleaved protein. Sometimes binding sites on the proteins are found inthe interface between the structural domains. Many proteins seem to share functional and structure domains, suggestingthat the DNA of each shared domain might have arisen from duplication of a primordial gene with a particular structureand function.
Evolution has led towards increasing complexity which has required proteins of new structure and function. Increased anddifferent functionalities in proteins have been obtained with additions of domains to base protein. Chothia (2003) hasdefined domain in an evolutionary and genetic sense as "an evolutionary unit whose coding sequence can be duplicatedand/or undergo recombination". Proteins range from small with a single domain (typically from 100-250 amino acids) tolarge with many domains. From recent analyzes of genomes, new protein functionalities appear to arise from addition orexchange of other domains which, according to Chothia, result from
"duplication of sequences that code for one or more domainsdivergence of duplicated sequences by mutations, deletions, and insertions that produce modified structures that mayhave useful new properties to be selectedrecombination of genes that result in novel arrangement of domains."
Structural analyses show that about half of all protein coding sequences in genomes are homologous to other knownprotein structures. There appears to be about 750 different families of domains (i.e small proteins derived from a common

Henry Jakubowski 2.3.4.4 1/1/2022 https://bio.libretexts.org/@go/page/64216
ancestor) in vertebrates, each with about 50 homologous structures. About 430 of these domain families are found in allthe genomes that have been solved.
Contributors and AttributionsProf. Henry Jakubowski (College of St. Benedict/St. John's University)

Henry Jakubowski 2.3.5.1 1/15/2022 https://bio.libretexts.org/@go/page/64217
2.3.5: C5. Structual Clases of ProteinsProteins can be divided into 3 classes of protein, depending on their characteristic secondary structure. Click below forChime structures showing examples of these proteins.
alpha proteins - consist of predominately alpha helix.
Jmol: Updated cytochrome B562 Jmol14 (Java) | JSMol (HTML5)
Jmol: Updated met-myoglobin Jmol14 (Java) | JSMol (HTML5)
alpha/beta proteins - consist of a common of alpha and beta structure. These are the most common class.
Jmol: Updated triose phosphate isomerase Jmol14 (Java) | JSMol (HTML5)
Jmol: Updated hexokinase Jmol14 (Java) | JSMol (HTML5)
beta proteins - consist of predominantly beta structure.
Jmol: Updated superoxide dismutase Jmol14 (Java) | JSMol (HTML5)
Jmol: Updated human IgG1 antibodyJmol14 (Java) | JSMol (HTML5)
Jmol: Updated retinol binding proteinJmol14 (Java) | JSMol (HTML5)
fatty acid binding proteins; Peptide-N(4)-(N-Acetyl-b-D-Glucosaminyl) Asparagine Amidase (PNGase F) - underconstruction.
Tertiary Protein Structure and Folds from ExPAYsPrinciples of Protein Structure on the Web
A more complete classification of protein structure has been developed based on the following hierarchy of organization:Class, Architecture, Topology, and Homologous Superfamilies - CATH.
Class: the highest level of organization which consists of four classes - mainly alpha, mainly beta, alpha-beta, and fewsecondary structuresArchitecture (40 types): describes the shape of domain based on secondary structures but doesn't describe how they areconnected. Ex: beta barrel, beta propellorTopology (or fold group, 1233 types): members in topology groups have a common fold or topology in the "core" ofthe domain structure.Homologous Superfamilies (2386 types): These groups are homologous in sequence or structure and derive from acommon precursor gene/protein.
Structural Biology Knowledge Base
Here are some 3D structures resources, accessible through a sequence or ID-based search. and collated in Nature'sStructural Biology Knowledge Base.
Biological Magnetic Resonance Data Bank
CATH - structural classification of manually curated classification of protein domain structures
DisProt - Database of Protein Disorder
Gene3D - CATH domain assignments for protein sequences

Henry Jakubowski 2.3.5.2 1/15/2022 https://bio.libretexts.org/@go/page/64217
NESG Functional Annotation Database - Computational analysis of function of protein of unknown function
Membrane proteins of known 3D structure
RCSB PDB - Protein Data Bank USA
PDBe - Protein Databank Europe
PDBj - Protein Databank Japan
PDBsum - a pictorial database that provides an at-a-glance overview of the contents of each 3D structure deposited inthe Protein Data Bank
PROCOGNATE - database of cognate ligands for the domains of enzyme structures in CATH, SCOP and Pfam
SCOP - Structural Classification of Proteins: detailed and comprehensive description of the structural and evolutionaryrelationships between all proteins whose structures are known
SMART (Simple Modular Architecture Research Tool) - allows the identification and annotation of genetically mobiledomains and the analysis of domain architectures
Contributors and Attributions
Prof. Henry Jakubowski (College of St. Benedict/St. John's University)

Henry Jakubowski 2.3.6.1 1/5/2022 https://bio.libretexts.org/@go/page/64218
2.3.6: C6. Quarternary StructurePrimary structure is the linear sequence of the protein. Secondary structure is the repetitive structure formed from H-bondsamong backbone amide H and carbonyl O atoms. Tertiary structure is the overall 3D structure of the protein. Quaternarystructure is the overall structure that arises when tertiary structures aggregate to self to form homodimers, homotrimers, orhomopolymers OR aggregate with different proteins to form heteropolymers.
Quaternary Structure from ExPAYs
Globular versus fibril structures
We will deal exclusively with proteins which have a "globular" tertiary structure in this course. However, there are manyproteins that form elongated fibrils with properties like elasticity, which measures the extent of deformation with a givenforce and subsequent return to the original state. Elastic molecules must store energy (go to a higher energy state) when theelongating force is applied, and the energy must be released on return to the equilibrium resting structure. Structures thatcan store energy and release it when subjected to a force have resiliency. Proteins that stretch with an applied forcesinclude elastin (in blood vessels, lungs and skins where elasticity is required), resilin in insects (which stretches on wingbeating), silk, found in spider web) and fibrillin found in most connective tissues and cartilage. Some proteins have highresiliency (90% in elastin and resilin), while others are only partially resilient (35% in silk, which have a tensile strengthapproaching that of stainless steel. In contrast to rubber, which has an amorphous structure which imparts elasticity, theseproteins, although they have a dissimilar amino acid sequence, seem to have a common structure inferred from their DNAsequences. In some (like fibrillin), the protein has a folded b-sheet domain which unfold like a stretched accordion. Others(like elastin and spider silk) have b-sheet domain and other secondary structures (a-helices and (b turns) along with Proand Ala repetitions. Researcher are studying these structures to help in the synthesis of new elastic and resilient products
Comprehensive Database for Protein Analysis - BiozonSCOP: Structural Characterization of Proteins - Database showing folds, superfamiles, families, and domains
Contributors and Attributions
Prof. Henry Jakubowski (College of St. Benedict/St. John's University)
Henry Jakubowski 2.3.7.1 12/18/2021 https://bio.libretexts.org/@go/page/64219
2.3.7: C7. Recent References1. Pace, C. et al. Protein Ionizable Groups: pK values and Their Contribution to Protein Stability and Solubility. J. Biol
Chem. 284, 13285 (2009)2. Chothia, C. et al. Evolution of Protein Repertoire. Science, 300, pg1701 (2003)3. Stebbins & Galan. Structural Mimicry in Bacterial Virulence . Nature. 416. pg 701 (2001)4. Taylor. A deeply knotted protein structure and how it might fold. Nature. 406. pg 916 (2000)5. Innate immunity: ancient system gets new respect (about antimicrobial peptides). Science. 291 pg 2068 (2001)6. Graether et al. b-helix structure and ice-binding properties of a hyperactive antifreeze protein from an insect. Nature.
406, pg 249, 325 (2000); Liou et al. Mimicry of ice structure of surface hydroxyls and water of a b-helix antifreezeprotein. Nature. 406, pg 322,(2000)
7. Kanamaru. S et al. Structure of the cell-puncturing device of Bacteriophage T4. Nature. 415. pg 553 (2002)
Contributors and AttributionsProf. Henry Jakubowski (College of St. Benedict/St. John's University)

Henry Jakubowski 2.4.1 1/29/2022 https://bio.libretexts.org/@go/page/64220
2.4: Protein Folding - in Vivo and in Vitro
differentiate between thermodynamic (equilibrium) and kinetic (timed) approaches to the study of protein foldingreactionsdescribe techniques to study transient (kinetic) and long-lived (thermodynamic) intermediates in protein foldingdescribe the following intermediates in protein folding: molten globule, X-Pro isomers; Disulfide bondintermediatesinterpret spectral and chromatographic data from protein folding studies and use this to determine or explain amechanism for foldingdescribe properties of folded, unfolded, molten globule, and intrinsically disordered proteinsexplain the difference between the environments for protein folding when performed in vitro and in vivostate the role of molecular chaperones in in vivo protein foldingdescribe differences in disulfide bond occurrence in cytoplasmic and extracellular proteins
Learning Objectives
2.4.1: D1. IntroductionTo think about how proteins fold, we have to think dynamically. Luckily we have the tools of molecular dynamics(MD) at our fingertips which helps us imagine how these processes take place and concomitantly how to probeprotein folding experimentally. View the following two MD simulations and compare the spontaenously formation ofa micelle and the folding of a protein before we delve into the complex topic of protein folding and stability.
2.4.2: D2. Protein Folding In Vitro
2.4.3: D3. Folding of Single Protein Molecules
2.4.4: D4. The Denatured State
2.4.5: D5. Multiple Conformations from The Same Sequence
2.4.6: D6. Protein Folding In Vivo
2.4.7: D7. Redox Chemistry and Protein Folding
2.4.6.1: Do you find biochemistry amazing?
Topic hierarchy

Henry Jakubowski 2.4.2 1/29/2022 https://bio.libretexts.org/@go/page/64220
Thumbnail: Structure of human hemoglobin. The proteins α and β subunits are in red and blue, and the iron-containingheme groups in green. From PDB: 1GZX . (GNU; Proteopedia Hemoglobin).
Contributors and Attributions
Prof. Henry Jakubowski (College of St. Benedict/St. John's University)
2.4.8: D8. Protein Transport Across Membranes
2.4.9: D9. Recent References

Henry Jakubowski 2.4.1.1 1/22/2022 https://bio.libretexts.org/@go/page/64221
2.4.1: D1. IntroductionWe've seen many static images of lipids and their aggregates as well as proteins. To think about how proteins fold, we haveto think dynamically. Luckily we have the tools of molecular dynamics (MD) at our fingertips which helps us imagine howthese processes take place and concomitantly how to probe protein folding experimentally. View the following two MDsimulations and compare the spontaenously formation of a micelle and the folding of a protein before we delve into thecomplex topic of protein folding and stability.
MD simulation of micelle formationMD simulation of protein folding
Given the number of possibly nonnative states, it is amazing that proteins fold to the native state at all, let alone in areasonable time frame. Consider this greatly simplified view of protein folding for a protein containing 100 amino acids. Ifeach amino acid can adopt only 3 possible conformations, the total number of conformations could be 3100 = 5 x 10 .Assuming that it would take 10-13s to change each conformation, the time required to "test" all conformations would be 5x 1034s or 1027 years, longer than the age of the universe (14 x 109 yr). Yet the protein can fold within seconds. Thisparadox is called the Levinthal paradox, after Cyrus Levinthal.
Lubert Stryer (in his classic Biochemistry text), shows a way out of this dilemma by using an analogy of a monkey sittingat a typewriter, and typing this line out of Hamlet: "Me thinks it is like a weasel." Random typing would produce that lineafter 1040 keystrokes on average, but if the correct letters were maintained, the number of keystrokes would be in therealm of a few thousand. Proteins could fold more quickly if they retain native-like intermediates along the way. Alsoremember that much of conformation space is already restricted by allowed phi/psi angles. (Remember the blank areas inthe Ramachandran plot?)
Before we study the classic experiment of protein folding conducted by Anfinsen, study the simpler analogy below:
Figure: Socks and protein folding
The classic experiment of Anfinsen has shown that, at least for some proteins, all the necessary and sufficient informationrequired to direct the folding of a protein into the native state is present in the primary sequence of a protein. Anfinsenstudied the in vitro (outside the cell, as opposed to in vivo, which is inside the cell, tissue, organ) folding of a single chainprotein, RNase, which has 4 intrachain disulfide bonds.
Figure: RNase A with 4 Disulfide Bonds in red (image with VMD)
47

Henry Jakubowski 2.4.1.2 1/22/2022 https://bio.libretexts.org/@go/page/64221
We have previously discussed how chemical agents (such as beta-mercaptoethanol, a disulfide reducing agent) cancovalently interact with specific protein functional groups. Other substances can bind through complementaryintermolecular forces to the active site or other cavities on the surface. Other reagents, like urea, acting through generalizedsolvent changes or nonspecific interactions with the protein, can alter protein folding. Anfinsen used two differentreagents, 8 M urea and beta-mercaptoethanol, in combination to unfold, or denature, RNase to the nonnative or denaturedstate. He then removed the bME using dialysis, allowing the disulfides to reform. Next he removed the denaturing reagent,urea. To monitor if the protein was correctly refolded or renatured, he tested the activity of the protein compared to nativeprotein. He found that the "refolded" protein retained only 1% of its initial activity. If, however, he added a catalyticamounts of bME, the protein soon retained 100% of its initial activity. For his work, he was awarded the Nobel Prize inChemistry in 1972.
Figure: Anfinsen Experiment: Folding of RNase
Figure: CATALYTIC SHUFFLING OF DISULFIDES WITH BETA-MERCAPTOETHANOL

Henry Jakubowski 2.4.1.3 1/22/2022 https://bio.libretexts.org/@go/page/64221
Jmol: Updated RNase A Jmol14 (Java) | JSMol (HTML5)
Scientists have investigated the folding of proteins both in vitro and in vivo. In vitro experiments involve denaturing theprotein with urea, guanidine hydrochloride, or heat, then refolding the protein by removing the perturbant (denaturingagent), using spectral techniques to follow the process. In vivo experiments involve the study of intracellular proteins thatassist folding. The in vitro experiments involve unfolding the native state and then refolding it, while the in vivo onesinvolve folding of the newly synthesized protein. An understanding of protein folding can not be separated from anunderstanding of protein stability, and an understanding of the nature of the native and denatured state.
In studying protein folding and stability/structure of the native and denatured states, both equilibrium (thermodynamic)and timed (kinetic) measurements are made. Folding occurs in the ms to second range, which limits the ability to study thepresence of intermediates in the process. Some clever methods have been developed to study intermediates in proteinfolding by trapping specific intermediate structures, and investigating their structure and stability in a "leisurely" fashion.Alternatively, intermediates can be studied as they occur using stop flow kinetics. In this technique, a protein underdenaturing conditions is rapidly mixed with a solution containing no denaturant or protein by injecting both solutions intoa mixer/cuvette using syringes. The denaturant in the protein solution is now diluted such that renaturation can occur.Spectral measurements can begin at once.
stop flow Java applet
A diagram summarizing these methods is shown below. Study it in conjunction with the text which follows.
Figure: Kinetic and thermodynamic measurements of proteins stability and folding

Henry Jakubowski 2.4.1.4 1/22/2022 https://bio.libretexts.org/@go/page/64221
In considering the folding pathway, we will consider that the native protein represents the global energy minimum. Allother states represent variations of the denatured state. Some, closer in energy to the native state, could be consideredintermediates in the folding process. Instead of considering a folding "trajectory", consider protein folding occurringwithin a large folding landscape of free energy. Folding appears to proceed not by an obligatory pathway but aprobabilistic or stochastic search of possible conformation. The free energy landscape must be shaped somewhat like afunnel such that a proteins could adopt a "reasonable" number of conformations which lead to the native state. Evolutionhas surely selected for sequences that can make it to that state. Localized secondary structure motifs (like a short alphahelix and beta turns) can form quickly (about 1 ms). Small proteins folding occurs, depending on the structure, over a widetime frame (ms to minutes). Mostly likely, a small number of amino acids coalesce into a core which nucleates folding intostructures that are similar to the native state. Finally packing interactions collapse the structure into the native state.
In general, the more complex the fold of the backbone, the longer it takes the protein to fold. If complexity requires moreinteractions among distal regions of the polypeptide change, then the more complex the fold, the less probable that randominteractions would lead to quick protein folding. The mechanisms of folding for larger proteins (greater than 100 aminoacids) appear to proceed through intermediates, suggesting that different domains of the protein can fold independently.
Figure: Protein Folding Landscape: One View from Ken Dill
Contributors and Attributions
Prof. Henry Jakubowski (College of St. Benedict/St. John's University)
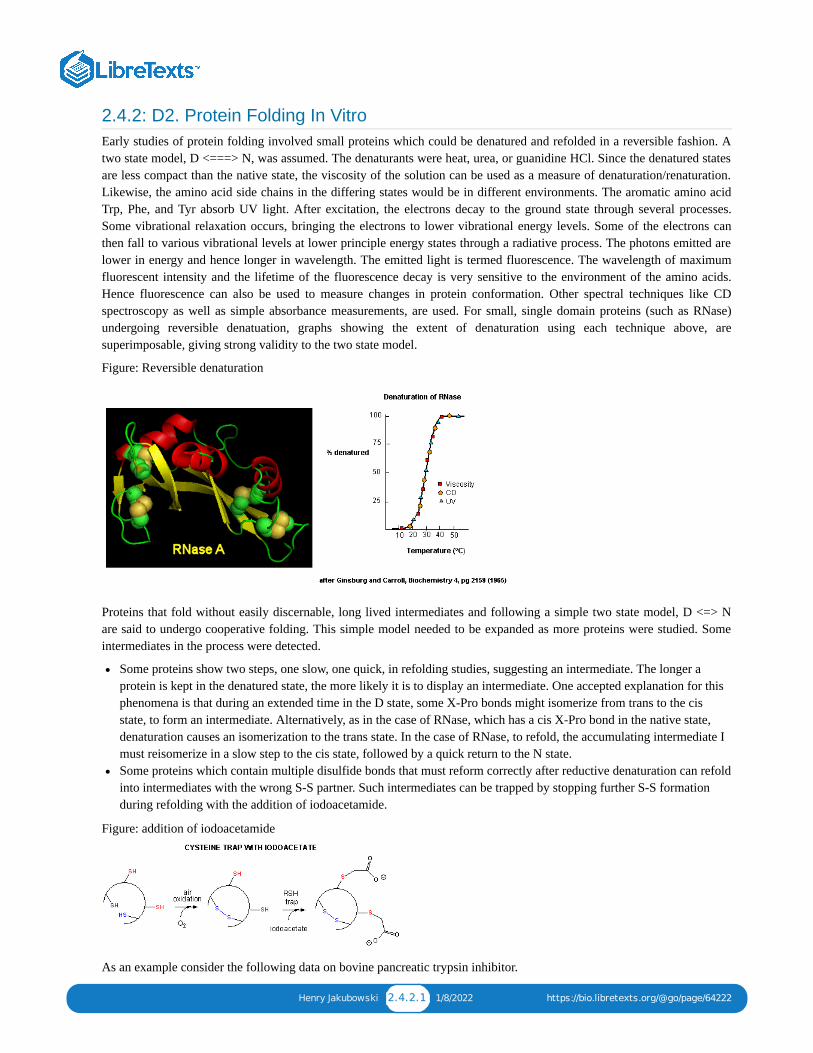
Henry Jakubowski 2.4.2.1 1/8/2022 https://bio.libretexts.org/@go/page/64222
2.4.2: D2. Protein Folding In VitroEarly studies of protein folding involved small proteins which could be denatured and refolded in a reversible fashion. Atwo state model, D <===> N, was assumed. The denaturants were heat, urea, or guanidine HCl. Since the denatured statesare less compact than the native state, the viscosity of the solution can be used as a measure of denaturation/renaturation.Likewise, the amino acid side chains in the differing states would be in different environments. The aromatic amino acidTrp, Phe, and Tyr absorb UV light. After excitation, the electrons decay to the ground state through several processes.Some vibrational relaxation occurs, bringing the electrons to lower vibrational energy levels. Some of the electrons canthen fall to various vibrational levels at lower principle energy states through a radiative process. The photons emitted arelower in energy and hence longer in wavelength. The emitted light is termed fluorescence. The wavelength of maximumfluorescent intensity and the lifetime of the fluorescence decay is very sensitive to the environment of the amino acids.Hence fluorescence can also be used to measure changes in protein conformation. Other spectral techniques like CDspectroscopy as well as simple absorbance measurements, are used. For small, single domain proteins (such as RNase)undergoing reversible denatuation, graphs showing the extent of denaturation using each technique above, aresuperimposable, giving strong validity to the two state model.
Figure: Reversible denaturation
Proteins that fold without easily discernable, long lived intermediates and following a simple two state model, D <=> Nare said to undergo cooperative folding. This simple model needed to be expanded as more proteins were studied. Someintermediates in the process were detected.
Some proteins show two steps, one slow, one quick, in refolding studies, suggesting an intermediate. The longer aprotein is kept in the denatured state, the more likely it is to display an intermediate. One accepted explanation for thisphenomena is that during an extended time in the D state, some X-Pro bonds might isomerize from trans to the cisstate, to form an intermediate. Alternatively, as in the case of RNase, which has a cis X-Pro bond in the native state,denaturation causes an isomerization to the trans state. In the case of RNase, to refold, the accumulating intermediate Imust reisomerize in a slow step to the cis state, followed by a quick return to the N state.Some proteins which contain multiple disulfide bonds that must reform correctly after reductive denaturation can refoldinto intermediates with the wrong S-S partner. Such intermediates can be trapped by stopping further S-S formationduring refolding with the addition of iodoacetamide.
Figure: addition of iodoacetamide
As an example consider the following data on bovine pancreatic trypsin inhibitor.

Henry Jakubowski 2.4.2.2 1/8/2022 https://bio.libretexts.org/@go/page/64222
Figure: Bovine pancreatic trypsin inhbitor (BPTI): Folding Kinetics - only native disulfide structures seem to form.
Figure: BPTI Folding Pathway In Vitro - gives possible scheme of folding intermediates
Some proteins form partially folded but stable intermediates when folded under partially denaturing conditions. A goodexample is lactalbumin, which under mildly acidic conditions (pH 4), low levels of guanidine HCl, or neutral pH andlow ionic strength in the absence of calcium (which normally binds to the protein), forms a stable, isolatableintermediate (I) called the molten globule (MG). The image below shows the folded state with two calcium ions bound.
Figure: lactalbumin (image made with Pymol)

Henry Jakubowski 2.4.2.3 1/8/2022 https://bio.libretexts.org/@go/page/64222
Data show that the MG is about 50% larger in volume than the N state. This compares to the denatured state, which can be300% larger than the native state. Hence, it is more like the native state as studied by hydrodynamic techniques, but withmore solvent accessibility of hydrophobic side chains. The MG has a similar CD spectra as the native state, but thearomatic side chains display the same UV absorption and fluorescent characteristics as the protein in 6 M guanidine HCl,suggesting that the final tertiary state has not yet completely formed. The secondary structure in the MG may not be thesame as in the native state
NMR can also be used to detect folding intermediates. Using this technique, proteins are unfolded in D2O, which willcause the exchange of all Cs with ionizable protons, including, the amide Hs. An amine is a weak base (pKb around 3.5) soits conjugate acid, the protonated amine, has a pKa of around 9.5. An amide or peptide bond would be a weaker base thanan amine since it's lone pair is less available (due to delocalization through resonance) for sharing with a proton. The pKafor the conjugate acid of the amide (in which the amide N is protonated and has a plus charge) is much lower, around -0.5,than the pKa for the conjugate acid of an amine. At 2 pH units greater than its pKa, the charged amide N is close to 100%deprotonated The pka of the protonated group is important since the rate of H exchange is related to the pKa, holding othervariables constant. The pka of an unprotonated amine (RNH2 -> RNH- is very high (30s) and hence deprotonation of theRNH2 amine to form RNH- is not likely under normal conditions.
Figure: Exchange of all Cs with ionizable protons, including the amide Hs
Refolding is initiated by diluting the protein into a solution without the denaturatant, but still in D2O. As the protein foldsand becomes more compact, the buried atoms are now sequestered from the solvent, and no longer readily exchange Ds.Then the protein is placed in H2O at pH 9.0 for 10 ms, after which the pH is changed to pH 4.0. D --> H exchange ispromoted at high pH, and quenched for the amide Ds and Hs at low pH. Amide H's that continue to exchange must beaccessible to water. Those that aren't are usually buried in secondary structure.
Hydrogen Exchange and Mass Spectrometry in the Study of Proteins
Figure: Experimental data on model proteins. How would you interpret these graphs.

Henry Jakubowski 2.4.2.4 1/8/2022 https://bio.libretexts.org/@go/page/64222
When the same techniques are applied to large, multidomain or oligomeric proteins, only a few percent refold in vitro.Incorrect intermolecular interactions and heterogeneous aggregation seems to be the main problems which prevent correctprotein folding in vitro.
Jmol: Updated Apolactalbumin (w/o Ca2+)/Hololactalbumin Jmol14 (Java) | JSMol (HTML5)
Contributors and Attributions
Prof. Henry Jakubowski (College of St. Benedict/St. John's University)

Henry Jakubowski 2.4.3.1 1/15/2022 https://bio.libretexts.org/@go/page/64223
2.4.3: D3. Folding of Single Protein MoleculesProtein folding/unfolding reactions can now be studied on single protein molecule using an optical tweezer, as illustratedin the figure below based on a study of RNase H from E. Coli (Cecconi et al, 2005). RNaseH was mutated to contain twoCys residues at positions 4 and 155 (near the ends of the chain). This allowed the protein to be covalently linked throughthe free sulfhydryl of Cys to two dsDNA molecules (500 bp) chemically modified at one end to form covalent bond to theCys- containing protein. The CD spectra of the protein linked to the DNA tether was identical to the unmodified protein.The DNA linkers were linked to two different styrene beads though different chemistries to produce the structure shownbelow.
Figure: Unfolding of RNase H with Optical Tweezers
The enzyme was active as shown by enzyme activity measurements. The protein can be stretched and contracted bymoving the bead connected to the pipet relative to the bead in the optical trap. As the force (measured in piconewtons) isincreased, the molecule is stretched. As a control, the two beads were connected directly with DNA handles without theprotein. In the control case, a graph showing extension between the beads vs force increases slowly in a curvilinear fashionat first and then linearly. When the protein is inserted, differences are observed. Upon stretching and relaxing twotransitions (shifts) were observed with RNase H that are not seen with DNA alone. These occurred at about 19 pN (anabrupt shift) and a smaller one at 5 pN. These transitions are consistent with the N→D and an I --> D transition , as shownin the figure below (adapted from Cecconi et al). These data are consistent with previous studies of this protein whichshow the the central, stable core of the protein folds first.
Figure: RNaseH Folding Transitions: Optical Trap
Figure: Folding Lanscape of RNase H: Optical Tweezers

Henry Jakubowski 2.4.3.2 1/15/2022 https://bio.libretexts.org/@go/page/64223
Contributors and AttributionsProf. Henry Jakubowski (College of St. Benedict/St. John's University)

Henry Jakubowski 2.4.4.1 12/25/2021 https://bio.libretexts.org/@go/page/64224
2.4.4: D4. The Denatured StateAlthough the structure of native and native-like states can be determined using x-ray crystallography and in solution usingNMR, little detailed information exists on the actual structure of denatured and intermediate states. Intermediate states aredifficult to trap in a way that allow details structural analysis. In contrast to the "native" state which consists of anensemble of closely related states, intermediates and denatured states would consist of an ensemble of many differentstates, making structural analysis more difficult. Religa and others from Fersht's lab have engineered a mutant of theengrailed homeodomain (En-HD) from Drosophila melanogaster that allows such structural analyses to be performed. Themutation, Leu16Ala (L16A), destabilizes the protein such that it can be denatured simply by changing ionic strength. It isstable at high ionic strength and folds quickly under those condition. However at physiological ionic strength it is"denatured" but contains significant alpha-helical structure but has nonnative contacts. It behaves like an early foldingintermediate in that if placed in solutions of higher ionic strength it rearranges to form the native state. If placed in lowerionic strength, it progressively "unfolds" to yet other states. Given the ambiguities in how to define denatured and earlyfolding intermediates states, Ferscht's group suggest an "explicit" definition of the denatured state. They define theunfolded state (U) as the "maximally unfolded state of a protein, in which the backbone NH groups have little protectionagainst 1H/2H exchange". They define the denatured state, D, as the "lowest energy non-native state under a defined set ofconditions". In this scenario, the denatured state could also be a folding intermediate if placed in conditions that promotefolding. Previous work from the group showed that the denatured state of En-HD has three helices protected from 2Hexchange and was one kcal/mol lower in energy than the unfolded state.
Jmol: Updated Engrailed homeodomain - denatured and native state Jmol14 (Java) | JSMol (HTML5)
Contributors and Attributions
Prof. Henry Jakubowski (College of St. Benedict/St. John's University)

Henry Jakubowski 2.4.5.1 12/25/2021 https://bio.libretexts.org/@go/page/64225
2.4.5: D5. Multiple Conformations from The Same Sequence1. Silent Single nucleotide polymorphisms (SNPs): For some amino acids, multiple triplet nucleotide sequences (codons)in the coding regions of a gene for a protein lead to the incorporation of the same amino acid in the protein sequence.Hence two proteins identical in amino acid sequence might have slightly different nucleotide sequences in the gene thatencodes them. Such single nucleotide polymorphisms (SNPs) in coding regions were thought to have no effect on thetertiary structure and biological function of a protein if the single nucleotide variation did not lead to the insertion of adifferent amino acid into the growing peptide chain (i.e the codons were synonymous and the mutations presumably silentwith no effect). Recently single nucleotide polymorphisms (SNPs) in the gene for the product of the MDR1 (multidrugresistance 1) gene, P-glycoprotein, was shown to result in a protein with different substrate specificity and inhibitorinteractions, and hence a different 3D structure. One possible explanation for this observation is a difference in the rate oftranslation of the mRNA for this membrane protein. Different rates might lead to different intra- and intermolecularassociations, which could lead to different final 3D structures as the protein cotranslationally folds and inserts into themembrane. This would especially be true if two possible structures where close enough in free energy but separated by asignificant activation energy barrier, precluding simple conformational rearrangement of one conformation to another.
2. Metamorphic Proteins: In addition to prion proteins, it appears that many proteins can adopt more than oneconformation under the same set of conditions. In contrast to prion proteins, however, in which the formation of the beta-structure variant is irreversible since the conformational change is associated with aggregation, many proteins can changeconformations reversibly. Often, these changes do not appear to be associated only with binding interactions that triggerthe change. Murzin has described proteins that change conformations on change of pH (viral glycoproteins), redox state(chloride channel), disulfide isomerization (lysozyme), and bound ligand (RNA polymerase as it initiates and thenelongates the growing RNA polymer). He cites two proteins that appear to changes state without external signals. Theseinclude Mad2, in which the two conformers share extensive similarity, and Ltn10 (lymphotactin), in which they don't. Oneform of lymphotactin (Ltn 10) binds to similar lymphokine receptors, while the other (Ltn 40) binds to heparin. Foldingkinetics may play a part in these examples as well, as proteins capable of folding to two conformers independently andquickly might prevent misfolding and aggregation that might occur if they had to completely unfold first before aconformational transition. Both Mad2 and Ltn10 alter conformation through transient formations of dimers, whichfacilitate conformational changes without widespread unfolding. Mutations in Ltn10 can cause the protein to adopt theLtn40 conformation, Hence primordial "metamorphic" proteins could, by simple mutation, produce new proteinfunctionalities.
3. Intrinsically Disordered Proteins (IDPs): Many examples of proteins that are partially or completely disordered but stillretain biological function have been found. At first glance this might appear to be unexpected, since how could such aprotein bind its natural ligand with specificity and selectivity to express its function? Of course one could postulate ligandbinding would induce conformational changes necessary for function (such as catalysis) in an extreme example of aninduced fit of a ligand compared to a "lock-and-key" fit. Decades ago, Linus Pauling predicted that antibodies, proteinsthat recognize foreign molecules (antigens), would bind loosely to the antigen, followed by a conformational change toform a more complementary and tighter fit. This was the easiest way to allow for a finite number of possible proteinantibodies to bind a seemingly endless number of possible foreign molecules. This is indeed one method in whichantibodies can recognize foreign antigens. Antibodies that bind to antigen with high affinity and hence high specificitymore likely bind through a lock and key fit. (Pauling, however, didn't know that the genes that encode the proteins chainsin antibodies are differentially spliced and subjected to enhanced mutational rates which allow the generation of incredibleantibody diversity from a limited set of genes.)
It's been estimated that over half of all native proteins have regions (greater than 30 amino acids) that are disordered, andupwards of 20% of proteins are completely disordered. Regions of disorder are enriched in polar and charged side chainswhich follows since these might expected to assume many available conformations in aqueous solutions compared tosequences enriched in hydrophobic side chains, which would probably collapse into a compact core stabilized by thehydrophobic effect. Mutations in the disordered regions tend to preserve the disordered region, suggesting that thedisordered region is advantageous for "future" function. In addition, mutations that cause a noncoding sequence to producea coding one invariably produce disordered protein sequences. Disordered proteins tend to have regulatory properties andbind multiple ligands, in comparison to ordered one, which are involved in highly specific ligand binding necessary for

Henry Jakubowski 2.4.5.2 12/25/2021 https://bio.libretexts.org/@go/page/64225
catalysis and transport. The intracellular concentration of disordered proteins has also been shown to be lower than orderedproteins, possibly to prevent occurrences of inappropriate binding interactions mediated through hydrophobic interactions,for example. Processes to accomplish this include more rapid mRNA and protein degradation and slower translation ofmRNA for disordered proteins. For a similar reason, misfolded proteins are targeted for degradation as well. Figure Abelow shows the mean net charge vs the mean hydrophobicity for 275 folded and 91 natively unfolded proteins. Figure Bshows the relative amino acid composition of globular (ordered) proteins compared to regions of disorder greater than 10amino acids in disordered proteins. The two different grey bars were obtained with two different versions of the softwareused to analyze the proteins. Again the graph shows an enrichment of hydrophilic amino acids in disordered proteins.
Figure: Characteristics of Intrinsically Disordered Proteins
from open access journal: Dunker, A. et al. BMC Genomics 2008, 9(Suppl 2):S1 doi:10.1186/1471-2164-9-S2-S1
Many experimental methods can be used to detect disordered regions in proteins. Such regions are not resolved well in X-Ray crystal structures (have high B factors). NMR solution structures would show multiple, and differing conformations.CD spectroscopy likewise would show ill-defined secondary structure. In addition solution measurements of size (lightscattering, centrifugation) would show larger size distributions for a given protein.
What types of proteins contain disorder? The above experimental and new computational methods have been developed toclassify proteins as to their degree of disorder. There appears to be more IDPs in eukaryotes than in archea andprokaryotes. Many IDPS are involved in cell signaling processes (when external molecules signal cells to respond byproliferating, differentiating, dying, etc). Most appear to reside in the nucleus. The largest percentage of known IDPs bindto other proteins and also to DNA. These results suggest that IEPs are essential to protein function and probably confersignificant advantages to eukaryotic cells as multiple functions can be elicited from the interaction of a single IEP (derivedfrom a single gene) with different protein binding partners. This would greatly extend the effective genome size in humans,

Henry Jakubowski 2.4.5.3 12/25/2021 https://bio.libretexts.org/@go/page/64225
for examples, from around 25,000 with specified function, to many more. This doesn't even take into account the increasefunctionalities derived from post-translational chemical modifications.
We will discuss intrinsically disordered proteins further in Chapter 5. What is clear from recent finding is that proteinstructure is fluid and complex and our simple notions and words to denote proteins as either native or denatured aremisguided and constrain our ideas about how protein structure elicits biological function. For example, what does the word"native" mean, if proteins exist in multiple states in vivo and in vitro simultaneously? Dunker et al (2001) have coined theconcept "Protein Trinity" to move past the notion that a single protein folds to a single state which elicits a single function.Rather each of the states in the "trinity", the ordered, collapsed (or molten globule) and extended (random coil) coexist inthe cell. Hence all can be considered "native" and all contribute to the function of the cell. A single IDP could bind tomany different protein partners, each producing different final structures and functions. IDPs would also be moreaccessible and hence susceptible to proteolysis, which would lead to a simple mechanism to control their concentrations,an important way to regulate their biological activity. Their propensity to post-translational chemical modification wouldlikewise lead to new types of biological regulation.
Figure: The Protein Trinity: Ordered, Collapsed and Extended States
These ideas have profound ramifications for our understanding of the expression of cellular phenotype. In addition, awhole new world of drug target is available by finding drugs that modulate the transitions between ordered, collapsed andextended protein states. Likewise, side effects of drugs might be understood by investigating drug effects of thesetransitions in IDPs not initially targeted.
PONDR - Predictor of Naturally Occurring DisorderDatabase of Protein Disorder
4. Catalysis by Molten Globule: A recent example (Bemporad) that a bacterial acylphosphatase has catalytic activity as amolten globule further questions our notions of structure and enzyme activity. In this example, substrate interaction did notinduce global conformational changes in the protein. Molecular dynamics simulations showed that many partiallydisordered conformations of the protein are present, and the disorder involved the active site. However, parts of the proteinare more ordered and form a "scaffold" which keeps the catalytic and substrate binding amino acids near enough thatbinding could engender conformational rearrangements at the active side and subsequent catalytic activity.
Contributors and Attributions
Prof. Henry Jakubowski (College of St. Benedict/St. John's University)

Henry Jakubowski 2.4.6.1 1/5/2022 https://bio.libretexts.org/@go/page/64226
2.4.6: D6. Protein Folding In VivoThere are many differences between how a protein might fold or unfold in a cell compared to a test tube.
The total concentration of all the proteins and nucleic acids in cells are estimated to be about 350 g/L, or 350 mg/ml.Most measurement in the lab are conducted in the range of 0.1 to 10 mg/mlProteins are synthesized in cells from an N to C terminal direction. Hence the nascent protein, as it emerges from itssite of synthesis (the ribosome), might fold into intermediate structures since not all of the protein sequence is yetavailable to direct folding.Proteins are synthesized in the cytoplasm, but they have to find their final place in the cell. Some end up in membranes,some must translocate across one or even two different membranes to end up in specific organelles like the Golgi,mitochondria, chloroplasts (in plant cells), nuclei, lysosomes, peroxisomes, etc. Do they translocate in their nativestate?
Additional evidence suggests that protein folding/translocation requires assistance (i.e. catalysis) in the cell.
Mutant cells defective in certain proteins can lead to the accumulation in the cells of misfolded and aggregatedproteins.eukaryotic genes (taken from higher cells which contain nuclei and internal organelles), when transferred intoprokaryotes (bacteria, like E. Coli), can be expressed to form protein, but they often misfold and aggregate in thebacterial cells and form structures called inclusion bodies.
Hence recombinant proteins expressed in vivo have the same problems in folding as larger proteins in vitro. In both cases,conditions favor accumulation of nonnative proteins with exposed hydrophobic groups leading to aggregation.Aggregation also occurs in vivo when a protein is over-expressed or expressed at a higher temperature than normal. Why?Mutant cells have been selected that actually suppress inclusion bodies in vivo. This effect was mediated by a class ofproteins which are expressed by the bacteria and other cells when their temperature is raised. The function of theseproteins, called heat shock proteins (Hsp), was unknown until it was realized that they facilitate correct protein folding, inpart, by binding to denatured proteins in the cells before they aggregate into inclusion bodies. Further studies discovered alarge number of proteins that seem to facilitate protein folding and prevent aggregation in vivo. These proteins are nowcalled molecularchaperones. They are classified on the basis of their molecular weight) and can be divided into at least twofamilies, the Hsp-70 chaperone family and the chaperonin and Hsp 90 families as illustrated and summarized in the figureand text below.
Hsp-70 Family: This family includes DnaK/DnaJ and GrpE proteins in prokaryotes and immunolglobulin heavy chainbinding protein (BiP) and alpha crystalline in eukaryotes. Alpha crystalline comprises 30% of the lens proteins in the eye,where it functions, in part, to prevent nonspecific, irreversible aggregates. These proteins have molecular weights of about70K and :
bind to growing polypeptide chains as they are synthesized on ribosomes.express activity as monomers.have ATPase activity - i.e. they cleave the phosphoanhydride ATP (which can drive reactions).bind short, extended peptides, which stimulates the ATPase activityrelease bound peptides after ATP cleavage
A figure showing
In prokaryotes, a protein called trigger factor (TF) binds in a co-translational process to proteins as they begin to emergefrom the ribosome and catalyzes correct folding of about 70% of bacterial protein. The rest requires additional chaperones,including DnaJ and DnaK which bind proteins during synthesis in a cotranslational process. Upon interaction with theDnaJ-bound protein, DnaK hydrolyzes bound ATP, resulting in the formation of a stable complex between DnaJ andDnaK. GrpE, a nucleotide exchange factor for DnaK, facilitates the releases ADP from DnaK. Rebinding of ATP to DnaKthen triggers the release of the substrate protein. This cycle repeats itself until the protein is fully folded. For about 20% ofproteins in E. Coli, the DnaK/DnaJ/GrpE cycle leads to complete post-translational folding of proteins . Eukaryotes utilizean analogous set of proteins Hsp70 complex proteins including If folding is still incomplete after several rounds, the fullysynthesized yet incompletely folded protein interacts with an amazing catalyst of protein folding, the chaperonin system.
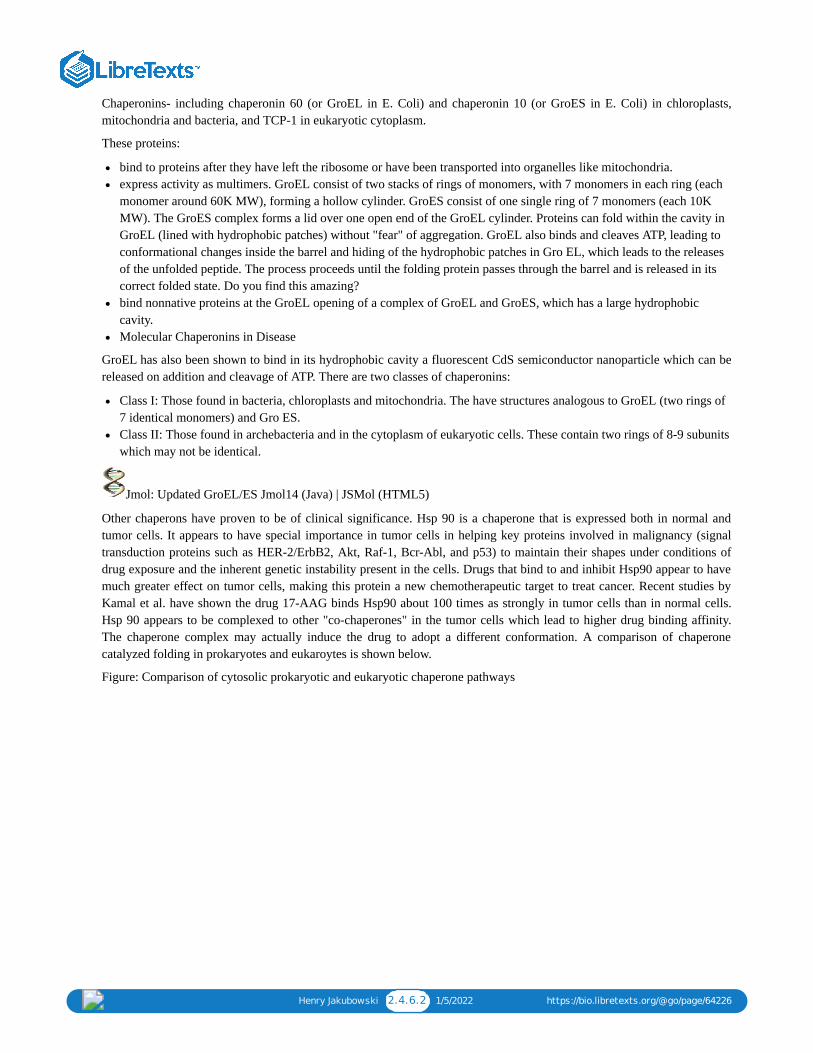
Henry Jakubowski 2.4.6.2 1/5/2022 https://bio.libretexts.org/@go/page/64226
Chaperonins- including chaperonin 60 (or GroEL in E. Coli) and chaperonin 10 (or GroES in E. Coli) in chloroplasts,mitochondria and bacteria, and TCP-1 in eukaryotic cytoplasm.
These proteins:
bind to proteins after they have left the ribosome or have been transported into organelles like mitochondria.express activity as multimers. GroEL consist of two stacks of rings of monomers, with 7 monomers in each ring (eachmonomer around 60K MW), forming a hollow cylinder. GroES consist of one single ring of 7 monomers (each 10KMW). The GroES complex forms a lid over one open end of the GroEL cylinder. Proteins can fold within the cavity inGroEL (lined with hydrophobic patches) without "fear" of aggregation. GroEL also binds and cleaves ATP, leading toconformational changes inside the barrel and hiding of the hydrophobic patches in Gro EL, which leads to the releasesof the unfolded peptide. The process proceeds until the folding protein passes through the barrel and is released in itscorrect folded state. Do you find this amazing?bind nonnative proteins at the GroEL opening of a complex of GroEL and GroES, which has a large hydrophobiccavity.Molecular Chaperonins in Disease
GroEL has also been shown to bind in its hydrophobic cavity a fluorescent CdS semiconductor nanoparticle which can bereleased on addition and cleavage of ATP. There are two classes of chaperonins:
Class I: Those found in bacteria, chloroplasts and mitochondria. The have structures analogous to GroEL (two rings of7 identical monomers) and Gro ES.Class II: Those found in archebacteria and in the cytoplasm of eukaryotic cells. These contain two rings of 8-9 subunitswhich may not be identical.
Jmol: Updated GroEL/ES Jmol14 (Java) | JSMol (HTML5)
Other chaperons have proven to be of clinical significance. Hsp 90 is a chaperone that is expressed both in normal andtumor cells. It appears to have special importance in tumor cells in helping key proteins involved in malignancy (signaltransduction proteins such as HER-2/ErbB2, Akt, Raf-1, Bcr-Abl, and p53) to maintain their shapes under conditions ofdrug exposure and the inherent genetic instability present in the cells. Drugs that bind to and inhibit Hsp90 appear to havemuch greater effect on tumor cells, making this protein a new chemotherapeutic target to treat cancer. Recent studies byKamal et al. have shown the drug 17-AAG binds Hsp90 about 100 times as strongly in tumor cells than in normal cells.Hsp 90 appears to be complexed to other "co-chaperones" in the tumor cells which lead to higher drug binding affinity.The chaperone complex may actually induce the drug to adopt a different conformation. A comparison of chaperonecatalyzed folding in prokaryotes and eukaroytes is shown below.
Figure: Comparison of cytosolic prokaryotic and eukaryotic chaperone pathways

Henry Jakubowski 2.4.6.3 1/5/2022 https://bio.libretexts.org/@go/page/64226
Reprinted by permission from Macmillan Publishers Ltd: Nature 475, 324-332 (2011) doi:10.1038/nature10317Chaperone-assisted protein folding: Arthur Horwich (Yale/HHMI) Part 1A:
Additional Proteins Which Catalyze Protein Folding: Chaperons function to minimize protein aggregation, which increasesthe efficiency of the entire process. Other proteins in the cell actually catalyze specific steps. Here are two examples:
Protein Disulfide Isomerase (PDI) - catalyzes the conversion of incorrect to correct disulfides. The active site consistsof 2 sets of the the following sequence - Cys-Gly-His-Cys, in which the pKa of the Cys are much lower (7.3) thannormal (8.5). How would this facilitate disulfide isomerization?Peptidyl Prolyl-Isomerase (PPI) - catalyses X-Pro isomerization, by a mechanism which probably involves bending theX-Pro peptide bond. How would this facilitate the process?
Many proteins have been found to possess PPI activity. One class is the immunophilins. These are small proteins found inthe cytoplasm that bind anti-rejections drugs used to prevent tissue rejection after transplanation. The immunophilinFK506 binding protein (FKBP) binds FK506 while the protein cyclophilin binds that anti-rejection drug cyclosporin. Thecomplex of cyclophilin:cyclosporin or FKBP:FK506 binds to an inhibits calcineurin, an important protein (withphosphatase activity) in immune cells (T cells) required for T cell function. In this case, immunophilin:drug binding tocalcineurin inhibits the activity of the T cell, preventing immune attack on the transplanted tissue, preventing rejection.The immunosuppressant drugs (FK506 and cyclosporin) inhibit the PPI activity of their respective immunnophilin. Theextent to which the PPI activity of cyclophiin is required for its activity is unclear, but it seems to be important for some ofits biological effects.
Jmol: Updated Cyclophilin Jmol14 (Java) | JSMol (HTML5)
Animation: Folding and Degradation of Proteins in vivo
As the site responsible for folding of membrane proteins and proteins destined for secretion, as well as the major site forlipid synthesis, the endoplasmic reticulum (ER) must be able to maintain homeostatic conditions to ensure proper proteinformation. Plasma cells that synthesize antibodies for secretion as part of the immune activation, show large increases inprotein chaperones and ER membrane size
The main pathway controlling ER biology is the unfolded protein response (UPR) signaling pathway. If demand forprotein synthesis in the ER exceeds capacity, unfolded proteins accumulate. This ER stress conditions activates a proteincalled IRE1, a transmembrane Ser/Thr protein kinases (which phosphorylates proteins). IRE1 activates a transcriptionfactor that controls transcription of many genes associated with protein folding in the ER. Another protein, ERAD (ER-associated degradation) which moves unfolded proteins back into the cytoplasm where they are degraded by the

Henry Jakubowski 2.4.6.4 1/5/2022 https://bio.libretexts.org/@go/page/64226
proteasome. Proteins involved in lipid synthesis are also activated as lipids are needed for membranes as the ER increasesin size. If the stress can not be mitigated the signaling pathway leads to programmed cell death (apoptosis).
Schuck at al investigated the specific role and importance of UPR in the homeostasis of ER as modeled by the yeastSaccharomyces cervisiae. The UPR signaling pathway was analyzed using light and electron microscopy to visualize andquantify ER growth under various stress conditions. Western blotting procedures were performed to determine chaperoneprotein concentrations after stress induction and association with ER expansion after the ER was exposed to varioustreatment conditions. The authors found ER membrane expansion occurred through lipid synthesis since stress inductionincreased concentrations of proteins responsible for promoting lipid synthesis and expansion failed when the proteins wereabsent and lipid concentration was low. In addition, these lipid synthesis proteins were activated by the UPR signalingpathway. By separating ER size control and UPR signaling, they found that expansion occurred regardless of chaperoneprotein concentrations. However, if lipid synthesis genes were not available, raising the ER chaperone level helpedalleviate stress levels in ER.
Contributors and Attributions
Prof. Henry Jakubowski (College of St. Benedict/St. John's University)

Henry Jakubowski 2.4.6.1.1 1/15/2022 https://bio.libretexts.org/@go/page/64227
2.4.6.1: Do you find biochemistry amazing?The structure and mechanism of GroEL/GroES in protein folding are about as good as it gets in biochemistry. I think theseproteins can be viewed as a litmus test to see if biochemistry is something that grabs you, that excites you. If you don't findthese proteins, their evolution, and their mechanism amazing, then maybe biochemistry is not your "thing".
Using an analogy to another field, consider a statement by Socrates in Plato's Euthyphro, and describe in Rachel's book,Elements of Moral Philosphy:
Is conduct right because the gods command it, or do the godscommand it because it is right.British philosopher Antony Flew states
"One good test of a persons aptitude for philosophy is to discoverwhether he can grasp its [the above statement] force and point."Contributors and Attributions
Prof. Henry Jakubowski (College of St. Benedict/St. John's University)

Henry Jakubowski 2.4.7.1 1/1/2022 https://bio.libretexts.org/@go/page/64228
2.4.7: D7. Redox Chemistry and Protein FoldingIn general we envision the interior of a cell to be in a reducing environment. Cells have sufficient concentrations of "b-mercaptoethanol"-like molecules (used to reduce disulfide bonds in proteins in vitro) such as glutathione (g-Glu-Cys-Gly)and reduced thioredoxin (with an active site Cys) to prevent disulfide bond formation in cytoplasmic proteins. Fordisulfide bonds to occur in a protein, a free sulfhydryl reacts with another one on a protein to form the more oxidizeddisulfide bond. This reaction occurs more readily if one of the Cys side chains had a lowered pKa (due to its immediateenvironment) making it a better nucleophile in the reaction. Most cytoplasmic proteins contain Cys with side chain pKa >8, which would minimize disulfide bond formation as the Cys are predominantly protonated at that pH.
Disulfide bonds in proteins are typically found in extracellular proteins, where they serve to keep multisubunit proteinstogether as they become diluted in the extracellular milieu. These proteins destined for secretion are cotranslationallyinserted into the endoplasmic reticulum (see below) which presents an oxidizing environment to the folding protein andwhere sugars are covalently attached to the folding protein and disulfide bonds are formed (see Chapter 3D: Glycoproteins- Biosynthesis and Function). Protein enzymes involved in disulfide bond formation contain free Cys which form mixeddisulfides with their target substrate proteins. The enzymes (thiol-disulfide oxidoreductases, protein disulfide isomerases)have a Cys-XY-Cys motif and can promote disulfide bond formation or their reduction to free sulfhydryls. They areespecially redox sensitive since their Cys side chains must cycle between and free disulfide forms.
Intracellular disulfide bonds are found in protein in the periplasm of prokaryotes and in the endoplasmic reticulum (ER)and mitochondrial intermembrane space (IMS) of eukaryotes. For these proteins, the beginning stage of protein synthesis(in the cytoplasm) is separated temporally and spatially from the site of disulfide bond formation and final folding.Disulfide bonds can be generated in a target protein by concomitant reduction of a disulfide in a protein catalyst, leavingthe net number of disulfides constant (unless the enzyme is reoxidized by an independent process). Alternatively, adisulfide can be formed by transfer of electrons to oxidizing agents such as dioxygen.
In the ER, disulfide bond formation is catalyzed by proteins in the disulfide isomerase family (PDI). To function ascatalysts in this process, the PDIs must be in an oxidized state capable of accepting electrons from the protein target fordisulfide bond formation. A flavoprotein, Ero1, recycles PDI back to an oxidized state, and the reduced Ero1 isregenerated on passing electrons to dioxygen to form hydrogen peroxide. In summary, on formation of disulfides in theER, electrons flow from the nascent protein to PDIs to the flavin protein Ero1 to dioxgen (i.e. to better and better electronacceptors). The first step is really a disulfide shuffle, which, when coupled to the subsequent steps, leads to de novodisulfide bond formation.
In the mitochondria, disulfide bond formation occurs in the intermembrane space (IMS) and is guided by the�mitochondria disulfide relay system.� This system requires two important proteins: Mia40 and Erv1. Mia40 containsa redox active disulfide bond cys-pro-cys and oxidizes cys residues in polypeptide chains. Erv1 can then reoxidize Mia40which can in turn get reoxized itself by the heme in cytochrome c. Reduced cytochrome C is oxidized by cytochrome Coxidase of electron transport through passage of electrons to dioxygen to form water. The importance of IMS proteinoxidation is less understood, but it is believe that the oxidative stress caused by a dysfunction could lead toneurodegenerative diseases.
A recent review by Riemer et al compares the ER and mitochondrial processes for disulfide bond formation:
Many more and diverse proteins form disulfides in the ER compared to the IMS. Most in the IMS have low molecularmass and have two disulfide bonds between helix-turn-helix motifs. These protein substrates include chaperones thatfacilitate localization of proteins in the inner membrane, and in proteins involved in electron transport in the innermembrane.
There are many PDIs in the ER, probably reflecting the structural diversity of protein substrates in the ER. HoweverMia40 appears to be the only PDI in the IMS.
"De novo" disulfide bond formation is initiated by Ero1 in the ER and Erv1 in the IMS. Convergent evolution led to thesimilar structures for both - a 4-helix bundle that binds FAD with two proximal Cys.
The mitochondria pathway lead to water formation on reduction of dioxygen, not hydrogen peroxide, minimizing theformation of reactive oxygen species in the mitochondria. The peroxide formed in the ER is presumably convert to an

Henry Jakubowski 2.4.7.2 1/1/2022 https://bio.libretexts.org/@go/page/64228
inert form.
The IMS is in more intimate contact with the cytoplasm through outer membrane proteins called porins which wouldallow some glutathione access. The IMS presents a more oxidizing environment than the cytoplasm (with moreglutathione). The ER, without a porin analog, would be more oxidizing.
Reversible formation of disulfides in the ER regulates protein activity.
Disulfide bond regulation in the Periplasmic Space of Bacteria
The redox sensitivity of the Cys side chain found in disulfide bonds is important in regulating protein activity. In particular,the thiol group of the amino acid Cys, an important nucleophile often found in active site, can be modified to controlprotein activity. The formation of a disulfide bond or the oxidation of free thiols to sulfenic acid or further to sulfinic orsulfonic acid can block protein activity. The E. Coli periplasmic proteins DsbA (disulfide bond A) converts adjacent freethiols into disulfide-linked Cystine, in the process becoming reduced. DsbB reoxidized DsbA back to its catalytyicallyactive form. What about periplasmic protein like YbiS with an active site Cys? Since the environment of the periplasm isoxidizing, YbiS mist be protected from oxidative conversion of the free Cys to either sulfinic or sulfonic acids causing theprotein to become inactive. The mechanism involves two periplasmic proteins known as DsbG and DsbC which are similarto thioredoxin. These two proteins are able to donate electrons to the unprotected thiol preventing it from becomingoxidized, which allows YbiS to remain active in the periplasm. To maintain activity, DsbG and DsbC are reduced byanother periplasmic protein, DsbD.
Contributors and AttributionsProf. Henry Jakubowski (College of St. Benedict/St. John's University)

Henry Jakubowski 2.4.8.1 12/25/2021 https://bio.libretexts.org/@go/page/64229
2.4.8: D8. Protein Transport Across MembranesHow does a protein "decide" its final location after synthesis? Protein synthesis occurs in the cytoplasm, but proteins mayend up outside of the cell, in cell membranes, internalized into various organelles, or remain in the cytoplasm. How is thedecision made? There must be signals in the protein which target proteins to various sites in a cell, where processing canoccur. Proteins that are destined for secretion or plasma membrane insertion typically have a signal peptide at the N-terminus which binds to a signal recognition particle in a cotranslational process which temporarily arrests translation. Thiscomplex docks to signal recognition complex docking sites in the endoplasmic reticulum membrane, where translationcontinues as the nascent polypeptide extends through a protein pore in the ER membrane. Gunter Blobel won the NoblePrize in Medicine in 1999 for "for the discovery that proteins have intrinsic signals that govern their transport andlocalization in the cell".
Figure: Overview - Synthesis of Protein Destined for Secretion
Figure: Signal Recognition Particle Complex
Figure: Sec Dependent Pathway for Post-translational translocation
(reprinted with permission from Kanehisa Laboratories and the KEGG project: www.kegg.org )

Henry Jakubowski 2.4.8.2 12/25/2021 https://bio.libretexts.org/@go/page/64229
If destined for secretion, it enters the lumen of the ER. Proteins destined for insertion into the cell surface membrane gets"stuck" in the ER membrane, and through a process of vesiculation merges with the Golgi and eventually with the cellsurface membrane. Proteins that are taken into organelles like mitochondria are done so in a post-translational process thatrequires facilitation by protein chaperones. Final protein folding occurs inside the organelle. In both cases, nonnativeproteins pass through the membrane after which final folding occurs.
An intriguing question is how the decision is made to keep a protein either in the membrane or allow it to pass throughcompletely (in the case of proteins destined for secretion). Hessa et al investigated this "decision-making" process bystudying the eukaryotic membrane pore protein complex, Sec 61 translocon (show in the above figures), whose activitymust be closely regulated with the folding of the growing protein. In studying this process, they considered three localregions in a membrane: the hydrophobic region comprised of the nonpolar acyl tails of membrane lipids, the interfacialregion in the vicinity of the polar head groups, and the aqueous regions (bulk water) on each side of the head groups. A 19amino acid peptide was used as the experimental model protein which was added to the translocon. This size was chosensince it is just long enough to span the hydrophobic part of the membrane if the peptide were in an alpha-helicalconformation (which is common in membrane-spanning proteins). They varied the proportion of amino acids that tend topartition into each of three regions and studied the disposition of the peptide after interaction with membrane andtranslocon. To test if the results were consistent with the thermodynamics of amino acid partitioning into nonpolarenvironments (and not kinetic considerations), they used the Wimley and White hydrophobicity scale, based on the freeenergy of transfer of amino acid side chains into nonpolar environments, to predict target peptide disposition with themembrane. The table below shows the propensity of amino acids to be in each region at equilibrium, based on thishydrophobicity scale.
Table: Amino Acid Partitioning Into Membrane Regions
Region Amino Acids
Bulk water Arg, Asn, Asp, Gln, Glu, His, Lys, Pro
Bulk water + interfacial Ala, Cys, Gly, Ser, Thr
Interfacial Tyr
Hydrophobic Ile, Leu, Met, Phe, Trp, Val
Their experimental result were in concordance with those predicted using the above scale. If a polyalanine 19 mer wasused, no insertion was observed. With five leucines in the peptide, almost 90% inserted into the membrane. The resultswould be modeling using a two-state equilibrium: Peptide inserted <==> Peptide translocated.

Henry Jakubowski 2.4.8.3 12/25/2021 https://bio.libretexts.org/@go/page/64229
They then substituted each of the twenty amino acids into a given position into a target peptide and used the results todevelop an empirical scale for membrane transfer, not one based on simple transfer to nonpolar medium. This new scalematched the hydophobicity scale, suggesting insertion and transfer decisions where based on thermodynamics of sidechain partitioning. They also varied the position of the varied amino acid in the test peptide. If the amino acid favored thebulk and/or interfacial region, the peptide would be inserted if that amino acid were at the end of the peptide, not themiddle. For translocation, the peptide had to be amphiphilic with one face polar and the other nonpolar.
They developed a simple equilibrium model to show the processes involved, as shown below in a top-down view of themembrane.
Figure: Translocon Equilibrium Model
The translocon, shown in green, has a water-filled pore but also a sidewise opening toward the membrane interior. Thetarget peptide enters the pore. Transient conformational changes in the pore expose the peptide to the nonpolar membranecore. The target peptide samples both the aqueous and nonpolar environments and partitions into them based onconsiderations mentioned above. If it partitions more favorably into the hydrophobic core, it will do so and cause thepeptide to become membrane bound. Otherwise it will pass through to the other side. This can be modeled as anequilibrium process if the rate of translocation is slow compared to the rates of translocon conformational change andenvironmental sampling by the peptide. Obviously, the process becomes more complicated if the target is a large protein.
Jmol: Updated SecYEB Protein Translocase Jmol14 (Java) | JSMol (HTML5)
Bacterial toxin proteins also have evolved ways to pass through a cell membrane, again in a nonnative state, through aprotein channel in the membrane. Krantz et al have recently worked out details of how the anthrax toxin protein movesthrough eukaryotic cell membranes. Three anthrax proteins are involved. One is a "prepore" protein that binds to specificproteins on the cell membrane, where it is activated by limited proteolysis to form a pore protein which assembles into thehomoheptamer prepore in the membrane. Two other proteins secreted by the bacteria, lethal factor and edema factor, bindto the heptamar complex and the whole assembly is then taken up into the cell by invagination to form a vesicle with thepore complex in the membrane. This vesicles fuses with a lysosome in the cell, and upon acidification, a conformationalchange occurs in the prepore complex to activate it. The lethal and edema factors unfold partially, possibly to a moltenglobule state, and are then passed though the pore into the cell where they exert their toxic influences. An electrochemicalpotential gradient (which we will discuss later in the semester) is required for passage of the factors through themembrane. The active pore further unravels the factor protein, facilitating transport.
Krantz et al. studied the pore protein by mutating two amino acids, Phe427 and Ser 429, on each monomer of the pore toCys. They then postranslationally modified the Cys with [2-(trimethylammonium) ethylmethanethiosulfonate and observedeffects on ion conductance of the pore and pore conformations. They noted that when both residues were mutated andchemically modified, that ion conductance was blocked, suggesting that these side chains were localized in the narrowestpart of the channel. When Phe 427 alone was mutated to smaller side chains (Ala), ion conductance increased but transferof peptides from the factor proteins was inhibited. This suggested that an aromatic ring in the narrow part of the channelopening participates in translocation of bacterial proteins through the membrane. They then analyzed the transport of avariety of small molecules with varying hydrophobicity through the wild type pore. Their results were consistent with the

Henry Jakubowski 2.4.8.4 12/25/2021 https://bio.libretexts.org/@go/page/64229
binding of the molecules through hydrophobic and aromatic electron interactions. They suggest a mechanism of transportconsistent with their data in which the unfolded protein "ratchets" through the pore, which promotes factor proteinunfolding to expose more hydrophobic groups to the nonpolar aromatic ring in the pore. This mechanism is similar to howthe chaperone complex GroEL/GroES unfolds protein in its large central cavity, in a process which requires the chemicalpotential released by hydrolysis of ATP, not a transmembrane potential. In addition, the Sec61 translocon in the innermembrane of bacteria and in eukaryotic ER membranes also has a pore containing a ring of hydrophobic groups (Ile).
Contributors and AttributionsProf. Henry Jakubowski (College of St. Benedict/St. John's University)

Henry Jakubowski 2.4.9.1 1/22/2022 https://bio.libretexts.org/@go/page/64230
2.4.9: D9. Recent References1. F. Ulrich Hartl, Andreas Bracher & Manajit Hayer-Hartl. Molecular chaperones in protein folding and proteostasis.
Nature 475, 324-332 (2011) doi:10.1038/nature103172. Dunker, A et al. Intrinsically disordered proteins. Journal of Molecular Graphics and Modeling. 19, 26 (2001)3. Dunker, A. et al. The unfoldomics decade: an update on intrinsically disordered proteins.BMC Genomics 2008,
9(Suppl 2):S1 doi:10.1186/1471-2164-9-S2-S14. Schuck, S. et al.
Membrane expansion alleviates endoplasmic reticulum stress independently of the unfolded protein response.:
J. Cell Biol 187, 525 (2009)5. Riemer, J. et al. Disulfide Formation in the ER and Mitochondria: Two Solutions to a Common Process. Science 324,
1284 (2009)6. Depuydt, M. et al. A Periplasmic Reducing System Protects Single Cysteine Residues from Oxidation. Science 326,
1109 (2009)7. Uversky, V & Dunker, A. Controlled Chaos. Science. 320, 1340 (2008)8. Bemporad, F. et al. Biological function in a non-native partially folded state of a protein. EMBO Journal 27, 1525
(2008)9. Murzin, A. Metamorphic Proteins. Science 320, 1725 (2008)
10. Kimchi-Sarfaty, C. et al. A "Silent Polymorphism in the MDR1 Gene Alters Substrate Specificity. Science 315, 525(2007)
11. Religa, T. et al. Solution Structure of a protein denatured state and folding intermediate. Nature. 437, 1053 (2005)12. Cecconi et al. Direct Observation of the Three-State Folding of a Single Protein Molecule. Science 309, 2057 (2005)13. Krantz, B.A. et al. A Phenylalanine Clamp Catalyzes Protein Translocation Through the Anthrax Toxin Pore. Science
309, 777 (2005)14. Hessa, T. et al. Recognition of transmembrane helices by the endoplasmic reticulum translocon. Nature 433, 377 (2005)15. Bowie, J. U. Cell Biology: Border Crossing. Nature 433, 367 (2005)16. van den Berg, B et al. X-ray structure of a protein-conducting channel. Nature, 427, pg 36 (2004)17. Dobson, C. Protein folding and misfolding. Nature. 426, pg 884 (2003)18. Kamal, A. et al. A high-affinity conformation of Hsp90 confers tumour selectivity on Hsp90 inhibitors. Nature. 425, pg
407, 357 (2003)19. Ishii, D et al. Chaperonin-mediated stabilization and ATP-triggered release of semiconductor nanoparticles. Nature.
423, pg 628 (2003)20. Hartl and Hartl. Molecular Chaperones in the Cytosol: from nascent chain to folded protein Sicence. 295, og 1852
(2002)21. Houry et al. Identification of in vivo substrates of the chaperonin GroEL. Nature Nov 1999, pg 147. (Vol 402?)22. Vendruscolo et al. Three key residues form a critical contact network in a protein folding transition state. Nature 409,
pg 641 (2001)23. Baker. A surprising simplicity to protein folding. Nature. 405, pg 39 (2000)24. Batey et al. Crystal structure of the ribonucleoprotein core of the signal recognition particle. (which binds newly
synthesized proteins cotranslationally, arrests the synthesis, and docks the particle to the endoplasmic reticulum wheresynthesis restarts and the protein is discharged into the ER lumen for movement elsewhere in the cell). Science. 287, pg1232 (2000)
25. Shin et al. Interaction of partially unfolded forms of Torpedo acetylcholinesterase with liposomes. Protein Science. 5,pg 42 (1996)
26. Ren et al. Interaction of diphtheria toxin T domain (transmembrane domain) with molten globule-like proteins and itsimplication for translocation. Science. 284. pg 955 (1999)
27. Netzer and Hartl. Recombination of protein domains facilitated by co-translational folding in eukaryotes. Nature. 388,pg 329, 343 (1997)
28. Weber-Ban et al. Global unfolding of a substrate protein (GFP) by the Hsp 100 chaperone ClpA. Nature. 401, pg 29, 90(1999)

Henry Jakubowski 2.4.9.2 1/22/2022 https://bio.libretexts.org/@go/page/64230
Contributors and AttributionsProf. Henry Jakubowski (College of St. Benedict/St. John's University)

Henry Jakubowski 2.5.1 1/8/2022 https://bio.libretexts.org/@go/page/64231
2.5: G. Predicting Protein Properties From Sequences
find web based proteomics protein to analyze protein sequences and structuresdescribe the basis for methods used to predict the secondary structure and hydrophobic structures of proteinsanalyze secondary structure and hydropathy plots from web-based proteomics programs.describe differences between integral and peripheral membranes proteins, and how each could be purified.explain how hydropathy and secondary structure plots can be used to predict membrane spanning sequences ofproteinsdescribe in general the theoretical and empirically based methods to predict protein tertiary structure from aprimary sequencedescribe possible early intermediates in protein folding as determined by theoretical methods
Thumbnail: Structure of human hemoglobin. The proteins α and β subunits are in red and blue, and the iron-containingheme groups in green. From PDB: 1GZX . (GNU; Proteopedia Hemoglobin).
Learning Objectives
2.5.1: G1. Introduction to Bioinformatics, Computational Biology and Proteomics
2.5.2: G2. Prediction of Secondary Structure
2.5.3: G3. Prediction of Hydrophobicity
2.5.4: G4. Prediction of Membrane Protein Structure
2.5.5: G5. Prediction of Protein Tertiary Structure
2.5.6: G6. Proteomics Problem Set 1
2.5.7: G7. Proteomics Problem Set 2
2.5.8: G8. General Links and References
Topic hierarchy

Henry Jakubowski 2.5.2 1/8/2022 https://bio.libretexts.org/@go/page/64231
Contributors and AttributionsProf. Henry Jakubowski (College of St. Benedict/St. John's University)

Henry Jakubowski 2.5.1.1 1/5/2022 https://bio.libretexts.org/@go/page/64232
2.5.1: G1. Introduction to Bioinformatics, Computational Biology andProteomicsWith the solving of the human genome, intensive effort has been devoted to analysis of the human genome to determinethe number and transcriptional regulation of the encoded genes. Much has been learned from comparative genomics, asgenomes from mice, rats, chimpanzees, and a variety of prokaryotes are compared in an effort to help understand thenature of genes and their transcriptional regulation. The vast amount of genomic data that has to be "mined" has requiredthe development of computational and computer programs to enable the analysis. Two relatively new fields havesubsequently arisen: bioinformatics and computational biology. (In a personal note, the words computational biology seemsomewhat restrictive since the field of computational chemistry, which has a longer history, has significant overlap with"computational biology". I prefer computational biochemistry). These fields have significant overlap (as do physicalchemistry/chemical physics and biochemistry/molecular biology/chemical biology), so I defer to others to define them.
The NIH Biomedical Information Science and Technology Initiative Consortium: "This consortium has agreed on thefollowing definitions of bioinformatics and computational biology, recognizing that no definition could completelyeliminate overlap with other activities or preclude variations in interpretation by different individuals and organizations.
Bioinformatics: Research, development, or application of computational tools and approaches for expanding the use ofbiological, medical, behavioral or health data, including those to acquire, store, organize, archive, analyze, or visualizesuch data.
Computational Biology: The development and application of data-analytical and theoretical methods, mathematicalmodeling and computational simulation techniques to the study of biological, behavioral, and social systems."
This web book has been developed as a first semester biochemistry text and choices have been made to limit the scope ofthe material to exclude content covered in detail in a molecular biology/genetics class. Hence, this text will not discuss insignificant detail the genome and transcriptome, and mechanisms of replication, transcription, or translation. However,with its emphasis on protein structure and function, proteomics, the characterization of structure and function of allproteins within a cell, is a logical candidate for inclusion.
In the last several years, computational biology/chemistry and web-based programs have become available for thesystematic analysis of individual proteins, and for the comparative analysis of many proteins, based on either their DNA oramino acid sequence. Clearly the ultimate goal in the description of a protein would be to determine, from the amino acidor nucleotide sequence, the three dimensional structure of a protein and its biological function, including all its bindingpartners.
Here is a list of proteome web resources and tutorials
Bioinformatics and Homology Modeling: A Student-Tested Tutorial for BeginnersExPASy Proteomics PortalAnimations: Proteins and ProteomicsProtein Matchmaking - Protein Data Base Search Engine: allows superposition of similar protein structuresSIB: Swiss Institute of Bioinformatics:Protein Structure and Proteome Analysis
Voluminous databases of biomolecule sequence and structural data, as well as analysis software packages, are available ata variety of web sites, including:
BioGrid: General Repository for Interaction (protein, NA) DatasetsGenBank: DNA sequence database (over 100 billion bases as of 9/05), from the NCBIBLAST finds regions of similarity between biological sequencesUniProtKB/Swiss-Prot: manually annotated and reviewed section of the UniProt Knowledgebase (UniProtKB)ProSite: database of protein families and domains. It consists of biologically significant sites, patterns and profiles thathelp to reliably identify to which known protein family (if any) a new sequence belongs. From the Swiss Institute ofBioinformaticsSwiss-2D Gel Database: from the Swiss Institute of Bioinformatics

Henry Jakubowski 2.5.1.2 1/5/2022 https://bio.libretexts.org/@go/page/64232
RSCB Protein Data Bank: Protein and nucleic acid 3D structures from x-ray crystallography and NMR spectroscopy(about 33,000 as of 9/15/05)SWISS-MODEL Repository: 3D comparative protein structure models (675,000) generated by the fullyautomated homology-modeling pipeline SWISS-MODEL. (again from Swiss Institute of Bioinformatics)ExPASy (Expert Protein Analysis System) server of the Swiss Institute of Bioinformatics
The NCBI has an extensive array of available tools (free), including:
literature databases: including word searches in many booksAll resources: including nucleotide, protein, structure, genome, chemicalEntrez: the life science search engineBlast Quick Start: easy way to start a BLAST searchcomplete human proteome from UniProtKB/Swiss-Prot
A summary of three important sites:
• NCBI-Protein: The Protein database is a collection of sequences from several sources, including translations fromannotated coding regions in GenBank, RefSeq and TPA, as well as records from SwissProt, PIR, PRF, and PDB. Proteinsequences are the fundamental determinants of biological structure and function • Uniprot: The UniProt Knowledgebase (UniProtKB) is the central hub for the collection of functional information onproteins, with accurate, consistent and rich annotation. In addition to capturing the core data mandatory for eachUniProtKB entry (mainly, the amino acid sequence, protein name or description, taxonomic data and citation information),as much annotation information as possible is added. • Gene Card: GeneCards is a searchable, integrative database that provides comprehensive, user-friendly information on allannotated and predicted human genes. It automatically integrates gene-centric data from ~125 web sources, includinggenomic, transcriptomic, proteomic, genetic, clinical and functional information
The table below (directly taken from Wikipedia) shows some of the incredible information available the proteome andgenome of each human chromosome.
Table: Human proteome and genome from Wikipedia (Data source: Ensembl genome browser release 68, July 2012)
Chromsome
Length(mm) BP
Variations
ConfirmedProteins
PutativeProteins
Pseudogenes miRNA rRNA snRNA snoRNA
miscncRNA Links
1 85 249,250,621
4,401,091
2,012 31 1,130 134 66 221 145 106 EBI
2 83 243,199,373
4,607,702
1,203 50 948 115 40 161 117 93 EBI
3 67 198,022,430
3,894,345
1,040 25 719 99 29 138 87 77 EBI
4 65 191,154,276
3,673,892
718 39 698 92 24 120 56 71 EBI
5 62 180,915,260
3,436,667
849 24 676 83 25 106 61 68 EBI
6 58 171,115,067
3,360,890
1,002 39 731 81 26 111 73 67 EBI
7 54 159,138,663
3,045,992
866 34 803 90 24 90 76 70 EBI
8 50 146,364,022
2,890,692
659 39 568 80 28 86 52 42 EBI
9 48 141,213,431
2,581,827
785 15 714 69 19 66 51 55 EBI
10 46 135,534, 2,609,80 745 18 500 64 32 87 56 56 EBI

Henry Jakubowski 2.5.1.3 1/5/2022 https://bio.libretexts.org/@go/page/64232
747 2
11 46 135,006,516
2,607,254
1,258 48 775 63 24 74 76 53 EBI
12 45 133,851,895
2,482,194
1,003 47 582 72 27 106 62 69 EBI
13 39 115,169,878
1,814,242
318 8 323 42 16 45 34 36 EBI
14 36 107,349,540
1,712,799
601 50 472 92 10 65 97 46 EBI
15 35 102,531,392
1,577,346
562 43 473 78 13 63 136 39 EBI
16 31 90,354,753
1,747,136
805 65 429 52 32 53 58 34 EBI
17 28 81,195,210
1,491,841
1,158 44 300 61 15 80 71 46 EBI
18 27 78,077,248
1,448,602
268 20 59 32 13 51 36 25 EBI
19 20 59,128,983
1,171,356
1,399 26 181 110 13 29 31 15 EBI
20 21 63,025,520
1,206,753
533 13 213 57 15 46 37 34 EBI
21 16 48,129,895
787,784 225 8 150 16 5 21 19 8 EBI
22 17 51,304,566
745,778 431 21 308 31 5 23 23 23 EBI
X 53 155,270,560
2,174,952
815 23 780 128 22 85 64 52 EBI
Y 20 59,373,566
286,812 45 8 327 15 7 17 3 2 EBI
mtDNA 0.0054 16,569 929 13 0 0 0 2 0 0 22 EBI
This chapter will describe programs that allow predictions of secondary and tertiary structures of proteins. Specificexercises using web-based bioinformatics programs can be found at the end.
Contributors and Attributions
Prof. Henry Jakubowski (College of St. Benedict/St. John's University)
Save

Henry Jakubowski 2.5.2.1 1/15/2022 https://bio.libretexts.org/@go/page/64233
2.5.2: G2. Prediction of Secondary StructureAs we have seen previously, amino acids vary in their propensity to be found in alpha helices, beta strands, or reverse turns(beta bends, beta turns). These difference can be rationalized from the structure of each amino acid, as described before.
Figure: Amino Acid Structure and propensity for secondary structure
From the data bases, propensities can be calculated to determine the likelihood that a given amino acid will be in one ofthose structures. Glycine for example would have a high propensity to be in reverse turns, while Pro, a helix breaker,would have a low propensity to be in an alpha helix. A number is assigned to each amino acid for each category ofsecondary structure. High numbers favor the likelihood that that amino acid would be in that structure. One of the earliestpropensity scales was from Chou-Fasman, where H indicates high propensity for secondary structure, h intermediatepropensity, i is inhibitory, b is a intermediate breaker, and B is a significant breaker of secondary structure.
Chou-Fasman Amino Acid Propensities
A.A.Helix Sheet
Designation P Designation P
Ala H 1.42 i 0.83
Cys i 0.70 h 1.19
Asp I 1.01 B 0.54
Glu H 1.51 B 0.37
Phe h 1.13 h 1.38
Gly B 0.57 b 0.75

Henry Jakubowski 2.5.2.2 1/15/2022 https://bio.libretexts.org/@go/page/64233
His I 1.00 h 0.87
Ile h 1.08 H 1.60
Lys h 1.16 b 0.74
Leu H 1.21 h 1.30
Met H 1.45 h 1.05
Asn b 0.67 b 0.89
Pro B 0.57 B 0.55
Gln h 1.11 h 1.10
Arg i 0.98 i 0.93
Ser i 0.77 b 0.75
Thr i 0.83 h 1.19
Val h 1.06 H 1.70
Trp h 1.08 h 1.37
Tyr b 0.69 H 1.47
Next a stretch or "window" of amino acids about 7 amino acids is taken, starting from the N-terminal of the protein. Firstthe average alpha helical propensities for amino acids 1-7 are determined and assigned, let's say, to the middle (4th) aminoacid in that sequence. Then alpha helical propensities for amino acids 2-8 (the next window) are averaged and assigned tothe middle (5) amino acid in that range. The window slide down the protein sequence until all but the first and last fewamino acids have an average value assigned to them. If a contiguous stretch of amino acids has high average propensity,they are probably in an alpha helix in the native protein. This process is repeated using beta strand and reverse turnpropensities. The final assignments of most probably secondary structure are made. Of course this system was testedagainst proteins whose tertiary structure was known. See the results for secondary structure prediction for one protein. Inthis example, the average propensity for four contiguous amino acids is calculated (starting with amino acids 1-4, thenamino acids 5-8, etc, and continuing to the end of the polypeptide). Next this process is repeated for contiguous stretches2-5, 6-9, etc, and continuing to the end. The original Chou Fasman propensities have been updated using known proteinstructure to give better predictions.
Chou Fasman Online Secondary Structure Predictor
Additional information about putative helices can be obtained by determining if they are amphiphilic (one side of the helixcontaining mostly hydrophobic side chains, with the opposite side containing polar or charged side chains. A helical wheelprojection can be made. In this a circle is draw representing a downward cross-sectional view of the helix axis.
Figure: Helical wheel projection

Henry Jakubowski 2.5.2.3 1/15/2022 https://bio.libretexts.org/@go/page/64233
The side chains are placed on the outside of the circle, staggered in a fashion determined by the fact that there are 3.6amino acids per turn of the helix. If one side of the wheel contains predominantly nonpolar side chains while the other sidehas polar side chains, the helix is amphiphilic. Imagine how such helices might be packed in a protein.
Helical wheel predictor | Another Helical wheel predictor | AnotherPrograms for Secondary Structure Prediction
Contributors and Attributions
Prof. Henry Jakubowski (College of St. Benedict/St. John's University)

Henry Jakubowski 2.5.3.1 1/22/2022 https://bio.libretexts.org/@go/page/64234
2.5.3: G3. Prediction of HydrophobicityIn a completely analogous fashion, a hydrophobic propensity or hydopathy can be calculated. In this system, empiricalmeasures of the hydrophobic nature of the side chains are used to assign a number to a given amino acid. Manyhydropathy scales are used. Several are based on the Dmo transfer of the side chains from water to a nonpolar solvent. Twocommonly used scales are the Kyte-Doolittle Hydropathy and Hopp-Woods scales (used more like a hydrophilicity indexto predict surface or water accessible structures that might be recognized by the immune system)
Hydrophobicity Indices for Amino Acids
Amino Acid Kyte-Doolittle Hopp-Woods
Alanine 1.8 -0.5
Arginine -4.5 3.0
Asparagine -3.5 0.2
Aspartic acid -3.5 3.0
Cysteine 2.5 -1.0
Glutamine -3.5 0.2
Glutamic acid -3.5 3.0
Glycine -0.4 0.0
Histidine -3.2 -0.5
Isoleucine 4.5 -1.8
Leucine 3.8 -1.8
Lysine -3.9 3.0
Methionine 1.9 -1.3
Phenylalanine 2.8 -2.5
Proline -1.6 0.0
Serine -0.8 0.3
Threonine -0.7 -0.4
Tryptophan -0.9 -3.4
Tyrosine -1.3 -2.3
Valine 4.2 -1.5
Kyte-Doolittle Online Hydropathy PlotKD Hydropathy Plot
For a water-soluble protein, a continuous stretch of amino acids found to have a high average hydropathy is probablyburied in the interior of the protein. Consider the example of bovine a-chymotrypsinogen, a 245 amino acid protein, whosesequence is shown below in single letter code.
1 CGVPAIQPVLSGLSRIVNGEEAVPGSWPWQVSLQDKTGFHFCGGSLINENWVVTAAHCGV 61 TTSDVVVAGEFDQGSSSEKIQKLKIAKVFKNSKYNSLTINNDITLLKLSTAASFSQTVSA 121 VCLPSASDDFAAGTTCVTTGWGLTRYTNANTPDRLQQASLPLLSNTNCKKYWGTKIKDAM 181 ICAGASGVSSCMGDSGGPLVCKKNGAWTLVGIVSWGSSTCSTSTPGVYARVTALVNWVQQ 241 TLAAN
A hydrophathy plot for chymotrypsinogen (sum of hydropathies of seven consecutive residues) shows many stretches thatare presumably buried in the interior of the protein.
Figure: hydrophathy plot for chymotrypsinogen

Henry Jakubowski 2.5.3.2 1/22/2022 https://bio.libretexts.org/@go/page/64234
Contributors and AttributionsProf. Henry Jakubowski (College of St. Benedict/St. John's University)

Henry Jakubowski 2.5.4.1 1/5/2022 https://bio.libretexts.org/@go/page/64235
2.5.4: G4. Prediction of Membrane Protein StructureSo far we have discussed predominantly globular proteins that are soluble in water. Proteins are also found associated withmembranes. Two major classes of membrane proteins are found in nature.
peripheral membrane proteins: water soluble proteins bound reversibly and non-covalently to the membrane throughelectrostatic attractions between charged polar head groups of the phospholipids and the protein. These proteins canoften be released from the membrane by addition of high salt, since they are often attracted to the bilayer byelectrostatic interactions between charged phospholipid head groups and polar/charged groups on the protein surface.integral membrane proteins: actually insert into the bilayer. These can be released from the membrane and effectivelysolubilized by the addition of single chain amphiphiles (detergents) which form a mixed micelle with the integralmembrane protein. Nonionic detergents (Trition X-100, octylglucoside, etc) are often used in the purification ofmembrane proteins. Ionic detergents (like SDS) not only solubilize the integral membrane proteins, but also denaturethem.
Figure: Types of membrane proteins
In some of these integral membrane proteins, large extracellullar and intracellular domains of the protein are present,connected by the intramembrane regions. The intramembrane spanning region often consists of either a single alpha helix,or 7 different helical regions which zig-zag through the membrane. These transmembrane sequences can readily bedetermined through hydropathy calculations. For example, consider the integral membrane bovine protein rhodopsin. Its348 amino acid sequence (in single letter code) is shown below:
MNGTEGPNFYVPFSNKTGVVRSPFEAPQYYLAEPWQFSMLAAYMFLLIMLGFPINFLTLY VTVQHKKLRTPLNYILLNLAVADLFMVFGGFTTTLYTSLHGYFVFGPTGCNLEGFFATLG GEIALWSLVVLAIERYVVVCKPMSNFRFGENHAIMGVAFTWVMALACAAPPLVGWSRYIP EGMQCSCGIDYYTPHEETNNESFVIYMFVVHFIIPLIVIFFCYGQLVFTVKEAAAQQQES ATTQKAEKEVTRMVIIMVIAFLICWLPYAGVAFYIFTHQGSDFGPIFMTIPAFFAKTSAV YNPVIYIMMNKQFRNCMVTTLCCGKNPLGDDEASTTVSKTETSQVAPA
Rhodopsin hydropathy plot calculations shows that is contains seven transmembrane helices which wind through themembrane in a serpentine fashion..
Figure: Rhodopsin hydropathy plot

Henry Jakubowski 2.5.4.2 1/5/2022 https://bio.libretexts.org/@go/page/64235
Figure: seven transmembrane helices
Rhodopsin Hydropathy Results
No. N terminal transmembraneregion
C terminal type length
1 40 LAAYMFLLIMLGFPINFLTLYVT
62 PRIMARY 23
2 71 PLNYILLNLAVADLFMVFGGFTT
93 SECONDARY 23
3 113 EGFFATLGGEIALWSLVVLAIER
135 SECONDARY 23
4 156 GVAFTWVMALACAAPPLVGWSRY
178 SECONDARY 23
5 207 MFVVHFIIPLIVIFFCYGQLVFT
229 PRIMARY 23
6 261 FLICWLPYAGVAFYIFTHQGSDF
283 PRIMARY 23
7 300 VYNPVIYIMMNKQFRNCMVTTLC
322 SECONDARY 23
In summary, hydropathy plots are hence useful in finding buried regions in water soluble proteins, transmembrane helicesin integral membrane proteins as well as short stretches of polar/charged amino acids that might form surface loopsrecognizable by immune system antibodies. The window size used in hydropathy plots would obviously affect thecalculated results. Windows of 20 amino acids are useful to determine transmembrane helices while windows of 5-7 aminoacids are used to find surface-exposed hydrophilic sites.

Henry Jakubowski 2.5.4.3 1/5/2022 https://bio.libretexts.org/@go/page/64235
Membrane proteins call be solubilized by addition of single chain amphiphiles (detergents). The nonpolar tails of thedetergents interact with the hydrophobic transmembrane domain of the membrane protein forming a "mixed" micelle-likestructure. Nonionic detergents like Triton X-100 and octyl-glucoside are often used to solubilize membrane proteins intheir near native state. In contrast, ionic detergents like sodium dedecyl sulfate (with a negatively charged head group)denature proteins during the solubilization process. To study membrane proteins in a more native-like environment,proteins solubilized by nonionic detergent can be reconstituted into bilayer liposome structures using methods similar tothose from Lab 1 in which you prepared dye-capsulated large unilamellar vesicles (LUVs). However, it can be difficult tostudy the intra- and extracellular domains of membrane proteins in liposomes, given that one of those domains is hiddeninside the liposome. A novel technique that removes this barrier was recently developed by Sligar. He created anamphiphilic protein disc with an opening in the center. The inner opening is lined with nonpolar residues, while the outersurface of the disc is polar. When the discs were added to phosphlipids, small bilayers formed inside the disc. Membraneproteins like the b-2 adrenergic receptor could be reconstituted in the nanodisc bilayers, allowing solvent exposure of boththe intracellular and extracellular domains of the receptor protein.
Figure: Nanodisc with membrane protein
Experimentally Determined Hydropathy ScalesProtein Sequence Structural FeaturesMembrane Protein ResourcesMembrane Proteins of Known 3D Structure57 Different Amino Acid Scale Predictors from ExPASy
Contributors and Attributions
Prof. Henry Jakubowski (College of St. Benedict/St. John's University)

Henry Jakubowski 2.5.5.1 1/5/2022 https://bio.libretexts.org/@go/page/64236
2.5.5: G5. Prediction of Protein Tertiary StructureWe are getting closer to predicting the tertiary structure of a protein, but as we have seen from molecular mechanics anddynamics calculations, it is a huge computational task. There are two basic approaches which are often combined.
calculations using energy minimization and statistical mechanics: These "semi-empirical" techniques don't assume anygiven secondary structure propensities or hydrophobicities. Such methods have produced limited success with smallproteins whose actual structure is known.homology modeling based on proteins of known structure: The structures of about 117,00 (3/16) different biologicalmacromolecules are known. This can serve as an empirical data base of possible conformations. Instead of an infinitenumber of prototypical structures, it is becoming clear that there may be a reasonably low number (in the hundreds) ofbasic structural motifs that are used over and over in nature. By aligning the amino acid sequences of different proteins,and comparing their properties (such as secondary structure propensities, hydrophobicities, etc.), probable low energystructures of the new protein can be determined. This initial structure can be run through multiple minimization anddynamic simulations to produce a tentative "lowest" energy structure. The structure should be compact (checkedthrough calculation of packing density) and experimental techniques (such as spectroscopic methods) should beemployed to validate the structure.
Many mechanisms of the actual folding process have been postulated, most of which have some experimental support. Inone, a hydrophobic collapse of the protein produces a seed structure upon which secondary structure and final tertiarycollapse results. Alternatively, initial formation of an alpha helix might serve as the seed structure. A combination of thetwo is likely. In one scenario, two small amphiphilic helices might form which interact through their nonpolar faces toproduce the initial seed structure.
Many studies have been done on a domain of the protein villin. A company at Stanford University (Folding at Home)actually allows you to process protein folding data on your own computer when you're not using it (an example ofdistributed computing). The example below shows one simulation of length greater than 1 ms. In the simulation, itcollapses to a near native-like state then unfolds again as it iteratively probes conformational space as it "seeks" the globalenergy minimum.
molecular dynamics of villin foldingMD simulation of villin folding using NAMD
Zhou and Karplus simulated the folding of residues 10-55 of Staphylococcus aureus protein A which form a 3-helix bundlestructure.
Figure: 3-helix bundle

Henry Jakubowski 2.5.5.2 1/5/2022 https://bio.libretexts.org/@go/page/64236
Using molecular dynamics, they carried out 100 folding simulations. Two types of folding trajectories were noted.
In the first type, helices form early (70% within 10 ns), but the fraction of native interhelical contacts (indicating properpacking of the helices together) and the overall packing density are not similar to the native state. Then the helicesdiffuse and collide with each (in the rate-limiting step) until the native state is reached at about 19 ms. In this model,non-obligatory intermediates can occur (due to collapse to non-native interhelical packing in the rate-limiting step)which could slow down folding.
Figure: helices form early
In another type, there is a simultaneous and quick partial helix formation and collapse (90% at 200 ns), to a state whichis similar to the molten globule. At this point, only about 20% of the native contacts are present. The final tertiarystructure is achieved after a slow process of forming native contacts within the compact state, which takes about 500ms.
Figure: simultaneous and quick partial helix formation and collapse

Henry Jakubowski 2.5.5.3 1/5/2022 https://bio.libretexts.org/@go/page/64236
The Fersht lab has been combining experimental and theoretical approaches to the folding/unfolding of another three helixbundle protein, Engrailed homeodomain.
Figure: Engrailed homeodomain
This protein is among the fastest folding and unfolding proteins known (ms time scale). This time frame is now alsoamenable to study through molecular dynamics simulations. Both sets of data support a folding pathway in which theunfolded state (U) collapses in a microsecond to an intermediate state (I) characterized by significant native secondarystructure and mobile side chains that is less compact than the native state (N). The I state hence resembles the moltenglobule state. To more clearly understand the unfolded state, they generated a mutant (Leu16Ala) which was onlymarginally stable at room temperature (2.5 kcal/mol). Spectroscopic measurements (CD, NMR) showed this state toresemble the intermediate (I) state, with much native secondary structure and a 33% greater radius of gyration than the Nstate. In effect they could study the transient intermediate of the wild type protein more easily by making that state morestable through mutagenesis. These studies showed that the intermediate is on the folding pathway and not inhibitory to theprocess. Using molecular dynamic simulations, the intermediate to native state transition was shown to proceed via atransition state (TS) in which the native secondary structure is almost all present and the helices are engaged in the finalpacking process.
Figure: Complete Folding Pathway of Engrailed Homeodomain by Experiment and Simulation
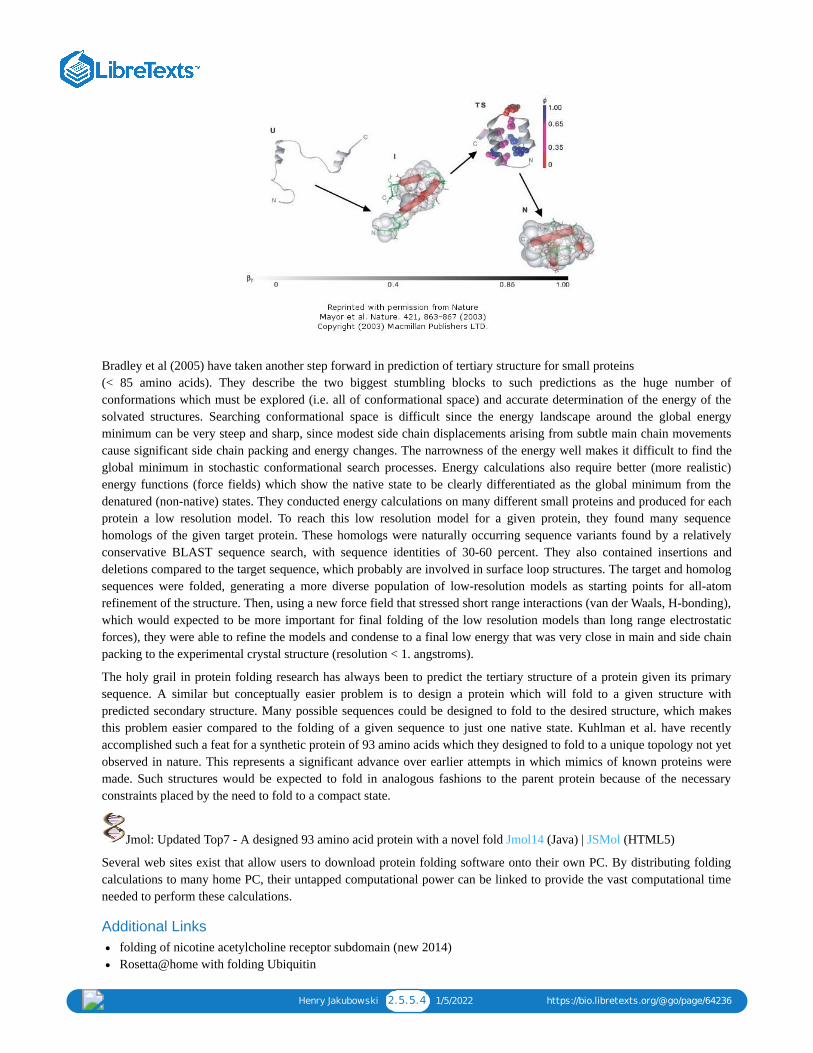
Henry Jakubowski 2.5.5.4 1/5/2022 https://bio.libretexts.org/@go/page/64236
Bradley et al (2005) have taken another step forward in prediction of tertiary structure for small proteins (< 85 amino acids). They describe the two biggest stumbling blocks to such predictions as the huge number ofconformations which must be explored (i.e. all of conformational space) and accurate determination of the energy of thesolvated structures. Searching conformational space is difficult since the energy landscape around the global energyminimum can be very steep and sharp, since modest side chain displacements arising from subtle main chain movementscause significant side chain packing and energy changes. The narrowness of the energy well makes it difficult to find theglobal minimum in stochastic conformational search processes. Energy calculations also require better (more realistic)energy functions (force fields) which show the native state to be clearly differentiated as the global minimum from thedenatured (non-native) states. They conducted energy calculations on many different small proteins and produced for eachprotein a low resolution model. To reach this low resolution model for a given protein, they found many sequencehomologs of the given target protein. These homologs were naturally occurring sequence variants found by a relativelyconservative BLAST sequence search, with sequence identities of 30-60 percent. They also contained insertions anddeletions compared to the target sequence, which probably are involved in surface loop structures. The target and homologsequences were folded, generating a more diverse population of low-resolution models as starting points for all-atomrefinement of the structure. Then, using a new force field that stressed short range interactions (van der Waals, H-bonding),which would expected to be more important for final folding of the low resolution models than long range electrostaticforces), they were able to refine the models and condense to a final low energy that was very close in main and side chainpacking to the experimental crystal structure (resolution < 1. angstroms).
The holy grail in protein folding research has always been to predict the tertiary structure of a protein given its primarysequence. A similar but conceptually easier problem is to design a protein which will fold to a given structure withpredicted secondary structure. Many possible sequences could be designed to fold to the desired structure, which makesthis problem easier compared to the folding of a given sequence to just one native state. Kuhlman et al. have recentlyaccomplished such a feat for a synthetic protein of 93 amino acids which they designed to fold to a unique topology not yetobserved in nature. This represents a significant advance over earlier attempts in which mimics of known proteins weremade. Such structures would be expected to fold in analogous fashions to the parent protein because of the necessaryconstraints placed by the need to fold to a compact state.
Jmol: Updated Top7 - A designed 93 amino acid protein with a novel fold Jmol14 (Java) | JSMol (HTML5)
Several web sites exist that allow users to download protein folding software onto their own PC. By distributing foldingcalculations to many home PC, their untapped computational power can be linked to provide the vast computational timeneeded to perform these calculations.
Additional Linksfolding of nicotine acetylcholine receptor subdomain (new 2014)Rosetta@home with folding Ubiquitin

Henry Jakubowski 2.5.5.5 1/5/2022 https://bio.libretexts.org/@go/page/64236
K.A. Dill, S. Banu Ozkan, T.R.Weikl, J.D. Chodera and V.A. Voelz. The protein folding problem: when will it besolved?. Current Opinion in Structural Biology 17 : 342--346 (2007). (PDF)
Contributors and AttributionsProf. Henry Jakubowski (College of St. Benedict/St. John's University)

Henry Jakubowski 2.5.6.1 1/22/2022 https://bio.libretexts.org/@go/page/64237
2.5.6: G6. Proteomics Problem Set 1You will study a signal transduction protein and their interaction domains using a variety of web-based proteomicsprograms. For most of these programs you will need to input the amino acid sequence in FASTA format. Select a PDBcode for a protein from the table at the end of this section. You could also use these programs to study any protein in thePDB.
Getting the FASTA sequence 1. First go to the PDB. Input the name of your protein (which has an interaction domain) in the search box. Limit thesearch to homo sapiens. Pick from the list of protein structure files the most appropriate one. The example below is for the2YYN pdb code.
2. Select the Download Files dropdown and save the FASTA sequence to your home directory. Download the file as aWordpad. You might have to remove recurring sections that don’t correspond to the single letter amino acid sequence oridentical sequences if the structure consists of identical subunits To see if that might be the case, select JSmol (see figureabove), rotate the structure with your mouse to see if there are multiple chains, and hover the mouse over the chains to seehow the amino acids in that chain are labeled. You might see [TRP]33A: for example, where A indicates a separate Achain. Move to other chains. Then go to the Wordpad version of the FASTA sequences. You can examine the chains to seeif the chains are identical. If so delete all but the first. See the above FASTA link for help.
I. Prediction of Protein Properties from Sequence DataUse the following programs to gain information about your protein. Snip (with snipping tool for example) and paste a bitof relevant info from each program (using Snipping Tool) into this DOCX file and save it into the folder and upload it intoSharepoint. Name the file Lastname_LastName_FirstInitial_WebInteraction. If you have any problem with any of theprograms (lots of error messages), skip that particular program. Several of them do the same type of analyzes. Compare theresult. Snip and paste sufficient content to show that you complete the question. Write answers when asked to interpret theoutput. a. Sequence Manipulation Suite: Determine the molecular weight of the protein.
b. Eukaryotic Linear Motif: Linear motifs are short, evolutionarily intrinsically disordered section of regulatory proteinsand provide low-affinity interaction interfaces. These compact modules play central roles in mediating every aspect of theregulatory functionality of the cell. They are particularly prominent in mediating cell signaling, controlling proteinturnover and directing protein localization. The Eukaryotic Linear Motif (ELM) provides the biological community with acomprehensive database of known experimentally validated motifs, and an exploratory tool to discover putative linearmotifs in user-submitted protein sequences. Snip and paste the top of the output that shows the IUPRED showing thedisorder/order graph.
c. TargetP 1.1 : predicts the subcellular location of eukaryotic protein. Snip and paste the results. Interpret them based onthis link. Where is your protein likely found?
d. NET-NES 1.1 Server:: predicts leucine-rich nuclear export signals (NES) in eukaryotic protein This link will help youexplain the output. Does yours?
e. NLSdb -- Database of nuclear localization signals: Search for information on nuclear localization signals (NLSs) andnuclear proteins. Select Query. Input the PDB code and select NL. Does yours?

Henry Jakubowski 2.5.6.2 1/22/2022 https://bio.libretexts.org/@go/page/64237
f. NetPhos 2.0 server: produces neural network predictions for serine, threonine and tyrosine phosphorylation sites ineukaryotic proteins. (other cool prediction programs from this site)
g. TMPRED: The TMpred program makes a prediction of membrane-spanning regions and their orientation. The algorithmis based on the statistical analysis of TMbase, a database of naturally occurring transmembrane proteins. The prediction ismade using a combination of several weight-matrices for scoring. Paste in your FASTA sequence but remove the headerbefore running. Does it have a transmembrane helix?
h. TopPred 1.1 – Topology predictor for membrane proteins at the Pasteur Institute. You will have to input your emailaddress. Paste in the entire FASTA file. Does it have transmembrane helices? (Part of Mobyle)
Save the first graph (PNG graphic file) of the output, open it with Adobe Photoshop, and paste the image into your report.Does the graph show alternating hydrophobic (+ values)/hydrophilic (- values) sections consistent with transmembranehelices (for example you would expect to see 7 hydrophobic stretches for GPCR)?
i. PFAM – multiple analyses of Protein FAMilies. This program looks at the domain organization of a protein sequence.Input the pdb code. When finished, select “sequences” in the list below.
Then select the human sequence. Snip the resulting diagram and legend showing the domain structure of the protein. Youcan also click on each domain in the diagram to get more info on the domain. Does the protein have the domain suggestedin the beginning table?
j. Prosite: Input your FASTA sequence in the Quick Scan mode. Select Exclude motifs with a high probability ofoccurrence from the scan. Snip and Paste the Hits by Proifle domain structure. Sometimes you might need a different codenumber, the UniProtKB: Accession number. Get this from the PDB web page as shown below:
k. eFindSite: is a ligand binding site prediction and virtual screening algorithm that detects common ligand binding sites.Put in the PDB code and then the pdb file you downloaded.
l. eFindSitePPI: detects protein binding sites and residues using meta-threading. It also predicts interfacial geometry andspecific interactions stabilizing protein-protein complexes, such as hydrogen bonds, salt bridges, aromatic andhydrophobic interactions
m. NCBI Standard Protein BLAST: Input the FASTA file. The output shows the domain and domain superfamily followedby other protein sequences nearly identical to your protein. The results are graphical followed by descriptive. Snip domainstructure with the closest aligned sequences. Then select under PDB structures the pdb code (example below 1xww). You will see a window similar to below. Select under domain 1xwwwA00 (as an example). :

Henry Jakubowski 2.5.6.3 1/22/2022 https://bio.libretexts.org/@go/page/64237
Then select the UniProtKB accession number. Confirm the many of the predictions you made above.
n. Predict Protein Open: Physiochemical properties of your protein. You will have to provide your email address. Whencomplete you can access much of what you learned above by the links to the left under the Dashboard.
II. Visualizing Protein Interactions
It is important to be able to visualize the binding interactions between the targeted domain and the ligand (small molecule,PTM modified protein, protein or DNA). Here are some programs that allow that. Note: which programa you select willdepend on if your protein is bound to a small ligand or to another protein or other macromolecule, in which case you needto explore protein interaction interfaces.
LIGAND:PROTEIN INTERACTIONS
Assignment: You will study the interaction of Protein Kinase C (PKC) with the ligand phorbal ester, which is a mimic ofthe 2nd messenger diacylglyceride with two programs: Ligand Explorer and Protein-Ligand Interaction Profilers
a. Ligand Explorer is a Java-based program. It probably will NOT work on a Mac running Safari. You will need the latestversion of Java to run it. Try the various computer labs around campus as well. Go to the PDB page for your protein. Afteryou input the pdb code, scroll down to Small Molecules section in the middle of the displayed page for that complex.There are links for both 2D and 3D visualization of the interactions. .
Select the 2D plot showing the interactions. The select Jsmol to see the ligand with a binding surface) interacting withcontact residues in the protein. You can select a white background and toggle on and off H bonds. SNIP and PASTE.
Now select Ligand Explorer for a more detailed view. Make sure to select the correct ligand (see table below). You may beprompted to allow pop-ups form the site. If so, allow it. You may have to reselect Ligand Explorer again to start theprogram. Keep giving permissions and following prompts until Ligand Explorer is open. Once launched, select open thislink in a new tab or window and instructions will open in a browser. Use the mouse to help find the best view of theinteractions. Select in turn hydrogen bond, hydrophobic, bridged H bond (mediated by a water molecule) and metal interaction (shownon the left hand side. Select Label Interactions by Distance. Take a cropped screenshot of each interaction (see instructionsbelow). For the final rendering, move the toggle on the Select Surfaces to opaque. Then change the distance in the best way toshow the cavity in which the ligand binds. Color by hydrophobicity which gives two colors representing nonpolar andpolar parts of cavity. Select solid surfaces
b. Protein-Ligand Interaction Profilers: Input the name of your PDB file. After the run is complete, select SMALLMOLECULE and then the appropriate ligand. You will get a 2D representation you can snip and paste. Then select Pymol3D view (first 5 computers in ASC 135). You will see an interactive rendering of a small bound ligand and the protein

Henry Jakubowski 2.5.6.4 1/22/2022 https://bio.libretexts.org/@go/page/64237
residues it contacts in the complex. You can get a free student download of Pymol for your own computer. Snip and Pasterelevant info.
PROTEIN:MACROMOLECULE SURFACE INTERACTIONS
You will study protein:protein interactions between a Src domain and small phospho-Tyr peptide using InterProSurf andCOCOMAPS.
a. InterProSurf: Reports numbers of surface and buried atoms for each chain, and areas for each residue deemed to be inthe interface. Select PDB Complex in the top menu tabs and input your pdb file. This gives numerical data only. Snip andPaste relevant info.
b. COCOMAPS: analyzes and visualizes interfaces in biological complexes (such as protein-protein, protein-DNA andprotein-RNA complexes). Input the PDB file name and then the chains within the PDB file that you wish to see theinteraction surface. Put in the letter for one of the interacting chains you selected into the first input box and the secondletter into the second box. Detailed results will appear in graphical and tabular form.
A great way to visualize the binding interface is to download the new .pdb and .pml files and open the pdb file in Pymol .Once the PDB file is opened in Pymol, select file -> run -> script_name.pml. Snip and Paste relevant info.
Table: Signaling Proteins for Analysis
Domains in Signaling Molecules
Domain Binding Target Cellular Process Example protein Pdb file
Bromo Acetyl-Lys Chromatin reg. BRD4 2YYN
C1 diacylglycerol Plasma memb recruitment Raf-1 3OMV
C2 Phospholipid (Cadependent)
Membrane targeting,vesicle trafficking
PRKCA 3IW4
CARD Homotypic interactins apoptosis CRADD 3CRD
Chromo Methyl-Lys Chromo reg, gene txn CBX1 3F2U
Death (DD) Homotypic inter. Apoptosis Fas 3EZQ
DED Homotypic inter. Apoptosis Caspase 8 1F9E
DEP Memb, GPCRs Sig trans, prot trafficking Dshhuman dishevelled 2
2REY
GRIP Arf/Art G prot Golgi traffic Golgin-97 (Golga5) 1R4A
PDZ C-term peptide motifs Diverse, scaffolding PSD-95Or discs large homolog 4
1L6O
PH Phospholipids Membrane recuirt Akt 1O6L3CQW
PTB Phosphor-Y Y kinase signalingShc 1
SHC-transforming protein1
1UEF1irs
europe
RGS GTP binding pocket ofGalpha
Sig trans RGS4 1EZT
SH2 phosphoY pY-signaling Src 4U5W
SH3 Pro-rich sequence Diverse, cytoskelet Src 2PTK
TIR Homo/Heterotypic Cytokine and immune TLR4 3VQ2
TRAF TNF signaling Cell survival TRAF-1 3ZJB

Henry Jakubowski 2.5.6.5 1/22/2022 https://bio.libretexts.org/@go/page/64237
VHL hydroxyPro ubiquitinylation VHL 1VCB
Protein Ligand and Protein Protein Interactions
Protein (PKC) :Ligand (phorbal ester mimic of 2nd messenger diacylglyceride with Ligand Explorer and Protein-Ligand Interaction Profilers
1PTR
Protein (Chain E-Src fragment) : Protein (Chain I – phospho-peptide) with COCOMAPS 1QG1
H-Ras-GppNHp bound to the Ras binding domain (RBD) of Raf KinaseGppNHp binding with Ligand Explorer and Protein-Ligand Interaction ProfilersProtein (Ras, chain A):Protein (RBD-Raf, Chain B) interactions with COCOMAPS
4G0N
Contributors and Attributions
Prof. Henry Jakubowski (College of St. Benedict/St. John's University)

Henry Jakubowski 2.5.7.1 1/22/2022 https://bio.libretexts.org/@go/page/64238
2.5.7: G7. Proteomics Problem Set 2You will study a protein, Myelin Regulatory Factor (MYRF), which may be a transcription factor. One way to learn moreabout the features and likely function of the MYRF protein is to explore the structure of the 1,139 amino acid sequence insilico.
You will analyze the protein sequence using a variety of web-based proteomics programs. For most of these programs youwill need to input the amino acid sequence in FASTA format. Here is the FASTA amino acid sequence (in single letteramino acid code).
Use these programs to gain information about this protein. If you have any problem with any of the programs (lots of errormessages), skip that particular program. a. Sequence Manipulation Suite: Determine the molecular weight of the protein. b. Eukaryotic Linear Motif : Linear motifs are short, evolutionarily plastic components of regulatory proteins and providelow-affinity interaction interfaces. These compact modules play central roles in mediating every aspect of the regulatoryfunctionality of the cell. They are particularly prominent in mediating cell signaling, controlling protein turnover anddirecting protein localization. Given their importance, our understanding of motifs is surprisingly limited, largely as aresult of the difficulty of discovery, both experimentally and computationally. The Eukaryotic Linear Motif (ELM)provides the biological community with a comprehensive database of known experimentally validated motifs, and anexploratory tool to discover putative linear motifs in user-submitted protein sequences.
c. PSORT II: programs for prediction of eukaryotic sequence subcellular localization as well as other datasets andresources relevant to cellular localization prediction. After running it, examine the link shown as PSORT features andtraditional PSORTII prediction. You might get an error message saying the protein does not begin with an N (Met). Met is the first amino acid encodedfrom a gene sequence in eukaryotes (using the codon AUG). It is usually removed after or during protein synthesis. Don’t’worry about it. Either way, the output shows you the number of homologous proteins found and where they are located(cyto, nuc, secreted, etc). Go to the Details link and the protein are listed. The ones on top are most homologous to theMYRF.
d. NucPred: analyses a eukaryotic protein sequence and predicts if the protein spends at least some time in the nucleus orspends no time in the nucleus
e. TMPRED: The TMpred program makes a prediction of membrane-spanning regions and their orientation. The algorithmis based on the statistical analysis of TMbase, a database of naturally occurring transmembrane proteins. The prediction ismade using a combination of several weight-matrices for scoring
f. CCTOP - Prediction of transmembrane helices and topology of proteins. Select the advanced tab. This program mightnot work. In the output under each amino acid you will see I (inside), O (outside), H for transmembrane helical region, andi of indeterminate.
g. Das-TMfilter: might have to remove nonsequence part of fasta file
h. TopPred 1.1 – Topoloyg predictor for membrane proteins at the Pasteur Institute. You will have to input your emailaddress. bioweb.pasteur.fr/seqanal/int...s/toppred.html
i. PFAM – multiple analyses of Protein FAMilies. View a sequence. Look at the domain organization of a proteinsequence. Input MRF_Mouse. Click on the various domains discovered based on sequence homology.
j. Prosite: input your sequence in the fast scan region. Prosite can determine the likely function of the protein MYRF basedon presence of "patterns, motifs, or signatures " in the protein sequences which are characteristic of a specific biologicalfunction, such as ligand binding, catalysis, in vivo chemical modification. We will only use it to probe for post-translational modification sites. Select Scan a sequence against PROSITE patterns and profiles, and see possible sites for invivo chemical modification of the protein. In Prosite Tools uncheck exclude patterns of high probability of occurrence.
k. HHPRED will give you homology detection and structure prediction, returning domain information and alignment withother proteins of known function. Select the input link (FASTA format) to input your sequence.
l. NCBI Standard Protein BLAST:

Henry Jakubowski 2.5.7.2 1/22/2022 https://bio.libretexts.org/@go/page/64238
m. Use CATH (Protein Structure Classification - Class, Architecture, Topology, homology Superfamilies) to determine itsdomain structure and the superfamily it resides in. Select Search and type in 1XWW in the ID/Key Word box. Selectreturn. Determine its class, architecture, topology and homologous Superfamily classifications. After search, select theBLAST tab, then select CATH Code OR click CATH Code Superfamily (whichever works)Go to
n. UniProt and input the mouse MYRF sequence (accession number Q3UR85)for a trove of information which you haveprobably just discovered.
Do the in silico analysis support the fact that the protein is a transcription factor?
Contributors and AttributionsProf. Henry Jakubowski (College of St. Benedict/St. John's University)

Henry Jakubowski 2.5.8.1 1/5/2022 https://bio.libretexts.org/@go/page/64239
2.5.8: G8. General Links and References1. Bradley, P. et al. Toward high-resolution de novo structure prediction for small proteins. Science. 309, 1868 (2005)2. Boyle J. A. Bioinformatics in Undergraduate Education. Biochemistry and Molecular Biology Education. 32, 236
(2004)3. Feig, A. L., & Jabri, E. . Incorporation of Bioinformatics Exercises into the Undergraduate Biochemistry. Biochemistry
and Molecular Biology Education. 30, 224 (2002)4. Mayor et al. The complete folding pathway of a protein from nanoseconds to microseconds. Nature 421, pg 863 (2003)5. Zhou and Karplus. Interpreting the folding kinetics of helical proteins. Nature 401, pg 400(1999)
Contributors and AttributionsProf. Henry Jakubowski (College of St. Benedict/St. John's University)

Henry Jakubowski 2.6.1 1/5/2022 https://bio.libretexts.org/@go/page/64240
2.6: H. Protein Aggregates and Disease
describe experimental evidence to show that protein misfolding and aggregation depends on the amino acidsequence and the environment in which folding occurs.describe conditions in vitro that may promote aggregation and how these might be minimized in vivodescribe alternative conformations of prion proteins and relate them to a energy topology landscapeexplain how prion diseases may be transmitted in the absence of genetic material
Thumbnail: Structure of human hemoglobin. The proteins α and β subunits are in red and blue, and the iron-containingheme groups in green. From PDB: 1GZX . (GNU; Proteopedia Hemoglobin).
Contributors and AttributionsProf. Henry Jakubowski (College of St. Benedict/St. John's University)
Learning Objectives
2.6.1: H1. Protein AggregationWe have seen that protein aggregates complicate the lives of people who study protein folding in vitro and who try toexpress human proteins in prokaryotes like E. Coli in vivo. Instead of viewing these aggregates as junk, some nowstudy them avidly. It turns out that these aggregates are not as non-specific as earlier believed. In addition, anunderstanding of how and when they form will give us clues into the etiology and treatment of some of the mostdebilitating and feared diseases.
2.6.2: H2. Prions and DiseaseThe problem in the transmissible spongiform encephalopathies (TSE's) is that amyloid-like protein aggregates formwhich appear to be neurotoxic. The protein found in the plaques has the same primary sequence as the PrPc but adifferent secondary and presumably tertiary structure. The protein found in the plaques, called the PrPsc (the scrapieform of the the normal protein) is insoluble in aqueuous solution, protease resistant.
2.6.3: H3. Misfolding and Aggregation Summary
2.6.4: H4. Recent Links and References
Topic hierarchy

Henry Jakubowski 2.6.1.1 12/18/2021 https://bio.libretexts.org/@go/page/64241
2.6.1: H1. Protein AggregationWe have seen that protein aggregates complicate the lives of people who study protein folding in vitro and who try toexpress human proteins in prokaryotes like E. Coli in vivo. Instead of viewing these aggregates as junk, some now studythem avidly. It turns out that these aggregates are not as non-specific as earlier believed. In addition, an understanding ofhow and when they form will give us clues into the etiology and treatment of some of the most debilitating and feareddiseases. Much of this review is based on the following reference: Taubes, G. Misfolding the Way to Disease, G. Science,271, 1493-1495 (1996)
Clues Showing the Specificity of Aggregate Formation
1970's: It was shown that chymotrypsinogen could not be folded in vitro without aggregates forming. An intermediatewas presumed to have formed that if present in high concentration would aggregate irreversibly instead of fold to thenative state. Refolding of tryptophanase showed that it aggregated only with itself, suggesting specificity.1981: King, at MIT, found a single amino acid folding mutant in a viral protein. Both the normal and mutant viralprotein unfold at high temperature, but only the mutant would aggregate at high temperature, suggesting thataggregation could be programmed into or out of a genemid 80's: The biotech industry, struggling to express growth hormone, found that a single amino acid change in bovinegrowth hormone completely prevented aggregation without affecting correct folding.
This knowledge of protein folding and aggregation was soon turn toward understanding several diseases in which proteinaggregates were observed which either initiated or were associated with disease. These protein aggregates were termed"amyloid deposits" and seemed to be associated and perhaps causative of several neurodegenerative diseases. The nameamyloid was first used by a German pathologist, Rudolf Virchow, who in 1853 described waxy tissue deposits associatedwith eosinophils (a type of immune cell). These deposits seemed to resemble starch (made of amylose and amylopectin) sohe termed them amyloid. All known amyloid deposits are, however, composed of protein, not starch. It now appears thatthese disease may be caused by improper protein folding and subsequent aggregation. Except in certain rare inheriteddiseases, the amyloid deposits are composed of normal proteins (often called wild-type proteins) which seems topolymerize into fibrils. Sometimes, in inherited conditions, or when mutations appear in a specific protein, the amyloidprotein deposits consist of the mutant protein. The proteins in these deposited fibers are composed predominantly of betasheets which are perpendicular to the fiber axis, while the polymerized protein usually has little beta sheet structure.Examples are given below:
1. Familial amyloidotic polyneuropathy (FAP) - Affects 1/10,00 to 1/100,000 people. The protein involved is calledtransthyrein, which normally exists in blood as a tetramer formed by association of 4 identical monomers. In mildlyacid condition in vitro, the equilibrium between tetramer and monomer is shifted to monomer, which can aggregate intofibrils. This aggregation could be promoted by possible transition to a molten globule (discussed previously withlactalbumin) like state. This has secondary structure but loosely packed tertiary structure with more exposedhydrophobes. If the concentration is high enough the molten globules aggregate. In people with the disease, mutationsin the protein destabilize the tetramer, pushing the equilibrium to the monomer, which presumably increases moltenglobule formation and aggregation. Specifically, Val30Met and Leu55Pro mutations promote dissociation of thetetramer and formation of aggregates. Conversely, Thr119Met inhibits tetramer dissociation. The aggregates deposit inheart, lungs, kidney, etc, leading to death.
2. Light Chain Amyloidosis; Light Chain Deposition Disease - The light chain protein is a normal component ofcirculating antibody molecules. Mutants in the light chain cause a destabilization of the native state to state similar to amolten globule, which then aggregates.
3. Lysozyme amyloidosis - This protein, with extensive alpha-helix structure, is usually involved in carbohydratecatabolism. Two mutants, Asp67His and another, Ile56Thr (normal amino acid/number in sequence/mutant amino acid)destabliize the protein structure (as indicated by a decrease in the Tm of about 10 degrees C) to a molten-globule form,which probably aggregates to fibrils characterized by extensive beta structure.
4. Alzheimers-This disease involves a defect in a protein normally found in the membrane of neurons. The protein, calledbeta-amyloid precursor protein (BAPP), is a transmembrane protein. A slightly truncated, soluble form is also foundsecreted from cells and is found in extracellular fluid (such as cerebrospinal fluid and blood). The normal function ofthese BAPP proteins is not yet clear. An endoprotease cleaves a small 40-42 amino acid fragment from this protein,

Henry Jakubowski 2.6.1.2 12/18/2021 https://bio.libretexts.org/@go/page/64241
forming the amyloid beta (Ab) protein. It is this protein or a mutant form of it which aggregates to form beta-sheetcontaining fibrils in Alzheimer's disease. Several mutations in different proteins have been linked to Alzheimer's, butthey all seem to increase production or deposition or both of the amyloid beta protein. These deposited plaques areextracellular, and have been shown to cause neuronal damage. The are found in areas of the brain required for memoryand cognition. The BAPP gene is found on chromosome 21, the same chromosome which is present in an extra copy(trisomy 21) in Downs Syndrome, whose symptoms include presenile dementia and amyloid plaques. Aggregateformation appears to be driven by increased expression of BAPP and hence amyloid beta protein. In addition, somemutants may serve to destabilize the amyloid beta protein, increasing its aggregation.
5. Transmissible spongiform encephalopathies (TSEs) - Including scrapie in sheep, bovine spongiformencephalopathy (mad cow disease), and in humans Creutzfeld-Jacob Disease (CJD), Fatal FamilialInsomnia (FFI),Gerstman-Straussler-Scheinker Syndrome, and Kuru (associated with cannibalism). In thesefatal diseases, the brain, on autopsy, resembles a sponge with holes. In contrast to the diseases above,these diseases can be transmitted from one animal to another, but typically not between species. (However,consider the controversy with mad cow disease.) Also, the infectious agent can self-replicate in vivo. Thelogical conclusion is that a virus (slow-acting) is the causative agent. However, the infectious agent survivesradiation, heat, chemical agents, and enzymes designed to kill viruses and their associated nucleic acids.Mathematical analyses suggested that the infectious agent in such diseases could be nothing more than aprotein. Stanley B. Prusiner in the 80's isolated just such a protein which he named a prion, forproteinaceous infectious agent. Since then he and others have amassed substantial evidence to support hiscontention. In October 1997 he was awarded the Nobel Prize in Medicine.
Contributors and AttributionsProf. Henry Jakubowski (College of St. Benedict/St. John's University)

Henry Jakubowski 2.6.2.1 1/29/2022 https://bio.libretexts.org/@go/page/64242
2.6.2: H2. Prions and DiseaseThe normal cellular form of this protein, PrPc is highly conserved in mammals, and is widely expressed in embryogenesis.Techniques exist to delete or make ineffectual genes in mice. When a mice knockout of the PrPc (i.e. the gene for theprotein was deleted in all cells) was made, the mice appeared normal. More recent data suggests however, that these micehad altered circadian rhythms and sleep patterns, which suggest a possible link to Fatal Familial Insomnia. The PrPc is anormal membrane protein in neurons. It is anchored to the membrane through a glycosyl-phosphatidyl inositol link, withthe protein chain on the outside of the neuronal plasma membrane. The PrPc (without the PI link) is water soluble,protease sensitive, and consists of 42% alpha helix and 3% beta sheet.
Jmol: Updated Prion Protein, Mad Cow Disease, and Mutations Jmol14 (Java) | JSMol (HTML5)
The problem in the transmissible spongiform encephalopathies (TSE's) is that amyloid-like protein aggregates form whichappear to be neurotoxic. The protein found in the plaques (in cases other that those that are inherited) has the same primarysequence as the PrPc but a different secondary and presumably tertiary structure. The protein found in the plaques, calledthe PrPsc (the scrapie form of the the normal protein) is insoluble in aqueuous solution, protease resistant, and has a highbeta sheet content (43%) and lower alpha helix content (30%) than the normal version of the protein PrPc.
Figure: Cartoon Models of PrPc and PrPsc
A genetic, inheritable form of disease also exists, in which a mutant form of the PrPc occurs, whose normal structure isdestabilized by the mutation. The aggregates caused by the mutant form of the disease are understandable in light of theother diseases which we discussed above. The question is how does the normal PrPc form PrPsc . Evidence shows that ifradiolabeled PrP*c from scrapie free cells is added to unlabeled PrPsc from scapie infected cells, the PrP*c is converted toPrP*sc! It appears that the PrPc protein has two forms not that much different in energy, one composed of mostly alphahelix and the other of beta sheet. A dimer of PrP .PrPsc might form, which destabilizes the PrP*c causing a conformationalshift to the PrPsc form, which would then aggregate. Exposure to the PrPsc form would then catalyze the conversion ofnormal PrPc to PrPsc . Hence, it would be transmissible by contact with just the PrPsc form of the protein. Likewisespecies specificity could be explained if only dimers of PrP .PrPsc formed from proteins of the same species could occur.The inherited form of the disease would be explained since the mutant form of the normal protein would more easily formthe beta structure found in the aggregate.
It has recently been found that the very same mutation in PrPc, Asp178Asn can cause two different diseases - CJD andFFI. Which disease you get depends on if you have 1 of two naturally occurring, nonharmful variants at amino acid 129 ofthe normal PrPc gene. If you have a Met at that position, and acquire the Asp178Asn mutation, you get CJD. If, on theother hand, you have a Val at amino acid 129 and acquire the Asp178Asn mutation, you get FFI. This disease was firstobserved in 1986 and has been reported in five families in the world. It occurs in the late 50's, equally in men and women.It is characterized by a progressive loss of the ability to sleep and disrupted circadian rhythms. The brain shows neuronalloss. It is known that amino acids 129 and 178 occur at the start of alpha helices, as predicted from propensity calculations.
c
c

Henry Jakubowski 2.6.2.2 1/29/2022 https://bio.libretexts.org/@go/page/64242
Chronic exposure to micromolar levels of synthetic fragment 106-126 of PrPc kills hippocampal neurons. This peptide alsohas the greatest tendency to aggregate synthetic PrPc peptides.
A series of recent studies have expanded on our knowledge of prion structure. Nelson et al. have obtained the crystalstructure of a fibril aggregate made of a short peptide (7 amino acids) from the yeast prion protein Sup35. As presumablyoccurs in amyloid fibers, these crystals show beta-sheet structures stacked vertically to produce fibril structures. The unitof stacking appears to be pairs of beta-sheets, with the inner side amino acids of one member of the pair interacting withthe inner amino acid side chains of the other member of the pair, in a process which excludes water. Similar studies byRitter et al, using NMR and fluorescence, found pair of beta sheets to be the motif of the fibril. Using fluorescence, theyidentified two regions, each 15 amino acids, important in collapse to molten-globule like state for nucleation of fibrilformation.
Kuru killed many members of the Fore tribe in New Guinea until the cannibalistic practice of eating dead relatives wasstopped. Analysis of the genes for the prion protein in the Fore tribe and other ethnic groups in the world show two versiondiffering by just one amino acid in all people (remember that a single gene is represented in both maternal and paternalchromosomes. That these two forms exist through the world suggest that they have been selected for by evolution andconfer some biological advantage. People who have just one form of the protein are more susceptible to the developmentof prion diseases. Mead and Collinge have shown that about 75% of older Fore women (who had lived throughcannibalistic practices) had two different prion genes, compared to about 15% of women from other ethnic groups. Thishigh percentage suggests that these women were protected from the disease, leading through natural selection to a highpercentage of heterozygotes in this defined population. The general presence of two forms of the prion gene (whichprobably offers protection from prion disease) suggests that cannibalism might have been widespread in our earlyancestors.
There appears to be one main difference between the formation of amyloid fibers from prion proteins and others such asmutant lysozymes. If you add mutant lysozyme to normal lysozyme, the amyloid fibers contain only the mutant protein.However, if you incubate mutant prion proteins with normal prions, the normal proteins become pathological.
QED - Protein Aggregates are not just test tube artifacts, but rather matters of life and death.
CDC: Prion Disease
Jsmol: Protopedia - Prions
Contributors and AttributionsProf. Henry Jakubowski (College of St. Benedict/St. John's University)

Henry Jakubowski 2.6.3.1 12/11/2021 https://bio.libretexts.org/@go/page/64243
2.6.3: H3. Misfolding and Aggregation SummaryRecent work has shown the proteins considered to be completely harmless can generate misfolded intermediates thataggregate to produce pre-fibril structures that are toxic to cells. This process is usually prevented in the cell by interactionof nascent forms of the proteins with chaperones, which sequester exposed hydrophobic patches and prevent aggregation.(Obviously prion proteins and the others mentioned above are exceptions). Amyloid fibers (characterized by subunits withan abnormal amount of beta-structure) can be made from many different types of proteins as noted above. Is this propertyspecific to just a handful of proteins, or is it more common than expected from the limited examples noted so far? The newstudies show that when a bacterial protein HypF is incubated at pH 5.5 in the presence of trifluoroethanol, aggregates (butnot fibrils) form with enhanced beta structure. These aggregates slowly form into fibrils characteristic of amyloid proteinfibers. The early aggregates (before fibril formation) proved cytotoxic. Similar results were seen with dimers and trimers(prefibril states) of the amyloid-b peptide released from cultured neurons.
A diverse group of proteins that do not share significant secondary or tertiary structure can form amyloid-like proteinaggregates. Even though their monomer forms share little in common, the insoluble amyloid aggregates have a commonstructure in which the monomer in the aggregates has significant b-structure whose strands run perpendicular to theaggregate axis. Since it has recently been shown that almost any protein, under the "right" set of conditions can form suchaggregates, the stabilizing feature of protein aggregates must be potentially found in any protein. Evidence suggests that isthe presence of a polypeptide backbone, which can form stable interstrand H-bonds in beta secondary structure, and not theside-chains, that is the source of the common amyloid structure. In contrast, native, nonamyloid forms of normal proteinsmust arise through specific interactions of unique side chain sequence and structure, which out competes nonspecificinteractions among backbone atoms found in amyloid structures. Nonspecific aggregation becomes more prevalent whenburied hydrophobic side chains and buried main chain atoms become more solvent exposed. Such exposure occurs whennative proteins form intermediate molten globule states when subjected to altered solvent conditions or when destabilizingmutants of the wild-type protein arise. Some mutations may alter the cooperativity of folding which would increases thefraction of nonnative proteins states. Other mutations that decrease the charge on the protein or increasing theirhydrophobicity might enhance aggregation. In addition, chemical modifications to proteins (such as oxidation ordeamination) might destabilize the native state, leading to the formation of the molten globule state. Once formed, thisstate may aggregate through sequestering exposed side chain hydrophobes or through inter-main chain H bond formation.Aggregate formation appears to proceed through the initial formation of soluble units (which may or not be more toxic tocells than the final aggregate). Aggregates are kinetically stable species. Since amyloid aggregates are cytotoxic andalmost any protein can form them, albeit with different propensities, nature, through evolutionary selection, haspresumably disfavored proteins with high tendencies to form such aggregates.
Nature Insights: Protein Folding and Misfolding (2003) - Great series of articles (PDFs).
Wasmer et al have determined a solid state NMR structure of an amyloid fiber state for a prion forming domain of theHET-s protein from the fungus P. anserina. It consists of a left-handed b solenoid.
Jmol: Amyloid Fibril Models from UCLA
Clearly accurate protein folding is required for cell viability. Aberrant protein folding clearly can be the cause of seriousillness. Given the extraordinary nature of the task and its failure, the process governing protein folding must be highlyregulated. The diagram below shows the steps that determine intracellular concentrations and locations of normal andaberrant protein structures.

Henry Jakubowski 2.6.3.2 12/11/2021 https://bio.libretexts.org/@go/page/64243
Potential therapies of diseases of proteostasis include replacing aberrant proteins, shifting the equilibria toward activeforms with small ligands, or modulating the pathways with agents that influence pathways such as signal transduction,transcription, translation, degradation, and translocation using molecules like siRNAs to modulate concentrations ofchaperons, disaggregases, and signal pathways.
Contributors and Attributions
Prof. Henry Jakubowski (College of St. Benedict/St. John's University)
Henry Jakubowski 2.6.4.1 12/25/2021 https://bio.libretexts.org/@go/page/64244
2.6.4: H4. Recent Links and References1. Wasmer, C. Amyloid Fibrils of the HET-s(218-289) Prion Form a b Solenoid with a Triangular Hydrophobic Core.
Science. 319, 1523 (2008)2. Balch, W. et al. Adapting Proteostasis for Disease Intervention. Science. 319, 916 (2008)3. Krishnan and Linquist, Structural insights into a yeast prion illuminate nucleation and strain diversity. Nature, 435, 765
(2005)4. Ritter et al. Correlation of structural elements and infectivity of the HET-s prion. Nature, 435, 844 (2005)5. Nelson, R. et al. Structure of the cross-b spine of amyloid-like fibrils. Nature 435, 773 (2005).6. Hardy and Selkoe. The Amyloid Hypothesis of Alzheimer's Disease: Progress and Problems on the Road to
Therapeutics. Science 297, pg 353 (2002)7. Pepys et al. Targeted Pharmacological Depletion of Serum Amyloid P Component for Treatment of human
amyloidosis. Nature. 254, 231 and 254 (2002)8. Bucciantini et al. Inherent toxicity of aggregates implies a common mechanism for protein misfolding diseases. Nature.
416, pgs. 483, 507 (2002)9. Walsh et al. Naturally secreted oligomers of amyloid b protein potently inhibit hippocampal long-term potentiation in
vivo. Nature. 416, pgs. 483, 535 (2002)10. Esler et al., A Portrait of Alzheimer Secretases - New Features and Familiar Faces. . Science. 293, pg 1449 (2001)11. Happarstrom et al. Trans-Suppression of Misfolding in an Amyloid Disease. Science 293 pg 2459 (2001)12. An Inflammatory Drug Prospect (for Alzheimers). Nature. 414, pg 199 (2001)13. Saborio et al. Sensitive Detection of Pathological prion protein by cyclic amplification of protein misfolding. Nature.
411, pg 810 (2001)14. Bence et al. Impairment of the Ubiquitin-Proteasome System by Protein Aggregation. Science. 292, pg 1552 (2001)15. Cao et al. Elusive Protein Auditions for Several Roles (about APP in neural cells) Science. 293, pg 28, 115 (2001)16. Serio et al. Nucleated Conformational Conversion and the Replication of Conformational Information by a prion
determinant. Science. 289, pg 1317 (2000)17. Chien and Weissman. the Shape of a species barrier (in prion conformation transformation). Nature. 410, pg 161. 223
(2001)
Contributors and AttributionsProf. Henry Jakubowski (College of St. Benedict/St. John's University)

1 1/29/2022
CHAPTER OVERVIEW3: (T1)ENZYMES -
3.1: THE LAWS OF THERMODYNAMICSTwo fundamental concepts govern energy as it relates to living organisms: the First Law of Thermodynamics states that total energyin a closed system is neither lost nor gained — it is only transformed. The Second Law of Thermodynamics states that entropyconstantly increases in a closed system.
3.2: ENZYMESBiological catalysts are called enzymes, and the overwhelming majority of enzymes are proteins. The exceptions are a class of RNAmolecules known as ribozymes, of which most act upon themselves (i.e. part of the RNA strand is a substrate for the ribozyme part ofthe strand). In this book (and most textbooks in this field), unless otherwise specified, the term enzyme refers to one made of protein.Enzymes also confer extraordinary specificity to a chemical reaction.
3.3: ENZYME KINETICSUnlike uncatalyzed (but readily occurring) reactions, in which the rate of the reaction is dependent only on the concentration of thereactants, the rate of enzyme-catalyzed reactions is limited by the number of enzyme molecules available. This maximal rate ofturnover from substrate to product is a function of the speed of the enzyme and the number of enzyme molecules.
3.4: REGULATION OF ENZYME ACTIVITYEnzymes can be slowed down or even prevented from catalyzing reactions in many ways including preventing the substrate fromentering the active site or preventing the enzyme from altering conformation to catalyze the reaction. The inhibitors that do this can doso either reversibly or irreversibly. The irreversible inhibitors are also called inactivators, and reversible inhibitors are generallygrouped into two basic types: competitive and non-competitive.
3.5: ENZYME INHIBITIONSince structure mediates function, anything that would significantly change the structure of an enzyme would inhibit the activity ofthe enzyme. Hence extremes of pH and high temperature, all of which can denature the enzyme, would inhibit the enzyme in airreversible fashion, unless it could refold properly. Alternatively we could add a small molecule which interacts noncovalently withthe enzyme to either change its conformation or directly prevent substrate binding.
3.5.1: IRREVERSIBLE COVALENT INHIBITIONWe can covalently modify certain side chains, that if they are essential to enzymatic activity, would irreversibly inhibit the enzyme.The rest of the chapter will deal with reversible, noncovalent inhibition
3.5.2: COMPETITIVE INHIBITIONCompetitive inhibition occurs when substrate (S) and inhibitor (I) both bind to the same site on the enzyme. In effect, they competefor the active site and bind in a mutually exclusive fashion. Allosteric competitive inhibition is another type of inhibition where If Sand I bound to different sites, and S bound to E and produced a conformational change in E such that I could not bind (and viceversa), then the binding of S and I would be mutually exclusive.
3.5.3: UNCOMPETITIVE INHIBITIONReversible uncompetitive inhibition occurs when (I) binds only to the enzyme-substrate complex (ES) and not free EE . One canhypothesize that on binding S, a conformational change in E occurs which presents a binding site for I. Inhibition occurs since ESIcan not form product. It is a dead end complex which has only one fate, to return to ES.
3.5.4: NONCOMPETITIVE AND MIXED INHIBITIONReversible noncompetitive inhibition occurs when I binds to both E and ES. We will look at only the special case in which thedissociation constants of I for E and ES are the same. This is called noncompetiive inhibition. It is quite rare as it would be difficult toimagine a large inhibitor which inhibits the turnover of bound substrate having no effect on binding of S to E. If the Kd's aredifferent, the inhibition is called mixed.
3.5.5: C5. ENZYME INHIBITION IN VIVO3.5.6: C6. AGONIST AND ANTAGONIST OF LIGAND BINDING TO RECEPTORS - AN EXTENSIONThe analysis of competitive, uncompetitive and noncompetitive inhibitors of enzymes can now be extended to understand how theactivity of membrane receptors are affected by the binding of drugs. Drugs targeted to membrane receptors can have a variety ofeffects. They may elicit the same biological effects as the natural ligand. If so, they are called agonists. Conversely they may inhibitthe biological activity of the receptor. If so they called antagonists

2 1/29/2022
3.5.7: C7. INHIBITION BY TEMPERATURE AND PH CHANGES3.5.8: C8. LINKS AND REFERENCES3.6: ENZYME CATALYSIS AND KINETICSEnzyme Catalysis, Activation Energy, Understanding Enzyme Kinetics
3.7: MORE COMPLICATED ENZYMESIn reality, many enzymes have more than one substrate (A, B) and more than one product (P, Q). For example, the enzyme alcoholdehydrogenase catalyzes the oxidation of ethanol with NAD (a biological oxidizing agent) to form acetaldehyde and NADH.
3.7.1: D1. MULTI-SUBSTRATE SEQUENTIAL MECHANISMS3.7.2: MULTI-SUBSTRATE PING-PONG MECHANISMSIn this mechanism, one substrate binds first to the enzyme followed by product P release. Typically, product P is a fragment of theoriginal substrate A. The rest of the substrate is covalently attached to the enzyme E , which is designated as E'. Now the secondreactant, B, binds and reacts with the E' and forms a covalent bond to the fragment of A still attached to the enzyme, forming productQ. This is now released and the enzyme is restored to its initial form, E.
3.7.3: INHIBITORS IN MULTI-SUBSTRATE REACTIONS3.7.4: D4. ALLOSTERIC ENZYMESMany enzymes do not demonstrate hyperbolic saturation kinetics, or typical Michaelis-Menten kinetics. Graphs of initial velocity vssubstrate demonstrate sigmoidal dependency of v on S, much as we discussed with hemoglobin binding of dioxygen. Enzymes thatdisplay this non Michaelis-Menten behavior have common characteristics.
3.7.5: D5. INTEGRATION OF BINDING, DIFFUSION AND KINETICS3.7.6: D6. LINKS AND REFERENCES3.8: HOMEWORK PROBLEMS - LITERATURE LEARNING MODULES- ENZYME INHIBITION 1 - KCAT
3.8.1: HOMEWORK PROBLEMS - LITERATURE LEARNING MODULE ENZYME INHIBITION - KAT- KEY

E. V. Wong 3.1.1 1/15/2022 https://bio.libretexts.org/@go/page/64246
3.1: The Laws of ThermodynamicsTwo fundamental concepts govern energy as it relates to living organisms: the First Law of Thermodynamics states thattotal energy in a closed system is neither lost nor gained — it is only transformed. The Second Law of Thermodynamicsstates that entropy constantly increases in a closed system.
More specifically, the First Law states that energy can neither be created nor destroyed: it can only change form.Therefore, through any and all processes, the total energy of the universe or any other closed system is constant. In asimple thermodynamic system, this means that the energy is transformed either by the transfer of heat energy (i.e. heatingand cooling of a substance) or by the production of mechanical work (i.e. movement). In biological and chemical terms,this idea can be extended to other forms of energy such as the chemical energy stored in the bonds between atoms of amolecule, or the light energy that can be absorbed by plant leaves.
Work, in this case, need not imply a complicated mechanism. In fact, there is work accomplished by each molecule inthe simple expansion of a heated mass of gaseous molecules (as visualized by expansion of a heated balloon, forexample). This is expressed mathematically as the Fundamental Thermodynamic Relation:
in which is internal energy of the system, is temperature, is entropy, is pressure, and is volume.
Unlike the First Law which applies even to particles within a system, the Second Law is a statistical law — it appliesgenerally to macroscopic systems. However, it does not preclude smallscale variations in the direction of entropy overtime. In fact, the Fluctuation theorem (proposed in 1993 by Evans et al, and demonstrated by Wang et al in 2002)states that as the length of time or the system size increases, the probability of a negative change in entropy (i.e. goingagainst the Second Law) decreases exponentially. So on very small time scales, there is a real probability thatfluctuations of entropy against the Second Law can exist.
The Second Law dictates that entropy always seeks to increase over time. Entropy is simply a fancy word for chaos ordisorder. The theoretical final or equilibrium state is one in which entropy is maximized, and there is no order to anythingin the universe or closed system. Spontaneous processes, those that occur without external influence, are always processesthat convert order to disorder. However, this does not preclude the imposition of order upon a system. Examining thestandard mathematical form of the Second Law:
ΔS + ΔS = ΔS ,
where ΔS > 0
shows that entropy can decrease within a system as long as there is an increase of equal or greater magnitude in theentropy of the surroundings of the system.
The phrase “in a closed system” is a key component of these laws, and it is with the idea encapsulated in that phrase thatlife can be possible. Let’s think about a typical cell: in its lifetime, it builds countless complex molecules - huge proteinsand nucleic acids formed from a mixture of small amino acids or nucleotides, respectively. On its surface, this examplemight seem to be a counterexample to the second law - clearly going from a mixture of various small molecules to a largermolecule with bonded and ordered components would seem to be a decrease in entropy (or an increase in order). How isthis possible with respect to the second law? It is, because the second law applies only to closed systems. That is, a systemthat neither gains nor loses matter or energy.
The “universe” is a closed system by definition because there is nothing outside of it.
A living cell is not a closed system: it has inputs and outputs. However, the second law is still useful if we recognize thatthe only way that it can be bypassed is through the input of energy. If a cell cannot take in food (input of matter and energyinto the system) it dies, because the second law requires that everything eventually breaks down into more random/chaoticcollections of smaller components. The order required to sustain life (think about all the different complex molecules thatwere mentioned in the previous chapter) is phenomenal. The same thing applies on the organismal level (Figure ) -without an input of energy (in the form of food molecules for animals or in the form of light for plants), the organism willdie and subsequently decompose.
E T S p V
system surroundings universe
universe
3.1.1

E. V. Wong 3.1.2 1/15/2022 https://bio.libretexts.org/@go/page/64246
Figure . In the top panel, depicting an open system in which there are inputs for matter and energy (in the form offood), the box is open and air can be exchanged, food dropped in, etc, thus allowing the mouse to grow. However, in thebottom panel, depicting a closed system, the mouse does not have ready access any more oxygen than is in the box, nordoes it have access to food. Without these inputs, the second law takes effect, and the mouse dies and decomposes intomany smaller molecules.
Creating molecules from atoms costs energy because it takes a disordered collection of atoms and forces them, throughchemical bonds, into ordered, non-random positions. There is likewise an energy cost to formation of macromoleculesfrom smaller molecules. By imposing order in the system, there must be an associated input of energy. This happens atevery level of the system: atoms to molecules, small molecules to macromolecules, groups of molecules to organelles, etc.
As the polymerizing reaction reduces entropy, it requires energy generated (usually) by the breakdown of ATP intoAMP and PPi, which is a reaction that increases entropy.
Where does that energy go? It ends up in the bonds that are holding the molecules or macromolecules in their orderedstate. When such a bond is broken, and a molecule is turned back into a collection of atoms, energy is released. The energyin a chemical bond is thus potential energy - it is stored energy that, when released, has the ability to do work. This term, ifyou recall your high school physics, is usually learned along with kinetic energy, which is energy that is being used in theprocess of actually doing work (i.e. moving an object from one place to another). The classic example is the rock on thetop of a hill: it has potential energy because it is elevated and could potentially come down. As it tumbles down, it haskinetic energy as it moves. Similarly in a cell, the potential energy in a chemical bond can be released and then used forprocesses such as putting smaller molecules together into larger molecules, or causing a molecular motor to spin or bend -actions that could lead to pumping of protons or the contraction of muscle cells, respectively.
Coming back to the second law, it essentially mandates that breaking down molecules releases energy and that making newmolecules (going against the natural tendency towards disorder) requires energy. Every molecule has an intrinsic energy,and therefore whenever a molecule is involved in a chemical reaction, there will be a change in the energy of the resultingmolecule(s). Some of this change in the energy of the system will be usable to do work, and that energy is referred to as thefree energy of the reaction. The remainder is given off as heat.
The Gibbs equation describes this relationship as
where ΔG is the change in free energy, ΔH is the change in enthalpy (roughly equivalent to heat), T is the temperature atwhich the reaction takes place, and ΔS is the change in entropy. As a matter of convention, release of free energy is anegative number, while a requirement for input of energy is denoted with a positive number. Generally, a chemical reactionin which ΔG < 0 is a spontaneous reaction (also called an exergonic reaction), while a chemical reaction in which ΔG > 0
3.1.1
ΔG = ΔH −T ΔS (3.1.1)
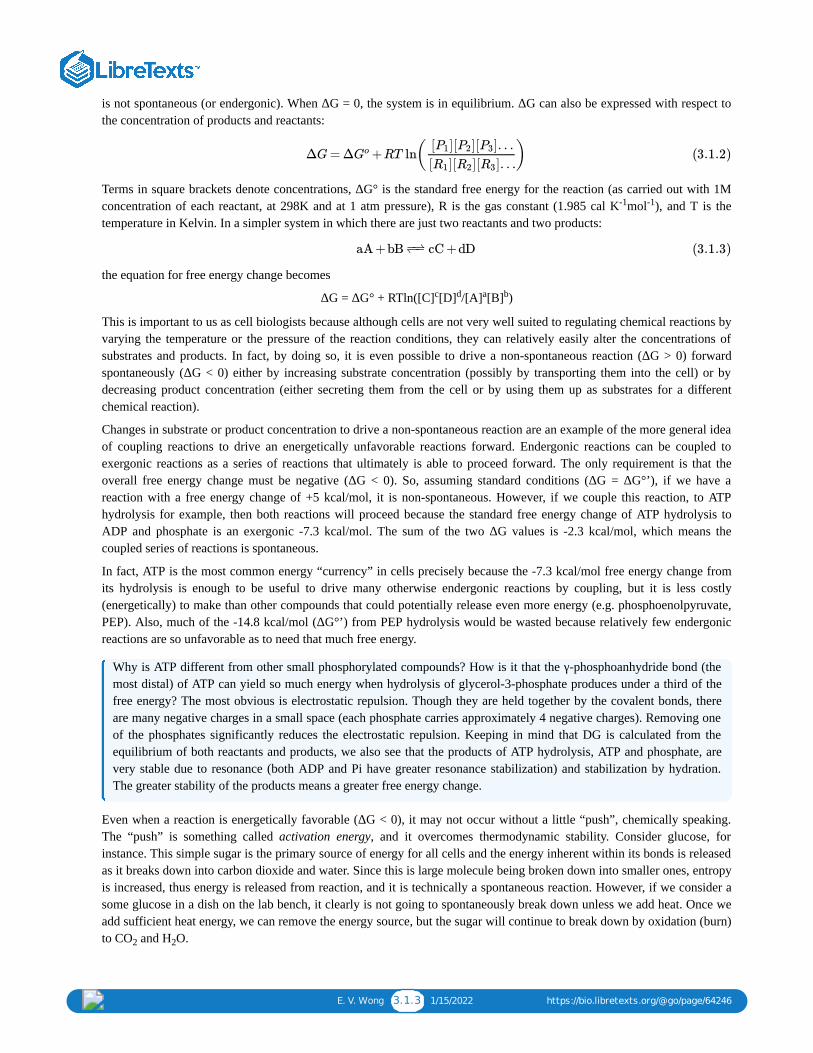
E. V. Wong 3.1.3 1/15/2022 https://bio.libretexts.org/@go/page/64246
is not spontaneous (or endergonic). When ΔG = 0, the system is in equilibrium. ΔG can also be expressed with respect tothe concentration of products and reactants:
Terms in square brackets denote concentrations, ΔG° is the standard free energy for the reaction (as carried out with 1Mconcentration of each reactant, at 298K and at 1 atm pressure), R is the gas constant (1.985 cal K mol ), and T is thetemperature in Kelvin. In a simpler system in which there are just two reactants and two products:
the equation for free energy change becomes
ΔG = ΔG° + RTln([C] [D] /[A] [B] )
This is important to us as cell biologists because although cells are not very well suited to regulating chemical reactions byvarying the temperature or the pressure of the reaction conditions, they can relatively easily alter the concentrations ofsubstrates and products. In fact, by doing so, it is even possible to drive a non-spontaneous reaction (ΔG > 0) forwardspontaneously (ΔG < 0) either by increasing substrate concentration (possibly by transporting them into the cell) or bydecreasing product concentration (either secreting them from the cell or by using them up as substrates for a differentchemical reaction).
Changes in substrate or product concentration to drive a non-spontaneous reaction are an example of the more general ideaof coupling reactions to drive an energetically unfavorable reactions forward. Endergonic reactions can be coupled toexergonic reactions as a series of reactions that ultimately is able to proceed forward. The only requirement is that theoverall free energy change must be negative (ΔG < 0). So, assuming standard conditions (ΔG = ΔG°’), if we have areaction with a free energy change of +5 kcal/mol, it is non-spontaneous. However, if we couple this reaction, to ATPhydrolysis for example, then both reactions will proceed because the standard free energy change of ATP hydrolysis toADP and phosphate is an exergonic -7.3 kcal/mol. The sum of the two ΔG values is -2.3 kcal/mol, which means thecoupled series of reactions is spontaneous.
In fact, ATP is the most common energy “currency” in cells precisely because the -7.3 kcal/mol free energy change fromits hydrolysis is enough to be useful to drive many otherwise endergonic reactions by coupling, but it is less costly(energetically) to make than other compounds that could potentially release even more energy (e.g. phosphoenolpyruvate,PEP). Also, much of the -14.8 kcal/mol (ΔG°’) from PEP hydrolysis would be wasted because relatively few endergonicreactions are so unfavorable as to need that much free energy.
Why is ATP different from other small phosphorylated compounds? How is it that the γ-phosphoanhydride bond (themost distal) of ATP can yield so much energy when hydrolysis of glycerol-3-phosphate produces under a third of thefree energy? The most obvious is electrostatic repulsion. Though they are held together by the covalent bonds, thereare many negative charges in a small space (each phosphate carries approximately 4 negative charges). Removing oneof the phosphates significantly reduces the electrostatic repulsion. Keeping in mind that DG is calculated from theequilibrium of both reactants and products, we also see that the products of ATP hydrolysis, ATP and phosphate, arevery stable due to resonance (both ADP and Pi have greater resonance stabilization) and stabilization by hydration.The greater stability of the products means a greater free energy change.
Even when a reaction is energetically favorable (ΔG < 0), it may not occur without a little “push”, chemically speaking.The “push” is something called activation energy, and it overcomes thermodynamic stability. Consider glucose, forinstance. This simple sugar is the primary source of energy for all cells and the energy inherent within its bonds is releasedas it breaks down into carbon dioxide and water. Since this is large molecule being broken down into smaller ones, entropyis increased, thus energy is released from reaction, and it is technically a spontaneous reaction. However, if we consider asome glucose in a dish on the lab bench, it clearly is not going to spontaneously break down unless we add heat. Once weadd sufficient heat energy, we can remove the energy source, but the sugar will continue to break down by oxidation (burn)to CO and H O.
ΔG = Δ +RT ln( )Go [ ][ ][ ]. . .P1 P2 P3
[ ][ ][ ]. . .R1 R2 R3
(3.1.2)
-1 -1
aA +bB cC +dD↽−−⇀ (3.1.3)
c d a b
2 2
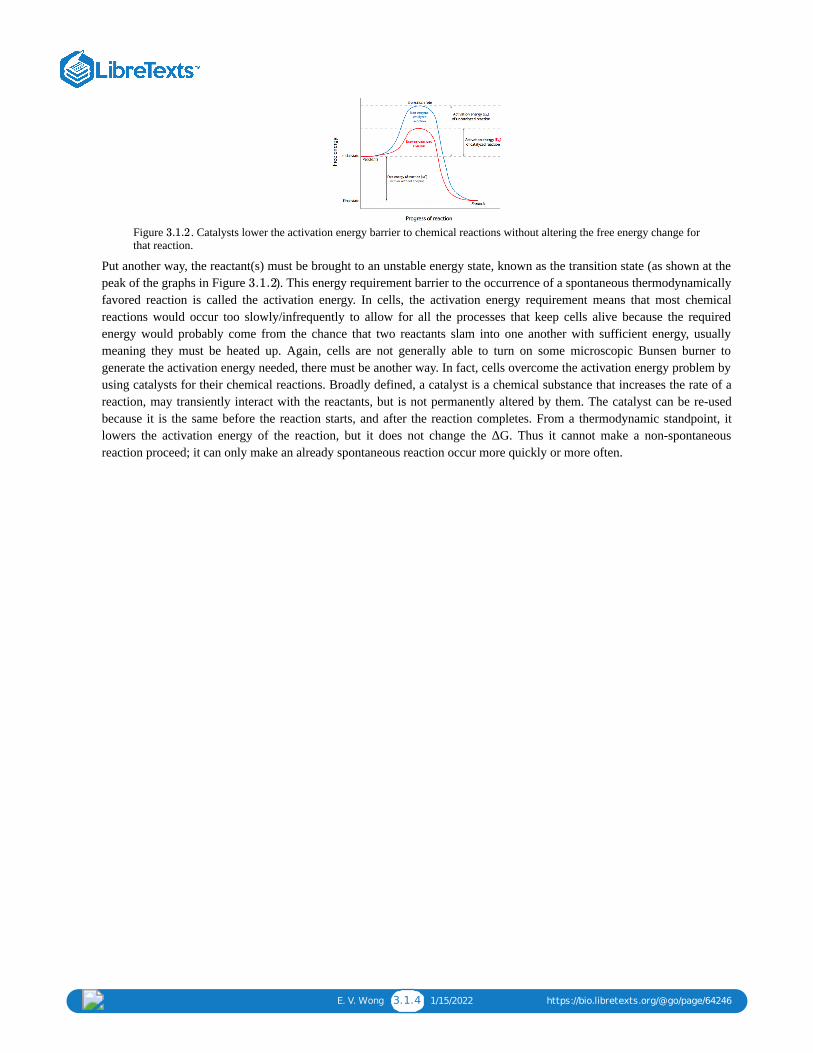
E. V. Wong 3.1.4 1/15/2022 https://bio.libretexts.org/@go/page/64246
Figure . Catalysts lower the activation energy barrier to chemical reactions without altering the free energy change forthat reaction.
Put another way, the reactant(s) must be brought to an unstable energy state, known as the transition state (as shown at thepeak of the graphs in Figure ). This energy requirement barrier to the occurrence of a spontaneous thermodynamicallyfavored reaction is called the activation energy. In cells, the activation energy requirement means that most chemicalreactions would occur too slowly/infrequently to allow for all the processes that keep cells alive because the requiredenergy would probably come from the chance that two reactants slam into one another with sufficient energy, usuallymeaning they must be heated up. Again, cells are not generally able to turn on some microscopic Bunsen burner togenerate the activation energy needed, there must be another way. In fact, cells overcome the activation energy problem byusing catalysts for their chemical reactions. Broadly defined, a catalyst is a chemical substance that increases the rate of areaction, may transiently interact with the reactants, but is not permanently altered by them. The catalyst can be re-usedbecause it is the same before the reaction starts, and after the reaction completes. From a thermodynamic standpoint, itlowers the activation energy of the reaction, but it does not change the ΔG. Thus it cannot make a non-spontaneousreaction proceed; it can only make an already spontaneous reaction occur more quickly or more often.
3.1.2
3.1.2

E. V. Wong 3.2.1 1/1/2022 https://bio.libretexts.org/@go/page/64247
3.2: EnzymesBiological catalysts are called enzymes, and the overwhelming majority of enzymes are proteins. The exceptions are aclass of RNA molecules known as ribozymes, of which most act upon themselves (i.e. part of the RNA strand is asubstrate for the ribozyme part of the strand). In this book (and most textbooks in this field), unless otherwise specified, theterm enzyme refers to one made of protein. Enzymes confer extraordinary specificity to a chemical reaction: a reaction thatmight occur between a variety of potential substrates in an uncatalyzed situation may only be allowed between twospecific substrates when catalyzed by an enzyme. Enzymes allow cells to run chemical reactions at rates from a million toeven a trillion times faster than the same reactions would run under similar conditions without enzymes. In some cases, theenzymes al - low reactions to proceed that would normally (i.e. sans enzyme) require more extreme temperature, pressure,or acidity/alkalinity. Finally, and perhaps most importantly for life, enzymes can be regulated. This is crucial for the cell,since it must be able to react to different situations, such as availability of energy, accumulation of toxic byproducts, theneed to reproduce, etc. Not only can enzymes be modified either covalently or noncovalently to increase or decrease theiractivity, the cell can also regulate production of the enzymes, providing another level of control over particular cellularbiochemical reactions.
Enzymes have been cataloged and classified since the 1950’s, during which time there was an explosion of enzymediscoveries and a need for a unified nomenclature and catalog. An International Commission on Enzymes wasestablished and thus started the Enzyme List. All enzymes now have both recommended names for common usage,often reflecting historical naming, and a systematic name, which is highly specific. They also have a classificationnumber based on their activity. The major classes of enzymes are
1. Oxidoreductases that carry out oxidation-reduction reactions,2. Transferases that transfer functional groups,3. Hydrolases that carry out hydrolysis reactions,4. Lyases that eliminate groups to form double bonds,5. Isomerases that rearrange the bonds in a molecule but do not add or remove atoms, and6. Ligases that form bonds in reactions coupled to ATP hydrolysis.
As an example, DNA ligase (recommended name) catalyzes the formation of a phosphodiester bond between the 3’end of one DNA fragment and the 5’ end of another. Its rather long and tedious systematic name is“poly(deoxyribonucleotide):poly(deoxyr ibonucleotide) ligase (AMP-forming)” and its classification number is6.5.1.1. As a ligase, it is class 6; because it forms phosphoric ester bonds, it is subclass 5; the sub-subclass of 1 in thiscase is meaningless because it is the only sub-subclass of phosphoricester bond-forming ligases, but the final numberdesignates the DNA ligase separately from other 6.5.1 enzymes such as RNA ligase, which is 6.5.1.3.
Enzymes are the most diverse type of protein in a cell. They vary not only in size, but also in the number of independentlymanufactured subunits that must come together to form an active enzyme, or holoenzyme. Part of the reason for requiringso many different enzymes is that they are usually very specific for their substrate molecules, and that specificity is basedupon a combination of shape and charge. The interactions between substrate and enzyme are often likened to a lock andkey or pieces of a jigsaw puzzle. If the substrate fits the shape of the enzyme’s active site (the part of the enzyme thatcarries out the actual catalytic reaction), and the charges interact (e.g. positively charged amino acids on the enzyme liningup with negative charges on the substrate), then there may be further stabilization of the interaction by Van der Waals andhydrogen bond interactions. In fact, formation of a stable Enzyme-Substrate (ES) intermediate is energetically analogousto the transition state (Figure ) of reactions.
The specificity of enzymes is such that stereoisomers may not be recognized by some enzymes: for example, a protease(enzymes that chop up proteins into smaller pieces by hydrolyzing the peptide bonds between specific amino acids) suchas trypsin can be stymied by the presence of a D-amino acid in place of the usual L-amino acid in a protein, even though itis a mirror image of the very same amino acid. This specificity means that enzymes are highly selective with respect to thereactions they catalyze, which means that specific reactions can be greatly enhanced without causing a general increase inmany related chemical reactions. Another implication of the high specificity is that enzymes can (and often do) have high
enzyme classification
3.2.2

E. V. Wong 3.2.2 1/1/2022 https://bio.libretexts.org/@go/page/64247
affinity for their substrates without the problem of binding non-substrate molecules (other than specific inhibitors - seebelow).
If most biochemical reactions would proceed extremely slowly, if at all, without catalysis, enzymes are needed to lower theactivation energy needed for chemical reactions to support life. Exactly how does an enzyme lower the activation energyof a reaction? What exactly does “activation energy” mean in the context of a cell? To understand this, there are twoprinciples to keep in mind: first, when we talk about chemical reactions, generally, we are concerned with populations ofsubstrate, product, and enzyme molecules, not individuals; and second, the reactions are generally taking place betweenmolecules dissolved in the aqueous cytoplasm of the cell.
Figure . Enzymes can lower activation energy by binding substrates individually and bringing them together underoptimal conditions to react.
Consider a reaction in which substrates A and B interact to form product C (Figure ). If this reaction is not catalyzed,it depends on the happenstance that a molecule of A runs into a molecule of B in just the right orientation, and with theright amount of energy, to react and form the new molecule. We can conceptualize “activation energy” as the difficulty ingetting A and B together perfectly so the reaction can proceed. How might an enzyme lower this activation energy? Bymaking it easier for A and B to find each other with the right orientation and energy. So it could have binding sites formolecule A and molecule B, and once it has bound these two molecules, it changes its conformation, bringing A and Btogether under exactly the right conditions to react and form C. Once the reaction is complete, the product floats offbecause the enzyme has no affinity for it, and the enzyme returns to its initial shape, ready to bind more substrates.
Figure . The enzyme (A) binds a specific substrate, leading to a conformational change (B) that stresses the molecule(C) until it breaks down into two smaller component molecules (D), which are released.
Enzymes may also facilitate a chemical reaction by acting as a temporary holding site for an active group beingtransferred from one substrate to another. Alternatively, temporary formation of hydrogen bonds or even covalentbonds between the enzyme and substrate can alter chemical characteristics of the substrate to make it react more easily.An example of enzyme mechanisms on the molecular level is shown in Chapter 5: Figure .
Another example may be found with enzymes that break apart a molecule (Figure ). In order for a molecule to breakapart, it may need to collide with another molecule with sufficient energy to break one or more of its covalent bonds. Anenzyme that catalyzes the breakdown reaction might bind to the molecule, and in binding it, undergoes a conformationalshift that bends or twists the molecule in such a way that the bonds in the substrate molecule are weakened or broken.
3.2.3
3.2.3
3.2.4
3.2.1
3.2.4

E. V. Wong 3.2.3 1/1/2022 https://bio.libretexts.org/@go/page/64247
These two examples oversimplify the chemistry of enzyme activity into a mechanical idea, but the general relationship inhow an enzyme lowers activation energy for a reaction is accurate.
Figure . Saturation curve for a single-substrate enzyme-catalyzed reaction.3.2.5

E. V. Wong 3.3.1 1/1/2022 https://bio.libretexts.org/@go/page/64248
3.3: Enzyme KineticsUnlike uncatalyzed (but readily occurring) reactions, in which the rate of the reaction is dependent only on theconcentration of the reactants, the rate of enzyme-catalyzed reactions is limited by the number of enzyme moleculesavailable. This maximal rate of turnover from substrate to product is a function of the speed of the enzyme and the numberof enzyme molecules. , this theoretical maximal rate or reaction, is approached when there is such a highconcentration of substrate molecules that not only is every available enzyme at a given time occupied, but as soon as anenzyme finishes converting substrate to product, it immediately binds a new substrate. Another term, Km, is related to
in that (the Michaelis constant) is the concentration of substrate at which half-maximal reaction rate occurs. These two terms are related in the Michaelis-Menten equation, which describes the reaction rate with respect tothe substrate concentration [S].
The Michaelis-Menten equation was derived by Leonor Michaelis and his graduate student Maud Menten in 1913,based on work by Victor Henri, and is applicable only to simple enzyme kinetics in which there is only one substratethat is changed immediately to a product during the reaction without forming any intermediate compound, the enzymein question shows no allostericity, and the reaction is unidirectional.
It should be noted that the reaction rate v is actually the initial reaction rate at a particular substrate concentration, andis sometimes denoted vo. Naturally, as the reaction continues, the substrate concentration decreases, along with thereaction rate.
The Michaelis-Menten equation assumes a simple reaction of the form:
where is an enzyme, is the substrate, and is the product. Note the formation of the intermediate enzyme-substratecomplex, ES, which is a transition state (recall Figure ) in which the substrate is unstable and associated with theenzyme. In fact, could as easily be considered , since this state is essentially the tipping point between theconversion from substrate to product. In this construction, the Michaelis constant, , of an enzyme-catalyzed reactionis (k + k )/k . That is the rate of ES dissociation over the rate of ES association. , of course, varies not only dependingon the enzyme, but also with respect to the identity of the substrate. Some enzymes can work with multiple substrates, andthe of that enzyme for the different substrates is usually different. Because the saturation curve in Figure can bedifficult to work with, linearizations of the Michaelis-Menten equation (Equation ) were developed. The mostcommon is the double reciprocal plot, better known as the Lineweaver-Burk plot. On this type of graphical representationof enzyme kinetics, the reciprocal of the substrate concentration is plotted against the reciprocal of the reaction velocity.This generates a line in which the x-intercept is then , the y-intercept is , and the slope of the line is
.
Vmax
Vmax Km /2Vmax
v
v =[S]Vmax
+[S]KM
(3.3.1)
E +S ES⟶ E +P↽−−⇀ (3.3.2)
E S P
3.3.2
ES EP
KM
2 3 1 KM
KM 3.3.5
3.3.1
−1/Km 1/Vmax
/Km Vmax

E. V. Wong 3.3.2 1/1/2022 https://bio.libretexts.org/@go/page/64248
Figure . Lineweaver-Burk plot of enzyme kinetics and the effect of competitive and non-competitive inhibitors atconstant concentrations.
Obtaining and from a direct plot of v against [S] can be difficult because even at very high substrateconcentrations, experimental data may still be significantly under the . This leads to underestimation of the V .
The Lineweaver-Burk plot addresses this concern, but has some shortcomings of its own. Because it is easier to obtaindata at high concentrations, most of the data points are near 0, and fewer data points are available further out (to theright of the graph). Because these are reciprocals, under these low [S] conditions, small errors in measured values of \(v\) turn into large errors in 1/v, and therefore large errors in and V . This is evident on examination of theLineweaver-Burk equation:
3.3.7
The Lineweaver-Burk plot
Vmax Km
Vmax max
KM max
=( ) +1
v
KM
Vmax
1
[S]
1
Vmax(3.3.3)

E. V. Wong 3.4.1 12/25/2021 https://bio.libretexts.org/@go/page/64249
3.4: Regulation of Enzyme ActivityFigure (and 9) also illustrates the effects of two different types of inhibition on the different components of enzymekinetics. Enzymes can be slowed down or even prevented from catalyzing reactions in many ways including preventing thesubstrate from entering the active site or preventing the enzyme from altering conformation to catalyze the reaction. Theinhibitors that do this can do so either reversibly or irreversibly. The irreversible inhibitors are also called inactivators,and either bind to the enzyme with such high afinity as to be virtually irreversible, or they actually form covalent bondswith the enzyme. Reversible inhibitors are generally grouped into two basic types: competitive and non-competitive.
Finasteride (trade names include Propecia and Proscar) is an irreversible inhibitor that binds very tightly to the enzyme5-a-re- ductase, used in converting testosterone to dihydrotestosterone. It is used in the treatment of male patternbaldness, benign pro- static hyperplasia, and prostate cancer.
Aspirin is an example of an irreversible inhibitor that actually forms a covalent bond with the enzyme. The aspirin(acetylsalicylic acid) transfers its acetyl group onto a serine residue on cyclooxygenase-2 (COX-2). This stops theproduction of in ammation-producing prostaglandins and thromboxanes by COX-2.
Methotrexate is a competitive inhibitor of dihydrofolate reductase (DHFR), an enzyme that synthesizestetrahydrofolate, which is a precursor for purine synthesis, and therefore for DNA and RNA. It has a very similarmolecular structure for folic acid, the natural substrate of DHFR. Methotrexate is used as an anti-cancer drug becauseit affects rapidly reproducing cells (which need to make DNA sooner than other cells) more than non-cancerous cells.
Competitive inhibition is perhaps the simplest to understand. The inhibitor molecule competes directly with the substratefor the active site of an unbound enzyme. If an inhibitor binds to the active site, the substrate is unable to do so until theinhibitor has vacated the site. Thus, one could potentially overwhelm competitive inhibition with sufficiently largerconcentrations of substrate so that the probability that the enzyme bumps into a substrate to bind becomes exceeding largecompared to the probability of bumping into an inhibitor. Normal, uninhibited V is then achieved despite the presenceof the competitive inhibitor, which has only affected the K , that is, the concentration of substrate needed to reach V /2.This is the kinetic signature of competitive inhibitors: with increasing inhibitor concentrations, K is increased but V isunaffected.
Figure . Saturation curves for enzyme-catalyzed reactions without inhibitor (red) with competitive inhibitor (blue) ata constant concentration, and with noncompetitive inhibi- tor (green) at a constant concentration.
Non-competitive inhibition involves inhibiting the enzyme by altering its ability to complete the catalyzed reaction throughbinding of the enzyme at a position that is not the active site. When the inhibitor binds to the enzyme, it causes a change,
3.4.7
max
m max
M max
3.4.9

E. V. Wong 3.4.2 12/25/2021 https://bio.libretexts.org/@go/page/64249
usually con- formational, that may either prevent the enzyme from binding the substrate, or prevent the enzyme fromacting upon a bound substrate. In either case, increasing the availability of substrate will not ultimately overcome the effectof the inhibitor. Thus, is reduced not because some proportion of the enzymes are no longer usable, but because theenzymes that are available have the same access to substrate as it would without inhibitor (that is, it is not in competitionwith an inhibitor), the is not affected.
AllosteryNon-competitive regulation is one example of allosteric regulation of enzymes. Allosteric interactions occur when thebinding of a ligand (not necessarily a substrate) to a protein influences the binding of another ligand to the protein at aseparate binding site. These kinds of interactions can be either positive (activating) or negative (inhibitory), and eitherhomotropic (both ligands are identical) or heterotropic (ligands are different). Interestingly, sometimes the regulator ligandmay actually be a product of the catalyzed reaction. In this kind of feedback mechanism, the progress of a reaction is self-regulating.
Figure . Feedback control loops. (Left) Negative feedback is a common biological mechanism for self-regulatingprocesses. The product of the reaction, either by itself or inconjunction with other molecules, acts as an allosteric inhibitorof the enzyme. (Right) Positive feedback is less common because it can lead to rapid expansion of the scope of a reaction,and requires an external (relative to the enzymatic reaction) mechanism for slowing or stopping the reaction.
Many of the enzymes in metabolic pathways (chapters 5 and 6) are regulated by a naturally occurring non-competitiveinhibitor. One example is phosphofructokinase (PFK), which is involved in glycolysis, which produces ATP for the cell.However, if there are high enough levels of ATP in the cell that other cellular processes aren’t using, then it can bind tophosphofructokinase outside of its active site (it binds fructose-6-phosphate) and turn it off. This blocks glycolysis andproduction of excess ATP when the cell does not need it. As ATP is used up, there is less available to inhibit PFK andglycolysis starts back up.
There are two models for such allosteric interactions.
The symmetry model, also known as the concerted model, or MWC model (Monod, Wyman, and Changeux,1965), proposes that the allosteric enzyme is an oligomer of several subunits, each of which are symmetricallyrelated, and can be in either a “tensed” or “relaxed” state, but all of the subunits are in the same state and atequilibrium. When a ligand binds, it changes the state of the subunit(s) to which it binds, and to maintainequilibrium, that in turn causes the state of the other subunits to match, thus altering binding properties for asubsequent ligand.The sequential model, or the KNF model (Koshland, Nemethy, and Filmer, 1966), proposes something quitedifferent: although it also supposes subunits in either tensed or relaxed states, it does not require all subunits to beconnected in such a way as to mandate that all subunits be in the same state, and therefore conformational changesin one subunit need not be propagated to all. Instead, using an induced-fit model of ligand binding rather than themore rigid basic lock and key mechanism, it suggests that when a ligand binds to the enzyme, it induces a slightconformational change in the active site that increases its affinity for the ligand. The conformational change mayslightly alter the conformation of other subunits of the enzyme, but may not constitute a state change betweenrelaxed and tensed depending on how tightly the subunits are interacting. However, the change is enough toincrease substrate affinity in adjacent subunits.
Vmax
Km
3.4.10
Modeling Allosteric Behavior
E. V. Wong 3.4.3 12/25/2021 https://bio.libretexts.org/@go/page/64249
Most cell/molecular courses stop the discussion of enzyme inhibitors at competitive vs non-competitive based on theirkinetic profiles. However, it should be noted that if you take a biochemistry course, you may encounter the termsuncompetitive inhibitor and mixed inhibitor. These terms are defined not just by the enzyme kinetics, but themechanism of interaction:
Uncompetitive inhibitors bind only to the enzyme-substrate (ES) complex, and not to the enzyme before it hasencountered substrate. This leads to decreased V and decreased K .Mixed inhibition means that the inhibitor can bind to either enzyme alone or the enzyme-substrate complex.Because the affinities of the inhibitor for the two forms of the enzyme are different, and because part of it dependson substrate concentration while the other kind of binding does not, generally, V decreases and K increases.Non-competitive inhibition is a special case of mixed inhibition in which the catalytic activity of the enzyme isdiminished or abolished, but the ability to bind substrate is unaltered.
Other Mechanisms of Inhibition
While important, especially pharmaceutically, the use of enzyme inhibitors is not the only way to regulate enzymes. Thereare numerous examples of one type of enzyme activating or inhibiting another. The most common general example are theprotein kinases. These enzymes phosphorylate (transfer phosphate group to) other enzymes and thereby activate them.Kinases are generally fast and very specific, and this is an efficient method for activating large numbers of particularenzymes quickly. Conversely, protein phosphatases are enzymes (also quite fast, but much less specific than kinases) thatremove the phosphate groups from phosphorylated proteins, thereby turning off those enzymes. Keep in mind that this is ageneralization, and that not all phosphorylations are activating. In addition to enzymatic inhibition of enzymes, there isalso inhibition by binding and sequestration of the substrates. In fact, the antibiotic vancomycin works just this way,binding to the substrate peptide for transpeptidase and preventing the enzyme from recognizing it. Transpeptidase normallyhelps stabilize the cell wall of certain bacteria by altering some of the proteins, and without its activity, the protection ofthe cell wall is compromised and the bacteria may be more easily killed.
Well over half of the enzymes discovered so far do not act in the simplistic Michaelis-Menten one-substrate-one-product mechanism, but rather operate with two substrates and two products, usually with the transfer of an activegroup. These types of reactions are sometimes known as Bi Bi reactions. There are two major classes of thesereactions: the sequential reactions, in which all substrates bind with the enzyme before the reaction proceeds, and theping pong reactions, in which one or more products are created and released before all of the substrates have beenbound. In fact, unlike sequential reactions, the two substrates do not interact with one another while bound to theenzyme.
Optimal Conditions
The activity of enzymes is greatly influenced by both pH and temperature, as expected from the discussion of proteinstructure in the previous chapter. Activity profiles of most enzymes show a peak of activity that tails off on either side,whether it is pH or temperature. This is an innate characteristic of the enzyme. For example, pepsin, a digestive enzymesecreted into the stomach (pH 2) does not function when the pH > 5. On the other hand, another digestive enzyme, trypsin,which is secreted into the duodenum (proximal small intestine) where the pH is ~8, does not work in acidic environments.Changes in pH can change ionization of amino acid side chains that can thereby alter interaction with the substrate, or leadto changes in tertiary structure.
Advanced: Uncompetitive and Mixed inhibition
max m
max m

E. V. Wong 3.4.4 12/25/2021 https://bio.libretexts.org/@go/page/64249
Figure . pH dependence of enzymatic activity. This graph depicts three hypothetical enzymes with acidic, neutral,and basic pH optima.
Similarly, at suboptimal temperatures, the likelihood of protein-substrate interaction is low but above the optimaltemperature, the increased energy can lead to breaking of hydrogen bonds within the structure of the enzyme, resulting inchanges that in- activate the catalytic ability of enzyme or prevent it from binding substrate with sufficient affinity. Thetemperature optimum of most enzymes is very close to its typical environment. Thus, a human enzyme would operateoptimally around 37°C, while an enzyme from bacteria that live in deep-sea volcanic vents (e.g. Thermophilus aquaticus)might have temperature optima over 90°C. This is one of the reasons that refrigeration can slow down growth ofmicroorganisms (which obviously have no ability to regulate their temperature), and why most microorganisms are killed(enzymes permanently denatured) when put into sustained high temperature environments. Interestingly, the DNApolymerase from the T. aquaticus bacteria, also commonly called Taq polymerase, is used in a rapid DNA-amplifying labtechnique known as PCR (polymerase chain reaction, see Methods chapter) in which samples are repeatedly heated to hightemperatures to separate DNA strands in preparation for making copies of them. DNA polymerases from most prokaryoticor eukaryotic species would be denatured and in- activated by the high heat, but Taq has evolved (with respect to itstertiary structure) for extraordinary structural stability even in heat extremes.
Finally, many enzymes require a molecular partner that has no catalytic activity of its own, but like a catalyst, is notpermanently altered by the chemical reaction. These molecules are cofactors. Some are simple: elemental, in fact,including metal ions such as Zn or Ca . Others are slightly more complex: small organic cofactors are called coenzymes,and accomplish the same thing, acting as a required partner to the enzyme in catalyzing a reaction. The interaction with theenzyme itself varies and may be only transient, as in NAD /NADH which are coenzymes used in redox reactions, orpermanently bound to the enzyme by covalent bond like the heme group of hemoglobin. Often the function of thecoenzyme is to provide an active group to facilitate the catalyzed reaction. Coenzyme A, in various metabolic pathwayssuch as glycolysis or the tricarboxylic acid cycle, can be bound to a substrate to form a stable product that then acts as anintermediate. The Co-A is released from the molecule as it undergoes the next step in a series of reactions in the metabolicpathway (see Chapter 5).
From a human health standpoint, it is interesting to note that many coenzymes are vitamins, or derived from vitamins.These are the B vitamins biotin (B ), cobalamin (B ), folic acid (B ), niacin/nicotinamide (B ), pantothenic acid (B ),pyridoxine (B ), riboflavin (B ), and thiamine (B ). Vitamins are small organic compounds that are not synthesized by anorganism and must therefore be ingested. They are generally needed only in small quantities, but necessary nonetheless.Naturally, the vitamins we are familiar with are those required by humans. The specific roles of these vitamins and thecon- sequences of not having enough of them are discussed later in this textbook, as the enzymes that they work with areintroduced in detail.
3.4.11
2+ 2+
+
7 12 3 9 5
6 2 1

Henry Jakubowski 3.5.1 1/5/2022 https://bio.libretexts.org/@go/page/64250
3.5: Enzyme Inhibition
differentiate among competitive, uncompetitive, and mixed inhibition of enzymes by reversible, noncovalentinhibitors by writing coupled chemical equilibria equations and drawing cartoons showing molecular interactionsamong, E, S, and I;using LeChatelier's principle and coupled chemical equilibria equations, draw double reciprocal (Lineweaver-Burkplots) and semilog plots for enzyme catalyzed reactions in the presence of different fixed concentrations ofinhibitors and activators of enzymedefine KIS and KII for competitive, uncompetitive, and mixed inhibition from coupled chemical equilibria anddouble reciprocal plots;differentiate between apparent and actual dissociations constants constants of an inhibitor and enzyme from doublereciprocal plots and equations initial rate mathematical equations;define agonist, partial agonist, antagonist, and mixed (noncompetitive antagonists) from analogy to enzymes andtheir inhibitors;describe different ways that pH changes could affect the activity of an enzyme and suggest how each could affectKm and kcat.
Learning Objectives
3.5.1: Irreversible Covalent InhibitionWe can covalently modify certain side chains, that if they are essential to enzymatic activity, would irreversibly inhibitthe enzyme. The rest of the chapter will deal with reversible, noncovalent inhibition
3.5.2: Competitive InhibitionCompetitive inhibition occurs when substrate (S) and inhibitor (I) both bind to the same site on the enzyme. In effect,they compete for the active site and bind in a mutually exclusive fashion. Allosteric competitive inhibition is anothertype of inhibition where If S and I bound to different sites, and S bound to E and produced a conformational change inE such that I could not bind (and vice versa), then the binding of S and I would be mutually exclusive.
3.5.3: Uncompetitive InhibitionReversible uncompetitive inhibition occurs when (I) binds only to the enzyme-substrate complex (ES) and not free EE. One can hypothesize that on binding S, a conformational change in E occurs which presents a binding site for I.Inhibition occurs since ESI can not form product. It is a dead end complex which has only one fate, to return to ES.
3.5.4: Noncompetitive and Mixed InhibitionReversible noncompetitive inhibition occurs when I binds to both E and ES. We will look at only the special case inwhich the dissociation constants of I for E and ES are the same. This is called noncompetiive inhibition. It is quiterare as it would be difficult to imagine a large inhibitor which inhibits the turnover of bound substrate having no effecton binding of S to E. If the Kd's are different, the inhibition is called mixed.
Topic hierarchy

Henry Jakubowski 3.5.2 1/5/2022 https://bio.libretexts.org/@go/page/64250
Contributors and AttributionsProf. Henry Jakubowski (College of St. Benedict/St. John's University)
3.5.5: C5. Enzyme Inhibition in Vivo
3.5.6: C6. Agonist and Antagonist of Ligand Binding to Receptors - An ExtensionThe analysis of competitive, uncompetitive and noncompetitive inhibitors of enzymes can now be extended tounderstand how the activity of membrane receptors are affected by the binding of drugs. Drugs targeted to membranereceptors can have a variety of effects. They may elicit the same biological effects as the natural ligand. If so, they arecalled agonists. Conversely they may inhibit the biological activity of the receptor. If so they called antagonists
3.5.7: C7. Inhibition by Temperature and pH Changes
3.5.8: C8. Links and References

Henry Jakubowski 3.5.1.1 1/1/2022 https://bio.libretexts.org/@go/page/64251
3.5.1: Irreversible Covalent InhibitionGiven what you already know about protein structure, it should be easy to figure how to inhibit an enzyme. Since structuremediates function, anything that would significantly change the structure of an enzyme would inhibit the activity of theenzyme. Hence extremes of pH and high temperature, all of which can denature the enzyme, would inhibit the enzyme in airreversible fashion, unless it could refold properly. Alternatively we could add a small molecule which interactsnoncovalently with the enzyme to either change its conformation or directly prevent substrate binding. Finally, we couldcovalently modify certain side chains, that if they are essential to enzymatic activity, would irreversibly inhibit the enzyme.
We discussed previously the types of reagents that would chemically modify specific side chains that might be critical forenzymatic activity. For example, iodoacetamide might abolish enzyme activity if a Cys side chain is required for activity.These reagents will usually modify several side chains, however, and determining which is critical for binding or catalyticconversion of the substrate can be difficult. One way would be to protect the active site with a saturating quantities of aligand which binds reversibly at the active site. Then the chemical modification can be performed at varying reactiontimes. The critical side chain would be protected from the chemical modification, but the extent of protection woulddepend on the Kd, concentration of the protecting ligand., and the length of the reaction.
more TBA
The rest of the chapter will deal with reversible, noncovalent inhibition
Contributors and AttributionsProf. Henry Jakubowski (College of St. Benedict/St. John's University)

Henry Jakubowski 3.5.2.1 1/22/2022 https://bio.libretexts.org/@go/page/64252
3.5.2: Competitive InhibitionCompetitive inhibition occurs when substrate ( ) and inhibitor ( ) both bind to the same site on the enzyme. In effect, theycompete for the active site and bind in a mutually exclusive fashion. This is illustrated in the chemical equations andmolecular cartoon below.
There is another type of inhibition that would give the same kinetic data. If and bound to different sites, and boundto and produced a conformational change in such that could not bind (and vice versa), then the binding of and would be mutually exclusive; this is called allosteric competitive inhibition.
Inhibition studies are usually done at several fixed and non-saturating concentrations of and varying concentrations.The key kinetic parameters to understand are Vm and . Let us assume for ease of equation derivation that I bindsreversibly, and with rapid equilibrium to E, with a dissociation constant Kis. The "s" in the subscript "is" indicates that theslope of the 1/v vs 1/S Lineweaver Burk plot changes while the y intercept stays constant. Kis is also named K c where thesubscript "c" stands for competitive inhibition constant.
The key kinetic parameters to understand are and . Let us assume for ease of equation derivation that bindsreversibly, and with rapid equilibrium to , with a dissociation constant . A look at the top mechanism shows that evenin the presence of , as increases to infinity, all is converted to . That is, there is no free to which could bind.Now remember that
Under these condition,
and
Hence is not changed, but the apparent ( ) will.
We can use Le Châtelier's Principle to understand this. If binds to alone, and not ES, it will shift the equilibrium of to the left, which would have the effect of increasing the (i.e., it would appear that the affinity of
and has decreased.). The double reciprocal plot (Lineweaver Burk plot) offers a great way to visualize the inhibition. Inthe presence of , does not change, but appears to increase. Therefore, , the x-intercept on the plot will getsmaller, and closer to 0. Therefore the plots will consists of a series of lines, with the same y intercept ( ), and the xintecepts ( ) closer and closer to the 0 as increases. These intersecting plots are the hallmark of competitiveinhibition.
S I
S I S
E E I S I
I S
Km
i
Vm Km I
E Kis
I S E ES E I
= .Vm kcatEo (3.5.2.1)
ES = Eo (3.5.2.2)
v= .Vm (3.5.2.3)
Vm Km Kmapp
I E
E+S ⇌ ES Kmapp E
S
I Vm Km 1/Km
1/Vm
−1/Km I

Henry Jakubowski 3.5.2.2 1/22/2022 https://bio.libretexts.org/@go/page/64252
Note that in the first three inhibition models discussed in this section, the Lineweaver-Burk plots are linear in thepresence and absence of inhibitor. This suggests that plots of vs. in each case would be hyperbolic and conform to theusual form of the Michaelis Menton equation, each with potentially different apparent and values.
An equation, shown in the diagram above, can be derived which shows the effect of the competitive inhibitor on thevelocity of the reaction. The only change is that the term is multiplied by the factor . Hence
. This shows that the apparent does increase as we predicted. is the inhibitordissociation constant in which the inhibitor affects the slope of the double reciprocal plot.
Wolfram Mathematica CDF Player - Competitive Inhibition v vs S (free plugin required)
4/6/14 Wolfram Mathematica CDF Player - Competitive Inhibition - Lineweaver Burk(free plugin required)
If the data was plotted as vs. , the plots would be sigmoidal, as we saw for plots of vs. in Chapter 5B.In the case of competitive inhibitor, the plot of vs/ in the presence of different fixed concentrations of inhibitorwould consist of a series of sigmoidal curves, each with the same , but with different apparent values (where
, progressively shifted to the right. Enyzme kinetic data is rarely plotted this way, but simplebinding data for the equilibrium, in the presence of different inhibitor concentrations is.
Reconsider our discussion of the simple binding equilibrium, . When we wished to know how much isbound, or the fractional saturation, as a function of the log L, we considered three examples.
1. (i.e. , which implies that . Then
This implies that irrespective of the actual [L], if , then Y ≈0.01.2. (i.e. , which implies that . Then
This implies that irrespective of the actual , if , then .3. , then
These scenarios show that if L varies over 4 orders of magnitude ( ), or, in log terms, from
irrespective of the magnitude of the , that Y varies from approximately 0 - 1.
In other words, Y varies from 0-1 when L varies from log by +2. Hence, plots of vs. for a series of bindingreactions of increasingly higher (lower affinity) would reveal a series of identical sigmoidal curves shiftedprogressively to the right, as shown below.
v S
Vm Km
Km 1 +I/Kis
= (1 +I/ )Kmapp Km Kis Km Kis
vo logS ML log L
vo log S
Vm Km
= (1 +I/ )Kmapp Km Kis
M +L ⇌ ML
M +L ⇌ ML
L = 0.01Kd L ≪ )Kd = 100LKd
Y = = ≈ 1/100.L
[ +L]Kd
L
[100L+L](3.5.2.4)
L = 0.01Kd
L = 100Kd L ≫ )Kd = L/100Kd
Y = = = ≈ 1.L
[ +L]Kd
L
[(L/100) +L]
100L
101L(3.5.2.5)
[L] L = 100Kd Y ≈ 1
L = Kd Y = 0.5.
0.01 < < 100Kd Kd Kd
−2 +log < log < 2 +log ),Kd Kd Kd (3.5.2.6)
Kd
Kd Y log L
Kd

Henry Jakubowski 3.5.2.3 1/22/2022 https://bio.libretexts.org/@go/page/64252
The same would be true of vs. in the presence of different concentration of a competitive inhibitor, for initial flux, vs. ligand outside, in the presence of a competitive inhibitor, or vs. (or vs. ) in the presence of a competitiveinhibitor.
Wolfram Mathematica CDF Player - Competitive Inhibition v vs logS (free plugin required)
In many ways plots of v0 vs lnS are easier to visually interpret than plots of v0 vs S . As noted for simple binding plots,textbook illustrations of hyperbolas are often misdrawn, showing curves that level off too quickly as a function of [S] ascompared to plots of v0 vs lnS, in which it is easy to see if saturation has been achieved. In addition, as the curves aboveshow, multiple complete plots of v0 vs lnS at varying fixed inhibitor concentration or for variant enzyme forms (differentisoforms, site-specific mutants) over a broad range of lnS can be made which facilitates comparisons of the experimentalkinetics under these different conditions. This is especially true if Km values differ widely.
Now that you are more familiar with binding, flux, and enzyme kinetics curves, in the presence and absence of inhibitors,you should be able to apply the above analysis to inhibition curves where the binding, initial flux, or the initial velocity isplotted at varying competitive inhibitor concentration at different fixed concentration nonsaturating concentrations ofligand or substrate. Consider the activity of an enzyme. Lets say that at some reasonable concentration of substrate (notinfinite), the enzyme is approximately 100% active. If a competitive inhibitor is added, the activity of the enzyme woulddrop until at saturating (infinite) , no activity would remain. Graphs showing this are shown below.
Figure: Inhibition of Enzyme Activity - % Activity vs log [Inhibitor]
A special case of competitive inhibition: the specificity constant: In the previous chapter, the specificity constant wasdefined as kcat/KM which we also described as the second order rate constant associated with the bimolecular reaction of
and when . It also describes how good an enzyme is in differentiating between different substrates. If hasenzyme encounters two substrates, one can be considered to be a competitive inhibitor of the other. The followingderivation shows that the ratio of initial velocities for two competing substrates at the same concentration is equal to theratio of their values.
vo S Jo
ML L Y L
I
E S S ≪ KM
/kcat KM

Henry Jakubowski 3.5.2.4 1/22/2022 https://bio.libretexts.org/@go/page/64252
Java Applet: Competitive Inhibition I; Competitive Inhibition II
Contributors and Attributions
Prof. Henry Jakubowski (College of St. Benedict/St. John's University)

Henry Jakubowski 3.5.3.1 1/5/2022 https://bio.libretexts.org/@go/page/64253
3.5.3: Uncompetitive InhibitionReversible uncompetitive inhibition occurs when ( ) binds only to the enzyme-substrate complex ( ) and not free .One can hypothesize that on binding S, a conformational change in occurs which presents a binding site for . Inhibitionoccurs since can not form product. It is a dead end complex which has only one fate, to return to . This isillustrated in the chemical equations and molecular cartoon below.
Let us assume for ease of equation derivation that binds reversibly to ES with a dissociation constant Kii. A look at thetop mechanism shows that in the presence of , as increases to infinity, not all of is converted to ES. That is, there is afinite amount of ESI, even at infinite . Now remember that if and only if all is in the form ES . Underthese conditions, the apparent , is less than the real without inhibitor. In addition, the apparent , ,will change. We can use Le Chatelier's principle to understand this. If binds to ES alone, and not , it will shift theequilibrium of to the right, which would have the affect of decreasing the (i. ., it would appear thatthe affinity of and has increased.).
The double reciprocal plot (Lineweaver Burk plot) offers a great way to visualize the inhibition. In the presence of , both and decrease. Therefore, , the x-intercept on the plot, will get more negative, and will get more
positive. It turns out that they change to the same extent. Therefore the plots will consist of a series of parallel lines, whichis the hallmark of uncompetitive inhibition.
An equation, shown in the diagram above, can be derived which shows the effect of the uncompetitive inhibitor on thevelocity of the reaction. The only change is that the term in the denominator is multiplied by the factor . Wewould like to rearrange this equation to show how and are affected by the inhibitor, not , which obviously is not.Rearranging the equation as shown above shows that
and
This shows that the apparent and do decrease as we predicted. is the inhibitor dissociation constant in whichthe inhibitor affects the intercept of the double reciprocal plot. Note that if is zero, and are unchanged.
Java Applet: Uncompetitive Inhibition
I ES E
E I
ESI ES
I
I S E
S =Vm kcatEo E
Vm Vmapp Vm Km Kmapp
I E
E +S ⇌ ES Kmapp E
E S
I
Vm Km −1/Km 1/Vm
S 1 +I/Kii
Km Vm S
=Kmapp
Km
(1 +I/ )Kii
(3.5.3.1)
= .Vmapp
Vm
1 +I/Kii
(3.5.3.2)
Km Vm Kii
I Km Vm

Henry Jakubowski 3.5.3.2 1/5/2022 https://bio.libretexts.org/@go/page/64253
Wolfram Mathematica CDF Player - Uncompetitive Inhibition v vs S (free plugin required)
4/6/14 Wolfram Mathematica CDF Player - Uncompetitive Inhibition - Lineweaver Burk(free plugin required)
Contributors and AttributionsProf. Henry Jakubowski (College of St. Benedict/St. John's University)

Henry Jakubowski 3.5.4.1 1/15/2022 https://bio.libretexts.org/@go/page/64254
3.5.4: Noncompetitive and Mixed InhibitionReversible noncompetitive inhibition occurs when I binds to both E and ES. We will look at only the special case in whichthe dissociation constants of for and are the same. This is called noncompetiive inhibition. It is quite rare as itwould be difficult to imagine a large inhibitor which inhibits the turnover of bound substrate having no effect on binding of
to . However covalent interaction of protons with both E and ES can lead to noncompetitive inhibition. In the moregeneral case, the 's are different, and the inhibition is called mixed. Since inhibition occurs, we will hypothesize thatESI can not form product. It is a dead end complex which has only one fate, to return to or . This is illustrated inthe chemical equations and in the molecular cartoon below.
Let us assume for ease of equation derivation that I binds reversibly to E with a dissociation constant of Kis (as we denotedfor competitive inhibition) and to ES with a dissociation constant (as we noted for uncompetitive inhibition). Assumefor noncompetitive inhibition that Kis = Kii. A look at the top mechanism shows that in the presence of I, as S increases toinfinity, not all of is converted to . That is, there is a finite amount of ESI, even at infinite S. Now remember that
if and only if all is in the form . Under these conditions, the apparent , is less than the real withoutinhibitor. In contrast, the apparent Km, , will not change since I binds to both and with the same affinity, andhence will not perturb that equilibrium, as deduced from Le Chatelier's principle. The double reciprocal plot (LineweaverBurk plot) offers a great way to visualize the inhibition. In the presence of I, just Vm will decrease. Therefore, -1/Km, thex-intercept will stay the same, and will get more positive. Therefore the plots will consists of a series of linesintersecting on the x axis, which is the hallmark of noncompetitive inhibition. You should be able to figure out how theplots would appear if is different from (mixed inhibition).
An equation, shown in the diagram above can be derived which shows the effect of the noncompetitive inhibitor on thevelocity of the reaction. In the denominator, Km is multiplied by , and by . We would like torearrange this equation to show how Km and Vm are affected by the inhibitor, not S, which obviously isn't. Rearrangingthe equation as shown above shows that
when
and
This shows that the is unchanged and decreases as we predicted. The plot shows a series of lines intersecting onthe x axis. Both the slope and the y intercept are changed, which are reflected in the names of the two dissociationconstants, Kis and Kii. Note that if is zero, and . Sometimes the and inhibitiondissociations constants are referred to as and (competitive and uncompetitive inhibition dissociation constants.
I E ES
S E
Kd
ES EI
Kii
E ES
=Vm kcatEo (3.5.4.1)
E ES Vm Vm,app Vm
Km,app E ES
1/Vm
Kis Kii
1 +I/Kis S 1 +I/Kii
= =Km,app
(1 +I/ )Km Kis
1 +I/Kii
Km (3.5.4.2)
=Kis Kii (3.5.4.3)
= .Vm,appVm
1 +I/Kii(3.5.4.4)
Km Vm
I =Km,app Km =Vm,app Vm Kis Kii
Kc Ku

Henry Jakubowski 3.5.4.2 1/15/2022 https://bio.libretexts.org/@go/page/64254
Mixed (and non-)competitive inhibition (as shown by mechanism above) differ from competitive and uncompetiiveinhibition in that the inhibitor binding is not simply a dead end reaction in which the inhibitor can only dissociate in asingle reverse step. In the above equilibrium, can dissociate from to form so the system may not be atequilibrium. With dead end steps, no flux of reactants occurs through the dead end complex so the equilibrium for the deadend step is not perturbed.
Other mechanisms can commonly give mixed inhibition. For example, the product released in a ping pong mechanism(discussed in the next chapter) can give mixed inhibition.
If , acting as a product inhibitor, can bind to two different forms of the enzyme ( and also ), it will act as an mixedinhibitor.
Java Applet: Noncompetitive Inhibition
4/26/13 Wolfram Mathematica CDF Player - Mixed Inhibition v vs S curves; Kis and Kii called Kc and Ku (startsliders at high values) (free plugin required)
4/26/13 Wolfram Mathematica CDF Player - Mixed Inhibition v vs S curves (start sliders at high values) (freeplugin required). Note where the inhibited and inhibited curves intersect at different values of Kis and Kii (in the graphtermed Kc and Ku).
If you can apply Le Chatelier's principle, you should be able to draw the Lineweaver-Burk plots for any scenario ofinhibition or even the opposite case, enzyme activation!
S ESI EI
P E ′ E

Henry Jakubowski 3.5.4.3 1/15/2022 https://bio.libretexts.org/@go/page/64254
Figure: Summary of Reversible Enzyme Inhibition
Contributors and AttributionsProf. Henry Jakubowski (College of St. Benedict/St. John's University)

Henry Jakubowski 3.5.5.1 1/1/2022 https://bio.libretexts.org/@go/page/64255
3.5.5: C5. Enzyme Inhibition in VivoThe whole pharmaceutical industrial is devoted to finding drug molecules that affect biological processes. Usually thismeans the development of small molecule inhibitors of target proteins, although recent work has expanded to developmentof inhibitory RNA molecules that affect DNA transcription and mRNA translation. Using combinatorial synthetictechniques and computational modeling, it has gotten easier to develop small molecule inhibitors (especially competitiveones) that inhibit proteins in vitro using purified enzymes, substrates, and inhibitors in lab testing. Assuming that theinhibitor could pass through the membrane and accumulate to a sufficient enough concentration, would it have the sameinhibitory properties in the cell as in the test tube? The answer turns out to be maybe. Remember that a cell is tightlypacked with a multitude of other small molecules and macromolecules. In addition, the enzyme targeted for inhibition ismost likely in part of a pathway of enzymes that feeds reactant into the enzyme and removes the product. Hence the flux ofsubstrate and product is controlled by the entire pathway and not just the single target enzyme although the productconcentration of the target enzyme is determined by kinetic parameters for the enzyme and available substrateconcentration. .
The conditions under which the enzymes are studied (in vitro) and operate (in vivo) are very different.
In vitro (in the lab), the enzyme is held at a constant concentration while the substrate is varied (i.e the substrateconcentration is the independent variable). The velocity is determined by the substrate concentration. When inhibitionis studied, the substrate is varied while the inhibitor is held constant at several different fixed concentrations.
In vivo (in the cell), the velocity might be held at a relatively fixed level with the substrate determined by the velocity.To avoid a bottleneck in flux, substrate can't build up at the enzyme, so the enzyme processes it in a steady state fashionto produce product as determined by the Michael-Menten equation.
What happens when an inhibitor is added in vivo? Let's assume that the enzyme is running at v = Vm/2. We saw before forin vitro inhibition that it is sometimes difficult to differentiate competitive and uncompetiive inhibition (as evidenced fromreal, not hypothetical perfect double reciprocal plots). How might in vivo inhibition plots look at constant velocity (forexample v=Vm/2) when both I and S can vary and in which S for an enzyme in the middle of a pathway is determined byv?
The equations and graph below shows the ratio of S/Km vs I/Kix for inhibition at constant v, a condition encountered whenan enzyme in a metabolic pathways is subject to flux controls imposed by the entire pathway. The x axis reflects therelative amount of inhibitor compared to its inhibition constant. Likewise the y axis reflects the relative amount ofsubstrate compared to its Km. The graph for in vivo competitive inhibition is linear, but it "blows up" for uncompetitiveinhibition.
Figure: Competitive and Uncompetitive Inhibition in vivo
Competitive Inhibition at Contant v Uncompetitive Inhibition at Contant v
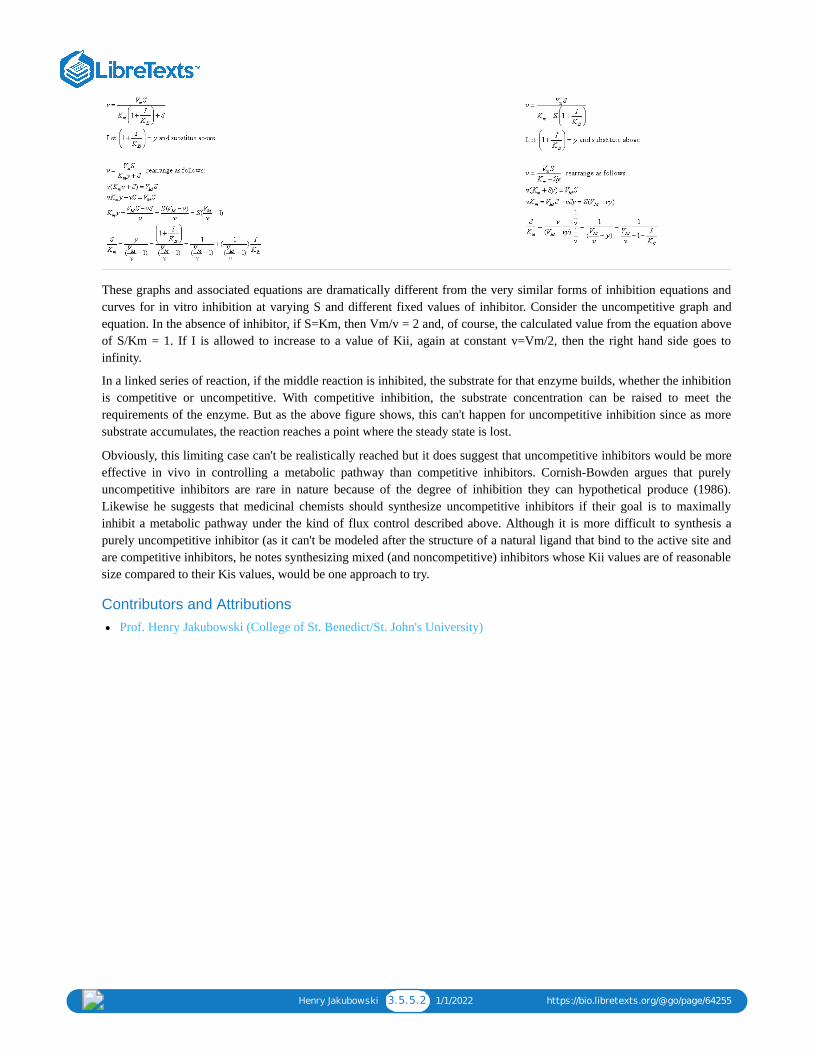
Henry Jakubowski 3.5.5.2 1/1/2022 https://bio.libretexts.org/@go/page/64255
These graphs and associated equations are dramatically different from the very similar forms of inhibition equations andcurves for in vitro inhibition at varying S and different fixed values of inhibitor. Consider the uncompetitive graph andequation. In the absence of inhibitor, if S=Km, then Vm/v = 2 and, of course, the calculated value from the equation aboveof S/Km = 1. If I is allowed to increase to a value of Kii, again at constant v=Vm/2, then the right hand side goes toinfinity.
In a linked series of reaction, if the middle reaction is inhibited, the substrate for that enzyme builds, whether the inhibitionis competitive or uncompetitive. With competitive inhibition, the substrate concentration can be raised to meet therequirements of the enzyme. But as the above figure shows, this can't happen for uncompetitive inhibition since as moresubstrate accumulates, the reaction reaches a point where the steady state is lost.
Obviously, this limiting case can't be realistically reached but it does suggest that uncompetitive inhibitors would be moreeffective in vivo in controlling a metabolic pathway than competitive inhibitors. Cornish-Bowden argues that purelyuncompetitive inhibitors are rare in nature because of the degree of inhibition they can hypothetical produce (1986).Likewise he suggests that medicinal chemists should synthesize uncompetitive inhibitors if their goal is to maximallyinhibit a metabolic pathway under the kind of flux control described above. Although it is more difficult to synthesis apurely uncompetitive inhibitor (as it can't be modeled after the structure of a natural ligand that bind to the active site andare competitive inhibitors, he notes synthesizing mixed (and noncompetitive) inhibitors whose Kii values are of reasonablesize compared to their Kis values, would be one approach to try.
Contributors and AttributionsProf. Henry Jakubowski (College of St. Benedict/St. John's University)

Henry Jakubowski 3.5.6.1 1/29/2022 https://bio.libretexts.org/@go/page/64256
3.5.6: C6. Agonist and Antagonist of Ligand Binding to Receptors - AnExtensionThe analysis of competitive, uncompetitive and noncompetitive inhibitors of enzymes can now be extended to understandhow the activity of membrane receptors are affected by the binding of drugs. When receptors bind their natural targetligands (hormones, neurotransmitters), a biological effect is elicited. This usually involves a shape change in the receptor, atransmembrane protein, which activates intracellular activities. The bound receptor usually does not directly expressbiological activity, but initiates a cascade of events which leads to expression of intracellular activity. In some cases,however, the occupied receptor actually expresses biological activity itself. For example, the bound receptor can acquireenzymatic activity, or become an active ion channel.
Drugs targeted to membrane receptors can have a variety of effects. They may elicit the same biological effects as thenatural ligand. If so, they are called agonists. Conversely they may inhibit the biological activity of the receptor. If so theycalled antagonists
AgonistAn agonist is a mimetic of the natural ligand and produces a similar biological effect as the natural ligand when it binds tothe receptor. It binds at the same binding site, and leads, in the absence of the natural ligand, to either a full or partialresponse. In the latter case, it is called a partial agonist. The figure below shows the action of ligand, agonist, and partialagonist.
There is another kind of agonist, given the bizarre name inverse agonist. This term only makes sense when applied to areceptor that has a basal (or constitutive) activity in the absence of a bound ligand. If either the natural ligand or an agonistbinds to the receptor site, the basal activity is increased. If however, an inverse agonists binds, the activity is decreased. Anexample of an inverse agonist (which we will discuss later) is the binding of the drug Ro15-4513 to the GABA receptor,which also binds benzodiazepines such as valium. When occupied by its natural ligand, GABA, the protein receptor is"activated" to become a channel allowing the inward flow of Cl- into a neural cell, inhibiting neuron activation. Valiumpotentiates the effect of GABA, which is enhanced even further in the presence of ethanol. Ro15-4513 binds to thebenzodiazepine site, which leads to the opposite effect of valium, the inhibition of the receptor bound activity - a chloridechannel.
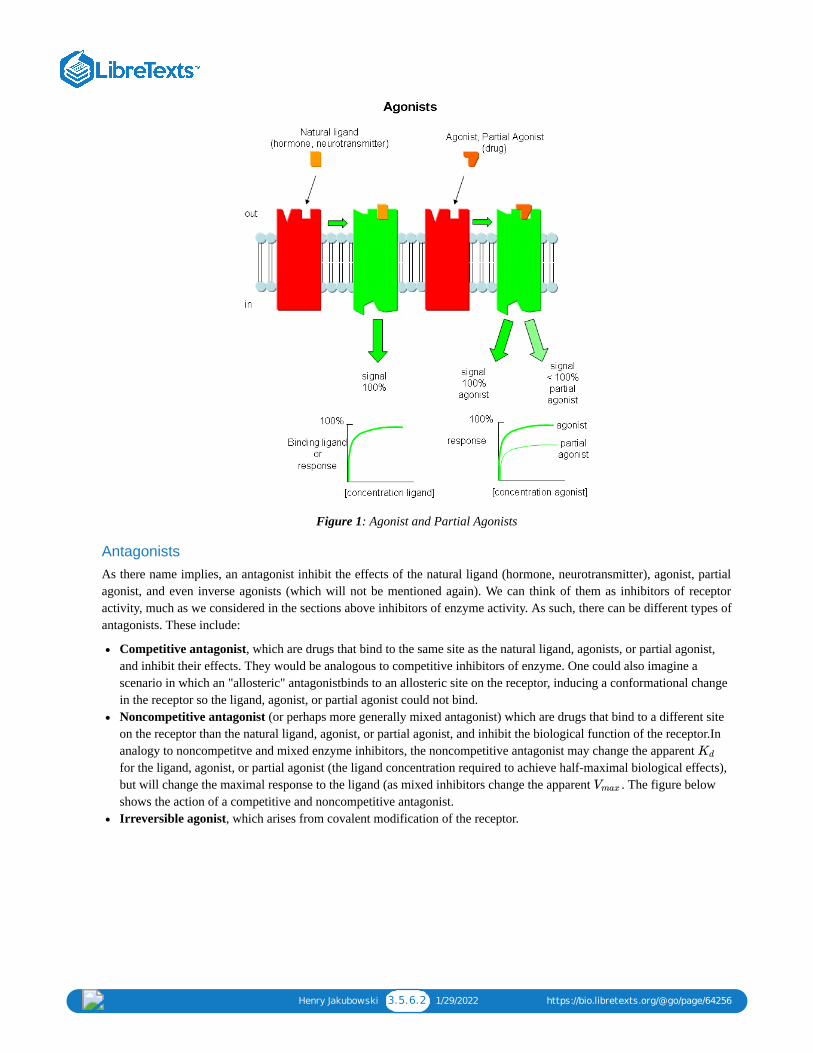
Henry Jakubowski 3.5.6.2 1/29/2022 https://bio.libretexts.org/@go/page/64256
Figure 1: Agonist and Partial Agonists
AntagonistsAs there name implies, an antagonist inhibit the effects of the natural ligand (hormone, neurotransmitter), agonist, partialagonist, and even inverse agonists (which will not be mentioned again). We can think of them as inhibitors of receptoractivity, much as we considered in the sections above inhibitors of enzyme activity. As such, there can be different types ofantagonists. These include:
Competitive antagonist, which are drugs that bind to the same site as the natural ligand, agonists, or partial agonist,and inhibit their effects. They would be analogous to competitive inhibitors of enzyme. One could also imagine ascenario in which an "allosteric" antagonistbinds to an allosteric site on the receptor, inducing a conformational changein the receptor so the ligand, agonist, or partial agonist could not bind.Noncompetitive antagonist (or perhaps more generally mixed antagonist) which are drugs that bind to a different siteon the receptor than the natural ligand, agonist, or partial agonist, and inhibit the biological function of the receptor.Inanalogy to noncompetitve and mixed enzyme inhibitors, the noncompetitive antagonist may change the apparent for the ligand, agonist, or partial agonist (the ligand concentration required to achieve half-maximal biological effects),but will change the maximal response to the ligand (as mixed inhibitors change the apparent . The figure belowshows the action of a competitive and noncompetitive antagonist.Irreversible agonist, which arises from covalent modification of the receptor.
Kd
Vmax
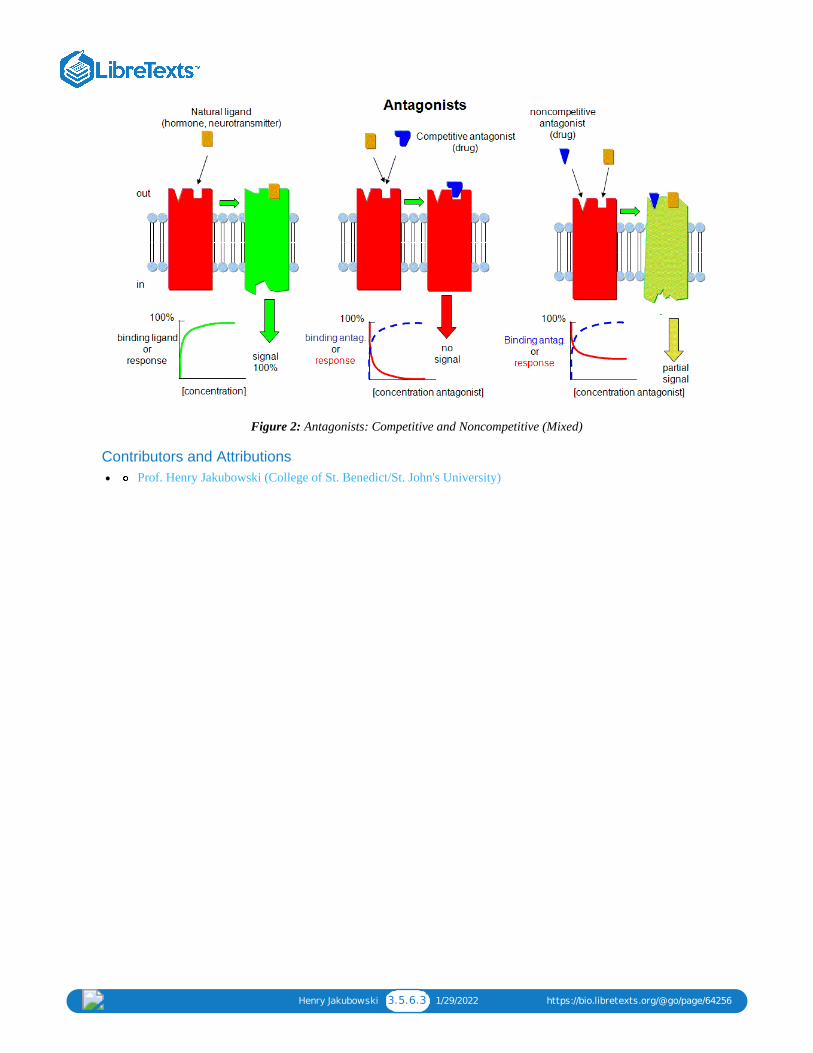
Henry Jakubowski 3.5.6.3 1/29/2022 https://bio.libretexts.org/@go/page/64256
Figure 2: Antagonists: Competitive and Noncompetitive (Mixed)
Contributors and AttributionsProf. Henry Jakubowski (College of St. Benedict/St. John's University)

Henry Jakubowski 3.5.7.1 1/8/2022 https://bio.libretexts.org/@go/page/64257
3.5.7: C7. Inhibition by Temperature and pH ChangesFrom 0 to about 40-50° C, enzyme activity usually increases, as do the rates of most reactions in the absence of catalysts.(Remember the general rule of thumb that reaction velocities double for each increase of 10°C.). At higher temperatures,the activity decreases dramatically as the enzyme denatures.
Figure: Temperature and Enzyme Activity
INHIBITION BY pH CHANGEpH has a marked effect on the velocity of enzyme-catalyzed reactions.
Figure: pH and Enzyme Activity
Think of all the things that pH changes might affect. It might
affect E in ways to alter the binding of S to E, which would affect Kmaffect E in ways to alter the actual catalysis of bound S, which would affect kcataffect E by globally changing the conformation of the proteinaffect S by altering the protonation state of the substrate
The easiest assumption is that certain side chains necessary for catalysis must be in the correct protonation state. Thus,some side chain, with an apparent pKa of around 6, must be deprotonated for optimal activity of trypsin which shows anincrease in activity with the increase centered at pH 6. Which amino acid side chain would be a likely candidate?
See the following figure which shows how pH effects on enzyme kinetics can be modeled at the chemical andmathematical level.
Figure: Chemical equations showing the mechanism of pH effects on enzyme catalyzed reactions

Henry Jakubowski 3.5.7.2 1/8/2022 https://bio.libretexts.org/@go/page/64257
Figure: Mathematic equations modeling pH effects on enzyme catalyzed reactions
Figure: Graphs of pH effects on enzyme catalyzed reactions
Contributors and AttributionsProf. Henry Jakubowski (College of St. Benedict/St. John's University)

Henry Jakubowski 3.5.8.1 12/25/2021 https://bio.libretexts.org/@go/page/64258
3.5.8: C8. Links and ReferencesMathcad: Effect of pH on enzyme catalysis (by Paul Krause, Chemistry Department, Univ. of Central Arkansas.
1. Cornish-Bowden, Athel. Why is uncompetitive inhibition so rare? FEBS Letters. 203, 3 (1986)
2. Cornish-Bowden, Athel. Teaching Enzyme Kinetics and Mechanism in the 21st Century. Beilstein Symposium onExperimental Standard Conditions of Enzyme Characterizations (ESCEC). Pg 3, September 23-26 (2007)
Contributors and Attributions
Prof. Henry Jakubowski (College of St. Benedict/St. John's University)

Gerald Bergtrom 3.6.1 1/29/2022 https://bio.libretexts.org/@go/page/64259
3.6: Enzyme Catalysis and Kinetics
Thumbnail: diagram showing the induced fit model in enzymes ( (Public Domain; LadyofHats).

Henry Jakubowski 3.7.1 1/5/2022 https://bio.libretexts.org/@go/page/64260
3.7: More Complicated Enzymes
draw Cleland chemical reaction diagrams showing enzyme, substrate, and product interactions for multisubstrateand multiproduct sequential and ping-pong enzyme-catalyzed reactions;draw double reciprocal 1/v vs 1/A plots at different fixed B concentrations for sequential and ping-pongmultisubstrate reactions;draw v vs S graphs in the presence and absence of allosteric inhibitors and activators for multi-subunit enzymesthat display sigmoidal cooperative behavior (K systems) conforming to the MWC model;differentiate between K and V systems for allosterically regulated enzymes using the MWC model and explainshifts in graphs of v vs S in the presence of allosteric effectors
In reality, many enzymes have more than one substrate (A, B) and more than one product (P, Q). For example, the enzymealcohol dehydrogenase catalyzes the oxidation of ethanol with NAD (a biological oxidizing agent) to form acetaldehydeand NADH.
Learning Objectives
3.7.1: D1. Multi-Substrate Sequential Mechanisms
3.7.2: Multi-Substrate Ping-Pong MechanismsIn this mechanism, one substrate binds first to the enzyme followed by product P release. Typically, product P is afragment of the original substrate A. The rest of the substrate is covalently attached to the enzyme E , which isdesignated as E'. Now the second reactant, B, binds and reacts with the E' and forms a covalent bond to the fragmentof A still attached to the enzyme, forming product Q. This is now released and the enzyme is restored to its initialform, E.
3.7.3: Inhibitors in Multi-substrate Reactions
3.7.4: D4. Allosteric EnzymesMany enzymes do not demonstrate hyperbolic saturation kinetics, or typical Michaelis-Menten kinetics. Graphs ofinitial velocity vs substrate demonstrate sigmoidal dependency of v on S, much as we discussed with hemoglobinbinding of dioxygen. Enzymes that display this non Michaelis-Menten behavior have common characteristics.
3.7.5: D5. Integration of Binding, Diffusion and Kinetics
3.7.6: D6. Links and References
Topic hierarchy

Henry Jakubowski 3.7.2 1/5/2022 https://bio.libretexts.org/@go/page/64260
Contributors and AttributionsProf. Henry Jakubowski (College of St. Benedict/St. John's University)

Henry Jakubowski 3.7.1.1 1/1/2022 https://bio.libretexts.org/@go/page/64261
3.7.1: D1. Multi-Substrate Sequential MechanismsIn reality, many enzymes have more than one substrate (A, B) and more than one product (P, Q). For example, the enzymealcohol dehydrogenase catalyzes the oxidation of ethanol with NAD (a biological oxidizing agent) to form acetaldehydeand NADH. How do you do enzymes kinetics on these more complicated systems? The answer is fairly straightforward.You keep one of the substrates (B, for example) fixed, and vary the other substrate (A) and obtain a series of hyperbolicplots of vs. at different fixed concentrations. This would give a series of linear 1/v vs 1/A double-reciprocal plots(Lineweaver-Burk plots) as well. The pattern of Lineweaver-Burk plots depends on how the reactants and products interactwith the enzyme.
Sequential MechanismIn this mechanism, both substrates must bind to the enzyme before any products are made and released. The substratesmight bind to the enzyme in a random fashion (A first then B or vice-versa) or in an ordered fashion (A first followed byB). An abbreviated notation scheme developed by W.W. Cleland is shown below for the sequential random and sequentialordered mechanisms. For both mechanisms, Lineweaver-Burk plots at varying A and different fixed values of B give aseries of intersecting lines. Derivative curves can be solved to obtain appropriate kinetic constants.
Contributors and AttributionsProf. Henry Jakubowski (College of St. Benedict/St. John's University)
vo A B

Henry Jakubowski 3.7.2.1 1/1/2022 https://bio.libretexts.org/@go/page/64262
3.7.2: Multi-Substrate Ping-Pong MechanismsIn this mechanism, one substrate binds first to the enzyme followed by product release. Typically, product is afragment of the original substrate . The rest of the substrate is covalently attached to the enzyme , which is designatedas . Now the second reactant, , binds and reacts with the E' and forms a covalent bond to the fragment of stillattached to the enzyme, forming product . This is now released and the enzyme is restored to its initial form, . Thisrepresents a ping-pong mechanism An abbreviated notation scheme is shown below for ping-pong mechanisms. For thismechanism, Lineweaver-Burk plots at varying and different fixed values of give a series of parallel lines.
One example of a ping-pong enzyme is low molecular weight protein tyrosine phosphatase. It reacts with the smallsubstrate p-initrophenylphosphate (A) which binds to the enzyme covalently with the expulsion of the product P, the p-nitrophenol leaving group. Water (B) then comes in and covalently attacks the enzyme, forming an adduct with thecovalently bound phosphate releasing it as inorganic phosphate. In this particular example, however, you can't vary thewater concentration and it would be impossible to generate the parallel Lineweaver-Burk plots characteristic of ping-pongkinetics.
What are the meanings of the kinetic parameters, and , for multisubstrate/multiproduct mechanisms? Consider arandom sequential bi-bi reaction for a "simple" case in which the rapid equilibrium assumption defines the binding ofsubstrates and .
By inspection, there would appear to be two types of "effective" dissociation constants for reactant . One describes thebinding of to E ( ) and the other the binding of to ( ). Using mass balance for and relationship that
the following initial rate equation can be derived.
P P
A E
E ′ B A
Q E
A B
Km Vm
A B
A
A Kia A EB Ka E
= [EAB]v0 kcat (3.7.2.1)

Henry Jakubowski 3.7.2.2 1/1/2022 https://bio.libretexts.org/@go/page/64262
Note that Kib does not appear in the final equation. How can that be? The answer lies in the fact that the finalconcentration of can be derived from the path to to or from the path to to . Assumingrapid equilibrium,
The following equation can be derived from ping-pong bi-bi mechanism.
For simplicity, all of the enzyme kinetic equations have been derived assuming no products are present.
Contributors and AttributionsProf. Henry Jakubowski (College of St. Benedict/St. John's University)
EAB E EA EAB E EB EAB
= .KiaKb KibKa (3.7.2.2)
v =ABVM
A + B +ABKb Ka
(3.7.2.3)

Henry Jakubowski 3.7.3.1 1/15/2022 https://bio.libretexts.org/@go/page/64263
3.7.3: Inhibitors in Multi-substrate ReactionsProduct Inhibition: Interpretation of kinetic experiments can be complicated by the fact that the reactions can bereversed. Even if the catalytic conversions of the reverse steps have too high an activation energy to actual proceed, theproducts, which obviously have some structural resemblance to the reactants could inhibit the enzyme as they couldcompete with reactants for binding to the enzyme. In contrast to studying enzyme inhibition using varying concentrationsof substrate at different fixed concentrations of inhibitor, the concentration of products produced by an enzyme areconstantly increasing over the time course of the reaction. This suggests one immediate reason that most kineticparameters are determined by initial rate methods in which the inhibitor-product has not yet build to a sufficientconcentration to alter the rate of conversion of substrate to product. Product inhibition can occur in single substratereactions as well.
Dead End Inhibition: How do added inhibitors affect the double reciprocal plots of multisubstrate reactions? Let'sconsider a special case of inhibitors call dead-end inhibitors. These reversible inhibitors bind to a form of the enzyme andinhibit product formation but do not participate in the reaction. It would be represented on a Cleland diagram as a verticalline coming off the the horizontal line which represent different enzymes forms (E, EA, EAB, E'Q, EP, EQ, etc) that leadto product formation. A quick inspection of Cleland diagrams lead to two simple rules that helps in the interpretation ofdouble reciprocal plots in the presence of different fixed and nonsaturating concentrations of dead-end inhibitors (I) inmultisubstrate reactions (when one substrate S is varied):
1. Slope changes when:
I and S bind to the same form of the enzyme (for example E binds both S and I) ORI binds to a form of E (on the horizontal line) which is connected to the form that S binds, and I binds first (forexample, I binds to E and then S binds).
2. Y Intercept changes when:
I and S bind to different forms of the enzyme unless I binds first and the binding of I and S are in rapid equilibrium.
The rules predict 1/v vs 1/S plots for simple competitive inhibition (S and I bind to the same enzyme form, E) anduncompetitive (S binds to E followed by binding of I to ES). If the slope changes and the y intercept doesn't, that'scompetitive inhibition. If the y intercept changes and the slope remains constant, that is uncompetitive inhibition. It worksalso for mixed inhibition where I binds to E (the same form as S binds to), which changes the slope, AND also binds to EA(a different form of the enzyme than S binds to which is E), which changes the y intercept.
These same rules apply for product inhibition. Consider the rapid equilibrium ordered bibi reaction above when theconcentration of the other substrate is around its Kx value:
Ia (an inhibitor that resembles A) and A both bind to E and EB, so the inhibition is competitive as the slope changes butnot the Y interceptIa and B both bind to the same enzyme form (E) so the slope should change, but Ia also binds to EB (to which B cannot bind) so the Y intercept would change, which when combined would give either uncompetitive or noncompetitive.
Contributors and AttributionsProf. Henry Jakubowski (College of St. Benedict/St. John's University)

Henry Jakubowski 3.7.4.1 12/25/2021 https://bio.libretexts.org/@go/page/64264
3.7.4: D4. Allosteric EnzymesMany enzymes do not demonstrate hyperbolic saturation kinetics, or typical Michaelis-Menten kinetics. Graphs of initialvelocity vs substrate demonstrate sigmoidal dependency of on , much as we discussed with hemoglobin binding ofdioxygen. Enzymes that display this non Michaelis-Menten behavior have common characteristics. They:
are multi-subunitbind other ligands at sites other than the active site (allosteric sites)can be either activated or inhibited by allosteric ligandsexist in two major conformational states, and often control key reactions in major pathways, which must be regulated.
A classic examples of allosterically regulated enzymes includes glycogen phosphorylase which breaks down intracellularglycogen reserves.
Glycogen Phosphorylase
Aspartate Transcarbamyolase
Another is aspartate transcarbamyolase, which catalyzes the first step in the synthesis of pyrimidine nucleotides. CTP is anallosteric inhibitor of this enzyme, which makes physiological sense since high levels of this pyrimidine nucleotide shouldinhibit the first enzyme in the synthesis of pyrimidines. ATP is a allosteric activator. This also makes sense since if highlevels of the purine nucleotide ATP are present, one would also want to balance the level of pyrimidine nucleotides.
Figure : Aspartate transcarbamoylase: reactions
Earlier we saw that cooperative binding equilibrium could be modeled with the Hill Equation, which was introducedthrough the equation
v S
R T
3.7.4.1
Y = /( + ) = /( + )Ln
Kd Ln
Ln
Pn
50 Ln (3.7.4.1)

Henry Jakubowski 3.7.4.2 12/25/2021 https://bio.libretexts.org/@go/page/64264
where n is the cooperativity or Hill Coefficient. Likewise, for an enzyme which demonstrates cooperative (sigmoidal)initial rates plots,
When , the equation reduces to the classical hyperbolic Michaelis Menten equation. For values of n>1, sigmoidalplots are observed. We found a more easily understandable molecular interpretation of cooperative binding of oxygen tohemoglobin using the MWC model (T and R states). The MWC model has also been applied successfully to multi-subunitenzymes which display cooperative, sigmoidal kinetics. In this model, allosteric inhibitors (which often don't resemble thesubstrate) bind preferentially to the T state, leading to lower activity, while allosteric activators bind preferentially to the Rstate, leading to greater activity. Activators shift the vo vs S curve to the left while inhibitors shift it to the right (much likeprotons and carbon dioxide in hemoglobin binding). These allosteric ligands induce their effects by shifting the To <=> Roequilibrium.
Figure : spartate transcarbamoylase: Non Michaelis-Menten Kinetics
How Do Allosteric Effectors Change and ?
We have just studied how competitive, uncompetitive, and noncompetitive (or mixed) inhibitors influence the apparent and values for enzymes that display Michaelis-Menten kinetics.How are and influenced in allosteric
enzymes? The example given above (ATCase), analogous to effects observed in hemoglobin:oxgyen binding, influence theapparent , but not the . Remember that in the case of hemoglobin binding curves, the allosteric activators andeffectors we discussed shifted the sigmoidal binding curves to the left or right, but all reached a plateau at the samefractional saturation value of 1. Allosteric enzyme systems that behave like this are called K systems.
Enzymes in which allosteric regulators change , called V systems, are also known. V systems display hyperbolic vs. curves in which activators display a greater apparent and inhibitors display a lower without affecting the
apparent .In these systems, both the T and R forms have the same affinity for substrate (hence the same apparent ).This would be analogous to a situation in the MWC model where KR/KT =1 which also gave hyperbolic, not
sigmoidal Y vs. a curves. This difference in V systems is that the R and T states have different catalytic rate constants, , for turnover of the bound substrate (hence different apparent values).In addition, the activator A and inhibitor I
bind to the R and T forms with different affinity, which again shifts the equilibrium in the presence of theallosteric effectors.
Cooperative binding of dioxygen to hemoglobin, regulated by allosteric effectors (protons and carbon dioxide), was idealfor an oxygen transport system which must load and unload oxygen over a narrow range of oxygen concentrations andallosteric effectors. Allosteric enzymes are usually positioned at key metabolic steps which can be regulated to activate orinhibit whole pathways.
=voVmS
n
K +0.50n Ln(3.7.4.2)
n= 1
3.7.4.2
Vm Km
Km Vm Vm Km
Km Vm
Vm vo
S Vm Vm
Km
Km
atkc Vm
⇌To Ro

Henry Jakubowski 3.7.4.3 12/25/2021 https://bio.libretexts.org/@go/page/64264
Enzyme Regulation by Covalent ModificationMany enzymes are regulated not by allosteric ligands (activators and inhibitors), but by covalent modification. Often thecovalent modification involves phosphorylation (by enzymes called kinases which transfer a phosphate from ATP to a Ser,Thr, or Tyr on the target enzyme) or phosphatases (which remove the phosphates from phospho-Ser, Thr, or Tyr in thetarget protein). In fact 1-2% of all genes in the human genome code for kinases and phosphatases.
Contributors and Attributions
Prof. Henry Jakubowski (College of St. Benedict/St. John's University)

Henry Jakubowski 3.7.5.1 12/11/2021 https://bio.libretexts.org/@go/page/64265
3.7.5: D5. Integration of Binding, Diffusion and KineticsBy now you should realize the similarities among the chemical and mathematical equations used to describe binding,facilitated diffusion, and enzyme kinetics of macromolecule interactions with ligands and substrates. In simple,noncooperative systems, it all starts with a macromolecule, usually a protein, binding a ligand, which can be a smallmolecule or another macromolecule.
In some cases, the only function of M is to bind and release ligand (as in the case of myoglobin). In other cases, the ligandis transformed. In the simplest case involving transformation, the ligand is moved across a membrane down aconcentration gradient (facilitated diffusion), a purely physical step.
In a yet more complicated case, the ligand can be transformed chemically (enzyme kinetics) into product.
In this chapter we added interactions (multiple substrates, inhibitors) and saw that the basic form of the binding, facilitateddiffusion, and enzyme kinetic equations and graphs for noncooperative system were extremely similar since the biologicalfunction always depended in some fashion on the concentration of the macromolecule complex ( ML, RA, ES, EI, ESIetc). The PowerPoint below reviews the similarity in the results of the mathematical analyses and resulting graphs showingthe concentration dependencies of complex formation, facilitated diffusion, and enzyme-catalyzed chemical reactions.
PowerPoint: Summary of Graphical Descriptions of Noncooperative Binding, Facilitated Diffusion, and EnzymeKinetics
A feel for the dissociation constantIn all of the curves shown in the above PowerPoint, a ligand concentration can be found at which the biological effect ishalf maximum (either activation or inhibition of a biological function). Remember, only in certain conditions is thatnumber equal to the dissociation constant for ligand. This is clearly the case when the only interaction is a 1:1 binding of amacromolecule and ligand. If an inhibitor was unknowingly present during the direct or indirect measurement of a bindingreaction, the ligand concentration at half-maximal binding would equal the apparent Kd, not the actual dissociationconstant. In the case of facilitated diffusion and enzyme-catalyzed chemical transformation of a single substrate, the ligandconcentration at half-maximal binding is equal to the dissociation constant only in the rapid equilibrium assumption holds.It clearly doesn't in the steady state assumption, and clearly not in more complicated systems. Consider the case when aligand binds a neurotransmitter receptor and alters intracellular the calcium ion concentration through a complicated signaltransduction system. If the step leading to the releases of stored intracellular calcium is several steps removed from theactual binding of ligand to a neurotransmitter receptor, the likelihood that the ligand concentration at half-maximalincrease in intracellular calcium is equal to the Kd for ligand binding is small. If however, the actual ligand dissociationconstant for the receptor can be determined (using radiolabeled ligand, for example), and it is equal to the ligandconcentration for half-maximal calcium increase, then it might be argued the binding is "rate or effect determining". Wheninhibitors of biological function are used, IC50 values (the inhibitor concentration at which the response is reduced to50%) are usually reported.
From the Simple to the ComplexEnzymes don't work in isolation. Most are part of complex synthetic/degradative or signal transduction systems in whichtheir biological response (product formation or degradation, pathway regulation, etc.) are functions of ligand concentrationand are subject to signals further upstream or downstream in their resident pathways. How are the dose responses forbiological activity modulated by other parts of the pathway? Although the equations we've derived don't directly predictthe responses in lieu of knowing the concentrations, rate constants, and dissociation constants for all the steps in thepathway, an approach based on simple assumptions might illuminate the possibilities. A recent paper by Bashor et al andan analysis of it by Pryciak describe the input and output responses of signaling enzymes attached "in series" to a scaffoldprotein and how different dose responses outputs can be engineered to meet the requirements of the pathway. Examples of
M +L ⇌ ML (3.7.5.1)
R + ⇌ RA → R +Aout Ain (3.7.5.2)
E +S ⇌ ES → E +P (3.7.5.3)

Henry Jakubowski 3.7.5.2 12/11/2021 https://bio.libretexts.org/@go/page/64265
different dose-response curves from Bashor analysis are shown below. We've actually seen many of these response curvesfor individual protein/enzymes or chemical reaction systems. Curve A represents a typical response curve which could beproduced by a process governed by a simple equilibrium. Curves B and C are sigmoidal and could beproduced by a process governed by a multisubunit enzyme following the MWC model with different values for theparameters L and c. Curve D is similar to the output of consecutive irreversible reactions such as , where theresponse would be similar to the rise and fall B with time (not concentration, however). One could envision adose/response, however, that could produce a rise/fall as in curve D. Likewise Curve E would reflect the rise of C in thesame chemical reaction. To a first approximation, one could image that the responses shown below are produced by stepsthat are rate-limiting in the overall pathway such that the overall response is governed by those steps. Obviously a complexmathematical systems analysis involving the solving of matrices of differential equations for each step would be requiredfor a more realistic understanding of actual biological responses, but I hope you can see that an understanding of realbiological networks must start with a kinetic and thermodynamic understanding of the "simple" steps that constitute largersystem pathways.
Contributors and Attributions
Prof. Henry Jakubowski (College of St. Benedict/St. John's University)
M +L ⇌ ML
A → B → C

Henry Jakubowski 3.7.6.1 1/29/2022 https://bio.libretexts.org/@go/page/64266
3.7.6: D6. Links and References1. Pryciak, P. Customized Signaling Circuits. Science 319, pg 1489 (2008)2. Bashor, C. Science 319, pg 1539 (2008)
Contributors and AttributionsProf. Henry Jakubowski (College of St. Benedict/St. John's University)

Henry Jakubowski 3.8.1 1/15/2022 https://bio.libretexts.org/@go/page/64267
3.8: Homework Problems - Literature Learning Modules- Enzyme Inhibition 1 -KCAT
This page contains assessment/exam questions using data, figures, and graphs from research journals such as the Journal ofBiological Chemistry which allow their use, or from journals such as from PLOS that are completely open access Thepapers and topics chosen were selected to assess student understanding of the American Society for Biochemistry andMolecular Biology (ASBMB) foundational concepts and learning objectives as well as MCAT2015 foundational conceptsand objectives. These two sets of standards broadly overlap. Both ASBMB and the MCAT2015 strongly emphasisscientific inquiry and reasoning skills, which are perhaps best assessed by open-ended questions derived from the literaturein which students must employ higher level Bloom skills of application and analysis.
These questions can also be used by students who seek more opportunities to practice interpreting research literatureresults. The ability to apply, analyze, and evaluate information and concepts are at the heart of scientific inquiry andreasoning skills which are central to the new ASBMB and MCAT2015 competency standards. The questions in thislearning module are designed to assess these competencies using open-ended responses instead of multiple-choicequestions. Answers can be found at the link at the bottom of this page.
Research Paper: The following questions are based on data, graphs, and figures from the following article:Naphthoquinone-mediated Inhibition of Lysine Acetyltransferase KAT3B/p300, Basis for Non-toxic Inhibitor Synthesis.Mohankrishna Dalvoy Vasudevarao et al. The Journal of Biological Chemistry, 289, 7702-7717. March 14, 2014 . doi:10.1074/jbc.M113.486522
BACKGROUND
Double-standed DNA is a polyanion as every phosphate in the backbone is negatively charged. To pack it intochromosome in the nucleus, DNA is complexed to a variety of proteins. In the first stage of packing, DNA is woundaround a core of positively charged histones protein, forming a nucleosome. The size of the nucleosome is about the size ofRNA polymerase.
Nucleosome: Jmol14 (Java) | JSMol (HTML5)
3.8.1: Homework Problems - Literature Learning Module Enzyme Inhibition - KAT- KEY
Topic hierarchy

Henry Jakubowski 3.8.2 1/15/2022 https://bio.libretexts.org/@go/page/64267
A. For RNA polymerase to transcribe DNA that is packed in a nucleosome, what must likely happen to the nucleosomecomplex?
The DNA must unwind from the histone core of then nucleosome to allow binding of transcription factors and ultimatelyRNA polymerase to the regulatory regions of the DNA (promoter, etc). Otherwise DNA-dependent RNA polymerizationwill not occur.
B. The phenotype of a cell depends on the DNA sequence of the cell and the subset of genes that are expressed by that cell.The emerging field of epigenetics describes how factors other than the DNA sequence control cell phenotype andheritability of traits. Key features in epigenetic regulation of gene transcription are chromatin remodeling, packing andcovalent modification of DNA. Chromatin packing at the level of DNA:histone interactions are critical. Key to theseinteractions are the state of covalent modification of lysine (K) side chains in protein by histone acetylases (HATs) whichare also called lysine acetylases (KATs) and histone deacetylases (HDACs). Two chemical modifications of lysine sidechains in histones are shown below.
a. Offer a chemical explanation of why structure b will not be acetylated by KAT.
b. What affect might KAT modification of histone lysine side chains have on transcriptional competency of DNA innucleosomes?
1,4-Naphthoquinone derivatives are naturally occurring compounds that are present in the Plumbago and Diospyros plantgenera and have a variety of biological activities. One such derivative, plumbagin, is a potent inhibitor of a particularlysine acetyltransferase, KAT p300 lysine acetyltransferases 3B/3A (p300/CBP). Some of the inhibitors are toxic to cellsas they react with free RSH groups in cells and generate reactive oxygen species (ROS). An ideal drug would be nontoxicand an effective inhibitor/activator of a specific enzyme. Investigators synthesized a derivative (PTK1) of plumbaginwhich inhibit p300 and with much lower toxicity that plumbagin. How does it work?
Fig 1A: To study the toxicity of plumbagin, investigators dissolved it in the solvent DMSO + N-acetylcysteine (NAC)which scavenges ROS. They added these reagents to three different human cells lines, SHSY-5Y, HEK293, and HeLa S3as shown below.
a. What effect did plumbagin have on cell toxicity?
.
b. What effect did NAC have plumbagin cell effects?

Henry Jakubowski 3.8.3 1/15/2022 https://bio.libretexts.org/@go/page/64267
c. What did the investigators conduct an experiment just DMSO alone?
Fig 1B. It has been shown that on DNA oxidative damage or breaks, one of the histones, H2AX is phosphorylated by akinase, pI3K. Cells were treated as describe below (Plu = plumbagin_ and subjected to SDS-polyacrylamide gelelectrophoresis. After the electrophoresis, a nitrocellluose membrane was placed on top and the proteins in the gel wereelectrophoresed into the membrane (a technique called Western blotting. Individual protein band were visualized by addingantibodies that recognized phosphorylated H2AXg, or histone H3 (without modification), followed by reagents thatproduce a dark band. Interpret the results. Why did the investigators do blots for unmodified H3?
Fig 1C. What affect did plumbagin have on histone acetylation? Immuoblots were performed after plumbagin treatment inthe presence or absence of NAC in the indicated cell lines as above using antibodies that recognized acetylated Lys 9 onH3 (H3K9), or histone H3 (without modfication). Does Plu inhibit H3K9 acetylation? How does NAC affect Plumbagineffect on acetylation?
Fig 1D: Another inhibitor of H3K9 acetylation, isogarcinol (IsoGar) was studied by western blotting. Did NAC have sameeffect on H3K9 acetylation of cells treated with IsoGAr as those treated with Plu, shown in Fig 1C?
NAC seems to behave differently in the presence of two acetylation inhibitors. These results offer two possibilities for itseffects. • ROS could lead to decrease acetylation of histones, and NAC, by decreasing ROS, restore acetylation. •Alternatively, plumbagin reacts with the RSH of NAC, which decreases it effect on KAT and restores acetylation.
Draw cartoon models that would reflect these two different scenarios using a line with an arrow to indicate activation orpromotion of an activity, and a line with a blunt end to show inhibition. Also use and these symbols:

Henry Jakubowski 3.8.4 1/15/2022 https://bio.libretexts.org/@go/page/64267
Investigators found no increase in ROS with purified KAT in a cell free in vitro produced no free radicals. Which of yourmodels is more likely?
Fig 2AB. To simplify study of these effects, the investigators performed in vitro (cell free) assays in which no ROS(superoxide, hydrogen peroxide) would be produced. They studied two different KATs, p300 (A) and CBP (B) using HeLacell core histones, with 100 μm plumbagin (lanes 5–7 in A and B) either in the presence or absence of NAC, DTT, andanother reducing agent Trolox (lane 8). Interpret the results. What part of NAC and DTT appear important in their effectson plumbagin inhibition.
Fig 3A: These data suggest a chemical reaction of NAC and DTT with plumgartin. The generic structure of 1,4-Naphthoquinone derivatives, including plumgartin, are shown below, along with NAC and DTT.
Fig 3B; The thiol group on NAC is likely to react with a sp C, ultimately leading to a product which retains conjugation ifpossible. Draw a mechanism showing how NAC might react with the structure below, and show the final products.
2

Henry Jakubowski 3.8.5 1/15/2022 https://bio.libretexts.org/@go/page/64267
Fig 4 A: A variety of 1,4-Naphthoquinone derivatives were tested to see their effect on p300 activity in the presence andabsence of NAC. One, lawsone, whose structure is given below, showed no inhibitory effects, as shown below. Give alikely chemical explanation for this observation.
Fig 4C. If they reacted with free thiols, then the naphthoquinone derivatives should have an effect on the concentration offree thiols in an in vitro assays. Results of one such assay are shown below.
Compare this graph with the proceeding one. What conclusion can you draw?
Fig 5 (not shown): The authors used UV-Vis and fluorescence spectroscopy to study the effect of NAC on the spectra of1,4-naphthoquinone analogs. What likely effects would you expect to observe on the spectrum of lawsone?
Fig 6A: The ultimate goal of the investigators was to make a 1,4-naphthoquinone derivative that was not cytotoxic whichpresumably results from its interactions with free thiols. They synthesized PTK1 as shown below. Why would this reactionproduce a potential inhibitor that did not react with free thols in cells?

Henry Jakubowski 3.8.6 1/15/2022 https://bio.libretexts.org/@go/page/64267
FIGURE 6B. Investigators studied the effects of PTK1 on P300 acetylation of HeLa core histones with differentconcentrations of PTK1 in the absence and presence of NAC (Figure B) as well the presence of free thiol in the presenceor absence of PTK1 (Figure C).
What can you conclude from these graphs?
Figure 6D: The figure below shows the UV-visible absorption spectrum of PTK1 in the in presence or absence of NAC?
What conclusions can you draw?
Fig 6E: The figure below shows immunoblotting analysis (IB) of cell lysates upon 24 h of treatment by PTK1 using H3K9acetylation antibodies. The concentrations of PTK1 used are indicated in the figure E. Error bars, S.D. What conclusionscan you draw from the blots?
7. How might PTK1 inhibit p300 KAT activity. Enzyme kinetic analyses would be useful. The enzyme has two substates,acetyl CoA and histones. Previous studies have shown that substrates bind to p300 , in an ordered mechanism. The non-competitive inhibitor PTK1 could bind to the free enzyme as well as to the substrate-bound form, resulting in an abortiveternary complex. T

Henry Jakubowski 3.8.7 1/15/2022 https://bio.libretexts.org/@go/page/64267
Presume that added reversible inhibitors behavior in a similar fashion with single and multi-substrate reactions. Here aresome simple rules that apply to double reciprocal plots (1/v vs 1/[S} when 1 substrate is kept constant:
The slope changes when:
I and S bind to the same form of the enzyme (for example E binds both S and I) ORI binds to a form of E (on the horizontal line) which is connected to the form that S binds, and I binds first (forexample, I binds to E and then S binds).
The Y intercept changes when:
I and S bind to different forms of the enzyme unless I binds first and the binding of I and S are in rapid equilibrium.
Figure 7 AB: Figure 7 A and B below show double reciprocal or Lineweaver-Burk plots (1/v vs 1/[S]) of p300 KAT withone substrate fixed and the other varying at different fixed concentrations of inhibitor PTK1.
In Figure 7A, the concentration of core histones was kept constant at 1.7 μm while increasing the concentration ofisotope labeled [ H]acetyl-CoA from 1 to 8 μm either in the absence (no inhibitor) or increasing concentrations ofPTK1 (15, 20, 25, 35, and 45 μm). The direction of increasing inhibitor concentration is shown by the red arrow.In Figure 7B: inhibition of p300 KAT activity by PTK1 was studied at a fixed concentration of [ H]acetyl-CoA (1.6μm) and increasing concentrations of core histones (5–70 nm) either in the absence of (no inhibitor) or increasingconcentrations of PTK1 (15, 20, 25, 35, and 45 μm).
By analogy with single substrate reactions shown below in the linked chemical equations, which type of inhibition isdisplayed by PTK1?
3
3

Henry Jakubowski 3.8.8 1/15/2022 https://bio.libretexts.org/@go/page/64267
Answer Key

Henry Jakubowski 3.8.1.1 1/15/2022 https://bio.libretexts.org/@go/page/64268
3.8.1: Homework Problems - Literature Learning Module Enzyme Inhibition -KAT- KEYResearch Paper: The following questions are based on data, graphs, and figures from the following article:Naphthoquinone-mediated Inhibition of Lysine Acetyltransferase KAT3B/p300, Basis for Non-toxic Inhibitor Synthesis.Mohankrishna Dalvoy Vasudevarao et al. The Journal of Biological Chemistry, 289, 7702-7717. March 14, 2014 . doi:10.1074/jbc.M113.486522
BACKGROUND
Double-standed DNA is a polyanion as every phosphate in the backbone is negatively charged. To pack it intochromosome in the nucleus, DNA is complexed to a variety of proteins. In the first stage of packing, DNA is woundaround a core of positively charged histones protein, forming a nucleosome. The size of the nucleosome is about the size ofRNA polymerase.
Nucleosome: Jmol14 (Java) | JSMol (HTML5)
A. For RNA polymerase to transcribe DNA that is packed in a nucleosome, what must likely happen to the nucleosomecomplex?
The DNA must unwind from the histone core of then nucleosome to allow binding of transcription factors and ultimatelyRNA polymerase to the regulatory regions of the DNA (promoter, etc). Otherwise DNA-dependent RNA polymerizationwill not occur.
B. The phenotype of a cell depends on the DNA sequence of the cell and the subset of genes that are expressed by that cell.The emerging field of epigenetics describes how factors other than the DNA sequence control cell phenotype andheritability of traits. Key features in epigenetic regulation of gene transcription are chromatin remodeling, packing andcovalent modification of DNA. Chromatin packing at the level of DNA:histone interactions are critical. Key to theseinteractions are the state of covalent modification of lysine (K) side chains in protein by histone acetylases (HATs) whichare also called lysine acetylases (KATs) and histone deacetylases (HDACs). Two chemical modifications of lysine sidechains in histones are shown below.
a. Offer a chemical explanation of why structure b will not be acetylated by KAT.
The epsilon amino group of Lys acts as a nucleophile when it attacked the electrophilic carbonyl C of acetyl CoA. Aprotonated amine is not nucleophilic.

Henry Jakubowski 3.8.1.2 1/15/2022 https://bio.libretexts.org/@go/page/64268
b. What affect might KAT modification of histone lysine side chains have on transcriptional competency of DNA innucleosomes?
The pKa of Lys in aqueous solution is around 9.0. In a protein it may vary from that, but at physiological pH, it would bemainly protonated with a positive charge. On acetylation, histone Lys side chains would lose any positive charge,weakening Coulombic interactions with DNA, which would promote unwinding of DNA from the histone core of thenucleosome. This would increase the transcriptional competency of the DNA.
1,4-Naphthoquinone derivatives are naturally occurring compounds that are present in the Plumbago and Diospyros plantgenera and have a variety of biological activities. One such derivative, plumbagin, is a potent inhibitor of a particularlysine acetyltransferase, KAT p300 lysine acetyltransferases 3B/3A (p300/CBP). Some of the inhibitors are toxic to cellsas they react with free RSH groups in cells and generate reactive oxygen species (ROS). An ideal drug would be nontoxicand an effective inhibitor/activator of a specific enzyme. Investigators synthesized a derivative (PTK1) of plumbaginwhich inhibit p300 and with much lower toxicity that plumbagin. How does it work?
Fig 1A: To study the toxicity of plumbagin, investigators dissolved it in the solvent DMSO + N-acetylcysteine (NAC)which scavenges ROS. They added these reagents to three different human cells lines, SHSY-5Y, HEK293, and HeLa S3as shown below.
a. What effect did plumbagin have on cell toxicity?
Addition of plumbagin to the cells (row 2) clearly changes cell morphology, properties and numbers. One can infer that itleads to cell death.
b. What effect did NAC have plumbagin cell effects?
It is clear from Figure 1A row C that NAC prevents/interferes with the cytotoxic effects of plumbagin.
c. What did the investigators conduct an experiment just DMSO alone?
Plumbagin was dissolve in DMSO before it was added to the cells. To determine any observed cellular effects did notderive from DMSO, they conducted this experiment. DMSO, the “vehicle” that carried the drug, served as the control inthis experiment.
Fig 1B. It has been shown that on DNA oxidative damage or breaks, one of the histones, H2AX is phosphorylated by akinase, pI3K. Cells were treated as describe below (Plu = plumbagin_ and subjected to SDS-polyacrylamide gelelectrophoresis. After the electrophoresis, a nitrocellluose membrane was placed on top and the proteins in the gel wereelectrophoresed into the membrane (a technique called Western blotting. Individual protein band were visualized by addingantibodies that recognized phosphorylated H2AXg, or histone H3 (without modification), followed by reagents thatproduce a dark band. Interpret the results. Why did the investigators do blots for unmodified H3?

Henry Jakubowski 3.8.1.3 1/15/2022 https://bio.libretexts.org/@go/page/64268
When Plumbagin was added to the cells without NAC (red boxed lanes), there was robust phosphorylation of H2AXgamma. Addition of NAC prevented the phosphorylation that arose with Plu in the absence of NAC. The third row acrossis another control which assure that the same amount of samples were loaded on the gel. H3 would not be expected tochange in the short time course of the experiment.
Fig 1C. What affect did plumbagin have on histone acetylation? Immuoblots were performed after plumbagin treatment inthe presence or absence of NAC in the indicated cell lines as above using antibodies that recognized acetylated Lys 9 onH3 (H3K9), or histone H3 (without modfication). Does Plu inhibit H3K9 acetylation? How does NAC affect Plumbagineffect on acetylation?
Plu appears to decrease the intensity of the bands when added in the absence of NAC. This suggests the Plu inhibits H3K9acetylation by some mechanism. As in the previous experiment, NAC seemed to completely antagonize the effect of Plu inthat it prevented Plu from decreasing acetylation (compare the red and green boxed lanes). NAC inhibited the inhibitoryeffects of Plu on H3K9 acetylation.

Henry Jakubowski 3.8.1.4 1/15/2022 https://bio.libretexts.org/@go/page/64268
Fig 1D: Another inhibitor of H3K9 acetylation, isogarcinol (IsoGar) was studied by western blotting. Did NAC have sameeffect on H3K9 acetylation of cells treated with IsoGAr as those treated with Plu, shown in Fig 1C?
HINT | ANS
In contrast to the Blumgartin, another inhibitor, IsoGar, clearly inhibits acetylation of H3K9 but this inhibition is notrelieved by NAC (see the red boxed lanes below).
NAC seems to behave differently in the presence of two acetylation inhibitors. These results offer two possibilities for itseffects. • ROS could lead to decrease acetylation of histones, and NAC, by decreasing ROS, restore acetylation. •Alternatively, plumbagin reacts with the RSH of NAC, which decreases it effect on KAT and restores acetylation.
Draw cartoon models that would reflect these two different scenarios using a line with an arrow to indicate activation orpromotion of an activity, and a line with a blunt end to show inhibition. Also use and these symbols:
Investigators found no increase in ROS with purified KAT in a cell free in vitro produced no free radicals. Which of yourmodels is more likely?
Model B above since Model A would lead to increased ROS such as peroxide or superoxide
Fig 2AB. To simplify study of these effects, the investigators performed in vitro (cell free) assays in which no ROS(superoxide, hydrogen peroxide) would be produced. They studied two different KATs, p300 (A) and CBP (B) using HeLacell core histones, with 100 μm plumbagin (lanes 5–7 in A and B) either in the presence or absence of NAC, DTT, andanother reducing agent Trolox (lane 8). Interpret the results. What part of NAC and DTT appear important in their effectson plumbagin inhibition.

Henry Jakubowski 3.8.1.5 1/15/2022 https://bio.libretexts.org/@go/page/64268
Lanes 5 and 7 and Lane 5 and 8 show that both NAC and DTT (both of which have thiols) relieve the inhibitory effect ofblumbagin on KAT activity. Lanes 5 and 8 show that Trolox, which does not have a thiol group, does not relieveblumbagin inhibition.
Fig 3A: These data suggest a chemical reaction of NAC and DTT with plumgartin. The generic structure of 1,4-Naphthoquinone derivatives, including plumgartin, are shown below, along with NAC and DTT.

Henry Jakubowski 3.8.1.6 1/15/2022 https://bio.libretexts.org/@go/page/64268
Fig 3B; The thiol group on NAC is likely to react with a sp C, ultimately leading to a product which retains conjugation ifpossible. Draw a mechanism showing how NAC might react with the structure below, and show the final products.
Fig 4 A: A variety of 1,4-Naphthoquinone derivatives were tested to see their effect on p300 activity in the presence andabsence of NAC. One, lawsone, whose structure is given below, showed no inhibitory effects, as shown below. Give alikely chemical explanation for this observation.
2
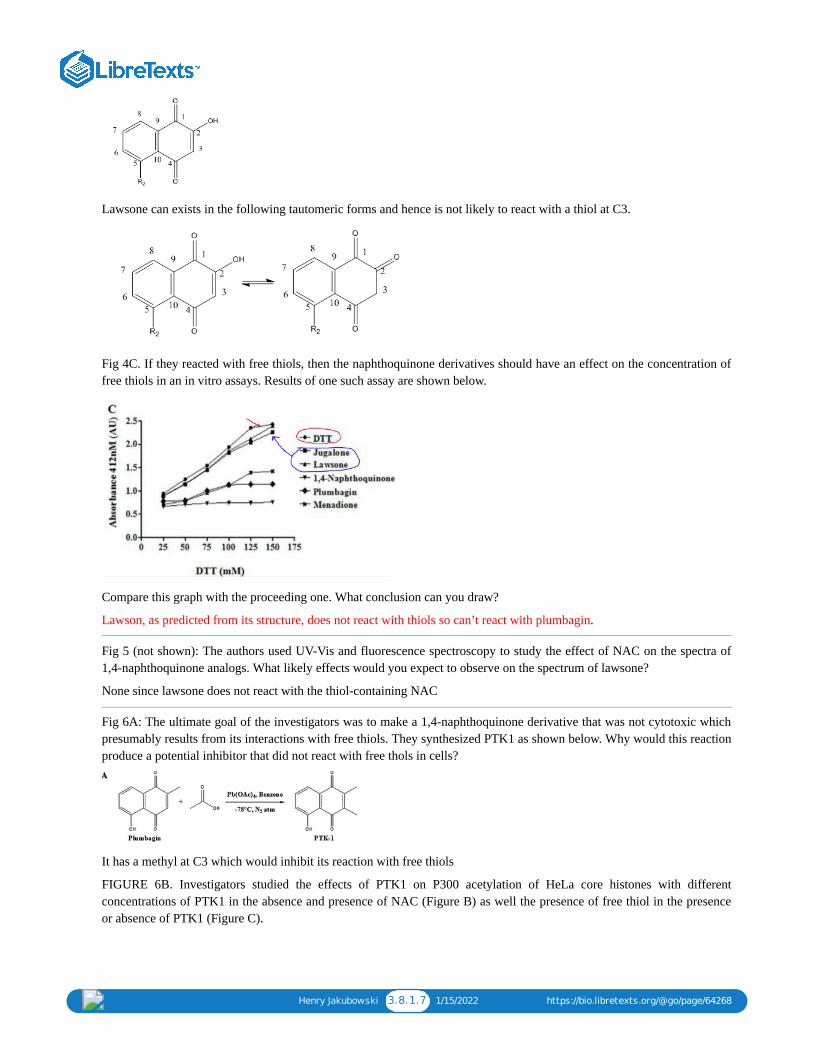
Henry Jakubowski 3.8.1.7 1/15/2022 https://bio.libretexts.org/@go/page/64268
Lawsone can exists in the following tautomeric forms and hence is not likely to react with a thiol at C3.
Fig 4C. If they reacted with free thiols, then the naphthoquinone derivatives should have an effect on the concentration offree thiols in an in vitro assays. Results of one such assay are shown below.
Compare this graph with the proceeding one. What conclusion can you draw?
Lawson, as predicted from its structure, does not react with thiols so can’t react with plumbagin.
Fig 5 (not shown): The authors used UV-Vis and fluorescence spectroscopy to study the effect of NAC on the spectra of1,4-naphthoquinone analogs. What likely effects would you expect to observe on the spectrum of lawsone?
None since lawsone does not react with the thiol-containing NAC
Fig 6A: The ultimate goal of the investigators was to make a 1,4-naphthoquinone derivative that was not cytotoxic whichpresumably results from its interactions with free thiols. They synthesized PTK1 as shown below. Why would this reactionproduce a potential inhibitor that did not react with free thols in cells?
It has a methyl at C3 which would inhibit its reaction with free thiols
FIGURE 6B. Investigators studied the effects of PTK1 on P300 acetylation of HeLa core histones with differentconcentrations of PTK1 in the absence and presence of NAC (Figure B) as well the presence of free thiol in the presenceor absence of PTK1 (Figure C).

Henry Jakubowski 3.8.1.8 1/15/2022 https://bio.libretexts.org/@go/page/64268
What can you conclude from these graphs?
As expected, PTIK1 inhibits P300 acetylation with no effects from the addition of NAC.
Figure 6D: The figure below shows the UV-visible absorption spectrum of PTK1 in the in presence or absence of NAC?
What conclusions can you draw?
PTK1 does not react with NAC, as expected.
Fig 6E: The figure below shows immunoblotting analysis (IB) of cell lysates upon 24 h of treatment by PTK1 using H3K9acetylation antibodies. The concentrations of PTK1 used are indicated in the figure E. Error bars, S.D. What conclusionscan you draw from the blots?
PTK1 acts as a potent inhibitor of acetylation of H3K9 in vivo.
7. How might PTK1 inhibit p300 KAT activity. Enzyme kinetic analyses would be useful. The enzyme has two substates,acetyl CoA and histones. Previous studies have shown that substrates bind to p300 , in an ordered mechanism. The non-competitive inhibitor PTK1 could bind to the free enzyme as well as to the substrate-bound form, resulting in an abortiveternary complex. T

Henry Jakubowski 3.8.1.9 1/15/2022 https://bio.libretexts.org/@go/page/64268
Presume that added reversible inhibitors behavior in a similar fashion with single and multi-substrate reactions. Here aresome simple rules that apply to double reciprocal plots (1/v vs 1/[S} when 1 substrate is kept constant:
The slope changes when:
I and S bind to the same form of the enzyme (for example E binds both S and I) ORI binds to a form of E (on the horizontal line) which is connected to the form that S binds, and I binds first (forexample, I binds to E and then S binds).
The Y intercept changes when:
I and S bind to different forms of the enzyme unless I binds first and the binding of I and S are in rapid equilibrium.
Figure 7 AB: Figure 7 A and B below show double reciprocal or Lineweaver-Burk plots (1/v vs 1/[S]) of p300 KAT withone substrate fixed and the other varying at different fixed concentrations of inhibitor PTK1.
In Figure 7A, the concentration of core histones was kept constant at 1.7 μm while increasing the concentration ofisotope labeled [ H]acetyl-CoA from 1 to 8 μm either in the absence (no inhibitor) or increasing concentrations ofPTK1 (15, 20, 25, 35, and 45 μm). The direction of increasing inhibitor concentration is shown by the red arrow.In Figure 7B: inhibition of p300 KAT activity by PTK1 was studied at a fixed concentration of [ H]acetyl-CoA (1.6μm) and increasing concentrations of core histones (5–70 nm) either in the absence of (no inhibitor) or increasingconcentrations of PTK1 (15, 20, 25, 35, and 45 μm).
By analogy with single substrate reactions shown below in the linked chemical equations, which type of inhibition isdisplayed by PTK1?
It appears to be a noncompetitive inhibit for each substrate. For a single substrate enzyme, noncompetitive inhibition ischaracterized by double-reciprocal plots which vary in slope and intersect on the x axis. This applies that the Km isunaltered by the inhibitor but the apparent Vm is decreased. This analysis is a bit simplified.
3
3

Henry Jakubowski 3.8.1.10 1/15/2022 https://bio.libretexts.org/@go/page/64268

1 1/29/2022
CHAPTER OVERVIEW4: (T2) MEMBRANE STRUCTUREMembrane Structure and Function- proteins, glycoproteins, glycolipids
4.1: KEY WORDS AND TERMS4.2: OVERVIEWThe plasma membrane has the same phospholipid bilayer construction as all intracellular membranes. All membranes are a fluidmosaic of proteins attached to or embedded in the phospholipid bilayer. The different proteins and to some extent, differentphospholipids, structurally and functionally differentiate one kind of cellular membrane from another. Integral (trans-membrane)proteins span the phospholipid lipid bilayer, with one hydrophobic domain and two hydrophilic domains.
4.3: PLASMA MEMBRANE STRUCTUREIn eukaryotic cells, the plasma membrane surrounds a cytoplasm filled with ribosomes and organelles. Organelles are structures thatare themselves encased in membranes. Some organelles (nuclei, mitochondria, chloroplasts) are even surrounded by doublemembranes. All cellular membranes are composed of two layers of phospholipids embedded with proteins. All are selectivelypermeable (semi-permeable), allowing only certain substances to cross the membrane.
4.4: MEMBRANE PROTEINSClearly, membrane proteins themselves have domains that keep membranes in or attached to the membrane, provide catalytic surfacesand allow interactions inside, across and outside of cells and organelles. Membranes anchor proteins in several ways. As noted,membrane proteins, like phospholipids, are amphipathic, with hydrophobic domains that non-covalently interact strongly with thefatty acid interior of membranes. Some integral membrane proteins span the entire membrane, with hydrophilic domai
4.5: HOW MEMBRANE PROTEINS ARE HELD IN MEMBRANESThe hydrophobic domain of integral membrane proteins consists of one or more alphahelical regions that interact with thehydrophobic interior of the membranes. Hydrophilic domains tend to have more tertiary structure with hydrophilic surfaces, and soface the aqueous cytosol and cell exterior. Two trans-membrane proteins are cartooned below.
4.6: A DIVERSITY OF MEMBRANE PROTEIN FUNCTIONSTransmembrane proteins perform most of the functions illustrated here. However, peripheral membrane proteins also play vital rolesin membrane function. Remember that Cytochrome c in the electron transport system on the mitochondrial cristal membrane is aperipheral protein. Other peripheral membrane proteins may serve to regulate the transport or signaling activities of transmembraneprotein complexes or may mediate connections between the membrane and cytoskeletal elements.
4.7: GLYCOPROTEINSMembrane proteins are often covalently linked to oligosaccharides, which are branched glycoside-linked sugars (averaging around 15sugar residues). As glycans, they are the sugars linked to glycoproteins. Glycoproteins are rare in the cytosol, but common on secretedand membrane proteins. Oligosaccharides are typically linked to proteins via the hydroxyl group on serine or threonine. Occasionallinkages are to modified amino acids like hydroxylysine or hydroxyproline (O-glycosylation), and to th
4.8: GLYCOLIPIDSGlycolipids are phospholipids attached to oligosaccharides, and as noted, are part of the glycocalyx. Both are only found on theextracellular surface. Glycolipids are synthesized in much the same way as glycoproteins. Specific enzymes catalyze initialglycosylation of either phospholipids or polypeptides, followed by the addition of more sugars. Along with glycoproteins, glycolipidsplay roles in cell-cell recognition and the formation of tissues. The glycans on the surfaces of one cell will re
4.9: GLYCOPROTEINS AND HUMAN HEALTHWe’ll close this chapter with a few examples of glycoproteins that play crucial roles in human physiology. Let’s look first at the majorhuman blood groups. The major A, B, AB, O and Rh blood groups result from the presence or absence of glycoprotein antigensembedded in red blood cell membranes and the presence or absence in the blood, of antibodies against the antigens.

Gerald Bergtrom 4.1.1 12/18/2021 https://bio.libretexts.org/@go/page/64270
4.1: Key Words and Termsamphipathic molecules glycolipids preipheral membrane proteins
asparagine glycosylation phospholipid bilayer
cell membrane Golgi vesicles plasma membrane
cell-cell attachment Hyropathy plot poikilothermic organisms
cytoskeleton hydrophilic phosphate heads RER
Davson-Danielli membrane model hydrophobic fatty acid tails Rough endoplasmic reticulum
endomembrane system hydrophobicity plot saturated fatty acids
exocytosis hydroxyproline serine
extracellular matrix (ECM) hydroxylysine temperature effects on membranes
fluid mosiac integral membrane proteins threonine
freeze facture method membrane asymmetry transmembrane proteins
membrane evolution membrane proteins unsaturated fatty acids
glycan N-glycoslyation
glycocalyx O-glycoslyation

Gerald Bergtrom 4.2.1 1/5/2022 https://bio.libretexts.org/@go/page/64271
4.2: OverviewThe plasma membrane has the same phospholipid bilayer construction as all intracellular membranes. All membranes area fluid mosaic of proteins attached to or embedded in the phospholipid bilayer. The different proteins and to some extent,different phospholipids, structurally and functionally differentiate one kind of cellular membrane from another. Integral(trans-membrane) proteins span the phospholipid lipid bilayer, with one hydrophobic domain and two hydrophilicdomains. In the case of the plasma membrane, the hydrophilic domains interact with the aqueous extracellular fluid on oneside and the cytoplasm on the other, while the hydrophobic domain keeps the proteins anchored in the membrane. Onceembedded in the fatty acid interior of a membrane, integral membrane proteins cannot escape! In contrast, peripheralmembrane proteins bind to membrane surfaces, typically held in place by hydrophilic interactions with charged featuresof the membrane surface (phospholipid heads, hydrophilic surface domains of integral proteins). Integral membraneproteins are often glycoproteins whose sugars face the outside of the cell. Cells thus present a sugar coating, or glycocalyx,to the outside world. As cells form tissues and organs, they become bound to extracellular proteins and glycoproteins thatthey, or other cells, secrete to form an extracellular matrix. We will spend much of this chapter looking at characteristicstructures and biological activities of plasma membrane proteins and their functions.
When you have mastered the information in this chapter, you should be able to:
1. distinguish components of the membrane that can move (diffuse) laterally in the membrane from those that can flip(switch) from the outer to the inner surface of the phospholipid bilayer
2. compare the fluid mosaic membrane to earlier membrane models and cite the evidence for and against each (asappropriate).
3. describe how cells might make their plasma membranes and suggest an experiment that would demonstrate yourhypothesis.
4. distinguish between transmembrane and peripheral membrane proteins, and provide specific examples of each.5. decide whether a newly discovered protein might be a membrane protein.6. predict the effect of molecular and physical influences on membrane fluidity7. suggest how organisms living in warm tropical waters have adapted to the higher temperatures. Likewise, fish
living under the arctic ice.8. explain how salmon are able to spend part of their lives in the ocean and another part swimming upstream in
freshwater, without their cells shriveling or exploding9. list the diverse functions of membrane proteins.
10. speculate on why only eukaryotic cells have evolved sugar coated cell surfaces.11. compare and contrast the glycocalyx and extracellular matrix of cells.
Learning Objectives

Gerald Bergtrom 4.3.1 1/8/2022 https://bio.libretexts.org/@go/page/64272
4.3: Plasma Membrane StructureIn eukaryotic cells, the plasma membrane surrounds a cytoplasm filled with ribosomes and organelles. Organelles arestructures that are themselves encased in membranes. Some organelles (nuclei, mitochondria, chloroplasts) are evensurrounded by double membranes. All cellular membranes are composed of two layers of phospholipids embedded withproteins. All are selectively permeable (semi-permeable), allowing only certain substances to cross the membrane. Theunique functions of cellular membranes are due to their different phospholipid and protein compositions. Decades ofresearch have revealed these functions (see earlier discussions of mitochondrial and chloroplast function for instance).Here we’ll describe general features of membranes, using the plasma membrane as our example.
A. The Phospholipid BilayerGorter and Grendel predicted the bilayer membrane structure as early as 1925. They knew that red blood cells(erythrocytes) have no nucleus or other organelles, and thus have only a plasma membrane. They also knew that the majorchemical component of these membranes were phospholipids. The space-filling molecular model below shows the basicstructure of phospholipids, highlighting their hydrophilic (polar) heads and hydrophobic tails.
Molecules with hydrophilic and hydrophobic domains are amphipathic molecules. Gorter and Grendel had measured thesurface area of red blood cells. They then did a ‘blood count’ and then disrupted a known number of red blood cells. Theythen measured the amount of phospholipids in the membrane extracts. From this, they calculated that there were enoughlipid molecules per cell to wrap around each cell twice. From these observations, they predicted the phospholipid bilayerwith fatty acids interacting within the bilayer. Curiously, Gorter and Grendel had made two calculation errors indetermining the amount of phospholipid per cells. Nevertheless, their errors compensated each other so that, while notstrictly speaking correct, their conclusion remained prophetic! Common membrane phospholipids are shown below.
Amphipathic molecules mixed with water spontaneously aggregate to ‘hide’ their hydrophobic regions from the water. Inwater, these formed actual structures called liposomes that sediment when centrifuged!
276 Membrane Lipids and the Phospholipid Bilayer
277 Experiments with and Uses of Liposomes
Liposome membrane structure is consistent with the predicted phospholipid bilayer, with the hydrophobic tails interactingwith each other and the polar heads facing away from each other, forming a phospholipid bilayer. This led to a picture ofmembrane architecture based on phospholipid interactions. An iconic illustration of the phospholipid bilayer, with itshydrophobic fatty acid interior and hydrophilic external surfaces is drawn below.

Gerald Bergtrom 4.3.2 1/8/2022 https://bio.libretexts.org/@go/page/64272
Liposome membrane structure is consistent with the predicted phospholipid bilayer, with the hydrophobic tails interactingwith each other and the polar heads facing away from each other, forming a phospholipid bilayer. This led to a picture ofmembrane architecture based on phospholipid interactions. An iconic illustration of the phospholipid bilayer, with itshydrophobic fatty acid interior and hydrophilic external surfaces is drawn below.
B. Models of Membrane StructureIn 1935, Davson and Danielli suggested that proteins might be bound to the polar heads of the phospholipids in the plasmamembrane, creating a protein/lipid/protein sandwich. Decades later, J.D. Robertson observed membranes in thetransmission electron microscope at high power, revealing that all cellular membranes had a trilamellar structure. Theclassic trilamellar appearance of a cellular membrane in the electron microscope is illustrated below
The trilamellar structure is consistent with the protein-coated hydrophilic surfaces of a phospholipid bilayer in Davsonand Danielli’s protein-lipid-protein sandwich. Observing that all cellular membranes had this trilamellar structure,Robertson he further proposed his Unit Membrane model: all membranes consist of a clear phospholipid bilayer coatedwith electron-dense proteins.
The static view of the trilamellar models of membrane structure implied by the Davson-Danielli or Robertson models wasreplaced in 1972 by Singer and Nicolson’s Fluid Mosaic model (see The fluid mosaic model of membranes. Science175:720- 731). They suggested that in addition to peripheral proteins that do bind to the surfaces of membranes, manyintegral membrane proteins actually span the membrane. Integral membrane proteins were imagined as a mosaic of protein

Gerald Bergtrom 4.3.3 1/8/2022 https://bio.libretexts.org/@go/page/64272
‘tiles’ embedded in a phospholipid medium. But unlike a mosaic of glazed tiles set in a firm, cement-like structure, theprotein ‘tiles’ were predicted to be mobile (fluid) in a phospholipid sea. In this model, membrane proteins are anchored inmembranes by one or more hydrophobic domains; their hydrophilic domains would face aqueous external and cytosolicenvironments. Thus, like phospholipids themselves, membrane proteins are amphipathic. We know that cells exposedifferent surface structural (and functional) features to the aqueous environment on opposite sides of a membrane.Therefore, we also say that cellular membranes are asymmetric. A typical model of the plasma membrane of a cell isillustrated below.
In this model, peripheral proteins have a hydrophobic domain that does not span the membrane, but that anchors it to oneside of the membrane. Other peripheral (or socalled “surface”) proteins are bound to the membrane by interactions withthe polar phosphate groups of phospholipids, or with the polar domains of integral membrane proteins.
Because of their own aqueous hydrophilic domains, membrane proteins are a natural barrier to the free passage of chargedmolecules across the membrane. On the other hand, membrane proteins are responsible for the selective permeability ofmembranes, facilitating the movement of specific molecules in and out of cells. Membrane proteins also account forspecific and selective interactions with their extracellular environment. These interactions include the adhesion of cells toeach other, their attachment to surfaces, communication between cells (both direct and via hormones and neurons), etc.The ‘sugar coating’ of the extracellular surfaces of plasma membranes comes from oligosaccharides covalently linked tomembrane proteins (as glycoproteins) or to phospholipids (as glycolipids). Carbohydrate components of glycosylatedmembrane proteins inform their function. Thus, glycoproteins enable specific interactions of cells with each other to formtissues. They also allow interaction with extracellular surfaces to which they must adhere. In addition, they figureprominently as part of receptors for many hormones and other chemical communication biomolecules. Protein domainsexposed to the cytoplasm, while not glycosylated, often articulate to components of the cytoskeleton, giving cells theirshape and allowing cells to change shape when necessary. Many membrane proteins have essential enzymatic features, aswe will see. Given the crucial role of proteins and glycoproteins in membrane function, it should come as no surprise thatproteins constitute an average of 40-50% of the mass of a membrane. In some cases, proteins are as much as 70% ofmembrane mass (think cristal membranes in mitochondria!).
278 Properties of Proteins Embedded in a Phospholipid Bilayer
279 Different Membrane Compositions
C. Evidence for Membrane StructureMembrane asymmetry refers to the different membrane features facing opposite sides of the membrane. This wasdirectly demonstrated by the scanning electron microscope technique of freeze-fracture. The technique involves freezingof isolated membranes in water and then chipping the ice. When the ice cracks, the encased membranes split along a line ofleast resistance… that turns out to be between the hydrophobic fatty acid opposing tails in the interior of the membrane.Scanning electron microscopy then reveals features of the interior and exterior membrane surfaces. Among the prominentfeatures in a scanning micrograph of freeze-fractured plasma membranes are the pits and opposing mounds facing eachother on opposite flaps of the membrane, as illustrated below.

Gerald Bergtrom 4.3.4 1/8/2022 https://bio.libretexts.org/@go/page/64272
Other features shown here are consistent with phospholipid membrane structure.
280 Freeze Fracture Electron Microscopy of Cell Membranes
Cytochemistry confirmed the asymmetry of the plasma membrane, showing that only the external surfaces of plasmamembranes are sugar coated, Check the link below for more detailed descriptions of the experiments.
281 EM Cytochemical Demonstration of Membrane Asymmetry
Finally, the asymmetry of membranes was also demonstrated biochemically. In one experiment, whole cells treated withproteolytic enzymes, followed by extraction of the membranes and then isolation of membrane proteins. In a secondexperiment, plasma membranes were isolated from untreated cells first, and then treated with the enzymes. In a thirdexperiment, proteins were extracted from plasma membranes isolated from untreated cells. Electrophoretic separation ofthe three protein extracts by size demonstrated that different components of integral membrane proteins were present in thetwo digest experiments, confirming the asymmetry of the plasma membrane. Again, for more details, check the link below.
282 Electrophoretic Demonstration of Membrane Asymmetry
The idea that membranes are fluid was also tested. In yet another elegant experiment, antibodies were made to mouse andhuman cell membrane proteins. Membranes were isolated and injected into a third animal (a rabbit most likely). The rabbitsaw the membranes and their associated proteins as foreign and responded by making specific anti-membrane antibodymolecules. The antibodies against each membrane source were isolated and separately tagged with different coloredfluorescent labels so that they would glow a different color when subjected to ultraviolet light. After mouse and humancells were mixed under conditions that caused them to fuse, making human-mouse hybrid cells. When added to fused cells,the tagged antibodies bound to the cell surface proteins. After a short time, the different fluorescent antibodies were seen tomix under a fluorescence microscope under UV light. The fluorescent tags seemed to moving from their original locationin the fused membranes. Clearly, proteins embedded in the membrane are not static, but are able to move laterally in themembrane, in effect floating and diffusing in a “sea of phospholipids”. The mouse antibodies as seen in the hybrid cellright after fusion are cartooned below.
283 Two Demonstrations of Membrane Fluidity: The Fluid Mosaic

Gerald Bergtrom 4.3.5 1/8/2022 https://bio.libretexts.org/@go/page/64272
D. Membrane Fluidity is Regulated
1. Chemical Factors Affecting Membrane Fluidity
As you might imagine, the fluidity of a membrane depends on its chemical composition and physical conditionssurrounding the cell, for example the outside temperature. Factors that affect membrane fluidity are summarized below.
Just as heating a solution causes dissolved molecules and particulates to move faster, phospholipid and protein componentsof membranes are also more fluid at higher temperatures. If the fatty acids of the phospholipids have more unsaturated(C=C) carbon bonds, these hydrophobic tails will have more kinks, or bends. The kinks tend to push apart the phospholipidtails. With more space between the fatty acid tails, membrane components can move more freely. Thus, morepolyunsaturated fatty acids in a membrane make it more fluid. On the other hand, cholesterol molecules tend to fill thespace between fatty acids in the hydrophobic interior of the membrane. This reduces the lateral mobility of phospholipidand protein components in the membrane. By reducing fluidity, cholesterol reduces membrane permeability to some ions.
2. Functional Factors Affecting Membrane Fluidity
Evolution has adapted cell membranes to different and changing environments to maintain the fluidity necessary for propercell function. Poikilothermic, or coldblooded organisms, from prokaryotes to fish and reptiles, do not regulate their bodytemperatures. Thus, when exposed to lower temperatures, poikilotherms respond by increasing the unsaturated fatty acidcontent of their cell membranes. At higher temperatures, they increase membrane saturated fatty acid content. Thus, thecell membranes of fish living under the arctic ice maintain fluidity by having high levels of both monounsaturated andpolyunsaturated fatty acids. What about fish species that range across warmer and colder environments (or that live inclimates with changing seasons). For these fish, membrane composition can change to adjust fluidity to environment.
The warm-blooded (homeothermic) mammals and birds maintain a more or less constant body temperature. As a result,their membrane composition is also relatively constant. But there is a paradox! Their cell membranes are very fluid, with ahigher ratio of polyunsaturated fat to monounsaturated fats than say, reptiles. The apparent paradox is resolved however,when we understand that this greater fluidity supports the higher metabolic rate of the warm-blooded species compared topoikilotherms. Just compare the life styles of almost any mammal to a lazy floating alligator, or a snake basking in theshade of a rock!
284 Factors Influencing Membrane Fluidity
E. Making and Experimenting with Artificial MembranesMembrane-like structures can form spontaneously. When phospholipids interact in an aqueous environment, theyaggregate to exclude their hydrophobic fatty tails from water, forming micelles. Micelles are spherical phospholipid

Gerald Bergtrom 4.3.6 1/8/2022 https://bio.libretexts.org/@go/page/64272
monolayer vesicles that self-assemble, a natural aggregation of the hydrophobic fatty acid domains of these amphipathicmolecules.
A micelle is drawn below.
Micelles can further self-assemble into spherical phospholipid bilayers called liposomes (below).
When formed in the laboratory, these structures behave somewhat like cells, for example, forming a pellet at the bottom ofa tube when centrifuged. Liposomes can be custom designed from different kinds of phospholipids and amphipathicproteins that become integral to the liposome membranes. When liposomes can be prepared in the presence of specificproteins or other molecules that can’t cross the membrane. The trapped molecules cannot get out of this synthetic‘organelle’. Such were the studies that allowed the identification of the mitochondrial respiratory chain complexes. Theability to manipulate liposome content and membrane composition also make them candidates for the drug delivery tospecific cells and tissues (google liposome for more information).
F. The Plasma Membrane is Segragated into Regions with Different Properties of Fluidity andSelective PermeabilityAs we will see shortly, fluidity does not result in an equal diffusion of all membrane components around the cellmembrane surface. Instead, extracellular connections between cells as well as intracellular connections of the membrane todifferentiated regions of the cytoskeleton, effectively compartmentalize the membrane into subregions. To understand this,imagine a sheet of epithelial like those in the cartoon below.
The sheet of cells exposes one surface with unique functions to the inside of the organ they line. It exposes the oppositesurface, one with a quite different function, to the other side of the sheet. The lateral surfaces of the cells are yet anothermembrane compartment, one that functions to connect and communicate between the cells in the sheet. Components, i.e.,membrane proteins illustrated with different symbolic shapes and colors, may remain fluid within a compartment. Ofcourse, this macrodifferentiation of cell membranes to permit cell-cell and cell-environmental interactions makes intuitivesense.

Gerald Bergtrom 4.3.7 1/8/2022 https://bio.libretexts.org/@go/page/64272
The recent observation that cellular membranes are even more compartmentalized was perhaps less anticipated. In fact,membranes are further divided into microcompartments. Within these compartments, components are fluid but seldommove between compartments. Studies indicate that cytoskeletal elements create and maintain these micro-discontinuities.For example, integral membrane proteins are immobilized in membranes if they are attached to cytoskeletal fibers (e.g.,actin) in the cytoplasm. Furthermore, when aggregates of these proteins line up due to similar interactions, they form kindof fence, inhibiting other membrane components from crossing. By analogy, this mechanism of micro-compartmentalization is called the Fences and Pickets model; proteins attached to the cytoskeleton serve as the pickets.The movement across the fences (i.e., from one membrane compartment to another) is infrequent. Extra kinetic energy ispresumably needed for a molecule to ‘jump’ a fence between compartments. Hence, this kind of motion, or hop diffusiondistinguishes it from the Brownian motion implied by the original fluid mosaic model.
285 Membrane Domains: Regional Differentiation of a Plasma Membrane

Gerald Bergtrom 4.4.1 12/25/2021 https://bio.libretexts.org/@go/page/64273
4.4: Membrane ProteinsClearly, membrane proteins themselves have domains that keep membranes in or attached to the membrane, providecatalytic surfaces and allow interactions inside, across and outside of cells and organelles. Membranes anchor proteins inseveral ways. As noted, membrane proteins, like phospholipids, are amphipathic, with hydrophobic domains that non-covalently interact strongly with the fatty acid interior of membranes. Some integral membrane proteins span the entiremembrane, with hydrophilic domains facing the cytosol or cell exterior. Peripheral proteins bind to a membrane surfacethrough non-covalent interactions. Examples of integral and peripheral membrane proteins, glycoproteins and lipoproteinsare illustrated below.
286 Domains of Membrane Proteins

Gerald Bergtrom 4.5.1 1/8/2022 https://bio.libretexts.org/@go/page/64274
4.5: How Membrane Proteins are Held in MembranesThe hydrophobic domain of integral membrane proteins consists of one or more alphahelical regions that interact with thehydrophobic interior of the membranes. Hydrophilic domains tend to have more tertiary structure with hydrophilicsurfaces, and so face the aqueous cytosol and cell exterior. Two trans-membrane proteins are cartooned below.
The protein on the left crosses the membrane once, while the one on the right crosses the membrane three times. How atransmembrane protein inserts into the membrane during synthesis dictates the locations of its N- and C-terminus.Transmembrane proteins can in fact cross a membrane more than once, which also determines the location of its N- and C-termini. N-terminal end of a plasma membrane polypeptide always ends up exposed to the outside of the cell. The alphahelical domains that anchor proteins in membranes are mostly non-polar and hydrophobic themselves. As an example,consider the amino acids in the alpha-helical domain of the red blood cell protein glycophorin A, a membrane protein thatprevents red blood cells from aggregating, or clumping in the circulation. One glycophorin A polypeptide with itshydrophobic trans-membrane alpha helix is cartooned below. Glycophorin A monomers pair to form dimers in the plasmamembrane.
Proteins that span membranes multiple times may include amino acids with charged, polar side chains, provided that theseside chains interact between helices so that they are shielded from the fatty acid environment in the membrane. Because ofthese hydrophilic interactions, such proteins can create pores for the transport of polar molecules and ions; we will seesome of these proteins later. Integral membrane proteins that do not span the membrane also have a hydrophobic helicaldomain that anchors them in the membrane, while their hydrophilic domains typically interact with intracellular orextracellular molecules to e.g., hold cells in place give cells and tissues their structure, etc.
The very presence of the hydrophobic alpha-helical domains in trans-membrane proteins makes them difficult if notimpossible to isolate from membranes in a biologically active form. By contrast, the peripheral polypeptide cytochrome creadily dissociates from the cristal membrane, making it easy to purify. For many years, an inability to purify other cristalmembrane electron carriers in biologically active form limited our understanding of the structure and function of themitochondrial electron transport system.
Hydrophobic alpha-helical domains are in fact, a hallmark of membrane-spanning proteins. It is even possible to determinethe primary structure of a polypeptide encoded by a gene before the protein itself has been isolated. For example, knowingthe DNA sequence of a gene, we can infer the amino acid sequence of the protein encoded by the gene. A hydrophobicityanalysis of the inferred amino acid sequence can tell us if a protein is likely to be a membrane protein. Let’s look at ahydropathy (hydrophobicity) plot (below).

Gerald Bergtrom 4.5.2 1/8/2022 https://bio.libretexts.org/@go/page/64274
To see how an hydropathy plot can predict whether a protein is a membrane protein, check out the link below.
287 Hydropathy Predicts Hydrophobic Domains and Membrane Proteins

Gerald Bergtrom 4.6.1 12/18/2021 https://bio.libretexts.org/@go/page/64275
4.6: A Diversity of Membrane Protein Functions
receptors for hormones or neurotransmittersantibodies of the immune system that recognize foreign substances (antigens)cell-recognition molecules that bind cells togethercell membrane structures that directly pass chemical information between cellsanchoring cells to extracellular surfaces like connective tissuemolecular transport (entry into or exit of substances from cells)enzymes that catalyze crucial reactions in cells.
Transmembrane proteins perform most of the functions illustrated here. However, peripheral membrane proteins also playvital roles in membrane function. Remember that Cytochrome c in the electron transport system on the mitochondrialcristal membrane is a peripheral protein. Other peripheral membrane proteins may serve to regulate the transport orsignaling activities of transmembrane protein complexes or may mediate connections between the membrane andcytoskeletal elements. The peripheral membrane proteins by shown here do not penetrate membranes. They bind reversiblyto the internal or external surfaces of the biological membrane with which they are associated. We will be looking moreclosely at what holds membrane proteins in place and how they perform their unique functions. Check out majormembrane protein functions, actions and cellular locations below
Basic Function Specific Actions Examples
Facilitated Transport Regulate diffusion of substances acrossmembranes along a concentration gradient
Ca & other ion channels, glucosetransporters
Active Transport Use energy to move ions from low to highconcentrations across membranes
Mitochondrial protein pumps, the Na /K ionpump in neurons
Signal TransductionFor e.g., hormones that can't enter cells, theseconvey information from molecular signals tocytoplasm, leading to a cellular response
Protein hormone and growth factor signaling,antibody/antigen interactions, cytokinemediation of inflammatory responses etc.
Cell-cell interactions Cell-cell recognition and binding to formtissues
Formation of desmosomes gap junctions andtight junctions.
Anchors to cytoskeleton Link membrane proteins to cytoskeleton Give cells their shape, cell movement andresponse to molecular signals
Enzymatic Usually multifunctional proteins withenzymatic activities
The F1 ATP synthase that uses protongradient to make ATP; adenylyl cyclase thatmakes cAMP during signal transduction; note
Example Membrane Protein Functions
2+
+ +

Gerald Bergtrom 4.6.2 12/18/2021 https://bio.libretexts.org/@go/page/64275
that some receptor proteins are linked toenzymatic domains in the cytoplasm
288 Diversity of Membrane Protein Structure and Function
289 Pore Proteins May Cross the Membrane Many Times
290 Red Blood Cell (Erythrocyte) Membrane Protein Functions

Gerald Bergtrom 4.7.1 1/5/2022 https://bio.libretexts.org/@go/page/64276
4.7: GlycoproteinsMembrane proteins are often covalently linked to oligosaccharides, which are branched glycoside-linked sugars(averaging around 15 sugar residues). As glycans, they are the sugars linked to glycoproteins. Glycoproteins are rare inthe cytosol, but common on secreted and membrane proteins. Oligosaccharides are typically linked to proteins via thehydroxyl group on serine or threonine. Occasional linkages are to modified amino acids like hydroxylysine orhydroxyproline (O-glycosylation), and to the amide nitrogen on asparagine (N-glycosylation). The oligosaccharidedomains of glycoproteins often play a major role in membrane protein function. For example, the glycoproteins, alongwith the polar domains of integral and peripheral proteins and glycolipids, are a major feature of the glycocalyx. A cellmembrane and its glycocalyx are illustrated below.
Oligosaccharides begin their synthesis in the rough endoplasmic reticulum (RER), with the creation of a core glycoside.Partial glycans are enzymatically linked to compatible amino acids of a membrane protein. As these proteins travelthrough the Golgi vesicles of the endomembrane system, terminal glycosylation attaches more sugars to the coreglycoside to complete glycoprotein synthesis. When vesicles budding from the transGolgi vesicles fuse with the plasmamembrane, the sugars on the glycoproteins end up on the exterior cell surface. This is illustrated in the link below.
291 The Path to Sugar Coated Cells

Gerald Bergtrom 4.8.1 1/1/2022 https://bio.libretexts.org/@go/page/64277
4.8: GlycolipidsGlycolipids are phospholipids attached to oligosaccharides, and as noted, are part of the glycocalyx. Both are only foundon the extracellular surface. Glycolipids are synthesized in much the same way as glycoproteins. Specific enzymescatalyze initial glycosylation of either phospholipids or polypeptides, followed by the addition of more sugars. Along withglycoproteins, glycolipids play roles in cell-cell recognition and the formation of tissues. The glycans on the surfaces ofone cell will recognize and bind to carbohydrate receptors (lectins) on adjacent cells, leading to cell-cell attachment aswell as intracellular responses in the interacting cells. Glycoproteins and glycolipids also mediate the interaction of cellswith extracellular molecular signals and with chemicals of the extracellular matrix (ECM). The ECM includescomponents of connective tissue, basement membranes, in fact any surface to which cells attach.
292 The Extracellular Matrix

Gerald Bergtrom 4.9.1 1/5/2022 https://bio.libretexts.org/@go/page/64278
4.9: Glycoproteins and Human HealthWe’ll close this chapter with a few examples of glycoproteins that play crucial roles in human physiology. Let’s look firstat the major human blood groups. The major A, B, AB, O and Rh blood groups result from the presence or absence ofglycoprotein antigens embedded in red blood cell membranes and the presence or absence in the blood, of antibodiesagainst the antigens. Typically, exposure to antigens (foreign substances like bacteria, viruses, toxins…) generatesimmunoglobulins, the antibody molecules of our immune system; immunoglobulins are glycoproteins. The situation withblood groups is something of a paradox. The blood group antibodies already in the blood of a healthy person are not aresponse to foreign antigen invasion
You probably know that these blood groups must be compatible for a successful blood transfusion. A mismatch betweendonor and recipient can be devastating. The interaction of the red cell antigens of one blood group with antibodies inanother blood group will cause the red cells to clump, restricting blood flow and ultimately killing the transfusionrecipient. The table below summarizes why transfusions with mismatched A, B, AB, O blood groups must be avoided.
Group A Group B Group AB Group O
Cell-surface antigens
Antibodies inthe blood None
Acceptable donor-recipient matches
Group A or Group Odonors
Group B or Group Odonors
Universal Recipient(Group AB, A, B, Odonors)
Only Group O donors
Why red cells clump inmismatched blood
Anti-A from Group Bdonor binds, aggregatesrecipient red cells;recipient Anti B binds,aggregated donor red cells
Anti-B from Group Adonor binds, aggregatesrecipient red cells;recipient Anti A binds,aggregates donor red cells
Antibodies in Group Oblood will bind any donorred cell antigens and causethe cells to clump
Another red blood cell antigen is the Rh factor. People have either it (Rh+ ) or not (Rh- ). In contrast, when an Rhrecipientreceives blood from an Rh+ donor, the recipient’s immune system makes defensive anti-Rh antibodies in the usual way.This too can cause blood cell clumping with bad consequences. A word to the wise: it’s a good idea to know your ownblood group!
Check the Red Cross website (here) or Wikipedia for more detail about blood groups.
The last example here involves the cell surface major histocompatibility complex (MHC) glycoproteins that distinguishself from non-self in body tissues and organs. Major organ Transplantation (liver, kidneys, heart) from donors into patientswith failing organs has become, if not routine, then at least increasingly common. Before a transplant, MHC tissue typingdetermines donor and recipient compatibility, reducing the chances of the rejection of the transplanted organ. Sinceavailable donors are few, and good matches even fewer, patients wait on prioritized lists for a matched organ. Even whenMHC typing is a match for a patient, the immune systems of transplant recipients are suppressed with hormones to reducefurther the chance of rejection. Unlike the limited number of blood groups, many MHC proteins are analyzed to determinea match. Thus, it is not practical (or routinely necessary) to ‘know’ your MHC type! In the next chapter, we look at membrane functions intrinsic to cellular existence itself.

Henry Jakubowski 5.1 12/25/2021 https://bio.libretexts.org/@go/page/64279
5: (Test 2)Transport and Kinetics
5.1: Passive and Facilitated DiffusionThis chapter will discuss diffusion processes. First, diffusion equations will be derived for cases not involving abinding receptor. Next we will derive equations for receptor-mediated diffusion across a membrane - facilitateddiffusion. We will deal with the situation when the solute must be transported up a concentration gradient, a processcalled active transport.
Contributors and Attributions
Prof. Henry Jakubowski (College of St. Benedict/St. John's University)
5.1.1: A1. Simple Diffusion
5.1.2: A2. Facilitated Diffusion
5.1.3: A3. Receptors in Facilitated Diffusion
5.1.4: A4. Membrane Pores
5.1.5: A5. Cell Junctions - TBA
5.1.6: A6. Links and References

Henry Jakubowski 5.1.1 12/11/2021 https://bio.libretexts.org/@go/page/64280
5.1: Passive and Facilitated Diffusion
define flux (J) of solute (A) across a membrane;write mathematical relationship that show how flux J depends on the concentration gradient of solute across themembrane (dA/dx) and also on the difference of solute concentration across the membrane (ΔA) for passivediffusion;differentiate between passive diffusion, facilitated diffusion mediated by a receptor transporter, and active transportwrite chemical equations which show the physical steps in the process of passive and facilitated diffusionderive a mathematical equation and graphs which shows the dependencies of flux J as a function of Aout and ARfor facilitated diffusion assuming rapid equilibrium binding of ;differentiate between carrier proteins, permeases or transport proteins on one hand and channels on the other;
This chapter will discuss diffusion processes. First, diffusion equations will be derived for cases not involving a bindingreceptor. The equation will show the rate of diffusion of a solute across a membrane from a region of high concentration toa region of low concentration ( ) is a linear function of across the membrane. Next we will derive equationsfor receptor-mediated diffusion across a membrane - facilitated diffusion. We will deal with the situation when the solutemust be transported up a concentration gradient (which requires ATP as an exogenous source of energy), a process calledactive transport.
Learning Objectives
Δμ < 0 [ΔL]
5.1.1: A1. Simple Diffusion
5.1.2: A2. Facilitated DiffusionFacilitated diffusion is the process of spontaneous passive transport (as opposed to active transport) of molecules orions across a biological membrane via specific transmembrane integral proteins.
5.1.3: A3. Receptors in Facilitated DiffusionTwo types of proteins are involved in facilitated diffusion. Carrier proteins (also called permeases or transporters)such as the glucose transporter (GLUT1) move solute molecules across a membrane, Channels facilitate diffusion ofions down a concentration gradient. In the former cases, the ligand binds the receptor (permease, transport protein)which induces a conformational change in the receptor.
5.1.4: A4. Membrane PoresChannels have pores which can be gated open and allow selective flow of ions. Porins have larger entrances whichallow larger molecules to pass the bilayer
5.1.5: A5. Cell Junctions - TBA
Topic hierarchy

Henry Jakubowski 5.1.2 12/11/2021 https://bio.libretexts.org/@go/page/64280
Contributors and Attributions
Prof. Henry Jakubowski (College of St. Benedict/St. John's University)
5.1.6: A6. Links and References

Henry Jakubowski 5.1.1.1 1/15/2022 https://bio.libretexts.org/@go/page/64281
5.1.1: A1. Simple DiffusionSo far we have studied molecular aggregates (micelles and bilayers) and macromolecular structure (mostly proteins). Nextwe studied binding interactions which are the first steps in the expression of biological activity of a macromolecule. Forsome proteins, reversible binding is their sole function (consider the binding of dioxygen to myoglobin and hemoglobin).For many others, it is not. For those, what can happen next?
The answer to that question clearly depends on the biological function of the macromolecule. We can simplify this processby adding one additional step as reflected in the equilibrium binding expression shown below:
This expression indicates that the free ligand has changed in some fashion to x. In the next two chapters, we will considertwo kinds of transformations:
L is a ligand on the outside of a biological membrane (Lout) which binds to a membrane protein receptor, R. Thisundergoes a conformational change (as we studied in the binding of dioxygen to hemoglobin) which leads to theexpulsion of the bound ligand to the inside of the membrane (Lin). This can modeled with the simple equation:
. This process is called facilitated diffusion and represents a physical as opposed tochemical process since no covalent bonds are made or broken. This process proceeds down a concentration or chemicalpotential gradient (Δμ < 0) and hence is spontaneous (thermodynamically favored). If the ligand concentration is higherinside the cell, net diffusion moves it to the outside of the cell. Passive (non-facilitated) diffusion is kinetically slow inthe absence of a receptor since membranes present formidable barriers to the passage of polar molecules.L is a ligand (or substrate S) which binds to a protein enzyme, E. The bound substrate is chemically altered to producea new product, P, which dissociates from the enzyme. This can be expressed most simply as:
This chapter will discuss diffusion processes. First, diffusion equations will be derived for cases not involving a bindingreceptor. The equation will show the rate of diffusion of a solute across a membrane from a region of high concentration toa region of low concentration (Δμ < 0) is a linear function of [ΔL] across the membrane. Next we will derive equations forreceptor-mediated diffusion across a membrane - facilitated diffusion. We will deal with the situation when the solute mustbe transported up a concentration gradient (which requires ATP as an exogenous source of energy), a process called activetransport, later in this web book.
PASSIVE DIFFUSION THROUGH A MEMBRANE - CASE 1: no receptor
Java Applet: Before you study the derivation for simple passive diffusion, view the applet file below. First select clearto remove all molecules. Add 100 molecules to left. Move speed slider to left just until in indicates slow. Run thesimulation. Count the number that move to the right hand side in 20 seconds. Refresh browser and repeat with 200 andthen 300 on the left (unfortunately this slows down the molecules on the left so quantitation is impossible). Graph thatnumber of molecules that moved to the right chamber (y axis) versus the the initial number on the left hand side (100, 200,and 300, respectively, x axis).
Diffusion Applet 1
M +L ⇌ ML ⇌ M +X (5.1.1.1)
R+ ⇌ RL ⇌ R+Lout Lin
E+S ⇌ ES ⇌ E+P (5.1.1.2)

Henry Jakubowski 5.1.1.2 1/15/2022 https://bio.libretexts.org/@go/page/64281
The flux of molecule A (JA) across a membrane of thickness dx, is proportional to the concentration gradient across themembrane, dA/dx., which is expressed as Fick's First Law of Diffusion:
or
where D is the diffusion coefficient. The negative sign is necessary since concentration increases in the opposite directionof net flux. For these derivations, we will assume the JA is the initial flux. That is, the flux is measured for a short enoughtime that the relative concentrations of A on both sides of the membrane does not change significantly. It should be clearthat eventually the net flux levels off to zero, when the concentrations of A on both sides of the membrane are equal (i.e.the chemical potential of A on both sides is identical).
This can also be expressed as JA = -L dμA/dx , which bridges kinetic and thermodynamic aspects of diffusion.
For JA = - D dA/dx, dimensional analysis shows that
J = moles/area/sec = mol/cm2.s = - (cm2/s) mol/cm3/cm. Hence the units of D are cm2/s.
Rearranging Fick's Law gives the following:
Integrate both sides with x varying between 0 and x (the thickness of the membrane), and A from Aout to Ain.
JA x = -D [Ain - Aout] = D [Aout - Ain] or
JA = (D/x) [Aout - Ain] or
JA = P [Aout - Ain]
where P is the permeability coefficient, which has units of cm2/s/cm or cm/s. (We discussed permeability coefficientsfor different solutes traversing model bilayers when we discussed lipids.)
A plot of JA vs (Aout - Ain) is linear, with a slope of D/x
Contributors and Attributions
Prof. Henry Jakubowski (College of St. Benedict/St. John's University)
∝JAdA
dx(5.1.1.3)
= −DJAdA
dx(5.1.1.4)
= −DJAdA
dx(5.1.1.5)
dx = −DdAJA (5.1.1.6)

Henry Jakubowski 5.1.2.1 12/18/2021 https://bio.libretexts.org/@go/page/64282
5.1.2: A2. Facilitated DiffusionConsider the following mechanism:
Let's assume that for this system the initial flux will be measured. We would like to derive equations which show as afunction of (assuming that is negligible over the time course of measuring the initial flux. Also assume that the facilitated is much greater than passive. In contrast to passive diffusion, JA is not proportional to but rather to
.
Consider this example to help you understand that proportionality. Pretend that the receptor is a truck which can carry oneparticle across the membrane at a time (i.e. 1/1 stoichiometry). Also assume that the particle can't get across without beingcarried by the truck. If there are no trucks in the membrane, no load can be delivered. If there are trucks in the membranebut no particles in them, no load will be delivered. As the number of particles available to be loaded into the truck increase,the truck will have an increased chance to be loaded (depending of course on the affinity of the particle for the truck). Ifthe number of loaded trucks is doubled, the number of particles dumped to the other side will double. Therefore, byanalogy, is proportional to :
How can we calculate when we know and ? Let us assume that ( ) is much greater than , as is thelikely biological case, and . We can calculate using the following equations, and the same procedure we usedfor the derivation of the binding equation:
Dissociation constant:
has units of molarity.
Mass Balance of R:
so
Since we will assume that is much greater than , we will not need the mass balance for (which is )
Substitute Equation into :
J
Aout Ain J
J Aout
[ ]Abound
JA [RA]
JA ∝ [RA]
= [RA]k3
(5.1.2.1)
RA A R Atotal A0 R0
= 0Ain RA
ML =LMo
+LKd
(5.1.2.2)
= =Kd
[A [R]eq ]eq
[AR]eq
[A][R]
[RA](5.1.2.3)
Kd
= R+RARo (5.1.2.4)
R = −RARo (5.1.2.5)
Ao R0 A = A+RAAo
5.1.2.5 5.1.2.3
(RA) = (Ro)A−(RRA)AKd (5.1.2.6)
(RA) +(RA)A = (Ro)AKd (5.1.2.7)

Henry Jakubowski 5.1.2.2 12/18/2021 https://bio.libretexts.org/@go/page/64282
Substitute into Equation gives the final equation,
It should be clear to you from this equations that:
a plot of vs. is hyperbolic when .
when is much greater than when .
Wolfram Mathematica CDF Player - Jo vs A (free plugin required)
These are the same conditions we detailed for our understanding of the binding equation
RAPID EQUILIBRIUM ASSUMPTIONThis derivation is based on the assumption that the relative concentrations of , , and can be determined by the for the interactions and the concentrations of each species during the early part of diffusion (i.e. under initial rateconditions). Remember under these conditions, does not change much with time. Is this a valid assumption? Examinethe mechanism shown in the above figure. binds to with a second order rate constant . RA has two fates. It candissociate with a first order rate constant to Aout + R (to give the original species), or dissociate with a first order rateconstant of k3 to give + (as A moves across the membrane). If we assume that (i.e. that the complex fallsapart much more quickly than A is carried in), then the relative ratios of , , and can be described by .Alternatively, you can think about it this way. If binds to , most of will dissociate, and a small amount will becarried across the membrane. If this happened, then is now free, and will quickly bind and reequilibrate. Thisoccurs since the most likely fate of bound A is to dissociate, not to be carried across the membrane, since .
Diffusion of Ions and Molecules Across Membranes
As we saw previously, the permeability coefficients of synthetic membranes (liposomes) to solutes is related to the sizeand polarity of the solute.
RA = (Ro)A
+AKd
(5.1.2.8)
5.1.2.8 5.1.2.1
JA = const[RA] = [RA] = ( ) .k3 k3 Ro
A
+AKd
(5.1.2.9)
JA A
JA = 0 A = 0
JA = Jmax A Kd
A = Kd JA = /2Jmax
ML =LMo
+LKd
(5.1.2.10)
A R AR Kd
Aout
Aout R k1
k2
Ain R ≫k2 k3
A R RA Kd
A R A
R Aout
≪k3 k2

Henry Jakubowski 5.1.2.3 12/18/2021 https://bio.libretexts.org/@go/page/64282
Figure: permeability coefficients
Smaller, higher charge density ions (like ) have a lower permeability coefficient than do larger, lower charge densityions (like ). What about natural membranes? Look at the chart below.
Table 1: Permeability coefficient (cm/s) of natural and synthetic membranes to D-Glucose and D-mannitol at 25oC.Membrane Preparation D-Glucose D-Mannitol
Synthetic Lipid Bilayer
Calculated Passive Diffusion
Intact Human Erythrocyte (red blood cell)
Why do the permeability coefficients differ for D-Glc and D-Mannitol across the red blood cell membrane?
Animation of Facilitated DiffusionAnimation of Diffusion and Active Transport from the HHMI
Contributors and AttributionsProf. Henry Jakubowski (College of St. Benedict/St. John's University)
Na+
K+
2.4 × 10⁻¹⁰ 4.4 × 10⁻¹¹
4 × 10⁻⁹ 3 × 10⁻⁹
2.0 × 10 − 4 5 × 10⁻⁹

Henry Jakubowski 5.1.3.1 1/5/2022 https://bio.libretexts.org/@go/page/64283
5.1.3: A3. Receptors in Facilitated DiffusionTwo types of proteins are involved in facilitated diffusion. Carrier proteins (also called permeases or transporters) such asthe glucose transporter (GLUT1) move solute molecules across a membrane, Channels facilitate diffusion of ions down aconcentration gradient. In the former cases, the ligand binds the receptor (permease, transport protein) which induces aconformational change in the receptor as illustrated in the animation above and in the figure link below.)
Figure: Models for facilitated diffusion of glucose
In the latter case, a ligand can bind to the receptor (channel protein) which induces a conformational change in thereceptor, a "ligand-gated" channel through the membrane. This process would lead to the diffusion of many ions across themembrane (down a concentration gradient) until the channel closes (which can be induced by ligand dissociation or otherevents). Clearly, the mathematics we derived for the carrier proteins does not apply to the channel proteins. In addition,there are other ways to "gate" open a channel protein, which we will discuss later. Also some transporters can move solutemolecules across a membrane against a concentration gradient. These proteins require an external energy source (like ATPor coupling to the favorable collapse of a second transmembrane gradient ) to drive this thermodynamically unfavoredprocess.
Animation of ribitol diffusion through a glycerol channel using interactive molecular dynamics fromAnimation of lactose diffusion through the LacY receptor
Both links above are from the Theoretical and Computational Biophysics group at the Beckman Institute, University ofIllinois at Urbana-Champaign. These molecular dynamic simulations were made with VMD/NAMD/BioCoRE/JMV/othersoftware support developed by the Group with NIH support.
Recently, the x-ray structures of two transporters that are powered by the collapse of a second gradient, were reported.
Jmol: Updated Lactose Permease Jmol14 (Java) | JSMol (HTML5)
Jmol: Updated Glycerol-3-Phosphate Transporter From E. Coli Jmol14 (Java) | JSMol (HTML5)
Although it is clear that conformational changes in membrane proteins must occur for activity to be expressed, the exactstructural rearrangements of these proteins has been difficult to determine given the lack of structural data for membraneproteins, especially as contrasted to water-soluble enzymes. Transporters allow slow (102 to 10-5 s-1) movement ofligands through pores which must be alternately open and closed to allow extracellular and intracellular access/egress.They need at a minimum an "open-to-out" and "open-to-in" conformational states. The pores must be transient and notcontinuous. Structural studies have been performed on E. Coli Lac Y Permease, a member of the largest transporter family,

Henry Jakubowski 5.1.3.2 1/5/2022 https://bio.libretexts.org/@go/page/64283
Major Facilitator Superfamily (MFS). These proteins have two halves with symmetrical halves each with 6 transmembranedomains. Crystal structures suggest a rocker switch like the figure above for the Glu transport protein.
Structural work by Singh et al on the Leu Transporter (LeuT), a member of the solute carrier 6 or sodium coupledtransporters, which is an active transporter requiring movement of Na ion into the cells to power the uptake of Leu, showan "open-to-out" and occluded binding state for ligand (Leu). Tryptophan, a competitive nontransportable inhibitors bindsto the open-to-out state, but is too large for the obligate occluded state so it is not transported.
Ionophores
Carriers of ligands need not be proteins. Ionophores are small organic molecules which can bind metal ions and move themdown a concentration gradient across a bilayer. Most ionophores are not resident in the cell membrane. Rather they aremobile carriers of ions. They bind ions in solution, ferry them through the membrane, and then release them on the otherside. As with receptor carrier proteins, they work in both directions but move ions in a net fashion down the concentrationgradient of the ion. One example is valinomycin, a natural product of Streptomyces fulvissimus. It is a cyclic peptideconsisting of L and D-Val along with L-lactate and D-hydroxyisovalerate, connected through both ester and amide bonds.
Jmol: Valinomycin
The structure of the valinomycin in its K+ form give clues to its function. The six Val carbonyl oxygens bind the K+ ion.The hydrophilic groups are pointed toward the center, while the hydrophobic groups point to the outside of the structure,allowing the K+ ion to be sequesters in a polar environment as the nonpolar exterior of the complex passes through themembrane. This ionophore is specific for K+ and binds the smaller Na+ ion weakly. This can be accounted for by twofactors. The smaller sodium ion doesn't bind as tightly to the chelating carbonyl oxygens. Also, the sodium ion has ahigher charge density, so the Na+/water interactions must be more stable and more difficult to break than those to K+. Theion must be desolvated before it binds to the complex. Other ionophores are specific for other ions.
Some ionophores, like gramicidin, from Bacillus brevis, forms a pore in the membrane through which different types ofGroup I ions may flow. It is a 15-residue peptide consisting of alternating D and L amino acids of significanthydrophobicity. The peptide appears to form a dimer helix (not an alpha helix, however), in a bilayer membrane.
Jmol : Gramicidin
(go to the bottom link for next page in the top frame of this page and continue until you get to the Gramicidin page - anincredible Chime presentation.)
Aquaporins are tetrameric complexes that facilitate water diffusion through bilayers. They have amazing selectivity as theydon't pass other solute or even protons (H3O+ or naked H+ ions). See the amazing link below to molecular dynamicssimulations of the process.
Aquaporins: MD simulation
Jmol: Aquaporin
Jmol: Updated Aquaporin Monomer Jmol14 (Java) | JSMol (HTML5)
Gram negative bacteria (as well as mitochondria in eukaryotic cells) have protein complexes called porins (different fromthe aquaporin discussed above). The monomer porin forms a trimer in the membrane which forms a pore allowing smallsolute molecules necessary for bacterial cell growth to pass. The porin proteins share a 16 stranded anti-parallel beta barrelas a common motif. Solute molecules can pass through the pore created by the beta barrel. An example, maltoporin, isshown below:
Jmol: Updated Maltoporin Transport Protein Jmol14 (Java) | JSMol (HTML5)

Henry Jakubowski 5.1.3.3 1/5/2022 https://bio.libretexts.org/@go/page/64283
Contributors and AttributionsProf. Henry Jakubowski (College of St. Benedict/St. John's University)

Henry Jakubowski 5.1.4.1 1/29/2022 https://bio.libretexts.org/@go/page/64284
5.1.4: A4. Membrane Pores
The Nuclear Pore Complex
Channels have pores which can be gated open and allow selective flow of ions. Porins have larger entrances which allowlarger molecules to pass the bilayer. The biggest pore structure known is the nuclear pore complex, which has a combinedmolecular mass around 125,000,000! It's job is to shuttle small molecules through passive diffusion down a concentrationgradient through the pore. In addition it moves large molecules and molecular structures (proteins, RNA, and perhapsribosomes) across the nuclear membrane in a process which requires energy. The proteins that comprise this complex arecalled nucleoporins, of which there appears to be around 30 in yeast. Large proteins that pass through the pore must first bebound to a cargo receptor, which can move the "cargo" across the pore with concomitant GTP hydrolysis.
nuclear pore complex
Figure: Movement of Molecules and Particles Through Membranes
Porins: TBA
Contributors and AttributionsProf. Henry Jakubowski (College of St. Benedict/St. John's University)

Henry Jakubowski 5.1.5.1 1/8/2022 https://bio.libretexts.org/@go/page/64285
5.1.5: A5. Cell Junctions - TBA
Drugs and Diffusion
One of the biggest challenges in medical drug development is the synthesis of drugs that can diffuse across the cellmembrane. This requires that the drug be sufficiently nonpolar while at the same time it must be sufficiently polar to havereasonable aqueous solubility, allowing blood transport. One way around this problem is to develop a water soluble drugand a protein "receptor" which would allow drug passage across the membrane. A novel mechanism not based onfacilitated diffusion has been developed that allows certain protein sequences to transduce the drug across the membrane (aprocess called protein transduction or molecular transportation). Researchers have looked to nature to find proteins whichcan move across the membrane and adapted them for this process. Several viral proteins (including TAT from the HIVvirus) possess such properties, which require the presence of a short "transporter" amino acid sequence in the protein.Drugs are covalently attached to the sequence, and carried through the membrane by the short protein sequence. Thismechanism does not fit the criteria of facilitated diffusion since the required protein fragment is not a classical receptor. Itis amphiphilic and can pass through the membrane even if synthesized in the lab using D-amino acids or if the sequence isscrambled. The fusion domain of the TAT protein is ionic (containing 5-15 Arg residues) and probably interacts initiallywith negatively charged glycosoaminoglycans on the cell surface. Many different types of drugs can be delivered in thisfashion (large to small, proteins, nucleic acids, and large liposomes, etc).
Another approach is to design artificial receptors. For example, a ligand that might ordinarily bind to a protein could becovalently modified with a hydrophobic group (often a cholesterol derivative) which would allow it to partition into thecell membrane, exposing the ligand on the cell surface. The surface ligand can then bind its target protein. If the protein ismultivalent (can bind more than one ligand per protein, such as an antibody), lateral diffusion and clustering of protein-artificial receptor complexes in the membrane can occur, as well as the formation of lipid rafts. Similar to other ligand-receptor interactions that display such properties, these membrane changes can lead to endocytosis of the protein-artificialligand complex.
Contributors and AttributionsProf. Henry Jakubowski (College of St. Benedict/St. John's University)
Henry Jakubowski 5.1.6.1 1/1/2022 https://bio.libretexts.org/@go/page/64286
5.1.6: A6. Links and References1. Singh, S. et al. A Competitive Inhibitor Traps LeuT in an Open-to-Out Conformation. :
Science 322: 1655 (2008)2. Huang, Y. et al. Structure and mechanism of the Glycerol-3-Phosphate Transporter from E. Coli. Scinec. 301, pg 616-
620 (2003)3. Abramson, J. et al. Structure and mechanism of the Lactose Permase of E. Coli. Science. 301, pg 610-615 (2003)4. Locher, K. et al. Breaching the Barrier (review of transport proteins LacY and GlpT. Science. 301, pg 603 (2003)5. Alper, J. Breaching the membrane (new ways to move drugs through membranes). Science. 296. pg 838 (2002)6. Murata et al. Structural Determinants of Water Permeation through Aquaporin I. Nature. 407, pg 599 (2000)7. Fu et. al. Structure of a glycerol-conducting channel and the basis for its selectivity. Science 290. pg 481 (2000)8. Sui et al. Structural basis of water-specific transport through the AQP1 water channel. Nature. 414. pg 872 (2001)9. deGroot and Grubmuller. Water Permeation Across Biological Membranes: Mechanism and Dynamics of Aquaporin-1
and GlpF. Science. 294. pg 2304, 2353 (2001)10. Aqivst and Luzhkov. Ion permeation mechanism of the potassium channel. (dynamics results). Nature. 404 pg 881
(2000)
Contributors and AttributionsProf. Henry Jakubowski (College of St. Benedict/St. John's University)

1 1/29/2022
CHAPTER OVERVIEW6: (T2) PROTEIN MODIFICATION AND TRAFFICKINGOnce a polypeptide has been translated and released from the ribosome, it may be ready for use, but often it must undergo post-translational processing in order to become fully functional. While many of these processes are carried out in both prokaryotes andeukaryotes, the presence of organelles provides the need as well as some of the mechanisms for eukaryote-specific modifications suchas glycosylation and targeting.
6.1: PROTEOLYTIC CLEAVAGEThe most common modification is proteolytic cleavage. Some of the pre-cleavage polypeptides are immediately cleaved, while othersare stored as inactive precursors to form a pool of enzymes (or other kinds of proteins) that can be activated very quickly, on atimescale of seconds to minutes, as compared to having to go through transcription and translation, or even just translation.
6.2: PROTEIN TRAFFICKINGA major class of cleaved peptide sequences is signal peptides. Signal peptides direct the protein from the cytoplasm into a particularcellular compartment. In the case of prokaryotes, this essentially means the cell membrane, but for eukaryotes, there are specificsignal peptides that can direct the protein to the nucleus, to the mitochondria, to the endoplasmic reticulum, and other intracellularorganelles.
6.3: PROTEIN FOLDING IN THE ENDOPLASMIC RETICULUMThe ER lumen plays four major protein processing roles: folding/refolding of the polypeptide, glycosylation of the protein, assemblyof multi-subunit proteins, and packaging of proteins into vesicles. Refolding of proteins is an important process because the initialfolding patterns as the polypeptide is still being translated and unfinished may not be the optimal folding pattern once the entireprotein is available. This is true for H-bonds and more permanent disulfide bonds as well.
6.4: N-LINKED PROTEIN GLYCOSYLATION BEGINS IN THE ERGlycosylation is an important modification to eukaryotic proteins because the added sugar residues are often used as molecular flagsor recognition signals to other cells than come in contact with them. There are two types of protein glycosylation, both of whichrequire import of the target polypeptide into the ER. N-linked glycosylation actually begins in the endoplasmic reticulum, but O-linked glycosylation does not occur until the polypeptide has been transported into the Golgi apparatus.
6.5: O-LINKED PROTEIN GLYCOSYLATION TAKES PLACE ENTIRELY IN THE GOLGIO-linked glycoproteins begin their glycosylation with the action of the Golgi-specific enzyme, GalNAc transferase, which attaches anN-acetylgalactosamine to the hydroxyl group of a serine or threonine. Determining which residue to glycosylate appears to bedirected by secondary and tertiary structure and often occurs in dense clusters of glycosylation. The combined oligosaccharide chainsattached to an O-linked glycoprotein can contribute over 50% of the mass of a glycoprotein.
6.6: VESICULAR TRANSPORTVesicles (membrane-bound bubbles, essentially) pinch off from the ER, Golgi, and other membranous organelles, carrying with themwhatever soluble molecules were inside the uid that was enclosed as well as any molecules embedded in that section of membrane.These vesicles then catch a ride on a molecular motor such as kinesin or myosin, and travel along the cytoskeleton until they dock atthe appropriate destination and fuse with the target membrane or organelle.
6.7: RECEPTOR-MEDIATED ENDOCYTOSIS

E. V. Wong 6.1.1 1/1/2022 https://bio.libretexts.org/@go/page/64288
6.1: Proteolytic CleavageThe most common modification is proteolytic cleavage. Some of the pre-cleavage polypeptides are immediately cleaved,while others are stored as inactive precursors to form a pool of enzymes (or other kinds of proteins) that can be activatedvery quickly, on a timescale of seconds to minutes, as compared to having to go through transcription and translation, oreven just translation. Interestingly, though methionine (Met) is universally the first amino acid of a newly synthesizedpolypeptide, many proteins have that methionine cleaved off (also true for some prokaryotic f-Met).
Figure . Proteolytic processing is necessary to make biologically active insulin. (A) The linear protein contains asignal sequence, which is cleaved after the protein enters the ER, an A chain, a B chain, and a C-peptide. (B) Inside theER, the proinsulin (insulin precursor) folds and disulfide bonds form between cysteines. (C) Finally, two cleavages releasethe C peptide, which leaves the A and B chains attached by the disulfide bonds. This is now active insulin.
Activation of proteins by cleavage of precursors is a common theme: the precursor protein is termed a proprotein, and thepeptide that is cleaved off of it to activate the protein is called the propeptide. Among the better known examples ofproteins that are derived from proproteins are the hormone insulin, the cell death protein family of caspases, and theAlzheimer-associated neural protein β-amyloid. Insulin is an interesting example (Figure ) in mammals: preproinsulin(inactive as a hormone) is first translated from the insulin mRNA. After a cleavage that removes an N-terminal sequence,proinsulin (still inactive) is generated. The proinsulin forms some internal disulfide bonds, and when the final proteolyticaction occurs, a substantial chunk (called the C-peptide) is taken out of the middle of the proinsulin. Since the protein wasinternally disulfide bonded though, the two end pieces remain connected to become the active insulin hormone.
Another interesting protein processing example is that of collagen assembly (Figure ). As you will read in chapter 13,collagen is a very large secreted protein that provides structure and shock absorbance for the extracellular matrix inanimals. You can find it in skin, hooves, cartilage, and various connective tissues. An individual collagen protein isactually a twisted triple-helix of three subunits. The collagen subunits are made as procollagen, and propeptides are loppedoff of both N- and C- termini to generate the final protein. However, they are not cleaved off until after the three subunitsassemble around one another. In fact, collagen subunits that have already been processed do not assemble into triple-helical proteins. The propeptide sequences are clearly necessary for efficient assembly of the final protein complex.
6.1.1
6.1.1
6.1.2

E. V. Wong 6.1.2 1/1/2022 https://bio.libretexts.org/@go/page/64288
Figure . Processing and assembly of procollagen into collagen.6.1.2
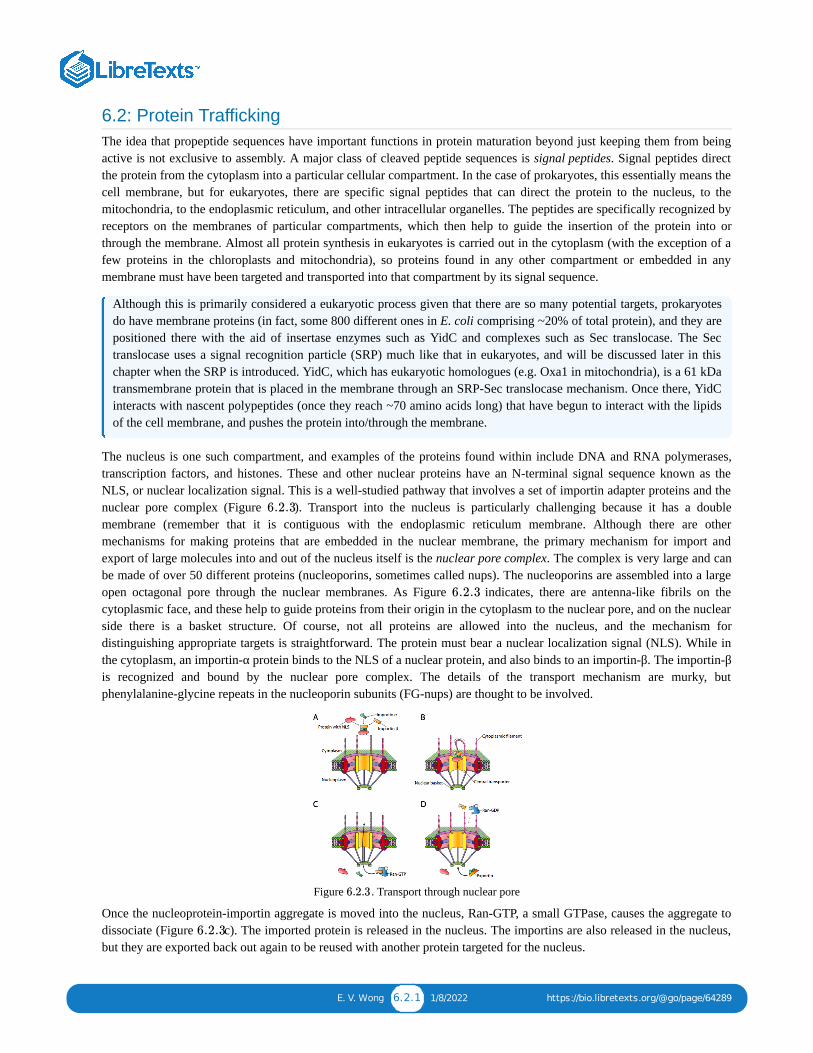
E. V. Wong 6.2.1 1/8/2022 https://bio.libretexts.org/@go/page/64289
6.2: Protein TraffickingThe idea that propeptide sequences have important functions in protein maturation beyond just keeping them from beingactive is not exclusive to assembly. A major class of cleaved peptide sequences is signal peptides. Signal peptides directthe protein from the cytoplasm into a particular cellular compartment. In the case of prokaryotes, this essentially means thecell membrane, but for eukaryotes, there are specific signal peptides that can direct the protein to the nucleus, to themitochondria, to the endoplasmic reticulum, and other intracellular organelles. The peptides are specifically recognized byreceptors on the membranes of particular compartments, which then help to guide the insertion of the protein into orthrough the membrane. Almost all protein synthesis in eukaryotes is carried out in the cytoplasm (with the exception of afew proteins in the chloroplasts and mitochondria), so proteins found in any other compartment or embedded in anymembrane must have been targeted and transported into that compartment by its signal sequence.
Although this is primarily considered a eukaryotic process given that there are so many potential targets, prokaryotesdo have membrane proteins (in fact, some 800 different ones in E. coli comprising ~20% of total protein), and they arepositioned there with the aid of insertase enzymes such as YidC and complexes such as Sec translocase. The Sectranslocase uses a signal recognition particle (SRP) much like that in eukaryotes, and will be discussed later in thischapter when the SRP is introduced. YidC, which has eukaryotic homologues (e.g. Oxa1 in mitochondria), is a 61 kDatransmembrane protein that is placed in the membrane through an SRP-Sec translocase mechanism. Once there, YidCinteracts with nascent polypeptides (once they reach ~70 amino acids long) that have begun to interact with the lipidsof the cell membrane, and pushes the protein into/through the membrane.
The nucleus is one such compartment, and examples of the proteins found within include DNA and RNA polymerases,transcription factors, and histones. These and other nuclear proteins have an N-terminal signal sequence known as theNLS, or nuclear localization signal. This is a well-studied pathway that involves a set of importin adapter proteins and thenuclear pore complex (Figure ). Transport into the nucleus is particularly challenging because it has a doublemembrane (remember that it is contiguous with the endoplasmic reticulum membrane. Although there are othermechanisms for making proteins that are embedded in the nuclear membrane, the primary mechanism for import andexport of large molecules into and out of the nucleus itself is the nuclear pore complex. The complex is very large and canbe made of over 50 different proteins (nucleoporins, sometimes called nups). The nucleoporins are assembled into a largeopen octagonal pore through the nuclear membranes. As Figure indicates, there are antenna-like fibrils on thecytoplasmic face, and these help to guide proteins from their origin in the cytoplasm to the nuclear pore, and on the nuclearside there is a basket structure. Of course, not all proteins are allowed into the nucleus, and the mechanism fordistinguishing appropriate targets is straightforward. The protein must bear a nuclear localization signal (NLS). While inthe cytoplasm, an importin-α protein binds to the NLS of a nuclear protein, and also binds to an importin-β. The importin-βis recognized and bound by the nuclear pore complex. The details of the transport mechanism are murky, butphenylalanine-glycine repeats in the nucleoporin subunits (FG-nups) are thought to be involved.
Figure . Transport through nuclear pore
Once the nucleoprotein-importin aggregate is moved into the nucleus, Ran-GTP, a small GTPase, causes the aggregate todissociate (Figure c). The imported protein is released in the nucleus. The importins are also released in the nucleus,but they are exported back out again to be reused with another protein targeted for the nucleus.
6.2.3
6.2.3
6.2.3
6.2.3

E. V. Wong 6.2.2 1/8/2022 https://bio.libretexts.org/@go/page/64289
The mechanisms of small GTPase activation of other processes will be discussed again in more detail in later chapters(cytoskel- eton, signaling). The key to understanding the mechanism is to remember that the GTPase hydrolyzes GTPto GDP, but still holds onto the GDP. Although the GTPase will hydrolyze GTP spontaneously, the GTPase-activatingprotein, GAP (or Ran-GAP in this case) greatly speeds the rate of hydrolysis. In order to cycle the system back to GTP,the GDP is not re-phosphorylated: it is exchanged for a new GTP. The exchange is greatly facilitated by the action ofan accessory protein, the guanine nucleotide exchange factor (GEF), in this particular case, a Ran-GEF.
Export from the nucleus to the cytoplasm also occurs through the nuclear pore. The Ran-GTP is also a part of the exportcomplex (Figure d), and in conjunction with an exportin protein and whatever is to be exported, is moved out of thenucleus via the nuclear pore. Once in the cytoplasm, the hydrolysis of GTP to GDP by Ran (activated by Ran-GAP, acytoplasmic protein) provides the energy to dissociate the cargo (e.g. mRNA) from the exporting transport molecules. TheRan-GDP then binds to importins, re-enters the nucleus, and the GDP is exchanged for GTP.
The nuclear pore is the only transport complex that spans dual membrane layers, although there are coordinated pairs oftransport complexes in double-membraned organelles such as mitochondria. The transport proteins in the outermitochondrial membrane link with transport proteins in the inner mitochondrial membrane to move matrix-bound proteins(e.g. those involved in the TCA cycle) in from the cytoplasm. The complexes that move proteins across the outermembrane are made up of Tom (translocator outer membrane) family of proteins. Some of the proteins will stay embeddedin the outer membrane: they are processed by a SAM (sorting and assembly machinery) complex also embedded in theouter membrane). Meanwhile, others continue to the Tim (translocator inner membrane) proteins that move them acrossthe inner membrane. As with the nuclear proteins, there is a consensus signal sequence on mitochondrial proteins that isbound by cytosolic chaperones that bring them to the Tom transporters. As shown in the table below, there are signalsequences/propeptides that target proteins to several other compartments.
Of particular importance for the rest of this chapter, is the sequence targeting proteins to the endoplasmic reticulum, and byextension, any proteins destined for the ER, the Golgi apparatus, the cell membrane, vesicles and vesicularly-derivedcompartments, and secretion out of the cell. Here, in addition to an N-terminal signal sequence, the position of secondaryinternal signal sequences (sometimes called signal patches) helps to determine the disposition of the protein as it enters theER.
The initial insertion requires recognition of the signal sequence by SRP, the signal recognition protein. The SRP is a G-protein and exchanges its bound GDP for a GTP upon binding to a protein’s signal sequence. The SRP with its attachedprotein then docks to a receptor (called the SRP receptor, astoundingly enough) embedded in the ER membrane andextending into the cytoplasm. The SRP usually binds as soon as the signal sequence is available, and when it does so, itarrests translation until it is docked to the ER membrane. Incidentally, this is the origin of the “rough” endoplasmicreticulum: the ribosomes studding the ER are attached to the ER cytoplasmic surface by the nascent polypeptide it isproducing and an SRP. The SRP receptor can exist on its own or in association with a translocon, which is a bipartitetranslocation channel. The SRP receptor (SR) is also a GTPase, and is usually carrying a GDP molecule whenunassociated. However, upon association with the translocon it exchanges its GDP for a GTP. These GTPs are importantbecause when the SRP binds to the SR, both GTPase activities are activated and the resulting release of energy dissociatesboth from the translocon and the nascent polypeptide. This relieves the block on translation imposed by the SRP, and thenew protein is pushed on through the translocon as it is being synthesized. Once the signal sequence has completelyentered the lumen of the ER, it reveals a recognition site for signal peptidase, a hydrolytic enzyme that resides in the ERlumen and whose purpose is to snip off the signal peptide.
Prokaryotes also use an SRP homolog. In E. coli, the SRP is simple, made up of one protein subunit (Ffh) and a small4.5S RNA. By comparison, some higher eukaryotes have an SRP comprised of six different proteins subunits and a 7SRNA. Similarly, there is a simple prokaryotic homologue to the SRP receptor, FtsY. An interesting difference is that
6.2.3

E. V. Wong 6.2.3 1/8/2022 https://bio.libretexts.org/@go/page/64289
FtsY generally does not interact with exported proteins, and appears to be necessary only for membrane-embeddedproteins. Otherwise, there are many similarities in mechanism for SRP-based insertion of membrane proteins ineukaryotic and prokaryotic species, including GTP dependence, and completion of the mechanism by a translocase(SecYEG in E. coli).
Figure . SRP and its receptor SR mediate movement of proteins through the ER membrane. The SRP recognizes thesignal sequence and binds to it and the ribosome, temporarily arresting translation. The SRP-polypeptide-ribosomecomplex is bound by its receptor, SR, which positions the complex on a translocon. Once the ribosome and polypeptide aredocked on the translocon, the SRP dissociates, and translation resumes, with the polypeptide moving through thetranslocon as it is being synthesized.
If that was the only signal sequence in the protein, the remainder of the protein is synthesized and pushed through thetranslocon and a soluble protein is deposited in the ER lumen, as shown in Figure . What about proteins that areembedded in a membrane? Transmembrane proteins have internal signal sequences (sometimes called signal patches).Depending on their relative locations, they may be considered either start-transfer or stop-transfer sequence, where“transfer” refers to translocation of the peptide through the translocon. This is easiest to understand by referring to Figure
.
Figure . Single-pass transmembrane protein insertion. (1) the signal sequence has allowed the ribosome to dock on atranslocon and newly made polypeptide is threaded through until the stop-transfer sequence. (2) The hydrophobic stoptransfer sequence gets “stuck” in the membrane, forcing the rest of the polypeptide to stay in the cytoplasm as it istranslated.
If there is a significant stretch of mostly-uninterrupted hydrophobic residues, it would be considered a stop-transfer signal,as that part of the protein can get stuck in the translocon (and subsequently the ER membrane) forcing the remainder of theprotein to remain outside the ER. This would generate a protein that inserts into the membrane once, with its N-terminus inthe ER lumen and the C-terminus in the cytoplasm. In a multi-pass transmembrane protein, there could be several start-and stop- transfer hydrophobic signal patches.
Figure . Insertion of 2-pass transmembrane protein.
6.2.4
6.2.4
6.2.5
6.2.5
6.2.6

E. V. Wong 6.2.4 1/8/2022 https://bio.libretexts.org/@go/page/64289
Building on the single-pass example, if there was another signal patch after the stop-transfer sequence, it would act as astart-transfer sequence, attaching to a translocon and allowing the remainder of the protein to be moved into the ER. Thisresults in a protein with both N- and C- termini in the ER lumen, passing through the ER membrane twice, and with acytoplasmic loop sticking out. Of course, the N-terminus could be on the other side. For a cytoplasmic N-terminus, theprotein cannot have an N-terminal signal sequence (Figure ). It has an internal signal patch instead. It playsessentially the same role, but the orientation of the patch means that the N-terminal stays cytoplasmic. The polypeptidetranslated after the patch is fed into the ER. And just as in the last example, multiple stop- and start- sequences can reinsertthe protein in the membrane and change the facing of the next portion.
Figure . Insertion of a single-pass protein with N-terminus in cytoplasm uses a signal patch but no N-terminal signal.
6.2.7
6.2.7

E. V. Wong 6.3.1 1/5/2022 https://bio.libretexts.org/@go/page/64290
6.3: Protein Folding in the Endoplasmic ReticulumThe endoplasmic reticulum (ER) lumen plays four major protein processing roles:
1. folding/refolding of the polypeptide,2. glycosylation of the protein,3. assembly of multi-subunit proteins, and4. packaging of proteins into vesicles.
Refolding of proteins is an important process because the initial folding patterns as the polypeptide is still being translatedand unfinished may not be the optimal folding pattern once the entire protein is available. This is true not just of H-bonds,but of the more permanent (i.e. covalent) disulfide bonds as well. Looking at the hypothetical example polypeptide, thesecondary structure of the N-terminal half may lead to the formation of a stable disulfide bond between the first cysteineand the second cysteine, but in the context of the whole protein, a more stable disulfide bond might be formed betweencysteine 1 and cysteine 4. The exchange of disulfide bonding targets is catalyzed by protein disulfide isomerase (PDI).
Figure . Protein Disulfide Isomerase rearranges disulfide bonds.
The internal redox environment of the endoplasmic reticulum, is significantly more oxidative than that in the cytoplasm.This is largely determined by glutathione, which is found in a 30:1 GSH:GSSG ratio or higher in the cytoplasm but atnearly 1:1 ratio in the ER lumen. This oxidative environment is also conducive to the disulfide remodeling. It should benoted that PDI does not choose the “correct” bonding partners. It simply moves the existing disulfide bonds to a moreenergetically stable arrangement. As the rest of the polypeptide continues to refold, breaking and making H-bonds quickly,new potential disulfide bond partners may move near one another and PDI can again attempt to rearrange the disulfidebonding pattern if the resulting pattern is more thermodynamically stable.
Figure . Protein Disulfide Isomerase. This enzyme uses a sulfhydryl group of a cysteine residue as temporary bondingpartner in order to break disulfide bonds on the target protein and allow for new ones to form. Note that the formation of anew bond is not directed by PDI, but is instead a stochastic process in which a stronger binding partner displaces the PDI—SH.
The assembly of multisubunit proteins and the refolding of polypeptides are similar in their use of chaperone proteins thathelp prevent premature folding, sequestering parts of the protein from H-bonding interaction until the full protein is in theER lumen.
6.3.8
6.3.9

E. V. Wong 6.3.2 1/5/2022 https://bio.libretexts.org/@go/page/64290
Figure . Protein folding is optimized in the ER. Proteins such as calnexin can temporarily bind to nascentpolypeptides, preventing them from forming secondary structures from incomplete information, releasing the protein forfolding once the entire polypeptide has been translated.
This mechanism simply makes finding the thermodynamically optimal conformation easier by preventing the formation ofsome potential suboptimal conformations. These chaperone proteins bind to the new proteins as they enter the lumenthrough the translocon and in addition to simply preventing incorrect bonds that would have to be broken, they alsoprevent premature interaction of multiple polypeptides with one another. This can be a problem because prior to the properfolding that would normally hide such domains within the protein, the immature polypeptides may have interactiondomains exposed, leading to indiscriminate binding, and potentially precipitation of insoluble protein aggregates.
Chaperone proteins can also be found in prokaryotes, archaea, and in the cytoplasm of eukaryotes. These aresomewhat similar to each other, and function somewhat differently than the types of folding proteins found in the ERlumen. They are referred to generally as chaperonins, and the best characterized is the GroEL/ GroES complex in E.coli. As the structure in Figure indicates, it is similar in shape to the proteasome, although with a completelydifferent function. GroEL is made up of two stacked rings, each composed of 7 subunits, with a large central cavityand a large area of hydrophobic residues at its opening. GroES is also composed of 7 subunits, and acts as a cap on oneend of the GroEL. However, GroES only caps GroEL in the presence of ATP. Upon hydrolysis of the ATP, thechaperonins undergo major concerted conformational changes that impinge on the protein inside, causing refolding,and then the GroES dissociates and the protein is released back into the cytosol.
Figure . GroEL/GroES complex. The two heptameric rings of GroEL are shown in green and blue/purple. TheGroES heptamer (red/yellow) caps the GroEL complex in the presence of ATP. Illustration by D.S. Goodsell, 2002.
6.3.10
Chaperones
6.3.11
6.3.11
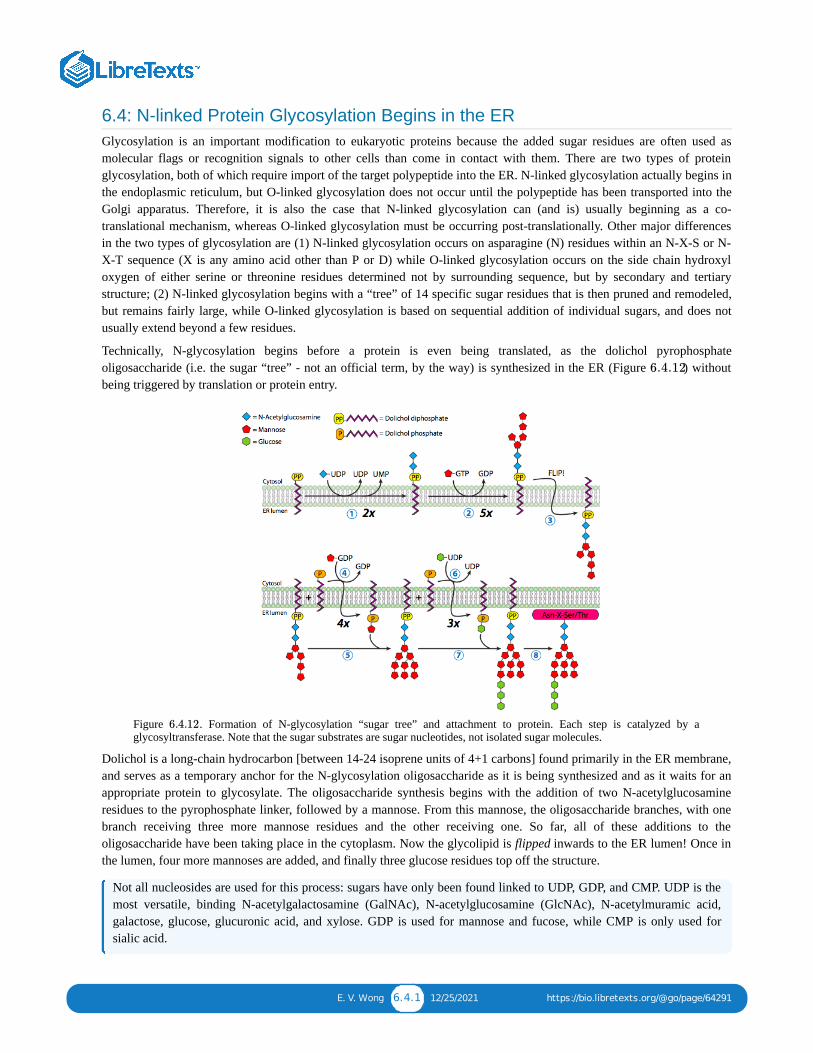
E. V. Wong 6.4.1 12/25/2021 https://bio.libretexts.org/@go/page/64291
6.4: N-linked Protein Glycosylation Begins in the ERGlycosylation is an important modification to eukaryotic proteins because the added sugar residues are often used asmolecular flags or recognition signals to other cells than come in contact with them. There are two types of proteinglycosylation, both of which require import of the target polypeptide into the ER. N-linked glycosylation actually begins inthe endoplasmic reticulum, but O-linked glycosylation does not occur until the polypeptide has been transported into theGolgi apparatus. Therefore, it is also the case that N-linked glycosylation can (and is) usually beginning as a co-translational mechanism, whereas O-linked glycosylation must be occurring post-translationally. Other major differencesin the two types of glycosylation are (1) N-linked glycosylation occurs on asparagine (N) residues within an N-X-S or N-X-T sequence (X is any amino acid other than P or D) while O-linked glycosylation occurs on the side chain hydroxyloxygen of either serine or threonine residues determined not by surrounding sequence, but by secondary and tertiarystructure; (2) N-linked glycosylation begins with a “tree” of 14 specific sugar residues that is then pruned and remodeled,but remains fairly large, while O-linked glycosylation is based on sequential addition of individual sugars, and does notusually extend beyond a few residues.
Technically, N-glycosylation begins before a protein is even being translated, as the dolichol pyrophosphateoligosaccharide (i.e. the sugar “tree” - not an official term, by the way) is synthesized in the ER (Figure ) withoutbeing triggered by translation or protein entry.
Figure . Formation of N-glycosylation “sugar tree” and attachment to protein. Each step is catalyzed by aglycosyltransferase. Note that the sugar substrates are sugar nucleotides, not isolated sugar molecules.
Dolichol is a long-chain hydrocarbon [between 14-24 isoprene units of 4+1 carbons] found primarily in the ER membrane,and serves as a temporary anchor for the N-glycosylation oligosaccharide as it is being synthesized and as it waits for anappropriate protein to glycosylate. The oligosaccharide synthesis begins with the addition of two N-acetylglucosamineresidues to the pyrophosphate linker, followed by a mannose. From this mannose, the oligosaccharide branches, with onebranch receiving three more mannose residues and the other receiving one. So far, all of these additions to theoligosaccharide have been taking place in the cytoplasm. Now the glycolipid is flipped inwards to the ER lumen! Once inthe lumen, four more mannoses are added, and finally three glucose residues top off the structure.
Not all nucleosides are used for this process: sugars have only been found linked to UDP, GDP, and CMP. UDP is themost versatile, binding N-acetylgalactosamine (GalNAc), N-acetylglucosamine (GlcNAc), N-acetylmuramic acid,galactose, glucose, glucuronic acid, and xylose. GDP is used for mannose and fucose, while CMP is only used forsialic acid.
6.4.12
6.4.12

E. V. Wong 6.4.2 12/25/2021 https://bio.libretexts.org/@go/page/64291
The enzymes that accomplish the glycosylation are glycosyltransferases specific for both the added sugar residue and thetarget oligosaccharide. The sugars used by the enzymes are not simply the sugar, but nucleotide sugars - usually a sugarlinked to a nucleoside diphosphate, for example, uracil diphosphate glucose (UDP-glucose) or GDP- mannose.
The N-linked oligosaccharide has two physiological roles: it acts as the base for further glycosylation, and it is used as amarker for error-checking of protein folding by the calnexin-calreticulin system (Figure ). Once the oligosaccharideis attached to the new polypeptide, the process of further glycosylation begins with the action of a glucosidase and thatremoves two of the glucoses. The last glucose is necessary to help the glycoprotein dock with either calnexin orcalreticulin (Figure13, step 1 or 4), which are very similar proteins that have a slow glucosidase activity and associate witha protein disulfide isomerase-like activity.
The protein disulfide isomerase-like activity comes from ERp57, which is technically a thiol oxidoreductase, but isfunctionally similar to PDI.
The major difference is that calreticulin is soluble in the ER lumen while calnexin is bound to the ER membrane. Bothtemporarily hold onto the glycoprotein giving it time to (re)fold and possibly rearrange disulfide bonds, then it removes theglucose, allowing the glycoprotein to continue on its way. Importantly, if the glycoprotein has not been completely folded(step 2a), the enzyme UDP-glucose:glycoprotein glucosyltransferase (GT) recognizes it and adds back the glucose residue(step 3), forcing it to go through the calreticulin/calnexin cycle again in hopes of folding correctly this time. If it has beenfolded correctly (step 2b), it can be recognized by ER-α-1,2-mannosidase, which removes a mannose, completing theglycosylation modifications in the ER.
Figure . N-glycosylation can be used in error-checking.
Most glycoproteins continue with oligosaccharide remodeling once they have been moved from the ER to the Golgiapparatus by vesicular transport. There, a variety of glycosidases and glycosyltransferases prune and add to theoligosaccharide. Although the glycosylation is consistent and stereotyped for a given protein, it is still unclear exactly howthe glycosylation patterns are determined.
6.4.13
6.4.13

E. V. Wong 6.4.3 12/25/2021 https://bio.libretexts.org/@go/page/64291
Figure . N-linked glycosylation can continue in the Golgi. Sugars may be added and removed in different patternsby glycosyltransferases resident in the Golgi.
Two common antibiotics, tunicamycin and bacitracin, can target N-linked glycosylation, although their antibioticproperties come from disrupting formation of bacterial cell walls. Tunicamycin is an analogue of UDP-GlcNAc, andinside eukaryotic cells can disrupt the initial oligosaccharide formation by blocking the initial GlcNAc addition to thedolichol-phosphate. Since it can be transported into eukaryotic cells, tunicamycin is not clinically useful due to itstoxicity. Bacitracin, on the other hand, is a small cyclic polypeptide that binds to dolichol-PP preventing itsdephosphorylation to dolichol-P, which is needed to build the oligosaccharide. Bacitracin is not cell-permeable, soeven though it has similar activity to tunicamycin on bacteria by disrupting extracellular glycolipid synthesis neededfor cell wall formation, it is harmless to eukaryotes and thus is a useful therapeutic antibiotic.
6.4.14

E. V. Wong 6.5.1 1/8/2022 https://bio.libretexts.org/@go/page/64292
6.5: O-linked Protein Glycosylation Takes Place Entirely in the GolgiO-linked glycoproteins begin their glycosylation with the action of the Golgi-specific enzyme, GalNAc transferase, whichattaches an N-acetylgalactosamine to the hydroxyl group of a serine or threonine. The determination of which residue toglycosylate appears to be directed by secondary and tertiary structure as previously mentioned, and often occurs in denseclusters of glycosylation. Despite being fairly small additions (usu. <5 residues), the combined oligosaccharide chainsattached to an O-linked glycoprotein can contribute over 50% of the mass of a glycoprotein. Two of the better known O-linked glycoproteins are mucin, a component of saliva, and ZP3, a component of the zona pellucida (which protects eggcells). These two examples also illustrate a key property of glycoproteins and glycolipids in general: the sugars are highlyhydrophilic and hold water molecules to them, greatly expanding the volume of the protein.
Figure . O-linked glycosylation in the Golgi involves attachment of only a few sugars to serine or threonine.
Interestingly, this protective waterlogged shell can mask parts of the protein core. In the case of the cell adhesion molecule,NCAM, which is a highly polysialylated glyco- protein at certain developmental stages and locations, and unglycosylatedin others, the naked protein can be recognized as an adhesive substrate while the glycosylated protein can be recognized asa repulsive substrate to other cells. Even in highly glycosylated proteins though, the sugar residues often acts asrecognition sites for other cells. For instance, the zona pellucida is very important as a physical barrier that protects theegg, but glycosylated ZP3 also acts as a sperm receptor.
6.5.15

E. V. Wong 6.6.1 12/25/2021 https://bio.libretexts.org/@go/page/64293
6.6: Vesicular TransportIn addition to protein processing, the ER and Golgi also take care of some types of protein transport. Vesicles (membrane-bound bubbles, essentially) pinch off from the ER, Golgi, and other membranous organelles, carrying with them whateversoluble molecules were inside the fluid that was enclosed as well as any molecules embedded in that section of membrane.These vesicles then catch a ride on a molecular motor such as kinesin or myosin, and travel along the cytoskeleton untilthey dock at the appropriate destination and fuse with the target membrane or organelle. In general, vesicles move from theER to the cis Golgi, from the cis to the medial Golgi, from the medial to the trans Golgi, and from the trans Golgi to theplasma membrane or other compartments. Although most movement is in this direction, there are also vesicles that moveback from the Golgi to the ER, carrying proteins that were supposed to stay in the ER (e.g. PDI) and were accidentallyscooped up within a vesicle.
Figure . Vesicles bud from the endoplasmic reticulum and merge to form ERGIC, which matures into the cis Golgi,then the medial Golgi, and finally the trans Golgi. Vesicles may also bud from any of these other compartments to otherorganelles or to the plasma membrane.
The formation of vesicles is dependent on coat proteins that will, under proper conditions, self-assemble into sphericalcages. When associated with transmembrane proteins, they can pull the attached membrane along into a spherical shapealso. The major types of coat proteins used in vesicle formation are COPII, COPI, and clathrin.
COPII coat proteins form the vesicles that move from ER to Golgi. COPI coat proteins are used between parts of the Golgiapparatus as well as to form vesicles going from the Golgi back to the ER. Finally, clathrin is used to form vesicles leavingthe Golgi for the plasma membrane as well as for vesicles formed from the plasma membrane for endocytosis.
Figure . Clathrin. (A) clathrin binds to adapter proteins which are bound to transmembrane cargo receptors, linkingthe membrane with the clathrin. (B) A single clathrin triskelion is composed of three heavy chains and three light chains.(c) The triskelions self-assemble into a roughly spherical construct without the need for any additional energy or enzymes.
Clathrin (Figure ) is the best described of the three, and the vesicular coats are made from arrangements of clathrintriskelions (from Greek, meaning three-legged). Each triskelion is composed of three heavy chains joined together at theC-terminus, and three light chains, one associated with each heavy chain. The heavy chains of different triskelions interactalong the length of their heavy chain “legs” to create a very sturdy construct. The light chains are unnecessary for vesicleformation, and are thought to help prevent accidental interactions of clathrin molecules in the cytoplasm.
There is significant similarity between the vesicle formation mechanisms using these different coat proteins, beginningwith the recruitment of ARF1 (ARF stands for ADP ribosylation factor, which has nothing to do with its function here) tothe membrane. This requires the ARNO-facilitated exchange of a GTP for GDP (ARNO is ARF nucleotide binding site
6.6.16
6.6.17
6.6.17

E. V. Wong 6.6.2 12/25/2021 https://bio.libretexts.org/@go/page/64293
opener). Once ARF1 has bound GTP, the conformational change reveals an N-terminal myristoyl group which inserts intothe membrane. Both COPI and clathrin-coated vesicles use ARF1 and ARNO, but COPII uses similar proteins calledSar1p and Sec12p.
Figure . COP-coated vesicles
The ARF1 (or Sar1p) is used to recruit adapter proteins that bind to the “tail” end of membrane-bound receptor proteins.The business end of these receptors binds to car- go molecules that need to be packaged into the vesicle. The adapterproteins act as the link between the membrane (through the receptors) and the coat proteins. For clathrin, the adapterproteins are AP1 for trans-Golgi-derived vesicles and AP2 for endocytic vesicles. For COPI vesicles, the approximatehomologues are the β-, γ-, δ-, and ζ- COPs while the COPII system uses Sec23p and Sec24p.
Finally, the adapters link to the actual coat proteins: clathrin, α- or ε- COP, Sec13p and Sec31p. What these proteins allhave in common is that spontaneously (i.e. without any requirement for energy expenditure), they self-assemble into cage-like spherical structures. Under the electron microscope, the clathrin-coated vesicles are more sharply defined and thehexagonal and pentagonal shapes bounded by the clathrin subunits give the vesicle a “soccer ball” look. COP coatamer-coated vesicles are much fuzzier in appearance under EM.
All three types of vesicle coat proteins have the ability to spontaneously associate into a spherical construct, but only theCOPI and COPII coated vesicle also spontaneously “pinch off” the membrane to release the vesicle from its originatingmembrane. Clathrin-coated vesicles require an external mechanism to release the vesicle (Figure ).
Figure . Dynamin monomers, each of which is a GTPase, polymerizes around the neck of the vesicle. When theGTP is hydrolyzed, the dynamin “noose” tightens and pinches off the vesicle.
Once the vesicle has almost completed, there is still a small stalk or neck of membrane that connects the vesicle to themembrane. Around this stalk, dynamic GTP molecules aggregate in a ring/spiral construction. Dynamin molecules areglobular GTPases that contract upon hydrolysis of GTP. When they associate around the vesicle stalk, each dynaminprotein contracts, with the combined effect of constricting the stalk enough that the membrane pinches together, sealing offand releasing the vesicle from the originating membrane.
6.6.18
6.6.19
6.6.19

E. V. Wong 6.6.3 12/25/2021 https://bio.libretexts.org/@go/page/64293
Figure . Glycerophospholipids are made primarily in the ER. Although the ER also makes the ceramide precursorsfor sphingolipids, the sphingolipids are made only in the Golgi.
Although lipids and membranes were discussed in chapter 4, we neglected to discuss the location of their syntheses ineukaryotes. As Figure indicates, the synthesis of certain types of lipids is segregated and exclusive.Glycerophospholipids are primarily formed in the endoplasmic reticulum, although they are also made in mitochondriaand peroxisomes. In contrast, sphingolipids are not made in the ER (though their ceramide precursors are) inmammals, the necessary enzymes are found in the lumen of the cis and medial Golgi. There is evidence of anterogradeand retrograde vesicular traffic between the various Golgi and ER compartments, which would theoretically indicate aredistribution of lipid types. However, the sphingolipids tend to aggregate into lipid rafts and seem to be moreconcentrated in anterograde-moving vesicles.
The coat proteins come off shortly after vesicular release. For clathrin, the process involves Hsc70, an ATPase. However,for COPI or COPII coated vesicles, hydrolysis of the GTP on ARF/Sar1p appears to weaken the coat protein affinity forthe adapters and initiates uncoating. The GTPase activator is ARF GAP (or Sec23p) and is an integral part of the COP I (orII) coat.
The vesicles carry two categories of cargo: soluble proteins and transmembrane proteins. Of the soluble proteins, some aretaken up in the vesicle by virtue of being bound to a receptor. Other proteins just happen to be in the vicinity and arescooped up as the vesicle forms. Occasionally, a protein is taken up that was not supposed to be; for example, PDI may beenclosed in a vesicle forming from the ER. It has little function in the Golgi, and is needed in the ER, so what happens toit? Fortunately, PDI and many other ER proteins have a C-terminal signal sequence, KDEL (Lysine-Aspartic Acid-Glutamic Acid-Leucine), that screams “I belong in the ER.” This sequence is recognized by KDEL receptors inside theGolgi, and binding of the KDEL proteins to the receptors triggers vesicle formation to send them back to the ER.
Secretory vesicles have a special problem with soluble cargo. If the vesicle was to rely simply on enclosing proteins withinit during the formation process, it would be difficult to get high concentrations of those proteins. Many secreted proteinsare needed by the organism quickly and in significant amounts, so there is a mechanism in the trans Golgi for aggregatingsecretory proteins. The mechanism uses aggregating proteins such as secretogranin II and chromogranin B that bringtogether the target proteins in large concentrated granules. These granins work best in the trans Golgi milieu of low pH andhigh Ca , so when the vesicle releases its contents outside of the cell, the higher pH and lower Ca breaks apart theaggregates to release the individual proteins.
There is a consistent pH change during the maturation of the Golgi, so that as we go from ER to Golgi, eachcompartment has a progressively lower (more acidic) lumenal pH.
Finally, there is the question of targeting the vesicles. The vesicles are much less useful if they are tossed on a molecularfreight train and dropped off at random. Therefore, there is a docking mechanism that requires a matching of the v-SNAREprotein on the vesicle’s cytoplasmic surface and the t-SNARE on the cytoplasmic surface of the target membrane. Fusion
6.6.20
6.6.20
2+ 2+

E. V. Wong 6.6.4 12/25/2021 https://bio.libretexts.org/@go/page/64293
of the vesicle to the membrane only proceeds if there is a match. Otherwise, the vesicle cannot fuse, and will attach toanother molecular motor to head to another, hopefully correct, destination. This process is aided by tethering proteinswhich initially make contact with an incoming vesicle and draw it close enough to the target to test for SNARE proteininteraction. Other proteins on the vesicle and target membranes then interact and if the SNAREs match, can help to“winch” the vesicle into the target membrane, whereupon the membranes fuse. An important rule of thumb tounderstanding vesicular fusion and also the directionality of membrane proteins and lipids, is that the cytoplasmic-facingside of a membrane is always going to be facing the cytoplasm. Therefore a protein that is eventually found on the outersurface of the cell membrane will have been inserted into the lumenal surface of the ER membrane to begin with.
Figure . Vesicles first interact with tethering proteins (A), which help bring the vesicle and target membranes close.SNAREs can then interact, and if they match, then they will begin to twist around each other, ratcheting the twomembranes closer as they twist.
More specifically, as a vesicle approaches the target membrane, the tethering protein Rab-GTP, which is linked to thetarget membrane via a double geranylgeranyl lipid tail, loosely associates with the vesicle and holds it in the vicinity of thetarget membrane to give the SNARES a chance to work. The v-SNAREs and t-SNAREs now have the opportunity tointeract and test for a match. Recently, the SNAREs have been renamed R-SNAREs and Q-SNAREs, respectively, basedon conserved arginine and glutamine residues. In addition to these two primary SNAREs, at least one other SNARE isinvolved, together forming a bundle of four α-helices (four, not three, because at least in the best studied example, one ofthe SNAREs is bent around so that two of its alpha-helical domains participate in the interaction. The four helices wraparound each other and it is thought that as they do so, they pull the vesicle and the target membrane together.
The tetanus toxin, tetanospasmin, which is released by Clostridium tetani bacteria, causes spasms by acting on nervecells, and preventing neurotransmitter release. The mechanism for this is that it cleaves synaptobrevin, a SNAREprotein, so that the synaptic vesicles cannot fuse with the cell membrane. Botulinum toxin, from Clostridiumbotulinum, also acts on SNAREs to prevent vesicle fusion and neurotransmitter release, although it targets differentneurons and so has the opposite effect: tetanus is caused by preventing the release of inhibitory neurotransmitters,while botulism is caused by preventing release of excitatory neurotransmitters.
6.6.21

6.7.1 1/1/2022 https://bio.libretexts.org/@go/page/64294
6.7: Receptor-mediated EndocytosisJust as there is vesicular traffic towards the plasma membrane, either for secretion or for incorporation of membrane lipidsor proteins, there can also be vesicular traffic from the plasma membrane. Endocytosis is the process by which a coatprotein (usually clathrin) on the cytoplasmic side of the plasma membrane, begins to polymerize a coat that draws themembrane with it into a vesicle. However, instead of capturing a bit of ER or Golgi lumen with it, the vesicle contains alittle material from outside of the cell. Sometimes endocytosis is initiated internally, perhaps to remove a particular proteinfrom the cell surface (for an example, see trailing edge dynamics in cell motility in the next chapter), but often, theendocytosis is the result of a ligand binding to an extracellular receptor molecule, leading to its activation and subsequentnucleation of a clathrin assembly and vesicle formation.
There are many types of ligands: a nutrient molecule (usually on a carrier protein, as in the examples below) or even anattacking virus which has co-opted the endocytic mechanism to facilitate entry into the cell. The example depicted here is aclassic example: endocytosis of cholesterol (via low-density lipoprotein). This illustrates one potential pathway that thereceptors and their cargo may take. In the case of cholesterol, the carrier protein is broken down fully, although in the caseof transferrin, a serum protein that carries iron in the blood, the carrier protein is just recycled after releasing its transferrincargo. It is packaged into an exocytic vesicle headed back to the cell surface.
Serum cholesterol is usually esterified and bound by LDL (low density lipoprotein), which then floats about in thebloodstream until it meets up with an LDL receptor on the surface of a cell. When the LDL binds to its receptor, thereceptor is activated, and a clathrin-coated vesicle forms around the LDL/receptor complex. LDL receptors tend toaggregate in what are known as clathrin-coated pits — crater-like partial vesicles that already have a small number ofpolymerized clathrin molecules. The vesicle forms exactly as described previously for Golgi-derived clathrin vesicles: theclathrin self- assembles into a spherical vesicle, and dynamin pinches the vesicle off the cell membrane. This vesicle thenfuses with an early endosome, which carries proton pumps in its membrane, causing the environment inside the vesicle toacidify (~pH 6). This acidification can cause conformational shifts in proteins that could, for example, lead to a receptorreleasing its ligand, as is the case here with LDL and LDL receptor. The early endosome also functions as a sorting station:the receptor is re-vesicularized and transported back to the plasma membrane. Meanwhile, the LDL is packaged into adifferent vesicle and heads off for further processing.
The endosomal proton pumps are ATP-driven, Mg -dependent V-type pump (as opposed to the F-type pump in themitochondrial inner membrane). Structurally, the two are similar though, and ATP hydrolysis drives the rotary unit,which then powers the movement of protons across the membrane from cytoplasm into endosome.
Figure . Receptor-mediated endocytosis of cholesterol via low-density lipoprotein.
The endosomal vesicle with the LDL in it next fuses with another acidic, membrane-bound compartment. The lysosome, atpH ~5.0, is even more acidic than the endosome, and it also contains a large complement of acid hydrolases — hydrolyticenzymes ranging across substrates (including proteases, lipases, glycosidases, nucleases) that operate optimally in acidicconditions, and minimally in the neutral or slightly basic conditions in the cytoplasm. In part, this is a safety mechanism —leakage of digestive enzymes from the lysosome will not result in wholesale digestion of the cell because the enzymeshave little or no activity in the cytoplasm. The lysosomal membrane, in addition to having proton pumps to acidify the
2+
6.7.22

6.7.2 1/1/2022 https://bio.libretexts.org/@go/page/64294
internal environment, also incorporates many transporter proteins to aid in moving the digestion products of the acidhydrolases out of the lysosome so that the cell can make use of the amino acids, sugars, nucleotides, and lipids that result.Back to our example, that means that the cholesterol esters are broken apart into individual cholesterol molecules, and thelipoprotein is broken down into lipids and amino acids. Interestingly, these transporter proteins are not digested by thelysosomal proteases because they are very heavily glycosylated, which shields potential proteolytic sites from theproteases.
Lysosomal enzymes are specifically tagged by a mannose-6-phosphate that is added in the cis Golgi. This is a two-stepprocess in which N-acetylglucosamine phosphotransferase adds a phospho-GlcNAc to a mannose residue, connectingvia the phosphate group, then a phosphodiesterase removes the GlcNAc, leaving the mannose-6-P. This specificallytargets lysosomal enzymes because they all have specific protein recognition sequences that the phosphotransferasebinds to before transferring the P-GlcNAc. Although the lysosomal enzymes are tagged in the cis Golgi, they do notsort until the trans Golgi, when mannose-6-P receptors bind to the lysosomal enzymes and form lysosomal vesiclesthat will bud off and travel to late endosomes and lysosomes to deliver their acid hydrolase payload. Again, the pHchange is important: in the somewhat acidic (pH 6.5) environment of the trans Golgi, the receptor binds the mannose-6-P-tagged enzymes, but in the more acidic lysosome, the acid hydrolases are released to do their work.
When one or more acid hydrolases do not function properly or do not make it into the lysosome due to impropersorting, the result is incomplete digestion of the lysosomal contents. This in turn leads to the formation of largeinclusions of partially digested material inside the lysosomes. This accumulation of material can be cytotoxic, andgenetic disorders that affect the expression or sorting of lysosomal hydrolases are collectively referred to as lysosomalstorage diseases. These fall into several categories depending on the types of molecules accumulated.
A common and easily treatable disease of glycosaminoglycan accumulation is Hurler’s disease, which can beeffectively treated and non-neurological effects even reversed by enzyme replacement therapy. Hurler’s others in itsclass affect a wide variety of tissues because glycosaminoglycans are ubiquitous. On the other hand, because the brainis enriched in gangliosides, lysosomal storage diseases like Gaucher’s disease show defects primarily in the CNS.Many lysosomal storage diseases have similar presentation: developmental abnormalities, especially stunted bonegrowth, lack of fine facial features, and neuromuscular weakness.
Since it depends greatly on the contents of the endosome(s) that fused with it, the size and contents of lysosomes can varygreatly. In fact, the lysosome may also degrade internal cellular components through the process of autophagy. Usually,this is initiated under starvation conditions which lead to inhibition of mTor, and subsequent expression of autophagicgenes. These then interact with mitochondria and other cellular components, and promote the formation of a double-membraned autophagosome around them. The origin of the membranes is unclear, although the ER is suspected. Finally,the autophagosome fuses with a lysosome, and the acid hydrolases break down the cell parts for energy. A variation on thiscalled microautophagy can also occur, in which the lysosome itself invaginates a bit of cytoplasmic material andinternalizes an intralysosomal vesicle that is then broken down.
The most severe, I-cell disease (mucolipidosis type II) occurs when nearly all lysosomal enzymes are missing in thefibroblasts of the affected individual. There is severe developmental delay and early growth failure, neuromuscularproblems, and malformations in early skeletal development. The severity of this disorder is due to the almost completelack of lysosomal enzymes, which is caused by a deficiency of GlcNAc phosphotransferase. Without it, no enzymesare tagged for sorting to the lysosome.
Other relatively common disorders include Tay-Sachs and Niemann-Pick diseases. Tay-Sachs is caused by anaccumulation of gangliosides in the brain and is usually fatal by 5 years of age. Niemann-Pick, on the other hand, maymanifest as Type A with an even shorter life expectancy, or as Type B, in which symptoms are relatively minor. Themajor difference is that Type A patients have very little (<5%) of their sphingomyelinase activity, while Type Bpatients have only slightly less than normal (~90%) activity.
Finally, it should be noted that the large vacuoles of plant cells are in fact specialized lysosomes. Recall that vacuoles helpto maintain the turgor, or outward water pressure on the cell walls that lead to a rigid plant part rather than a limp, wilted

6.7.3 1/1/2022 https://bio.libretexts.org/@go/page/64294
one. One of the ways in which this occurs is that the acid hydrolases inside the vacuole alter the osmotic pressure insidethe vacuole to regulate the movement of water either in or out.
Another example of receptor-mediated endocytosis is the import of iron into a mammalian cell. As with serum cholesterol,iron is not generally imported into the cell by itself. Instead, it is bound to apotransferrin, a serum protein that binds twoFe ions. Once it has bound the iron ions, the apotransferrin is now referred to as transferrin, and it can be recognized andbound by transferrin receptors (TfR) located on the extracellular surface of cell membranes. This initiates receptor-mediated endocytosis just as described above. However, in this case, the lysosome is not involved. As the transferrin andtransferrin receptor reach the early endosome, they do not dissociate, but rather the Fe releases from the transferrin, andthen exits the endosome via DMT1, a divalent metal transport protein to be used in heme groups or other complexes. Thisleaves the apotransferrin-TfR complex, which is recycled back to the cell membrane via vesicle. Once the vesicle fuseswith the extracellular space, the acidity of the endosome is dissipated and the apotransferrin no longer binds to TfR.Apotransferrin can thus go back to its duty of finding iron ions and bringing them back to the cell.
3+
2+

1 1/29/2022
CHAPTER OVERVIEW7: (T3) CYTOSKELETONWhen a eukaryotic cell is taken out of its physiological context and placed in a plastic or glass Petri dish, it is generally seen to flattenout to some extent. On a precipice, it would behave like a Salvador Dali watch, oozing over the edge. However, the cell actually has anintricate microstructure within it, framed internally by the components of the cytoskeleton.
7.1: INTRODUCTION TO THE CYTOSKELETONAs the name implies, the cytoskeleton acts much like our own skeletons in supporting the general shape of a cell. Unlike our skeletonsthough, the cytoskeleton is highly dynamic and internally motile, shifting and rearranging in response to the needs of the cell. It alsohas a variety of purposes beyond simply providing the shape of the cell. Generally, these can be categorized as structural andtransport.
7.2: INTERMEDIATE FILAMENTS“Intermediate filaments” is actually a generic name for a family of proteins (grouped into 6 classes based on sequence andbiochemical structure) that serve similar functions in protecting and shaping the cell or its components. Interestingly, they can even befound inside the nucleus. The nuclear filamins, which constitute class V intermediate filaments, form a strong protective meshattached to the inside face of the nuclear membrane.
7.3: ACTIN MICROFILAMENTSMicrofilaments are also known as actin filaments, filamentous actin, and f-actin, and they are the cytoskeletal opposites of theintermediate filaments. These strands are made up of small globular actin (g-actin) subunits that stack on one another with relativelysmall points of contact.
7.4: MICROTUBULESMicrotubules are made up of two equally distributed, structurally similar, globular subunits: α and β tubulin. Like microfilaments,microtubules are also dependent on a nucleotide triphosphate for polymerization, but in this case, it is GTP.
7.5: MICROTUBULE ORGANIZING CENTERSMicrofilaments do not have any kind of global organization with respect to their polarity. They start and end in many areas of the cell.On the other hand, almost all microtubules have their (-) end in a perinuclear area known as the MTOC, or microtubule organizingcenter and they radiate outward from that center. Since the microtubules all radiate outward from the MTOC, it is not surprising thatthey are concentrated more centrally in the cell than the microfilaments.
7.6: TRANSPORT ON THE CYTOSKELETONWhile it can be useful to think of these cytoskeletal structures as analogous to an animal skeleton, perhaps a better way to rememberthe relative placement of the microtubules and microfilaments is by their function in transporting intracellular cargo from one part ofthe cell to another. By that analogy, we might consider the microtubules to be a railroad track system, while the microfilaments aremore like the streets.
7.7: ACTIN - MYOSIN STRUCTURES IN MUSCLEThe motor proteins that transport materials along the acting microfilaments are similar in some ways, such as the globular head groupthat binds and hydrolyzes ATP, yet different in other ways, such as the motion catalyzed by the ATP hydrolysis. Much of the f-actinand myosin in striated and cardiac muscle cells is found in a peculiar arrangement designed to provide a robust contractile responseover the entire length of the cell. The sarcomere is an arrangement of alternating fibers of f-actin.
7.8: CYTOSKELETAL DYNAMICSIn the early development of animals, there is a huge amount of cellular rearrangement and migration as the roughly spherical blob ofcells called the blastula starts to differentiate and form cells and tissues with specialized functions. These cells need to move fromtheir point of birth to their eventual positions in the fully developed animal. Some cells, like neurons, have an additional type of cellmotility - they extend long processes (axons) out from the cell body.
7.9: CELL MOTILITYThere are a number of ways in which a cell can move from one point in space to another. In a liquid medium, that method may besome sort of swimming, utilizing ciliary or flagellar movement to propel the cell. On solid surfaces, those mechanisms clearly will notwork efficiently, and the cell undergoes a crawling process. In this section, we begin with a discussion of ciliary/flagellar movement,and then consider the more complicated requirements of cellular crawling.
7.10: NEW PAGE

E. V. Wong 7.1.1 1/29/2022 https://bio.libretexts.org/@go/page/64296
7.1: Introduction to the CytoskeletonWhen a eukaryotic cell is taken out of its physiological context and placed in a plastic or glass Petri dish, it is generallyseen to flatten out to some extent. On a precipice, it would behave like a Salvador Dali watch, oozing over the edge. Theimmediate assumption, particularly in light of the fact that the cell is known to be mostly water by mass and volume, is thatthe cell is simply a bag of fluid. However, the cell actually has an intricate microstructure within it, framed internally bythe components of the cytoskeleton.
Although the genes are not particularly well conserved, a combination of genetic similarity and protein structure haveconfirmed the presence of prokaryotic proteins that are related to eukaryotic cytoskeletal proteins in both form andfunction. Compared to the eukaryotic cytoskeleton, study of prokaryotic proteins is very recent, and for a long time,there was an assumption that prokaryotes did not have or need cytoskeletal architecture. FtsZ, the bacterial equivalentof tubulin, was discovered in 1980 but most of the work on it has occurred in the last decade. MreB is an actin-likeprotein, first compared to actin in 1992, and crescentin, an intermediate filament class protein, was only described in2003. For comprehensive review of prokaryotic cytoskeleton proteins, see Graumann, P.L., Ann. Rev. Microbiology61:589-618, 2007.
As the name implies, the cytoskeleton acts much like our own skeletons in supporting the general shape of a cell. Unlikeour skeletons though, the cytoskeleton is highly dynamic and internally motile, shifting and rearranging in response to theneeds of the cell. It also has a variety of purposes beyond simply providing the shape of the cell. Generally, these can becategorized as structural and transport. While all three major components of the cytoskeleton perform each of thesefunctions, they do not do so equally, as their biophysical characteristics are quite different. With respect to structure, atsome point in the life of every cell, it must change shape, whether simply increasing or decreasing in size, or a more drasticalteration like the super-elongated form of neurons with axons, the cytoskeleton must be able to respond by dynamicallyincreasing and decreasing the size of the internal structures as needed. Structure also applies to the relative position ofinternal cellular elements, such as organelles or proteins, to one another. In many highly specialized cells, the segregationof particular structures within certain parts of the cell is crucial for it to function. Transport refers to the movement ofmolecules and organelles within the cell as well as movement of the cell as a whole. We just discussed intracellularmovement of proteins and lipids by way of vesicles in the last chapter. Those vesicles, as we will see in this chapter, arenot just floating from one place to another; they are moved purposefully and directionally along the cytoskeleton like cargoon highways or railroad tracks. With respect to whole cell movement, this can range from paddling or swimming bysingle-celled organisms to the stereotyped and highly coordinated crawling of many cells from their point of origin to theireventual destination during the development of a metazoan organism or the movement of fibroblasts to heal a cut in yourskin.
Figure . Cytoskeletal element distribution in a prototypical eukaryotic cell. The purple ball is the nucleus.
The three major components of the cytoskeleton are microtubules, microfilaments, and intermediate filaments. Each ofthese are polymers composed of repeating subunits in specific arrangements. With just a quick glance (Figure ), it isvery clear that the intermediate filaments will likely play a significantly different role from either microtubules ormicrofilaments. Because the IF’s are made of long fibrous subunits that coil around one another to form the filament, thereis clearly a great deal of contact (which facilitates formation of hydrogen bonds, aka molecular velcro ) between subunitsproviding great tensile strength. It is very difficult to break these subunits apart, and thus the IF’s are primarily used forlong-term or permanent load-bearing purposes. Looking at the other two components of the cytoskeleton, one can see thatwith the globular instead of fibrous shape of the subunits, the maximum area of contact between subunits is greatly limited
7.1.1
7.1.1
TM

E. V. Wong 7.1.2 1/29/2022 https://bio.libretexts.org/@go/page/64296
(think of the contact area when you push two basketballs together), making it easier to separate the subunits or break themicrofilament or microtubule. The cell can use this characteristic to its advantage, by utilizing these kinds of cytoskeletalfibers in dynamic situations where formation or destruction of intermediate filaments would take far too long. We nowaddress these three groups of cytoskeletal elements in more detail.

E. V. Wong 7.2.1 1/15/2022 https://bio.libretexts.org/@go/page/64297
7.2: Intermediate Filaments“Intermediate filaments” is actually a generic name for a family of proteins (grouped into 6 classes based on sequence andbiochemical structure) that serve similar functions in protecting and shaping the cell or its components. Interestingly, theycan even be found inside the nucleus. The nuclear filamins, which constitute class V intermediate filaments, form a strongprotective mesh attached to the inside face of the nuclear membrane. Neurons have neurofilaments (class IV), which helpto provide structure for axons — long, thin, and delicate extensions of the cell that can potentially run meters long in largeanimals. Skin cells have a high concentration of keratin (class I), which not only runs through the cell, but connects almostdirectly to the keratin fibers of neighboring cells through a type of cellular adhesion structure called a desmosome(described in the next chapter). This allows pressure that might be able to burst a single cell to be spread out over manycells, sharing the burden, and thus protecting each member. In fact, malformations of either keratins or of the proteinsforming the desmosomes can lead to conditions collectively termed epidermolysis bullosa, in which the skin isextraordinarily fragile, blistering and breaking down with only slight contact, compromising the patient’s first line ofdefense against infection.
Most intermediate filaments fall between 50-100 kDa, including keratins (40-67 kDa), lamins (60-70 kDa), andneurofilaments (62-110 kDa). Nestin (class VI), found mostly in neurons, is an exception, at approximately 240 kDa.
Figure . Intermediate filaments are composed of linear subunits that wrap around each other and interact very tightly.
Structurally, as mentioned previously, all intermediate laments start from a fibrous subunit (Figure ). This then coilsaround another filamentous subunit to form a coiled-coil dimer, or protofilament. These protofilaments then interact toform tetramers, which are considered the basic unit of intermediate filament construction. Using proteins called plectins,the intermediate laments can be connected to one another to form sheets and meshes. Plectins can also connect theintermediate laments to other parts of the cytoskeleton, while other proteins can help to attach the IF cytoskeleton to thecell membrane (e.g. desmoplakin). The most striking characteristic of intermediate filaments is their relative longevity.Once made, they change and move very slowly. They are very stable and do not break down easily. They are not usuallycompletely inert, but compared to microtubules and microfilaments, they sometimes seem to be.
Epidermolysis bullosa simplex is a collection of congenital diseases caused by mutations to the keratin genes KRT5 orKRT14, or to the plectin gene PLEC1. These mutations either weaken the polymerization of keratin into filaments, orthe interaction between keratin filaments. This leads to the inability of each individual cell to maintain structuralintegrity under pressure. Another type of EB, junctional epidermolysis bullosa (JEB), is caused by mutations tointegrin receptors (b4, a6) or laminins. This includes JEB gravis or Herlitz disease, which is the most severe, oftenleading to early postnatal death. JEB is also related to dystrophic epidermolysis bullosa (DEB) diseases such asCockayne-Touraine, each of which s due to a mutation in collagen type VII. The gene products involved in JEB andDEB are discussed in more detail in the next chapter. They play a role in adhering the cells to the basement membrane,and without them, the disorganization of the cells leads to incomplete connections between the epidermal cells, andtherefore impaired pressure-sharing.
Some forms of Charcot-Marie-Tooth disease, the most common inherited peripheral nerve disease, are also linked tomutations of intermediate filament genes. This disease, also known as peroneal muscular atrophy or hereditary motorsensory neuropathy, is a non-lethal degenerative disease primarily affecting the nerves of the distal arms and legs.
7.2.2
7.2.2

E. V. Wong 7.2.2 1/15/2022 https://bio.libretexts.org/@go/page/64297
There is a broad variety of CMT types and causes, the most common being malformations of Schwann cells and themyelin sheath they form. CMT type 2 is characterized by malformations of the peripheral nerve axons, and is linked tomutations of lamin A proteins and of light neurofilaments. The causal mechanism has not yet been established;however, the neurofilaments are significant elements in maintaining the integrity of long axons.

E. V. Wong 7.3.1 1/5/2022 https://bio.libretexts.org/@go/page/64298
7.3: Actin MicrofilamentsMicrofilaments are also known as actin filaments, filamentous actin, and f-actin, and they are the cytoskeletal opposites ofthe intermediate filaments. These strands are made up of small globular actin (g-actin) subunits that stack on one anotherwith relatively small points of contact. You might envision two tennis balls, one fuzzy and the other covered in velcrohooks. Even if you push hard to mush them together, the area of contact between the balls (i.e. the area available for H-bonding between subunits) is fairly small compared to the overall surface area, or to the area of contact between IFsubunits. They will hold together, but they can also fall apart with relatively little force. Contrast this with intermediatefilaments, which might be represented as two ribbons of velcro hooks or loops. Considerably more work is required to takethem apart. Because there are fewer H-bonds to break, the microfilaments can be deconstructed very quickly, making itsuitable for highly dynamic applications.
Figure . Actin microfilaments have a (+) and (-) end. When the free (globular) actin concentration is low, actin isprimarily added to the (+) end, and lost from the (-) end. However at high levels of g-actin, new monomers can potentiallyadd onto the filament from either end.
When the actin subunits come together to form microfilaments, they interact directionally. That is, subunits have a “top”and a “bottom”, and the top of one subunit always interacts with the bottom of another. If we go to the “bottom”-mostsubunit of a filament, the open end is called the minus (-) end, while the opposite end, which incidentally sees moreadditive action, is called the plus (+) end. Microfilaments are also said to have polarity, but again this is only in the senseof having directionality, and has nothing to do with electrical charge. Individual microfilaments can exist, but mostmicrofilaments in vivo are twisted pairs. Unlike DNA; however, microfilament pairs are not antiparallel: both strands havethe same directionality.
The formation of filaments from g-actin is an ATP-dependent process, although not in the conventional sense of utilizingthe energy released in hydrolysis. Instead, the globular actin subunits will only bind with another g-actin subunit if it hasfirst bound an ATP. If the g-actin has bound ADP, then it must first exchange the ADP for ATP before it can be added ontoa filament. This alters the conformation of the subunit to allow for a higher-affinity interaction. A short time later,hydrolysis of the ATP to ADP (with release of P ) weakens the affinity but does not directly cause dissolution of thesubunit binding. The hydrolysis is brought about by the actin itself, which has this ATPase enzymatic activity built in.
Although f-actin primarily exists as a pair of filaments twisted around each other, addition of new actin occurs by theaddition of individual g-actin monomers to each filament (Figure ). Accessory proteins can be used to help or hindereither the building or breakdown of the filaments, but the primary mechanism is essentially self-regulating. When free g-actin levels are high, elongation of actin filaments is favored, and when the g-actin concentration falls, depolymerization off-actin predominates. Under average physiological conditions, though, what is often seen in actin microfilaments is aneffect called treadmilling. Since actin is mostly added onto one end but removed from the other, the net effect is that anygiven actin monomer in a filament is effectively moving from (+) end to (-) end even if the apparent length of the filamentdoes not change.
In most cell types, the greatest concentration of actin-based cytoskeletal structures is found in the periphery of the cellrather than towards the center. This fits well with the tendency of the edges of the cell to be more dynamic, constantlyadjusting to sense and react to its environment. Clearly, the polymerization and depolymerization of actin filaments ismuch faster than for intermediate filaments. The big exception to the actin-in-periphery rule is found in muscle cells. Actinfilaments, and the myosin motor proteins that work on them, are the basis for muscle cell contraction, and ll up most of themuscle cells, not just the periphery. We will discuss the role of actin in both types of cell movement later in the chapter.
7.3.3
i
7.3.3

E. V. Wong 7.4.1 1/8/2022 https://bio.libretexts.org/@go/page/64299
7.4: MicrotubulesMicrotubules are made up of two equally distributed, structurally similar, globular subunits: α and β tubulin. Likemicrofilaments, microtubules are also dependent on a nucleotide triphosphate for polymerization, but in this case, it isGTP.
Microtubule stability is temperature-dependent: if cooled to 4°C, microtubules fall apart into αβ-tubulin heterodimers.Warmed back up to 37°C, the tubulin repolymerizes if there is GTP available.
Another similarity is that microtubules have a polarity in which the (-) end is far less active than the (+) end. However,unlike the twisted-pair microfilaments, the microtubules are mostly found as large 13-stranded (each strand is called aprotofilament) hollow tube structures. Also, the α and β tubulin used for building the microtubules not only alternate, butthey are actually added in pairs. Both the α-tubulin and β-tubulin must bind to GTP to associate, but once bound, the GTPbound to α-tubulin does not move. On the other hand, GTP bound in the β-tubulin may be hydrolyzed to GDP. GDP-boundαβ-dimers will not be added to a microtubule, so similar to the situation with ATP and g-actin, if the tubulin has GDPbound to it, it must first exchange it for a GTP before it can be polymerized. Although the affinity of tubulin for GTP ishigher than the affinity for GDP, this process is usually facilitated by a GEF, or guanine nucleotide exchange factor. As thesignal transduction chapter will show in more detail, this type of nucleotide exchange is a common mechanism foractivation of various biochemical pathways.
Figure . Microtubules exhibit dynamic instability. GTP-bound αβ-tubulin dimers are added onto the microtubule.Once the GTP is hydrolyzed, the conformational shift strains the microtubule, which will tend to break apart unless newtubulin dimers are added to stabilize the structure.
Again like actin, the tubulin itself has enzymatic activity, and over time, the GTPase activity hydrolyzes the GTP to GDPand phosphate. This changes the attachment between β-tubulin of one dimer and the α-tubulin of the dimer it is stacked onbecause the shape of the subunit changes. Even though it isn’t directly loosening its hold on the neighboring tubulin, theshape change causes increased stress as that part of the microtubule tries to push outward. This is the basis of a property ofmicrotubules known as dynamic instability. If there is nothing to stabilize the microtubule, large portions of it will fallapart. However, as long as new tubulin (which will have GTP bound) is being added at a high enough rate to keep asection of low-stress “stable”-conformation microtubule (called the GTP cap) on top of the older GDP-containing part,then it stabilizes the overall microtubule. When new tubulin addition slows down, and there is only a very small ornonexistent cap, then the microtubule undergoes a catastrophe in which large portions rapidly break apart. Note that this isa very different process than breakdown by depolymerization, which is the gradual loss of only a few subunits at a timefrom an end of the microtubule. Depolymerization also occurs, and like with actin, is determined partially by the relativeconcentrations of free tubulin and microtubules.
From a physical standpoint, the microtubule is fairly strong, but not very flexible. A microfilament will flex and bendwhen a deforming force is applied (imagine the filament anchored at the bottom end standing straight up, and somethingpushing the tip to one side). The microtubule in the same situation will bend only slightly, but break apart if the deformingforce is sufficient. There is, of course, a limit to the flexibility of the microfilament and eventually, it will also break.
7.4.4

E. V. Wong 7.4.2 1/8/2022 https://bio.libretexts.org/@go/page/64299
Intermediate filaments are slightly less flexible than the microfilaments, but can resist far more force that eithermicrofilaments or microtubules.

E. V. Wong 7.5.1 12/18/2021 https://bio.libretexts.org/@go/page/64300
7.5: Microtubule Organizing CentersMicrotubules, like microfilaments, are dynamic structures, changing in length and interactions to react to intra- and extra-cellular changes. However, the general placement of microtubules within the cell is significantly different frommicrofilaments, although there is some overlap as well as interaction. Microfilaments do not have any kind of globalorganization with respect to their polarity. They start and end in many areas of the cell. On the other hand, almost allmicrotubules have their (-) end in a perinuclear area known as the MTOC, or microtubule organizing center and theyradiate outward from that center. Since the microtubules all radiate outward from the MTOC, it is not surprising that theyare concentrated more centrally in the cell than the microfilaments which, as mentioned above, are more abundant aroundthe periphery of the cell. In some cell types (primarily animal), the MTOC contains a structure known as the centrosome.This consists of a centriole (two short barrel-shaped microtubule- based structures positioned perpendicular to each other)and a poorly defined concentration of pericentriolar material (PCM). The centriole is composed of nine fibrils, allconnected to form a cylinder, and each also connected by radial spokes to a central axis. The electron micrograph in Figure
shows a cross-section of a centriole. In it, each fibril is shown to actually be a fused triplet of microtubules.
Figure . An electron micrograph depicting the cross-section of a centriole in an embryonic mouse brain cell. L.Howard and M. Marin-Padilla, 1985
Inhibition of γ-tubulin function by antibody blocking, RNA interference of expression, and gene knockout confirm thatwithout γ-tubulin function, the microtubule structures did not form. In addition, it appears to be play roles incoordination of late mitosis (anaphase onwards).
However, in each triplet, only one is a complete microtubule (designated the A tubule), while the B and C tubules do notform complete tubes (they share a wall with the A and B tubules, respectively). Interestingly, the centrioles do not appearto be connected to the cellular microtubule network. However, whether there is a defined centrosome or not, the MTOCregion is the point of origin for all microtubule arrays. This is because the MTOC contains a high concentration of γ-tubulin. Why is this important? With all of the cytoskeletal elements, though it is most pronounced with microtubules, therate of nucleation, or starting a microtubule is significantly slower than the rate of elongating an existing structure. Since itis the same biochemical interaction, the assumption is that the difficulty lies in getting the initial ring of dimers intoposition. The γ-tubulin facilitates this process by forming a γ-tubulin ring complex that serves as a template for thenucleation of microtubules (Figure ).
7.5.5
7.5.5
7.5.6

E. V. Wong 7.5.2 12/18/2021 https://bio.libretexts.org/@go/page/64300
Figure . γ-tubulin ring complex facilitates microtubule nucleation.
This is true both in animal and fungal cells with a single defined MTOC, as well as in plant cells, which have multiple,dispersed sites of microtubule nucleation.
7.5.6

E. V. Wong 7.6.1 12/4/2021 https://bio.libretexts.org/@go/page/64301
7.6: Transport on the CytoskeletonWhile it can be useful to think of these cytoskeletal structures as analogous to an animal skeleton, perhaps a better way toremember the relative placement of the microtubules and microfilaments is by their function in transporting intracellularcargo from one part of the cell to another. By that analogy, we might consider the microtubules to be a railroad tracksystem, while the microfilaments are more like the streets. By the same analogy, we can suggest that the microtubulenetwork and microfilament network are connected at certain points so that when cargo reaches its general destination bymicrotubule (rail), then it can be taken to its specific address by microfilament. Let’s extend this analogy a bit further. Ifthe microtubules and microfilaments are the tracks and streets, then what are the trains and trucks? Ah, an astute question,Grasshopper. On the microtubules, the “trains” are one of two families of molecular motors: the kinesins and the dyneins.
We can generalize somewhat and say that the kinesins drive towards the (+) end (toward periphery of cell) while thedyneins go toward the (-) end (toward the MTOC). On actin microfilaments, the molecular motors are proteins of themyosin family. At this point, the analogies end, as the functioning of these molecular motors is very different fromlocomotion by train or truck. Finally, one might question the biological need for such a transport system. Again, if weanalogize to human transport, then we could say that transport via simple diffusion is akin to people carrying packagesrandomly about the cell. That is to say, the deliveries will eventually be made, but you wouldn’t want to count on thismethod for time-critical materials. Thus a directed, high-speed system is needed to keep cells (particularly larger,eukaryotic cells) alive.
Although this type of transport occurs in all eukaryotic cells, a particularly well-studied case is axonal transport (alsocalled axoplasmic transport) in neurons. Here, the transport of materials from the cell body (soma) to the tips of theaxons can sometimes traverse very long distances up to several meters in larger animals, and must do so in a timelymanner. Axonal transport is generally classified as anterograde (from soma to axon terminal) or retrograde (fromterminals back). The types of material transported in these two directions is very different: much of the anterogradetransport is protein building blocks for extending the axon or synaptic vesicles containing neurotransmitters; retrogradetransport is mostly endocytic vesicles and signaling molecules. Axonal transport is also categorized as fast and slow.Slow transport is primarily the movement of proteins directly bound to the motors, and they can move from from 100mm per day (SCa, slow component a) up to 3mm/day (SCb). In comparison, fast transport is generally movement ofvesicles, and can vary from 50 to 400 mm/day. The mechanism of slow transport had been debated for over a decadeuntil 2000, when direct visualization of fluorescently labeled neurofilaments in transport showed that the actualmovement of the proteins was very similar to the movement in fast axonal transport, but there were many pauses in thetransport, a “stop and go” mechanism rather moving from source to destination continuously.

E. V. Wong 7.6.2 12/4/2021 https://bio.libretexts.org/@go/page/64301
Figure . Transport on microtubules and microfilaments.
All of the kinesins and dyneins have a few key commonalities. There is a catalytic energy-releasing “head” connected to ahinge or neck region allowing the molecule to flex or “step”, and there is a cargo-carrying tail beyond that (Figure ).The head of a kinesin or dynein catalyzes the hydrolysis of ATP, releasing energy to change its conformation relative to theneck and tail of the molecule, allowing it to temporarily release its grip on the microtubule, swivel its “hips” around toplant itself a “step” away, and rebind to the microtubule (Figure ). On the actin microfilaments, the myosins, of whichthere are also many types (some depicted in Figure ) are the molecular motors. Their movement is different fromdyneins and kinesins, as will be described in the next section, but also uses the energy of ATP hydrolysis to provide energyfor the conformational changes needed for movement. We have introduced the motors, but considering the enormousdiversity in the molecules that need to be transported around a cell, it would be impossible for the motors to directly bindto all of them. In fact, the motors bind to their cargo via adapter molecules that bind the motor on one side, and a cargomolecule or vesicle on the other. Further examination of the cargo and the routing of the cargo by address markers(SNAREs) was discussed in the vesicular transport chapter.
Figure . Kinesin (A) and Dynein (B) are motor proteins that move along microtubules. Generally, kinesins move tothe (+) end while dyneins move to the (-) end. Their motor function requires ATP hydrolysis. ATP binding sites are markedin white.
7.6.7
7.6.8
7.6.9
7.6.10
7.6.8

E. V. Wong 7.6.3 12/4/2021 https://bio.libretexts.org/@go/page/64301
Figure . A cargo vesicle (yellow) can be simultaneously bound by dynein (green) and kinesin (blue) via adapterproteins. This top side also depicts the movement of the kinesin, in which binding of ATP causes one “foot” to release, andhydrolysis of ATP causes the molecule to swivel the other foot in front.
Figure . Selected Myosins. (A) Type I myosin, primarily for binding membranes to f-actin, including endocyticvesicles. (B) Type II myosin, binds f-actin on both ends to slide filaments against each other. (C) Type V myosin, used invesicular transport. (D) Type VI myosin, used in endocytosis. (E) Type XI myosin, a fast myosin used in cytoplasmicstreaming in plant cells.
7.6.9
7.6.10

7.7.1 1/22/2022 https://bio.libretexts.org/@go/page/64302
7.7: Actin - Myosin Structures in MuscleThe motor proteins that transport materials along the acting microfilaments are similar in some ways, such as the globularhead group that binds and hydrolyzes ATP, yet different in other ways, such as the motion catalyzed by the ATP hydrolysis.Much of the f-actin and myosin in striated and cardiac muscle cells is found in a peculiar arrangement designed to providea robust contractile response over the entire length of the cell. The sarcomere is an arrangement of alternating fibers of f-actin (also known as “thin fibers” based on their appearance in electron micrographs) and myosin II (or “thick fibers”).Although we do not normally think of the motor protein as a fiber, in this case the tails of the myosin II moleculesintertwine to form a continuous fiber of myosin molecules. As the contractile cycle proceeds, the myosin molecules gripthe adjacent actin fibers, and move them. In Figure , you can see that a sarcomere is constructed so that thestationary myosin fibers are located centrally, with two parallel sets of actin fibers interspersed between the myosin fibers,to the left and the right of the center. Note that the actin fibers do not cross the center line, and that at the center, themyosin molecules switch orientation. The physiological effect of this is that the actin filaments are all pulled inwardstoward the center of the sarcomere. The sarcomere in turn, is merely one of many connected together to form a myofibril.The myofibrils extend the length of the muscle cell.
Figure . Sarcomere. Myosin II is depicted as in Figure , but here entwined with other myosins to form the thickfilament. They are supported and anchored by titin (shown as long tangled orange ribbons). The myosin heads act on theactin filaments (blue), pulling them towards each other in a contractile movement.
Figure . Human skeletal muscle is organized into sarcomeres. The dark Z lines are a clear reference point incomparing this to diagram in Figure11. This electron micrograph placed in the public domain by L. Howard.
When the myosin head is in its resting state, it is tightly attached to the actin filament. In fact, rigor mortis occurs in deadanimals because there is no more ATP being made, and thus the sarcomeres are locked into place. Rigor beginsapproximately 2-3 hours after death in humans, after reserves of ATP are depleted. When the body relaxes again in about 3days, it is due to the decomposition and breakdown of the actin and myosin proteins. However, while they are still livinganimals, ATP is generally available, and it can bind to the myosin head, causing it to lose affinity for the f-actin, and let go(Figure ). At this point, no significant movement has occurred. Once the ATP is hydrolyzed though, the myosin headcan reattach to the f-actin a little further down the filament than it had originally. The energy released is stored in the neckregion. The ADP and P are still attached to the myosin head as well. The next step is for the P to drop off the myosin,leading to the power stroke. The neck of the myosin swivels around, leading to a translocation of the head byapproximately 10 nm for myosin II. The distance of translocation varies depending on the type of myosin, but it is not yet
7.7.11
7.7.11 7.7.9
7.7.12
7.7.12
i i

7.7.2 1/22/2022 https://bio.libretexts.org/@go/page/64302
clear whether the length of the neck is proportional to the displacement of the head. Finally, the ADP drops off the myosinhead, increasing the affinity of the head for the f-actin.
Figure . The myosin power stroke. Myosin can only attach to f-actin if there Ca available to bind troponin (green)and move tropomyosin (yellow) out of the binding groove. When ATP binds to the myosin head, it releases the f-actin.Hydrolysis of the ATP leads to cocking of the myosin head (moving it relative to the f-actin). As Pi leaves the myosinhead, it reattaches to the f-actin, but slightly displaced from its original binding site. ADP is then released and the myosinundergoes a power stroke in which it springs back to its original position, moving the f-actin along with it.
The sarcomere structure described in the first paragraph was incomplete in order to place the major players clearly in theirroles. There are other proteins in the sarcomere with important structural and regulatory functions. One of the keyregulatory components is tropomyosin. This is a fibrous protein that lies in the groove of an actin microfilament and blocksaccess to the myosin binding site. Tropomyosin attaches to the microfilament in conjunction with a multi-subunit troponincomplex. When Ca is available, it can bind to troponin-C, leading to a conformational change that shifts the position oftropomyosin to reveal the myosin binding site. This is the primary point of control for muscle contraction: recall thatintracellular Ca levels are kept extremely low because its primary function is in intracellular signaling. One way that theCa levels are kept that low is to pump it into a reservoir, such as the endoplasmic reticulum.
Figure . In low Ca conditions, tropomyosin (yellow line) is held in the myosin-binding groove of f-actin (blue) bya tripartite troponin complex (light green). Once Ca levels increase, it can bind to troponin-C, causing a conformationalshift that moves the tropomyosin out of the way so that myosin (orange) can bind the actin microfilaments.
In muscle cells, there is a specialization of the ER called the sarcoplasmic reticulum (SR) that is rich in Ca pumps andCa . When a signal is sent from a controlling nerve cell to the muscle cell, it causes a depolarization of the muscle cellmembrane. This consequently depolarizes a set of membranes called the transverse tubules (T-tubules) that lie directly onparts of the sarcoplasmic reticulum. There are proteins on the t-tubule surface that directly interact with a set of Cachannel proteins, holding the channel closed normally. When the t-tubule is depolarized, the proteins change shape, whichchanges the interaction with the Ca channels on the SR, and allows them to open. Ca rushes out of the SR where it isavailable to troponin-c. Troponin-C bound to Ca shifts the tropomyosin away from the actin filament, and the myosinhead can bind to it. ATP can bind the myosin head to start the power stroke cycle, and voila, we have controlled musclecell contraction.
7.7.12 2+
2+
2+
2+
7.7.132+
2+
2+
2+
2+
2+ 2+
2+

7.7.3 1/22/2022 https://bio.libretexts.org/@go/page/64302
The SR is a specialization of part of the endoplasmic reticulum, and contains a high concentration of Ca ionsbecause the SR membrane is embedded with Ca pumps (ATPases) to keep the cytoplasmic concentration low andsequester the Ca ions inside the SR. This is regulated by phosphorylation and [Ca ] via a regulatory protein such asphospholamban (in cardiac muscle). Phospholamban is an integral membrane protein of the SR that normallyassociates with and inhibits the Ca pump. However when it is phosphorylated, or as cytoplasmic Ca levels rise, thephospholamban releases from the Ca pump and allows it to function.
In addition to the “moving parts”, there are also more static, structural, proteins in the sarcomere (Figure ). Titin is agigantic protein (the largest known, at nearly 3 MDa), and can be thought of as something of a bungee cord tether to themyosin fiber. Its essential purpose is to prevent the forces generated by the myosin from pulling the fiber apart. Titin wrapsaround the myosin fiber and attaches at multiple points, with the most medial just near the edge of the H zone. At the Z-line, titin attaches to a telethonin complex, which attach to the Z-disk proteins (antiparallel α-actinin). Titin also interactswith obscurin in the I-band region, where it may link myofibrils to the SR, and in the M-band region it can interact withthe Ca -binding protein calmodulin-1 and TRIM63, thought to acts as a link between titin and the microtubulecytoskeleton. There are multiple isoforms of titin from alternative splicing, with most of the variation coming in the I-bandregion.
Disturbances to the proper formation of the titin-based support structure can be a cause of dilated cardiomyopathy, andfrom that, congestive heart failure. Some 20-30% of cases of dilated cardiomyopathy are familial, and mutations havebeen mapped to the N-terminal region of titin, where the protein interacts with telethonin. Defects in titin are alsobeing investigated with respect to chronic obstructive pulmonary disease, and some types of muscular dystrophy.
Of course in an actual muscle (Figure ), what happens is that nerves grow into the muscle and make synapticconnections with them. At these synaptic connections, the nerve cell releases neurotransmitters such as acetylcholine(ACh), which bind to receptors (AChR) on the muscle cell. This then opens ion channels in the muscle cell membrane,triggering a voltage change across that membrane, which also happens to affect the nearby membrane of the transversetubules subsequently opening Ca channels in the SR. The contraction of sarcomeres can then proceed as alreadydescribed above.
Figure . The sarcomere in context. The sarcomere of Figures 11 and 12 is one tiny contractile unit within an arraythat forms a myofibril. The myofibril is one of many within a muscle cell, surrounded by the sarcoplasmic reticulum, aspecialized extension of the ER that sequesters Ca until T-tubule excitation causes its release.
2+
2+
2+ 2+
2+ 2+
2+
7.7.11
2+
7.7.14
2+
7.7.14
2+

7.8.1 1/5/2022 https://bio.libretexts.org/@go/page/64303
7.8: Cytoskeletal DynamicsIn the early development of animals, there is a huge amount of cellular rearrangement and migration as the roughlyspherical blob of cells called the blastula starts to differentiate and form cells and tissues with specialized functions. Thesecells need to move from their point of birth to their eventual positions in the fully developed animal. Some cells, likeneurons, have an additional type of cell motility - they extend long processes (axons) out from the cell body to their targetof innervation. In both neurite extension and whole cell motility, the cell needs to move first its attachment points and thenthe bulk of the cell from one point to another. This is done gradually, and uses the cytoskeleton to make the process moreefficient. The major elements in cell motility are changing the point of forward adhesion, clearing of internal space bymyosin-powered rearrangement of actin microfilaments and the subsequent filling of that space with microtubules.
For force to be transmitted, the membrane must be attached to the cytoskeleton. In fact, signaling from receptors in themembrane can sometimes directly induce rearrangements or movements of the cytoskeleton via adapter proteins thatconnect actin (or other cytoskeletal elements) to transmembrane proteins such as integrin receptors. One of the earliestexperimental systems for studies of cytoskeleton-membrane interaction was the erythrocyte (red blood cell).
Figure . Membrane to microfilament linkage complexes in erythrocytes involve spectrin.
The illustrations above (Figure ) show some of the interactions of an extensive actin microfilament network withtransmembrane proteins. Ankyrin and spectrin are important linkage proteins between the transmembrane proteins and themicrofilaments. This idea of building a protein complex around the cytoplasmic side of a transmembrane protein isubiquitous, and scaffolding (linking) proteins are used not only in connecting the extracellular substrate (viatransmembrane protein) to the cytoskeleton, but also to physically connect signaling molecules and thus increase the speedand efficiency of signal transduction.
Accessory proteins to actinfilaments and microtubules were briefly mentioned earlier. Among other functions, they cancontrol polymerization and depolymerization, form bundles, arrange networks, and bridge between the differentcytoskeletal networks. For actin, the primary polymerization control proteins are profilin, which promotes polymerizationand thymosin β , which sequesters g-actin. The minus end capping proteins Arp 2/3 complex and tropomodulin, and theplus end capping proteins CapZ, severin, and gelsolin can stabilize the ends of f-actin. Finally, cofilin can increasedepolymerization from the (-) end.
Profilin has two activities that promote polymerization. First, it is a nucleotide exchange factor that removes ATP bound tog-actin, and replaces it with ADP. This sounds counterintuitive, but keep reading through to the next paragraph. Second,when bound to a g-actin, it increases the rate of addition to actin microfilaments. It does so by binding to the end oppositethe ATP-binding site, leaving that site and that side open to binding both ATP and the (+) end of a microfilament. Profilincan be found both in the cytoplasm at large, and associated with phospholipids (PIP ) and membrane proteins, to controlsuch processes as leading edge remodeling of f-actin cytoskeletal structures.
Thymosin β regulates microfilament assembly by controlling the available pool of g-actin. We already stated that greaterconcentrations of g-actin can increase polymerization rates. However, because of the highly dynamic nature of the actincytoskeleton, the time constraints of degrading and producing new actin would prevent the fast-response control necessary.Therefore, the optimal mechanism is to maintain a large pool of g-actin monomers, but regulate its availability by tying itup with a sequestering protein - thymosin β . Thymosin β has a 50x higher affinity for g-actin-ATP than for g-actin-ADP,
7.8.15
7.8.15
4
2
4
4 4

7.8.2 1/5/2022 https://bio.libretexts.org/@go/page/64303
so here is where profilin comes back into the picture. Profilin exchanges the ATP of a Tβ -g-actin-ATP complex for anADP. The result is that the Tβ releases the g-actin-ADP, allowing it to enter the general pool for building up filaments.
Increased depolymerization and slowing or cessation of polymerization can gradually break down f-actin structures, butwhat if there is a need for rapid breakdown? Two of the capping proteins previously mentioned, gelsolin and severin, havean alternate mode of action that can sever actin microfilaments at any point by binding alongside an actin filament andaltering the conformation of the subunit to which it is bound. The conformational change forces the actin-actin interactionto break, and the gelsolin or severin then remains in place as a (+) end capping protein.
Gelsolin is inhibited by the phospholipid PIP . Phospholipase C, which breaks down PIP can also increase cytosolicCa , which is an activator of gelsolin. Thus it is possible to rapidly upregulate gelsolin activity by PLC signaling.
On the microtubule side of things, due to dynamic instability, one might think that a severing enzyme is not needed, but infact, spastin and katanin are microtubule-severing proteins found in a variety of cell types, particularly neurons. There isalso a Tβ -like protein for tubulin: Op18, or stathmin, which binds to tubulin dimers (not monomers), acting to sequesterthem and lower the working concentration. It is regulated by phosphorylation (which turns off its tubulin binding).
Mutations in spastin are linked to 40% of those spastic paraplegias distinguished by degeneration of very long axons.The severing ability of spastin appears to be required for remodeling of the cytoskeleton in response to neuronaldamage.
Microtubule-associated proteins MAP1, MAP2, and tau (t) each work to promote assembly of microtubules, as well asother functions. MAP1 is the most generally distributed of the three, with tau being found mostly in neurons, and MAP2even more restricted to neuronal dendrites. These and some other MAPs also act to stabilize microtubules againstcatastrophe by binding alongside the microtubule and reinforcing the tubulin-tubulin interactions.
Tau has a complicated biomedical history. Its normal function is clear - assembling, stabilizing, and linkingmicrotubules. However, it is also found in hyperphosphorylated neurofibrillary tangles that are associated withAlzheimer’s disease. A cause for Alzheimer’s is not yet known, so it is still unclear whether the tau protein tangles areplay a major role in any of the symptoms.
Finally, with respect to microfilament and microtubule accessory proteins, there are the linkers. Some of theaforementioned MAPs can crosslink microtubules either into parallel or mesh arrays, as can some kinesins and dyneins,although they are conventionally considered to be motor proteins. On the microfilament side, there are many knownproteins that crosslink f-actin, many of which are in the calponin homology domain superfamily, including fimbrin, α-actinin, β-spectrin, dystrophin, and filamin. Although they all can bind to actin, the shape of the protein dictates differenttypes of interaction: for example, fimbrin primarily bundles f-actin in parallel to form bundles, while filamin brings actinfilaments together perpendicularly to form mesh networks.
FG Syndrome is a genetically linked disease characterized by mental retardation, enlarged head, congenital hypotonia,imperforate anus, and partial agenesis of the corpus callosum. It has been linked to mutations in several Xchromosome genes, including filamin A (FLNA, FLN1, located Xq28).
Mutations in dystrophin, which is a major muscle protein of the CD-domain superfamily, can result in DuchenneMuscular Dystrophy or the related but less severe Becker Muscular Dystrophy. The most distinctive feature is aprogressive proximal muscular degeneration and pseudohypertrophy of the calf muscles. Onset of DMD is usuallyrecognized before age 3 and is lethal by age 20. However, symptoms of BMD may not present until the 20s, with goodprobability of long-term survival. Although it is primarily a muscle-wasting disease, dystrophin is present in other celltypes, including neurons, which may explain a link to mild mental retardation in some DMD patients. Like FLNA, thedystrophin gene is also located on the X chromosome (Xp21.2).
4
4
2 22+
4

7.9.1 1/22/2022 https://bio.libretexts.org/@go/page/64304
7.9: Cell MotilityThere are a number of ways in which a cell can move from one point in space to another. In a liquid medium, that methodmay be some sort of swimming, utilizing ciliary or flagellar movement to propel the cell. On solid surfaces, thosemechanisms clearly will not work efficiently, and the cell undergoes a crawling process. In this section, we begin with adiscussion of ciliary/flagellar movement, and then consider the more complicated requirements of cellular crawling.
Cilia and flagella, which differ primarily in length rather than construction, are microtubule-based organelles that movewith a back-and-forth motion. This translates to “rowing” by the relatively short cilia, but in the longer flagella, theflexibility of the structure causes the back-and-forth motion to be propagated as a wave, so the flagellar movement is moreundulating or whiplike (consider what happens as you waggle a garden hose quickly from side to side compared to a shortpiece of the same hose). The core of either structure is called the axoneme, which is composed of 9 microtubule doubletsconnected to each other by ciliary dynein motor proteins, and surrounding a central core of two separate microtubules.
Figure . Partial (cutaway) diagram of an axoneme, the central bundle of cilia and flagella.
This is known as the “9+2” formation, although the nine doublets are not the same as the two central microtubules. The Atubule is a full 13-protofilaments, but the B tubule fused to it contains only 10 protofilaments. Each of the centralmicrotubules is a full 13 protofilaments. The 9+2 axoneme extends the length of the cilium or flagellum from the tip untilit reaches the base, and connects to the cell body through a basal body, which is composed of 9 microtubule tripletsarrange in a short barrel, much like the centrioles from which they are derived.
This section refers only to eukaryotes. Some prokaryotes also have motile appendages called flagella, but they arecompletely different in both structure and mechanism. The flagella themselves are long helical polymers of the proteinflagellin, and the base of the flagellin fibers is connected to a rotational motor protein, not a translational motor. Thismotor (Figure ) utilizes ion (H or Na depending on species) down an electrochemical gradient to provide theenergy to rotate as many as 100000 revolutions per minute. It is thought that the rotation is driven by conformationalchanges in the stator ring, nestled in the cell membrane.
7.9.16
7.9.18 + +

7.9.2 1/22/2022 https://bio.libretexts.org/@go/page/64304
Figure . The bacteria flagellum is completely different from eukaryotic flagella. It is moved by a rotary motordriven by proton or Na ion ow down the electrochemical gradient. Illustration released to public domain by M.R.Villareal.
The ciliary dyneins provide the motor capability, but there are two other linkage proteins in the axoneme as well. There arenexins that join the A-tubule of one doublet to the B-tubule of its adjacent doublet, thus connecting the outer ring. And,there are radial spokes that extend from the A tubule of each doublet to the central pair of microtubules at the core of theaxoneme. Neither of these has any motor activity. However, they are crucial to the movement of cilia and flagella becausethey help to transform a sliding motion into a bending motion. When ciliary dynein (very similar to cytoplasmic dyneinsbut has three heads instead of two) is engaged, it binds an A microtubule on one side, a B microtubule from the adjacentdoublet, and moves one relative to the other. A line of these dyneins moving in concert would thus slide one doubletrelative to the other, if (and it’s a big “if”) the two doublets had complete freedom of movement. However, since thedoublets are interconnected by the nexin proteins, what happens as one doublet attempts to slide is that it bends theconnected structure instead (Figure ). This bend accounts for the rowing motion of the cilia, which are relativelyshort, as well as the whipping motion of the long flagella, which propagate the bending motion down the axoneme.
Figure . The nexin bridges connecting adjacent microtubule doublets transform the sliding motion generated by theciliary dynein into a bending motion.
Although we think of ciliary and flagellar movement as methods for the propulsion of a cell, such as the flagellarswimming of sperm towards an egg, there are also a number of important places in which the cell is stationary, and thecilia are used to move fluid past the cell. In fact, there are cells with cilia in most major organs of the body. Several ciliarydyskinesias have been reported, of which the most prominent, primary ciliary dyskinesia (PCD), which includesKartagener syndrome (KS), is due to mutation of the DNAI1 gene, which encodes a subunit (intermediate chain 1) ofaxonemal (ciliary) dynein. PCD is characterized by respiratory distress due to recurrent infection, and the diagnosis of KSis made if there is also situs inversus, a condition in which the normal left-right asymmetry of the body (e.g. stomach onleft, liver on right) is reversed. The first symptom is due to inactivity of the numerous cilia of epithelial cells in the lungs.Their normal function is to keep mucus in the respiratory track constantly in motion. Normally the mucus helps to keep the
7.9.18+
7.9.17
7.9.17

7.9.3 1/22/2022 https://bio.libretexts.org/@go/page/64304
lungs moist to facilitate function, but if the mucus becomes stationary, it becomes a breeding ground for bacteria, as wellas becoming an irritant and obstacle to proper gas exchange.
Situs inversus is an interesting malformation because it arises in embryonic development, and affects only 50% of PCDpatients because the impaired ciliary function causes randomization of left-right asymmetry, not reversal. In very simpleterms, during early embryonic development, left-right asymmetry is due in part to the movement of molecular signals in aleftward ow through the embryonic node. This flow is caused by the coordinated beating of cilia, so when they do notwork, the flow is disrupted and randomization occurs.
Other symptoms of PCD patients also point out the work of cilia and flagella in the body. Male infertility is common dueto immotile sperm. Female infertility, though less common, can also occur, due to dysfunction of the cilia of the oviductand fallopian tube that normally move the egg along from ovary to uterus. Interestingly there is also a low association ofhydrocephalus internus (overfilling of the ventricles of the brain with cerebrospinal fluid, causing their enlargement whichcompresses the brain tissue around them) with PCD. This is likely due to dysfunction of cilia in the ependymal cells liningthe ventricles, and which help circulate the CSF, but are apparently not completely necessary. Since CSF bulk flow isthought to be driven primarily by the systole/ diastole change in blood pressure in the brain, some hypothesize that the ciliamay be involved primarily in ow through some of the tighter channels in the brain.
Figure . Cells crawl by (a) extending the leading edge primarily through remodeling of the actin cytoskeleton, (b)forming new adhesive contacts at that leading edge while releasing adhesions to the rear, and (c) bulk internal movementforward to “catch up” with the leading edge.
Cell crawling (Figure ) requires the coordinated rearrangement of the leading edge microfilament network,extending (by both polymerization and sliding filaments) and then forming adhesions at the new forward-most point. Thiscan take the form of filopodia or lamellipodia,and often both simultaneously. Filopodia are long and very thin projectionswith core bundles of parallel microfilaments and high concentrations of cell surface receptors. Their purpose is primarilyto sense the environment. Lamellipodia often extend between two lopodia and is more of a broad ruffle than a finger.Internally the actin forms more into meshes than bundles, and the broader edge allows for more adhesions to be made tothe substrate. The microfilament network then rearranges again, this time opening a space in the cytoplasm that acts as achannel for the movement of the microtubules towards the front of the cell. This puts the transport network in place to helpmove intracellular bulk material forward. As this occurs, the old adhesions on the tail end of the cell are released. Thisrelease can happen through two primary mechanisms: endocytosis of the receptor or deactivation of the receptor bysignaling/conformational change. Of course, this oversimplification belies the complexities in coordinating and controllingall of these actions to accomplish directed movement of a cell.
One model of microfilament force generation, the Elastic Brownian Ratchet Model (Mogilner and Oster, 1996),proposes that due to Brownian motion of the cell membrane resulting from continuous minute thermal fluctuation, theactin filaments that push out towards the edges of the membrane are flexed to varying degrees. If the flex is largeenough, a new actin monomer can fit in between the membrane and the tip of the filament, and when the now longerfilament flexes back, it can exert a greater push on the membrane. Obviously a single filament does not generate muchforce, but the coordinated extension of many filaments can push the membrane forward.
7.9.19
7.9.19

7.9.4 1/22/2022 https://bio.libretexts.org/@go/page/64304
Once a cell receives a signal to move, the initial cytoskeletal response is to polymerize actin, building more microfilamentsto incorporate into the leading edge. Depending on the signal (attractive or repulsive), the polymerization may occur on thesame or opposite side of the cell from the point of signal-receptor activation. Significantly, the polymerization of new f-actin alone can generate sufficient force to move the membrane forward, even without involvement of myosin motors!Models of force generation are being debated, but generally start with the incorporation of new g-actin into a filament at itstip; that is, at the filament-membrane interface. Even if that might technically be enough, in a live cell, myosins areinvolved, and help to push and arrange filaments directionally in order to set up the new leading edge. In addition, somefilaments and networks must be quickly severed, and new connections made, both between filaments and betweenfilaments and other proteins such as adhesion molecules or microtubules.
How is the polymerization and actin rearrangement controlled? The receptors that signal cell locomotion may initiatesomewhat different pathways, but many share some commonalities in activating one or more members of the Ras-familyof small GTPases. These signaling molecules, such as Rac, Rho, and cdc42 can be activated by receptor tyrosine kinases(see RTK-Ras activation pathways, Chap. 14). Each of these has a slightly different role in cell motility: cdc42 activationleads to filopodia formation, Rac activates a pathway that includes Arp2/3 and cofilin to lamellipodia formation, and Rhoactivates myosin II to control focal adhesion and stress fiber formation. A different type of receptor cascade, the G-proteinsignaling cascade (also Chapter 14), can lead to activation of PLC and subsequent cleavage of PIP and increase incytosolic Ca . These changes, as noted earlier, can also activate myosin II, as well as the remodeling enzymes gelsolin,cofilin, and profilin. This breaks down existing actin structures to make the cell more fluid, while also contributing more g-actin to form the new leading edge cytoskeleton.
In vitro experiments show that as the membrane pushes forward, new adhesive contacts are made through adhesionmolecules or receptors that bind the substrate (often cell culture slides or dishes are coated with collagen, filaminin, orother extracellular matrix proteins). The contacts then recruit cytoskeletal elements for greater stability to form a focaladhesion (Figure ). However, the formation of focal adhesions appears to be an artifact of cell culture, and it isunclear if the types of adhesions that form in vivo recruit the same types of cytoskeletal components.
Figure . Focal adhesions form when integrins bind to an artificial ECM surface in cell culture dishes.
The third step to cell locomotion is the bulk movement of the cellular contents forward. The mechanisms for this phase areunclear, but there is some evidence that using linkages between the actin cytoskeleton at the leading edge and forwardparts of the microtubule cytoskeleton, the microtubules are rearranged to form an efficient transport path for bulkmovement. Another aspect to this may be a “corralling” effect by the actin networks, which directionally open up spacetowards the leading edge. The microtubules then enter that space more easily than working through a tight actin mesh,forcing flow in the proper direction.
Much of the work on microtubule-actin interactions in cell motility has been done through research on the neuronalgrowth cone, which is sometimes referred to as a cell on a leash, because it acts almost independently like a crawlingcell, searching for the proper pathway to lead its axon from the cell body to its proper synaptic connection (A.W.Schaefer et al, Dev. Cell 15: 146-62, 2008).
Finally, the cell must undo its old adhesions on the trailing edge. This can happen in a number of different ways. In vitro,crawling cells have been observed to rip themselves off of the substrate, leaving behind tiny bits of membrane andassociated adhesion proteins in the process. The force generated is presumed to come from actin-myosin stress fibersleading from the more forward focal adhesions. However, there are less destructive mechanisms available to the cells. Insome cases, the adhesivity of the cellular receptor for the extracellular substrate can be regulated internally, perhaps byphosphorylation or dephosphorylation of a receptor. Another possibility is endocytosis of the receptor, taking it off the cell
22+
7.9.20
7.9.20

7.9.5 1/22/2022 https://bio.libretexts.org/@go/page/64304
surface. It could simply recycle up to the leading edge where it is needed (i.e. transcytosis), or if it is no longer needed ordamaged, it may be broken down in a lysosome.

7.10.1 1/5/2022 https://bio.libretexts.org/@go/page/64305
7.10: New Page

1 1/29/2022
CHAPTER OVERVIEW8: (T3) SIGNAL TRANSDUCTIONMetazoan organisms are not just conglomerations of cells that happen to stick together. The cells each have specific functions that mustbe coordinated with one another in order to assure the survival of the organism and thus the shared survival of the component cells. Ifcoordination is required, then a method of communication between cells is also required.
8.1: INTRODUCTION TO SIGNAL TRANSDUCTIONThere are three primary modes of intercellular communication. (1) These are direct contact between signaling molecules bound to themembranes of two adjacent cells, (2) short-range soluble signals that diffuse over short distances, and (3) long-range soluble signalsthat are secreted into the circulation to be carried anywhere in the body.
8.2: RECEPTORS AND LIGANDSA protein that happens to bind something is not necessarily a receptor. A receptor is defined as a protein that binds to an extracellularligand, and then undergoes a con- formational or biochemical shift in such a way that it initiates a chain of intracellular events bywhich the cell reacts to the extracellular signal. What are these ligands and their receptors?
8.3: 7-TM RECEPTORS (G-PROTEIN-COUPLED)The 7-transmembrane receptors, or G-protein-coupled receptors are, unsurprisingly, a family of proteins that pass through the cellmembrane 7 times. The amino terminal is extracellular and the carboxyl terminal is intracellular.
8.4: RECEPTOR TYROSINE KINASESIn contrast to the 7-TM receptors, the receptor tyrosine kinases (RTK) pass through the membrane only once, and have a built-inenzyme domain - a protein tyrosine kinase. RTKs must dimerize to be functional receptors, although individual RTKs can bind totheir ligands. The ligands also dimerize, and when a dimerized receptor is activated, the kinase domains cross-phosphorylate thecytoplasmic domain on the other receptor unit.
8.5: CALCIUM ION SIGNALINGSignaling by increasing cytosolic calcium is an important and ubiquitous intracellular coordination mechanism. We already saw thatrelease of Ca2+ in muscle cells is required to allow contraction of each sarcomere, and the positioning of the sarcoplasmic reticulummakes possible rapid changes in concentration nearly simultaneous across the entire cell. Another extremely important physiologicalmechanism that relies on calcium is fertilization.

E. V. Wong 8.1.1 12/18/2021 https://bio.libretexts.org/@go/page/64307
8.1: Introduction to Signal TransductionThere are three primary modes of intercellular communication. These are
1. direct contact between signaling molecules bound to the membranes of two adjacent cells,2. short-range soluble signals that diffuse over short distances, and3. long-range soluble signals that are secreted into the circulation to be carried anywhere in the body.
An example of juxtacrine signaling is exemplified by the activity of some cell adhesion or ECM proteins, such as laminin,that do not just allow a cell to move over them, but act as signals to promote increased motility. This likely happens byactivation of integrin receptors on the moving cell, which then initiate and coordinate changes through the rest of the cellto accomplish the change in activity. Another example is the Delta-Notch pathway used in embryonic patterning.
Figure . Delta-Notch signaling.
Delta, a transmembrane protein on the signaling cell, binds to Notch, a receptor on the receiving cell. Notch alters itsconformation, allowing its cytoplasmic domain to be cut off by g-secretase. The cytoplasmic domain then translocates intothe nucleus, where it acts as an activating transcription factor by binding with CSL. In the example sketched in Figure
B, stochastic upregulation of delta in one cell activates notch in the surrounding cells, which then activates a specificdifferentiation pathway for them. Thus the central cell may be a sensory neuron, like a hair cell, while those immediatelysurrounding it are support cells like glia. This type of signaling imposes a spacing pattern on the expression of neurons (orother cell).
The Delta-Notch pathway is well characterized and somewhat more complicated than portrayed in the paragraphabove. The cleavage of Notch involves two proteases and two sites. Once the Notch cytoplasmic domain binds to CSL,it displaces a number of co-repressors bound to the CSL, and also recruits MAM (Mastermind-1) as a coactivator.MAM recruits histone acetylases to allow further increase transcription of targeted genes, but also recruits kinases thatinitiate the process of targeting the Notch cytoplasmic domain for ubiquitin-mediated destruction. The expression ofNotch-controlled genes is thus self-regulated and shuts off soon after Delta is no longer available. Reviewed in R.A.Kovall, Curr. Opin. Struct. Biol. 17: 117-27, 2007.
Diffusion limited signals from near neighbors is called paracrine signaling, and some- times the signals can act onreceptors right on the cell that secreted the signal, which would be autocrine signaling. Paracrine signals are only active ifthey can bind to a cell above a critical concentration to activate a signaling pathway. Therefore, as the signals diffuse awayfrom the source, there is a cutoff, beyond which the concentration of signal is insufficient to activate a receiving cell.Growth factors are often paracrine signals. Although they do often encourage growth, they are also often survival factors.In that context, Nerve Growth Factor (NGF) is secreted by target cells that then reward the neurons that make the rightconnections by providing NGF for their survival. Those neurons that head off in the wrong direction, are unable to obtainNGF, and they do not survive, promoting efficiency and a better signal:noise ratio within the nervous system.
8.1.1
8.1.1

E. V. Wong 8.1.2 12/18/2021 https://bio.libretexts.org/@go/page/64307
Endocrine signaling is essentially whole-body signaling. A signal produced by a hormone-producing gland is secreted intothe bloodstream, where it becomes accessible to nearly any cell in the body. Of course, not every cell will respond to thehormone: like every other case of intercellular signaling, response is wholly dependent on receptors, so only the cells thathave receptors to recognize the signal will react. For example, estrogen is released into the circulation, but in females, onlysome organs show significant impact when estrogen levels are significantly altered. Most tissues are unaffected. Endocrinesignals may circulate in other extracellular fluids such as lymph.

E. V. Wong 8.2.1 1/15/2022 https://bio.libretexts.org/@go/page/64308
8.2: Receptors and LigandsA protein that happens to bind something is not necessarily a receptor. A receptor is defined as a protein that binds to anextracellular ligand, and then undergoes a conformational or biochemical shift in such a way that it initiates a chain ofintracellular events by which the cell reacts to the extracellular signal. What are these ligands and their receptors?
Intercellular signals span a very wide range of molecule types. Some are simple gases, like NO, while others are aminoacids or derivatives, including glutamate, dopamine, or epinephrine. Lipids such as steroids (e.g. estrogen, cortisol) oreicosanoids (e.g. prostaglandins, leukotrienes) can be intercellular messengers. Finally many signals are peptides or evencomplex proteins (recall our juxtacrine signaling example). Although most are recognized by cell surface receptors, this isnot always the case since, for example, steroids are lipid-soluble and can diffuse through the plasma membrane.
Receptors are a far less varied group of molecules, since they are all proteins, though it must be said that they representmany different protein structures and functions. In general, receptors are very speci c for their ligands, but the specificity isnot mutual: ligands can be rather promiscuous and bind with multiple receptors. This is part of the coordination aspect ofsignaling, though as a single ligand can initiate different effects in different cells depending on what receptor is expressed.The remainder of this chapter will delve into some of the intracellular signaling cascades that are characteristic ofparticular receptor types.
Because receptors, even at high density, represent only a minute fraction of the surface area of the cell, and therefore aneven tinier fraction of the volume of the cell, the activation of a receptor must be amplified in order for it to initiate cellularactivities (e.g. locomotion, growth, cell cycle progression). Thus one of the rst things a receptor does upon activation is toinitiate a signaling cascade. This aptly named sequence of events begins with the receptor activating an enzyme. Theenzyme may be the cytoplasmic domain of the receptor itself, or it may be an independent protein but closely linked to thereceptor. The enzyme does what enzymes do: it rapidly converts substrate molecules into product molecules. In this case,sometimes the product is an activator for another enzyme, and sometimes, the substrate is an inactive enzyme and theproduct is an activated enzyme. Either way, because of the high activity rates, the single activation of the receptor hasincreased first to tens or hundreds of enzyme activations, and each of those activates hundreds, and so on, so that the effectof the receptor can be rapidly distributed throughout the cell.

E. V. Wong 8.3.1 12/18/2021 https://bio.libretexts.org/@go/page/64309
8.3: 7-TM receptors (G-protein-coupled)The 7-transmembrane receptors, or G-protein-coupled receptors are, unsurprisingly, a family of proteins that pass throughthe cell membrane 7 times. The amino terminal is extracellular and the carboxyl terminal is intracellular. Figure shows the transmembrane regions spread out for clarity, but the transmembrane domains actually form together in more ofa cylindrical shape.
Figure . Activation of the 7-TM receptor rhodopsin by light.
7-TM proteins are used as receptors for neurotransmitters such as epinephrine (β-adrenergic receptor), acetylcholine(muscarinic receptor), and serotonin, as well as hormones like glucagon or thyroid-stimulating hormone, and even non-molecular ligands such as light! Rhodopsins are a class of 7-TM receptors that are activated when they absorb a photon(Figure ). Activating this family of receptors, whether by photon or by more conventional ligand binding, induces aconformational change in the cytoplasmic domain that alters the interaction between the receptor and a protein complexknown as a heterotrimeric G protein.
The heterotrimeric G protein consists of an a, b, and g subunit, of which the a subunit can bind either GTP or GDP, and canhydrolyze GTP to GDP. When the 7-TM receptor is inactive, the G protein complex is usually nearby associated with themembrane by myristoylation or palmitoylation of the a subunit and farnesylation or geranylgeranylation of the g subunit.Once the 7-TM receptor is activated, it associates with the heterotrimeric G-protein, which causes the Ga to let go of theGDP and bind to a GTP. This then dissociates the Ga from the other two subunits. It can then associate with and activate anenzyme to expand the signaling cascade. One of the two classical path- ways starts with Ga activation of adenylate(adenylyl) cyclase. Adenylate cyclase (AC) converts ATP to cAMP. Since ATP is plentiful and AC is a relatively fastenzyme, the rst ampli cation of the signal comes with generation of the “second messenger” molecule cAMP. Each cAMPmolecule can then activate other enzymes, the primary one being protein kinase A. PKA can then phosphorylate a varietyof substrates to alter cellular activity by gene expression, molecular motors, or metabolic changes.
Figure . The heterotrimeric G-protein can act as a timed activator of adenylate cyclase.
The other classical pathway for 7-TM receptors is the activation of phosphlipase Cb, also by Ga. PLCb actually producestwo second messenger molecules: it hydrolyzes phosphatidylinositol into diacylgylcerol (DAG) and inositol triphosphate(IP ). IP primarily induces the release of Ca from the endoplasmic reticulum. The DAG can activate protein kinase C.
8.3.2
8.3.5
8.3.5
8.3.3
3 32+

E. V. Wong 8.3.2 12/18/2021 https://bio.libretexts.org/@go/page/64309
PKC is also activated by Ca and both Ca and DAG can activate PKC synergistically. Protein kinase C is an importantcentral kinase that has been shown to phosphorylate and control the activity of numerous other enzymes from cytoskeletalelements to transcription factors.
Figure . G-protein activated Phospholipase C. (A) The G-protein is inactive with GDP bound. (B) Upon ligandbinding, G-protein binds receptor, exchanges GDP for GTP, and Ga dissociates. (C) Ga-GTP activates PLCg, whichproduces DAG and IP . The latter induces Ca release into the cytoplasm and together with DAG, activates PKC.
An interesting variation from the classic 7-TM pathways starts with the rhodopsin receptors in rod cells. Thesereceptors bind photons for activation, and engage a heterotrimeric G protein. The Ga-GTP then binds to the g subunitof phosphodiesterase (PDE), activating it and catalyzing conversion of cGMP to GMP. As cGMP decreases, ionchannels close, polarizing the membrane and changing the signal from the rod cell to the brain (via connectingneurons).
Figure . Activation of the 7-TM receptor rhodopsin by light.
Second messengers must have two properties. They must be small enough to diffuse effectively, and the cell must be ableto generate them quickly. Ca and cAMP fall into this category. Furthermore they can both be removed from circulationfairly quickly: the former by Ca pumps in the ER and Golgi, and the latter by phosphodiesterase activity. When the G-protein-pathway was discovered, the use of lipid second messengers was surprising. Membrane phospholipids were largelyignored at the time as simple static components of membranes. It is now clear that some of the phospholipids arebiochemically active, with several enzymes that modify them, including phospholipases, phospholipid kinases, andphospholipid phosphatases. Some of these enzymes have a variety of functions because their substrate of product may bean important messenger molecule. For example, PI3K (phosphatidylinositol-3-kinase) is a central signaling kinase because
2+ 2+
8.3.4
32+
8.3.5
2+
2+

E. V. Wong 8.3.3 12/18/2021 https://bio.libretexts.org/@go/page/64309
its product, PIP3 (phosphatidylinositol (3,4,5)-triphosphate) is an activator for Akt/PKB and other enzymes that canactivate several signaling pathways.
Figure . Modifications of Phosphatidylinositol generate various biologically active species.
The activation must eventually end, and it does so when Ga hydrolyzes the GTP bound to it. In this way, the Ga acts as akind of timer for the signaling cascade. This is im- portant because for signaling to be effective, it must be tightlycontrolled. Very early in this course, it was pointed out that Ca is kept at a very low concentration in the cytoplasm of thecell because we want Ca -sensitive mechanisms to be able to react quickly to an influx of calcium, but we equally want tobe able to quickly turn off the signal as needed, and that is obviously much easier to do by sequestering a small amount ofCa than a lot of it. Similarly, if sustained activity of a recipient cell is called for, it is accomplished by continuousactivation of the receptor and not by a long-lasting effect from a single activation. This ensures that if a cellular effect mustbe abruptly and quickly cut off, it can be accomplished without a significant lag period between cessation of hormonesecretion and cessation of intracellular signaling.
The receptor is a part of another shutoff mechanism as well: to prevent overstimulation, the receptors are desensitized for ashort time after they have activated. G-protein-coupled receptor kinase (GRK) phos- phorylates the 7-TM receptor. Thephosphorylation creates recognition sites for arrestins. The arrestins have a variety of functions, the simplest of which is toact as a competitive inhibitorofG-proteinbindingbythe receptor. This is a relatively short- lived desensitization.
Figure . (A) After GRK phosphorylates a 7-TM receptor, arrestin can bind. In some cases, arresting can also bindAP1 andclathrin,(B)nucleatingtheformationofaclathrin-coated vesicle and endocytosis of the receptor (C).
For longer desensitization, arrestin binds to AP2 and clathrin, nucleating formation of a clathrin-coated endocytic vesicle.This removes the receptor from the cell surface, desensitizing the cell for a much longer period of time than simplecompetition between arrestin and G-protein.
8.3.6
2+
2+
2+
8.3.7

E. V. Wong 8.3.4 12/18/2021 https://bio.libretexts.org/@go/page/64309
The arrestins have another potential function. They can act as scaffolding proteins that bring a completely differentsignaling complex to the 7-TM receptor. Figure shows an example in which the 7-TM receptor is used to activate aJun transcription factor.
The b-arrestin brings AJK-1, MKKY, and JNK-1 to activate JNK-1, which can then phosphorylate Jun. This allowstranslocation of phospho-Jun into the nucleus and subsequent dimerization, converting it into an active transcription factor.
What are some of the cellular actions that can be evoked by 7-TM receptor activation? Ca dynamics will be addressed ina separate section. IP has been shown to evoke contraction of smooth and skeletal muscle, actin polymerization and cellshape changes, calcium release from intracellular stores, opening of potassium channels, and membrane depolarization.cAMP has been implicated in control of glycogen breakdown and gluconeogenesis, triacyglycerol metabolism, secretion ofestrogens by ovarian cells, secretion of glucocorticoids, and increased permeability of kidney cells to water.
Figure . Interestingly, arrestins can also act to initiate a completely different type of signaling cascade from a 7-TMreceptor. Here, the Jun transcription factor is activated.
8.3.8
2+
3
8.3.8

E. V. Wong 8.4.1 1/29/2022 https://bio.libretexts.org/@go/page/64310
8.4: Receptor Tyrosine KinasesIn contrast to the 7-TM receptors, the receptor tyrosine kinases (RTK) pass through the membrane only once, and have abuilt-in enzyme domain - a protein tyrosine kinase. RTKs must dimerize to be functional receptors, although individualRTKs can bind to their ligands. The ligands also dimerize, and when a dimerized receptor is activated, the kinase domainscross-phosphorylate the cytoplasmic domain on the other receptor unit.
Figure . Receptor Tyrosine Kinases can activate the MAP pathway.
This phosphorylation is necessary to form recognition sites for scaffolding or effector proteins. Figure shows anexample of an adapter protein, Grb2, which binds to a phosphorylated SH2/SH3 type domain on the receptor as well as toSos (a guanine nucelotide exchange factor), which binds to and activates the GTPase Ras by exchanging a GDP for a GTP.This is the start of a very common RTK intracellular signaling pathway, the MAP kinase pathway. Following activation ofRas, it can activate Raf by phosphorylation and translocating it from the cytoplasm to the inner surface of the plasmamembrane. Raf is a Ser/Thr kinase (also known by the unwieldy but fun to say, MAP kinase kinase kinase) thatphosphorylates MEK (aka MAP kinase kinase). MEK is interesting because it is a dual-specificity kinase, phosphorylatingboth Ser/Thr sites as well as Tyr sites. The targets we are particularly interested here though, are MAP kinases (mitogenactivated protein kinase), also known as ERKs (extracellular signal regulated kinases).
Each kinase along the canonical MAP kinase pathway has other potential substrates besides the next one in the MAPKsequence, so the variety of cellular responses that can be initiated by this pathway is very broad. There are at least 20classes of RTK by structural similarity, including the fibroblast growth factor receptor (FGFR) class, epidermal growthfactor receptor (EGFR) class, neurotrophin receptor (Trk) class, and insulin receptor class. Some growth factors not onlyinduce growth, but survival, and sometimes proliferation. In fact, mutations to growth factors can be oncogenic (cancer-causing).
Figure . Insulin receptor signaling pathways.
8.4.9
8.4.9
8.4.10

E. V. Wong 8.4.2 1/29/2022 https://bio.libretexts.org/@go/page/64310
One of the aspects of cell signaling that make studying it both fun and frustrating is the immensity of possibilities. Theinsulin receptor example above (Figure ) demonstrates this. When the receptor is activated, the IRS-1 scaffoldingprotein binds to it, and brings with it binding sites to recruit a number of different signaling molecules such as Grb2-Sos-Ras to head down the MAPK pathway, but also PI3K, which can lead to activation of PDK1 and Protein Kinase B,important in regulation of glucose transport. PKB (also known as Akt), is also an important mediator of cell survival (byinhibiting BAD), cell proliferation, and angiogenesis.
Figure . The JAK-STAT pathway.
Activation of cytokine receptors can initiate the JAK-STAT pathway. Cytokines are generally immunomodulatory signals,some of which act as hormones and others in a paracrine fashion. Interferon-γ is an example (Figure ) of a cytokine,and the inactive RTK receptor binds to JAK (Janus kinase) in the inactive state. Upon ligand binding to the dimerizedreceptor, the JAK units are activated and the phosphorylate the receptor. This receptor phosphorylation leads to binding ofSTATs (the creatively named “signal transducers and activators of transcription”), which are then phosphorylated by thestill-active JAK. Upon phosphorylation, the STAT-P proteins dissociate from the receptor and dimerize in the cytoplasm,where they are bound by importins and translocated into the nucleus where they act as transcription factors.
8.4.10
8.4.11
8.4.11
E. V. Wong 8.5.1 1/5/2022 https://bio.libretexts.org/@go/page/64311
8.5: Calcium Ion SignalingSignaling by increasing cytosolic calcium is an important and ubiquitous intracellular coordination mechanism. We alreadysaw that release of Ca in muscle cells is required to allow contraction of each sarcomere, and the positioning of thesarcoplasmic reticulum makes possible rapid changes in concentration nearly simultaneous across the entire cell. Anotherextremely important physiological mechanism that relies on calcium is fertilization. Immediately upon penetration of theegg by the sperm, a wave of intracellular Ca increase spreads across the egg starting from the point of fertilization. Thisactivates CaMKII (a kinase) and calcineurin (a phosphatase). Both are needed to overcome meiotic arrest and may also benecessary in initial embryonic development by control of chromatin decondensation, nuclear-envelope formation, and themovement and fusion of the two nuclei.
The aforementioned CaMKII is Ca /calmodulin-dependent kinase II, and illustrates a fairly common theme, which is theuse of Ca -binding proteins as intermediate Ca sensing activators. Calmodulin is a ubiquitous calcium-binding proteinin eukaryotes and its importance is highlighted by the extraordinarily high homology across species. In normal cytosolicCa levels, the relatively low affinity of the 4 Ca binding sites on calmodulin are unfilled. But when Caconcentrations rise, they occupy the sites, causing a conformational change in calmodulin and allowing it to interact withother proteins. In addition to calmodulin, troponin-C, and PKC, a few other important calcium-sensitive proteins arecalsequestrin, a Ca buffer protein, gelsolin, the f-actin severing enzyme, the protease calpain, and calretinin, an activatorof guanylyl cyclase (which makes the second messenger cGMP).
Guanylate (guanylyl) cyclase is also an important player in signal transduction by nitric oxide (NO). Nitric oxide is a gasproduced by the action of nitric oxide synthase (NOS) on the substrate amino acid arginine. It is used as a super-solublesignal that passes through cells easily. However, it requires relatively high concentrations for physiological effect, so it isstrictly a paracrine factor working on near neighbors. Perhaps the best studied example of NO signaling is vasodilation, inwhich the NOS-expressing endothelial cells of a blood vessel release NO to the smooth muscle cells surrounding them.The NO binds to and stimulates guanylate cyclase. The resulting increase in cGMP concentration leads to relaxationthrough multiple targets of protein kinase G.
Sildena l (Viagra) and its chemical siblings take advantage of this pathway by inhibiting cGMP-specificphosphodiesterases (PDE5) which normally break down cGMP to limit the response to NO. However, it should benoted that though PDE5 expression is limited, it is expressed not only in the genitalia but in the retina as well.
Finally, no discussion of signal transduction would be complete without at least a fleeting mention of the extraordinarycrosstalk (Figure ) that can occur between the different pathways mentioned.
2+
2+
2+
2+ 2+
2+ 2+ 2+
2+
8.5.12
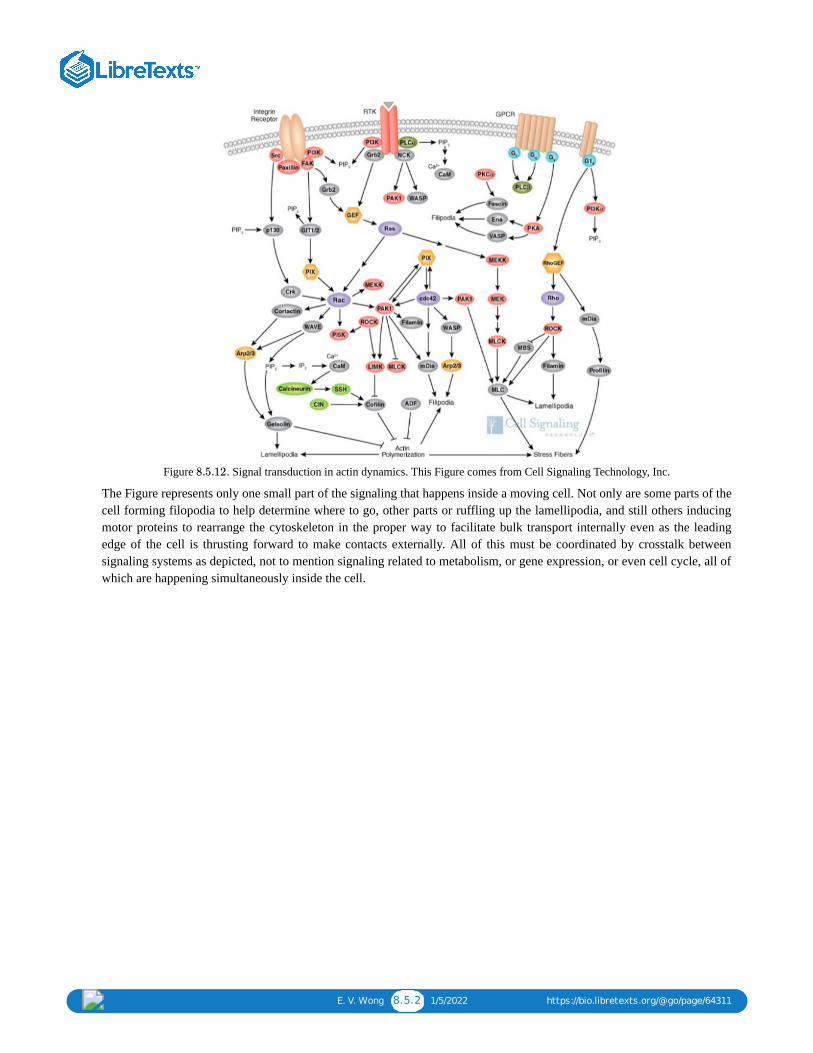
E. V. Wong 8.5.2 1/5/2022 https://bio.libretexts.org/@go/page/64311
Figure . Signal transduction in actin dynamics. This Figure comes from Cell Signaling Technology, Inc.
The Figure represents only one small part of the signaling that happens inside a moving cell. Not only are some parts of thecell forming filopodia to help determine where to go, other parts or ruffling up the lamellipodia, and still others inducingmotor proteins to rearrange the cytoskeleton in the proper way to facilitate bulk transport internally even as the leadingedge of the cell is thrusting forward to make contacts externally. All of this must be coordinated by crosstalk betweensignaling systems as depicted, not to mention signaling related to metabolism, or gene expression, or even cell cycle, all ofwhich are happening simultaneously inside the cell.
8.5.12

1 1/29/2022
CHAPTER OVERVIEW9: (T3) CELL CYCLECells, whether prokaryotic or eukaryotic, eventually reproduce or die.
9.1: THE PROKARYOTIC CELL CYCLEFor prokaryotes, the mechanism of reproduction is relatively simple, since there are no internal organelles. The process consists ofthree distinct but short phases: first, a growth phase in which the mass of the cell is increased, then the chromosomal replicationphase, and finally the chromosomes are separated and the cells are physically split into two independent new cells. In bacteria, theseare referred to as the B, C, and D periods, respectively.
9.2: THE EUKARYOTIC CELL CYCLEMost eukaryotic cells undergo a reproductive cycle to generate either another copy of themselves or to generate gametes (sex cells),and in doing so require a complex mechanism to govern the safe and accurate replication of their much larger (than prokaryote)genomes. Immediately following mitosis, the newly created cells are in the G1 phase. This is largely a growth phase, during whichthere is a lot of biosynthesis of proteins, lipids, and carbohydrates.
9.3: CONTROLLING THE CELL CYCLEThere are three major checkpoints for cell cycle control
9.4: ACTIVATION AND INACTIVATION OF THE CYCLIN-CDK COMPLEX9.5: PRE-MITOTIC PHASES9.6: MITOSISMitosis consists of prophase, metaphase, anaphase, and telophase, with distinct cellular activities characterizing each phase. Thiscompletes the duplication of the nucleus, and is followed by cytokinesis, in which the cell divides to produce two daughter cells.
9.7: CELL DEATHA cell may die either intentionally (usually referred to as apoptosis or programmed cell death, though also once known also as“cellular suicide”), or unintentionally (necrosis). The microscopic observation of these two processes shows strikingly differentmechanisms at work. In apoptosis, the cell begins to shrink and lose shape as the cytoskeleton is degraded, then the organelles appearto pack together, except for the nucleus.
9.8: MEIOSISTo maintain the proper number of chromosomes in each generation, the gametes each contribute one set of chromosomes, so that thefertilized egg and all other cells in the organism have two sets of chromosomes — one from each parent. The purpose of meiosis, andits primary difference with mitosis, is not generating daughter cells that are exact replicates, but generating daughter cells that onlyhave half the amount of genetic material as the original cell.

E. V. Wong 9.1.1 1/1/2022 https://bio.libretexts.org/@go/page/64313
9.1: The Prokaryotic Cell CycleCells, whether prokaryotic or eukaryotic, eventually reproduce or die. For prokaryotes, the mechanism of reproduction isrelatively simple, since there are no internal organelles. The process consists of three distinct but short phases: first, agrowth phase in which the mass of the cell is increased, then the chromosomal replication phase, and finally thechromosomes are separated and the cells are physically split into two independent new cells. In bacteria, these are referredto as the B, C, and D periods, respectively. Initiation of the reproductive process appears to be primarily a function of cellsize. The length of the overall cell cycle is determined by the B period, as the C and D periods have relatively fixed timeconstraints. The length of B is determined, in part, by environmental conditions and the gain in cell mass. Generation timesfor bacteria can vary from under half an hour to several days, although most bacterial cultures in laboratory settings andnutrient-rich media have generation times under a day.
DNA replication has already been covered in detail in Chapter 7. In bacteria, the process is initiated at the origin ofreplication by DnaA. However, in archaea, synchronous initiation of replication at multiple sites on the chromosome aswell as recognition proteins homologous to eukaryotic ORC proteins suggests that there are similarities betweenarchaebacterial and eukaryotic DNA replication to be explored.
Once the DNA is replicated and moved to opposite sides of the cell, the midcell septum forms to split the cell. At least 9gene products are involved in this process including FtsZ, the prokaryotic tubulin homologue that forms a circumferentialring, FtsI, a peptidoglycan synthetase involved in septum formation, FtsL, whose function is unclear but is involved iningrowth of the cell wall at the septum, and ZipA, which anchors the FtsZ ring. The ring contracts, pulling the membranein with it. Eventually the membrane is pinched in enough to fuse and generate two completely separate cytoplasmiccompartments. Other septation enzymes make cell wall components that ll in as the septum forms simultaneously withmembrane/FtsZ contraction, and the cells separate.

E. V. Wong 9.2.1 1/1/2022 https://bio.libretexts.org/@go/page/64314
9.2: The Eukaryotic Cell CycleMost eukaryotic cells undergo a reproductive cycle to generate either another copy of themselves or to generate gametes(sex cells), and in doing so require a complex mechanism to govern the safe and accurate replication of their much larger(than prokaryote) genomes. Immediately following mitosis, the newly created cells are in the G phase. This is largely agrowth phase, during which there is a lot of biosynthesis of proteins, lipids, and carbohydrates. However, there is nosynthesis of new DNA at this time. G is the longest of the cell cycle phases in many cell types, and most of thephysiological activity of a cell happens during G . Following G , the next phase of the cell cycle is the S phase, duringwhich synthesis of new DNA occurs. In other words, the genome is being replicated during this phase; thus at the end of Sphase, the cell has twice the normal amount of DNA. After S phase, the cell proceeds into G , which provides anopportunity for the cell to perform a self-assessment and make final preparations (such as more cell growth, repairs ofDNA) as necessary before it finally heads into mitosis. Mitosis, or M phase, is primarily
1. the breakdown of the nucleus,2. re-distribution of the DNA to opposite sides of the cell, and3. formation of two new nuclei around that DNA, and cytokinesis, the final splitting of the cell itself.
As the cell progresses through the various phases of mitosis, and for that matter, the phases of the cell cycle overall, it doesso in a specific and controlled manner, with checkpoints that “ask” if the cell is ready for the next step: is it big enough, isthe DNA healthy, etc. so that the cell has the best chance of generating healthy daughter cells. For example, if the cellcycle runs too rapidly through each phase, then there is not enough time for the cell to build up its mass in preparation forreproduction, and that leads to abnormally small daughter cells, and potentially even daughter cells that are too small tosurvive. If a cell undergoes mitosis with damaged or mutated DNA, then that may increase the likelihood of a pathologicalmutation surviving and harming the organism by turning into a cancerous tumor.
1
1
1 1
2

E. V. Wong 9.3.1 12/18/2021 https://bio.libretexts.org/@go/page/64315
9.3: Controlling the Cell CycleThere are three major checkpoints for cell cycle control (Figure ). The first regulates the transition from G to Sphase. Recall that G can be a very long phase, even (in the case of G ) as long as the lifespan of the cell. However, oncethe cell reaches S phase, it is committed to going through S, G , and M phases to reproduce. This is because once S phasehas begun, there is more than the normal diploid complement of DNA inside the cell. Over time this would confuse the cell(e.g., by overexpression of duplicated genes) as it tried to use the DNA to direct RNA and protein synthesis, and it couldbecome sick and die. The second major checkpoint regulates entry into mitosis. Once mitosis begins, most of the metabolicactivity of the cell is shut down, and the cell concentrates its resources on dividing the nuclear and cellular material equallyto support the life of both resulting daughter cells. If the cell needs more time to make final repairs on the DNA or even tobulk up a little, this checkpoint can hold the cell in G a little longer for those things to happen. Finally, the third majorcheckpoint occurs during mitosis, and regulates the transition from metaphase into anaphase. Since the sister chromatidsare being split apart and moved to opposite poles to form the new nuclei, it is important that all of them are perfectly linedup at metaphase and the proteins holding them together have dropped off. If they do not split evenly, the daughter cells willhave abnormal numbers of chromosomes (aneuploidy) usually leading to deleterious consequences.
Figure ). Interestingly, the intracellular level of cdks is fairly constant. The level of cyclins, on the other hand,uctuates dramatically depending on the state of the cell with respect to the cell cycle.
9.3.1 1
1 0
2
2
9.3.2

E. V. Wong 9.3.2 12/18/2021 https://bio.libretexts.org/@go/page/64315
Figure . Cyclins are involved in control of the cell cycle.
The methodology of some of the early experiments is perfectly suited to explaining how this works. The seminal paper inthis field was a 1971 paper in J. Exp. Zool. by Masui and Markert. In it, they examined frog (Xenopus laevis) eggs thatwere arrested at G . The oocytes arrest for about 8 months naturally in order to build up the mass needed to start a neworganism once it has been fertilized. The basic question being asked is what is causing the eggs to come out of G and intoM phase? It was already known that the hormone progesterone can trigger this transition, but what are the intracellularplayers in the change in cell state? Masui and Markert decided to test whether there was a cytoplasmic molecule that wasresponsible. They took a small amount of cytoplasm from an M-phase egg and injected it into a G -arrested egg. Thistriggered the maturation of the G2-arrested egg and pushed it into M phase, even without progesterone. The activity wascalled maturation promoting factor (MPF), and was hypothesized to be a soluble, cytosolic protein.
In later experiments, other investigators attempted to find the specific protein trigger, and from there, presumably, the restof the mechanism. Fractionating the M-phase oocyte cytoplasm by column chromatography, a protein, named cyclin B,was found to rise and fall in concentration in direct synchronization with MPF activity. Furthermore, addition of cyclin Balone was sufficient to rescue MPF activity from M-phase cytoplasmic extract that had been depleted by RNase treatment(preventing synthesis of any new proteins, including cyclin B, and abolishing MPF activity). This clearly places cyclin Bin the forefront of the maturation mechanism, but there was one major issue: cyclin B had no enzymatic activity. How wasit effecting the changes needed for progress from G to M phase?
This problem was answered by experiments on a very different organism, the fission yeast, Schizosaccharomyces pombe.Because they have a very short cycle time, a relatively small genome, and they can be given random mutations en masseby irradiation or chemical treatment, yeast are excellent model organisms for many types of biological study. After randommutation of a population of yeast, they can be screened for mutations of particular types, such as cell division cycle (cdc).When the mutations are sequenced and identified, they are often named by the type of mutation and order of discovery.Cdc2, it turns out, showed two interesting phenotypes when mutated in opposite directions. Mutations that knocked outfunction of cdc2 caused the formation of extremely large yeast that do not undergo cell division, while mutations that madecdc2 overactive caused the formation of rapidly dividing very small cells. The interpretation was that when cdc2 is missingor inactive, the cells cannot progress to mitosis, so they stay in G2 accumulating bulk material in preparation for a cell splitthat never comes. Conversely, when cdc2 is overactive, it drives the cell quickly into mitosis, even if it has not been in Glong enough to synthesize enough mass to form two normal-sized cells. This ties cdc2 nicely to cell cycle regulation, and iteven has an enzymatic activity: it is a kinase. This made it a perfect candidate as a first-order coordinator of cellular eventsbecause phosphorylation is fast, phosphorylation usually activates some other enzyme, and kinases usually act on an arrayof targets, not just one. So we now have a cyclin (identified as cdc13 in S. pombe) and a cyclin-dependent kinase that worktogether to promote cell cycle progression into M phase.
9.3.2
2
2
2
2
2

E. V. Wong 9.4.1 1/29/2022 https://bio.libretexts.org/@go/page/64316
9.4: Activation and inactivation of the cyclin-cdk complexAs more mutant yeast were being screened for changes to their cell cycle, two other genes were found in which mutationsgave rise to similar phenotypes. Nonfunctional cdc25 or overactive wee1 mutants generated the overly large cells with asingle nucleus, and conversely, overactive cdc25 or inactive wee1 generated many severely undersized cells. Both cdc25and wee1 gene products interact with cdk, and in fact, they are positive and negative regulators of cdk, respectively. Actingtogether with one more enzyme, CAK (cdk-activating kinase), they activate the cdk (Figure ).
Figure . Activation of mitotic cyclin/cdk complex
Using the mitotic cyclin/cdk complex as an example, the cyclin (cdc13) and cdk (cdc2) come together to form an inactivecomplex. The cdk is then phosphorylated by wee1, a kinase. The phosphate it puts on tyrosine-15 is needed for the rest ofthe activation sequence, but it is inhibitory: it actually prevents final activation. But once Tyr-15 is phosphorylated, CAKcan phosphorylate a neighboring threonine (Thr-161), which is required for activation. Finally, cdc25, a proteinphosphatase, removes the phosphate on Tyr-15, allowing activation of the cdk by the phosphorylated Thr-161, and theMPF is finally on its way. There is self-amplification of the activation as well, because one of the targets of MPF is cdc25,so there is a positive feedback loop in which the activity of cdc25 is upregulated by phosphorylation.
As you will see in a later section of this chapter, MPF performs many functions, some of which prevent progress of mitosispast anaphase. Therefore, there must be a way to turn off MPF (and for that matter, any cyclin/cdk complex) quickly andcompletely when the cell reaches the appropriate stage of the cell cycle. This is borne out by time-course studies of MPFactivity, which show a precipitous drop in activity in anaphase. This coincides with a depletion of the cyclin B (cdc13 in S.pombe) due to a combination of turning off transcription of the gene, and specific proteolytic degradation. The degradationpathway is now well understood, and is an interesting example of a sort of feedback regulation.
9.4.3
9.4.3

E. V. Wong 9.4.2 1/29/2022 https://bio.libretexts.org/@go/page/64316
Figure . MPF activity and cyclin B protein expression rise as the cell enters mitosis but drop just before anaphase.However, cdk levels remain steady throughout the cell cycle.
Essentially, MPF ensures its own destruction: one of its phosphorylation targets is cdc20. Upon phosphorylation, cdc20 isactivated and then activates anaphase promoting complex (APC). APC is a ubiquitin ligase (type E3) that polyubiquitinatesthe cyclin of the MPF complex, making it a target for proteolytic degradation by a proteosome. Note that only the cyclin isdestroyed, while the kinase is left alone. Without the cyclin, the kinase is inactive and must wait for cyclin levels to riseagain before it can be re- activated by a fresh round of phosphorylation and dephosphorylation.
Figure . MPF and other cyclin/cdk complexes are inactivated by destroying the cyclin.
9.4.4
9.4.5
E. V. Wong 9.5.1 12/25/2021 https://bio.libretexts.org/@go/page/64317
9.5: Pre-mitotic Phases
G /G Phase
The G phase is the state a cell is in immediately following cytokinesis. At that point, the cells will be somewhatundersized, and need to take up materials and energy sources, and convert them to cellular components in order to supportthe eventual cell division. During this time, the cell goes about doing its “normal” business - an endocrine cell makes andsecretes hormones, an intestinal epithelial cell absorbs nutrients from the gut and passes them on to the bloodstream, aneuron conducts signals, etc. Most types of cells spend the majority of their cycle in G , although there are exceptions,such as the frog oocytes mentioned earlier. The length of G is generally constant for a given cell type under normalconditions, but can vary greatly between different cell types. Post-mitotic cells, which have left the cell cycle and will nolonger divide, are in G until they die, barring reactivation of the cell cycle by stress conditions. This continuous G -likestate is referred to as G .
For those cells preparing to move from G into S, cyclins D and E, and cdk 2, 4, and 6 predominate, with activation ofcyclin D complexes preceding activation of cyclin E complexes. Two major questions are asked by the cell: is the DNAundamaged and complete, and is the extracellular environment favorable for cell division? The cellular sensors for theseconditions then link to cyclin complexes effect restriction points on cell cycle progression. The extracellular environmentquestions can be a tricky one, because this can include more than just assessment of nutrient availability or predatorythreats; it can also be a requirement for an external trigger such as a mitogenic hormone or paracrine signal. In fact, nearlyall normal animal cells require an extracellular signal to progress through the G1/S checkpoint. The cyclin E/cdk2combination is the principal regulator of entry into S phase and DNA replication.
The active cyclin E/cdk2 complex phosphorylates the tumor suppressor protein Rb (retinoblastoma), which causes E2Fto translocate to the nucleus and turn on genes needed for entry into S phase.
S phaseThe mechanisms of DNA replication were discussed in Chapter 7. It is important to note that once a cell has entered Sphase, it has essentially committed to going through cell division. Cells do not cope well with extra copies ofchromosomes, and a cell that went through S phase without going through mitosis would likely have major malfunctions ingene regulation. For similar reasons, the cell must only undergo DNA replication once per cell division. The cyclinA/ cdk2complex plays a key role in initiation of repli- cation by activating the pre-replicative complex. It also phosphorylatescdc6, causing it to dissociate from the ORC, and consequently the rest of the pre-RC. This prevents immediate re-use ofthis origin of replication, and since the phosphorylation of cdc6 allows it to be recognized by a ubiquitin ligase complex, itis tagged for proteolysis In addition to DNA replication, S phase is also the cell cycle stage in which centrosomes areduplicated in animal cells. The cyclin E/cdk2 combination licenses the duplication of centrosome, phosphorylatingnucleophosmin, which then dissociates from the cen- trosome. This helps to trigger the centrosome duplication.Nucleophosmin does not reassociate with centrosomes until telophase, when it is no longer phosphorylated. Plk4 (Polo-family kinase 4) activity is necessary for centriole duplication, and appears to initiate the centriole assembly mechanism.
The ubiquitin ligase complex, SCF, is made up of three major proteins and several minor species. Skp1 (S-phasekinase-associated protein 1) can be an RNA polymerase elongation factor, but in this complex links the other twoproteins together. Cul1 (Cullin 1) is an E3 type ubiquitin ligase. Finally, an F-box family protein like Rbx1 (Ring-box1), that heterodimerizes with cullin-1 and may also recruit E2 ubiquitinating enzyme.. In addition to cdc6, it alsorecognizes and ubiquitinates CKIs (cyclin complex kinase inhibitors) such as p27, which is involved in processes suchas DNA repair and error-checking.
G PhaseThe G phase begins when DNA replication has completed. Having said that, before the cell is allowed out of G and on toM phase, it must pass a DNA fidelity checkpoint, ensuring that not only has replication been fully completed, but that thereare no major errors. G is a relatively short phase (compared to G ) in most cell types, and it is spent building up energy
1 0
1
1
1
1 1
0
1
2
2 2
2 1

E. V. Wong 9.5.2 12/25/2021 https://bio.libretexts.org/@go/page/64317
and material stores for cell division and checking the DNA. If everything is ok, and the cyclin B/cdk1 complex has beenactivated, the cell proceeds to M phase.

E. V. Wong 9.6.1 1/29/2022 https://bio.libretexts.org/@go/page/64318
9.6: MitosisMitosis consists of prophase, metaphase, anaphase, and telophase, with distinct cellular activities characterizing eachphase. This completes the duplication of the nucleus, and is followed by cytokinesis, in which the cell divides to producetwo daughter cells.
Figure . Mitosis. During mitosis, the nuclear envelope breaks apart to allow the spindle access to the chromosomes.Once they have been moved to opposite ends, the nuclear membrane reforms around each set. Finally, cytokinesis dividesthe cell into two new daughter cells.
Prophase is the preparation of each component for this complex cellular dance. The DNA condenses (it is wrapped arounditself tightly to make it a smaller and stronger package) so that it is less susceptible to breakage during movement acrossthe cell. In doing so, most of the DNA becomes transcriptionally inactive. The Golgi bodies and the endoplasmic reticulumbegin to break apart into membranous vesicles that can be more easily and evenly distributed across the cell so that bothdaughter cells receive about the same. The centrosomes (in animal cells) move from their original position near the nucleustoward opposite sides of the cell, to establish the poles of the mitotic spindle.
Figure . The mitotic spindle. The spindle is made of microtubules that originate from the centrosomes, which havemigrated to opposite sides of the cell. There are three types of spindle microtubules: the kinetochore microtubules (K),polar microtubules (P), and astral microtubules (A).
MPF phosphorylates microtubule motor proteins and microtubule associated proteins (MAPs) to alter the normalmicrotubule dynamics and allow the massive reorganization into a mitotic spindle to occur. For example, one target ofMPF is PRC1, a bundling protein that is inactivated by phosphorylation, thus allowing individual microtubules to move tonew locations more easily than a large bundle could. Other effects are inactivation of stabilizing MAPs, which leads togreater lability of microtubules due to increased incidences of catastrophe. The motor protein targets of MPF are in thekinesin family and the phosphorylation is necessary for some of them to bind to the mitotic spindle.
Prometaphase is sometimes considered a separate phase but is also referred to as late prophase, and is primarily defined bythe breakup of the nuclear envelope. This process is induced by MPF phosphorylation of the nuclear lamins. Adorned withnegative charges from the phosphates, the lamins refuse to associate with one another any longer, leading to the breakdownof the nuclear lamina. As the lamins dissociate, the nuclear envelope remains bound to them, and fragments. This nuclearfragmentation must happen so that the mitotic spindle can reach inside and attach to the chromosomes.
Some of the microtubules of the mitotic spindle attach to the chromosomes via the kinetochore proteins, which link thespindle microtubules to the centromere region of each chromosome. These are known as kinetochore microtubules (Figure
). There are two other types of microtubules in the mitotic spindle (Figure ): the polar microtubules that reach
9.6.6
9.6.7
9.6.8 9.6.7

E. V. Wong 9.6.2 1/29/2022 https://bio.libretexts.org/@go/page/64318
across the cell and interact with one another to help maintain the separation of the centrosomes and defining the overalllength of the spindle, and the aster microtubules that are generally short, radiating out from, and stabilizing thecentrosome. Remember that the DNA replicated earlier in S phase, and thus sister chromatids are still partially attached.Visually, the centromere region appears narrower or more compressed than the rest of the chromosome, and generally liesnear the middle. The centromere contains repeated sequences that are involved in kinetochore binding and assembly.
In primates, the repeating motif is known as alpha satellite DNA, which is made of multiple instances of tandemrepeats of a core ~170bp sequence over a centromeric DNA span over a megabase in length. Similar repeats are foundin various other vertebrates as well. In other eukaryotes, the size and sequence may vary; for example, much shorterrepeats of ~5bp are found in centromeric DNA measuring 200-600kb in Drosophila chromosomes, and S. pombe hascentromeric DNA well under 10kb.
Figure . The kinetochore assembles on the centromere of the chromosome. Spindle microtubules attach to the fibrouscorona of the kinetochore through kinesins and dyneins.
The kinetochores attaching to the centromere DNA are trilaminar protein structures consisting of an inner layer, an outerlayer, and a fibrous corona. The kinetochore microtubules of the mitotic spindle are primarily attached to the fibrouscorona. As depicted in the Figure, it is attached through CENP-E, a kinesin, and dynein motor proteins that bind along thebarrel of the microtubule. In fact, sometimes the first contact between a chromosome (via the kinetochore) and a spindlemicrotubule is somewhere in the middle of the microtubule, and a combination of microtubule dynamics and motor proteinactivity move the chromosome to the distal end of the microtubule. This is facilitated by MCAK (mitotic centromere-associated kinesin), which is associated with the kinetochore core proteins and plays a role in depolymerizing microtubulesnear the (+) end.
The transition from the interphase microtubule cytoskeleton to a mitotic spindle require a number of molecular motorsto move the centrosomes, align the microtubules, and expand the spindle. These are depicted in Figure . Initially,as the duplicated centrosomes move away from each other along with some of the cytoskeletal microtubules, themicrotubules will interact at various angles. Because the polar microtubules that help to expand or maintain the spindlewidth must ineract in parallel, cytoplasmic dyneins bind to the eventual polar microtubules and by moving one alongthe other, bring them into parallel (9a). Once in that position, BimC and other kinesins take over as the primary motorsalong polar microtubules. They create an outward pushing force by holding onto a microtubule facing one direction,and driving along a parallel MT facing the opposite direction towards the (+) end (9b). Finally, cytosolic dyneinsattached to cortical cytoskeleton pull on the astral microtubules, which pulls the spindle ends further from center (9c).
9.6.8
9.6.9

E. V. Wong 9.6.3 1/29/2022 https://bio.libretexts.org/@go/page/64318
Figure . Molecular motors set up the mitotic spindle.
In fact, there appear to be two mechanisms at work: the bub1/bub2 system works in the tension sensing pathway, whileanother metaphase protein, mad2 appears to be important in suspending mitosis upon disconnection of the kinetochorewith the spindle microtubule.
As the nuclear envelope is breaking apart, the mitotic spindle microtubules are undergoing increased dynamic instability,cycling between periods of growth spurts (polymerization) and rapid shortening (catastrophic disassembly), searching forchromosomes to connect to. Once the kinetochore microtubules connect to the chromosomes, the microtubule dynamicsshift. The microtubule will primarily undergo shortening if it is beyond the center of the spindle and primarily lengtheningif it is short of center. Since eventually each set of sister chromatids is connected to microtubules on both kinetochores,each chromatid is connected to one shortening and one lengthening microtubule. As the chromosomes approach the centerof the mitotic spindle, the rate of microtubule shortening/lengthening slows. The sister chromatids are pushed and pulledby the spindle microtubules until they are all lined up along the midline of the mitotic spindle, which in most (but not all)cases is also the midline of the cell. Once they are all lined up, the cell is considered to have reached metaphase. Unlike theother phases, metaphase is a relatively static phase - it is a checkpoint for lining up the chromosomes.
Figure . A cell at metaphase. Microtubules are stained green, f-actin is stained red, and chromosomes, withcentromeres lined up along the midline, are stained blue. Note the surrounding cells, which are not in mitosis, with theirMT and MF cytoskeletons more overlapped. This photo released to public domain by the US government.
The chromosomes must be properly aligned to ensure that both daughter cells receive the proper complement ofchromosomes. How does the cell know when the chromosomes have reached the center of the spindle? An elegantlysimple experiment demonstrated that the general mechanism is a tension check - if the two microtubules connecting to thepair of sister chromatids from each side are of the same length, they should be exerting equal tension on the chromosomes.If the microtubule-kinetochore connection is severed at metaphase, the cell will be prevented from progressing (Nicklas,R.B., et al, J. Cell Biol. 130: 929-39, 1995). However, if an equivalent tension is applied by tugging on the chromosomewith a glass microneedle, progression of mitosis is restored!
9.6.9
9.6.10

E. V. Wong 9.6.4 1/29/2022 https://bio.libretexts.org/@go/page/64318
In addition to the tension check, there is another condition that must be met for continuation of mitosis: the MPF must beinactivated. As outlined earlier, MPF in part leads to its own inactivation by activating the anaphase-promoting complex(APC), which polyubiquitinates the cyclin, leading to its destruction and thus MPF-cdk inactivation. APC also tags securinfor destruction. Securin is a protein that binds and inhibits the proteolytic enzyme, separase, the activation of which isneeded to allow the sister chromatids to separate, which in turn, is necessary for anaphase to proceed.
Barring pathological situations, if and only if the chromosomes all line up at the metaphase plate will the cell proceed tothe next stage of mitosis: anaphase. The sister chromatids separate and are pulled toward opposite poles of the mitoticspindle. Somewhat perversely, even as the chromosomes move towards the spindle poles, the poles themselves moveoutward slightly. Separation of the sister chromatids requires the dissociation of the molecular “glue” holding themtogether: the cohesin proteins. The cohesins bind to both molecules of DNA and hold them together shortly afterreplication back in S phase. As anaphase approaches, the enzyme separase is activated, which then cuts the cohesinmolecules. Once all of the cohesin molecules are cut, the sister chromatids can finally be separated. The removal of thecohesins proceeds roughly inwards from the distal points of the chromosomes to the centromere, which is generally the lastregion of attachment.
A cohesin is a multimer of four subunits, Scc1, Scc3, Smc1, and Smc3 in yeast. An additional protein has also beenobserved in Xenopus. The SCC1 protein is cleaved by separin in yeast, but in metazoans, SCC1 may be removed fromchromosomes by another method as well. It is phosphorylated, which decreases its affinity for DNA, and may expose asite for separase-catalyzed hydrolysis.
Separase also promotes anaphase by activating Cdc14, a phosphatase needed to dephosphorylate the cdk substratesthat had been phosphorylated by the cyclin-cdk complexes of early mitosis. In addition, Cdc14 is also required forcytokinesis in the yeast S. cerevisiae and nematode C. elegans.
Anaphase can actually be divided into two stages, sometimes referred to as early and late or A and B. At first, thekinetochore microtubules are shortening from both ends, and kinesin-family motors pull the microtubules back toward thespindle poles. As late anaphase starts, polar microtubules elongate, and an additional chromatid-separating force is appliedby kinesin-family motor proteins [kinesin-5] that push the polar microtubules against one another to increase theseparation between the poles. Dynein-family motors help to direct movement of the poles as well, through their attachmentto the aster microtubules and the cortical (peripheral) cytoskeleton.
When both sets of chromosomes arrive at their respective poles, telophase begins. Technically, it was slowly building upsince anaphase: when MPF was inactivated by APC, its ability to phosphorylate nuclear lamins was ended. Proteinphosphatases in the cell remove the phosphate groups, allowing the lamins to once again interact with one another, and bytelophase they are reconstituting the nuclear lamina and the nuclear envelope. Since the lamins and other nuclearmembrane proteins also interact with DNA, the nuclear membrane fragments dispersed back in late prophase now coalescearound each set of DNA to form the new nuclear envelopes. The other fragmented membranous organelles (ER, Golgi)also start to re-form. By the end of telophase, the product is a single large cell with two complete nuclei on opposite sides.The next and last step, cytokinesis, splits the cell into two separate and independent daughter cells. In animal cells,cytokinesis is similar to the tightening of a drawstring in the middle of the cell, pulling the “waist” in until all edges meet,and two separate cells result. This contractile ring is composed of actin (structural) and myosin (motive) subunits. Theseproteins, using ATP for energy, ratchet themselves closer and closer together similar to the actin-myosin “power stroke”described for muscle cell sarcomeres, also primarily made from actin and myosin. This mechanism is universal for animalcells, but the placement of the ring is not always in the center of the cell. The ring often coincides with the center of thecell, but is in fact positioned by the metaphase plate (i.e. the center of mitotic spindle). The most obvious example of ametaphase plate that does not coincide with the center of the cell is found in the formation of egg cells. Because thepurpose of an egg cell is to provide all of the material necessary to make a viable new organism upon fertilization (thesperm contributes negligible biomass beyond the genetic material), it divides asymmetrically, with the mitotic spindlelocated far to one side of the cell (Figure ).9.6.11

E. V. Wong 9.6.5 1/29/2022 https://bio.libretexts.org/@go/page/64318
Figure . Telophase/Cytokinesis. The contractile ring and other actin structures are stained green, the microtubulesare orange, and the chromosomes are blue. Photo released to public domain by US government.
When cytokinesis occurs, one daughter cell, the presumed oocyte, is very large, while the other cell, called a polar body,has minimal cytoplasmic material surrounding the nucleus. The contractile ring works in animal cells because the cellmembrane is flexible. In plant cells, the cell membrane is firmly attached to a rigid cell wall, and thus cannot be pulled in.So, the plant cell ingeniously builds a wall down the middle of the cell using specialized vesicles that originate from partof the Golgi, and which contain the materials necessary to form a cell wall. The vesicles travel along the phragmoplast, astructure built from the mitotic spindle microtubules, and as the vesicles line up along the middle of the cell, they begin tofuse to form bigger vesicles and then a large disk-like vesicle, the cell plate. Eventually they reach the cell membraneitself, and fusing with that leads to formation of a new cell wall, and two complete and independent cells.
Figure . Cytokinesis in plant cells. Golgi-derived vesicles filled with cell wall material travel along the phragmoplastand fuse in the center to form a new cell wall.
The contents of the vesicles traveling along the phragmoplast are not well described. Callose, a glucose polysaccharidewith β1-3 linkages is known to be present in the developing cell plate, but has not been found in the Golgi or vesicles.Interestingly, once the cell plate has fused completely with the existing cell walls, callose gradually disappears. It isthought that the same enzyme system that synthesized callose may switch to synthesizing cellulose as the cell platematures.
9.6.11
9.6.12

9.7.1 12/18/2021 https://bio.libretexts.org/@go/page/64319
9.7: Cell DeathA cell may die either intentionally (usually referred to as apoptosis or programmed cell death, though also once knownalso as “cellular suicide”), or unintentionally (necrosis). The microscopic observation of these two processes showsstrikingly different mechanisms at work. In apoptosis, the cell begins to shrink and lose shape as the cytoskeleton isdegraded, then the organelles appear to pack together, except for the nucleus. Inside the nucleus, the chromatin condensesand attaches to the nuclear envelope, which then loses its integrity and starts to break apart. The cell membrane begins toshow irregularities, descriptively known as blebs, and eventually, the cell breaks apart into vesicles that are neatly cleanedup by phagocytes drawn to the site by apoptotic signals emitted by the dying cell. Necrosis, on the other hand, is quiteliterally a mess. The cell appears to swell and the plasma membrane begins to lose its integrity. It is soon catastrophicallyleaking cytoplasm, and leaves behind cell debris that can accumulate and trigger necrotic death of adjacent cells.
Figure . (A) A cell underdying by necrosis is disorganized, generally bursts and leaks its contents. (B) A cellundergoing apoptosis first subdivides itself, digesting itself in an orderly fashion and compartmentalizing everything forscavenging by phagocytes.
Apoptosis is ultimately put into action by a cascade of caspases, a family of proteolytic enzymes. This family of enzymesis generally produced as proenzymes that are activated by other members of the caspase family. Thus a cascade effectoccurs, after the initial trigger activating one set of caspases, they can then cleave a variety of proteins includingprocaspases that are thereby activated and can hydrolyze even more proteins, including yet another type of procaspase, andso on. Of course, other enzymes are also activated and participate by widening the response, activating other groups ofproteases and apoptotic enzymes. Triggering the apoptotic cascade is usually one of two general pathways: an internaltrigger, arising from damage to the mitochondria, and an external trigger, started by binding an extracellular signalmolecule to activate a “death receptor”. Although there are many variations on both triggers, they follow similar paths tothe examples we will use here.
If you recall the section on electron transport in oxidative phosphorylation, then you may also recall the soluble electroncarrier, cytochrome c. This protein is exclusively found in the mitochondrial matrix under normal circumstances, so itspresence in the cytoplasm can be taken to indicate mitochondria in distress. Given the importance of mitochondria inproviding the energy for most aerobic cells to carry out their normal life, such distress is an early indicator that the cell willdie soon. The diagram below shows a sample pathway that can cause cytochrome c leakage from the mitochondria, butmitochondria can also just “get old”, and if the cell is “programmed” (by transcription factors) not to replace failingcomponents, then as the mitochondrial membranes lose integrity and allow cytochrome c out, it is a clear signal to initiatetermination protocols, to use the parlance of science fiction novels.
Figure . Apoptotic signaling cascades may be initiated by leakage of cytochrome c into cytoplasm.
The cytochrome c is bound by APAF-1 (apoptotic protease activating factor 1) which oligomerizes to form an apoptosomemade of 7 APAF-1 moecules and 7 cytochrome c molecules. The apoptosome binds and activates procaspase-9 to initiate acaspase cascade that continues with activation of procaspase-3. When the mitochondria leaks cytochrome c, it also leaksanother apoptotic protein, SMAC/Diablo. This protein, among other functions, inhibits IAP (inhibitor of apoptosis)-familyproteins. The IAP proteins normally inhibit caspase activation both directly and indirectly to prevent cell death, andSMAC/Diablo blocks that inhibition.
9.7.13
9.7.14

9.7.2 12/18/2021 https://bio.libretexts.org/@go/page/64319
Figure . Apoptotic signaling cascades may be started by external activation of a “death receptor” such as FasR.
When death receptors are activated, the subsequent caspase cascade does not involve the mitochondria or APAF-1. Thebest studied case, FasR (Fas receptor) activates caspases 2, 8, and 10 by clipping procaspases and by releasing caspasesfrom inhibiting complexes. These activate caspases 3, 6, and 7, which leads to the final stages of apoptosis. In bothinternally and externally triggered apoptosis, the final steps are the same: some of the final targets of the caspases are thenuclear lamins and ICAD (inhibitor of caspase-activated DNase). Destroying the nuclear lamins leads to fragmentation ofthe nuclear envelope, while removing ICAD activated the caspase-activated DNase (CAD) which then be- gins to digestthe DNA.
Why does the apoptosis mechanism exist? There are two major (and many other) reasons for apoptosis. The first isdevelopmental. In the development of an organism, the most effective strategy is often to have overgrowth of cells that arethen pruned back to the proper formations. Examples of this are the apoptotic death of tissue between initially connectedfingers and toes (we humans start with webbed fingers and toes embryonically), and death of unconnected or improperlyconnected neurons. The latter case also illustrates a fundamental principle in mammalian cell biology, and most othervertebrates as well: cells require signals (trophic factors) to stay alive. In this example, the neurons that do not make properconnections to a target cell do not receive the necessary trophic factor (secreted by the target). This leads to apoptotic deathof the unconnected neuron. In fact, if apoptosis is blocked due to mutation to a gene in the pathway, there is severeovergrowth of the brain and spinal cord, causing serious mal- function and craniofacial deformities. Thus in development,apoptosis is necessary to control the growth of different parts of a metazoan organism.
The other major function for apoptosis is to kill dangerous cells. In some cases, these may be cells infected by a pathogen.In others, the cells have accumulated mutations that do have affected the DNA error-correction system or cell-cyclecheckpoints. When the former occurs, each generation has an increased likelihood of even more mutations. It is importantto activate apoptosis in such cells before they have a chance to acquire errors that removes all cell cycle checkpoints,allowing unchecked cell proliferation. This could lead to tumor formation and potentially cancer (see next chapter). Whensuch cells need to be killed for the benefit of the organism, it may happen by the triggering of an internal sensor such asmitochondrial damage, or by external means, such as an immune system cell recognizing an infected cell.
9.7.15

9.8.1 12/25/2021 https://bio.libretexts.org/@go/page/64320
9.8: MeiosisIn metazoa, there are two situations in which a cell gives rise to daughter cells. The first, and by far most common, ismitosis. The second is meiosis. Meiosis is the process by which gametes (sex cells) are generated. Animals and plants aregenerated by sexual reproduction (if this is news to you, please consider majoring in something other than biology). Theseorganisms start life through the fusion of two cells: a sperm and an egg. Both contribute genetic material to the neworganism. In order to maintain the proper number of chromosomes in each generation, the gametes each contribute one setof chromosomes, so that the fertilized egg and all other cells in the organism have two sets of chromosomes — one fromeach parent. The purpose of meiosis, and its primary difference with mitosis, is not generating daughter cells that are exactreplicates, but generating daughter cells that only have half the amount of genetic material as the original cell.
Let us take a look at this situation selfishly: meiosis in human beings. Almost every cell in your body has a nucleuscontaining 46 chromosomes, a set of 23 from your father, and a set of 23 from your mother. The only exceptions are thegametes: the spermatocytes in men and the oocytes in women. The somatic cells are said to be 2n or diploid, that is having2 sets of chromosomes, and the gametes are 1n or haploid, having only one set of chromosomes. Sometimes, meiosis canbe a little confusing to students because it occurs in the same part of the cell cycle as mitosis, which is to say after G .Because of this, the cell entering meiosis actually has 4 sets of chromosomes, since the DNA has already undergonereplication in S phase.
Mature red blood cells contain no nucleus, and some muscle cells, while multinucleated because they form from thefusion of several myoblasts, nevertheless have 46 chromosomes in each of the nuclei. Polyploidy, while uncommon inhumans, is a normal state for many organisms. The frog, Xenopus laevis, a common research animal, is tetraploid.
Meiosis consists of two consecutive meiotic divisions each of which has phases similar to mitosis: prophase, metaphase,anaphase, telophase, and each of which finishes with complete cytokinesis. Note that immediately following meiotictelophase I, the cell divides, and both daughter cells are immediately in prophase II. There is no intervening G , S, or Gphase.
Prophase I of meiosis begins very similarly to prophase of mitosis: MPF (mitotic-cdk) activation, chromosomecondensation, spindle formation and nuclear envelope breakdown. However, compared to mitosis, meiotic prophase I lastsfor a very long time and can be subdivided into five stages: leptotene, zygotene, pachytene, diplotene, and diakinesis.During leptotene, the two sets (maternal and paternal) of sister chromatids for each chromosome condense, align and forma structure known as a bivalent. To clarify, this bivalent consists of four copies of a given chromosome: two copies each ofthe maternal chromosome and of the paternal chromosome. Because the maternal and paternal versions of a givenchromosome are kept in extremely close proximity for an extended period of time, there is a greater chance of arecombination, or crossing over and exchange of homologous pieces of each chromosome.
Figure . The five stages of Meiotic Prophase I.
Recombination occurs when a piece of the paternal chromosome is swapped for the homologous piece of DNA on thematching maternal chromosome (or vice versa). Note that sister chromatids (i.e. exact copies) do not recombine - onlyhomologous non-sister chromatids can recombine. Obviously, this kind of a DNA swap must be done carefully and withequivalence, so that the resultant DNA on each side contains all the genetic information it is supposed to, and no moreinformation than it is supposed to. In order to ensure this precision in recombination, the non-sister homologous
2
1 2
9.8.16

9.8.2 12/25/2021 https://bio.libretexts.org/@go/page/64320
chromatids are held together in a synaptonemal complex (SC). This ladder-like complex begins to form in the zygotenestage of prophase I and completes in pachytene. The complete SC consists of proteinaceous lateral elements (aka axialelements) that run along the length of the chromatids and a short central element composed of fibrous proteins forming therungs of the ladder perpendicular to the two lateral elements. The central element is formed of transverse lament dimersthat interact with one another in offset fashion, as well as with the lateral elements. These lament proteins (e.g. SCP1(mouse), Zip1p (yeast)) have central coiled-coil regions that function as protein interaction domains. Although SCP3 andtherefore complete lateral element formation are unnecessary for a functional synaptonemal complex, condensin andcohesin do appear to be necessary for proper transverse lament attachment of the lateral elements.
Recombination may occur with or without the formation of double-strand breaks, and in fact, can occur without theformation of the synaptonemal complex, although the SC probably enhances the efficiency of recombination. In S. pombe,meiosis occurs without the formation of a synaptonemal complex, but there are small discontinuous structures somewhatsimilar to parts of the SC. In the fruit fly, Drosophila melanogaster, females undergo meiosis using a synaptonemalcomplex, but males do not undergo meiotic recombination, and their chromosomes do not form synaptonemal complexes.In most cases, recombination is preceded by the formation of recombination nodules, which are protein complexes thatform at potential points for recombination. The best studied mechanism for meiotic recombination involves a double-stranded break of one of the chromosomes initiated by the meiosis-specific endonuclease, Spo11. The 5’ ends (one in eachdirection) of this cut are degraded slightly to form 3’ single-stranded overhangs. This leads to the formation of Hollidayjunctions with a strand from one chromosome acting as a template for a missing portion of the homologous cutchromosome. This may be resolved one of two ways, with or without a crossover, as illustrated (Figure ).
Figure . Recombination of homologous chromosomes.
The recombination is initiated in pachytene and completes in diplotene, at which time the synaptonemal complex breaksdown. As the chromatids begin to separate, chias- mata become apparent at some of the recombination sites. As prophasecompletes, the chiasmata resolve from the center of the chromosomes to the ends.
As the cell goes from meiotic prophase I to meiotic metaphase I, another difference between mitosis and meiosis isrevealed: the chromosomes line up at the metaphase plate as tetrads rather than as pairs. Because of this, when they pullapart in anaphase, sets of sister chromatids segregate to opposite poles. Of course, due to recombination, the sisterchromatids are unlikely to still be identical.
9.8.17
9.8.17

9.8.3 12/25/2021 https://bio.libretexts.org/@go/page/64320
Figure . Meiosis generates 4 haploid daughter cells from one diploid precursor. To do so, it undergoes a two roundsof meiotic nuclear and cell division.
After a conventional anaphase and telophase, the cell splits, and immediately the daughter cells begin the second meioticdivision (Figure , right side). In some cell types, chromosomes do not decondense in meiotic telophase I, but if theyhave, they re-condense in meiotic prophase II. Prophase II proceeds similarly to mitotic prophase, in that there is noformation of synaptonemal complexes or recombination. At metaphase II, the sister chromatids line up along themetaphase plate just as in mitosis, although now there are only 2n chromosomes in the cell, while in mitosis there wouldhave been 4n (because the DNA has replicated). Again, nishing the rest of the division almost exactly like mitosis, thesister chromatids pull apart in anaphase II, the nucleus reforms in telophase II, and the final cytokinesis generates a total offour cells from the original one that entered into meiosis, each containing 1n chromosomes.
Egg cells, as genetic and bulk material donors, need to be large but sperm cells, as genetic donors only, do not. Thediagram below depicts the generation of the egg cells. Only one oocyte is generated from a meiotic event; the other threedaughter cells are termed polar bodies, and contain so little cytoplasmic material that they are only viable for a short time.The asymmetric distribution of cytoplasm in the first meiotic division for oocytes is due to the position of the meioticspindle in the periphery of the cell rather than centered. Since the center of the spindle determines the position of thecontractile ring for cytokinesis, this leads to unevenly sized daughter cells.
Figure . Oogenesis.
The generation of the very small sperm is a different mechanism altogether. In the meiotic steps of spermatogenesis, thecell divisions are equal, with the meiotic spindle aligned with the center of the cell, and the cells have equal amounts ofcytoplasm, much like an average cell that has undergone mitosis. The streamlined, minimal-cytoplasm mature sperm is aproduct of post-meiotic differentiation, in which it gains the flagellar tail, and ejects most of its cytoplasmic material,
9.8.18
9.8.18
9.8.19

9.8.4 12/25/2021 https://bio.libretexts.org/@go/page/64320
keeping only some mitochondria to power the flagella, and an acrosomal vesicle, that contains the enzymes and othermolecules needed to reach and fuse with (i.e. fertilize) an egg.
Figure . Spermatogenesis.
Not all organisms reproduce with the human-like egg and sperm mechanism, i.e. gametic meiosis. As just described, in agametic meiosis life cycle, meiosis generates haploid gametes, which then fuse/fertilize to become a diploid zygote. Thezygote becomes a multicellular diploid organism, and once it reaches sexual maturity can make more haploid gametes viameiosis. The only multicellular state is diploid, and the gametes are haploid.
A common variation is sporic meiosis, used in all plants and many types of algae. In this usage, “spore” refers toeukaryotic spores, and not to bacterial endospores, which are simply dormant bacteria. Sporic meiosis does not directlyproduce gametes. Instead, meiosis produces haploid spores, which can develop by mitosis in haploid multicellularorganisms. These organisms (termed gametophytes) can produce (still haploid) gametes by mitosis, that whenfused/fertilized form a diploid zygote. This zygote can then develop into a diploid multicellular form called the sporophyte.Finally, the sporophyte is able to generate more spores by meiosis.
Figure . Gametic meiosis (left) and Sporic meiosis (right).
An example of this type of life-cycle and the role of meiosis is found in moss. What we think of as the body of the moss isactually a gametophyte, made up of haploid cells generated by mitotic division of a haploid spore. These gametophytesgenerate either sperm or eggs in specialized structures in their distal tips, and under the right conditions (e.g. rain) thesperm is carried to the eggs and fertilization occurs. The fertilized (diploid) egg now develops by mitotic division anddifferentiation into a sporophyte. In this case, the sporophyte is a specialized reproductive structure on the tip of the moss,and is also diploid. On the tip of the sporophyte is the sporangium, which is where meiosis takes place to generate haploidspores. The spores may then be dispersed (by wind or rain) and begin the cycle again by dividing and forming a newgametophyte.
9.8.20
9.8.21

E. V. Wong 10.1 12/18/2021 https://bio.libretexts.org/@go/page/64321
10: CancerCancer encompasses a set of genetic diseases that lead to uncontrolled cell proliferation in multicellular organisms. Thediscussion of cancer also happens to be useful in a cell biology course, because it ties together many of the concepts thatyou just spent most of the semester learning. Although it can be caused in part by an outside agent, the development ofcancer is essentially a series of uncorrected mistakes by a cell’s regular processes. It can strike plants as well as animals,and because of intense research and subsequent deeper understanding of the cellular events that lead to cancer, it can nowbe treated in humans with some degree of success, depending on the type, location, and progression of the tumor.
Figure . (left) A tumor on a cypress branch. (right) A tumor of the small intestine. Cypress tumor photo by W. Calder,cc licensed 2009. Small bowel tumor by E. Uthman, public domain 1999.
Abnormal replication of a cell generally leads to the formation of a tumor, which is simply a solid mass of abnormallygrowing cells, usually clonal colonies of one or a few original tumorigenic cells. However, a tumor is not necessarilycancerous. A benign tumor is one that is ensconced within an extracellular matrix sheath, does not spread beyond thatsheath, and whose growth is slow or limited. In contrast, a cancerous or malignant tumor grows quickly due touncontrolled proliferation, expands significantly beyond its original boundaries, invading new tissue, and can metastasize,spreading through the circulatory system. Once this happens, not only is it no longer possible to remove all of thecancerous cells by surgical excision of the primary tumor, it is also nearly impossible to know how many secondary tumorshave formed or where they formed, since the metastatic cancer cells in the bloodstream may theoretically exit almostanywhere. However, in reality, certain tumors metastasize preferentially to particular target tissues/organs, presumablybased on molecular markers on the surface of the cells or in the extracellular matrix. Metastasis is considered the greatestmedical problem with respect to cancer treatment. If cancer is detected after metastasis has occurred, the chances ofsurvival drop dramatically.
At the cellular level, cancerous cells differ from normal cells in a number of important ways. Normal cells are regulated bythe cells around them, and by adulthood, most cells are inhibited from proliferation by contact with their neighboring cells.In vitro, this can be demonstrated by the observation that non-cancerous proliferative cells such as epithelial cells canproliferate until the culture dish bottom is completely covered (confluence), but once that happens, proliferation stops. Thisphenomenon is known as contact inhibition. If cancerous cells are allowed to proliferate in culture, they do not stop afterthe surface is covered, and instead can mound up on one another. The cell surface and internal cellular organization ofcancer cells is often disorganized in comparison to normal cells. Finally, cancer cells usually appear de-differentiated incomparison to their original cell type. If the original cell type was a at cell, the cancerous cell would be more rounded andthree-dimensional. This is an expected consequence of becoming a cancerous cell. Not only is proliferation deregulated,cell surface protein expression is altered to promote metastasis.
Figure . Normal human breast cells in culture at left. At right, similar cultured cells that have been transformed (i.e.they are now cancerous). Note the irregularity of both cell and nuclear morphology. Membranes are arbitrarily stained indifferent colors; chromosomes are stained blue in both panels. Photos from Ince et al, Cancer Cell 12:160-170, 2007.
10.9
10.10

E. V. Wong 10.2 12/18/2021 https://bio.libretexts.org/@go/page/64321
Differentiation is a key part of normal metazoan development. All cells come from the fertilized egg, and even afterseveral divisions, the cells are very similar. Eventually, though, they begin to specialize for their particularphysiological functions, whether as lung cells, brain cells, or bone cells, and that process of specialization isdifferentiation. In cancer cells, this process is partially reversed, as the cell reverts to a less specialized, more primitivestate.
Cancer is considered a genetic disease because it is caused by alterations to the DNA. However, it is rarely an inheriteddisease. An inherited disease would mean a disease that can be passed from one generation to the next, implying that thedisease-causing DNA mutation is found in the gametes (sperm or egg) of the stricken adult. Most cancers are due tospontaneously arising mutation in the DNA of one or a few somatic cells, and not a systemic aberration. Spontaneousmutation in the germ cells are possible, but most potentially cancer-causing ones lead to non-viable offspring. So, althoughit is exceedingly rare for cancer to be inherited, however, it is much more common to inherit a predisposition or increasedchance of developing a cancer.
Figure . Development of colon cancer takes time and multiple mutations.
An individual cancer-causing mutation generally creates a problem that can be corrected by some other cellularmechanism. Therefore, development of cancer comes about through the accumulation of multiple mutations and not theacquisition of just one. The best studied example of this gradual development of cancer is colon cancer (Figure11). Thereis a fairly characteristic progression of mutations in the genes APC, RAS, DCC, TP53, and PRL3. Note that theprogression depicted here is not inevitable: the presence of polyps does not lead invariably to colon cancer. Furthermore,intervention can be highly successful if it occurs early in the progression, so oncologists need to consider a range of riskfactors in weighing the cost and benefits of medical intervention. RAS and PRL3 are oncogenes, while APC, TP53, andDCC are tumor suppressor genes.
10.11

Index
Aacid
1.2: Acids and Bases actin
7.3: Actin Microfilaments Agonist
3.5.6: C6. Agonist and Antagonist of LigandBinding to Receptors - An Extension allosteric competitive inhibition
3.5.2: Competitive Inhibition Allosteric Enzymes
3.7.4: D4. Allosteric Enzymes alpha helix
2.3.2: C2. Secondary Structure Antagonists
3.5.6: C6. Agonist and Antagonist of LigandBinding to Receptors - An Extension apoptosis
9.7: Cell Death Aspartate Transcarbamyolase
3.7.4: D4. Allosteric Enzymes
Bbase
1.2: Acids and Bases beta hairpins
2.3.2: C2. Secondary Structure beta strands
2.3.2: C2. Secondary Structure
CCarrier proteins
5.1.3: A3. Receptors in Facilitated Diffusion cell cycle
9: (T3) Cell Cycle channel protein
5.1.3: A3. Receptors in Facilitated Diffusion Chaperones
6.3: Protein Folding in the EndoplasmicReticulum chirality
1.6: Amino Acids Cleland chemical reaction diagrams
3.7: More Complicated Enzymes cofactor
3.4: Regulation of Enzyme Activity Competitive antagonist
3.5.6: C6. Agonist and Antagonist of LigandBinding to Receptors - An Extension competitive inhibition
3.4: Regulation of Enzyme Activity 3.5.2: Competitive Inhibition
competitive inhibition constant3.5.2: Competitive Inhibition
Covalent Inhibition3.5.1: Irreversible Covalent Inhibition
cyclins9.3: Controlling the Cell Cycle
Cysteine Redox Chemistry2.1.7: A7. Cysteine Chemistry
Cytoskeletal Dynamics7.8: Cytoskeletal Dynamics
cytoskeleton7: (T3) Cytoskeleton 7.8: Cytoskeletal Dynamics
DDead End Inhibition
3.7.3: Inhibitors in Multi-substrate Reactions Dolichol
6.4: N-linked Protein Glycosylation Begins inthe ER double reciprocal plot
3.3: Enzyme Kinetics
Eendoplasmic reticulum
6.3: Protein Folding in the EndoplasmicReticulum Enzyme classification
3.2: Enzymes Enzymes
3.2: Enzymes
Ffacilitated diffusion
5.1.2: A2. Facilitated Diffusion fatty acids
1.7: Fatty Acids Fick's Law
5.1.1: A1. Simple Diffusion first law of thermodynamics
3.1: The Laws of Thermodynamics
GG1 phase
9.5: Pre-mitotic Phases Glycolipids
4.8: Glycolipids glycosylation
6.4: N-linked Protein Glycosylation Begins inthe ER glycosyltransferases
6.4: N-linked Protein Glycosylation Begins inthe ER
Iinsulin
6.1: Proteolytic Cleavage intermediate filaments
7.2: Intermediate Filaments Ionophores
5.1.3: A3. Receptors in Facilitated Diffusion Irreversible agonist
3.5.6: C6. Agonist and Antagonist of LigandBinding to Receptors - An Extension
KK systems
3.7.4: D4. Allosteric Enzymes KNF model
3.4: Regulation of Enzyme Activity
LLevinthal paradox
2.4.1: D1. Introduction ligand
8.2: Receptors and Ligands
Mmeiosis
9.8: Meiosis Membrane Pores
5.1.4: A4. Membrane Pores microfilaments
7.3: Actin Microfilaments Microtubule Organizing Centers
7.5: Microtubule Organizing Centers microtubules
7.4: Microtubules mitosis
9.6: Mitosis Mixed Inhibition
3.4: Regulation of Enzyme Activity 3.5.4: Noncompetitive and Mixed Inhibition
MWC model3.4: Regulation of Enzyme Activity
myofibril7.7: Actin - Myosin Structures in Muscle
myosin7.7: Actin - Myosin Structures in Muscle
Nnecrosis
9.7: Cell Death Noncompetitive antagonist
3.5.6: C6. Agonist and Antagonist of LigandBinding to Receptors - An Extension Noncompetitive Inhibition
3.4: Regulation of Enzyme Activity Noncompetitive inhibitors
3.5.4: Noncompetitive and Mixed Inhibition nuclear pore
6.2: Protein Trafficking nucleoporins
5.1.4: A4. Membrane Pores nucleotide
1.5: Nucleotides nucleotide bases
1.5: Nucleotides
Ppermeases
5.1.3: A3. Receptors in Facilitated Diffusion pi helix
2.3.2: C2. Secondary Structure Polyploidy
9.8: Meiosis primary structure
1.6: Amino Acids prions
2.6.2: H2. Prions and Disease Product Inhibition
3.7.3: Inhibitors in Multi-substrate Reactions proinsulin
6.1: Proteolytic Cleavage Prokaryotic Cell Cycle
9.1: The Prokaryotic Cell Cycle propeptide
6.1: Proteolytic Cleavage protein disulfide isomerase
6.3: Protein Folding in the EndoplasmicReticulum

Protein Folding2.4: Protein Folding - in Vivo and in Vitro
Proteolytic Cleavage6.1: Proteolytic Cleavage
QQuarternary Structure
1.6: Amino Acids 2.3.6: C6. Quarternary Structure
RRamachandran plot
2.3.1: C1. Main Chain Conformations receptor
8.2: Receptors and Ligands Receptor Tyrosine Kinases (RTKs)
8.4: Receptor Tyrosine Kinases
Ssarcomere
7.7: Actin - Myosin Structures in Muscle
second law of thermodynamics3.1: The Laws of Thermodynamics
secondary structure1.6: Amino Acids
secondary structure2.3.2: C2. Secondary Structure
signal peptides6.2: Protein Trafficking
signal transduction8: (T3) Signal Transduction
Simple Diffusion5.1.1: A1. Simple Diffusion
sphingolipids1.7: Fatty Acids
sugars1.4: Sugars
Ttertiary protein structure
1.6: Amino Acids
transmissible spongiformencephalopathies
2.6.2: H2. Prions and Disease transporters
5.1.3: A3. Receptors in Facilitated Diffusion tyrosine phosphatase
3.7.2: Multi-Substrate Ping-Pong Mechanisms
UUncompetitive Inhibition
3.4: Regulation of Enzyme Activity 3.5.3: Uncompetitive Inhibition
VV systems
3.7.4: D4. Allosteric Enzymes Vesicle
6.6: Vesicular Transport Vesicular Transport
6.6: Vesicular Transport

Glossary
Sample Word 1 | SampleDefinition 1