Synthetic biology through biomolecular design and engineering
Upload
independentCategory
view
0download
0
Fluorescent Proteins and in Vitro Genetic Organization for Cell-FreeSynthetic BiologyRoberta Lentini, Michele Forlin, Laura Martini, Cristina Del Bianco, Amy C. Spencer, Domenica Torino,and Sheref S. Mansy*
CIBIO, University of Trento, via delle Regole 101, 38123 Mattarello (TN), Italy
*S Supporting Information
ABSTRACT: To facilitate the construction of cell-free geneticdevices, we evaluated the ability of 17 different fluorescent proteinsto give easily detectable fluorescence signals in real-time from invitro transcription-translation reactions with a minimal system consisting of T7 RNA polymerase and E. coli translationmachinery, i.e., the PUREsystem. The data were used to construct a ratiometric fluorescence assay to quantify the effect ofgenetic organization on in vitro expression levels. Synthetic operons with varied spacing and sequence composition between twogenes that coded for fluorescent proteins were then assembled. The resulting data indicated which restriction sites and where therestriction sites should be placed in order to build genetic devices in a manner that does not interfere with protein expression.Other simple design rules were identified, such as the spacing and sequence composition influences of regions upstream anddownstream of ribosome binding sites and the ability of non-AUG start codons to function in vitro.
KEYWORDS: cell-free, fluorescent protein, transcription-translation, ribosome binding site, synthetic biology
The majority of synthetic biology research makes use of aliving chassis that provides for the necessary but poorly
characterized biological components required for life. Con-versely, a smaller community of synthetic biologists has begunto build cell-like systems with a nonliving, cell-free chassis.1−7
Although the cell-free branch of synthetic biology hasprogressed more slowly, success could provide for newtechnologies with several beneficial features. For example, theresulting cellular mimics would consist of fully definedcomponents. Therefore, it should be possible to build acomplete mathematical model describing the cellular mimicthat could aid in designing new features. Additionally,potentially technologically problematic features of life, such asevolution, could be intentionally removed by building systemsthat do not replicate.A significant step forward in allowing for the construction of
such well-defined, bottom-up systems came from Ueda andcolleagues, who showed that coupled transcription andtranslation reactions can be mediated by fully definedcomponents in vitro.8 Their system, hereafter referred to asthe PUREsystem, consisted of T7 RNA polymerase andEscherichia coli translation machinery. Subsequent workdemonstrated the compatibility of the PUREsystem withliposomes9,10 and with the expression of gene networks.11
Nevertheless, there has been little attempt to better define theinfluences of genetic organization on protein output withpurified transcription-translation machinery. Recently, a S30 E.coli cell extract translation system and the PUREsystem wereused to determine the influences of different ribosome bindingsites and transcriptional repressors on the synthesis ofeGFP.12,13
Although much is known about natural, in vivo genetics,much still remains unresolved. For example, the refactoring of
the T7 genome was successful in the sense that viablebacteriophage were produced; however, the refactoredbacteriophage was significantly less infective.14 Similarchallenges are routinely encountered when genetic elementsare inserted into organisms to engineer new circuitry. Typically,many permutations are required before desired function isachieved.15 The situation is perhaps even more challenging forsystems that exploit a cell-free chassis since biological parts areevolved to function optimally under the chemical conditionsfound in vivo. In vitro conditions are undoubtedly different.Further, unidentified molecular components necessary foractivity in vivo may be missing from in vitro constructions.The design and implementation of predictable, geneticallyencoded cell-free systems is difficult because of the lack of cell-free chassis data coupled with an incomplete understanding ofnatural, in vivo genetics.Here we sought to identify some practical rules for the
construction of genetically encoded, cell-free systems. First, 17different fluorescent proteins were screened for their ability togenerate easily detectable fluorescence signals after in vitrotranscription and translation with the PUREsystem. Fluores-cent proteins then were expressed from a bicistronic constructto identify fluorescent protein pairs that could be used toquantify the influences of genetic organization on proteinproduction. A series of synthetic operons that differed in thespacing and sequence between the two encoded genes, thespacing and sequence between the ribosome binding site andthe start codon, and the influence of the first nucleotideposition of the start codon on in vitro expression levels wasassessed with the developed ratiometric fluorescence assay. We
Received: January 17, 2013Published: March 8, 2013
Research Article
pubs.acs.org/synthbio
© 2013 American Chemical Society 482 dx.doi.org/10.1021/sb400003y | ACS Synth. Biol. 2013, 2, 482−489
found that a high guanosine content inhibited translation, thatsequences 5′ to the ribosome binding site were more amenableto the incorporation of restriction sites for cloning, and thatribosome binding sites were most efficient when separated fromthe start codon by 4−9 nucleotide positions. GUG, UUG, andCUG were functional as start codons in minimal, reconstitutedtranslation systems, although their associated expression levelswere significantly reduced.
■ RESULTS AND DISCUSSION
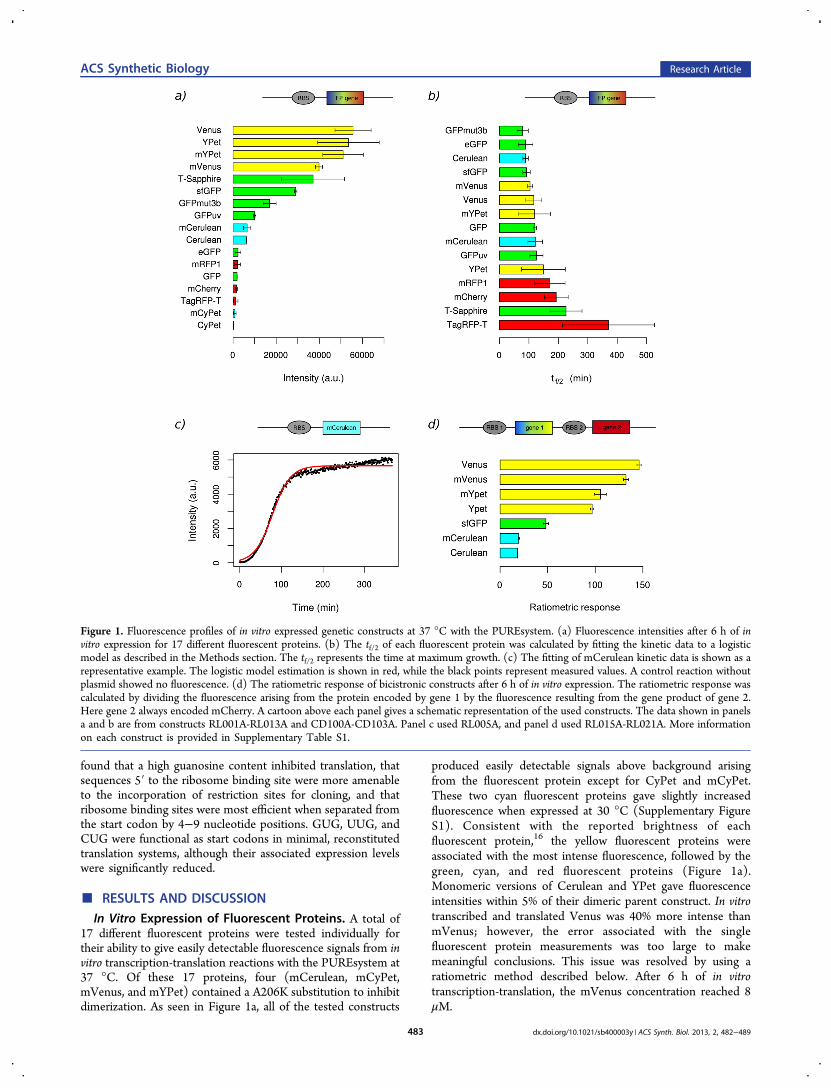
In Vitro Expression of Fluorescent Proteins. A total of17 different fluorescent proteins were tested individually fortheir ability to give easily detectable fluorescence signals from invitro transcription-translation reactions with the PUREsystem at37 °C. Of these 17 proteins, four (mCerulean, mCyPet,mVenus, and mYPet) contained a A206K substitution to inhibitdimerization. As seen in Figure 1a, all of the tested constructs
produced easily detectable signals above background arisingfrom the fluorescent protein except for CyPet and mCyPet.These two cyan fluorescent proteins gave slightly increasedfluorescence when expressed at 30 °C (Supplementary FigureS1). Consistent with the reported brightness of eachfluorescent protein,16 the yellow fluorescent proteins wereassociated with the most intense fluorescence, followed by thegreen, cyan, and red fluorescent proteins (Figure 1a).Monomeric versions of Cerulean and YPet gave fluorescenceintensities within 5% of their dimeric parent construct. In vitrotranscribed and translated Venus was 40% more intense thanmVenus; however, the error associated with the singlefluorescent protein measurements was too large to makemeaningful conclusions. This issue was resolved by using aratiometric method described below. After 6 h of in vitrotranscription-translation, the mVenus concentration reached 8μM.
Figure 1. Fluorescence profiles of in vitro expressed genetic constructs at 37 °C with the PUREsystem. (a) Fluorescence intensities after 6 h of invitro expression for 17 different fluorescent proteins. (b) The tf/2 of each fluorescent protein was calculated by fitting the kinetic data to a logisticmodel as described in the Methods section. The tf/2 represents the time at maximum growth. (c) The fitting of mCerulean kinetic data is shown as arepresentative example. The logistic model estimation is shown in red, while the black points represent measured values. A control reaction withoutplasmid showed no fluorescence. (d) The ratiometric response of bicistronic constructs after 6 h of in vitro expression. The ratiometric response wascalculated by dividing the fluorescence arising from the protein encoded by gene 1 by the fluorescence resulting from the gene product of gene 2.Here gene 2 always encoded mCherry. A cartoon above each panel gives a schematic representation of the used constructs. The data shown in panelsa and b are from constructs RL001A-RL013A and CD100A-CD103A. Panel c used RL005A, and panel d used RL015A-RL021A. More informationon each construct is provided in Supplementary Table S1.
ACS Synthetic Biology Research Article
dx.doi.org/10.1021/sb400003y | ACS Synth. Biol. 2013, 2, 482−489483
Most of the constructs gave sigmoidal shaped kinetic profilesand were complete within 6 h. The exceptions were T-Sapphireand TagRFP-T (Supplementary Figure S2), both of which didnot reach their maximal fluorescence within 6 h. The fitting ofthe kinetic data to a logistic model was used to determine thetime point at which the rate of fluorescence increase wasmaximal, which corresponded to the time required to reach halfmaximal fluorescence (tf/2) (Figure 1b,c). Note that the tf/2includes all of the steps involved in converting the informationencoded in DNA to a fluorescence signal and does not solelydescribe the last oxidation step of chromophore formation.17
The shortest tf/2 value was 79 min for GFPmut3b, and thelongest tf/2 was over 300 min for TagRFP-T (SupplementaryTable S4). The average tf/2 values for the expression of cyan,green, yellow, and red fluorescent proteins were 105, 122, 122,and 245 min, respectively. The tf/2 was 40% larger formCerulean than Cerulean, whereas mVenus and mYPet hadtf/2 values 12% and 26% smaller than Venus and YPet,respectively. On the basis of fluorescence intensity and kineticdata, Cerulean, mCerulean, super folder GFP (sfGFP), Venus,mVenus, YPet, mYPet, mRFP1, and mCherry were selected forfurther analysis.To reduce experimental error, we pursued the construction
of a ratiometric fluorescence system based on synthetic operonsthat encoded two fluorescent proteins. In this way theinfluences of pipetting, lamp performance, and DNA templatequality and concentration, among other difficult to controlvariables, would be removed. To build such a ratiometricsystem, a red fluorescent protein was desirable because theexcitation and emission spectra of red fluorescent proteins arebetter separated from the fluorescence spectra of otherfluorescent proteins. mRFP1 and mCherry were, therefore,tested in bicistronic constructs that additionally encoded sfGFPto evaluate their utility in characterizing expression levels. Morespecifically, small synthetic operons containing a standard T7transcriptional promoter, a ribosome binding site (RBS), a geneencoding sfGFP followed by a sequence that encoded the redfluorescent protein and a T7 transcriptional terminator wereassembled. All of the fluorescent proteins in these constructsgave reproducible and easily detectable fluorescence signals.After 6 h of expression with purified transcription-translationmachinery, the ratio of sfGFP fluorescence to mRFP1 and tomCherry fluorescence was 115.1 ± 6.9 and 49.9 ± 2.4,respectively (Supplementary Figure S3). We chose to usemCherry for the remaining experiments, because mCherryshowed more intense fluorescence from the bicistronicconstruct and because mCherry was shown to be morephotostable than mRFP1.16
We next assembled six additional synthetic operons thatencoded different fluorescent proteins followed by a sequencecoding for mCherry. After in vitro transcription and translation,the fluorescence profiles were similar to those obtained with thesingle fluorescent protein constructs in that the yellowfluorescent proteins were the most intense, followed bygreen, and cyan fluorescent proteins (Figure 1d). However,the error of each ratiometric measurement was significantlyreduced (relative standard error <8%) in comparison to thedata obtained from the monocistronic, single fluorescentprotein constructs (relative standard error <60%, excludingTagRFP-T). The A206K substitution that inhibits proteindimerization had a small effect on fluorescence intensity. Morespecifically, the ratiometric response, i.e., the fluorescenceintensity of the fluorescent protein tested divided by the
fluorescence intensity of mCherry, for mVenus, mYPet, andmCerulean were within 10% of the values measured for Venus,YPet, and Cerulean, respectively. The ratiometric response overtime showed that stable readings could be taken after 3 h for allconstructs tested (Supplementary Figure S4).It was not clear from the outset which fluorescent proteins
would perform well in vitro with minimal transcription-translation machinery. Although the physical characteristics ofindividually purified proteins, such as brightness and photo-stability, are useful in deciding if a protein could be suitable fora specific application, these parameters are not enough tounderstand if in vitro expression will give a robust, reproduciblesignal. For example, if in vitro produced protein is insoluble,folds slowly, or requires a long period of time for chromophoreformation, then that protein would be less useful as an in vitrogenetic reporter. Even within cells, differences in fluorescentprotein behavior have been noted, particularly for multidomainproteins.18 Despite these difficulties, we found that most of thefluorescent proteins tested function satisfactorily in in vitrotranscription-translation reactions with the PUREsystem at 37°C. One exception is CyPet, which fails to give a significantfluorescent output. The fact that CyPet expression at 30 °Cgives a better fluorescence signal is consistent with previousreports on the poor folding properties of CyPet.16 If afluorescent protein with cyan spectral properties were desired,cerulean would be a better choice. The green fluorescentproteins are generally bright and rapidly give rise tofluorescence signals, e.g., the tf/2 of sfGFP is 92 min. sfGFP isparticularly amenable to in vitro transcription-translation;however, GFPmut3b performs similarly well. GFPmut3b isone of the more common fluorescent proteins used in syntheticbiology. Two of the tested green fluorescent proteins fluoresceupon excitation with near-UV light. Of these two, T-Sapphirehas a tf/2 approximately 100 min longer than that of GFPuv.Therefore, GFPuv would be better for real-time detectionassays than T-Sapphire. The yellow fluorescent proteins Venusand YPet are the brightest fluorescent proteins that we testedand have tf/2 values below 150 min. Venus and YPet areexcellent choices to monitor in vitro reactions particularly whenlow protein output is expected, e.g., when expressing inside ofvesicles.19 YPet is more photostable,16 which could beimportant depending upon the nature of the plannedexperiments. The red fluorescent proteins mCherry andmRFP1 perform similarly well in in vitro transcription-translation reactions, but mCherry is more photostable.Although TagRFP-T is a highly photostable red fluorescentprotein alternative, the long tf/2 of TagRFP-T limits itsusefulness.All of the seven tested double fluorescent protein constructs
performed well, and so the choice of fluorescent protein pairsdepends on the specifics of the experimental setup. We foundthat the mVenus-mCherry pair gives easy to detect fluorescencesignals and reproducible data without interference between theemission of mVenus and the emission of mCherry. Therefore,the subsequent experiments that probed the effects of geneticorganization on protein production were performed withsynthetic operons encoding mVenus and mCherry. However,for the remaining experiments the order of the genes wasreversed so that mCherry was encoded first followed bymVenus in the bicistronic message. In this way, the lowerintensity fluorescent protein, i.e., mCherry, could be used toprovide the reference fluorescence signal and the influences ofthe region between the two genes on the expression of the
ACS Synthetic Biology Research Article
dx.doi.org/10.1021/sb400003y | ACS Synth. Biol. 2013, 2, 482−489484
brighter fluorescent protein, i.e., mVenus, could be more easilyassessed. Nevertheless, care should be taken in interpreting theresulting data. The assay can be used to characterize howchanges in DNA sequence influence the ratio of the twoencoded proteins. However, the assay does not differentiatebetween the decrease of expression of gene 1 or the increase ofexpression of gene 2. In other words, multiple mechanisms cangive indistinguishable results.Influence of Sequences Upstream of the Ribosome
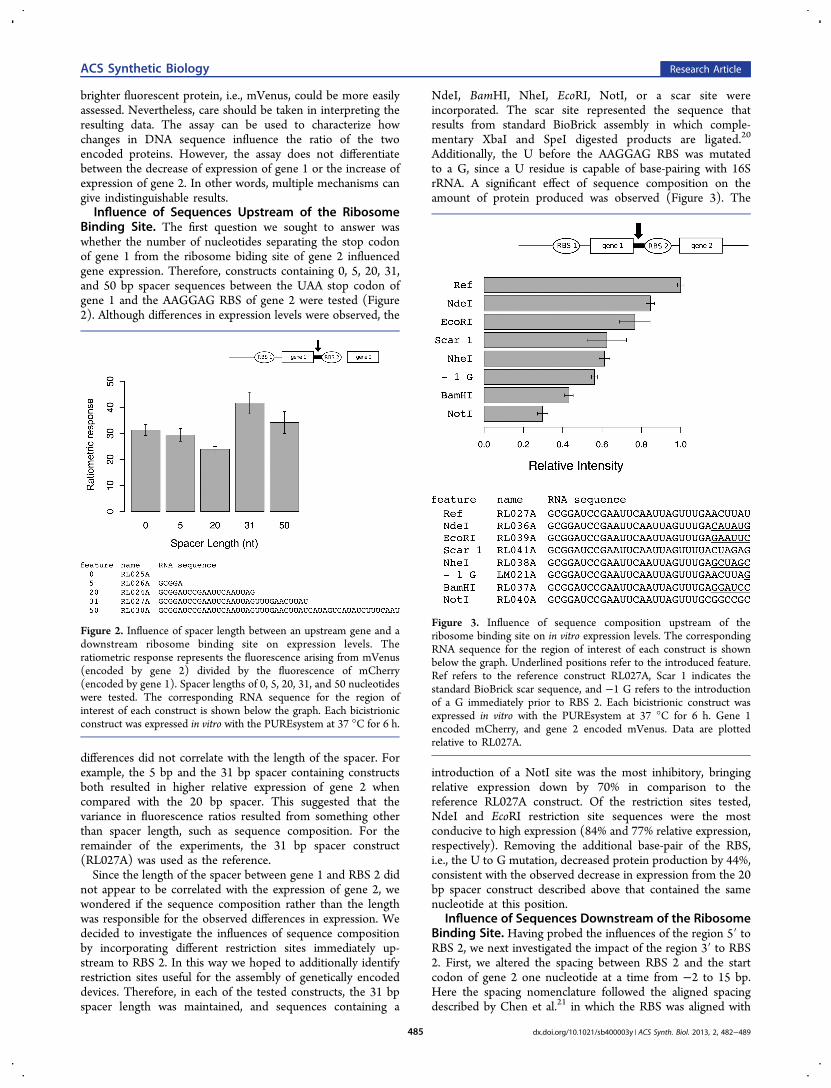
Binding Site. The first question we sought to answer waswhether the number of nucleotides separating the stop codonof gene 1 from the ribosome biding site of gene 2 influencedgene expression. Therefore, constructs containing 0, 5, 20, 31,and 50 bp spacer sequences between the UAA stop codon ofgene 1 and the AAGGAG RBS of gene 2 were tested (Figure2). Although differences in expression levels were observed, the
differences did not correlate with the length of the spacer. Forexample, the 5 bp and the 31 bp spacer containing constructsboth resulted in higher relative expression of gene 2 whencompared with the 20 bp spacer. This suggested that thevariance in fluorescence ratios resulted from something otherthan spacer length, such as sequence composition. For theremainder of the experiments, the 31 bp spacer construct(RL027A) was used as the reference.Since the length of the spacer between gene 1 and RBS 2 did
not appear to be correlated with the expression of gene 2, wewondered if the sequence composition rather than the lengthwas responsible for the observed differences in expression. Wedecided to investigate the influences of sequence compositionby incorporating different restriction sites immediately up-stream to RBS 2. In this way we hoped to additionally identifyrestriction sites useful for the assembly of genetically encodeddevices. Therefore, in each of the tested constructs, the 31 bpspacer length was maintained, and sequences containing a
NdeI, BamHI, NheI, EcoRI, NotI, or a scar site wereincorporated. The scar site represented the sequence thatresults from standard BioBrick assembly in which comple-mentary XbaI and SpeI digested products are ligated.20
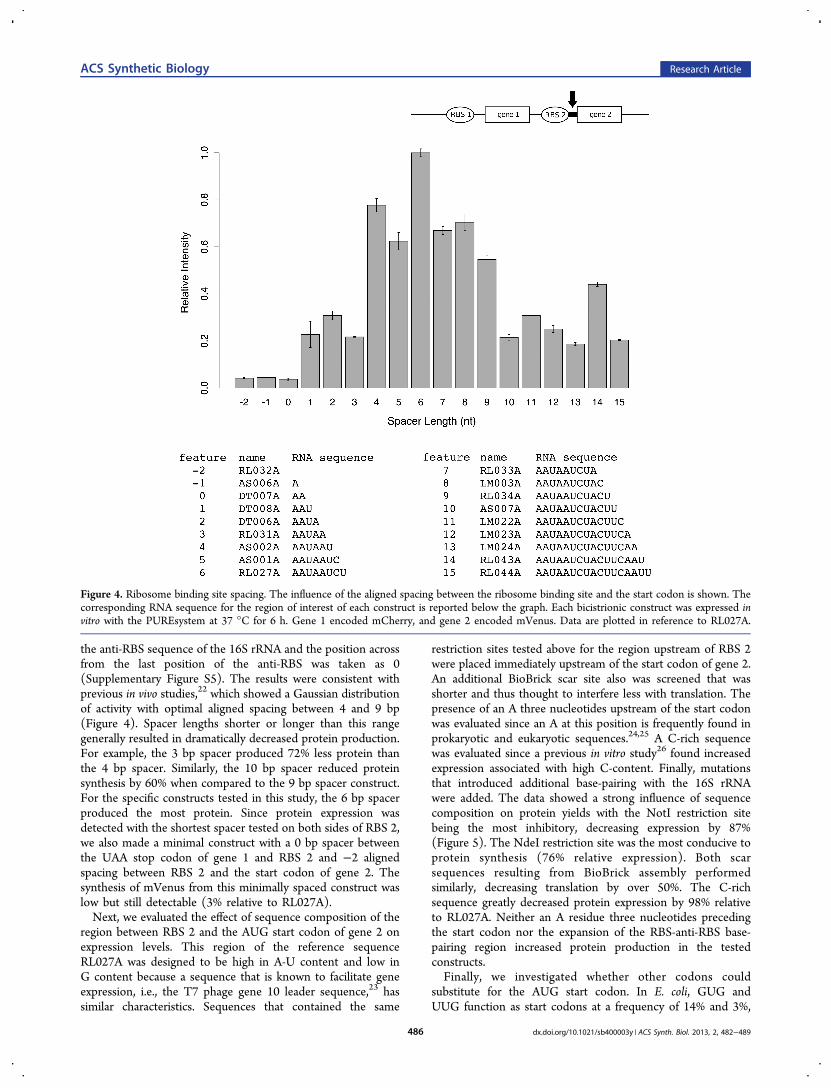
Additionally, the U before the AAGGAG RBS was mutatedto a G, since a U residue is capable of base-pairing with 16SrRNA. A significant effect of sequence composition on theamount of protein produced was observed (Figure 3). The
introduction of a NotI site was the most inhibitory, bringingrelative expression down by 70% in comparison to thereference RL027A construct. Of the restriction sites tested,NdeI and EcoRI restriction site sequences were the mostconducive to high expression (84% and 77% relative expression,respectively). Removing the additional base-pair of the RBS,i.e., the U to G mutation, decreased protein production by 44%,consistent with the observed decrease in expression from the 20bp spacer construct described above that contained the samenucleotide at this position.
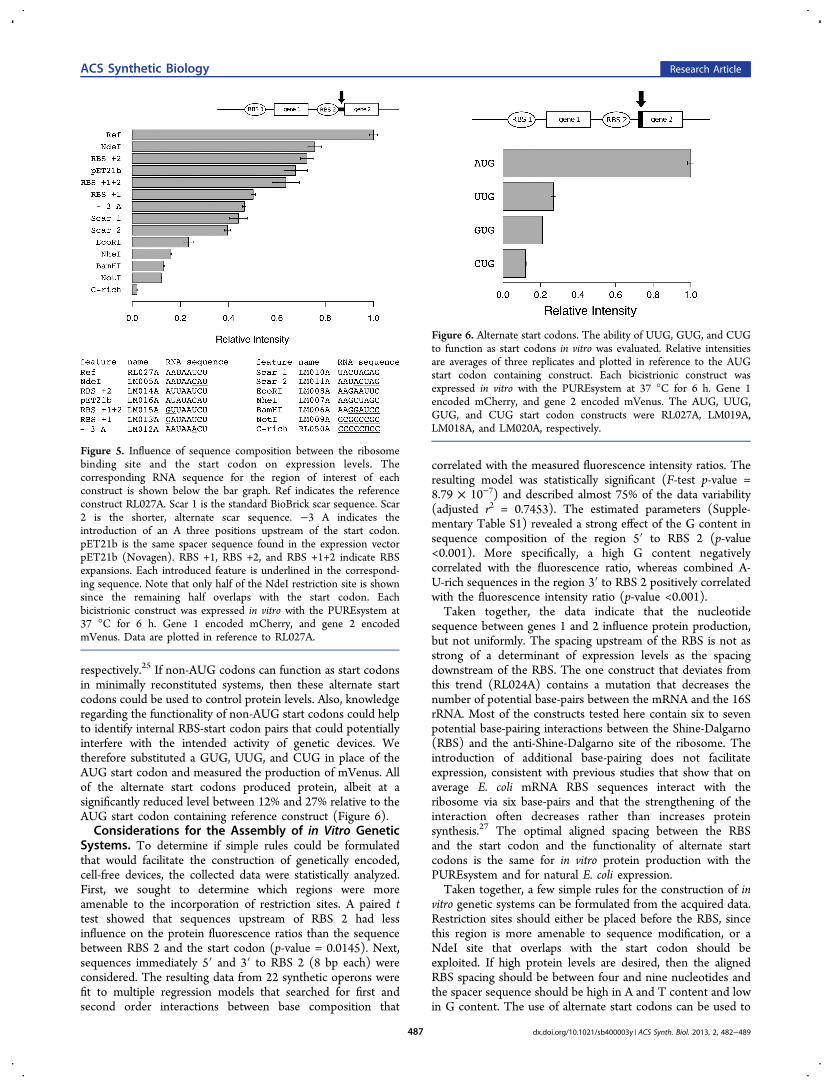
Influence of Sequences Downstream of the RibosomeBinding Site. Having probed the influences of the region 5′ toRBS 2, we next investigated the impact of the region 3′ to RBS2. First, we altered the spacing between RBS 2 and the startcodon of gene 2 one nucleotide at a time from −2 to 15 bp.Here the spacing nomenclature followed the aligned spacingdescribed by Chen et al.21 in which the RBS was aligned with
Figure 2. Influence of spacer length between an upstream gene and adownstream ribosome binding site on expression levels. Theratiometric response represents the fluorescence arising from mVenus(encoded by gene 2) divided by the fluorescence of mCherry(encoded by gene 1). Spacer lengths of 0, 5, 20, 31, and 50 nucleotideswere tested. The corresponding RNA sequence for the region ofinterest of each construct is shown below the graph. Each bicistrionicconstruct was expressed in vitro with the PUREsystem at 37 °C for 6 h.
Figure 3. Influence of sequence composition upstream of theribosome binding site on in vitro expression levels. The correspondingRNA sequence for the region of interest of each construct is shownbelow the graph. Underlined positions refer to the introduced feature.Ref refers to the reference construct RL027A, Scar 1 indicates thestandard BioBrick scar sequence, and −1 G refers to the introductionof a G immediately prior to RBS 2. Each bicistrionic construct wasexpressed in vitro with the PUREsystem at 37 °C for 6 h. Gene 1encoded mCherry, and gene 2 encoded mVenus. Data are plottedrelative to RL027A.
ACS Synthetic Biology Research Article
dx.doi.org/10.1021/sb400003y | ACS Synth. Biol. 2013, 2, 482−489485
the anti-RBS sequence of the 16S rRNA and the position acrossfrom the last position of the anti-RBS was taken as 0(Supplementary Figure S5). The results were consistent withprevious in vivo studies,22 which showed a Gaussian distributionof activity with optimal aligned spacing between 4 and 9 bp(Figure 4). Spacer lengths shorter or longer than this rangegenerally resulted in dramatically decreased protein production.For example, the 3 bp spacer produced 72% less protein thanthe 4 bp spacer. Similarly, the 10 bp spacer reduced proteinsynthesis by 60% when compared to the 9 bp spacer construct.For the specific constructs tested in this study, the 6 bp spacerproduced the most protein. Since protein expression wasdetected with the shortest spacer tested on both sides of RBS 2,we also made a minimal construct with a 0 bp spacer betweenthe UAA stop codon of gene 1 and RBS 2 and −2 alignedspacing between RBS 2 and the start codon of gene 2. Thesynthesis of mVenus from this minimally spaced construct waslow but still detectable (3% relative to RL027A).Next, we evaluated the effect of sequence composition of the
region between RBS 2 and the AUG start codon of gene 2 onexpression levels. This region of the reference sequenceRL027A was designed to be high in A-U content and low inG content because a sequence that is known to facilitate geneexpression, i.e., the T7 phage gene 10 leader sequence,23 hassimilar characteristics. Sequences that contained the same
restriction sites tested above for the region upstream of RBS 2were placed immediately upstream of the start codon of gene 2.An additional BioBrick scar site also was screened that wasshorter and thus thought to interfere less with translation. Thepresence of an A three nucleotides upstream of the start codonwas evaluated since an A at this position is frequently found inprokaryotic and eukaryotic sequences.24,25 A C-rich sequencewas evaluated since a previous in vitro study26 found increasedexpression associated with high C-content. Finally, mutationsthat introduced additional base-pairing with the 16S rRNAwere added. The data showed a strong influence of sequencecomposition on protein yields with the NotI restriction sitebeing the most inhibitory, decreasing expression by 87%(Figure 5). The NdeI restriction site was the most conducive toprotein synthesis (76% relative expression). Both scarsequences resulting from BioBrick assembly performedsimilarly, decreasing translation by over 50%. The C-richsequence greatly decreased protein expression by 98% relativeto RL027A. Neither an A residue three nucleotides precedingthe start codon nor the expansion of the RBS-anti-RBS base-pairing region increased protein production in the testedconstructs.Finally, we investigated whether other codons could
substitute for the AUG start codon. In E. coli, GUG andUUG function as start codons at a frequency of 14% and 3%,
Figure 4. Ribosome binding site spacing. The influence of the aligned spacing between the ribosome binding site and the start codon is shown. Thecorresponding RNA sequence for the region of interest of each construct is reported below the graph. Each bicistrionic construct was expressed invitro with the PUREsystem at 37 °C for 6 h. Gene 1 encoded mCherry, and gene 2 encoded mVenus. Data are plotted in reference to RL027A.
ACS Synthetic Biology Research Article
dx.doi.org/10.1021/sb400003y | ACS Synth. Biol. 2013, 2, 482−489486
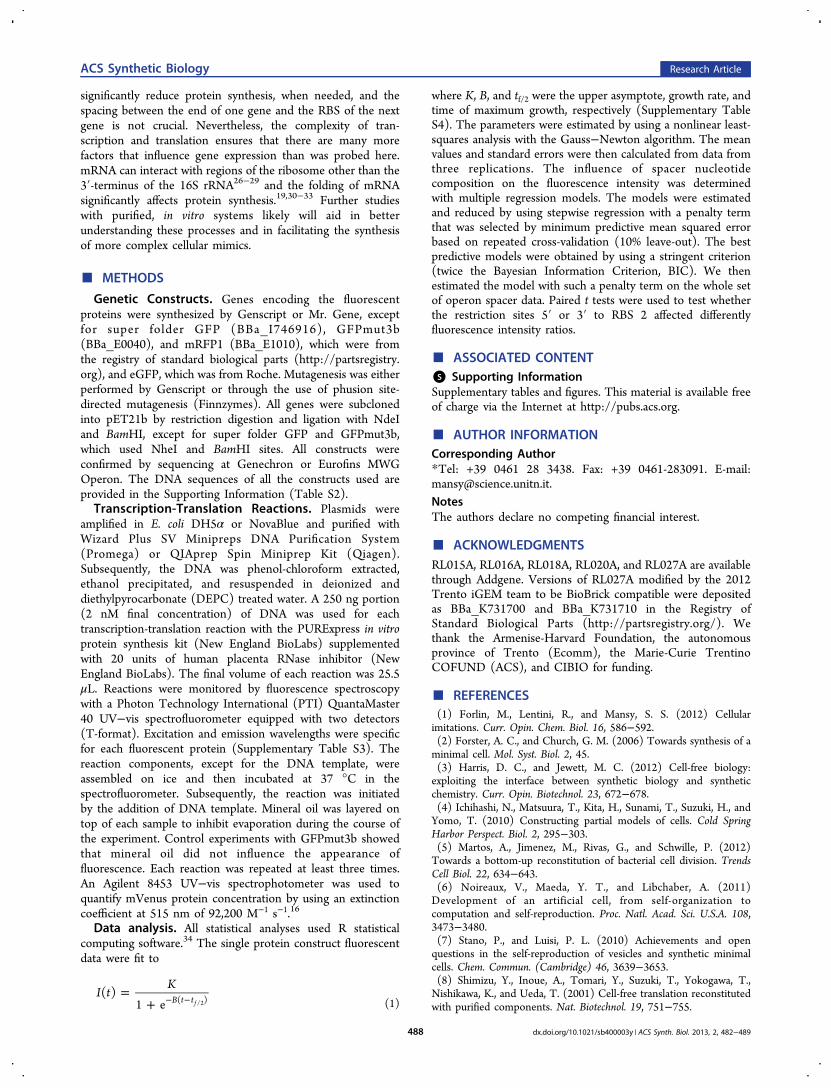
respectively.25 If non-AUG codons can function as start codonsin minimally reconstituted systems, then these alternate startcodons could be used to control protein levels. Also, knowledgeregarding the functionality of non-AUG start codons could helpto identify internal RBS-start codon pairs that could potentiallyinterfere with the intended activity of genetic devices. Wetherefore substituted a GUG, UUG, and CUG in place of theAUG start codon and measured the production of mVenus. Allof the alternate start codons produced protein, albeit at asignificantly reduced level between 12% and 27% relative to theAUG start codon containing reference construct (Figure 6).Considerations for the Assembly of in Vitro Genetic
Systems. To determine if simple rules could be formulatedthat would facilitate the construction of genetically encoded,cell-free devices, the collected data were statistically analyzed.First, we sought to determine which regions were moreamenable to the incorporation of restriction sites. A paired ttest showed that sequences upstream of RBS 2 had lessinfluence on the protein fluorescence ratios than the sequencebetween RBS 2 and the start codon (p-value = 0.0145). Next,sequences immediately 5′ and 3′ to RBS 2 (8 bp each) wereconsidered. The resulting data from 22 synthetic operons werefit to multiple regression models that searched for first andsecond order interactions between base composition that
correlated with the measured fluorescence intensity ratios. Theresulting model was statistically significant (F-test p-value =8.79 × 10⁻⁷) and described almost 75% of the data variability(adjusted r2 = 0.7453). The estimated parameters (Supple-mentary Table S1) revealed a strong effect of the G content insequence composition of the region 5′ to RBS 2 (p-value<0.001). More specifically, a high G content negativelycorrelated with the fluorescence ratio, whereas combined A-U-rich sequences in the region 3′ to RBS 2 positively correlatedwith the fluorescence intensity ratio (p-value <0.001).Taken together, the data indicate that the nucleotide
sequence between genes 1 and 2 influence protein production,but not uniformly. The spacing upstream of the RBS is not asstrong of a determinant of expression levels as the spacingdownstream of the RBS. The one construct that deviates fromthis trend (RL024A) contains a mutation that decreases thenumber of potential base-pairs between the mRNA and the 16SrRNA. Most of the constructs tested here contain six to sevenpotential base-pairing interactions between the Shine-Dalgarno(RBS) and the anti-Shine-Dalgarno site of the ribosome. Theintroduction of additional base-pairing does not facilitateexpression, consistent with previous studies that show that onaverage E. coli mRNA RBS sequences interact with theribosome via six base-pairs and that the strengthening of theinteraction often decreases rather than increases proteinsynthesis.27 The optimal aligned spacing between the RBSand the start codon and the functionality of alternate startcodons is the same for in vitro protein production with thePUREsystem and for natural E. coli expression.Taken together, a few simple rules for the construction of in
vitro genetic systems can be formulated from the acquired data.Restriction sites should either be placed before the RBS, sincethis region is more amenable to sequence modification, or aNdeI site that overlaps with the start codon should beexploited. If high protein levels are desired, then the alignedRBS spacing should be between four and nine nucleotides andthe spacer sequence should be high in A and T content and lowin G content. The use of alternate start codons can be used to
Figure 5. Influence of sequence composition between the ribosomebinding site and the start codon on expression levels. Thecorresponding RNA sequence for the region of interest of eachconstruct is shown below the bar graph. Ref indicates the referenceconstruct RL027A. Scar 1 is the standard BioBrick scar sequence. Scar2 is the shorter, alternate scar sequence. −3 A indicates theintroduction of an A three positions upstream of the start codon.pET21b is the same spacer sequence found in the expression vectorpET21b (Novagen). RBS +1, RBS +2, and RBS +1+2 indicate RBSexpansions. Each introduced feature is underlined in the correspond-ing sequence. Note that only half of the NdeI restriction site is shownsince the remaining half overlaps with the start codon. Eachbicistrionic construct was expressed in vitro with the PUREsystem at37 °C for 6 h. Gene 1 encoded mCherry, and gene 2 encodedmVenus. Data are plotted in reference to RL027A.
Figure 6. Alternate start codons. The ability of UUG, GUG, and CUGto function as start codons in vitro was evaluated. Relative intensitiesare averages of three replicates and plotted in reference to the AUGstart codon containing construct. Each bicistrionic construct wasexpressed in vitro with the PUREsystem at 37 °C for 6 h. Gene 1encoded mCherry, and gene 2 encoded mVenus. The AUG, UUG,GUG, and CUG start codon constructs were RL027A, LM019A,LM018A, and LM020A, respectively.
ACS Synthetic Biology Research Article
dx.doi.org/10.1021/sb400003y | ACS Synth. Biol. 2013, 2, 482−489487
significantly reduce protein synthesis, when needed, and thespacing between the end of one gene and the RBS of the nextgene is not crucial. Nevertheless, the complexity of tran-scription and translation ensures that there are many morefactors that influence gene expression than was probed here.mRNA can interact with regions of the ribosome other than the3′-terminus of the 16S rRNA26−29 and the folding of mRNAsignificantly affects protein synthesis.19,30−33 Further studieswith purified, in vitro systems likely will aid in betterunderstanding these processes and in facilitating the synthesisof more complex cellular mimics.
■ METHODS
Genetic Constructs. Genes encoding the fluorescentproteins were synthesized by Genscript or Mr. Gene, exceptfor super folder GFP (BBa_I746916), GFPmut3b(BBa_E0040), and mRFP1 (BBa_E1010), which were fromthe registry of standard biological parts (http://partsregistry.org), and eGFP, which was from Roche. Mutagenesis was eitherperformed by Genscript or through the use of phusion site-directed mutagenesis (Finnzymes). All genes were subclonedinto pET21b by restriction digestion and ligation with NdeIand BamHI, except for super folder GFP and GFPmut3b,which used NheI and BamHI sites. All constructs wereconfirmed by sequencing at Genechron or Eurofins MWGOperon. The DNA sequences of all the constructs used areprovided in the Supporting Information (Table S2).Transcription-Translation Reactions. Plasmids were
amplified in E. coli DH5α or NovaBlue and purified withWizard Plus SV Minipreps DNA Purification System(Promega) or QIAprep Spin Miniprep Kit (Qiagen).Subsequently, the DNA was phenol-chloroform extracted,ethanol precipitated, and resuspended in deionized anddiethylpyrocarbonate (DEPC) treated water. A 250 ng portion(2 nM final concentration) of DNA was used for eachtranscription-translation reaction with the PURExpress in vitroprotein synthesis kit (New England BioLabs) supplementedwith 20 units of human placenta RNase inhibitor (NewEngland BioLabs). The final volume of each reaction was 25.5μL. Reactions were monitored by fluorescence spectroscopywith a Photon Technology International (PTI) QuantaMaster40 UV−vis spectrofluorometer equipped with two detectors(T-format). Excitation and emission wavelengths were specificfor each fluorescent protein (Supplementary Table S3). Thereaction components, except for the DNA template, wereassembled on ice and then incubated at 37 °C in thespectrofluorometer. Subsequently, the reaction was initiatedby the addition of DNA template. Mineral oil was layered ontop of each sample to inhibit evaporation during the course ofthe experiment. Control experiments with GFPmut3b showedthat mineral oil did not influence the appearance offluorescence. Each reaction was repeated at least three times.An Agilent 8453 UV−vis spectrophotometer was used toquantify mVenus protein concentration by using an extinctioncoefficient at 515 nm of 92,200 M−1 s−1.16
Data analysis. All statistical analyses used R statisticalcomputing software.34 The single protein construct fluorescentdata were fit to
=+ − −I t
K( )
1 e B t t( )f /2 (1)
where K, B, and tf/2 were the upper asymptote, growth rate, andtime of maximum growth, respectively (Supplementary TableS4). The parameters were estimated by using a nonlinear least-squares analysis with the Gauss−Newton algorithm. The meanvalues and standard errors were then calculated from data fromthree replications. The influence of spacer nucleotidecomposition on the fluorescence intensity was determinedwith multiple regression models. The models were estimatedand reduced by using stepwise regression with a penalty termthat was selected by minimum predictive mean squared errorbased on repeated cross-validation (10% leave-out). The bestpredictive models were obtained by using a stringent criterion(twice the Bayesian Information Criterion, BIC). We thenestimated the model with such a penalty term on the whole setof operon spacer data. Paired t tests were used to test whetherthe restriction sites 5′ or 3′ to RBS 2 affected differentlyfluorescence intensity ratios.
■ ASSOCIATED CONTENT*S Supporting InformationSupplementary tables and figures. This material is available freeof charge via the Internet at http://pubs.acs.org.
■ AUTHOR INFORMATIONCorresponding Author*Tel: +39 0461 28 3438. Fax: +39 0461-283091. E-mail:[email protected] authors declare no competing financial interest.
■ ACKNOWLEDGMENTSRL015A, RL016A, RL018A, RL020A, and RL027A are availablethrough Addgene. Versions of RL027A modified by the 2012Trento iGEM team to be BioBrick compatible were depositedas BBa_K731700 and BBa_K731710 in the Registry ofStandard Biological Parts (http://partsregistry.org/). Wethank the Armenise-Harvard Foundation, the autonomousprovince of Trento (Ecomm), the Marie-Curie TrentinoCOFUND (ACS), and CIBIO for funding.
■ REFERENCES(1) Forlin, M., Lentini, R., and Mansy, S. S. (2012) Cellularimitations. Curr. Opin. Chem. Biol. 16, 586−592.(2) Forster, A. C., and Church, G. M. (2006) Towards synthesis of aminimal cell. Mol. Syst. Biol. 2, 45.(3) Harris, D. C., and Jewett, M. C. (2012) Cell-free biology:exploiting the interface between synthetic biology and syntheticchemistry. Curr. Opin. Biotechnol. 23, 672−678.(4) Ichihashi, N., Matsuura, T., Kita, H., Sunami, T., Suzuki, H., andYomo, T. (2010) Constructing partial models of cells. Cold SpringHarbor Perspect. Biol. 2, 295−303.(5) Martos, A., Jimenez, M., Rivas, G., and Schwille, P. (2012)Towards a bottom-up reconstitution of bacterial cell division. TrendsCell Biol. 22, 634−643.(6) Noireaux, V., Maeda, Y. T., and Libchaber, A. (2011)Development of an artificial cell, from self-organization tocomputation and self-reproduction. Proc. Natl. Acad. Sci. U.S.A. 108,3473−3480.(7) Stano, P., and Luisi, P. L. (2010) Achievements and openquestions in the self-reproduction of vesicles and synthetic minimalcells. Chem. Commun. (Cambridge) 46, 3639−3653.(8) Shimizu, Y., Inoue, A., Tomari, Y., Suzuki, T., Yokogawa, T.,Nishikawa, K., and Ueda, T. (2001) Cell-free translation reconstitutedwith purified components. Nat. Biotechnol. 19, 751−755.
ACS Synthetic Biology Research Article
dx.doi.org/10.1021/sb400003y | ACS Synth. Biol. 2013, 2, 482−489488
(9) Stano, P., Kuruma, Y., Souza, T. P., and Luisi, P. L. (2010)Biosynthesis of proteins inside liposomes. Methods Mol. Biol. 606,127−145.(10) Sunami, T., Matsuura, T., Suzuki, H., and Yomo, T. (2010)Synthesis of functional proteins within liposomes. Methods Mol. Biol.607, 243−256.(11) Kita, H., Matsuura, T., Sunami, T., Hosoda, K., Ichihashi, N.,Tsukada, K., Urabe, I., and Yomo, T. (2008) Replication of geneticinformation with self-encoded replicase in liposomes. ChemBioChem 9,2403−2410.(12) Karig, D. K., Iyer, S., Simpson, M. L., and Doktycz, M. J. (2012)Expression optimization and synthetic gene networks in cell-freesystems. Nucleic Acids Res. 40, 3763−3774.(13) Shin, J., and Noireaux, V. (2012) An E. coli cell-free expressiontoolbox: application to synthetic gene circuits and synthetic cell. ACSSynth. Biol. 1, 29−41.(14) Chan, L. Y., Kosuri, S., and Endy, D. (2005) (2005) Refactoringbacteriophage T7. Mol. Syst. Biol. 1, 0018.(15) Kwok, R. (2010) Five hard truths for synthetic biology. Nature463, 288−290.(16) Shaner, N. C., Steinbach, P. A., and Tsien, R. Y. (2005) A guideto choosing fluorescent proteins. Nat. Methods 2, 905−909.(17) Iizuka, R., Yamagishi-Shirasaki, M., and Funatsu, T. (2011)Kinetic study of de novo chromophore maturation of fluorescentproteins. Anal. Biochem. 414, 173−178.(18) Chang, H. C., Kaiser, C. M., Hartl, F. U., and Barral, J. M.(2005) De novo folding of GFP fusion proteins: high efficiency ineukaryotes but not in bacteria. J. Mol. Biol. 353, 397−409.(19) Martini, L., and Mansy, S. S. (2011) Cell-like systems withriboswitch controlled gene expression. Chem. Commun. (Cambridge)47, 10734−10736.(20) Shetty, R. P., Endy, D., and Knight, T. F., Jr. (2008) EngineeringBioBrick vectors from BioBrick parts. J. Biol. Eng. 2, 5.(21) Chen, H., Bjerknes, M., Kumar, R., and Jay, E. (1994)Determination of the optimal aligned spacing between the Shine-Dalgarno sequence and the translation initiation codon of Escherichiacoli mRNAs. Nucleic Acids Res. 22, 4953−4957.(22) Ringquist, S., Shinedling, S., Barrick, D., Green, L., Binkley, J.,Stormo, G. D., and Gold, L. (1992) Translation initiation inEscherichia coli: sequences within the ribosome-binding site. Mol.Microbiol. 6, 1219−1229.(23) Olins, P. O., Devine, C. S., Rangwala, S. H., and Kavka, K. S.(1998) The T7 phage gene 10 leader RNA, a ribosome-binding sitethat dramatically enhances the expression of foreign genes inEscherichia coli. Gene 73, 227−235.(24) Kozak, M. (1986) Point mutations define a sequence flankingthe AUG initiator codon that modulates translation by eukaryoticribosomes. Cell 44, 283−292.(25) Shultzaberger, R. K., Bucheimer, R. E., Rudd, K. E., andSchneider, T. D. (2001) Anatomy of Escherichia coli ribosome bindingsites. J. Mol. Biol. 313, 215−228.(26) Barendt, P. A., Shah, N. A., Barendt, G. A., and Sarkar, C. A.(2012) Broad-specificity mRNA-rRNA complementarity in efficientprotein translation. PLoS Genet. 8, e1002598.(27) Vimberg, V., Tats, A., Remm, M., and Tenson, T. (2007)Translation initiation region sequence preferences in Escherichia coli.BMC Mol. Biol. 8, 100.(28) Etchegaray, J. P., Xia, B., Jiang, W., and Inouye, M. (1998)Downstream box: a hidden translational enhancer. Mol. Microbiol. 27,873−874.(29) Boni, I. V., Isaeva, D. M., Musychenko, M. L., and Tzareva, N. V.(1991) Ribosome-messenger recognition: mRNA target sites forribosomal protein S1. Nucleic Acids Res. 19, 155−162.(30) Caschera, F., Bedau, M. A., Buchanan, A., Cawse, J., de Lucrezia,D., Gazzola, G., Hanczyc, M. M., and Packard, N. H. (2011) Copingwith complexity: machine learning optimization of cell-free proteinsynthesis. Biotechnol. Bioeng. 108, 2218−2228.
(31) de Smit, M. H., and van Duin, J. (1990) Secondary structure ofthe ribosome binding site determines translational efficiency: aquantitative analysis. Proc. Natl. Acad. Sci. U.S.A. 87, 7668−7672.(32) Kobori, S., Ichihashi, N., Kazuta, Y., Matsuura, T., and Yomo, T.(2012) Kinetic analysis of aptazyme-regulated gene expression in acell-free translation system: modeling of ligand-dependent and-independent expression. RNA 18, 1458−1465.(33) Winkler, W. C., and Breaker, R. R. (2005) Regulation ofbacterial gene expression by riboswitches. Annu. Rev. Microbiol. 59,487−517.(34) R Development Core Team (2011) R: A language andenvironment for statistical computing, R Foundation for StatisticalComputing, Vienna.
ACS Synthetic Biology Research Article
dx.doi.org/10.1021/sb400003y | ACS Synth. Biol. 2013, 2, 482−489489
Copyright © 2022 FDOKUMEN