Water reactions on reconstructed rutile TiO2: a DFT / DFTB ...
Upload
khangminh22Category
view
3download
0
Nordic Mining Prefeasibility Study
30 October 2017 Engebø Rutile and Garnet Project H352410
H352410-00000-280-066-0001, Rev. 0 Page i
© Hatch 2017 All rights reserved, including all rights relating to the use of this document or its contents.
Nordic Mining
Engebø Rutile and Garnet Project
Prefeasibility Study
2017-10-30 0 Approved for
Use P de Garis D Nel C Blake I S Fossum
Date Rev. Status Prepared By Checked By Approved By Approved By Client

Nordic Mining Prefeasibility Study
30 October 2017 Engebø Rutile and Garnet Project H352410
H352410-00000-280-066-0001, Rev. 0 Page ii
© Hatch 2017 All rights reserved, including all rights relating to the use of this document or its contents.
Revision History
Date Rev No Description Revised By
2017-10-30 0 Issued for Use P de Garis

Nordic Mining Prefeasibility Study
30 October 2017 Engebø Rutile and Garnet Project H352410
H352410-00000-280-066-0001, Rev. 0 Page iii
© Hatch 2017 All rights reserved, including all rights relating to the use of this document or its contents.
Report Disclaimer and Limitations of Use
This Report was prepared for Nordic Mining (the "Client") by Hatch Africa (Pty) Ltd.
("Hatch") based on the agreement entered into by the parties dated 18 August 2016 (the
"Agreement") in part upon information believed to be accurate and reliable from data
supplied by Client and other sub-consultants engaged by Client, which Hatch has not
verified as to accuracy and completeness. Hatch has not made an analysis, verified or
rendered an independent judgment as to the validity of the information provided by such
other sub-consultants. While it is believed that the information contained in this Report is
reliable under the conditions and subject to the limitations set forth herein, Hatch does not
and cannot warrant nor guarantee the accuracy thereof or any outcomes or results of any
kind. Hatch takes no responsibility and accepts no liability whatsoever for any losses,
claims, expenses or damages arising in whole or in part from any review, use of or
reliance on this Report by parties other than Client.
This Report is intended to be read as a whole, and sections should not be read or relied
upon out of context, and any person using or relying upon this Report agrees to be
specifically bound by the terms of this Disclaimer and Limitations of Use. This Report
contains the expression of the professional opinions of Hatch, based upon information
available at the time of preparation.
The Report must be read in light of:
The limited readership and purposes for which it was intended
Its reliance upon information provided to Hatch by the Client and others which has not
been verified by Hatch and over which it has no control
The limitations and assumptions referred to throughout the Report
The cost and other constraints imposed on the Report
Other relevant issues which are not within the scope of the Report
Subject to any contrary agreement between Hatch and the Client
Hatch makes no warranty or representation to the Client or third parties (express or
implied) in respect of the Report, particularly with regard to any commercial
investment decision made on the basis of the Report
Use of the Report by the Client and third parties shall be at their own and sole risk
Extracts from the Report may only be published with permission of Hatch.
It is understood that Hatch does not warrant nor guarantee any specific outcomes or
results, including project estimates or construction or operational costs, the return on
investment if any, or the ability of any process, technology, equipment or facility to meet
specific performance criteria, financing goals or objectives, or the accuracy, completeness
or timeliness of any of the data contained herein.
Nordic Mining Prefeasibility Study
30 October 2017 Engebø Rutile and Garnet Project H352410
H352410-00000-280-066-0001, Rev. 0 Page iv
© Hatch 2017 All rights reserved, including all rights relating to the use of this document or its contents.
Hatch disclaims all responsibility and liability whatsoever to third parties for any direct,
economic, special, indirect, punitive or consequential losses, claims, expenses or
damages of any kind that may arise in whole or in part from the use, review of or reliance
upon the Report or such data or information contained therein by any such third parties.
The review, use or reliance upon the Report by any such third party shall constitute their
acceptance of the terms of this Disclaimer and Limitations of Use and their agreement to
waive and release Hatch and its Client from any such losses, claims, expenses or
damages. This Report is not to be referred to or quoted in whole or in part, in any
registration statement, prospectus, fairness opinion, public filing, loan agreement or other
financing document without the prior written consent by Hatch. Such consent shall be
contingent upon an opportunity to review and amend such document.
Readers are cautioned that this is a preliminary Report, and that all results, opinions and
commentary contained herein are based on limited and incomplete data. While the work,
results, opinions and commentary herein may be considered to be generally indicative of
the nature and quality of the subject of the Report, they are by nature preliminary only are
not definitive. No representations or predictions are intended as to the results of future
work, nor can there be any promises that the results, opinions and commentary in this
Report will be sustained in future work. This Disclaimer and Limitations of Use constitute
an integral part of this Report and must be reproduced with every copy.

Nordic Mining Prefeasibility Study
30 October 2017 Engebø Rutile and Garnet Project H352410
H352410-00000-280-066-0001, Rev. 0 Page v
© Hatch 2017 All rights reserved, including all rights relating to the use of this document or its contents.
Table of Contents
1. Executive Summary ........................................................................................................................ 1
1.1 Introduction .............................................................................................................................. 1
1.2 Key Project Outcomes ............................................................................................................. 1 1.2.1 Key Figures: Production and Financials ........................................................................ 1 1.2.2 Key Project Characteristics ............................................................................................ 3 1.2.3 Future Upside Opportunities and Flexibility ................................................................... 4
1.3 Contributors ............................................................................................................................. 5
1.4 Property Description, Location and Access ............................................................................. 5
1.5 Deposit Mineralisation and Geology ........................................................................................ 7
1.6 Land and Mineral Tenure ......................................................................................................... 9
1.7 Mineral Processing .................................................................................................................. 9 1.7.1 Comminution .................................................................................................................. 9 1.7.2 Processing ................................................................................................................... 10
1.8 Mining .................................................................................................................................... 11 1.8.1 Geotechnical and Hydrogeology .................................................................................. 11 1.8.2 Mining ........................................................................................................................... 11 1.8.3 Mining Trade-offs Performed ....................................................................................... 13 1.8.4 Underground Mining..................................................................................................... 15 1.8.5 Plant Capacity Analysis ............................................................................................... 16
1.9 Mineral Resource Estimate .................................................................................................... 17
1.10 Ore Reserve Estimate ........................................................................................................... 18
1.11 Infrastructure .......................................................................................................................... 19
1.12 Environment and Permitting .................................................................................................. 21 1.12.1 Zoning Plan and Discharge Permit .............................................................................. 21 1.12.2 Environmental Impact Assessment .............................................................................. 22 1.12.3 Socio-economic Studies .............................................................................................. 23 1.12.4 Other Permits Required ............................................................................................... 23
1.13 Capital Cost Estimate ............................................................................................................ 23
1.14 Operating Cost Estimate ........................................................................................................ 24
1.15 Project Economics ................................................................................................................. 25 1.15.1 Key Project Financials.................................................................................................. 25 1.15.2 Sensitivity ..................................................................................................................... 26
1.16 Markets .................................................................................................................................. 26 1.16.1 Rutile ............................................................................................................................ 26 1.16.2 Garnet .......................................................................................................................... 27
1.17 Project Schedule .................................................................................................................... 28
2. Introduction .................................................................................................................................... 29
2.1 Terms of Reference and Purpose of the Report .................................................................... 29
2.2 Qualifications of Consultants and Project Team .................................................................... 29
2.3 Sources of Information ........................................................................................................... 29
2.4 Reliance on Other Experts ..................................................................................................... 31
2.5 Effective Date ......................................................................................................................... 31
2.6 Units of Measure .................................................................................................................... 31
2.7 Glossary ................................................................................................................................. 32 2.7.1 Rutile (TiO2).................................................................................................................. 32 2.7.2 Mineral Resources and Ore Reserves ......................................................................... 32

Nordic Mining Prefeasibility Study
30 October 2017 Engebø Rutile and Garnet Project H352410
H352410-00000-280-066-0001, Rev. 0 Page vi
© Hatch 2017 All rights reserved, including all rights relating to the use of this document or its contents.
2.7.3 Permits and Legislation ................................................................................................ 32
2.8 Abbreviations ......................................................................................................................... 32
3. Property Description ..................................................................................................................... 37
3.1 Property Location ................................................................................................................... 37
3.2 Topography and Elevation ..................................................................................................... 38
3.3 Climate ................................................................................................................................... 39
3.4 Accessibility and Infrastructure .............................................................................................. 39
4. History ............................................................................................................................................ 40
4.1 Prior and Current Ownership ................................................................................................. 40
4.2 Historic Development of the Project ...................................................................................... 40
5. Land/Mineral Tenure and Licences.............................................................................................. 43
5.1 Permits and Licences ............................................................................................................ 43
5.2 Land Requirements and Associated Negotiations ................................................................. 44
5.3 Land Access .......................................................................................................................... 44
5.4 Relocation of People .............................................................................................................. 45
5.5 Compensation ........................................................................................................................ 45
6. Geology .......................................................................................................................................... 46
6.1 Regional Geology .................................................................................................................. 46
6.2 Local Geology ........................................................................................................................ 47
6.3 Deposit Type .......................................................................................................................... 48
6.4 Mineralogy ............................................................................................................................. 49
6.5 Waste Rock Types ................................................................................................................. 49
7. Drilling, Sampling and Ore Characterisation .............................................................................. 50
7.1 Sample Preparation and Analyses ........................................................................................ 51
7.2 Nordic Mining 2016 Drilling Campaign .................................................................................. 53 7.2.1 Nordic Mining Core Drilling .......................................................................................... 53 7.2.2 Nordic Mining Logging, Sampling and Assaying ......................................................... 54 7.2.3 Quality Control ............................................................................................................. 54 7.2.4 Garnet Analysis ............................................................................................................ 55 7.2.5 Nordic Mining 2016 Surface Sampling......................................................................... 57
7.3 Data Verification ..................................................................................................................... 58 7.3.1 Precision ...................................................................................................................... 58 7.3.2 Accuracy ...................................................................................................................... 58 7.3.3 Contamination .............................................................................................................. 58 7.3.4 Verification of Nordic Mining 2016 Surface Sampling .................................................. 59 7.3.5 Verification of Historical Database ............................................................................... 59
8. Mineral Resource Estimate ........................................................................................................... 60
8.1 Mineral Resource Model ........................................................................................................ 60
8.2 Mineral Resource Statement ................................................................................................. 62
8.3 Competent Person Sign-off ................................................................................................... 62
8.4 Future Work Programme ....................................................................................................... 63
9. Mining Geotechnical ..................................................................................................................... 64

Nordic Mining Prefeasibility Study
30 October 2017 Engebø Rutile and Garnet Project H352410
H352410-00000-280-066-0001, Rev. 0 Page vii
© Hatch 2017 All rights reserved, including all rights relating to the use of this document or its contents.
9.1 Open Pit Geotechnical Study ................................................................................................. 64
9.2 Underground Geotechnical Study .......................................................................................... 66
9.3 Seismic Risk .......................................................................................................................... 68
9.4 Future Work Programme ....................................................................................................... 68
10. Hydrogeology, Hydrology and Geochemistry ............................................................................ 69
10.1 Hydrogeology ......................................................................................................................... 69 10.1.1 Open Pit ....................................................................................................................... 69 10.1.2 Underground ................................................................................................................ 69
10.2 Hydrology ............................................................................................................................... 70
10.3 Geochemistry ......................................................................................................................... 71
10.4 Future Work Programme ....................................................................................................... 72
11. Mineral Processing ........................................................................................................................ 73
11.1 Introduction to Process Development and Results ................................................................ 73 11.1.1 Main Results ................................................................................................................ 73 11.1.2 Achieved Rutile Products ............................................................................................. 74 11.1.3 Achieved Garnet Products ........................................................................................... 77 11.1.4 Historic Test Work Programmes .................................................................................. 80 11.1.5 Introduction to the Developed Flowsheet .................................................................... 80 11.1.6 Selection of Yield as the Basis for Garnet Calculations ............................................... 82
11.2 Sample Selection and Data Acquisition ................................................................................. 82 11.2.1 Sample Preparation and Comminution ........................................................................ 83 11.2.2 Production of the 1231 Sample .................................................................................... 84 11.2.3 Production of the 1245 Sample .................................................................................... 84 11.2.4 Production of the 1308 Sample .................................................................................... 84 11.2.5 Production of the 1234 Sample .................................................................................... 85 11.2.6 Sample Characterisation – Grain Size Distributions, Chemical Assays and
QEMSCAN ................................................................................................................... 85 11.2.7 Theoretical Recovery Calculations and Theoretical Yield Figures .............................. 87
11.3 Comminution Testwork .......................................................................................................... 88 11.3.1 Introduction to Comminution Testwork ........................................................................ 88 11.3.2 Developed Comminution Circuit .................................................................................. 89 11.3.3 Ore Hardness Characterisation Testwork .................................................................... 89 11.3.4 Comminution Process Route Determination ................................................................ 92
11.4 Bulk Process Testwork and Flowsheet Definition .................................................................. 97 11.4.1 Programme 1231 – Fine Ferro Bulk Sample to Develop Process Flowsheets for Rutile
and Garnet Final Products ......................................................................................... 100 11.4.2 Programme 1245 – Coarse Ferro Bulk Sample to Validate Flowsheet for Rutile and
Fine Garnet Final Products and Develop the Process Flow for Coarse Garnet Final Product ....................................................................................................................... 104
11.4.3 Programme 1308 – Processing of a Coarse Ferro Bulk Sample to Optimise Metallurgical Performance of the Selected Flowsheets for Rutile, Fine Garnet and Coarse Garnet ............................................................................................................ 111
11.4.4 Programme 1234 – Processing of a Coarse Transitional Bulk Sample to Determine Metallurgical Performance of the Selected Flowsheets for Rutile, Fine Garnet and Coarse Garnet ............................................................................................................ 121
11.4.5 Supplementary Testwork and Flowsheet Optimisation .............................................. 125
11.5 Plant Operating Factor ......................................................................................................... 139
11.6 Process Design .................................................................................................................... 141 11.6.1 Equipment Selection .................................................................................................. 141 11.6.2 Process Design Basis / Criteria ................................................................................. 142

Nordic Mining Prefeasibility Study
30 October 2017 Engebø Rutile and Garnet Project H352410
H352410-00000-280-066-0001, Rev. 0 Page viii
© Hatch 2017 All rights reserved, including all rights relating to the use of this document or its contents.
11.6.3 Process Overview – Process Flow Diagrams ............................................................ 147 11.6.4 Mass and Mineral Balances ....................................................................................... 162 11.6.5 Tailings Evaluation ..................................................................................................... 164
11.7 Process Functional Description ........................................................................................... 166
11.8 Basic Plant Layout and Plant Design................................................................................... 167
11.9 Future Work Programme ..................................................................................................... 171 11.9.1 Comminution Circuit ................................................................................................... 171 11.9.2 Processing Circuits .................................................................................................... 173
12. Mining ........................................................................................................................................... 174
12.1 Introduction .......................................................................................................................... 174
12.2 Open Pit Mining Block Model Development ........................................................................ 174 12.2.1 Definition of Mining Model Shape for the Open Pit .................................................... 174
12.3 Pit Optimisation Studies ....................................................................................................... 176 12.3.1 Introduction ................................................................................................................ 176 12.3.2 Background ................................................................................................................ 176 12.3.3 Approach .................................................................................................................... 178 12.3.4 Options Evaluated ...................................................................................................... 179 12.3.5 Inputs ......................................................................................................................... 179 12.3.6 Open Pit Optimisation Results ................................................................................... 181 12.3.7 Results and Recommendation ................................................................................... 191
12.4 Open Pit Mine Design .......................................................................................................... 193 12.4.1 Pushbacks .................................................................................................................. 194
12.5 Underground Mining Block Model Development ................................................................. 195 12.5.1 Defining the Mining Model for the Underground ........................................................ 195
12.6 Underground Mining Method Selection ............................................................................... 196 12.6.1 Major Underground Mining Methods in Use Globally ................................................ 196 12.6.2 Project Objectives and Capacity of the Orebody ....................................................... 203 12.6.3 Fatal Flaws/Other Considerations .............................................................................. 203 12.6.4 Selection Methods...................................................................................................... 204
12.7 Underground Mine Design ................................................................................................... 207 12.7.1 Stoping Design ........................................................................................................... 207 12.7.2 Underground Infrastructure Design............................................................................ 212
12.8 Plant Design Capacity ......................................................................................................... 214 12.8.1 Background ................................................................................................................ 214 12.8.2 Approach .................................................................................................................... 215 12.8.3 Evaluation Discussion ................................................................................................ 216 12.8.4 Scenario 1 – Cut-off Grade Analysis .......................................................................... 217 12.8.5 Scenario 2 - Capacity Analysis .................................................................................. 219
12.9 Mining Options Evaluated .................................................................................................... 225
12.10 Mine Plan and Production Schedule ................................................................................... 228 12.10.1 Mining Process ........................................................................................................... 228 12.10.2 Key Production Statistics ........................................................................................... 229 12.10.3 Methodology and Key Assumptions........................................................................... 232 12.10.4 Pit Development Sequence ....................................................................................... 234 12.10.5 Underground Development Sequence ...................................................................... 236 12.10.6 Waste Rock Disposal Facility ..................................................................................... 239 12.10.7 Mining Labour ............................................................................................................ 241 12.10.8 Capital Cost Estimate................................................................................................. 242 12.10.9 Operating Cost Estimate ............................................................................................ 242
13. Ore Reserve Estimate ................................................................................................................. 243

Nordic Mining Prefeasibility Study
30 October 2017 Engebø Rutile and Garnet Project H352410
H352410-00000-280-066-0001, Rev. 0 Page ix
© Hatch 2017 All rights reserved, including all rights relating to the use of this document or its contents.
13.1 Overview .............................................................................................................................. 243
13.2 Ore Reserve Statement ....................................................................................................... 243
13.3 Competent Person Sign-off ................................................................................................. 244
14. Project Infrastructure .................................................................................................................. 245
14.1 Open Pit Mine Facilities ....................................................................................................... 247
14.2 Haul Road ............................................................................................................................ 247
14.3 Underground Mine Facilities ................................................................................................ 247
14.4 Process Plant Site Facilities ................................................................................................ 247 14.4.1 Tailings Disposal ........................................................................................................ 248
15. General Infrastructure ................................................................................................................. 250
15.1 Power ................................................................................................................................... 250
15.2 Water ................................................................................................................................... 250
15.3 Natural Gas .......................................................................................................................... 251
15.4 Access Roads ...................................................................................................................... 251
15.5 Communications .................................................................................................................. 251
16. Engineering Design ..................................................................................................................... 252
16.1 Civil and Earthworks Design ................................................................................................ 252
16.2 Structural Design and Engineering ...................................................................................... 252
16.3 Mechanical Design and Engineering ................................................................................... 252
16.4 Instrumentation Design ........................................................................................................ 253
16.5 Electrical Design .................................................................................................................. 253
17. Market Information ...................................................................................................................... 254
17.1 Rutile Market ........................................................................................................................ 254 17.1.1 Introduction to Titanium Feedstocks .......................................................................... 254 17.1.2 TiO2 Pigment Market .................................................................................................. 255 17.1.3 Titanium Feedstock Market ........................................................................................ 257 17.1.4 Rutile Supply/Demand and Outlook to 2025 .............................................................. 260 17.1.5 Rutile Prices ............................................................................................................... 263 17.1.6 Product Quality Considerations ................................................................................. 264 17.1.7 Engebø Rutile ............................................................................................................ 264 17.1.8 Revenue to Cost and Competitor Analysis ................................................................ 266 17.1.9 Contractual Structure ................................................................................................. 267 17.1.10 Conclusion ................................................................................................................. 268
17.2 Garnet Market ...................................................................................................................... 268 17.2.1 Introduction ................................................................................................................ 268 17.2.2 Key Producers ............................................................................................................ 270 17.2.3 Demand Forecast ....................................................................................................... 270 17.2.4 Supply Forecast ......................................................................................................... 271 17.2.5 Competitor Analysis ................................................................................................... 272 17.2.6 Marketing ................................................................................................................... 272 17.2.7 Pricing ........................................................................................................................ 272 17.2.8 Contractual Structure ................................................................................................. 274 17.2.9 Specific Downstream Treatment and Upgrading Requirements ............................... 274
18. Health and Safety......................................................................................................................... 275
18.1 Health and Safety Standards to be Followed by the Project ............................................... 275

Nordic Mining Prefeasibility Study
30 October 2017 Engebø Rutile and Garnet Project H352410
H352410-00000-280-066-0001, Rev. 0 Page x
© Hatch 2017 All rights reserved, including all rights relating to the use of this document or its contents.
18.2 Health and Safety Plan ........................................................................................................ 275
19. Environmental and Social Responsibility ................................................................................. 276
19.1 Introduction .......................................................................................................................... 276
19.2 Environmental Setting .......................................................................................................... 276 19.2.1 Discharge Permit ........................................................................................................ 276 19.2.2 Zoning Plan (Planning Permit) ................................................................................... 276
19.3 Environmental Studies ......................................................................................................... 277
19.4 Ongoing Environmental Initiatives ....................................................................................... 279
19.5 Waste Management Plan .................................................................................................... 279
19.6 Social Setting ....................................................................................................................... 279
19.7 Socio-economic Studies ...................................................................................................... 280
19.8 Closure Planning.................................................................................................................. 280
20. Human Resources ....................................................................................................................... 282
20.1 Introduction .......................................................................................................................... 282
20.2 Labour Costs ........................................................................................................................ 282
20.3 Labour Complement ............................................................................................................ 285
20.4 Training/Skills Requirement ................................................................................................. 288
21. Capital Cost Estimate .................................................................................................................. 289
21.1 Capital Estimate Summary .................................................................................................. 289
21.2 Basis of Estimate ................................................................................................................. 290
21.3 Exclusions and Clarifications ............................................................................................... 290
21.4 Estimating Methodology ...................................................................................................... 291
21.5 Estimating Methodology for Direct Costs ............................................................................ 292 21.5.1 Permanent Equipment ............................................................................................... 292 21.5.2 Bulk Materials ............................................................................................................. 292
21.6 Estimating Methodology for Indirect Costs .......................................................................... 293 21.6.1 Temporary Construction Facilities and Services ....................................................... 293 21.6.2 Engineering and Project Construction Management ................................................. 293 21.6.3 Owner’s Costs ............................................................................................................ 293 21.6.4 Contingency/Risk Allowance ...................................................................................... 293
21.7 Escalation ............................................................................................................................ 293
22. Operating Cost Estimate ............................................................................................................. 294
22.1 Introduction .......................................................................................................................... 294
22.2 Summary of Operating Cost Estimate ................................................................................. 294
22.3 Operating Cost Estimates per Discipline ............................................................................. 296 22.3.1 Mining ......................................................................................................................... 296 22.3.2 Comminution .............................................................................................................. 297 22.3.3 Processing ................................................................................................................. 298 22.3.4 Tailings Disposal ........................................................................................................ 298 22.3.5 Product Dispatch ........................................................................................................ 299 22.3.6 Overheads .................................................................................................................. 300 22.3.7 Rehabilitation ............................................................................................................. 300
23. Financial Analysis ....................................................................................................................... 301
23.1 Key Assumptions ................................................................................................................. 301

Nordic Mining Prefeasibility Study
30 October 2017 Engebø Rutile and Garnet Project H352410
H352410-00000-280-066-0001, Rev. 0 Page xi
© Hatch 2017 All rights reserved, including all rights relating to the use of this document or its contents.
23.2 Options Evaluated................................................................................................................ 302
23.3 Inputs ................................................................................................................................... 303 23.3.1 Production .................................................................................................................. 303 23.3.2 OPEX ......................................................................................................................... 304 23.3.3 CAPEX ....................................................................................................................... 305 23.3.4 Cashflows ................................................................................................................... 306 23.3.5 Key Financials ............................................................................................................ 307
23.4 Sensitivity Analysis .............................................................................................................. 309 23.4.1 NPV Sensitivity to WACC .......................................................................................... 309 23.4.2 NPV Sensitivity ........................................................................................................... 309 23.4.3 IRR Sensitivity ............................................................................................................ 310
23.5 Upside Potential to the Business Model .............................................................................. 311
24. Definitive Feasibility Study Planning......................................................................................... 312
24.1 DFS Objectives .................................................................................................................... 312
24.2 Scope of Work ..................................................................................................................... 313
24.3 Schedule .............................................................................................................................. 314
24.4 Project Team Location/Coordination ................................................................................... 315
25. Execution Planning ..................................................................................................................... 316
25.1 Introduction .......................................................................................................................... 316
25.2 Key Programme Drivers ...................................................................................................... 316 25.2.1 Process Plant Design and Build Schedule ................................................................ 316 25.2.2 Construction and Contracting Strategy ...................................................................... 316 25.2.3 Mine Ramp-up ............................................................................................................ 316 25.2.4 Logistics ..................................................................................................................... 317 25.2.5 Operational Readiness .............................................................................................. 317 25.2.6 Health and Safety....................................................................................................... 317 25.2.7 Environmental and Social Responsibility ................................................................... 317 25.2.8 Expansion Opportunities ............................................................................................ 317 25.2.9 Cost Sensitivity ........................................................................................................... 317
25.3 Guiding Principles ................................................................................................................ 317 25.3.1 Health and Safety....................................................................................................... 317 25.3.2 Project and Construction Organisation ...................................................................... 318 25.3.3 Contracting Models .................................................................................................... 318 25.3.4 Project Controls .......................................................................................................... 319 25.3.5 Construction Services, Procurement and Logistics ................................................... 319 25.3.6 Design Principles ....................................................................................................... 320 25.3.7 Information Technology ............................................................................................. 320 25.3.8 Security ...................................................................................................................... 321
25.4 Organisation and Responsibilities ....................................................................................... 321
25.5 Local and Government Relations ........................................................................................ 321
26. Risks and Opportunities ............................................................................................................. 322
26.1 “Hazard 2” Study .................................................................................................................. 322
26.2 Risk ...................................................................................................................................... 322
26.3 Opportunities ........................................................................................................................ 326
26.4 Capital Cost Risks................................................................................................................ 328
27. Value Improving Practices .......................................................................................................... 329
28. Reference List .............................................................................................................................. 334

Nordic Mining Prefeasibility Study
30 October 2017 Engebø Rutile and Garnet Project H352410
H352410-00000-280-066-0001, Rev. 0 Page xii
© Hatch 2017 All rights reserved, including all rights relating to the use of this document or its contents.
List of Tables
Table 1-1: Summary of Key Production and Financial Figures .............................................................. 2 Table 1-2: Key Project Contributors ........................................................................................................ 5 Table 1-3: Summary of the Key Processing Testwork Results ............................................................... 9 Table 1-4: Key Schedule Production Statistics ..................................................................................... 13 Table 1-5: Key Pit Design Parameters .................................................................................................. 14 Table 1-6: Mining Methods Shortlist for Engebø .................................................................................. 15 Table 1-7: 2008 Resource Estimate (@ 3% TiO2 Cut-off) .................................................................... 17 Table 1-8: 2016 Mineral Resource Estimate (3% TiO2 Cut-off) ............................................................ 17 Table 1-9: 2016 Mineral Resource Statement (2% TiO2 Cut-off) ......................................................... 17 Table 1-10: Ore Reserve Statement ..................................................................................................... 19 Table 1-11: Capital Estimate ................................................................................................................. 24 Table 1-12: Deferred Capital Estimate for Underground Mining........................................................... 24 Table 1-13: Operating Cost Summary .................................................................................................. 25 Table 1-14: Key Project Financials ....................................................................................................... 25 Table 2-1: Sources of Information ......................................................................................................... 29 Table 2-2: Abbreviations ....................................................................................................................... 32 Table 4-1: 2008 and the 2016 Resource Estimates (@ 3% TiO2 Cut-off) ............................................ 41 Table 7-1: Summary of Drilling Campaigns .......................................................................................... 50 Table 7-2: DuPont/Conoco Sample Summary – for total TiO2 and Fe2O3 Measurements ................... 52 Table 7-3: QA/QC Samples – Insertion Rates and Acceptance Criteria .............................................. 55 Table 8-1: Mineral Resource Statement (3% TiO2 Cut-off)................................................................... 62 Table 8-2: Mineral Resource Statement (2% TiO2 Cut-off)................................................................... 62 Table 9-1: Recommended Open Pit Slope Angles ............................................................................... 66 Table 11-1: Summary of the Main Garnet and Rutile Process Results ................................................ 74 Table 11-2: Composition of the Rutile Product from the Ferro Ore Testwork Programme Determined by XRF .................................................................................................................................................. 75 Table 11-3: Particle Size Distribution of the Rutile Product from Ferro Ore Testwork ......................... 76 Table 11-4: Mineralogy of the Coarse and Fine Garnet Products from the Ferro Ore Testwork Programme Determined by QEMSCAN Analysis (SGS Canada) ........................................................ 77 Table 11-5: Particle Size Distributions of the Coarse and Fine Garnet Products from the Ferro Ore Testwork Programme ............................................................................................................................ 78 Table 11-6: Source Samples for Process Testwork ............................................................................. 83 Table 11-7: Source Samples that Contributed to each of the Blended Samples for Process Testwork .............................................................................................................................................................. 84 Table 11-8: An Overview of the Different Bulk Samples ....................................................................... 85 Table 11-9: Prepared Bulk Sample Cumulative Particle Size Distributions .......................................... 86 Table 11-10: Prepared Bulk Sample Properties ................................................................................... 87 Table 11-11: UCS Results .................................................................................................................... 90 Table 11-12: Bond Crushability Work Index Results Obtained at Mintek and Grinding Solutions ....... 90 Table 11-13: Abrasion Index Results .................................................................................................... 90 Table 11-14: Bond Rod Work Index Results ......................................................................................... 90 Table 11-15: Bond Ball Work Index Results ......................................................................................... 91 Table 11-16: SMC Results .................................................................................................................... 91 Table 11-17: Summary of Bench Scale Comminution Testwork .......................................................... 92 Table 11-18: Testwork Programmes for Process Definition and Metallurgical Performance ............... 98 Table 11-19: Supplementary Testwork Programmes to Optimise Metallurgical Performance ............. 99 Table 11-20: Summary of the Performance of Each Bulk Testwork Programme ................................. 99 Table 11-21: Garnet Product Quality of Programme 1231 Determined by QEMSCAN (SGS Canada) ............................................................................................................................................................ 102 Table 11-22: Rutile Product Chemical Assay of Programme 1231 Determined by XRF ................... 103 Table 11-23: Overall TiO2 and Fine Garnet Recovery for Programme 1231 ...................................... 104 Table 11-24: Garnet Product Quality Determined by QEMSCAN (SGS Canada) of Programme 1245 ............................................................................................................................................................ 109 Table 11-25: Rutile Product Chemical Assay by XRF of Programme 1245 ....................................... 109
Nordic Mining Prefeasibility Study
30 October 2017 Engebø Rutile and Garnet Project H352410
H352410-00000-280-066-0001, Rev. 0 Page xiii
© Hatch 2017 All rights reserved, including all rights relating to the use of this document or its contents.
Table 11-26: Overall TiO2 Recovery of Programme 1245 .................................................................. 110 Table 11-27: Overall Coarse and Fine Garnet Recovery of Programme 1245 .................................. 110 Table 11-28: 1286-005 Sample A – Hazemag Comminuted >212 µm Fraction (QXRD) ................... 113 Table 11-29: 1286-005 Sample B – Rod Mill Comminuted >212 µm Fraction (QXRD) ..................... 113 Table 11-30: 1286-005 Sample C – Combined Comminuted >212 µm Fraction (QXRD).................. 113 Table 11-31: Garnet Product Quality Determined by QEMSCAN (SGS Canada) of Programme 1308 ............................................................................................................................................................ 114 Table 11-32: Overall Coarse and Fine Garnet Recoveries and Mass Yields of Programme 1308 .... 114 Table 11-33: Comparison of the Location of Flotation in the Flowsheet ............................................ 117 Table 11-34: Rutile Products Chemical Assay by XRF of Programme 1308 ..................................... 118 Table 11-35: Overall TiO2 Recovery of Programme 1308 (Post-dry Circuit Flotation) ....................... 119 Table 11-36: Particle Size Distribution of the Rutile Product from 1308 ............................................. 120 Table 11-37: Garnet Product Quality Determined by QEMSCAN (SGS Canada) of Programme 1234 ............................................................................................................................................................ 122 Table 11-38: Rutile Products Chemical Assay by XRF of Programme 1234 ..................................... 123 Table 11-39: Overall TiO2 Recovery of Programme 1234 .................................................................. 124 Table 11-40: Overall Coarse and Fine Garnet Recoveries and Yields of Programme 1234 .............. 125 Table 11-41: Magnetic Fractionation of the Coarse Garnet Product .................................................. 126 Table 11-42: Magnetic Fractionation of the Fine Garnet Product ....................................................... 126 Table 11-43: Size Fractionation of the Coarse Garnet Product .......................................................... 127 Table 11-44: Size Fractionation of the Fine Garnet Product .............................................................. 127 Table 11-45: Magnetic Fractionation of the 1231 Bulk Sample Rutile Concentrate ........................... 129 Table 11-46: Electrostatic Separation of the 1231 Bulk Sample Rutile Concentrate ......................... 130 Table 11-47: Magnetic Fractionation of the 1245 Bulk Sample Rutile Concentrate ........................... 131 Table 11-48: Summary of the Results for Samples A, B and C of Programme 1286-003 ................. 133 Table 11-49: Sample A – Hazemag Comminuted +212 µm Fraction ................................................. 134 Table 11-50: 1286-004 Sample B – Rod Mill Comminuted +212 µm Fraction ................................... 135 Table 11-51: 1286-004 Sample C – Combined Hazemag and Rod Mill Comminuted +212µm Fraction ............................................................................................................................................................ 135 Table 11-52: 1286-004 Overall Circuit Performance for Samples A, B and C ................................... 135 Table 11-53: Dry Magnetic Circuit Performance Comparison for Rutile Upgrading ........................... 136 Table 11-54: Comparison of the Rutile Dry Circuit Before and after Supplementary Test Work ....... 137 Table 11-55: Flotation Reagents Tested ............................................................................................. 137 Table 11-56: Pyrite Flotation Performance ......................................................................................... 138 Table 11-57: Operating Factors of Each Process Area ...................................................................... 141 Table 11-58: Equipment Types Selected for the Process .................................................................. 142 Table 11-59: Average Grades of Rutile and Garnet for the Engebø Deposit ..................................... 142 Table 11-60: Annual Product Capacity for 1.5 Mtpa Ferro Ore (excluding mining ore losses and dilution) ................................................................................................................................................ 143 Table 11-61: Rutile Product Properties Achieved in Test Work Programme 1308............................. 144 Table 11-62: Coarse Garnet Product Properties Achieved in Test Work Programme 1308 (i.e. 1286-005) ..................................................................................................................................................... 145 Table 11-63: Fine Garnet Product Specifications Achieved in Test Work Programme 1308 ............. 146 Table 11-64: Summary of the Process Reagents ............................................................................... 165 Table 11-65: Expected Concentration of SIBX at Different Locations in the Process ........................ 165 Table 11-66: Expected Concentration of DF400 at Different Locations in the Process ..................... 165 Table 11-67: Expected Concentration of Magnafloc 5250 at Different Locations in the Process ...... 166 Table 12-1: Rock Type Classifications in Resource Model ................................................................ 180 Table 12-2: Open Pit Optimisation Input Parameters ......................................................................... 181 Table 12-3: Reconciliation Summary .................................................................................................. 182 Table 12-4: Open Pit Ramp Design Specification per Haul Truck ...................................................... 183 Table 12-5: Adjusted Overall Slope Angles ........................................................................................ 183 Table 12-6: Impact of Ramp Design on Optimisation ......................................................................... 184 Table 12-7: Optimisation Results - Option 3 ....................................................................................... 186 Table 12-8: Optimisation Results - Cut-off Grade Sensitivity - Option 4a .......................................... 187 Table 12-9: Optimisation Results - Cut-off Grade Sensitivity - Option 4b .......................................... 187

Nordic Mining Prefeasibility Study
30 October 2017 Engebø Rutile and Garnet Project H352410
H352410-00000-280-066-0001, Rev. 0 Page xiv
© Hatch 2017 All rights reserved, including all rights relating to the use of this document or its contents.
Table 12-10: Optimisation Results - Cut-off Grade Sensitivity - Option 6 .......................................... 190 Table 12-11: Key Pit Design Parameters ............................................................................................ 194 Table 12-12: UBC Modified Nicholas Scoring – Orebody defined as Massive ................................... 205 Table 12-13: UBC Modified Nicholas Scoring – Orebody defined as Tabular .................................... 205 Table 12-14: Mining Methods Shortlist for Engebø ............................................................................ 207 Table 12-15: Summary of Excavation Dimensions ............................................................................. 214 Table 12-16: Summary of Options Evaluated ..................................................................................... 227 Table 12-17: Mine Plan Key Production Statistics .............................................................................. 230 Table 12-18: Key Schedule Production Statistics ............................................................................... 231 Table 12-19: Mining Labour Requirements – Open Pit ...................................................................... 242 Table 13-1: Ore Reserve Estimate ..................................................................................................... 243 Table 17-1: Engebø Indicative Rutile Assay ....................................................................................... 265 Table 20-1: Summary of Cost-to-Company Salary Calculations ........................................................ 283 Table 20-2: Steady-state Labour Complement Summary .................................................................. 285 Table 20-3: Management and Administration Labour Complement ................................................... 286 Table 20-4: Technical Services Labour Complement ......................................................................... 286 Table 20-5: Mining Labour Complement ............................................................................................. 287 Table 20-6: Comminution and Process Labour Complement ............................................................. 287 Table 20-7: Product Dispatch Labour Complement ............................................................................ 287 Table 20-8: Engineering Labour Complement .................................................................................... 288 Table 21-1: Upfront Capital Estimate .................................................................................................. 289 Table 21-2: Deferred Capital Estimate for Underground Mining......................................................... 289 Table 22-1: Key Input Cost Assumptions ............................................................................................ 294 Table 22-2: Operating Cost Summary ................................................................................................ 295 Table 23-1: Summary of Options Evaluated ....................................................................................... 302 Table 23-2: Financial Metrics for Options Evaluated .......................................................................... 303 Table 23-3: Fixed and Variable Operating Costs for Non-Mining Activities ........................................ 304 Table 23-4: Key Financials for Base Case Option .............................................................................. 307 Table 23-5: Post-tax Financials for Base Case Option ....................................................................... 309 Table 26-1: Threats ............................................................................................................................. 323 Table 26-2: Opportunities .................................................................................................................... 327 Table 26-3: Project Contingency Summary ........................................................................................ 328 Table 26-4: Project Capital Estimate Accuracy................................................................................... 328 Table 26-5: Confidence Levels and Contingency Results .................................................................. 328 Table 27-1: Value Improvement Opportunities ................................................................................... 330
List of Figures
Figure 1-1: 2021 Revenue to Cash Cost Curve ...................................................................................... 4 Figure 1-2: Location of the Engebø Deposit ........................................................................................... 6 Figure 1-3: Location of the Engebø Deposit in the Sunnfjord Region .................................................... 6 Figure 1-4: Aerial View of Engebø looking West towards the North Sea ............................................... 7 Figure 1-5: Geology of the Engebø Deposit ........................................................................................... 8 Figure 1-6: Simplified Schematic of the Selected Comminution Circuit ............................................... 10 Figure 1-7: Simplified Schematic of the Selected Process Flowsheet ................................................. 10 Figure 1-8: Open Pit and Underground Mine Design (looking South-East) .......................................... 12 Figure 1-9: Pit Design Pushbacks ......................................................................................................... 14 Figure 1-10: Underground Infrastructure Layout................................................................................... 15 Figure 1-11: Decline Development and Ore Development ................................................................... 16 Figure 1-12: West-East Long Section of Drillhole Data ........................................................................ 18 Figure 1-13: NPV Sensitivity ................................................................................................................. 26 Figure 3-1: Location of Naustdal Municipality (circled) in western Norway .......................................... 37 Figure 3-2: Engebø Site (circled) in Naustdal Municipality ................................................................... 38 Figure 3-3: Aerial View of Engebø Ridge looking West ........................................................................ 38 Figure 5-1: Extraction Permits held by Nordic Mining in the Vicinity of Engebø ................................... 43 Figure 6-1: Geological Map of the Førde Fjord Area (NGU) ................................................................. 47

Nordic Mining Prefeasibility Study
30 October 2017 Engebø Rutile and Garnet Project H352410
H352410-00000-280-066-0001, Rev. 0 Page xv
© Hatch 2017 All rights reserved, including all rights relating to the use of this document or its contents.
Figure 6-2: Geology of the Engebø Deposit ......................................................................................... 48 Figure 7-1: Plan of Drillholes ................................................................................................................. 50 Figure 7-2: West-East Long Section of Drillhole Data .......................................................................... 51 Figure 7-3: Example of QEMSCAN Results from Thin Section of Core Analysis ................................. 56 Figure 7-4: Graph of Test Variable vs. Garnet for Trans-Eclogite and Ferro-Eclogite ......................... 57 Figure 7-5: 2016 Surface Sample Locations......................................................................................... 58 Figure 8-1: Block Modelling Methodology ............................................................................................. 60 Figure 8-2: 3D View of Interpreted Wireframe Model showing main Eclogite Ore Types (looking North-East) ...................................................................................................................................................... 61 Figure 9-1: WAI Geotechnical Design Sectors ..................................................................................... 65 Figure 9-2: Pit Slope Configuration Illustration (Read and Stacey, 2009) ............................................ 65 Figure 9-3: Mining Layouts Analysed by SINTEF for Geotechnical Stability ........................................ 67 Figure 10-1: Map of Registered Rivers and Streams at Engebø .......................................................... 70 Figure 11-1: Particle Size Distributions of the Rutile Products from the Two Ferro Ore Bulk Testwork Programmes .......................................................................................................................................... 76 Figure 11-2: Particle Size Distributions of the Two Garnet Products achieved in the PFS .................. 79 Figure 11-3: Particle Size Distributions of the Three Target Garnet Products ..................................... 79 Figure 11-4: Block Flow Diagram of the Developed Flowsheet ............................................................ 81 Figure 11-5: ENG07 Sample in Storage ............................................................................................... 83 Figure 11-6: Prepared Bulk Sample Cumulative Particle Size Distributions ........................................ 86 Figure 11-7: Laboratory Batch Rod Mill Testwork Results ................................................................... 91 Figure 11-8: Base Case Flowsheet ....................................................................................................... 93 Figure 11-9: HPGR Flowsheet .............................................................................................................. 93 Figure 11-10: Hazemag Flowsheet ....................................................................................................... 93 Figure 11-11: Vertical Shaft Impactor Flowsheet .................................................................................. 94 Figure 11-12: Selected Comminution Circuit ........................................................................................ 96 Figure 11-13: Grade-Recovery Curves for TiO2 for the Different Testwork Programmes .................. 100 Figure 11-14: Grade-Yield Curves for Coarse Garnet for the Different Testwork Programmes ......... 100 Figure 11-15: An Alternative Coarse Garnet Flowsheet Including Wet Magnetic and Gravity Separation. Mass Distribution Shown in Percentage .......................................................................... 106 Figure 11-16: Coarse Garnet Flowsheet Selected as the Optimal for Further Test Work. Mass Distribution Shown in Percentage ....................................................................................................... 107 Figure 11-17: An Alternative Coarse Garnet Flowsheet Including Wet Magnetic Separation. Mass Distribution Shown in Percentage ....................................................................................................... 108 Figure 11-18: Coarse Garnet Product from Programme 1308 ........................................................... 115 Figure 11-19: Microscope Image of the Coarse Garnet Product from Programme 1308 ................... 115 Figure 11-20: Fine Garnet Product from Programme 1308 ................................................................ 116 Figure 11-21: Microscope Image of the Fine Garnet Product from Programme 1308 ...................... 116 Figure 11-22: Comparison of the Particle Size Distributions of the Rutile Products from Different Testwork Programmes ........................................................................................................................ 119 Figure 11-23: Image of the Rutile Product from Programme 1308 ..................................................... 120 Figure 11-24: Microscope Image of the Rutile Product from Programme 1308 ................................. 121 Figure 11-25: Coarse Garnet Flowsheet of Programme 1286-003 .................................................... 132 Figure 11-26: PSDs of Samples A, B and C of Programme 1286-003 ............................................... 133 Figure 11-27: Simplified Block Diagram .............................................................................................. 148 Figure 11-28: Schematic of the Secondary and Tertiary Crushing Circuit ......................................... 149 Figure 11-29: Primary Feed Preparation Area .................................................................................... 151 Figure 11-30: Schematic of Coarse Garnet Processing Circuit .......................................................... 152 Figure 11-31: Schematic of Rod Milling and WHIMS Circuit .............................................................. 153 Figure 11-32: Schematic of Rutile Wet Circuit .................................................................................... 156 Figure 11-33: Rutile Dry Processing Circuit ........................................................................................ 158 Figure 11-34: Schematic of Fine Garnet Processing Circuit ............................................................... 160 Figure 11-35: Summary Block Flow Diagram of the Process Including TiO2 Grades ........................ 163 Figure 11-36: Plan View of the Proposed Plant Layout ...................................................................... 169 Figure 11-37: Overview of the Proposed Plant Layout ....................................................................... 170

Nordic Mining Prefeasibility Study
30 October 2017 Engebø Rutile and Garnet Project H352410
H352410-00000-280-066-0001, Rev. 0 Page xvi
© Hatch 2017 All rights reserved, including all rights relating to the use of this document or its contents.
Figure 11-38: Rod Mill in Closed Circuit with a Screen with the Option of Producing a Coarser Garnet (-850/+550 µm) Fraction ..................................................................................................................... 172 Figure 12-1: Initial Geological Block Model showingTiO2 Grade ........................................................ 175 Figure 12-2: Block Model Grades ....................................................................................................... 175 Figure 12-3: Orebody Block Model Filtered on JORC Material Class ................................................ 176 Figure 12-4: Open Pit Optimisation Iteration Steps ............................................................................ 178 Figure 12-5: Open Pit Visuals - Options 1 .......................................................................................... 182 Figure 12-6: Geotechnical Slope Sector Design ................................................................................. 184 Figure 12-7: Open Pit Visuals - Options 2 .......................................................................................... 185 Figure 12-8: Open Pit Visuals - Option 3 ............................................................................................ 186 Figure 12-9: Open Pit Visuals - Option 4a .......................................................................................... 188 Figure 12-10: Open Pit Visuals - Option 4b ........................................................................................ 188 Figure 12-11: Pushback Visuals - Option 4b ...................................................................................... 189 Figure 12-12: Cumulative NPV for Various Cut-off Grades – Option 6 .............................................. 190 Figure 12-13: Option 6 - Pit Shells for TiO2 Cut-offs of 1.5%, 2.0%, 2.5% and 3% ............................ 191 Figure 12-14: Ultimate Pit Design Strings ........................................................................................... 193 Figure 12-15: Categorisation of Ore in the Pit .................................................................................... 194 Figure 12-16: Pit Design Pushbacks ................................................................................................... 195 Figure 12-17: Pit Excavation including Geotechnical Boundary ......................................................... 195 Figure 12-18: Underground Mining Method Selection Process .......................................................... 196 Figure 12-19: Major Mining Methods in Use Globally ......................................................................... 197 Figure 12-20: Sub-level Open Stoping ................................................................................................ 198 Figure 12-21: Sub-level Long Hole Open Stoping .............................................................................. 198 Figure 12-22: Vertical Crater Retreat .................................................................................................. 199 Figure 12-23: Cut and Fill .................................................................................................................... 199 Figure 12-24: Sub-level Caving .......................................................................................................... 200 Figure 12-25: Block Caving ................................................................................................................. 201 Figure 12-26: Room and Pillar Mining ................................................................................................ 202 Figure 12-27: Shrinkage Stoping ........................................................................................................ 202 Figure 12-28: Boshkov and Wright Mining Methods Ranking ............................................................. 205 Figure 12-29: Hartman Ranking Method ............................................................................................. 206 Figure 12-30: Stoping Block showing Stoping Design Grid Overlain ................................................. 208 Figure 12-31: Final Mining Shape (shown in brown) .......................................................................... 208 Figure 12-32: Stope Design ................................................................................................................ 209 Figure 12-33: Final Underground Design Shape ................................................................................ 210 Figure 12-34: Decline Development and Ore Development ............................................................... 211 Figure 12-35: Stope Design and Mining Methodology ........................................................................ 212 Figure 12-36: Underground Infrastructure Layout............................................................................... 213 Figure 12-37: Capacity Analysis Process Steps ................................................................................. 215 Figure 12-38: NPV vs. TiO2 Cut-off Grade .......................................................................................... 218 Figure 12-39: IRR vs. TiO2 Cut-off Grade ........................................................................................... 218 Figure 12-40: NPV vs. Garnet Cut-off Grade ...................................................................................... 219 Figure 12-41: IRR vs. Garnet Cut-off Grade ....................................................................................... 219 Figure 12-42: NPV vs. Capacity for TiO2 Price Ranges...................................................................... 220 Figure 12-43: IRR vs. Capacity for TiO2 Price Ranges ....................................................................... 221 Figure 12-44: NPV vs. Capacity for Garnet Price Ranges .................................................................. 222 Figure 12-45: IRR vs. Capacity for Garnet Price Ranges ................................................................... 223 Figure 12-46: NPV vs. Capacity for Base Line Prices ........................................................................ 224 Figure 12-47: IRR vs. Capacity for Base Line Prices ......................................................................... 224 Figure 12-48: Ore Profile for 1.5 Mtpa Option..................................................................................... 225 Figure 12-49: Ore Profile for 1.5 Mtpa with Stepped Upgrade to 2.0 Mtpa Option............................. 226 Figure 12-50: Ore Profile for 1.5 Mtpa with Smoothed Upgrade to 2.0 Mtpa Options ........................ 226 Figure 12-51: Pit Shape before Mining (looking North-East), Coloured in Years ............................... 234 Figure 12-52: Extent of Mining after 5 Years (January 2026) (looking North-East) ............................ 235 Figure 12-53: Extent of Mining after 10 Years (January 2031) (looking North-East).......................... 235 Figure 12-54: Extent of Mining after 15 Years (January 2036) (looking North-East).......................... 236

Nordic Mining Prefeasibility Study
30 October 2017 Engebø Rutile and Garnet Project H352410
H352410-00000-280-066-0001, Rev. 0 Page xvii
© Hatch 2017 All rights reserved, including all rights relating to the use of this document or its contents.
Figure 12-55: Extent of Underground Mining in January 2036 ........................................................... 236 Figure 12-56: Extent of Underground Mining in January 2041 ........................................................... 237 Figure 12-57: Extent of Underground Mining in January 2046 ........................................................... 237 Figure 12-58: Extent of Underground Mining in 2049 (end of Life of Mine) ........................................ 238 Figure 12-59: Open Pit and Underground Mine Plan (looking south-east) ......................................... 238 Figure 12-60: Plan Showing Waste Rock Disposal Facility (circled) .................................................. 240 Figure 14-1: Site Layout ...................................................................................................................... 246 Figure 14-2: Schematic of the COWI Design for Sea Disposal of Tailings ......................................... 249 Figure 15-1: Bulk Water Supply – Alternative Routes considered from Skorven to Engebø ............. 250 Figure 17-1: Global TiO2 Pigment Demand by End-use Segment in 2016......................................... 256 Figure 17-2: Regional TiO2 Pigment Demand for 2016 ...................................................................... 256 Figure 17-3: Global TiO2 Pigment Production by Technology: 2010 to 2025 ..................................... 257 Figure 17-4: TiO2 Feedstock Demand by End-use: 2005 to 2025 ...................................................... 258 Figure 17-5: Global Titanium Feedstock Supply by Product: 2005 to 2025 ....................................... 258 Figure 17-6: Global Titanium Feedstock Supply/Demand Balance .................................................... 260 Figure 17-7: Global Rutile Demand: 2005 to 2025 ............................................................................. 260 Figure 17-8: Global Rutile Supply from Existing Operations: 2005 to 2025 ....................................... 261 Figure 17-9: Global Rutile Supply/Demand Balance to 2025 ............................................................. 262 Figure 17-10: Nominal Rutile Prices to 2021 ...................................................................................... 263 Figure 17-11: 2021 Revenue to Cash Cost Curve .............................................................................. 267 Figure 17-12: Annual Garnet Production ............................................................................................ 270 Figure 17-13: Garnet Consumption Development (TAK Industrial Mineral Consultancy) .................. 271 Figure 17-14: Average FOB Garnet Export Prices (TAK Industrial Mineral Consultancy) ................. 273 Figure 19-1: Schematic of the Planned Sea Disposal System for Tailings ........................................ 278 Figure 23-1: Cashflow Drivers for Project Activities ............................................................................ 301 Figure 23-2: Ore and Waste Production Profiles ................................................................................ 304 Figure 23-3: OPEX over the Life of the Project................................................................................... 305 Figure 23-4: CAPEX Over the Life of the Project................................................................................ 306 Figure 23-5: Cashflows Over the Life of the Project ........................................................................... 307 Figure 23-6: NPV Sensitivity to WACC for Option 1 ........................................................................... 309 Figure 23-7: NPV Sensitivity to OPEX, CAPEX and Revenue ........................................................... 310 Figure 23-8: IRR Sensitivity for Option 1 ............................................................................................ 310 Figure 23-9: Upside Potential of Business Case ................................................................................ 311 Figure 24-1: DFS Schedule................................................................................................................. 315
List of Appendices
Appendix A : JORC Code 2012 Supporting Information

Nordic Mining Prefeasibility Study
30 October 2017 Engebø Rutile and Garnet Project H352410
H352410-00000-280-066-0001, Rev. 0 Page 1
© Hatch 2017 All rights reserved, including all rights relating to the use of this document or its contents.
1. Executive Summary
1.1 Introduction
This Technical Report has been prepared by Hatch Africa (Proprietary) Limited (Hatch) on
behalf of Nordic Mining ASA. Hatch was commissioned to prepare a Technical Report
compliant with the “Australasian Code for Reporting of Exploration Results, Mineral
Resources and Ore Reserves” (JORC Code 2012 Edition) for a Prefeasibility Study (PFS)
of the Engebø Rutile and Garnet Project (the Project) located near Førde in Norway. The
project involves the establishment of a mining and processing operation at the Engebø
deposit. The mineral rights to the Engebø deposit are held by Nordic Mining’s wholly
owned subsidiary Nordic Rutile AS. Nordic Mining is a public company listed on Norway’s
Oslo Stock Exchange Axess list (OAX: NOM).
Two minerals, rutile (TiO2) and garnet, will be produced from Engebø, which is a hard
rock deposit with high grades of both rutile and garnet. Rutile is a titanium feedstock,
primarily used in the production of titanium pigment, titanium metal and welding rods. The
Engebø garnet, which is almandine, is used commercially in the abrasives and waterjet
cutting industry.
The deposit is situated in a sparsely populated part of western Norway next to an existing
deep-water ice-free port. The port is situated in a fjord adjacent to the North Sea,
providing environmentally-friendly shipping to Europe and North America. The coastal
climate with mild winters and summers will enable mining and processing operations to
continue uninterrupted throughout the year.
The regulatory setting for the Project is driven by two key legislative requirements, namely
the discharge permit and the zoning plan (planning permit). Both permits have been
granted by Norwegian authorities, without further possibility for appeal.
1.2 Key Project Outcomes
1.2.1 Key Figures: Production and Financials
The foundation for the Project is the geological properties of the Engebø deposit including
the Mineral Resource Statement, the mine plan and process flowsheet with estimates for
capital expenditures and operating costs, and the Ore Reserve Statement. All these
fundamentals are further described in this Executive Summary and in separate sections
of the Technical Report.
The business case developed for the Project is based on two product revenue streams
from a 1.5 Mtpa mining and processing operation, with open pit mining starting in 2021
and continuing for 16 years. Development of the underground mine will start in year 13 to
enable underground production to take over from the open pit. The Life of Mine runs until
2049. The mining plan and mineral processing for the Project is based on ferro-eclogite
only. Significant additional mineral resources (Inferred Resources) to extend the Life of
Mine may be qualified through drilling. The mine plan has been developed in line with the
guidelines of the JORC Code. Table 1-1 shows the key production and financial figures
for the Project.

Nordic Mining Prefeasibility Study
30 October 2017 Engebø Rutile and Garnet Project H352410
H352410-00000-280-066-0001, Rev. 0 Page 2
© Hatch 2017 All rights reserved, including all rights relating to the use of this document or its contents.
Table 1-1: Summary of Key Production and Financial Figures
Project Financials Unit Value
Pre-tax NPV @ 8.0% US$ M 332
Pre-tax IRR % 23.8
Payback Period years 4.1
Net Project Pre-tax Cashflow (Undiscounted) US$ M 1,613
Post-tax NPV @ 6.8% US$ M 305
Post-tax IRR % 20.8
Pre-tax Opportunity NPV @ 8.0% US$ M 465
Production Capacity
Initial Production Capacity ROM Mtpa 1.5
Capital Expenditure
Initial Capital Expenditure for Open Pit and Processing Plant US$ M 207.2
Deferred Capital Expenditure for Underground Mine (Year 13) US$ M 16.9
Operating Cost
Total Operating Cost US$/ROM
tonne 16.28
Total Operating Cost US$/Sales
tonne 86.92
Mining and Processing
Open Pit Life years 16
Total Open Pit Ferro-eclogite Ore Production Mt 22.6
Underground Life years 13
Total Underground Ferro-eclogite Ore Production Mt 19.4
Total Project Mine Life years 29
Total Project Ferro-eclogite Ore Production (LOM) Mt 41.9
Ferro Ore Grade – Rutile * % 3.46
Rutile Recovery* % 58.5
Ferro Ore Yield – Garnet * % 17.47

Nordic Mining Prefeasibility Study
30 October 2017 Engebø Rutile and Garnet Project H352410
H352410-00000-280-066-0001, Rev. 0 Page 3
© Hatch 2017 All rights reserved, including all rights relating to the use of this document or its contents.
Rutile and Garnet Sales (Average for First 5 Years of Operation)
Rutile Sales Tonnes per
annum 30,525
Rutile Sales Revenue US$ M per
annum 32.7
Garnet Sales Tonnes per
annum 176,000
Garnet Sales Revenue US$ M per
annum 44.0
Garnet Basket Price US$ per
tonne 250
Rutile Price US$ per
tonne 1,070
* Diluted by waste rock: 4% for open pit and 6% for underground
The key financials illustrate a profitable, robust and flexible business case with an Internal
Rate of Return (IRR) of 23.8% and a Net Present Value (NPV8) of US$ 332 M. The
Project indicates a payback period of less than five years.
The initial capital expenditure for the Project is estimated at US$ 207 M. This includes the
open pit mining operation and the processing plant facilities. A deferred capital
expenditure of US$ 17 M related to the underground mining operation will accrue in year
13, and will, therefore, likely be financed from the operating cashflow.
The undiscounted net cashflow from the Project over the 29 year Life of Mine is around
US$ 1.6 billion, indicating a sizeable business operation.
1.2.2 Key Project Characteristics
Low Cost Mining Operation
The Engebø deposit is a large, outcropping high-grade resource which is open at depth
and to the east and west. This allows for easy transition from open pit mining to effective
underground bulk mining. The ridge profile of the deposit enables the use of a glory hole
for open pit mining. Consequently, ore transportation costs are limited. The open pit
stripping ratio is 1.34, with limited overburden. The geotechnical setting favours low
operating costs due to low support requirements which allows for progressive mining both
in the open pit and the underground operation. Hydrogeological conditions for the open
pit and underground mine offer low risk of water inflows and low hydraulic conductivity
through competent ore and country rocks.
High-quality Products
A comprehensive programme of comminution and process testwork has shown that
standard technologies can be used to achieve high recoveries of rutile and garnet. The
PFS programme has been successful in making pigment grade rutile at market
specifications. Commercial products of both coarse and fine garnet have been made,
meeting market specifications of 30/60, 80 and 100 mesh garnet products. There is
potential for further optimisation of recoveries of rutile and coarse garnet.

Nordic Mining Prefeasibility Study
30 October 2017 Engebø Rutile and Garnet Project H352410
H352410-00000-280-066-0001, Rev. 0 Page 4
© Hatch 2017 All rights reserved, including all rights relating to the use of this document or its contents.
Favourable Infrastructure
The Project is surrounded by local infrastructure with reliable power and process water
sources available within a few kilometres of the site. Natural gas for product drying is
available from local suppliers. The existing deep-water port caters for simple and
environmentally-friendly logistics during the construction and operational phases.
High Revenue to Cost Ratio
The Project benefits from having high value products and relatively low operating costs.
The dual mineral business case with shared production costs offers a revenue to cost
ratio for rutile of approximately 3.9 over the first 10 years, ranking the Project in the first
quartile amongst global titanium feedstock producers. This is illustrated in the figure
below with estimations for 2021.
Source: TZMI ©
Figure 1-1: 2021 Revenue to Cash Cost Curve
Note: The Project revenue has been estimated using TZMI’s long-term inducement price for rutile (US$
1,070/t FOB) while the garnet price is assumed at US$ 250/t FOB. Operating cost estimates were provided
by Nordic Mining.
1.2.3 Future Upside Opportunities and Flexibility
There are upside potentials in the business case related to, inter alia:
Expanding the Run of Mine throughput to enable increased product sales
Extending the Life of Mine through increased ore reserves from Inferred Resources
Selling surplus garnet produced in the first years of production.
The above initiatives may offer a 40% improvement in the NPV8 to US$ 465 M.
In addition to the ferro-eclogite which is the basis for the Project, the Engebø deposit also
contains lower grade trans-eclogite. Possible utilisation of the trans-eclogite may offer
flexibility and potential upside to the Life of Mine which could be investigated at a later
stage.

Nordic Mining Prefeasibility Study
30 October 2017 Engebø Rutile and Garnet Project H352410
H352410-00000-280-066-0001, Rev. 0 Page 5
© Hatch 2017 All rights reserved, including all rights relating to the use of this document or its contents.
1.3 Contributors
The PFS has been prepared through collaboration between a number of recognised
consulting firms. The key project contributors are summarised in Table 1-2 below.
Table 1-2: Key Project Contributors
Company/Person Primary Source of Services
Hatch Johannesburg, South Africa
Main Technical Consultant
Mineral Processing and Comminution
Mining
Project Infrastructure and General Infrastructure
Engineering Design
Human Resources
Capital and Operational Cost Estimate
Financial Analysis
PFS coordination, report write-up and quality assurance
Adam Wheeler Independent Mining Consultant, Cornwall, United Kingdom
Competent Person for Resource and Reserve Estimations in accordance with the guidelines of the JORC Code
Mineral Resource Statement
Mining
Ore Reserve Statement
Wardell Armstrong International Truro, United Kingdom
Mining Geotechnical (Open Pit Mine Design)
SINTEF Trondheim, Norway
Mining Geotechnical (Underground Mine Design)
Hydrogeology
IHC Robbins Brisbane, Australia
Metallurgical testwork programmes and results
Flowsheet development and advisory
Mintek
Johannesburg, South Africa
Comminution testwork and results
COWI Fredrikstad, Norway
Tailings Disposal
TAK Industrial Mineral Consultancy Gerrards Cross, United Kingdom
Garnet market information
TZMI Perth, Australia
Rutile market information
1.4 Property Description, Location and Access
The Engebø deposit is located between the towns of Førde and Florø in south-western
Norway, with direct access to the North Sea. Engebø is on the northern side of the Førde
Fjord in the Naustdal municipality, in the Sogn og Fjordane county.

Nordic Mining Prefeasibility Study
30 October 2017 Engebø Rutile and Garnet Project H352410
H352410-00000-280-066-0001, Rev. 0 Page 6
© Hatch 2017 All rights reserved, including all rights relating to the use of this document or its contents.
The Fv 611 county road runs along the south side of the deposit before entering a 630 m
long tunnel which runs through the deposit. The location of the Engebø deposit in south-
western Norway is shown in Figure 1-2 and Figure 1-3 below; an aerial view of the site is
shown in Figure 1-4 below.
Figure 1-2: Location of the Engebø Deposit
Figure 1-3: Location of the Engebø Deposit in the Sunnfjord Region

Nordic Mining Prefeasibility Study
30 October 2017 Engebø Rutile and Garnet Project H352410
H352410-00000-280-066-0001, Rev. 0 Page 7
© Hatch 2017 All rights reserved, including all rights relating to the use of this document or its contents.
Figure 1-4: Aerial View of Engebø looking West towards the North Sea
Engebø is the local name of a small hill which varies in elevation from sea level to
335 masl. On the south side, the hill dips steeply into the Førde fjord, with more gentle
slopes on the northern, eastern and western sides.
The climate at Engebø is characterised by long, warm days in summer and colder, darker
and shorter days in winter. Snow is common in winter but proximity to the sea and
relatively low altitude result in no permanent snow accumulation which allows for all-year
operation. Annual rainfall is about 2,000 mm, through all four seasons. The fjord is
permanently ice-free.
The town of Førde, with about 10,000 inhabitants, is located about 30 km east of Engebø.
Førde has a regional airport nearby. The town of Florø with a population of 9,000 people
lies 30 km west of Engebø, and has a regional airport. Between Engebø and Førde lies
the municipality centre of Naustdal. The Naustdal municipality has about 2,500
inhabitants.
On the eastern part of the Engebø hill is a closed quarry and the harbour facilities
constructed for rock shipment still exist. The harbour facility is designed for vessels with a
capacity of up to 80 kt.
Power and water are easily accessible with a 22 kV power line close by and a reliable
water supply within 9 km.
1.5 Deposit Mineralisation and Geology
The Engebø deposit is one of the world’s highest-grade rutile deposits and is unique due
to its substantial content of garnet. With negligible contents of radioactive elements and
heavy metals, the deposit is a clean source of high-grade and high-quality titanium and
garnet minerals. Unlike most rutile deposits, the Engebø rutile is contained in a hard-rock
ore, a massive body of eclogite.

Nordic Mining Prefeasibility Study
30 October 2017 Engebø Rutile and Garnet Project H352410
H352410-00000-280-066-0001, Rev. 0 Page 8
© Hatch 2017 All rights reserved, including all rights relating to the use of this document or its contents.
The deposit forms a 2.5 km long east-west trending lens that runs parallel with the Førde
Fjord and the ridge, Engebøfjellet (Norwegian for Engebø Mountain). The deposit dips
steeply towards the north with a dip of 60° to 85° degrees. Structural studies reveal many
episodes of complex major folding and development of foliation. There is considerable
exposure of eclogite on surface, although the overburden increases to the east and the
country rocks frequently fold into the eclogite on its margins.
Geological investigations have determined that the eclogite can be subdivided into three
different types, based on appearance and titanium content:
Ferro-eclogite; dark and massive appearance, generally >3% TiO2
Transitional-eclogite; intermediate dark, generally 2 to 3% TiO2
Leuco-eclogite; light coloured and foliated, generally <2% TiO2.
The contacts between the eclogite types are gradational, moving from ferro- to
transitional- and leuco-eclogite. Figure 1-5 below shows the relationship between the
different eclogite types.
Figure 1-5: Geology of the Engebø Deposit
The main titanium bearing mineral is rutile. Only 5% of the titanium is found as ilmenite,
and the presence of titanite/sphene is negligible. The rutile is practically free of uranium,
thorium and other radioactive elements (less than 1 ppm). The mineral assemblage gives
the rock a characteristic green and red colour. In general, the eclogite contains 40% to
50% almandine type garnet. The garnet content decreases gradually with the TiO2 grade.
Other major minerals present in the ore are pyroxene and amphibole.

Nordic Mining Prefeasibility Study
30 October 2017 Engebø Rutile and Garnet Project H352410
H352410-00000-280-066-0001, Rev. 0 Page 9
© Hatch 2017 All rights reserved, including all rights relating to the use of this document or its contents.
1.6 Land and Mineral Tenure
Nordic Mining has access to the mining and processing plant areas both by land and sea
as a result of option agreements with landowners, as well as an approved zoning plan for
the area and a development agreement with Naustdal municipality.
Nordic Mining holds nine valid extraction permits covering the entire planned mining area,
which gives the right to extract and utilise deposits of minerals within certain limits as
described in section 32 of the Norwegian Minerals Act. The permits are valid until
12 November 2027. The Directorate of Mining may extend the duration period of the
permits for up to ten years at a time. Extensions are normally granted if the deposit is
deemed to be a reasonable reserve.
The land required for the processing plant is owned by three private landowners. Nordic
Mining has entered into private option agreements with two of the landowners whereby
the Company has an unconditional right to acquire the relevant area and exclusive right
for mining operations. Renegotiations with the landowners are ongoing. By law, Nordic
Mining has the right to acquire areas for operation through compulsory acquisition.
1.7 Mineral Processing
Comprehensive testwork programmes involving both comminution (crushing and grinding)
and processing have been carried out, mainly in South Africa and Australia. The testwork
has been successful in making a pigment grade rutile product with significantly increased
recovery compared to historic testwork results. Coarse and fine garnet products that meet
the market specifications of 30/60, 80 and 100 mesh products have also been achieved.
Table 1-3 below shows the key results from the testwork.
Table 1-3: Summary of the Key Processing Testwork Results
Key Processing Results Weight %
Rutile Product Grade (as TiO2) 94.9
TiO2 Recovery to Rutile Product 60.2
Coarse Garnet Product (>212 µm) Grade 95.4
Fine Garnet Product (<212 µm) Grade 95.5
Overall Garnet Yield 18.3
1.7.1 Comminution
Comprehensive comminution testwork has been undertaken in South Africa to develop a
flowsheet capable of producing a suitable feed for garnet and rutile processing, while
minimising overgrinding.
A three-stage comminution circuit was developed to produce a 550 µm to 212 µm feed for
coarse garnet recovery, and a 212 µm to 45 µm fine feed for rutile and fine garnet
recovery.
A series of different crushing and grinding technologies were evaluated based on:
Mineral liberation (based on QEMSCAN analysis)
Fines (<45 µm) generation

Nordic Mining Prefeasibility Study
30 October 2017 Engebø Rutile and Garnet Project H352410
H352410-00000-280-066-0001, Rev. 0 Page 10
© Hatch 2017 All rights reserved, including all rights relating to the use of this document or its contents.
Theoretical product recoveries
Capital and operational cost
Net Present Value
Technology maturity and viability.
A circuit using an impact crusher in the tertiary crushing stage outperformed other
methods due to better liberation and less fines production and was consequently selected
for the project.
A simplified flowsheet for the selected comminution route is shown in Figure 1-6 below.
Figure 1-6: Simplified Schematic of the Selected Comminution Circuit
As illustrated, a primary jaw crusher is followed by a secondary cone crusher. The tertiary
crushing stage is carried out with impact crushers operating in a closed circuit. Finally, a
rod mill is employed to produce a <550 µm feed for the processing plant. The rod mill was
selected as opposed to a ball mill due to the superior performance in terms of minimising
fines and enhancing liberation of garnet and rutile.
1.7.2 Processing
IHC Robbins has been the main laboratory facility responsible for the process testwork.
Comprehensive testwork programmes have been conducted with industrial scale
equipment and run in 0.5-t to 4.0-t feed batches for testing of different process
configurations. A viable process flowsheet has been developed using conventional and
cost-effective process equipment.
Figure 1-7 below illustrates the developed flowsheet for garnet and rutile production.
Figure 1-7: Simplified Schematic of the Selected Process Flowsheet

Nordic Mining Prefeasibility Study
30 October 2017 Engebø Rutile and Garnet Project H352410
H352410-00000-280-066-0001, Rev. 0 Page 11
© Hatch 2017 All rights reserved, including all rights relating to the use of this document or its contents.
The developed flowsheet has been successful in making both marketable garnet and
rutile products as well as maximising product recoveries.
The processing circuit, following comminution, consists of the following stages:
De-sliming and primary screening to reject fines and to split the de-slimed feed into
two size fractions for processing
The >212 µm fraction reports to the coarse garnet process consisting of a wet gravity
circuit followed by a dry magnetic circuit to recover a high-grade, coarse garnet
product
The rejects from the coarse garnet circuit are milled and combined with the <212 µm
feed from the primary screening
The <212 µm material containing the fine garnet and rutile reports to a wet magnetic
separation circuit to split the feed into magnetic and non-magnetic concentrates
containing the fine garnet and rutile respectively
The magnetic concentrate is further processed through a wet gravity circuit followed
by a dry magnetic circuit to produce a high-grade, fine garnet product
The non-magnetic concentrate reports to a wet gravity circuit followed by a dry
magnetic and electrostatic separation circuit, and finally to a flotation circuit to
produce a high-quality rutile product.
The flowsheet employs tried-and-tested physical separation equipment extensively used in the mineral sands industry.
1.8 Mining
1.8.1 Geotechnical and Hydrogeology
Wardell Armstrong International has performed the geotechnical assessment and pit
slope design for the Engebø open pit. A programme of diamond drilling and logging of
oriented core, as well as geotechnical field mapping of the road tunnel exposure through
the deposit, has been conducted. Recommended inter-ramp angles used for pit
optimisation are between 54°and 67°, with one sector at 47°. Since the open pit is at high
relief there is little risk of water inflows. In addition, hydraulic conductivity was found to be
low with little to no ingress of water into excavations.
SINTEF Building and Infrastructure has undertaken a geotechnical analysis of potential
underground mining methods suitable for Engebø. The rock mass quality was found to be
high and all proposed underground mining methods will be stable. It is recommended to
undertake in-situ stress assessments in the next phase of the underground study.
1.8.2 Mining
Norway is renowned for its hard rock mining, both open pit and underground. From a
mining perspective, the deposit supports a low-cost production operation for the following
reasons:

Nordic Mining Prefeasibility Study
30 October 2017 Engebø Rutile and Garnet Project H352410
H352410-00000-280-066-0001, Rev. 0 Page 12
© Hatch 2017 All rights reserved, including all rights relating to the use of this document or its contents.
The high relief location of the open pit enables the use of a glory hole for open pit
mining. The ore pass (glory hole) will be raise-bored into the pit shell, with a crusher
and silo system developed below the pit. As consequence, ore transport costs are
minimal
An attractive stripping ratio with almost no overburden. The waste is determined by
the cut-off grade with the potential to stockpile low grade ore close to the pit for
processing later
A large resource which is open at depth and to the east and west. This allows for an
easy transition to effective underground bulk mining
The geotechnical setting does not require intensive support and further favours low
operating costs in both open pit and underground mining.
The mining studies undertaken in this phase set out to determine the following:
Plant capacity
Mining cut-off grade
Mining volumes and the balance between open pit and underground
Mine design and scheduling for both open pit and underground.
The optimised business case results in an open pit mine at 1.5 Mtpa for 16 years followed
by underground operations for a further 13 years. Figure 1-8 below shows the open pit
and underground mine design used to derive the mine plan. Only the high-grade ore
(ferro-eclogite) will be processed, with significant upside to the Life of Mine if transitional-
eclogite is processed at a later stage.
Figure 1-8: Open Pit and Underground Mine Design (looking South-East)

Nordic Mining Prefeasibility Study
30 October 2017 Engebø Rutile and Garnet Project H352410
H352410-00000-280-066-0001, Rev. 0 Page 13
© Hatch 2017 All rights reserved, including all rights relating to the use of this document or its contents.
The key metrics for the mining operation are summarised in Table 1-4 below.
Table 1-4: Key Schedule Production Statistics
Activity Units Life of Mine
Open Pit Mining
Production start 2021
Capacity Mtpa 1.5
Life years 16
Waste Mined kt 30,446
Ferro Ore Mined kt 22,616
Strip Ratio tonne waste: tonne ore 1.34
Underground Mining
Production start 2034
Capacity Mtpa 1.5
Life years 13
Waste Mined kt 10,020
Ferro Ore Mined kt 19,432
Feed to Plant *
Ferro Ore Feed to Plant kt 41,896
Ferro Ore Grade – Rutile % 3.46
Ferro Ore Grade – Garnet % 40.45
* Diluted by waste rock: 4% for open pit and 6% for underground
1.8.3 Mining Trade-offs Performed
Mining optimisation started with the aim of determining the plant capacity to select, and
thereafter, decide the best mine design and schedule. The mining optimisation process
was iterative, with information updated as the process testwork and design dictated which
recoveries and flowsheets were possible. A full description of the process is given in
Section 12.3.
The following conclusions were reached as the study progressed through the iterative
process:
1. Pit optimisation resulted in a final pit with very little difference between the different
options. The size of the pit is constrained to the south-east and to the west by the
owner’s boundary (permitting boundary) and all pit shells extend to these boundaries
2. There are minor differences to the north for the different options. Since the north has
mainly low grade leuco-eclogite, the higher cut-offs would exclude some of this ore
3. The final pit depth is determined by the slope angles and the boundaries in the
southerly, easterly and westerly directions. There is no significant difference in pit
depth for the different options

Nordic Mining Prefeasibility Study
30 October 2017 Engebø Rutile and Garnet Project H352410
H352410-00000-280-066-0001, Rev. 0 Page 14
© Hatch 2017 All rights reserved, including all rights relating to the use of this document or its contents.
4. The results of the metallurgical testwork on recovery of coarse garnet will strongly
impact the business case
5. The impact of higher feed grades and recoveries outweighs the effect of a higher
stripping ratio. The business case is improved for higher grade and lower volume
scenarios.
Based on the above, the final pit was selected for design and further scheduling
optimisation. The pit design was performed with input parameters as per Table 1-5 below.
Table 1-5: Key Pit Design Parameters
Parameters Unit Value
Bench height m 15
Berm width m 5
Bench face angle º Varies per pit sector
Ramp grade % 10
Ramp width m 23
Turning clearance diameter m 29
Top bench elevation m 330
Bottom bench elevation m 90
The scheduled was improved by using a two-stage pushback strategy as shown in Figure
1-9 below to defer waste stripping. The waste includes all Inferred material, as well as all
leuco- and transitional-eclogite. This lower grade ore may be stockpiled for potential
future use.
Figure 1-9: Pit Design Pushbacks
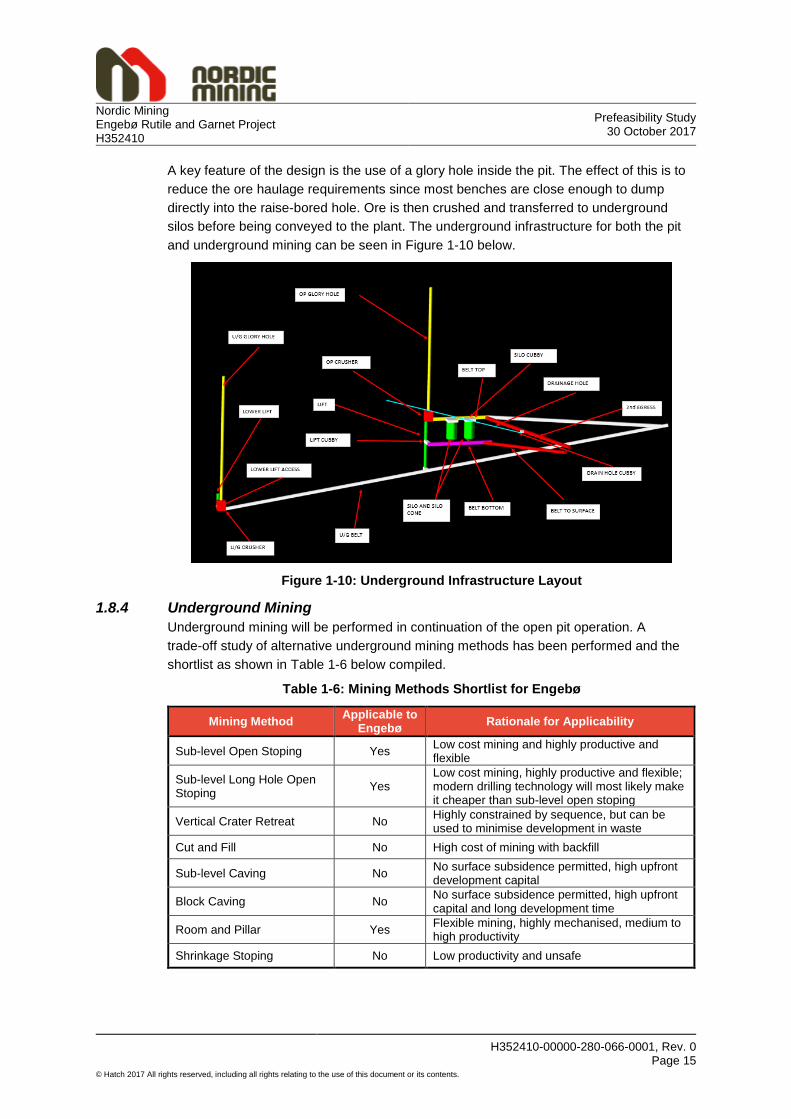
Nordic Mining Prefeasibility Study
30 October 2017 Engebø Rutile and Garnet Project H352410
H352410-00000-280-066-0001, Rev. 0 Page 15
© Hatch 2017 All rights reserved, including all rights relating to the use of this document or its contents.
A key feature of the design is the use of a glory hole inside the pit. The effect of this is to
reduce the ore haulage requirements since most benches are close enough to dump
directly into the raise-bored hole. Ore is then crushed and transferred to underground
silos before being conveyed to the plant. The underground infrastructure for both the pit
and underground mining can be seen in Figure 1-10 below.
Figure 1-10: Underground Infrastructure Layout
1.8.4 Underground Mining
Underground mining will be performed in continuation of the open pit operation. A
trade-off study of alternative underground mining methods has been performed and the
shortlist as shown in Table 1-6 below compiled.
Table 1-6: Mining Methods Shortlist for Engebø
Mining Method Applicable to
Engebø Rationale for Applicability
Sub-level Open Stoping Yes Low cost mining and highly productive and flexible
Sub-level Long Hole Open Stoping
Yes Low cost mining, highly productive and flexible; modern drilling technology will most likely make it cheaper than sub-level open stoping
Vertical Crater Retreat No Highly constrained by sequence, but can be used to minimise development in waste
Cut and Fill No High cost of mining with backfill
Sub-level Caving No No surface subsidence permitted, high upfront development capital
Block Caving No No surface subsidence permitted, high upfront capital and long development time
Room and Pillar Yes Flexible mining, highly mechanised, medium to high productivity
Shrinkage Stoping No Low productivity and unsafe
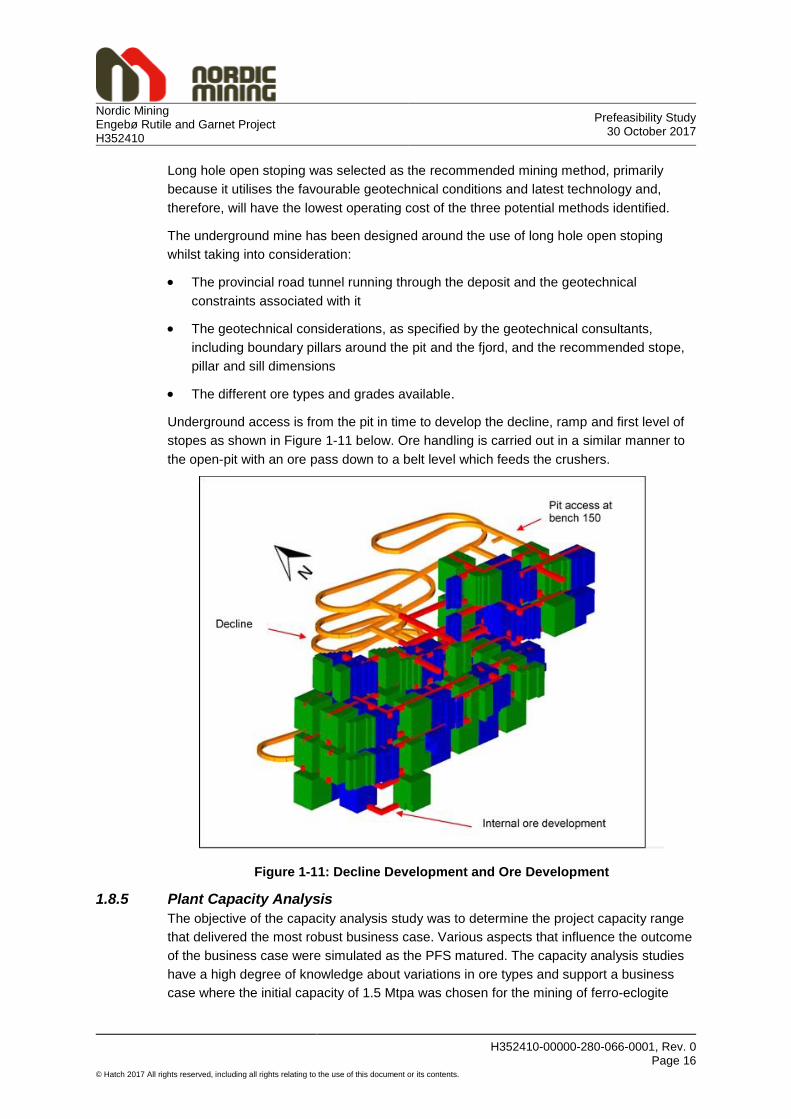
Nordic Mining Prefeasibility Study
30 October 2017 Engebø Rutile and Garnet Project H352410
H352410-00000-280-066-0001, Rev. 0 Page 16
© Hatch 2017 All rights reserved, including all rights relating to the use of this document or its contents.
Long hole open stoping was selected as the recommended mining method, primarily
because it utilises the favourable geotechnical conditions and latest technology and,
therefore, will have the lowest operating cost of the three potential methods identified.
The underground mine has been designed around the use of long hole open stoping
whilst taking into consideration:
The provincial road tunnel running through the deposit and the geotechnical
constraints associated with it
The geotechnical considerations, as specified by the geotechnical consultants,
including boundary pillars around the pit and the fjord, and the recommended stope,
pillar and sill dimensions
The different ore types and grades available.
Underground access is from the pit in time to develop the decline, ramp and first level of
stopes as shown in Figure 1-11 below. Ore handling is carried out in a similar manner to
the open-pit with an ore pass down to a belt level which feeds the crushers.
Figure 1-11: Decline Development and Ore Development
1.8.5 Plant Capacity Analysis
The objective of the capacity analysis study was to determine the project capacity range
that delivered the most robust business case. Various aspects that influence the outcome
of the business case were simulated as the PFS matured. The capacity analysis studies
have a high degree of knowledge about variations in ore types and support a business
case where the initial capacity of 1.5 Mtpa was chosen for the mining of ferro-eclogite

Nordic Mining Prefeasibility Study
30 October 2017 Engebø Rutile and Garnet Project H352410
H352410-00000-280-066-0001, Rev. 0 Page 17
© Hatch 2017 All rights reserved, including all rights relating to the use of this document or its contents.
only. The business case secures a suitable start-up and provides several possibilities for
expansions in capacity and ore types as the project evolves.
A full description of the various processes through to the chosen capacity is given in
Section 12.8.
1.9 Mineral Resource Estimate
In 2008, Nordic Mining assigned the independent Qualified Person, Adam Wheeler to
make an updated resource estimation for the Engebø deposit in accordance with the
guidelines of the JORC Code. The resource estimate was published in a scoping study
and is summarised in Table 1-7 below.
Table 1-7: 2008 Resource Estimate (@ 3% TiO2 Cut-off)
2008 Estimate Tonnes (Mt) TiO2 Grade (%)
Indicated 31.7 3.77
Inferred 122.6 3.75
The mineral resource estimate for Engebø was updated in 2016 by Mr. Wheeler following
completion of a diamond drilling and surface sampling campaign. The estimate
substantially improved and increased the 2008 classification and enabled a qualified
quantification of the garnet. The 2016 resource estimate, as shown in Table 1-8 and
Table 1-9 below, is the basis for the PFS, as well as the Mineral Resource and Ore
Reserve Statements made in this report.
A third party independent review of the mineral resource estimate has been carried out by
SRK Consulting (UK) Limited (SRK) in December 2016. SRK concluded that the mineral
resource estimate did not contain any fatal flaws and that the geological model produced
for use in this PFS was fit for purpose.
Table 1-8: 2016 Mineral Resource Estimate (3% TiO2 Cut-off)
TiO2 Cut-off
Classification Tonnes
(Mt) Total TiO2
(%) Garnet
(%)
3%
Measured 15.0 3.97 44.6
Indicated 77.5 3.87 43.6
Total – Measured and Indicated 92.5 3.89 43.7
Inferred 138.4 3.86 43.5
Table 1-9: 2016 Mineral Resource Statement (2% TiO2 Cut-off)
TiO2
Cut-off Classification
Tonnes (Mt)
Total TiO2 (%) Garnet
(%)
2%
Measured 19.0 3.68 43.9
Indicated 105.7 3.51 43.0
Total – Measured and Indicated 124.7 3.53 43.2
Inferred 254.5 3.22 42.5

Nordic Mining Prefeasibility Study
30 October 2017 Engebø Rutile and Garnet Project H352410
H352410-00000-280-066-0001, Rev. 0 Page 18
© Hatch 2017 All rights reserved, including all rights relating to the use of this document or its contents.
Notes:
Grades presented above are total TiO2
Resource below sea level has been restricted by a boundary no closer than 50 m to
the edge of the fjord
Above Mineral Resources are inclusive of Ore Reserves.
At present, the Ore Reserve is defined with a 3% cut-off. The 2% cut-off includes ferro-
and transitional-eclogite and has been included to facilitate the investigation of mining and
processing options. The transitional-eclogite represents a potential future ore reserve. All
leuco-eclogite (<2% TiO2) has been excluded from the resource.
The resource remains open to the east, west and at depth, with potential to convert
Inferred resources to Measured and Indicated Resources with additional drilling.
The updated resource delineates the garnet at an average grade of 43.7%.
The 2016 drilling and surface sampling campaign focused on the open pit area as
indicated by the red drillholes in Figure 1-12 below, with most of the increases in the
Resource Estimate occurring in the open pit.
The garnet content is 40% to 50% in the ferro-eclogite and transitional-eclogite, and 30%
to 40% in the leuco-eclogite.
Figure 1-12: West-East Long Section of Drillhole Data
1.10 Ore Reserve Estimate
The ore reserve for the mine plan was estimated and qualified by Mr. Wheeler. The Ore
Reserve Statement is presented in Table 1-10 below. The reserve estimation was carried
out using Datamine and DESWIK software.

Nordic Mining Prefeasibility Study
30 October 2017 Engebø Rutile and Garnet Project H352410
H352410-00000-280-066-0001, Rev. 0 Page 19
© Hatch 2017 All rights reserved, including all rights relating to the use of this document or its contents.
Table 1-10: Ore Reserve Statement
Ore Type Proven Reserves Probable Reserves
M Tonnes TiO2
% Garnet
% M Tonnes
TiO2
% Garnet
%
Ferro Ore - Open Pit 8.519 3.87 43.8 13.826 3.54 41.8
Ferro Ore - Underground 1.675 3.49 37.8 17.876 3.21 37.8
Ferro Ore - Total 10.194 3.81 43.4 31.702 3.35 39.5
The basis of conversion of Mineral Resources to Ore Reserves is as follows:
Ore Reserve estimate is as of 30 September 2017
Only Measured and Indicated Resources have been used to determine reserves; all
Inferred Resources within the mineable envelope have been classified as waste
Open pit mining is carried out for the first 16 years; thereafter the mining method is
bulk underground mining (long hole open stoping)
The open pit mine design is based on the recommendations of the geotechnical
consultants for all pit design parameters
The underground mine design is based on recommendations of the geotechnical
consultants, assuming 100 m-long stopes, 45 m wide and 60 m high, with continuous
pillars 20 m wide between stopes and sills 15 m thick above and below the stopes
The garnet grades as reported above were not used to determine the final product
volumes for garnet. Instead, a yield approach was used, which was considered to be
more applicable for determining recoveries of a bulk mineral such as garnet. The
yield approach assumed a yield of 17.5% garnet for ferro ore
A rutile recovery of 58.5% was assumed
A cut-off of 3% on TiO2 has been applied to ferro ore
Ore losses of 5% have been assumed throughout the mine plan
Dilution of 4% for open pit and 6% for underground has been applied with a dilution
grade of 0% for rutile and garnet.
1.11 Infrastructure
The Project’s infrastructure includes open pit mine facilities, a haul road, underground
mine facilities, process plant facilities, tailings disposal facilities and infrastructure (power,
water, gas, access roads and communications).
The open pit mine facilities include a security fence, offices, preparation of the platform for
a heavy vehicle service area and an LDV workshop, a haul road to the waste rock storage
facility, a waste rock facility, agri-soil and subsoil stockpiles, a settling dam and a
domestic and industrial waste site.

Nordic Mining Prefeasibility Study
30 October 2017 Engebø Rutile and Garnet Project H352410
H352410-00000-280-066-0001, Rev. 0 Page 20
© Hatch 2017 All rights reserved, including all rights relating to the use of this document or its contents.
A new haul road will be constructed from the Fv 611 county road up to the open pit. The
haul road will be a new construction, following the route of the existing gravel access road
to the top of Engebø for part of its route.
Underground mine facilities will be built in two phases to support open pit mining from the
start of production and underground mining once the open pit has been mined out. To
support open pit mining, open pit dewatering facilities will be installed and underground
excavations will be built, which include a glory hole plus grizzly arrangement in the pit, a
primary crusher and crusher chamber, a silo and ore reclaim system, top and bottom
access to the silo system, an ore conveyor belt from the silo reclaim system to the plant
site, and a second egress from the top of the silo system to the plant site. For
underground mining, a new ore pass (underground glory hole) and primary crusher
chamber and crusher will be constructed to the east of the main underground mining
areas. The crusher chamber will be connected to the existing silos and reclaim system by
means of an underground conveyor belt system; electrical installations to support
underground mining include switchgear, substations, cabling and transformers.
The process plant site facilities include water storage and process water reticulation
facilities, natural gas storage facilities, compressed air systems, dust and off-gas handling
systems, potable water and sewage treatment plants, fire protection and HVAC (Heating,
Ventilation and Air Conditioning) systems, security fencing around the site, and an
upgrade/rejuvenation of the existing quay. Administration and support buildings to be built
at the process plant site include an administration office building, a process plant control
room building, a change house, ablution and canteen building, a first aid building, and
process plant laboratory and stores buildings.
A sea disposal system for tailings will be installed consisting of a mixing tank, where
seawater is added to tailings, and an outfall line which transports the seawater/tailings
mix via a gravity driven system to the seafloor. Equipment for continuous monitoring of
the discharge system will be a part of the tailings disposal system.
Bulk power for the Project will be supplied by SFE, the regional power supply company.
By upgrading the existing 22 kV grid, a new 22 kV grid line across the fjord and additional
grid reinforcements, SFE will have sufficient grid capacity and reliability for the Project.
The power intake transformers at Engebø will be supplied by SFE.
Bulk water supply for the Project will be purchased from SFE and will be sourced in a
dedicated pipeline from the Skorven power plant, situated at the southern side of the
fjord.
Natural gas for the Project will be supplied by a local gas supplier. An area has been
located on the overall site layout for gas storage tanks and the supplier will transport gas
to site by road regularly.
The main county road (Fv 611) providing access to the Engebø site will be diverted
around the process plant facility.
For communications to site, it is envisaged that at the time of project implementation a 5G
communication link will be available at the Engebø site. Facilities will be installed on site
to ensure effective communications from the incoming 5G connection.

Nordic Mining Prefeasibility Study
30 October 2017 Engebø Rutile and Garnet Project H352410
H352410-00000-280-066-0001, Rev. 0 Page 21
© Hatch 2017 All rights reserved, including all rights relating to the use of this document or its contents.
1.12 Environment and Permitting
Nordic Mining’s overarching principle when operating the Engebø deposit is to adopt a
good citizen approach and demonstrate that it can plan, build and operate Engebø in a
manner that:
Demonstrates environmental responsibility and adheres to the environmental terms of
the permits and approvals requirements
Continuously improves the environmental track record
Commits to a sustainable long-term mining operation that will benefit the community.
1.12.1 Zoning Plan and Discharge Permit
The regulatory setting for the Project is driven by two key legislative requirements for
Nordic Mining to establish a mining and processing operation at Engebø, namely the
discharge permit and the zoning plan (planning permit). Both requirements have been
fully met and the initiative is compliant with Norwegian environmental legislation.
The zoning plan was adopted by the local municipalities in 2011 and finally approved by
the Ministry of Local Government and Modernisation on 17 April 2015. The zoning plan
allows for, and provides guidelines on, the operation of the following activities:
The processing site at Engebø
The extraction of rock mass in open pit production and underground mining
The service area at Engebø
The waste rock disposal site in Engjabødalen
Subsea area, tailings deposition in the Førde Fjord
The works road running between the deposit and the processing plant
The rerouting of county road Fv 611
The rerouting of a 22 KV power line and the stringing of a new cable between the
plant area and the deposit.
A final discharge permit for Engebø was issued on 29 September 2016. The discharge
permit clearly states how the mining operation and the tailings deposition for the Project
should be run and regulates areas such as:
Dust and sound emission
Mining, processing and blasting activity
Tailings deposition
Requirements for monitoring environmental footprints
Requirements for environmental baseline studies.
The regulatory framework ensures that measures are put in place to minimise the
environmental impact.

Nordic Mining Prefeasibility Study
30 October 2017 Engebø Rutile and Garnet Project H352410
H352410-00000-280-066-0001, Rev. 0 Page 22
© Hatch 2017 All rights reserved, including all rights relating to the use of this document or its contents.
1.12.2 Environmental Impact Assessment
To obtain the discharge permit and zoning plan, a comprehensive Environmental Impact
Assessment (EIA) programme with numerous environmental studies has been carried out
between 2008 and 2015. Forty-four environmental and social responsibility
studies/reports have been developed to date over the life of the Project.
A major topic for the EIA was the deposition of tailings. The permitted solution is a sea
disposal system for transporting tailings through a pipeline down to the seafloor of the
Førde Fjord, at a depth of 320 m. The fjord basin is a sedimentation environment confined
by thresholds to the inner part of the fjord and by a glaciation sill to open sea. A 4.4 km2
area of the fjord seafloor has been regulated for tailings deposition.
Detailed baseline studies were carried out to map the biodiversity in the fjord; this
included test fishing, grab sampling and remotely operated vehicle (ROV) investigations.
Currents, salinity, turbidity and temperature were measured in the fjord throughout a
12- month period to document the fjord environment.
The main conclusions regarding the fjord disposal solution from the EIA studies were:
The tailings will sediment within the area regulated for disposal, which comprises 5%
of the total fjord area
The currents in the tailings area are moderate and there is limited risk of erosion
currents that could potentially transport tailings outside the regulated area
Limited effects are expected outside the regulated area and in the water column
above the tailings outlet
The tailings are benign, meaning they consist of non-harmful naturally occurring
minerals with negligible contents of heavy metals
The chemical additives that follow the tailings from flotation and thickening are
biodegradable and in non-harmful concentrations
The tailings consist of mainly sand and silt fractions and a little from the clay fraction;
they are somewhat coarser than the sediments constituting the fjord bottom today
The baseline studies showed that the fjord habitat has biodiversity that is typical for
western Norwegian fjords
There are no corals found in the tailings area
The tailings deposits pose little threat to cod which have their breeding grounds in
shallow fjord areas
The tailings solution poses little threat to endangered fish that dwell in the fjord
The tailings will affect bottom living organisms within the regulated area where the
sedimentation rate is high. Mobile species such as fish will avoid areas with high
turbidity

Nordic Mining Prefeasibility Study
30 October 2017 Engebø Rutile and Garnet Project H352410
H352410-00000-280-066-0001, Rev. 0 Page 23
© Hatch 2017 All rights reserved, including all rights relating to the use of this document or its contents.
The tailings will likely be recolonised within a few years after the tailings deposition
ends. The biodiversity is expected to return to as good a state as it was before the
depositing took place
The fjord has no commercial fishing, but some recreational fishing. The tailings will
not affect recreational fishing in the fjord
The tailings will not affect fish farms that are operated in the fjord.
Norway has long-term experience with sea disposal of tailings. Currently there are five
active tailings deposits in Norway and two (including Engebø) have recently been
permitted. Experience with fjord deposition in Norway is, for the most part, positive.
Advanced systems for continuous monitoring exist and there are established best practise
guidelines for tailings deposition to limit the environmental footprint.
1.12.3 Socio-economic Studies
The social consequences of the planned mining activities have been assessed as part of
the EIA. The EIA concludes that the Project will have positive effects on the local
settlements as well as the local business community. The location of the Project, close to
the cities of Førde and Florø, makes it attractive for the recruitment of local labour. Based
on assumptions regarding local settlement for future employees, the study concludes that
that the Project will have significant positive consequence for the economy of the
Naustdal municipality.
It is expected that the regional contributions to the capital investments may represent up
to 17%. It is estimated that during operation the local region will represent approximately
17% of regular supply and services, based on statistics from other mining industries in
Norway. The direct and indirect employments from the Project are estimated to be
approximately 110 direct employees with an indirect employment factor of 2.9. The
Project is, therefore, likely to generate approximately 320 jobs in total, of which 60 to 90
will be indirect employees in the local region. Due to historic imbalances in the local
labour market, relocation and commuting of the workforce has been a significant factor in
the local region. The study indicates that the Project will have a positive impact on local
settlement and the commuting trend.
1.12.4 Other Permits Required
Nordic Mining will need to apply to the Directorate of Mining for an operating license upon
commencement of operations.
1.13 Capital Cost Estimate
The capital estimate to establish the open pit mining operation and the process plant is
US$ 207 M, as summarised in Table 1-11 below.

Nordic Mining Prefeasibility Study
30 October 2017 Engebø Rutile and Garnet Project H352410
H352410-00000-280-066-0001, Rev. 0 Page 24
© Hatch 2017 All rights reserved, including all rights relating to the use of this document or its contents.
Table 1-11: Capital Estimate
Capital Estimate US$ M
Open Pit Mining 10.027
Comminution 16.802
Mineral Processing 61.573
Tailings Handling and Disposal 7.045
Product Storage and Loadout Facilities 13.108
Infrastructure 22.565
Indirects (excluding contingency) 41.862
Contingency 34.194
Total 207.176
The estimated cost of establishing the underground mine after 15 years of open pit
operation is US$ 17 M (in current money terms), as summarised in Table 1-12 below.
Table 1-12: Deferred Capital Estimate for Underground Mining
Deferred Capital Estimate – Underground Mining US$ M
Underground Mining 7.833
Comminution 2.970
Indirects (excluding contingency) 2.747
Contingency 3.381
Total 16.931
The contingency allowances in the above capital estimates has been calculated by
means of a quantitative risk analysis (QRA) to determine the Project’s capital risk profile.
Contingency at an 80% confidence level has been allowed for, equating to 19.8% of the
initial project capital cost.
The above estimates exclude taxes (general sales tax, fringe benefits tax, sales tax, and
any government levies and taxes), working capital, sustaining capital and Stay in
Business (SIB) capital.
1.14 Operating Cost Estimate
The operating cost estimate developed from the production schedule is summarised in
Table 1-13 below. The total average operating cost over the Life of Mine is US$
16.28/RoM t and US$ 86.92/product t (rutile and garnet combined, Free on Board).
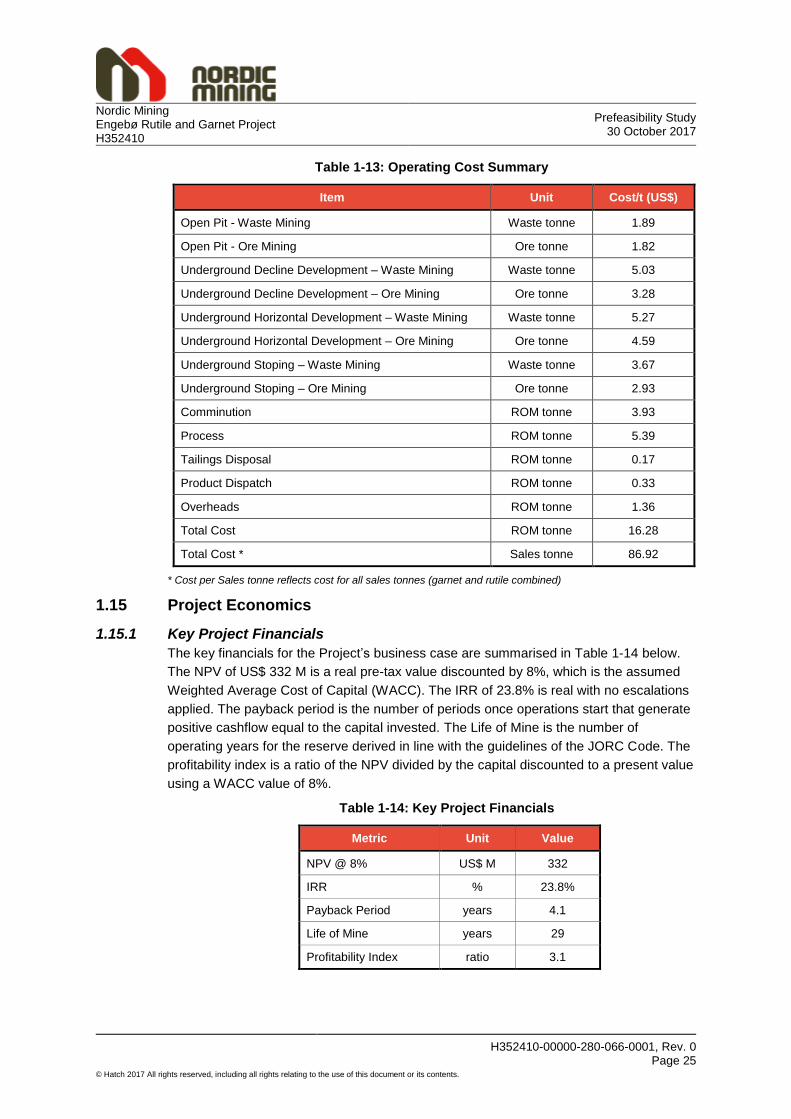
Nordic Mining Prefeasibility Study
30 October 2017 Engebø Rutile and Garnet Project H352410
H352410-00000-280-066-0001, Rev. 0 Page 25
© Hatch 2017 All rights reserved, including all rights relating to the use of this document or its contents.
Table 1-13: Operating Cost Summary
Item Unit Cost/t (US$)
Open Pit - Waste Mining Waste tonne 1.89
Open Pit - Ore Mining Ore tonne 1.82
Underground Decline Development – Waste Mining Waste tonne 5.03
Underground Decline Development – Ore Mining Ore tonne 3.28
Underground Horizontal Development – Waste Mining Waste tonne 5.27
Underground Horizontal Development – Ore Mining Ore tonne 4.59
Underground Stoping – Waste Mining Waste tonne 3.67
Underground Stoping – Ore Mining Ore tonne 2.93
Comminution ROM tonne 3.93
Process ROM tonne 5.39
Tailings Disposal ROM tonne 0.17
Product Dispatch ROM tonne 0.33
Overheads ROM tonne 1.36
Total Cost ROM tonne 16.28
Total Cost * Sales tonne 86.92
* Cost per Sales tonne reflects cost for all sales tonnes (garnet and rutile combined)
1.15 Project Economics
1.15.1 Key Project Financials
The key financials for the Project’s business case are summarised in Table 1-14 below.
The NPV of US$ 332 M is a real pre-tax value discounted by 8%, which is the assumed
Weighted Average Cost of Capital (WACC). The IRR of 23.8% is real with no escalations
applied. The payback period is the number of periods once operations start that generate
positive cashflow equal to the capital invested. The Life of Mine is the number of
operating years for the reserve derived in line with the guidelines of the JORC Code. The
profitability index is a ratio of the NPV divided by the capital discounted to a present value
using a WACC value of 8%.
Table 1-14: Key Project Financials
Metric Unit Value
NPV @ 8% US$ M 332
IRR % 23.8%
Payback Period years 4.1
Life of Mine years 29
Profitability Index ratio 3.1

Nordic Mining Prefeasibility Study
30 October 2017 Engebø Rutile and Garnet Project H352410
H352410-00000-280-066-0001, Rev. 0 Page 26
© Hatch 2017 All rights reserved, including all rights relating to the use of this document or its contents.
The post-tax key financials have been calculated using a post-tax WACC of 6.8%. A post-
tax NPV of US$ 305 M and an IRR of 20.8% are estimated assuming a 60% debt
financing of the Project and general implementation of accounting standards for
depreciation and tax calculation.
There are upside potentials in the business case related to, inter alia:
Expanding the Run of Mine throughput to enable increased product sales
Extending the Life of Mine through increased ore reserves from Inferred Resources
Selling surplus garnet produced in the first years of production.
The above initiatives may offer a 40% improvement in the NPV8 up to US$ 465 M.
In addition to the ferro-eclogite which is basis for the Project, the Engebø deposit also
contains lower grade eclogite. Possible utilisation of the trans-eclogite may offer flexibility
and potential upside to the Life of Mine which possibly could be investigated at a later
stage.
1.15.2 Sensitivity
Figure 1-13 below illustrates that the NPV is positively correlated to rutile revenue and
garnet revenue, and negatively to CAPEX and OPEX. Garnet revenue has a larger
influence than rutile. OPEX has a slightly larger influence on NPV than CAPEX.
Figure 1-13: NPV Sensitivity
1.16 Markets
1.16.1 Rutile
The key minerals mined to supply titanium raw materials are ilmenite and rutile; Engebø
plans to produce rutile. The global TiO2 pigment market accounts for approximately 90%
of all titanium feedstock demand, and is, therefore, the dominant driver of offtake.
-
100
200
300
400
500
600
-50% -40% -30% -20% -10% 0% 10% 20% 30% 40% 50%
NP
V @
8%
(U
S $
)
Mill
ions
Capex Opex Rutile Revenue Garnet Revenue

Nordic Mining Prefeasibility Study
30 October 2017 Engebø Rutile and Garnet Project H352410
H352410-00000-280-066-0001, Rev. 0 Page 27
© Hatch 2017 All rights reserved, including all rights relating to the use of this document or its contents.
TZMI, a leading global technical and marketing consultant, considers that the longer-term
outlook for rutile production indicates that a significant supply deficit will develop if no new
projects are commissioned. The global supply of rutile is set to decline considerably
during the period 2017 to 2025, with output in 2025 expected to be 50% lower than 2016
levels.
Prices of rutile shipments into western markets are generally in the range US$ 750/t to
US$ 850/t FOB at the current time (second half of 2017). In the longer term, TZMI
expects prices to trend towards the inducement price level (US$ 1,070/t real 2016 dollars)
by 2020/2021, along with other high-grade chloride feedstocks, to ensure there is
sufficient new supply being induced to meet demand growth.
TZMI has used the preliminary product specifications generated during the PFS testwork
campaign as a basis for assessing the Engebø rutile product quality. The preliminary
quality of the rutile compares favourably to most other competing products. Based on
product quality and particle size distribution, the Engebø rutile is considered being a
suitable feedstock for chloride pigment and titanium metal applications.
Global demand for rutile for pigment and titanium metal end-use is estimated to reach
540 k TiO2 units by 2020 and 710 k TiO2 units by 2025. TZMI’s current forecast indicates
that supply deficit of the global rutile market could reach more than 250 k TiO2 units by
2020 and 600 k TiO2 units by 2025. As such, the planned output of approximately 30 ktpa
from Engebø should easily be absorbed by the market by the time the Project comes on
stream.
From a pricing perspective, TZMI estimates that the planned rutile product should be able
to achieve the long-term price of a standard rutile (US$ 1,070/t FOB real 2016 dollars) if
targeted at chloride pigment or as a feed for titanium sponge manufacture. US$ 1,070/t
FOB has been used as the basis for financial evaluation in this study.
From a rutile revenue-to-cash-cost perspective, a primary measure of competitiveness
used by TZMI for individual operations in the industry, the Project is positioned in the first
quartile, which indicates a robust cost position.
1.16.2 Garnet
The primary markets for garnet are in abrasive blasting and waterjet cutting, although for
some coarse grades there is also a market in water filtration. There is also a market in
abrasion resistant materials such as in flooring, but this market is primarily restricted to
China at the current time.
Whilst titanium feedstock production including rutile has developed in line with global
economic growth ore many decades, garnet production has primarily developed over the
last 20 to 25 years. The current world production of garnet is estimated at 1.4 Mtpa; India
is the largest producer (estimated production is 450 ktpa to 500 ktpa); with Australia being
the next largest producer at an estimated 280 ktpa production level. China is the third
significant producer at an estimated 200 ktpa to 300 ktpa output. In line with the country
production statistics, India and Australia are the primary exporters to world markets at
estimated levels of 478 ktpa and 293 ktpa respectively.

Nordic Mining Prefeasibility Study
30 October 2017 Engebø Rutile and Garnet Project H352410
H352410-00000-280-066-0001, Rev. 0 Page 28
© Hatch 2017 All rights reserved, including all rights relating to the use of this document or its contents.
Logistics is an important element of garnet marketing, with deliveries often expected
within a few days of order. In this regard Engebø is very well placed with its direct access
to the North Sea and, thereafter, major European waterways, resulting in lower transport
costs and reduced time to market relative to the key global producers in India, Australia
and China.
The three garnet products which Engebø will target are 80 mesh waterjet, 100 mesh
waterjet and 30/60 mesh blast market. Whilst there are no terminal markets for garnet
and no reliable published prices for products, average price trends show a clear uptrend
from 2008 onwards. Shortages of supply from India at the current time continue to
support higher prices, and TAK expects garnet prices in Europe going forward to average
US$ 275/t to US$ 300/t on a CIF (Cost, Insurance and Freight basis) for an 80 or a 100
Mesh material range and US$ 300/t to US$ 320/t for 30/60 mesh grades. For the
purposes of financial evaluation in this study, an FOB garnet basket price of US$ 250/t
has been assumed. This number is in line with expected export prices as shown above,
but assumes that some recovery in the growth rates of global economies will occur. The
US$ 250/t price is based on an average price for the three products which Engebø is
expected to produce in approximately equal volumes.
Nordic Mining has signed a Memorandum of Understanding with a leading, international
producer of industrial minerals. The parties intend to establish long-term cooperation
within development, production, sales, marketing and distribution of garnet products from
Engebø. This may include an off-take agreement, joint marketing, and sales and
distribution arrangements for garnet products to the international markets.
1.17 Project Schedule
A high-level Definitive Feasibility Study (DFS) schedule has been developed based on
start in November 2017 with a duration of approximately 12 months. Thereafter, it is likely
that the Project will proceed directly into a FEED (Front End Engineering Design) phase,
where critical path engineering and procurement work will be continued to expedite the
start of construction.
Once the DFS has been completed in Q4 2018, the following preliminary and indicative
milestones apply:
Start of FEED – Q4 2018
Completion of FEED – Q2 2019
Start of construction – Q2 2019
End of construction – Q2 2021
Start of commissioning and production ramp-up – Q2 2021
End of commissioning – Q3 2021
End of production ramp-up – Q4 2021.

Nordic Mining Prefeasibility Study
30 October 2017 Engebø Rutile and Garnet Project H352410
H352410-00000-280-066-0001, Rev. 0 Page 29
© Hatch 2017 All rights reserved, including all rights relating to the use of this document or its contents.
2. Introduction
2.1 Terms of Reference and Purpose of the Report
Nordic Mining commissioned Hatch Africa (Proprietary) Limited (Hatch) to prepare a
Technical Report which corresponds to the guidelines of the ‘Australasian Code for
Reporting of Exploration Results, Mineral Resources and Ore Reserves’ (The JORC
Code 2012 Edition) for a Prefeasibility Study (PFS) of the Engebø Rutile and Garnet
Project (the Project) located near Førde, Norway.
This report provides Mineral Resource and Ore Reserve estimates using a classification
of resources and reserves in accordance with the JORC Code 2012 Edition.
2.2 Qualifications of Consultants and Project Team
The information in this report that relates to Mineral Resources and Ore Reserves is
based on information compiled by Mr. Adam Wheeler, who is an independent mining
consultant. Mr. Wheeler is a Fellow of the Institute of Material, Minerals and Mining and
has adequate experience, which is relevant to the style of mineralisation and type of
deposit under consideration, and to the activity he is undertaking, to qualify as a
Competent Person in terms of the JORC Code 2012 Edition. Mr. Wheeler consents to the
inclusion of such information in this report in the form and context in which it appears.
2.3 Sources of Information
The persons and companies that have delivered information and results for the PFS are
set out in Table 2-1 below.
Table 2-1: Sources of Information
Competent Person
Independent of Owner
Company Primary Area of Information Relevant Sections
No Nordic Mining in Oslo, Norway
Executive Summary Section 1
Property Description Section 3
History Section 4
Land/Mineral Tenure and Licences
Section 5
Geology Section 6
Drilling, Sampling and Ore Characterisation
Section 7
Mining Geotechnical Section 9
Hydrogeology, Hydrology and Geochemistry
Section 10
Market Information Section 17
Environment and Social Responsibility
Section 19
Yes Hatch in Johannesburg, South Africa
Introduction Section 2
Mineral Processing Section 11
Mining Section 12
Project Infrastructure Section 14

Nordic Mining Prefeasibility Study
30 October 2017 Engebø Rutile and Garnet Project H352410
H352410-00000-280-066-0001, Rev. 0 Page 30
© Hatch 2017 All rights reserved, including all rights relating to the use of this document or its contents.
Competent Person
Independent of Owner
Company Primary Area of Information Relevant Sections
General Infrastructure Section 15
Engineering Design Section 16
Health and Safety Section 18
Human Resources Section 20
Capital Cost Estimate Section 21
Operating Cost Estimate Section 22
Financial Analysis Section 23
Feasibility Study Planning Section 24
Execution Planning Section 25
Risks and Opportunities Section 26
Value Improving Practices Section 20
Mr. A Wheeler
Yes Independent Consultant in Redruth, Cornwall, UK
Mineral Resource Estimate Section 8
Mining Section 12
Ore Reserve Estimate Section 13
Yes Kvale Advokatfirma in Oslo, Norway
Land/Mineral Tenure and Licences
Section 5
Yes Wardell Armstrong International (WAI) in Truro, Cornwall, UK
Mining Geotechnical (Open Pit Mine Design)
Section 9
Yes SINTEF in Trondheim, Norway
Mining Geotechnical (Underground Mine Design)
Section 9
Hydrogeology Section 10
Yes IHC Robbins in Brisbane, Australia
Metallurgical testwork programmes and results
Section 11
Yes Mintek in Johannesburg, South Africa
Comminution testwork and results
Section 11
Yes JKTech in Brisbane, Australia
Metallurgical testwork programmes and results
Section 11
Yes Core in Brisbane, Australia
Metallurgical testwork programmes and results
Section 11
Yes Mineral Technologies, Carrara, Australia
Metallurgical testwork programmes and results
Section 11
Yes SGS in Vancouver, Canada
QEMSCAN analytical results Section 11

Nordic Mining Prefeasibility Study
30 October 2017 Engebø Rutile and Garnet Project H352410
H352410-00000-280-066-0001, Rev. 0 Page 31
© Hatch 2017 All rights reserved, including all rights relating to the use of this document or its contents.
Competent Person
Independent of Owner
Company Primary Area of Information Relevant Sections
Yes SGS in Johannesburg, South Africa
Comminution testwork and results
Section 11
Yes IMS in Johannesburg, South Africa
Metallurgical testwork programmes and results
Section 11
Yes COWI in Fredrikstad, Norway
Tailings disposal Section 14
Yes DNV GL in Oslo, Norway
Monitoring of subsea tailings disposal
Section 22
Yes TAK Industrial Mineral Consultancy in Gerrards Cross, United Kingdom
Garnet market information Section 17
Yes TZMI in Perth, Australia
Rutile market information Section 17
Yes Asplan Viak in Sandvika, Norway
General permitting Section 5
County road re-alignment Section 14
Process water supply Section 15
2.4 Reliance on Other Experts
This report is intended to be read as a whole, and sections should not be read or relied
upon out of context, and any person using or relying upon this report agrees to be
specifically bound by the terms of this Disclaimer and Limitations of Use. This report
contains the expression of the professional opinions of Hatch, based upon information
available at the time of preparation.
The report must be read in light of:
The limited readership and purposes for which it was intended
Its reliance upon information provided to Hatch by the Client and others which has not
been verified by Hatch and over which it has no control
The limitations and assumptions referred to throughout the report
The cost and other constraints imposed on the report
Other relevant issues which are not within the scope of the report.
2.5 Effective Date
The effective date of this report is 30 October 2017.
2.6 Units of Measure
The metric system has been used throughout this report. Tonnes are metric of 1,000
kilograms (kg), or 2,204.6 lb. All currency is in U.S. dollars (US$) unless otherwise stated.

Nordic Mining Prefeasibility Study
30 October 2017 Engebø Rutile and Garnet Project H352410
H352410-00000-280-066-0001, Rev. 0 Page 32
© Hatch 2017 All rights reserved, including all rights relating to the use of this document or its contents.
2.7 Glossary
2.7.1 Rutile (TiO2)
Rutile is composed essentially of crystalline titanium dioxide and, in its pure state, would
contain close to 100% TiO2. Naturally occurring rutile exhibits minor impurities and
commercial concentrates of the mineral typically contain 94% to 96% TiO2. Throughout
this report the term rutile is used interchangeably with TiO2.
2.7.2 Mineral Resources and Ore Reserves
As noted, the Mineral Resources and Ore Reserves have been classified according to the
“Australasian Code for Reporting of Exploration Results, Mineral Resources and Ore
Reserves” (JORC Code 2012 Edition). Mineral Resources have been classified as
Measured, Indicated or Inferred in line with the guidelines of the JORC Code; Ore
Reserves have been classified as Proven and Probable in line with the guidelines of the
JORC Code.
2.7.3 Permits and Legislation
Throughout this report:
Extraction permits means the right to extract and utilise deposits of minerals within
certain limits as described in section 32 of the Norwegian Minerals Act
Norwegian Minerals Act means Act of 19 June 2009 No. 101 relating to the
acquisition and extraction of minerals resources.
2.8 Abbreviations
The following abbreviations have been used in this report:
Table 2-2: Abbreviations
Abbreviation Unit or Term
3D three-dimensional
AACEI Association for the Advancement of Cost Engineering - International
AI Abrasion Index
amsl above mean sea level
BBWI Bond Ball Work Index
BRWI Bond Rod Work Index
°C degrees Centigrade
Ca calcium
CAGR Compound Annual Growth rate
CAPEX Capital Expenditure
CIF Cost, Insurance and Freight
cm centimetre
cm3 cubic centimetre
CP Competent Person

Nordic Mining Prefeasibility Study
30 October 2017 Engebø Rutile and Garnet Project H352410
H352410-00000-280-066-0001, Rev. 0 Page 33
© Hatch 2017 All rights reserved, including all rights relating to the use of this document or its contents.
Abbreviation Unit or Term
CPI Consumer Price Inflation
CWI Crushability Work Index
DFS Definitive Feasibility Study
DTM digital terrain model
° degree (degrees)
dia. diameter
EBITDA Earnings Before Interest, Tax, Depreciation and Amortisation
EIA Environmental Impact Assessment
FOB Free on Board
FS Feasibility Study
g gram
GDP Gross Domestic Product
GNT garnet
g/cm3 grams per cubic centimetre
GSI Geological Strength Index
g/t gram per tonne
ha hectare
HCl hydrochloric acid
hp horsepower
HPGR High Pressure Grinding Roller
HTR High Tension Roll
Ilm Ilmenite
IRR Internal Rate of Return
JORC Australasian Joint Ore Reserves Committee
kA kilo Amperes
kbar Kilobar
kg kilograms
kg/m3 kilogram per cubic metre
km kilometre
km2 square kilometre
kr Norwegian Krone or Swedish Krone
kt thousand tonnes
kV kiloVolt
kW kiloWatt
kWh kiloWatt-hour

Nordic Mining Prefeasibility Study
30 October 2017 Engebø Rutile and Garnet Project H352410
H352410-00000-280-066-0001, Rev. 0 Page 34
© Hatch 2017 All rights reserved, including all rights relating to the use of this document or its contents.
Abbreviation Unit or Term
kWh/t kiloWatt-hour per metric tonne
l litre
l/s litre per second
lb pound
LHD Long-Haul Dump truck
LiDAR Light detection and ranging
LoM Life of Mine
m metre
m/s metre per second
m2 square metre
m3 cubic metre
m3/s cubic metre per second
masl metre above sea level
Mg magnesium
ml millilitre
mm millimetre
mm2 square millimetre
mm3 cubic millimetre
Mn manganese
MoU Memorandum of understanding
Mt Million tonnes
Mtpa Million tonnes per annum
MVAr Mega Volt Amps reactive
MW Million Watts
n/a not applicable
n/d not detected
NPV Net Present Value
NTNU Norwegian University of Science and Technology
OPEX Operating Expenditure
% percent
PEP project execution plan
PFS Prefeasibility Study
PPI Producer Price Inflation
ppm parts per million
PSD particle size distribution

Nordic Mining Prefeasibility Study
30 October 2017 Engebø Rutile and Garnet Project H352410
H352410-00000-280-066-0001, Rev. 0 Page 35
© Hatch 2017 All rights reserved, including all rights relating to the use of this document or its contents.
Abbreviation Unit or Term
QA/QC Quality Assurance/Quality Control
QEMSCAN Quantitative Evaluation of Materials by Scanning
QXRD Quantitative X-ray Diffraction
RED Rare Earth Drum
RER Rare Earth Roll
RoM Run of Mine
rpm revolutions per minute
RQD Rock Quality Description
RMB Renminbi (Chinese Yuan)
s second
SG Specific Gravity
SMC SAG Mill Comminution
Sn Tin
t tonne (metric tonne) (2,204.6 pounds)
Th thorium
Ti titanium
TiO2 titanium dioxide
tph tonnes per hour
tpd tonnes per day
t/m3 tonnes per cubic metre
U Uranium
UCC Up-current Classifier
UCS Uniaxial Compression Strength
UoM Unit of Measure
µm micron or microns
US$ U.S. Dollar
UTM Universal Transverse Mercator
V Volts
VDM Value Distribution Model
VSI Vertical Shaft Impactor
W Watt
WAI Wardell Armstrong International
WBS Work Breakdown Structure
WHIMS Wet High Intensity Magnetic Separator
wt Weight

Nordic Mining Prefeasibility Study
30 October 2017 Engebø Rutile and Garnet Project H352410
H352410-00000-280-066-0001, Rev. 0 Page 36
© Hatch 2017 All rights reserved, including all rights relating to the use of this document or its contents.
Abbreviation Unit or Term
XRD X-ray Diffraction
XRF X-ray Fluorescence
y year

Nordic Mining Prefeasibility Study
30 October 2017 Engebø Rutile and Garnet Project H352410
H352410-00000-280-066-0001, Rev. 0 Page 37
© Hatch 2017 All rights reserved, including all rights relating to the use of this document or its contents.
3. Property Description
3.1 Property Location
The Engebø deposit is found within the Engebø hill, a ridge that runs parallel with the
Førde Fjord. The site is located close to the town of Førde in western Norway, with
navigable access to the North Sea. Engebø is on the northern side of the Førde Fjord in
the Naustdal municipality, in the Sogn og Fjordane county. Its grid reference position is
310,200m E, 6,822,750m N, on the EU89-UTM zone 32 system. Its latitude is 61° 29’ 35’’
N with longitude 5° 25’ 44’’ E.
The Fv 611 county road, a single lane tarmac road, runs along the south side of the
deposit (on the north side of the fjord) before entering a 630 m long tunnel which runs
through the deposit.
The location of the Naustdal municipality near the south-western coast of Norway is
shown in Figure 3-1 below.
Figure 3-1: Location of Naustdal Municipality (circled) in western Norway
The site location in Naustdal Municipality is shown in more detail in Figure 3-2 below.

Nordic Mining Prefeasibility Study
30 October 2017 Engebø Rutile and Garnet Project H352410
H352410-00000-280-066-0001, Rev. 0 Page 38
© Hatch 2017 All rights reserved, including all rights relating to the use of this document or its contents.
Figure 3-2: Engebø Site (circled) in Naustdal Municipality
An aerial view of Engebø is shown in Figure 3-3 below.
Figure 3-3: Aerial View of Engebø Ridge looking West
3.2 Topography and Elevation
Engebø is the local name of a small hill which varies in elevation from sea level to
335 masl. On the south side, the hill dips steeply into the Førde Fjord, with more gentle
slopes on the northern, eastern and western sides.

Nordic Mining Prefeasibility Study
30 October 2017 Engebø Rutile and Garnet Project H352410
H352410-00000-280-066-0001, Rev. 0 Page 39
© Hatch 2017 All rights reserved, including all rights relating to the use of this document or its contents.
3.3 Climate
The climate at Engebø is characterised by long, warm days in summer and colder, darker
and shorter days in winter. Snow is common in winter but proximity to the sea and
relatively low altitude result in no permanent snow accumulation and there is no time of
the year when operations are not possible. Over 2,000 mm of rain falls each year, through
all four seasons. The fjord is permanently ice-free.
3.4 Accessibility and Infrastructure
The town of Førde (with a population of about 10,000 people), in Førde municipality, is
located about 30 km east of Engebø, at the inner most part of the Førde Fjord. Førde has
two regional airports nearby. It can also be reached by bus from Oslo, Bergen and
Trondheim. West of Førde is the municipality centre of Naustdal, in Naustdal municipality.
Naustdal municipality has a population of about 2,500 people. On the eastern part of the
Engebø deposit is a closed quarry and harbour facilities constructed for shiploading of
armours stone from the quarry, which still exist. The harbour facility is designed for
vessels with a capacity of up to 80 kt and provides direct access to the North Sea and
European ports.
Currently there is a small access/haul road from the Fv 611 county road to the top of the
Engebø ridge. It is planned to upgrade this road to provide access to the mining area.
Small rivers and streams drain down to the sea at both the east and west end of Engebø,
but the most likely source of fresh water for the process plant is a dam next to a
hydroelectric power plant on the south side of the Førde Fjord. Process water will be
transported to site via a dedicated pipeline across the fjord.
Electricity for the operations will be sourced from a connection to either the 22 kV grid that passes across the site, or a 132 kV national grid power line approximately four km from the site.

Nordic Mining Prefeasibility Study
30 October 2017 Engebø Rutile and Garnet Project H352410
H352410-00000-280-066-0001, Rev. 0 Page 40
© Hatch 2017 All rights reserved, including all rights relating to the use of this document or its contents.
4. History
4.1 Prior and Current Ownership
The Engebø deposit was first recognised as a rutile deposit in the 1970s, after
development of a local road tunnel. A small-scale quarrying operation was started in 1998
to produce armour stone from the western part of the deposit, due to the high density of
the rock. The company Fjord Blokk built a deep-water quay and ran the operation until
1999.
The deposit was not systematically explored before the 1990s when DuPont, a major
global titanium pigment producer, made claims for exploration of rutile in the deposit.
DuPont initiated several exploration and beneficiation programs related to the Engebø
deposit. In 1998, DuPont placed its interests in Engebø in the subsidiary Conoco (later
ConocoPhillips). As a fossil energy focused Company, Conoco did not invest in any
further exploration of the Engebø deposit. In September 2006, Nordic Mining acquired the
claims from ConocoPhillips. Since 2011 the claims have been held by Nordic Mining’s
wholly owned subsidiary Nordic Rutile AS. The Norwegian Directorate of Mining granted
Nordic Mining an extension of the extraction permits which are now valid until 2027.
4.2 Historic Development of the Project
DuPont carried out comprehensive drilling and sampling programmes that lasted between
1995 and 1998. The work was done in close cooperation with the Norwegian Geological
Survey (NGU). A resource estimate was made based on the exploration results. The
estimate showed 382 Mt of ore at an average grade of 3.96% TiO2 for a cut-off at 3%. A
range of comminution (crushing and grinding) tests were carried out by DuPont. The test
work came short of systematically determining a recovery for rutile. A recovery of 47%
was indicated and pigment grade rutile concentrates were achieved. At the time, little
emphasis was put on recovering garnet.
In 2008 Nordic Mining assigned an independent Qualified Person, Mr. Wheeler, to make
an updated resource estimation for the Engebø deposit in line with the guidelines of the
JORC Code. The estimation was a more conservative approach than the earlier estimate
made by DuPont. The resource estimate was published in a scoping study made by Mr.
Wheeler together with independent Mining Engineer Mr. Dowdell.
Nordic Mining’s strategy for the first years was to secure permits for the mining operation
and for safe disposal of tailings. Comprehensive environmental impact assessment
studies were carried out between 2008 and 2015. In 2015 an industrial area plan (zoning
plan) and a discharge permit for the Engebø Project were approved. The permits are final
with no possibility for appeals.
In early 2016, Nordic Mining started a significant drilling campaign to improve the
resource classification and to quantify the garnet content of the deposit. Based on the
results, Mr. Wheeler made an updated resource estimate. The estimate substantially
improved and increased the 2008 classification and enabled a qualified quantification of
the garnet. The 2016 resource estimate is the basis for the Prefeasibility Study and the
resource and reserves statements made in this report. The 2008 and 2016 resource
estimates are shown in Table 4-1 below.

Nordic Mining Prefeasibility Study
30 October 2017 Engebø Rutile and Garnet Project H352410
H352410-00000-280-066-0001, Rev. 0 Page 41
© Hatch 2017 All rights reserved, including all rights relating to the use of this document or its contents.
Table 4-1: 2008 and the 2016 Resource Estimates (@ 3% TiO2 Cut-off)
2008 Estimate Tons (Mt) TiO2 Grade (%) Garnet Grade (%)
Indicated 31.7 3.77 -
Inferred 122.6 3.75 -
2016 Estimate Tons (Mt) TiO2 Grade (%) Garnet Grade (%)
Measured 15.0 3.97 44.6
Indicated 77.5 3.87 43.6
Inferred 138.4 3.86 43.5
Notes:
Grades presented above are total TiO2
Resource below sea level has been restricted by a boundary no closer than 50 m to
the edge of the fjord
Above Mineral Resources are inclusive of Ore Reserves.
A brief outline of the history of the Engebø deposit is as follows:
1970s and mid-1980s - Engebø was recognised as a rutile deposit by Elkem. Elkem
and the Geological Survey of Norway (NGU) collaborated on additional sampling on
various rutile-bearing eclogites in the area
1989 - DuPont and NGU started an evaluation of Norwegian rutile projects, aimed at
deposits suitable for DuPont’s chlorination process pigment plants. Engebø was
identified as the most favourable project
1995 to 1997 - DuPont and the local company Fjord Blokk undertook a joint sampling
and mapping exercise, with additional core drilling and beneficiation testing. NGU
was involved as an external consultant. More than 15,000 m of drill cores and 40,000
assays were produced. DuPont discontinued the project after 1997 due to a change
in company strategy. The daughter company Conoco maintained the mineral rights
2005 to 2006 - a number of mining companies visited Engebø, partly organised by
“Rutilnett”, an informal working group organised through Naustdal municipality. As a
result, in 2006 several parties indicated their interest in purchasing the deposit from
ConocoPhillips. Nordic Mining was the most successful and initiated further
development of the Engebø deposit
2008 – a Scoping Study for the Engebø Project was completed for Nordic Mining by
Messrs. Wheeler and Dowdell, independent mining consultants. This included an
updated resource estimation, and preliminary underground and open pit mine
planning. This enabled the approximate extent of a potential open pit to be defined.
Mr. Wheeler, a Competent Person (CP), classified the deposit according to
international standards

Nordic Mining Prefeasibility Study
30 October 2017 Engebø Rutile and Garnet Project H352410
H352410-00000-280-066-0001, Rev. 0 Page 42
© Hatch 2017 All rights reserved, including all rights relating to the use of this document or its contents.
2008 to 2015 – a comprehensive Environmental Impact Assessments (EIA) was
carried out, culminating in the granting of a complete zoning plan and discharge
permit for the Project. Except for some smaller programmes related to re-assaying of
old drill cores and garnet characterisation, no larger exploration programmes were
undertaken before Nordic Mining initiated a drilling programme in 2016
2016 – a comprehensive diamond drilling and surface sampling campaign was
carried out. The programme aimed at updating the open pit ore to reserve status as
the basis for the PFS. In addition, data from the DuPont drilling programme was
evaluated by relogging and re-assaying to confirm the quality of the data as the basis
for an updated resource model which resulted in the issuing of a revised Mineral
Resource estimate. The revised estimate forms the basis of the PFS as summarised
in this report.

Nordic Mining Prefeasibility Study
30 October 2017 Engebø Rutile and Garnet Project H352410
H352410-00000-280-066-0001, Rev. 0 Page 43
© Hatch 2017 All rights reserved, including all rights relating to the use of this document or its contents.
5. Land/Mineral Tenure and Licences
Nordic Mining (through Nordic Rutile AS) has access to the mining and processing plant
areas both by land and sea as a result of option agreements with landowners, as well as
an approved zoning plan for the area and a development agreement with Naustdal
municipality.
5.1 Permits and Licences
Nordic Mining holds nine valid extraction permits covering the entire planned mining area,
as shown in Figure 5-1 below.
Figure 5-1: Extraction Permits held by Nordic Mining in the Vicinity of Engebø
The extraction permits give Nordic Mining the right to extract and utilise deposits of
minerals within certain limits as described in section 32 of the Norwegian Minerals Act.
The permits are valid until 12 November 2027. The Directorate of Mining may extend the
duration period of the permits for up to ten years at a time. Extensions are normally
granted if the deposit is deemed to be a reasonable reserve for the applicant’s operations.
The extraction permits entitle Nordic Mining to extract and utilise all deposits of minerals
(rutile) owned by the Norwegian State in the extraction area. Minerals owned by a
landowner (garnet, aggregates and possible other industrial minerals) may be extracted
to the extent that this is necessary to extract deposits of minerals owned by the State.
The extraction permits are registered with the Land Register.

Nordic Mining Prefeasibility Study
30 October 2017 Engebø Rutile and Garnet Project H352410
H352410-00000-280-066-0001, Rev. 0 Page 44
© Hatch 2017 All rights reserved, including all rights relating to the use of this document or its contents.
Nordic Mining will be required to apply for a regular operating license upon
commencement of operations at Engebø, the threshold for application being the
extraction of mineral deposits of more than 10,000 m3 of mineral product. The operating
license may be granted by the Directorate of Mining and is conditional on Nordic Mining
being deemed to be qualified to extract the deposit. The license will be subject to
standard conditions for mining.
5.2 Land Requirements and Associated Negotiations
The land required for the processing plant operations is owned by three private
landowners. Nordic Mining has entered into option agreements with two of the
landowners whereby Nordic Mining has an unconditional right to acquire the area for the
planned processing plant and exclusive right to use the area for mining operations. The
option agreements entitle Nordic Mining to acquire/take possession of the areas by giving
the landowners 60 days’ notice. These option agreements expire on 31 December 2017.
Nordic Mining is currently discussing an extension of the option agreements with the
landowners.
By law, Nordic Mining has the right to acquire areas for mining through compulsory
acquisition of areas in accordance with the zoning plan. This process will not hinder the
planned milestones for development of the Project.
5.3 Land Access
The Engebø deposit and the planned mining and processing plant areas are located
adjacent to the Fv 611 provincial road and a deep water harbour facility. As noted, Nordic
Mining has access to the planned mining and processing plant areas by means of an
approved zoning plan. The zoning plan (planning permit), which was adopted by the
Municipal Council for Naustdal Municipality in business item no. 022/11 on 11 May 2011
and the Municipal Council for Askvoll Municipality in business item no. 018/11 on 12 May
2011, and finally approved by the Ministry of Local Government and Modernisation on
17 April 2015, allows for and provides guidelines on the operation of the following
activities:
The extraction of rock mass in open pit production and underground mining
The processing site at Engebø
The service area at Engebø
The waste rock deposition site in Engjabødalen
Subsea area for tailings disposal on the sea floor of the Førde Fjord
The works road running between the Fv 611 county road and the Engebø ridge
The rerouting of county road Fv 611
The rerouting of a 22 kV power line and the stringing of a new local cable at Engebø.
The zoning plan also ensures that measures are put in place to reduce the environmental
consequences of the above activities for the local society and with respect to the
landscape.

Nordic Mining Prefeasibility Study
30 October 2017 Engebø Rutile and Garnet Project H352410
H352410-00000-280-066-0001, Rev. 0 Page 45
© Hatch 2017 All rights reserved, including all rights relating to the use of this document or its contents.
Nordic Mining has entered into a development agreement with Naustdal municipality
regulating, inter alia, the improvement of the road infrastructure to facilitate the needs of
the planned mining operations.
The harbour facility is covered by the option agreements entered into and under
discussion with landowners; this will enable Nordic Mining to ship products directly to
customers from the local deep-sea quay.
5.4 Relocation of People
There will be no need for relocation of people and moveable assets other than as
prescribed by the option agreements with landowners as described in Section 5.2 above.
5.5 Compensation
The Project will affect three households, of which two are currently party to option
agreements. There will, therefore, be no need for re-establishment of communities and
their main livelihoods.

Nordic Mining Prefeasibility Study
30 October 2017 Engebø Rutile and Garnet Project H352410
H352410-00000-280-066-0001, Rev. 0 Page 46
© Hatch 2017 All rights reserved, including all rights relating to the use of this document or its contents.
6. Geology
The Engebø deposit is one of the world’s highest-grade rutile deposits and is unique due
to its substantial content of garnet. Being almost free of radioactive elements and heavy
metals, the deposit is a clean source of high-grade and high-quality titanium and garnet
minerals.
6.1 Regional Geology
The rocks found in the Engebø area belong to the Western Gneiss Region, which is
dominated by Proterozoic ortho-gneisses. These rocks have been subjected to varying
degrees of pressure and temperature as revealed by the stages of metamorphism
exhibited. There are several eclogite bodies in the Western Gneiss Region, among them
the massive Engebø eclogite.
The Førde Fjord is located within the Western Gneiss Region, structurally situated in the
footwall beneath rocks of Devonian age. The area has been subject to faulting and
folding, resulting in regional east-west trending folds. These folds are the result of north-
south compressional forces associated with the Caledonian orogenic event peaking some
400 million years ago. The rocks show different and complex deformation styles. The
Western Gneiss Region is in general preserved in amphibolite facies with some isolated
lenses preserved in eclogite facies.
There are two, mainly intrusive, units seen in the Førde Fjord area, the Hegreneset
complex and the surrounding Helle complex. A geological map of the Førde Fjord area is
shown in Figure 6-1 below. The Hegreneset complex consists of a variety of potassium-
poor rocks, while Helle has more potassium-rich rocks. Hegreneset consists of basic to
ultramafic, mainly eclogitic rocks with cross-cutting dioritic and granodioritic intrusives.
The eclogites are best preserved in the central part of the dome structure which the
complex exhibits. This is represented by the Engebø deposit. The Helle complex is
comprised of mainly granitic to granodioritic gneisses, often migmatitic or banded and red
to grey in colour. The rocks have been subject to strong deformation resulting in varied
structures and textures.

Nordic Mining Prefeasibility Study
30 October 2017 Engebø Rutile and Garnet Project H352410
H352410-00000-280-066-0001, Rev. 0 Page 47
© Hatch 2017 All rights reserved, including all rights relating to the use of this document or its contents.
Figure 6-1: Geological Map of the Førde Fjord Area (NGU)
The Caledonian orogenic event is responsible for the eclogite facies metamorphism
which has developed in the area. The early structures caused high-ductile deformation-
zones to develop. These zones contain high amplitude, isoclinal and modified folds. The
rapid exhumation of the rocks by structural means appears to have assisted in the
preservation of the rutile grains. The late-Caledonian simple shear and asymmetric
folding probably occurred after the eclogite was formed. The regional and local structures
and general rock composition are readily evidenced on Landsat images.
DuPont's experience with Norwegian eclogites led it to conclude that those located within
the Western Gneiss Region would have attractive rutile contents had they not been
greatly affected by shearing. Exploration and drilling campaigns on other Norwegian
eclogites within the Western Gneiss Region were unable to indicate potentially mineable
material in sufficient quantities to justify development. Therefore, Engebø became the
focus of the DuPont exploration effort as it has both the tonnage and grade to justify
development.
6.2 Local Geology
The Engebø eclogite and the surrounding undifferentiated mafic and felsic rocks belong
to the Hegreneset complex. The eclogite forms a 2.5 km long east-west trending lens with
a distinctly massive character compared to the surrounding amphibolite facies rocks. The
lens runs parallel with the Førde Fjord and the Engebø ridge. The eclogite is believed to
represent a Proterozoic gabbroic intrusion that was enriched in iron and titanium
(ilmenite) due to fractionated crystallisation. Due to the high pressure and temperature
during the peak Caledonian metamorphism approximately 400 million years ago, the
gabbro transformed to eclogite. During this process, ilmenite broke down to form rutile
and excess iron that went in to the iron rich mineral garnet. The strike of the eclogite is
generally east-west with a dip of 85° north. However, the dip varies from a steep angle

Nordic Mining Prefeasibility Study
30 October 2017 Engebø Rutile and Garnet Project H352410
H352410-00000-280-066-0001, Rev. 0 Page 48
© Hatch 2017 All rights reserved, including all rights relating to the use of this document or its contents.
northwards through vertical to southwards but for the most part is 60 to 85° to the north.
Detailed structural studies reveal many episodes of complex major folding and
development of foliation. In general, the eclogite may be considered an anticlinorium with
a major fold axis trending about east-west. The limbs of the major fold are also highly
contorted.
There is considerable exposure of eclogite on surface although the overburden increases
to the east and the country rocks frequently fold into the eclogite on its extreme margins.
6.3 Deposit Type
Unlike most rutile deposits, the Engebø rutile is contained in a hard-rock ore, a massive
body of eclogite. Rutile and garnet was formed deep into the earth’s crust at high
pressure and temperature. Rare circumstances led to the preservation of these minerals
during rapid uplifting of the rock to its current position. The high quality of the minerals is
owed to the unaltered state of the host rock.
Geological investigations of the Engebø deposit have determined that the eclogite can be
subdivided into three different eclogite types, based on titanium content and appearance
Ferro-eclogite; dark and massive appearance, >3% TiO2
Transitional-eclogite; intermediate dark, 3-2% TiO2
Leuco-eclogite; light coloured and foliated, <2% TiO2.
The contact between the eclogite types are gradational, moving from ferro- to transitional-
and leuco-eclogite. Figure 6-2 shows the relationship between the different eclogite types.
Figure 6-2: Geology of the Engebø Deposit
The economically significant ferro-eclogite is generally found in the southern portions of
the deposit.

Nordic Mining Prefeasibility Study
30 October 2017 Engebø Rutile and Garnet Project H352410
H352410-00000-280-066-0001, Rev. 0 Page 49
© Hatch 2017 All rights reserved, including all rights relating to the use of this document or its contents.
6.4 Mineralogy
Engebø originates from a gabbroic intrusion that was metamorphosed under eclogite-
facies conditions of approximately 15 to17 kbar pressure and approximately 600°C
temperature during the peak of the Caledonian metamorphism. Eclogitisation is defined
as the mineralogical alteration where the plagioclase in the lower facies breaks down to
form the sodium containing pyroxene omphacite. No relict magmatic minerals have been
found.
The main titanium bearing mineral is rutile. Only 5% of the titanium is found as ilmenite
and the presence of titanite/sphene is negligible. The rutile is practically free of uranium,
thorium and other radioactive elements (less than 1 ppm). The mineral assemblage gives
the rock a characteristic green and red colour. In general, the eclogite contains 40% to
50% almandine type garnet. The garnet content becomes gradually less for the low-grade
eclogite types. Other major minerals are pyroxene (omphacite) and amphibole which
gives the rock its green colour. Phengite and paragonite (white micas) are characteristic
of leuco-and trans-eclogites, but minor amounts are also found in mafic ferro-eclogite.
Other accessory minerals include epidote, carbonates (dolomite/ankerite), quartz, pyrite
and apatite. Zircon occurs as trace mineral and typically as tiny inclusions in and close to
rutile and garnet.
The texture is generally equi-granular but garnets are commonly coarser than other
minerals. Garnet grain size is typically between 0.1 mm and 0.5 mm in diameter, but
larger grains up of to 1 mm are not uncommon. Larger garnet grains (up to 1 cm) typically
contain inclusions of other minerals.
6.5 Waste Rock Types
Except for low-grade eclogite rocks, the main waste rock types are:
Amphibolite: this is the main side rock and encloses the eclogite lens. It is generally
homogenous with no banding and with a sugarish texture. It is darker green than the
eclogite, often with visible plagioclase feldspar. No garnets are visible
Garnet Amphibolite: this is an amphibole type that is often found as internal zones in
the eclogite. it is generally homogenous with no banding and with a sugarish texture.
It is darker green than the eclogite, often with visible plagioclase feldspar and a
distinct garnet content
Gneiss: this generally occurs outside of the main eclogite body and the amphibole
unit, and is dominated by felsic minerals like quartz, mica and feldspars. The gneiss
is strongly foliated and sheared often with porphyroblasts of reddish feldspars.
Alternating Mafic and Felsic rocks: the alternating rocks occur mostly in the contact
between the eclogite and the side rock and are more or less altered sequences of
mixed eclogite and gneiss
Quartz veins: there are some occasional massive quartz veins, with thicknesses up to
1 m.

Nordic Mining Prefeasibility Study
30 October 2017 Engebø Rutile and Garnet Project H352410
H352410-00000-280-066-0001, Rev. 0 Page 50
© Hatch 2017 All rights reserved, including all rights relating to the use of this document or its contents.
7. Drilling, Sampling and Ore Characterisation
A summary of the drilling and sampling campaigns, both historic and resent, for the
Engebø deposit is given in this section. The summary includes a description of how
drilling, sampling and assaying was carried out, and the Quality Assurance/Quality
Control (QA/QC) system put in place. Different methods used to characterise the ore are
described.
A summary of all diamond drilling carried out at Engebø both by DuPont/Conoco and
Nordic Mining is shown in Table 7-1: below. All the DuPont/Conoco drilling produced BQ
(36.5 mm) core. All the 2016 Nordic Mining drilling produced NQ2 core (50.7 mm).
Table 7-1: Summary of Drilling Campaigns
Drilling Campaign Drillholes Length (m) Average
Length/hole (m)
1997 DuPont/Conoco 49 15,198 310
2016 Nordic Mining 38 6,348 167
Figure 7-1 and Figure 7-2 below illustrate the historic drilling by DuPont (shown in green)
and the 2016 drilling by Nordic Mining (shown in red). The historic drilling was
concentrated in the western part of the deposit while the new drilling was centred in the
planned open pit area located in the central part of the deposit.
Figure 7-1: Plan of Drillholes

Nordic Mining Prefeasibility Study
30 October 2017 Engebø Rutile and Garnet Project H352410
H352410-00000-280-066-0001, Rev. 0 Page 51
© Hatch 2017 All rights reserved, including all rights relating to the use of this document or its contents.
Figure 7-2: West-East Long Section of Drillhole Data
DuPont/Conoco carried out an extensive drilling campaign between 1995 and 1997. The
drilling focused on the western part of the deposit which was regarded as the higher-
grade part of the deposit. The road tunnel that runs through the deposit was also sampled
through the full length (630 m). No geotechnical drilling was done at the time, nor was an
attempt made to quantify the garnet content. Drill hole recoveries were excellent with
negligible losses. NGU participated in the drilling campaign.
7.1 Sample Preparation and Analyses
The DuPont/Conoco core material was assayed by a portable, handheld, XRF (X-ray
Fluorescence) instrument (X-Met). Analysis for TiO2 and Fe2O3 was made directly on the
core and recorded every 25 cm along the core. About 116 core laboratory composites (at
10 m intervals) were prepared and measured by XRF. These data were used to test and
correct the X-Met analysis.
Additional measurements of total TiO2 and Fe2O3 were obtained from samples taken from
the sidewalls of the road tunnel that runs approximately through the middle of the deposit.
These samples were taken by chip sampling or by obtaining the drill cuttings from small
holes drilled into the walls. Drill cuttings were milled and the X-Met instrument was used
for measurement.
Surface samples for measurement of total TiO2 and Fe2O3 were taken by either chip
sampling, drill dust sampling or direct X-Met measurement on the bedrock. X-Met
measurements were made directly on milled chip samples or drill dust samples.
A summary of the X-Met and XRF sample assays from the DuPont/NGU campaign is
shown in Table 7-2 below.

Nordic Mining Prefeasibility Study
30 October 2017 Engebø Rutile and Garnet Project H352410
H352410-00000-280-066-0001, Rev. 0 Page 52
© Hatch 2017 All rights reserved, including all rights relating to the use of this document or its contents.
Table 7-2: DuPont/Conoco Sample Summary – for total TiO2 and Fe2O3 Measurements
Additional procedures and measurements applied were:
Extensive core logging of all drill-holes
Photo-documentation of each drill-hole
Bulk density measurements
Magnetic susceptibility measurements, using a portable instrument
Rutile/ilmenite content was determined for each laboratory composite, by additional
measurement of acid-soluble TiO2 by ICP-AES. Wt% Rutile = bulk wt% TiO2 – acid
soluble wt% TiO2.
Although there was no specific QA/QC programme in place, the different X-Met methods
were quality checked and evaluated against each other and XRF analysis.
The average X-met assay over an interval related to a laboratory composite sample was
found to correlate well with the XRF measurements. However, the variation between the
25 cm X-met analysis within a composite was found to be large.
In the 2016 Nordic Mining drilling campaign, 709 m of the old core were re-sampled and
re-assayed by ALS Minerals in Sweden to assist with verification of these data.
Although some computer modelling work was done previously by DuPont, the modelling
was done completely anew as part of the Scoping Study initiated by Nordic Mining,
starting from master database files (in Access) that were provided by DuPont/Conoco.
The resource model obtained by use of the DuPont data was merged with the model
created from the 2016 drilling. The data generation from the 2016 drilling was done to
ensure that the data were comparable and as mergeable with the DuPont/Conoco data as
possible. The main differences between the DuPont/Conoco and the 2016 data sets are:
TYPE HOLES LENGTH
NUMBER
SAMPLES
Total Drilled 49 15,198
X-Met Lokken TIO2 29 6,033 24,133
Measurements Lokken FE2O3 29 6,045 24,180
Drillholes Engebo TIO2 30 4,306 17,225
Engebo FE2O3 27 3,714 14,855
Either TIO2 measurement 49 9,431 37,726
Either FE2O3 measurement 48 9,070 36,279
Lab Composite XRF 34 952 116
Tunnel 660 34
Chip samples Chip97-NGU 229
chip96-NGU 44
Surface Drilldust samples dd95-NGU 108
Samples dd96-DuPont 118
dd96-NGU 76
Direct X-Met xmet96-NGU 680
xmet97-DP 104
DESCRIPTION

Nordic Mining Prefeasibility Study
30 October 2017 Engebø Rutile and Garnet Project H352410
H352410-00000-280-066-0001, Rev. 0 Page 53
© Hatch 2017 All rights reserved, including all rights relating to the use of this document or its contents.
The 2016 drilling programme was done in a more structured manner based on a 60 m
by 40 m grid spacing of the drill-holes rather than a more sporadic drilling pattern.
The aim of the 2016 drilling was to classify existing resources from Inferred to
Indicated/Measured categories
Higher quality chemical assaying was employed in 2016 using 5 m laboratory
composites for XRF measurements for all ore zones in all drill-holes
A proper QA/QC system was set in place in the 2016 campaign
Garnet was quantified in the 2016 campaign using QEMSCAN (scanning electron
microscope analysis) and calculated from chemistry
Measurement of acid-soluble TiO2 by ICP-AES was carried out in the 2016 campaign
for all laboratory composites to determine the ilmenite content and the ilmenite/rutile
ratio.
7.2 Nordic Mining 2016 Drilling Campaign
The drilling campaign included recovery of 6,348 m of drill cores, collection of 77 surface
samples and outcrop mapping. The cores were logged and sampled at Nordic Mining’s
core storage facility in Naustdal. 1,517 whole rock chemical analyses (XRF) and 336 rutile
specific analyses (ME-ICP41) were carried out by ALS Minerals in Sweden. QEMSCAN
was carried out by SGS Canada on 68 samples to investigate mineralogical, textural and
petro-graphical variations within the deposit. Garnet was successfully quantified by
correlating QEMSCAN data with iron content from chemical assays.
As part of the drilling programme, historical datasets have been re-assessed and old drill
cores were re-logged and re-analysed. The results show a good correlation between new
and historical data and thereby fully validate the historical datasets.
7.2.1 Nordic Mining Core Drilling
The 2016 drilling was carried out by Finnish contractors Kati Oy using Sandvik DE130
and DE140 drilling rigs. Both rigs used wireline drilling. Downhole survey measurements
were taken every 5 m downhole. The majority of the holes were laid out on a regular 60 m
by 40 m grid in the area demarcated as the potential open pit area in the 2008 scoping
study. The holes were positioned using a total station. Seven holes were drilled using
marking for orientation with the purpose of geotechnical logging.
The principal reasons for the 2016 drilling included:
To provide a better coverage of sample data in the prospective open pit area, and
thereby achieve at least an Indicated Resource category for the majority of the ore in
this area
To provide a bank of recent data which would help verify the 1997 drill hole data
To provide samples for metallurgical testing in the potential open pit area
To provide geotechnical samples and data to assist with selection of mine and slope
design parameters

Nordic Mining Prefeasibility Study
30 October 2017 Engebø Rutile and Garnet Project H352410
H352410-00000-280-066-0001, Rev. 0 Page 54
© Hatch 2017 All rights reserved, including all rights relating to the use of this document or its contents.
To provide extensive additional data for assessment of garnet and different
mineralisation qualities.
7.2.2 Nordic Mining Logging, Sampling and Assaying
All core material was brought to Nordic Mining’s office in Naustdal where a logging and
sampling facility was set up. The holes were carefully logged and separate logs were
recorded, including lithology logs, geotechnical logs, retrogression zone logs, textural
logs, pyrite and mica logs, and sample interval logs.
A handheld XRF (XMET) was used to aid the geologists in the logging and determination
of different ore types. Samples were selected in accordance with major lithological
breaks, and were restricted to a maximum length of 5 m. Core was sawn longitudinally in
half, with one half being selected as a sample for chemical analysis and the other left in
the core box for storage. All samples were continually labelled and trucked to ALS
Minerals in Sweden for sample preparation and chemical analysis. Related to titanium,
the principal assays determined were TiO2 (total) by XRF, and TiO2 (dissolvable in HCl)
by ICP to determine the ilmenite content.
Other elements assayed were Fe2O3, MnO, Al2O3, BaO, CaO, Cr2O3, K2O, MgO, Na2O,
P2O5, SO3, SiO2 and SrO.
Density measurements were taken at approximately 25 m intervals downhole. All holes
were photographed.
7.2.3 Quality Control
A pre-planned QA/QC programme was used for all of the 2016 drilling campaign. The
different types of quality control samples taken are depicted in Table 7-3 below. For field
duplicates the core was additionally cut into four quarters in order be able to provide both
additional samples and still have some core left in storage.
Coarse blanks were introduced by Nordic Mining into the sample batches, using standard
blank material obtained from ALS Minerals. Fine blank material came from the same
source after being ground by ALS for Nordic Mining to allocate into the sample stream.
A standard sample was purchased from the USGS, a Hawaiian basalt sample, code
BHV0-2. This sample has certified grades of 2.73% TiO2 and 12.3% Fe2O3.

Nordic Mining Prefeasibility Study
30 October 2017 Engebø Rutile and Garnet Project H352410
H352410-00000-280-066-0001, Rev. 0 Page 55
© Hatch 2017 All rights reserved, including all rights relating to the use of this document or its contents.
Table 7-3: QA/QC Samples – Insertion Rates and Acceptance Criteria
7.2.4 Garnet Analysis
Associated with the 2016 drilling campaign, garnet was analysed by SGS Canada in two
ways using QEMSCAN measurements:
a) Thin Sections. 10 core billets were selected over a range of different locations
throughout the drilled areas. These were analysed by QEMSCAN using a textural
analysis method.
b) Coarse Pulp Rejects. For the coarse rejects available from core sampling, 68
samples were selected over a range of grades and locations. The coarse reject
material was ground carefully at the SGS laboratory in Canada with the aim of
liberating grains and not over grinding. Slides were prepared for each of these
samples by spreading a thin layer of pulp material onto each slide. The slides were
then analysed by QEMSCAN. These results gave a percentage of garnet, which
could be compared with the original assay data for the same sample.
Thin section analysis enabled:
An assessment of the grain size distribution for each sample to be made. The
QEMSCAN analysis indicates that the garnets have grain sizes typically between
0.1 to 0.5 mm (100-500 µm)
The conclusion to be drawn that the textural feature that seems to mainly affect the
distribution of garnet is a retrogression of the ore.
Observations from garnet analyses in the tests included:
Typically, ferro- and trans -eclogite have between 40% and 50% garnet, leuco-
eclogite has between 30% and 40% garnet
Evaluation
ParameterType of Sample CODE
Frequency
%
Process being
evaluatedAcceptance Criteria
Field Duplicates FD 2Precision of taking
samples<=10% failed samples
Coarse Duplicates CD 2Precision of sample
preparation<=10% failed samples
Pulp Duplicates PD 2 Precision of analysis <=10% failed samples
Standard Samples STD 6Accuracy with respect
to primary labBias <=5%
External Duplicates ED 4Accuracy with respect
to secondary labBias <=5%; adjusted R2=1
Coarse Blanks CB 2Contamination during
sample preparationContamination <=2%
Fine Blanks FB 2Contamination during
analysisContamination <=2%
Total 20
Precision
Accuracy
Contamination

Nordic Mining Prefeasibility Study
30 October 2017 Engebø Rutile and Garnet Project H352410
H352410-00000-280-066-0001, Rev. 0 Page 56
© Hatch 2017 All rights reserved, including all rights relating to the use of this document or its contents.
The crystal shape of the garnet is euhedral to subhedral. In intensely foliated or
sheared samples, the grains are somewhat more elongated and irregular
The garnets typically have few inclusions but the larger garnets are more likely to
have mineral inclusions
In heavily altered zones, the garnet tends to break down and grain size is reduced.
This constitutes a minor part of the deposit
The principal garnet type is almandine.
Figure 7-3: Example of QEMSCAN Results from Thin Section of Core Analysis
A way to estimate the grade of garnet was investigated by studying the relationship
between garnet quantity from QEMSCAN data and the chemical analysis of the same
sample. The best results were obtained by relating garnet to iron (Fe2O3) content. This
was carried out using the following steps:
The total iron content per sample is directly available from the assayed Fe2O3
As well as garnet, it is known that other minerals containing iron will be ilmenite,
pyrite (reflected by the SO3 assay) and amphibole (reflected by the K2O assay)
Therefore, it can be reasoned that the amount of garnet will have some relationship
as follows: Test (GNT) = Fe2O3 – (b x SO3 + c x K2O + d x ilmenite).
The test variable will be a number which can be correlated to the measured GNT values.
After some analysis, it was also found that this it was best to split the analysis between
different eclogite types.
For the ferro-eclogite sample and trans-eclogite sample sets, the best relationships were
found to be:
Trans-eclogite: Test (GNT) = Fe2O3 – (4.1 x SO3 + 3.0 x K2O + 2.5 x Ilm)
Ferro-eclogite: Test (GNT) = Fe2O3 – (3.9 x SO3 + 1.5 x K2O + 2.5 x Ilm)
The %Ilmenite grade is derived from the assayed %TiO2 in ilmenite value from the
relationship below:

Nordic Mining Prefeasibility Study
30 October 2017 Engebø Rutile and Garnet Project H352410
H352410-00000-280-066-0001, Rev. 0 Page 57
© Hatch 2017 All rights reserved, including all rights relating to the use of this document or its contents.
%Ilmenite = [TiO2(total) x % TiO2 (in ilmenite)] / 0.5265.
These test variables determined for the two sample sets plotted against the measured
garnet grades gave the results as shown in Figure 7-4 below. The regression equations
from these trendlines are:
Trans-eclogite: y = 1.988x + 17.167
Ferro-eclogite: y = 3.438x + 3.792
where: y = derived garnet wt%; x = test variable (as derived above).
Figure 7-4: Graph of Test Variable vs. Garnet for Trans-Eclogite and Ferro-Eclogite
These regression coefficients were then used to derive a garnet assay for each sample.
The pairs of the measured garnet and derived garnet values were then analysed using
RMA (reduction to major axis) analysis. The analyses gave correlation values (R2) and
low bias values of less than 5% when a very small number of outliers had been removed.
This analysis, therefore, supported the use of these formulae in the derivation of garnet
grades in the resource estimation.
7.2.5 Nordic Mining 2016 Surface Sampling
Additional surface samples were taken by Nordic Mining in 2016 using a handheld Makita
drill. All the surface samples, each of which was approximately 100 g in mass, were sent
to ALS Minerals for XRF analysis. The purpose of the surface sampling campaign was to
provide additional surface grade information to assist with modelling, as well as to provide
some verification of surface sampling made in previous campaigns.
The samples were located on 60 m section lines, with a spacing of 30 m to 60 m in the
north-south direction, as shown in Figure 7-5 below. The figure shows both the Nordic
samples and the historic samples taken by NGU. The Nordic samples were mostly
located within the planned open pit area. The colour scheme in Figure 7-5 shows the
different ore types of each sample.

Nordic Mining Prefeasibility Study
30 October 2017 Engebø Rutile and Garnet Project H352410
H352410-00000-280-066-0001, Rev. 0 Page 58
© Hatch 2017 All rights reserved, including all rights relating to the use of this document or its contents.
Figure 7-5: 2016 Surface Sample Locations
7.3 Data Verification
As noted, the Competent Person, Mr. Wheeler, has reviewed all the QA/QC results from
Nordic Mining’s 2016 drilling campaign. The results of this review are summarised below
and are detailed in Mr. Wheeler’s 2016 resource report.
7.3.1 Precision
Precision graphs for the results of field duplicates (FD), coarse duplicates (CD) and pulp
duplicates (PD) were determined. No failures were encountered for any of the duplicate
types, which is an extremely good result. Generally, up to 10% of failures would be
considered a satisfactory result.
7.3.2 Accuracy
The standard assay results for 98 submitted samples were analysed. The results showed
that there are only three outliers, and a very small bias value, well less than the 5%
acceptable level. The accuracy level of the results is, therefore, very high.
7.3.3 Contamination
The TiO2 level of the blank material was 0.11%, so this value became the lowest level of
detection (LD). Of the 32 blank samples submitted by Nordic Mining, the highest coarse
blank assay value was 0.13% TiO2, well inside the 3x LD limit normally considered
acceptable. The highest pulp blank assay from the 33 pulp blank samples submitted by
Nordic Mining was 0.12% TiO2, which is well inside the 3x LD limit normally considered
acceptable. There is, therefore, no indication of any contamination during sample
preparation or analysis.

Nordic Mining Prefeasibility Study
30 October 2017 Engebø Rutile and Garnet Project H352410
H352410-00000-280-066-0001, Rev. 0 Page 59
© Hatch 2017 All rights reserved, including all rights relating to the use of this document or its contents.
7.3.4 Verification of Nordic Mining 2016 Surface Sampling
Seventy-nine primary surface samples were taken. Along with samples, nine field
duplicates were taken (representing 12%). The field duplicates showed a very good
correlation with the original samples, so it can be concluded that the surface samples are
acceptable for use in resource estimation.
7.3.5 Verification of Historical Database
To assist with verification of the historical DuPont/Conoco diamond drilling data, samples
were taken from 14 of the old holes. These were then prepared and re-assayed in the
ALS laboratory in the same way as the samples from the 2016 drilling campaign. This re-
assaying involved 709 m of core, representing approximately 6% of the eclogite core from
the DuPont/Conoco drilling campaigns. Favourable results were obtained from the re-
assay data. The results represent more than 25% of all original 49 NGU holes. It can be
concluded, therefore, that the historical NGU data can be used for estimation in the
updated resource estimation study for all resource category levels.

Nordic Mining Prefeasibility Study
30 October 2017 Engebø Rutile and Garnet Project H352410
H352410-00000-280-066-0001, Rev. 0 Page 60
© Hatch 2017 All rights reserved, including all rights relating to the use of this document or its contents.
8. Mineral Resource Estimate
A summary of the 2016 mineral resource estimate for Engebø is given below. A third
party independent review of the mineral resource estimate was carried out by SRK
Consulting (UK) Limited (SRK) in December 2016. SRK concluded that the mineral
resource estimate did not contain any fatal flaws and that the geological model produced
for use in this PFS was fit for purpose.
8.1 Mineral Resource Model
The mineral resource estimation was completed using a 3D block modelling approach,
with the application of Datamine software. The overall methodology used is depicted
diagrammatically in the flowsheet in Figure 8-1 below. A combination of 79 surface
samples and 87 drillholes, composing 21,546 m of drilling, was used to derive the
3D block model.
Figure 8-1: Block Modelling Methodology
Three different principal types of eclogite have been coded during the logging of the
drillhole data. For each of these principal zones, sectional strings and perimeters were
defined, based on all available lithological and sample data. Where possible, these
perimeters were then converted into 3D wireframe envelopes. Along with topographical
data, these wireframe data were used to create volumetric block models.
Block Modelling Methodology
Sectional Strings-
Principal Eclogite
Types
Sample Data
TopographyWireframe
Models
Samples
Allocated by
Eclogite Types
Volumteric
Block Model
Geostatical
Analysis
Grade
Interpolation
Composites
Interpolation
Parameters
Resource
Block Model

Nordic Mining Prefeasibility Study
30 October 2017 Engebø Rutile and Garnet Project H352410
H352410-00000-280-066-0001, Rev. 0 Page 61
© Hatch 2017 All rights reserved, including all rights relating to the use of this document or its contents.
Samples associated with these overall interpreted zones were assigned logical codes,
corresponding with the defined eclogite wireframe models. These sample data were then
converted into approximately 5 m composites. The composite TiO2 and other grade
values were then used to interpolate grades into the block model according to the parent
eclogite type to which they belonged. Geostatistical analysis was used to assist in the
selection of interpolation parameters, as well as with subsequent resource classification.
Solid wireframe models were created for the three principal eclogite types, as well as
some major zones of alternating mafic material, as shown in the 3D view in Figure 8-2.
Figure 8-2: 3D View of Interpreted Wireframe Model showing main Eclogite Ore Types (looking North-East)
Sample data processing was then carried out using the eclogite wireframe models to
select a sample set, after which top-cut levels were applied and 5 m downhole
composites were created according to a zone classification. Thereafter geostatistical
analysis of the downhole composites was carried out, followed by volumetric modelling
and grade estimation.
The principal grade interpolation method used for TiO2 was ordinary kriging, with nearest-
neighbour and inverse-distance weighting methods being used for subsequent testing
and validation.
Grade interpolation for garnet used a different method based on a formula which used
Fe2O3, K2O, SO3 and TiO2 ilmenite values.
Density values were estimated into the block model using inverse-distance weighting.

Nordic Mining Prefeasibility Study
30 October 2017 Engebø Rutile and Garnet Project H352410
H352410-00000-280-066-0001, Rev. 0 Page 62
© Hatch 2017 All rights reserved, including all rights relating to the use of this document or its contents.
8.2 Mineral Resource Statement
The August 2016 resource statement prepared in line with the JORC Code (2012 Edition)
guidelines is shown in Table 8-1 and Table 8-2 below. Resource statements for two
different cut-off grades are reported to provide flexibility for mine planning. Both resource
statements given below are inclusive of Ore Reserves.
Table 8-1: Mineral Resource Statement (3% TiO2 Cut-off)
TiO2 Cut-off
Classification Tonnes
(Mt) Total TiO2 (%)
Garnet (%)
3%
Measured 15.0 3.97 44.6
Indicated 77.5 3.87 43.6
Total – Measured and Indicated 92.5 3.89 43.7
Inferred 138.4 3.86 43.5
Table 8-2: Mineral Resource Statement (2% TiO2 Cut-off)
TiO2
Cut-off Classification
Tonnes (Mt)
Total TiO2 (%) Garnet
(%)
2%
Measured 19.0 3.68 43.9
Indicated 105.7 3.51 43.0
Total – Measured and Indicated 124.7 3.53 43.2
Inferred 254.5 3.22 42.5
Notes:
Grades presented above are total TiO2
Resource below sea level has been restricted by a boundary no closer than 50 m to
the edge of the fjord. This is a vertical boundary that is defined 50 m horizontally from
the fjord limit into the Engebø hill from sea level, and then vertically to the deepest
part of the defined ore body. No ore within this 50 m zone is part of resource
estimations
Above Mineral Resources are inclusive of Ore Reserves as reported in Section 13
below.
8.3 Competent Person Sign-off
As noted, the geology and mineral resource study for Engebø was completed by an
independent mining consultant, Mr. Adam Wheeler, who has been working on the
Engebø Project since 2008. He has received full access to all available data and
information connected with the deposit and project development, and has received
unlimited assistance from all Nordic personnel connected with the Project. Mr. Wheeler
has visited the site several times, including three times during 2016, in connection with
the recent drilling campaign. Mr. Wheeler qualifies as a Competent Person in terms of the
JORC Code 2012 Edition.

Nordic Mining Prefeasibility Study
30 October 2017 Engebø Rutile and Garnet Project H352410
H352410-00000-280-066-0001, Rev. 0 Page 63
© Hatch 2017 All rights reserved, including all rights relating to the use of this document or its contents.
8.4 Future Work Programme
A drilling programme will be considered as part of the FS phase. The following objectives
for drilling will be considered:
To increase the amount of Measured ore in the ore resource
To increase the amount of Indicated ore in the ore resource
To aid the overall understanding of the structural geology of the orebody
To enable an FS standard geotechnical model to be compiled, in part using additional
geology drillholes.

Nordic Mining Prefeasibility Study
30 October 2017 Engebø Rutile and Garnet Project H352410
H352410-00000-280-066-0001, Rev. 0 Page 64
© Hatch 2017 All rights reserved, including all rights relating to the use of this document or its contents.
9. Mining Geotechnical
Mining geotechnical studies for both the planned open pit and underground mining
operations have been carried out to support the ore reserve estimate.
9.1 Open Pit Geotechnical Study
WAI was engaged to complete a PFS level geotechnical assessment and pit slope design
for the Engebø open pit. A summary of the WAI studies is provided below.
Geotechnical site investigations to collect geotechnical information and laboratory
samples were completed in May 2016. A programme of diamond drilling and logging of
oriented core, as well as geotechnical field mapping of the road tunnel exposure through
the deposit, was conducted. Hydrogeological information was interpreted as no detailed
information was available at that time.
Based on a 2012 optimised pit shell provided to WAI, six geotechnical design sectors
were identified for slope stability analysis. Kinematic analysis was performed for all design
sectors using stereographic analysis to review failure modes that are kinematically
possible at bench or inter-ramp scales. Inter-ramp scales wedge failures were identified in
the North (1) Sector. In addition, bench scale wedge, planar and toppling features were
identified in various geotechnical sectors. Bench face angles were selected to reduce the
risk from structural controlled failures.
The overall slope rock mass stability was assessed using limit equilibrium models for
inter-ramp and proposed North West, South, North East and South East walls (see
Figure 9-1 below). The analysis indicates that the following wall designs, as summarised
in Table 9-1, are achievable. The definitions of the terms used in Table 9-1 are provided
in Figure 9-2 below.
Operational considerations to support the selected wall designs and to improve
geotechnical stability recommended by WAI include controlled blasting practices, scale
removal on bench faces, slope dewatering and slope monitoring.

Nordic Mining Prefeasibility Study
30 October 2017 Engebø Rutile and Garnet Project H352410
H352410-00000-280-066-0001, Rev. 0 Page 65
© Hatch 2017 All rights reserved, including all rights relating to the use of this document or its contents.
Figure 9-1: WAI Geotechnical Design Sectors
Figure 9-2: Pit Slope Configuration Illustration (Read and Stacey, 2009)

Nordic Mining Prefeasibility Study
30 October 2017 Engebø Rutile and Garnet Project H352410
H352410-00000-280-066-0001, Rev. 0 Page 66
© Hatch 2017 All rights reserved, including all rights relating to the use of this document or its contents.
Table 9-1: Recommended Open Pit Slope Angles
The above recommended slope angles were used as the basis of the pit optimisation
work and subsequent mine design carried out in this study.
9.2 Underground Geotechnical Study
SINTEF Building and Infrastructure, a Norwegian company affiliated to the Norwegian
University of Science and Technology (NTNU) and the largest independent research
organisation in Scandinavia, was commissioned to undertake a PFS standard
geotechnical review of potential underground mining methods for Engebø. A summary of
the SINTEF studies is given below.
Based on workshops and high-level evaluations, SINTEF were provided with three
underground design concepts for geotechnical evaluation as follows; the design concepts
were drawn up by the Project mining team:
A long hole open stoping design, which tests the applicability of bulk mining methods
at Engebø
A room and pillar stoping design, which enables a more selective mining method to
be tested
A modified long hole open stoping design, which aimed to stretch the boundaries of
the first long hole open stoping design provided to SINTEF.
The above mining layouts are summarised in below.

Nordic Mining Prefeasibility Study
30 October 2017 Engebø Rutile and Garnet Project H352410
H352410-00000-280-066-0001, Rev. 0 Page 67
© Hatch 2017 All rights reserved, including all rights relating to the use of this document or its contents.
Figure 9-3: Mining Layouts Analysed by SINTEF for Geotechnical Stability
For more details of the process undertaken to derive the above underground design
concepts, refer to Section 12 of this report.
For each of the above layouts numerical modelling was carried out in the FLAC3D
(Itasca) finite element modelling software by creating simple 3D models to enable each
layout to be evaluated from a stability/rock mechanics point of view. The numerical
models were set up by analysing rock properties and rock mass, and by deriving key
assumptions for in-situ stress measurements at Engebø based on regional data (in the
absence of detailed in-situ stress measurements which will only be available for Engebø
in the next phase of the Project). Key assumptions made for modelling include the
following:
In-situ stress conditions were extrapolated from previous measurements in the area
(among others, one reading was taken 15 km south of the Engebø area across the
fjord)
The rock mass quality used in the modelling was considered to be ‘Very Good” with a
Geological Strength Index (GSI) of 80; this value is considered to be conservative
No explicit discontinuities were included in the model
Each mining level was assumed to be excavated at the same time and no
consideration was taken of the possible influence of sequential excavations.
The results obtained from the numerical modelling can be summarised as follows:
Layout 1 – long hole open stope design with 15 m wide pillars, 15 m wide sills
between mining levels and stopes of 45 m width, 60 m height and 60 m length
Sigma 1, the main induced stress, reaches up to 20 MPa at its highest compared
to a rock mass global strength of 80 MPa; this indicates that the selected vertical
and sill pillar thicknesses are considered stable
Consideration should be given in the next round to reducing the pillar thickness to
pillar height from the current ratio of 4 to 3; the easiest way to do this is to
increase the pillar width to 20 m from the current 15 m
Consideration in future studies should be given to increasing the stope length
from the current 60 m to 100 m; this will increase the extraction percentage

Nordic Mining Prefeasibility Study
30 October 2017 Engebø Rutile and Garnet Project H352410
H352410-00000-280-066-0001, Rev. 0 Page 68
© Hatch 2017 All rights reserved, including all rights relating to the use of this document or its contents.
Layout 2 – room and pillar stope design with 15 m wide by 15 m high by 30 m long
pillars, 15 m wide sills between mining levels and rooms of 30 m width, 15 m height
and 1,200 m length
The deepest vertical pillars are exposed to Sigma 1 stresses of 40 MPa
compared to the global rock mass strength of 80 MPa; this indicates that
instability might occur, which can be mitigated by increasing the pillar widths in
the deeper parts of the mine to greater than 15 m
Layout 3 – modified long hole open stope design with 20 m wide pillars, 15 m wide
sills between mining levels and stopes of 45 m width, 60 m height and 150 m length
The deepest vertical pillars and sill pillars are exposed to Sigma 1 stresses of
20 MPa compared to the global rock mass strength of 80 MPa; this indicates that
the layout is considered to be stable.
In conclusion, 3D numerical modelling indicates that from a stability/rock mechanics
perspective all three layouts can be used for PFS design purposes, although on site in-
situ stress measurements should be made in the next phase to support more detailed
modelling. Based on this high-level SINTEF evaluation, both a bulk mining (long hole
open stoping) and room and pillar layout are considered to be geotechnically stable
alternatives for design of an underground mine for the PFS mine plan. More details on the
selection process of the preferred option, long hole open stoping, are provided in
Section 12.6 below.
9.3 Seismic Risk
With Norway being classified as low to intermediate on a global scale of seismicity, the
seismic risk associated with the Project is considered to be low. Norway does, however,
have the highest seismic risk in north-western Europe owing to its proximity to the
continental shelf off its west coast.
9.4 Future Work Programme
To support the FS phase of the Project the following work programmes will be
undertaken:
Hydrogeological studies
In-situ rock stress measurements
Geotechnical laboratory testing programme
Detailed geotechnical mapping
Further geotechnical drilling
Geotechnical modelling of the open pit and underground orebodies.

Nordic Mining Prefeasibility Study
30 October 2017 Engebø Rutile and Garnet Project H352410
H352410-00000-280-066-0001, Rev. 0 Page 69
© Hatch 2017 All rights reserved, including all rights relating to the use of this document or its contents.
10. Hydrogeology, Hydrology and Geochemistry
During this phase of the Project, a geological drillhole dipping programme was
undertaken by Nordic Mining to determine the water levels in boreholes drilled at Engebø.
Data gathered during this programme, together with site observations and information
provided in WAI’s report were used by SINTEF to carry out a high level hydrological/
hydrogeological assessment of Engebø. A summary of the review is given below.
10.1 Hydrogeology
10.1.1 Open Pit
Since the planned open pit at Engebø is in an area with high relief and fresh outcrops with
no regional fault zones/weakness zones it is not expected that water flow and water
pressure will result in significant rock instability in the open pit. However, highly jointed
zones may lead to infiltration of water and possible increased water pressure locally. If
water pressure occurs in the pit slopes, a solution would be to drill drainage holes to
release the water pressure and thereby reduce the risk of slope instability. Construction of
ditches leading water outside of the open pit area is an additional mitigation measure to
reduce water in-flow into the pit. Excessive water is expected to accumulate at the lowest
part of the open pit and the design caters for removal of this water by means of a
drainage hole through the underground workings and subsequent cleaning up prior to
discharge to the environment.
10.1.2 Underground
Based on available information (which is limited at this stage) and observations in the
nearby road tunnel, high water in-flows to the underground excavations are not expected.
Water-bearing weakness zones may appear in parts of the underground mine but these
are not expected to give severe stability challenges. The design caters for the removal of
all water which enters the underground workings.
In summary, limited hydrology and hydrogeological data are available at present for the
Engebø deposit. The likely impact of hydrology and hydrogeology on the final mine plans,
however, is considered to be low for the following reasons:
The Engebø deposit is situated on an isolated outcrop of the Engebø ridge above the
Førde Fjord
Limited surface water on the outcrop can be observed. Only minor water flows from
horizontal fractures in the lower quarry exposures can be seen
The only water flow which can be seen in the 0.63 km-long road tunnel, which runs
through the western portion of the deposit, consists of minor drips near to each portal
Hydraulic conductivity is anticipated to be low, pre-dominantly through fractures, and
associated water levels are anticipated to be low owing to the location of the deposit
in isolated high ground.

Nordic Mining Prefeasibility Study
30 October 2017 Engebø Rutile and Garnet Project H352410
H352410-00000-280-066-0001, Rev. 0 Page 70
© Hatch 2017 All rights reserved, including all rights relating to the use of this document or its contents.
It is essential, however, that a more detailed hydrogeological study is undertaken in the
FS phase to support the above conclusion that the impact of water on the mine plans
(open pit slopes and dewatering) is considered to be limited. This comment is particularly
important when deeper portions of the orebody are included in the mine plan where
groundwater pressures are likely to be higher and where mining will take place below sea
level. The volumes and qualities of water pumped out of the open pit and underground
workings also needs to be considered. Hydrogeology considerations remain a risk to
achievement of the overall mine plan although the risk is not considered to be high.
10.2 Hydrology
There is limited surface water at Engebø, with only one stream (leading to the Gryta river)
running on the northern side of the proposed waste rock disposal area to the north-east of
the pit, as shown in Figure 10-1 below.
Figure 10-1: Map of Registered Rivers and Streams at Engebø
As a result of the lack of streams or rivers through the mining area and processing site,
flood line determination does not apply; no river diversions will be required.
Conditions relating to hydrology which are specified in the zoning plan (planning permit)
are as follows:
Run-off from the open pit mining area must be secured by means of a sediment basin
with the appropriate capacity
In order to provide a safeguard against run-off from the waste rock disposal site into
the Gryta river, a sedimentation pool with sufficient capacity must be established, as
must a drainage ditch to carry water to and alongside the works road down to the
processing site at the port.
For further details of the environmental requirements associated with the permitting
process, refer to Section 19.

Nordic Mining Prefeasibility Study
30 October 2017 Engebø Rutile and Garnet Project H352410
H352410-00000-280-066-0001, Rev. 0 Page 71
© Hatch 2017 All rights reserved, including all rights relating to the use of this document or its contents.
10.3 Geochemistry
The deposition of waste rock on land will not have a negative impact on the environment
from a geochemistry perspective. This was determined through a testwork programme as
summarised below.
To support the process of obtaining a discharge permit and zoning plan (planning permit),
two of the key legislative requirements for Nordic Mining to construct and operate a
mining and processing operation at Engebø, testwork was carried out on seven core
samples from the drilling programme. ALS Global, an internationally accredited laboratory
for analytical chemistry and testing services, carried out the testwork. The critical number
for permitting purposes is the Neutralisation Potential Ratio (NPR). Norwegian standards
follow the California and Nevada standards, which require an NPR of greater than three.
The lowest number achieved for the Engebø samples was 101.60, more than 30 times
higher than the minimum requirement. The Net Neutralisation Potential (NNP) is also an
important number with typical requirement for readings to be higher than 20 kg/t CaCO3.
In the case of the Engebø samples, the readings are all above 500 kg/t, which exceeds
the guideline by a factor of 25.
The testwork clearly demonstrates that there are no minerals present in the ore or waste
rock that could cause acid drainage; as a result, Nordic Mining has permission to
construct a standard waste rock site (a Category 3 site), with no extra requirement such
as plastic lining to cater for acid mine drainage.
The following excerpt from the discharge permit summarises the findings of the
Norwegian Ministry of Climate and the Environment, which led to the granting of the
permit:
“In order to reach the eclogite ore the gangue material covering the orebody must be
removed. Permission has been granted to deposit the gangue tailings in a separate fill in
Engjabødalen, northeast of the open pit. In the course of the open pit phase there will be
a production of 2-3 million tonnes of gangue tailings per year; in total, 35 million tonnes
equalling 15 million m3. Once there is a transition into underground mining, the need for
removing additional gangue will be very limited. The disposal site at Engjabødalen will
have a total surface area of 460 decares (0.46 km2)”.
To mitigate any negative environmental impacts on the waste rock disposal site, the
following conditions have been placed on the disposal process:
Leachate from the disposal site shall be collected, which means that under normal
operating conditions leachate and particulate material will not reach the Grytelva river
and drinking water wells
Ongoing monitoring must be undertaken
An environmental risk assessment must be undertaken to determine pollution risks in
the event of extreme weather and to establish design requirements for runoff water
requirements in such situations
The site must be closed in accordance with the plan submitted for closure and after-
use.

Nordic Mining Prefeasibility Study
30 October 2017 Engebø Rutile and Garnet Project H352410
H352410-00000-280-066-0001, Rev. 0 Page 72
© Hatch 2017 All rights reserved, including all rights relating to the use of this document or its contents.
10.4 Future Work Programme
To support the FS phase, the following work programmes will be undertaken:
Structural geology (fault zones/weakness zones) study
Joint sets, persistence, filling analysis
Study of visible water in the Project area
Rainfall regime and intensity determination
Determination of the catchment area for the open pit
Systematic study of the water level in selected drill-holes
Observation and registration of the condition and current use of the water wells below
Engebø
Pumping tests of selected drill-holes
Lugeon measurements (double packer tests to determine hydraulic conductivity in
sections with joints)
Flowmeter tests using an impeller to find the location of water-bearing joints)
Hydrogeological analysis.

Nordic Mining Prefeasibility Study
30 October 2017 Engebø Rutile and Garnet Project H352410
H352410-00000-280-066-0001, Rev. 0 Page 73
© Hatch 2017 All rights reserved, including all rights relating to the use of this document or its contents.
11. Mineral Processing
11.1 Introduction to Process Development and Results
11.1.1 Main Results
The main goal of the PFS process testwork was to develop an integrated flowsheet to
produce both rutile and garnet products from the Engebø ore. The PFS programme was
successful in making pigment grade rutile ~ 95% TiO2 at market specifications. Recovery
of TiO2 was significantly increased from previous testwork to above 60%. Marketable
products of both coarse and fine garnet were made from the Engebø ore that meet the
current market specifications of 30/60, 80 and 100 mesh products.
The PFS testwork commenced in September 2016 and marked the start of a series of
testwork programs to define suitable process technologies to recover rutile and garnet
products that meet current market product specifications. Process test work was
conducted with industrial scale equipment and tested in 0.5 t to 4.0 t feed batches for
different process sequences. The sections that follow describe in detail the evolution of
the testwork portfolio driven and shaped by testwork results that successfully developed a
viable process flowsheet as shown in section 11.1.5 below using conventional and
cost-effective process equipment. The salient results of the process development efforts
are summarised in Table 11-1 below, and include the metrics used as inputs to the
financial model. As shown in Table 11-1, two ore types were considered in the PFS,
namely ferro ore and trans ore. Ferro ore is higher grade with a TiO2 content greater than
3% while trans ore is lower grade with a TiO2 content between 2% and 3% TiO2. Although
ferro ore is defined as the sole ore for the PFS, testwork was also conducted on trans ore
to explore and develop mining and processing options that include a larger fraction of the
deposit.
In addition to process testwork, comminution testwork was undertaken to develop a
flowsheet capable of producing suitable feed to the process to maximise garnet and rutile
liberation and ultimately lead to marketable products while minimising the generation of
fines and overgrinding of rutile. A staged comminution circuit was selected which
produces a feed at 212 µm to 550 µm for coarse garnet recovery and through regrinding,
a <212 µm stream for rutile and fine garnet recovery.

Nordic Mining Prefeasibility Study
30 October 2017 Engebø Rutile and Garnet Project H352410
H352410-00000-280-066-0001, Rev. 0 Page 74
© Hatch 2017 All rights reserved, including all rights relating to the use of this document or its contents.
Table 11-1: Summary of the Main Garnet and Rutile Process Results
Garnet
Parameter Units Ferro Ore > 3% TiO2
Trans Ore 2% to 3% TiO2
Garnet grade of sample Wt% 50.4 47.5
Garnet grade of coarse product Wt% 95.4 94.1
Garnet grade of fine product Wt% 95.5 93.3
Overall yield to coarse product Wt% 11.4 6.9
Total garnet yield (62.5% coarse; 37.5% fine) Wt% 18.3 11.0
Coarse product particle size distribution: D50 µm 274 249
Rutile
Parameter Units Ferro Ore > 3% TiO2
Trans Ore 2% to 3% TiO2
TiO2 grade of sample Wt% 4.7 2.7
TiO2 grade of rutile product Wt% 94.9 92.8
TiO2 recovery to rutile product Wt% 60.2 42.1
De-rating factor for scale-up* % 97 -
De-rated Recovery Wt% 58.4 -
Particle size distribution: D50 µm 106 101
*A de-rating factor is applied to account for an expected decrease in recovery when operating a full-scale process, thereby providing a more conservative input to the financial model
11.1.2 Achieved Rutile Products
The chemical composition of the rutile product from the ferro ore testwork programme is
provided below in Table 11-2. The target rutile grade for a pigment-grade rutile product
was met and elements are within the specifications.
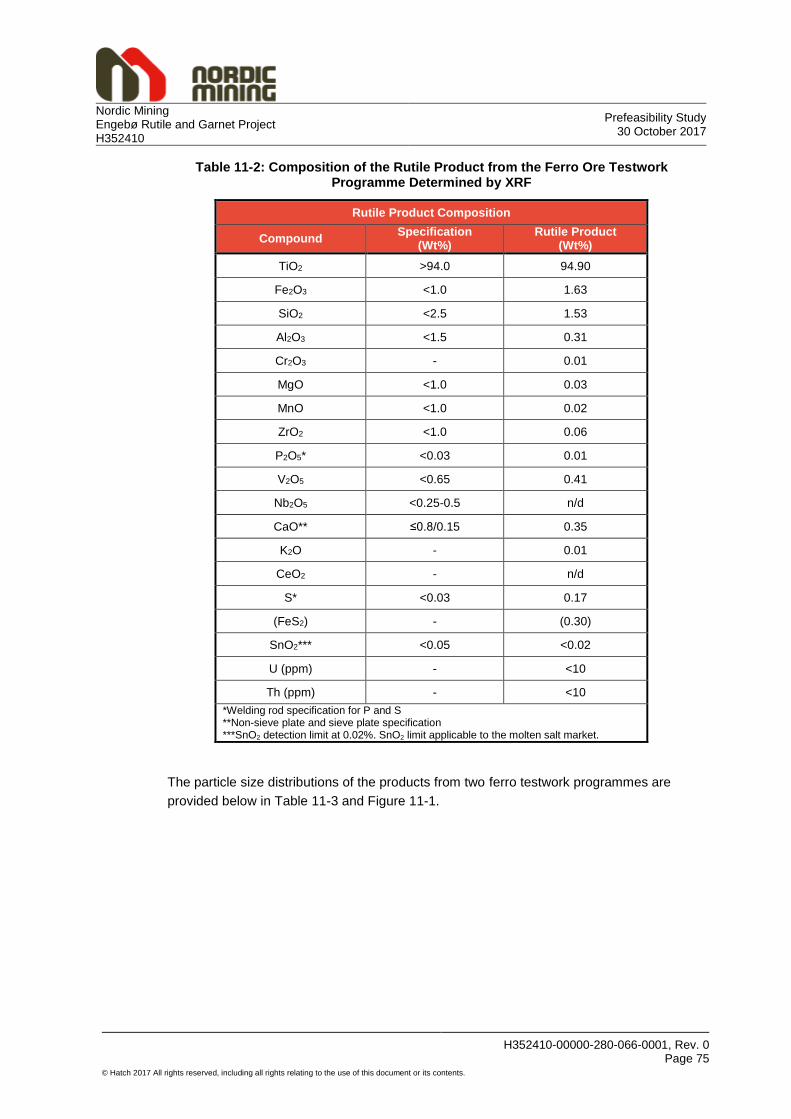
Nordic Mining Prefeasibility Study
30 October 2017 Engebø Rutile and Garnet Project H352410
H352410-00000-280-066-0001, Rev. 0 Page 75
© Hatch 2017 All rights reserved, including all rights relating to the use of this document or its contents.
Table 11-2: Composition of the Rutile Product from the Ferro Ore Testwork Programme Determined by XRF
Rutile Product Composition
Compound Specification
(Wt%) Rutile Product
(Wt%)
TiO2 >94.0 94.90
Fe2O3 <1.0 1.63
SiO2 <2.5 1.53
Al2O3 <1.5 0.31
Cr2O3 - 0.01
MgO <1.0 0.03
MnO <1.0 0.02
ZrO2 <1.0 0.06
P2O5* <0.03 0.01
V2O5 <0.65 0.41
Nb2O5 <0.25-0.5 n/d
CaO** ≤0.8/0.15 0.35
K2O - 0.01
CeO2 - n/d
S* <0.03 0.17
(FeS2) - (0.30)
SnO2*** <0.05 <0.02
U (ppm) - <10
Th (ppm) - <10
*Welding rod specification for P and S **Non-sieve plate and sieve plate specification ***SnO2 detection limit at 0.02%. SnO2 limit applicable to the molten salt market.
The particle size distributions of the products from two ferro testwork programmes are
provided below in Table 11-3 and Figure 11-1.

Nordic Mining Prefeasibility Study
30 October 2017 Engebø Rutile and Garnet Project H352410
H352410-00000-280-066-0001, Rev. 0 Page 76
© Hatch 2017 All rights reserved, including all rights relating to the use of this document or its contents.
Table 11-3: Particle Size Distribution of the Rutile Product from Ferro Ore Testwork
Rutile Product Particle Size Distribution
Aperture (µm) Programme 1308*
(Cum. Wt%) Programme 1245**
(Cum. Wt%)
250 100 100
212 99.9 100
180 93.1 75.2
150 81.7 52.1
125 65.0 31.0
106 50.0 18.3
90 29.7 6.6
75 15.1 2.3
63 6.9 n/a
45 0.7 0
0 0 0
D50 (µm) 106 147
D80 (µm) 147 186
*See section 11.4.3 for details of testwork programme 1308 **See section 11.4.2 for details of testwork programme 1245
Figure 11-1: Particle Size Distributions of the Rutile Products from the Two Ferro Ore Bulk Testwork Programmes
0
10
20
30
40
50
60
70
80
90
100
0 25 50 75 100 125 150 175 200 225 250
Cum
ula
tive
Wt%
Size (µm)
1308 1245

Nordic Mining Prefeasibility Study
30 October 2017 Engebø Rutile and Garnet Project H352410
H352410-00000-280-066-0001, Rev. 0 Page 77
© Hatch 2017 All rights reserved, including all rights relating to the use of this document or its contents.
Looking at the data in Table 11-3 and Figure 11-1, it can be seen that the PSD for the
1308 product is more fine-grained than the 1245 product. The product from programme
1308 contains approximately 12.8 percentage points more <75 µm material than the
product from 1245. A pigment grade rutile product with minimal material below 75 µm is
favoured and should in general be below 5%, although this varies between producers.
Although the PSD of the 1308 product is finer than the 1245 product, the process
development programme has demonstrated that a product conforming to the industry
standard can be made. More work will be done as part of the Definitive Feasibility Study
testwork programmes to optimise the comminution and screening of the rutile feed to
produce a coarser product. The molten salt industry for titanium metal production could
serve as a potential market for the finer rutile (45 µm to 75 µm) produced in the process.
This should represent a smaller product stream that could easily be absorbed by this
market. The tin (as SnO2) level of the produced rutile is below 0.05% which is the
threshold for the molten salt feed, as higher levels of tin make the metal brittle. Based on
this information it is assumed that all produced rutile as presented above is a saleable
product.
11.1.3 Achieved Garnet Products
The mineralogy of the coarse and fine garnet products achieved in the testwork
programmes on ferro ore are provided below in Table 11-4. Both products are within the
target of more than 92% garnet and have acceptable levels of quartz and other impurities.
Table 11-4: Mineralogy of the Coarse and Fine Garnet Products from the Ferro Ore Testwork Programme Determined by QEMSCAN Analysis (SGS Canada)
Garnet Product Mineralogy
Mineral Coarse Garnet (Wt%) Fine Garnet (Wt%)
Garnet 95.4 95.5
Rutile 0.43 0.45
Pyrite 0.05 0.02
Quartz 0.47 0.28
Amphiboles 0.59 0.76
Clinopyroxenes 2.21 2.31
Other 0.85 0.68
The particle size distributions of the coarse and fine garnet products are shown below in
Table 11-5.

Nordic Mining Prefeasibility Study
30 October 2017 Engebø Rutile and Garnet Project H352410
H352410-00000-280-066-0001, Rev. 0 Page 78
© Hatch 2017 All rights reserved, including all rights relating to the use of this document or its contents.
Table 11-5: Particle Size Distributions of the Coarse and Fine Garnet Products from the Ferro Ore Testwork Programme
Garnet Product Particle Size Distributions
Aperture (µm)
Coarse Garnet (Cum. Wt%)
Fine Garnet (Cum Wt%)
600 100 -
500 98.8 -
425 95.1 -
355 84.0 -
300 65.2 -
250 34.9 100
212 13.2 99.2
180 1.5 83.3
150 0.5 57.2
125 0.2 26.2
106 0 7.8
90 - 0.7
75 - 0
D50 (µm) 274 144
D80 (µm) 342 176
The particle size distributions of the two garnet products achieved in the PFS and the
three target garnet products, namely 30/60, 80 and 100 mesh, are provided in Figure 11-2
and Figure 11-3 below (for a note on the meaning of mesh sizes, refer to Section 17.2.1).
The target products will be derived from the coarse and fine garnet products by blending
in the necessary ratios. The target is to achieve a blend such that 30/60 mesh, 80 mesh
and 100 mesh are produced in the relative amounts of 35%, 32.5% and 32.5%,
respectively. A surplus of fine garnet is produced; therefore, coarse garnet drives overall
capacity and the expectation is that a coarse-to-fine ratio of 62.5:37.5 is sufficient to meet
the target PSD of each product type.

Nordic Mining Prefeasibility Study
30 October 2017 Engebø Rutile and Garnet Project H352410
H352410-00000-280-066-0001, Rev. 0 Page 79
© Hatch 2017 All rights reserved, including all rights relating to the use of this document or its contents.
Figure 11-2: Particle Size Distributions of the Two Garnet Products achieved in the PFS
Figure 11-3: Particle Size Distributions of the Three Target Garnet Products
0
10
20
30
40
50
60
70
80
90
100
0 100 200 300 400 500 600
Cum
ula
tive W
t%
Size (µm)
Coarse Garnet (Nordic Mining) Fine Garnet (Nordic Mining)
0
10
20
30
40
50
60
70
80
90
100
0 100 200 300 400 500 600
Cum
ula
tive W
t%
Size (µm)
30/60 mesh 80 Mesh 100 Mesh

Nordic Mining Prefeasibility Study
30 October 2017 Engebø Rutile and Garnet Project H352410
H352410-00000-280-066-0001, Rev. 0 Page 80
© Hatch 2017 All rights reserved, including all rights relating to the use of this document or its contents.
11.1.4 Historic Test Work Programmes
Previous testwork conducted by DuPont in the late nineties included work to understand
and define comminution, wet magnetic separation, wet gravity separation, flotation, dry
magnetic separation, electrostatic separation and agglomeration testwork. The
information from historic testwork consisted of a hand drawn flowsheet, laboratory assay
results, various memos from comminution tests and particle size distributions of various
testwork fractions. Based on the test work, DuPont defined a flowsheet for rutile
processing. A simple pilot setup revealed a rutile recovery of approximately 47%. DuPont
stated that this was based on non-optimised process conditions and that the recovery
most likely could be improved. No test work was done to recover garnet.
Nordic Mining acquired the asset in 2008 and undertook preliminary testwork
programmes at several institutions to improve knowledge and understanding of the
contained valuable minerals rutile and garnet. Several small-scale tests of different
process stages were undertaken. Testwork included magnetic and electrostatic
separation at Outotec, and several test programmes including flotation, at NTNU. The
results did not show significant improvement of the processing performance and
recoveries that were achieved by DuPont. A garnet concentration test by magnetic
separation was done by a commercial garnet producer and was successful in producing a
water-jet quality garnet product. All reports were made available for the PFS team.
11.1.5 Introduction to the Developed Flowsheet
The flowsheet developed in the PFS is shown below in Figure 11-4. Run of mine passes
through a multi-stage comminution circuit that produces coarse (212 µm to 550 µm) and
fine (<212 µm) products through jaw crushing, cone crushing, impact (Hazemag) crushing
and rod milling. The material is de-slimed to reject material less than 45 µm. The coarse
fraction (>212 µm) is processed through a gravity concentration circuit and the resultant
concentrate is fed to a two-stage dry magnetic separation circuit. The final middlings from
magnetic separation are screened at 212 µm and the oversize serves as the coarse
garnet product. Meanwhile, the tails from the gravity circuit and a portion of the magnetic
and non-magnetic rejects from the magnetic circuit are reground to <212 µm to liberate
and recover additional rutile and garnet. This stream is combined with the fine stream
from the comminution circuit and fed to a wet magnetic separation circuit that produces
magnetic and non-magnetic streams. The non-magnetic stream serves as feed to the
rutile circuit which comprises gravity concentration followed by flotation to remove pyrite
and then dry magnetic and electrostatic separation, producing a final conductive, rutile
product. The magnetic stream from wet magnetic separation is fed to a gravity
concentration circuit where the resultant concentrate is fed to a dry magnetic separator.
The middlings from dry magnetic separation are screened at 106 µm and the oversize
serves as the fine garnet product. Wet rejects are fed to a dewatering circuit to recover
process water and the underflow is combined with dry rejects and sent to the co-disposal
system. The rejects are then diluted with sea water in the co-disposal system and
discharged to the fjord bed.

Nordic Mining Prefeasibility Study
30 October 2017 Engebø Rutile and Garnet Project H352410
H352410-00000-280-066-0001, Rev. 0 Page 81
© Hatch 2017 All rights reserved, including all rights relating to the use of this document or its contents.
Figure 11-4: Block Flow Diagram of the Developed Flowsheet

Nordic Mining Prefeasibility Study
30 October 2017 Engebø Rutile and Garnet Project H352410
H352410-00000-280-066-0001, Rev. 0 Page 82
© Hatch 2017 All rights reserved, including all rights relating to the use of this document or its contents.
11.1.6 Selection of Yield as the Basis for Garnet Calculations
The overall mass yield to the coarse garnet product was selected as the basis for
reporting the garnet processing performance for the following reasons:
The particle size distribution of the garnet products is an important factor considering
the amount of garnet that can be retrieved from the process. Therefore, there is not a
clear connection between garnet grade and recovery
Using yield instead of recovery is common practice for a number of industrial minerals
where quality of the product and not necessarily grade is important to predict the
retrievable amount
Garnet grades throughout the deposit are difficult to measure correctly because there
is no chemical assay that can directly quantify the garnet content. For the deposit,
mineralogical analysis of garnet was performed by QEMSCAN and a calculation
based on chemistry was applied as explained in Section 7 of this report. For the
quantification of garnet, a conservative approach was taken due to the limitation of
the data. A yield approach for predicting the retrievable amount of garnet was
determined to give a better result than recovery calculations based on head grade
and a set recovery factor.
As part of the DFS work, a programme aiming to increase the knowledge of the grade
and quality variations of garnet in the deposit, and to better understand how this affects
the recovery and yield, will be investigated.
Mass yield (referred to simply as ‘yield’ in this report) is defined as the fraction of the feed
mass reporting to a specified product or outflow stream. Therefore, the “overall yield” to a
specified product is the fraction of RoM reporting to that product, which in the current
context is the garnet product. This should not be confused with recovery, which refers to a
particular species present in the ore. Recovery then, is the fraction of the total amount of
the species (e.g. TiO2) that reports to the specified product (e.g. rutile), and does not
consider overall or total masses.
11.2 Sample Selection and Data Acquisition
In 2012 six (6) bulk samples were drilled and blasted at the Engebø mountain. The
blasting was carried out by a local entrepreneur, Røyseth Maskin. The samples were
selected based on being representative samples of the ore in the first years of open pit
mining of the deposit. In total 110 t were obtained. Table 11-6 below lists the name, ore
type, location, size and chemically assayed rutile grade and ilmenite content of each
sample. Drill cuttings were obtained from each blast site and representative samples were
obtained for chemical assays.

Nordic Mining Prefeasibility Study
30 October 2017 Engebø Rutile and Garnet Project H352410
H352410-00000-280-066-0001, Rev. 0 Page 83
© Hatch 2017 All rights reserved, including all rights relating to the use of this document or its contents.
Table 11-6: Source Samples for Process Testwork
Sample Lithology TiO2
Grade* (XRF)
% TiO2 Ilmenite*
(HCl)
X-Coordinate
Y-Coordinate
Sample Size
(tonnes)
ENG1 Trans 2.60 % 0.40 % 310189 6822818 18.0
ENG2 Ferro 5.22 % 0.12 % 310170 6822852 21.0
ENG3 Ferro 3.81 % 0.12 % 310214 6822794 23.0
ENG7 Ferro 4.71 % 0.12 % 310062 6822788 14.0
ENG205 Trans 2.42 % 0.07 % 310285 6822833 16.0
ENG217 Ferro 5.20 % 0.13 % 310099 6822766 17.2
*All samples were assayed in 2016 except ENG01 which was assayed in 2013. ENG01 is not included
in the PFS testwork.
The material was stored outdoors as blasted blocks at a local sand pit. The material does
not seem to be affected by the short-term outdoor storage, and there is little evidence of
weathering or oxidation. The iron oxidation surface can be found in freshly blasted
samples and is believed to have been placed prior to storage.
Figure 11-5: ENG07 Sample in Storage
11.2.1 Sample Preparation and Comminution
In 2016 the blasted samples were crushed to < 200 mm and transferred to big bags and
moved to Nordic Mining’s office building in Naustdal.
Representative samples for further comminution and process tests were assembled by
laying out material from each sample in an elongated heap, and then shovelling material
by the length of the heap to create representative samples. The samples were continually
weighed to achieve the right mass.

Nordic Mining Prefeasibility Study
30 October 2017 Engebø Rutile and Garnet Project H352410
H352410-00000-280-066-0001, Rev. 0 Page 84
© Hatch 2017 All rights reserved, including all rights relating to the use of this document or its contents.
Table 11-7 below shows the blending ratios of the different source samples that were
used to create blended samples for process and comminution testwork. Samples 1231,
1245 and 1308 are blends that represent ferro-eclogite, high-grade ore samples with a
rutile grade above 3%; sample 1234 represents a transitional (trans) eclogite, a low-grade
ore sample with a rutile content between 2% and 3%.
Table 11-7: Source Samples that Contributed to each of the Blended Samples for Process Testwork
Source Sample Lithology Processing Sample
1231 1245 1234 1308
ENG1 Ferro
ENG2 Ferro 1 1 2.3
ENG3 Ferro 1 1 1
ENG7 Ferro 1 1 1
ENG205 Trans 1 1 1 1
ENG217 Ferro 2 2 0.7
11.2.2 Production of the 1231 Sample
The 1231 sample was made by crushing each source sample through a jaw crusher at
NTNU to <8 mm and then mixing the samples as shown in Table 11-7. The combined
<8 mm material was then crushed by a High Pressure Grinding Roller (HPGR) and
screened on a Derrick screen at 212 µm. The oversize was further milled to <212 µm in a
rod mill while continuously being mixed with the screen undersize. The 1231 is
characterised as a finely comminuted ferro blend sample that was made to liberate rutile.
The sample was shipped in plastic barrels to IHC Robbins for process testing to recover
rutile and fine garnet.
11.2.3 Production of the 1245 Sample
The 1245 sample source material was jaw crushed to <30 mm at NTNU and blended
according to Table 11-7 above. The combined <30 mm feed was crushed by a laboratory
scale impact crusher and screened at 500 µm. The impact crusher at NTNU broke down
so that only 70% of the material was crushed this way. The residual material was crushed
using an HPGR. The oversize was milled to <500 µm in a rod mill while continuously
being mixed with the screen undersize. The 1245 represents a coarsely comminuted ferro
ore sample with the aim of recovering both coarse and fine garnet products as well as
making a rutile product. The sample was sent to IHC Robbins in plastic barrels for
process testing.
11.2.4 Production of the 1308 Sample
The 1308 sample is a carefully comminuted sample that was run through an optimised
comminution route established through extensive testwork as described in Section 11.3.4.
In brief, <200 mm material was stage crushed in a cone crusher at Mintek (South Africa)
to <12 mm to make a suitable feed for the impact crusher. The <12 mm material was
further crushed in a larger scale Hazemag Impact crusher at IMS (South Africa) to
<550 µm. The crushing was monitored to ensure optimum crushing conditions. The
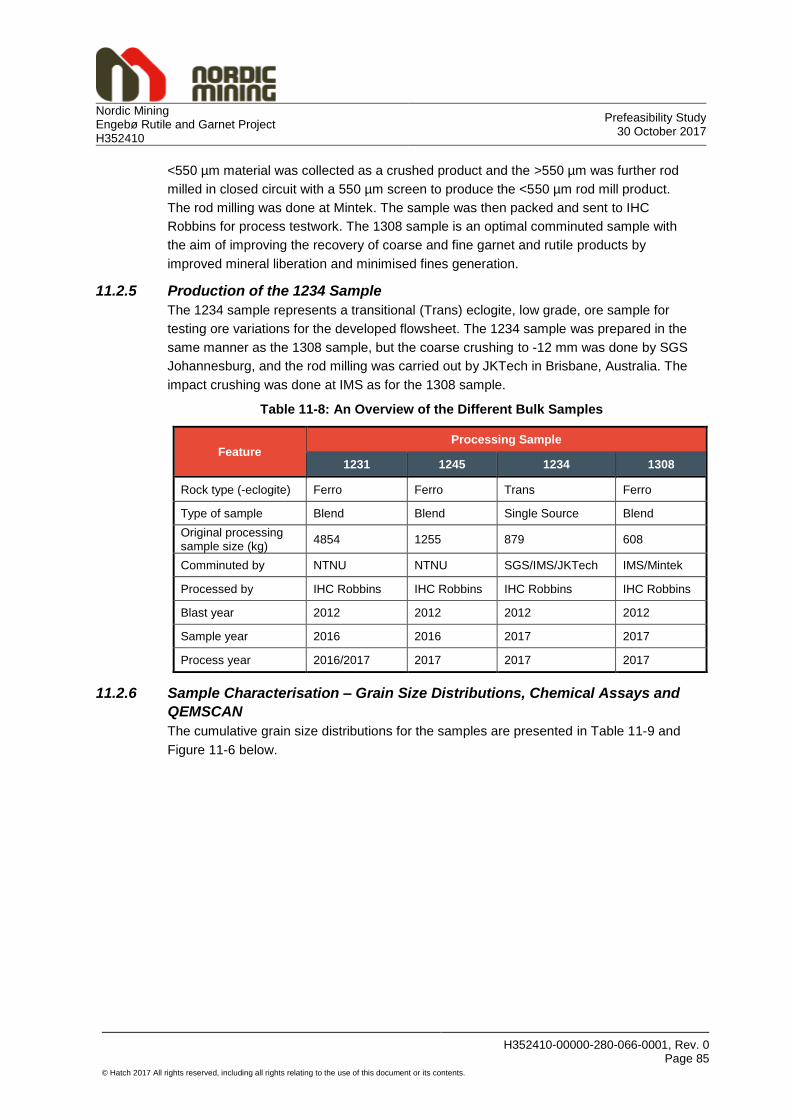
Nordic Mining Prefeasibility Study
30 October 2017 Engebø Rutile and Garnet Project H352410
H352410-00000-280-066-0001, Rev. 0 Page 85
© Hatch 2017 All rights reserved, including all rights relating to the use of this document or its contents.
<550 µm material was collected as a crushed product and the >550 µm was further rod
milled in closed circuit with a 550 µm screen to produce the <550 µm rod mill product.
The rod milling was done at Mintek. The sample was then packed and sent to IHC
Robbins for process testwork. The 1308 sample is an optimal comminuted sample with
the aim of improving the recovery of coarse and fine garnet and rutile products by
improved mineral liberation and minimised fines generation.
11.2.5 Production of the 1234 Sample
The 1234 sample represents a transitional (Trans) eclogite, low grade, ore sample for
testing ore variations for the developed flowsheet. The 1234 sample was prepared in the
same manner as the 1308 sample, but the coarse crushing to -12 mm was done by SGS
Johannesburg, and the rod milling was carried out by JKTech in Brisbane, Australia. The
impact crushing was done at IMS as for the 1308 sample.
Table 11-8: An Overview of the Different Bulk Samples
Feature Processing Sample
1231 1245 1234 1308
Rock type (-eclogite) Ferro Ferro Trans Ferro
Type of sample Blend Blend Single Source Blend
Original processing sample size (kg)
4854 1255 879 608
Comminuted by NTNU NTNU SGS/IMS/JKTech IMS/Mintek
Processed by IHC Robbins IHC Robbins IHC Robbins IHC Robbins
Blast year 2012 2012 2012 2012
Sample year 2016 2016 2017 2017
Process year 2016/2017 2017 2017 2017
11.2.6 Sample Characterisation – Grain Size Distributions, Chemical Assays and
QEMSCAN
The cumulative grain size distributions for the samples are presented in Table 11-9 and
Figure 11-6 below.

Nordic Mining Prefeasibility Study
30 October 2017 Engebø Rutile and Garnet Project H352410
H352410-00000-280-066-0001, Rev. 0 Page 86
© Hatch 2017 All rights reserved, including all rights relating to the use of this document or its contents.
Table 11-9: Prepared Bulk Sample Cumulative Particle Size Distributions
Size (µm)
Processing Sample
1231 1245 1234 1308
600 100 100 99.6 100
500 100 100 96.5 99.4
425 100 99.0 91.4 94.1
300 100 87.5 77.7 80.0
212 91.0 74.0 65.3 65.9
150 75.8 56.6 49.5 50.9
106 54.0 40.7 36.1 36.8
75 32.5 24.1 23.9 25.0
63 27.0 18.9 19.1 17.4
45 20.7 14.7 15.0 14.5
Figure 11-6: Prepared Bulk Sample Cumulative Particle Size Distributions
Table 11-10 below shows the most important chemical and mineralogical features of the
different samples.
0
20
40
60
80
100
0 100 200 300 400 500 600
Cum
ula
tive %
Passin
g
Grain size (µm)
1231 1245 1234 1308

Nordic Mining Prefeasibility Study
30 October 2017 Engebø Rutile and Garnet Project H352410
H352410-00000-280-066-0001, Rev. 0 Page 87
© Hatch 2017 All rights reserved, including all rights relating to the use of this document or its contents.
Table 11-10: Prepared Bulk Sample Properties
Feature Processing Sample
UoM 1231 1245 1234 1308
Garnet grade in total sample* wt% 43.2 47.3 47.5 50.4
Garnet distribution to +212 µm wt% n/a 26.8 34.5 35.1
Garnet distribution to +300 µm wt% n/a 10.5 20.0 20.7
Theoretical garnet recovery** % n/a 13.8 27.1 39.5
Theoretical garnet yield (at 92% product grade)
wt% n/a 7.1 14.0 21.7
TiO2 grade of total sample* wt% 4.50 4.47 2.66 4.67
TiO2 grade in -212/+45 µm wt% 4.63 5.27 2.87 5.78
TiO2 distribution to +212 µm wt% 0 13.9 26.7 22.3
TiO2 distribution to -212/+45 µm wt% 79.3 72.4 56.1 65.8
TiO2 distribution to -45 µm wt% 20.7 13.7 17.2 11.9
Theoretical TiO2 recovery % 67.4 63.1 59.9 73.3
* Garnet mineralogy by QEMSCAN and TiO2 chemistry by XRF; ** Based on free + liberated garnet
All the comminuted samples were further sampled for chemical and mineralogical
analysis by XRF and QEMSCAN. Where the comminution circuit consisted of both
crushing and milling the two products were sampled individually before being combined
into a total sample. In this way, important information regarding the performance of the
two stages in the comminution circuit could be revealed. All the samples were assayed by
both XRF (eight fractions) and QEMSCAN (six fractions). Analysing all the samples by the
same setup every time gave good opportunities to compare the different comminution
method and feeds for the processing testwork and made direct comparisons possible.
The samples were marked, and detailed information on all the samples were recorded in
Nordic Mining’s database together with tracking information from the couriers. The
laboratories were informed about the estimated arrival time of the samples as well as
information and procedures for treating the samples so that reliable data could be
recorded rapidly with reduced risk of analytical or procedural errors.
Analyses of crush and rod mill products were copied into an MS Excel programme that
combined the data correctly each time. For comparing and assessing different samples
and comminution methods, pre-set parameters and criteria were investigated such as
mineral and element distribution, liberation data and theoretical recoveries.
11.2.7 Theoretical Recovery Calculations and Theoretical Yield Figures
The theoretical garnet recovery calculations were based on the distribution of garnet to
the coarse fraction (>212 µm) and the garnet liberation (>80% liberated) in this fraction.
By multiplying the distribution of garnet with the liberation data, the potential garnet
available for recovery is estimated, and dividing this by the head grade gives the
theoretical recovery. The theoretical recovery of the coarse garnet is multiplied by 1.6 in

Nordic Mining Prefeasibility Study
30 October 2017 Engebø Rutile and Garnet Project H352410
H352410-00000-280-066-0001, Rev. 0 Page 88
© Hatch 2017 All rights reserved, including all rights relating to the use of this document or its contents.
order to include the specified amount of fine garnet (<212 µm) in the total garnet recovery
that will constitute the three products: 30/60, 80 and 100 mesh. As there is a surplus of
fine garnet, the coarse garnet recovery is the limiting factor in determining overall garnet
recovery. The total garnet product should include 62.5% of the coarse garnet (>212 µm)
and 37.5% of the fine garnet (<212 µm) products. The theoretical garnet yield is
determined by multiplying the theoretical garnet recovery by the ratio of the garnet grade
of the feed to the target garnet grade of the product.
The theoretical recovery of TiO2 is calculated from the liberated (>80% liberation) TiO2
available in the <212 µm product from the comminution circuit and the liberated TiO2 from
the regrind of the coarse garnet rejects (>212 µm). In both sources, rutile deportment to
the <45 µm fraction is considered a loss of recovery.
The theoretical recoveries and yields were important factors in comparing different
comminution methods when selecting the optimised comminution circuit as well as for
predicting and comparing process testwork efficiencies.
11.3 Comminution Testwork
11.3.1 Introduction to Comminution Testwork
Comminution testwork was conducted in order:
To characterise the ore
To determine the optimal comminution route by:
maximising liberation of rutile and garnet
minimising production of fines
determining the comminution circuit with highest NPV.
To determine key input figures for economic calculations.
Ore hardness characterisation testwork were conducted at Mintek, JKTech and Grinding
Solutions. The following bench scale tests were conducted: Uniaxial Compression
Strength testwork, Bond Crushability testwork, Bond Abrasion testwork, Bond Rod Work
Index, Bond Ball Work Index, Grindmill testwork and SMC testwork.
Testwork at pilot scale using bulk samples was also conducted using different
technologies in order to determine their performance and select the most cost-effective
process route. The following pilot scale testwork were conducted: High Pressure Grinding
Roll (HPGR), impact crusher using Hazemag technology, rod mill, cone crusher, Vertical
Shaft Impactor (VSI).
The comminution circuit aimed to crush/mill the ore to <550 µm for coarser garnet
beneficiation and re-grind the material to create a rutile and fine garnet feed at 212 µm.
From the different circuits tested using different technologies, a three-stage crushing
circuit comprising: (i) a jaw crusher as the primary crusher, (ii) a cone crusher as the
secondary crusher, (iii) an impact crusher as the tertiary crusher and (iv) a rod mill to mill
the ore to <550 µm, was found to be the most cost-effective process route. The success
of this circuit is mainly due to: (i) a better liberation of coarser garnet produced by the

Nordic Mining Prefeasibility Study
30 October 2017 Engebø Rutile and Garnet Project H352410
H352410-00000-280-066-0001, Rev. 0 Page 89
© Hatch 2017 All rights reserved, including all rights relating to the use of this document or its contents.
impact crusher, (ii) a relatively significant proportion of liberated coarser garnet produced
by the impact crusher, and (iii) the lower proportion of fines (<45 µm) generated.
11.3.2 Developed Comminution Circuit
The developed comminution circuit includes a jaw crusher as the primary crushing stage.
The jaw crusher will operate in open circuit with pre-screening of the feed before the jaw
crusher. The target size for the primary crushing stage is 80% passing 150 mm. The
product of the primary crushing stage is fed to a secondary crushing stage which includes
a bin and a double deck screen followed by a secondary cone crusher treating the
oversize of the screen. The target size for the secondary crushing stage is 80% passing
50 mm. The product of the secondary crusher feeds the tertiary crushing stage. The
tertiary crushing stage consists mainly of impact crushers operating in closed circuit with
a 6 mm screen. The secondary crusher product is conveyed to a tertiary crusher bin. The
tertiary crusher bin feeds screens ahead of the impact crushers. The screen oversize
feeds the impact crushers operating in closed circuit with a 6 mm screen. The tertiary
crushing stage product (<6 mm) is stored in a bin/silo before feeding the milling circuit.
The crushing circuit product (<6 mm) is pre-screened to 550 µm. The oversize (>550 µm)
feeds the primary rod mill operating in closed circuit with a 550 µm screen. The <550 µm
generated from the pre-screening stage and rod-milling stage constitutes the feed to the
coarse garnet beneficiation circuit.
11.3.3 Ore Hardness Characterisation Testwork
Comminution bench scale testwork was conducted on Nordic Mining’s samples in order to
characterise the ore and generate data for the design of the comminution circuit. The
following testwork was conducted:
The Uniaxial Compression Strength (UCS) test
The Bond Crushability Work Index (CWI)
The Bond Abrasion Index (AI)
The Bond Rod Work Index (BRWI)
The Bond Ball Work Index (BBWI)
The SAG Mill Comminution (SMC) test
The grind rod mill testwork.
Testwork was conducted at Geolabs Limited, Mintek and Grinding Solutions in the UK.
The Uniaxial Compression Strength (UCS) test was conducted at Geolabs Limited on
different rock types and the results are given in Table 11-11 below. The average UCS
value for the ferro and trans rock types which are mineralised is 141.2 MPa, while the
80th percentile is 172 MPa.

Nordic Mining Prefeasibility Study
30 October 2017 Engebø Rutile and Garnet Project H352410
H352410-00000-280-066-0001, Rev. 0 Page 90
© Hatch 2017 All rights reserved, including all rights relating to the use of this document or its contents.
Table 11-11: UCS Results
No Rock Types
UCS (MPa)
Minimum Maximum Average
1 Ferro 150 188 166
2 Trans 56.1 172 116.4
3 Leuco 72.2 133 97.3
4 Amphibolite 28.2 92.3 69.4
5 Alt 61.9 72.7 67.3
6 Gneiss 128
The Bond CWI test was conducted at Mintek and Grinding Solutions. The 80th percentile
of the combined results obtained at both laboratories is 16.3 kWh/t. The summary results
obtained at Mintek and Grinding Solutions are reported in Table 11-12.
Table 11-12: Bond Crushability Work Index Results Obtained at Mintek and Grinding Solutions
Bond Crushability Work Index (kWh/t)
Laboratory Minimum Maximum Average 80th
Percentile
Mintek 8.6 20.2 13.3 16.6
Grinding Solutions 4.8 18.6 10.9 14.3
The Bond AI test conducted at Grinding Solutions shows that the ore is abrasive with an
index of 0.68. The AI results are summarised in Table 11-13 below.
Table 11-13: Abrasion Index Results
Bond Abrasion Index 0.68
Abrasiveness (French abrasiveness standard) 1,380
The BRWI test was conducted at Grinding Solutions at a limiting screen of 1,180 µm and
at Mintek at a limiting screen of 550 µm. Results of 10.92 kWh/t and 10.90 kWh/t were
achieved at closing screen of 1,180 µm and 550 µm respectively. The BRWI results are
summarised in Table 11-14 below.
Table 11-14: Bond Rod Work Index Results
Sample ID Limiting Screen
(µm) F80 (µm) P80 (µm)
Net Production
(g/rev)
Work Index (kWh/t)
Nordic Mining 550 10,851.20 323.02 6.63 10.90
Nordic Mining 1,180 10,751 778 11.87 10.92

Nordic Mining Prefeasibility Study
30 October 2017 Engebø Rutile and Garnet Project H352410
H352410-00000-280-066-0001, Rev. 0 Page 91
© Hatch 2017 All rights reserved, including all rights relating to the use of this document or its contents.
The BBWI test was conducted at Mintek at a limiting screen of 212 µm. A BBWI value of
8.91 kWh/t classifying the ore as soft for ball milling was achieved as indicated in Table
11-15 below.
Table 11-15: Bond Ball Work Index Results
Sample ID Limiting
Screen (µm) F80 (µm) P80 (µm)
Net Production
(g/rev)
Work Index
(kWh/t)
Nordic Mining 212 2,522.53 182.42 3.77 8.91
An SMC test was conducted to generate the JK parameter A x b which is used for the
modelling of the crushing circuit. The result of A x b of 35 was achieved classifying the
ore as hard at coarser size. The SMC results are summarised in Table 11-16 below.
Table 11-16: SMC Results
Sample ID DWI
(kWh/m3)
DWI (%)
MIi Parameters (kWh/t) SG A b
A x b
ta Mia Mih Mic
Nordic Mining 10.27 89 20.7 16.7 8.6 3.6 100 0.35 35 0.25
Laboratory batch rod mill testwork was conducted at different energies on a sample
crushed to -13.2 mm. The objective of the testwork was to generate breakage parameters
to be used for the design of the rod mill operating in closed circuit. The results are
reported in Figure 11-7.
Figure 11-7: Laboratory Batch Rod Mill Testwork Results
The comminution bench scale results are summarised in Table 11-17 below.

Nordic Mining Prefeasibility Study
30 October 2017 Engebø Rutile and Garnet Project H352410
H352410-00000-280-066-0001, Rev. 0 Page 92
© Hatch 2017 All rights reserved, including all rights relating to the use of this document or its contents.
Table 11-17: Summary of Bench Scale Comminution Testwork
Testwork Results
1 Uniaxial Compression Strength 172 MPa
2 Bond Crushability Work Index 16.3 kWh/t
3 Bond Abrasion Index 0.68
4 Bond Rod Work Index 10.90 kWh/t at 550 µm closing screen 10.92 kWh/t at 1,180 µm closing screen
5 Bond Ball Work Index 8.91 kWh/t at 212 µm closing screen
6 JK A x b parameter ta
35 0.25
The results generated during this PFS were used to design the comminution circuit.
Testwork recommendations for the FS were made in terms of ore hardness variability
testwork and material flow properties testwork.
11.3.4 Comminution Process Route Determination
A comprehensive comminution testwork programme was conducted in order to determine
the most cost-effective comminution process route to be used for the Project in order to
extract the garnet and rutile.
The main comminution circuit involves crushing and milling the ore to <550 µm before the
beneficiation process to extract garnet and rutile. The main characteristic of this Project is
to maximise the production of garnet and rutile within specifications of grade and size
distribution while minimising the fines (<45 µm) generation. This requirement makes the
task of selecting the most cost-effective technology and circuit difficult.
The selection of a comminution circuit and technology is an economical choice influenced
by factors such as: plant capacity, ore characteristics and product size. Secondary factors
to the selection of a comminution circuit and technology such as the LoM, the
geology/mining method, the process requirement and project specifics (client preference,
commonality of equipment, lead time of major equipment, financial resources, risk profile
of project, experience of work force, logistical equipment transport, perceived potential for
expansion) also have a strong influence on the choice of a comminution circuit.
The following technologies and circuits were considered:
Base case circuit: this is a three-stage crushing circuit using a jaw crusher – cone
crusher – cone crusher followed by a rod mill in closed circuit with a 550 µm screen.
The base case flowsheet is represented in Figure 11-8 below.

Nordic Mining Prefeasibility Study
30 October 2017 Engebø Rutile and Garnet Project H352410
H352410-00000-280-066-0001, Rev. 0 Page 93
© Hatch 2017 All rights reserved, including all rights relating to the use of this document or its contents.
Figure 11-8: Base Case Flowsheet
HPGR circuit: this circuit is similar to the base case but includes an HPGR in the
tertiary crushing stage instead of a cone crusher as represented in Figure 11-9.
Figure 11-9: HPGR Flowsheet
Hazemag impact crusher circuit: the Hazemag impact crusher can be used in
secondary, tertiary and quaternary crushing stages. The results obtained in tertiary
crushing application were satisfactory and the flowsheet is represented in Figure
11-12.
Figure 11-10: Hazemag Flowsheet
Barmac/ VSI: the VSI is similar to the Hazemag in terms of mode of crushing. The
flowsheet investigated is represented in Figure 11-11.

Nordic Mining Prefeasibility Study
30 October 2017 Engebø Rutile and Garnet Project H352410
H352410-00000-280-066-0001, Rev. 0 Page 94
© Hatch 2017 All rights reserved, including all rights relating to the use of this document or its contents.
Figure 11-11: Vertical Shaft Impactor Flowsheet
Different technologies and circuit configurations were investigated during this PFS in
order to determine the most cost-effective comminution process route. Since different
technologies for the same target grind will achieve different liberation of garnet and rutile
and hence different recoveries, Nordic Mining has developed and implemented a testwork
programme with quantification of liberation using QEMSCAN results. Based on the
liberation of garnet and rutile data provided, it was possible to determine a theoretical
recovery of garnet and rutile that could be achieved. The recovery was used to determine
the NPV for each case and the NPV was used as a criterion to select the most cost-
effective comminution circuit.
The results obtained by using a plant capacity of 2.0 Mtpa, a 20-year LoM and an 8%
discount rate indicate that the circuit using the impact crusher technology in the tertiary
crushing application is the most cost-effective comminution process route for achieving a
better NPV. Impact crushing gave a superior liberation of mineral particles and less fines
production compared to other methods and therefore a better theoretical recovery for
both rutile and garnet.
The most cost-effective comminution circuit is presented in Figure 11-12 below. The
crushing circuit of the most cost-effective circuit includes a primary jaw crusher producing
a product of <150 mm, a secondary cone crusher producing <50 mm and a tertiary
impact crusher operating in closed circuit with a screen to produce <6 mm. In comparison
to other technologies tested during this phase of work (cone crusher, HPGR, VSI), the
Hazemag technology in tertiary crushing application has offered a better liberation of
garnet and rutile, maximising its yield/recovery and grade while generating fewer fines.
The wear rate of the impact crusher blow bars is higher requiring a rotation/replacement
every three days. All technologies selected in the crushing circuit are mature technologies
with many suppliers offering them across the world. The impact crusher has gained
popularity in the last two decades with manufacturer such as Metso, Weir Minerals,
Hazemag offering this technology. The primary milling circuit is conducted in a rod mill.
The rod mill was selected as opposed to the ball mill in order (i) to minimise fines
(<45 µm) generation resulting in a loss of rutile and garnet, (ii) to improve the yield of
coarser garnet. The rod mill is also a mature technology offered by many suppliers.

Nordic Mining Prefeasibility Study
30 October 2017 Engebø Rutile and Garnet Project H352410
H352410-00000-280-066-0001, Rev. 0 Page 95
© Hatch 2017 All rights reserved, including all rights relating to the use of this document or its contents.
It is recommended that further testwork be conducted during the DFS phase to improve
the accuracy of the study, improve the profitability of the Project and obtained process
guarantee. The additional testwork includes more Hazemag wear testwork to reflect the
circuit selected with pre-screening of fines to reduce the wear rate, variability testwork to
understand better the deposit and design the circuit for the LoM and pilot testwork with a
sample representing the first five years of operation.

Nordic Mining Prefeasibility Study
30 October 2017 Engebø Rutile and Garnet Project H352410
H352410-00000-280-066-0001, Rev. 0 Page 96
© Hatch 2017 All rights reserved, including all rights relating to the use of this document or its contents.
Figure 11-12: Selected Comminution Circuit

Nordic Mining Prefeasibility Study
30 October 2017 Engebø Rutile and Garnet Project H352410
H352410-00000-280-066-0001, Rev. 0 Page 97
© Hatch 2017 All rights reserved, including all rights relating to the use of this document or its contents.
11.4 Bulk Process Testwork and Flowsheet Definition
Following a review of all the previous testwork undertaken by others, a scope of work was
drafted to provide to suitable testwork laboratories in order to develop time and cost
estimates to undertake the testwork. The scope of work provided insights to previous work
undertaken including technology and technology sequence and endeavoured to relay the
results to provide insight into successes and failures from previous testwork. It was
acknowledged that process testwork was done previously and it was deemed important to
draw from the results of this previous work to ensure that testwork undertaken as part of
this PFS did not waste valuable resources exploring previous, similar testwork concepts.
Both Mineral Technologies and IHC Robbins were invited to participate in the testwork
programmes. Since Mineral Technologies was unable to commit to the project time lines,
IHC Robbins was selected as the primary laboratory to undertake the flowsheet
development testwork. Both laboratories are considered competent and both are
frequently involved in typical heavy mineral sands developments. In the Project team’s
opinion, both are equally competent to undertake this kind of testwork.
Table 11-18 below provides a summary of the bulk testwork programmes and the
associated samples prepared and shipped to IHC Robbins in Australia for process
definition testwork. The programmes in Table 11-18 below reflect the primary testwork
programmes which served as the main focus of the process development. However,
because suboptimal grades were obtained supplementary programmes were initiated to
achieve grades and enhance recoveries and these are summarised in Table 11-19 below.
As shown in Table 11-18 below, four main samples were subject to process test work at
IHC Robbins. The 1231 sample is a high-grade ore sample (ferro-eclogite) that was milled
to a fine grain size (212 µm) with the intention to specifically liberate and recover rutile.
The 1245 sample was the same high-grade material as 1231, but with a coarser grind to
recover coarse garnet, and with regrinding to recover rutile. The 1308 and 1234 samples
are both optimally comminuted samples using impact crushing and rod milling which
proved to give the best liberation. The samples were processed to recover both coarse
garnet and rutile through the enhanced process flowsheet developed through the 1231 and
1245 programmes. Figure 11-4 above shows the selected flowsheet as developed through
extensive testing.
A summary of the performance of the bulk testwork programmes is included in Table 11-20
below, and Figure 11-13 and Figure 11-14 provide a graphical comparison of the different
programmes. As can be seen in the table and the figures, the high-grade 1308 sample
shows a significant increase in recovery and grade, and yield and grade for rutile and
garnet products respectively. In addition, Figure 11-13 and Figure 11-14 show how each
successive ferro ore programme improved upon the previous programme. Note that Figure
11-14 only includes the mass yield to the coarse garnet product and the overall mass yield
to garnet (including fine garnet) is greater than that depicted in the figure. The process was
successful in producing a pigment grade rutile product and garnet products meeting both
coarse and fine market product requirements. The 1234 sample showed an inferior
performance as can be expected when processing low grade ore. It should be noted that
all the testwork reports from IHC Robbins contain QEMSCAN and QXRD results from
Bureau Veritas Minerals (BVM) Australia, while final garnet products presented in this

Nordic Mining Prefeasibility Study
30 October 2017 Engebø Rutile and Garnet Project H352410
H352410-00000-280-066-0001, Rev. 0 Page 98
© Hatch 2017 All rights reserved, including all rights relating to the use of this document or its contents.
report are based on results from SGS Canada. A decision was made to use SGS Canada
to align with the analytical procedures used by a prominent US garnet producer.
Table 11-18: Testwork Programmes for Process Definition and Metallurgical Performance
Bulk Testwork Programmes
Programme/ Sample
Sample Type Grain Size
Objective
1231 High grade. Fine grained ferro- eclogite sample
100% -212 µm
To develop a flowsheet for production of rutile and garnet final products.
1245 High grade. Coarse grained ferro- eclogite sample
100% -500 µm
To validate the flowsheets developed during programme 1231 and to define a flowsheet for production of a coarse garnet final product.
1308 High grade. Coarse grained ferro- eclogite sample, optimally comminuted
100% -550 µm
To optimise metallurgical performance and validate the flowsheet developed in 1231, 1245 and the supplementary programmes using an optimally comminuted, high-grade sample.
1234 Low grade. Coarse grained trans- eclogite sample, optimally comminuted
100% -550 µm
To determine the performance of the flowsheet developed in the previous bulk and supplementary testwork programmes, including comminution and beneficiation, on a typical lower grade Trans ore sample.

Nordic Mining Prefeasibility Study
30 October 2017 Engebø Rutile and Garnet Project H352410
H352410-00000-280-066-0001, Rev. 0 Page 99
© Hatch 2017 All rights reserved, including all rights relating to the use of this document or its contents.
Table 11-19: Supplementary Testwork Programmes to Optimise Metallurgical Performance
Supplementary Testwork Programmes
Programme Description Objective
1286-001 Coarse and fine garnet magnetic and size fractionation (T22 mag and T304 O/S)
To investigate magnetic and size fractionation of the fine and coarse garnet products in an effort to explore the upgrading potential.
1286-002 Rutile upgrade post pyrite flotation (using programme 1293 results)
To upgrade the post-pyrite flotation product and ensure that a rutile product of sufficient TiO2 grade is achievable.
1286-003 High density attritioning of coarse garnet
To determine whether additional or improved garnet liberation could be obtained by high density attritioning.
1286-004 Optimally comminuted 1308 bulk sample scouting tests
To formulate a process flowsheet and conduct detailed scouting tests to ensure that a coarse garnet product that meets the grade specification can be generated.
1286-005 Optimally comminuted 1308 bulk sample scouting tests inclusive of a wet gravity circuit
To determine whether the inclusion of a wet gravity circuit upstream of the dry magnetic circuit enhanced garnet grades and yields
1293 Rutile upgrade optimisation (including IHC Robbins and Mineral Technologies programmes)
To validate independently the performance of the rutile upgrading circuit and to investigate the potential benefits of alternative operating conditions
1280 Rutile recovery from 1245 fines, 100% passing 45 µm
To determine whether there is potential to recover rutile from the <45 µm fraction, and produce a fine rutile product
JKTech (17059) Reverse flotation to reject pyrite from rutile concentrate
To determine the potential of pyrite rejection and rutile upgrading through reverse flotation
Core Metallurgy (1090A)
Forward flotation and reverse flotation (including pyrite and silica flotation) of rutile concentrate
To determine the potential of pyrite rejection and rutile upgrading through forward and reverse flotation
Table 11-20: Summary of the Performance of Each Bulk Testwork Programme
Parameter Programme
UoM 1231* 1245* 1308 1234
Garnet grade, coarse % - 86.0 95.4 94.1
Garnet grade, fine % 93.1 92.6 95.5 93.3
TiO2 grade in produced rutile % 91.5 93.7 94.9 92.8
TiO2 overall recovery % 49.3 52.7 60.5 42.1
Garnet yield coarse product % - 6.6 11.4 6.0
Garnet yield fine product** % 11.6 17.1 7.8 12.7
*The results from the supplementary programmes are included in determining the overall values **Actual yield (i.e. not factored by the 62.5:37.5 coarse: fine garnet product specification)

Nordic Mining Prefeasibility Study
30 October 2017 Engebø Rutile and Garnet Project H352410
H352410-00000-280-066-0001, Rev. 0 Page 100
© Hatch 2017 All rights reserved, including all rights relating to the use of this document or its contents.
Figure 11-13: Grade-Recovery Curves for TiO2 for the Different Testwork Programmes
Figure 11-14: Grade-Yield Curves for Coarse Garnet for the Different Testwork Programmes
11.4.1 Programme 1231 – Fine Ferro Bulk Sample to Develop Process Flowsheets
for Rutile and Garnet Final Products
Prior to programme 1231, all process knowledge held by the processing team was in the
form of previous testwork results. Therefore, the 1231 programme was the first bulk
sample programme undertaken and the objective of the programme was to define the
process flow using standard heavy mineral sands process equipment and to produce rutile
and garnet products that met market specifications.
A summary of the leading aspects of the testwork programme follows.
ROM
DESLIMING
GARNET SEP.
WHIMSGRAVITY SEP. DRY MAGNETIC SEP.
ELECTROSTATIC SEP.
FLOTATION
0
10
20
30
40
50
60
70
80
90
100
0 20 40 60 80 100
TiO
2R
ecovery
(%
)
TiO2 Grade (%)
1245 1231 1308 1234
ROM
SCREENING
GRAVITY SEPARATION
MAGNETIC SEPARATION
SCREENING
0
10
20
30
40
50
60
70
80
90
100
40 50 60 70 80 90 100
Overa
ll M
ass Y
ield
to
the C
oars
e G
arn
et P
roduct (%
)
Coarse Garnet Grade (%)
1245 1308 1234

Nordic Mining Prefeasibility Study
30 October 2017 Engebø Rutile and Garnet Project H352410
H352410-00000-280-066-0001, Rev. 0 Page 101
© Hatch 2017 All rights reserved, including all rights relating to the use of this document or its contents.
The Project scope of work called for a “clean sheet” approach to the testwork programme
and the team reviewed most of the previous testwork conducted. Following the
characterisation of a representative sample of the bulk sample, testwork got underway with
a high-level comparison of gravity vs. magnetic separation as the first separation
technology. Three representative sub-samples derived from the feed preparation process
area sand fraction were used to compare the metallurgical performance of a spiral
separator process, a three stage Wet High Intensity Magnetic Separator (WHIMS) process
prior to gravimetric separation and a two stage WHIMS process. Metallurgical sighter test
work confirmed that the three stage WHIMS process provided the most optimum
metallurgical performance and consequently it was selected for the bulk processing of the
sand fraction. This bulk processing delivered two products, a magnetic concentrate
containing most of the contained fine garnet and a non-magnetic concentrate containing
most of the contained rutile.
Sighter tests completed on the non-magnetic fraction comparing the performance of an
Up-current Classifier (UCC)/spiral separator process to that of an all spiral separator
process indicated no metallurgical advantage associated with the UCC/spiral separator
process. Consequently, the non-magnetic concentrate upgrade process was developed
using spiral separators. The primary process non-magnetic concentrate material was
processed on a stage-by-stage basis through a five-stage spiral separator process.
Sighter tests conducted on the magnetic concentrate from the WHIMS circuit to develop
the fine garnet circuit to produce a garnet product at >106 μm, evaluated a UCC and spiral
separator circuit. Data confirmed that a UCC operating at a 60:40 (underflow: overflow)
split followed by a spiral separator to remove residual pyroxene would produce a
concentrate containing >80% garnet in the >106 μm size fraction. A bulk sub-sample
derived from the primary process magnetic concentrate was processed on a stage by
stage basis through a UCC and spiral separator operating at conditions as determined by
the sighter tests, with resultant spiral separator concentrate upgraded into a garnet product
by processing over two stages of rare earth drum magnetic separators and final screening
at 106 µm. The mineralogy of the garnet product is provided in Table 11-21 and the garnet
grade of 93.1% achieved exceeds the specification of 92%.
Finally, the concentrate from the gravity circuit that upgraded the non-magnetic product
from the WHIMS circuit was used to develop a dry physical separation circuit to produce a
final rutile product. This circuit would typically employ dry magnetic and electrostatic
separation equipment to recover the rutile into a (non-magnetic and conductive) final
product. Sighter tests were undertaken to establish the sequence of the magnetic and
electrostatic separation technologies, results showed that superior upgrading of TiO2 and
TiO2 distribution was achieved with a magnetic separation circuit ahead of the electrostatic
separation equipment. However, the dry physical separation step did not achieve a high
recovery of rutile and did not achieve product specifications as shown in Table 11-33
below. Flowsheet development testwork was undertaken on the spiral concentrate but this
initial testwork programme failed to produce a final rutile product that met typical market
chemical specifications. Effectively the “rutile” product still contained elevated levels of
SiO2 and mineralogical analysis confirmed the SiO2 levels were contributed by the
presence of amphiboles and pyroxenes. The concentrate also contained high levels of

Nordic Mining Prefeasibility Study
30 October 2017 Engebø Rutile and Garnet Project H352410
H352410-00000-280-066-0001, Rev. 0 Page 102
© Hatch 2017 All rights reserved, including all rights relating to the use of this document or its contents.
sulphur and the sulphur was confirmed to be contributed by the presence of pyrite (FeS2).
Recovery of TiO2 to the concentrate of this circuit was suboptimal and as a result it was
decided to undertake rutile flotation testwork as an alternative option to typical dry physical
separation. The results of this work are summarised in section 11.4.5.6. However, results
achieved were well below that achieved in the dry physical separation circuit and a
decision was taken not to pursue this option further. It was further decided to provide a
parallel sample to a competing laboratory (namely Mineral Technologies) to validate the
metallurgical performance of the dry physical separation circuit. Results from Mineral
Technologies confirmed that improved metallurgical performance was possible with
improved focus on individual equipment testwork conditions (see section 11.4.5.5.1).
These testwork conditions included feed rate, roll speeds, feed temperature, roll diameter
(rare earth roll magnet) and voltage (electrostatic plate separator). IHC Robbins was also
afforded the opportunity to repeat the dry circuit testwork now that detailed mineralogical
analysis was available. The results of this work were undertaken as a separate proposal
and are reported in section 11.4.5.5.2. Essentially, a significant improvement in the TiO2
recovery of 16.3% was achieved through rigorous process equipment feed condition
testing and will result in an increase of equipment quantities.
Table 11-21: Garnet Product Quality of Programme 1231 Determined by QEMSCAN (SGS Canada)
Mineral Grade Obtained (%)
Garnet 93.1
Rutile 0.3
Quartz 0.4
Leucoxene 0.0
Ilmenite 0.0
Ti intergrowths 0.1
Pyrite 0.0
Pyroxene/Amphibole 4.6
Others 1.5

Nordic Mining Prefeasibility Study
30 October 2017 Engebø Rutile and Garnet Project H352410
H352410-00000-280-066-0001, Rev. 0 Page 103
© Hatch 2017 All rights reserved, including all rights relating to the use of this document or its contents.
Table 11-22: Rutile Product Chemical Assay of Programme 1231 Determined by XRF
Major Oxide Specification
(%) Adjusted Grades
for FeS2 (%)
TiO2 >94.0 82.78
Fe2O3 <1.0 2.02
SiO2 <2.5 3.56
Al2O3 <1.5 0.66
Cr2O3 - 0.01
MgO <1.0 0.52
MnO <1.0 0.02
ZrO2 <1.0 0.03
P2O5* <0.03 0.01
U (ppm) - <10
Th (ppm) - 12
V2O5 <0.65 0.34
Nb2O5 <0.25-0.5 n/d
CaO** ≤0.8/0.15 0.87
K2O - 0.03
CeO2 - n/d
S* <0.03 4.64
FeS2 - 8.69
SnO2*** <0.05 <0.02
*Welding rod specification for P and S **Non-sieve plate and sieve plate specification ***SnO2 detection limit at 0.02%. SnO2 limit applicable to the molten salt market.
From the chemical analysis by XRF shown in Table 11-22, it can be seen that the rutile
product still contained significant amounts of impurities mainly in the form of iron- and
silicon oxides and pyrite (as per the adjusted data). The iron and silicon impurities can be
attributed to the presence of amphibole and pyroxene minerals.
It is important that pyrite be removed from the product to further upgrade TiO2 and to
reduce the sulphur level to a value below the market specified maximum. To address this
issue, reverse flotation was employed which was shown to remove pyrite effectively with
trivial losses of TiO2 to the flotation froth (Section 11.4.5.6). The optimisation work carried
out in programme 1293 referred to above, focused on improving rutile recoveries and as
such did not focus on achieving the required rutile grade. The resultant programme
1286-002 was initiated to upgrade the dry circuit rutile product where a TiO2 grade of
94.9% was achieved, although at a recovery penalty. This demonstrated that a market-
grade product was achievable. Details of programme 1286-002 are captured in section
11.4.5.2. It should be noted that the additional magnetic fractionation stage employed in

Nordic Mining Prefeasibility Study
30 October 2017 Engebø Rutile and Garnet Project H352410
H352410-00000-280-066-0001, Rev. 0 Page 104
© Hatch 2017 All rights reserved, including all rights relating to the use of this document or its contents.
1286-002 will not form part of the final flowsheet and was merely used to determine and
confirm final TiO2 grade.
Table 11-23 summarises the overall mineral recoveries achieved in programme 1231:
Table 11-23: Overall TiO2 and Fine Garnet Recovery for Programme 1231
Processing Area TiO2 Fine Garnet
% %
Feed Preparation Process (Desliming and screening)
Screen, de-slimed sand 95.2 96.4
Primary concentration Process (WHIMS)
Magnetic concentrate 65.6
Non-Magnetic concentrate 85.0
Non-Magnetic/Rutile Concentrate Upgrade Process (gravity concentration)
Concentrate 86.8
Magnetic/Fine Garnet Concentrate Upgrade Process (gravity concentration and magnetic separation)
Fine garnet product 38.5
Rutile Upgrade Process (magnetic and electrostatic separation)
Rutile product 70.6
Overall
Rutile product 49.6
Fine garnet product (+106 µm) 24.4
11.4.2 Programme 1245 – Coarse Ferro Bulk Sample to Validate Flowsheet for
Rutile and Fine Garnet Final Products and Develop the Process Flow for
Coarse Garnet Final Product
Based on the outcome from the first testwork programme (1231), IHC Robbins provided a
detailed proposal to undertake testwork on a second bulk sample to validate the
flowsheets developed during the 1231 testwork programme and to define a flowsheet for a
coarse garnet final product. A significant amount was learned during the first testwork
programme through both process testwork outcomes as well as detailed mineralogical
analysis of intermediate and final products. These learnings were incorporated into the
scope of this testwork programme. The 1245 sample was from the same source material
as the 1231 sample, but with a coarser grind at <500 µm so as not to overgrind retrievable
coarse garnet in the ore.
A summary of the leading aspects of the testwork programme follows.
The primary objective of this testwork programme was the development of a process flow
suitable for production of a coarse garnet product. The 1245 sample was split in two parts,
a +250 µm fraction for recovery of coarse garnet and a -250 µm fraction to recover rutile
and fine garnet. After removal of garnet from the +250 µm material, the rejects were
reground to -250 µm and added to the initial -250 µm material. Following sample

Nordic Mining Prefeasibility Study
30 October 2017 Engebø Rutile and Garnet Project H352410
H352410-00000-280-066-0001, Rev. 0 Page 105
© Hatch 2017 All rights reserved, including all rights relating to the use of this document or its contents.
characterisation, three representative samples were retrieved from the +250 µm bulk, de-
slimed sample and used in scouting tests to explore different circuit configurations. The
circuits evaluated to recover coarse garnet were:
A three-stage WHIMS circuit followed by a wet gravity circuit and cleaning of the wet
gravity circuit concentrate over a three-stage dry magnetic circuit as shown in Figure
11-15 below
A three-stage dry magnetic circuit as shown in Figure 11-16 below
A two-stage WHIMS circuit followed by a three-stage dry magnetic circuit as shown in
Figure 11-17 below.
Metallurgical scouting test work confirmed the dry magnetic separation process using Rare
Earth Drum (RED) magnetic separators and Rare Earth Roll (RER) magnetic separators
as shown in Figure 11-16 to provide the most optimum metallurgical performance and
consequently, was selected for bulk processing of the +250 µm fraction. This circuit was
significantly less complicated than the two alternative circuits. Additionally, the more
complex circuits had lower overall mass yields to the coarse garnet product, resulting in
RoM tonnages that exceed Nordic Mining’s mining license tonnage if aiming at meeting the
target of producing 300 ktpa garnet.

Nordic Mining Prefeasibility Study
30 October 2017 Engebø Rutile and Garnet Project H352410
H352410-00000-280-066-0001, Rev. 0 Page 106
© Hatch 2017 All rights reserved, including all rights relating to the use of this document or its contents.
Figure 11-15: An Alternative Coarse Garnet Flowsheet Including Wet Magnetic and Gravity Separation. Mass Distribution Shown in Percentage
100
WHIMS
Mag
60.0
N/M 40.0
Mag
19.0
N/M 21.0 79.0
N/M
41.0
62.0 Mag 38.0
Tails
SHAKING TABLE 17.0
Con 21.0
RED
Mag N/M
1.1 5.1
14.8
Mag N/M
0.1 1.2
13.5
1.2 6.3
RER
Mag N/M
12.1 1.4
Coarse Garnet Product

Nordic Mining Prefeasibility Study
30 October 2017 Engebø Rutile and Garnet Project H352410
H352410-00000-280-066-0001, Rev. 0 Page 107
© Hatch 2017 All rights reserved, including all rights relating to the use of this document or its contents.
Figure 11-16: Coarse Garnet Flowsheet Selected as the Optimal for Further Test Work. Mass Distribution Shown in Percentage
100.0
Mag N/M
6.4 52.3
41.3
Mag N/M
1.1 3.2
37.0
7.5 55.4
Mag N/M
31.0 6.0
Coarse Garnet Product

Nordic Mining Prefeasibility Study
30 October 2017 Engebø Rutile and Garnet Project H352410
H352410-00000-280-066-0001, Rev. 0 Page 108
© Hatch 2017 All rights reserved, including all rights relating to the use of this document or its contents.
Figure 11-17: An Alternative Coarse Garnet Flowsheet Including Wet Magnetic Separation. Mass Distribution Shown in Percentage
The rejects from the coarse garnet circuit containing an appreciable amount of TiO2 were
milled to 100% passing 250 µm and mixed in the right proportion with the <250 µm of the
feed sample. This sample was processed through the previously developed processes.
Results obtained were similar to the results achieved during the 1231 testwork
programme, but with improved performance of the dry magnetic circuit and a slightly
poorer performance of the WHIMS stage.
Final garnet and rutile product qualities are provided in Table 11-24 and Table 11-25
respectively, and overall TiO2 and garnet recoveries are provided below in Table 11-26
and Table 11-27, respectively.
100
Mag
62.6
N/M 37.4
Mag
16.0
N/M 21.4 78.6
Mag N/M
3.8 41.1 33.7
Mag N/M
0.6 32.3 8.2
4.4
Mag N/M
25.7 6.7
Coarse Garnet Product

Nordic Mining Prefeasibility Study
30 October 2017 Engebø Rutile and Garnet Project H352410
H352410-00000-280-066-0001, Rev. 0 Page 109
© Hatch 2017 All rights reserved, including all rights relating to the use of this document or its contents.
Table 11-24: Garnet Product Quality Determined by QEMSCAN (SGS Canada) of Programme 1245
Mineral Fine Garnet Grade
Obtained (%) Coarse Garnet
Grade Obtained (%)
Garnet 92.6 86.0
Rutile 0.3 0.7
Leucoxene 0.0 0.0
Ilmenite 0.0 0.0
Ti intergrowths 0.1 0.2
Pyrite 0.1 0.1
Pyroxene/Amphibole 4.8 9.6
Quartz 0.5 1.0
Others 1.9 3.1
Table 11-25: Rutile Product Chemical Assay by XRF of Programme 1245
Major Oxide Specification (%) Adjusted Grade for
FeS2 (%)
TiO2 >94.0 82.30
Fe2O3 <1.0 1.72
SiO2 <2.5 1.68
Al2O3 <1.5 0.37
Cr2O3 - n/d
MgO <1.0 0.14
MnO <1.0 0.01
ZrO2 <1.0 0.04
P2O5* <0.03 0.02
U (ppm) - <10
Th (ppm) - <10
V2O5 <0.65 0.34
Nb2O5 <0.25-0.5 n/d
CaO** ≤0.8/0.15 0.38
K2O - 0.01
CeO2 - n/d
S* <0.03 7.13
FeS2 - 13.34
SnO2*** <0.05 <0.02
*Welding rod specification for P and S **Non-sieve plate and sieve plate specification ***SnO2 detection limit at 0.02%. SnO2 limit applicable to the molten salt market.

Nordic Mining Prefeasibility Study
30 October 2017 Engebø Rutile and Garnet Project H352410
H352410-00000-280-066-0001, Rev. 0 Page 110
© Hatch 2017 All rights reserved, including all rights relating to the use of this document or its contents.
Table 11-26: Overall TiO2 Recovery of Programme 1245
Processing Area TiO2
%
Feed Preparation Process (desliming and screening)
Screen, de-slimed sand (<250 µm) 73.3
Screened oversize (>250 µm) 12.1
Coarse Garnet Process (magnetic separation)
Coarse garnet rejects 89.7
Primary Concentration Process (WHIMS)
Non-magnetic concentrate 86.2
Non-Magnetic/Rutile Concentrate Upgrade Process (gravity concentration)
Concentrate 82.3
Rutile Upgrade Process (magnetic and electrostatic separation)
Rutile product 79.5
Overall
Rutile product 47.5
Table 11-27: Overall Coarse and Fine Garnet Recovery of Programme 1245
Processing Area Recovery
%
Feed Preparation Process (desliming and screening)
Screen, de-slimed sand (<250 µm) 59.1
Screened oversize (>250 µm) 17.8
Coarse Garnet Process (magnetic separation)
Coarse garnet product 51.5
Coarse garnet rejects 48.5
Primary Concentration Process (WHIMS)
Magnetic concentrate 80.0
Magnetic Concentrate Upgrade Process
Fine garnet product 62.3
Overall
Coarse garnet product 9.2
Fine garnet product 33.7

Nordic Mining Prefeasibility Study
30 October 2017 Engebø Rutile and Garnet Project H352410
H352410-00000-280-066-0001, Rev. 0 Page 111
© Hatch 2017 All rights reserved, including all rights relating to the use of this document or its contents.
As in programme 1231, the rutile concentrate generated from the dry rutile separation
circuit still contained significant levels of impurities especially pyrite. The pyrite grade in the
dry rutile circuit concentrate was approximately 13.3% compared to 8.7% in the 1231
programme. Therefore, as in programme 1231, the rutile concentrate was subjected to a
reverse flotation process to reject the pyrite. The flotation feed grade of TiO2 was 82.3%
and this increased to 93.7% after flotation with a sulphur concentration of 0.17%, equating
to a pyrite concentration of 0.32%. However, the TiO2 grade achieved was still less than
the required grade of 95%.
Consequently, programme 1286-002 was initiated to upgrade the dry circuit rutile product
where a TiO2 grade of 95% was achieved, although at a recovery penalty. This confirmed
that a market-grade product was achievable. Details of programme 1286-002 are captured
in Section 11.4.5.2. It should be noted that the additional magnetic fractionation stage
employed in 1286-002 will not form part of the final flowsheet and was merely used to
determine and confirm final TiO2 grade.
11.4.3 Programme 1308 – Processing of a Coarse Ferro Bulk Sample to Optimise
Metallurgical Performance of the Selected Flowsheets for Rutile, Fine Garnet
and Coarse Garnet
Based on the outcomes of programmes 1231, 1245 and the supplementary optimisation
programmes, a further bulk testwork programme was undertaken to optimise metallurgical
performance and validate the flowsheet on an optimally comminuted, high-grade sample.
A significant amount was learned during the 1231, 1245 and optimisation test work
programmes as well as detailed mineralogical analysis of intermediate and final products.
These learnings were incorporated into the scope of this testwork programme. The 1308
sample consisted of a blend of source samples of which a sixth was transitional eclogite
material but overall it was considered a high-grade ferro-eclogite sample. The sample was
comminuted to 100% passing 550 µm according to the comminution flowsheet in Figure
11-12 above.
A summary of the salient points of programme 1308 is included below.
The first objective of the programme was to develop a robust flowsheet capable of
producing a coarse garnet product at the required grade (>92%). To this end, the
supplementary testwork programme 1286-004 was initiated. Details of the programme are
provided in Section 11.4.5.4. In summary, coarse garnet grade was achieved in
programme 1286-004 but it was apparent that the final separation stages (i.e. the rare
earth rolls) offered limited upgrading potential which suggested that the process may lack
robustness, especially given that a coarse garnet product of the required grade was not
achieved in the previous bulk testwork programmes. During the course of programme
1286-004, observations from the mass and mineral balance (Section 11.6.4.1) indicated
that a wet gravity circuit provided substantial upgrading potential of garnet through
effective rejection of amphibole and pyroxene minerals and it was decided that a two-stage
gravity circuit be tested up front of the dry magnetic circuit. This testwork was initiated as
programme 1286-005 which ultimately formed the coarse garnet circuit of the bulk 1308
programme. The coarse garnet flowsheet of 1286-005 consisted of a two-stage spiral
circuit with rougher and scavenger stages where the scavenger concentrate (i.e. cons)
was returned to the rougher stage. The rougher cons were then fed to a dry magnetic

Nordic Mining Prefeasibility Study
30 October 2017 Engebø Rutile and Garnet Project H352410
H352410-00000-280-066-0001, Rev. 0 Page 112
© Hatch 2017 All rights reserved, including all rights relating to the use of this document or its contents.
circuit comprising two RED stages where the middlings (i.e. mids) from stage 1 were fed to
stage 2, and the mids of stage 2 were screened with the oversize serving as the final
coarse product. To remain consistent with 1286-004, the flowsheet of programme
1286-005 was tested using the following three samples to account for unknowns in the
comminution results:
Sample A – Hazemag crushed sample
Sample B – Rod mill crushed sample and
Sample C – Combined Hazemag and rod mill sample.
The QXRD results from programme 1286-005 are provided below in Table 11-28, Table
11-29 and Table 11-30 for samples A, B and C respectively. Note that QXRD was only
available on the screened products of sample C, and therefore the mids of the second
RED stage are reported as the product and used as a basis of comparison. As can be
seen from the results, a product above 92% garnet was achieved in samples A and B,
while screening was required in sample C before grade was achieved. However, QXRD
readings for garnet are less accurate than QEMSCAN and tend to underestimate the
garnet content. The final coarse garnet product for sample C, according to QEMSCAN, is
95.4% garnet as shown in Table 11-31 below, which is greater than the QXRD value of
92.5%. This product is considered the final coarse garnet product of programme 1308 and
the decision was made to define the flowsheet for a combined Hazemag-rod mill feed to
the coarse circuit. Images of the coarse garnet product are shown below in Figure 11-18
and Figure 11-19.
Comparing the overall garnet distribution of programme 1286-004 and 1286-005, it can be
seen that including the wet gravity circuit enhances garnet recovery while still achieving
grade. In addition, the mass yield to the garnet product in 1286-005 (33.3%) was greater
than that in 1286-004 (25.5%), further reflecting the improvement achieved through the wet
gravity circuit. Gangue removal upfront of the dry circuit has the added advantage of
reducing the required capacity of the dryer. The overall mass yield to the coarse garnet
product for programme 1308 was 11.4%, when corrected for recoverable garnet not
included due to incorrect feed preparation as discussed below.
The flowsheet to produce a fine garnet product remained the same as that of programme
1245 and a fine garnet product of 95.5% was achieved as shown in Table 11-31 below.
Images of the fine garnet product are shown below in Figure 11-20 and Figure 11-21.
Overall garnet yields and recoveries are included in Table 11-32 together with the yield
input for the financial model. The garnet yield input to the financial model was calculated
by applying an adjustment factor of 13.3% to the mass yield to the >212 µm fraction due to
incorrect blending of the feed sample during testwork. Neglecting this adjustment
negatively biases the amount of coarse material produced in the comminution circuit which
underestimates the true amount of coarse garnet available for recovery. The adjustment
increases the >212 µm yield to 38.6%. Furthermore, at the time of defining the financial
model inputs, a mistaken mass yield of 67.2% was provided for the yield across the coarse
garnet gravity circuit which was later corrected to 65.8%. Combining the adjustment factor
and the original mass yield across the coarse garnet gravity circuit led to a coarse garnet

Nordic Mining Prefeasibility Study
30 October 2017 Engebø Rutile and Garnet Project H352410
H352410-00000-280-066-0001, Rev. 0 Page 113
© Hatch 2017 All rights reserved, including all rights relating to the use of this document or its contents.
yield of 11.4%. Applying the factor of 1.6 to account for the specified amount of fine garnet
gives an overall garnet yield of 18.3% which was used as an input to the financial model.
Table 11-28: 1286-005 Sample A – Hazemag Comminuted >212 µm Fraction (QXRD)
Test Garnet Grade (%) Overall Garnet Distribution
(%)
Spiral Tails 27.5 19.0
RED 1 Mags 53.4 1.1
RED 1 Non-mags 15.4 5.2
RED 2 Mags 75.9 0.6
RED 2 Non-mags 46.7 0.7
RED 2 Mids 93.4 73.5
Table 11-29: 1286-005 Sample B – Rod Mill Comminuted >212 µm Fraction (QXRD)
Test Garnet Grade (%) Overall Garnet Distribution
(%)
Spiral Tails 27.0 28.2
RED 1 Mags 56.2 2.0
RED 1 Non-mags 15.4 6.5
RED 2 Mags 73.4 1.2
RED 2 Non-mags 60.3 1.5
RED 2 Mids 93.4 60.7
Table 11-30: 1286-005 Sample C – Combined Comminuted >212 µm Fraction (QXRD)
Test Garnet Grade (%) Overall Garnet Distribution
(%)
Spiral Tails 26.1 18.0
RED 1 Mags 54.7 2.4
RED 1 Non-mags 18.5 10.8
RED 2 Mags 76.0 2.0
RED 2 Non-mags 65.7 3.7
RED 2 Mids 90.5 63.2
Screen O/S 92.5 57.3

Nordic Mining Prefeasibility Study
30 October 2017 Engebø Rutile and Garnet Project H352410
H352410-00000-280-066-0001, Rev. 0 Page 114
© Hatch 2017 All rights reserved, including all rights relating to the use of this document or its contents.
Table 11-31: Garnet Product Quality Determined by QEMSCAN (SGS Canada) of Programme 1308
Mineral Fine Garnet Grade
Obtained (%)
Coarse Garnet Grade Obtained
(%)*
Garnet 95.5 95.4
Rutile 0.45 0.43
Mica 0.08 0.14
Ilmenite 0.07 0.05
Quartz 0.28 0.47
Pyrite 0.02 0.05
Pyroxene/Amphibole 3.07 2.8
Others 0.53 0.66
*Programme 1286-005 Sample C
Table 11-32: Overall Coarse and Fine Garnet Recoveries and Mass Yields of Programme 1308
Processing Area
Garnet Recovery
Mass Yield
% %
Feed Preparation Process (desliming and screening)
Screened oversize (+212 µm) 38.5 34.1
Screen, de-slimed sand (-212; +45 µm) 55.9 57.3
Fines (-45 µm) 5.6 8.6
Coarse Garnet Process (gravity and magnetic separation)
Coarse garnet product 50.3 29.0
Coarse garnet rejects 10.5 7.5
Coarse garnet rejects to milling 36.6 57.1
Secondary de-sliming 2.6 6.4
Primary Concentration Process (WHIMS)
Magnetic concentrate 75.4 38.8
Fine Garnet Process (gravity and magnetic separation)
Fine garnet product 29.6 25.5
Overall
Coarse garnet product 19.4 9.9
Fine garnet product 15.4 7.6
Financial model input
Coarse garnet yield n/a 11.4
Overall garnet yield n/a 18.3

Nordic Mining Prefeasibility Study
30 October 2017 Engebø Rutile and Garnet Project H352410
H352410-00000-280-066-0001, Rev. 0 Page 115
© Hatch 2017 All rights reserved, including all rights relating to the use of this document or its contents.
Figure 11-18: Coarse Garnet Product from Programme 1308
Figure 11-19: Microscope Image of the Coarse Garnet Product from Programme 1308

Nordic Mining Prefeasibility Study
30 October 2017 Engebø Rutile and Garnet Project H352410
H352410-00000-280-066-0001, Rev. 0 Page 116
© Hatch 2017 All rights reserved, including all rights relating to the use of this document or its contents.
Figure 11-20: Fine Garnet Product from Programme 1308
Figure 11-21: Microscope Image of the Fine Garnet Product from Programme 1308
The flowsheet to produce a rutile product combined all previous learnings and it was
required that the position of flotation in the circuit be assessed. As such, two rutile
concentrates were generated in programme 1308 to determine whether the location of the
flotation circuit in the flowsheet has an impact on process performance. It was found that a
rutile product of 94.9% TiO2 was achieved when flotation is placed after the dry circuit and
a product of 93.0% TiO2 was achieved when flotation is placed after the wet spiral stage
and before the dry circuit as shown in Table 11-33 below. In addition, the TiO2 recovery
from the spiral concentrate to the final rutile product is superior when flotation is placed
after the dry circuit. The composition of the final rutile products for each case is provided in

Nordic Mining Prefeasibility Study
30 October 2017 Engebø Rutile and Garnet Project H352410
H352410-00000-280-066-0001, Rev. 0 Page 117
© Hatch 2017 All rights reserved, including all rights relating to the use of this document or its contents.
Table 11-34 below and a breakdown of the TiO2 recovery across the overall process is
provided in Table 11-35 below. For the case where flotation is placed after the dry circuit,
an overall TiO2 recovery of 60.5% was achieved which is substantially greater than the
previous bulk programmes. It should be noted that the overall TiO2 recovery of 60.2% used
as the basis for the financial model (and further de-rated to 58.4% for scale-up as shown
above in Table 11-1), was calculated using a TiO2 recovery of 98.1% (instead of 99.2%)
for the post-dry circuit flotation stage as this was the only data available (from JKTech) at
the time of performing the initial financial analysis. IHC Robbins had not yet issued their
final results as contained in the report for programme 1308, where the overall TiO2
distribution to the pyrite concentrate of 0.7% for the rutile upgrading process translates to a
flotation recovery of 99.2% TiO2. In addition to the different TiO2 recovery for flotation, a
different calculation approach was employed. IHC Robbins determined the overall
recovery by multiplying the stage-wise recoveries together, whereas the 60.2% was
calculated by using a continuous recovery through the process, and applying recovery
values as calculated by feed and product grades, and stage mass splits. The use of a
continuous recovery reduces rounding error which may contribute to the difference
observed between the 60.2% and the 60.5%. However, the disparity of 0.3 percentage
points is minor and the financial model is conservative as a consequence of the difference.
Despite the improved recoveries achieved in programme 1308, the particle size distribution
of the final rutile product was finer than expected (for example compared to 1245 as shown
in Figure 11-22 below) where ~15% of the material was below 75 µm (see Table 11-36
below). The PSD specification for pigment grade rutile should contain less than 5%
<75 µm material. However, the fine fraction of the rutile product could potentially be
absorbed by titanium metal producing customers located in Kazakhstan, Ukraine and
Russia. According to market specialists, this market could consume between 5,000 tpa
and 10,000 tpa, and from preliminary estimates, up to 3,200 tpa of <75 µm material could
potentially be generated from this ore. Therefore, the amount of 3,200 tpa could easily be
absorbed by this market. To ensure that a coarser product is generated, a detailed
testwork programme is being developed for execution during the DFS. In short, the
testwork comprises processing three samples generated from the same source rock to
explore in detail the feed size distribution that leads to the optimal final rutile product
particle size distribution at maximised grade and recovery. Images of the final rutile
products are shown in Figure 11-23 and Figure 11-24.
Table 11-33: Comparison of the Location of Flotation in the Flowsheet
Position of Flotation Final Product TiO2
Grade (%) TiO2 Recovery Across the
Rutile Upgrading Process* (%)
Before the dry circuit 93.0 77.1
After the dry circuit 94.9 83.9
*From spiral concentrate to final rutile product

Nordic Mining Prefeasibility Study
30 October 2017 Engebø Rutile and Garnet Project H352410
H352410-00000-280-066-0001, Rev. 0 Page 118
© Hatch 2017 All rights reserved, including all rights relating to the use of this document or its contents.
Table 11-34: Rutile Products Chemical Assay by XRF of Programme 1308
Main Compounds Specification (%)
Final Rutile Product
Post-dry Circuit Flotation Route (%)
Pre-dry Circuit Flotation Route (%)
TiO2 >94.0 94.90 93.02
Fe2O3 <1.0 1.63 1.62
SiO2 <2.5 1.53 2.41
Al2O3 <1.5 0.31 0.56
Cr2O3 - 0.01 0.01
MgO <1.0 0.03 0.27
MnO <1.0 0.02 0.01
ZrO2 <1.0 0.06 0.08
P2O5* <0.03 0.01 0.01
U (ppm) - <10 <10
Th (ppm) - <10 <10
V2O5 <0.65 0.41 0.38
Nb2O5 <0.25-0.5 n/d n/d
CaO** ≤0.8/0.15 0.35 0.52
K2O - 0.01 0.03
CeO2 - n/d 0.02
S* <0.03 0.17 0.20
FeS2 - 0.30 0.37
SnO2*** <0.05 <0.02 <0.02
*Welding rod specification for P and S **Non-sieve plate and sieve plate specification ***SnO2 detection limit at 0.02%. SnO2 limit applicable to the molten salt market.

Nordic Mining Prefeasibility Study
30 October 2017 Engebø Rutile and Garnet Project H352410
H352410-00000-280-066-0001, Rev. 0 Page 119
© Hatch 2017 All rights reserved, including all rights relating to the use of this document or its contents.
Table 11-35: Overall TiO2 Recovery of Programme 1308 (Post-dry Circuit Flotation)
Processing Area TiO2 Recovery
Cum. Wt% Stage Wt%
Feed Preparation Process (desliming and screening)
Deslimed sand 92.2 92.2
Coarse Garnet Process (gravity and magnetic concentration)
Garnet Processing 89.9 83.5
Secondary de-sliming 88.5 91.8
Primary concentration Process (WHIMS)
Non-magnetic concentrate 82.4 93.2
Non-Magnetic/Rutile Concentrate Upgrade Process (Gravity concentration)
Concentrate 72.1 87.5
Rutile Upgrade Process (magnetic and electrostatic separation)
Rutile product 61.0 84.6
Pyrite Flotation
Flotation tails 60.5 99.2
Overall
Rutile product 60.5
Figure 11-22: Comparison of the Particle Size Distributions of the Rutile Products from Different Testwork Programmes
0
10
20
30
40
50
60
70
80
90
100
0 25 50 75 100 125 150 175 200 225 250
Cum
ula
tive w
t%
Size (µm)
1308 1245 1231

Nordic Mining Prefeasibility Study
30 October 2017 Engebø Rutile and Garnet Project H352410
H352410-00000-280-066-0001, Rev. 0 Page 120
© Hatch 2017 All rights reserved, including all rights relating to the use of this document or its contents.
Table 11-36: Particle Size Distribution of the Rutile Product from 1308
Aperture (µm) Cum. Wt%
250 100
212 99.9
180 93.1
150 81.7
125 65.0
106 50.0
90 29.7
75 15.1
63 6.9
45 0.7
D50 (µm) 106
D80 (µm) 147
Figure 11-23: Image of the Rutile Product from Programme 1308

Nordic Mining Prefeasibility Study
30 October 2017 Engebø Rutile and Garnet Project H352410
H352410-00000-280-066-0001, Rev. 0 Page 121
© Hatch 2017 All rights reserved, including all rights relating to the use of this document or its contents.
Figure 11-24: Microscope Image of the Rutile Product from Programme 1308
11.4.4 Programme 1234 – Processing of a Coarse Transitional Bulk Sample to
Determine Metallurgical Performance of the Selected Flowsheets for Rutile,
Fine Garnet and Coarse Garnet
In addition to ferro-eclogite, trans-eclogite is a major rock type in the Engebø deposit and
can contribute substantially to garnet and rutile tonnages. However, transitional material
has a lower garnet grade (around 47.5%) and a substantially lower TiO2 grade (between
2% and 3%) compared to ferro-eclogite as shown in Table 11-10. Since trans ore is
excluded from the PFS mine plan, understanding the performance of the developed
flowsheet when processing trans ore, merely provides insight into process performance
and does not contribute to the conclusions of the PFS, but may be instructive in developing
options for future studies.
ICH Robbins provided a proposal to undertake detailed testwork on a bulk sample of Trans
eclogite (1234). The objective of the programme was to determine the performance of the
flowsheet developed in the previous bulk and supplementary testwork programmes,
including comminution and beneficiation, on a typical lower grade Trans ore sample.
The results of programme 1234 still need to be finalised by IHC Robbins but the
preliminary results are summarised below in Table 11-37, Table 11-38, Table 11-39 and
Table 11-40.

Nordic Mining Prefeasibility Study
30 October 2017 Engebø Rutile and Garnet Project H352410
H352410-00000-280-066-0001, Rev. 0 Page 122
© Hatch 2017 All rights reserved, including all rights relating to the use of this document or its contents.
So far, an overall mass yield to the coarse garnet product of 6% at a garnet grade of
94.1% has been attained and a rutile product of 92.8% TiO2 has been achieved at a TiO2
recovery of 42.1%. The grade is similar to that of 1308 and meets product requirements.
However, the mass yield is substantially lower than that of 1308 and given that the
theoretical garnet recovery for 1234 (27.1%) is lower than 1308 (39.5%), it suggests that
the liberation performance for 1234 was poorer than that of 1308. This is due in part to a
smaller grain size compared to the ferro-eclogite and possibly due to the bulk sample (~1
t) being below the optimal size (~3 t) for efficient Hazemag crushing. Note that after
repeating testwork on the second RED stage of the coarse garnet circuit, the grade of
94.1% was achieved at the overall yield of 6.0%, however, the yield used in the financial
model (6.9%) corresponds to the initial RED testwork which corresponds to a garnet
product grade of 85.4% (QXRD).
Table 11-37: Garnet Product Quality Determined by QEMSCAN (SGS Canada) of Programme 1234
Mineral Fine Garnet Grade
Obtained (%) Coarse Garnet Grade
Obtained (%)
Garnet 93.3 94.1
Rutile 0.39 0.52
Mica 0.09 0.13
Ilmenite 0.05 0.10
Quartz 0.20 0.29
Pyrite 0.04 0.07
Pyroxene/Amphibole 5.1 4.07
Others 0.83 0.74

Nordic Mining Prefeasibility Study
30 October 2017 Engebø Rutile and Garnet Project H352410
H352410-00000-280-066-0001, Rev. 0 Page 123
© Hatch 2017 All rights reserved, including all rights relating to the use of this document or its contents.
Table 11-38: Rutile Products Chemical Assay by XRF of Programme 1234
Main Compounds Specification (%)
Final Rutile Product
Post-dry Circuit Flotation Route (%)
Pre-dry Circuit Flotation Route (%)
TiO2 >94.0 92.79 89.90
Fe2O3 <1.0 1.89 2.27
SiO2 <2.5 2.48 4.00
Al2O3 <1.5 0.57 0.83
Cr2O3 - n/d n/d
MgO <1.0 0.33 0.62
MnO <1.0 0.01 0.02
ZrO2 <1.0 0.09 0.11
P2O5* <0.03 n/d n/d
U (ppm) - <10 <10
Th (ppm) - <10 <10
V2O5 <0.65 0.54 0.56
Nb2O5 <0.25-0.5 n/d n/d
CaO** ≤0.8/0.15 0.60 1.03
K2O - 0.01 0.01
CeO2 - 0.01 0.01
S* <0.03 0.25 0.23
FeS2 - 0.47 0.43
SnO2*** <0.05 not available not available
*Welding rod specification for P and S **Non-sieve plate and sieve plate specification ***SnO2 detection limit at 0.02%. SnO2 limit applicable to the molten salt market.

Nordic Mining Prefeasibility Study
30 October 2017 Engebø Rutile and Garnet Project H352410
H352410-00000-280-066-0001, Rev. 0 Page 124
© Hatch 2017 All rights reserved, including all rights relating to the use of this document or its contents.
Table 11-39: Overall TiO2 Recovery of Programme 1234
Processing Area TiO2 Recovery
Cum. Wt% Stage Wt%
Feed Preparation Process (desliming and screening)
Deslimed sand 87.1 87.1
Coarse Garnet Process (gravity and magnetic concentration)
Garnet Processing 81.5 82.2
Secondary de-sliming 79.0 90.5
Primary concentration Process (WHIMS)
Non-magnetic concentrate 67.3 85.2
Non-Magnetic/Rutile Concentrate Upgrade Process (Gravity concentration)
Concentrate 55.9 83.0
Rutile Upgrade Process (magnetic and electrostatic separation)
Rutile product 42.4 76.0
Pyrite Flotation
Flotation tails (and screening) 42.1 99.2
Overall
Rutile product 42.1

Nordic Mining Prefeasibility Study
30 October 2017 Engebø Rutile and Garnet Project H352410
H352410-00000-280-066-0001, Rev. 0 Page 125
© Hatch 2017 All rights reserved, including all rights relating to the use of this document or its contents.
Table 11-40: Overall Coarse and Fine Garnet Recoveries and Yields of Programme 1234
Processing Area
Garnet Recovery
Mass Yield
% %
Feed Preparation Process (desliming and screening)
Screened oversize (>212 µm fraction) 37.8 37.5
Screen, de-slimed sand (<212 µm and 45 µm) 54.1 49.4
Fines (<45 µm) (loss) 8.1 13.1
Coarse Garnet Process (gravity and magnetic separation)
Coarse garnet product 34.2 15.9* 18.4
Coarse garnet rejects 18.8 13.5* 10.9
Coarse garnet rejects to milling 47.0 70.7
Secondary de-sliming** 93.4 90.5
Primary Concentration Process (WHIMS)
Magnetic concentrate 75.7 47.8
Fine Garnet Process (gravity and magnetic separation)
Fine garnet product 45.3 36.3
Overall
Coarse garnet product 12.9 6.0* 6.9
Fine garnet product** 24.2 12.7
*IHC Robbins repeated the second RED stage in an attempt to increase the garnet grade. The higher mass yields were used as inputs to the financial model because the results of the repeat test were not available at the time. The final product grade corresponds to the lower yield values. **Garnet recovery data for the secondary de-sliming stage was not available at the time of writing this report. Therefore, the same recovery as for the secondary de-sliming in 1308 is assumed for completeness. The overall garnet recovery to the fine garnet product is also dependent on this assumption.
11.4.5 Supplementary Testwork and Flowsheet Optimisation
The following supplementary testwork programmes were initiated during the course of the
bulk sample programmes 1231 and 1245. As the title suggests, this testwork was
supplementary in nature and was deemed necessary to achieve the objectives of the
respective bulk sample programmes.
11.4.5.1 Programme 1286-001 - Coarse and Fine Garnet Magnetic and Size Fractionation
(T22 mag and T304 O/S)
As part of the 1245 bulk sample programme, it was decided to investigate magnetic and
size fractionation of the fine and coarse garnet products in an effort to explore the
upgrading potential. Initial QXRD results suggested that both fine and coarse garnet
products would be below quality specifications with regard to the garnet content. At that
time, the QEMSCAN results had not been received and only the QXRD results were
available. The garnet specification applicable to this project calls for final garnet products
to contain greater than 92% garnet. This exercise therefore looked at splitting the garnet

Nordic Mining Prefeasibility Study
30 October 2017 Engebø Rutile and Garnet Project H352410
H352410-00000-280-066-0001, Rev. 0 Page 126
© Hatch 2017 All rights reserved, including all rights relating to the use of this document or its contents.
concentrates into several smaller fractions (magnetically and by size) in a bid to isolate
impurities into discreet mass fractions. However, from the magnetic and size fractionation
results it was clear that impurities were evenly distributed across all size and magnetic
fractions rendering these mechanisms ineffective. Results are summarised in Table 11-41,
Table 11-42 and Table 11-43 below.
Table 11-41: Magnetic Fractionation of the Coarse Garnet Product
QXRD
Rutile Amphiboles Pyroxene Garnet
Wt % % % % %
Mag 1 (7,000 Gauss) 11.0 <1.0 10.0 9.0 75.0
Mag 2 (10,000 Gauss) 45.3 <1.0 7.0 6.0 85.0
Mag 3 (16,000 Gauss) 38.5 <1.0 6.0 6.0 84.0
N/M 5.2 <1.0 7.0 7.0 82.0
Coarse Garnet Product (T 22 Mag) 100.0 <1.0 6.9 6.4 83.4
Table 11-42: Magnetic Fractionation of the Fine Garnet Product
QXRD
Rutile Amphiboles Pyroxene Garnet
Wt % % % % %
Mag 1 (7,000 Gauss) 15.4 <1.0 5.0 2.0 91.0
Mag 2 (10,000 Gauss) 63.6 <1.0 4.0 4.0 90.0
Mag 3 (16,000 Gauss) 20.1 <1.0 5.0 9.0 84.0
N/M 0.8 3.0 7.0 28.0 58.0
Fine Garnet Product (T 304 O/S) 100.0 <1.0 4.4 4.9 88.7

Nordic Mining Prefeasibility Study
30 October 2017 Engebø Rutile and Garnet Project H352410
H352410-00000-280-066-0001, Rev. 0 Page 127
© Hatch 2017 All rights reserved, including all rights relating to the use of this document or its contents.
Table 11-43: Size Fractionation of the Coarse Garnet Product
QXRD
Rutile Amphiboles Pyroxene Garnet
Aperture (µm) Wt % % % % %
425 1.1 <1.0 13.0 13.0 64.0
300 28.2 <1.0 7.0 7.0 82.0
250 32.1 <1.0 8.0 5.0 84.0
212 20.1 <1.0 8.0 6.0 84.0
180 11.6 <1.0 9.0 5.0 83.0
150 3.7 <1.0 7.0 4.0 86.0
125 1.9 <1.0 9.0 3.0 84.0
0 1.5 <1.0 12.0 7.0 77.0
Coarse Garnet Product (T 22 Mag) 100.0 <1.0 7.9 5.8 83.1
Table 11-44: Size Fractionation of the Fine Garnet Product
QXRD
Rutile Amphiboles Pyroxene Garnet
Aperture (µm) Wt % % % % %
250 0.7 <1.0 5.0 5.0 87.0
212 11.9 <1.0 2.0 1.0 95.0
180 32.6 <1.0 3.0 1.0 94.0
150 25.5 <1.0 3.0 2.0 92.0
125 16.8 <1.0 2.0 7.0 88.0
106 9.0 <1.0 13.0 12.0 72.0
90 3.2 <1.0 7.0 21.0 69.0
0 0.2 <1.0 11.0 36.0 45.0
Fine Garnet Product (T 304 O/S)
100.0 <1.0 3.8 4.0 89.7
11.4.5.2 Programme 1286-002 - Rutile Upgrade Post Pyrite Flotation
During the processing of bulk samples 1231 and 1245, and treatment of the non-magnetic
fraction for rutile flowsheet development, the emphasis was placed on mineral recovery
(i.e. rutile as TiO2) as it was known from previous testwork results that mineral recovery
would be challenging. This resulted in the final rutile product grade not being achieved as
shown above in Table 11-22 and Table 11-25 due to the presence of residual amphibole
and pyroxene minerals. Rutile concentrate from the dry physical separation circuit was
therefore subjected to a reverse flotation process for the removal of pyrite. Following pyrite
rejection by flotation, the TiO2 levels were still below (approximately 90%) the target grade
of 95% TiO2. Therefore, the underflow from this flotation process (rutile concentrate) was
then subjected to additional electrostatic and magnetic separation processes to confirm

Nordic Mining Prefeasibility Study
30 October 2017 Engebø Rutile and Garnet Project H352410
H352410-00000-280-066-0001, Rev. 0 Page 128
© Hatch 2017 All rights reserved, including all rights relating to the use of this document or its contents.
that the final rutile product grade is achievable but with a corresponding recovery penalty.
The results from the post-pyrite flotation physical separation testwork are shown below in
Table 11-45, Table 11-46 and Table 11-47. Results showed that both magnetic and
electrostatic separation were successful in achieving the final target TiO2 grade for the
rutile product. During weekly telephonic review sessions, it was decided to select the
magnetic separation technology as the final upgrading technology. However, it is important
to note that although this final upgrading step was necessary in these testwork rounds, it
was acknowledged that in future programmes it would be endeavoured to achieve a grade
high enough to avoid having this final magnetic separation stage.
In addition, it should be noted that during the 1231 and 1245 bulk sample programmes, it
was neither known nor confirmed that flotation would be required to reject pyrite to reduce
the sulphur content of the rutile product to market-acceptable levels. During the course of
these testwork programmes, it became evident that flotation would be required but the
actual position within the rutile processing train was not confirmed. Testwork was
undertaken using both gravity circuit concentrate as well as rutile dry circuit product as
feed to the flotation circuit. Following this testwork, a trade-off study (H352410-4000-210-
030-0001) was undertaken to support the decision to place the flotation circuit ahead of
the dry rutile separation circuit.

Nordic Mining Prefeasibility Study
30 October 2017 Engebø Rutile and Garnet Project H352410
H352410-00000-280-066-0001, Rev. 0 Page 129
© Hatch 2017 All rights reserved, including all rights relating to the use of this document or its contents.
Table 11-45: Magnetic Fractionation of the 1231 Bulk Sample Rutile Concentrate
Assay
Magnetic Fractionation Wt % TiO2 Fe2O3 SiO2 MgO MnO P2O5 V2O5 Nb2O5 CaO S
% % % % % % % % % %
T 1 Mag 1 7.8 54.9 6.77 23.1 3.3 0.04 0.00 0.3 0.01 5.8 0.30
T 1 Mag 2 10.6 76.1 4.96 10.8 1.5 0.03 0.01 0.3 0.01 2.7 0.50
T 1 Mag 3 8.2 89.7 3.18 3.4 0.4 0.02 0.01 0.4 0.01 0.8 0.46
T 1 N/M 73.4 95.5 1.56 0.72 0.1 0.00 0.01 0.4 0.01 0.2 0.49
Feed 100 89.8 2.5 3.7 0.5 0.01 0.01 0.4 0.01 0.9 0.48
T 1 N/M 73.4 95.5 1.56 0.72 0.05 0.00 0.01 0.4 0.01 0.2 0.49
T1 N/M + Mag 3 81.6 94.9 1.7 1.0 0.09 0.00 0.01 0.4 0.01 0.2 0.49
T 1 N/M + Mag 3 + Mag 2 92.2 92.8 2.1 2.1 0.25 0.01 0.01 0.4 0.01 0.5 0.49
Distribution
T 1 Mag 1 4.8 21.4 47.9 52.7 39.2 6.0 5.9 3.4 49.8 5.0
T 1 Mag 2 9.0 21.4 30.6 32.9 40.1 12.3 9.1 10.2 31.0 11.1
T 1 Mag 3 8.2 10.6 7.4 6.8 20.7 11.1 7.9 9.3 7.0 8.0
T 1 N/M 78.1 46.6 14.1 7.6 0.0 70.7 77.1 77.1 12.1 76.0
Feed 100.0 100.0 100.0 100.0 100.0 100.0 100.0 100.0 100.0 100.0
T 1 N/M 78.1 46.6 14.1 7.6 0.0 70.7 77.1 77.1 12.1 76.0
T1 N/M + Mag 3 86.3 57.2 21.5 14.4 20.7 81.7 85.0 86.4 19.2 84.0
T 1 N/M + Mag 3 + Mag 2 95.2 78.6 52.1 47.3 60.8 94.0 94.1 96.6 50.2 95.0

Nordic Mining Prefeasibility Study
30 October 2017 Engebø Rutile and Garnet Project H352410
H352410-00000-280-066-0001, Rev. 0 Page 130
© Hatch 2017 All rights reserved, including all rights relating to the use of this document or its contents.
Table 11-46: Electrostatic Separation of the 1231 Bulk Sample Rutile Concentrate
Assay
Electrostatic Separation Wt % TiO2 Fe2O3 SiO2 MgO MnO P2O5 V2O5 Nb2O5 CaO S
% % % % % % % % % %
Cond 86.0 93.7 2.2 1.5 0.2 0.01 0.01 0.4 0.01 0.4 0.5
Mids 11.7 73.3 3.4 13.2 1.8 0.01 0.01 0.3 0.01 3.3 0.2
N/C 2.2 30.6 6.4 38.2 5.1 0.03 0.03 0.2 0.00 9.0 0.0
Feed 100.0 89.9 2.4 3.7 0.5 0.01 0.01 0.4 0.01 0.9 0.5
Distribution
Cond 86.0 89.7 77.6 35.1 30.0 82.3 80.1 88.8 92.0 34.6 95.7
Mids 11.7 9.6 16.5 41.8 45.4 11.2 10.9 9.9 8.0 42.8 4.1
N/C 2.2 0.8 5.9 23.1 24.6 6.4 9.0 1.3 0.0 22.6 0.1
Feed 100.0 100.0 100.0 100.0 100.0 100.0 100.0 100.0 100.0 100.0 100.0

Nordic Mining Prefeasibility Study
30 October 2017 Engebø Rutile and Garnet Project H352410
H352410-00000-280-066-0001, Rev. 0 Page 131
© Hatch 2017 All rights reserved, including all rights relating to the use of this document or its contents.
Table 11-47: Magnetic Fractionation of the 1245 Bulk Sample Rutile Concentrate
Assay
Magnetic Fractionation Wt % TiO2 Fe2O3 SiO2 Al2O3 MgO MnO P2O5 V2O5 Nb2O5 CaO S
% % % % % % % % % % %
T 3 Mag 1 3.4 73 7.0 10.4 2.5 1.3 0.1 0.03 0.3 0.01 2.05 0.9
T 3 Mag 2 11.1 86.8 3.9 4.8 1.1 0.7 0.0 0.01 0.4 0.01 1.06 0.4
T 3 Mag 3 9.0 91.4 2.9 2.9 0.7 0.4 0.0 0.01 0.4 0.01 0.63 0.3
T 3 N/M 76.5 96.6 1.3 1.0 0.2 0.1 0.0 0.01 0.4 0.02 0.19 0.1
Feed 100 94.2 1.9 1.9 0.4 0.2 0.0 0.01 0.4 0.01 0.39 0.2
T 3 N/M 76.5 96.6 1.3 1.0 0.2 0.1 0.0 0.01 0.4 0.02 0.19 0.1
T3 N/M + Mag 3 85.5 96.1 1.4 1.2 0.2 0.1 0.0 0.01 0.4 0.02 0.24 0.1
T 3 N/M + Mag 3 + Mag 2 96.6 95.0 1.7 1.6 0.3 0.2 0.0 0.01 0.4 0.01 0.33 0.2
Distribution
T 3 Mag 1 3.4 2.7 12.7 18.6 21.0 20.2 12.3 6.9 2.8 2.6 18.1 16.0
T 3 Mag 2 11.1 10.2 22.7 27.9 30.5 31.5 26.3 9.6 10.2 6.0 30.1 21.8
T 3 Mag 3 9.0 8.7 13.5 13.7 14.9 14.9 16.0 6.5 8.5 8.0 14.5 13.7
T 3 N/M 76.5 78.4 51.2 39.8 33.6 33.4 45.4 77.0 78.5 83.4 37.2 48.5
Feed 100 100 100 100 100 100 100 100 100 100 100 100
T 3 N/M 76.5 78.4 51.2 39.8 33.6 33.4 45.4 77.0 78.5 83.4 37.2 48.5
T3 N/M + Mag 3 85.5 87.1 64.7 53.5 48.5 48.3 61.4 83.5 87.0 91.4 51.8 62.2
T 3 N/M + Mag 3 + Mag 2 96.6 97.3 87.3 81.4 79.0 79.8 87.7 93.1 97.2 97.4 81.9 84.0

Nordic Mining Prefeasibility Study
30 October 2017 Engebø Rutile and Garnet Project H352410
H352410-00000-280-066-0001, Rev. 0 Page 132
© Hatch 2017 All rights reserved, including all rights relating to the use of this document or its contents.
11.4.5.3 Programme 1286-003 - High Density Attritioning of Coarse Garnet
Programme 1286-003 was initiated during the coarse garnet circuit flowsheet development
of bulk sample 1245. Refer also to Section 11.4.2 that describes the review of the three
coarse garnet circuits that were considered. At the time of flowsheet development,
chemical analysis was used as a guide and compared to microprobe chemical analysis of
the coarse garnet. The chemical analysis obtained compared well to the microprobe
analysis provided by Nordic Mining but it was acknowledged that mineralogical analysis
would be required to confirm the garnet grade. Once it was confirmed by QXRD results
that the coarse garnet grade was below specification, programme 1286-003 was
commissioned.
The scope of work called for three representative coarse garnet circuit feed samples to be
retrieved from the bulk +250 µm sample. It is important to note that at the time the coarse
garnet circuit consisted only of the dry magnetic circuit as shown in Figure 11-25 below.
The primary objective of this work was to establish if additional or improved garnet
liberation could be obtained by high density attritioning (effectively determining if
composite particles could be liberated into discreet mineral particles). The three samples
were labelled A to C where sample A would not be attritioned and processed through the
coarse garnet circuit, sample B would be attritioned for five minutes at 80% solids and
processed through the circuit and sample C would undergo the same process as B, but
attritioned for ten minutes. It was also requested that the particle size distribution (PSD) of
each sample be determined after attritioning to get an understanding of the degree of
change that took place following the attritioning treatments.
Figure 11-25: Coarse Garnet Flowsheet of Programme 1286-003
+212 µm
RED
Mag Non-mag
RED
Mag Non-mag
RER
Mag Non-mag
O/S
U/S Garnet
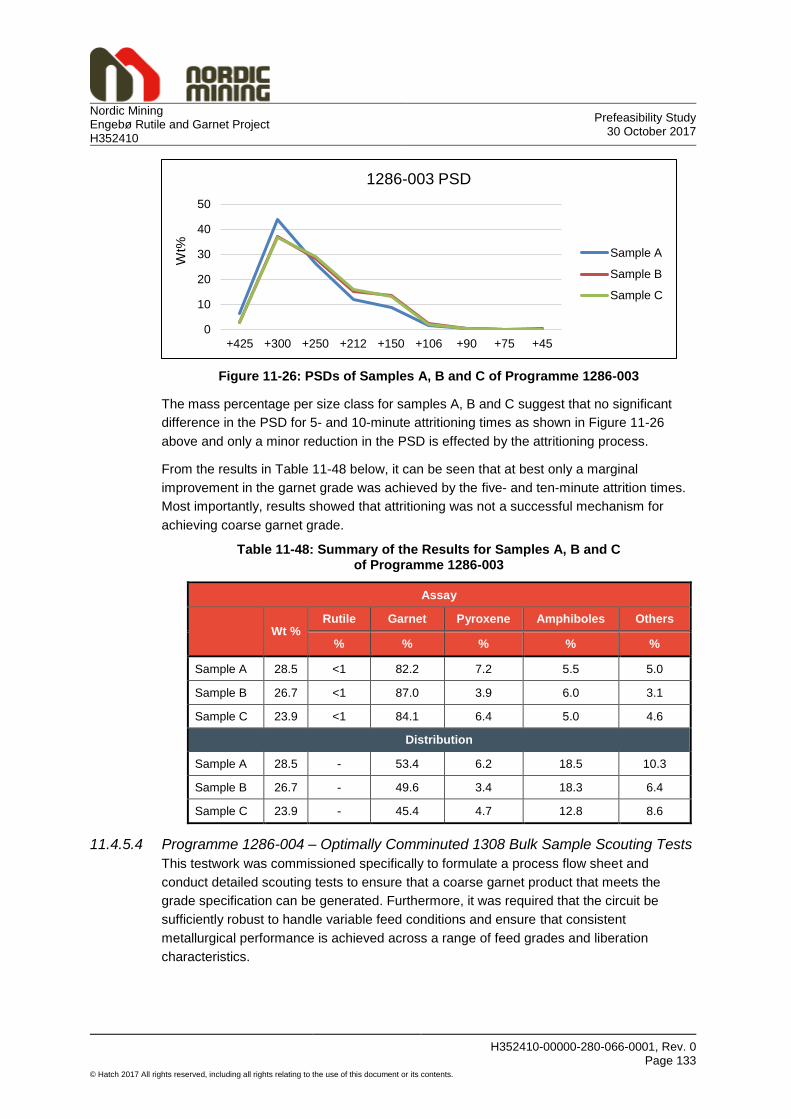
Nordic Mining Prefeasibility Study
30 October 2017 Engebø Rutile and Garnet Project H352410
H352410-00000-280-066-0001, Rev. 0 Page 133
© Hatch 2017 All rights reserved, including all rights relating to the use of this document or its contents.
Figure 11-26: PSDs of Samples A, B and C of Programme 1286-003
The mass percentage per size class for samples A, B and C suggest that no significant
difference in the PSD for 5- and 10-minute attritioning times as shown in Figure 11-26
above and only a minor reduction in the PSD is effected by the attritioning process.
From the results in Table 11-48 below, it can be seen that at best only a marginal
improvement in the garnet grade was achieved by the five- and ten-minute attrition times.
Most importantly, results showed that attritioning was not a successful mechanism for
achieving coarse garnet grade.
Table 11-48: Summary of the Results for Samples A, B and C of Programme 1286-003
Assay
Wt % Rutile Garnet Pyroxene Amphiboles Others
% % % % %
Sample A 28.5 <1 82.2 7.2 5.5 5.0
Sample B 26.7 <1 87.0 3.9 6.0 3.1
Sample C 23.9 <1 84.1 6.4 5.0 4.6
Distribution
Sample A 28.5 - 53.4 6.2 18.5 10.3
Sample B 26.7 - 49.6 3.4 18.3 6.4
Sample C 23.9 - 45.4 4.7 12.8 8.6
11.4.5.4 Programme 1286-004 – Optimally Comminuted 1308 Bulk Sample Scouting Tests
This testwork was commissioned specifically to formulate a process flow sheet and
conduct detailed scouting tests to ensure that a coarse garnet product that meets the
grade specification can be generated. Furthermore, it was required that the circuit be
sufficiently robust to handle variable feed conditions and ensure that consistent
metallurgical performance is achieved across a range of feed grades and liberation
characteristics.
0
10
20
30
40
50
+425 +300 +250 +212 +150 +106 +90 +75 +45
Wt%
1286-003 PSD
Sample A
Sample B
Sample C

Nordic Mining Prefeasibility Study
30 October 2017 Engebø Rutile and Garnet Project H352410
H352410-00000-280-066-0001, Rev. 0 Page 134
© Hatch 2017 All rights reserved, including all rights relating to the use of this document or its contents.
As seen from the results from programme 1286-003, at this point a coarse garnet product
containing >92% garnet was not achieved and programme 1286-004 was specifically set
up to achieve this goal. As such, a comprehensive set of scouting tests was undertaken to
test systematically all known feed and equipment set-up conditions to determine the
optimal testwork conditions to maximise both grade and recovery. At this time, the
comminution testwork results were being processed and it was now known that the
Hazemag crusher delivered the most optimally comminuted sample with the highest garnet
and rutile liberation compared to the other crusher options. Outflows from the comminution
testwork were kept separate as results showed that the Hazemag crusher delivered
superior liberation of minerals compared to the rod mill. At this point it was not yet decided
to process the output from the crushing and milling circuit as a single stream. As such,
three samples were generated to be used in this testwork programme, they were:
Sample A – Hazemag crushed sample
Sample B – Rod milled sample and
Sample C – Combined Hazemag and rod mill sample.
Each of the above samples were then subjected to a matrix of scouting tests consisting of
variations of feed rates and roll speeds with variations in the mass distribution to the
different products of the coarse garnet circuit consisting of a dry magnetic separation
circuit only (two RED stages followed by a single RER stage, as shown in Figure 11-25
above). Scouting test performance curves were generated and reviewed once the QXRD
results were available. IHC Robbins included the perfect separation line (line from the zero
point to the average of the feed grade) as well as the no separation line (diagonal line
connecting the zero and 100% points) in the graphical representation, where data points
were scattered between these two lines. Results showed that following the initial RED
stage, very little separation benefit existed as the next stage feed grade increased and the
difference between actual separation and no separation was becoming increasingly small.
Once the results from the scouting tests were received for sample A (Hazemag +212 µm),
optimal condition selection could be made and the bulk sample was processed at the
selected conditions. During the processing of samples B and C, learnings from sample A
were used and it was decided to fast track samples B and C by using mass splits similar to
those of sample A. At the time, due to the large number of QXRD samples generated in
this process, BVM experienced a back log in the QXRD sample analysis. As a result, it
was decided to prioritise the bulk sample analysis over the sighter tests for samples B and
C. Bulk sample results are shown below in Table 11-49, Table 11-50 and Table 11-51. In
each instance, Test- 101, 201 and 301 refer to the first stage RED, the second RED and
the RER magnet performance respectively.
Table 11-49: Sample A – Hazemag Comminuted +212 µm Fraction
Test Garnet Grade Garnet Distribution Overall Garnet
Distribution
Test 101A 89 83 83
Test 201A 94 90 75
Test 301A 94 68 51

Nordic Mining Prefeasibility Study
30 October 2017 Engebø Rutile and Garnet Project H352410
H352410-00000-280-066-0001, Rev. 0 Page 135
© Hatch 2017 All rights reserved, including all rights relating to the use of this document or its contents.
Table 11-50: 1286-004 Sample B – Rod Mill Comminuted +212 µm Fraction
Test Garnet Grade Garnet Distribution Overall Garnet
Distribution
Test 101B 82 64 64
Test 201B 83 91 58
Test 301B 93 71 41
Table 11-51: 1286-004 Sample C – Combined Hazemag and Rod Mill Comminuted +212µm Fraction
Test Garnet Grade Garnet Distribution Overall Garnet
Distribution
Test 101C 84 76 76
Test 201C 88 90 68
Test 301C 93 65 44
Overall circuit results for samples A, B and C are shown in Table 11-52 below.
Table 11-52: 1286-004 Overall Circuit Performance for Samples A, B and C
Test Garnet Grade Garnet Distribution
Test 301A 94 53
Test 301B 93 42
Test 301C 93 45
With limited benefit achieved from the subsequent separation stages, in particular the final
RER stage, it became increasingly clear that perhaps an abbreviated wet gravity circuit
may add value to the coarse garnet circuit and it was decided to investigate this in
programme 1286-005 which was incorporated into programme 1308.
11.4.5.5 Programme 1293 - Rutile Upgrade Optimisation
11.4.5.5.1 Mineral Technologies
As discussed in Section 0, following below-target metallurgical performance results from
the dry rutile processing circuit, it was decided to provide a parallel sample to a competing
laboratory, namely Mineral Technologies (MT), to validate the performance and to
investigate the potential benefits of alternative operating conditions. The scope of work
was split into two parts. Part A consisted of sighter tests to confirm optimal operating
conditions including high density attritioning of the feed material prior to physical
separation; part B covered the processing of a bulk sample once optimal conditions were
established in part A.
A short letter style report (A.12 Mineral Technologies 83207 Item A Report) covering part
A of the scope reported results inferior to that obtained by IHC Robbins. Based on these
results, it was decided not to go ahead with part B. Mineral Technologies reported that
closely following similar mass splits to that developed by IHC Robbins was the root cause

Nordic Mining Prefeasibility Study
30 October 2017 Engebø Rutile and Garnet Project H352410
H352410-00000-280-066-0001, Rev. 0 Page 136
© Hatch 2017 All rights reserved, including all rights relating to the use of this document or its contents.
for the poor performance. As such Mineral Technologies took it upon themselves to repeat
the magnetic separation testwork following a different operating philosophy and returned
results significantly improved to their first attempt as well as a notable improvement
compared to the first attempt by IHC Robbins. These results provided confidence that with
improved operating conditions, improved metallurgical performance was possible.
Table 11-53 below shows that a significant improvement was realised by Mineral
Technologies over the first attempt by IHC Robbins. However, it must be noted that these
results exclude electrostatic separation as Mineral Technologies could not match the
results achieved by IHC Robbins.
Table 11-53: Dry Magnetic Circuit Performance Comparison for Rutile Upgrading
Laboratory % Wt TiO2 Fe2O3 SiO2 Al2O3 MgO ZrO2 CaO TiO2 Dist
MT 22.0 69.2 7.7 12.7 2.0 1.6 0.08 3.1 86.7
IHCR 23.0 57.6 8.3 18.9 3.1 2.7 0.03 4.7 76.4
11.4.5.5.2 IHC Robbins
Following the decision to conduct parallel testwork for the rutile dry circuit at a competing
laboratory, it was further decided to provide IHC Robbins the opportunity to repeat the
testwork of this circuit now that valuable mineralogical analysis was available.
During the 1231 bulk sample programme, particularly during the dry rutile processing, it
became increasingly clear that dry physical separation at standard operating conditions
would result in substantial TiO2 losses due to overlapping physical properties of the
mineral assemblage. Therefore, it was decided to undertake extensive sighter testwork to
establish the optimal operating conditions in a bid to improve the TiO2 recovery across the
dry rutile circuit. The operating variables investigated included:
Feed rate
Roll speed
Feed temperature
Roll diameter (rare earth roll)
Voltage (electrostatic plate separator).
The above operating variables were used to define an overall matrix of tests to establish
the optimal operating conditions for each separation technology. A bulk sample was
processed through the developed flow sheet at the optimal conditions and a significant
increase in the overall TiO2 recovery of 16.3% was observed for the dry rutile circuit, as
shown in Table 11-54 below. The final grade of the rutile concentrate did not change from
the approximate mark of 80% TiO2 as the focus of this effort was placed on TiO2 recovery.
High density attritioning of the rutile concentrate was included in the scope of work and the
results indicated very limited improvement in the grade and recovery performance.

Nordic Mining Prefeasibility Study
30 October 2017 Engebø Rutile and Garnet Project H352410
H352410-00000-280-066-0001, Rev. 0 Page 137
© Hatch 2017 All rights reserved, including all rights relating to the use of this document or its contents.
Table 11-54: Comparison of the Rutile Dry Circuit Before and after Supplementary Test Work
Processing Area Programme 1231 Programme 1293
Rutile Upgrade Process
Rutile product TiO2 recovery (%) 70.6 86.9
Overall
Rutile product 49.6 61.0
11.4.5.6 Flotation to Reject Pyrite and Upgrade Rutile
The investigation of the use of both forward and reverse flotation in the Nordic Mining
flowsheet was conducted in two separate programmes:
Core Metallurgy (Australia) investigated both forward and reverse flotation of the spiral
concentrate stream, prior to the dry mill for programme 1231
JKTech (Australia) investigated flotation of the dry mill rutile concentrate for
programmes 1231 and 1245, focusing on reverse flotation of pyrite only.
This testwork evaluated the potential for removal of gangue minerals such as pyroxene
and pyrite, from the valuable minerals, rutile and garnet. Two process routes were
considered: forward flotation of rutile, or reverse flotation of firstly pyrite, then silica. It was
found that garnet tends to follow the rutile in most flotation tests.
The reagents investigated are summarised in Table 11-55 below.
Table 11-55: Flotation Reagents Tested
Process pH Range Activators Collectors
Rutile flotation 2-12 MgOH Flotinor SM15 (Phosphoric acid)
CaOH Flotinor FS2 (Carboxylic acid)
None Flotinor FS3 (Carboxylic acid)
Flotinor 3635 (Carboxylic acid ester)
Hydroxamic acid
Pyrite flotation Natural CuSO4 SIBX
6.0 None PAX
Silica flotation 3-12 MgOH Flotigam 2835-2 (alkyl ether diamine)
CaOH Flotigam EDA 3 (alkyl ether amine)
None
The following was concluded from the Core Metallurgy testwork programme:

Nordic Mining Prefeasibility Study
30 October 2017 Engebø Rutile and Garnet Project H352410
H352410-00000-280-066-0001, Rev. 0 Page 138
© Hatch 2017 All rights reserved, including all rights relating to the use of this document or its contents.
Rutile flotation:
Flotigam FS2 was the best performing collector, which produced high rutile recoveries
(75% to 89%) at concentrate rutile grades of 21% to 25%. Rutile grades were low due
to the high proportion of garnet in the concentrate
Unfortunately, repeat tests using FS2 demonstrated that the repeatability of this
reagent was poor. The method of preparation of the FS2 reagent was also a factor in
determining the results.
Forward flotation could not match conventional physical separation in terms of
upgrading of TiO2 and TiO2 recovery to the final concentrate.
Pyrite flotation:
The pyrite tests performed well with ~97% total sulphur (ST) recovery at a concentrate
ST grade of ~46%. This test was polished grind and had copper sulphate and SIBX
addition
A test was trialled without copper sulphate addition, which produced a slightly lower ST
recovery (86%) and ST grade (~44%)
Tests on dry mill product indicated that copper sulphate was not required to activate
the pyrite. Recoveries of 97.2% were obtained at natural pH using 200 g/t of SIBX. It is
believed that the sample of spiral concentrate may have been oxidised during the
laboratory procedure, thus requiring copper sulphate to activate the surface.
Pyrite/silica flotation:
The pyrite/silica tests failed to produce a high-grade rutile tails stream with high rutile
recoveries. A test with Flotigam 2835 silica collector and CaOH addition had the
highest rutile grade tails stream at ~23.5% but at an average rutile recovery of ~54%.
Overall, the pyrite flotation process was considered substantially more effective compared
to the rutile and silica flotation processes and was incorporated into the flowsheet with the
results summarised in Table 11-56 below. Pyrite recoveries were similar for both spiral
concentrate and rutile concentrate. A high-level trade-off study (H352410-4000-210-030-
0001) was conducted to determine the best position for the flotation process, looking at
both the capital and operating costs. Locating the flotation process on the spiral
concentrate, prior to the dry mill, was found to be significantly more cost effective due to
the additional drying costs required if the flotation circuit is located after the dry mill.
Table 11-56: Pyrite Flotation Performance
Laboratory Sample Programme Feed Grade
TiO2 Recovery to Tails
Tails Grade
%TiO2 %S % %TiO2 %S
Core Spiral Concentrate
1231 17.5 1.1 99.6 18.1 0.03
JKTech Dry Mill Product 1231 82.5 4.7 99.4 91.5 0.14
Dry Mill Product 1245 82.3 7.1 97.3 93.7 0.17

Nordic Mining Prefeasibility Study
30 October 2017 Engebø Rutile and Garnet Project H352410
H352410-00000-280-066-0001, Rev. 0 Page 139
© Hatch 2017 All rights reserved, including all rights relating to the use of this document or its contents.
Tails grades from the spiral concentrate sample were substantially lower than from the dry
circuit product, since the garnet tends to follow the rutile in the flotation process. However,
this material is then directed to the dry magnetic separation process for further removal of
garnet and pyroxene.
11.4.5.7 Rutile Recovery from 1245 Fines, 100% passing 45 µm
Although recovery of TiO2 from the fines (particles smaller than -45 µm) did not specifically
form part of the PFS testwork, the team identified early in the programme that this stream
could contain a significant percentage (10 to 15%) of the total TiO2, should the necessary
caution not be exercised during the comminution process.
Introductory testwork was undertaken with limited success but it is the intention to explore
this opportunity further during the next study phase to confirm firstly if a fine rutile product
can be produced and once this is confirmed, to determine the recovery of such a product.
To understand the value of this opportunity, a financial analysis based on high level
assumptions was made during the PFS to confirm if this opportunity warranted the
expenditure of financial and human resources. Based on the parameters below it is evident
that this opportunity should be explored during the next study phase and hence this work is
included in the future work programme.
The following input parameters were used in the financial analysis:
Capital investment of US$ 3 M
Annual operating cost of US$ 300,000
Rutile price based on 70% of the coarse rutile price (US$ 735)
Annual fine rutile production of 2,205 t.
The following financial performance indicators were derived from the analysis:
NPV of US$ 8 M over a 20 year period
IRR of 24%
NPV/capital ratio of 1.57.
11.5 Plant Operating Factor
An Operating Factor (OF) definition and basis were developed in order to estimate the
achievable operating factor and plant utility for the three major product streams, being
coarse garnet, rutile and fine garnet.
Ideally this would have entailed Reliability-Availability-Maintainability (RAM) modelling to
ascertain predicted availabilities for the various unit operations, but a first approximation
based on the number, and type of equipment involved, as well as assumed planned
maintenance periods was believed to be sufficient at this stage due to limited final
equipment details and vendor information with regards to maintenance requirements,
frequencies and durations.
Nordic Mining Prefeasibility Study
30 October 2017 Engebø Rutile and Garnet Project H352410
H352410-00000-280-066-0001, Rev. 0 Page 140
© Hatch 2017 All rights reserved, including all rights relating to the use of this document or its contents.
An Operating Factor for a facility is an indication of the percentage of time the production
will be at instantaneous design rate and required quality. Operating factor is therefore
dependant on the amount of time a facility is available for operation, the percentage of
available time utilised, the achieved rate of operation/production, and the quality of the
product. Mathematically the operating factor is expressed as:
𝑂𝑝𝑒𝑟𝑎𝑡𝑖𝑛𝑔 𝐹𝑎𝑐𝑡𝑜𝑟 = 𝐴𝑣𝑎𝑖𝑙𝑎𝑏𝑖𝑙𝑖𝑡𝑦 𝑥 𝑈𝑡𝑖𝑙𝑖𝑠𝑎𝑡𝑖𝑜𝑛 𝑥 𝑅𝑎𝑡𝑒 𝐹𝑎𝑐𝑡𝑜𝑟 𝑥 𝑄𝑢𝑎𝑙𝑖𝑡𝑦 𝐹𝑎𝑐𝑡𝑜𝑟
Where:
Availability = available time/calendar time
Utilisation = utilised time/available time
Rate Factor = average instantaneous rate/design rate
Quality Factor = percentage of first pass quality achieved
Plant utility is defined as the total utilised or operating time of the facility, and is calculated
by the product of availability and utilisation.
Thus:
𝑃𝑙𝑎𝑛𝑡 𝑈𝑡𝑖𝑙𝑖𝑡𝑦 = 𝐴𝑣𝑎𝑖𝑙𝑎𝑏𝑖𝑙𝑖𝑡𝑦 𝑥 𝑈𝑡𝑖𝑙𝑖𝑠𝑎𝑡𝑖𝑜𝑛
Plant utility does not have a linear relationship with production, as rate and quality are not
considered; it does, however, give an indication of expected operating and therefore
production time (uptime) per annum. On the assumption of always running to design
capacity and achieving 100% first pass quality, the operating factor will be equal to the
plant utility.
An operating factor estimation will ideally involve availability calculation or modelling on a
higher level of granularity, i.e. planned maintenance as per recommended maintenance
intervals and tasks from supply or fabrication vendors on individual equipment items,
synchronised to a certain starting point, and a best common interval selected to capture
most preventative and scheduled maintenance activities. For the purposes of this study,
four- and six-week intervals were selected for process areas, as these are medians in
industry ranging from three- to twelve-week intervals for scheduled maintenance
shutdowns.
On a similar level of detail, failure or breakdown events could be estimated on an individual
equipment item level, supported by typical modes of failure, the (industry average)
frequency of expected failure for the type of item, its application and environment of
operation (MTBF), corrective action durations (MTTR) and spares requirements.
Vendor information and recommendations for the study were not available at the time of
operating factor estimation, and industry best practice maintenance and failure events
were therefore assumed on the basis of complexity, number of unique equipment items
and type of equipment. These values were also compared to the performance of
organisations in similar industries and locales, to validate the assumptions.

Nordic Mining Prefeasibility Study
30 October 2017 Engebø Rutile and Garnet Project H352410
H352410-00000-280-066-0001, Rev. 0 Page 141
© Hatch 2017 All rights reserved, including all rights relating to the use of this document or its contents.
It is recommended that a more detailed assessment of expected availabilities and other
secondary contributors to operating factor is done when vendor information is available
during the next study phase. For now, the operating factors listed in Table 11-57 below
have been determined for each process area based on the above approach. Using unique
operating factors for each process area is reasonable due to the presence of buffers
between each main process area, allowing increased availability.
Table 11-57: Operating Factors of Each Process Area
Process Area Operating Factor (%)
Crushing 95.7
Primary Milling 94.3
Primary Desliming and Screening 94.3
Coarse Garnet Gravity Separation 97.0
Coarse Garnet Dry Mill 96.8
Secondary Milling and Desliming 96.8
Rutile Gravity Separation 96.8
Rutile Flotation 96.8
Rutile Dry Mill 96.5
Fine Garnet Magnetic Separation (WHIMS) 96.8
Fine Garnet Gravity Separation 96.8
Fine Garnet Dry Mill 96.8
Tails and Co-disposal 96.5
11.6 Process Design
11.6.1 Equipment Selection
The processing equipment selected was based on typical, industry-standard equipment
that has an established presence in heavy mineral sands-type applications. The only major
difference is the equipment required for the comminution circuit, as comminution is
typically not required in mineral sands operations. Table 11-58 below summarises the
equipment selected for the testwork programmes together with the separation feature of
each.

Nordic Mining Prefeasibility Study
30 October 2017 Engebø Rutile and Garnet Project H352410
H352410-00000-280-066-0001, Rev. 0 Page 142
© Hatch 2017 All rights reserved, including all rights relating to the use of this document or its contents.
Table 11-58: Equipment Types Selected for the Process
Equipment Type Separation Feature Duty
Screen Particle size Wet
Cyclone Particle size/density Wet
Wet High Intensity Magnetic Separator (WHIMS)
Magnetic susceptibility Wet
Gravity Spiral Particle density Wet
Up-Current Classifier Particle size & density Wet
Rare Earth Drum (RED) Magnetic susceptibility Dry
Rare Earth Roll (RER) Magnetic susceptibility Dry
Electrostatic Separator Conductivity Dry
Electrostatic Plate Separator Conductivity Dry
Flotation Surface properties Wet
11.6.2 Process Design Basis / Criteria
11.6.2.1 Plant Capacity, Design Life and Production Profile
The processing plant is based on a RoM of 1.5 Mtpa dry solids. Total garnet production is
expected to average 176 ktpa over the first five years and 224 ktpa over the first ten years.
11.6.2.2 Feed Grades
The feed grades of rutile and garnet for the two primary ore types, ferro ore and trans ore,
are shown in Table 11-59 below.
Table 11-59: Average Grades of Rutile and Garnet for the Engebø Deposit
Ore Type Rutile* Garnet**
wt% wt%
Ferro eclogite 3.73 44.6
Trans eclogite 2.56 42.4
Leuco eclogite*** - 35.7
*Approximate grades from the mine plan for the open pit and underground schedules
**Grades as stated in “Technical Report – Resource Estimation for the Engebo Rutile/Garnet Deposit, Norway” by A. Wheeler
*** Not included in the current study but considered a potential future ore if economic considerations call for lower grade material
11.6.2.3 Final Products Production Capacity
The plant production capacity for rutile, fine garnet, coarse garnet, total garnet and the
potential product, pyrite, is shown in Table 11-60 for the 1.5- and 2.0 Mtpa cases. These
values are also used in the financial model. A short description of their origin is provided
below.

Nordic Mining Prefeasibility Study
30 October 2017 Engebø Rutile and Garnet Project H352410
H352410-00000-280-066-0001, Rev. 0 Page 143
© Hatch 2017 All rights reserved, including all rights relating to the use of this document or its contents.
In Table 11-60 below, the total garnet yield is based on a blend of ferro- and trans ore in
the ratio of 1.95 parts ferro to 1 part trans, as per the mine plan at the time of writing.
Furthermore, a total garnet yield on ferro ore of 18.3% is used as determined from the
coarse yield in programme 1308 of 11.4% and multiplied by 1.6 to account for the
coarse/fine garnet ratio requirement of 62.5% to 37.5%. A de-rating factor of 97% was
applied to the TiO2 recovery of the ferro and trans programmes to account for a potential
decrease in process performance as a result of scaling and to adopt a conservative
position with respect to rutile recovery. Annual rutile production values are determined for
ferro ore using a TiO2 recovery and grade of 58.4% and 4.66%.
Table 11-60: Annual Product Capacity for 1.5 Mtpa Ferro Ore (excluding mining ore losses and dilution)
Product
Expected Product Yield
Annual Production: 1.5 Mtpa ROM
Wt% kt/annum
Total Garnet* 18.3 274.5
Coarse Garnet (212 to 550 µm) 11.4 171.0
Fine Garnet (106 to 212 µm) 6.9 103.5
Rutile** (45 to 212 µm) 2.32 34.4
*Based on a coarse: fine garnet ratio of 62.5:37.5 **Based on a de-rated (at 97%) recovery of 58.4%, ahead grade of 3.73% and a rutile product grade of 95% TiO2
11.6.2.4 Final Product Grades Achieved
The rutile and garnet products achieved in the two representative bulk test work
programmes for the ferro-eclogite (1308) and trans-eclogite (1234) ore types are included
in the following tables below:
Ferro-eclogite, rutile product: Table 11-61
Ferro-eclogite, coarse garnet product: Table 11-62
Ferro-eclogite, fine garnet product: Table 11-63

Nordic Mining Prefeasibility Study
30 October 2017 Engebø Rutile and Garnet Project H352410
H352410-00000-280-066-0001, Rev. 0 Page 144
© Hatch 2017 All rights reserved, including all rights relating to the use of this document or its contents.
Table 11-61: Rutile Product Properties Achieved in Test Work Programme 1308
Rutile Product Composition (XRF)
Compound Wt%
TiO2 94.90
Fe2O3 1.63
SiO2 1.53
Al2O3 0.31
Cr2O3 0.01
MgO 0.03
MnO 0.02
ZrO2 0.06
P2O5 0.01
V2O5 0.41
Nb2O5 n/d
CaO 0.35
K2O 0.01
CeO2 n/d
S 0.17
(FeS2) (0.30)
SnO2 <0.02
U (ppm) <10
Th (ppm) <10
Rutile Product Particle Size Distribution
Aperture (µm) Cum Wt%
250 100
212 99.9
180 93.1
150 81.7
125 65.0
106 50.0
90 29.7
75 15.1
63 6.9
45 0.7
0 0
D50 (µm) 106
D80 (µm) 147

Nordic Mining Prefeasibility Study
30 October 2017 Engebø Rutile and Garnet Project H352410
H352410-00000-280-066-0001, Rev. 0 Page 145
© Hatch 2017 All rights reserved, including all rights relating to the use of this document or its contents.
Table 11-62: Coarse Garnet Product Properties Achieved in Test Work Programme 1308 (i.e. 1286-005)
Coarse Garnet Product Composition (QEMSCAN)
Mineral Wt%
Garnet 95.4
Rutile 0.43
Pyrite 0.05
Quartz 0.47
Amphiboles 0.59
Clinopyroxenes 2.21
Other 0.85
Coarse Garnet Product Particle Size Distribution
Aperture (µm) Wt%
600 100
500 98.8
425 95.1
355 84.0
300 65.2
250 34.9
212 13.2
180 1.5
150 0.5
125 0.2
106 0
D50 (µm) 274
D80 (µm) 342

Nordic Mining Prefeasibility Study
30 October 2017 Engebø Rutile and Garnet Project H352410
H352410-00000-280-066-0001, Rev. 0 Page 146
© Hatch 2017 All rights reserved, including all rights relating to the use of this document or its contents.
Table 11-63: Fine Garnet Product Specifications Achieved in Test Work Programme 1308
Fine Garnet Product Composition (QEMSCAN)
Compound Wt%
Garnet 95.5
Rutile 0.45
Pyrite 0.02
Quartz 0.28
Amphiboles 0.76
Clinopyroxenes 2.31
Other 0.68
Fine Garnet Product Particle Size Distribution
Aperture (µm) Wt%
250 100
212 99.2
180 83.3
150 57.2
125 26.2
106 7.8
90 0.7
75 0
D50 (µm) 144
D80 (µm) 176

Nordic Mining Prefeasibility Study
30 October 2017 Engebø Rutile and Garnet Project H352410
H352410-00000-280-066-0001, Rev. 0 Page 147
© Hatch 2017 All rights reserved, including all rights relating to the use of this document or its contents.
11.6.2.5 Process Plant Battery Limits
The battery limits for the processing plant are as follows:
Incoming
Secondary crushing feed conveyor discharge into secondary screen feed bin
Receipt of raw / fresh water from the source
Receipt of natural gas for the driers and re-heaters via trucks1
Receipt of reagents via trucks into storage sheds, including flocculants and flotation
reagents (collector and frother).
Outgoing
Load out of primary rutile product from ship loader into ocean going vessel
Load out of 30/60 mesh garnet product from ship loader into ocean going vessel
Load out of 80 mesh garnet product from ship loader into ocean going vessel
Load out of 100 mesh garnet product from ship loader into ocean going vessel
Wet plant tailings and coarse plant rejects discharge into blending chamber via
pumping system.
11.6.3 Process Overview – Process Flow Diagrams
The circuit design of the process plant comprises three stages: crushing, milling and
beneficiation to extract rutile and garnet. Figure 11-27 below summarises the key plant
areas.
1 Delivery to be confirmed

Nordic Mining Prefeasibility Study
30 October 2017 Engebø Rutile and Garnet Project H352410
H352410-00000-280-066-0001, Rev. 0 Page 148
© Hatch 2017 All rights reserved, including all rights relating to the use of this document or its contents.
Figure 11-27: Simplified Block Diagram
11.6.3.1 Primary Crushing and Screening – Areas 3110 and 3120
The primary crusher will be supplied with ore from a glory hole in the pit on the Engebø
mine. A static bar grizzly will be installed at the top of the glory hole. Oversize will be
broken by a fixed rock breaker. Material will gravitate through the hole onto a pile and will
be withdrawn at a controlled rate from the pile by an apron feeder and fed onto the
150 mm grizzly screen. A fixed rock breaker will also be available here to break any large
oversize material.
The grizzly screen oversize will fall into the primary (jaw) crusher, where it will be reduced
to -150 mm. The screen undersize will join the primary crushed ore and discharged onto a
conveyor belt that will transfer the material to RoM silos with an estimated capacity of
40,000 t for both silos. The silos will be used both to store ore and to blend it if required
prior to processing. A magnet will be installed over the conveyor for removal of any tramp
steel that may damage the equipment downstream.
From the RoM holding/blending silos, material will be drawn onto a conveyor belt by
feeders at the required rate to achieve the RoM blend required at the time. The conveyor
belt will transfer the ore through a tunnel to the processing site. The primary crushing
station will not operate between the hours of 22h00 and 06h00 daily including week-ends
and public holidays.
A water spray dust suppression system will be installed at the crusher area. Spray nozzles
will create a fine mist of spray water to lay dust.

Nordic Mining Prefeasibility Study
30 October 2017 Engebø Rutile and Garnet Project H352410
H352410-00000-280-066-0001, Rev. 0 Page 149
© Hatch 2017 All rights reserved, including all rights relating to the use of this document or its contents.
11.6.3.2 Secondary and Tertiary Crushing - Areas 3130, 3140 and 3150
The purpose of the secondary and tertiary crushing circuit is to produce <6 mm material
that will be fed to the milling circuit. A simplified schematic of the circuit is given in Figure
11-28 below.
Figure 11-28: Schematic of the Secondary and Tertiary Crushing Circuit
The secondary crushing feed conveyor will deliver crushed ore (<150 mm) to the
secondary screen buffer bin. Material will be withdrawn from the bin by a vibrating feeder
and fed to a double deck secondary screen. The secondary screen will produce two
oversize fractions (>50 mm and >12 mm) and an undersize fraction (<12 mm). The two
oversize fractions will gravitate into the secondary (cone) crusher, while the undersize
discharges onto the tertiary screen feed conveyor (not to be confused with the tertiary
crusher feed conveyor). The secondary cone crusher discharges onto the tertiary crusher
feed conveyor and reports to the tertiary crusher feed bin. The purpose of the feed bin is to
ensure that the tertiary crushers are choke fed. The screens ahead of the tertiary crushers
will remove the -6 mm undersize fractions to minimise the amount of fines reporting to the
tertiary crushers. The screen undersize together with the tertiary crusher (Hazemag)
product will join the secondary screen undersize and be conveyed to the tertiary screen.
The tertiary screen feed conveyor will deliver the material into a tertiary screen feed bin.
The purpose of this bin is to facilitate even feeding of this relatively wide screen. This
screen is a single deck fitted with a 6.0 mm wire mesh screen. The >6.0 mm fraction will
be conveyed back to the tertiary crusher feed conveyor while the <6.0 mm fraction is
conveyed to a buffer silo/s (primary rod mill feed silo) with a capacity of approximately
1,500 t. The tertiary crushers will thus operate in closed circuit with the tertiary screen.
A dedicated dust extraction system will be installed in the circuit to ensure the dust levels
are kept low.

Nordic Mining Prefeasibility Study
30 October 2017 Engebø Rutile and Garnet Project H352410
H352410-00000-280-066-0001, Rev. 0 Page 150
© Hatch 2017 All rights reserved, including all rights relating to the use of this document or its contents.
11.6.3.3 Primary Rod Milling - Area 3210
The mill feed conveyor will deliver crushed ore to the primary rod milling circuit. Material
will discharge onto the rod mill feed screen distribution bin. The purpose of this bin is to
distribute feed evenly to two sizing screens. The purpose of the feed screen is to reject the
<550 µm fraction, this is required to minimise generation of fines (-45 µm solids). Oversize
from this screen will report to the rod mill. Inlet dilution water will be added to the mill feed
chute to control mill slurry density.
The mill is in closed circuit with another 550 µm screen to return only the >550 µm fraction
while the <550 µm from the rod mill joins the <550 µm from the rod mill feed screen and is
fed to the desliming circuit. Both these <550 µm streams report to the desliming cyclone
feed sump.
A spillage sump pump will be provided in the mill bunded spillage area. Spillage will be
pumped to the mill feed inlet.
11.6.3.4 Primary Feed Preparation - Area 4110
The <550 µm streams from the primary rod milling circuit report to the desliming cyclone
feed sump where dilution water is added before the slurry is pumped by a variable speed
pump to the desliming cyclone cluster for fines (<45 µm solids) removal, as shown in
Figure 11-29 below. The cyclone overflow will gravitate to the slimes thickener to separate
the fine solids from the process water, typically a conventional thickener underflow
achieves a solids concentration ranging between 32% to 35% solids by mass. Clear water
will overflow the thickener overflow rim and will be returned to the process water tank.
Underflow from the de-sliming cyclone cluster will be pumped to the primary (Derrick)
screen where dilution water will be added to achieve a slurry solids concentration of
approximately 35% solids by mass. The slurry will report to a three-way distributor to split
the feed into equal flows to feed the three Derrick screens. The cut size on the Derrick
screens will be 212 µm.
Oversize (>212 µm) from primary sizing screen will gravitate to the coarse garnet rougher
spiral feed sump while the undersize will be transferred to the primary WHIMS feed sump.
During times when the wet gravity circuit is off line, the feed to the wet gravity circuit will be
dewatered by belt filter and stored in a bin. Conversely, when the primary WHIMS circuit is
off line, the feed to the WHIMS will be diverted to a dewatering belt filter and stored in a
bin.

Nordic Mining Prefeasibility Study
30 October 2017 Engebø Rutile and Garnet Project H352410
H352410-00000-280-066-0001, Rev. 0 Page 151
© Hatch 2017 All rights reserved, including all rights relating to the use of this document or its contents.
Figure 11-29: Primary Feed Preparation Area
11.6.3.5 Coarse Garnet Processing – Areas 4310 and 4320
The function of the coarse garnet circuit is to produce a high grade coarse garnet product
by means of spiral gravity concentrators and dry RED magnetic separators. The coarse
garnet in the ore is concentrated by using the difference in relative densities (specific
gravity) of the valuable mineral and the gangue. A schematic of the circuit is given in
Figure 11-30 below.
DESLIMING
-45 µm
Fines
+212 µm
SCREENING
-212 µm
Comminuted material (-550 µm)

Nordic Mining Prefeasibility Study
30 October 2017 Engebø Rutile and Garnet Project H352410
H352410-00000-280-066-0001, Rev. 0 Page 152
© Hatch 2017 All rights reserved, including all rights relating to the use of this document or its contents.
Figure 11-30: Schematic of Coarse Garnet Processing Circuit
The gravity circuit has two stages of HG10i spirals, namely rougher and scavenger. The
rougher spirals produce two products, a concentrate that gravitates to the final concentrate
sump and a tailing that gravitates to the scavenger spiral feed sump. The scavenger
spirals produce three products, a concentrate that gravitates to the rougher spiral feed
sump, a middling that gravitates back to the scavenger spiral feed sump and a tailing that
gravitates to the final tails sump. The concentrate is laundered to a sump and pumped via
a dewatering cyclone onto a vacuum belt filter. The vacuum belt filter reduces the moisture
Tails
Tails
Midds
N/M Mags
N/M Mags
Midds
Coarse Garnet Product
+212 µm from Primary Screen
Concentrate
Concentrate
Rejects
To rejects milling
Midds
Rougher Spirals
Scavenger Spirals
Primary RED
Secondary RED

Nordic Mining Prefeasibility Study
30 October 2017 Engebø Rutile and Garnet Project H352410
H352410-00000-280-066-0001, Rev. 0 Page 153
© Hatch 2017 All rights reserved, including all rights relating to the use of this document or its contents.
to below 5% (by mass) and the concentrate is dried through a fluid bed dryer. The tailings
are pumped to the secondary milling circuit before feeding the WHIMS circuit.
The dried concentrate discharges from the dryer into a bucket elevator that feeds the
mineral cooler. The hot mineral (~100 ºC) gravitates through multiple tube nests fed with
cooled water and cooled mineral will discharge from the mineral cooler. Hot water will flow
from the tube nests and be cooled in an adiabatic water cooler before re-entering the
mineral cooler inlet port. Cooled mineral (~60 ºC) will report to the process consisting of
two stages of RED magnetic separators. The primary RED magnets produce three
products, a mag, a middling and a non mag. The mag and non mag contains recoverable
amounts of TiO2 and as such will also report to the secondary milling circuit as is the case
with the coarse garnet wet gravity tails. The middlings from the primary RED report to the
secondary RED magnets via a bucket elevator. This stage also generates three products
where the mag and non mag report to tails and the middling is directed to final product. In
the event that the secondary milling circuit is off line, the primary RED mag and non mag
can be diverted to the final tails system as well.
11.6.3.6 Secondary Feed Preparation - Area 4120
The secondary feed preparation area is made up of secondary rod milling and WHIMS.
The function of this area is to produce feed for the fine garnet and rutile processing
circuits. A schematic of the process area is given in Figure 11-31 below.
Figure 11-31: Schematic of Rod Milling and WHIMS Circuit
Fines (-45 µm)
-212 µm
Coarse Rejects
Mags
N/M
Mags
N/M
N/M Mags
To Rutile Process To Fine Garnet Process
-212 µm from Primary Screen
To thickener
Primary WHIMS
Secondary WHIMS
Tertiary WHIMS
Desliming Cycclone
Rod Mill

Nordic Mining Prefeasibility Study
30 October 2017 Engebø Rutile and Garnet Project H352410
H352410-00000-280-066-0001, Rev. 0 Page 154
© Hatch 2017 All rights reserved, including all rights relating to the use of this document or its contents.
Feed to the secondary milling is received from two sources; namely the coarse garnet wet
gravity circuit tails and the coarse garnet dry circuit primary RED rejects. These streams
will report to the rod mill that is in closed circuit with a 212µm screen. The >212µm fraction
is recirculated back to the rod mill while the <212µm from the rod mill reports to the
secondary desliming cyclone cluster feed sump. Slurry is transferred to the desliming
cluster where most of the <45µm solids will report to the cyclone overflow. The cyclone
overflow will gravitate to the slimes thickener to separate the fine solids from the process
water, while the underflow joins the <212µm from the Derrick screen undersize and fed to
the WHIMS circuit feed sump. The primary WHIMS produces two products, a mag and a
non mag. The mags gravitate to the tertiary WHIMS feed sump while the non mags
gravitate to the secondary WHIMS feed sump. The secondary WHIMS feed reports to the
dewatering cyclone before the underflow gravitates to a two-way gravity distributor. This
WHIMS stage produces two products: a mag and a non-mag. The mags gravitate to the
tertiary WHIMS feed sump while the non mags gravitate to the non mag concentrate feed
sump. The tertiary WHIMS are fed via a two-way gravity distributor and produce two
products: a mag and a non-mag. The mags gravitate to the mags dewatering feed sump
and are pumped to the fine garnet processing circuit, while the non mags is combined with
the secondary WHIMS non-mags and are pumped to the rutile gravity separation circuit.
11.6.3.7 Rutile Processing – Areas 4210, 4220 and 4230
The non mags from the WHIMS non mag sump are pumped to the rougher spirals. The
rougher spirals produce three products: a concentrate that gravitates to the cleaner feed
sump, a middling that gravitates to the mids scavenger spiral feed sump and a tailing that
gravitates to the rougher scavenger spiral feed sump. The mids scavenger spirals are fed
by the rougher spiral mids, the mids scavenger spiral mids and the rougher scavenger
spiral concentrate and is split to four banks of spirals via a four-way distributor. The mids
scavenger spirals produce three products: a concentrate that gravitates to the cleaner feed
sump, a middling that gravitates to the mids scavenger spiral feed sump and a tailing that
gravitates to the rougher scavenger spiral feed sump. Feed to the cleaner spirals
consisting of the rougher spiral concentrate, mids scavenger spiral concentrate and
cleaner spiral mids is pumped to a three-way pressure distributor feeding the cleaner
spirals. The cleaner spirals produce three products: a concentrate that gravitates to the
gravity circuit concentrate sump, a middling that gravitates to the cleaner spiral feed sump
and a tailing that gravitates to the cleaner scavenger spiral feed sump. The rougher
scavenger spirals produce three products, a concentrate that gravitates to the mids
scavenger feed sump, a middling that gravitates to the rougher scavenger spiral feed
sump and a tailing that gravitates to the tails sump.
Feed to the cleaner scavenger spirals consisting of the cleaner spiral tails is pumped to a
two-way pressure distributor feeding the cleaner scavenger spirals. The cleaner scavenger
spirals produce two products; a concentrate that gravitates to the gravity circuit
concentrate sump and a tailing that gravitates to the rougher scavenger spiral feed sump.
The rutile concentrate is pumped to the pyrite flotation bank while the tailings are pumped
to the tails de-watering process.

Nordic Mining Prefeasibility Study
30 October 2017 Engebø Rutile and Garnet Project H352410
H352410-00000-280-066-0001, Rev. 0 Page 155
© Hatch 2017 All rights reserved, including all rights relating to the use of this document or its contents.
The spiral concentrate is pumped from the rutile concentrate sump to the feed box of the
flotation bank where it is combined with frother and collector. Air from the air compressor
supplies the flotation cells. Spray water is added to the lip and launder of each cell for froth
washing and mobility. Frother is delivered to the plant via tanker trucks and pumped to a
frother storage tank. This frother is then pumped in batches to an agitated mixing tank
where it is diluted with raw water from the raw water tank. This diluted mixture is pumped
to the frother header tank which overflows back to the agitated mixing tank to maintain a
constant level. A peristaltic pump draws frother from the frother header tank and pumps to
the flotation bank.
Collector (xanthate) is delivered to the plant in bags via delivery trucks. A hoist is used to
lift bags off the truck into the storage area and from the storage area to the mixing tank. A
chute and bag breaker are installed above the mixing tank which breaks the bags and
directs the dry xanthate pellets into the agitated tank. Raw water is added from the raw
water tank and the solution is allowed to mix until the pellets are fully dissolved. Fumes are
collected in a specialised vent to collect any carbon disulphide gas before being released.
The xanthate mixture is pumped to an agitated holding tank. The collector is then pumped
to the collector header tank which overflows back to the agitated holding tank. A peristaltic
pump draws collector from the collector header tank and pumps to the flotation bank.
The reagents area is fitted with a spillage pump, eye wash stations and safety showers.
Spillage is collected in drums for hazardous waste disposal.
The flotation froth phase (containing the pyrite) is directed to the flotation froth sump and
pumped to the tails dewatering circuit. The flotation slurry product (containing rutile) is
directed to the flotation product sump and pumped to the dewatering cyclone located
above a vacuum belt filter. The vacuum belt filter reduces the moisture to below five
percent (by mass) and the concentrate is dried through a fluid bed dryer. A schematic of
the rutile wet circuit is given in Figure 11-32 below.

Nordic Mining Prefeasibility Study
30 October 2017 Engebø Rutile and Garnet Project H352410
H352410-00000-280-066-0001, Rev. 0 Page 156
© Hatch 2017 All rights reserved, including all rights relating to the use of this document or its contents.
Figure 11-32: Schematic of Rutile Wet Circuit
Conc Tails
Midds
Conc Tails
Midds
Conc Tails
Midds
Conc Tails
Midds
Conc Tails
Midds
Froth
Rejects
Tails
Rutile Concentrate
WHIMS Non-mags
Pyrite Flotation
Cleaner Scavenger Spirals
Cleaner Spirals
Rougher Scavenger Spirals
Rougher Spirals
Midds Scavenger Spirals

Nordic Mining Prefeasibility Study
30 October 2017 Engebø Rutile and Garnet Project H352410
H352410-00000-280-066-0001, Rev. 0 Page 157
© Hatch 2017 All rights reserved, including all rights relating to the use of this document or its contents.
The dried concentrate discharges from the dryer into a bucket elevator that feeds the
mineral cooler. The hot mineral (~100 ºC) gravitates through multiple tube nests fed with
cooled water and cooled mineral will discharge from the mineral cooler. Hot water will flow
from the tube nests and be cooled in an adiabatic water cooler before re-entering the
mineral cooler inlet port. Cooled mineral (~60 ºC) will report to a single stage of RED
magnetic separators where magnetic and non-magnetic products are generated. The
magnetic fraction reports to the primary RER stage to scavenge misplaced non-magnetic
minerals from the magnetic feed. The RER generates two products; a magnetic fraction
that reports to rejects and a non-magnetic fraction that joins the non mags from the
primary RED magnet stage.
The combined non-magnetic fraction from the first two stages report to the secondary RER
stage where two products are generated; a magnetic fraction that reports to the tertiary
RER magnet and a non-magnetic fraction that reports to the re-heater ahead of the
electrostatic separation circuit. The tertiary RER generates two products: a magnetic
fraction that reports to rejects and a non-magnetic fraction that joins the non mags from the
secondary RER to the re-heater. Secondary and tertiary RER non-magnetic fractions
along with the electrostatic plate separator conductors report to a fluid bed re-heater. The
re-heater is required to elevate the mineral temperature to approximately 80 to 100ºC for
optimal electrostatic separation efficiency. Hot mineral will be transferred to the primary
High Tension Roll (HTR) machines where three products will be generated; a conductor
reporting to the cleaner HTR machines, a middling reporting to the scavenger HTR
machines and a non-conductor reporting to the scavenger cleaner HTR machines.
The scavenger HTR machines generate two products; a conductor reporting to the cleaner
HTR machines and a non-conductor reporting to the scavenger cleaner HTR machines.
The scavenger cleaner HTR machines generate two products; a conductor reporting to the
scavenger re-cleaner HTR machines and a non-conductor reporting to the electrostatic
plate separator re-heater. The scavenger re-cleaner HTR machines generate two
products: a conductor reporting to the cleaner HTR machines and a non-conductor
reporting to the electrostatic plate separator re-heater. The cleaner HTR machines
generate two products: a conductor reporting to the rutile product bin and a non-conductor
reporting to the electrostatic plate separator re-heater. Electrostatic plate separators
generate two products: a conductor reporting to the primary HTR re-heater and a non-
conductor reporting to the rejects conveyor. A process equipment baghouse is included in
the design to capture dust generated in the process. Fine solids captured in the bag house
will be directed to rejects while the clean air is released back into the atmosphere. A
schematic of the rutile dry circuit is given in Figure 11-33 below.

Nordic Mining Prefeasibility Study
30 October 2017 Engebø Rutile and Garnet Project H352410
H352410-00000-280-066-0001, Rev. 0 Page 158
© Hatch 2017 All rights reserved, including all rights relating to the use of this document or its contents.
Figure 11-33: Rutile Dry Processing Circuit
Mag N/M
Mag N/M
Mags N/M
Mags N/M
Conductors N/C
Midds
Conductors N/C
Conductors N/C
Conductors N/C
Conductors N/C
Conductors N/C
Rejects
Dried rutile concentrate
Rutile Product
Rejects
Rejects
Primary HTRS
Scavenger HTRS
Scavenger Cleaner
HTRS
CleanerHTRS
Electrostatic Plate Separator
Scavenger Re-cleaner
HTRS
Primary RER
SecondaryRER
Tertiary RER
RED

Nordic Mining Prefeasibility Study
30 October 2017 Engebø Rutile and Garnet Project H352410
H352410-00000-280-066-0001, Rev. 0 Page 159
© Hatch 2017 All rights reserved, including all rights relating to the use of this document or its contents.
11.6.3.8 Fine Garnet Processing – Areas 4330 and 4340
Magnetic product from the WHIMS circuit is pumped to a de-watering cyclone located
above the UCC. The cyclone underflow reports to the UCC while the overflow reports to
the process water distribution box and all excess water gravitates to the thickener feed
well. The UCC separates on size and density and is operated to prepare feed for spiral
separation. The teeter water establishes an upward current and a solids bed form in the
unit that acts as a dense media separation zone. Large heavy particles overcome the
upward current as well as the “dense bed” while lighter (and smaller dense) particles
cannot penetrate the “dense bed” and is swept away by the up current. The UCC overflow
reports to the final tails while the underflow is fed to the spirals. Two banks of spirals make
up the gravity section of the fine garnet circuit. The spiral concentrate gravitates into the
concentrate transfer sump which delivers the slurry to a dewatering cyclone located above
the vacuum belt filter. The vacuum belt filter reduces the moisture to below five per cent
and the concentrate is dried through a fluid bed dryer. The tails from the spirals joins the
overflow from the UCC and pumped to the tails dewatering area. A schematic of the
gravity circuit is given in below.

Nordic Mining Prefeasibility Study
30 October 2017 Engebø Rutile and Garnet Project H352410
H352410-00000-280-066-0001, Rev. 0 Page 160
© Hatch 2017 All rights reserved, including all rights relating to the use of this document or its contents.
Figure 11-34: Schematic of Fine Garnet Processing Circuit
The dried concentrate discharges from the dryer into a bucket elevator that feeds the
mineral cooler. The hot mineral (~100 ºC) gravitates through multiple tube nests fed with
cooled water and cooled mineral will discharge from the mineral cooler. Hot water will flow
from the tube nests and be cooled in an adiabatic water cooler before re-entering the
mineral cooler inlet port. Cooled mineral (~60 ºC) will report to the process consisting of
two stages of RED magnetic separators. The primary RED magnets produce three
products: a mag, a middling and a non mag. The primary RED mag and non mag reports
to the rejects while the middling from the primary RED reports to the secondary RED
magnets via a bucket elevator. This stage also generates three products where the mag
and non-mag report to tails and the middling is routed to final product.
O/F
Concentrate Tails
Rejects
Mags N/M
Midds
Mags N/M
WHIMS Mags
Fine Garnet Product
Midds
Rejects
Rejects
Up current classifier
Spirals
Primary RED
Secondary RED

Nordic Mining Prefeasibility Study
30 October 2017 Engebø Rutile and Garnet Project H352410
H352410-00000-280-066-0001, Rev. 0 Page 161
© Hatch 2017 All rights reserved, including all rights relating to the use of this document or its contents.
11.6.3.9 Product Handling and Load-out Plant
Final products from the rutile, coarse garnet and fine garnet circuits are stored in large
product silos. The size of the product silos will be better defined once shipping schedules
are better defined. Prior to storage, fine and coarse garnet will pass over two sizing
screens to split the two products into three final size fractions. The coarse garnet will report
to a 355 µm screen (to be confirmed) where the oversize reports to the coarse garnet
product bin and the undersize to the intermediate garnet bin. Similarly, the fine garnet will
report to a 106 µm screen where the oversize reports to the fine garnet product bin and the
undersize to the dry rejects conveyor.
11.6.3.10 Tails Handling
Tailings from production will be safely placed in a deep fjord deposit at a depth of 300 m.
The tailings material consists of natural minerals and process reagents. It is a requirement
to remove as much fresh water as possible, not only to limit the fresh water consumption
but also to ensure limited low density water (fresh) enters the co-disposal system.
Wet plant tails consist of thickener underflow with a solids concentration of approximately
35% (m/m) as well as tails from the wet gravity separation plants. The tails from the wet
gravity circuits will be dewatered by dewatering cyclones. The cyclone underflow will report
to a dewatering linear screen while the overflow gravitates to a water collection sump. The
screen underflow gravitates to a water collection sump which transfers the water to the
cyclone overflow water sump. The dewatering screen discharges the moist tails onto a belt
conveyor that will transfer the material to a mixing sump upstream of the co-disposal
system. Discard from the dry processing areas will be combined onto a single belt
conveyor system that will carry the rejects to the same mixing sump as above. The
underflow from the slimes thickener will also be pumped to the mixing sump where all
three rejects stream will be diluted with sea water then pumped to the feed chamber of the
co-disposal system. Further dilution by sea water will take place in the co-disposal
chamber after which the stream will be deposited in the deep see fjord disposal area.
11.6.3.11 Services and Utilities
11.6.3.11.1 Plant Water
Raw water from the source will be discharge into the fire water tank. Only the fire water
pumps are connected to the fire water tank. The fire water tank overflows into the raw
water tank and the raw water reservoir overflows into the process water tank. Three water
pump systems draw water from the raw water reservoir, one delivering water to the gland
seal water distribution, one delivering raw water to various process plant areas via a raw
water ring main system and the other supplying the potable water treatment plant.

Nordic Mining Prefeasibility Study
30 October 2017 Engebø Rutile and Garnet Project H352410
H352410-00000-280-066-0001, Rev. 0 Page 162
© Hatch 2017 All rights reserved, including all rights relating to the use of this document or its contents.
The process water tank receives process water from thickener overflow. Make up water to
process water tank will be supplied by the raw water from the source. Five pump systems
(quantity to be confirmed during next study phase) draw water from the process water
tank; one supplying comminution and feed preparation, one supplying dust handling, one
supplying the central processing header, one supplying the coarse garnet circuit and one
supplying the tails dewatering process area. The fire water tank will supply only the fire
water pumps consisting of an electrical pump system consisting of a supply pump and
jockey pump as well as a diesel fire water pump in the event that the electrical supply is
off.
11.6.3.11.2 Plant and Instrument Air
The processing site will be serviced by a single compressed air facility comprising two
compressors, two air receivers and two air dryers. It is anticipated that a single train will be
sufficient to provide compressed air to the plant and the other train will act as a stand-by
unit. The compressors, air receivers and dryers will be piped to provide maximum flexibility
in the event of one of the components in a system becoming unavailable. Piping of the
systems will also allow connection of a mobile compressor to the compressed air system.
11.6.3.11.3 Natural Gas
Natural gas will be consumed at various process areas within the process plant. The fuel
will be utilised as a source of energy in the fluid bed dryers and re-heaters.
11.6.3.11.4 MSP Dry Process Area Dust and Off-Gas Handling
The dry process areas will generate dust during the normal processing (and drying) and
this dust and off gas will be captured in dedicated bag houses to ensure the working
environments are safe for operators to work in. The design philosophy for dust capturing
and handling is to keep bag houses treating exhaust off gases from liquid fuel burning
dryers and re-heaters separate from those connected to process equipment and materials
handling equipment in the process areas.
As a preliminary basis, each bag house will discharge dust via a rotary valve and/or
possibly a screw feeder (depending on the number of discharge points) into the dust pump
system. The dust pump system will consist of a typical froth pump system. Each bag
house will, therefore, have a dedicated froth pump pumping to a central baghouse dust
collection sump before the combined dust laden slurry is pumped to the slimes thickener.
Process water will be supplied to each froth pump system as make-up including the central
baghouse dust collection sump.
11.6.4 Mass and Mineral Balances
11.6.4.1 High-level Mass and Mineral Balance
A high-level mass and mineral balance was developed in MS Excel to guide process
development by tracking the distribution of mineral species through the proposed
flowsheet, and to determine indicative solids flow rates through each stage of the process.
The balance was based on data from the IHC Robbins test work programmes including
mass splits, XRF, QXRD and QEMSCAN results. The grade and recovery of TiO2 (i.e.
rutile) and garnet were of primary interest and allow for direct comparisons of the different
testwork programmes, as shown in Figure 11-35 below.

Nordic Mining Prefeasibility Study
30 October 2017 Engebø Rutile and Garnet Project H352410
H352410-00000-280-066-0001, Rev. 0 Page 163
© Hatch 2017 All rights reserved, including all rights relating to the use of this document or its contents.
Figure 11-35: Summary Block Flow Diagram of the Process Including TiO2 Grades
1231 1245 1234 1308 1231 1245 1234 1308 1231 1245 1234 1308 1231 1245 1234 1308 1231 1245 1234 1308 1231 1245 1234 1308
4.8 4.9 3.2 4.7 3.3 4.9 3.2 4.5 2.8 2.7 2.8 2.1 2.9 0.9 0.6 0.6 0.0 2.5 3.3
27.9 25.2 22.5 14.6 0.0 36.6 64.3 58.5 43.3 38.5 11.3 10.2 16.9 0.0 4.5 3.7
1231 1245 1234 1308 1231 1245 1234 1308 1231 1245 1234 1308 1231 1245 1234 1308 1231 1245 1234 1308
5.1 4.9 3.2 4.7 5.1 5.7 3.6 5.8 2.2 2.8 3.9 2.9 5.5 3.9 2.5 4.1
143.3 146.1 148.8 156.6 143.3 109.5 84.5 98.1 20.9 20.0 20.3 24.5 17.2 20.3 40.9 33.4
1231 1245 1234 1308
2.1 1.8 2.1
5.0 8.6 4.4
1231 1245 1234 1308 1231 1245 1234 1308 1231 1245 1234 1308 1231 1245 1234 1308
1.0 1.4 0.9 1.0 1.8 1.2 0.7 0.7 1.8 0.7 0.6 0.6 0.5 0.6 0.5 0.6
62.4 72.5 59.9 51.1 32.5 56.1 22.7 19.3 25.2 39.7 19.0 16.6 19.9 35.8 16.7 13.0
1231 1245 1234 1308 1231 1245 1234 1308 1231 1245 1234 1308 1231 1245 1234 1308 1231 1245 1234 1308
5.1 5.4 3.3 5.4 8.0 10.8 5.6 8.8 1.1 1.5 0.8 1.2 1.7 2.5 1.4 1.4 6.4 1.9 1.2 1.9
143.3 129.7 125.4 131.5 81.0 57.3 65.5 80.5 29.8 16.4 37.2 31.7 7.3 16.3 3.7 2.7 5.4 3.9 2.3 3.6
1231 1245 1234 1308 1231 1245 1234 1308 1231 1245 1234 1308 1231 1245 1234 1308
17.9 25.4 17.5 20.4 57.4 77.5 TBD 76.6 79.7 81.0 TBD 87.4 91.0 93.7 TBD 94.9
31.4 20.1 17.0 30.4 7.2 5.8 4.2 7.4 4.9 5.3 3.3 6.1 4.4 4.2 TBD 5.5
1231 1245 1234 1308 1231 1245 1234 1308 1231 1245 1234 1308 1231 1245 1234 1308
1.7 2.9 1.3 1.8 5.3 4.5 TBD 2.6 9.8 42.7 TBD 25.3 2.7 2.5 TBD 16.9
49.6 37.2 48.5 50.1 24.2 14.3 12.8 23.0 2.3 0.5 1.0 1.3 0.5 0.6 TBD 0.6
%TiO2
Solids t/h
COARSE DRY MILL
COARSE GARNETROM
UF (+45 µm) TailsUS (-212 µm)
171.2
DESLIMING GRAVITY SEPARATION
OF (-45 µm) Concentrate
SCREEN
OS (+212 µm)
DESLIMING
OF (-45 µm)
Rejects to mill
Rejects
UF (+45 µm)ROD MILL
WHIMS
FINE GARNET
FLOTATIONELECTROSTATIC SEP.
DRY MAGNETIC SEP.
Products t/h
Non-mags
Non-conductors Froth
Concentrate
Tails
Mags
Rejects Undersize
Tails
TAILS (RUTILE)
Mids
GRAVITY SEP.
DRY MAGNETIC SEP.
WHIMS Feed Non-mags
Rejects t/h
Conductors
GRAVITY SEP.
Concentrate
Mags
SCREEN

Nordic Mining Prefeasibility Study
30 October 2017 Engebø Rutile and Garnet Project H352410
H352410-00000-280-066-0001, Rev. 0 Page 164
© Hatch 2017 All rights reserved, including all rights relating to the use of this document or its contents.
In addition to TiO2 and garnet, gangue minerals were tracked (where available) in an
attempt to understand how effectively each process step upgrades the target minerals and
rejects unwanted minerals. Importantly, the mineral balance provided insight into the
inclusion of a wet gravity stage in the coarse garnet circuit. In essence, the balance
highlighted that spirals achieved the best upgrading ratio of garnet through effective
rejection of amphiboles and pyroxenes. These insights guided development of the
supplementary testwork programme 1286-005.
11.6.4.2 Detailed Mass Balance
The high-level balance described in Section 11.6.4.1 was used to guide process
development. In addition to the high-level balance, a detailed mass balance, including
solids and water, was developed in MS Excel. The balance provides sufficient detail for a
PFS-level study and is used to generate stream tables which inform equipment sizing and
mechanical design. The mass balance was linked directly to the Process Design Criteria
(PDC) which include all relevant test work data.
The mass balance was based on an average hourly flow rate (using 8760 hours per
annum) and a specified RoM of 1.5 Mtpa. Using an average flow rate allows the balance to
close without disparity across process areas due to different operating factors. From the
average hourly flow rate, nominal flow rates were calculated using unique operating factors
for each process area. Each main process area has a unique operating factor due to the
inclusion of buffers which segment the process. A second mass balance was developed
for a RoM of 2.0 Mtpa to provide insight into process requirements for the future expansion
case.
For the spiral circuits, modelling of the recycle/circulating streams led to different overall
mass yields compared to test work data, as these streams were simulated by using
shaking tables in the laboratory. To ensure that overall mass yields match those of the test
work data, the overall mass yields of the spiral circuits were fixed while the mass yields
across the spiral stages that determine recycle stream flow rates were allowed to vary. It is
recommended that a dynamic model of the spirals that includes release curve data be
employed in the next study phase to more accurately capture feed grade variation on spiral
stage mass splits. However, the methodology employed here is deemed sufficient for PFS-
level detail. The output of the mass balance is captured in the stream tables that are
included with the PFDs.
11.6.5 Tailings Evaluation
The tailings were subject to extensive testing as part of the permitting of the tailings
disposal. The tailings contain gangue minerals that are typically found in Norwegian
bedrock. The minerals are evaluated as benign, meaning that the levels of sulphides,
heavy metals and radioactive elements are low and will not pose a risk to the environment.
The PFS testwork has identified three reagents that are recommended in the processing of
the ore, namely: sodium isobutyl xanthate (SIBX), polypropylene glycol and Magnafloc
5250. These reagents will be present in low concentrations in the tailings. A summary of
each reagent is included in the following sections with the annual utilisation rates of each
provided below in Table 11-64.

Nordic Mining Prefeasibility Study
30 October 2017 Engebø Rutile and Garnet Project H352410
H352410-00000-280-066-0001, Rev. 0 Page 165
© Hatch 2017 All rights reserved, including all rights relating to the use of this document or its contents.
Table 11-64: Summary of the Process Reagents
Reagent Purpose Annual Utilisation (t/a)
Sodium isobutyl xanthate Flotation Collector 26.0
Polypropylene glycol Flotation Frother 10.5
Magnafloc 5250 Thickener Flocculant 1.4
11.6.5.1 Flotation Collector – Sodium Isobutyl Xanthate
Collector is required in the flotation process to assist with the attachment of minerals to air
bubbles. In the current process, SIBX will be used as the collector. SIBX is widely used in
the mining industry. The expected dosage of SIBX to the flotation circuit is 100 g/t which
leads to the concentrations shown in Table 11-65 below. As can be seen from the table,
the discharge concentration of SIBX is substantially lower than the LC50 values identified in
literature, before and after dilution in the fjord. Note that SIBX is not one of the permitted
chemicals in Nordic Mining’s discharge permits. Therefore, the substance must pass
through the formal legislation procedure to be utilised in the process.
Table 11-65: Expected Concentration of SIBX at Different Locations in the Process
Location SIBX Concentration
g/m3 ppm
Thickener underflow 61.4 48.4
Co-disposal stream 2.13 2.0
In fjord 50 m around the discharge point - dilution factor of 30*
0.071 0.067
LC50 values identified in literature - 56 to 100
*Recommended value from EIA study
11.6.5.2 Flotation Frother – Polypropylene Glycol
Testwork conducted by Core Metallurgy identified DF400 as the optimal frother required
for reverse flotation of pyrite. Additional testwork by JKTech suggests a dosage of 40 g/t to
be sufficient. This dosage results in the concentrations in Table 11-66 below. DF400 is not
one of the permitted chemicals in Nordic Mining’s discharge permits. Therefore, the
substance must go through the formal legislation procedure to be utilised in the process.
Table 11-66: Expected Concentration of DF400 at Different Locations in the Process
Location
DF400 Concentration
g/m3 ppm
Thickener underflow 24.5 19.3
Co-disposal stream 0.85 0.80
In fjord 50 m around the discharge point - dilution factor of 30*
0.028 0.027
LC50 values identified in literature 1,000 -
*Recommended value from EIA study

Nordic Mining Prefeasibility Study
30 October 2017 Engebø Rutile and Garnet Project H352410
H352410-00000-280-066-0001, Rev. 0 Page 166
© Hatch 2017 All rights reserved, including all rights relating to the use of this document or its contents.
11.6.5.3 Flocculant – Magnafloc 5250
After preliminary testwork, BASF recommended the use of Magnafloc 5250 as the
appropriate flocculant for the slimes thickener. Magnafloc 5250 is a high molecular weight
anionic polyacrylamide flocculant supplied as a free-flowing granular powder. The optimal
dose was found to be 8.6 g/t, which translates to the concentrations presented in Table
11-67 below.
Table 11-67: Expected Concentration of Magnafloc 5250 at Different Locations in the Process
Location
Magnafloc 5250 Concentration
g/m3 ppm
Thickener underflow 3.3 2.6
Co-disposal stream 0.11 0.11
In fjord 50 m around the discharge point - dilution factor of 30*
0.004 0.004
LC50 values identified in literature 100** -
* Recommended value from EIA study **For fish and aquatic invertebrates (MSDS)
Nordic Mining has received a permit for the use of 60 tpa of Magnafloc 155 which is also
classified as a polyacrylamide. Current estimates place the annual usage of Magnafloc
5250 at 1.4 t which is well below the maximum value of the permit of 60 tpa. However,
Magnafloc 5250 specifically is not part of the permitted chemicals and must go through the
formal legislation procedure to be utilised in the process.
11.7 Process Functional Description
A functional description was developed for use in subsequent study phases, which
describes the high-level control philosophy of the various process components of the
Project.
The Functional Description (FD) is an intermediate artefact of the software engineering
process. The purpose of the FD is to facilitate the design process by:
Communicating requirements, summary criteria/constraints, context and knowledge to
team members
Acting as a catalyst to focus development systematically to encompass all aspects of
requirements
Visualising the proposed realisation by:
Enumerating and expanding requirements
Developing and capturing salient design principles
Outlining the proposed user/system interfaces

Nordic Mining Prefeasibility Study
30 October 2017 Engebø Rutile and Garnet Project H352410
H352410-00000-280-066-0001, Rev. 0 Page 167
© Hatch 2017 All rights reserved, including all rights relating to the use of this document or its contents.
Presenting displays/examples and operational scenarios/examples to facilitate
validation of the proposed design with the team and functional validation with key
stakeholders.
Serving as a record of the engineering process, summarising salient requirements,
design approach and operating scenarios for use in test scenarios and preparing
formal system documentation.
The sections that make up the FD document includes a brief description of the process
area followed by a high-level summary of the primary and secondary (if included) control
requirement. This document will become the foundation of the Functional Specification
which will develop the control philosophy in detail during the next study phase. Essentially
each PFD is used to describe the driving control requirement/s necessary to ensure that
optimal control of that section is achieved to ensure the design intent is achieved.
11.8 Basic Plant Layout and Plant Design
As illustrated in Figure 11-36 and Figure 11-37 below, the plant layout consists of three
geographical levels. The overall plant is divided across the three levels as follows:
Level 1
Primary crushed ore conveyor (from underground primary crusher)
Secondary crushing and screening
Tertiary crushing and screening
Primary rod milling and screening
Administration buildings
Buffer storage and dewatering circuits
Process water storage.
Level 2
Primary feed preparation (de-sliming and screening at 212 µm)
Tails thickening
Wet garnet circuits (coarse and fine)
Dry garnet circuits (coarse and fine)
Secondary feed preparation (coarse rejects milling (i.e. secondary milling), secondary
desliming, and WHIMS)
Wet rutile circuit
Dry rutile circuit
Tails dewatering
LPG storage.

Nordic Mining Prefeasibility Study
30 October 2017 Engebø Rutile and Garnet Project H352410
H352410-00000-280-066-0001, Rev. 0 Page 168
© Hatch 2017 All rights reserved, including all rights relating to the use of this document or its contents.
Level 3
Product storage (rutile, 100 mesh garnet, 80 mesh garnet and 30x60 mesh garnet)
Product loadout for shipping.

Nordic Mining Prefeasibility Study
30 October 2017 Engebø Rutile and Garnet Project H352410
H352410-00000-280-066-0001, Rev. 0 Page 169
© Hatch 2017 All rights reserved, including all rights relating to the use of this document or its contents.
Figure 11-36: Plan View of the Proposed Plant Layout

Nordic Mining Prefeasibility Study
30 October 2017 Engebø Rutile and Garnet Project H352410
H352410-00000-280-066-0001, Rev. 0 Page 170
© Hatch 2017 All rights reserved, including all rights relating to the use of this document or its contents.
Figure 11-37: Overview of the Proposed Plant Layout
Nordic Mining Prefeasibility Study
30 October 2017 Engebø Rutile and Garnet Project H352410
H352410-00000-280-066-0001, Rev. 0 Page 171
© Hatch 2017 All rights reserved, including all rights relating to the use of this document or its contents.
11.9 Future Work Programme
List all metallurgical testwork including any other testwork such as comminution work
required to demonstrate ore variability.
Following completion of the extensive testwork programme undertaken as part of the
PFS, the following testwork should be undertaken as part of the DFS for the reasons
listed below:
Risk Mitigation – Areas were identified during the PFS that will require additional
testwork to deliver technical data to understand ore variability better
Opportunity Definition – Opportunities were identified during the PFS and will require
additional testwork to enable the Project Team to interpret and progress these
opportunities into the design.
The following testwork for the comminution and the processing areas was identified:
11.9.1 Comminution Circuit
11.9.1.1 Introduction
Additional comminution testwork will be required in order to improve the understanding of
the deposit and the design of the comminution circuit.
11.9.1.2 Material Flow Properties Testwork
Material flow properties testwork are required in order to design correctly chutes, bins,
silos and conveyors.
The following testwork is typically required:
Direct shear test
Wall friction test
Compressibility test
Moisture content test
Surface roughness test
Particle size test
Angle of repose test.
11.9.1.3 Ore Hardness Variability Testwork
Ore hardness variability testwork is required in order to understand the deposit better.
Data generated together with the mining plan will be used to design the circuit and predict
the performance as a function of the LoM.
The variability assessment will include a spatial variability assessment and a rock type
variability assessment. The following ore hardness characterisation testwork will be
conducted per sample:
Uniaxial Compression Strength test
Bond Crushability Work Index test

Nordic Mining Prefeasibility Study
30 October 2017 Engebø Rutile and Garnet Project H352410
H352410-00000-280-066-0001, Rev. 0 Page 172
© Hatch 2017 All rights reserved, including all rights relating to the use of this document or its contents.
Bond Abrasion Index test
Bond Rod Work Index test
Bond Ball Work Index test
SMC test
Laboratory batch rod mill testwork at different energy inputs on fresh feed and coarser
garnet reject product.
11.9.1.4 Pilot Plant Testwork
The following pilot plant testwork is required:
Hazemag pilot plant testwork
Hazemag wear testwork: This testwork will be required to confirm the OPEX.
Testwork will conducted to replicate the selected flowsheet. The effect of ore moisture
and feed particle size distribution to the Hazemag will also be investigated
Rod mill pilot testwork at different percentage circulating load
Rod mill pilot testwork with recovery of coarser garnet on the screen oversize, as
shown in Figure 11-38 below.
Figure 11-38: Rod Mill in Closed Circuit with a Screen with the Option of Producing a Coarser Garnet (-850/+550 µm) Fraction
11.9.1.5 New Technologies
All comminution technologies investigated during this phase of study cover all mode of
crushing and milling that are used in different crushing and milling technologies. It is
therefore not expected that a new technology will provide significant benefits in terms of
liberation. However, from an operating cost point of view, it will be interesting to monitor
the progress achieved by technologies such as the Vero liberator to assess if it can be
used in the future in the circuit.

Nordic Mining Prefeasibility Study
30 October 2017 Engebø Rutile and Garnet Project H352410
H352410-00000-280-066-0001, Rev. 0 Page 173
© Hatch 2017 All rights reserved, including all rights relating to the use of this document or its contents.
11.9.2 Processing Circuits
During the course of the PFS, four bulk testwork programmes were conducted to develop
the process flow sheet and to gain a better understanding of how process parameters and
ore characteristics influence material behaviour in the defined processing circuits. These
testwork programmes are detailed in Table 11-18 above. During the execution of the
PFS, the following testwork was identified to be completed as part of the DFS and is listed
in no particular order:
Bulk sample testwork programmes to confirm metallurgical performance that could be
expected from ferro-eclogite ores
Testwork to determine the optimal screen size to prepare feed for the rutile
processing circuit. This testwork programme is specifically developed to deal with the
unexpected fine rutile product achieved in the 1308 testwork programme
Coarse garnet recovery from wet gravity coarse garnet tails and dry coarse garnet
circuit tails, QEMSCAN will be required from these streams to reveal where the most
liberated coarse garnet is as well as which stream requires milling to 100% passing
~400 µm before a slightly less coarse garnet can be recovered
Testwork to be specified to determine if the Hazemag and Rod mill -550 µm fractions
to be processed separately or combined. Comminution testwork has shown these
streams to have different liberation characteristics and there may be benefit in
treating these separately
Reworking of the fine WHIMS to limit the mags tonnage to satisfy the fine garnet
production. Screening may have limited success due to it being a difficult screening
application and a small mass will be rejected to undersize. This work may lead to not
requiring the fine garnet gravity circuit
From the comminution variability testwork, glean data to define the variability in the
coarse circuit PSD better. In particular, define the variability in the mass balance due
to misplaced -212 µm material due to expected screening efficiencies and or variation
in the proportion of near size material. This will directly impact the requirement for
design factors to ensure equipment loadings remain in line with testwork
In line with the point above, glean data from the comminution testwork results to
define the variability of the crushed and milled ore as a function of the comminution
process and as a result of ore hardness
Develop laboratory procedures to mimic the currently developed process to determine
key performance parameters from drill core samples. This work will be key to kick off
the geo-metallurgical testwork programme
Based on the above, develop a geo-metallurgical testwork programme to define the
correlation between the geology and metallurgy of the processing circuits. This work
programme will be vital to predict metallurgical performance based on the ore
geology.

Nordic Mining Prefeasibility Study
30 October 2017 Engebø Rutile and Garnet Project H352410
H352410-00000-280-066-0001, Rev. 0 Page 174
© Hatch 2017 All rights reserved, including all rights relating to the use of this document or its contents.
12. Mining
12.1 Introduction
This section summarises the mining work undertaken during the PFS. The key mining
related work packages undertaken are as follows:
Development of a mining block model to be used as the basis for the open pit and
underground mine design
Pit optimisation studies
Open pit mine design
Underground mining method selection
Underground mine design (including underground infrastructure)
Incorporation of updated from ongoing process testwork and other studies into mine
optimisation
Plant capacity determination
Production schedule, including equipment selection, operating and capital cost
estimates.
Subsequent to completion of most of the mining studies in this phase, financial modelling
of a number of mining options using updated OPEX and CAPEX numbers indicated that
the development of a high-grade option to mine and process ferro ore only at a capacity
of 1.5 Mtpa provided a better IRR than options which mined both trans ore and ferro ore.
One of the main factors driving the value of the ferro ore option was the change in
understanding of the garnet contribution to the Project revenue; recent testwork results
indicated that the expected garnet recovery for ferro ore would be significantly higher than
for trans ore, which changed the Project economics. For these reasons, the final mine
plan developed considered the mining and processing of ferro ore only, with trans ore
being treated as waste. The bulk of the write-up in this section of the report reflects early
work carried out before the Project decision was made to exclude trans ore.
12.2 Open Pit Mining Block Model Development
12.2.1 Definition of Mining Model Shape for the Open Pit
The first step in the development of the open pit block model was to regularise and
reconcile the block model received to 5 m by 5 m by 15 m (x, y and z) blocks. This
resizing of the blocks allowed for more efficient design in terms of both processing power
and geometry.
Figure 12-1 below provides an isometric view of the block model as supplied of the
Engebø deposit, coloured on TiO2 grade.

Nordic Mining Prefeasibility Study
30 October 2017 Engebø Rutile and Garnet Project H352410
H352410-00000-280-066-0001, Rev. 0 Page 175
© Hatch 2017 All rights reserved, including all rights relating to the use of this document or its contents.
Figure 12-1: Initial Geological Block Model showingTiO2 Grade
After regularisation the distribution of garnet and TiO2 grades in the block model is shown
in Figure 12-2 below.
Figure 12-2: Block Model Grades
The next step in the design process was to filter the block model on material class to
target the mining area to ensure that only mineral resources in line with the JORC
guidelines were used as the basis of the mine design.

Nordic Mining Prefeasibility Study
30 October 2017 Engebø Rutile and Garnet Project H352410
H352410-00000-280-066-0001, Rev. 0 Page 176
© Hatch 2017 All rights reserved, including all rights relating to the use of this document or its contents.
Figure 12-3: Orebody Block Model Filtered on JORC Material Class
The above model formed the basis for the pit and underground design used in the study.
12.3 Pit Optimisation Studies
12.3.1 Introduction
The following sections summarise the open pit optimisation analysis undertaken and the
recommendations which resulted from the work in terms of a practical pit design to be
used as the basis of the PFS mine plan.
12.3.2 Background
The Project is being developed in line with the guidelines of the JORC Code. However,
opportunities have been investigated outside of the JORC standard to include Inferred
Resources, and are reported separately. This is to support project decisions related to
exploration, mine capacity, processing, infrastructure and the market. However, only the
open pit optimisation studies undertaken to support a mine plan which corresponds to the
guidelines of the JORC Code are discussed in this section.
It is foreseen that two products will be produced from the Engebø deposit, namely rutile
concentrates and garnet. Mining will commence from an open pit which will provide
access to an underground mine. Ore will be drilled, blasted, loaded and hauled to a glory
hole (ore pass) in the pit, after which it will undergo primary crushing underground.
Thereafter, the ore will be transported via a conveyor belt to the secondary and tertiary
crushing facilities in the processing area next to the deposit. Finally, processing of the ore
to extract rutile and garnet products will take place. Waste will be stripped and hauled to a
waste disposal site to the north-east of the pit. Three ore types have been modelled,
namely:
Ferro-eclogite, which generally contains >16% Fe2O3 and >3% TiO2
Trans-eclogite, which generally contains 14% to 16% Fe2O3 and 2% to 3% TiO2
Leuco-eclogite, which generally contains <14% Fe2O3 and <2% TiO2.
Open pit optimisation formed the initial step within the reserve estimation process. During
the early stages of the Project, limited information and resolution was available, which
impacted negatively on the pit optimisation process. The following limitations had a
significant impact on the open pit optimisation:

Nordic Mining Prefeasibility Study
30 October 2017 Engebø Rutile and Garnet Project H352410
H352410-00000-280-066-0001, Rev. 0 Page 177
© Hatch 2017 All rights reserved, including all rights relating to the use of this document or its contents.
Permitting limitations: to limit the visual impact of the open pit, a permitting string as
supplied by Nordic Mining defined the outermost physical limit of the pit. The final pit
designs mined to the permit string in the eastern, western and southern directions; it
is only in the northern direction that the pit does not extend to reach the permitting
string
Capacity decision: the capacity options investigated range from 1.0 Mtpa to 4.0 Mtpa
RoM ore processed through the plant. For this range, the mining Operating
Expenditure (OPEX) varies by 82% per RoM tonne from the low to high capacity
(US$ 4.6/ROM t to US$ 2.6$/ROM t respectively)
Market demand: the selling of two products with a limited understanding of garnet
market volumes and prices. The Project’s view on the garnet price dropped over the
duration of this study phase (from US$ 300/t of product to an interim price of US$
220/t, with a final price of US$ 250/t). The first optimisation runs considered 100 ktpa
of garnet sales, after which 200 ktpa was considered before the most recent runs
which used 300 ktpa garnet as maximum sales per year. The average over the LoM
is 250 ktpa with a total of almost 8 Mt that can be placed in the market
Metallurgical results: initially, the recovery for garnet was not well defined; in addition,
the lower limit cut-off grade for TiO2 was not well understood in terms of metallurgical
recovery. The current view from a process perspective of the lowest grade ore which
can be treated varies from 1% to 2% TiO2; this implies that ore below a 2% TiO2
grade will have a very unpredictable recovery. A lower cut-off grade limit for TiO2 of
1% has been used in open pit optimisation. This has a significant impact on the
waste: ore definition based on cut-off grade; there could be a significant number of
blocks that are economical based on garnet content that could be classified as waste
It became evident during the study that garnet, and in particular recovery of coarse
garnet, plays a significant role in improving the business case.
To accommodate these limitations, a first pass iteration process was adopted consisting
of reconciliation, design sensitivities, ultimate pit sensitivities and pushback pit
optimisation. The iteration process incorporated:
Owner’s boundary limit
Geotechnical design specifications
Rock types
Consideration of Measured and Indicated Resources, and exclusion of Inferred
Resources
Rutile cut-off grade
Mining method
Mining factors for dilution and recovery
Mine design and pit access implications

Nordic Mining Prefeasibility Study
30 October 2017 Engebø Rutile and Garnet Project H352410
H352410-00000-280-066-0001, Rev. 0 Page 178
© Hatch 2017 All rights reserved, including all rights relating to the use of this document or its contents.
Mining equipment size and operability
Mine infrastructure and waste rock disposal location
Process and infrastructure cost.
12.3.3 Approach
The approach followed to define the ultimate pit, initial pushback and design criteria is laid
out in Figure 12-4 below. The main aspects of the approach are described in more detail
within this report. During the evaluation process, various ultimate pit shells were
developed to evaluate the sensitivity of the mentioned limitations.
The first pass iteration compared this study’s optimisation model with the pit optimisation
reported as part of the Resource Estimate report conducted by Mr. Wheeler and reported
within the Technical Report – Resource Estimation for the Engebø Deposit.
During the second pass, the aim was to obtain the ultimate pit shell considering additional
detail. The base case input parameters were adjusted to incorporate:
A ramp design: this was done by adjusting the overall slope angle to accommodate
various haul truck sizes
Update operational cost over the total value chain.
In addition to the above changes, a cut-off-grade analysis has been conducted on both
JORC and opportunity business cases.
The final pass iteration focused on pushback analysis. The aim was to optimise the
business case focusing on JORC requirements. The main aspect evaluated was the
influence of resource classification on the business case, as well as a strategy to defer
waste stripping.
Figure 12-4: Open Pit Optimisation Iteration Steps

Nordic Mining Prefeasibility Study
30 October 2017 Engebø Rutile and Garnet Project H352410
H352410-00000-280-066-0001, Rev. 0 Page 179
© Hatch 2017 All rights reserved, including all rights relating to the use of this document or its contents.
12.3.4 Options Evaluated
The following main pit optimisation cases were evaluated:
Option 1: reconciliation between the optimisation model developed for this study and
the model defined for the Resource Estimation report. Run 3 from the above report
has been used for reconciliation purposes
Option 2: incorporation of a ramp design within Option 1 by adjusting the overall slope
angle to accommodate 90 t haul trucks (CAT 777 or similar), in line with the
anticipated equipment which would be used on a deposit of the size and configuration
of Engebø
Option 3: an update of operational cost and recovery factors based on PFS
information including mining, processing, product handling and overheads
Option 4: a cut-off grade analysis. Cut-off grade analysis (decision for rock to be
classified either as ore or waste) has been conducted based on TiO2 grade values
Options 4b: recovery sensitivity analysis. Garnet recovery has not been well defined.
To investigate the effect of garnet recovery on the ultimate pit shell, recoveries per
ore rock type have been evaluated
Option 5: a final ultimate pit shell in line with the JORC Code guidelines. The aim was
to include up to 10% non-Measured and Indicated Resources within the initial open
pit design and schedule – this amount was considered at the time to be an
acceptable upper limit to develop a mine plan which corresponded to the guidelines
of the JORC code; the Project Team subsequently agreed to consider only Measured
and Indicated Resources in the mine plan
Option 6: consider ferro-eclogite as the primary ore type with high-grade transitional-
eclogite and remove leuco-eclogite as ore. This option has been included to verify the
impact on metallurgical results received towards the end of the PFS as well as to
investigate options to improve the Project’s Internal Rate of Return (IRR).
12.3.5 Inputs
The open pit optimisation was conducted using the 2016 regularised resource model
supplied by the client. NPV Scheduler was used to perform the open pit optimisation. A
base case pit design was created using DESWIK software, classifying ore based on
Measured and Indicated resources for rock type 1, 2 and 3. Rock types 4 to 8 were
classified as waste, together with all ore blocks below the specified cut-off grade. The
classification of the above rock types in the resource model is summarised in Table 12-1
below.

Nordic Mining Prefeasibility Study
30 October 2017 Engebø Rutile and Garnet Project H352410
H352410-00000-280-066-0001, Rev. 0 Page 180
© Hatch 2017 All rights reserved, including all rights relating to the use of this document or its contents.
Table 12-1: Rock Type Classifications in Resource Model
Rock Type
Category Description
1 Leuco-eclogite <14% Fe2O3 and <2% TiO2; often light coloured, but can be dark green; often more coarser grained
2 Transitional-eclogite 14% to 16% Fe2O3 and 2% to 3% TiO2; a mix between ferro and leuco, no clear boundary, a transitional change
3 Ferro-eclogite >16% Fe2O3 and >3% TiO2; often dark and fine grained, often has a homogenous appearance; abundant garnet and rutile
4 Amphibolite Homogenous, no banding; moss green with no garnets
5 Garnet Amphibolite Homogenous, no banding; darker green than eclogite
6 Gneiss (including felsic rocks)
Usually internal zones within main eclogite body; quartz vein like
7 Alternating mafic and felsic rocks
Usually country rock surrounding main eclogite body; mixing of mafic and felsic rocks
8 Quartz Massive quartz vein of more than 1 m
The open pit optimisation runs aligned to the JORC constraints (i.e. Inferred Resources
classified as waste) were limited within the perimeter for which the owner has permission
to evaluate as a potential open pit.
The following table provides the pit optimisation parameters used during this study:

Nordic Mining Prefeasibility Study
30 October 2017 Engebø Rutile and Garnet Project H352410
H352410-00000-280-066-0001, Rev. 0 Page 181
© Hatch 2017 All rights reserved, including all rights relating to the use of this document or its contents.
Table 12-2: Open Pit Optimisation Input Parameters
Parameter Unit Option 1 Option 2 Option 3 Options 4 and 5
Prices
TiO2 US$/t product
1,000 1,000 1,050 1,050
Garnet US$/t product
300 300 220 220
Mining OPEX Waste
US$/t rock
2.64 2.64 2.5 2.5
Ore US$/t ore 2.64 2.64 2.1 2.1
Processing OPEX
Direct US$/t ore 9.14 9.14 10.00 10.00
G&A US$/t ore 0.85 0.85 In
Processing OPEX
In Processing
OPEX
Shipping TiO2
US$/t product
3.00 3.00
Shipping Garnet
US$/t product
3.00 3.00
Total US$/t ore 10.00 10.00 10.30 10.30
Mining Factors Dilution % 5 5 5 5
Recovery % 95 95 95 95
Cut-Off Grades TiO2 % 2.0 2.0 2.0
0 1.5 2.0 2.5
Process Factors TiO2
Recovery % 55 55 55 55
Garnet Recovery
% 16 16
21.2 (Leuco & Trans),
33.5 (Ferro)
21.2 (Leuco & Trans),
33.5 (Ferro)
Discount Rate % 10 10 8 8
Overall Slope Angles*
0 ° 56 49.72 49.72 49.72
90 ° 55 45.20 45.20 45.20
180 ° 55 49.14 49.14 49.14
270 ° 59 50.23 50.23 50.23
*See Figure 12-6 for overlay of main quadrant (above) and sector specific values.
12.3.6 Open Pit Optimisation Results
12.3.6.1 Option 1: Reconciliation
A representative block model was created for the pit optimisation study with the input
parameters provided for Option 1. The following table provides the results created within
the open pit model created to replicate the Resource Estimate optimised pit. The models
reconciled to each other to within 1%, which is an acceptable variance for a PFS. No Net
Percent Value (NPV) has been reported within the Resource Estimate. However, based
on this study the Option 1 open pit optimisation provided an NPV of US$ 290.9 M and
total rock tonnes of 60.7 Mt.

Nordic Mining Prefeasibility Study
30 October 2017 Engebø Rutile and Garnet Project H352410
H352410-00000-280-066-0001, Rev. 0 Page 182
© Hatch 2017 All rights reserved, including all rights relating to the use of this document or its contents.
Table 12-3: Reconciliation Summary
Option Reference NPV Profit Revenue Processing
Cost Mining Cost
Rock Ore Waste TiO2
Product Garnet
Product
US$ M US$ M US$ M US$ M US$ M Mt Mt Mt Mt Mt
RE Run 3, RE - 419.8 958.0 375.5 162.7 61.6 37.6 24.1 0.7 0.9
1 Pits_28 290.9 417.1 953.1 375.7 160.2 60.7 37.7 23.0 0.7 0.9
Comparison Pits_28: Run 3 99% 99% 100% 98% 99% 100% 96% 100% 99%
The following figures provide plan, North-South and East-West section views for Option 1.
Figure 12-5: Open Pit Visuals - Options 1
12.3.6.2 Option 2: Incorporation of Ramp Design into Option 1
The ultimate pit in Option 1 was derived from the geotechnical recommendation for
overall slope angles. These overall slope angles did not incorporate a ramp design. Two
shortfalls of this approach are, firstly, that an optimistic business case is presented and
secondly, that the detailed pit design normally goes outside of the optimised pit shell to
accommodate the ramp design.
The following process steps were taken to obtain realistic overall pit slopes that comply to
both the geotechnical design recommendations and detailed pit design requirements:
Export of the ultimate pit shell to DESWIK to create a high-level pit design that
included a ramp per haul truck size alternative
At this stage of the PFS, the final haul truck size had not been selected; ramp designs
for five haul truck sizes were constructed, therefore, to accommodate several
possible truck sizes
The overall slope angles for the major geotechnical sectors were measured and the
NPV Scheduler slope settings were adjusted accordingly

Nordic Mining Prefeasibility Study
30 October 2017 Engebø Rutile and Garnet Project H352410
H352410-00000-280-066-0001, Rev. 0 Page 183
© Hatch 2017 All rights reserved, including all rights relating to the use of this document or its contents.
This process was repeated three times until minor adjustments were required when
constructing the pit design.
Table 12-4 below provides the ramp design specifications based on the respective haul
truck sizes:
Table 12-4: Open Pit Ramp Design Specification per Haul Truck
Truck Capacity (t) Width (m) Dual Traffic
Passing Width (m)
Tyre Size Tyre Height Berm (m)
Drainage (m)
Barrier Width (Tyre
Height Berm plus Drainage Berm (m))
Ramp Width (m)
ADT 740 40 4.2 12.6 29.5R25 1.9 2 3.9 17
CAT 775 60 5.8 17.4 24.00R35 2.2 2 4.2 22
CAT 777 90 6.1 18.3 27.11R49 2.6 2 4.6 23
CAT 785 130 6.7 20.1 33.00R51 3 2 5 26
CAT 789 180 7.7 23.1 37.00R57 3.4 2 5.4 29
Table 12-5 below provides the adjusted overall slope angles per major geotechnical
sector for the 90 t haul truck type (CAT 777):
Table 12-5: Adjusted Overall Slope Angles
Sector Orientation Max
Slope (degrees)
Bench Height
(m)
Berm Width
(m)
Bench Face Angle
(degrees)
Ramp Width
(m)
Inter Ramp Angle with-Out Ramp (degrees)
Inter Ramp Angle with
Ramp (degrees)
Overall Slope Angle
(degrees)
Overall Slope Angle
(degrees)
Overall Slope Angle
(degrees)
Step 1 Step 2 Step 3
North 327.8-21.3
270 15 5 85 23 67.18 27.10 67.18 51.68 51.68
North East
21.3-88.6 260 15 5 68 23 53.60 23.77 53.60 47.77 47.77
South East
88.6-151.2
145 15 5 68 23 53.60 23.77 53.60 45.20 45.20
South 151.2-253.9
215 15 5 68 23 53.60 23.77 53.60 45.20 49.14
North West
253.9-327.8
180 15 5 74 23 58.20 24.91 58.20 48.79 48.79
Figure 12-6 below provides the major geotechnical sector definition as recommended by
WAI. These sectors have been used for Options 3, 4 and 5. Overlaid in red are the four
major sectors used for Options 1 and 2.

Nordic Mining Prefeasibility Study
30 October 2017 Engebø Rutile and Garnet Project H352410
H352410-00000-280-066-0001, Rev. 0 Page 184
© Hatch 2017 All rights reserved, including all rights relating to the use of this document or its contents.
Figure 12-6: Geotechnical Slope Sector Design
Table 12-6 below shows the results generated within the open pit model created to
replicate the Resource Estimate optimised pit incorporating a ramp design for the CAT
777 haul truck. The ramp design reduced the total rock tonnes mined to 49.7 Mt and
generated an NPV of US$ 253.4 M.
Table 12-6: Impact of Ramp Design on Optimisation
Option Reference NPV Profit Revenue Processing
Cost Mining Cost
Rock Ore Waste TiO2
Product Garnet
Product
US$ M US$ M US$ M US$ M US$ M Mt Mt Mt Mt Mt
1 Pits_28 290.9 417.1 953.1 375.7 160.2 60.7 37.7 23.0 0.7 0.9
2 Pits_79 253.4 341.3 778.0 305.4 131.3 49.7 30.6 19.1 0.6 0.7
Comparison Pits_79Pits_28
87% 82% 82% 81% 82% 82% 81% 83% 82% 81%
Figure 12-7 below shows plan, North-South and East-West section views for Option 2.

Nordic Mining Prefeasibility Study
30 October 2017 Engebø Rutile and Garnet Project H352410
H352410-00000-280-066-0001, Rev. 0 Page 185
© Hatch 2017 All rights reserved, including all rights relating to the use of this document or its contents.
Figure 12-7: Open Pit Visuals - Options 2
12.3.6.3 Option 3: Updated Information Generated During the PFS Phase
During the optimisation phase of the PFS, the following updated information was
received:
Product prices: a rutile sales price US$ 1,050/t, a garnet sales price of US$ 220/t
Garnet sales volume: the view on the garnet market volume increased from 100 ktpa
to 300 ktpa at steady state from 2029 onwards. This implies that at the lower
expected garnet recoveries, little to no garnet disposal will occur. The total market
volume for the open pit period is estimated at 8 Mt
Mining OPEX: a quotation was obtained from a large mining contractor with
operations in Norway. The pricing obtained from the contractor was subsequently
benchmarked from first principles for owner operation. Waste stripping costs are
estimated at US$ 2.5/t and ore mining at US$ 2.1/t. Ore mining unit costs are lower
due to the short and horizontal hauling to the RoM glory hole which will be accessible
from each bench
Product distribution: distribution unit cost for both products are estimated at US$ 3/t
Free on Board based on bulk sales
Garnet recovery: low confidence exists pertaining to garnet recovery of leuco-eclogite
and transitional-eclogite. A recovery of 22.1% is expected for both rock types. Higher
confidence exists for the garnet associated with ferro-eclogite for which a recovery of
33.5% is expected (note: these recoveries were subsequently amended later in the
study once more testwork results became available)
TiO2 cut-off grade: moderate confidence existed for TiO2 except for lower cut-off
grade values. A 2% cut-off grade was, therefore, used as a lower limit.

Nordic Mining Prefeasibility Study
30 October 2017 Engebø Rutile and Garnet Project H352410
H352410-00000-280-066-0001, Rev. 0 Page 186
© Hatch 2017 All rights reserved, including all rights relating to the use of this document or its contents.
Table 12-7 below shows the results for Option 3. The total rock mined increased to
59.6 Mt and the NPV to US$ 580.7 M.
Table 12-7: Optimisation Results - Option 3
Option Reference NPV Profit Revenue Processing
Cost Mining Cost
Rock Ore Waste TiO2
Product Garnet
Product
US$ M US$ M US$ M US$ M US$ M Mt Mt Mt Mt Mt
1 Pits_28 290.9 417.1 953.1 375.7 160.2 60.7 37.7 23.0 0.7 0.9
3 Pits_40 580.7 984.0 1,440.7 329.2 127.5 59.6 31.7 27.9 0.6 3.8
Comparison Pits_40: Pits_28
200% 236% 151% 88% 80% 98% 84% 121% 84% 417%
Figure 12-8 below shows plan, North-South and East-West section views for Option 3.
Figure 12-8: Open Pit Visuals - Option 3
12.3.6.4 Option 4: Cut-off Grade Analysis
Cut-off grade analysis based on TiO2 was conducted for two scenarios. In both scenarios,
the TiO2 cut-off grades were calculated from 0% to 2.5% at increments of 0.5%.
Option 4a: evaluate the impact of TiO2 cut-off grade whilst keeping all other inputs the
same as for Option 3
Option 4b: evaluate the impact of TiO2 cut-off grade whilst reducing garnet recovery
for the respective ore rock types. A zero garnet recovery for leuco-eclogite was used.
A trans-eclogite yield of 11% and a ferro-eclogite yield of 18.3% was used.
Table 12-8 below shows the results for Option 4a. Total rock mined remained at 59.7 Mt
up to a TiO2 cut-off grade of 1.5%, where after the NPV dropped for higher TiO2 cut-off
grades. The corresponding NPV was US$ 580.8 M.

Nordic Mining Prefeasibility Study
30 October 2017 Engebø Rutile and Garnet Project H352410
H352410-00000-280-066-0001, Rev. 0 Page 187
© Hatch 2017 All rights reserved, including all rights relating to the use of this document or its contents.
Table 12-8: Optimisation Results - Cut-off Grade Sensitivity - Option 4a
Option Reference Cut-off Grade
NPV Profit Revenue Processing
Cost Mining Cost
Rock Ore TiO2
Product Garnet
Product
% US$ M US$ M US$ M US$ M US$ M Mt Mt Mt Mt
4a Pit_49 0 580.8 1,003.1 1,471.5 340.8 127.7 59.7 32.8 0.6 3.9
4a Pit_54 1 580.8 1,003.1 1,471.5 340.8 127.7 59.7 32.8 0.6 3.9
4a Pit_59 1.5 580.8 1,003.1 1,471.5 340.8 127.7 59.7 32.8 0.6 3.9
4a Pit_64 2 580.7 984.0 1,440.7 329.2 127.5 59.6 31.7 0.6 3.8
4a Pit_104 2.5 564.2 897.3 1,308.0 284.9 125.8 58.8 27.4 0.5 3.5
Table 12-9 below shows the results for Option 4b. Total rock mined dropped to 54.8 Mt up
to a TiO2 cut-off grade of 2%. The corresponding NPV was US$ 361.6 M; the main
reason for the drop in NPV in comparison to Option 4a was the reduced garnet recoveries
(yields). There was a slight improvement, 0.1%, in NPV at a TiO2 cut-off grade of 2%;
however, for higher cut-off grades the NPV dropped.
Table 12-9: Optimisation Results - Cut-off Grade Sensitivity - Option 4b
Option Reference Cut-off Grade
NPV Profit Revenue Processing
Cost Mining Cost
Rock Ore TIO2
Product Garnet
Product
% US$ M US$ M US$ M US$ M US$ M Mt Mt Mt Mt
4b Pit_84 0 361.6 609.6 1,056.5 329.9 117.0 54.8 32.3 0.6 2.1
4b Pit_89 1 361.6 609.6 1,056.5 329.9 117.0 54.8 32.3 0.6 2.1
4b Pit_94 1.5 361.6 609.6 1,056.5 329.9 117.0 54.8 32.3 0.6 2.1
4b Pit_99 2 362.1 601.3 1,037.5 319.3 116.8 54.8 31.2 0.6 2.0
4b Pit_109 2.5 354.9 554.6 945.8 276.7 114.5 53.7 27.0 0.5 1.9
Figure 12-9 below shows a plan view of the pit at varying cut-offs for Option 4a.

Nordic Mining Prefeasibility Study
30 October 2017 Engebø Rutile and Garnet Project H352410
H352410-00000-280-066-0001, Rev. 0 Page 188
© Hatch 2017 All rights reserved, including all rights relating to the use of this document or its contents.
Figure 12-9: Open Pit Visuals - Option 4a
Figure 12-10 below shows a plan view of the pit at varying cut-offs for Option 4b.
Figure 12-10: Open Pit Visuals - Option 4b
12.3.6.5 Option 5: Pushback Strategy
In Option 5, a pushback strategy was developed for Option 4b at a TiO2 cut-off grade of
1.5%. Three pushbacks of similar size, with an average rock mined of 18 Mt per
pushback, were created. The aim with the pushback strategy was to reduce the stripping
ratio in the first few years. In practice, however, only two pushbacks were used with
pushbacks 1 and 2 being combined to incorporate the isolated portion on the south-west
side of the pit which was not considered to be practically mineable.

Nordic Mining Prefeasibility Study
30 October 2017 Engebø Rutile and Garnet Project H352410
H352410-00000-280-066-0001, Rev. 0 Page 189
© Hatch 2017 All rights reserved, including all rights relating to the use of this document or its contents.
Figure 12-11 below shows a plan view and section view towards the North for the three
pushbacks created. On the plan views shown on the left-hand side, the blue colour
indicates the active mining area. On the section views shown on the right-hand side, the
red colour indicates the active mining area.
Figure 12-11: Pushback Visuals - Option 4b
12.3.6.6 Option 6: Ferro and High-grade Trans Ore
Towards the end of the PFS phase, metallurgical results were received that indicated low
garnet yields, nominally less than 7%, could be expected when leuco-eclogite is
processed. Consequently, a Project decision was taken to classify leuco-eclogite as
waste and at the same time to evaluate options for a high-grade garnet and TiO2
operation. The objectives of this evaluation were twofold; firstly, to identify options that
would improve the IRR of the Project and secondly, to minimise the loss of value (in terms
of NPV and the LoM) due to ore being classified as waste.
The following cut-off assumptions were, therefore, applied to Option 6:

Nordic Mining Prefeasibility Study
30 October 2017 Engebø Rutile and Garnet Project H352410
H352410-00000-280-066-0001, Rev. 0 Page 190
© Hatch 2017 All rights reserved, including all rights relating to the use of this document or its contents.
Leuco-eclogite was classified as waste, irrespective of its TiO2 grade
Trans-eclogite was classified as ore if its TiO2 grade exceeded certain cut-offs,
evaluated in increments of 0.5% from 0% to 3.0%
For ferro-eclogite, no cut-off grade was applied to either TiO2 or garnet.
Table 12-10 shows the results obtained from the NPV Scheduler runs.
Table 12-10: Optimisation Results - Cut-off Grade Sensitivity - Option 6
Option Reference Cut-off Grade
NPV Profit Revenue Processing
Cost Mining Cost
Rock Ore TIO2
Product Garnet
Product
% US$ M US$ M US$ M US$ M US$ M Mt Mt Mt Mt
6 Pit_134 0 279.3 557.6 995.8 324.1 114.1 53.5 31.7 0.6 1.7
6 Pit_129 1.5 279.3 557.6 995.8 324.1 114.1 53.5 31.7 0.6 1.7
6 Pit_119 2 294.2 567.9 995.3 313.3 114.0 53.5 30.6 0.6 1.7
6 Pit_124 2.5 318.1 548.4 898.0 236.2 113.4 53.2 23.0 0.5 1.7
6 Pit_139 3 318.7 548.9 897.0 235.9 112.1 52.6 22.9 0.5 1.7
Figure 12-12 below provides the cumulative NPV over the first five years for cut-offs
varying from 0% to 3% for transitional-eclogite. The graph indicates potential impact of
cut-off on IRR; since all options have the same capital (same capacity), the steeper angle
options (2.5% and 3.0%) indicate potential improvements in IRR.
Figure 12-12: Cumulative NPV for Various Cut-off Grades – Option 6
It can be seen from Table 12-10 and Figure 12-12 above that selecting a 2.5% or 3% cut-
off generates the best NPVs. It is recommended that a 2.5% cut-off is selected in this
case to ensure that the ore tonnes mined and NPV are both maximised.
0
20
40
60
80
100
120
140
160
1 2 3 4 5
US$
M
Cumulative NPV for First Five Years
0% Trans TiO2 Cut-off 1.5 % Trans TiO2 Cut-off 2% Trans TiO2 Cut-off
2.5% Trans TiO2 Cut-off 3% Trans TiO2 Cut-off

Nordic Mining Prefeasibility Study
30 October 2017 Engebø Rutile and Garnet Project H352410
H352410-00000-280-066-0001, Rev. 0 Page 191
© Hatch 2017 All rights reserved, including all rights relating to the use of this document or its contents.
Figure 12-13 below indicates the ultimate pit shell for the transitional-eclogite for TiO2 cut-
off grades varying from 1.5% to 3.0%.
Figure 12-13: Option 6 - Pit Shells for TiO2 Cut-offs of 1.5%, 2.0%, 2.5% and 3%
It can be seen from Figure 12-13 above that changes to the pit outline are minimal when moving from a 1.5% TiO2 cut-off to 3% TiO2 cut-off for trans-eclogite ore.
12.3.7 Results and Recommendation
The reconstructed model reconciles with the Resource Estimate report. Once the ramp
was included in the open pit optimisation process to accommodate a CAT 777 truck, the
total rock within the Resource Estimate pit dropped by approximately 10 Mt. During the
next study phase, the economic impact of using smaller equipment or in-pit conveying
alternatives should be investigated.
In all the options investigated, the pit boundaries to the southern, western and eastern
sides are consistent and fully extend to the owner’s boundary limit. The major contributors
to the ultimate pit shell within these sectors are the owner’s boundary limit, geotechnical
recommendations and ramp dimension. The northern pit boundary, however, varies in
each optimisation run as a result of metallurgical and economic considerations that result
from unit cost and revenue related aspects. The northern sector consists mainly of leuco-
eclogite ore. Uncertainty exists pertaining to the metallurgical properties of this ore and
further test-work is required before the ore classification within this sector is improved.
Garnet contributes significantly to the economic value of the Project, with additional
market volumes the major contributor. Any additional sales will have a significant positive
impact on the Project. It should be noted that garnet market volumes do not alter the
shape of the ultimate pit.
No significant impact was observed by increasing the TiO2 cut-off grade from zero to 2%.
However, it was noted that above a 2% TiO2 cut-off grade the business cases are
negatively impacted. This is due to the positive contribution of garnet.

Nordic Mining Prefeasibility Study
30 October 2017 Engebø Rutile and Garnet Project H352410
H352410-00000-280-066-0001, Rev. 0 Page 192
© Hatch 2017 All rights reserved, including all rights relating to the use of this document or its contents.
It is recommended that the pit shell derived from Option 4b (TiO2 cut-off grade 1%) is
taken forward as the basis of the pit design; the pit shell for this option has been termed
Pit 1. Within the Pit 1 shell, two major pushbacks have been designed (Option 5) to
improve the project economics with pushback 2 containing predominantly lower grade
ore.
Further to the completion of the initial pit optimisation as reported here, it was agreed by
the Project Team to remove leuco-eclogite from consideration as an ore type due
uncertainties around the ability of the process plant to recover products from this ore. This
resulted in leuco-eclogite ore being classified as waste. The impact of this change on the
pit shape is minimal as the pit optimisation continues to the bottom of the pit to extract
high value ore. However, the economics of the Project is impacted negatively by the
exclusion of leuco-eclogite due to the higher waste stripping requirements. Option 6
indicated that selecting a TiO2 cut-off grade for trans-eclogite of 2.5% generates a higher
NPV than lower cut-offs. It should be noted that the pit shell for Option 6 is similar, but not
identical, to the Pit 1 shell used for earlier options.
In summary, the recommended option to be taken into detailed design and scheduling as
the basis of the final PFS mine design is:
Pit 1 ultimate pit shell (ultimate pit)
A two-pushback strategy within Pit 1
Ferro-eclogite with no cut-offs applied to either TiO2 or garnet
Trans-eclogite with a TiO2 cut-off grade of 2.5%
No consideration of leuco-eclogite as ore; this material should be classified as waste
to be stripped and stockpiled for future use.
Subsequent to completion of the pit optimisation study, financial modelling of a number of
mining options (see Section 12.9) using updated OPEX and CAPEX numbers indicated
that the development of a high-grade option to mine and process ferro ore only at a
capacity of 1.5 Mtpa provided a better IRR than options which mined both trans ore and
ferro ore. For this reason, the final mine plan developed considered the mining and
processing of ferro ore only, with trans ore being treated as waste. A Project decision was
made, however, to continue to use the Pit 1 ultimate pit shell as the basis of the open pit
mine plan and schedule. This decision is valid when considering the pit shells developed
for Option 4b and Option 6 respectively (see Figure 12-10 and Figure 12-13 above). As
can be seen from these options, the change in ultimate pit shell shape with increasing
trans cut-off grades is insignificantly small. Typically, there is a 1 Mt difference in total
tonnes mined (ore and waste, i.e. rock) between low cut-off grade and high cut-off grade
options. The main change, therefore, is the way ore and waste is classified, with more ore
being classified as waste for the high cut-off grade options.
The pit optimisation studies carried out in this phase will need to be reviewed and
updated in the DFS to consider all changes to modifying factors which have occurred to
date and which may occur.

Nordic Mining Prefeasibility Study
30 October 2017 Engebø Rutile and Garnet Project H352410
H352410-00000-280-066-0001, Rev. 0 Page 193
© Hatch 2017 All rights reserved, including all rights relating to the use of this document or its contents.
12.4 Open Pit Mine Design
Based on the Pit 1 shell for Option 5 derived from the pit optimisation as reported above,
the following steps describe the pit design process undertaken in the DESWIK mine
design software package:
Step 1: import of the Pit 1 NPV Optimisation shell derived from Option 5
Step 2: contouring of the NPV Pit 1 shell and smoothing of the contours
Step 3: generation of a Digital Terrain Model (DTM) surface based on smoothed
contours
Step 4: using the DESWIK open pit mine design tools, pit strings (for the top and
bottom of benches and for ramps) were created based on the DTM surface, the mine
boundary, the geotechnical parameters as defied by WAI (see Section 9.1), as well
as the equipment parameters (truck size and turning radius). A bottom up design
approach was taken. The design strings are shown in Figure 12-14 below.
Figure 12-14: Ultimate Pit Design Strings
Key parameters for the pit design are summarised in Table 12-11 below.

Nordic Mining Prefeasibility Study
30 October 2017 Engebø Rutile and Garnet Project H352410
H352410-00000-280-066-0001, Rev. 0 Page 194
© Hatch 2017 All rights reserved, including all rights relating to the use of this document or its contents.
Table 12-11: Key Pit Design Parameters
Parameters Unit Value
Bench height m 15
Berm width m 5
Bench face angle º Varies per pit sector
Ramp grade % 10
Ramp width m 23
Turning clearance diameter m 29
Top bench elevation m 330
Bottom bench elevation m 90
Step 5: using the ultimate design strings, a DTM was created which was then cut to
the topography and made into a solid shape. This shape was used for interrogation of
the block model
Step 6: sequencing of the blocks within the shape.
12.4.1 Pushbacks
Before the sequencing of the pit was carried out, it was observed that significant amounts
of Inferred material were to be found in the northern and eastern parts of the pit, which, in
line with the guidelines of the JORC code, would be classified as waste in the mine plan.
This Inferred material is shown in Figure 12-15 below, coloured in red. To minimise waste
mining in the early years, therefore, pushback sequencing was introduced to defer the
waste material stripping to later in the LoM with a view to improving the NPV of the
Project.
Figure 12-15: Categorisation of Ore in the Pit

Nordic Mining Prefeasibility Study
30 October 2017 Engebø Rutile and Garnet Project H352410
H352410-00000-280-066-0001, Rev. 0 Page 195
© Hatch 2017 All rights reserved, including all rights relating to the use of this document or its contents.
The pushbacks were designed to be practical pushbacks from a production perspective.
To achieve this, the bottom bench of pushback 1 (the initial cut) had to be large enough to
be accessed by the selected equipment fleet. Furthermore, a minimum mining width of
40 m was employed for pushback 2. Consideration was given to the drop rate on
pushback 2 to ensure that only a maximum of four benches were mined per year.
The two pushbacks used to sequence the pit are shown in Figure 12-16 below.
Figure 12-16: Pit Design Pushbacks
12.5 Underground Mining Block Model Development
12.5.1 Defining the Mining Model for the Underground
Development of the underground mining model started with the removal of blocks which
protruded above surface (caused by regularisation of the model). Thereafter, a 50 m
geotechnical boundary was applied around the pit to ensure that underground design did
not encroach on the open pit, which could result in stability issues. This is in line with the
recommendations of SINTEF, the geotechnical consultants employed to validate the
underground design.
The result of applying geotechnical boundaries around the pit is shown in Figure 12-17.
Figure 12-17: Pit Excavation including Geotechnical Boundary

Nordic Mining Prefeasibility Study
30 October 2017 Engebø Rutile and Garnet Project H352410
H352410-00000-280-066-0001, Rev. 0 Page 196
© Hatch 2017 All rights reserved, including all rights relating to the use of this document or its contents.
Attention was now focussed on the underground orebody and, in particular, the extent of
the Measured and Indicated Resources, which formed the basis for the underground
mining method selection process.
12.6 Underground Mining Method Selection
The pit design studies, as summarised in Section 12.4 above, defined an economic pit
which mined the Engebø orebody from 330 masl to 90 m masl elevation. Below this level,
and laterally outside of the pit, all ore can be considered as mineable by underground
mining methods only. A high-level study was undertaken to determine the underground
mining methods applicable for Engebø. By doing this, the scope of the PFS was more
clearly defined and a mine design and schedule, including associated mining operating
and capital cost estimates, were drawn up as input to the business case financial model.
The following methodology was used to shortlist possible underground mining methods
for Engebø.
Figure 12-18: Underground Mining Method Selection Process
The process to select applicable mining methods for Engebø started with a consideration
of all possible mining methods. Thereafter, the Project objectives were aligned with the
potential mining methods, after which capacity considerations were brought into the
analysis. Finally, fatal flaws applicable to the Engebø orebody were considered as well as
other factors (such as grade control and dilution).
12.6.1 Major Underground Mining Methods in Use Globally
The first step in the high-level study to determine viable underground mining methods for
Engebø was to consider all major mining methods in use globally. These are summarised
in Figure 12-19 below.

Nordic Mining Prefeasibility Study
30 October 2017 Engebø Rutile and Garnet Project H352410
H352410-00000-280-066-0001, Rev. 0 Page 197
© Hatch 2017 All rights reserved, including all rights relating to the use of this document or its contents.
Figure 12-19: Major Mining Methods in Use Globally
A summary of the each of the above mining methods follows.
12.6.1.1 Sub-level Stoping
Sub-level stoping is a method of underground mining that involves vertical mining in a
large, open stope that has been created inside an orebody. Drilling, blasting and mining
are carried out at different elevations within the stope. The mining process starts with
sublevel drifts being drilled into the orebody. The drilled sublevels are situated directly
above a main haulage level. Drill rigs are used to drill a ring of holes around the drift or to
drill holes below the sublevel; the holes are then filled with explosives. The explosives,
once detonated, blast apart the drilled rock which falls to the bottom of the stope. Load
Haul Dump trucks (LHDs) are then used to transport the muck to an ore pass from where
it normally enters a crusher before being conveyed to surface. The excavation process is
repeated until the stope is left completely empty.
Three variants of the sub-level mining method – sub-level open stoping, sub-level long
hole open stoping and vertical crater retreat, are illustrated in Figure 12-20 to Figure
12-22 below.

Nordic Mining Prefeasibility Study
30 October 2017 Engebø Rutile and Garnet Project H352410
H352410-00000-280-066-0001, Rev. 0 Page 198
© Hatch 2017 All rights reserved, including all rights relating to the use of this document or its contents.
Figure 12-20: Sub-level Open Stoping
Figure 12-21: Sub-level Long Hole Open Stoping

Nordic Mining Prefeasibility Study
30 October 2017 Engebø Rutile and Garnet Project H352410
H352410-00000-280-066-0001, Rev. 0 Page 199
© Hatch 2017 All rights reserved, including all rights relating to the use of this document or its contents.
Figure 12-22: Vertical Crater Retreat
12.6.1.2 Cut and Fill
Cut and fill mining is a method of short-hole mining used in steeply dipping or irregular ore
zones, in particular where the hanging wall limits the use of long-hole methods. The ore is
mined in horizontal or slightly inclined slices, and then filled with waste rock, sand or
tailings. Fill may be consolidated with concrete or left unconsolidated. Cut and fill mining
is an expensive but selective method, with low ore loss and dilution. This mining method
is illustrated in Figure 12-23 below.
Figure 12-23: Cut and Fill

Nordic Mining Prefeasibility Study
30 October 2017 Engebø Rutile and Garnet Project H352410
H352410-00000-280-066-0001, Rev. 0 Page 200
© Hatch 2017 All rights reserved, including all rights relating to the use of this document or its contents.
12.6.1.3 Caving
Cave mining is a mass mining method that allows for the bulk mining of large, relatively
lower grade, orebodies. In this method, the orebody is undercut on a number of levels
and selectively blasted above the undercut levels. Two key variants of the caving method
are sub-level caving and block caving, as described below. In block caving, removal of
ore at the undercut level induces the remainder of the orebody, which does not need to
be blasted, to cave.
12.6.1.3.1 Sub-level Caving
This is a large-scale mining method suitable for large ore bodies with a steep dip and a
rock mass with a host rock in the hanging wall which will fracture under controlled
conditions. Infrastructure is always placed on the footwall side. Mining starts at the top of
the orebody and progresses downwards in a safe sequence. All the ore is fragmented by
blasting, causing the host rock in the hanging wall of the orebody to cave. Once the
production drifts have been excavated and reinforced, long hole drilling is carried out.
Rock is loaded from the cave front after each blast. To control dilution of waste rock in the
cave, loading of a predetermined extraction percentage of rock is done. Ore is dumped
into orepasses which connect to a haulage level. Caving will, sooner or later, also cause
subsidence on the surface. The sub-level caving mining method is shown in Figure 12-24
below.
Figure 12-24: Sub-level Caving
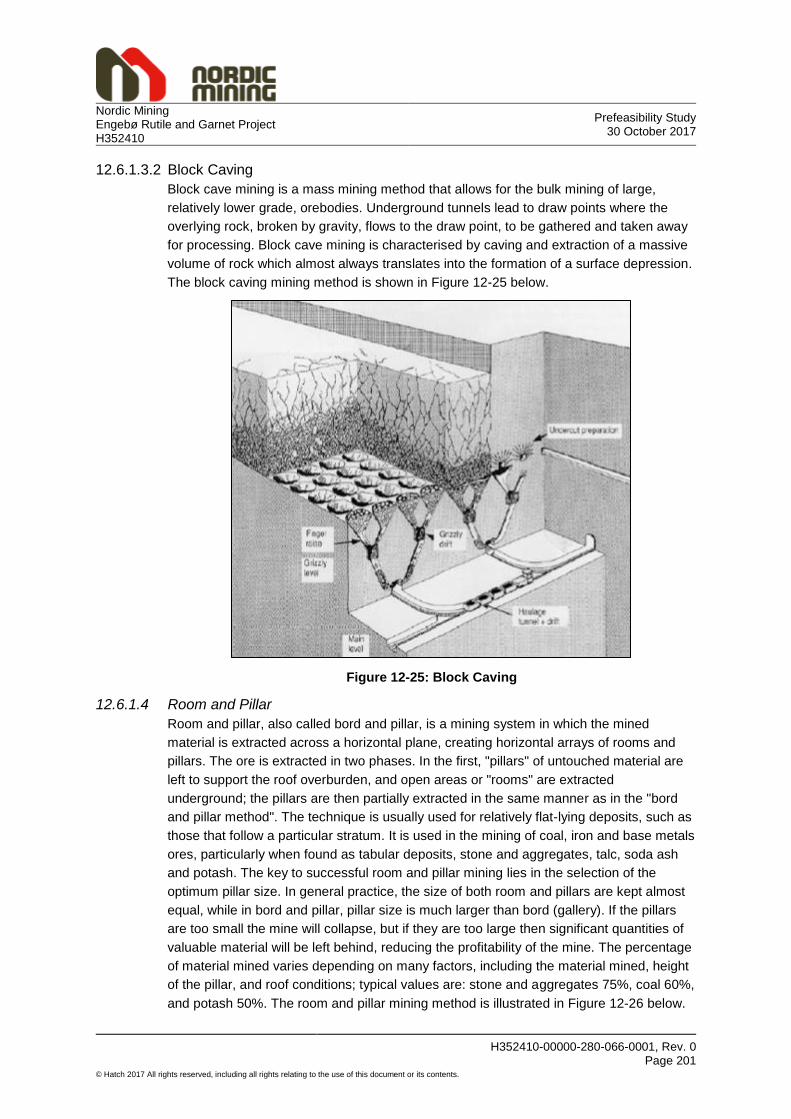
Nordic Mining Prefeasibility Study
30 October 2017 Engebø Rutile and Garnet Project H352410
H352410-00000-280-066-0001, Rev. 0 Page 201
© Hatch 2017 All rights reserved, including all rights relating to the use of this document or its contents.
12.6.1.3.2 Block Caving
Block cave mining is a mass mining method that allows for the bulk mining of large,
relatively lower grade, orebodies. Underground tunnels lead to draw points where the
overlying rock, broken by gravity, flows to the draw point, to be gathered and taken away
for processing. Block cave mining is characterised by caving and extraction of a massive
volume of rock which almost always translates into the formation of a surface depression.
The block caving mining method is shown in Figure 12-25 below.
Figure 12-25: Block Caving
12.6.1.4 Room and Pillar
Room and pillar, also called bord and pillar, is a mining system in which the mined
material is extracted across a horizontal plane, creating horizontal arrays of rooms and
pillars. The ore is extracted in two phases. In the first, "pillars" of untouched material are
left to support the roof overburden, and open areas or "rooms" are extracted
underground; the pillars are then partially extracted in the same manner as in the "bord
and pillar method". The technique is usually used for relatively flat-lying deposits, such as
those that follow a particular stratum. It is used in the mining of coal, iron and base metals
ores, particularly when found as tabular deposits, stone and aggregates, talc, soda ash
and potash. The key to successful room and pillar mining lies in the selection of the
optimum pillar size. In general practice, the size of both room and pillars are kept almost
equal, while in bord and pillar, pillar size is much larger than bord (gallery). If the pillars
are too small the mine will collapse, but if they are too large then significant quantities of
valuable material will be left behind, reducing the profitability of the mine. The percentage
of material mined varies depending on many factors, including the material mined, height
of the pillar, and roof conditions; typical values are: stone and aggregates 75%, coal 60%,
and potash 50%. The room and pillar mining method is illustrated in Figure 12-26 below.

Nordic Mining Prefeasibility Study
30 October 2017 Engebø Rutile and Garnet Project H352410
H352410-00000-280-066-0001, Rev. 0 Page 202
© Hatch 2017 All rights reserved, including all rights relating to the use of this document or its contents.
Figure 12-26: Room and Pillar Mining
Shrinkage Stoping
Shrinkage stoping is a mining method used for steeply dipping, narrower orebodies with
self-supporting walls and ore. It is an overhand mining method that relies on broken ore
being left in the stope to be used as the “working floor” and to support the walls. During
the mining cycle, only 30% to 35% of the ore blasted is extracted being equivalent to the
swell factor of in-situ ore to broken. When mining is complete to the next upper horizon,
the ore is extracted. Although it is not necessary to fill the resulting voids, they are
commonly filled with waste rock from development. Level intervals seldom exceed 40 m
due to uneven muck draw. Recoverable pillars are left at each level. The shrinkage
stoping mining method is shown in Figure 12-27 below.
Figure 12-27: Shrinkage Stoping

Nordic Mining Prefeasibility Study
30 October 2017 Engebø Rutile and Garnet Project H352410
H352410-00000-280-066-0001, Rev. 0 Page 203
© Hatch 2017 All rights reserved, including all rights relating to the use of this document or its contents.
12.6.2 Project Objectives and Capacity of the Orebody
All the above mining methods were then evaluated in terms of the project objectives and
the match of the mining method to the size of the orebody and the mining rate. Key
project objectives were defined as follows:
To optimise underground extraction to improve the mine plan and Project economics
To maximise underground extraction through the mining of reserves in line with the
guidelines of the JORC Code
To determine the practically achievable extraction – primary and secondary extraction
To give due consideration to garnet income, which is key for the project economics
To align the mining method to the size of the orebody and the mining rate.
12.6.3 Fatal Flaws/Other Considerations
A list of fatal flaws, against which the mining methods were considered, follows:
In terms of the current permits and social licence to operate, subsidence of the
ground surface at Engebø will not be allowed
Will the orebody cave naturally or will caving need to be induced? There are cost and
safety implications to induced caving
Affordability of backfill to maximise extraction percentage.
Caving methods were discarded due to the fact that they inevitably lead to surface
subsidence, as well as the fact that the competent nature of the orebody means that it is
unlikely to cave naturally, thereby incurring additional cost to induce caving.
At this stage of the study high-level work indicated that backfilling of the orebody to
enable secondary extraction to take place would not be economically viable, in which
case a lower overall extraction percentage could be assumed. This precluded the use of
cut and fill mining methods for Engebø.
Other factors which were taken into consideration when studying viable mining methods
for Engebø were:
Grade control – this is likely to be an important consideration to maximises plant
recoveries by controlling the grade of ore fed to the plant. Grade control has an
impact on the stope size, with large stopes (generally extracted at a low operating
cost) having low grade certainty and smaller stopes (higher operating cost) providing
much better control of grades fed to the plant. This may preclude the use of caving
mining methods
Dilution, which is likely to be lower for bulk mining methods
Blending – the blending of ore may be critical to optimal operation of the process
plant. If blending is required, then a number of stopes needs to be available for
mining at any one time; this may preclude the use of caving mining methods

Nordic Mining Prefeasibility Study
30 October 2017 Engebø Rutile and Garnet Project H352410
H352410-00000-280-066-0001, Rev. 0 Page 204
© Hatch 2017 All rights reserved, including all rights relating to the use of this document or its contents.
Overall mining operating costs, both for primary extraction and for secondary
extraction (post backfill). Lower operating costs will inevitably improve the business
case
Timing of the underground – with approximately 27 Mt of ore reserves in the open pit,
it was assumed that underground mining would only take place after at least ten
years of open pit mining.
12.6.4 Selection Methods
The common mining methods in use globally, as summarised in Section 12.6.1 above,
were then ranked according to the three common selection methods, taking cognisance
of the project objectives, capacity of the orebody, fatal flaws and other factors. The three
selection methods used globally are as follows:
UBC Modified Nicholas: this method involves summation and ranking of numerical
values associated with orebody characteristics that reflect the suitability of a particular
mining method. In this case, the Engebø orebody was considered for massive mining
and tabular mining (room and pillar mining)
Boshkov and Wright: this is a qualitative method of ranking mining methods where
geometry, grade distribution and rock mechanical characteristics are ranked
according to acceptability for ten common mining methods
Hartman: this is a qualitative procedure oriented towards both open pit and
underground mining. Once the selection of either open pit mining or underground
mining has been made based on the depth of the orebody, ore rock strength and the
geometry of the orebody are considered to determine suitable mining methods.
All three of the above methods were used to determine suitable mining methods for
Engebø. The results of the analysis are summarised below.
12.6.4.1 UBC Modified Nicholas Ranking
As shown in Table 12-12 and Table 12-13 below, this analysis, which ranked the mining
method in terms of orebody geometry and strength, showed that sub-level stoping,
followed by sub-level caving and cut and fill, are the highest scoring massive mining
methods; sub-level caving, however, can be ruled out in this case as this method is
considered fatally flawed for Engebø. Likewise, cut and fill mining is considered to be
fatally flawed due to the high cost of backfilling. For massive (bulk) mining, therefore, sub-
level stoping is seen as the only viable mining method.
If the Engebø orebody is considered as an orebody suitable for tabular mining, the
longwall and cut and fill methods score the highest, followed by room and pillar mining.
Longwall mining cannot be applied at Engebø as the ore is too hard for shearers (which
are typically used in softer rock environments such as coal mines) and there is a risk of
surface subsidence. Cut and fill mining is considered to be fatally flawed on the grounds
of the high backfill cost. As a result, only room and pillar mining can be considered for use
at Engebø.

Nordic Mining Prefeasibility Study
30 October 2017 Engebø Rutile and Garnet Project H352410
H352410-00000-280-066-0001, Rev. 0 Page 205
© Hatch 2017 All rights reserved, including all rights relating to the use of this document or its contents.
Table 12-12: UBC Modified Nicholas Scoring – Orebody defined as Massive
Ranking Mining Method Points
1 Sub-level Stoping 29
2 Sub-level Caving 27
3 Cut and Fill 25
Table 12-13: UBC Modified Nicholas Scoring – Orebody defined as Tabular
Ranking Mining Method Points
1 Longwall 31
2 Cut and Fill 29
3 Room and Pillar 25
12.6.4.2 Boshkov and Wright Ranking
The Boshkov and Wright ranking method identified ten applicable mining methods for
Engebo, as shown in Figure 12-28 below.
Figure 12-28: Boshkov and Wright Mining Methods Ranking
A number of the methods, such as square-set stoping (which is labour intensive and is
high risk from a safety perspective) and the caving methods cannot be considered for use
at Engebø. Out of the list of 10 methods identified, only underground glory hole,
shrinkage stoping, sub-level stoping, and cut and fill are major mining methods worthy of
consideration.
12.6.4.3 Hartman Ranking
Probably the most comprehensive of the three ranking methods considered in this study
and one which is in common use in the industry, the Hartman method first divides mining
methods into surface and underground, after which the competence (rock strength) of the
orebody is considered. By dividing the potential underground mining methods into
competent, incompetent and weak (caveable), the method identifies three major mining
methods for Engebo, namely stope and pillar, shrinkage stoping and sub-level stoping.
The Hartman ranking method applied to Engebø is shown in Figure 12-29 below.
Shrinkage stoping can be ruled out on the grounds of safety concerns, leaving only stope
and pillar mining and sub-level stoping.

Nordic Mining Prefeasibility Study
30 October 2017 Engebø Rutile and Garnet Project H352410
H352410-00000-280-066-0001, Rev. 0 Page 206
© Hatch 2017 All rights reserved, including all rights relating to the use of this document or its contents.
Figure 12-29: Hartman Ranking Method

Nordic Mining Prefeasibility Study
30 October 2017 Engebø Rutile and Garnet Project H352410
H352410-00000-280-066-0001, Rev. 0 Page 207
© Hatch 2017 All rights reserved, including all rights relating to the use of this document or its contents.
Combining the results of the above ranking methods as well as taking due consideration
of the qualitative nature of the ranking, the following selection of applicable mining
methods was made.
Table 12-14: Mining Methods Shortlist for Engebø
Mining Method Applicable to
Engebø Rationale for Applicability
Sub-level Open Stoping Yes Low cost mining and highly productive and flexible
Sub-level Long Hole Open Stoping
Yes Low cost mining, highly productive and flexible; modern drilling technology will most likely make it cheaper than sub-level open stoping
Vertical Crater Retreat No Highly constrained by sequence, but can be used to minimise development in waste
Cut and Fill No High cost of mining with backfill
Sub-level Caving No No surface subsidence permitted, high upfront development capital
Block Caving No No surface subsidence permitted, high upfront capital and long development time
Room and Pillar Yes Flexible mining, highly mechanised, medium to high productivity
Shrinkage Stoping No Low productivity and unsafe
For the purposes of this study, long hole open stoping was selected as the mining method
to be used, primarily for the reason that it uses the latest technology and, therefore, will
have the lowest operating cost of the three potential methods identified in Table 12-14
above.
12.7 Underground Mine Design
The underground mine design comprises two key components, namely the stoping design
and associated access tunnels design, as well as the design of the underground
infrastructure to support open pit and underground mining. Both components are
described below.
12.7.1 Stoping Design
Having selected long hole open stoping as the underground mining method design basis,
the steps to define the underground mine design were as follows:
Step 1: based on initial mining layouts as reviewed by SINTEF (see Section 9.2), the final
stope shape was determined and a grid with the appropriate stoping design initially
overlaid on top of the mining blocks in areas with Measured and Indicated ore resources.
Figure 12-30 below illustrates the grid used for the stoping design.

Nordic Mining Prefeasibility Study
30 October 2017 Engebø Rutile and Garnet Project H352410
H352410-00000-280-066-0001, Rev. 0 Page 208
© Hatch 2017 All rights reserved, including all rights relating to the use of this document or its contents.
Figure 12-30: Stoping Block showing Stoping Design Grid Overlain
Step 2: the overlaid grid was then trimmed to meet additional constraining parameters,
namely:
Blocks that penetrated the topography
Blocks within the geotechnical boundary of the open pit and the fjord.
The constrained mining zone is shown in Figure 12-31 below.
Figure 12-31: Final Mining Shape (shown in brown)

Nordic Mining Prefeasibility Study
30 October 2017 Engebø Rutile and Garnet Project H352410
H352410-00000-280-066-0001, Rev. 0 Page 209
© Hatch 2017 All rights reserved, including all rights relating to the use of this document or its contents.
Step 3: this exercise was repeated for all mining blocks in the design. The resulting stope
design in shown in Figure 12-32 below.
Figure 12-32: Stope Design
Step 4: further geotechnical, geological, physical and practical constraints were then
applied. These constraints included:
In terms of the SINTEF recommendations, the requirement of a 15 m sill pillar at the
top and bottom of the 60 m high stopes
The existence of a road tunnel through the orebody resulting in sterilisation of an area
within a 50 m radius of the tunnel
Removal from the layout of stopes that were not considered practical to mine
All rock types within the layout which were not ferro ore being classified as waste.
The final design shape after consideration of the above constraints is shown in Figure
12-33 below.

Nordic Mining Prefeasibility Study
30 October 2017 Engebø Rutile and Garnet Project H352410
H352410-00000-280-066-0001, Rev. 0 Page 210
© Hatch 2017 All rights reserved, including all rights relating to the use of this document or its contents.
Figure 12-33: Final Underground Design Shape
Step 5: the final design component for the underground mine design was the
development of an access system from the pit via a decline, as well as ore development
so that each stope could be accessed from top and bottom to enable the mining method
to be implemented. This development is illustrated in Figure 12-34 below.

Nordic Mining Prefeasibility Study
30 October 2017 Engebø Rutile and Garnet Project H352410
H352410-00000-280-066-0001, Rev. 0 Page 211
© Hatch 2017 All rights reserved, including all rights relating to the use of this document or its contents.
Figure 12-34: Decline Development and Ore Development
The stope design layout is based on top and bottom access to the stope by means of a
single tunnel, which is then widened to create a slot covering the entire area of the stope.
Thereafter, vertical slots are created to enable them to be drilled, blasted and loaded
(mucked) from the bottom of the stope. This layout enables a long hole open stoping mine
design to be scheduled. This is illustrated in Figure 12-35 below.

Nordic Mining Prefeasibility Study
30 October 2017 Engebø Rutile and Garnet Project H352410
H352410-00000-280-066-0001, Rev. 0 Page 212
© Hatch 2017 All rights reserved, including all rights relating to the use of this document or its contents.
Figure 12-35: Stope Design and Mining Methodology
12.7.2 Underground Infrastructure Design
The underground infrastructure design to support open pit and underground mining is
illustrated in Figure 12-36 below. To support open pit mining, underground excavations
will be built, which include a glory hole plus grizzly arrangement in the pit, a primary
crusher and crusher chamber, a silo and ore reclaim system, top and bottom access to
the silo system, an ore conveyor belt from the silo reclaim system to the plant site, and a
second egress from the top of the silo system to the plant site. For underground mining, a
new ore pass (underground glory hole) and primary crusher chamber and crusher will be
constructed to the east of the main underground mining areas. The crusher chamber will
be connected to the existing silos and reclaim system by means of an underground
conveyor belt system.
The design was reviewed by SINTEF, geotechnical consultants, who confirmed that the
design was acceptable from a geotechnical perspective.

Nordic Mining Prefeasibility Study
30 October 2017 Engebø Rutile and Garnet Project H352410
H352410-00000-280-066-0001, Rev. 0 Page 213
© Hatch 2017 All rights reserved, including all rights relating to the use of this document or its contents.
Figure 12-36: Underground Infrastructure Layout

Nordic Mining Prefeasibility Study
30 October 2017 Engebø Rutile and Garnet Project H352410
H352410-00000-280-066-0001, Rev. 0 Page 214
© Hatch 2017 All rights reserved, including all rights relating to the use of this document or its contents.
Key dimensions of the underground excavations are summarised in Table 12-15 below.
Table 12-15: Summary of Excavation Dimensions
Description Volume
(m3) Length
(m) Diameter
(m) Width
(m) Height
(m)
Belt Bottom 4,554 127 6 6
Belt Top 3,996 133 6 5
Drain Hole Cubby 166 6 5 5
Drain Hole 859 1,094 1
Belt Surface 9,150 305 6 5
Egress 8,954 298 6 5
Lift 2,482 88 6
Lift Cubby 2,069 59 6 6
Underground Crusher 4,500 15 15 20
Lower Lift 624 22 6
Lower Lift Access 672 22 6 5
Open Pit Crusher 4,500 15 15 20
Open Pit Glory Hole 6,795 240 6
Silos 20,697 20 40
Silo Cones 1,813 10 5-15
Silo Cubby 4,304 43 20 5
Underground Glory Hole 6,816 241 6
Underground Belt 38,834 1,294 6 5
12.8 Plant Design Capacity
12.8.1 Background
Capacity analysis forms an important part of the initial steps within the project
development process. The capacity analysis was conducted within a matrix environment
capable of simulating multiple variables simultaneously. The analysis included the total
value chain from mining to sales. The capacity optimisation process incorporated:
Mining block model attribute analysis for both the open pit and underground design
Mine sequencing per level
Multi-bench scheduling
Processing alternatives
Market volume alternatives.

Nordic Mining Prefeasibility Study
30 October 2017 Engebø Rutile and Garnet Project H352410
H352410-00000-280-066-0001, Rev. 0 Page 215
© Hatch 2017 All rights reserved, including all rights relating to the use of this document or its contents.
12.8.2 Approach
The approach followed to define the capacity analysis is laid out in Figure 12-37 below.
The objective of the simulation model was to combine design configurations and business
sensitivity drivers within one simulation environment. Design aspects consist of two
components: firstly, a cut-off grade sensitivity analysis, and secondly, a sequence and
schedule optimisation functionality.
Figure 12-37: Capacity Analysis Process Steps
The sequence and schedule optimisation functionality ensured that an optimum mining
schedule was obtained for each sensitivity seeded within the model. This functionality
was not analysed further within this part of the study and was addressed as part of the
mine schedule. However, it is important to note that this functionality was actively working
in the background whilst the sensitivity runs were performed.
The design sensitivity analysis (cut-off grade) was combined with the business sensitivity
analysis (price and sales volume) to obtain the most optimal project capacity. Plant (RoM)
capacities from 1.5 Mtpa to 4 Mtpa in increments of 0.1 Mtpa were analysed.
The first step of the capacity analysis (mining block model attribute filtering) consisted of a
cut-off grade seeding, where material containing less grade than the seeded grade was
classified as waste and material with a higher grade than the seeded grade was classified
as ore. The following scenarios were analysed:
Ore based only on material with a grade higher than the TiO2 cut-off grade (1.0% to
3.0% in increments of 0.1%)
Ore based only on material with a grade higher than the garnet cut-off grade (1% to
35% in increments of 5%)
Ore based on material where both TiO2 and garnet grades were higher than the
respective cut-off grades (using the same increments as indicated above).
The second step of the capacity model consisted of an economic value calculation per
mining block, also known as a Value Distribution Model (VDM). The VDM values are
closely related to the profit per mining block and were calculated by subtracting the direct
related operating cost from the revenue. The total value chain, from mining to shipment,

Nordic Mining Prefeasibility Study
30 October 2017 Engebø Rutile and Garnet Project H352410
H352410-00000-280-066-0001, Rev. 0 Page 216
© Hatch 2017 All rights reserved, including all rights relating to the use of this document or its contents.
was included within the VDM values. The VDM values were then used to rank each
mining block for both open pit and underground operations.
The third step consisted of optimising the block sequence per level. The outcome of this
step was to select the most economical starting block and consequent mining sequence.
The following aspects are of importance:
VDM values were used as ranking criteria
The mining sequence per level followed a practical path from a starting block,
progressing to the next block with the highest VDM value, selected from all available
blocks. Blocks became available only if the particular block could be mined from a
mined-out block in a perpendicular direction
Each starting block was linked to the level access by means of a development drive.
The block sequence optimisation included the VDM value for each development drive
per starting block.
The fourth step consisted of schedule optimisation. For the open pit, each level was
mined out before progressing to the next level. Within the underground workings, up to
three levels could be mined simultaneously; each level’s starting time was dependent on
completions of the decline and development drive per level. Start-up and up-grade capital
was included during this step.
12.8.3 Evaluation Discussion
The objective of the capacity analysis was to determine the project capacity range that
delivered the most robust business case. Various aspects that influence the outcome of
the business case were simulated as variable inputs in Steps 1 and 2 of the capacity
analysis process, as shown in Figure 12-37. However, to analyse the effect of each
aspect, a step-by-step approach was followed, starting with cut-off grade. NPV and IRR
were used as primary ranking criteria.
Using the assumption that ferro-eclogite, transitional-eclogite and leuco-eclogite were all
considered as ore, the following scenarios were considered:
Scenario 1 – varying cut-off grades:
Ore based only on material with a grade higher than the TiO2 cut-off grade (1.0%
to 3.0% in increments of 0.1%)
Ore based only on material with a grade higher than the garnet cut-off grade
(25% to 40% in increments of 5%)
Ore based on material where both TiO2 and garnet grades are higher than the
respective cut-off grades (same increments as indicated above).
Scenario 2 – 16% garnet yield with price sensitivity:
TiO2 price range from US$ 700/t to US$ 1,500/t of product
Garnet price range from US$ 150/t to US$ 300/t of product.

Nordic Mining Prefeasibility Study
30 October 2017 Engebø Rutile and Garnet Project H352410
H352410-00000-280-066-0001, Rev. 0 Page 217
© Hatch 2017 All rights reserved, including all rights relating to the use of this document or its contents.
12.8.4 Scenario 1 – Cut-off Grade Analysis
The following options were analysed:
TiO2 cut-off grade: ore based only on material with a grade higher than the TiO2 cut-
off grade (1.0% to 3.0% in increments of 0.1%), with a 16% garnet yield
Garnet cut-off grade: ore based only on material with a grade higher than the garnet
cut-off grade (25% to 40% in increments of 5%), with a 1% TiO2 cut-off grade.
For the cut-off grade analysis, the following input assumptions were applied:
TiO2 price range from US$ 700/t to US$ 1,500/t of product
A garnet price range from US$ 150/t to US$ 300/t of product
A constrained garnet market (garnet sales profile is matched and not exceeded).
12.8.4.1 TiO2 Cut-off Grade
The following graphs compare NPV and IRR with TiO2 cut-off grade. NPV is indicated in
US$ M and IRR in percentage. The TiO2 cut-off grade (*10%) is indicated on the x-axis.
The vertical scatter within the graphs relates to the TiO2 and garnet price ranges seeded
per TiO2 cut-off grade. The red oval indicates the 90% confidence range. From the
analysis, the lower range TiO2 cut-off grades are preferred. Both NPV and IRR follows the
same trend in the sense that at a cut-off grade of 3% almost half of the value is
destroyed; however, between 1% and 2% the difference is only 15%.
At a 1% cut-off grade the net revenue from only TiO2 is below its marginal cost. The effect
that low TiO2 cut-off grade contributes to NPV and IRR indicates that firstly, the combined
revenue, from both TiO2 and garnet is above the marginal cost; and secondly, that the
rate (tempo) of revenue generation in the early years is not significantly diluted by lower
value ore. In the event that lower grade ore impacts on the margin generated within the
early years, one would see a downwards trend towards the lower cut-off grades,
especially within the IRR graph.
To simplify the capacity analysis, a TiO2 cut-off grade equal to 1% was used from here
onwards.

Nordic Mining Prefeasibility Study
30 October 2017 Engebø Rutile and Garnet Project H352410
H352410-00000-280-066-0001, Rev. 0 Page 218
© Hatch 2017 All rights reserved, including all rights relating to the use of this document or its contents.
Figure 12-38: NPV vs. TiO2 Cut-off Grade
Figure 12-39: IRR vs. TiO2 Cut-off Grade
12.8.4.2 Garnet Cut-off Grade
The following graphs compare NPV and IRR with garnet cut-off grade. Garnet cut-off
grades from 25% to 40% in increments of 5% were evaluated. The garnet cut-off grade
follows the same trend as the TiO2 cut-off grade graphs, indicating that lower garnet cut-
off grades are preferred.
To simplify the capacity analysis, a TiO2 cut-off grade equal to 1% was used going
forward. Based on Figure 12-38 and Figure 12-39, it was confirmed that up to a 1% TiO2
cut-off, both the NPV and IRR improve.
50
100
150
200
250
300
350
400
5
10
15
20
25
30
35
NP
V (
US
$ M
)
TiO2 Cut-off Grade % (Divisor of 10)
NPV vs. TiO2 Cut-off Grade
10%
11%
12%
13%
14%
15%
16%
17%
18%
10
12
14
16
18
20
22
24
26
28
30
IRR
(%
)
TiO2 Cut-off Grade % (Divisor of 10)
IRR vs. TiO2 Cut-off Grade

Nordic Mining Prefeasibility Study
30 October 2017 Engebø Rutile and Garnet Project H352410
H352410-00000-280-066-0001, Rev. 0 Page 219
© Hatch 2017 All rights reserved, including all rights relating to the use of this document or its contents.
Figure 12-40: NPV vs. Garnet Cut-off Grade
Figure 12-41: IRR vs. Garnet Cut-off Grade
12.8.5 Scenario 2 - Capacity Analysis
The capacity analysis is presented using a 1% cut-off grade for both TiO2 and garnet
together with a fixed 16% yield for garnet recoveries. It should be noted that although
these fixed values are used to simplify the discussion, the simulation data contain results
for all cut-off grade ranges as discussed in Section 12.8.4 above. To estimate the effect of
sales price on capacity, the following price ranges were analysed:
A TiO2 price range from US$ 700/t to US$ 1,500/t of product (combined with a garnet
base price of US$ 220/t of product)
50
100
150
200
250
300
350
24
26
28
30
32
34
36
38
40
NP
V (
US
$ M
)
Garnet Cut-off Grade % (Divisor of 10)
NPV vs. Garnet Cut-off Grade
11%
12%
13%
14%
15%
16%
17%
24
26
28
30
32
34
36
38
40
IRR
(%
)
Garnet Cut-off Grade % (Divisor of 10)
IRR vs. Garnet Cut-off Grade

Nordic Mining Prefeasibility Study
30 October 2017 Engebø Rutile and Garnet Project H352410
H352410-00000-280-066-0001, Rev. 0 Page 220
© Hatch 2017 All rights reserved, including all rights relating to the use of this document or its contents.
A garnet price range from US$ 150/t to US$ 300/t of product (combined with a TiO2
base price of US$ 1,050/t of product).
Figure 12-42 below indicates NPV vs. capacity for TiO2 price ranges. NPV is indicated on
the y-axis, capacity on the x-axis and the respective TiO2 price options are plotted.
Figure 12-42: NPV vs. Capacity for TiO2 Price Ranges
From the above graph, the following can be observed:
There is no gain in NPV for capacities above 2.0 Mtpa, even at the highest TiO2 price
of US$ 1,500/t
For the lower price options, the NPV drops off significantly above 2.0 Mtpa capacity
For all prices, NPVs are consistently lower below 2.0 Mtpa; the effect is less for prices
below US$1,100/t TiO2, however.
Figure 12-43 below indicates the IRR vs. capacity for TiO2 price ranges. IRR is indicated
on the y-axis, capacity on the x-axis and the respective TiO2 price options are plotted.
0
100
200
300
400
500
600
15 16 17 18 19 20 21 22 23 24 25 26 27 28 29 30 31 32 33 34 35 36 37 38 39 40
NP
V (
US
$ M
)
Feed Capacity (M Tonnes per annum) (Divisor of 10)
NPV vs. Capacity for TiO2 Price Ranges
700 800 900 1000 1100
1200 1300 1400 1500

Nordic Mining Prefeasibility Study
30 October 2017 Engebø Rutile and Garnet Project H352410
H352410-00000-280-066-0001, Rev. 0 Page 221
© Hatch 2017 All rights reserved, including all rights relating to the use of this document or its contents.
Figure 12-43: IRR vs. Capacity for TiO2 Price Ranges
From the above graph, the following can be observed:
For prices above US$ 1,300/t TiO2 there is a slight advantage for capacities above
1.9 Mtpa
For prices below US$ 1,100/t TiO2 there is an increasing disadvantage for capacities
below 1.9 Mtpa
For all capacities below 1.9 Mtpa there is almost no change in the respective IRR for
the total range of prices evaluated.
Figure 12-44 below indicates NPV vs. capacity for garnet price ranges. NPV is indicated
on the y-axis, capacity on the x-axis and the respective garnet price options are plotted.
10%
12%
14%
16%
18%
20%
22%
24%
15 16 17 18 19 20 21 22 23 24 25 26 27 28 29 30 31 32 33 34 35 36 37 38 39 40
IRR
(%
)
Feed Capacity (M Tonnes per annum) (Divisor of 10)
IRR vs. Capacity for TiO2 Price Ranges
700 800 900 1000 1100
1200 1300 1400 1500

Nordic Mining Prefeasibility Study
30 October 2017 Engebø Rutile and Garnet Project H352410
H352410-00000-280-066-0001, Rev. 0 Page 222
© Hatch 2017 All rights reserved, including all rights relating to the use of this document or its contents.
Figure 12-44: NPV vs. Capacity for Garnet Price Ranges
From the above graph, the following can be observed:
All price scenarios indicate an optimum capacity of around 2.0 Mtpa
For all the price scenarios, the higher capacity ranges have a lower NPV than the
lower capacity ranges.
Figure 12-45 below indicates the IRR vs. capacity for garnet price ranges. IRR is
indicated on the y-axis, capacity on the x-axis and the respective garnet price ranges are
plotted.
100
200
300
400
500
600
700
15 16 17 18 19 20 21 23 24 25 26 27 28 29 30 31 32 33 34 35 36 37 38 39 40
NP
V (
US
$ M
)
Feed Capacity (M Tonnes per annum) (Divisor of 10)
NPV vs. Capacity for Garnet Price Ranges
150 160 170 180 190 200 210 220
230 240 250 260 270 280 290 300

Nordic Mining Prefeasibility Study
30 October 2017 Engebø Rutile and Garnet Project H352410
H352410-00000-280-066-0001, Rev. 0 Page 223
© Hatch 2017 All rights reserved, including all rights relating to the use of this document or its contents.
Figure 12-45: IRR vs. Capacity for Garnet Price Ranges
From the above graph, the following can be observed:
For all price scenarios, there is a slight disadvantage for higher capacities
For the lower capacity scenarios, there is almost no change in the IRR below
2.0 Mtpa.
At this stage of the Project, the base line price assumptions for TiO2 and garnet were
US$ 1,050/t and US$ 220/t of product respectively. Figure 12-46 and Figure 12-47 below
show the indicative Project NPV and IRR compared to capacity. From these graphs, it
can be concluded that the most suitable final installed capacity should be within a range
between 1.8 Mtpa to 2.0 Mtpa. Based on these capacities, the pre-tax indicative NPV is
US$ 383 M and the IRR is 18%.
12%
14%
16%
18%
20%
22%
24%
15 16 17 18 19 20 21 23 24 25 26 27 28 29 30 31 32 33 34 35 36 37 38 39 40
IRR
(%
)
Feed Capacity (M Tonnes per annum) (Divisor of 10)
IRR vs. Capacity for Garnet Price Ranges
150 160 170 180 190 200 210 220
230 240 250 260 270 280 290 300

Nordic Mining Prefeasibility Study
30 October 2017 Engebø Rutile and Garnet Project H352410
H352410-00000-280-066-0001, Rev. 0 Page 224
© Hatch 2017 All rights reserved, including all rights relating to the use of this document or its contents.
Figure 12-46: NPV vs. Capacity for Base Line Prices
Figure 12-47: IRR vs. Capacity for Base Line Prices
It is important to note that if the IRR criterion alone is considered in the above analysis,
there is minimal change in the IRR in the capacity range of 1.5 Mtpa to 2.0 Mtpa.
Capacity modelling studies such as the one reported here are, by definition, high level
and the results are not absolute. Subsequent definitive financial modelling (run for
increased base line price assumptions for TiO2 of US$ 1,070/t and US$ 250/t for garnet)
indicated that on an IRR basis, a capacity of 1.5 Mtpa used for high grade ore (ferro only)
showed a better return than 2.0 Mtpa options where lower grade ore was mined and
processed. As a result of this work, the decision was made to select a 1.5 Mtpa capacity
100
150
200
250
300
350
400
450
15 16 17 18 19 20 21 23 24 25 26 27 28 29 30 31 32 33 34 35 36 37 38 39 40
NP
V (
US
$ M
)
Feed Capacity (M Tonnes per annum) (Divisor of 10)
NPV vs. Capacity for Base Line Prices
Garnet 220 and TIO2 1050
12%
13%
14%
15%
16%
17%
18%
19%
15 16 17 18 19 20 21 23 24 25 26 27 28 29 30 31 32 33 34 35 36 37 38 39 40
IRR
(%
)
Feed Capacity (M Tonnes per annum) (Divisor of 10)
IRR vs. Capacity for Base Line Prices
Garnet 220 and TIO2 1050

Nordic Mining Prefeasibility Study
30 October 2017 Engebø Rutile and Garnet Project H352410
H352410-00000-280-066-0001, Rev. 0 Page 225
© Hatch 2017 All rights reserved, including all rights relating to the use of this document or its contents.
mine and plant as the preferred business case for the Project. It is recommended,
however, that the capacity decision is reconsidered in the DFS phase, incorporating a
revised set of input assumptions, as new information becomes available. This
recommendation is made because the IRR for a 2.0 Mtpa plant capacity option was only
marginally lower than the 1.5 Mtpa option.
12.9 Mining Options Evaluated
Before the final production schedule could be drawn up, a number of options were
evaluated based on the mining and processing of two ore types, ferro-eclogite (ferro ore)
and trans-eclogite (trans ore). The ferro ore has higher grades of rutile and garnet than
trans ore. The ferro ore also has higher recoveries. The mining of these two ore types
drives mining strategy as grade drives revenue, which in turn dominates profitability.
A number of options were investigated to evaluate the best financial option. The options
fall into three main categories, namely:
The mining and processing of ore at a rate of 1.5 Mtpa. In this option, a process plant
is commissioned in 2021 to treat 1.0 Mtpa in that year (the ramp-up year), after which
a maximum of 1.5 Mtpa is treated going forward
Figure 12-48 below illustrates the ore treatment profile associated with this option.
Figure 12-48: Ore Profile for 1.5 Mtpa Option
After ramping up in 2021 to 1.0 Mtpa of ore, the process plant will operate at 1.5 Mtpa
capacity until 2027 when it will be upgraded to run at 2.0 Mtpa capacity.
Figure 12-49 below illustrates the ore treatment profile associated with this option.
-
200,000
400,000
600,000
800,000
1,000,000
1,200,000
1,400,000
1,600,000
20
21
20
22
20
23
20
24
20
25
20
26
20
27
20
28
20
29
20
30
20
31
20
32
20
33
20
34
20
35
20
36
20
37
20
38
20
39
20
40
20
41
20
42
20
43
20
44
20
45
20
46
20
47
20
48
20
49
20
50
20
51
20
52
20
53
20
54
20
55
20
56
20
57
20
58
20
59
20
60
Ore Tonnes Mined

Nordic Mining Prefeasibility Study
30 October 2017 Engebø Rutile and Garnet Project H352410
H352410-00000-280-066-0001, Rev. 0 Page 226
© Hatch 2017 All rights reserved, including all rights relating to the use of this document or its contents.
Figure 12-49: Ore Profile for 1.5 Mtpa with Stepped Upgrade to 2.0 Mtpa Option
After ramping up in 2021 to 1.0 Mtpa of ore, the process plant will operate at
incrementally increasing tonnages up to 1.5 Mtpa. Sufficient tonnes will be treated to
ensure the garnet sales profile is achieved. Once the mine plan requires more than
1.5 Mtpa of ore to be mined and treated to achieve the garnet sales profile, the
process plant will be upgraded to treat 2.0 Mtpa. It will then operate at incrementally
increasing tonnages until the 2.0 Mpa steady state production rate is achieved.
Figure 12-50 below indicates the ore treatment profile associated with this option.
Figure 12-50: Ore Profile for 1.5 Mtpa with Smoothed Upgrade to 2.0 Mtpa Options
Besides plant capacity, the options evaluated considered three main ore categories,
namely:
The mining of ferro ore only, effectively a high grading strategy
The mining of ferro ore plus trans ore above a 2.5% cut-off grade
The mining of ferro plus trans with no cut-off grade applied.
Based on the above categories, nine options as follows were evaluated:
-
500,000
1,000,000
1,500,000
2,000,000
2,500,000
20
21
20
22
20
23
20
24
20
25
20
26
20
27
20
28
20
29
20
30
20
31
20
32
20
33
20
34
20
35
20
36
20
37
20
38
20
39
20
40
20
41
20
42
20
43
20
44
20
45
20
46
20
47
20
48
20
49
20
50
20
51
20
52
20
53
20
54
20
55
20
56
20
57
20
58
20
59
20
60
Ore Tonnes Mined
-
200,000
400,000
600,000
800,000
1,000,000
1,200,000
1,400,000
1,600,000
1,800,000
20
21
20
22
20
23
20
24
20
25
20
26
20
27
20
28
20
29
20
30
20
31
20
32
20
33
20
34
20
35
20
36
20
37
20
38
20
39
20
40
20
41
20
42
20
43
20
44
20
45
20
46
20
47
20
48
20
49
20
50
20
51
20
52
20
53
20
54
20
55
20
56
20
57
20
58
20
59
20
60
Ore Tonnes Mined

Nordic Mining Prefeasibility Study
30 October 2017 Engebø Rutile and Garnet Project H352410
H352410-00000-280-066-0001, Rev. 0 Page 227
© Hatch 2017 All rights reserved, including all rights relating to the use of this document or its contents.
Option 1 - mining of ferro ore only at a rate of 1.5 Mtpa
Option 2 - mining of ferro ore only, starting at a rate of 1.5 Mtpa and assuming a
stepped upgrade of plant capacity to reach a final nameplate capacity of 2.0 Mtpa
Option 3 - mining of ferro ore only, having a smoothed upgrading of plant capacity to
match the anticipated garnet sales profile
Option 4 - mining of ferro ore and trans ore with a cut-off of 2.5% for rutile at a rate of
1.5 Mtpa
Option 5 - mining of ferro ore and trans ore with a cut-off of 2.5% for rutile, having a
stepped upgrade of plant capacity to reach a final nameplate capacity of 2.0 Mtpa
Option 6 - mining of ferro ore and trans ore with a cut-off of 2.5% for rutile, having a
smoothed upgrading of plant capacity to match the anticipated garnet sales profile
Option 7 - mining of ferro ore and trans ore with no cut-off grade for the trans ore at a
rate of 1.5 Mtpa
Option 8 - mining of ferro ore and trans ore with no cut-off grade for the trans ore,
having a stepped upgrade of plant capacity to reach a final nameplate capacity of
2.0 Mtpa
Option 9 - mining of ferro ore and trans ore with no cut-off grade for the trans ore,
having a smoothed upgrading of plant capacity to match the anticipated garnet sales
profile.
For ease of understanding the above options are summarised in Table 12-16 below.
Table 12-16: Summary of Options Evaluated
Option Number
Option Description 1.5 Mtpa
1.5 Mtpa, Stepped
Upgrade to 2.0 Mtpa
1.5 Mtpa, Smoothed Upgrade to
2.0 Mtpa
1 Ferro only √
2 Ferro only √
3 Ferro only √
4 Ferro and Trans, Trans cut-off 2.5% √
5 Ferro and Trans, Trans cut-off 2.5% √
6 Ferro and Trans, Trans cut-off 2.5% √
7 Ferro and Trans, no cut-off √
8 Ferro and Trans, no cut-off √
9 Ferro and Trans, no cut-off √
Nordic Mining Prefeasibility Study
30 October 2017 Engebø Rutile and Garnet Project H352410
H352410-00000-280-066-0001, Rev. 0 Page 228
© Hatch 2017 All rights reserved, including all rights relating to the use of this document or its contents.
Based primarily on IRR, Option 1, the mining and processing of ferro-eclogite only at a
rate of 1.5 Mtpa, was selected as the preferred business case. A mine plan and
production schedule was developed for Option 1, therefore, as reported below. Refer to
Section 23 for more details on the financial analysis of the nine options.
12.10 Mine Plan and Production Schedule
A mine plan and production schedule for the LoM for Option 1 were developed using the
DESWIK scheduling package. Key elements of the schedule are summarised below.
12.10.1 Mining Process
Mining will commence from an open pit which will give access from the highwall to an
underground mine at a later stage in the LoM. It is planned to mine and process only one
ore type, ferro-eclogite (which generally contains >16% Fe2O3 and >3% TiO2). Trans-
eclogite, which generally contains 14% to 16% Fe2O3 and 2% to 3% TiO2, and Leuco-
eclogite (which generally contains <14% Fe2O3 and <2% TiO2), are considered future
potential additions to the reserves.
Ore in the open pit will be drilled, blasted, loaded and hauled to a glory hole (ore pass) in
the pit, after which it will undergo primary, secondary and tertiary crushing, followed by
processing. Waste will be drilled, blasted, loaded and hauled to a waste rock disposal
area to the north-east of the pit. To prevent blockages, there will be a grizzly (coarse
screen) on top of the glory hole to ensure that large rocks do not enter the glory hole
system. Once ore from the open pit has been dumped into the glory hole, primary
crushing will take place underground by means of a jaw crusher, after which the ore will
be transported via conveyor to one of two 20,000 t silos for storage. Ore from the ore silos
will be reclaimed and conveyed to the secondary (cone) and tertiary (impact) crusher on
surface at the process plant site. Secondary egress to the underground facilities as
required by law is catered for by means of a second tunnel to the process plant site from
the top of the silos. Processing of garnet will be achieved by means of milling, gravity
concentration and dry magnetic separation to generate a fine and coarse product stream;
rutile recovery is primarily achieved by means of flotation and spirals. Final products from
the rutile, fine garnet and coarse garnet streams will be stored in product silos prior to
shipping as bulk products from the port adjacent to the process plant site. All tailings from
production will be safely placed in a deep sea fjord disposal area near the process plant
site.
Towards the end of the life of the open pit, access to the underground orebody lying to
the west of the pit will be made via a roadway driven through the highwall of one of the
lower benches of the pit (bench 150 masl). This will enable decline development and
access to open up five levels of underground mining. As noted, the underground mine
plan is based on the long hole open stoping mining method, a bulk mining method
whereby slots are opened at the top and bottom of a stope to enable vertical drilling and
blasting of slices of ore within the stope. Ore is loaded out from the bottom level of the
stopes and hauled to a crosscut where it is dumped into a glory hole. The glory hole
enables the ore to be fed into a primary crusher, after which a conveyor will transport the
ore to the silo system situated below the open pit. Both the glory hole and primary crusher
for underground operations will be a duplicate of the open pit system established before
the start of the open pit mining operation.

Nordic Mining Prefeasibility Study
30 October 2017 Engebø Rutile and Garnet Project H352410
H352410-00000-280-066-0001, Rev. 0 Page 229
© Hatch 2017 All rights reserved, including all rights relating to the use of this document or its contents.
The Project is being developed in line with the guidelines of the JORC Code. The mine
plan makes use, therefore, of Measured and Indicated resources only, which have been
converted to Probable and Proven reserves by means of modifying factors. No Inferred
ore resources have been used in the mine plan to determine the reserves.
12.10.2 Key Production Statistics
Key production statistics for the mine plan are summarised in Table 12-18 below.

Nordic Mining Prefeasibility Study
30 October 2017 Engebø Rutile and Garnet Project
H352410
H352410-00000-280-066-0001, Rev. 0 Page 230
© Hatch 2017 All rights reserved, including all rights relating to the use of this document or its contents.
Table 12-17: Mine Plan Key Production Statistics
Activity Units
Total –
Life of
Mine
2021 2022 2023 2024 2025 2026 2027 2028 2029 2030 2031 2032 2033 2034
Open Pit Mining
Waste Mined kt 30,446 2,139 1,866 1,377 1,202 1,670 1,787 1,151 893 3,238 3,608 1,895 3,090 3,512 1,599
Ferro Ore Mined (before losses and dilution) kt 22,616 1,000 1,500 1,500 1,500 1,500 1,500 1,500 1,500 1,500 1,500 1,500 1,500 1,500 1,410
Underground Mining
Waste Mined kt 10,020 - - - - - - - - - - - - - 226
Ferro Ore Mined (before losses and dilution) kt 19,432 - - - - - - - - - - - - - 90
All Mining
Total Waste Mined kt 40,466 2,139 1,866 1,377 1,202 1,670 1,787 1,151 893 3,238 3,608 1,895 3,090 3,512 1,826
Total Ferro Ore Mined (before losses and dilution) kt 42,048 1,000 1,500 1,500 1,500 1,500 1,500 1,500 1,500 1,500 1,500 1,500 1,500 1,500 1,500
Total Ferro Ore Mined Rutile Grade (before losses and dilution) % 3.72 3.98 3.69 3.69 3.95 3.73 3.57 3.53 3.76 3.41 3.77 3.87 3.86 3.81 3.80
Total Ferro Ore Mined Garnet Grade (before losses and dilution) % 40.3 39.6 39.7 39.9 41.6 40.1 39.7 40.6 41.2 35.4 35.2 35.0 35.8 36.6 40.7
Feed to Plant
Ferro Ore Feed to Plant kt 41,896 988 1,482 1,482 1,482 1,482 1,482 1,482 1,482 1,482 1,482 1,482 1,482 1,482 1,482
Ferro Ore Grade - Rutile % 3.46 3.83 3.55 3.55 3.80 3.59 3.43 3.39 3.61 3.27 3.62 3.72 3.71 3.66 3.65
Ferro Ore Yield - Garnet % 17.47 16.72 17.63 17.63 17.63 17.63 17.63 17.63 17.63 17.63 17.63 17.63 17.63 17.63 17.63
Plant Production and Sales kt
Rutile Produced kt 910.4 20.2 32.4 32.3 34.6 32.7 31.3 30.9 32.9 29.9 33.0 34.0 33.8 33.4 33.3
Rutile Sales kt 910.4 20.2 32.4 32.3 34.6 32.7 31.3 30.9 32.9 29.9 33.0 34.0 33.8 33.4 33.3
Garnet Produced kt 7,318.1 165.2 261.3 261.3 261.3 261.3 261.3 261.3 261.3 261.3 261.3 261.3 261.3 261.3 261.3
Garnet Sales kt 6,956.2 140.0 158.0 175.0 194.0 213.0 234.0 257.0 261.3 261.3 261.3 261.3 261.3 261.3 261.3

Nordic Mining Prefeasibility Study
30 October 2017 Engebø Rutile and Garnet Project
H352410
H352410-00000-280-066-0001, Rev. 0 Page 231
© Hatch 2017 All rights reserved, including all rights relating to the use of this document or its contents.
Table 12-18: Key Schedule Production Statistics
Activity Units
Total –
Life of
Mine
2035 2036 2037 2038 2039 2040 2041 2042 2043 2044 2045 2046 2047 2048 2049
Open Pit Mining
Waste Mined kt 30,446 862 556 - - - - - - - - - - - - -
Ferro Ore Mined kt 22,616 1,004 1,201 - - - - - - - - - - - - -
Underground Mining
Waste Mined kt 10,020 180 131 498 603 880 781 1,312 163 78 265 1,188 548 405 1,962 802
Ferro Ore Mined kt 19,432 496 299 1,500 1,500 1,500 1,500 1,500 1,500 1,500 1,500 1,500 1,500 1,500 1,500 548
All Mining
Total Waste Mined kt 40,466 1,042 687 498 603 880 781 1,312 163 78 265 1,188 548 405 1,962 802
Total Ferro Ore Mined (before losses and dilution) kt 42,048 1,500 1,500 1,500 1,500 1,500 1,500 1,500 1,500 1,500 1,500 1,500 1,500 1,500 1,500 548
Total Ferro Ore Mined Rutile Grade (before losses and dilution) % 3.72 3.89 3.73 3.52 3.74 3.89 3.78 3.99 3.61 3.51 3.78 3.56 3.40 3.74 3.64 3.57
Total Ferro Ore Mined Garnet Grade (before losses and dilution) % 40.30 41.0 41.4 42.2 41.8 41.1 41.0 43.6 42.4 44.5 43.9 41.4 39.7 44.3 37.3 41.9
Feed to Plant
Ferro Ore Feed to Plant kt 41,896 1,482 1,482 1,511 1,511 1,511 1,511 1,511 1,511 1,511 1,511 1,511 1,511 1,511 1,511 552
Ferro Ore Grade - Rutile % 3.46 3.74 3.59 3.32 3.53 3.67 3.57 3.76 3.40 3.31 3.56 3.36 3.20 3.53 3.43 3.37
Ferro Ore Yield - Garnet % 17.47 17.63 17.63 17.31 17.31 17.31 17.31 17.31 17.31 17.31 17.31 17.31 17.31 17.31 17.31 17.31
Plant Production and Sales
Rutile Produced kt 910.4 34.1 32.7 30.9 32.8 34.1 33.2 35.0 31.6 30.8 33.1 31.2 29.8 32.8 31.9 11.4
Rutile Sales kt 910.4 34.1 32.7 30.9 32.8 34.1 33.2 35.0 31.6 30.8 33.1 31.2 29.8 32.8 31.9 11.4
Garnet Produced kt 7,318.1 261.3 261.3 261.5 261.5 261.5 261.5 261.5 261.5 261.5 261.5 261.5 261.5 261.5 261.5 95.5
Garnet Sales kt 6,956.2 261.3 261.3 261.5 261.5 261.5 261.5 261.5 261.5 261.5 261.5 261.5 261.5 261.5 261.5 95.5

Nordic Mining Prefeasibility Study
30 October 2017 Engebø Rutile and Garnet Project
H352410
H352410-00000-280-066-0001, Rev. 0 Page 232
© Hatch 2017 All rights reserved, including all rights relating to the use of this document or its contents.
12.10.3 Methodology and Key Assumptions
The methodology and key assumptions used to develop the mine plan and schedule are
summarised below:
In line with the guidelines of the JORC Code, only Measured and Indicated Resources
have been used to determine reserves. All ore tonnages and grades reported in the
mine plan are for Probable and Proven reserves
The mine plan targets an ore mining rate of 1.5 Mtpa, with the exception of the ramp-
up year (2021). In total, 22.6 Mt of ore is mined from the open pit and 30.4 Mt of
waste, giving a stripping ratio of 1.35 (t: t). In the underground 19.4 Mt of ore is mined
and 10.0 Mt of waste, comprising development waste and ore in stopes which are not
in the Measured or Indicated Resource classifications. In total, 41.8 Mt of ore and 40.5
Mt of waste is mined over the LoM
Only ferro ore was mined and processed in the mine plan. Other ore types present in
the Engebø orebody – trans ore and leuco ore – are treated as waste and are hauled
to the waste rock disposal facility. Some of the waste material may be disposed of
underground once mined-out stopes are available. The trans ore and leuco ore will be
stockpiled separately to pure waste as consideration may be given in future to
processing this material if it can be shown to improve the project economics
The LoM is 29 years, with the open pit producing for 16 years, followed by bulk
underground mining (long hole open stoping)
Production is assumed to start in January 2021. A ramp-up in Year 1 has been
incorporated. The ramp-up assumes that 30 kt of ore is processed through the plant in
January 2021, with production building up to steady-state production of 125 kt in
December 2021. The total ore to be processed in Year 1 is 1.0 Mt. The plant efficiency
(a percentage of the expected steady-state recovery) is assumed to increase from
60% to 100% in six months for the garnet recovery part of the plant; due to the higher
complexity of the rutile recovery part of the plant, it is assumed that it will take 12
months for the rutile plant to achieve 100% recovery efficiency
Assuming a mining contractor is used upfront to establish the mine, it is estimated that
it will take two years to construct and equip the underground infrastructure required to
start production from the open pit (access tunnels from the process plant site, a
crusher chamber; silos and reclaim system and a glory hole); this construction period
is in line, therefore, with the time required to construct the process plant and
associated infrastructure including product loadout facilities and bulk services.
Construction of the underground infrastructure and the process plant is expected to
run in parallel. For the open pit, all ore is mined to a glory hole in the pit; all waste is
mined to a waste rock disposal facility to the north-east of the pit
For underground mining, tonnages have been split into six material types, namely:

Nordic Mining Prefeasibility Study
30 October 2017 Engebø Rutile and Garnet Project
H352410
H352410-00000-280-066-0001, Rev. 0 Page 233
© Hatch 2017 All rights reserved, including all rights relating to the use of this document or its contents.
Decline development in waste: a 15% allowance was added to the DESWIK
production statistics to cater for cubbies and passing bays. This allowance is
included in the numbers reported in Table 12-18 above
Decline development in ore
Horizontal development in waste: in the main, this represents development
between stopes
Horizontal development in ore. In the main, this represents development along the
top of a stope to develop the slot from which bulk mining of the stope can take
place
Stoping in waste – this is ore which needs to be mined as part of the stope design
but which is not Proven and Probable reserves of ferro ore
Stoping in ore.
The targeted production rate in the mine plan is 1.5 Mtpa of ferro ore mined; this
equates to a feed to plant production rate of 1.482 Mtpa of ferro ore once ore losses
and dilution have been included. The methodology used for applying ore losses and
dilution to the mined ore tonnes is as follows:
Throughout the mine plan, ore losses of 5% were applied to the 1.5 Mtpa ore
production rate, resulting in an ore feed to plant tonnage of 1.425 Mtpa
Dilution was then applied to the ore feed. A percentage dilution of 4% was
assumed for the open pit and 6% for the underground. This increased the ore feed
to plant tonnage to 1.482 Mtpa for open pit production and to 1.510 Mtpa for
underground production
The final grade of the ore fed to the plant represents a diluted ore grade, where
the grade of dilution was assumed to be nil for both open pit and underground
dilution.
Except for the ramp-up year (2021) when lower plant recoveries have been assumed,
a recovery of 58.4% for pure rutile from ferro ore over the LoM has been assumed at a
product grade of 94.9%. The diluted grade of ferro ore mined has been used to
determine the production of final product. The recovery and product grade factors are
based on testwork programme results. In line with the pricing strategy as outlined in
Section 17, final rutile production tonnes reflect the selling of a 94.9% rutile product, so
the plant output volumes of pure rutile have been increased by a factor of 100/94.9 to
cater for product grade
To determine garnet production volumes, a different approach was taken due to the
bulk nature of the product. Irrespective of the garnet grade in ore a garnet yield of
18.3% was assumed for ferro ore throughout the Life of Mine (except for the ramp-up
year when lower plant recoveries were assumed. The yield factor is based on testwork
programme results. The yield factor was applied to the ferro ore tonnage sent to the
Plant (ore mined less ore losses plus dilution) to determine the production of final

Nordic Mining Prefeasibility Study
30 October 2017 Engebø Rutile and Garnet Project
H352410
H352410-00000-280-066-0001, Rev. 0 Page 234
© Hatch 2017 All rights reserved, including all rights relating to the use of this document or its contents.
product. It should be noted that not all garnet produced is sold. In the early years of
the Project, more garnet is produced than can be sold, so some garnet is disposed of
with tailings by means of sea disposal. At steady state, the targeted garnet sales
volume of 300 ktpa is not achieved, with garnet production only reaching 261.3 ktpa
The underground stoping area is accessed via a decline from the open pit (from bench
150 masl). To act as a second egress, additional level drive extensions connecting to
surface on the western side of the Engebø mountain have been planned at the 150
masl level and at the 90 masl level. These holings will also assist with the ventilation
and drainage of the underground workings
The following advance rates were used in the production schedule:
Access tunnels from plant site and decline advance rate = 4.5 m/day
(135 m/month)
Glory holes development rate (including piloting and reaming) = 4.5m/day
Top and bottom stope slot development rate = 1,000 t/day
Stope mining rate – typically 5,000 t/day to 6,000 t/day.
12.10.4 Pit Development Sequence
Figure 12-51 to Figure 12-54 below illustrate the extent of open pit mining at various points
in the LoM.
Figure 12-51: Pit Shape before Mining (looking North-East), Coloured in Years

Nordic Mining Prefeasibility Study
30 October 2017 Engebø Rutile and Garnet Project
H352410
H352410-00000-280-066-0001, Rev. 0 Page 235
© Hatch 2017 All rights reserved, including all rights relating to the use of this document or its contents.
Figure 12-52: Extent of Mining after 5 Years (January 2026) (looking North-East)
Figure 12-53: Extent of Mining after 10 Years (January 2031) (looking North-East)

Nordic Mining Prefeasibility Study
30 October 2017 Engebø Rutile and Garnet Project
H352410
H352410-00000-280-066-0001, Rev. 0 Page 236
© Hatch 2017 All rights reserved, including all rights relating to the use of this document or its contents.
Figure 12-54: Extent of Mining after 15 Years (January 2036) (looking North-East)
12.10.5 Underground Development Sequence
Figure 12-55 to Figure 12-58 below illustrate the extent of underground mining at various
points in the LoM.
Figure 12-55: Extent of Underground Mining in January 2036

Nordic Mining Prefeasibility Study
30 October 2017 Engebø Rutile and Garnet Project
H352410
H352410-00000-280-066-0001, Rev. 0 Page 237
© Hatch 2017 All rights reserved, including all rights relating to the use of this document or its contents.
Figure 12-56: Extent of Underground Mining in January 2041
Figure 12-57: Extent of Underground Mining in January 2046

Nordic Mining Prefeasibility Study
30 October 2017 Engebø Rutile and Garnet Project
H352410
H352410-00000-280-066-0001, Rev. 0 Page 238
© Hatch 2017 All rights reserved, including all rights relating to the use of this document or its contents.
Figure 12-58: Extent of Underground Mining in 2049 (end of Life of Mine)
The full design used to derive the open pit and underground mine plans is shown in Figure
12-59 below.
Figure 12-59: Open Pit and Underground Mine Plan (looking south-east)

Nordic Mining Prefeasibility Study
30 October 2017 Engebø Rutile and Garnet Project
H352410
H352410-00000-280-066-0001, Rev. 0 Page 239
© Hatch 2017 All rights reserved, including all rights relating to the use of this document or its contents.
12.10.6 Waste Rock Disposal Facility
A waste rock disposal facility (landfill deposition site) has been designed to fit in the valley
to the north-east of the open pit, as shown in Figure 12-60 below.

Nordic Mining Prefeasibility Study
30 October 2017 Engebø Rutile and Garnet Project
H352410
H352410-00000-280-066-0001, Rev. 0 Page 240
© Hatch 2017 All rights reserved, including all rights relating to the use of this document or its contents.
Figure 12-60: Plan Showing Waste Rock Disposal Facility (circled)

Nordic Mining Prefeasibility Study
30 October 2017 Engebø Rutile and Garnet Project
H352410
H352410-00000-280-066-0001, Rev. 0 Page 241
© Hatch 2017 All rights reserved, including all rights relating to the use of this document or its contents.
The disposal facility has been designed in nine steps (benches), each 20 m high, to
provide stability to the rock face. Disposal will start from the lowest bench in the valley to
provide a containment face, behind which the facility will be extended up the valley in line
with the mining rate. The total volume of the disposal facility is approximately 14 Mm3.
Assuming an SG of 3.3 for rock and a loose rock factor of 1.6, the capacity of the facility is
approximately 29 Mt. The discharge permit states that a maximum of 15 Mm3 of waste
rock can be disposed of in the landfill deposition site, or approximately 30 Mt. The
permitted disposal tonnage is slightly higher than the disposal capacity, therefore.
The total tonnage of waste rock to be disposed of according to the mine plan is 40.5 Mt,
consisting of 30.5 Mt of open pit waste and 10.0 Mt of underground waste. Therefore,
additional disposal areas and/or solutions will be required such as:
Disposal of underground waste in mined-out stopes underground – this will allow
approximately 10 Mt of waste to be stored underground
Optimisation of the mine plan in the DFS phase to reduce the amount of waste mining
from underground
The mining and processing of trans-eclogite so that it is treated as ore and not as
waste
Disposal of underground waste rock in the bottom of the pit once it is mined out
Selling of waste rock as armour stone.
Once the mine plan has been optimised in the DFS phase, a waste rock storage solution
will be drawn up to cater for the total volume as dictated by the mine plan.
12.10.7 Mining Labour
The mining labour requirement is summarised in Table 12-19 below, based on two mining
shifts operating for five days per week, which is in line with the permitting restrictions of the
Project. It should be noted that the labour count shown reflects typical values for the life of
the open pit; in practice, the labour count may vary in some years, depending on the ore
and waste stripping requirements and associated equipment numbers.
Once mining operations move underground, similar labour requirements are envisaged
with the addition of one additional labourer per shift.

Nordic Mining Prefeasibility Study
30 October 2017 Engebø Rutile and Garnet Project
H352410
H352410-00000-280-066-0001, Rev. 0 Page 242
© Hatch 2017 All rights reserved, including all rights relating to the use of this document or its contents.
Table 12-19: Mining Labour Requirements – Open Pit
Mining (Two Shifts per Day, 5 Days per Week) Head Count
Foreman 2
Primary Open Pit Equipment
Haul Truck 4
Wheel Loader 2
Surface Drill Rig 2
General Labourer 2
Secondary Open Pit Equipment
Wheel Dozer 2
Track Dozer 2
Track Dozer 2
Grader 2
Water Truck 2
Service Truck 2
Water Bowser 4
Total 28
12.10.8 Capital Cost Estimate
For a summary of the mining related capital cost estimate, refer to Section 21.
12.10.9 Operating Cost Estimate
For a summary of the mining related operating costs, refer to Section 22.

Nordic Mining Prefeasibility Study
30 October 2017 Engebø Rutile and Garnet Project
H352410
H352410-00000-280-066-0001, Rev. 0 Page 243
© Hatch 2017 All rights reserved, including all rights relating to the use of this document or its contents.
13. Ore Reserve Estimate
13.1 Overview
The approach taken to estimate the Ore Reserves included the following steps:
The Mineral Resource block model was prepared for pit optimisation and underground
design purposes
Pit optimisation was carried out to produce a series of optimised pit shells
The optimised pit shell was used as a guide in the design of an ultimate pit design,
with haul road access, bench and berm configurations. This refined ultimate pit was
used as the basis for Mineral Reserve evaluation
The ultimate pit design was split into two pushbacks to improve the Project economics
by deferring waste stripping. Practical mining constraints such as pit room for
equipment and the annual drop rate of the pit were considered when defining the
pushbacks. All leuco-eclogite and trans-eclogite was included as waste
Based on the selected mining method (long hole open stoping) for underground
mining, a stoping grid was overlain over the Measured and Indicated Resources
The stoping layout was trimmed to cater for topographical constraints and constraints
such as the pit and fjord geotechnical stability boundaries
Stopes, pillars and sills in line with the geotechnical consultant’s recommendations
were designed within the remaining Measured and Indicated Resources
The ultimate pit design with pushbacks, together with the underground design, was
scheduled using the DESWIK software package to target an annual RoM capacity of
1.5 Mtpa at steady-state production.
13.2 Ore Reserve Statement
The ore reserve for the mine plan is presented in Table 13-1 below.
Table 13-1: Ore Reserve Estimate
Ore Type
Proven Reserves Probable Reserves
M Tonnes TiO2
% Garnet
% M Tonnes
TiO2
% Garnet
%
Ferro Ore - Open Pit 8.519 3.87 43.8 13.826 3.54 41.8
Ferro Ore - Underground 1.675 3.49 37.8 17.876 3.21 37.8
Ferro Ore - Total 10.194 3.81 43.4 31.702 3.35 39.5
The basis of conversion of Mineral Resources to Ore Reserves is as follows:
Ore reserve estimate is as of 30 September 2017
Only Measured and Indicated Resources have been used to determine reserves; all
Inferred Resources within the mineable envelope have been classified as waste

Nordic Mining Prefeasibility Study
30 October 2017 Engebø Rutile and Garnet Project
H352410
H352410-00000-280-066-0001, Rev. 0 Page 244
© Hatch 2017 All rights reserved, including all rights relating to the use of this document or its contents.
Open pit mining is carried out for the first 16 years; thereafter the mining method is
bulk underground mining (long hole open stoping)
The open pit mine design is based on the recommendations of the geotechnical
consultants for all pit design parameters
The underground mine design is based on recommendations of the geotechnical
consultants, assuming 100 m-long stopes, 45 m wide and 60 m high, with continuous
pillars 20 m wide between stopes and sills 15 m thick above and below the stopes
The garnet grades as reported above were not used to determine the final product
volumes for garnet. Instead, a yield approach was used, which was considered to be
more applicable for determining recoveries of a bulk mineral such as garnet. The yield
approach assumed a yield of 17.6% garnet for ferro ore (18.3% before dilution was
applied – see Table 11-1 for garnet recovery results)
A rutile recovery of 58.5% was assumed, based on an operational factor of 97%
A cut-off of 3% on TiO2 has been applied to ferro ore
Ore losses of 5% have been assumed throughout the mine plan
Dilution of 4% for open pit and 6% for underground has been applied for all ore with a
dilution grade of 0% for rutile and garnet.
13.3 Competent Person Sign-off
The mine plan and associated ore reserve statement for Engebø was compiled by an
independent mining consultant, Mr. Adam Wheeler, who has been working on the Engebø
Project since 2008. He has received full access to all available data and information
connected with the deposit and project development, and has received unlimited
assistance from all Nordic Mining personnel connected with the Project. Mr. Wheeler has
visited the site several times, including three times during 2016, in connection with the
recent drilling campaign.
As noted in Section 2.2, Mr. Wheeler qualifies as a Competent Person in terms of the
JORC Code.

Nordic Mining Prefeasibility Study
30 October 2017 Engebø Rutile and Garnet Project
H352410
H352410-00000-280-066-0001, Rev. 0 Page 245
© Hatch 2017 All rights reserved, including all rights relating to the use of this document or its contents.
14. Project Infrastructure
The project infrastructure facilities, shown in Figure 14-1 below, can be broken down into
the following main areas:
Open pit mine facilities
Haul road
Underground mine facilities
Process plant site facilities.
The facilities in each of the above main areas are described in more detail below.

Nordic Mining Prefeasibility Study
30 October 2017 Engebø Rutile and Garnet Project
H352410
H352410-00000-280-066-0001, Rev. 0 Page 246
© Hatch 2017 All rights reserved, including all rights relating to the use of this document or its contents.
Figure 14-1: Site Layout

Nordic Mining Prefeasibility Study
30 October 2017 Engebø Rutile and Garnet Project
H352410
H352410-00000-280-066-0001, Rev. 0 Page 247
© Hatch 2017 All rights reserved, including all rights relating to the use of this document or its contents.
14.1 Open Pit Mine Facilities
The open pit facilities consist of the following:
Separate stockpiles for agri-topsoil (the top seed-bearing layer of the topsoil) and
subsoil stockpiles
A waste rock disposal facility in the valley to the north-east of the pit to dispose of all
open pit waste rock and a portion of the underground waste
A settling dam for all runoff water from the waste rock disposal facility
Open pit dewatering pipes and pumps
Earthworks for the construction of workshops and a tyre bay to maintain the open pit
equipment fleet, including heavy mine vehicle parking, a wash bay and brake testing
ramps. It is assumed that the actual facilities will be built by the open pit equipment
supplier
Earthworks to establish an open pit explosives plant and magazine
Open pit office administration buildings (to be used by Management, Geology, Mine
Planning, Survey etc.) and an ablution block
Security fencing around the waste rock disposal facility and open pit area.
14.2 Haul Road
A 10 m wide haul road will be constructed from near the plant site at the Fv 611 county
road to the top of the open pit area. The haul road will be a new construction, following the
route of the existing gravel access road to the top of Engebø for part of its route.
14.3 Underground Mine Facilities
Underground mine facilities will be built in two phases as follows to support open pit and
underground mining:
To support open pit mining, underground excavations will be built (see Section 12.7.2)
which include a glory hole plus grizzly arrangement in the pit, a primary crusher and
crusher chamber, a silo and ore reclaim system, top and bottom access to the silo
system, an ore conveyor belt from the silo reclaim system to the plant site and a
second egress from the top of the silo system to the plant site
For underground mining, it has been assumed that a new ore pass (underground glory
hole) and primary crusher chamber and crusher will be constructed to the east of the
main underground mining areas. The crusher chamber will be connected to the
existing silos and reclaim system by means of an underground conveyor belt system
Electrical installations to support underground mining, including switchgear,
substations, cabling and transformers
14.4 Process Plant Site Facilities
The general infrastructure and services required for the process plant facility include:

Nordic Mining Prefeasibility Study
30 October 2017 Engebø Rutile and Garnet Project
H352410
H352410-00000-280-066-0001, Rev. 0 Page 248
© Hatch 2017 All rights reserved, including all rights relating to the use of this document or its contents.
Water storage and process water reticulation as described in Section 15.2 below
Natural gas as described in Section 15.3 below
Compressed air systems (instrumentation and plant air) as described in Section 11.6.3
Dust and off-gas handling of the process plant dust extraction systems as described in
Section 11.6.3
Potable water and sewage treatment plants sized and provided for the operational
personnel
Communication as described in Section 15.5 below
A cost allowance for fire protection and HVAC (Heating, Ventilation and Air
Conditioning)
Security fencing of the open pit mining facility as described in Section 14.1 above
A cost allowance for the upgrade and rejuvenation of the existing port/quay at the
Engebø site has been made.
The following administration and support buildings have been included:
Administration office building
Process plant control room building
Change house, ablution and canteen buildings for operational and administrative
personnel
First aid building
Process plant laboratory and stores buildings.
14.4.1 Tailings Disposal
The tailings disposal system for Engebø has been designed by COWI AS, an international
consulting group based in Norway specialising in engineering, environmental science and
economics. In their study COWI considered a number of designs and they recommend a
system, termed the outfall design, which has been used successfully at Island Copper
Mine, Vancouver Island, Canada.
COWI’s design consists of a mixing tank, where seawater is added to tailings from the
process plant, and an outfall line which transports the seawater/tailings mix to the bottom
of the fjord. The system is self-propelling due to the difference in density between the
diluted tailings and the seawater. Continuous monitoring of the discharge system is a vital
element of the design. A schematic of the outfall design is shown in Figure 14-2 below.

Nordic Mining Prefeasibility Study
30 October 2017 Engebø Rutile and Garnet Project
H352410
H352410-00000-280-066-0001, Rev. 0 Page 249
© Hatch 2017 All rights reserved, including all rights relating to the use of this document or its contents.
Figure 14-2: Schematic of the COWI Design for Sea Disposal of Tailings

Nordic Mining Prefeasibility Study
30 October 2017 Engebø Rutile and Garnet Project
H352410
H352410-00000-280-066-0001, Rev. 0 Page 250
© Hatch 2017 All rights reserved, including all rights relating to the use of this document or its contents.
15. General Infrastructure
15.1 Power
Bulk power for the Project will be supplied by SFE, the regional power supply company. By
upgrading the existing 22 kV grid from Øyravatnet transformer station to Engebø in
combination with a new 22 kV crossing of the fjord (most likely a subsea cable) and with
additional grid reinforcements from the crossing-point to Engebø, SFE will have sufficient
grid capacity and reliability for the Project. The power intake transformers positioned at the
main incoming substation at Engebø will be supplied by SFE.
15.2 Water
Bulk water supply for the Project is planned to be sourced from the Skorven water system,
situated at the southern side of the fjord. The power company SFE controls the waterfall,
and it is possible to obtain water next to their power plant as part of their permit.
A new pump station will be constructed adjacent to SFE’s power plant.
Four alternative water pipeline routes (as indicated in Figure 15-1 below) have been
considered by Asplan Viak, who carried out a bulk water supply study for the PFS.
Alternative 1 option, which has the most favourable routing and the lowest capital cost, has
been selected as the basis for this study.
The distance for sourcing bulk water from Skorven to Engebø is approximately 9 km.
Figure 15-1: Bulk Water Supply – Alternative Routes considered from Skorven to Engebø
The bulk water pumped to Engebø will be discharged into the fire and raw water storage
tanks at the process plant facility.

Nordic Mining Prefeasibility Study
30 October 2017 Engebø Rutile and Garnet Project
H352410
H352410-00000-280-066-0001, Rev. 0 Page 251
© Hatch 2017 All rights reserved, including all rights relating to the use of this document or its contents.
15.3 Natural Gas
Natural gas for the Project will be supplied by a local gas supplier. An appropriate area for
gas storage tanks has been located on site, and the supplier will transport gas to site by
road on a weekly basis.
15.4 Access Roads
The main county road (Fv 611) providing access to the Engebø site will be diverted around
the process plant site. The re-routing design and cost estimate of this road have been
completed by Asplan Viak for this study.
15.5 Communications
A cost allowance for communications on site has been made for this study. At the time of
project implementation, it is envisaged that a 5G communication link will be available at the
Engebø site.

Nordic Mining Prefeasibility Study
30 October 2017 Engebø Rutile and Garnet Project
H352410
H352410-00000-280-066-0001, Rev. 0 Page 252
© Hatch 2017 All rights reserved, including all rights relating to the use of this document or its contents.
16. Engineering Design
16.1 Civil and Earthworks Design
The bulk earthworks consist of a raised terrace area at three distinct levels (as described
in Section 11.8) for the process plant facility. A storm water sand trap has been included to
facilitate the storm water control around the process plant site.
Security fencing is positioned around the full perimeter of the open pit mining area and the
Process Plant area.
The terraces and bulk earthworks were modelling in a 3D CAD environment and quantities
based on the LIDAR survey and the 3D model. Fencing quantities were established by
measurements of the overall site layout plan.
The route and alignment of the mining haul and access haul roads (as described in
Section 14.2) have been indicated on the overall site layout plan. In-plant roads for the
process plant have also been included.
16.2 Structural Design and Engineering
The structural steel and concrete quantities are based on the mechanical 3D model of the
plant. Quantitative metrics, based on similar projects, were used to determine the overall
steel tonnages and concrete cubic meters.
No basic engineering analysis and design was done for the steel or concrete scope; this
will be developed further in the DFS phase of the Project.
The quantitative metrics consider the local environmental factors such as wind and
temperature. These metrics have assumed no pre-assembly or modularisation of the plant
and are based on the plant being constructed as “stick built”. This will be investigated
further in the DFS phase of the Project.
The metrics also consider the use of the structure, for example heavy cranes or
equipment, as well as whether the structures are open or enclosed with cladding.
No detailed geotechnical information regarding founding conditions was available and it
was assumed that standard pad footings, strip footings and, in selected cases, raft
foundations will be used. It is recommended that a geotechnical investigation is conducted
in the DFS phase of the Project.
16.3 Mechanical Design and Engineering
The mechanical equipment required for the process plant is prescribed by the process
design and site layout requirements, as described in Section 11.8. All equipment indicated
on the PFDs has been sized and selected in accordance with these requirements. The
mechanical equipment requirements (such as maintenance and access) as indicated in the
preliminary Mechanical Design Criteria have also been considered.

Nordic Mining Prefeasibility Study
30 October 2017 Engebø Rutile and Garnet Project
H352410
H352410-00000-280-066-0001, Rev. 0 Page 253
© Hatch 2017 All rights reserved, including all rights relating to the use of this document or its contents.
Preliminary vendor equipment sizes and information has been used to develop the
mechanical 3D model of the plant. A mechanical equipment list for the 1.5 Mtpa plant with
preliminary vendor information has been generated. The plant mechanical layout and
general arrangement drawings, as well as preliminary design calculations for equipment
dependent on the layout (pumps, sumps/bins and conveyors) have been generated for this
study.
Mechanical equipment supply costs have been obtained from budget quotations received
from the market. About 90% of the mechanical equipment costs have been obtained from
the market, while 10% of the costs have been obtained from database costs from similar
recently-completed projects. Database rates have been used for conveyors and platework.
16.4 Instrumentation Design
No instrumentation design was completed for this study. This will be developed further in
the DFS phase.
16.5 Electrical Design
The electrical engineering and design has been based on the electrical design criteria with
the following deliverables being generated for the study:
Electrical load list: the electrical load list had been based on the mechanical equipment
list with a total estimated load of 10.5 MVA
Single line diagram for the overall medium voltage reticulation based on the
reticulation network simulation study
Cable schedule: this was based on the electrical load list and site general arrangement
drawings. Cable lengths had been estimated and scaled from the site general
arrangement drawings
Medium voltage reticulation network load flow and fault current simulation study: this
study had been carried out using the software package ETAP (Electrical Transient
Analysis Program). The short circuit power had been based on an estimated 10.5 MVA
at 66 kV. This number needs to be confirmed in the DFS phase prior to further network
simulation studies. Electrical plant item data have been based on the ETAP standard
library. With a total power factor correction facility of 4 MVAr, no undesirable voltage
regulations were recorded
Typical schematic diagrams: these have been based on standard typical schematic
diagrams as well as the load list requirements. These were used for pricing of the
proposed motor control centers (MCCs).
The intake power battery limit will be the secondary terminations on the two intake power
transformers. These transformers will be supplied by the Power Supply Utility/Company
(SFE). Electrical plant item battery limits for the mechanical packages will be the
termination of power onto electrical motors, hydraulic power packs etc. Lighting and small
power has been excluded from the engineering and design. A factored cost allowance for
these items has been included.

Nordic Mining Prefeasibility Study
30 October 2017 Engebø Rutile and Garnet Project
H352410
H352410-00000-280-066-0001, Rev. 0 Page 254
© Hatch 2017 All rights reserved, including all rights relating to the use of this document or its contents.
17. Market Information
A summary of the market studies completed in this phase is given below. The market
study for rutile was carried out by TZMI, a leading global independent consulting and
publishing company which specialises in technical, strategic and commercial analyses of
the opaque minerals, chemical and metals sector. TZMI has a worldwide presence with
offices in Australia, China, Africa and the USA. The market study for garnet was carried
out by TAK Industrial Mineral Consultancy, a UK based minerals marketing company.
Nordic Mining has signed a Memorandum of Understanding (MoU) with a leading,
international producer of industrial minerals. The parties intend to establish long-term
cooperation within development, sales, marketing and distribution of garnet products from
Engebø. This may include off-take agreements, joint marketing, and sales and distribution
arrangements for garnet products to be sold in international markets.
Further market information in relation to garnet production, assumptions of market
penetration, product qualities and sales has been guided by Nordic Mining’s MoU partner.
17.1 Rutile Market
17.1.1 Introduction to Titanium Feedstocks
The mineral sands industry is orientated primarily towards the supply of titanium raw
materials to produce titanium dioxide (TiO2) pigments and titanium metal. The term
“mineral sands” refers to concentrations of minerals commonly found in sand deposits,
which include the titanium minerals ilmenite and rutile. The other mineral of significance
usually found in these deposits is zircon, which most producers consider a co-product of
their titanium mineral products.
Ilmenite is the most abundant titanium mineral and typically has a TiO2 content ranging
from 44% to 65% depending on its geological history. TZMI has classified ilmenite
feedstock with TiO2 content between 58% and 65% as chloride ilmenite and ilmenite with
TiO2 content between 44% and 57% as sulphate ilmenite.
Leucoxene is a natural alteration product of ilmenite, having a TiO2 content ranging from
65% to more than 90%. The weathering process responsible for the alteration of ilmenite
to leucoxene results in the removal of iron and hence, upgrading of the TiO2 content.
Circulating groundwater can also redeposit impurity elements within and around the
weathered ilmenite grain. Commercial leucoxene products in the marketplace have a very
wide range of compositions with varying levels of impurities.
Rutile is composed essentially of crystalline titanium dioxide and, in its pure state, would
contain close to 100% TiO2. Naturally occurring rutile exhibits minor impurities and
commercial concentrates of the mineral typically contain 94% to 96% TiO2.
Naturally-occurring high-level TiO2 minerals suitable for the chloride process for production
of TiO2 pigments are limited in supply. This situation has prompted the mineral sands
industry to develop beneficiated products that can be used as substitutes for, or in
conjunction with, natural rutile. Two processes have been developed commercially, one for

Nordic Mining Prefeasibility Study
30 October 2017 Engebø Rutile and Garnet Project
H352410
H352410-00000-280-066-0001, Rev. 0 Page 255
© Hatch 2017 All rights reserved, including all rights relating to the use of this document or its contents.
synthetic rutile manufacture and the other to produce titanium slag. Both processes use
ilmenite as raw material and are essentially processes for the removal of iron oxides.
Synthetic rutile: this is a product that is made by pyro-metallurgical processing of an
ilmenite, typically having a 58% to 62% TiO2 content, to remove the iron. The final
product typically has a TiO2 content of 90% to 95%
Sulphate and chloride slag: a slag is created when an ilmenite source is reduced in an
electric furnace to produce two products: metallic iron and a TiO2 slag. The slag is then
crushed and, depending on the impurity content, is either used in the chloride or the
sulphate process. Commercial sulphate slag products generally have a TiO2 content of
75% to 80%, while chloride slag products have a TiO2 content of 85% to 90%. The
fines which are generated when crushing chloride slag are mostly used in the sulphate
process under the name “chloride fines”
Upgraded slag or UGS: UGS has a TiO2 content of more than 94%. It is only produced
by Rio Tinto Fer et Titane in Canada.
17.1.2 TiO2 Pigment Market
The global TiO2 pigment market accounts for approximately 90% of all titanium feedstock
demand, and is, therefore, the dominant driver of offtake. The following analysis is based
on TZMI’s latest supply/demand update completed in August 2017.
TiO2 pigment is used predominantly in the production of high-quality surface finishes, and
is essentially a lifestyle product. Historically, its use has developed strongly in the most
economically developed countries of the world where it is an essential component of basic
consumer products such as housing, motor vehicles and plastic products.
TiO2 consumption generally increases as disposable income increases, and thus there is a
close link between GDP growth, urbanisation and TiO2 pigment consumption. The
evolution of the demand historically was driven by a significant shift in urbanisation in
emerging economies (most notably China) and the shift of the industrial base from the
west to the east as free trade agreements were put into place. Future evolution will be
driven more by changing consumption patterns of the newly industrialised countries in the
east and growth in infrastructure. Movements away from free trade agreements – both in
the US and in Europe – may shift these growth patterns.
Figure 17-1 below shows the segmentation for TiO2 pigment demand in 2016, while Figure
17-2 below indicates regional demand for the same period.

Nordic Mining Prefeasibility Study
30 October 2017 Engebø Rutile and Garnet Project
H352410
H352410-00000-280-066-0001, Rev. 0 Page 256
© Hatch 2017 All rights reserved, including all rights relating to the use of this document or its contents.
Source: TZMI ©
Figure 17-1: Global TiO2 Pigment Demand by End-use Segment in 2016
Total demand for 2016 is estimated at approximately 5.99 Mt globally, with China and
Europe dominating demand, accounting for nearly 50% of global TiO2 pigment
consumption.
Source: TZMI ©
Figure 17-2: Regional TiO2 Pigment Demand for 2016
Global pigment production capacity grew from 5.4 Mt in 2005 to 6.7 Mt in 2010 and 7.2 Mt
in 2016. The industry is dominated by six producers of which five operate in multiple
regions. These six producers account for approximately 61% of global capacity.

Nordic Mining Prefeasibility Study
30 October 2017 Engebø Rutile and Garnet Project
H352410
H352410-00000-280-066-0001, Rev. 0 Page 257
© Hatch 2017 All rights reserved, including all rights relating to the use of this document or its contents.
Figure 17-3 below shows TZMI’s forecast for global TiO2 pigment production between
2010 to 2025. In terms of supply, global TiO2 production is estimated at 5.80 Mt for 2016,
up 3.4% from 2015 levels and recapturing any losses seen in 2014. TZMI is forecasting
global TiO2 pigment supply to reach close to 6.4 Mt by 2020 and 7.2 Mt by 2025, a growth
rate of approximately 2.5% per annum. It is expected that Chinese pigment production will
display the highest growth rates globally.
Sulphate pigment accounted for 52% of total production in 2016, but this is expected to
reverse by 2025, with chloride pigment accounting for a slightly larger proportion of the
production share.
Source: TZMI ©
* Hi-Tox is a beige coloured rutile TiO2 pigment produced by TOR Minerals, designed for use in non-white paints or coatings
Figure 17-3: Global TiO2 Pigment Production by Technology: 2010 to 2025
The TiO2 pigment industry has been plagued with supply overhang during the past few
years, which did nothing to bolster demand for titanium feedstocks. As a result, the global
titanium feedstock market has, up until recently, been in a state of oversupply, with high
inventory levels throughout the supply chain. Most pigment producers are understood to
be holding normal to low inventory currently, based on recent public releases by
companies.
17.1.3 Titanium Feedstock Market
Global demand for titanium feedstock is dominated by the TiO2 pigment end-use. TZMI
estimated that pigment end-use accounted for approximately 91% of total demand in 2016,
or 6.26 M TiO2 units.

Nordic Mining Prefeasibility Study
30 October 2017 Engebø Rutile and Garnet Project
H352410
H352410-00000-280-066-0001, Rev. 0 Page 258
© Hatch 2017 All rights reserved, including all rights relating to the use of this document or its contents.
For the purposes of the titanium feedstock supply/demand analysis, TiO2 unit is used as
the common denominator to account for the varying TiO2 content in feedstock products
and to address the issue of combining consumption of products with a range of TiO2
levels. One TiO2 unit is equal to one ton of contained TiO2.
Figure 17-4 below shows the TZMI forecast for TiO2 feedstock demand by end-use
segment between 2005 and 2025.
Source: TZMI ©
Figure 17-4: TiO2 Feedstock Demand by End-use: 2005 to 2025
Global demand for titanium feedstocks is estimated to reach 8.7 M TiO2 units by 2025, a
growth of 2.6% Compound Annual Growth Rate (CAGR). Pigment is expected to lead the
growth in volume terms, adding 1.44 M TiO2 units during the next nine years, with a CAGR
of 2.3%. Both titanium metal and other uses are also expected to show strong growth,
estimated at 5.6% and 3.8% CAGR respectively, albeit from a lower base.
In terms of supply, global titanium feedstock production is estimated at 6.55 M TiO2 units in
2016. To avoid double counting, total feedstock supply reflects net production excluding
production of ilmenite used in the manufacture of titanium slag and synthetic rutile.
Figure 17-5 below shows the global titanium feedstock supply between 2005 and 2025.
Source: TZMI ©
Figure 17-5: Global Titanium Feedstock Supply by Product: 2005 to 2025

Nordic Mining Prefeasibility Study
30 October 2017 Engebø Rutile and Garnet Project
H352410
H352410-00000-280-066-0001, Rev. 0 Page 259
© Hatch 2017 All rights reserved, including all rights relating to the use of this document or its contents.
Following a period of continuous growth between 2005 and 2012, global supply fell
modestly during the past few years, partially reflecting the decision by several major
producers to cut back on production to meet demand, to avoid the build-up of feedstock
inventory.
TZMI’s current forecasts suggest a supply recovery during 2017 and 2018 as market
conditions improve, with output of most feedstocks projected to move higher. In particular,
output of chloride slag is forecast to rise considerably, underpinned by the production ramp
up at TiZir Tyssedal, improved utilisation rates in South Africa, and higher output at Cristal
Jazan.
In addition, higher sulphate ilmenite output from China is anticipated during the forecast
period as progressively higher sulphate ilmenite prices are being achieved, prompting
some vanadium titano-magnetite (VTM) producers and processing plants to increase
production. Higher furnace utilisation rates in Canada and South Africa are also expected
to contribute to supply growth in the medium term.
For 2016, the global feedstock market was in considerable supply deficit, estimated at
356 k TiO2 units, predominantly reflecting the 4% increase in global demand, while supply
remained flat year-on-year.
Figure 17-6 below shows the supply/demand balance and outlook to 2025 for titanium
feedstocks.
TZMI expects overall feedstock supply and demand to be in balance in 2017 and 2018,
before new projects bring additional supply into the market from 2019. The probabilistic
estimate of new supply could see oversupply occur through to 2023 before demand
catches up. However, in all likelihood, only the initial projects to be financed for
construction in 2017 and early 2018 will come on stream in this period. Projects that do not
obtain financing are likely to be pushed out into the early/mid 2020s to align with the next
supply deficit that is forecast.

Nordic Mining Prefeasibility Study
30 October 2017 Engebø Rutile and Garnet Project
H352410
H352410-00000-280-066-0001, Rev. 0 Page 260
© Hatch 2017 All rights reserved, including all rights relating to the use of this document or its contents.
Source: TZMI ©
Figure 17-6: Global Titanium Feedstock Supply/Demand Balance
17.1.4 Rutile Supply/Demand and Outlook to 2025
As with other TiO2 feedstocks, rutile is consumed largely for pigment manufacture with
consumption by TiO2 pigment producers accounting for approximately 73% of global rutile
demand in 2016 or 548 k TiO2 units. Rutile consumption in titanium sponge manufacture
and other uses account for the remaining 7% and 20% respectively. In the other uses
segment, rutile is predominantly consumed for the manufacture of welding electrode
fluxes. Figure 17-7 below depicts the global demand for rutile for the period 2005 to 2025.
Source: TZMI ©
Figure 17-7: Global Rutile Demand: 2005 to 2025

Nordic Mining Prefeasibility Study
30 October 2017 Engebø Rutile and Garnet Project
H352410
H352410-00000-280-066-0001, Rev. 0 Page 261
© Hatch 2017 All rights reserved, including all rights relating to the use of this document or its contents.
Global rutile demand growth for all end-use over the next nine years (2016 to 2025) is
expected to average 1.8% CAGR, reaching 930 k TiO2 units by 2025, or an increase of
approximately 140 k TiO2 units on 2016 levels.
Consumption for titanium metal end-use is expected to lead demand growth, adding 77 k
TiO2 units during the forecast period. Strong demand growth from this end-use is projected
due to demand pull from commercial aerospace flowing through to sponge demand with
the rollout of next generation aircraft, particularly the B787 and A350, which consume
more titanium by weight compared to the older models.
Following the decline in prices initiated by the destocking by pigment producers in late
2012, there has been an increase in rutile consumption by pigment producers to take
advantage of the low rutile prices (on a relative economic value basis) compared to other
high-grade feedstocks, but this trend is expected to reverse in the short term as prices
begin to trend up during the period 2017 to 2020. The share of rutile consumption for TiO2
pigment use is estimated at 62% by 2025.
As far as rutile supply is concerned, global rutile production was down 2% year-on-year in
2016 to approximately 773 kt (704 k TiO2 units). The majority of this decline can be
attributed to reduced output from the Australian operations, offset by higher output in other
regions. TZMI’s global rutile supply forecast is shown in Figure 17-8 below.
Source: TZMI ©
Figure 17-8: Global Rutile Supply from Existing Operations: 2005 to 2025
Global supply of rutile is set to decline considerably during the forecast period, with output
in 2025 expected to be 50% lower than 2016 levels.

Nordic Mining Prefeasibility Study
30 October 2017 Engebø Rutile and Garnet Project
H352410
H352410-00000-280-066-0001, Rev. 0 Page 262
© Hatch 2017 All rights reserved, including all rights relating to the use of this document or its contents.
Australia’s position as the global rutile powerhouse is slowly diminishing as mine grade
declines and with the closure of several mines. Mining at Iluka Murray Basin was
completed in early 2015, with rutile currently produced from heavy minerals concentrate
stockpiles. There will be no rutile output from this location following the scheduled closure
of the Hamilton Mineral Separation Plant in October 2017. Sibelco, another major rutile
producer, is also expected to close its North Stradbroke mine in 2019.
Even with the onset of likely new supply from new projects, global rutile output is unlikely
to exceed 800 k TiO2 units.
Figure 17-9 below shows the supply/demand balance for rutile for the period to 2025.
Source: TZMI ©
Figure 17-9: Global Rutile Supply/Demand Balance to 2025
The global rutile market was in significant surplus in 2012 as chloride pigment producers
embarked on a de-stocking cycle and curtailed pigment production, resulting in reduced
consumption of high-grade feedstocks. The resultant inventory overhang is progressively
being worked through and by end-2016 should have trended back below normal levels.
General consensus is that the global rutile market will experience tight market conditions in
2017, underpinned by improving market conditions in the chloride pigment sector.
The longer-term outlook indicates that a significant supply deficit will develop if no new
projects are commissioned. TZMI has adjusted its demand outlook for rutile in the short to
medium term to take into consideration the interchangeability of feedstock blend among
some pigment producers given the declining rutile supply profile and the availability of
other high-grade feedstocks. However, the trend should reverse beyond 2020 once the
existing supply of other high-grade feedstocks is exhausted.

Nordic Mining Prefeasibility Study
30 October 2017 Engebø Rutile and Garnet Project
H352410
H352410-00000-280-066-0001, Rev. 0 Page 263
© Hatch 2017 All rights reserved, including all rights relating to the use of this document or its contents.
17.1.5 Rutile Prices
The global rutile market was stable in 2016, with identified imports estimated at 574 kt,
down 2% year-on-year, with a weighted average price of US$ 725/t FOB.
Global rutile prices have been relatively stable throughout the first half of 2017, but it is
worth noting that rutile prices in the domestic Chinese market have witnessed a strong
recovery in recent months. Domestic Chinese rutile prices grew slowly during the first three
months of 2017, from RMB 5,500/t inclusive of VAT in early January to RMB 6,500/t
inclusive of VAT by the end of March. Prices then jumped considerably during April and
May, up nearly RMB 1,200/t from prices at the end of March. Current spot prices for rutile
95% TiO2 in Hainan are quoted at RMB 6,700/t inclusive of VAT, down approximately
RMB1,000/t from the peak at the end of May.
Prices of rutile shipments into western markets are generally in the range US$ 690/t to
US$ 800/t FOB during the first half of 2017.
Higher prices are anticipated in the second half 2017, with increases in the order of US$
60/t expected, taking the weighted average price in the second half of 2017 to just under
US$ 800/t FOB. The weighted average price for 2017 is estimated at US$ 765/t FOB.
While the current expectation is for rutile to lead the price growth among high-grade
chloride feedstocks in 2018, the downside risks remains if chloride slag prices were to stay
low (in the mid to high US$ 600s/t range), particularly if the idled capacity within the supply
chain is restarted, which would result in an increase in supply in the near term.
Over the longer term, TZMI expects prices to trend towards the inducement price level
(US$ 1,070/t real 2016 dollars) by 2020/2021, along with other high-grade chloride
feedstocks, to ensure there is sufficient inducement for new supply to meet demand
growth.
TZMI’s price forecast for rutile is shown in Figure 17-10 below.
Source: TZMI ©
Figure 17-10: Nominal Rutile Prices to 2021

Nordic Mining Prefeasibility Study
30 October 2017 Engebø Rutile and Garnet Project
H352410
H352410-00000-280-066-0001, Rev. 0 Page 264
© Hatch 2017 All rights reserved, including all rights relating to the use of this document or its contents.
17.1.6 Product Quality Considerations
There are many feedstock options available to chloride route pigment manufacturers
ranging from ilmenite with TiO2 contents above 58%, through to natural or beneficiated
products with TiO2 contents above 95%. The feedstock selected for a given chloride
pigment plant is primarily a function of processing cost of the feedstock, the technical
expertise of the operator and the emissions and waste disposal options available.
Additional consequences of the feedstock choice are the plant capital requirements, the
ongoing maintenance requirements and the importance of logistics management,
particularly for very large chloride plants that are located a long distance from the
feedstock source.
When evaluating a feedstock for the chloride process there are two main qualities that
must be examined. These are the feedstock physical characteristics and the presence and
quantity of specific impurities.
For chloride route pigment production, an important quality consideration is low levels of
elements that form high boiling point chlorides, particularly for calcium, magnesium and to
a lesser extent manganese. Chlorides of these elements tend to liquefy at fluid bed
operating temperatures, causing bed “stickiness” and ultimately de-fluidisation.
Elevated levels of vanadium in the feedstock could result in significant decolourisation of
the base pigment if not removed fully.
Radionuclides (U+Th) are important for both the sulphate and chloride processes, but
more so for the chloride process as they concentrate in the waste stream and result in
environmental constraints on the disposal of this waste.
Particle size is also an important quality criterion. Finer particles tend to blow-over from the
chlorinator, thus increasing the extent of material to be recycled, resulting in higher TiO2
losses. Particle density is also a factor that affects the overall transportation and storage of
the feedstock, including the delivery method into the chlorinator and the fluidisation
dynamics.
If the feedstock is targeted at titanium metal manufacture, it should have low levels of tin
dioxide, as the presence of tin tends to make the metal more brittle. For welding electrodes
application, the feedstock should have low levels of phosphorus and sulphur so that the
integrity of the weld strength is not compromised.
17.1.7 Engebø Rutile
TZMI has used the preliminary product specifications generated during the PFS testwork
campaign as a basis for assessing the Engebø rutile product quality. The indicative quality
of the rutile compares favourably to most other competing products as shown in Table
17-1 below.

Nordic Mining Prefeasibility Study
30 October 2017 Engebø Rutile and Garnet Project
H352410
H352410-00000-280-066-0001, Rev. 0 Page 265
© Hatch 2017 All rights reserved, including all rights relating to the use of this document or its contents.
Table 17-1: Engebø Indicative Rutile Assay
Chemical Analysis
TiO2 Fe2O3 Al2O3 CaO Cr2O3 V2O5 MgO MnO
Engebø 94.9 1.63 0.31 0.35 0.01 0.41 0.03 0.02
Typical Market Specifications
95.0 <1.0 <1.5 ≤0.8/0.15* - <0.65 <1.0 <1.0
Chemical Analysis
Nb2O5 S P2O5 SiO2 SnO2 ZrO2 U+Th (ppm)
D50 (µm)
Engebø n/d 0.17 0.01 1.53 <0.02 0.06 <10 147/106
Typical Market Specifications
<0.25-0.5 <0.03** <0.03** <2.5 <0.05*** <1.0 - >120
*Non-sieve plate and sieve plate specification
**Welding rod specification
***Molten salt, titanium metal specification
The following comments are applicable to the Engebø planned rutile product:
The industry standard for a “premium” grade rutile classification requires a TiO2
content >95%, Fe2O3 <1%, SiO2 <2.5% and ZrO2 <1%. The Engebø rutile product
appears to meet these criteria except for the elevated Fe2O3 content at 1.63%
While the Fe2O3 level in the Engebø rutile is higher than other commercial rutile
products in the marketplace, it is still an acceptable product for chloride pigment
production. The level of Fe2O3 does not impact on final pigment product quality, as
there are other chloride grade feedstocks such as synthetic rutile and chloride ilmenite
with a much higher presence of iron which are still being used in chloride pigment
production. However, high iron content in the feedstock will result in high iron chloride
production and can lead to downstream duct and heat exchanger deposition issues if
the system is not operated correctly. This could result in higher pigment production
costs and on this basis, pigment producers could ask for a price discount on the
Engebø product; the counter argument should be that normal operation of the
chlorinator and exit cyclone should not create issues
The calcium oxide content at 0.35% is higher than other commercial rutile products. A
value of 0.21% has been achieved for a rutile product at an earlier stage. Reduction in
the level of CaO will be further investigated as part of the DFS. The magnesium oxide
level at 0.03% is acceptable.
All other reported impurities appear to be in line with other commercial rutile products
in the market
The D50 of the Engebø rutile product at 147 µm is suitable for use in western
chlorinators. However, the latest test results gave a finer rutile product with a D50 of
106 µm with about 15% material below 75 µm, compared with the earlier results
showing approximately 5% below 75 µm. The finer product can be removed from the
main product and sold into the molten sand market. The Engebø output of
approximately 3.5 ktpa of this material should be readily absorbed in this market. The
main pigment grade rutile will then be within the current grain size specifications.
Considering the market opportunity to supply rutile to the molten sand titanium

Nordic Mining Prefeasibility Study
30 October 2017 Engebø Rutile and Garnet Project
H352410
H352410-00000-280-066-0001, Rev. 0 Page 266
© Hatch 2017 All rights reserved, including all rights relating to the use of this document or its contents.
production industry, no recovery or price penalty has been applied in the financial
model to compensate for the high fine particle content. Testwork in the DFS will be
carried out with the aim of making a coarser grained rutile, as has been achieved in
parts of the testwork programme in this phase
For titanium metal application, the tin dioxide level needs to be less than 0.05%.
Feedstocks with tin dioxide levels greater than 0.05% tend to make the final titanium
metal products brittle. Some sponge producers specify a maximum threshold as low
as 0.03% tin dioxide. Engebø rutile has a tin dioxide level of less than 0.02% and
should therefore not impact negatively on final sponge quality.
For welding applications, phosphorus and sulphur contents of <0.03% are preferred.
Thus, the sulphur at 0.17% will be too high and hence preclude Engebø rutile for this
end-use.
Based on the indicative product quality and particle size distribution, the Engebø rutile
would be a suitable feedstock for chloride pigment and titanium metal applications.
Global demand for rutile for pigment and titanium metal end-use is estimated to reach
540 k TiO2 units by 2020 and 710 k TiO2 units by 2025, although higher demand is a
possibility if there is a shortage of chloride ilmenite and other high-grade feedstocks such
as chloride slag and synthetic rutile. TZMI’s current forecast indicates that supply deficit of
the global rutile market could reach more than 250 k TiO2 units by 2020 and 600 k TiO2
units by 2025. As such, the planned output of approximately 30 ktpa should easily be
absorbed by the market by the time the Project comes on stream.
From a pricing perspective, TZMI estimates that the planned rutile product should be able
to achieve the long-term price of a standard rutile (US$1,070/t FOB real 2016 dollars) if
targeted at chloride pigment or as a feed for titanium sponge manufacture.
17.1.8 Revenue to Cost and Competitor Analysis
Due to the multi-product nature of individual feedstock producers the cash cost of
production cannot be directly compared across the industry. Similarly, due to the wide
difference in product values and varying product revenue streams, revenue also needs to
be taken into account when comparing the relative competitiveness of TiO2 feedstock
operations across the sector. TZMI uses the ratio of revenue to cash costs (R/C) as its
primary measure of competitiveness for individual operations in the industry.
The industry R/C ratio curve for 2021 is shown in Figure 17-11 below. The industry
weighted average R/C is estimated at 1.85, with individual R/C ratio ranging between 1.23
and 3.46. The Project is positioned towards the top end of the curve, with an average R/C
ratio of 3.90. This R/C ratio is estimated based on the first ten years of operations.
However, it should be noted that the high R/C ratio for the Project is not typical of mineral
sands projects. The Project benefits from having high value products such as rutile and
garnet in the product mix, and relatively low mining costs.

Nordic Mining Prefeasibility Study
30 October 2017 Engebø Rutile and Garnet Project
H352410
H352410-00000-280-066-0001, Rev. 0 Page 267
© Hatch 2017 All rights reserved, including all rights relating to the use of this document or its contents.
Source: TZMI ©
Figure 17-11: 2021 Revenue to Cash Cost Curve
Note: The Project revenue has been estimated using TZMI’s long-term inducement price
for rutile (US$ 1,070/t FOB) while the garnet price is assumed at US$ 250/t FOB.
Operating cost estimates were provided by Nordic Mining.
17.1.9 Contractual Structure
Prior to 2010, the titanium feedstock market had been dominated by long-term contracts
(five- to ten-year duration) that typically had an annual price negotiation, based on a base
price determined at the start of the contract that was escalated at the USA PPI or CPI.
Many contracts without price escalation formulas had pricing “cap and collars”, such that
irrespective of the supply demand dynamics of the market, annual price moves were
constrained, often to a maximum of 5% per annum. These pricing mechanisms ensured
that there was little cyclicality in prices for titanium feedstocks, and that in real terms prices
remained flat or declined.
However, the contractual regime in the sector has changed considerably in the past few
years, partially underpinned by the supply/demand dynamics that evolved during 2010 to
2011, which saw contract durations and frequency of price negotiation being cut short to
six monthly or quarterly as opposed to the historic norm of annual price negotiation. The
concept is to remove any supply certainty from consumers to extract maximum pricing
upside and ensure considerable competition amongst customers to position for what
product is available.
Most of the large supply contracts (five- to ten-years duration with cap and collar pricing
constraints) between major feedstock supplier and TiO2 pigment producers had expired by
the end of 2014, and prices in new contracts were reset to reflect market prices at the time.
There were also some suppliers (amongst new projects that were commissioned after
2012), who adopted the concept of providing supply under a longer-term contract (five
years) with guaranteed minimum price level protection over the contract period but with
market pricing to apply above the minimum.

Nordic Mining Prefeasibility Study
30 October 2017 Engebø Rutile and Garnet Project
H352410
H352410-00000-280-066-0001, Rev. 0 Page 268
© Hatch 2017 All rights reserved, including all rights relating to the use of this document or its contents.
17.1.10 Conclusion
The Engebø rutile product is suitable as a feed for chloride pigment production or as a
feedstock for titanium sponge manufacture.
With global supply from existing operations expected to decline rapidly over the period to
2025, and a lack of new rutile projects being introduced to the pipeline, TZMI believes
there will be no impediment to selling the Engebø rutile at prices close to the market
average. The projected rutile output of approximately 30 ktpa is minor on a global scale
and should be readily absorbed by the market by the time the Project is commissioned.
17.2 Garnet Market
17.2.1 Introduction
Garnet is a family of minerals. The main garnet used commercially is almandine, which is
the type found in the Engebø ore. Almandine has a hardness normally quoted as 7.5 to 8
on the Mohs scale and a density of 3.9 to 4.2 SG.
Garnet is a general name for a family of six complex silicate minerals based on the same
general chemical formula and with similar crystal structures and therefore physical
properties. The general formula for the garnet group is:
R++3R+++2(SiO4)3
Where:
R++ is calcium, magnesium, iron or manganese; R+++ is iron, aluminium, chromium, or
titanium.
In nature, garnets rarely approach the theoretical compositions due to substitution and
solid solution which in turn affects characteristics such as specific gravity and hardness.
Garnet can be derived from heavy mineral sands or from hard rock sources. All the Indian
and Australian-sourced material is currently produced from heavy mineral sands, generally
in conjunction with titanium minerals. Hard rock sources like the one at Engebø are
exploited in China and the USA.
The primary markets for garnet are in abrasive blasting and waterjet cutting, although for
some coarse grades there is also a market in water filtration, which is unlikely to be a
significant market for garnet from Engebø because of the size requirements. There is also
a market in abrasion resistant materials such as in flooring, but that seems to be restricted
mainly to China at the moment.

Nordic Mining Prefeasibility Study
30 October 2017 Engebø Rutile and Garnet Project
H352410
H352410-00000-280-066-0001, Rev. 0 Page 269
© Hatch 2017 All rights reserved, including all rights relating to the use of this document or its contents.
In the abrasive blasting sector, a wide range of materials is used and garnet has currently
a relatively small share of the total market compared with lower priced materials such as
coal slag, copper or nickel slag, and other abrasives such as crushed glass, olivine, and
staurolite. Garnet tends to be the preferred abrasive where a good profile is required on
steel being prepared for painting, especially in harsh environments such as the offshore oil
industry, although the specification normally requires a coarse-grained product, certainly a
30/60 mesh size and frequently a 20/40 grade. (Mesh is a commonly used unit in the
abrasive industry; a 30 mesh product has been passed over a screen with 30 openings per
square inch; a 60 mesh product has passed over a screen with 60 openings per square
inch; as the number indicating the mesh size increases, the size of the openings and thus
the size of particles captured decreases).
In the waterjet cutting industry, garnet is the dominant abrasive used. Other materials such
as olivine have been tried in this relatively young industry and staurolite has been
proposed as an alternative. However, garnet has proved to be the most efficient and
economical material. The primary grade used in waterjet cutting is an 80 mesh product
which makes up 90% or more of the material used, although 120 mesh or 240 mesh
grades can be used for some specialised cutting applications and there is a small portion
of 60 mesh used. Larger grain sizes are not used because of the apertures of the nozzles
commonly used in waterjet equipment.
Garnet used in water filtration is generally a coarse-grained material. A support bed of
garnet is used as the base of a water filtration bed with a grainsize generally around 1.4 to
2 mm. A relatively thin finer grained filtration layer is put on top of this normally with a
grainsize of about 30 mesh and strict limits on any grains below 50 mesh. Some 30/60
mesh material may be specified as well as 20/40 but also sizes up to almost 5.0 mm if
available.
Compared with rutile, garnet is a relatively “young” mineral in industrial applications. Whilst
titanium feedstock production including rutile has developed basically in line with global
economic growth over many decades, garnet production has primarily developed over the
last 20 to 25 years. This is illustrated in Figure 17-12 below.

Nordic Mining Prefeasibility Study
30 October 2017 Engebø Rutile and Garnet Project
H352410
H352410-00000-280-066-0001, Rev. 0 Page 270
© Hatch 2017 All rights reserved, including all rights relating to the use of this document or its contents.
Figure 17-12: Annual Garnet Production
17.2.2 Key Producers
Current world production of garnet is estimated to be about 1.4 Mtpa. India is the largest
producer, with estimated production of 450 ktpa to 500 ktpa; however, the installed
capacity is estimated to be around 800 ktpa. Indian garnet production has dropped
significantly over the last two years as a result of claimed illegal mining of mineral sands
with elevated levels of radioactive elements.
Australia is the next largest producer essentially from a single company, GMA, with
production in 2015 of over 280 kt. China is the other major producer. Whilst it is difficult to
obtain accurate estimates of total production from China, USGS estimates that actual
production is in the range of 200 ktpa to 300 ktpa, most of which is used domestically.
The USA is a relatively minor producer, producing at about 34 ktpa, with even lower
production from Canada and Mexico. Currently there are no garnet producers in Europe.
17.2.3 Demand Forecast
The size of the three main markets for garnet is as follows:
The current European market for garnet is estimated at about 160 ktpa. This market is
split roughly evenly between abrasive blasting and waterjet cutting. As economies
improve the European demand is expected to grow to above 200 ktpa within five years
and possibly 250 ktpa within ten years. Additional potential lies in more distant markets
in North America and the Persian Gulf
The US market (net imports and domestic production) is estimated to be 290 ktpa
The third major consuming region is the Persian Gulf, with imports of almost 180 kt in
2015.

Nordic Mining Prefeasibility Study
30 October 2017 Engebø Rutile and Garnet Project
H352410
H352410-00000-280-066-0001, Rev. 0 Page 271
© Hatch 2017 All rights reserved, including all rights relating to the use of this document or its contents.
Total apparent global consumption of garnet excluding Chinese domestic consumption is
estimated to be almost 890 ktpa (see Figure 17-13 below). If historic growth rates over the
last 20 years are extrapolated linearly, apparent consumption excluding China could grow
to over 1.4 Mtpa in the next ten years.
In the waterjet sector, there is still growth in what is a relatively young industry. The largest
users tended to be in the aerospace, automobile and high-tech industries, but there have
been more recent developments in stone cutting, paper and other industries. Growth rates
are expected to be of the order of 6% per annum in terms of garnet volumes, possibly
even higher as the economy recovers.
In addition to the current market, if a very competitively priced garnet was offered to the
abrasive blasting market there is the possibility of gaining market share from lower priced
but lesser performing materials such as coal or copper slags. The European market alone
for these materials is estimated to be of the order of 1.0 Mtpa. It may be possible to sell a
product with a lower level of garnet than current grades to compete with slags, although
this will need comparative testwork to demonstrate its effectiveness combined with a
market development programme.
Figure 17-13: Garnet Consumption Development (TAK Industrial Mineral Consultancy)
17.2.4 Supply Forecast
The current world production of garnet is estimated at 1 Mtpa; India is the largest producer
(estimated production is 450 ktpa to 500 ktpa); with Australia being the next largest
producer at an estimated 280 ktpa production level. China is the third significant producer
at an estimated 200 ktpa to 300 ktpa output.
Whilst supply from India comes from a number of companies, output from Australia
essentially comes from a single company, namely GMA.
0
200,000
400,000
600,000
800,000
1,000,000
1,200,000
1,400,000
1,600,000
Ton
nes
Apparent Consumption of Garnet (excluding China)

Nordic Mining Prefeasibility Study
30 October 2017 Engebø Rutile and Garnet Project
H352410
H352410-00000-280-066-0001, Rev. 0 Page 272
© Hatch 2017 All rights reserved, including all rights relating to the use of this document or its contents.
In line with the above production statistics India and Australia are the primary exporters to
world markets at estimated levels of 478 ktpa and 293 ktpa respectively.
17.2.5 Competitor Analysis
Through its long-standing MoU partner for garnet, Nordic Mining has established relevant
insight into the garnet industry, although no detailed competitor analysis has been carried
out. It is unclear at this stage how competitors will respond to this Project; however, Nordic
Mining will be the first industrial producer of garnet in Europe. The overall strategy of
Nordic Mining is to be a consistent high-quality garnet producer and to establish a long-
term market position in the European and other markets.
17.2.6 Marketing
Logistics is an important element of garnet marketing, with deliveries often expected within
a few days of order. In this regard Engebø is very well placed with its direct access to the
North Sea and thereafter, major European waterways, resulting in lower transport costs
and reduced time to market relative to the key global producers in India, Australia and
China. Bagging and distribution costs can add significant costs to the delivered price,
especially for smaller quantities.
The ultimate consumers in Europe tend to be relatively small, but there are a number of
companies that trade and distribute abrasive media including garnet. Some are closely
linked to producers in India and Australia with GMA having its own extensive warehousing
and distribution network. Suppliers of abrasive blasting and waterjet cutting machinery may
also supply garnet and other abrasives to their customers as part of their service.
17.2.7 Pricing
Prices for garnet are normally quoted as:
Cost, Insurance and Freight (CIF), requiring the seller to arrange for the carriage of
goods by sea to a port of destination at his cost, and provide the buyer with the
documents necessary to obtain the goods from the carrier; or
Free on Board (FOB), meaning that the seller pays for transportation of the goods to
the port of shipment, plus loading costs. The buyer pays the cost of marine freight
transport, insurance, unloading and transportation from the arrival port to the final
destination. The passing of risks occurs when the goods are loaded on board at the
port of shipment.
There are no terminal markets for garnet and no reliable published prices for products.
Products are sold through negotiations between buyer and seller. In the case of abrasives
for both blasting and waterjet cutting there are different levels of sale -- from the producer
with bulk quantities through to a primary distributor, who may, in some cases, be a
subsidiary or division of the producing company, and on through secondary distributors
and even down to local and retail sellers. At every stage, a handling and profit margin is
added. Delivered prices can be significantly higher than CIF bulk prices especially for less
than truckload quantities. Larger international shipments may be in bulk containers of
breakbulk transport, but equally can be in 1.0 t or 2.0 t big bags or 2.0 kg bags, depending
on where the added value of bagging takes place and the relative economy of shipping

Nordic Mining Prefeasibility Study
30 October 2017 Engebø Rutile and Garnet Project
H352410
H352410-00000-280-066-0001, Rev. 0 Page 273
© Hatch 2017 All rights reserved, including all rights relating to the use of this document or its contents.
bagged vs bulk material. Currently, container shipping rates from India or Australia to
Europe, North America or the Middle East are at very low levels, potentially reducing CIF
costs, although at some stage the costs should increase as freight markets normalise.
While care must be taken regarding the accuracy of trade statistics, some general trends
can be derived from average prices (it must be stressed that these are average prices and
do not account for the differences in price of the various grades on the market). In 2015,
average prices FOB Australia were US$ 212/t, followed by China at US$ 208/t and India at
US$ 196/t. Australian prices had been generally rising up to 2012, but have fallen since
that time. Indian prices had been very stable in the period 2008 to 2012 but rose to virtually
equal Australian prices before falling in 2015. USA average prices have been omitted as
they involve considerably higher priced grades averaging US$ 704/t in 2015 and in some
years over US$ 1000/t; these prices apply for low volume specialist products.
Figure 17-14 below shows average FOB garnet export prices for the period 1996 to 2015.
Figure 17-14: Average FOB Garnet Export Prices (TAK Industrial Mineral Consultancy)
Increased freight rates alone are likely to have added 10% to those prices and these are
expected to remain in place. If there continues to be shortages from India, prices are likely
to remain significantly higher but even if the supply situation stabilises either from India or
alternative sources, including Engebø, many in the industry feel that while the price
increases being pushed through due to lack of supply may moderate they will remain at
above historic prices by a further 10%. The new plant opened by GMA in the USA to
process South African garnet may ease the situation in North America but the cost of
freight from South Africa and then shipping on to European markets should they decide to
do that adds to the cost from that source.

Nordic Mining Prefeasibility Study
30 October 2017 Engebø Rutile and Garnet Project
H352410
H352410-00000-280-066-0001, Rev. 0 Page 274
© Hatch 2017 All rights reserved, including all rights relating to the use of this document or its contents.
Once the situation stabilises it is reasonable to expect prices in Europe to be in the € 240/t
to € 260/t ton CIF range for an 80 or a 100 mesh material and € 260/t to € 280/t for 30/60
mesh grades; longer term increases will probably be following general inflation trends,
unless there is any further disruption to supplies.
For the purposes of financial evaluation in this study, an FOB garnet basket price of US$
250/t has been assumed. This number is in line with expected export prices as shown
above, but assumes that some recovery in the growth rates of global economies will occur.
The US$ 250/t price is based on an average price for three products, – 80 mesh waterjet,
100 mesh waterjet and 30/60 mesh blast market. It is anticipated that Engebø will produce
approximately equal volumes of each of the above products.
Once the European economy makes a reasonable recovery it is possible that total demand
for garnet will exceed 200 ktpa within the next five years, and as the growth in waterjet
cutting progresses, could reach 250 ktpa tonnes within 10 years. This is a significant
increase above the current estimate demand of 160 ktpa, which is expected to have a
positive impact on prices. These numbers do not take into account the gaining of
significant market share from other abrasives if Engebø can produce a price-competitive
garnet with grades coarser than 30/60 mesh.
17.2.8 Contractual Structure
The contract regime for garnet is to a large extent dominated by spot trading where cargos
are purchased individually. At the same time, part of the garnet market has been
dominated by a few larger players who have been integrated down to end-user level in
certain markets. As the garnet market grows it is expected to be more structured with a
contract regime which is more similar to other industrial minerals. In the bigger markets,
there is a tendency to operate on a forward stocking basis where the distributors take
positions in product in storage hubs for further sales and distribution. There are also
examples of lifting contracts on an exclusive basis, however with dynamic pricing.
17.2.9 Specific Downstream Treatment and Upgrading Requirements
The assumed FOB garnet basket price of US$ 250/t used for revenue estimation in this
study is based on production of final end-user products according to established market
specifications; hence, the products will not need any further treatment or upgrading.
Testwork has shown that three various garnet products, 30/60 mesh, 80 mesh and
100 mesh, can be produced according to market specifications with respect to grade and
particle distribution. Most of the garnet production is assumed to be sold in bulk, i.e. some
bagging may be carried out in the market place at the centre of distribution or by
customers, which normally will increase the unit prices.

Nordic Mining Prefeasibility Study
30 October 2017 Engebø Rutile and Garnet Project
H352410
H352410-00000-280-066-0001, Rev. 0 Page 275
© Hatch 2017 All rights reserved, including all rights relating to the use of this document or its contents.
18. Health and Safety
18.1 Health and Safety Standards to be Followed by the Project
Health and safety are important aspects of everyday life in Norway, as well as in the work
place. To meet these expectations, Nordic Mining has adopted the following health and
safety goals:
No injuries or serious incidents during construction and operation
All employees and subcontractors shall follow planned health and safety procedures
All health and safety procedures to be in compliance with the Working Environment
Act
Comply with ISO 9001 to ensure systematic quality control.
18.2 Health and Safety Plan
A detailed Health and Safety Plan will be developed during the DFS phase to ensure:
Health and safety standards meet statutory requirements and industrial best practice
That every employee and subcontractor knows and abides by all health and safety
procedures through training in, amongst others, documentation, routines and
checklists
Ongoing reviews to improve performance.

Nordic Mining Prefeasibility Study
30 October 2017 Engebø Rutile and Garnet Project
H352410
H352410-00000-280-066-0001, Rev. 0 Page 276
© Hatch 2017 All rights reserved, including all rights relating to the use of this document or its contents.
19. Environmental and Social Responsibility
19.1 Introduction
The overarching principle which will be adhered to when operating Engebø is that Nordic
Mining will adopt a good citizen approach and demonstrate that it can plan, build
and operate Engebø as follows:
In a manner which demonstrates environmental responsibility within the environmental
terms of permitting and approvals requirements
With a commitment to a long-term life of the operation by building a solid long-term
mining company that will benefit the community
In a way that introduces factors that can positively influence the operation’s
neighbours
With established routines to continuously improve the environmental track record.
The following sections provide more detail of how Nordic Mining will apply the above
principle in practice.
19.2 Environmental Setting
The environmental setting for the Project is driven by two key legislative requirements for
Nordic Mining to construct and operate a mining and processing operation at Engebø. The
two legislative requirements, the discharge permit and the zoning plan, have been fully met
and mean that Engebø is fully compliant according to Norwegian environmental legislation,
as discussed in more detail below.
19.2.1 Discharge Permit
The final discharge permit for Engebø was issued on 29 September 2016 after minor
adjustments were made to the permit by the Order in Council on 19 February 2016,
resulting from consideration of complaints on the matter. Changes to the permit may be
made by the Norwegian Environment Agency if all or substantial parts of the permit have
not been exercised within four years of the date of issue (i.e. by 29 September 2020). The
discharge permit allows for an annual tailings disposal volume corresponding to a RoM of
approximately 4 Mtpa, i.e. a significantly higher tonnage than the PFS business case.
The permit covers both an environmental and social license to operate; in the process of
granting the permit, the Norwegian Environment Agency focuses on pollution-related
issues and their mitigation.
19.2.2 Zoning Plan (Planning Permit)
The Engebø deposit and the planned mining and processing plant areas are located
adjacent to the Fv 611 county road and a deep-water harbour facility. Nordic Mining has
access to the mining area both by land and sea by means of an approved zoning plan for
the planned mining area and processing plant. The zoning plan was adopted by the local
Municipalities in 2011 and finally approved by the Ministry of Local Government and
Modernisation on 17 April 2015. The zoning plan allows for, and provides guidelines on,
the operation of the following activities:

Nordic Mining Prefeasibility Study
30 October 2017 Engebø Rutile and Garnet Project
H352410
H352410-00000-280-066-0001, Rev. 0 Page 277
© Hatch 2017 All rights reserved, including all rights relating to the use of this document or its contents.
The processing site at Engebø
The extraction of rock mass in open pit production and underground mining
The service area at Engebø
The gangue deposition site in Engjabødalen
A subsea area for tailings disposal on the sea floor of the Førde Fjord
The works road running between the Engebø mining operation and the process plant
The rerouting of county road Fv 611
The rerouting of a 22 kV power line and the stringing of a new cable between the
process plant and the top of the Engebø ridge.
The zoning plan also ensures that measures are put in place to reduce the consequences
of the above activities on the landscape.
Nordic Mining will need to apply for a regular operating license upon commencement of
operations at Engebø.
19.3 Environmental Studies
To obtain the Discharge Permit and Zoning Plan (Planning Permit) discussed above,
numerous environmental studies were carried out for the Project. Some 44 environmental
and social responsibility documents have been developed to date over the life of the
Project to demonstrate Nordic Mining’s commitment to environmental and social
responsibility.
The tailings discharge will be conditioned by seawater and de-aired in a sea disposal
system and transported in a pipeline down to the Førde Fjord seafloor at a depth of
approximately 320 m. The fjord basin is a sedimentation environment confined by
thresholds to the inner part of the fjord and by a glaciation sill to open sea. A 4,4 km2 area
of the fjord has been regulated for tailings deposition.
A comprehensive EIA programme has been carried out in several campaigns in the period
2009 to 2013. Detailed baseline studies were done to map the biodiversity in the fjord; this
included test fishing, grab sampling and remotely operated vehicle (ROV) investigations.
Currents, salinity, turbidity and temperature was measured in the fjord throughout a twelve-
month period to document the fjord environment. Figure 19-1 below shows the planned
disposal system with the pipe transporting the tailings to the fjord basin.

Nordic Mining Prefeasibility Study
30 October 2017 Engebø Rutile and Garnet Project
H352410
H352410-00000-280-066-0001, Rev. 0 Page 278
© Hatch 2017 All rights reserved, including all rights relating to the use of this document or its contents.
Figure 19-1: Schematic of the Planned Sea Disposal System for Tailings
The main conclusions regarding the fjord disposal solution from the EIA studies were:
The tailings will mainly sediment within the area regulated for tailings disposal which
comprises 5% of the total fjord area
The currents in the tailings area are moderate and there is limited risk for erosion
currents that could potentially transport tailings outside the regulated area
Limited effects are expected outside the regulated area and in the water column above
the tailings outlet
The tailings are benign, meaning they consist of non-harmful naturally occurring
minerals with no heavy metal contamination
The chemical additives that follow the tailings from flotation and thickening are
biodegradable and in non-harmful concentrations
The tailings consist of mainly sand and silt fractions and a little clay; they are
somewhat coarser than the sediments constituting the fjord bottom today
The baseline studies showed that the fjord habitat has biodiversity that is typical for
western Norwegian fjords
There are no corals found in the tailings area
The tailings deposits pose little threat to cod which have their breeding grounds in
shallow fjord areas

Nordic Mining Prefeasibility Study
30 October 2017 Engebø Rutile and Garnet Project
H352410
H352410-00000-280-066-0001, Rev. 0 Page 279
© Hatch 2017 All rights reserved, including all rights relating to the use of this document or its contents.
The tailings solution poses little threat to endangered fish that dwell in the fjord
The tailings will affect bottom living organisms within the regulated area where the
sedimentation rate is high. Mobile species such as fish will avoid areas with high
turbidity
The tailings will likely be recolonised within a few years after the tailings deposition
ends. The biodiversity is expected to return to as good a state as it was before the
depositing took place
The fjord has no commercial fishing, but some recreational fishing. The tailings will not
affect recreational fishing in the fjord
The tailings will not affect fish farms that are operated in the fjord.
Norway has long-term experience with deposition of tailings into fjords. Currently there are
five active tailings deposits in Norway and two (including Engebø) have recently been
permitted. Experience with fjord deposition in Norway is, for the most part, positive.
Advanced systems for monitoring exist and there are guidelines for tailings deposition to
limit the environmental footprint as far as possible.
19.4 Ongoing Environmental Initiatives
Current initiatives include consideration of the following measures to reduce environmental
impacts in the designs:
Cladding on buildings to reduce heating requirements
Recycling of water on site and minimisation of water discharge from the property
Power optimisation
Green mining (e.g. autonomous mining, electric hauling). Ratification of the Paris
Accord restricting future use of fossil fuels means that mining companies need to
consider ways in which they can reduce dependence on fossil fuels.
19.5 Waste Management Plan
Nordic Mining’s discharge permit states that the company shall establish a waste
management plan in place before production starts. The plan will describe all waste
generated from mining and processing, how it is to be disposed of, and if there are
alternative uses. It will also cover environmental impacts and mitigating actions.
A complete waste management plan will be developed as a part of the DFS and will be in
accordance with the discharge permit and legislation.
19.6 Social Setting
The Naustdal municipality is located in the Sogn og Fjordane County and has its northern
border towards the Gloppen municipality; to the east it has a border with Jølster, to the
west against the Flora municipality and towards the south-east against the city municipality
of Førde. Across the Førde Fjord to the south is the Askvoll municipality.
The land area of Naustdal is 370 km² and the total population is approximately 2,700.

Nordic Mining Prefeasibility Study
30 October 2017 Engebø Rutile and Garnet Project
H352410
H352410-00000-280-066-0001, Rev. 0 Page 280
© Hatch 2017 All rights reserved, including all rights relating to the use of this document or its contents.
Naustdal is an agricultural area with milk production and sheep herding as the main
agricultural activities on small- to medium-sized farms. In addition, the municipality has
several smaller businesses in housing and earthworks, as well as handcrafts of various
sorts. Almost 60% of the active workforce in Naustdal have work outside the municipality,
mainly in the city municipality of Førde. Førde is located in the inner eastern part of the
Førde Fjord and is the main centre in the Sogn and Fjordane County.
Naustdal has entered into an agreement with three other municipalities, Førde, Gaular and
Jølster to merge into one larger municipality called Sunnfjord kommune in 2020.
Naustdal has four hydroelectric power plants with a total capacity of approximately
20 GWh. Three months before the liberation in 1945, Naustdal and the Førde Fjord was
the scene of the biggest air battle in Norway during the Second World War. The battle is
displayed at the Air Battle Museum located close to the Engebø deposit.
19.7 Socio-economic Studies
As a part of the EIA, the Norwegian research institution “Norwegian Institute for Urban and
Regional Research” carried out a study on the social consequences of the planned mining
activities at Engebø. The study concluded that the Project will have substantial positive
effects on the local settlements as well as the local business community. The location of
the Project, close to the city centres of Førde and Florø, makes it attractive for the
recruitment of local labour. Based on assumptions regarding local settlement for future
employees, the study concluded that that the Project will have a significant positive
consequence for the economy of the Naustdal Municipality.
In 2013, the Norwegian research institution SINTEF was engaged by the regional
development organisation “Sunnfjord Næringsutvikling” to carry out a study on regional
economic consequences from mining activities at Engebø. The study included model
simulations based on updated data for demographics, labour markets and regional
economy. The Project is situated in a region consisting of nine municipalities. The study
concluded that the regional contributions to the capital investments may represent up to
17%. Further, it was estimated that during local operation the local region will represent
approximately 17% of regular supplies and services, based on statistics from other mining
operations in Norway. On direct and indirect employments as a result from the Project, the
study estimates an indirect employment factor of 2.9, i.e. if the Project needs 110 direct
employees, the total number of jobs generated will be approximately 340, of which 60 to
90 will be indirect employees in the local region. Due to historic in-balances in the local
labour market, there have been significant relocations and commuting of the workforce in
the local region. The study indicated that the Project will have a significant impact on local
settlement and the commuting trend.
19.8 Closure Planning
No consideration of closure planning has been made in this phase of the Project and,
consequently, no capital cost allowance has been made in the financial model for closure
planning costs in light of the fact that the current LoM of 29 years is likely to be extended
significantly by means of a drilling programme to be undertaken in the DFS phase. It is
considered likely, therefore, that these resources will be shown to be technically and

Nordic Mining Prefeasibility Study
30 October 2017 Engebø Rutile and Garnet Project
H352410
H352410-00000-280-066-0001, Rev. 0 Page 281
© Hatch 2017 All rights reserved, including all rights relating to the use of this document or its contents.
economically mineable, in which case they will be converted to reserves. This implies a
significant increase in the LoM.
It should be noted that although no capital provision for closure has been made, an annual
contribution of 0.9 M kr (US$ 0.108 M) to a rehabilitation fund has been made in the
financial model. This provision has been made every year over the LoM.
Detailed closure planning studies will be carried out in the DFS phase.

Nordic Mining Prefeasibility Study
30 October 2017 Engebø Rutile and Garnet Project
H352410
H352410-00000-280-066-0001, Rev. 0 Page 282
© Hatch 2017 All rights reserved, including all rights relating to the use of this document or its contents.
20. Human Resources
20.1 Introduction
The labour complement for the Project was developed from individual estimates for each
Work Breakdown Structure (WBS) area, based on first principles. An owner operating
philosophy will be adopted for the Project, driven primarily by the fact that the long
potential LoM dictates that a contracting operation will become expensive over such a long
period of time; the potential to use contractors for various activities, particularly mining, will
be considered in the next phase based on economic analysis. It has been assumed that
full time employees will be used for all production activities on site. The following working
hours and shift schedule are assumed:
Mining – in line with the requirements of the zoning plan, mining will operate five days
a week from 07h00 am to 23h00 (16 hours per day) from Monday to Friday, amounting
to an 80 hour working week. The mining team will work two, eight-hour shifts
Processing and Product Dispatch – these areas will operate on a continuous basis,
24 hours per day, seven days a week. This equates to 168 hours per week
Norwegian working hours are strongly regulated. A five-shift system has been
assumed for Engebø, which is an accepted system for operating a plant continuously
365 days a year where the working hours and free time are averaged out over the
year. This system means that there are always four shift teams at work while the fifth
shift is on leave. The mining operation will only operate on a two, eight-hour shift
basis, however.
20.2 Labour Costs
Labour costs per hour on a basic salary basis were determined for five main categories of
workers – unskilled, skilled, foreman, middle manager and senior manager – to reflect the
pay scales of workers who will be employed at Engebø. Cost-to-company annual salary
packages were then calculated for each of these categories, taking cognisance of the
requirements of the local trade union agreement Hustadmarmor AS 2014-2016, which
stipulates minimum hourly rates, add-ons for workers on shifts and age increments to
reflect the experience of workers, overtime allowances and social costs.
Table 20-1 below summarises the cost-to-company salaries used as part of the
calculations to determine the operating costs for Engebø.

Nordic Mining Prefeasibility Study
30 October 2017 Engebø Rutile and Garnet Project
H352410
H352410-00000-280-066-0001, Rev. 0 Page 283
© Hatch 2017 All rights reserved, including all rights relating to the use of this document or its contents.
Table 20-1: Summary of Cost-to-Company Salary Calculations
Basic Salary kr/hr
Age Increment (estimated at kr 5/hr)
Annual Salary
(1,800hrs)
Shift Allowance
Salary including
Shift Allowance
Overtime Allowance
(10% @ 1.75
hourly rate)
Salary including Overtime
Social Costs*
Cost-to-Company Salary (kr)
Cost-to- Company
Salary (US$)
Unskilled
Surface Labourer – Day Shift 151.00 156.00 271,800 0% 271,800 47,565 319,365 38% 440,724 52,819
Surface Labourer – Two Shifts 151.00 156.00 271,800 10% 298,980 52,322 351,302 38% 484,796 58,101
Surface Labourer – Three Shifts 151.00 156.00 271,800 16% 315,288 55,175 370,463 38% 511,239 61,270
Underground Labourer – Day Shift 168.52 173.52 303,336 0% 303,336 53,084 356,420 38% 491,859 58,948
Underground Labourer – Two Shifts 168.52 173.52 303,336 10% 333,670 58,392 392,062 38% 541,045 64,842
Underground Labourer – Three Shifts 168.52 173.52 303,336 16% 351,870 61,577 413,447 38% 570,557 68,379
Weekend Shifts 80% add on to basic salary
Skilled (with certificate)
Surface Labourer – Day Shift 161.00 166.00 289,800 0% 289,800 50,715 340,515 38% 469,911 56,317
Surface Labourer – Two Shifts 161.00 166.00 289,800 10% 318,780 55,787 374,567 38% 516,902 61,949
Surface Labourer – Three Shifts 161.00 166.00 289,800 16% 336,168 58,829 394,997 38% 545,096 65,328
Underground Labourer – Day Shift 178.52 183.52 321,336 0% 321,336 56,234 377,570 38% 521,046 62,446
Underground Labourer – Two Shifts 178.52 183.52 321,336 10% 353,470 61,857 415,327 38% 573,151 68,690
Underground Labourer – Three Shifts 178.52 183.52 321,336 16% 372,750 65,231 437,981 38% 604,414 72,437
Weekend Shifts 80% add on to the day shift salary

Nordic Mining Prefeasibility Study
30 October 2017 Engebø Rutile and Garnet Project
H352410
H352410-00000-280-066-0001, Rev. 0 Page 284
© Hatch 2017 All rights reserved, including all rights relating to the use of this document or its contents.
Basic Salary kr/hr
Age Increment (estimated at kr 5/hr)
Annual Salary
(1,800hrs)
Shift Allowance
Salary including
Shift Allowance
Overtime Allowance
(10% @ 1.75
hourly rate)
Salary including Overtime
Social Costs*
Cost-to-Company Salary (kr)
Cost-to- Company
Salary (US$)
Foreman (assumes 30% above skilled labour rate)
1.30
Surface Labourer – Day Shift 209.30 214.30 376,740 0% 376,740 65,930 442,670 38% 610,884 73,212
Surface Labourer – Two Shifts 209.30 214.30 376,740 10% 414,414 72,522 486,936 38% 671,972 80,534
Surface Labourer – Three Shifts 209.30 214.30 376,740 16% 437,018 76,478 513,497 38% 708,625 84,926
Underground Labourer – Day Shift 232.08 237.08 417,737 0% 417,737 73,104 490,841 38% 677,360 81,179
Underground Labourer – Two Shifts 232.08 237.08 417,737 10% 459,510 80,414 539,925 38% 745,096 89,297
Underground Labourer – Three Shifts 232.08 237.08 417,737 16% 484,575 84,801 569,375 38% 785,738 94,168
Weekend Shifts 80% add on to the day shift salary
Middle Manager (assumes 50% above skilled labour rate)
1.75
Working on day shift only 281.75 286.75 507,150 0% 507,150 88,751 595,901 38% 822,344 98,555
Senior Manager (assumes 100% above skilled labour rate)
2.75
Working on day shift only 442.75 447.75 796,950 0% 796,950 139,466 936,416 38% 1,292,254 154,872
Notes: Above costs are based on trade union agreement Hustadmarmor AS 2014-2016
Cost-to-company estimates above make no allowance for annual leave, sick leave and absenteeism, which is catered for in the labour complement
* Social costs cover health benefits, pension, 13th cheque (leave bonus) etc.

Nordic Mining Prefeasibility Study
30 October 2017 Engebø Rutile and Garnet Project
H352410
H352410-00000-280-066-0001, Rev. 0 Page 285
© Hatch 2017 All rights reserved, including all rights relating to the use of this document or its contents.
20.3 Labour Complement
The steady-state labour complement and associated annual labour costs for the 1.5 Mtpa
feed to plant business case are summarised in Table 20-2 below. The total staffing
requirement is estimated at 106 people. The mining complement of 28 people given below
represents the typical complement for the 1.5 Mtpa RoM mine plan for the open pit
operation; in practice, the complement will vary per year depending on the production
profile of ore and waste, as well as the mining method employed (open pit or
underground).
Table 20-2: Steady-state Labour Complement Summary
Summary Head Count Annual Cost-to-Company
(US$)
Management and Administration 18 1,768,360
Technical Services 4 270,323
Mining 28 1,764,044
Comminution & Process 40 2,500,274
Product Dispatch 1 56,317
Engineering 15 1,000,015
Total 106 7,359,332
The labour complement per discipline by job description is shown in Table 20-3 to Table 20-8 below.

Nordic Mining Prefeasibility Study
30 October 2017 Engebø Rutile and Garnet Project
H352410
H352410-00000-280-066-0001, Rev. 0 Page 286
© Hatch 2017 All rights reserved, including all rights relating to the use of this document or its contents.
Table 20-3: Management and Administration Labour Complement
Management and Administration Head Count Annual Cost-to-Company
(US$)
General Manager 1 154,872
Plant Manager 1 154,872
Mine Manager 1 154,872
Maintenance Manager (Engineering) 1 154,872
Finance Manager 1 154,872
Marketing Manager 1 98,555
Environmental Manager, SHEQ and Training Manager 1 98,555
HR Manager 1 98,555
Marketing Admin Officer (loading coordinator 1 73,212
Marketing Assistant 1 73,212
Accountant 1 98,555
IT Professional 1 98,555
Accounts Clerical 1 56,317
General Clerical and others 1 56,317
SHEQ and Training Officers 1 56,317
HR Officers 1 56,317
Buyers 1 73,212
Issuing Clerks 1 56,317
Total 18 1,768,360
Table 20-4: Technical Services Labour Complement
Technical Services (Mining, Geology, Survey, Environmental, Laboratory)
Head Count Annual Cost-to-Company
(US$)
Mine Planner 1 98,555
Geologist (modelling etc.) 1 98,555
Surveyor 1 73,212
Laboratory Assistant (incl. Environmental Monitoring) 1 73,212
Total 4 270,323

Nordic Mining Prefeasibility Study
30 October 2017 Engebø Rutile and Garnet Project
H352410
H352410-00000-280-066-0001, Rev. 0 Page 287
© Hatch 2017 All rights reserved, including all rights relating to the use of this document or its contents.
Table 20-5: Mining Labour Complement
Mining (Two Shifts Per Day, 5 Days Per Week) Head Count Annual Cost-to-Company
(US$)
Foreman 2 161,067
Primary Open Pit Equipment
Haul Truck 4 247,796
Wheel Loader 2 123,898
Surface Drill Rig 2 123,898
General Labourer 2 116,202
Secondary Open Pit Equipment
Wheel Dozer 2 123,898
Track Dozer 2 123,898
Track Dozer 2 123,898
Grader 2 123,898
Water Truck 2 123,898
Service Truck 2 123,898
Water Bowser 4 247,796
Total 28 1,764,044
Table 20-6: Comminution and Process Labour Complement
Comminution and Process – All Areas Head Count Annual Cost -to-Company
(US$)
Production Area Manager 1 98,555
Process Engineering/Metallurgist 1 98,555
Control Room Operators 10 653,279
Production Shift Operators 20 1,306,559
Production Day Labourers 5 264,096
Trainees (training rates apply – 50% of surface labourer rate)
3 79,229
Total 40 2,500,274
Table 20-7: Product Dispatch Labour Complement
Product Dispatch Head Count Annual Cost- to-Company
(US$)
Product Logistics Operator 1 56,317
Total 1 56,317

Nordic Mining Prefeasibility Study
30 October 2017 Engebø Rutile and Garnet Project
H352410
H352410-00000-280-066-0001, Rev. 0 Page 288
© Hatch 2017 All rights reserved, including all rights relating to the use of this document or its contents.
Table 20-8: Engineering Labour Complement
Engineering Head Count Annual Cost- to-Company
(US$)
Mechanical Fitter 2 146,425
Electrician 2 146,425
Automation Electrician/IT Assistants 3 219,637
Assistants 2 112,634
Maintenance Engineer (1 x Mechanical, 1 x Electrician, 1 x Automation)
3 295,665
Trainees (training rates apply – 50% of surface labourer rate)
3 79,229
Total 15 1,000,015
20.4 Training/Skills Requirement
It is anticipated that the majority of human resources will be sourced locally and regionally,
and trained as required. Senior management and key technical skills will, however, most
likely be sourced nationally from within Norway as they are unlikely to be available in the
local region.

Nordic Mining Prefeasibility Study
30 October 2017 Engebø Rutile and Garnet Project
H352410
H352410-00000-280-066-0001, Rev. 0 Page 289
© Hatch 2017 All rights reserved, including all rights relating to the use of this document or its contents.
21. Capital Cost Estimate
The capital cost estimate for the 1.5 Mtpa RoM business case was developed to PFS
estimating standards. The estimate covers all capital spent during construction and the
ramp-up period for establishment of an open pit mining operation and associated process
plant, as well as for establishment of the underground mining operation after approximately
15 years of open pit life. A new primary crusher, glory hole and conveyor to feed crushed
ore to the existing silo system under the open pit have been included in the estimate to
support underground mining.
With the exception of the underground mine capital, any capital spent after nameplate
capacity is reached has been defined as sustaining and working capital; this has been
included in the financial model developed for the project business case.
21.1 Capital Estimate Summary
The upfront capital estimate to establish the open pit mining operation and the process
plant is US$ 207.176 M. The estimated cost of establishing the underground mine after
15 years of open pit operation is US$ 16.931 M (current money terms). The capital
estimates per main WBS areas are as follows:
Table 21-1: Upfront Capital Estimate
Upfront Capital Estimate US$ M
Open Pit Mining 10.027
Comminution 16.802
Mineral Processing 61.573
Tailings Handling and Disposal 7.045
Product Storage and Loadout Facilities 13.108
Infrastructure 22.565
Indirects (excluding contingency) 41.834
Contingency 34.222
Total 207.176
Table 21-2: Deferred Capital Estimate for Underground Mining
Deferred Capital Estimate – Underground Mining US$ M
Underground Mining 7.833
Comminution 2.970
Indirects (excluding contingency) 2.747
Contingency 3.381
Total 16.931

Nordic Mining Prefeasibility Study
30 October 2017 Engebø Rutile and Garnet Project
H352410
H352410-00000-280-066-0001, Rev. 0 Page 290
© Hatch 2017 All rights reserved, including all rights relating to the use of this document or its contents.
21.2 Basis of Estimate
The estimates were prepared on the following basis:
Software used - the final estimate was produced using Construction Computer
Software’s (CCS) Candy application, an analytical, resource-based estimating system
utilising both simple and complex resources and worksheets to create unit rates. The
unit rates are stored as libraries and used for generating estimates
Estimate base date – 30 September 2017
Estimate currency – United States Dollars (US$)
Exchange rates used:
1 US$ = 8.30 Norwegian Krone (kr)
1 US$ = 0.90 Euro (€)
1 US$ = 13.40 South African Rand (R)
1 kr (Swedish Krone) = 1.070 kr (Norwegian Krone).
Target accuracy of -20% to +30%
Budget quotes were sourced for selected major equipment and combined with
historical data for minor packages
Labour rates were calculated based on recent Norwegian contractor rates and
compared against data received from contractors for other recent studies in Northern
Europe
Equipment lists and Material Take-Offs (MTOs)
A defined WBS was used
Metric units of measure were used
Contingency was included based on a Quantitative Risk Analysis.
21.3 Exclusions and Clarifications
Allowances for the following items were not included in the estimates:
General sales tax, fringe benefits tax, sales tax, and any government levies and taxes
Working capital, sustaining capital and Stay in Business (SIB) capital
Foreign exchange currency fluctuations
Forward escalation
Schedule acceleration costs
Schedule delays and associated costs, such as those caused by:
Unexpected site conditions
Unidentified ground conditions

Nordic Mining Prefeasibility Study
30 October 2017 Engebø Rutile and Garnet Project
H352410
H352410-00000-280-066-0001, Rev. 0 Page 291
© Hatch 2017 All rights reserved, including all rights relating to the use of this document or its contents.
Labour disputes
Force majeure
Permit applications.
21.4 Estimating Methodology
The approach used for preparation of the estimate was as follows:
Set-up:
An Estimate Plan was prepared
Review of Scope of Work for the Project
Review of available drawings and other project information
Review of available procurement plans and strategies
Development of the WBS.
Inputs:
Quantification of the work in accordance with standard commodities, Equipment
lists and MTOs developed by discipline engineers
Budget quotations for major equipment
Models and drawings as provided by discipline engineers to assist estimating
Project Execution Schedule and plan assumptions
Determined purchase cost of the installed equipment and materials. Major
equipment supply pricing was generally based on budget quotations and historical
data for minor equipment and bulk commodities
Construction costs were generally included based on first principles estimates and
compared with data received in September 2017 from contractors for other current
studies in Northern Europe
Project Indirects were included based on direct cost factors
Contingency was included based on Quantitative Risk Analysis.
Estimating
Set-up the estimate in iPas CE according to the established WBS
Calculate direct labour rates and contractor distributable
Establish, and allow for, items excluded from budget quotes e.g. freight, vendor
representatives, spares etc. on a factor basis of the material and equipment supply
cost
Determine the purchase cost of equipment and commodity bulk materials.

Nordic Mining Prefeasibility Study
30 October 2017 Engebø Rutile and Garnet Project
H352410
H352410-00000-280-066-0001, Rev. 0 Page 292
© Hatch 2017 All rights reserved, including all rights relating to the use of this document or its contents.
Reviews (scope, quantities and rates)
Project Team review including Owner’s Team.
21.5 Estimating Methodology for Direct Costs
Direct costs are generally quantity based and include all the permanent equipment,
materials and labour associated with the physical construction of the permanent process
facility, and include:
Purchase and installation of permanent plant, equipment and materials
Freight
Construction labour
Contractor’s supplied construction facilities
General construction plant and equipment
Contractor’s preambles overheads and profit.
21.5.1 Permanent Equipment
A mechanical equipment list was developed and used as an input to the estimate.
Major mechanical equipment was priced based on budget quotations and supplemented
with historical data for minor equipment. A bid evaluation process took place for all vendor-
sourced pricing; during this process, the vendor submissions were evaluated for technical
and commercial compliance. A recommendation was made by discipline engineers as to
which vendor’s submission should be included in the final capital estimate.
All equipment pricing in the estimate was reviewed to ensure the following criteria were
addressed, and considered, where necessary:
Allowance for attendance by vendor/supplier technical support for installation and pre-
commissioning support, including transport to site and accommodation
Freight and packaging
Duty and taxes
Exchange rate variations (i.e. between quoted rates and agreed rates adopted in the
estimate)
Site access, crane selection and scaffolding requirements were determined for special
items of equipment.
Equipment installation was estimated using a combination of historical data and first
principles estimating.
21.5.2 Bulk Materials
Bulk materials estimates were developed from MTOs and applied to unit rates based on
first principles estimating and budget quotes.

Nordic Mining Prefeasibility Study
30 October 2017 Engebø Rutile and Garnet Project
H352410
H352410-00000-280-066-0001, Rev. 0 Page 293
© Hatch 2017 All rights reserved, including all rights relating to the use of this document or its contents.
21.6 Estimating Methodology for Indirect Costs
Indirect costs include items that are necessary for the completion of the Project, but are
not directly related to the direct construction costs, and included the following items.
21.6.1 Temporary Construction Facilities and Services
Temporary construction facilities for the Engineering, Procurement, Construction
Management (EPCM) and Owner’s Team were included in the estimate based on a factor
of the direct project costs.
21.6.2 Engineering and Project Construction Management
The execution strategy for the Project and the associated EPCM costs are based on a
factor of the direct project costs.
21.6.3 Owner’s Costs
Owner’s costs were included based on a factor of the direct project costs.
21.6.4 Contingency/Risk Allowance
Contingency is a provision for known project costs which will occur, but which cannot be
defined in sufficient detail for estimating purposes due to the lack of complete, accurate
and detailed information, as well as limited engineering which has been performed. The
addition of contingency is required in order to determine the most likely cost of the Project.
Contingency is not intended to cover scope changes and Project exclusions.
To assess the uncertainty associated with the project cost and schedule, a Quantitative
Risk Analysis (QRA) was conducted which integrated project risks, schedule and estimate
uncertainty to provide:
An overall project cost risk profile
A schedule risk profile
A project risk profile that quantifies the identified project risk events.
The QRA also allowed the team to make risk based decisions and integrate with value
management processes.
The final contingency provision was calculated at 19.8%, or US$ 34.222 M, based on
Monte Carlo analysis using @Risk and Pertmaster. This represents the P80 contingency
value derived from the QRA process. This means that, with the above contingency added
into the capital estimate, there is an 80% probability that the final capital cost estimate will
be at or below the total estimate cost of US$ 207.176 M.
Contingency was excluded on the upfront payments for bulk water and electricity supply,
rehabilitation fund payments, and royalties.
21.7 Escalation
No allowance for forward escalation was included/calculated in the estimate.

Nordic Mining Prefeasibility Study
30 October 2017 Engebø Rutile and Garnet Project
H352410
H352410-00000-280-066-0001, Rev. 0 Page 294
© Hatch 2017 All rights reserved, including all rights relating to the use of this document or its contents.
22. Operating Cost Estimate
22.1 Introduction
Operating costs have been developed per WBS area from first principles, based on the
following cost categories:
Labour
Reagents
Spares and consumables
Power and water
Hourly costs for capital recovery for the mining fleet.
Key input cost assumptions used by all disciplines to derive operating costs are as follows:
Table 22-1: Key Input Cost Assumptions
Item Unit Cost (US$)
Power kWh 0.056
Diesel l 0.84
Natural Gas tonne 590
Water m3 0.07
22.2 Summary of Operating Cost Estimate
Operating costs for the 1.5 Mtpa RoM production case are summarised in Table 22-2
below. The total average operating cost per RoM ton and per sales ton are US$
16.28/RoM t and US$ 86.92/product t FOB (rutile and garnet combined) respectively.

Nordic Mining Prefeasibility Study
30 October 2017 Engebø Rutile and Garnet Project
H352410
H352410-00000-280-066-0001, Rev. 0 Page 295
© Hatch 2017 All rights reserved, including all rights relating to the use of this document or its contents.
Table 22-2: Operating Cost Summary
Item Unit 1.5 Mtpa RoM –
Cost/t (US$) Source
Open Pit - Waste Mining Waste tonne 1.89 Estimate
Open Pit - Ore Mining Ore tonne 1.82 Estimate
Underground Decline Development – Waste Mining Waste tonne 5.03 Estimate
Underground Decline Development – Ore Mining Ore tonne 3.28 Estimate
Underground Horizontal Development – Waste Mining Waste tonne 5.27 Estimate
Underground Horizontal Development – Ore Mining Ore tonne 4.59 Estimate
Underground Stoping – Waste Mining Waste tonne 3.67 Estimate
Underground Stoping – Ore Mining Ore tonne 2.93 Estimate
Comminution ROM tonne 3.93 Estimate
Process ROM tonne 5.39 Estimate
Tailings Disposal ROM tonne 0.17 COWI and DNVGL estimate (sea disposal and continuous monitoring)
Product Dispatch ROM tonne 0.33 Estimate
Overheads ROM tonne 1.36 Estimate
Rehabilitation US$ per annum 108,434 NOK 0.9 M per year contribution to a rehabilitation fund
Cost per RoM Tonne US$ 16.28
Cost per Sales Tonne* US$ 86.92
* Cost per Sales Tonne reflects cost for all sales tonnes (garnet and rutile combined)

Nordic Mining Prefeasibility Study
30 October 2017 Engebø Rutile and Garnet Project
H352410
H352410-00000-280-066-0001, Rev. 0 Page 296
© Hatch 2017 All rights reserved, including all rights relating to the use of this document or its contents.
22.3 Operating Cost Estimates per Discipline
22.3.1 Mining
Mining operating costs were calculated as a function of the production schedule for ore
and waste, and equipment operating and consumption factors. The production schedule
was drawn up using the DESWIK mining software package. The following process was
followed to derive the costs:
A primary mining fleet of Caterpillar (CAT) 777 trucks (100 t capacity) and CAT 992
front end loaders (FELs) was assumed. This is considered to be the best practical size
of equipment for the Engebø pit; the same equipment was used for underground
mining
For underground mining, the use of a long hole open stoping mining method was
assumed, including horizontal development, opening of a top and bottom horizontal
access slot for each stope, as well as vertical slot to provide space to drill and blast
into for each stope. For waste ore underground, the assumption was made that this
material would be loaded, hauled and deposited on the surface waste rock disposal
facility to be used for open pit waste disposal
For blasting the assumption was made that down-the-hole slurry would be used with a
powder factor of 0.91 kg/m3 for the open pit and 0.9 kg/m3 for underground
The cycle time for ore and waste was calculated for the queuing, loading, hauling and
deposition time per block, taking cognisance of the position of the block in the pit and
efficiencies. Ore loading and hauling to a glory hole and underground primary crusher
system in the pit and underground was assumed. In this way, Direct Operating Hours
(DOH) for the primary fleet were generated
For drill and blast costs the drilling time in minutes per metre was calculated for open
pit and underground drilling, assuming an Atlas Copco ROC L8 drill rig was used in the
open pit and a Sandvik DT1331i drilling jumbo for horizontal drilling underground. In
this way, Direct Operating hours for drilling were generated
Costs for a secondary fleet of equipment (CAT 824 wheel dozer, CAT D8 and D10
wheel dozers, a CAT 16M grader and a CAT 777W water bowser, as well as a service
truck and diesel bowser) were calculated based on an assumed 2,000 operating hours
per year. In this way DOHs for the secondary fleet were generated
Mining labour costs to operate each piece of equipment on a two-shift basis, together
with supervision (one foreman) and a labourer, were calculated using standard labour
costs as summarised in Section 20 of this report
Assuming an owner mining strategy, operating costs for each piece of equipment per
hour were calculated for:
Capital recovery (capital costs divided by typical replacement hours, which vary
from 40,000 hours for the primary mining fleet to 20,000 hours for drills)
Overhaul costs (parts and labour)

Nordic Mining Prefeasibility Study
30 October 2017 Engebø Rutile and Garnet Project
H352410
H352410-00000-280-066-0001, Rev. 0 Page 297
© Hatch 2017 All rights reserved, including all rights relating to the use of this document or its contents.
Maintenance costs (parts and labour)
Fuel consumption, lubes, tyres and wear parts.
The final open pit operating costs (as summarised in Table 22-2 above) for steady-state
production of US$ 1.82/RoM t for ore and US$ 1.89/waste t were benchmarked against
similar operations in Scandinavia; the costs compare favourably and are in line with a
budget quotation obtained from a Norwegian mining contractor. The contractor quoted an
open pit drill, blast, load and haul cost for ore of US$ 3.73/RoM t for ore and US$ 3.65/ton
for waste. Once a contactor margin of 20% is taken off these figures, the average
contractor cost amounts to US$ 2.95/ton (ore and waste) in comparison to the Project
estimate of US$ 2.35/ton (ore and waste). It is important to note, however, that the
contractor quoted a higher cost for ore mining than waste mining; this indicates that the
contractor did not fully account for the short hauls to the glory hole for ore in the mining
schedule. The ore load and haul cost should, therefore, be significantly lower than the
waste mining cost where waste will be hauled out of the pit to a waste rock disposal
facility.
22.3.2 Comminution
Comminution (crushing and milling) for Engebø consists of a primary jaw crusher, a
secondary cone crusher, a tertiary impact crusher circuit as well as screening.
Comminution operating costs were calculated from first principles as per the following
categories:
Labour
Spares and consumables
Power and water.
Due to the interrelated nature of the comminution and process plants, the comminution
labour was estimated together with process in combination. Labour costs were calculated
on a cost to company basis for five main categories of workers; the cost amounts to US$
1.17/RoM t for 28 personnel. For more details of the comminution labour count and costs,
refer to Section 20 of this report.
Spares and consumables requirements were estimated from a similar project in South
Africa; the total estimated cost for the 1.5 Mtpa RoM production case is US$ 2.38/RoM ton,
with the main spares costs being associated with the tertiary crusher circuit and rod mills.
The power consumption for comminution assumes a total installed power requirement of
2.4 MW used for 5,840 hours per year (16 hours per day as per mining plus an additional
four hours to crush and mill ore in the underground silos). The power cost amounts to US$
0.38/RoM t. Water consumption has been assumed to be nil.
Adding the above incremental costs gives an overall estimated comminution operating cost
for a 1.5 Mtpa RoM production rate of US$ 3.93/RoM t.
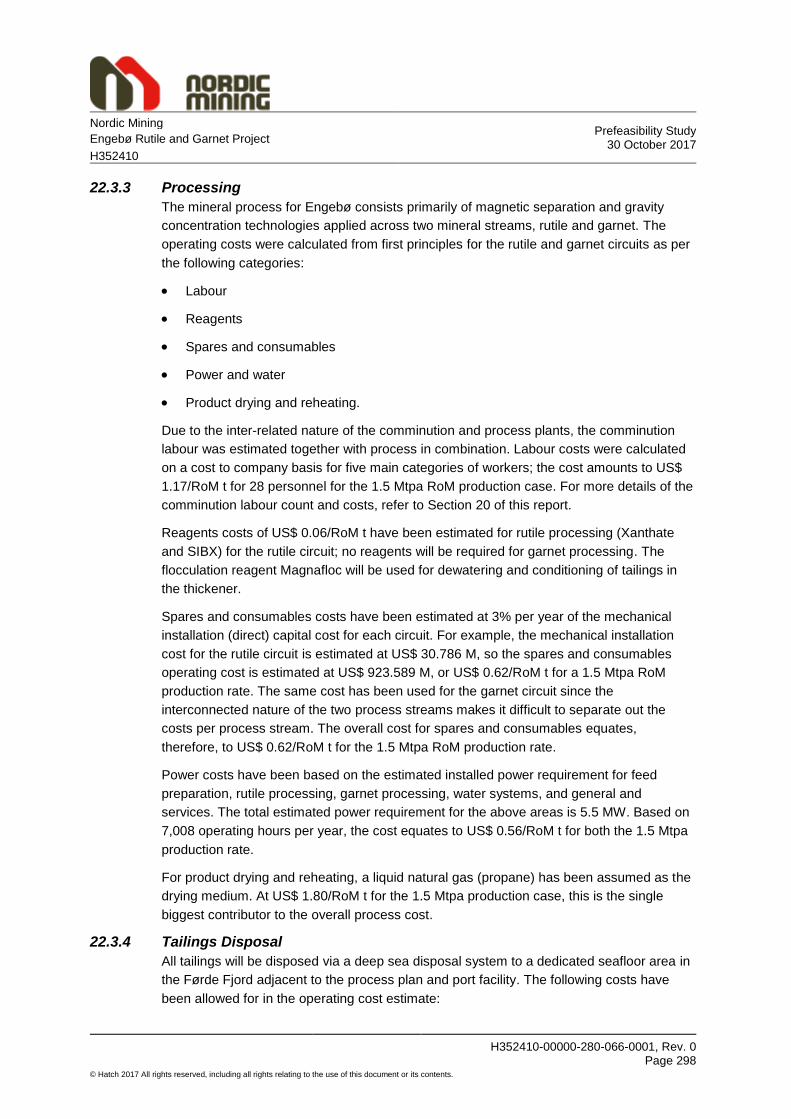
Nordic Mining Prefeasibility Study
30 October 2017 Engebø Rutile and Garnet Project
H352410
H352410-00000-280-066-0001, Rev. 0 Page 298
© Hatch 2017 All rights reserved, including all rights relating to the use of this document or its contents.
22.3.3 Processing
The mineral process for Engebø consists primarily of magnetic separation and gravity
concentration technologies applied across two mineral streams, rutile and garnet. The
operating costs were calculated from first principles for the rutile and garnet circuits as per
the following categories:
Labour
Reagents
Spares and consumables
Power and water
Product drying and reheating.
Due to the inter-related nature of the comminution and process plants, the comminution
labour was estimated together with process in combination. Labour costs were calculated
on a cost to company basis for five main categories of workers; the cost amounts to US$
1.17/RoM t for 28 personnel for the 1.5 Mtpa RoM production case. For more details of the
comminution labour count and costs, refer to Section 20 of this report.
Reagents costs of US$ 0.06/RoM t have been estimated for rutile processing (Xanthate
and SIBX) for the rutile circuit; no reagents will be required for garnet processing. The
flocculation reagent Magnafloc will be used for dewatering and conditioning of tailings in
the thickener.
Spares and consumables costs have been estimated at 3% per year of the mechanical
installation (direct) capital cost for each circuit. For example, the mechanical installation
cost for the rutile circuit is estimated at US$ 30.786 M, so the spares and consumables
operating cost is estimated at US$ 923.589 M, or US$ 0.62/RoM t for a 1.5 Mtpa RoM
production rate. The same cost has been used for the garnet circuit since the
interconnected nature of the two process streams makes it difficult to separate out the
costs per process stream. The overall cost for spares and consumables equates,
therefore, to US$ 0.62/RoM t for the 1.5 Mtpa RoM production rate.
Power costs have been based on the estimated installed power requirement for feed
preparation, rutile processing, garnet processing, water systems, and general and
services. The total estimated power requirement for the above areas is 5.5 MW. Based on
7,008 operating hours per year, the cost equates to US$ 0.56/RoM t for both the 1.5 Mtpa
production rate.
For product drying and reheating, a liquid natural gas (propane) has been assumed as the
drying medium. At US$ 1.80/RoM t for the 1.5 Mtpa production case, this is the single
biggest contributor to the overall process cost.
22.3.4 Tailings Disposal
All tailings will be disposed via a deep sea disposal system to a dedicated seafloor area in
the Førde Fjord adjacent to the process plan and port facility. The following costs have
been allowed for in the operating cost estimate:

Nordic Mining Prefeasibility Study
30 October 2017 Engebø Rutile and Garnet Project
H352410
H352410-00000-280-066-0001, Rev. 0 Page 299
© Hatch 2017 All rights reserved, including all rights relating to the use of this document or its contents.
Daily monitoring of sea disposal of tailings
Annual inspection of sea pipes
Moving of the discharge point to a new position every fifth year
Annual maintenance of valves and monitors
Power and test pumping of the seawater pump
Sampling and analysis of recipient water.
In addition to the tailings deposition activities, for permitting purposes allowance has been
made for continuous monitoring of the sea disposal of tailings as follows:
Mobilisation, fieldwork and overhaul for third-party personnel
Maintenance of a vessel
Equipment maintenance, data control and sediment sampling
Quality control, data handling and data presentation.
The cost estimation input for the above has been provided by COWI for the tailings
deposition system and DNV GL for the monitoring of the sea disposal area. Combining the
COWI and DNV GL costs gives a total estimated operating cost for tailings disposal for a
1.5 Mtpa RoM operation of US$ 0.17/RoM t.
22.3.5 Product Dispatch
Product dispatch for Engebø consists of storage silos and a shiploading system to enable
the rutile product and three garnet products to be loaded onto ships at the port. Product
dispatch operating costs were calculated from first principles as per the following
categories:
Labour
Spares and consumables
Power and water.
A labour cost for one operator for the shiploading system has been allocated, equating to a
cost of US$ 0.03/RoM t.
In a similar manner to Processing, spares and consumables costs for product dispatch
have been estimated at 3% per year of the mechanical installation (direct) capital cost for
the product dispatch equipment. For a mechanical installation cost of US$ 13.108 M, the
spares and consumables operating cost is estimated at US$ 393.249 M, or US$ 0.26/RoM
t for a 1.5 Mtpa RoM production rate.
Power costs have been based on the estimated installed power requirement for product
dispatch, which is 314 kW operating for approximately 1,000 hours per year. The cost
equates to US$ 0.03/RoM t. No water cost has been estimated for the product dispatch
facilities as this cost will be minimal.

Nordic Mining Prefeasibility Study
30 October 2017 Engebø Rutile and Garnet Project
H352410
H352410-00000-280-066-0001, Rev. 0 Page 300
© Hatch 2017 All rights reserved, including all rights relating to the use of this document or its contents.
22.3.6 Overheads
The overheads for the operation consist of a labour cost for the management,
administration and technical services team. This team is estimated to have a head count of
18, equating to US$1.18/RoM t. For further details of the make-up of the overheads cost,
refer to Section 20.
22.3.7 Rehabilitation
The cost of rehabilitation of the open pit has been estimated at NOK 0.9 M per year in the
form of a contribution to a rehabilitation fund. This cost has been allowed for in the
financial model every year throughout the LoM. On a RoM ton basis, the cost equates to
US$ 0.07/RoM t at steady state production.

Nordic Mining Prefeasibility Study
30 October 2017 Engebø Rutile and Garnet Project
H352410
H352410-00000-280-066-0001, Rev. 0 Page 301
© Hatch 2017 All rights reserved, including all rights relating to the use of this document or its contents.
23. Financial Analysis
To carry out financial analysis of the Project, a financial model was built using the FAST
(Flexible, Appropriate, Structured and Transparent) standard of financial modelling.
Figure 23-1 below shows the make-up of the main cash flows for the financial model. The
main cash flow types are revenue, capital expenditure (CAPEX), operating expenditure
(OPEX) and stay-in-business (SIB) capital. The different cash flow streams have different
drivers. These different drivers were identified and quantified when constructing the
financial model.
Figure 23-1: Cashflow Drivers for Project Activities
23.1 Key Assumptions
The financial model assumed the following as its basis:
The base date of the model is September 2017
The model calculates the cashflows on an annual basis
The design end date is 1 January 2019
The construction end date is 1 January 2021
The dilution during the open pit operation is based on a half drilling burden of 1.75 m
The dilution during the underground operation is a half burden around the stope of
1.75 m

Nordic Mining Prefeasibility Study
30 October 2017 Engebø Rutile and Garnet Project
H352410
H352410-00000-280-066-0001, Rev. 0 Page 302
© Hatch 2017 All rights reserved, including all rights relating to the use of this document or its contents.
The product sales prices used for garnet is US$ 250/t (basket price) and US$ 1,070/t
for rutile
Working capital assumptions:
Accounts receivable = 30 days
Accounts payable = 30 days
Inventory days = 60 days.
A royalty of 0.5% of the revenue from sales was applied
A corporate tax rate of 23% was assumed
A Weighted Average Cost of Capital (WACC) of 8.0% was assumed with a
corresponding post-tax WACC of 6.4%
The SIB capital is an annual expenditure which is 3% of the initial capital investment.
23.2 Options Evaluated
The orebody has two ore types, ferro-eclogite (ferro ore) and trans-eclogite (trans ore),
considered for mining. The ferro ore has higher grades of rutile and garnet than trans ore.
The ferro ore also has higher recoveries. The mining of these two ore types drives mining
strategy as grade drives revenue, which in turn dominates profitability.
A number of options were investigated to evaluate the best financial option, as discussed
in Section 12.9. The options are summarised in Table 23-1 below.
Table 23-1: Summary of Options Evaluated
Option Number
Option Description 1.5 Mtpa
1.5 Mtpa, Stepped
Upgrade to 2.0 Mtpa
1.5 Mtpa, Smoothed Upgrade to
2.0 Mtpa
1 Ferro only √
2 Ferro only √
3 Ferro only √
4 Ferro and Trans, Trans cut-off 2.5% √
5 Ferro and Trans, Trans cut-off 2.5% √
6 Ferro and Trans, Trans cut-off 2.5% √
7 Ferro and Trans, no cut-off √
8 Ferro and Trans, no cut-off √
9 Ferro and Trans, no cut-off √
Table 23-2 below summarises the key metrics for the options evaluated. The payback
period is the time to payback the initial capital invested. The internal rate of return (IRR)
calculates the return for a discounted present value for the Project of zero. The net present
value (NPV) is the discounted present value for the Project at a pre-tax WACC of 8.0%.

Nordic Mining Prefeasibility Study
30 October 2017 Engebø Rutile and Garnet Project
H352410
H352410-00000-280-066-0001, Rev. 0 Page 303
© Hatch 2017 All rights reserved, including all rights relating to the use of this document or its contents.
The operating years is the number of production years of the Project for the current
declared resource.
Table 23-2: Financial Metrics for Options Evaluated
Metric IRR
(Pre-tax) NPV
(Pre-tax) Payback Period
Life of Mine
Unit % US$ M Years Years
Options 1 23.8% 332 4.1 29
Options 2 23.4% 324 4.1 23
Options 3 22.2% 326 4.4 28
Options 4 22.9% 326 4.2 34
Options 5 23.0% 348 4.2 27
Options 6 22.3% 343 4.6 29
Options 7 21.5% 298 4.4 39
Options 8 22.2% 349 4.4 31
Options 9 21.6% 344 4.6 32
Based on its superior IRR, the preferred option is Option 1. This option forms the basis of
the discussion in the rest of this section.
23.3 Inputs
23.3.1 Production
The mined tonnage and their grade of rutile and garnet is based on the mine plan inputted
into the financial model. Figure 23-2 below shows the ore and waste production profiles for
Option 1 over the life of the Project.

Nordic Mining Prefeasibility Study
30 October 2017 Engebø Rutile and Garnet Project
H352410
H352410-00000-280-066-0001, Rev. 0 Page 304
© Hatch 2017 All rights reserved, including all rights relating to the use of this document or its contents.
Figure 23-2: Ore and Waste Production Profiles
23.3.2 OPEX
Key assumptions used to derive the OPEX are as follows:
The mine unit cost for each year was provided by the mining discipline and is based
on haulage distances, direct operating hours on equipment, drilling and blasting costs,
and labour
The non-mining operating costs were split into a fixed and variable component to be
used in the financial model. These are summarised in Table 23-3 below.
Table 23-3: Fixed and Variable Operating Costs for Non-Mining Activities
Description Fixed Annual
Cost (US$) Variable Cost (US$/RoM t)
Comminution 164,046 3.82
Garnet and Rutile Beneficiation - 5.43
Tailings Disposal 240,000 0.01
Product Dispatch 60,000 0.29
Rehabilitation 108,434
Overheads 1,700,779 0.23
0
1
2
3
4
5
6
201
7
201
9
202
1
202
3
202
5
202
7
202
9
203
1
203
3
203
5
203
7
203
9
204
1
204
3
204
5
204
7
204
9
An
nu
al T
on
na
ge
(M
illio
n T
on
ne
s)
Total Mined (Ore+Waste) Ore Mined

Nordic Mining Prefeasibility Study
30 October 2017 Engebø Rutile and Garnet Project
H352410
H352410-00000-280-066-0001, Rev. 0 Page 305
© Hatch 2017 All rights reserved, including all rights relating to the use of this document or its contents.
Figure 23-3 below shows the OPEX over the life of the Project. The total OPEX and the
OPEX per activity is shown. There is an open pit and underground mining phase with
OPEX shown by the red and green lines respectively. The red area shows the total mining
cost, open pit plus underground.
Figure 23-3: OPEX over the Life of the Project
The processing of the ore (mill) costs is the largest contributor to the OPEX over the
project life, followed by mining, overheads, product dispatch and rehabilitation.
23.3.3 CAPEX
Figure 23-4 shows the CAPEX over the life of the Project.
The initial CAPEX investment of US$ 207.2 M is profiled to be spent during initial
construction (2019 to 2021), with the last payment of US$ 23.5 M being spent in 2021
when the production is ramping up.
There is CAPEX spending of US$ 16.9 M in 2033 prior to mining going underground.
-
5
10
15
20
25
30
35
20
17
20
18
20
19
20
20
20
21
20
22
20
23
20
24
20
25
20
26
20
27
20
28
20
29
20
30
20
31
20
32
20
33
20
34
20
35
20
36
20
37
20
38
20
39
20
40
20
41
20
42
20
43
20
44
20
45
20
46
20
47
20
48
20
49
20
50
Annua
l O
PE
X (
US
$ M
illio
ns)
Total OPEX Mill Mining Overhead
Product Dispatch Rehabilitation Opencast Mine U/G Mine

Nordic Mining Prefeasibility Study
30 October 2017 Engebø Rutile and Garnet Project
H352410
H352410-00000-280-066-0001, Rev. 0 Page 306
© Hatch 2017 All rights reserved, including all rights relating to the use of this document or its contents.
Figure 23-4: CAPEX Over the Life of the Project
23.3.4 Cashflows
Figure 23-5 below shows the cashflows over the life of the Project. The net cash flow,
CAPEX, OPEX, SIB, Royalty and change in working capital are shown as vertical bars.
The red area is the total Revenue and the green and purple lines are the garnet and rutile
Revenues respectively.
56.2
127.8
23.5
16.9
-
20
40
60
80
100
120
140
20
17
20
18
20
19
20
20
20
21
20
22
20
23
20
24
20
25
20
26
20
27
20
28
20
29
20
30
20
31
20
32
20
33
20
34
20
35
20
36
20
37
20
38
20
39
20
40
20
41
20
42
20
43
20
44
20
45
20
46
20
47
20
48
20
49
20
50
CA
PE
X (U
S$
mill
ions)

Nordic Mining Prefeasibility Study
30 October 2017 Engebø Rutile and Garnet Project
H352410
H352410-00000-280-066-0001, Rev. 0 Page 307
© Hatch 2017 All rights reserved, including all rights relating to the use of this document or its contents.
Figure 23-5: Cashflows Over the Life of the Project
23.3.5 Key Financials
The key financials are summarised in Table 23-4 below. The NPV is a real pre-tax value
discounted by 8%, which is the WACC for the Project. The IRR is real with no escalations
applied. The payback period is the number of periods once operations start that generate
positive cashflow equal to the capital invested. The Life of Mine is the number of operating
years for the reserve derived in line with the guidelines of the JORC Code. The profitability
index is a ratio of the NPV divided by the capital discounted to a present value using a
WACC value of 8%.
Table 23-4: Key Financials for Base Case Option
Parameter Unit Value
NPV @ 8% US$ M 332
IRR % 23.8%
Payback Period years 4.1
Life of Mine years 29
Profitability Index ratio 3.1
The Project has a positive NPV and an IRR above 20%. Viewing Table 23-2, the base
case option (Option 1) has the highest IRR, although the NPV is not the highest. The
capital investment is lower, however, than the high NPV options. The low CAPEX
( 150)
( 100)
( 50)
-
50
100
150
20
17
20
18
20
19
20
20
20
21
20
22
20
23
20
24
20
25
20
26
20
27
20
28
20
29
20
30
20
31
20
32
20
33
20
34
20
35
20
36
20
37
20
38
20
39
20
40
20
41
20
42
20
43
20
44
20
45
20
46
20
47
20
48
20
49
Ca
shflo
w (
US
$ m
illio
ns)
Year
Total Revenue OPEX CAPEX
SIB Change in Working Capital Royalty
Nett Cashflow Garnet Revenue Rutile Revenue

Nordic Mining Prefeasibility Study
30 October 2017 Engebø Rutile and Garnet Project
H352410
H352410-00000-280-066-0001, Rev. 0 Page 308
© Hatch 2017 All rights reserved, including all rights relating to the use of this document or its contents.
requirement relative to the return is shown by the payback period (refer also to Table
23-2). The base case option has a profitability index of 3.1, implying more than three times
the return than the amount invested accounting for the time value of money in the WACC
used.
The base case option was optimised to lower the initial CAPEX investment; this lowers
overall project risk and allows flexibility to change the operation should business conditions
change.
The base case produces excess garnet, more than the expected sales profile (see Figure
23-2), in the early years. This creates an opportunity that could be exploited in a number of
ways, namely:
The extra garnet could be sold to generate revenue if the market can absorb the
garnet
The garnet could be stored for later sales. The cost of storing the garnet should be
considered. Garnet does not degrade, making storage relatively easy
The extra garnet could be sold at a discount to increase market penetration.
23.3.5.1 Post-tax financials
Table 23-5 shows the post-tax financials for the business case. The post-tax calculations
have been made for illustrative purposes only and the taxation needs to be verified by an
auditing company specialising in such services.
The corporate tax rate is assumed to be 23%. A Norwegian government budget proposal
in 2017 is for a reduction of the corporate tax rate from 24% to 23% as from 2018. At the
time of writing, there was broad political consensus for this change.
The post-tax NPV WACC is reduced to 6.4% from 8% to account for the tax effect of an
assumed Project finance structure of 60% debt and 40% equity.
The depreciation was calculated based on the allocation of the CAPEX to different
depreciation categories with different depreciation rules. The categories were:
Plant and Buildings, which for tax purposes is 32% of the capital investment. This was
depreciated using a 4% amortisation rule, where 4% of the outstanding capital can be
considered a depreciation expense
Machinery, which for tax purposes is 28% of the capital investment. This was
depreciated using a 20% amortisation rule, where 20% of the outstanding capital can
be considered a depreciation expense
The intangible capital was depreciated using a straight-line method for a period of 30
years.
The remainder of the capital that could not depreciated was subtracted from the cashflow
to calculate the taxable income. If it was more than the taxable income, the capital was
carried forward as a tax loss until all the capital was written off against taxable income.

Nordic Mining Prefeasibility Study
30 October 2017 Engebø Rutile and Garnet Project
H352410
H352410-00000-280-066-0001, Rev. 0 Page 309
© Hatch 2017 All rights reserved, including all rights relating to the use of this document or its contents.
Table 23-5: Post-tax* Financials for Base Case Option
Parameter Unit Value
Post-Tax NPV @ 6.4% US$ M 305
Post-Tax IRR % 20.8%
* The post-tax calculations have been made for illustrative purposes only. Such
calculations need to be verified by an auditing company specialising in such services
23.4 Sensitivity Analysis
23.4.1 NPV Sensitivity to WACC
Figure 23-6 shows the sensitivity of the NPV to the WACC used.
Figure 23-6: NPV Sensitivity to WACC for Option 1
Lowering the WACC has a substantial positive influence on NPV. WACC is an indicator of
the cost of capital; if a project can negotiate a low interest rate with a bank, a low WACC is
justified.
23.4.2 NPV Sensitivity
Figure 23-7 below shows the NPV sensitivity to OPEX, CAPEX and Revenue. Revenue
sensitivity is split into the contributions of garnet and rutile.
484
332
229
0
100
200
300
400
500
600
WACC=6% WACC=8% WACC=10%
NP
V (
US
$)
Mill
ions

Nordic Mining Prefeasibility Study
30 October 2017 Engebø Rutile and Garnet Project
H352410
H352410-00000-280-066-0001, Rev. 0 Page 310
© Hatch 2017 All rights reserved, including all rights relating to the use of this document or its contents.
Figure 23-7: NPV Sensitivity to OPEX, CAPEX and Revenue
The NPV is positively correlated to rutile Revenue and garnet Revenue, and negatively to
CAPEX and OPEX. Garnet Revenue has a larger influence than rutile, showing their
relative Revenue contributions. OPEX has a slightly larger influence on NPV than CAPEX.
23.4.3 IRR Sensitivity
Figure 23-8 below shows IRR sensitivity to OPEX, CAPEX and Revenue. Revenue
sensitivity is split into the contributions of garnet and rutile.
Figure 23-8: IRR Sensitivity for Option 1
-
100
200
300
400
500
600
-50% -40% -30% -20% -10% 0% 10% 20% 30% 40% 50%
NP
V @
8%
(U
S $
)
Mill
ions
Capex Opex Rutile Revenue Garnet Revenue
0%
5%
10%
15%
20%
25%
30%
35%
40%
45%
-50% -40% -30% -20% -10% 0% 10% 20% 30% 40% 50%
NP
V @
8%
(U
S $
)
Capex Opex Rutile Revenue Garnet Revenue

Nordic Mining Prefeasibility Study
30 October 2017 Engebø Rutile and Garnet Project
H352410
H352410-00000-280-066-0001, Rev. 0 Page 311
© Hatch 2017 All rights reserved, including all rights relating to the use of this document or its contents.
The IRR is positively correlated to rutile Revenue and garnet Revenue, and negatively
correlated to CAPEX and OPEX. Garnet Revenue has a larger influence than rutile,
showing their relative Revenue contributions. CAPEX has a larger influence on IRR than
OPEX. This is different to the NPV sensitivity as shown in Figure 23-8 above due to
CAPEX being an early negative cashflow.
23.5 Upside Potential to the Business Model
Figure 23-9 below shows the upside potential of the base case (Option 1).
Three upside cases as follows are shown:
Option 1A - explores increasing the production of garnet in the seventh year of
production to meet the expected garnet sales profile, which is an annual amount of
300 kt. The invested amount is estimated to be US$ 36.3 million for an increase in
RoM capacity of 240 ktpa
Option 1B - builds on Option 1A where the Project life is extended to 40 years by
including Inferred Resources. A rutile grade of 3.4% was assumed, based on the
grade of the Inferred Resources in the mine schedule (this ore was excluded from the
base case mine plan as it is not in line with the guidelines of the JORC Code)
Option 1C - builds on Option 1B, where the garnet sales match the garnet production.
This option assumes that the excess production of garnet during the initial ten year
sales build-up period is sold.
Figure 23-9: Upside Potential of Business Case
As can be seen from Figure 23-9 above, there is significant upside potential in the Project
if increased production, Inferred Resources and additional garnet sales are considered. In
this scenario, there is a 40% increase in NPV from US$ 332 M to US$ 465 M.

Nordic Mining Prefeasibility Study
30 October 2017 Engebø Rutile and Garnet Project
H352410
H352410-00000-280-066-0001, Rev. 0 Page 312
© Hatch 2017 All rights reserved, including all rights relating to the use of this document or its contents.
24. Definitive Feasibility Study Planning
Based on the favourable results achieved in this phase, it is planned for the Project to
move into the DFS phase during Q4 2017. The DFS will be undertaken in two broad
phases; the intent of this approach is to ensure that key studies, testwork, trade-offs and
set-up have been completed before mobilisation of the discipline engineering and
procurement personnel.
24.1 DFS Objectives
The primary objectives of the FS are to:
Optimise a single Project concept arising from the PFS
Mature the understanding of the risks, both for construction and performance of the
mine
Mature the engineering to an extent that supports the estimates and facilitates an
understanding of the risks to performance of the mine
Develop an AACE Class 3 CAPEX and OPEX cost estimate
Develop a firm and detailed Project Execution Plan (PEP) that defines the way the
Project will be delivered, and sets the baselines for monitoring project performance
during implementation/execution.
Secondary objectives within specific work packages include:
Business Case:
Confirm the cut-off grade
CAPEX and OPEX definition accuracy to -10 to +15%
Develop a financial model that gives direction to trade-offs and financial
sensitivities
Maintain or improve the PFS financial metrics.
Marketing:
Develop take-off agreements
Update market understanding and pricing of rutile and garnet.
Mining:
Optimise open pit design
Finalise underground infrastructure requirements
Carry out an underground mining methods study to determine the preferred mining
method
Cut-off grade determination
Update the mining production schedule.

Nordic Mining Prefeasibility Study
30 October 2017 Engebø Rutile and Garnet Project
H352410
H352410-00000-280-066-0001, Rev. 0 Page 313
© Hatch 2017 All rights reserved, including all rights relating to the use of this document or its contents.
Resource / Reserve:
Update resource model with updated drilling results
Update reserve with outcome of the feasibility study.
Process / Metallurgical:
Carr out variability testwork to confirm/validate the current flowsheets
Update the process design criteria
Update the mass and energy balance and flow sheets.
Engineering:
Complete Arena modelling to show the material flow
Finalise the bulk water requirements and storage capacities
Optimise the bulk power requirements
Mature the 3D model to suit the execution strategy
Complete enough engineering to support an AACE Class 3 estimate.
Modularisation:
Carry out trade-off studies to confirm whether modularisation is to be adopted as
part of the Project development strategy
Visit potential module yards if the strategy confirms the adoption of modularisation.
Project Planning:
Tailings disposal
Mature engineering to support an AACE Class 3 estimate.
24.2 Scope of Work
The high-level activities envisaged for the two study phases include:
Phase 1 – Project set-up, key studies and trade-offs, including:
Update resource model
Mining geotechnical studies, including open pit, underground and seismic risk
Mining trade-off studies, including mine design and schedule, and mine planning
Mineral processing testwork to provide input to the process design criteria and
process flow sheets. The phase 1 testwork will be used to develop the flow sheets
for the DFS. Additional testwork will run in parallel and will be considered
confirmatory
Project set-up for Phase 2, including development of key documentation for the
DFS, finalisation of project design standards and criteria

Nordic Mining Prefeasibility Study
30 October 2017 Engebø Rutile and Garnet Project
H352410
H352410-00000-280-066-0001, Rev. 0 Page 314
© Hatch 2017 All rights reserved, including all rights relating to the use of this document or its contents.
Modularisation and logistics studies – the strategy for the process plant fabrication,
assembly and construction will be evaluated and approved before commencement
of Phase 2 design development work. This study will encompass engineering,
logistics and construction
Determination of a procurement strategy and a procurement operating plan for the
DFS
Jetty assessment.
Phase 2 – FEL-3 Design Development
Multi-disciplinary engineering design development
Procurement engagement with the market to support development of capital cost
estimate
To protect the schedule, the construction enquiries will be issued to the market
with indicative bills. Once the tenders have been received, the proposals will be
updated with the latest bills from the engineering team
Development of DFS CAPEX and OPEX
Other studies and support for external consultants
Development of the Project Execution Plan (PEP) and Construction Schedule
QRA.
24.3 Schedule
A high-level DFS schedule as shown in Figure 24-1 below has been developed. Based on
a start date of 1 November 2017, it is planned to complete the DFS by 22 November 2018.
Thereafter, it is likely that the Project will proceed directly into the FEED (Front End
Engineering Design) phase, where critical path engineering and procurement work will be
continued to expedite the start of construction and to minimise the construction period.

Nordic Mining Prefeasibility Study
30 October 2017 Engebø Rutile and Garnet Project
H352410
H352410-00000-280-066-0001, Rev. 0 Page 315
© Hatch 2017 All rights reserved, including all rights relating to the use of this document or its contents.
Figure 24-1: DFS Schedule
24.4 Project Team Location/Coordination
The DFS Project team will be based in Johannesburg, South Africa, with significant input
from the Nordic Mining team based in Oslo, Norway. Coordination trips between the
Johannesburg and Oslo teams, typically once every four weeks, have been allowed for in
the Project schedule, together with weekly meetings, monthly steering committee meetings
and monthly reports.
Nordic Mining Prefeasibility Study
30 October 2017 Engebø Rutile and Garnet Project
H352410
H352410-00000-280-066-0001, Rev. 0 Page 316
© Hatch 2017 All rights reserved, including all rights relating to the use of this document or its contents.
25. Execution Planning
25.1 Introduction
A preliminary Project Execution Plan (PEP) has been developed for the Project, based on
the following key dates:
Start of the DFS – Q4 2017
Completion of the DFS – Q4 2018
Start of FEED – Q4 2018
Completion of FEED – Q2 2019
Start of construction – Q2 2019
End of construction – Q2 2021
Start of commissioning and production ramp-up – Q2 2021
End of commissioning – Q3 2021
End of production ramp-up – Q4 2021.
The above dates assume that timeous availability of funding for each phase to enable the
phases to run continuously. Key aspects of the PEP are summarised below.
25.2 Key Programme Drivers
Key programme drivers are summarised below.
25.2.1 Process Plant Design and Build Schedule
To de-risk the schedule, certified vendor data will be procured during the FEED phase.
This will enable the engineering to mature to allow contractors to mobilise the moment
funding is secured.
A two-year construction period is currently forecasted; this period may be optimised with a
modularisation strategy that will be finalised during the DFS.
25.2.2 Construction and Contracting Strategy
Even with a low experience base in terms of construction of processing plants for hard
rock mines, the manufacturing and construction industry in Norway is considered to be
mature due to its support of the hydrocarbons industry and large infrastructure projects.
During the DFS, the project team will engage with the construction industry in Europe to
assess their capacity to develop the infrastructure. This will be significantly influenced by
the modularisation strategy that will decided on at the start of the DFS. A modularisation
study will be undertaken to assess module yards in both Europe and the Far East. It is
anticipated that due to the plant position and the ability to dock right next to the plant site,
modularisation will be cost and safety effective.
25.2.3 Mine Ramp-up
The ramp-up of the open pit mine to 1.5 Mtpa Run of Mine (ROM) is estimated to take one
year, including commissioning of the process plant.

Nordic Mining Prefeasibility Study
30 October 2017 Engebø Rutile and Garnet Project
H352410
H352410-00000-280-066-0001, Rev. 0 Page 317
© Hatch 2017 All rights reserved, including all rights relating to the use of this document or its contents.
At this stage, it is planned to mine and treat only ferro-eclogite ore, which will eliminate the
need to ore blending.
25.2.4 Logistics
With the availability of the existing deep-water quay adjacent to the plant area, logistics is
not seen as a major risk to the Project. Some work will be required in the DFS phase to
confirm the condition of the quay and to take remedial action (if required) to enable it to
load ships of up to 30 kt capacity. Such a capacity may be required to ship garnet to
potential markets in the USA or Europe.
25.2.5 Operational Readiness
This will be a key focus area for Nordic Mining as Engebø will be the company’s first
operating mine; Nordic Mining will be required to rapidly transition from an exploration
company to a project development company and then to an operating company.
25.2.6 Health and Safety
A project specific health and safety policy and associated standards will be developed.
These will be practical application in line with Norwegian regulations and industry best
practice standards.
25.2.7 Environmental and Social Responsibility
Environmental and social responsibility will be a key focus area in DFS. With daily
restrictions on mining hours (7 am to 11 pm only, weekdays only) and annual restrictions
on mining during the salmon spawning season in June, the extent to which such
restrictions will apply during the construction period will need to be determined.
Construction is anticipated to run for two years without any restrictions.
25.2.8 Expansion Opportunities
There may be an opportunity to increase the throughput of the mine and plant at a later
stage; in particular, the mining of trans-eclogite ore will be considered should process
testwork in the next phase indicate economic recovery of this ore. The current design
caters for expansion of the mining and process facilities at a future date.
25.2.9 Cost Sensitivity
With Norway being a high cost country in which to construct and operate a Project (albeit
Norway is also a highly productive country), minimising operating costs and capital costs
will be key to the long-term success of the Project. As such, the Project design needs to
adopt a ‘mean and lean’ approach as early as possible. Value engineering throughout the
DFS and FEED phases will be essential to ensure that capital costs are minimised and
that reduced capital costs do not result in increased operating costs.
25.3 Guiding Principles
25.3.1 Health and Safety
Nordic Mining will need the Project to be designed and constructed using a ‘best
practice’ safety approach in a country with stringent health and safety regulations

Nordic Mining Prefeasibility Study
30 October 2017 Engebø Rutile and Garnet Project
H352410
H352410-00000-280-066-0001, Rev. 0 Page 318
© Hatch 2017 All rights reserved, including all rights relating to the use of this document or its contents.
Safety will be carried out according to policies and systems. On the ground
supervision will be mobilised to site once construction starts, reporting to the Nordic
Mining Safety Manager; all contractors will supply safety supervision to manage their
own staff
The Project Team will finalise the construction infrastructure in the DFS, but due to the
proximity of medical facilities, it is not foreseen that the Project will develop extensive
medical facilities.
25.3.2 Project and Construction Organisation
The primary consultant appointed for the DFS and subsequent phases will co-ordinate
all other consultants and contractors
The primary consultant will report to all other consultants on the work done during the
DFS, FEED and construction phases
The primary consultant will compile all standard project-wide technical and commercial
specifications and issue and receive all enquiries for the studies on behalf of all
consultants.
25.3.3 Contracting Models
Key contract packages will be identified during the DFS phase
The contracting model will be EPCM for consultants (rates reimbursable)
Contractor versus owner mining will be traded off during DFS to ensure the best
strategy is selected for execution; if applicable, a number of contractor mining
strategies will be considered to determine the best fit for the Project
The mine equipment supplies and maintenance philosophy will be finalised in DFS
Contracting models will be finalised in DFS
During the DFS, it will be determined if it is feasible to place a low cost fixed price
construction contract (SMEIP – Structural, Mechanical, Electrical, Instrumentation and
Piping)
There is a possibility of appointing a separate contractor from processing for all
surface and underground conveyors
Final project budget will be released when the construction contractors are appointed
For major packages, the site installation shall be done by one SMEIP contractor.
Package suppliers to provide installation supervision support (where required)
A logistics contractor or contractors will be selected during the DFS. It is
recommended that this contractor be used by all companies transporting goods to the
Project site
An in-country customs clearing agent may need to be appointed to expedite import of
all materials required for construction

Nordic Mining Prefeasibility Study
30 October 2017 Engebø Rutile and Garnet Project
H352410
H352410-00000-280-066-0001, Rev. 0 Page 319
© Hatch 2017 All rights reserved, including all rights relating to the use of this document or its contents.
A construction housing strategy will be finalised during DFS. Depending on the
planned number of construction personnel, a temporary construction camp may be
built on site to house construction workers with catering facilities on site; alternatively,
housing of construction staff in the local area (including Naustdal) will be considered if
the numbers are low.
The mine contracting model for underground development and operations will be
finalised in DFS
Insurance needs and requirements will be developed during the DFS
Three separate allowances will be estimated and managed:
Growth allowance (managed by EPCM)
Contingency (managed by owner’s team)
Executive fund (managed by Executives).
25.3.4 Project Controls
During the DFS, the system configuration for project controls will be finalised; the
system will be managed by the primary consultant
The primary consultant will complete cost reports for all areas they are managing,
including all sub-consultants
The primary consultant will compile a monthly report for review and edit by Nordic
Mining before distribution. The report will cover all activities relevant to the Project and
not just the areas under the primary consultant’s control
A master schedule in Primavera will be managed by the primary consultant
Nordic Mining will be responsible for consolidating owner’s costs. Where appropriate,
information will be shared with the primary consultant to ensure correct incorporation
into reporting
A suitably qualified QS company will be appointed to provide the project quantity
surveying services during construction
All consultants will certify and approve their respective estimates
The QS company appointed will provide contract administrators to the Project team
during execution. These administrators will be managed by the primary consultant’s
commercial manager
A document management system will be set up based on the primary consultant’s
system for central filing of all incoming and outgoing project documentation. Company
standards will be set for document and asset numbering.
25.3.5 Construction Services, Procurement and Logistics
During the DFS, the optimum procurement strategy will be investigated and finalised

Nordic Mining Prefeasibility Study
30 October 2017 Engebø Rutile and Garnet Project
H352410
H352410-00000-280-066-0001, Rev. 0 Page 320
© Hatch 2017 All rights reserved, including all rights relating to the use of this document or its contents.
Commercial templates to support the selected contracting strategy will be developed
by the primary consultant and to be used for all contracts
Logistics:
To be managed by the primary consultant with the primary consultant’s resources
in Norway
The Project will appoint a loadmaster to be present at the logistics supplier’s
warehouse
The primary consultant will ensure that the proper administration is carried out for
all the logistics. A detailed RACI matrix will be developed in DFS for the entire
supply chain
A warehouse will be established on site and managed by the primary consultant
for all project related equipment and materials.
A low-cost procurement strategy for low-risk items (certain equipment, bulk materials
and construction) will be identified and investigated during DFS
Site fabrication for low-tech bulky items will be investigated during DFS
All bulks will be procured by the contractors (cement, piping, steel, cable, etc.).
Contracts for fabrication and installation will be re-measurable from drawings. It
remains the contractor’s responsibility to order and manage the bulk material to
fabricate as per design
The primary consultant will develop a quality and inspection plan for manufacturing at
works (before shipping) if applicable
A temporary fuel station will be established on site by a fuel supplier with the supplier
selling fuel to contractors at negotiated rates
Finance auditing will be managed by Nordic Mining’s Chief Financial Officer.
25.3.6 Design Principles
Engineering Standards will be finalised in DFS
Construction facilities (offices, stores, accommodation, workshops etc.), where
possible, will be used for permanent operational use to save CAPEX
All documentation will be in English. Final copies of documentation to be used for
training and operations (e.g. installation procedures, operating and maintenance
manuals) may need to be supplied both in English and Norwegian
All safety related signs and documents will be in English and Norwegian.
25.3.7 Information Technology
A 5G cellular network (to replace the current 4G network) at site is being established by
cellphone companies at the current time and is likely to be available in 2018 before the
start of construction facilities. Such a system will be able to handle all the data
requirements of the Project.

Nordic Mining Prefeasibility Study
30 October 2017 Engebø Rutile and Garnet Project
H352410
H352410-00000-280-066-0001, Rev. 0 Page 321
© Hatch 2017 All rights reserved, including all rights relating to the use of this document or its contents.
25.3.8 Security
A security plan will be developed during the DFS phase and will be amended as required
by the main contracting companies once they have been appointed.
25.4 Organisation and Responsibilities
As a minimum, the owner’s team should consist of the following key roles:
CEO, Nordic Mining
CFO, Nordic Mining
Project Manager/COO, Nordic Mining
(The above three personnel will constitute the Project Steering Committee, together
with Project Engineering Team personnel)
Process and Engineering Manager, Nordic Mining
Mining Manager, Nordic Mining
Geology Manager, Nordic Mining
Site Manager, Nordic Mining
Procurement Manager, Nordic Mining
Operational Readiness Manager, Nordic Mining
Environmental and Social Manager
Marketing Manager
Chief Accountant.
Some of the above roles may be combined as applicable. As an example, marketing could
fall under Process or Geology; the Chief Accountant role could be combined with the CFO
role. The Environmental and Social Manager or the Operational Readiness Manager may
take on the role of Safety Manager.
25.5 Local and Government Relations
All local and government relations will be handled by Nordic Mining, with input from
consultants and the EPCM company as required. It is recommended that Nordic Mining
appoint an Environmental Manager in the DFS phase to manage environmental and
permitting issues.

Nordic Mining Prefeasibility Study
30 October 2017 Engebø Rutile and Garnet Project
H352410
H352410-00000-280-066-0001, Rev. 0 Page 322
© Hatch 2017 All rights reserved, including all rights relating to the use of this document or its contents.
26. Risks and Opportunities
Risks and opportunities for the Project were assessed by means of four exercises, namely:
A “Hazard 2” study (PFD risk review)
An overall risk assessment, resulting in the generation of a risk register
Opportunities assessment
Capital cost risks associated with the capital cost estimate, schedule to first production
and project risks.
The results of the above studies are summarised below.
26.1 “Hazard 2” Study
A “Hazard 2” study was undertaken to review potential risks related to the process flow,
mass balances, operational interface concerns, equipment locations, maintenance access
and general occupational safety hazards. The scope of the study covered the open pit
mine and plant. The study included the identification of appropriate remedial measures
which can be taken to mitigate risks and hazards. No consideration was given to the
hazards associated with underground mining at this stage since underground mining is
only expected to start after 15 years of open pit operations at the earliest.
A total of 265 potential hazards were identified. All potential deviations and hazard
scenarios with a high or extreme risk rating were assigned additional mitigation measures,
resulting in 27 risk reduction and mitigation actions being noted. One of the 27 risk
reduction measures was addressed through the mine design in this phase and the
remaining 26 areas will be addressed in the DFS phase.
26.2 Risk
Project risk is defined as the effect of uncertainty on Project objectives (ISO31000:2009).
Risks to the Project were identified, described and treatment plans proposed using the
Hatch Project Risk Management framework and process. A risk assessment workshop
was held on 9 August 2017 and the risks identified were prioritised in terms of their
consequences and likelihood according to the Hatch Risk Matrix. Material risks were
assigned to risk champions who proposed risk response plans (treatment actions).
Response plans have been described and need to be considered in the overall project
scope for the DFS phase of the Project.
Twenty-one project risks were identified and initially rated according to their expected
consequence(s) and likelihood of occurrence. Of the 21 project risks, two were
opportunities, and four were retired or closed as any uncertainty around their occurrence
was eliminated. Fourteen risks described in the register are threats, of which seven are
considered high risks (with a risk score above 20), five are moderate risks (with a risk
score between 10 and 20) and two are low risks (with a score of less than 10). Table 26-1
below describes the threats from the risk register and the response plans which need to be
considered when the scope for the DFS phase is defined.

Nordic Mining Prefeasibility Study
30 October 2017 Engebø Rutile and Garnet Project
H352410
H352410-00000-280-066-0001, Rev. 0 Page 323
© Hatch 2017 All rights reserved, including all rights relating to the use of this document or its contents.
Table 26-1: Threats
ID Risk Name & Description Cause Impact Timing C L Score Risk Response
001 Variability in Ore Variability in ore types reduces recoveries and increases RoM production requirements
1. Variability in ore types 2. Blending will be required to reduce variability in feed to process plant
Lower recoveries & revenue; increased ore losses due to need to blend unmatched volumes of different ore types
Operations
E
Ma
jor
C
Po
ssib
le
29 Identify suitable sighter tests to estimate recovery of rutile from different ore types, potentially at NTNU.
004 Sea Disposal Permitting Compliance Non-compliance with permitting requirements of sea disposal site
Various - technical or operational
Operational shutdown; major fines & prosecution; major litigation
Operations
E
Ma
jor
D
Unlik
ely
25 Conceptual design advanced to a PFS standard, including measures to ensure compliance with permitting requirements
006 Rutile Product Price Lower than anticipated product prices for rutile
Natural chemical and physical properties; no rutile marketing sample presented for customer evaluation
Project economics PFS
D
Sig
nific
an
t
C
Po
ssib
le
24 Marketing sample planned to be produced early in DFS for customer evaluation
007 Garnet Product Price Lower than anticipated product prices for garnet
Potential impact of Engebø production on the European market is unknown at this stage
Project economics PFS
D
Sig
nific
an
t
C
Po
ssib
le 24 Marketing sample
planned to be produced early in DFS for customer evaluation
022 Laboratory Capacities Large amount of test work required, laboratories may be bottleneck
Laboratory capacity relative to test work required
Schedule impact during FS DFS
D
Sig
nific
an
t
C
Po
ssib
le
24 Ascertain current workloads and see about “booking slots” as soon as project decision is made
021 Highly Abrasive Material Highly abrasive material may require expensive equipment and maintenance levels and could lead to unacceptable down time, compromising revenue
Abrasive material to process Production downtime compromises revenue. High maintenance costs increases OPEX and reduces net revenue
Operations
C
Mo
de
rate
B
Lik
ely
22 Import lessons from other rutile and garnet sites, investigate and design for abrasion resistance. Added 5% to high and max ranges in QRA (4 September 2017)

Nordic Mining Prefeasibility Study
30 October 2017 Engebø Rutile and Garnet Project
H352410
H352410-00000-280-066-0001, Rev. 0 Page 324
© Hatch 2017 All rights reserved, including all rights relating to the use of this document or its contents.
ID Risk Name & Description Cause Impact Timing C L Score Risk Response
023 Quay Access during Construction The road from the site to the quay, which may need to be used to deliver heavy plant & equipment for construction, may need to be upgraded
Road between quay and site not adequate for heavy deliveries, steep gradient (due to short distance) between key (sea level) and site (30- to 60 m elevation)
Temporary access road may need to be developed to cater for heavy and large deliveries (cranes, plant & equipment, vendor packages etc.)
Construction
C
Mo
de
rate
B
Lik
ely
22 Determine requirement to construct a temporary road from the key and update the contingency fund accordingly
017 Xanthate in Waste Stream Xanthate, a chemical required in the process, will be present in the waste stream. An environmental assessment of this and other chemicals that follow the tailings stream will be done in order to apply for a discharge permit to include the chemicals
Xanthate, the chemical required in the flotation circuit for rutile recoveries, is potentially toxic at certain levels and in certain environments. The risk through deposition in a fjord environment needs to be evaluated
Toxicity levels could compromise permitting, or require additional OPEX to remediate
DFS
D
Sig
nific
an
t
D
Unlik
ely
19 Identify opportunities to minimise waste stream; Quantify volumes reporting to co-disposal and determine impact on eco-systems; Identify contingency waste disposal of pyrite; Test work indicates lower consumption requirement approaching the legal threshold
016 Variability in Comminution Performance Comminution results may vary compromising liberation
Variability in the ore and inherent to the comminution process (hard rock)
Lower recoveries & revenue DFS
C
Mo
de
rate
C
Po
ssib
le 18 Adjust the flow sheet and
re-estimate based on new PFD
009 Garnet Recoveries Lower than anticipated process recoveries for coarse garnet
Recovery of coarse garnet requires additional testwork
Reduced revenue; increased OPEX & CAPEX
PFS
C
Mo
de
rate
D
Unlik
ely
13 Coarse sample will be sent to the laboratory; should results be below expectations, additional test work will be required to determine at which next finer PSD an acceptable recovery is achieved. Work will be scoped and scheduled as soon as preliminary results are received

Nordic Mining Prefeasibility Study
30 October 2017 Engebø Rutile and Garnet Project
H352410
H352410-00000-280-066-0001, Rev. 0 Page 325
© Hatch 2017 All rights reserved, including all rights relating to the use of this document or its contents.
ID Risk Name & Description Cause Impact Timing C L Score Risk Response
019 Uncertainty in Pricing Parameters There are many specifications that determine pricing and discount levels that may be difficult to meet on a sustained basis
Customer specifications are stringent and thresholds are tight
Lower prices, increased discounts compromises revenue
Operations
C
Mo
de
rate
D
Unlik
ely
13 Ensure product quality (impurities and PSD) complies with market specifications through the market analysis and process optimisation. Ensure Nordic Mining understands exactly what customers use the product for
015 PFD Updates Test work is not complete, bulk sample results are outstanding for variability test. PFDs may need to be re-developed to ensure minimum rutile recovery of 94.9%
Test work not completed, bulk sample results outstanding for variability test (rutile recovery below 94.9%)
Process design requires adjustment before the end of the PFS phase/ at the start of the FS
PFS
B
Min
or
C
Po
ssib
le
12 Understand trans ore characteristics before the QRA is conducted; cost and time implications to be catered for in contingencies for the first stage of DFS
008 Permitting Relevant permits not obtained in time
Several permits are required to construct and operate, e.g. planning, building, production, pollution, permitting for water supply etc. Key permits (zoning plan and discharge permit) are already in place
Schedule and production impact - production may be delayed
Ramp Up
B
Min
or
D
Unlik
ely
8 Permitting checklist & schedule to be drawn up in early DFS. Management has a knowledge of requirements and will track permitting documentation timeously from PFS onwards
018 Construction Restrictions Noise levels may lead to objections to construction activities after hours and over weekends
Construction activities will be noisy
Inability to recover schedule during weekends or after hours
Construction
B
Min
or
D
Unlik
ely
8 Ensure communication is timely and comprehensive

Nordic Mining Prefeasibility Study
30 October 2017 Engebø Rutile and Garnet Project
H352410
H352410-00000-280-066-0001, Rev. 0 Page 326
© Hatch 2017 All rights reserved, including all rights relating to the use of this document or its contents.
26.3 Opportunities
Two risks were considered opportunities (i.e. uncertainty that could have a positive effect
on project objectives). Table 26-2 below describes the opportunities captured in the risk
register.

Nordic Mining Prefeasibility Study
30 October 2017 Engebø Rutile and Garnet Project
H352410
H352410-00000-280-066-0001, Rev. 0 Page 327
© Hatch 2017 All rights reserved, including all rights relating to the use of this document or its contents.
Table 26-2: Opportunities
ID Risk Name & Description Cause Impact Timing C L Priority Risk Response
012 Eastern Ore Resource Definition
Ore resource definition in Eastern extension of orebody may support additional flexibility in 15+ years of the mine plan
Eastern extension exploration drilling to be conducted
Additional flexibility regarding ore variability and blending requirements
DFS
C
Mo
de
rate
C
Po
ssib
le
18 Decision to be made on the need for additional drilling after construction
020 Time to Market
There may be significant upside to early production given current price trends
Garnet and rutile prices trending upwards
Increased revenue, payback acceleration
Ramp Up
C
Mo
de
rate
C
Po
ssib
le
18 Compile an alternative, fast track project schedule; ensure risks to acceleration are considered

Nordic Mining Prefeasibility Study
30 October 2017 Engebø Rutile and Garnet Project
H352410
H352410-00000-280-066-0001, Rev. 0 Page 328
© Hatch 2017 All rights reserved, including all rights relating to the use of this document or its contents.
26.4 Capital Cost Risks
In accordance with PFS standards and requirements, a QRA was carried out on the
Project to determine the Project capital risk profile.
Taking into account the Project’s context (greenfields mine and plant), and the fact that
Nordic Mining has a limited portfolio of projects, contingency is proposed at 80%
confidence (i.e. the P80 amount) and described at 50% confidence (i.e. the P50 amount).
Table 26-3: Project Contingency Summary
P50 %* P80 %
Contingency US$ 19.234 M 11.1% US$ 34.195 M 19.8%
* Percentage of the base estimate, i.e. US$ 172.953 M before contingency
As the Project is in the PFS phase, the project execution and construction schedule is not
yet at a detailed stage of development, therefore this aspect of the Project was not
modelled. Assuming the DFS is completed and approved by the end of 2018, the project
execution phase would commence in Q4 2018 or Q1 2019 and commissioning will finish
by the end of Q1 2021. This QRA assumes a risk allowance of three months for this
timeline, which would need to be catered for in a detailed execution plan.
When benchmarked to the AACEI guidelines, the accuracy of the capital estimate for a
Class 3 to 4 estimate is as shown in Table 26-4 below:
Table 26-4: Project Capital Estimate Accuracy
Accuracy AACEI Project
Low -5% to -20% -9%
High +10% to +30% 14%
Table 26-5 below summarises the P Value profile of the total capital risk analysis, taking
into account the estimate and schedule risk allowance, as well as discrete project risk
events.
Table 26-5: Confidence Levels and Contingency Results
Confidence Value
(US$ M) Contingency
(US$) Percentage
Base Estimate 172.953 0 0%
10% 178.683 5.729 3.3%
Mean 194.532 21.578 12.5%
50% 192.188 19.234 11.1%
80% 207.149 34.195 19.8%
90% 215.496 42.542 24.6%

Nordic Mining Prefeasibility Study
30 October 2017 Engebø Rutile and Garnet Project
H352410
H352410-00000-280-066-0001, Rev. 0 Page 329
© Hatch 2017 All rights reserved, including all rights relating to the use of this document or its contents.
27. Value Improving Practices
Project guidelines for value improvement practices were used to focus on identifying
opportunities to improve the business case of the Project, as well as capital estimate
opportunities to be addressed in the DFS phase of the Project. The following aspects of
value improvement were considered:
Technology selection - to ensure that the technology chosen is the most competitive
available technology; focuses on evaluation and selection of technology that is
appropriate for the Project and is a viable solution for the business need
Process simplification - to reduce capital and/or operating costs by reduction of
process steps/ process complexity; an examination of the Project’s overall
manufacturing process and facilities to identify non-revenue producing and non-value
adding processes or process steps
Energy optimisation - to identify the facility, process and equipment options that
achieve the most economical use of energy; employ technologies or materials of
construction to optimise energy usage; make use of thermal or fuel waste streams to
generate energy or reduce thermal or fuel requirement via recycling
Sustainable development - to address sustainability objectives during the study
phases in order to meet Nordic Mining’s corporate sustainability objectives
Designing for safety - to consistently produce facility designs that are safe to construct,
operate and maintain
Standardisation - to apply proven engineering and process standards and
specifications that will facilitate a broad spectrum of proven manufacturing methods
and vendors, negating the need for managing changes on-the-run
Customised standards and specifications - to ensure that the cost of a facility is not
increased by the application of codes, standards and specifications that exceed the
actual needs of the specific facility.
The above elements were considered in the application of engineering and design
deliverables, which resulted in the opportunities listed below in Table 27-1 being identified.

Nordic Mining Prefeasibility Study
30 October 2017 Engebø Rutile and Garnet Project
H352410
H352410-00000-280-066-0001, Rev. 0 Page 330
© Hatch 2017 All rights reserved, including all rights relating to the use of this document or its contents.
Table 27-1: Value Improvement Opportunities
Idea Generation 1st Pass Evaluation 2nd Pass Risk Rating Decision
# Idea Description Benefit Feasible? Reduce CAPEX
?
Business Case
Discard / Proceed
1 By incorporating recovery processes, materials handling facilities and catering for stockpiles in the design of the plant layout, produce armour rock from mined waste rock
Armour rock can be produced from hard waste rock mined. The opportunity requires test- and design- work to determine recovery processes required, as well as determination of product specifications that can be achieved which needs to be compared to market requirements
High level returns and possible NPV improvements are promising and warrant additional investigation of the opportunity
Yes No Yes Proceed Space, due to topographical conditions, may be limited, and stockpiling will require some space. Product and material handling will need to be carefully considered to prevent Armour rock collections from disrupting rutile and garnet collections at the quay.
Medium Study
2 By moving the comminution circuit underground, save CAPEX by eliminating the need for waffle cladding of the comminution structure
Moving the grinding, crushing and milling circuits underground will eliminate the need for waffle cladding for reducing noise levels
Potential difference between cost of cladding versus cost of underground accommodation to be investigated
Yes No No Discard Initial consideration of the opportunity highlighted the impracticalities as well as the high costs of this idea. The costs are unlikely to be less than the cost of waffle cladding the comminution structure.
High No Go

Nordic Mining Prefeasibility Study
30 October 2017 Engebø Rutile and Garnet Project
H352410
H352410-00000-280-066-0001, Rev. 0 Page 331
© Hatch 2017 All rights reserved, including all rights relating to the use of this document or its contents.
Idea Generation 1st Pass Evaluation 2nd Pass Risk Rating Decision
# Idea Description Benefit Feasible? Reduce CAPEX
?
Business Case
Discard / Proceed
3 By incorporating recovery and potentially drying processes, as well as designing product stockpiling/ binning in the design and layout of the plant, coarse garnet waste streams may be converted into a saleable sandblasting product
Garnet is a very hard material and may be suitable as a sandblasting material, or as an additive to sandblasting material
High-level returns and possible NPV improvements may warrant additional investigation of this opportunity, depending on the extent of process and product storage requirements
Maybe No Maybe Proceed Space, due to topographical conditions, may be limited, and product storage will require some space. Product and material handling will need to be carefully considered to prevent collections from disrupting rutile and garnet collections at the quay.
Medium Study
4 By reducing primary crusher bins capacity to 4 or 5 days, maintain operability levels and reduce CAPEX
Reduce primary crusher bin capacity from 8 to 4 to 5 days, and make an allowance for the balance of 3 to 4 days to be constructed later (CAPEX to be deferred)
Deferment of CAPEX may increase the business case and assist in reaching the Project financial hurdle rates
Yes Yes Yes Proceed Bin capacity will need to be 8 days for sustaining operations in the event of significant disruptions in mining, therefore the CAPEX will need to be spent at some stage.
Medium Study
5 Reduce CAPEX by removing the fine and coarse buffer silos ahead of the dry mill circuit; to be replaced with conventional outdoor stockpiles
Replace buffer silos, together with conveyance mechanisms with a conventional stockpile combined with front-end loading into a loading bin
Conventional stockpiles can be established for significantly lower CAPEX requirements, although there will be operational implications for the reclamation of stockpiles through an FEL into a loading bin
Yes Yes Maybe Proceed Conventional loading will require a front-end loader, a loading bin, as well as the employment of an operator for loading, although loading will not be continuous and should only be required for about 10% of operating time.
High Study

Nordic Mining Prefeasibility Study
30 October 2017 Engebø Rutile and Garnet Project
H352410
H352410-00000-280-066-0001, Rev. 0 Page 332
© Hatch 2017 All rights reserved, including all rights relating to the use of this document or its contents.
Idea Generation 1st Pass Evaluation 2nd Pass Risk Rating Decision
# Idea Description Benefit Feasible? Reduce CAPEX
?
Business Case
Discard / Proceed
6 Defer fine garnet circuit by 2 to 4 years (remove WHIMS)
The fine garnet product has a long sales ramp-up period; deferring the production of the product may save CAPEX thereby enhancing the business case
CAPEX can be deferred by deferring the construction of the fine garnet circuit; will comprise 37.5% of garnet revenue for the deferment period
Yes Yes No Discard The net revenue discarded by discarding fine garnet product in the first 2 years is greater than the CAPEX likely to be deferred
Very High
No Go
7 Investigate fine garnet recovery through the dry rutile circuit only (i.e. not through WHIMS)
Remove fine garnet wet gravity circuit and all dewatering and drying components of the dry garnet circuit. Remove the tails dewatering required for the fines garnet circuit.
Removal of dewatering and drying components of the dry garnet circuit, as well as the tails dewatering required for the fines garnet circuit resulting in CAPEX reduction
Yes Yes Yes Proceed The WHIMS circuit was incorporated for the process effectiveness, and the alternative needs to have comparable effectiveness
Medium Study
8 By adding saline to tails, reduce and/or eliminate the water recovery process and reduce CAPEX
Adding saline to the tails will allow tailings to report directly to fjord disposal without water recovery requirements
Reduction in CAPEX Maybe Yes Maybe Proceed Fresh water recovery is central to the water and environmental permits; the opportunity would mean higher water consumption (due to no recovery) which could compromise permitting
Very High
Study
9 Reduce CAPEX by reducing fresh water tank capacity from 24 to 12 hours
Reduce the capacity in the fresh water reservoir tank to 12 hours
Reduction in CAPEX Yes Yes Maybe Proceed Reduced water capacity to 12 hours; any disruption to supply beyond 12 hours will cause the plant to shut down
High Go
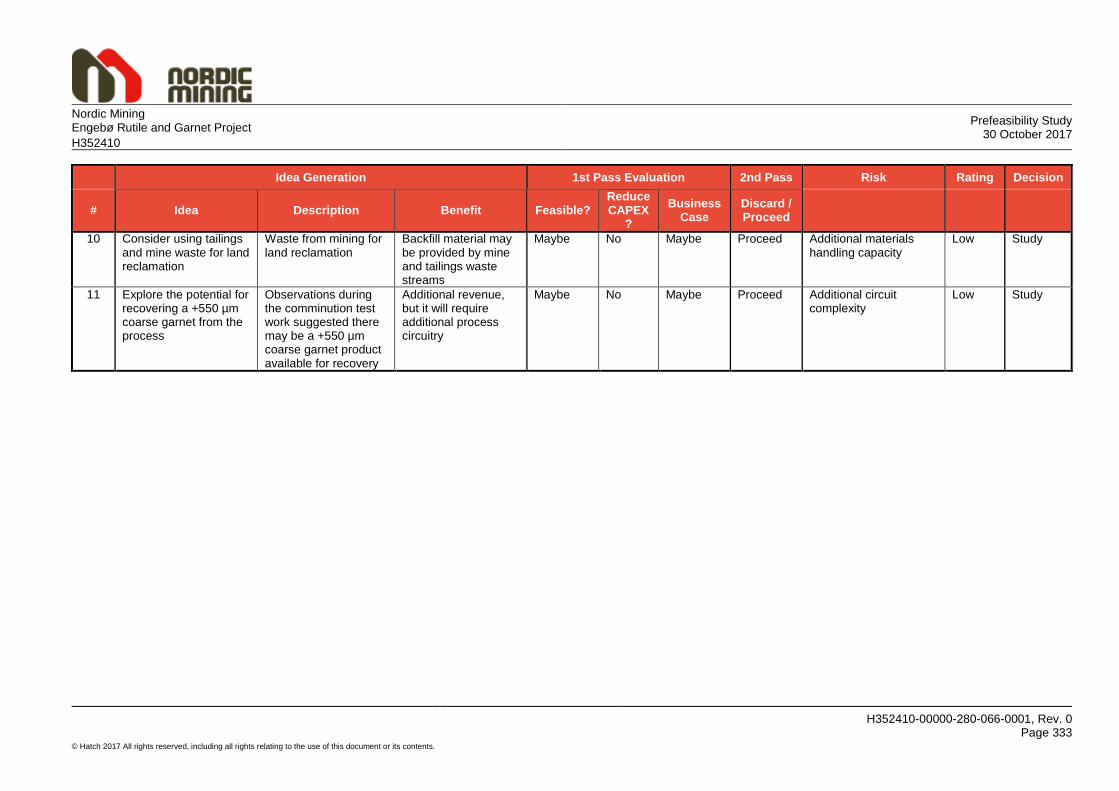
Nordic Mining Prefeasibility Study
30 October 2017 Engebø Rutile and Garnet Project
H352410
H352410-00000-280-066-0001, Rev. 0 Page 333
© Hatch 2017 All rights reserved, including all rights relating to the use of this document or its contents.
Idea Generation 1st Pass Evaluation 2nd Pass Risk Rating Decision
# Idea Description Benefit Feasible? Reduce CAPEX
?
Business Case
Discard / Proceed
10 Consider using tailings and mine waste for land reclamation
Waste from mining for land reclamation
Backfill material may be provided by mine and tailings waste streams
Maybe No Maybe Proceed Additional materials handling capacity
Low Study
11 Explore the potential for recovering a +550 µm coarse garnet from the process
Observations during the comminution test work suggested there may be a +550 µm coarse garnet product available for recovery
Additional revenue, but it will require additional process circuitry
Maybe No Maybe Proceed Additional circuit complexity
Low Study

Nordic Mining Prefeasibility Study
30 October 2017 Engebø Rutile and Garnet Project
H352410
H352410-00000-280-066-0001, Rev. 0 Page 334
© Hatch 2017 All rights reserved, including all rights relating to the use of this document or its contents.
28. Reference List
Land and Mineral Tenure
Kvale Advokatfirma – Land Tenure Memo.
Geology, Drilling and Sampling, Mineral Resource Estimate
A Wheeler - Engebø Resource Estimation - April 2008
A Wheeler - Engebø Resource Report - August 2016 .pdf
SRK - Engebø Resource Review Report.pdf.
Mining Geotechnical
Wardell Armstrong International – Open Pit Mining Geotechnical Slope Design Report
SINTEF – Underground Mining Geotechnical Report
SINTEF – Report on Rock Mass Quality at Engebø.
Hydrogeology, Hydrology and Geochemistry
SINTEF - Hydrogeological Report
ALS Global – Geochemistry Core Sample Analyses.
Mineral Processing
Bulk Process Testwork Scoping (H352410-00000-210-248-0001 Rev A)
IHC Robbins Proposal – Programme 1231 (1231-PM-QU-0000-8001 Rev C)
IHC Robbins Report – Programme 1231 (1231-PM-REP-0000-8002 Rev 0)
Core Metallurgy Report No. 1090A-001 – Flotation Testwork Programme on Spirals
Concentrate
IHC Robbins Proposal – Programme 1245 (1245-PM-QU-0000-8001 Rev B)
IHC Robbins Report – Programme 1245 (1245-PM-REP-0000-8002 Rev 0)
IHC Robbins Proposal – Programme 1308 (1308-PM-QU-0000-8001 Rev B)
IHC Robbins Report – Programme 1308 (1308-PM-REP-0000-8002 Rev 4)
IHC Robbins Proposal – Programme 1234 (1234-PM-QU-0000-8001 Rev D)
IHC Robbins Report – Programme 1234 (TBC)
Flotation Trade-off Study Memo (H352410-4000-210-030-0001)
Testwork Results of Programme 1286-003
Testwork Results of Programme 1286-004
Mineral Technologies 83207 Item A report

Nordic Mining Prefeasibility Study
30 October 2017 Engebø Rutile and Garnet Project
H352410
H352410-00000-280-066-0001, Rev. 0 Page 335
© Hatch 2017 All rights reserved, including all rights relating to the use of this document or its contents.
JKTech Report (17059 Pyrite Flotation Report rev02)
IHC Robbins Report – Programme 1293 (1293-PM-REP-0000-8002 Rev 0)
Plant Operating Factor (H352410-0000-210-230-0001 Rev A)
Mass and Mineral Balance Insights (H352410-00000-210-030-0004)
Use of Flotation Reagents in the Engebø Process (H352410-00000-210-030-0007)
Garnet and Rutile Grade and Recovery Factors for PFS Financial Modelling
(H352410-00000-210-030-0008)
Block Flow Diagram (H352410-0000-210-252-0001)
Process Flow Diagrams (H352410-3100-210-282-0001-0001 to H352410-7600-210-
282-0003-0001).
Mining and Ore Reserve Estimate
Pit Optimisation Results - H352410-00000-280-202-0001
PFS Mine Plan - H352410-1000-280-076-0001.
Project Infrastructure
Cowi AS – Tailings Study
DNV GL – Monitoring of Sea Disposal of Tailings
Asplan Viak – Bulk Water Supply Report.
Engineering Design
Plant Wide - Mechanical - Design Criteria - H352410-00000-240-210-0001
Plant Wide - Electrical - Design Criteria - H352410-00000-260-210-0001
Plant Wide - Mechanical - Equipment List – 1.5 Mtpa Plant - H352410-00000-240-
216-0001
Process Plant – Site Plan - H352410-00000-240-270-0001-0001
Comminution – Plan and Elevation – General Arrangement - H352410-00000-240-
270-0002-0001
Comminution – Side Elevations – General Arrangement - H352410-00000-240-270-
0003-0001
Primary Feed Preparation – Plan and Elevation – General Arrangement - H352410-
00000-240-270-0004-0001
Garnet Processing – Plan and Elevation – General Arrangement - H352410-00000-
240-270-0005-0001
Rutile Processing – Plan and Elevation – General Arrangement - H352410-00000-
240-270-0006-0001

Nordic Mining Prefeasibility Study
30 October 2017 Engebø Rutile and Garnet Project
H352410
H352410-00000-280-066-0001, Rev. 0 Page 336
© Hatch 2017 All rights reserved, including all rights relating to the use of this document or its contents.
Secondary Feed Preparation – Plan and Elevation – General Arrangement -
H352410-00000-240-270-0007-0001
Secondary Feed Preparation – Elevation – General Arrangement - H352410-00000-
240-270-0008-0001
Primary Crusher – Plan and Elevations – General Arrangement - H352410-00000-
240-270-0009-0001
Primary Crusher – Elevation – General Arrangement - H352410-00000-240-270-
0010-0001.
Market Information
TZMI - Global Rutile Market Study (August 2017)
TAK Industrial Mineral Consultancy – Garnet Market Analysis (October 2016)
TAK Industrial Mineral Consultancy – Garnet Market Analysis Update (July 2017).
Environmental and Social Responsibility
Nordic Mining - Summary of Environmental and Social Studies
Norwegian Environment Agency - Pollution Permit
Municipal Council for Naustdal Municipality and Municipal Council for Askvoll
Municipality - Zoning Plan.
Human Resources
Labour summary - H352410-00000-210-202-0002.
Capital Cost Estimate
Capital cost estimate - H352410-00000-200-016-0003.
Operating Cost Estimate
Operating cost estimate (Comminution, Processing, Tailings, Product Dispatch,
Rehabilitation and Overheads) - H352410-00000-210-202-0002
Operating cost estimate (Mining) - H352410-1000-280-016-0001.
Financial Analysis
Financial model - H352410-00000-200-016-0004.
Risks and Opportunities
Hazard 2 Study – H352410-00000-142-066-00001
Risk management and value improvement - H352410-00000-140-066-00001
Quantitative Risk Assessment - H352410-00000-140-066-00002.

Nordic Mining Prefeasibility Study
30 October 2017 Engebø Rutile and Garnet Project
H352410
H352410-00000-280-066-0001, Rev. 0 Page 337
© Hatch 2017 All rights reserved, including all rights relating to the use of this document or its contents.
Appendix A: JORC Code 2012 Supporting Information

JORC Code, 2012 Edition – Table 1 Section 4. Estimation and Reporting of Ore Reserves
Criteria JORC Explanation Information Required
MRE conversion to Ore Reserves (OR)
Description of Mineral Resource Estimate (MRE) Stated in Table 8-1.
MRE - inclusive of, or additional to, OR The Mineral Resources are reported inclusive of the Ore Reserves.
Site Visit Comment re CP visit Mr. A. Wheeler visited the Engebø site and core processing facilities in Førde, from 8 to 10 February
2016, 7 to 8 March 2016 and 12 to 14 June 2016. If not, why not. Not relevant.
Study status Type and level of study undertaken This current report is at a Prefeasibility (PFS) level. The reserve estimation work has been done by
Hatch Africa (Pty) Ltd (“Hatch”). This work has subsequently been reviewed by Mr. A. Wheeler. At least PFS level required; has a viable mine plan been determined
This PFS study has determined that a mine plan is technically achievable and economically viable. Reasonable Modifying Factors have been applied.
Cut-off parameters Basis and parameters
For Ore Reserve reporting, all ferro-eclogite material within the mine design has been included as ore. The ferro-eclogite is classified as such greater than 3% TiO2. No ore reserves stem from transitional- or leuco-eclogite rock type. This ore definition approach was determined by economic analysis of the overall project, with respect to potential revenues from both rutile and garnet products. In this analysis assumed long-term prices of US$ 1,070/t rutile and US$ 250/t garnet were applied, with an average processing recovery of 60.2% for rutile and an 18.3% yield for garnet.
Mining Factors/Assumptions
Methods and assumptions Ore Reserves were determined from the Measured and Indicated Mineral Resources contained within designed open pit and underground layouts.
Choice of mining methods and parameters
For the open pit, a conventional drill and blast operation has been developed, using 15 m benches. For the underground part of the mine, long hole open stopes have been laid out. The mining methods and parameters are described in Section 12. The maximum open stope size used was 45 m by 150 m by 60 m.
Assumptions for geotechnics, grade control and pre-production drilling
For the open pit, an independent geotechnical review was completed by Wardell Armstrong International (WAI). For the underground mine, geotechnical analysis was completed by Sintef Rock and Soil Mechanics (SINTEF). This analysis involved numerical modelling for different stoping methods and parameters. These analyses, and the design recommendations resulting, are shown in Section 10. Hatch has followed the recommendations of both studies in developing the open put and underground mine designs.
Major assumptions used in pit/stope optimisation
The principal open pit optimisation parameters are summarised in Table 12-2. All the optimisation runs were limited by a hard boundary on all sides, reflecting the zoning planning for the Engebø project. Overall slopes angles were applied according to different sectors, varying from 55º to 59º, as per the geotechnical recommendations.
Mining dilution factors After regularisation of the resource block model to 15 m by 15 m by 15 m blocks, additional unplanned dilution factors of 4% and 6% were applied to open pit and underground reserves respectively, at zero grades. These factors were derived from approximately half the planned production drill spacing.
Mining recovery factors A mining recovery factor of 95% was applied (5% losses) in both open pit and underground reserve calculations.
Minimum mining widths A minimum mining width of 15 m has been applied implicitly, stemming from the regularisation of the resource block model.

Criteria JORC Explanation Information Required
No use of inferred in MRE in mining studies Any Inferred resource material within the planned open pit or underground designs was treated as waste, with zero grades assigned.
Infrastructure requirements Described in Section 14.
Metallurgical factors/assumptions
Met. Process proposed: appropriateness for mineralisation Described in Section 13.
Whether met. process is well tested. The mineral processing envisaged is using well-tested technology.
Nature of met test work Described in Section 11
Assumptions made for deleterious elements
While the Fe2O3 level in the Engebø rutile (1.7% from indicative tests) is higher than other commercial rutile products in the marketplace, it is still an acceptable product for chloride pigment production. The CaO content at 0.21% is slightly higher than other commercial rutile products but is nevertheless still acceptable for chloride pigment production. The MgO levels at 0.09% are also acceptable. All other reported impurities appear to be in line with other commercial rutile products in the market. No deleterious elements are anticipated in the garnet product.
Bulk sample/pilot test > orebody representivity Six bulk samples were drilled and blasted from the surface of the Engebø mountain, spread over the length of the eclogite outcrop, so as to provide representative samples of the ore in the first years of open pit mining of the deposit. In total, 110 tons were obtained.
OR based on appropriate mineralogy The Ore reserve estimation used assumed product recoveries based on proposed mineral processing that is appropriate for the expected mineralogy.
Environmental EI studies. Waste rock characterisation. Residue storage, waste dumps.
The environmental setting for the Project is driven by two key legislative requirements, both of which have been fully met for the Engebø project. These requirements are the pollution permit and the zoning plan (planning permit), as described in Section 19.2.
Infrastructure Existing land for development, power, water, transportation, labour. Described in Section 14.
Costs
Derivation of capital costs. Capital costs have been derived from first principles. For all mining works, all costs have been estimated on an owner-operated basis.
Methodology for operating costs. Mine and plant operating costs have also been derived from first principles, with a detailed cost model connected to all physical data obtained from the mine designs.
Allowances for deleterious elements. No penalties associated with deleterious elements are anticipated, so no additional costs have been for this.
Source of exchange rates. The source of exchange rate used in this report is prevailing exchange rates at the time of the study derived from Oanda.com website
Derivation of transport charges. Transportation costs are part of the mining cost estimates.
Basis for treatment and refining charges, penalties. Treatment and refining costs are not applicable. No penalties should be applied, prices applied are FOB.
Allowances for royalties. A royalty of 0.5% was calculated on the revenue of the Project.
Revenue Factors Assumptions for head grades, exchange rates and other charges.
Feed grades assumed for process test work were 3.73% rutile and 44.6% garnet. Assumed exchange rates were 1 US$ = 8.30 Norwegian Krone (NOK); 1 US$ = 0.90 Euro (€); 1 US$ = 13.40 South African Rand (ZAR) and 1 SEK (Swedish Krone) = 1.070 NOK.
Assumptions for metal prices. In this analysis assumed long-term prices of US$ 1,070/t rutile and US$ 250/t garnet were applied.
Market Assessment Demand, supply and stock situation Global rutile demand growth for all end-use over the next 9 years (2016 to 2025) is expected to average 1.8% CAGR, reaching 930 kt TiO2 units by 2025, or an increase of approximately 140 kt TiO2 units on

Criteria JORC Explanation Information Required 2016 levels. Global supply of rutile is set to decline considerably or the next decade, with output in 2025 expected to be 50% lower than 2016 levels. Total apparent annual global consumption of garnet (excluding Chinese domestic consumption) is estimated to be almost 890 kt. If historic growth rates over the last 20 years are extrapolated linearly, apparent consumption (excluding) China could grow to over 1.4 Mt in the next 10 years. The current world production of garnet is estimated at 1.1 Mtpa. India and Australia are the primary exporters to world markets at estimated levels of 478 ktpa and 293 ktpa respectively.
Customer analysis, market windows.
Based on the indicative product quality and particle size distribution, the Engebø rutile would be a suitable feedstock for chloride pigment and titanium metal applications. Nordic Mining would be the first producer of garnet in Europe. The overall strategy of Nordic Mining is to be a consistent high-quality producer, establishing a long-term stronghold in the European and other markets
Price and volume forecasts.
From a pricing perspective, TZMI estimates that the planned rutile product should be able to achieve the long-term price of a standard rutile (US$1,070 per ton FOB real 2016 dollars) if targeted at chloride pigment or as a feed for titanium sponge manufacture. The production schedule has been built up to produce a maximum of 35 ktpa of saleable rutile product. The assumed FOB garnet basket price of US$ 250/t used for revenue estimation in this study is based on production of final end-user products according to established market specifications; hence the products do not need any further treatment or upgrading. The production schedule has been built up to produce a maximum of 262 kt saleable garnet product.
For industrial minerals: specification, testing and acceptance requirements.
With an expected Fe2O3 level of approximately 1.7% in the final rutile product, this is acceptable for the chloride pigment market. The D50 of the Engebø rutile product has been between 106 µm and147 µm. In general, the pigment producers would like to see the amount of material below 75 µm less than 5%. For the latest test results the level of <75 µm was 15%. The <75µm material is however a suitable feed stock for the molten salt industry. Surplus material can therefore be placed into this market which could take between 5 ktpa and 10 ktpa per year to plants in Russia, Ukraine and Kazakhstan. For titanium metal application, the SnO2 levels need to be less than 0.05%. Analysis of the latest rutile concentrate shows that the SnO2 content is below detection limit of 0.02% and should therefore be suitable for metal production. The assumed garnet US$ 250/t price is based on an average price for three products – 80 mesh waterjet, 100 mesh waterjet and 30/60 mesh blast market. It is anticipated that Engebø will produce approximately equal volumes of each of the above products.
Economic Inputs for NPV in study. Source and confidence of economic inputs.
The discounted cashflow analysis has been based on 2017 Constant US$ values. The derivation of the project NPV is described in Section 23
NPV ranges and sensitivities. The NPV results are summarised in Section 23, with key results in Table 23-2.
Social Status of agreements with key stakeholders, for social license to operate.
The social setting for the Project is driven by the same two key legislative requirements as for the Environmental Requirements, both of which have been fully met for the Engebø project. These requirements are the pollution permit and the zoning plan (planning permit), as described in Section 19.2.
Other
Impact of identified material risks. The project risk analysis has been described in Section 26.
Status of legal agreements and marketing arrangements.
There are no formal Marketing arrangements in place. However, it is considered that with global supply from existing rutile operations expected to decline rapidly over the period to 2025, and a lack of new rutile projects being introduced to the pipeline, TZMI believes there will be no impediment to selling the Engebø rutile at prices close to the market average. In terms of garnet, Nordic Mining has signed an MOU with a leading, international, producer of industrial minerals. The intention of the parties is to develop the relation further including off-take agreements etc.

Criteria JORC Explanation Information Required
Status of government agreements and approvals.
The pollution permit for Engebø was issued on 5 June 2015 and minor adjustments were made to the permit by the Order in Council on 19 February 2016. The zoning plan, which was adopted by the Municipal Council for Naustdal Municipality in business item no. 022/11 on 11 May 2011 and the Municipal Council for Askvoll Municipality in business item no. 018/11 on 12 May 2011, allows for and provides guidelines on the operation of the following activities: � The processing site at Engebø � The extraction of rock mass in open pit production and underground mining � The service area at Engebøfjellet � The gangue deposition site in Engjabødalen � Subsea area, sea deposition in Førdefjorden � The works road running between Engebø and Engebøfjellet � The rerouting of county road Fv 611 � The rerouting of a 22kv power line and the stringing of a new cable between Engebø and Engebøfjellet.
Classification
Basis for classification of OR, into varying confidence categories.
The Ore Reserve estimate considers only Measured and Indicated Resources, which inside the designed open pit have been converted into Proven and Probable Ore Reserves. Any Inferred resource material within the designed pit was treated as waste.
Whether results reflect CP’s view. The results do reflect the Competent Person’s view of the deposit.
Proportion of Probable Ore Reserves derived from Measured Mineral Resources. There are no Measured Mineral Resources.
Audits or reviews Results of any audits/reviews on OR estimates. No audit or review of the Ore Reserve estimates has been completed by an independent external individual or company.
Discussion of relative accuracy/confidence
Statement of relative accuracy in the OR estimates, or if not appropriate, qualitative discussion.
Carried over from the resource model, the principal control on the resource categories, and consequently reserve categories, are the spacings of diamond drillhole intersections. Key drillhole section spacing limits have been established which are used as a guide in the assignment of resource categories, as described in Section 7.2
Relation to global or local estimates. The Ore Reserve statement relates to global estimates of tonnes and grade.
Accuracy discussion with respect to any Modifying Factors.
All the Measured and Indicated Resources within the designed open pit, above the applied cut-off grade, have been converted into Proven and Probable Reserves. The Ore Reserve calculations are described in Section 12.3 and Section 12.4
Where possible, comparison with production data. Not applicable.


Copyright © 2022 FDOKUMEN