PREFEASIBILITY STUDY:FANOVANA - World Bank Document
-
Upload
khangminh22 -
Category
Documents
-
view
3 -
download
0
Transcript of PREFEASIBILITY STUDY:FANOVANA - World Bank Document
Small Hydro Resource Mapping in Madagascar
PREFEASIBILITY STUDY: FANOVANA [ENGLISH VERSION] April 2017
Pub
lic D
iscl
osur
e A
utho
rized
Pub
lic D
iscl
osur
e A
utho
rized
Pub
lic D
iscl
osur
e A
utho
rized
Pub
lic D
iscl
osur
e A
utho
rized

This report was prepared by SHER Ingénieurs-Conseils s.a. in association with Mhylab, under contract to The World Bank.
Energy Resource Mapping and Geospatial Planning [Project ID: P145350]. This activity is funded and supported by the Energy Sector Management Assistance Program (ESMAP), a multi-donor trust fund administered by The World Bank, under a global initiative on Renewable Energy Resource Mapping. Further details on the initiative can be obtained from the ESMAP website. This document is an interim output from the above-mentioned project. Users are strongly advised to exercise caution when utilizing the information and data contained, as this has not been subject to full peer review. The final, validated, peer reviewed output from this project will be a Madagascar Small Hydro Atlas, which will be published once the project is completed.
Copyright © 2017 THE WORLD BANK
Washington DC 20433
Telephone: +1-202-473-1000
Internet: www.worldbank.org
The World Bank, comprising the International Bank for Reconstruction and Development (IBRD) and the
International Development Association (IDA), is the commissioning agent and copyright holder for this
publication. However, this work is a product of the consultants listed, and not of World Bank staff. The
findings, interpretations, and conclusions expressed in this work do not necessarily reflect the views of The
World Bank, its Board of Executive Directors, or the governments they represent.
The World Bank does not guarantee the accuracy of the data included in this work and accept no
responsibility for any consequence of their use. The boundaries, colors, denominations, and other
information shown on any map in this work do not imply any judgment on the part of The World Bank
concerning the legal status of any territory or the endorsement or acceptance of such boundaries.
The material in this work is subject to copyright. Because The World Bank encourages dissemination of its
knowledge, this work may be reproduced, in whole or in part, for non-commercial purposes as long as full
attribution to this work is given. Any queries on rights and licenses, including subsidiary rights, should be
addressed to World Bank Publications, The World Bank Group, 1818 H Street NW, Washington, DC 20433,
USA; fax: +1-202-522-2625; e-mail: [email protected]. Furthermore, the ESMAP Program Manager
would appreciate receiving a copy of the publication that uses this publication for its source sent in care of
the address above, or to [email protected].
ENGLISH VERSION
IN ASSOCIATION WITH
Phase 2 – Ground Based Data Collection
PREFEASIBILITY STUDY OF THE
FANOVANA HYDROELECTRIC SCHEME Renewable Energy Resource Mapping: Small Hydro – Madagascar [P145350]
April 2017
FINAL OUTPUT

Correspondence Table between the terms of reference and reporting and the ESMAP phases:
ESMAP General Phasing Correspondence
with ESMAP-Small Hydro Madagascar ToR
Phase 1 Preliminary resource mapping output based on satellite and site visits
Activity 1 - Data collection and production of Hydro Atlas, review and validation of small hydro potential Activity 2 - Small hydro electrification planning Activity 3 - Small hydro prioritization and workshop
Phase 2 Ground-based data collection
Activity 4 - Data collection and final validation (from the REVISED TERMS OF REFERENCES FOR THE ACTIVITY 4) : A - Review of previously studied small hydropower sites B - Data collection and final validation C - Pre-feasibility study of two priority sites for small hydropower development
Phase 3 Production of a validated resource atlas that combines satellite and ground-based data
D - Support to the Ministry of Energy to build capacity and take ownership of the created GIS database for hydropower E - Updated Small Hydro Mapping Report for Madagascar
SHER Ingénieurs-conseils s.a. Rue J. Matagne, 15 5020 Namur – Belgium Phone : +32 81 32 79 80 Fax : +32 81 32 79 89 www.sher.be
Project Manager: Rebecca DOTET SHER reference: MAD04 Phone : +32 (0) 81 327 982 Fax : +32 (0) 81 327 989 E-mail : [email protected]
Rev.n° Date Content Drafted Verified
1 April 2017 Prefeasibility Study of the Fanovana Hydroelectric Scheme (English version, final output)
Gérard CHASSARD Quentin GOOR Vincent DENIS Alice VANDENBUSSCHE Jean René RATSIMBAZAFY Sandy RALAMBOMANANA Flore RABENJARISON Haja RAKOTONANAHARY
Pierre SMITS
In case of discrepancy, the French version prevails
SHER INGÉNIEURS-CONSEILS S.A.
IS ISO 9001 CERTIFIED

Small Hydro Madagascar ESMAP / The World Bank Prefeasibility Study of the Fanovana Hydroelectric Scheme
SHER / Mhylab / ARTELIA-Madagascar April 2017 Page 5
ABREVIATIONS AND ACRONYMS
ADER Agence de Développement de l’Electrification Rurale
AO Appel d’Offre
APD Avant-Projet Détaillé
APS Avant-Projet Sommaire
DGE Direction de l’Energie
DGM Direction Générale de la Météorologie
ENR ENergie Renouvelable
ESMAP Energy Sector Management Assistance Program
EU European Union
FTM FOIBEN-TAOSARINTANIN'I MADAGASIKARA
GRDC Global Runoff Data Centre
GWh Giga Watt heure, Milliards de kWh ou Millions de MW
INSTAT Institut National de la Statistique
IPP’s Independent Power Producer’s
IRENA International Renewable Energy Agency
JIRAMA Jiro sy Rano Malagasy (Société d'électricité et d'eau de Madagascar)
kW kilo Watt
kWh kilo Watt heure
LCOE Levelized Cost Of Electricity
MEH Ministère de l’Energie et des Hydrocarbures
MNS Modèle numérique de surface
MW Mega Watt
MWh Mega Watt heure
ORE Office de Régulation de l’Electricité
ORSTOM Office de la recherche scientifique et technique outre-mer
PIC Projet Pôles Intégrés de Croissance
PPP Partenariat Public Privé
SAPM Système des Aires Protégées de Madagascar
SE Système Electrique
SIG Système d’Information Géographique
SNAT Stratégie Nationale d’Aménagement du Territoire
TWh Tera Watt heure
WB World Bank

Small Hydro Madagascar ESMAP / The World Bank Prefeasibility Study of the Fanovana Hydroelectric Scheme
SHER / Mhylab / ARTELIA-Madagascar April 2017 Page 6
TABLE OF CONTENT
TABLE OF CONTENT .................................................................................................................................... 6
TABLE OF FIGURES ..................................................................................................................................... 9
LISTE OF TABLES ...................................................................................................................................... 10
1 EXECUTIVE SUMMARY ....................................................................................................................... 11
2 INTRODUCTION ................................................................................................................................. 12
2.1 Overview of the ESMAP Programme ................................................................................................... 12
2.2 Objectives, Results and Activities of the Study .................................................................................... 12
2.3 Context and Scope of the Prefeasibility Study ..................................................................................... 13
3 CONTEXT OF THE FANOVANA HYDROELECTRIC SCHEME ...................................................................... 14
3.1 Project Area ......................................................................................................................................... 14
3.2 Site Access .......................................................................................................................................... 14
3.3 General Site Description ...................................................................................................................... 17
3.4 Previous Studies .................................................................................................................................. 18
4 TOPOGRAPHY ET MAPPING ............................................................................................................... 19
4.1 Existing Mapping .................................................................................................................................. 19
4.1.1 Topographic Mapping ......................................................................................................................... 19
4.1.2 Thematic Mapping .............................................................................................................................. 19
4.1.3 Digital Surface Model .......................................................................................................................... 19
4.2 Mapping Carried out as Part of the Study ............................................................................................ 20
4.2.1 Digitization and geo-referencing ........................................................................................................... 20
4.2.2 Additional surveying ........................................................................................................................... 20
5 HYDROLOGICAL STUDY ..................................................................................................................... 22
5.1 Objectives and Limits ........................................................................................................................... 22
5.2 Description of the Study Area .............................................................................................................. 22
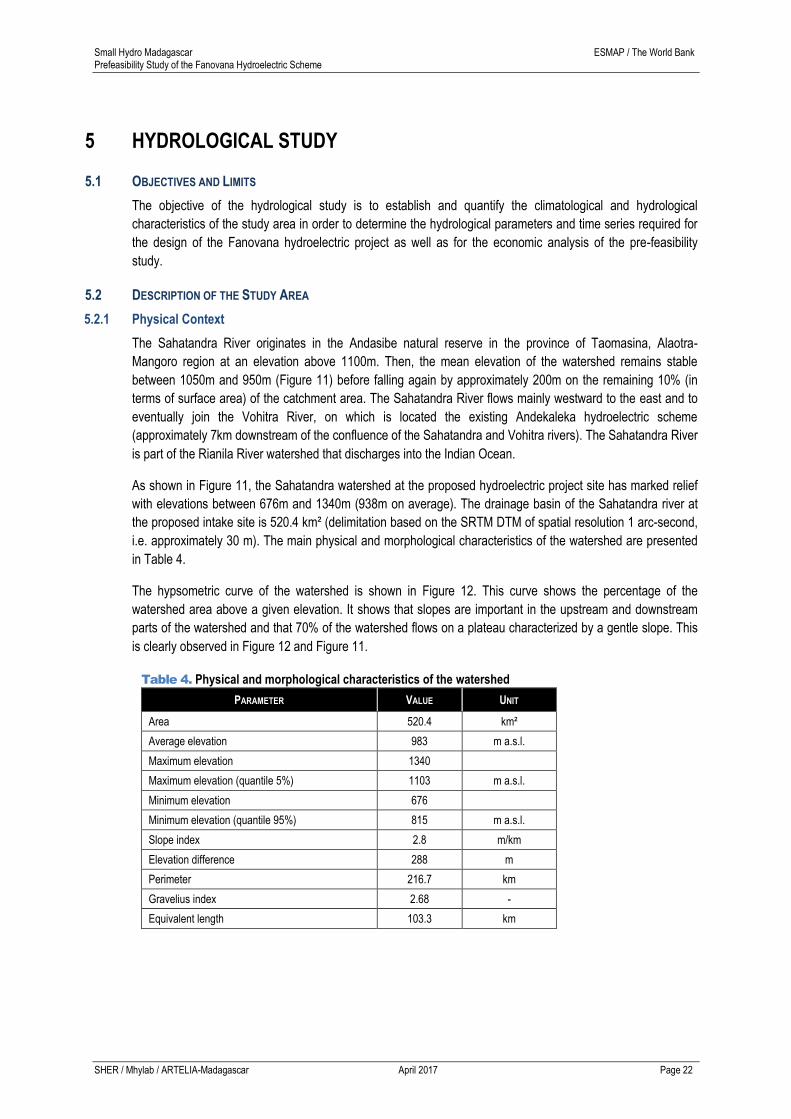
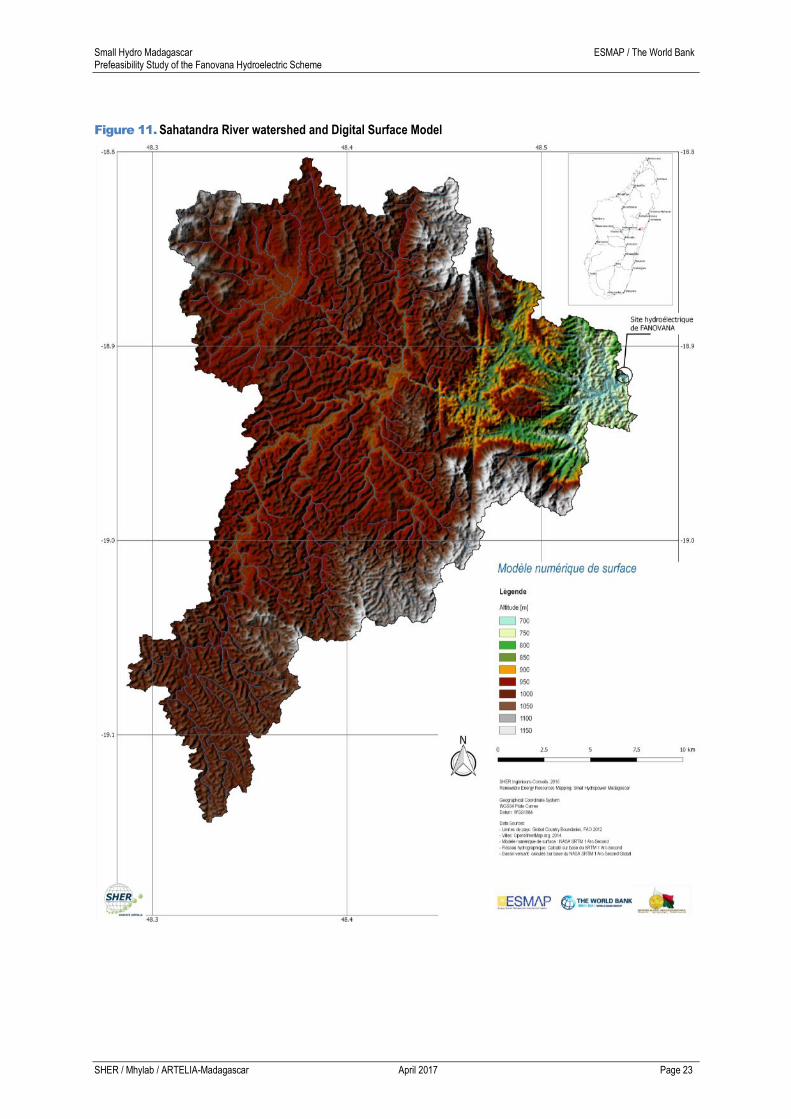
5.2.1 Physical Context ................................................................................................................................ 22
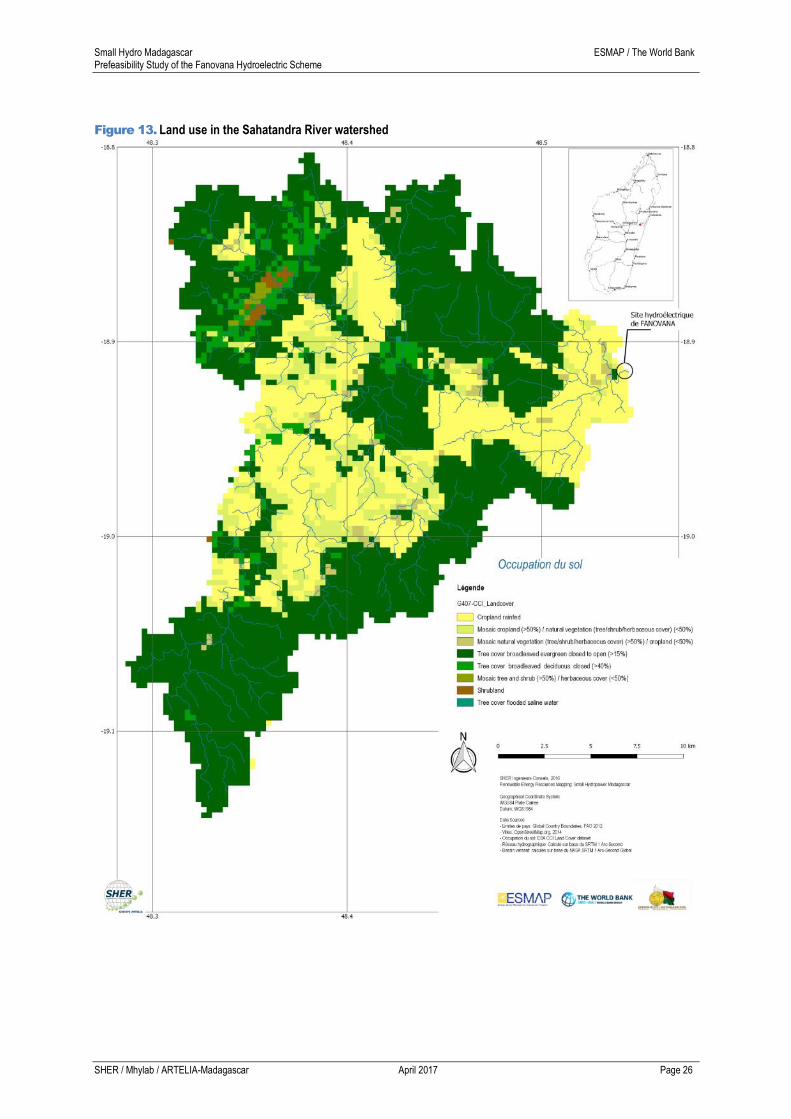
5.2.2 Land use and protected areas ............................................................................................................. 24
5.2.3 Climate.............................................................................................................................................. 28
5.3 Hydro-meteorological database ........................................................................................................... 29
5.3.1 Rainfall and meteorological data .......................................................................................................... 29
5.3.2 Hydrological data ............................................................................................................................... 29
5.4 Rainfall and Streamflow Data Analysis ................................................................................................ 32
5.4.1 Annual and monthly rainfall ................................................................................................................. 32
5.4.2 Monthly streamflow............................................................................................................................. 32
5.4.3 Daily streamflow analysis .................................................................................................................... 36
5.5 Flood Study .......................................................................................................................................... 39
5.5.1 Introduction ........................................................................................................................................ 39
5.5.2 Methodology ...................................................................................................................................... 39
5.5.3 Daily precipitation estimates ................................................................................................................ 40
5.5.4 Flood Estimates ................................................................................................................................. 42
5.6 Study of the Erosion Hazard in the Sahatandra River Watershed ....................................................... 42
5.6.1 Objectives ......................................................................................................................................... 42
5.6.2 Methodology ...................................................................................................................................... 42
5.6.3 Potential and actual soil erosion hazard ................................................................................................ 43
5.7 Key Hydrological Parameters of the Fanovana Site............................................................................. 47

Small Hydro Madagascar ESMAP / The World Bank Prefeasibility Study of the Fanovana Hydroelectric Scheme
SHER / Mhylab / ARTELIA-Madagascar April 2017 Page 7
5.8 References ........................................................................................................................................... 47
6 GEOLOGY ........................................................................................................................................ 49
6.1 Introduction .......................................................................................................................................... 49
6.2 Geological Reference Map................................................................................................................... 49
6.3 Local geological setting ........................................................................................................................ 49
6.3.1 Petrographic setting ............................................................................................................................ 50
6.3.2 Structural and tectonic setting .............................................................................................................. 50
6.4 Remarks on the Proposed Weir Location ............................................................................................ 52
6.4.1 Axe A ................................................................................................................................................ 52
6.4.2 Axe B ................................................................................................................................................ 53
6.5 Construction Materials ......................................................................................................................... 54
6.6 Seismicity ............................................................................................................................................. 54
6.7 Conclusions and Recommendations for Additional Investigations ....................................................... 55
6.7.1 Conclusion ........................................................................................................................................ 55
6.7.2 Additional investigations ...................................................................................................................... 56
6.8 References ........................................................................................................................................... 56
7 PRELIMINARY ENVIRONMENTAL AND SOCIAL IMPACT ANALYSIS .............................................................. 57
7.1 Description of the Biophysical Context ................................................................................................. 57
7.1.1 Relief ................................................................................................................................................ 57
7.1.2 Vegetation ......................................................................................................................................... 57
7.1.3 Observations ..................................................................................................................................... 59
7.1.4 Sensitivity .......................................................................................................................................... 59
7.2 Socio-Economic Context ...................................................................................................................... 60
7.2.1 Local Area ......................................................................................................................................... 60
7.2.2 Activities ............................................................................................................................................ 61
7.2.3 Others ............................................................................................................................................... 62
7.3 Applicable World Bank Operational Safeguard Policies....................................................................... 62
7.4 Recommendations for Further Studies ................................................................................................ 62
7.5 References ........................................................................................................................................... 62
8 PROPOSED SCHEME AND DESIGN ...................................................................................................... 63
8.1 Proposed Scheme Description ............................................................................................................. 63
8.1.1 Weir, intake, waterway and powerhouse ............................................................................................... 63
8.1.2 Type of scheme ................................................................................................................................. 64
8.1.3 Design flow ........................................................................................................................................ 65
8.1.4 Design Floods .................................................................................................................................... 65
8.2 Structures Design ................................................................................................................................ 67
8.2.1 Weir type and characteristics ............................................................................................................... 67
8.2.2 Temporary diversion ........................................................................................................................... 69
8.2.3 Outlet structures ................................................................................................................................. 69
8.2.4 Waterway .......................................................................................................................................... 70
8.2.5 Electromechanical Equipment.............................................................................................................. 72
8.2.6 Power and energy generation performance assessment ........................................................................ 78
8.2.7 Powerhouse ...................................................................................................................................... 80
8.2.8 Transmission line and substation ......................................................................................................... 81
8.2.9 Access .............................................................................................................................................. 82
8.2.10 Temporary infrastructure during the construction period ..................................................................... 82
8.2.11 Permanent camp ........................................................................................................................... 83

Small Hydro Madagascar ESMAP / The World Bank Prefeasibility Study of the Fanovana Hydroelectric Scheme
SHER / Mhylab / ARTELIA-Madagascar April 2017 Page 8
8.3 Key Project Features ........................................................................................................................... 83
9 COSTS AND QUANTITIES ESTIMATES .................................................................................................. 84
9.1 Assumptions ........................................................................................................................................ 84
9.1.1 Unit Costs .......................................................................................................................................... 84
9.1.2 Reinforcements and concrete .............................................................................................................. 85
9.1.3 Indirect costs ..................................................................................................................................... 85
9.1.4 Site facilities costs .............................................................................................................................. 85
9.1.5 Environmental and Social Impact Assessment Mitigation Costs .............................................................. 85
9.2 Bill of Quantities ................................................................................................................................... 85
9.3 Total Costs (CAPEX) ........................................................................................................................... 88
10 ECONOMIC ANALYSIS ........................................................................................................................ 89
10.1 Methodology ........................................................................................................................................ 89
10.2 Assumptions and Input Data ................................................................................................................ 90
10.2.1 Economic modelling assumptions .................................................................................................... 90
10.3 Economic Analysis and Conclusions ................................................................................................... 90
11 CONCLUSIONS AND RECOMMANDATIONS ............................................................................................. 92
12 APPENDICIES ................................................................................................................................... 93
12.1 Appendix 1 : Pictures associated with the investigations of the surface geology ................................. 93
12.2 Annexe 2 : Schéma d’aménagement proposé ................................................................................... 104
12.3 Appendix 3 : Hydrological data - Rogez Station on the Vohitra River ................................................ 105

Small Hydro Madagascar ESMAP / The World Bank Prefeasibility Study of the Fanovana Hydroelectric Scheme
SHER / Mhylab / ARTELIA-Madagascar April 2017 Page 9
TABLE OF FIGURES
Figure 1. Study area .............................................................................................................................................................................. 15
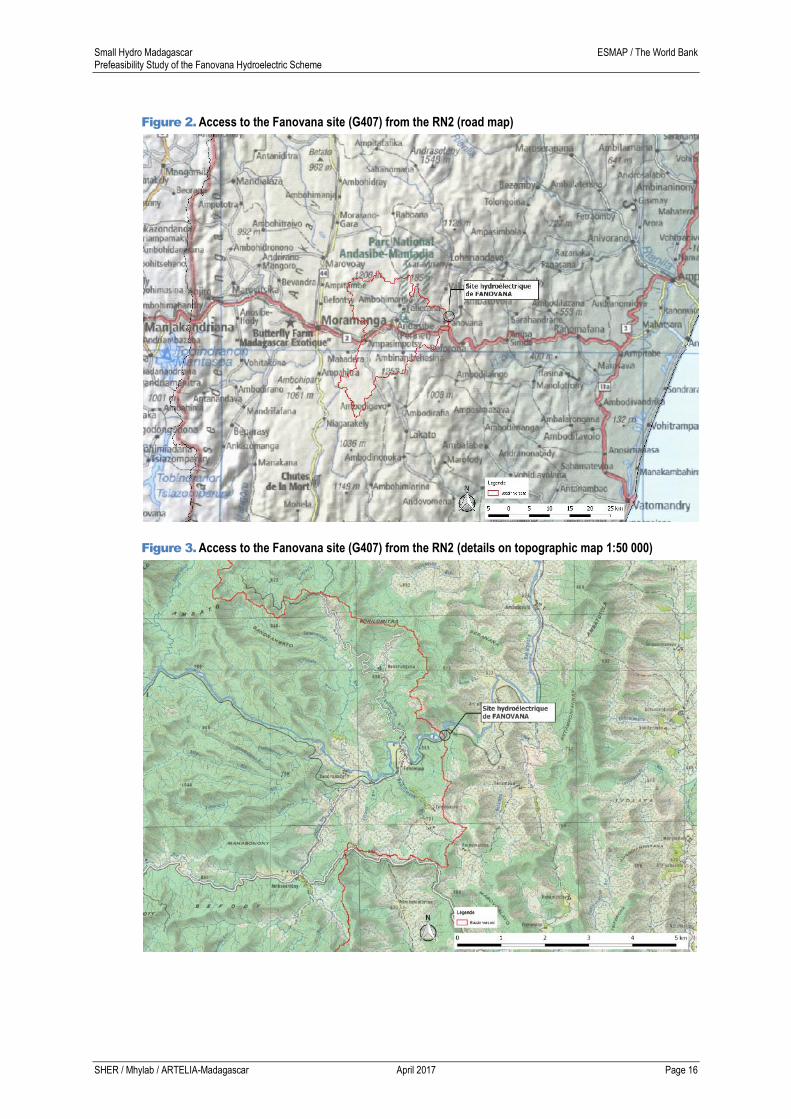
Figure 2. Access to the Fanovana site (G407) from the RN2 (road map) ............................................................................................. 16
Figure 3. Access to the Fanovana site (G407) from the RN2 (details on topographic map 1:50 000) .................................................. 16
Figure 4. Overview of the main waterfall (Landsat image, Google Earth) ........................................................................................... 17
Figure 5. Downstream view of the waterfall......................................................................................................................................... 17
Figure 6. Intake and weir view (right bank).......................................................................................................................................... 17
Figure 7. Tailwater view ....................................................................................................................................................................... 18
Figure 8. Upstream view of the waterfall ............................................................................................................................................. 18
Figure 9. Avion et nacelle contenant les capteurs pour le levé topographique aérien .......................................................................... 20
Figure 10. Ortho-photography of the Fanovana site and contour lines (5 m interval) ........................................................................... 21
Figure 11. Sahatandra River watershed and Digital Surface Model ...................................................................................................... 23
Figure 12. Hypsometric curve of the Sahatrandra River watershed .................................................................................................... 24
Figure 13. Land use in the Sahatandra River watershed ...................................................................................................................... 26
Figure 14. Protected areas (SAPM) in the watershed ........................................................................................................................... 27
Figure 15. Climatic diagram at the Andasibe meteorological station ..................................................................................................... 28
Figure 16. Temperature curve at the Andasibe meteorological station ................................................................................................. 29
Figure 17. Location of the hydrometric stations ..................................................................................................................................... 31
Figure 18. Spatial Variation of the annual rainfall on the Sahatrandra watershed ................................................................................. 33
Figure 19. Hydrograph of the Sahatandra River at Fanovana ............................................................................................................... 34
Figure 20. Flow duration curve of the Sahatandra River at Fanovana .................................................................................................. 35
Figure 21. Time series of average monthly streamflow of the Sahatandra River at Fanovana ............................................................. 35
Figure 22. Time series of average annual streamflow of the Sahatandra River at Fanovana ............................................................... 36
Figure 23. Daily streamflow of the Sahatandra River at the ESMAP station (2015-2016) .................................................................... 37
Figure 24. Monthly hydrograph of the Sahatandra River at the ESMAP station (2015-2016) ............................................................... 37
Figure 25. Comparison of the flow duration curves (2015-2016 vs transposition of the data from the Rogez station (1952-2000)) .... 38
Figure 26. October 2015 - February 2016: Abnoral precipitations (% of average 1982-2011) .............................................................. 39
Figure 27. Rainfall gauges location and Thiessen polygons ............................................................................................................... 41
Figure 28. Potential soil losses ............................................................................................................................................................ 44
Figure 29. Potential relative erosion hazard ........................................................................................................................................ 45
Figure 30. Actual relative erosion hazard ............................................................................................................................................ 46
Figure 31. Mapping of the investigated areas ..................................................................................................................................... 49
Figure 32. Most notable faults and breaks in the study area ............................................................................................................... 51
Figure 33. Accélération horizontale due à la sismique (source : GSHAP)............................................................................................. 55
Figure 34. Representative pictures of the vegetation in the proposed site surroundings ...................................................................... 58
Figure 35. Land use in the study area ................................................................................................................................................... 59
Figure 36. Pictures illustrating the socio-economic context around the proposed hydropower site ...................................................... 60
Figure 37. Waterway and main components of the scheme .................................................................................................................. 63
Figure 38. Detailed proposed scheme and main components .............................................................................................................. 64
Figure 39. Flow duration curve of the Sahatandra River at Fanovana .................................................................................................. 65
Figure 40. Spillway capacity comparison ............................................................................................................................................... 68
Figure 41. Typical cross section of an ogee-shape type spillway ...................................................................................................................... 69
Figure 42. Usable flow duration curve of the Sahatandra River at Fananova ..................................................................................................... 73
Figure 43. Example of two vertical shaft Francis units .................................................................................................................................... 76
Figure 44. Typical efficiency curve of a Francis turbine developed in laboratory .................................................................................................. 78
Figure 45. Typical generator efficiency curve ................................................................................................................................................ 79
Figure 46. Average monthly generation (period 1953-2000) ........................................................................................................................... 80
Figure 47. Tailwater zone to be recalibrated ................................................................................................................................................. 81
Figure 48. Access to create and rehabilitate to access the proposed Fanovana hydropower scheme ................................................. 82

Small Hydro Madagascar ESMAP / The World Bank Prefeasibility Study of the Fanovana Hydroelectric Scheme
SHER / Mhylab / ARTELIA-Madagascar April 2017 Page 10
LISTE OF TABLES
Table 1. Key features of the proposed Fanovana hydroelectric scheme ................................................................................... 11
Table 2. Administrative data ...................................................................................................................................................... 14
Table 3. Collected thematic maps .............................................................................................................................................. 19
Table 4. Physical and morphological characteristics of the watershed .................................................................................... 22
Table 5. Land use in the Sahatandra River watershed .............................................................................................................. 24
Table 6. Flow duration curve of the Sahatandra River at Fanovana .......................................................................................... 34
Table 7. Ten years and hundred years return period flood events ........................................................................................... 42
Table 8. Key hydrological characteristics of the site .................................................................................................................. 47
Table 9. Size classification (USACE) ......................................................................................................................................... 65
Table 10. Hazard potential classification (USACE) .................................................................................................................... 66
Table 11. Recommended spillway design floods (USACE) ....................................................................................................... 66
Table 12. Spillway characteristics ............................................................................................................................................ 68
Table 13. Flushing gates characteristics .................................................................................................................................. 69
Table 14. Intake characteristics ................................................................................................................................................ 70
Table 15. Characteristics of the power plant ............................................................................................................................ 80
Table 16. Key features of the proposed scheme ........................................................................................................................ 83
Table 17. Unit prices (2016 USD) .............................................................................................................................................. 84
Table 18. Indirect costs .............................................................................................................................................................. 85
Table 19. Bill of Quantities (BOQ) .............................................................................................................................................. 85
Table 20. Estimated total project costs ...................................................................................................................................... 88
Table 21. Economic modelling assumptions .............................................................................................................................. 90
Table 22. Levelized Cost of Energy (LCOE) .............................................................................................................................. 90
Small Hydro Madagascar ESMAP / The World Bank Prefeasibility Study of the Fanovana Hydroelectric Scheme
SHER / Mhylab / ARTELIA-Madagascar April 2017 Page 11
1 EXECUTIVE SUMMARY
The key features of the Fanovana hydroelectric scheme are summarized in Table 1 below.
Table 1. Key features of the proposed Fanovana hydroelectric scheme
FEATURE PARAMETER VALUE UNITS
Location Region Alaotra-Mangoro -
River Sahatandra -
Hydrology Watershed area 520.4 km²
Median streamflow (Q50%) 14.1 m³/s
Firm streamflow (Q95%) 6.7 m³/s
Weir and intake Watershed closure Overflowing weir + flushing gates (3 bays) -
Type Concrete gravity -
Average height 3.20 m
Crest elevation 582.20 m
Crest length 123 m
Spillway Type Overflowing Ogee-type weir -
Crest elevation 582.20 m
Design flood (100 years) 1351 m³/s
Water head at design flood 3.0 m
Waterways Intake structure
Invert elevation 580.0 m
Design flow 16 m³/s
Number of bays 5 -
Canal
Length 410 m
Average slope 0.05 %
Forebay Equipped with an emergency spillway -
Forebay operating water level 581.90 m
Penstock
Number 1 -
Diameter 2.0 m
Length 95 m
Hydropower Type Surface type structure -
Plant Location Right river bank -
Number of bays 3 -
Tailwater level 509.40 m
Floor elevation 510.40 m
Available gross head 72.50 m
Number of turbines and type 2 vertical shaft Francis turbines -
Rated output of each turbine 4.615 MW
Rated discharge 8 m³/s
Installed capacity 9.230 MW
Average annual energy generation 61.78 GWh
Economics Capital expenditure costs (CAPEX) – Without transmission lines and existing access roads to be rehabilitated
13.634 M€
Levelized Cost of Energy (LCOE) - Without transmission lines and existing access roads to be rehabilitated
0.0264 €/kWh
Capital expenditure costs (CAPEX) – Incl. transmission lines and existing access roads to be rehabilitated
22.08 M€
Levelized Cost of Energy (LCOE) – Incl. transmission lines and existing access roads to be rehabilitated
0.0418 €/kWh

Small Hydro Madagascar ESMAP / The World Bank Prefeasibility Study of the Fanovana Hydroelectric Scheme
SHER / Mhylab / ARTELIA-Madagascar April 2017 Page 12
2 INTRODUCTION
2.1 OVERVIEW OF THE ESMAP PROGRAMME
ESMAP (Energy Sector Management Assistance Program) is a technical assistance program managed by the
World Bank and supported by 11 bilateral donors. ESMAP launched in January 2013 an initiative to support the
efforts of countries to improve the knowledge of renewable energy resources (REN), establish appropriate
institutional framework for the development of REN and provide "free access" to geospatial resources and data.
This initiative will also support the IRENA-GlobalAtlas program by improving data availability and quality,
consulted through an interactive atlas.
This study "Renewable Energy Resource Mapping: Small Hydro Madagascar", is part of a technical assistance
project funded by ESMAP, implemented by the World Bank in Madagascar (the "Client"), which aims to support
mapping resources and geospatial planning for small hydropower. It is conducted in close coordination with the
Ministry of Energy, the Electricity Regulation Office (ERO), Development Agency of Rural Electrification (DARE)
and JIRAMA.
2.2 OBJECTIVES, RESULTS AND ACTIVITIES OF THE STUDY
The objectives of the Study are:
To improve the quality and availability of the information related to hydropower resource in
Madagascar ;
To undertake a detailed review and update of the small hydropower potential (1-20 MW) ;
To formulate recommendations regarding where small hydro can be implemented in regards to
energy sector planning in the country.
The expected results of the Study are:
A consolidated data in a Geographical Information System (GIS) ;
A thematic Atlas on Hydropower in Madagascar with an emphasis on Small Hydro (1-20 MW) ;
Recommendations to develop the small hydropower sector in Madagascar.
The ESMAP Study is divided into three phases:
PHASE 1 : Preliminary resource mapping based on spatial analysis and site visits
PHASE 2 : Ground-based data collection
PHASE 3 : Production of a validated resource Atlas that combines cartographic and ground-based
data
In the specific context of the Small Hydro Resource Mapping Study in Madagascar, those 3 phases have been
broken down into 4 Activities;
Activity 1 : Data collection and production of Hydro Atlas, review and validation of small hydro
potential
Activity 2 : Small hydro electrification planning

Small Hydro Madagascar ESMAP / The World Bank Prefeasibility Study of the Fanovana Hydroelectric Scheme
SHER / Mhylab / ARTELIA-Madagascar April 2017 Page 13
Activity 3 : Small hydro prioritization, site visits and workshop
Activity 4 : Data collection and final validation (HydroAtlas update / hydrological monitoring
campaign / additional geological and environmental field investigations)
2.3 CONTEXT AND SCOPE OF THE PREFEASIBILITY STUDY
This report is delivered in the context of PHASE 2 (Ground-based data collection). In accordance with our
Terms of References (Revised Terms of References for the Phase 2 (Activity 4) of the Project, 16 April 2015),
the prefeasibility study covers the following aspects:
Review of the existing data and GIS information ;
Additional site visit to the two sites and main load centers / national grid connection by relevant
sector experts ;
Additional topographic and geotechnical surveys, update of the hydrology, and assessments of
environmental and social impact to reach study results at pre-feasibility level;
Preparation of a conceptual design and drawings at pre-feasibility level; Schematic Layout of Hydro
Powerhouse, weir or dam (when applicable), waterways and Transmission Lines to the main load
centers / national grid connection;
Preparation of a Budgetary Cost Estimate, including costs for environmental and social costs, and
Electricity Generation Estimate for a range of installed capacities;
Preliminary economic analysis.

Small Hydro Madagascar ESMAP / The World Bank Prefeasibility Study of the Fanovana Hydroelectric Scheme
SHER / Mhylab / ARTELIA-Madagascar April 2017 Page 14
3 CONTEXT OF THE FANOVANA HYDROELECTRIC SCHEME
3.1 PROJECT AREA
The Fanovana site is located on the Sahatandra River approximately 16.5 km upstream of the confluence with
the Vohitra River on which is sited the existing Andekaleka Hydroelectric Scheme (itself location approximated
7 km downstream that confluence). The geographical coordinates (WGS1984) of the proposed weir location are
18.9156°South and 48.5447°East.
At the proposed intake weir location, the watershed of the Sahanadra River drains an area of 520 km². Figure 1
presents the exact location of the proposed site in Madagascar. The administrative and location data are
detailed in Table 2 below.
Table 2. Administrative data
Site code (Small Hydro Atlas) G407
Site name Fanovana
River Sahatandra
Major river basin Rianila
Province Toamasina
Region Alaotra-Mangoro
District Moramanga
Commune Ambatovola
Village Fanovana
Reference topographic map IGN S47 Nord (scale 1:50,000)
3.2 SITE ACCESS
Access to the Fanovana train station is easy from the RN2. Approximately 4.2 km of the gravel access track is
in good condition (Figure 2 and Figure 3), but partial rehabilitation (including the installation of an efficient
drainage system) is required for the construction phase. From the Fanovana train station, you have to walk
about 2 km along the railway line to get to the intake site.
Small Hydro Madagascar ESMAP / The World Bank Prefeasibility Study of the Fanovana Hydroelectric Scheme
SHER / Mhylab / ARTELIA-Madagascar April 2017 Page 15
Figure 1. Study area
Small Hydro Madagascar ESMAP / The World Bank Prefeasibility Study of the Fanovana Hydroelectric Scheme
SHER / Mhylab / ARTELIA-Madagascar April 2017 Page 16
Figure 2. Access to the Fanovana site (G407) from the RN2 (road map)
Figure 3. Access to the Fanovana site (G407) from the RN2 (details on topographic map 1:50 000)
Small Hydro Madagascar ESMAP / The World Bank Prefeasibility Study of the Fanovana Hydroelectric Scheme
SHER / Mhylab / ARTELIA-Madagascar April 2017 Page 17
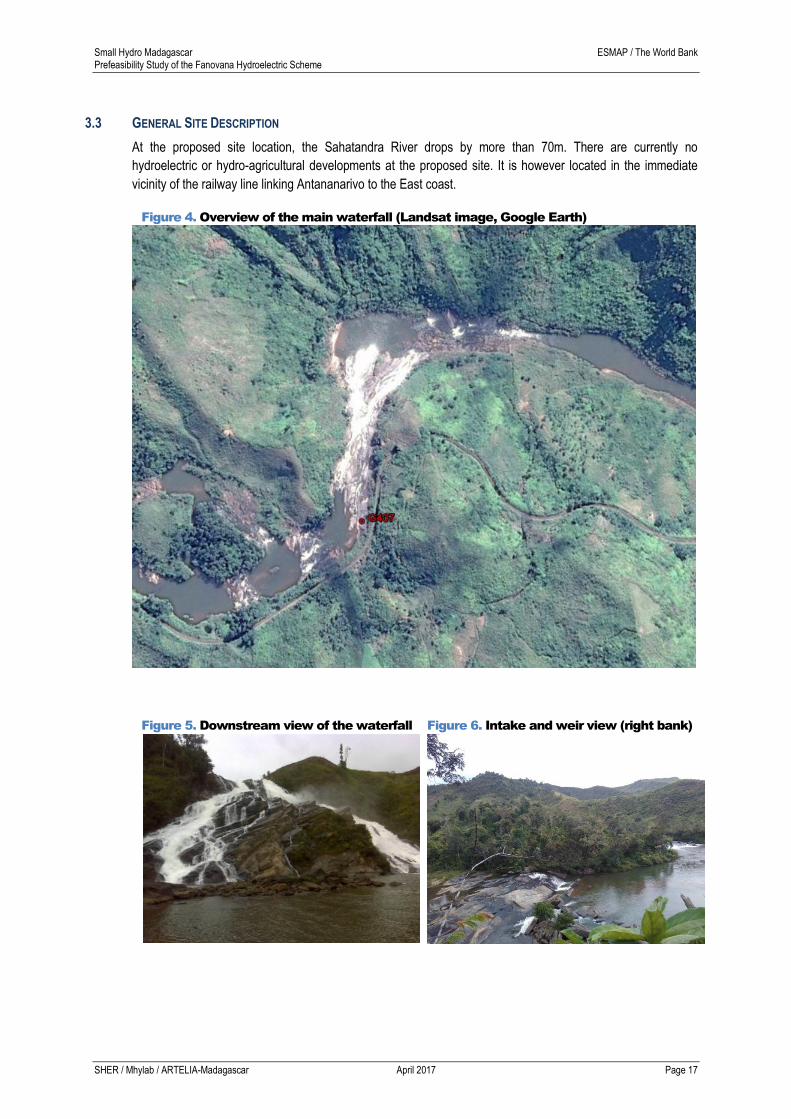
3.3 GENERAL SITE DESCRIPTION
At the proposed site location, the Sahatandra River drops by more than 70m. There are currently no
hydroelectric or hydro-agricultural developments at the proposed site. It is however located in the immediate
vicinity of the railway line linking Antananarivo to the East coast.
Figure 4. Overview of the main waterfall (Landsat image, Google Earth)
Figure 5. Downstream view of the waterfall
Figure 6. Intake and weir view (right bank)

Small Hydro Madagascar ESMAP / The World Bank Prefeasibility Study of the Fanovana Hydroelectric Scheme
SHER / Mhylab / ARTELIA-Madagascar April 2017 Page 18
Figure 7. Tailwater view
Figure 8. Upstream view of the waterfall
3.4 PREVIOUS STUDIES
To the best of our knowledge, there are no previous studies of the site.
Small Hydro Madagascar ESMAP / The World Bank Prefeasibility Study of the Fanovana Hydroelectric Scheme
SHER / Mhylab / ARTELIA-Madagascar April 2017 Page 19
4 TOPOGRAPHY ET MAPPING
4.1 EXISTING MAPPING
4.1.1 Topographic Mapping
The JPEG format (not georeferenced) 1:50,000 scale topographic maps have been acquired from the “Institut
Géographique et Hydrographique de Madagascar” (Foiben-Taosarintanin' i Madagasikara - FTM) in order to
cover the entire site of the Fanovana hydroelectric scheme. The JPEG format (not georeferenced) 1:100,000
scale topographic maps have been also obtained from the FTM. The 1:50,000 scale map of interest is the sheet
S47 Nord - Perinet 1:50,000, 1963. The contour lines interval is 25m. All the topographic maps have been
georeferenced as described in section 4.2.
4.1.2 Thematic Mapping
Thematic maps and their key features, sources and format are presented in Table 3 below.
Table 3. Collected thematic maps
THEMATIC FORMAT KEY FEATURES SOURCES
Administrative boundaries Vector Country / Provinces / Regions / Districts / Communes
Institut Géographique et Hydrographique de Madagascar (FTM) FTM BD500, FTM BD200
Main cities Vector 32 cites and towns Open Street Map, 2014
Landuse Vector 11 classes d’occupation du sol Schéma National d’Aménagement du Territoire (SNAT)
Protected areas Vector SAPM / sites prioritaires / sites potentiels
Atlas numérique du système des aires protégées de Madagascar (SAPM) http://atlas.rebioma.net/
Geology
Raster 1:1,000,000 Schéma National d’Aménagement du Territoire (SNAT)
Vector Digitalisation des planches au 1 :500,000
Service Géologique 1969
Soils map Raster 1:1,000,000 ISRIC-WISE, 2006
Pedology
Raster 1:1,000,000 Schéma National d’Aménagement du Territoire (SNAT)
Raster 1:10,000,000
Gemorphology Raster 1:1,000,000 Schéma National d’Aménagement du Territoire (SNAT)
Mines Raster - Bureau Du Cadastre Miniers de Madagascar (BCMM)
Satellite imagery Raster Landsat 1999 Google Earth
Raster Landsat 2005 Google Earth
Hydrometric stations Vector Location GRDC, Direction Générale de la Météorologie de Madagascar, ouvrage « Fleuves et Rivières de Madagascar, 1992 »
Rainfall and temperature Raster Spatial resolution ~ 1km WorldClim, v1.4 http://www.worldclim.org/
Roads Vector National roads, provincial roads and tracks
FTM BD500, FTM BD200
Transmission network (RI) Vector Build up from various sources JIRAMA, ORE, SHER
4.1.3 Digital Surface Model
The digital surface model (DSM) used in the hydrological study is based on the "Shuttle Radar Topography
Mission" (SRTM, version 1 arc-second). These data were acquired in February 2000 by the United States
Space Agency (NASA) through radar measurements from space shuttle Endeavor. These data have a spatial

Small Hydro Madagascar ESMAP / The World Bank Prefeasibility Study of the Fanovana Hydroelectric Scheme
SHER / Mhylab / ARTELIA-Madagascar April 2017 Page 20
resolution of 1 arc-second (about 30 m at the equator). The MNS of the study area is illustrated in Figure 11 of
the chapter describing the Hydrological Study.
4.2 MAPPING CARRIED OUT AS PART OF THE STUDY
4.2.1 Digitization and geo-referencing
The 1:50,000 scale topographic maps were geo-referenced using the Quantum GIS software and the following
projection parameters:
Projection Laborde Madagascar (Gauss Laborde)
Latitude of origin = 49
Longitude of origin = -21
Scale factor = 0.9995
False Easting = 800 000
False Northing = 400 000
Ellipsoïde de Hayford 1909
4.2.2 Additional surveying
A topographical survey of the site was carried out by triangulation
of aerial images taken from a specially equipped light aircraft
(Figure 9).
The topographic survey is characterized by a density greater than
5 points / m² and a relative accuracy of 2%.
The results of the survey are, on the one hand, a digital surface
model (DSM) which includes vegetation. It nevertheless provides
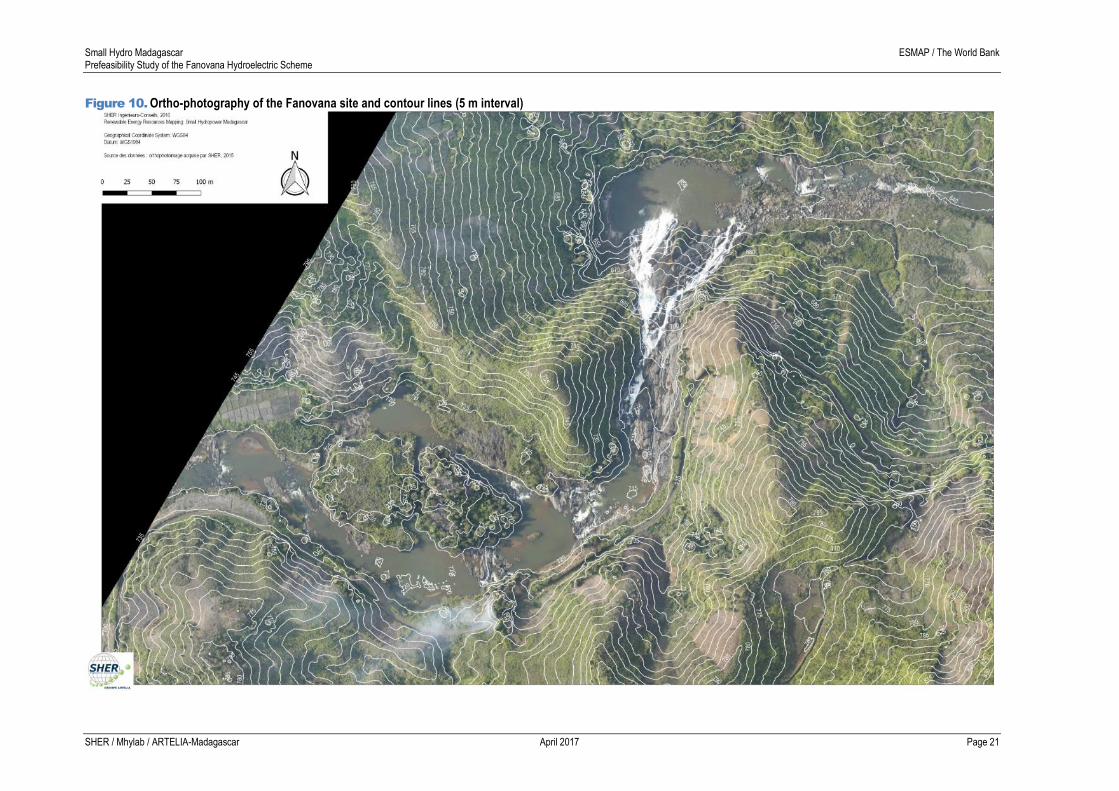
an excellent representation of the topographic context of the site and an ortho-photography of the site whose
pixel size is between 0.20m and 0.40m. The ortho-photography as well as contour lines deduced from the
digital surface model are presented at Figure 10.
Elevations resulting from this topographic survey are relative to each other and have not been linked to
the national system. Consequently, the elevations of the works mentioned in this report are not the
absolute altitudes of the Malagasy national system.
.
Figure 9. Aircraft and dedicated survey
equipment
Small Hydro Madagascar ESMAP / The World Bank Prefeasibility Study of the Fanovana Hydroelectric Scheme
SHER / Mhylab / ARTELIA-Madagascar April 2017 Page 21
Figure 10. Ortho-photography of the Fanovana site and contour lines (5 m interval)
Small Hydro Madagascar ESMAP / The World Bank Prefeasibility Study of the Fanovana Hydroelectric Scheme
SHER / Mhylab / ARTELIA-Madagascar April 2017 Page 22
5 HYDROLOGICAL STUDY
5.1 OBJECTIVES AND LIMITS
The objective of the hydrological study is to establish and quantify the climatological and hydrological
characteristics of the study area in order to determine the hydrological parameters and time series required for
the design of the Fanovana hydroelectric project as well as for the economic analysis of the pre-feasibility
study.
5.2 DESCRIPTION OF THE STUDY AREA
5.2.1 Physical Context
The Sahatandra River originates in the Andasibe natural reserve in the province of Taomasina, Alaotra-
Mangoro region at an elevation above 1100m. Then, the mean elevation of the watershed remains stable
between 1050m and 950m (Figure 11) before falling again by approximately 200m on the remaining 10% (in
terms of surface area) of the catchment area. The Sahatandra River flows mainly westward to the east and to
eventually join the Vohitra River, on which is located the existing Andekaleka hydroelectric scheme
(approximately 7km downstream of the confluence of the Sahatandra and Vohitra rivers). The Sahatandra River
is part of the Rianila River watershed that discharges into the Indian Ocean.
As shown in Figure 11, the Sahatandra watershed at the proposed hydroelectric project site has marked relief
with elevations between 676m and 1340m (938m on average). The drainage basin of the Sahatandra river at
the proposed intake site is 520.4 km² (delimitation based on the SRTM DTM of spatial resolution 1 arc-second,
i.e. approximately 30 m). The main physical and morphological characteristics of the watershed are presented
in Table 4.
The hypsometric curve of the watershed is shown in Figure 12. This curve shows the percentage of the
watershed area above a given elevation. It shows that slopes are important in the upstream and downstream
parts of the watershed and that 70% of the watershed flows on a plateau characterized by a gentle slope. This
is clearly observed in Figure 12 and Figure 11.
Table 4. Physical and morphological characteristics of the watershed
PARAMETER VALUE UNIT
Area 520.4 km²
Average elevation 983 m a.s.l.
Maximum elevation 1340
Maximum elevation (quantile 5%) 1103 m a.s.l.
Minimum elevation 676
Minimum elevation (quantile 95%) 815 m a.s.l.
Slope index 2.8 m/km
Elevation difference 288 m
Perimeter 216.7 km
Gravelius index 2.68 -
Equivalent length 103.3 km
Small Hydro Madagascar ESMAP / The World Bank Prefeasibility Study of the Fanovana Hydroelectric Scheme
SHER / Mhylab / ARTELIA-Madagascar April 2017 Page 23
Figure 11. Sahatandra River watershed and Digital Surface Model
Small Hydro Madagascar ESMAP / The World Bank Prefeasibility Study of the Fanovana Hydroelectric Scheme
SHER / Mhylab / ARTELIA-Madagascar April 2017 Page 24
Figure 12. Hypsometric curve of the Sahatrandra River watershed
5.2.2 Land use and protected areas
Data from the CCI Land Cover project (© ESA Climate Change Initiative - Land Cover project 2016) is a widely
accepted source of information for land use around the world. These data are freely available and are derived
from satellite images acquired by the MERIS instrument of the European Space Agency. The land cover
includes 5 years of satellite imagery acquisition between 2008 and 2012. The information is provided in raster
format with a spatial resolution of 300 m and allows defining the land use classes shown in Figure 13
Figure 13 and Table 5 show that the Sahatandra watershed is characterized by a very abundant vegetation
cover composed mainly of a forest of evergreen, open-to-closed (57.9% Area of the catchment area, i.e.
301.5 km²) and non-irrigated agriculture (26.2% of the catchment area, i.e. 136.2 km²).
Table 5. Land use in the Sahatandra River watershed
CODE
LEGEND
AREA
[%] [HA]
10 Agriculture, non-irriguée 26.2% 13621.8
30 Mosaïque agriculture (>50%) / végétation naturelle (<50%) 9.4% 4884.7
40 Mosaïque végétation naturelle herbacée, arbustive ou arborée (>50%) / agriculture (<50%) 1.5% 783.9
50 Forêt, arbres de type feuillus, sempervirente, couverture ouverte à fermée (>15%) 57.9% 30149.6
61 Forêt, arbres de type feuillus, décidus, couverture fermée (>40%) 4.3% 2217.7
100 Mosaïque végétation naturelle arbustive ou arborée (>50%) / végétation naturelle herbacée
(<50%) 0.3% 143.4
120 Végétation naturelle arbustive 0.4% 229.4
170 Forêt inondée, eau saline (=mangrove) 0.0% 9.6
TOTAL 100% 52040
400
500
600
700
800
900
1000
1100
1200
1300
1400
0% 10% 20% 30% 40% 50% 60% 70% 80% 90% 100%
Alt
itu
de
(SR
TM
) [m
]
Surface cumulée [%]

Small Hydro Madagascar ESMAP / The World Bank Prefeasibility Study of the Fanovana Hydroelectric Scheme
SHER / Mhylab / ARTELIA-Madagascar April 2017 Page 25
The Digital Atlas of the System of Protected Areas of Madagascar (Atlas Numérique du Système des Aires
Protégées de Madagascar - SAPM) highlights existing protected areas, protected areas with a temporary
protection status and new protected areas identified by the "Promoters". The SAPM defines three classes as
follows:
SAPM (blue zone): Existing Protected Areas, Protected Areas with Temporary Protection Status and New
Protected Areas identified by "Promoters". The granting of a new mining permit is prohibited.
Priority areas (red zone): Priority areas identified as the most important to be Protected Areas by MARXAN
analysis, overlapping (identified) by priority sites KBAs, APAPC, identified by "promoters" (without funding). On-
site and KoloAla priority sites (Sustainable Forest Management Site). The granting of a new mining permit is
prohibited. If sites in the Blue Zone become mining squares, then the sites in the red areas may be used as
"compensation". At the same time, certain sites will be subject to reduction of area during the final delimitation.
Potential sites (green zone): Potential conservation sites identified by scientific analyzes (MARXAN) that do
not overlap with other prioritization schemes and potential KoloAla sites. Subject to conditions for the issuance
of mining permits (eg Environmental Impact Assessment and other measures defined in specifications). As a
condition, for example, taking into account sites containing RTS (very rare species). These sites are most of the
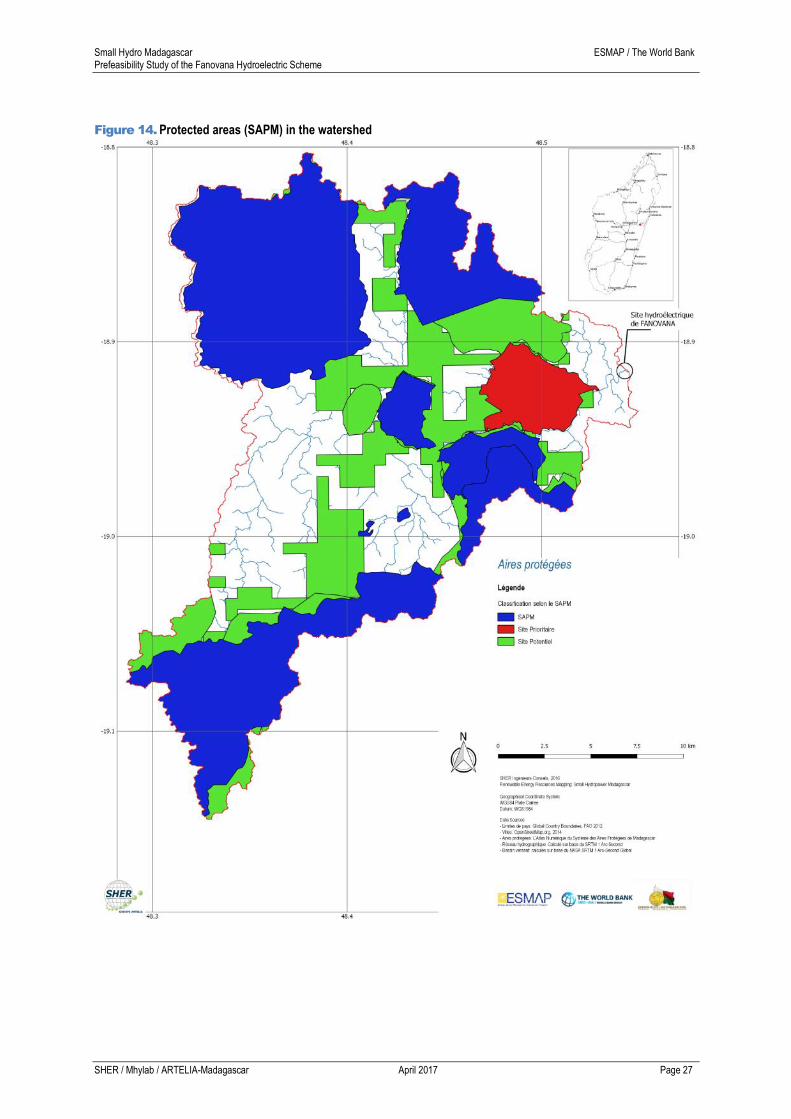
fragments of natural habitat that have been identified recently and that are difficult to convert into Protected
Areas but will now be taken into account during different schedules.
Figure 14 shows that 72.7% (or 378.3 km²) of the catchment area is classified as protected area (MPI, priority
sites or potential sites). These protected areas correspond mainly to the shrub forest type occupancy class. As
a result, we can consider that the basin is relatively well protected against soil degradation and that the
potential sediment load in the river will be limited compared to other watersheds in Madagascar.
Small Hydro Madagascar ESMAP / The World Bank Prefeasibility Study of the Fanovana Hydroelectric Scheme
SHER / Mhylab / ARTELIA-Madagascar April 2017 Page 26
Figure 13. Land use in the Sahatandra River watershed
Small Hydro Madagascar ESMAP / The World Bank Prefeasibility Study of the Fanovana Hydroelectric Scheme
SHER / Mhylab / ARTELIA-Madagascar April 2017 Page 27
Figure 14. Protected areas (SAPM) in the watershed
Small Hydro Madagascar ESMAP / The World Bank Prefeasibility Study of the Fanovana Hydroelectric Scheme
SHER / Mhylab / ARTELIA-Madagascar April 2017 Page 28
5.2.3 Climate
According to the Köppen classification based on rainfall and temperature, the study area (Sahatandra River
watershed) is characterized by a warm temperate climate with no dry season (oceanic) and warm summer (Cfa
class). Köppen defines the temperate climate «C» by the following characteristics:
Average temperature of the 3 coldest months between -3 °C and 18 °C ;
Average temperature of the warmest month > 10°C ;
Winter and summer seasons are well defined.
The rainfall regime « f » (humid climate) is defined by precipitation spread over every month of the year, with no
dry season.
Finally, the amplitude of the annual cycle of « a » type temperatures means a hot summer with an average
temperature of the hottest month above 22 °C.
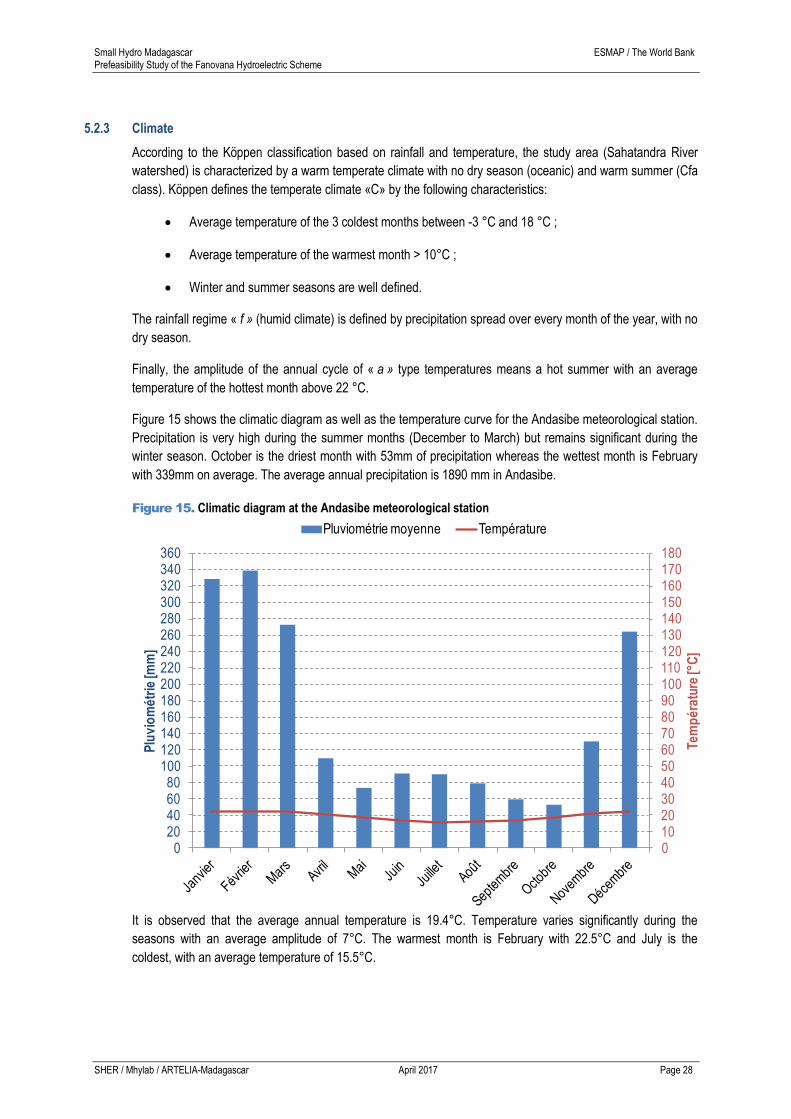
Figure 15 shows the climatic diagram as well as the temperature curve for the Andasibe meteorological station.
Precipitation is very high during the summer months (December to March) but remains significant during the
winter season. October is the driest month with 53mm of precipitation whereas the wettest month is February
with 339mm on average. The average annual precipitation is 1890 mm in Andasibe.
Figure 15. Climatic diagram at the Andasibe meteorological station
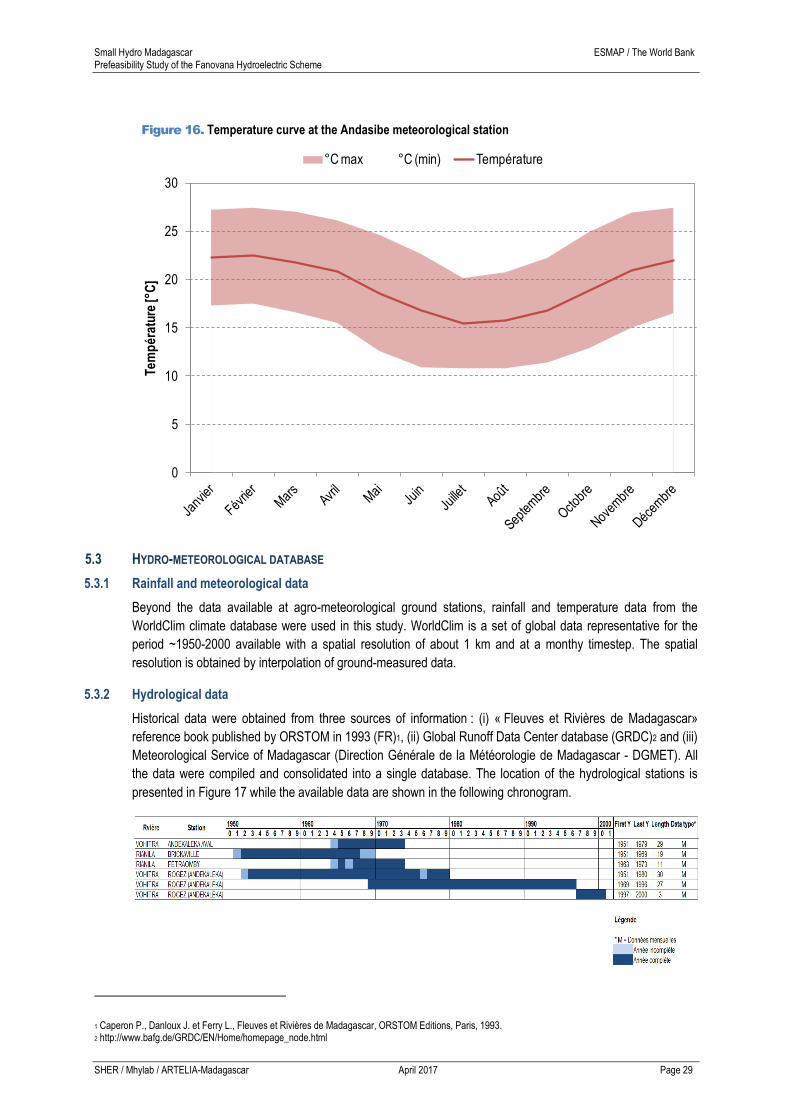
It is observed that the average annual temperature is 19.4°C. Temperature varies significantly during the
seasons with an average amplitude of 7°C. The warmest month is February with 22.5°C and July is the
coldest, with an average temperature of 15.5°C.
0102030405060708090100110120130140150160170180
020406080
100120140160180200220240260280300320340360
Te
mp
éra
ture
[°C
]
Plu
vio
mé
trie
[mm
]
Pluviométrie moyenne Température
Small Hydro Madagascar ESMAP / The World Bank Prefeasibility Study of the Fanovana Hydroelectric Scheme
SHER / Mhylab / ARTELIA-Madagascar April 2017 Page 29
Figure 16. Temperature curve at the Andasibe meteorological station
5.3 HYDRO-METEOROLOGICAL DATABASE
5.3.1 Rainfall and meteorological data
Beyond the data available at agro-meteorological ground stations, rainfall and temperature data from the
WorldClim climate database were used in this study. WorldClim is a set of global data representative for the
period ~1950-2000 available with a spatial resolution of about 1 km and at a monthy timestep. The spatial
resolution is obtained by interpolation of ground-measured data.
5.3.2 Hydrological data
Historical data were obtained from three sources of information : (i) « Fleuves et Rivières de Madagascar»
reference book published by ORSTOM in 1993 (FR)1, (ii) Global Runoff Data Center database (GRDC)2 and (iii)
Meteorological Service of Madagascar (Direction Générale de la Météorologie de Madagascar - DGMET). All
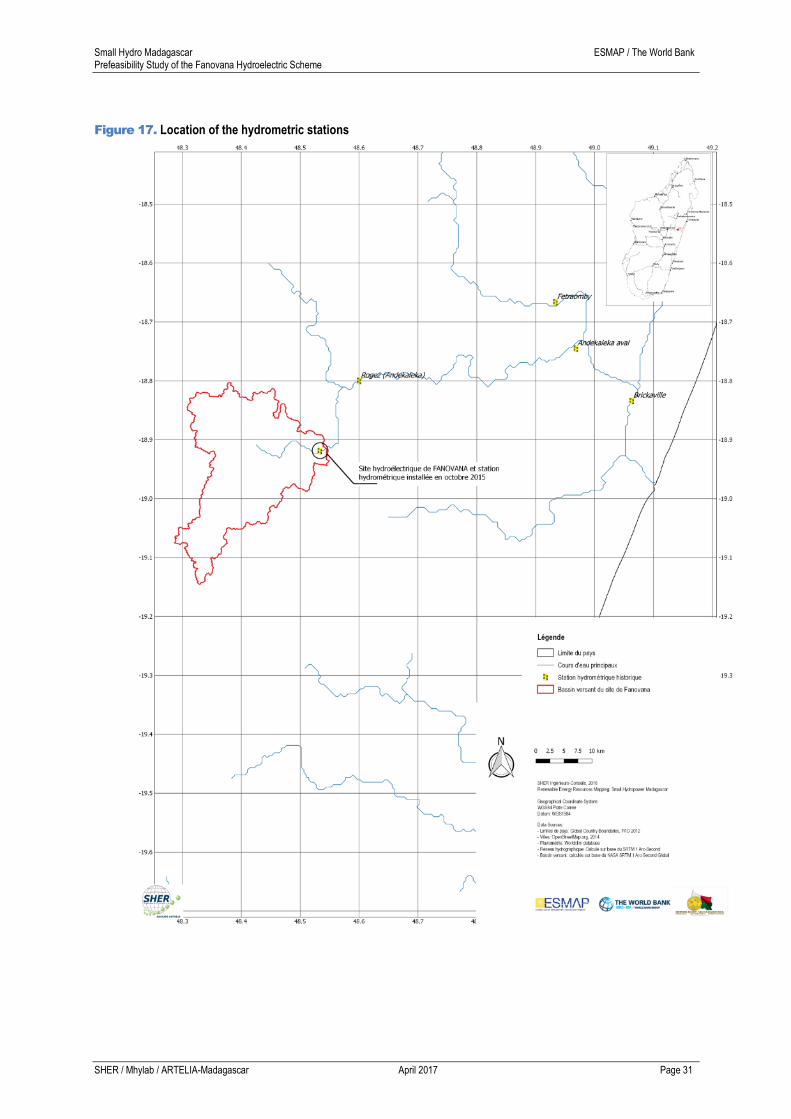
the data were compiled and consolidated into a single database. The location of the hydrological stations is
presented in Figure 17 while the available data are shown in the following chronogram.
1 Caperon P., Danloux J. et Ferry L., Fleuves et Rivières de Madagascar, ORSTOM Editions, Paris, 1993. 2 http://www.bafg.de/GRDC/EN/Home/homepage_node.html
0
5
10
15
20
25
30
Te
mp
éra
ture
[°C
]°C max °C (min) Température

Small Hydro Madagascar ESMAP / The World Bank Prefeasibility Study of the Fanovana Hydroelectric Scheme
SHER / Mhylab / ARTELIA-Madagascar April 2017 Page 30
The reference hydrometric station for this study is the Rogez station on the Vohitra River. At that location,
historical streamflow records from various sources covers the period from 1952 to 2000 (48 years) with monthly
data. The Vohitra River watershed at the Rogez hydrometric station is 1895 km². It has a 27.5% catchment
area ratio with the Sahatandra River at the Fanovana site. The location of these stations is shown in Figure 17.
As part of the ESMAP Small Hydropower Resource Mapping study, a hydrometric station was installed in
October 2015 about 2 km upstream of the potential hydroelectric site of Fanovana. The preliminary rating curve
has been established during the hydrological year 2015-2016. Given the limited length of the records, it will only
be used to validate the hydrological study carried out based on the data from the Rogez station on the Vohitra.
Small Hydro Madagascar ESMAP / The World Bank Prefeasibility Study of the Fanovana Hydroelectric Scheme
SHER / Mhylab / ARTELIA-Madagascar April 2017 Page 31
Figure 17. Location of the hydrometric stations
Small Hydro Madagascar ESMAP / The World Bank Prefeasibility Study of the Fanovana Hydroelectric Scheme
SHER / Mhylab / ARTELIA-Madagascar April 2017 Page 32
5.4 RAINFALL AND STREAMFLOW DATA ANALYSIS
5.4.1 Annual and monthly rainfall
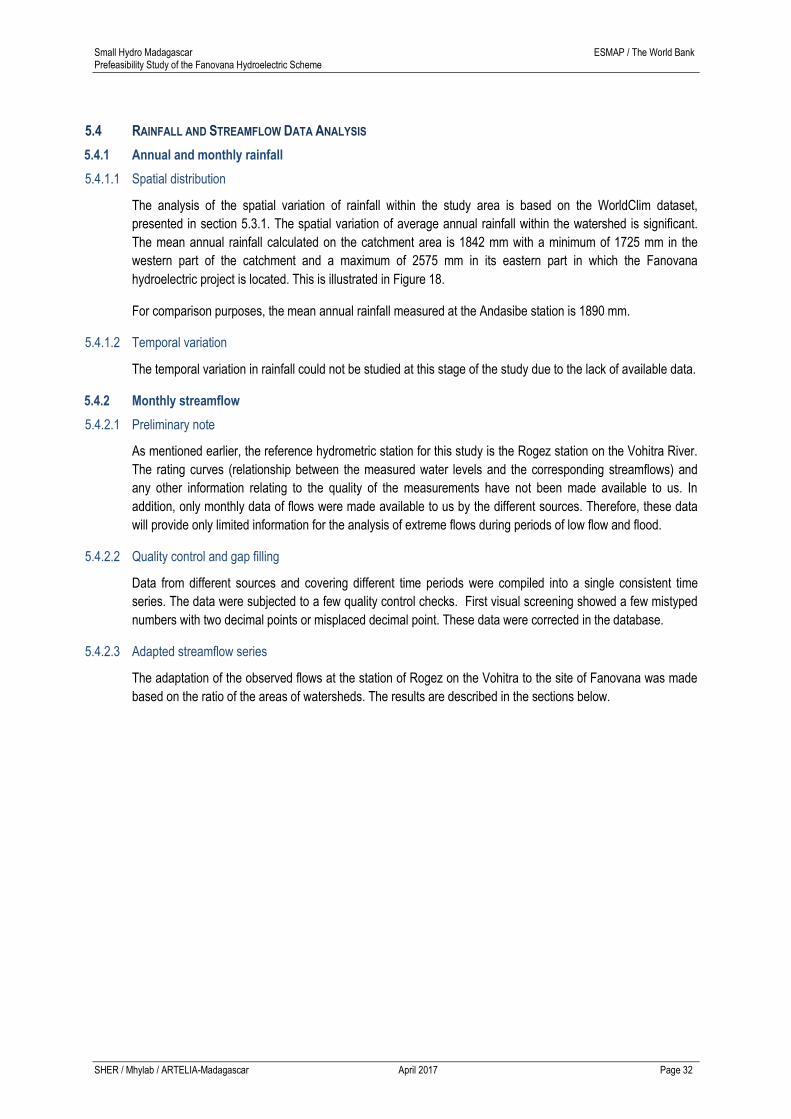
5.4.1.1 Spatial distribution
The analysis of the spatial variation of rainfall within the study area is based on the WorldClim dataset,
presented in section 5.3.1. The spatial variation of average annual rainfall within the watershed is significant.
The mean annual rainfall calculated on the catchment area is 1842 mm with a minimum of 1725 mm in the
western part of the catchment and a maximum of 2575 mm in its eastern part in which the Fanovana
hydroelectric project is located. This is illustrated in Figure 18.
For comparison purposes, the mean annual rainfall measured at the Andasibe station is 1890 mm.
5.4.1.2 Temporal variation
The temporal variation in rainfall could not be studied at this stage of the study due to the lack of available data.
5.4.2 Monthly streamflow
5.4.2.1 Preliminary note
As mentioned earlier, the reference hydrometric station for this study is the Rogez station on the Vohitra River.
The rating curves (relationship between the measured water levels and the corresponding streamflows) and
any other information relating to the quality of the measurements have not been made available to us. In
addition, only monthly data of flows were made available to us by the different sources. Therefore, these data
will provide only limited information for the analysis of extreme flows during periods of low flow and flood.
5.4.2.2 Quality control and gap filling
Data from different sources and covering different time periods were compiled into a single consistent time
series. The data were subjected to a few quality control checks. First visual screening showed a few mistyped
numbers with two decimal points or misplaced decimal point. These data were corrected in the database.
5.4.2.3 Adapted streamflow series
The adaptation of the observed flows at the station of Rogez on the Vohitra to the site of Fanovana was made
based on the ratio of the areas of watersheds. The results are described in the sections below.
Small Hydro Madagascar ESMAP / The World Bank Prefeasibility Study of the Fanovana Hydroelectric Scheme
SHER / Mhylab / ARTELIA-Madagascar April 2017 Page 33
Figure 18. Spatial Variation of the annual rainfall on the Sahatrandra watershed
Small Hydro Madagascar ESMAP / The World Bank Prefeasibility Study of the Fanovana Hydroelectric Scheme
SHER / Mhylab / ARTELIA-Madagascar April 2017 Page 34
5.4.2.4 Monthly Streamflow Records Analysis
Figure 19 presents the hydrograph of the adapted streamflows at the Fanovana potential hydropower site. The
hydrology of the river is characterized by two seasons:
- Dry season from May to November ;
- Wet season from December to April where the average monthly streamflow in March peaks at
33 m³/s.
Figure 19. Hydrograph of the Sahatandra River at Fanovana
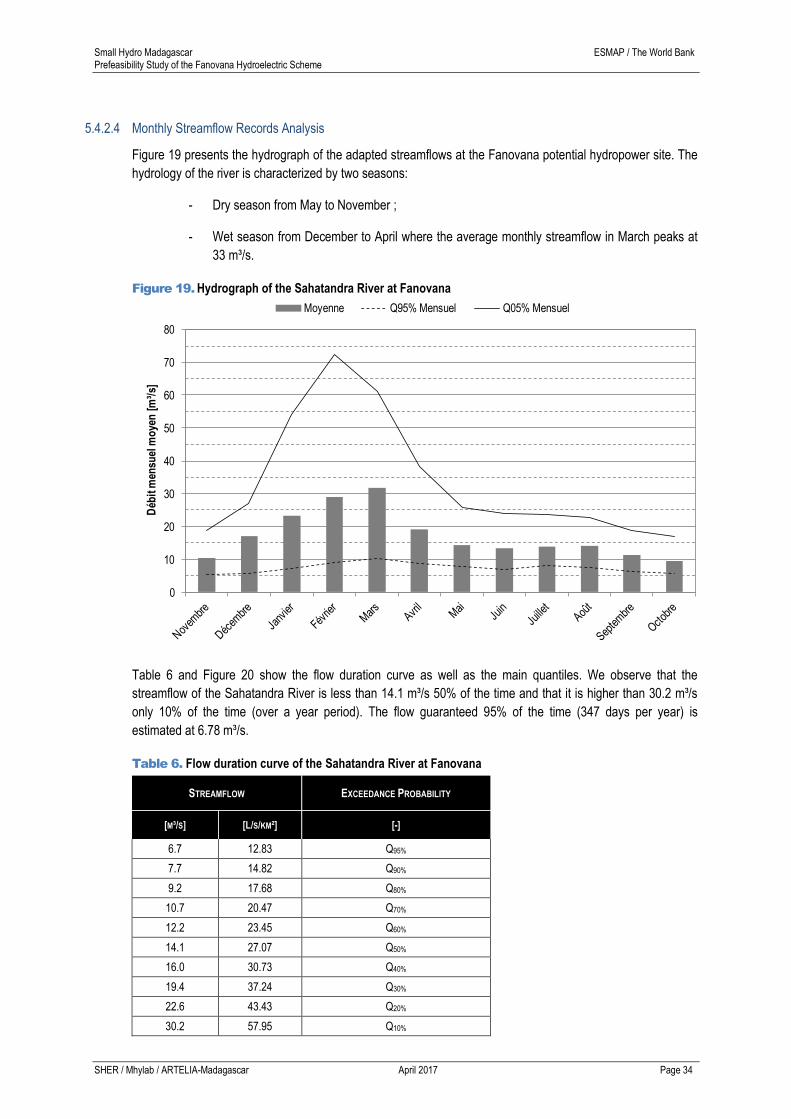
Table 6 and Figure 20 show the flow duration curve as well as the main quantiles. We observe that the
streamflow of the Sahatandra River is less than 14.1 m³/s 50% of the time and that it is higher than 30.2 m³/s
only 10% of the time (over a year period). The flow guaranteed 95% of the time (347 days per year) is
estimated at 6.78 m³/s.
Table 6. Flow duration curve of the Sahatandra River at Fanovana
STREAMFLOW EXCEEDANCE PROBABILITY
[M³/S] [L/S/KM²] [-]
6.7 12.83 Q95%
7.7 14.82 Q90%
9.2 17.68 Q80%
10.7 20.47 Q70%
12.2 23.45 Q60%
14.1 27.07 Q50%
16.0 30.73 Q40%
19.4 37.24 Q30%
22.6 43.43 Q20%
30.2 57.95 Q10%
0
10
20
30
40
50
60
70
80
Déb
it m
ensu
el m
oye
n [
m³/
s]
Sahatandra @ G407 (Fanovana)
Moyenne Q95% Mensuel Q05% Mensuel
Small Hydro Madagascar ESMAP / The World Bank Prefeasibility Study of the Fanovana Hydroelectric Scheme
SHER / Mhylab / ARTELIA-Madagascar April 2017 Page 35
Figure 20. Flow duration curve of the Sahatandra River at Fanovana
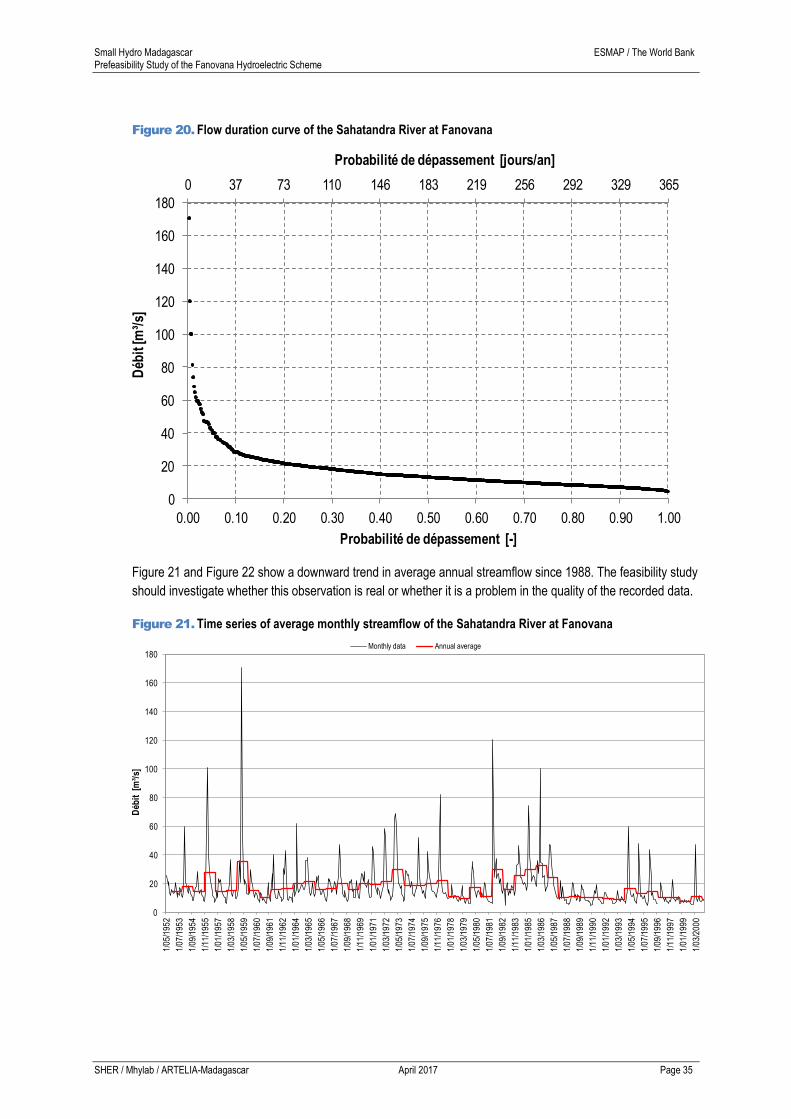
Figure 21 and Figure 22 show a downward trend in average annual streamflow since 1988. The feasibility study
should investigate whether this observation is real or whether it is a problem in the quality of the recorded data.
Figure 21. Time series of average monthly streamflow of the Sahatandra River at Fanovana
0 37 73 110 146 183 219 256 292 329 365
0
20
40
60
80
100
120
140
160
180
0.00 0.10 0.20 0.30 0.40 0.50 0.60 0.70 0.80 0.90 1.00
Probabilité de dépassement [jours/an]
Déb
it [m
³/s]
Probabilité de dépassement [-]
Sahatandra @ G407 (Fanovana)
0
20
40
60
80
100
120
140
160
180
1/05
/195
2
1/07
/195
3
1/09
/195
4
1/11
/195
5
1/01
/195
7
1/03
/195
8
1/05
/195
9
1/07
/196
0
1/09
/196
1
1/11
/196
2
1/01
/196
4
1/03
/196
5
1/05
/196
6
1/07
/196
7
1/09
/196
8
1/11
/196
9
1/01
/197
1
1/03
/197
2
1/05
/197
3
1/07
/197
4
1/09
/197
5
1/11
/197
6
1/01
/197
8
1/03
/197
9
1/05
/198
0
1/07
/198
1
1/09
/198
2
1/11
/198
3
1/01
/198
5
1/03
/198
6
1/05
/198
7
1/07
/198
8
1/09
/198
9
1/11
/199
0
1/01
/199
2
1/03
/199
3
1/05
/199
4
1/07
/199
5
1/09
/199
6
1/11
/199
7
1/01
/199
9
1/03
/200
0
Déb
it [
m³/
s]
Sahatandra @ G407 (Fanovana)
Monthly data Annual average
Small Hydro Madagascar ESMAP / The World Bank Prefeasibility Study of the Fanovana Hydroelectric Scheme
SHER / Mhylab / ARTELIA-Madagascar April 2017 Page 36
Figure 22. Time series of average annual streamflow of the Sahatandra River at Fanovana
5.4.3 Daily streamflow analysis
5.4.3.1 ESMAP hydrometric station: Hydrological year 2015-2016
As mentioned earlier, a hydrometric station was installed in October 2015 about 2 km upstream of the potential
Fanovana hydroelectric site as part of the ESMAP Small Hydropower Resource Mapping study funded by the
World Bank. The station is equipped with a pressure sensor (capacitive sensor with thermal and atmospheric
compensation OTT PLS) for automatic water level measurement, an integrated recording and communication
solution (OTTNetDL500) and a staff gauge read daily by an observer.
The measurement campaign took place during the hydrological year 2015-2016, from October 2015 to October
2016.
A preliminary rating curve was established on the basis of 11 gauging carried out with an ADCP (Accoustic
Doppler Current Profiler). Those gauging cover a range of streamflow measured between 2.44 m³/s and
12.65 m³/s and have been done in good conditions. The preliminary rating curve covers an interesting range of
water level but will have to be completed, especially in the water level range above 0.40m in order to validate
and improve the accuracy of the curve.
The streamflows calculated using the preliminary rating curve are presented below. Figure 23 shows the
average daily streamflows during the hydrological year 2015-2016. It is observed that the winter of 2015-2016
(corresponding to the rainy season and cyclones) is characterized by a late start (mid-December), a fairly low
amplitude and a lack of flood during the month of February while it is usually one of the wettest months. The
low-water season started late, around the end of July.
The graph in Figure 23 also shows the recorded daily maximum and minimum flows. We note that the peaks
are generally high during the winter, but have a very limited duration in time (a few tens of minutes). Indeed, the
latter have a limited impact on the daily average.
0
5
10
15
20
25
30
35
40
Déb
it a
nn
uel
mo
yen
[m
³/s]
Sahatandra @ G407 (Fanovana)
Interannual average [m³/s] Moyenne mobile (3 ans)
Small Hydro Madagascar ESMAP / The World Bank Prefeasibility Study of the Fanovana Hydroelectric Scheme
SHER / Mhylab / ARTELIA-Madagascar April 2017 Page 37
Figure 23. Daily streamflow of the Sahatandra River at the ESMAP station (2015-2016)
The monthly hydrograph is shown in Figure 24. It represents the monthly averages of the daily flows shown in
Figure 23. It is observed that the largest daily peaks occurred during the month of January while on average the
flow rate was higher during the month of June 2016. The month of February 2016 is the 7th wettest month of the
year, confirming the absence of significant floods and rain during this month which is however during the rainy
season.
Figure 24. Monthly hydrograph of the Sahatandra River at the ESMAP station (2015-2016)
0
5
10
15
20
25
30
35
40
Novembre Décembre Janvier Février Mars Avril Mai Juin Juillet Août Septembre Octobre
Déb
it m
ensu
el m
oye
n [
m³/
s]
Sahatandra @ Fanovana
Moyenne Min Max
Small Hydro Madagascar ESMAP / The World Bank Prefeasibility Study of the Fanovana Hydroelectric Scheme
SHER / Mhylab / ARTELIA-Madagascar April 2017 Page 38
This analysis can be confirmed by comparing the flow duration curve obtained by transposition of the
measurements on the Vohitra (Rogez station) and the flow duration curve obtained at the end of the 12 months
of measurements on the Sahatandra. The results illustrated in Figure 25. It is observed that few floods occurred
in 2015-2016 (February abnormally dry).
Figure 25. Comparison of the flow duration curves (2015-2016 vs transposition of the data from the Rogez
station (1952-2000))
It should also be borne in mind that the flow duration curve for the 2015-2016 season are based on a
preliminary rating curve.
5.4.3.2 Comments on the hydrological year 2015-2016
El Niño is a natural phenomenon characterized by the abnormal warming of sea surface temperatures (SST) in
the central and eastern regions along the equatorial Pacific Ocean. On average, it occurs every 2 to 7 years
and can last up to 18 months. El Niño has significant environmental and climate impacts at the global scale. In
some areas, this can lead to reduced rainfall and drought, while other areas are subject to intense rainfall and
flooding. Climatologists have announced that the event El Niño 2015-2016 could be the most severe ever
recorded.
In Madagascar, an extreme drought hit the south of the country directly affecting agriculture production and
access to water, which led to severe problems on human health and nutrition. Four southern districts recorded
below-average precipitation that occurs statistically every 20 years prior to April 2016 and precipitation since
April 2016 in two districts arrived too late for the June crop harvest. The northern part of the country has been
affected by extreme precipitation, causing numerous floods.
The map below (Figure 26) shows the differences in precipitation that occurred between October 2015 and
February 2016 compared to the 1982-2011 average. It is observed that the watersheds studied in this
hydrological monitoring campaign are all in the zone where precipitation deficits are more or less severe.
0
5
10
15
20
25
30
35
40
45
0.00 0.10 0.20 0.30 0.40 0.50 0.60 0.70 0.80 0.90 1.00
Déb
it m
ensu
el m
oye
n [
m³/
s]
Probabilité de dépassement [-]
Sahatandra @ Fanovana
Moyennes journalières Transpose Vohitra@Rogez
Small Hydro Madagascar ESMAP / The World Bank Prefeasibility Study of the Fanovana Hydroelectric Scheme
SHER / Mhylab / ARTELIA-Madagascar April 2017 Page 39
Figure 26. October 2015 - February 2016: Abnoral precipitations (% of average 1982-2011)3
5.5 FLOOD STUDY
5.5.1 Introduction
The flood study is essential for design calculations of structures and equipment such as spillways or floodgates
but also for temporary infrastructure such as cofferdams and temporary diversions during the construction
period.
The flood study will focus on 10 years and 100 years return period. These floods will be used respectively for
the construction and exploitation phases. A detailed justification for these return periods can be found in section
8.1.4 of this report.
5.5.2 Methodology
Since only monthly data are available for all the hydrometric stations studied, a frequency analysis of these
data would provide only very limited information for estimating floods and their probability of occurrence.
Indeed, the most important flows observed during the floods occur only during a few hours and does not appear
in the average values.
3 Source: FEWS NET/USGS

Small Hydro Madagascar ESMAP / The World Bank Prefeasibility Study of the Fanovana Hydroelectric Scheme
SHER / Mhylab / ARTELIA-Madagascar April 2017 Page 40
Consequently, floods were estimated using the Duret method that allows estimating the maximum flood of a
river, for a given return period, based on the morphological characteristics of the watershed and the daily
precipitations of the same return period falling on this watershed. This method was established in the 1970’s to
respond to a need for a practical flood-determining tool for any river in Madagascar, given the lack in historical
data. The method has been established mainly for watersheds with a surface area of more than 150 km². An
adapted version exists however to extend its validity to a watershed area down to 5 km².
The Duret method (1973) is based on the following equation:
Q(T) = k S I0.32 H(24,T) (1 – 36/H(24,T))2
Where I is the average slope of the watershed (m/km), S is the watershed area (km²), T is the return period of
the event (year), H(24,T) is the daily precipitation heigth (over 24h) on the watershed for a return period T
(year), k and are variables depending on S and H.
For S ≥ 150 km², k = 0.025 and = 0.8. Hence, the general equation becomes:
Q(T) = 0.025 S0.8 I0.32 H(24,T) (1 – 36/H(24,T))2
5.5.3 Daily precipitation estimates
In his book, Duret presents daily rainfall (over 24 hours) for different return periods for a set of 105 stations
spread over Madagascar. Those data were estimated from a frequency analysis of available 30 to 40 years-
long time series.
Given the size of the Sahatandra River watershed, application of the Duret method requires taking into account
the spatial variability of precipitation. The Thiessen polygon method is a simple method for interpolating point
measurements of rainfall stations on a territory. Thiessen polygons are formed by mediators of straight lines
joining adjacent rainfall stations as shown in Figure 27. Hence, weighted average precipitation on the
watershed surface is calculated by the arithmetic sum of precipitation from each station, weighted by the area
of the corresponding Thiessen polygon in relation to the total area of the watershed area.
It is observed that the Thiessen polygons are particularly consistent with the spatial distribution of annual
rainfall observed in Figure 18.
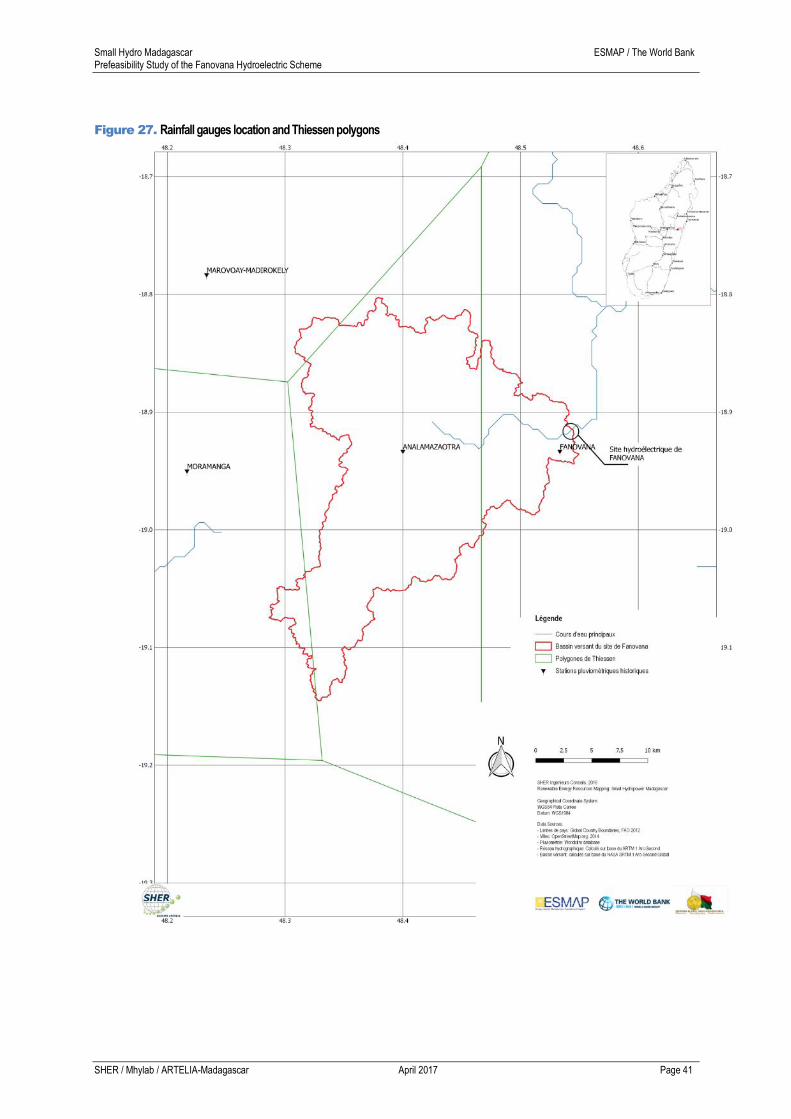
Small Hydro Madagascar ESMAP / The World Bank Prefeasibility Study of the Fanovana Hydroelectric Scheme
SHER / Mhylab / ARTELIA-Madagascar April 2017 Page 41
Figure 27. Rainfall gauges location and Thiessen polygons
Small Hydro Madagascar ESMAP / The World Bank Prefeasibility Study of the Fanovana Hydroelectric Scheme
SHER / Mhylab / ARTELIA-Madagascar April 2017 Page 42
5.5.4 Flood Estimates
Ten years and hundred years return period flood estimates at the Fanovana hydroelectric scheme are
presented in the following table.
Table 7. Ten years and hundred years return period flood events
ATLAS
CODE SITE NAME
DAILY PRECIPITATIONS H(24,T) [MM] FLOODS [M³/S]
T = 10 YEARS T = 100 YEARS T = 10 YEARS T = 100 YEARS
G407 Fanovana 191.3 331.4 646 1351
5.6 STUDY OF THE EROSION HAZARD IN THE SAHATANDRA RIVER WATERSHED
5.6.1 Objectives
No information on solid transport in the river is available at this stage. Solid transport is strongly linked to
land use conditions, agricultural practices in the catchment area and to extreme rainfall events.
The objective of this study is to map the actual erosion hazard (taking into account the land use) for non-
artificialized area (crops, grasslands, forests, savannas, etc.) based on the soil losses estimates resulting from
water erosion. The objective is not about estimating the solid transport in the river but rather mapping the areas
where erosion is potentially important in order to appropriately manage the issue, in particular by the
development of watershed management policies that include conservation soil measures.
5.6.2 Methodology
Soil losses resulting from erosion by water were estimated using the RUSLE model (Revised Universal Soil
Loss Equation), widely used and accepted across the scientific community. RUSLE is an empirical model
based on five determining factors that impacts soil loss (Wischmeier et Smith, 19784).
𝐸 = 𝑅 ∙ 𝐾 ∙ 𝐿𝑆 ∙ 𝐶 ∙ 𝑃
Where E expressed the soil losses [t.ha-1.y-1], R is the rainfall-runoff erosivity factor [MJ.mm.ha-1.h-1.y-1], K is the
soil erodibility factor [t.h.mm-1.MJ-1], L and S are the slope length and slope steepness factors (dimensional), C
is the cover-management factor (dimensional) and P is the support practice factor (dimensional).
The use of RUSLE is justified by its simplicity, in particular due to the relatively small number of parameters
taken into account, its clarity and its easy integration into a GIS. However, this model has a number of
limitations both in terms of limits of applicability and design. These limitations, which are inherent to the
conceptual model, must be taken into account when analyzing the model outputs. A literature review of the
limits of the RUSLE is presented below (Yoder et al., 20015 et Roose, 19946):
Many factors influencing soil erosion are taken into account, but the interaction between these
parameters is sometimes overlooked.
The model calculates long-term average erosion rates. It is not valid at the timescale of the rainfall
event nor a year.
The model is only valid for slopes steepness below 35% and slope lengths less than 300 m. Beyond
that the results are uncertain and indicative only.
4 Wischmeier W. H., Smith D. 1978. Predicting rainfall erosion losses, a guide to conservation planning, Agriculture Handbook 537, Washington D. C.
5 Yoder D. C., Foster G. R., ., Weesies G. A., Renard K. G., McCool D. K., Lown J. B. 2001. Evaluation of the RUSLE Soil Erosion Model, in Agricultural
Non-Point Source Water Quality Model: Their use and application, Parsons et al., Southern Cooperative Series Bulletin 398.
6 Roose E. 1994. Introduction à la gestion conservatoire de l'eau, de la biomasse et de la fertilité des sols (GCES), Bulletin pédologique de la FAO 70.
Small Hydro Madagascar ESMAP / The World Bank Prefeasibility Study of the Fanovana Hydroelectric Scheme
SHER / Mhylab / ARTELIA-Madagascar April 2017 Page 43
Calibration data are taken from plots not exceeding a few hundred m². The results obtained at the
watershed scale are only indicative.
Only detachment and transport of soil are taken into consideration. The deposition of eroded
sediments due either to the topography or to the carrying capacity of the runoff water is not taken into
account.
The model outputs that quantify the soil losses are therefore to be considered with caution. However, the model
is extremely interesting to map the relative intensity of erosion hazard over large areas.
5.6.3 Potential and actual soil erosion hazard
Potential soil erosion reflects the erosion related to the physiographic properties of the environment (rainfall,
soil type, topography) irrespective of land use or possible anti-erosion measures. The results are presented in
Figure 28. Due to the limitations of the method used to calculate soil losses but also due to the quality and
resolution of the input data, it is preferable to classify the absolute erosion values into potential intensity of the
erosion hazard. Five classes of erosion hazards were defined based on the statistical distribution of the
absolute values of potential erosion calculated over Madagascar:
Low hazard : quantiles 0 - 25 ;
Medium hazard : quantiles 25 - 50 ;
High hazard : quantiles 50 - 75 ;
Very high hazard : quantiles 75 - 95 ;
Extreme hazard : quantiles 95 - 100.
The mapping of the potential erosion hazard in the Sahatandra watershed is presented in Figure 29. It is
observed that the potential erosion hazard is relatively high over the entire watersged area, particularly in the
downstream part of the watershed where the slopes are the steepest.
On the other hand, the calculation of the actual erosion takes into account the land use. This is illustrated in
Figure 30.
As mentioned earlier, it is not the absolute values of soil loss that are of interest here but the comparison
between potential erosion and actual erosion. This comparison highlights the positive impact of land use in the
Sahatandra River watershed, particularly the positive impact of the protected areas on the erosion rates. The
latter are drastically reduced in the vast majority of the watershed but remain important in the downstream part
of the watershed due to the steep slopes and a mainly agricultural land use.
These results lead to the conclusion that the Fanovana site should not be characterized by a strong solid
transport (except during flood events) which would lead to problems of operation and maintenance of the
hydroelectric plant.
It is important to note that the results obtained below can not be transposed directly into sediment inputs into
rivers. Indeed, the above analysis is valid for pixel-by-pixel mapping of potential and effective erosion and does
not take into consideration the transport of soil particles between pixels. Consequently, a large part of these soil
particles will not be found in the watercourses because they will have been sedimented on their way to the
watercourses because of changes in slope intensities, land use, etc.
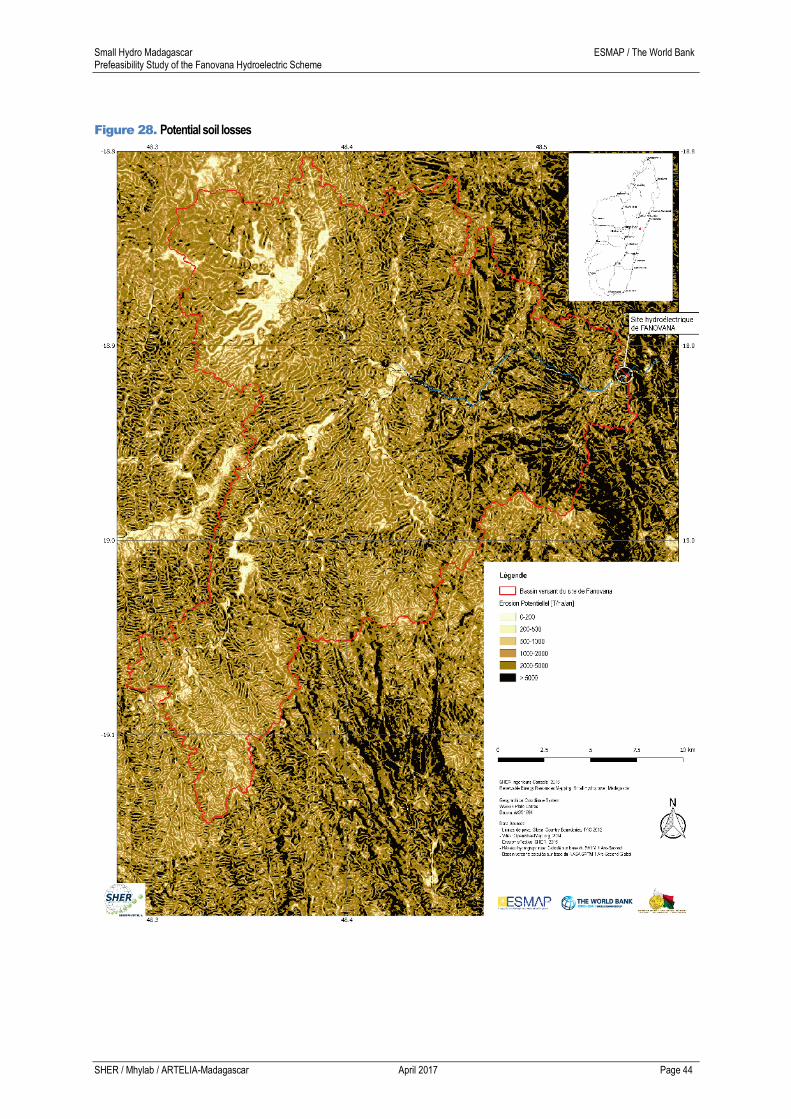
Small Hydro Madagascar ESMAP / The World Bank Prefeasibility Study of the Fanovana Hydroelectric Scheme
SHER / Mhylab / ARTELIA-Madagascar April 2017 Page 44
Figure 28. Potential soil losses
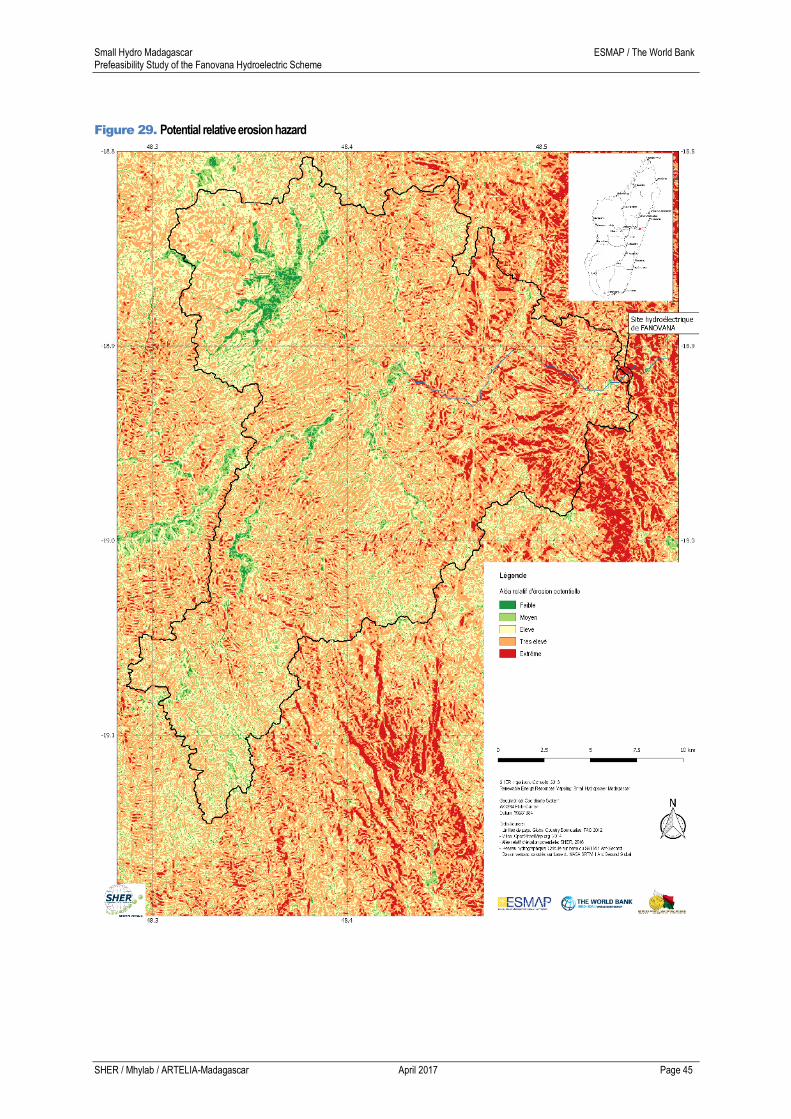
Small Hydro Madagascar ESMAP / The World Bank Prefeasibility Study of the Fanovana Hydroelectric Scheme
SHER / Mhylab / ARTELIA-Madagascar April 2017 Page 45
Figure 29. Potential relative erosion hazard
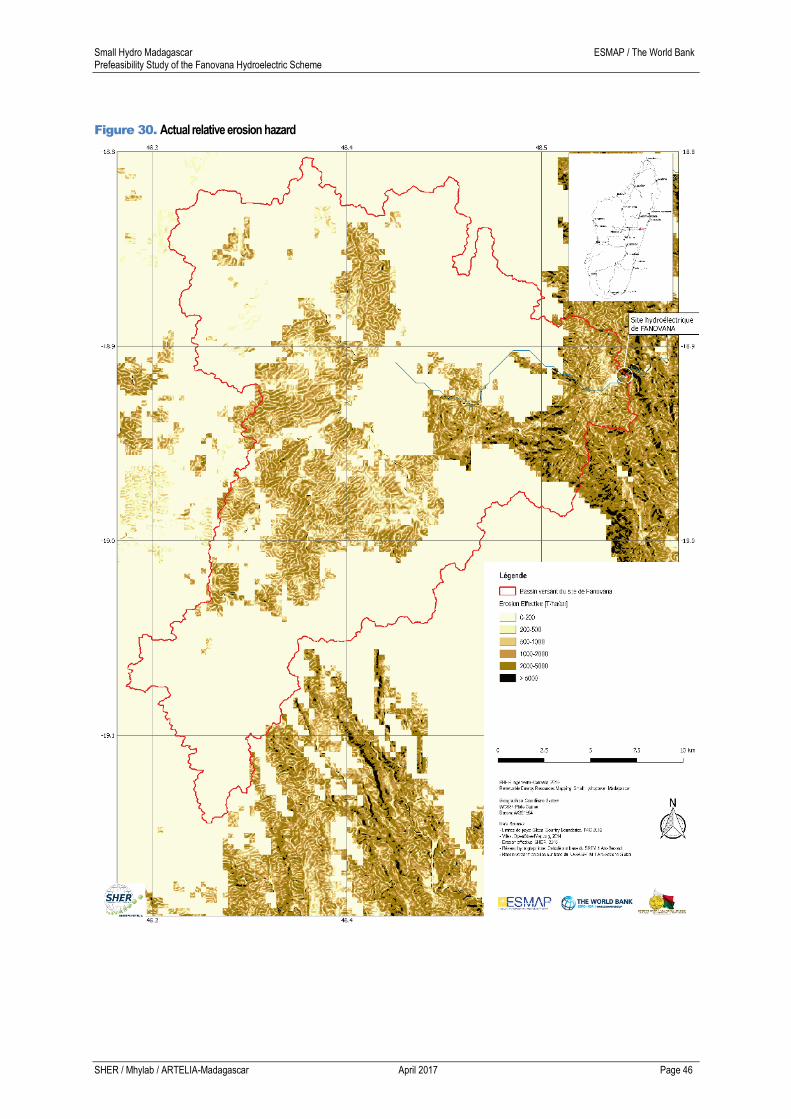
Small Hydro Madagascar ESMAP / The World Bank Prefeasibility Study of the Fanovana Hydroelectric Scheme
SHER / Mhylab / ARTELIA-Madagascar April 2017 Page 46
Figure 30. Actual relative erosion hazard
Small Hydro Madagascar ESMAP / The World Bank Prefeasibility Study of the Fanovana Hydroelectric Scheme
SHER / Mhylab / ARTELIA-Madagascar April 2017 Page 47
5.7 KEY HYDROLOGICAL PARAMETERS OF THE FANOVANA SITE
The key hydrological characteristics of the Fanovana hydroelectric project on the Sahatandra River are
summarized in Table 8 below.
Table 8. Key hydrological characteristics of the site
CHARACTERISTIC PARAMETER VALUE UNIT
Watershed Area 520.4 km²
Mean elevation
Maximum elevation
983.4
1340
m a.s.l.
m a.s.l.
Minimum elevation 676 m a.s.l.
Average slope 2.8 m/km
Rainfall Average 1842 mm/y
(WorldClim)
Natural inflows Average
Average
Average specific
18
567.7
34.7
m³/s
hm³/y
L/s/km²
Driest year (1999) 7.5 m³/s
Wettest year (1959) 37.2 m³/s
Floods 10 years 646 m³/s
(Duret approach) 100 years 1351 m³/s
The study reveals that the Sahatandra River features a favorable hydrology at the proposed location of the
Fanovana hydroelectric project. However, hydrological uncertainties are important and it is strongly
recommended that hydrological monitoring of the river be continued beyond this study. This will include:
- To continue the measurement of water levels at the automatic station installed in October 2015 at the
village of Fanovana and whose ownership and responsibility for its operation have been transferred to
the MEH in October 2016;
- To continue the gauging operations of this river in order to improve and validate the rating curve.
Indeed, as mentioned in the hydrological study, the data presented in the flow duration curve of the
season 2015-2016 are the results of a preliminary curve established during the season 2015-2016.
Beyond the development of the Fanovana hydroelectric project, it is strongly recommended that the
Government of Madagascar set up a hydrological monitoring network for its rivers with high hydropower
potential in order to better understand the available water resources and thus promote the development of
hydroelectric projects across the country. It is only in a context of reduced uncertainties through reliable, recent
and long-term records (more than 20 years) that technical parameters and economic and financial analyzes of
hydroelectric developments can be defined accurately, enabling optimization of their design and their flood
control infrastructure (temporary and permanent).
5.8 REFERENCES
1. Fleuves et Rivières de Madagascar, ORSTOM 1993
2. Food and Agriculture Organization of the United Nations (FAO) : http://www.fao.org/emergencies/crisis/elnino-
lanina/intro/en/
3. Unicef : http://reliefweb.int/sites/reliefweb.int/files/resources/UNICEF%20Madagascar%20Humanitarian%20SitRep%20-%20Sep%202016.pdf

Small Hydro Madagascar ESMAP / The World Bank Prefeasibility Study of the Fanovana Hydroelectric Scheme
SHER / Mhylab / ARTELIA-Madagascar April 2017 Page 48
4. Famine Early Warming Systems Network (FEWS NET) : http://www.fews.net/southern-africa/special-
report/march-2016
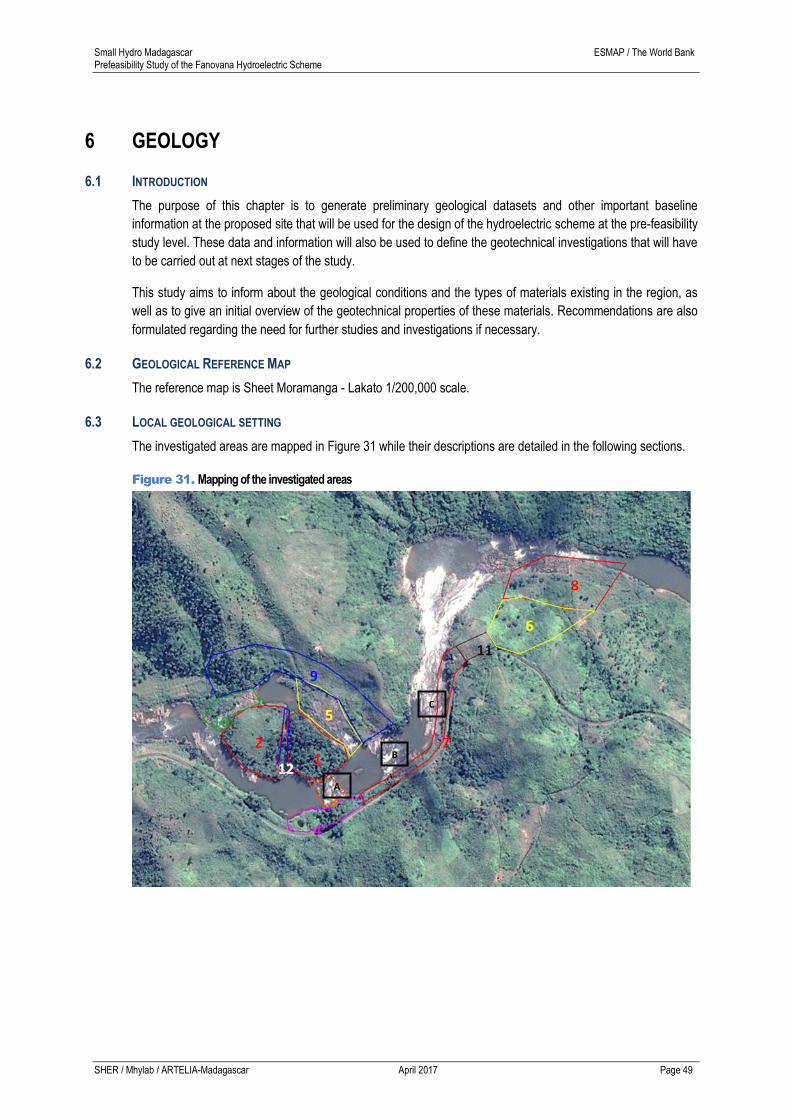
Small Hydro Madagascar ESMAP / The World Bank Prefeasibility Study of the Fanovana Hydroelectric Scheme
SHER / Mhylab / ARTELIA-Madagascar April 2017 Page 49
6 GEOLOGY
6.1 INTRODUCTION
The purpose of this chapter is to generate preliminary geological datasets and other important baseline
information at the proposed site that will be used for the design of the hydroelectric scheme at the pre-feasibility
study level. These data and information will also be used to define the geotechnical investigations that will have
to be carried out at next stages of the study.
This study aims to inform about the geological conditions and the types of materials existing in the region, as
well as to give an initial overview of the geotechnical properties of these materials. Recommendations are also
formulated regarding the need for further studies and investigations if necessary.
6.2 GEOLOGICAL REFERENCE MAP
The reference map is Sheet Moramanga - Lakato 1/200,000 scale.
6.3 LOCAL GEOLOGICAL SETTING
The investigated areas are mapped in Figure 31 while their descriptions are detailed in the following sections.
Figure 31. Mapping of the investigated areas
A
B
C

Small Hydro Madagascar ESMAP / The World Bank Prefeasibility Study of the Fanovana Hydroelectric Scheme
SHER / Mhylab / ARTELIA-Madagascar April 2017 Page 50
ZONE DESCRIPTION INFRASTRUCTURE
1 Downstream island Weir (part 1)
2 Upstream island -
3 Rocks – right river bank Weir (part 2) and flushing gates
4 Right bank Intake
5 Rock – left river bank Weir (part 3)
6 Penstock Penstock
7 Right bank Canal
8 Hydropower plant and tailrace canal Hydropower plant and tailrace canal
9 Left bank Weir abutment
10 - -
11 Crossing / bypassing Tunnel or canal
12 Between islands -
6.3.1 Petrographic setting
The petrographic formation which dominates the sector is schistose migmatite (migmatite shisteuse) presented
in its multiple forms according to the observed zones.
Following a longitudinal profile along the Sahatandra River, we observe:
Upstream zone (zones 1, 2, 3, 4, 5 et 10 - Figure 31) : migmatite schisteuse which occurs in
laminated plates of metric thickness (1m to 3m) due to the desquamation effect (Phenomenon of
decompression affecting the schistous rocks arrived at the surface, Fig.2, Appendix 3). Their
structural direction oscillates around N10E with a dipping of 40°E to 50°E. Their basic mineralogical
composition is quartz, amphibole, mica and feldspar; where quartzo-feldspathic inlays are encrusted
during migmatization, tracing the lines of schistosity. (Fig.3, Appendix 3).
On some passages there is a rather greenish background indicating the presence of pyroxenite minerals with
micas and feldspars.
These migmatites are traversed by numerous diacases, of various directions (N100W - N60W). They play an
important role in the implementation of the surface layout of rock blocks. In fact, at the river level, for example,
they facilitate the separation of reefs into metric blocks so that they become large boulders that can be moved
by the water flow. This is what is observed in zones 3, 4, 7. Sometimes very open, they favor the passage of
heavy water flows. The latter, in the long run, ends by making the gaping diaclases to make it sometimes its
bed (case observed on the side zone 7).
Further downstream (zone C), based on the observation of rocky platforms along the river, several
other rock formations intervene affecting the previous migmatitic background: the migmatites
sometimes become granitoid, there are also amphibolite passages with sometimes spots of
quartzite inclusions. Greenish pyroxene migmatites become clearer here (they are less apparent
upstream).
There, we can also observe thin basaltic veins. These rocks appear very massive sometimes. They were used
in quarry in the past.
6.3.2 Structural and tectonic setting
Following the different tectonic movements that may have affected the region over time, there are numerous
impacts on the area (diaclastic openings, slippage between migmatitic plates, mass collapse or elevation, and
more or less important basic rocks intrusions).
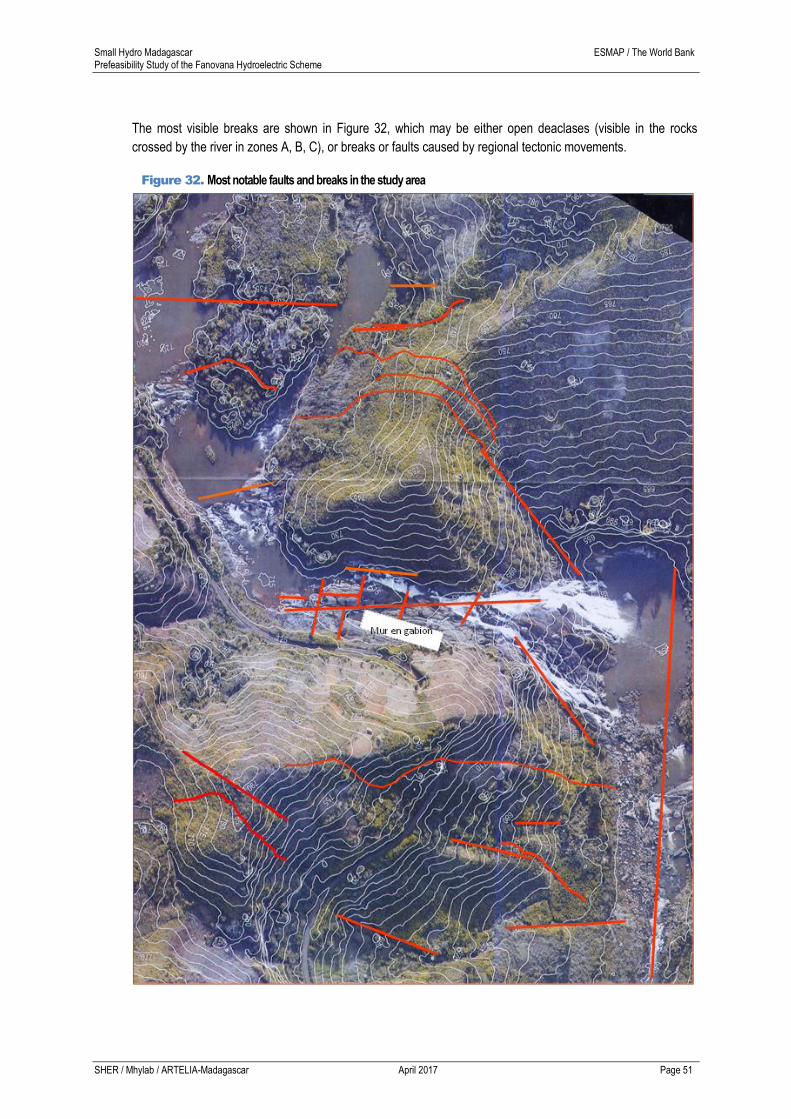
Small Hydro Madagascar ESMAP / The World Bank Prefeasibility Study of the Fanovana Hydroelectric Scheme
SHER / Mhylab / ARTELIA-Madagascar April 2017 Page 51
The most visible breaks are shown in Figure 32, which may be either open deaclases (visible in the rocks
crossed by the river in zones A, B, C), or breaks or faults caused by regional tectonic movements.
Figure 32. Most notable faults and breaks in the study area

Small Hydro Madagascar ESMAP / The World Bank Prefeasibility Study of the Fanovana Hydroelectric Scheme
SHER / Mhylab / ARTELIA-Madagascar April 2017 Page 52
This is the case for the headrace canac between zones 1 and 2 which can only be the passage of a sliding fault
between migmatitic plates, the one carrying the 2 (upstream island) would have collapsed with respect to 1
(downstream island) .
The same applies to the eastern sector (a receiving basin located downstream of the Great Falls) where a
series of shifting migmatite plates, superimposed between them, are pinched at the level of the large basin by
an EW regional fault that suddenly turns the Sahatandra River aside (flow EW became NS).
Consequently, the morphology of the whole area is characterized by a narrow alternation of hills and
depression. This is due to the structural disposition of schistose migmatites (Fig. 6, Appendix 3).
Note that the neck between two superimposed plates is always more or less marked by the morphology (Fig. 6
bis, Annex 3). It is an area where water flows, which initially promotes the sloping erosion of the back of the
bottom plate and then the water circuit along the neckline, sometimes making the inter-layer open. This is the
case in zone C where the Sahatandra River creates its bed following the N10E structural fault, representing a
deep neck of slat migmatitic rocks.
If, upstream of the waterfall, the Sahatandra River follows the structural direction of the rock formations, in zone
3 and 4, it cuts them against the river flow (the banks in place plunge downstream), the direction of the river
being here of N100E.
Several other small channels linked to secondary breaks are also visible in the area following cracks
accompanying the phenomenon of desquamation or following the line of the diaclases.
At the level of the hills, the lamellar migmatitic reefs are arranged in layers one on top of the other. Their
present configuration is the result of alteration and erosion over time. Thus, if the original migmatitic plates have
remained contiguous to one another, the effects of tectonics also contribute to shaping the appearance of the
terrain.
The basic migmatitic plates in place underline the structural geological line of the area. On the surface are only
small boulders resulting from the dismantling of the schist beds (zones 5 and 9).
6.4 REMARKS ON THE PROPOSED WEIR LOCATION
There are two possible weir locations. The first would be axis A located across the downstream island. The
second would be axis B, located a further downstream of the previous one. The rest of layout (headrace canal,
tunnel, penstock and powerhouse) remain the same.
6.4.1 Axe A
Bed at weir location (fig.7, Appendix 3) : Here we find migmatitic reefs in place (2m of apparent thickness,
oriented at N10E and plunging downstream of 40° -50°E), but on the same axis there are also deviated blocks
of their original structural direction by opening the diaclases subjected to the force of the water current.
The migmatitic rocks are hard and resistant. However, their schistous and laminated appearance, which does
not always become massive rock in spreading blocks, but rather reefs adjoining one another, reduces their
value relatively. To this must be added the numerous diaclases which traverse them. The fact that dipping is
oriented towards downstream also leads to certain difficulties of stability for the weir which will be built on rocks
having a countercurrent dipping.
Right bank support: On this right bank side there are reefs of migmatites not in place that would have to be
cleared to examine the rock formation in place below. A study after clearing would be necessary here to better
study the arrangement of the rocks, hidden by thick vegetation (Figure 8, Appendix 3).
Small Hydro Madagascar ESMAP / The World Bank Prefeasibility Study of the Fanovana Hydroelectric Scheme
SHER / Mhylab / ARTELIA-Madagascar April 2017 Page 53
Left bank support: A series of migmatitic reefs in place is observed, disappearing beneath the downstream
island (Figure 9, Appendix 3). The sequence is to be checked by sampling at the level of the downstream islet
(need of clearing brushing for a more detailed study).
Headrace canal: it follows the retaining wall of the railway in zone 7. Fig. 12 (Appendix 3) shows the area of the
canal. The area (zone 7) consists of a series of migmatitic plates inclined towards the east with debris of semi-
altered rock more or less cemented by laterite. Some of these plates are disturbed due to the presence of
breaks and are detached from their base by gravity, creating inconvenient positions for the passage of the
canal (Fig. 13, Appendix 3). The presence of gabion protection of the railway retaining wall is to be reported at
point G (shown in Fig. 5, Annex 3). It was probably built because of a fault running across it. The headrace
canal could be built along it depending on its elevation. It should also be noted that the baskets of the gabions
are almost rusty (fig.14, Annex 3).
Bypassing / crossing the hill :
- Tunnel option: The rock formation to be crossed is identical to that of the tunnel of the railway. The
direction of the gallery is also parallel to that of the tunnel of the track for a breakthrough length of the
order of 80m. It is always a series of reefs of schistose migmatite, which are very close to each other,
plunging between 40 ° and 50 ° towards the east, without any intervention of transverse breakage
(Fig. 15, Appendix 3). The beginning of the tunnel dominates the valley of the Sahatandra River. The
slope of the hill doesn’t show the presence of boulders on the surface and does show evidence of
difficulties to work.
- Canal option: the alternative would be to continue the headrace canal bypassing the hill until it
reaches the forebay. The powerhouse would be placed on the same level as the previous one and
under the same conditions. The descent for the penstock is less hilly here and avoids crossing the line
of fault that is present in that zone (see below).
Penstock: At the exit from the tunnel, the terrain for the penstock is hardly altered. It represents the superficial
part of the reefs of schistose migmatite constituting the hill traversed by the tunnel. The surface is dotted with
small boulders inserted into thin lateritic layers. Note that the slope is very steep (at 45 ° from the vertical),
overlooking the Sahatandra River over some sixty meters (Fig.16, Appendix 3). As a result, the slope of the hill
is seen to be breached, caused by the water running during heavy rainy periods. A fault line is clearly visible on
the map and it should be closely studied at a later stage, given its apparent importance.
Powerhouse: The low, valley-like zone immediately above the river, was used over time as a rice paddy by the
inhabitants (Fig.17, Appendix 3). This proves that this area can be flooded in rainy weather. The
powerhouseshould therefore be placed further upstream on the basis of this hill. The ground here consists of
rocky debris inserted in laterite. However, some core drilling is required at the plant site to recognize the depth
and condition of the sound rock (which can probably be found at shallow depth), its layout and compactness.
6.4.2 Axe B
Bed at weir location: There is a series of migmatitic reefs in place intersecting the river (Fig. 18, Appendix 3).
The structural direction remains the same (N10E and plunging at 40° -50° E). They appear in enormous blocks
but often dismantled by the current of water flowing through the diacases.
Migmatitic reefs in place can be observed at low water level during low water periods. Metric blocks of rock
have, however, been deviated from their original location by the water currents which flow in a row along the
breaks and faults formed by widely open diaclases which affect the blocks. Other blocks are disengaged from
their alignment and, carried away by the current, form scattered blocks both upstream and downstream of the
waterfall.

Small Hydro Madagascar ESMAP / The World Bank Prefeasibility Study of the Fanovana Hydroelectric Scheme
SHER / Mhylab / ARTELIA-Madagascar April 2017 Page 54
Support right bank: It consists of rock masses in superposition, the same suite as those supporting the railway.
A few later clearing will enable us to decide on the technical value of the masses in place.
Left shore support: The side of the support hill is devoid of vegetation, and the surface of the supporting
benches in place is seen directly on the surface and represent the surface terminus of the migmatitic slabs of
the hill.
6.5 CONSTRUCTION MATERIALS
There is no apparent sand deposit in and around the area. However, the following points may be noted:
- The downstream island consists partly of sand. This was observed in a 1.50-meter deep hole made
during the site visit (Fig. 19, Appendix 3). It's fine sand. Penetrometer sampling on this island will
allow us to know more about the extension and the nature of the sand in presence.
- If sand banks are not observed along the river, sand deposits would occupy the bottom of the deep
zones immediately upstream of each rocky bar (upstream, from axis B.). They are observed across
the surface of the water. The nature and composition of the sand will have to be verified by sampling.
6.6 SEISMICITY
Madagascar is characterized as a stable area. This very old plateau is still characterized by some tectonic
activities. Seismicity in this area is relatively unknown, mainly due to the lack of historical data. Within the
framework of the Global Sismic Hazard Assessment (GSHAP), the assessment of the seismic hazard in West
Africa was carried out on the basis of two data sources:
- The catalog of the British Geological Survey (Musson, 1994), containing quakes of magnitude greater
than 4 from 1600-1993 (this is assumed to be complete for magnitudes greater than 5 beyond the
year 1950 and for Magnitudes greater than 6 since the beginning of the 20th century),
- The NEIC catalog for more recent events (1993-1998).
A statistical method was used to determine the horizontal acceleration values due to earthquakes. The map
below shows the distribution of seismic acceleration coefficients for the entire African continent. It can be seen
that the project area is characterized by horizontal accelerations of less than 0.4 m / s². This value will of course
have to be confirmed by additional studies.
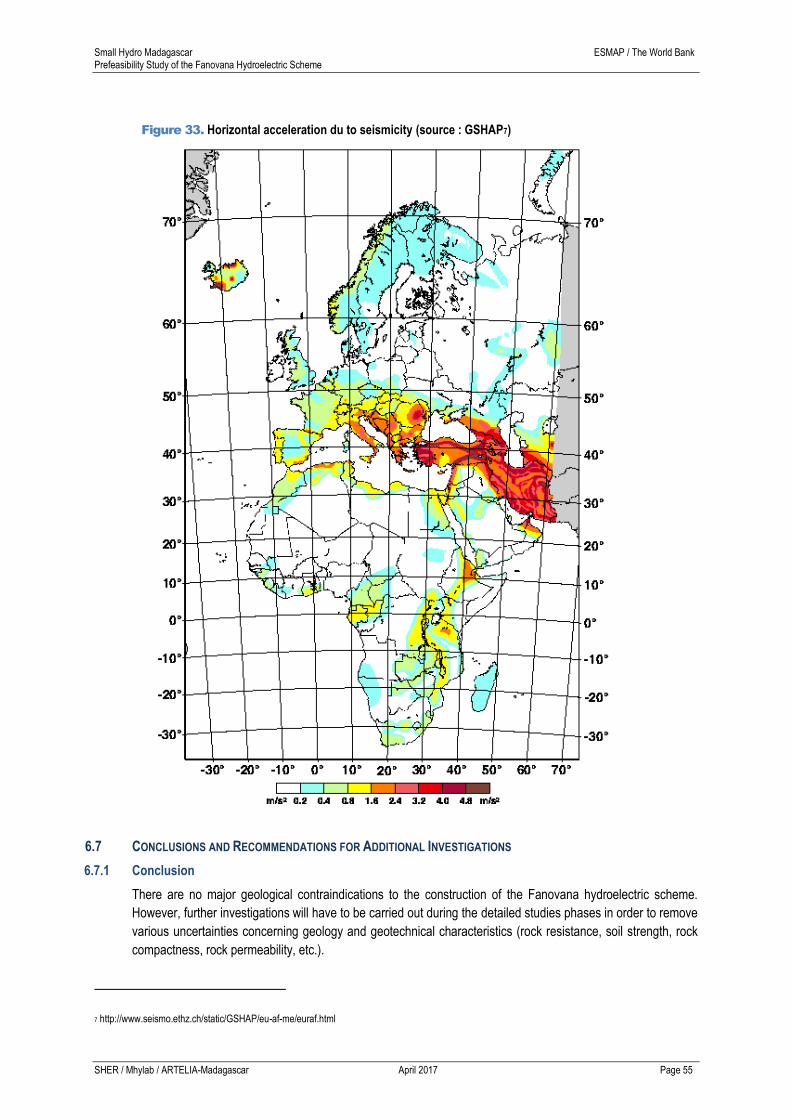
Small Hydro Madagascar ESMAP / The World Bank Prefeasibility Study of the Fanovana Hydroelectric Scheme
SHER / Mhylab / ARTELIA-Madagascar April 2017 Page 55
Figure 33. Horizontal acceleration du to seismicity (source : GSHAP7)
6.7 CONCLUSIONS AND RECOMMENDATIONS FOR ADDITIONAL INVESTIGATIONS
6.7.1 Conclusion
There are no major geological contraindications to the construction of the Fanovana hydroelectric scheme.
However, further investigations will have to be carried out during the detailed studies phases in order to remove
various uncertainties concerning geology and geotechnical characteristics (rock resistance, soil strength, rock
compactness, rock permeability, etc.).
7 http://www.seismo.ethz.ch/static/GSHAP/eu-af-me/euraf.html

Small Hydro Madagascar ESMAP / The World Bank Prefeasibility Study of the Fanovana Hydroelectric Scheme
SHER / Mhylab / ARTELIA-Madagascar April 2017 Page 56
The choice of bypassing the hill as a canal seems the most appropriate and will therefore be retained at this
stage of the study.
A table presented in the following section summarizes the uncertainties to be removed and the type of
investigations to be carried out to remove them.
6.7.2 Additional investigations
ELEMENT UNCERTAINTIES TO REMOVE INVESTIGATION
Bed at weir Fear of leakage due to the pressure
induced by the waterpond.
Clogging of the fault below the weir by injection of
cement grout or other systems
Right support Rock type underneath the migmatites Clearing of the area to study the arrangement of the
rocks
Surface tests to identify the location of the reefs
Left support Rock type underneath the migmatites Clearing of the area to study the arrangement of the
rocks
Surface tests to identify the location of the reefs
Check the geotechnical quality of the laterite on the
downstream islet.
Intake and
waterway
Fault near the existing retaining wall of the
railway
Fear of tunnel collapsing due to vibrations
resulting from passing trains
Clearing of the area to study the arrangement of the
rocks
Analyze of the rock foundation compactness where
the railway crosses the tunnel (horizontal or inclined
core drilling)
Penstock Fault near the proposed penstock
alignment
Detailed geological and geotechnical investigations
Powerhouse Nature of the supporting ground (Massive
rock? Boulder in place or not? Depth of
laterite?)
Auger drilling or seismic reflection geophysical
survey
6.8 REFERENCES
Compilation of the GSHAP regional seismic hazard for Europe, Africa and the Middle East
(http://www.seismo.ethz.ch/static/GSHAP/eu-af-me/euraf.html).
Small Hydro Madagascar ESMAP / The World Bank Prefeasibility Study of the Fanovana Hydroelectric Scheme
SHER / Mhylab / ARTELIA-Madagascar April 2017 Page 57
7 PRELIMINARY ENVIRONMENTAL AND SOCIAL IMPACT ANALYSIS
The Environmental and Social Impact Assessment (ESIA) is the procedure for prior analysis of the impacts that
a project may have on the environment. It ensures the integration of environmental concerns into project
planning and allows for consideration of likely environmental measures from the design stage of the project.
7.1 DESCRIPTION OF THE BIOPHYSICAL CONTEXT
7.1.1 Relief
The proposed Fanovana site is located at the "Koma Fall". The area is surrounded by several hills and is
bounded by:
- to the east by the Marovoalavo - Antamponankay - Ambatosoa complex which extends over an
average altitude of 800 m;
- to the south by the summit of Vohidrazana which culminates at more than 1200 m.
The area presents a hilly relief, characterized by multi-sided slopes with steep slopes. The valleys and wetlands
are narrow and occupy only a very limited area. The slopes are often cleared of vegetation by the practice of
"tavy" (culture on brulis).
The area is crossed by small streams and rivers that join the main Sahatandra River. At the proposed weir
location, the Sahatandra river is encased between two hills oriented North-South and which culminates to more
than 800m. The Sahatandra runs east-northeast, passing Ambatovola at about 7 km, and then flowing into the
Vohitra River about 15 km from the site.
7.1.2 Vegetation
The study area belongs to the East region characterized by an evergreen vegetation. The vegetation in the
immediate vicinity of the site is generally formed by Savoka without ligneous elements dominating Psiadia
altissima and Helychrysum. Nevertheless, at the proposed weir site, an islet of dense evergreen humid forest
more or less degraded with mainly Weinmannia, Tambourissa.
In the 1960s, major forestry work was undertaken in the area with the construction of the TCE (Tananarive Côte
Est) railway. The different stages of vegetation degradation, associated with a strong exploitation of the slopes
by the cultivation on brulis, make that nowadays the surroundings of the site’s vegetation is composed of
shrubs or herbaceous formations. However, there is still a part of humid degraded formation (IEFN 2005).
Some scraps of forest issued from reforestation, reminders of the Fanalamanga company, are scattered on the
summits and slopes of the hills. These reforestation usually consists of Eucalyptus.
Within a radius of 1 km around the site, the percentage of forest cover is fairly low (approximately 25%). The
vegetation is relatively uniform: the high slope is covered by Eucalyptus; The slopes are occupied by Savoka
without ligneous elements, dominating Psiadia altissima, Aphramomum angustifolium and Helichrysum; The
low slope is occupied by mosaics of plantations (banana, sugar cane, cassava).
Despite of the more or less advanced degradation of the area, a number of forest massifs still persist, such as
the Vohidrazana forest (10 km south of the site) and the Vohimana experimental reserve (3 km West of the
site).

Small Hydro Madagascar ESMAP / The World Bank Prefeasibility Study of the Fanovana Hydroelectric Scheme
SHER / Mhylab / ARTELIA-Madagascar April 2017 Page 58
Figure 34. Representative pictures of the vegetation in the proposed site surroundings
Savoka and Musa plantation (Svk) on the slopes S18°54'57.71" E48°32'42.48"
Savoka S18°54'57.63" E48°32'42.42"
Islet of degradated humid forest and Eucalyptus sp. S18°54'56.86" E48°32'43.14"
Mosaic of plantations near the powerhouse location S18°54'51.91" E48°32'47.59"
GptEuc
Savoka
FDHS
l
l
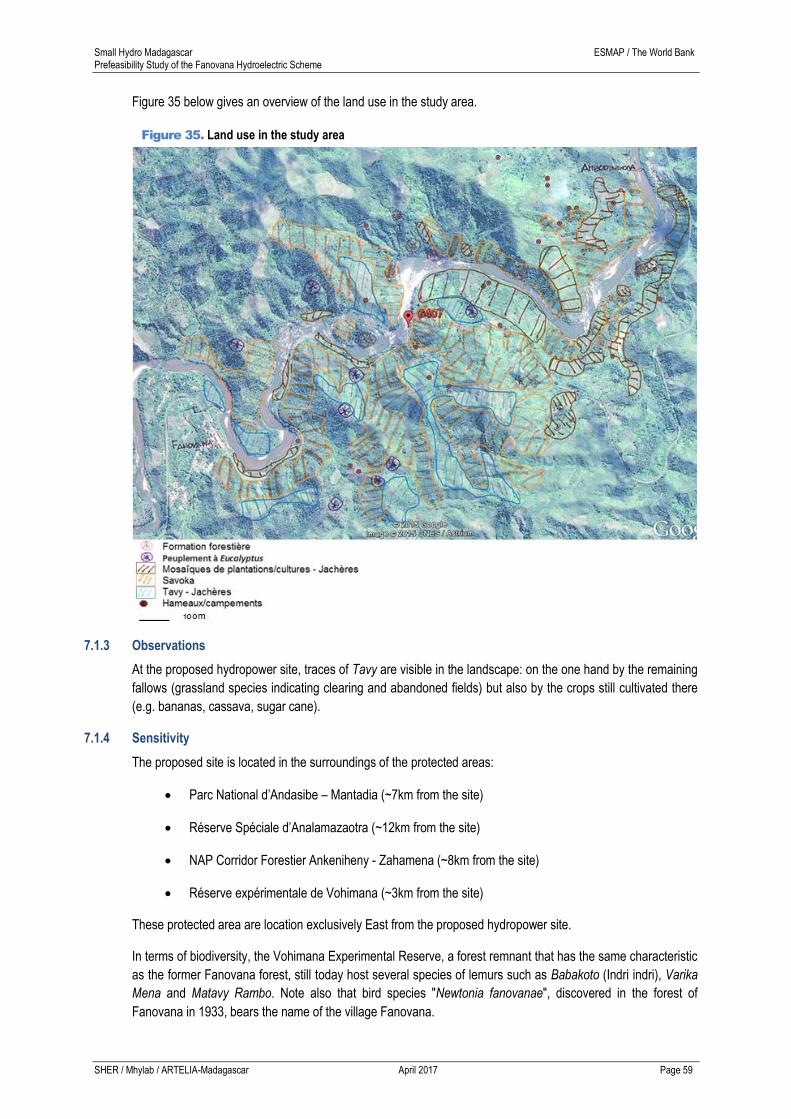
Small Hydro Madagascar ESMAP / The World Bank Prefeasibility Study of the Fanovana Hydroelectric Scheme
SHER / Mhylab / ARTELIA-Madagascar April 2017 Page 59
Figure 35 below gives an overview of the land use in the study area.
Figure 35. Land use in the study area
7.1.3 Observations
At the proposed hydropower site, traces of Tavy are visible in the landscape: on the one hand by the remaining
fallows (grassland species indicating clearing and abandoned fields) but also by the crops still cultivated there
(e.g. bananas, cassava, sugar cane).
7.1.4 Sensitivity
The proposed site is located in the surroundings of the protected areas:
Parc National d’Andasibe – Mantadia (~7km from the site)
Réserve Spéciale d’Analamazaotra (~12km from the site)
NAP Corridor Forestier Ankeniheny - Zahamena (~8km from the site)
Réserve expérimentale de Vohimana (~3km from the site)
These protected area are location exclusively East from the proposed hydropower site.
In terms of biodiversity, the Vohimana Experimental Reserve, a forest remnant that has the same characteristic
as the former Fanovana forest, still today host several species of lemurs such as Babakoto (Indri indri), Varika
Mena and Matavy Rambo. Note also that bird species "Newtonia fanovanae", discovered in the forest of
Fanovana in 1933, bears the name of the village Fanovana.

Small Hydro Madagascar ESMAP / The World Bank Prefeasibility Study of the Fanovana Hydroelectric Scheme
SHER / Mhylab / ARTELIA-Madagascar April 2017 Page 60
The absence of ligneous vegetation on the slopes favors the landslide.
7.2 SOCIO-ECONOMIC CONTEXT
7.2.1 Local Area
The site is located on the Sahatandra River, at the "Koma waterfall". It is located in the fokontany of Fanovana,
Rural district of Ambatovola, district of Moramanga, Region Alaotra-Mangoro.
Rural municipality of Ambatovola: The rural municipality of Ambatovola has about 10500 inhabitants spread
over in 7 fokontany, an average of about 1600 inhabitants per fokontany. The Commune has educational
facilities, public primary schools (10) and a general education college (1). However, there is not yet a high
school in the Commune. In terms of health conditions, Ambatovola has a a basic level II health center plus also
a private clinic.
Localities and villages: The site is located near two large villages:
- the village of Fanovana, also the chef-lieu of the fokontany Fanovana. It has about 1600 inhabitants
for less than 450 households8 in 6 neighborhoods. In terms of infrastructure, the fokontany is supplied
by a drinking water supply network managed by a private association, with 12 hydrants9, of which only
4 are functional; A public primary school, and a railway station, all located at the chef-lieu of the
fokontany. In terms of accessibility, the fokontany is connected to the RN2 in the village of
Ambavaniasy by a track of about 5 km from the village of Tombakata. This track is Ambatovy's n°3
track. Railway station Fanovana is located at a distance of 4 km from the station of Vohimana in the
East and 25 km from the station of Perrinet Andasibe. The train passes 4 times a week making the
round trip Moramanga - Toamasina on Monday (going) and Tuesday (return); And the return trip
Moramanga - Ambila on Thursday (departure) and Friday (return).
- the village of Ambodinikoma is located downstream of the proposed hydropower site at the edge of
the Sahatandra River at the foot of the Koma waterfall. It has about fifty roofs and is crossed to the
East by the railway that connects Fanovana to the Rural Commune of Ambatovola.
There are also a few hamlets and encampments locally called "pôtro" in the direct vicinity of the site. These
camps are generally seasonal: occupied 6 months per year for a maximum duration of 5 years.
Figure 36. Pictures illustrating the socio-economic context around the proposed hydropower site
House in the fokontany/village of Fanovana
Fanovana train station
8 Donnée : Fokontany, Recensement 2013 9 CREAM 2009 – Monographie de la Région Alaotra – Mangoro / Annexe 3
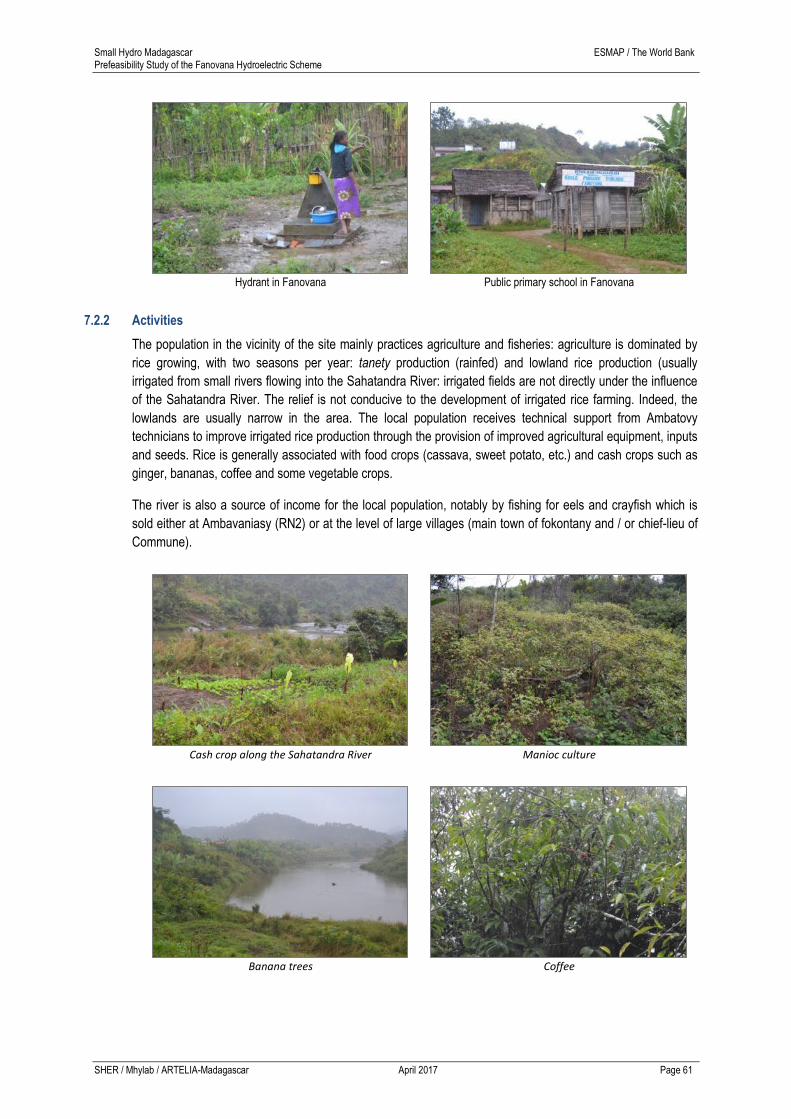
Small Hydro Madagascar ESMAP / The World Bank Prefeasibility Study of the Fanovana Hydroelectric Scheme
SHER / Mhylab / ARTELIA-Madagascar April 2017 Page 61
Hydrant in Fanovana Public primary school in Fanovana
7.2.2 Activities
The population in the vicinity of the site mainly practices agriculture and fisheries: agriculture is dominated by
rice growing, with two seasons per year: tanety production (rainfed) and lowland rice production (usually
irrigated from small rivers flowing into the Sahatandra River: irrigated fields are not directly under the influence
of the Sahatandra River. The relief is not conducive to the development of irrigated rice farming. Indeed, the
lowlands are usually narrow in the area. The local population receives technical support from Ambatovy
technicians to improve irrigated rice production through the provision of improved agricultural equipment, inputs
and seeds. Rice is generally associated with food crops (cassava, sweet potato, etc.) and cash crops such as
ginger, bananas, coffee and some vegetable crops.
The river is also a source of income for the local population, notably by fishing for eels and crayfish which is
sold either at Ambavaniasy (RN2) or at the level of large villages (main town of fokontany and / or chief-lieu of
Commune).
Cash crop along the Sahatandra River Manioc culture
Banana trees Coffee

Small Hydro Madagascar ESMAP / The World Bank Prefeasibility Study of the Fanovana Hydroelectric Scheme
SHER / Mhylab / ARTELIA-Madagascar April 2017 Page 62
7.2.3 Others
The majority of the population is of Bezanozano and Betsimisaraka origin.
The nearest mining activity is the mine of graphite and associated plant in Falierana Andasibe.
7.3 APPLICABLE WORLD BANK OPERATIONAL SAFEGUARD POLICIES
This section summarizes the World Bank's safeguard policies that contribute to the sustainability and
effectiveness of development within the Bank' s projects and programs by helping to avoid or mitigate the
impacts of these activities on people and society, environment.
OP 4.01 – Environmental assessment ☒
OP 4.04 – Natural habitats ☒
The Sahatandra River is an habitat for halieutics species like eels and crayfish.
OP 4.11 – Cultural Heritage ☐
The site is not known to contain particular material cultural resources.
OP 4.12 – Involuntary resettlement of people ☒
The inundated area may affect agricultural cropped area.
OP 4.37 – Dam safety ☐
Application of standard dam safety measures as the weigh height is lower than 15m.
7.4 RECOMMENDATIONS FOR FURTHER STUDIES
The construction of the weir may reduce the socio-economic value of the Sahatandra River, particularly in
terms of tourism and fishery resources.
On the other hand, the existence of the railway at the right of the site constitutes a non-negligible socio-
environmental constraint. A train passes regularly, 4 times a week (Moramanga-Toamasina and Moramanga-
Ambila); The integration of the work will have to be considered so that they do not become obstacles to the
usual railway traffic, which is strategic for the economy of the region.
Finally, villages and hamlets are present in the vicinity of the site (within a radius of just over 1 km around the
site), including the main Fanovana fokontany and the village of Ambidinikoma. Implementation of the project will
impact these villages, particularly in terms of discomfort and nuisance during construction (traffic, noise,
atmospheric emissions ...).
7.5 REFERENCES
1. CREAM 2009 – Monographie de la Région Alaotra – Mangoro / Annexe 1
2. Donnée Fokontany, Recensement 2013
3. CREAM 2009 – Monographie de la Région Alaotra – Mangoro / Annexe 3
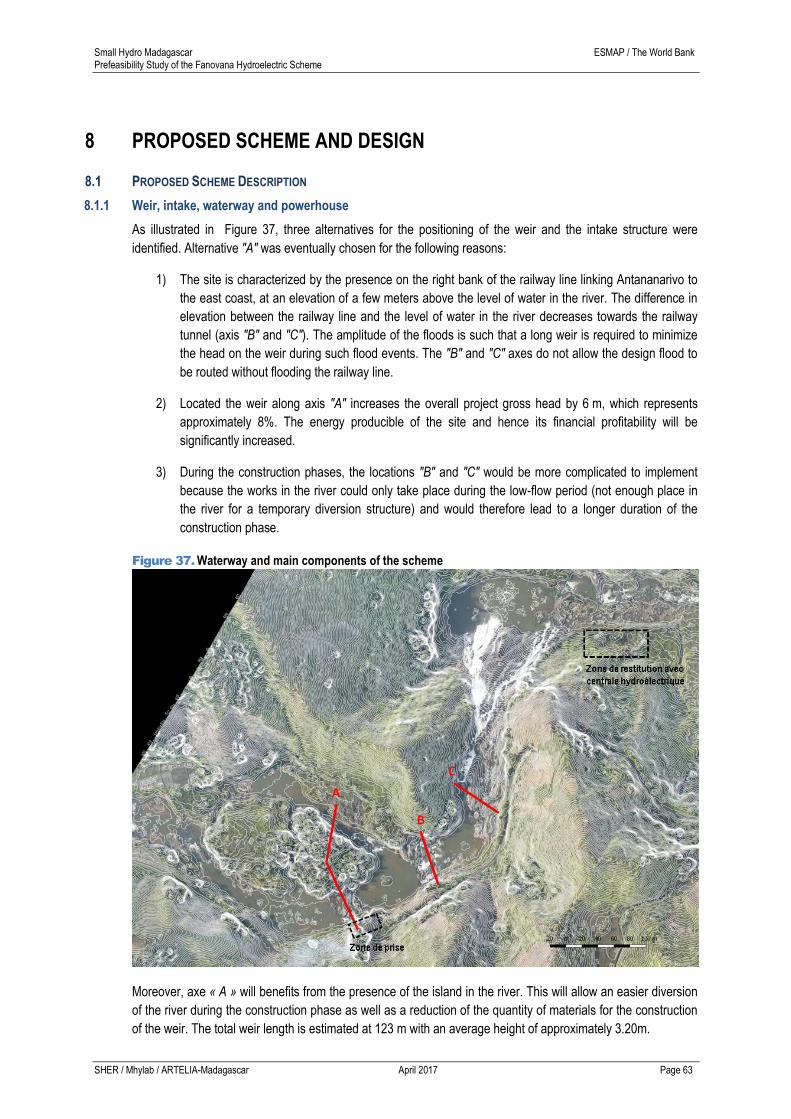
Small Hydro Madagascar ESMAP / The World Bank Prefeasibility Study of the Fanovana Hydroelectric Scheme
SHER / Mhylab / ARTELIA-Madagascar April 2017 Page 63
8 PROPOSED SCHEME AND DESIGN
8.1 PROPOSED SCHEME DESCRIPTION
8.1.1 Weir, intake, waterway and powerhouse
As illustrated in Figure 37, three alternatives for the positioning of the weir and the intake structure were
identified. Alternative "A" was eventually chosen for the following reasons:
1) The site is characterized by the presence on the right bank of the railway line linking Antananarivo to
the east coast, at an elevation of a few meters above the level of water in the river. The difference in
elevation between the railway line and the level of water in the river decreases towards the railway
tunnel (axis "B" and "C"). The amplitude of the floods is such that a long weir is required to minimize
the head on the weir during such flood events. The "B" and "C" axes do not allow the design flood to
be routed without flooding the railway line.
2) Located the weir along axis "A" increases the overall project gross head by 6 m, which represents
approximately 8%. The energy producible of the site and hence its financial profitability will be
significantly increased.
3) During the construction phases, the locations "B" and "C" would be more complicated to implement
because the works in the river could only take place during the low-flow period (not enough place in
the river for a temporary diversion structure) and would therefore lead to a longer duration of the
construction phase.
Figure 37. Waterway and main components of the scheme
Moreover, axe « A » will benefits from the presence of the island in the river. This will allow an easier diversion
of the river during the construction phase as well as a reduction of the quantity of materials for the construction
of the weir. The total weir length is estimated at 123 m with an average height of approximately 3.20m.
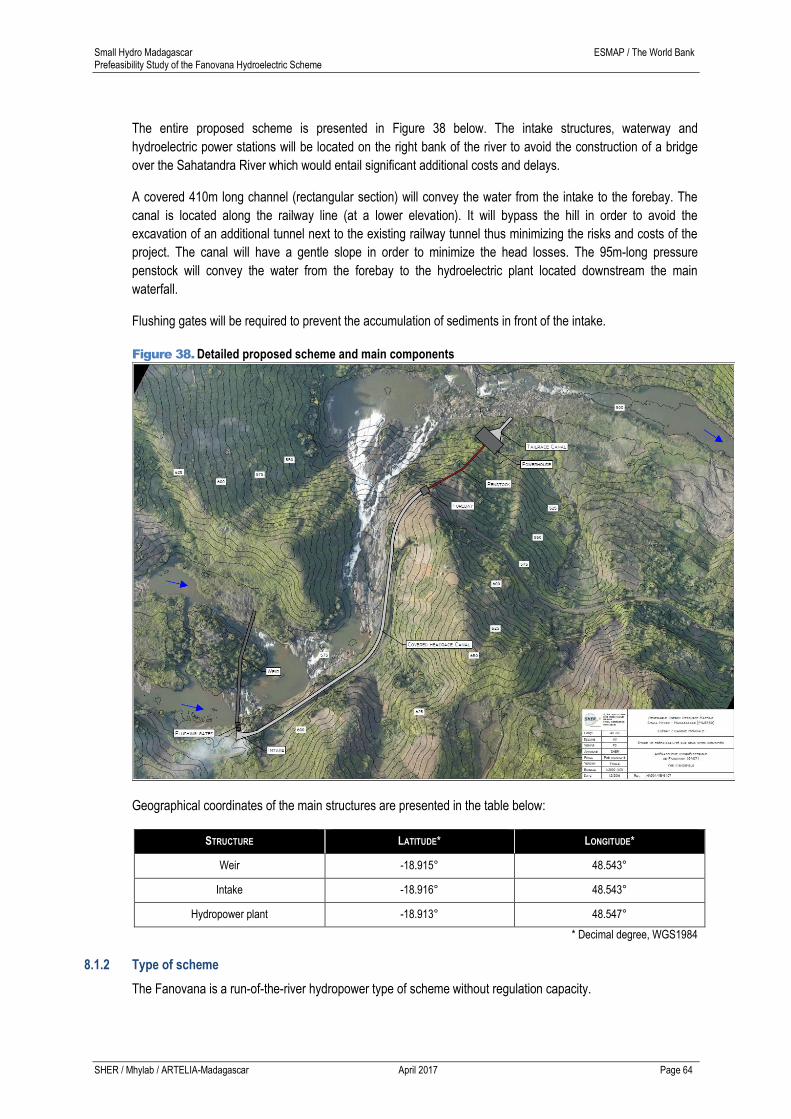
Small Hydro Madagascar ESMAP / The World Bank Prefeasibility Study of the Fanovana Hydroelectric Scheme
SHER / Mhylab / ARTELIA-Madagascar April 2017 Page 64
The entire proposed scheme is presented in Figure 38 below. The intake structures, waterway and
hydroelectric power stations will be located on the right bank of the river to avoid the construction of a bridge
over the Sahatandra River which would entail significant additional costs and delays.
A covered 410m long channel (rectangular section) will convey the water from the intake to the forebay. The
canal is located along the railway line (at a lower elevation). It will bypass the hill in order to avoid the
excavation of an additional tunnel next to the existing railway tunnel thus minimizing the risks and costs of the
project. The canal will have a gentle slope in order to minimize the head losses. The 95m-long pressure
penstock will convey the water from the forebay to the hydroelectric plant located downstream the main
waterfall.
Flushing gates will be required to prevent the accumulation of sediments in front of the intake.
Figure 38. Detailed proposed scheme and main components
Geographical coordinates of the main structures are presented in the table below:
STRUCTURE LATITUDE* LONGITUDE*
Weir -18.915° 48.543°
Intake -18.916° 48.543°
Hydropower plant -18.913° 48.547°
* Decimal degree, WGS1984
8.1.2 Type of scheme
The Fanovana is a run-of-the-river hydropower type of scheme without regulation capacity.
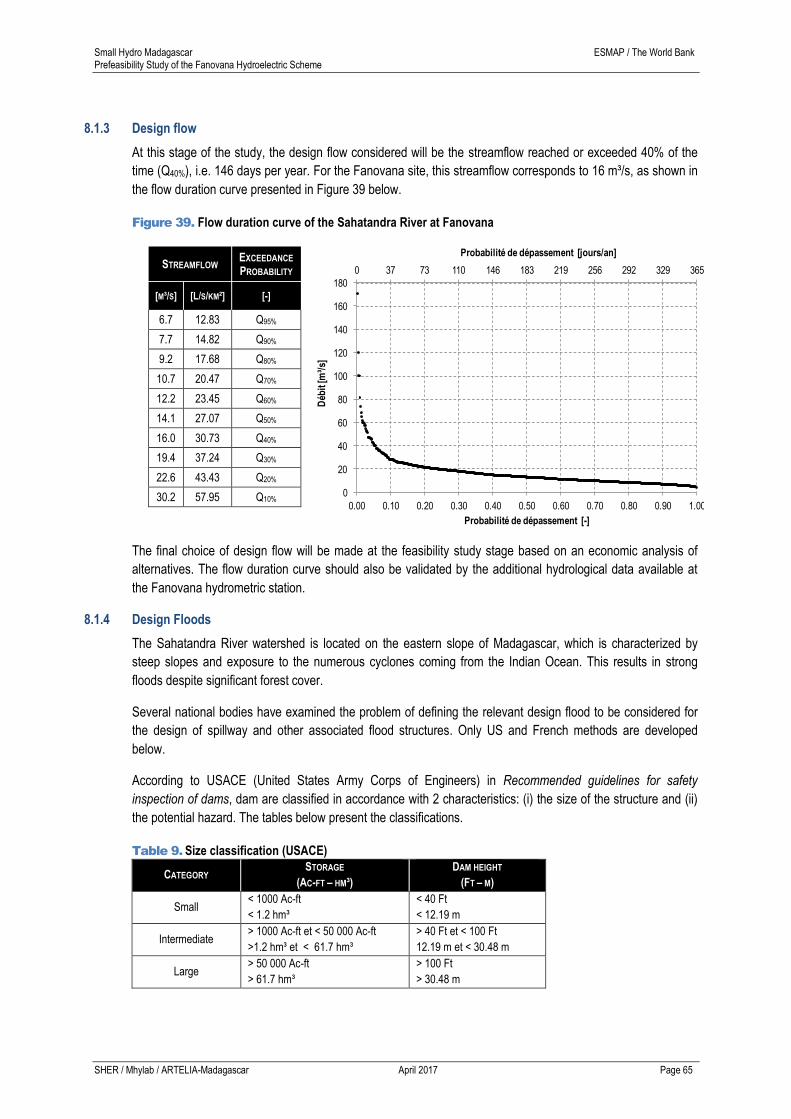
Small Hydro Madagascar ESMAP / The World Bank Prefeasibility Study of the Fanovana Hydroelectric Scheme
SHER / Mhylab / ARTELIA-Madagascar April 2017 Page 65
8.1.3 Design flow
At this stage of the study, the design flow considered will be the streamflow reached or exceeded 40% of the
time (Q40%), i.e. 146 days per year. For the Fanovana site, this streamflow corresponds to 16 m³/s, as shown in
the flow duration curve presented in Figure 39 below.
Figure 39. Flow duration curve of the Sahatandra River at Fanovana
STREAMFLOW EXCEEDANCE
PROBABILITY
[M³/S] [L/S/KM²] [-]
6.7 12.83 Q95%
7.7 14.82 Q90%
9.2 17.68 Q80%
10.7 20.47 Q70%
12.2 23.45 Q60%
14.1 27.07 Q50%
16.0 30.73 Q40%
19.4 37.24 Q30%
22.6 43.43 Q20%
30.2 57.95 Q10%
The final choice of design flow will be made at the feasibility study stage based on an economic analysis of
alternatives. The flow duration curve should also be validated by the additional hydrological data available at
the Fanovana hydrometric station.
8.1.4 Design Floods
The Sahatandra River watershed is located on the eastern slope of Madagascar, which is characterized by
steep slopes and exposure to the numerous cyclones coming from the Indian Ocean. This results in strong
floods despite significant forest cover.
Several national bodies have examined the problem of defining the relevant design flood to be considered for
the design of spillway and other associated flood structures. Only US and French methods are developed
below.
According to USACE (United States Army Corps of Engineers) in Recommended guidelines for safety
inspection of dams, dam are classified in accordance with 2 characteristics: (i) the size of the structure and (ii)
the potential hazard. The tables below present the classifications.
Table 9. Size classification (USACE)
CATEGORY STORAGE
(AC-FT – HM³)
DAM HEIGHT
(FT – M)
Small < 1000 Ac-ft
< 1.2 hm³
< 40 Ft
< 12.19 m
Intermediate > 1000 Ac-ft et < 50 000 Ac-ft
>1.2 hm³ et < 61.7 hm³
> 40 Ft et < 100 Ft
12.19 m et < 30.48 m
Large > 50 000 Ac-ft
> 61.7 hm³
> 100 Ft
> 30.48 m
0 37 73 110 146 183 219 256 292 329 365
0
20
40
60
80
100
120
140
160
180
0.00 0.10 0.20 0.30 0.40 0.50 0.60 0.70 0.80 0.90 1.00
Probabilité de dépassement [jours/an]
Déb
it [m
³/s]
Probabilité de dépassement [-]
Sahatandra @ G407 (Fanovana)

Small Hydro Madagascar ESMAP / The World Bank Prefeasibility Study of the Fanovana Hydroelectric Scheme
SHER / Mhylab / ARTELIA-Madagascar April 2017 Page 66
In the table above, the height of the dam is calculated from the lowest point of the structure to the maximum
level of the reservoir. The category is defined either by the storage capacity of the reservoir or by the height of
the dam, depending on the characteristic that classify the dam into the less favorable category.
The proposed weir on the Sahatandra will be less than 12m high and the storage volume or the reservoir will be
less than 1.2 hm³. Therefore, the proposed weir is classified as being "Small".
As far as potential hazard is concerned, it can be considered as "Low" according to the table below: there is no
risk of loss of human life in the event of failure or misoperation of the dam or appurtenant facilities. There is no
significant industry or cultivated area have been identified downstream of the proposed weir.
Table 10. Hazard potential classification (USACE)
CATEGORY LOSS OF LIFE
(EXTENT OF DEVELOPMENT)
ECONOMIC LOSS
(EXTENT OF DEVELOPMENT)
Low None expected
(No permanent structures for human habitation)
Minimal
(undeveloped to occasional structures or
agriculture)
Significant
Few
(No urban development and not more than a
small number of inhabitable structures)
Appreciable (Notable agriculture, industry or
structures)
High More than a few Extensive community, industry or agriculture
Table 11 presents the USACE's recommendations for the design flood to be considered as a function of the
potential hazard that may occur in the event of failure or misoperation of the dam or appurtenant facilities and
the size of the structure. The flood is expressed either by its return period (or frequency) or by the PMF. The
PMF (Probable Maximum Flood) is the largest possible flood that can occur through the most severe
combination of critical meteorological, geographic, geological and hydrological conditions reasonably possible
in a watershed.
Table 11. Recommended spillway design floods (USACE)
HAZARD SIZE SPILLWAY DESIGN FLOOD
Low
Small 50 to 100-year frequency
Intermediate 100-year to ½ PMF
Large ½ PMF to PMF
Significant
Small 100-year to ½ PMF
Intermediate ½ PMF to PMF
Large PMF
High
Small ½ PMF to PMF
Intermediate PMF
Large PMF
Following the aforementioned guidelines of the USCA, the recommended design flood for the Fanovana
hydroelectric scheme is from 50-years to 100-years frequency. The hydrological study presented in Section 5.5
estimates the 100-year return period flood to be 1351 m³ / s (2596 L / s / km²).
Small Hydro Madagascar ESMAP / The World Bank Prefeasibility Study of the Fanovana Hydroelectric Scheme
SHER / Mhylab / ARTELIA-Madagascar April 2017 Page 67
8.2 STRUCTURES DESIGN
8.2.1 Weir type and characteristics
Given the nature of the foundations as well as the estimated water head on the weir for the design flood, a
concrete gravity-overflow weir (spillway) seems the most appropriate structure. As mentioned in Section 8.1, it
is recommended that the hydraulic profile of the weir be profiled in order to minimize the impact of the weir on
the upstream water level. A concrete structure is also particularly recommended for submersible structures.
This choice is motivated by the following elements:
- The local geology shows that the rock is of good quality, adapted to the foundations of a concrete
weir;
- Given the magnitude of the design flood, the weir must be as low as possible in order to minimize the
impact of the upstream water level rise (presence of the railway).
- An ungated weir/spillway will be easier to build and safer in design since there is no risk of dysfunction
or misoperation of the gates, particularly during flood events.
The weir will be equipped with flushing gates on the right bank to flush the sediments that would have
accumulated in front of the water intake (see section 8.2.3).
The main function of a spillway is to allow the passage of normal (operational) and/or exceptional flood flows in
a manner that protects the structural integrity of the structures and / or its foundations.
For the Fanovana scheme, given the proximity of the railway line (see section 8.1.1), it is recommended to
minimize the raise of the water level during extreme flood events. Therefore, the Fanovana hydroelectric
scheme will be equipped with ogee-shaped type of spillway. The profile of this type of weir is close to the
hydraulic profile of the nappe springing freely from a sharp crested weir. The advantage of such a profile is that,
at an equivalent discharge, the ogee-shaped spillway is characterized by a lower rise in the water level
compared to a broad-crested weir. Similarly, considering the same hydraulic head on the spillway, a longer
crest length is required for a broad-crested weir than for an ogee-shaped weir.
The discharge flowing over a spillway is calculated based on the following equation:
𝑄 = 𝐶𝑑𝐿ℎ32√2𝑔
Where Q is the discharge [m³/s], Cd the spillway coefficient [-], L the length of the overflowing crest [m], h is the
total hydraulic head (static and dynamic head) over the crest [m] and g is the gravitational acceleration [m/s²].
The comparison of the spillways capacities is based on spillway coefficients of 0.325 and 0.4806 for the ogee-
shape and broad-crest type of spillway respectively (for the design flood). It is worth mentioning that the
spillway coefficient of the ogee-shape spillway varies according to the hydraulic head (which is taken into
consideration in the calculations). The difference of the spillways capacity is presented in Figure 40. For the
design flood (1351 m³/s), an ogee-shaped reduces the hydraulic head on the crest by approximately 1.10 m
compared to a broad-crest spillway.
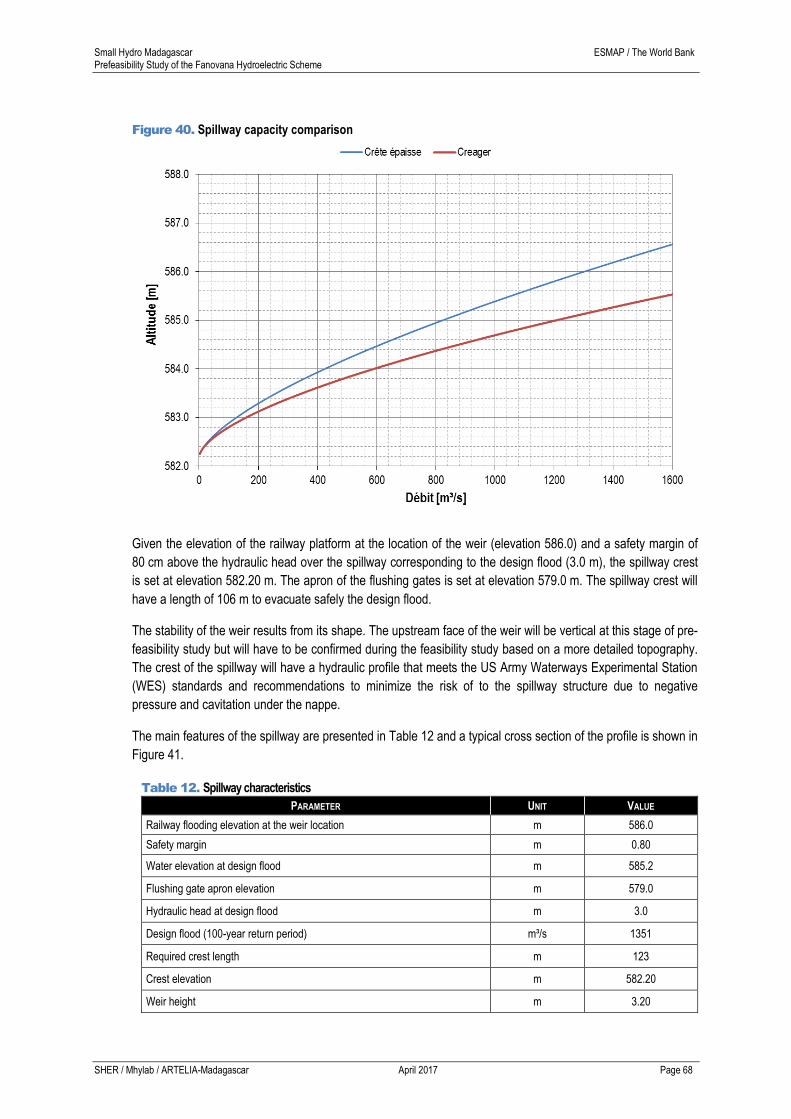
Small Hydro Madagascar ESMAP / The World Bank Prefeasibility Study of the Fanovana Hydroelectric Scheme
SHER / Mhylab / ARTELIA-Madagascar April 2017 Page 68
Figure 40. Spillway capacity comparison
Given the elevation of the railway platform at the location of the weir (elevation 586.0) and a safety margin of
80 cm above the hydraulic head over the spillway corresponding to the design flood (3.0 m), the spillway crest
is set at elevation 582.20 m. The apron of the flushing gates is set at elevation 579.0 m. The spillway crest will
have a length of 106 m to evacuate safely the design flood.
The stability of the weir results from its shape. The upstream face of the weir will be vertical at this stage of pre-
feasibility study but will have to be confirmed during the feasibility study based on a more detailed topography.
The crest of the spillway will have a hydraulic profile that meets the US Army Waterways Experimental Station
(WES) standards and recommendations to minimize the risk of to the spillway structure due to negative
pressure and cavitation under the nappe.
The main features of the spillway are presented in Table 12 and a typical cross section of the profile is shown in
Figure 41.
Table 12. Spillway characteristics
PARAMETER UNIT VALUE
Railway flooding elevation at the weir location m 586.0
Safety margin m 0.80
Water elevation at design flood m 585.2
Flushing gate apron elevation m 579.0
Hydraulic head at design flood m 3.0
Design flood (100-year return period) m³/s 1351
Required crest length m 123
Crest elevation m 582.20
Weir height m 3.20
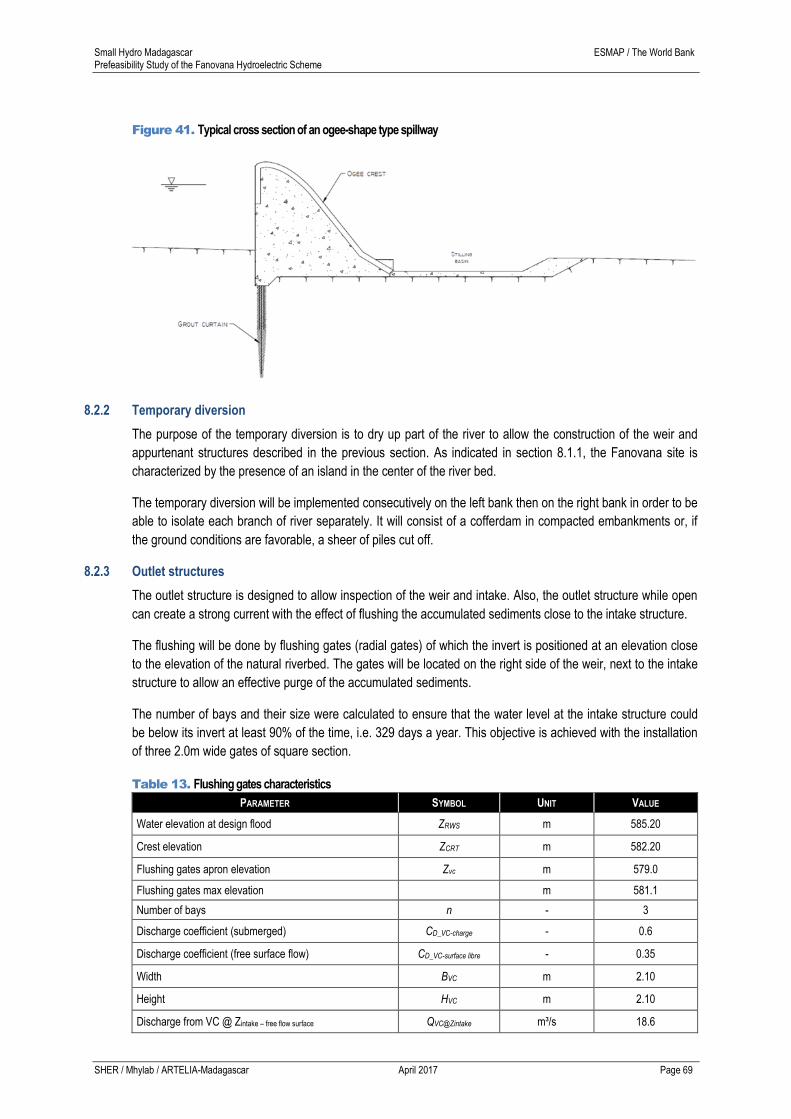
Small Hydro Madagascar ESMAP / The World Bank Prefeasibility Study of the Fanovana Hydroelectric Scheme
SHER / Mhylab / ARTELIA-Madagascar April 2017 Page 69
Figure 41. Typical cross section of an ogee-shape type spillway
8.2.2 Temporary diversion
The purpose of the temporary diversion is to dry up part of the river to allow the construction of the weir and
appurtenant structures described in the previous section. As indicated in section 8.1.1, the Fanovana site is
characterized by the presence of an island in the center of the river bed.
The temporary diversion will be implemented consecutively on the left bank then on the right bank in order to be
able to isolate each branch of river separately. It will consist of a cofferdam in compacted embankments or, if
the ground conditions are favorable, a sheer of piles cut off.
8.2.3 Outlet structures
The outlet structure is designed to allow inspection of the weir and intake. Also, the outlet structure while open
can create a strong current with the effect of flushing the accumulated sediments close to the intake structure.
The flushing will be done by flushing gates (radial gates) of which the invert is positioned at an elevation close
to the elevation of the natural riverbed. The gates will be located on the right side of the weir, next to the intake
structure to allow an effective purge of the accumulated sediments.
The number of bays and their size were calculated to ensure that the water level at the intake structure could
be below its invert at least 90% of the time, i.e. 329 days a year. This objective is achieved with the installation
of three 2.0m wide gates of square section.
Table 13. Flushing gates characteristics
PARAMETER SYMBOL UNIT VALUE
Water elevation at design flood ZRWS m 585.20
Crest elevation ZCRT m 582.20
Flushing gates apron elevation Zvc m 579.0
Flushing gates max elevation m 581.1
Number of bays n - 3
Discharge coefficient (submerged) CD_VC-charge - 0.6
Discharge coefficient (free surface flow) CD_VC-surface libre - 0.35
Width BVC m 2.10
Height HVC m 2.10
Discharge from VC @ Zintake – free flow surface QVC@Zintake m³/s 18.6
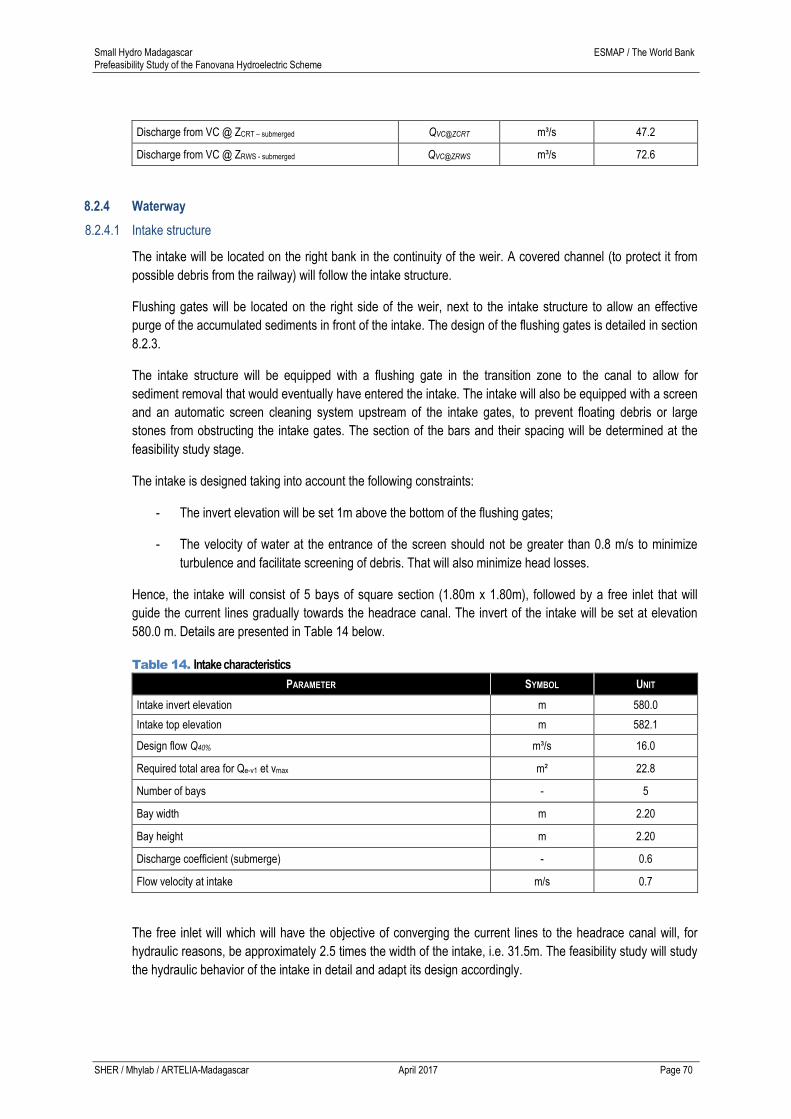
Small Hydro Madagascar ESMAP / The World Bank Prefeasibility Study of the Fanovana Hydroelectric Scheme
SHER / Mhylab / ARTELIA-Madagascar April 2017 Page 70
Discharge from VC @ ZCRT – submerged QVC@ZCRT m³/s 47.2
Discharge from VC @ ZRWS - submerged QVC@ZRWS m³/s 72.6
8.2.4 Waterway
8.2.4.1 Intake structure
The intake will be located on the right bank in the continuity of the weir. A covered channel (to protect it from
possible debris from the railway) will follow the intake structure.
Flushing gates will be located on the right side of the weir, next to the intake structure to allow an effective
purge of the accumulated sediments in front of the intake. The design of the flushing gates is detailed in section
8.2.3.
The intake structure will be equipped with a flushing gate in the transition zone to the canal to allow for
sediment removal that would eventually have entered the intake. The intake will also be equipped with a screen
and an automatic screen cleaning system upstream of the intake gates, to prevent floating debris or large
stones from obstructing the intake gates. The section of the bars and their spacing will be determined at the
feasibility study stage.
The intake is designed taking into account the following constraints:
- The invert elevation will be set 1m above the bottom of the flushing gates;
- The velocity of water at the entrance of the screen should not be greater than 0.8 m/s to minimize
turbulence and facilitate screening of debris. That will also minimize head losses.
Hence, the intake will consist of 5 bays of square section (1.80m x 1.80m), followed by a free inlet that will
guide the current lines gradually towards the headrace canal. The invert of the intake will be set at elevation
580.0 m. Details are presented in Table 14 below.
Table 14. Intake characteristics
PARAMETER SYMBOL UNIT
Intake invert elevation m 580.0
Intake top elevation m 582.1
Design flow Q40% m³/s 16.0
Required total area for Qe-v1 et vmax m² 22.8
Number of bays - 5
Bay width m 2.20
Bay height m 2.20
Discharge coefficient (submerge) - 0.6
Flow velocity at intake m/s 0.7
The free inlet will which will have the objective of converging the current lines to the headrace canal will, for
hydraulic reasons, be approximately 2.5 times the width of the intake, i.e. 31.5m. The feasibility study will study
the hydraulic behavior of the intake in detail and adapt its design accordingly.

Small Hydro Madagascar ESMAP / The World Bank Prefeasibility Study of the Fanovana Hydroelectric Scheme
SHER / Mhylab / ARTELIA-Madagascar April 2017 Page 71
8.2.4.2 Gravel trap et sand trap
The study of the soil losses quantification carried out in section 5.6 concludes that the Fanovana site should not
feature heavy solid transport except during flood events, that would result in operational and maintenance
problem of the hydroelectric plant. This is confirmed by observations made at different times of the year during
site visits.
Consequently, the intake structure will not be followed by a sand trap. The sediments that would accumulate in
front of the intake will be flushed by frequent flushing operations using the flushing gates designed for this
purpose.
The sediments that accumulate in the inlet that follow the intake, before entering the headrace canal, will be
flushed by a dedicated gate back to the river downstream the flushing gates.
8.2.4.3 Headrace canal
The concrete headrace canal will have a rectangular cross section. It will be covered to protect it from possible
debris coming from the railway as well as to minimize the risk to human falling into the canal. The canal will be
equipped with a lateral spillway. The slope of the headrace canal will be kept below 0.05% in order to minimize
the head losses. The canal dimensions are defined on the basis of the uniform flow equation (Manning):
𝑄
𝐴= 𝑉 = 𝑛−1 𝑅ℎ
23 𝑖
12
where A is the wetted area [m²], V is the mean flow velocity [m/s], n is the Manning coefficient, 𝑅ℎ is the
hydraulic radius [m] and i the slope of the canal [-].
The headrace canal is designed taking into account:
- the average flow velocity is less than 2 m/s in order to avoid erosion of the concrete.
- the cross section is the most economical section: for a given discharge, slope and Manning
coefficient, the discharge capacity will be maximum when the hydraulic radius (ratio of the wetted
section on the wet perimeter) is maximum.
The canal will have a rectangular cross-section of 4.5 m in width for a water height of 2.11 m, to which is added
a freeboard of 25cm, which results in a total height of 2.40 m (rounding off to the top unit). The headrace canal
will have a length of 410m following a slope of 0.05%.
To allow for the evacuation of any sediment or coarse gravel in the canal, it will be equipped with a gravel trap
in its upstream part, after the inlet following the intake. This gravel trap will consist of an over-depth of one
meter over a distance of 6 meters and equipped with a gate that will allow the flushing of the sediment back to
the natural riverbed.
An alternative layout considering a penstock departure following the intake instead of the headrace canal
should be evaluated during the detailed studies.
8.2.4.4 Penstock
The headrace canal and the pressure penstock meet at the forebay. The forebay will be equipped with a scour
gate in order to drain the channel as well as the particles that would have sedimented in the latter back to the
river. The forebay will be equipped with a safety spillway in the event of excessive inflows coming from the
headrace canal or allowing the spill of the water in excess during variations flow through the turbines
(production decrease, shutdown of a group, etc).
Small Hydro Madagascar ESMAP / The World Bank Prefeasibility Study of the Fanovana Hydroelectric Scheme
SHER / Mhylab / ARTELIA-Madagascar April 2017 Page 72
The pressure penstock will be overground and 95m-long. The penstock will be supported by reinforced
concrete support blocks. Anchoring blocks will be placed at each elbow to balance the forces related to the
change of direction of the flow. A suitable system allowing the thermal expansion of the penstock should be
defined at the feasibility study stage.
In order to limit the head losses to a maximum of 2% of the gross head, the penstock will have a diameter of
2 m.
8.2.5 Electromechanical Equipment
8.2.5.1 Basic data
The following basic constants are considered for all calculations and considerations related to the
electromechanical equipment:
CONSTANT SYMBOL UNIT VALUE
Gravity acceleration g m/s2 9.786
Average water temperature Teau C 20
Water density at 20C ρ kg/m3 998.2
8.2.5.2 Usable Flow Duration Curve
The flow duration curve was determined in Chapter 8.1.3 of this report. It does not, however, correspond
directly to the flow available to the equipment. Indeed, the Sahatandra River will be by-passed over a length of
approximately 610m. An ecological flow guarantee at all times is required for environmental and ecological
reasons.
In the absence of standards, the ecological flow is set at 705 L/s, which corresponds to approximately 10% of
the guaranteed flow (Q95%) of the river. Since this flow is not available for the turbines, it is necessary to
subtract it from the flow duration curve of the river.
The flow duration curve that can actually flow through the turbines is finally obtained by considering the design
flow rate of equipment chosen at the pre-feasibility stage, namely 16 m³/s. The choice of the design flow should
be optimized in the feasibility study stage considering technical and economic aspects.
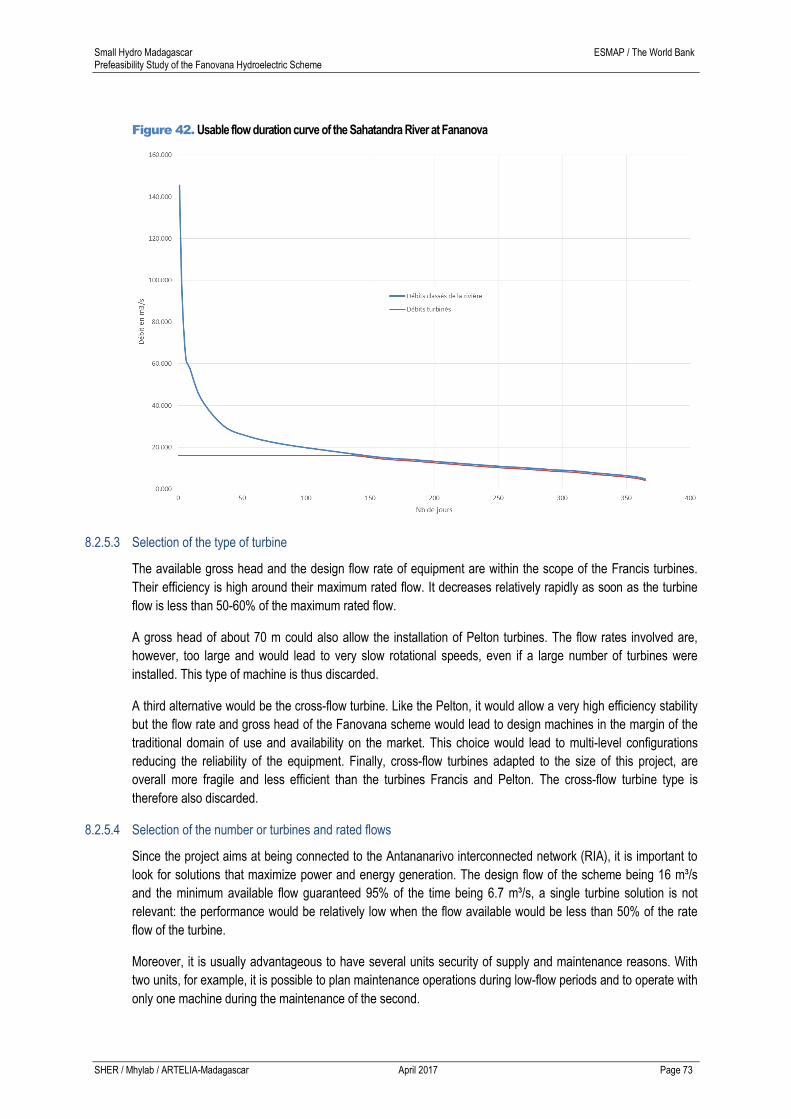
Small Hydro Madagascar ESMAP / The World Bank Prefeasibility Study of the Fanovana Hydroelectric Scheme
SHER / Mhylab / ARTELIA-Madagascar April 2017 Page 73
Figure 42. Usable flow duration curve of the Sahatandra River at Fananova
8.2.5.3 Selection of the type of turbine
The available gross head and the design flow rate of equipment are within the scope of the Francis turbines.
Their efficiency is high around their maximum rated flow. It decreases relatively rapidly as soon as the turbine
flow is less than 50-60% of the maximum rated flow.
A gross head of about 70 m could also allow the installation of Pelton turbines. The flow rates involved are,
however, too large and would lead to very slow rotational speeds, even if a large number of turbines were
installed. This type of machine is thus discarded.
A third alternative would be the cross-flow turbine. Like the Pelton, it would allow a very high efficiency stability
but the flow rate and gross head of the Fanovana scheme would lead to design machines in the margin of the
traditional domain of use and availability on the market. This choice would lead to multi-level configurations
reducing the reliability of the equipment. Finally, cross-flow turbines adapted to the size of this project, are
overall more fragile and less efficient than the turbines Francis and Pelton. The cross-flow turbine type is
therefore also discarded.
8.2.5.4 Selection of the number or turbines and rated flows
Since the project aims at being connected to the Antananarivo interconnected network (RIA), it is important to
look for solutions that maximize power and energy generation. The design flow of the scheme being 16 m³/s
and the minimum available flow guaranteed 95% of the time being 6.7 m³/s, a single turbine solution is not
relevant: the performance would be relatively low when the flow available would be less than 50% of the rate
flow of the turbine.
Moreover, it is usually advantageous to have several units security of supply and maintenance reasons. With
two units, for example, it is possible to plan maintenance operations during low-flow periods and to operate with
only one machine during the maintenance of the second.

Small Hydro Madagascar ESMAP / The World Bank Prefeasibility Study of the Fanovana Hydroelectric Scheme
SHER / Mhylab / ARTELIA-Madagascar April 2017 Page 74
Finally, the relative difficulties of access are in favor of the installation of several units that are more easily
transportable and installable compared to one large unit. This is also reflected in the infrastructure associated
with the power plant, particularly with regard to the crane which may be of lower capacity, the loads being
lower.
All these reasons lead, at the prefeasibility stage, to choosing a configuration with two identical turbines each
rated at 8 m³/s. The exact number can be refined as part of a technical and economic comparative analysis at
the feasibility study stage.
8.2.5.5 Net Head Calculation
The net head for a Francis turbine must take into account the loss of energy corresponding to the remaining
velocity at the outlet of the draft tube. This velocity depends on manufacturer-specific criteria. It is generally
close to 2 m/s, which will be used in this study.
Hence, the net head is expressed using the following equation:
g
vQHQZQH rc
2)()()(
2
[m]
Where:
H(Q): Net head as a function of the turbined flow [m]
Z(Q): Difference in elevation [m]
Hrc(Q) : Head losses in pipe [m]
v: velocity at the outlet of the draft tube (2.0 m/s) [m]
g = 9.786 [m/s2]
The choice of a flow velocity of 2 m/s is a balance between the recovery of the kinetic energy in the draft tube
and the flow conditions at the turbine outlet. Moreover, it is assumed that, at this stage, that the head losses in
the draft tube are constant whatever the turbined outflow.
In addition, since the Francis turbine is a reaction machine that does not require dewatering, the tailwater level
to be considered is the downstream water level which may be either the level of the river or the water level kept
constant by a small weir in the tailrace canal.
The powerhouse slab is set at elevation 510.40 m in order to put the equipment out of extreme flood
(downstream water level estimated at 509.40 m at the design flood).
The equipment will consist of Francis hydroelectric units with vertical shaft. This allows the turbines to be
installed in such a way that their median plane is at the same level as the slab of the power plant, ensuring that
the generators are always off-flood. If, on the other hand, it is considered that the suction head for machines of
this type operating under these conditions will be at most of the order of one meter, the downstream level could
consequently be set equal to 509.40 m. Considering that the water level in the forebay will be 581.90m, the
available gross head would be 72.5m. The tailwater level would be kept constant by a weir at elevation
509.40 m. This choice will ensure the normal operation of the turbines in the event of extreme floods.
Further optimization of the various elevations may be done in later phases of the project.
8.2.5.6 Overview of the units operation
The turbines will be controlled by the upstream water level measured in the forebay. The foreseen operation of
the scheme is as follows:

Small Hydro Madagascar ESMAP / The World Bank Prefeasibility Study of the Fanovana Hydroelectric Scheme
SHER / Mhylab / ARTELIA-Madagascar April 2017 Page 75
- As long as the available flow is less than the minimum rated flow of one turbine, the power plant is
stopped;
- As long as the available flow is between the minimum and maximum rated flows of one turbine, all the
water passes through a single hydroelectric unit;
- As soon as the available flow exceeds the maximum rated flow of one turbine, the second unit starts.
The first unit reduces its opening, while the second increases its own, until the two turbines operate at
the same opening;
- The two units are then adjusted in parallel until each one operates at full opening according to the
total available flow;
- As soon as the available flow exceeds the maximum rated flow of the two turbines, the surplus is
discharged over the spillway of the forebay;
- When the flow rate decreases, the control system reduces the opening of the two turbines in reverse
sequences.
If one or two groups are shut down, the flow in excess is discharged from the forebay over the spillway.
8.2.5.7 Francis Turbines
The following indications correspond to pre-designed units from the consultant's database. They are indicative
only and may vary according to the manufacturer. The performance and characteristics of the turbines (speed,
efficiency, reliability, etc.) correspond to machines for which the manufacturer can indisputably prove the origin
of his guarantees. Thus, the announced characteristics are realistic, provided that the turbines are constructed
in accordance with a hydraulic profile resulting from developments in the laboratory.
The calculation based on the specific energy, the rotation speed and the maximum flow allow to determine the
following characteristics and dimensions of the turbines:
Design flow m3/s 16.0
Available gross head m 72.50
Head losses at design flow m 1.5
Head losses in the draft tube (kinetic) m approx. 0.2
Net head at design flow m 70.8
Number of units - 2
Type of turbine - Vertical shaft Francis
Maximal unit mechanical power kW 5000
Rotation speed t/min 500
Maximum rotation speed t/min 1100
Reference turbine diameter D e1 mm 1100
Maximum suction head m ≈ 1.0
The selection of a vertical shaft arrangement and cantilevered wheels is made to simplify the assembly and
alignment operations and to simplify the disassembly of the machines during the maintenance operations. This
configuration makes it possible to limit the number of bearings of the unit to one bearing and one thrust bearing,
both located in the generator, which has the effect of increasing the reliability.
During the subsequent phases of the studies, variants of rotation speed can be analyzed bearing in mind that
the higher it will be, the more the suction head will have to be reduced.
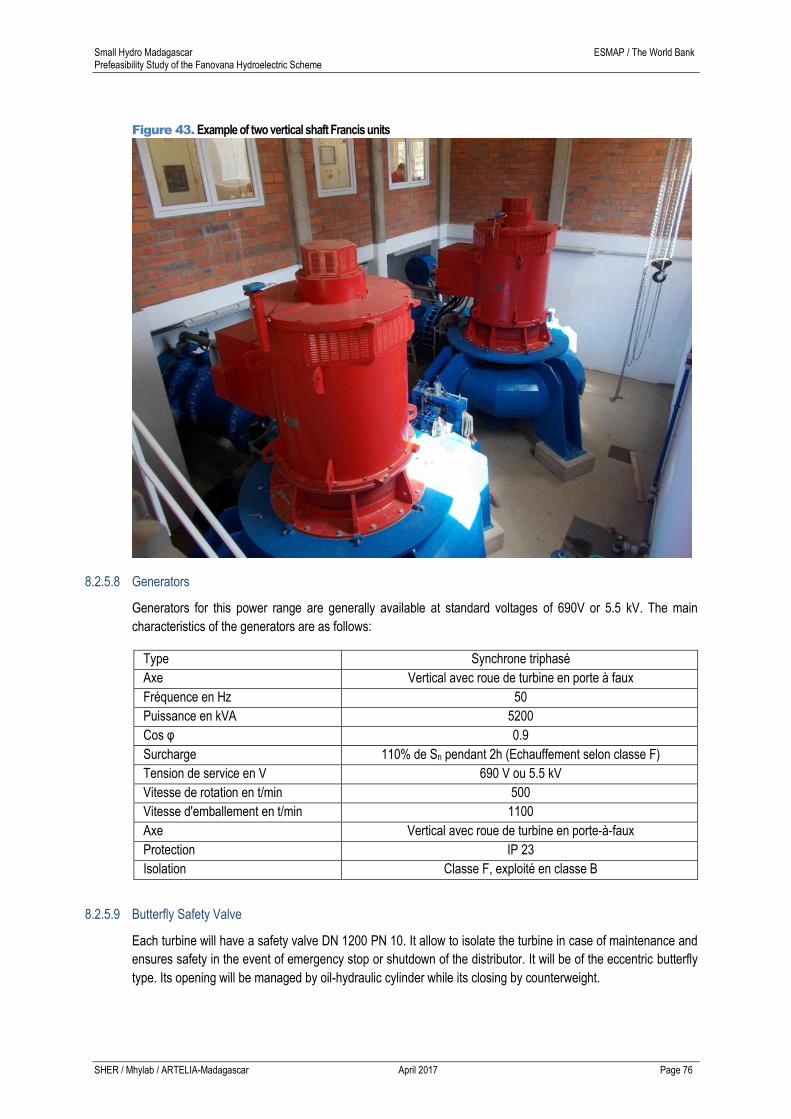
Small Hydro Madagascar ESMAP / The World Bank Prefeasibility Study of the Fanovana Hydroelectric Scheme
SHER / Mhylab / ARTELIA-Madagascar April 2017 Page 76
Figure 43. Example of two vertical shaft Francis units
8.2.5.8 Generators
Generators for this power range are generally available at standard voltages of 690V or 5.5 kV. The main
characteristics of the generators are as follows:
Type Synchrone triphasé
Axe Vertical avec roue de turbine en porte à faux
Fréquence en Hz 50
Puissance en kVA 5200
Cos φ 0.9
Surcharge 110% de Sn pendant 2h (Echauffement selon classe F)
Tension de service en V 690 V ou 5.5 kV
Vitesse de rotation en t/min 500
Vitesse d'emballement en t/min 1100
Axe Vertical avec roue de turbine en porte-à-faux
Protection IP 23
Isolation Classe F, exploité en classe B
8.2.5.9 Butterfly Safety Valve
Each turbine will have a safety valve DN 1200 PN 10. It allow to isolate the turbine in case of maintenance and
ensures safety in the event of emergency stop or shutdown of the distributor. It will be of the eccentric butterfly
type. Its opening will be managed by oil-hydraulic cylinder while its closing by counterweight.

Small Hydro Madagascar ESMAP / The World Bank Prefeasibility Study of the Fanovana Hydroelectric Scheme
SHER / Mhylab / ARTELIA-Madagascar April 2017 Page 77
8.2.5.10 Hydraulic control unit
Each unit will have an oil-hydraulic high-pressure control unit which will enable the turbine distributor and the
safety valve to be operated. It will be equipped with a hydraulic accumulator to ensure safety in the event of
high-pressure pump failure.
8.2.5.11 Control and monitoring system
Since the power plant is designed to operate fully automatically, its control and operation must be simple in
order to minimize human interventions.
The flow will be controlled by the water level in the forebay, which will be measured by a probe connected to
the plant by optical fiber. Each generation unit will have a dedicated control system. A plant controller will also
be installed to manage both units.
If required to maintain the frequency of the network, the installation will be equipped with a speed control sytem.
Each turbine must be able to operate either automatically or manually. A key to prevent misoperation will lock
the manual operation.
In the event of a network trip, the restart will be automatic. For safety reasons of plant operating personnel and
the power grid, the automatic restarting following an alarm, even if turned off without human intervention,
should not be authorized.
The electrical switchboards will include the following: Control of the distributor with display of the opening,
Cos , voltage and frequency setting, inverters.
The following indicators are provided: grid and generators voltmeters, wattmeter, frequency meter, Cos
measurement, synchroscope, rev counter, upstream water level indicator, hour counter, starts counter,
alternator bearing and winding temperatures, emergency stop, load indicator for emergency power supply.
The following alarms should be considered: insufficient upstream water level, insufficient upstream pressure,
generator overload, overspeed, emergency stop, start fault, bearing fault, winding faults, current feedback,
battery overloads, and battery faults.
A remote control could be installed.
8.2.5.12 Emergency power unit
A 48 or 110 V DC back-up power supply, including batteries, chargers, inverters, load indicators, protections,
etc., is provided to ensure safety in the event of network loss. The battery fault and battery overload alarms
must be relayed in the control command unit. In normal operation, the backup power supply will be powered by
the LV network. It is also planned to install a 100 kVA thermal generator. Its exact power will be defined in a
later stage.
8.2.5.13 Transformers
Each group will be connected to a three-phase transformer immersed in oil 5500 kVA (or of a minimum power
compatible with the power of the generator, according to the standard ranges of the market) making it possible
to raise the output voltage of the generators to 63 kV. It is also planned to install a 100 kVA 63 / 0.4 kV
transformer supplying ancillary services. A block of 63 kV cells (group arrival, network start) will also be
installed. These equipment will be defined according to market standards.
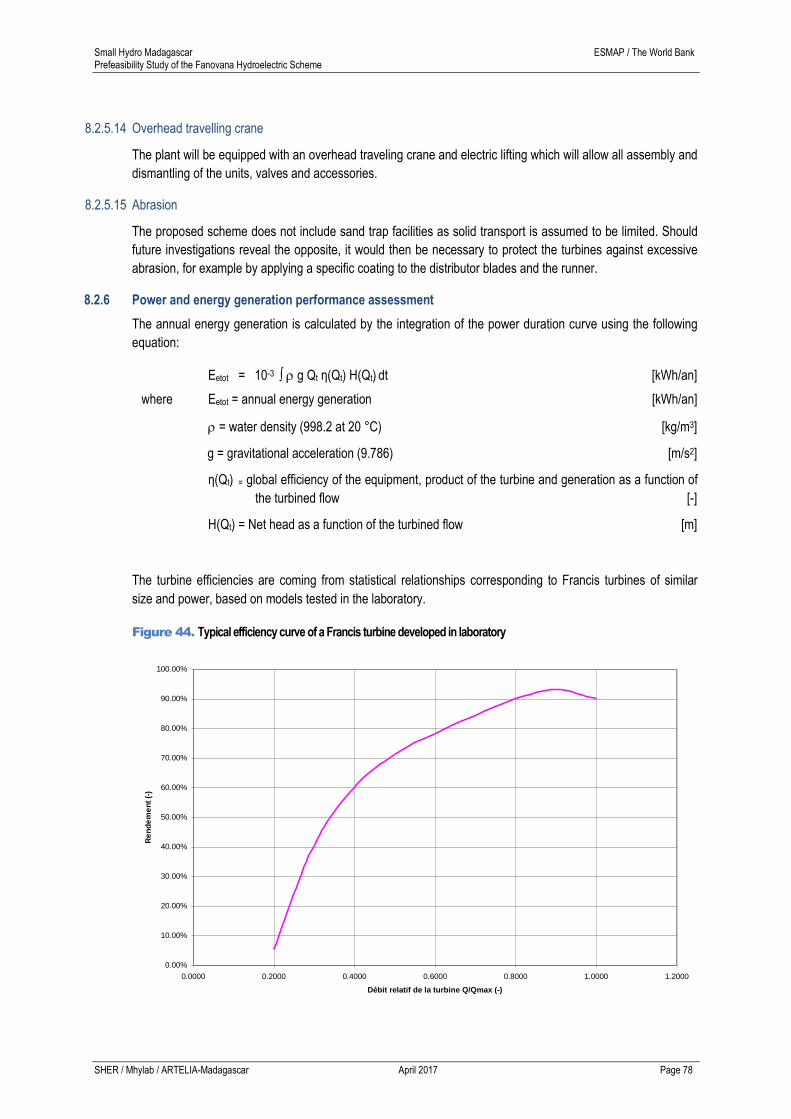
Small Hydro Madagascar ESMAP / The World Bank Prefeasibility Study of the Fanovana Hydroelectric Scheme
SHER / Mhylab / ARTELIA-Madagascar April 2017 Page 78
8.2.5.14 Overhead travelling crane
The plant will be equipped with an overhead traveling crane and electric lifting which will allow all assembly and
dismantling of the units, valves and accessories.
8.2.5.15 Abrasion
The proposed scheme does not include sand trap facilities as solid transport is assumed to be limited. Should
future investigations reveal the opposite, it would then be necessary to protect the turbines against excessive
abrasion, for example by applying a specific coating to the distributor blades and the runner.
8.2.6 Power and energy generation performance assessment
The annual energy generation is calculated by the integration of the power duration curve using the following
equation:
Eetot = 10-3 g Qt η(Qt) H(Qt) dt [kWh/an]
where Eetot = annual energy generation [kWh/an]
= water density (998.2 at 20 °C) [kg/m3]
g = gravitational acceleration (9.786) [m/s2]
η(Qt) = global efficiency of the equipment, product of the turbine and generation as a function of
the turbined flow [-]
H(Qt) = Net head as a function of the turbined flow [m]
The turbine efficiencies are coming from statistical relationships corresponding to Francis turbines of similar
size and power, based on models tested in the laboratory.
Figure 44. Typical efficiency curve of a Francis turbine developed in laboratory
0.00%
10.00%
20.00%
30.00%
40.00%
50.00%
60.00%
70.00%
80.00%
90.00%
100.00%
0.0000 0.2000 0.4000 0.6000 0.8000 1.0000 1.2000
Débit relatif de la turbine Q/Qmax (-)
Re
nd
em
en
t (-
)
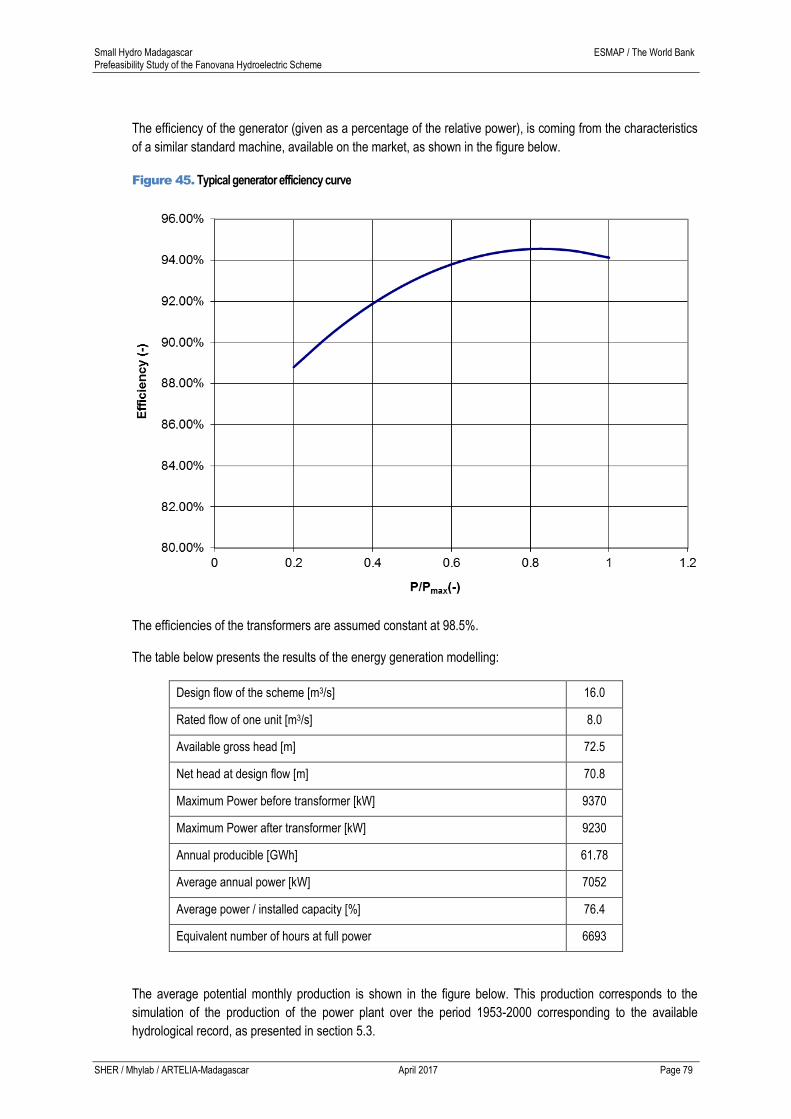
Small Hydro Madagascar ESMAP / The World Bank Prefeasibility Study of the Fanovana Hydroelectric Scheme
SHER / Mhylab / ARTELIA-Madagascar April 2017 Page 79
The efficiency of the generator (given as a percentage of the relative power), is coming from the characteristics
of a similar standard machine, available on the market, as shown in the figure below.
Figure 45. Typical generator efficiency curve
The efficiencies of the transformers are assumed constant at 98.5%.
The table below presents the results of the energy generation modelling:
Design flow of the scheme [m3/s] 16.0
Rated flow of one unit [m3/s] 8.0
Available gross head [m] 72.5
Net head at design flow [m] 70.8
Maximum Power before transformer [kW] 9370
Maximum Power after transformer [kW] 9230
Annual producible [GWh] 61.78
Average annual power [kW] 7052
Average power / installed capacity [%] 76.4
Equivalent number of hours at full power 6693
The average potential monthly production is shown in the figure below. This production corresponds to the
simulation of the production of the power plant over the period 1953-2000 corresponding to the available
hydrological record, as presented in section 5.3.
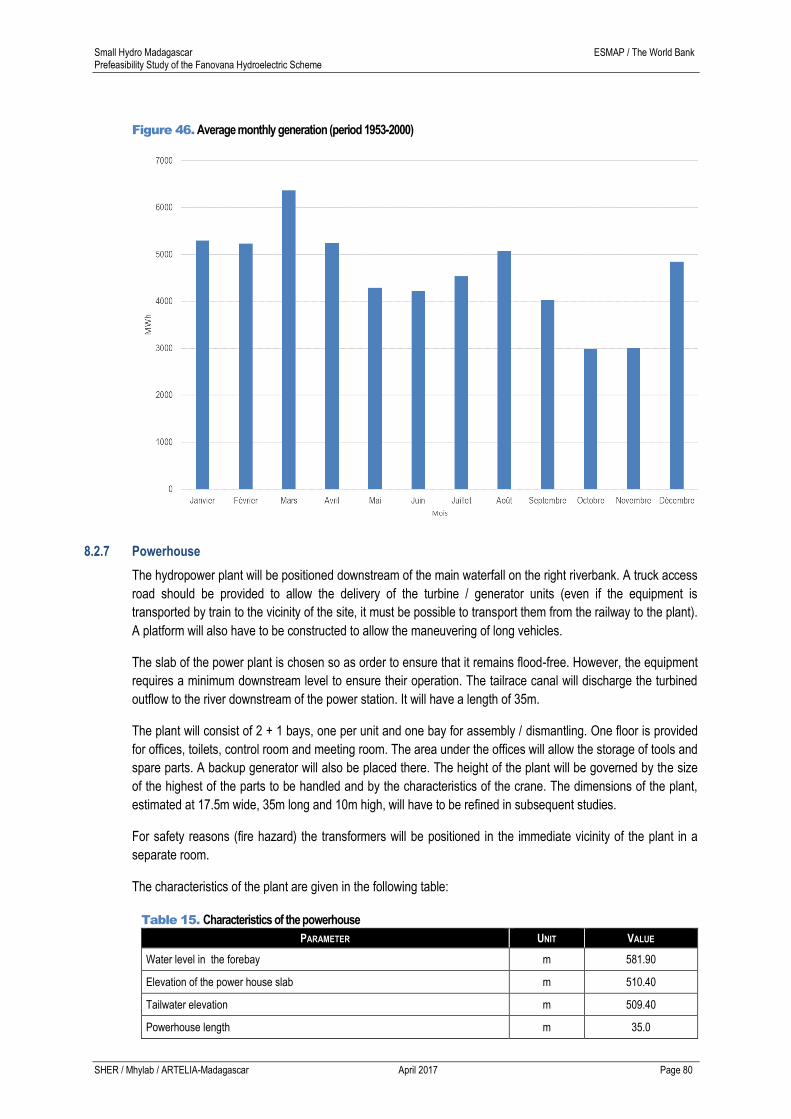
Small Hydro Madagascar ESMAP / The World Bank Prefeasibility Study of the Fanovana Hydroelectric Scheme
SHER / Mhylab / ARTELIA-Madagascar April 2017 Page 80
Figure 46. Average monthly generation (period 1953-2000)
8.2.7 Powerhouse
The hydropower plant will be positioned downstream of the main waterfall on the right riverbank. A truck access
road should be provided to allow the delivery of the turbine / generator units (even if the equipment is
transported by train to the vicinity of the site, it must be possible to transport them from the railway to the plant).
A platform will also have to be constructed to allow the maneuvering of long vehicles.
The slab of the power plant is chosen so as order to ensure that it remains flood-free. However, the equipment
requires a minimum downstream level to ensure their operation. The tailrace canal will discharge the turbined
outflow to the river downstream of the power station. It will have a length of 35m.
The plant will consist of 2 + 1 bays, one per unit and one bay for assembly / dismantling. One floor is provided
for offices, toilets, control room and meeting room. The area under the offices will allow the storage of tools and
spare parts. A backup generator will also be placed there. The height of the plant will be governed by the size
of the highest of the parts to be handled and by the characteristics of the crane. The dimensions of the plant,
estimated at 17.5m wide, 35m long and 10m high, will have to be refined in subsequent studies.
For safety reasons (fire hazard) the transformers will be positioned in the immediate vicinity of the plant in a
separate room.
The characteristics of the plant are given in the following table:
Table 15. Characteristics of the powerhouse
PARAMETER UNIT VALUE
Water level in the forebay m 581.90
Elevation of the power house slab m 510.40
Tailwater elevation m 509.40
Powerhouse length m 35.0
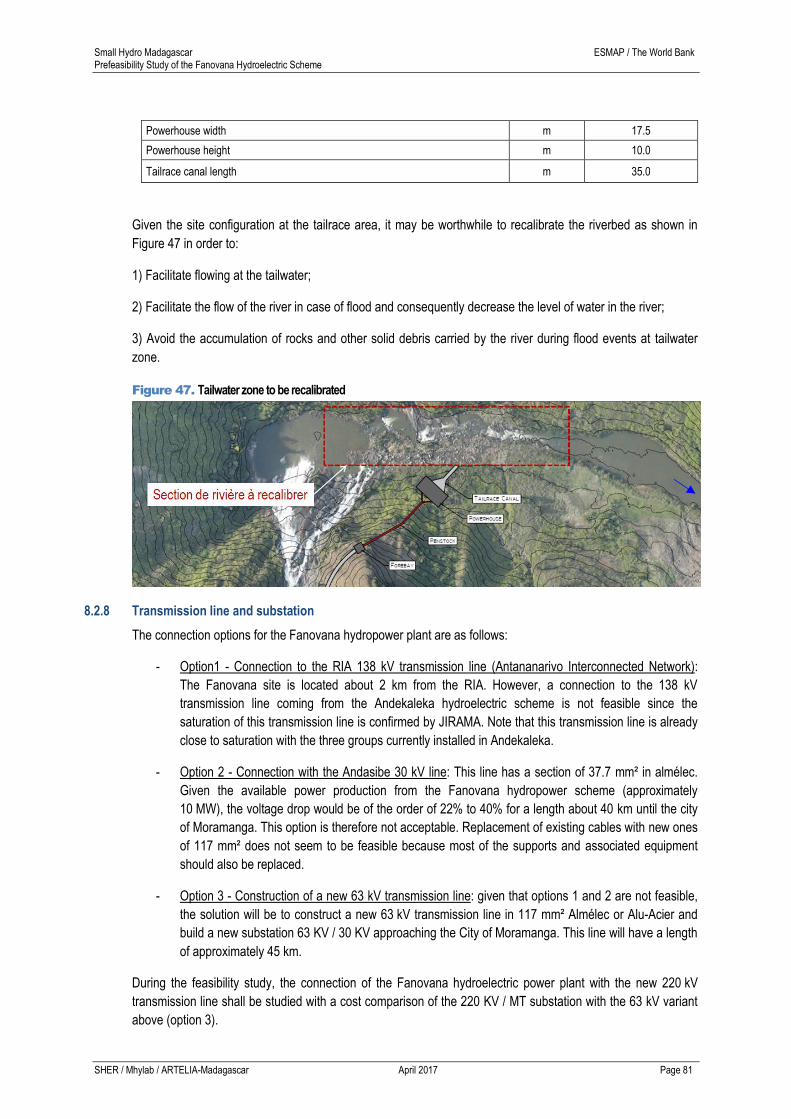
Small Hydro Madagascar ESMAP / The World Bank Prefeasibility Study of the Fanovana Hydroelectric Scheme
SHER / Mhylab / ARTELIA-Madagascar April 2017 Page 81
Powerhouse width m 17.5
Powerhouse height m 10.0
Tailrace canal length m 35.0
Given the site configuration at the tailrace area, it may be worthwhile to recalibrate the riverbed as shown in
Figure 47 in order to:
1) Facilitate flowing at the tailwater;
2) Facilitate the flow of the river in case of flood and consequently decrease the level of water in the river;
3) Avoid the accumulation of rocks and other solid debris carried by the river during flood events at tailwater
zone.
Figure 47. Tailwater zone to be recalibrated
8.2.8 Transmission line and substation
The connection options for the Fanovana hydropower plant are as follows:
- Option1 - Connection to the RIA 138 kV transmission line (Antananarivo Interconnected Network):
The Fanovana site is located about 2 km from the RIA. However, a connection to the 138 kV
transmission line coming from the Andekaleka hydroelectric scheme is not feasible since the
saturation of this transmission line is confirmed by JIRAMA. Note that this transmission line is already
close to saturation with the three groups currently installed in Andekaleka.
- Option 2 - Connection with the Andasibe 30 kV line: This line has a section of 37.7 mm² in almélec.
Given the available power production from the Fanovana hydropower scheme (approximately
10 MW), the voltage drop would be of the order of 22% to 40% for a length about 40 km until the city
of Moramanga. This option is therefore not acceptable. Replacement of existing cables with new ones
of 117 mm² does not seem to be feasible because most of the supports and associated equipment
should also be replaced.
- Option 3 - Construction of a new 63 kV transmission line: given that options 1 and 2 are not feasible,
the solution will be to construct a new 63 kV transmission line in 117 mm² Almélec or Alu-Acier and
build a new substation 63 KV / 30 KV approaching the City of Moramanga. This line will have a length
of approximately 45 km.
During the feasibility study, the connection of the Fanovana hydroelectric power plant with the new 220 kV
transmission line shall be studied with a cost comparison of the 220 KV / MT substation with the 63 kV variant
above (option 3).
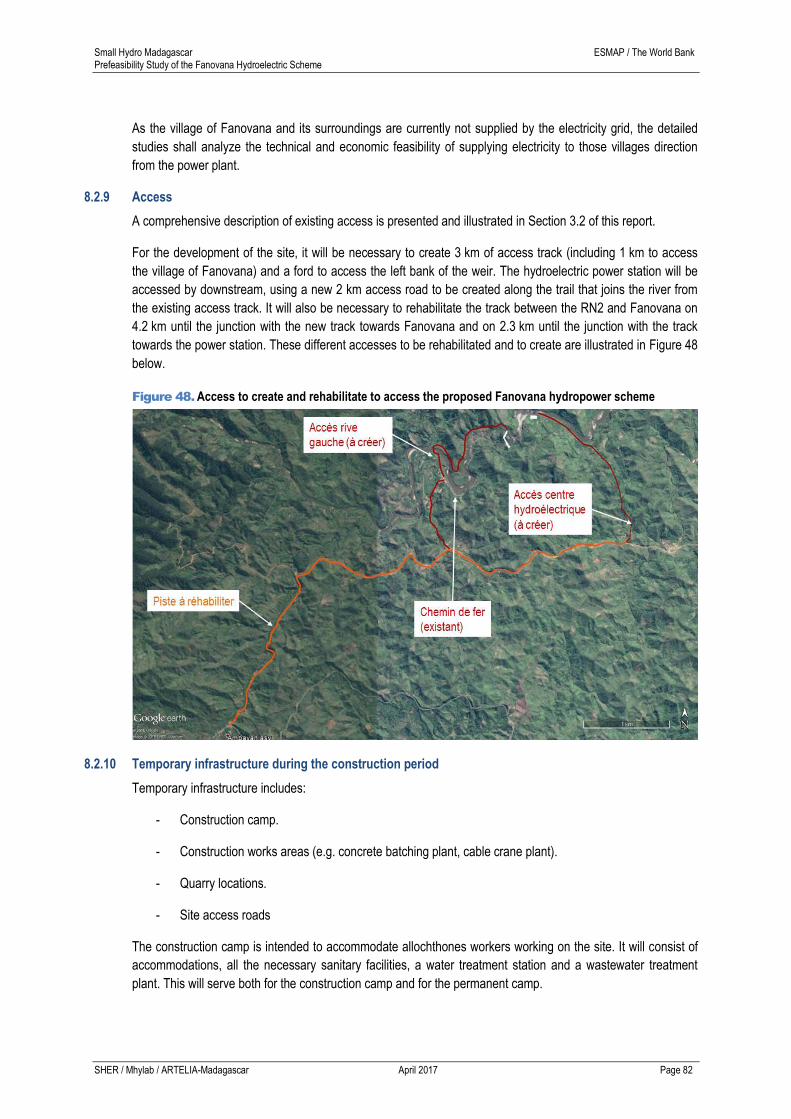
Small Hydro Madagascar ESMAP / The World Bank Prefeasibility Study of the Fanovana Hydroelectric Scheme
SHER / Mhylab / ARTELIA-Madagascar April 2017 Page 82
As the village of Fanovana and its surroundings are currently not supplied by the electricity grid, the detailed
studies shall analyze the technical and economic feasibility of supplying electricity to those villages direction
from the power plant.
8.2.9 Access
A comprehensive description of existing access is presented and illustrated in Section 3.2 of this report.
For the development of the site, it will be necessary to create 3 km of access track (including 1 km to access
the village of Fanovana) and a ford to access the left bank of the weir. The hydroelectric power station will be
accessed by downstream, using a new 2 km access road to be created along the trail that joins the river from
the existing access track. It will also be necessary to rehabilitate the track between the RN2 and Fanovana on
4.2 km until the junction with the new track towards Fanovana and on 2.3 km until the junction with the track
towards the power station. These different accesses to be rehabilitated and to create are illustrated in Figure 48
below.
Figure 48. Access to create and rehabilitate to access the proposed Fanovana hydropower scheme
8.2.10 Temporary infrastructure during the construction period
Temporary infrastructure includes:
- Construction camp.
- Construction works areas (e.g. concrete batching plant, cable crane plant).
- Quarry locations.
- Site access roads
The construction camp is intended to accommodate allochthones workers working on the site. It will consist of
accommodations, all the necessary sanitary facilities, a water treatment station and a wastewater treatment
plant. This will serve both for the construction camp and for the permanent camp.
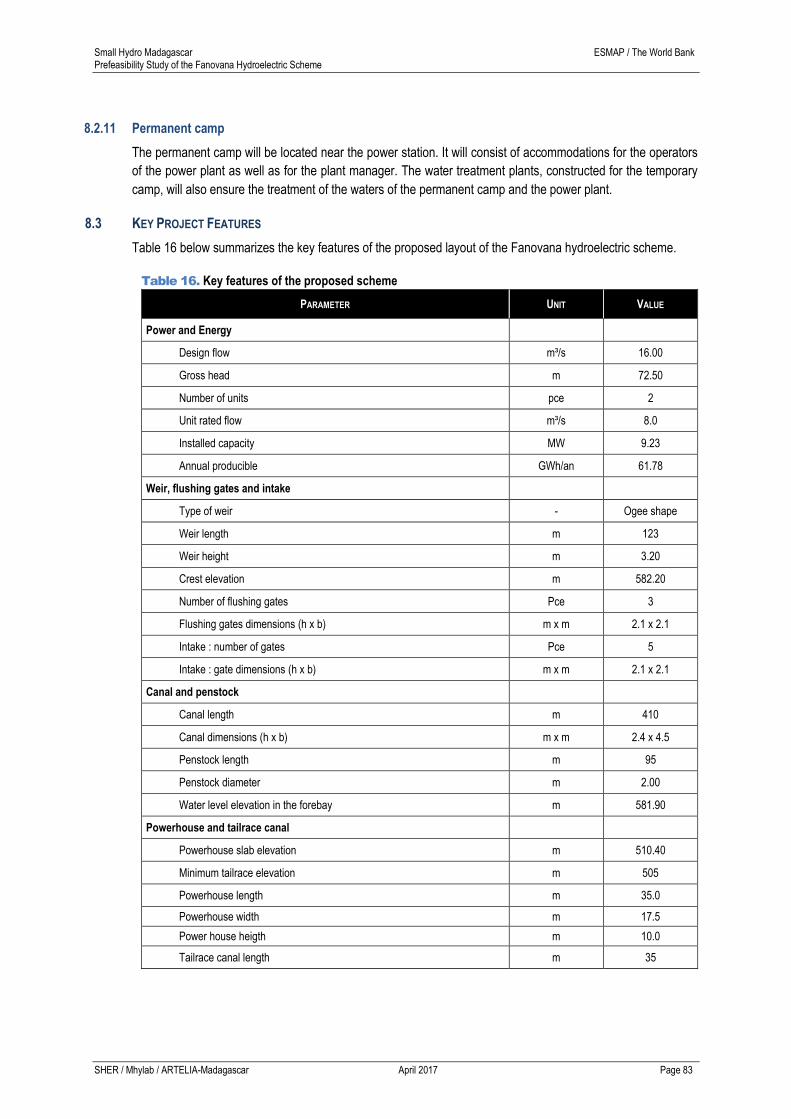
Small Hydro Madagascar ESMAP / The World Bank Prefeasibility Study of the Fanovana Hydroelectric Scheme
SHER / Mhylab / ARTELIA-Madagascar April 2017 Page 83
8.2.11 Permanent camp
The permanent camp will be located near the power station. It will consist of accommodations for the operators
of the power plant as well as for the plant manager. The water treatment plants, constructed for the temporary
camp, will also ensure the treatment of the waters of the permanent camp and the power plant.
8.3 KEY PROJECT FEATURES
Table 16 below summarizes the key features of the proposed layout of the Fanovana hydroelectric scheme.
Table 16. Key features of the proposed scheme
PARAMETER UNIT VALUE
Power and Energy
Design flow m³/s 16.00
Gross head m 72.50
Number of units pce 2
Unit rated flow m³/s 8.0
Installed capacity MW 9.23
Annual producible GWh/an 61.78
Weir, flushing gates and intake
Type of weir - Ogee shape
Weir length m 123
Weir height m 3.20
Crest elevation m 582.20
Number of flushing gates Pce 3
Flushing gates dimensions (h x b) m x m 2.1 x 2.1
Intake : number of gates Pce 5
Intake : gate dimensions (h x b) m x m 2.1 x 2.1
Canal and penstock
Canal length m 410
Canal dimensions (h x b) m x m 2.4 x 4.5
Penstock length m 95
Penstock diameter m 2.00
Water level elevation in the forebay m 581.90
Powerhouse and tailrace canal
Powerhouse slab elevation m 510.40
Minimum tailrace elevation m 505
Powerhouse length m 35.0
Powerhouse width m 17.5
Power house heigth m 10.0
Tailrace canal length m 35
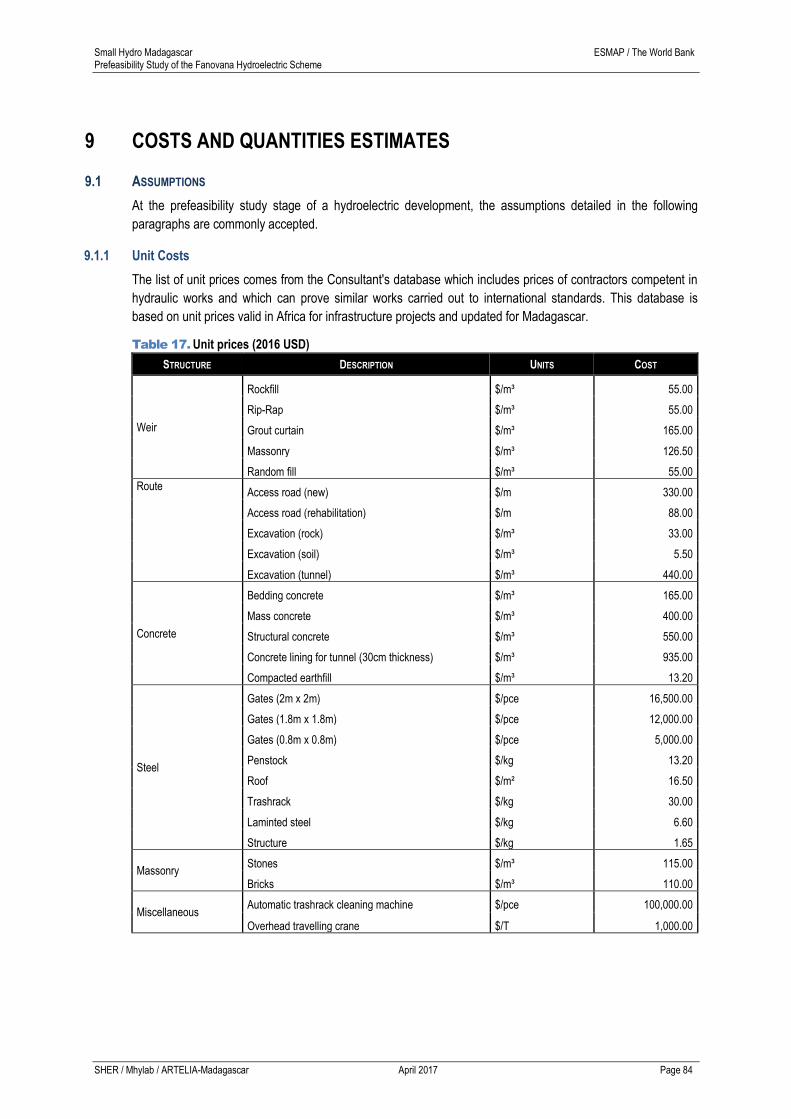
Small Hydro Madagascar ESMAP / The World Bank Prefeasibility Study of the Fanovana Hydroelectric Scheme
SHER / Mhylab / ARTELIA-Madagascar April 2017 Page 84
9 COSTS AND QUANTITIES ESTIMATES
9.1 ASSUMPTIONS
At the prefeasibility study stage of a hydroelectric development, the assumptions detailed in the following
paragraphs are commonly accepted.
9.1.1 Unit Costs
The list of unit prices comes from the Consultant's database which includes prices of contractors competent in
hydraulic works and which can prove similar works carried out to international standards. This database is
based on unit prices valid in Africa for infrastructure projects and updated for Madagascar.
Table 17. Unit prices (2016 USD)
STRUCTURE DESCRIPTION UNITS COST
Weir
Rockfill $/m³ 55.00
Rip-Rap $/m³ 55.00
Grout curtain $/m³ 165.00
Massonry $/m³ 126.50
Random fill $/m³ 55.00
Route Access road (new) $/m 330.00
Access road (rehabilitation) $/m 88.00
Excavation (rock) $/m³ 33.00
Excavation (soil) $/m³ 5.50
Excavation (tunnel) $/m³ 440.00
Concrete
Bedding concrete $/m³ 165.00
Mass concrete $/m³ 400.00
Structural concrete $/m³ 550.00
Concrete lining for tunnel (30cm thickness) $/m³ 935.00
Compacted earthfill $/m³ 13.20
Steel
Gates (2m x 2m) $/pce 16,500.00
Gates (1.8m x 1.8m) $/pce 12,000.00
Gates (0.8m x 0.8m) $/pce 5,000.00
Penstock $/kg 13.20
Roof $/m² 16.50
Trashrack $/kg 30.00
Laminted steel $/kg 6.60
Structure $/kg 1.65
Massonry Stones $/m³ 115.00
Bricks $/m³ 110.00
Miscellaneous Automatic trashrack cleaning machine $/pce 100,000.00
Overhead travelling crane $/T 1,000.00
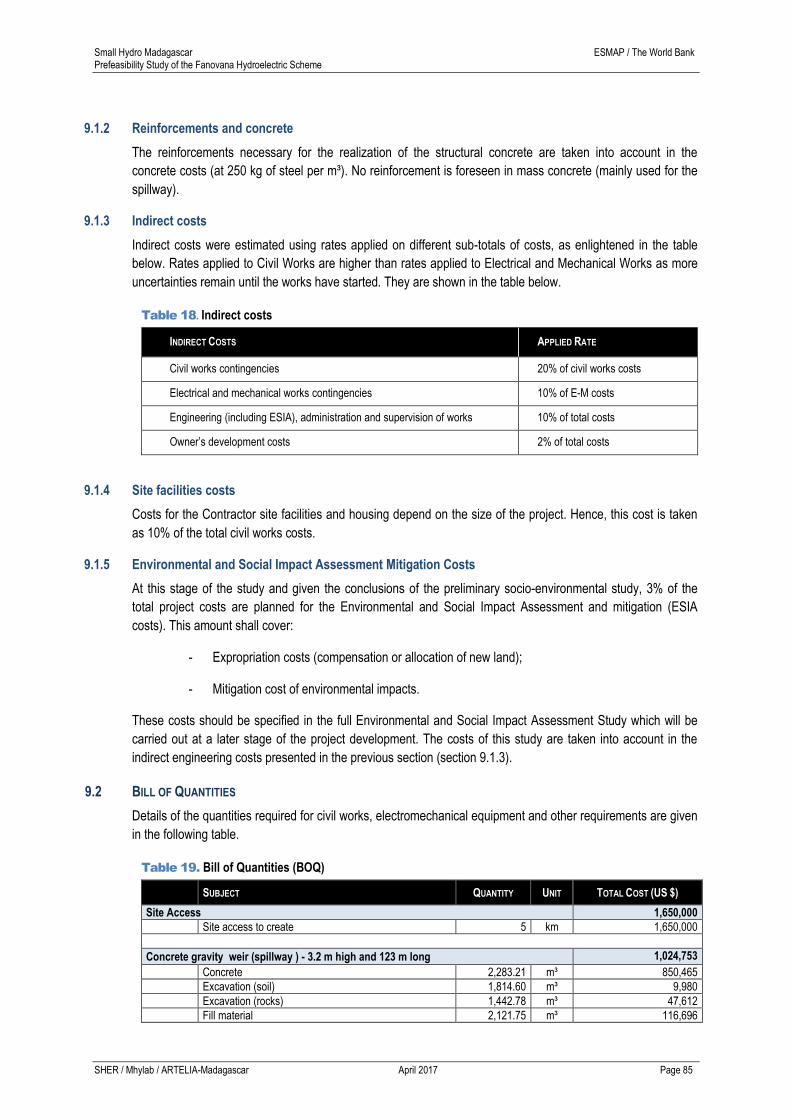
Small Hydro Madagascar ESMAP / The World Bank Prefeasibility Study of the Fanovana Hydroelectric Scheme
SHER / Mhylab / ARTELIA-Madagascar April 2017 Page 85
9.1.2 Reinforcements and concrete
The reinforcements necessary for the realization of the structural concrete are taken into account in the
concrete costs (at 250 kg of steel per m³). No reinforcement is foreseen in mass concrete (mainly used for the
spillway).
9.1.3 Indirect costs
Indirect costs were estimated using rates applied on different sub-totals of costs, as enlightened in the table
below. Rates applied to Civil Works are higher than rates applied to Electrical and Mechanical Works as more
uncertainties remain until the works have started. They are shown in the table below.
Table 18. Indirect costs
INDIRECT COSTS APPLIED RATE
Civil works contingencies 20% of civil works costs
Electrical and mechanical works contingencies 10% of E-M costs
Engineering (including ESIA), administration and supervision of works 10% of total costs
Owner’s development costs 2% of total costs
9.1.4 Site facilities costs
Costs for the Contractor site facilities and housing depend on the size of the project. Hence, this cost is taken
as 10% of the total civil works costs.
9.1.5 Environmental and Social Impact Assessment Mitigation Costs
At this stage of the study and given the conclusions of the preliminary socio-environmental study, 3% of the
total project costs are planned for the Environmental and Social Impact Assessment and mitigation (ESIA
costs). This amount shall cover:
- Expropriation costs (compensation or allocation of new land);
- Mitigation cost of environmental impacts.
These costs should be specified in the full Environmental and Social Impact Assessment Study which will be
carried out at a later stage of the project development. The costs of this study are taken into account in the
indirect engineering costs presented in the previous section (section 9.1.3).
9.2 BILL OF QUANTITIES
Details of the quantities required for civil works, electromechanical equipment and other requirements are given
in the following table.
Table 19. Bill of Quantities (BOQ)
SUBJECT QUANTITY UNIT TOTAL COST (US $)
Site Access 1,650,000
Site access to create 5 km 1,650,000
Concrete gravity weir (spillway ) - 3.2 m high and 123 m long 1,024,753
Concrete 2,283.21 m³ 850,465
Excavation (soil) 1,814.60 m³ 9,980
Excavation (rocks) 1,442.78 m³ 47,612
Fill material 2,121.75 m³ 116,696
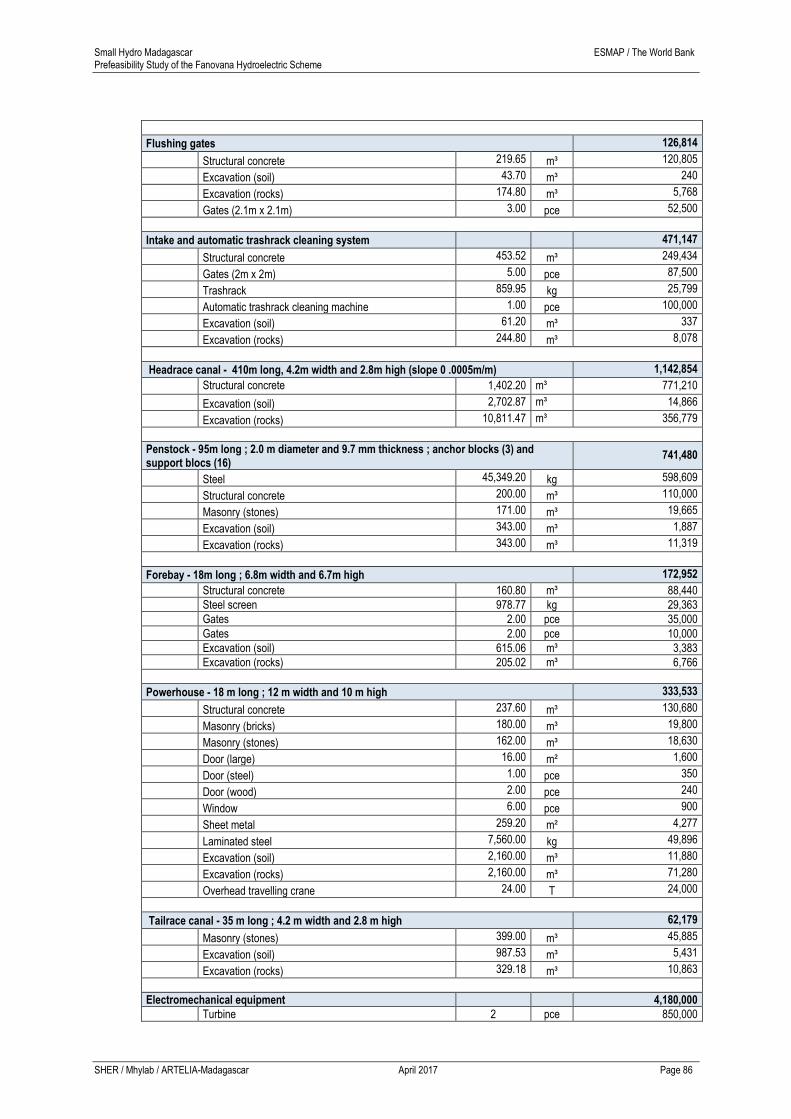
Small Hydro Madagascar ESMAP / The World Bank Prefeasibility Study of the Fanovana Hydroelectric Scheme
SHER / Mhylab / ARTELIA-Madagascar April 2017 Page 86
Flushing gates 126,814
Structural concrete 219.65 m³ 120,805
Excavation (soil) 43.70 m³ 240
Excavation (rocks) 174.80 m³ 5,768
Gates (2.1m x 2.1m) 3.00 pce 52,500
Intake and automatic trashrack cleaning system
471,147
Structural concrete 453.52 m³ 249,434
Gates (2m x 2m) 5.00 pce 87,500
Trashrack 859.95 kg 25,799
Automatic trashrack cleaning machine 1.00 pce 100,000
Excavation (soil) 61.20 m³ 337
Excavation (rocks) 244.80 m³ 8,078
Headrace canal - 410m long, 4.2m width and 2.8m high (slope 0 .0005m/m) 1,142,854
Structural concrete 1,402.20 m³ 771,210
Excavation (soil) 2,702.87 m³ 14,866
Excavation (rocks) 10,811.47 m³ 356,779
Penstock - 95m long ; 2.0 m diameter and 9.7 mm thickness ; anchor blocks (3) and support blocs (16)
741,480
Steel 45,349.20 kg 598,609
Structural concrete 200.00 m³ 110,000
Masonry (stones) 171.00 m³ 19,665
Excavation (soil) 343.00 m³ 1,887
Excavation (rocks) 343.00 m³ 11,319
Forebay - 18m long ; 6.8m width and 6.7m high 172,952
Structural concrete 160.80 m³ 88,440
Steel screen 978.77 kg 29,363
Gates 2.00 pce 35,000
Gates 2.00 pce 10,000
Excavation (soil) 615.06 m³ 3,383
Excavation (rocks) 205.02 m³ 6,766
Powerhouse - 18 m long ; 12 m width and 10 m high 333,533
Structural concrete 237.60 m³ 130,680
Masonry (bricks) 180.00 m³ 19,800
Masonry (stones) 162.00 m³ 18,630
Door (large) 16.00 m² 1,600
Door (steel) 1.00 pce 350
Door (wood) 2.00 pce 240
Window 6.00 pce 900
Sheet metal 259.20 m² 4,277
Laminated steel 7,560.00 kg 49,896
Excavation (soil) 2,160.00 m³ 11,880
Excavation (rocks) 2,160.00 m³ 71,280
Overhead travelling crane 24.00 T 24,000
Tailrace canal - 35 m long ; 4.2 m width and 2.8 m high 62,179
Masonry (stones) 399.00 m³ 45,885
Excavation (soil) 987.53 m³ 5,431
Excavation (rocks) 329.18 m³ 10,863
Electromechanical equipment
4,180,000
Turbine 2 pce 850,000

Small Hydro Madagascar ESMAP / The World Bank Prefeasibility Study of the Fanovana Hydroelectric Scheme
SHER / Mhylab / ARTELIA-Madagascar April 2017 Page 87
Generator 2 pce 1,200,000
Control system + transformers + electrical board and protections
1 pce
1,480,000
HPU 1 pce 150,000
Backup energy supply 1 pce 50,000
Transport 1 pce 230,000
Installation 1 pce 140,000
Commissioning 1 pce 60,000
Training of personal 1 pce 20,000
Miscellaneous
8,447,000
Transmission line 45 km 7,875,000
Rehabilitation of existing access roads 6.5 km 572,000
TOTAL
18,352,712
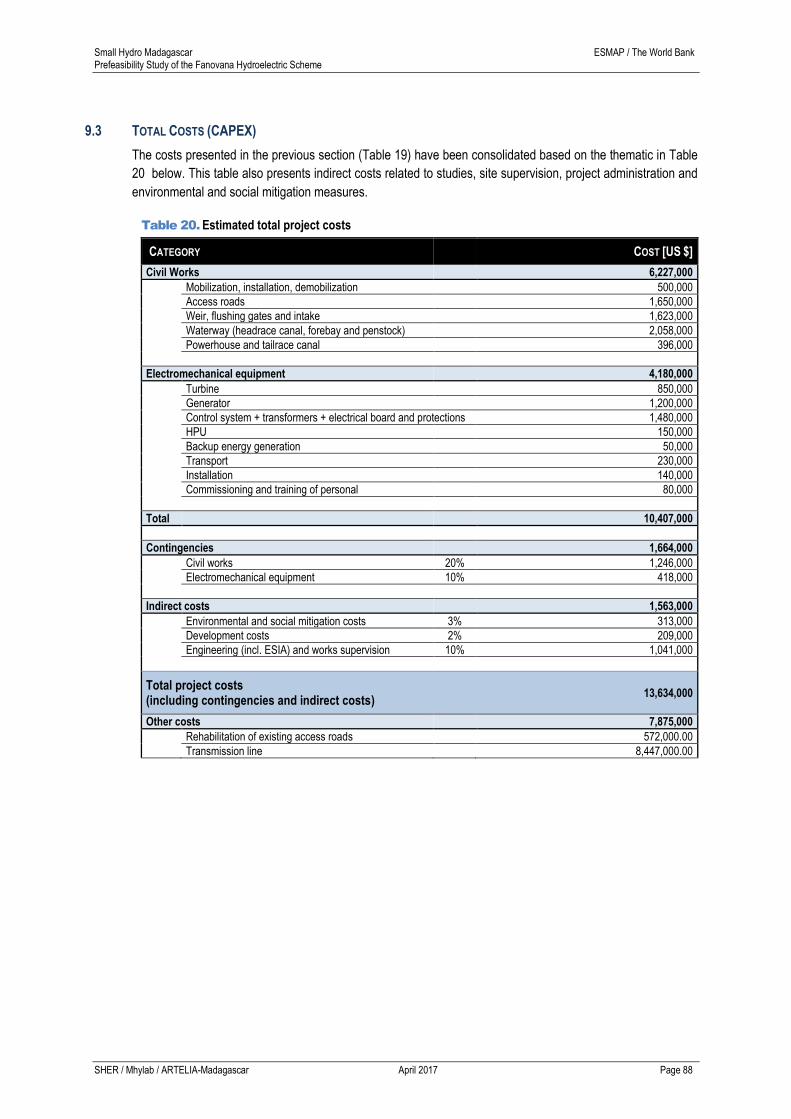
Small Hydro Madagascar ESMAP / The World Bank Prefeasibility Study of the Fanovana Hydroelectric Scheme
SHER / Mhylab / ARTELIA-Madagascar April 2017 Page 88
9.3 TOTAL COSTS (CAPEX)
The costs presented in the previous section (Table 19) have been consolidated based on the thematic in Table
20 below. This table also presents indirect costs related to studies, site supervision, project administration and
environmental and social mitigation measures.
Table 20. Estimated total project costs
CATEGORY
COST [US $]
Civil Works 6,227,000
Mobilization, installation, demobilization 500,000
Access roads 1,650,000
Weir, flushing gates and intake 1,623,000
Waterway (headrace canal, forebay and penstock) 2,058,000
Powerhouse and tailrace canal 396,000
Electromechanical equipment 4,180,000
Turbine 850,000
Generator 1,200,000
Control system + transformers + electrical board and protections 1,480,000
HPU 150,000
Backup energy generation 50,000
Transport 230,000
Installation 140,000
Commissioning and training of personal 80,000
Total 10,407,000
Contingencies 1,664,000
Civil works 20% 1,246,000
Electromechanical equipment 10% 418,000
Indirect costs 1,563,000
Environmental and social mitigation costs 3% 313,000
Development costs 2% 209,000
Engineering (incl. ESIA) and works supervision 10% 1,041,000
Total project costs (including contingencies and indirect costs)
13,634,000
Other costs 7,875,000
Rehabilitation of existing access roads 572,000.00
Transmission line 8,447,000.00

Small Hydro Madagascar ESMAP / The World Bank Prefeasibility Study of the Fanovana Hydroelectric Scheme
SHER / Mhylab / ARTELIA-Madagascar April 2017 Page 89
10 ECONOMIC ANALYSIS
10.1 METHODOLOGY
The economic analysis is based on the results of the field investigations and various studies presented in the
previous chapters, which includes an estimate of the quantities and the construction costs of the project
(Chapter 9) and the definition of the installed capacity and power output. Based on these results, the Consultant
estimated the cost of to deliver energy for the development of the Fanovana hydropower scheme.
The energy production alternatives (currently thermal units) will be compared based on their costs per kWh, the
latter being expressed in terms Levelized Cost Of Energy (LCOE) which is a stream of equal payments,
normalized over expected energy production periods that would allow a project owner to recover all costs, an
assumed return on investment, over a predetermined life span.
The LCOE is defined from investment costs (CAPEX – Capital Expenditure), operating costs (OPEX –
Operational Expenditure) and the expected production of energy.
Investment costs are:
Study and work supervision costs, hereafter called “Studies and engineering costs” which include:
o Civil works study and supervision costs
o Electromechanical works study and supervision costs
o Owner’s development costs
Civil works and equipment costs, hereafter called “HPP costs”
Resettlement and environmental impact costs, hereafter called “ESIA costs”
Annual operating costs are:
Operation and maintenance costs, hereafter called “O&M costs” which include:
o Fixed operation and maintenance costs (annual scheduled maintenance)
o Costs related to interim replacement and refurbishments of major items in the course of
the project’s life
o Insurance costs
The LCOE is then calculated based on expected production and costs from the following formula:
𝐿𝐶𝑂𝐸 =𝑁𝑃𝑉(𝐶𝐴𝑃𝐸𝑋 + 𝑂𝑃𝐸𝑋)
𝑁𝑃𝑉(𝐸𝑛𝑒𝑟𝑔𝑦 𝑝𝑟𝑜𝑑𝑢𝑐𝑡𝑖𝑜𝑛)
Where NPV is the Net Present Value which is obtained by: 𝑁𝑃𝑉(𝑣𝑎𝑙𝑢𝑒) = ∑𝑣𝑎𝑙𝑢𝑒𝑟𝑖
(1+𝑛)𝑖𝑖 where n is the
discount rate.
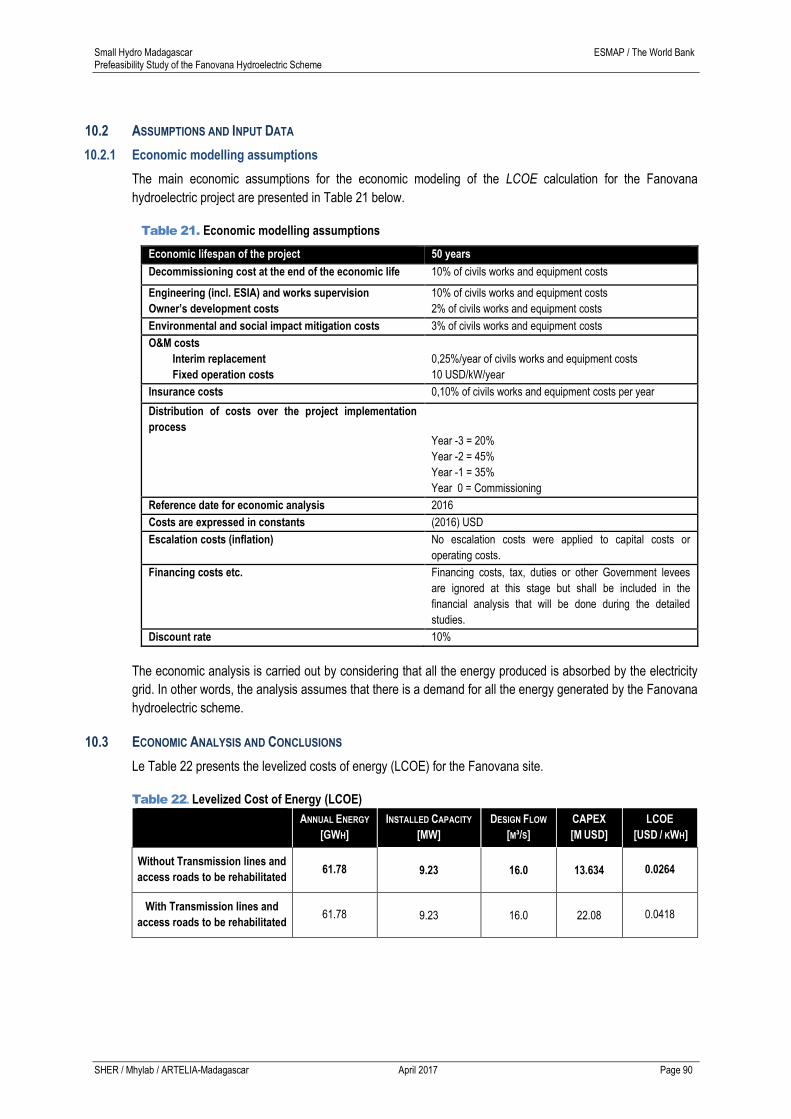
Small Hydro Madagascar ESMAP / The World Bank Prefeasibility Study of the Fanovana Hydroelectric Scheme
SHER / Mhylab / ARTELIA-Madagascar April 2017 Page 90
10.2 ASSUMPTIONS AND INPUT DATA
10.2.1 Economic modelling assumptions
The main economic assumptions for the economic modeling of the LCOE calculation for the Fanovana
hydroelectric project are presented in Table 21 below.
Table 21. Economic modelling assumptions
Economic lifespan of the project 50 years
Decommissioning cost at the end of the economic life 10% of civils works and equipment costs
Engineering (incl. ESIA) and works supervision
Owner’s development costs
10% of civils works and equipment costs
2% of civils works and equipment costs
Environmental and social impact mitigation costs 3% of civils works and equipment costs
O&M costs
Interim replacement
Fixed operation costs
0,25%/year of civils works and equipment costs
10 USD/kW/year
Insurance costs 0,10% of civils works and equipment costs per year
Distribution of costs over the project implementation
process
Year -3 = 20%
Year -2 = 45%
Year -1 = 35%
Year 0 = Commissioning
Reference date for economic analysis 2016
Costs are expressed in constants (2016) USD
Escalation costs (inflation) No escalation costs were applied to capital costs or
operating costs.
Financing costs etc. Financing costs, tax, duties or other Government levees
are ignored at this stage but shall be included in the
financial analysis that will be done during the detailed
studies.
Discount rate 10%
The economic analysis is carried out by considering that all the energy produced is absorbed by the electricity
grid. In other words, the analysis assumes that there is a demand for all the energy generated by the Fanovana
hydroelectric scheme.
10.3 ECONOMIC ANALYSIS AND CONCLUSIONS
Le Table 22 presents the levelized costs of energy (LCOE) for the Fanovana site.
Table 22. Levelized Cost of Energy (LCOE)
ANNUAL ENERGY
[GWH]
INSTALLED CAPACITY
[MW]
DESIGN FLOW
[M³/S]
CAPEX
[M USD]
LCOE
[USD / KWH]
Without Transmission lines and
access roads to be rehabilitated 61.78 9.23 16.0 13.634 0.0264
With Transmission lines and
access roads to be rehabilitated 61.78 9.23 16.0 22.08 0.0418

Small Hydro Madagascar ESMAP / The World Bank Prefeasibility Study of the Fanovana Hydroelectric Scheme
SHER / Mhylab / ARTELIA-Madagascar April 2017 Page 91
The economic analysis highlights that the Fanovana hydroelectric scheme is an economically attractive project
with a LCOE of 0.0264 $US/kWh (excluding the cost of transmission lines and the rehabilitation of the existing
access roads). This figure should be compared with the cost of energy production by the thermal power plants
currently in service since the development of the Fanovana hydroelectric project would replace the production
of thermal energy by hydroelectricity. The cost of generating thermal power plants depends largely on the fuel
costs.
Given a cost per kWh estimated between 0.180 to 0.250 $US/kWh for the HFO thermal and between 0.300 and
0.340 $US/kWh for the thermal GO (statistics from JIRAMA 2011), the Fanovana site has production costs
significantly lower than production costs by existing thermal units. These JIRAMA statistics are confirmed by
the diagnosis of the energy sector in Madagascar carried out by WWF in 2012, which mentions a cost of
production of thermal power plants between 0.3 US$/kWh for diesel-fired plants and 0.2 US$/kWh for fuel-fired
plants, according to the ORE calculation.
It is important to note that the conclusions of this economic analysis are conditioned to the validation of the flow
duration curve estimated in the hydrological study. This validation can only be done by pursuing the
hydrological monitoring of the Sahatandra River at the hydrometric station installed in October 2015 a few
kilometers upstream from the site of the project.
This hydrological monitoring should include not only the continuation of the recordings of water levels but also
the continuation of the gauging operations of the river for the establishment of a validated rating curve.
Small Hydro Madagascar ESMAP / The World Bank Prefeasibility Study of the Fanovana Hydroelectric Scheme
SHER / Mhylab / ARTELIA-Madagascar April 2017 Page 92
11 CONCLUSIONS AND RECOMMANDATIONS
The hydrological study revealed that the Sahatandra River is characterized by a good guaranteed low-flow
which should be confirmed by the continuation of the hydrological monitoring carried out during the hydrological
year 2015-2016 in the framework of the ESMAP Programme.
The preliminary investigation of the surface geology concludes that from a geological point of view the site is
favorable for the construction of the project as long as the appropriate mitigation measures are put in place.
The site has no major problems of stability and leakages. Further studies will however have to be undertaken in
further studies.
Preliminary socio-environmental studies show that the development of the Fanovana site has no major impacts
that can not be mitigated by adequate measures.
The economic analysis reveals that the costs of rehabilitating existing access roads and the construction of the
63 kV transmission line to Moramanga is high. The Fanovana hydroelectric development is an economically
attractive site with a total LCOE (including transmission line and rehabilitation of existing access roads) of
0.0418 US$/kWh. This LCOE decreases to 0.0264 US$/kWh if the costs of the transmission line costs and the
rehabilitation of the existing access are excluded. The Fanovana site features a production costs significantly
lower than production costs by thermal units (0.18 to 0.25 US$/kWh for HFO and 0.30 to 0.34 US$/kWh).
It is therefore recommended that the rehabilitation of the access road between the RN2 and the village of
Fanovana and the construction of the 63 kV transmission line to Moramanga should be implemented and
financed under the structural projects of the Government of Madagascar.
The Fanovana hydroelectric development project could be developed via a Public Private Partnership (PPP), in
particular in accordance with the law of 9 December 2015 organizing PPPs. The modalities of selection and
invitation to tender must be very clearly defined and a firm specialized in PPPs must be recruited to accompany
the tendering process.
It is important to note that the conclusions of this economic analysis are conditioned to the validation of the flow
duration curve estimated in the hydrological study. This validation can only be achieved by pursuing the
hydrological monitoring of the Sahatandra River at the hydrometric station installed in October 2015 a few
kilometers upstream from the proposed project site. This hydrological monitoring should include not only the
continuation of the water level monitoring but also the continuation of the gauging operations of the river for the
establishment of a validated rating curve.
Beyond the development of the Fanovana hydroelectric project, it is strongly recommended that the
Government of Madagascar set up a hydrological monitoring network for its rivers with high hydropower
potential in order to better understand the available water resources and thus promote the development of
hydroelectric projects across the country. It is only in a context of reduced uncertainties through reliable, recent
and long-term records (more than 20 years) that technical parameters and economic and financial analyzes of
hydroelectric developments can be defined accurately, enabling optimization of their design and their flood
control infrastructure (temporary and permanent).
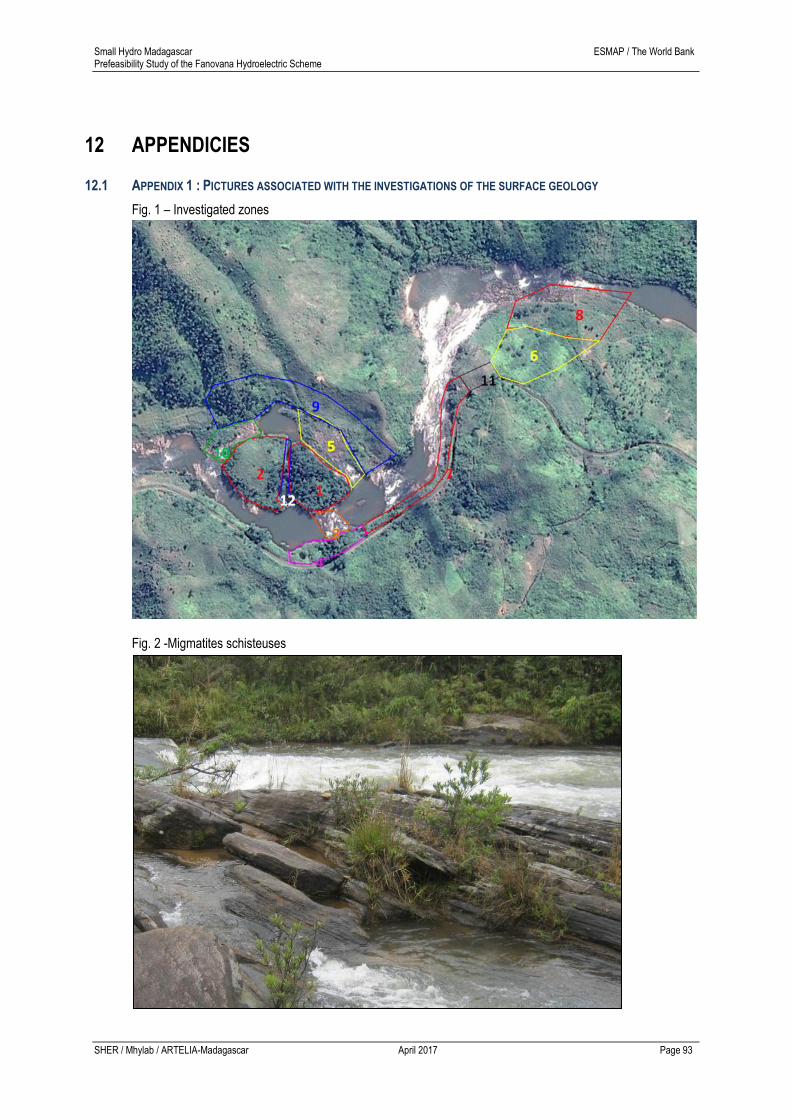
Small Hydro Madagascar ESMAP / The World Bank Prefeasibility Study of the Fanovana Hydroelectric Scheme
SHER / Mhylab / ARTELIA-Madagascar April 2017 Page 93
12 APPENDICIES
12.1 APPENDIX 1 : PICTURES ASSOCIATED WITH THE INVESTIGATIONS OF THE SURFACE GEOLOGY
Fig. 1 – Investigated zones
Fig. 2 -Migmatites schisteuses
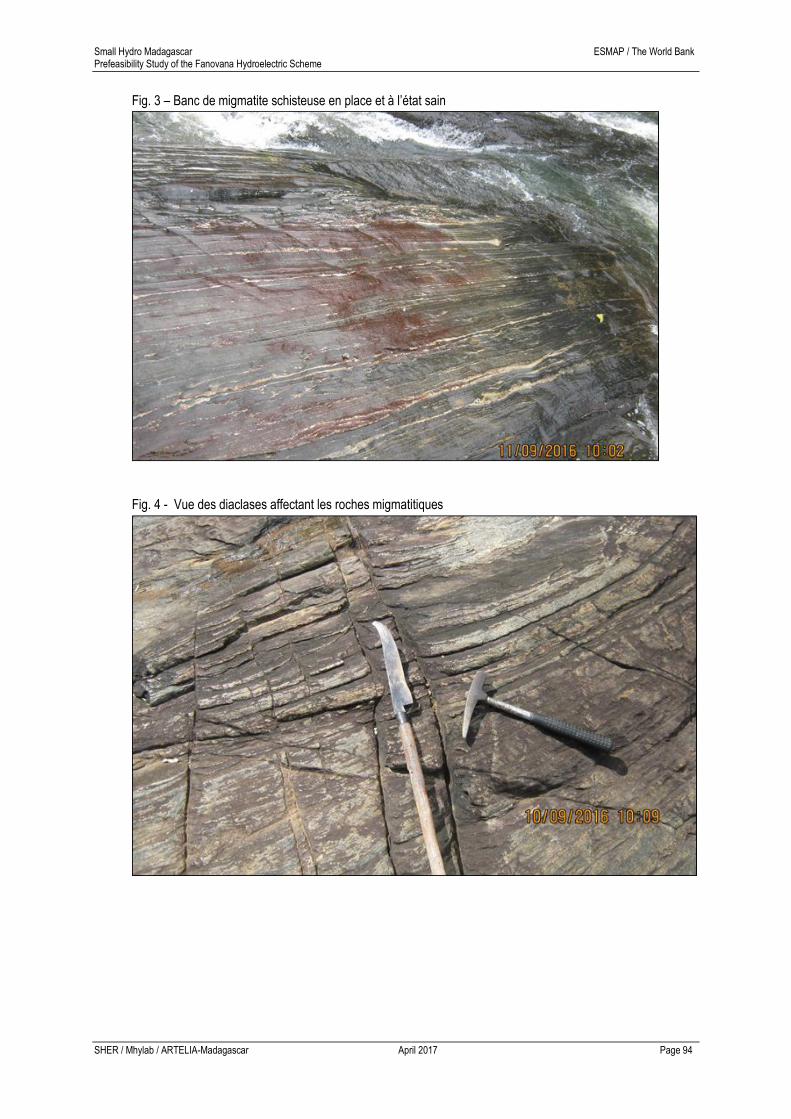
Small Hydro Madagascar ESMAP / The World Bank Prefeasibility Study of the Fanovana Hydroelectric Scheme
SHER / Mhylab / ARTELIA-Madagascar April 2017 Page 94
Fig. 3 – Banc de migmatite schisteuse en place et à l’état sain
Fig. 4 - Vue des diaclases affectant les roches migmatitiques
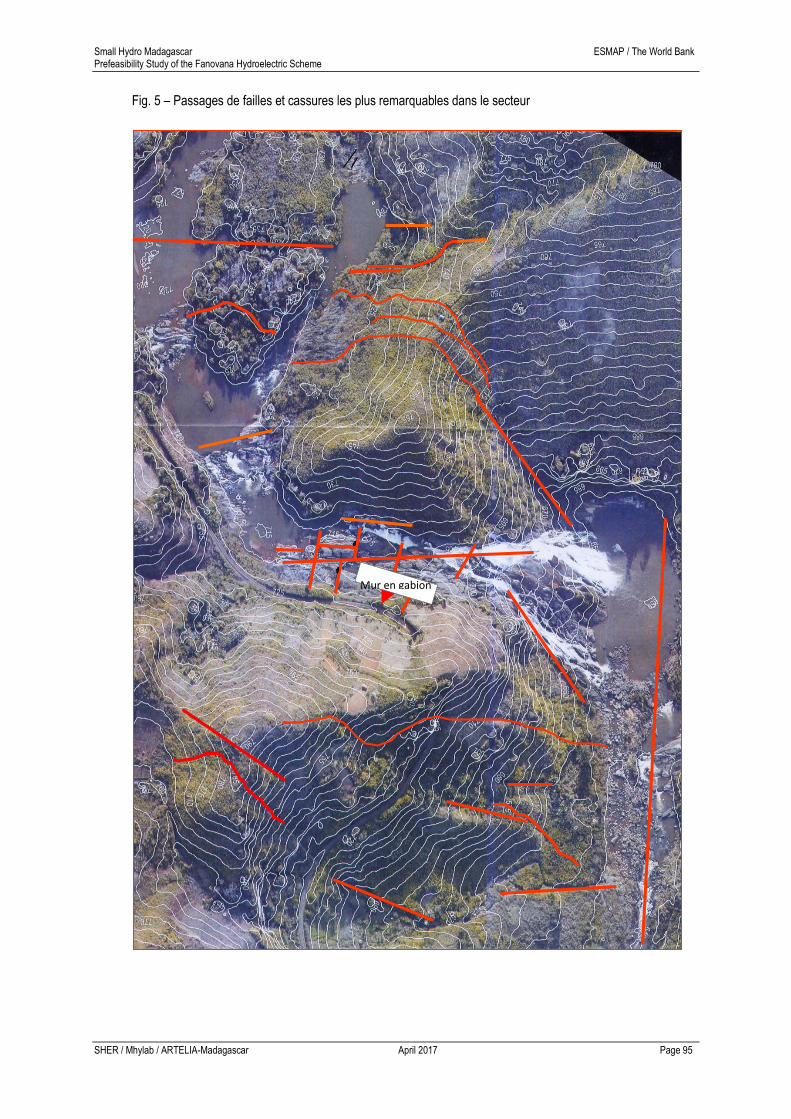
Small Hydro Madagascar ESMAP / The World Bank Prefeasibility Study of the Fanovana Hydroelectric Scheme
SHER / Mhylab / ARTELIA-Madagascar April 2017 Page 95
Fig. 5 – Passages de failles et cassures les plus remarquables dans le secteur
Mur en gabion
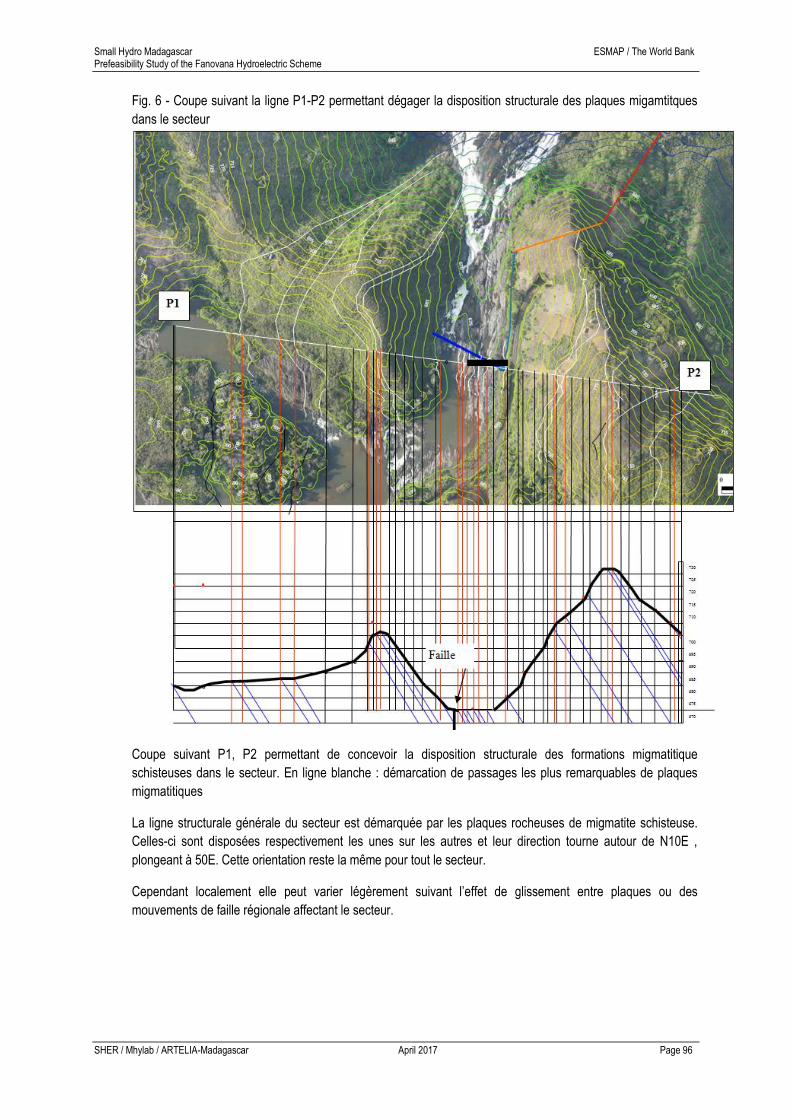
Small Hydro Madagascar ESMAP / The World Bank Prefeasibility Study of the Fanovana Hydroelectric Scheme
SHER / Mhylab / ARTELIA-Madagascar April 2017 Page 96
Fig. 6 - Coupe suivant la ligne P1-P2 permettant dégager la disposition structurale des plaques migamtitques
dans le secteur
Coupe suivant P1, P2 permettant de concevoir la disposition structurale des formations migmatitique
schisteuses dans le secteur. En ligne blanche : démarcation de passages les plus remarquables de plaques
migmatitiques
La ligne structurale générale du secteur est démarquée par les plaques rocheuses de migmatite schisteuse.
Celles-ci sont disposées respectivement les unes sur les autres et leur direction tourne autour de N10E ,
plongeant à 50E. Cette orientation reste la même pour tout le secteur.
Cependant localement elle peut varier légèrement suivant l’effet de glissement entre plaques ou des
mouvements de faille régionale affectant le secteur.

Small Hydro Madagascar ESMAP / The World Bank Prefeasibility Study of the Fanovana Hydroelectric Scheme
SHER / Mhylab / ARTELIA-Madagascar April 2017 Page 97
Fig. 6bis – Morphologie issue de la disposition structurale des migmatites
Fig. 7 – Vue sur les rochers de l’assise de l’Axe A
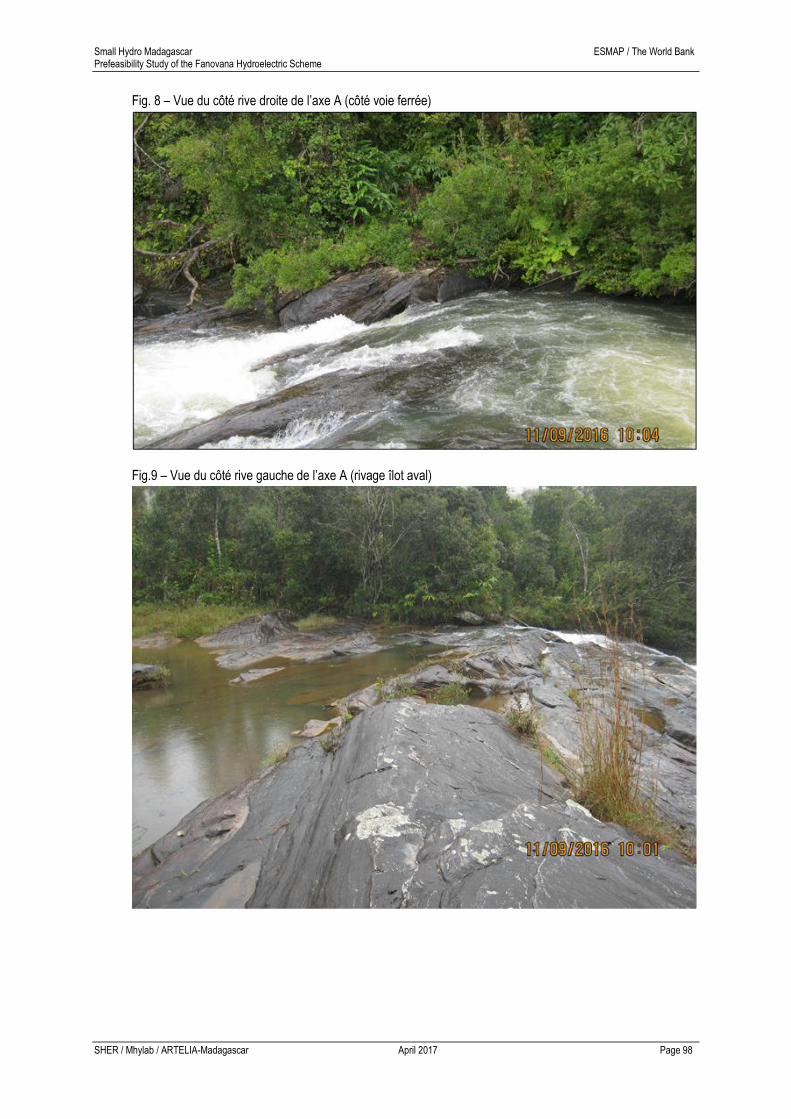
Small Hydro Madagascar ESMAP / The World Bank Prefeasibility Study of the Fanovana Hydroelectric Scheme
SHER / Mhylab / ARTELIA-Madagascar April 2017 Page 98
Fig. 8 – Vue du côté rive droite de l’axe A (côté voie ferrée)
Fig.9 – Vue du côté rive gauche de l’axe A (rivage îlot aval)
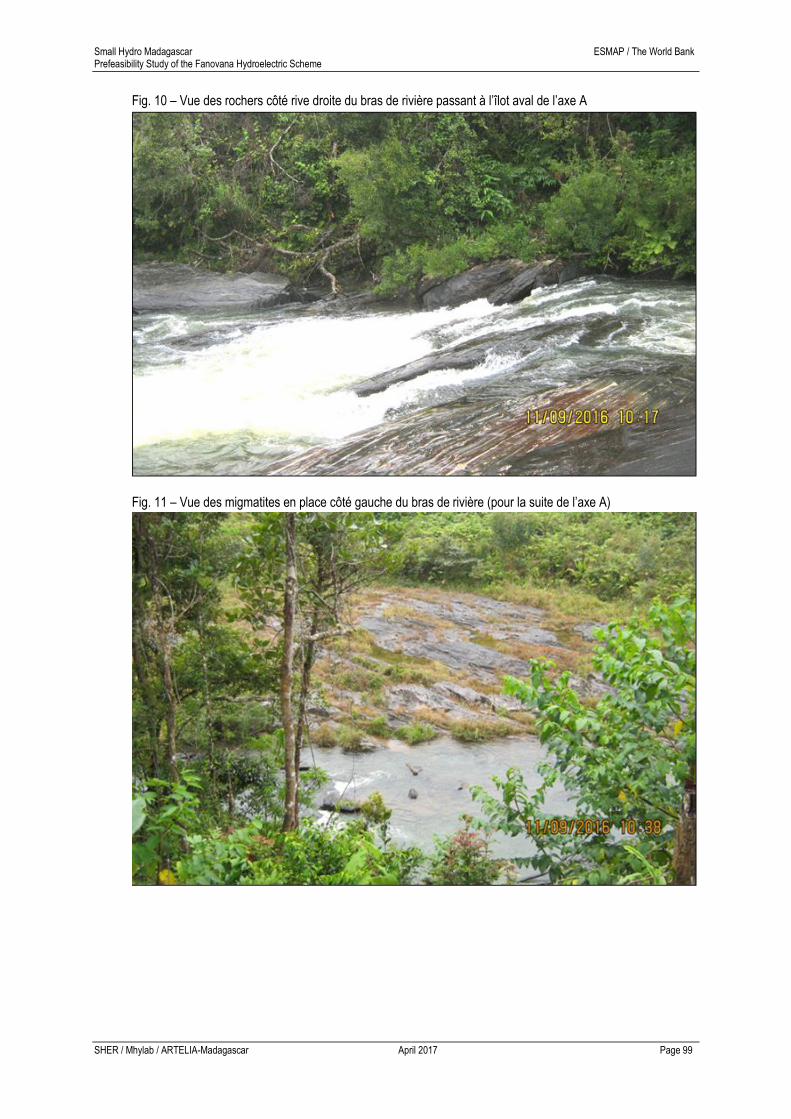
Small Hydro Madagascar ESMAP / The World Bank Prefeasibility Study of the Fanovana Hydroelectric Scheme
SHER / Mhylab / ARTELIA-Madagascar April 2017 Page 99
Fig. 10 – Vue des rochers côté rive droite du bras de rivière passant à l’îlot aval de l’axe A
Fig. 11 – Vue des migmatites en place côté gauche du bras de rivière (pour la suite de l’axe A)
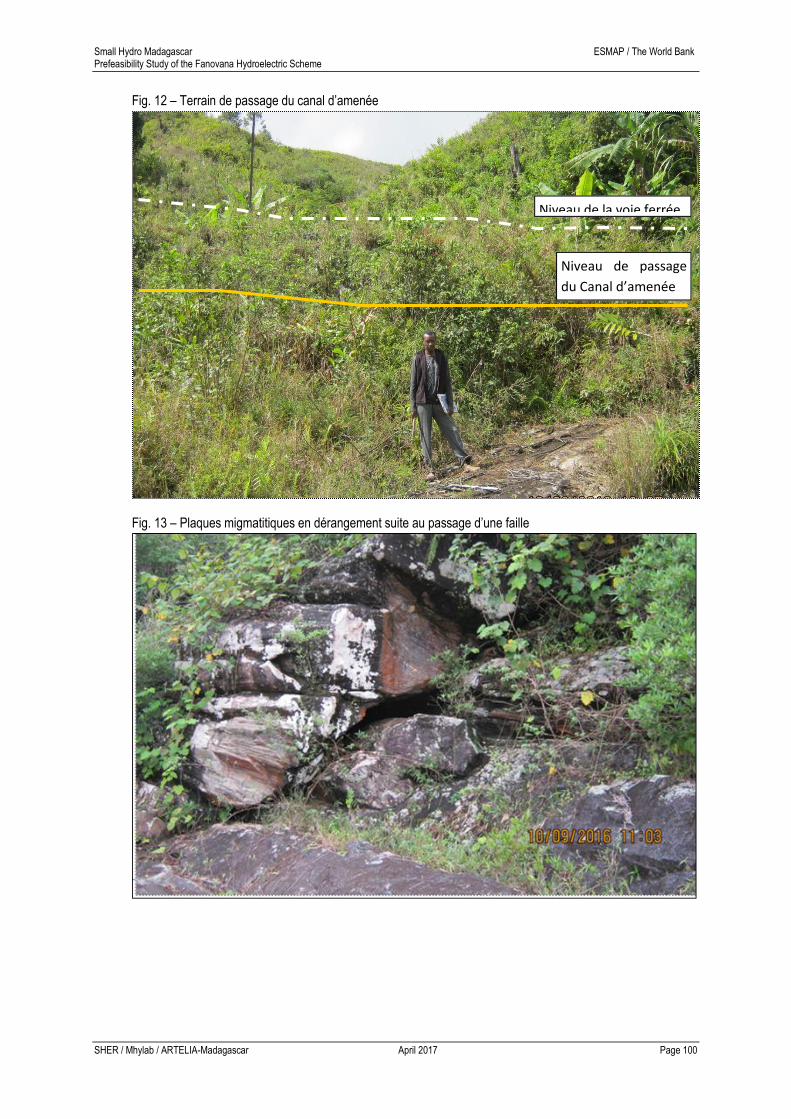
Small Hydro Madagascar ESMAP / The World Bank Prefeasibility Study of the Fanovana Hydroelectric Scheme
SHER / Mhylab / ARTELIA-Madagascar April 2017 Page 100
Fig. 12 – Terrain de passage du canal d’amenée
Fig. 13 – Plaques migmatitiques en dérangement suite au passage d’une faille
Niveau de passage
du Canal d’amenée
Niveau de la voie ferrée
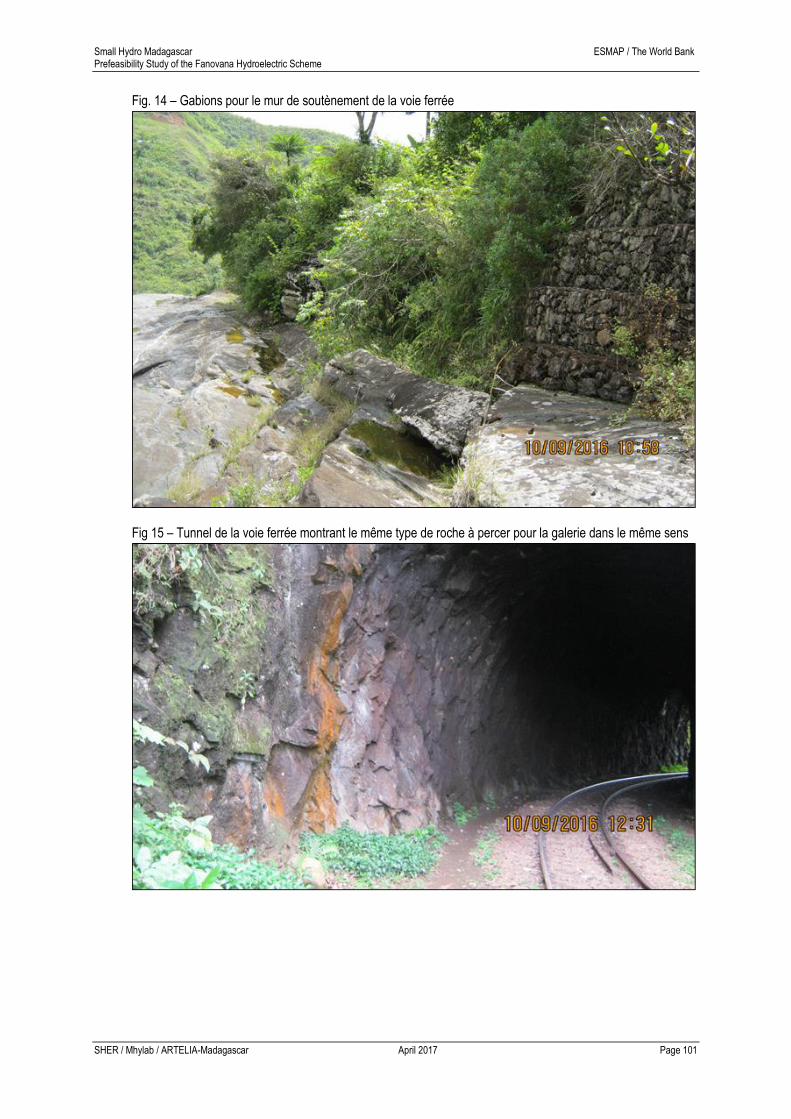
Small Hydro Madagascar ESMAP / The World Bank Prefeasibility Study of the Fanovana Hydroelectric Scheme
SHER / Mhylab / ARTELIA-Madagascar April 2017 Page 101
Fig. 14 – Gabions pour le mur de soutènement de la voie ferrée
Fig 15 – Tunnel de la voie ferrée montrant le même type de roche à percer pour la galerie dans le même sens
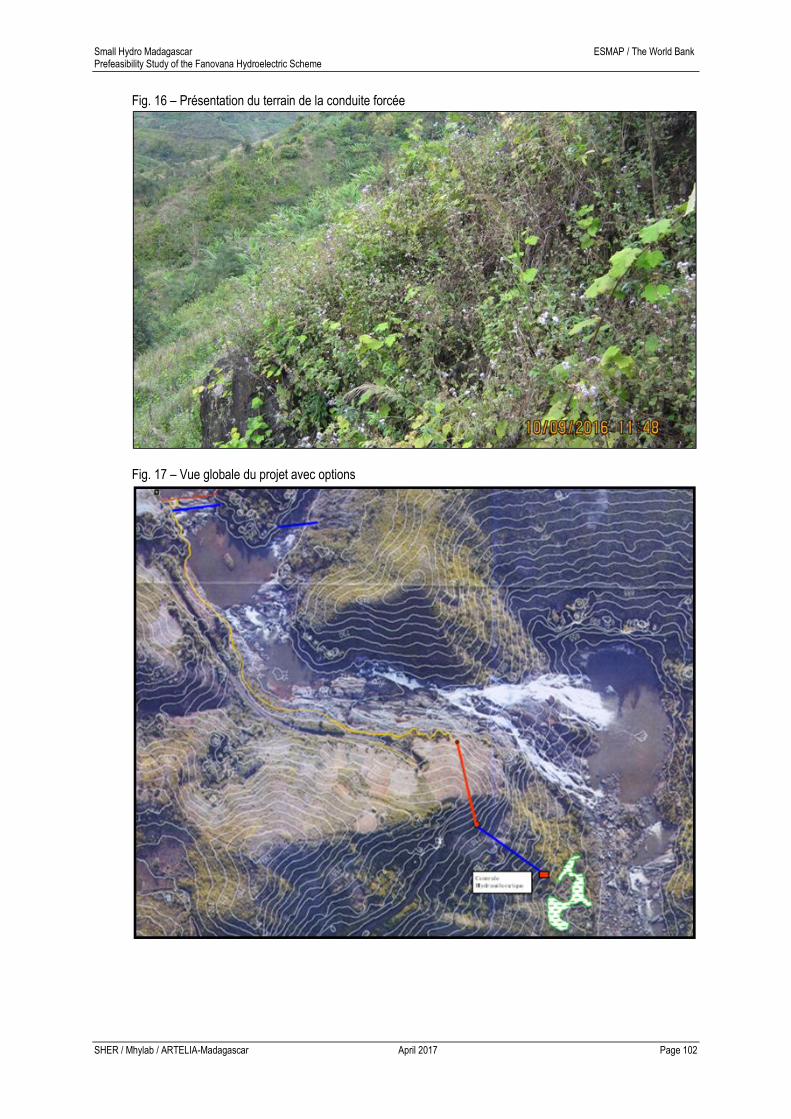
Small Hydro Madagascar ESMAP / The World Bank Prefeasibility Study of the Fanovana Hydroelectric Scheme
SHER / Mhylab / ARTELIA-Madagascar April 2017 Page 102
Fig. 16 – Présentation du terrain de la conduite forcée
Fig. 17 – Vue globale du projet avec options
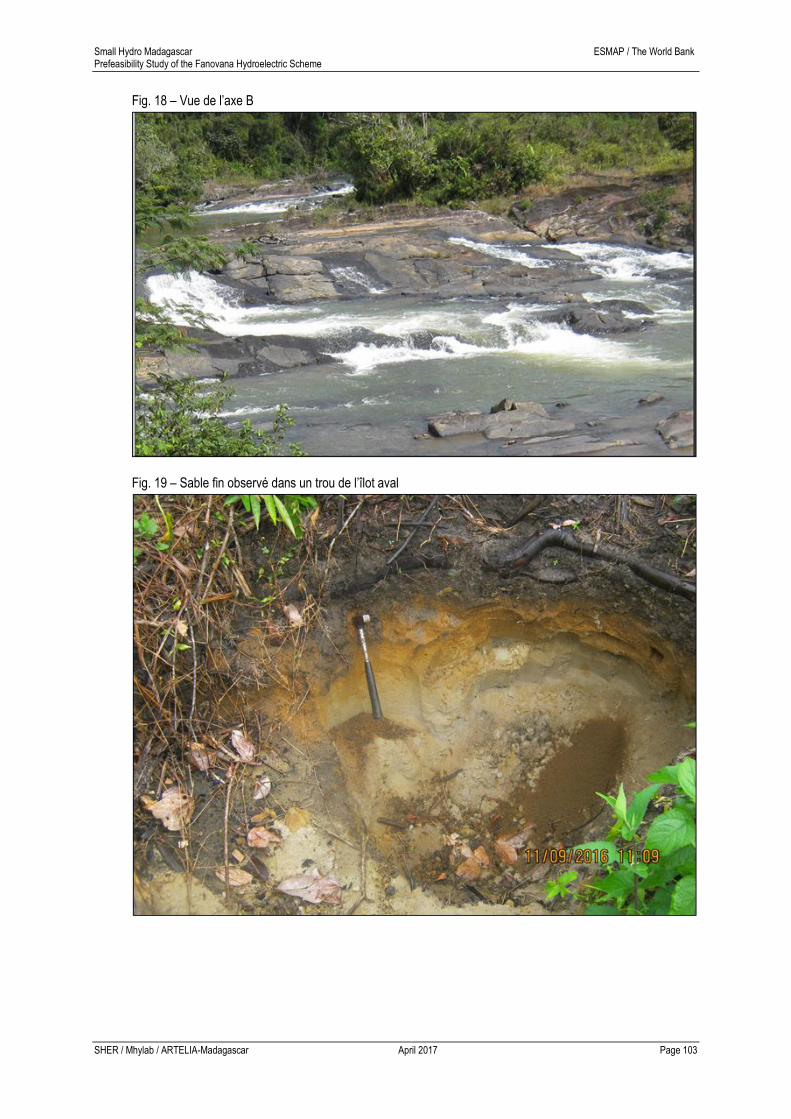
Small Hydro Madagascar ESMAP / The World Bank Prefeasibility Study of the Fanovana Hydroelectric Scheme
SHER / Mhylab / ARTELIA-Madagascar April 2017 Page 103
Fig. 18 – Vue de l’axe B
Fig. 19 – Sable fin observé dans un trou de l’îlot aval

Small Hydro Madagascar ESMAP / The World Bank Prefeasibility Study of the Fanovana Hydroelectric Scheme
SHER / Mhylab / ARTELIA-Madagascar April 2017 Page 104
12.2 APPENDIX 2 : PROPOSED LAYOUT
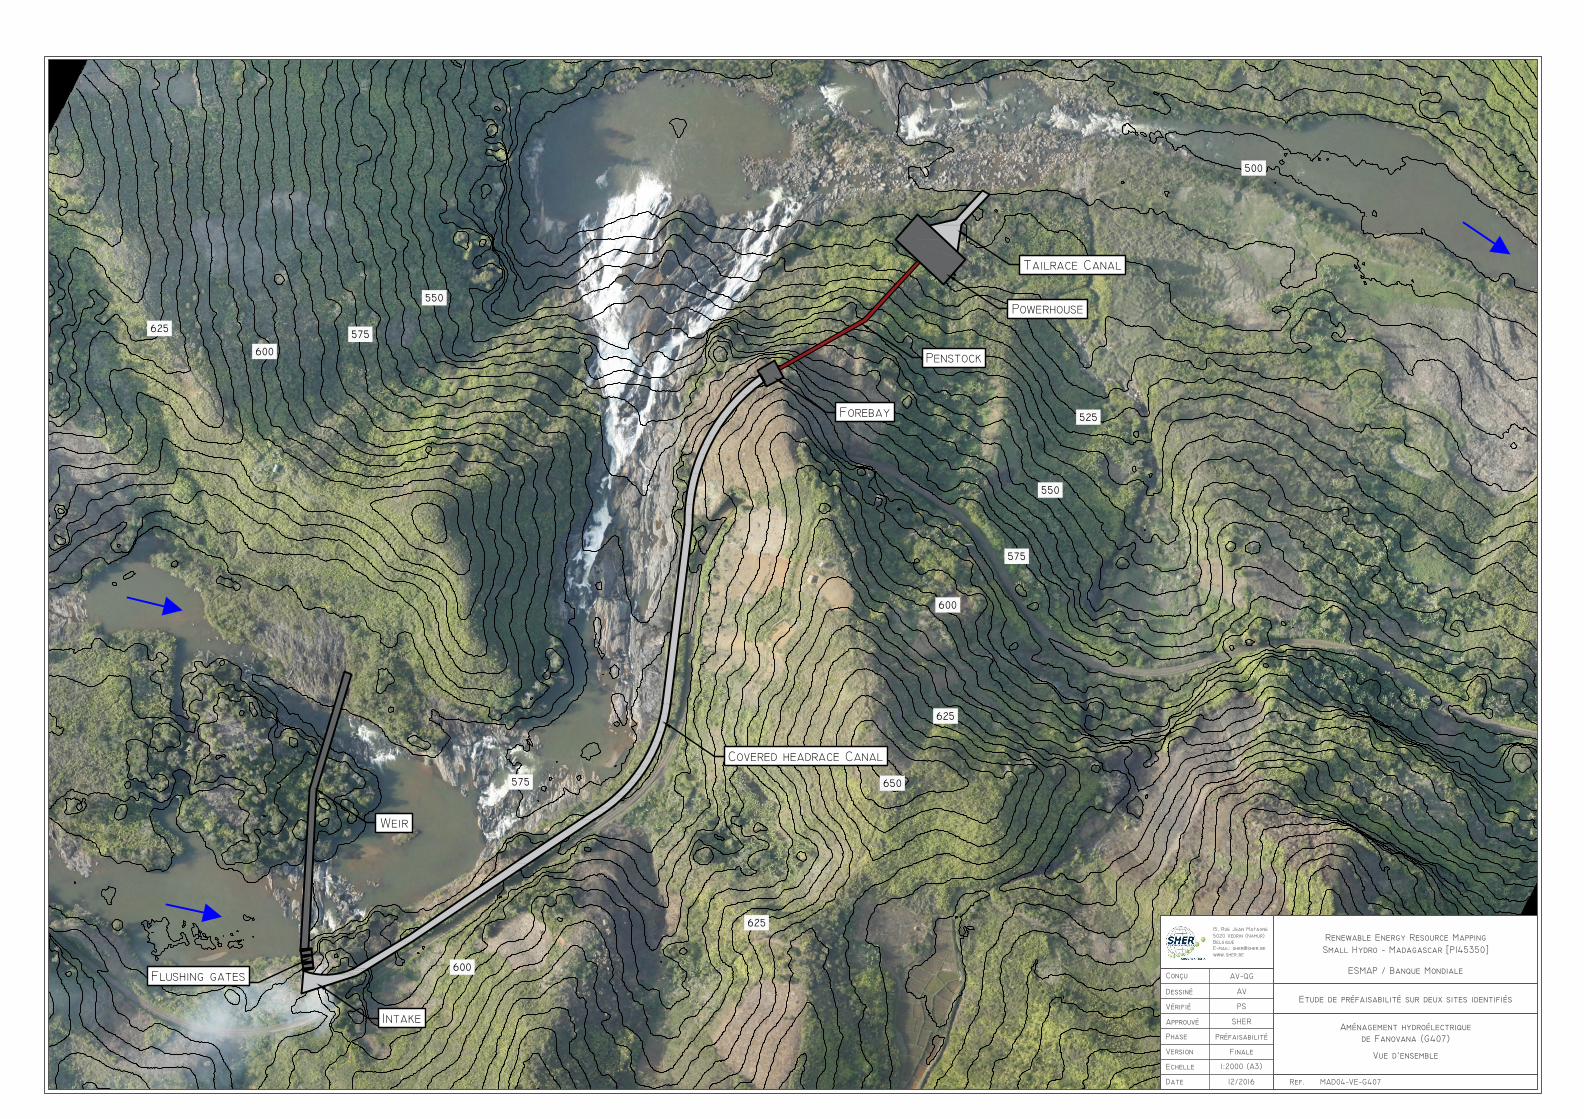
Tailrace Canal
Powerhouse
Penstock
Forebay
Covered headrace Canal
Intake
Flushing gates
Weir
600
625
650575
600
575
550
625
600
575
550
525
500
625
MAD04-VE-G407
15, Rue Jean Matagne5020 Vedrin (Namur)BelgiqueE-mail: [email protected]
Date
Approuvé
Version
Dessiné
Echelle
Ref.
Vue d'ensemble1:2000 (A3)
Finale
AV
12/2016
Renewable Energy Resource MappingSmall Hydro - Madagascar [P145350]
ESMAP / Banque Mondiale
Etude de préfaisabilité sur deux sites identifiés
Aménagement hydroélectriquede Fanovana (G407)
SHER
Conçu AV-QG
Vérifié PS
Phase Préfaisabilité

Small Hydro Madagascar ESMAP / The World Bank Prefeasibility Study of the Fanovana Hydroelectric Scheme
SHER / Mhylab / ARTELIA-Madagascar April 2017 Page 105
12.3 APPENDIX 3 : HYDROLOGICAL DATA - ROGEZ STATION ON THE VOHITRA RIVER
Janvier Février Mars Avril Mai Juin Juillet Août Septembre Octobre Novembre Décembre
1952 95.0 98.0 69.4 81.5 54.2 44.4 59.8 54.5
1953 49.8 51.3 78.1 58.6 40.2 51.7 45.4 65.1 59.4 44.0 40.0 57.6
1954 228.0 80.6 70.6 57.6 49.6 71.2 52.9 48.0 38.4 30.7 30.7 54.5
1955 66.8 68.6 110.0 63.9 50.1 56.0 60.4 47.2 39.0 30.2 28.0 54.4
1956 221.0 385.0 154.0 109.0 80.6 71.1 53.1 44.1 34.9 26.3 38.8 57.4
1957 40.9 89.9 77.5 87.3 59.9 49.1 44.7 40.2 41.0 25.9 22.7 55.0
1958 56.0 76.2 141.0 49.7 41.6 56.3 57.7 57.4 36.4 37.5 46.6 65.7
1959 137.0 77.9 654.0 210.0 95.4 72.8 88.3 70.6 50.6 47.0 73.7 48.5
1960 114.0 81.9 74.0 51.3 38.4 54.2 48.8 41.3 36.2 27.7 25.7 52.7
1961 47.7 32.3 34.8 32.8 25.5 22.9 52.3 80.3 48.7 28.1 45.1 105.0
1962 62.9 154.0 57.5 40.9 35.9 37.6 56.7 47.5 40.7 39.5 27.3 35.9
1963 117.0 100.0 166.0 85.7 34.1 32.3 41.6 38.6 38.8 25.1 44.0 74.9
1964 42.4 237.0 68.9 53.7 57.2 67.2 73.6 71.0 62.0 61.2 75.1
1965 139.0 137.0 145.0 86.2 55.1 43.4 52.7 77.5 53.3 41.3 53.9 95.8
1966 78.9 97.1 72.0 53.6 47.3 47.0 56.6 56.5 44.8 33.3 28.7 50.5
1967 88.9 81.8 86.9 64.0 52.2 56.9 63.6 81.6 74.9 46.8 77.0 93.8
1968 181.0 130.0 101.0 64.1 50.5 40.3 56.3 44.0 33.1 27.1 35.1 81.2
1969 80.2 87.4 54.4 59.9 39.7 40.2 49.0 85.4 56.5 38.1 34.7 77.2
1970 103.0 100.0 81.0 110.0 77.0 68.0 67.0 87.0 57.0 40.0 39.9 41.6
1971 175.0 160.0 89.3 65.3 58.4 46.3 65.0 55.9 48.4 36.2 48.3 62.1
1972 69.6 222.0 203.0 95.1 65.0 49.2 60.8 39.0 31.8 42.8 41.4 78.9
1973 249.0 262.0 229.0 121.0 75.8 73.9 62.9 70.5 49.7 38.0 28.1 33.6
1974 110.3 110.1 97.8 100.0 75.0 65.4 82.4 66.2 50.8 41.4 46.3 64.6
1975 63.1 83.7 197.4 98.4 68.0 64.2 49.3 59.0 44.1 35.2 48.1 98.4
1976 162.1 116.6 95.8 83.4 60.4 55.5 55.6 51.7 44.1 38.4 44.6 72.1
1977 91.6 312.4 121.0 83.4 54.8 50.1 47.7 51.4 45.5 35.4 35.5 40.6
1978 39.2 38.4 73.3 52.1 36.4 44.6 46.0 35.2 32.0 29.4 38.1 31.1
1979 33.9 72.2 43.3 35.0 28.0 24.6 36.3 35.7 25.0 22.7 24.3 47.2
1980 134.4 122.2 108.8 62.3 54.2 40.4 54.7 56.7 48.0 44.2 41.0 51.9
1981 39.6 48.4 79.2 71.5 39.4 33.7 26.8 28.6 25.8 25.7 22.6 460.6
1982 91.2 100.0 144.0 88.9 100.0 105.0 77.0 89.0 61.0 49.8 67.0 61.0
1983 18.7 58.0 79.0 66.0 44.8 57.0 51.0 72.0 67.0 64.0 44.7 64.0
1984 124.1 126.4 129.5 179.2 107.5 92.2 91.5 80.4 73.0 77.8 75.6 57.2
1985 73.9 283.5 201.2 153.9 94.5 81.2 91.3 98.3 93.0 75.8 68.2 138.9
1986 103.1 145.6 383.5 132.0 129.1 90.6 97.1 81.1 55.8 65.0 68.9 102.0
1987 179.9 177.8 131.4 104.4 85.8 73.2 53.4 53.1 42.4 37.4 38.8 32.9
1988 85.0 35.3 68.7 43.0 31.0 29.7 33.2 23.3 21.6 20.4 22.8 32.4
1989 44.5 80.5 73.5 40.2 46.3 31.9 35.4 46.1 38.8 28.7 29.7 73.8
1990 61.1 59.5 37.8 32.7 32.2 32.1 27.3 29.6 22.2 18.0 20.0 29.2
1991 34.0 59.0 50.8 75.0 41.6 33.8 33.2 28.7 25.3 24.3 22.3 27.0
1992 51.3 53.8 43.1 37.9 37.4 33.9 35.4 34.4 28.6 23.0 22.5 21.6
1993 26.9 34.5 56.8 40.1 31.1 29.5 42.3 36.2 30.7 27.0 26.8 22.0
1994 62.5 88.4 229.0 70.4 50.0 41.7 41.5 48.7 30.7 28.9 24.5 30.9
1995 62.1 182.5 48.1 42.2 42.9 36.6 35.0 43.7 29.5 23.5 19.0 34.0
1996 109.9 166.4 90.7 43.6 53.4 34.0 34.5 33.1 24.1 21.6
1997 38.0 79.4 49.9 42.1 32.5 28.0 38.6 28.1 28.9 22.9 32.7 29.5
1998 42.3 86.8 55.7 37.8 32.1 27.5 35.4 33.5 41.2 22.5 23.1 30.1
1999 30.0 25.5 34.0 27.1 30.1 25.6 30.8 31.6 27.1 23.9 21.3 21.4
2000 20.4 46.0 179.9 35.3 29.3 30.2 44.0 31.4 29.0 28.8 33.4 30.9

