
Electrochemical chlorine evolution at rutile oxide (110) surfaces
8
Electrochemical chlorine evolution at rutile oxide (110) surfacesw Heine A. Hansen, a Isabela C. Man, b Felix Studt, ab Frank Abild-Pedersen, ab Thomas Bligaard ac and Jan Rossmeisl* a Received 24th August 2009, Accepted 7th October 2009 First published as an Advance Article on the web 11th November 2009 DOI: 10.1039/b917459a Based on density functional theory (DFT) calculations we study the electrochemical chlorine evolution reaction on rutile (110) oxide surfaces. First we construct the Pourbaix surface diagram for IrO 2 and RuO 2 , and from this we find the chlorine evolution reaction intermediates and identify the lowest overpotential at which all elementary reaction steps in the chlorine evolution reaction are downhill in free energy. This condition is then used as a measure for catalytic activity. Linear scaling relations between the binding energies of the intermediates and the oxygen binding energies at cus-sites are established for MO 2 (M being Ir, Ru, Pt, Ti). The linear relations form the basis for constructing a generalized surface phase diagram where two parameters, the potential and the binding energy of oxygen, are needed to determine the surface composition. We calculate the catalytic activity as function of the oxygen binding energy, giving rise to a Sabatier volcano. By combining the surface phase diagram and the volcano describing the catalytic activity, we find that the reaction mechanism differs depending on catalyst material. The flexibility in reaction path means that the chlorine evolution activity is high for a wide range of oxygen binding energies. We find that the required overpotential for chlorine evolution is lower than the overpotential necessary for oxygen evolution. Introduction Chlorine is an essential product for the global chemical industry – approximately 50% of the total turnover of the chemical industry depends on chlorine and caustic soda. 1 Chlorine production by chlor-alkali processes is one of the largest current technological applications of electrochemistry. 2 The most active anode catalysts are usually based on RuO 2 , however, RuO 2 is barely stable at the high potentials. Therefore RuO 2 is mixed with IrO 2 and additives such as TiO 2 and SnO 2 , in order to improve the stability. The most commonly used electrocatalyst in industrial chlorine processes is the so-called Dimensionally Stable Anodes (DSA s ) which is named according to its improved lifetime compared with earlier used electrocatalysts. 3 The equilibrium potential for Cl 2 evolution is 1.36 V at room temperature and standard conditions, which is slightly larger than the equilibrium potential for oxygen evolution, which is 1.23 V under the same conditions. This means that under chlorine evolution the simultaneous evolution of oxygen tends to occur as a parasitic side reaction, especially at high current densities. However, depending on the employed catalyst, oxygen evolution usually requires a somewhat larger overpotential than chlorine evolution. Unfortunately, RuO 2 is known to be a good catalyst for oxygen evolution as well as for chlorine evolution. This suggests an overlap of the activity volcanoes for the two reactions, and it has in fact been suggested that high catalytic activity for chlorine evolution is fundamentally linked with high oxygen evolution activity. 2 Anodic chlorine evolution at oxide electrodes, and especially chlorine evolution on RuO 2 , has been widely studied experimentally. A variety of different reaction mechanisms have been suggested based on indirect experimental quantities such as Tafel slopes and reaction orders. 4 Among the possible reactions are the Volmer–Tafel reaction 5 2* + 2Cl - 2Cl* + 2e - 2* + Cl 2 + 2e , (1) the Volmer–Heyvrosky reaction 6 * +2Cl - Cl* + e + Cl - * +Cl 2 + 2e , (2) and the Khrishtalik reaction 7,8 * +2Cl - Cl* + e + Cl - (Cl*) + + 2e + Cl - * + Cl 2 + 2e . (3) Here, * is an active site, which may be a surface oxygen or a metal atom. 8 Very little is known about the reaction mechanism for chlorine evolution and about the atomic-scale structure of the surface, which depends strongly on catalyst material, electrostatic potential, and electrolyte. Recent developments within density functional theory analysis of electrochemical reactions have opened up the possibilities to study these reactions at the atomic scale. 9 In particular, investigations of fuel cell catalysis such as oxygen reduction 10–13 and methanol a Department of Physics, Building 307, Center for Atomic-scale Materials Design, Technical University of Denmark, DK-2800 Kgs. Lyngby, Denmark b Computational.Materials Design ApS, Fysikvej-Building 307-DTU, DK-2800 Kgs. Lyngby, Denmark c Materials Sciences Division, Lawrence Berkeley National Laboratory, Berkeley, CA94720, USA w Electronic supplementary information (ESI) available: Details regarding construction of the phase diagrams; Tables S1–S5, and linear relations. See DOI: 10.1039/b917459a This journal is c the Owner Societies 2010 Phys. Chem. Chem. Phys., 2010, 12, 283–290 | 283 PAPER www.rsc.org/pccp | Physical Chemistry Chemical Physics
-
Upload
independent -
Category
Documents
-
view
1 -
download
0
Transcript of Electrochemical chlorine evolution at rutile oxide (110) surfaces

Electrochemical chlorine evolution at rutile oxide (110) surfacesw
Heine A. Hansen,aIsabela C. Man,
bFelix Studt,
abFrank Abild-Pedersen,
ab
Thomas Bligaardac
and Jan Rossmeisl*a
Received 24th August 2009, Accepted 7th October 2009
First published as an Advance Article on the web 11th November 2009
DOI: 10.1039/b917459a
Based on density functional theory (DFT) calculations we study the electrochemical chlorine
evolution reaction on rutile (110) oxide surfaces. First we construct the Pourbaix surface diagram
for IrO2 and RuO2, and from this we find the chlorine evolution reaction intermediates and
identify the lowest overpotential at which all elementary reaction steps in the chlorine evolution
reaction are downhill in free energy. This condition is then used as a measure for catalytic
activity. Linear scaling relations between the binding energies of the intermediates and the oxygen
binding energies at cus-sites are established for MO2 (M being Ir, Ru, Pt, Ti). The linear relations
form the basis for constructing a generalized surface phase diagram where two parameters, the
potential and the binding energy of oxygen, are needed to determine the surface composition.
We calculate the catalytic activity as function of the oxygen binding energy, giving rise to a
Sabatier volcano. By combining the surface phase diagram and the volcano describing the
catalytic activity, we find that the reaction mechanism differs depending on catalyst material.
The flexibility in reaction path means that the chlorine evolution activity is high for a wide range
of oxygen binding energies. We find that the required overpotential for chlorine evolution is
lower than the overpotential necessary for oxygen evolution.
Introduction
Chlorine is an essential product for the global chemical
industry – approximately 50% of the total turnover of the
chemical industry depends on chlorine and caustic soda.1
Chlorine production by chlor-alkali processes is one of the
largest current technological applications of electrochemistry.2
The most active anode catalysts are usually based on RuO2,
however, RuO2 is barely stable at the high potentials.
Therefore RuO2 is mixed with IrO2 and additives such as
TiO2 and SnO2, in order to improve the stability. The most
commonly used electrocatalyst in industrial chlorine processes
is the so-called Dimensionally Stable Anodes (DSAs
) which is
named according to its improved lifetime compared with
earlier used electrocatalysts.3
The equilibrium potential for Cl2 evolution is 1.36 V at
room temperature and standard conditions, which is slightly
larger than the equilibrium potential for oxygen evolution,
which is 1.23 V under the same conditions. This means that
under chlorine evolution the simultaneous evolution of oxygen
tends to occur as a parasitic side reaction, especially at high
current densities. However, depending on the employed
catalyst, oxygen evolution usually requires a somewhat larger
overpotential than chlorine evolution. Unfortunately, RuO2 is
known to be a good catalyst for oxygen evolution as well as for
chlorine evolution. This suggests an overlap of the activity
volcanoes for the two reactions, and it has in fact been
suggested that high catalytic activity for chlorine evolution is
fundamentally linked with high oxygen evolution activity.2
Anodic chlorine evolution at oxide electrodes, and especially
chlorine evolution on RuO2, has been widely studied
experimentally. A variety of different reaction mechanisms
have been suggested based on indirect experimental quantities
such as Tafel slopes and reaction orders.4 Among the possible
reactions are the Volmer–Tafel reaction5
2* + 2Cl� - 2Cl* + 2e� - 2* + Cl2 + 2e�, (1)
the Volmer–Heyvrosky reaction6
* +2Cl� - Cl* + e� + Cl� - * +Cl2 + 2e�, (2)
and the Khrishtalik reaction7,8
* +2Cl�- Cl* + e� + Cl�- (Cl*)+ + 2e� + Cl�
- * + Cl2 + 2e�. (3)
Here, * is an active site, which may be a surface oxygen or a
metal atom.8
Very little is known about the reaction mechanism for
chlorine evolution and about the atomic-scale structure of
the surface, which depends strongly on catalyst material,
electrostatic potential, and electrolyte. Recent developments
within density functional theory analysis of electrochemical
reactions have opened up the possibilities to study these
reactions at the atomic scale.9 In particular, investigations of
fuel cell catalysis such as oxygen reduction10–13 and methanol
aDepartment of Physics, Building 307, Center for Atomic-scaleMaterials Design, Technical University of Denmark,DK-2800 Kgs. Lyngby, Denmark
bComputational.Materials Design ApS, Fysikvej-Building 307-DTU,DK-2800 Kgs. Lyngby, Denmark
cMaterials Sciences Division, Lawrence Berkeley NationalLaboratory, Berkeley, CA94720, USAw Electronic supplementary information (ESI) available: Detailsregarding construction of the phase diagrams; Tables S1–S5, andlinear relations. See DOI: 10.1039/b917459a
This journal is �c the Owner Societies 2010 Phys. Chem. Chem. Phys., 2010, 12, 283–290 | 283
PAPER www.rsc.org/pccp | Physical Chemistry Chemical Physics
oxidation14–17 have deepened the insight into reaction
mechanisms and surface composition under electrocatalytic
reaction conditions. In a previous study the oxygen evolution
reaction was investigated.18 There it was established that it is
possible to describe the trends in the oxygen evolving activity
using one single descriptor: the adsorption energy of O-atoms
on the surfaces. RuO2 was determined to be the most active
rutile (110) surface, which is in good agreement with the
experiments. Recently, theoretical studies have addressed
heterogeneously catalyzed chlorine production by the
so-called Deacon process.19,20 However, in spite of the
significant importance of electrochemical chlorine evolution,
detailed electronic structure studies of this process have not
appeared in the literature.
The aim of the present study is to analyze the surface
structure and the activity trends underlying electrochemical
chlorine evolution over rutile oxides. We start by analyzing
IrO2 and RuO2 and we construct surface phase diagrams of
the rutile (110) surfaces. This allows us to derive plausible
mechanisms of the electrochemical chlorine evolution based
on the reaction intermediates. We determine the lowest
potential where Cl evolution is possible. Applying adsorption
energy correlations, we can determine a reduced set of key
energetic descriptors for the surface reactions involved, and
generalize the analysis of IrO2 and RuO2 to a trend study
where all the material dependence is included in a single
descriptor, in this case the oxygen binding energy.
Methods
Calculation details
All electronic structure calculations have been carried out
using density functional theory (DFT), with the RPBE
functional for exchange and correlation.21 A periodically
repeated 4-layer slab is chosen for the rutile (110) surfaces of
RuO2, IrO2, TiO2, and PtO2. A vacuum layer of 16 A is used
to separate the slab from its periodically repeated images. We
use a 2� 1 surface unit cell and 4� 4� 1 Monkhorst–Pack
type k-point sampling for slab calculations.22 The
Kohn–Sham equations are solved using a plane wave basis
with a cutoff of 350 eV for the eigenstates, and the densities are
described using a cutoff corresponding to 500 eV. Vanderbilt
ultrasoft pseudopotentials are used to deal with the ion
cores.23 A Fermi smearing of 0.1 eV is used, and energies are
extrapolated to an electronic temperature of 0 K. The two
bottom layers of the slab are fixed in their bulk structure,
while the two top layers as well as possible adsorbates on it
are relaxed until the sum of the absolute forces is less than
0.05 eV A�1. All calculations are performed using the Dacapo
and ASE simulation package.24
The surface of the unit cell contains two bridge and two cus
sites, which means that the total coverage at each type site
varies between 50% and 100%. We consider all relevant
combinations of adsorption site and adsorbates. We find that
adsorbates bind stronger at bridge sites than on cus sites and
bridge sites are therefore occupied with oxygen for a
large range of conditions. We therefore focus on cus sites
throughout this paper. Mixed phases where different kinds of
adsorbates are mutually present at the cus sites may exist,
however, we find that they are in general only stable in very
narrow windows of conditions.
We consider the adsorption of Clc, OHc and Oc at a
cus site, c, as well as the formation of O2cc and Cl(Oc)2
adsorbed at two cus sites. The adsorption energy of chlorine
is calculated using:
DE(Clc) = E(Clc) � E(c) � 12E(Cl2). (4)
For oxygen the energy is calculated relative to water
DE(Oc) = E(Oc) � E(c) � E(H2O) + E(H2) (5)
and for ClOc we apply the combined reference energy states
from above
DE(ClOc)=E(ClOc)� E(c)� 12E(Cl2)� E(H2O)+E(H2). (6)
The adsorption energy of O2cc is defined with reference to
water and hydrogen
DE (O2cc) = E(O2
cc) � E(2c) � 2E(H2O) + 2E(H2), (7)
and the adsorption energy of Cl(Oc)2 is defined by
DE(Cl(Oc)2) = E(Cl(Oc)2) � E(2c) � 2E(H2O)
+ 2E(H2). � 12E(Cl2). (8)
The changes in the interaction between the liquid electrolyte
and the surface upon adsorption of molecules are expected to
be small as long as all hydrogen bonds are saturated. It has
previously been shown that the O and OH adsorption energies
at the cus site is changed by less than 0.05 eV by the presence
of water at the surface on RuO2.18 These interactions are
therefore neglected in the present study.
Furthermore, the effect of the local field in the Helmholtz
layer is not accounted for. Previously, it has been shown that
for metal surfaces the effect of the field is negligible for
adsorbates with small dipole moments perpendicular to the
surface.25 For RuO2 we find that applying a homogeneous
external field up to �0.53 V A�1, corresponding to a 1.6 V
potential drop across a 3 A thick Helmholtz layer, changes the
relative adsorption energies by less than 0.11 eV.
The above simplifications are expected to be independent on
the catalyst material, and therefore the resulting trends in
catalytic activity should only be weakly affected by them.
Variations in the adsorption energy of e.g. oxygen on the
(110) surfaces are several eV between e.g. IrO2 and TiO2, while
differences in water interaction and field effects are at least an
order of magnitude smaller, and therefore vanish on the
adsorption energy scale.
Surface phase diagram
There are four parameters determining the surface composition:
the potential, the pH, the concentration of Cl�, and the
electrode material. Only the latter is directly available in the
simulations, and the other three parameters can be included
analytically as described below. By applying the computa-
tional standard hydrogen electrode,9 it is possible to construct
surface Pourbaix diagrams, and identify the most stable
structure of the catalyst surface at a range of potentials and
pH values.26 At conditions where oxygen and chlorine
284 | Phys. Chem. Chem. Phys., 2010, 12, 283–290 This journal is �c the Owner Societies 2010

evolution are negligible, the structure of the catalyst surface is
determined by the equilibrium with water, protons and
chloride ions. The oxidation of water may lead to the
formation of OHc or Oc through
H2O(l) +c "HOc + H+(aq) + e�" Oc + 2H+(aq) + 2e�
(9)
Chloride ions may be exchanged with the surface via
Cl�(aq) + c " Clc + e� (10)
ClOc may be formed by first having Oc adsorbed on the
surface followed by Cl� adsorption on top of Oc. At potentials
where evolution of Cl2 or O2 is appreciable, the surface
structure is, however, controlled by the steady-state reaction.
At standard conditions (zero pH), H+(aq) + e� is in
equilibrium with 12H2(g) at zero potential vs. the standard
hydrogen electrode. At finite pH and potential the chemical
potential of a proton and an electron is:
m(H+(aq)) + m(e�) = 12mH2(g)
� eUSHE + kBT ln(10)pH.
(11)
Similarly, Cl�(aq) is in equilibrium with 12Cl2 + e� under
standard conditions at the potential of standard chlorine
electrode,
Cl�(aq) " 12Cl2 + e� @USHE = 1.36 V. (12)
For an arbitrary potential and activity we therefore obtain
m(Cl�(aq)) � m(e�) = 12mCl2(g) � e(USHE � 1.36 V) + kBT lnaCl�.
(13)
Eqns (11) and (13) allow us to calculate the free energies of Oc,
OHc, Clc, and ClOc adsorbed at a surface site in the
electrochemical environment, based on calculations of the
gas-phase molecules rather than the solvated ions.
The free energy of adsorption for a surface with an
adsorbate at USHE = 0 V is given by
DG = DE + DZPE � TDS + DGref, (14)
where DZPE is the change in zero point energy, T is the
temperature, DS is the change in entropy upon absorption,
and DE is the DFT-calculated adsorption energy. The
zero-point energy contribution and the entropy for the
adsorbed species are obtained from harmonic vibrational
analysis and from tables of thermodynamic properties in the
case of gas-phase species. The numbers for DZPE and �TDSare listed in the ESIw (in Table S1). The correction DGref is
1.36 eV for Clc, ClOc and Cl(Oc)2 and zero for HOc and Oc,
and is related to the reversible potentials of the chlorine and
hydrogen electrodes, respectively (see ESI for detailsw).To obtain a measure of the activity we apply a simplified
estimate: the chlorine evolution reaction is considered possible
if and only if all the involved reaction steps are neutral or
downhill in free energy. For a given reaction we can determine
the lowest potential for which this is the case. Due to the
significant challenges in treating reaction barriers for electro-
chemical processes, we do not include reaction barriers in the
present study, and can therefore not directly compare e.g. the
relative rates of the Volmer–Tafel and the Volmer–Heyvrosky
reactions. Our approach can thus be viewed as a ‘‘lower-bound
overpotential analysis’’ of the chlorine evolution activity.
Since barriers of surface reactions27 as well as barriers for
proton transfer reactions28 are known to often be linearly
dependent on the reaction energy, we expect that the trends
are conserved even when barriers are included.
Results and discussion
Surface phase diagram for IrO2
Fig. 1 shows the interesting part of the phase diagram of
IrO2. At pH = 7 the surface sites are covered by OH and O at
most potentials. At low potential, the surface is covered by OH
groups (not shown). Increasing the potential oxidizes OH to O
first at the bridge sites and then at the cus sites. Eventually
formation of OOH becomes thermodynamically favored.
When this happens, we expect oxygen evolution to become
appreciable,18 and the surface structure is then determined by
the kinetics of the steady-state evolution of oxygen. The
formation of chlorine adsorbates directly at the cus sites
requires pHo �3. Formation of Cl at the bridge sites requires
even lower pH.
We would expect that for a good catalyst the formation of
the Cl intermediate has DG B 0 eV near 1.36 V and that
there are free sites available for the formation of this inter-
mediate. A mechanism involving Cl adsorbed directly at an Ir
cation, does not fulfill any of these requirements. Instead we
see from the phase diagram that a ClOc intermediate is
thermodynamically favored for U 4 1.5 V in the pH range
from 0 to 3.
Fig. 1 Surface phase diagram for IrO2 (110) in equilibrium with Cl�,
H+ and H2O at 298.15 K and aCl� = 1. The regions where we expect
chlorine or oxygen evolution to become significant have been marked.c and b denote cus site and bridge sites, respectively. The adsorbate
phases are shown in the insets. Ir atoms are cyan, O atoms are red,
H atoms are white and Cl atoms are green.
This journal is �c the Owner Societies 2010 Phys. Chem. Chem. Phys., 2010, 12, 283–290 | 285
This suggests the following sequence of intermediates on
IrO2
Oc + 2Cl�(aq) - ClOc + Cl�(aq) + e�
- Oc + Cl2(g) + 2e� (15)
as both steps have |DG| = 0.14 eV at U = 1.36 V, and a
significant amount of Oc sites exist at U 4 1.36 V. The
reaction is written here as a Volmer–Heyvrosky mechanism.
However, as we only consider the stability of the adsorbed
intermediate, we cannot compare the relative rates of the
Tafel, Heyvrosky and Khrishtalik steps.
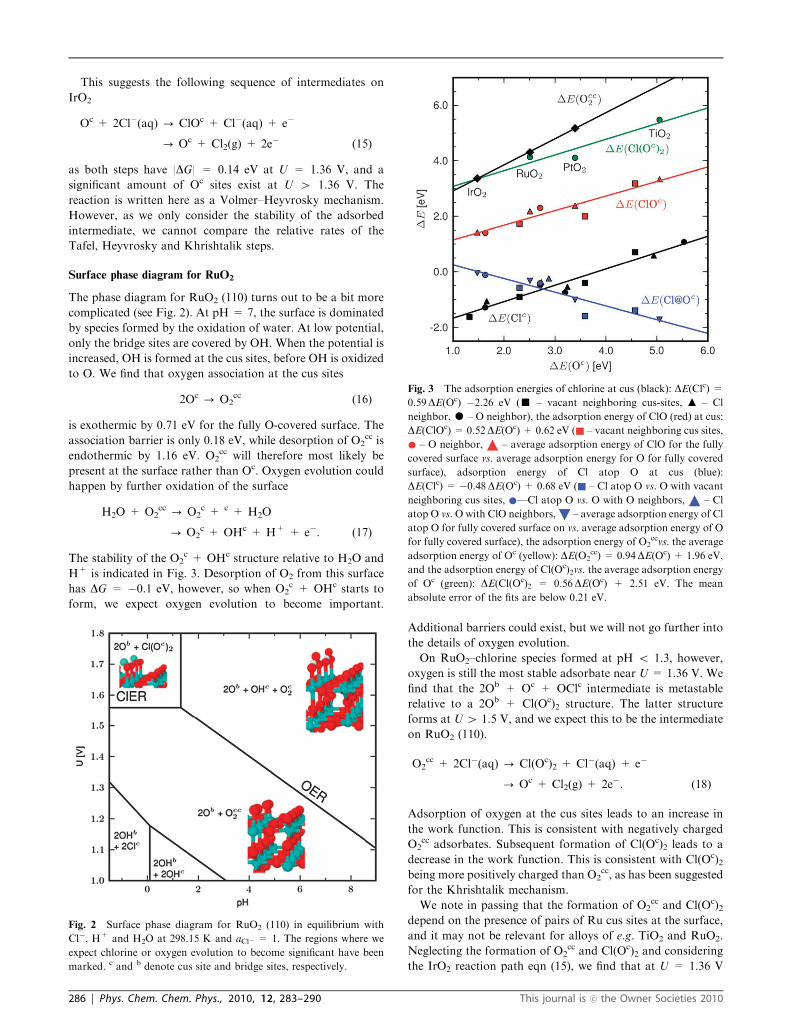
Surface phase diagram for RuO2
The phase diagram for RuO2 (110) turns out to be a bit more
complicated (see Fig. 2). At pH = 7, the surface is dominated
by species formed by the oxidation of water. At low potential,
only the bridge sites are covered by OH. When the potential is
increased, OH is formed at the cus sites, before OH is oxidized
to O. We find that oxygen association at the cus sites
2Oc - O2cc (16)
is exothermic by 0.71 eV for the fully O-covered surface. The
association barrier is only 0.18 eV, while desorption of O2cc is
endothermic by 1.16 eV. O2cc will therefore most likely be
present at the surface rather than Oc. Oxygen evolution could
happen by further oxidation of the surface
H2O + O2cc - O2
c + c + H2O
- O2c + OHc + H+ + e�. (17)
The stability of the O2c + OHc structure relative to H2O and
H+ is indicated in Fig. 3. Desorption of O2 from this surface
has DG = �0.1 eV, however, so when O2c + OHc starts to
form, we expect oxygen evolution to become important.
Additional barriers could exist, but we will not go further into
the details of oxygen evolution.
On RuO2–chlorine species formed at pH o 1.3, however,
oxygen is still the most stable adsorbate near U = 1.36 V. We
find that the 2Ob + Oc + OClc intermediate is metastable
relative to a 2Ob + Cl(Oc)2 structure. The latter structure
forms at U 4 1.5 V, and we expect this to be the intermediate
on RuO2 (110).
O2cc + 2Cl�(aq) - Cl(Oc)2 + Cl�(aq) + e�
- Oc + Cl2(g) + 2e�. (18)
Adsorption of oxygen at the cus sites leads to an increase in
the work function. This is consistent with negatively charged
O2cc adsorbates. Subsequent formation of Cl(Oc)2 leads to a
decrease in the work function. This is consistent with Cl(Oc)2being more positively charged than O2
cc, as has been suggested
for the Khrishtalik mechanism.
We note in passing that the formation of O2cc and Cl(Oc)2
depend on the presence of pairs of Ru cus sites at the surface,
and it may not be relevant for alloys of e.g. TiO2 and RuO2.
Neglecting the formation of O2cc and Cl(Oc)2 and considering
the IrO2 reaction path eqn (15), we find that at U = 1.36 V
Fig. 2 Surface phase diagram for RuO2 (110) in equilibrium with
Cl�, H+ and H2O at 298.15 K and aCl� = 1. The regions where we
expect chlorine or oxygen evolution to become significant have been
marked. c and b denote cus site and bridge sites, respectively.
Fig. 3 The adsorption energies of chlorine at cus (black): DE(Clc) =0.59DE(Oc) �2.26 eV (’ – vacant neighboring cus-sites, m – Cl
neighbor,K – O neighbor), the adsorption energy of ClO (red) at cus:
DE(ClOc) = 0.52DE(Oc) + 0.62 eV ( – vacant neighboring cus sites,
– O neighbor, – average adsorption energy of ClO for the fully
covered surface vs. average adsorption energy for O for fully covered
surface), adsorption energy of Cl atop O at cus (blue):
DE(Clc) = �0.48DE(Oc) + 0.68 eV ( – Cl atop O vs. O with vacant
neighboring cus sites, —Cl atop O vs. O with O neighbors, – Cl
atop O vs.Owith ClO neighbors, – average adsorption energy of Cl
atop O for fully covered surface on vs. average adsorption energy of O
for fully covered surface), the adsorption energy of O2ccvs. the average
adsorption energy of Oc (yellow): DE(O2cc) = 0.94DE(Oc) + 1.96 eV,
and the adsorption energy of Cl(Oc)2vs. the average adsorption energy
of Oc (green): DE(Cl(Oc)2 = 0.56DE(Oc) + 2.51 eV. The mean
absolute error of the fits are below 0.21 eV.
286 | Phys. Chem. Chem. Phys., 2010, 12, 283–290 This journal is �c the Owner Societies 2010

each step has |DG| = 0.05–0.12 eV, depending on whether
there is Oc or OClc adsorbed at the other cus site in the (2 � 1)
unit cell. The trend in the change of the function upon
formation of Oc and ClOc is similar to the change of the work
function upon formation of O2cc and Cl(Oc)2.
Scaling relations. As mentioned above, it is possible to
construct the surface phase diagram and reaction intermediate
as function of pH, potential and the Cl� concentration for a
given material. The aim is now to generalize the analysis,
not studying a single or a few oxide surfaces but rather
determining a descriptor which will be a continuous material
variable. The starting point of our analysis is to establish
correlations between adsorption energies of intermediates on
various (110) rutile oxide surfaces. Such relations can be useful
in establishing simplified models describing the surface activity
and composition, and can be suitable for subsequent screening
purposes.29 In Fig. 3 the adsorption energies of Clc and ClOc
as defined above are plotted against the O binding at the
cus-site with the same environment at the surface. The plot
clearly shows that the Cl and O adsorption energies are
linearly correlated. Such linear energy relations between
adsorption energies of hydrogenated species (CHx, OH, SH,
and NHx) and the adsorption of the corresponding unhydro-
genated atoms: (C, O, S, and N) have previously been shown
for transition metals30,31 and transition metal compounds
including oxides.18,32 The scaling of Cl with respect to O is
very similar to the scaling of OH with respect to O. This
reflects the fact that Cl has a valency of one like the oxygen
atom in OH. ClOc thus also scales as OH (and similar to
HOOc). The present results suggest that the oxygen adsorption
energy is a general measure (a so-called ‘‘descriptor’’) for the
reactivity of oxides which has also been suggested for the case
of cations in oxides by Pankratiev.33
Adsorption of Cl atop Oc is determined by:
DE = E(ClOc) � E(Oc) � 12E(Cl2) = DE(ClOc) � DE(Oc)
(19)
The linear scaling relations established above makes it possible
to analyze the reaction, not only for a specific metal oxide
surface, but for potential metal oxide catalyst surfaces with
continuously varying reactivity as measured by the adsorption
energy of oxygen at the cus-site. The obtained reactivity curves
will then be continuous in the oxygen adsorption energy,
whereas specific oxides (e.g. RuO2, IrO2, PtO2, and TiO2) will
show up as discrete points. The descriptor approach provides a
fast overview of the ‘‘phase-space’’ of materials, but leaves the
problem of how to find specific materials with the desired
descriptor properties unanswered.
Generalized phase diagram
Since the binding energy of all intermediates at the cus sites
scales directly with DE(Oc), it is possible to construct a
generalized phase diagram showing the most stable phase at
potential U as function of the material-dependent descriptor,
DE(Oc).
We choose the electrolytic conditions such that when
increasing the potential the most stable form of chlorine goes
directly from Cl� to Cl2, which means that the pH value
should be between �1 and 3. HCl(aq) is more stable than Cl�
at pH values below B�1, whereas HClO(aq) becomes stable
at pH values higher than B3. We keep the electrolyte pH and
Cl� concentration fixed (pH= 0, aCl�= 1) and investigate the
surface phase diagram as a function of DE(Oc ) and potential.
This approach is not a limitation of the method, since other
electrolyte conditions can be treated just by changing the free
energies accordingly.
This is shown in Fig. 4. In the limit of weak binding, oxygen
association becomes exothermic and barrierless, so phases like
ClOc and Cl(Oc)2 cannot form. From the linear relations we
find that
O2cc - O2(g) + 2c (20)
has |DG| o 0 for DE(Oc) 4 2.97 eV. We therefore chose to
consider only OHc and Clc for DE(Oc) 4 2.97 eV. The free
energies of OHc and Clc are within 0.01–0.27 eV depending on
the oxide, and we expect some coexistence in these regions of
phase space. The range of DE(Oc) for some rutile oxides is seen
in Fig. 5. For IrO2 and RuO2 the line at lowest DE(Oc) marks
the adsorption energy with free neighboring cus sites, and the
line at highest DE(Oc) marks the adsorption energy with Oc
neighbors as calculated in the (2 � 1) unit cell. For PtO2 and
TiO2 the line at weakest binding marks the binding energy at
high Oc coverage. The variation in adsorption energy with
coverage may be seen as an uncertainty arising from neglecting
adsorbate–adsorbate interactions. For the considered oxides
DE(Oc) is more affected by changing the oxide than changing
the Oc coverage. The change of the most stable adsorbate
when the potential is increased is qualitatively reproduced for
RuO2 and IrO2.
Chlorine evolution activity. Firstly, we investigate the
mechanism involving ClOc
Oc + 2Cl�(aq) - ClOc + Cl�(aq) + e�
- Oc + Cl2(g) + 2e�. (21)
Fig. 4 The most stable surface at pH = 0 and aCl�= 1 as a function
of potential, U, and the surface reactivity descriptor, DE(Oc). Metal
ions are blue, O atoms red, hydrogen atoms white, and chlorine atoms
are green. The regions in the figure are determined by the most stable
surface configuration at the given potential. The phase borders are
defined by the equilibrium point of the reactions. So for example, the
border between the surface with Oc on the surface and the surface
with ClOc is defined by: Oc + Cl�(aq) " ClOc + e�, DG(Oc) �DG(ClOc) � eUSHE = 0.
This journal is �c the Owner Societies 2010 Phys. Chem. Chem. Phys., 2010, 12, 283–290 | 287

The potential at which all steps are neutral or downhill is:
U = Ueq + |DG(ClOc) � DG(Oc)|/e, (22)
where Ueq is the equilibrium potential for chlorine evolution,
in this case 1.36 VSHE. Secondly, we investigate the mechanism
involving Cl(Oc)2:
O2cc + 2Cl�(aq) - Cl(Oc)2 + Cl�(aq) + e�
- Oc + Cl2(g) + 2e�. (23)
The potential at which all steps are neutral or downhill is:
U = Ueq + |DG(Cl(Oc)2) � DG(O2cc)|/e. (24)
Thirdly we consider a mechanism involving Clc adsorbed
directly at the metal cus site.
2Cl�(aq) + c - Cl�(aq) + Clc + e�
- Cl2(g) +c + 2e�. (25)
This mechanism could be relevant for oxides with weaker
adsorption energy at the cus site than RuO2. However, our
calculations suggest that this mechanism will be somewhat
poisoned by OHc formation at the cus sites. The potential
where all steps are neutral or downhill is:
U = Ueq + |DG(Clc)|/e, (26)
RuO2 and PtO2 have |DG(Clc)| o 0.05 eV for high and low
coverage of Clc, respectively, and could in principle work as
good catalysts following this path; however, for RuO2 we find
the cus sites to be blocked by O2cc.
Since the different chlorine evolution potentials all are
functions of DE(Oc), the potentials can be plotted directly on
the phase diagram as shown in Fig. 5. This is similar to the
Sabatier activity volcano curves known from heterogeneous
catalysis.34 To have the surface phase diagram in the same plot
as the potential volcano directly assures that the activity
volcano and the stable surface configuration agree. In other
words, the different activity plots are relevant in different areas
of the phase diagram, which are easily obtained by looking at
Fig. 5. The thick black line marks the volcanoes, where the
mechanism involves one of the most stable surfaces as an
intermediate at the potential where all steps are neutral or
downhill in free energy. We note that the surface composition
during oxygen and chlorine evolution is not determined by
equilibrium, but rather by a steady state. However, it seems
plausible that the surface composition determined by
equilibrium is one of the intermediates during the reaction.
Fig. 5 also shows the activity of IrO2 and RuO2 based on Oc
adsorption energy, with the error bars corresponding to the
variation of the Oc adsorption energy when going from low to
high Oc coverage.
If the accuracy of the linear relations are taken into account,
the three investigated mechanisms form a single volcano with a
broad plateau for DE(Oc) from 1.5 eV to 3.5 eV. Deviations
from the linear relations could be important in this area. The
agreement between the detailed analysis for IrO2 and RuO2
and the linear relations is therefore surprisingly good.
We find RuO2 to be at the top of the volcano, whereas IrO2
binds Cl on top Oc too weakly. TiO2 does not show up on this
activity scale. To our knowledge, only a few studies of the
relative activity of rutile oxides have been carried out. Kuhn
and Mortimer found IrO2 and RuO2 to have similar activities
and to be more active than TiO2. Mixtures of TiO2 with Ir and
Ru are more active than mixtures of TiO2 with Cr, Co, or Pt.35
Arikado et al. found the overpotential to increase in the order
RuO2 o Ti/PtO2 o IrO2.36 Kelly et al. found the specific
activity of Ru sites at RuxTi1�xO2 to be 45% more active than
the Ir sites at IrxTi1�xO2.4,37 We note the discrepancy between
the relative activity of RuO2, IrO2, and PtO2 could be because
different preparation methods may lead to different surface
roughness factors and different concentrations of residual
chlorine in thermally prepared oxides.4 The high activity of
RuO2 and IrO2 relative to TiO2 is in agreement with experi-
ments. The rutile crystal structure of PtO2 is not the most
stable structure for PtO2. It is however possible that some
PtO2 may be found in the rutile crystal phase if PtO2 is mixed
with oxides that do form the rutile crystal phase.
For comparison the potential for oxygen evolution is also
shown in Fig. 5. It is seen that the potential for chlorine
evolution is lower than the potential for oxygen evolution in
spite of the lower equilibrium potential for oxygen evolution.
This is the reason why electrochemical chlorine evolution is
possible. It is also seen that a good oxygen evolution catalyst is
also a good chlorine evolution catalyst. A comparison of the
experimental potentials for OER and ClER has suggested that
the selectivity of oxides does not depend appreciably on the
catalyst material.2 The potential of chlorine evolution changes
with the potential of oxygen evolution with a slope of 1.
Interestingly, one of the biggest outliers in the comparison
above was a Pt/MnO2 catalyst in acid where the potential for
oxygen evolution was 0.3 eV higher than the potential of
chlorine evolution. MnO2 has an oxygen binding energy
around 3.2 eV.38 Based on Fig. 5 we would therefore expect
the potential for chlorine evolution to be 0.4 V lower than the
potential for oxygen evolution. We note that at other pH
Fig. 5 Sabatier volcanoes (black dotted) for the considered reaction
paths involving ClOc, Cl(Oc)2 and Clc (from left to right). The domains
of the most stable surface structure as function of potential and
oxygen binding energy is marked by gray. To be truly active, the
intermediate should form at sites that are stable, as this makes the
active site abundant. The solid black line shows the combined Sabatier
volcano taking into account the stability of the active sites for a given
mechanism. The Sabatier volcano for oxygen evolution18 (dashed blue
line) shows OER always requires a higher potential than ClER. The
activity of IrO2 and RuO2 are indicated with error bars derived from
the variation of the Oc adsorption energy with varying Oc coverage.
288 | Phys. Chem. Chem. Phys., 2010, 12, 283–290 This journal is �c the Owner Societies 2010

values the competition between chlorine and oxygen evolution
will change; see Fig. 1 and Fig. 2.
Single-crystal experiments on RuO2 show that the (110)
surface is less active for Cl2 evolution than the (101) and the
(320) surfaces.8,39 On polycrystalline RuO2,40 mixed RuO2 +
TiO2,41 and RuO2 (320)
39 the activity depends on pH, whereas
the activity of RuO2 (110) is independent on pH. The variation
of activity with pH has been explained by the reaction
OHc " Oc + H+(aq) + e� (22)
determining the availability of active Oc sites.7,39,40,42 This
clearly requires Oc and OHc to be near equilibrium at the
reaction conditions for Cl2 evolution. Since the bridge sites
and cus-sites on the (110) surface of rutile oxides fulfill the
same scaling relations between O and OH adsorption as
perovskites,32 it is reasonable to assume the scaling relations
are identical for all rutile oxide surfaces. In this case Fig. 5
applies for any rutile oxide surface, but with the oxygen
adsorption energy depending on the specific surface facet. It
has been argued that the binding energy on the stepped (320)
surface is stronger than on the (110) surface.39 If it is assumed
the O2cc and Cl(Oc)2 intermediates form at the (320) surface as
well, Fig. 5 shows that as DE(Oc) is decreased from ca. 2.6 eV,
the OHc–O2cc equilibrium shifts to higher potential, which
leads to increased blocking of the active sites by OHc at a fixed
overpotential. We note the overpotential at constant current is
found to be 80 meV lower on the (320) surface than on
the (110) surface,39 and thus within the vertical error bars
indicated in Fig. 5.
Conclusion
Based on DFT calculations, we have established linear scaling
relations between Cl, ClO, and O adsorption energies at the
cus-sites of rutile oxides. These linear energy relations enable
the construction of a generalized surface phase diagram where
potential and binding of oxygen are the descriptors determining
the surface composition. By applying an electrochemical–
thermodynamic approach we can make the first simple
theoretical analysis of the electrocatalytic chlorine evolution
reaction based on the free energies of the reaction inter-
mediates. A lower-bound to the overpotential required for
driving the reaction is thereby determined as function of
the oxygen adsorption energy. This approach is an electro-
chemical analogue to the Sabatier analysis used in hetero-
geneous catalysis. Combining the surface phase diagram and
the Sabatier volcano, one obtains a qualified suggestion for the
surface structure during reaction condition. The analysis
shows that ClO or Cl(Oc)2 will form spontaneously on the
cus-sites of IrO2 and RuO2 at the potential required for
chlorine evolution. This indicates that the Cl2 evolution occurs
through these intermediates on IrO2 and RuO2. The potential
necessary for Cl2 evolution is always smaller than the potential
for oxygen evolution for oxides exhibiting certain oxygen
adsorption energies. A simple explanation is that the oxide
evolution reaction involves three intermediates, and since the
bindings of these intermediates to the catalyst are linearly
related, there cannot be found a material that binds all of them
to the surface with exactly the right binding strength. This is
the reason for the high overpotential even at the top of the
oxygen evolution volcano. The chlorine evolution reaction, on
the other hand, involves only a single intermediate, and a
material that optimizes this bond could in principle exist. This
difference in overpotential is consistent with experiments2 and
rationalizes experimental findings.
Acknowledgements
The authors thank Prof. M. T. M. Koper for useful discus-
sions. The Center for Atomic-scale Materials Design is funded
by the Lundbeck Foundation. This work was supported by the
Danish Center for Scientific Computing through Grant No.
HDW-1103-06, the European Commission (Marie Curie
Research Training Network MRTNCT-2006-032474) and
The Danish Council for Strategic Research though the
HyCycle Center (No. 2104-07-0041).
References
1 EuroChlor (representing the chloro-alkali industry), ChlorineIndustry Review, 2007–2008.
2 S. Trasatti, Electrochim. Acta, 1984, 29, 1503–1512.3 S. Trasatti, Electrochim. Acta, 2000, 45, 2377–2385.4 E. J. Kelly, D. E. Heatherly, C. E. Vallet and C. W. White,J. Electrochem. Soc., 1987, 134, 1667–1675.
5 S. Trasatti and W. E. O’Grady, Adv. Electrochem. Electrochem.Eng., 1981, 12, 117–261.
6 S. Trasatti and G. Lodi, Electrodes of Conductive metallic Oxides,Elsevier, 1980, pp. 301–358.
7 L. I. Krishtalik, Electrochim. Acta, 1981, 26, 329.8 T. Hepel, F. Pollak and W. E. J. O’Grady, J. Electrochem. Soc.,1986, 133, 69–75.
9 J. K. Nørskov, J. Rossmeisl, A. Logadottir, L. Lindqvist,J. R. Kitchin, T. Bligaard and H. J. Jonsson, J. Phys. Chem. B,2004, 108, 17886–17892.
10 M. Lischka, C. Mosch and A. Gross, Electrochim. Acta, 2007, 52,2219–2228.
11 A. Panchenko, M. T. M. Koper, T. E. Shubina, S. J. Mitchell andE. J. Roduner, J. Electrochem. Soc., 2004, 151, A2016–A2026.
12 A. U. Nilekar and M. Mavrikakis, Surf. Sci., 2008, 602, L89–L94.13 J. Rossmeisl, G. S. Karlberg, T. Jaramillo and J. K. Nørskov,
Faraday Discuss., 2008, 140, 337–346.14 P. Liu, A. Logadottir and J. K. Nørskov, Electrochim. Acta, 2003,
48, 3731.15 D. Cao, G. Q. Lu, A. Wieckowski, S. A. Wasileski and
M. J. Neurock, J. Phys. Chem. B, 2005, 109, 11622.16 P. Ferrin, A. U. Nilekar, J. Greeley, M. Mavrikakis and Rossmeisl,
Surf. Sci., 2008, 602, 3424–3431.17 M. T. M. Koper, T. E. Shubina and R. A. van Santen, J. Phys.
Chem. B, 2002, 106, 686.18 J. Rossmeisl, Z.-W. Qu, H. Zhu, G.-J. Kroes and J. K. Nørskov,
J. Electroanal. Chem., 2007, 607, 83–89.19 N. Lopez, J. Gomez-Segura, R. P. Martin and J. Perez-Ramırez,
J. Catal., 2008, 255, 29–39.20 D. Crihan, M. Knapp, S. Zweidinger, E. Lundgren,
C. J. Weststrate, J. N. Andersen, A. P. Seitsonen and H. Over,Angew. Chem., Int. Ed., 2008, 47, 2131–2134.
21 B. Hammer, L. B. Hansen and J. K. Nørskov, Phys. Rev. B:Condens. Matter Mater. Phys., 1999, 59, 7413–7421.
22 H. J. Monkhorst and J. D. Pack, Phys. Rev. B, 1976, 13, 5188.23 D. Vanderbilt, Phys. Rev. B: Condens. Matter, 1990, 41,
7892–7895.24 Open-source codes available at http://wiki.fysik.dtu.dk/dacapo
and http://wiki.fysik.dtu.dk/ase.25 G. S. Karlberg, J. Rossmeisl and J. K. Nørskov, Phys. Chem.
Chem. Phys., 2007, 9, 5158–5161.26 H. A. Hansen, J. Rossmeisl and J. K. Nørskov, Phys. Chem. Chem.
Phys., 2008, 10, 3722–3730.
This journal is �c the Owner Societies 2010 Phys. Chem. Chem. Phys., 2010, 12, 283–290 | 289

27 J. K. Nørskov, T. Bligaard, A. Logadottir, S. Bahn, L. B. Hansen,M. Bollinger, H. S. Bengaard, B. Hammer, Z. Sljivancanin,M. Mavrikakis, Y. Xu, S. Dahl and C. J. H. Jacobsen, J. Catal.,2002, 209, 275.
28 J. Rossmeisl, E. Skulason, M. E. Bjorketun, V. Tripkovic andJ. K. Nørskov, Chem. Phys. Lett., 2008, 466, 68–71.
29 J. K. Nørskov, T. Bligaard, J. Rossmeisl and C. H. Christensen,Nat. Chem., 2009, 1, 37–46.
30 F. Abild-Pedersen, J. Greeley, F. Studt, J. Rossmeisl,T. R. Munter, P. G. Moses, E. Skulason, T. Bligaard andJ. K. Nørskov, Phys. Rev. Lett., 2007, 99, 016105.
31 J. Rossmeisl, A. Logadottir and J. K. Nørskov, Chem. Phys., 2005,319, 178–184.
32 E. Fernandez, P. G. Moses, A. Toftelund, H. A. Hansen,J. I. Martinez, F. Abild-Pedersen, J. Kleis, B. Hinnemann,J. Rossmeisl, T. Bligaard and J. K. Nørskov, Angew. Chem., Int.Ed., 2008, 47, 4683–4686.
33 Y. D. Pankratiev, React. Kinet. Catal. Lett., 1982, 20, 255.
34 T. Bligaard, J. K. Nørskov, S. Dahl, J. Matthiesen,C. H. Christensen and J. Sehested, J. Catal., 2004, 224,206–217.
35 A. T. Kuhn and C. J. Mortimer, J. Electrochem. Soc., 1973, 120,231–236.
36 T. Arikado, C. Iwakura and H. Tamura, Electrochim. Acta, 1978,23, 9–15.
37 E. J. Kelly, C. E. Vallet and C. W. White, J. Electrochem. Soc.,1990, 137, 2482–2491.
38 J. Rossmeisl, K. Dimitrievski, P. Siegbahn and J. K. Nørskov,J. Phys. Chem. C, 2007, 111, 18821–18823.
39 E. Guerrini, V. Consonni and S. Trasatti, J. Solid StateElectrochem., 2005, 9, 320–329.
40 J. L. Fernandez, M. R. Gennero de Chialvo and A. C. Chialvo,Electrochim. Acta, 2002, 47, 1129–1136.
41 R. G. Erenburg, L. I. Krishtalik and N. P. Rogozhina,Elektrokhimiya, 1984, 20, 1183.
42 R. G. Erenburg, Elektrokhimiya, 1984, 20, 1602.
290 | Phys. Chem. Chem. Phys., 2010, 12, 283–290 This journal is �c the Owner Societies 2010