Elevated temperature fracture toughness of Al-Cu-Mg-Ag sheet: Characterization and modeling
15
METALLURGICAL AND MATERIALS TRANSACTIONS A VOLUME 28A, SEPTEMBER 1997—1815 Elevated Temperature Fracture Toughness of Al-Cu-Mg-Ag Sheet: Characterization and Modeling MICHAEL J. HAYNES and RICHARD P. GANGLOFF The plane-strain initiation fracture toughness (K JICi ) and plane-stress crack growth resistance of two Al-Cu-Mg-Ag alloy sheets are characterized as a function of temperature by a J-integral method. For AA2519 1 Mg 1 Ag, K JICi decreases from 32.5 MPa at 25 7C to 28.5 MPa at 175 7C, = = m m while K JICi for a lower Cu variant increases from 34.2 MPa at 25 7C to 36.0 MPa at 150 7C. = = m m Crack-tip damage in AA2519 1 Mg 1 Ag evolves by nucleation and growth of voids from large undissolved Al 2 Cu particles, but fracture resistance is controlled by void sheeting coalescence as- sociated with dispersoids. Quantitative fractography, three-dimensional (3-D) reconstruction of frac- ture surfaces, and metallographic crack profiles indicate that void sheeting is retarded as temperature increases from 25 7C to 150 7C, consistent with a rising fracture resistance. Primary microvoids nucleate from smaller constituent particles in the low Cu alloy, and fracture strain increases. A strain- controlled micromechanical model accurately predicts K JICi as a function of temperature, but includes a critical distance parameter (l*) that is not definable a priori. Nearly constant initiation toughness for AA2519 1 Mg 1 Ag is due to rising fracture strain with temperature, which balances the effects of decreasing flow strength, work hardening, and elastic modulus on the crack-tip strain distribution. Ambient temperature toughnesses of the low Cu variant are comparable to those of AA2519 1 Mg 1 Ag, despite increased fracture strain, because of reduced constituent spacing and l*. I. INTRODUCTION ALUMINUM alloys (AA) for the airframe of the high-speed civil transport (HSCT) will be required to main- tain microstructural stability, strength, and toughness at temperatures ranging from 100 7C to 200 7C for a life of 60,000 hours. [1] Advanced ingot metallurgy (IM) alloys, rapidly solidified powder metallurgy (RS/PM) alloys, and metal matrix composites are candidates. Selection of HSCT materials hinges on at least three critical issues: (1) inter- mediate loading-rate fracture toughness at ambient to ele- vated temperatures, (2) slow loading rate or creep crack growth fracture resistance at elevated temperatures, and (3) elevated-temperature thermal exposure effects on ambient temperature fracture toughness. The first issue is considered here for two wrought IM Al-Cu-Mg-Ag alloys. Prior ther- mal exposure effects, [2] as well as static-load crack growth at elevated temperature, [3–6] are considered elsewhere. Polmear and Couper showed that certain IM Al-Cu- Mg-Ag alloys possess superior elevated-temperature yield strength and creep/stress rupture properties over conven- tional AA2024, AA2219, and AA2618. [7] This improve- ment was attributed to the formation of a coherent precipitate phase, V, promoted by small Ag additions to an alloy with a sufficiently high Cu/Mg ratio. The V phase is a metastable variant of the equilibrium u (Al 2 Cu) phase, forming on {111} Al matrix planes as a uniform dispersion of thin hexagonal-shaped plates, [8] and is more resistant to MICHAEL J. HAYNES, formerly Graduate Research Assistant, Department of Materials Science and Engineering, University of Virginia, is Product Engineer, Texas Instruments, Inc., Attleboro, MA 02703. RICHARD P. GANGLOFF, Professor, is with the Department of Materials Science and Engineering, University of Virginia, Charlottesville, VA 22903-2442. Manuscript submitted November 18, 1996. coarsening than u '. [9,10] The elevated-temperature fracture behavior of Ag-modified Al-Cu-Mg alloys has not been de- fined. Ductile fracture of metals usually occurs by microvoid nucleation, growth, and coalescence, as reviewed in gen- eral [11–16] and specifically for aluminum alloys. [17–20] Impor- tant microstructural variables affecting the three stages of microvoiding in aluminum alloys, and hence the intrinsic fracture resistance, include size, spacing, and fracture be- havior of brittle constituent phases; [17–19] composition, size, and volume fraction of dispersoids; [15,18,19] slip mode as af- fected by precipitation hardening; [18,21] and grain boundary precipitation. [18,20] Continuum factors, including alloy yield strength, [11,13–15,17] strain hardening, [11,14–16,18] strain-rate hard- ening, [14] and stress-state triaxiality, [11,14,15] dictate the local stresses and strains that control the rates of void nucleation, growth, and coalescence. The effects of these factors on plane-strain fracture toughness are well defined for precip- itation-hardened aluminum alloys deformed at cryogenic to ambient temperatures [17,19] but not sufficiently for elevated temperatures. [3,22,23] Understanding of ductile fracture within the crack-tip process zone is derived by coupling micromechanical mod- eling and microstructural studies. Current models of micro- void fracture initiation toughness combine a measure of the intrinsic fracture resistance, crack-tip stress and strain dis- tributions, and a microstructural-based critical strain/critical distance failure criterion. [22,24–28] These models are tested ef- fectively by predicting and measuring the temperature de- pendence of fracture toughness, [22,26,27] but additional work is required. Experimental estimates of a constraint-sensitive intrinsic fracture strain [22,25–27,29,30] and the use of an adjust- able critical-distance parameter in modeling must be supplemented by microstructural studies of the strain-de- pendent progression of void nucleation, growth, and coa- lescence. [30–32] Results on stress-based void nucleation [33–35]
-
Upload
independent -
Category
Documents
-
view
4 -
download
0
Transcript of Elevated temperature fracture toughness of Al-Cu-Mg-Ag sheet: Characterization and modeling
METALLURGICAL AND MATERIALS TRANSACTIONS A VOLUME 28A, SEPTEMBER 1997—1815
Elevated Temperature Fracture Toughness of Al-Cu-Mg-AgSheet: Characterization and Modeling
MICHAEL J. HAYNES and RICHARD P. GANGLOFF
The plane-strain initiation fracture toughness (KJICi) and plane-stress crack growth resistance of twoAl-Cu-Mg-Ag alloy sheets are characterized as a function of temperature by a J-integral method.For AA2519 1 Mg 1 Ag, KJICi decreases from 32.5 MPa at 25 7C to 28.5 MPa at 175 7C,= =m mwhile KJICi for a lower Cu variant increases from 34.2 MPa at 25 7C to 36.0 MPa at 150 7C.= =m mCrack-tip damage in AA2519 1 Mg 1 Ag evolves by nucleation and growth of voids from largeundissolved Al2Cu particles, but fracture resistance is controlled by void sheeting coalescence as-sociated with dispersoids. Quantitative fractography, three-dimensional (3-D) reconstruction of frac-ture surfaces, and metallographic crack profiles indicate that void sheeting is retarded as temperatureincreases from 25 7C to 150 7C, consistent with a rising fracture resistance. Primary microvoidsnucleate from smaller constituent particles in the low Cu alloy, and fracture strain increases. A strain-controlled micromechanical model accurately predicts KJICi as a function of temperature, but includesa critical distance parameter (l*) that is not definable a priori. Nearly constant initiation toughnessfor AA2519 1 Mg 1 Ag is due to rising fracture strain with temperature, which balances the effectsof decreasing flow strength, work hardening, and elastic modulus on the crack-tip strain distribution.Ambient temperature toughnesses of the low Cu variant are comparable to those of AA2519 1 Mg1 Ag, despite increased fracture strain, because of reduced constituent spacing and l*.
I. INTRODUCTION
ALUMINUM alloys (AA) for the airframe of thehigh-speed civil transport (HSCT) will be required to main-tain microstructural stability, strength, and toughness attemperatures ranging from 100 7C to 200 7C for a life of60,000 hours.[1] Advanced ingot metallurgy (IM) alloys,rapidly solidified powder metallurgy (RS/PM) alloys, andmetal matrix composites are candidates. Selection of HSCTmaterials hinges on at least three critical issues: (1) inter-mediate loading-rate fracture toughness at ambient to ele-vated temperatures, (2) slow loading rate or creep crackgrowth fracture resistance at elevated temperatures, and (3)elevated-temperature thermal exposure effects on ambienttemperature fracture toughness. The first issue is consideredhere for two wrought IM Al-Cu-Mg-Ag alloys. Prior ther-mal exposure effects,[2] as well as static-load crack growthat elevated temperature,[3–6] are considered elsewhere.
Polmear and Couper showed that certain IM Al-Cu-Mg-Ag alloys possess superior elevated-temperature yieldstrength and creep/stress rupture properties over conven-tional AA2024, AA2219, and AA2618.[7] This improve-ment was attributed to the formation of a coherentprecipitate phase, V, promoted by small Ag additions to analloy with a sufficiently high Cu/Mg ratio. The V phase isa metastable variant of the equilibrium u (Al2Cu) phase,forming on {111} Al matrix planes as a uniform dispersionof thin hexagonal-shaped plates,[8] and is more resistant to
MICHAEL J. HAYNES, formerly Graduate Research Assistant,Department of Materials Science and Engineering, University of Virginia,is Product Engineer, Texas Instruments, Inc., Attleboro, MA 02703.RICHARD P. GANGLOFF, Professor, is with the Department ofMaterials Science and Engineering, University of Virginia, Charlottesville,VA 22903-2442.
Manuscript submitted November 18, 1996.
coarsening than u '.[9,10] The elevated-temperature fracturebehavior of Ag-modified Al-Cu-Mg alloys has not been de-fined.
Ductile fracture of metals usually occurs by microvoidnucleation, growth, and coalescence, as reviewed in gen-eral[11–16] and specifically for aluminum alloys.[17–20] Impor-tant microstructural variables affecting the three stages ofmicrovoiding in aluminum alloys, and hence the intrinsicfracture resistance, include size, spacing, and fracture be-havior of brittle constituent phases;[17–19] composition, size,and volume fraction of dispersoids;[15,18,19] slip mode as af-fected by precipitation hardening;[18,21] and grain boundaryprecipitation.[18,20] Continuum factors, including alloy yieldstrength,[11,13–15,17] strain hardening,[11,14–16,18] strain-rate hard-ening,[14] and stress-state triaxiality,[11,14,15] dictate the localstresses and strains that control the rates of void nucleation,growth, and coalescence. The effects of these factors onplane-strain fracture toughness are well defined for precip-itation-hardened aluminum alloys deformed at cryogenic toambient temperatures[17,19] but not sufficiently for elevatedtemperatures.[3,22,23]
Understanding of ductile fracture within the crack-tipprocess zone is derived by coupling micromechanical mod-eling and microstructural studies. Current models of micro-void fracture initiation toughness combine a measure of theintrinsic fracture resistance, crack-tip stress and strain dis-tributions, and a microstructural-based critical strain/criticaldistance failure criterion.[22,24–28] These models are tested ef-fectively by predicting and measuring the temperature de-pendence of fracture toughness,[22,26,27] but additional workis required. Experimental estimates of a constraint-sensitiveintrinsic fracture strain[22,25–27,29,30] and the use of an adjust-able critical-distance parameter in modeling must besupplemented by microstructural studies of the strain-de-pendent progression of void nucleation, growth, and coa-lescence.[30–32] Results on stress-based void nucleation[33–35]
1816—VOLUME 28A, SEPTEMBER 1997 METALLURGICAL AND MATERIALS TRANSACTIONS A
and strain-based void growth to coalescence[11,15,31,36] mustbe related to crack-tip damage and toughness prediction.
The objective of the current study is to quantitatively char-acterize and understand the temperature-dependent fracturebehavior of two IM Al-Cu-Mg-Ag alloys. Fracture experi-ments include initiation and growth toughness measurementsdetermined from J-integral resistance curves, as well as ex-tensive qualitative and quantitative fractography. A secondobjective is to test the capability of a strain-controlled mi-cromechanical model to predict elevated-temperature initia-tion toughness. Experiments are conducted to measureparameters associated with the model, including alloy flowproperties, stress-state-dependent fracture strain, constituentparticle spacing, and the character of void growth.
II. EXPERIMENTAL PROCEDURE
A. Material
The Aluminum Company of America (ALCOA Center,PA) supplied two alloys based on modified AA2519 chem-istries: (1) a 3.2-mm-thick, hot-rolled sheet of AA2519 1Mg 1 Ag with a measured composition in wt pct of5.75Cu, 0.52Mg, 0.49Ag, 0.30Mn, 0.16Zr, 0.09V, 0.06Fe,0.05Si, and balance aluminum, and (2) a 2.3-mm-thicksheet with a composition of 5.38Cu, 0.53Mg, 0.52Ag,0.31Mn, 0.12Zr, 0.07Fe, 0.05Si, and balance aluminum (al-loy C416). The AA2519 1 Mg 1 Ag was solution treatedat 529 7C for 1 hour, cold-water quenched, stretched 7 pct,and aged at 177 7C for 3 hours, producing a peak strength(T87) condition.[37] Alloy C416 was solution treated at 5297C for 0.33 hours, cold-water quenched, stretched 2 pct,and aged at 163 7C for 36 hours, producing a peak strength(T82) condition.[38]
Optical microscopy and scanning electron microscopy(SEM) were employed to analyze constituent distributions andtypes. Constituent particles in AA2519 1 Mg 1 Ag wereidentified qualitatively through SEM with energy dispersivespectroscopy (EDS). Constituent area fraction (Af) and sizedistribution were measured for both alloys by optical micros-copy and image analysis on polished surfaces of the threeprincipal planes of the sheet. The average radius (RO) and Af
were used to determine the constituent volume fraction (Vf 5Af) and the nearest-neighbor spacing in a volume (D3) betweenrandomly distributed spherical particles[39]
1/3pD 5 1.18 R [1]3 O ~ !6Vf
The microstructure of AA2519 1 Mg 1 Ag was ex-amined in detail. Grain structure was revealed by a 45-second Graff–Sargent etch followed by a 10-secondexposure to Keller’s etch. Dispersoids and precipitates wereresolved through transmission electron microscopy (TEM).The TEM disks were mechanically reduced to a thicknessof 150 mm and thinned by electrolytic polishing at 230 7Cin 30 pct HNO3 and 70 pct methanol solution.
B. Elastic-Plastic Fracture Toughness Experiments
Fracture toughness was characterized with thin-sheetcompact tension, CT, specimens and a J-integral-basedcrack growth resistance (J-Da) curve method detailed else-
where.[40] Specimens were machined in the LT orientation,*
*The loading direction is parallel to the rolling direction (L) of thesheet, and Mode I crack growth is parallel to the transverse direction (T).
with a width (W) of 76.2 mm and as-rolled thicknesses (B)of 3.2 and 2.3 mm for AA2519 1 Mg 1 Ag and C416,respectively. Specimens were fatigue cracked prior to frac-ture toughness experiments, at a constant stress ratio (R 5Kmin/Kmax) of 0.1 and under decreasing stress intensity (K)conditions (from a Kmax of 19.4 MPa at a/W of 0.4 to=m8.5 MPa at a/W of 0.6, where a is crack length).=m
Fracture toughness experiments were performed on aclosed-loop servoelectric testing system operated underconstant grip-displacement rate control. The CT specimenwas enclosed in a convective oven, heated to temperatureover a 30-minute interval, and stabilized for 30 minutesprior to loading. Crack length was monitored continuouslyduring the test by the direct-current electrical potential dif-ference (DCPD) method.[26,40,41] A linear variable differen-tial transformer (LVDT) measured notch mouth openingdisplacement for conversion to load-line displacement usinga geometric relationship.[42] The CT specimens were frac-tured at a constant load-line displacement rate (dd/dt) of0.26 mm/s, corresponding to crack initiation in about 40minutes and 3 mm of stable crack growth in 2.4 hours.
The J-integral accounts for uncracked ligament plasticityand was utilized to obtain both plane-strain initiation tough-ness and plane-stress crack growth resistance data.[43] TheJ-Da resistance curves were calculated according to ASTMStandard E 1152, and requirements of the standard weremet.[40,44] A displacement-rate partitioning analysis validatedJ as the correct crack-tip parameter at all test tempera-tures.[6,40,45]
Initiation fracture toughness (Ji) was defined by a changein slope of potential difference vs load-line displacementdata,[46,47] combined with a 0.2-mV potential difference off-set definition of crack initiation described elsewhere.[40] Thestress state at initiation was plane strain for all cases ex-amined, as established in Section III–B–1 and elsewhere.[40]
The Ji was converted to a plane-strain linear elastic initia-tion toughness (KJICi) by the relation[43]
1/2J EiK 5 [2]JICi ~ !21 2 n
The linear elastic R curve (KJ-Da) for small-scale yield-ing was determined from J-Da curves (KJ 5 (J * E)1/2) andgenerally described 45-deg-slant plane-stress cracking forDa above about 1.5 mm. A plane-stress tearing modulus( ) was defined from the average slope (dJ/dDa) of thepsTR
linear portion of the J-Da curve over 1.5 mm , Da , 3mm.*[24] At a crack extension of 2 mm, values of J (J2mm)
* 5 [ ](dJ/dDa), where the flow stress (sY) is estimated as theps 2T E/sR Y
average of the yield and ultimate tensile strengths.
and KJ ( ) were determined for each temperature. These2mmKJ
parameters rank plane-stress crack growth resistance, as de-tailed elsewhere.[40]
C. Fracture Surface Characterization
1. SEM fractographyPlane-strain fracture surfaces[40] at the midplane of the
CT specimen and within 500 mm of the fatigue precrack

METALLURGICAL AND MATERIALS TRANSACTIONS A VOLUME 28A, SEPTEMBER 1997—1817
tip, were analyzed for C416 fractured at 25 7C and AA25191 Mg 1 Ag fractured at 25 7C and 150 7C. For each case,a 500- by 500-mm montage was constructed with 30 (mag-nification 1000 times) fractographs, and the followingparameters were measured: (1) , the number of point hitsP'pin areal features per grid test point (an 850-point grid wasemployed, with each point spaced 10 mm apart);[48] (2) RD,the average radius of primary dimples nucleated at constit-uent particles; and (3) RI, the average radius of constituentparticles in primary dimples. For AA2519 1 Mg 1 Agfractured at 25 7C and 150 7C, RO from quantitative met-allography was used in place of RI, since most particles indimples were shattered. The extent of primary void growthwas characterized by RD/RI and RD/RO.
2. Fracture surface reconstructionThe 3-D morphologies of plane-strain crack surfaces
were reconstructed from stereo-pair fractographs (magnifi-cation 150 times). Reconstruction, based on the principleof stereoscopy, is described elsewhere.[49] The output of thereconstruction is a 300- by 300-pixel elevation map, whereeach pixel represents 1 mm2 and a 1-mm change in elevationis represented by a one-unit change in gray level (on a 256gray-level scale). From elevation maps, fracture surfaceprofiles were obtained along the crack growth and throughthickness directions. The lineal roughness parameter (RL)was calculated for each profile and defined as the true pro-file length divided by its projected length on the fractureplane.[48] Three-dimensional fracture surface maps wereconstructed by interpolation of more than 10,000 surfacecoordinates obtained from these profiles.
D. Fracture Toughness Model Inputs
Deformation and fracture properties are necessary inputsto model fracture toughness.
1. Uniaxial compression experimentsThe compressive flow properties of AA2519 1 Mg 1 Ag,
including the 0.2 pct offset yield strength ( ) and the strain-cs ys
hardening exponent (n), were measured as a function of tem-perature. Compression specimens, with a 2.6- by 2.6-mmsquare base and a height of 5.2 mm, were machined withthe long axis parallel to L. The compression fixture consistedof two aligned and interlocking four post cages that con-verted tensile motion to compressive force. An LVDT,mounted on the inner two compression plates, measured totaldisplacement to a resolution of 2 mm. The specimen wascentered between two Al2O3 platelets, lubricated with col-loidal graphite to minimize barreling, and deformed to 5 pcttrue strain at a constant cage displacement rate of 0.33 mm/s.The displacement rate corresponded to an average true strainrate of 6 3 1025 s21 over the full strain range.
The measured LVDT displacement equaled sample plas-tic displacement plus sample and fixture elastic displace-ments. Total elastic displacement was subtracted from eachLVDT measurement to give load vs sample plastic displace-ment data that were converted to true stress (s) vs trueplastic strain by the usual relations. The temperature de-pendence of the AA2519 1 Mg 1 Ag elastic modulus (E)was estimated with E vs temperature for pure aluminum,[50]
scaled to the ambient temperature modulus of AA2519 1Mg 1 Ag (E 5 72.4 GPa). Elastic strain, based on theestimated modulus, was added to plastic strain to obtain ε.
The Ramberg–Osgood (R–O) constitutive equation (ε/ε0
5 s/s0 1 k(s/s0)1/n) was fit to compression s-ε data.[51]
Fitting parameters include a reference stress (s0), a refer-ence strain (ε0) given by s0/E, a constant (k), and the in-verse of the work-hardening exponent (1/n). From 1.0 to5.0 pct true strain, 1/n was determined from the linear re-gression slope of true plastic strain vs true stress plottedlogarithmically.[52] The parameters s0 and k are not inde-pendent; assuming a value of one for k yielded reasonables0 values and accurate curve fits.
2. Tensile experimentsThe L-oriented round tensile bars of AA2519 1 Mg 1
Ag and C416, with a 19.1-mm gage length and a 1.6-mmdiameter, were strained to failure at a grip displacement rateof 1 3 1023 mm/s or an initial true strain rate of 6 3 1025
s21. The 0.2 pct offset tensile yield strength ( ), ultimatetsys
tensile strength (suts), and percentage reduction in area (RA)were ascertained at each fracture toughness testing temper-ature for AA2519 1 Mg 1 Ag, and at 25 7C for C416.
The L-oriented, circumferentially notched tensile speci-mens of AA2519 1 Mg 1 Ag, with varying notch acuity,were fractured to establish a stress-state-dependent fracturestrain locus ( (sm/sfl)) for AA2519 1 Mg 1 Ag. Stress-pεf
state triaxiality was expressed as the ratio of mean stress(sm) to effective flow stress (sfl) and depended on notchgeometry according to[30,53–55]
s 1 dm 5 1 ln 1 1 [3]~ ! ~ !s 3 4Rf l
The initial notch-root profile radius (Ri) for a semicircularnotch was varied, at a constant initial notch-root diameter(di) of 1.6 mm, to obtain five initial constraint levels: sm/sfl
values of 1.54, 1.13, 0.77, 0.55, and 0.33. The later ratiocorresponds to a uniform-gage, uniaxial tensile specimen.The small size of the notch precluded continuous measure-ment of notch-root contraction with a diametral extensom-eter. The diameter at failure (df) was determined to aresolution of 2.5 mm from four equally spaced diametralmeasurements of the fracture surface. Effective plasticstrain at fracture ( ) depends on diametral contraction or,pεf
equivalently, RA according to[30]
d RAipε 5 2 ln 5 2ln 1 2 [4]f ~ ! ~ !d 100f
Since d and R were not monitored during testing, waspε f
related to the initial stress-state triaxiality.
III. RESULTS
A. Microstructure
1. Constituent particlesA bimodal distribution of constituent particles is present
in AA2519 1 Mg 1 Ag, as shown in Figure 1(a). Onepopulation consists of inhomogenously distributed andcracked large particles, while the second consists of smallerparticles visible in the background. Based on the smallestparticles observed in primary* dimples on fracture surfaces,constituent
*‘‘Primary’’ voids nucleate from the dominant population of constituentparticles,[11] as inferred by fractography.
1818—VOLUME 28A, SEPTEMBER 1997 METALLURGICAL AND MATERIALS TRANSACTIONS A
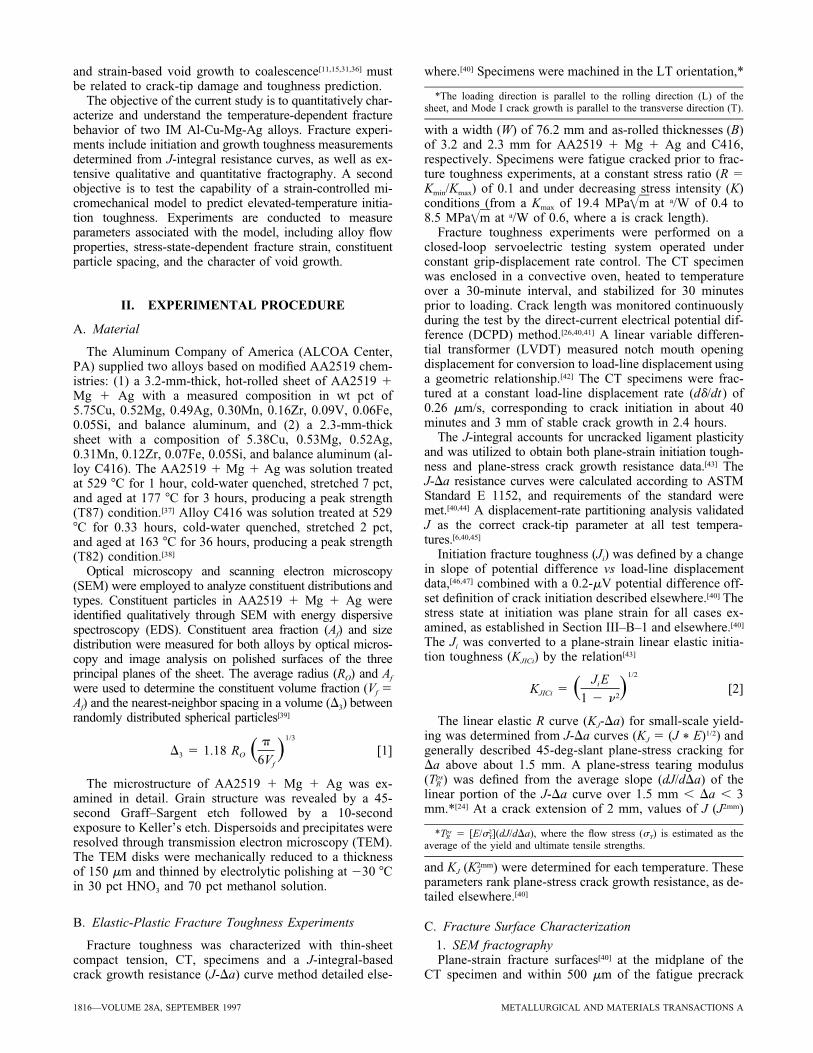
(a)
(b)
Fig. 1—Optical micrographs of (a) AA2519 1 Mg 1 Ag and (b) C416.The directions marked L, T, and S represent the rolling, transverse, andshort transverse directions in the sheet, respectively.
diameters less than 2.5 mm were not included in Vf and D3
determinations. For the large particles, Vf is 0.012, RO is2.85 mm, and D3 is 11.8 mm. Based on EDS, most of theseconstituents are undissolved u (Al2Cu), although Al-Cu-Mn-Fe particles were also detected. Constituent particles inC416 are substantially smaller and more uniformly distrib-uted relative to the population of larger particles in AA25191 Mg 1 Ag, as shown in Figure 1(b). For particles largerthan 1 mm in diameter, Vf equals 0.011, RO equals 1.0 mm,and D3 equals 4.3 mm.
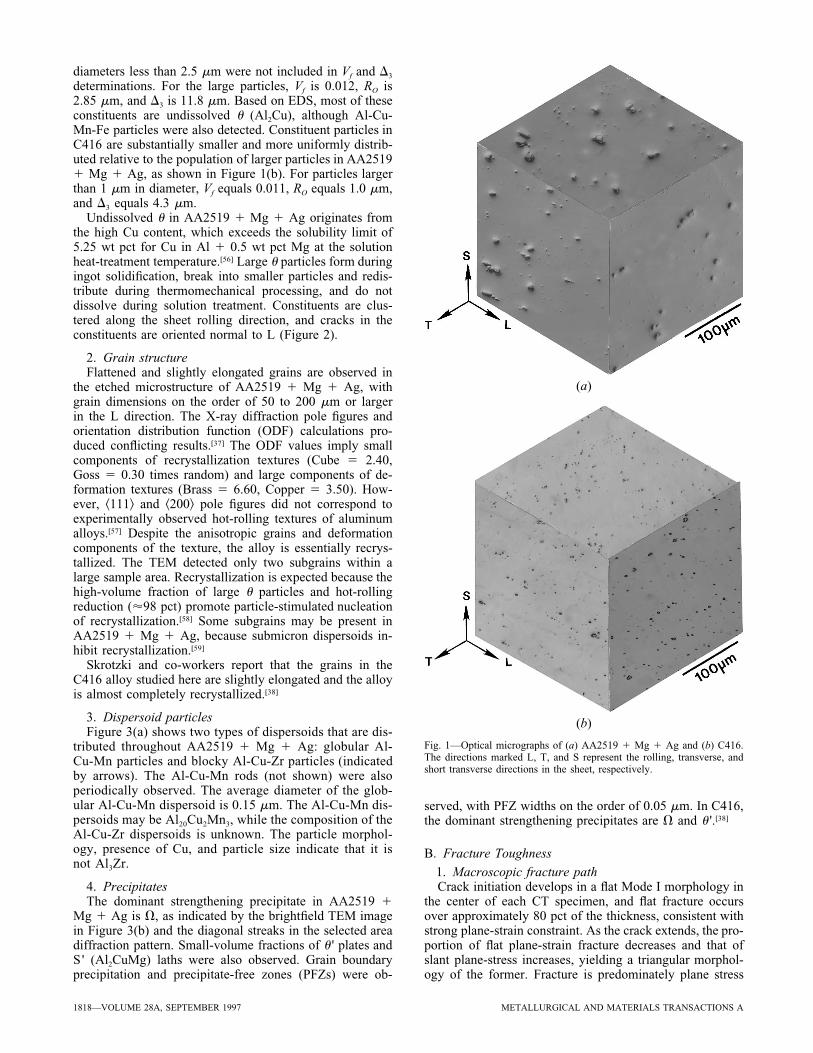
Undissolved u in AA2519 1 Mg 1 Ag originates fromthe high Cu content, which exceeds the solubility limit of5.25 wt pct for Cu in Al 1 0.5 wt pct Mg at the solutionheat-treatment temperature.[56] Large u particles form duringingot solidification, break into smaller particles and redis-tribute during thermomechanical processing, and do notdissolve during solution treatment. Constituents are clus-tered along the sheet rolling direction, and cracks in theconstituents are oriented normal to L (Figure 2).
2. Grain structureFlattened and slightly elongated grains are observed in
the etched microstructure of AA2519 1 Mg 1 Ag, withgrain dimensions on the order of 50 to 200 mm or largerin the L direction. The X-ray diffraction pole figures andorientation distribution function (ODF) calculations pro-duced conflicting results.[37] The ODF values imply smallcomponents of recrystallization textures (Cube 5 2.40,Goss 5 0.30 times random) and large components of de-formation textures (Brass 5 6.60, Copper 5 3.50). How-ever, ^111& and ^200& pole figures did not correspond toexperimentally observed hot-rolling textures of aluminumalloys.[57] Despite the anisotropic grains and deformationcomponents of the texture, the alloy is essentially recrys-tallized. The TEM detected only two subgrains within alarge sample area. Recrystallization is expected because thehigh-volume fraction of large u particles and hot-rollingreduction ('98 pct) promote particle-stimulated nucleationof recrystallization.[58] Some subgrains may be present inAA2519 1 Mg 1 Ag, because submicron dispersoids in-hibit recrystallization.[59]
Skrotzki and co-workers report that the grains in theC416 alloy studied here are slightly elongated and the alloyis almost completely recrystallized.[38]
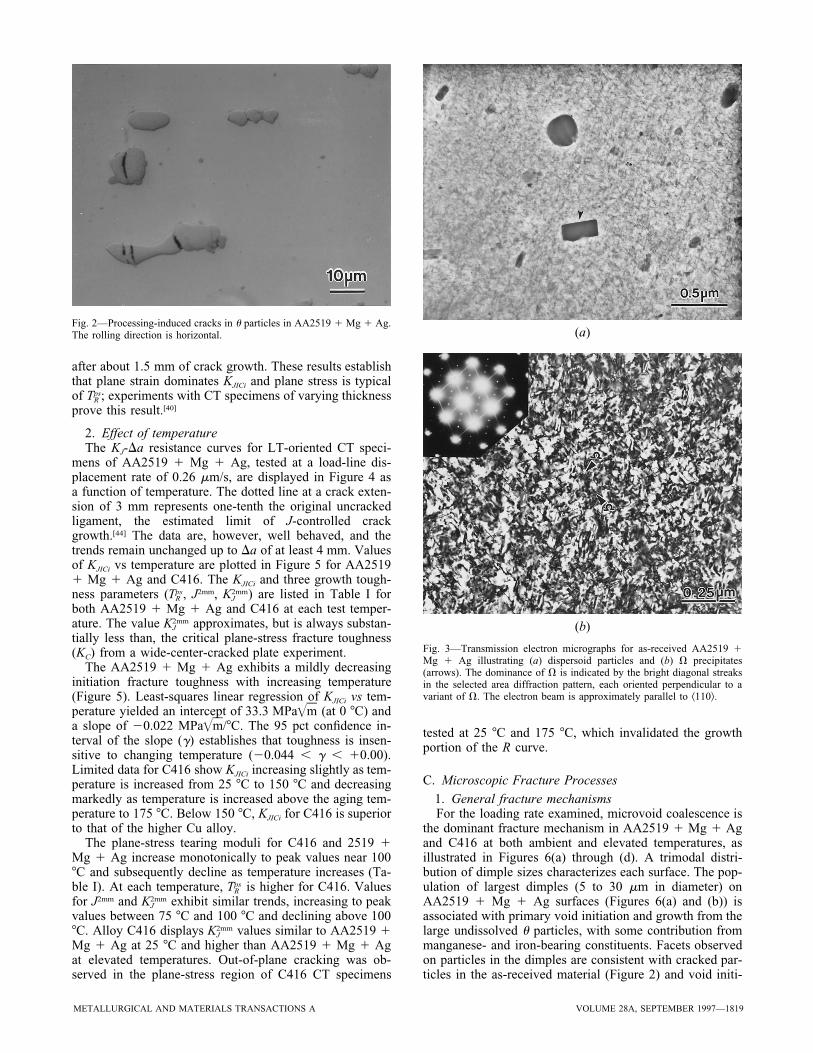
3. Dispersoid particlesFigure 3(a) shows two types of dispersoids that are dis-
tributed throughout AA2519 1 Mg 1 Ag: globular Al-Cu-Mn particles and blocky Al-Cu-Zr particles (indicatedby arrows). The Al-Cu-Mn rods (not shown) were alsoperiodically observed. The average diameter of the glob-ular Al-Cu-Mn dispersoid is 0.15 mm. The Al-Cu-Mn dis-persoids may be Al20Cu2Mn3, while the composition of theAl-Cu-Zr dispersoids is unknown. The particle morphol-ogy, presence of Cu, and particle size indicate that it isnot Al3Zr.
4. PrecipitatesThe dominant strengthening precipitate in AA2519 1
Mg 1 Ag is V, as indicated by the brightfield TEM imagein Figure 3(b) and the diagonal streaks in the selected areadiffraction pattern. Small-volume fractions of u ' plates andS' (Al2CuMg) laths were also observed. Grain boundaryprecipitation and precipitate-free zones (PFZs) were ob-
served, with PFZ widths on the order of 0.05 mm. In C416,the dominant strengthening precipitates are V and u '.[38]
B. Fracture Toughness
1. Macroscopic fracture pathCrack initiation develops in a flat Mode I morphology in
the center of each CT specimen, and flat fracture occursover approximately 80 pct of the thickness, consistent withstrong plane-strain constraint. As the crack extends, the pro-portion of flat plane-strain fracture decreases and that ofslant plane-stress increases, yielding a triangular morphol-ogy of the former. Fracture is predominately plane stress
METALLURGICAL AND MATERIALS TRANSACTIONS A VOLUME 28A, SEPTEMBER 1997—1819
Fig. 2—Processing-induced cracks in u particles in AA2519 1 Mg 1 Ag.The rolling direction is horizontal. (a)
(b)
Fig. 3—Transmission electron micrographs for as-received AA2519 1Mg 1 Ag illustrating (a) dispersoid particles and (b) V precipitates(arrows). The dominance of V is indicated by the bright diagonal streaksin the selected area diffraction pattern, each oriented perpendicular to avariant of V. The electron beam is approximately parallel to ^110&.
after about 1.5 mm of crack growth. These results establishthat plane strain dominates KJICi and plane stress is typicalof ; experiments with CT specimens of varying thicknesspsTR
prove this result.[40]
2. Effect of temperatureThe KJ-Da resistance curves for LT-oriented CT speci-
mens of AA2519 1 Mg 1 Ag, tested at a load-line dis-placement rate of 0.26 mm/s, are displayed in Figure 4 asa function of temperature. The dotted line at a crack exten-sion of 3 mm represents one-tenth the original uncrackedligament, the estimated limit of J-controlled crackgrowth.[44] The data are, however, well behaved, and thetrends remain unchanged up to Da of at least 4 mm. Valuesof KJICi vs temperature are plotted in Figure 5 for AA25191 Mg 1 Ag and C416. The KJICi and three growth tough-ness parameters ( , J2mm, ) are listed in Table I forps 2mmT KR J
both AA2519 1 Mg 1 Ag and C416 at each test temper-ature. The value approximates, but is always substan-2mmKJ
tially less than, the critical plane-stress fracture toughness(KC) from a wide-center-cracked plate experiment.
The AA2519 1 Mg 1 Ag exhibits a mildly decreasinginitiation fracture toughness with increasing temperature(Figure 5). Least-squares linear regression of KJICi vs tem-perature yielded an intercept of 33.3 (at 0 7C) and=MPa ma slope of 20.022 /7C. The 95 pct confidence in-=MPa mterval of the slope (g) establishes that toughness is insen-sitive to changing temperature (20.044 , g , 10.00).Limited data for C416 show KJICi increasing slightly as tem-perature is increased from 25 7C to 150 7C and decreasingmarkedly as temperature is increased above the aging tem-perature to 175 7C. Below 150 7C, KJICi for C416 is superiorto that of the higher Cu alloy.
The plane-stress tearing moduli for C416 and 2519 1Mg 1 Ag increase monotonically to peak values near 1007C and subsequently decline as temperature increases (Ta-ble I). At each temperature, is higher for C416. ValuespsTR
for J2mm and exhibit similar trends, increasing to peak2mmKJ
values between 75 7C and 100 7C and declining above 1007C. Alloy C416 displays values similar to AA2519 12mmKJ
Mg 1 Ag at 25 7C and higher than AA2519 1 Mg 1 Agat elevated temperatures. Out-of-plane cracking was ob-served in the plane-stress region of C416 CT specimens
tested at 25 7C and 175 7C, which invalidated the growthportion of the R curve.
C. Microscopic Fracture Processes
1. General fracture mechanismsFor the loading rate examined, microvoid coalescence is
the dominant fracture mechanism in AA2519 1 Mg 1 Agand C416 at both ambient and elevated temperatures, asillustrated in Figures 6(a) through (d). A trimodal distri-bution of dimple sizes characterizes each surface. The pop-ulation of largest dimples (5 to 30 mm in diameter) onAA2519 1 Mg 1 Ag surfaces (Figures 6(a) and (b)) isassociated with primary void initiation and growth from thelarge undissolved u particles, with some contribution frommanganese- and iron-bearing constituents. Facets observedon particles in the dimples are consistent with cracked par-ticles in the as-received material (Figure 2) and void initi-

1820—VOLUME 28A, SEPTEMBER 1997 METALLURGICAL AND MATERIALS TRANSACTIONS A
Fig. 4—KJ-Da data as a function of temperature for AA2519 1 Mg 1Ag.
Fig. 5—Initiation fracture toughness as a function of temperature forAA2519 1 Mg 1 Ag and C416; load-line displacement rate 5 0.26 mm/s.
Table I. Temperature-Dependent Initiation and GrowthToughnesses of AA2519 1 Mg 1 Ag and C416
Temperature(7C)
Variant of2519
KJICi
=(MPa m) TRps
J 2mm
(kJ/m2)KJ
2mm
=(MPa m)
25 1Mg 1 Ag 31.4 4.0 110.4 89.430.4 5.4 106.0 87.635.8 — — —
75 1Mg 1 Ag 32.6 7.0 125.0 92.5100 1Mg 1 Ag 30.2 7.2 120.4 90.2125 1Mg 1 Ag 31.5 6.6 115.7 87.6150 1Mg 1 Ag 31.0 6.4 93.1 77.7
29.4 — — —30.3 — — —
175 1Mg 1 Ag 28.5 5.5 68.4 66.025 C416 35.3 6.3 105.2 87.3
36.7 6.0 104.0 86.830.6 OOP* OOP OOP
75 C416 36.3 8.8 152.5 102.1100 C416 36.9 11.8 177.1 109.4150 C416 36.0 11.5 145.7 95.0175 C416 25.7 OOP* OOP OOP
*Out-of-plane crack growth.
ation due to particle fracture. Intermediate-sized dimplesare associated with void initiation and growth from thesmall constituent particles. The primary dimples in C416are of intermediate size, consistent with the smaller con-stituents observed in Figure 1(b).
During void coalescence, sheets of small voids nucleate,grow, and coalesce from dispersoid particles to form voidsheets in strain-localized regions between primary voids(some examples are marked by ‘‘vs’’ in Figures 6(a)through (d)).[15,32] Void sheets truncate the growth of pri-mary voids and thus reduce the fracture strain. From thereconstructed profiles, void sheets are calculated to propa-gate 55 deg from the Mode I crack plane on average andat angles ranging between 30 and 80 deg. Extensive 3-Dstereographic viewing enabled identification of void sheetslike those shown in Figure 6 and showed more dominantvoid sheeting at 25 7C compared to 150 7C.
A minority feature is intergranular or grain boundaryductile fracture (some examples are marked by ‘‘i’’ in Fig-ures 6(a) through (d)). These features appear as very finedimples on a facet.
2. Quantitative fractographyTable II summarizes the quantitative fracture surface in-
formation derived from fractograph montages of C416 frac-tured at 25 7C and AA2519 1 Mg 1 Ag fractured at 257C and 150 7C. The percentage of grid points associatedwith dimples nucleated from large constituents decreasesfrom 38.2 to 29.4 pct as the fracture temperature forAA2519 1 Mg 1 Ag increases from 25 7C to 150 7C.Similarly, the percentage of points associated with voidsheets decreases from 41.4 to 37.0 pct as temperature isincreased. The decreasing fraction of these two features isbalanced by an increase in the percentage of intermediate-sized dimples from 18.6 to 31.1 pct. At both temperatures,the percentage of intergranular facets associated with grainboundary ductile fracture is very small. For C416 fracturedat 25 7C, the percentage of grid points for large constituentdimples is very small (2.5 pct). Primary void nucleation andgrowth in this alloy is controlled by smaller constituents,which account for 57.4 pct of the grid points. The per-centage of points for void sheets equals 24.8 pct, which issmaller than the percentages for AA2159 1 Mg 1 Ag at
both ambient and elevated temperatures. The percentage ofintergranular facets is modest in C416, equaling 15.3 pct at25 7C. Statistical analysis is not possible for these results,but the modest percentage differences are likely meaningfulgiven the large (850-point) grid.
Primary void size increases as temperature increases forAA2519 1 Mg 1 Ag. The value of RD increases from 9.25 0.7 mm at 25 7C to 10.8 5 0.8 mm at 150 7C, basedon a 95 pct confidence level. Consequently, the primaryvoid growth ratio (RD/RO) increases from 3.2 5 0.2 to 3.85 0.3 (Table II). The average RD/RO at 25 7C is statisticallysmaller than this ratio at 150 7C, by 0.6 5 0.4.
For C416, RD equals 4.8 mm, which is substantiallysmaller than primary void sizes in AA2519 1 Mg 1 Ag.However, RD/RO is higher for C416, since RO equals 0.99mm. The ratio RD/RI evaluated for each void is inverselyrelated to RI. Average RD/RI equals 5.1 5 0.4, although theconfidence interval has little meaning in the context of theinverse relationship.

METALLURGICAL AND MATERIALS TRANSACTIONS A VOLUME 28A, SEPTEMBER 1997—1821
(a) (b)
(c) (d)
Fig. 6—SEM fractography of microvoid fracture in AA2519 1 Mg 1 Ag and C416 demonstrating primary void nucleation at large constituents and voidsheeting (vs) in AA2519 1 Mg 1 Ag at (a) 25 7C and (b) 150 7C, and primary void nucleation at smaller constituents, intergranular ductile fracture (i),and void sheeting in C416 at (c) 25 7C and (d ) 150 7C. Micrographs were taken from the midplane of the plane strain fracture surface and just beyondthe fatigue precrack tip. The crack growth direction is from bottom to top.
Table II. Quantitative Fractography Data for C416 and AA2519 1 Mg 1 Ag
Alloy:Fracture Temperature:
AA2519 1 Mg 1 Ag25 7C
AA2519 1 Mg 1 Ag150 7C
C41625 7C
Pp' - Large constituent dimples 0.382 0.294 0.025Pp' - Small constituent dimples 0.186 0.311 0.574Pp' - Void sheets 0.414 0.370 0.248Pp' - Intergranular 0.018 0.025 0.153Primary dimple radius, RD (mm) 9.2 5 0.7 10.8 5 0.8 4.8 5 0.4Primary particle radius, RI (mm) — — 0.93 5 0.1Primary particle radius, RO (mm) 2.85 5 0.08 2.85 5 0.08 0.99 5 0.02Primary void growth ratio, RD /RI — — 5.1 5 0.4Primary void growth ratio, RD /RO 3.2 5 0.2 3.8 5 0.3 4.8 5 0.4Lineal roughness parameter, RL 1.56 5 0.04 1.44 5 0.03 —
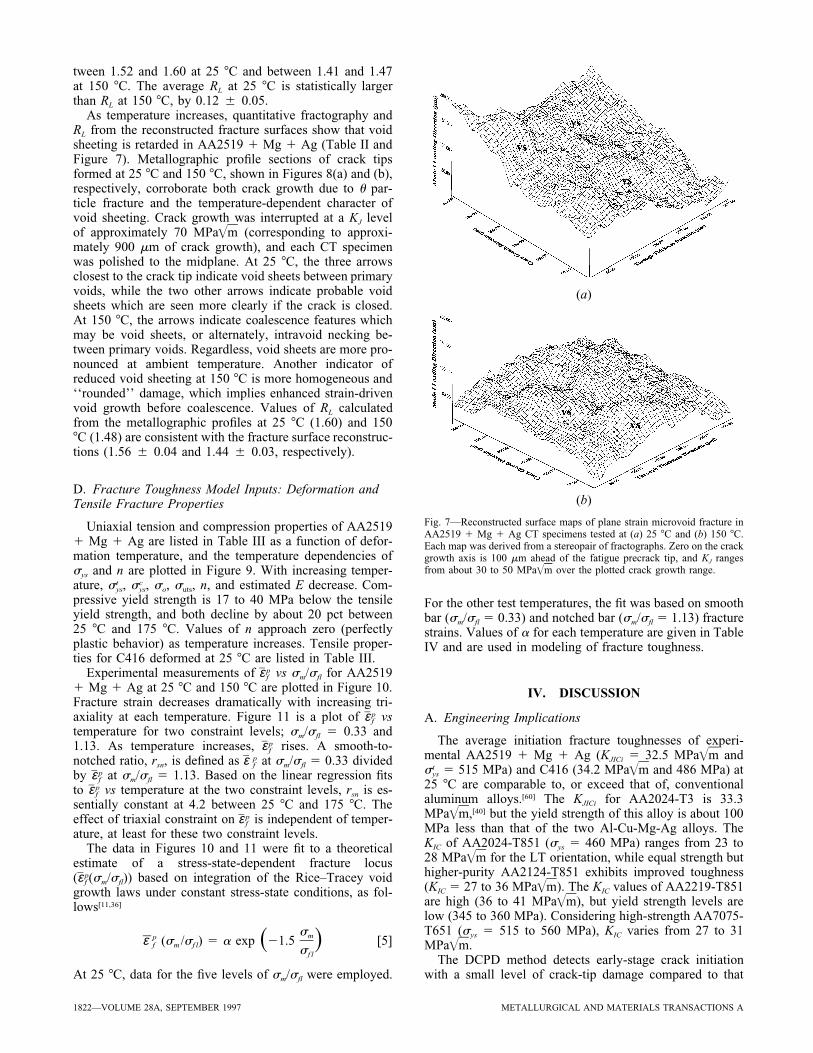
Three-dimensional surface maps from reconstructions areshown in Figures 7(a) and (b) for AA2519 1 Mg 1 Agfractured at 25 7C and 150 7C, respectively. Elevationchanges associated with void sheeting (some examples aremarked by ‘‘vs’’) are significantly larger at 25 7C. Fracture
surface roughness, parallel to the Mode I loading direction,is quantified with the lineal roughness parameter RL (TableII) and reflects directly the amount of void sheeting. To a99 pct degree of confidence, the surface is significantlyrougher at ambient temperature; the true average RL is be-
1822—VOLUME 28A, SEPTEMBER 1997 METALLURGICAL AND MATERIALS TRANSACTIONS A
(a)
(b)
Fig. 7—Reconstructed surface maps of plane strain microvoid fracture inAA2519 1 Mg 1 Ag CT specimens tested at (a) 25 7C and (b) 150 7C.Each map was derived from a stereopair of fractographs. Zero on the crackgrowth axis is 100 mm ahead of the fatigue precrack tip, and KJ rangesfrom about 30 to 50 MPa over the plotted crack growth range.=m
tween 1.52 and 1.60 at 25 7C and between 1.41 and 1.47at 150 7C. The average RL at 25 7C is statistically largerthan RL at 150 7C, by 0.12 5 0.05.
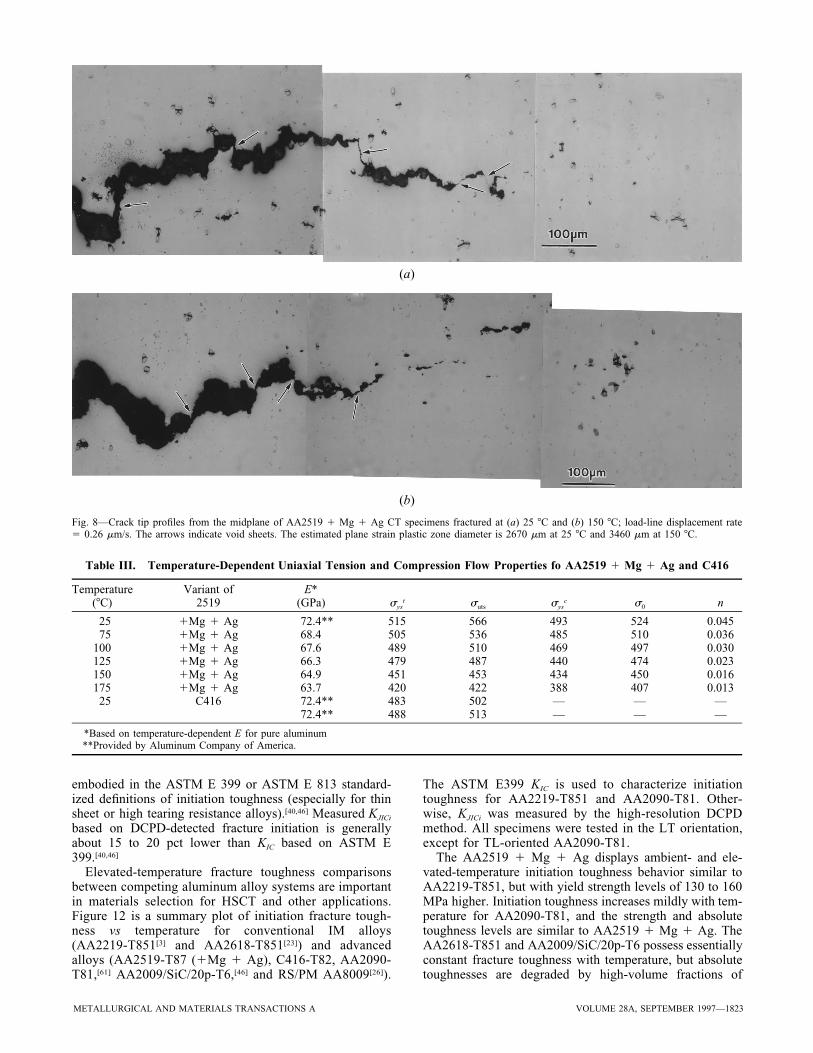
As temperature increases, quantitative fractography andRL from the reconstructed fracture surfaces show that voidsheeting is retarded in AA2519 1 Mg 1 Ag (Table II andFigure 7). Metallographic profile sections of crack tipsformed at 25 7C and 150 7C, shown in Figures 8(a) and (b),respectively, corroborate both crack growth due to u par-ticle fracture and the temperature-dependent character ofvoid sheeting. Crack growth was interrupted at a KJ levelof approximately 70 MPa (corresponding to approxi-=mmately 900 mm of crack growth), and each CT specimenwas polished to the midplane. At 25 7C, the three arrowsclosest to the crack tip indicate void sheets between primaryvoids, while the two other arrows indicate probable voidsheets which are seen more clearly if the crack is closed.At 150 7C, the arrows indicate coalescence features whichmay be void sheets, or alternately, intravoid necking be-tween primary voids. Regardless, void sheets are more pro-nounced at ambient temperature. Another indicator ofreduced void sheeting at 150 7C is more homogeneous and‘‘rounded’’ damage, which implies enhanced strain-drivenvoid growth before coalescence. Values of RL calculatedfrom the metallographic profiles at 25 7C (1.60) and 1507C (1.48) are consistent with the fracture surface reconstruc-tions (1.56 5 0.04 and 1.44 5 0.03, respectively).
D. Fracture Toughness Model Inputs: Deformation andTensile Fracture Properties
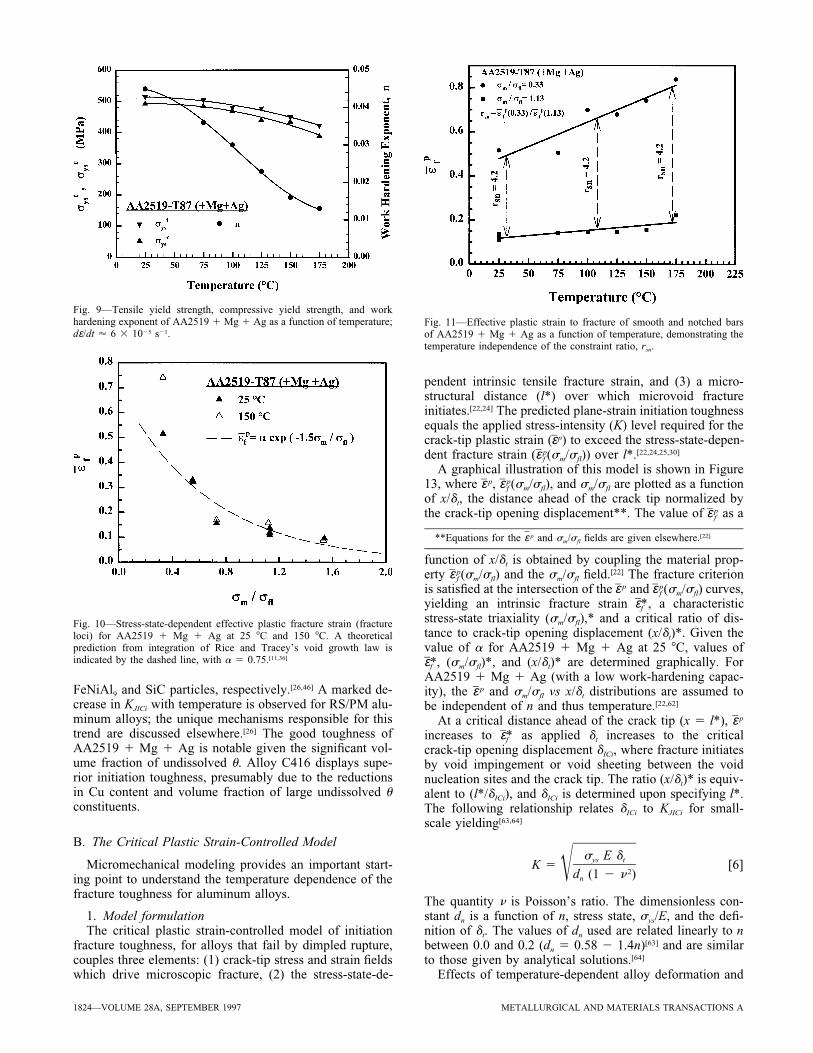
Uniaxial tension and compression properties of AA25191 Mg 1 Ag are listed in Table III as a function of defor-mation temperature, and the temperature dependencies ofsys and n are plotted in Figure 9. With increasing temper-ature, , , so, suts, n, and estimated E decrease. Com-t cs sys ys
pressive yield strength is 17 to 40 MPa below the tensileyield strength, and both decline by about 20 pct between25 7C and 175 7C. Values of n approach zero (perfectlyplastic behavior) as temperature increases. Tensile proper-ties for C416 deformed at 25 7C are listed in Table III.
Experimental measurements of vs sm/sfl for AA2519pε f
1 Mg 1 Ag at 25 7C and 150 7C are plotted in Figure 10.Fracture strain decreases dramatically with increasing tri-axiality at each temperature. Figure 11 is a plot of vspε f
temperature for two constraint levels; sm/sfl 5 0.33 and1.13. As temperature increases, rises. A smooth-to-pε f
notched ratio, rsn, is defined as at sm/sfl 5 0.33 dividedpε f
by at sm/sfl 5 1.13. Based on the linear regression fitspε f
to vs temperature at the two constraint levels, rsn is es-pε f
sentially constant at 4.2 between 25 7C and 175 7C. Theeffect of triaxial constraint on is independent of temper-pε f
ature, at least for these two constraint levels.The data in Figures 10 and 11 were fit to a theoretical
estimate of a stress-state-dependent fracture locus( (sm/sfl)) based on integration of the Rice–Tracey voidpε f
growth laws under constant stress-state conditions, as fol-lows[11,36]
smpε (s /s ) 5 a exp 21.5 [5]f m f l ~ !sf l
At 25 7C, data for the five levels of sm/sfl were employed.
For the other test temperatures, the fit was based on smoothbar (sm/sfl 5 0.33) and notched bar (sm/sfl 5 1.13) fracturestrains. Values of a for each temperature are given in TableIV and are used in modeling of fracture toughness.
IV. DISCUSSION
A. Engineering Implications
The average initiation fracture toughnesses of experi-mental AA2519 1 Mg 1 Ag (KJICi 5 32.5 MPa and=m
5 515 MPa) and C416 (34.2 MPa and 486 MPa) att =s mys
25 7C are comparable to, or exceed that of, conventionalaluminum alloys.[60] The KJICi for AA2024-T3 is 33.3MPa ,[40] but the yield strength of this alloy is about 100=mMPa less than that of the two Al-Cu-Mg-Ag alloys. TheKIC of AA2024-T851 (sys 5 460 MPa) ranges from 23 to28 MPa for the LT orientation, while equal strength but=mhigher-purity AA2124-T851 exhibits improved toughness(KIC 5 27 to 36 MPa ). The KIC values of AA2219-T851=mare high (36 to 41 MPa ), but yield strength levels are=mlow (345 to 360 MPa). Considering high-strength AA7075-T651 (sys 5 515 to 560 MPa), KIC varies from 27 to 31MPa .=m
The DCPD method detects early-stage crack initiationwith a small level of crack-tip damage compared to that
METALLURGICAL AND MATERIALS TRANSACTIONS A VOLUME 28A, SEPTEMBER 1997—1823
(a)
(b)
Fig. 8—Crack tip profiles from the midplane of AA2519 1 Mg 1 Ag CT specimens fractured at (a) 25 7C and (b) 150 7C; load-line displacement rate5 0.26 mm/s. The arrows indicate void sheets. The estimated plane strain plastic zone diameter is 2670 mm at 25 7C and 3460 mm at 150 7C.
Table III. Temperature-Dependent Uniaxial Tension and Compression Flow Properties fo AA2519 1 Mg 1 Ag and C416
Temperature(7C)
Variant of2519
E*(GPa) sys
t suts sysc s0 n
25 1Mg 1 Ag 72.4** 515 566 493 524 0.04575 1Mg 1 Ag 68.4 505 536 485 510 0.036
100 1Mg 1 Ag 67.6 489 510 469 497 0.030125 1Mg 1 Ag 66.3 479 487 440 474 0.023150 1Mg 1 Ag 64.9 451 453 434 450 0.016175 1Mg 1 Ag 63.7 420 422 388 407 0.013
25 C416 72.4** 483 502 — — —72.4** 488 513 — — —
*Based on temperature-dependent E for pure aluminum**Provided by Aluminum Company of America.
embodied in the ASTM E 399 or ASTM E 813 standard-ized definitions of initiation toughness (especially for thinsheet or high tearing resistance alloys).[40,46] Measured KJICi
based on DCPD-detected fracture initiation is generallyabout 15 to 20 pct lower than KIC based on ASTM E399.[40,46]
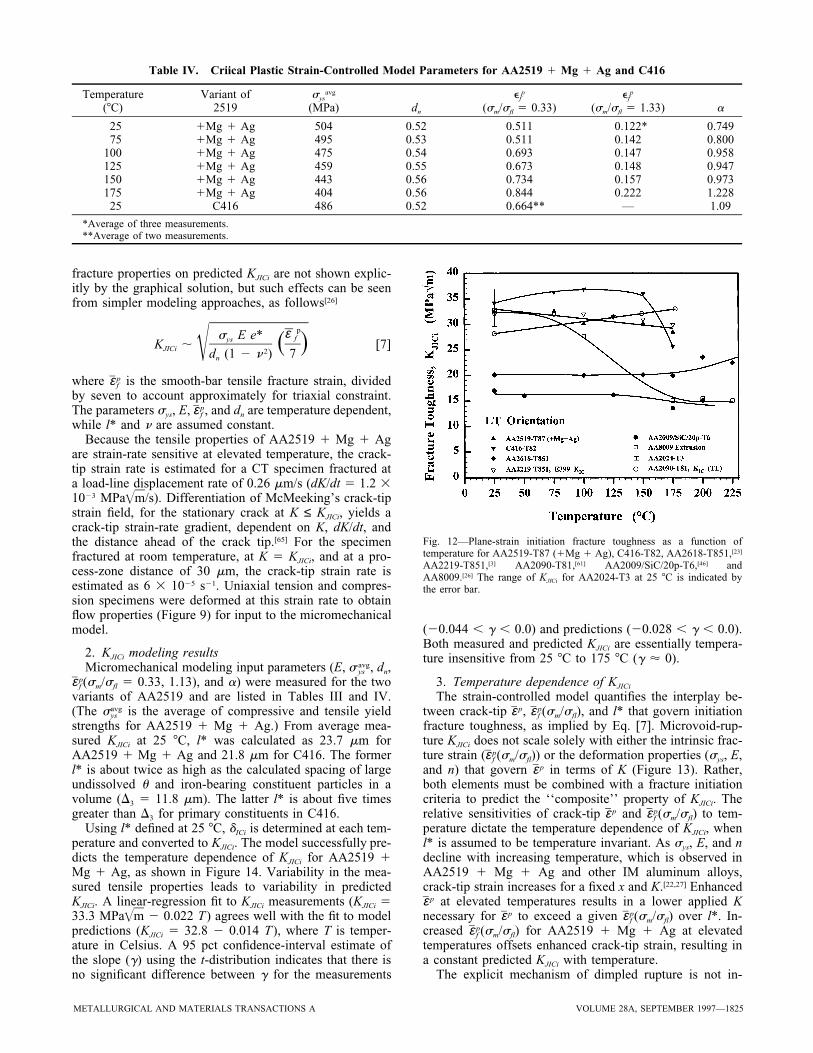
Elevated-temperature fracture toughness comparisonsbetween competing aluminum alloy systems are importantin materials selection for HSCT and other applications.Figure 12 is a summary plot of initiation fracture tough-ness vs temperature for conventional IM alloys(AA2219-T851[3] and AA2618-T851[23]) and advancedalloys (AA2519-T87 (1Mg 1 Ag), C416-T82, AA2090-T81,[61] AA2009/SiC/20p-T6,[46] and RS/PM AA8009[26]).
The ASTM E399 KIC is used to characterize initiationtoughness for AA2219-T851 and AA2090-T81. Other-wise, KJICi was measured by the high-resolution DCPDmethod. All specimens were tested in the LT orientation,except for TL-oriented AA2090-T81.
The AA2519 1 Mg 1 Ag displays ambient- and ele-vated-temperature initiation toughness behavior similar toAA2219-T851, but with yield strength levels of 130 to 160MPa higher. Initiation toughness increases mildly with tem-perature for AA2090-T81, and the strength and absolutetoughness levels are similar to AA2519 1 Mg 1 Ag. TheAA2618-T851 and AA2009/SiC/20p-T6 possess essentiallyconstant fracture toughness with temperature, but absolutetoughnesses are degraded by high-volume fractions of
1824—VOLUME 28A, SEPTEMBER 1997 METALLURGICAL AND MATERIALS TRANSACTIONS A
Fig. 9—Tensile yield strength, compressive yield strength, and workhardening exponent of AA2519 1 Mg 1 Ag as a function of temperature;dε/dt ' 6 3 1025 s21.
Fig. 10—Stress-state-dependent effective plastic fracture strain (fractureloci) for AA2519 1 Mg 1 Ag at 25 7C and 150 7C. A theoreticalprediction from integration of Rice and Tracey’s void growth law isindicated by the dashed line, with a 5 0.75.[11,36]
Fig. 11—Effective plastic strain to fracture of smooth and notched barsof AA2519 1 Mg 1 Ag as a function of temperature, demonstrating thetemperature independence of the constraint ratio, rsn.
FeNiAl9 and SiC particles, respectively.[26,46] A marked de-crease in KJICi with temperature is observed for RS/PM alu-minum alloys; the unique mechanisms responsible for thistrend are discussed elsewhere.[26] The good toughness ofAA2519 1 Mg 1 Ag is notable given the significant vol-ume fraction of undissolved u. Alloy C416 displays supe-rior initiation toughness, presumably due to the reductionsin Cu content and volume fraction of large undissolved uconstituents.
B. The Critical Plastic Strain-Controlled Model
Micromechanical modeling provides an important start-ing point to understand the temperature dependence of thefracture toughness for aluminum alloys.
1. Model formulationThe critical plastic strain-controlled model of initiation
fracture toughness, for alloys that fail by dimpled rupture,couples three elements: (1) crack-tip stress and strain fieldswhich drive microscopic fracture, (2) the stress-state-de-
pendent intrinsic tensile fracture strain, and (3) a micro-structural distance (l*) over which microvoid fractureinitiates.[22,24] The predicted plane-strain initiation toughnessequals the applied stress-intensity (K) level required for thecrack-tip plastic strain ( p) to exceed the stress-state-depen-εdent fracture strain ( (sm/sfl)) over l*.[22,24,25,30]pε f
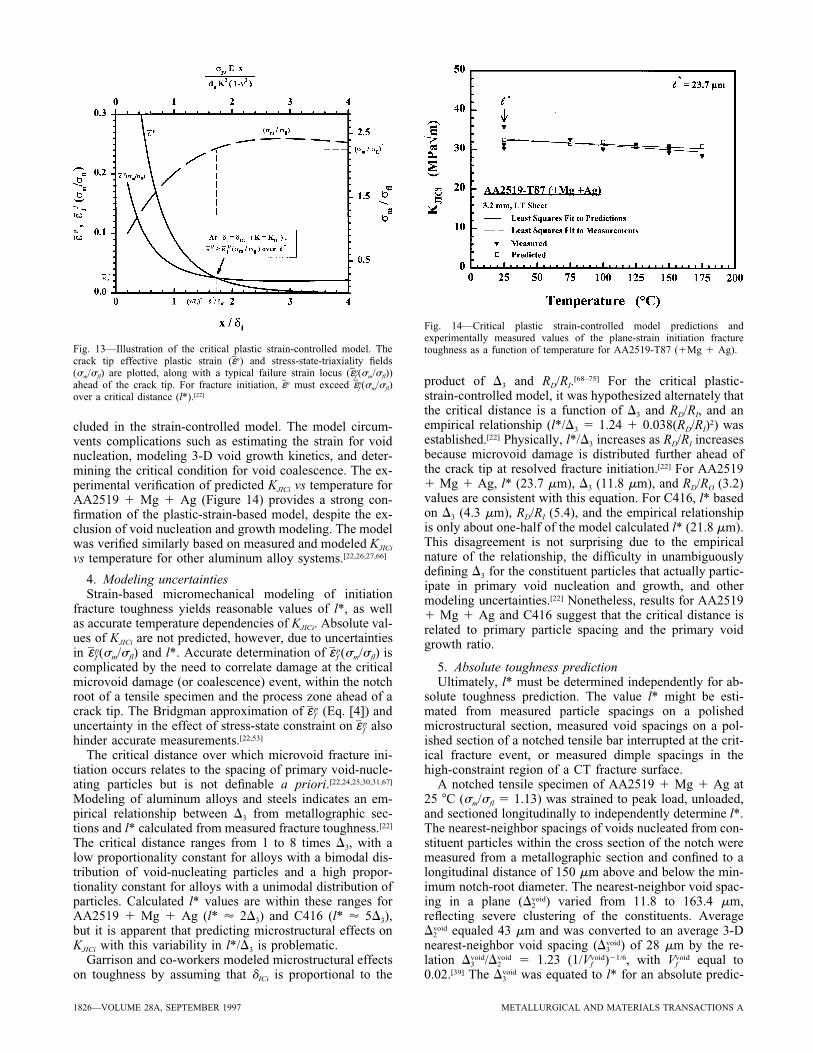
A graphical illustration of this model is shown in Figure13, where , (sm/sfl), and sm/sfl are plotted as a functionp pε ε f
of x/dt, the distance ahead of the crack tip normalized bythe crack-tip opening displacement**. The value of as apε f
**Equations for the and sm/sfl fields are given elsewhere.[22]pε
function of x/dt is obtained by coupling the material prop-erty (sm/sfl) and the sm/sfl field.[22] The fracture criterionpε f
is satisfied at the intersection of the and (sm/sfl) curves,p pε ε f
yielding an intrinsic fracture strain , a characteristicε*fstress-state triaxiality (sm/sfl),* and a critical ratio of dis-tance to crack-tip opening displacement (x/dt)*. Given thevalue of a for AA2519 1 Mg 1 Ag at 25 7C, values of
, (sm/sfl)*, and (x/dt)* are determined graphically. Forε*fAA2519 1 Mg 1 Ag (with a low work-hardening capac-ity), the and sm/sfl vs x/dt distributions are assumed topεbe independent of n and thus temperature.[22,62]
At a critical distance ahead of the crack tip (x 5 l*), pεincreases to as applied dt increases to the criticalε*fcrack-tip opening displacement dICi, where fracture initiatesby void impingement or void sheeting between the voidnucleation sites and the crack tip. The ratio (x/dt)* is equiv-alent to (l*/dICi), and dICi is determined upon specifying l*.The following relationship relates dICi to KJICi for small-scale yielding[63,64]
s E dys tK 5 [6]= 2d (1 2 n )n
The quantity n is Poisson’s ratio. The dimensionless con-stant dn is a function of n, stress state, sys/E, and the defi-nition of dt. The values of dn used are related linearly to nbetween 0.0 and 0.2 (dn 5 0.58 2 1.4n)[63] and are similarto those given by analytical solutions.[64]
Effects of temperature-dependent alloy deformation and
METALLURGICAL AND MATERIALS TRANSACTIONS A VOLUME 28A, SEPTEMBER 1997—1825
Table IV. Criical Plastic Strain-Controlled Model Parameters for AA2519 1 Mg 1 Ag and C416
Temperature(7C)
Variant of2519
sysavg
(MPa) dn
efp
(sm/sfl 5 0.33)ef
p
(sm/sfl 5 1.33) a
25 1Mg 1 Ag 504 0.52 0.511 0.122* 0.74975 1Mg 1 Ag 495 0.53 0.511 0.142 0.800
100 1Mg 1 Ag 475 0.54 0.693 0.147 0.958125 1Mg 1 Ag 459 0.55 0.673 0.148 0.947150 1Mg 1 Ag 443 0.56 0.734 0.157 0.973175 1Mg 1 Ag 404 0.56 0.844 0.222 1.22825 C416 486 0.52 0.664** — 1.09
*Average of three measurements.**Average of two measurements.
Fig. 12—Plane-strain initiation fracture toughness as a function oftemperature for AA2519-T87 (1Mg 1 Ag), C416-T82, AA2618-T851,[23]
AA2219-T851,[3] AA2090-T81,[61] AA2009/SiC/20p-T6,[46] andAA8009.[26] The range of KJICi for AA2024-T3 at 25 7C is indicated bythe error bar.
fracture properties on predicted KJICi are not shown explic-itly by the graphical solution, but such effects can be seenfrom simpler modeling approaches, as follows[26]
pεs E e* fysK ; [7]JICi ~ != 2d (1 2 n ) 7n
where is the smooth-bar tensile fracture strain, dividedpε f
by seven to account approximately for triaxial constraint.The parameters sys, E, , and dn are temperature dependent,pε f
while l* and n are assumed constant.Because the tensile properties of AA2519 1 Mg 1 Ag
are strain-rate sensitive at elevated temperature, the crack-tip strain rate is estimated for a CT specimen fractured ata load-line displacement rate of 0.26 mm/s (dK/dt 5 1.2 31023 MPa /s). Differentiation of McMeeking’s crack-tip=mstrain field, for the stationary crack at K ≤ KJICi, yields acrack-tip strain-rate gradient, dependent on K, dK/dt, andthe distance ahead of the crack tip.[65] For the specimenfractured at room temperature, at K 5 KJICi, and at a pro-cess-zone distance of 30 mm, the crack-tip strain rate isestimated as 6 3 1025 s21. Uniaxial tension and compres-sion specimens were deformed at this strain rate to obtainflow properties (Figure 9) for input to the micromechanicalmodel.
2. KJICi modeling resultsMicromechanical modeling input parameters (E, , dn,avgs ys
(sm/sfl 5 0.33, 1.13), and a) were measured for the twopε f
variants of AA2519 and are listed in Tables III and IV.(The is the average of compressive and tensile yieldavgsys
strengths for AA2519 1 Mg 1 Ag.) From average mea-sured KJICi at 25 7C, l* was calculated as 23.7 mm forAA2519 1 Mg 1 Ag and 21.8 mm for C416. The formerl* is about twice as high as the calculated spacing of largeundissolved u and iron-bearing constituent particles in avolume (D3 5 11.8 mm). The latter l* is about five timesgreater than D3 for primary constituents in C416.
Using l* defined at 25 7C, dICi is determined at each tem-perature and converted to KJICi. The model successfully pre-dicts the temperature dependence of KJICi for AA2519 1Mg 1 Ag, as shown in Figure 14. Variability in the mea-sured tensile properties leads to variability in predictedKJICi. A linear-regression fit to KJICi measurements (KJICi 533.3 MPa 2 0.022 T) agrees well with the fit to model=mpredictions (KJICi 5 32.8 2 0.014 T), where T is temper-ature in Celsius. A 95 pct confidence-interval estimate ofthe slope (g) using the t-distribution indicates that there isno significant difference between g for the measurements
(20.044 , g , 0.0) and predictions (20.028 , g , 0.0).Both measured and predicted KJICi are essentially tempera-ture insensitive from 25 7C to 175 7C (g ' 0).
3. Temperature dependence of KJICi
The strain-controlled model quantifies the interplay be-tween crack-tip , (sm/sfl), and l* that govern initiationp pε ε f
fracture toughness, as implied by Eq. [7]. Microvoid-rup-ture KJICi does not scale solely with either the intrinsic frac-ture strain ( (sm/sfl)) or the deformation properties (sys, E,pε f
and n) that govern in terms of K (Figure 13). Rather,pεboth elements must be combined with a fracture initiationcriteria to predict the ‘‘composite’’ property of KJICi. Therelative sensitivities of crack-tip and (sm/sfl) to tem-p pε ε f
perature dictate the temperature dependence of KJICi, whenl* is assumed to be temperature invariant. As sys, E, and ndecline with increasing temperature, which is observed inAA2519 1 Mg 1 Ag and other IM aluminum alloys,crack-tip strain increases for a fixed x and K.[22,27] Enhanced
at elevated temperatures results in a lower applied Kpεnecessary for to exceed a given (sm/sfl) over l*. In-p pε ε f
creased (sm/sfl) for AA2519 1 Mg 1 Ag at elevatedpε f
temperatures offsets enhanced crack-tip strain, resulting ina constant predicted KJICi with temperature.
The explicit mechanism of dimpled rupture is not in-
1826—VOLUME 28A, SEPTEMBER 1997 METALLURGICAL AND MATERIALS TRANSACTIONS A
Fig. 13—Illustration of the critical plastic strain-controlled model. Thecrack tip effective plastic strain ( ) and stress-state-triaxiality fieldspε(sm/sfl) are plotted, along with a typical failure strain locus ( (sm/sfl))pεf
ahead of the crack tip. For fracture initiation, must exceed (sm/sfl)p pε εf
over a critical distance (l*).[22]
Fig. 14—Critical plastic strain-controlled model predictions andexperimentally measured values of the plane-strain initiation fracturetoughness as a function of temperature for AA2519-T87 (1Mg 1 Ag).
cluded in the strain-controlled model. The model circum-vents complications such as estimating the strain for voidnucleation, modeling 3-D void growth kinetics, and deter-mining the critical condition for void coalescence. The ex-perimental verification of predicted KJICi vs temperature forAA2519 1 Mg 1 Ag (Figure 14) provides a strong con-firmation of the plastic-strain-based model, despite the ex-clusion of void nucleation and growth modeling. The modelwas verified similarly based on measured and modeled KJICi
vs temperature for other aluminum alloy systems.[22,26,27,66]
4. Modeling uncertaintiesStrain-based micromechanical modeling of initiation
fracture toughness yields reasonable values of l*, as wellas accurate temperature dependencies of KJICi. Absolute val-ues of KJICi are not predicted, however, due to uncertaintiesin (sm/sfl) and l*. Accurate determination of (sm/sfl) isp pε εf f
complicated by the need to correlate damage at the criticalmicrovoid damage (or coalescence) event, within the notchroot of a tensile specimen and the process zone ahead of acrack tip. The Bridgman approximation of (Eq. [4]) andpε f
uncertainty in the effect of stress-state constraint on alsopε f
hinder accurate measurements.[22,53]
The critical distance over which microvoid fracture ini-tiation occurs relates to the spacing of primary void-nucle-ating particles but is not definable a priori.[22,24,25,30,31,67]
Modeling of aluminum alloys and steels indicates an em-pirical relationship between D3 from metallographic sec-tions and l* calculated from measured fracture toughness.[22]
The critical distance ranges from 1 to 8 times D3, with alow proportionality constant for alloys with a bimodal dis-tribution of void-nucleating particles and a high propor-tionality constant for alloys with a unimodal distribution ofparticles. Calculated l* values are within these ranges forAA2519 1 Mg 1 Ag (l* ' 2D3) and C416 (l* ' 5D3),but it is apparent that predicting microstructural effects onKJICi with this variability in l*/D3 is problematic.
Garrison and co-workers modeled microstructural effectson toughness by assuming that dICi is proportional to the
product of D3 and RD/RI.[68–75] For the critical plastic-strain-controlled model, it was hypothesized alternately thatthe critical distance is a function of D3 and RD/RI, and anempirical relationship (l*/D3 5 1.24 1 0.038(RD/RI)2) wasestablished.[22] Physically, l*/D3 increases as RD/RI increasesbecause microvoid damage is distributed further ahead ofthe crack tip at resolved fracture initiation.[22] For AA25191 Mg 1 Ag, l* (23.7 mm), D3 (11.8 mm), and RD/RO (3.2)values are consistent with this equation. For C416, l* basedon D3 (4.3 mm), RD/RI (5.4), and the empirical relationshipis only about one-half of the model calculated l* (21.8 mm).This disagreement is not surprising due to the empiricalnature of the relationship, the difficulty in unambiguouslydefining D3 for the constituent particles that actually partic-ipate in primary void nucleation and growth, and othermodeling uncertainties.[22] Nonetheless, results for AA25191 Mg 1 Ag and C416 suggest that the critical distance isrelated to primary particle spacing and the primary voidgrowth ratio.
5. Absolute toughness predictionUltimately, l* must be determined independently for ab-
solute toughness prediction. The value l* might be esti-mated from measured particle spacings on a polishedmicrostructural section, measured void spacings on a pol-ished section of a notched tensile bar interrupted at the crit-ical fracture event, or measured dimple spacings in thehigh-constraint region of a CT fracture surface.
A notched tensile specimen of AA2519 1 Mg 1 Ag at25 7C (sm/sfl 5 1.13) was strained to peak load, unloaded,and sectioned longitudinally to independently determine l*.The nearest-neighbor spacings of voids nucleated from con-stituent particles within the cross section of the notch weremeasured from a metallographic section and confined to alongitudinal distance of 150 mm above and below the min-imum notch-root diameter. The nearest-neighbor void spac-ing in a plane ( ) varied from 11.8 to 163.4 mm,voidD2
reflecting severe clustering of the constituents. Averageequaled 43 mm and was converted to an average 3-DvoidD2
nearest-neighbor void spacing ( ) of 28 mm by the re-voidD3
lation / 5 1.23 (1/ )21/6, with equal tovoid void void voidD D V V3 2 f f
0.02.[39] The was equated to l* for an absolute predic-voidD3
METALLURGICAL AND MATERIALS TRANSACTIONS A VOLUME 28A, SEPTEMBER 1997—1827
tion of initiation toughness. The measured diametral con-traction of the notch and Eq. [4] were used to calculate anaverage of 0.071, and a was calculated as 0.39 from Eq.pε f
[5]. Predicted KJICi with these modeling parameters was31.1 MPa for AA2519 1 Mg 1 Ag at 25 7C. This=mabsolute prediction agrees well with the average measuredKJICi of 32.5 MPa , but is not rigorous. Peak load prob-=mably represents a lower amount of microvoid damage rel-ative to that in the crack-tip process zone at KJICi. Moreover,l* may depend on both D3 (or ) and RD/RI, as discussedvoidD3
previously.Void size and spacing measurements from CT fracture
surfaces or sectioned notched tensile bars appear to be themost promising method of independently determining l*,since information on both and RD can be obtained.voidD3
Detailed microscopic studies of the evolution of microvoidfracture are required to understand the relationships be-tween l*, , and RD/RI. The strong distance and angularvoidD3
dependencies of crack-tip , coupled with a heterogeneouspεdistribution of void-nucleating particles, make independentdetermination of l* a formidable problem.
C. Microvoid Fracture Mechanisms in High-StrengthAluminum Alloys
Micromechanical modeling has established that KJICi isessentially constant with increasing temperature—despitedeclining sys, E, and n—because increases. Understand-pε f
ing of temperature-dependent KJICi thus requires analysis ofthe temperature-dependent factors that govern with re-pε f
spect to microvoid nucleation, growth, and coalescence.
1. Ambient-temperature fracture evolutionIn alloys such as AA2519 1 Mg 1 Ag and C416, mi-
crovoid nucleation from a dilute volume fraction (,5 pct)of large constituents occurs at a small fraction of the strainrequired for dimpled rupture.[15,18,29,76,77] For AA2519 1 Mg1 Ag, Figure 2 demonstrates that large undissolved u con-stituents are cracked prior to tensile straining, most likelydue to the 7 pct stretch. As plastic strain is applied, addi-tional large constituents nucleate voids, followed by nucle-ation at the population of smaller constituents.[15] Thesubstantially smaller size of constituents in C416 (Figure1) implies that the applied plastic strain necessary for voidnucleation is higher, benefiting fracture toughness throughincreased .pε f
Voids at constituent particles grow, with increasing plas-tic strain to a critical size determined by the onset of voidsheet coalescence. The fracture strain depends strongly onthe extent of primary void growth before void coalescence(RD/RI).[11,36] The ratio RD/RI is higher for C416 thanAA2519 1 Mg 1 Ag (Table II), indicating that more strainis required for void growth, is higher (Table IV), andpε f
toughness is improved (Eq. [7]).Similar initiation and growth toughnesses for AA2519 1
Mg 1 Ag and C416 at room temperature suggest that arefinement in the size of undissolved u constituent does notguarantee a higher fracture toughness. Primary void-nucle-ating particles are smaller but more closely spaced in C416.The dominant influence of D3 on microvoid fracture tough-ness, as opposed to the effects of particle size or volumefraction, is well established by experimental re-sults.[67,68,70,71,73,75,78–80] The reduced particle spacing in C416
counters the increased extent of primary void growth, andl* is, in fact, somewhat reduced for C416 compared toAA2519 1 Mg 1 Ag.
2. Elevated-temperature fracture evolutionIntrinsic resistance to microvoid fracture increases with
temperature for IM aluminum alloys. Elevated temperatureaffects this increase by promoting stress relaxation aroundsecond-phase particles and by altering flow properties suchas yield strength, work hardening, and strain-rate hardening.Higher temperature (or lower strain rate) enhances recoveryat particle/matrix interfaces, lowering the stresses on theinterface and postponing void nucleation to higher appliedplastic strain, provided that interfacial strength is not de-graded.[81]
Because primary microvoid nuclei pre-exist or developat low strain in AA2519 1 Mg 1 Ag, the temperaturedependence of the nucleation rate is not significant in de-scribing the temperature dependence of . However, tem-pε f
perature may affect primary void nucleation at the smallerpopulation of constituents and influence in C416. Higherpε f
initiation and growth fracture toughnesses at elevated tem-peratures for C416 relative to AA2519 1 Mg 1 Ag couldbe due to stress relaxation at small constituent particles,which retards primary void nucleation and results in in-creased void-nucleating (primary) particle spacing, primaryvoid growth, and fracture resistance.
Temperature affects microvoid growth rates and thestrain at the onset of void coalescence.[81] Strain-based ratesof void growth increase with higher stress-state triaxialityand lower work hardening.[36,82] The global stress-state tri-axiality did not change from ambient temperature to 1757C, based on fracture surface appearance. Work hardeningdecreases with temperature for 2519 1 Mg 1 Ag (Figure9), and the void growth rate is expected to increase. Since
increases with increasing temperature for AA2519 1 Mgpεf
1 Ag (Figure 11), counter to an increasing void growthrate, temperature-dependent void coalescence must domi-nate fracture.
Strain-rate-sensitive plastic deformation and hardening atelevated temperatures retards void coalescence.[14,81,83,84]
Fractography of AA2519 1 Mg 1 Ag shows clusters of unucleated voids separated by void sheets associated withsubmicron dispersoids (Figure 6). Qualitative and quanti-tative fractography indicate that void sheeting is retarded atelevated temperature (Figure 8 and Table II). At ambienttemperature, the fracture surface is dominated by large-con-stituent dimples and void sheets. At 150 7C, the fraction ofsmall-constituent dimples increases at the expense of large-constituent dimples and void sheets, suggesting that higherapplied nucleation strains are achieved at elevated temper-atures before coalescence. The fracture surface reconstruc-tions and calculated RL values further demonstrate that voidsheeting is retarded at 150 7C (Figure 7 and Table II).
A prerequisite for void sheeting is intravoid strain local-ization (ISL) of shear deformation between large primaryvoids nucleated at constituents. The onset of ISL dependson stress-state triaxiality,[31,85] strain hardening,[83,86,87] strain-rate hardening,[14,81,83,84] constituent particle spacing and dis-tribution,[86,87] slip mode,[18,29] and microvoid nucleation atdispersoids within the strain-localized band.[15,76] The criti-cal strain for ISL rises with increasing strain hardening andstrain-rate hardening. Increasing triaxiality, clustering of
1828—VOLUME 28A, SEPTEMBER 1997 METALLURGICAL AND MATERIALS TRANSACTIONS A
constituents, planar slip (from cutting of precipitates), or ahigher volume fraction of voids nucleated at submicron dis-persoids should decrease this critical strain.
Speculatively, reduced void sheeting in AA2519 1 Mg1 Ag at elevated temperatures is responsible for increasing
. The change in void sheeting is not due to changes inpεf
triaxiality, constituent particle distributions, or slip mode.Macroscopic fracture surface observations suggest that tri-axiality did not change with temperature, and the large con-stituent spacing distribution remains unchanged to 175 7C.Slip is not localized due to dislocation cutting of V anddoes not exacerbate ISL. Li found that V precipitates arenot fully sheared during plastic deformation at 25 7C or 1507C; rather, dislocation cutting disperses evenly along V.[88]
It is hypothesized that strain hardening, strain-rate harden-ing, and void nucleation at dispersoids control the temper-ature dependence of ISL and void sheeting behavior inAA2519 1 Mg 1 Ag. This hypothesis is developed infuture work.
V. CONCLUSIONS
1. Plane-strain fracture initiation toughness is high (KJICi 530 to 36 MPa ) for AA2519 1 Mg 1 Ag with a=msubstantial volume fraction of large undissolved Al2Cu(u) particles, and decreases slightly with increasing tem-perature from 25 7C to 175 7C. Alloy C416, with reducedCu and a lower volume fraction of large u, exhibits higherKJICi, but only between 75 7C and 150 7C.
2. Plane-stress growth toughness increases to peak valuesbetween 75 7C and 100 7C, and declines above 100 7C.The growth toughness of C416 is superior to that ofAA2519 1 Mg 1 Ag, but only at elevated temperatures.
3. Fracture of AA2519 1 Mg 1 Ag evolves by primaryvoid nucleation at large, processing-cracked u, followedby limited primary void growth and coalescence throughpropagation of fine-dimpled void sheets nucleated at dis-persoids.
4. Fracture of C416 evolves by primary void nucleation atsmall constituents, followed by moderate growth andvoid sheeting.
5. The plastic strain to fracture AA2519 1 Mg 1 Ag de-creases markedly with increasing constraint, and in-creases with increasing temperature for two levels ofconstraint. Void sheeting governs fracture strain and isretarded as temperature increases.
6. The critical plastic strain-controlled micromechanicalmodel of initiation toughness accurately predicts themeasured temperature dependence of KJICi for AA25191 Mg 1 Ag, based on alloy flow properties and smoothand notched bar reduction in area. As temperature in-creases, nearly constant initiation toughness is due toincreasing fracture strain, which offsets enhancedcrack-tip strain from decreasing sys, E, and n.
7. Model-calculated critical distances (l*) for AA2519 1Mg 1 Ag and C416 are similar, but depend on the near-est-neighbor spacing of primary constituents and the ex-tent of primary void growth. The value of l* is notdeterminable a priori, and prediction of absolute KJICi
levels is not possible.8. The fracture strain is higher at 25 7C for C416 compared
to AA2519 1 Mg 1 Ag, probably due to higher void
nucleation strains and an increased extent of void growth.However, toughnesses are comparable due to the delete-rious effect of reduced particle spacing and l* in C416.
VI. ACKNOWLEDGMENTS
This research was supported by the NASA Langley Re-search Center under Grant No. NAG-1-745, with W.B. Lis-agor and D.L. Dicus as technical monitors. The authorsgratefully acknowledge Qiong Li (Reynolds Metals) forproviding TEM micrographs, J.J. Ammann (University ofCampinas) for providing fracture surface reconstructions,and L.M. Karabin (Alcoa Technical Center) for providingthe alloys. The authors acknowledge informative discus-sions with B.P. Somerday, A.P. Reynolds, L.M. Karabin,Q. Li, J.J. Ammann, M.F. Bartholomeusz, J.A. Wert, S.S.Kim, and E.A. Starke, Jr.
REFERENCES
1. W.B. Lisagor: in Thermal Structures and Materials for High SpeedFlight, E.A. Thornton, ed., AIAA, Washington, DC, 1992, vol. 140, pp.141-60.
2. A.P. Reynolds and D.M. Royster: Scripta Metall. Mater., 1994, vol. 30,pp. 1485-90.
3. J.G. Kaufman, K.O. Bogardus, D.A. Mauney, and R.C. Malcolm: inMechanics of Crack Growth, ASTM STP 590, J.R. Rice and P.C. Paris,eds., ASTM, Philadelphia, PA, 1976, pp. 149-68.
4. P.L. Bensussan, D.A. Jablonski, and R.M. Pelloux: Metall. Trans. A,1984, vol. 15A, pp. 107-20.
5. K.M. Nikbin and G.A. Webster: in Micro and Macro Mechanics ofCrack Growth, K. Sadananda, B.B. Rath, and D.J. Michel, eds.,TMS-AIME, Warrendale, PA, 1982, pp. 137-48.
6. B.C. Hamilton and A. Saxena: The 4th Int. Conf. on Aluminum Alloys,T.H. Sanders, Jr. and E.A. Starke, Jr., eds., Georgia Institute ofTechnology, Atlanta, GA, 1994, pp. 749-56.
7. L.J. Polmear and M.J. Couper: Metall. Trans. A, 1988, vol. 19A, pp.1027-35.
8. Y.C. Chang and J.M. Howe: Metall. Trans. A, 1993, vol. 24A, pp.1461-70.
9. Q. Li and F.E. Wawner, Jr.: in Control of Interface in Metal andCeramic Composites, R. Lin and S. Fishman, eds., TMS-AIME,Warrendale, PA, 1993, pp. 107-18.
10. S.P. Ringer, W. Yeung, B.C. Muddle, and I.J. Polmear: Acta Metall.,1994, vol. 42, pp. 1715-25.
11. W.M. Garrison, Jr. and N.R. Moody: J. Phys. Chem. Solids, 1987,vol. 48, pp. 1035-74.
12. I.C. Howard and A.A. Willoughby: in Advances in FractureMechanics, G.G. Chell, ed., Applied Science Publishers, London,1984, pp. 39-99.
13. K.-H. Schwalbe: Eng. Fract. Mech., 1977, vol. 9, pp. 795-832.14. P.F. Thomason: Ductile Fracture of Metals, Pergamon Press, Oxford,
United Kingdom, 1990, pp. 105-11.15. R.H. Van Stone, T.B. Cox, J.R. Low, and J.A. Psioda: Int. Met. Rev.,
1985, vol. 30, pp. 157-79.16. H.G.F. Wilsdorf: Mater. Sci. Eng., 1983, vol. 59, pp. 1-39.17. R.J. Bucci: Eng. Fract. Mech., 1979, vol. 12, pp. 407-41.18. G.T. Hahn and A.R. Rosenfield: Metall. Trans. A, 1975, vol. 6A, pp.
653-68.19. J.G. Kaufman and J.S. Santner: in Applications of Fracture Mechanics
for Selection of Structural Materials, J.E. Campbell, W.W. Gerberich,and J.H. Underwood, eds., ASM INTERNATIONAL, Metals Park,OH, 1982, pp. 169-211.
20. A.K. Vasudevan and R.D. Doherty: Acta Metall., 1987, vol. 35, pp.1193-1219.
21. C.P. Blankenship, Jr., E. Hornbogen, and E.A. Starke, Jr.: Mater. Sci.Eng., 1993, vol. 169, pp. 33-41.
22. M.J. Haynes, B.P. Somerday, C.L. Lach, and R.P. Gangloff: inElevated Temperature Effects on Fatigue and Fracture, ASTM STP1297, R.S. Piascik, R.P. Gangloff, and A. Saxena, eds., ASTM,Philadelphia, PA, 1997, pp. 165-90.
23. W.C. Porr, Jr.: Ph.D. Dissertation, University of Virginia,Charlottesville, VA, 1992.

METALLURGICAL AND MATERIALS TRANSACTIONS A VOLUME 28A, SEPTEMBER 1997—1829
24. R.O. Ritchie and A.W. Thompson: Metall. Trans. A, 1985, vol. 16A,pp. 233-48.
25. R.O. Ritchie, W.L. Server, and R.A. Wullaert: Metall. Trans. A, 1979,vol. 10A, pp. 1557-70.
26. W.C. Porr, Jr. and R.P. Gangloff: Metall. Mater. Trans. A, 1994, vol.25A, pp. 365-79.
27. B.P. Somerday, Yang Leng, and R.P. Gangloff: Fatigue Fract. Eng.Mater. Struct., 1995, vol. 18, pp. 1031-50.
28. R.C. Bates: in Metallurgical Treatises, J.K. Tien and J.F. Elliot, eds.,TMS-AIME, Warrendale, PA, 1982, pp. 551-70.
29. J.A. Walsh, K.V. Jata, and E.A. Starke, Jr.: Acta Metall., 1989, vol. 37,pp. 2861-71.
30. A.C. Mackenzie, J.W. Hancock, and D.K. Brown: Eng. Fract. Mech.,1977, vol. 9, pp. 167-88.
31. J.W. Hancock and A.C. Mackenzie: J. Mech. Phys. Solids, 1976, vol.24, pp. 147-69.
32. T.B. Cox and J.R. Low, Jr.: Metall. Trans., 1974, vol. 5, pp. 1457-70.33. A.S. Argon, J. Im, and R. Safoglu: Metall. Trans. A, 1975, vol. 6A, pp.
825-37.34. S.H. Goods and L.M. Brown: Acta Metall., 1979, vol. 27, pp. 1-15.35. G. LeRoy, J.D. Embury, G. Edwards, and M.F. Ashby: Acta Metall.,
1981, vol. 29, pp. 1509-22.36. J.R. Rice and D.M. Tracey: J. Mech. Phys. Solids, 1969, vol. 17, pp.
201-17.37. L.M. Karabin: ALCOA Technical Center, Alcoa Center, PA,
unpublished research, 1995.38. B. Skrotzki, H. Hargarter, and E.A. Starke, Jr.: Mater. Sci. Forum, 1996,
vols. 217–22, pp. 1245-50.39. C.W. Corti, P. Cotterill, and G.A. Fitzpatrick: Int. Met. Rev., 1974, vol.
19, pp. 77-88.40. M.J. Haynes and R.P. Gangloff: J. Testing Evaluation, 1997, vol. 25,
pp. 82-98.41. J.K. Donald and J. Ruschau: in Fatigue Crack Measurement:
Techniques and Applications, K.J. Marsh, R.A. Smith, and R.O. Ritchie,eds., EMAS, West Midlands, United Kingdom, 1991, pp. 11-37.
42. J.D. Landes: Int. J. Fract., 1980, vol. 16, pp. R183-R186.43. J.W. Hutchinson: J. Appl. Mech. Trans. ASME, 1983, vol. 50, pp.
1042-51.44. Annual Book of ASTM Standards, Designation E 1152-87, ASTM,
Philadelphia, PA, 1991, vol. 3.01, pp. 825-35.45. A. Saxena and J.D. Landes: in Advances in Fracture Research, P. Rama
Rao, K.N. Raju, J.F. Knott, and D.M.R. Taplin, eds., Pergamon Press,Oxford, United Kingdom, 1984, pp. 3977-88.
46. B.P. Somerday, Yang Leng, and R.P. Gangloff: Fatigue Fract. Eng.Mater. Struct., 1995, vol. 18, pp. 565-82.
47. A. Bakker: in Elastic-Plastic Fracture Test Methods: The User’sExperience, ASTM STP 856, E.T. Wessel and F.J. Loss, eds., ASTM,Philadelphia, PA, 1985, pp. 394-410.
48. E.E. Underwood and K. Banerji: in ASM Handbook, vol. 12,Fractography, K. Mills, J.R. Davis, and D.F. Baxter, Jr., eds., ASM,Metals Park, OH, 1987, pp. 193-210.
49. J.J. Ammann, L.R. Hein, and A.M. Nazar: Mater. Characterization,1996, vol. 36, pp. 379-86.
50. L.F. Mondolfo: Aluminum Alloys Structure and Properties, Butterworthand Co., Woburn, MA, 1976, p. 82.
51. Yang Leng, W.C. Porr, Jr., and R.P. Gangloff: Scripta Metall. Mater.,1990, vol. 24, pp. 2163-68.
52. Annual Book of ASTM Standards, Designation E 646-91, ASTM,Philadelphia, PA, 1991, vol. 3.01, pp. 647-53.
53. B.P. Somerday and R.P. Gangloff: Metall. Mater. Trans. A, 1994, vol.25A, pp. 1471-79.
54. J.C. Earl and D.K. Brown: Eng. Fract. Mech., 1976, vol. 8, pp. 599-611.
55. P.W. Bridgman: Studies in Large Plastic Flow and Fracture, McGraw-Hill Book Co., New York, NY, 1952, pp. 9-37.
56. C.R. Brooks: Heat Treatment, Structure and Properties of NonferrousAlloys, ASM INTERNATIONAL, Metals Park, OH, 1982, p. 123.
57. W.G. Fricke, Jr. and M.A. Przystupa: in Treatise on Materials Scienceand Technology, Vol. 31, Aluminum Alloys-Contemporary Research andApplications, A.K. Vasudevan and R.D. Doherty, eds., Academic Press,New York, NY, 1989, pp. 563-78.
58. F.J. Humphreys: Acta Metall., 1978, vol. 25, pp. 1323-44.59. J.A. Wert and L.K. Austin: Metall. Trans. A, 1988, vol. 19A, pp.
617-25.60. R.W. Hertzberg: Deformation and Fracture Mechanics of Engineering
Materials, 3rd ed., John Wiley & Sons, New York, NY, 1989, pp. 410-13.
61. R.J. Bucci, R.C. Malcolm, E.L. Colvin, S.J. Murtha, and R.S. James:Cooperative Test Program for the Evaluation of Engineering Propertiesof Al-Li Alloy 2090-T8X Sheet, Plate, and Extrusion Products, NSWCTR 89-106, Naval Surface Warfare Center, Dahlgren, VA, 1989, p. 66.
62. J.W. Hancock and M.J. Cowling: Met. Sci., 1980, vol. 14, pp. 293-304.63. R.M. McMeeking: J. Mech. Phys. Solids, 1977, vol. 25, pp. 357-81.64. C.F. Shih: J. Mech. Phys. Solids, 1981, vol. 29, pp. 305-26.65. L.M.L. Young: Master’s Thesis, University of Virginia, Charlottesville,
VA, 1992.66. S.S. Kim, M.J. Haynes, and R.P. Gangloff: Mater. Sci. Eng. A, 1995,
vol. 203, pp. 256-71.67. S. Lee, L. Manjo, and R.J. Asaro: Metall. Trans. A, 1985, vol. 16A,
pp. 1633-48.68. J.W. Bray, K.J. Handerhan, W.M. Garrison, Jr., and A.W. Thompson:
Metall. Trans. A, 1992, vol. 23A, pp. 485-96.69. W.M. Garrison, Jr.: Scripta Metall., 1984, vol. 18, pp. 583-86.70. W.M. Garrison, Jr.: Metall. Trans. A, 1986, vol. 17A, pp. 669-78.71. W.M. Garrison, Jr.: Scripta Metall., 1986, vol. 20, pp. 633-36.72. W.M. Garrison, Jr. and N.R. Moody: Metall. Trans. A, 1987, vol. 18A,
pp. 1257-63.73. K.J. Handerhan and W.M. Garrison, Jr.: Metall. Trans. A, 1988, vol.
19A, pp. 2989-3003.74. K.J. Handerhan and W.M. Garrison, Jr.: Scripta Metall., 1988, vol. 22,
pp. 607-10.75. K.J. Handerhan, W.M. Garrison, Jr., and N.R. Moody: Metall. Trans.
A, 1989, vol. 20A, pp. 105-23.76. D. Broek: in Prospects of Fracture Mechanics, G.C. Shih, H.C. Van
Elst, and D. Broek, eds., Noordhoff, The Netherlands, 1974, pp. 19-34.77. J.P. Tanaka, C.A. Pampillo, and J.R. Low, Jr.: in Review of
Developments in Plane Strain Fracture Toughness Testing, ASTM STP463, W.F. Brown, Jr., ed., ASTM, Philadelphia, PA, 1970, pp. 191-215.
78. A.J. Birkle, R.P. Wei, and G.E. Pellissier: ASM Trans. Q., 1966, vol.59, pp. 981-90.
79. G. Green and J.F. Knott: J. Eng. Mater. Technol. Trans. ASME, 1976,vol. 98, pp. 37-45.
80. J.C. Latridou and A. Pineau: Eng. Fract. Mech., 1981, vol. 15, pp.55-71.
81. M.F. Ashby, C. Gandhi, and D.M.R. Taplin: Acta Metall., 1979, vol.27, pp. 699-729.
82. F.A. McClintock: J. Appl. Mech. Trans. ASME, 1968, vol. 35, pp. 363-71.
83. R. Becker and R.E. Smelser: J. Mech. Phys. Solids, 1994, vol. 42, pp.773-96.
84. J. Pan, M. Saje, and A. Needleman: Int. J. Fract., 1983, vol. 21, pp.261-78.
85. N. Ohno and J.W. Hutchinson: J. Mech. Phys. Solids, 1984, vol. 32,pp. 63-85.
86. E.M. Dubensky and D.A. Koss: Metall. Trans. A, 1987, vol. 18A, pp.1887-95.
87. H. Yamamoto: Int. J. Fract., 1978, vol. 14, pp. 347-65.88. Q. Li: Proc. Microscopy Society of America, Fifty-Second Annual
Meeting, G.W. Bailey and A.J. Garratt-Reed, eds., San Francisco Press,San Francisco, CA, 1994, pp. 694-95.