Mode II Fracture Toughness of Adhesively Bonded Joints as a Function of Temperature: Experimental...
19
This article was downloaded by: [Dr M. D. Banea] On: 25 April 2012, At: 10:54 Publisher: Taylor & Francis Informa Ltd Registered in England and Wales Registered Number: 1072954 Registered office: Mortimer House, 37-41 Mortimer Street, London W1T 3JH, UK The Journal of Adhesion Publication details, including instructions for authors and subscription information: http://www.tandfonline.com/loi/gadh20 Mode II Fracture Toughness of Adhesively Bonded Joints as a Function of Temperature: Experimental and Numerical Study M. D. Banea a , L. F. M. da Silva b & R. D. S. G. Campilho c a Instituto de Engenharia Mecânica (IDMEC), Porto, Portugal b Departamento de Engenharia Mecânica, Faculdade de Engenharia, Universidade do Porto, Porto, Portugal c Departamento de Engenharia Mecânica, Instituto Superior de Engenharia do Porto, Porto, Portugal Available online: 25 Apr 2012 To cite this article: M. D. Banea, L. F. M. da Silva & R. D. S. G. Campilho (2012): Mode II Fracture Toughness of Adhesively Bonded Joints as a Function of Temperature: Experimental and Numerical Study, The Journal of Adhesion, 88:4-6, 534-551 To link to this article: http://dx.doi.org/10.1080/00218464.2012.660835 PLEASE SCROLL DOWN FOR ARTICLE Full terms and conditions of use: http://www.tandfonline.com/page/terms-and-conditions This article may be used for research, teaching, and private study purposes. Any substantial or systematic reproduction, redistribution, reselling, loan, sub-licensing, systematic supply, or distribution in any form to anyone is expressly forbidden. The publisher does not give any warranty express or implied or make any representation that the contents will be complete or accurate or up to date. The accuracy of any instructions, formulae, and drug doses should be independently verified with primary sources. The publisher shall not be liable for any loss, actions, claims, proceedings, demand, or costs or damages whatsoever or howsoever caused arising directly or indirectly in connection with or arising out of the use of this material.
Transcript of Mode II Fracture Toughness of Adhesively Bonded Joints as a Function of Temperature: Experimental...

This article was downloaded by: [Dr M. D. Banea]On: 25 April 2012, At: 10:54Publisher: Taylor & FrancisInforma Ltd Registered in England and Wales Registered Number: 1072954 Registeredoffice: Mortimer House, 37-41 Mortimer Street, London W1T 3JH, UK
The Journal of AdhesionPublication details, including instructions for authors andsubscription information:http://www.tandfonline.com/loi/gadh20
Mode II Fracture Toughness of AdhesivelyBonded Joints as a Function ofTemperature: Experimental andNumerical StudyM. D. Banea a , L. F. M. da Silva b & R. D. S. G. Campilho ca Instituto de Engenharia Mecânica (IDMEC), Porto, Portugalb Departamento de Engenharia Mecânica, Faculdade de Engenharia,Universidade do Porto, Porto, Portugalc Departamento de Engenharia Mecânica, Instituto Superior deEngenharia do Porto, Porto, Portugal
Available online: 25 Apr 2012
To cite this article: M. D. Banea, L. F. M. da Silva & R. D. S. G. Campilho (2012): Mode II FractureToughness of Adhesively Bonded Joints as a Function of Temperature: Experimental and NumericalStudy, The Journal of Adhesion, 88:4-6, 534-551
To link to this article: http://dx.doi.org/10.1080/00218464.2012.660835
PLEASE SCROLL DOWN FOR ARTICLE
Full terms and conditions of use: http://www.tandfonline.com/page/terms-and-conditions
This article may be used for research, teaching, and private study purposes. Anysubstantial or systematic reproduction, redistribution, reselling, loan, sub-licensing,systematic supply, or distribution in any form to anyone is expressly forbidden.
The publisher does not give any warranty express or implied or make any representationthat the contents will be complete or accurate or up to date. The accuracy of anyinstructions, formulae, and drug doses should be independently verified with primarysources. The publisher shall not be liable for any loss, actions, claims, proceedings,demand, or costs or damages whatsoever or howsoever caused arising directly orindirectly in connection with or arising out of the use of this material.

Mode II Fracture Toughness of AdhesivelyBonded Joints as a Function of Temperature:
Experimental and Numerical Study
M. D. BANEA1, L. F. M. DA SILVA2, and R. D. S. G. CAMPILHO3
1Instituto de Engenharia Mecanica (IDMEC), Porto, Portugal2Departamento de Engenharia Mecanica, Faculdade de Engenharia,
Universidade do Porto, Porto, Portugal3Departamento de Engenharia Mecanica,
Instituto Superior de Engenharia do Porto, Porto, Portugal
In this work, an experimental and numerical study is performed toevaluate the effect of temperature on the Mode II fracture toughnessof a high temperature epoxy adhesive. Mode II fracture testing onend notch flexure (ENF) test specimens was performed at roomtemperature (RT) and high temperatures (100, 150, and 200�C)and the Mode II fracture toughness, GIIc, as a function of tempera-ture was obtained. It is shown that at temperatures well below theglass transition temperature, the fracture toughness, GIIc, increaseswith temperature and decreases as the temperature approaches Tg,while above Tg a drastic decrease in fracture toughness wasobserved. Furthermore, cohesive zone models, in which the failurebehaviour is expressed by a bilinear traction–separation law, wereused to define the adhesive behaviour in Mode II and to predict theadhesive load-displacement (P–d) curves as a function of tempera-ture. The simulation response matched the experimental resultsvery well at temperatures below Tg. The sensitivity of the variouscohesive zone parameters in predicting the overall mechanicalresponse of the joint was examined as well for a deeper under-standing of this predictive method.
Received 7 July 2011; in final form 14 December 2011.Presented in part at the 1st International Conference on Structural Adhesive Bonding
(AB2011), Porto, Portugal, 7–8 July 2011.Address correspondence to M. D. Banea, Instituto de Engenharia Mecanica, Faculdade de
Engenharia, Universidade do Porto, Rua Dr. Roberto Frias 4200-465, Porto, Portugal. E-mail:[email protected]
The Journal of Adhesion, 88:534–551, 2012
Copyright # Taylor & Francis Group, LLC
ISSN: 0021-8464 print=1545-5823 online
DOI: 10.1080/00218464.2012.660835
534
Dow
nloa
ded
by [
Dr
M. D
. Ban
ea]
at 1
0:54
25
Apr
il 20
12

KEYWORDS End notch flexure (ENF) test specimen; High tem-perature adhesives; Mode II fracture toughness; Temperature tests
1. INTRODUCTION
It is fundamental for the design of adhesively bonded joints that reliabledamage models to predict their fracture behaviour are available. Therefore,in order to apply a fracture mechanics or damage mechanics approach,it is essential to have the fracture toughness of the material. The fracturetoughness varies with the type of loading, i.e., Modes I, II, III, and mixed.In addition, the adhesives used in structural high temperature aerospaceapplications must operate in extreme environments and have to maintaintheir mechanical properties at elevated temperatures. Hence, their high-temperature mechanical performances, especially fracture toughness, shouldbe taken into consideration.
It was reported that the adhesive strength generally shows temperaturedependence [1–6]. Similarly the fracture toughness is expected to show tem-perature dependence. Several investigators addressed the determination ofthe fracture toughness in tension (pure Mode I) of thin adhesive layers inadhesively bonded assemblies as a function of temperature [7–12]. Melcherand Johnson [7] studied the Mode I fracture toughness, GIc, of an adhesivelybonded composite-composite joint in a cryogenic environment. Theyobserved a substantial decrease in the fracture toughness at cryogenic tem-perature compared with room temperature (RT). Banea et al. [8] used thedouble cantilever beam (DCB) test to evaluate the temperature dependenceof the Mode I fracture toughness, GIc, for adhesive joints bonded with aroom temperature vulcanizing (RTV) silicone adhesive (useable at high tem-perature), covering a range of temperatures between RT and 200�C. Thepure Mode I cohesive laws were obtained by a direct method that consistedof the differentiation of the J-integral vs. end-opening displacement (J-w)curve. They concluded that the fracture toughness and the traction–separ-ation laws exhibit temperature dependence. Carlberger et al. [9] showedin an experimental study that the Mode I fracture toughness is fairly unaf-fected by temperature, from �40�C to þ80�C; (the glass transition tempera-ture of the epoxy adhesive investigated was þ90�C) and the peak stress inpeel loading decreased monotonically with increasing temperature in thistemperature range. More recently, Banea et al. [11,12] performed an experi-mental and numerical study to evaluate the effect of temperature on theMode I fracture toughness of a high temperature epoxy adhesive. Theyfound that the fracture toughness of the epoxy adhesive investigated isessentially temperature-independent below Tg (Tg � 155�C), while abovethe Tg of the adhesive (at 200�C), a drastic drop in fracture toughnesswas observed.
Mode II Toughness of Adhesively Bonded Joints 535
Dow
nloa
ded
by [
Dr
M. D
. Ban
ea]
at 1
0:54
25
Apr
il 20
12

Chai [13] investigated the influence of temperature on the fractureenergy in shear and showed that the Mode II fracture energy decreased inthe region 0.7< T=Tg< 1.0. However, only limited data are available relativeto the effect of the temperature on the fracture toughness for pure Mode II.One of the reasons is that no joint geometry has been standardised for ModeII testing. On the other hand, in Mode II tests crack length monitoring is dif-ficult, as propagation occurs rapidly and without a clear opening. In addition,identification of the crack tip can be ambiguous, due to micro-cracks in therelatively large fracture process zone (FPZ) [14]. Therefore, there is growinginterest in equivalent or effective crack methods [15–18], which consists inusing the experimental compliance and a beam theory-based relation tocompute the crack length.
For the determination of the toughness in Mode II there are various testmethods available: the end notched flexure (ENF) test, the end loaded split(ELS) test, and the four-point notched flexure (4ENF) test. The ELS test pre-sents large displacements and is sensitive to the clamping device [15]. The4ENF is more sophisticated but has problems of friction due to the loadingmode in the pre-crack region [19]. Therefore, the most suitable testingmethod for Mode II appears to be the ENF test [16,20]. The ENF test is essen-tially a three-point flexure test on a pre-cracked specimen causing a shearmode loading in the adhesive.
Most of the results in the literature concerning the effect of temperatureon the fracture toughness are for Mode I. However, adhesive joints are alsoloaded in Mode II and under mixed mode. In this work, an experimental andnumerical study is performed to evaluate the effect of the temperature on theMode II fracture toughness of a high temperature epoxy adhesive. Mode IIfracture testing on ENF test specimens were performed at RT and hightemperatures (100, 150, and 200�C) and the Mode II fracture toughness, GIIc,as a function of temperature was obtained. Furthermore, cohesive zonemodels, in which the failure behaviour is expressed by a bilinear traction–separation law, were used to define the adhesive behaviour in pure ModeII and to predict the adhesive load-displacement (P–d) curves as a functionof temperature. The sensitivity of the various cohesive zone parameters inpredicting the overall mechanical response as a function of temperaturewas examined as well for a deeper understanding of this predictive method.
2. EXPERIMENTAL DETAILS
2.1. Materials
The adhesive investigated in this study was a one-component high-temperature paste epoxy adhesive XN1244, supplied by Nagase ChemteX(Osaka, Japan).
536 M. D. Banea et al.
Dow
nloa
ded
by [
Dr
M. D
. Ban
ea]
at 1
0:54
25
Apr
il 20
12

A key parameter in the testing of adhesive joints is the Tg of theadhesive. When adhesively bonded joints are tested below this temperature,the adhesive behaves like a low-strain rigid material while above this tem-perature it has a more rubber-like behaviour. The Tg of XN1244 adhesiveis approximately 155�C, obtained by a dynamical mechanical thermal analy-sis (DMTA) method [21].
The characterization tests for XN1244 adhesive were carried out undertension and shear considering three specimens for each condition, whichallowed the determination of the strengths and moduli in both loadings.The tensile properties (Mode I loading) of XN1244 adhesive were determinedusing ‘‘dogbone’’ tensile specimens in a previous study [21].
The thick adherend shear test (TAST) was performed in order to mea-sure the shear properties (Mode II loading) of the adhesive according tostandard ISO 11003-2:1999 [22], using steel substrates of dimensions 110�25� 12mm3 (Fig. 1). The joint surfaces were grit blasted and degreased withacetone prior to the application of the adhesive. The bondline thickness wasnominally 0.7mm and the length of the overlap test section was 5mm. Twospacers (1.5mm thick) were inserted in the gaps between the adherends afterthe application of the adhesive and prior to curing in order to provide thenecessary spacing between the two adherends. These spacers were removedafter the adhesive was cured. The joints were cured in a hot press followingthemanufacturer’s suggested curing conditions (1 h at 140�C). TAST tests wereperformed at RT on a MTS servo-hydraulic machine, model 312.31 (MTS,Eden Prairie, MN, USA) at a constant crosshead rate of 0.1mm=min. Thedisplacement was measured with two methods: a 25mm length MTS exten-someter and a non-contact method (video microscopy). As the extensometeris mounted in the metallic substrate, the extensometer measures not only thedisplacement of the adhesive, but also the displacement of the adherend.
FIGURE 1 Standard TAST specimen (dimensions in mm).
Mode II Toughness of Adhesively Bonded Joints 537
Dow
nloa
ded
by [
Dr
M. D
. Ban
ea]
at 1
0:54
25
Apr
il 20
12

Therefore, it is necessary to apply a correction to the measured displace-ments [23]. At the same time, video microscopy was used to record thedisplacements, which gives only the adhesive displacement. The strains werecalculated using the spatial correlation method developed by Chousal andGomes [24].
A characteristic shear stress-strain curve of XN1244 adhesive measuredby the two methods (MTS extensometer and video microscopy) at RT isshown in Fig. 2. The XN1244 adhesive has a shear modulus of 2.15� 0.10[GPa], shear failure strength of 31.61� 2.83 [MPa], and a maximum shearstrain of 8.05� 1.2 [%]. The shear modulus was determined from thestress-strain curve measured by the video microscopy method (the adhesivecurve). The shear strength is coincident for the two curves. The shear strainto failure presented in the text was obtained from the ‘‘steelþ adhesive’’curve because it is not always possible to get the last part of the curve byspatial correlation due to image focus problems at the break point.
Hard tool steel DIN 40CrMnMo7 substrates were used for the ENF speci-mens, in order to assure an elastic behaviour of the adherends. The mechan-ical and physical properties of the tool steel DIN 40CrMnMo7 are given inTable 1 (data provided by supplier).
FIGURE 2 Typical XN1244 adhesive shear stress-strain curve measured by the two methods(MTS extensometer and video microscopy).
TABLE 1 Mechanical and Physical Properties of Steel Adherends
Tensile failure strength [MPa] 1000–1068Yield stress [MPa] 861–930Elongation % 14–17
Temperature20�C 200�C 400�C
Young’s modulus, E [MPa] 205 000 200 000 185 000
538 M. D. Banea et al.
Dow
nloa
ded
by [
Dr
M. D
. Ban
ea]
at 1
0:54
25
Apr
il 20
12

2.2. Specimen Fabrication
The ENF joint surfaces were grit blasted and degreased with acetone prior tothe application of the adhesive. The specimen geometry and the loading areshown in Fig. 3 (the width b of the specimen is 25mm). The bondline thick-ness was nominally 0.2mm. Spacers (calibrated steel bars of 0.20mm) wereinserted between the adherends before the application of the adhesive inorder to control the bondline thickness. These spacers were removedafter the adhesive was cured. A sharp pre-crack in the adhesive layermid-thickness was assured using a razor blade. A mould with spacers forthe correct alignment of the adherends was used and is shown in Fig. 4.The ENF joints were cured at 140�C for 1 hour.
2.3. Test Procedure
The ENF specimens were tested at RT (approximately 30�C) and hightemperatures (100, 150, and 200�C) using a universal testing machineInstron1 model 8801 (Instron Co., Narwood, MA, USA) with a 100kN loadcell, under a constant crosshead rate of 0.5mm=min. For the high tem-perature tests, the environmental chamber of the machine was used to reachthe desired test temperatures.
Before the testing was initiated, in order to avoid a blunt crack, all speci-mens were slightly loaded to ensure 2-3mm of crack propagation, afterwhich a0 was measured. The P–d curve was registered during the test.
Three joints were tested to failure at each temperature. The ENF speci-mens set-up is shown in Fig. 5.
A thermocouple was applied to the specimen in order to assure that thespecimen’s temperature was equal to the air temperature in the chamber. The
FIGURE 3 ENF specimen geometry.
Mode II Toughness of Adhesively Bonded Joints 539
Dow
nloa
ded
by [
Dr
M. D
. Ban
ea]
at 1
0:54
25
Apr
il 20
12

tests were always performed after approximately 5min of achieving the testtemperature in the specimens, to ensure a steady-state temperature through-out the specimen prior to testing.
FIGURE 5 ENF specimens set-up. (Color figure available online.)
FIGURE 4 Mould with ENF specimens. (Color figure available online.)
540 M. D. Banea et al.
Dow
nloa
ded
by [
Dr
M. D
. Ban
ea]
at 1
0:54
25
Apr
il 20
12

2.4. ENF Data Analysis
The compliance-based beam method (CBBM) that was developed by deMoura et al. [18,25] was used to evaluate GIIc. This method is based on thecrack equivalent concept, depending only on the specimen’s compliance dur-ing the test. Thus, it does not require crack length monitoring during crackgrowth which was observed to be very difficult to perform with accuracy inthe ENF test. In addition, the equivalent crack length, aeq, accounts for theFPZ effects at the crack tip, which is not taken into account when the realcrack length is considered. GIIc can be obtained by the following expression:
GIIc ¼9P2a2eq16b2Ef h3
; ð1Þ
where P is applied load; Ef is an equivalent flexural modulus calculated fromthe initial compliance and initial crack length; thus avoiding the influence ofspecimen variability on the results; b is the specimen width; aeq is the equiva-lent crack length; and h is the adherend thickness. The readers are referred toRef [18]. for the detailed formulations of the CBBM method.
3. EXPERIMENTAL RESULTS AND DISCUSSION
3.1. ENF Failure Mode
After the tests, the failure modes of the specimens were evaluated visually. Ascan be observed in Fig. 6, the failure in the ENF specimens was cohesive forall temperatures.
3.2. Determination of GIIc Values as a Function of Temperature
Representative experimental P–d curves of the ENF specimens at each tem-perature are presented in Fig. 7. The load increases until the crack initiation
FIGURE 6 Typical failure modes at (a) RT, (b) 100�C, (c) 150�C, and (d) 200�C. (Color figureavailable online.)
Mode II Toughness of Adhesively Bonded Joints 541
Dow
nloa
ded
by [
Dr
M. D
. Ban
ea]
at 1
0:54
25
Apr
il 20
12

process is completed. After that, the crack tip starts propagating. A continu-ous drop in the force is seen as the crack continuously propagates until thecrack reaches the ENF specimen’s middle (at the time the crack approachesthe loading cylinder, the load starts to increase due to the compression nearthe crack tip, which obstruct propagation because of friction effects).
The maximum loads increased at 100�C and decreased at 150�C, while asignificant increase in displacement can be seen at both temperatures. At200�C, a dramatic drop in maximum load and displacement was observed.
It is known that crack propagation is controlled by the plastic defor-mation processes taking place ahead of the crack tip [26]. From Fig. 7 itcan be seen that at 150 and 200�C, the post-peak load reduction is signifi-cantly smaller than at 100�C and RT, which indicates an increasing plasticzone and a reduced yield stress of the adhesive.
The critical fracture energy in Mode II, GIIc, was estimated using theCBBM method presented in Section 2.4.
Representative experimental R-curves for one specimen at RT, 100, 150,and 200�C are presented in Fig. 8. At RT and 100�C, it can be seen that afterthe crack initiation, as the crack advances, the R-curves rise rapidly in theinitial stages of crack growth and gradually reach the steady state, (a moreor less stable plateau region of approximately constant GIIc) after some10mm of crack propagation. These results are in agreement with previousstudies [26,27].
At 150�C, after the crack initiation, the R-curve rises and reaches a steadystate region less stable than at RT and 100�C. This can be explained by anincreasing plastic zone at this temperature. After approximately 15mm ofcrack propagation the R-curve starts to rise, which signifies that the crack willnot propagate, but will be embedded in an increasing plastic zone.
At 200�C, the crack propagated a very short distance (approximately10mm) and no initial rise of the R-curve was observed. This is explained
FIGURE 7 Representative experimental P–d curves of the ENF specimens as a function oftemperature.
542 M. D. Banea et al.
Dow
nloa
ded
by [
Dr
M. D
. Ban
ea]
at 1
0:54
25
Apr
il 20
12

by the fact that if the yield stress of the adhesive is very low, it will flow easilyat the crack tip, offering little resistance to crack initiation.
The effect of temperature on the fracture toughness, GIIc, is presented inFig. 9. At 100�C the fracture toughness, GIIc, of the adhesive increased byapproximately 33% in relation to the value at RT. This can be explainedby the fact that, as the temperature increases, the strength decreases butthe ductility increases giving an additional plastic deformation at the cracktip, hence an increase in toughness. At 150�C, GIIc decreased by approxi-mately 22%, indicating the apporach to the Tg. These results are consistentwith the results from Chai [13] which found that the Mode II fracture energydecreased in the region 0.7< T=Tg< 1.0.
Nevertheless, a drastic drop in GIIc was observed at 200�C. As is known,the value of Gllc of a bonded joint is directly related to the material’s ability toresist shear flow at the crack tip [28]. Thus, if the yield stress of the adhesive isvery low, it will flow easily at the crack tip, offering little resistance to crack
FIGURE 9 Fracture toughness GIIc as a function of temperature.
FIGURE 8 Representative experimental R-curves for one specimen at RT, 100�C, 150�C and200�C. (Color figure available online.)
Mode II Toughness of Adhesively Bonded Joints 543
Dow
nloa
ded
by [
Dr
M. D
. Ban
ea]
at 1
0:54
25
Apr
il 20
12

initiation. This was expected as the testing temperature overpasses the Tg ofthe adhesive.
3.3. Comparison of the Mode I and Mode II Fracture Characteristics
The fracture toughness measured here as a function of temperature in Mode IIcan be compared with that measured in Mode I by the same authors in a pre-vious work [11,12]. The fracture toughness in Mode I was measured using theDCB method under a test speed similar to that used in the present study. Theadhesive thickness used was 0.2mm, similar to the present study. The valuesare presented in Table 2 alongwith the Mode II values and the relationGIIc=GIc.It can be seen that the GIIc follows the same trend as GIc as a function of tem-perature, but the increase in ductility with the increase of temperature affectsGIIc more as shear deformation involves more plastic work of the adhesive.
In the literature, it is most common to assume a value of 2 for GIIc=GIc
when the value of GIIc is unknown [18,29]. On the other hand, there arestudies that found higher values for GIIc=GIc, such as 14 for a brittle epoxyadhesive and 22 for a ductile adhesive [30], while in [31] the value found isapproximately 10. Therefore, it is important to test not only in Mode I but alsoin Mode II for a complete and accurate characterization of an adhesive bond.
4. NUMERICAL MODELLING
A numerical analysis of the ENF joints as a function of temperature was per-formed in the commercial finite element (FE) package ABAQUS1 to assessthe viability of its cohesive zone model (CZM) formulation, discussed furtherin terms of generic principles, in reproducing the experimental tests per-formed. The numerical analysis was carried out using non-linear geometricalconsiderations using the material properties defined in Table 3. Thedeformed shape of the ENF specimen during damage propagation and theapplied boundary and loading conditions are shown in Fig. 10. The speci-men arms were modelled with plane-strain four-node quadrilateral solidfinite elements (CPE4 from ABAQUS) and the adhesive was modelled withfour-node cohesive elements, including the bilinear CZM. Twelve solid finiteelements were used through-thickness in each arm, with a more refined
TABLE 2 Comparison of the Fracture Toughness in Mode I (GIc) and Mode II (GIIc) as aFunction of Temperature (Average Values)
Temperature (�C) Mode I GIc (N=mm) Mode II GIIc (N=mm) GIIc=GIc
RT 0.47 2.18 4.68100 0.50 2.90 5.80150 0.42 1.70 4.04200 0.07 0.34 4.25
544 M. D. Banea et al.
Dow
nloa
ded
by [
Dr
M. D
. Ban
ea]
at 1
0:54
25
Apr
il 20
12

mesh near the adhesive region [32–34]. The meshes were constructed takingadvantage of the automatic meshing capabilities of ABAQUS, from a manualseeding procedure that included biasing effects from the loading pointstowards the crack tip, where large stress gradients are expected. In the dam-age propagation region and near the cylinders a more refined mesh wasused, considering 0.20-mm length elements. The applied boundary con-ditions consisted in fixing the supporting cylinders in the directions x andy and restraining the loading cylinder in the direction x. The lowest nodeat the specimen mid-section was restrained in the direction x (Fig. 10). Also,at the initial crack (a0), contact conditions were imposed to prevent interpen-etration of the cracked parts.
4.1. Cohesive Zone Model
A CZM models the fracture process, extending the concept of continuummechanics by including a zone of discontinuity modelled by cohesive zones,thus using both strength and energy parameters to characterize the debond-ing process [35]. The choice of these parameters and how they are measureddepends on the problem that is being investigated. In general, the CZM para-meters are related to the material system that is being studied.
The areas under the traction-separation laws in each mode of loading(tension and shear) are equalled to the respective fracture energy. Under
FIGURE 10 Deformed shape of the ENF specimen during damage propagation and theapplied boundary and loading conditions.
TABLE 3 The Adhesive Material Properties Used for Simulations
Temperature (�C) Gsc [N=mm] ts
0 [MPa] E [MPa] G [MPa]
RT 2.2 37 5872 2150100 2.9 25 4173 1527150 1.7 12 72 25200 0.3 – 40 14.6
Mode II Toughness of Adhesively Bonded Joints 545
Dow
nloa
ded
by [
Dr
M. D
. Ban
ea]
at 1
0:54
25
Apr
il 20
12

pure mode, damage propagation occurs at a specific integration point whenthe stresses are released in the respective traction-separation law. Undermixed mode, energetic criteria are often used to combine tension and shear[36], thus simulating the typical mixed mode behaviour inherent in bondedassemblies. In this work, a continuum-based approach was considered tomodel the finite thickness of the adhesive layer. The cohesive layer wasassumed to be under one direct component of strain (through-thickness)and one transverse shear strain; these are computed directly from the ele-ment kinematics. The membrane strains are assumed as zero, which is appro-priate for thin and compliant layers between stiff adherends.
In this work, the shape of the traction–separation law was defined as abilinear model (Fig. 11). The subscripts n and s relate to pure normal(tension) and shear behaviours, respectively. tn and ts are the correspondingcurrent stresses, and dn and ds the current values of d. For pure Mode II, onlythe ‘‘s’’ parameters are considered. ts
0 can be extracted by comparing numeri-cal predictions from cohesive-zone simulations with the results of experi-mental tests. The maximum relative displacement, ds
f, for which completefailure occurs, is obtained by equating the area under the softening curve(the triangle of Fig. 11) to the respective critical fracture energy [Eq. (2)]:
Gcs ¼
1
2t0s d
fs : ð2Þ
5. NUMERICAL RESULTS AND DISCUSSION
5.1. Comparison with the Experiments
The cohesive parameter, Gsc (the fracture toughness in pure Mode II), for
various temperatures was obtained experimentally from the ENF tests. Theremaining cohesive parameters were obtained with an inverse method,
FIGURE 11 Traction-separation law with linear softening available in ABAQUS1.
546 M. D. Banea et al.
Dow
nloa
ded
by [
Dr
M. D
. Ban
ea]
at 1
0:54
25
Apr
il 20
12

fitting the numerical P–d curves with the experiments and allowing completefracture characterization of the adhesive as a function of temperature in pureMode II. This method consisted of inputting each Gs
c in the respective ENFmodel as a function of temperature.
The value of the Young’s modulus, E, was obtained from bulk tensiletests as a function of temperature [21], while the value of shear modulus Gwas obtained from TAST at RT, and at high temperatures it was obtained ana-lytically from the Hooke’s law relation for isotropic materials:
G ¼ E
2ð1þ nÞ ; ð3Þ
where n � 0.35 is the Poisson’s ratio.The values introduced in ABAQUS1 for the simulation of damage in the
adhesive layer are listed in Table 3.In Fig. 12, experimental and numerical P–d curves of the ENF specimens
at (a) RT, (b) 100�C, (c) 150�C, and (d) 200�C can be seen. The simulationresponse at RT, 100�C, and 150�C matches the experimental results very well.However, at 200�C the model was not able to simulate the P-d curve. This canbe explained by the fact that at temperatures above Tg the behaviour of theadhesive is not completely understood and some uncertainties about thephysical and the state of chemical degradation of the adhesive exists.
5.2. Sensitivity of the Cohesive Parameters Study
It is known that the numerical predictions for different geometries and mate-rial combinations can have different sensitivities to the cohesive parameters.
With the intent of understanding the sensitivity of the ENF output to thetest parameters, it is recognized that the ENF data reduction method pre-sented in Section 2.4. finds that GIIc is dependent on the square of the load(P2). As a result, the FE sensitivity study presented here is motivated by theform of Eq. (1), and uses the maximum predicted load as the output. Thus,different values of toughness (approximately �20% variation of theexperimental value) and strength (in the range of �10% and �50% of theexperimental value) were used for the bilinear traction–separation lawshown in Fig. 13, and the resultant numerical load–displacement curves werecompared to the experimental results.
As can be seen from the Fig. 13a, the P-d curve is sensitive to GIIc. Thepeak load value is affected by variation of GIIc. This is not surprising, as GIIc isexpected to be proportional to P2 [Eq. (1)].
Figure 13b shows that the numerical results are also sensitive to thevalue chosen for the cohesive strength of the adhesive layer. The cohesivestrength found is 37MPa, which is different from the average value foundfrom the TAST specimens tested at RT (32MPa). This difference can be
Mode II Toughness of Adhesively Bonded Joints 547
Dow
nloa
ded
by [
Dr
M. D
. Ban
ea]
at 1
0:54
25
Apr
il 20
12
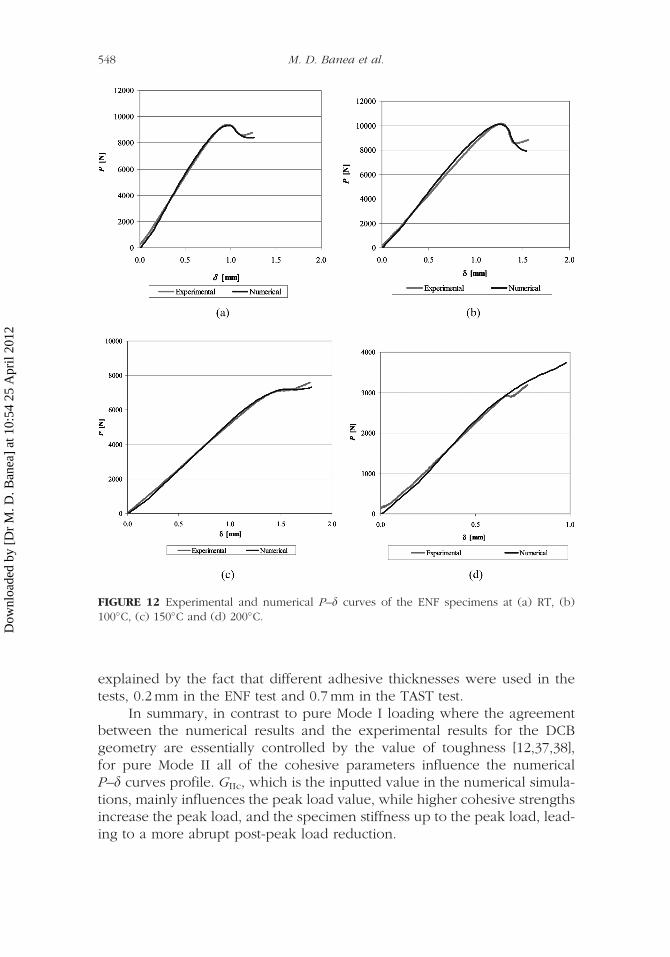
explained by the fact that different adhesive thicknesses were used in thetests, 0.2mm in the ENF test and 0.7mm in the TAST test.
In summary, in contrast to pure Mode I loading where the agreementbetween the numerical results and the experimental results for the DCBgeometry are essentially controlled by the value of toughness [12,37,38],for pure Mode II all of the cohesive parameters influence the numericalP–d curves profile. GIIc, which is the inputted value in the numerical simula-tions, mainly influences the peak load value, while higher cohesive strengthsincrease the peak load, and the specimen stiffness up to the peak load, lead-ing to a more abrupt post-peak load reduction.
FIGURE 12 Experimental and numerical P–d curves of the ENF specimens at (a) RT, (b)100�C, (c) 150�C and (d) 200�C.
548 M. D. Banea et al.
Dow
nloa
ded
by [
Dr
M. D
. Ban
ea]
at 1
0:54
25
Apr
il 20
12

6. CONCLUSIONS
In this study, the cohesive parameters [Mode II adhesive fracture toughness(GIIc) and maximum shear stress] for subsequent use in building damagelaws to model crack propagation of a thin layer of a structural epoxyadhesive in bonded structures at different temperatures (RT, 100, 150, and200�C) were determined.
Pure Mode II ENF adhesive fracture toughness (GIIc) tests were per-formed at room and high temperatures (100, 150, and 200�C). The Mode IIfracture toughness was found to increase at 100�C and decrease at 150�C,as the temperature approaches Tg. Moreover, a drastic drop in fracture tough-ness was observed at 200�C, when the Tg of the adhesive was overpassed.
Cohesive zonemodels have been used to characterize the adhesive behav-iour and to predict the adhesive P–d curves as a function of temperature. Thesimulation response matched the experimental results very well at temperaturesbelow Tg, while above this value of temperature it was not possible to mimic theexperiments as a clear drop of load could not be related to crack propagationdue to the excessive degradation of the adhesive. From the numerical simula-tions, the parameters that describe the bilinear CZM were determined. Theagreement between the numerical results and the experimental results for theENF geometry were essentially controlled by both values, of toughness andby the value chosen for the cohesive strength of the adhesive layer.
ACKNOWLEDGMENTS
The authors would like to thank the Portuguese Foundation for Science andTechnology for supporting the work presented here, through the individual
FIGURE 13 Sensitivity of the cohesive parameters study: (a) toughness; (b) cohesive strength.
Mode II Toughness of Adhesively Bonded Joints 549
Dow
nloa
ded
by [
Dr
M. D
. Ban
ea]
at 1
0:54
25
Apr
il 20
12

grant SFRH=BD=61880=2009 and through the research project PTDC=EME-PME=67022=2006, and Nagase ChemteX (Osaka, Japan) for supplying theadhesive.
REFERENCES
[1] Adams, R. D. and Mallick, V., J. Adhesion 43 (1–2), 17–33 (1993).[2] da Silva, L. F. M. and Adams, R. D., Int. J. Adhesion Adhesives 27 (3), 216–226
(2007).[3] Banea, M. D. and da Silva, L. F. M., Proc. IMechE, Part L: Journal of Materials:
Design and Applications 224 (2), 51–62 (2010).[4] da Silva, L. F. M. and Adams, R. D., J. Adhesion Sci. Technol. 19 (2), 109–141
(2005).[5] Banea, M. D. and da Silva, L. F. M., Materialwiss. Werkstofftech. 41 (5), 325–335
(2010).[6] Banea, M. D. and da Silva, L. F. M., J. Adhesion 85 (4–5), 261–285 (2009).[7] Melcher, R. J. and Johnson, W. S., Composites Science and Technology 67 (3–4),
501–506 (2007).[8] Banea, M. D., da Silva, L. F. M., and Campilho, R. D. S. G., J. Adhes. Sci. Technol.
24 (11–12), 2011–2026 (2010).[9] Carlberger, T., Biel, A., and Stigh, U., Internat. J. Fract. 155 (2), 155–166 (2009).
[10] Ashcroft, I. A., Hughes, D. J., and Shaw, S. J., Internat. J. Adhesion andAdhesives 21 (2), 87–99 (2001).
[11] Banea, M. D., da Silva, L. F. M., and Campilho, R. D. S. G., J. Adhesion Scienceand Technol. (2011) DOI:10.1163=156856111X593649.
[12] Banea, M. D., da Silva, L. F. M., and Campilho, R. D. S. G., Internat. J. Adhesionand Adhesives 31 (5), 273–279 (2011).
[13] Chai, H., Internat. J. Fracture 130 (1), 497–515 (2004).[14] O’Brien, T. K., ASTM STP 1330, 3–18 (1998).[15] Blackman, B. R. K., Kinloch, A. J., and Paraschi, M., Eng. Fract. Mech. 72 (6),
877–897 (2005).[16] Blackman, B. R. K., Brunner, A. J., and Williams, J. G., Eng. Fract Mech 73 (16),
2443–2455 (2006).[17] Brunner, A. J., Blackman, B. R. K., and Williams, J. G., Compos. Sci. Technol. 66
(6), 785–795 (2006).[18] de Moura, M. F. S. F. and de Morais, A. B., Eng. Fract. Mech. 75 (9), 2584–2596
(2008).[19] Schuecker, C. and Davidson, B. D., ASTM STP 1383, 334–344 (2000).[20] de Moura, M. F. S. F., Campilho, R. D. S. G., and Goncalves, J. P. M., Internat.
J. Solids and Structures 46 (6), 1589–1595 (2009).[21] Banea, M. D., de Sousa, F. S. M., da Silva, L. F. M., Campilho, R. D. S. G., and de
Bastos Pereira, A. M., J. Adhes Sci. Technol. 25 (18), 2461–2474 (2011).[22] ISO 11003–2:1993(E). Adhesives-determination of shear behavior of structural
bonds, part II: Thick adherend tensile test method, (ISO, 1993).[23] da Silva, L. F. M., Silva, R. A. M., Chousal, J. A. G., and Pinto, A. M. G., J.
Adhesion Sci. Technol. 22, 15–29 (2008).
550 M. D. Banea et al.
Dow
nloa
ded
by [
Dr
M. D
. Ban
ea]
at 1
0:54
25
Apr
il 20
12

[24] Chousal, J. A. G. and Gomes, J. F., Image processing aided shearography–processing correlation, in Proc. M2D, 3rd International Conference onMechanics & Materials in Design, Orlando, FL (2000).
[25] de Moura, M. F. S. F., Silva, M. A. L., de Morais, A. B., and Morais, J. J. L.,Engineering Fracture Mechanics 73 (8), 978–993 (2006).
[26] Li, H. and Chandra, N., Internat. J. Plasticity 19 (6), 849–882 (2003).[27] Campilho, R. D. S. G., Banea, M. D., Chaves, F. J. P., and da Silva, L. F. M., Com-
putational Materials Science 50 (4), 1543–1549 (2011).[28] Wade, G. A. and Cantwell, W. J., J. Adhesion 76 (3), 245–264 (2001).[29] da Silva, L. F. M., Rodrigues, T. N. S. S., Figueiredo, M. A. V., de Moura, M. F. S.
F., and Chousal, J. A. G., J. Adhesion 82 (11), 1091–1115 (2006).[30] da Silva, L. F. M., de Magalhaes, F. A. C. R. G., Chaves, F. J. P., and de Moura, M.
F. S. F., J. Adhesion 86 (9), 889–903 (2010).[31] Campilho, R. D. S. G., de Moura, M. F. S. F., Ramantani, D. A., Morais, J. J. L., and
Domingues, J. J. M. S., Int. J. Adhes. Adhes. 29 (6), 678–686 (2009).[32] Trantina, G. G., J. Composite Mater. 6 (2), 192–207 (1972).[33] Daghyani, H. R., Ye, L., and Mai, Y. W., J. Composite Materials 30 (11), 1248–
1265 (1996).[34] Campilho, R. D. S. G., de Moura, M. F. S. F., Barreto, A. M. J. P., Morais, J. J. L.,
and Domingues, J. J. M. S., Composites: Part A – Applied Science and Manufac-turing 40 (6–7), 852–859 (2009).
[35] Banea, M. D. and da Silva, L. F. M., Proc. IMechE, Part L: Journal of Materials:Design and Applications 223 (1), 1–18 (2009).
[36] Campilho, R. D. S. G., de Moura, M. F. S. F., and Domingues, J. J. M. S., Inter. J.Solids and Structures 45, 1497–1512 (2008).
[37] Sun, C., Thouless, M. D., Waas, A. M., Schroeder, J. A., and Zavattieri, P. D.,Internat. J. Solids and Structures 45 (17), 4725–4738 (2008).
[38] Gustafson, P. A. and Waas, A. M., Int. J. Solids and Structures 46 (10), 2201–2215 (2009).
Mode II Toughness of Adhesively Bonded Joints 551
Dow
nloa
ded
by [
Dr
M. D
. Ban
ea]
at 1
0:54
25
Apr
il 20
12