Expansion of Propylene Glycol Plant by 50000 MTPA
294
ENVIRONMENTAL IMPACT ASSESSMENT REPORT For Expansion of Propylene Glycol Plant by 50000 MTPA At S.F.No. 1/6, 1/8, 23 to 29, 30/3 & 31 Manali Industrial Area, Manali, Chennai – 600 068 Village: Sathangadu Taluk: Ambattur District: Thiruvallur State: Tamil Nadu [Project termed under Schedule 5(f) Category ‘B’ – “Synthetic organic chemicals industry (dyes & dye intermediates; bulk drugs and intermediates excluding drug formulations; synthetic rubbers; basic organic chemicals, other synthetic organic chemicals and chemical intermediates)” as per EIA Notification 2006 and its Amendments- However due to applicability of General Condition (Project site located at Critically Polluted Area as notified by CPCB from time to time– Manali Industrial Area), the project to be appraised as Category ‘A’] Submitted by: MANALI PETROCHEMICALS LIMITED-PLANT-II EIA CONSULTANT: ECOTECH LABS PVT. LTD. No. 48, 2 nd Main Road, South Extension, Ram Nagar, Pallikaranai, Chennai – 600 100. March 2022
-
Upload
khangminh22 -
Category
Documents
-
view
0 -
download
0
Transcript of Expansion of Propylene Glycol Plant by 50000 MTPA

ENVIRONMENTAL IMPACT ASSESSMENT REPORT
For
Expansion of Propylene Glycol Plant by 50000 MTPA
At
S.F.No. 1/6, 1/8, 23 to 29, 30/3 & 31
Manali Industrial Area, Manali, Chennai – 600 068
Village: Sathangadu
Taluk: Ambattur
District: Thiruvallur
State: Tamil Nadu
[Project termed under Schedule 5(f) Category ‘B’ – “Synthetic organic chemicals
industry (dyes & dye intermediates; bulk drugs and intermediates excluding drug
formulations; synthetic rubbers; basic organic chemicals, other synthetic organic
chemicals and chemical intermediates)” as per EIA Notification 2006 and its
Amendments- However due to applicability of General Condition (Project site located
at Critically Polluted Area as notified by CPCB from time to time– Manali Industrial
Area), the project to be appraised as Category ‘A’]
Submitted by:
MANALI PETROCHEMICALS LIMITED-PLANT-II
EIA CONSULTANT:
ECOTECH LABS PVT. LTD.
No. 48, 2nd
Main Road,
South Extension,
Ram Nagar,
Pallikaranai,
Chennai – 600 100.
March 2022


Declaration by the Head of the Accredited Consultant Organization
I, Dr. A. Dhamodharan, hereby confirm that the below mentioned experts prepared the
EIA/EMP for the “Expansion of Propylene Glycol Plant by 50000 MTPA” at
S.F.No. 1/6, 1/8, 23 to 29, 30/3 & 31, Sathangadu Village, Manali Industrial Area,
Manali, Chennai – 600 068, Ambattur Taluk, Thiruvallur District, Tamil Nadu State by
M/s. Manali Petrochemicals Limited- Plant II and also confirms that the prescribed ToR
have been complied with and that the data submitted is factually correct as per the project
data provided by Proponent.
Signature:
Date: 29.03.2022
Name: Dr.A.Dhamodharan
Designation: Managing Director
Name of the EIA Consultant Organization: Eco Tech Labs Pvt Ltd
NABET Certificate No & Validity: NABET/EIA/2124/SA 0147 & 15.09.2023

Declaration of Experts contributing to the EIA
I hereby certify that I was involved in the preparation of EIA/EMP for the “Expansion of
Propylene Glycol by 50000 MTPA” at S.F.No. 1/6, 1/8, 23 to 29, 30/3 & 31,
Sathangadu Village, Manali Industrial Area, Manali, Chennai – 600 068, Ambattur Taluk,
Thiruvallur District, Tamil Nadu State by M/s. Manali Petrochemicals Limited-Plant II as
EIA Coordinator with the support of the following Functional Area Experts.
EIA Co-ordinator
Name : Ms Vijayalakshmi
Signature:
Date:29.03.2022
Contact Information:
M/s Eco Tech Labs Pvt Ltd
No.48, 2 nd main road,
Ram Nagar South Extension,
Pallikaranai,
Chennia – 600100.
Email: [email protected]
Functional Area Experts (FAEs):
S. No. Functional
areas
Name of the
experts
Involvement
(Period and task)
Signature and date
1
AP
Mrs. K.
Vijayalakshmi
1. Selection of Baseline
Monitoring stations based on the wind
direction
2. Interpretation of Baseline
data by comparing it with standards
prescribed by CPCB against the type
of area
3. Identification of sources
of air pollution and suggesting
mitigation measures to minimize
impact
Period: December 2021 – March 2022

2
WP
Dr. A.
Dhamodharan
1. Selection of baseline
Monitoring Locations for Ground
water analysis and also identifying
nearest surface water to be studied.
2. Interpretation of baseline
data collected
3. Identification of impacts
based on the baseline study conducted
and also to the ground water and
nearby surface water due to the
proposed project
4. Preparation of suitable
and appropriate mitigation plan.
Period: December 2021 –March 2022
3
SHW
Dr. A.
Dhamodharan
1. Identification of nature of
solid waste generated
2. Categorization of the
generated waste and estimating the
quantity of waste to be generated
based on the per capita basis.
Identification of impacts of SHW on
Environment
3. Suggesting suitable
mitigation measures by recommending
appropriate disposal method for each
category of waste generated
4. Top soil and refuse
management
Period: December 2021 –March 2022
4
SE
Mr. S. Pandian
1. Primary data collection
through the census questionnaire
2. Obtaining Secondary data
from authenticated sources and
incorporating the same in EIA report.
3. Impact assessment &
proposing suitable mitigation plan
4. CSR budget allocation by
discussing with the local body and
allotting the same for need based
activity.
Period: December 2021 –March 2022
5
EB
Dr. A.
Dhamodharan
1. Primary data collection
through field survey and sheet
observation for ecology and
biodiversity
2. Secondary Collection
through various authenticated sources
3. Prediction of anticipated
impacts and suggesting appropriate
mitigation measures.
Period: December 2021 –March 2022

6
HG
Dr. T. P. Natesan
1. Study of existing surface
drainage arrangements in the core and
buffer zone, impact due to mining on
these drainage courses and suggestion
of mitigative measures
2. Determination of
groundwater use pattern, development
of rainwater harvesting program.
Storm water management through
garland drainage system.
Period: December 2021 –March 2022
7 GEO Dr. T. P.
Natesan
1. Field survey for assessing
regional and local geology, aquifer
distribution, Determination of
groundwater use pattern, development
of rainwater harvesting program.
Period: December 2021 –March 2022
8
SC
Dr. A.
Dhamodharan
1. Interpretation of baseline
report
2. Identification of possible
impacts on soil, prediction of soil
conservation and suggesting suitable
mitigation measures.
Period: December 2021 –March 2022
9
AQ
Mrs. K.
Vijayalakshmi
1. Collection of
Meteorological data for the baseline
study period
2. Plotting wind rose plot
and thereby selecting the monitoring
locations based on the wind pattern
3. Estimation of sources of
air emissions and air quality modeling
is done
4. Interpretation of the
results obtained
5. Identification of the
impacts and suggesting suitable
mitigation measures.
Period: December 2021 –March 2022
10
NV
Mr. Vivek
Mariappan
1. Selection of monitoring
locations
2. Interpretation of baseline
data
3. Prediction of impacts due
to noise pollution and suggestion of
appropriate mitigation measures
Period: December 2021

11
LU
Dr. T. P. Natesan
1. Collection of Remote
sensing satellite data to study the land
use pattern.
2. Primary field survey and
limited field verification for land
categorization in the study area
3. Preparation of Land use
map using Satellite data for 10km
radius around the project site.
Period: December 2021 –March 2022
12
RH
Mrs. K.
Vijayalakshmi
1. Identification of the risk
2. Interpreting consequence
contours
3. Suggesting risk
mitigation measures
Period: December 2021 –March 2022
AP - Air pollution monitoring, prevention and control
AQ - Meteorology, air quality modeling and prediction
EB - Ecology and biodiversity
HG - Hydrology, ground water and water conservation
LU - Land use
NV - Noise & Vibration
RH - Risk assessment and hazards management
SC - Soil conservation
SE - Socio-economics
SHW - Solid and hazardous waste management
WP - Water pollution monitoring, prevention and control
Geo -Geology
Acknowledgement
The following personnel are gratefully acknowledged for their fullest support in collection,
compilation of needful data regarding the project and kind cooperation in fulfilling the report
on Environmental Impact Assessment (EIA)/EMP for “Expansion of Propylene Glycol
Plant by 50000 MTPA” at S.F.No. 1/6, 1/8, 23 to 29, 30/3 & 31, Sathangadu Village,
Manali Industrial Area, Manali, Chennai – 600 068, Ambattur Taluk, Thiruvallur
District, Tamil Nadu State by M/s. Manali Petrochemicals Limited-Plant II.
M/s. Manali Petrochemicals Limited-Plant II
Mr. M. Karthikeyan Whole Time Director (OPERATIONS)
Mr. T. Thangasagaran HOG (TS/PROJECTS/QA)
Mr. G. R. Sridhar GM (OPERATIONS)
Mr. R. Sivasankaran DGM (PROJECTS)
Mr. T. Balaguru AGM (SHE)
Mr. C. Saravanan DM (SHE)
Mr. R. Raghuraman DM (PROJECTS)
M/s Eco Tech Labs Pvt Ltd
Dr A.Dhamodharan - Managing Director
Ms K.Vijayalakshmi - Technical Manager
Ms K.Vijayalakshmi - EIA Cordinator
Ms K.Amudha - Trainee Engineer

List of Abbreviations
EO
FO
HC
Ethylene Oxide
Fuel oil
Hydrocarbon
HSE Health,Safety And Environment
IMD India Meteorological Department
LFL Lower Flammable Limit
LP Low Pressure
MPL Manali Petrochemicals Limited
PFD Process Flow Diagram
PO Propylene Oxide
RA Risk Assessment
TNPCB Tamil Nadu Pollution Control Board
MoEF&CC Ministry of Environment, Forest & Climate Change
SPIC Southern Petrochemicals Industries Corporation Limited
HSD High Speed Diesel
STP Sewage Treatment Plant
ETP Effluent Treatment Plant
DPG Di-propylene Glycol
TPG Tri-propylene Glycol
PG Propylene Glycol
DCP Di-Chloro Propane
R-LNG Regasified-Liquefied Natural gas

RVDF Rotary Vacuum Drum Filter
NGT National Green Tribunal
CTO Consent to Operate
CTE Consent to Establish
NABET National Accreditation Board for Education and Training

1
TABLE OF CONTENTS
EXECUTIVE SUMMARY……………………………………………………………………………………………………………………………….14
1 INTRODUCTION...................................................................................................................................... 36
1.1 Introduction ........................................................................................................................................36
1.2 Purpose of the EIA Report .................................................................................................................37
1.3 Brief description of the project ...........................................................................................................37
1.4 Scope & Methodology Adopted .........................................................................................................38
1.4.1 Objective of EIA Report ............................................................................................................38
1.4.2 Scope of Work ............................................................................................................................39
1.4.3 EIA Process ................................................................................................................................40
1.5 Objective of the study ........................................................................................................................42
1.6 Applicable Regulatory Framework ....................................................................................................42
1.7 TOR COMPLIANCE ..............................................................................................................................45
2 PROJECT DESCRIPTION ........................................................................................................................ 98
2.1 Project Description .............................................................................................................................98
2.2 Type of Project ...................................................................................................................................98
2.3 Need of the project .............................................................................................................................98
2.4 Site Location ......................................................................................................................................99
2.5 Salient features of the Project site ....................................................................................................105
2.6 Proposed Schedule for Approval and Implementation .....................................................................107
2.7 Project Details ..................................................................................................................................107
2.7.1 Existing Facility .......................................................................................................................107
2.7.2 Existing Utilities .......................................................................................................................109
2.7.3 Existing ETP facilities ..............................................................................................................111
2.7.4 Existing Product Production .....................................................................................................113
2.7.5 Proposed Facility ......................................................................................................................114

2
2.7.6 Proposed Utilities .....................................................................................................................121
2.7.7 Proposed RO and Sewage Treatment Plant ..............................................................................121
2.7.8 Sulphur Balance .......................................................................................................................123
2.8 Raw materials and Transportation ....................................................................................................124
2.9 Land use Details ...............................................................................................................................126
2.10 Manpower ........................................................................................................................................131
2.11 Power and Fuel Requirements ..........................................................................................................131
2.12 Site Photographs ...............................................................................................................................132
2.13 Project cost .......................................................................................................................................134
2.14 Water Requirement ..........................................................................................................................134
2.14.1 Source of Water Supply ..........................................................................................................139
2.15 Solid Waste Management .................................................................................................................139
2.16 Hazardous Waste Management ........................................................................................................140
2.17 Non-Hazardous Waste Management ................................................................................................142
2.18 Greenbelt Development ....................................................................................................................143
2.19 Air Pollution Control Measures........................................................................................................147
2.20 Odour Control Measures ..................................................................................................................147
2.21 Water Pollution Control Measures ...................................................................................................147
3 Description of Environment ..................................................................................................................... 149
3.1 Introduction ......................................................................................................................................149
3.2 Study Area ........................................................................................................................................149
3.2.1 Classification of the study Area: ..............................................................................................153
3.3 Land use Analysis ............................................................................................................................154
3.3.1 Land Use Classification ...........................................................................................................154
3.3.2 Methodology ............................................................................................................................154
3.3.3 Satellite Data ............................................................................................................................156
3.3.4 Scale of mapping ......................................................................................................................156
3.3.5 Interpretation Technique ..........................................................................................................156

3
3.3.6 Field Verification .....................................................................................................................157
3.3.7 Description of the Land Use / land cover classes .....................................................................157
3.3.8 Land use Land cover for the Study area ..................................................................................158
3.4 Hydrogeology ...................................................................................................................................160
3.4.1 Drainage Pattern .......................................................................................................................162
3.5 Geomorphology of District ..............................................................................................................162
3.5.1 Geomorphology of study area ..................................................................................................163
3.6 Geology: ...........................................................................................................................................165
3.7 Soil Profile in district .......................................................................................................................166
3.8 Water Environment ..........................................................................................................................167
3.8.1 Ground water quality monitoring .............................................................................................167
3.8.2 Surface Water Analysis ............................................................................................................174
3.9 Climatology & Meteorology ............................................................................................................176
3.9.1 Ambient Air Quality .................................................................................................................178
3.10 Noise Environment ...........................................................................................................................182
3.10.1 Day Noise Level (Leq day) ......................................................................................................183
3.10.2 Night Noise Level (Leq Night) ................................................................................................184
3.11 Soil Environment..............................................................................................................................184
3.11.1 Baseline Data............................................................................................................................184
3.12 Ecology and Biodiversity .................................................................................................................186
3.12.1 Methods available for floral analysis .......................................................................................186
3.12.2 Field study& Methodology adopted .........................................................................................187
3.12.3 Study outcome ..........................................................................................................................187
3.12.4 Calculation of species diversity by Shannon – wiener Index, Evenness and richness by
Margalef: 195
3.12.5 Calculation of species diversity by Shannon – wiener Index, Evenness and richness by
Margalef for trees .....................................................................................................................................196
3.12.6 Frequency Pattern .....................................................................................................................198
3.12.7 Floral study in the Buffer Zone: ...............................................................................................200

4
3.12.8 Faunal Communities ................................................................................................................200
3.13 Demography & Socio Economics ....................................................................................................202
3.13.1 Literacy & Education ...............................................................................................................203
3.13.2 Employment details ..................................................................................................................204
3.13.3 Salient features in the study area: .............................................................................................206
Key Socio economic Indicator ...............................................................................................................206
3.14 Traffic Survey ....................................................................................................................................207
4 Anticipated Environmental Impacts & Mitigation Measures................................................................... 209
4.1 Introduction .....................................................................................................................................209
4.2 Environmental Impacts ....................................................................................................................209
4.2.1 AERMOD SOFTWARE ................................................................................................................229
5 ANALYSES OF ALTERNATIVES ........................................................................................................ 244
5.1 Introduction ......................................................................................................................................244
5.2 Site Alternative .................................................................................................................................244
5.3 Alternative for Technologies ............................................................................................................244
5.3.1 Water supply stream .................................................................................................................244
5.3.2 Technology ...............................................................................................................................244
6 Environmental Monitoring Program ........................................................................................................ 245
6.1 Introduction ......................................................................................................................................245
6.2 Environmental Monitoring Plan .......................................................................................................245
6.3 Environmental Monitoring Methodologies ......................................................................................247
6.4 Budget for Environmental Monitoring Plan .....................................................................................247
6.5 EHS Policy and Environment Management Cell .............................................................................248
7 ADDITIONAL DETAILS ....................................................................................................................... 251
7.1 Public Consultation ..........................................................................................................................251
7.2 Risk Assessment ...............................................................................................................................251
7.3 R&R Action Plan .............................................................................................................................252
8 Project Benefits ........................................................................................................................................ 253

5
8.1 Improvements in Physical Infrastructure ..........................................................................................253
8.2 Improvements in Social Infrastructure .............................................................................................253
8.3 Employment Potential-Skilled, Semi-Skilled & unskilled ...............................................................253
8.4 Benefits of Propylene Glycol (PG) ..................................................................................................253
9 Environmental Cost Benefit Analysis ...................................................................................................... 255
10 Environment Management Plan ............................................................................................................... 256
10.1 Introduction ......................................................................................................................................256
10.2 Objectives of EMP ...........................................................................................................................256
10.3 EMP Structure and Organization......................................................................................................256
10.4 EMP Roles and Responsibilities ......................................................................................................257
10.5 Environmental Management Plan for Construction Phase ...............................................................259
10.6 Environmental Management Plan for Operation Phase ...................................................................260
10.6.1 Air Quality Management ..........................................................................................................260
10.6.2 Noise Environment ...................................................................................................................261
10.6.3 Water and Wastewater Management ........................................................................................265
10.6.4 Solid and Hazardous Waste Management ................................................................................269
10.6.5 Land Environment ....................................................................................................................269
10.6.6 Socio – Economic Environment ...............................................................................................270
10.7 Occupational Health and Safety .......................................................................................................270
10.7.1 Safety Practice in MPL ............................................................................................................272
10.7.2 Work Zone Monitoring Equipments .........................................................................................274
10.7.3 Trainings Provided ....................................................................................................................276
10.7.4 Facilities Available ....................................................................................................................277
10.8 Environmental Management Cell ....................................................................................................278
10.9 Corporate Environmental Policy ......................................................................................................279
10.10 Budgetary Provision for Environmental Management Plan ........................................................280
10.11 Corporate Environmental Responsibility .....................................................................................280
10.12 Corporate Social Responsibility ....................................................................................................281

6
11 Summary & Conclusion ............................................................................................................................ 282
12 Disclosure of Consultant .......................................................................................................................... 284
12.1 Introduction .....................................................................................................................................284
12.2 Eco Tech Labs Pvt. Ltd – Environment Consultant ...........................................................................284
12.2.1 Quality Policy ...........................................................................................................................284

7
LIST OF TABLES
Table 1-1 Chronology of Environmental clearances .........................................................................................37
Table 1-2 Applicable Acts and Rules for the proposed project ..........................................................................42
Table 2-1 Coordinates of the Project Site ........................................................................................................101
Table 2-2 Salient features of Project site..........................................................................................................105
Table 2-3 Time Schedule for completion of the proposed project ...................................................................107
Table 2-4 Existing Facility ...............................................................................................................................107
Table 2-5 List of Existing utilities ....................................................................................................................109
Table 2-6 List of Existing Bullets Storage .......................................................................................................110
Table 2-7 Existing storage for Products and Raw materials ............................................................................110
Table 2-8 Existing ETP facility ........................................................................................................................111
Table 2-9 Existing Product Production (FY 2020-2021) .............................................................................113
Table 2-10 Proposed Facility ...........................................................................................................................114
Table 2-11 Proposed Major Equipment List for PG Unit ................................................................................115
Table 2-12 Proposed Utilities ...........................................................................................................................121
Table 2-13 Proposed Storage Tanks .................................................................................................................121
Table 2-14 Existing and Proposed raw material details ...................................................................................124
Table 2-15 Land use planning of the project site .............................................................................................126
Table 2-16 Manpower Requirement .................................................................................................................131
Table 2-17 Power and Fuel requirement ..........................................................................................................131
Table 2-18 R-LNG composition ......................................................................................................................131
Table 2-19 Existing and Proposed Water Requirements ..................................................................................135
Table 2-20 Solid waste Generation and Management during Construction phase...........................................139
Table 2-21 Solid waste Generation and Management during Operation phase ...............................................139
Table 2-22 Other Solid Waste Generation .......................................................................................................140
Table 2-23 Hazardous Waste Management......................................................................................................140
Table 2-24 Non-Hazardous Waste Management .............................................................................................142

8
Table 2-25 Land area breakup of greenbelt......................................................................................................143
Table 2-26 Greenbelt Plant Species .................................................................................................................144
Table 2-27 Existing Air Pollution Sources and Control Measures ..................................................................147
Table 2-28 Characteristics of Existing Effluent ...............................................................................................148
Table 2-29 Characteristics of Effluent to be generated from the proposed project (RO Rejects) ...................148
Table 3-1 Study area with Environmental surroundings around the project site .............................................150
Table 3-2 Classification of the study Area .......................................................................................................153
Table 3-3 Environmental Attributes .................................................................................................................153
Table 3-4 District land use/land cover statistics (2015-16) for Tiruvallur district ...........................................157
Table 3-5 Land use pattern of the Study Area..................................................................................................158
Table 3-6 Geomorphology of study area ..........................................................................................................163
Table 3-7 Ground water Monitoring locations .................................................................................................168
Table 3-8 Ground water sampling results ........................................................................................................171
Table 3-9 surface water sample results ............................................................................................................175
Table 3-10 Ambient Air Quality - Results .......................................................................................................180
Table 3-11 Ambient Air Quality ......................................................................................................................181
Table 3-12 Noise Analysis ...............................................................................................................................182
Table 3-13 Day Noise Level (Leq day) ............................................................................................................183
Table 3-14 Night Noise Level (Leq Night) .....................................................................................................184
Table 3-15 Soil Quality Analysis ...................................................................................................................185
Table 3-16 Soil Quality Analysis ...................................................................................................................185
Table 3-17 Calculation of Density, Frequency (%), Dominance, Relative Density, Relative Frequency,
Relative Dominance & Important Value Index ................................................................................................187
Table 3-18 Tree Species in the core Zone .......................................................................................................189
Table 3-19 Shrubs in the Core Zone ................................................................................................................192
Table 3-20 Herbs & Grasses in the core zone ..................................................................................................193
Table 3-21 Calculation of species diversity .....................................................................................................195
Table 3-22 Shrubs ............................................................................................................................................197

9
Table 3-23 Herbs ..............................................................................................................................................197
Table 3-24 Species Richness (Margalef) .........................................................................................................198
Table 3-25 Frequency Pattern ..........................................................................................................................198
Table 3-26 Raunkiaer’s class for the observed species ....................................................................................198
Table 3-27 list of fauna species .......................................................................................................................201
Table 3-28 Demographic status around 10km radius .......................................................................................203
Table 4-1 Impact on Environment during Construction Phase ........................................................................210
Table 4-2 Impact on Environment during Operation Phase .............................................................................218
Table 4-3 Impact & Mitigation measures on Land Environment.....................................................................224
Table 4-4 Impact & Mitigation measures on Water Environment ...................................................................226
Table 4-5 Impact & Mitigation measures on Air Environment .......................................................................227
Table 4-6 Existing Stack Emission Details ......................................................................................................230
Table 4-7 Proposed Stack Emission Details.....................................................................................................230
Table 4-8 Estimated Top 10 Highest Concentrations of Sulphur Dioxide Obtained Through Modeling .......233
Table 4-9 Estimated Top 10 Highest Concentrations of oxide of Nitrogen Obtained through Modeling .......235
Table 4-10 Estimated Top 10 Highest Concentrations of PM10 Obtained through Modeling ........................237
Table 4-11 Estimated Top 10 Highest Concentrations of CO Obtained through Modeling ............................239
Table 4-12 Total Maximum GLCs of the cumulative emissions .....................................................................240
Table 4-13 Impact & Mitigation measures on Noise Environment .................................................................241
Table 4-14 Socio Economic Environment .......................................................................................................241
Table 4-15 Biological Environment .................................................................................................................242
Table 4-16 Occupational Health and safety .....................................................................................................242
Table 6-1 Post Environmental Monitoring plan ...............................................................................................245
Table 6-2 Budgetary allocation for Environmental Monitoring .......................................................................247
Table 10-1 Responsibility for EMP Implementation .......................................................................................257
Table 10-2 Water Management ........................................................................................................................266
Table 10-3 Wastewater Management ...............................................................................................................266
Table 10-4 Rainwater Harvesting methods and quantification ........................................................................268

10
Table 10-5 Installation of LEL Detectors at Plant-II .......................................................................................275
Table 10-6 Budget for EMP .............................................................................................................................280
Table 10-7 CER Cost Breakup .........................................................................................................................281
11
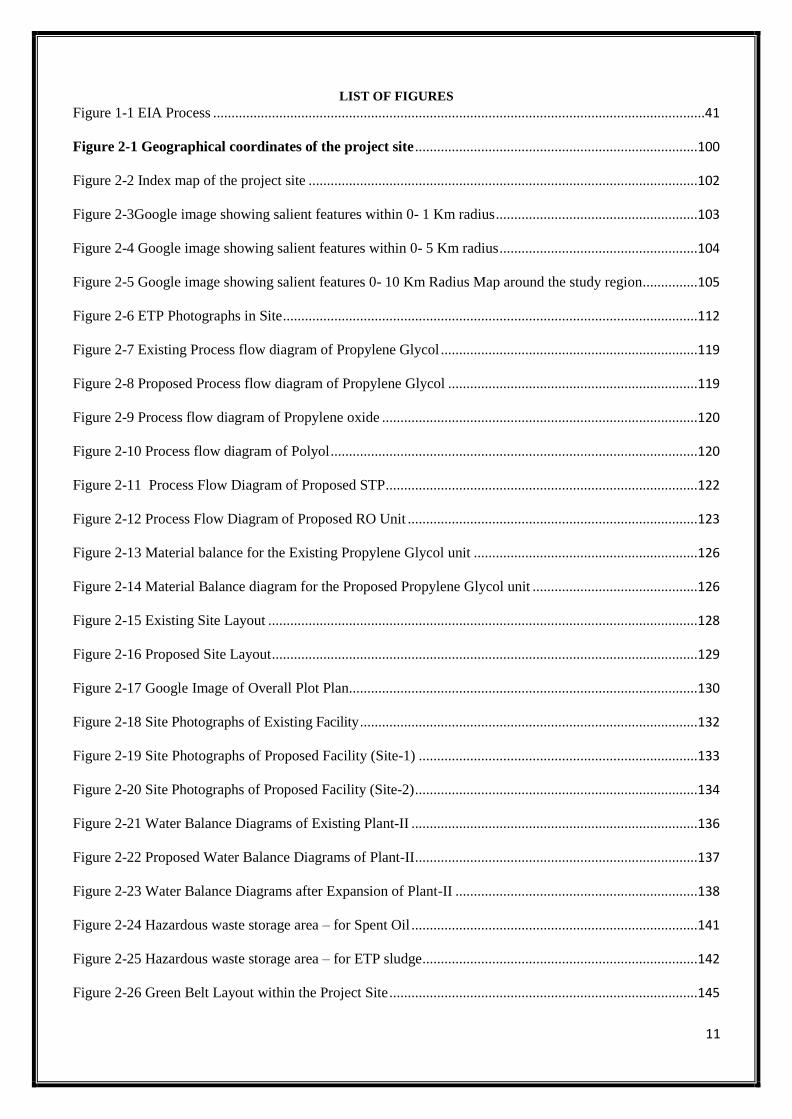
LIST OF FIGURES
Figure 1-1 EIA Process ......................................................................................................................................41
Figure 2-1 Geographical coordinates of the project site .............................................................................100
Figure 2-2 Index map of the project site ..........................................................................................................102
Figure 2-3Google image showing salient features within 0- 1 Km radius .......................................................103
Figure 2-4 Google image showing salient features within 0- 5 Km radius ......................................................104
Figure 2-5 Google image showing salient features 0- 10 Km Radius Map around the study region ...............105
Figure 2-6 ETP Photographs in Site .................................................................................................................112
Figure 2-7 Existing Process flow diagram of Propylene Glycol ......................................................................119
Figure 2-8 Proposed Process flow diagram of Propylene Glycol ....................................................................119
Figure 2-9 Process flow diagram of Propylene oxide ......................................................................................120
Figure 2-10 Process flow diagram of Polyol ....................................................................................................120
Figure 2-11 Process Flow Diagram of Proposed STP .....................................................................................122
Figure 2-12 Process Flow Diagram of Proposed RO Unit ...............................................................................123
Figure 2-13 Material balance for the Existing Propylene Glycol unit .............................................................126
Figure 2-14 Material Balance diagram for the Proposed Propylene Glycol unit .............................................126
Figure 2-15 Existing Site Layout .....................................................................................................................128
Figure 2-16 Proposed Site Layout ....................................................................................................................129
Figure 2-17 Google Image of Overall Plot Plan...............................................................................................130
Figure 2-18 Site Photographs of Existing Facility ............................................................................................132
Figure 2-19 Site Photographs of Proposed Facility (Site-1) ............................................................................133
Figure 2-20 Site Photographs of Proposed Facility (Site-2) .............................................................................134
Figure 2-21 Water Balance Diagrams of Existing Plant-II ..............................................................................136
Figure 2-22 Proposed Water Balance Diagrams of Plant-II .............................................................................137
Figure 2-23 Water Balance Diagrams after Expansion of Plant-II ..................................................................138
Figure 2-24 Hazardous waste storage area – for Spent Oil ..............................................................................141
Figure 2-25 Hazardous waste storage area – for ETP sludge ...........................................................................142
Figure 2-26 Green Belt Layout within the Project Site ....................................................................................145

12
Figure 2-27 Green Belt Layout in Govt. Allocated Lands ................................................................................146
Figure 3-1 Toposheet of 10km radius around the project site ..........................................................................149
Figure 3-2 Environmental sensitive areas covering within 15 km from project boundary ..............................152
Figure 3-3 Flow Chart showing Methodology of Land use mapping ..............................................................155
Figure 3-4 Land use/Land cover pattern for Tiruvallur district .......................................................................158
Figure 3-5 Land Use Pattern for Study Area ....................................................................................................159
Figure 3-6 Land use classes around 10 km radius from the project site ..........................................................160
Figure 3-7 Hydrogeology Map of Thiruvallur District ....................................................................................161
Figure 3-8 Drainage map of study area ............................................................................................................162
Figure 3-9 Geomorphology pattern of the study area ......................................................................................164
Figure 3-10 Geomorphology map of Thiruvallur District ................................................................................164
Figure 3-11 Geomorphology Map of Study Area ............................................................................................165
Figure 3-12 Geology map of Tamilnadu ..........................................................................................................166
Figure 3-13 Soil map of India ..........................................................................................................................167
Figure 3-14 Ground water monitoring locations ..............................................................................................169
Figure 3-15 Windrose ......................................................................................................................................178
Figure 3-16 Maximum Value of PM10, PM2.5, SO2, NOx ............................................................................182
Figure 3-17 Minimum Value of PM10, PM2.5, SO2, NOx .............................................................................182
Figure 3-18 Day Time Noise Levels (Day time shall mean from 6.00 a.m. to 10.00 p.m) .............................183
Figure 3-19 Night noise levels (Night time shall mean from10.00 p.m. to 6.00 a.m.).....................................184
Figure 3-20 Raunkiaer’s class for the observed species ...................................................................................199
Figure 3-21 Comparison of Male and Female Literacy Rate to the 2001 and 2011 census .............................204
Figure 3-22 Employment details ......................................................................................................................205
Figure 4-1 Predicted 24-Hrs’ GLC’s of SO2 within 10 km Radius of the Study Area ....................................232
Figure 4-2 Predicted 24-Hrs’ GLC’s of NOX within 10 km Radius of the Study Area ..................................234
Figure 4-3 Predicted 24-Hrs’ GLC’s of PM10 within 10 km Radius of the Study Area .................................236
Figure 4-4 Predicted 24-Hrs’ GLC’s of CO within 10 km Radius of the Study Area .....................................238
Figure 6-1 Online Monitoring of Ambient air (PM10 and PM2.5) .................................................................246

13
Figure 6-2 Online Monitoring of Effluent (BOD, COD, Temperature and Flow of Effluent) .........................247
Figure 6-3 Environment Management Cell ......................................................................................................249
Figure 7-1 Propylene Oxide, Ethylene Oxide, Chlorine & Propylene Storage Tank with bund wall (Isolated
area) ..................................................................................................................................................................252
Figure 10-1 Typical HSE Department Organogram ........................................................................................257
Figure 10-2 Online Monitoring photographs of VOC, PM, SOx, CO and NOx ..............................................261
Figure 10-3 AAQ Online Monitoring of PM10, PM2.5 connected to TNPCB & CPCB .................................261
Figure 10-4 Green Belt Photographs ...............................................................................................................263
Figure 10-5 Green Belt Photographs (Newly developed) ................................................................................264
Figure 10-6 Photographs of Online Monitoring on BOD & COD of effluent .................................................265
Figure 10-7 Photographs of Online Monitoring on Flow, Temperature of effluent and pH ...........................266
Figure 10-8 Effluent discharge pipe line to sea and buoy float at disposal point .............................................267
Figure 10-9 Existing Rainwater Harvesting in Project site ..............................................................................268
Figure 10-10 Self Contained Breathing Apparatus ..........................................................................................274
Figure 10-11 Hydrocarbon Sensors control .....................................................................................................276
Figure 10-12 Organization chart of safety department ....................................................................................277
Figure 10-13 Fire Alarm Control ....................................................................................................................278
Figure 10-14 HS policy of Manali Petrochemicals Limited-Plant-II ...............................................................279
Figure 10-15 Environment policy of Manali Petrochemicals Limited-Plant-II ...............................................280
14
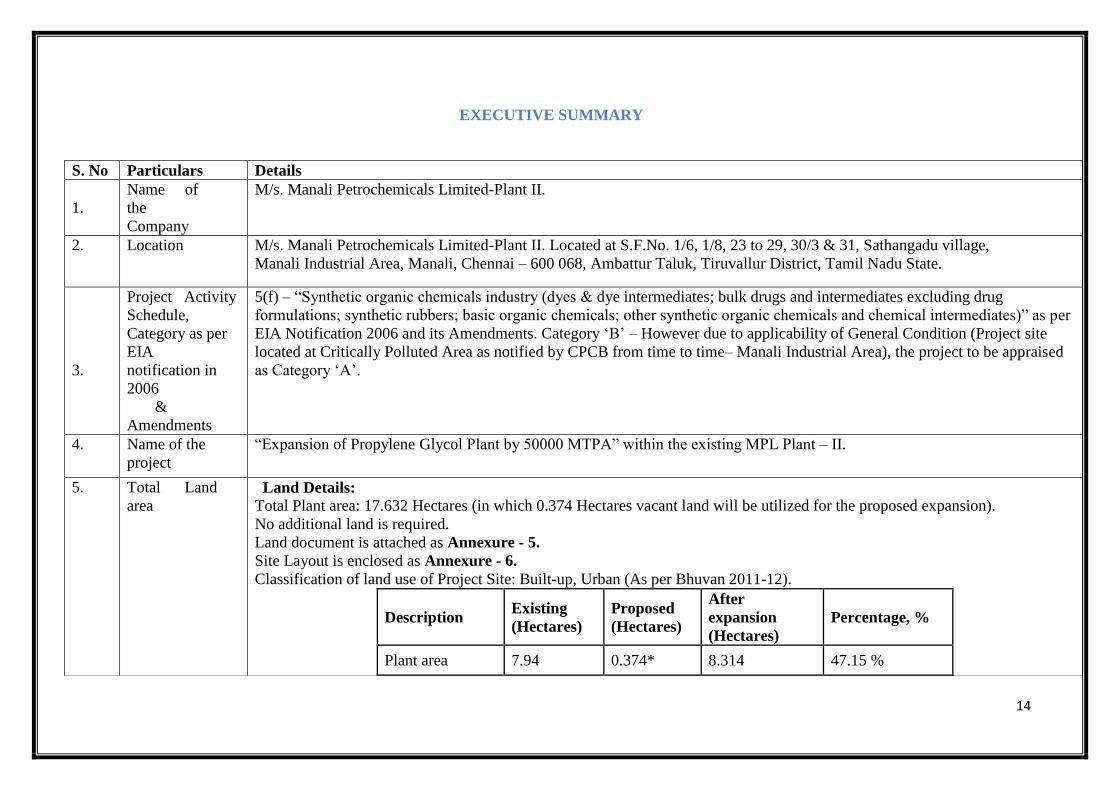
EXECUTIVE SUMMARY
S. No Particulars Details
1.
Name of
the
Company
M/s. Manali Petrochemicals Limited-Plant II.
2. Location M/s. Manali Petrochemicals Limited-Plant II. Located at S.F.No. 1/6, 1/8, 23 to 29, 30/3 & 31, Sathangadu village,
Manali Industrial Area, Manali, Chennai – 600 068, Ambattur Taluk, Tiruvallur District, Tamil Nadu State.
3.
Project Activity
Schedule,
Category as per
EIA
notification in
2006
&
Amendments
5(f) – “Synthetic organic chemicals industry (dyes & dye intermediates; bulk drugs and intermediates excluding drug
formulations; synthetic rubbers; basic organic chemicals; other synthetic organic chemicals and chemical intermediates)” as per
EIA Notification 2006 and its Amendments. Category ‘B’ – However due to applicability of General Condition (Project site
located at Critically Polluted Area as notified by CPCB from time to time– Manali Industrial Area), the project to be appraised
as Category ‘A’.
4. Name of the
project
“Expansion of Propylene Glycol Plant by 50000 MTPA” within the existing MPL Plant – II.
5. Total Land
area Land Details:
Total Plant area: 17.632 Hectares (in which 0.374 Hectares vacant land will be utilized for the proposed expansion).
No additional land is required.
Land document is attached as Annexure - 5.
Site Layout is enclosed as Annexure - 6.
Classification of land use of Project Site: Built-up, Urban (As per Bhuvan 2011-12).
Description Existing
(Hectares)
Proposed
(Hectares)
After
expansion
(Hectares)
Percentage, %
Plant area 7.94 0.374* 8.314 47.15 %

15
Roads 2.092 0 2.092 11.86 %
Greenbelt 2.7659 0 2.7659 15.69 %
Vacant Land 4.8341 -0.374 4.4601 25.30 %
Total land 17.632 0 17.632 100.00%
*Proposed PG plant area of 0.374 hectare is part of the existing vacant land ((4.8341 hectares). So, no additional land acquisition
is identified.
Green belt Area within the plant is 2.7659 hectares (15.69 %). Green belt area developed in the lands allocated by Greater
Chennai Corporation and Vilangadupakkam Panchayat, Puzhal Union is 4.4322 hectares (25.14 %).
The details of cost incurred for Green belt development in an area of 5.2381 hectares (29.70 %) to comply the Green belt cover
as per CEPI condition is mentioned in the Table below:
S.No Description Details
1
Additional area of Green Belt
(Ha.) developed to comply
Green belt cover as per CEPI
condition
5.2381 hectares
(Additional green belt cover in MPL – Plant –II : 0.8059 hectares)
(Green belt cover in GCC allocated land : 0.9322 hectares)
(Green belt cover in land allocated by Vilangadupakkam Panchayat, Puzhal
Union : 3.5 hectares)
2
Additional Green belt cover in
terms of Percentage of total
project site area (%)
29.70 %
(Additional green belt cover in MPL – Plant – II: 4.57 %)
(GCC allocated land: 5.28 %)
(Land allocated in Vilangadupakkam Panchayat, Puzhal Union: 19.85 %)
3 No. of Plants 8390
4 Funds Spent INR 22,65,300

16
6. Product
with
capacity Existing Units Product
Category
of
Product
Quantity (MTPA)
Existing Proposed After
expansion
Propylene Oxide Propylene Oxide Main Product 18000 - 18000
Di-Chloro propane By-Product 3600 - 3600
Propylene Glycol
Propylene glycol Main Product 12000 50000 62000
Di- Propylene Glycol By-Product 1581 6588 8169
Tri-Propylene Glycol By-Product 202 842 1044
Polyol Polyol Main Product 22705 - 22705
Note:
The existing EC was issued vide file no J-11011/156/2008-IA (II), dated 07.05.2008 and the same enclosed as
Annexure – 1. The existing plant is under operation with TNPCB Water Consent Order No. 2108131941933 dated
03.09.2021 valid till 31.03.2022 enclosed as Annexure - 2 and TNPCB Air Consent Order No. 2108231941933 dated
03.09.2021 valid till 31.03.2022 enclosed as Annexure - 3.Change in product mix with no increase in pollution load
certificate was granted based on pollution load assessment committee decision by TNPCB vide
Lr.No.T5/TNPCB/F.0112AMB/RL/2019 dated 16.09.2019 which is attached with this proposal as Annexure – 4.
7.
Raw
materials
List of raw materials (MTPA)
S.No. Raw
Material
Principal
Use
Existing
Quantity
Proposed
Quantity
After
Expansion
Source from
M/s.
Mode
of
Transport
Storage
capacity
1 Propylene
(96% Purity)
Production
of 15510 --- 15510
CPCL (95%) 4" Pipeline 86 MT
BPCL (5%) Tankers

17
2 Chlorine
Propylene
Oxide
(PO)
26950 --- 26950
Grasim
Industries
Tonners-
trucks
244 MT
TGV-
Rayalaseema/
DCW/ + 1 No.
dump
bullet Grasim
Industries
3 Lime
(90 % Purity) 31500 --- 31500
Imported from
UAE/Vietnam In bags -
trucks
Chemical
Godown Malaysia (PGP
international)
4 Caustic soda Production
of PO &
DM Water
1260 --- 1260
TPL/TGV
Rayalseema/
Chemfab/
DCW
Tankers 32 MT
5 HCl 787.5 --- 787.5 TPL Tankers 27.5 MT
6 Propylene
Oxide
Production
of
Propylene
Glycol
10500 44646 55146 Local-
TPL,MPL-I
Within the
plant/
Tankers
334 MT
7 Ethylene
Oxide
Production
of Polyol
630 --- 630 RIL Tankers 29 MT
8 Glycerine 147 ---- 147 3F industries/
Kaleeswari Tankers 32MT
9 Di Propylene
Glycol 59.5 ---- 59.5 MPL Drums
Chemical
Godown 10 Styrene 70 ---- 70
Supreme
Petrochem Drums
11 Sugar 388.5 ---- 388.5
Bannari
Sugars/EID
Parry
Bags in
Trucks
Chemical
Godown
12 Sorbitol (70%) 1004.5 ---- 1004.5 Kashyap Tankers 120 MT

18
Industries/
Blue Cross
13 KOH 38.5 ---- 38.5 TGV
Rayalseema
Tankers 29 MT
Bags in
Trucks
Chemical
Godown
14 Furnace Oil
Production
of Steam
9457 ---- ---- IOCL/BPCL Tankers 290 MT
15 R-LNG --- 8778 8778
IOCL R-LNG
Terminal
Ennore
Proposed
pipeline of
IOCL
No
Storage
8. Utilities
The demand for the utilities such as Nitrogen, Instrument Air and DM water for the proposed Propylene Glycol expansion will
be met from existing facilities. In order to meet the needs of Cooling water and Steam for the proposed expansion, an additional
Cooling Tower and a Boiler will be installed respectively.
S. No Description
Existing
Proposed
After Expansion
Working Standby Total Working Standby Total
1 Boiler 1
(21MTPH)
2
(10MTPH) 3
1
(30MTPH) 1(30MTPH)
(1 x 10MTPH+
1x 21 MTPH) 3
2
Refrigeration
System for
Chilled Water
2 (75 TR) 1 (120TR) 3 - 2 (75 TR) 1 (120 TR) 3
3
Refrigeration
System for
Chilled Brine
1
(10TR) 0 1 - 1 (10 TR) 0 1
4 DM Plant
1
(28m3/h)
1
(20m3/h)
2 - 1
(28 m3/
/h)
1
(20m3/h)
2
5 Cooling Tower
1
(Circulatio
n rate:
1950m3/h)
0 1
1
(Circulation
rate: 1950
m3/h)
2
(each
Circulation
rate: 1950
m3/h)
0 2

19
6 Instrument Air
Compressor
2
(1290
m3/h)
2
(908 m3/h)
4 - 2
(1290 m3/h)
2 (908 m3/h) 4
7
Liquid
Nitrogen
Storage
- -
2
(1
x7500
kg +
1
x13889
kg)
- - -
2 (1 x7500
kg +1
x13889
kg)
8 STP - - - 1
(20KLD)
1
(20KLD) -
1
(20KLD)
9 RO Unit - - -
1
(350 KLD)
1
(350 KLD) -
1
(350
KLD)
10
Vapour
Absorption
Machine for
Chilled water
1 (150TR) -
1
(150
TR)
- - - 1
(150TR)
11 Proposed - Sludge Drying Bed of area – 2.5m x 5m (2 nos)
12 4 Nos. of Rainwater Harvesting Pit proposed – Each pit of Diameter-1.5m and Depth-3m
* Note: The Utility Boiler B (10 MT) will be replaced by new Utility Boiler-E and combined with existing stack
itself.
Boiler - C 10 Ton + Boiler - D 21 Ton will be standby boiler for the Boiler-E with a common stack
20
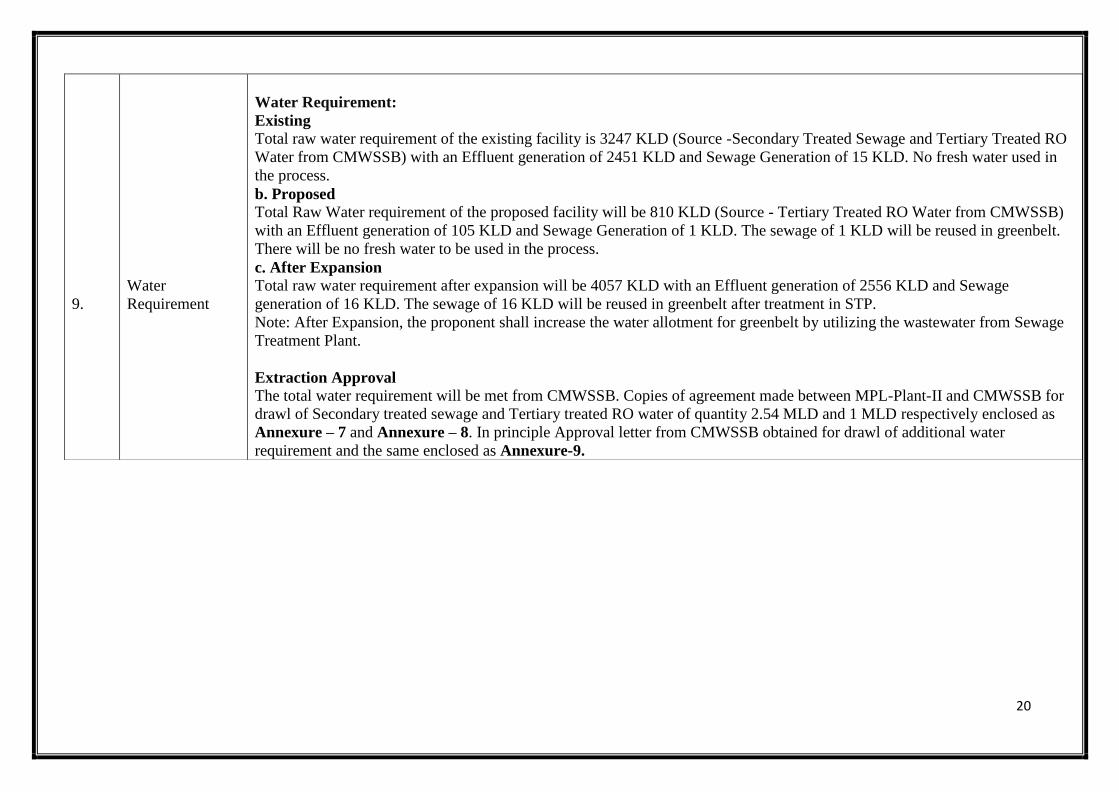
9.
Water
Requirement
Water Requirement:
Existing Total raw water requirement of the existing facility is 3247 KLD (Source -Secondary Treated Sewage and Tertiary Treated RO
Water from CMWSSB) with an Effluent generation of 2451 KLD and Sewage Generation of 15 KLD. No fresh water used in
the process.
b. Proposed
Total Raw Water requirement of the proposed facility will be 810 KLD (Source - Tertiary Treated RO Water from CMWSSB)
with an Effluent generation of 105 KLD and Sewage Generation of 1 KLD. The sewage of 1 KLD will be reused in greenbelt.
There will be no fresh water to be used in the process.
c. After Expansion
Total raw water requirement after expansion will be 4057 KLD with an Effluent generation of 2556 KLD and Sewage
generation of 16 KLD. The sewage of 16 KLD will be reused in greenbelt after treatment in STP.
Note: After Expansion, the proponent shall increase the water allotment for greenbelt by utilizing the wastewater from Sewage
Treatment Plant.
Extraction Approval The total water requirement will be met from CMWSSB. Copies of agreement made between MPL-Plant-II and CMWSSB for
drawl of Secondary treated sewage and Tertiary treated RO water of quantity 2.54 MLD and 1 MLD respectively enclosed as
Annexure – 7 and Annexure – 8. In principle Approval letter from CMWSSB obtained for drawl of additional water
requirement and the same enclosed as Annexure-9.

21
10.
Waste Water and
Mode of
Disposal
Effluents details:
Generation:
Unit Existing
(KLD) Proposed (KLD)
After Expansion
(KLD)
Effluent
(Without Sewage) 2451 105 2556
Treatment Capacity
Description Existing (KLD) Proposed (KLD) After Expansion
(KLD)
ETP 3600 - 3600
Mode of Disposal
Description
Mode of
discharge
Quantity
(KLD)
Approval
Existing
(With
Sewage)
Disposed
to sea
2466
(2451+15) Discharge approval limit of 8000 KLD as per the CRZ clearance 11-20/2009-
IA.III dated 03.07.2009 and its amendment 11-20/2009- IA.III dated 03.06.2011
and enclosed as Annexure - 10. As per latest CTO issued by TNPCB under
water act dated 03.09.2021, The allowable effluent quantity is 2559 KLD and
sewage quantity is 15 KLD.
On total 2574 KLD is allowed for disposal to sea. It is proposed to install STP
for treating 16 KLD (Existing – 15 KLD + Proposed – 1 KLD)
Proposed
(Without
Sewage)
Disposed
to sea 105
After
Expansion
(Without
Sewage)
Disposed
to sea
2556
(2451+105)

22
11. Hazardous waste
generation and
their management
Hazardous waste materials will be properly disposed as per the Hazardous Wastes (Management, Handling and Trans boundary
Movement) Rules 2016; Hazardous Waste Authorization obtained from TNPCB and the same enclosed as Annexure - 11.
Existing authorized qunatity sufficient to accommodate additional proposed quantity.
S.No
Details
of
Waste
Schedul
e as per
HWM
rules
Unit
Quantity
Physic
al
status
Storage
Disposal Existing Propose
d
After
Expansi
on
Approva
l
1
Waste
Lube
Oil
generated
from
Rotary
Equipme
nt -
Spent Oil
5.1
KL/
Annu
m
1.38 0.5 1.88 4.0 Oily MS
drums
Disposed
through
TNPCB
authorized
recyclers
2
ETP
Secondar
y
Clarifier
Bottom
Sludge
35.3
T/
Annu
m
110 Nil 110 110 Solid
Concrete
floored
covered
shed
Common
TSDF Landfill
Facility
The unit has provided adequate designated storage area for the hazardous waste storage within premises having impervious
floor, roof cover system and leachate collection system. The hazardous wastes are disposed through the TNPCB approved
/authorized recyclers/Pre-processors/TSDF site.
For Spent Oil: Shri. Sathya Sai Lubricants - S.F.No. 86/IF, Kunnathur Village, Annur Taluk, Coimbatore dist.
For ETP Sludge: Tamilnadu Waste Management Limited, Plot No. 5-15, 28-33, Sipcot Industrial Complex, Gummidipoondi,
Thiruvallur District, 601201.
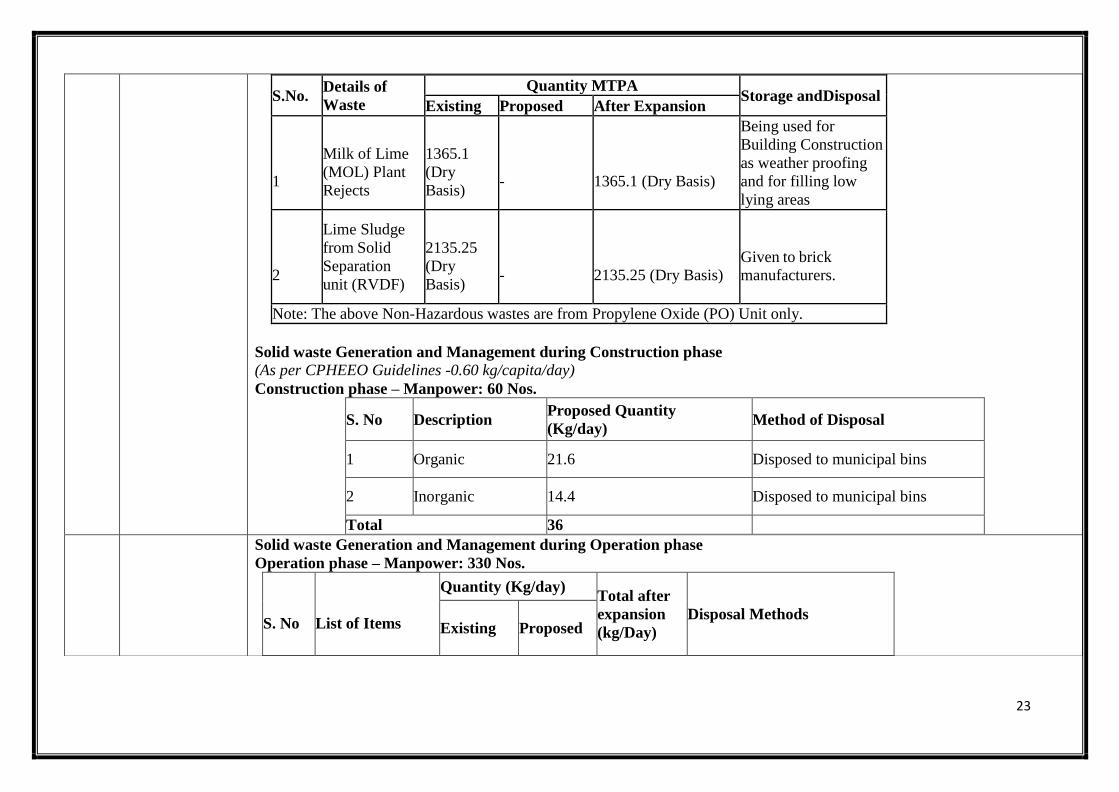
Non-Hazardous Waste Management
The Existing and proposed Non-Hazardous Waste generated is given below
23
S.No. Details of
Waste
Quantity MTPA Storage and Disposal
Existing Proposed After Expansion
1
Milk of Lime
(MOL) Plant
Rejects
1365.1
(Dry
Basis)
-
1365.1 (Dry Basis)
Being used for
Building Construction
as weather proofing
and for filling low
lying areas
2
Lime Sludge
from Solid
Separation
unit (RVDF)
2135.25
(Dry
Basis)
-
2135.25 (Dry Basis)
Given to brick
manufacturers.
Note: The above Non-Hazardous wastes are from Propylene Oxide (PO) Unit only.
Solid waste Generation and Management during Construction phase
(As per CPHEEO Guidelines -0.60 kg/capita/day)
Construction phase – Manpower: 60 Nos.
S. No Description Proposed Quantity
(Kg/day) Method of Disposal
1 Organic 21.6 Disposed to municipal bins
2 Inorganic 14.4 Disposed to municipal bins
Total 36
Solid waste Generation and Management during Operation phase
Operation phase – Manpower: 330 Nos.
S. No
List of Items
Quantity (Kg/day) Total after
expansion
(kg/Day)
Disposal Methods Existing Proposed

24
1 Organic waste 115.2 3.6 118.8 Disposed to municipal bins
2 Inorganic waste 76.8 2.4 79.2 Disposed to municipal bins
Total 192 6 198
12.
Power and
Backup
The additional Power requirement is 1.06 MW. This will be met by TANGEDCO power. For emergency power, the supply will
be from DG set which will ensure safe shut down of the plant. The existing and proposed power and fuel content is given in the
Table below.
Description Unit Existing Proposed After
Expansion Source
Power Requirement MW 2.54 1.06 3.6 TANGEDCO *
Source Of Power
Diesel based DG
set (For
Emergency)
KVA 2 x 1500 0 2 x 1500 Captive Generation
Grid Power MW 2.54 1.06 3.6 TANGEDCO
* Extraction Approval
Agreement made between MPL-Plant-II and TANGEDCO dated 30.05.2020 with an approval quantity of 4000 KVA is
attached as Annexure-12

25
13.
Manpower
Description Contract
Workers
Permanent
Workers Total (Nos.)
Construction Phase (Nos.) 60 0 60
Operation Phase (Nos.)
Existing 204 116 320
Proposed 0 10 10
Total 204 126 330
14.
Fuel
Requirements
Details
Capacity
Source Existing Proposed After
expansion
FO (KL/DAY) 28* --- --- IOCL/BPCL
R - LNG (SCM/day) - 33000 33000 IOCL LNG Terminal,
Ennore
Diesel (KLPA) 132.154 - 132.154 IOCL/BPCL
Note: *The FO of 28 KL/day is being utilized for existing production only. After Expansion,
FO will be replaced by R- LNG.
Copy of agreement made between MPL and IOCL for R-LNG supply enclosed as Annexure – 13

26
15.
Project
Cost
S.No. Activities Investment cost
(INR crores)
1 Design (Basic & Detailed Engineering) 6.25
2 Civil & Structural (Construction, Painting &
Insulation) 27.5
3 Mechanical (Equipment, Piping & Erection) 40
4 Electrical (Equipment, Panel, Cabling& Erection) 11.25
5 Instrumentation (Instruments, Panel, Cabling &
Erection) 27.5
6 Contingency 12.5
TOTAL 125

27
The existing EC was issued vide file no J-11011/156/2008-IA (II), dated 07.05.2008 for existing
facility. The EC matrices of the MPL are given below. Following is the EC matrix:
S.
No
MoEF File No Units Date of issue Status of Project
1 J-11011/156/2008-IA(II)
EC for Augmentation
of Propylene Glycol,
Propylene Oxide,
Polyol.
07.05.2008 Commissioned
2
J-11011/156/2008-IA-II(I)
EC for Expansion of
Propylene Glycol
Plant by 50000
MTPA
-
Applied Now
BASELINE STUDY
Ambient Air Quality
The ambient air quality has been monitored at 8 locations for 14 parameters as per NAAQS/CPCB
guidelines within the study area. The minimum and maximum baseline levels are PM10 (32 – 82
µg/m³), PM2.5 (15 – 38 µg/m³), SO2 (5 –33µg/m³), NO2(17 – 59 µg/m³), CO (1.2-4 mg/m³).
The nearest CPCB AAQ monitoring station is Manali, Chennai and TNPCB AAQ monitoring station
is Manali Village in which the average value of two station during the study period is
PM10 (45 µg/m³), PM2.5 (29.53 µg/m³), SO2(7.37 µg/m³), NO2(20 µg/m³) and CO(1.06 mg/m³).
Source:
https://app.cpcbccr.com/ccr/#/caaqm-dashboard-all/caaqm-landing/caaqm-comparison-data All the
parameters are well within the National Ambient Air Quality Standards for Industrial, Commercial
and Residential areas at all monitoring locations during the study period from 27/12/2021 to
27/03/2022.
Noise Environment
The observations of day equivalent and night equivalent noise levels at all locations are tabulated
and compared with CPCB Standards given below
Site
Day Time (dB(A))
Night Time (dB(A))
Results
Standards
Results
Standards

28
Industrial areas (Project site)
55
75
45
70
Commercial areas
56,60 65 47,52 55
Residential area 51-54 55 40-45 45
Water Environment
Surface water quality
Surface water sampling results are compared with Surface water standards IS 2296:1992 and given
below
Parameter Surface water
sample
Results
Standard Limit
Class A Class B Class C Class D Class E
pH 6.96-7.89 8.5 8.5 8.5 8.5 8.5
Total Dissolved
Solids (TDS)
168-3026 500 - 1500 - 2100
Hardness 93-825 300 - - - -
BOD 7-900 2 3 3 - -
COD 0.5-77.3 - - - - -
Class A- Drinking water without conventional treatment but after disinfection.
Class B-Water for outdoor bathing.
Class C- Drinking water with conventional treatment followed by disinfection.
Class D-Water for fish culture and wild life propagation.
Class E-Water for irrigation, industrial cooling and controlled waste disposal.
Ground water quality
The ground water quality test results are tabulated and compared with drinking water standards IS
10500:2012 and given below
Parameter
Range of Results
Standard Limit
Acceptable Limit Permissible Limit
pH 6.78-7.82 6.5-8.5 No Relaxation
Total Dissolved Solids (TDS) 795 mg/l – 2802 mg/l 500mg/l 2000 mg/l
Fluoride 0.25 mg/l – 0.49 mg/l 1mg/l 1.5 mg/l
Hardness 290 mg/l – 877 mg/l 200mg/l 600 mg/l

29
Soil Environment
Summary of analytical results
The pH of the soil samples ranged from 6.78-7.82, indicating the soils are neutral to moderately
alkaline in nature.
Electrical Conductivity of the soil samples ranged from 1445 to 4627 µs/cm.
Nitrogen content ranged from 5.46 mg/l to 45.3 mg/l.
Potassium content ranges from 16.5 mg/l to 88.7 mg/l.
Biological Environment
Ecology and Biodiversity of the study area i.e. 15km radius from the project site is done based on
the available governmental and Semi-governmental published data. There is no National park/Wild
life Sanctuary within 15 Km radius from the study area. Under fauna, in consolidated list of estuarine
fish of Adyar river mouth region, Glaucostegus obtusus (Fish) are in Vulnerable condition. Along
with this Somniosus microcephalus (Fish), Albula vulpes (Fish), Anguilla bicolor (Fish) and
Oreochromis mossambicus(Fish) are near threatened fish Habitat. The other flora and fauna list is
also listed in the Section 3.11 from the below source.
SOURCE:Birds: Ali, S. (2002). The Book of Indian Birds (13th Revised Edition). Oxford University
Press, New Delhi, 326pp.
Butterflies: Kehimkar I. The Book of Indian Butterflies. Bombay Natural History Society, 2008, 497.
Evans WH. Identification of Indian butterflies. The Bombay Natural History Society, Bombay, 1927,
32.
Kunte K (2000a). Butterflies of Peninsular India. Indian Academy of Science, University of Press
(India) Limited, Hyderabad, India, 354.
Mammals: Kamalakannan, M. & P.O. Nameer (2019). A checklist of mammals of Tamil Nadu,
India. Journal of Threatened Taxa 11(8): 13992–14009;
https://doi.org/10.11609/jott.4705.11.8.13992–14009.
Reptiles: Aengals, R., Sathish Kumar, V.M., Palot, M.J. & Ganesh, S.R. (2018). A Checklist of
Reptiles of India. 35 pp. Version 3.0. Online publication is available at www.zsi.gov.in (Last update:
May 2018)
Fish : H.S. Mogalekar*, J. Canciyal
#, P. Jawahar, D.S. Patadiya, C. Sudhan, P. Pavinkumar,
Prateek, S. Santhoshkumar & A. Subburaj. 2017. Estuarine fish diversity of Tamil Nadu, India.
Indian Journal of Geo Marine Sciences.

30
Socio Economic Environment
The Socioeconomic profile of the study area shows that the majority of people in the study area work
in non-agricultural sector, however in rural area majority of the people depends on agricultural
sector. They have good educational infrastructures and the people in the study area are well
connected to the educational infrastructures. The average literacy rate of the study area is
79.82%. The people in the study area are well connected to Government primary health centres and
Primary health sub-centres.
Anticipated Environmental Impacts
Air Environment
Construction phase
The emissions are from civil works, handling of construction material and movement of vehicles
carrying the equipments and construction materials will generate dust, gaseous pollutants and
particulate matter and affect the air quality temporarily which can be minimized by ensuring
preventive maintenance of vehicles and equipment, water sprinkling on unpaved site, controlled
vehicle speed, avoiding unnecessary engine operations and also ensuring vehicle are covered during
transportation of material.
Operational Phase
The incremental concentration of PM10, SOx, NOx and CO is observed to be 0.26%, 7.04%,
11.5% and 66 % respectively. The total pollutant concentrations of PM10, SO2, NOx and CO are
82.22 µg/m3, 35.5 µg/m3, 66.74 µg/m3 and 11.76 mg/m3 which is observed to be within NAAQ
standards.
Noise Environment
Construction phase
Civil works, Mechanical works and tying up of new facilities with the existing systems etc.
are sources of increasing the ambient noise level. However, these effects are for a short term and of
temporary in nature.
Operational Phase
The noise generated due to heavy duty machineries at the project site such as compressors, DG sets,
pumps etc. and mobile source corresponding to mainly vehicular traffic for staff mobilization,
materials, material transportation, liquid fuel transportation to project site etc. To overcome all, the
equipment is specified with maximum noise generation upto 85 dB (A). Only in some areas like

31
Process Air Compressor House, where the sound level is expected to be higher (>90 dB (A)),
mandatory use of ear plugs recommended.
Water Environment
Construction phase
The waste materials would contribute to certain amount of water pollution within the
construction site. But these would be for a short duration. All liquid waste will be collected and
disposed at identifed water impoundment within the construction site.
Operational Phase
The total raw water requirement for existing facility is 3247 KLD and for proposed operation phase
total requirement will be 810 KLD. On total after expansion 4057 KLD of raw water will be taken
from existing water source (i.e. Chennai MetroWater Supply and Sewage Board). After expansion,
there is an additional requirement of water over the existing water agreement. Approval letter from
CMWSSB obtained for drawl of additional water requirement and the same enclosed as Annexure-
9. No water will be drawn from ground water sources.
Land Environment
Construction phase
The impact shall be due to generation of debris/construction material, which shall be properly
collected and disposed. However, the generation of waste shall be minimal and there will be
no such discharge or activity degrading soils and groundwater. Change in soil structure due to use of
heavy construction vehicles and machineries can be avoided by restricting access during wet
condition and use of low ground pressure machineries to minimize compaction of soil. The
excavated soil in excess can be used for road and green belt development.
Operational Phase
During operational phase the impact shall be due to disposal of solid and hazardous waste generated
during operation of the plant. Waste Lube Oil, generated from rotary equipment will be disposed to
TNPCB authorized recyclers. The ETP sludge generated from Secondary clarifier bottom is
disposed to Common TSDF Landfill Facility.
Socio Economic Environment
Construction phase
There will be temporary employment for manpower required during construction phase
available from local communities. Overall socioeconomic effect of construction phase will be
positive due to direct and indirect employment opportunities for the local population

32
Operational Phase
Thre will be 10 nos. of additional manpower for operating the plant. The project will provide better
socio-economic benefits by providing direct and indirect employment.
Marine Impact Assessment
The existing and proposed effluent/sewage disposal into deep sea is 2466 KLD and 105 KLD
respectively. On total, 16KLD of sewage will be reused to greenbelt and 2556 KLD will be
discharged into deep sea that it is observed to be within the discharge approval limit of 8000KLD as
per the CRZ clearance 11-20/2009-IA.III dated 03.07.2009 and its amendment 11-20/2009-IA.III
dated 03.06.2011 and within 2574 KLD as per Consent order issued by TNPCB. The Latest CRZ
Complaince statement is also enclosed as Annexure - 14. The treated effluent is discharged into
deep sea through the pipeline where its outlet of pipe is at a distance of 750 m from Sea Shore. The
effluent pipeline diagram is enclosed as Annexure - 15. The water quality modeling for the effluent
discharged to deep sea from the pipe line is enclosed as Annexure - 16.
Environmental Monitoring Program
A monitoring schedule with respect to AAQ, Stack, water & treated wastewater quality, noise
quality prepared and maintained. The online monitoring of air emission, VOC emission and effluent
monitoring is available in existing site and connected to TNPCB and CPCB servers.
Environmental Management Plan
Construction Phase
Transport vehicles and construction equipment’s/machineries will be properly maintained to reduce
air emissions. Construction activities will be done on round the clock basis. Adequate measure is
taken to reduce the noise level. Using of PPE is kept mandatory during construction activities.
Proper and sufficient sanitary facility will be created at the site in the form of adequate & suitable
toilets. All the solid wastes will be stored at a designated site within the premises to prevent
scattering, discharge on land. Topsoil layers shall be stored for reclamation and re-vegetation and re-
forestation at approved locations. There will be temporary employment required during construction
phase from available local communities.
Operational Phase
Air Environment
The air emission is controlled by installing stack at required heights and in near future R-LNG will
be used as fuel in boilers. Boiler stack emission and Ambient Air Quality is monitored periodically
and as well as through Online continuous monitoring system as per the CPCB/MoEF&CC

33
guidelines. For every year, Manali Petrochemicals Limited-Plant-II allocates INR 40 lakhs budget
towards expenditure on stack, ambient and effluent monitoring.
Noise Environment
All equipment is specified with maximum noise generation upto 85 dB (A). Only in some areas like
process air compressor house, where the sound level is expected to be higher (>90 dB (A),
mandatory use of ear plugs recommended. Erecting suitable enclosures, sizing the flare lines with
low mach number and providing Green belt of appropriate width all around the plant reduces the
noise level as per Occupational Safety and Health Administration (OSHA) standards.
Water and Wastewater management
The rawwater used is secondary treated sewage and tertiary treated RO from CMWSSB. The
main source of water itself is treated water. The treated effluent will be discharged into deep sea and
it is observed to be within the discharge approval limit of 8000 KLD as per the the
CRZ clearance 11-20/2009-IA.III dated 03.07.2009 and its amendment 11-20/2009-IA.III
dated 03.06.2011 and within 2574 KLD as per Consent order issued by TNPCB. The Latest CRZ
Compliance statement is also enclosed as Annexure - 14. The industrial effluent is discharged into
deep sea through the pipeline where its outlet of pipe is at a distance of 750 m from Sea Shore. The
effluent will be disposed to sea with compliance to CPCB/MoEF&CC norms for marine disposal.
The Water Quality Modeling for the effluent discharged to deep sea from the pipe line is enclosed as
Annexure - 16. For every year, Manali Petrochemicals Limited- Plant-II allocates INR 540 lakhs
budget towards expenditure on Water pollution control and treatment of effluent.
Solid and Hazardous Waste Management
STP sludge dried and used as manure and canteen waste disposed to municipal bins. The Sludge
separated from RVDF is given to brick manufacturers and for beneficial use and MOL unslaked
rejects is collected and being used for Landfilling. Manali Petrochemicals Limited-Plant-II allocates
INR 5 lakhs per annum towards expenditure on management and disposal of waste. The Waste Lube
Oil generated from rotary equipment - spent oil is disposed through TNPCB authorized recyclers and
the agreement is attached as Annexure - 17. The ETP sludge generated is disposed to common
TSDF as landfill and the agreement is attached as Annexure - 18.
Risk Assessment
The consequence analysis study has been carried out for Chlorine, Propylene, Propylene Oxide and
Ethylene Oxide storage tank. The recommendations and mitigation measures of Risk Assessment
will be implemented. The impact contours will be kept within the petrochemical complex limit and

34
surrounding industries. Continuous onsite and offsite emergency plan will be done in accordance
with local district authorities. Periodic mock drills will be conducted and gaps if any found will be
addressed. The summaries of consequences observed with major receptors are as follows
For Propylene Oxide Storage Tank, the radiation profile (4 kw/m2 ) received at maximum
distance due to Late pool fire in Catastrophic rupture scenario is 591.7 m at
1.5 m/s wind speed and stability classes D and F. The major receptors are employees within
the facility.
For Propylene Oxide Storage Tank, the radiation profiles (12.5 kw/m2 & 37.5 kw/m
2)
received at maximum distance due to Late pool fire in 150 mm leak scenario is 343 m and
547 m respectively at 1.5 m/s wind speed and stability classes D and F. The major receptors
are employees within the facility.
For Propylene Storage Tank, the radiation profiles (4 kw/m2, 12.5 kw/m
2& 37.5 kw/m
2)
received at maximum distance due to Jet fire in 150 mm leak scenario is 391.6 m, 304.4 m
and 249.6 m respectively at 1.5 m/s wind speed and stability classes D and F. The major
receptors are employees within the facility.
For Chlorine Storage Tank, maximum Spreading distance due to Cloud dispersion in 50 mm
leak scenario is 4000 m at 5 m/s wind speed, 29.9 ppm Concentration and stability class D.
The major receptors are employees within the facility and surrounding industries.
For Ethylene Oxide Storage Tank, maximum Spreading distance due to Cloud dispersion in
50 mm leak scenario is 2550 m at 5 m/s wind speed, 52.7 ppm Concentration and stability
class D. The major receptors are employees within the facility and surrounding industries.
Corporate Social Responsibility
In the financial year 2020 – 21, a total of INR 92.79 lakh was spent towards establishment of
Drinking water and Sanitation facilities in nearby schools, INR 9 lakhs was spent towards
establishment of Primary Health Centre and INR 0.95 lakhs was spent towards establishment
of individual House Latrines.
Project Benefits
In the production of PG, Propylene Glycol (PG) is the main product followed by Di-Propylene
Glycol (DPG) and Tri-Propylene Glycol (TPG). Propylene Glycol (PG) is essentially used as a
solvent in the pharmaceutical industry for oral, injectable and topical formulations and further in
food, fragrance and other industrial applications. Specifically, it is used to make deicing and
antifreeze fluids, food industry coolants, non-ionic detergents, plasticisers and hydraulic brake fluids.
It is an excellent solvent and extractant, and can be used as a humectant as well in sanitizers.
35
Propylene Glycol (PG) is the main product, and Di-Propylene Glycol (DPG) and Tri-Propylene
Glycol (TPG) are the by- products. The project will provide better socio-economic benefits by
providing direct and indirect employment.

36
1 INTRODUCTION
1.1 Introduction
Manali Petrochemicals Limited (MPL) is a leader in the production and marketing of
Propylene Oxide (PO), Propylene Glycol (PG) and various grades of Polyols in India. It
operates two production facilities (Plant-I and Plant-II) at Manali Industrial Area, near
Chennai.
Plant-II is situated at the Manali Industrial Area – Sathangadu Village, Manali, and
Chennai, adjacent to Balmer Lawrie & Co. Ltd, having an installed capacity of 18,000
MTPA of PO, 12,000 MTPA of PG and 22,705 MTPA of Polyol. This Plant has been in
operation for more than 3 decades. Plant–II was originally established by UB Petro
Products Limited. Its commercial production commenced in the year 1990, post which the
Plant was taken over by SPIC in 1995. MPL has taken over the Plant – II facility from
SPIC in the year 2000.
The total area of Plant-II is 17.632 hectares and Land document is enclosed as
Annexure - 5. Chennai Central Railway Junction is located approximately at a distance of
6.51 km towards South from the project boundary. Chennai-Srikakulam Highway is
located towards SSW at a distance of ~3.60 km and SH56 (Tiruvottiyur-Ponneri-Panjetti)
is located towards North at a distance of 2.51 km from the project boundary. Since this is
an established industrial belt there are several large industries like Chennai Petroleum
Corporation Limited, Madras Fertilizers Limited, Tamilnadu Petroproducts Limited, Cetex
Petrochmicals Limited, Balmer Lawrie & Co Limited, Tyres and Nylon Filaments, Dairy
Products, Kothari Industrial Corporation, Indian Oil Tanking and Raj Lubricants.
The existing Environmental Clearance was obtained from MoEF vide: J- 11011 / 156/
2008-IA (II) dated 7th May 2008, enclosed as Annexure-1. The existing plant is under
operation with TNPCB Water Consent Order No. 2108131941933 dated 03.09.2021 valid
till 31.03.2022 enclosed as Annexure-2 and TNPCB Air Consent Order No.
2108231941933 dated 03.09.2021 valid till 31.03.2022 enclosed as Annexure-3. The
PESO License for Liquid Nitrogen, Chlorine, Ethylene oxide, Propylene, LPG, HSD and
Fuel oil is enclosed as Annexure - 19. To fulfil online application condition, proponent
has obtained Certified Environmental Compliance from MoEF & CC, Regional office

37
(SEZ), Southern Regional office, Chennai and the same enclosed as Annexure – 20.
Table 1-1 Chronology of Environmental clearances
S.No MoEF File No Units Date of
issue
Status of
Project
1 J-11011/156/2008-
IA(II)
Propylene Glycol, Propylene
Oxide, Polyol.
07.05.2008 Commissioned
2
J-11011/156/2008-
IA-II(I)
EC for Expansion of Propylene
Glycol Plant by 50000 MTPA
-
Applied Now
ToR application was filed for “Expansion of Propylene Glycol by 50,000 MTPA”, vide Proposal
No.IA/TN/IND2/248620/2021 dated 30-12-2021 under 5(f) “Synthetic organic chemicals industry
(dyes & dye intermediates; bulk drugs and intermediates excluding drug formulations; synthetic
rubbers; basic organic chemicals, other synthetic organic chemicals and chemical intermediates)”
and obtained standard ToR- J-11011/156/2008-IA-II(I) dated 09-03-2022. The Base Line Monitoring
has been carried out from End of December 2021 – End of March 2022 (27.12.2021 to 27.03.2022).
1.2 Purpose of the EIA Report
The Government of India, Ministry of Environment, Forest and Climate Change (MoEF&CC),
New Delhi, vide notification no. S. O. 1533 (E) dated 14th
September, 2006, and its
amendments, has made ‘Prior Environmental Clearance (EC)’ mandatory for New projects,
Expansion and Modernization of existing projects , any change in product mix in the existing
manufacturing unit which are listed in the schedule of that notification from MoEF&CC (for
Category - A projects) or from SEIAA (for Category - B projects).
The EIA report submission pertains to the Proposed “Expansion of Propylene Glycol Plant by
50000 MTPA”, at Manali Industrial Area,Sathangadu Village, Manali, Chennai – 600 068,
Thiruvallur District. The Project is considered under Schedule 5 (f) - “Synthetic organic
chemicals industry (dyes & dye intermediates; bulk drugs and intermediates excluding drug
formulations; synthetic rubbers; basic organic chemicals, other synthetic organic chemicals and
chemical intermediates)” - Category B. However due to applicability of General Condition
(Project site located at Critically Polluted Area as notified by CPCB from time to time– Manali
Industrial Area), the project to be appraised as Category ‘A’.
1.3 Brief description of the project
Nature:
M/s. Manali Petrochemicals Limited-Plant-II as a part of the compliance to the regulatory
requirement i.e., to obtain Environmental Clearance from MoEF& CC, has appointed M/s.

38
Ecotech Labs Pvt. Ltd.,Chennai as EIA Consultant who is accredited by National Accreditation
Board for Education and Training (NABET)-Quality Council of India (QCI), New Delhi for
Schedule 5(f) - “Synthetic organic chemicals industry (dyes & dye intermediates; bulk drugs and
intermediates excluding drug formulations; synthetic rubbers; basic organic chemicals, other
synthetic organic chemicals and chemical intermediates)” – Category - A.
Size:
It operates two production facilities (Plant-I and Plant-II) at Manali, near Chennai. Plant-II is
situated at the Manali Industrial Area, Sathangadu Village, Manali, Chennai – 600 068,
(adjacent to Balmer Lawrie & Co Ltd), having an installed capacity of 18,000 MTPA of
Propylene Oxide, 12,000 MTPA of Propylene Glycol and 22,705 MTPA of Polyol.
Location:
The existing complex is located at Manali Industrial Area, Sathangadu Village, Manali, Chennai
– 600 068, Ambattur Taluk, Thiruvallur District, Tamil Nadu State. The site is located within
the Greater Chennai Corporation.
Importance to the Country & Region:
Manali Petrochemicals Limited being the only domestic manufacturer of Propylene Glycol
currently, meeting around 20-25% of domestic demand. With the emphasis on Make in India,
MPL would like to increase its capacity by 50000 MTPA in its Plant – II facility to meet about
70-75% of the market demand. The market of Propylene Glycol in India is having a growth rate
of 6%. Propylene Glycols are the key ingredient material for manufacturing of Pharmaceuticals
products, Food products and Cosmetics. Hence, the project to expand the Propylene Glycol
capacity by 50000 MTPA is financially viable and will reduce India’s dependence on imports.
1.4 Scope & Methodology Adopted
EIA is the process of identifying, predicting, evaluating and mitigating the bio-physical, social and
other relevant effects of development proposals prior to major decisions being taken and
commitments made. These studies integrate the environmental concerns of developmental activities
into the process of decision – making.
An Environmental Impact Assessment (EIA) is an assessment of the possible impact, whether
positive or negative, that a proposed project may have on the environment, together consisting of
the natural, social and economic aspects, i.e., aiming at “Sustainable Development” due to the
project activities.
1.4.1 Objective of EIA Report
To ensure environmental considerations are explicitly addressed and incorporated into the
development decision-making process.

39
To anticipate and avoid, minimize or offset the adverse significant biophysical, social and
other relevant effects of the above project proposal.
To protect the productivity and capacity of natural systems and the ecological processes
which maintain their respective functions.
To promote development that is sustainable and optimizes resource use as well as
management opportunities.
To fully recognize the scope and requirements of the ToR and comply with the same.
1.4.2 Scope of Work
The scope of the work mentioned includes an assessment study of proposed manufacturing unit
and their impact on the region. This study put forward the most effective ways to protect the
environment form increasing pollution caused by the burgeoning industrial development and
recommendations for environmental-friendly development initiatives in the region.
An Environmental Impact Assessment (EIA) is an assessment of the possible impact, whether
positive or negative, that a proposed project may have on the environment, together consisting
of the natural, social and economic aspects, i.e., aiming at “Sustainable Development” due to the
project activities.
This EIA report presents the existing baseline scenario and the assessment and evaluation of the
environmental impacts that may rise during the construction and operational phases of the
project. This report also highlights the Environmental Monitoring Program during the
construction and operation phases of the project and the post project monitoring program. In
terms of the EIA Notification of the MoEF & CC dated 14th September 2006 and subsequent
amendments the generic structure of the EIA document will be as under:
Chapter 1: Introduction
Introductory information is presented in this Chapter. The introduction chapter provides background
to the project, project proponent details and describes the objective of this document. The purpose
and organization of the report is also presented in this chapter.
Chapter 2: Project Description
This Chapter includes Project Description and Infrastructure Facilities delineating all the industrial
and environmental aspect of the industry of Manali Petrochemicals Limited - Plant- II existing as
well as process details of proposed expansion.
Chapter 3: Description of the Environment
This Chapter provides baseline environmental status of Environmental Components (Primary data)
delineating meteorological details of the project site and surrounding area.
Chapter 4: Anticipated Environmental Impacts & Mitigation Measures

40
This Chapter presents the analysis of impacts on the environmental and social aspects of the project
as a result of establishment of plan and thereby suggesting the mitigation measures.
Chapter 5: Analysis of Alternatives (Technology and Sites)
This chapter includes the justification for the selection of the suitable technology and project site
from Environmental point of view as well as from economic point of view.
Chapter 6: Environmental Monitoring Program
This chapter will include the technical aspects of monitoring, the effectiveness of mitigation
measures which will include the measurement methodologies, frequency, location, data analysis,
reporting schedules etc.
Chapter 7: Additional Studies
This chapter will detail about the Public Consultation sought regarding the project. It will also
identify the risks of the Project in relation to the general public and the surrounding environment
during construction and operation phases of the plant and thereby presents Disaster Management
Plan, Social impact assessment and R&R action plans.
Chapter 8: Project Benefits
This chapter deals with improvement in physical and social infrastructures, employment potential
and other tangible benefits.
Chapter 9: Environmental Cost Benefit Analysis
Not Recommended in Scoping Stage.
Chapter 10: Environmental Management Plan
This is the key Chapter of the report and presents the mitigation plan, covers the institutional and
monitoring requirements to implement environmental mitigation measures and to assess their
adequacy during project implementation.
Chapter 11: Summary and Conclusion
This chapter summarizes the information given in Chapters of this EIA/EMP report and the
conclusion based on the environmental study, impact identification, mitigation measures and the
environmental management plan.
Chapter 12: Disclosure of the Consultant
Name of the consultant engaged in the preparation of the EIA/EMP report along with their brief
resume and nature of Consultancy rendered are included in this Chapter.
1.4.3 EIA Process
The EIA process followed for this EIA report is composed of the following stages:
1. Study of project information.

41
2. Screening & Scoping of environmental pre-feasibility study & application for approval of
ToR.
3. Collection of detailed project management plan/report.
4. Baseline data collection.
5. Impact identification, Prediction & Evaluation.
6. Mitigation measures & delineation of EMP.
7. Risk assessment and safety & disaster management plan.
8. Review & finalization of EIA Report based on the ToR requirements.
Submission of EIA report for the implementation of mitigation measures & EMP as well as
necessary clearances from relevant Authority.
The EIA Cycle based on the above stages has been illustrated as per the ToR dated 09.03.2022, in
Figure 1-1.
Figure 1-1 EIA Process

42
1.5 Objective of the study
The major objective of this study is to prepare a detailed Environmental Impact Assessment report
within the study area i.e. 10 km radius from the project.
1.6 Applicable Regulatory Framework
The following are some of the acts and rules related to environment which are applicable for
the proposed project:
1. EIA Notification 2006 and its amendments
2. Manufacture Storage and Import of Hazardous Chemicals Rules, 1989 and its subsequent
amendments
3. Water (Prevention and Control of Pollution) Act, 1974 and its subsequent amendments
4. Air (Prevention and Control of Pollution) Act, 1981 and its subsequent amendments
5. Hazardous Waste (Management, Handling and Transboundary movement)
Rules, 2016 and its subsequent amendments
6. Public Liability Insurance Act, 1991 and its subsequent amendments
7. Environmental (Protection) Rules, 1986 and its subsequent amendments
8. The Noise Pollution (Regulation and control) rules, 2000
9. Factories Rules 1950 and its subsequent amendments
10. Petroleum Act, 1934
11. Explosive Act, 1884
12. Central Motor Vehicle Act, 1988
The details of applicable Acts and Rules and the applicability to the project is given in Table 1-2
Table 1-2 Applicable Acts and Rules for the proposed project
S.
No
Act and Rules
applicable
Purpose Objective Applicability
1. EIA Notification
2006 and its
amendments.
New projects,
Expansion
modernization,
change of product
mix of the existing
project
Protection and
Improvement of
the Environment
As the proposal is for
expansion within the
existing facility,
Environmental
clearance from
Ministry of
Environment, Forest
and Climate Change
(MoEF&CC) is
applicable

43
2. The Manufacture,
Storage and
Import of
Hazardous
Chemicals Rules,
1989 and its
amendments
Handling
of Hazardous
Chemicals
Regulate the
manufacture,
storage
and
import
of
Hazardous
Chemicals
Preparation/ update of
On-site Emergency
Preparedness Plan and
submission to Factory
Inspectorate.
Preparation / update of
Safety audit Report
and submit to
Factory Inspectorate.
Preparation of Material
Safety Data Sheet.
3. The Water
(Prevention and
Control of
Pollution) Act,
1974 and its
amendments
New projects,
Expansion
modernization,
change of product
mix of the existing
project, Existing
plants
Prevention,
control and
abatement of
water pollution
Consent to
Establish and Consent
to Operate from
State Pollution Control
Board to be obtained
for expansion
4 The Air
(Prevention and
Control of
Pollution) Act,
1981 and its
amendments.
New projects,
Expansion
/Modernization,
change of product
mix of the existing
project, Existing
industries
Prevention,
control and
abatement of air
pollution
Consent to Establish
and Consent to
Operate from State
Pollution Control
Board to be obtained
for expansion
5 The Hazardous
and other wastes
(Management,
Handling and
Transboundary
Movement Rules)
2016 and Solid
Waste
Management
Rules 2016.
Management,
Handling and
Transboundary
Movement of
Hazardous waste
Prevention,
Control
and
abatement of
pollution
Hazardous waste
Authorization from
State Pollution Control
Board to be obtained
for expansion
6 The
Environmental
(Protection)
Rules, 1986 and
its Amendments
New projects,
Expansion /
modernization
change of product
mix of the existing
project, Existing
industries
Protection and
Improvement of
the Environment
Environmental
Standards as specified
are to be complied.
Submission of
Environment
Statement on yearly
basis to TNPCB
7 The Noise
Pollution
(Regulation and
Control) Rules,
2000
New projects,
Expansion/
modernization
change of product
mix of the existing
project, Existing
industries
To protect
the workers and
public from
noise related
problems
Noise control measure
to be taken up. Comply
with Noise standards
and submission of
monthly report to
TNPCB

44
8 The Public
Liability
Insurance Act,
1991 and its
amendments
Transportation of
Hazardous
Substance.
To provide
immediate relief
to persons
affected by
accident
involving
hazardous
substances and
also for
Establishing an
Environmental
Relief fund
Provision of Liability
Insurance Policy.
9 Factories Rules
1950 and its
amendments.
New projects,
Expansion/
modernization
change of product
mix of the existing
project, Existing
industries.
Control of
workplace
environment,
and providing
for good health
and safety of
workers.
Factory License from
Factory Inspectorate.
10 The Petroleum
Act, 1934
New projects,
Expansion/
modernization
change of product
mix of the existing
project, Existing
industries
Production,
Storage and
import of
petroleum and
products as per
the regulations
License to be acquired
for storage and
adequate safety
measures are in place.
11 The Explosive
Act, 1884
New projects,
Expansion /
modernization
change of product
mix of the existing
project, Existing
industries
Production,
Storage and
import of
explosive
substance as per
the regulations
for the safety and
environmental
measures
License for storage
from PESO.
12 The Central
Motor Vehicle
Act, 1988
New projects,
Expansion/
modernization
change of product
mix of the existing
project, Existing
industries.
Monitoring the
pollution load of
vehicles inside
the plant
Control of vehicular
movement within the
plant.

45
1.7 TOR COMPLIANCE
S.No. A. Standard Terms of Reference Compliance
1. Executive Summary Brief executive summary is provided in Page.No.14 of EIA Report
2. Introduction
i. Details of the EIA
Consultant including
NABET accreditation
M/s. Ecotech Labs Pvt. Ltd., Chennai
NABET Accredited Number: NABET/EIA/2124/SA 0147 valid till 15.09.2023
ii. Information about the
project proponent
M. Karthikeyan
Whole Time Director (Operations)
Manali Petrochemicals Limited
Manali Industrial Area
Sathangadu Village, Manali, Chennai 600068
iii. Importance and benefits of
the Project
Importance of the project:
The Project aims to reduce India’s dependence on imports of Propylene glycol with the emphasis on Make in India (Atmanirbhar Bharat).
The market of Propylene Glycol in India is having a growth rate of 6%. Currently MPL meeting around 20-25% of domestic demand and would like to
increase its capacity to meet 70-75% of the market demand in India.
Also, the State and Central Government gets benefited from the Taxes and Duties on the revenue generated out of this project.
Benefits of the project:
In PG manufacture, Propylene Glycol (PG) is the main product followed by Di-Propylene Glycol (DPG) and Tri-Propylene Glycol (TPG).
Propylene Glycol finds broad use as a humectant in the pharmaceutical, products & sanitizers.
Also, the Propylene Glycol is used in cosmetic, animal food and fragrance industries.
Another major use of PG is its use as an ingredient in engine coolants, deicing fluids and antifreeze.
Industrial grade PG is used in the production of poly glycols for hydraulic and brake fluids.
Propylene glycol is used as a solvent and extractant. Solvent applications include alkyd resins, printing inks and coatings.
A major use for DPG is specialty plasticizers.
DPG and TPG have many applications in the fragrance, cosmetic and personal care industries while a fragrance-grade DPG is used as a carrier for cosmetics
and fragrances.
This project will provide direct and in-direct employments.
3. Project Description
i. Cost of project and time of
completion
The cost of the project is INR 125 Crores.
Time of completion is expected - June 2024.
ii. Products with capacities for
the proposed project S. No. Units Products Category of
Product
Existing
Capacity
(MTPA)
Proposed
Capacity
(MTPA)
After Expansion
Capacity
(MTPA)
1.
Propylene Oxide unit
Propylene Oxide Main
Product 18000 NIL 18000
Di-Chloro Propane By Product 3600 NIL
3600

46
2. Propylene Glycol unit
Propylene Glycol Main
Product 12000 50000 62000
Di-Propylene Glycol By Product 1581 6588 8169
Tri-Propylene Glycol By Product 202 842 1044
3. Polyol unit Polyol Main
Product 22705 NIL 22705
Note:
Change in product mix with no increase in pollution load certificate was granted based on Pollution Load Assessment committee decision by TNPCB vide
Lr.No.T5/TNPCB/F.0112AMB/RL/2019 dated 16.09.2019 which is attached with this proposal as Annexure - 4.
iii. If expansion project, details
of existing products with
capacities and whether
adequate land is available
for expansion, reference of
earlier EC if any.
No additional land required. The total land area is 17.632 Ha. (43.57 Acres). Adequate land is available for expansion & Land document attached as Annexure - 5.
S. No. Units Products Category of
Product
Existing
Capacity
(MTPA)
Proposed
Capacity
(MTPA)
EC details
1.
Propylene Oxide unit
Propylene Oxide Main Product 18000 NIL
J-11011/ 156/ 2008- IA
(II) dated 07-05-2008
Di-Chloro Propane By Product 3600 NIL
2. Propylene Glycol unit
Propylene Glycol Main Product 12000 50000
Di-Propylene Glycol By Product 1581 6588
Tri-Propylene Glycol By Product 202 842
3. Polyol unit Polyol Main Product 22705 NIL
Note:
Change in product mix with no increase in pollution load certificate was granted based on Pollution Load Assessment committee decision by TNPCB vide
Lr.No.T5/TNPCB/F.0112AMB/RL/2019 dated 16.09.2019 which is attached with this proposal as Annexure - 4.
iv. List of Raw materials and
their source with mode of
transportation S. No.
Raw Material
Name Principal Use
Raw Material Quantity (MTPA)
Source Mode of Transport Storage Facility
Existing Proposed After
Expansion
1. Propylene
(96% purity)
Production of
Propylene Oxide
15510 -- 15510 CPCL 4” Pipeline
86 MT BPCL Tankers
2. Chlorine 26950 -- 26950
Grasim
Industries
Tonners in Trucks 244 MT & 1 No.
Dump Bullet TGV
Rayalaseema
DCW
3. Lime
(90% purity) 31500 -- 31500
Imported
from
UAE/Vietnam Bags in Trucks
Chemical
Godown Malaysia
(PGP
international)

47
4. Caustic soda
Production of
Propylene Oxide &
For DM plant
regeneration
1260 -- 1260
TPL
Tankers 32 MT
TGV
Rayalaseema
Chemfab
DCW
5. Hydrochloric
Acid
For DM plant
regeneration 787.5 -- 787.5 TPL Tankers 27.5 MT
6. Propylene
Oxide
Production of
Propylene Glycol 10500 44646 55146
In-house Pipeline
334 MT MPL – Plant
– I Tankers
TPL Tankers
7. Ethylene
Oxide
Production of Polyol
630 -- 630 RIL Tankers 29 MT
8. Glycerine 147 -- 147 3F industries
Tankers 32 MT Kaleeswari
9. Di-Propylene
Glycol 59.5 -- 59.5 In-house Drums
Chemical
Godown
10. Styrene 70 -- 70 Supreme
Petrochem Drums
Chemical
Godown
11. Sugar 388.5 -- 388.5
Bannari
Sugars Bags in Trucks Chemical
Godown EID Parry
12. Sorbitol (70%) 1004.5 -- 1004.5
Kashyap
Industries Tankers 120 MT
Blue Cross
13. Caustic potash 38.5 -- 38.5 TGV
Rayalaseema
Tankers (for Liquid KOH) 29 MT
Bags in Trucks
(for KOH flakes)
Chemical
Godown
14. Fuel Oil
Production of Steam
9457 -- --- IOCL
Tankers 290 MT BPCL
15. R - LNG -- 8778 8778
IOCL R-LNG
Terminal,
Ennore
Proposed pipeline of IOCL No storage
v. Other chemicals and materials
required with quantities and
storage capacities
No other chemicals, catalyst and materials will be required in this project.
vi. Details of Emission, effluents, 1. Emission
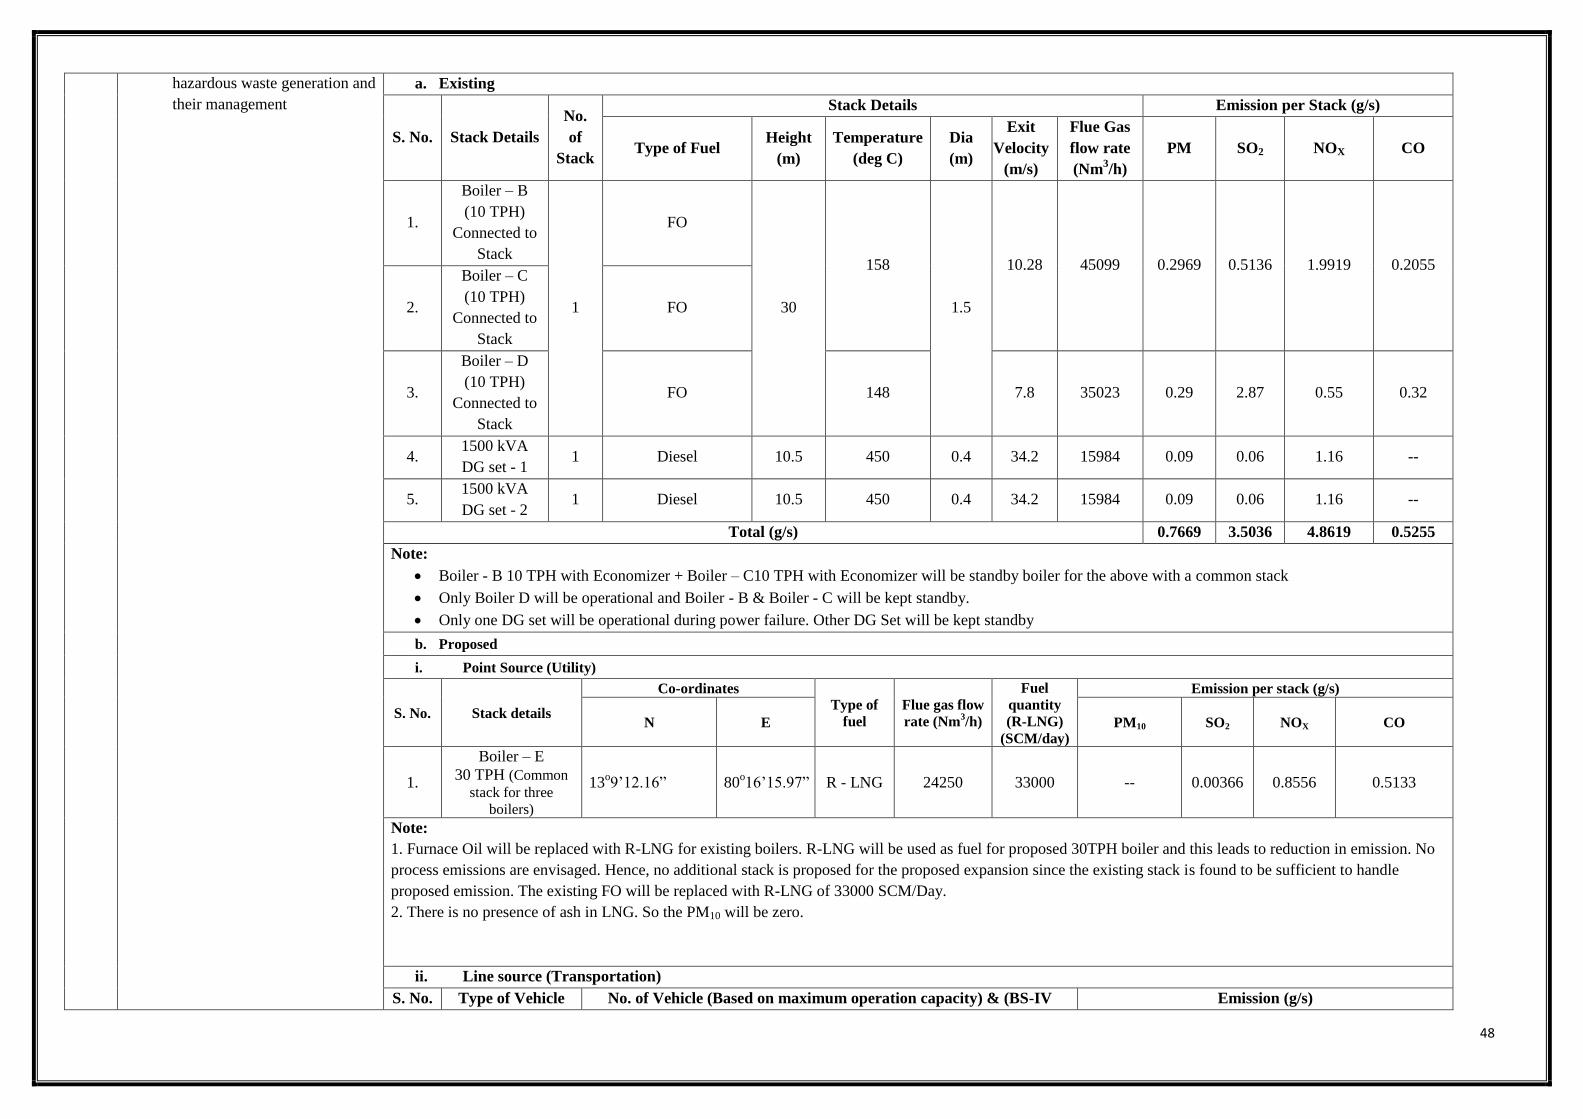
48
hazardous waste generation and
their management
a. Existing
S. No. Stack Details
No.
of
Stack
Stack Details Emission per Stack (g/s)
Type of Fuel Height
(m)
Temperature
(deg C)
Dia
(m)
Exit
Velocity
(m/s)
Flue Gas
flow rate
(Nm3/h)
PM SO2 NOX CO
1.
Boiler – B
(10 TPH)
Connected to
Stack
1
FO
30
158
1.5
10.28 45099 0.2969 0.5136 1.9919 0.2055
2.
Boiler – C
(10 TPH)
Connected to
Stack
FO
3.
Boiler – D
(10 TPH)
Connected to
Stack
FO 148 7.8 35023 0.29 2.87 0.55 0.32
4. 1500 kVA
DG set - 1 1 Diesel 10.5 450 0.4 34.2 15984 0.09 0.06 1.16 --
5. 1500 kVA
DG set - 2 1 Diesel 10.5 450 0.4 34.2 15984 0.09 0.06 1.16 --
Total (g/s) 0.7669 3.5036 4.8619 0.5255
Note:
Boiler - B 10 TPH with Economizer + Boiler – C10 TPH with Economizer will be standby boiler for the above with a common stack
Only Boiler D will be operational and Boiler - B & Boiler - C will be kept standby.
Only one DG set will be operational during power failure. Other DG Set will be kept standby
b. Proposed
i. Point Source (Utility)
S. No. Stack details
Co-ordinates Type of
fuel
Flue gas flow
rate (Nm3/h)
Fuel
quantity
(R-LNG)
(SCM/day)
Emission per stack (g/s)
N E PM10 SO2 NOX CO
1.
Boiler – E
30 TPH (Common
stack for three
boilers)
13o9’12.16” 80
o16’15.97” R - LNG 24250 33000 -- 0.00366 0.8556 0.5133
Note:
1. Furnace Oil will be replaced with R-LNG for existing boilers. R-LNG will be used as fuel for proposed 30TPH boiler and this leads to reduction in emission. No
process emissions are envisaged. Hence, no additional stack is proposed for the proposed expansion since the existing stack is found to be sufficient to handle
proposed emission. The existing FO will be replaced with R-LNG of 33000 SCM/Day.
2. There is no presence of ash in LNG. So the PM10 will be zero.
ii. Line source (Transportation)
S. No. Type of Vehicle No. of Vehicle (Based on maximum operation capacity) & (BS-IV Emission (g/s)

49
Type of Vehicle) PM10 NOX CO HC
1. Bike 19 0.0000132 0.0515 0.185 0.00132
2. Car 8 0.00139 0.0139 0.0278 0.00278
3. Truck/Tanker 25 0.00347 0.608 0.26 0.0799
Total (g/s) 0.00487 0.673 0.473 0.084
iii. Cumulative emission (Utility & Vehicular emission)
S. No. Stack
details
Co-ordinates of Stack Stack Details Emission (g/s)
N E Type of
fuel
Hei
gh
t (m
)
Tem
per
atu
re
(deg
C)
Dia
(m)
Exit
Velocity
(m/s)
Flue
gas
flow
rate
(Nm3/h)
PM SO2 NOX CO HC
1.
Boiler –E
(30 TPH)
(Common
stack for
Three
boilers)
13o9’12.16” 80
o16’15.97” R-LNG 30 140 1.5 5.769 24250 -- 0.00367 0.856 0.513 0
Boiler – C – 10 TPH with Economizer + Boiler – D – 21 TPH with Economizer will be standby boiler for the above with a common stack
Furnace Oil will be replaced with R-LNG for existing boilers. R-LNG will be used as fuel for proposed 30TPH boiler and this leads to reduction in emission. No
process emissions are envisaged. Hence, no additional stack is proposed for the proposed expansion since the existing stack is found to be sufficient to handle
proposed emission. The existing FO will be replaced with R-LNG of 33000 SCM/Day.
There is no presence of ash in LNG. So the PM10 will be zero.
S.No. Type of
Vehicle No. of Vehicle (Based on maximum operation capacity) & (BS-IV Type of Vehicle) PM SO2 NOX CO HC
1. Bike 19 0.000013 -- 0.051 0.19 0.00132
2. Car 8 0.0014 -- 0.014 0.028 0.00278
3. Truck 25 0.0035 -- 0.61 0.26 0.0799
Total (g/s) 0.00487 0.00367 1.53 0.987 0.084
2. Effluents
i. Generation
Description of Effluent Existing (KLD) Proposed (KLD) After Expansion (KLD)
Effluent (Without Sewage) 2451 105 2556
ii. Treatment Capacity
Description Existing (KLD) Proposed (KLD) After Expansion (KLD)
ETP
3600 --- 3600
iii. Mode of Disposal
Description Mode of discharge Quantity
(KLD) Approval
Existing (With Sewage) Disposed to sea after treatment in 2466 As per the CRZ clearance

50
ETP (2451 + 15) 11-20/2009.IA.III dated 03.07.2009
and its amendment 11-20/2009-IA.III
dated 03.06.2011, the discharge
approval limit is 8000 KLD and the
copy of the same enclosed as
Annexure – 10.
As per the CTO issued by TNPCB
under water act dated 03.09.2021, the
allowable effluent quantity is 2559
KLD and sewage quantity is 15 KLD.
On total, 2574 KLD is allowed for
disposal to sea.
*It is proposed to install STP for
treating 16 KLD (Existing – 15 KLD
+ Proposed – 1 KLD)
Proposed (Without Sewage)* Disposed to sea after treatment in
ETP 105
After Expansion Disposed to sea after treatment in
ETP
2556
(2451 + 105)
3. Hazardous Waste generation and their management
Hazardous waste materials will be properly disposed as per the Hazardous Wastes (Management, Handling and Transboundary Movement) Rules 2016; Hazardous
Waste Authorization for spent oil already available for 4 KL/Annum. No additional generation of ETP sludge quantity. Existing authorized quantity is sufficient to
accommodate additional proposed quantity. The Hazardous Waste Authorization issued by TNPCB enclosed as Annexure – 11.
S. No. Details of Waste
Schedule as
per HWM
rules
Unit
Quantity Physical
status Storage Disposal
Existing Proposed After
Expansion Approval
1.
Waste lube oil
generated from
Rotary equipment
– Spent Oil
5.1 KL/Annum 1.38 0.5 1.88 4.0 Oily MS drums
Disposed
through
TNPCB
authorized
recyclers
2.
ETP Secondary
Clarifier Bottom
Sludge
35.3 T/Annum 110 NIL* 110 110 Solid
Concrete
floored
covered
shed
Common
TSDF
Landfill
facility Note:
1.Details of Authorized Recycler/TSDF given below
For Spent Oil:
Shri. Sathya sai Lubricants
S.F.No. 86/IF, Kunnathur Village, Annur Taluk, Coimbatore dist. The agreement is attached as Annexure-17
For ETP Sludge:
Tamilnadu Waste Management Limited, TSDF site: Gummidipoondi Office: Ramky Grandiose, 12
th & 13
th floor, Ramky Towers Complex, Gachibowli, Hyderabad-500032. The agreement is attached a s Annexure-18
2. *There will not be any effluent from proposed Propylene Glycol plant. The blow down from cooling tower, boiler and regeneration water will be treated
in the proposed RO unit and RO rejects sans COD/BOD is the additional input to ETP. Hence no additional ETP sludge will be generated.
vii. Requirement of water, power,
with source of supply, status of
approval, water balance
a. Requirement of Water
S. No. Water Source Required Quantity (KLD)
Extraction Approval Existing Proposed After

51
diagram, man-power
requirement (regular and
contract)
Expansion
1. Chennai Metro Water
Supply and Sewerage Board
3247 810 4057 The total Existing water approval: 3.54 MLD
1. Agreement dated 15.12.2004 made between
MPL-Plant-II and CMWSSB (for secondary treated
sewage) enclosed as Annexure – 7.
2. Agreement dated 24.10.2019 made between
MPL-Plant-II and CMWSSB (for Tertiary treated RO
water) enclosed as Annexure – 8.
3. After Expansion, there is an additional requirement of
water 0.81 MLD over the above agreement for which
a request letter provided to CMWSSB and the reply
letter from CMWSSB for 1.2 MLD is enclosed as
Annexure-9.
b. Water Balance diagram
Existing Water Balance diagram

52
Proposed Water Balance diagram

53
After Expansion – Water Balance Diagram

54
c. Requirement of Power
S. No. Power Source Required Quantity (MW) Extraction Approval

55
Existing Proposed
After
Expa
nsion
1. TANGEDCO 2.54 1.06 3.6
Agreement made between MPL and TANGEDCO dated
30.05.2020 with approval quantity of 4000 kVA is
enclosed as Annexure – 12.
d. Requirement of Manpower
Construction Phase: On Contract - 60 Nos.
Operational Phase
S. No. Description Regular (Nos.) Contract (Nos.) Total (Nos.)
1. Existing 116 204 320
2. Proposed 10 0 10
3. After Expansion 126 204 330
viii. Process description along with
major equipments and
machineries, process flow sheet
(quantative) from raw material
to products to be provided
a. Process description
Proposed production of Propylene Glycol (PG) is by hydration of Propylene oxide. Di- Propylene glycol (DPG) and Tri- Propylene glycol (TPG) are also produced
as by-products in the reaction. The process does not require any catalyst or any additive chemicals. Hence there is no possibility of catalyst leftovers like heavy
metals can get into the product. The reaction of Propylene Oxide with water is exothermic and realized in liquid phase. Internal energy recycle is used to preheat the
feed material to conserve energy. The preheated mixture will be sent to reactor and the reaction takes place at a temperature of 200oC and 20 kg/cm2 (g) pressure.
The amount of water is controlled to favor PG production. The ratio of PG to DPG and TPG is depending upon the composition of the aqueous mixture fed into the
reactor.
Detailed process description is given in Chapter 2 Section 2.7.5.1 of EIA report
b. Proposed major equipment and machineries for PG unit
S. No. Tag No. Equipment description Specification
1. R-2511 Reactor 8” x 6 m x 36 Nos.
MOC: CS
2. SR-2502 PO Buffer drum Operating volume: 11.8 m
3
MOC: CS
3. PD-2502 PO feed pump Capacity: 4.7 m
3/h
MOC: Contact parts SS 304L
4. PC-2541 Process Water Recovery pump Capacity: 23.4 m
3/h
MOC: Contact parts SS 304L
5. E-2521 Process Pre-Heater - 1
Heat transfer area: 11.997 m2
MOC Shell: CS
MOC Tube: SS 304
6. E-2523 Process Pre-Heater - 2
Heat transfer area: 11.997 m2
MOC Shell: CS
MOC Tube: SS 304
7. E-2525 Process Pre-Heater - 3
Heat transfer area: 11.997 m2
MOC Shell: CS
MOC Tube: SS 304
8. E-2527 Process Pre-Heater - 4
Heat transfer area: 11.997 m2
MOC Shell: CS
MOC Tube: SS 304
9. C-2611 First Effect Evaporator
Top: 0.488D x 4 mH
Sump: 2D x 1.75H = 6.73 m3
MOC packing: SS 316L

56
10. E-2611 First Effect Evaporator Reboiler
Heat transfer area: 95.86 m2
MOC Shell: CS
MOC Tube: SS 304
11. C-2621 Second Effect Evaporator
Top: 0.65D x 4 mH
Sump: 2D x 1.6H = 6.25 m3
MOC packing: SS 316L
12. E-2621 Second Effect Evaporator Reboiler
Heat transfer area: 133.19 m2
MOC Shell: CS
MOC Tube: SS 304
13. C-2631 Third Effect Evaporator
Top: 0.75D x 4 mH
Sump: 1.5D x 1.7H = 3.54 m3
MOC packing: SS 316L
14. E-2631 Third Effect Evaporator Reboiler
Heat transfer area: 151.99 m2
MOC Shell: CS
MOC Tube: SS 304
15. C-2641 Fourth Effect Evaporator
Top: 1.3D x 4 mH
Sump: 2D x 2.05H = 7.67 m3
MOC packing: SS 316L
16. E-2641 Fourth Effect Evaporator Reboiler
Heat transfer area: 236.65 m2
MOC Shell: CS
MOC Tube: SS 304
17. C-2651 Dryer Top: 1D x 5 mH
Sump: 1.5D x 2.0H = 4.07 m3
18. E-2651 Dryer Reboiler
Heat transfer area: 6.89 m2
MOC Shell: CS
MOC Tube: SS 304
19. E-2661 Fourth Effect Evaporator Vapour Condenser
Heat transfer area: 9.56 m2
MOC Shell: CS
MOC Tube: SS 304
20. SR-2681 Fourth Effect Evaporator Reflux Drum Operating volume: 1.66 m
3
MOC: CS
21. PC-2681 A/B Fourth Effect Evaporator Reflux Drum pump Capacity: 7.3 m
3/h
MOC: Contact parts SS 304L
22. SR-2541 Process Water Recovery vessel Operating volume: 10.81 m
3
MOC: CS
23. E-2541 Vent Condenser
Heat transfer area: 1.51 m2
MOC Shell: CS
MOC Tube: SS 304
24. MX-2502 Static Mixer MOC: SS 304L
25. SR-2531 Pure steam condensate drum Operating volume: 4 m3, MOC: CS
26. SR-2551 Surge condensate drum Operating volume: 3.86 m
3
MOC: CS
27. PC-2551 Surge condensate drum pump Capacity: 8.1 m
3/h
MOC: Contact parts MS
28. C-2701 PG Distillation column Top: 1.9D x 15 mH
Sump: 1.3D x 2.1H = 3.15 m3
29. E-2701 PG column Reboiler
Heat transfer area: 54.58 m2
MOC Shell: SS 304
MOC Tube: SS 304
30. E-2711 PG column vapour condenser Heat transfer area: 0.97 m
2
MOC Shell: SS 304

57
MOC Tube: SS 304
31. E-2721 PG column bottom cooler
Heat transfer area: 9.05 m2
MOC Shell: SS 304
MOC Tube: SS 304
32. E-2731 PG Product cooler
Heat transfer area: 11.36 m2
MOC Shell: SS 304
MOC Tube: SS 304
33. SR-2741 PG column Reflux drum Operating volume: 1.6 m
3
MOC: SS 304L
34. PC-2741 A/B PG column Reflux pump Capacity: 7.7 m
3/h
MOC: Contact parts SS 304L
35. SR-2761 A/B PG Day drum Operating volume: 50.41 m
3
MOC: SS 304L
36. PC-2761 A/B PG Day drum pump Capacity: 48.5 m
3/h
MOC: Contact parts SS 304L
37. C-2801 DPG distillation column Top: 0.95D x 15 mH
Sump: 0.6D x 1.8H = 0.55 m3
38. E-2801 DPG column reboiler
Heat transfer area: 15.95 m2
MOC Shell: SS 304
MOC Tube: SS 304
39. E-2811 DPG column vapour condenser
Heat transfer area: 27.08 m2
MOC Shell: SS 304
MOC Tube: SS 304
40. E-2821 DPG column bottom cooler
Heat transfer area: 7.73 m2
MOC Shell: SS 304
MOC Tube: SS 304
41. E-2831 DPG Product cooler
Heat transfer area: 6.05 m2
MOC Shell: SS 304
MOC Tube: SS 304
42. SR-2841 DPG column reflux drum Operating volume: 0.28 m
3
MOC: SS 304L
43. PC-2841 A/B DPG column reflux pump Capacity: 1.3 m
3/h
MOC: Contact parts SS 304L
44. SR-2861 A/B DPG Day drum Operating volume: 4.31 m
3
MOC: SS 304L
45. PC-2861 A/B DPG Day drum pump Capacity: 4.7 m
3/h
MOC: Contact parts SS 304L
46. PD-2801 A/B DPG column bottom pump Capacity: 0.2 m
3/h
MOC: Contact parts SS 304L
47. SR-2751 DPG column buffer drum Operating volume: 11.7 m
3
MOC: SS 304L
48. PC-2751 A/B DPG column buffer drum pump
Capacity: 0.8 m3/h
MOC: Contact parts SS 304L
49. SR-2601 Offspec drum Operating volume: 46.66 m
3
MOC: SS 304L
50. PC-2601 Offspec Product Re-cycle pump Capacity: 0.8 m
3/h
MOC: Contact parts SS 304L
51. PC-2701 A/B PG column bottom pump Capacity: 0.9 m3/h

58
MOC: Contact parts SS 304L
52. E-2931 TPG Product cooler
Heat transfer area: 9.13 m2
MOC Shell: SS 304
MOC Tube: SS 304
53. SR-2961 TPG Day drum Operating volume: 4.31 m
3
MOC: SS 304L
54. PC-2641 A/B Fourth Effect Evaporator bottom pump Capacity: 6.4 m
3/h
MOC: Contact parts SS 304L
55. PC-2651 A/B Dryer Bottom pump Capacity: 5.9 m
3/h
MOC: Contact parts SS 304L
c. Process flow diagram of proposed PG unit and utilities

59

60
ix. Hazard identification and Hazard identification

61
details of proposed safety
systems
1. ETHYLENE OXIDE
Ethylene Oxide Forms Explosive Mixtures with Air.
If involved in a fire, this product may emit irritating and potentially toxic fumes.
Vapours are heavier than air and may collect in low spots.
HAZARD STATEMENTS
Hazard Code falls for Ethylene Oxide Effects
H220 EXTREMELY FLAMMABLE GAS
H280 CONTAINS GAS UNDER PRESSURE; MAY EXPLODE IF HEATED
H315 + H320 CAUSES SKIN AND EYE IRRITATION
H319 CAUSES SERIOUS EYE IRRITATION
H317 MAY CAUSE AN ALLERGIC SKIN REACTION
H331 TOXIC IF INHALED
H335 MAY CAUSE RESPIRATORY IRRITATION
H340 MAY CAUSE GENETIC DEFECTS
H350 MAY CAUSE CANCER
H360 MAY DAMAGE FERTILITY OR THE UNBORN CHILD
H372 CAUSES DAMAGE TO ORGANS (NERVOUS SYSTEM, KIDNEYS) THROUGH PROLONGED
CGA-HG01 OR REPEATED EXPOSURE
CGA-HG04 MAY CAUSE FROSTBITE
CGA-HG11 MAY FORM EXPLOSIVE MIXTURES WITH AIR
POTENTIAL HEALTH HAZARD
Cancer and reproductive hazard
Toxic
Flammable liquefied gas
POTENTIAL HEALTH EFFECTS
INHALATION:
Dry/sore throat.
Irritation of the respiratory tract.
Irritation of the nasal mucous membranes.
Central nervous system depression, Nausea, Vomiting, Headache, Dizziness, Disturbances of consciousness.
Exposure to High Concentrations: Disturbances of heart rate. Respiratory difficulties.
Following Symptoms may appear Later: Cramps/uncontrolled muscular contractions. Risk of lung oedema.
SKIN CONTACT:
Frostbites.
Tingling/irritation of the skin.
Following Symptoms may appear Later: Swelling of the skin. Red skin. Blisters. May stain the skin.
After Contact with Water: Caustic burns/corrosion of the skin.
EYE CONTACT:
Irritation of the eye tissue.
EXTINGUISHING MEDIA:
Carbon dioxide, Dry chemical, Water spray or fog.
NFPA RATING:
CHEMICAL FLASH POINT BOILING POINT NFPA RATING

62
HEALTH FIRE REACTIVITY
Ethylene Oxide -20 deg C 10.5 deg C 2 4 3
2. PROPYLENE OXIDE
Propylene Oxide - Extremely flammable liquid.
May cause reproductive and fetal effects. Potential cancer hazard.
Causes severe eye and skin irritation with possible burns.
Harmful if swallowed.
May be harmful if absorbed through the skin.
May cause allergic skin reaction.
Causes respiratory tract irritation.
TARGET ORGANS: Central nervous system, respiratory system, eyes, skin.
HAZARD STATEMENTS
Hazard Code falls for Propylene Oxide Effects
H224 EXTREMELY FLAMMABLE LIQUID AND VAPOUR
H302 HARMFUL IF SWALLOWED
H312 HARMFUL IN CONTACT WITH SKIN
H315 CAUSES SKIN IRRITATION
H319 CAUSES SERIOUS EYE IRRITATION
H332 HARMFUL IF INHALED
H335 MAY CAUSE RESPIRATORY IRRITATION
H340 MAY CAUSE GENETIC DEFECTS
H350 MAY CAUSE CANCER
POTENTIAL HEALTH EFFECTS
EYE:
Produces irritation, burning sensation, redness, tearing, inflammation, and possible corneal injury.
SKIN: May cause skin sensitization, an allergic reaction, which becomes evident upon re-exposure to this material. Causes severe skin irritation and possible burns.
May lead to the formation of blisters.
INGESTION: Harmful if swallowed. Causes gastrointestinal irritation with nausea, vomiting and diarrhoea. May cause central nervous system depression,
characterized by excitement, followed by headache, dizziness, drowsiness, and nausea. Advanced stages may cause collapse, unconsciousness, coma and possible
death due to respiratory failure. Aspiration of material into the lungs may cause chemical pneumonitis, which may be fatal.
INHALATION: Inhalation of high concentrations may cause central nervous system effects characterized by nausea, headache, dizziness, unconsciousness and
coma. Causes respiratory tract irritation. Aspiration may cause respiratory swelling and pneumonitis. Vapours may cause dizziness or suffocation.
CHRONIC: Prolonged inhalation may cause respiratory tract inflammation and lung damage. Prolonged or repeated skin contact may cause dermatitis. May cause
cancer according to animal studies. May cause reproductive and fetal effects. Laboratory experiments have resulted in mutagenic effects. May cause heritable
genetic damage.
EXTINGUISHING MEDIA: Use water spray, fog, or alcohol-resistant foam.
NFPA RATING:
CHEMICAL FLASH POINT BOILING POINT NFPA RATING
HEALTH FIRE REACTIVITY
Propylene Oxide -37 deg C 34 deg C 3 4 2
3. LIQUID CHLORINE
Avoid Contact with Liquid and Vapour. May cause fire on contact with combustibles. Poisonous Gases are produced in Fires. Harmful to Aquatic Life in very low
Concentrations.

63
HAZARD STATEMENTS
Hazard Code falls for Liquid Chlorine Effects
H314 Causes severe skin burns and eye damage
H318 Causes serious eye damage
H400 Very toxic to aquatic life
H290 May be corrosive to metals
POTENTIAL HEALTH EFFECTS:
AFTER INHALATION: Dry/sore throat, Coughing, Irritation of the respiratory tract, Irritation of the nasal mucous membranes, Exposure to High Concentrations:
Possible laryngeal spasm/oedema, Risk of lung oedema, Respiratory difficulties.
AFTER SKIN CONTACT: Caustic burns/corrosion of the skin, Burns
AFTER EYE CONTACT: Corrosion of the eye tissue, Permanent eye damage, Serious damage to eyes.
AFTER INGESTION: Vomiting, Burns to the gastric/intestinal mucosa, Possible esophageal perforation, Bleeding of the gastrointestinal tract, Disturbances of
consciousness. Following Symptoms may appear later: Tumours of the gastrointestinal tract, Burns.
CHRONIC SYMPTOMS: On Continuous/ Repeated Exposure/ Contact: Fall of hair, Skin rash/inflammation, Gastrointestinal complaints.
NFPA RATING:
CHEMICAL FLASH POINT BOILING POINT NFPA RATING
HEALTH FIRE REACTIVITY
Liquid Chlorine -- -- 3 0 0
4. PROPYLENE
Extremely flammable gas.
Contains gas under pressure; may explode if heated.
May displace oxygen and cause rapid suffocation.
May form explosive mixtures with air.
HAZARD STATEMENTS
Hazard Code falls for Propylene Effects
H220 EXTREMELY FLAMMABLE GAS
H220 CONTAINS GAS UNDER PRESSURE; MAY EXPLODE IF HEATED
H402 HARMFUL TO AQUATIC LIFE
H412 HARMFUL TO AQUATIC LIFE WITH LONG LASTING EFFECTS
OSHA-H01 MAY DISPLACE OXYGEN AND CAUSE RAPID SUFFOCATION
CGA-HG04 MAY FORM EXPLOSIVE MIXTURES WITH AIR
CGA-HG01 MAY CAUSE FROSTBITE
POTENTIAL HEALTH EFFECTS:
INHALATION: Inhalation of high concentrations may cause central nervous system depression such as dizziness, drowsiness, headache, and similar narcotic
symptoms, but no long-term effects.
In high concentrations it will displace oxygen from the breathing atmosphere, particularly in confined spaces. Signs of asphyxiation will be noticed when oxygen is
reduced to below 16%
Symptoms may include rapid breathing and pulse rate, headache, dizziness, visual disturbances, mental confusion, incoordination, mood changes, muscular
weakness, tremors, cyanosis, narcosis and numbness of the extremities
Unconsciousness leading to central nervous system injury and possibly death will occur when the atmospheric oxygen concentration is reduced to about ≤8%.
SKIN CONTACT: Contact with gas/liquid escaping the container can cause frostbite and freeze burns.
EYE CONTACT:
Contact with gas/liquid escaping the container can cause frostbite, freeze burns, and permanent eye damage.
EXTINGUISHING MEDIA:

64
Carbon dioxide, Dry chemical, Water spray or fog.
NFPA RATING:
CHEMICAL FLASH POINT BOILING POINT NFPA RATING
HEALTH FIRE REACTIVITY
PROPYLENE -107.8 deg C -47.7 deg C 1 4 1
Following are the safety measures adopted in the plant and the same to be continued.
1. Digital Level Gauge and Level Indicator with alarm provided for High level (85% of Tank) to avoid overflow.
2. Sprinklers provided for storage tanks.
3. All safety and emergency inter-locks are in place and being checked before commencing operation.
4. Adequate Hydrocarbon and VOC detectors are installed on downwind direction based on the predominant wind direction
5. LDAR (Leak Detection and Repair) protocol are followed and recorded on regular basis.
6. Sufficient Foam and fire water quantity are maintained assuming double contingency scenario.
7. Flame proof electrical fittings are provided based on HAC (Hazardous Area Classification).
8. Operator training and retraining and Mock Drills are carried out regularly.
9. WPS (Work Permit System) are strictly enforced and are not be allowed to be circumvented.
10. Hoses are inspected and tested once in every three months.
11. Static protection and integrity of explosion proof equipment are ensured through regular inspection. Every electrical equipment and lighting features are
meeting explosion proof requirement, in classified area.
12. Smoking and carrying smoking material are strictly prohibited.
13. Earth link are connected to pump circuit before commencing tanker unloading/loading.
14. Safety Procedures and Do’s and Don’ts are displayed in handling and storage area.
15. Periodic inspection of Pipelines and painting are done to avoid corrosion and subsequent leak.
16. The Plant commissioning has an important role to ensure long term safety. Proper cleaning and flushing of the system are ensured in storage area and fire
hydrant system to avoid possible hold up of welding slag’s, bolts, nuts etc. which could hamper smooth operation.
17. The Environment team are trained on industrial hygiene and sampling /testing techniques.
x. Expansion/modernization
proposals:
c. Copy of all the Environmental
Clearance(s) including
Amendments thereto obtained for
the project from MOEF/SEIAA
shall be attached as an Annexure.
A certified copy of the latest
Monitoring Report of the Regional
Office of the Ministry of
Environment and Forests as per
circular dated 30th May, 2012 on
the status of compliance of
conditions stipulated in all the
existing environmental clearances
including Amendments shall be
provided. In addition, status of
compliance of Consent to Operate
Expansion proposal:
The details regarding earlier Environmental Clearance tabulated below
S.No. MoEF File No. Units Date of
Issue Status of Project Status of Compliance
1. J-11011/156/2008-IA(II)
Propylene Oxide
Propylene Glycol
Polyol
07.05.2008 Commissioned Complied
2. J-11011/156/2008-IA-II(I)
EC for Expansion of
Propylene Glycol
plant by 50000
MTPA
Ongoing Applied Now --
Copy of earlier EC issued vide File No. J-11011/156/2008-IA(II) dated 7th
May, 2008 enclosed as Annexure – 1.
Certified EC compliance report issued by the MoEF & CC, Regional Office, Chennai enclosed as Annexure – 20.
S.No. Latest CTO No. Date of issue Valid till
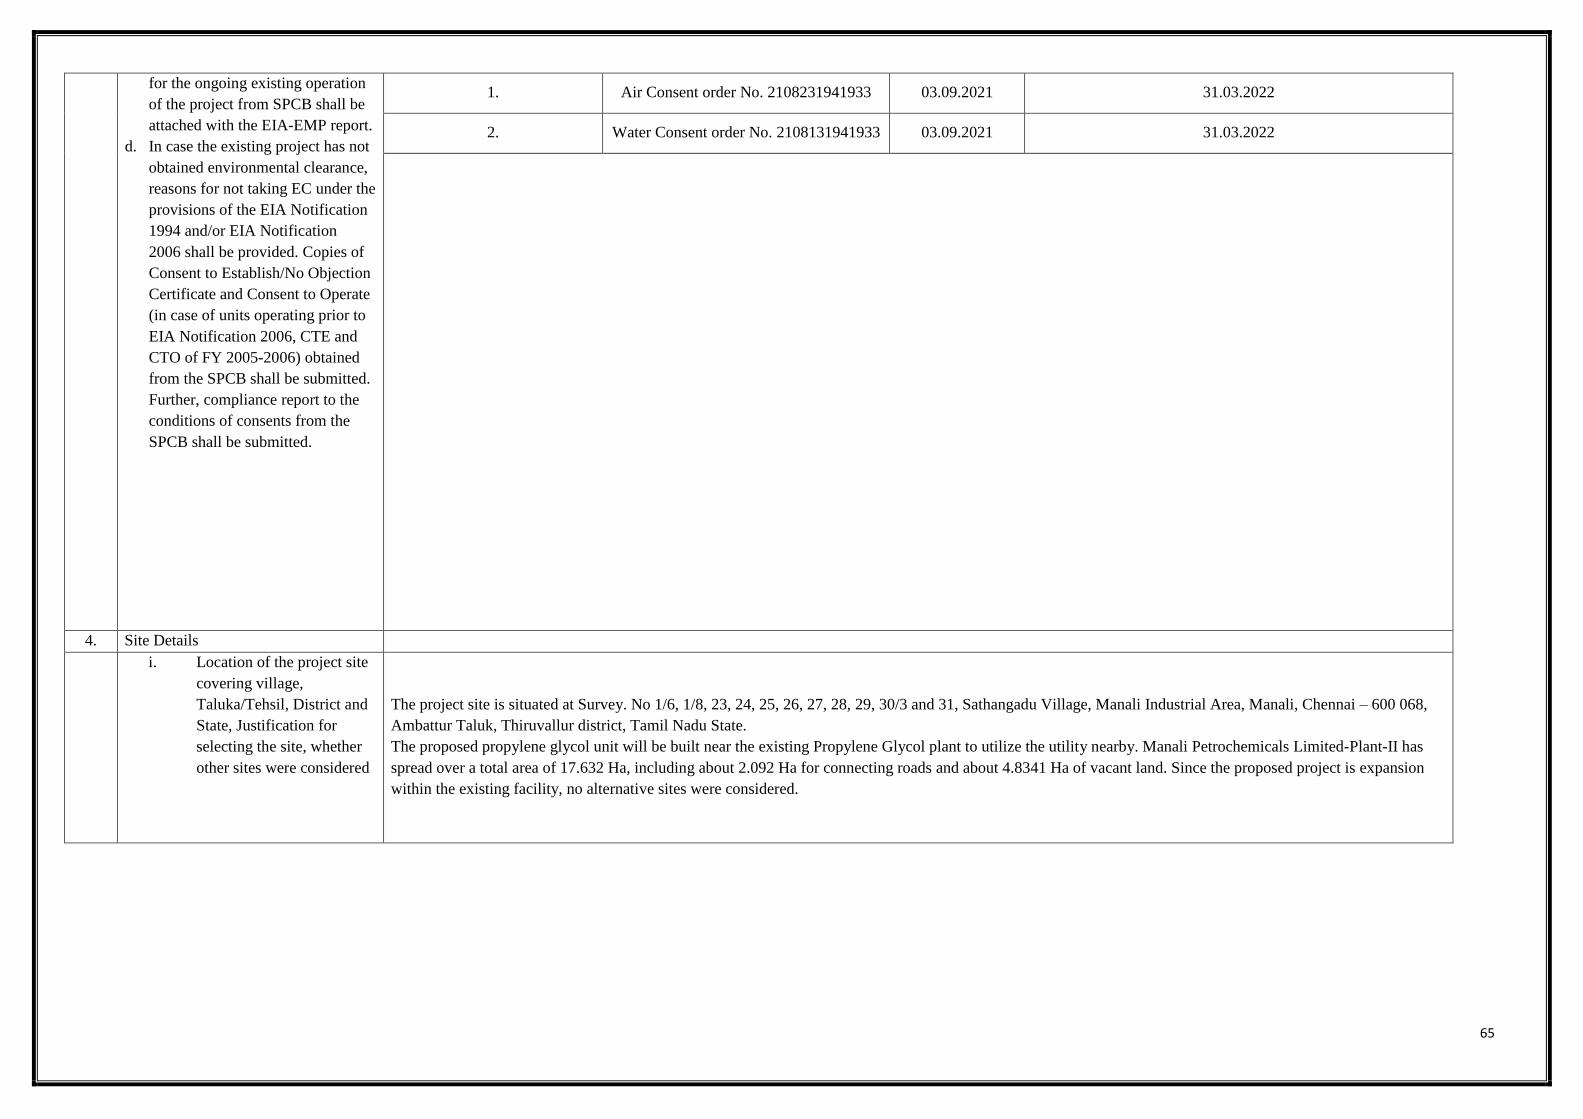
65
for the ongoing existing operation
of the project from SPCB shall be
attached with the EIA-EMP report.
d. In case the existing project has not
obtained environmental clearance,
reasons for not taking EC under the
provisions of the EIA Notification
1994 and/or EIA Notification
2006 shall be provided. Copies of
Consent to Establish/No Objection
Certificate and Consent to Operate
(in case of units operating prior to
EIA Notification 2006, CTE and
CTO of FY 2005-2006) obtained
from the SPCB shall be submitted.
Further, compliance report to the
conditions of consents from the
SPCB shall be submitted.
1. Air Consent order No. 2108231941933 03.09.2021 31.03.2022
2. Water Consent order No. 2108131941933 03.09.2021 31.03.2022
4. Site Details
i. Location of the project site
covering village,
Taluka/Tehsil, District and
State, Justification for
selecting the site, whether
other sites were considered
The project site is situated at Survey. No 1/6, 1/8, 23, 24, 25, 26, 27, 28, 29, 30/3 and 31, Sathangadu Village, Manali Industrial Area, Manali, Chennai – 600 068,
Ambattur Taluk, Thiruvallur district, Tamil Nadu State.
The proposed propylene glycol unit will be built near the existing Propylene Glycol plant to utilize the utility nearby. Manali Petrochemicals Limited-Plant-II has
spread over a total area of 17.632 Ha, including about 2.092 Ha for connecting roads and about 4.8341 Ha of vacant land. Since the proposed project is expansion
within the existing facility, no alternative sites were considered.
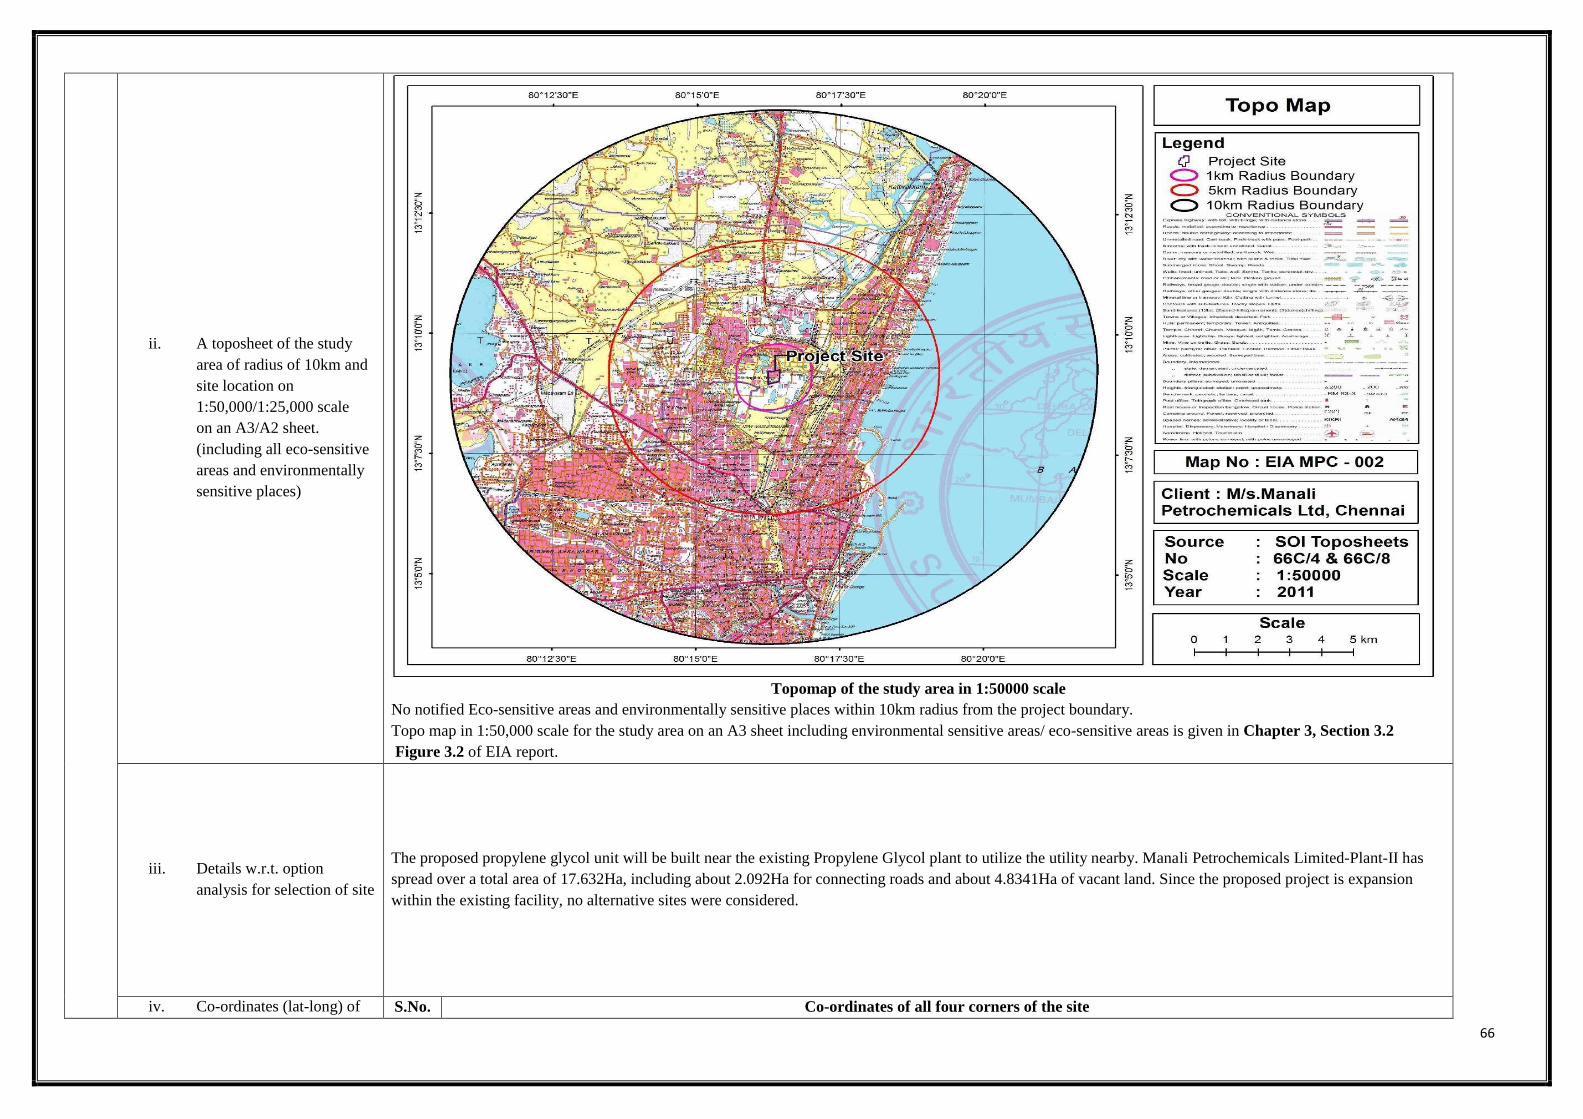
66
ii. A toposheet of the study
area of radius of 10km and
site location on
1:50,000/1:25,000 scale
on an A3/A2 sheet.
(including all eco-sensitive
areas and environmentally
sensitive places)
Topomap of the study area in 1:50000 scale
No notified Eco-sensitive areas and environmentally sensitive places within 10km radius from the project boundary.
Topo map in 1:50,000 scale for the study area on an A3 sheet including environmental sensitive areas/ eco-sensitive areas is given in Chapter 3, Section 3.2
Figure 3.2 of EIA report.
iii. Details w.r.t. option
analysis for selection of site
The proposed propylene glycol unit will be built near the existing Propylene Glycol plant to utilize the utility nearby. Manali Petrochemicals Limited-Plant-II has
spread over a total area of 17.632Ha, including about 2.092Ha for connecting roads and about 4.8341Ha of vacant land. Since the proposed project is expansion
within the existing facility, no alternative sites were considered.
iv. Co-ordinates (lat-long) of S.No. Co-ordinates of all four corners of the site

67
all four corners of the site Latitude (N) Longitude (E)
1. 13° 9'13.80" 80°16'14.46"
2. 13° 9'14.99" 80°16'27.01"
3. 13° 9'1.02" 80°16'26.28"
4. 13° 8'57.75" 80°16'14.63"
v. Google map-Earth Google map Earth downloaded of the project site

68
downloaded of the project
site
vi. Layout maps indicating
existing unit as well as
proposed unit indicating
storage area, plant
area, greenbelt area,
utilities etc. If located
within an Industrial
area/Estate/Complex,
layout of Industrial Area
indicating location of unit
The layout indicating storage area, plant area, greenbelt area, utilities etc is appended in Chapter 2, Section 2.9, Figure 2-16 of EIA report and the layout including
existing unit as well as proposed unit enclosed as Annexure-6.
The project site is situated in Manali industrial area.
Layout of industrial area indicating location of unit within the industrial area is given below and the full layout is attached in
Annexure-43.

69
within the Industrial
area/Estate.
vii. Photographs of the Photographs of Existing facility

70
proposed and existing (if
applicable) plant site. If
existing, show photographs
of plantation/greenbelt, in
particular.
Photographs of Proposed Site-1

71
Photographs of Proposed Site-2
Photos of Plantation/Greenbelt in particular

72

73
viii. Landuse break-up of total
land of the project site
(identified and acquired),
government/private -
agricultural, forest,
wasteland, water bodies,
settlements, etc shall be
included. (not required for
industrial area)
Classification of land use of Project Site: Builtup, Urban (As per Bhuvan 2011-12).
Description Existing (Hectares) Proposed
(Hectares) After Expansion (Hectares) Percentage (%)
Plant area 7.94 0.374* 8.314 47.15%
Roads 2.092 0 2.092 11.86%
Green belt 2.7659 0 2.7659 15.69%
Vacant Land 4.8341 -0.374 4.4601 25.30%
Total Land 17.632 0 17.632 100.00%
*Proposed PG plant area of 0.374 hectare is part of the existing vacant land (4.8341 hectares). So, no additional land acquisition is identified.
ix. A list of major industries
with name and type within
study area (10km radius)
shall be incorporated. Land
use details of the study area
List of major industries within the study area (10 km radius)
S. No. Industries Distance (~ km) Direction
1. Balmer Lawrie & Co. Ltd Adjacent to Site N
2. Kothari Petrochemicals Limited 0.14 N
3. Cetex Petrocemicals Limited 0.19 W
4. Indian Oil Corporation Limited- Tondairpet
Terminal
0.93 SE
5. Madras Fertilizer Limited 1.08 N
6. Manali Petrochemical Limited Plant-I 1.93 N
7. Tamilnadu Petroproducts Limited 1.98 N
8. Indian Additives Limited 2.04 NNE
x. Geological features and a. Geological features

74
Geo-hydrological status of
the study area shall be
included
The geological formation of the study area is entirely alluvium/Laterite.
b. Geo-hydrological status
The Geo-hydrological formation of study area in which the condition of ground water is discontinuous, thin and unconfined to semi-confined.
Further detailed Geological features and Geo-hydrological status is provided in Chapter 3, Section 3.4 and Section 3.4.1 of EIA report.
xi. Details of Drainage of the
project upto 5km radius of
study area. If the site is
within 1 km radius of any
major river, peak and lean
season river discharge as
well as flood occurrence
frequency based on peak
rainfall data of the past 30
years. Details of Flood
Level of the project site and
maximum Flood Level of
the river shall also be
provided. (mega green field
projects)
Drainage Map showing the study area
Buckingham canal is one of the major canals running from North to South towards the project site at a distance of 0.84km (ESE).
Korttalaiyar (Kosisttalaiyar) River originates near Pallipattu in Thiruvallur district and drains into the Bay of Bengal is flowing from West to East towards the
project site at a distance of 2.72km (NNE).
Kuvam (Cooum) River originates near Kesavaram Dam and drains into the Bay of Bengal is also flowing from West to East towards the project site at a distance of
7.65km(S).
Bay of Bengal is located at a distance of 2.94km (ESE) from the project site.
Puzhal lake (Red Hills) is one of the rain-fed reservoirs from where water is drawn for supply to Chennai City. It is located at a distance of 8.35km (W) from the
project site.
Details of drainage of the project upto 5 km of the study area:
S.No. Description Distance (~ km) Direction

75
Coastal Zone
1. Bay of Bengal 2.93 ESE
Lakes
2. Sattangadu Lake 0.17 W
3. Lake near Sekkadu 2.33 WNW
4. Periyathoppu Lake 2.46 NW
5. Kadappakkam Lake 5.06 NNW
6. Madavaram Eri/Retteri Lake 5.85 W
7. Pulal/Red Hills Lake 8.35 W
River
8. Korttalaiyar/ Kosisttalaiyar R 2.72 NNE
9. Cooum/Kuvam R 7.65 S
10. Adyar River 13.80 S
Nala
11. Otteri Nala 4.69 S
Canal
12. Buckingham Canal 0.84 ESE
13. Kodungaiyur Canal 1.90 SW
14. Captain Cotton Canal 2.44 S
15. Korattur Eri Canal 7.24 W
16. Canal near Padiyanallur 11.31 WNW
Details of major river, peak and lean season river present within 1Km radius of the study area
There is no major river present within the study area.
xii. Status of acquisition of
land. If acquisition is not
complete, stage of the
acquisition process and
expected time of complete
possession of the land
Land acquisition is not required as the proposed expansion is within the existing facility.
Land Documents are enclosed as Annexure - 5
xiii. R&R details in respect of
land in line with state
Government policy
Not applicable.
The project site is located within the existing land area.
5. Forest and wildlife related issues (if applicable)
i. Permission and approval for
the use of forest land
(forestry clearance), if any,
and recommendations of
the State Forest
Department. (if applicable)
Not Applicable.
The project site is located within the existing land area.
ii. Landuse map based on
High resolution satellite
imagery (GPS) of the
proposed site delineating
the forestland (in case of
Not Applicable.
The project site is located within the existing land area.
76
projects involving forest
land more than 40 ha)
iii. Status of Application
submitted for obtaining the
stage I forestry clearance
along with latest status shall
be submitted.
Not Applicable.
The project site is located within the existing land area.
iv. The projects to be located
within 10 km of the
National Parks, Sanctuaries,
Biosphere Reserves,
Migratory Corridors of
Wild Animals, the project
proponent shall submit the
map duly authenticated by
Chief Wildlife Warden
showing these features vis-
à-vis the project location
and the recommendations
or comments of the Chief
Wildlife Warden-thereon
Not Applicable.
The project site is located within the existing land area.
v. Wildlife Conservation Plan
duly authenticated by the
Chief Wildlife Warden of
the State Government for
conservation of Schedule I
fauna, if any exists in the
study area
Not Applicable.
The project site is located within the existing land area.
vi. Copy of application
submitted for clearance
under the Wildlife
(Protection) Act, 1972, to
the Standing Committee of
the National Board for
Wildlife
Not Applicable.
The project site is located within the existing land area.
6. Environmental status
i. Determination of
atmospheric inversion level
at the project site and site-
The details are given in Chapter 3, Section 3.9 of EIA report.

77
specific micro-
meteorological data using
temperature, relative
humidity, hourly wind
speed and direction
and rainfall
ii. AAQ data (except
monsoon) at 8 locations for
PM10, PM2.5, SO2, NOX,
CO and other parameters
relevant to the project shall
be collected. The
monitoring stations shall be
based CPCB guidelines and
take into account the pre-
dominant wind direction,
population zone
and sensitive receptors
including reserved forests.
AAQ data (except monsoon) at 8 locations for PM10, PM2.5, SO2, NOX, CO and other parameters relevant to the project are collected. The monitoring stations are
identified based on CPCB guidelines and the pre-dominant wind direction, population zone, sensitive receptors including reserved forests are considered for
monitoring. The baseline air quality of the study area, Eight (08) monitoring locations have been identified as per Indian Meteorological data. Baseline monitoring
was conducted during study period 27th December 2021 to 27th March 2022.
The minimum and maximum baseline levels of PM10 (32 – 82 µg/m³), PM2.5 (15 – 38 µg/m³), SO2 (5 –33µg/m³), NO2(17 – 59 µg/m³), CO (1.2-4 mg/m³).
The nearest CPCB AAQ monitoring station is Manali-Chennai and TNPCB AAQ monitoring station is Manali-Village in which the average value of two station
during the study period is: PM10 (45 µg/m³), PM2.5 (29.53 µg/m³), SO2(7.37 µg/m³), NO2(20 µg/m³) and CO (1.06 mg/m³).
AAQ monitoring locations detail are provided in the Chapter 3, Section 3.9.1.1 and monitoring results are provided in the Section 3.9.1.2 of EIA report.
iii. Raw data of all AAQ
measurement for 12 weeks
of all stations as per
frequency given in the
NAQQM Notification of
Nov. 2009 along with -
min., max., average and
98% values for each of the
AAQ parameters from data
of all AAQ stations should
be provided as an annexure
to the EIA Report.
Raw data of all AAQ measurement for 12 weeks of all stations as per frequency given in the NAAQM notification of Nov. 2009 along with- min-max, average and
98% values for each of the AAQ parameters from data of all AAQ stations are provided as Annexure - 21.

78
iv. Surface water quality of
nearby River (100m
upstream and downstream
of discharge point)
and other surface drains at
eight locations as per
CPCB/MoEF&CC
guidelines.
Parameters Unit Cooum river
(upstream)
Buckingham
canal (upstream)
Cooum river
(downstream)
Buckingham canal
(downstream)
Madhavaram Eri Kosasthalai
river
Puzhal
lake
Retteri
pH - 7.56 7.5 6.96 7.87 7.14 7.2 7.89 7.79
Electrical
Conductivity
µs/cm 3618 4210 2925 4960 2060 261 1067 1042
Turbidity NTU 45 5.2 28 6.5 15.5 4.2 3 6
Total Dissolved
Solids
mg/l 2065 2836 1965 3026 1390 168 710 655
Total Suspended
Solids
mg/L 75 156 68 216 10.1 10 10 10
Total Hardness mg/L 745 790 712 825 668 93 265 245
Calcium Hardness
as CaCo3
mg/L 430 146 386 170 107 26 128 116
Magnesium
Hardness as MgCo3
mg/L 315 104 285 146 97.3 6.9 65.8 49.4
Calcium Ca mg/L 172 1222 165 1765 435 22.6 54 51
Magnesium Mg mg/L 76.9 165 64.8 182 162 5.8 32 28.6
Chloride
Cl
mg/L 656 227 586 325 210 75 160 176
Sulphte SO4 mg/L 189 0.21 176 0.45 BQL(LOQ:0.1) BQL(LOQ:0.1) 152 150
Total Alkalinity mg/L 520 85 480 105 65 8.5 195 218
Iron Fe mg/L 0.52 0.95 0.48 0.97 0.21 BQL(LOQ:0.2) 0.27 0.36
Silica SiO2 mg/L 39.2 1008 29.6 1247 340 18.2 9.65 10
Sodium Na mg/L 517 141 487 175 94 2.9 80 94
Potassium K mg/L 95.2 11.5 87.2 13 11.5 4.2 9 12
Fluorides F mg/L BQL(LOQ:0.2
)
104 BQL(LOQ:0.2) 113 9.4 BQL(LOQ:2) 0.21 0.22
Nitrate NO3 mg/L 19.1 319 14.6 342 35.2 8.5 1.98 1.32
Chemical Oxygen
Demand
mg/L 77.3 0.5 63.5 1.2 4.2 5.5 32 38
Biological Oxygen
Demand
mg/L 22.1 900 19.7 865 22 7 8.26 9.86
Total Kjedhal
Nitrogen
mg/L 23.4 11 18.4 13 7 <2 27 42
Dissolved Oxygen mg/L BQL(LOQ:2) 5.2 BQL(LOQ:2) 5.5 15.5 4.2 5.5 4.5
Surface water quality of nearby river and other surface drains at eight location as per CPCB/MoEF&CC guidelines are collected & analyzed and the details are
provided in the Chapter 3, Section 3.8.2, Table 3-9 of EIA report.
v. Whether the site falls near
to polluted stretch of river
identified by the
CPCB/MoEF&CC, if yes
give details.
No Polluted stretch of river identified as per CPCB within 10km radius from the project site.
vi. Ground water monitoring at
minimum at 8 locations
shall be included.
Ground water monitoring results at 8 locations
Parameter Range of Results Standard Limit
Acceptable Limit Permissible Limit
pH 6.78 – 7.82 6.5 – 8.5 No Relaxation

79
Total Dissolved
Solids (TDS) 795 mg/L – 2802 mg/L 500 mg/L 2000 mg/L
Fluoride 0.37 mg/L – 0.49 mg/L 1 mg/L 1.5 mg/L
Hardness 308 mg/L - 877 mg/L 200 mg/L 600 mg/L
Ground water monitoring at minimum 8 locations are collected & analyzed. Further detailed Ground water monitoring results were provided in the Chapter 3,
Section 3.8.1, Table 3-8 of EIA report.
vii. Noise levels monitoring at
8 locations within the study
area.
Noise levels monitoring results at 8 locations within the study area
Site Day Time (dB(A)) Night Time (dB(A))
Results Standards Results Standards
Industrial Areas (Project site) 63 75 56 70
Commercial Areas 51 - 58 65 40 – 46 55
Residential Area 42 - 48 55 34 - 39 45
Noise levels monitoring at 8 locations within the study area are collected & analyzed. Further detailed Noise level monitoring results were provided in the
Chapter 3, Section 3.10, Table 3-13 & 3-14 of EIA report.
viii. Soil Characteristic as per
CPCB guidelines
Soil characteristics as per CPCB guidelines
The pH of the soil samples ranged from 6.72 to 8.15, indicating the soils are neutral to moderately alkaline in nature.
Conductivity of the soil samples ranged from 0.133 to 1.96 µs/cm.
Nitrogen content ranged from 0.01 meq/100 g to 0.025 meq/100 g kg/ha.
Phosphorous ranged from 10 meq/100 g to 45 meq/100 g.
Potassium content ranges from 6.39 mg/kg to 86 mg/kg.
Further detailed Soil characteristics are analyzed as per CPCB guidelines are provided in the Chapter 3, Section 3.11 Table 3-16 of EIA report.
ix. Traffic study of the area,
type of vehicles, frequency
of vehicles for
transportation of materials,
additional traffic due to
proposed project, parking
arrangement etc.
Traffic study is carried out including type and frequency of vehicles, transportation of materials and additional traffic due to the proposed project based on IRC:106-
1990- Guideline for capacity of urban road in plain area. Details are given in Chapter 3, Section 3.14of EIA report. The existing parking arrangements are
sufficient for the proposed project.
S. No. Type of Vehicle Existing
Vehicles Existing PCU
Proposed
Vehicles
Proposed
PCU
Total Vehicles after
project
implementation
PCU factors
IRC (SP 41)
Total PCU after
project
implementation
1. Motor cycles or Scooters
etc. 325 243.75 19 14.25 344 0.75 258
2. Three Wheelers/Auto
Rickshaw 112 224 3 3.6 115 2.0 227.6
3. Four Wheelers/Cars 120 120 6 6 126 1.0 126
4. Truck/Bus 340 1258 25 92.5 365 3.7 1350.5
5. Agricultural Tractor 3 12 0 0 3 4.0 12
6. Light commercial vehicle 62 86.8 2 2.8 64 1.4 89.6
Total 958 1944.55 55 119.15 1013 12.85 2063.7
Traffic Volume after Implementation of the Project
For the Road Volume of Volume (V) Capacity (C) V/C LOS Category* Traffic Classification

80
Traffic Ratio
Existing 958 1944.55 3600 0.54 “B” Stable Traffic Flow
After implementation 1013 2063.7 3600 0.57 “B” Stable Traffic Flow
*LOS categories are A-Free Flow, B- Stable Traffic Flow, C- Restricted Flow, D- High Density flow, E- Unstable flow, F- Forced or breakdown flow
Due to proposed project there will be slight increment in the vehicle movement but the level of service (LOS) anticipated will be Stable Traffic flow.
x. Detailed description of flora
and fauna (terrestrial and
aquatic) existing in the
study area shall be given
with special reference to
rare, endemic and
endangered species. If
ScheduleI fauna are found
within the study area, a
Wildlife Conservation Plan
shall be prepared and
furnished.
Flora and Fauna study is carried out found within the 10 km radius study area and the details are provided in Chapter 3, Section 3.12 of EIA report.
a. Flora
The IUCN status of the List of plant species found in each quadrant is Least Concern.
b. Fauna
The IUCN status of the List of fauna species found in each quadrat is Least Concern.
xi. Socio-economic status of
the study area
Socio-economic status of the study area
The average literacy rate of the study area is 75 %.
Summary of Socio-economic indicators within the study area are shown below
S. No. Indicator Percentage (%)
1. People below age 18 38
2. People age limit above 18 62
3. Literates 75
4. Illiterates 25
5. % of people employed in company 50
6. % of people self employed 43
7. % of people seasonally employed 3
8. % of people unemployed 4
9. % of houses covered with LPG Cooking gas 80
10. % of houses covered with toilet facility 70
11. % of houses covered with piped water supply 60
7. Impact and Environmental Management Plan
i. Assessment of ground level
concentration of pollutants
from the stack emission
based on site-specific
meteorological features. In
case the project is located
The ground level concentration of pollutants (PM10, SO2, NOx & CO) using AERMOD software were assessed and presented in Chapter 4 Section 4.2.1 of EIA
report.
AERMOD Software Version 8.0.5 was used for air dispersion modeling and is applicable to a wide range of buoyant or neutrally buoyant emissions up to a range of
10 km. The air quality contours shall be plotted on a location map showing the location of the project site are shown in GLCs for proposed is given in Chapter 4
Section 4.2.1 of EIA report
Total Maximum GLCs from the Stack Emissions including transportation

81
on a hilly terrain, the AQIP
Modelling shall be done
using inputs of the specific
terrain characteristics for
determining the potential
impacts of the project on
the AAQ. Cumulative
impact of all sources of
emissions (including
transportation) on the AAQ
of the area shall be
assessed. Details of the
model used and the input
data used for modelling
shall also be provided. The
air quality contours shall be
plotted on a location map
showing the location of
project site, habitation
nearby, sensitive receptors,
if any.
Pollutant
Max. Base line
Concentration
(µg/m3)
Location of Max.
Baseline concentration
Estimated
Incremental
concentration
(µg/m3)
Total concentration
(µg/m3)
NAAQ standard
(µg/m3)
% Increase
PM 10 82 Tondiarpet 0.22 82.22 100 0.26
SOX 33 Tondiarpet 2.5 35.5 80 7.04
NOX 59 Project Site 7.74 66.74 80 11.5
CO 0.004 Site & 8 7.76 7.764 4000 99
ii. Water Quality modelling -
in case of discharge in
water body
The existing and proposed effluent/sewage disposal into deep sea is 2466 KLD and 105 KLD respectively along with that 16KLD of sewage will be reused for
green belt. On total, 2556 KLD will be discharged into deep sea and it is observed to be within the discharge approval limit of 8000 KLD as per the CRZ clearance
11-20/2009-IA.III dated 03.07.2009 and its amendment 11-20/2009-IA.III dated 03.06.2011 and within 2574 KLD as per Consent order issued by TNPCB which is
enclosed as Annexure – 2.
The Effluent discharge pipeline drawing is enclosed as Annexure – 15.
The Water Quality Modeling for the effluent discharged to deep sea from the Pipe line is enclosed as Annexure - 16. The CRZ Clearance for the same is enclosed
as Annexure - 10 and its latest compliance report is enclosed as Annexure - 14. NIOT has carried out MIA study in 2020 as part of NGT Joint – committee and
the report is enclosed as Annexure - 22.
iii. Impact of the transport of
the raw materials and end
products on the surrounding
environment shall be
assessed and provided. In
this regard, options for
transport of raw materials
and finished products and
wastes (large quantities) by
rail or rail-cum road
transport or conveyor cum-
rail transport shall be
Material Handling, Storage and Transportation
S. No. Raw Material Quantity Unit Source Mode of Transport
1. Propylene Oxide 44646 MTPA In-house, MPL-Plant – I, TPL
In-house distributed
through pipeline.
From other sources
through tankers.
2. R - LNG 33000 SCM/day IOCL LNG Terminal, Ennore Proposed pipeline of
IOCL
S. No. End product/By-product Quantity Unit Source Mode of Transport
1. Propylene Glycol 50000 MTPA End product Road

82
examined 2. Di-Propylene Glycol 6588 MTPA End By-product Road
3. Tri-Propylene Glycol 842 MTPA End By-product Road
Hazardous chemicals are stored in closed tanks with appropriate blanketing systems.
All transfers from tanks are being done through pumps in closed pipelines.
The loading of finished products to trucks and drums is done through automated filling systems with overflow protections.
All key raw materials are charged to the reactors through closed pipeline systems and ejector systems are used for solid handling.
iv. A note on treatment of
wastewater from different
plant operations, extent
recycled and reused
for different purposes shall
be included. Complete
scheme of effluent
treatment. Characteristics
of untreated and treated
effluent to meet the
prescribed standards of
discharge under E(P) Rules
a. Waste water Management
Description Existing (KLD) Proposed (KLD) After Expansion (KLD)
Effluent generation 2451 105 2556
ETP capacity 3600 - 3600
Sewage generation 15 1 16
STP capacity - 20 20
Reuse of Treated
Effluent
1. The treated water quantity of 16 KLD, generated from proposed STP will be reused in green belt
2. The total Source of water itself is the treated water from CMWSSB.
Existing
Total raw water requirement of the existing facility is 3247 KLD (Source- Treated Water from CMWSSB) .There is no fresh water used in the process. Approx.
2451 KLD of effluent and 15 KLD of Sewage is generated in the existing facility. On total, 2466 KLD is disposed to Deep Sea after treatment.
Proposed
Total raw water requirement of the proposed facility will be 810 KLD (Source- Tertiary Treated RO Water from CMWSSB). There will be no fresh water to be used
in the process. Approx. 105 KLD of effluent and 1 KLD of Sewage will be generated in the proposed facility. On total, 105 KLD will be disposed to Deep Sea after
treatment and 1KLD will be reused to green belt.
Total Sewage water will be treated in the STP and will be reused in green belt development.
b. Characteristics of untreated Effluent (Existing)
S. No. Parameter Unit Inlet to ETP - Results
1. BOD@20°C for 5 days mg/L 307
2. Calcium as Ca mg/L 14589
3. Chloride as Cl mg/L 25592
4. COD mg/L 1512
5. Fluoride as F mg/L 0.78
6. Hexavalent Chromium as Cr6+ mg/L BDL (DL 0.01)
7. Oil & Grease -- 8
8. pH@ 25°C mg/L 11.29
9. Phenolic compound (as C6H5OH) mg/L BDL (DL 0.1)
10. Phosphate as PO4 mg/L 5.79
11. Sulphate as SO4 mg/L 309.8
12. Sulphide as S mg/L 3.2
13. Total Chromium as Cr mg/L 0.063
14. Total Dissolved Solids @ 180°C mg/L 44504
15. Total Residual Chlorine mg/L BDL (DL 0.1)
16. Total suspended solids @ 105°C mg/L 81
c. Characteristics of Treated Effluent (Existing)

83
S. No. Characteristics Unit ETP outlet - Results Standard specification by
TNPCB
1. pH -- 6.32 5.5 - 9.0
2. Oil & Grease mg/L 8 20 Max.
3. BOD (5 days) @ 20 deg C mg/L 49 100 Max.
4. COD mg/L 236 250 Max.
5. Sulphate mg/L 206 1000 Max.
6. Chloride mg/L 26792 --
7. Total Suspended Solids mg/L 88 100 Max.
8. Total Dissolved Solids mg/L 43656 --
9. Total Residual Chlorine mg/L BDL (DL 0.1) 1 Max.
10. Phosphate mg/L 2.26 --
11. Calcium mg/L 14749 --
12. Total Chromium mg/L 0.069 2 Max.
13. Hexavalent Chromium mg/L BDL (DL 0.01) 1 Max.
14.
Phenolic compounds
mg/L BDL (DL 0.1) 5 Max.
d. Characteristics of Untreated Effluent to be generated from the proposed project (RO Rejects)
S. No. Characteristics Unit Expected result
1. pH -- 7.5 – 9.0
2. BOD (5 days) @ 20 deg C mg/L 5 - 25
3. COD mg/L 40 - 100
4. Chloride mg/L 6000
5. Total Dissolved Solids mg/L 15000
The effluent treatment scheme is given in Chapter 2, Section 2.21 of EIA report.
Wastewater treatment and disposal details are provided in the Chapter 10, Section 10.6.4 of EIA report.
v. Details of stack emission
and action plan for control
of emissions to meet
standards.
S. No. Proposed Stack
Details
Co-ordinates of Stack Stack Details Emission per Stack (g/s)
N E Type of
Fuel
Flue gas
Flow rate
(Nm3/h)
PM10 SO2 NOX CO
1.
Boiler – E
30 TPH (Common
stack for three
boilers)
13o9’12.16” 80
o16’15.97” R - LNG 24250
-
0.00367
0.856
0.513
Boiler - C 10 TPH with Economiser + Boiler - D 21 TPH with Economiser will be standby boiler for boiler-E with a common stack.
Total (g/s) - 0.00367 0.856 0.513
Note:
1. Furnace Oil will be replaced with R-LNG for existing boilers. R-LNG will be used as fuel for proposed 30TPH boiler and this leads to reduction in emission.
No process emissions are envisaged. Hence, no additional stack is proposed for the proposed expansion since the existing stack is found to be sufficient to
handle proposed emission. The existing FO will be replaced with LNG of 33000 SCM/Day after expansion.
2. There is no presence of ash in LNG. So the PM10 will be zero.
Details of action plan for control of emissions:
Usage of R-LNG as fuel instead of Furnace Oil in boiler after expansion
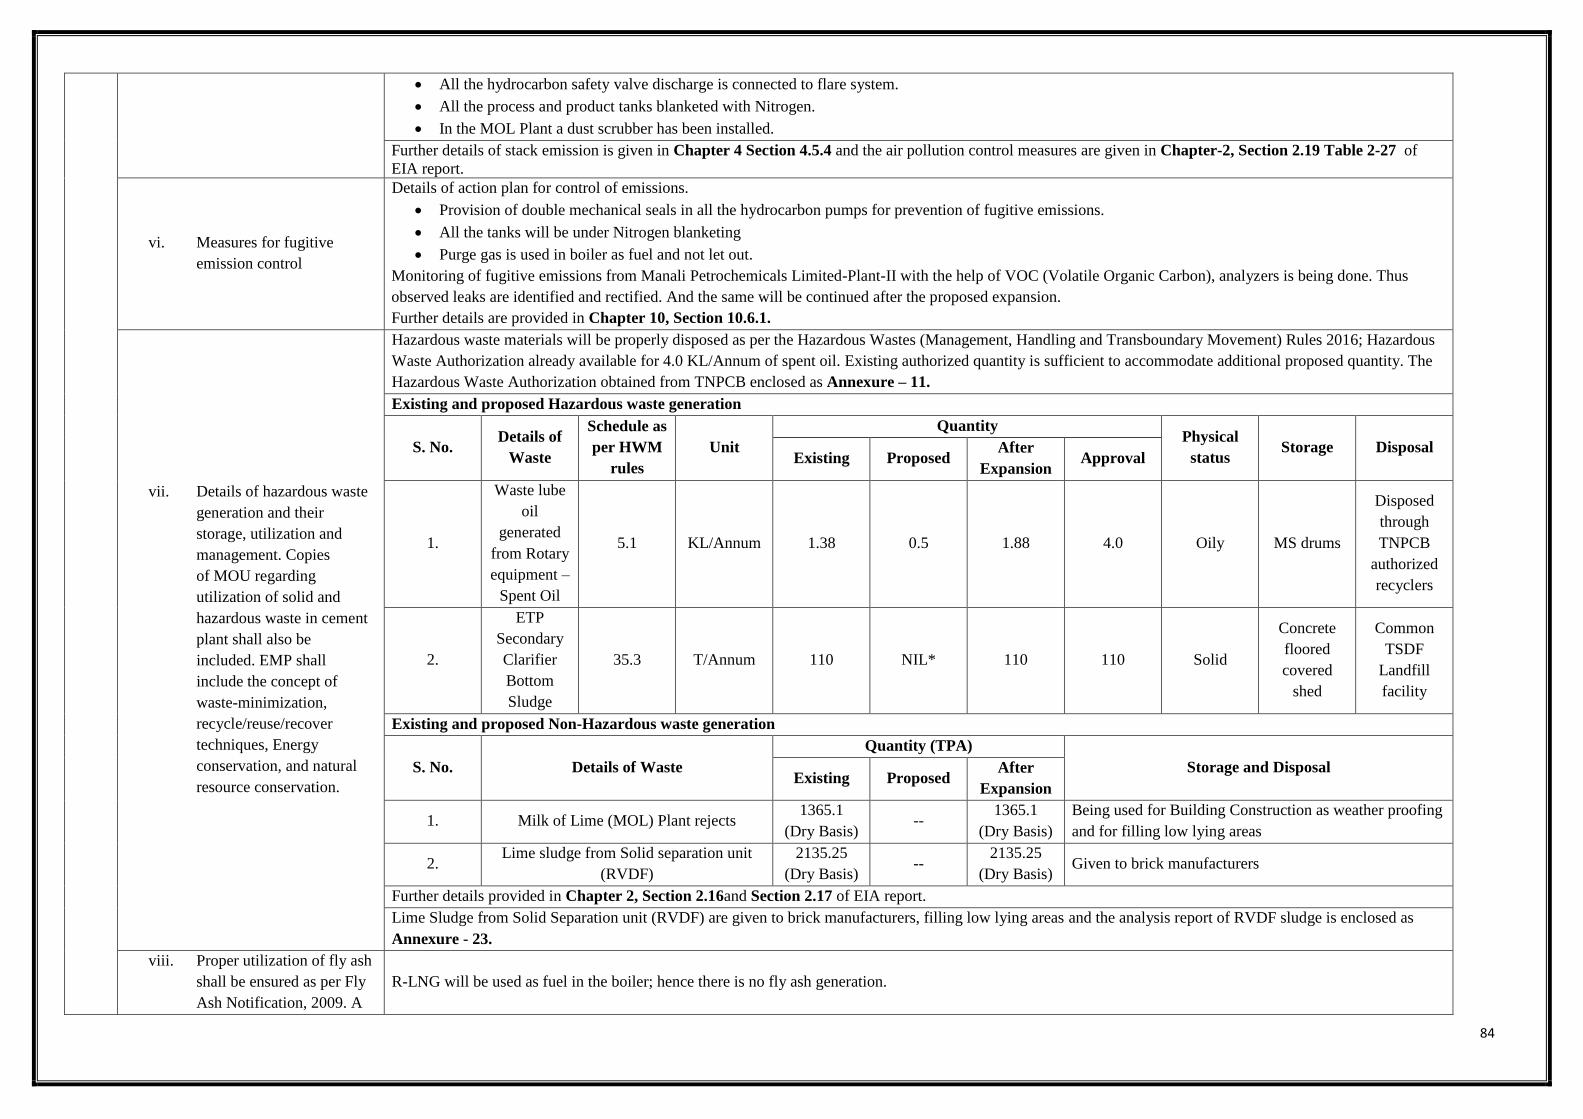
84
All the hydrocarbon safety valve discharge is connected to flare system.
All the process and product tanks blanketed with Nitrogen.
In the MOL Plant a dust scrubber has been installed.
Further details of stack emission is given in Chapter 4 Section 4.5.4 and the air pollution control measures are given in Chapter-2, Section 2.19 Table 2-27 of
EIA report.
vi. Measures for fugitive
emission control
Details of action plan for control of emissions.
Provision of double mechanical seals in all the hydrocarbon pumps for prevention of fugitive emissions.
All the tanks will be under Nitrogen blanketing
Purge gas is used in boiler as fuel and not let out.
Monitoring of fugitive emissions from Manali Petrochemicals Limited-Plant-II with the help of VOC (Volatile Organic Carbon), analyzers is being done. Thus
observed leaks are identified and rectified. And the same will be continued after the proposed expansion.
Further details are provided in Chapter 10, Section 10.6.1.
vii. Details of hazardous waste
generation and their
storage, utilization and
management. Copies
of MOU regarding
utilization of solid and
hazardous waste in cement
plant shall also be
included. EMP shall
include the concept of
waste-minimization,
recycle/reuse/recover
techniques, Energy
conservation, and natural
resource conservation.
Hazardous waste materials will be properly disposed as per the Hazardous Wastes (Management, Handling and Transboundary Movement) Rules 2016; Hazardous
Waste Authorization already available for 4.0 KL/Annum of spent oil. Existing authorized quantity is sufficient to accommodate additional proposed quantity. The
Hazardous Waste Authorization obtained from TNPCB enclosed as Annexure – 11.
Existing and proposed Hazardous waste generation
S. No. Details of
Waste
Schedule as
per HWM
rules
Unit
Quantity Physical
status Storage Disposal
Existing Proposed After
Expansion Approval
1.
Waste lube
oil
generated
from Rotary
equipment –
Spent Oil
5.1 KL/Annum 1.38 0.5 1.88 4.0 Oily MS drums
Disposed
through
TNPCB
authorized
recyclers
2.
ETP
Secondary
Clarifier
Bottom
Sludge
35.3 T/Annum 110 NIL* 110 110 Solid
Concrete
floored
covered
shed
Common
TSDF
Landfill
facility
Existing and proposed Non-Hazardous waste generation
S. No. Details of Waste
Quantity (TPA)
Storage and Disposal Existing Proposed
After
Expansion
1. Milk of Lime (MOL) Plant rejects 1365.1
(Dry Basis) --
1365.1
(Dry Basis)
Being used for Building Construction as weather proofing
and for filling low lying areas
2. Lime sludge from Solid separation unit
(RVDF)
2135.25
(Dry Basis) --
2135.25
(Dry Basis) Given to brick manufacturers
Further details provided in Chapter 2, Section 2.16and Section 2.17 of EIA report.
Lime Sludge from Solid Separation unit (RVDF) are given to brick manufacturers, filling low lying areas and the analysis report of RVDF sludge is enclosed as
Annexure - 23.
viii. Proper utilization of fly ash
shall be ensured as per Fly
Ash Notification, 2009. A
R-LNG will be used as fuel in the boiler; hence there is no fly ash generation.

85
detailed plan of action shall
be provided.
ix. Action plan for the green
belt development plan in 33
% area i.e. land with not
less than 1,500 trees per ha.
Giving details of species,
width of plantation,
planning schedule etc. shall
be included. The green belt
shall be around the project
boundary and a scheme for
greening of the roads used
for the project shall also be
incorporated.
Due to lesser area availability within the site for green belt development, permission was obtained from Greater Chennai Corporation (GCC) and Vilangadupakkam
Panchayat (Puzhal Union) for green belt development in their lands to an extent of 4.4322 hectares at 4 different locations nearby the project site and green belt
cover development completed and complied 40% green belt cover as per CEPI conditions. The breakup of green belt development given below.
S. No. Location Allocated area
(Hectares)
Green belt area
(Hectares)
Percentage of
Green belt (%) No. of Trees planted
1.
MPL – Plant – II
(within premises) –
Already completed
1.96 1.96 11.12 % 3100
2.
MPL – Plant – II
(within premises) –
Recently completed
0.8059 0.8059 4.57 % 1300
3.
Land allocated by
Vilangadupakkam
Panchayat,
Puzhal Union
6.07 3.5 19.85 % 5600
4.
V.C.N. Salai,
Vadaperumbakkam
(GCC allocated land)
0.4122 0.4122 2.33 % 660
5.
Thyagi Viswanathadoss
Nagar, SITE – 1
(GCC allocated land)
0.3028 0.3028 1.72 % 480
6.
Thyagi Viswanathadoss
Nagar,SITE – 2
(GCC allocated land)
0.2172 0.2172 1.23 % 350
TOTAL 7.1981 40.82 % 11490
The details of cost incurred for Green belt development in an area of 5.2381 hectares (29.70 %) to comply the Green belt cover as per CEPI condition is mentioned
in the Table below:
S. No. Description Details
1. Additional area of Green Belt (Ha.) developed to
comply Green belt cover as per CEPI condition
5.2381 hectares
(Additional green belt cover in MPL – Plant –II : 0.8059 hectares)
(Green belt cover in GCC allocated land : 0.9322 hectares)
(Green belt cover in land allocated by Vilangadupakkam Panchayat,
Puzhal Union : 3.5 hectares)
2. Additional Green belt cover in terms of Percentage
of total project site area (%)
29.70 %
(Additional green belt cover in MPL – Plant – II: 4.57 %)
(GCC allocated land: 5.28 %)
(Land allocated in Vilangadupakkam Panchayat, Puzhal Union: 19.85 %)
3. No. of Plants 8390
4. Funds Spent INR 22,65,300
Further details are given in Chapter 2, Section 2.18 of EIA report.
x. Action plan for rainwater
harvesting measures at
plant site shall be submitted
to harvest rainwater from
Around 103.3KL/hr of runoff harvested for 1 hr of rainfall. In Existing, the rainwater harvesting is collected by roof top method from Drumming shed and redirected
to rainwater harvesting pit to recharge the groundwater table. The same method will be adopted after expansion. Existing and Proposed Rainwater Harvesting
Layout is enclosed as Annexure - 24.

86
the roof tops and storm
water drains to recharge the
ground water and also to
use for the various activities
at the project site to
conserve fresh water and
reduce the water
requirement from other
sources
It is proposed to install 4 Nos. of RWH pits within the Plant – II site. The rain water collected from the roofs of respective buildings passed on to respective RWH
pits layered with sand, pebbles and gravel. In the pit, collected rain water percolates through this bed to the land beneath thus increasing and sustaining the ground
water level.
Further details are given in Chapter 10, Section 10.6.3.1 of EIA Report.
xi. Total capital cost and
recurring cost/annum for
environmental pollution
control measures
shall be included.
Existing EMP cost breakup utilized
S. No Equipment Recurring cost (lakhs)
1. Air Pollution Control INR 40 lakhs
2. Water Pollution Control INR 480 lakhs
3. Solid Waste Management INR 5 lakhs
4. Green Belt and Maintenance cost INR 7.00 lakhs
5. Occupational Health and Safety INR 84 lakhs
6. Environmental Monitoring & Management INR 8 lakhs
TOTAL INR 226.73 lakhs
Capital cost and Recurring cost /annum for environmental pollution control measures
S. No Equipment Capital cost (lakhs)
(Proposed)
Recurring cost (lakhs) per Annum
(After Expansion)
1 Air Pollution Control 1200 40
2 Water Pollution Control 204 540
3 Solid waste management 0 5
4 Storm Water and RWH Management 7 0
5 Occupational health and safety 0 84
6 Environmental monitoring and
management 0 8
TOTAL 1411 677
xii. Action plan for post-project
environmental monitoring
shall be submitted.
Action plan for post-project environmental monitoring
S. No. Particulars Frequency of monitoring Parameters of monitoring
1.
Air Pollution monitoring
Ambient air quality within the
premises Once in a month PM, SO2, NOX, NO2, CO, VOC
Ambient air quality within the
premises Once in a month All 12 parameters as given in NAAQS
Ambient air quality at 1 location in
Prevalent Down Wind Direction Once in a month All 12 parameters as given in NAAQS
Ambient air quality at 1 location in Up
Wind Direction Once in a month All 12 parameters as given in NAAQS
Stack monitoring Continuous SPM, SO2, NO2 ,CO, CO2 and O2
2. Noise monitoring
At two locations within the premises Once in a month Noise Levels in dB(A)

87
3. Soil quality monitoring
One location near Hazardous waste
storage area at site and one location
outside site
Once in a year Physicochemical properties, Nutrients,
Heavy metals as per IS 2720 (All Parts)
4. Effluent quality monitoring
Inlet and outlet of ETP
Twice a month for Inlet/Outlet of ETP.
Continuous monitoring of ETP outlet
for pH, Temperature, Flow, TSS, COD
& BOD.
pH, Temperature, TDS, TSS, Chloride,
Sulphide, Sulphate, fluoride, Phenolic
compounds, Oil and Grease, BOD,
COD, Total Residual Chlorine,
Calcium, Total Chromium, Hexavalent
Chromium, Phosphates. All the
Parameters are to be verified as per
CPCB
5. Workplace Monitoring
Noise – Once in a month VOC
Continuous
Lux levels – Once in a year
Noise, VOC, Lux
6. Marine Quality Monitoring Once in a year jointly with TPL & KPL
Temperature, Salinity, pH, TSS,
DO, BOD, Neutriants- Ammoniacal
Nitrogen, Nitrate Nitrogen, Nitrite
Nitrogen, Phosphate Phosphorous.
Petroleum hydrocarbon, Heavy
Metals- Ni, Co, Cu, Cd, Pb, Cr, Hg,
Fe, Mn and Zn. Along with the
Biological Oceanographic Status.
xiii. Onsite and Offsite Disaster
(natural and Man-made)
Preparedness and
Emergency Management
Plan including Risk
Assessment and damage
control. Disaster
management plan should be
linked with District Disaster
Management Plan.
The Risk Assessment has been carried out by using the PHAST software. Risk Assessment report and is attached as Annexure - 25.
On-site emergency preparedness plan which is prepared in accordance with Manufacture Storage, Import of Hazardous Chemicals (MSIHC) rules enclosed as
Annexure - 26. In case of declaration of Offsite emergency, information will be given to Sathangadu Village Police Station.
Offsite emergency preparedness plan to be prepared by the concerned authority. During Offsite emergency, the instructions laid out by the District Collector will be
followed.
\8. Occupational health
i. Plan and fund allocation to
ensure the occupational
health & safety of all
contract and casual
workers
All the occupational health related expenditure of casual & contract workers incorporated in the scope of contractor and compliance to the statutory rules in this
regard is ensured. Approximate cost for OHC checkup is Rs.1075 per person.
Spent money towards OHS for the last month is INR 1,49,340/-
For all the employees of Manali Petrochemicals Limited-Plant-II OHC checkup is carried out under composite contract with the Anand hospitals.
For M/s MPL-Plant-II, Safety, Health and Environment Policy (SHE) provided in Chapter 10, Section 10.7.1, Figure 10-10 and Figure 10-11 of EIA report.
ii. Details of exposure specific
health status evaluation of
worker. If the workers'
health is being evaluated by
pre designed format, chest x
rays, Audiometry,
The specific health status evaluation of worker carried out and medical report and Form -17 records enclosed as Annexure – 27.

88
Spirometry, Vision testing
(Far & Near vision, colour
vision and any other ocular
defect) ECG, during pre-
placement and periodical
examinations give the
details of the same. Details
regarding last month
analyzed data of above
mentioned parameters as
per age, sex, duration of
exposure and department
wise.
iii. Details of existing
Occupational & Safety
Hazards. What are the
exposure levels of hazards
and whether they are within
Permissible Exposure level
(PEL). If these are not
within PEL, what measures
the company has adopted to
keep them within PEL so
that health of the workers
can be preserved
Main Hazards identified within the petrochemical complex are
1.Fire Hazard
2.Electrical Hazards
3.Thermal Hazard
4.Occupational Hazards etc.,
The unit has multi gas / toxic gas and oxygen detectors that can be used to check oxygen, LEL of Propylene Oxide, Propylene & Ethylene Oxide, VOC
concentration in atmosphere and also in confined spaces like inside the reactor, overhead tanks.
The unit has provision of Hydro Carbon Sensors (HCS) for measuring concentrations of Propylene, Propylene Oxide, Ethylene
Oxide in the atmosphere and Chlorine sensor for measuring concentration of chlorine in the atmosphere. The unit also has VOC monitoring stations at
specific locations.
All these sensors will provide the alarm once the threshold limit crossed. The list of LEL detectors installed in MPL-Plant-II is listed in Table 10-5. The
threshold limit for all hydrocarbons in Manali Petrochemicals Limited-Plant-II is given below.
LEL for Propylene : 2% v/v
LEL for Propylene Oxide : 1.7% v/v
LEL for Ethylene Oxide : 3% v/v
LEL Detectors installed at Manali Petrochemicals Limited-Plant-II
S. No. TAG No. PLANT LOCATION
1. AIK101 PO K101 SUCTION (G.FLOOR)
2. AIC105 PO PO STRIPPER PUMP(G.FLOOR)
3. AI1105 PO GC ROOM (G.FLOOR)
4. AIE116 PO E116 (G.FLOOR)
5.
AI1403 PO NEAR C1402 (G.FLOOR - NEAR
PC1403A/B)
6. AI1501 PO NEAR FL1501/2/3 (2ND FLOOR-
FILTER TOP)
7. AI2101 PG NEAR MX2101 (G.FLOOR)
8. AI3102 POLYOL-TI NEAR SA3102 REACTOR TOP
(2ND FLOOR)
9. AI3105 POLYOL-TI NEAR PC3101 (G. FLOOR)
10. AI7101 PRH STR NEAR X7101

89
11. AI7301 EO STR NEAR SR7301
12. AI7302 EO STR NEAR PC 7301 A/B
13. AI7401 PO STR NEAR PO DAY TANK PUMPS
14. AI7402 PO STR NEAR PO STORAGE PUMPS
15. AIP621 POLYOL TII P621 (G. FLOOR)
16. AIFCV202 POLYOL TII EO/PO FCV (2ND FLOOR)
17. AIX214 POLYOL TII EO/PO BLOCK VALVE (3RD FLOOR)
18. AIA621 POLYOL TII A621 (3RD FLOOR)
iv. Annual report of health
status of workers with
special reference to
Occupational Health and
Safety.
Periodic medical examination is the same as the pre-employment screening and may be modified according to current conditions, such as changes in the employee's
symptoms, site hazards or exposures. Medical reports of few Employees of MPL are attached as Annexure – 27.
9. Corporate Environment Policy
i. Does the company have a well
laid down Environment Policy
approved by its Board of
Directors? If so, it may be
detailed in the EIA report.
Yes, the company have a well laid down Environmental Policy approved by its Board of Directors.
Environment Policy provided in Chapter 10, Section 10.9 of EIA report
ii. Does the Environment Policy
prescribe for standard operating
process / procedures to bring
into focus any infringement /
deviation / violation of the
environmental or forest norms /
conditions? If so, it may be
detailed in the EIA.
Yes, A dedicated Environmental Management Cell (EMC) is already in force to bring into focus of any infringement/ deviation/ violation of the environment.
Further details are provided in Chapter 10 and Section 10.8 of EIA report
iii. What is the hierarchical system
or Administrative order of the
company to deal with the
environmental issues and for
ensuring compliance with the
environmental clearance
conditions? Details of this
system may be given.
Hierarchical system or Administrative order of the company to deal with the environmental issues and for ensuring compliance is provided in
Chapter 10, section 10.3 of EIA report.
iv. Does the company have system
of reporting of non
compliances / violations of
environmental norms to the
Board of Directors of the
company and / or shareholders
or stakeholders at large? This
reporting mechanism shall be
detailed in the EIA report
The details regarding System of reporting of non-compliances/ violations of environmental norms & the Board Hierarchical system or Administrative order of the
company to deal with the environmental issues and for ensuring compliance is provided in Chapter 10, Section 10.3 of EIA report.
The existing reporting mechanism is given below:
The information is captured in the periodical compliance report of the Operations Head
Based on the above, the information is furnished to the Board in the report under Section 205 of the Companies Act, 2013
The subject is also discussed in detail by the Risk Management Committee and reported to the Board. The latest periodical compliance report of the
Operations Head is enclosed as Annexure – 28.

90
10. Details regarding infrastructure
facilities such as sanitation, fuel,
restroom etc. to be provided to the
labour force during construction as
well as to the casual workers including
truck drivers during
operation phase.
The site layout indicating all the facilities is enclosed as Annexure - 6.
Infrastructure facilities such as sanitation, restroom etc. will be provided to the labour force during construction as well as to the casual workers including truck
drivers during operation phase.
During construction phase, 3 Nos. of Toilets and 3 Nos. of Urinals will be provided.
In Operational phase there is no major increase in manpower and hence available sanitation facilities are sufficient.
11. Enterprise Social Commitment (ESC)
i. Adequate funds (at least 2.5
% of the project cost) shall
be earmarked towards the
Enterprise Social
Commitment based on
Public Hearing issues and
item-wise details along with
time bound action plan
shall be included. Socio-
economic development
activities need to be
elaborated upon.
Since, M/s MPL-Plant-II is present in Manali Industrial area, Public hearing is exempted under the provisions as per para 7 III stage (3) (b) of the EIA notification,
2006. CSR fund allotment : INR 162.87 lakhs (2% of Avg. net profit for FY 2020-21)
a) Fund allotted and utilized for development of Drinking water and Sanitation facilities in nearby schools in FY 2020-21: INR 92.79 lakhs
Government Primary School, Manali
Government Primary School, Mathur
Jai Gopal Garodia Higher Secondary School, Manali New Town
Government High School, Mathur
Jai Gopal Garodia Higher Secondary School, Manali
Government boys Higher secondary School, Ponneri
Government Primary School, Old Napalayam
Jai Gopal Garodia Higher Secondary School, Tiruvotriyur
Government Higher Secondary School, Kattivakkam, Ennore
Government High School, Chinna Sekkadu, Manali
Government Adi Dravidar Girls Higher Secondary School, Vadagarai
Primary Union Middle School, Sadayankuppam, Chennai 103
Panchayat Union Elementary School, Andal Kuppam, Chennai – 103
Panchayat Union Primary School, New Napalayam, Chennai 103
Govt (adw) Middle school, Vilangadu Pakkam, Chennai 52
Panchayat Union Primary School, Periyamullaivoyal
Government Higher Secondary School, Thiruvellaivoyal
Government High School, Subbareddypalayam
Government Girls Higher Secondary School, Sholavaram
b) Fund allotted and utilized for development of Primary Health Center in nearby community in FY 2020-21 : INR 9 lakhs
Primary Health Center, Kalaingar Nagar, Tiruvottiyur
c) Fund allotted and utilized for development of individual house latrines in nearby community in FY 2020-21: INR 0.95 lakhs.
d) About INR 60.13 lakhs remain unspent due to prevailed COVID situations and the same transferred to Unspent CSR
Account for the project as per Section 135(6)
12. Any litigation pending against the
project and/or any direction/order
passed by any Court of Law
against the project, if so, details thereof
shall also be included. Has the unit
received any notice
under the Section 5 of Environment
a) Name of the Sub-court: NGT(SZ)
b) Case No.1: O.A. No. 19/2013(SZ), 248/2016(SZ) - Disposed
Case No.2: O.A. No. 256/2020(SZ)- In Progress
With regards to NGT case O.A. No. 19/2013 (SZ), 248/2016 (SZ), NGT pronounced the verdict on 22-03-2022 and the copy of judgment order enclosed as
Annexure-42. NGT appointed Joint Committee report submitted by Mr. S. Suresh, Regional Director, CPCB is enclosed as Annexure – 29. The compliance status
report for the judgment directions and for the Joint Committee recommendations enclosed as Annexure – 30.

91
(Protection) Act, 1986 or relevant
Sections of Air and Water
Acts? If so, details thereof and
compliance/ATR to the notice(s) and
present status of the case.
With regards to NGT case OA No. 256/2020, last hearing was held on 26th August, 2021 and the next hearing scheduled on 13th April, 2022. Inspection was
carried out by NGT appointed committee during February 2021. MPL has filed counter affidavit stating NO EXCEEDANCE and requested Hon’ble NGT to
discharge them from the case during July 2021.
The following directions issued by TNPCB based on NGT orders pertaining to O.A.No. 1038/2018 and O.A.No. 681/2018:
1) Direction received from TNPCB regarding levy of Rs. 100 lacs fine based on NGT order, O.A.No. 1038/2018 for non-
compliance - Stay order given by Hon’ble Supreme Court viz., Civil Appeal Diary No. 19271/2020 enclosed as Annexure – 31.
2) Direction from TNPCB on Retrofitting of Emission Control Device based on NGT order, O.A.No. 681/2018 - Purchase order
placed for procurement of DG Set Retrofit, for Emission Control and the same enclosed as Annexure – 32.
13. A tabular chart with index for point
wise compliance of above TOR
Point wise ToR compliance is provided in Chapter 1 & Section 1.8 of EIA report.
B. SPECIFIC TERMS OF REFERENCEFOREIASTUDIES FOR SYNTHETIC ORGANIC CHEMICALS INDUSTRY (DYES & DYE INTERMEDIATES; BULK DRUGS AND INTERMEDIATES
EXCLUDING DRUG FORMULATIONS; SYNTHETIC RUBBERS; BASIC ORGANIC CHEMICALS, OTHER SYNTHETIC ORGANIC CHEMICALS AND CHEMICAL INTERMEDIATES)
1. Details on solvents to be used ,
measures for solvent recovery and for
emissions control
No solvents are used in the process of manufacturing.
2. Details of process emissions from the
proposed unit and its arrangement to
control
No process emissions from existing and proposed unit.
3. Ambient air quality data should
include VOC, other process-specific
pollutants* like NH3*, chlorine*,
HCl*, HBr*, H2S*, HF*,etc.,(*-as
applicable)
AAQ data (except monsoon) at 8 locations for PM10, PM2.5, SO2, NOX, CO, Pb, O3,include VOC components Benzene (C6H6 ), Benzo (a) Pyrene(C20H12(a)),
Arsenic (As) , Nickel as Ni , Ammonia(NH3 ) parameters relevant to the project are collected. The monitoring stations are identified based on CPCB guidelines and
the pre-dominant wind direction, population zone, sensitive receptors including reserved forests are considered for monitoring. The baseline air quality of the study
area, Eight (08) monitoring locations have been identified as per Indian Meteorological data. Baseline monitoring was conducted during study period End of
December 2021 – End of March 2022.
The nearest CPCB AAQ monitoring station is Manali-Chennai and TNPCB AAQ monitoring station is Manali-Village in which the average value of two station
during the study period is: PM10 (45 µg/m³), PM2.5 (29.53 µg/m³), SO2(7.37 µg/m³), NO2(20 µg/m³) and CO (1.06 mg/m³).
AAQ monitoring locations detail are provided in the Chapter 3, Section 3.9.1.1 and monitoring results are provided in the Section 3.9.1.2 of EIA report.
The minimum and maximum baseline levels of PM10 (32 – 82 µg/m³), PM2.5 (15 – 38 µg/m³), SO2 (5 –33µg/m³), NO2(17 – 59 µg/m³), CO (1.2-4 mg/m³).
The nearest CPCB AAQ monitoring station is Manali-Chennai and TNPCB AAQ monitoring station is Manali-Village in which the average value of two station
during the study period is: PM10 (45 µg/m³), PM2.5 (29.53 µg/m³), SO2(7.37 µg/m³), NO2(20 µg/m³) and CO (1.06 mg/m³).
4. Work zone monitoring arrangements
for hazardous chemicals
Work zone monitoring arrangements
The unit have multi gas / toxic gas and oxygen detectors to check oxygen, LEL of Propylene Oxide, Propylene & Ethylene Oxide, VOC concentration in
atmosphere and also in confined spaces like inside the reactor, overhead tanks.
The unit has provision of Hydrocarbon Sensors (HCS) for measuring concentrations of Propylene, Propylene Oxide, Ethylene Oxide in the atmosphere and
Chlorine sensor for measuring concentration of chlorine in the atmosphere. The unit also has VOC monitoring stations at specific locations.
All these sensors will provide the alarm once the threshold limit crossed. The list of LEL detectors installed in MPL-Plant- II is listed in Table 10-5. The
threshold limit for all hydrocarbons in Manali Petrochemicals Limited-Plant-II is given below.
- LEL for Propylene : 2% v/v
- LEL for Propylene Oxide : 1.7% v/v

92
- LEL for Ethylene Oxide : 3% v/v
LEL Detectors installed at Manali Petrochemicals Limited-Plant-II
S. No. TAG No. PLANT LOCATION
1. AIK101 PO K101 SUCTION (G.FLOOR)
2. AIC105 PO PO STRIPPER PUMP(G.FLOOR)
3. AI1105 PO GC ROOM (G.FLOOR)
4. AIE116 PO E116 (G.FLOOR)
5.
AI1403 PO NEAR C1402 (G.FLOOR - NEAR
PC1403A/B)
6. AI1501 PO NEAR FL1501/2/3 (2ND FLOOR-
FILTER TOP)
7. AI2101 PG NEAR MX2101 (G.FLOOR)
8. AI3102 POLYOL-TI NEAR SA3102 REACTOR TOP
(2ND FLOOR)
9. AI3105 POLYOL-TI NEAR PC3101 (G. FLOOR)
10. AI7101 PRH STR NEAR X7101
11. AI7301 EO STR NEAR SR7301
12. AI7302 EO STR NEAR PC 7301 A/B
13. AI7401 PO STR NEAR PO DAY TANK PUMPS
14. AI7402 PO STR NEAR PO STORAGE PUMPS
15. AIP621 POLYOL TII P621 (G. FLOOR)
16. AIFCV202 POLYOL TII EO/PO FCV (2ND FLOOR)
17. AIX214 POLYOL TII EO/PO BLOCK VALVE (3RD FLOOR)
18. AIA621 POLYOL TII A621 (3RD FLOOR)
Further details of Work Zone Monitoring are given in Chapter 10 Section 10.7.2 of EIA report.
5. Detailed effluent treatment scheme
including segregation of effluent
streams for units adopting
'Zero' liquid discharge.
Unit Liquid waste (KLD)
Disposal Method Facility Details Existing Additional After Expansion
Sewage 15 1 16
Existing: Disposed in
Deep sea after treatment
in ETP
Proposed: Reused to
greenbelt
Combined with Plant
Effluent and treated in
ETP.
STP of capacity 20 KLD
will be installed.
Effluent 2451 105 2556
Existing: Disposed in
Deep sea after treatment
in ETP
Proposed: Disposed in
ETP of capacity
3600 KLD

93
Deep sea after treatment
in ETP
The existing ETP facility is given in Chapter 2 Section 2.7.3 of EIA report.
Zero liquid discharge is not proposed for the project. Treated effluent will be discharged in sea through pipelines as per the CRZ Clearance approval for 8 MLD
which is enclosed as Annexure – 10.
6. Action plan for odour control to be
submitted.
All the storage tanks present in Manali Petrochemicals Limited-Plant-II are provided with Inert Gas (Nitrogen) blanketing system and any vents from PVRV or PSV
of a storage tank contains only inert gas and no process vapours. Hence no process odours envisaged.
7. A copy of the Memorandum of
Understanding signed with cement
manufacturers indicating clearly
that they co-process organic
solid/hazardous waste generated.
No MoU has been signed with cement manufacturers as organic solid waste generated are disposed to municipal bins and the hazardous waste generated are
disposed through TNPCB authorized recyclers/disposed to TSDF land fill facility.
In addition, Non-hazardous waste generated are given to brick manufacturers/filling low lying areas.
8. Authorization/Membership for the
disposal of liquid effluent in CETP and
solid/hazardous waste in
TSDF, if any.
The agreement with the authorized Hazardous waste recyclers/TSDF for the disposal of Spent Oil and ETP Sludge is enclosed as Annexure - 17 & Annexure - 18
respectively.
Treated effluent being discharges into sea through pipelines as per the CRZ Clearence approval for 8MLD which is enclosed as Annexure – 10.
Waste Lube Oil generated from Rotary Equipment – Spent Oil is Disposed through TNPCB authorized recyclers.
ETP Sludge disposed to common TSDF as landfill.
Hazardous Waste Authorization obtained from TNPCB enclosed as Annexure – 11
9. Action plan for utilization of
MEE/dryers salts.
MEE/dryers salts are not proposed for this project.
10. Material Safety Data Sheet for all the
Chemicals are being used/will be used
Material Safety Data Sheets is enclosed as Annexure – 33
11. Authorization/Membership for the
disposal of solid/hazardous waste in
TSDF
The agreement with the TSDF is enclosed as Annexure - 18
12. Details of incinerator if to be installed. The Membership for disposal of ETP Sludge in TSDF is enclosed as Annexure - 34
13. Risk assessment for storage and
handling of hazardous
chemicals/solvents. Action plan for
handling & safety system to be
incorporated.
i. Risk assessment for storage and handling of hazardous chemicals/solvents
The Risk Assessment has been carried out by using the PHAST software. Risk Assessment report is attached as Annexure – 25.
1. ETHYLENE OXIDE:
Safe Handling:
Emergency eye wash fountains and safety showers are available in the immediate vicinity of any potential exposure.
Keep away from heat, hot surfaces, sparks, open flames and other ignition sources.
No smoking. Use only non-sparking tools. Use only explosion-proof equipment.
Wear leather safety gloves and safety shoes when handling cylinders.
Protect cylinders from physical damage; do not drag, roll, slide or drop.
When moving cylinders, even for short distances, use a cart (trolley, hand truck, etc.) especially designed to transport cylinders.
Never insert an object (E.g., wrench, screwdriver, pry bar) into cap openings; doing so may damage the valve and cause a leak.
Use an adjustable strap wrench to remove over-tight or rusted caps.
Slowly open the valve.
If the valve is hard to open, discontinue use and contact your supplier.
Close the container valve after each use; keep closed even when empty.
Never apply flame or localized heat directly to any part of the container.
High temperatures may damage the container and could cause the pressure relief device to fail prematurely, venting the container contents.
Safe Storage Practices:
Because of the potential for violent decomposition, containers of ethylene oxide are properly blanketed with an inert gas and given extraordinary protection
against fire exposure.

94
Store only where temperature will not exceed 125°F (52°C). Post “No Smoking/No Open Flames” signs in storage and use areas. There must be no sources
of ignition.
Separate packages and protect against potential fire and explosion damage.
Always secure containers upright to keep them from falling or being knocked over.
Install valve protection cap, if provided, firmly in place by hand when the container is not in use.
Store full and empty containers separately.
Use a first-in, first-out inventory system to prevent storing full containers for long periods.
All equipment in storage areas are explosion-proof.
To avoid ignition of vapours by static discharge, all metal parts and equipment are grounded.
2. PROPYLENE OXIDE:
Safe Handling:
Ensure good ventilation/exhaustion at the workplace.
Open and handle receptacle with care.
Keep ignition sources away.
Do not smoke.
Protect against electrostatic charges.
Keep respiratory protective device available.
Safe Storage Practices:
Keep receptacle tightly sealed.
Do not gas tight seal receptacle.
Store in cool, dry conditions in well-sealed receptacles.
Protect from heat and direct sunlight.
3. LIQUID CHLORINE:
Safe Handling:
Do not get in eyes or on skin or clothing.
Use only with adequate ventilation.
Wear appropriate respirator when ventilation is inadequate.
Do not puncture or incinerate container.
Close valve after each use and when empty.
Protect cylinders from physical damage; do not drag, roll, slide, or drop.
Use a suitable EOT crane for cylinder movement.
Avoid release to the environment.
Keep away from clothing, incompatible materials and combustible materials.
Do not breathe gas.
Keep valves free from grease and oil.
Eating, drinking and smoking should be prohibited in areas where this material is handled, stored and processed.
Workers should wash hands and face before eating, drinking and smoking.
Remove contaminated clothing and protective equipment before entering eating areas.
Safe Storage Practices:
Store in accordance with local regulations.
Store in a segregated and approved area.
Store away from direct sunlight in a dry, cool and well-ventilated area, away from incompatible materials.
Keep container tightly closed and sealed until ready for use.
4. PROPYLENE:
Safe Handling:
Keep away from heat, hot surfaces, sparks, open flames and other ignition sources.
No smoking. Use only non-sparking tools. Use only explosion-proof equipment.
Never apply flame or localized heat directly to any part of the container.
High temperatures may damage the container and could cause the pressure relief device to fail prematurely, venting the container contents.

95
Safe Storage Practices:
Post “No Smoking/No Open Flames” signs in storage and use areas. There must be no sources of ignition.
Protect against potential fire and/or explosion damage by following appropriate codes and requirements.
ii. Action Plan for safety measures & Handling Chemicals in the plant are as follows (which are already in place and will be continued after expansion):
1. Digital Level Gauge and Level Indicator with alarm are provided for High level (85% of Tank) to avoid overflow.
2. Sprinklers are provided around the storage tanks.
3. All safety and emergency inter-locks are in place and checked before commencing operation.
4. Adequate Hydrocarbon and VOC detectors are installed on downwind direction based on the predominant wind direction
5. LDAR (Leak Detection and Repair) protocol being followed and recorded on regular basis.
6. Sufficient Foam and fire water quantity are maintained assuming double contingency scenario.
7. Flame proof electrical fittings are provided based on HAC (Hazardous Area Classification).
8. Operator training and retraining should be a continuous effort and Mock Drills should be carried out regularly on identified scenarios.
9. WPS (Work Permit System) is strictly enforced.
10. Hoses are inspected and tested once in every three months for the recommended test pressure.
11. Static protection and integrity of explosion proof equipment should be ensured through regular inspection. Every electrical equipment and lighting features
should meet explosion proof requirement, in classified area.
12. Smoking and carrying smoking material are strictly prohibited.
13. Earth link may be connected to pump circuit to ensure start up only after providing tank earth - connection.
14. Safety Procedures & Do’s and Don’ts should be prepared and displayed in handling and storage area.
15. Periodic inspection of Pipelines and painting to be done to avoid corrosion and subsequent leak.
16. The Plant commissioning has an important role to ensure long term safety. Proper cleaning and flushing of the system are ensured in storage area and fire
hydrant system.
17. The Environment team are trained on industrial hygiene and sampling /testing techniques.
14. Arrangements for ensuring health and
safety of workers engaged in handling
of toxic materials.
The unit have multi gas / toxic gas and oxygen detectors in that multi gas detector can be used to check oxygen, LEL of Propylene Oxide, Propylene & Ethylene
Oxide, VOC concentration in atmosphere and also in confined spaces like inside the reactor, overhead tanks.
The List of PPE’s used in the plant while handling toxic substance are listed below
1. Self contained Air Breathing apparatus
2. On line Air Mask
3. Gloves:
a) Cotton
b) Leather
c) Asbestos
d) PVC Gloves
e) Surgical Gloves
f) Electrical Gloves
g) Dust Mask
h) Organic vapor mask
4. Safety Shoes
5. Safety Helmets
6. Safety Goggles –various types
7. Welding Shield
8. Welding Goggles
9. Gum Boot
10. Ear muff
11. Ear Plugs
12. PVC Suits
13. Cotton over coat

96
14. Asbestos suit.
15. Safety belt.
16. Fire soot
17. Toxic material handling soot
Further details of Occupation health and safety measures are given in Chapter 10, Section 10.7 of EIA report.

97

98
2 PROJECT DESCRIPTION
2.1 Project Description
Manali Petrochemicals Limited (MPL) is a leader in the production and marketing of Propylene
Oxide (PO), Propylene Glycol (PG) and Polyols in India
It operates two production facilities (Plant-I and Plant-II) at Manali, near Chennai. Plant-II is
situated at the Manali Industrial Area, Chennai, (adjacent to Balmer Lawrie & Co Ltd)., having
an installed capacity of 18,000 MTPA of PO, 12,000 MTPA of PG and 22,705 MTPA of
Polyol.
Propylene Glycol (PG) is essentially used as a solvent in the pharmaceutical industry for oral,
injectable and topical formulations, and further in food, fragrance and other industrial
applications. Specifically, it is used to make Unsaturated Polyester Resins (UPRs), deicing and
antifreeze fluids, food industry coolants, non-ionic detergents, plasticizers and hydraulic brake
fluids. It is an excellent solvent and extractant, and can be used as a humectant as well in
sanitizers. Propylene Glycol (PG) is the main product, and Di-Propylene Glycol (DPG) and
Tri-Propylene Glycol (TPG) are the by-products.
Manali Industrial area attracts CEPI score of 84.15. The CEPI Compliance statement is enclosed
as Annexure - 36.
2.2 Type of Project
M/s Manali Petrochemicals Plant-II proposes “Expansion of Propylene Glycol Plant by 50000
MTPA”. The Project is considered under Schedule 5 (f) - “Synthetic organic chemicals industry
(dyes & dye intermediates; bulk drugs and intermediates excluding drug formulations; synthetic
rubbers; basic organic chemicals, other synthetic organic chemicals and chemical intermediates)” as
per EIA Notification 2006 and its Amendments- but due to applicability of general condition
(Critically Polluted areas as identified by the Central Pollution Control Board from time to time),
appraisal will be done at central as Category A project.
2.3 Need of the project
Manali Petrochemicals Limited being the only domestic manufacturer of Propylene Glycol currently
meeting around 20-25% of domestic demand. With the emphasis on Make in India, MPL would like
to increase its capacity to meet about 70-75 % of the market demand.

99
The market of Propylene Glycol in India is having a growth rate of 6%. Propylene glycols are the
key ingredient material for manufacturing of Pharmaceuticals products, food products and cosmetics.
Hence, the project to expand the Propylene glycol capacity by 50000 MTPA is financially viable and
will reduce India’s dependence on imports.
2.4 Site Location
The existing complex is located at Manali Industrial Area, Thiruvallur District, Tamil Nadu State.
The site is located within the Greater Chennai Corporation. Index map of the project site is given in
Figure 2.2. Base map showing area within, 10 km (Figure 2.5), 5km (Figure 2.4) and 1 km (Figure
2.3) around study region. Geographical coordinates of the project site given below in Figure 2.1 and
the co-ordinates listed in Table 2.1.

100
Figure 2-1 Geographical coordinates of the project site

101
Table 2-1 Coordinates of the Project Site
MPL – PLANT - II
S.No. Latitude Longitude
1 13° 9' 13.7988'' N 80° 16' 14.4588'' E
2 13° 9' 13.3596'' N 80° 16' 19.7688'' E
3 13° 9' 15.21'' N 80° 16' 25.5792'' E
4 13° 9' 14.9904'' N 80° 16' 27.0084'' E
5 13° 9' 1.0188'' N 80° 16' 26.2812'' E
6 13° 8' 57.75'' N 80° 16' 14.6316'' E
7 13° 9' 12.3984'' N 80° 16' 14.3904'' E
Proposed expansion within Site
S.No. Latitude Longitude
A1 13° 9' 12.88'' N 80° 16' 20.79'' E
A2 13° 9' 12.83'' N 80° 16' 21.38'' E
A3 13° 9' 10.55'' N 80° 16' 20.70'' E
A4 13° 9' 10.52'' N 80° 16' 21.29'' E
B1 13° 9'0.78"N 80°16'19.61"E
B2 13° 9'1.13"N 80°16'20.30"E
B3 13° 9'2.76"N 80°16'19.60"E
B4 13° 9'2.73"N 80°16'20.30"E
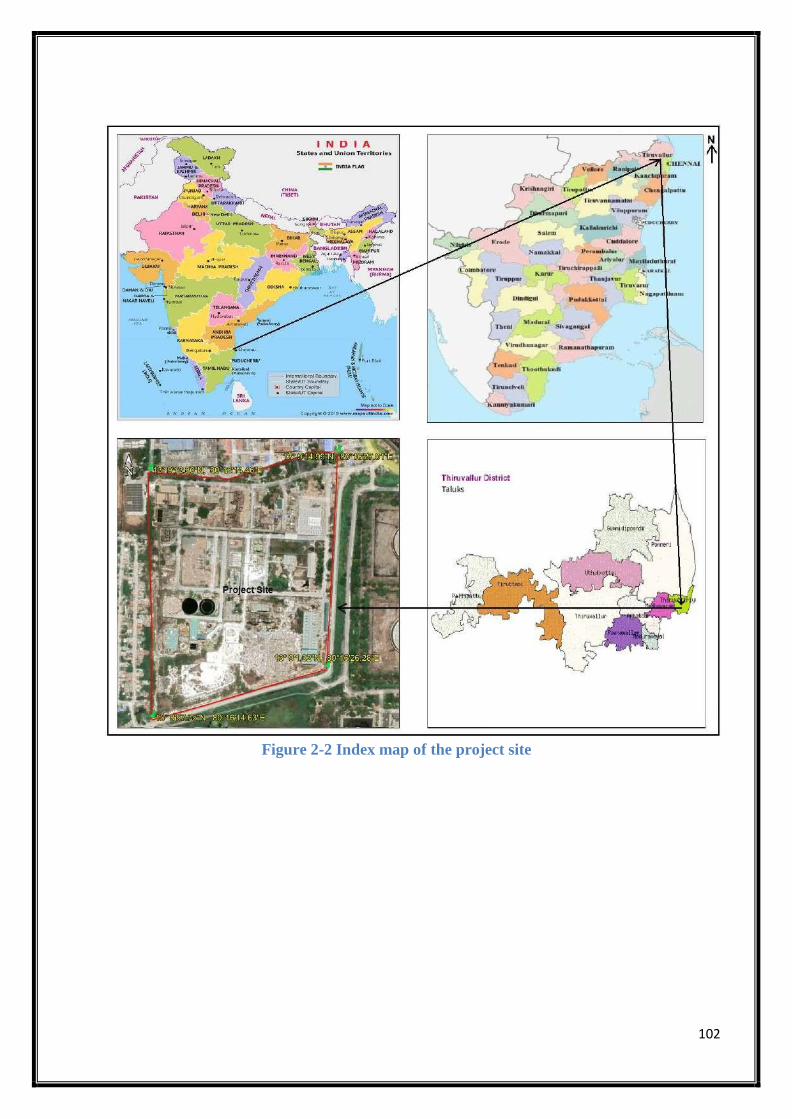
102
Figure 2-2 Index map of the project site

103
Figure 2-3Google image showing salient features within 0- 1 Km radius

104
Figure 2-4 Google image showing salient features within 0- 5 Km radius

105
Figure 2-5 Google image showing salient features 0- 10 Km Radius Map around the study
region
2.5 Salient features of the Project site
The site details and the surrounding features are summarized in Table 2-2
Table 2-2 Salient features of Project site
S.No Particulars Details
1. Geographical
Coordinates (centre
coordinates)
13° 9'6.82"N - 80°16'20.50"E
2. Elevation above
Mean
Sea Level
3-7 m
3. Present Land Use Industrial
4. Nearest Railway
station
Chennai Central - 6.51km, S
5. Nearest Airport Chennai International Airport- 18.93km, SSW

106
6.
Nearest Highway
SH 56(Tiruvottiyur- Ponneri-Panjetti)- 2.51km, N
Chennai – Srikakulam Highway- 3.60 km, SSW
7. Nearest Road Nearest Road (Chinna Sekkadu-Railway Colony) - 0.06 km,
ENE
8.
Nearest habitation
/Village
Thanthai Periyar Nagar (Hamlet) Adjacent to Site in
West direction.
Chinna Sekkadu village at 0.64km in NW direction.
9. Nearest Port Chennai Port - 4.14 km, SE
10 Nearest Town Manali - Site present within Manali
9. Nearest City Site is located within Greater Chennai corporation
10. Densely populated
area
Chinnasekadu located at a distance of 0.64 km in NW
direction with a population of 12396.
11. Inland water bodies S.
No
Name Distance (~
km)
Direction
Lakes
1 Sathangadu Lake 0.17 W
2 Lake near Sekkadu 2.33 WNW
3 Periyathoppu Lake 2.46 NW
4 Kadappakkam Lake 5.06 NNW
5 Madavaram Eri/Retteri
Lake
5.85 W
6 Pulal/Red Hills Lake 8.35 W
River
7 Korttalaiyar/Kosisttalaiyar
R
2.72 NNE
8 Cooum/Kuvam R 7.65 S
9 Adyar River 13.80 S
Canal
10 Buckingham Canal 0.84 ESE
11 Kodungaiyur Canal 1.90 SW
12 Captain Cotton Canal 2.44 S
13 Korattur Eri Canal 7.24 W
14 Canal near Padiyanallur 11.31km WNW
15 Krishna River Canal 14.61km W
Tank
16 Korattur Tank 8.86 WSW
17 Ambattur Tank 14.08 WSW
18 Cholavaram Tank 14.56 WNW
Nala
19 Otteri Nala 4.69km S
Creek
20 Ennore Creek 9.44km NNE
12 Reserved Forests /
Protected Forests/
Notified Wildlife
Sanctuary / Notified
national parks /
Ecologically
Alamadi RF is located approximately at a distance of
14.59 km towards WNW from the Project boundary

107
sensitive areas
13 Defense
Installations
INS Adyar - 8.46 km , SSE
Cholavaram Air Field - 13.26 km,WNW
14 Archeologically
Important places /
sites
Old Town Wall Tondiarpet- 5.35 km, SSE
Tomb of David Yale and Joseph Hymners in the
compound of Law College-7.06 km, S
Ramparts, gates bastions, Ravelins with vaulted
chambers and water cisterns underneath; moat and
defense walls all round with glacis to the extent of the
existing barbed wire fence - 7.51km , S
King’s Barracks Block No.XXV Fort St. George-
7.62km, S
Big Warehouse south of the Church Library (in Block
No.II/7) Fort St. George- 8.01km, S
Nursing Sister’s House (Block 1/3) Fort St. George -
8.03km,S
Megalithic cists and cairns pottur-12.03km, W
15 Inter state boundary None
16 Hills/Valleys None
2.6 Proposed Schedule for Approval and Implementation
The Time Schedule for completion of the proposed project is given in Table 2-3
Table 2-3 Time Schedule for completion of the proposed project
S. No. Particulars Time Schedule
1 Environmental Clearance from
MoEF & CC
June 2022
2 Consent to Establish from TNPCB September 2022
3 Commissioning expected June 2024
4 Consent to Operate from TNPCB August 2024
2.7 Project Details
2.7.1 Existing Facility
The Existing facilities of MPL-Plant-II is given in Table 2-4
Table 2-4 Existing Facility
S.No. Existing Units Product Category of Product Existing
Capacity
(MTPA)
1
Propylene Oxide
unit
Propylene Oxide Main
Product
18000
Di-chloro Propane By -
Product
3600
2
Propylene Glycol
unit
Propylene Glycol Main
Product
12000
Di- propylene
Glycol
By - Product
1581

108
Tri-
propylene Glycol
By - Product
202
3 Polyol unit Polyol Main
Product
22705
Note:
Change in product mix with no increase in pollution load certificate was granted
based on pollution load assessment committee decision by TNPCB vide
Lr.No.T5/ TNPCB/ F.0112AMB/ RL/ 2019 dated 16.09.2019 which is attached
with this proposal as Annexure - 4.
2.7.1.1 Process Description & Technology of Propylene Oxide
Propylene Oxide is produced utilising the chlorohydrins technology. In a titanium hollow vessel full
with water, chlorine is injected at the bottom, which immediately forms hypochlorous acid and
propylene vapour is injected in this zone and it is converted to propylene chlorohydrins (PCH). By-
product, Dichloropropane (DCP) is also produced in small quantities. Always excess of propylene is
maintained in the reactor and hence the entire chlorine is converted into propylene chlorohydrins and
DCP. The unreacted propylene is recycled back to the reactor
The reactor operates at near atmospheric pressure and at around 55 to 60 Deg. centigrade. It is a
simple vessel without any internals and no catalysts or any other additive are used in the reaction
process. The reactor relies on good upward velocity provided by the circulating gas and incoming
process water to move the produced chlorohydrins from the place of injection to maximise the
production efficiency.
Propylene chlorohydrins overflows from the reactor and is pumped into a saponifier along with milk
of lime. Saponifier is stream stripped from the bottom to remove the “PO” formed from the reaction
zone. The PO along with excess and the entire quantity of DCP present in the reactor overflows
enters a separation column where PO is removed as a top product as it boils at 34 Deg C at
atmospheric pressure and the high boiling DCP and water moves to the bottom of the separation
column. PO is condensed with chilled water and sent to the storage tank.
The DCP liquid and water enters the decanter where water is decanted and recycled back to the
reactor. The DCP liquid is sent to storage tank for sales. Thus, it could be seen that this process does
not utilise equipments like furnace, heaters nor use any catalytic reaction processes. It does not
produce any listed hazardous waste.
The Saponifier bottom wastewater is pumped to a High Rate Thickener after heat recovery where all
the unreacted inerts in the milk of lime are settled and sent to a rotary vacuum filter. In the rotary
filter, the solid is washed and removed to a disposal area for solar drying. The material is disposed
for manufacture of low cost lime bricks or landfill.

109
2.7.1.2 Process Description & Technology of Polyol
Polyols are macro molecules of polyhydric alcohols. Depending on the end of use of the “foam”
desired, various grades of polyols are manufactured. Flexible, Slab stock polyol are produced out of
Glycerine. Glycerine molecular chain is extended by addition of Propylene oxide into its molecules
thus increases its molecular weight from 92 to 3000. The above polyol is known as triol, as it has
three linear chains. Similarly, we can also use glycol as a chain starter, which has two linear chains
and results in diols. When we use sugar, it has eight active sites and produces a “octol”. We can also
use a mixture, these polyols are known as cross linked polyols, as they are not linear in nature and
are used for the production of rigid polyurethanes.
In any polyol production process, the chain length is extended using potassium hydroxide as a chain
initiator. For example, glycol and potassium hydroxide (5%) are mixed together to form an alkoxide
and the reaction water is stripped. To this chain starters, PO is added in the reactor and oxide
molecules attaches itself at the site where potassium ions are present. The intermediate Polyol is then
neutralized with Pyro phosphate solution in Treater and then filtered. To this filtered polyol, anti-
oxidants are added to preserve product quality and then transferred to Finished Polyol storage
2.7.2 Existing Utilities
The list of Existing utilities and bullets storage are given in the Table 2.5 and Table 2.6
respectively.
Table 2-5 List of Existing utilities
S.No. Description Working Standby Total Capacity
1
Boiler
1
2
3
1 x 21 MTPH (or)
2 x 10 MTPH
2
Refrigeration system for
C hilled water
2
1
3
1 x 120 TR (or)
2 x 75 TR
3 Refrigeration system for
Chilled brine
1 0 1 1 x 10 TR
4 Vapour Absorption
Machine for Chilled
water
1 1 150 TR
5 DM plant 1 1 2 1 x 28 cu.m/h
1 x 20 cu.m/h
6
Cooling tower
1
0
1
No. of cells: 3 Circulation
rate : 1950 m3/h
7 Instrument air
Compressor
2 2 4 2 x 908 cu.m/h
2 x 1290 cu.m/h
8 Liquid Nitrogen Storage - - 2 1 x 7500 kg
1 x 13889 kg

110
Table 2-6 List of Existing Bullets Storage
S.
No.
Equipt.
No
Description Max.
Capacity
Stored
Capacity
Dimension Stored in M.
Tons
1 SR
7101A
Propylene
Bullet
112 m3 100 m
3 dia 3.20 m X 14
m Lg
43MT
2 SR
7101B
Propylene
Bullet
112 m3 100 m
3 dia 3.20 m X 14
m Lg
43MT
3 SR
7301
EO Storage
Bullet
38 m3 32 m
3 dia 2.60 m X
7.20 m Lg
24.138MT
4 SR
7201 A
Chlorine
Bullet
112 m3 100 m
3 dia 3.20 m X 14
m Lg
122MT
5 SR
7201 B
Chlorine
Bullet
112 m3 100 m
3 dia 3.20 m X 14
m Lg
122MT
6 SR
7201 C
Chlorine
Bullet
112 m3 100 m
3 dia 3.20 m X 14
m Lg
Dummy
Bullet
7 SR
7401 A
PO Storage
Vessel
226 m3 200 m
3 dia 4 m X 18 m
Lg
167MT
8 SR
7401 B
PO Storage
Vessel
226 m3 200 m
3 dia 4 m X 18 m
Lg
167MT
The listed storages are of Vertical cylindrical tank with conical roof (Low pressure/Atmospheric
storage tanks). The details regarding Existing storage for Products and Raw materials are given in
Table 2.7
Table 2-7 Existing storage for Products and Raw materials
Tank Service Type Dia
(m)
Ht
(m)
SFH
(m)
SFV
(m3)
TK
7901A/B
FO Storage Tank Vertical Cylindrical
Tank
5 7.5 7.49 147
TK 7902 HSD Storage Tank Vertical Cylindrical
Tank
3.6 4.5 3.93 40
TK 7801 Sorbitol Storage Tank Vertical Cylindrical
Tank
4.5 7.2 6.29 100
TK 8201 Acid Storage Tank Vertical Cylindrical
Tank
2.8 4.5 4.47 27.5
TK 8202 Caustic Storage Tank Vertical Cylindrical
Tank
2.6 4 3.77 20
TK 8204 Potassium Hydroxide
Tank
Vertical Cylindrical
Tank
2.6 4 3.77 20
TK 7501A PG Storage tank Vertical Cylindrical
Tank
4.5 7.2 6.29 100
TK 7501B PG Storage tank Vertical Cylindrical
Tank
4.5 7.2 6.29 100
TK 7501C PG Storage tank Vertical Cylindrical
Tank
2 4.9 3.18 10
TK 7501D PG Storage tank Vertical Cylindrical
Tank
7.2 7 5.53 225

111
TK 701 Polyol Storage tank Vertical Cylindrical
Tank
7.2 7 5.53 225
TK 702 Polyol Storage tank Vertical Cylindrical
Tank
7.2 18 17.81 725
TK 703 Polyol Storage tank Vertical Cylindrical
Tank
7.2 7 5.53 225
TK 7502 Polyol Storage tank Vertical Cylindrical
Tank
3.6 4.5 3.93 40
TK 7601A Polyol Storage tank Vertical Cylindrical
Tank
4.5 7.2 6.29 100
TK 7601B Polyol Storage tank Vertical Cylindrical
Tank
3.6 4.5 3.93 40
TK 7601C Polyol Storage tank Vertical Cylindrical
Tank
4.25 4.5 4.23 60
TK 7601D Polyol Storage tank Vertical Cylindrical
Tank
4.25 4.5 4.23 60
TK 7601E Polyol Storage tank Vertical Cylindrical
Tank
4.5 9 7.86 125
TK 7701A DCP Storage Tank Vertical Cylindrical
Tank
4 5.6 5.01 63
TK 7701B DCP Storage Tank Vertical Cylindrical
Tank
2 3.5 3.18 10
TK 7701C DCP Storage Tank Vertical Cylindrical
Tank
5 5.2 4.07 80
TK 7503 DPG storage Tank Vertical Cylindrical
Tank
2.6 4 3.77 20
2.7.3 Existing ETP facilities
The Existing ETP facility details are given in Table 2.8
Table 2-8 Existing ETP facility
S.No. Equipment’s Name Size Capacity
1 High Rate Thickener 9m dia. x 3.4m depth. RCC (Old)
13m dia. X 4.5m depth. RCC(New)
216.3 m3 (Old)
597.3 m3 (New)
2 Cooling Tower 5.5m x 4.5m 87.47 m3
3 Equalization Tank 1 15m x 40m x 1.5m (RCC) 900 m3
4 Equalization Tank 2 7m x 6m x 2m (RCC) 84 m3
5 Equalization Tank 3 10m x 25m x 2.5m (RCC) 625 m3
6 Neutralization Tank 3m x 3m x 3m (RCC) 27 m3
7 Aeration Tank 21m x 40m x 3.5m (RCC) 2940 m3
8 Secondary Clarifier 14m x 3.5m (RCC) 538.783 m3
9 Treated Effluent
Sump
12m x 15m x 2m (RCC) 360 m3
10 Rotary Vacuum Drum
Filter
2.44m x 3.05 length (2nos.) 21.867 m3(Each)
11 Bio-Reactor 33.3m Dia x 6.3 m SWD (RCC) 5487m3

112
2.7.3.1 ETP Photographs in Site
Figure 2-6 ETP Photographs in Site

113
2.7.4 Existing Product Production
There are various product and by-products produced in the plant which are given in the Table
2.9
Table 2-9 Existing Product Production (FY 2020-2021)
Sl.No. Products Quantity (MTPA)
1 Propylene Oxide 15885.068
2 Propylene Glycol 10794.233
3 Base Polyols 20141.999
Sl.No. By-Products Quantity (MTPA)
1 Di-Chloro Propane 2877.012
2 Di-Propylene Glycol 877.582
3 Tri-Propylene Glycol 46.25
2.7.4.1 Existing Fire Protection system
1. Fire protection facility has been provided as per TAC rules covering the following components.
Fire Hydrant / Monitor piping distribution network
Medium Velocity Spray System
Fire Water Pumps
Fire Water Storage
Medium Velocity spray System has been provided for bullets, pumping station. Deluge valves are
provided which operate automatically or through manual intervention, once fire conditions are
sensed through quartzoid bulbs.
Water spray design is based on 10.2 LPM / Sq.m of fire covered area in all areas except pump house
where it is 20.4 LPM/Sq.m.
2. Hose protection system consisting of single hydrants, double hydrants and monitors are provided
throughout the plant.
3. The facilities available are listed below
Hydrants 43 Nos
Double Hydrants 3 Nos
Water Monitors 7 Nos
Deluge Valves 11 Nos
4. Four hours of Fire Protection has been provided for storage.
5. There are two fire hydrant pumps each with capacity of 410 m3/hr. One pump works and another
is a standby. Pumps are diesel driven and free from power interruptions.
6. Fire water storage tank, above ground, has been provided with a capacity of 6000KL.
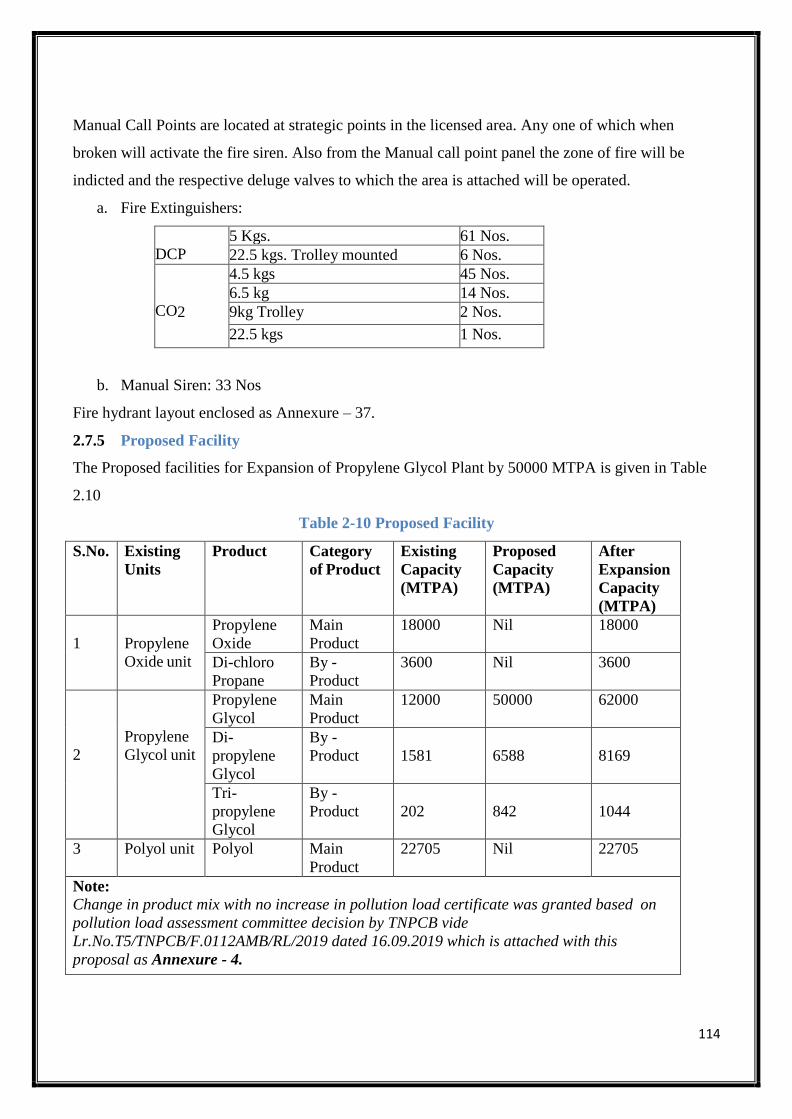
114
Manual Call Points are located at strategic points in the licensed area. Any one of which when
broken will activate the fire siren. Also from the Manual call point panel the zone of fire will be
indicted and the respective deluge valves to which the area is attached will be operated.
a. Fire Extinguishers:
DCP
5 Kgs. 61 Nos.
22.5 kgs. Trolley mounted 6 Nos.
CO2
4.5 kgs 45 Nos.
6.5 kg 14 Nos.
9kg Trolley 2 Nos.
22.5 kgs 1 Nos.
b. Manual Siren: 33 Nos
Fire hydrant layout enclosed as Annexure – 37.
2.7.5 Proposed Facility
The Proposed facilities for Expansion of Propylene Glycol Plant by 50000 MTPA is given in Table
2.10
Table 2-10 Proposed Facility
S.No. Existing
Units
Product Category
of Product
Existing
Capacity
(MTPA)
Proposed
Capacity
(MTPA)
After
Expansion
Capacity
(MTPA)
1
Propylene
Oxide unit
Propylene
Oxide
Main
Product
18000 Nil 18000
Di-chloro
Propane
By -
Product
3600 Nil 3600
2
Propylene
Glycol unit
Propylene
Glycol
Main
Product
12000 50000 62000
Di-
propylene
Glycol
By -
Product
1581
6588
8169
Tri-
propylene
Glycol
By -
Product
202
842
1044
3 Polyol unit Polyol Main
Product
22705 Nil 22705
Note:
Change in product mix with no increase in pollution load certificate was granted based on
pollution load assessment committee decision by TNPCB vide
Lr.No.T5/TNPCB/F.0112AMB/RL/2019 dated 16.09.2019 which is attached with this
proposal as Annexure - 4.

115
2.7.5.1 Process Description & Technology of Propylene glycol
Proposed production of Propylene glycol (PG) is by hydration of Propylene oxide. Di Propylene
glycol (DPG) and Tri Propylene glycol (TPG) are also produced as by-product in the reaction. The
process does not require any catalyst or any additive chemicals. Hence there
is no chance that catalyst left overs like heavy metals can get into the product. The reaction of
Propylene Oxide with water is exothermic and realized in liquid phase. Internal energy recycle is
used to preheat the feed material to conserve energy. The preheated mixture will be sent to reactor
and the reaction takes place at a temperature of 200oC and 20 kg/cm2 (g) pressure. The amount of
water is controlled to favour PG production. The ratio PG to DPG and TPG is depending upon the
composition of the aqueous mixture fed into the reactor.
The reaction mixture is dehydrated by evaporation and the various glycols separated by vacuum
distillation. The multistage evaporation is highly energy efficient. Only one evaporator is heated by
steam while the subsequent evaporators are driven by the vapours of the previous step. Thus it is
possible to use the same energy multiple times at descending temperature levels. By following
multistage evaporation method, the proposed project utilizes minimum energy in the evaporation
section.
The process water recovered from the top section of multiple effect evaporators is sent to the process
water recovery drum. It is recycled back to the reaction section to reduce the usage of freshwater
requirement. Stoichiometric water requirement can be realized by Demineralized water (DM).
Finally, products of distillation column, Mono Propylene Glycol and the other by-products will be
sent to the respective storage tank. The existing and proposed process flow diagram of Propylene
Glycol is given in Figure 2.7 and Figure 2.8 respectively.
In addition to Propylene Glycol, the other products manufactured in MPL-Plant-II are Propylene
Oxide and Polyols. The process flow diagram of Propylene Oxide and Polyols is given in Figure 2.8
and Figure 2.9 respectively.
Table 2-11 Proposed Major Equipment List for PG Unit
S.No. Tag No. Equipment Description Specification
1 R-2511 Reactor 8" x 6m x 36 nos.
MOC: CS
2 SR-2502 PO Buffer Drum Operating volume : 11.8 m3
MOC: CS
3 PD-2502 PO feed pump Capacity: 4.7 m3/h
MOC: Contact parts SS 304L

116
4 PC-2541 Process water Recovery pump Capacity: 23.4 m3/h
MOC: Contact parts SS 304L
5
E-2521
Process Pre-Heater – 1
Heat transfer area : 11.997 m2
MOC shell: CS
MOC tube: SS 304
6 E-2523 Process Pre-Heater – 2 Heat transfer area : 11.997 m2
MOC shell: CS
MOC tube: SS 304
7
E-2525
Process Pre-Heater – 3
Heat transfer area : 11.997 m2
MOC shell: CS
MOC tube: SS 304
8
E-2527
Process Pre-Heater – 4
Heat transfer area : 11.997 m2
MOC shell: CS
MOC tube: SS 304
9
C-2611
First Effect Evaporator
Top : 0.488D x 4mH Sump:2D x
1.75H= 6.73m3
MOC packing : SS 316L
10
E-2611
First Effect Evaporator Reboiler
Heat transfer area : 95.86 m2 MOC
shell: CS
MOC tube: SS 304
11
C-2621
Second Effect Evaporator
Top : 0.65D x 4mH Sump:2D x
1.6H=6.25m3
MOC packing : SS 316L
12
E-2621
Second Effect Evaporator Reboiler
Heat transfer area : 133.19 m2
MOC shell: CS
MOC tube: SS 304
13
C-2631
Third Effect Evaporator
Top : 0.75D x 4mH Sump:1.5D x
1.7H=3.54m3
MOC packing : SS 316L
14
E-2631
Third Effect Evaporator Reboiler
Heat transfer area : 151.99 m2
MOC shell: CS
MOC tube: SS 304
15
C-2641
Fourth Effect Evaporator
Top : 1.3D x 4mH Sump:2D x
2.05H=7.67m3
MOC packing : SS 316L
16
E-2641
Fourth Effect Evaporator Reboiler
Heat transfer area : 236.65 m2
MOC shell: CS
MOC tube: SS 304
17 C-2651 Dryer Top : 1D x 5mH
Sump:1.5D x 2.0H=4.07m3
18
E-2651
Dryer Reboiler
Heat transfer area : 6.89 m2 MOC
shell: CS
MOC tube: SS 304
19
E-2661
Fourth Effect Evaporator Vapour
Condenser
Heat transfer area : 9.56 m2 MOC
shell: CS
MOC tube: SS 304
20 SR-2681 Fourth Effect Evaporator Reflux
Drum
Operating volume : 1.66 m3
MOC: CS
21 PC-2681
A/B
Fourth Effect Evaporator Reflux
Drum pump
Capacity: 7.3 m3/h
MOC: Contact parts SS 304L

117
22 SR-2541 Process Water Recovery vessel Operating volume : 10.81 m3
MOC: CS
23 E-2541 Vent Condenser Heat transfer area : 1.51 m2
MOC shell: CS
MOC tube: SS 304
24 MX-2502 Static Mixer MOC: SS 304L
25 SR-2531 Pure steam condensate drum Operating volume : 4 m3
MOC: CS
26 SR-2551 Surge condensate drum Operating volume : 3.86 m3
MOC: CS
27 PC-2551 Surge condensate drum pump Capacity: 8.1 m3/h
MOC: Contact parts MS
28 C-2701 PG Distillation column Top : 1.9D x 15mH
Sump:1.3D x 2.1H=3.15m3
29
E-2701
PG column Reboiler
Heat transfer area :54.58 m2 MOC
shell: SS 304
MOC tube: SS 304
30
E-2711
PG column vapour Condenser
Heat transfer area : 0.97 m2 MOC
shell: SS 304
MOC tube: SS 304
31
E-2721
PG Bottom Cooler
Heat transfer area : 9.05 m2 MOC
shell: SS 304
MOC tube: SS 304
32
E-2731
PG Product Cooler
Heat transfer area : 11.36 m2 MOC
shell: SS 304
MOC tube: SS 304
33 SR-2741 PG column Reflux Drum Operating volume : 1.6 m3
MOC: SS 304L
34 PC-2741
A/B
PG column Reflux pump Capacity: 7.7 m3/h
MOC: Contact parts SS 304L
35 SR-2761
A/B
PG Day Drum Operating volume : 50.41 m3
MOC: SS 304L
36 PC-2761
A/B
PG Day Drum pump Capacity: 48.5 m3/h
MOC: Contact parts SS 304L
37 C-2801 DPG Distillation column Top : 0.95D x 15mH
Sump:0.6D x 1.8H=0.55m3
38
E-2801
DPG column Reboiler
Heat transfer area : 15.95 m2 MOC
shell: SS 304
MOC tube: SS 304
39
E-2811
DPG column vapour Condenser
Heat transfer area : 27.08 m2 MOC
shell: SS 304
MOC tube: SS 304
40
E-2821
DPG Bottom Cooler
Heat transfer area : 27.08 m2 MOC
shell: SS 304
MOC tube: SS 304
41
E-2831
DPG Product Cooler
Heat transfer area : 7.73 m2 MOC
shell: SS 304
MOC tube: SS 304
42 SR-2841 DPG column Reflux Drum Operating volume : 0.28 m3
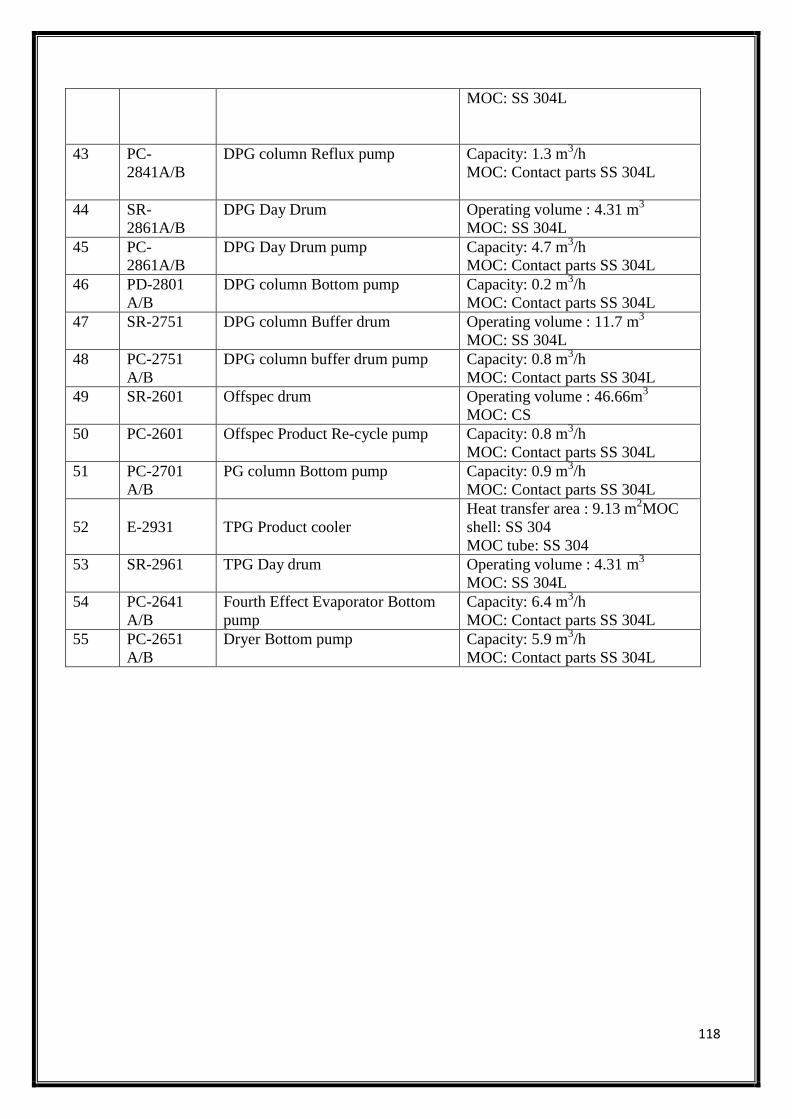
118
MOC: SS 304L
43 PC-
2841A/B
DPG column Reflux pump Capacity: 1.3 m3/h
MOC: Contact parts SS 304L
44 SR-
2861A/B
DPG Day Drum Operating volume : 4.31 m3
MOC: SS 304L
45 PC-
2861A/B
DPG Day Drum pump Capacity: 4.7 m3/h
MOC: Contact parts SS 304L
46 PD-2801
A/B
DPG column Bottom pump Capacity: 0.2 m3/h
MOC: Contact parts SS 304L
47 SR-2751 DPG column Buffer drum Operating volume : 11.7 m3
MOC: SS 304L
48 PC-2751
A/B
DPG column buffer drum pump Capacity: 0.8 m3/h
MOC: Contact parts SS 304L
49 SR-2601 Offspec drum Operating volume : 46.66m3
MOC: CS
50 PC-2601 Offspec Product Re-cycle pump Capacity: 0.8 m3/h
MOC: Contact parts SS 304L
51 PC-2701
A/B
PG column Bottom pump Capacity: 0.9 m3/h
MOC: Contact parts SS 304L
52
E-2931
TPG Product cooler
Heat transfer area : 9.13 m2 MOC
shell: SS 304
MOC tube: SS 304
53 SR-2961 TPG Day drum Operating volume : 4.31 m3
MOC: SS 304L
54 PC-2641
A/B
Fourth Effect Evaporator Bottom
pump
Capacity: 6.4 m3/h
MOC: Contact parts SS 304L
55 PC-2651
A/B
Dryer Bottom pump Capacity: 5.9 m3/h
MOC: Contact parts SS 304L

119
Figure 2-7 Existing Process flow diagram of Propylene Glycol
Source: Manali Petrochemicals Limited -Plant-II
Figure 2-8 Proposed Process flow diagram of Propylene Glycol
Source: Manali Petrochemicals Limited -Plant-II

120
Figure 2-9 Process flow diagram of Propylene oxide
Source: Manali Petrochemicals Limited -Plant-II
Figure 2-10 Process flow diagram of Polyol
Source: Manali Petrochemicals Limited -Plant-II

121
2.7.6 Proposed Utilities
The proposed utilities and proposed storage tanks of MPL P-II to meet the requirement of proposed
Propylene Glycols facility are given in Table 2-12 and Table 2-13 respectively.
Table 2-12 Proposed Utilities
S.No Description Capacity Units Area to be Occupied
1 Utility Boiler-E* 30 Ton/hr 9.95 m x 16 m
2 Cooling Tower 1950 (Circulation
rate)
m3/hr 14.4 m x 16 m
3 STP 20 KLD 4 m x 12 m
4 RO Unit 350 KLD 16 m x 38 m
5 Sludge Drying Bed of area- 2.5m x 5m (2 nos.)
6 4 Nos. of Rainwater Harvesting Pit – Each pit of Diameter-1.5m and Depth-3m
* Note: The Utility Boiler B (10MT) will be replaced by new Utility Boiler-E and
combined with existing stack itself.
Boiler - C 10 Ton + Boiler - D 21 Ton will be standby boiler for Boiler E with a
common stack
Table 2-13 Proposed Storage Tanks
S.No Tank No. Service Type Dia (m) Height
(m)
SFH
(m)
SFV
(m3)
1
TK 7501E
PG storage tank
Vertical
cylindrical
tank with
conical roof
7.5
18
14.40
636
2
TK 7501F
PG storage tank
Vertical
cylindrical
tank with
conical roof
7.5
18
14.40
636
3
TK 7502B
DPG storage
tank
Vertical
cylindrical
tank with
conical roof
4.25
9
7.12
101
4
TK 7502C
DPG storage
tank
Vertical
cylindrical
tank with
conical roof
4.25
9
7.12
101
5
TK 7503B
TPG storage
tank
Vertical
cylindrical
tank with
conical roof
4.25
9
7.12
101
2.7.7 Proposed RO and Sewage Treatment Plant
A Sewage Treatment plant of capacity 20 KLD is proposed in Manali Petrochemicals Limited-Plant-
II which will occupy an area of about 4m x 12 m (48m2). Additionally, a sludge drying bed is
proposed which will occupy an area of 25 m2.

122
It is proposed to install an RO unit of capacity 350 KLD to treat the Cooling tower blowdown water,
Boiler blow down water, DM unit regeneration water.RO permeate quantity of 243 KLD will be
reused as cooling tower make-up water. RO rejects quantity of 105 KLD will be generated as
effluent and will be treated in the existing ETP.
The Process flow diagram of proposed STP and RO is attached as Figure 2-11 and Figure 2-12
respectively.
Figure 2-11 Process Flow Diagram of Proposed STP

123
Figure 2-12 Process Flow Diagram of Proposed RO Unit
2.7.8 Sulphur Balance
In existing facility, Sulphur is mainly present in the Furnace Oil which is being used as fuel in
existing Boiler. This Sulphur content gets converted into SOx in the form of Sulphur-di- oxide and
Sulphur-Tri-Oxide. Very minimum level of elemental sulphur will exhaust along with flue gas from
chimney.
FEED
Sulphur in furnace oil entering Boiler = 5.63 kg/h of SULPHUR
OUTLET
Sulphur di-oxide qty. = 10.59 kg/h in Flue gas. (Qty. of sulphur in SO2 = 5.29 kg/h of SULPHUR)
Sulphur tri-oxide qty. = 0.13 kg/h in Flue gas. (Qty. of sulphur in SO3 = 0.05 kg/h of SULPHUR)
Unreacted sulphur in flue gas = 0.29 kg/h of SULPHUR.
Note: The Existing fuel oil containing Sulphur content will not be used after expansion. It is
proposed to use LNG as fuel in boiler instead of Furnace Oil after expansion.

124
2.8 Raw materials and Transportation
The main raw material for manufacture of Propylene Glycols is Propylene Oxide and Water. The
other raw materials used in the plant are Propylene, Chlorine, Burnt Lime, Fuel oil, Sodium
Hydroxide and Hydrochloric Acid.
Propylene Oxide
The source of propylene oxide will be Propylene oxide produced by MPL. Also propylene oxide will
be sourced from Tamilnadu Petro products Limited’s Propylene oxide plant. PO requirement, over
and above MPL and TPL Plant quantity, will be made up with imported material that will be stored
in M/s Ennore Tank Terminals Private Limited (ETTPL), Ennore Port, Chennai. Propylene Oxide is
the major raw material for manufacture of Propylene Glycols and there is sufficient quantity
available from both indigenous and imported source.
Water
The additional water requirement for the MPL-Plant-II and utilities would be approximately 810
KLD over and above the current requirement. This will be met from CMWSSB.
The Existing and Proposed raw material used for the production of Propylene Oxide (PO), Propylene
Glycols and Polyols are given in Table 2-14
Table 2-14 Existing and Proposed raw material details
S.
No.
Raw
Materia
l
Principal
Use
Existing
Quantity
Proposed
Quantity
After
Expansion
Source
from M/s.
Mode
of
Transport
Storage
capacity
1 Propyle
ne
(96%
Purity)
Production
of Propylene
Oxide (PO)
15510 --- 15510 CPCL
(95%)
4" Pipeline 86 MT
BPCL
(5%)
Tankers
2 Chlorin
e
26950 --- 26950 Grasim
Industries
Tonners-
trucks
244 MT
TGV-
Rayalasee
ma/
DCW/
+ 1 No.
dump
bullet
Grasim
Industries
3 Lime
(90 %
Purity)
31500 --- 31500 Imported
from
UAE/Viet
nam
In bags -
trucks
Chemica
l
Godown
Malaysia
(PGP
internatio

125
nal)
4 Caustic
soda
Production
of PO &
DM Water
1260 --- 1260 TPL/TGV
Rayalsee
ma/
Chemfab/
DCW
Tankers 32 MT
5 HCl 787.5 --- 787.5 TPL Tankers 27.5 MT
6 Propyle
ne
Oxide
Production
of Propylene
Glycol
10500 44646 55146 Local-
TPL,MPL
-I
Within the
plant/
Tankers
334 MT
7 Ethylen
e
Oxide
Production
of Polyol
630 --- 630 RIL Tankers 29 MT
8 Glyceri
ne
147 ---- 147 3F
industries/
Kaleeswa
ri
Tankers 32MT
9 Di
Propyle
ne
Glycol
59.5 ---- 59.5 MPL Drums Chemica
l
Godown
10 Styrene 70 ---- 70 Supreme
Petroche
m
Drums
11 Sugar 388.5 ---- 388.5 Bannari
Sugars/EI
D Parry
Bags in
Trucks
Chemica
l
Godown
12 Sorbito
l (70%)
1004.5 ---- 1004.5 Kashyap
Industries
/
Blue
Cross
Tankers 120 MT
13 KOH 38.5 ---- 38.5 TGV
Rayalsee
ma
Tankers 29 MT
Bags in
Trucks
Chemica
l
Godown
14 Furnac
e Oil
Production
of Steam
9457 ---- ---- IOCL/BP
CL
Tankers 290 MT
15 R-LNG --- 8778 8778 IOCL R-
LNG
Terminal
Ennore
Proposed
pipeline of
IOCL
No
Storage
The material balance for the Existing and proposed Propylene Glycols are given in Figure 2-13 and
Figure 2-14 respectively

126
Figure 2-13 Material balance for the Existing Propylene Glycol unit
Figure 2-14 Material Balance diagram for the Proposed Propylene Glycol unit
2.9 Land use Details
Detailed Land breakup is summarized in Table 2-15. The existing and proposed site layout is given
in Figure 2-20 and Figure 2-21 respectively. The Google image of Overall Plot plan is given in
Figure 2-22.
Table 2-15 Land use planning of the project site
Description Existing
(Hectares)
Proposed
(Hectares)
After expansion
(Hectares)
Percentage,%
Plant area 7.94 0.374* 8.314 47.15 %
Roads 2.092 0 2.092 11.86 %
Greenbelt 2.7659 0 2.7659 15.69 %

127
Vacant Land 4.8341 -0.374 4.4601 25.30 %
Total land 17.632 0 17.632 100.00%
Proposed PG plant area of 0.374 hectare is part of the existing vacant land ((4.8341 hectares). So,
no additional land acquisition is identified.
Green belt Area within the plant is 2.7659 hectares (15.69 %). Green belt area developed in the
lands allocated by Greater Chennai Corporation and Vilangadupakkam Panchayat, Puzhal Union is
4.4322 hectares (25.14 %).
The details of cost incurred for Green belt development in an area of 5.2381 hectares (29.70 %) to
comply the Green belt cover as per CEPI condition is mentioned in the Table below:
S.
No
Description Details
1 Additional area of Green
Belt (Ha.) developed to
comply Green belt cover as
per CEPI condition
5.2381 hectares
(Additional green belt cover in MPL – Plant –II : 0.8059 hectares)
(Green belt cover in GCC allocated land : 0.9322 hectares)
(Green belt cover in land allocated by Vilangadupakkam Panchayat,
Puzhal Union : 3.5 hectares)
2 Additional Green belt
cover in terms of
Percentage of total project
site area (%)
29.70 %
(Additional green belt cover in MPL – Plant – II: 4.57 %)
(GCC allocated land: 5.28 %)
(Land allocated in Vilangadupakkam Panchayat, Puzhal Union:
19.85 %)
3 No. of Plants 8390
4 Funds Spent INR 22,65,300

128
Figure 2-15 Existing Site Layout

129
Figure 2-16 Proposed Site Layout

130
Figure 2-17 Google Image of Overall Plot Plan

131
2.10 Manpower
There is 10 nos. additional manpower required for operating the plant and contract manpower of
around 60 nos. will be used during construction stage. The total manpower requirement is given in
Table 2-16
Table 2-16 Manpower Requirement
During construction phase
S. No. Description Proposed
1 Contract workers 60
2 Permanent workers Nil
Total 60
During operation phase
S.No. Description Existing Proposed Total
Permanent Contract Others Permanent Contract
1. General
Shift
116 204 - 10 Nil 330
2.11 Power and Fuel Requirements
The additional power requirement is 1.06 MW. This will be met by TANGEDCO power. For
emergency power the supply will be from DG set which will ensure safe shut down of the plant. The
existing and proposed power and fuel content is given in Table 2-17
Table 2-17 Power and Fuel requirement
Details
Capacity
Source
Existing
Proposed
Total
after
expansion
Power Requirement (MWH) 2.54 1.06 3.6 TANGEDCO
FO (MT/DAY) 27.02* - --- IOCL/BPCL
R-LNG (MMSCM/day) - 0.033 0.033 IOCL LNG
Terminal,
Ennore
Diesel(KLPA) 132.154 - 132.154 IOCL/BPCL
Note: *The Existing fuel oil will be replaced by R-LNG after Expansion of Propylene glycol.
Table 2-18 R-LNG composition
COMPONENT MOLE %
Methane 92.069
Ethane 5.833
Propane 1.35
i-Butane 0.233

132
Propylene Glycol Plant
n-Butane 0.341
i-Pentane 0.0154
n-Pentane 0.00594
Hexane NIL
Nitrogen 0.153
Carbon-di-oxide 0.000255
Hydrogen Sulphide 0.00000233
There is no presence of ash in LNG
2.12 Site Photographs
Site photographs of existing facility and proposed facility is enclosed as Figure 2-18 and
Figure 2-19 and Figure 2-20 respectively.
Figure 2-18 Site Photographs of Existing Facility
Propylene Oxide Plant
Polyol Plant

133
Figure 2-19 Site Photographs of Proposed Facility (Site-1)
Proposed Propylene Glycol Plant Area

134
Figure 2-20 Site Photographs of Proposed Facility (Site-2)
2.13 Project cost
The estimated cost for the proposed Expansion of Propylene Glycol Plant by 50000 MTPA projects
is approx. INR 125 Crores. The project cost breakup is given below:
S.No. Activities Investment Cost
(INR Crores)
1 Design (Basic & Detailed Engineering) 6.25
2 Civil & Structural (Construction, Painting &
Insulation)
27.5
3 Mechanical (Equipment, Piping & Erection) 40
4 Electrical (Equipment, Panel, Cabling& Erection) 11.25
5 Instrumentation (Instruments, Panel, Cabling &
Erection)
27.5
6 Contingency 12.5
TOTAL 125
2.14 Water Requirement
Existing
2451 KLD of effluent and 15 KLD of sewage is being generated in the existing facility. On total,
2466 KLD is being disposed to Deep Sea after treatment in ETP.
Proposed Propylene Glycol Plant Area

135
Proposed
It is proposed to install an RO unit of capacity 350 KLD to treat the Cooling tower blowdown water,
Boiler blow down water & DM unit regeneration water.RO permeate quantity of 243 KLD will be
reused as cooling tower make-up water. RO rejects quantity of 105 KLD will be generated as
effluent and 1 KLD of Sewage will be generated in the proposed STP facility. On total,
105 KLD will be disposed to Deep Sea after treatment in ETP and 1 KLD of sewage will be reused
for green belt after treatment in STP.
After Expansion
2556 KLD of effluent and 16 KLD of Sewage will be generated after expansion. On total, 2556 KLD
is disposed to Deep Sea after treatment in ETP and 16 KLD of sewage will be reused for green belt
after treatment in STP.
Existing and proposed water consumption details are given in Table 2-19
Table 2-19 Existing and Proposed Water Requirements
Description Existing in KLD Proposed in KLD After expansion in KLD
From
CMWSSB
Recycled Total From
CMWSSB
Recycled Total From
CMWSSB
Recycle Total
PO unit 2111 200 2311 0 0 0 2111 200 2311
MOL unit 76 205 281 205 0 0 281 0 281
DM unit 300 0 300 104 0 104 404 0 404
Cooling
Tower
735 0 735 492 243 735 1227 243 1470
Domestic 17 0 17 1 0 1 18 0 18
Green Belt 8 0 8 8 16 24 16 16 32
Total 3247 405 3652 810 259 1069 4057 459 4516

136
Figure 2-21 Water Balance Diagrams of Existing Plant-II

137
Figure 2-22 Proposed Water Balance Diagrams of Plant-II
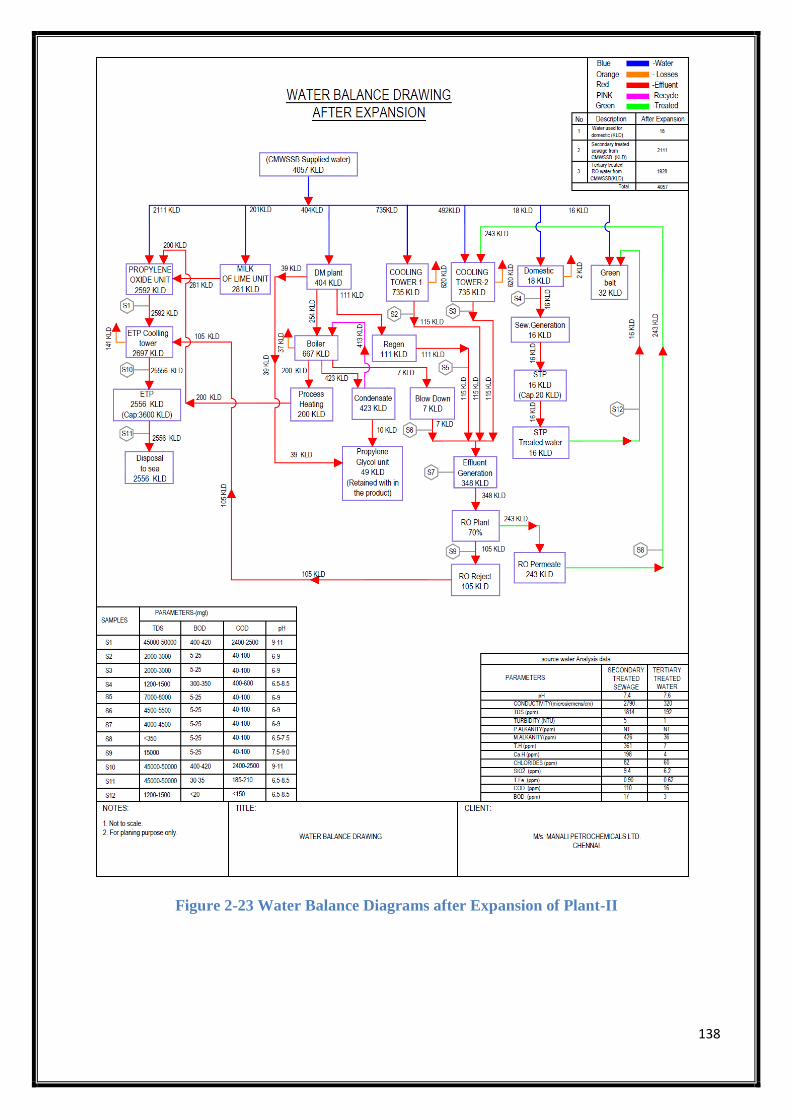
138
Figure 2-23 Water Balance Diagrams after Expansion of Plant-II

139
2.14.1 Source of Water Supply
The total water requirement will be met from Chennai Metro Water Supply and Sewage Board.
Agreement for sourcing of water is enclosed as Annexure - 8 and the reply letter for additional
water requirement from CMWSSB is enclosed as Annexure – 9.
2.15 Solid Waste Management
a. During Construction Phase
During construction phase 36 kg/day of solid waste is envisaged. The details are given in
Table 2-20.
Construction phase – Man Power: 60 Nos.
Table 2-20 Solid waste Generation and Management during Construction phase
S. No Description Proposed Quantity
(Kg/day)
Method of Disposal
1 Organic 21.6 Disposed to municipal bins
2 Inorganic 14.4 Disposed to municipal bins
Total 36
(As per CPHEEO Guidelines -0.60 kg/capita/day)
b. During Operation Phase
During Operation Phase Total of 198 Kg/day of solid waste is generated of which 118.8 kg/day of
organic waste and 79.2 kg/day of inorganic waste will be disposed to municipal bins. The existing
and proposed waste generated is given in Table 2-21.
Operation phase – Man Power: 330 Nos.
Table 2-21 Solid waste Generation and Management during Operation phase
S. No
List of Items
Quantity (Kg/day) Total after
expansion
(kg/Day)
Disposal Methods
Existing Proposed
1 Organic waste 115.2 3.6 118.8 Disposed to municipal bins
2 Inorganic waste 76.8 2.4 79.2 Disposed to municipal bins
Total 192 6 198 -
c. Other Solid waste Generation
Sewage generated from domestic needs collected in a settling tank. Then the supernatant sewage is
sent to ETP for Biological Effluent Treatment process through pumping in existing case. A new STP
is proposed and after expansion sewage will be treated in STP. The separated sludge is being dried
and used as manure at present and will be continued as such after expansion. The details are
mentioned in Table 2.22.

140
Table 2-22 Other Solid Waste Generation
S.No. List of
Items
Quantity (Kg/day) Total after
expansion
(kg/Day)
Disposal Methods Existing Proposed
1 STP Sludge 23.28 1.6 24.88 Dried and used as manure.
2.16 Hazardous Waste Management
The Existing and Proposed Hazardous waste generated is given in Table 2.23 and the storage area of
hazardous waste is shown in Figure 2.28 and Figure 2.29.
Table 2-23 Hazardous Waste Management
S.No
.
Details
of
Waste
Sched
ule as
per
HWM
rules
Unit Quantity
Physi
cal
status
Stora
ge
Dispos
al Existi
ng
Propos
ed
After
Expansi
on
Appro
val
1
Waste
Lube
Oil
generat
ed
from
Rotary
Equip
ment -
Spent
Oil
5.1 KL/Ann
um
1.38 0.5 1.88 4.0 Oily MS
drums
Dispose
d
through
TNPCB
authori
zed
recycler
s
2
ETP
Second
ary
Clarifie
r
Bottom
Sludge
35.3 T/Annu
m
110 Nil* 110 110 Solid Concr
ete
floore
d
covere
d shed
Commo
n TSDF
Landfill
Facility
The unit has provided adequate designated storage area for the hazardous waste storage within
premises having impervious floor, roof cover system and leachate collection system. The hazardous
waste are disposed of through the TNPCB approved /authorized recyclers/Pre-processors/TSDF site.
For Spent Oil: Shri. Sathya Sai Lubricants - S.F.No. 86/IF, Kunnathur Village, Annur Taluk,
Coimbatore dist. The agreement is attached as Annexure – 17.

141
For ETP Sludge: Tamilnadu Waste Management Limited, Plot No. 5-15, 28-33, Sipcot Industrial
Complex, Gummidipoondi, Thiruvallur District, 601201. The agreement is attached as Annexure –
18.
*There will not be any effluent from proposed propylene glycol plant. The blow down from cooling
tower, boiler and regeneration water will be treated in RO unit and RO rejects sans COD/BOD is the
additional input to ETP. Hence no additional ETP sludge will be generated.
Figure 2-24 Hazardous waste storage area – for Spent Oil

142
Figure 2-25 Hazardous waste storage area – for ETP sludge
2.17 Non-Hazardous Waste Management
The Existing and proposed Non-Hazardous waste generated is given in Table 2.24. The Non-
Hazardous RVDF sludge analysis report is enclosed as Annexure - 23.
Table 2-24 Non-Hazardous Waste Management
S.No. Details of
Waste
Quantity- MTPA Storage and
Disposal Existing Proposed After Expansion
1
Milk of Lime
(MOL) Plant
Rejects
1365.1
(Dry
Basis)
-
1365.1 (Dry Basis)
Being used for
Brick Plant and in
Building
Construction as
weather proofing
2
PO Plant
Sludge from
Solid
Separation
unit (RVDF)
2135.25
(Dry
Basis)
-
2135.25 (Dry Basis)
Given to brick
manufacturers.
Note: The above Non-Hazardous wastes are from Propylene Oxide (PO) Unit only.

2.18 Greenbelt Development
The Greenbelt area breakup is given in Table 2-21. The plant species of trees is given below in
Table 2-25. The Green Belt Layout is given in Figure 2-26 and Figure 2-27.
Table 2-25 Land area breakup of greenbelt
S.No Location Allocated area
(Hectares)
Green belt
area
(Hectares)
Percentage
of Green
belt (%)
No. of
Trees
planted
1. MPL – Plant – II
(within premises) – Already
completed
1.96 1.96 11.12 % 3100
2. MPL – Plant – II
(within premises) – Recently
completed
0.8059 0.8059 4.57 % 1300
3. Land allocated by
Vilangadupakkam Panchayat,
Puzhal Union
6.07 3.5 19.85 % 5600
4. V.C.N. Salai, Vadaperumbakkam
(GCC allocated land)
0.4122 0.4122 2.33 % 660
5. Thyagi Viswanathadoss Nagar,
SITE – 1
(GCC allocated land)
0.3028 0.3028 1.72 % 480
6. Thyagi Viswanathadoss Nagar,
SITE – 2
(GCC allocated land)
0.2172 0.2172 1.23 % 350
TOTAL 7.1981 40.82 % 11490
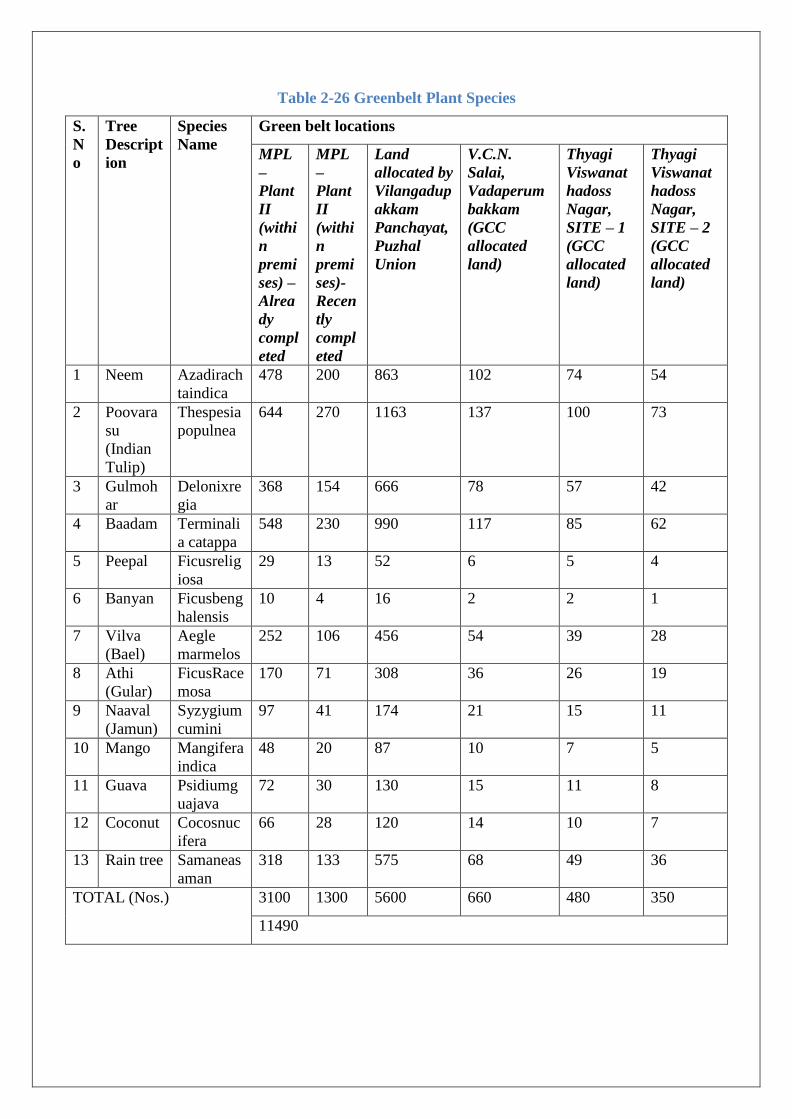
Table 2-26 Greenbelt Plant Species
S.
N
o
Tree
Descript
ion
Species
Name
Green belt locations
MPL
–
Plant
II
(withi
n
premi
ses) –
Alrea
dy
compl
eted
MPL
–
Plant
II
(withi
n
premi
ses)-
Recen
tly
compl
eted
Land
allocated by
Vilangadup
akkam
Panchayat,
Puzhal
Union
V.C.N.
Salai,
Vadaperum
bakkam
(GCC
allocated
land)
Thyagi
Viswanat
hadoss
Nagar,
SITE – 1
(GCC
allocated
land)
Thyagi
Viswanat
hadoss
Nagar,
SITE – 2
(GCC
allocated
land)
1 Neem Azadirach
taindica
478 200 863 102 74 54
2 Poovara
su
(Indian
Tulip)
Thespesia
populnea
644 270 1163 137 100 73
3 Gulmoh
ar
Delonixre
gia
368 154 666 78 57 42
4 Baadam Terminali
a catappa
548 230 990 117 85 62
5 Peepal Ficusrelig
iosa
29 13 52 6 5 4
6 Banyan Ficusbeng
halensis
10 4 16 2 2 1
7 Vilva
(Bael)
Aegle
marmelos
252 106 456 54 39 28
8 Athi
(Gular)
FicusRace
mosa
170 71 308 36 26 19
9 Naaval
(Jamun)
Syzygium
cumini
97 41 174 21 15 11
10 Mango Mangifera
indica
48 20 87 10 7 5
11 Guava Psidiumg
uajava
72 30 130 15 11 8
12 Coconut Cocosnuc
ifera
66 28 120 14 10 7
13 Rain tree Samaneas
aman
318 133 575 68 49 36
TOTAL (Nos.) 3100 1300 5600 660 480 350
11490

Figure 2-26 Green Belt Layout within the Project Site

Figure 2-27 Green Belt Layout in Govt. Allocated Lands

2.19 Air Pollution Control Measures
Modulation control available in the boiler to regulate the air – fuel ratio for proper combustion. The
Other APC are as follows
Usage of LNG as fuel instead of Furnace Oil in boiler after expansion.
All the hydrocarbon safety valve discharge is connected to flare system.
All the process and product tanks blanketed with Nitrogen.
In the MOL Plant a dust scrubber has been installed.
The source of emission, capacity and the various Air Pollution Control (APC) measures proposed are
listed in Table 2.27.
Table 2-27 Existing Air Pollution Sources and Control Measures
S.No. Air Pollution sources Control Measures Stack Height
from GL(m)
1
Boiler- B 10 Ton/hr (Stack
Common for Three Boilers)
Stack
30 Boiler - C 10 Ton/hr (Stack
Common for Three Boilers)
Boiler - D 21 Ton/hr (Stack
Common for Three Boilers)
2 EO / PO Blow Down Unit Wet scrubber with stack 10
3 Flare Stack Stack 30
4 1500 KVA DG Set -I Stack 10.5
5 1500 KVA DG Set –II Stack 10.5
6 Lime Charging Hopper Dust collectors with stack 6
7 Lime Slacker Outlet Wet scrubber with stack 6
There are no stacks proposed for the expansion of Propylene Glycol. The Existing boiler itself has
sufficient capacity to run the proposed unit. The existing fuel oil will be replaced by LNG in the
proposed project of quantity 33000 SCM/day in boilers.
2.20 Odour Control Measures
All the storage tanks present in Manali Petrochemicals Limited-Plant-II are provided with Inert Gas
(Nitrogen) blanketing system and any vents from PVRV or PSV of a storage tank contains only inert
gas and no process vapours. Hence no process odours envisaged.
2.21 Water Pollution Control Measures
The effluent generated is treated in the existing Effluent Treatment plant having capacity of 3600
KLD. The Characteristics of existing effluent is given in Table 2.25. The Characteristics of effluent
to be generated from the proposed project is given in Table 2.26 respectively.

Table 2-28 Characteristics of Existing Effluent
S.No. Characteristics Unit ETP outlet -
Results
Standard specification by
TNPCB
1. pH -- 6.32 5.5 - 9.0
2. Oil & Grease mg/L 8 20 Max.
3. BOD (5 days) @
20 deg C
mg/L 49 100 Max.
4. COD mg/L 236 250 Max.
5. Sulphate mg/L 206 1000 Max.
6. Chloride mg/L 26792 --
7. Total Suspended
Solids
mg/L 88 100 Max.
8. Total Dissolved
Solids
mg/L 43656 --
9. Total Residual
Chlorine
mg/L BDL (DL 0.1) 1 Max.
10. Phosphate mg/L 2.26 --
11. Calcium mg/L 14749 --
12. Total Chromium mg/L 0.069 2 Max.
13. Hexavalent
Chromium
mg/L BDL (DL 0.01) 1 Max.
14. Phenolic
compounds
mg/L BDL (DL 0.1) 5 Max.
Table 2-29 Characteristics of Effluent to be generated from the proposed project (RO Rejects)
S.No. Characteristics Unit Expected result
1. pH -- 7.5 – 9.0
2. BOD (5 days) @ 20 deg C mg/L 5 - 25
3. COD mg/L 40 - 100
4. Chloride mg/L 6000
5. Total Dissolved Solids mg/L 15000

3 Description of Environment
3.1 Introduction
This chapter provides information on existing environmental status incorporating land use of study
area, air environment, water environment, biological environment and socio-economic environment.
3.2 Study Area
As per the standard Terms of Reference (ToR) notified on August 2010 for Synthetic Organic
chemical industry by MoEF & CC study area considered for this report is 10 Km radius around the
project site.
Figure 3-1 Toposheet of 10km radius around the project site

Table 3-1 Study area with Environmental surroundings around the project site
S.No Particulars Details
1. Geographical
Coordinates (centre
coordinates)
13° 9'6.82"N - 80°16'20.50"E
2. Elevation above
Mean
Sea Level
3-7 m
3. Present Land Use Industrial
4. Nearest Railway
station
Chennai Central - 6.51km, S
5. Nearest Airport Chennai International Airport- 18.93km, SSW
6.
Nearest Highway
SH 56(Tiruvottiyur- Ponneri-Panjetti)- 2.51km, N
Chennai – Srikakulam Highway- 3.60 km, SSW
7. Nearest Road Nearest Road (Chinna Sekkadu-Railway Colony) - 0.06 km,
ENE
8.
Nearest habitation
/Village
.
Chinna Sekkadu village at 0.64km in NW direction.
9. Nearest Port Chennai Port - 4.14 km, SE
10 Nearest Town Manali - Site present within Manali
11 Nearest City Site is located within Greater Chennai corporation
12. Densely populated
area
Chinnasekadu located at a distance of 0.64 km in NW
direction with a population of 12396.
13. Inland water bodies S.
No
Name Distance (~
km)
Direction
Lakes
1 Sathangadu Lake 0.17 W
2 Lake near Sekkadu 2.33 WNW
3 Periyathoppu Lake 2.46 NW
4 Kadappakkam Lake 5.06 NNW
5 Madavaram Eri/Retteri
Lake
5.85 W
6 Pulal/Red Hills Lake 8.35 W
River
7 Korttalaiyar/Kosisttalaiyar
R
2.72 NNE
8 Cooum/Kuvam R 7.65 S
9 Adyar River 13.80 S
Canal
10 Buckingham Canal 0.84 ESE
11 Kodungaiyur Canal 1.90 SW
12 Captain Cotton Canal 2.44 S
13 Korattur Eri Canal 7.24 W
14 Canal near Padiyanallur 11.31km WNW
15 Krishna River Canal 14.61km W
Tank
16 Korattur Tank 8.86 WSW
17 Ambattur Tank 14.08 WSW

18 Cholavaram Tank 14.56 WNW
Nala
19 Otteri Nala 4.69km S
Creek
20 Ennore Creek 9.44km NNE
14 Reserved Forests /
Protected Forests/
Notified Wildlife
Sanctuary / Notified
national parks /
Ecologically
sensitive areas
Alamadi RF is located approximately at a distance of
14.59 km towards WNW from the Project boundary
15 Defense
Installations
INS Adyar - 8.46 km , SSE
Cholavaram Air Field - 13.26 km, WNW
16 Archeologically
Important places /
sites
Old Town Wall Tondiarpet- 5.35 km, SSE
Tomb of David Yale and Joseph Hymners in the
compound of Law College-7.06 km, S
Ramparts, gates bastions, Ravelins with vaulted
chambers and water cisterns underneath; moat and
defense walls all round with glacis to the extent of the
existing barbed wire fence - 7.51km , S
King’s Barracks Block No.XXV Fort St. George-
7.62km, S
Big Warehouse south of the Church Library (in Block
No.II/7) Fort St. George- 8.01km, S
Nursing Sister’s House (Block 1/3) Fort St. George -
8.03km,S
Megalithic cists and cairns pottur-12.03km, W
17 Inter state boundary None
18 Hills/Valleys None

Figure 3-2 Environmental sensitive areas covering within 15 km from project boundary

3.2.1 Classification of the study Area:
Baseline information with respect to air quality, noise level, water, soil quality, biological
environment in the study area was collected by conducting primary sampling/ field studies during
End of December 2021 to End of March 2022. Baseline status of Land and Socio-economical
environment are also studied simultaneously. The environmental attributes studied are detailed out in
Table below.
Table 3-2 Classification of the study Area
S.No. Description Primary/Secondary Attributes
1 Project Site Primary Ambient air quality, Ground water,
Surface water, Noise levels, Flora,
Fauna, Socio economic aspects, Traffic
studies.
2 Area with
angular distance
of 2 km
surrounding the
project site
Primary Ambient air quality, Ground water,
Surface water, Flora, Fauna, Noise
levels (500 m radius from site), Traffic
study (at major traffic junctions)
3 Area with
angular distance
of 2 km up to 10
km surrounding
the project site
Secondary data from
Government /
Government approved
sources
Meteorological data, Surface water
bodies, Flora, Fauna, Socio economic
aspects, Land environment.
Table 3-3 Environmental Attributes
S.No. Attribute Details of Baseline data Remarks
1. Air Environment
i Ambient air quality Type of data: Primary data
Sampling Locations: Project site and 7
surrounding locations
within 7 km radius of the project site
Period: End of December to End of
March
Locations were
selected within 7 Km
radius of project site
Upwind – 2
Downwind – 2
Crosswind - 3
ii Noise Level Type of data: Primary data
Sampling Locations: Project site and 7
surrounding locations
within 7 km radius of the project site
Period: One time sampling
Locations were
selected within 7 Km
radius of project site.
iii Meteorological
Data
Type of data: Secondary for choosing
the baseline monitoring locations
Source:2020 - Indian Meteorological
Department (IMD), Chennai
--
2 Water Environment
iv Ground water Type of data: Primary data
Sampling Locations: 7 surrounding
locations
--

Within 7 km radius of the project site
Period: Once during the study period
v Surface water Project site – Nil
Within 5 km – 1 No
Locations were
selected within 5 Km
radius of project site
3 Land Environment
vi Land use &
land cover
Type of data : Secondary
Source: GIS Study for Land use/
Land cover details of 10 km radius
Land use/ land cover
classification was
made based on the
satellite data
collected from
LANDSAT_8,
OLI_TIRS and using
ARC _GIS / ERDAS
software.
vii Soil analysis Type of data: Primary data
Sampling Locations: Project site and 6
surrounding locations
within 7 km radius of the project site
Period: Once during the study period
--
4 Socio –
Economic
Environment
1. Primary data: Project site (10km
around the project site)
2. Secondary data :
Source : 2011 ‘Census of India’
--
5 Biological
Environment
1. Primary data: Project site and
selected locations in the 7 Km radius
from the project site (Period: February
2022)
2. Secondary data : From 2 Km upto
10 km radius from the project site
The proposed unit is
located in the Manali
Industrial Area. Study
area is confined
within 7km.
3.3 Land use Analysis
3.3.1 Land Use Classification
Land Use / Land Cover - Land Use refers to man's activity and the various uses, which are carried on
land. Land Cover refers to natural vegetation, water bodies, rock/soil, artificial cover and others,
resulting due to land transformation. The present Land Use/Land Classification map is developed
with following objectives. The main objective of the study is to classify the different land use within
10 km from the project boundary.
3.3.2 Methodology
Information of land use and land cover is important for many planning and management activities
concerning the surface of the earth (Agarwal and Garg, 2000). Land use refers to man's activities on
land, which are directly related to land (Anderson et al., 1976). The land use and the land cover
determine the infiltration capacity. Barren surfaces are poor retainers of water as compared to

grasslands and forests, which not only hold water for longer periods on the surface, but at the same
time allow it to percolate down.
The terms ‘land use’ and ‘land cover’ (LULC) are often used to describe maps that provide
information about the types of features found on the earth’s surface (land cover) and the human
activity that is associated with them (land use). Satellite remote sensing is being used for determining
different types of land use classes as it provides a means of assessing a large area with limited time
and resources. However, satellite images do not record land cover details directly and they are
measured based on the solar energy reflected from each area on the land. The amount of multi
spectral energy in multi wavelengths depends on the type of material at the earth’s surface and the
objective is to associate particular land cover with each of these reflected energies, which is achieved
using either visual or digital interpretation. In the present study the task is to study in detail the land
use and land cover in and around the project site. The study envisages different LULC around the
proposed project area and the procedure adopted is as below.
Figure 3-3 Flow Chart showing Methodology of Land use mapping

3.3.3 Satellite Data
IRS Resourcesat-2 LISS-III multispectral satellite data of 05th March 2016 was utilized for the
present study. Details of satellite data is given below. The rectification of imagery was carried out on
to bring the digital data on the earth coordinate system by means of ground control point (GCP)
assignments/SOI topo sheets.
3.3.4 Scale of mapping
Considering the user defined scale of mapping, 1:50000 IRS-P6, LISS-III data on 1:50000 Scale
was used for Land use / Land cover mapping of 10 km radius for proposed site. The description of
the land use categories for 10 km radius and the statistics are given for 10 km radius.
3.3.5 Interpretation Technique
Standard on screen visual interpretation procedure was followed. The various Land use / Land cover
classes interpreted along with the SOI topographical maps during the initial rapid reconnaissance of
the study area. The physiognomic expressions conceived by image elements of color, tone, texture,
size, shape, pattern, shadow, location and associated features are used to interpret the FCC imagery.
Image interpretation keys were developed for each of the LU/LC classes in terms of image elements.
February 2016 FCC imagery (Digital data) of the study area was interpreted for the relevant land use
classes. On screen visual interpretation coupled with supervised image classification techniques are
used to prepare the land use classification.
1. Digitization of the study area (10 km radius from the proposed site) from the topo maps
2. In the present study the IRS –P6 satellite image and SOI topo sheets of 66 C/4 & 66 C/8 have
been procured and interpreted using the ERDAS imaging and ARC-GIS soft ware adopting the
necessary interpretation techniques.
3. Satellite data interpretation and vectorisation of the resulting units
4. Adopting the available guidelines from manual of LULC mapping using Satellite imagery
(NRSA, 1989)
5. Field checking and ground truth validation
6. Composition of final LULC map
The LULC Classification has been done at three levels where level -1 being the broad classification
about the land covers that is Built-up land, agriculture land, waste land, wet lands, and water bodies.
These are followed by level –II where built-up land is divided into towns/cities as well villages. The
Agriculture land is divided into different classes such as cropland, Fallow, Plantation, while

wastelands are broadly divided into, Land with scrub and without Scrub and Mining and Industrial
wasteland. The wetlands are classified into inland wetlands, coastal wetlands and islands. The water
bodies are classified further into River/stream, Canal, Tanks and bay. In the present study level II
classification has been undertaken.
3.3.6 Field Verification
Field verification involved collection, verification and record of the different surface features that
create specific spectral signatures / image expressions on FCC. In the study area, doubtful areas
identified in course of interpretation of imagery is systematically listed and transferred on to the
corresponding SOI topographical maps for ground verification. In addition to these, traverse routes
were planned with reference to SOI topographical maps to verify interpreted LU/LC classes in such
a manner that all the different classes are covered by at least 5 sampling areas, evenly distributed in
the area. Ground truth details involving LU/LC classes and other ancillary information about crop
growth stage, exposed soils, landform, nature and type of land degradation are recorded and the
different land use classes are taken the Land use map is presented in Annexure
3.3.7 Description of the Land Use / land cover classes
Total geographic area of Tiruvallur district is 3423 Sq.Km. Urban Builtup area is 295.16
Sq.Km and Rural Builtup area is 272.76 Sq.Km. Details of land use/land cover statistics for
Tiruvallur district were given in Table 3-4 and Land Use pattern/cover of Tiruvallur district is given
in Figure 3-3.
Table 3-4 District land use/land cover statistics (2015-16) for Tiruvallur district
S.No Division of Land Use / Land Cover Area in
Sq.km
Area in
acres
Area in
Ha
Total
area %
1. Agriculture, Crop land 1834.25 453252.35 183425 53.59
2. Agriculture, Plantation 87.77 21688.41 8777 2.56
3. Agriculture, Fallow 115.92 28644.41 11592 3.39
4. Barren/Unculturable/Wastelands, Salt
Affected land
7.42 1833.52 742 0.22
5. Barren/Unculturable/ Wastelands,
Scrub land
190.58 47093.27 19058 5.57
6. Barren/Unculturable/Wastelands,
Sandy area
12.83 3170.36 1283 0.37
7. Barren/Unculturable/Wastelands,
Gullied/Ravinous Land
0.11 27.18 11 0.00
8. Barren/Unculturable/Wastelands,
Barren rocky
2.39 590.58 239 0.07
9. Builtup, Urban 295.16 72935.5 29516 8.62
10. Builtup, Rural 272.76 67400.36 27276 7.97
11. Builtup, Mining 7.54 1863.17 754 0.22
12. Forest, Evergreen/Semi evergreen 18.22 4502.25 1822 0.53

13. Forest, Deciduous 68.13 16835.26 6813 1.99
14. Forest, Forest Plantation 10.57 2611.9 1057 0.31
15. Forest, Swamp/Mangrooves 3.03 748.73 303 0.09
16. Forest, Scrub forest 0.03 7.41 3 0.00
17. Wetlands, Water bodies, Inland
wetland
0.65 160.62 65 0.02
18. Wetlands, Water bodies,
Reservoir/Lakes/Ponds
341.57 84403.65 34157 9.98
19. Wetlands, Water bodies,
River/stream/canals
67.33 16637.58 6733 1.97
20. Wetlands/Water bodies, Coastal
wetland
86.74 21433.89 8674 2.53
21. Total 3423 845840.415 342300 100
Figure 3-4 Land use/Land cover pattern for Tiruvallur district
3.3.8 Land use Land cover for the Study area
The land use pattern of the study area is 331.99Sq.Km given in Table 3-5, Land use pattern and land
use map of the study area is given in Figure 3-4 and Figure 3-5 respectively.
Table 3-5 Land use pattern of the Study Area
S.NO Description Area
(Sq.km)
Area
(ACRES)
AREA
(Hectare)
Percentage
(%)
1. Urban 153.63 37962.74 15363 46.28
2. Cropland 35.33 8730.22 3533 10.64
3. Rural 14.56 3597.85 1456 4.39
4. Reservoirs/Lakes/Ponds 13.64 3370.51 1364 4.11

5. Rivers/Stream/Canals 8.36 2065.80 836 2.52
6. Scrub land 7.13 1761.86 713 2.15
7. Coastal wetland 5.14 1270.12 514 1.55
8. Plantation 4.08 1008.19 408 1.23
9. Sandy area 2.49 615.27145 249 0.75
10. Fallow land 1.61 397.84 161 0.48
11. Salt affected land 0.04 9.88 4 0.01
12. Ocean 85.98 21246.09 8598 25.90
13. Total 331.99 82036.39 33199 100.0
Figure 3-5 Land Use Pattern for Study Area

Figure 3-6 Land use classes around 10 km radius from the project site
3.4 Hydrogeology
The district underlain by both porous and fissured formations. The important aquifer systems in
the district are considered by Unconsolidated & semi-consolidated formations and Weathered,
fissured and fractured crystalline rocks. The porous formations in the district include
sandstones and clays of Jurassic age (Upper Gondwana), marine sediments of Cretaceous age,
sandstones of Tertiary age and recent alluvial formations. As the Gondwana formations are well-
compacted and poorly jointed, the movement of ground water in these formations is mostly
restricted to shallow levels. Ground water occurs under phreatic to semi-confined conditions
in the inter-granular pore spaces in sands and sandstones and the bedding planes and thin
fractures in shales. In the area underlain by Cretaceous sediments, ground water development is
rather poor due to the rugged nature of the terrain and the poor quality of the formation water.
Quaternary formations comprising mainly sands, clays and gravels are confined to major
drainage courses in the district. The maximum thickness of alluvium is 30.0 m. whereas the
average thickness is about 15.0m. Ground water occurs under phreatic to semi-confined
conditions in these formations and is being developed by means of dug wells and filter

points. Alluvium which forms a good aquifer system along Araniyar and Korattalaiyar river
bed which is one of the major sources of water supply to urban areas of Chennai city and
also to the industrial units. Ground water generally occurs under phreatic conditions in the
weathered mantle and under semi-confined conditions in the fissured and fractured zones at deeper
levels. The thickness of weathered zone in the district is in the range of 2 to 12 m. The depth of the
wells ranged from 8.00 to 15.00 mbgl. The yield of large diameter wells tapping the weathered
mantle of crystalline rocks ranges from 100 to 500 lpm and are able to sustain pumping for 2 to 6
hours per day. The yield of bore wells drilled down to a depth of 50 to 60 m ranges from 20 to 400
lpm. The yield of successful bore wells drilled down to a depth of 150 m bgl during the ground water
exploration programme of Central Ground Water Board ranged from 1.2 to 7.6 lpm. The depth to
water level in the district varied between 2.38 – 7.36 m bgl during pre-monsoon (May 2006) and
0.79 – 5.30 m bgl during post monsoon (Jan 2007). The seasonal fluctuation shows a rise between
0.28 and 4.80 mbgl. The piezometric head varied between 2.20 to 10.30 m bgl (May 2006)
during premonsoon and 2.72 to 8.55 m bgl during post monsoon. The hydrogeology map of
Thiruvallur District is given in Figure 3-6.
Source:http://cgwb.gov.in/District_Profile/TamilNadu/TIRUVALLUR.pdf
Figure 3-7 Hydrogeology Map of Thiruvallur District

3.4.1 Drainage Pattern
Araniyar, Korattalayar, Cooum, Nagari and Nandhi are the important rivers. The drainage
pattern, in general, is dendritic. All the rivers are seasonal and carry substantial flows during
monsoon period. Korattaliar river water is supplied to Cholavaram and Red Hill tanks by
constructing an Anicut at Vellore Tambarambakkam. After filling a number of tanks on its further
course, the river empties into the Ennore creek a few kilometres north of Chennai. The
Cooum River, flowing across the southern part of the district, has its origin in the surplus waters of
the Cooum tank in Tiruvallur taluk and also receives the surplus waters of a number of tanks. It
feeds the Chembarambakkam tank through a channel. It finally drains into the Bay of Bengal. The
drainage map of the Study Area is given as Figure 3-7.
Source:http://cgwb.gov.in/District_Profile/TamilNadu/TIRUVALLUR.pdf
Figure 3-8 Drainage map of study area
3.5 Geomorphology of District
The prominent geomorphic units identified in the district through interpretation of Satellite
imagery are Alluvial Plain, Old River Courses, Coastal plains, Shallow & deep buried
Pediments, Pediments and Structural Hills. The elevation of the area ranges from 183 m amsl in the
west to sea level in the east. Four cycles of erosion gave rise to a complex assemblage of fluvial,
estuarine and marine deposits. The major part of the area is characterised by an undulating
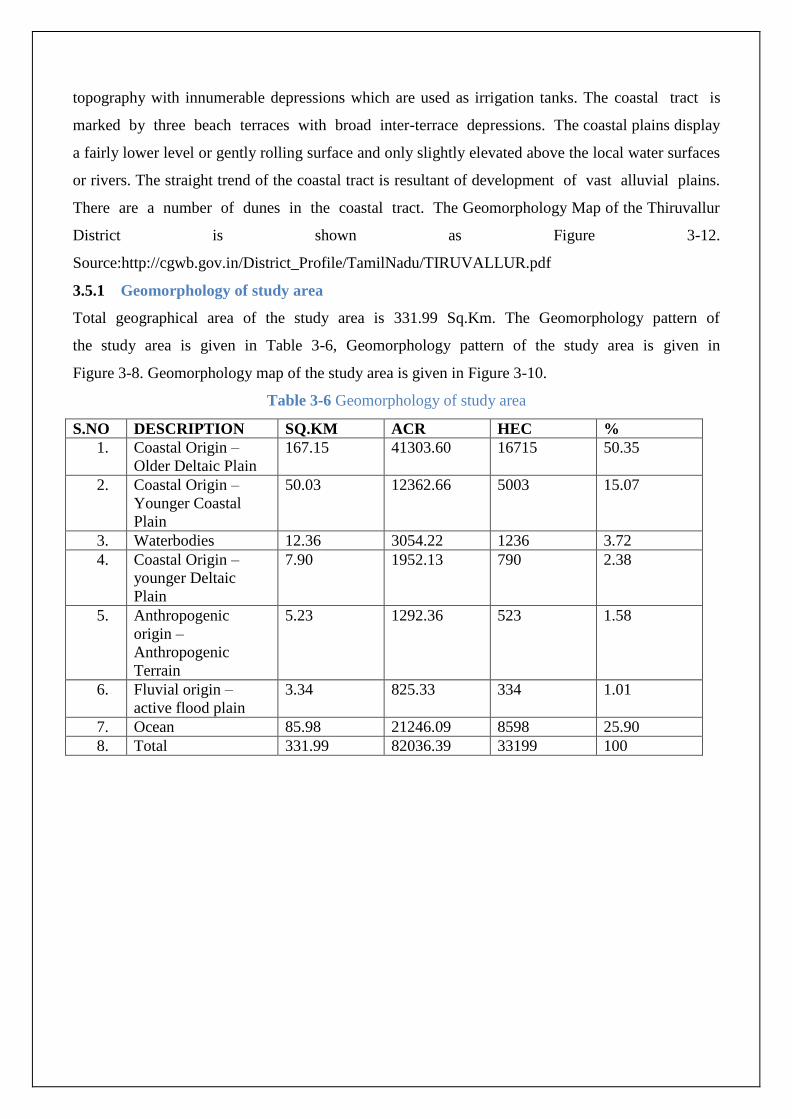
topography with innumerable depressions which are used as irrigation tanks. The coastal tract is
marked by three beach terraces with broad inter-terrace depressions. The coastal plains display
a fairly lower level or gently rolling surface and only slightly elevated above the local water surfaces
or rivers. The straight trend of the coastal tract is resultant of development of vast alluvial plains.
There are a number of dunes in the coastal tract. The Geomorphology Map of the Thiruvallur
District is shown as Figure 3-12.
Source:http://cgwb.gov.in/District_Profile/TamilNadu/TIRUVALLUR.pdf
3.5.1 Geomorphology of study area
Total geographical area of the study area is 331.99 Sq.Km. The Geomorphology pattern of
the study area is given in Table 3-6, Geomorphology pattern of the study area is given in
Figure 3-8. Geomorphology map of the study area is given in Figure 3-10.
Table 3-6 Geomorphology of study area
S.NO DESCRIPTION SQ.KM ACR HEC %
1. Coastal Origin –
Older Deltaic Plain
167.15 41303.60 16715 50.35
2. Coastal Origin –
Younger Coastal
Plain
50.03 12362.66 5003 15.07
3. Waterbodies 12.36 3054.22 1236 3.72
4. Coastal Origin –
younger Deltaic
Plain
7.90 1952.13 790 2.38
5. Anthropogenic
origin –
Anthropogenic
Terrain
5.23 1292.36 523 1.58
6. Fluvial origin –
active flood plain
3.34 825.33 334 1.01
7. Ocean 85.98 21246.09 8598 25.90
8. Total 331.99 82036.39 33199 100

Figure 3-9 Geomorphology pattern of the study area
Figure 3-10 Geomorphology map of Thiruvallur District

Figure 3-11 Geomorphology Map of Study Area
3.6 Geology:
The Thiruvallur district can be geologically classified into hard rock and sedimentary
(alluvial) formation. This district is principally made up of Archaean, upper Gondwana and
the tertiary formations. These are over laid by laterites and alluvium. The oldest of the
crystalline rocks of Archaean age are of Biotite and Hornblende Gneiss, Charnockite and
granite. These are intruded by Amphibole dykes, and occasionally with veins of quartz and
pegmatites. Granites and gneisses of Archaean age are mainly seen in Tiruthani taluk.
Geological map of Tamilnadu is given as Figure 3-11.
Source:http://nwm.gov.in/sites/default/files/Notes%20on%20Thiruvallur%20District.pdf

Figure 3-12 Geology map of Tamilnadu
3.7 Soil Profile in district
Soils in the area have been classified into Red soil, Black soil, Alluvial soil and colluvial soil. The
major part is covered by Red soil of red sandy/clay loam type. Ferruginous red soils are also seen at
places. Black soils are deep to very deep and generally occurs in the depressions adjacent to hilly
areas, in the western part. Alluvial soils occur along the river courses and eastern part of the
coastal areas. Sandy coastal alluvium (arenaceous soil) are seen all along the sea coast as a narrow
belt. Soil map of India is given in Figure 3-12.
Source:http://cgwb.gov.in/District_Profile/TamilNadu/TIRUVALLUR.pdf
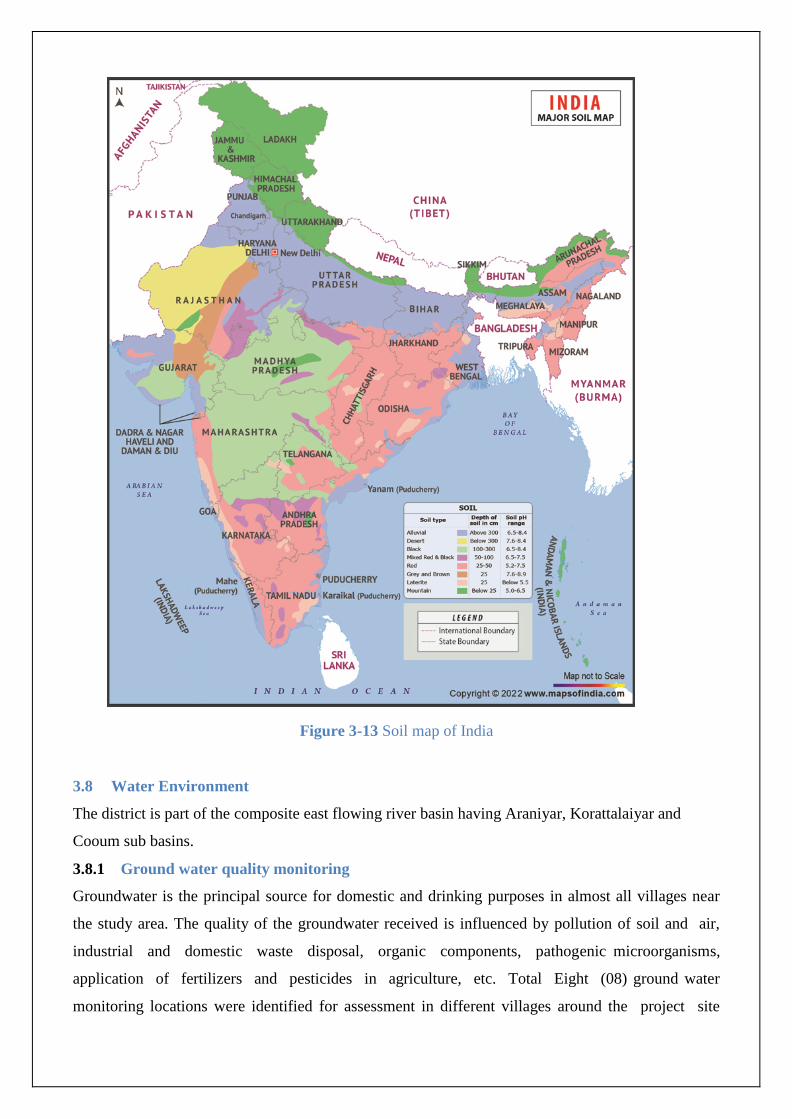
Figure 3-13 Soil map of India
3.8 Water Environment
The district is part of the composite east flowing river basin having Araniyar, Korattalaiyar and
Cooum sub basins.
3.8.1 Ground water quality monitoring
Groundwater is the principal source for domestic and drinking purposes in almost all villages near
the study area. The quality of the groundwater received is influenced by pollution of soil and air,
industrial and domestic waste disposal, organic components, pathogenic microorganisms,
application of fertilizers and pesticides in agriculture, etc. Total Eight (08) ground water
monitoring locations were identified for assessment in different villages around the project site

based on the usage of sub surface water by the settlements/ villages in the study area. The
groundwater results are compared with the desirable and permissible water quality standards as
per IS 10500 (2012) for drinking water. Groundwater quality monitoring locations and results are
given in Table 3-7 and Table 3-8. Map showing the groundwater monitoring locations are given in
Figure 3-8.
Table 3-7 Ground water Monitoring locations
S.No Location Distance Direction
1. Project site (GW 1) - -
2. Kodungaiyur (GW 2) 2.9 SW
3. Madhavaram milk colony
(GW 3)
3.37 W
4. Manjambakkam (GW 4) 5.51 W
5. Rayapuram (GW 5) 5 SE
6. Manali new town (GW 6) 5 N
7. Thangal (GW 7) 2.81 E
8. Tondiarpet (GW 8) 3.30 SSE

Figure 3-14 Ground water monitoring locations
Sampling Procedure
Quality of ground water was compared with IS: 10500: 1991 (Reaffirmed 1993 With Amendment
No -3 July 2010) for drinking purposes. Water samples were collected as Grab sample from five
sampling locations in a 5-liter plastic jerry can and 250 ml sterilized clean glass/pet bottle for
complete physico-chemical and bacteriological tests respectively. The samples were analyzed as per
standard procedure / method given in IS: 3025 (Revised Part) and standard method for examination
of water and wastewater Ed. 21st, published jointly by APHA.
S. No Parameters Test Method
1 pH (at 25°C) IS:3025(P -11)1983 RA: 2012
2 Electrical Conductivity IS:3025(P -14) 2013
3 Colour IS:3025 (P -4)1983 RA: 2012
4 Turbidity IS:3025(P -10)1984 RA: 2012

5 Total Dissolved Solids APHA 22nd
Edn.2012-2540-C
6 Total Suspended Solids IS:3025(P-17)-1984 RA:2012
7 Total Hardness as CaCO3 APHA 22nd
Edn.2012-2340-C
8 Calcium as Ca APHA 22nd
Edn2012.3500 Ca-B
9 Magnesium as Mg APHA 22nd
Edn.2012-3500 Mg-B
10 Chloride as Cl IS:3025(P -32)-1988 RA: 2014
11 Sulphate as SO4 APHA 22nd
Edn.2012-4500 SO4--E
12 Total Alkalinity as CaCO3 APHA 22nd
Edn.2012-2320-B
13 Iron as Fe IS:3025(P -53):2003 RA: 2014
14 Silica as SiO2 IS:3025(P -35)1988 RA: 2014
15 Fluoride as F APHA 22nd
Edn.2012-4500-F-D
16 Nitrate as NO3 IS:3025(P -34):1988 RA: 2014
17 Sodium as Na IS:3025(P -45):1993 RA: 2014
18 Potassium as K IS:3025(P -45):1993 RA: 2014

Table 3-8 Ground water sampling results
Paramet
er
Uni
t
Proje
ct
Site
(GW
1)
Kod
unga
iyur
(GW
2)
Milk
Colony
(GW3)
Manjamp
akkam
(GW4)
Rayapur
am (GW
5)
Manali
New
Town
(GW 6)
Than
gal
(GW
7)
Tondia
rpet
(GW 8)
pH - 7.6 7.54 6.93 6.78 7.59 7.82 7.32 7.15
Electrical
Conducti
vity
µS/
cm
3080
4627 1445 2410 1747 3460 3380 1484
Colour Ha
zen 4
2 1 1 2 10 1 3
Turbidity NT
U
5
5.5 BQL(L
OQ:1)
BQL(LOQ
:1)
1.5 7 BQL(
LOQ:
1)
4.5
Total
Dissolved
Solids
mg/
l
1940
2802 795 1326 1005 2140 2070 855
Total
Suspende
d Solids
mg/
l
3
7 BQL(L
OQ:2)
BQL(LOQ
:2)
2.3 9.2 BQL(
LOQ:
2)
6.8
Total
Hardness
mg/
l 570
877 518 698 290 592 826 308
Calcium
Hardness
as CaCo3
mg/
l
362
450 385 573 200 338 552 255
Magnesiu
m
Hardness
as
MgCo3
mg/
l
208
427 133 125 89.8 254 274 53
Calcium mg/
l 145
180 154 229 80.1 135 221 102
Magnesiu
m
mg/
l 50.4
104 32.7 30.8 21.8 61.8 66.4 12.9
Chlorine mg/
l 640
846 143 337 288 724 626 245
Sulphate mg/
l 184
618 163 212 146.4 190 244 146
Alkalinit
y
mg/
l 461
295 200 174 282 376 452 140
Iron mg/
l 1.2
0.96 BQL 0.27 0.34 1.65 0.114 2.04
Silica mg/
l 52.3
49.1 35.3 37.4 34.1 72.5 71.4 28.4
Sodium mg/
l 520
775 115.4 293 235 648 500 218
Potassiu
m
mg/
l 83.5
58.3 15.2 24.2 29.4 88.7 72.1 16.5

Fluorides mg/
l
0.25
0.49 0.37 BQL(LOQ
:0.2)
BQL
(LOQ:0.2
)
BQL
(LOQ:0.2)
BQL
(LOQ:
0.2)
BQL
(LOQ:0.
2)
Nitrate mg/
l 19.2
5.46 42.8 45.3 17.54 7.305 23.95 23
Coliform 26 <2 17 30 17 <2 <2 <2 <2
E coli <2 <2 <2 <2 <2 <2 <2 <2 <2

Interpretation of results:
Physical parameters of water:
The basic physical parameters of water include
Colour:
Value observed (True/ Apparent Color): 2 Hazel unit in GW2, GW. 3 Hazel unit in GW 8, 1 Hazel
unit in GW 3,4,7. 10 Hazel unit in GW 6.
Acceptable and permissible limits: 5 Hazel units and 15 Hazel units respectively. The value in the
project site is as less than the Permissible limits prescribed by IS 10500: 2012
Odour:
The water is odourless. As per the standards, the odour and taste should be agreeable.
pH:
Value observed: 6.78 – 7.82.
Acceptable and permissible limits: 6.5-8.5. The pH value is the measure of acid – base equilibrium.
The value of pH in the project site clearly indicates that water is neutral in nature.
Turbidity:
Value observed:1.5,5.5,7 in GW 5, GW2-GW1, GW 6 & BQL in other locations.
Acceptable and permissible limits:1 NTU & 5 NTU respectively. The value of turbidity generally
indicates the presence of phytoplanktons and other sediments. The value in the project site indicates
the water is less turbid and no any physical treatment is required to treat the turbidity of the water.
Total Dissolved Solids:
Value observed: 795 – 2802 mg/l.
Acceptable and permissible limits: 500 mg/L and 2000 mg/L respectively.
The TDS is the presence of the inorganic salts and small amounts of organic matter present in the
water. This is mainly due to the result of surface runoff as the cations and anions in the top soil is
carried away by the water. As per the Guidelines of WHO, if the value of TDS is greater than 1200
mg/L, it is designated as unacceptable. The value of TDS is found to be within the limit except
GW2, 4, 6, 7. The high value of TDS is due to the presence of salt deposits, and sea water intrusion.
Chemical parameters of water:
The chemical parameters of the drinking water include
Calcium:
Value observed: 80.1– 229 mg/L.
Acceptable and permissible limits:75mg/L and 200 mg/L respectively.

Calcium is the essential macronutrient. The value of the calcium is within the prescribed permissible
standards. The higher level of calcium may cause hardening in domestic equipment and will also
reduce the detergent efficiency. The value of calcium is found to be higher in GW 4 & 7 locations.
Magnesium:
Value observed: 12.9 – 104 mg/L.
Acceptable and permissible limits:30 mg/L and 100 mg/L respectively.
The value of Magnesium in the project site is less than the permissible limit. The increase in the
level of magnesium will cause diarrhea and vomiting in children.
Chloride
Value observed: 143-846 mg/L.
Acceptable and permissible limits: 250 mg/L and 1000 mg/L respectively.
The chloride level in the project site is less than the permissible limit.
Hardness:
Value observed in project site: 308 - 877 mg/L.
Acceptable and permissible limits:200 mg/L and 600 mg/L respectively.
The value of Hardness in the project site is within than permissible limit. The increase in the level of
hardness may cause corrosion and scaling problems, increased soap consumption and it also
contributes to the salty taste of water.
The value of heavy metals such as Arsenic, cadmium, lead, Mercury, Nickel Lead is found to be
BQL. Overall the ground water quality is within the standards except location 2&6.
3.8.2 Surface Water Analysis
Surface water sample were taken from 8 rivers nearby. The Sampling locations & results are given
below.
S.No Location Distance Direction
1. Kosasthalaiyar River (SW1) 8.96 NNE
2. Buckingham canal (SW2) 2.94 NE
3. Cooum river (u/s) SW 3 8.97 SSW
4. Buckingham canal (u/s) SW4 1.25 SSE
5. Cooum river (d/s) SW5 8.86 S
6. Puzhal lake SW 6 8.42 W
7. Retteri SW 7 7 W
8. Madhavaram lake SW 8 6.64 W

Table 3-9 surface water sample results
Parameter
s
Unit Cooum
river
(upstrea
m)
Buckingha
m canal
(upstream
)
Cooum
river
(downstrea
m)
Buckingha
m canal
(downstrea
m)
Madhavar
am Eri
Kosasthal
aiyar
river
Puzha
l lake
Retteri
pH - 7.56 7.5 6.96 7.87 7.14 7.2 7.89 7.79
Electrical
Conductivit
y
µs/c
m
3618 4210 2925 4960 2060 261 1067 1042
Turbidity NTU 45 5.2 28 6.5 15.5 4.2 3 6
Total
Dissolved
Solids
mg/l 2065 2836 1965 3026 1390 168 710 655
Total
Suspended
Solids
mg/
L
75 156 68 216 10.1 10 10 10
Total
Hardness
mg/
L
745 790 712 825 668 93 265 245
Calcium
Hardness as
CaCo3
mg/
L
430 146 386 170 107 26 128 116
Magnesium
Hardness as
MgCo3
mg/
L
315 104 285 146 97.3 6.9 65.8 49.4
Calcium Ca mg/
L
172 1222 165 1765 435 22.6 54 51
Magnesium
Mg
mg/
L
76.9 165 64.8 182 162 5.8 32 28.6
Chloride
Cl
mg/
L
656 227 586 325 210 75 160 176
Sulphte
SO4
mg/
L
189 0.21 176 0.45 BQL(LOQ:
0.1)
BQL(LO
Q:0.1)
152 150
Total
Alkalinity
mg/
L
520 85 480 105 65 8.5 195 218
Iron Fe mg/
L
0.52 0.95 0.48 0.97 0.21 BQL(LO
Q:0.2)
0.27 0.36
Silica SiO2 mg/
L
39.2 1008 29.6 1247 340 18.2 9.65 10
Sodium Na mg/
L
517 141 487 175 94 2.9 80 94
Potassium
K
mg/
L
95.2 11.5 87.2 13 11.5 4.2 9 12
Fluorides F mg/
L
BQL(L
OQ:0.2)
104 BQL(LOQ:
0.2)
113 9.4 BQL(LO
Q:2)
0.21 0.22
Nitrate
NO3
mg/
L
19.1 319 14.6 342 35.2 8.5 1.98 1.32
Chemical
Oxygen
mg/
L
77.3 0.5 63.5 1.2 4.2 5.5 32 38

Demand
Biological
Oxygen
Demand
mg/
L
22.1 900 19.7 865 22 7 8.26 9.86
Total
Kjedhal
Nitrogen
mg/
L
23.4 11 18.4 13 7 <2 27 42
Dissolved
Oxygen
mg/
L
BQL(L
OQ:2)
5.2 BQL(LOQ:
2)
5.5 15.5 4.2 5.5 4.5
Inference: The surface water quality is compared with the CPCB Water Quality Criteria against A,
B, C, D & E class of water. From the test result, it is found that the both the water does not fit Class
A (Drinking Water Source without conventional treatment but after disinfection). But they can be
used for outdoor bathing as it meets the requirements shown for class B water.
3.9 Climatology & Meteorology
Climate and meteorology of a place can play an important role in the implementation of any
developmental project. Meteorology is also the key to understand local air quality as there is an
essential relationship between meteorology and atmospheric dispersion involving wind in the
broadest sense of the term.
The year may broadly be divided into four seasons:
Winter season : December to February
Pre-monsoon season : March to May
Monsoon season : June to September
Post-monsoon season : October to November
i) Climate
The pre-monsoon rainfall is almost uniform throughout the district. The coastal regions receive more
rainfall than the interior ones. Northeast and Southwest monsoons are the major donors, with 54%
and 36% contribution each to the total annual rainfall. During normal monsoon, the district receives
a rainfall of 1200 mm. The normal annual rainfall over the district varies from 1105 mm to 1214
mm.
ii) Temperature
The months between March and May are generally hot with temperatures going up to an average
maximum of 36.6ºC. In winter (December - February) the average minimum temperature is 19.8ºC.

Rainfall:
The historical rainfall data of past years is collected. The maximum rainfall is observed in
November, 2015 with a rainfall of 1061.3 mm.
Year Jan Feb Mar Apr May Jun Jul Aug Sep Oct Nov Dec
R/F R/F R/F R/F R/F R/F R/F R/F R/F R/F R/F R/F
2014 0.5 3.4 0.0 0.0 35.7 117.6 50.9 130.9 130.6 196.3 135.0 106.9
2015 1.7 0.0 0.0 49.5 45.4 32.2 102.2 140.4 70.3 179.8 1061.3 574.0
2016 0.4 0.0 0.0 0.0 173.2 81.6 76.6 112.7 213.3 28.6 26.1 280.0
2017 16.4 0.1 0.0 0.0 14.4 67.8 98.8 228.6 98.7 287.6 335.7 49.3
2018 2.6 1.8 7.9 0.4 6.2 51.1 64.8 189.7 91.4 133.0 241.1 43.0
2019 0.2 0.3 0.1 2.7 5.6 39.3 150.7 130.9 108.8 303.3 205.6 184.1
2020 53.8 0.6 0.0 13.3 2.1 39.7 231.7 68.4 67.0 119.8 465.1 244.9
Source: IMD, GoI
iii) Relative humidity
High relative humidity between 58 and 84% prevail throughout the year. Relative humidity is
maximum in the morning and minimum in the evening. Higher rates of relative humidity are
observed between November and January i.e., 83 to 84%. In the months of June, the humidity is
lower i.e., around 58%. Average relative humidity in the morning and evening is 74 and 64%
respectively.
iv) Wind Speed:
Wind speed was in the range of 4 Km/hr to 12 Km/hr. The wind speed was almost close to each
other during the whole study period. The wind speed varied from 4 Km/hr to 24 Km/hr.
v) Wind Rose Diagram
The wind rose denotes a class of diagrams designed to display the distribution of wind direction at a
given location over a period of time. Wind roses are also useful as they project a large quantity of
data in a simple graphical plot.
The wind speed & wind direction data are taken and wind rose is plotted for (End of December
2020 to End of March 2021). The wind rose is plotted using WR Plot.

Figure 3-15 Windrose
Selection of Sampling Locations:
Eight Monitoring locations along with the project site is selected based on Wind Direction & Wind
Speed. All the monitoring locations are chosen in the downwind direction.
3.9.1 Ambient Air Quality
Environmental Parameters: Ambient Air
Monitoring Period End of December 2021 – End of March 2022
Design Criteria The monitoring stations are selected based on factors like
Topography / terrain, prevailing meteorological conditions
like predominant wind direction (End of December 2020 –
End of March 2021), etc, play vital role in selection of air
sampling stations. Based on these criteria, 8 air sampling
stations were selected in the area as shown below.
Monitoring Locations
S.No Location Distance Direction
1. Project site - -
2. Kodungaiyur 2.9 SW
3. Madhavaram milk
colony
3.37 W
4. Manjambakkam 5.51 W
5. Rayapuram 5 SE
6. Manali new town 5 N
7. Thangal 2.81 E
8. Tondiarpet 3.30 SSE
Methodology Respirable Particulate Matter (PM10) - Gravimetric (IS 5182:
Part 23:2006)
Particulate Matter PM2.5 - Gravimetric (Fine particulate
matter)

Sulphur Dioxide - Calorimetric (West & Gaeke Method) (IS
5182: Part 02: 2001)
Nitrogen Dioxide - Calorimetric (Modified Jacob &
Hocheiser Method) (IS 5182: Part 06:2006)
Frequency of Monitoring 2 days in a week, 4 weeks in a month for 3 months in a
season.
3.9.1.1 Ambient Air Quality: Results & Discussion
The test results of the ambient air quality monitored in project site and other seven locations were
summarized below.

Table 3-10 Ambient Air Quality - Results C
od
e PM 10 (µg/m3
) PM 2.5 (µg/m3
) SO2 (µg/m3
) NOx (µg/m3
)
Max
Min
Avg
98 p
erce
nti
le
Max
Min
Avg
98 p
erce
nti
le
Max
Min
Avg
98 p
erce
nti
le
Max
Min
Avg
98 p
erce
nti
le
AAQ 1 79 68 73 78 38 31 34 38 29 19 24 29 59 45 53 59
AAQ 2 58 48 53 58 29 23 25 29 16 10 13 16 27 19 23 27
AAQ 3 51 32 44 51 26 15 22 26 16 8 12 16 26 17 21 26
AAQ 4 60 52 55 59 30 24 27 30 17 12 14 17 30 24 27 30
AAQ 5 69 58 63 69 34 27 30 34 11 5 7 11 20 13 16 20
AAQ 6 69 59 65 69 36 28 33 36 22 14 18 22 42 33 37 41
AAQ 7 72 63 68 72 37 32 35 37 30 23 26 30 48 42 45 48
AAQ 8 82 75 78 82 36 32 34 36 33 21 27 33 45 37 41 45
NAAQ
Standar
ds -
Residen
tial
Area
100 (µg/m3
) 60(µg/m3
) 80 (µg/m3)
80 (µg/m3)

Table 3-11 Ambient Air Quality
S.No Parameter
s
Uni
ts
AAQ
1
AAQ
2
AAQ
3
AAQ
4
AAQ
5
AAQ
6
AAQ
7
AAQ
8
Carbon
monoxid
e
ETL/CHL/I
OP/029
mg/
m3
4 1.5 BQL(
LOQ
:1.1)
1.2 3 1.4 BQL(
LOQ
:1.1)
4
Lead IS: 5182
(P- 22
:2004(RA:2
014)
µg/
m3
BQL(
LOQ
:0.025
)
BQL(
LOQ
:0.025
)
BQL(
LOQ
:0.025
)
BQL(
LOQ
:0.025
)
BQL(
LOQ
:0.025
)
BQL(
LOQ
:0.025
)
BQL(
LOQ
:0.025
)
BQL(
LOQ
:0.025
)
Ozone IS: 5182
(P- 9)
:1974(RA:2
009)
µg/
m3
15.5 20.2
BQL(
LOQ
:10)
13.5 14.2 18.5 19.3
BQL(
LOQ
:10)
Ammoni
a
ETL/CHL/
SOP/002
µg/
m3
12.5 13.5 14.5 15.5 16.5 17.5 18.5 19.5
Benzene IS: 5182
(P- 11)
:2006(RA:2
012)
µg/
m3
BQL(
LOQ
:0.5)
BQL(
LOQ
:0.5)
BQL(
LOQ
:0.5)
BQL(
LOQ
:0.5)
BQL(
LOQ
:0.5)
BQL(
LOQ
:0.5)
BQL(
LOQ
:0.5)
BQL(
LOQ
:0.5)
Benzo(a)
pyrene
IS: 5182
(P-12)
:2004(RA:2
014)
ng/
m3
BQL
(LOQ
: 0.5)
BQL
(LOQ
: 0.5)
BQL
(LOQ
: 0.5)
BQL
(LOQ
: 0.5)
BQL
(LOQ
: 0.5)
BQL
(LOQ
: 0.5)
BQL
(LOQ
: 0.5)
BQL
(LOQ
: 0.5)
Arsenic ETL/INS/S
OP/002
ng/
m3
BQL
(LOQ
: 1)
BQL
(LOQ
: 1)
BQL
(LOQ
: 1)
BQL
(LOQ
: 1)
BQL
(LOQ
: 1)
BQL
(LOQ
: 1)
BQL
(LOQ
: 1)
BQL
(LOQ
: 1)
Nickel USEPA IO
– 3.2
ng/
m3
BQL
(LOQ
: 2.5)
BQL
(LOQ
: 2.5)
BQL
(LOQ
: 2.5)
BQL
(LOQ
: 2.5)
BQL
(LOQ
: 2.5)
BQL
(LOQ
: 2.5)
BQL
(LOQ
: 2.5)
BQL
(LOQ
: 2.5)
3.9.1.2 Interpretation of ambient air quality:
To assess the impact, AAQ were monitored in project site and seven locations in and around the
project site. The values of the AAQ in terms of NOx, Sox, PM10, PM 2.5 is maximum in the AAQ 8
than all other locations, which is located at a distance of 3.3 m in SSE. The observed concentrations
were found to be within the permissible limits as per the NAAQS prescribed by the CPCB. The
maximum value is observed near Tondiarpet (3km, SSE) for all the parameters. Though the location
is in the Crosswind, the incremental value is observed due to the cumulative effect of movement of
vehicles in the area.

Figure 3-16 Maximum Value of PM10, PM2.5, SO2, NOx
Figure 3-17 Minimum Value of PM10, PM2.5, SO2, NOx
Conclusion: Ambient air quality is observed to be within NAAQS limits at all locations in study
area.
3.10 Noise Environment
Table 3-12 Noise Analysis
Environmental Parameters: Noise Analysis
Monitoring Period End of December 2021 – End of March 2022
Design Criteria Based on the Environmental settings in the study area

Monitoring Locations
S.No Location Distance Direction
1. Project site – N1 - -
2. Kodungaiyur - N2 2.9 SW
3. Madhavaram milk
colony –N3
3.37 W
4. Manjambakkam –
N4
5.51 W
5. Rayapuram – N5 5 SE
6. Manali new town –
N6
5 N
7. Thangal – N7 2.81 E
8. Tondiarpet – N8 3.30 SSE
Methodology Noise level measurements were taken at the selected
locations using noise level meter both during day and night
time. Noise level measurements were taken continuously
for 24 hours at hourly intervals.
Frequency of Monitoring Noise samples were collected from 8 locations - Once in a
season.
Ambient Noise Levels are monitored in the chosen 8 Locations including the project Site and the
monitoring results are summarized below.
3.10.1 Day Noise Level (Leq day)
Table 3-13 Day Noise Level (Leq day)
N1 N2 N3 N4 N5 N6 N7 N8
Max 55 54 52 52 56 52 51 60
Min 47 44 42 43 49 45 42 52
Avg 52 51 48 49 53 48 47 55
Figure 3-18 Day Time Noise Levels (Day time shall mean from 6.00 a.m. to 10.00 p.m)

3.10.2 Night Noise Level (Leq Night)
Table 3-14 Night Noise Level (Leq Night)
N1 N2 N3 N4 N5 N6 N7 N8
Max 45 44 40 42 47 45 42 52
Min 37 37 32 35 42 40 33 46
Avg 41 40 36 38 44 42 38 49
Figure 3-19 Night noise levels (Night time shall mean from10.00 p.m. to 6.00 a.m.)
Inference: Noise levels at the plant site were reported to be within the noise limits prescribed for
industrial area. As per NAAQS w.r.t. noise prescribed by CPCB, the day time and night time noise
levels in a residential area shall not exceed 55 and 45 dB(A) Leq respectively whereas for industrial
area shall not exceed 75 dB (A) for day time and 70 dB (A) for night time. Noise level in the study
area was found to exceed the standards in few locations due to rural, urban activities and vehicular
traffic in the region, which represents a typical urban area.
The noise level in the project site is within the CPCB standards.
3.11 Soil Environment
The project site is not prone to sheet erosion and gully erosion.
3.11.1 Baseline Data
The present study of the soil quality establishes the baseline characteristics which will help in future
in identifying the incremental concentrations if any, due to the operation Phase of the proposed
project. The sampling locations have been identified with the following objectives:
To determine the impact of proposed project on soil characteristics and

To determine the impact on soils more importantly from agricultural productivity
point of view.
Table 3-15 Soil Quality Analysis
Environmental Parameters: Soil Analysis
Monitoring Period End of Dec 2021 - End of March 2022
Design Criteria Based on the Environmental settings in the study area
Monitoring Locations
S.No Location Distance Direction
1. Project site - -
2. Kodungaiyur 2.9 SW
3. Madhavaram milk
colony
3.37 W
4. Manjambakkam 5.51 W
5. Rayapuram 5 SE
6. Manali new town 5 N
7. Tondiarpet 3.30 SSE
Methodology Composite soil samples using sampling augers and field
capacity apparatus
Frequency of Monitoring Soil samples were collected from 8 locations Once in a
season
To assess the soil quality of the study area, 8 monitoring stations were selected and the results are
summarized below
Table 3-16 Soil Quality Analysis
Param
eter
Unit Project
Site
Kodungaiy
ur
Milk
Colony
Manja
mpakka
m
Rayapura
m
Manali
New
Town
Thandaiy
artpettai
PH - 7.15 7.85 8.15 7.14 7.18 6.72 7.17
Electric
al
Conduc
tivity
µs/c
m
0.37 0.49 0.33 1.96 0.43 0.133 0.72
Water
Holdin
g
Capacit
y
% 2.67 2.17 1.16 7.26 8.7 1.65 3.1
Chlorid
es
mg/k
g
22 19.2 18 61 50.5 32.4 97.3
Calciu
m
mg/k
g
58 60.3 61 73 22.8 BQL
(LOQ 10)
17.7
Sodium mg/k
g
110 89 120 145 36.2 26.8 46.5
Potassi
um
mg/k
g
62 26.4 80 86 14.3 BQL(LO
Q 5)
6.39
Organi
c
% 0.32 0.31 0.29 0.32 0.52 0.42 0.32

matter
Magnes
ium
mg/k
g
20 15.2 16 41 10.8 BQL(LO
Q 10)
10.8
Sulphat
es
mg/k
g
31 30.6 35 81 54.1 24.5 123
Cation
Exchan
ge
Capacit
y
meq/
100g
6.8 10.2 9.5 15.9 9.5 6.3 12.7
Carbon
ate
mg/k
g
NIL NIL NIL NIL Nil Nil NIL
Bicarbo
nate
mg/k
g
51 54.3 49 110 71.3 56.8 119
Nitroge
n
meq/
100g
0.012 0.015 BQL(LOQ
0.01)
0.01 0.02 0.025 0.021
Phospo
rous
meq/
100g
35 18 42 45 12 10 37.8
Physical Properties:
The water holding capacity was found in the range of 1.16% to 3.1%.
Chemical Properties:
Chemical characteristics of soils include pH, exchangeable cations and fertility status in the
form of NPK values and organic matter. The value of the pH is slightly alkaline and it ranges from
6.72 to 8.15. The soil in the project site is sodic in nature, which challenges because they tend to
have very poor structure which limits or prevents water infiltration and drainage.
3.12 Ecology and Biodiversity
Ecology and Biodiversity is studied for 5 km radius around the project site. Project site and 2 km
around the project site is considered as core zone and from 2 km to 5 km radius, it is considered as
buffer zone.
Primary field survey is carried out for the assessment of flora and fauna in the core zone
Secondary data from Journals/Literature were studied and compiled to understand the species
present in the buffer zone.
3.12.1 Methods available for floral analysis
Plot Sampling Methods
Quadrat – 2D shape (e.g. square or rectangle, or other shape) used as a sampling unit
Transect
o Line transects feature only a length dimension, usually defined by a tape stretched
across the area to be sampled.
o Belt transects have a width as well as length.

o Pace-transects are established when the observer strides along an imaginary line
across the sample site, and uses their foot placement to determine specific sampling
points.
Plot less Sampling Methods
Closest individual method - Distance is measured from each random point to the nearest
individual.
Nearest neighbour method - Distance is measured from an individual to its nearest neighbour.
Random pairs method - Distance is measured from one individual to another on the opposite
side of the sample point.
Point-centered quarter (PCQ) method - Distance is measured from the sampling point to the
nearest individual in each quadrat.
3.12.2 Field study& Methodology adopted
To assess the suitability of the methodology, random field survey was done. Field survey was
conducted around 5 km radius from the project site and five locations were chosen based on the
species density. Quadrat method is chosen for the proposed study as compared to other sampling
methods, because they are relatively simple to use. Quadrat plots are uniform in size and shape and
distributed randomly throughout the sample area, which makes the study design straightforward.
They are also one of the most affordable techniques because they require very few materials.
3.12.3 Study outcome
Phytosociological parameters, such as Density, Frequency, Basal Area, Abundance and
Importance Value Index of individual species (Trees) were determined in randomly placed quadrate
of different sizes in the study area. Relative frequency, relative basal area and relative density were
calculated and the sum of these three represented Importance Value Index(IVI) for various species.
For shrubs, herbs and grasses, Density, Frequency, Relative Density & Relative Frequency were
found.
Sample plots were selected in such a way to get maximum representation of different types of
vegetation and plots were laid out in different part of the study area of 5 km radius. Analysis of the
vegetation will help in determining the relative importance of each species in the study area and to
reveal if any economically valuable species is threatened in the process.
Table 3-17 Calculation of Density, Frequency (%), Dominance, Relative Density, Relative
Frequency, Relative Dominance & Important Value Index
Parameters Formula
Density Total No. of individuals of species/ Total No. of Quadrats used in
sampling
Frequency (%) (Total No. of Quadrats in which species occur/ Total No. of Quadrats

studied) * 100
Dominance Total Basal Area /Total area sampled
Abundance Total No. of individuals of species/ No. of Quadrats in which they occur
Relative Density (Total No. of individuals of species/Sum of all individuals of all species)
* 100
Relative Frequency (Total No. of Quadrats in which species occur/ Total No. of Quadrats
occupied by all species) * 100
Relative Dominance Dominance of a given species/Total Dominance of all species
Important Value Index Relative Density + Relative Frequency + Relative Dominance

Table 3-18 Tree Species in the core Zone
S. No. Scientific Name Local Name
Tota
l N
o.
of
spec
ies
Tota
l of
Qu
ad
ran
ts
wit
h s
pec
ies
Tota
l N
o.
of
Qu
ad
ran
ts
Den
sity
Fre
qu
ency
(%)
Ab
un
dan
ce
Dom
inan
ce
Rel
ati
ve
Den
sity
Rel
ati
ve
Fre
qu
ency
Rel
ati
ve
Dom
inan
ce
IVI
IUCN
Conservatio
n Status
1 Ficus carica Athi maram 2 2 6 0.
3
3
33.33 1 0.2
8
2.7
0
2.8
2
4.45 9.9
7
Least
Concern
2 Cassia siamea ManjalKonrai 2 2 6 0.
3
3
33.33 1 0.0
7
2.7
0
2.8
2
1.11 6.6
3
Least
Concern
3 Acacia nilotica Karuvelai 4 4 6 0.
6
7
66.67 1 0.2
8
5.4
1
5.6
3
4.45 15.
49
Least
Concern
4 Bambusa vulgaris Moongil 4 4 6 0.
6
7
66.67 1 0.5
0
5.4
1
5.6
3
7.92 18.
96
Not assessed
5 Anacardium occidentale Cashew 2 2 6 0.
3
3
33.33 1 0.4
4
2.7
0
2.8
2
6.96 12.
48
Not assessed
6 Alstoniascholaris Elilaipalai 2 2 6 0.
3
3
33.33 1 0.2
7
2.7
0
2.8
2
4.31 9.8
3
Least
Concern
7 Butea monosperma Parasa 3 3 6 0.
5
0
50.00 1 0.2
3
4.0
5
4.2
3
3.61 11.
89
Not assessed
8 Aegle marmelos Vilvam 1 1 6 0.
1
7
16.67 1 0.1
6
1.3
5
1.4
1
2.50 5.2
6
Not assessed
9 Causuarinaequisetifolia Savukku 2 2 6 0. 33.33 1 0.2 2.7 2.8 3.34 8.8 Not assessed

3
3
1 0 2 6
10 Albizia amara Wunja 1 1 6 0.
1
7
16.67 1 0.2
0
1.3
5
1.4
1
3.22 5.9
8
Not assessed
11 Cocos nucifera Thennai 15 6 6 2.
5
100.0
0
2.5 0.1
5
13.
39
6.4
5
2.39 22.
24
Not assessed
12 Artocarpus
heterophyllus
Palaa 2 2 6 0.
3
3
33.33 1 0.1
8
2.7
0
2.8
2
2.85 8.3
7
Not assessed
13 Bombax ceiba Sittan 4 4 6 0.
6
7
66.67 1 0.0
8
5.4
1
5.6
3
1.27 12.
31
Not assessed
14 Azadirachta indica Veppam 10 6 6 1.
6
7
100 1.6
7
0.1
3
8.9
3
6.4
5
2.39 22.
24
Not assessed
15 Delonix regia Cemmayir-
Konrai
1 1 6 0.
1
7
16.67 1 0.2
1
1.3
5
1.4
1
3.34 6.1
0
Least
Concern
16 Delonixelata Perungondrai 1 1 6 0.
1
7
16.67 1 0.1
7
1.3
5
1.4
1
2.62 5.3
8
Least
Concern
17 Dalbergia sissoo Shisham 1 1 6 0.
1
7
16.67 1 0.1
5
1.3
5
1.4
1
2.29 5.0
5
Not assessed
18 Ficus benghalensis Alai 2 2 6 0.
3
3
33.33 1 0.0
8
2.7
0
2.8
2
1.19 6.7
1
Not assessed
19 Annona squamosa Sitapalam 1 1 6 0.
1
7
16.67 1 0.2
3
1.3
5
1.4
1
3.61 6.3
7
Not assessed
20 Citrullus colocynthis Kumatti 1 1 6 0.
1
16.67 1 0.1
4
1.3
5
1.4
1
2.18 4.9
4
Not assessed

7
21 Ficus religiosa Arasamaram 3 3 6 0.
5
0
50.00 1 0.0
9
4.0
5
4.2
3
1.35 9.6
3
Not assessed
22 Polyalthia longifolia Nettilinkam 5 3 6 0.
8
3
50.00 1.6
7
0.1
4
6.7
6
4.2
3
2.18 13.
16
Not assessed
23 Musa paradise Vaazhai 3 3 6 0.
5
0
50.00 1 0.0
8
4.0
5
4.2
3
1.19 9.4
7
Not assessed
24 Prosopis juliflora Vaelikaruvai 3 3 6 0.
5
0
50.00 1 0.2
1
4.0
5
4.2
3
3.34 11.
62
Not assessed
25 Mangifera indica Mamaram 8 6 6 1.
3
3
100.0
0
1.3
3
0.0
7
7.1
4
6.4
5
1.11 14.
71
Data
insufficient
26 Terminalia catappa Nattuvadamai 2 2 6 0.
3
3
33.33 1 0.1
8
2.7
0
2.8
2
2.85 8.3
7
Not assessed
27 Morindapubescens Nuna 6 6 6 1 100 1 0.2
4
5.3
6
6.4
5
3.74 15.
55
Not assessed
28 Thespesia populnea Poovarasam 3 3 6 0.
5
0
50.00 1 0.1
5
4.0
5
4.2
3
2.39 10.
67
Not assessed
29 Tectona grandis Thekku 3 3 6 0.
5
0
50.00 1 0.1
2
4.0
5
4.2
3
1.88 10.
16
Not assessed
30 Tamarindus indica Puli 8 6 6 1.
3
3
100 1.3
3
0.2
0
7.1
4
6.4
5
3.09 16.
69
Not assessed
31 Syzygiumcumini Naval 1 1 6 0.
1
7
16.67 1 0.1
1
1.3
5
1.4
1
1.79 4.5
5
Not assessed

32 Psidium guajava Segapu 3 3 6 0.
5
0
50.00 1 0.0
9
4.0
5
4.2
3
1.43 9.7
1
Not assessed
33 Ziziphus mauritiana Elandai 1 1 6 0.
1
7
16.67 1 0.2
8
1.3
5
1.4
1
4.45 7.2
1
Not assessed
34 Citrus medica Elumichai 2 2 6 0.
3
3
33.33 1 0.2
3
2.7
0
2.8
2
3.61 9.1
3
Not assessed
Total 74 71 6.3
5
Table 3-19 Shrubs in the Core Zone
S. No. Scientific Name Local Name
Tota
l N
o. of
spec
ies
Tota
l of
Qu
ad
ran
ts
wit
h s
pec
ies
Tota
l N
o. of
Qu
ad
ran
ts
Den
sity
Fre
qu
ency
(%)
Ab
un
dan
ce
Rel
ati
ve
Den
sity
Rel
ati
ve
Fre
qu
ency
IUC
N
Con
serv
ati
o
n S
tatu
s
1 Jatropagossypifolia Kaatamanaku 28 17 24 1.17 0.71 1.65 14.43 17.17 Not
Assessed
2 Lantana trifolia Shrub verbana 10 3 24 0.42 0.13 3.33 5.15 3.03 Not
Assessed
3 Robiniapseudoacacia Black locust 17 5 24 0.71 0.21 3.4 8.76 5.05 Least
Concern
4 Lantana camara Unnichedi 9 6 24 0.38 0.25 1.5 4.64 6.06 Not
Assessed
5 Calotropis gigantea Erukam 14 12 24 0.58 0.50 1.17 7.22 12.12 Not
Assessed
6 Stachytarpheaurticifolia Rat tail 15 9 24 0.63 0.38 1.67 7.73 9.09 Not
Assessed
7 Datura metal Ummattangani 5 4 24 0.21 0.17 1.25 2.58 4.04 Not

Assessed
8 Hibiscus rosa sinensis Sembaruthi 3 2 24 0.13 0.08 1.5 1.55 2.02 Not
Assessed
9 Tabernaemontanadivaricata Crepe Jasmine 3 3 24 0.13 0.13 1 1.55 3.03 Not
Assessed
10 Chloromolaena odorata Venapacha 9 6 24 0.38 0.25 1.5 4.64 6.06 Least
Concern
11 Euphorbia geniculata Amman Pacharisi 3 3 24 0.13 0.13 1 1.55 3.03 Not
Assessed
12 Catharanthus roseus Nithyakalyani 3 3 24 0.13 0.13 1 1.55 3.03 Not
Assessed
13 Woodfordiafruiticosa Velakkai 3 3 24 0.13 0.13 1 1.55 3.03 Least
Concern
14 Morindapubescens Mannanunai 2 2 24 0.08 0.08 1 1.03 2.02 Not
Assessed
15 Acalypha indica Kuppaimeni 20 8 24 0.83 0.33 2.5 10.31 8.08 Not
Assessed
16 Parthenium hysterophorous Vishapoondu 50 13 24 2.08 0.54 3.85 25.77 13.13 Not
Assessed
Table 3-20 Herbs & Grasses in the core zone
S. No. Scientific Name Local Name T
ota
l N
o. of
spec
ies
Tota
l of
Qu
ad
ran
ts
wit
h s
pec
ies
Tota
l N
o. of
Qu
ad
ran
ts
Den
sity
Fre
qu
ency
(%)
Ab
un
dan
ce
Rel
ati
ve
Den
sity
Rel
ati
ve
Fre
qu
ency
IUC
N
Con
serv
ati
on
sta
tus
1 Plumbago zeylanica Chittiramoolam 3 3 30 0.10 0.10 1 1.19 3.23 Not assessed
2 Mimosa pudica Thottacherungi 6 5 30 0.20 0.17 1.2 2.38 5.38 Least concern
3 Sida acuta Malaidangi 10 3 30 0.33 0.10 3.33 3.97 3.23 Not assessed
4 Scrophularia nodosa Sarakkothini 15 7 30 0.50 0.23 2.14 5.95 7.53 Not assessed
5 Helicteresisora Valampuri 2 2 30 0.07 0.07 1 0.79 2.15 Not assessed
6 Cynodondactylon Arugu 12 6 30 0.40 0.20 2 4.76 6.45 Not assessed

7 Sporobolus fertilis Giant Parramatta Grass 9 4 30 0.30 0.13 2.25 3.57 4.30 Not assessed
8 Viburnum dentatum Viburnum 5 5 30 0.17 0.17 1 1.98 5.38 Least concern
9 Heraculem spondylium Hog Weed 20 10 30 0.67 0.33 2 7.94 10.75 Not assessed
10 Laportea canadensis Peruganchori 30 20 30 1.00 0.67 1.5 11.90 21.51 Not assessed
11 Euphorbia hirta Amman Pacharisi 5 4 30 0.17 0.13 1.25 1.98 4.30 Not assessed
12 Tridax procumbens Vettukaayathalai 5 4 30 0.17 0.13 1.25 1.98 4.30 Not assessed
13 Tephrosia purpurea Kavali 20 4 30 0.67 0.13 5 7.94 4.30 Not assessed
14 Sida cordifolia Maanikham 45 4 30 1.50 0.13 11.25 17.86 4.30 Not assessed
15 Tridax procumbens Cuminipachai 15 4 30 0.50 0.13 3.75 5.95 4.30 Not assessed
16 Ruelliastrepens Grandinayagam 25 4 30 0.83 0.13 6.25 9.92 4.30 Not assessed
17 Senna occidentalis Nattamsakarai 25 4 30 0.83 0.13 6.25 9.92 4.30 Not assessed

3.12.4 Calculation of species diversity by Shannon – wiener Index, Evenness and richness by
Margalef:
Biodiversity index is a quantitative measure that reflects how many different type of species, there
are in a dataset, and simultaneously takes into account how evenly the basic entities (such as
individuals) are distributed among those types of species. The value of biodiversity index increases
both when the number of types increases and when evenness increases. For a given number of type
of species, the value of a biodiversity index is maximized when all type of species are equally
abundant. Interpretation of Vegetation results in the study area is given below.
Table 3-21 Calculation of species diversity
Description Formula
Species diversity – Shannon – Wiener
Index H=(pi)*ln(pi)]
Where pi : Proportion of total sample represented by species
i:number of individuals of species i/ total number of
samples
Evenness H/Hmax
Hmax = ln(s)= maximum diversity possible
S=No. of species
Species Richness by Margalef
RI = S-1/ln N
Where S = Total Number of species in the community
N = Total Number of individuals of all species in the
community

3.12.5 Calculation of species diversity by Shannon – wiener Index, Evenness and richness by
Margalef for trees
i. Species Diversity
Scientific Name Common Name No. of
Species
Pi ln (Pi) Pi x ln (Pi)
Ficus carica Athi maram 2 0.017857 -4.02535 -0.07188
Cassia siamea ManjalKonrai 2 0.017857 -4.02535 -0.07188
Acacia nilotica Karuvelai 4 0.035714 -3.3322 -0.11901
Bambusa vulgaris Moongil 4 0.035714 -3.3322 -0.11901
Anacardium occidentale Cashew 2 0.017857 -4.02535 -0.07188
Alstoniascholaris Elilaipalai 2 0.017857 -4.02535 -0.07188
Butea monosperma Parasa 3 0.026786 -3.61989 -0.09696
Aegle marmelos Vilvam 1 0.008929 -4.7185 -0.04213
Causuarinaequisetifolia Savukku 2 0.017857 -4.02535 -0.07188
Albizia amara Wunja 1 0.008929 -4.7185 -0.04213
Cocos nucifera Thennai 15 0.133929 -2.01045 -0.26926
Artocarpus heterophyllus Palaa 2 0.017857 -4.02535 -0.07188
Bombax ceiba Sittan 4 0.035714 -3.3322 -0.11901
Azadirachta indica Veppam 10 0.089286 -2.41591 -0.21571
Delonix regia Cemmayir-
Konrai
1 0.008929 -4.7185 -0.04213
Delonixelata Perungondrai 1 0.008929 -4.7185 -0.04213
Dalbergia sissoo Shisham 1 0.008929 -4.7185 -0.04213
Ficus benghalensis Alai 2 0.017857 -4.02535 -0.07188
Annona squamosa Sitapalam 1 0.008929 -4.7185 -0.04213
Citrullus colocynthis Kumatti 1 0.008929 -4.7185 -0.04213
Ficus religiosa Arasamaram 3 0.026786 -3.61989 -0.09696
Polyalthia longifolia Nettilinkam 5 0.044643 -3.10906 -0.1388
Musa paradise Vaazhai 3 0.026786 -3.61989 -0.09696
Prosopis juliflora Vaelikaruvai 3 0.026786 -3.61989 -0.09696
Mangifera indica Mamaram 8 0.071429 -2.63906 -0.1885
Terminalia catappa Nattuvadamai 2 0.017857 -4.02535 -0.07188
Morindapubescens Nuna 6 0.053571 -2.92674 -0.15679
Thespesia populnea Poovarasam 3 0.026786 -3.61989 -0.09696
Tectona grandis Thekku 3 0.026786 -3.61989 -0.09696
Tamarindus indica Puli 8 0.071429 -2.63906 -0.1885
Syzygiumcumini naval 1 0.008929 -4.7185 -0.04213
Psidium guajava Segapu 3 0.026786 -3.61989 -0.09696
Ziziphus mauritiana Elandai 1 0.008929 -4.7185 -0.04213
Citrus medica Elumichai 2 0.017857 -4.02535 -0.07188
Total 112 -3.22
H (Shannon Diversity Index) =3.22

Table 3-22 Shrubs
Scientific Name Common
Name
No. of
Species
Pi ln (Pi) Pi x ln (Pi)
Jatropagossypifolia Kaatamanaku 28 0.14433 -1.93565 -0.27937
Lantana trifolia Shrub verbana 10 0.051546 -2.96527 -0.15285
Robiniapseudoacacia Black locust 17 0.087629 -2.43464 -0.21335
Lantana camara Unnichedi 9 0.046392 -3.07063 -0.14245
Calotropis gigantea Erukam 14 0.072165 -2.6288 -0.18971
Stachytarpheaurticifolia Rat tail 15 0.07732 -2.55981 -0.19792
Datura metal Ummattangani 5 0.025773 -3.65842 -0.09429
Hibiscus rosa sinensis Sembaruthi 3 0.015464 -4.16925 -0.06447
Tabernaemontanadivaricata Crepe Jasmine 3 0.015464 -4.16925 -0.06447
Chloromolaena odorata Venapacha 9 0.046392 -3.07063 -0.14245
Euphorbia geniculata Amman
Pacharisi
3 0.015464 -4.16925 -0.06447
Catharanthus roseus Nithyakalyani 3 0.015464 -4.16925 -0.06447
Woodfordiafruiticosa Velakkai 3 0.015464 -4.16925 -0.06447
Morindapubescens Mannanunai 2 0.010309 -4.57471 -0.04716
Acalypha indica Kuppaimeni 20 0.103093 -2.27213 -0.23424
Parthenium hysterophorous Vishapoondu 50 0.257732 -1.35584 -0.34944
194 -2.3656
H (Shannon Diversity Index) =2.36
Table 3-23 Herbs
Scientific Name Common Name No. of
Species
Pi ln (Pi) Pi x ln (Pi)
Plumbago
zeylanica
Chittiramoolam 3 0.011905 -4.43082 -0.05275
Mimosa pudica Thottacherungi 6 0.02381 -3.73767 -0.08899
Sida acuta Malaidangi 10 0.039683 -3.22684 -0.12805
Scrophularia
nodosa
Sarakkothini 15 0.059524 -2.82138 -0.16794
Helicteresisora Valampuri 2 0.007937 -4.83628 -0.03838
Cynodondactylon Arugu 12 0.047619 -3.04452 -0.14498
Sporobolus fertilis Giant Parramatta
Grass
9 0.035714 -3.3322 -0.11901
Viburnum
dentatum
Viburnum 5 0.019841 -3.91999 -0.07778
Heraculem
spondylium
Hog Weed 20 0.079365 -2.5337 -0.20109
Laportea
canadensis
Peruganchori 30 0.119048 -2.12823 -0.25336
Euphorbia hirta Amman Pacharisi 5 0.019841 -3.91999 -0.07778
Tridax procumbens Vettukaayathalai 5 0.019841 -3.91999 -0.07778
Tephrosia purpurea Kavali 20 0.079365 -2.5337 -0.20109
Sida cordifolia Maanikham 45 0.178571 -1.72277 -0.30764
Tridax procumbens Cuminipachai 15 0.059524 -2.82138 -0.16794

Ruelliastrepens Grandinayagam 25 0.099206 -2.31055 -0.22922
Senna occidentalis Nattamsakarai 25 0.099206 -2.31055 -0.22922
252 -2.56298
H (Shannon Diversity Index) =2.56
ii. Evenness
Table 3-24 Species Richness (Margalef)
Details H Hmax Evenness Species Richness (Margalef)
Trees 3.22 3.5 0.9 7
Shrubs 2.36 2.77 0.85 2.84
Herbs 2.56 2.83 0.9 2.89
From the above, it can be interpreted that tree community has higher diversity. While the shrub
community shows less diversity. It is also observed that most of the quadrates havecontrolled
generation of plant species with older strands. Higher tree species diversity canbe interpreted as a
greater number of successful species and a more stable ecosystem where more ecological niches are
available, environmental change is less likely to be damaging to the ecosystem as a whole. Species
richness is high for tree community when compared with herbs and shrubs.
3.12.6 Frequency Pattern
To understand the frequency pattern, the observed frequency is compared with the Raunkiaer’s
frequency. Any deviation from Raunkiaer’s frequency implies disturbed community.
Classes of species in a community and normal value of class according to Raunkiaer
Table 3-25 Frequency Pattern
Class Frequency (%) Normal Value in the class
A 1-20 53
B 21-40 14
C 41-60 9
D 61-80 8
E 81-100 16
Where A>B>C>=<D<E
Table 3-26 Raunkiaer’s class for the observed species
S. No. Scientific Name Local Name Frequency
(%)
Class as per
Raunkiaer’s Law
1. Ficus carica Athi maram 33.33 B
2. Cassia siamea ManjalKonrai 33.33 B
3. Acacia nilotica Karuvelai 66.67 D
4. Bambusa vulgaris Moongil 66.67 D
5. Anacardium
occidentale
Cashew 33.33 B
6. Alstoniascholaris Elilaipalai 33.33 B
7. Butea monosperma Parasa 50.00 C
8. Aegle marmelos Vilvam 16.67 A
9. Causuarinaequisetifolia Savukku 33.33 B

10. Albizia amara Wunja 16.67 A
11. Cocos nucifera Thennai 100 E
12. Artocarpus
heterophyllus
Palaa 33.33 B
13. Bombax ceiba Sittan 66.67 D
14. Azadirachta indica Veppam 100 E
15. Delonix regia Cemmayir-
Konrai
16.67 A
16. Delonixelata Perungondrai 16.67 A
17. Dalbergia sissoo Shisham 16.67 A
18. Ficus benghalensis Alai 33.33 B
19. Annona squamosa Sitapalam 16.67 A
20. Citrullus colocynthis Kumatti 16.67 A
21. Ficus religiosa Arasamaram 50.00 C
22. Polyalthia longifolia Nettilinkam 50.00 C
23. Musa paradise Vaazhai 50.00 C
24. Prosopis juliflora Vaelikaruvai 50.00 C
25. Mangifera indica Mamaram 100 E
26. Terminalia catappa Nattuvadamai 33.33 B
27. Morindapubescens Nuna 100 E
28. Thespesia populnea Poovarasam 50.00 C
29. Tectona grandis Thekku 50.00 C
30. Tamarindus indica Puli 100 E
31. Syzygiumcumini naval 16.67 A
32. Psidium guajava Segapu 50.00 C
33. Ziziphus mauritiana Elandai 16.67 A
34. Citrus medica Elumichai 33.33 B
Figure 3-20 Raunkiaer’s class for the observed species

Interpretation: The observed frequency is A>B>C<D>E, which follows Raunkiaer’s Distribution
Frequency and hence the ecology is undisturbed.
3.12.7 Floral study in the Buffer Zone:
Economically important Flora of the study area
Agricultural crops:Paddy, Maize are the main crop grown. Different fruits like Banana, papaya,
mangoes, guava and vegetables like brinjal, drumsticks, onion, Coriander alsogrown by the local
people.
Medicinalspecies:The nearby area is also endowed with the several medicinalspecies which are
commonly available in the shrub forest and waste lands. The commonmedicinal species of the region
are Asparagus racemosus (satamulli), Aegle marmelos (golden apple),Azadirachta indica (Neem)
etc.
Rare and endangered floral species:There are no rare or endangered or threatened (RET) species
of in the study area. During the vegetation survey, there are noany species which are endangered or
threatened under IUCN (International Union for Conservation of Nature and Natural
resources)guidelines.
3.12.8 Faunal Communities
Both direct and indirect observation methods were used to survey the fauna.
Point Survey Method: Observations were made in each site for 15 minutes duration.
Road Side Counts: The observer traveled by motor vehicles from site to site, all sightings
were recorded (this was done both in the day and night time). An index of abundance of each
species was also established.
Pellet and Track Counts: All possible animal tracks and pellets were identified and recorded
(South Wood, 1978).
Additionally, survey of relevant literature was also done to consolidate the list of fauna distributed in
the buffer zone.
Based on the Wildlife Protection Act, 1972 (WPA 1972, Anonymous. 1991, Upadhyay 1995,
Chaturvedi and Chaturvedi 1996) species were short-listed as Schedule II or I and considered herein
as endangered species. Species listed in Ghosh (1994) are considered as Indian Red List species.
Methodology Adopted:
Point Survey method was adopted for this development project where observations were made in
each site for 15 minutes duration (10 times).
Study in the core zone:
Point Survey method was adopted for the study within 2 km radius and the following species were
observed

Study in the core Zone
Mammals: No wild mammalian species was directly sighted during the field survey. Discussion
with local villagers located around the study area also could not confirm presence of any wild animal
in that area. Three stripped Palm Squirrel, Common Indian Hare, Common mongoose, Common
Mouse etc were observed during primary survey.
Avifauna: Since birds are considered to be the indicators for monitoring and understanding human
impacts on ecological systems (Lawton, 1996) attempt was made to gather quantitative data on the
avifauna by walk through survey within the entire study area and surrounding areas. From the
primary survey, a total of 26 species of avifauna were identified and recorded in the study area. The
diversity of avifauna from this region was found to be quite high and encouraging.
The list of fauna species found in the study area is mentioned in Table below.
Table 3-27 list of fauna species
Scientific Name Common Name Schedule of wild life
protection act
IUCN conservation
status
Mammals
Funambulus
pennanti
Palm Squirrel IV Least Concern
Mus rattus Indian rat IV Not listed
Bandicota
bengalensis
Indian mole rat IV Least Concern
Funambulus
palmarum
Three stripped palm
squirrel
IV Least Concern
Herestesedwardsii Common Mangoose IV Not listed
Mus musculus Common Mouse IV Least Concern
Bandicota indica Rat IV Least Concern
Lepus nigricollis Indian Hare IV Least Concern
Felis catus Cat Not listed Not listed
Canis lupus
familiaris
Indian dog Not listed Not listed
Bos Indicus Indian Cow Not listed Not listed
Bubalus bubalis Buffalo I Not listed
Sus scrofa
domesticus
Domestic pig Not listed Not listed
Birds
Milvus migrans Black kite IV Least concern
Vanellus indicus Red wattled lapwing IV Least concern
Saxicoloidesfulicatu
s
Indian Robin IV Least concern
Pycnonotuscafer Red vented Bulbul IV Least concern
Phragamaticolaaedo
n
Thick billed warbler IV Least concern
Pericrocotuscinnam Small Minivet IV Least concern

omeus
pseudibispapillosa Black lbis IV Least concern
Eudynamysscolopac
eus
Koel IV Least concern
Ergettagarzetta Little Erget IV Least concern
Psittaculakrameni Rose ringed parakeet IV Least concern
Bubulcus ibis Cattle Erget IV Least concern
Dicrurusmarcocercu
s
Black drongo IV Least concern
Streptopelia
chinensis
Spotted dove IV Least concern
Columba livia Rock pigeon IV Least concern
Corvus splendens House crow IV Least concern
Cypsirurusbalasiensi
s
Asian palm swift IV Least concern
Ardeolagrayii Pond heron IV Least concern
Elanus caeruleus Black-winged kite IV Least concern
Alcedoatthis Small blue kingfisher IV Least concern
Cuculuscanorus Common Cukoo IV Least concern
Centropus sinensis Greater coucal IV Least concern
Phalacrocraxniger Little comorant IV Least concern
Perdicula asiatica Bush Quail IV Least concern
Alauda gulgula Oriental skylark IV Least concern
Passer domesticus House sparrow IV Least concern
Meropsorientalis Green bee eater IV Least concern
Reptiles & Amphibians
Chameleon
zeylanicum
Chameleon IV Not listed
Calotes versicolor Common garden
lizard
II Not listed
Bungarus caeruleus Common krait IV Not listed
Ophisops
leschenaultia
Snake eyed lizard -- Not listed
Bufo melanostictus Toad IV Least concern
Ptyas mucosa Rat snakes IV Least concern
Hemidactylus sp. House lizard -- Not listed
Butterflies
Danaus chrysippus Plain Tiger -- Not listed
Papiliodemoleus Common lime -- Not listed
Euploea core Common crow -- Least concern
Danaus genutia Common tiger -- Not listed
Euremabrigitta Small grass yellow -- Least concern
3.13 Demography & Socio Economics
A socio-economic study was undertaken in assessing aspects which are dealing with social and
cultural conditions, and economic status in the study area. The study provides information
such as demographic structure, population dynamics, infrastructure resources, and the status of

human health and economic attributes like employment, per-capita income, agriculture, trade, and
industrial development in the study area. The study of these characteristic helps in
identification, prediction and evaluation of impacts on socio-economic and parameters of human
interest due to proposed project developments. The parameters are:
Demographic structure
Infrastructure Facility
Economic Status
Health status
Cultural attributes
Awareness and opinion of people about the project and Industries in the area.
Table 3-28 Demographic status around 10km radius
S.
No
Villages Population HH Sex Ratio Literacy rate SC ST
Male Female Male Female
1. Perungavoor 5710 1276 2974 2736 2375 1908 2148 26
2. Sirugvaur 99 31 56 43 51 32 16 0
3. Vilangadupakkam 5668 1481 2864 2804 2195 1895 4033 67
4. Payasambakkam 1097 268 563 534 460 380 169 5
5. Vadaperumbakkam 1682 433 859 823 723 592 1280 1
6. Puzhal 90733 22729 46120 44613 37981 33035 25242 470
7. Madavaram 788 205 394 394 295 265 217 23
8. Mathur 27674 6886 14081 13593 11815 10439 4585 37
9. Kosapur 780 190 358 422 277 264 713 8
10. Ariyalur 2693 697 1357 1336 1088 887 1716 0
11. Manali 311 88 166 145 96 64 118 0
12. Vichoor 5765 1437 2868 2897 2211 1896 2925 9
13. Kadapakkam 2941 787 1436 1505 1194 1002 825 0
14. Edayanchavadi 12119 3142 6042 6077 4969 4371 1402 5
15. Sadayankuppam 5348 1355 2704 2644 2126 1895 1406 165
3.13.1 Literacy & Education
The school education system in Tamil Nadu is characterized by high literacy rates, enrolment and
Completion rated and impressive facilities for higher education. Mostly significantly education
system has been made accessible to marginalized groups and women. Higher enrolment rated in
primary and upper primary classes are an important indicator for education empowerment of the
people.
3.13.1.1 Literacy rate
The Comparison of Male and Female Literacy Rate to the 2001 and 2011 census details is given
below;

Figure 3-21 Comparison of Male and Female Literacy Rate to the 2001 and 2011 census
The literacy rate is 84% in 2011 in the district. There was an increase in literacy rate by 7% in
between 2001 and 2011. There has been a positive change in both male and female literacy rates,
with a 4.4 % increase in literacy among men and approximately 10 % increase among the women
during the same period. The higher level in female literacy is encouraging from the gender
perspective.
3.13.2 Employment details
The workers details of Main Workers who has employment for more than 6 months and marginal
workers who are seasonal workers and Non-Workers has been compared with the 2001 and 2011
census details is shown below;

Figure 3-22 Employment details
Workers Participation Rate (WPR) is the proportion of workers to the total population. While, the
total population in this district has increased from 2,754,761in 2001 to 3,728,104 registering an
increase by 35.33% during the same period.
Occupation: Agriculture is the prevalent occupation in tiruvallur with 47% of the population
engaged in it. The major crop grown in tiruvallur is Paddy followed by sugarcane, groundnuts,
cereals and pulses. Koasthalai river along with tanks and wells are the main sources of irrigation in
this district.
The district leads in the production of fruits, vegetables and flowers in the State. The major
horticultural crops are Mango, Cashew and Banana.
Socio-economic survey methodology
Purposive sampling methods were used for selecting respondents (male and female) for household
survey. For official information of village, Gram Panchyat member has been chosen. Structured
questionnaire was used for survey. For group discussion, Panchyat bhavan, Aanganwadi bhavan,
community halls were used. Out of total 15 villages, 3 villages (20%) were surveyed for which
selection criteria is based on proximity to the project site and area with dense and scarce populations
were chosen.
The villages chosen for primary study area
Manali
Puzhal
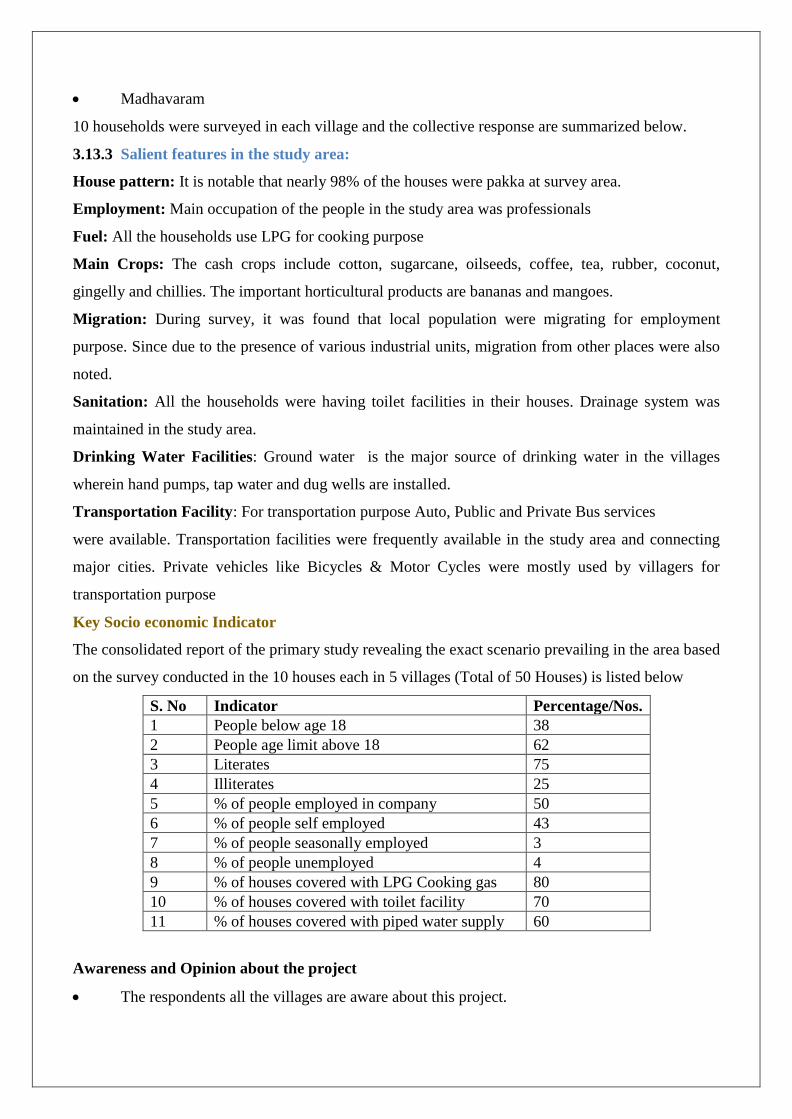
Madhavaram
10 households were surveyed in each village and the collective response are summarized below.
3.13.3 Salient features in the study area:
House pattern: It is notable that nearly 98% of the houses were pakka at survey area.
Employment: Main occupation of the people in the study area was professionals
Fuel: All the households use LPG for cooking purpose
Main Crops: The cash crops include cotton, sugarcane, oilseeds, coffee, tea, rubber, coconut,
gingelly and chillies. The important horticultural products are bananas and mangoes.
Migration: During survey, it was found that local population were migrating for employment
purpose. Since due to the presence of various industrial units, migration from other places were also
noted.
Sanitation: All the households were having toilet facilities in their houses. Drainage system was
maintained in the study area.
Drinking Water Facilities: Ground water is the major source of drinking water in the villages
wherein hand pumps, tap water and dug wells are installed.
Transportation Facility: For transportation purpose Auto, Public and Private Bus services
were available. Transportation facilities were frequently available in the study area and connecting
major cities. Private vehicles like Bicycles & Motor Cycles were mostly used by villagers for
transportation purpose
Key Socio economic Indicator
The consolidated report of the primary study revealing the exact scenario prevailing in the area based
on the survey conducted in the 10 houses each in 5 villages (Total of 50 Houses) is listed below
S. No Indicator Percentage/Nos.
1 People below age 18 38
2 People age limit above 18 62
3 Literates 75
4 Illiterates 25
5 % of people employed in company 50
6 % of people self employed 43
7 % of people seasonally employed 3
8 % of people unemployed 4
9 % of houses covered with LPG Cooking gas 80
10 % of houses covered with toilet facility 70
11 % of houses covered with piped water supply 60
Awareness and Opinion about the project
The respondents all the villages are aware about this project.

Since most of the respondents were about the project, some of the people welcomed this
project for the employment opportunity but they need commitment that, only local people should be
hired for the construction work.
The skill based employment should be given to the local people.
Road accident may increase due to transport and associated activities.
Expectation from the project
Local employment
Plantation at nearby areas and ensure their survival rate.
Increase educational facility in Govt. School and promote vocational & higher educational
institute.
3.14 Traffic Survey
Traffic study is carried out including type and frequency of vehicles, transportation of materials and
additional traffic due to the proposed project based on IRC:106-1990- Guideline for capacity of
urban road in plain area. The existing parking arrangements are sufficient for the proposed project.
S.
No
.
Type of
Vehicle
Existin
g
Vehicle
s
Existin
g PCU
Propos
ed
Vehicle
s
Propos
ed PCU
Total
Vehicles
after
project
implementa
tion
PCU
factors
IRC
(SP 41)
Total PCU
after project
implementati
on
1. Motor
cycles or
Scooters
etc.
325 243.75 19 14.25 344 0.75 258
2. Three
Wheelers/
Auto
Rickshaw
112 224 3 3.6 115 2.0 227.6
3. Four
Wheelers/
Cars
120 120 6 6 126 1.0 126
4. Truck/Bus 340 1258 25 92.5 365 3.7 1350.5
5. Agricultur
al Tractor
3 12 0 0 3 4.0 12
6. Light
commercia
l vehicle
62 86.8 2 2.8 64 1.4 89.6
Total 958 1944.55 55 119.15 1013 12.85 2063.7

Traffic Volume after Implementation of the Project
For the Road Volume of Traffic Volume
(V)
Capacity
(C)
V/C
Ratio
LOS
Category*
Traffic
Classification
Existing 958 1944.55 3600 0.54 “B” Stable Traffic
Flow
After
implementation
1013 2063.7 3600 0.57 “B” Stable Traffic
Flow
*LOS categories are A-Free Flow, B- Stable Traffic Flow, C- Restricted Flow, D- High Density
flow, E- Unstable flow, F- Forced or breakdown flow
Due to proposed project there will be slight increment in the vehicle movement but the level of
service (LOS) anticipated will be Stable Traffic flow.

4 Anticipated Environmental Impacts & Mitigation Measures
4.1 Introduction
An environmental impact is defined as any change to the environment, whether adverse or
beneficial, resulting from a facility's activities, products, or services. The anticipation of the possible
& potential Environmental impact due to the proposed project is a key step in EIA. Based on the
impacts assessed, appropriate mitigation measures should be adopted to maintain the environment
with less or no damage.
4.2 Environmental Impacts
Environmental Impacts can be group into Primary impacts & Secondary Impacts
Primary Impacts: These impacts are directly attributed by the project
Secondary Impacts: These are those which are induced by primary impacts and include the
associated investments and changed patterns of the social and economic activities by the action.
Assessment of impacts is done for the following Environmental Parameters:
Land Environment
Water Environment
Air Environment
Noise Environment
Biological Environment
Socio Economic Environment

Table 4-1 Impact on Environment during Construction Phase
S.
No.
Impact on
Environme
nt
Activity
/ Aspect
Anticipat
ed
Impacts
Impact Classification Total
Marks
M1*M2*
M3*M4*
M5*M6
Weight
age
Dir
ect
(D)/
Indir
ect
(ID
)
Man
dat
ory
(M)/
Not
Man
dat
ory
(NM
)
Loca
l(L
)/
Wid
espre
ad
(W)
Tem
pora
ry
(T)/
Per
man
ent
(P)
Long T
erm
(LT
)/ S
hort
Ter
m (
ST
)
Mit
igat
ion
avai
lable
(yes
/No)
Marks Marks Marks Marks Marks Marks
D/I
D
M1 M/
NM
M2 L/W M3 T/P M4 LT/S
T
M5 Y/N M6
AIR ENVIRONMENT
Air Site Clearance
& Excavation
Dust &
Vehicula
r
Emission
s
D 2 M 2 L 1 T 1 ST 1 Y 1 4 N
Air Construction
activities
Dust
emission
s from
construct
ion
activities
D 2 NM 1 L 1 T 1 ST 1 Y 1 2 N
Air Point source
emissions
from
operation of
DG sets
Particula
te matter
&
Gaseous
emission
s
(includin
g worst
D 2 M 2 W 2 T 1 LT 2 Y 1 16 Y

condition
of
operating
all DG
sets)
Air Line source
emissions
from
movement of
construction
& other
vehicles,
machineries
Fugitive
dust &
gaseous
emission
s from
vehicle
exhaust
D 2 NM 1 W 2 T 1 LT 2 Y 1 8 N
WATER ENVIRONMENT
Water Site
preparation &
infrastructure
development
Use of
large
quantity
of water
for dust
suppressi
on,
consolid
ation &
compacti
on
D 2 NM 1 L 1 P 2 LT 2 Y 1 8 N
Water Excavation
for below
ground level
structures
Impacts
on
hydrogeo
logy due
to
dewateri
ng
D 2 NM 1 L 1 P 2 LT 2 Y 1 8 N
Water Construction Impact D 2 NM 1 W 2 P 2 LT 2 Y 1 16 Y

Activities on
competin
g users
due to
large
consump
tion of
water for
curing,
dust
suppressi
on,
construct
ion,
domestic
use etc
Water Loose
excavated
earth & loose
constructions
material at the
site
Contami
nation of
surface
water
body
(drain
passing
through
the
site)&aq
uatic life
D 2 NM 1 L 1 T 1 ST 1 Y 1 2 N
Water Storm water
from the site
Improper
channeli
zation
may lead
to
contamin
D 2 NM 1 L 1 T 1 ST 1 Y 1 2 N

ation of
surface
water &
ground
water by
non
point
sources
of
pollution
like
litter,
oil&
grease,
loose
earth
Water Storm water
from the site
Clogging
of storm
water
drainage
system
by stilt &
other
materials
may lead
to the
flooding
condition
s
D 2 NM 1 L 1 T 1 ST 1 Y 1 2 N
Water Temporary
stay of
construction
workers
Impact
on
surface/
ground
D 2 M 2 L 1 T 1 ST 1 Y 1 4 N

water
quality
due to
untreated
discharg
e of
sewage
& solid
waste
from the
labor
colony
NOISE ENVIRONMENT
Noise Constru
ction
activitie
s
Noise &
Vibratio
n due to
construct
ion
activities
D 2 M 2 L 1 T 1 ST 1 Y 1 4 N
LAND ENVIRONMENT
Soil Infrastru
cture
develop
ment
Compact
ion of
soil by
earth
moving
vehicles
D 2 NM 1 L 1 T 1 ST 1 Y 1 2 N
Soil Site
clearanc
e &
excavati
on
Erosion
&
modifica
tion of
surface
D 2 NM 1 L 1 T 1 ST 1 Y 1 2 N
Soil Storm
water
Improper
channeli
D 2 NM 1 L 1 T 1 LT 2 Y 1 4 N

zation
may lead
to loss of
fertile
top soil
along
with
surface
run off
and
subseque
nt loss of
water
holding
and
infiltratio
n
capacity
of soil
Soil Tempor
ary stay
of
construc
tion
workers
Impact
due to
untreated
discharg
e of
sewage
& solid
waste in
to the
land
D 2 NM 1 L 1 T 1 LT 2 Y 1 4 N
Soil Constru
ction
waste &
MSW
Improper
disposal
of
construct
D 2 M 2 L 1 T 1 LT 2 Y 1 8 N

ion
waste &
MSW in
to the
land
BIOLOGICAL ENVIRONMENT
Biologic
al
Site
clearanc
e &
excavati
on
Loss of
vegetatio
n and
loss of
habitat
of faunal
species
(resource
loss)
D 2 NM 1 L 1 P 2 LT 2 Y 1 8 N
Biologic
al
Constru
ction
activitie
s
Vibratio
n due to
moveme
nt /
operation
of heavy
machiner
y
D 2 NM 1 L 1 T 1 ST 1 Y 1 2 N
SOCIO ECONOMIC
Socio
Economi
c
Tempor
ary stay
of
construc
tion
workers
Impact
on native
social
fabric of
the site
surround
ings like
cultural
diversity,
D 2 NM 1 L 1 T 1 ST 1 Y 1 2 N

possible
increase
in anti-
socialacti
vities
etc
Socio
Economi
c
Constru
ction
workers
Unhygie
nic site
sanitatio
n
facilities
may
cause
health
damage
to
construct
ion
workers
D 2 M 2 W 2 T 1 LT 2 Y 1 16 Y
OTHERS
Disaster
manage
ment
Fire &
other
hazards
Absence
of proper
fire
protectio
n
systems
may lead
to fire
hazards
D 2 M 2 L 2 T 2 ST 2 Y 1 32 Y
Disaster
manage
ment
Fire &
other
hazards
Absence
of
signage,
mock
D 2 M 2 L 2 T 2 ST 2 Y 1 32 Y

drills &
assembly
points
Table 4-2 Impact on Environment during Operation Phase
S.
No
Impact
on
Environ
ment
Activity/As
pect
Anticipated
Measures
Impact Classification
Direct (D)/
Indirect(ID)
Mandator
y (M)/ Not
Mandator
y (NM)
Local (L)/
Widespre
ad (W)
Temporary(T
)/
Permanent(P)
Long
Term
(LT)/Shor
t term
(ST)
Mitigati
on
availabl
e
(Yes/N
o)
Total
Mark
s
Obtai
ned
M1 x
M2…
x M6
Wheth
er
Signifi
cant or
not
Marks Marks Marks Marks Marks Marks
D/ID M1 M/N
M
M
2
L/
W
M3 T/P M4 LT/S
T
M
5
Y/
N
M
6
AIR ENVIRONMENT
1 Air Unloading
of raw
materials
of raw
materials &
Products
of
products
Deterioration
of
ambient air
quality due
to fugitive
emissions
during
handling and
storage of
chemicals
D 2 M 1 L 1 P 2 LT 2 Y 1 8 Y
2 Air Fuel
consumptio
n
and Flue gas
Particulate
Matter &
Gaseous
Emissions
D 2 M 2 L 2 P 2 ST 1 Y 1 16 Y

generation
due to
operation of
Boilers and
Thermic
Fluid
Heater
(including
worst
condition of
operating all
DG sets)
3 Air Process gas
generation
due to
operation of
reaction
vessel
Deterioration
of ambient
air quality
D 2 M 1 L 1 P 2 ST 2 Y 1 8 Y
4 Air Fugitive
emission
from
process and
raw material
storage are
Particulate
Matter &
Gaseous
Emissions
D 2 M 2 L 1 P 2 ST` 2 Y 1 16 Y
WATER ENVIRONMENT
1 Water Washing of
leakage /
spillage
due to material
handling
Unplanned
handling
of
materials
D 2 M 2 L 1 T 1 ST 1 Y 1 4 Y
2 Water Consumption
of
fresh water for
industrial
operation
No ground
water
extraction
D 1 M 2 L 1 P 2 LT 2 Y 1 8 Y
4 Water Wastewater
generation due
Contamina
tion of
D 2 M 2 W 1 P 1 LT 1 Y 1 4 Y

to
industrial
operation
ground
water
sources
due to
improper
handling
5 Water Storage,
handling
and disposal of
liquid effluent
and
hazardous
wastes
Contamina
tion due to
spillage of
effluent
and
hazardous
wastes
D 2 M 2 W 2 P 2 LT 2 Y 1 32 Y
6 Water Storm Water Improper
Channeliz
ation may
lead to
contamina
tion of
water
body
D 2 M 2 L 1 P 2 LT 2 Y 1 8 N
NOISE ENVIRONMENT
1 Noise Noise
generation
due to plant
operations
Hearing defects
to
workers
D 2 M 1 L 1 P 2 LT 2 Y 1 8 N
LAND ENVIRONMENT
1 Soil Leakage /
spillage
due to material
handling
Contamination of
soil
due to leakages /
spillages of
chemicals
D 2 M 2 L 1 P 2 LT 2 Y 1 16 Y
2 Soil storage, Contamination D 2 M 2 L 1 P 2 LT 2 Y 1 16 Y

handling
and disposal of
liquid effluent
and
hazardous
wastes
soil due to
spillage of
effluent and
hazardous wastes
3 Soil Development
and
maintenance of
green belt
Improvement in
soil
quality due to
plantation
activity
D 1 M 1 W 1 P 1 LT 1 Y 1 1 Y
4 Soil Development
and
maintenance of
green belt
Benefit to local
flora
and fauna
beautification of
plant
site
D 1 M 1 W 1 P 1 LT 1 Y 1 1 Y
5 Soil Storm Water Non-point
sources of
pollution like
litter, oil &
grease, loose
earth. Clogging
of storm water
drainage system
by silt & other
material may
lead to flooding
D 2 NM 1 L 1 P 2 LT 2 Y 1 8 N
BIOLOGICAL ENVIRONMENT
1 Biological storage,
handling
and
adverse
effect on
floral
D 2 NM 1 L 1 T 1 ST 1 Y 1 2 N

disposal of
liquid
effluent and
hazardous
wastes
emissions
species
grown as part
of green belt
development
OTHER ASPECTS
1 Occupational
health
&
Safety
Material
handling
and storage
Accidents
involving
workers
leakages of
chemicals
leading to
emergency
within in
plant
premises
D 2 M 2 L 2 T 1 ST 1 Y 1 8 Y
2 Occupational
health
&
Safety
Industrial
operation
Chances of
accidents
to workers /
employees
D 2 M 1 W 2 T 1 ST 1 Y 1 4 Y
3 Occupational
health
&
Safety
Storage,
handling
and disposal
of liquid
effluent and
hazardous
wastes
Detrimental
(Acute/
chronic)
effect on
worker’s
health due to
exposure to
effluent
and
D 2 M 1 W 2 T 1 ST 1 Y 1 4 Y

hazardous
waste
as well as
gaseous
emissions
3 Disaster
Management
Fire & other
Hazards
Absence of
trained
personnel &
mock drills
may lead to
major fire
accidents
&non
maintenance
of system
D 2 NM 1 L 1 P 2 LT 2 Y 1 8 N
4 Biodiversity Impacts on
the
drainage,
loss of tree
cover, loss
of critical
species
The loss of
biodiversity
will lead to
disturbance
in the local
ecology
D 2 NM 1 L 1 P 2 LT 2 Y 1 8 N
5 Socio economic Generation
of
direct and
indirect
employment
generation of
job
opportunities
for local
people
D 1 M 1 L/
W
1 P 2 LT 1 Y 1 1

Table 4-3 Impact & Mitigation measures on Land Environment
Aspect Impact Mitigation Measures
Construction Phase
Site Clearance and Excavation Impacts during Construction Phase:
The construction of the proposed project
involves Site Clearance. Hence there will be
loss of top soil leading to erosion
In addition to that, during Construction
phase, Solid waste like litters, Cement
residue, scraps and also settlement of dust
may pollute the soil.
Mitigation Measures during Construction
Phase
Topsoil required for the establishment of
vegetation will be stockpiled and covered in
the North Side of the project site.
Also, the excavated earth and other
construction waste materials like concrete
blocks will be used for site filling & leveling.
Proper Maintenance of site will be done and
the same will be monitored by a special team
headed by an Environmental Engineer to
ensure the site is Litter free.
Oil spillage Spillage of oil & grease from DG set,
Vehicles during construction phase will
pollute the soil as they pose chemical hazards
and decrease the quality of soil.
Proper training will be given to avoid
spillage. Containers for storing fuel and oil
will be covered tightly
Operation Phase
Leakage / spillage due to material handling The main impact during the material handling
is the leakage/ spillage of chemicals which
may lead to contamination of soil
environment. The soil quality gets affected.
Proper training will be given to avoid
spillage. Containers for storing fuel ,
chemicals and oil will be covered tightly

Storage, handling and disposal of liquid
effluent and hazardous wastes
Contamination of soil may occur due to
spillage of effluent and hazardous wastes.
This may lead to acute or chronic detrimental
effect to the workers causing health disorder.
The spent oil will be stored in drums and the
lids are tightened properly to avoid leaks
during handling/disposal. The ETP sludge
will be collected in a bag and moved to
storage without spillage. The hazardous
wastes will be stored in concrete covered
shed.
Improper management of Wastewater
Improper management of the wastewater
from the project site may affect the soil and
also stagnant water in the project site acts a
breeding place for mosquitoes causing water
borne diseases like Malaria, Dengue etc
The project site has got well laid storm water
system. The wastewater will be routed to
ETP and water stagnation will be avoided.
Improper management of Storm water flow
Improper management of Storm water may
lead to erosion
The project will have proper storm water
management with RWH structures like storm
water trench (600mm x750 mm) will be
provided around the periphery of the project
site. In addition to that, green belt plantation
with native tree species of greater girth will
be provided around the periphery of the
project site for a width of 3m. Along with
that, grasses or cover crops are allowed to
grow under their foliage to prevent erosion of
soil. No surface will be unpaved to prevent
the loss of topsoil.

Table 4-4 Impact & Mitigation measures on Water Environment
Aspect Impact Mitigation Measures
Construction Phase
Dumping of Construction waste
There may be chances for the dumping of
Construction waste and disposal of
wastewater generated by construction
labors into Buckingham canal (700m, E),
which may pose a serious Environmental
threat to the flora and fauna which are
using these water bodies.
The proponent will engage a third party for the
collection of non-recyclable wastes. For the
management of recyclable waste, the proponent
will hand over the same to concerned contractor
(Paint Cans & Barrels, Glass etc if any). In
addition to that, construction debris such as
concrete blocks, etc will be used in laying
internal roads. Domestic waste generated by
construction workers will be handed over to
local body on a daily basis.
Installation, testing, and commissioning of plant
equipment and machineries
Water consumption for hydraulic testing of
machineries.
Since the proposed project is expansion activity,
there will be meagre quantity of water usage.
Possible reuse of water will be made during
equipment and machineries testing.
Operation Phase
Washing of leakage / spillage due to material
handling
Improper management of the wastewater
from the project site may affect the ground
water and nearby surface waters.
The project site has got well laid storm water
system. The wastewater will be routed to ETP
and water stagnation will be avoided.
Improper Management of Storm water Improper management of Storm water may
lead to flooding
The project will have proper storm water
management with RWH structures like storm
water trench (600mm x750 mm) will be
provided around the periphery of the project site.
In addition to that, green belt plantation with
native tree species of greater girth will be
provided around the periphery of the project site
for a width of 3m. Along with that, grasses or
cover crops are allowed to grow under their
foliage to prevent erosion of soil. No surface will
be unpaved to prevent the loss of top soil.

Extraction of Ground water There may be chances of ground water
extraction, which may lead to ground water
depletion and also less resource availability
to the competent users
There is no extraction of ground water. Source
of water is from CMWSSB and DM water.
Table 4-5 Impact & Mitigation measures on Air Environment
Aspect Impact Mitigation Measures
Construction Phase
Site clearance
There may be chance of dusting due to site
cleaning, excavation, foundation and
construction
Storage of sand and other such dispersible material by
covering with
tarpaulin sheet
Keeping minimum inventory/stock of sand and other such
dispersible material at site Proper storage of excavated
materials with use of protective sheets
Periodical water sprinkling to prevent dusting
Storage of topsoil in covered and isolated area for its
replenishing and reuse for green belt development
Use of RMC to possible extent Excavated materials to
transport in sound manner to prevent dust spread during
movement
Loading and Unloading of
Construction Materials
Transportation as well as loading / unloading of
construction materials,
equipment and machineries
All transportation vehicles will be suitably covered with
tarpaulin & overloading of the vehicles will be avoided.
PUC certified vehicles will be used to avoid the exhaust
emission.
Operation Phase
Handling of raw materials and
products
Deterioration of ambient air quality due
to fugitive emissions during handling and
storage of chemicals, Unloading of raw
materials, Storage of raw materials &
Products, Loading of products
Regular checking / inspection and periodic maintenance of
chemical storage and transfer equipment and machineries.
Transportation and handling of chemicals as per
established SOPs and precaution measures as per MSDS.
Provision of adequate ventilation system Periodical
review of storage area and related SOPs implementation.
Handling of raw materials and Odour problem may cause health issues to the Implementation of closed handling system for odorous

products
workers causing nausea, insomnia and
discomfort
chemicals.
All odorous chemicals are procured in bulk quantity and
taken in through closed system.
Generation of flue gas and fugitive
emission during operation
Fuel consumption and Flue gas generation due
to operation of Boilers. Thermic Fluid Heater;
Process gas generation due to operation of
reaction vessels Fugitive emission from process
and raw material storage area may detoriate the
ambient air quality which affects the respiratory
system.
Process operations to be done as per established SOPs of
production plan.
No fugitive emission is envisaged. All the raw materials
are stored in bullets with nitrogen blanketing. The pumps
are provided with double mechanical seal to avoid any
leaks.
Adequate stack height will be provided for proper
dispersion of gaseous pollutants into atmosphere.
Usage of PPEs

4.2.1 AERMOD SOFTWARE
AERMOD Software Version 8.0.1 was used for air dispersion modelling and is applicable to a wide
range of buoyant or neutrally buoyant emissions up to a range of 50 km. In addition to more straight
forward cases, AERMOD is also suitable for complex terrain and urban dispersion scenarios.
AERMOD is a steady-state plume model. In the stable boundary layer (SBL), it assumes the
concentration distribution to be Gaussian in both the vertical and horizontal. In the convective
boundary layer (CBL), the horizontal distribution is also assumed to be Gaussian, but the vertical
distribution is described with a bi-Gaussian probability density function (pdf). This behavior of the
concentration distributions in the CBL was demonstrated by Willis and Deardorff (1981) and Briggs
(1993). Additionally, in the CBL, AERMOD treats “plume lofting,” whereby a portion of plume
mass, released from a buoyant source, rises to and remains near the top of the boundary layer before
becoming mixed into the CBL. AERMOD also tracks any plume mass that penetrates into the
elevated stable layer, and then allows it to re-enter the boundary layer when and if appropriate.
For sources in both the CBL and the SBL AERMOD treats the enhancement of lateral dispersion
resulting from plume meander. The GLC for all the parameters such as PM10, SO2, and NO2 likely
to be emitted from the various stacks of the proposed project have been predicted using above
mathematical model.
The following methodology is adopted for the prediction based on above model.
1. Input Parameters
The input parameters required for the mathematical model uses micrometeorological data and
potential of the air pollutants. The details of all the input parameters are discussed here below.
Micrometeorological Data
Micrometeorological data viz. ambient temperature, Relative Humidity, wind speed, wind direction,
Cloud Cover, Rainfall, Radiation etc. required for the mathematical modeling.
Potential of the Air Pollutants
The probable sources of air pollution are flue gas emission and process gas emission. The details of
stack emissions viz, physical stack height, inner diameter of the stack at exit, gas exit temperature,
gas exit velocity, quantity of pollutant discharge etc. have been considered and taken for the
processing of mathematical model.
The ground level concentration of pollutants as simulated by software tool is compared with the
AAQ monitoring results, to infer percentage increase in emissions due to the proposed project.

Table 4-6 Existing Stack Emission Details
S.N
o
Stack
details
No.
of
Stac
k
Stack details Emission per stack (g/s)
Typ
e of
fuel
Heig
ht
(m)
Tem
p
(C)
Di
a
(m
)
Exit
veloci
ty
(m/s)
Flow
gas
flow
rate
(Nm3/h
r)
PM SO2 NOX CO
1. Boiler-
B(10TP
H)-
connecte
d to
stack
1 FO 30
158 1.
5
10.28 45099 0.29
69
0.51
36
1.99
19
0.20
55
2. Boiler-
C(10TP
H)-
connecte
d to
stack
3. Boiler-
D(21TP
H)-
connecte
d to
stack
FO 30 148 1.
5
7.8 35023 0.29 2.87 0.55 0.32
4. 1500
KVA
DG Set –
I
1 Dies
el
10.5 450 0.
4
34.2 15984 0.09 0.06 1.16 -
5. 1500
KVA
DG set -
II
1 Dies
el
10.5 450 0.
4
34.2 15984 0.09 0.06 1.16 -
Total (g/s) 0.76
69
3.50
36
4.86
19
0.52
55
Note:
1. Boiler - B 10 TPH with Economiser + Boiler – C10 TPH with Economiser will be standby boiler
for the above with a common stack.
2. Only Boiler D will be operational and Boiler B&Boiler C will be kept standby.
3. Only one DG set will be operational during power failure. Other DG Set will be kept standby
Table 4-7 Proposed Stack Emission Details
S.
N
o
Stack
detail
s
Coordinates Ty
pe
of
fu
el
Fuel
quant
ity
(Natu
ral
Gas )
(SCM
/day)
Stack details Emission per stack
(g/s)
E N Hei
ght
(m)
Te
mp
(◦C
)
D
ia
(
m
)
Exit
velo
city
(m/s
)
Flow
gas
flow
rate
(Nm3/hr)
P
M1
0
SO2 NO
X
CO

1 Boiler
.E-30
TPH(
Stack
comm
en for
three
boiler
s)
80◦16’
15.97”
13◦9’1
2.16”
L
N
G
33000 30 14
0
1.
5
5.76
9
2425
0
- 0.00
366
0.8
556
0.5
133
Note:
1. Furnace Oil will be replaced with LNG for existing boilers. LNG will be used as fuel for
proposed 30TPH boiler and this leads to reduction in emission. No process emissions are
envisaged. Hence, there is no stack is proposed for the proposed expansion since the existing stack is
found to be sufficient to handle proposed emission. The existing FO is replaced with LNG of 33000
SCM/Day is proposed.
2. There is no presence of ash in LNG. So the PM10 will be zero.
Note: 1. Emission details, stack details and fuel quantity provided by proponent

Figure 4-1 Predicted 24-Hrs’ GLC’s of SO2 within 10 km Radius of the Study Area

Table 4-8 Estimated Top 10 Highest Concentrations of Sulphur Dioxide Obtained Through Modeling
S.No UTM Coordinates (m) Conc (µg/m3) Elevation
E N
1. 421102.1 1454091 2.55582 7.1
2. 420109.2 1454091 2.49795 4.8
3. 421102.1 1455084 1.83484 5.3
4. 420109.2 1453098 1.66505 4
5. 420109.2 1455084 1.48873 8.7
6. 419116.2 1453098 1.42615 5.2
7. 421102.1 1453098 1.34127 -1.4
8. 419116.2 1454091 1.29314 13.1
9. 420109.2 1452105 1.2413 3.5
10. 420109.2 1451112 0.96933 5
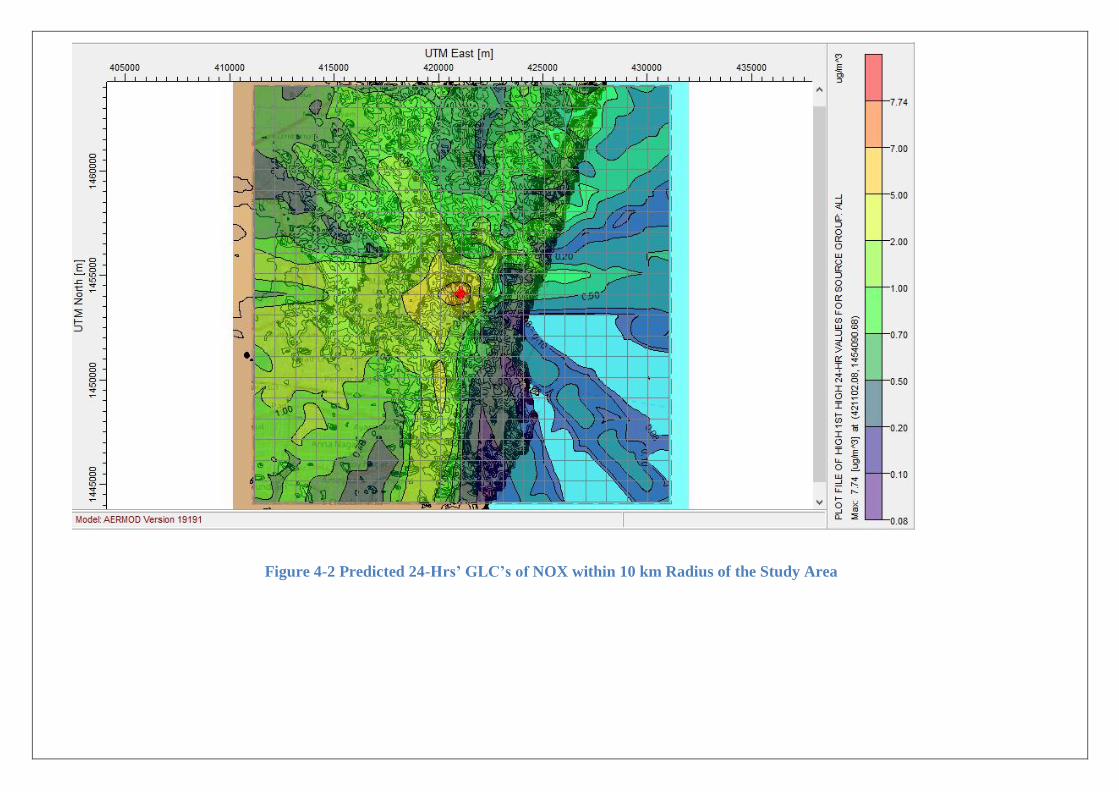
Figure 4-2 Predicted 24-Hrs’ GLC’s of NOX within 10 km Radius of the Study Area

Table 4-9 Estimated Top 10 Highest Concentrations of oxide of Nitrogen Obtained through Modeling
S.No UTM Coordinates (m) Conc (µg/m3) Elevation
E N
1. 421102.1 1454091 7.74208 7.1
2. 420109.2 1454091 5.53245 4.8
3. 421102.1 1455084 3.12486 5.3
4. 420109.2 1453098 2.95283 4
5. 420109.2 1455084 2.79481 8.7
6. 419116.2 1454091 2.75524 13.1
7. 419116.2 1453098 2.63313 5.2
8. 420109.2 1450119 2.57184 6.8
9. 420109.2 1452105 2.43754 3.5
10. 420109.2 1449126 2.38233 6.9
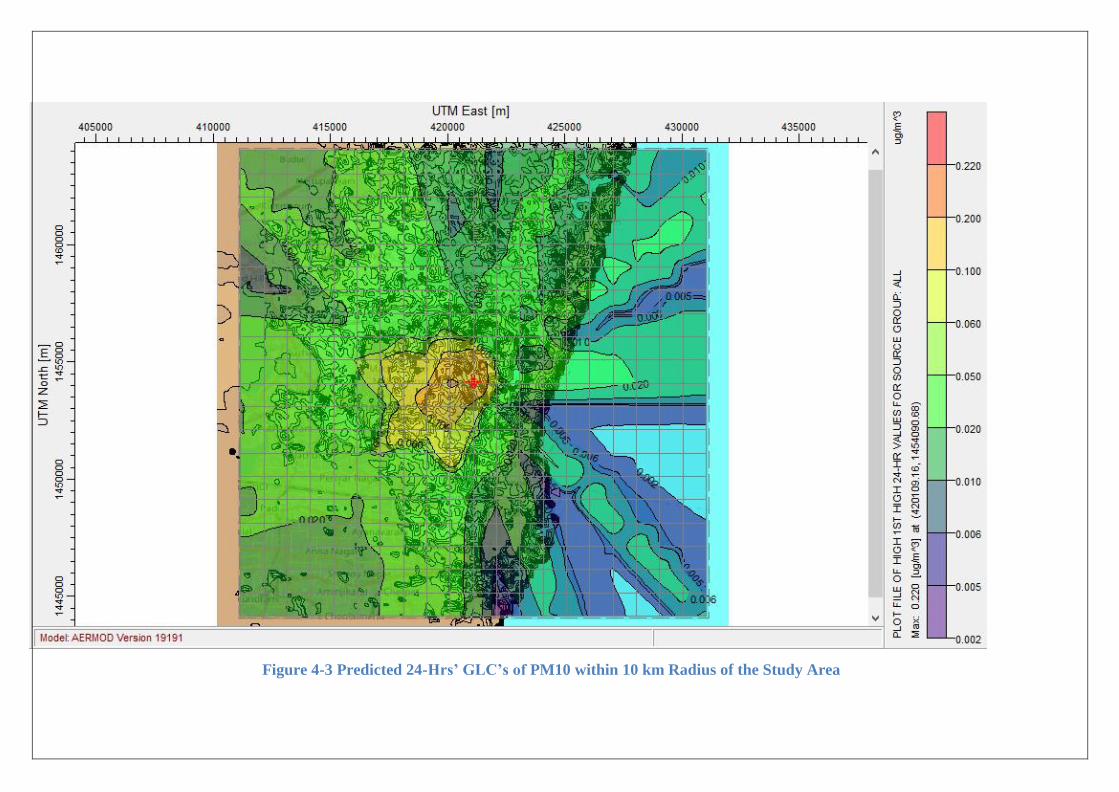
Figure 4-3 Predicted 24-Hrs’ GLC’s of PM10 within 10 km Radius of the Study Area

Table 4-10 Estimated Top 10 Highest Concentrations of PM10 Obtained through Modeling
S.No UTM Coordinates (m) Conc (µg/m3) Elevation
E N
1. 420109.2 1454091 0.22003 4.8
2. 421102.1 1454091 0.17526 7.1
3. 421102.1 1455084 0.16978 5.3
4. 420109.2 1453098 0.1347 4
5. 419116.2 1453098 0.12949 5.2
6. 420109.2 1455084 0.12673 8.7
7. 420109.2 1452105 0.09991 3.5
8. 419116.2 1454091 0.09662 13.1
9. 420109.2 1451112 0.08565 5
10. 421102.1 1453098 0.08422 4

Figure 4-4 Predicted 24-Hrs’ GLC’s of CO within 10 km Radius of the Study Area

Table 4-11 Estimated Top 10 Highest Concentrations of CO Obtained through Modeling
S.No UTM Coordinates (m) Conc (µg/m3) Elevation
E N
1. 421102.1 1454091 7.7626 7.1
2. 420109.2 1454091 6.09071 4.8
3. 421102.1 1455084 3.75386 5.3
4. 420109.2 1453098 3.46332 4
5. 419116.2 1454091 3.19374 13.1
6. 420109.2 1455084 3.19284 8.7
7. 419116.2 1453098 3.14313 5.2
8. 420109.2 1452105 2.88379 3.5
9. 421102.1 1453098 2.65308 4
10. 418123.3 1454091 2.16026 8.2

4.2.1.1 Results and Discussion
Maximum pollutant concentrations of PM, SO2, NOx observed due to proposed expansion for
an 24hr-average period have been studied and CO maximum concentration for 1 hr- average period
have been studied . The total increase in concentrations above baseline status to estimate the
percentage increase and summarized in Table 4-12.
Table 4-12 Total Maximum GLCs of the cumulative emissions
Pollutant Max.
Baseline
conc
Location of
Max. Baseline
Conc.
Estimated
incremental
Conc (µg/m3)
Total
conc.
(µg/m3)
NAAQ
Standards
%
increase
PM 10 82 Tondiarpet 0.22 82.22 100 0.26
SOX 33 Tondiarpet 2.5 35.5 80 7.04
NOX 59 Project Site 7.74 66.74 80 11.5
CO (mg/
m3)
4 Site & 8 7.76 11.76 4000 66
The incremental concentration of PM10, SOx, NOx and CO is observed to be 0.26%, 7.04%,
11.5% and 66 % respectively. The total pollutant concentrations of PM10, SO2, NOx and CO are
82.22 µg/m3, 35.5 µg/m3, 66.74 µg/m3 and 11.76 mg/m3
which is observed to be within NAAQ
standards.

Table 4-13 Impact & Mitigation measures on Noise Environment
Aspect Impact Mitigation Measures
Construction Phase
Working of Construction
Machineries
Generation of noise and
vibration due to
operation / working of
construction machineries
causing hearing defects in
workers / employees working
with the
machineries
Avoid construction activities
during
nighttime
Periodical servicing and
lubrication of moving parts of
machineries for reducing tear
and wear
Provision of PPEs (earmuffs,
ear plug) to workers working
with machineries generating
loud noise
Installation, testing and
commissioning
of plant equipment and
machineries
Chances of hearing defects to
workers engaged in activity
Provision of PPEs (ear muffs,
ear plug) to workers working
with machineries generating
loud noise
Provision of acoustic enclosures
and vibrating absorbance pads
Operation Phase
Noise generation due to plant
operations
Continuous operation may lead
to hearing defects to workers
Proper foundation, alignment
and installation of rubber
padding as well acoustic
enclosures for noise and
vibration generating equipments
and machineries
Preparation and implementation
of preventive maintenance
schedule for equipment’s and
machineries
Provision of PPEs to workers
Isolation of high noise
generating machineries
“Work permit system” for
restricted entry to high noise
generating areas
Ensure effectiveness of
implementation of preventive
maintenance schedule for
equipments and machineries
Regular monitoring of noise
levels with plant area as well
factory premises as per
Environmental monitoring plan
Table 4-14 Socio Economic Environment

Aspect Impact Mitigation Measures
Construction & Operation Phase
Socio Economic
Generation of direct and indirect
employment
Allocation of fund for CER
activities
Priority shall be given to local
people based on their
educational qualification and
skills
Table 4-15 Biological Environment
Aspect Impact Mitigation Measures
Operation Phase
Greenbelt development
development and maintenance
of green belt
Benefit to local flora and fauna
Aesthetic beautification of plant
site
Table 4-16 Occupational Health and safety
Aspect Impact Mitigation Measures
Construction Phase
Handling of materials during
construction
Working at height, construction
of building, use of lift and
elevators may pose accident to
workers
Impart adequate training to
workers / labours working on site
Make them aware about risks
involved
Provision of required PPEs for
the related work
Preparation and implementation
of safe work procedures
Operation Phase
Material handling and storage
during operation
Industrial Operations
Chances of accidents to workers
Spillages / leakages of
chemicals leading to emergency
within in plant premises
Provision of necessary safety
measures (i.e. safety showers and
fire extinguishers) for storage
area
Provision of PPEs to workers to
avoid any kind of accident
Training to workers for safe
handling of chemicals
Training to workers for handling
emergency situations and
application of safety measures
Availability of first aid kits and
necessary medical provision in
plant premises at prominent
locations preparation of onsite
emergency plan and awareness
of the same to employees /
workers
Periodical safety audit of the

plant for ensuring effectiveness
of safety measures proposed /
implemented
Periodical mock drills for
ensuring effectiveness of training
to works
Supervision by experts / EHS
head Agreement / contract with
local medical services
Storage, handling and
disposal of liquid effluent and
hazardous waste
Detrimental (Acute/ chronic)
effect on worker’s health due to
exposure to effluent and
hazardous waste as well as
gaseous emissions
Handling of hazardous wastes
within premises through trolleys
and handcarts.
Persons involved in effluent
handling and hazardous waste
storage should be aware about
risks involved and SOPs to
follow for safe work.
Use of PPEs to avoid exposure.
Transportation of wastes to be
done in environmentally sound
manner.
Ensuring of use of PPEs by
workers

5 ANALYSES OF ALTERNATIVES
5.1 Introduction
Manali Petrochemicals Limited-Plant-II proposes “Expansion of Propylene Glycol Plant by 50000
MTPA” at Manali Industrial Area, Sathangadu Village, Manali, Chennai – 600 068, Ambattur Taluk,
Thiruvallur District.
The range of alternatives selected for the purpose of analysis includes:
Site alternative
Alternative for technologies
5.2 Site Alternative
The proposed Propylene Glycol unit will be built near the existing Propylene Glycol plant to utilize
the utility nearby. Since the proposed project is expansion within the existing facility, no alternative
sites were considered.
5.3 Alternative for Technologies
The proposed project involves expansion in the existing manufacturing unit of Propylene Glycol
Plant by 50000 MTPA.
5.3.1 Water supply stream
The total raw water requirement of 3247 KLD for the existing usage is met from Chennai Metro
Water Supply and Sewerage Board. After expansion, there will be an additional requirement of water
over the existing water agreement, for which a request letter given to CMWSSB and the reply letter
from CMWSSB is enclosed as Annexure - 9. Since the proposed project uses the existing water
source no alternative water supply is considered.
5.3.2 Technology
It is proposed to set up an additional 50000 MTPA Propylene Glycol plant at MPL-Plant II facility.
Manali Petrochemicals Limited-Plant-II utilizes the technology of Technip, France for the existing
Propylene oxide and the technology of Enichem Italy for the existing Propylene Glycol along with
Press Industria for manufacture of existing Polyol.
An alternative technology offered by Thyssenkrupp Industrial solutions was explored, but on
comparing with the technology of Technip France, it didn’t offer better energy conservation and
economic benefits.
Hence, for the proposed expansion facility of Propylene Glycol manufacturing facility, the
technology of Technip, France has been considered since it offers less energy consumption and
improvement in product quality. So, no alternative technology is considered.

6 Environmental Monitoring Program
6.1 Introduction
Environmental monitoring is an essential tool for sustainable development and ensuring effective
implementation of environmental management plan and mitigation measures. Environmental
monitoring will be undertaken primarily to determine the environmental effects of the proposed
project activities on human and secondarily to understand the cause and effect relationships between
project activity and environmental change. Environment monitoring is a repetitive and systematic
measurement of the characteristics of environmental components to test specific hypotheses of the
effect of project on the environment. Environmental monitoring program enables the proponent to
identify the deviation of environmental quality due to the proposed project activities.
6.2 Environmental Monitoring Plan
The summarized form of post monitoring details is presented in the following Table 6-1
Table 6-1 Post Environmental Monitoring plan
S.
No
Particulars Frequency of
monitoring
Parameters for Monitoring
1. Air pollution monitoring
Ambient air quality within
the Premises
Once in a month PM, SO2, NOX, NO2, CO, VOC
Ambient air quality within
the premises
Once in a month All 12 parameters as given in
NAAQS
Ambient air quality at 1
location in
Prevalent Down Wind
Direction
Once in a month All 12 parameters as given in
NAAQS
Ambient air quality at 1
location in
Up Wind Direction
Once in a month All 12 parameters as given in
NAAQS
Stack monitoring Continuous. SPM, SO2, NO2 ,CO, CO2 and
O2
2. Noise monitoring
At two locations
within the
Premises
Once in a month Noise Levels in dB(A)
3. Soil Quality monitoring
One location near
Hazardous waste
storage area at site and one
location outside site
Once in a year Physicochemical properties,
Nutrients, Heavy metals as per IS
2720 (All Parts)
4. Effluent Quality Monitoring

Inlet and outlet of ETP Twice a month
for Inlet/Outlet of
ETP. Continuous
monitoring of
ETP outlet for
pH, Temperature,
Flow, TSS, COD
& BOD.
pH, Temp, TDS, TSS, Chloride,
Sulphide, Sulphate, fluoride,
Phenolic compounds, Oil and
Grease, BOD, COD, Total
Residual Chlorine, Calcium,
Total Chromium, Hexavalent
Chromium, Phosphates. All the
Parameters are to be verified as
per CPCB Standard Guidelines.
5. Workplace Monitoring Noise – Once in
a month
VOC –
Continuous Lux
levels – Once in a
year
Noise, VOC, Lux
6 Marine Quality Monitoring Once in a year
jointly with TPL &
KPL
Temp, Salinity, pH, TSS, DO,
BOD, Nutrients- Ammoniacal
Nitrogen, Nitrate Nitrogen, Nitrite
Nitrogen, Phosphate
Phosphorous. Petroleum
hydrocarbon, Heavy Metals- Ni,
Co, Cu, Cd, Pb, Cr, Hg, Fe, Mn
and Zn. Along with the
Biological Oceanographic Status.
The Online Monitoring for Ambient Air (PM10 and PM2.5) and Effluent (BOD, COD, Temperature
and Flow of Effluent) is given in Figure 6-1 and Figure 6-2 respectively.
Figure 6-1 Online Monitoring of Ambient air (PM10 and PM2.5)

Figure 6-2 Online Monitoring of Effluent (BOD, COD, Temperature and Flow of Effluent)
6.3 Environmental Monitoring Methodologies
Monitoring of environmental samples shall be carried out as per the guidelines provided by MoEF &
CC/ CPCB/ SPCB-Tamil Nadu. The methods conducted or applied shall be approved or sanctioned
by any recognized body or authority i.e. MoEF & CC/ CPCB/ SPCB-Tamil Nadu.
6.4 Budget for Environmental Monitoring Plan
Particulars and frequency of Environmental Monitoring is given in Table 6-2
Table 6-2 Budgetary allocation for Environmental Monitoring
S. No Particulars Frequency of monitoring Cost in INR
Lakhs
1. Air pollution monitoring
Stack monitoring Continuous. 2.55
Ambient Monitoring
within the premises, 1
location in Prevalent
Down Wind and Up
Wind Direction
Once in a month
1.4
2. Noise monitoring
At two locations
within the premises
Once in a month 0.075
3. Soil Monitoring
One location near
Hazardous waste
storage area at site
Once in a year 0.5

and one location
outside site
4. Effluent Quality Monitoring
Inlet and outlet
of ETP
Twice a month for 16 parameters.
Continuous monitoring of outlet of
ETP for pH, Temperature, Flow, TSS,
COD & BOD.
2.55
5. VOC monitoring Online 0.5
Total 7.575
6.5 EHS Policy and Environment Management Cell
Apart from carrying out business only, unit will also be taken care of its responsibilities towards the
Environment. The unit believes in sustainable development and is equally concerned about
environment preservation and pollution control. The unit will provide an adequate Environmental
Management System to meet desired norms of effluent discharge (Water + Air + Solid) as per the
statutory requirements for their proposed expansion project and will continue its endeavor for the
pollution prevention and betterment of environment.
Unit established a well-organized Environmental Management Cell (EMC) which performs all the
environmental management activities. The unit prepared Environment, Occupational Health &
Safety (EHS) Policy for effective and efficient working with view of environment protection.
The EHS Policy formulated is complied with statutory norm with regards to the Environment,
Occupational Health & Safety and strive for the continuous improvement to prevent pollution,
reduce wastages, conserve energy, reduced risk and health hazards. All employees at each cadre of
the unit will be made aware about the EHS Policy of the company and policy will be posted at
various prominent places in the unit.
Apart from EHS policy, there will be different SOPs related to EHS of the unit, which will
be implemented and reviewed periodically.
The following SOPs are prepared for the safe & smooth functioning of operations and the same will
be continued after expansion:
1. Work Permit System
2. Accident Reporting & Investigation
3. General Safety Rules and Regulation
4. Procedure for Safe use of Personal Protective Equipment
5. Procedure for Handling of Hazardous Chemicals
6. Safe Handling of Gas Cylinders
7. SOP for Use of Goods Forklift

8. SOP for Use of Safety Shower
9. Role of HSE Representative
10. Procedure for Effluent Collection and Treatment
11. Procedure for Handling of Hazardous & Non-Hazardous waste
12. Medical check up
All the above SOPs have following basic contents –
a) Safe preparedness of system to start.
b) Safe Shut down procedure of system.
c) Safe handling of system.
d) PPE required to handle the system.
e) Trouble shooting of the system.
f) Operational control procedures
Employees will be made aware about the relevant SOPs in their working area at the time of
recruitment and whenever the SOPs are amended.
For effective implementation of the monitoring program, it is also necessary to have a permanent
organizational set-up. Unit will set set-up permanent environmental management cell (EMC) for the
effective implementation and monitoring of environmental management system as given in Figure 6-
3.
Figure 6-3 Environment Management Cell

Role of Plant Head:
Responsible for entire activities of Unit and to define HSE policy and ensure that this policy
is understood, implemented, and maintained at all levels in the organization.
Responsible to provide adequate resources for achieving improved Occupational Health
Safety and environmental performance and setting organizational HSE objectives and targets.
Responsible for reviewing HSE management system at appropriate intervals, to ensure its
continuing and effectiveness. Monitoring of effectiveness of the system shall be done
through Management Reviews
Responsible for procurement of raw material (Indigenous & Imported) and engineering
goods as per the specifications
Overall responsible to ensure that legal requirements are met as per the legal register.

7 ADDITIONAL DETAILS
7.1 Public Consultation
The Proposed project is located in notified Manali Industrial Area. Public Hearing is exempted under
the provisions as per para 7 III stage (3) (b) of the EIA notification, 2006
7.2 Risk Assessment
The Consequence analysis study has been carried out for Chlorine, Propylene, Propylene
Oxide and Ethylene Oxide storage tank. The summaries of consequences observed with
major receptors are as follows
For Propylene Oxide Storage Tank, the radiation profile (4 kw/m2) received at maximum
distance due to Late pool fire in Catastrophic rupture scenario is 591.7 m at 1.5 m/s wind
speed and stability classes D and F. The major receptors are employees within the facility.
For Propylene Oxide Storage Tank, the radiation profiles (12.5 kw/m2 & 37.5 kw/m2)
received at maximum distance due to Late pool fire in 150 mm leak scenario is 343 m and
547 m respectively at 1.5 m/s wind speed and stability classes D and F. The major receptors
are employees within the facility.
For Propylene Storage Tank, the radiation profiles (4 kw/m2, 12.5 kw/m2& 37.5 kw/m2)
received at maximum distance due to Jet fire in 150 mm leak scenario is 391.6 m, 304.4 m
and 249.6 m respectively at 1.5 m/s wind speed and stability classes D and F. The major
receptors are employees within the facility.
For Chlorine Storage Tank, maximum Spreading distance due to Cloud dispersion in 50 mm
leak scenario is 4000 m at 5 m/s wind speed, 29.9 ppm Concentration and stability class D.
The major receptors are employees within the facility and surrounding industries.
For Ethylene Oxide Storage Tank, maximum Spreading distance due to Cloud dispersion in
50 mm leak scenario is 2550 m at 5 m/s wind speed, 52.7 ppm Concentration and stability
class D. The major receptors are employees within the facility and surrounding industries

Figure 7-1 Propylene Oxide, Ethylene Oxide, Chlorine & Propylene Storage Tank with bund
wall (Isolated area)
The detailed Risk Assessment report is enclosed as Annexure - 25.
Material Safety Data Sheet is enclosed as Annexure – 33 and the Disaster Management Plan is
enclosed as Annexure - 26. Copy of compliance report on the EC condition submitted six month
once to MoEF & CC regional office is enclosed as Annexure - 35.
7.3 R&R Action Plan
It is not applicable. The project site is located within the existing plant land area.

8 Project Benefits
8.1 Improvements in Physical Infrastructure
In the proposed expansion project, it has been planned to set up Roof top Cooling tower which will
be located at the top floor of the PG processing unit. This will reduce the pump head requirement of
cooling water circulation pumps and thereby conservation of electrical energy (power) will be
achieved.
8.2 Improvements in Social Infrastructure
This project aims to reduce India’s dependence on imports.
This project will generate revenue in the form of Taxes to the Government.
Propylene Glycol caters majorly to the Pharma Grade industries and this project aims to meet the
growing demand in this sector. The projected market demand in India for Propylene Glycol is having
growth rate of 6%.
8.3 Employment Potential-Skilled, Semi-Skilled & unskilled
This project provides opportunity for Potential-Skilled, Semi-Skilled and Unskilled employment.
During Construction phase, this project will provide employment for 60 Nos. of Semi- skilled
workers.
During Operational phase, this project will provide employment for 10 Nos. of Potential – skilled
workers.
8.4 Benefits of Propylene Glycol (PG)
Propylene Glycol (PG) is essentially used as a solvent in the pharmaceutical industry for oral,
injectable and topical formulations, and further in food, fragrance and other industrial applications. It
is an excellent solvent and extractant and can be used as a humectant as well in sanitizers. Propylene
Glycol (PG) is the main product, and Di-Propylene Glycol (DPG) and Tri-Propylene Glycol (TPG)
are the by-products.
Another major use of PG is its use as an ingredient in engine coolants, deicing fluids and antifreeze.
It has replaced ethylene glycol as the base fluid for aircraft deicing formulations and a coolant in the
food industry. Propylene glycol is preferred over ethylene glycol due to its much lower toxicity.
Industrial grade PG is used in the production of polyglycols for hydraulic and brake fluids.
Propylene glycol is used as a solvent and extractant. Solvent applications include alkyd resins,
printing inks and coatings.

Propylene glycol finds broad use as a humectant in the pharmaceutical, products, sanitizers,
cosmetic, animal food and tobacco industries. Cosmetics include personal care products such as
antiperspirants and deodorants. In these applications, PG keeps the moisture content of the materials
in a narrow range despite fluctuations in environmental humidity.
A major use of DPG is speciality plasticizers, and TPG have many applications in the fragrance,
cosmetic and personal care industries while a fragrance-grade DPG is used as a carrier for cosmetics
and fragrances. DPG is also used in the manufacture of UPRs.
Propylene glycol may see some substitution by glycerine in antifreeze and de-icing applications as
well as a replacement as a humectant in food applications.
This project will provide direct and in-direct employments. Also, the State and Central Government
gets benefited from the Taxes and Duties on the revenue generated out of this project. It also enables
in reduction of India’s dependence on imports.

9 Environmental Cost Benefit Analysis
This project is not under scoping stage.

10 Environment Management Plan
10.1 Introduction
The main purpose of the Environmental Management Plan (EMP) is to identify project specific
actions that will be undertaken by the project authority for mitigation of the specific impacts
identified for the proposed project. These actions will be incorporated into project management
system and integrated into the implementation at various stages of proposed of project. The EMP
describes both generic good practice measures and site-specific measures, the implementation of
which is aimed at mitigating potential impact associated with the project activity.
10.2 Objectives of EMP
To suggest the formation of a core group (Environment Management Cell) responsible for
implementation of environmental control & protective measures as well as monitoring of such
implementation.
To ensure project components are compliant with all laws and approval conditions
Continue baseline monitoring
Facilitate a continual review of post construction and operation activities.
To suggest preventive and mitigation measures to minimize adverse impact and to maximize
beneficial impact like
Preparation of afforestation or Greenbelt Development scheme.
Preparation of rain water harvesting scheme and energy conservation actions.
To prepare a capital cost estimate and annual recurring cost for Environmental Management Plan.
To prepare a detailed action plan for implementation of mitigation measures.
Measure the effectiveness and success of proposed mitigation measures
10.3 EMP Structure and Organization
This EMP is designed as an overriding document in a hierarchy of control plans, and sets out the
overarching framework of environmental management principles that will be applied to the project
during preconstruction, construction and operation phase of the project.
The EMP contains guiding environmental principles and procedures for communication, reporting,
training, monitoring and plan review to which all staff, contractors and subcontractors are required to
comply with throughout the preconstruction, construction and operation phases of the proposed
projects The typical HSE Department Organogram is given in Figure 10.1

Figure 10-1 Typical HSE Department Organogram
The EMP should also be considered as an overall framework document that establishes the terms of
reference for all project environmental and social sub-plans including the following:
Environmental Supervision Plan (construction);
Environmental Monitoring Plan (construction and operation); and
Social and Health Management Plan (construction and operation).
10.4 EMP Roles and Responsibilities
This section describes the organizational structure and responsibilities for implementation of the
EMP as shown below in Table 10.1
Table 10-1 Responsibility for EMP Implementation
S.No. Members of
Organization
Responsibility for EMP
1 Mr. M. Karthikeyan
WTD (Operations)
[OCCUPIER], B.Tech
Overall responsibility for environmental performance
Decision-maker on applicable policies.
Overall supervisory role during the construction phase
Overall responsibility for EMP implementation during
Whole Time Director (Operations)
GM (Operations)
AGM (SHE)
HEAD (Operations)
Shift In - Charge
Shift ETP Supervisor
ETP Operators

the operating phase
Responsible for changes to the EMP as part of an
adaptive
approach to environmental and social management
2 Mr. T. Balaguru,
AGM (Safety, Health
& Environment), Dip.
in Chemical
Technology, Dip. in
Industrial Safety, PG
Dip. in Petrochemical
Technology
Develop an environmental unit, headed by the Project
Environmental Officer to implement EMP
responsibilities.
Oversight, implementation, monitoring and compliance
of the EMP and any approval conditions, including
construction supervision and performance of all staff,
contractors and all subcontractors
Review of EMP performance and implementation of
correction action, or stop work procedures, in the event
of breaches of EMP conditions, that may lead to serious
impacts on local communities, or affect the reputation
of the project.
Ensuring effective communication and dissemination
of the content and requirements of the EMP to
contractors and subcontractors
Assisting the contractor with implementation of EMP
sub- plans
Ensuring compliance to all project social commitments,
including implementation of corporate social
responsibility.
Report environmental performance of the project
directly to MoEF& CC
Report on environmental performance also to
other
Government regulators as required.
3 Mr. Sivaramakrishnan,
Deputy Plant Head
(Operations), B.Tech.
Implementation of the Environmental Monitoring Plan
during construction and operation.
Supervision of contractor performance of
implementation of the Construction.
Reporting any incidents or non-compliance with the
EMP to the PCB.
Ensuring adequate training and education of all staff
involved in environmental supervision.
Making recommendations to the MoEF&CC
regarding
EMP performance as part of an overall commitment
to continuous improvement.
4 Mr. R. Sivasankaran
Head (Projects)
Preparation and implementation of the Construction
Management Plan
Prepare and maintain records and all required reporting
data as stipulated by the EMP, for submission to the
Supervising Engineer.
Ensure that all construction personnel and
subcontractors are informed of the intent of the EMP
and are made aware of the required measures for
environmental and social compliance and performance
During construction, maintain traffic safety along

access roads, with special emphasis on high trafficked
areas
5 Mr.S.Vasudevan,
Manager (Safety,
Health &
Environment)
A.M.I.I.Ch.E, Dip. in
Industrial Safety
Report to MoEF&CC on project compliance with
environmental and social commitments in the EMP,
EIA and other applicable standards.
10.5 Environmental Management Plan for Construction Phase
Environmental impacts during the construction phase can be attributed to the site preparation activity
and the mobilization of workforce. The impacts of the construction phase on the environment would
be basically of transient nature and are expected to wear out gradually on completion of the
construction programme. However, once the construction of the project is completed and its
operations started, these operation stage impacts would overlap the impacts due to the construction
activities.
In order to mitigate such impacts and restrict them within tolerable levels, the following measures
shall be adopted:
1 Proper and prior planning of approach and access roads, and appropriate sequencing and
scheduling of all major construction activities.
2 Adoption of appropriate soil conservation programme and its timely implementation in the
proposed project site.
3 Initiation of an appropriate landscape programme including plantation of trees and flowering
plants in and around the project site particularly, at all available spaces which would serve
the dual purpose of controlling fugitive dust and abatement of noise levels in addition to
improving the aesthetics of the area.
4 Water sprinkling in the vulnerable areas to suppress the dust generated during excavation,
levelling and other operations.
5 Use of properly tuned construction machinery & vehicles in good working condition with
low noise & emission and engines turned off when not in use.
6 Control of quality of construction wastewater within the construction site through suitable
drainage system with traps for arresting the sediment load for its proposed disposal into the
main natural drainage system around the site.
7 Implementation of suitable disposal methods of sediment/ construction debris at designated
places to avoid water logging at construction site.

8 Provision of protective gears such as ear mufflers etc. for construction personnel exposed to
high noise levels.
10.6 Environmental Management Plan for Operation Phase
Monitoring during the operation phase will reflect those environmental and socio-economic issues
that may persist upon completion of construction activities. Monitoring will focus on evaluating the
effectiveness of project mitigation measures and continue baseline monitoring and sampling. The
mitigation measures to prevent adverse impact during the operation phase of the project shall focus
on the following:
1. Air quality
2. Noise environment
3. Water quality and water resources
4. Solid and hazardous waste
5. Land environment
6. Socio Economic
10.6.1 Air Quality Management
The major air pollution sources from the industry are Boiler & DG set. DG sets will be occasionally
run only during power failure for running critical equipments. The details of proposed source of air
pollution & corresponding Air Pollution control measures are already given in Chapter 2, Section
2.17. The AAQ Online Monitoring of PM10, PM2.5 connected to TNPCB & CPCB is given in
Figure 10.3.
Adequate stack height is provided for DG and boiler to disperse the pollutants. Adequate green belt
is available and being maintained to mitigate the pollution arising due to movement of vehicles.
a) Fugitive emission control
There will not be any fugitive emissions from the company as all the storages are provided with
nitrogen blanketing. However, VOC (Volatile Organic Carbon) sensors are provided and monitoring
of fugitive emissions from Manali Petrochemicals Limited-Plant-II program is being done. The
same will be continued after the proposed expansion. The Online Monitoring of Stack and VOC is
given in Figure 10.2 .

Figure 10-2 Online Monitoring photographs of VOC, PM, SOx, CO and NOx
Figure 10-3 AAQ Online Monitoring of PM10, PM2.5 connected to TNPCB & CPCB
10.6.2 Noise Environment
Following measures are proposed to mitigate negative impact of operation phase of the project on
the surrounding noise environment.
All the noise generating equipment’s will be designed / operated to ensure that noise level does not
exceed 70-75 dB (A) at plant boundary as per the requirement of Central / State Pollution Control
Board.
Noise generating sources will be maintained properly to minimize noise generated by them.

Compliance with noise control norms will be given due importance at the time of purchase of
various equipment’s and it will be mentioned while placing the purchase orders and guarantee for
noise standards will be sought from suppliers.
Green belt will act as a noise barrier.
Training will be imparted to personnel to generate awareness about effects of noise and importance
of using PPEs.
10.6.2.1 Green Belt Development
A comprehensive green belt development plan was prepared for the Manali Petrochemicals Limited-
Plant-II in consultation with eminent ecologist and consequently, a large number of trees were
planted inside the premises to enhance the aesthetic look of the Plant as well as to serve the purpose
of a pollution sink. Utmost priority is given to the Tree plantation activity, which is undertaken on a
regular basis. The Species of trees selected as per CPCB Guidelines provided. The Green Belt
Photographs of Plant-II is given in Figure 10-4 & Figure 10-5.

Figure 10-4 Green Belt Photographs

Figure 10-5 Green Belt Photographs (Newly developed)

10.6.3 Water and Wastewater Management
A. Existing
Total raw water requirement of the existing facility is 3247 KLD (Treated Water from CMWSSB is
the main water source). There is no fresh water used in the process
Approx. 2451 KLD of effluent and 15 KLD of Sewage is generated in the existing facility. On total,
2466 KLD is disposed to Deep Sea after treatment.
B. Proposed
Total raw water requirement of the proposed facility will be 810 KLD (Treated Water from
CMWSSB is the main water source). There will be no fresh water to be used in the process Approx.
105 KLD of effluent and 1 KLD of Sewage will be generated in the proposed facility. On total, 105
KLD, after treatment will be disposed to Deep Sea and 1KLD after treatment in STP will be reused
for green belt.
The Water and wastewater management is given in Table 10-2 and Table 10-3 respectively.
The Photographs of Online monitoring of BOD & COD effluent is given in Figure 10-6. The
Photographs of Online monitoring of Flow & Temperature of effluent is given in Figure
10-7. In Diffuser area, Buoy Float has been installed for identifying the diffuser point location. The
Photographs of Effluent discharge pipeline to sea from plant and Buoy Float at disposal point is
given in Figure 10.8. It is around 750 to 800 meters from the sea shore.
Figure 10-6 Photographs of Online Monitoring on BOD & COD of effluent

Figure 10-7 Photographs of Online Monitoring on Flow, Temperature of effluent and pH
Table 10-2 Water Management
S.No Requirement Existing Proposed After Expansion
1 Raw water (KLD) 3247 810 4057
2 Reuse of treated effluent The effluent generated in STP of 16 KLD is reused
in green belt. No other reuse of water is practiced-
All the traded effluent is Disposed to Deep Sea
after ETP treatment.
The total Source of water for the entire plant is
treated water from CMWSSB.
Table 10-3 Wastewater Management
Unit Liquid waste (KLD) Disposal Method Facility Details
Existing Proposed Total After
expansion

Sewage 15 1 16 Existing: Disposed in Deep
Sea after treatment in ETP
Proposed: Reused to
greenbelt after treatment in
STP.
Existing-
Combined with
Plant Effluent.
Proposed- STP of
capacity 20 KLD.
Effluent
2451
105
2556
Existing: Disposed in Deep
Sea after treatment in ETP
Proposed: Disposed in Deep
Sea after treatment in ETP.
ETP of capacity
3600 KLD
Figure 10-8 Effluent discharge pipe line to sea and buoy float at disposal point
The raw water used in the Manali Petrochemicals Limited-Plant-II is a Secondary treated
sewage and tertiary treated RO collected from CMWSSB. The main source of water itself is
retreated water which leads to conservation of fresh water resource. The Treated effluent will be
discharged into deep sea which is observed to be within the discharge approval limit of 8000 KLD as
per the CRZ clearance 11-20/2009-IA.III dated 03.07.2009 and its amendment 11-20/2009-IA.III
dated 03.06.2011 and also within 2574 KLD as per Consent order issued by TNPCB which is
enclosed as Annexure - 2. CRZ clearance document is also enclosed as Annexure – 10. The Latest
CRZ Compliance statement is also enclosed as Annexure - 14. The industrial effluent is discharged
into deep sea through the pipeline where its outlet of pipe is at a distance of 750 m from Sea Shore.
The effluent will be disposed to marine with compliance to CPCB/ MoEF & CC norms for marine
disposal. The Effluent discharge pipeline drawing is enclosed as Annexure - 15. The Water Quality
Modeling for the effluent discharged to deep sea from the Pipe line is enclosed as Annexure - 16.

10.6.3.1 Rainwater Harvesting
Rainwater harvesting is an important component of area wise resource use and environmental
management. The total amount/quantity of water i.e., received in the form of rainfall over an area is
called the rain water endowment of that area, out of which the amount of water that can be
effectively harvested is called the rain water harvesting potential. The collection efficiency accounts
for the fact that all the rain water falling over an area cannot be effectively harvested due to losses on
account of evaporation, spillage or run off etc.,
Figure 10-9 Existing Rainwater Harvesting in Project site
Rainwater Harvesting will be implemented at project site to conserve rainwater. Roof top area,
greenbelt/ green area, road/paved area and open areas proposed in the project site are considered for
rainwater which can be harvested. The approximate quantities of rainwater that can be harvested at
project site is given in Table 10-4
The calculations are based on the following values:
The heaviest 24hr rainfall- 452.4mm
Average No of rainy days are 59.1
Run of co-efficient is 0.85.
Source: Climatology normals 1971-2000
Table 10-4 Rainwater Harvesting methods and quantification
S.
No.
Land Use Area
(Ac)
Area
(m2)
Volume
per hr
(m3/hr)
Run off
Coefficient
Volume
harvested
(m3/hr)
Volume
of runoff
harvested
for 1 hr
rainfall
(KL)
Rainwater
Harvesting
method
Existing

1 Drumming
shed
0.56 2268 42.8 0.85 36.3 36.3
Roof top
Collection
and
directed to
pit for
recharging
ground
water table
Proposed
2
Electrical
substation
Location
0.40
1628
30.7
0.85
26.1
26.1
3 Control
Room
0.09 350 6.6 0.85 5.6 5.6
4
Chlorine
shed
location
0.14
576
10.9
0.85
9.2
9.2
5 CPP fuel
Shed
0.40 1628 30.7 0.85 26.1 26.1
Total runoff harvested for 1 hr of rainfall (KL) 103.3
Around 103.3 KL/hr of runoff harvested for 1 hr of rainfall. In Existing, the rainwater harvesting is
collected by roof top method from Drumming shed and redirected to rainwater harvesting pit to
recharge the groundwater table. The same method will be used for the expansion. Existing and
Proposed Rainwater Harvesting Layout is enclosed as Annexure - 24. It is proposed to install 4 Nos.
of RWH pits within the Plant – II site. The rain water collected from the roofs of respective buildings
passed on to respective RWH pits layered with sand, pebbles and gravel. In the pit, collected rain
water percolates through this bed to the land beneath thus increasing and sustaining the ground water
level.
10.6.4 Solid and Hazardous Waste Management
During operation phase is likely to generate various types of solid waste which can be broadly
categorized as Hazardous Waste and Municipal Solid Waste. Further, the generated solid waste may
include biodegradable, recyclable and inert compounds. Municipal solid wastes will be segregated as
organic and inorganic wastes. Organic wastes and inorganic wastes will be disposed to municipal
bins.
The hazardous wastes (Waste Lube Oil) will be stored separately in hazardous waste storage area
and disposed to TNPCB authorized vendors within a stipulated period of time and the ETP Sludge to
Common TSDF Landfill Facility. Hazardous waste materials will be properly disposed as per the
Hazardous and Other Wastes (Management and Transboundary Movement) Rules 1989 and
subsequent amendment in 2016.
Solid and hazardous wastes generated in the facility and their disposal methods are detailed in the
Chapter 2 & Section 2.20.
10.6.5 Land Environment
Following measures are proposed to mitigate negative impact during operational phase of the project
on the land environment.

Air emissions are effectively controlled by appropriate air pollution control systems and
therefore deposition of air pollutants in and around the premises and surrounding area is not
envisaged.
Organic wastes and inorganic wastes will be disposed in municipal bins. All the hazardous
wastes generated from the project will be properly stored in a concrete floored covered shed
and disposed as per the Hazardous and Other Wastes (Management and Transboundary
Movement) Rules 2016.Hence there may not be any impact to the land environment.
As the treated trade effluent will be discharged to sea as per the approval limit and treated
sewage will be treated in STP and reused, the impact on land environment is not envisaged.
The hazardous wastes (Waste Lube Oil) will be stored separately in hazardous waste storage
area and disposed to TNPCB authorized vendors within a stipulated period of time and the
ETP Sludge to Common TSDF Landfill Facility. Hazardous waste materials will be properly
disposed as per the Hazardous and Other Wastes (Management and Transboundary
Movement) Rules 1989 and subsequent amendment in 2016.
Thus, no impact on land is envisaged due to discharge of gaseous emission, solid waste or liquid
effluent from the proposed project.
10.6.6 Socio – Economic Environment
The proponent is committed to the socio – economic upliftment of the people in region and has
actively involved in formulating and implementing proactive measures as part of the corporate social
responsibility. Moreover, various modes of direct and indirect employment i.e., transportation,
increased business opportunities to shopkeepers, small scale business entrepreneurs etc. will lead to
development of the area.
10.7 Occupational Health and Safety
Manali Petrochemicals Limited-Plant-II has Occupational Health Centre at our both plants and have
one full time medical officer for both OHCs. Further, MPL has tie-up with M/s Anand hospital for
providing medical services during emergency situation and other medical service like medical tests
as and when required.
We have extended free transport facility for employee pick-up and drop to attend duty in addition to
conveyance allowance. Subsidized canteen facility is also provided to all employees including
contract workers round the clock service. Floater Mediclaim facility is provided to all employees.
The Anand Hospital is tied up with the Plant for the health and safety of employees. The medical
reports of workers carrying out job inside plant areas enclosed as Annexure – 27.
The lists of medical test to be carried out on periodical basis to employees are
Complete Blood Count

Blood Sugar Random
Urea
Total Cholesterol
Urine Routine
ECG
PFT
X-ray
Audiometry for Nitrogen plant employees
The workers are provided with proper health and safety measures. Personal protection equipment’s
are given to the employers and made sure they wear it during the work. Regular health camps are
conducted for all the workers alike. The Health & Safety department makes sure all the workers are
not exposed to any kind of toxicity and is within the prescribed limit. Copy of EHS policy enclosed
as Figure 10.15. The OHC is managed by A Doctor assisted by Male Nurses and First Aid certified
Ambulance Driver.
The main objectives are
Maintenance and promotion of workers’ health and working capacity.
Improvement of working environment by following well-being program for its employees.
Monitor the workplace to maintain industrial hygiene practices.
Development of work culture in a direction which will support health and safety at work and
thereby promoting positive social climate for smooth operation that will enhance
productivity.
Area monitoring.
Employees to undergo annual health check-up.
All personnel will be provided with personal protective equipment’s individually as required.
A. Construction Phase
During the construction phase the following measures will be employed.
The existing Occupational Health Centre to address the emergencies that may arise.
Personnel will be trained about firefighting systems and first aid practices.
Regular monitoring of occupational health of employees
Personal Protective equipment’s will be provided to the workers.
B. Operational phase
1 General functions of the safety committee will be;
2 Conduct routine workplace inspections.

3 Provide Personal Protective Equipment.
4 Develop and implement safe work procedures and rules.
5 Provide on-going safety training & Enforce safety rules and appropriate discipline.
6 Promote safety awareness and reduce the potential for injury/loss.
7 Identify workplace hazards.
8 Enforce of safety rules, measure safety performance & reduce frequency/severity of injuries.
10.7.1 Safety Practice in MPL
The highest standards of safety are being implemented by examining the potential hazards,
accessibility, constructability, operability and maintainability to ensure a safe and environmentally
sound plant and facilities.
Work permit system for hot work, high elevation, confined space entry and cold work
Lock out and tag out for electrical equipment release.
Mock drill conducted for different scenarios.
Safety alert messages communicated for unsafe practices
Carrying our root cause analysis and prevention of recurrence for any near miss incidents.
Frequent safety survey carried out to prevent any unsafe acts
Ensuring TREM card while transporting hazardous cargo
PPEs (Personnel Protective Equipment) are issued to employees and contractors
Safety belts, lifting tools and tackles are checked and certified by competent person.
Vehicles are allowed inside premises with valid documents and spark arrestors.
Safety instruction slip is handed over to all the visitors and truck drivers.
Interlock system available for the safety of the plant.
Fire hydrant is always kept under pressure with jockey pump running.
SCBA (Self-contained breathing apparatus), fire extinguishers are tested at regular intervals
Safety Audit conducted every year through DISH/DGFASLI approved auditors.
Plant safety inspections carried out regularly to eliminate unsafe conditions
Aim zero accidents, all near miss incidents, accidents investigated to eliminate recurrence
Checklist system used for upkeeping all fire fighting equipments, deluges, sprinklers,
All fire call points checked manual actuation to ensure the working condition
Emergency siren checked every day at 8.00hours to ensure the working condition
Smoke detectors installed and connected with hooters at Electrical cable bay, Substations,
control room, Admin block, Lab buildings
MSDS ensured for all the chemicals handled at MPL
Risk committee meeting conducted and minutes given input to APEX Committee

Safety committee meeting conducted every month, reviewed all safety aspects and Safety
Beacon given to learn from others experience
All portable tools, welding machine checked and certified for use inside MPL with ELCB
Adequate scaffolding with safety belt ensured for working at height jobs
Emergency plan updated based on addition of Plant equipments and obtained for approval
from DISH
Fire License renewed every year
OFF Site Mock drill was conducted/practiced with District collector coordination
All hot works taken by close LEL monitoring and confined space entry jobs by following
special protocols
The List of PPE’s used in the plant while handling toxic substance are listed below
1 Self-contained Air Breathing apparatus
2 On line Air Mask
3 Gloves:
a) Cotton
b) Leather
c) Asbestos
d) PVC Gloves
e) Surgical Gloves
f) Electrical Gloves
4. Dust Mask
5. Organic vapor mask
6. Safety Shoes
7. Safety Helmets
8. Safety Goggles –various types
9. Welding Shield
10. Welding Goggles
11. Gum Boot
12. Ear muff
13. Ear Plugs
14. PVC Suits
15. Cotton over coat
16. Asbestos suit.
17. Safety belt.

18. Fire soot
19. Toxic material handling soot
Figure 10-10 Self Contained Breathing Apparatus
10.7.2 Work Zone Monitoring Equipments
The unit has multi gas / toxic gas & oxygen detectors. Gas detectors are used to check LEL of
Propylene Oxide, Propylene & Ethylene Oxide, VOC concentration in atmosphere, in confined
spaces like inside the reactor, overhead tanks and oxygen detector can be used for checking oxygen
concentration in atmosphere and also in confined spaces like inside the reactor, overhead tanks.
The unit has provision of Hydrocarbon Sensors (HCS) for measuring concentrations of Propylene,
Propylene Oxide, Ethylene Oxide in the atmosphere and Chlorine sensor for measuring
concentration of chlorine in the atmosphere. The unit also has VOC monitoring stations at specific
locations.

All these sensors will provide the alarm once the threshold limit is crossed. The list of LEL detectors
installed in MPL-Plant-II is listed in Table 10.5. The threshold limit for all hydrocarbons in Manali
Petrochemicals Limited-Plant-II is given below,
• LEL for Propylene : 2% v/v
• LEL for Propylene Oxide : 1.7% v/v
• LEL for Ethylene Oxide : 3% v/v
Table 10-5 Installation of LEL Detectors at Plant-II
S.No Tag No Plant Location
1 AIK101 PO K101 Suction (G.Floor)
2 AIC105 PO PO Stripper Pump(G.Floor)
3 AI1105 PO GC Room (G.Floor)
4 AIE116 PO E116 (G.Floor)
5 AI1403 PO Near C1402 (G.Floor - Near PC1403A/B)
6 AI1501 PO Near FL1501/2/3 (2ND Floor-Filter Top)
7 AI2101 PG Near MX2101 (G.Floor)
8 AI3102 POLYOL-TI Near SA3102 Reactor Top (2ND Floor)
9 AI3105 POLYOL-TI Near PC3101 (G. Floor)
10 AI7101 PRH STR Near X7101
11 AI7301 EO STR Near SR7301
12 AI7302 EO STR Near PC 7301 A/B
13 AI7401 PO STR Near PO Day Tank Pumps
14 AI7402 PO STR Near PO Storage Pumps
15 AIP621 POLYOL TII P621 (G. Floor)
16 AIFCV202 POLYOL TII EO/PO FCV (2ND Floor)
17 AIX214 POLYOL TII EO/PO Block Valve (3RD Floor)
18 AIA621 POLYOL TII A621 (3RD Floor)

Figure 10-11 Hydrocarbon Sensors control
10.7.3 Trainings Provided
Manali Petrochemicals Limited-Plant-II has improved the safety standards by providing training to
the employees which are given below. The organization chart of safety department is given in Figure
10-12.
• Firefighting training to employees at regular intervals
• Training contractors in safety aspects
.

• First aid training by St Johns Ambulance is conducted to 30 persons every year.
• PEP talk is given to employees and contractors to follow safety, regularly.
• Contractor safety meeting is conducted and information on safe practices is shared.
• Feed-back forms help to improve the training methodology followed.
• Refresher training program conducted for different safety
topics to employees/contractors
• EMS/ESS placed in the plant based on training output
• Performance monitoring done with need of training is indicated
Figure 10-12 Organization chart of safety department
10.7.4 Facilities Available
Manali Petrochemicals Limited-Plant-II has provided various facilities to cover the safety measures.
They are as follows.
• Fire tender and dedicated fire crew to tackle emergencies.
• Mutual aid agreement in place with TPL, in case of need.

• Sprinkler system for bullets storing hazardous chemicals with AUTO deluge
• Fire water pumps and diesel driven pumps as back up.
• Gas Sensors at vantage points to alert in case of leaks.
• Smoke detectors at important places and alert messages given to control room.
• Automatic sprinkler system with Deluges for all critical storages.
• Plant premises is protected with liquid ring fire water system with Fire hydrant points.
• Fire call points placed in the entire plant premises to activate emergency alarm
• Fire alarm panel with electronic display available at control room and safety
• Three siren is available for emergency communication
• Paging system available for all the plants for communication.
• All plant is protected with trip logic with hardware alarm system
• Dedicated fire water reservoir s available to mitigate the emergency requirements and
ensured always full by entry of water inlet to FH reservoir.
Figure 10-13 Fire Alarm Control
10.8 Environmental Management Cell
A separate environment management cell, HSE department consisting of qualified engineers is in
place which monitors all aspects of environmental impacts being caused due to process units at
Manali Petrochemicals Limited-Plant-II. The environment management cell is re-constituted and
meets once in every 3 months. The details enclosed as Annexure – 39.

10.9 Corporate Environmental Policy
The Environmental, Health and Safety policy of Manali Petrochemicals Limited-Plant-II is given in
Figure 10-14 and Figure 10-15.
Figure 10-14 HS policy of Manali Petrochemicals Limited-Plant-II

Figure 10-15 Environment policy of Manali Petrochemicals Limited-Plant-II
10.10 Budgetary Provision for Environmental Management Plan
M.s Manali Petrochemicals Limited-Plant-II allocates budget every year towards expenditure of
environment related jobs is summarized in Table 10-6.
Table 10-6 Budget for EMP
S.No Equipment Capital cost
(lakh)
Recurring cost
(lakhs) per Annum
1 Air Pollution Control 1200 40
2 Water Pollution Control 204 540
3 Solid waste management 0 5
4 Storm Water and RWH Management 7 0
5 Occupational health and safety 0 84
6 Environmental monitoring and management 0 8
Total 1411 677
10.11 Corporate Environmental Responsibility The company is aware of the obligations towards the Environment and to fulfill the social
obligations. As per OM F. No: 22-65/2017-IA.III dated 1st May 2018 M/s MPL will Allocate 0.75%
of the project cost (125 Crores) towards CER i.e. 0.75% of 125 Crores = 0.9375Crores. As per CEPI
compliance for CPA 2 times of slab to be allotted (2 * 0.9375) =1.875 Crores. The detailed cost
breakup is given in Table 10-7.

Table 10-7 CER Cost Breakup
S.No Focus Areas Amount (INR) Total
(Crores) 1st
year
2nd
year
3rd
year
4th
year
5th
year
1 Avenue Plantation/Plantation in
community areas
0.2 0.03 0.035 0.05 0.08 0.395
2 Drinking water system 0.1 0.2 0.1 0.1 0.12 0.62
3 Sanitation 0.03 0.1 0.15 0.1 0.09 0.47
4 Health Centres 0.02 0.035 0.04 0.045 0.035 0.175
5 Solid waste management facilities 0.025 0.01 0.05 0.08 0.05 0.215
Total 0.375 0.375 0.375 0.375 0.375 1.875
10.12 Corporate Social Responsibility
CSR activities shall be carried out as per corporation’s CSR policy. Existing activities and spending
for the Period 2019-2020, 2020 -2021 enclosed as Annexure 40. The Photographs of CSR activity is
attached as Annexure.

11 Summary & Conclusion
An Environmental Impact Assessment Study has been carried out and assessed for the proposed
project based on the ToR and baseline quality data collected for the study area. Identification and
anticipation of the potential environmental impacts due to the proposed project with a delineation of
appropriate impact mitigation measures in an Environmental Management plan during both
construction and operation phases is provided in the EIA report prepared.
Based on the above evaluation the significance, value addition, impact on various components of
environment during construction and operation phases is summarized below;
Manali Industrial area attracts CEPI score of 84.15 and Manali Petrochemicals Limited-
Plant-II will comply the CEPI guidelines by MoEF & CC.
Covering letter has been enclosed with this EIA report submission of product mix change and
without increasing the number of products and the cumulative production capacity of 58088
MTPA’ by TNPCB and Pollution load assessment committee vide Lr.No.
T5/TNPCB/F.0112AMB/RL/2019 dt. 16-09-2019. Subsequently, CTO (Direct) was issued
vide Order No. 2005228692412 (under Air act) and Order No. 2005128692412 (under Water
act) dt. 25-02-2020 for the above.
The project proponent will follow all the statutory norms and guidelines as per CPCB /
MoEF & CC to safeguard environment.
No land acquisition is carried out since the existing land area is used for proposed expansion.
The incremental concentration of PM10, SOx, NOx and CO is observed to be 0%, 0.087%,
9.237%, and 0.751% respectively. The total pollutant concentrations of PM10, SO2, NOx
and CO are 75.1 µg/m3, 11.51 µg/m3, 25.78 µg/m3 and 785.86 µg/m3 which is observed to
be within NAAQ standards.
Green Belt cover to an extent of 40.82% of the total land area has been completed to comply
the CEPI / MoEF & CC conditions.
RO Plant will be installed to treat the cooling tower / boiler blow down, DM plant
regeneration water and recycle the permeate to cooling tower as makeup.
R-LNG will be used in boilers which is a clean fuel.
On total after expansion 4057 KLD of raw water will be taken from existing water source
(i.e. Chennai Metro Water Supply and Sewage Board). The additional requirement of water
over the existing water agreement for which a request letter provided to CMWSSB and the
reply letter from CMWSSB is enclosed as Annexure - 9. No water will be drawn from
ground water sources.

New STP Plant will be installed for a capacity of 20 KLD to treat the sewage generated from
the facility.
The Effluent/Sewage generated in the facility will be treated in ETP / STP and will be
disposed to marine in compliance to CPCB/MoEF & CC norms for marine disposal and
reused in green belt respectively.
There is no land disposal practiced in M/s MPL-Plant-II. The Hazardous waste generated like
Rotary Equipment (Waste Lube Oil) Generated- Spent Oil will be disposed through TNPCB
authorized recyclers. The ETP Sludge is disposed to common TSDF as landfill.
The Consequence analysis study has been carried out for as Chlorine, Propylene, Propylene
Oxide and Ethylene Oxide storage tank. The recommendations and mitigation measures of
Risk Assessment will be implemented.
The project will induce direct and indirect employment generation for local communities as
well as state & region as a whole and preference will be given to the local communities as per
MPL Policy.

12 Disclosure of Consultant
12.1 Introduction
This chapter presents the details of the environmental consultants engaged, their background and the
brief description of the key personnel involved in the project. Specific studies on the mining project
have been carried out by engaging engineers/experts of Ecotech Labs Pvt. Ltd, Chennai. Ecotech
Labs Pvt. Ltd (ETL), Chennai is NABET accredited consultancy organization. ETL is equipped with
in-house, spacious laboratory, accredited by NABL (National Accreditation Board for Testing &
Calibration Laboratories), Department of Science & Technology, Government of India and MoEF &
CC.
12.2 Eco Tech Labs Pvt. Ltd – Environment Consultant
Eco Tech Labs Pvt. Ltd is a multi-disciplinary testing and research laboratory in India. Eco Tech labs
provides high quality services in environmental consultancy, engineering solution, chemical and
microbiological laboratory analysis of food, water and environment (Air, Water, Soil) with highest
accuracy.
12.2.1 Quality Policy
We, at Eco Tech Labs Pvt. Ltd. engaged in providing Environmental consulting services and
we are committed to strengthen our capabilities in all areas of our operations in line with
customer requirements & expectations, applicable legal requirements & stakeholders
expectations.
We are committed to establish and maintain Quality Management System (QMS) for
continual improvement in processes and Services
We are committed to provide customized solutions in realistic, time bound and cost effective
to achieve highest degree of customer satisfaction and Environmental improvement.
We shall establish, maintain & periodically review our documented management systems,
objectives and performance in consultation with our employees and prevailing best practices.
Effective communication of organization’s policy and objectives to employees and seeking
feedbacks from all our employees and concerned stakeholders for continual improvement.