Flow-induced crystallization of propylene/ethylene random copolymers
13
Flow-induced crystallization of propylene/ethylene random copolymers Jan-Willem Housmans • Gerrit W. M. Peters • Han E. H. Meijer Rheological Analysis of Polymers/Special Chapter Ó The Author(s) 2009. This article is published with open access at Springerlink.com Abstract The influence of the co-monomer content and processing conditions on the crystallization kinetics of propylene/ethylene (P/E) random copolymers is studied using DSC and rheometry. The presence of ethylene lowers the melting and crystallization temperature compared to pure polypropylene, and the quiescent crystallization rate, _ X; increases at equal nominal undercooling, because both the crystal growth rate, G, and number of nuclei, N, increases. The effect of flow on the kinetics of crystalli- zation decreases with the ethylene content. Still, different regimes of flow-induced crystallization are observed, but their size and the position of the transitions between them depend on the ethylene content, and can be expressed in terms of the level of molecular orientation, molecular stretch, and crystallization capacity of the system. Keywords Random co-polymers Flow-induced crystallization Polypropylene Flow regimes Rheology Introduction Properties of polymer products depend on the morphology distribution within the product, which itself depends on both the molecular properties of the polymer used and the pro- cessing conditions applied during fabrication. Not only mechanical properties depend on crystal structures [1–3], but also properties, like dimensional stability [4] and transpar- ency [5]. In production processes like injection molding, film blowing, and fiber spinning the polymer is subjected to high pressures and speeds, and it is cooled from temperatures well above its melting point to room temperature within seconds. Due to the complex geometries of the molds and extruder dies, the flow history has a complex nature; the material experiences both shear and elongational flow. The effect of shear deformation on the crystallization kinetics and struc- ture development of semi-crystalline polymers has gained a lot of interest in the last decade, see for example [6–14] and references therein. It is now well known that the flow field applied accelerates the crystallization process, alters the morphology; the effect of shear rate is more pronounced than that of the shear time. The importance of the high molecular weight tail on the formation of oriented, anisotropic struc- tures was stressed [6, 11, 12]. Van Meerveld et al. [15] proposed a rheological clas- sification of different flow regimes, i.e., regimes leading to different types of crystalline morphologies, derived from molecular-based rheology and rubber elasticity theory. The transitions between the different flow regimes and the associated physical processes governing the flow-induced crystallization (FIC) processes are defined by the critical values of the Deborah numbers (De) related to the molecular orientation (De rep ) and molecular stretch (De s ). An extensive evaluation of experiments reported in the literature illustrates that the transition, from just an enhanced nucleation rate of spherulites toward the devel- opment of fibrillar structures, correlates with the transition from chain segment orientation to chain stretch applied at least to the high molecular weight chains in the melt. Polymers are often modified to improve their perfor- mance. The changes are implemented on (a) a molecular J.-W. Housmans G. W. M. Peters (&) H. E. H. Meijer Materials Technology, Eindhoven University of Technology, P. O. Box 513, 5600MB Eindhoven, The Netherlands e-mail: [email protected] J.-W. Housmans The Dutch Polymer Institute (DPI), P.O. Box 902, 5600AX Eindhoven, The Netherlands 123 J Therm Anal Calorim (2009) 98:693–705 DOI 10.1007/s10973-009-0532-3
Transcript of Flow-induced crystallization of propylene/ethylene random copolymers
Flow-induced crystallization of propylene/ethylene randomcopolymers
Jan-Willem Housmans • Gerrit W. M. Peters •
Han E. H. Meijer
Rheological Analysis of Polymers/Special Chapter
� The Author(s) 2009. This article is published with open access at Springerlink.com
Abstract The influence of the co-monomer content and
processing conditions on the crystallization kinetics of
propylene/ethylene (P/E) random copolymers is studied
using DSC and rheometry. The presence of ethylene lowers
the melting and crystallization temperature compared to
pure polypropylene, and the quiescent crystallization rate,_X; increases at equal nominal undercooling, because both
the crystal growth rate, G, and number of nuclei, N,
increases. The effect of flow on the kinetics of crystalli-
zation decreases with the ethylene content. Still, different
regimes of flow-induced crystallization are observed, but
their size and the position of the transitions between them
depend on the ethylene content, and can be expressed in
terms of the level of molecular orientation, molecular
stretch, and crystallization capacity of the system.
Keywords Random co-polymers �Flow-induced crystallization � Polypropylene �Flow regimes � Rheology
Introduction
Properties of polymer products depend on the morphology
distribution within the product, which itself depends on both
the molecular properties of the polymer used and the pro-
cessing conditions applied during fabrication. Not only
mechanical properties depend on crystal structures [1–3], but
also properties, like dimensional stability [4] and transpar-
ency [5]. In production processes like injection molding, film
blowing, and fiber spinning the polymer is subjected to high
pressures and speeds, and it is cooled from temperatures well
above its melting point to room temperature within seconds.
Due to the complex geometries of the molds and extruder
dies, the flow history has a complex nature; the material
experiences both shear and elongational flow. The effect of
shear deformation on the crystallization kinetics and struc-
ture development of semi-crystalline polymers has gained a
lot of interest in the last decade, see for example [6–14] and
references therein. It is now well known that the flow field
applied accelerates the crystallization process, alters the
morphology; the effect of shear rate is more pronounced than
that of the shear time. The importance of the high molecular
weight tail on the formation of oriented, anisotropic struc-
tures was stressed [6, 11, 12].
Van Meerveld et al. [15] proposed a rheological clas-
sification of different flow regimes, i.e., regimes leading to
different types of crystalline morphologies, derived from
molecular-based rheology and rubber elasticity theory. The
transitions between the different flow regimes and the
associated physical processes governing the flow-induced
crystallization (FIC) processes are defined by the critical
values of the Deborah numbers (De) related to the
molecular orientation (Derep) and molecular stretch (Des).
An extensive evaluation of experiments reported in the
literature illustrates that the transition, from just an
enhanced nucleation rate of spherulites toward the devel-
opment of fibrillar structures, correlates with the transition
from chain segment orientation to chain stretch applied at
least to the high molecular weight chains in the melt.
Polymers are often modified to improve their perfor-
mance. The changes are implemented on (a) a molecular
J.-W. Housmans � G. W. M. Peters (&) � H. E. H. Meijer
Materials Technology, Eindhoven University of Technology,
P. O. Box 513, 5600MB Eindhoven, The Netherlands
e-mail: [email protected]
J.-W. Housmans
The Dutch Polymer Institute (DPI), P.O. Box 902,
5600AX Eindhoven, The Netherlands
123
J Therm Anal Calorim (2009) 98:693–705
DOI 10.1007/s10973-009-0532-3
level and/or (b) a microscopic level. In the first case, the
polymer chain itself is modified or another material is
added and dissolved, while in the latter situation, particles
or a phase separated second polymer are added. These
alterations to the material have a strong influence on the
polymer’s FIC behavior.
Several researchers studied case (b), investigating
experimentally the particle-morphology-properties rela-
tionship [2, 16–20]. The presence of particles leads to
strong molecular orientation throughout the complete
sample caused by a ‘shear amplification effect’ between the
particles and sometimes an improved impact resistance.
Numerical work on particle-filled viscoelastic systems
showed that the presence of particles results in the occur-
rence of regions of high molecular stretch between the
layers of particles and regions shielded by the particles
inside the layers [21] giving rise to anisotropic flow-
induced structures. Another additive is the family of
nucleating agents and they are often blended with polymers
to decrease conversion cycle times [22]. Crystallization on
heterogeneous nuclei leads to the formation of smaller
crystal structures which improves the optical and
mechanical properties of the materials. An example of such
an additive is based on sorbitol (DMDBS), which already
in relatively small amounts (*0.2 wt%) enhances the
clarity, and gives rise to an increase in yield stress of
isotactic polypropylene (iPP) [5, 23]. The effect of flow on
crystallization of iPP/DMDBS blends was studied by
Balzano et al. [24, 25]. Recently, even much more effective
and selective nucleating agents based on 1,3,5-benzene
tricarboxylic acid were developed with which the same
effects are obtained for concentrations as low as 0.02 wt%
[26, 27]. This family of organic compounds is thermally
stable and some members form the iPP b-polymorph which
exhibits a higher impact toughness than the most common
a-form [28].
Examples of chain modifications (case (a)) are long
chain branching (J. F. Vega, personal communication) and
copolymerization with other monomers creating, e.g.,
random or blockcopolymers.
In this experimental study, the focus is on the effect of
random copolymerization of PP with ethylene on FIC.
Copolymerization of polypropylene with a small amount of
ethylene is an appropriate way to improve both the optical
and certain mechanical properties (low temperature brit-
tleness) [29–31]. First, the four grades used are character-
ized using differential scanning calorimetry (DSC) and
rheometry. Next short term shear experiments are per-
formed at equal nominal undercooling, and the flow effects
are quantified with a characteristic time scale. Finally, the
effect of copolymerization on the rheological classifica-
tion is investigated. Different regimes are observed and
the transitions between regimes are specific for every
polymer.
Experimental
Materials
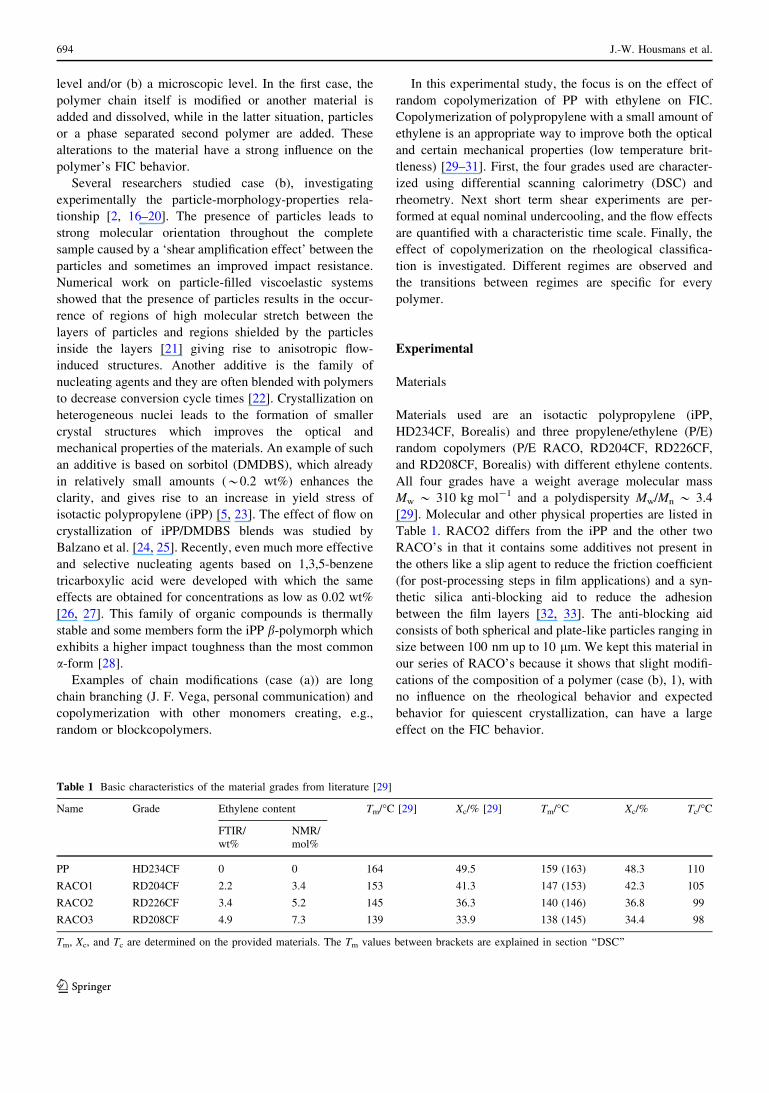
Materials used are an isotactic polypropylene (iPP,
HD234CF, Borealis) and three propylene/ethylene (P/E)
random copolymers (P/E RACO, RD204CF, RD226CF,
and RD208CF, Borealis) with different ethylene contents.
All four grades have a weight average molecular mass
Mw * 310 kg mol-1 and a polydispersity Mw/Mn * 3.4
[29]. Molecular and other physical properties are listed in
Table 1. RACO2 differs from the iPP and the other two
RACO’s in that it contains some additives not present in
the others like a slip agent to reduce the friction coefficient
(for post-processing steps in film applications) and a syn-
thetic silica anti-blocking aid to reduce the adhesion
between the film layers [32, 33]. The anti-blocking aid
consists of both spherical and plate-like particles ranging in
size between 100 nm up to 10 lm. We kept this material in
our series of RACO’s because it shows that slight modifi-
cations of the composition of a polymer (case (b), 1), with
no influence on the rheological behavior and expected
behavior for quiescent crystallization, can have a large
effect on the FIC behavior.
Table 1 Basic characteristics of the material grades from literature [29]
Name Grade Ethylene content Tm/�C [29] Xc/% [29] Tm/�C Xc/% Tc/�C
FTIR/
wt%
NMR/
mol%
PP HD234CF 0 0 164 49.5 159 (163) 48.3 110
RACO1 RD204CF 2.2 3.4 153 41.3 147 (153) 42.3 105
RACO2 RD226CF 3.4 5.2 145 36.3 140 (146) 36.8 99
RACO3 RD208CF 4.9 7.3 139 33.9 138 (145) 34.4 98
Tm, Xc, and Tc are determined on the provided materials. The Tm values between brackets are explained in section ‘‘DSC’’
694 J.-W. Housmans et al.
123
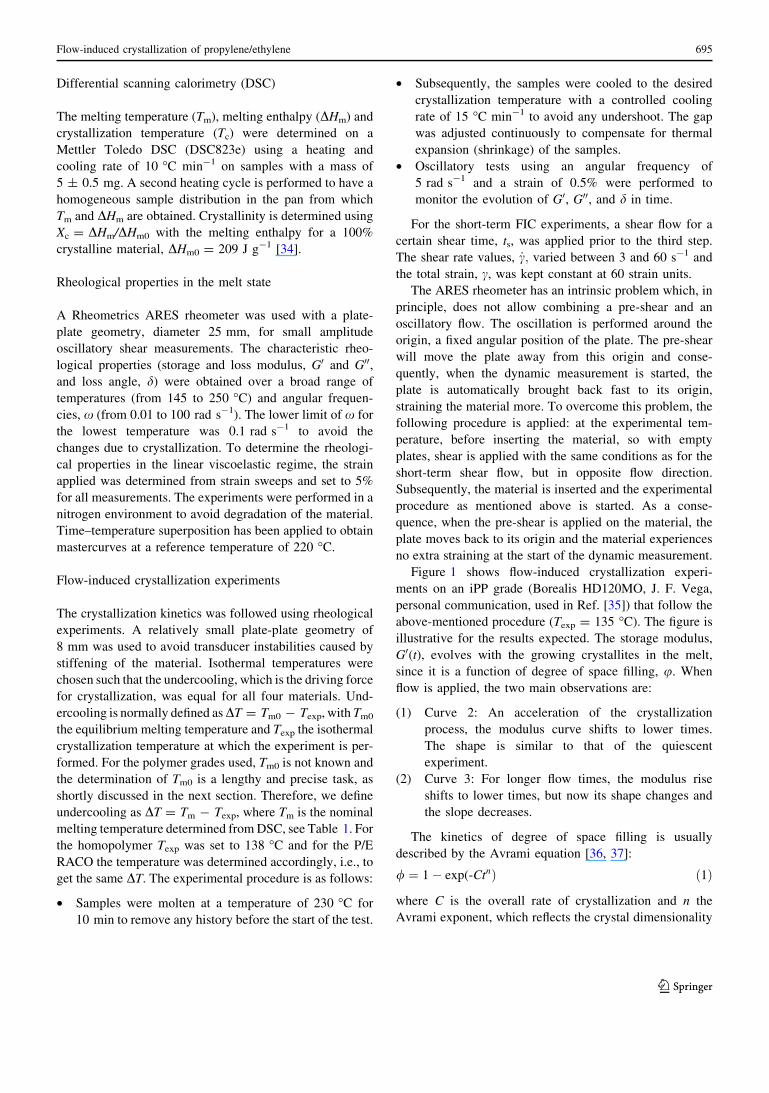
Differential scanning calorimetry (DSC)
The melting temperature (Tm), melting enthalpy (DHm) and
crystallization temperature (Tc) were determined on a
Mettler Toledo DSC (DSC823e) using a heating and
cooling rate of 10 �C min-1 on samples with a mass of
5 ± 0.5 mg. A second heating cycle is performed to have a
homogeneous sample distribution in the pan from which
Tm and DHm are obtained. Crystallinity is determined using
Xc = DHm/DHm0 with the melting enthalpy for a 100%
crystalline material, DHm0 = 209 J g-1 [34].
Rheological properties in the melt state
A Rheometrics ARES rheometer was used with a plate-
plate geometry, diameter 25 mm, for small amplitude
oscillatory shear measurements. The characteristic rheo-
logical properties (storage and loss modulus, G0 and G00,and loss angle, d) were obtained over a broad range of
temperatures (from 145 to 250 �C) and angular frequen-
cies, x (from 0.01 to 100 rad s-1). The lower limit of x for
the lowest temperature was 0.1 rad s-1 to avoid the
changes due to crystallization. To determine the rheologi-
cal properties in the linear viscoelastic regime, the strain
applied was determined from strain sweeps and set to 5%
for all measurements. The experiments were performed in a
nitrogen environment to avoid degradation of the material.
Time–temperature superposition has been applied to obtain
mastercurves at a reference temperature of 220 �C.
Flow-induced crystallization experiments
The crystallization kinetics was followed using rheological
experiments. A relatively small plate-plate geometry of
8 mm was used to avoid transducer instabilities caused by
stiffening of the material. Isothermal temperatures were
chosen such that the undercooling, which is the driving force
for crystallization, was equal for all four materials. Und-
ercooling is normally defined as DT = Tm0 - Texp, with Tm0
the equilibrium melting temperature and Texp the isothermal
crystallization temperature at which the experiment is per-
formed. For the polymer grades used, Tm0 is not known and
the determination of Tm0 is a lengthy and precise task, as
shortly discussed in the next section. Therefore, we define
undercooling as DT = Tm - Texp, where Tm is the nominal
melting temperature determined from DSC, see Table 1. For
the homopolymer Texp was set to 138 �C and for the P/E
RACO the temperature was determined accordingly, i.e., to
get the same DT. The experimental procedure is as follows:
• Samples were molten at a temperature of 230 �C for
10 min to remove any history before the start of the test.
• Subsequently, the samples were cooled to the desired
crystallization temperature with a controlled cooling
rate of 15 �C min-1 to avoid any undershoot. The gap
was adjusted continuously to compensate for thermal
expansion (shrinkage) of the samples.
• Oscillatory tests using an angular frequency of
5 rad s-1 and a strain of 0.5% were performed to
monitor the evolution of G0, G00, and d in time.
For the short-term FIC experiments, a shear flow for a
certain shear time, ts, was applied prior to the third step.
The shear rate values, _c; varied between 3 and 60 s-1 and
the total strain, c, was kept constant at 60 strain units.
The ARES rheometer has an intrinsic problem which, in
principle, does not allow combining a pre-shear and an
oscillatory flow. The oscillation is performed around the
origin, a fixed angular position of the plate. The pre-shear
will move the plate away from this origin and conse-
quently, when the dynamic measurement is started, the
plate is automatically brought back fast to its origin,
straining the material more. To overcome this problem, the
following procedure is applied: at the experimental tem-
perature, before inserting the material, so with empty
plates, shear is applied with the same conditions as for the
short-term shear flow, but in opposite flow direction.
Subsequently, the material is inserted and the experimental
procedure as mentioned above is started. As a conse-
quence, when the pre-shear is applied on the material, the
plate moves back to its origin and the material experiences
no extra straining at the start of the dynamic measurement.
Figure 1 shows flow-induced crystallization experi-
ments on an iPP grade (Borealis HD120MO, J. F. Vega,
personal communication, used in Ref. [35]) that follow the
above-mentioned procedure (Texp = 135 �C). The figure is
illustrative for the results expected. The storage modulus,
G0(t), evolves with the growing crystallites in the melt,
since it is a function of degree of space filling, u. When
flow is applied, the two main observations are:
(1) Curve 2: An acceleration of the crystallization
process, the modulus curve shifts to lower times.
The shape is similar to that of the quiescent
experiment.
(2) Curve 3: For longer flow times, the modulus rise
shifts to lower times, but now its shape changes and
the slope decreases.
The kinetics of degree of space filling is usually
described by the Avrami equation [36, 37]:
/ ¼ 1� exp(-CtnÞ ð1Þ
where C is the overall rate of crystallization and n the
Avrami exponent, which reflects the crystal dimensionality
Flow-induced crystallization of propylene/ethylene 695
123

and the type of nucleation (pre-determined or sporadic) [38].
When the nucleation is heterogeneous and the crystal growth
rate, G, is constant, the n values of 1, 2, and 3 correspond to a
crystal geometry of rods (1-dimensional, 1D), disks
(2-dimensional, 2D) and spheres (3-dimensional, 3D),
respectively. For sporadic nucleation, the n values of 2, 3,
and 4 correspond to the crystal geometry of rods, disks, and
spheres [37, 39]. For the change of the modulus it can be
derived that:
dG0
dt¼ dG0
d/d/dt
ð2Þ
in which du/dt is given by (using Eq. 1):
d/dt¼ Cntn�1exp(�CtnÞ ð3Þ
From Eqs. 1 and 3 it can be derived that to achieve a
shift over the time axis to lower times, without changing
the shape of the curve (curve 2), the Avrami exponent, n,
has to be the same, and only the overall rate of
crystallization, C, increases. Hence, for a shift and a
change in slope (curve 3), C increases and n decreases.
Under quiescent conditions in the temperature range
applied, no sporadic nucleation occurs and the number of
nuclei, N, is constant. Crystal lamellae grow with a
constant growth rate, G, in all directions, thus a 3D
growth, from these nuclei forming spherulites (Fig. 1,
micrograph 1 [40]). In that case, n = 3 and C = 4/3pNG3
[37, 38, 41, 42]. When flow, applied for a short time, only
leads to a shift in modulus (curve 2), only C increases and n
stays the same and we expect no sporadic nucleation. This
implies that the same type of morphology is formed as in
the quiescent case (spherulites), but with a higher number
density N, since C increases and the growth rate G is
unaltered [42] (Fig. 1, micrograph 2 [40]). For longer flow
times, where a change in the slope is observed (curve 3), n
decreases. Oriented, shish–kebabs are formed by
crystalline lamellae growing in two dimensions (2D) off
fibrillar nuclei (Fig. 1, micrograph 3 [40]), for which it can
be derived, that n = 2 and C = pNLG2, with L, the total
length of the shishes [37, 41]. Also in this situation, no
sporadic nucleation is expected. Of course, not only
fibrillar structures are formed, spherulites will grow as
well, and thus 2 \ n \ 3. For the experiments shown in
Fig. 1, the resulting morphologies were confirmed using
optical microscopy (OM) and wide-angle X-ray diffraction
(WAXD) (D. G. Hristova, personal communication, used
in Ref. [35]). To summarize the above, three morphology
types are distinguished as
(1) Quiescent crystallization: Spherulites are formed by
crystalline lamellae growing in three dimensions off
point-like nuclei, whose number density depends on
the temperature.
(2) Shift of modulus curve: The number density of point-
like nuclei increases with the strain rate. This leads to
a more fine grained but still spherulitic morphology.
(3) Shift and shape change: Shish–kebabs are formed by
crystalline lamellae growing in two dimensions off
fibrillar nuclei, whose number density and length
increases with strain rate.
Four flow regimes, based on the rheology of the poly-
mer, are defined by van Meerveld et al. [15]. The transi-
tions between these regimes are defined by critical values
of the Deborah number, De (s=t;) or Weissenberg number,
Wi ¼ _c sð Þ; related to molecular orientation and molecular
stretch. Both orientation and stretch are characterized by a
time scale: the reptation time, srep, and the stretch relaxa-
tion time or Rouse time, ss, respectively. In regime I, for
Derep and Des \ 1, the chains are at equilibrium. The
transition to regime II corresponds to orientation of the
contour path (Derep [ 1, Des \ 1). The onset of chain
stretching (Derep [ 1, Des [ 1) marks regime III, and in
the fourth and final regime, the chains are strongly stret-
ched and deviate from the Gaussian configuration caused
by rotational isomerization. The analysis of FIC experi-
ments reported in literature indicated that the high molec-
ular weight (HMW) chains dictate the FIC dynamics
[6, 12]. Furthermore, the number density of spherulites
increases in regime II (Derep [ 1, Des \ 1-10) and the
shish–kebab morphology develops for Des [ 1-10 based
on ss of the longest chains. Characterization of the melt
′
Fig. 1 Evolution of the storage modulus during crystallization of iPP
HD120MO at Texp = 135 �C, measured under quiescent conditions
(open circle, 1) and after shearing at _c ¼ 60s�1 for ts = 1 s (opensquare, 2) and ts = 6 s (open triangle, 3). Optical micrographs
indicate the characteristic morphology for the three crystallization
experiments [40]
696 J.-W. Housmans et al.
123
provides the relaxation time spectrum, i.e., srep from which
ss can be estimated as
ss ¼ srep=3Z ð4Þ
with Z = Mw/Me is the number of entanglements per chain
and Me is the weight average molecular weight between
entanglements, being 5,200 g mol-1 for iPP [43]. The
classification is only valid for short time shear. Although it
gives a clear indication in which flow regime experiments
are performed and whether fibrillar morphologies will
develop or not, the flow time is not specifically included.
Nevertheless, for regime III/IV, it is stated that the flow
time, ts, has to be sufficiently long in order to fulfill the
condition k[ k*(T), i.e., the molecular stretch ratio k has
to be larger than a certain critical value k*(T), marking the
transition between weak and strong stretching conditions.
Moreover, it is expected that this critical value has to be
maintained long enough to cause significant shish growth.
On the other hand, when shearing in regime II for a too
long time, the rheology of the material will change, i.e.,
due to nucleation physical crosslinking will occur which
increases the relaxation times and thus the Deborah num-
ber, and, therefore the flow regime changes to type III/IV.
This self enhancing effect is described and modeled by
Zuidema et al. [44] and Peters et al. [45]. A recent model
that takes these effects into account is given by Custodio
[46].
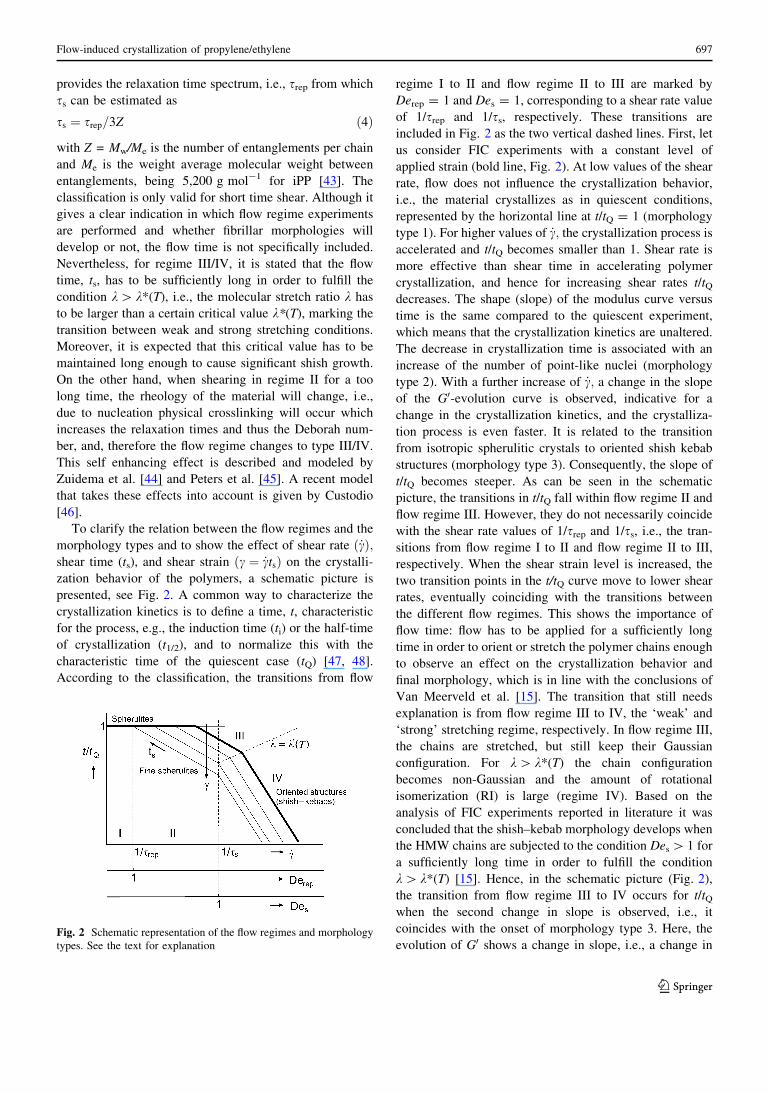
To clarify the relation between the flow regimes and the
morphology types and to show the effect of shear rate _cð Þ;shear time (ts), and shear strain c ¼ _ctsð Þ on the crystalli-
zation behavior of the polymers, a schematic picture is
presented, see Fig. 2. A common way to characterize the
crystallization kinetics is to define a time, t, characteristic
for the process, e.g., the induction time (ti) or the half-time
of crystallization (t1/2), and to normalize this with the
characteristic time of the quiescent case (tQ) [47, 48].
According to the classification, the transitions from flow
regime I to II and flow regime II to III are marked by
Derep = 1 and Des = 1, corresponding to a shear rate value
of 1/srep and 1/ss, respectively. These transitions are
included in Fig. 2 as the two vertical dashed lines. First, let
us consider FIC experiments with a constant level of
applied strain (bold line, Fig. 2). At low values of the shear
rate, flow does not influence the crystallization behavior,
i.e., the material crystallizes as in quiescent conditions,
represented by the horizontal line at t/tQ = 1 (morphology
type 1). For higher values of _c; the crystallization process is
accelerated and t/tQ becomes smaller than 1. Shear rate is
more effective than shear time in accelerating polymer
crystallization, and hence for increasing shear rates t/tQdecreases. The shape (slope) of the modulus curve versus
time is the same compared to the quiescent experiment,
which means that the crystallization kinetics are unaltered.
The decrease in crystallization time is associated with an
increase of the number of point-like nuclei (morphology
type 2). With a further increase of _c; a change in the slope
of the G0-evolution curve is observed, indicative for a
change in the crystallization kinetics, and the crystalliza-
tion process is even faster. It is related to the transition
from isotropic spherulitic crystals to oriented shish kebab
structures (morphology type 3). Consequently, the slope of
t/tQ becomes steeper. As can be seen in the schematic
picture, the transitions in t/tQ fall within flow regime II and
flow regime III. However, they do not necessarily coincide
with the shear rate values of 1/srep and 1/ss, i.e., the tran-
sitions from flow regime I to II and flow regime II to III,
respectively. When the shear strain level is increased, the
two transition points in the t/tQ curve move to lower shear
rates, eventually coinciding with the transitions between
the different flow regimes. This shows the importance of
flow time: flow has to be applied for a sufficiently long
time in order to orient or stretch the polymer chains enough
to observe an effect on the crystallization behavior and
final morphology, which is in line with the conclusions of
Van Meerveld et al. [15]. The transition that still needs
explanation is from flow regime III to IV, the ‘weak’ and
‘strong’ stretching regime, respectively. In flow regime III,
the chains are stretched, but still keep their Gaussian
configuration. For k[ k*(T) the chain configuration
becomes non-Gaussian and the amount of rotational
isomerization (RI) is large (regime IV). Based on the
analysis of FIC experiments reported in literature it was
concluded that the shish–kebab morphology develops when
the HMW chains are subjected to the condition Des [ 1 for
a sufficiently long time in order to fulfill the condition
k[ k*(T) [15]. Hence, in the schematic picture (Fig. 2),
the transition from flow regime III to IV occurs for t/tQwhen the second change in slope is observed, i.e., it
coincides with the onset of morphology type 3. Here, the
evolution of G0 shows a change in slope, i.e., a change inFig. 2 Schematic representation of the flow regimes and morphology
types. See the text for explanation
Flow-induced crystallization of propylene/ethylene 697
123

the crystallization kinetics, and the shish–kebab crystal
structure forms. In the schematic picture, the direction of
the line that marks the transition from III to IV is arbitrarily
chosen.
Equilibrium melting point, Tm0
Usually, two extrapolation methods are used to determine
the equilibrium melting point, Tm0, the Gibbs–Thomson
(GT) [49] and the Hoffman–Weeks (HW) [50] method. As
a result of a finite crystal thickness, l, Tm is depressed
below that of an infinite size crystal which is expressed in
the GT equation:
Tm ¼ Tm0 1� 2re
lDHf
� �ð5Þ
where re is the surface free energy of the crystal plane
normal to the thickness direction and DHf the heat of
fusion. From Eq. 5, it can be seen that Tm0 can be estimated
by extrapolating Tm versus 1/l data to infinite thickness.
This method requires X-ray scattering techniques to
determine the thickness of the crystals and a method (e.g.,
DSC) to measure the melting point of these lamellae.
The HW procedure correlates directly the temperature of
crystallization Tc to the melting temperature Tm of the
structures formed during subsequent melting (Eq. 6).
Tm ¼ Tm0 1� 1
c
� �þ Tc
cð6Þ
The parameter c = l/li accounts for isothermal lamellar
thickening after formation of an initial crystal with thick-
ness li. Thicker crystals are usually formed when a polymer
crystallizes at higher temperatures, resulting in a higher Tm.
Tm0 can be determined by linear extrapolation of Tm as a
function of Tc to the equilibrium line Tm = Tc. This method
only requires a DSC device which makes it easy to obtain
the necessary data.
In both methods, lamellar thickening plays an important
role. When the lamellar thickness for GT is determined at
room temperature, an increase of the crystal height can
occur during melting. A correct extrapolation is only pos-
sible for the HW method when the thickening coefficient is
independent of the crystallization temperature, i.e., only
samples crystallized at different temperatures, but with the
same value for c, can be used to correctly determine Tm0
[51].
Both methods were applied by [52] to evaluate the
discrepancies between two groups of Tm0 values reported
for iPP, one group around 187 �C and the other around
210 �C. They found for the GT method an equilibrium
melting temperature of around 186 �C. The result deter-
mined with the HW method was however greatly influ-
enced by the crystallization time. Where impinged, big
spherulites (*long crystallization times) gave a value of
210 �C, Tm0 determined from small spherulites, crystal-
lized for a short time, was around 188 �C. According to
Mezghani et al. [52], the most accurate result with the HW
procedure would be obtained when Tm of very small, newly
initiated spherulites could be measured, because the poly-
mer continues to crystallize during heating.
In a subsequent paper on P/E RACO’s with similar
molecular weights, a significant decrease of Tm0 was
observed for an increase in ethylene content
(*5 �C mol%-1) using the HW method [53]. In a crys-
tallization study on fractionated P/E RACO’s, it was found
that the equilibrium melting point was lowered by
approximately 2.3 �C mol%-1 [54]. These observations
imply for RACO3 with an ethylene content of 7.3 wt% a
significant difference in Tm0, i.e., 150 �C [53] and 170 �C
[54], adapting Tm0 = 187 �C for the iPP homopolymer.
The preference would maybe go to the former, because
commercially available polymer grades are used with a
comparable molar mass to our materials, where the latter
used fractionated samples. The choice for either one would,
however, be equally right (or wrong).
As discussed here, determination of the equilibrium
melting point is a tedious procedure in which errors can be
made easily. It is outside the scope of this study to get exact
values. The melting temperatures mentioned in Table 1
show a dependence on ethylene content of 3 - 3.5 �C/mol%
which is of the same order as reported in [53, 54]. Therefore,
we will use the nominal undercooling as mentioned in sec-
tion ‘‘Flow-induced crystallization experiments’’ to deter-
mine Tc,exp.
Results and discussion
DSC
The melting temperature Tm, the amount of crystallinity Xc,
determined from the melting enthalpy, and the crystalli-
zation temperature Tc are given in Table 1. The melting
thermograms of all four materials show bimodal melting,
see Fig. 3. The Tm values in Table 1 are the values of the
low temperature peak which is the most pronounced. The
high temperature peak/shoulder values are given in
brackets. No influence of the additives in RACO2 is
observed, i.e., the results nicely fit the trend that with
increasing amount of ethylene, Tm, Xc, and Tc decrease.
Measurements of Laihonen et al. [54] indicated that the
bimodal melting behavior for fractionated P/E RACO’s
occurs due to recrystallization during heating. At high
heating rates the melting behavior of their fractions was
unimodal. A slightly lower melting temperature is observed
compared to the values of Gahleitner et al. [29], which is
698 J.-W. Housmans et al.
123
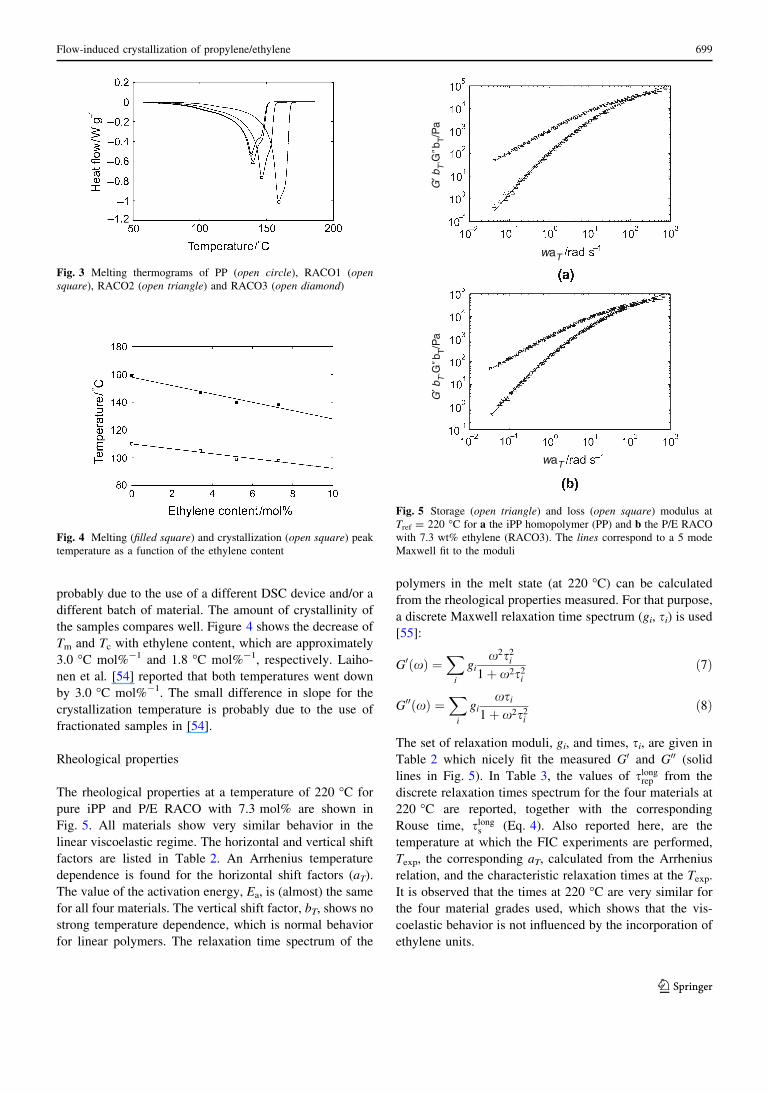
probably due to the use of a different DSC device and/or a
different batch of material. The amount of crystallinity of
the samples compares well. Figure 4 shows the decrease of
Tm and Tc with ethylene content, which are approximately
3.0 �C mol%-1 and 1.8 �C mol%-1, respectively. Laiho-
nen et al. [54] reported that both temperatures went down
by 3.0 �C mol%-1. The small difference in slope for the
crystallization temperature is probably due to the use of
fractionated samples in [54].
Rheological properties
The rheological properties at a temperature of 220 �C for
pure iPP and P/E RACO with 7.3 mol% are shown in
Fig. 5. All materials show very similar behavior in the
linear viscoelastic regime. The horizontal and vertical shift
factors are listed in Table 2. An Arrhenius temperature
dependence is found for the horizontal shift factors (aT).
The value of the activation energy, Ea, is (almost) the same
for all four materials. The vertical shift factor, bT, shows no
strong temperature dependence, which is normal behavior
for linear polymers. The relaxation time spectrum of the
polymers in the melt state (at 220 �C) can be calculated
from the rheological properties measured. For that purpose,
a discrete Maxwell relaxation time spectrum (gi, si) is used
[55]:
G0 xð Þ ¼X
i
gix2s2
i
1þ x2s2i
ð7Þ
G00 xð Þ ¼X
i
gixsi
1þ x2s2i
ð8Þ
The set of relaxation moduli, gi, and times, si, are given in
Table 2 which nicely fit the measured G0 and G00 (solid
lines in Fig. 5). In Table 3, the values of slongrep from the
discrete relaxation times spectrum for the four materials at
220 �C are reported, together with the corresponding
Rouse time, slongs (Eq. 4). Also reported here, are the
temperature at which the FIC experiments are performed,
Texp, the corresponding aT, calculated from the Arrhenius
relation, and the characteristic relaxation times at the Texp.
It is observed that the times at 220 �C are very similar for
the four material grades used, which shows that the vis-
coelastic behavior is not influenced by the incorporation of
ethylene units.
Fig. 3 Melting thermograms of PP (open circle), RACO1 (opensquare), RACO2 (open triangle) and RACO3 (open diamond)
Fig. 4 Melting (filled square) and crystallization (open square) peak
temperature as a function of the ethylene content
waT
waT
G′ b
T G
bT/P
aG
′ bT G
bT/P
a
Fig. 5 Storage (open triangle) and loss (open square) modulus at
Tref = 220 �C for a the iPP homopolymer (PP) and b the P/E RACO
with 7.3 wt% ethylene (RACO3). The lines correspond to a 5 mode
Maxwell fit to the moduli
Flow-induced crystallization of propylene/ethylene 699
123
Flow-induced crystallization
Figure 6 shows the evolution of G0 without flow application
for all grades at their specific crystallization temperature.
Clear differences between the different materials are
observed. The starting plateau is higher for increasing eth-
ylene content. When a polymer melt is cooled down, the
stiffness of the melt increases. Since the materials used show
the same visco-elastic behavior and the crystallization
experiments are performed at lower temperatures for the
copolymers, the melt stiffness and thus the starting plateaus
are higher. The horizontal shift factors, aT (Table 3), at their
respective Texp, calculated using the Arrhenius equation and
normalized to aT of the homopolymer, are 1, 1.4, 2.1, and 2.3
for the homopolymer PP and copolymers RACO1, RACO2,
and RACO3, respectively. This corresponds well to the rise
in starting plateau which increases by a factor 1.4 (RACO1),
1.9 (RACO2), and 2.1 (RACO3) compared to that of PP. The
end levels of the storage moduli decrease with increasing
ethylene content, which is correlated to the crystallinity
values determined from DSC.
At equal nominal undercooling, crystallization is faster
with increasing amount of ethylene monomers. The tran-
sition half-time, t1/2, the time at which the half change of
the viscoelastic functions occur, is defined as a character-
istic time scale of the process. To determine t1/2, the G0 data
are converted to space filling, u (ranging from 0 to 1).
Khanna [56] defined u as:
u ¼ G0 � G00G01 � G00
ð9Þ
with G00 and G0? the values of the start and end plateau
respectively. Pogodina et al. [57] normalized the storage
modulus by:
u ¼log G0=G00� �
log G01=G00� � ¼ log G0 � log G00
log G01 � log G00ð10Þ
When u, determined from optical microscopy, is plotted
versus the log of time, S-shaped curves similar to those in
Figs. 6 and 7 are obtained [35]. Although Eq. 10 is too
simple to accurately estimate the degree of space filling
and a more advanced suspension modeling is needed to
derive the proper u, the time scales obtained are similar.
The end plateau shows a slight but steady increase, which
makes a consistent determination of G0? problematic.
Here, it is defined as the intercept of the tangents drawn
along the end plateau and the regime of maximum changes
(Fig. 6). The homopolymer and RACO3 have a t1/2 of
7,300 and 1,100 s, respectively, giving a ratio of 6.6. The
often used Avrami equation describes u in case of
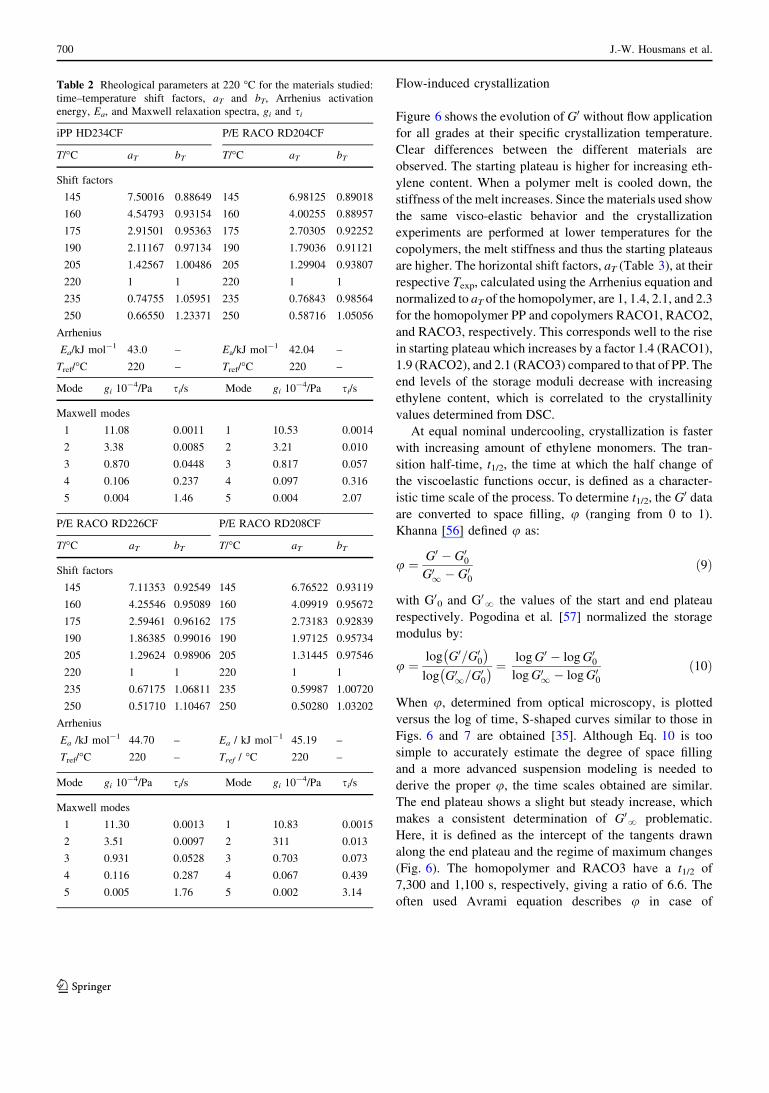
Table 2 Rheological parameters at 220 �C for the materials studied:
time–temperature shift factors, aT and bT, Arrhenius activation
energy, Ea, and Maxwell relaxation spectra, gi and si
iPP HD234CF P/E RACO RD204CF
T/�C aT bT T/�C aT bT
Shift factors
145 7.50016 0.88649 145 6.98125 0.89018
160 4.54793 0.93154 160 4.00255 0.88957
175 2.91501 0.95363 175 2.70305 0.92252
190 2.11167 0.97134 190 1.79036 0.91121
205 1.42567 1.00486 205 1.29904 0.93807
220 1 1 220 1 1
235 0.74755 1.05951 235 0.76843 0.98564
250 0.66550 1.23371 250 0.58716 1.05056
Arrhenius
Ea/kJ mol-1 43.0 – Ea/kJ mol-1 42.04 –
Tref/�C 220 – Tref/�C 220 –
Mode gi 10-4/Pa si/s Mode gi 10-4/Pa si/s
Maxwell modes
1 11.08 0.0011 1 10.53 0.0014
2 3.38 0.0085 2 3.21 0.010
3 0.870 0.0448 3 0.817 0.057
4 0.106 0.237 4 0.097 0.316
5 0.004 1.46 5 0.004 2.07
P/E RACO RD226CF P/E RACO RD208CF
T/�C aT bT T/�C aT bT
Shift factors
145 7.11353 0.92549 145 6.76522 0.93119
160 4.25546 0.95089 160 4.09919 0.95672
175 2.59461 0.96162 175 2.73183 0.92839
190 1.86385 0.99016 190 1.97125 0.95734
205 1.29624 0.98906 205 1.31445 0.97546
220 1 1 220 1 1
235 0.67175 1.06811 235 0.59987 1.00720
250 0.51710 1.10467 250 0.50280 1.03202
Arrhenius
Ea /kJ mol-1 44.70 – Ea / kJ mol-1 45.19 –
Tref/�C 220 – Tref / �C 220 –
Mode gi 10-4/Pa si/s Mode gi 10-4/Pa si/s
Maxwell modes
1 11.30 0.0013 1 10.83 0.0015
2 3.51 0.0097 2 311 0.013
3 0.931 0.0528 3 0.703 0.073
4 0.116 0.287 4 0.067 0.439
5 0.005 1.76 5 0.002 3.14
700 J.-W. Housmans et al.
123
isothermal crystallization, for which all nuclei N appear at
the same time t0, and the growth rate G is constant in time:
u ¼ 1� exp �4
3pNG3 t � t0ð Þ3
� �ð11Þ
Gahleitner et al. [29] determined N and G from thin slice
experiments over a temperature between 80 and 120 �C. At
all temperatures, a factor of 4 difference between the
growth rate of PP (high G) and RACO3 (low G) was found.
The growth rates of RACO1 and RACO2 are in between
the two extremes. At their experimental crystallization
temperatures, the difference in number of nuclei for PP and
RACO3 is a factor 10 (*1012.5 and *1013.5 m-3,
respectively) and the difference in growth rate is a factor 3
(*10-7.5 and *10-7 m s-1, respectively). From Eq. 11
the ratio of t1/2 between the two materials can be derived,
using u = 0.5, and is equal to
t1=2;PP
t1=2;RACO3
¼ffiffiffiffiffiffiffiffiffiffiffiffiffiffiffiffiffiffiffiffiffiffiffiffiNG3ð ÞRACO3
NG3ð ÞPP
3
sð12Þ
With the values found for N and G the ratio is 6.8, which is
very similar to the measured value.
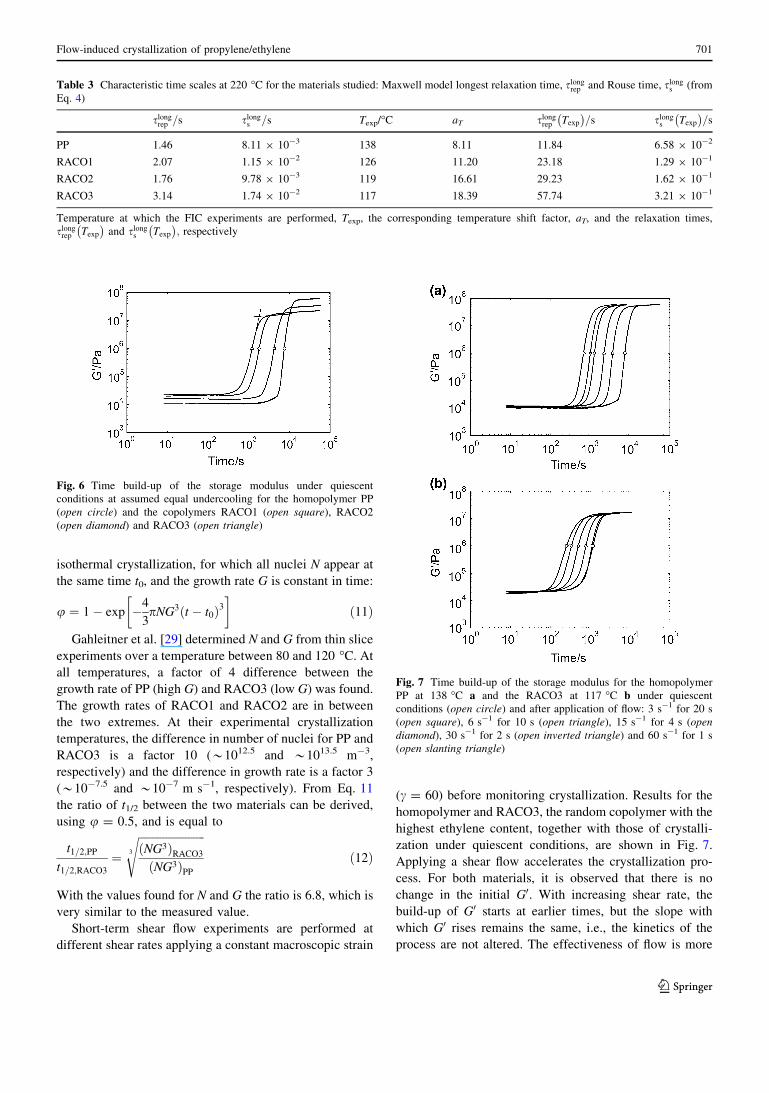
Short-term shear flow experiments are performed at
different shear rates applying a constant macroscopic strain
(c = 60) before monitoring crystallization. Results for the
homopolymer and RACO3, the random copolymer with the
highest ethylene content, together with those of crystalli-
zation under quiescent conditions, are shown in Fig. 7.
Applying a shear flow accelerates the crystallization pro-
cess. For both materials, it is observed that there is no
change in the initial G0. With increasing shear rate, the
build-up of G0 starts at earlier times, but the slope with
which G0 rises remains the same, i.e., the kinetics of the
process are not altered. The effectiveness of flow is more
Table 3 Characteristic time scales at 220 �C for the materials studied: Maxwell model longest relaxation time, slongrep and Rouse time, slong
s (from
Eq. 4)
slongrep =s slong
s =s Texp/�C aT slongrep Texp
� �=s slong
s Texp
� �=s
PP 1.46 8.11 9 10-3 138 8.11 11.84 6.58 9 10-2
RACO1 2.07 1.15 9 10-2 126 11.20 23.18 1.29 9 10-1
RACO2 1.76 9.78 9 10-3 119 16.61 29.23 1.62 9 10-1
RACO3 3.14 1.74 9 10-2 117 18.39 57.74 3.21 9 10-1
Temperature at which the FIC experiments are performed, Texp, the corresponding temperature shift factor, aT, and the relaxation times,
slongrep Texp
� �and slong
s Texp
� �; respectively
Fig. 6 Time build-up of the storage modulus under quiescent
conditions at assumed equal undercooling for the homopolymer PP
(open circle) and the copolymers RACO1 (open square), RACO2
(open diamond) and RACO3 (open triangle)
Fig. 7 Time build-up of the storage modulus for the homopolymer
PP at 138 �C a and the RACO3 at 117 �C b under quiescent
conditions (open circle) and after application of flow: 3 s-1 for 20 s
(open square), 6 s-1 for 10 s (open triangle), 15 s-1 for 4 s (opendiamond), 30 s-1 for 2 s (open inverted triangle) and 60 s-1 for 1 s
(open slanting triangle)
Flow-induced crystallization of propylene/ethylene 701
123

pronounced for the homopolymer than for the copolymer,
RACO3, where the evolution of G0 for the lowest shear rate
_c ¼ 3s�1ð Þ is almost equal to the quiescent result. Appar-
ently, a critical shear rate exists (at a constant macroscopic
strain level) below which flow does not speed up the
crystallization process. The effectiveness of flow can be
quantified by defining a dimensionless crystallization half-
time H as [47]:
H ¼t1=2; _c
t1=2;Qð13Þ
The FIC experiments are indicated by _c; the Q indicates the
half-time for quiescent conditions.
Figure 8 shows the dimensionless crystallization half-
time, H, as a function of shear rate, for the condition that
the macroscopic applied shear strain is constant (c = 60).
It shows that, under these conditions, there is a transition to
morphology type 2 in which the flow is strong enough to
accelerate the crystallization process. No change in crys-
tallization kinetics is observed (Fig. 7), and hence, only the
number of point nuclei is increased. Morphology type 2
starts at a critical shear rate, _cc; above which the step shear
influences the crystallization kinetics. With increasing
ethylene content, _ccshifts toward higher values. For
RACO3, the lowest applied shear rate of _c ¼ 3 s�1 is very
close to _cc; which is a factor 4 higher than that of the
homopolymer (*0.7 s-1). For all 4 grades, the onset of
this regime, i.e., the critical shear rate, falls within flow
regime II, but it does not coincide with the transition
between flow regime I and II, given by _c ¼ 1=slongrep
(Table 3). Furthermore, no transition to morphology type
3, where fibrillar structures form, is observed. An exception
in this picture is RACO2 which is influenced more by flow
than the homopolymer, i.e., _cc shifts to a lower value, due
to the presence of the silica anti-blocking agent. When flow
is applied, the presence of these particles constituting the
additives locally increases the velocity gradients [21]. As
such, fillers increase the influence of flow on crystallization
and crystal orientation [19], and alter mechanical proper-
ties [16]. An indication for the increased effective
stretching is hard to obtain, since these particles show a
large distribution of size (100 nm–10 lm) and shape dif-
ferences (spherical and plate-like), which should be taken
into account in the modeling. It has to be noticed that the
quiescent experiments are not influenced by the presence of
the particles, i.e., no extra nucleation effect is observed,
both in the DSC measurements, which would show an
increase in Tc (Fig. 4) and in the quiescent rheometry
measurements (Fig. 6).
The minimum _c for chain stretching for PP is calculated to
be 15 s-1 (Des = 1). However, for shear rates (equal and)
higher than this critical value (15, 30, and 60 s-1), no tran-
sition toward morphology type 3 is observed. The pre-shear
conditions that fulfill Des [ 1, i.e., deformations strong
enough to stretch the molecules and enter the fibrillar regime
are not the sole requirement for a change in the crystalliza-
tion kinetics [15]. The duration of the flow also plays an
important role. It is necessary to reach a characteristic strain
at which a transition from one to the other regime is
observed. This is demonstrated in Fig. 9. Figure 9a to c show
FIC experiments with a shear rate of 3, 15, and 60 s-1,
respectively, with increasing shear time such that the total
shear strain applied is constant for all shear rates applied and
equals to 60, 120, and 240. In all figures, the quiescent case is
included as well. For the low shear rates (up to 15 s-1), no
change in crystallization kinetics is observed, only an effect
in the onset time of crystallization (Fig. 9a, b). Above a shear
rate of 15 s-1, Fig. 9c, the time evolution of the viscoelastic
properties is changed. First, an initial increase of G0 indicates
the formation of some initial structure in the melt during flow
and secondly, the slope of the G0-evolution curve is altered.
For the three strain levels, the dimensionless crystallization
half-time H is displayed in Fig. 9d. It is shown that with an
increasing c, the critical shear rate at which flow starts to
effect the crystallization process shifts to lower values. For
the highest strain level _cc ¼ 0:3s�1; which is close to the
transition from flow regime I to II, determined from the
condition Derep = 1 to be 0.09 s-1 based on the longest
chains (slongrep ). Furthermore, for the high strain level of 240,
the slope of H versus _c changes around a shear rate of 15 s-1,
which is the lowest shear rate that can possibly stretch the
polymer chains according to Des [ 1-10. Higher strain
levels can not be reached because of arising problems like
edge fracture and material loss, i.e., polymer flowing outside
the plates.
The results shown in Fig. 8 have a total macroscopic
strain of 60 as a pre-shear condition at equal undercooling.
The flow strength experienced by the molecules, i.e., the
g
Fig. 8 Dimensionless crystallization half-time H obtained from
dynamical mechanical experiments for PP (open circle), RACO1
(open square), RACO2 (open triangle) and RACO3 (open diamond)
as a function of shear rate _c applied during the pre-shear condition
with the macroscopic strain, c = 60. The critical shear rate _cc for PP
is indicated with the dotted line
702 J.-W. Housmans et al.
123

molecular strain, is however not of the same level. The
molecular strain is the driving force for flow enhanced
nucleation and crystallization [44, 58]. This implies that the
molecular strain, and thus the driving force, experienced by
the homopolymer is lowest and increases for the RACO
grades because of the decreased Texp. A better comparison
would therefore be to apply pre-shear conditions with the
same molecular strain. To achieve equal molecular strain
levels, the Deborah number for the FIC experiments has to
be the same. The Deborah numbers for PP corresponding to
the measurements in Fig. 7 are reported in Table 4 using
slongrep as the characteristic time scale. To achieve the same
molecular strain for the RACO grades either Texp or _c has
to be altered. Since Texp is already fixed from the require-
ment that the undercooling is constant, _cwill be changed.
The _c values are listed in Table 4.
Figure 10 shows H as a function of the Deborah number
for orientation, Derep, at constant strain within one grade,
thus keeping the product Derep ts constant for all grades. It
shows that a critical Deborah number, Dec, is necessary to
influence the crystallization kinetics. This is most clearly
demonstrated with the results of RACO3. Under these shear
conditions, the differences between the grades become even
more pronounced. The influence of filler particles in RACO2
is still present, i.e., the curve is shifted to the left (lower De)
compared to RACO1, but, in this case, the flow has more
effect on the crystallization of pure PP.
Fig. 9 Time build-up of the
storage modulus for the
homopolymer PP at 138 �C
after application of flow at
different shear rates: a _c ¼ 3s�1;b _c ¼ 15s�1; c _c ¼ 60s�1; and
different strains; quiescent
conditions (open circle), FIC
with c = 60 (open square),
c = 120 (open triangle), and
c = 240 (open diamond).
d Dimensionless crystallization
half-time, H, versus _c for the
three different levels of shear
strain, symbols are as in (a–c)
Table 4 Deborah numbers determined from the applied pre-shear
conditions (c = 60) for PP (using aT and slongrep from Table 3) and
corresponding shear rates for the three RACO material grades
De _c=s�1
PP RACO1 RACO2 RACO3
36 3 1.5 1.2 0.6
71 6 3.1 2.4 1.2
178 15 7.7 6.1 3.1
355 30 15.3 12.2 6.2
710 60 30.6 24.3 12.3
Fig. 10 Dimensionless crystallization half-time, H, obtained from
dynamical mechanical experiments for PP (open circle), RACO1
(open square), RACO2 (open diamond), and RACO3 (open diamond)
as a function of Deborah number related to molecular orientation,
Derep, applied during the pre-shear condition. The critical Deborah
number, Dec, for PP, is indicated with the dotted line
Flow-induced crystallization of propylene/ethylene 703
123

To show, once more, the importance of shear time,
experiments at different levels of strain are performed and
the effect is shown in Fig. 11 for PP and RACO1. For the
same conditions applied, i.e., De ts = constant, the
behavior of the grades is not identical and the onset of
morphology type 2 occurs at different values of De. Fur-
thermore, where PP forms shish–kebab structures for the
strongest flow conditions (morphology type 3), RACO1 is
still in morphology type 2. So, although different mor-
phology types exist for all grades, the transitions between
the regimes are specific for every grade, under the same
flow conditions applied.
Conclusions
• The presence of ethylene co-monomers does not
change the linear visco-elastic behavior of iPP.
• At equal nominal undercooling, the rate of crystalliza-
tion increases with increasing amount of ethylene.
• At a given shear rate, keeping the total macroscopic
strain applied constant (c = 60), the effect on the
crystallization rate decreases with increasing ethylene
content. The difference between the grades is even
more pronounced at equal levels of molecular defor-
mation, i.e., De is constant.
• For the homopolymer it is shown that, in accordance
with van Meerveld et al. [15], a change in the
crystallization kinetics, i.e., a transition from isotropic
toward oriented structures, occurs when the HMW
chains are subjected to the condition Des [ 1, based on
slongs for a sufficiently long time.
• Although the different morphology types exist, the
transitions between the regimes are specific for every
grade, under the same flow conditions applied.
Acknowledgements This work is part of the Research Programme
of the Dutch Polymer Institute (DPI), PO Box 902, 5600 AX Eind-
hoven, The Netherlands, projectnr. #454.
Open Access This article is distributed under the terms of the
Creative Commons Attribution Noncommercial License which per-
mits any noncommercial use, distribution, and reproduction in any
medium, provided the original author(s) and source are credited.
References
1. Schrauwen BAG, van Breemen LCA, Spoelstra AB, Govaert LE,
Peters GWM, Meijer HEH. Structure, deformation and failure of
flow-oriented semi-crystalline polymers. Macromolecules.
2004;39:8618–33.
2. Schrauwen BAG. Deformation and failure of semi-crystalline
polymer systems. PhD-thesis, Eindhoven University of Tech-
nology, The Netherlands; 2003.
3. Kalay G, Sous RA, Reis RL, Cunha AM, Bevis MJ. The
enhancement of the mechanical properties of a high-density
polyethylene. J Appl Polym Sci. 1999;73:2473–83.
4. Zuidema H. Flow induced crystallization of polymers. PhD-the-
sis, Eindhoven University of Technology, The Netherlands, 2000.
5. Kristiansen M, Werner M, Tervoort T, Smith P, Blomenhofer M,
Schmidt H-W. The binary system isotactic polypropylene/bis(3,
4-dimethylbenzylidene)sorbitol: phase behavior, nucleation, and
optical properties. Macromolecules. 2003;36:5150–6.
6. Vleeshouwers S, Meijer HEH. A rheological study of shear
induced crystallization. Rheol Acta. 1996;35:391–9.
7. Vega JF, Hristova DG, Peters GWM. Flow-induced crystalliza-
tion regimes and rheology of isotactic polypropylene: effects of
molecular architecture. J Therm Anal Calorim. 2009;doi:
10.1007/s10973-009-0516-3.
8. Liedauer S, Eder G, Janeschitz-Kriegl H, Jerschow P, Geymayer
W, Ingolic E. On the kinetics of shear-induced crystallization of
polypropylene. Int Polym Proccess 1993;8:236–50.
9. Kumaraswamy G, Issaian AM, Kornfield JA. Shear-enhanced
crystallization in isotactic polypropylene. 1. Correspondence
between in situ rheo-optics and ex situ structure determination.
Macromolecules. 1999;32:7537–47.
10. Kumuraswamy G, Verma RK, Issaian AM, Wang P, Kornfield
JA, Yeh F, et al. Shear-enhanced crystallization in isotactic
polypropylene. Part 2. Analysis of the formation of the oriented
‘‘skin’’. Polymer. 2000;41:8931–40.
11. Somani RH, Hsiao BS, Nogales A, Srinivas S, Tsou AH, Sics I,
et al. Structure development during shear flow-induced crystal-
lization of i-PP: in-situ small-angle X-ray scattering study.
Macromolecules. 2000;33:9385–94.
12. Seki M, Thurman DW, Oberhauser JP, Kornfield JA. Shear-
mediated crystallization of isotactic polypropylene: the role of
long chain–long chain overlap. Macromolecules. 2002;35:
2583–94.
13. Baert J, Van Puyvelde P. Effect of molecular and processing
parameters on the flow-induced crystallization of poly-1-butene.
Part 1: kinetics and morphology. Polymer. 2006;47:5871–9.
14. Baert J, Van Puyvelde P, Langouche F. Flow-induced crystalli-
zation of PB-1: from the low shear rate region up to processing
rates. Macromolecules. 2006;39:9215–22.
15. van Meerveld J, Peters GWM, Hutter M. Towards a rheological
classification of flow induced crystallization experiments of
polymer melts. Rheol Acta. 2004;44:119–34.
16. Schrauwen BAG, Govaert LE, Peters GWM, Meijer HEH. The
influence of flow-induced crystallization on the impact toughness
Fig. 11 Dimensionless crystallization half-time, H, obtained from
dynamical mechanical experiments for PP (closed symbols) and
RACO1 (open symbols) as a function of Deborah number, De, with
the pre-shear conditions Derep ts = 710 (open square/filled square),
Derep ts = 1,420 (open triangle/filled triangle) and Derep ts = 2840
(open diamond/filled triangle)
704 J.-W. Housmans et al.
123

of high-density polyethylene. Macromol Symp. 2002;185:
89–102.
17. Muratoglu OK, Argon AS, Cohen RE, Weinberg M. Toughening
mechanism of rubber-modified polyamides. Polymer.
1995;36:921–30.
18. Ergungor Z, Cakmak M, Batur C. Effect of processing conditions
on the development of morphology in clay nanoparticle filled
nylon 6 fibers. Macromol Symp. 2002;185:259–76.
19. Yalcin B, Valladares D, Cakmak M. Amplification effect of
platelet type nanoparticles on the orientation behavior of injection
molded nylon 6 composites. Polymer. 2003;44:6913–25.
20. Yalcin B, Cakmak M. Superstructural hierarchy developed in
coupled high shear/high thermal gradient conditions of injection
molding in nylon 6 nanocomposites. Polymer. 2004;45:2691–710.
21. Hwang WR, Peters GWM, Hulsen MA, Meijer HEH. Flow-
induced crystallization of particle-filled polymers. Macromole-
cules. 2006;39:8389–98.
22. Fillon B, Lotz B, Thierry A, Wittmann JC. Self-nucleation and
enhanced nucleation of polymers. Definition of a convenient
calorimetric ‘‘efficiency scale’’ and evaluation of nucleating
additives in isotactic polypropylene (a phase). J Polym Sci B.
1993;31:1395–405.
23. Kristiansen M, Tervoort T, Smith P, Goossens H. Mechanical
properties of sorbitol-clarified isotactic polypropylene: influence
of additive concentration on polymer structure and yield behav-
ior. Macromolecules. 2005;38:10461–5.
24. Balzano L, Rastogi S, Peters GWM. Flow induced crystallization
in iPP-DMDBS blends: implications on morphology of shear ad
phase separation. Macromolecules. 2008;41:399–408.
25. Balzano L, Portale G, Peters GWM, Rastogi S. Thermo-revers-
ible DMDBS phase separation in iPP: effects of flow induced
crystallization. Macromolecules. 2008;41:5350–5.
26. Blomenhofer M, Ganzleben S, Hanft D, Schmidt H-W, Kris-
tiansen M, Smith P, et al. ‘‘Designer’’ nucleating agents for
polypropylene. Macromolecules. 2005;38:3688–95.
27. Kristiansen M. Nucleation and clarification of semi-crystalline
polymers. PhD-Thesis, ETH Zurich; 2004.
28. Grein C. Toughness of neat, rubber modified and filled b-nucleated
polypropylene: from fundamentals to applications. In: HH Kausch,
editor. Advances in polymer science, intrinsic molecular mobility
and toughness of polymers II. Berlin:Springer; 2005. pp. 43–104.
29. Gahleitner M, Jaaskelainen P, Ratajski E, Paulik C, Reussner J,
Wolfschwenger J, et al. Propylene-ethylene random copolymers:
comonomer effects on crystallinity and application properties.
J Appl Polym Sci. 2005;95:1073–81.
30. Maspoch MLl, Gamez-Perez J, Gimenez E, Santana OO, Gordillo
A. Influence of processing on ethylene-propylene block copoly-
mers: structure and mechanical behavior. J Appl Polym Sci.
2004;93:2866–78.
31. Gamez-Perez J, Munoz P, Santana OO, Gordillo A. Maspoch
MLl. Influence of processing on ethylene propylene block
copolymers (II): fracture behavior. J Appl Polym Sci.
2006;101:2714–24.
32. Resch K, Wallner GM, Teichert C, Maier G, Gahleitner M.
Optical properties of highly transparent polypropylene cast films:
influence of material structure, additives, and processing condi-
tions. Polym Eng Sci. 2006;46:520–31.
33. Wallner GM, Resch K, Teichert C, Gahleitner M, Binder W.
Effect of material structure and additives on the optical properties
of PP cast films. Monatshefte fur Chemie. 2006;137:887–97.
34. Bu H-S, Cheng SZD, Wunderlich B. Addendum to the thermal
properties of polypropylene. Makromol Chem Rapid Commun.
1988;9:75–7.
35. Steenbakkers RJA, Peters GWM. Suspension-based rheological
modeling of crystallizing polymer melts. Rheol Acta.
2008;47:643–65.
36. Avrami M. Kinetics of phase change. I. General theory. J Chem
Phys. 1939;7:1103–12.
37. Avrami M. Kinetics of phase change. II. Transformation-time
relations for random distribution of nuclei. J Chem Phys.
1940;8:212–24.
38. Lamberti G. A direct way to determine iPP density nucleation from
DSC isothermal measurements. Polym Bull. 2004;52:443–9.
39. Avila-Orta CA, Burger C, Somani R, Yang L, Marom G,
Medellin-Rodriguez FJ, et al. Shear-induced crystallization of
isotactic polypropylene within the oriented scaffold of noncrys-
talline ultrahigh molecular weight polyethylene. Polymer.
2005;46:8859–71.
40. Swartjes FHM. Stress induced crystallization in elongational
flow. PhD thesis, Eindhoven University of Technology, The
Netherlands; 2001.
41. Eder G, Janeschitz-Kriegl H. Crystallization. In: HEH Meijer,
editor. Materials science and technology, vol 18: processing of
polymers, chap. 5. Weinheim: VCH; 1997.
42. Koscher E, Fulchiron R. Influence of shear on polypropylene
crystallization: morphology development and kinetics. Polymer.
2002;43:6931–42.
43. Vega JF, Rastogi S, Peters GWM, Meijer HEH. Rheology and
reptation of linear polymers. Ultrahigh molecular weight chain
dynamics in the melt. J Rheol. 2004;48:663–78.
44. Zuidema H, Peters GWM, Meijer HEH. Development and vali-
dation of a recoverable strain based model for flow-induced
crystallization of polymers. Macromol Theor Simul.
2001;10:447–60.
45. Peters GWM, Swartjes FHM, Meijer HEH. A recoverable strain
based model for flow-induced crystallization. Macromol Symp.
2002;185:277–92.
46. Custodio FJMF, Steenabkkers RJA, Anderson PD, Peters GWM,
Meijer HEH. Model development and validation of crystalliza-
tion behavior in injection molding prototype flows. Macromol.
Theory Simul. 2009;doi:10.1002/mats.200900016
47. Acierno S, Palomba B, Winter HH, Grizzuti N. Effect of
molecular weight on the flow-induced crystallization of isotactic
poly(1-butene). Rheol Acta. 2003;42:243–50.
48. Coppola S, Balzano L, Gioffredi E, Maffettone PL, Grizzuti N.
Effects of the degree of undercooling on flow induced crystalli-
zation in polymer melts. Polymer. 2004;45:3249–56.
49. Wunderlich B. Thermal analysis of polymeric materials. Berlin:
Springer-Verlag; 2005.
50. Hoffman JD, Weeks JJ. J Res Nat Bur Stand. 1962;66A:13–28.
51. Xu J, Srinavas S, Marand H, Argawal P. Equilibrium melting
temperature and undercooling dependence of the spherulitic
growth rate of isotactic polypropylene. Macromolecules.
1998;31:8230–42.
52. Mezghani K, Anderson Campbell R, Phillips PJ. Lamellar
thickening and the equilibrium melting point of polypropylene.
Macromolecules. 1994;27:997–1002.
53. Mezghani K, Phillips PJ. c-phase in propylene copolymers at
atmospheric pressure. Polymer. 1995;36:2407–11.
54. Laihonen S, Gedde UW, Werner P-E, Matrinez-Salazar J. Crys-
tallization kinetics and morphology of poly(propylene-stat-eth-
ylene) fractions. Polymer. 1997;38:361–9.
55. Macosko CW. Rheology, principles, measurements and applica-
tion. New York: Wiley-VCH; 1994.
56. Khanna YP. Rheological mechanism and overview of nucleated
crystallization kinetics. Macromolecules. 1993;26:3639–43.
57. Pogodina NV, Winter HH, Srinivas S. Polypropylene crystalli-
zation as a physical gelation process. Macromolecules.
1999;31:8164–72.
58. McHugh AJ, Guy RK, Tree DA. Extensional flow-induced
crystallization of a polyethylene melt. Colloid Polym Sci.
1993;271:629–45.
Flow-induced crystallization of propylene/ethylene 705
123