Effect of Melt Processing on Crystallization Behavior
10
Macromol. Mater. Eng. 2002, 287, 363–372 363 Effect of Melt Processing on Crystallization Behavior and Rheology of Poly(3-hydroxybutyrate) (PHB) and its Blends Ahmed El-Hadi,* 1, 2 Rainer Schnabel, 1 Ekkehard Straube, 2 Gert Müller, 3 M. Riemschneider 4 1 Department of Engineering Science, Institute of Process Engineering, Martin-Luther University of Halle-Wittenberg, Germany E-mail: [email protected] 2 Department of Physics, Martin-Luther University of Halle-Wittenberg, Germany 3 Institute of Technical Macromolecular Chemistry, Martin-Luther University of Halle-Wittenberg, Germany 4 Bruker Optik GmbH, Leipzig, Germany Keywords: crystallization behavior; differential scanning calorimetry (DSC); FTIR; PHB blends; rheology; thermogravi- metric analysis (TG); Introduction The amount of plastic waste increases each year and the time needed for its biodegradation is still unknown. PHB has attracted much attention in recent years, because it is environmentally friendly. [1] Nowadays, plastics and syn- thetic polymers are mostly produced using petrochemical materials that cannot be decomposed, contribute to envir- onmental pollution, and are a serious danger to many ani- mals. After being used these polymers are burned or recycled. The carbon dioxide concentration increases in the atmosphere during combustion, while after recycling the materials are of a lower quality. If biodegradable polymers are to gain acceptability in future, the costs have to be kept down, like those of conventional polymers. As an example, 1 kg polyethylene (PE) or poly(propylene) (PP) cost $ 1 but PHB costs approximately $ 3–10. PHB must meet the qual- ity and processing requirements, as do PE and PP. PHB is a bacterial polyester, which is produced by different microor- ganisms as a storage material. [2] PHB has multiple applica- tions because it is not soluble in water, and is biodegrad- Full Paper: Poly(3-hydroxybutyrate) (PHB) is sensitive to high processing temperatures. This leads to a decrease in molar mass as well as a lower melt viscosity. The crys- tallization temperature shifts to lower values, and crystal- lization kinetics is slow. A mixture was developed in order to improve the manufacturing properties and the final product. The blends exhibit a slight reduction in molar mass because they have a lower melting point than pure PHB, and can be extruded at their melt temperature of 170 to 180 8C. Then they immediately crystallize at 125 to 100 8C. Differential scanning calorimetry (DSC) shows the effect of holding time in the melt on crystallization behavior. It has been shown that the crystallization time has to be longer in the case of PHB and shorter for the blends. Thermal degradation of PHB and its blends has been investigated using thermogravimetry analysis (TG). Derivative thermogravimetry coupled with TG (TG/DTG) curves show three decomposition stages for blends at 290, 340 and 445 8C, respectively. Acetic acid, water, carbon dioxide and methane are produced by degradation at a higher temperature. Macromol. Mater. Eng. 2002, 287, No. 5 i WILEY-VCH Verlag GmbH, 69469 Weinheim 2002 1438-7492/2002/0505–0363$17.50+.50/0 Viscosity vs. time for PHB and blend 1.
Transcript of Effect of Melt Processing on Crystallization Behavior
Macromol. Mater. Eng. 2002, 287, 363–372 363
Effect of Melt Processing on Crystallization Behaviorand Rheology of Poly(3-hydroxybutyrate) (PHB) and itsBlends
Ahmed El-Hadi,* 1, 2 Rainer Schnabel,1 Ekkehard Straube,2 Gert Müller,3 M. Riemschneider 4
1 Department of Engineering Science, Institute of Process Engineering, Martin-LutherUniversity of Halle-Wittenberg, GermanyE-mail: [email protected]
2 Department of Physics, Martin-Luther University of Halle-Wittenberg, Germany3 Institute of Technical Macromolecular Chemistry, Martin-Luther University of Halle-Wittenberg, Germany4 Bruker Optik GmbH, Leipzig, Germany
Keywords: crystallization behavior; differential scanning calorimetry (DSC); FTIR; PHB blends; rheology; thermogravi-metric analysis (TG);
IntroductionThe amount of plastic waste increases each year and thetime needed for its biodegradation is still unknown. PHBhas attracted much attention in recent years, because it isenvironmentally friendly.[1] Nowadays, plastics and syn-thetic polymers are mostly produced using petrochemicalmaterials that cannot be decomposed, contribute to envir-onmental pollution, and are a serious danger to many ani-mals. After being used these polymers are burned orrecycled. The carbon dioxide concentration increases in the
atmosphere during combustion, while after recycling thematerials are of a lower quality. If biodegradable polymersare to gain acceptability in future, the costs have to be keptdown, like those of conventional polymers. As an example,1 kg polyethylene (PE) or poly(propylene) (PP) cost $ 1 butPHB costs approximately $ 3–10. PHB must meet the qual-ity and processing requirements, as do PE and PP. PHB is abacterial polyester, which is produced by different microor-ganisms as a storage material.[2] PHB has multiple applica-tions because it is not soluble in water, and is biodegrad-
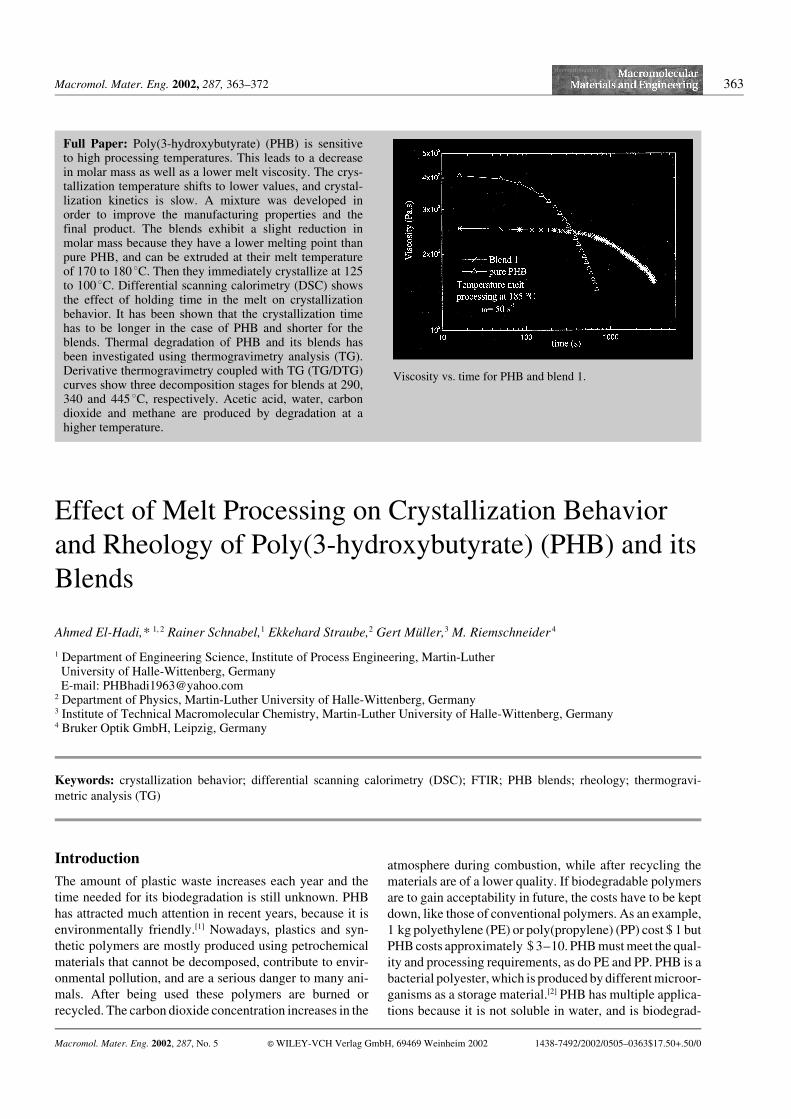
Full Paper: Poly(3-hydroxybutyrate) (PHB) is sensitiveto high processing temperatures. This leads to a decreasein molar mass as well as a lower melt viscosity. The crys-tallization temperature shifts to lower values, and crystal-lization kinetics is slow. A mixture was developed inorder to improve the manufacturing properties and thefinal product. The blends exhibit a slight reduction inmolar mass because they have a lower melting point thanpure PHB, and can be extruded at their melt temperatureof 170 to 1808C. Then they immediately crystallize at 125to 1008C. Differential scanning calorimetry (DSC) showsthe effect of holding time in the melt on crystallizationbehavior. It has been shown that the crystallization timehas to be longer in the case of PHB and shorter for theblends. Thermal degradation of PHB and its blends hasbeen investigated using thermogravimetry analysis (TG).Derivative thermogravimetry coupled with TG (TG/DTG)curves show three decomposition stages for blends at 290,340 and 4458C, respectively. Acetic acid, water, carbondioxide and methane are produced by degradation at ahigher temperature.
Macromol. Mater. Eng. 2002, 287, No. 5 i WILEY-VCH Verlag GmbH, 69469 Weinheim 2002 1438-7492/2002/0505–0363$17.50+.50/0
Viscosity vs. time for PHB and blend 1.

364 A. El-Hadi, R. Schnabel, E. Straube, G. Müller, M. Riemschneider
able.[3] For instance, it has a low permeability for watervapor.[3] Therefore, in the future, PHB could play a majorrole in packaging markets in the food industry. PHB isunstable in the melt[4] and after it reaches its melting pointthe thermal degradation begins. PHB degrades to crotonicacid at high temperatures.[5] A higher processing tempera-ture leads to a lower molar mass.[6, 7] Fewer nucleation bythe crystallization means larger spherulites in which crackscan be found.[8–10] If the size of the spherulites exceeds a cri-tical value, then the mechanical properties are lower. Thedecrease in molecular weight at high screw speeds in theextruder leads to stickiness on the metal surface in the chillroll or injection mould tool, and increases crystallizationtimes. In our experiments, mechanical properties were ser-iously affected by the processing conditions, and the stressdecreased when the processing temperature was increased.Attempts have been made to improve the mechanical andprocessing properties.[11–15] Grassie et al.[5, 6] and Kunioka etal.[7] have reported that the degradation in a temperaturerange of 180 to 2008C is due to the random chain scission ofthe six-member ring ester, resulting in a decrease in mole-cular weight. The depolymerization reaction of the esterifi-cation reaction occurs between the hydroxyl and carboxylgroups. The thermal degradation of PHB and some inor-ganic oxides, such as CaO, MgO, ZnO, PbO, PbO2, andAl2O3, was investigated.[16] These additives lead to the for-mation of many volatile products compared with PHB. Toimprove the mechanical properties we made miscibleblends of PHB using additives like plasticizers, lubricantsand nucleation agents. The aim of this work is the optimiza-tion and improvement of mechanical[17] and processingproperties such as extrusion, molding and film casting tosolve and eliminate the problem of plastic waste, and to usePHB instead of PP, PE, PVC, PS and PET. Therefore, westudied the effect of processing conditions, such as slowand fast cooling,[17] the holding time in the melt, and highprocessing temperatures on crystallization behavior, mor-phology and rheology.
Experimental Part
Materials
One PHB was supplied by COPERSUCAR, Brazil, and pro-duced by the fermentation of molasses by Alcaligens euthro-phus. It is a brown powder which melts at 1748C, with 50%crystallinity and an estimated molar mass of 220 kg/mol.
Another PHB was supplied by BIOMER (Dr. Haenggi)Krailling, Germany, and produced by the fermentation ofsugar by Alcaligens euthrophus. It is a white powder whichmelts at about 1758C, with 60% estimated crystallinity and amolar mass of 230 kg/mol.
Preparation of Samples
PHB powder was blended with additives by mixing in a Bra-bender (kneader) at 170 to 1808C and 50 rpm for 5 min, orin a single screw extruder at temperatures of 1458C (zone 1),1608C (zone 2) and 1708C (zone 3) using a 4 mm die and ascrew speed of 20 rpm. The extruded strand was cooled inwater and cut as a pelletizer. The mixed material (granulates)was molded under pressure (hydraulic press) at 170 to1808C between two sheets of Teflon and plates or plaques ofdifferent radii and thickness for 3 min without pressure andfor 2 min with pressure (50 bar). After melting the sample iscooled between cold metal plates with water. All additivesare biodegradable substances. Glycerol, tributyrin, triacetin,acetyltriethyl citrate, and acetyltributyl citrate were used asplasticizers and saccharin was used nucleation agent. Lubri-cants, e.g., glycerol monostearate, glycerol tristearate, 12-hydroxystearate, and 12-hydroxystearic acid were used. Theweight composition of the blends is listed in Table 1.
Methods
Differential Scanning Calorimetry (DSC)
The crystallization behaviors were investigated using a Per-kin-Elmer DSC 7.
1st series: the samples were heated by non-isothermal crys-tallization at 108C N min–1 to different melt processing tem-peratures of 175, 180, 185, 190, and 2008C, and held for3 min in the melt state. When they were cooled at108C N min–1, crystallization followed.
2nd series: the samples were heated to 2008C with variousholding times (1, 10 and 20 min) by isothermal crystalliza-tion at 808C.
3rd series: the samples were heated by isothermal crystalli-zation at different temperatures of melt processing at 185,190, 195 and 2008C, at a holding time of 3 min. Then theywere rapidly cooled at –1008C N min–1 to the isothermalcrystallization temperature at 1208C.
Thermogravimetric Analysis (TG)
The thermal degradation behavior of PHB and its blends wasinvestigated using Netzsch TG 209 thermogravimetry analy-sis at heating rates of 108C N min–1 under nitrogen at a flow
Table 1. Preparation of PHB/additives.
PHBwt:-%
Plasticizer (wt.-%) Lubricant (wt.-%) Nucleation (wt.-%) PVAcwt:-%
1 82 acetyltriethyl citrat (11.5) glycerol monostearate (2) saccharin (0.5) 42 80 glycerol (9.5) glycerol tristearate (2) saccharin (0.5) 83 78 triacetin (7.5) 12-hydroxystearic acid (2) saccharin (0.5) 124 76 tributyrin (5.5) 12-hydroxystearate (2) saccharin (0.5) 165 74 tributyrin (3.5) 12-hydroxystearate (2) saccharin (0.5) 20
Effect of Melt Processing on Crystallization Behavior and Rheology ... 365
rate of 10 ml N min–1. TG follows mass changes as a functionof time and temperature. The degradation temperature is thetemperature at which the maximum rates of decompositionare estimated.
Oscillatory Viscometers
The viscoelastic shear properties of PHB and its blends weremeasured using oscillatory shear moduli in a molten state atvarious melt temperatures with a parallel plate type Weissen-berg rheometer. The plates of the rheometer had a diameterof 40 mm. The storage modulus measures the elasticresponse of a polymer, and the loss modulus measures theenergy dissipated during flow deformation. The frequencysweep was in a range of 0.01 to 200 rad N s–1, at differenttemperatures ranging from 170 to 2108C.
Capillary Viscometers
A capillary rheometer (Göttfert rheographs 2002) was usedfor steady shear measurements, and viscosity was deter-mined at shear rates of 10 to 1000 s–1.
Melt Flow Index (MFI)
The melt flow index is used to characterize a polymer meltand as a quality control test. It is a single point measurementusing a standard test condition. The flow rate is determinedas a function of the applied load. The melt flow index (MFI)is the mass flow rate expressed in g/10 min. Extrusion takesplace isothermally in 10 min under constant temperaturethrough a die of standard size. A sample of 5 g as a powderor a pellet is heated for 5 min in the barrel and extrudedthrough the die under a constant load of 2.16 kg. The meltflow index (see Table 2) for PHB and blend 5 was measuredat various temperatures (170, 180 and 1908C).
FTIR Spectroscopy
IR spectroscopy provides information on structures, miscibil-ity, and analyzes the chemical or physical interactions in theblends. The spectra were obtained using a Bruker spectrom-eter. We used an ATR holder with EQUINOX55 golden gatesignal reflection in the mid-IR regions with a spectral resolu-tion of 2 cm–1 over a wave number range of 4000 to 600 cm–1.
TG-FTIR Spectroscopy
The coupling TG-FTIR method gives detailed informationon both thermo-gravimetrical and thermal degradation,respectively, with TG 209 Netzsch and FTIR spectrometerVECTORY.
Results and Discussion
FTIR Analysis
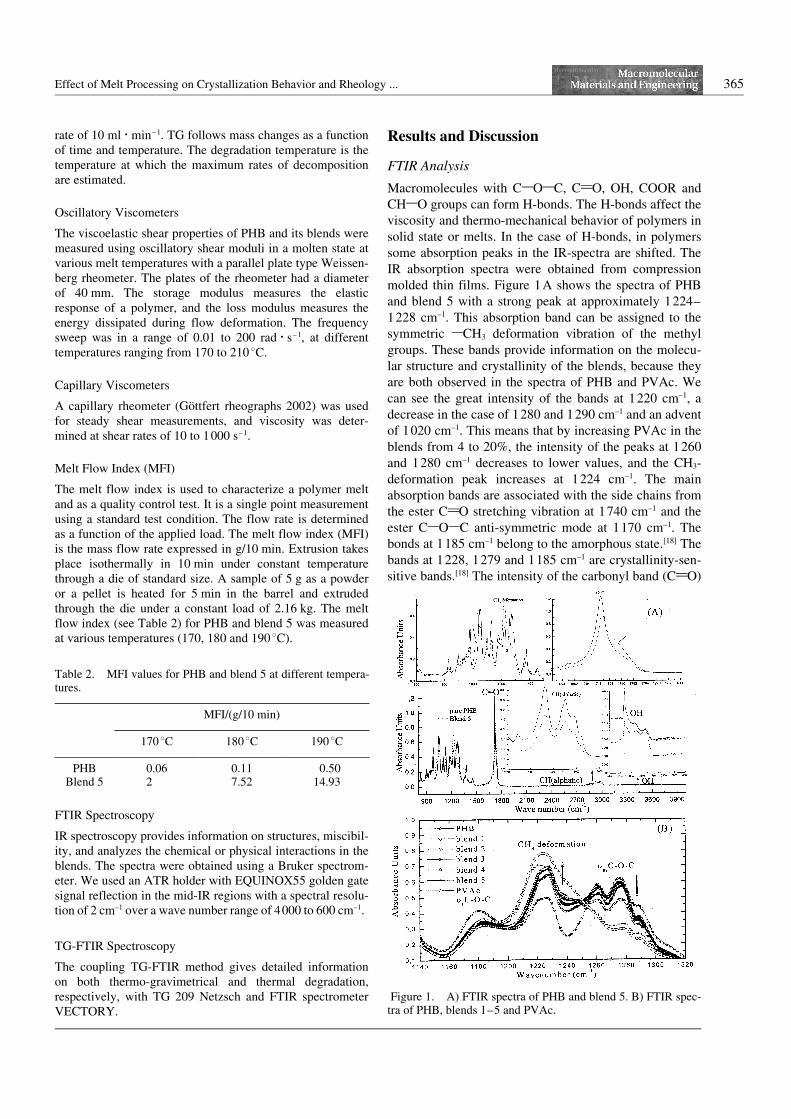
Macromolecules with C1O1C, C2O, OH, COOR andCH1O groups can form H-bonds. The H-bonds affect theviscosity and thermo-mechanical behavior of polymers insolid state or melts. In the case of H-bonds, in polymerssome absorption peaks in the IR-spectra are shifted. TheIR absorption spectra were obtained from compressionmolded thin films. Figure 1A shows the spectra of PHBand blend 5 with a strong peak at approximately 1224–1228 cm–1. This absorption band can be assigned to thesymmetric 1CH3 deformation vibration of the methylgroups. These bands provide information on the molecu-lar structure and crystallinity of the blends, because theyare both observed in the spectra of PHB and PVAc. Wecan see the great intensity of the bands at 1220 cm–1, adecrease in the case of 1280 and 1290 cm–1 and an adventof 1020 cm–1. This means that by increasing PVAc in theblends from 4 to 20%, the intensity of the peaks at 1260and 1280 cm–1 decreases to lower values, and the CH3-deformation peak increases at 1224 cm–1. The mainabsorption bands are associated with the side chains fromthe ester C2O stretching vibration at 1740 cm–1 and theester C1O1C anti-symmetric mode at 1170 cm–1. Thebonds at 1185 cm–1 belong to the amorphous state.[18] Thebands at 1228, 1279 and 1185 cm–1 are crystallinity-sen-sitive bands.[18] The intensity of the carbonyl band (C2O)
Table 2. MFI values for PHB and blend 5 at different tempera-tures.
MFI/(g/10 min)
170 8C 1808C 190 8C
PHB 0.06 0.11 0.50Blend 5 2 7.52 14.93
Figure 1. A) FTIR spectra of PHB and blend 5. B) FTIR spec-tra of PHB, blends 1–5 and PVAc.
366 A. El-Hadi, R. Schnabel, E. Straube, G. Müller, M. Riemschneider
of PHB is at 1719 cm–1 with a low shoulder at 1745cm–1. Therefore PHB is broad-band and the crystallinebecomes large. The intensity of the carbonyl band (C2O)of blend 5 is at 1723 cm–1 with a low shoulder at 1740cm–1, which leads to the crystallinity of blend 5 to belower than PHB. The new advent peak at 1020 cm–1 isdue to PVAc. The IR spectra of PHB and its blends areshown in Figure 1B. All peaks are at same position, indi-cating that the blends are miscibility. These results agreewith those from NMR.[17]
TG-FTIR Analysis
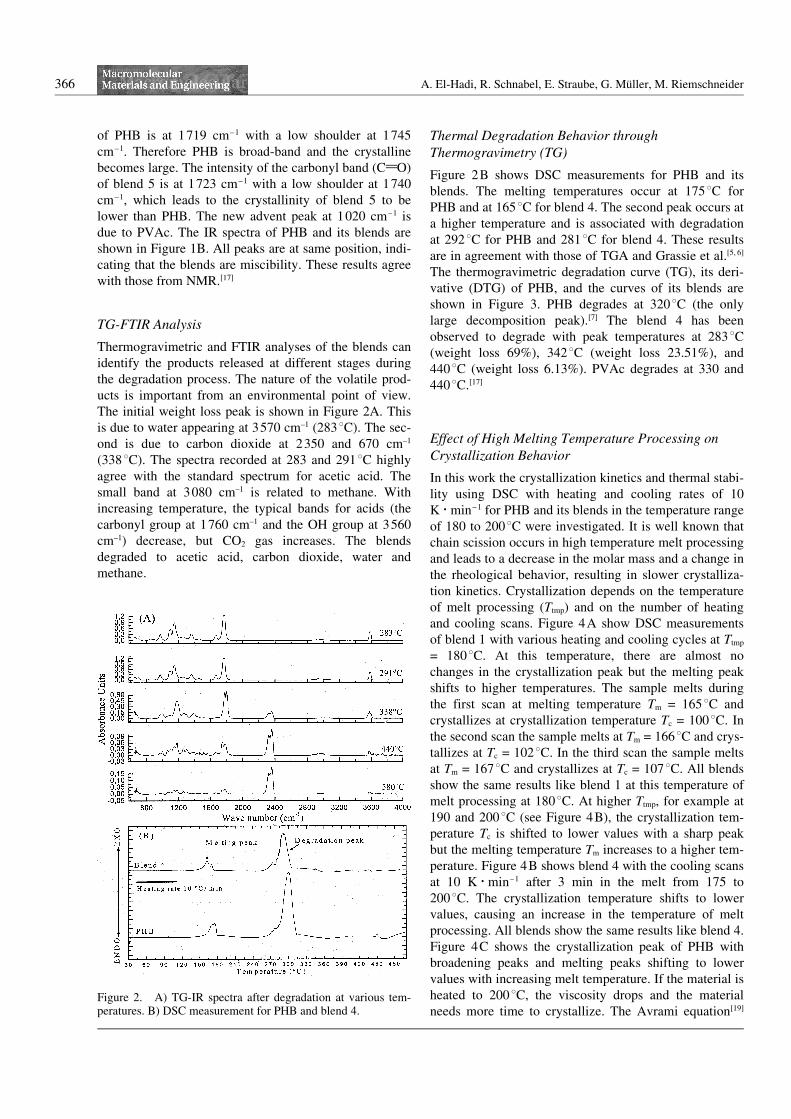
Thermogravimetric and FTIR analyses of the blends canidentify the products released at different stages duringthe degradation process. The nature of the volatile prod-ucts is important from an environmental point of view.The initial weight loss peak is shown in Figure 2A. Thisis due to water appearing at 3570 cm–1 (2838C). The sec-ond is due to carbon dioxide at 2350 and 670 cm–1
(3388C). The spectra recorded at 283 and 2918C highlyagree with the standard spectrum for acetic acid. Thesmall band at 3080 cm–1 is related to methane. Withincreasing temperature, the typical bands for acids (thecarbonyl group at 1760 cm–1 and the OH group at 3560cm–1) decrease, but CO2 gas increases. The blendsdegraded to acetic acid, carbon dioxide, water andmethane.
Thermal Degradation Behavior throughThermogravimetry (TG)
Figure 2B shows DSC measurements for PHB and itsblends. The melting temperatures occur at 1758C forPHB and at 1658C for blend 4. The second peak occurs ata higher temperature and is associated with degradationat 2928C for PHB and 2818C for blend 4. These resultsare in agreement with those of TGA and Grassie et al.[5, 6]
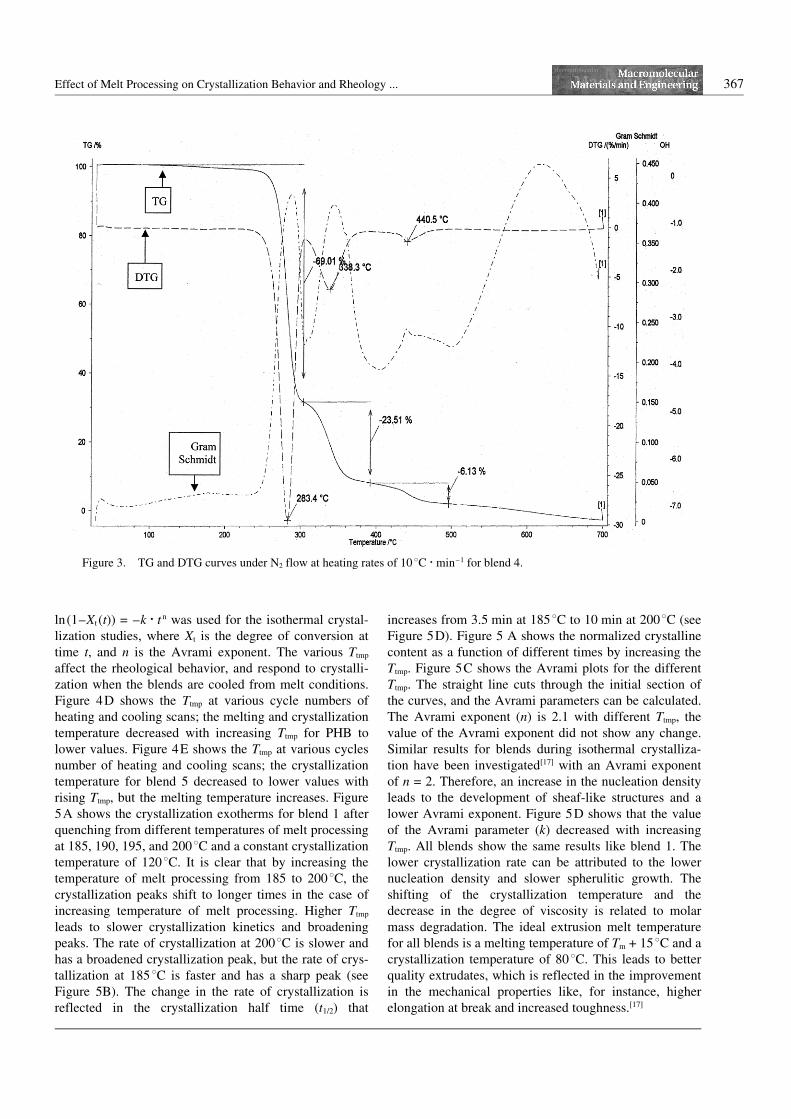
The thermogravimetric degradation curve (TG), its deri-vative (DTG) of PHB, and the curves of its blends areshown in Figure 3. PHB degrades at 3208C (the onlylarge decomposition peak).[7] The blend 4 has beenobserved to degrade with peak temperatures at 2838C(weight loss 69%), 3428C (weight loss 23.51%), and4408C (weight loss 6.13%). PVAc degrades at 330 and4408C.[17]
Effect of High Melting Temperature Processing onCrystallization Behavior
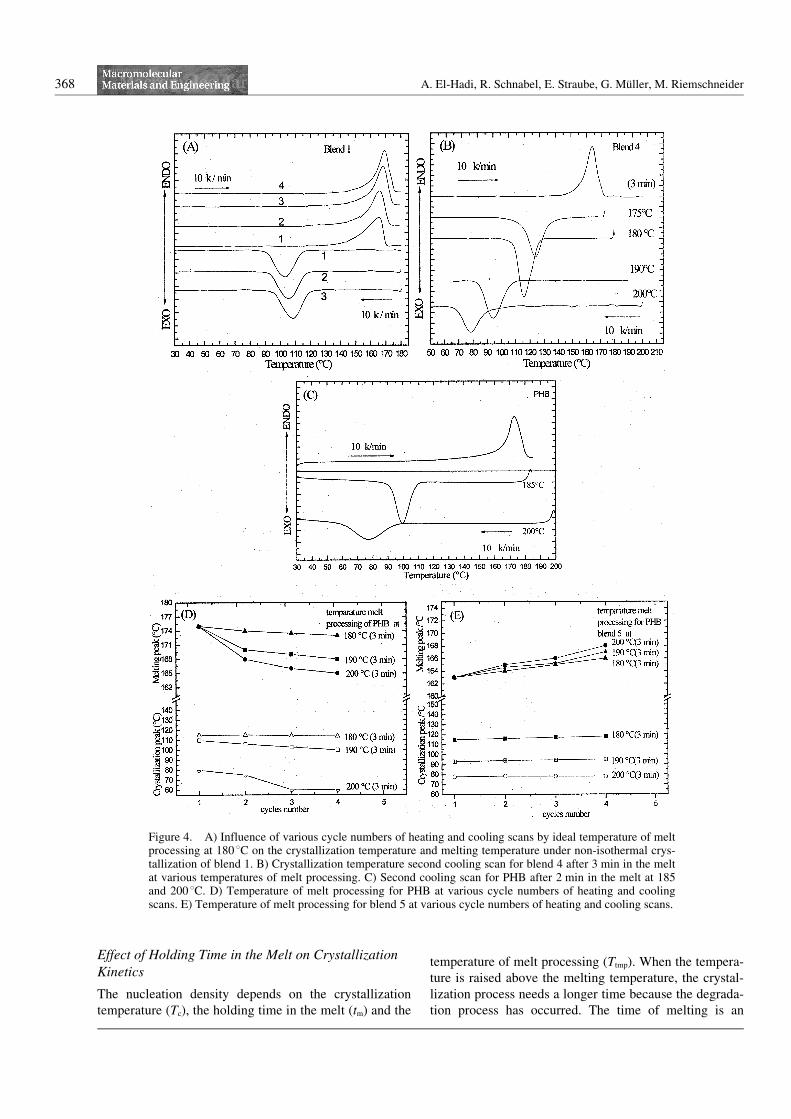
In this work the crystallization kinetics and thermal stabi-lity using DSC with heating and cooling rates of 10K N min–1 for PHB and its blends in the temperature rangeof 180 to 2008C were investigated. It is well known thatchain scission occurs in high temperature melt processingand leads to a decrease in the molar mass and a change inthe rheological behavior, resulting in slower crystalliza-tion kinetics. Crystallization depends on the temperatureof melt processing (Ttmp) and on the number of heatingand cooling scans. Figure 4A show DSC measurementsof blend 1 with various heating and cooling cycles at Ttmp
= 1808C. At this temperature, there are almost nochanges in the crystallization peak but the melting peakshifts to higher temperatures. The sample melts duringthe first scan at melting temperature Tm = 1658C andcrystallizes at crystallization temperature Tc = 1008C. Inthe second scan the sample melts at Tm = 1668C and crys-tallizes at Tc = 1028C. In the third scan the sample meltsat Tm = 1678C and crystallizes at Tc = 1078C. All blendsshow the same results like blend 1 at this temperature ofmelt processing at 1808C. At higher Ttmp, for example at190 and 2008C (see Figure 4B), the crystallization tem-perature Tc is shifted to lower values with a sharp peakbut the melting temperature Tm increases to a higher tem-perature. Figure 4B shows blend 4 with the cooling scansat 10 K N min–1 after 3 min in the melt from 175 to2008C. The crystallization temperature shifts to lowervalues, causing an increase in the temperature of meltprocessing. All blends show the same results like blend 4.Figure 4C shows the crystallization peak of PHB withbroadening peaks and melting peaks shifting to lowervalues with increasing melt temperature. If the material isheated to 2008C, the viscosity drops and the materialneeds more time to crystallize. The Avrami equation[19]
Figure 2. A) TG-IR spectra after degradation at various tem-peratures. B) DSC measurement for PHB and blend 4.
Effect of Melt Processing on Crystallization Behavior and Rheology ... 367
ln(1–Xt (t)) = –k N t n was used for the isothermal crystal-lization studies, where Xt is the degree of conversion attime t, and n is the Avrami exponent. The various Ttmp
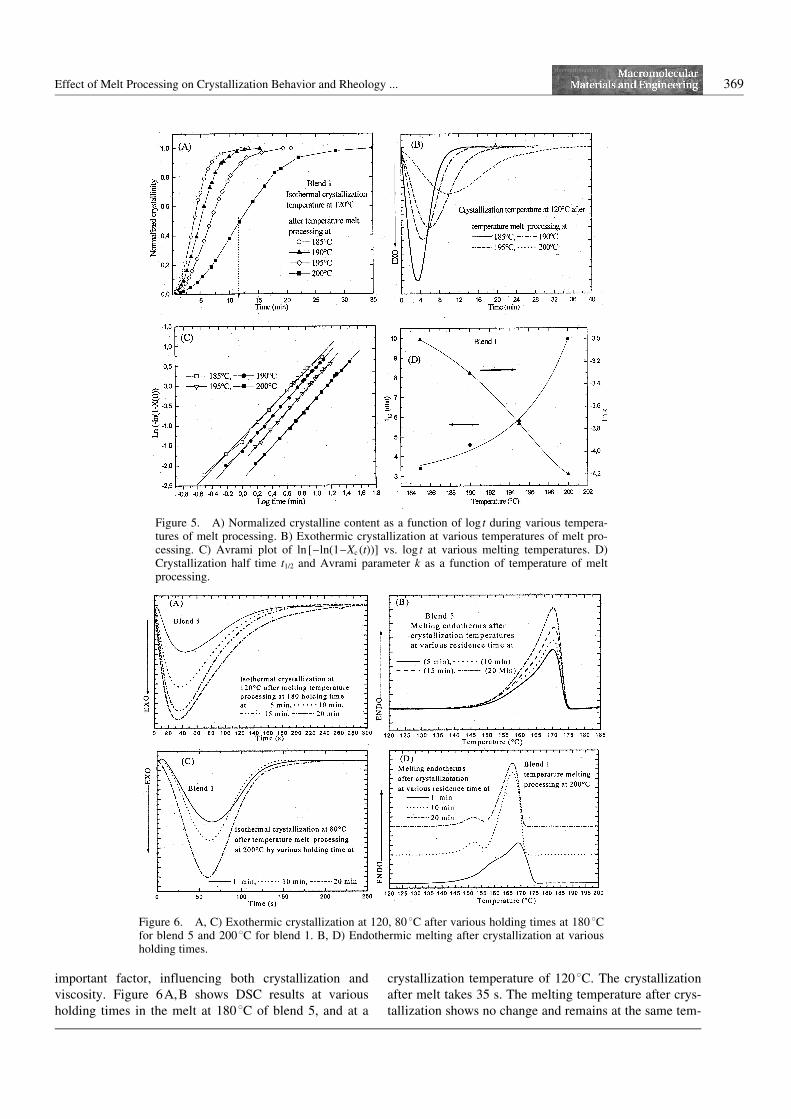
affect the rheological behavior, and respond to crystalli-zation when the blends are cooled from melt conditions.Figure 4D shows the Ttmp at various cycle numbers ofheating and cooling scans; the melting and crystallizationtemperature decreased with increasing Ttmp for PHB tolower values. Figure 4E shows the Ttmp at various cyclesnumber of heating and cooling scans; the crystallizationtemperature for blend 5 decreased to lower values withrising Ttmp, but the melting temperature increases. Figure5A shows the crystallization exotherms for blend 1 afterquenching from different temperatures of melt processingat 185, 190, 195, and 2008C and a constant crystallizationtemperature of 1208C. It is clear that by increasing thetemperature of melt processing from 185 to 2008C, thecrystallization peaks shift to longer times in the case ofincreasing temperature of melt processing. Higher Ttmp
leads to slower crystallization kinetics and broadeningpeaks. The rate of crystallization at 2008C is slower andhas a broadened crystallization peak, but the rate of crys-tallization at 1858C is faster and has a sharp peak (seeFigure 5B). The change in the rate of crystallization isreflected in the crystallization half time (t1/2) that
increases from 3.5 min at 1858C to 10 min at 2008C (seeFigure 5D). Figure 5 A shows the normalized crystallinecontent as a function of different times by increasing theTtmp. Figure 5C shows the Avrami plots for the differentTtmp. The straight line cuts through the initial section ofthe curves, and the Avrami parameters can be calculated.The Avrami exponent (n) is 2.1 with different Ttmp, thevalue of the Avrami exponent did not show any change.Similar results for blends during isothermal crystalliza-tion have been investigated[17] with an Avrami exponentof n = 2. Therefore, an increase in the nucleation densityleads to the development of sheaf-like structures and alower Avrami exponent. Figure 5D shows that the valueof the Avrami parameter (k) decreased with increasingTtmp. All blends show the same results like blend 1. Thelower crystallization rate can be attributed to the lowernucleation density and slower spherulitic growth. Theshifting of the crystallization temperature and thedecrease in the degree of viscosity is related to molarmass degradation. The ideal extrusion melt temperaturefor all blends is a melting temperature of Tm + 158C and acrystallization temperature of 808C. This leads to betterquality extrudates, which is reflected in the improvementin the mechanical properties like, for instance, higherelongation at break and increased toughness.[17]
Figure 3. TG and DTG curves under N2 flow at heating rates of 10 8C N min–1 for blend 4.
368 A. El-Hadi, R. Schnabel, E. Straube, G. Müller, M. Riemschneider
Effect of Holding Time in the Melt on CrystallizationKinetics
The nucleation density depends on the crystallizationtemperature (Tc), the holding time in the melt (tm) and the
temperature of melt processing (Ttmp). When the tempera-ture is raised above the melting temperature, the crystal-lization process needs a longer time because the degrada-tion process has occurred. The time of melting is an
Figure 4. A) Influence of various cycle numbers of heating and cooling scans by ideal temperature of meltprocessing at 180 8C on the crystallization temperature and melting temperature under non-isothermal crys-tallization of blend 1. B) Crystallization temperature second cooling scan for blend 4 after 3 min in the meltat various temperatures of melt processing. C) Second cooling scan for PHB after 2 min in the melt at 185and 200 8C. D) Temperature of melt processing for PHB at various cycle numbers of heating and coolingscans. E) Temperature of melt processing for blend 5 at various cycle numbers of heating and cooling scans.
Effect of Melt Processing on Crystallization Behavior and Rheology ... 369
important factor, influencing both crystallization andviscosity. Figure 6A,B shows DSC results at variousholding times in the melt at 1808C of blend 5, and at a
crystallization temperature of 1208C. The crystallizationafter melt takes 35 s. The melting temperature after crys-tallization shows no change and remains at the same tem-
Figure 5. A) Normalized crystalline content as a function of log t during various tempera-tures of melt processing. B) Exothermic crystallization at various temperatures of melt pro-cessing. C) Avrami plot of ln [–ln(1–Xc (t))] vs. log t at various melting temperatures. D)Crystallization half time t1/2 and Avrami parameter k as a function of temperature of meltprocessing.
Figure 6. A, C) Exothermic crystallization at 120, 80 8C after various holding times at 180 8Cfor blend 5 and 200 8C for blend 1. B, D) Endothermic melting after crystallization at variousholding times.

370 A. El-Hadi, R. Schnabel, E. Straube, G. Müller, M. Riemschneider
perature of 1708C. Figure 6C,D shows blend 1 at variousholding times at a Ttmp of 2008C and at a crystallizationtemperature of 808C; the crystallization after melt takes55 s and the melting peak after crystallization remains thesame. Figure 7A,C show melt temperatures of PHB witha holding time at 1858C and a crystallization temperatureof 1208C. The crystallization after melt needs 440–720 s.Figure 7B,D show a Ttmp of 2008C of PHB with a holdingtime at a crystallization temperature of 808C. The crystal-lization takes 450–600 s. The melting temperatures aftercrystallization have changed considerably from 1728C(1 min) to 1648C (20 min). It has been found that withincreasing the time of the melt, the crystallizationenthalpy of the blends becomes largely in the oppositepure PHB, i.e., blends are thermally stable as PHB. It isclear that the time in the melt has a major effect on thecrystallization of PHB, i.e., especially Tm + 308C degra-dation occurred and a longer holding time in the meltdecreases the crystallization kinetics by only 20 min.This means that a longer holding time of the meltdecreases the crystallization.
Rheological Analysis
The rheological characterization of PHB and blend 5 isperformed using a capillary and a oscillatory rheometer.Figure 8 A shows the isothermal viscosity of blend 5 as afunction of frequency. Increasing the temperature from170 to 2108C leads to a change in the viscosity to lowervalues. Figure 8B shows the storage and loss moduli ofblend 5 as a function of frequency at different tempera-
Figure 7. A, C) Exothermic crystallization of PHB at 120, 80 8C after various holding times at185 and 200 8C. B, D) Endothermic melting after crystallization at various holding times.
Figure 8. A) Complex viscosity for blend 5 at different tem-peratures. B) Storage G 9 and loss G 99 moduli for blend 5 at dif-ferent temperatures.

Effect of Melt Processing on Crystallization Behavior and Rheology ... 371
tures of melt processing. The thermal instability affectsthe viscosity and modules, especially at high temperaturemelt processing. By increasing the frequency, the modu-lus of blend 5 increases. Figure 9A shows the viscosityvs. steady shear rate at different Ttmp of 170, 175 and1808C. An increase in the shear rate decreases the viscos-ity. Figure 9B shows by applying the Cox-Merz rule[20]
that the complex viscosity is related to the viscosity insteady shear, i.e., g (c 9) = 0g*(x) 0c9=x where g (c 9) is theshear rate dependent viscosity, with c 9 as the steady stateshear rate. 0g*(x) 0 is the absolute value of the frequency-dependent complex viscosity derived from dynamic oscil-latory experiments, with frequency x in radians per sec-ond. Utracki and Schlund et al.[21] suggested that g (c 9) =0g*(x) 0 for miscible blends.
The frequency dependence of G 9, G 99 can be given bythe following equation of the Maxwell model:
G 9ðxiÞ ¼XN
i¼1
Gi
ðxikiÞ2
1þ ðxikiÞ2;G 99ðxiÞ ¼
XN
i¼1
Gi
ðxikiÞ1þ ðxik1Þ2
;G�ðxÞ ¼ ½G 9ðxÞ2 þ G 99ðxÞ2�1=2
The complex viscosity g* is defined as g 9–ig 99 and g* =G*(x)/x. The material parameters can be calculated fromthe relaxation properties like:
Zero shear viscosity
g0 ¼X
i
Giki
Elastic coefficient
Jg ¼P
G 9ðxÞx2
¼X
Gik2i
Equilibrium compliance
J0e ¼
X G 9ðxÞG 99ðxÞ ¼
PGik
2i
ðGikiÞ2
Retardation time
k 9 ¼ g0J0e ¼
PGik
2iP
Giki
where the Gi are the relaxation strengths and ki the relaxa-tion time.
Figure 10A shows the thermal stability of PHB andblend 1. At the beginning the viscosity for blend 1 islower than that of PHB because it contains lubricants andplasticizers, which during processing may reduce thethermal degradation of the chains. Figure 10B shows thatthe viscosity for blend 5 after one hour is equal to theviscosity of PHB after 10 min. Blend 5 is much morestable than PHB at processing.
Figure 10B shows for blend 5 the discrete relaxationtime spectrum calculated with the Nrleg program for dif-ferent temperatures of 170, 190 and 2108C from the meas-ured modulus G 9(x) and G 99(x). The result is g0 = 3.2Pa N s, Jg = 2.9, J0 = 4.9 Pa–1, k 9 = 3.264.9 s = 15.9 s. PHBmelts immediately at higher temperatures as a thin honey-like liquid because the polymer is without any branching.It is linear, therefore the material (blends) flows after melt-ing unlike the thermoplastics, PP or PE. After reaching themelting point their flow is weak. Only at a high tempera-ture melt processing they can flow faster.
Conclusions1. Melt processing at higher temperatures affects PHB,leading to a degradation process. Therefore, the rheologi-cal behavior changes, and consequently the viscosityfalls.
2. The effect of additives on PHB is governed by theprocessing conditions. The additives have improved rheo-logical properties and the blends can be extruded at low
Figure 9. A) Viscosity vs. shear rate from capillary viscometerat various temperatures for blend 5. B) Cox-Merz rule for blend5 at 170 8C.

372 A. El-Hadi, R. Schnabel, E. Straube, G. Müller, M. Riemschneider
temperatures of melt processing (170–1808C) withoutany changes in viscosity, molar mass and crystallizationbehavior.
3. The effect of the temperature of melt processing onthe crystallization and its rheological behavior may beattributed to the thermal stability of PHB and its blends.The relaxation times were calculated from oscillatoryshear data with the linear viscoelastic model and thematerial parameters g0, Jg, J0 and k 9. According to theresults, all blends flow immediately after having reachedthe melting point.
4. It was found that with increasing holding time in themelt, the crystallization enthalpy of the blends becomeslarger in the opposite pure PHB, i.e., the blends are ther-mally stable as PHB.
5. The higher temperatures of melt processing andlonger melt times affect PHB. This leads to a degradationprocess and results in a decrease of the molar mass.Therefore, the crystallization temperature is shifted tolower values, i.e., the crystallization takes a longer timebecause of the lower nucleation density. The degradation
of the chains during processing may be reduced by theaddition of a lubricant.
6. In light of the obtained results, the ideal melt tem-perature of processing is Tm + 158C and a crystallizationtemperature of 808C. This leads to better quality extru-dates, i.e., the mechanical and processing properties havebeen improved.[17]
Acknowledgement: The authors would like to thank the Ger-man Research Council (DFG) for financial support in the formof a Ph.D. grant. The authors are grateful to Dr. Stoll and Prof.Kressler for helpful discussions and suggestions.
Received: June 28, 2001Revised: April 15, 2002
Accepted: April 15, 2002
[1] P. A. Holmes, Phys. Technol. 1985, 16, 35.[2] H. M. Müller, D. Seebach, Angew. Chem., Int. Ed. Engl.
1993, 32, 477.[3] Y. Doi, “Microbial Polyesters”, VCH Publishers, New
York 1990.[4] A. Hoffman, Kreuzberger, G. Hinrichsen, Polym. Bull.
(Berlin) 1994, 33, 355.[5] N. Grassie, E. J. Murray, P. A. Holmes, Polym. Degrad.
Stabil. 1984, 6, 95.[6] N. Grassie, E. J. Murray, P. A. Holmes, Polym. Degrad.
Stabil. 1984, 6, 47.[7] M. Kunioka, Y. Doi, Macromolecules 1990, 23, 1933.[8] P. A. Holmes, in: “Development in crystalline polymers”,
Vol. 2, D.C. Bassett, Ed., Elsevier, London, New York,1988, p. 1–65.
[9] P. J. Barahem, A. Keller, J. Polym. Sci., Part B: Polym.Phys. 1986, 24, 69.
[10] S. Theobald, A. El-Hadi, W. Pechhold, in: “2nd Int. Symp.on Natural Polymers and Composites”, ISNa Pol., Brazil1998, p. 321–324.
[11] R. Renstand, S. Karlsson, A. C. Albertsson, MacromolSymp. 1998, 27, 241.
[12] Y. D. Wano, T. Yannoto, M. Cakmak, J. Appl. Poly. Sci.1996, 61, 1957.
[13] R. Renstand, S. Karlsson, A. C. Albertsson, Polym.Degrad. Stabil. 1999, 263, 201.
[14] S. Gogolewski, M. Jovanovic, S. M. Perren, J. G. Dillen,M. K. Hughes, Polym. Degrad. Stabil. 1993, 40, 313.
[15] Y. D. Wang, T. Yamamoto, M. Cokmak, J. Appl. Polym.Sci. 1996, 61, 1957.
[16] K. Csomorova, J. Rychly, D. Bakos, I. Janigova, Polym.Degrad. Stabil. 1994, 43, 441.
[17] A. El-Hadi, Ph.D. thesis, Martin-Luther-University, Halle-Wittenberg 2002.
[18] N. Galego, C. Rozsa, R. Sanchez, J. Polym. Test. 2000,485.
[19] M. Avrami, J. Chem. Phys. 1939, 7, 1103.[20] W. P. Cox, E. H. Merz, J. Polym. Sci. 1958, 28, 619.[21] L. A. Utracki, B. Schlund, Polym. Eng. Sci. 1987, 27,
1512.
Figure 10. A) Viscosity vs. time for PHB and blend 1. B)Relaxation strength vs. relaxation time for blend 5.