Anti-solvent crystallization of sucrose - TU Delft Repositories
69
Anti-solvent crystallization of sucrose Jeroen Muller February 25, 2016
-
Upload
khangminh22 -
Category
Documents
-
view
5 -
download
0
Transcript of Anti-solvent crystallization of sucrose - TU Delft Repositories
Anti-solvent crystallization of sucrose
Jeroen Muller
February 25, 2016
Abstract
In 2011, the Wageningen University discovered and patented a new process for crystal-lization of sugar. In this process ethanol is added to the sugar solution and water isselectively removed by a zeolite. Royal Cosun renounced the idea of working with zeolites,but remained interested in the concept of anti-solvent crystallization.
The study started out by analyzing the expected benefits of a process based on anti-solvent crystallization. The energy consuming process of water evaporation is no longerneeded if only anti-solvent crystallization is applied. However, the concept introduces anenergy consuming separation step to recover the anti-solvent.
A literature study was conducted to determine the properties of the anti-solvent(ethanol) and the basic principles behind anti-solvent crystallization. Various modelsfor the solubility, the viscosity and equilibrium data of sucrose mixtures were comparedand validated. The model based on the modified UNIQUAC method turned out to be inclose agreement with a variety of solubility sources and validated, by the authors, for theexpected ethanol concentrations and temperatures used in the process.
Several process designs were considered for the new concept and a selection was madebased on criteria provided by Royal Cosun. The selected process design consists of distil-lation columns to recover the ethanol, a crystallizer suitable for cooling and anti-solventcrystallization and recompression evaporators.
Over the last years the Cosun Food Technology Center (CFTC) developed Mat-lab/Simulink based models of almost all the components of the sugar factory. Thesecomponents can be linked together to represent the total sugar production plant. Thismodel was also used for the study, however this meant that certain changes had to be made.Various new process blocks were developed that allow for anti-solvent crystallization.
After several runs of the new model it turned out that only anti-solvent crystalliza-tion could not provide a high enough crystal yield. Therefor an additional cooling effectwas considered. After optimizing the ratio cooling crystallization/anti-solvent addition itbecame clear that more cooling crystallization would result in lower energy consumptions.
Finally two concepts were compared to the reference case, the traditional process. Theresults from the model showed that the new concept had a reduced energy consumption.However, the reduction is not enough to compensate the reduced electricity generationand the investment costs.
Acknowledgements
The completion of this graduation thesis would not have been possible without the supportof numerous people. First of all I would like to thank my supervisor Dr.Ir. Herman Kramerfor his guidance and advice during this graduation project. I would also like to thank mydaily supervisor Ir. Marc van Dijk, not only for the support he gave me continuouslythroughout this graduation project but also for the many times he cleared his schedule fora meeting with me.
Another word of thanks goes out the the people within the Process Modeling andEnergy group of the Cosun Food Technology Centre who made sure all the questions Ihad were answered while providing a pleasant and cheerful atmosphere. There has notbeen one disappointing day during my presence at Royal Cosun.
Last but not least I want to thank my partner G. Alfons, family and friends for allthe words of encouragement, motivation and above all the love I received which kept megoing throughout this graduation thesis.
Contents
1 Introduction 31.1 Background . . . . . . . . . . . . . . . . . . . . . . . . . . . . . . . . . . . . 31.2 Available literature . . . . . . . . . . . . . . . . . . . . . . . . . . . . . . . . 41.3 Problem statement and approach . . . . . . . . . . . . . . . . . . . . . . . . 41.4 Outline . . . . . . . . . . . . . . . . . . . . . . . . . . . . . . . . . . . . . . 5
2 Crystallization principles 72.1 Introduction . . . . . . . . . . . . . . . . . . . . . . . . . . . . . . . . . . . . 72.2 Cooling crystallization . . . . . . . . . . . . . . . . . . . . . . . . . . . . . . 112.3 Evaporative crystallization . . . . . . . . . . . . . . . . . . . . . . . . . . . . 112.4 Anti-solvent crystallization . . . . . . . . . . . . . . . . . . . . . . . . . . . 12
2.4.1 Batch operation . . . . . . . . . . . . . . . . . . . . . . . . . . . . . 132.4.2 Continuous operation . . . . . . . . . . . . . . . . . . . . . . . . . . 15
3 Current process 173.1 Sugar production process - general overview . . . . . . . . . . . . . . . . . . 173.2 Evaporation . . . . . . . . . . . . . . . . . . . . . . . . . . . . . . . . . . . . 183.3 Crystallization . . . . . . . . . . . . . . . . . . . . . . . . . . . . . . . . . . 193.4 Energy flows . . . . . . . . . . . . . . . . . . . . . . . . . . . . . . . . . . . 20
4 Cosun concept 244.1 Line of thought . . . . . . . . . . . . . . . . . . . . . . . . . . . . . . . . . . 244.2 Initial process design . . . . . . . . . . . . . . . . . . . . . . . . . . . . . . . 25
4.2.1 Distillation . . . . . . . . . . . . . . . . . . . . . . . . . . . . . . . . 264.2.2 Mechanical vapor recompression . . . . . . . . . . . . . . . . . . . . 27
4.3 Final process design . . . . . . . . . . . . . . . . . . . . . . . . . . . . . . . 274.4 Uncertainties . . . . . . . . . . . . . . . . . . . . . . . . . . . . . . . . . . . 30
5 Physical properties 325.1 Solubility . . . . . . . . . . . . . . . . . . . . . . . . . . . . . . . . . . . . . 32
5.1.1 Two sources . . . . . . . . . . . . . . . . . . . . . . . . . . . . . . . . 325.1.2 Effect of non-sugars . . . . . . . . . . . . . . . . . . . . . . . . . . . 345.1.3 Crystal recovery . . . . . . . . . . . . . . . . . . . . . . . . . . . . . 35
5.2 Vapor-liquid equilibrium . . . . . . . . . . . . . . . . . . . . . . . . . . . . . 365.3 Viscosity . . . . . . . . . . . . . . . . . . . . . . . . . . . . . . . . . . . . . . 375.4 Excess enthalpy . . . . . . . . . . . . . . . . . . . . . . . . . . . . . . . . . . 405.5 Appearance, Handling & Safety . . . . . . . . . . . . . . . . . . . . . . . . . 41
1

6 Model development 426.1 Introduction to the current model . . . . . . . . . . . . . . . . . . . . . . . 426.2 New process blocks . . . . . . . . . . . . . . . . . . . . . . . . . . . . . . . . 43
6.2.1 Crystallizer . . . . . . . . . . . . . . . . . . . . . . . . . . . . . . . . 436.2.2 Distillation column . . . . . . . . . . . . . . . . . . . . . . . . . . . . 446.2.3 Centrifuge . . . . . . . . . . . . . . . . . . . . . . . . . . . . . . . . . 486.2.4 Mixing . . . . . . . . . . . . . . . . . . . . . . . . . . . . . . . . . . . 49
6.3 Applied changes to the model . . . . . . . . . . . . . . . . . . . . . . . . . . 496.3.1 Evaporation & Mechanical vapor recompression . . . . . . . . . . . . 496.3.2 Electrical energy consumption . . . . . . . . . . . . . . . . . . . . . . 50
7 Optimization 547.1 Distillation . . . . . . . . . . . . . . . . . . . . . . . . . . . . . . . . . . . . 547.2 Ratio cooling/anti-solvent crystallization . . . . . . . . . . . . . . . . . . . . 55
8 Results 568.1 Capacities . . . . . . . . . . . . . . . . . . . . . . . . . . . . . . . . . . . . . 568.2 Energy consumption . . . . . . . . . . . . . . . . . . . . . . . . . . . . . . . 578.3 Costs . . . . . . . . . . . . . . . . . . . . . . . . . . . . . . . . . . . . . . . . 59
8.3.1 Energy costs . . . . . . . . . . . . . . . . . . . . . . . . . . . . . . . 598.3.2 Equipment costs . . . . . . . . . . . . . . . . . . . . . . . . . . . . . 59
9 Discussion 62
10 Conclusion 63
2

Chapter 1
Introduction
1.1 Background
In 2011, the Wageningen University discovered and patented a new process for crystal-lization of sugar. The patent claimed that the process allowed for more sustainable andprofitable sugar beet cultivation and sugar production. To investigate this new processfor crystallization of sugar and the opportunities for the sugar production industry, theproject entitled ”Development of a new method for sugar crystallization” was started inFebruary 2013. Royal Cosun provided data about the sugar production process and partlyfunded and reviewed the research [1].
Figure 1.1 shows the mass flows of the proposed process by the Wageningen University.In this process ethanol is added to the sugar solution and water is selectively removed by azeolite. Zeolites are microporous, aluminosilicate minerals commonly used as adsorbentsand catalysts. The removal of water and the addition of ethanol causes the sugar tocrystallize according to the crystallization principles described in the following chapters.
Figure 1.1: Mass flows of the Wageningen concept
The zeolite selectively absorbs the water during which heat is released. After a whilethe zeolite needs regeneration and this is done by applying heat in the form of superheatedvapor. The water leaves the zeolite in the vapor form and is later condensed in the
3

evaporator. The process of water separation with zeolites is similar to evaporation ofwater, the crystallization principle of traditional sugar production processes, and is highlyenergy consuming. Royal Cosun renounced the idea of working with zeolites, becauseit is very similar to evaporative crystallization and does not provide additional benefits.They remained interested in the concept of anti-solvent crystallization if it could replacethe traditional evaporative crystallization process. It is obvious that the use of an anti-solvent yields a crystal product without needing to evaporate the solvent, but still requiresa separation step to regenerate the anti-solvent [2, p. 4]. The concept could, in theory,reduce the energy demand of the factory. Especially in combination with an ethanolproduction plant. The residual stream, containing sugar and small amounts of ethanol,can be supplied to the fermentation section. The energy needed for recovery of the anti-solvent can potentially by used in other parts of the plant. The Anklam factory (Germany),owned by Royal Cosun, is such a factory. This study focuses in particular on this factory.In this report, you can read how the concept has been investigated and evaluated.
1.2 Available literature
Anti-solvent crystallization of sugars was investigated by Marco Giulietti and AndreBernardo [3]. In this study fructose was studied utilizing ethanol, and lactose was studiedutilizing ethanol, acetone and isopropanol. They concluded that crystallization of sug-ars may be improved by adding an organic liquid anti-solvent (as alcohol or ketone) andcooling the system. This addition shuts nucleation hindrance off, as it decreases systemviscosity. Simultaneously, the anti-solvent competes with solute for water of hydration,throwing solute out of the solution: promoting crystallization. As the solubility of sugarsin the mixture water-organic solvent is much lower than in water only, anti-solvent ad-dition increases the crystallization rate. Cooling the system maximizes the drowning-outeffect.
Refining of crystal sugar with ethanol was also investigated by E. R. Asquieri, E. M.de Assis and G.E. Serra [4]. The obtained results show that anti-solvent crystallizationof sucrose with ethanol can be applied in the refining of white sugar. The filtering ofhydroalcoholic solutions containing sucrose with filter paper, aiming at the elimination ofimpurities, proved to be efficient on a laboratory bench scale. The secondary nucleationtechnique, performed by seeding the solution and agitating it during an hour, proved to beapplicable to hydroalcoholic solutions containing sucrose. It is also proved to be efficientin relation to the production of sugar with low color and impurities.
The study conducted by Mary An Godshall, Michael Saska et al. [5] and other studieshave investigated the effect of ethanol on sucrose solubility and molasses exhaustion. Theyobserved a significant decrease of the massecuite viscosity, however they did not observea significant increase in molasses exhaustion.
1.3 Problem statement and approach
Literature shows that anti-solvent crystallization of sucrose might improve the productionprocess, however non of the studies provide information about the possible energy reduc-tion of anti-solvent crystallization implemented in an existing sugar plant. It is thereforthe aim of this report to answer the following question, which has played a leading rolethroughout the study:
4
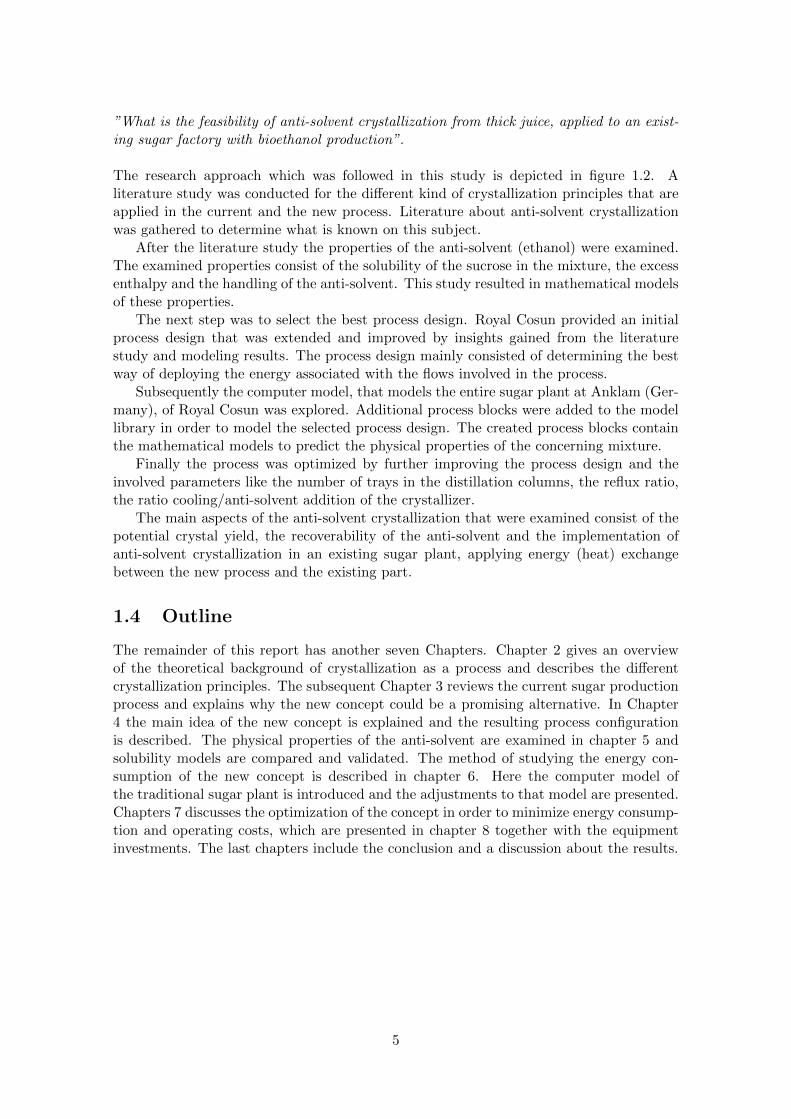
”What is the feasibility of anti-solvent crystallization from thick juice, applied to an exist-ing sugar factory with bioethanol production”.
The research approach which was followed in this study is depicted in figure 1.2. Aliterature study was conducted for the different kind of crystallization principles that areapplied in the current and the new process. Literature about anti-solvent crystallizationwas gathered to determine what is known on this subject.
After the literature study the properties of the anti-solvent (ethanol) were examined.The examined properties consist of the solubility of the sucrose in the mixture, the excessenthalpy and the handling of the anti-solvent. This study resulted in mathematical modelsof these properties.
The next step was to select the best process design. Royal Cosun provided an initialprocess design that was extended and improved by insights gained from the literaturestudy and modeling results. The process design mainly consisted of determining the bestway of deploying the energy associated with the flows involved in the process.
Subsequently the computer model, that models the entire sugar plant at Anklam (Ger-many), of Royal Cosun was explored. Additional process blocks were added to the modellibrary in order to model the selected process design. The created process blocks containthe mathematical models to predict the physical properties of the concerning mixture.
Finally the process was optimized by further improving the process design and theinvolved parameters like the number of trays in the distillation columns, the reflux ratio,the ratio cooling/anti-solvent addition of the crystallizer.
The main aspects of the anti-solvent crystallization that were examined consist of thepotential crystal yield, the recoverability of the anti-solvent and the implementation ofanti-solvent crystallization in an existing sugar plant, applying energy (heat) exchangebetween the new process and the existing part.
1.4 Outline
The remainder of this report has another seven Chapters. Chapter 2 gives an overviewof the theoretical background of crystallization as a process and describes the differentcrystallization principles. The subsequent Chapter 3 reviews the current sugar productionprocess and explains why the new concept could be a promising alternative. In Chapter4 the main idea of the new concept is explained and the resulting process configurationis described. The physical properties of the anti-solvent are examined in chapter 5 andsolubility models are compared and validated. The method of studying the energy con-sumption of the new concept is described in chapter 6. Here the computer model ofthe traditional sugar plant is introduced and the adjustments to that model are presented.Chapters 7 discusses the optimization of the concept in order to minimize energy consump-tion and operating costs, which are presented in chapter 8 together with the equipmentinvestments. The last chapters include the conclusion and a discussion about the results.
5

Literature study
Properties anti-solvent
Process design selection
Explore existing computer model
Modify computer model
Optimization
- Crystallisation principles
- Existing knowledge anti-
solvent crystallization
initi
- Solubility
- Vapor-liquid equilibrium
- Excess enthalpy
- Handling
initi
Figure 1.2: Research approach
6

Chapter 2
Crystallization principles
2.1 Introduction
Crystallization is the second most important separation process in chemical industry afterdistillation. Crystallization is the (natural or artificial) process of formation of solid crys-tals precipitating from a solution, melt or more rarely deposited directly from a gas. Thissolid phase formation occurs in two main steps: the formation of a new thermodynamicphase via self-assembly or self-organization, called nucleation, and the growth of thesestructures into solid particles, crystals [6, p. 204].
The reverse process of crystallization is dispersion of a solid in a solvent, termeddissolution. The dispersed solid that goes into solution is the solute. As dissolutionproceeds, the concentration of the solute increases. The solubility in impure solutions isdefined as the maximum amount of solute (in grams) that can be dissolved in 1 g of solutionat a given temperature. Given enough time at fixed conditions, the solute will eventuallydissolve up to a maximum solubility. Under these conditions, the solution is saturatedwith solute and is incapable of dissolving further solute under equilibrium conditions.
If the actual concentration is higher than the equilibrium concentration than the differ-ence in concentration is called supersaturation and it is the driving force of crystallization.The growth of the crystal depends on several factors such as temperature, crystal surfacearea, fluid dynamic conditions and the nature and concentration of the impurities. Super-saturation can be generated in the system by cooling, solvent evaporation, reducing thesolute solubility by addition of an anti-solvent, or changing the solute by chemical reactionproducing another substance with much lower solubility.
Crystallization is also a chemical solid-liquid separation technique, in which mass trans-fer of a solute from the liquid solution to a pure solid crystalline phase occurs. In chemicalengineering crystallization occurs in a crystallizer.
It might be expected that if a solute is dissolved in a solvent at a fixed temperatureuntil the solution achieves saturation and any excess solute is removed, and the solubilityis decreased, the solute would immediately start to crystallize from solution. However,solutions can often contain more solute than is present at saturation. Such supersaturatedsolutions are thermodynamically metastable and can remain unaltered indefinitely. Thisis because crystallization first requires formation or nucleation.
Nucleation theory tells us that when the solubility of a solution is exceeded and it issupersaturated, the molecules start to associate and form aggregates (clusters), or con-centration fluctuations. If we assume that these aggregates are spherical, we can write anequation (2.1 [7, p. 17]) for the Gibbs free energy change required to form a cluster of agiven size
7
∆G = 4πr2σ − 4πr3
3VmRT ln(1 + S) (2.1)
where r is the cluster radius, S the supersaturation ratio, σ is the solid-liquid interfacialtension, and Vmis the specific volume of a solute molecule.
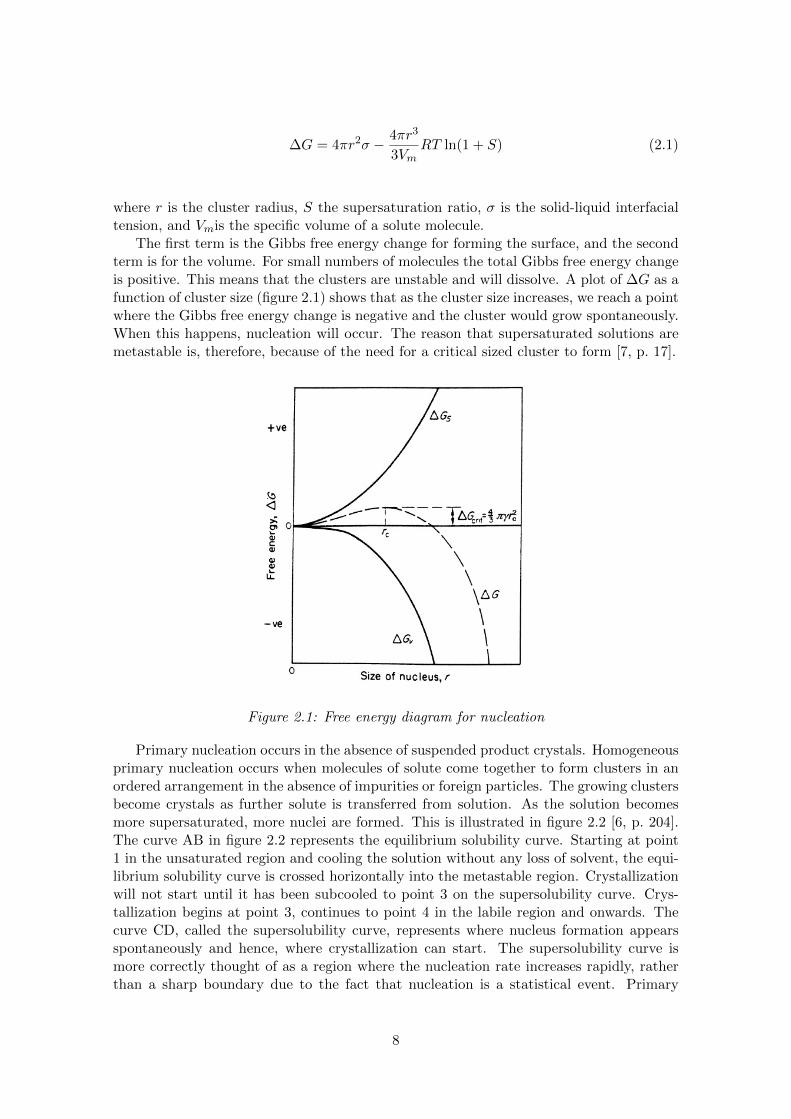
The first term is the Gibbs free energy change for forming the surface, and the secondterm is for the volume. For small numbers of molecules the total Gibbs free energy changeis positive. This means that the clusters are unstable and will dissolve. A plot of ∆G as afunction of cluster size (figure 2.1) shows that as the cluster size increases, we reach a pointwhere the Gibbs free energy change is negative and the cluster would grow spontaneously.When this happens, nucleation will occur. The reason that supersaturated solutions aremetastable is, therefore, because of the need for a critical sized cluster to form [7, p. 17].
Figure 2.1: Free energy diagram for nucleation
Primary nucleation occurs in the absence of suspended product crystals. Homogeneousprimary nucleation occurs when molecules of solute come together to form clusters in anordered arrangement in the absence of impurities or foreign particles. The growing clustersbecome crystals as further solute is transferred from solution. As the solution becomesmore supersaturated, more nuclei are formed. This is illustrated in figure 2.2 [6, p. 204].The curve AB in figure 2.2 represents the equilibrium solubility curve. Starting at point1 in the unsaturated region and cooling the solution without any loss of solvent, the equi-librium solubility curve is crossed horizontally into the metastable region. Crystallizationwill not start until it has been subcooled to point 3 on the supersolubility curve. Crys-tallization begins at point 3, continues to point 4 in the labile region and onwards. Thecurve CD, called the supersolubility curve, represents where nucleus formation appearsspontaneously and hence, where crystallization can start. The supersolubility curve ismore correctly thought of as a region where the nucleation rate increases rapidly, ratherthan a sharp boundary due to the fact that nucleation is a statistical event. Primary
8
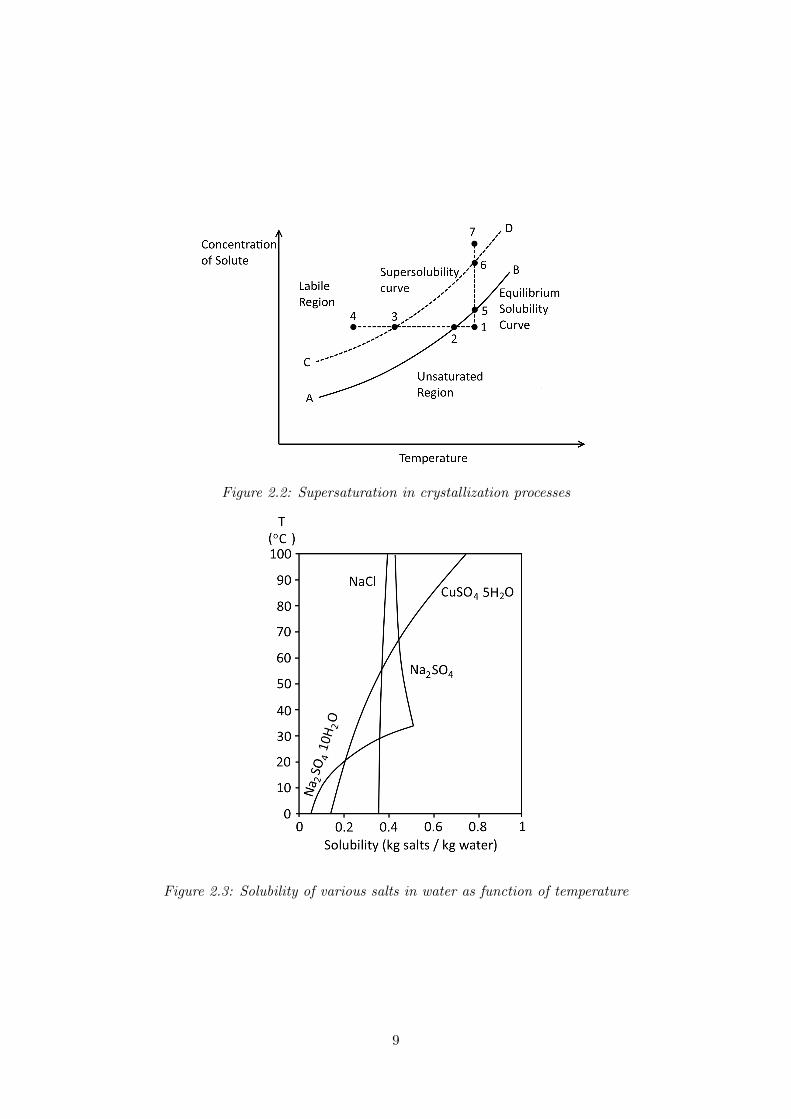
Figure 2.2: Supersaturation in crystallization processes
Figure 2.3: Solubility of various salts in water as function of temperature
9
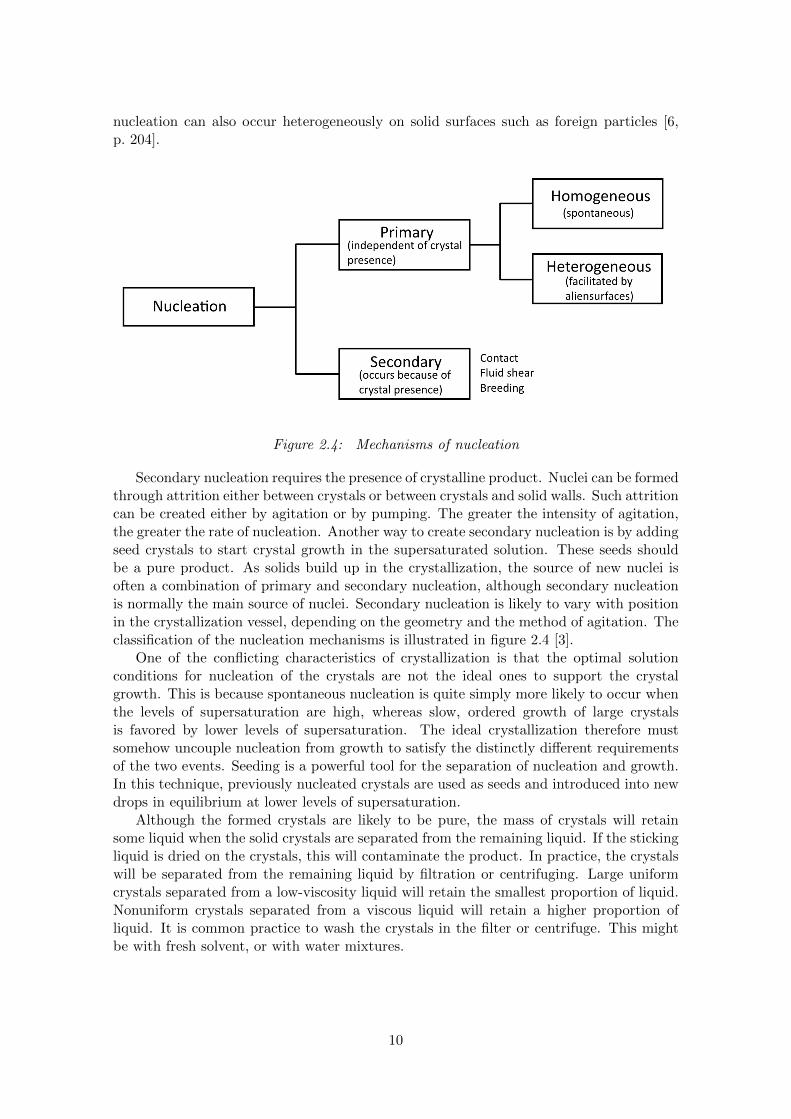
nucleation can also occur heterogeneously on solid surfaces such as foreign particles [6,p. 204].
Figure 2.4: Mechanisms of nucleation
Secondary nucleation requires the presence of crystalline product. Nuclei can be formedthrough attrition either between crystals or between crystals and solid walls. Such attritioncan be created either by agitation or by pumping. The greater the intensity of agitation,the greater the rate of nucleation. Another way to create secondary nucleation is by addingseed crystals to start crystal growth in the supersaturated solution. These seeds shouldbe a pure product. As solids build up in the crystallization, the source of new nuclei isoften a combination of primary and secondary nucleation, although secondary nucleationis normally the main source of nuclei. Secondary nucleation is likely to vary with positionin the crystallization vessel, depending on the geometry and the method of agitation. Theclassification of the nucleation mechanisms is illustrated in figure 2.4 [3].
One of the conflicting characteristics of crystallization is that the optimal solutionconditions for nucleation of the crystals are not the ideal ones to support the crystalgrowth. This is because spontaneous nucleation is quite simply more likely to occur whenthe levels of supersaturation are high, whereas slow, ordered growth of large crystalsis favored by lower levels of supersaturation. The ideal crystallization therefore mustsomehow uncouple nucleation from growth to satisfy the distinctly different requirementsof the two events. Seeding is a powerful tool for the separation of nucleation and growth.In this technique, previously nucleated crystals are used as seeds and introduced into newdrops in equilibrium at lower levels of supersaturation.
Although the formed crystals are likely to be pure, the mass of crystals will retainsome liquid when the solid crystals are separated from the remaining liquid. If the stickingliquid is dried on the crystals, this will contaminate the product. In practice, the crystalswill be separated from the remaining liquid by filtration or centrifuging. Large uniformcrystals separated from a low-viscosity liquid will retain the smallest proportion of liquid.Nonuniform crystals separated from a viscous liquid will retain a higher proportion ofliquid. It is common practice to wash the crystals in the filter or centrifuge. This mightbe with fresh solvent, or with water mixtures.
10
2.2 Cooling crystallization
Figure 2.3 [6, p. 203] shows the equilibrium solubility of various salts in water. Usually,the solubility increases as temperature increases. The solubility of copper sulfate increasessignificantly with increasing temperature. The solubility of sodium chloride increases withincreasing temperature, but the effect of temperature on solubility is small. The solubilityof sodium sulfate decreases with increasing temperature. Such reverse solubility behavioris unusual.
Cooling is probably the most common way of creating supersaturation [7, p. 244]. Theprinciple involves cooling a solution through indirect heat exchange. This is most effectivewhen the solubility of the solute decreases significantly with temperature (see figure 2.3).Rapid cooling will cause the crystallization to enter the labile region. Controlled cooling,perhaps in combination with seeding, can be used to keep the process in the metastableregion. Care must be taken to prevent fouling of the cooling surfaces by maintaining asmall temperature difference between the process and the coolant. Scraped surface heatexchange equipment might be necessary. In general, solubility is mainly a function oftemperature, generally increasing with increasing temperature. Pressure has a negligibleeffect on solubility. The solubility of sucrose as function of temperature will be discussedin a later chapter.
The yield and economy of cooling crystallization depends on the temperature andconcentration of the feed solution to be crystallized, and on whether cooling water oranother cooling agent is employed. Typically, a high temperature, concentrated solutionis delivered into a jacketed crystallizer equipped with a stirrer and often also a coolingcoil to increase the cooling surface area. The solution is stirred, and cold water or coolingagent is pumped through the jacket and, if so equipped, the cooling coil. Such a ”natural”cooling is continued until the temperature of the solution in the crystallizer is near thatof the cooling medium [7, p. 244].
An advantage of cooling crystallization can be the low energy consumption comparedto other crystallization principles, however the cooling surfaces become quickly coveredwith layers of crystallizing solute (fouling, scaling, incrustation). This phenomenon isdetrimental to the heat transfer efficiency and may bring about a decrease in the ratechange of supersaturation [7, p. 244].
2.3 Evaporative crystallization
For substances whose solubility is weakly dependent on temperature or for those withan inverse dependence of the solubility on temperature, a method of choice to createsupersaturation is evaporation of the solvent. In practice, evaporative crystallizers usuallyoperate at constant temperature and reduced pressure [7, p. 246].
This way of creating supersaturation is also depicted in figure 2.2 [6, p. 204]. Startingagain at point 1 in the unsaturated region, the temperature is kept constant and theconcentration is increased by removing the solvent. The equilibrium solubility curve isnow crossed vertically at point 5 and the metastable region entered. Crystallization isinitiated at point 6 , it continues to point 2 in the labile region and onwards.
Evaporative crystallization is not preferred if the product needs to be of high purity,because in addition to evaporation concentrating the solute, it also concentrates impurities.Such impurities might form crystals to contaminate the product or might be present in theresidual liquid enclosed within the solid product. Evaporation of water is a very energyconsuming process making this crystallization process less desirable. If the evaporated
11
water can be deployed elsewhere in the process, by condensing, the energy consumptioncan be reduced.
The traditional sugar production process relies on the principle of evaporative crystal-lization. This is discussed in detail in a later chapter.
2.4 Anti-solvent crystallization
Anti-solvent crystallization, also known as salting out or drowning out, involves adding anadditional substance, called the anti-solvent, which induces crystallization. Anti-solventcrystallization achieves supersaturation by exposing a solution of the product to anothersolvent (or multiple ones) in which the product is poorly soluble. The anti-solvent must bemiscible with the solvent and must change the solubility of the solute in the solvent. Theanti-solvent will usually have a polarity different from that of the solvent. For example,if the solvent is water, the anti-solvent might be acetone, or if the solvent is ethanol, theanti-solvent might be water.
Pharmaceutical and fine chemical makers frequently rely on anti-solvent crystalliza-tion to generate a solid from a solution in which the product has high solubility [8]. Thetechnique is used for a variety of applications such as polymorph control, purification froma reaction mixture and yield improvement. The process can be semi-batch or continuous.Although this technique has the potential to achieve a controlled and scalable size distri-bution, it’s not without problems. The product requires purification or separation stepsto remove the anti-solvent(s).
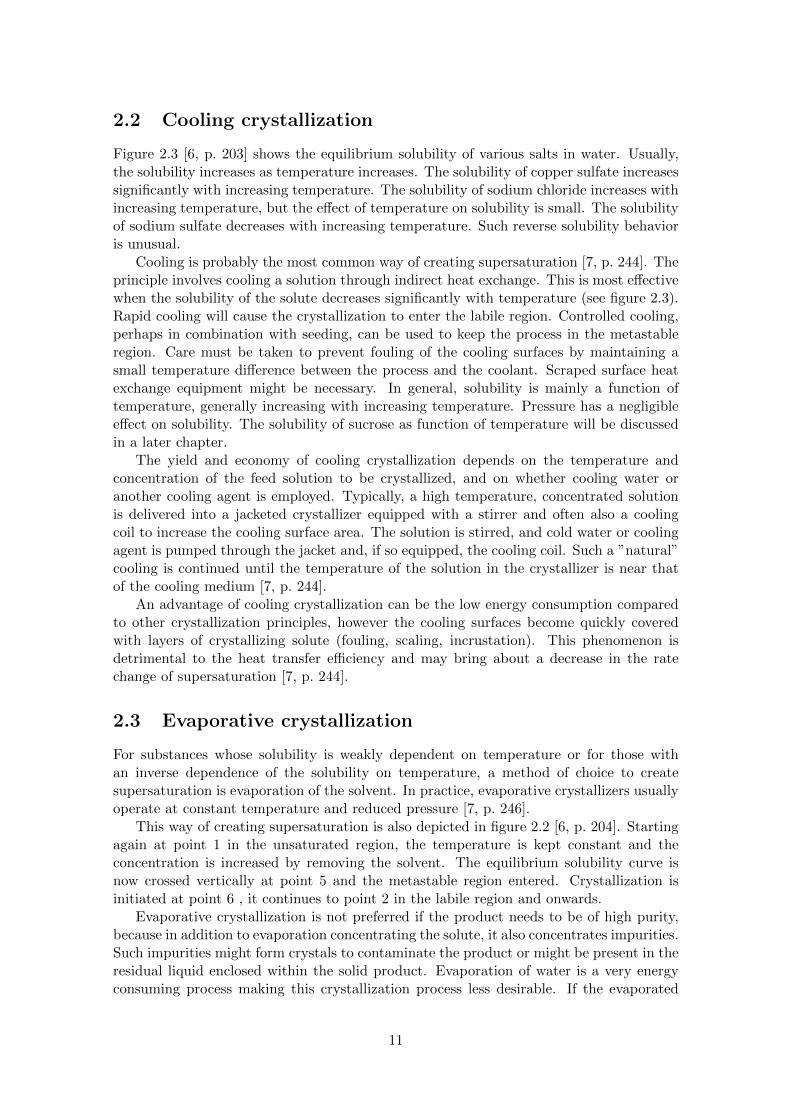
Figure 2.5: Schematic representation of an anti-solvent crystallization process with crys-tallization, filtration and anti-solvent regeneration
A schematic flow sheet of an ideal anti-solvent crystallization process is given in figure2.5[2, p. 4]. In the first section of this picture, the solution is mixed with anti-solvent. Dueto the anti-solvent’s ability to bind water, the solubility of the solute is reduced, resultingin the formation of solid phase either by precipitation or by crystallization. Subsequently,in the separation section, the solid phase is separated from the crystals, either by filtrationor centrifugation, leaving a clear filtrate that is sent to the anti-solvent regeneration sectionwhere solvent and anti-solvent are separated. Finally, the anti-solvent is recycled to thecrystallization section while the water can be used for the dissolution of new material.It is obvious that the use of an anti-solvent yields a crystal product without needing toevaporate the solvent, but still requires a separation step to regenerate the anti-solvent.Solvent (water) and anti-solvent (ethanol) could be separated by simply inducing liquid-liquid phase separation after which both concentrated phases could be recycled within theprocess. The most common way of separating ethanol from water, to a certain extent, isby distillation.
It is obvious that the feasibility of anti-solvent crystallization is strongly dependent on
12
the properties of the anti-solvent. To mention a few, there are its anti-solving effectiveness,recoverability, long-term chemical stability, toxicity, flammability, environmental stability,costs and acceptability as a trace impurity in the product.
As with all crystallization techniques, seeding may help avoid excessive nucleation.The seed can be added as a powder or in slurry form with the anti-solvent. The latteroften is preferred for ease of handling and reduced contamination. Adding seed with theanti-solvent offers an advantage over the traditional method of putting seed in at a singletime which poses the risk of adding too soon (seeds dissolve) or too late (nucleation hasalready occurred). The limited solubility of seed in the anti-solvent means a seed slurrycan be prepared beforehand. This mixture normally will represent a small amount of thetotal anti-solvent charge. It then is added near the saturation point until the metastablezone (MZ) is reached. The anti-solvent in this slurry reduces the solubility, causing themixture to achieve supersaturation, which is relieved in the presence of the added seeds.The goal is to stay within the MZ, thereby promoting growth with limited nucleation viasecondary mechanisms.
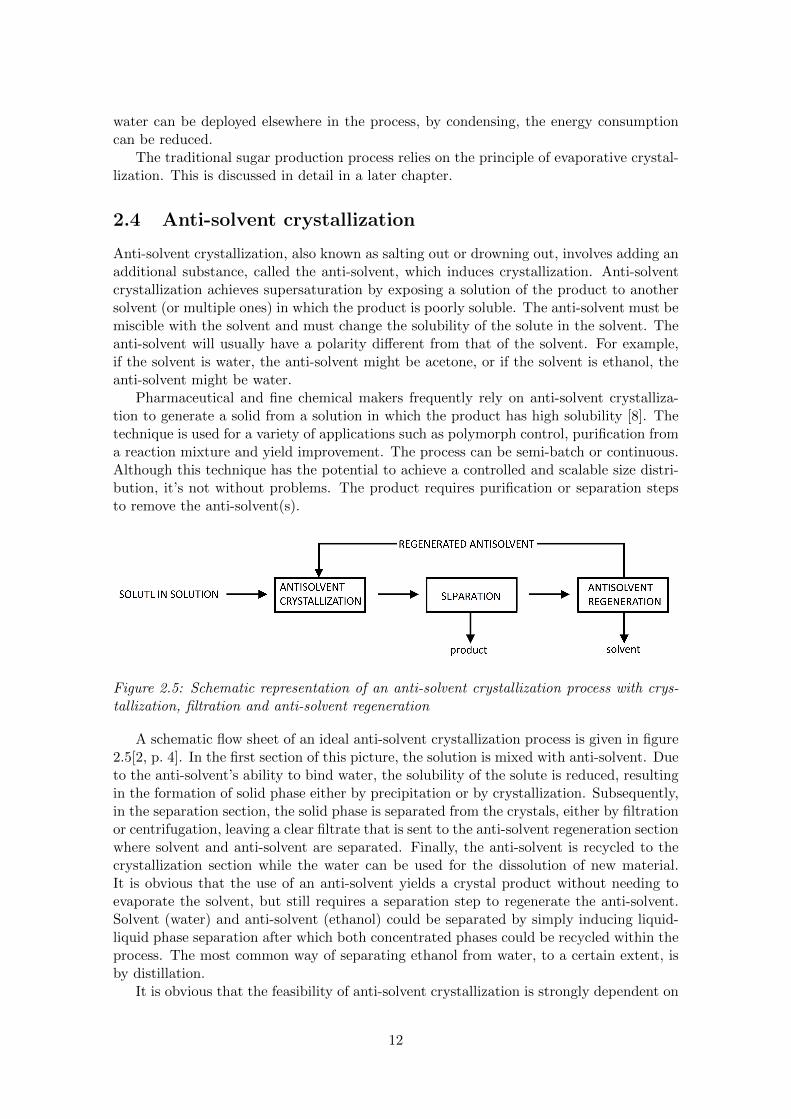
Figure 2.6: Supersaturation profile vs. mode of addition
Often addition takes place at a constant rate. This linear-profile procedure can yielda variable supersaturation whereby the MZ is exceeded early on, resulting in too muchnucleation. As figure 2.6 shows (for semi-batch process), an initial slow addition ratefollowed by a gradual increase in rate can achieve a fairly constant supersaturation withinthe zone [8]. This non-linear profile is analogous to the ones utilized for batch cooling orevaporative crystallization. The goal is to maintain the supersaturation of the solutionconsistently within the MZ while achieving growth on existing crystal surface area. Asalready noted, seeding techniques can help produce this desired outcome.
2.4.1 Batch operation
Figure 2.7 presents typical operating curves for normal addition and a representativeequilibrium solubility curve [8]. The metastable zone (MZ) is the area between B-C andD-E. From point A to point B, anti-solvent addition will proceed without crystallizationbecause the concentration of the solution is below the equilibrium solubility. At point B,the solubility curve is reached. As anti-solvent addition continues, supersaturation will
13
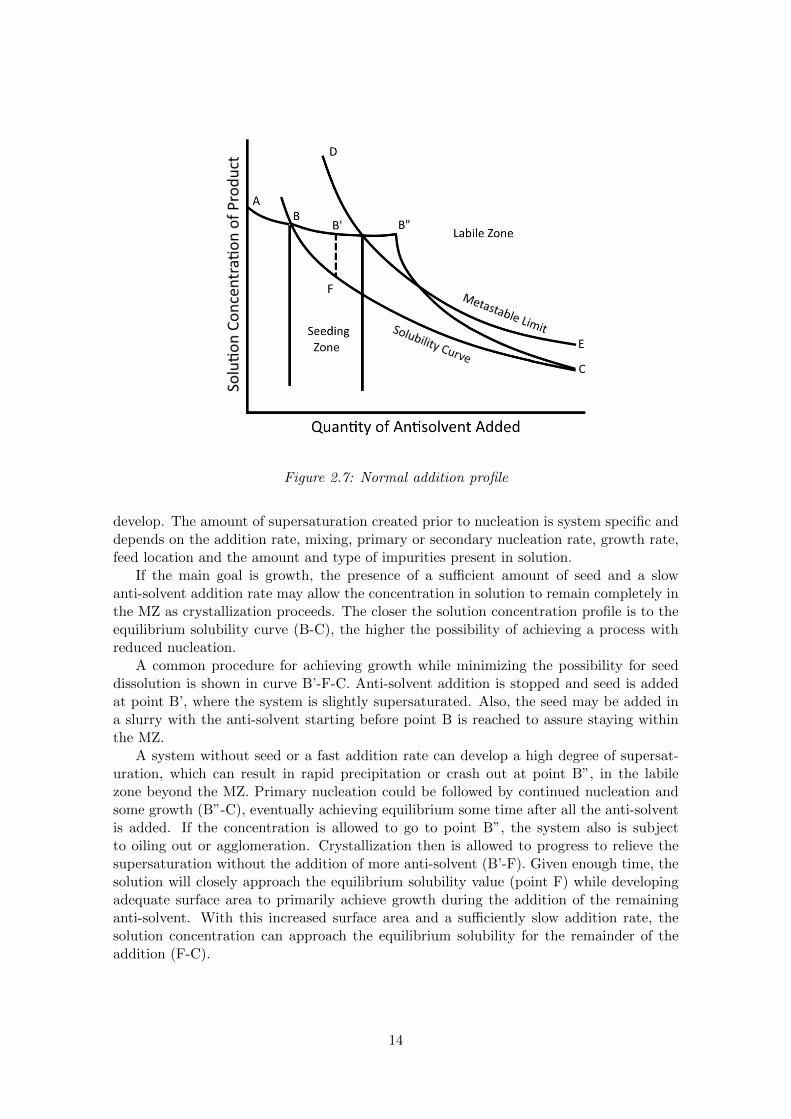
Figure 2.7: Normal addition profile
develop. The amount of supersaturation created prior to nucleation is system specific anddepends on the addition rate, mixing, primary or secondary nucleation rate, growth rate,feed location and the amount and type of impurities present in solution.
If the main goal is growth, the presence of a sufficient amount of seed and a slowanti-solvent addition rate may allow the concentration in solution to remain completely inthe MZ as crystallization proceeds. The closer the solution concentration profile is to theequilibrium solubility curve (B-C), the higher the possibility of achieving a process withreduced nucleation.
A common procedure for achieving growth while minimizing the possibility for seeddissolution is shown in curve B’-F-C. Anti-solvent addition is stopped and seed is addedat point B’, where the system is slightly supersaturated. Also, the seed may be added ina slurry with the anti-solvent starting before point B is reached to assure staying withinthe MZ.
A system without seed or a fast addition rate can develop a high degree of supersat-uration, which can result in rapid precipitation or crash out at point B”, in the labilezone beyond the MZ. Primary nucleation could be followed by continued nucleation andsome growth (B”-C), eventually achieving equilibrium some time after all the anti-solventis added. If the concentration is allowed to go to point B”, the system also is subjectto oiling out or agglomeration. Crystallization then is allowed to progress to relieve thesupersaturation without the addition of more anti-solvent (B’-F). Given enough time, thesolution will closely approach the equilibrium solubility value (point F) while developingadequate surface area to primarily achieve growth during the addition of the remaininganti-solvent. With this increased surface area and a sufficiently slow addition rate, thesolution concentration can approach the equilibrium solubility for the remainder of theaddition (F-C).
14
2.4.2 Continuous operation
Some applications require a small mean crystal size and narrow size distribution. Examplesinclude pharmaceutical materials requiring sub-micron or several-micron mean size wherethe active ingredient has marginal water solubility. Inhalation products also need theseattributes. Making such products demands continuous processing via an in-line mixingdevice or a stirred vessel.
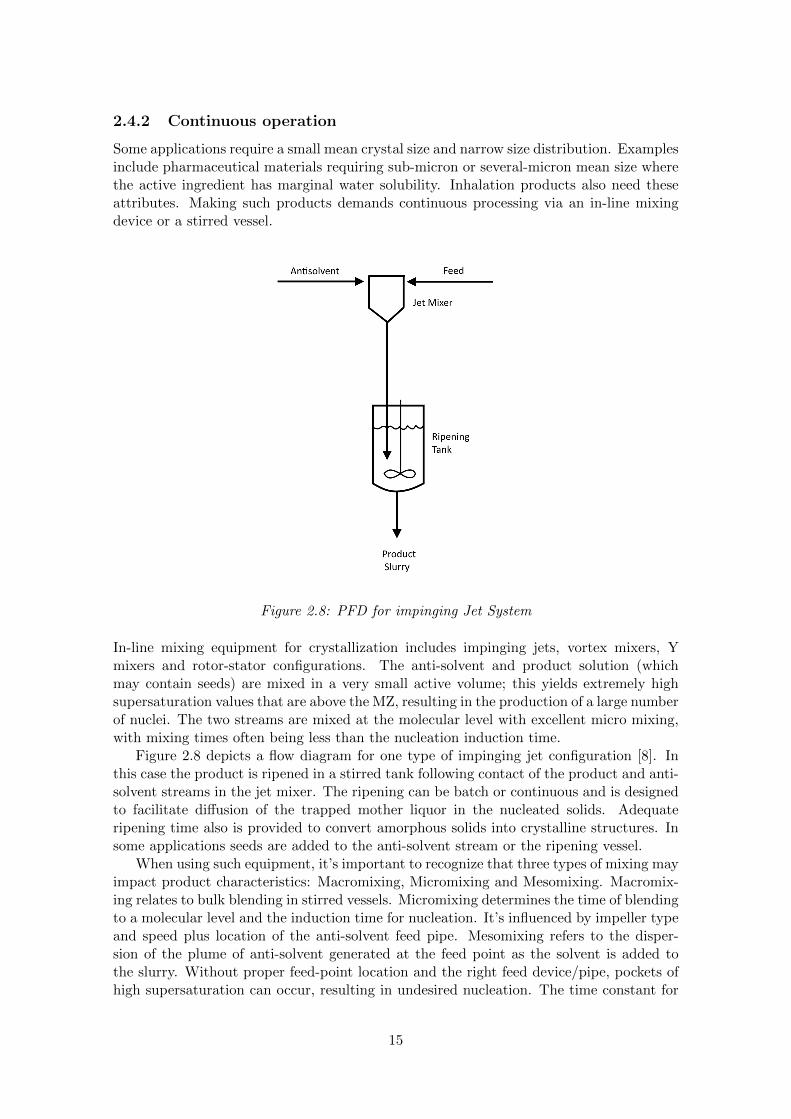
Figure 2.8: PFD for impinging Jet System
In-line mixing equipment for crystallization includes impinging jets, vortex mixers, Ymixers and rotor-stator configurations. The anti-solvent and product solution (whichmay contain seeds) are mixed in a very small active volume; this yields extremely highsupersaturation values that are above the MZ, resulting in the production of a large numberof nuclei. The two streams are mixed at the molecular level with excellent micro mixing,with mixing times often being less than the nucleation induction time.
Figure 2.8 depicts a flow diagram for one type of impinging jet configuration [8]. Inthis case the product is ripened in a stirred tank following contact of the product and anti-solvent streams in the jet mixer. The ripening can be batch or continuous and is designedto facilitate diffusion of the trapped mother liquor in the nucleated solids. Adequateripening time also is provided to convert amorphous solids into crystalline structures. Insome applications seeds are added to the anti-solvent stream or the ripening vessel.
When using such equipment, it’s important to recognize that three types of mixing mayimpact product characteristics: Macromixing, Micromixing and Mesomixing. Macromix-ing relates to bulk blending in stirred vessels. Micromixing determines the time of blendingto a molecular level and the induction time for nucleation. It’s influenced by impeller typeand speed plus location of the anti-solvent feed pipe. Mesomixing refers to the disper-sion of the plume of anti-solvent generated at the feed point as the solvent is added tothe slurry. Without proper feed-point location and the right feed device/pipe, pockets ofhigh supersaturation can occur, resulting in undesired nucleation. The time constant for
15
mesomixing depends on the addition rate, feed point and diameter of the feed pipe. Toohigh a value can lead to premature nucleation.
Feed pipe location, pipe diameter and anti-solvent flow can impact both micromixingand mesomixing times. A change in mean particle size and crystal size distribution (CSD)at different pipe locations would confirm product sensitivity to mixing.
Mesomixing can influence the product when the anti-solvent feed rate is faster than thelocal mixing rate, resulting in a plume of highly concentrated anti-solvent that isn’t mixedat the molecular level. This can yield a high localized nucleation rate; the phenomenoncan present scale-up difficulties, requiring a thorough engineering analysis for success.
The shortest mixing time constant occurs at the location of maximum turbulence inthe vessel, which is just above the impeller for a down-pumping pitched-blade turbine(PBT), or at the point of discharge flow for a radial flat-blade agitator.
If the anti-solvent is added in a poorly mixed zone such as at or near the surface or abaffle, a number of potentially undesirable results such as crash nucleation or agglomera-tion may occur.
Subsurface addition of anti-solvent at times can help avoid high levels of supersat-uration and nucleation when introduction is made at a zone of intensive micromixing.Results depend on the feed point location plus pipe diameter and anti-solvent feed rate.For example, too large a pipe diameter could prompt a high supersaturation region priorto blending at a molecular level. Reverse flow with potential pluggage also could occur.
16
Chapter 3
Current process
3.1 Sugar production process - general overview
Sugar production involves cultivation, transportation and processing of sugar beets andresidues. Figure 3.1 shows a schematic overview of a sugar production process includingseveral other production units that can be linked to a sugar factory like bio-ethanol pro-duction [9]. The process shown in 3.1 is quite similar to the production process of theAnklam sugar factory of Royal Cosun, except for the resin separation for the productionof betain and raffinate and the horticulture. Figure 3.2 shows a similar process with sugarproduction in combination with bioethanol production in more detail using a differentpresentation [10].
After harvesting and transport, beets are washed and sliced into cossettes. Thesecossettes enter a diffusion process for sugar extraction. The water temperature in thediffusers is about 70 ◦C. The sugar passes from the plant cells into the surrounding water.From this process two important substances remain the pulp and the sugar that is in thewater, which is known as raw juice.
The raw juice from the diffusion process passes through an important purificationstage. Milk of lime (calcium hydroxide) is added to increase the pH of the juice causingprecipitation of proteins and removal of invert sugar. Then CO2 gas is added, duringwhich CO2 and milk of lime re-combine to produce calcium carbonate which precipitatesout, taking some of the impurities with it. The juice that remains from the purificationprocess is called thin juice.
The next stage in the process, evaporation, is where the water is boiled off in a seriesevaporator vessels, known as multiple effect evaporators. This process increases the solidscontent of the juice. The liquid that remains is known as thick juice. A part of the thickjuice is diluted to a dry substance content of approximately 67-68 % and stored in thickjuice tanks.
Finally this thick juice is concentrated by vacuum pan boiling (evaporative crystalliza-tion). Here, sucrose crystals are grown to the required size. After multiple crystallisationsteps finally molasses remain as byproduct. In a separate thick juice campaign the thickjuice that has been stored is processed to white sugar.
The main product is white sugar. The by-products include tare, pellets, lime, sludgeand molasses. At the Anklam factory also ethanol is produced at the accompanyingethanol production plant using thick juice as substrate.
17
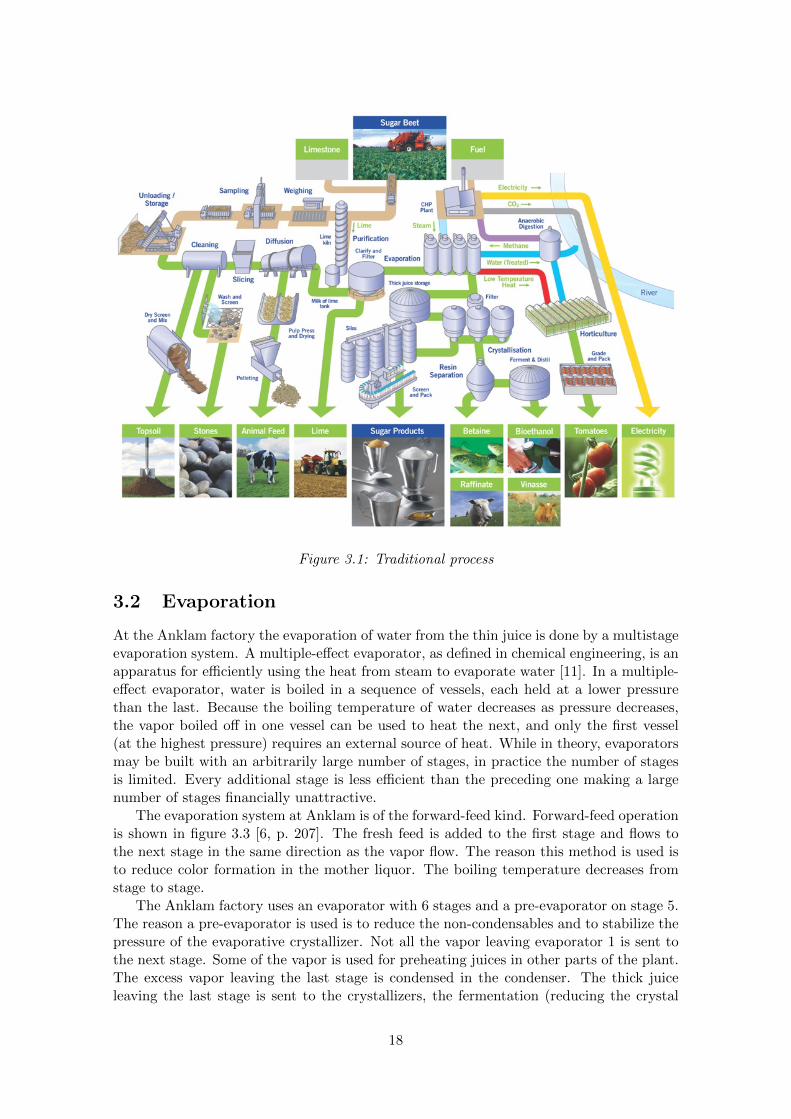
Figure 3.1: Traditional process
3.2 Evaporation
At the Anklam factory the evaporation of water from the thin juice is done by a multistageevaporation system. A multiple-effect evaporator, as defined in chemical engineering, is anapparatus for efficiently using the heat from steam to evaporate water [11]. In a multiple-effect evaporator, water is boiled in a sequence of vessels, each held at a lower pressurethan the last. Because the boiling temperature of water decreases as pressure decreases,the vapor boiled off in one vessel can be used to heat the next, and only the first vessel(at the highest pressure) requires an external source of heat. While in theory, evaporatorsmay be built with an arbitrarily large number of stages, in practice the number of stagesis limited. Every additional stage is less efficient than the preceding one making a largenumber of stages financially unattractive.
The evaporation system at Anklam is of the forward-feed kind. Forward-feed operationis shown in figure 3.3 [6, p. 207]. The fresh feed is added to the first stage and flows tothe next stage in the same direction as the vapor flow. The reason this method is used isto reduce color formation in the mother liquor. The boiling temperature decreases fromstage to stage.
The Anklam factory uses an evaporator with 6 stages and a pre-evaporator on stage 5.The reason a pre-evaporator is used is to reduce the non-condensables and to stabilize thepressure of the evaporative crystallizer. Not all the vapor leaving evaporator 1 is sent tothe next stage. Some of the vapor is used for preheating juices in other parts of the plant.The excess vapor leaving the last stage is condensed in the condenser. The thick juiceleaving the last stage is sent to the crystallizers, the fermentation (reducing the crystal
18

Figure 3.2: Block diagram of the traditional process
sugar yield) or stored in thick juice tanks to be processed later. The process flow diagramof the evaporation station is shown in figure 3.4.
Figure 3.5 shows the vinasse evaporation. Vinasse is a byproduct of the sugar industry.Sugar beet is processed to produce crystalline sugar, pulp and molasses. The latter arefurther processed by fermentation to ethanol, ascorbic acid or other products. After theremoval of the desired product (alcohol, ascorbic acid, etc.) the remaining material iscalled vinasse. Vinasse is sold after a partial dehydration and usually has a viscositycomparable to molasses. The dehydration is realized by evaporators as can be seen in thefigure. The vapor leaving the evaporators is sent to the mash column (stripper column inthe bioethanol plant).
3.3 Crystallization
Figure 3.6 shows the sugar house of the Anklam factory. The crystallization principle usedat Anklam is of the evaporative kind. The pressure in the crystallizers is kept around 300mbar, reducing the temperature of evaporation, and heat is applied to the crystallizers. Aconsequence of this reduced pressure and temperature is that the dry content of the thickjuice should be limited in order to prevent supersaturation and premature crystallizationor nucleation. The crystallization of sugar in the current situation does not happen inone single step. At the Anklam sugar plant there are three crystallization stations placedin series. The crystallization station consists of several batch crystallizer pans. Only thecrystals from the first crystallizer (crystallizer A) are sold as white sugar. The crystals fromthe other two crystallizers (crystallizers B & C) are again dissolved and transported back tocrystallizer A. Crystallizers B & C are actually just additional separation steps to exhaustthe syrup. The fact that crystals are produced in these crystallizers has no additionalvalue, besides the separation effect, because these crystals are immediately dissolved after
19
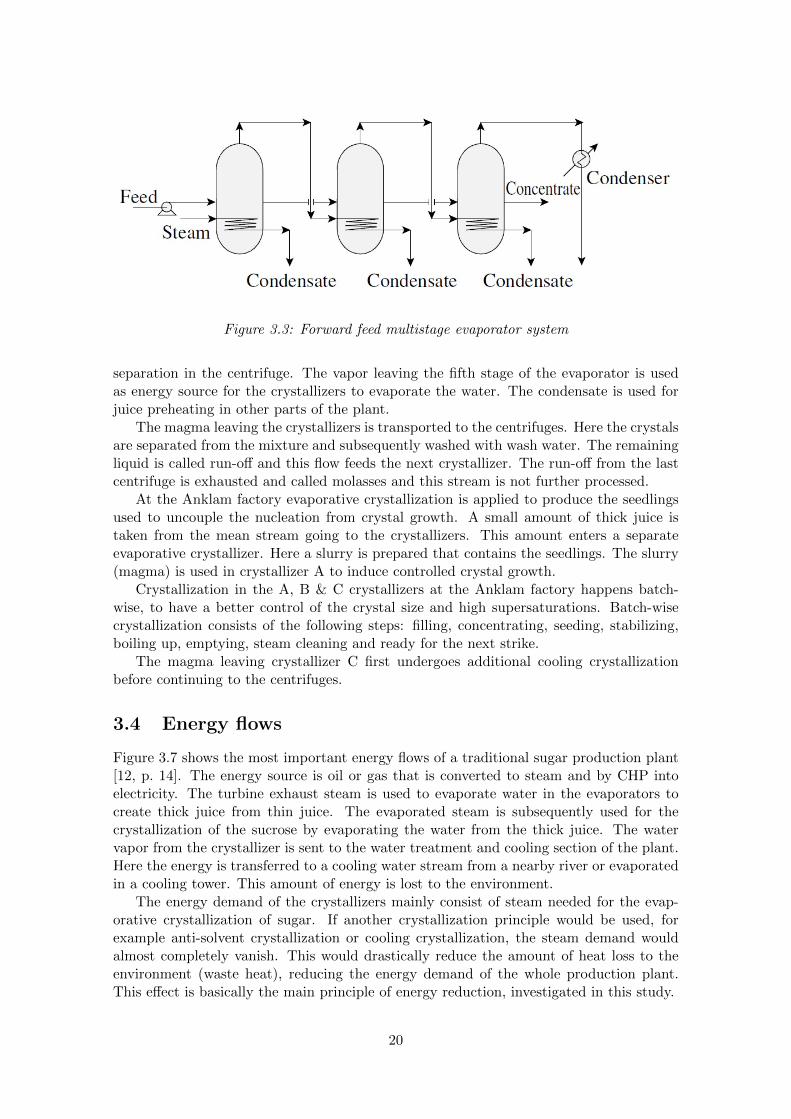
Figure 3.3: Forward feed multistage evaporator system
separation in the centrifuge. The vapor leaving the fifth stage of the evaporator is usedas energy source for the crystallizers to evaporate the water. The condensate is used forjuice preheating in other parts of the plant.
The magma leaving the crystallizers is transported to the centrifuges. Here the crystalsare separated from the mixture and subsequently washed with wash water. The remainingliquid is called run-off and this flow feeds the next crystallizer. The run-off from the lastcentrifuge is exhausted and called molasses and this stream is not further processed.
At the Anklam factory evaporative crystallization is applied to produce the seedlingsused to uncouple the nucleation from crystal growth. A small amount of thick juice istaken from the mean stream going to the crystallizers. This amount enters a separateevaporative crystallizer. Here a slurry is prepared that contains the seedlings. The slurry(magma) is used in crystallizer A to induce controlled crystal growth.
Crystallization in the A, B & C crystallizers at the Anklam factory happens batch-wise, to have a better control of the crystal size and high supersaturations. Batch-wisecrystallization consists of the following steps: filling, concentrating, seeding, stabilizing,boiling up, emptying, steam cleaning and ready for the next strike.
The magma leaving crystallizer C first undergoes additional cooling crystallizationbefore continuing to the centrifuges.
3.4 Energy flows
Figure 3.7 shows the most important energy flows of a traditional sugar production plant[12, p. 14]. The energy source is oil or gas that is converted to steam and by CHP intoelectricity. The turbine exhaust steam is used to evaporate water in the evaporators tocreate thick juice from thin juice. The evaporated steam is subsequently used for thecrystallization of the sucrose by evaporating the water from the thick juice. The watervapor from the crystallizer is sent to the water treatment and cooling section of the plant.Here the energy is transferred to a cooling water stream from a nearby river or evaporatedin a cooling tower. This amount of energy is lost to the environment.
The energy demand of the crystallizers mainly consist of steam needed for the evap-orative crystallization of sugar. If another crystallization principle would be used, forexample anti-solvent crystallization or cooling crystallization, the steam demand wouldalmost completely vanish. This would drastically reduce the amount of heat loss to theenvironment (waste heat), reducing the energy demand of the whole production plant.This effect is basically the main principle of energy reduction, investigated in this study.
20
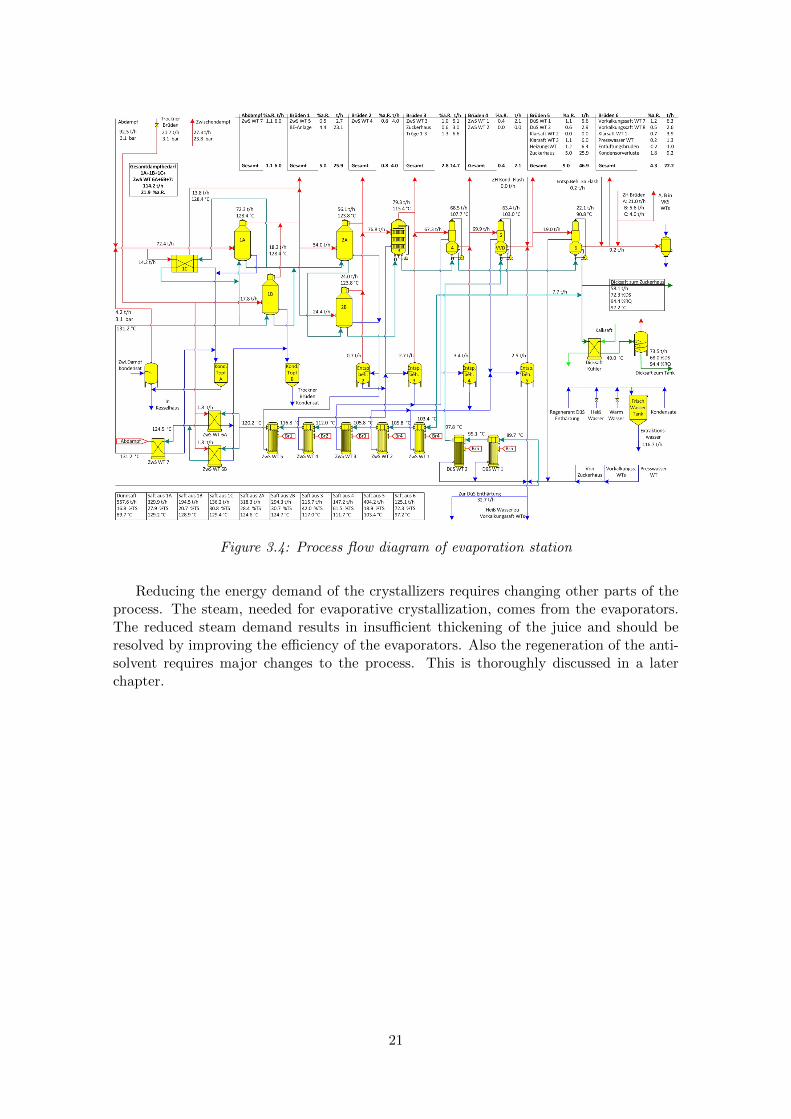
Figure 3.4: Process flow diagram of evaporation station
Reducing the energy demand of the crystallizers requires changing other parts of theprocess. The steam, needed for evaporative crystallization, comes from the evaporators.The reduced steam demand results in insufficient thickening of the juice and should beresolved by improving the efficiency of the evaporators. Also the regeneration of the anti-solvent requires major changes to the process. This is thoroughly discussed in a laterchapter.
21
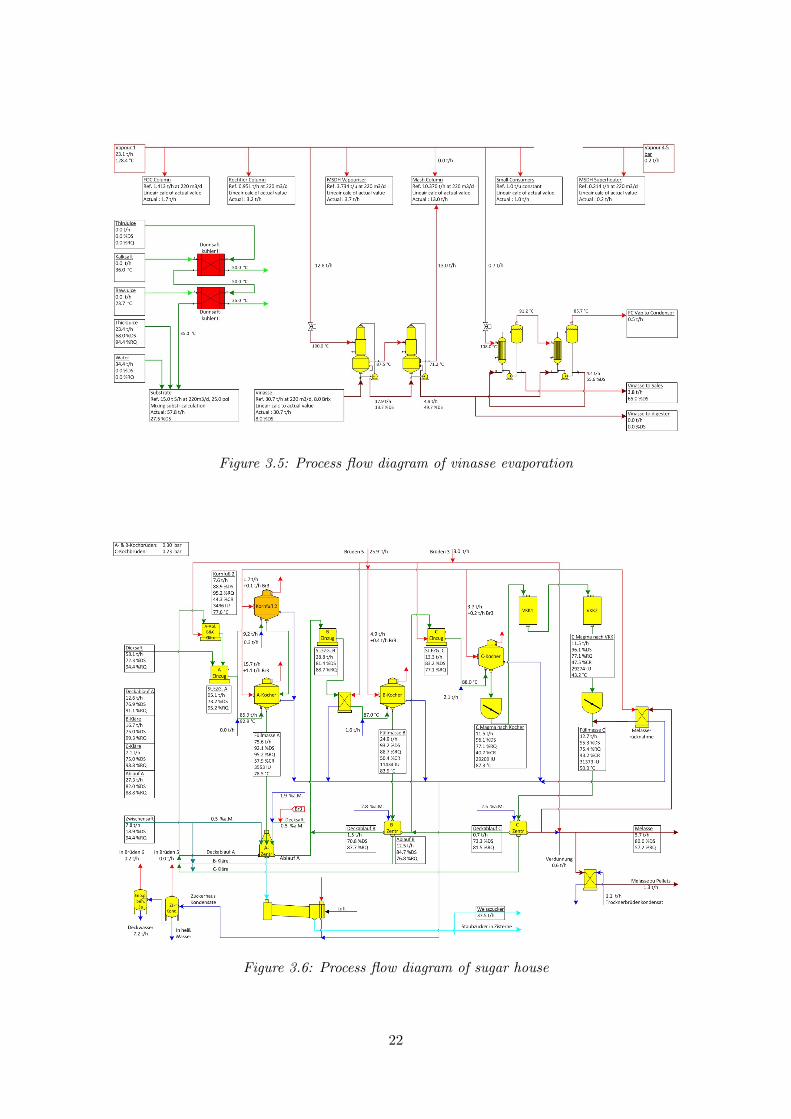
Figure 3.5: Process flow diagram of vinasse evaporation
Figure 3.6: Process flow diagram of sugar house
22

Figure 3.7: Energy flows
23
Chapter 4
Cosun concept
4.1 Line of thought
As previously mentioned, Royal Cosun renounced the idea of working with zeolites, butremained interested in working with an anti-solvent. The main advantage of working withan anti-solvent would be the reduced steam demand of the crystallizers. This because thewater in the thick juice no longer needs to be evaporated. The Wageningen Universityproposed the use of ethanol as anti-solvent. This also seemed to be a convenient choice forthe first concept, without the use of zeolites, investigated by Royal Cosun. Especially witha sugar factory in combination with an ethanol plant, like the one in Anklam Germany.Sugar that does not crystallize from the solution can be sent to the ethanol productionplant to be fermented. The ethanol that can not be recovered also ends up in the fermen-tation process, but does not disturb the process since ethanol is the final product of thefermentation.
Working with anti-solvents demands an additional separation step for the recovery ofthe anti-solvent. In the case of ethanol most of the industries use distillation to separatethe ethanol from the ethanol-water mixture. This is also the way ethanol is concentratedat the Anklam factory after fermentation. Furthermore the distillation process is drivenby a temperature gradient; the exhaust heat in the condenser can be further used in theprocess. That is why distillation was chosen by Royal Cosun, for the new concept, asmethod to recover the ethanol. In the distillation column heat is supplied to the reboilerand the ethanol concentration in the liquid increases in every successive equilibrium tray.The ethanol-rich vapor leaves the tower at the top of the column and the water-rich liquidleaves at the bottom. The process design regarding the distillation sequence is furtherdiscussed in a next chapter.
This way the energy demanding crystallizer, in the original process, is replaced by aless energy demanding crystallizer and an additional energy demanding separation step.However, it became clear that the energy needed for the distillation column can be reused,in the bioethanol plant, by condensing the vapor leaving the top of the column. Theexpected temperature of the vapor from the column (roughly the boiling temperature ofethanol) is high enough for the bioethanol plant, around 78 ◦C. The bioethanol plantrequires a lot of energy (equivalent to 13 t/h steam) making it the best choice for thedeployment of the ethanol vapor. This way it is possible to produce sugar all year roundinstead of producing in shorter campaigns. All year round production means less stor-age of raw materials, cheaper equipment (lower capacity) and the advantages of a morecontinuous process. Also the energy demand of the distillation column is assumed to beless than that of the evaporative crystallizers due to the reduced evaporation enthalpy of
24
ethanol. The temperature of the distillate can be changed by increasing or decreasing theoperating pressure of the columns to match the heat sink.
Another aspect of anti-solvent crystallization that should be considered is the effect ofthe reduced vapor demand of the crystallizers on the evaporation section. The evaporatorswill lose efficiency due to the new crystallization method. Additionally the anti-solventcrystallization demands a sugar content of the thick juice as high as possible to ensurea sufficient yield of sugar crystals. This is why also changes to the existing multi-effectevaporator should be made in order to make the new concept feasible.
The concept developed by Cosun is based on several key ideas:
1. Crystallization from thick juice with a much higher dry matter content than usualto ensure a sufficient yield of sugar crystals (in the traditional process the thick juice inflashed to saturation conditions due to crystallization under vacuum).
2. Crystallization by anti-solvent addition.
3. The recovery of the anti-solvent (ethanol) can be achieved by distillation.
4. The heat supplied to the reboiler of the distillation column can be reused in thebioethanol plant. This allows for year round sugar production from thick juice beingstored during the beet campaign.
5. The streams leaving the bottom of the distillation column can be fermented in theethanol production plant.
4.2 Initial process design
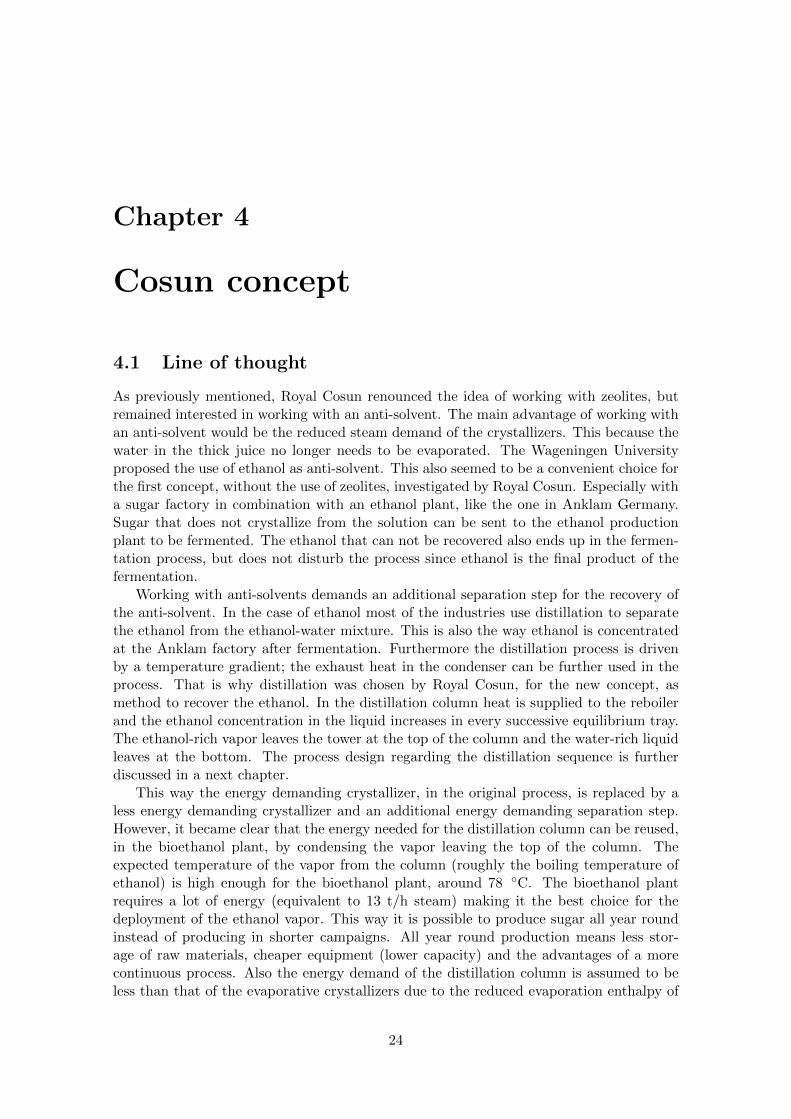
Figure 4.1: Initial Cosun concept
25

The initial study to determine the feasibility of anti-solvent crystallization was performedwith Chemcad (Chemstations). This program is used to simulate the material and energybalances of chemical processing plants by iteratively solving a system of equations. Thestudied process flow is displayed in figure 4.1.
This process flow contains the modifications to the original process that cope with thekey ideas mentioned in the previous section. In this concept the flow first enters a newlyadded evaporator stage, before continuing to the already existing multistage evaporator.This additional stage is of the vapor-compression kind. In a near subsection the principlebehind this kind of evaporation is further discussed.
The highly concentrated sugar-rich juice (thick juice) continues towards the crystal-lizer. Here the anti-solvent (ethanol) is added to the saturated solution inducing crys-tallization. The magma leaving the crystallizer is sent to the centrifuge where the sugarcrystals are separated. The juice is subsequently transported to the distillation columnwhere the ethanol is recovered from the mixture. The bottom flow goes to the ethanolproduction plant to be fermented. The ethanol-rich vapor leaving the top of the column iscondensed in a condenser. The released heat is used for the reboiler of an already existingdistillation column that is part of the ethanol production plant. The condensed ethanolis sent back to the crystallizer.
4.2.1 Distillation
The initial Cosun concept uses continuous distillation as separation method to recoverthe ethanol from the run-off stream leaving the centrifuge. Continuous distillation is anongoing distillation in which a liquid mixture is continuously fed into the process andseparated fractions are removed continuously as output streams during the operation.Continuous distillation produces a minimum of two output fractions, including at leastone volatile distillate fraction, which has been separately captured as a vapor, and thencondensed to a liquid.
In principle, by creating a large enough cascade, an almost complete separation canbe carried out. At the top of the cascade liquid is needed to feed the cascade. This isproduced by condensing vapor that leaves the top stage and returning this liquid to thefirst stage of the cascade as reflux. Changing the reflux (in combination with changes infeed and product withdrawal) can also be used to improve the separation properties of acontinuous distillation column while in operation (in contrast to adding plates or trays, orchanging the packing, which would, at a minimum, require quite significant downtime).All of the vapor leaving the top stage can be condensed in a total condenser to produce aliquid top product. Alternatively, only enough of the vapor to provide the reflux can becondensed in a partial condenser to produce a vapor top product if a liquid top productis not desired. Vapor is also needed to feed the cascade at the bottom of the column.This is produced by vaporizing some of the liquid leaving the bottom stage and returningthe vapor to the bottom stage of the cascade in a reboiler. The feed to the process isintroduced at an intermediate stage, and products are removed from the condenser andthe reboiler.
For this study a computer model of a distillation column was developed. The modelingof the distillation column and the employment of the column in the process is discussedin later chapters.
26

Figure 4.2: Heat flow diagram of an evaporator installation using Mechanical Vapor Re-compression.
4.2.2 Mechanical vapor recompression
Figure 4.2 shows the heat flow diagram of an evaporator installation using MechanicalVapor Recompression [13]. Mechanical Vapor Recompression (MVR) is the evaporationmethod by which a compressor is used to compress and thus increase the pressure of thesteam produced. Since the pressure increase of the steam also generates an increase inthe steam temperature, the same steam can serve as the heating medium for the liquidbeing concentrated from which the vapor was generated to begin with. This makes thisevaporation method very energy efficient. Usually the compressor of a MVR is electricaldriven. The reasons for using mechanical vapour recompression are [13]:
1. Low specific energy consumption
2. Gentle evaporation of the product due to low temperature differences
3. Short residence times of the product, as a single-effect system is most often used
4. High availability of the plants due to the simplicity of the process
5. Excellent partial load behavior
6. Low specific operating costs
4.3 Final process design
The final process design of the Cosun Concept sugar house, as developed in this study, isdisplayed in figure 4.3. The main process design selection of this study consists of choosingthe best configuration of the flows to reduce energy consumption. This means that paring
27
of process flows was done carefully. The condensate and vapor flows of the new processare coupled with existing flows in such a way that the temperature difference is kept lowand that most of the energy can be transfered from one flow to the other. This way thedestruction of exergy is limited.
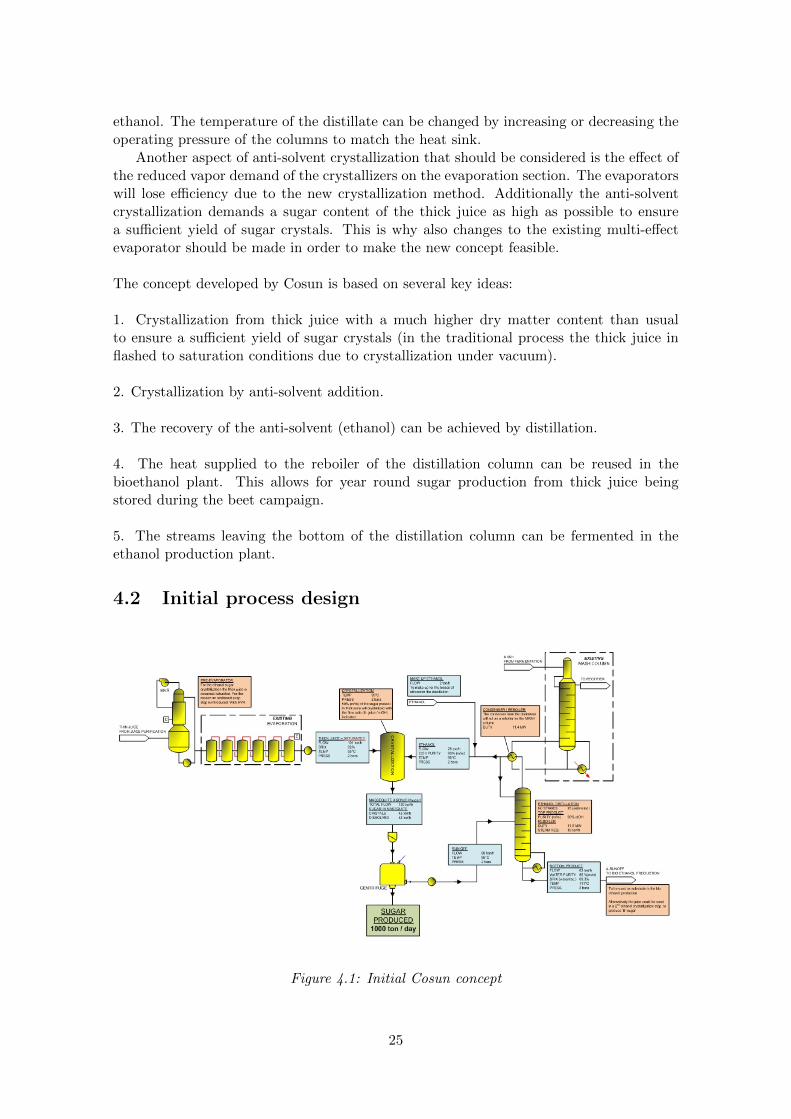
Figure 4.3: Process flow diagram of the Cosun concept sugar house
There are some distinct differences between the initial and the final Cosun concept sugarhouse:
1. An additional distillation column (two in total)
2. A cooling circuit for the crystallizer.
3. Vinasse evaporation with Mechanical Vapor Recompression
After an extensive literature study it was decided to add a second distillation column tothe Cosun concept creating an indirect sequence as displayed in figure 4.4. This deci-sion is based on already existing processes and heuristics that have been proposed for theselection of the sequence for simple distillation columns. In literature the additional distil-lation column is often referred to as ”beer” or ”mash” column [25]. In traditional ethanolproduction this tower takes feed directly from the fermenters complete with all the solids,proteins and sugars. This tower removes all the solids and other potentially fouling agentsalong with a majority of the water. In the Cosun Concept the sugars are removed in thiscolumn and the flow to the next column is reduced, facilitating a better separation of theethanol. The heuristics are based on observations made in many problems and attempt
28
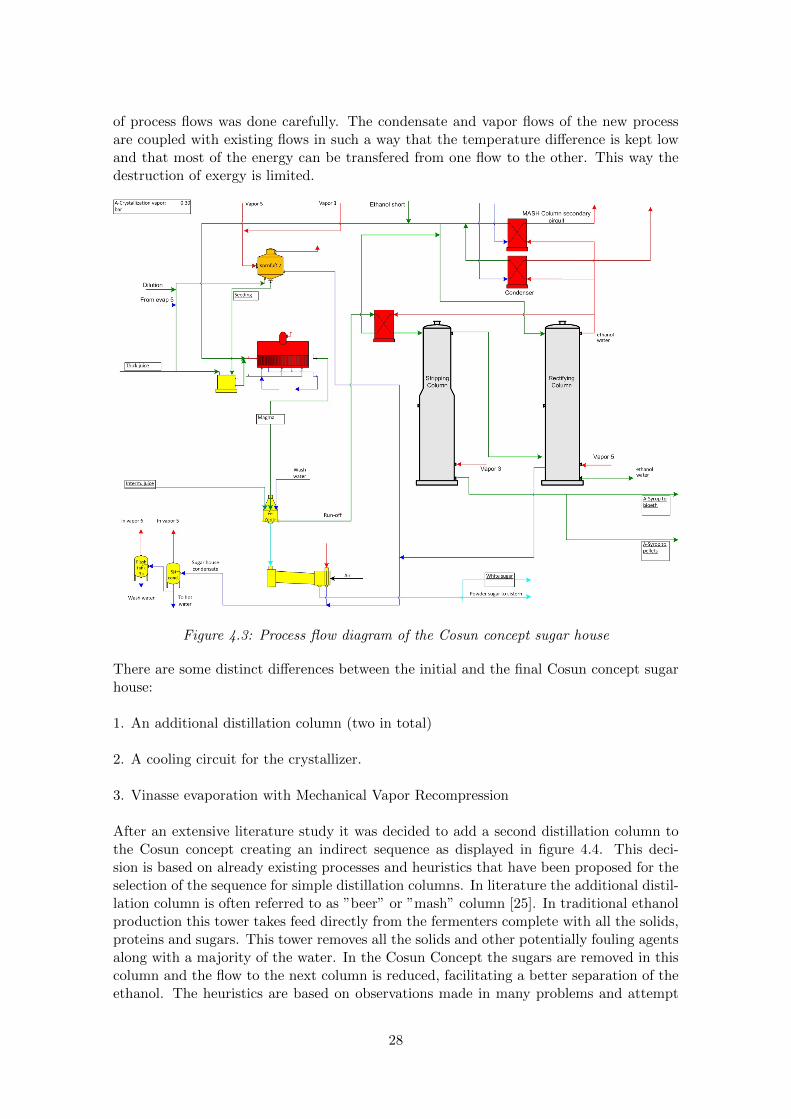
to generalize the observations [6, p. 212].
Figure 4.4: Indirect sequence
Heuristic 1. Separations where the relative volatility of the key components is close tounity or that exhibit azeotropic behavior should be performed in the absence of nonkeycomponents. In other words, do the most difficult separation last.
Heuristic 2. Sequences that remove the lightest components alone one by one in columnoverheads should be favored. In other words, favor the direct sequence.
Heuristic 3. A component composing a large fraction of the feed should be removed first.
Heuristic 4. Favor splits in which the molar flow between top and bottom products inindividual columns is as near equal as possible.
The heuristics 1, 3 & 4 apply to this process. Ethanol and water form an azeotrope witheach other (further discussed in a later chapter) and the large fraction of sugar, that doesnot enter the vapor phase, should be removed first to facilitate a better separation of theethanol.
The first distillation column is a stripper column. A typical stripper is a column wherethe feed tray enters at the top of the column, with few to zero stages (trays) above thefeed tray. The heat source enters the column at the bottom, and the feed trickles downto the bottom trays and is essentially ’stripped’ of light material by the vaporized refluxtraveling up the column. The light material vaporizes and leaves in the overhead product,and the heavy material is purified all the way down to the heavier product stream. Inthe second distillation column (the rectifier) the separation of ethanol and water happens.The fact that sugar is no longer present in the product stream means that an efficientreflux can be applied to increase the purity of the ethanol.
The cooling circuit is applied to remove the heat that is generated by the crystalliza-tion process and to introduce the option of applying additional cooling crystallization toincrease the crystal yield. This is further discussed in a next chapter.
Figure 4.5 shows the new process flow diagram of the vinasse evaporation. Becausethe vapor from the rectifier is now used for the mash column of the bioethanol a MVR isapplied to reduce the steam demand of the vinasse evaporation. Using the vapor of therectifier column reduces the consumption of higher quality steam.
29
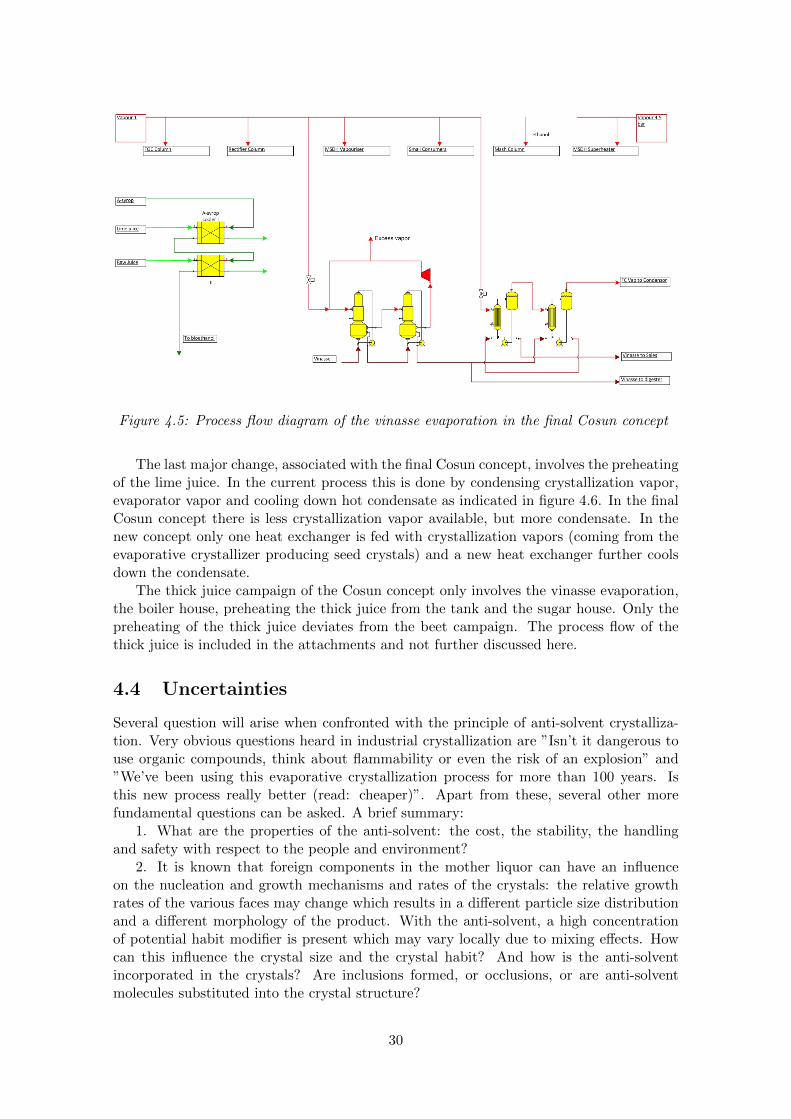
Figure 4.5: Process flow diagram of the vinasse evaporation in the final Cosun concept
The last major change, associated with the final Cosun concept, involves the preheatingof the lime juice. In the current process this is done by condensing crystallization vapor,evaporator vapor and cooling down hot condensate as indicated in figure 4.6. In the finalCosun concept there is less crystallization vapor available, but more condensate. In thenew concept only one heat exchanger is fed with crystallization vapors (coming from theevaporative crystallizer producing seed crystals) and a new heat exchanger further coolsdown the condensate.
The thick juice campaign of the Cosun concept only involves the vinasse evaporation,the boiler house, preheating the thick juice from the tank and the sugar house. Only thepreheating of the thick juice deviates from the beet campaign. The process flow of thethick juice is included in the attachments and not further discussed here.
4.4 Uncertainties
Several question will arise when confronted with the principle of anti-solvent crystalliza-tion. Very obvious questions heard in industrial crystallization are ”Isn’t it dangerous touse organic compounds, think about flammability or even the risk of an explosion” and”We’ve been using this evaporative crystallization process for more than 100 years. Isthis new process really better (read: cheaper)”. Apart from these, several other morefundamental questions can be asked. A brief summary:
1. What are the properties of the anti-solvent: the cost, the stability, the handlingand safety with respect to the people and environment?
2. It is known that foreign components in the mother liquor can have an influenceon the nucleation and growth mechanisms and rates of the crystals: the relative growthrates of the various faces may change which results in a different particle size distributionand a different morphology of the product. With the anti-solvent, a high concentrationof potential habit modifier is present which may vary locally due to mixing effects. Howcan this influence the crystal size and the crystal habit? And how is the anti-solventincorporated in the crystals? Are inclusions formed, or occlusions, or are anti-solventmolecules substituted into the crystal structure?
30

Figure 4.6: Preheating of the lime juice
3. The addition of anti-solvent and the subsequent decrease in solubility of the solutechanges the characteristics of the crystallizing system: low solubilities are combined withhigh supersaturations which are the features of precipitation. It is therefore necessary toknow if sufficiently large crystals can still be produced and whether the impurity uptake,which is closely related to the growth rate of the crystals, is not too high.
4. When a satisfactory product can be produced with an anti-solvent that fulfills allrequirements, the economic feasibility can be determined more accurately. What invest-ments need to be done and what are the operating costs ? How much energy can actuallybe saved ?
5. The possible regeneration of the anti-solvent strongly depends on the thermody-namic behavior of the ternary mixture of water, dissolved sugar and anti-solvent. What isknown about the system of interest? How does the anti-solvent influence the solubility ofthe dissolved sugar and how does the dissolved sugar influence the miscibility of the waterand the anti-solvent?
6. How does the anti-solvent affect the taste, flavor and smell of the food productor the acceptation of the food product sugar. Think of acceptation for halal or kosherproduction standards. Is food grade ethanol required to make up the ethanol losses.
31
Chapter 5
Physical properties
5.1 Solubility
The solubility of a solute in a solvent at determined conditions, such as pressure, temper-ature and the presence of other substances is the maximum amount of this solute thatcan be dissolved and stay in solution (saturation); the solute concentration above thesaturation concentration is the supersaturation. Depending upon the conditions, eithernucleation or growth may predominate, and as a result, crystals with different sizes andshapes are obtained.
5.1.1 Two sources
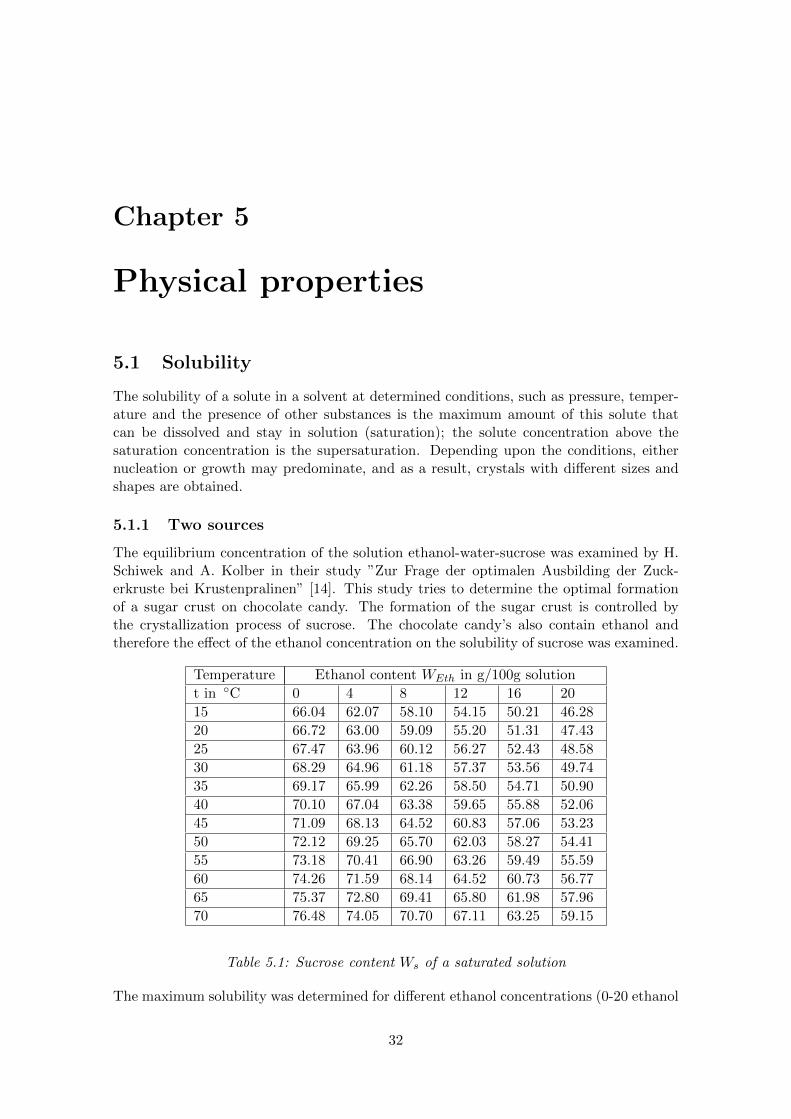
The equilibrium concentration of the solution ethanol-water-sucrose was examined by H.Schiwek and A. Kolber in their study ”Zur Frage der optimalen Ausbilding der Zuck-erkruste bei Krustenpralinen” [14]. This study tries to determine the optimal formationof a sugar crust on chocolate candy. The formation of the sugar crust is controlled bythe crystallization process of sucrose. The chocolate candy’s also contain ethanol andtherefore the effect of the ethanol concentration on the solubility of sucrose was examined.
Temperature Ethanol content WEth in g/100g solution
t in ◦C 0 4 8 12 16 20
15 66.04 62.07 58.10 54.15 50.21 46.28
20 66.72 63.00 59.09 55.20 51.31 47.43
25 67.47 63.96 60.12 56.27 52.43 48.58
30 68.29 64.96 61.18 57.37 53.56 49.74
35 69.17 65.99 62.26 58.50 54.71 50.90
40 70.10 67.04 63.38 59.65 55.88 52.06
45 71.09 68.13 64.52 60.83 57.06 53.23
50 72.12 69.25 65.70 62.03 58.27 54.41
55 73.18 70.41 66.90 63.26 59.49 55.59
60 74.26 71.59 68.14 64.52 60.73 56.77
65 75.37 72.80 69.41 65.80 61.98 57.96
70 76.48 74.05 70.70 67.11 63.25 59.15
Table 5.1: Sucrose content Ws of a saturated solution
The maximum solubility was determined for different ethanol concentrations (0-20 ethanol
32
w%) and temperatures (15-70 ◦C). Table 5.1 shows the sucrose content of the saturatedsolutions.
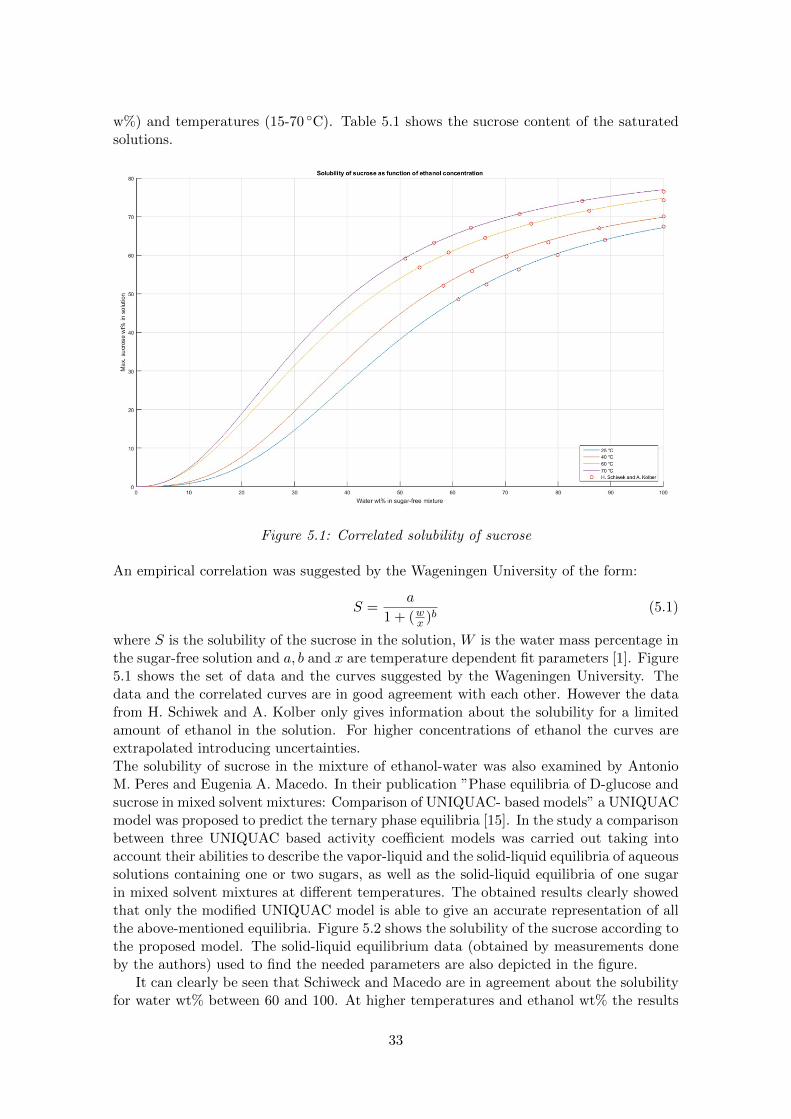
Figure 5.1: Correlated solubility of sucrose
An empirical correlation was suggested by the Wageningen University of the form:
S =a
1 + (wx )b(5.1)
where S is the solubility of the sucrose in the solution, W is the water mass percentage inthe sugar-free solution and a, b and x are temperature dependent fit parameters [1]. Figure5.1 shows the set of data and the curves suggested by the Wageningen University. Thedata and the correlated curves are in good agreement with each other. However the datafrom H. Schiwek and A. Kolber only gives information about the solubility for a limitedamount of ethanol in the solution. For higher concentrations of ethanol the curves areextrapolated introducing uncertainties.The solubility of sucrose in the mixture of ethanol-water was also examined by AntonioM. Peres and Eugenia A. Macedo. In their publication ”Phase equilibria of D-glucose andsucrose in mixed solvent mixtures: Comparison of UNIQUAC- based models” a UNIQUACmodel was proposed to predict the ternary phase equilibria [15]. In the study a comparisonbetween three UNIQUAC based activity coefficient models was carried out taking intoaccount their abilities to describe the vapor-liquid and the solid-liquid equilibria of aqueoussolutions containing one or two sugars, as well as the solid-liquid equilibria of one sugarin mixed solvent mixtures at different temperatures. The obtained results clearly showedthat only the modified UNIQUAC model is able to give an accurate representation of allthe above-mentioned equilibria. Figure 5.2 shows the solubility of the sucrose according tothe proposed model. The solid-liquid equilibrium data (obtained by measurements doneby the authors) used to find the needed parameters are also depicted in the figure.
It can clearly be seen that Schiweck and Macedo are in agreement about the solubilityfor water wt% between 60 and 100. At higher temperatures and ethanol wt% the results
33

Figure 5.2: Solubility of sucrose UNIQUAC
start to deviate from each other. Extrapolating to higher temperatures will give evenbigger deviations.
The range of the ethanol concentration in the measurements conducted by Macedois wider and therefore more trustworthy for higher ethanol concentrations. However thetemperature is only limited to 60 ◦C. The measurements conducted by Schiweck go upto 70 ◦C.
Solubility measurements were also conducted by A. Bouchard, G. W. Hofland andG-J. Witkamp [16]. The measurements were conducted at 310 K with varying ethanolconcentrations from 0 up to 100 wt%. These measurements are in total agreement withthe measurements conducted by by Antonio M. Peres and Eugenia A. Macedo.
The latter two solubility sources are in agreement with each other and the measure-ments were conducted with ethanol concentration varying over the whole range. For thisreason the modified UNIQUAC model, proposed by Antonio M. Peres and Eugenia A.Macedo is used to predict the solubility.
5.1.2 Effect of non-sugars
The juice treatment does not remove all the undesired components in the juice. The thickjuice also contains dissolved components that are not water or sucrose. These dissolvedcomponents are called non-sugars. The purity of the thick juice is the ratio between themass of sucrose and the total mass of the dissolved solids. The solution containing onlywater and sucrose is often referred to as a pure solution and if there are non-sugars presentit becomes a technical solution.
The non-sugars influence the solubility of sucrose in the solution. The TDS (totaldissolved solids) are tabulated in the ”Sugar Technologists Manual” for different temper-atures and varying purities [17, p. 210]. To predict the influence of the purity on thesolubility of the ternary mixture including ethanol a study was conducted to the influence
34
of the purity on the solubility of technical solutions not containing ethanol.The hypothesis is introduced that, for saturation mixtures, the non-sugars do not influ-
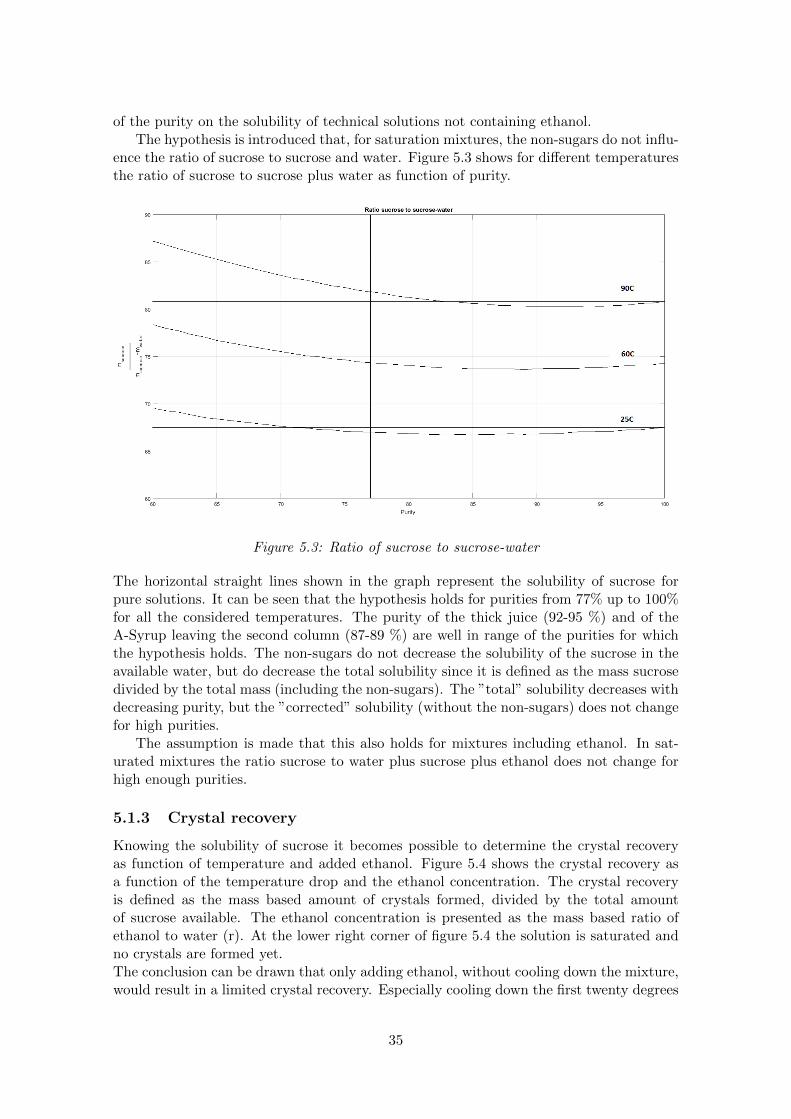
ence the ratio of sucrose to sucrose and water. Figure 5.3 shows for different temperaturesthe ratio of sucrose to sucrose plus water as function of purity.
Figure 5.3: Ratio of sucrose to sucrose-water
The horizontal straight lines shown in the graph represent the solubility of sucrose forpure solutions. It can be seen that the hypothesis holds for purities from 77% up to 100%for all the considered temperatures. The purity of the thick juice (92-95 %) and of theA-Syrup leaving the second column (87-89 %) are well in range of the purities for whichthe hypothesis holds. The non-sugars do not decrease the solubility of the sucrose in theavailable water, but do decrease the total solubility since it is defined as the mass sucrosedivided by the total mass (including the non-sugars). The ”total” solubility decreases withdecreasing purity, but the ”corrected” solubility (without the non-sugars) does not changefor high purities.
The assumption is made that this also holds for mixtures including ethanol. In sat-urated mixtures the ratio sucrose to water plus sucrose plus ethanol does not change forhigh enough purities.
5.1.3 Crystal recovery
Knowing the solubility of sucrose it becomes possible to determine the crystal recoveryas function of temperature and added ethanol. Figure 5.4 shows the crystal recovery asa function of the temperature drop and the ethanol concentration. The crystal recoveryis defined as the mass based amount of crystals formed, divided by the total amountof sucrose available. The ethanol concentration is presented as the mass based ratio ofethanol to water (r). At the lower right corner of figure 5.4 the solution is saturated andno crystals are formed yet.The conclusion can be drawn that only adding ethanol, without cooling down the mixture,would result in a limited crystal recovery. Especially cooling down the first twenty degrees
35
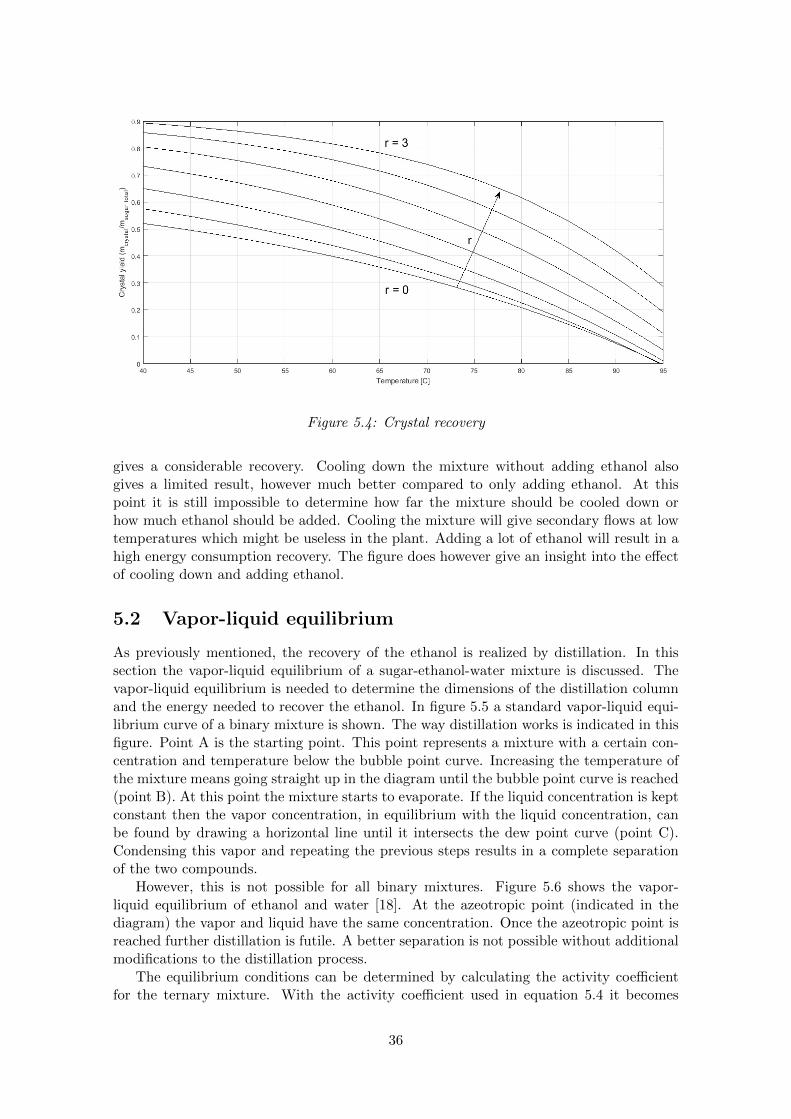
Figure 5.4: Crystal recovery
gives a considerable recovery. Cooling down the mixture without adding ethanol alsogives a limited result, however much better compared to only adding ethanol. At thispoint it is still impossible to determine how far the mixture should be cooled down orhow much ethanol should be added. Cooling the mixture will give secondary flows at lowtemperatures which might be useless in the plant. Adding a lot of ethanol will result in ahigh energy consumption recovery. The figure does however give an insight into the effectof cooling down and adding ethanol.
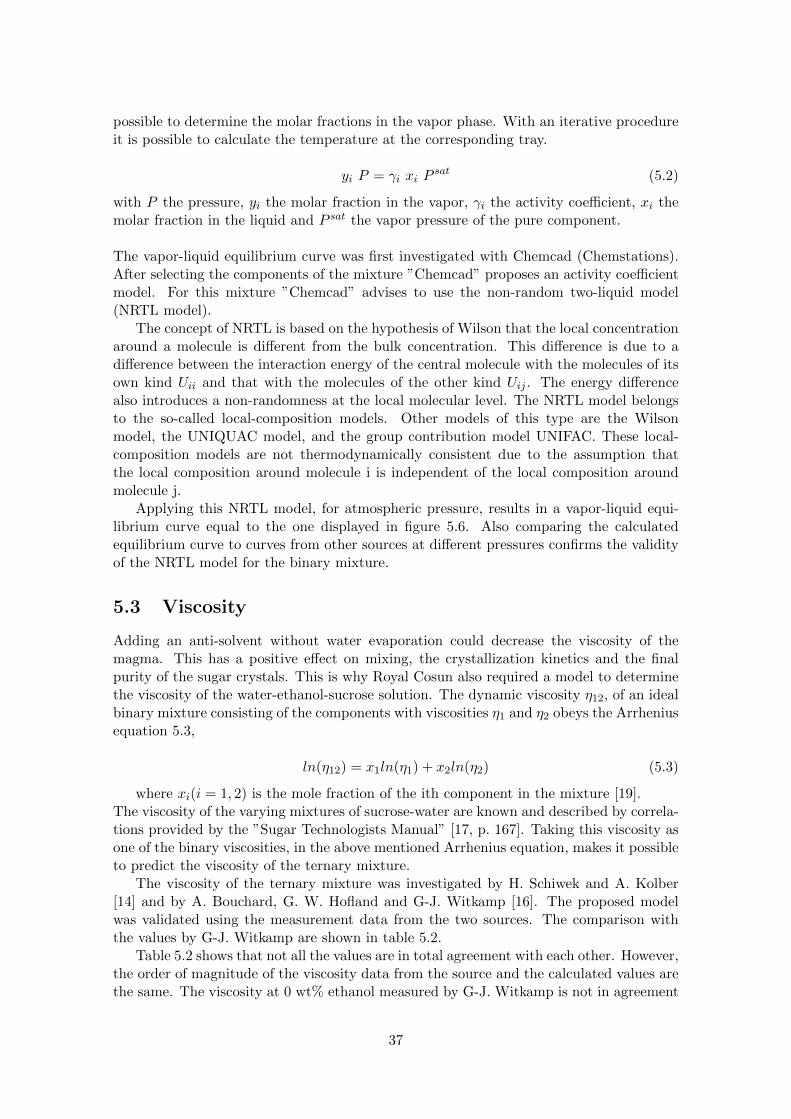
5.2 Vapor-liquid equilibrium
As previously mentioned, the recovery of the ethanol is realized by distillation. In thissection the vapor-liquid equilibrium of a sugar-ethanol-water mixture is discussed. Thevapor-liquid equilibrium is needed to determine the dimensions of the distillation columnand the energy needed to recover the ethanol. In figure 5.5 a standard vapor-liquid equi-librium curve of a binary mixture is shown. The way distillation works is indicated in thisfigure. Point A is the starting point. This point represents a mixture with a certain con-centration and temperature below the bubble point curve. Increasing the temperature ofthe mixture means going straight up in the diagram until the bubble point curve is reached(point B). At this point the mixture starts to evaporate. If the liquid concentration is keptconstant then the vapor concentration, in equilibrium with the liquid concentration, canbe found by drawing a horizontal line until it intersects the dew point curve (point C).Condensing this vapor and repeating the previous steps results in a complete separationof the two compounds.
However, this is not possible for all binary mixtures. Figure 5.6 shows the vapor-liquid equilibrium of ethanol and water [18]. At the azeotropic point (indicated in thediagram) the vapor and liquid have the same concentration. Once the azeotropic point isreached further distillation is futile. A better separation is not possible without additionalmodifications to the distillation process.
The equilibrium conditions can be determined by calculating the activity coefficientfor the ternary mixture. With the activity coefficient used in equation 5.4 it becomes
36
possible to determine the molar fractions in the vapor phase. With an iterative procedureit is possible to calculate the temperature at the corresponding tray.
yi P = γi xi Psat (5.2)
with P the pressure, yi the molar fraction in the vapor, γi the activity coefficient, xi themolar fraction in the liquid and P sat the vapor pressure of the pure component.
The vapor-liquid equilibrium curve was first investigated with Chemcad (Chemstations).After selecting the components of the mixture ”Chemcad” proposes an activity coefficientmodel. For this mixture ”Chemcad” advises to use the non-random two-liquid model(NRTL model).
The concept of NRTL is based on the hypothesis of Wilson that the local concentrationaround a molecule is different from the bulk concentration. This difference is due to adifference between the interaction energy of the central molecule with the molecules of itsown kind Uii and that with the molecules of the other kind Uij . The energy differencealso introduces a non-randomness at the local molecular level. The NRTL model belongsto the so-called local-composition models. Other models of this type are the Wilsonmodel, the UNIQUAC model, and the group contribution model UNIFAC. These local-composition models are not thermodynamically consistent due to the assumption thatthe local composition around molecule i is independent of the local composition aroundmolecule j.
Applying this NRTL model, for atmospheric pressure, results in a vapor-liquid equi-librium curve equal to the one displayed in figure 5.6. Also comparing the calculatedequilibrium curve to curves from other sources at different pressures confirms the validityof the NRTL model for the binary mixture.
5.3 Viscosity
Adding an anti-solvent without water evaporation could decrease the viscosity of themagma. This has a positive effect on mixing, the crystallization kinetics and the finalpurity of the sugar crystals. This is why Royal Cosun also required a model to determinethe viscosity of the water-ethanol-sucrose solution. The dynamic viscosity η12, of an idealbinary mixture consisting of the components with viscosities η1 and η2 obeys the Arrheniusequation 5.3,
ln(η12) = x1ln(η1) + x2ln(η2) (5.3)
where xi(i = 1, 2) is the mole fraction of the ith component in the mixture [19].The viscosity of the varying mixtures of sucrose-water are known and described by correla-tions provided by the ”Sugar Technologists Manual” [17, p. 167]. Taking this viscosity asone of the binary viscosities, in the above mentioned Arrhenius equation, makes it possibleto predict the viscosity of the ternary mixture.
The viscosity of the ternary mixture was investigated by H. Schiwek and A. Kolber[14] and by A. Bouchard, G. W. Hofland and G-J. Witkamp [16]. The proposed modelwas validated using the measurement data from the two sources. The comparison withthe values by G-J. Witkamp are shown in table 5.2.
Table 5.2 shows that not all the values are in total agreement with each other. However,the order of magnitude of the viscosity data from the source and the calculated values arethe same. The viscosity at 0 wt% ethanol measured by G-J. Witkamp is not in agreement
37
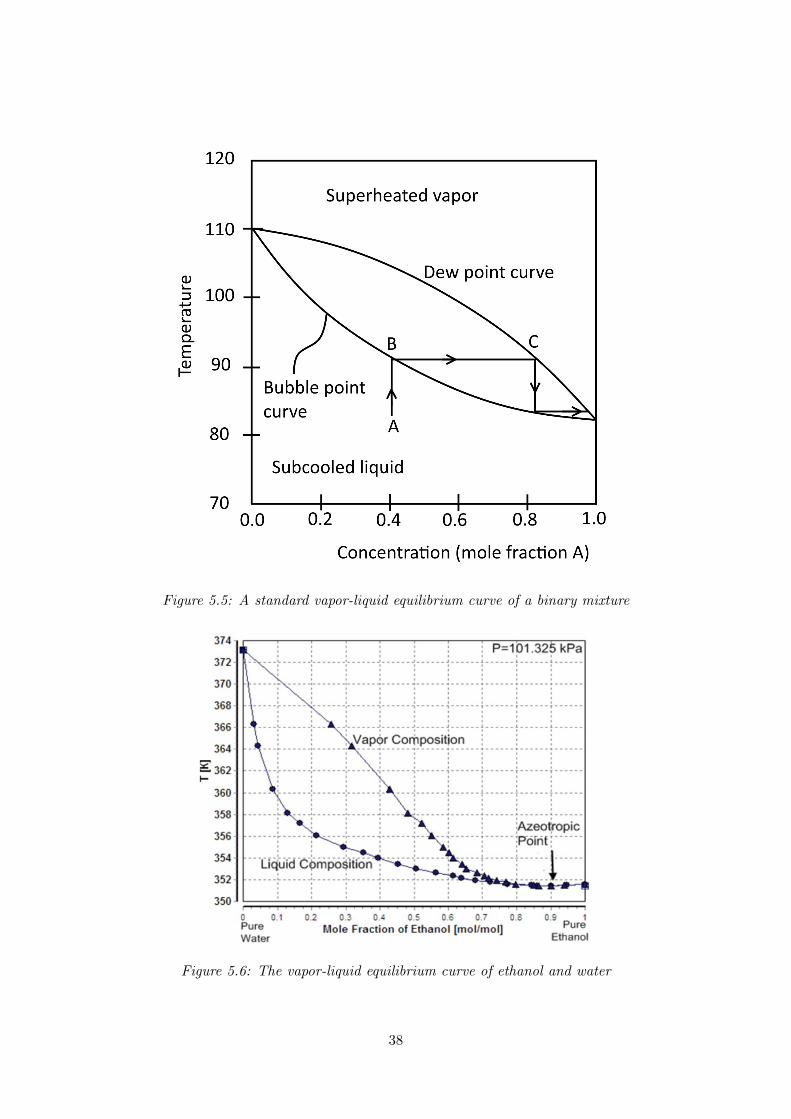
Figure 5.5: A standard vapor-liquid equilibrium curve of a binary mixture
Figure 5.6: The vapor-liquid equilibrium curve of ethanol and water
38
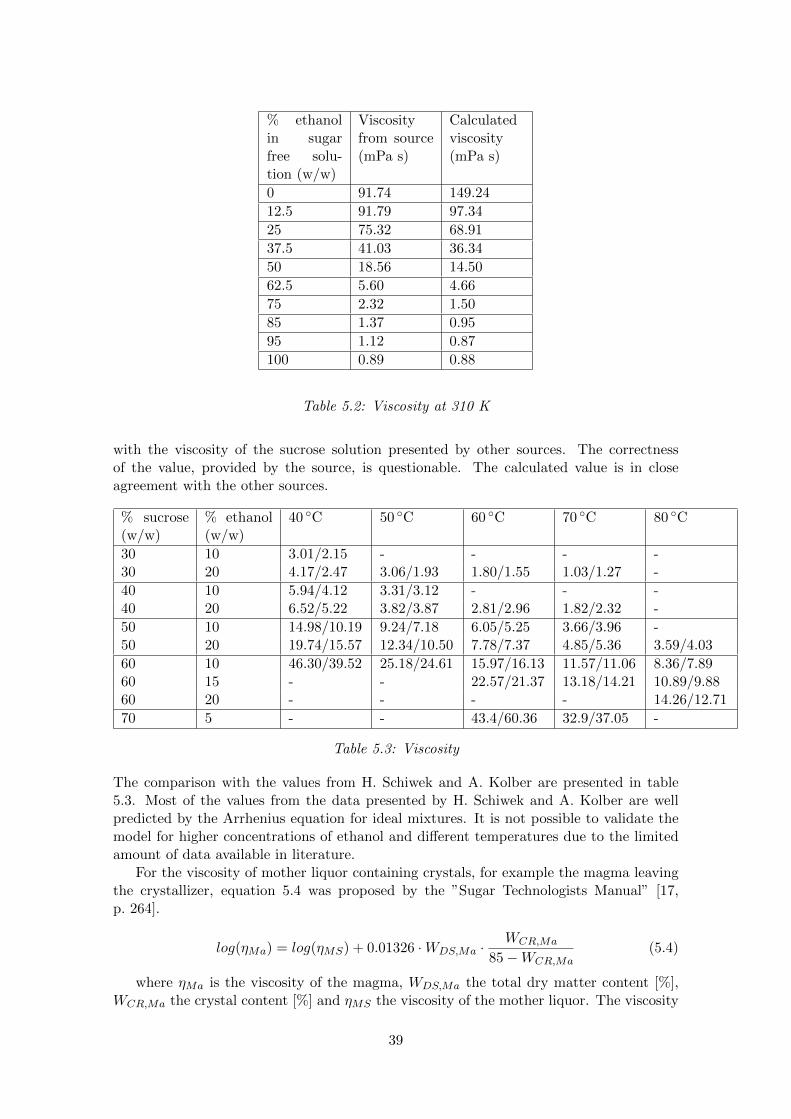
% ethanolin sugarfree solu-tion (w/w)
Viscosityfrom source(mPa s)
Calculatedviscosity(mPa s)
0 91.74 149.24
12.5 91.79 97.34
25 75.32 68.91
37.5 41.03 36.34
50 18.56 14.50
62.5 5.60 4.66
75 2.32 1.50
85 1.37 0.95
95 1.12 0.87
100 0.89 0.88
Table 5.2: Viscosity at 310 K
with the viscosity of the sucrose solution presented by other sources. The correctnessof the value, provided by the source, is questionable. The calculated value is in closeagreement with the other sources.
% sucrose(w/w)
% ethanol(w/w)
40 ◦C 50 ◦C 60 ◦C 70 ◦C 80 ◦C
30 10 3.01/2.15 - - - -30 20 4.17/2.47 3.06/1.93 1.80/1.55 1.03/1.27 -
40 10 5.94/4.12 3.31/3.12 - - -40 20 6.52/5.22 3.82/3.87 2.81/2.96 1.82/2.32 -
50 10 14.98/10.19 9.24/7.18 6.05/5.25 3.66/3.96 -50 20 19.74/15.57 12.34/10.50 7.78/7.37 4.85/5.36 3.59/4.03
60 10 46.30/39.52 25.18/24.61 15.97/16.13 11.57/11.06 8.36/7.8960 15 - - 22.57/21.37 13.18/14.21 10.89/9.8860 20 - - - - 14.26/12.71
70 5 - - 43.4/60.36 32.9/37.05 -
Table 5.3: Viscosity
The comparison with the values from H. Schiwek and A. Kolber are presented in table5.3. Most of the values from the data presented by H. Schiwek and A. Kolber are wellpredicted by the Arrhenius equation for ideal mixtures. It is not possible to validate themodel for higher concentrations of ethanol and different temperatures due to the limitedamount of data available in literature.
For the viscosity of mother liquor containing crystals, for example the magma leavingthe crystallizer, equation 5.4 was proposed by the ”Sugar Technologists Manual” [17,p. 264].
log(ηMa) = log(ηMS) + 0.01326 ·WDS,Ma ·WCR,Ma
85 −WCR,Ma(5.4)
where ηMa is the viscosity of the magma, WDS,Ma the total dry matter content [%],WCR,Ma the crystal content [%] and ηMS the viscosity of the mother liquor. The viscosity
39

of the magma, containing ethanol, can be calculated by applying equation 5.3, to determinethe viscosity of the mother liquor, and subsequently inserting this viscosity in equation 5.4.It is assumed that this procedure will give a good estimation of the viscosity of the magma,containing ethanol, because equation 5.4 only corrects for the crystal content. However,this could not be validated due to the limited amount of data available in literature. Thisprocedure was used to determine the viscosity of the magma leaving the crystallizer in theCosun Concept.
5.4 Excess enthalpy
Figure 5.7: Excess enthalpy
Enthalpy of mixing refers to the change in the enthalpy per mole of solution formedwhen pure components are mixed at the same temperature and pressure. Or in otherwords the difference between the enthalpy of a mixture and the sum of the enthalpiesof its components at the same pressure and temperature. Enthalpy effects on mixing ofliquids can be quite large and of considerable importance, especially for the design ofabsorption and distillation columns.
The excess enthalpy for water-ethanol mixtures was investigated by J.A. Larkin [20].Figure 5.7 depicts the molar excess enthalpy for different temperatures and varying ethanolmole fraction. Figure 5.7 shows that the excess enthalpy changes in shape dramaticallyas the temperature is increased. At 298.15 K and 323.15 K the curves are highly skewedwith sharp minima near x = 0.15 and inflexions near x = 0.3 and x = 0.8. Mixing isexothermal at all compositions. At temperatures between about 330 K and 370 K HE hasboth negative and positive portions with minima at x = 0.1 and maxima at x = 0.6. At383.15 K HE is nearly symmetrical about x = 0.5 and is positive at all compositions: the
40
specific molecular interactions which are so marked at 298.15 K have become insignificantat this temperature, except for mixtures rich in water where the excess enthalpy is smallerthan would be expected for a mixture with only physical molecular interactions.
The excess enthalpy is used in the calculation of the total enthalpy of the streamsentering and leaving the crystallizer. It is assumed that the total enthalpy of a streamequals the sum of the water-sucrose enthalpy, calculated with a correlation from the sugartechnologists manual, the enthalpy of pure ethanol and the excess enthalpy. The molefraction ethanol, used to determine the excess enthalpy, is calculated as if the solutiononly consists of ethanol and water. The study, conducted by J.A. Larkin, only containscorrelations for certain temperatures. The measured data, presented in the paper, areextrapolated with the 2-d lookup table function in Matlab/Simulink. This way is becomespossible to determine the excess enthalpy for all temperatures and mole fractions ethanol.
5.5 Appearance, Handling & Safety
The properties of the anti-solvent regarding the stability, the handling and safety withrespect to the people and environment are obtained from the book ”Chemiekaarten”[21,p. 555]. The concerning page is included in the attachments.
The appearance of ethanol is a colorless liquid, with a characteristic odor. The vapormixes well with air and explosive mixtures are easily formed. The chemical dangers includeslow reactions with calcium hypochlorite, silver oxide and ammonia, causing fire andexplosion hazard. It reacts violently with strong oxidants such as nitric acid, silver nitrate,mercuric nitrate or magnesium perchlorate, causing fire and explosion hazard.
The substance can be absorbed into the body by inhalation of its vapor and by inges-tion. A harmful contamination of the air will be reached rather slowly on evaporation ofthis substance at 20◦C. The inhalation of high concentration of vapor may cause irritationof the eyes and respiratory tract. Effect of long-term or repeated exposure include thedefatting of the skin. The substance may have effects on the upper respiratory tract andcentral nervous system, resulting in irritation, headache, fatigue and lack of concentration.Chronic ingestion of ethanol may cause liver cirrhosis.
Acute Hazards include fire and explosion. The liquid is highly flammable and vapor/airmixtures are explosive. The prevention of fire consists op avoiding open flames, sparks, andsmoking. The prevention of explosion consists of working with closed systems, ventilation,explosion-proof electrical equipment and lighting. Compressed air for filling should not beused.
Ethanol should be stored fireproof and separated from strong oxidants, acids en lightmetals (e.g. aluminium).
41
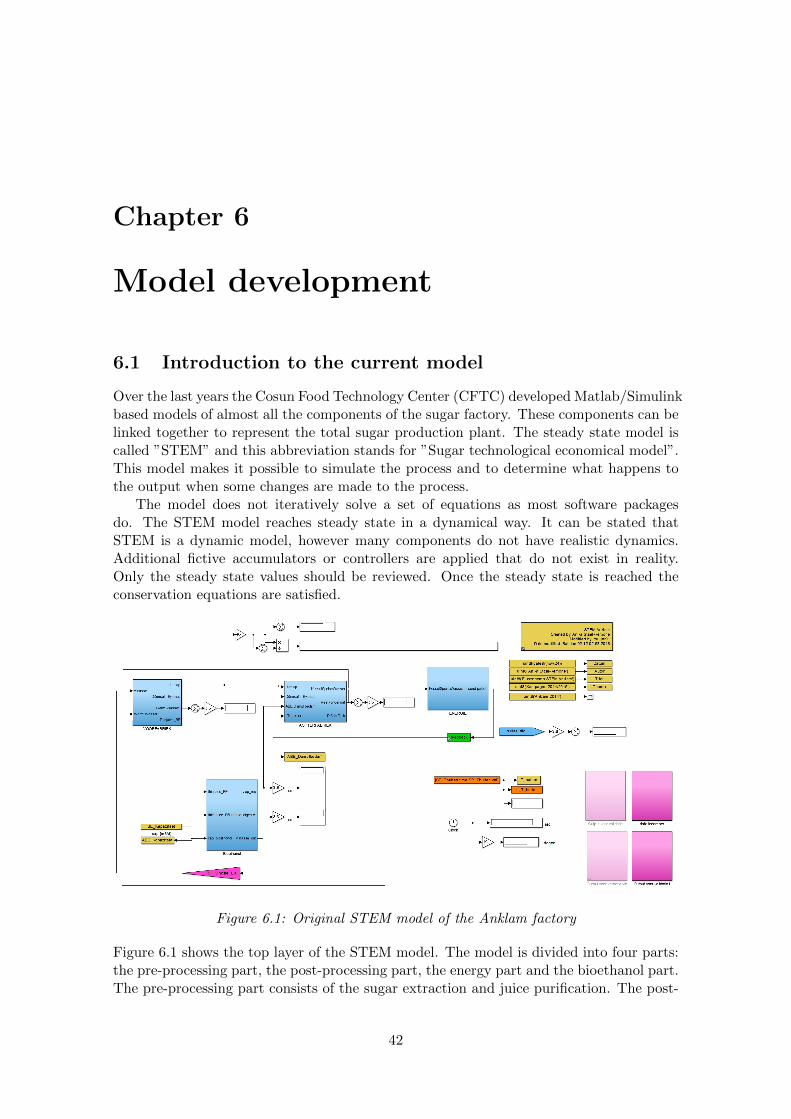
Chapter 6
Model development
6.1 Introduction to the current model
Over the last years the Cosun Food Technology Center (CFTC) developed Matlab/Simulinkbased models of almost all the components of the sugar factory. These components can belinked together to represent the total sugar production plant. The steady state model iscalled ”STEM” and this abbreviation stands for ”Sugar technological economical model”.This model makes it possible to simulate the process and to determine what happens tothe output when some changes are made to the process.
The model does not iteratively solve a set of equations as most software packagesdo. The STEM model reaches steady state in a dynamical way. It can be stated thatSTEM is a dynamic model, however many components do not have realistic dynamics.Additional fictive accumulators or controllers are applied that do not exist in reality.Only the steady state values should be reviewed. Once the steady state is reached theconservation equations are satisfied.
Figure 6.1: Original STEM model of the Anklam factory
Figure 6.1 shows the top layer of the STEM model. The model is divided into four parts:the pre-processing part, the post-processing part, the energy part and the bioethanol part.The pre-processing part consists of the sugar extraction and juice purification. The post-
42
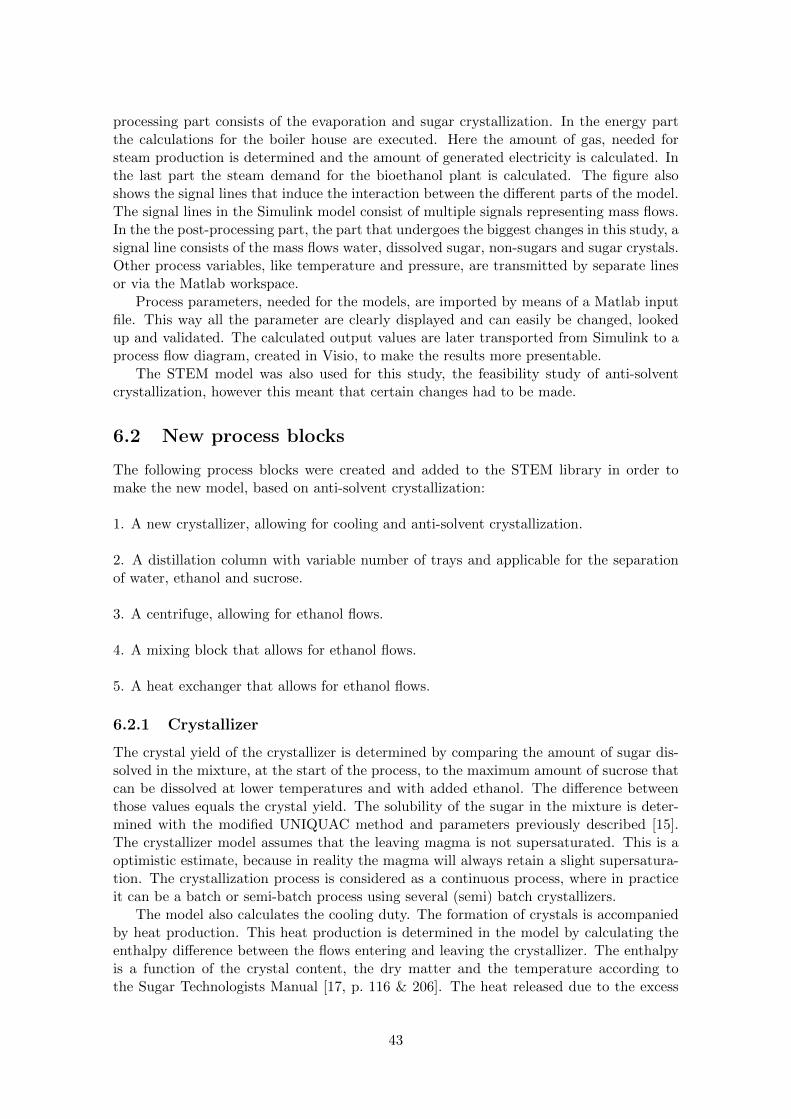
processing part consists of the evaporation and sugar crystallization. In the energy partthe calculations for the boiler house are executed. Here the amount of gas, needed forsteam production is determined and the amount of generated electricity is calculated. Inthe last part the steam demand for the bioethanol plant is calculated. The figure alsoshows the signal lines that induce the interaction between the different parts of the model.The signal lines in the Simulink model consist of multiple signals representing mass flows.In the the post-processing part, the part that undergoes the biggest changes in this study, asignal line consists of the mass flows water, dissolved sugar, non-sugars and sugar crystals.Other process variables, like temperature and pressure, are transmitted by separate linesor via the Matlab workspace.
Process parameters, needed for the models, are imported by means of a Matlab inputfile. This way all the parameter are clearly displayed and can easily be changed, lookedup and validated. The calculated output values are later transported from Simulink to aprocess flow diagram, created in Visio, to make the results more presentable.
The STEM model was also used for this study, the feasibility study of anti-solventcrystallization, however this meant that certain changes had to be made.
6.2 New process blocks
The following process blocks were created and added to the STEM library in order tomake the new model, based on anti-solvent crystallization:
1. A new crystallizer, allowing for cooling and anti-solvent crystallization.
2. A distillation column with variable number of trays and applicable for the separationof water, ethanol and sucrose.
3. A centrifuge, allowing for ethanol flows.
4. A mixing block that allows for ethanol flows.
5. A heat exchanger that allows for ethanol flows.
6.2.1 Crystallizer
The crystal yield of the crystallizer is determined by comparing the amount of sugar dis-solved in the mixture, at the start of the process, to the maximum amount of sucrose thatcan be dissolved at lower temperatures and with added ethanol. The difference betweenthose values equals the crystal yield. The solubility of the sugar in the mixture is deter-mined with the modified UNIQUAC method and parameters previously described [15].The crystallizer model assumes that the leaving magma is not supersaturated. This is aoptimistic estimate, because in reality the magma will always retain a slight supersatura-tion. The crystallization process is considered as a continuous process, where in practiceit can be a batch or semi-batch process using several (semi) batch crystallizers.
The model also calculates the cooling duty. The formation of crystals is accompaniedby heat production. This heat production is determined in the model by calculating theenthalpy difference between the flows entering and leaving the crystallizer. The enthalpyis a function of the crystal content, the dry matter and the temperature according tothe Sugar Technologists Manual [17, p. 116 & 206]. The heat released due to the excess
43
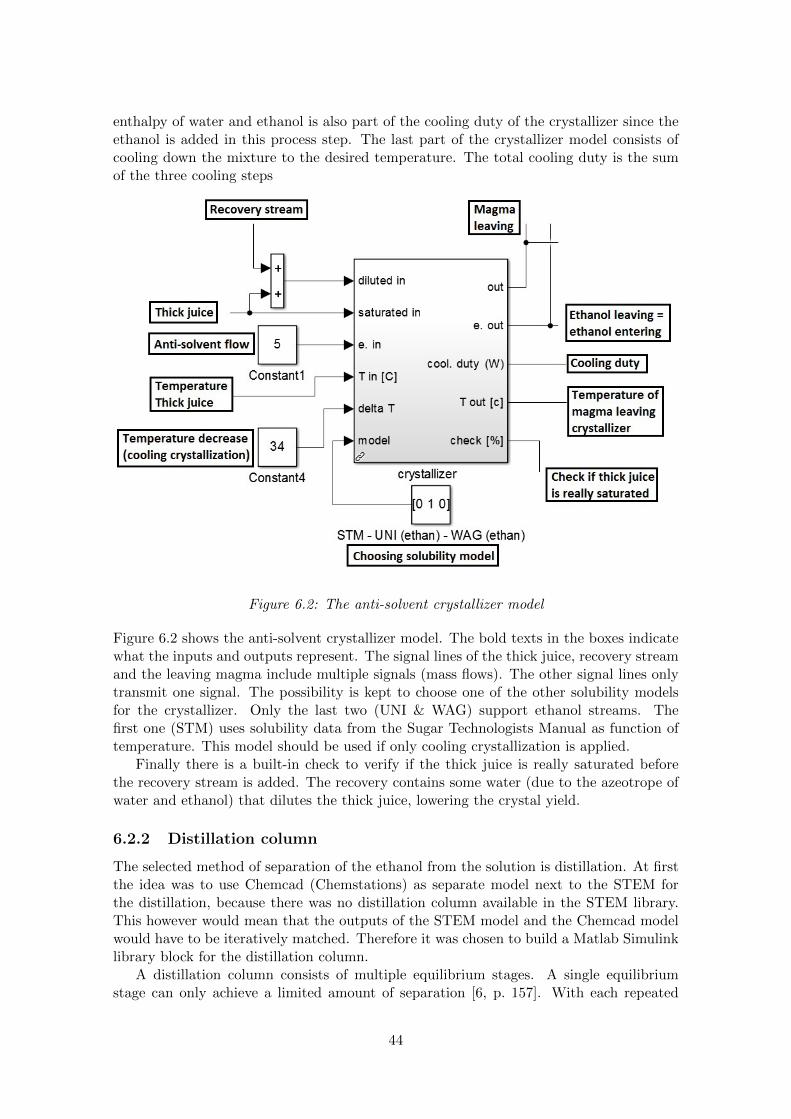
enthalpy of water and ethanol is also part of the cooling duty of the crystallizer since theethanol is added in this process step. The last part of the crystallizer model consists ofcooling down the mixture to the desired temperature. The total cooling duty is the sumof the three cooling steps
Figure 6.2: The anti-solvent crystallizer model
Figure 6.2 shows the anti-solvent crystallizer model. The bold texts in the boxes indicatewhat the inputs and outputs represent. The signal lines of the thick juice, recovery streamand the leaving magma include multiple signals (mass flows). The other signal lines onlytransmit one signal. The possibility is kept to choose one of the other solubility modelsfor the crystallizer. Only the last two (UNI & WAG) support ethanol streams. Thefirst one (STM) uses solubility data from the Sugar Technologists Manual as function oftemperature. This model should be used if only cooling crystallization is applied.
Finally there is a built-in check to verify if the thick juice is really saturated beforethe recovery stream is added. The recovery contains some water (due to the azeotrope ofwater and ethanol) that dilutes the thick juice, lowering the crystal yield.
6.2.2 Distillation column
The selected method of separation of the ethanol from the solution is distillation. At firstthe idea was to use Chemcad (Chemstations) as separate model next to the STEM forthe distillation, because there was no distillation column available in the STEM library.This however would mean that the outputs of the STEM model and the Chemcad modelwould have to be iteratively matched. Therefore it was chosen to build a Matlab Simulinklibrary block for the distillation column.
A distillation column consists of multiple equilibrium stages. A single equilibriumstage can only achieve a limited amount of separation [6, p. 157]. With each repeated
44
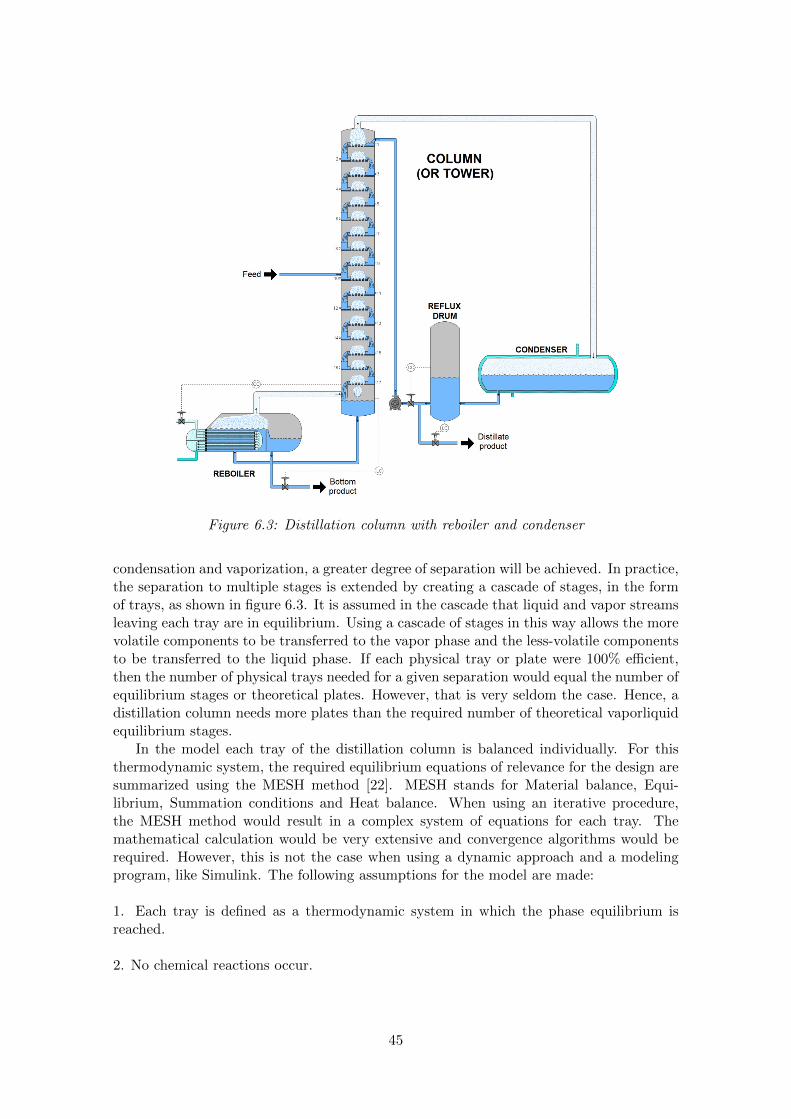
Figure 6.3: Distillation column with reboiler and condenser
condensation and vaporization, a greater degree of separation will be achieved. In practice,the separation to multiple stages is extended by creating a cascade of stages, in the formof trays, as shown in figure 6.3. It is assumed in the cascade that liquid and vapor streamsleaving each tray are in equilibrium. Using a cascade of stages in this way allows the morevolatile components to be transferred to the vapor phase and the less-volatile componentsto be transferred to the liquid phase. If each physical tray or plate were 100% efficient,then the number of physical trays needed for a given separation would equal the number ofequilibrium stages or theoretical plates. However, that is very seldom the case. Hence, adistillation column needs more plates than the required number of theoretical vaporliquidequilibrium stages.
In the model each tray of the distillation column is balanced individually. For thisthermodynamic system, the required equilibrium equations of relevance for the design aresummarized using the MESH method [22]. MESH stands for Material balance, Equi-librium, Summation conditions and Heat balance. When using an iterative procedure,the MESH method would result in a complex system of equations for each tray. Themathematical calculation would be very extensive and convergence algorithms would berequired. However, this is not the case when using a dynamic approach and a modelingprogram, like Simulink. The following assumptions for the model are made:
1. Each tray is defined as a thermodynamic system in which the phase equilibrium isreached.
2. No chemical reactions occur.
45
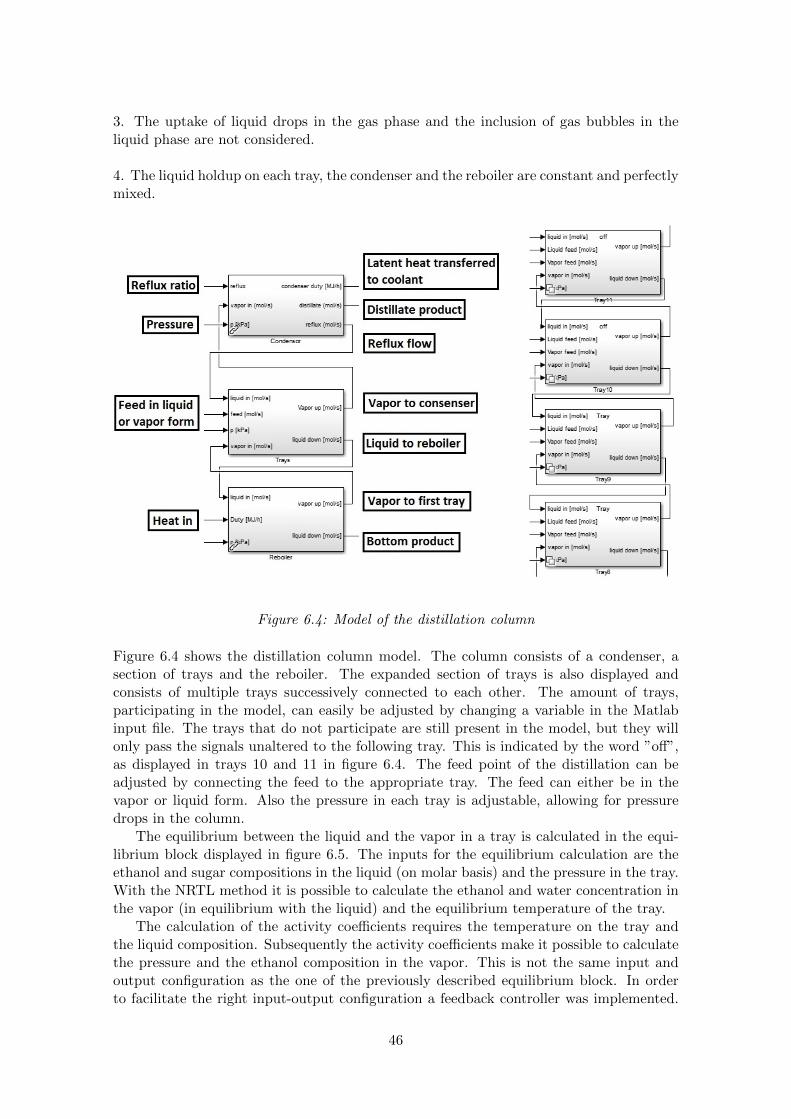
3. The uptake of liquid drops in the gas phase and the inclusion of gas bubbles in theliquid phase are not considered.
4. The liquid holdup on each tray, the condenser and the reboiler are constant and perfectlymixed.
Figure 6.4: Model of the distillation column
Figure 6.4 shows the distillation column model. The column consists of a condenser, asection of trays and the reboiler. The expanded section of trays is also displayed andconsists of multiple trays successively connected to each other. The amount of trays,participating in the model, can easily be adjusted by changing a variable in the Matlabinput file. The trays that do not participate are still present in the model, but they willonly pass the signals unaltered to the following tray. This is indicated by the word ”off”,as displayed in trays 10 and 11 in figure 6.4. The feed point of the distillation can beadjusted by connecting the feed to the appropriate tray. The feed can either be in thevapor or liquid form. Also the pressure in each tray is adjustable, allowing for pressuredrops in the column.
The equilibrium between the liquid and the vapor in a tray is calculated in the equi-librium block displayed in figure 6.5. The inputs for the equilibrium calculation are theethanol and sugar compositions in the liquid (on molar basis) and the pressure in the tray.With the NRTL method it is possible to calculate the ethanol and water concentration inthe vapor (in equilibrium with the liquid) and the equilibrium temperature of the tray.
The calculation of the activity coefficients requires the temperature on the tray andthe liquid composition. Subsequently the activity coefficients make it possible to calculatethe pressure and the ethanol composition in the vapor. This is not the same input andoutput configuration as the one of the previously described equilibrium block. In orderto facilitate the right input-output configuration a feedback controller was implemented.
46

Figure 6.5: Equilibrium block
This is displayed in figure 6.6, one level lower than the equilibrium block.
Figure 6.6: Inside equilibrium block
The calculation of the equilibrium temperature and vapor composition proceeds asfollows. The calculation starts with an arbitrary temperature and the composition ofthe liquid in the tray. The Matlab function calculates the activity coefficients, using theNRTL method, and the corresponding pressure. This pressure usually doesn’t equal theactual pressure in the tray. A PI controller is used to resolve this problem. The controllercontrols the pressure by manipulating the temperature. The setpoint for the controller isthe predetermined pressure. Once the closed loop system has converged, the equilibriumconditions are known.
In the distillation column a temperature gradient will arise due to the varying liquidcomposition and the assumption that the vapor and liquid on a tray are in equilibrium.Liquid falling from the overlying tray will have a cooling effect on the lower tray. This isalso accounted for in the model. The specific heat of the mixture is calculated and theamount of energy, associated with the cooling effect, is determined. This cooling energy
47

is subtracted from the energy available for evaporating the liquid on the tray. The refluxratio can be adjusted and is treated the same way as the internal overflow of water froman overlying tray to a lower tray.
The distillation column model was validated using Chemcad (Chemstations). Themodel was compared with the SCDS column of Chemcad. The SCDS column is one ofthe rigorous columns that can be used in CHEMCAD. SCDS stands for ”SimultaneousCorrection Distillation System”. It is a very versatile column model that is suited for allrectification processes. When calculating the rigorous SCDS column, a stationary statebetween liquid-vapour phase or liquid-liquid phase is assumed for each tray [22]. Figure 6.7shows the distillation column in Chemcad together with the entering and leaving streams.The amount of sugar in the feed stream is set to zero in order to make this model representthe rectifier column. The model is also suitable for a feed stream containing sugar. Thesame process was modeled with the distillation column in Simulink and the results aredisplayed in figure 6.8. The stream compositions and other outputs of the two models arevery similar, as expected, because the same thermodynamic model and assumptions wereused for both models.
An extensive validation was conducted by changing the different equipment parametersand process variables. Parameters and variables like the amount of trays, the feed pointposition and its composition, the reboiler duty, the reflux ratio and the pressure of thecolumn were considered. Each time the two models were almost in complete agreementwith each other.
6.2.3 Centrifuge
The STEM library contains a centrifuge model that separates the sugar crystals fromthe magma. This centrifuge model consists of three main parts; the flinging part, thesubstitution part and the rinsing part. The centrifuge model can be used for both batchcentrifuges where the different parts actually are different phases in the centrifugation orcontinuous centrifuges, where different parts really are different locations on the centrifuge.For production of white sugar crystals to the silo usually batch centrifuges are used toprevent fracture or abrasion of the crystals. So here it is probably better to speak ofphases. In the flinging part, the mother liquor gets flung until a predetermined dry mattercontent is reached. A small amount of the crystals leaves the centrifuge together with thesyrup. In the new concept an additional stream of ethanol is present in the centrifuge. Forthe flinging phase this means a simple modification of the dry matter content calculation.In the new situation the ethanol stream is also included in the calculation of the totalmass. The filtered crystals continue to the substitution phase. Here a predeterminedamount of wash water is sprayed on the crystals to substitute the mother liquor thatstill adheres to the crystals. The substitution of the mother liquor occurs based on asubstitution curve shown in figure 6.9. A Simulink Lookup table, including the curvedata, is used to determine the substituted liquor. The input for this Lookup table is theamount of water in the wash water divided by the amount of adhering liquid. The outputis a factor indicating the amount of liquor that gets replaced by the wash water. Theremoved mother liquor is completely replaced by the wash water. For the new concept(with ethanol) it is assumed that the same substitution curve can be used with a modifiedinput to the Lookup table. The difference lies in the additional ethanol in the adheringliquor. It might be possible that the ethanol is easier to expel from the crystals thanwater, but no data could be found to confirm this. Therefore the assumption was madethat the ethanol is similar to water when it comes to expulsion from the crystals.
A small amount of wet sugar remains on the sieve. This sugar is washed away in
48

the rinsing phase of the centrifuge model. The change in the model for the new conceptconsists of determining the amount of ethanol that remains on the sieve together with thesugar. The amount of ethanol is determined by the ethanol concentration of the sugar.Once the amount of sugar is known the amount of ethanol remaining on the sugar isknown.
6.2.4 Mixing
In the process, many process flows eventually get mixed together. In the model thecalculation of the resulting temperature happens in the mixing blocks. The mixing blockscontain the temperature dependent specif heats of the involved components. Equation 6.1shows how the temperature of the final mixture is calculated.
m1C1T1 +m2C2T2m1C1 +m2C2
= Tout (6.1)
with m the mass flow, C the specific heat and T the temperature. The subscripts indicatethe involving component.
This formula does not take into account non ideal mixing effects. This assumption isalso used for the additional ethanol stream. For the new concept the specific heat of liquidethanol is required. These were retrieved from Chemcad (Chemstations) and validatedwith other sources.
6.3 Applied changes to the model
6.3.1 Evaporation & Mechanical vapor recompression
An additional evaporator stage with Mechanical Vapor Recompression (MVR) was addedto the modified STEM model in order to achieve a higher dry matter content of the thickjuice and to compensate for the reduced steam demand from the crystallization. Boththe evaporator block and the MVR block are part of the original STEM library. In themodified STEM model they are connected to each other according to figure 6.10. Forthe evaporator it is assumed that a falling film plate evaporator is used. The k-valuewas estimated using a STEM library block to calculate k-values as function of dry mattercontent, purity and temperature for these type of evaporators.The evaporator surface wassized to have a temperature difference of approximately 7 ◦C. This to be able to workwith fan type compressors.
The amount of evaporated water is chosen in such a way that the condenser lossesare minimized. This water vapor enters the MVR block. Here the power, needed for thecompressor, is calculated using a polytropic compression equation. The vapor leaving thecompressor is superheated. Also the amount of additional vapor resulting from cooling thesteam down to the saturation temperature, by water addition, is calculated in this block.The vapor is cooled down to saturation conditions to ensure immediate condensation inthe heat exchanger. The model also contains a PI controller. This controller is a fictionalone and only exists in the model. The controller changes the temperature of the vaporgoing to the evaporator and with this the temperature level in the evaporator in order tominimize the excess vapor.
In the current situation the steam coming from the vinasse evaporators is used in thedistillation column of the fermentation. In the Cosun concept this is no longer the casesince the vapor of the new rectifier column is used. To reduce the amount of vapor needed
49
for the vinasse evaporation a second MVR is applied. The changes to the STEM modelare similar to the ones described above.
6.3.2 Electrical energy consumption
Some changes have been made to the way the electrical energy consumption is calculatedfor the Cosun concept. The previously mentioned MVR’s are electrically driven so theyare added to the energy consumption. The reduction of the amount of crystallizers alsomeans a decrease in the electrical energy consumption of the sugar house. The decreaseis predicted with calculations in a spreadsheet. The spreadsheet is included in the attach-ments. Here it is assumed that the specific electrical consumption, per ton white sugar, ofthe current process equals that of the Cosun concept with less crystallizers and additionaldistillation columns. Because of a lower production capacity of white sugar per hour theelectrical energy consumption is reduced with 0.97 MW.
50
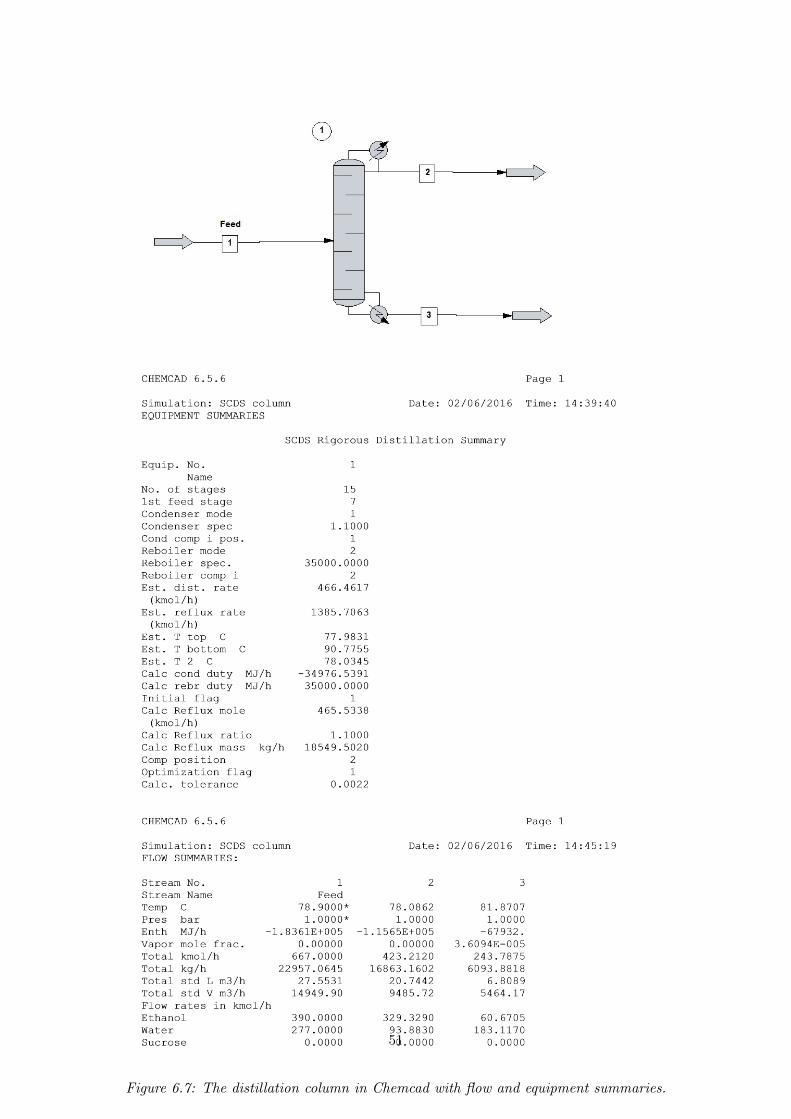
Figure 6.7: The distillation column in Chemcad with flow and equipment summaries.
51
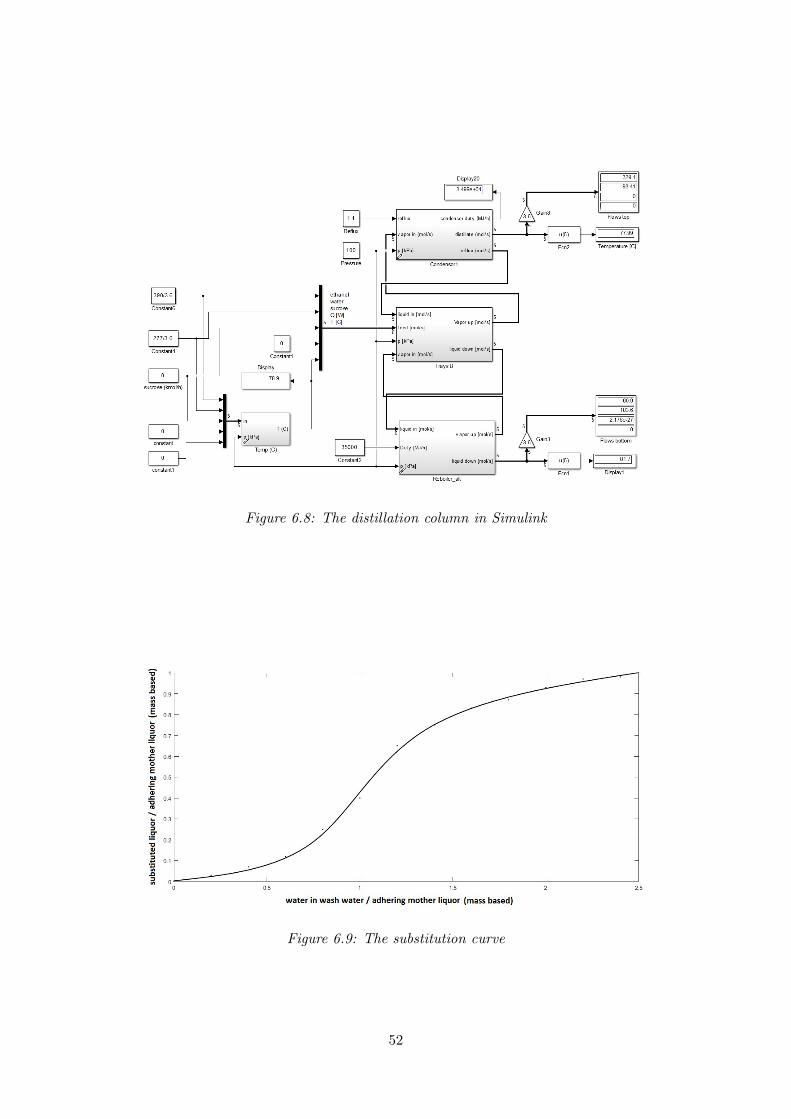
Figure 6.8: The distillation column in Simulink
Figure 6.9: The substitution curve
52
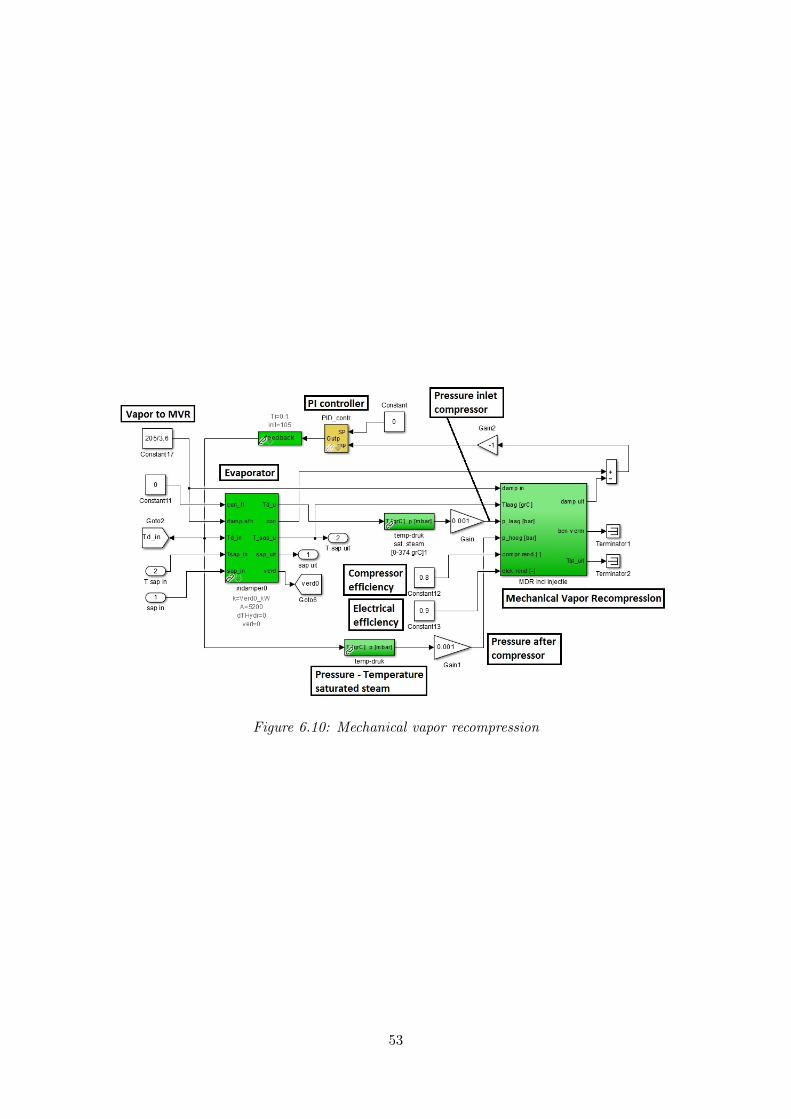
Figure 6.10: Mechanical vapor recompression
53
Chapter 7
Optimization
7.1 Distillation
In order to determine the most efficient feed point position of the stripping tower themodified STEM model was used. This was done by varying the feed point and minimizingthe amount of ethanol leaving the bottom of the column by adjusting the amount of powersupplied. The power is supplied in the form of vapor coming from evaporator 3. The vaporis directly injected at the bottom of the column. This way water is added to the productstream, reducing the boiling point elevation. The main aim for the stripper column isto separate the sugar without losing ethanol. All the ethanol should be present in thedistillate and all the sugar should leave the column at the bottom together with somewater. It became clear that the most efficient feed point is at the top of the column, asexpected. Also the amount of stages was determined using the modified STEM model.Increasing the amount of stages increases the efficiency of separation and reduces theamount of energy needed. However, the separation effect per added stage decreases and ata certain amount of added stages the separation does not improve. Adding more stages isfutile. For the Cosun concept the amount of theoretical stages was found to be 10. Addinga reflux to the column results is a less efficient separation, therefor no reflux is needed.
The vapor leaving the top of the column is directed towards the rectifier column. In therectifier column the water and ethanol are separated up to a certain purity. The reboileris fed by vapor coming from evaporator 5. This vapor has a lower temperature than thevapor used for the stripping column. The reason for this is that the rectifier column doesnot contain any sugar, so no boiling point elevation occurs, and the ratio ethanol/wateris different compared to the stripping column. A temperature of around 100 ◦C (boilingpoint water) is sufficient. The vapor is kept separate from the product in order to avoiddilutions and to maximize the separation efficiency.
It is desired that the rectifier column separates the ethanol to a purity (mass based)of around 90 % or higher with a minimum amount of energy supplied. Allowing for toomuch water in the ethanol would lead to lower crystallization yields increasing again theamount of ethanol or cooling required. The amount of energy required for water/ethanolseparation should be preferably lower than the energy demand in the bioethanol. The sameprocedure, used to determine the configuration of the stripping column, was also appliedto determine the configuration of the rectifying column. After an extensive analysis itbecame clear that the optimal feed point is the bottom tray.
Increasing the purity of the ethanol, leaving the top of the column, can be done byincreasing the reflux ratio or the amount of trays. Increasing the amount of trays meansincreased equipment costs and increasing the reflux ratio results in a higher energy demand
54
during production. The modified STEM model was used to determine how many traysshould be applied to reduce the energy demand and still have a significant separationeffect on all the trays. It turned out that roughly 20 theoretical trays is sufficient for therectifier column. More trays will not increase the separation efficiency and will lead tohigher equipment costs.
7.2 Ratio cooling/anti-solvent crystallization
As already mentioned in chapter 5 crystallizing with only anti-solvent (ethanol) is notfeasible because the crystal yield is simply not high enough. Additional cooling crystal-lization is considered in this study. Working with two crystallization principles introducesan additional variable that can be changed in order to optimize the process. In orderto determine the most energy reducing configuration several ethanol mass flows were im-posed and the cooling effect was adjusted in order to get a sufficient crystal yield andlow condenser losses. It turned out that the more ethanol was used the higher the energydemand turned out to be. The energy consumption for cooling the crystallizer is very lowcompared to the energy consumption associated with the ethanol flow. In the final com-parison two Cosun Concepts were chosen with ethanol flows that allow for high enoughpurities of the separated ethanol, the right crystal yield and a realistic temperature dropover the crystallizer allowing for convenient separation in the centrifuges. The processflow diagrams corresponding to the different ratio’s are included in the attachments. Thecrystallizer in Cosun Concept 1 is fed with 5 kg/s ethanol and is cooled down 35.5 degrees.This concept has a significant condenser loss, required to have a high enough purity ofthe separated ethanol. The Cosun Concept 2 crystallizer is fed with 4 kg/s ethanol andcooled down 40.3 degrees. This concept has zero condenser loss in the sugar house androughly the same purity of the ethanol.
After the optimization of the ratio cooling/anti-solvent addition it turned out thatthe cooling water, leaving the crystallizer, is not heated enough to deploy it elsewhere inthe sugar/bioethanol plant. The preheating of the process flows in the plant is alreadyachieved by other means or require higher temperatures. Therefor the associated energyof the cooling water should be considered as lost to the environment.
55
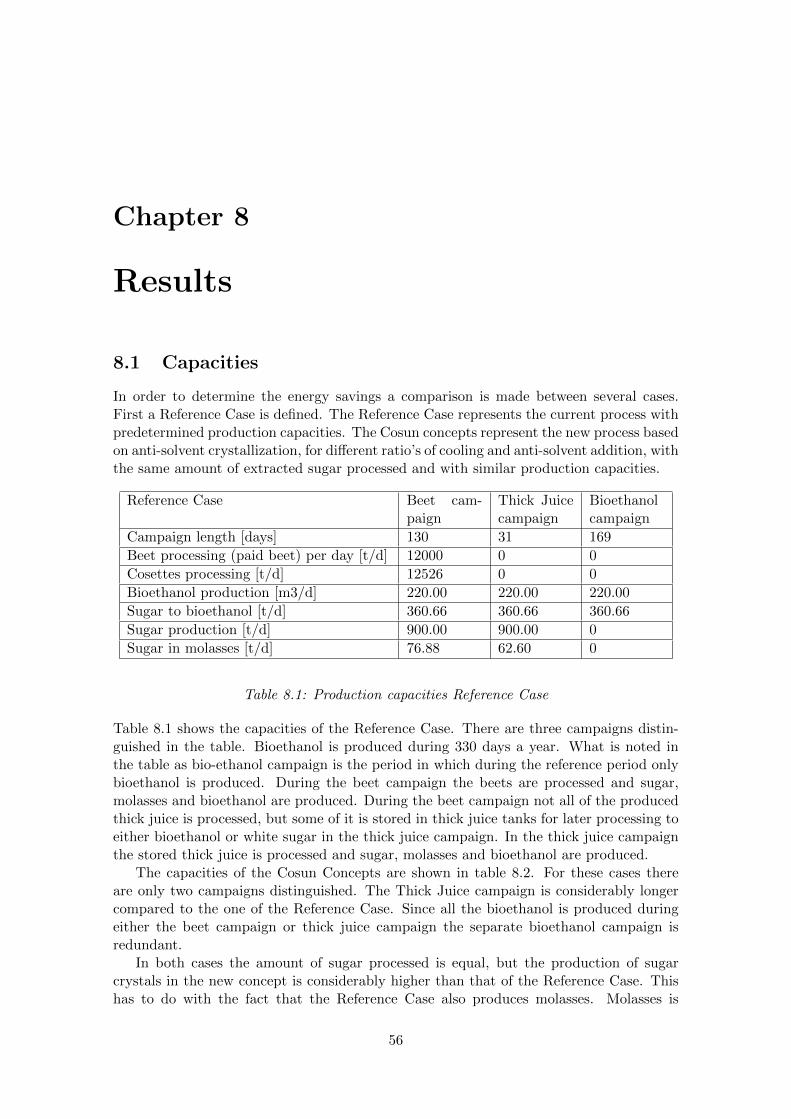
Chapter 8
Results
8.1 Capacities
In order to determine the energy savings a comparison is made between several cases.First a Reference Case is defined. The Reference Case represents the current process withpredetermined production capacities. The Cosun concepts represent the new process basedon anti-solvent crystallization, for different ratio’s of cooling and anti-solvent addition, withthe same amount of extracted sugar processed and with similar production capacities.
Reference Case Beet cam-paign
Thick Juicecampaign
Bioethanolcampaign
Campaign length [days] 130 31 169
Beet processing (paid beet) per day [t/d] 12000 0 0
Cosettes processing [t/d] 12526 0 0
Bioethanol production [m3/d] 220.00 220.00 220.00
Sugar to bioethanol [t/d] 360.66 360.66 360.66
Sugar production [t/d] 900.00 900.00 0
Sugar in molasses [t/d] 76.88 62.60 0
Table 8.1: Production capacities Reference Case
Table 8.1 shows the capacities of the Reference Case. There are three campaigns distin-guished in the table. Bioethanol is produced during 330 days a year. What is noted inthe table as bio-ethanol campaign is the period in which during the reference period onlybioethanol is produced. During the beet campaign the beets are processed and sugar,molasses and bioethanol are produced. During the beet campaign not all of the producedthick juice is processed, but some of it is stored in thick juice tanks for later processing toeither bioethanol or white sugar in the thick juice campaign. In the thick juice campaignthe stored thick juice is processed and sugar, molasses and bioethanol are produced.
The capacities of the Cosun Concepts are shown in table 8.2. For these cases thereare only two campaigns distinguished. The Thick Juice campaign is considerably longercompared to the one of the Reference Case. Since all the bioethanol is produced duringeither the beet campaign or thick juice campaign the separate bioethanol campaign isredundant.
In both cases the amount of sugar processed is equal, but the production of sugarcrystals in the new concept is considerably higher than that of the Reference Case. Thishas to do with the fact that the Reference Case also produces molasses. Molasses is
56
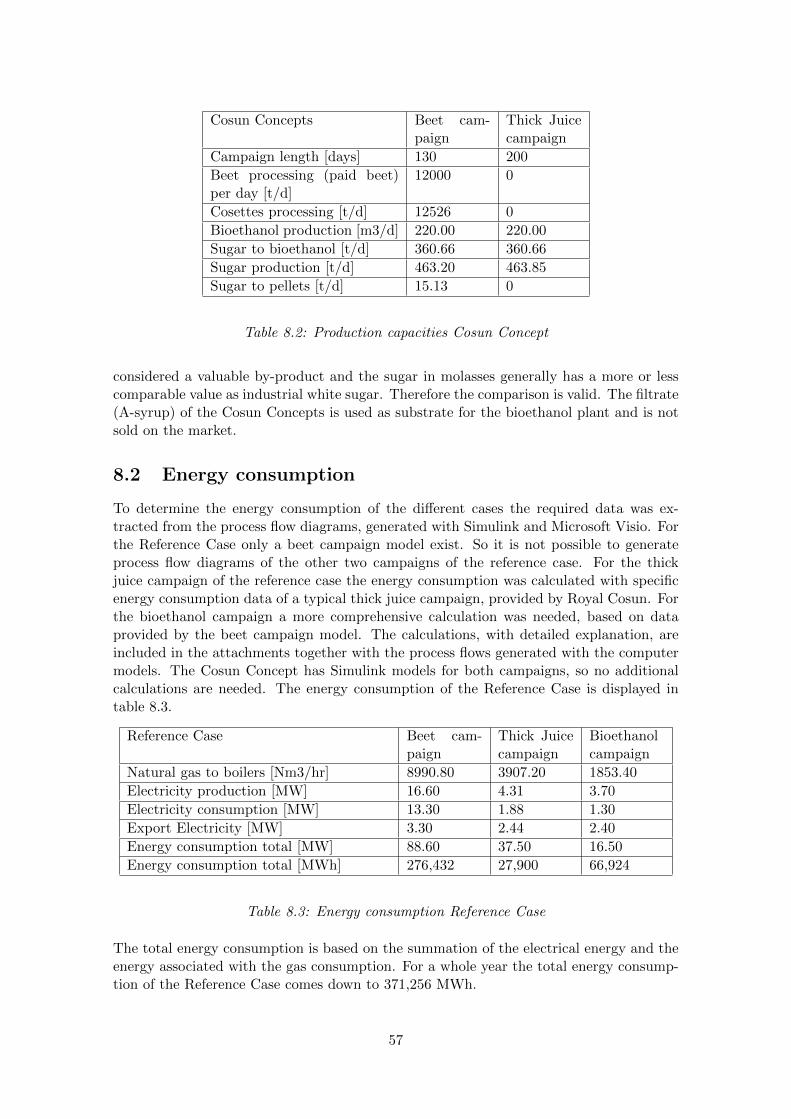
Cosun Concepts Beet cam-paign
Thick Juicecampaign
Campaign length [days] 130 200
Beet processing (paid beet)per day [t/d]
12000 0
Cosettes processing [t/d] 12526 0
Bioethanol production [m3/d] 220.00 220.00
Sugar to bioethanol [t/d] 360.66 360.66
Sugar production [t/d] 463.20 463.85
Sugar to pellets [t/d] 15.13 0
Table 8.2: Production capacities Cosun Concept
considered a valuable by-product and the sugar in molasses generally has a more or lesscomparable value as industrial white sugar. Therefore the comparison is valid. The filtrate(A-syrup) of the Cosun Concepts is used as substrate for the bioethanol plant and is notsold on the market.
8.2 Energy consumption
To determine the energy consumption of the different cases the required data was ex-tracted from the process flow diagrams, generated with Simulink and Microsoft Visio. Forthe Reference Case only a beet campaign model exist. So it is not possible to generateprocess flow diagrams of the other two campaigns of the reference case. For the thickjuice campaign of the reference case the energy consumption was calculated with specificenergy consumption data of a typical thick juice campaign, provided by Royal Cosun. Forthe bioethanol campaign a more comprehensive calculation was needed, based on dataprovided by the beet campaign model. The calculations, with detailed explanation, areincluded in the attachments together with the process flows generated with the computermodels. The Cosun Concept has Simulink models for both campaigns, so no additionalcalculations are needed. The energy consumption of the Reference Case is displayed intable 8.3.
Reference Case Beet cam-paign
Thick Juicecampaign
Bioethanolcampaign
Natural gas to boilers [Nm3/hr] 8990.80 3907.20 1853.40
Electricity production [MW] 16.60 4.31 3.70
Electricity consumption [MW] 13.30 1.88 1.30
Export Electricity [MW] 3.30 2.44 2.40
Energy consumption total [MW] 88.60 37.50 16.50
Energy consumption total [MWh] 276,432 27,900 66,924
Table 8.3: Energy consumption Reference Case
The total energy consumption is based on the summation of the electrical energy and theenergy associated with the gas consumption. For a whole year the total energy consump-tion of the Reference Case comes down to 371,256 MWh.
57

Cosun Concept 1 Beet cam-paign
Thick Juicecampaign
Natural gas to boilers[Nm3/hr]
5190.20 3093.00
Electricity production [MW] 8.50 6.20
Electricity consumption[MW]
18.60 5.90
Export Electricity [MW] -10.10 0.30
Energy consumption total[MW]
63.17 31.33
Energy consumption total[MWh]
197,090 150,384
Table 8.4: Energy consumption Cosun Concept 1
During all the campaigns of the Reference Case more electricity is produced thanconsumed, resulting in a year round export of electricity. For Cosun Concept 1 this isclearly not the case as can be be seen in table 8.4. During the beet campaign a lot ofelectrical energy has to be imported due to the decrease of electricity generation, causedby the reduced steam production, and the increase of electricity consumption, caused bythe mechanical vapor recompression evaporators. However, the total energy consumptionin lower than that of the Reference Case beet campaign and comes down to 347,474MWh. The results for Cosun Concept 2 are displayed in table 8.5. For a whole year thetotal energy consumption of Cosun Concept 2 comes down to 333,130 MWh. This is alower energy consumption compared to Cosun Concept 1. This was expected, as alreadymentioned in chapter ”Optimization”, due to the shift towards cooling crystallization.
Cosun Concept 2 Beet cam-paign
Thick Juicecampaign
Natural gas to boilers[Nm3/hr]
5,083.90 2,799.30
Electricity production [MW] 8.30 5.60
Electricity consumption[MW]
18.60 5.90
Export Electricity [MW] -10.30 -0.30
Energy consumption total[MW]
62.28 28.92
Energy consumption total[MWh]
194,314 138,816
Table 8.5: Energy consumption Cosun Concept 2
58
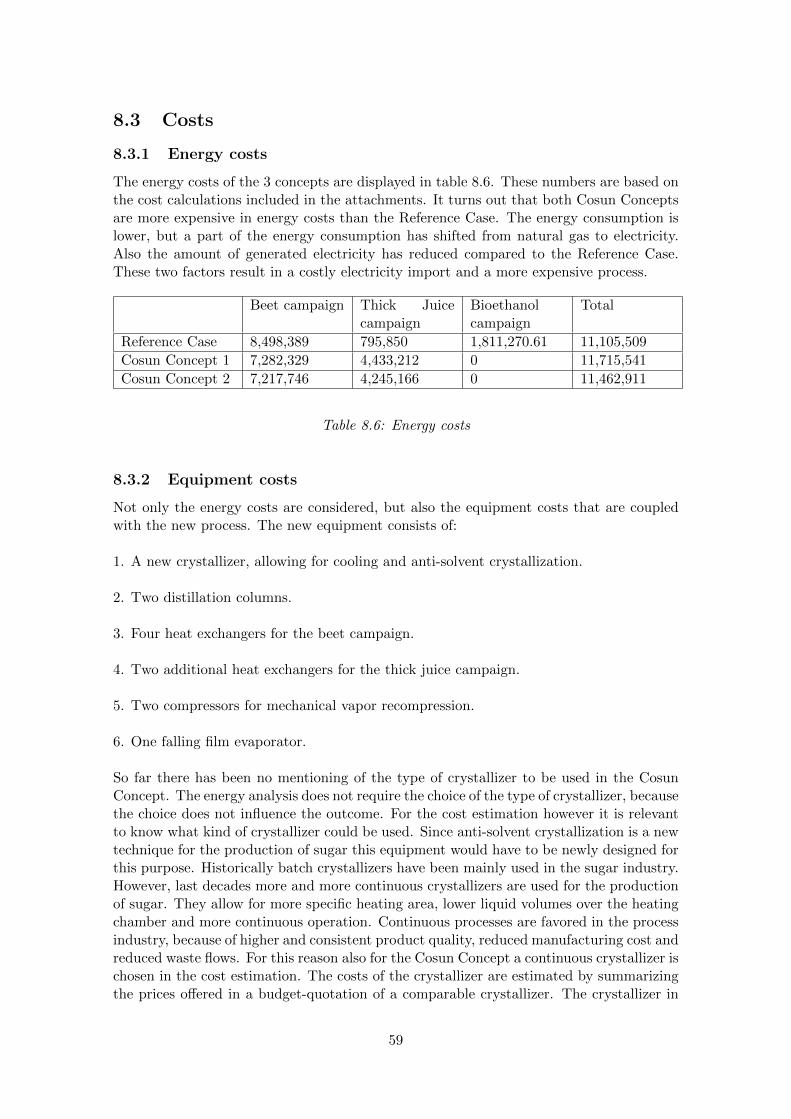
8.3 Costs
8.3.1 Energy costs
The energy costs of the 3 concepts are displayed in table 8.6. These numbers are based onthe cost calculations included in the attachments. It turns out that both Cosun Conceptsare more expensive in energy costs than the Reference Case. The energy consumption islower, but a part of the energy consumption has shifted from natural gas to electricity.Also the amount of generated electricity has reduced compared to the Reference Case.These two factors result in a costly electricity import and a more expensive process.
Beet campaign Thick Juicecampaign
Bioethanolcampaign
Total
Reference Case 8,498,389 795,850 1,811,270.61 11,105,509
Cosun Concept 1 7,282,329 4,433,212 0 11,715,541
Cosun Concept 2 7,217,746 4,245,166 0 11,462,911
Table 8.6: Energy costs
8.3.2 Equipment costs
Not only the energy costs are considered, but also the equipment costs that are coupledwith the new process. The new equipment consists of:
1. A new crystallizer, allowing for cooling and anti-solvent crystallization.
2. Two distillation columns.
3. Four heat exchangers for the beet campaign.
4. Two additional heat exchangers for the thick juice campaign.
5. Two compressors for mechanical vapor recompression.
6. One falling film evaporator.
So far there has been no mentioning of the type of crystallizer to be used in the CosunConcept. The energy analysis does not require the choice of the type of crystallizer, becausethe choice does not influence the outcome. For the cost estimation however it is relevantto know what kind of crystallizer could be used. Since anti-solvent crystallization is a newtechnique for the production of sugar this equipment would have to be newly designed forthis purpose. Historically batch crystallizers have been mainly used in the sugar industry.However, last decades more and more continuous crystallizers are used for the productionof sugar. They allow for more specific heating area, lower liquid volumes over the heatingchamber and more continuous operation. Continuous processes are favored in the processindustry, because of higher and consistent product quality, reduced manufacturing cost andreduced waste flows. For this reason also for the Cosun Concept a continuous crystallizer ischosen in the cost estimation. The costs of the crystallizer are estimated by summarizingthe prices offered in a budget-quotation of a comparable crystallizer. The crystallizer in
59

the budget-quotation has a volume of 224 m3 resulting in a residence time for the ReferenceCase of 2.5 hours. The residence time of the crystallizer in the Cosun Concept is estimatedto be twice the residence time of the traditional process. However the production capacityof white sugar is halved compared to the reference case. This means that the volume ofnew crystallizer is roughly the same as the one in the budget-quotation. The total costsof the crystallizer, excluding installation, comes down to 1.5 million euro.
The costs of the heat exchangers are estimated with the ”DACE Price Booklet” [23].For heat exchangers this booklet provides the costs as function of the surface area, materialand type of heat exchanger. Table 8.7 provides the specifications of the heat exchangersand the associated costs. Heat exchanger VKS WT 2 is a tube heat exchanger, becausethe product flow has a fouling tendency. The other heat exchangers are all plate heatexchangers. The area’s of the heat exchangers are taken from the modified STEM model.These area’s were chosen, together with typical heat transfer coefficients based on expe-rience, in order to facilitate a sufficient heat exchange. Table 8.8 shows the specificationsof the heat exchangers and the associated costs for the additional heat exchangers neededfor the thick juice campaign.
Name Type Material Area [m2] Price [Euro]
VKS WT 2 Tube AISI316 800 280,000
HEX MASH Plate AISI316 340 100,000
HEX COND Plate AISI 316 40 23,000
HEX STRIP Plate AISI 316 250 59,500
Table 8.7: Equipment costs additional heat exchangers for beet campaign
Name Type Material Area [m2] Price [Euro]
HEX SYR Plate AISI 316 310 70,000
HEX REG Plate AISI 316 92 32,000
Table 8.8: Equipment costs additional heat exchangers for thick juice campaign
According to the ”DACE Price Booklet” [23] the cost of a distillation column is afunction of the average wall thickness, the diameter and the material of the column. Theaverage wall thickness was estimated with available data of existing distillation columnsfor the purification of ethanol in the bioethanol plant. The estimated wall thickness of thestripping column is 10 mm and the wall thickness of the rectifying column 14 mm. For thematerial of the columns AISI 304 was chosen, equal to the material of the existing columnsof the bioethanol plant. The diameter of the columns were calculated using correlationsprovided by the book ”Separation Process Principles” [24, p. 225]. The calculations areincluded in the attachments. The required data was either extracted from the modifiedSTEM model or from other sources, clearly indicated at the calculations. The estimateddiameter of the rectifying column turns out to be a little more than 2 meters and thediameter of the stripping column close to 1,5 meters. According to the ”DACE PriceBooklet” [23] the cost for the rectifier column, without internals, with a diameter of 2,5meters, a wall thickness of 14 mm and made of AISI 304 would come down to 534,000euro. For the stripping column, with a diameter of 1,5 meters, a wall thickness of 10 mmand made out of AISI 304 this comes down to 286,000 euro. These prices do not includethe sieve trays of the distillation column. The total cost of the sieve trays is a function
60
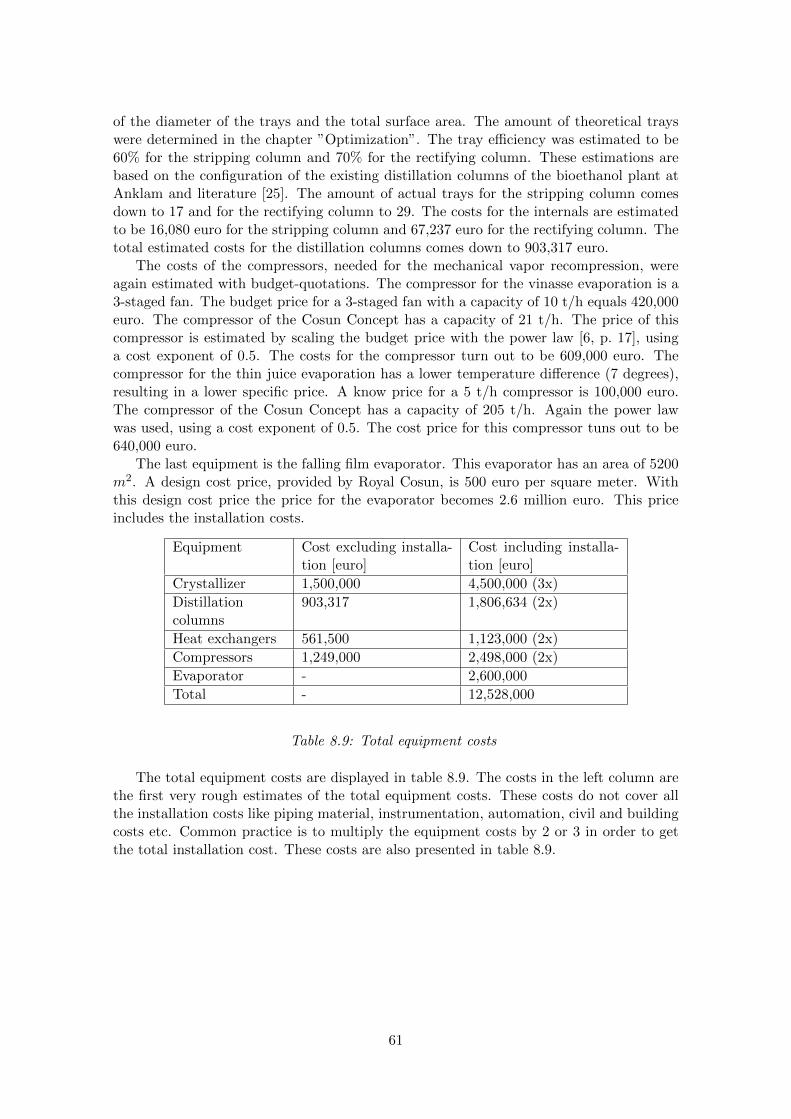
of the diameter of the trays and the total surface area. The amount of theoretical trayswere determined in the chapter ”Optimization”. The tray efficiency was estimated to be60% for the stripping column and 70% for the rectifying column. These estimations arebased on the configuration of the existing distillation columns of the bioethanol plant atAnklam and literature [25]. The amount of actual trays for the stripping column comesdown to 17 and for the rectifying column to 29. The costs for the internals are estimatedto be 16,080 euro for the stripping column and 67,237 euro for the rectifying column. Thetotal estimated costs for the distillation columns comes down to 903,317 euro.
The costs of the compressors, needed for the mechanical vapor recompression, wereagain estimated with budget-quotations. The compressor for the vinasse evaporation is a3-staged fan. The budget price for a 3-staged fan with a capacity of 10 t/h equals 420,000euro. The compressor of the Cosun Concept has a capacity of 21 t/h. The price of thiscompressor is estimated by scaling the budget price with the power law [6, p. 17], usinga cost exponent of 0.5. The costs for the compressor turn out to be 609,000 euro. Thecompressor for the thin juice evaporation has a lower temperature difference (7 degrees),resulting in a lower specific price. A know price for a 5 t/h compressor is 100,000 euro.The compressor of the Cosun Concept has a capacity of 205 t/h. Again the power lawwas used, using a cost exponent of 0.5. The cost price for this compressor tuns out to be640,000 euro.
The last equipment is the falling film evaporator. This evaporator has an area of 5200m2. A design cost price, provided by Royal Cosun, is 500 euro per square meter. Withthis design cost price the price for the evaporator becomes 2.6 million euro. This priceincludes the installation costs.
Equipment Cost excluding installa-tion [euro]
Cost including installa-tion [euro]
Crystallizer 1,500,000 4,500,000 (3x)
Distillationcolumns
903,317 1,806,634 (2x)
Heat exchangers 561,500 1,123,000 (2x)
Compressors 1,249,000 2,498,000 (2x)
Evaporator - 2,600,000
Total - 12,528,000
Table 8.9: Total equipment costs
The total equipment costs are displayed in table 8.9. The costs in the left column arethe first very rough estimates of the total equipment costs. These costs do not cover allthe installation costs like piping material, instrumentation, automation, civil and buildingcosts etc. Common practice is to multiply the equipment costs by 2 or 3 in order to getthe total installation cost. These costs are also presented in table 8.9.
61

Chapter 9
Discussion
In chapter 4 some uncertainties were presented that normally arise when confronted withthe principle of anti-solvent crystallization. With this study only a few of the uncertaintiescan be eliminated.
The stability, the handling and safety of the anti-solvent were briefly discussed inchapter 5. The Anti-solvent turns out to be flammable and explosive vapor mixtures caneasily emerge. The prevention of explosions consists of working with closed systems andexplosion-proof electrical equipment. This means that the investment costs increase dueto the properties of the anti-solvent.
The possible regeneration of the anti-solvent and how the anti-solvent influences thesolubility of the dissolved sugar has thoroughly been discussed in this report. Models werecreated to predict the energy consumption linked to the separation of the anti-solvent andseveral solubility models were examined to predict the influence of the anti-solvent.
The study answers the question what investments need to be done and what theoperating costs are. How much energy that can actually be saved. It turns out thatenergy can be saved, but the reduction is not enough to compensate for the investments.In the Cosun Concept the natural gas consumption is partly compensated by electricity.If another concept would be thought out, that limits the shift to electricity, the conceptcould become cost effective regarding the operating costs. However, the investments wouldstill tackle the concept.
The crystallization kinetics and the quality of the food product was not examined inthis study. The research approach was to first examine the feasibility of anti-solvent crys-tallization in regard of the energy consumption and operating costs. The crystallizationkinetics and the quality would be examined in a successive study when the first studywould provide promising results.
62
Chapter 10
Conclusion
During this study the feasibility of anti-solvent crystallization was investigated. Based onthe created models it turns out that the Cosun Concept, without evaporative crystallizers,is possible. The desired amount of sugar beets can be processed and the crystal yield ishigh enough. Also the energy consumption is slightly reduced. However, this concept isnot cost effective. The combination of reduced steam production, causing less electricitygeneration, and a higher electricity consumption results is a more expensive process.
The results of this study are less promising than the initial estimates made by RoyalCosun. This has to do with the fact that more ethanol is needed to create a high enoughcrystal yield than previously thought. Also the electricity consumption turns out to behigher than expected, due to the implementation of the compressors to facilitate an efficientthickening of the thin juice and vinasses.
It turns out that unavoidable heat losses remain and that energy is lost to the envi-ronment. For example the energy delivered by the crystallizer to the cooling water (1.8MW) can not be deployed in the process, because there is simply no need for it or thetemperature of the cooling water is too low. Also the A-syrup that is used as substratefor the fermentation has a high temperature (117 ◦C), but the associated energy cannotbe deployed usefully.
The last cause why the Cosun Concept is less promising has to do with the fact thatmore water is sent to the fermentation resulting in a more energy consuming thickeningof the vinasses by the recompression evaporators.
Throughout the study the principle of cooling crystallization revealed itself as a po-tential energy saving concept. The Cosun Concept already heavily relies on this principleand the optimization of the concept turned out positive for this principle. This studygives rise to a follow-up study to determine if cooling crystallization could provide betterresults.
63
Bibliography
[1] Ruben C. Kolfschoten, Folpert Douma, Johan P.M. Sanders, Arnoud Togtema,Marieke E, Bruins, Development of a new method for sugar crystallisation. Wagenin-gen UR, Wageningen, 2013.
[2] Harald Oosterhof, Antisolvent crystallization of Sodium Carbonate. Universal PressScience Publishers, Veenendaal, 1999.
[3] Martine Decloux, Frederique Labatut, Michael Saska and Mary An Godshall, Effectof ethanol on sucrose solubility and molasses exhaustion. International Sugar Journal,Vol. 103, 2001.
[4] E. R. Asquieri, E. M. de Assis and G.E. Serra, Refining of crystal sugar with ethanol.Alimentaria, Enero-Febrero, Madrid Vol. 38, 2002.
[5] Marco Giulietti and Andre Bernardo, Crystallization by Antisolvent Addition andCooling. Chemical Engineering Department Federal University of So Carlos UFSCar,Brasil.
[6] Robin Smith, Chemical Process Design and Integration. John Wiley & Sons, WestSussex, 1nd Edition, 2005.
[7] Albert M. Schwartz and Allan S. Myerson, Handbook of Industrial Crystallization.Butterworth-Heinemann, Boston, 2nd Edition, 2001.
[8] Wayne Genck, Make The Most of Antisolvent Crystallization. Genck International,Nov 08, 2010.
[9] Inside a sugar factory (presentation). British Sugar, 2010.
[10] Ruben C. Kolfschoten, Marieke E. Bruins and Johan P.M. Sanders, Opportunities forsmall-scale biorefinery for production of sugar and ethanol in the Netherlands. JohnWiley & Sons, 2014.
[11] R.L. Earle with M.D. Earle, Unit Operations in Food Processing, Web Edition. TheNew Zealand Institute of Food Science & Technology (Inc.), 2004.
[12] Cursus suikertechnologie CSM - RT. CSM Suiker BV & Tiense Suikerraffinaderij NV,1987.
[13] Evaporation Technology using Mechanical Vapour Recompression (Brochure). GEAWiegand GmbH, Ettlingen (Germany), no date.
[14] H. Schiwek & A. Kolber, Zur Frage der optimalen Ausbilding der Zuckerkruste beiKrustenpralinen. Susswaren 8, 1975.
64

[15] Antonio M. Peres, Eugenia A. Macedo, Phase equilibria of D-glucose and sucrosein mixed solvent mixtures: Comparison of UNIQUAC -based models. Laboratory ofSeparation and Reaction Engineering, Porto, 1997.
[16] Andreanne Bouchard, Gerard W. Hofland, Geert-Jan Witkamp, Properties of Sugar,Polyol and Polysaccharide Water-Ethanol Solutions. Process Equipment, Delft Uni-versity of technology, Delft, 2007.
[17] Z. Bubnik, P. Kadlec, D. Urban, M. Bruhns, Sugar Technologists Manual: Chemicaland Physical Data for Sugar Manufacturers and Users. Bartens, Berlin, 1995.
[18] Wilfried Cordes, Some Mixture Properties of Ethanol and Water: Vapor-liquid equi-librium of the mixture of Ethanol and Water. Dortmund Data Bank, 2008.
[19] Boris Zhmud, Ph.D., Assoc.Prof., MRSC, Viscosity Blending Equations. SveaconConsulting (Lube Magazine), Stockholm, 2014.
[20] J. A. LARKIN, Thermodynamic properties of aqueous non-electrolyte mixtures I. Ex-cess enthalpy for water + ethanol at 298.15 to 383.15 K. Division of Chemical Stan-dards, National Physical Laboratory, Teddington, U.K., 1974.
[21] Chemiekaarten, Chemiekaarten, Gegevens voor veilig werken met chemicalien. SduUitgevers, Den Haag 30th Edition, 2014.
[22] Lisa Weise, Rigorous column simulation - SCDS (Tutorial). Chemstations EuropeGmbH
[23] DACE Cost and Value, The Dutch Network and Knowledge Center for Cost Engi-neering and Value Management, DACE Price Booklet. Helene Hartlief, Nijkerk, 31thEdition, November 2015.
[24] J. D. Seader, Ernest J. Henley, D. Keith Roper, SEPARATION PROCESS PRINCI-PLES, Chemical and Biochemical Operations. John Wiley & Sons, Inc., 3th Edition,2011.
[25] Daniel R. Summers, P.E., RECTIFIER DESIGN FOR FUEL ETHANOL PLANTS.Sulzer Chemtech USA, Inc., San Francisco, November 2006.
65
Attachments
1. Energy and Costs calculation
2. Reduction energy costs calculation
3. Reference Case PFD
4. Beet campaign Cosun Concept 1 PFD
5. Beet campaign Cosun Concept 2 PFD
6. Thick Juice campaign Cosun Concept 1 PFD
7. Thick Juice campaign Cosun Concept 2 PFD
8. Equilibrium calculation column STEM
9. Phase equilibria of D-glucose and sucrose in mixed solvent mixtures - Comparison ofUNIQUAC models
10. Calculation Columns
11. Chemiekaarten - ethanol