Design of an adaptive weir - TU Delft Repositories
174
Design of an adaptive weir A case study of the replacement of weir Belfeld R.S.J. (Ruben) Frijns
-
Upload
khangminh22 -
Category
Documents
-
view
3 -
download
0
Transcript of Design of an adaptive weir - TU Delft Repositories

Design of an adaptive weir A case study of the replacement of weir Belfeld
R.S.J. (Ruben) Frijns

(This page is intentionally left blank)
Design of an adaptive weir
a case study of the replacement of weir Belfeld
by
R.S.J. (Ruben) Frijns
to obtain the degree of Master of Science
at the Delft University of Technology
to be defended publicly on Wednesday November 13, 2019 at 2:00 p.m.
Faculty Civil Engineering and Geosciences
Study programme Civil Engineering; Master’s track Hydraulic Engineering; specialization Hydraulic Structures and Flood Risk
Student number 4274652
Thesis committee
dr. ir. J.D. Bricker Chairman, Hydraulic Structures and Flood Risk, TU Delft
dr. ing. M.Z. Voorendt Daily supervisor, Hydraulic Structures and Flood Risk, TU Delft
dr. R.R.P. van Nooijen Supervisor, Water Resource Management, TU Delft
ir. H.G. Tuin Company supervisor, ARCADIS
An electronic version of this thesis is available at https://repository.tudelft.nl/.

Design of an adaptive weir
i
Preface
This thesis is the final result of the master study Hydraulic Engineering, specialization Hydraulic Structures,
at the faculty of Civil Engineering and Geosciences of the Delft University of Technology. This study on
the design of an adaptive weir has been proposed by the engineering firm ARCADIS. I am thankful to
ARCADIS for formulating such a suitable and hot subject for my thesis and the possibility to execute most
of the study on their offices in Rotterdam and Amersfoort.
More specific, this thesis focusses on the replacement of the weirs in the Meuse River. Seven weirs have
been built to transport coals in the previous century. Although this is not the case anymore, the weirs and
the water level control are indispensable. In the meantime, the weirs and their operation are ageing and
replacement is demanded by the asset owner Rijkswaterstaat. This project contains a proposal to replace the
weirs by adaptive weirs, which are based on an analysis of the total dammed section of the Dutch Meuse
River. The future uncertainty is taken into consideration by the Dutch delta scenarios, which represent a
wide spectrum of developments in the future. Eventually, an overview of useful measures in the specific
weir section of weir Belfeld is given for the upcoming century to deal with these developments; partly by
adapting the weir, partly by taking adaptation measures along the river section. Supporting analyses can be
found in the appendices of this report.
Without support, this report would have not been established. First of all, I want to thank my entire thesis
committee for their enthusiasm during the progress meetings. Jeremy Bricker, chair of my graduation
committee, has been important from the beginning by initiating the contact between ARCADIS and me. I
am also grateful to Mark Voorendt for his involvement during the project; I liked our pleasant relationship,
also during other activities. Ronald van Nooijen is certainly worth mentioning as well, since his great input
from the field of water management helped to solve and explain the related issues in a clear manner. Last, I
really appreciate the support from ARCADIS, specifically from Henry Tuin and Hessel Voortman. Both
assisted me in setting up my project plan and introduced me to the concept of adaptive designing. The
progress during the nearly weekly meetings with them has been invaluable.
Last, a big thanks to all my family and friends. They supported me and gave me distraction during the
challenging periods of this project. Without them, these periods would have been longer and harder as well.
Special thanks go to Patrick Steskens, who reviewed the final report and gave some last useful feedback.
R.S.J. Frijns
Rotterdam, November 2019

ii
Abstract
In contrast with other Dutch rivers parts, human measures in the upstream part of the River Meuse did not
mainly focus on discharging surplus water, but on retaining water in dry periods. Almost 100 years ago seven
weirs were constructed in the River Meuse to enable transport of coals. The structures reach, due to concrete
degradation, the end of their technical lifetime and the manual operation does not meet the current ARBO-
legislation; both make replacement of the weirs required. Rijkswaterstaat, asset owner of the waterways and
weirs, invited the civil engineering sector to collectively develop weir replacement strategies in 2015. The
future developments of the river and surroundings were an important subject during the meetings. With
this in mind, during the co-creation meetings under the title ‘Grip op de Maas’, one of the proposed weir
replacement strategies was called the Adaptive Meuse (De Bouwcampus, 2015). This perspective took the
future uncertainty into account by proposing adaptive designing of the weirs. This study builds on this
perspective by the objective of designing an adaptive weir in the River Meuse according to the approach of
adaptive delta management.
This approach states that designs have to be flexible and able to switch between multiple strategies for future
challenges concerning flood safety and freshwater storage. In this study, an overview of the measures
required to deal with the development of specific purposes is provided by adaptation schemes. When and
if a specific purpose applies, depends on which of the four Dutch delta scenarios, DRUK, STOOM, RUST
and WARM, evolves. These scenarios are based on a unique combination of the rate of climate change and
socioeconomic developments (Wolters, Van den Born, Dammers, & Reinhard, 2018). Adaptivity is obtained
by regional adaptation measures over a particular stretch of the river and by weir adaptation measures. To
address both the adaptivity of the river and the weirs, three design levels have been established. These levels
are shown in Figure 1 and summed below:
Figure 1: Differentiation of the global, regional and local design level (OpenStreetMap Nederland, n.d.).
• The global design level comprises the total dammed section of the Dutch River Meuse and two
weir sections in Belgium. The series of weirs in the river still suffices the requirements; on this
scale, no large adaptations have to be made now or in the future.
Design of an adaptive weir
iii
• The regional design level comprises the weir sections Roermond and Belfeld, since the adaptivity
of these sections is the largest of all weir sections in the global design area.
• The local design level addresses the geometric design of weir Belfeld itself. The adaptivity of the
designed weir enables the discard of regional adaptation measures with undesired implications.
Global design level: section Monsin – Lith
Since both dehydration and permanent flooding of the river valley have to be prevented and the water
distribution over Belgium and the Netherlands is fixed in an agreement, the global adaptivity is limited. Weir
removal or replacement of the current weir by a new weir at a different location is in most weir sections
infeasible. Weir section Roermond forms an exception, since the commercial navigation uses the later dug
parallel Lateral Canal, part of weir section Belfeld. Thus, the majority of weir section Roermond can be
restricted to only recreational vessels. By modifications of weir Belfeld, it could possibly (partly) take over
the functions of weir Roermond in future. In 2030 however, one-to-one weir replacement is selected to
avert significant changes in groundwater table.
Regional design level: section Linne – Belfeld
For the regional design level, the future developments are split into the flexibility to groundwater changes,
the use of freshwater for drinking water production, agriculture and industrial activities, the discharge of
flood waves and the navigation on the River Meuse and to the port of Roermond. An adaptation scheme
indicates what regional adaptation measures and weir adaptation measures are required to serve the purposes
per time period in each of the four delta scenarios. On basis of this adaptation scheme, it is concluded that
by designing an adaptive weir, measures along the entire weir section, for instance raising embankments or
raising bridges, can be discarded in the future. The freedom of choice of the future waterway manager is
preserved by an adaptive weir.
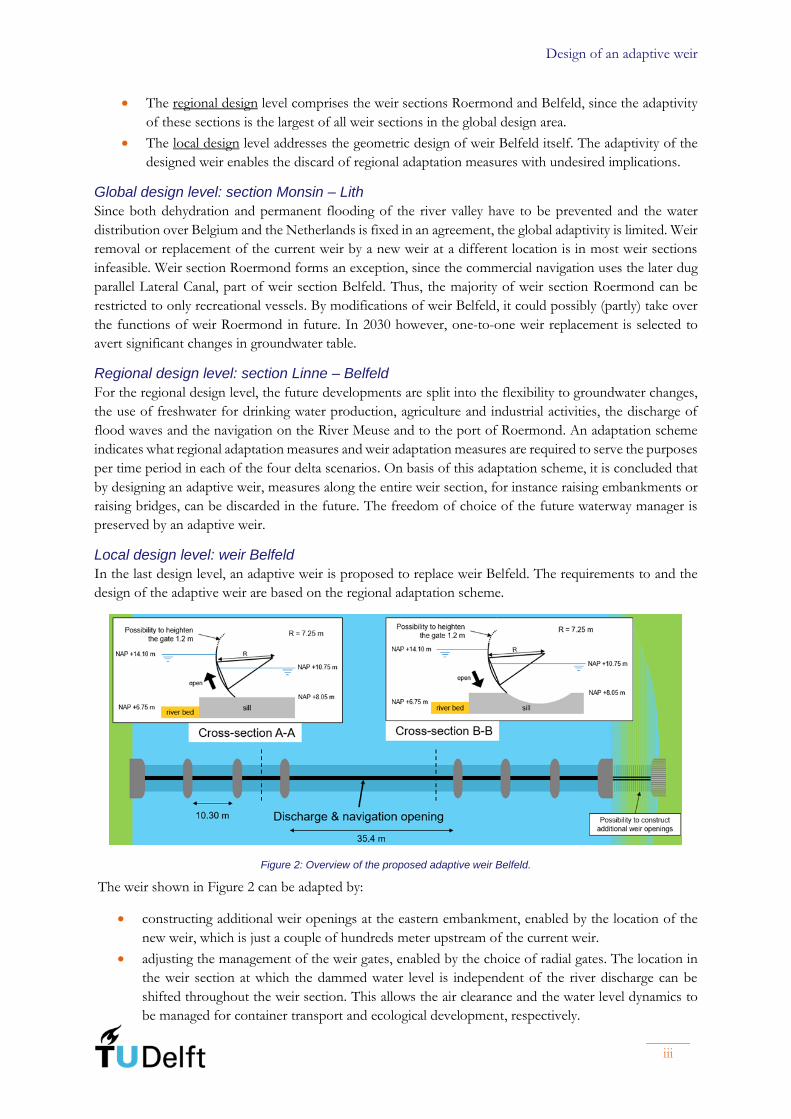
Local design level: weir Belfeld
In the last design level, an adaptive weir is proposed to replace weir Belfeld. The requirements to and the
design of the adaptive weir are based on the regional adaptation scheme.
Figure 2: Overview of the proposed adaptive weir Belfeld.
The weir shown in Figure 2 can be adapted by:
• constructing additional weir openings at the eastern embankment, enabled by the location of the
new weir, which is just a couple of hundreds meter upstream of the current weir.
• adjusting the management of the weir gates, enabled by the choice of radial gates. The location in
the weir section at which the dammed water level is independent of the river discharge can be
shifted throughout the weir section. This allows the air clearance and the water level dynamics to
be managed for container transport and ecological development, respectively.

iv
• heightening the dammed water level, also enabled by the choice of radial gates.
▫ To withstand the larger water head, the initial investment increases by 30%. However,
regional measures are saved in the future. Only the gates and height of the superstructure
have to be adapted in the future to heighten the dammed water level.
In conclusion, on global level, a change of the locations and numbers of weirs in the River Meuse is presently
not desired and required, since the functions are met with the current weir layout. To guarantee this in the
entire upcoming century, adaptations are required in the weir section Belfeld in the River Meuse. Table 1
shows the resulting adaptation scheme after construction of the proposed adaptive weir. Regional and weir
adaptation measures are presented that serve the mentioned scenario-dependent purposes. By the large
adaptivity of proposed weir design, regional adaptation measures along the river with undesired implications
can be discarded or minimized. Only if higher container vessels have to be accommodated on the Meuse
River or the accessibility of the Prins Willem-Alexanderport has to be improved, regional measures are
inevitable. The method used in this report can be used to set up adaptation schemes for all weir sections in
the River Meuse. By involving Rijkswaterstaat and other stakeholders, the schemes can be turned into
quantitative ones. Last, it is recommended to start structural calculations on the adaptive weir Belfeld.
Table 1: Adaptation scheme of weir section Belfeld after construction of the proposed design alternative.
Purpose Scenario (year) in
which the purpose
applies
Regional
adaptation measures
Binary
operator
Weir Belfeld
adaptation measures
Increasing the discharge
capacity of the river valley
DRUK (2050) ‘Room for the River’
measures ⊃
Enlarging the
flow opening
By 10%
STOOM (2050, 2100)
WARM (2100) By 15%
Preventing more frequent
flooding of the river valley
DRUK (2050) Raising the main
channel embankments
∪
dredging the main
channel
∪
Enlarging the
flow opening
By 10%
STOOM (2050) By 15%
∪
shifting the set point location
Accommodating higher
container vessels
DRUK (2050)
STOOM (2050)
Raising bridges on the
Maasroute ⊃ Shifting the set point location
Providing more
freshwater storage
DRUK (2050, 2075)
STOOM (2075, 2100)
WARM (2075, 2100)
Dredging a new lake
∪
enlarging an existing
lake
∪ Heightening to
maximum
NAP
+15.10 m
DRUK (2100) NAP
+15.30 m
Increasing the dynamics
in dedicated natural areas DRUK (2050) - - Shifting the set point location
Accommodating larger
vessels to the Prins
Willem-Alexanderport
DRUK (2075) Deepening the Prins
Willem-Alexanderport - -
Improving the
accessibility of the Prins
Willem-Alexanderport
DRUK (2100) Deepening the Prins
Willem-Alexanderport
∩
Removal of weir Roermond
∪
replacing weir Roermond
upstream
⊃ Heightening to maximum
NAP +15.30 m
Providing more frequent
flooding of the river valley WARM (2075, 2100)
Lowering the river
valley ∪
Heightening to maximum
NAP +15.10 m
Legend (A = regional adaptation measures; B = weir adaptation measures)
A ∩ B = intersection (A and B)
A ∪ B = union (A or B)
A ⊃ B = superset [(only A) or (minimized A + B)]

Design of an adaptive weir
v
List of symbols
Symbol Description Unit
A Cross-sectional area [m2]
B Width [m]
C Chézy-coefficient [m0.5/s]
D Draught [m]
Daquifer Saturated thickness of aquifer [m]
G Weight [kN]
H Energy head [m]
L Influence length [m]
N Infiltration [m/day]
PVt Present value at time t [€]
R Discount rate [%]
Q Discharge [m3/s]
coverflow Discharge coefficient for overflow [-]
cfreeunderflow Discharge coefficient for free underflow [-]
csubunderflow Discharge coefficient for submerged underflow [-]
d Water depth [m]
de Equilibrium water depth [m]
g Gravitational acceleration 9.81 [m/s2]
h Height [m]
ib Bed slope [-]
k Permeability [m/day]
q Specific discharge [m2/s]
u Flow velocity [m/s]
x Location along the river [m]
y Cross-sectional location [m]
zb River bed level [NAP + m]
η Water level [NAP + m]
ηGL Ground level [NAP + m]
ηGWT Groundwater table [NAP + m]
vi
Contents
Preface .............................................................................................................................................................................. i
Abstract ........................................................................................................................................................................... ii
List of symbols ............................................................................................................................................................... v
1 Introduction ......................................................................................................................................................... 1
1.1 Problem analysis .......................................................................................................................................... 2
1.2 Objective ...................................................................................................................................................... 3
1.3 Design method ............................................................................................................................................ 3
1.4 Thesis outline ............................................................................................................................................... 5
2 Framework of River Meuse’s weirs .................................................................................................................. 7
2.1 The hydrology of the River Meuse ........................................................................................................... 7
2.2 The development of the waterway network ........................................................................................... 8
2.3 Functioning of the current weirs ........................................................................................................... 10
2.4 Need for replacement of the current weirs .......................................................................................... 13
3 Global design: section Monsin-Lith .............................................................................................................. 17
3.1 Area analysis .............................................................................................................................................. 17
3.2 Functional analysis ................................................................................................................................... 18
3.3 Requirements analysis .............................................................................................................................. 22
3.4 Proposed weir replacement strategies ................................................................................................... 23
3.5 Verification & evaluation of weir replacement strategies .................................................................. 23
3.6 Selection of regional design area ............................................................................................................ 25
4 Regional design: section Linne-Belfeld ......................................................................................................... 27
4.1 Area analysis .............................................................................................................................................. 27
4.2 Functional analysis ................................................................................................................................... 29
4.3 Requirements analysis .............................................................................................................................. 34
4.4 Synthesis of regional design alternatives .............................................................................................. 36
4.5 Verification & evaluation of regional design alternatives .................................................................. 37
4.6 Weir replacement and adaptivity in section Linne-Belfeld ................................................................ 42
5 Local design: weir Belfeld ............................................................................................................................... 43
5.1 Area analysis .............................................................................................................................................. 43
5.2 Functional and requirement analysis ..................................................................................................... 44
5.3 Design synthesis & verification of local alternatives .......................................................................... 47
5.4 Evaluation of local design alternatives ................................................................................................. 53
5.5 Conceptual design of the adaptive weir Belfeld .................................................................................. 57
Design of an adaptive weir
vii
6 Conclusions & recommendations ................................................................................................................. 59
6.1 Conclusions ............................................................................................................................................... 59
6.2 Recommendations ................................................................................................................................... 61
References .................................................................................................................................................................. 62
Appendix A Delta scenarios ................................................................................................................................ 67
A.1 Regional scenario developments............................................................................................................ 67
A.2 Evolution of boundary conditions and requirements per scenario ................................................. 80
Appendix B System of the River Meuse ............................................................................................................ 83
B.1 Hydrological system ................................................................................................................................. 83
B.2 Discharge of the River Meuse ................................................................................................................ 85
B.3 Historical development of the waterway network .............................................................................. 88
Appendix C Weir hydraulics and weir management ........................................................................................ 95
C.1 Steady gradually-varying flow ................................................................................................................. 95
C.2 Weir flow conditions ............................................................................................................................... 97
C.3 Characteristics of the weir structures in the project area ................................................................. 100
Appendix D Reference projects......................................................................................................................... 105
Appendix E Navigation on the River Meuse .................................................................................................. 107
E.1 Classification and intensity of global navigation ............................................................................... 107
E.2 Regional navigation and limitations .................................................................................................... 109
Appendix F Global design area ......................................................................................................................... 115
Appendix G Global design: requirements analysis ......................................................................................... 117
Appendix H Global design: synthesis and verification .................................................................................. 121
Appendix I Regional design area ..................................................................................................................... 125
Appendix J Regional water management ....................................................................................................... 129
J.1 Geohydrology ......................................................................................................................................... 129
J.2 Water management of creeks and tributaries .................................................................................... 132
Appendix K Additional measures in regional design alternatives ................................................................ 135
Appendix L Types of gates ................................................................................................................................ 141
Appendix M Evaluation of local design alternatives ...................................................................................... 149
M.1 Multi-criteria analysis ............................................................................................................................. 149
M.2 Life cycle costs of local design alternatives ........................................................................................ 152
M.3 Weighted evaluation .............................................................................................................................. 160

viii
(This page is intentionally left blank)

Design of an adaptive weir
1
1
Introduction
The Netherlands is inextricably linked with water; the location at sea, surrounding the mouth of large rivers,
has been providing a strategic position in trade flows for many centuries. On the other hand, many river
floods and storm surges have threatened the inhabitants. To diminish the flood risk, one has taken flood
protection measures. The present course and nature of the Dutch coast and rivers have been steered by
humans over the last millennia, whereof the human influence in the last 300 years is most evident nowadays.
The vast majority of the Dutch rivers traverse the delta, in which dikes, flood plains and polders are typical
artificial features to manage and distribute water quantities in the low-lying area. The Dutch upstream
section of the River Meuse, see Figure 1-1, however, is substantially different. The gradient is relatively large
and the natural topography confines floods to the river valley. Instead of floods, the shortage of water has
been decisive for the water management in this area. Weirs retain water to create a buffer for the summer
during which the freshwater supply is small. In this way, one can utilize the river and its water intensively in
summer as well. This still is a hot issue, as in the calendar year 2018 the greatest drought on record nearly
occurred. Even in 2019, the groundwater table has not risen to the usual level and the freshwater use has
been restricted by the regional water board (De Limburger, 2019). On top of that, the drinking water
production sector notices a future shortage of water supply from the River Meuse (Van Heerde, 2019).
Figure 1-1: The location of the nine most downstream weirs in the River Meuse (OpenStreetMap Nederland, n.d.).

Introduction
2
Since 1930, control of the water level has been achieved in the Netherlands by constructing seven weirs in
the Dutch part of the River Meuse. Because the lifetime of the structures has nearly passed, Rijkswaterstaat,
asset-owner of the waterways and weirs, invited the civil engineering sector in 2015 to develop weir
replacement strategies. Under the title ‘Grip op de Maas’ (De Bouwcampus, 2015) perspectives have been
generated and elaborated during four co-creation meetings. ARCADIS was one of the many companies
which participated in those meetings and proposed a perspective focussing on the adaptivity of (the weirs
in) the system of the River Meuse. Besides the river itself, the connected canals and creeks and the
surrounding groundwater flow is of great importance in this replacement task, since weir replacement can
have large effects on all of these elements. The other way around, future developments (of these elements)
can change the boundary conditions and purposes the weirs have to serve.
1.1 Problem analysis
After presenting the concept versions of the perspectives, little progress has been made, while weir
replacement comes closer. After weir construction in the previous century, only minor modifications have
been implemented, while society, economy and the surrounding area did change surely. The focus lied on
maintenance of the weirs to keep fulfilling their functions, yet decay of material and change of the boundary
conditions demand a study to weir replacement and their role in the water system.
The first process, the decay of material, leads to a reduction of the structural safety and reliability. When the
latter do not meet the prescribed requirements, the structure has reached the end of its technical lifetime.
Due to the numerous Dutch infrastructural projects one century ago, this happens at many infrastructural
structures in the current and future decades. Considering only the wet infrastructure, over 200 structures
have to be addressed, ranging from water pumping stations and sluices to locks and weirs. Their replacement
and/or renovation is one of the main tasks of Rijkswaterstaat and requires a billion-euro investment
(Deltares, Marin, TNO, 2015).
The second process, the change of requirements and boundary conditions of the system, can induce the end
of the functional lifetime. In the worst-case scenario, structures have to be replaced while they are still
technically adequate. Maintaining the structure is no option, as it would lead to dissatisfied stakeholders for
the rest of the structure’s technical lifetime. The change of requirements and boundary conditions is a never-
ending and above all uncertain process. The long technical lifetime of weirs, 100 years, makes changes of
boundary conditions during its lifetime plausible.
The weirs in the River Meuse deal with both processes. Inspections, as part of the national replacement
programme, show that the end of technical lifetime of the weirs will be in the interval 2025-2040 (Iv-Infra
b.v., 2014). The end of functional lifetime is close as well, since many weirs are still operated manually, not
meeting the ARBO-legislation. Therefore, approximately 1.5 billion euro is reserved for the replacement of
the weirs in the River Meuse (Bartholomeus, 2019).
In summary, the actual problem is that:
• the weirs in the River Meuse approach the end of their lifetime. The structural safety and reliability
will not satisfy from the period 2025-2040 and the manual operation is outdated and unsafe.
• unforeseen changes of boundary conditions, which can demand other requirements than the
current ones, are expected during the long technical lifetime of weirs, 100 years.
Design of an adaptive weir
3
1.2 Objective
To cope with the uncertainty, one can consider the worst-case scenario and design the structure based on
this scenario. This, however, can result in large capital costs, which turn out inefficient if the worst-case
scenario does not evolve. Because the national replacement programme requires a large investment, doing
only efficient investments can make a significant difference in life cycle costs. One way of doing this is by
adapting the structures in the future only if the changed boundary conditions impose other demands on the
structure. The net present costs will then be lower, since investments are postponed to the future or even
cancelled if a particular scenario does not evolve. To be able to adapt the structure later on, possible
adaptations have to be considered during the design and construction of the new structure. This is the
starting point in the approach of adaptive delta management, which proposes designing in an adaptive way
to simplify the adaptations during the structure’s lifetime. In the delta programme, the key issues of this
approach are stated as below (Adaptief deltamanagement, n.d.):
• relating decisions to the challenges of flood safety and freshwater storage in the future;
• constructing flexible solutions;
• preparing for multiple strategies and switching between these if needed;
• combining investments in flood safety and freshwater storage with investments in the environment.
The perspective ‘Adaptive Meuse’ of the co-creation meetings proposes this approach for the replacement
of the weirs in the River Meuse. This idea has only been elaborated very basically, which leads to the
following objective of this study:
The objective of this study is to design an adaptive weir to replace a Dutch weir in the River Meuse
by using the approach of adaptive delta management.
1.3 Design method
To achieve the objective, the Systems Engineering methodology is applied to end up with an adequate,
structured analysis and design of the system. This methodology consists of an iterative process of a
functional analysis, requirements analysis, design synthesis and design verification & validation (Department
of Defense, 2001). The scale of analysis is downsized systemically during the design process to address the
adaptivity on each scale. Moreover, by the overall process of downscaling, the functions, boundary
conditions and requirements of the weir (sections) get clear from the entire water system. The three design
levels are defined as below:
1. the global design level, which covers the section Monsin-Lith. It includes the entire Dutch dammed
up section of the River Meuse and two weirs in Belgium, see Figure 1-1. The latter two are included,
because they impose boundary conditions on the Dutch water management.
2. the regional design level, which is selected on basis of the proposed weir replacement strategies in
the global design level. The regional design area includes the most adaptive weir section; in this
section, most adaptation measures are feasible and useful to meet the changed requirements. The
future uncertainty is specified in more detail in this design level.
3. the local design level, which addresses the design and feasibility of the adaptive weir itself. The
results of the regional design level are important input; it defines the maximum desired adaptivity
of the weir. A combination of weir adaptation measures and regional adaptation measures results
in a total overview of the measures that have to be taken to meet the changed requirements.
Introduction
4
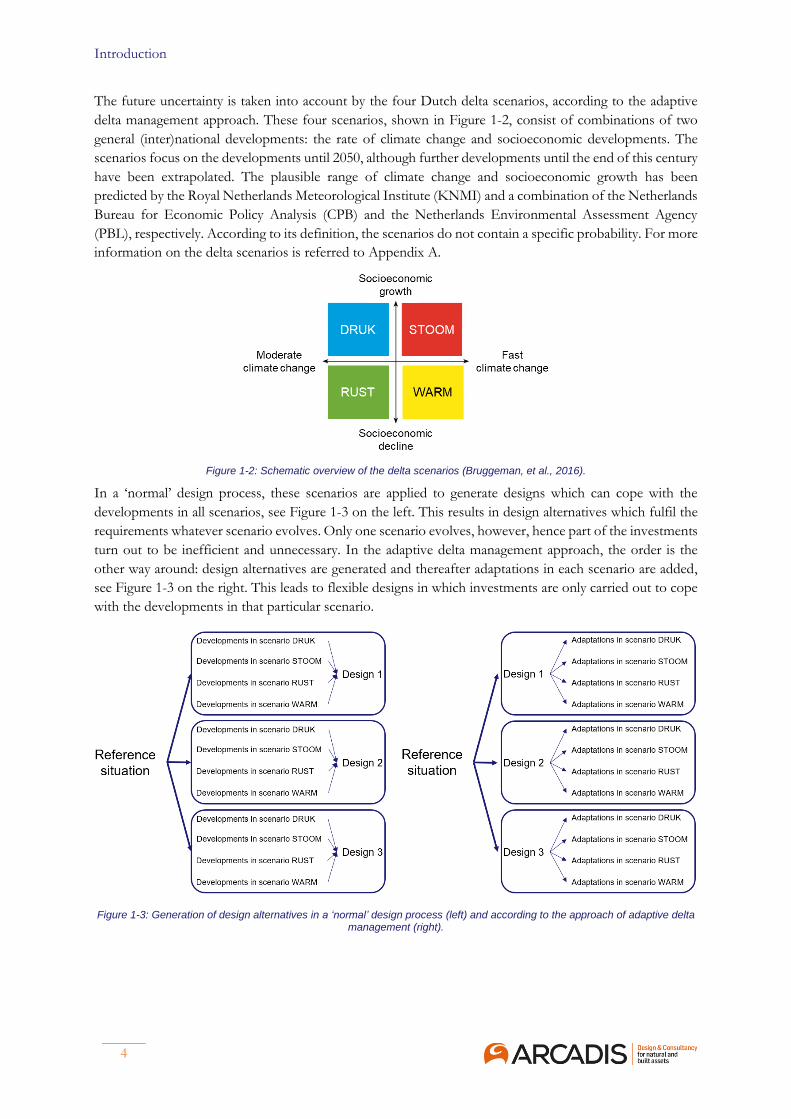
The future uncertainty is taken into account by the four Dutch delta scenarios, according to the adaptive
delta management approach. These four scenarios, shown in Figure 1-2, consist of combinations of two
general (inter)national developments: the rate of climate change and socioeconomic developments. The
scenarios focus on the developments until 2050, although further developments until the end of this century
have been extrapolated. The plausible range of climate change and socioeconomic growth has been
predicted by the Royal Netherlands Meteorological Institute (KNMI) and a combination of the Netherlands
Bureau for Economic Policy Analysis (CPB) and the Netherlands Environmental Assessment Agency
(PBL), respectively. According to its definition, the scenarios do not contain a specific probability. For more
information on the delta scenarios is referred to Appendix A.
Figure 1-2: Schematic overview of the delta scenarios (Bruggeman, et al., 2016).
In a ‘normal’ design process, these scenarios are applied to generate designs which can cope with the
developments in all scenarios, see Figure 1-3 on the left. This results in design alternatives which fulfil the
requirements whatever scenario evolves. Only one scenario evolves, however, hence part of the investments
turn out to be inefficient and unnecessary. In the adaptive delta management approach, the order is the
other way around: design alternatives are generated and thereafter adaptations in each scenario are added,
see Figure 1-3 on the right. This leads to flexible designs in which investments are only carried out to cope
with the developments in that particular scenario.
Figure 1-3: Generation of design alternatives in a ‘normal’ design process (left) and according to the approach of adaptive delta management (right).
Design of an adaptive weir
5
1.4 Thesis outline
The outline of this thesis corresponds to the steps of the presented design method. First, Chapter 2 gives
more context to the weirs in the River Meuse. This includes an analysis of the complete River Meuse and
addresses the functioning and deficiencies of the current weirs in the project area. The information
presented in this chapter provides the foundation of the waterway network and the role of the weirs in the
waterway network.
Subsequently, in Chapter 3, 4 and 5 design alternatives are generated on, respectively, the global, regional
and local scale. The outline of the beginning of these chapters is standardized: a description of the area is
followed by a functional and requirements analysis. In the continuation of the chapters, the outline differs,
as the objective of the chapters slightly diverges. In Chapter 3 weir replacement alternatives are proposed at
each weir section to be able to address the adaptivity of the weir sections after evaluation. The most adaptive
weir section is then selected as the regional design area. In Chapter 4, an adaptation scheme is set up for
this area, which shows what measures are required to serve the purposes in each time period and each delta
scenario. The measures consist of a combination of weir adaptation measures and regional adaptation
measures. The feasibility of the weir adaptation measures is questionable, since the adaptive weir itself is
only designed in Chapter 5. Keeping in mind the adaptation scheme, an adaptive weir is designed by
verification on the requirements and evaluation on the criteria and its adaptivity. The chapter is concluded
with the proposed design of the adaptive weir. The adaptivity of this weir design is used to end up with the
final adaptation scheme, as part of the conclusions in Chapter 6. Recommendation for further research are
mentioned in this chapter as well. Additional analyses are found in the appendices of this report.

Introduction
6
(This page is intentionally left blank)

Design of an adaptive weir
7
2
Framework of River Meuse’s weirs
This chapter gives a more thorough introduction to the system of the River Meuse in Section 2.1 and 2.2,
which addresses the hydrology and the development of the waterway network, respectively. Section 2.3
examines the global design area, focussing on the general operation of weirs and the weir structures
themselves. Section 2.4 concludes this chapter concentrating on weir replacement.
2.1 The hydrology of the River Meuse
The River Meuse is the second largest river in the Netherlands after the River Rhine. The river springs in
Northern France at the Plateau of Langres after which it flows through Belgium and the Netherlands to the
North Sea, see Figure 2-1. The catchment area of the River Meuse does not include any high-elevated areas,
glaciers are not present. Hence, the discharge of the River Meuse is solely dependent on the precipitation in
the catchment area. The precipitation is drained via eight main tributaries, named in Figure 2-1, to the River
Meuse. Appendix B.1 describes their characteristics.
Figure 2-1: Overview of the catchment area and tributaries (in turquoise) of the River Meuse (Rijkswaterstaat, 1992).
Framework of River Meuse’s weirs
8
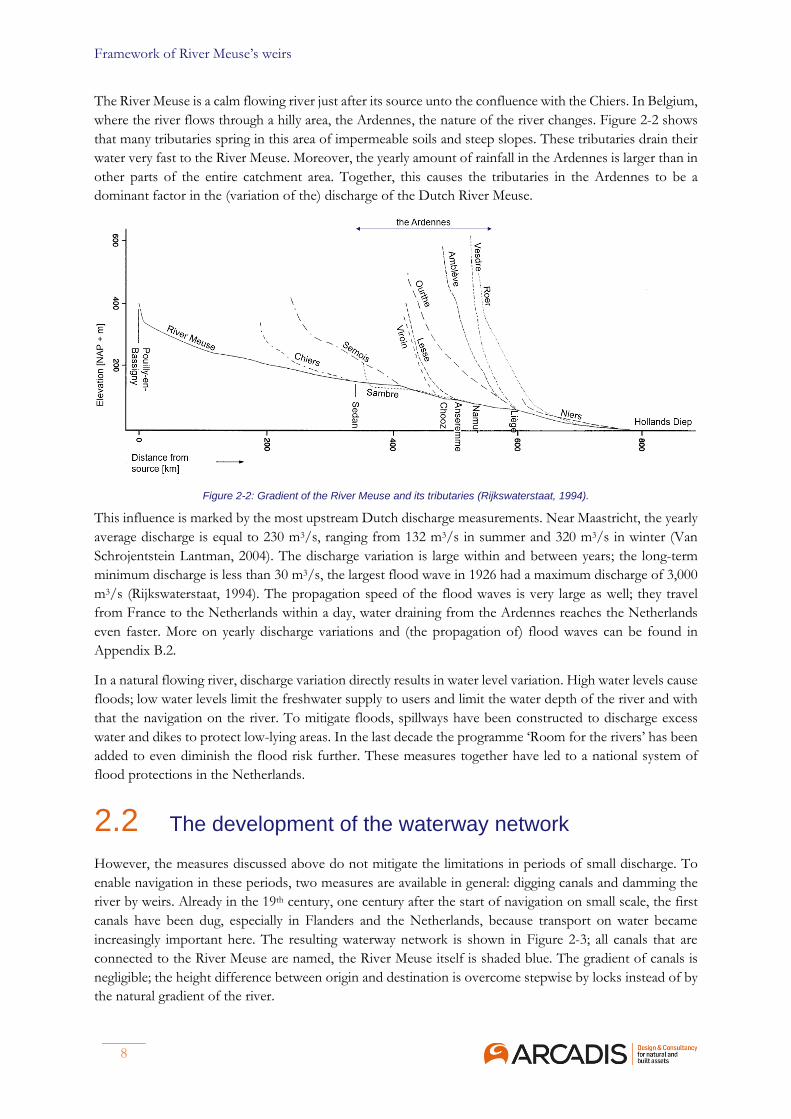
The River Meuse is a calm flowing river just after its source unto the confluence with the Chiers. In Belgium,
where the river flows through a hilly area, the Ardennes, the nature of the river changes. Figure 2-2 shows
that many tributaries spring in this area of impermeable soils and steep slopes. These tributaries drain their
water very fast to the River Meuse. Moreover, the yearly amount of rainfall in the Ardennes is larger than in
other parts of the entire catchment area. Together, this causes the tributaries in the Ardennes to be a
dominant factor in the (variation of the) discharge of the Dutch River Meuse.
Figure 2-2: Gradient of the River Meuse and its tributaries (Rijkswaterstaat, 1994).
This influence is marked by the most upstream Dutch discharge measurements. Near Maastricht, the yearly
average discharge is equal to 230 m3/s, ranging from 132 m3/s in summer and 320 m3/s in winter (Van
Schrojentstein Lantman, 2004). The discharge variation is large within and between years; the long-term
minimum discharge is less than 30 m3/s, the largest flood wave in 1926 had a maximum discharge of 3,000
m3/s (Rijkswaterstaat, 1994). The propagation speed of the flood waves is very large as well; they travel
from France to the Netherlands within a day, water draining from the Ardennes reaches the Netherlands
even faster. More on yearly discharge variations and (the propagation of) flood waves can be found in
Appendix B.2.
In a natural flowing river, discharge variation directly results in water level variation. High water levels cause
floods; low water levels limit the freshwater supply to users and limit the water depth of the river and with
that the navigation on the river. To mitigate floods, spillways have been constructed to discharge excess
water and dikes to protect low-lying areas. In the last decade the programme ‘Room for the rivers’ has been
added to even diminish the flood risk further. These measures together have led to a national system of
flood protections in the Netherlands.
2.2 The development of the waterway network
However, the measures discussed above do not mitigate the limitations in periods of small discharge. To
enable navigation in these periods, two measures are available in general: digging canals and damming the
river by weirs. Already in the 19th century, one century after the start of navigation on small scale, the first
canals have been dug, especially in Flanders and the Netherlands, because transport on water became
increasingly important here. The resulting waterway network is shown in Figure 2-3; all canals that are
connected to the River Meuse are named, the River Meuse itself is shaded blue. The gradient of canals is
negligible; the height difference between origin and destination is overcome stepwise by locks instead of by
the natural gradient of the river.

Design of an adaptive weir
9
To enable navigation on the River Meuse itself, damming the river was required. During dry periods, the
water level of a free flowing River Meuse would be that low that vessels could not navigate on the river.
Weirs have been applied to store fresh water and create sufficient water depth for navigation during these
periods. As in canals, vessels use locks; this time to overcome the head over the weirs. The right side of
Figure 2-3 shows the locks and weirs in or adjacent to the River Meuse.
Figure 2-3: Waterway network connected to (left) and lock and weir complexes in or adjacent to (right) the River Meuse.
The waterway network of today, a combination of canals and a canalized River Meuse, is the product of the
human interventions. A decisive factor of influence has been the competition between the ports of
Rotterdam and Antwerp. For decades, the contradictory interests of Belgium and the Netherlands led to
arguing about water distribution, proposing canalization plans and disapproving the measures executed by
the other country. World War I worsened the relationship and the Dutch import of mine products stopped,
whereupon the Netherlands started to mine its own coal products near Maastricht. An inland transport
network for the mine products was provided in 1927 after canalization of the River Meuse on Dutch
territory by construction of weirs Linne, Roermond, Belfeld, Sambeek and Grave and the completion of the
Maas-Waal Canal.
Navigation on the Grensmaas (in English: Border Meuse), jointly owned by Belgium and the Netherlands,
was still impossible by then, since no agreement had been reached on its canalization. In the end, both
countries choose their own path: the Dutch constructed the Juliana Canal in 1935, including inland ports,
to improve domestic transport of coal, the Belgians, on their turn, dug the Albert Canal to connect the
industry of Liège with the port of Antwerp.
Floods in the same period induced further improvement of the River Meuse. This included bend cut-offs
downstream of weir Grave, which led to smaller water depths in summer and the need for weir Lith. In
1972, the Lateral Canal was finished, the last major intervention in the system of the River Meuse. Appendix
B.3 describes the historical development of the waterway network in more detail.

Framework of River Meuse’s weirs
10
2.3 Functioning of the current weirs
Presently, nine weirs help in the water management in the global design area, whereof seven are located in
the Netherlands. In this section, the water level control is addressed, after which the controlling components
in this system, the weirs themselves, are examined.
2.3.1 Water level control
The control of water level is achieved by operation of the weir gates. It is, however, important to note that
there are two river modes distinguished:
• a free flowing river during which the weirs are open;
• a dammed river during which the weirs are operational.
In a free flowing river, the water depth is relatively large. The weir gates are fully opened and the weir does
not affect the water level. The bed friction and the gravitational force component in streamwise direction
are in equilibrium. The corresponding water depth, commonly named the equilibrium water depth, is
sufficient for navigation as long as the discharge is larger than a threshold. If not, weirs have to dam up the
water level. The threshold value is dependent on the characteristics of the river section, such as the Chézy
value, the river’s width and gradient and on the draught of the governing vessel. Due to the large gradient,
a free flowing river only occurs five days per year on average in the River Meuse.
The rest of the year, the water level is controlled by operation of the weirs by a negative feedback control
system, as shown in Figure 2-4. The disturbance (a change in river discharge) enters the system (of the River
Meuse) and causes a change in the controlled variable (the water level elevation). This result in a deviation
between the measurement of the controlled variable and the set point, which is defined as the target value
of the controlled variable. By operation of the controller (the weir) it is aimed to achieve a steady state
situation, in which the measurement and set point are equal.
Figure 2-4: Control system of the weirs in the River Meuse.
The set point of each weir section is the main input of the control system in the River Meuse. Besides, the
set point itself can be changed by modifying the maximum weir height, the location of the set point can be
shifted throughout the weir section. Here, two locations are highlighted to clarify the differences. The set
point is currently located just upstream of the weir itself, as shown in the left graph of Figure 2-5. In the
right graph of Figure 2-5, the set point is located at the most upstream navigable location in the weir section
(Bezuyen, Molenaar, & van der Toorn, Structures in hydraulic engineering 2: Weirs, 2010). As the latter
location is educated at university, this is called the theoretical location of the set point. The two mentioned
graphs show the water levels for various discharges in the weir sections of Belfeld and Roermond. The weirs
are, respectively, located at km 0 and km 17; the upstream parts of the weir sections are not navigable, since
vessels use parallel canals and locks at these parts. The resulting backwater curves has been obtained with
the hydraulic model described in Appendix C.1; the model calculates the water levels in the River Meuse
numerically for a steady state situation.
Design of an adaptive weir
11
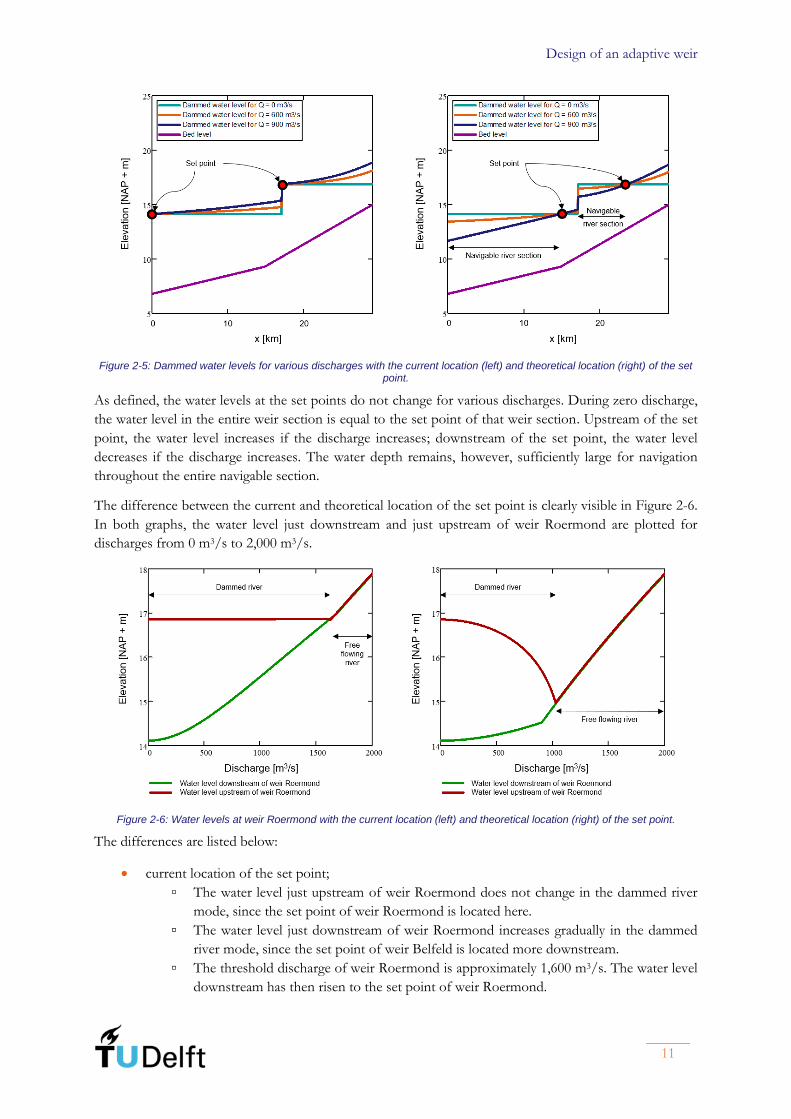
Figure 2-5: Dammed water levels for various discharges with the current location (left) and theoretical location (right) of the set point.
As defined, the water levels at the set points do not change for various discharges. During zero discharge,
the water level in the entire weir section is equal to the set point of that weir section. Upstream of the set
point, the water level increases if the discharge increases; downstream of the set point, the water level
decreases if the discharge increases. The water depth remains, however, sufficiently large for navigation
throughout the entire navigable section.
The difference between the current and theoretical location of the set point is clearly visible in Figure 2-6.
In both graphs, the water level just downstream and just upstream of weir Roermond are plotted for
discharges from 0 m3/s to 2,000 m3/s.
Figure 2-6: Water levels at weir Roermond with the current location (left) and theoretical location (right) of the set point.
The differences are listed below:
• current location of the set point;
▫ The water level just upstream of weir Roermond does not change in the dammed river
mode, since the set point of weir Roermond is located here.
▫ The water level just downstream of weir Roermond increases gradually in the dammed
river mode, since the set point of weir Belfeld is located more downstream.
▫ The threshold discharge of weir Roermond is approximately 1,600 m3/s. The water level
downstream has then risen to the set point of weir Roermond.

Framework of River Meuse’s weirs
12
• theoretical location of the set point.
▫ The water level just upstream of weir Roermond decreases gradually in the dammed river
mode, since the set point of weir Roermond is located more upstream.
▫ The water level just downstream of weir Roermond increases only a little in the dammed
river mode, since the set point of weir Belfeld is located just downstream.
▫ The threshold discharge for weir Belfeld is approximately 900 m3/s, for weir Roermond
approximately 1,050 m3/s. The difference is caused by the difference in slope.
A longitudinal overview of the weir sections in the River Meuse is mostly shown in the zero-discharge
situation. Thus, the indicated horizontal water levels in Figure 2-7 are equal to the set points of the
corresponding weirs. The location of the seven Dutch weirs is indicated by the Maaskilometre, which is
zero at the location where the River Meuse enters the Netherlands and increases in streamwise direction.
Figure 2-7: Set points and location of weirs in the River Meuse (Ministerie van Infrastructuur en Milieu, Ministerie van Economische Zaken, Landbouw en Innovatie, 2012).
2.3.2 Operation of the weirs in the River Meuse
Many types of weirs have been constructed over the world to obtain the desired dammed water level in
rivers. Because of the simultaneous construction of the weirs in the River Meuse, the weir structures are
very similar. Weirs Borgharen and Lith are equipped with wheel-gates which are lifted if the discharge
exceeds the threshold. More accurate water level control is achieved by small flaps on top of the gates. The
weir of Grave is combined with a traffic bridge; the weir elements are rotated onto the bridge deck in case
of a flood wave. The rest of the Dutch weirs (Linne, Roermond, Belfeld and Sambeek) all consist of two
parts by which it deals with the large discharge variability of the River Meuse; a Stoney part and a Poirée
part, which can be seen in Figure 2-8 and Figure 2-9.
Figure 2-8: Structure of the Stoney weirs (left) and a Poirée weirs (right) applied in the River Meuse (Schot, Lintsen, Rip, & De la Bruhèze, 1998).
Design of an adaptive weir
13
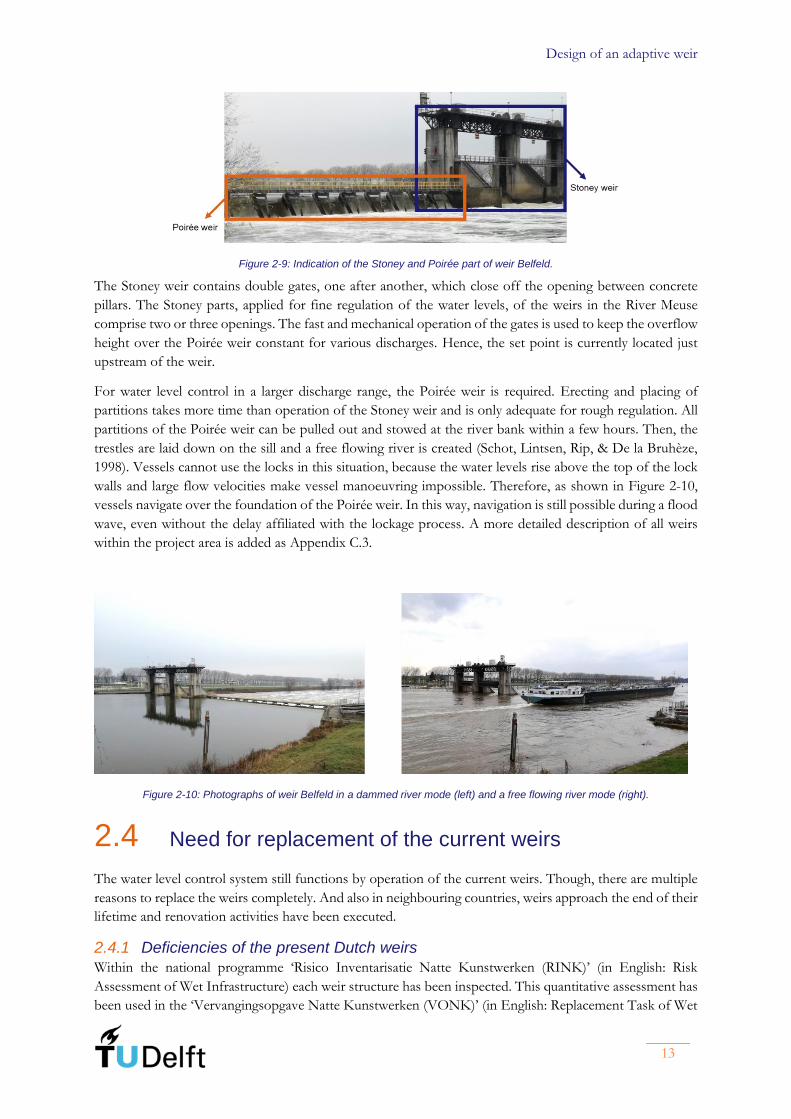
Figure 2-9: Indication of the Stoney and Poirée part of weir Belfeld.
The Stoney weir contains double gates, one after another, which close off the opening between concrete
pillars. The Stoney parts, applied for fine regulation of the water levels, of the weirs in the River Meuse
comprise two or three openings. The fast and mechanical operation of the gates is used to keep the overflow
height over the Poirée weir constant for various discharges. Hence, the set point is currently located just
upstream of the weir.
For water level control in a larger discharge range, the Poirée weir is required. Erecting and placing of
partitions takes more time than operation of the Stoney weir and is only adequate for rough regulation. All
partitions of the Poirée weir can be pulled out and stowed at the river bank within a few hours. Then, the
trestles are laid down on the sill and a free flowing river is created (Schot, Lintsen, Rip, & De la Bruhèze,
1998). Vessels cannot use the locks in this situation, because the water levels rise above the top of the lock
walls and large flow velocities make vessel manoeuvring impossible. Therefore, as shown in Figure 2-10,
vessels navigate over the foundation of the Poirée weir. In this way, navigation is still possible during a flood
wave, even without the delay affiliated with the lockage process. A more detailed description of all weirs
within the project area is added as Appendix C.3.
Figure 2-10: Photographs of weir Belfeld in a dammed river mode (left) and a free flowing river mode (right).
2.4 Need for replacement of the current weirs
The water level control system still functions by operation of the current weirs. Though, there are multiple
reasons to replace the weirs completely. And also in neighbouring countries, weirs approach the end of their
lifetime and renovation activities have been executed.
2.4.1 Deficiencies of the present Dutch weirs
Within the national programme ‘Risico Inventarisatie Natte Kunstwerken (RINK)’ (in English: Risk
Assessment of Wet Infrastructure) each weir structure has been inspected. This quantitative assessment has
been used in the ‘Vervangingsopgave Natte Kunstwerken (VONK)’ (in English: Replacement Task of Wet

Framework of River Meuse’s weirs
14
Infrastructure) to determine the end of technical and functional lifetime of all structures. The outcome is a
time window of 2025-2040, in which it is very likely that the Dutch weirs in the River Meuse reach the end
of their lifetime (Iv-Infra b.v., 2014). Figure 2-11 shows the hydraulic structures in the Dutch dammed
section of the River Meuse which have to be replaced in the upcoming decades. The end of lifetime, the
deficiencies and risks are mentioned for each weir.
Figure 2-11: Overview of the structures in need of replacement in the Dutch dammed section of the River Meuse (Ministerie van
Infrastructuur en Milieu, Ministerie van Economische Zaken, Landbouw en Innovatie, 2012).
The inspections in 2009 showed that many weirs are at risk of alkali-silica reactions, denoted as ASR in
Figure 2-11, going on in the concrete. These reactions form an expansive gel inside the structure, which
pushes the concrete apart. However, more recent inspections of the weirs in the River Meuse, as part of the
RINK-programme, have not confirmed alkali-silica reactions. Hence, the presence and degree of alkali-silica
reactions is unclear. Additional inspections should provide clarity, after which the end of technical lifetime
can be estimated more exactly (Iv-Infra b.v., 2014).
Besides the alkali-silica reactions, the labour conditions during erecting and lowering of the Poirée weirs of
Linne, Roermond, Belfeld and Sambeek are not sufficiently safe according to ARBO-legislation. A crane
moves over a rail on top of the Poirée weir and stows the partitions one-by-one and row-by-row at the river
bank (Verduijn, 2014). The workmen assist the crane without any attachment; falling into the fast flowing
river would lead to a life threatening situation (Iv-Infra b.v., 2014). On top of that, the functionality of the
Poirée weir is deficient, as the desired accuracy of water level control is not achieved by adding and removing
partitions (Antea Group, 2014).
2.4.2 Replacement of weirs
Since the state of the Stoney weir is unknown regarding the degradation of the concrete and the operation
of the Poirée weirs is outdated, renovation and life-extending measures are doubtful strategies. These can
keep the weirs operational until 2030, for the period thereafter even a large-scale renovation is not
considered to be sufficient (Antea Group, 2014). This conclusion has also been drawn in the French part
of the River Meuse. The French weirs are even older than the Dutch ones. A complete replacement of these
Design of an adaptive weir
15
weirs is currently going on, incorporating more modern technology to improve the functionality of the weir
(Chapital, 2015). The implementation of modern technology is a recurring part in weir replacement tasks in
neighbouring countries anyway, see Appendix D. The proposed renovation and replacement activities
mainly focus on the structures themselves; only in Belgium, the waterway network of canals is significantly
modified as a whole. Though in that project, the replacement of hydraulic structures deals particularly with
lock replacement.
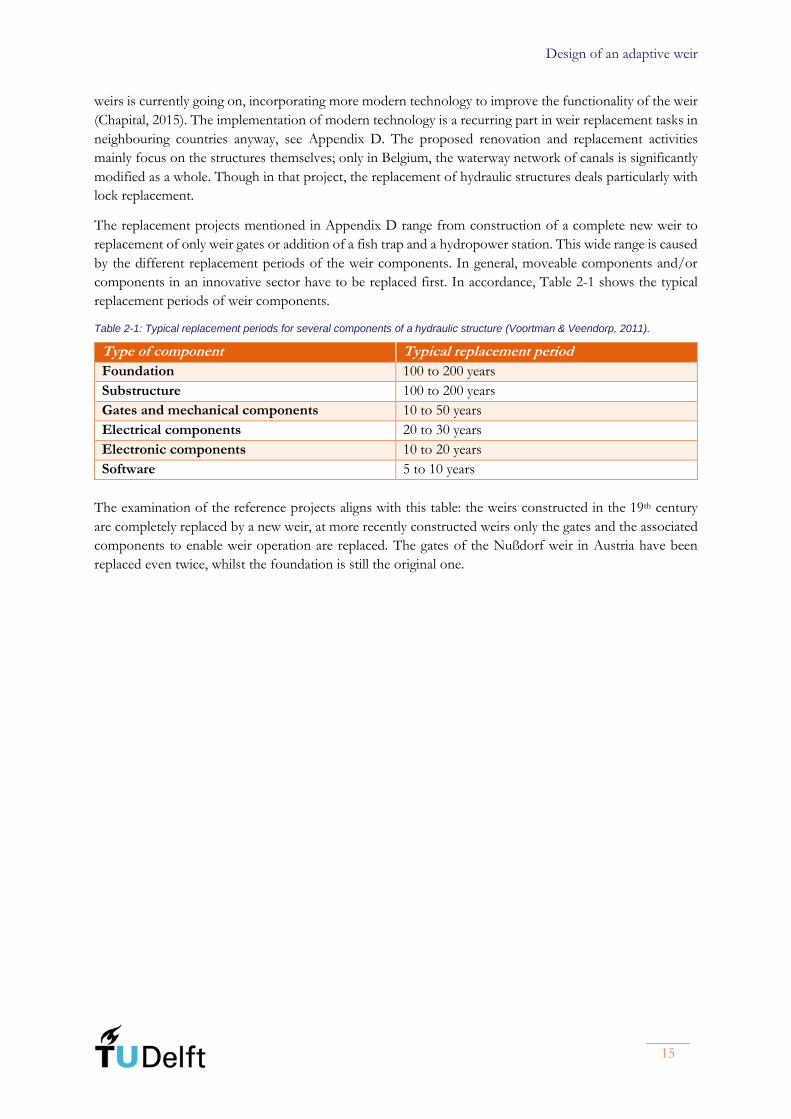
The replacement projects mentioned in Appendix D range from construction of a complete new weir to
replacement of only weir gates or addition of a fish trap and a hydropower station. This wide range is caused
by the different replacement periods of the weir components. In general, moveable components and/or
components in an innovative sector have to be replaced first. In accordance, Table 2-1 shows the typical
replacement periods of weir components.
Table 2-1: Typical replacement periods for several components of a hydraulic structure (Voortman & Veendorp, 2011).
Type of component Typical replacement period
Foundation 100 to 200 years
Substructure 100 to 200 years
Gates and mechanical components 10 to 50 years
Electrical components 20 to 30 years
Electronic components 10 to 20 years
Software 5 to 10 years
The examination of the reference projects aligns with this table: the weirs constructed in the 19th century
are completely replaced by a new weir, at more recently constructed weirs only the gates and the associated
components to enable weir operation are replaced. The gates of the Nußdorf weir in Austria have been
replaced even twice, whilst the foundation is still the original one.

Framework of River Meuse’s weirs
16
(This page is intentionally left blank)
Design of an adaptive weir
17
3
Global design:
section Monsin-Lith
This chapter presents the global design of the dammed River Meuse from weir Monsin to weir Lith. The
chapter starts in Section 3.1 with an area analysis, after which functions are allocated to the weir sections in
Section 3.2. Section 3.3 introduces the global requirements corresponding to these functions. For each weir
(section), multiple modifications are proposed in Section 3.4. Each weir modification is verified and
evaluated in Section 3.5 to the current requirements. The weir section with most feasible modifications
possesses the largest adaptivity and is selected in Section 3.6 as case study area for the regional design, which
is subject of Chapter 4.
3.1 Area analysis
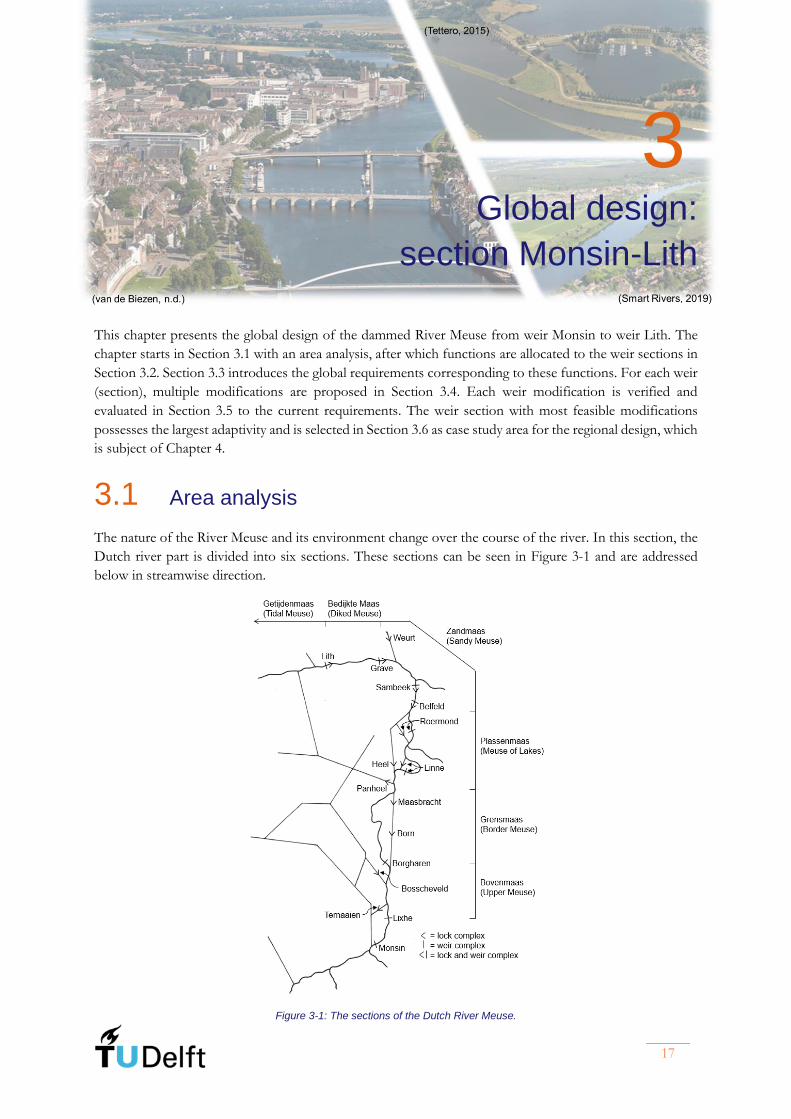
The nature of the River Meuse and its environment change over the course of the river. In this section, the
Dutch river part is divided into six sections. These sections can be seen in Figure 3-1 and are addressed
below in streamwise direction.
Figure 3-1: The sections of the Dutch River Meuse.

Global design: section Monsin-Lith
18
Bovenmaas
The Bovenmaas (in English: Upper Meuse) is the Dutch most upstream section of the River Meuse unto
weir Borgharen. At several locations gravel has been extracted in the past, creating lakes, now used for
recreational activities (Kater, Makaske, & Maas, 2012). The inflowing upstream discharge is irregular due to
the hydropower station next to weir Lixhe. It consists of three turbines with each a design discharge of 85
m3/s, resulting in equally sized stepwise variation of the outflow.
Grensmaas
The Grensmaas (in English: Border Meuse) is the meandering gravel river section from weir Borgharen to
roughly Maasbracht. Human interventions, among which gravel extraction, fixed the gravel riverbed of the
main channel. Flood waves are discharged via this main channel, on the contrary, in summer the water depth
is very limited. Therefore, vessels pass this section via the parallel Juliana Canal. Currently, measures are
taken to improve both the ecological value and flood safety of this section (Smart Rivers, 2019).
Plassenmaas
The Plassenmaas (in English: Meuse of Lakes) is located north of Maasbracht. A local geological fault near
Roermond created a wide low-lying area, now indicated as the valley of the River Meuse (Kater, Makaske,
& Maas, 2012). For many centuries, gravel was deposited by the river in this subsided area; in the previous
century much gravel has been extracted. Remnants of these extractions are the unique characteristic lakes,
called the Maasplassen (in English: Meuse Lakes) (Smart Rivers, 2019).
Zandmaas
North of the Plassenmaas, unto weir Grave, the river is called the Zandmaas (in English: Sandy Meuse),
named after the sandy subsoil. The area distinguishes itself by the terraces formed by geological uplift. The
River Meuse has incised into these terraces and does not show any large bends. Sideways of the river, shallow
seepage channels, fed by groundwater flow, are found (Smart Rivers, 2019).
Bedijkte Maas
The most downstream dammed section is called the Bedijkte Maas (in English: Diked Meuse). As is in the
name, the River Meuse is bordered by flood plains and dikes. The normalisation of this section in the 20s
of the previous century can be seen by the abandoned oxbow lakes. The backwater curve of weir Lith did
increase the groundwater table in the area substantially (Smart Rivers, 2019).
Getijdenmaas
Downstream of weir Lith the tide influences the water level, which is why this section is called Getijdenmaas
(in English: Tidal Meuse). The construction of The Haringvliet sluices reduced the tidal range considerably
to a maximum of 0.30 m (Smart Rivers, 2019).
3.2 Functional analysis
First in this section, three main functions of the River Meuse’s system are introduced and elaborated.
Thereafter, these functions, supplemented by other ones, are allocated to the weir sections.
3.2.1 Discharge of water and sediment
The vast majority of water and sediment is discharged by the River Meuse itself. The gradient of the river is
determinative from this viewpoint; the larger the gradient, the faster the discharge of water and the larger
the sediment particles that are transported. The negligible gradient of the connected canals leads to their
negligible contribution to the discharge capacity of the global waterway network. On top of that, the nature
of the river is more dynamic by the transport and deposition of sediment. Figure 3-2 shows that the natural
river gradient in the upstream subsections is relatively large; apparently from Section 3.1 it is sufficiently
large to transport sand, since mainly gravel is deposited in these subsections. From the Plassenmaas, the
Design of an adaptive weir
19
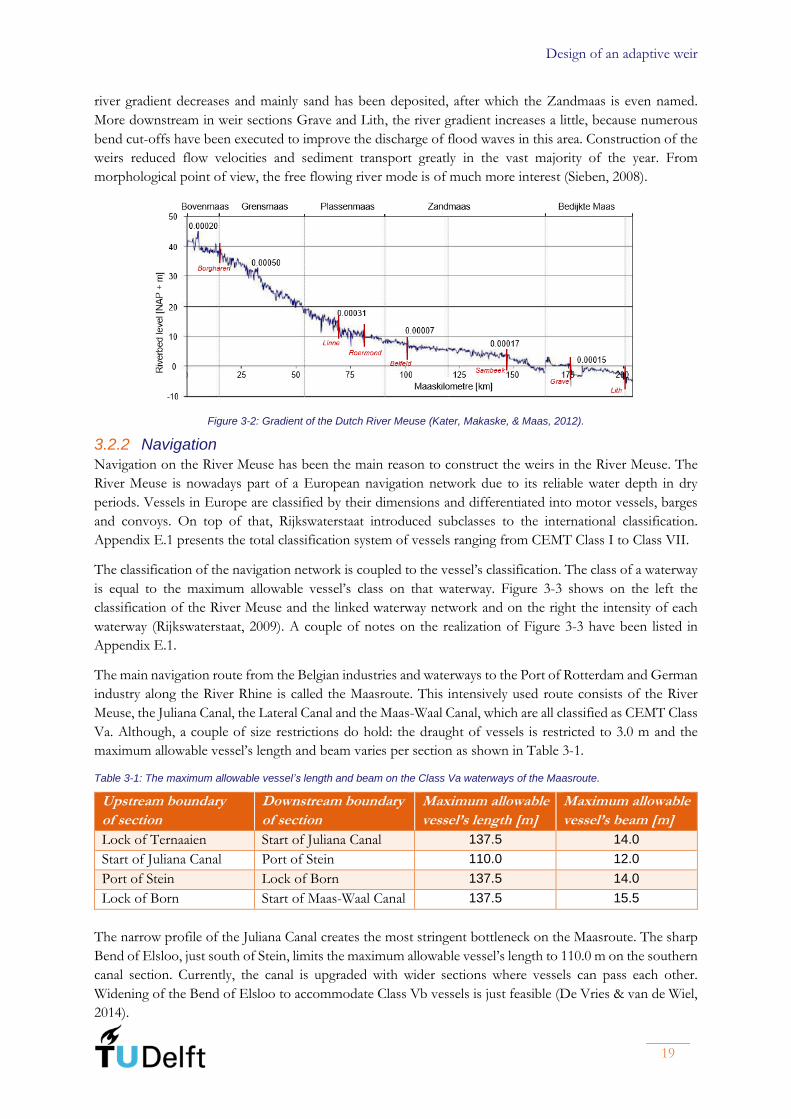
river gradient decreases and mainly sand has been deposited, after which the Zandmaas is even named.
More downstream in weir sections Grave and Lith, the river gradient increases a little, because numerous
bend cut-offs have been executed to improve the discharge of flood waves in this area. Construction of the
weirs reduced flow velocities and sediment transport greatly in the vast majority of the year. From
morphological point of view, the free flowing river mode is of much more interest (Sieben, 2008).
Figure 3-2: Gradient of the Dutch River Meuse (Kater, Makaske, & Maas, 2012).
3.2.2 Navigation
Navigation on the River Meuse has been the main reason to construct the weirs in the River Meuse. The
River Meuse is nowadays part of a European navigation network due to its reliable water depth in dry
periods. Vessels in Europe are classified by their dimensions and differentiated into motor vessels, barges
and convoys. On top of that, Rijkswaterstaat introduced subclasses to the international classification.
Appendix E.1 presents the total classification system of vessels ranging from CEMT Class I to Class VII.
The classification of the navigation network is coupled to the vessel’s classification. The class of a waterway
is equal to the maximum allowable vessel’s class on that waterway. Figure 3-3 shows on the left the
classification of the River Meuse and the linked waterway network and on the right the intensity of each
waterway (Rijkswaterstaat, 2009). A couple of notes on the realization of Figure 3-3 have been listed in
Appendix E.1.
The main navigation route from the Belgian industries and waterways to the Port of Rotterdam and German
industry along the River Rhine is called the Maasroute. This intensively used route consists of the River
Meuse, the Juliana Canal, the Lateral Canal and the Maas-Waal Canal, which are all classified as CEMT Class
Va. Although, a couple of size restrictions do hold: the draught of vessels is restricted to 3.0 m and the
maximum allowable vessel’s length and beam varies per section as shown in Table 3-1.
Table 3-1: The maximum allowable vessel’s length and beam on the Class Va waterways of the Maasroute.
Upstream boundary
of section
Downstream boundary
of section
Maximum allowable
vessel’s length [m]
Maximum allowable
vessel’s beam [m]
Lock of Ternaaien Start of Juliana Canal 137.5 14.0
Start of Juliana Canal Port of Stein 110.0 12.0
Port of Stein Lock of Born 137.5 14.0
Lock of Born Start of Maas-Waal Canal 137.5 15.5
The narrow profile of the Juliana Canal creates the most stringent bottleneck on the Maasroute. The sharp
Bend of Elsloo, just south of Stein, limits the maximum allowable vessel’s length to 110.0 m on the southern
canal section. Currently, the canal is upgraded with wider sections where vessels can pass each other.
Widening of the Bend of Elsloo to accommodate Class Vb vessels is just feasible (De Vries & van de Wiel,
2014).

Global design: section Monsin-Lith
20
Figure 3-3: Classification (left) and intensity (right) of the waterways in the global design area.
The other parts of the Maasroute are upgraded by Rijkswaterstaat from a Class Va to a Class Vb waterway
as well. This requires multiple modifications, stretched out over the entire Maasroute. The activities include
deepening the navigation channel, widening river bends and enlarging locks (Rijkswaterstaat, n.d.). The
upgrade is finished before the weirs have to be replaced.
3.2.3 Freshwater supply to adjacent areas
Despite the construction of the weirs, periods of low discharge still put pressure on the waterway network.
The limited supply of fresh water has to be distributed over multiple interests, while the freshwater demand
may even increase. In the Netherlands, a sequence has been set for water distribution, starting with the
interest with the highest priority for receiving water (Kenniscentrum InfoMil, n.d.):
1. stability of flood defences and irreversible damage including settlements and ecological damage;
2. user functions like drinking water production and generation of energy;
3. small-scaled, high-valued usage like capital intensive agriculture and process water;
4. remaining interests like navigation, other agriculture, industry, recreation and fishery.
This domestic sequence, however, does not hold for the Belgian weir sections in the global design area. To
mitigate the consequences of limited freshwater supply in Belgium and the Netherlands, both countries have
signed a bilateral agreement. Flanders receives fresh water via the Albert Canal, diverting from the Meuse
River at Monsin, and via the inlet structure at Bosscheveld near Maastricht. The starting point of the
agreement is an equal freshwater distribution for Dutch and Flemish use. The minimum discharge of the
Grensmaas of 10 m3/s, however, is prioritized, because of ecological concerns. Also, the discharge variations
in the Grensmaas have to be limited. The priority of the Grensmaas is infeasible and cancelled as the
discharge of the River Meuse falls below 30 m3/s. The exact regulations of the agreement are included in
Appendix G.
Design of an adaptive weir
21
Lockage and seepage through weirs even diminishes the freshwater availability in the upstream area, as water
thereby flows to the downstream weir section. Part of this discharge is needed from the viewpoint of water
quality, but the remainder is a loss of fresh water. In both countries, measures have been taken to reduce
this loss in canal and weir sections. In Flanders, pumping stations have been constructed next to multiple
lock complexes. Though, this is deficient for providing sufficient water depth for navigation on the Albert
Canal. As an additional measure, currently more fresh water is diverted to Flanders than stated in the
agreement; Flanders compensates the Netherlands by contributing to the additional pump costs made at for
example lock Maasbracht (Vansina, et al., 2017). The daily average discharge of the locks of Maasbracht is
16 m3/s, a significant amount with respect to the long-term minimum discharge of the River Meuse, see
Section 2.1. The pumping station pumps back a maximum of 12 m3/s to the Juliana Canal upstream
(Hensen, 2005). Besides pumps, at lock Panheel, water is stored in reservoirs to use it in the next lock cycle.
Via this lock and the Wessem-Nederweert Canal fresh water is supplied to the Province of Noord-Brabant
(Rijkswaterstaat, 2015). Additionally, the number of lock cycles is limited to reduce water loss at locks; a
time window is set or lockage is only permitted when the lock chamber is completely filled.
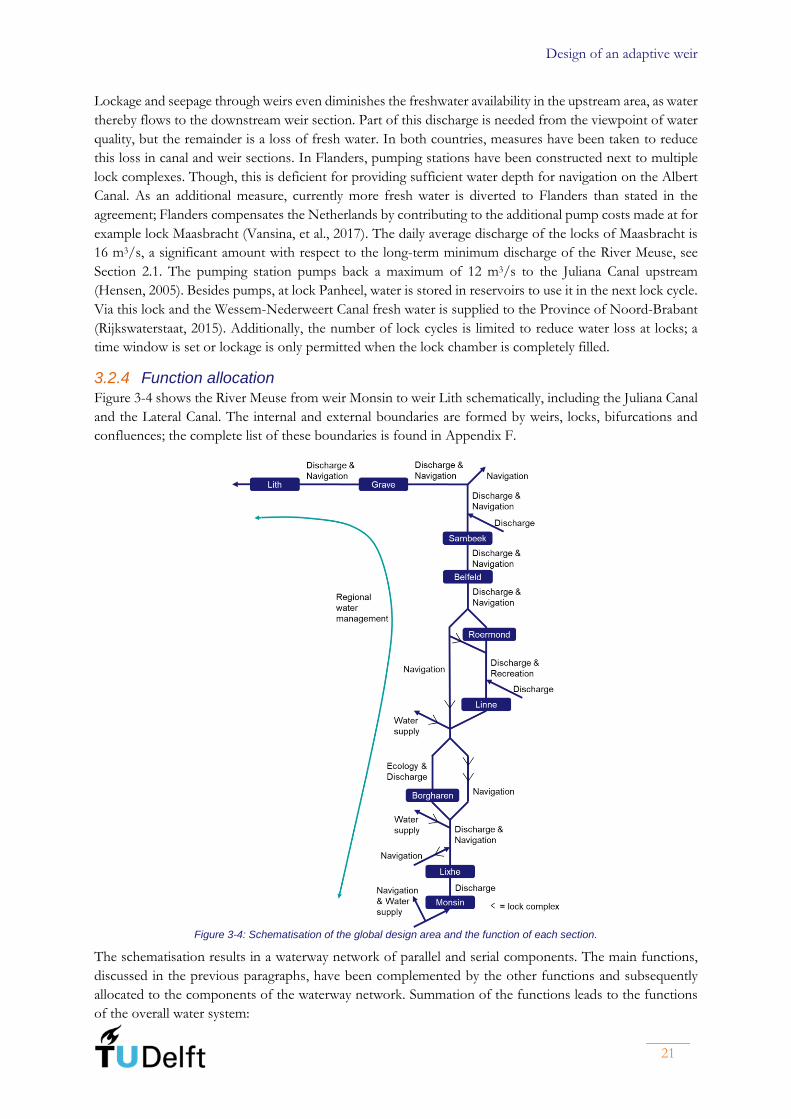
3.2.4 Function allocation
Figure 3-4 shows the River Meuse from weir Monsin to weir Lith schematically, including the Juliana Canal
and the Lateral Canal. The internal and external boundaries are formed by weirs, locks, bifurcations and
confluences; the complete list of these boundaries is found in Appendix F.
Figure 3-4: Schematisation of the global design area and the function of each section.
The schematisation results in a waterway network of parallel and serial components. The main functions,
discussed in the previous paragraphs, have been complemented by the other functions and subsequently
allocated to the components of the waterway network. Summation of the functions leads to the functions
of the overall water system:

Global design: section Monsin-Lith
22
• managing the regional water management;
• discharging water and sediment;
• enabling commercial navigation;
• distributing fresh water;
• maintaining ecology;
• providing recreation.
The regional water management has not been allocated to specific components, since the waterway network
as a whole contributes to this. In the last century, the land use is based on the current groundwater table,
which is indirectly maintained by the backwater curves. In addition, it is worth noting that the Juliana Canal
and Lateral Canal have taken over the navigation function from the parallel River Meuse’s sections. The
absence of commercial navigation in these two river sections, the Grensmaas and Plassenmaas, has led to
the establishment of the high-valued ecosystem and recreational activities, respectively.
The weir functions have been derived from the functions of the overall system. One important difference
is made, however: the discharge of water and sediment is not a function of a weir, as a weir should only not
hamper this function. Table 3-2 shows the functions of the weirs, which are determinative on the global
design level. The importance of regional water management and navigation stands out.
Table 3-2: Determinative functions of the weirs on the global design level.
Function Mon-
sin
Lixhe Borg-
haren
Linne Roer-
mond
Belfeld Sam-
beek
Grave Lith
Regional
water
management
V V V V V V V V V
Navigation V V V V V V V
Water
distribution V V V
Ecosystem V
Electricity
generation V
Recreation V
3.3 Requirements analysis
The requirements have been composed with reference to the functions described in the previous section of
this chapter and Appendix G. It is assumed that the waterway network remains unmodified until the weir
replacement project starts, except the CEMT Class upgrade of the Maasroute. Legislation and the bilateral
agreement remain unchanged as well. This results in the following requirements to the global design area:
• Flooding of surrounding areas has to be prevented.
▫ The water level in the zero-discharge situation has to be lower than the current
embankments of the main channel and linked water bodies such as lakes.
▫ The water levels in dammed mode should never exceed the crest of dikes and the ground
level of higher-elevated areas bordering the river valley.
• Dehydration of areas has to be prevented.
▫ Dammed water levels in a sandy area may not be lowered.
▫ The water supply from the Meuse River to the Province of Noord-Brabant has to be at
least equal to the current water supply.

Design of an adaptive weir
23
• The waterway network has to facilitate reliable, fast and safe navigation.
▫ The guaranteed water depth of the navigation route between Liège and the River Rhine
has to be sufficient to facilitate a vessel with a draught of maximum 3.5 m.
▫ The travel time of the navigation route between Liège and the River Rhine may not be
extended by a detour.
• The water distribution over the Grensmaas, Flanders and the Netherlands has to comply with the
bilateral agreement.
▫ The discharge variation of the Grensmaas has to comply with the agreement to not affect
the ecosystem.
▫ The dammed water level in the Grensmaas may not differ from the current dammed
water level.
• The fresh water available for the recreational, agricultural and industrial sector has to be at least
equal to the current freshwater availability.
• The modification of the system has to be completed before 2030.
▫ During implementation of the modifications, all other requirements have to be met.
3.4 Proposed weir replacement strategies
Potential modifications of the global waterway network have been developed for this study. The
modifications focus on the replacement of the current weirs on global level. Three weir replacement
strategies have been proposed:
1. removal of a weir and replacing the first downstream weir by a new, higher weir;
2. replacing a current weir by a new weir at a different location; either for several kilometres or to a
preceding or subsequent section of Figure 3-4.
a. downstream
b. upstream
3. replacing a current weir at the same location by a new weir with a different height.
a. lowering
b. heightening
For each of the seven weirs in the Dutch River Meuse all alternatives have been investigated. The two weirs
in Belgium are part of the global design area, but replacement of these weirs is a concern for the Belgian
waterway manager. One-to-one replacement of these two weirs without a change of weir functions has been
assumed.
3.5 Verification & evaluation of weir replacement strategies
Firstly, each of the proposed modifications is verified and secondly, if it does meet the requirements,
evaluated qualitatively. The evaluation focusses mainly on commercial navigation and the future water
distribution by application of the following four criteria:
• the travel time between Belgium and the River Rhine and between destinations within the global
design area;
• the accessibility of destinations within the global design area;
• the possibility to store fresh water for prolonged periods of small discharge;
• the possibility to increase the water supply to adjacent areas.

Global design: section Monsin-Lith
24
Additional measures can be taken in the global design area if the proposed weir replacement strategy only
just not meets the requirements. The costs of these additional measures are considered qualitatively as well.
The extensiveness of the measures is restricted by the realization time and/or the associated costs.
Additional measures to be taken along an entire weir section before 2030 are considered to be undesired
and infeasible.
Table 3-3 shows the result of the verification and evaluation. An explanation of the verification and
evaluation of each proposed modification is presented in Appendix H. The requirements that restrict the
weir replacement strategies the most are:
• in the two most upstream weir sections, the compliance with the bilateral agreement and the
facilitation of navigation on the Maasroute. Weir Borgharen is indispensable for regulation of the
water level (variation) in the Grensmaas and the water depth in the Bovenmaas and the southern
part of the Juliana Canal. Modification of weir Linne is infeasible, since it affects the dammed water
level in the Grensmaas as well.
• the prevention of dehydration on the one hand and the prevention of permanent floods of
embankments on the other hand. Replacement of a weir at an upstream location in a sandy area
does lead to the dehydration over the shift of replacement; removal of a weir and facilitating
navigation on the Maasroute by heightening the downstream weir leads to permanent floods of
embankments, see Figure 3-5.
Figure 3-5: Limitations on the removal and upstream replacement of a weir.
• the navigation on the Maasroute. Replacement by a lower weir does not meet the related
requirements without dredging the main channel in the entire weir section.
Table 3-3: Overview of verification & evaluation of proposed modifications. Modifications that meet the requirements are indicated with □; modifications that on top of that score positive on one of the criteria with ■.
Modification Borgharen Linne Roermond Belfeld Sambeek Grave Lith
1. Removal ■
2a. Replacement
downstream □ □ □ □ □ □
2b. Replacement
upstream □ ■
3a. Lowering □
3b. Heightening □ ■ ■ ■ ■ ■
After verification, it is clear that replacement by a new, higher weir or at a location downstream meets the
requirements in most weir sections. Evaluation, however, shows that replacement of the weir at a location
downstream is not beneficial; in most weir sections a new lock complex has to be constructed next to the
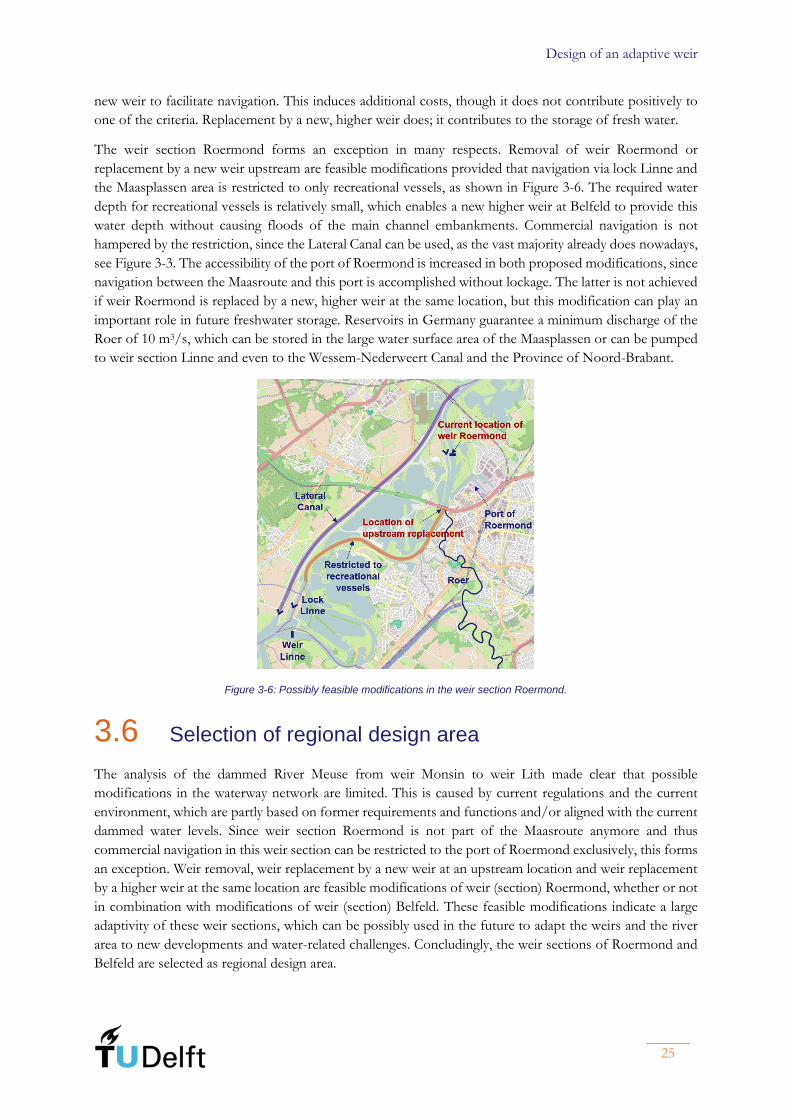
Design of an adaptive weir
25
new weir to facilitate navigation. This induces additional costs, though it does not contribute positively to
one of the criteria. Replacement by a new, higher weir does; it contributes to the storage of fresh water.
The weir section Roermond forms an exception in many respects. Removal of weir Roermond or
replacement by a new weir upstream are feasible modifications provided that navigation via lock Linne and
the Maasplassen area is restricted to only recreational vessels, as shown in Figure 3-6. The required water
depth for recreational vessels is relatively small, which enables a new higher weir at Belfeld to provide this
water depth without causing floods of the main channel embankments. Commercial navigation is not
hampered by the restriction, since the Lateral Canal can be used, as the vast majority already does nowadays,
see Figure 3-3. The accessibility of the port of Roermond is increased in both proposed modifications, since
navigation between the Maasroute and this port is accomplished without lockage. The latter is not achieved
if weir Roermond is replaced by a new, higher weir at the same location, but this modification can play an
important role in future freshwater storage. Reservoirs in Germany guarantee a minimum discharge of the
Roer of 10 m3/s, which can be stored in the large water surface area of the Maasplassen or can be pumped
to weir section Linne and even to the Wessem-Nederweert Canal and the Province of Noord-Brabant.
Figure 3-6: Possibly feasible modifications in the weir section Roermond.
3.6 Selection of regional design area
The analysis of the dammed River Meuse from weir Monsin to weir Lith made clear that possible
modifications in the waterway network are limited. This is caused by current regulations and the current
environment, which are partly based on former requirements and functions and/or aligned with the current
dammed water levels. Since weir section Roermond is not part of the Maasroute anymore and thus
commercial navigation in this weir section can be restricted to the port of Roermond exclusively, this forms
an exception. Weir removal, weir replacement by a new weir at an upstream location and weir replacement
by a higher weir at the same location are feasible modifications of weir (section) Roermond, whether or not
in combination with modifications of weir (section) Belfeld. These feasible modifications indicate a large
adaptivity of these weir sections, which can be possibly used in the future to adapt the weirs and the river
area to new developments and water-related challenges. Concludingly, the weir sections of Roermond and
Belfeld are selected as regional design area.

Global design: section Monsin-Lith
26
(This page is intentionally left blank)
Design of an adaptive weir
27
4
Regional design:
section Linne-Belfeld
Based on the previous chapter, section Linne-Belfeld has been selected as regional design area. After an area
analysis in Section 4.1, the functions, derived during the global analysis, are extended by functions on
regional scale in Section 4.2. Thereafter, the requirements and the changes in boundary conditions and
requirements are subject of Section 4.3. These are applied in Section 4.4 to generate regional design
alternatives, consisting of a weir replacement strategy and additional measures in the regional design area.
The verification and evaluation of the regional design alternatives in Section 4.5 is employed to define the
maximum desired adaptivity of the weir and to set up an adaptation scheme, which shows the adaptation
measures required to serve specific purposes. This all is summarized in Section 4.6.
4.1 Area analysis
The regional project area is confined by the weir and lock complex Belfeld in the north and by weir Linne
and the locks of Heel and Linne in the south. Since the Maaskilometre shows a number of deficiencies in
this section, a new coordinate system is introduced with kilometre 0 at weir Belfeld. The location of the
most essential lakes, structures, such as weirs, locks, bridges and ports, and tributaries is shown in Figure
4-1. The exact location of all of them is found in Appendix I. In addition, Figure 4-2 shows a longitudinal
cross-section of the waterway network. The waterway network within this area is split into three main
branches:
• the Lateral Canal: the 8 kilometre long canal from lock Heel to Buggenum, part of the Maasroute.
• the Afgesneden Maas (in English: Cut-off Meuse): the meandering river part from weir Linne to
Buggenum. Most of the Maasplassen are connected to the Afgesneden Maas. The Afgesneden Maas
and the Maasplassen area can be roughly split into a northern and a southern part:
▫ The northern part forms the centre of leisure near the city of Roermond. Smaller lakes are
completely taken by marinas; the larger lakes are used by marinas and for water sport
activities, boating, beach recreation and events. Commercial navigation makes use of this
river part as well by navigating to the Prins Willem-Alexanderport.
▫ In the southern part, high-valued ecosystems have developed. Navigation and recreation
on water is prohibited in the Loop of Linne and the linked lakes. Flora and fauna developed
due to seepage and the dynamic character of the water levels, which is directly linked to
the current location of the set point of weir Roermond, see Figure 2-5.
• the Zandmaas: the river part north of the confluence at Buggenum. The Maasroute runs via the
Zandmaas, yet it also contributes to recreation and ecology. Marinas are situated in small lakes along
the river and biodiversity is large in former river bends, draining creeks and tributaries.

Regional design: section Linne-Belfeld
28
Figure 4-1: Top view of the regional project area (OpenStreetMap Nederland, n.d.).
Figure 4-2: Longitudinal cross-section of the project area.
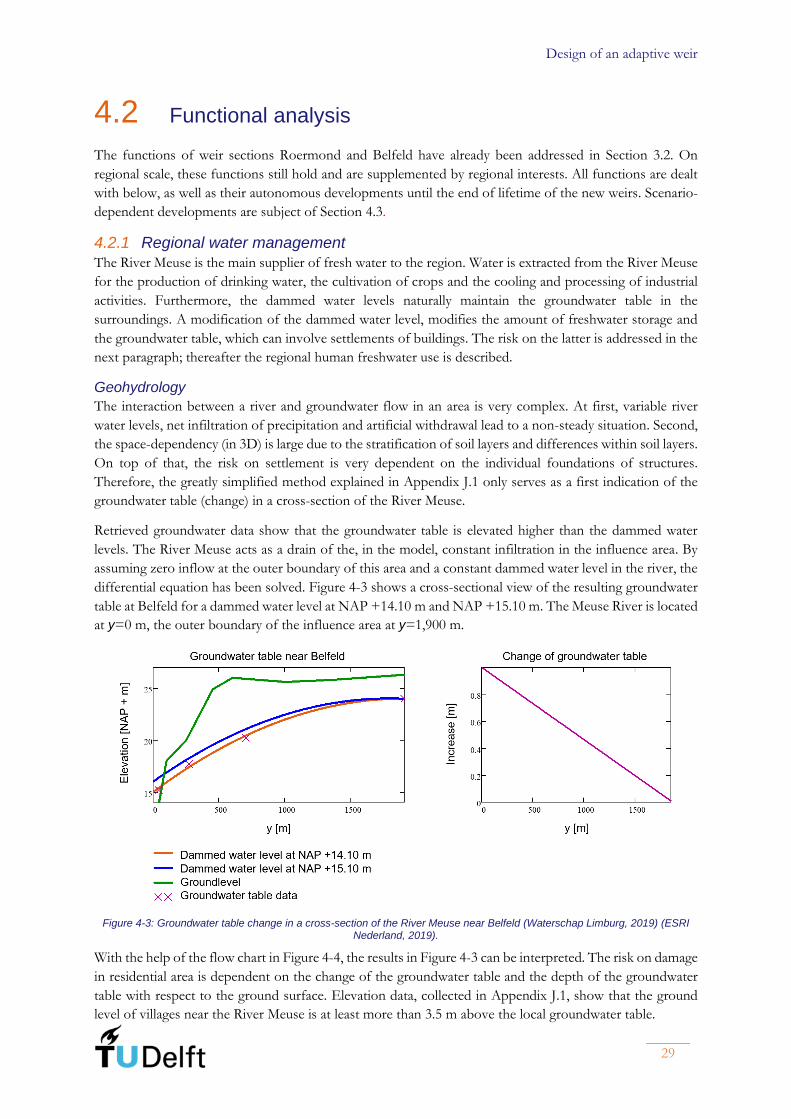
Design of an adaptive weir
29
4.2 Functional analysis
The functions of weir sections Roermond and Belfeld have already been addressed in Section 3.2. On
regional scale, these functions still hold and are supplemented by regional interests. All functions are dealt
with below, as well as their autonomous developments until the end of lifetime of the new weirs. Scenario-
dependent developments are subject of Section 4.3.
4.2.1 Regional water management
The River Meuse is the main supplier of fresh water to the region. Water is extracted from the River Meuse
for the production of drinking water, the cultivation of crops and the cooling and processing of industrial
activities. Furthermore, the dammed water levels naturally maintain the groundwater table in the
surroundings. A modification of the dammed water level, modifies the amount of freshwater storage and
the groundwater table, which can involve settlements of buildings. The risk on the latter is addressed in the
next paragraph; thereafter the regional human freshwater use is described.
Geohydrology
The interaction between a river and groundwater flow in an area is very complex. At first, variable river
water levels, net infiltration of precipitation and artificial withdrawal lead to a non-steady situation. Second,
the space-dependency (in 3D) is large due to the stratification of soil layers and differences within soil layers.
On top of that, the risk on settlement is very dependent on the individual foundations of structures.
Therefore, the greatly simplified method explained in Appendix J.1 only serves as a first indication of the
groundwater table (change) in a cross-section of the River Meuse.
Retrieved groundwater data show that the groundwater table is elevated higher than the dammed water
levels. The River Meuse acts as a drain of the, in the model, constant infiltration in the influence area. By
assuming zero inflow at the outer boundary of this area and a constant dammed water level in the river, the
differential equation has been solved. Figure 4-3 shows a cross-sectional view of the resulting groundwater
table at Belfeld for a dammed water level at NAP +14.10 m and NAP +15.10 m. The Meuse River is located
at y=0 m, the outer boundary of the influence area at y=1,900 m.
Figure 4-3: Groundwater table change in a cross-section of the River Meuse near Belfeld (Waterschap Limburg, 2019) (ESRI Nederland, 2019).
With the help of the flow chart in Figure 4-4, the results in Figure 4-3 can be interpreted. The risk on damage
in residential area is dependent on the change of the groundwater table and the depth of the groundwater
table with respect to the ground surface. Elevation data, collected in Appendix J.1, show that the ground
level of villages near the River Meuse is at least more than 3.5 m above the local groundwater table.
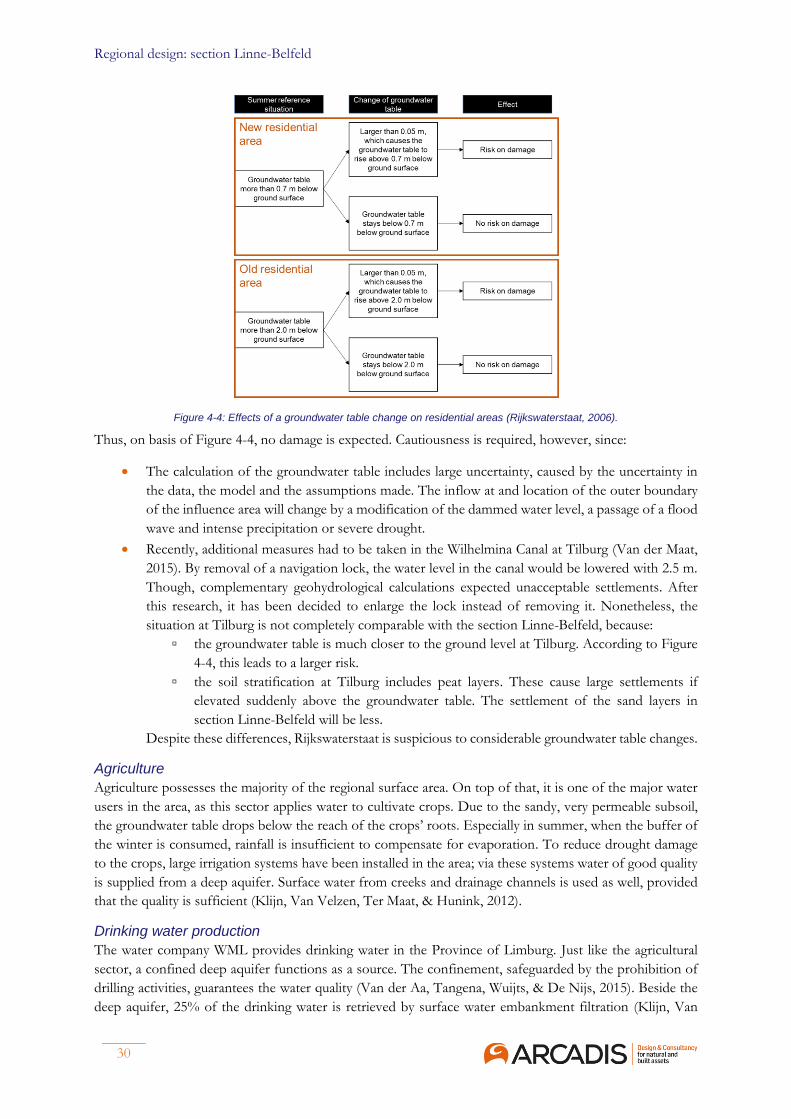
Regional design: section Linne-Belfeld
30
Figure 4-4: Effects of a groundwater table change on residential areas (Rijkswaterstaat, 2006).
Thus, on basis of Figure 4-4, no damage is expected. Cautiousness is required, however, since:
• The calculation of the groundwater table includes large uncertainty, caused by the uncertainty in
the data, the model and the assumptions made. The inflow at and location of the outer boundary
of the influence area will change by a modification of the dammed water level, a passage of a flood
wave and intense precipitation or severe drought.
• Recently, additional measures had to be taken in the Wilhelmina Canal at Tilburg (Van der Maat,
2015). By removal of a navigation lock, the water level in the canal would be lowered with 2.5 m.
Though, complementary geohydrological calculations expected unacceptable settlements. After
this research, it has been decided to enlarge the lock instead of removing it. Nonetheless, the
situation at Tilburg is not completely comparable with the section Linne-Belfeld, because:
▫ the groundwater table is much closer to the ground level at Tilburg. According to Figure
4-4, this leads to a larger risk.
▫ the soil stratification at Tilburg includes peat layers. These cause large settlements if
elevated suddenly above the groundwater table. The settlement of the sand layers in
section Linne-Belfeld will be less.
Despite these differences, Rijkswaterstaat is suspicious to considerable groundwater table changes.
Agriculture
Agriculture possesses the majority of the regional surface area. On top of that, it is one of the major water
users in the area, as this sector applies water to cultivate crops. Due to the sandy, very permeable subsoil,
the groundwater table drops below the reach of the crops’ roots. Especially in summer, when the buffer of
the winter is consumed, rainfall is insufficient to compensate for evaporation. To reduce drought damage
to the crops, large irrigation systems have been installed in the area; via these systems water of good quality
is supplied from a deep aquifer. Surface water from creeks and drainage channels is used as well, provided
that the quality is sufficient (Klijn, Van Velzen, Ter Maat, & Hunink, 2012).
Drinking water production
The water company WML provides drinking water in the Province of Limburg. Just like the agricultural
sector, a confined deep aquifer functions as a source. The confinement, safeguarded by the prohibition of
drilling activities, guarantees the water quality (Van der Aa, Tangena, Wuijts, & De Nijs, 2015). Beside the
deep aquifer, 25% of the drinking water is retrieved by surface water embankment filtration (Klijn, Van
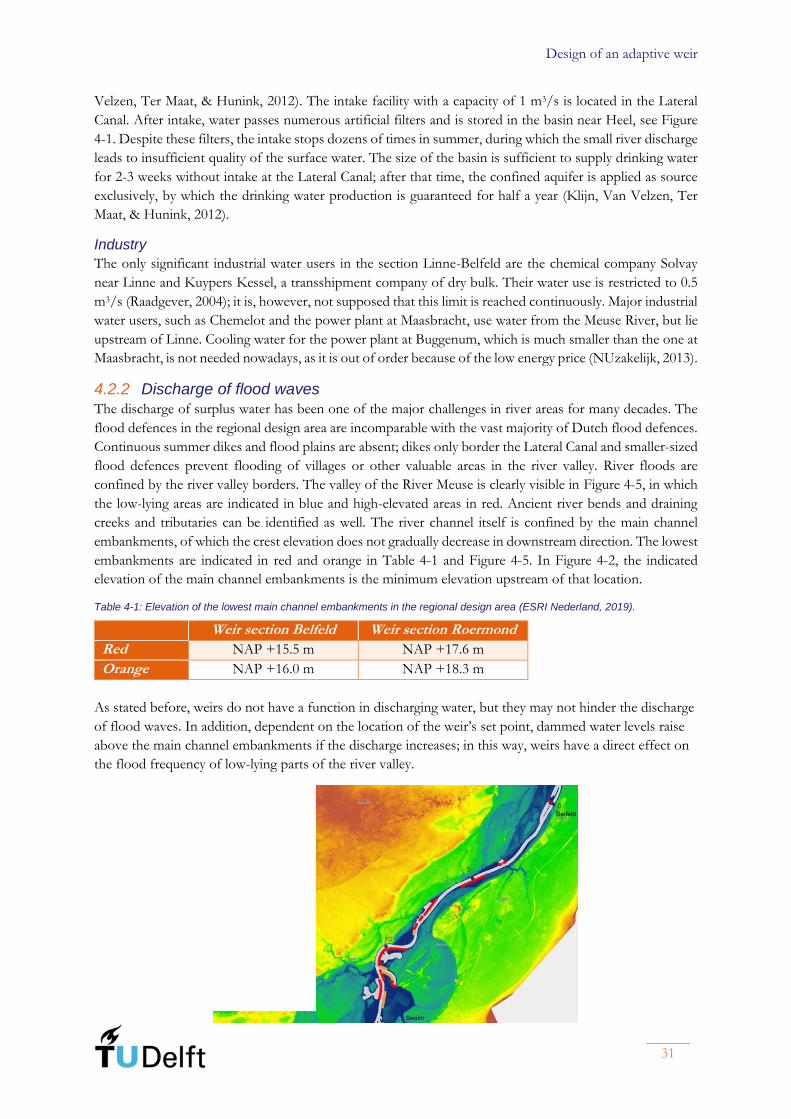
Design of an adaptive weir
31
Velzen, Ter Maat, & Hunink, 2012). The intake facility with a capacity of 1 m3/s is located in the Lateral
Canal. After intake, water passes numerous artificial filters and is stored in the basin near Heel, see Figure
4-1. Despite these filters, the intake stops dozens of times in summer, during which the small river discharge
leads to insufficient quality of the surface water. The size of the basin is sufficient to supply drinking water
for 2-3 weeks without intake at the Lateral Canal; after that time, the confined aquifer is applied as source
exclusively, by which the drinking water production is guaranteed for half a year (Klijn, Van Velzen, Ter
Maat, & Hunink, 2012).
Industry
The only significant industrial water users in the section Linne-Belfeld are the chemical company Solvay
near Linne and Kuypers Kessel, a transshipment company of dry bulk. Their water use is restricted to 0.5
m3/s (Raadgever, 2004); it is, however, not supposed that this limit is reached continuously. Major industrial
water users, such as Chemelot and the power plant at Maasbracht, use water from the Meuse River, but lie
upstream of Linne. Cooling water for the power plant at Buggenum, which is much smaller than the one at
Maasbracht, is not needed nowadays, as it is out of order because of the low energy price (NUzakelijk, 2013).
4.2.2 Discharge of flood waves
The discharge of surplus water has been one of the major challenges in river areas for many decades. The
flood defences in the regional design area are incomparable with the vast majority of Dutch flood defences.
Continuous summer dikes and flood plains are absent; dikes only border the Lateral Canal and smaller-sized
flood defences prevent flooding of villages or other valuable areas in the river valley. River floods are
confined by the river valley borders. The valley of the River Meuse is clearly visible in Figure 4-5, in which
the low-lying areas are indicated in blue and high-elevated areas in red. Ancient river bends and draining
creeks and tributaries can be identified as well. The river channel itself is confined by the main channel
embankments, of which the crest elevation does not gradually decrease in downstream direction. The lowest
embankments are indicated in red and orange in Table 4-1 and Figure 4-5. In Figure 4-2, the indicated
elevation of the main channel embankments is the minimum elevation upstream of that location.
Table 4-1: Elevation of the lowest main channel embankments in the regional design area (ESRI Nederland, 2019).
Weir section Belfeld Weir section Roermond
Red NAP +15.5 m NAP +17.6 m
Orange NAP +16.0 m NAP +18.3 m
As stated before, weirs do not have a function in discharging water, but they may not hinder the discharge
of flood waves. In addition, dependent on the location of the weir’s set point, dammed water levels raise
above the main channel embankments if the discharge increases; in this way, weirs have a direct effect on
the flood frequency of low-lying parts of the river valley.
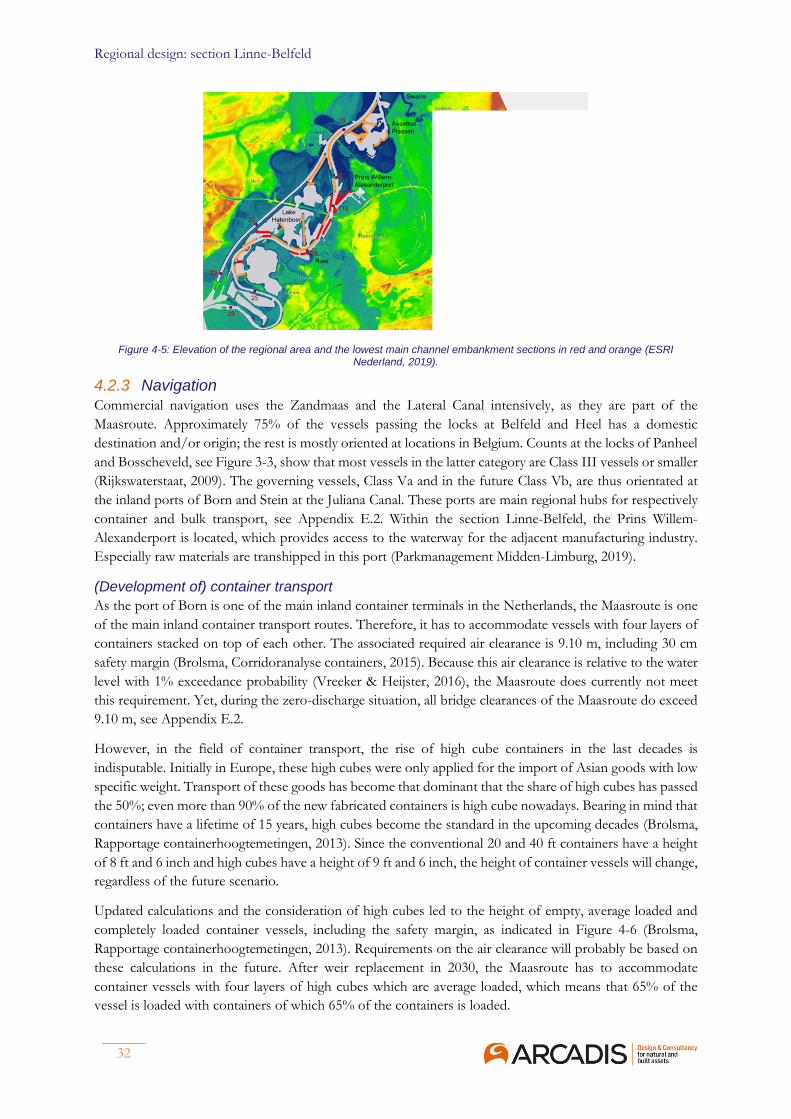
Regional design: section Linne-Belfeld
32
Figure 4-5: Elevation of the regional area and the lowest main channel embankment sections in red and orange (ESRI Nederland, 2019).
4.2.3 Navigation
Commercial navigation uses the Zandmaas and the Lateral Canal intensively, as they are part of the
Maasroute. Approximately 75% of the vessels passing the locks at Belfeld and Heel has a domestic
destination and/or origin; the rest is mostly oriented at locations in Belgium. Counts at the locks of Panheel
and Bosscheveld, see Figure 3-3, show that most vessels in the latter category are Class III vessels or smaller
(Rijkswaterstaat, 2009). The governing vessels, Class Va and in the future Class Vb, are thus orientated at
the inland ports of Born and Stein at the Juliana Canal. These ports are main regional hubs for respectively
container and bulk transport, see Appendix E.2. Within the section Linne-Belfeld, the Prins Willem-
Alexanderport is located, which provides access to the waterway for the adjacent manufacturing industry.
Especially raw materials are transhipped in this port (Parkmanagement Midden-Limburg, 2019).
(Development of) container transport
As the port of Born is one of the main inland container terminals in the Netherlands, the Maasroute is one
of the main inland container transport routes. Therefore, it has to accommodate vessels with four layers of
containers stacked on top of each other. The associated required air clearance is 9.10 m, including 30 cm
safety margin (Brolsma, Corridoranalyse containers, 2015). Because this air clearance is relative to the water
level with 1% exceedance probability (Vreeker & Heijster, 2016), the Maasroute does currently not meet
this requirement. Yet, during the zero-discharge situation, all bridge clearances of the Maasroute do exceed
9.10 m, see Appendix E.2.
However, in the field of container transport, the rise of high cube containers in the last decades is
indisputable. Initially in Europe, these high cubes were only applied for the import of Asian goods with low
specific weight. Transport of these goods has become that dominant that the share of high cubes has passed
the 50%; even more than 90% of the new fabricated containers is high cube nowadays. Bearing in mind that
containers have a lifetime of 15 years, high cubes become the standard in the upcoming decades (Brolsma,
Rapportage containerhoogtemetingen, 2013). Since the conventional 20 and 40 ft containers have a height
of 8 ft and 6 inch and high cubes have a height of 9 ft and 6 inch, the height of container vessels will change,
regardless of the future scenario.
Updated calculations and the consideration of high cubes led to the height of empty, average loaded and
completely loaded container vessels, including the safety margin, as indicated in Figure 4-6 (Brolsma,
Rapportage containerhoogtemetingen, 2013). Requirements on the air clearance will probably be based on
these calculations in the future. After weir replacement in 2030, the Maasroute has to accommodate
container vessels with four layers of high cubes which are average loaded, which means that 65% of the
vessel is loaded with containers of which 65% of the containers is loaded.
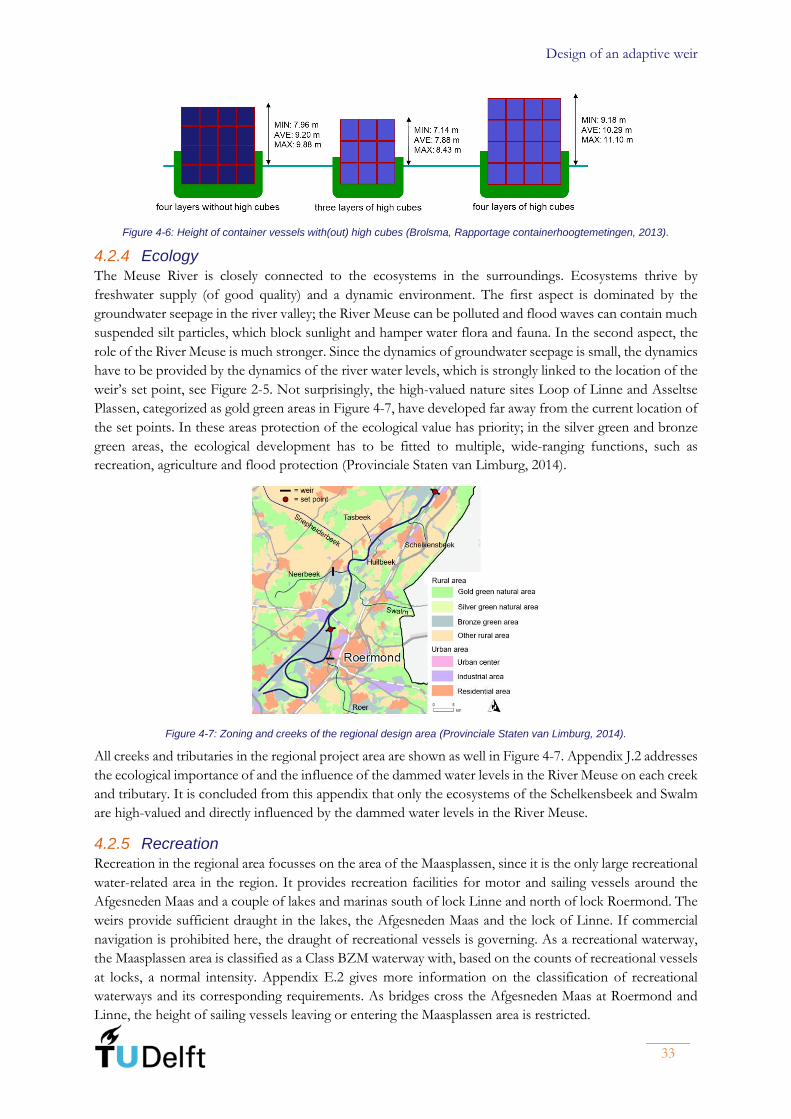
Design of an adaptive weir
33
Figure 4-6: Height of container vessels with(out) high cubes (Brolsma, Rapportage containerhoogtemetingen, 2013).
4.2.4 Ecology
The Meuse River is closely connected to the ecosystems in the surroundings. Ecosystems thrive by
freshwater supply (of good quality) and a dynamic environment. The first aspect is dominated by the
groundwater seepage in the river valley; the River Meuse can be polluted and flood waves can contain much
suspended silt particles, which block sunlight and hamper water flora and fauna. In the second aspect, the
role of the River Meuse is much stronger. Since the dynamics of groundwater seepage is small, the dynamics
have to be provided by the dynamics of the river water levels, which is strongly linked to the location of the
weir’s set point, see Figure 2-5. Not surprisingly, the high-valued nature sites Loop of Linne and Asseltse
Plassen, categorized as gold green areas in Figure 4-7, have developed far away from the current location of
the set points. In these areas protection of the ecological value has priority; in the silver green and bronze
green areas, the ecological development has to be fitted to multiple, wide-ranging functions, such as
recreation, agriculture and flood protection (Provinciale Staten van Limburg, 2014).
Figure 4-7: Zoning and creeks of the regional design area (Provinciale Staten van Limburg, 2014).
All creeks and tributaries in the regional project area are shown as well in Figure 4-7. Appendix J.2 addresses
the ecological importance of and the influence of the dammed water levels in the River Meuse on each creek
and tributary. It is concluded from this appendix that only the ecosystems of the Schelkensbeek and Swalm
are high-valued and directly influenced by the dammed water levels in the River Meuse.
4.2.5 Recreation
Recreation in the regional area focusses on the area of the Maasplassen, since it is the only large recreational
water-related area in the region. It provides recreation facilities for motor and sailing vessels around the
Afgesneden Maas and a couple of lakes and marinas south of lock Linne and north of lock Roermond. The
weirs provide sufficient draught in the lakes, the Afgesneden Maas and the lock of Linne. If commercial
navigation is prohibited here, the draught of recreational vessels is governing. As a recreational waterway,
the Maasplassen area is classified as a Class BZM waterway with, based on the counts of recreational vessels
at locks, a normal intensity. Appendix E.2 gives more information on the classification of recreational
waterways and its corresponding requirements. As bridges cross the Afgesneden Maas at Roermond and
Linne, the height of sailing vessels leaving or entering the Maasplassen area is restricted.
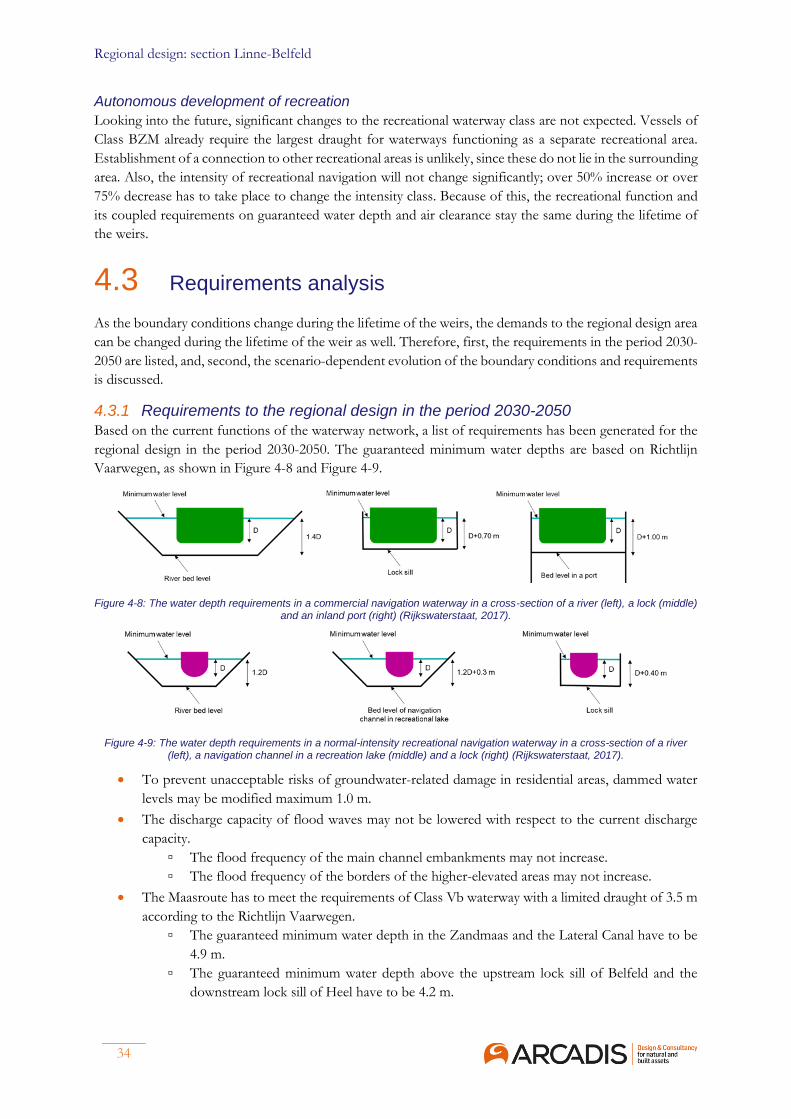
Regional design: section Linne-Belfeld
34
Autonomous development of recreation
Looking into the future, significant changes to the recreational waterway class are not expected. Vessels of
Class BZM already require the largest draught for waterways functioning as a separate recreational area.
Establishment of a connection to other recreational areas is unlikely, since these do not lie in the surrounding
area. Also, the intensity of recreational navigation will not change significantly; over 50% increase or over
75% decrease has to take place to change the intensity class. Because of this, the recreational function and
its coupled requirements on guaranteed water depth and air clearance stay the same during the lifetime of
the weirs.
4.3 Requirements analysis
As the boundary conditions change during the lifetime of the weirs, the demands to the regional design area
can be changed during the lifetime of the weir as well. Therefore, first, the requirements in the period 2030-
2050 are listed, and, second, the scenario-dependent evolution of the boundary conditions and requirements
is discussed.
4.3.1 Requirements to the regional design in the period 2030-2050
Based on the current functions of the waterway network, a list of requirements has been generated for the
regional design in the period 2030-2050. The guaranteed minimum water depths are based on Richtlijn
Vaarwegen, as shown in Figure 4-8 and Figure 4-9.
Figure 4-8: The water depth requirements in a commercial navigation waterway in a cross-section of a river (left), a lock (middle) and an inland port (right) (Rijkswaterstaat, 2017).
Figure 4-9: The water depth requirements in a normal-intensity recreational navigation waterway in a cross-section of a river (left), a navigation channel in a recreation lake (middle) and a lock (right) (Rijkswaterstaat, 2017).
• To prevent unacceptable risks of groundwater-related damage in residential areas, dammed water
levels may be modified maximum 1.0 m.
• The discharge capacity of flood waves may not be lowered with respect to the current discharge
capacity.
▫ The flood frequency of the main channel embankments may not increase.
▫ The flood frequency of the borders of the higher-elevated areas may not increase.
• The Maasroute has to meet the requirements of Class Vb waterway with a limited draught of 3.5 m
according to the Richtlijn Vaarwegen.
▫ The guaranteed minimum water depth in the Zandmaas and the Lateral Canal have to be
4.9 m.
▫ The guaranteed minimum water depth above the upstream lock sill of Belfeld and the
downstream lock sill of Heel have to be 4.2 m.

Design of an adaptive weir
35
• The Maasroute has to accommodate average loaded container vessels with four layers of containers
during the zero-discharge situation.
▫ The minimum air clearance on the Maasroute has to be 10.29 m in the zero-discharge
situation.
• The Prins Willem-Alexanderport has to be accessible for a governing vessel, which has a draught
of 2.6 m according to the Richtlijn Vaarwegen.
▫ The guaranteed minimum water depth above both lock sills of Roermond has to be 3.3 m.
▫ The guaranteed minimum water depth in the Prins Willem-Alexanderport has to be 3.6 m.
• The freshwater storage in summer may not be smaller than the current freshwater storage in
summer.
• The ecological value in Natura 2000 sites has to be maintained or, otherwise, the loss has to be
compensated according to the European legislation.
• Recreational waterways have to meet the requirements of a normal intensity Class BZM waterway,
although with a reduced air clearance.
▫ The guaranteed minimum water depth of the Afgesneden Maas has to be 2.3 m.
▫ The guaranteed minimum water depth of the navigation channels in the recreational lakes
has to be 2.6 m.
▫ The guaranteed minimum water depth above the downstream lock sill of Linne has to be
2.3 m.
▫ The minimum air clearance of the Afgesneden Maas has to be 4.0 m in the zero-discharge
situation.
4.3.2 Change of boundary conditions and requirements
A combination of socioeconomic developments and rate of climate change leads to a unique changing
environment in each of the four scenarios. As a result, the boundary conditions and the design area itself
change as well. Figure 4-10 shows which specified socioeconomic developments and climate change
indicators have been used to translate the (inter)national developments to the developments on regional
scale. The latter is eventually divided per subfunction and the development rate is addressed on basis of
literature and the technological innovation rate in each scenario. The recreation function does not appear in
Figure 4-10, since no scenario developments are taken into account for this function, see Section 4.2.5.
Appendix A.1 addresses the translation in more detail.
Figure 4-10: Translation of the (inter)national scenario developments to the regional scenario developments.
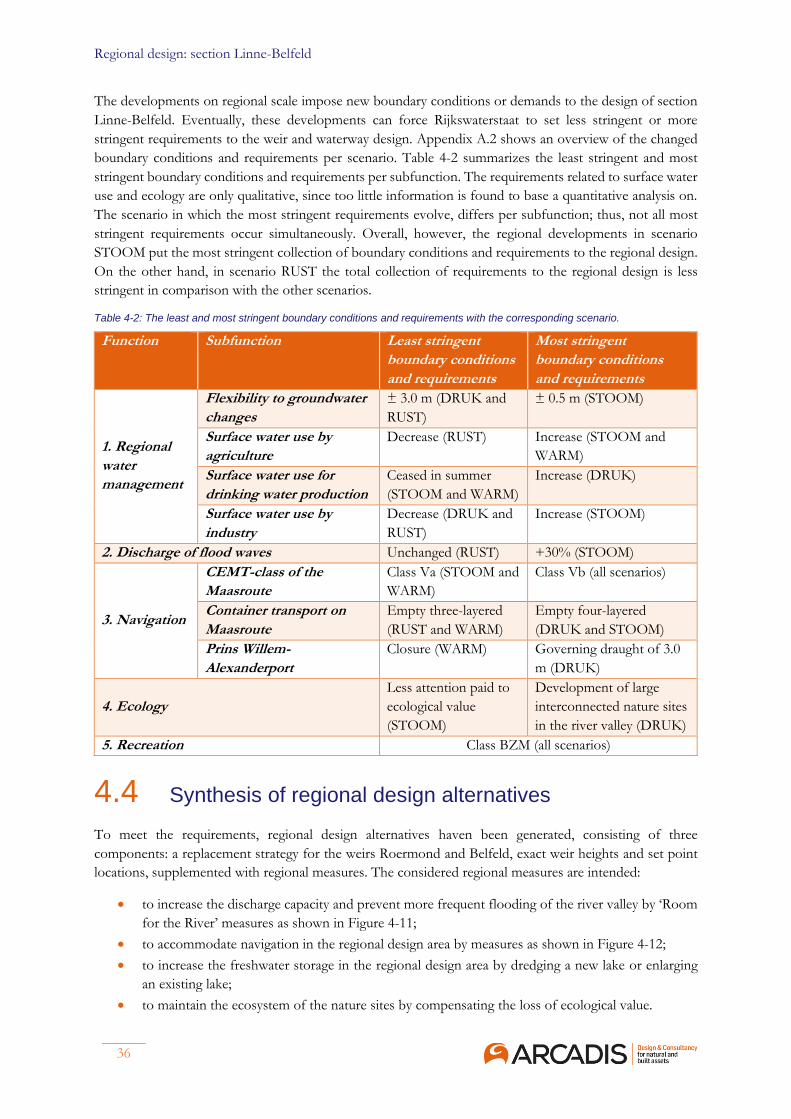
Regional design: section Linne-Belfeld
36
The developments on regional scale impose new boundary conditions or demands to the design of section
Linne-Belfeld. Eventually, these developments can force Rijkswaterstaat to set less stringent or more
stringent requirements to the weir and waterway design. Appendix A.2 shows an overview of the changed
boundary conditions and requirements per scenario. Table 4-2 summarizes the least stringent and most
stringent boundary conditions and requirements per subfunction. The requirements related to surface water
use and ecology are only qualitative, since too little information is found to base a quantitative analysis on.
The scenario in which the most stringent requirements evolve, differs per subfunction; thus, not all most
stringent requirements occur simultaneously. Overall, however, the regional developments in scenario
STOOM put the most stringent collection of boundary conditions and requirements to the regional design.
On the other hand, in scenario RUST the total collection of requirements to the regional design is less
stringent in comparison with the other scenarios.
Table 4-2: The least and most stringent boundary conditions and requirements with the corresponding scenario.
Function Subfunction Least stringent
boundary conditions
and requirements
Most stringent
boundary conditions
and requirements
1. Regional
water
management
Flexibility to groundwater
changes
± 3.0 m (DRUK and
RUST)
± 0.5 m (STOOM)
Surface water use by
agriculture
Decrease (RUST) Increase (STOOM and
WARM)
Surface water use for
drinking water production
Ceased in summer
(STOOM and WARM)
Increase (DRUK)
Surface water use by
industry
Decrease (DRUK and
RUST)
Increase (STOOM)
2. Discharge of flood waves Unchanged (RUST) +30% (STOOM)
3. Navigation
CEMT-class of the
Maasroute
Class Va (STOOM and
WARM)
Class Vb (all scenarios)
Container transport on
Maasroute
Empty three-layered
(RUST and WARM)
Empty four-layered
(DRUK and STOOM)
Prins Willem-
Alexanderport
Closure (WARM) Governing draught of 3.0
m (DRUK)
4. Ecology
Less attention paid to
ecological value
(STOOM)
Development of large
interconnected nature sites
in the river valley (DRUK)
5. Recreation Class BZM (all scenarios)
4.4 Synthesis of regional design alternatives
To meet the requirements, regional design alternatives haven been generated, consisting of three
components: a replacement strategy for the weirs Roermond and Belfeld, exact weir heights and set point
locations, supplemented with regional measures. The considered regional measures are intended:
• to increase the discharge capacity and prevent more frequent flooding of the river valley by ‘Room
for the River’ measures as shown in Figure 4-11;
• to accommodate navigation in the regional design area by measures as shown in Figure 4-12;
• to increase the freshwater storage in the regional design area by dredging a new lake or enlarging
an existing lake;
• to maintain the ecosystem of the nature sites by compensating the loss of ecological value.
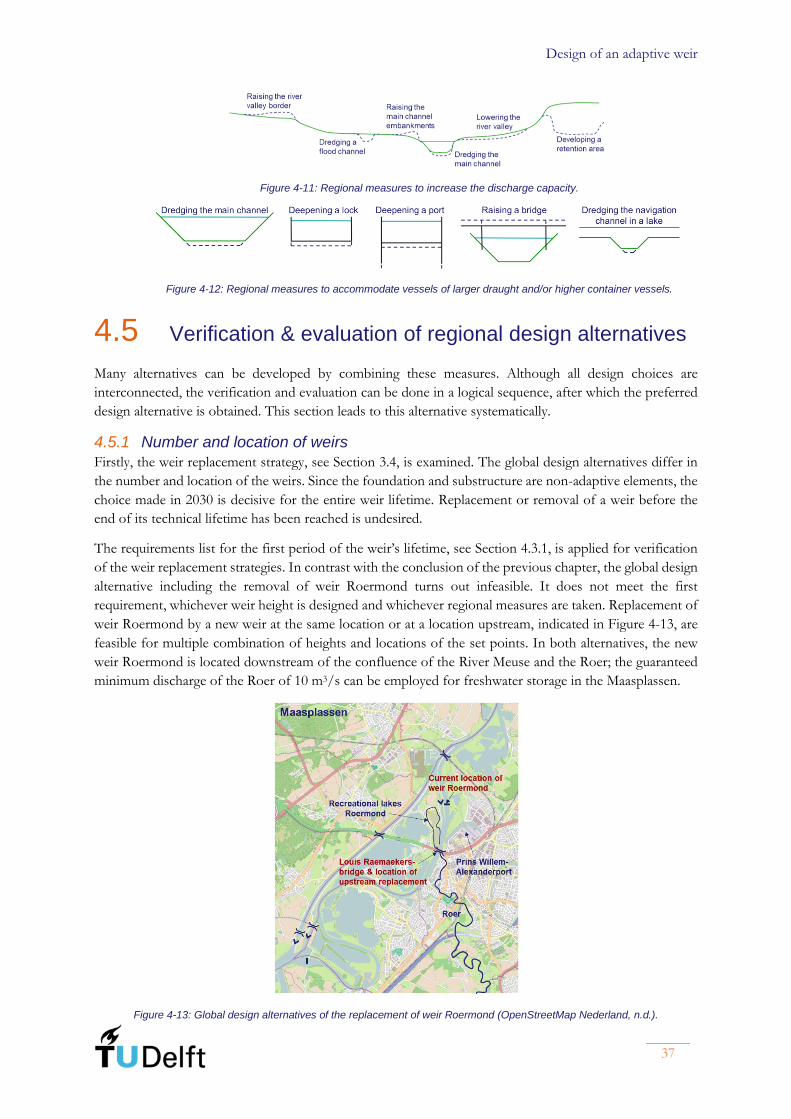
Design of an adaptive weir
37
Figure 4-11: Regional measures to increase the discharge capacity.
Figure 4-12: Regional measures to accommodate vessels of larger draught and/or higher container vessels.
4.5 Verification & evaluation of regional design alternatives
Many alternatives can be developed by combining these measures. Although all design choices are
interconnected, the verification and evaluation can be done in a logical sequence, after which the preferred
design alternative is obtained. This section leads to this alternative systematically.
4.5.1 Number and location of weirs
Firstly, the weir replacement strategy, see Section 3.4, is examined. The global design alternatives differ in
the number and location of the weirs. Since the foundation and substructure are non-adaptive elements, the
choice made in 2030 is decisive for the entire weir lifetime. Replacement or removal of a weir before the
end of its technical lifetime has been reached is undesired.
The requirements list for the first period of the weir’s lifetime, see Section 4.3.1, is applied for verification
of the weir replacement strategies. In contrast with the conclusion of the previous chapter, the global design
alternative including the removal of weir Roermond turns out infeasible. It does not meet the first
requirement, whichever weir height is designed and whichever regional measures are taken. Replacement of
weir Roermond by a new weir at the same location or at a location upstream, indicated in Figure 4-13, are
feasible for multiple combination of heights and locations of the set points. In both alternatives, the new
weir Roermond is located downstream of the confluence of the River Meuse and the Roer; the guaranteed
minimum discharge of the Roer of 10 m3/s can be employed for freshwater storage in the Maasplassen.
Figure 4-13: Global design alternatives of the replacement of weir Roermond (OpenStreetMap Nederland, n.d.).
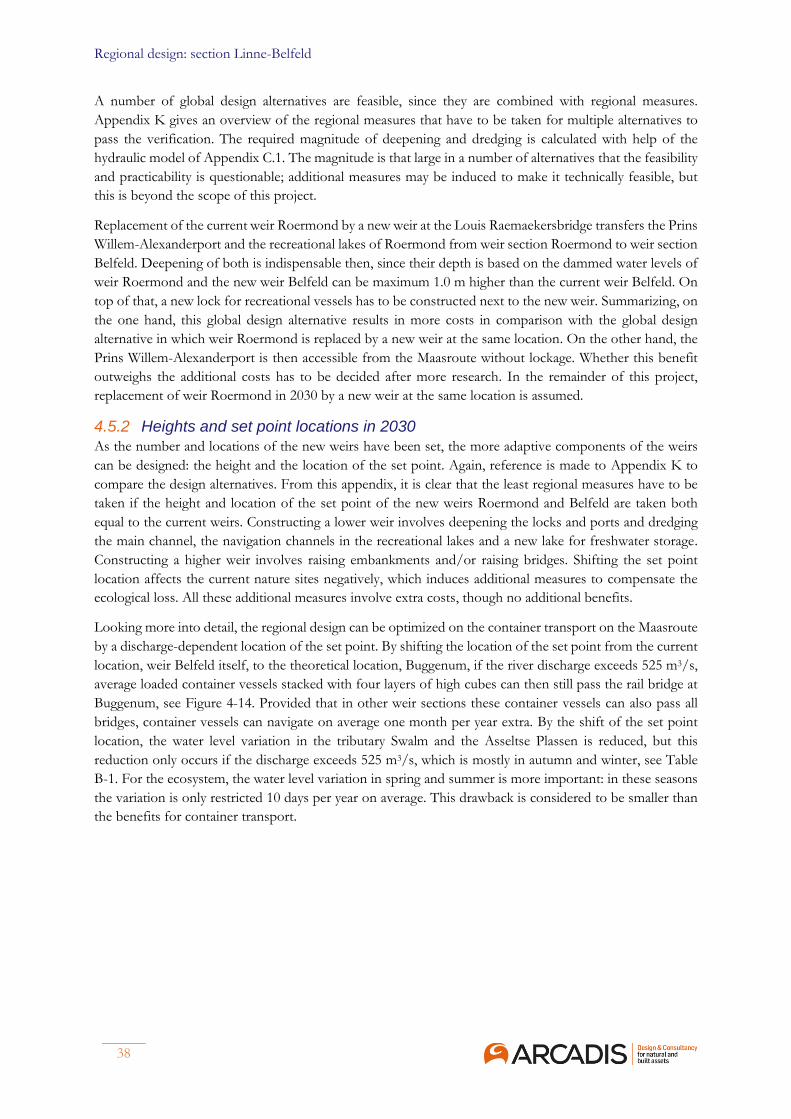
Regional design: section Linne-Belfeld
38
A number of global design alternatives are feasible, since they are combined with regional measures.
Appendix K gives an overview of the regional measures that have to be taken for multiple alternatives to
pass the verification. The required magnitude of deepening and dredging is calculated with help of the
hydraulic model of Appendix C.1. The magnitude is that large in a number of alternatives that the feasibility
and practicability is questionable; additional measures may be induced to make it technically feasible, but
this is beyond the scope of this project.
Replacement of the current weir Roermond by a new weir at the Louis Raemaekersbridge transfers the Prins
Willem-Alexanderport and the recreational lakes of Roermond from weir section Roermond to weir section
Belfeld. Deepening of both is indispensable then, since their depth is based on the dammed water levels of
weir Roermond and the new weir Belfeld can be maximum 1.0 m higher than the current weir Belfeld. On
top of that, a new lock for recreational vessels has to be constructed next to the new weir. Summarizing, on
the one hand, this global design alternative results in more costs in comparison with the global design
alternative in which weir Roermond is replaced by a new weir at the same location. On the other hand, the
Prins Willem-Alexanderport is then accessible from the Maasroute without lockage. Whether this benefit
outweighs the additional costs has to be decided after more research. In the remainder of this project,
replacement of weir Roermond in 2030 by a new weir at the same location is assumed.
4.5.2 Heights and set point locations in 2030
As the number and locations of the new weirs have been set, the more adaptive components of the weirs
can be designed: the height and the location of the set point. Again, reference is made to Appendix K to
compare the design alternatives. From this appendix, it is clear that the least regional measures have to be
taken if the height and location of the set point of the new weirs Roermond and Belfeld are taken both
equal to the current weirs. Constructing a lower weir involves deepening the locks and ports and dredging
the main channel, the navigation channels in the recreational lakes and a new lake for freshwater storage.
Constructing a higher weir involves raising embankments and/or raising bridges. Shifting the set point
location affects the current nature sites negatively, which induces additional measures to compensate the
ecological loss. All these additional measures involve extra costs, though no additional benefits.
Looking more into detail, the regional design can be optimized on the container transport on the Maasroute
by a discharge-dependent location of the set point. By shifting the location of the set point from the current
location, weir Belfeld itself, to the theoretical location, Buggenum, if the river discharge exceeds 525 m3/s,
average loaded container vessels stacked with four layers of high cubes can then still pass the rail bridge at
Buggenum, see Figure 4-14. Provided that in other weir sections these container vessels can also pass all
bridges, container vessels can navigate on average one month per year extra. By the shift of the set point
location, the water level variation in the tributary Swalm and the Asseltse Plassen is reduced, but this
reduction only occurs if the discharge exceeds 525 m3/s, which is mostly in autumn and winter, see Table
B-1. For the ecosystem, the water level variation in spring and summer is more important: in these seasons
the variation is only restricted 10 days per year on average. This drawback is considered to be smaller than
the benefits for container transport.
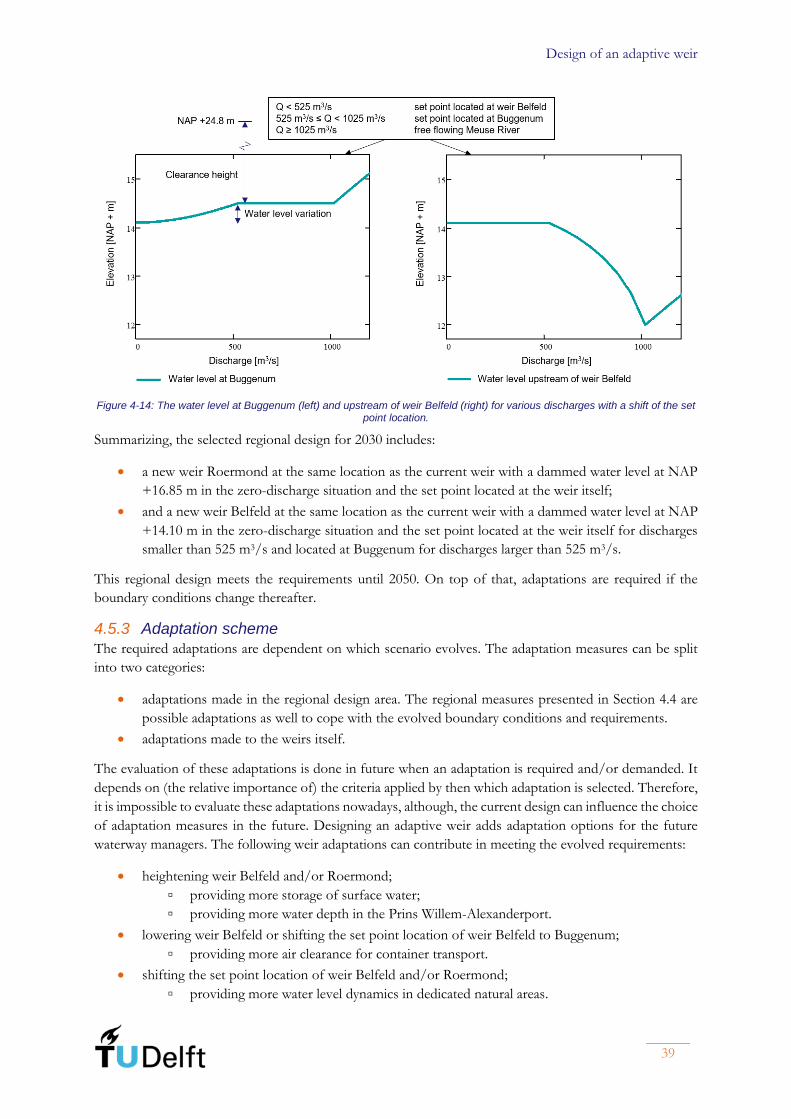
Design of an adaptive weir
39
Figure 4-14: The water level at Buggenum (left) and upstream of weir Belfeld (right) for various discharges with a shift of the set point location.
Summarizing, the selected regional design for 2030 includes:
• a new weir Roermond at the same location as the current weir with a dammed water level at NAP
+16.85 m in the zero-discharge situation and the set point located at the weir itself;
• and a new weir Belfeld at the same location as the current weir with a dammed water level at NAP
+14.10 m in the zero-discharge situation and the set point located at the weir itself for discharges
smaller than 525 m3/s and located at Buggenum for discharges larger than 525 m3/s.
This regional design meets the requirements until 2050. On top of that, adaptations are required if the
boundary conditions change thereafter.
4.5.3 Adaptation scheme
The required adaptations are dependent on which scenario evolves. The adaptation measures can be split
into two categories:
• adaptations made in the regional design area. The regional measures presented in Section 4.4 are
possible adaptations as well to cope with the evolved boundary conditions and requirements.
• adaptations made to the weirs itself.
The evaluation of these adaptations is done in future when an adaptation is required and/or demanded. It
depends on (the relative importance of) the criteria applied by then which adaptation is selected. Therefore,
it is impossible to evaluate these adaptations nowadays, although, the current design can influence the choice
of adaptation measures in the future. Designing an adaptive weir adds adaptation options for the future
waterway managers. The following weir adaptations can contribute in meeting the evolved requirements:
• heightening weir Belfeld and/or Roermond;
▫ providing more storage of surface water;
▫ providing more water depth in the Prins Willem-Alexanderport.
• lowering weir Belfeld or shifting the set point location of weir Belfeld to Buggenum;
▫ providing more air clearance for container transport.
• shifting the set point location of weir Belfeld and/or Roermond;
▫ providing more water level dynamics in dedicated natural areas.

Regional design: section Linne-Belfeld
40
• enlarging the flow opening of weir Belfeld and/or Roermond;
▫ providing more discharge capacity.
• replacing weir Roermond by a new weir at the Louis Raemaekersbridge;
▫ providing improved accessibility of the Prins Willem-Alexanderport.
• removing weir Roermond;
▫ providing improved accessibility of the Prins Willem-Alexanderport;
▫ providing more water level variation in the Loop of Linne.
An overview of the required adaptation measures during the weir’s lifetime are shown in Table 4-3. The
second column indicates in which scenario and year each purpose applies, which is based on the evolution
of boundary conditions and requirements, see Appendix A.2. The adaptation measures that have to be taken
to serve these purposes are split into regional and weir adaptation measures. Note that this adaptation
scheme assumes the construction of unlimited adaptive weirs at Roermond and Belfeld. The feasibility of
this unlimited adaptivity is addressed in the next chapter.
Table 4-3: Adaptation scheme of the weir sections Roermond and Belfeld.
Purpose Scenario (year) in
which the purpose
applies
Regional
adaptation measures
Binary
operator
Weir Belfeld and weir
Roermond adaptation
measures
Increasing the discharge
capacity of the river valley
DRUK (2050) ‘Room for the River’
measures ⊃
Enlarging the
flow opening
By 10%
STOOM (2050, 2100)
WARM (2100) By 15%
Preventing more frequent
flooding of the river valley
DRUK (2050) Raising the main
channel embankments
∪
dredging the main
channel
∪
Enlarging the
flow opening
By 10%
STOOM (2050) By 15%
∪
shifting the set point locations
Accommodating higher
container vessels
DRUK (2050)
STOOM (2050)
Raising bridges on the
Maasroute ⊃
Lowering weir Belfeld
∪
shifting the set point location
of weir Belfeld
Providing more
freshwater storage
DRUK (2050, 2075)
STOOM (2075, 2100)
WARM (2075, 2100)
Dredging a new lake
∪
enlarging an existing
lake
∪ Heightening
with maximum
1.0 m
DRUK (2100) 3.0 m
Increasing the dynamics
in dedicated natural areas DRUK (2050) - - Shifting the set point locations
Accommodating larger
vessels to the Prins
Willem-Alexanderport
DRUK (2075) Deepening the Prins
Willem-Alexanderport ⊃
Heightening weir Roermond
with maximum 1.0 m
Improving the
accessibility of the Prins
Willem-Alexanderport
DRUK (2100) Deepening the Prins
Willem-Alexanderport
∩
Removal of weir Roermond
∪
replacing weir Roermond
upstream
⊃ Heightening weir Belfeld with
maximum 3.0 m
Providing more frequent
flooding of the river valley WARM (2075, 2100)
Lowering the river
valley ∪
Heightening with maximum
1.0 m
Legend (A = regional adaptation measures; B = weir adaptation measures)
A ∩ B = intersection (A and B)
A ∪ B = union (A or B)
A ⊃ B = superset [(only A) or (minimized A + B)]
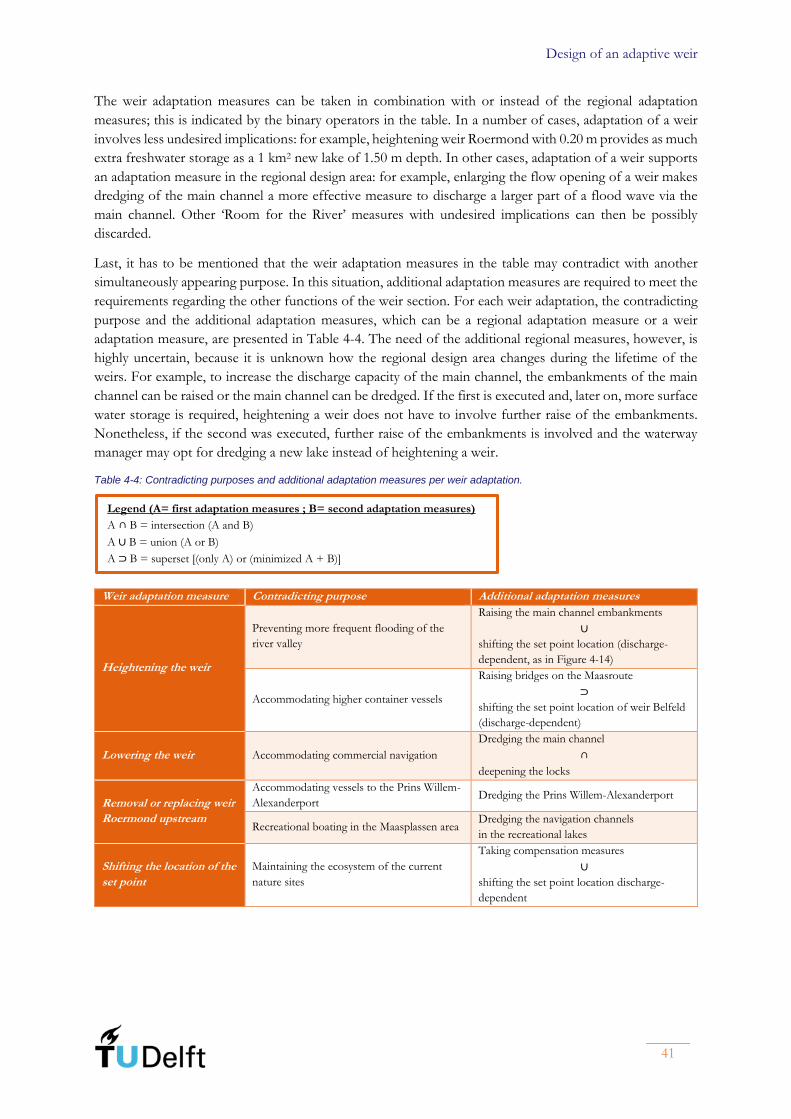
Design of an adaptive weir
41
The weir adaptation measures can be taken in combination with or instead of the regional adaptation
measures; this is indicated by the binary operators in the table. In a number of cases, adaptation of a weir
involves less undesired implications: for example, heightening weir Roermond with 0.20 m provides as much
extra freshwater storage as a 1 km2 new lake of 1.50 m depth. In other cases, adaptation of a weir supports
an adaptation measure in the regional design area: for example, enlarging the flow opening of a weir makes
dredging of the main channel a more effective measure to discharge a larger part of a flood wave via the
main channel. Other ‘Room for the River’ measures with undesired implications can then be possibly
discarded.
Last, it has to be mentioned that the weir adaptation measures in the table may contradict with another
simultaneously appearing purpose. In this situation, additional adaptation measures are required to meet the
requirements regarding the other functions of the weir section. For each weir adaptation, the contradicting
purpose and the additional adaptation measures, which can be a regional adaptation measure or a weir
adaptation measure, are presented in Table 4-4. The need of the additional regional measures, however, is
highly uncertain, because it is unknown how the regional design area changes during the lifetime of the
weirs. For example, to increase the discharge capacity of the main channel, the embankments of the main
channel can be raised or the main channel can be dredged. If the first is executed and, later on, more surface
water storage is required, heightening a weir does not have to involve further raise of the embankments.
Nonetheless, if the second was executed, further raise of the embankments is involved and the waterway
manager may opt for dredging a new lake instead of heightening a weir.
Table 4-4: Contradicting purposes and additional adaptation measures per weir adaptation.
Weir adaptation measure Contradicting purpose Additional adaptation measures
Heightening the weir
Preventing more frequent flooding of the
river valley
Raising the main channel embankments
∪
shifting the set point location (discharge-
dependent, as in Figure 4-14)
Accommodating higher container vessels
Raising bridges on the Maasroute
⊃
shifting the set point location of weir Belfeld
(discharge-dependent)
Lowering the weir Accommodating commercial navigation
Dredging the main channel
∩
deepening the locks
Removal or replacing weir
Roermond upstream
Accommodating vessels to the Prins Willem-
Alexanderport Dredging the Prins Willem-Alexanderport
Recreational boating in the Maasplassen area Dredging the navigation channels
in the recreational lakes
Shifting the location of the
set point
Maintaining the ecosystem of the current
nature sites
Taking compensation measures
∪
shifting the set point location discharge-
dependent
Legend (A= first adaptation measures ; B= second adaptation measures)
A ∩ B = intersection (A and B)
A ∪ B = union (A or B)
A ⊃ B = superset [(only A) or (minimized A + B)]
Regional design: section Linne-Belfeld
42
Since weir Belfeld dams the water level in part of the Maasroute, the adaptations are more complex in this
weir section. Moreover, if the accessibility of the Prins Willem-Alexanderport has to be improved, weir
Roermond has to be removed or replaced by a new weir upstream and weir Belfeld has to be heightened.
Therefore, the adaptivity of weir Belfeld serves more purposes. From the adaptation scheme, it is concluded
that the largest desired adaptivity of weir Belfeld, providing the most freedom of choice in the future,
includes:
• enlarging the discharge capacity by 30%;
• shifting the location of the set point (depending on the discharge);
• lowering the dammed water level to NAP +13.70 m and heightening the dammed water level to
NAP +17.10 m.
4.6 Weir replacement and adaptivity in section Linne-Belfeld
After analysis of the section Linne-Belfeld in more detail, removal of weir Roermond turns out to be
infeasible in 2030. The other two replacement strategies, replacement of the weir by a new higher weir or a
new weir at an upstream location, have to be combined with a couple of regional measures. Replacement
of both weir Roermond and Belfeld in 2030 by new, equally high weirs at the same location as the current
weirs has been selected after comparing the amount of required regional measures and advantages.
Nevertheless, there is a difference with the current weirs: the location of the set point of weir Belfeld is
shifted from weir Belfeld to Buggenum when the river discharge exceeds 525 m3/s to accommodate average
loaded container vessels, stacked with four layers of high cubes, during large discharges.
The scenario-dependent developments in the subsequent century require adaptations to this design
alternative. The adaptation scheme, shown in Table 4-3, presents an overview of the future developments
for each time period and scenario and links to them the adaptation measures that are required in case of
specific developments. The adaptation measures are split into weir adaptations and regional adaptations in
the river area. From this adaptation scheme, it is concluded that an adaptive weir provides more freedom
of choice for the future waterway managers. By adapting the weir, regional measures with undesired
implications for local governments and inhabitants can be discarded. The largest freedom of choice is
preserved if the weir is adaptive to the most stringent combination of evolved boundary conditions and
requirements, see Table 4-2. Finding out whether this adaptivity is feasible, is part of the next chapter. If it
is not, the freedom of choice has to be restricted: a combination of smaller adaptations to the weir and
adaptations in the regional design area will then be required to serve the purposes in the future.
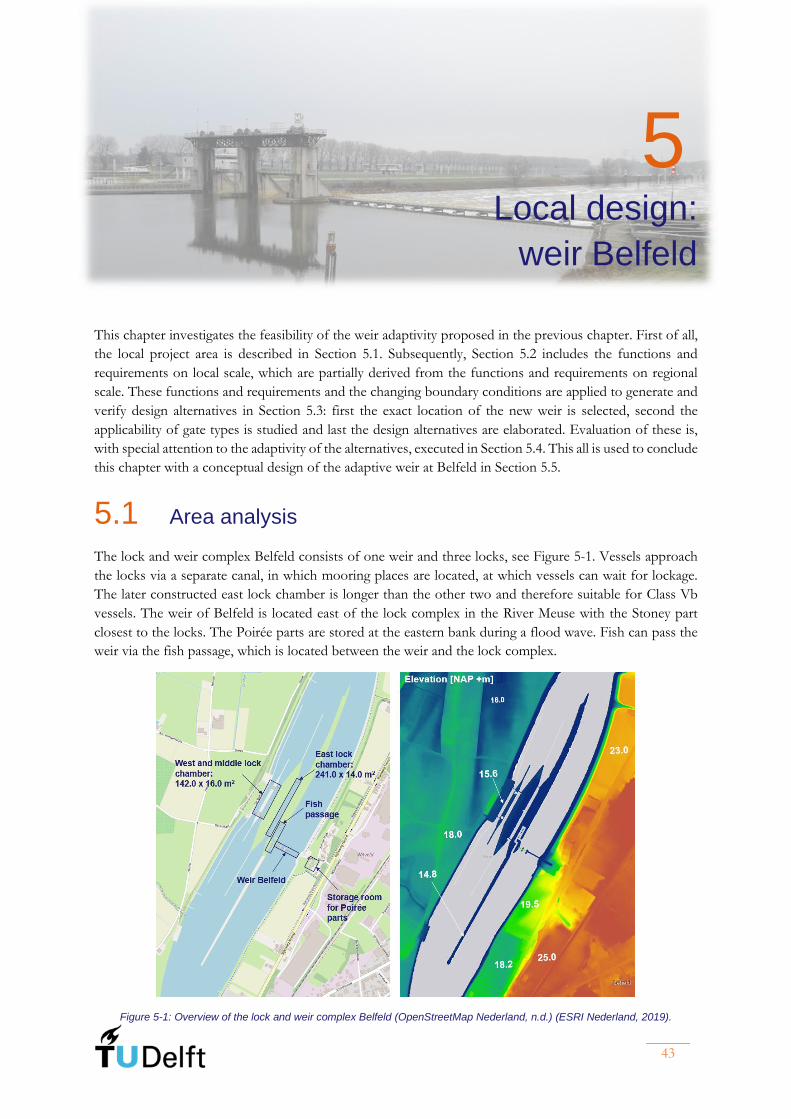
Design of an adaptive weir
43
5
Local design:
weir Belfeld
This chapter investigates the feasibility of the weir adaptivity proposed in the previous chapter. First of all,
the local project area is described in Section 5.1. Subsequently, Section 5.2 includes the functions and
requirements on local scale, which are partially derived from the functions and requirements on regional
scale. These functions and requirements and the changing boundary conditions are applied to generate and
verify design alternatives in Section 5.3: first the exact location of the new weir is selected, second the
applicability of gate types is studied and last the design alternatives are elaborated. Evaluation of these is,
with special attention to the adaptivity of the alternatives, executed in Section 5.4. This all is used to conclude
this chapter with a conceptual design of the adaptive weir at Belfeld in Section 5.5.
5.1 Area analysis
The lock and weir complex Belfeld consists of one weir and three locks, see Figure 5-1. Vessels approach
the locks via a separate canal, in which mooring places are located, at which vessels can wait for lockage.
The later constructed east lock chamber is longer than the other two and therefore suitable for Class Vb
vessels. The weir of Belfeld is located east of the lock complex in the River Meuse with the Stoney part
closest to the locks. The Poirée parts are stored at the eastern bank during a flood wave. Fish can pass the
weir via the fish passage, which is located between the weir and the lock complex.
Figure 5-1: Overview of the lock and weir complex Belfeld (OpenStreetMap Nederland, n.d.) (ESRI Nederland, 2019).

Local design: weir Belfeld
44
The overview on the right of Figure 5-1, a detailed view of Figure 4-5, shows the ground level. Downstream
of weir Belfeld, the dammed water level is determined by weir Sambeek. It is assumed that this dammed
water level, NAP +10.75 m in the zero-discharge situation, remains unchanged. The lock walls and approach
structure rise above the dammed water level of weir Belfeld, NAP +14.10 m in the zero-discharge situation,
to maintain the water head over the weir. If a large flood waves passes, first the western river embankment
floods; the terraces in the east, upon which the village of Belfeld is situated, are seldom flooded because of
their high elevation, above NAP +23.0 m.
Based on the previous chapter, the riverbed level at Belfeld is assumed at NAP +6.75 m and the top of the
upstream lock sills at NAP +7.25 m. Both just enable navigation of vessels with governing draught on the
Maasroute. The sill of the current weir protrudes from the riverbed to NAP +8.05 m (Rijkswaterstaat, 1989).
The height difference is the result of riverbed subsidence, caused by the sand extraction in the Maasplassen
and dredging of the Zandmaas for navigation purpose. Further autonomous riverbed subsidence is,
however, not expected in the Zandmaas (Ministerie van Verkeer en Waterstaat, 2007).
5.2 Functional and requirement analysis
As in the previous chapters, the design starts with the functions of and requirements to the design. The
global and regional design show the functions of weir Belfeld clearly. On local scale, additional functions
and requirements come into play. For example, fish has to be able to pass the weir and electricity can be
generated by a hydropower station. Space has to be reserved for fulfilling these two functions; this study
does not go into more detail about them. This section focusses on the fulfilment of the requirements related
to the regional design area: the water level control and the passage of flood waves. Furthermore, the
feasibility of constructing a navigation opening in the weir is addressed.
5.2.1 Water level control
To constantly control the water level in weir section Belfeld, weir gates are needed of which the position
can be adjusted to the river discharge. At the current weir, operation of the Stoney gates is sufficient to
provide the desired water level for discharges smaller than 200 m3/s, a discharge which is only exceeded
37% of the year on average, see Table B-1. The rest of the year, especially in summer, the Poirée part is
closed and untouched. Regardless of the type of gates in the new weir, water level control during small
discharges by an assigned part of the weir is favourable: movement of all gates simultaneously uses more
power and gives rise to wear of the hoist mechanism, such as cables and/or wheels. If the discharge is
smaller than the threshold value, the full discharge passes the assigned weir part, provided that the flow
velocity through the discharge opening is acceptable.
The threshold value is dependent on the dimensions, width and sill’s elevation, of the discharge opening
and the water levels upstream and downstream of the weir. If the difference between the upstream and
downstream water level is large, free flow occurs; otherwise it is called submerged flow. During free flow,
the discharge through the weir is not hampered by the downstream water level, whereas it is during
submerged flow. The underlying hydraulics and transition between the two flow situations are addressed in
Appendix C.2, from which Figure 5-2 has been obtained as well. The figure shows that for the same
discharge range, the crest of an overflow gate has to be adjusted more than the bottom of an underflow
gate. Therefore, the overflow gate is more suited for accurate water level control.
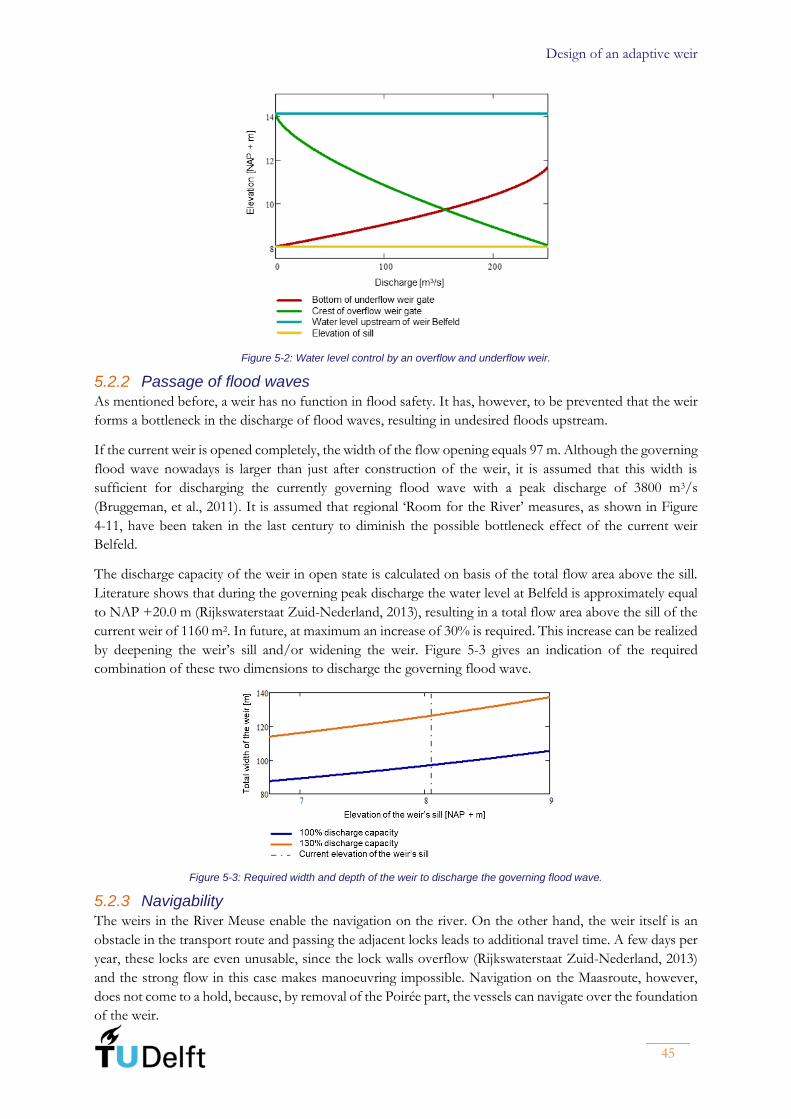
Design of an adaptive weir
45
Figure 5-2: Water level control by an overflow and underflow weir.
5.2.2 Passage of flood waves
As mentioned before, a weir has no function in flood safety. It has, however, to be prevented that the weir
forms a bottleneck in the discharge of flood waves, resulting in undesired floods upstream.
If the current weir is opened completely, the width of the flow opening equals 97 m. Although the governing
flood wave nowadays is larger than just after construction of the weir, it is assumed that this width is
sufficient for discharging the currently governing flood wave with a peak discharge of 3800 m3/s
(Bruggeman, et al., 2011). It is assumed that regional ‘Room for the River’ measures, as shown in Figure
4-11, have been taken in the last century to diminish the possible bottleneck effect of the current weir
Belfeld.
The discharge capacity of the weir in open state is calculated on basis of the total flow area above the sill.
Literature shows that during the governing peak discharge the water level at Belfeld is approximately equal
to NAP +20.0 m (Rijkswaterstaat Zuid-Nederland, 2013), resulting in a total flow area above the sill of the
current weir of 1160 m2. In future, at maximum an increase of 30% is required. This increase can be realized
by deepening the weir’s sill and/or widening the weir. Figure 5-3 gives an indication of the required
combination of these two dimensions to discharge the governing flood wave.
Figure 5-3: Required width and depth of the weir to discharge the governing flood wave.
5.2.3 Navigability
The weirs in the River Meuse enable the navigation on the river. On the other hand, the weir itself is an
obstacle in the transport route and passing the adjacent locks leads to additional travel time. A few days per
year, these locks are even unusable, since the lock walls overflow (Rijkswaterstaat Zuid-Nederland, 2013)
and the strong flow in this case makes manoeuvring impossible. Navigation on the Maasroute, however,
does not come to a hold, because, by removal of the Poirée part, the vessels can navigate over the foundation
of the weir.

Local design: weir Belfeld
46
The dimensions of the navigable opening in the weir are related to the dimensions of the governing vessel.
The governing draught and height of the vessels navigating on the Maasroute has been addressed in the
regional design. The evolution of the governing vessel’s beam, however, was not an issue on that scale level;
for the width of the navigation opening it can be. In two scenarios, the development of the transport of
pallet-wide containers leads to an increase of the container vessels’ beam from 11.4 m to 12.0 m. However,
this does not result in more stringent requirements, since Table 3-1 shows that the maximum allowable
vessel’s beam on the Zandmaas is currently already equal to 15.5 m.
To enable navigation through the weir without hindrance for the navigation sector, the navigation opening
has to be equal to the river width. Because the span of the gate has to be very large in this case, the costs
are very high. By using VTS systems near the weir, safe and efficient navigation through two one-lane
openings or one two-lane opening can be established. Two one-lane openings are preferred, because a two-
lane opening, more expensive due to its large span, does not hold any nautical advantages (Blokland, 1955).
The corresponding requirements of a one-lane opening are:
• The width and water depth have to meet the guidelines of the Richtlijn Vaarwegen when the weir
is about to open, see Figure 5-4. The crosswind results in the surcharge of 9 m.
Figure 5-4: The dimensional requirements of a navigation opening in a weir (Rijkswaterstaat, 2017).
• The weir may not be located within 380 m, which is two times the length of the governing vessel,
from the bifurcation of the river and the lock canal (Rijkswaterstaat, 2017).
• The air clearance has to be equal to that of bridges, see Figure 4-6, when the weir is about to
open.
Lastly, it is worth mentioning that the frequency of opening of weir Belfeld for navigation is dependent on
the height of the weir and the location of the set point, see Figure 5-5. Heightening the weir decreases the
frequency of opening and thus the added value of a navigation opening through the weir. On top of that,
heightening the weir could involve reinforcement of the locks themselves, which is an opportunity to make
them suitable for lockage during high water levels. In contrast, shifting the set point location to the
theoretical location increases the frequency of opening significantly. Moreover, the head over the locks is
smaller in this situation, which speeds up the lockage process.
Figure 5-5: Frequency of the weir in open state for a dammed water level of NAP +14.10 m (left) and a dammed water level of NAP +14.60 m (right).

Design of an adaptive weir
47
5.2.4 List of requirements
Based on the functions above, a list of requirements is set up, including special attention to the weir
adaptivity and feasibility of a navigation opening:
• Construction of the new weir has to be finished before the current weir reaches the end of its
lifetime.
• During construction of the new weir, the discharge function of the river and navigation through
the locks may not be hampered.
• The total flow opening of the new weir has to be sufficient to discharge the currently governing
flood wave as good as the current weir.
• The new weir has to be able to provide the currently desired water level in weir section Belfeld,
which is equal to NAP +14.10 m in the zero-discharge situation.
• Fish has to be able to pass the weir by a fish trap.
• The local flow conditions at the weir must not affect the navigation on the Zandmaas and the lock
canal.
• The water level control has to be provided on average at least half of the year by gates able to
control this accurately.
• If feasible,
▫ shifting the location of the set point of weir Belfeld has to be made possible;
▫ enlarging the weir’s capacity to discharge flood waves with maximum 30% has to be made
possible;
▫ adapting the dammed water levels ranging from NAP +13.70 m to NAP +17.10 m has to
be made possible;
▫ navigation of the governing vessel through/over the weir in open state has to be made
possible in compliance with the requirements in Richtlijn Vaarwegen;
▫ addition of a hydropower station has to be made possible.
5.3 Design synthesis & verification of local alternatives
The design alternatives have, again, been generated by first focussing on the non-adaptive design aspects.
One of these aspects is the location of the weir. The required amount of earth-moving activities and the
feasibility to enlarge the discharge capacity of the weirs and to add secondary functions in a couple of
decades are decisive for the site selection. The second non-adaptive design aspect deals with the concrete
superstructure. The dimensions of the weir openings determine the water level control throughout the year
and whether vessels can pass through/over the weir in open state. At last, the adaptivity of the weir, more
specific the adaptivity of the weir gates, is considered.
5.3.1 Selection of the new weir’s location
The location of the new weir is considered on three locations A, B and C, as shown in Figure 5-6. Since no
(old) river bends are present in the vicinity of the current weir, see Figure 4-5, constructing the weir outside
the area shown in Figure 5-6 is not advantageous. This namely requires a complete new lock complex as
well.
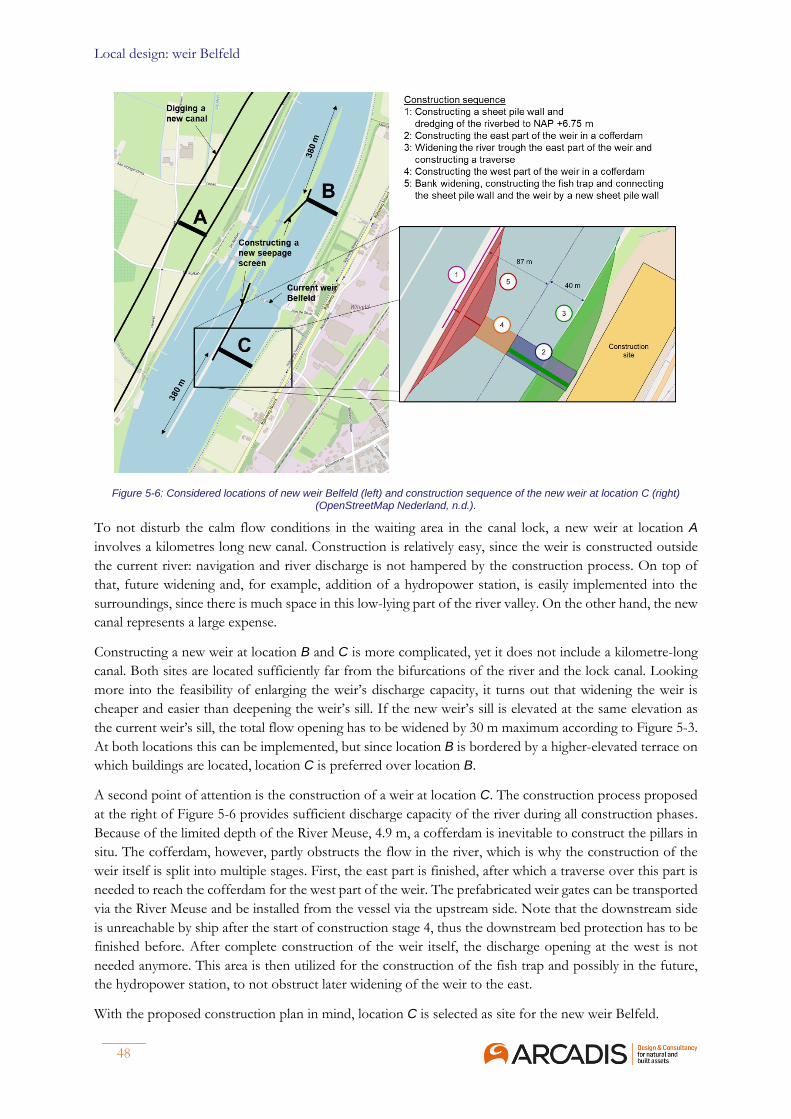
Local design: weir Belfeld
48
Figure 5-6: Considered locations of new weir Belfeld (left) and construction sequence of the new weir at location C (right) (OpenStreetMap Nederland, n.d.).
To not disturb the calm flow conditions in the waiting area in the canal lock, a new weir at location A
involves a kilometres long new canal. Construction is relatively easy, since the weir is constructed outside
the current river: navigation and river discharge is not hampered by the construction process. On top of
that, future widening and, for example, addition of a hydropower station, is easily implemented into the
surroundings, since there is much space in this low-lying part of the river valley. On the other hand, the new
canal represents a large expense.
Constructing a new weir at location B and C is more complicated, yet it does not include a kilometre-long
canal. Both sites are located sufficiently far from the bifurcations of the river and the lock canal. Looking
more into the feasibility of enlarging the weir’s discharge capacity, it turns out that widening the weir is
cheaper and easier than deepening the weir’s sill. If the new weir’s sill is elevated at the same elevation as
the current weir’s sill, the total flow opening has to be widened by 30 m maximum according to Figure 5-3.
At both locations this can be implemented, but since location B is bordered by a higher-elevated terrace on
which buildings are located, location C is preferred over location B.
A second point of attention is the construction of a weir at location C. The construction process proposed
at the right of Figure 5-6 provides sufficient discharge capacity of the river during all construction phases.
Because of the limited depth of the River Meuse, 4.9 m, a cofferdam is inevitable to construct the pillars in
situ. The cofferdam, however, partly obstructs the flow in the river, which is why the construction of the
weir itself is split into multiple stages. First, the east part is finished, after which a traverse over this part is
needed to reach the cofferdam for the west part of the weir. The prefabricated weir gates can be transported
via the River Meuse and be installed from the vessel via the upstream side. Note that the downstream side
is unreachable by ship after the start of construction stage 4, thus the downstream bed protection has to be
finished before. After complete construction of the weir itself, the discharge opening at the west is not
needed anymore. This area is then utilized for the construction of the fish trap and possibly in the future,
the hydropower station, to not obstruct later widening of the weir to the east.
With the proposed construction plan in mind, location C is selected as site for the new weir Belfeld.
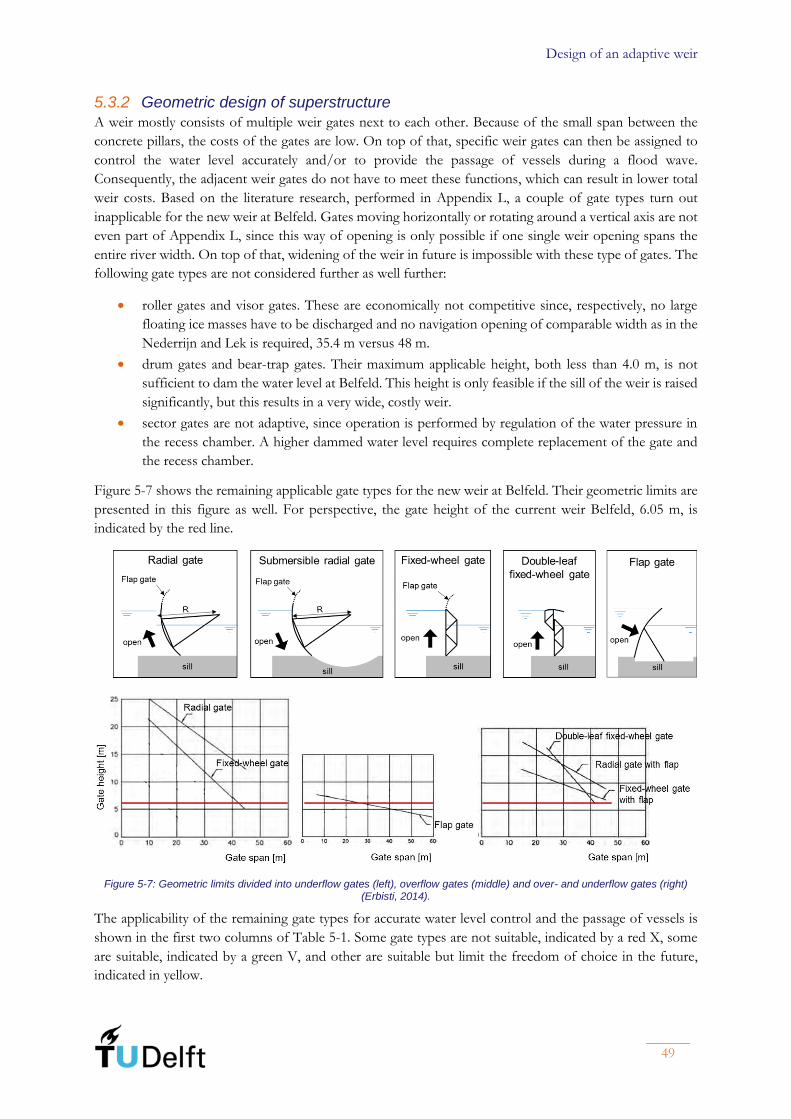
Design of an adaptive weir
49
5.3.2 Geometric design of superstructure
A weir mostly consists of multiple weir gates next to each other. Because of the small span between the
concrete pillars, the costs of the gates are low. On top of that, specific weir gates can then be assigned to
control the water level accurately and/or to provide the passage of vessels during a flood wave.
Consequently, the adjacent weir gates do not have to meet these functions, which can result in lower total
weir costs. Based on the literature research, performed in Appendix L, a couple of gate types turn out
inapplicable for the new weir at Belfeld. Gates moving horizontally or rotating around a vertical axis are not
even part of Appendix L, since this way of opening is only possible if one single weir opening spans the
entire river width. On top of that, widening of the weir in future is impossible with these type of gates. The
following gate types are not considered further as well further:
• roller gates and visor gates. These are economically not competitive since, respectively, no large
floating ice masses have to be discharged and no navigation opening of comparable width as in the
Nederrijn and Lek is required, 35.4 m versus 48 m.
• drum gates and bear-trap gates. Their maximum applicable height, both less than 4.0 m, is not
sufficient to dam the water level at Belfeld. This height is only feasible if the sill of the weir is raised
significantly, but this results in a very wide, costly weir.
• sector gates are not adaptive, since operation is performed by regulation of the water pressure in
the recess chamber. A higher dammed water level requires complete replacement of the gate and
the recess chamber.
Figure 5-7 shows the remaining applicable gate types for the new weir at Belfeld. Their geometric limits are
presented in this figure as well. For perspective, the gate height of the current weir Belfeld, 6.05 m, is
indicated by the red line.
Figure 5-7: Geometric limits divided into underflow gates (left), overflow gates (middle) and over- and underflow gates (right) (Erbisti, 2014).
The applicability of the remaining gate types for accurate water level control and the passage of vessels is
shown in the first two columns of Table 5-1. Some gate types are not suitable, indicated by a red X, some
are suitable, indicated by a green V, and other are suitable but limit the freedom of choice in the future,
indicated in yellow.
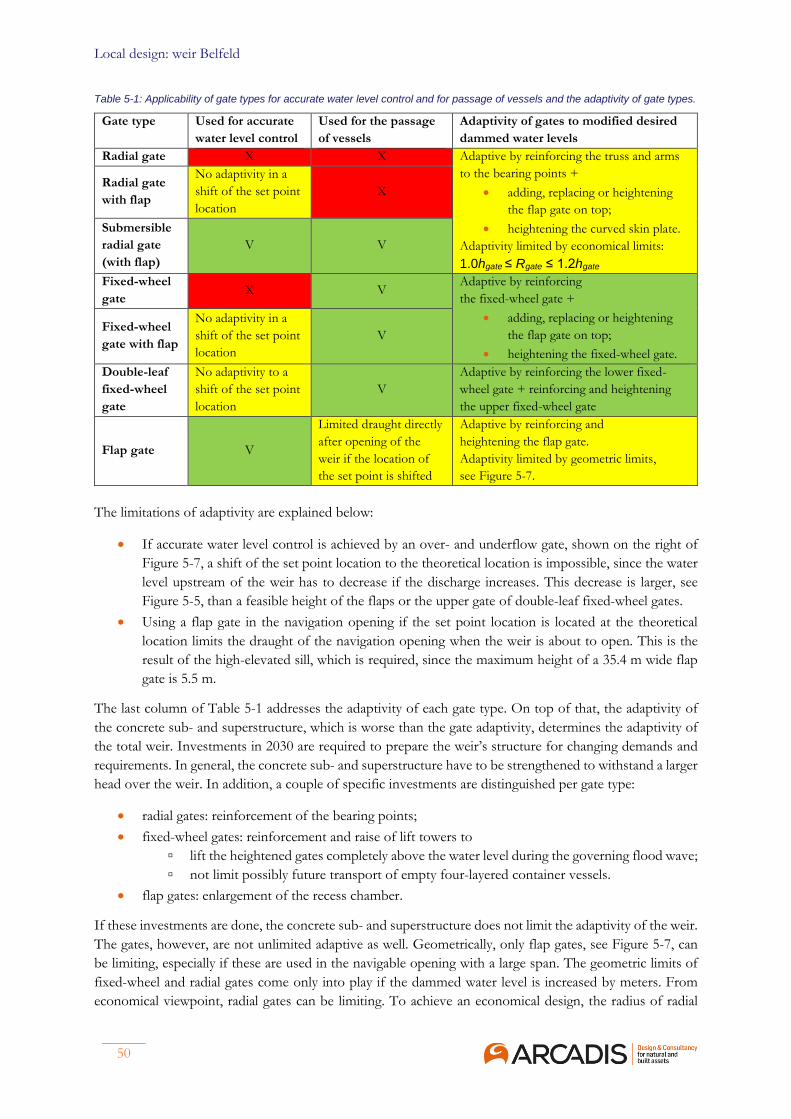
Local design: weir Belfeld
50
Table 5-1: Applicability of gate types for accurate water level control and for passage of vessels and the adaptivity of gate types.
Gate type Used for accurate
water level control
Used for the passage
of vessels
Adaptivity of gates to modified desired
dammed water levels
Radial gate X X Adaptive by reinforcing the truss and arms
to the bearing points +
• adding, replacing or heightening
the flap gate on top;
• heightening the curved skin plate.
Adaptivity limited by economical limits:
1.0hgate ≤ Rgate ≤ 1.2hgate
Radial gate
with flap
No adaptivity in a
shift of the set point
location
X
Submersible
radial gate
(with flap)
V V
Fixed-wheel
gate X V
Adaptive by reinforcing
the fixed-wheel gate +
• adding, replacing or heightening
the flap gate on top;
• heightening the fixed-wheel gate.
Fixed-wheel
gate with flap
No adaptivity in a
shift of the set point
location
V
Double-leaf
fixed-wheel
gate
No adaptivity to a
shift of the set point
location
V
Adaptive by reinforcing the lower fixed-
wheel gate + reinforcing and heightening
the upper fixed-wheel gate
Flap gate V
Limited draught directly
after opening of the
weir if the location of
the set point is shifted
Adaptive by reinforcing and
heightening the flap gate.
Adaptivity limited by geometric limits,
see Figure 5-7.
The limitations of adaptivity are explained below:
• If accurate water level control is achieved by an over- and underflow gate, shown on the right of
Figure 5-7, a shift of the set point location to the theoretical location is impossible, since the water
level upstream of the weir has to decrease if the discharge increases. This decrease is larger, see
Figure 5-5, than a feasible height of the flaps or the upper gate of double-leaf fixed-wheel gates.
• Using a flap gate in the navigation opening if the set point location is located at the theoretical
location limits the draught of the navigation opening when the weir is about to open. This is the
result of the high-elevated sill, which is required, since the maximum height of a 35.4 m wide flap
gate is 5.5 m.
The last column of Table 5-1 addresses the adaptivity of each gate type. On top of that, the adaptivity of
the concrete sub- and superstructure, which is worse than the gate adaptivity, determines the adaptivity of
the total weir. Investments in 2030 are required to prepare the weir’s structure for changing demands and
requirements. In general, the concrete sub- and superstructure have to be strengthened to withstand a larger
head over the weir. In addition, a couple of specific investments are distinguished per gate type:
• radial gates: reinforcement of the bearing points;
• fixed-wheel gates: reinforcement and raise of lift towers to
▫ lift the heightened gates completely above the water level during the governing flood wave;
▫ not limit possibly future transport of empty four-layered container vessels.
• flap gates: enlargement of the recess chamber.
If these investments are done, the concrete sub- and superstructure does not limit the adaptivity of the weir.
The gates, however, are not unlimited adaptive as well. Geometrically, only flap gates, see Figure 5-7, can
be limiting, especially if these are used in the navigable opening with a large span. The geometric limits of
fixed-wheel and radial gates come only into play if the dammed water level is increased by meters. From
economical viewpoint, radial gates can be limiting. To achieve an economical design, the radius of radial
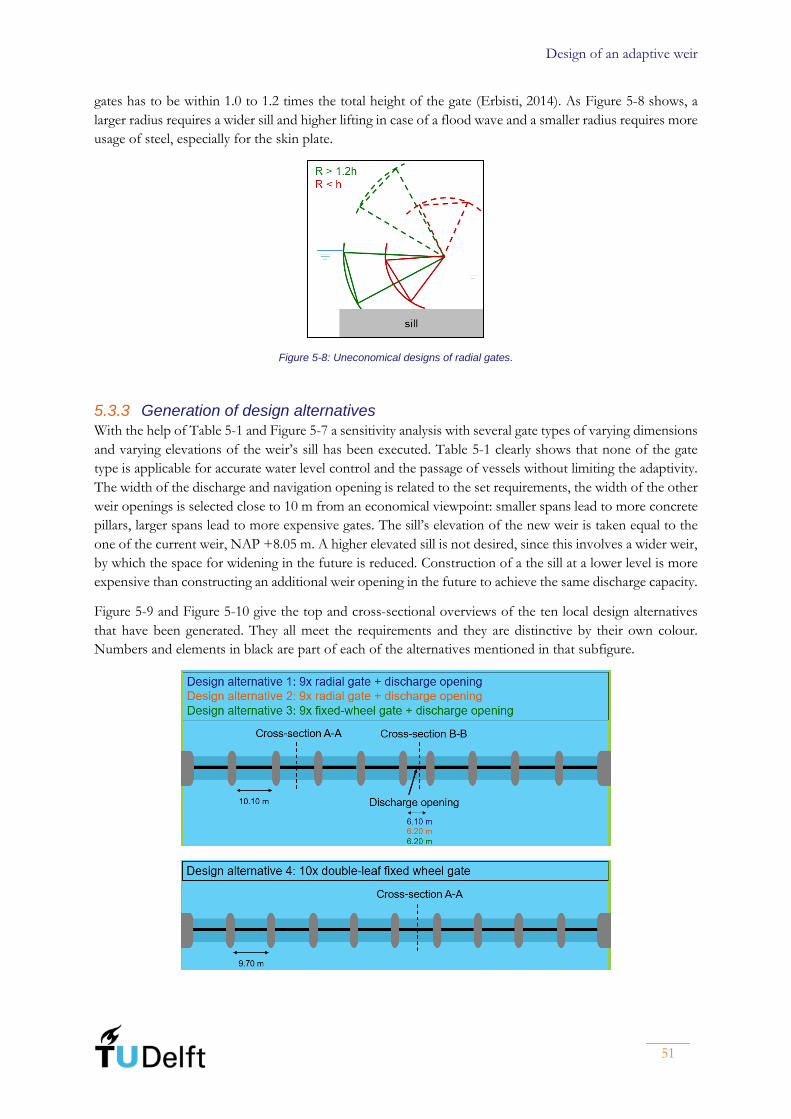
Design of an adaptive weir
51
gates has to be within 1.0 to 1.2 times the total height of the gate (Erbisti, 2014). As Figure 5-8 shows, a
larger radius requires a wider sill and higher lifting in case of a flood wave and a smaller radius requires more
usage of steel, especially for the skin plate.
Figure 5-8: Uneconomical designs of radial gates.
5.3.3 Generation of design alternatives
With the help of Table 5-1 and Figure 5-7 a sensitivity analysis with several gate types of varying dimensions
and varying elevations of the weir’s sill has been executed. Table 5-1 clearly shows that none of the gate
type is applicable for accurate water level control and the passage of vessels without limiting the adaptivity.
The width of the discharge and navigation opening is related to the set requirements, the width of the other
weir openings is selected close to 10 m from an economical viewpoint: smaller spans lead to more concrete
pillars, larger spans lead to more expensive gates. The sill’s elevation of the new weir is taken equal to the
one of the current weir, NAP +8.05 m. A higher elevated sill is not desired, since this involves a wider weir,
by which the space for widening in the future is reduced. Construction of a the sill at a lower level is more
expensive than constructing an additional weir opening in the future to achieve the same discharge capacity.
Figure 5-9 and Figure 5-10 give the top and cross-sectional overviews of the ten local design alternatives
that have been generated. They all meet the requirements and they are distinctive by their own colour.
Numbers and elements in black are part of each of the alternatives mentioned in that subfigure.
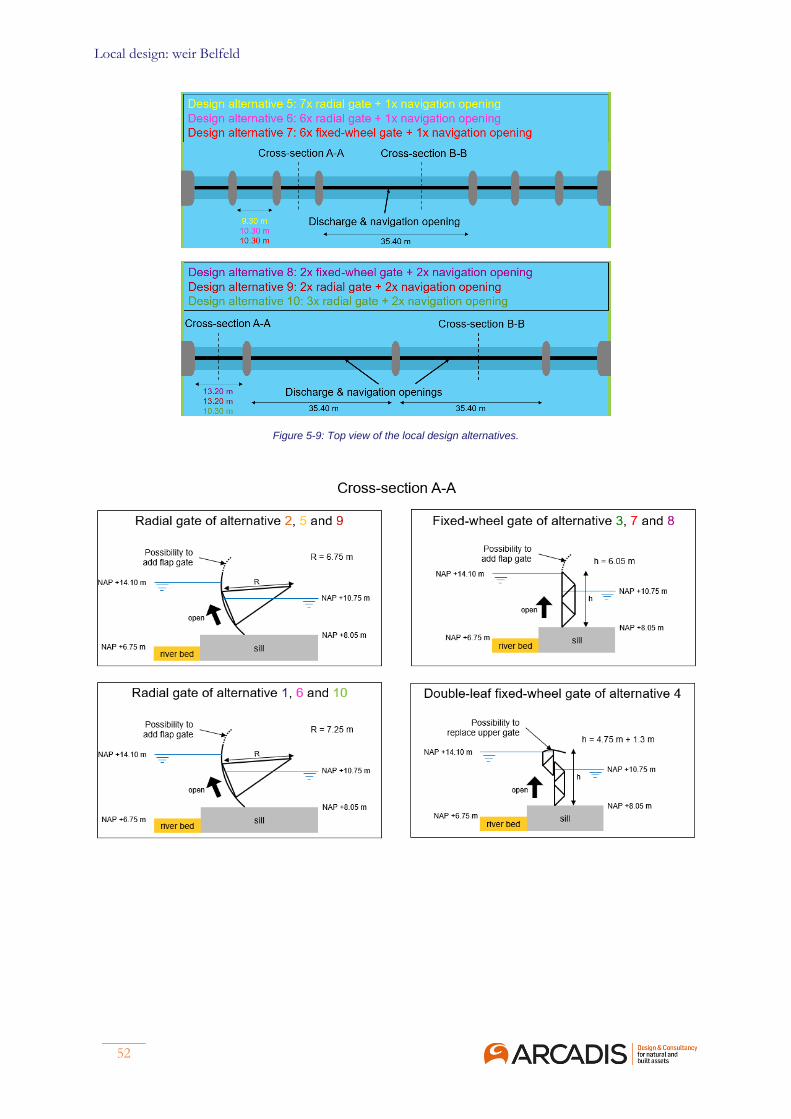
Local design: weir Belfeld
52
Figure 5-9: Top view of the local design alternatives.
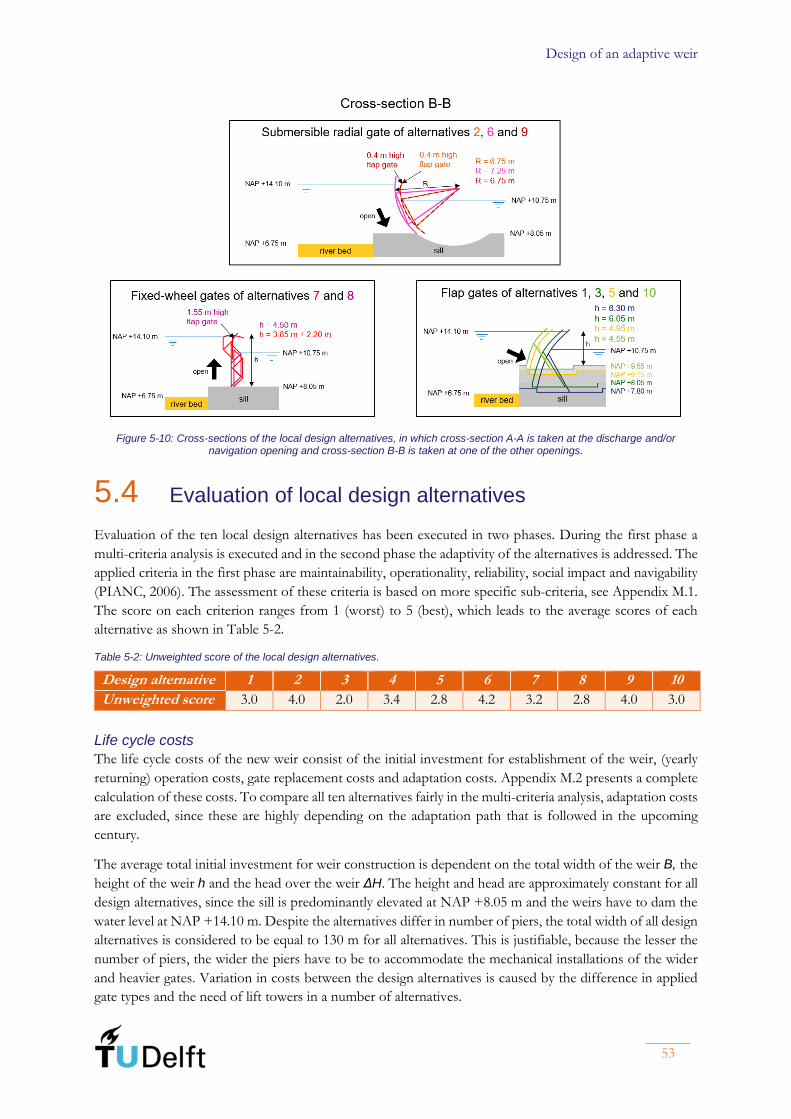
Design of an adaptive weir
53
Figure 5-10: Cross-sections of the local design alternatives, in which cross-section A-A is taken at the discharge and/or navigation opening and cross-section B-B is taken at one of the other openings.
5.4 Evaluation of local design alternatives
Evaluation of the ten local design alternatives has been executed in two phases. During the first phase a
multi-criteria analysis is executed and in the second phase the adaptivity of the alternatives is addressed. The
applied criteria in the first phase are maintainability, operationality, reliability, social impact and navigability
(PIANC, 2006). The assessment of these criteria is based on more specific sub-criteria, see Appendix M.1.
The score on each criterion ranges from 1 (worst) to 5 (best), which leads to the average scores of each
alternative as shown in Table 5-2.
Table 5-2: Unweighted score of the local design alternatives.
Design alternative 1 2 3 4 5 6 7 8 9 10
Unweighted score 3.0 4.0 2.0 3.4 2.8 4.2 3.2 2.8 4.0 3.0
Life cycle costs
The life cycle costs of the new weir consist of the initial investment for establishment of the weir, (yearly
returning) operation costs, gate replacement costs and adaptation costs. Appendix M.2 presents a complete
calculation of these costs. To compare all ten alternatives fairly in the multi-criteria analysis, adaptation costs
are excluded, since these are highly depending on the adaptation path that is followed in the upcoming
century.
The average total initial investment for weir construction is dependent on the total width of the weir B, the
height of the weir h and the head over the weir ΔH. The height and head are approximately constant for all
design alternatives, since the sill is predominantly elevated at NAP +8.05 m and the weirs have to dam the
water level at NAP +14.10 m. Despite the alternatives differ in number of piers, the total width of all design
alternatives is considered to be equal to 130 m for all alternatives. This is justifiable, because the lesser the
number of piers, the wider the piers have to be to accommodate the mechanical installations of the wider
and heavier gates. Variation in costs between the design alternatives is caused by the difference in applied
gate types and the need of lift towers in a number of alternatives.
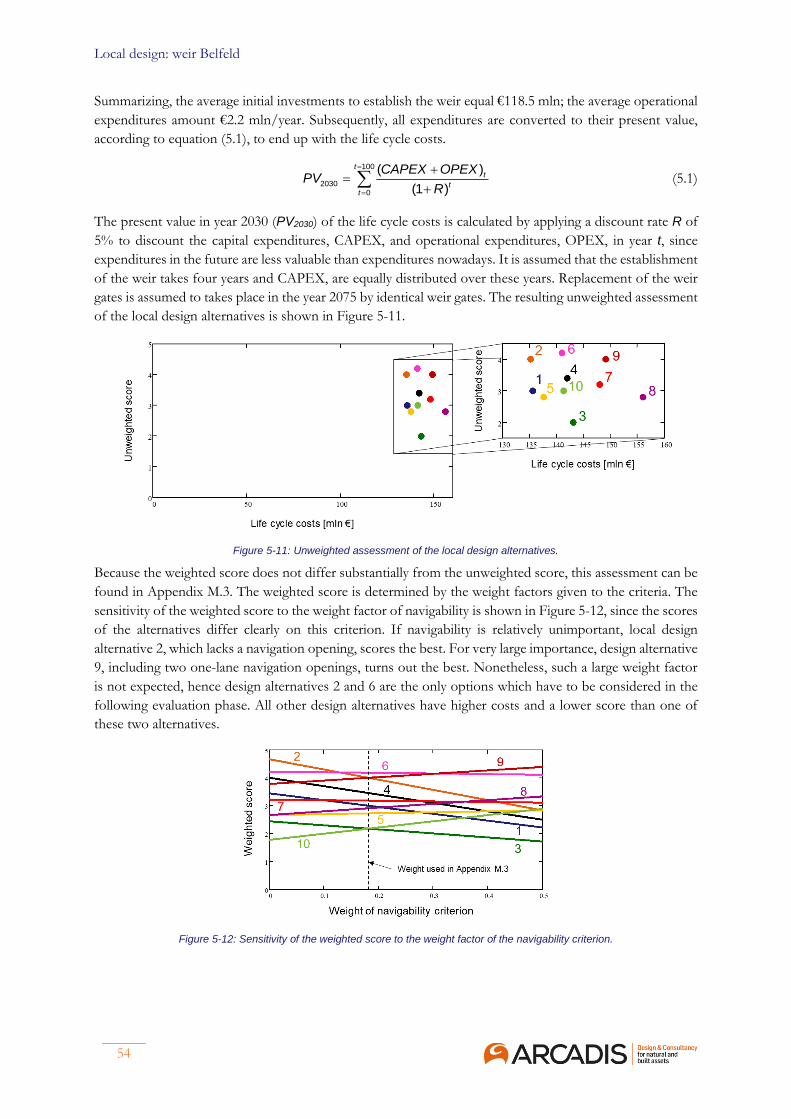
Local design: weir Belfeld
54
Summarizing, the average initial investments to establish the weir equal €118.5 mln; the average operational
expenditures amount €2.2 mln/year. Subsequently, all expenditures are converted to their present value,
according to equation (5.1), to end up with the life cycle costs.
=
=
+=
+100
20300
( )
(1 )
tt
tt
CAPEX OPEXPV
R (5.1)
The present value in year 2030 (PV2030) of the life cycle costs is calculated by applying a discount rate R of
5% to discount the capital expenditures, CAPEX, and operational expenditures, OPEX, in year t, since
expenditures in the future are less valuable than expenditures nowadays. It is assumed that the establishment
of the weir takes four years and CAPEX, are equally distributed over these years. Replacement of the weir
gates is assumed to takes place in the year 2075 by identical weir gates. The resulting unweighted assessment
of the local design alternatives is shown in Figure 5-11.
Figure 5-11: Unweighted assessment of the local design alternatives.
Because the weighted score does not differ substantially from the unweighted score, this assessment can be
found in Appendix M.3. The weighted score is determined by the weight factors given to the criteria. The
sensitivity of the weighted score to the weight factor of navigability is shown in Figure 5-12, since the scores
of the alternatives differ clearly on this criterion. If navigability is relatively unimportant, local design
alternative 2, which lacks a navigation opening, scores the best. For very large importance, design alternative
9, including two one-lane navigation openings, turns out the best. Nonetheless, such a large weight factor
is not expected, hence design alternatives 2 and 6 are the only options which have to be considered in the
following evaluation phase. All other design alternatives have higher costs and a lower score than one of
these two alternatives.
Figure 5-12: Sensitivity of the weighted score to the weight factor of the navigability criterion.

Design of an adaptive weir
55
Adaptivity
The adaptivity of the design alternatives is addressed with two sub-criteria:
• the ability to shift the location of the set point;
• the ability to adapt the dammed water level.
With the help of Table 5-1, Figure 5-13 is generated, which shows the adaptivity of all local design
alternatives: the gate adaptation costs are plotted against the dammed water level after the adaptation. The
maximum adaptivity of a design alternative is indicated by the coloured dots in the right graph. Design
alternatives that are not able to shift the location of the set point to the theoretical location are plotted by
the dotted lines. The indicated dammed water levels NAP +17.10 m and NAP +15.10 m are the maximum
desired dammed water levels in, respectively, the scenarios DRUK and STOOM and the scenario WARM.
Figure 5-13: Adaptivity of the local design alternatives regarding the dammed water level and the location of the set point.
These graphs include a number of remarkable aspects:
• The largest adaptivity regarding the dammed water levels is obtained by a weir consisting only of
fixed-wheel gates, provided that the strength and height of the, in 2030 constructed, lift towers does
not limit the adaptivity. The initial investment in the lift towers is an eminent example of non-
adaptivity, since only after the lifetime of the weirs, it turns out if this investment has been efficient.
Moreover, these weirs are not able to control the water levels accurately after a shift of the location
of the set point to the theoretical location. Thus, the large adaptivity regarding the dammed water
level goes at the expense of the adaptivity regarding the location of the set point.
• The variation of the gate adaptation costs between the alternatives is small. On top of that, the
absolute value of the gate adaptation costs is low compared to the life cycle costs of the weir.
• The adaptivity of the alternatives 2, 5 and 9 seems worse than that of 1, 6 and 10 regarding the
dammed water levels, because the first three alternatives consist of radial gates of smaller radii, see
Figure 5-10. However, thanks to these smaller radii, an economical gate design is still achieved if a
decrease of the dammed water level to NAP +13.70 m is desired. This is not achievable if design
alternative 1, 6 or 10 is selected.
Focussing on design alternatives 2 and 6, Table 5-3 compares their weir adaptivity with the adaptation
scheme set up in the regional design analysis, see Table 4-3. If the weir adaptivity is larger than the maximum
desired adaptivity in that scenario in that time period, the box is marked green; if not, it is marked yellow
and regional measures are required to serve that specific purpose.
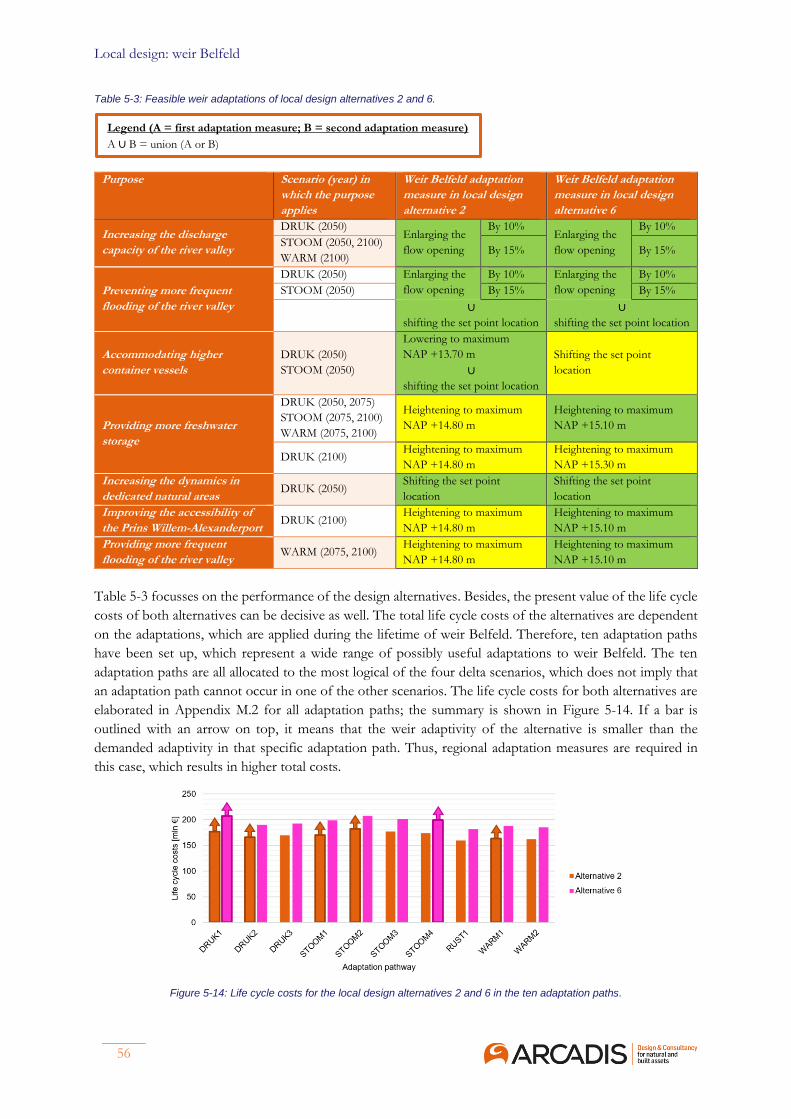
Local design: weir Belfeld
56
Table 5-3: Feasible weir adaptations of local design alternatives 2 and 6.
Purpose Scenario (year) in
which the purpose
applies
Weir Belfeld adaptation
measure in local design
alternative 2
Weir Belfeld adaptation
measure in local design
alternative 6
Increasing the discharge
capacity of the river valley
DRUK (2050) Enlarging the
flow opening
By 10% Enlarging the
flow opening
By 10%
STOOM (2050, 2100)
WARM (2100) By 15% By 15%
Preventing more frequent
flooding of the river valley
DRUK (2050) Enlarging the
flow opening
By 10% Enlarging the
flow opening
By 10%
STOOM (2050) By 15% By 15%
∪
shifting the set point location
∪
shifting the set point location
Accommodating higher
container vessels
DRUK (2050)
STOOM (2050)
Lowering to maximum
NAP +13.70 m
∪
shifting the set point location
Shifting the set point
location
Providing more freshwater
storage
DRUK (2050, 2075)
STOOM (2075, 2100)
WARM (2075, 2100)
Heightening to maximum
NAP +14.80 m
Heightening to maximum
NAP +15.10 m
DRUK (2100) Heightening to maximum
NAP +14.80 m
Heightening to maximum
NAP +15.30 m
Increasing the dynamics in
dedicated natural areas DRUK (2050)
Shifting the set point
location
Shifting the set point
location
Improving the accessibility of
the Prins Willem-Alexanderport DRUK (2100)
Heightening to maximum
NAP +14.80 m
Heightening to maximum
NAP +15.10 m
Providing more frequent
flooding of the river valley WARM (2075, 2100)
Heightening to maximum
NAP +14.80 m
Heightening to maximum
NAP +15.10 m
Table 5-3 focusses on the performance of the design alternatives. Besides, the present value of the life cycle
costs of both alternatives can be decisive as well. The total life cycle costs of the alternatives are dependent
on the adaptations, which are applied during the lifetime of weir Belfeld. Therefore, ten adaptation paths
have been set up, which represent a wide range of possibly useful adaptations to weir Belfeld. The ten
adaptation paths are all allocated to the most logical of the four delta scenarios, which does not imply that
an adaptation path cannot occur in one of the other scenarios. The life cycle costs for both alternatives are
elaborated in Appendix M.2 for all adaptation paths; the summary is shown in Figure 5-14. If a bar is
outlined with an arrow on top, it means that the weir adaptivity of the alternative is smaller than the
demanded adaptivity in that specific adaptation path. Thus, regional adaptation measures are required in
this case, which results in higher total costs.
Figure 5-14: Life cycle costs for the local design alternatives 2 and 6 in the ten adaptation paths.
Legend (A = first adaptation measure; B = second adaptation measure)
A ∪ B = union (A or B)
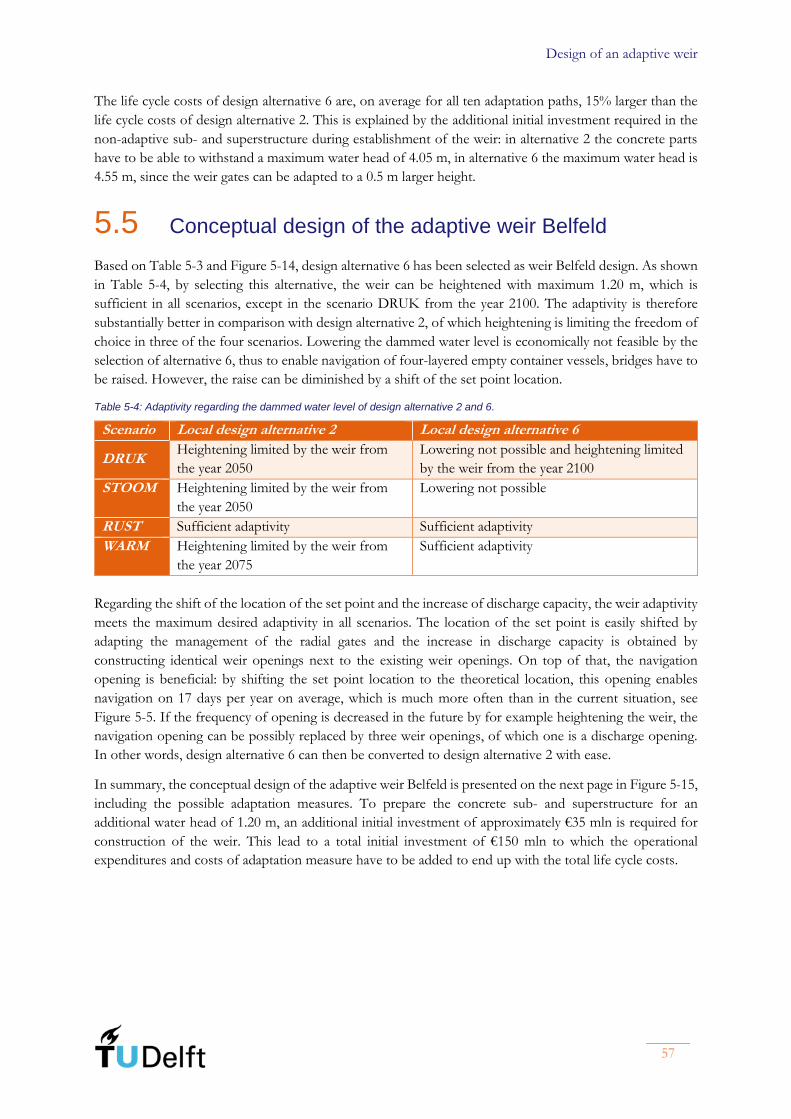
Design of an adaptive weir
57
The life cycle costs of design alternative 6 are, on average for all ten adaptation paths, 15% larger than the
life cycle costs of design alternative 2. This is explained by the additional initial investment required in the
non-adaptive sub- and superstructure during establishment of the weir: in alternative 2 the concrete parts
have to be able to withstand a maximum water head of 4.05 m, in alternative 6 the maximum water head is
4.55 m, since the weir gates can be adapted to a 0.5 m larger height.
5.5 Conceptual design of the adaptive weir Belfeld
Based on Table 5-3 and Figure 5-14, design alternative 6 has been selected as weir Belfeld design. As shown
in Table 5-4, by selecting this alternative, the weir can be heightened with maximum 1.20 m, which is
sufficient in all scenarios, except in the scenario DRUK from the year 2100. The adaptivity is therefore
substantially better in comparison with design alternative 2, of which heightening is limiting the freedom of
choice in three of the four scenarios. Lowering the dammed water level is economically not feasible by the
selection of alternative 6, thus to enable navigation of four-layered empty container vessels, bridges have to
be raised. However, the raise can be diminished by a shift of the set point location.
Table 5-4: Adaptivity regarding the dammed water level of design alternative 2 and 6.
Scenario Local design alternative 2 Local design alternative 6
DRUK Heightening limited by the weir from
the year 2050
Lowering not possible and heightening limited
by the weir from the year 2100
STOOM Heightening limited by the weir from
the year 2050
Lowering not possible
RUST Sufficient adaptivity Sufficient adaptivity
WARM Heightening limited by the weir from
the year 2075
Sufficient adaptivity
Regarding the shift of the location of the set point and the increase of discharge capacity, the weir adaptivity
meets the maximum desired adaptivity in all scenarios. The location of the set point is easily shifted by
adapting the management of the radial gates and the increase in discharge capacity is obtained by
constructing identical weir openings next to the existing weir openings. On top of that, the navigation
opening is beneficial: by shifting the set point location to the theoretical location, this opening enables
navigation on 17 days per year on average, which is much more often than in the current situation, see
Figure 5-5. If the frequency of opening is decreased in the future by for example heightening the weir, the
navigation opening can be possibly replaced by three weir openings, of which one is a discharge opening.
In other words, design alternative 6 can then be converted to design alternative 2 with ease.
In summary, the conceptual design of the adaptive weir Belfeld is presented on the next page in Figure 5-15,
including the possible adaptation measures. To prepare the concrete sub- and superstructure for an
additional water head of 1.20 m, an additional initial investment of approximately €35 mln is required for
construction of the weir. This lead to a total initial investment of €150 mln to which the operational
expenditures and costs of adaptation measure have to be added to end up with the total life cycle costs.

Local design: weir Belfeld
58
Figure 5-15: Overview of the proposed adaptive weir Belfeld.
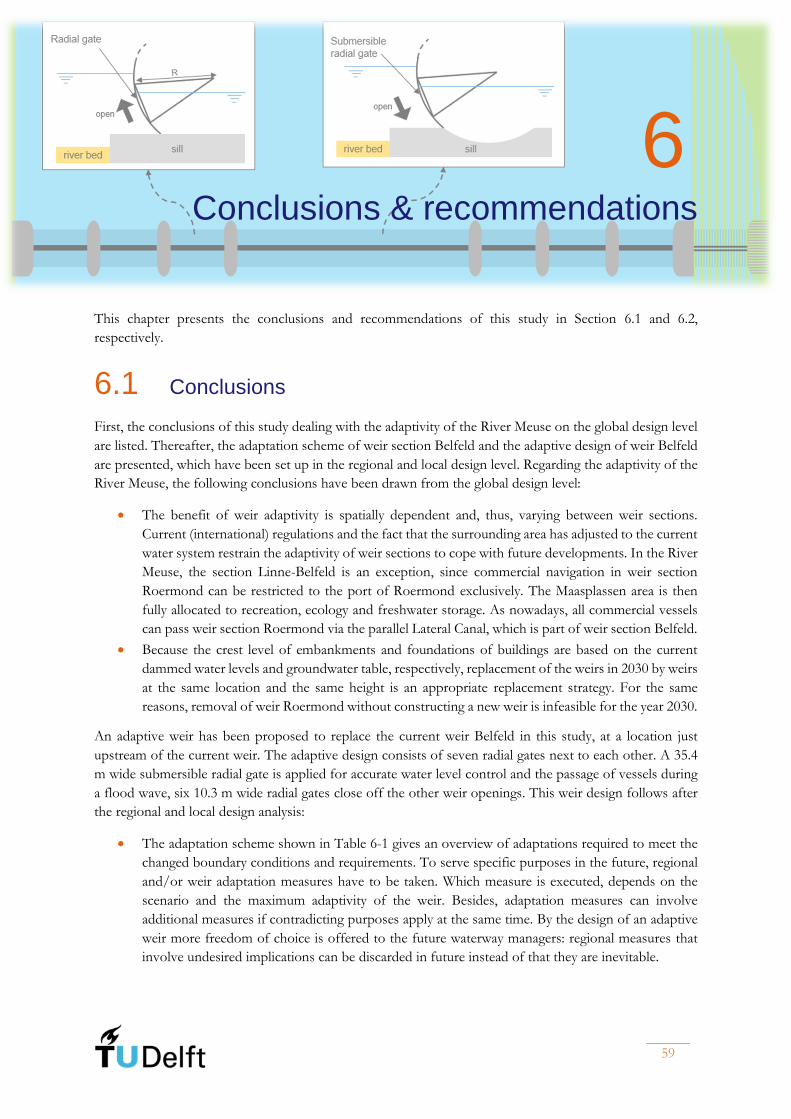
Design of an adaptive weir
59
6
Conclusions & recommendations
This chapter presents the conclusions and recommendations of this study in Section 6.1 and 6.2,
respectively.
6.1 Conclusions
First, the conclusions of this study dealing with the adaptivity of the River Meuse on the global design level
are listed. Thereafter, the adaptation scheme of weir section Belfeld and the adaptive design of weir Belfeld
are presented, which have been set up in the regional and local design level. Regarding the adaptivity of the
River Meuse, the following conclusions have been drawn from the global design level:
• The benefit of weir adaptivity is spatially dependent and, thus, varying between weir sections.
Current (international) regulations and the fact that the surrounding area has adjusted to the current
water system restrain the adaptivity of weir sections to cope with future developments. In the River
Meuse, the section Linne-Belfeld is an exception, since commercial navigation in weir section
Roermond can be restricted to the port of Roermond exclusively. The Maasplassen area is then
fully allocated to recreation, ecology and freshwater storage. As nowadays, all commercial vessels
can pass weir section Roermond via the parallel Lateral Canal, which is part of weir section Belfeld.
• Because the crest level of embankments and foundations of buildings are based on the current
dammed water levels and groundwater table, respectively, replacement of the weirs in 2030 by weirs
at the same location and the same height is an appropriate replacement strategy. For the same
reasons, removal of weir Roermond without constructing a new weir is infeasible for the year 2030.
An adaptive weir has been proposed to replace the current weir Belfeld in this study, at a location just
upstream of the current weir. The adaptive design consists of seven radial gates next to each other. A 35.4
m wide submersible radial gate is applied for accurate water level control and the passage of vessels during
a flood wave, six 10.3 m wide radial gates close off the other weir openings. This weir design follows after
the regional and local design analysis:
• The adaptation scheme shown in Table 6-1 gives an overview of adaptations required to meet the
changed boundary conditions and requirements. To serve specific purposes in the future, regional
and/or weir adaptation measures have to be taken. Which measure is executed, depends on the
scenario and the maximum adaptivity of the weir. Besides, adaptation measures can involve
additional measures if contradicting purposes apply at the same time. By the design of an adaptive
weir more freedom of choice is offered to the future waterway managers: regional measures that
involve undesired implications can be discarded in future instead of that they are inevitable.

Conclusions & recommendations
60
Table 6-1: Adaptation scheme of weir section Belfeld after construction of the proposed design alternative.
Purpose Scenario (year)
in which the purpose
applies
Regional
adaptation measures
Binary
operator
Weir Belfeld
adaptation measures
Increasing the discharge
capacity of the river valley
DRUK (2050 ‘Room for the River’
measures ⊃
Enlarging the
flow opening
By 10%
STOOM (2050, 2100)
WARM (2100) By 15%
Preventing more frequent
flooding of the river valley
DRUK (2050) Raising the main
channel embankments
∪
dredging the main
channel
∪
Enlarging the
flow opening
By 10%
STOOM (2050) By 15%
∪
shifting the set point location
Accommodating higher
container vessels
DRUK (2050)
STOOM (2050)
Raising bridges on the
Maasroute ⊃ Shifting the set point location
Providing more
freshwater storage
DRUK (2050, 2075)
STOOM (2075, 2100)
WARM (2075, 2100)
Dredging a new lake
∪
enlarging an existing
lake
∪ Heightening to
maximum
NAP
+15.10 m
DRUK (2100) NAP
+15.30 m
Increasing the dynamics
in dedicated natural areas DRUK (2050) - - Shifting the set point location
Accommodating larger
vessels to the Prins
Willem-Alexanderport
DRUK (2075) Deepening the Prins
Willem-Alexanderport - -
Improving the
accessibility of the Prins
Willem-Alexanderport
DRUK (2100) Deepening the Prins
Willem-Alexanderport
∩
Removal of weir Roermond
∪
replacing weir Roermond
upstream
⊃ Heightening to maximum
NAP +15.30 m
Providing more frequent
flooding of the river valley WARM (2075, 2100)
Lowering the river
valley ∪
Heightening to maximum
NAP +15.10 m
• The adaptivity of weir Belfeld enables to dam the water level to maximum NAP +15.30 m in the
future, 1.2 m higher than the current dammed water level of weir section Belfeld. The concrete
substructure is already designed in 2030 to withstand this larger water head; only heightening the
superstructure and the radial gates is needed then in future. A larger flood wave in the future can
be discharged by constructing an additional weir opening next to the designed weir. More weir
adaptivity is provided by adjusting the management of the radial gates: in this way, the location of
the set point, the location at which the dammed water level is maintained at its target value
regardless of the discharge, can be shifted throughout the weir section. The frequency of an open
weir can be increased from 6 to 17 days per year, which makes the weir design, including a
navigation opening, more beneficial.
• The adaptivity of weir Belfeld requires an additional initial investment of approximately €35 mln,
leading to a total of €150 mln. This additional investment is used to prepare the non-adaptive
substructure to the possibly higher dammed water level in the future. The proposed weir design is
sufficiently adaptive to serve the purposes in all scenarios, except in the scenario DRUK from the
year 2100 and if higher container vessels have to be accommodated on the River Meuse. To serve
Legend (A = regional adaptation measures; B = weir adaptation measures)
A ∩ B = intersection (A and B)
A ∪ B = union (A or B)
A ⊃ B = superset [(only A) or (minimized A + B)]
Design of an adaptive weir
61
the latter purpose, bridge heightening is inevitable, since lowering the dammed water level is not
possible with the proposed weir design. Although, the required bridge heightening can be decreased
by a shift of the set point location.
• A method of using adaptation schemes for designing an adaptive weir has been developed for weir
Belfeld. The method and approach is applicable for every weir in order to give the asset-owner a
full overview of measures to be taken in the future lifetime of the asset. Design choices of today
can enable easy adaptations in the future.
6.2 Recommendations
The enumeration below advices on further research subjects and the procedure to obtain a more detailed
adaptive weir Belfeld:
• To put adaptivity into practise, the entire system of the River Meuse has to be considered.
Adaptation schemes have to be developed for each weir section to generate designs for all weirs in
the river. The performance of each section should agree and complement on global functions, such
as navigation, water discharge and freshwater storage.
• This research can be improved by involving the asset-owner of the weirs and the waterway network,
Rijkswaterstaat, and other stakeholders, for instance the users of the River Meuse. Their knowledge
of the water system today can be employed to obtain quantitative adaptation schemes. Furthermore,
the current greatly simplified geohydrological analysis has to be improved with spatial-dependent
and time-dependent modelling software.
• The design of the adaptive weir Belfeld has to be elaborated by structural calculations; only a
geometric design is presented in this research. During the structural design, adaptivity has to be
kept in mind as well: continuously it has to be assessed if an initial investment is needed or an
adaptation can be made in the future.
• The dammed water levels have to be researched in transient flow conditions. If the set point is not
located at the weir itself, the combination of the downstream weir height and the discharge over
the upstream weir determines the dammed water level at each location. In this case, there is a lag
between the moment of weir operation and the water level change at the location of the set point.
During a continuously varying river discharge, the position of the weir gates has to be adjusted
continuously. Unified operation of the weirs is required to prevent counteracting weir operations
and up and down swaying dammed water levels.
• Further research has to be performed to the replacement of weir Roermond by a new weir at the
Louis Raemaekersbridge. This alternative enables vessels to navigate from the main navigation
route on the River Meuse to the port of Roermond without lockage. Disadvantageous aspects are
the more complicated weir construction and the required additional lock for recreational vessels.
Conclusions & recommendations
62
References
Adaptief deltamanagement. (n.d.). Retrieved from Deltacommissaris:
https://www.deltacommissaris.nl/deltaprogramma/wat-is-het-deltaprogramma/adaptief-
deltamanagement
ANDRITZ Hydro GmbH. (2013). Hydromatrix: Nussdorf - Austria. Linz.
Antea Group. (2014). Vervangingsopgave Natte Kunstwerken (VONK): Stuwen Maas. Almere.
ARCADIS. (2015). Kostenraming large barriers_MV3.
ARCADIS. (2015). Uitwerking methodiek waterbeschikbaarheid hoofdsysteem.
Bakker, M. (2019, May 14). Grondwaterstroming naar een rivier. (R. S. Frijns, Interviewer)
Bartholomeus, V. (2019, August 25). Bijna honderd jaar oude stuw Borgharen wordt niet vervangen. Retrieved from
DeLimburger: https://www.limburger.nl/cnt/dmf20190825_00119805/stuw-borgharen-wordt-
niet-vervangen
Bezuyen, K. G., Molenaar, W. F., & van der Toorn, A. (2010). Structures in hydraulic engineering 2: Weirs. Delft:
Delft University of Technology.
Bezuyen, K. G., Stive, M. J., Vaes, G. J., & Zitman, T. J. (2012). Inleiding Waterbouwkunde. Delft: VSSD.
Biemans, R. (2007). Sluizen- en stuwcomplex Lith. Lithoijen: Brabants Historisch Informatie Centrum.
Blokland. (1955). Nota betreffende stuwcomplex Hagestein.
Brolsma, J. U. (2013). Rapportage containerhoogtemetingen. Driebergen: Brolsma Advies.
Brolsma, J. U. (2015). Corridoranalyse containers. Driebergen: Brolsma Advies.
Bruggeman, W., Haasnoot, M., Hommes, S., Te Linde, S., Van der Brugge, A., Rijken, B., . . . Van der Born,
G. (2011). Deltascenario's: Verkenning van mogelijke fysieke en sociaaleconomische ontwikkelingen in de 21e eeuw
op basis van KNMI'06 en WLO-scenario's, voor gebruik in het Deltaprogramma 2011-2012. Delft: Deltares.
Bruggeman, W., Kwadijk, J., Van den Hurk, J., Beersma, J., Van Dorland, R., Van den Born, G., &
Matthijsen, J. (2016). Verkenning actualiteit Deltascenario's. Delft: Deltares.
Burgers, T. (2014). Nederlands grote rivieren: Drie eeuwen strijd tegen overstromingen. Utrecht: Uitgeverij Matrijs.
Chapital, L. (2015). Replacement of twenty-nine weirs on Aisne and Meuse rivers. Karlsruhe: Bundesanstalt für
Wasserbau.
Chbab, H., Den Bieman, J., & Groeneweg, J. (2017). Hydraulische Belastingen Rijntakken en Maas: Wettelijk
Beoordelingsinstrumentarium WBI-2017. Delft: Deltares.
Consortium Grensmaas BV. (2012, November). Nieuwsbrief november 2012. Retrieved from Nieuwsbrief
Consortium Grensmaas: https://www.grensmaas.nl/nieuwsbrieven/2012/nieuwsbrief-nov-
2012.html
Consortium Grensmaas BV. (2019, April). Nieuwsbrief april 2019 . Retrieved from Nieuwsbrief Consortium
Grensmaas: https://www.grensmaas.nl/nieuwsbrieven/2019/nieuwsbrief-april-2019.html

Design of an adaptive weir
63
De Bouwcampus. (2015, November 3). De adaptive Maas: In 30 jaar van 650 naar 300 objecten! Delft.
De Bouwcampus. (2015). Oogsboekje Grip op de Maas. Delft.
De Limburger. (2019, June 6). Neerslagtekort blijft ondanks hoosbuien. Retrieved from De Limburger:
https://www.limburger.nl/cnt/dmf20190612_00109720/neerslagtekort-blijft-ondanks-hoosbuien
De Vlaamse Waterweg nv. (2019, February 28). Onze projecten. Retrieved from Seine Schelde Vlaanderen:
https://www.seineschelde.be/projecten
De Vries & van de Wiel. (2014). Welkom op de projectwebsite Verruimen Julianakanaal. Retrieved from
Julianakanaal: http://www.julianakanaal.nl/
De Vries, M. (2000, October 9). Voortgang riverdijkversterkingen. Den Haag.
De Wit, M., Buiteveld, H., & Van Deursen, W. (2007). Klimaatverandering en de afvoer van Rijn en Maas. Arnhem:
Rijkswaterstaat.
Deltares, Marin, TNO. (2015). Natte kunstwerken. Retrieved from Natte kunstwerken van de Toekomst:
http://www.nattekunstwerkenvandetoekomst.nl/
Department of Defense. (2001). Systems Engineering Fundamentals. Fort Belvoir, Virginia: Defense Acquistion
University Press.
Douben, N. S., & Maris, D. P. (1994, March). Evaluatie baggerspeciestort Lateraalkanaal Linne-Buggenum.
H20, pp. 49-53.
Emmen, W. (2019, September 16). CAPEX en OPEX van een stuw. (R. S. Frijns, Interviewer)
Erbisti, P. C. (2014). Design of Hydraulic Gates. Leiden: CRC Press/Balkema.
ESRI Nederland. (2019, April 22). AHN-viewer.
Fust, A., & Reif, H. (2015). Ausganslage am neuen Wasserkraftwerk Rheinfelden. In S. Heimerl,
Wasserkrafprojekte Band II: Ausgewählte Beiträge aus der Fachzeitschrift WasserWirtschaft (pp. 203-210).
Wiesbaden: Springer Vieweg.
Geerling, G., Buijse, T., & Van Kouwen, L. (2010). Ecologische potenties van stuwpeilvariatie in de Maas. Delft:
Deltares.
grootte intrekgebied. (2019). Retrieved from grondwaterformules.nl: gereedschap voor grondwaterhydrologen:
http://grondwaterformules.nl/index.php/vuistregels/onttrekking/grootte-intrekgebied
Heijkoop, N. W., Wils, R. A., & Van de Kerk, A. J. (2008). Oriënteringsonderzoek Variabel Stuwen Maas.
Rijkswaterstaat.
Hensen, M. (2005, November 13). Binnenvaart in Beeld. Retrieved from Pompgemaal Maasbracht:
https://www.binnenvaartinbeeld.com/nl/julianakanaal/pompgemaal_maasbracht
Iv-Infra b.v. (2014). Levensduur stuwen in de Maas. Sliedrecht.
Jonkeren, O., Rietveld, P., & Van der Toorn, A. (2010). Economic analysis of adaptation measures to climate change
for inland waterway transport. VU University Amsterdam, Delft University of Technology.
Joustra, T. H., Muller, E. R., Van Asselt, M. B., & Verheij, C. A. (2018). Stuwaanvaring door Benzeentanker bij
Grave. Den Haag: Onderzoeksraad voor Veiligheid.

Conclusions & recommendations
64
Kater, E., Makaske, B., & Maas, G. (2012). Morfodynamiek langs de grote rivieren: Inventarisatie van processen en
evaluatie van maatregelen. Den Haag: Bosschap; Ministerie van Economische Zaken, Landbouw en
Innovatie.
Kenniscentrum InfoMil. (n.d.). Wetgeving. Retrieved from Kenniscentrum InfoMil:
https://www.infomil.nl/onderwerpen/lucht-water/handboek-water/wetgeving/
Klijn, F., Hegnauer, M., Beersma, J., & Sperna Weiland, F. (2015). Wat betekenen de nieuwe klimaatscenario's voor
de rivierafvoeren van Rijn en Maas? Delft: Deltares and KNMI.
Klijn, F., Van Velzen, E., Ter Maat, J., & Hunink, J. (2012). Zoetwatervoorziening in Nederland: aangescherpte
landelijke knelpuntenanalyse 21e eeuw. Delft: Deltares.
Koninkrijk der Nederlanden, Vlaams Gewest. (1995, 01 17). Verdrag tussen het Koninkrijk der Nederlanden en
het Vlaams Gewest inzake de afvoer van het water van de Maas. Retrieved from Wettenbank:
https://wetten.overheid.nl/BWBV0001232/1996-07-01
Kortweg, A., & Kuipers, B. (200). Binnenhaven Born en Stein. Rotterdam: Nederlandse Vereniging van
Binnenhavens.
Kranenbarg, J., & Kemper, J. (2006). Efficiëntere vismigratie bij vistrappen en kunstwerken. Delft: Delft Hydraulics.
Krebs+Kiefer. (2019). Projects: Weirs. Retrieved from IRS: http://www.irs-
stahlwasserbau.de/en/home.html
Ministerie van Infrastructuur en Milieu, Ministerie van Economische Zaken, Landbouw en Innovatie.
(2012). Deltaprogramma 2012: Bijlage D Uitwerking adaptief deltamanagement. Ministerie van
Infrastructuur en Milieu, Ministerie van Economische Zaken, Landbouw en Innovatie.
Ministerie van Landbouw, Natuur en Voedselkwaliteit. (n.d.). Beschermde natuur in Nederland: soorten en gebieden
in wetgeving en beleid. Retrieved from Natura 2000:
https://www.synbiosys.alterra.nl/natura2000/gebiedendatabase.aspx?subj=n2k&groep=0
Ministerie van Verkeer en Waterstaat. (2007). Leidraad rivieren. Den Haag: Ministerie van Verkeer en
Waterstaat.
NUzakelijk. (2013, March 18). 140 man op straat na sluiting energiecentrale. Retrieved from nu.nl:
https://www.nu.nl/economie/3372613/140-man-straat-sluiting-energiecentrale.html
Ondergrondmodellen. (n.d.). Retrieved from DINOloket: https://www.dinoloket.nl/ondergrondmodellen
OpenStreetMap Nederland. (n.d.). Retrieved from OpenStreetMap: https://www.openstreetmap.nl/
Parkmanagement Midden-Limburg. (2019, May 13). Duurzaamheid en Circulariteit Bedrijventerrein Willem-
Alexander. Retrieved from Parkmanagement Midden-Limburg:
https://www.parkmanagementroermond.nl/duurzaamheid-en-circulariteit-bedrijventerrein-
willem-alexander/
PIANC. (2006). Design of movable weirs and storm surge barriers. Brussels: PIANC.
Provinciale Staten van Limburg. (2014). Voor de Kwaliteit van Limburg: POL2014.
Raadgever, T. (2004). Schademodellering laagwater Maas. Enschede: Universiteit Twente.
Rijkswaterstaat. (1989). Modernisering Maasroute. Maastricht: Rijkswaterstaat.
Rijkswaterstaat. (1992). De Maas: Verleden, heden en toekomst. Lelystad: Rijkswaterstaat.
Design of an adaptive weir
65
Rijkswaterstaat. (1994). Hydrologische systeembeschrijving Maas. Rijkswaterstaat.
Rijkswaterstaat. (2006). Achtergronddocument peilopzet Grave. Lelystad: Rijkswaterstaat.
Rijkswaterstaat. (2009). Scheepvaartinformatie Hoofdvaarwegen. Den Haag: Rijkswaterstaat.
Rijkswaterstaat. (2015). Beheer- en ontwikkelplan voor de rijkswateren 2016-2021. Rijkswaterstaat.
Rijkswaterstaat. (2017). Richtlijn Vaarwegen 2017. Rijkswaterstaat.
Rijkswaterstaat. (2019). Vaarwegen in Nederland. Rijkswaterstaat.
Rijkswaterstaat. (n.d.). Maasroute. Retrieved from Rijkswaterstaat:
https://www.rijkswaterstaat.nl/water/waterbeheer/bescherming-tegen-het-water/maatregelen-
om-overstromingen-te-voorkomen/maaswerken/maasroute.aspx
Rijkswaterstaat Zuid-Nederland. (2013). Bijsluiter betrekkingslijnen 2013_2014. Maastricht: Rijkswaterstaat.
Santilman, H. N. (1939). L'ossature métallique. Brussels: Le centre Belgo-Luxembourgeois d'information de
l'acier.
Schot, J. W., Lintsen, H. W., Rip, A., & De la Bruhèze, A. A. (1998). Techniek in Nederland in de twintigste eeuw.
Deel 1. Techniek in ontwikkeling, waterstaat, kantoor en informatietechnologie. Zutphen: Stichting Historie
der Techniek / Walburg Pers.
Sieben, A. (2008). Kennis en instrumenten Maas morfologie. RWS Waterdient.
Silva, W., Slomp, R. M., Stijnen, J. W., & Van Velzen, E. (2005). Rampenbeheersingstrategie. Lelystad:
Rijkswaterstaat RIZA.
Smart Rivers. (2019). Smart Rivers. Retrieved from Posters and reviewdocumenten:
https://www.smartrivers.nl/posters/
Snippen, E., Mens, M., Hunink, J., & Ter Maat, J. (2016). Basisprognoses Zoetwater: Conrole NWM-
instrumentarium in het licht van de Knelpuntenanalyse Zoetwater. Delft: Deltares.
Sportvisserij Zuidwest Nederland. (2013, October 16). Eerste uitzetting SKP Benedenrivieren. Retrieved from
Sportvisserij Zuidwest Nederland: https://www.sportvisserijzwn.nl/actueel/1910/eerste-
uitzetting-skp-benedenrivieren.html
Tettero, S. (2015, March 18). Miljoeneninvestering in Limburgse Maasplassen. Retrieved from Zeilen:
https://www.zeilen.nl/nieuws/watersportinvesteringen-in-limburg/
Tuin, H. G. (2013). New canalization of the Nederrijn and Lek - Design of a weir with fibre reinforced polymer gates which
is designed using a structured design methodolyg based on Systems Engineering (Master Thesis). Delft: Delft
University of Technology.
Van Aubel, P. (2016). Objectbeschrijving sluiscomplex Heumen.
Van de Biezen, M. (n.d.). Maastricht - Luchtfoto met de Maas. Retrieved from Holland Luchtfoto:
http://www.hollandluchtfoto.nl/media/1c2c7858-3e79-4332-8665-3dc5b3537964-maastricht-
luchtfoto-met-de-maas
Van der Aa, N. G., Tangena, B. H., Wuijts, S., & De Nijs, A. C. (2015). Scenario's drinkwatervraag 2040 en
beschikbaarheid bronnen: Verkenning grondwatervoorraden voor drinkwater. Bilthoven: RIVM.
Van der Maat, C. (2015). Stand van zaken aanvullende maatregelen Verruiming Wilhelminakanaal Tilburg. Provincie
Noord-Brabant.
Conclusions & recommendations
66
Van Dorsser, J. C. (2012). Scheepvaartscenario's voor Deltaprogramma: 100 jaar later... Delft: Rijkswaterstaat.
Van Heerde, J. (2019, September 11). Er dreigt een tekort aan drinkwater uit de Maas. Retrieved from Trouw:
https://www.trouw.nl/duurzaamheid-natuur/er-dreigt-een-tekort-aan-drinkwater-uit-de-
maas~b10fa35e/
Van Schrojentstein Lantman, J. (2004). Hoogwatervoorspellingen op de Maas in crisissituaties. Enschede: University
of Twente.
Vansina, F., Bluekens, K., Aert, N., Neuteleers, C., Cloet, B., Couderé, K., & Verhaegen, K. (2017). Project-
MER Pompinstallaties en waterkrachtcentrales op twee sluizencomplexen langs het Albertkanaal. Antwerpen:
Tractebel.
Verduijn, M. (2014). Future of weir Linne. Delft: Delft University of Technology.
Voortman, H. G., & Veendorp, M. (2011). Robust flood defences in a changing environment. Amersfoort:
ARCADIS.
Vreeker, R., & Heijster, M. (2016). MKBA Aanpassing Doorvaarthoogte Kunstwerken. Rotterdam: ARCADIS.
Waterrecreatie Nederland. (2019). Basisvisie Recreatietoervaart 2015-2020. Retrieved from Waterrecreatie
Nederland: https://waterrecreatienederland.nl/projecten/brtn-2015-2020/
Waterschap Limburg. (2019, May 30). Retrieved from WaterstandenLimburg.
Wolters, H. A., Hunink, J., Delsman, J., De Lange, G., Van den Born, G. J., & Reinhard, S. (2018).
Deltascenario's voor de 21e eeuw: actualisering 2017: Achtergrondinformatie over gebruiksfuncties en sectoren.
Utrecht: Deltares.
Wolters, H. A., Van den Born, G. J., Dammers, E., & Reinhard, S. (2018). Deltascenario's voor de 21e eeuw:
actualisering 2017. Utrecht: Deltares.
Würzburg Weir and Lock. (n.d.). Retrieved from Structurea: https://structurae.net/structures/wurzburg-weir-
and-lock
Zomer, G., Harmsen, J., Buter, E., & Schilt, M. (2007). MIT Verkenning doorvaarthoogte Born-Ternaaien:
Eindrapportage. Rotterdam: ECORYS.

Design of an adaptive weir
67
Appendix A Delta scenarios
The four delta scenarios DRUK, STOOM, RUST and WARM are discussed below. The developments in
the scenarios can all be traced back to the rate of climate change and the socioeconomic developments. In
literature, the delta scenarios have been elaborated on (inter)national scale level. To apply the scenarios
during the design of an adaptive weir, the scenario-dependent developments have to be known on regional
scale level. The translation of the developments on (inter)national scale level to regional scale level is
performed in this appendix. As starting point, a combination of Figure 1-2 and Figure 4-10 is shown below.
Figure A-1: Schematic overview of the (inter)national scenario developments (Wolters, Van den Born, Dammers, & Reinhard, 2018).
A.1 Regional scenario developments
The translation of the scenario developments to the regional developments is exemplified below per
(sub)function. Each explanation starts with an overview of the (inter)national scenario-dependent
developments which are used to derive the regional developments related to that specific (sub)function. The
colours of each (sub)function agree with the colours in Figure 4-10. Thereafter, a textual explanation and a
table illustrate the regional development per scenario.
Flexibility to groundwater changes
Figure A-2: Translation of the (inter)national scenario developments to the development of the flexibility to groundwater changes.
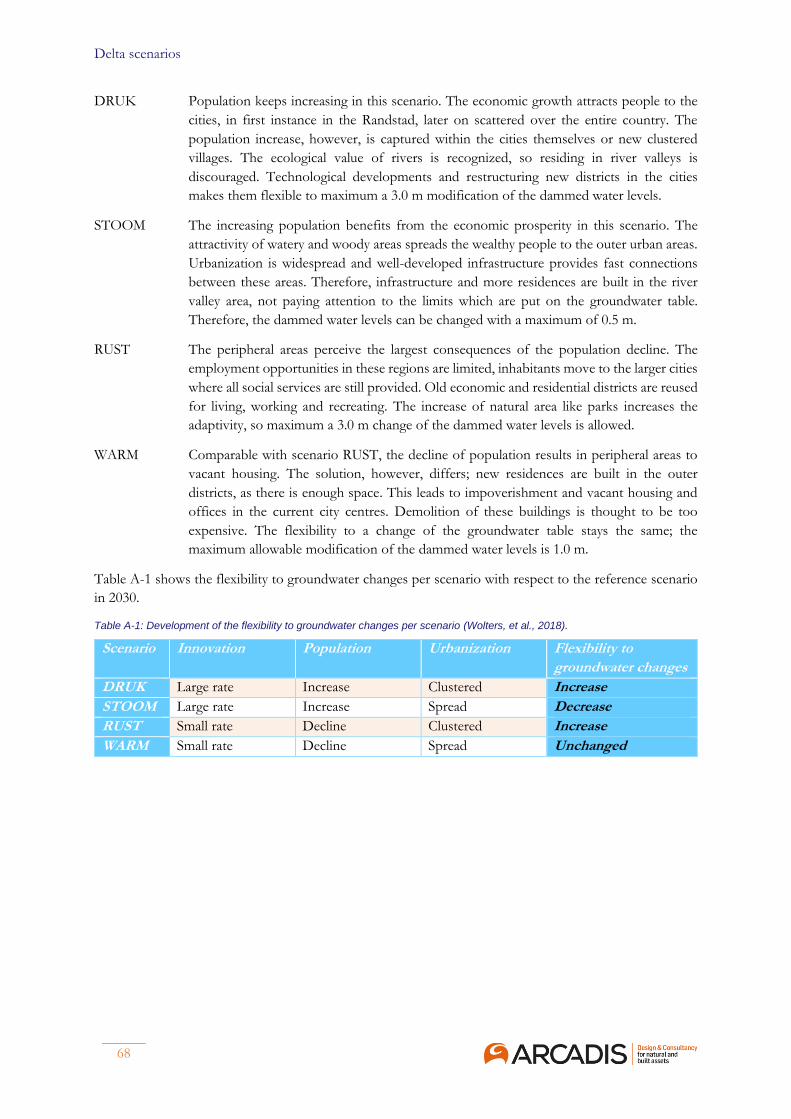
Delta scenarios
68
DRUK Population keeps increasing in this scenario. The economic growth attracts people to the
cities, in first instance in the Randstad, later on scattered over the entire country. The
population increase, however, is captured within the cities themselves or new clustered
villages. The ecological value of rivers is recognized, so residing in river valleys is
discouraged. Technological developments and restructuring new districts in the cities
makes them flexible to maximum a 3.0 m modification of the dammed water levels.
STOOM The increasing population benefits from the economic prosperity in this scenario. The
attractivity of watery and woody areas spreads the wealthy people to the outer urban areas.
Urbanization is widespread and well-developed infrastructure provides fast connections
between these areas. Therefore, infrastructure and more residences are built in the river
valley area, not paying attention to the limits which are put on the groundwater table.
Therefore, the dammed water levels can be changed with a maximum of 0.5 m.
RUST The peripheral areas perceive the largest consequences of the population decline. The
employment opportunities in these regions are limited, inhabitants move to the larger cities
where all social services are still provided. Old economic and residential districts are reused
for living, working and recreating. The increase of natural area like parks increases the
adaptivity, so maximum a 3.0 m change of the dammed water levels is allowed.
WARM Comparable with scenario RUST, the decline of population results in peripheral areas to
vacant housing. The solution, however, differs; new residences are built in the outer
districts, as there is enough space. This leads to impoverishment and vacant housing and
offices in the current city centres. Demolition of these buildings is thought to be too
expensive. The flexibility to a change of the groundwater table stays the same; the
maximum allowable modification of the dammed water levels is 1.0 m.
Table A-1 shows the flexibility to groundwater changes per scenario with respect to the reference scenario
in 2030.
Table A-1: Development of the flexibility to groundwater changes per scenario (Wolters, et al., 2018).
Scenario Innovation Population Urbanization Flexibility to
groundwater changes
DRUK Large rate Increase Clustered Increase
STOOM Large rate Increase Spread Decrease
RUST Small rate Decline Clustered Increase
WARM Small rate Decline Spread Unchanged

Design of an adaptive weir
69
Surface water use by agriculture
Figure A-3: Translation of the (inter)national scenario developments to the development of the surface water use by agriculture.
DRUK Although the population increase takes place in the existing cities, the agricultural acreage
decrease. The competitive position of the Dutch agriculture, however, is maintained by the
efficient hinterland connections of the sea ports and the application of innovations. The
innovations avert a larger freshwater demand. Fresh water of good quality is required, so
especially water from the deep aquifer, which stays supplied by the increasing yearly average
precipitation, is extracted. In the end, the use of surface water does not change significantly.
STOOM The pressure on the agricultural sector raises in this scenario, because of the more intense
dry periods and the population increase. The spread urbanization causes decrease of the
agricultural acreage. Investments are done in the efficiency, among which the establishment
of extra irrigation systems. These are needed to bridge the dry periods, in which the
increased temperature provides favourable circumstances for cultivation. Summarizing, the
use of fresh water in summer is that large that more surface water has to be stored.
RUST Internationally the agricultural sector cannot compete, so the focus is shifted towards
regional and local demand. Of all scenarios, the surface water use by agriculture in this
scenario is the smallest. The agricultural acreage stays the same, since population declines
and new residences are built within the current cities. Innovations are rare, because the
small economic growth does not provoke these. The demand of fresh water only increases
a little, which can be easily extracted from the deep aquifer. Eventually, the surface water
use by the agricultural sector even decreases.
WARM The products of agriculture change due to the fast climate change; Mediterranean crops
better deal with the drought in summer. The position on the international market
deteriorates, so the sector focusses more on regional sale. Just like in scenario RUST,
population declines and urbanization leads to only limited expansion of cities. Due to the
fast climate change and lack of innovations, the growth of irrigated area is enormous.
Therefore, more surface water has to be stored in summer to be used by agriculture.
Table A-2 shows the surface water use by agriculture per scenario with respect to the reference scenario in
2030.
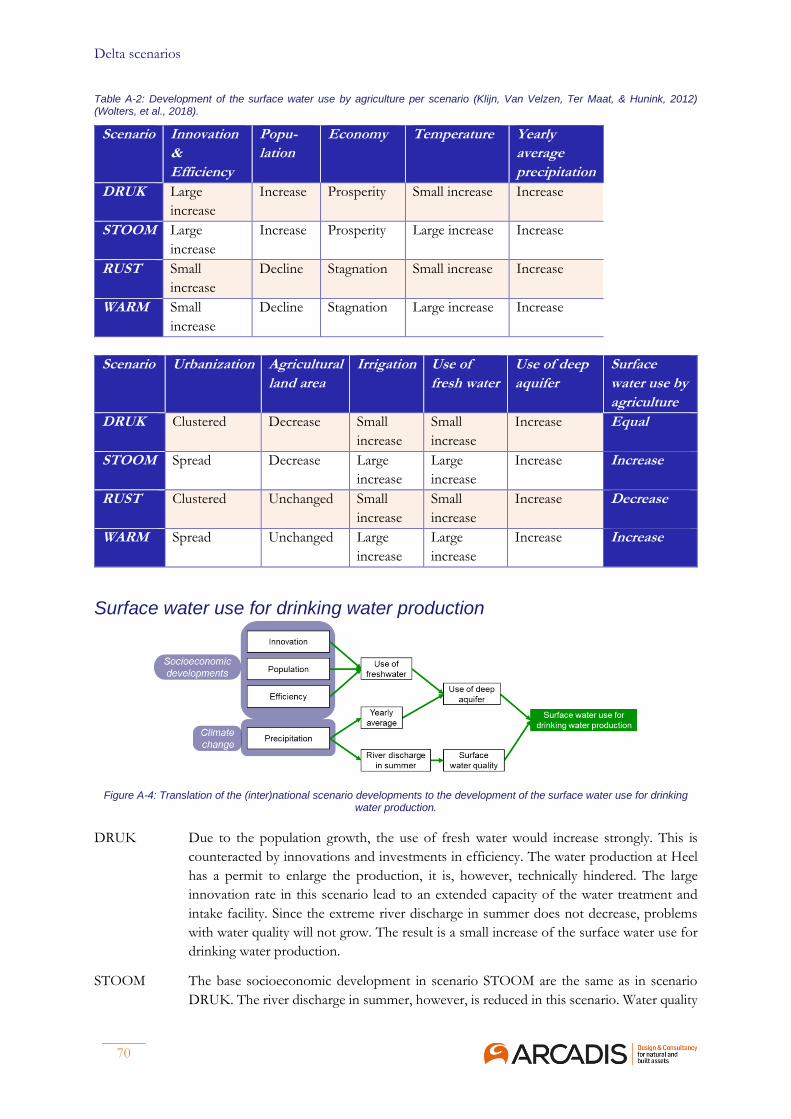
Delta scenarios
70
Table A-2: Development of the surface water use by agriculture per scenario (Klijn, Van Velzen, Ter Maat, & Hunink, 2012) (Wolters, et al., 2018).
Scenario Innovation
&
Efficiency
Popu-
lation
Economy Temperature Yearly
average
precipitation
DRUK Large
increase
Increase Prosperity Small increase Increase
STOOM Large
increase
Increase Prosperity Large increase Increase
RUST Small
increase
Decline Stagnation Small increase Increase
WARM Small
increase
Decline Stagnation Large increase Increase
Scenario Urbanization Agricultural
land area
Irrigation Use of
fresh water
Use of deep
aquifer
Surface
water use by
agriculture
DRUK Clustered Decrease Small
increase
Small
increase
Increase Equal
STOOM Spread Decrease Large
increase
Large
increase
Increase Increase
RUST Clustered Unchanged Small
increase
Small
increase
Increase Decrease
WARM Spread Unchanged Large
increase
Large
increase
Increase Increase
Surface water use for drinking water production
Figure A-4: Translation of the (inter)national scenario developments to the development of the surface water use for drinking water production.
DRUK Due to the population growth, the use of fresh water would increase strongly. This is
counteracted by innovations and investments in efficiency. The water production at Heel
has a permit to enlarge the production, it is, however, technically hindered. The large
innovation rate in this scenario lead to an extended capacity of the water treatment and
intake facility. Since the extreme river discharge in summer does not decrease, problems
with water quality will not grow. The result is a small increase of the surface water use for
drinking water production.
STOOM The base socioeconomic development in scenario STOOM are the same as in scenario
DRUK. The river discharge in summer, however, is reduced in this scenario. Water quality

Design of an adaptive weir
71
problems become more frequent in summer, during which most drinking water is needed.
Because the yearly average precipitation increases, the deep aquifer is not depleted by
human extraction. The good quality water in this aquifer (Van der Aa, Tangena, Wuijts, &
De Nijs, 2015) is therefore used in this scenario above the surface water.
RUST Until 2050 the demand to drinking water production stays the same. This is the result of
stabilizing population growth and little innovations. After 2050, water saving measures lead
to a decrease of the drinking water demand. Since the deep aquifer contains water of good
quality and is supplied by more precipitation averagely, the water from the deep aquifer is
sufficient to provide in the drinking water demand. The drinking water production at Heel
diminishes.
WARM The fast climate change results in a smaller discharge in summer, just like in scenario
STOOM. Therefore, the quality of surface water is insufficient in summer to produce
drinking water from it. Besides, the stockpile of water in the deep aquifer is sufficiently
large to provide drinking water for a declining population.
Table A-3 shows the surface water use for drinking water production per scenario with respect to the
reference situation in 2030. The focus lies on the intake in summer, since this is the critical period from the
viewpoint of surface water use.
Table A-3: Development of the surface water use for drinking water production per scenario (Snippen, Mens, Hunink, & Ter Maat, 2016) (Wolters, et al., 2018).
Scenario Innovation &
Efficiency
Population Yearly average
precipitation
Use of fresh
water
DRUK Large increase Increase Increase Small increase
STOOM Large increase Increase Increase Large increase
RUST Small increase Decline Increase Small increase
WARM Small increase Decline Increase Large increase
Scenario River discharge in
summer
Surface water
quality
Use of deep
aquifer
Surface water use
for drinking
water production
DRUK Unchanged Equal Small increase Increase
STOOM Decrease Decrease Large increase Stop
RUST Unchanged Equal Small decrease Decrease
WARM Decrease Decrease Equal Stop

Delta scenarios
72
Surface water use by industry
Figure A-5: Translation of the (inter)national scenario developments to the development of the surface water use by industry.
The delta scenarios, updated in 2017, split the surface water demand of the industry in two categories:
cooling water for energy production and process and cooling water for other industry. In the first category,
the transition to renewable energy sources is taken as an autonomous development; in 2030 wind and solar
energy are the dominant energy sources in all scenarios. Looking at the evolutions since 2017, this is not
realistic. Therefore, this section sticks not to the delta scenarios.
DRUK The economic prosperity and population growth result in an increase of the production of
industry. Innovation and investments in efficiency are large as well. Due to the fast
transition to renewable energy sources, reopening of the power plant at Buggenum is
unlikely. Cooling water is not required and, in total, the use of (surface) water by the
industrial sector decreases.
STOOM The socioeconomic development in scenario STOOM are similar to scenario DRUK
except the transition to the renewable energy sources. In scenario STOOM this transition
is much slower, so cooling water is required after reopening of the power plant at
Buggenum. The increase in temperature leads to an even larger demand for cooling water.
Therefore, more surface water storage is required to provide sufficient cooling and process
water.
RUST In this scenario, the decrease of freshwater use by the industrial sector is the largest.
Economy and population growth stabilize, so the need of industrial products declines.
Simultaneously, the transition to renewable energy sources is fast, so reopening of the
power plant at Buggenum is unlikely. Therefore, the required cooling water stays negligible.
WARM The fast climate change results in an increase of temperature. Because the transition to
renewable energy resources is only moderate, power plant Buggenum is reopened. More
surface water has to be stored to be used as cooling water. The population decline and
economic hardship, however, result in a larger decrease in process water use. In the end,
the surface water use in industrial activities is smaller.
Table A-4 shows the surface water use by industry per scenario with respect to the reference situation in
2030.
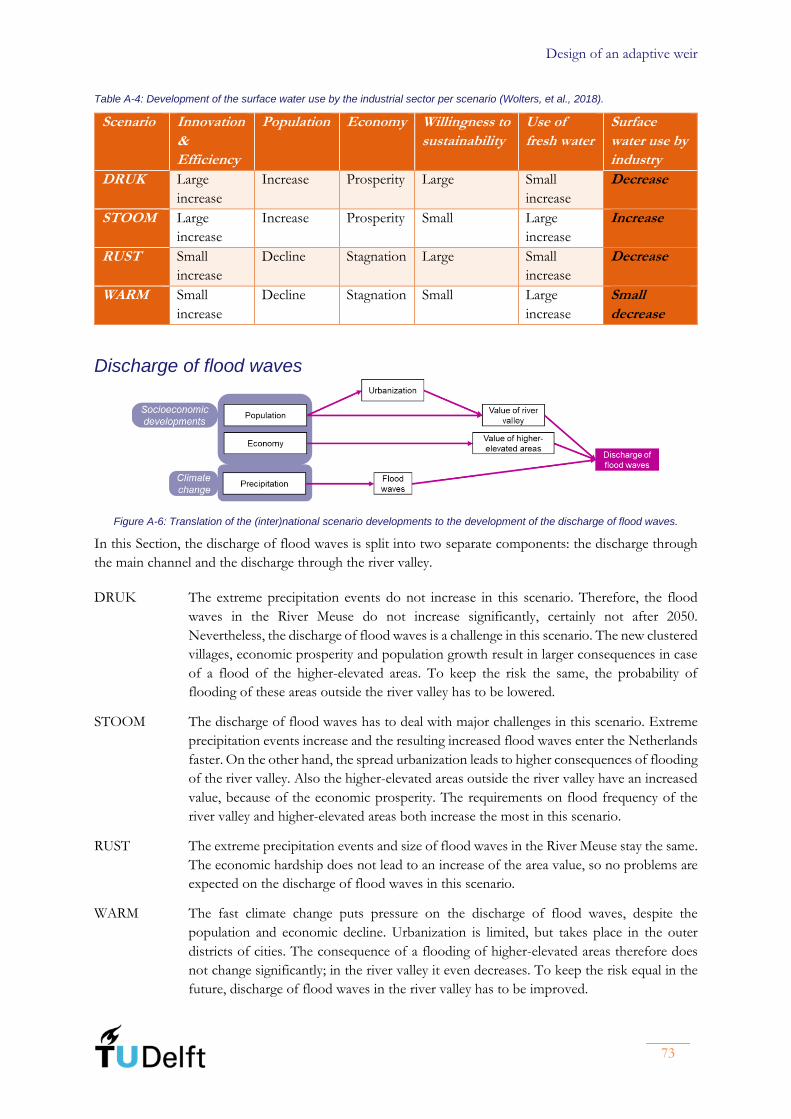
Design of an adaptive weir
73
Table A-4: Development of the surface water use by the industrial sector per scenario (Wolters, et al., 2018).
Scenario Innovation
&
Efficiency
Population Economy Willingness to
sustainability
Use of
fresh water
Surface
water use by
industry
DRUK Large
increase
Increase Prosperity Large Small
increase
Decrease
STOOM Large
increase
Increase Prosperity Small Large
increase
Increase
RUST Small
increase
Decline Stagnation Large Small
increase
Decrease
WARM Small
increase
Decline Stagnation Small Large
increase
Small
decrease
Discharge of flood waves
Figure A-6: Translation of the (inter)national scenario developments to the development of the discharge of flood waves.
In this Section, the discharge of flood waves is split into two separate components: the discharge through
the main channel and the discharge through the river valley.
DRUK The extreme precipitation events do not increase in this scenario. Therefore, the flood
waves in the River Meuse do not increase significantly, certainly not after 2050.
Nevertheless, the discharge of flood waves is a challenge in this scenario. The new clustered
villages, economic prosperity and population growth result in larger consequences in case
of a flood of the higher-elevated areas. To keep the risk the same, the probability of
flooding of these areas outside the river valley has to be lowered.
STOOM The discharge of flood waves has to deal with major challenges in this scenario. Extreme
precipitation events increase and the resulting increased flood waves enter the Netherlands
faster. On the other hand, the spread urbanization leads to higher consequences of flooding
of the river valley. Also the higher-elevated areas outside the river valley have an increased
value, because of the economic prosperity. The requirements on flood frequency of the
river valley and higher-elevated areas both increase the most in this scenario.
RUST The extreme precipitation events and size of flood waves in the River Meuse stay the same.
The economic hardship does not lead to an increase of the area value, so no problems are
expected on the discharge of flood waves in this scenario.
WARM The fast climate change puts pressure on the discharge of flood waves, despite the
population and economic decline. Urbanization is limited, but takes place in the outer
districts of cities. The consequence of a flooding of higher-elevated areas therefore does
not change significantly; in the river valley it even decreases. To keep the risk equal in the
future, discharge of flood waves in the river valley has to be improved.
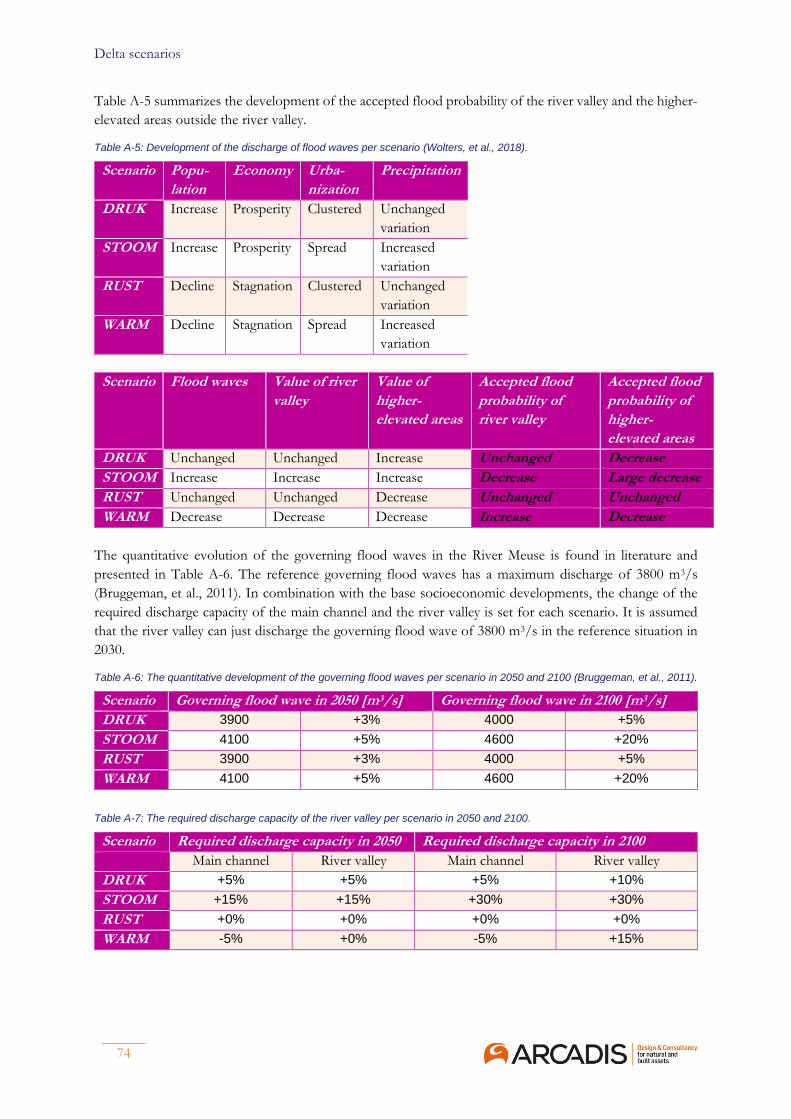
Delta scenarios
74
Table A-5 summarizes the development of the accepted flood probability of the river valley and the higher-
elevated areas outside the river valley.
Table A-5: Development of the discharge of flood waves per scenario (Wolters, et al., 2018).
Scenario Popu-
lation
Economy Urba-
nization
Precipitation
DRUK Increase Prosperity Clustered Unchanged
variation
STOOM Increase Prosperity Spread Increased
variation
RUST Decline Stagnation Clustered Unchanged
variation
WARM Decline Stagnation Spread Increased
variation
Scenario Flood waves Value of river
valley
Value of
higher-
elevated areas
Accepted flood
probability of
river valley
Accepted flood
probability of
higher-
elevated areas
DRUK Unchanged Unchanged Increase Unchanged Decrease
STOOM Increase Increase Increase Decrease Large decrease
RUST Unchanged Unchanged Decrease Unchanged Unchanged
WARM Decrease Decrease Decrease Increase Decrease
The quantitative evolution of the governing flood waves in the River Meuse is found in literature and
presented in Table A-6. The reference governing flood waves has a maximum discharge of 3800 m3/s
(Bruggeman, et al., 2011). In combination with the base socioeconomic developments, the change of the
required discharge capacity of the main channel and the river valley is set for each scenario. It is assumed
that the river valley can just discharge the governing flood wave of 3800 m3/s in the reference situation in
2030.
Table A-6: The quantitative development of the governing flood waves per scenario in 2050 and 2100 (Bruggeman, et al., 2011).
Scenario Governing flood wave in 2050 [m3/s] Governing flood wave in 2100 [m3/s]
DRUK 3900 +3% 4000 +5%
STOOM 4100 +5% 4600 +20%
RUST 3900 +3% 4000 +5%
WARM 4100 +5% 4600 +20%
Table A-7: The required discharge capacity of the river valley per scenario in 2050 and 2100.
Scenario Required discharge capacity in 2050 Required discharge capacity in 2100
Main channel River valley Main channel River valley
DRUK +5% +5% +5% +10%
STOOM +15% +15% +30% +30%
RUST +0% +0% +0% +0%
WARM -5% +0% -5% +15%
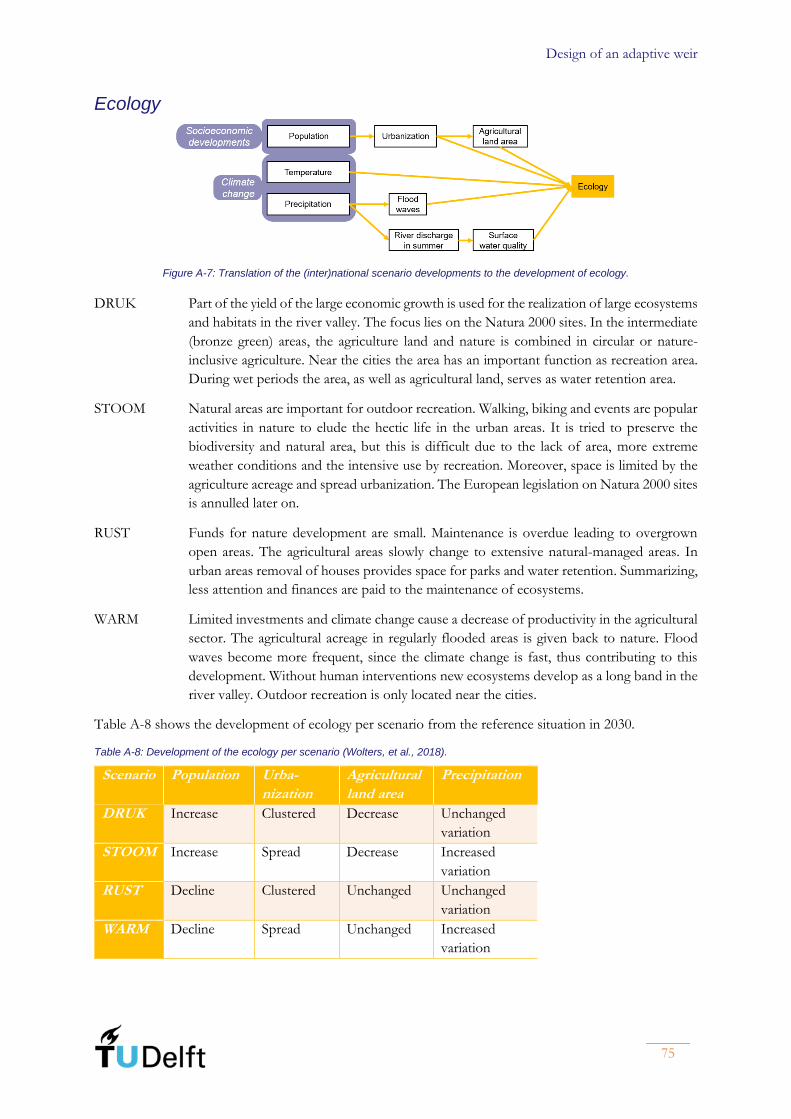
Design of an adaptive weir
75
Ecology
Figure A-7: Translation of the (inter)national scenario developments to the development of ecology.
DRUK Part of the yield of the large economic growth is used for the realization of large ecosystems
and habitats in the river valley. The focus lies on the Natura 2000 sites. In the intermediate
(bronze green) areas, the agriculture land and nature is combined in circular or nature-
inclusive agriculture. Near the cities the area has an important function as recreation area.
During wet periods the area, as well as agricultural land, serves as water retention area.
STOOM Natural areas are important for outdoor recreation. Walking, biking and events are popular
activities in nature to elude the hectic life in the urban areas. It is tried to preserve the
biodiversity and natural area, but this is difficult due to the lack of area, more extreme
weather conditions and the intensive use by recreation. Moreover, space is limited by the
agriculture acreage and spread urbanization. The European legislation on Natura 2000 sites
is annulled later on.
RUST Funds for nature development are small. Maintenance is overdue leading to overgrown
open areas. The agricultural areas slowly change to extensive natural-managed areas. In
urban areas removal of houses provides space for parks and water retention. Summarizing,
less attention and finances are paid to the maintenance of ecosystems.
WARM Limited investments and climate change cause a decrease of productivity in the agricultural
sector. The agricultural acreage in regularly flooded areas is given back to nature. Flood
waves become more frequent, since the climate change is fast, thus contributing to this
development. Without human interventions new ecosystems develop as a long band in the
river valley. Outdoor recreation is only located near the cities.
Table A-8 shows the development of ecology per scenario from the reference situation in 2030.
Table A-8: Development of the ecology per scenario (Wolters, et al., 2018).
Scenario Population Urba-
nization
Agricultural
land area
Precipitation
DRUK Increase Clustered Decrease Unchanged
variation
STOOM Increase Spread Decrease Increased
variation
RUST Decline Clustered Unchanged Unchanged
variation
WARM Decline Spread Unchanged Increased
variation

Delta scenarios
76
Scenario Flood waves River discharge
in summer
Surface water
quality
Ecology
DRUK Unchanged Unchanged Equal Large nature sites in
the river valley
STOOM Increase Decrease Decrease Decreased attention to
nature sites
RUST Unchanged Unchanged Equal Overgrown nature sites
WARM Increase Decrease Decrease Development of watery
nature sites
Navigation
Figure A-8: Translation of the (inter)national scenario developments to the development of navigation.
Before the evolution of the navigation is addressed per scenario, first the influence of climate change and
the willingness to sustainability is explained.
Climate change involves changing river discharge in summer and winter, which hampers the availability of
the waterway network. From the viewpoint of safety, navigation can be forbidden during flood waves,
leading to economic loss to the transport sector. Moreover, more or larger flood waves reduce the availability
of the waterway due to the bridge clearances. On the other hand, lack of water supply leads to small water
depths, which results in unnavigable rivers. Especially for the free flowing part of the River Rhine this can
become a problem. Since the governing vessels on the Maasroute use the River Rhine as well, a depth
limitation on the River Rhine effects the navigation on the Maasroute as well.
The willingness to create a sustainable environment is decisive to mitigate these effects and the increase of
the market share. Transport on water is relatively sustainable and includes economy of scale. To successfully
transfer the container transport from road to water, investments are needed in the waterway system. One
can think on heightening of bridges and better transhipment facilities to stimulate multimodal transport.
The rise of the pallet-wide high-cube 45 ft container, called the continental containers, is worth highlighting.
The conventional containers, 20 ft and 40 ft, have American dimensions, which just do not fit the European
pallets. Therefore, continental containers have been developed with a larger width, length and height to
increase the loading efficiency with European pallets. However, the efficiency of container vessels loading
with 45 ft containers is low nowadays. The width of the Class V vessels is just not sufficient to accommodate
four continental containers next to each other. Therefore, 45 ft containers are mostly transported by truck
and train. Investments in the waterway network and the container vessels itself determine the transfer of
transport of these containers from road and rail to water. The extent to which this will happen, is dependent
on the scenario.

Design of an adaptive weir
77
DRUK The transhipment in the large sea ports increases due to the economic prosperity. The
transport on water increases significantly, since the climate change does only affect the
system a little and industry settles near waterways and inland terminals. The large
willingness to sustainability involves large investments in the waterway system before 2050
to allow transport of four layers of containers on vessels. Structures are replaced bearing in
mind that container vessels become 0.5 m wider in the future to increase the loading
efficiency of vessels with continental containers.
STOOM Although the transhipment in the large sea ports increases due to the economic prosperity,
the throughput to the inland waterways increases less. Until 2050 the inland navigation
remains an important sector for the transport of bulk and continental containers, but after
2050 the effects of climate change affect the sector. The low willingness to sustainability
only involves limited investments; bridge heightening is limited, so the transport of
continental containers over water is therefore restricted. In the end of this century, the
availability of the River Rhine decreases in low water periods.
RUST The growth of transhipment in the large sea ports is, just like the economic growth, limited.
From 2050 a decrease of the total volume is expected. The inland navigation sector keeps
the leading sector regarding the bulk transport; the continental container transport is
limited. Nevertheless, the large willingness to a sustainable environment involves
investments in the waterway system to enable transport of four layers of containers on
vessels. Hereby, a vessel’s beam of 12.5 m instead of 12.0 m is taken into account in the
second half of the 21st century.
WARM The growth of the transhipment in seaports is limited until 2050; after that a decrease is
expected. This is caused by the deteriorated availability of the inland waterways and the
economic hardship. The negative climate change effects are not counteracted by
investments in the system. Therefore, the continental containers are still transported by
truck and train. The market share in bulk transport is kept until 2050, but also decreases
afterwards.
Table A-9 shows the development of navigation per scenario from the reference situation in 2030.
Table A-9: Development of navigation per scenario (Wolters, et al., 2018) (Van Dorsser, 2012).
Scenario Innovation
&
Efficiency
Economy Willingness to
sustainability
Precipitation Transport
of goods
DRUK Large
increase
Prosperity Large Unchanged
variation
Large
increase
STOOM Large
increase
Prosperity Small Increased
variation
Large
increase
RUST Small
increase
Stagnation Large Unchanged
variation
Small
increase
WARM Small
increase
Stagnation Small Increased
variation
Large
increase

Delta scenarios
78
Scenario Flood
waves
River
discharge
in summer
Navigable
depth of the
River Rhine
Bulk
transport
via water
Transshipment
facilities
DRUK Unchanged Unchanged Unchanged Unchanged Large
improvement
STOOM Increase Decrease Decrease Unchanged Limited
improvement
RUST Unchanged Unchanged Unchanged Decrease Large
improvement
WARM Increase Decrease Decrease Decrease No
improvement
Scenario Container transport
on Maasroute
Prins Willem-
Alexanderport
CEMT-Class of the Maasroute
DRUK Increase Increased importance Unchanged
STOOM Increase Unchanged Decrease in maximum depth
RUST Unchanged Unchanged Unchanged
WARM Unchanged Decreased importance Decrease in maximum depth
The result of Table A-9 is insufficiently specific to take into account as evolution in the scenarios. Moreover,
the time dimension is not addressed yet. With the help of Figure A-9, Figure A-10, Figure A-11 and Figure
A-12, the evolution of the navigational subfunctions is made quantitatively and the evolution rate is
addressed. In these figures, two extra scenarios are presented, namely DOORSTOMEN and
WATERDRUK. Since these scenarios are not elaborated for the other subfunctions, these are not applied
in this project.
Figure A-9: Development of the total domestic transport volume per scenario (Van Dorsser, 2012).
Figure A-10: Development of bulk transport via the inland waterway network per scenario (Van Dorsser, 2012).

Design of an adaptive weir
79
Figure A-11: Development of conventional container transport via the inland waterway network per scenario (Van Dorsser, 2012).
Figure A-12: Development of continental container transport via the inland waterway network per scenario (Van Dorsser, 2012).
Table A-10 includes the translated developments which are considered during the rest of the project.
Table A-10: Specific, time-related development of navigation per scenario (Wolters, et al., 2018) (Van Dorsser, 2012).
Scenario Maximum layers of high-cubes
containers
Prins Willem-
Alexanderport
CEMT-Class
Maasroute
Year 2050 2100 2050 2100
DRUK 4 empty
containers
4 empty
containers
Increase of governing
draught to 3.0 m Vb Vb
STOOM 4 empty
containers
4 average loaded
containers
Unchanged Vb Va
RUST 3 empty
containers
4 average loaded
containers
Unchanged Vb Vb
WARM 3 empty
containers
3 empty
containers
Port closed Vb Va

Delta scenarios
80
A.2 Evolution of boundary conditions and requirements per
scenario
On basis of Appendix A.1, the evolution of the boundary conditions and requirements are set up per
scenario. In Figure A-13 to Figure A-16, the developments are summarized per scenario per (sub)function
as mentioned in Section 4.2 and Appendix A.1. The time dimension of the developments is partly based on
information found in literature and partly based on the innovation rate in that particular scenario; in general,
if the technological innovation rate is large, the boundary conditions and requirements evolve faster than if
the technological innovation rate is small.
Figure A-13: Evolution of boundary conditions and requirements in scenario DRUK.
Figure A-14: Evolution of boundary conditions and requirements in scenario STOOM.
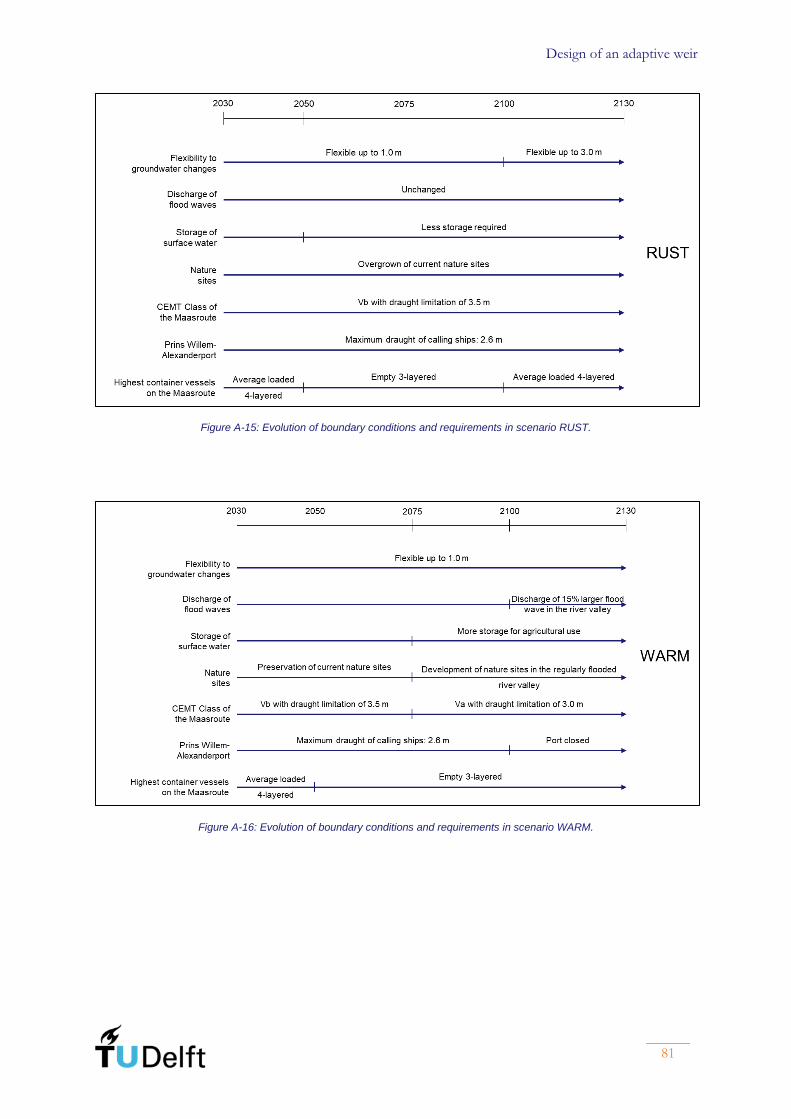
Design of an adaptive weir
81
Figure A-15: Evolution of boundary conditions and requirements in scenario RUST.
Figure A-16: Evolution of boundary conditions and requirements in scenario WARM.

Delta scenarios
82
(This page is intentionally left blank)

Design of an adaptive weir
83
Appendix B System of the River Meuse
This appendix describes the system of the River Meuse elaborately. This starts with an overview of the
current system of the River Meuse and its tributaries, after which Appendix B.2 addresses the variation of
the River Meuse’s discharge. Appendix B.3 includes the chronological development of the waterway
network. It covers the establishment and human interventions in the River Meuse and the connected
waterways. For completeness, Figure 2-1 of the main report, is repeated below.
Figure B-1: Overview of the catchment area of the River Meuse (Rijkswaterstaat, 1992).
B.1 Hydrological system
The source of the River Meuse is located at the Plateau of Langres near Pouilly-en-Bassigny at an elevation
of NAP +400 m. Near the source, the river, called the Meuse Lorraine, flows calm through a wide, flat
valley with parallel to it a canal. The river and the canal confluence and bifurcate a couple of times;
downstream of the bifurcations weirs control the water level and discharge of the river and the canal. The
subsoil consists of limestone and alluvial deposits which both have a high permeability. Consequently, in
dry periods the River Meuse here is mainly fed by groundwater. During these periods, the groundwater flow
in this area is a non-negligible contribution to the total river discharge in the Netherlands.
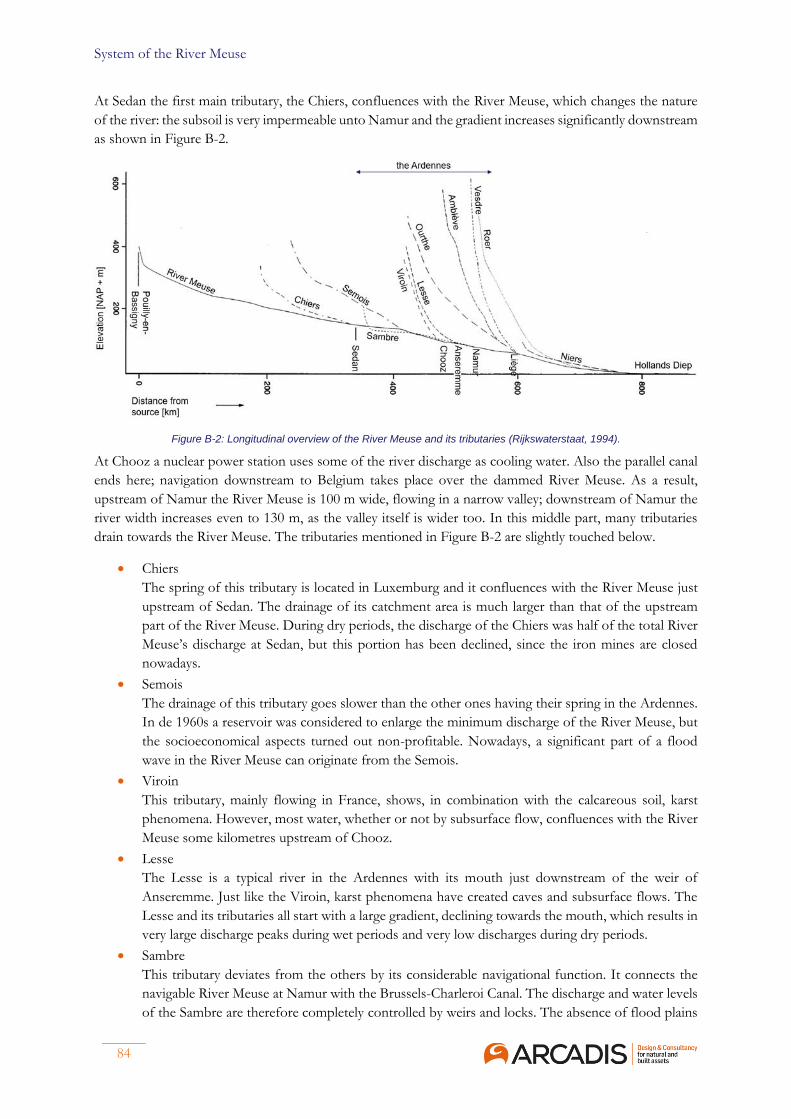
System of the River Meuse
84
At Sedan the first main tributary, the Chiers, confluences with the River Meuse, which changes the nature
of the river: the subsoil is very impermeable unto Namur and the gradient increases significantly downstream
as shown in Figure B-2.
Figure B-2: Longitudinal overview of the River Meuse and its tributaries (Rijkswaterstaat, 1994).
At Chooz a nuclear power station uses some of the river discharge as cooling water. Also the parallel canal
ends here; navigation downstream to Belgium takes place over the dammed River Meuse. As a result,
upstream of Namur the River Meuse is 100 m wide, flowing in a narrow valley; downstream of Namur the
river width increases even to 130 m, as the valley itself is wider too. In this middle part, many tributaries
drain towards the River Meuse. The tributaries mentioned in Figure B-2 are slightly touched below.
• Chiers
The spring of this tributary is located in Luxemburg and it confluences with the River Meuse just
upstream of Sedan. The drainage of its catchment area is much larger than that of the upstream
part of the River Meuse. During dry periods, the discharge of the Chiers was half of the total River
Meuse’s discharge at Sedan, but this portion has been declined, since the iron mines are closed
nowadays.
• Semois
The drainage of this tributary goes slower than the other ones having their spring in the Ardennes.
In de 1960s a reservoir was considered to enlarge the minimum discharge of the River Meuse, but
the socioeconomical aspects turned out non-profitable. Nowadays, a significant part of a flood
wave in the River Meuse can originate from the Semois.
• Viroin
This tributary, mainly flowing in France, shows, in combination with the calcareous soil, karst
phenomena. However, most water, whether or not by subsurface flow, confluences with the River
Meuse some kilometres upstream of Chooz.
• Lesse
The Lesse is a typical river in the Ardennes with its mouth just downstream of the weir of
Anseremme. Just like the Viroin, karst phenomena have created caves and subsurface flows. The
Lesse and its tributaries all start with a large gradient, declining towards the mouth, which results in
very large discharge peaks during wet periods and very low discharges during dry periods.
• Sambre
This tributary deviates from the others by its considerable navigational function. It connects the
navigable River Meuse at Namur with the Brussels-Charleroi Canal. The discharge and water levels
of the Sambre are therefore completely controlled by weirs and locks. The absence of flood plains
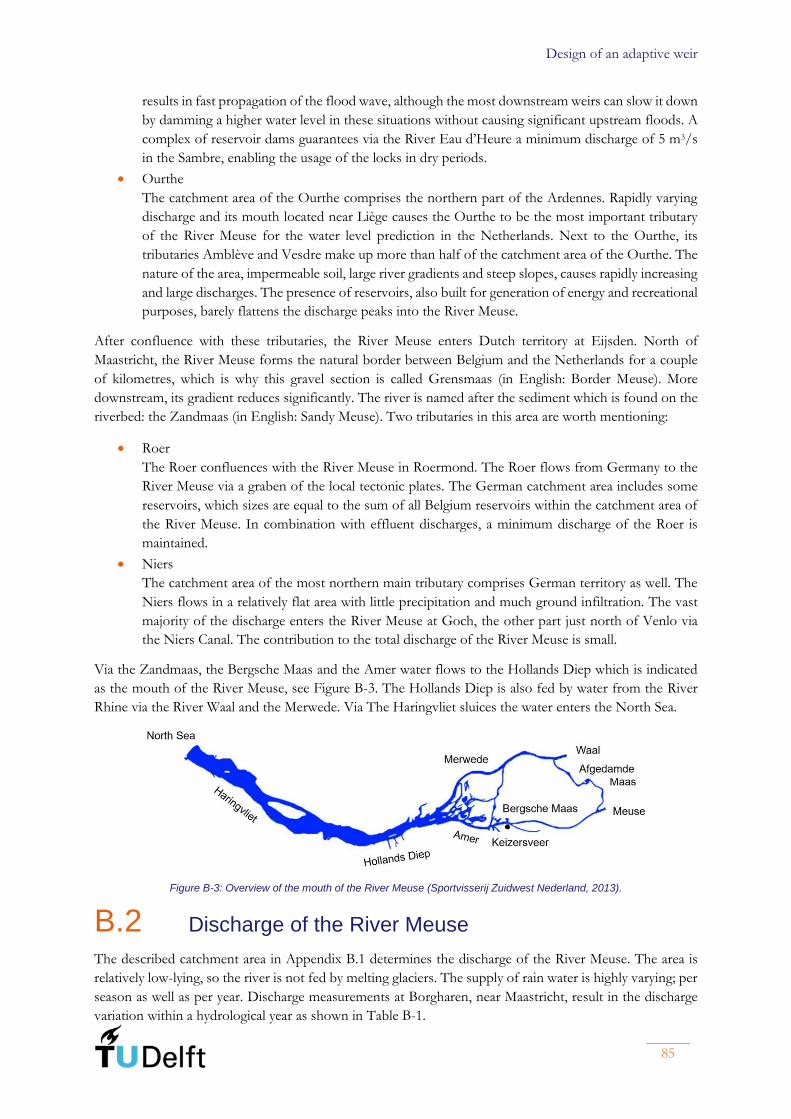
Design of an adaptive weir
85
results in fast propagation of the flood wave, although the most downstream weirs can slow it down
by damming a higher water level in these situations without causing significant upstream floods. A
complex of reservoir dams guarantees via the River Eau d’Heure a minimum discharge of 5 m3/s
in the Sambre, enabling the usage of the locks in dry periods.
• Ourthe
The catchment area of the Ourthe comprises the northern part of the Ardennes. Rapidly varying
discharge and its mouth located near Liège causes the Ourthe to be the most important tributary
of the River Meuse for the water level prediction in the Netherlands. Next to the Ourthe, its
tributaries Amblève and Vesdre make up more than half of the catchment area of the Ourthe. The
nature of the area, impermeable soil, large river gradients and steep slopes, causes rapidly increasing
and large discharges. The presence of reservoirs, also built for generation of energy and recreational
purposes, barely flattens the discharge peaks into the River Meuse.
After confluence with these tributaries, the River Meuse enters Dutch territory at Eijsden. North of
Maastricht, the River Meuse forms the natural border between Belgium and the Netherlands for a couple
of kilometres, which is why this gravel section is called Grensmaas (in English: Border Meuse). More
downstream, its gradient reduces significantly. The river is named after the sediment which is found on the
riverbed: the Zandmaas (in English: Sandy Meuse). Two tributaries in this area are worth mentioning:
• Roer
The Roer confluences with the River Meuse in Roermond. The Roer flows from Germany to the
River Meuse via a graben of the local tectonic plates. The German catchment area includes some
reservoirs, which sizes are equal to the sum of all Belgium reservoirs within the catchment area of
the River Meuse. In combination with effluent discharges, a minimum discharge of the Roer is
maintained.
• Niers
The catchment area of the most northern main tributary comprises German territory as well. The
Niers flows in a relatively flat area with little precipitation and much ground infiltration. The vast
majority of the discharge enters the River Meuse at Goch, the other part just north of Venlo via
the Niers Canal. The contribution to the total discharge of the River Meuse is small.
Via the Zandmaas, the Bergsche Maas and the Amer water flows to the Hollands Diep which is indicated
as the mouth of the River Meuse, see Figure B-3. The Hollands Diep is also fed by water from the River
Rhine via the River Waal and the Merwede. Via The Haringvliet sluices the water enters the North Sea.
Figure B-3: Overview of the mouth of the River Meuse (Sportvisserij Zuidwest Nederland, 2013).
B.2 Discharge of the River Meuse
The described catchment area in Appendix B.1 determines the discharge of the River Meuse. The area is
relatively low-lying, so the river is not fed by melting glaciers. The supply of rain water is highly varying; per
season as well as per year. Discharge measurements at Borgharen, near Maastricht, result in the discharge
variation within a hydrological year as shown in Table B-1.

System of the River Meuse
86
Table B-1: Average number of days a specific discharge is exceeded at Borgharen in a year (Geerling, Buijse, & Van Kouwen, 2010).
Discharge [m3/s] Winter Spring Summer Autumn Total
50 87.1 88.6 54.9 54.5 285.0 78%
75 84.5 83.7 39.6 44.5 252.3 69%
100 81.5 76.6 25.5 37.0 220.6 60%
150 74.5 59.3 12.3 26.6 172.6 47%
200 64.9 44.6 6.6 20.0 136.1 37%
300 49.6 28.0 2.8 12.7 93.1 25%
400 38.2 18.0 1.4 7.9 65.4 18%
500 28.9 11.7 0.7 5.1 46.3 13%
600 21.2 7.2 0.3 3.2 31.9 9%
700 15.8 4.7 0.2 2.0 22.6 6%
800 11.5 3.0 0.1 1.3 16.0 4%
900 8.7 2.0 0 1.0 11.7 3%
1,000 6.4 1.2 0 0.8 8.3 2%
The catchment area is narrow and elongated, so it can rain simultaneously in a large part of the catchment
area, which results in large flood waves. The discharge is amplified by the little water storage in the area.
Averagely, in the Ardennes the amount of precipitation is the largest of the catchment area as well. The
drainage of this area is also the fastest, which leads to the discharge variety shown in Figure B-4. The yearly
average river discharge is 230 m3/s, but the variation from year to year is significant. For example, between
1969 and 1979 the average discharge was only 160 m3/s. In summer, the period of May until October,
discharges of 10 m3/s are not exceptional, because of the small precipitation volumes and the evaporation
in the area (Rijkswaterstaat, 1992).
Figure B-4: Variety of the discharge of the River Meuse measured at Borgharen (Rijkswaterstaat, 1994).

Design of an adaptive weir
87
Flood wave size The discharge of the River Meuse has been measured since 1911. The highest measured discharge at
Borgharen equals 3,000 m3/s, measured in 1926 as a result of heavy rainfall and melting snow in the
Ardennes. More than 100 years of measurement data have been applied to derive extreme value distributions
by fitting the distributions to the data. In this way, the peak discharges of much larger return periods are
known, which is important for flood safety. Table B-2 shows the return periods and size of large flood
waves in the River Meuse.
The fitting of the distributions does include some unavoidable inaccuracies. The system of the River Meuse
has been changed in the last century, so the behaviour of flood waves as well. In former times, multiple
areas flooded which stay dry now during an equally sized flood wave. On top of that, river bend cut-offs
decreased the distance between the area of precipitation and the point of interest. The course of a peak
discharge of 3,000 m3/s will be completely different from the situation in 1926 (Rijkswaterstaat, 1994).
Therefore, the discharge peaks of the past are homogenized to the present situation. A new relation between
discharge and resulting water levels has been proposed after the flood waves in 1993 and 1995. The flood
of 1926 is comparable with a present flood wave of 3,175 m3/s. The homogenized discharges of the flood
waves are used to determine the extreme discharges, but these do not account for the effect of climate
change or climate variations (Van Schrojentstein Lantman, 2004). This enlarges the uncertainty of the
extreme discharges, which is supported by the wide 95% confidence interval in Table B-2.
Table B-2: Return periods with corresponding discharges and uncertainties (Chbab, Den Bieman, & Groeneweg, 2017).
Return period [y] Discharge [m3/s] 95% confidence interval
Lower limit [m3/s] Upper limit [m3/s]
2 1,440 1,270 1,610
5 1,970 1,740 2,200
10 2,300 2,010 2,590
50 2,970 2,430 3,510
100 3,220 2,650 3,800
250 3,520 2,950 4,090
1,250 3,910 3,210 4,290
Propagation speed of flood waves The short-term prediction of flood waves and the corresponding water levels is of large importance
nowadays to guarantee the flood safety in the Netherlands. Numerical models, which include the
characteristics of the river (area), are used to predict the river water levels. Predictions far ahead in time are
problematic, since the flood wave at Borgharen is hugely impacted by the tributaries in the Ardennes. In
Figure B-5 the travel time of flood waves unto Borgharen is shown. Within 48 hours water runs from France
to Borgharen; if water levels have to be predicted more in advance, rainfall prediction has to be added. The
accuracy reduces drastically in this case.

System of the River Meuse
88
Figure B-5: Flood wave propagation (Van Schrojentstein Lantman, 2004).
The flood wave propagation is slightly different for each flood wave, because the shape of the flood wave
differs. This shape changes during the propagation of the flood wave. Sharp-crested flood waves are topped
off by the Maasplassen, an area with many lakes and a wide river valley. Therefore, blunt flood waves cause
higher water levels downstream than sharp-crested flood waves. Consequentially, the travel time from
Borgharen to Lith ranges from 56 to 86 hours (Van Schrojentstein Lantman, 2004). Because of all these
variabilities, the standard tables, which are used to calculate the water levels downstream based on the
discharge near Borgharen, have to be applied with great care (Rijkswaterstaat Zuid-Nederland, 2013).
In contrast to the River Rhine, floods do not play a role before the flood waves reach the Netherlands. Near
Liège, the River Meuse flows in a natural valley, so floods are constrained to this area; downstream of
Maastricht, flood waves are for the first time significantly affected by the Maasplassen. The exact decrease
of the peak discharge is the result of a complex interaction of floods and water supply from these flooded
areas and tributaries. In general, the peak discharge at Lith is 50 m3/s smaller than the peak discharge at
Borgharen. This is mainly caused by the flooding of the subsided Flemish mine areas adjacent to the
Grensmaas (Silva, Slomp, Stijnen, & Van Velzen, 2005).
B.3 Historical development of the waterway network
Due to the rapid changing water levels, the nature of the River Meuse was unsuitable for navigation purposes
in the 18th century. During the reign of Napoleon navigation increased, because borders were abolished and
trading increased. Therefore, Napoleon instructed to connect the River Scheldt (from Antwerp) with the
River Meuse (via Venlo) and the River Rhine (to Neuss). Supply of water had to be guaranteed by
constructing an additional canal from Maastricht to this so-called Canal du Nord. Though, only a small part
has been constructed. In the following decades, more and more other waterways have been constructed. An
overview of the present waterway system in Flanders and the Netherlands is given in Figure B-6. In the text
below, the development of this network is chronologically explained (Rijkswaterstaat, 1994) (Burgers, 2014).
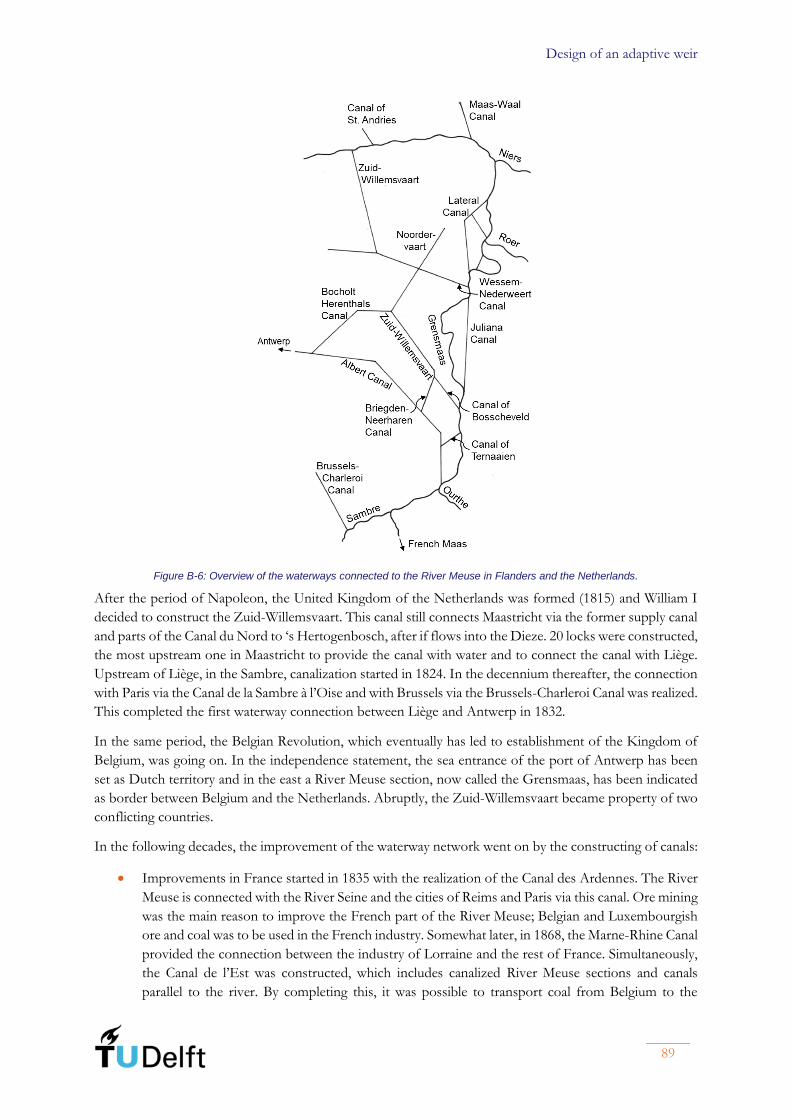
Design of an adaptive weir
89
Figure B-6: Overview of the waterways connected to the River Meuse in Flanders and the Netherlands.
After the period of Napoleon, the United Kingdom of the Netherlands was formed (1815) and William I
decided to construct the Zuid-Willemsvaart. This canal still connects Maastricht via the former supply canal
and parts of the Canal du Nord to ‘s Hertogenbosch, after if flows into the Dieze. 20 locks were constructed,
the most upstream one in Maastricht to provide the canal with water and to connect the canal with Liège.
Upstream of Liège, in the Sambre, canalization started in 1824. In the decennium thereafter, the connection
with Paris via the Canal de la Sambre à l’Oise and with Brussels via the Brussels-Charleroi Canal was realized.
This completed the first waterway connection between Liège and Antwerp in 1832.
In the same period, the Belgian Revolution, which eventually has led to establishment of the Kingdom of
Belgium, was going on. In the independence statement, the sea entrance of the port of Antwerp has been
set as Dutch territory and in the east a River Meuse section, now called the Grensmaas, has been indicated
as border between Belgium and the Netherlands. Abruptly, the Zuid-Willemsvaart became property of two
conflicting countries.
In the following decades, the improvement of the waterway network went on by the constructing of canals:
• Improvements in France started in 1835 with the realization of the Canal des Ardennes. The River
Meuse is connected with the River Seine and the cities of Reims and Paris via this canal. Ore mining
was the main reason to improve the French part of the River Meuse; Belgian and Luxembourgish
ore and coal was to be used in the French industry. Somewhat later, in 1868, the Marne-Rhine Canal
provided the connection between the industry of Lorraine and the rest of France. Simultaneously,
the Canal de l’Est was constructed, which includes canalized River Meuse sections and canals
parallel to the river. By completing this, it was possible to transport coal from Belgium to the

System of the River Meuse
90
industry of Lorraine. The location of the waterway network in northern France is shown in Figure
B-7.
Figure B-7: Overview of the waterways network to the River Meuse in Wallonia and France.
• The aim of the Canal du Nord was partly reached in 1846 by connecting the Zuid-Willemsvaart to
Antwerp by digging the Bocholt-Herentals Canal. The expansion of the canal between Herentals
and Antwerp, finished in 1859, resulted in more inland navigation from and to Antwerp. • A canal with 6 locks between Liège and Maastricht enabled navigation of vessels unto 450 tons in
1850. A transverse canal at Visé has been dug to connect the mines on the eastern bank of the River
Meuse. A weir in the River Meuse has been built to manage the water inlet of the Zuid-Willemsvaart
and the other Flemish waterways. • The first canalization of the River Meuse itself started in Liège in 1853. The section between Liège
and Namur was made suitable for vessels unto 600 tons within 12 years.
The measures in Wallonia and France did not result in much noise, but this does not apply to the extension
of the waterway network in Flanders. The position of the port of Antwerp was very important for the just
established Belgium; all domestic canals had been dug focussing on the hinterland connection of this port.
The competitive ports in the Netherlands regarded these canals as a threat for their market position. The
relationship between the neighbouring countries was already not too good, the port competition made it
even worse. Soon the countries had issues on the water inlet of the Flemish canals. Much water of the River
Meuse was directed into the Liège-Maastricht Canal. Moreover, the Belgian agricultural sector drained water
from the Grensmaas. During dry periods, the users of the Dutch River Meuse had to deal with largely
reduced water levels, during wet periods navigation in Flanders struggled with large flow velocities. After
several conflicts between both nations, an agreement was signed in 1863. An inlet structure at Bosscheveld
(in the Netherlands) replaced the inlet structure of the Zuid-Willemsvaart at Hocht (in Belgium). The water
distribution over the canals and the River Meuse was regulated to solve the existing problems; a minimum
discharge for the Dutch River Meuse and a maximum discharge for the Flemish canals and agriculture was
agreed upon. Part of the discharge diverted to the Flemish canals had to flow back to the Netherlands via
the Zuid-Willemsvaart. Last, Belgium agreed to pay for the canalization of the Dutch River Meuse.
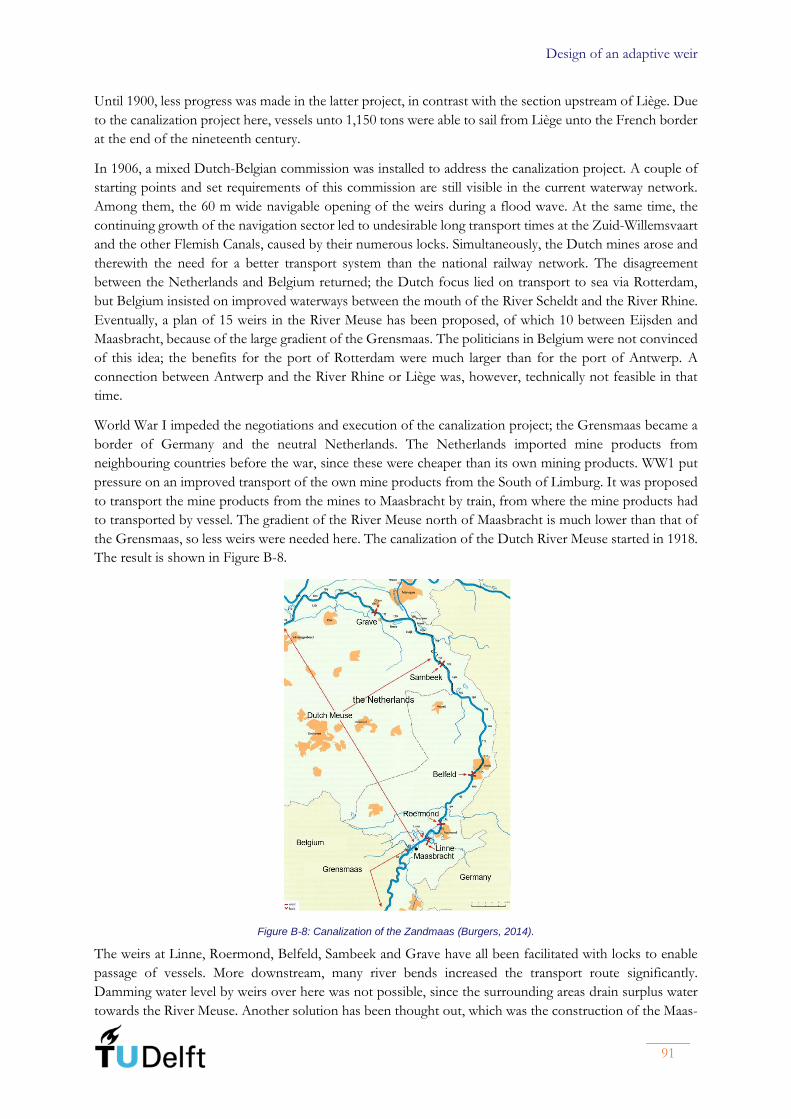
Design of an adaptive weir
91
Until 1900, less progress was made in the latter project, in contrast with the section upstream of Liège. Due
to the canalization project here, vessels unto 1,150 tons were able to sail from Liège unto the French border
at the end of the nineteenth century.
In 1906, a mixed Dutch-Belgian commission was installed to address the canalization project. A couple of
starting points and set requirements of this commission are still visible in the current waterway network.
Among them, the 60 m wide navigable opening of the weirs during a flood wave. At the same time, the
continuing growth of the navigation sector led to undesirable long transport times at the Zuid-Willemsvaart
and the other Flemish Canals, caused by their numerous locks. Simultaneously, the Dutch mines arose and
therewith the need for a better transport system than the national railway network. The disagreement
between the Netherlands and Belgium returned; the Dutch focus lied on transport to sea via Rotterdam,
but Belgium insisted on improved waterways between the mouth of the River Scheldt and the River Rhine.
Eventually, a plan of 15 weirs in the River Meuse has been proposed, of which 10 between Eijsden and
Maasbracht, because of the large gradient of the Grensmaas. The politicians in Belgium were not convinced
of this idea; the benefits for the port of Rotterdam were much larger than for the port of Antwerp. A
connection between Antwerp and the River Rhine or Liège was, however, technically not feasible in that
time.
World War I impeded the negotiations and execution of the canalization project; the Grensmaas became a
border of Germany and the neutral Netherlands. The Netherlands imported mine products from
neighbouring countries before the war, since these were cheaper than its own mining products. WW1 put
pressure on an improved transport of the own mine products from the South of Limburg. It was proposed
to transport the mine products from the mines to Maasbracht by train, from where the mine products had
to transported by vessel. The gradient of the River Meuse north of Maasbracht is much lower than that of
the Grensmaas, so less weirs were needed here. The canalization of the Dutch River Meuse started in 1918.
The result is shown in Figure B-8.
Figure B-8: Canalization of the Zandmaas (Burgers, 2014).
The weirs at Linne, Roermond, Belfeld, Sambeek and Grave have all been facilitated with locks to enable
passage of vessels. More downstream, many river bends increased the transport route significantly.
Damming water level by weirs over here was not possible, since the surrounding areas drain surplus water
towards the River Meuse. Another solution has been thought out, which was the construction of the Maas-

System of the River Meuse
92
Waal Canal. This canal connected the River Meuse in 1927 with the North Sea via the River Waal. The first
four weirs had been mentioned in the proposal of the Dutch-Belgian commission, the weir at Grave has
been added to control the water level of the Maas-Waal Canal. The location of the most upstream one, weir
Linne, is selected to just not influence the shared Grensmaas. In 1929 the main navigation route to
Rotterdam via the Maas-Waal Canal was suitable for vessels unto 2,000 tons. Maasbracht was an important
transhipment hub in this time, also because of the construction of the Wessem-Nederweert Canal, which
provides a domestic connection to the Zuid-Willemsvaart.
Simultaneously with the canalization of the Zandmaas, the disagreement between Belgium and the
Netherlands about the navigability of the Grensmaas dragged along. The Netherlands eventually
constructed a canal, parallel to the Grensmaas, with only three locks. Besides, a new inland port on this so-
called Juliana canal was more profitable for the access of the Dutch mines. Weir Borgharen, completed in
1928, controlled the water levels in the canal and the River Meuse section upstream of the Grensmaas. In
Maastricht faster waterway connections were added between the River Meuse and the Flemish canals by the
construction of locks at Bosscheveld and St. Pieter.
Belgium reacted by construction of the Albert Canal in Flanders in the 30s. This canal connects the southern
part of the Liège-Maastricht Canal and the Herentals-Antwerp Canal and was suitable for vessels unto 2,000
tons. The other Flemish Canals, except the Liège-Maastricht Canal, were enlarged to accommodate vessels
unto 600 tons. The weir of Monsin determines the water level at the bifurcation of the River Meuse and the
Albert Canal. During World War II, the first vessels used the six locks in the Albert Canal to navigate to
Antwerp. Upstream of Liège, improvements of earlier canalization works started. Near Maastricht, the
Briegden-Neerharen Canal formed a connection between the Albert Canal and the Zuid-Willemsvaart.
By construction of the Juliana Canal, the Briegden-Neerharen Canal and the lock at Bosscheveld, the
agreement of 1863 has been violated. Both countries developed their own navigation routes for vessels up
to 2,000 tons. The connection between these two navigation networks at Ternaaien, however, was only
suitable for vessels up to 450 tons. In 1961 a lock complex for larger vessels and the Canal of Ternaaien
solved this problem. The Liège-Maastricht Canal through the centre of Maastricht was damped. Figure B-9
shows the weirs and locks in or adjacent to the Dutch River Meuse.
Figure B-9: Overview of locks and weirs in or adjacent to the Dutch part of the River Meuse.
Design of an adaptive weir
93
After World War II navigation increased even more, so these decades have been dominated by enlargement
of the waterways and structures:
• Extension of the Juliana Canal was demanded and executed. The locks at Roosteren have been
demolished, the locks of Maasbracht have been renewed and now form the downstream boundary
of the canal. A little downstream, construction of the Lateral Canal have shortened the main
navigation route by five kilometre.
• The Canal Antwerp-Brussels-Charleroi has been enlarged to accommodate vessels unto 1,350 tons
with the number of locks decreasing from 13 to 8.
• In the canalized River Meuse in Belgium, the 5 locks between Namur and Huy have been replaced
by 2 large locks (9,000 tons) in the seventies. Weirs have been replaced as well; weir Lixhe replaced
weir Visé in 1980 for example. The section upstream of Liège unto the French border has been
made suitable for vessels unto 1,350 tons. The French part has not been modernized, because
navigation has not improved much in that region.
Besides the measures to improve navigation, the floods in the history have played an important role in the
development of the river system. In the past, many spillways were constructed to lower the effects of the
floods on the living environment of inhabitants. Among the spillways west of Roermond and near
Maastricht, the one from Cuijk (near Grave) to ‘s-Hertogenbosch was the largest. In this area, the River
Waal and River Meuse confluence, which has led to multiple floods. During flood periods the water level in
the River Waal was higher than in the River Meuse, so water, even more than the own discharge of the River
Meuse, flowed to the River Meuse. This caused floods of the River Meuse and the spillways. A couple of
interventions have been realized for a better safety against floods in this area:
• The connection between the River Meuse and the River Waal at St. Andries was replaced by a lock
in 1856.
• The distribution of water from the River Rhine over the River Waal and River IJssel has been
regulated at the Pannerdensche Kop.
• Construction of the New Merwede in 1860 created an own discharge canal for the Waal, see Figure
B-3.
• In 1904 the Bergsche Maas was opened, which completed the separation of both rivers. The old
course of the River Meuse is now called the Afgedamde Maas (in English: Dammed Meuse), see
Figure B-3.
These interventions resulted in a River Meuse which was partly able to discharge flood waves by its own.
After the flood wave in 1926 additional measures started, to increase flood safety. This included deepening
of the main navigation channel, shortening of the groins and cutting off some river bends. Water levels
decreased, which induced the construction of weir Lith in 1936. The large spillway was closed in 1942, the
spillways in the south were closed too, after the construction of the Juliana Canal and Lateral Canal. The
gravel extraction in the valley of the River Meuse since 1950 have created the Maasplassen, which also has
increased flood safety by lowering the peak discharge of flood waves.

System of the River Meuse
94
(This page is intentionally left blank)

Design of an adaptive weir
95
Appendix C
Weir hydraulics and
weir management
In this appendix, first, in Appendix C.1, the general hydraulics of a dammed river are elaborated. The applied
hydraulic model is derived and presents the formula, which is evaluated numerically to calculate the water
level in a weir section. The local flow conditions at the weir itself are subject of Appendix C.2. Thereafter,
Appendix C.3 addresses all weirs within the study area. It starts with the weirs in Belgium, followed up by
the weirs in downstream direction of the River Meuse. The focus lies on the type of gates and operation of
these gates to obtain the desired water level. The secondary functions of the weir complexes are mentioned
as well.
C.1 Steady gradually-varying flow
The water depth of a free-flowing river is dependent on the river characteristics and the discharge. The
relation between water depth and discharge is described by the Chézy formula:
= = e e bQ A u B d C d i (C.1)
The river characteristics that influence the water depth are the width, the gradient and the roughness. These
parameters are not constant over the entire stretch; the width is even changing for varying water depths. If
the water level rises, the river valley and/or floodplains may flood. Buildings, roads and trees all result in a
larger flow resistance to the flow in case of flooding. In other words, the roughness of the river valley in
total is larger than that of the main channel. Thus, the Chézy value is dependent on the water level as well.
Additionally, from this formula the need of weir Lith becomes clear. To prevent floods, river bends have
been cut-off, by which the gradient of the river section has been increased. As a result, for each discharge
the corresponding water depth decreases as well. Flood safety is increased, but in dry periods it also lowers
the water level, leading to problems for the navigation sector. Construction of weir Lith solved this problem.
To calculate the resulting water levels, an hydraulic model is set up (ARCADIS, 2015). The river is simplified
as a rectangular prismatic channel, as shown in Figure C-1. This figure shows the definition of the used
parameters as well.
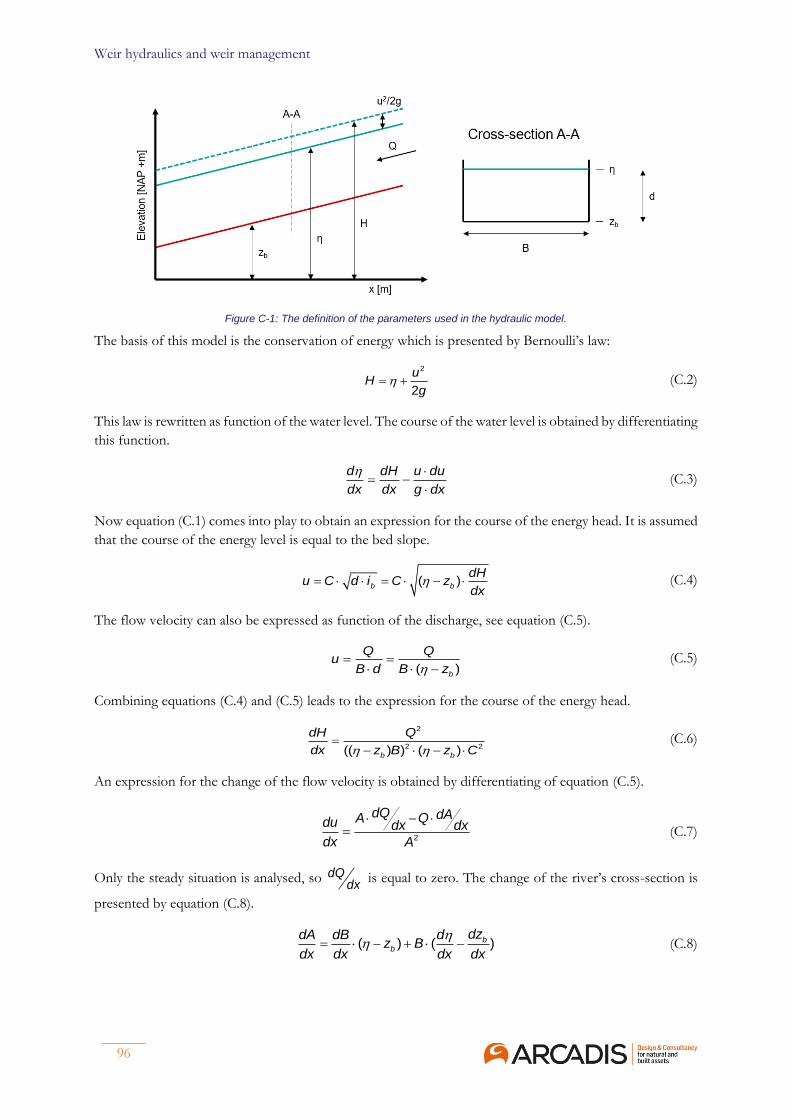
Weir hydraulics and weir management
96
Figure C-1: The definition of the parameters used in the hydraulic model.
The basis of this model is the conservation of energy which is presented by Bernoulli’s law:
= +2
2
uH
g (C.2)
This law is rewritten as function of the water level. The course of the water level is obtained by differentiating
this function.
= −
d dH u du
dx dx g dx (C.3)
Now equation (C.1) comes into play to obtain an expression for the course of the energy head. It is assumed
that the course of the energy level is equal to the bed slope.
= = − ( )b b
dHu C d i C z
dx (C.4)
The flow velocity can also be expressed as function of the discharge, see equation (C.5).
= = −( )b
Q Qu
B d B z (C.5)
Combining equations (C.4) and (C.5) leads to the expression for the course of the energy head.
=− −
2
2 2(( ) ) ( )b b
dH Q
dx z B z C (C.6)
An expression for the change of the flow velocity is obtained by differentiating of equation (C.5).
−
=2
dQ dAA Qdu dx dx
dx A (C.7)
Only the steady situation is analysed, so dQdx
is equal to zero. The change of the river’s cross-section is
presented by equation (C.8).
= − + −( ) ( )bb
dzdA dB dz B
dx dx dx dx (C.8)
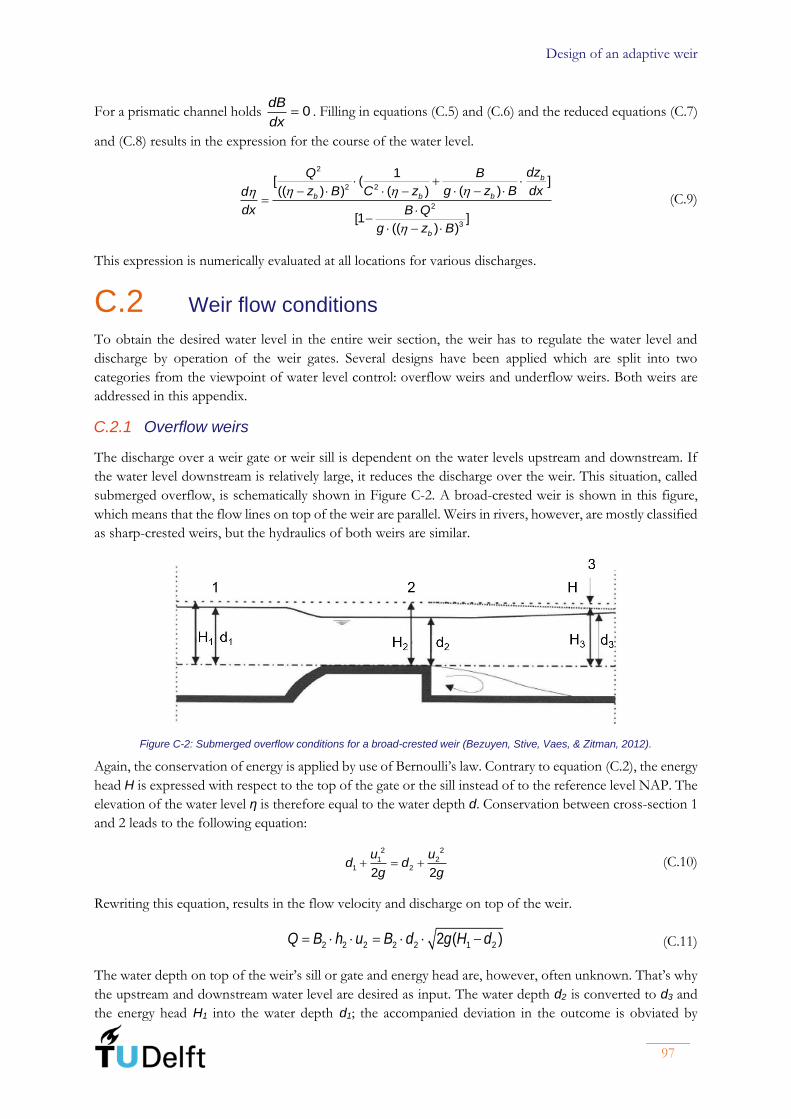
Design of an adaptive weir
97
For a prismatic channel holds = 0dB
dx. Filling in equations (C.5) and (C.6) and the reduced equations (C.7)
and (C.8) results in the expression for the course of the water level.
+ − − −
=
− −
2
2 2
2
3
1[ ( ]
( )(( ) ) ( )
[1 ](( ) )
b
bb b
b
dzQ B
g z B dxz B C zd
dx B Q
g z B
(C.9)
This expression is numerically evaluated at all locations for various discharges.
C.2 Weir flow conditions
To obtain the desired water level in the entire weir section, the weir has to regulate the water level and
discharge by operation of the weir gates. Several designs have been applied which are split into two
categories from the viewpoint of water level control: overflow weirs and underflow weirs. Both weirs are
addressed in this appendix.
C.2.1 Overflow weirs
The discharge over a weir gate or weir sill is dependent on the water levels upstream and downstream. If
the water level downstream is relatively large, it reduces the discharge over the weir. This situation, called
submerged overflow, is schematically shown in Figure C-2. A broad-crested weir is shown in this figure,
which means that the flow lines on top of the weir are parallel. Weirs in rivers, however, are mostly classified
as sharp-crested weirs, but the hydraulics of both weirs are similar.
Figure C-2: Submerged overflow conditions for a broad-crested weir (Bezuyen, Stive, Vaes, & Zitman, 2012).
Again, the conservation of energy is applied by use of Bernoulli’s law. Contrary to equation (C.2), the energy
head H is expressed with respect to the top of the gate or the sill instead of to the reference level NAP. The
elevation of the water level η is therefore equal to the water depth d. Conservation between cross-section 1
and 2 leads to the following equation:
+ = +2 2
1 21 2
2 2
u ud d
g g (C.10)
Rewriting this equation, results in the flow velocity and discharge on top of the weir.
= = −2 2 2 2 2 1 22 ( )Q B h u B d g H d (C.11)
The water depth on top of the weir’s sill or gate and energy head are, however, often unknown. That’s why
the upstream and downstream water level are desired as input. The water depth d2 is converted to d3 and
the energy head H1 into the water depth d1; the accompanied deviation in the outcome is obviated by

Weir hydraulics and weir management
98
introducing a discharge coefficient. This coefficient takes the loss of energy between cross-section 2 and 3
into account, too. Moreover, this coefficient considers the differences between a broad-crested and sharp-
crested weir. The discharge over a sharp-crested weir is slightly larger than the discharge over similar broad-
crested weirs like shown in Figure C-2. Finally, the discharge, in case of submerged overflow, is calculated
by equation (C.12).
= −2 3 1 32 ( )overflowQ c B d g d d (C.12)
From this equation it becomes clear that the discharge increases if the downstream water level subsides. The
water level on top of the weir itself subsides as well unto the submerged flow turns into critical flow. The
Froude number, calculated with equation (C.13), has then risen to 1.0. The threshold is reached when the
downstream water level d3 has subsided to two-third of the upstream energy head H1.
=u
Frgd
(C.13)
In critical flow, the discharge is maximum for a given width. If the downstream water level subsides even
more, the flow on top of the weir will not change. This means that the downstream water level does not
influence the flow and discharge over the weir. This situation, called free overflow, is shown in Figure C-3.
Figure C-3: Free overflow conditions for a broad-crested weir (Bezuyen, Stive, Vaes, & Zitman, 2012).
Again, equation (C.10) is taken as starting point. Since the Froude number is equal to 1.0 during free
overflow, equation (C.13) can be combined with equation (C.10). This results in the following expression
for the water depth on top of the weir, in case of free overflow.
= 2 12
3d H (C.14)
The discharge, in case of free overflow, is then:
= 3
2
12 2
3 3overflowQ c B g d (C.15)
C.2.2 Underflow weirs
As for overflow, underflow conditions are also split into a submerged and a free situation. Bernoulli’s law
is applicable for these situations as well and is used to obtain the discharge formulas. Since the derivation is
the same as for overflow weirs, this is not repeated here.
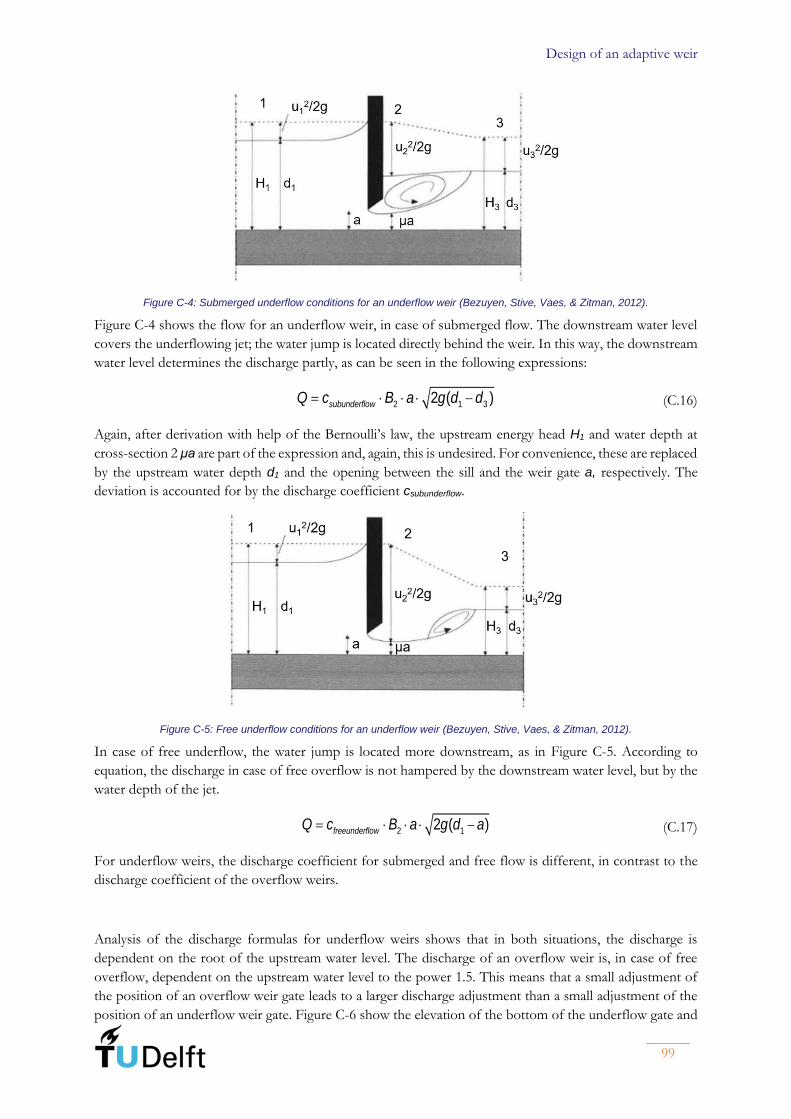
Design of an adaptive weir
99
Figure C-4: Submerged underflow conditions for an underflow weir (Bezuyen, Stive, Vaes, & Zitman, 2012).
Figure C-4 shows the flow for an underflow weir, in case of submerged flow. The downstream water level
covers the underflowing jet; the water jump is located directly behind the weir. In this way, the downstream
water level determines the discharge partly, as can be seen in the following expressions:
= −2 1 32 ( )subunderflowQ c B a g d d (C.16)
Again, after derivation with help of the Bernoulli’s law, the upstream energy head H1 and water depth at
cross-section 2 μa are part of the expression and, again, this is undesired. For convenience, these are replaced
by the upstream water depth d1 and the opening between the sill and the weir gate a, respectively. The
deviation is accounted for by the discharge coefficient csubunderflow.
Figure C-5: Free underflow conditions for an underflow weir (Bezuyen, Stive, Vaes, & Zitman, 2012).
In case of free underflow, the water jump is located more downstream, as in Figure C-5. According to
equation, the discharge in case of free overflow is not hampered by the downstream water level, but by the
water depth of the jet.
= −2 12 ( )freeunderflowQ c B a g d a (C.17)
For underflow weirs, the discharge coefficient for submerged and free flow is different, in contrast to the
discharge coefficient of the overflow weirs.
Analysis of the discharge formulas for underflow weirs shows that in both situations, the discharge is
dependent on the root of the upstream water level. The discharge of an overflow weir is, in case of free
overflow, dependent on the upstream water level to the power 1.5. This means that a small adjustment of
the position of an overflow weir gate leads to a larger discharge adjustment than a small adjustment of the
position of an underflow weir gate. Figure C-6 show the elevation of the bottom of the underflow gate and

Weir hydraulics and weir management
100
the crest of the overflow gate which are required to maintain a water level at NAP +14.10 m. The discharge
coefficients have been taken equal to 1.0, the width to 10 m and the sill’s elevation to NAP +8.05 m to
obtain this figure. The crest of the overflow gate is adjusted more than the bottom of the underflow gate in
this plotted discharge range. Thus, an overflow gate is able to regulate the water level more accurately than
an underflow gate.
Figure C-6: Water level regulation by an overflow and underflow weir.
C.3 Characteristics of the weir structures in the project area
The weirs in the project area are discussed in streamwise direction in this appendix.
Weirs in Belgium The most upstream weir in the project area is weir Monsin. It is combined with a bridge; in each of the six
bridge spans a 27 m wide Stoney gate is placed. With the help of small flap gates on top of the Stoney gates
the water level upstream is regulated accurately. The water level is maintained at NAP + 60.00 m, which is
demanded for navigation on the Albert Canal (Santilman, 1939).
The second Belgian weir in the project area is situated near Lixhe. The weir itself, however, does not affect
the Dutch part of the River Meuse. The hydropower station does; the 3 turbines are each designed for a
discharge of 85 m3/s, so the discharge through this hydropower station varies with steps of 85 m3/s as well.
Especially in dry periods, the management of this hydropower station determines the discharge and
discharge peaks downstream (Rijkswaterstaat, 1992).
Borgharen The weir of Borgharen is the most upstream Dutch weir in the River Meuse. It consists of four openings.
The widest opening is 30 m wide, equipped with only a fixed-wheel gate and was constructed as passage
opening for vessels during a flood wave. The width is much smaller than the width of the Poirée weirs more
downstream, because the Grensmaas was not part of the main transport route of coals during period of
construction (Schot, Lintsen, Rip, & De la Bruhèze, 1998). The wheels are fixed to the gate and slide up and
down to operate the gate. Drawback of this gate type is the lift of the total dead weight in case of opening.
A crane which runs on top of the weir over a steel bridge is needed for this. For accurate water level control,
the other three openings, each 23 m wide, are closed off by a fixed-wheel gate with a flap on top, see Figure
C-7. Adjustment of the flap enables accurate water level regulation and the disposal of floating material
(Erbisti, 2014).
0 100 200
8
10
12
14
Bottom of underflow weir gate
Crest of overflow weir gate
Water level upstream of weir Belfeld
Elevation of sil l
Discharge [m3/s]
Ele
vatio
n [
NA
P +
m]
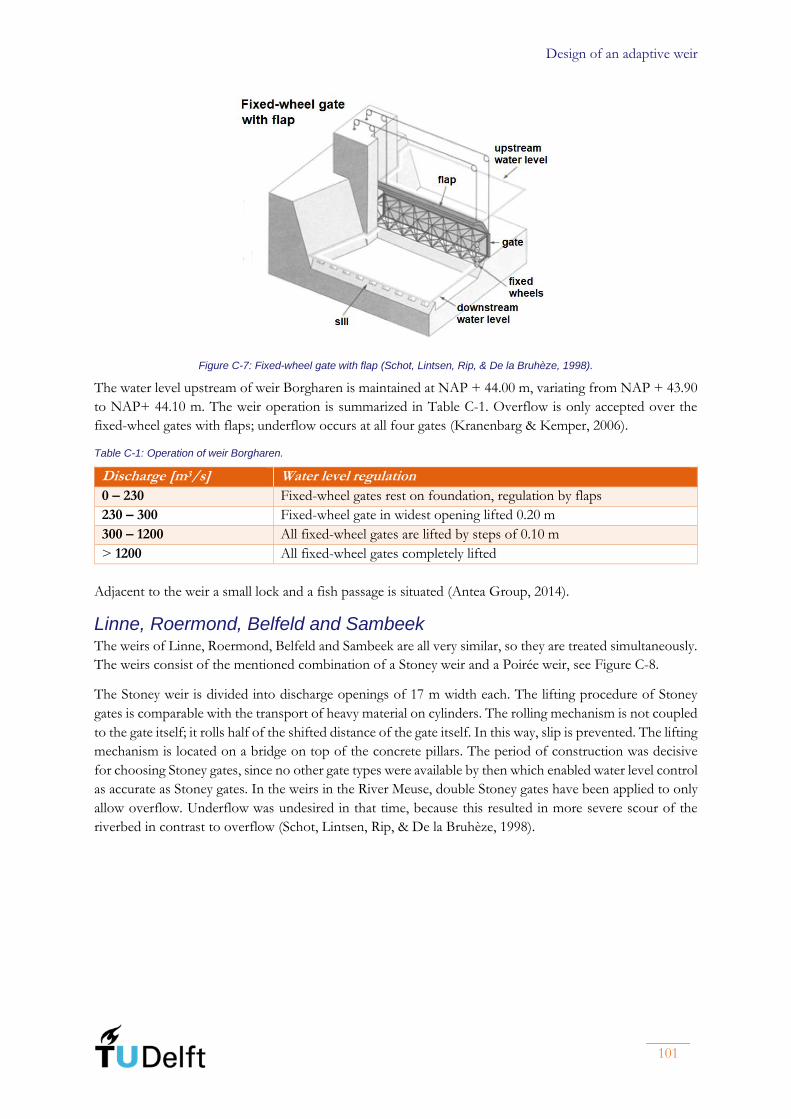
Design of an adaptive weir
101
Figure C-7: Fixed-wheel gate with flap (Schot, Lintsen, Rip, & De la Bruhèze, 1998).
The water level upstream of weir Borgharen is maintained at NAP + 44.00 m, variating from NAP + 43.90
to NAP+ 44.10 m. The weir operation is summarized in Table C-1. Overflow is only accepted over the
fixed-wheel gates with flaps; underflow occurs at all four gates (Kranenbarg & Kemper, 2006).
Table C-1: Operation of weir Borgharen.
Discharge [m3/s] Water level regulation
0 – 230 Fixed-wheel gates rest on foundation, regulation by flaps
230 – 300 Fixed-wheel gate in widest opening lifted 0.20 m
300 – 1200 All fixed-wheel gates are lifted by steps of 0.10 m
> 1200 All fixed-wheel gates completely lifted
Adjacent to the weir a small lock and a fish passage is situated (Antea Group, 2014).
Linne, Roermond, Belfeld and Sambeek The weirs of Linne, Roermond, Belfeld and Sambeek are all very similar, so they are treated simultaneously.
The weirs consist of the mentioned combination of a Stoney weir and a Poirée weir, see Figure C-8.
The Stoney weir is divided into discharge openings of 17 m width each. The lifting procedure of Stoney
gates is comparable with the transport of heavy material on cylinders. The rolling mechanism is not coupled
to the gate itself; it rolls half of the shifted distance of the gate itself. In this way, slip is prevented. The lifting
mechanism is located on a bridge on top of the concrete pillars. The period of construction was decisive
for choosing Stoney gates, since no other gate types were available by then which enabled water level control
as accurate as Stoney gates. In the weirs in the River Meuse, double Stoney gates have been applied to only
allow overflow. Underflow was undesired in that time, because this resulted in more severe scour of the
riverbed in contrast to overflow (Schot, Lintsen, Rip, & De la Bruhèze, 1998).
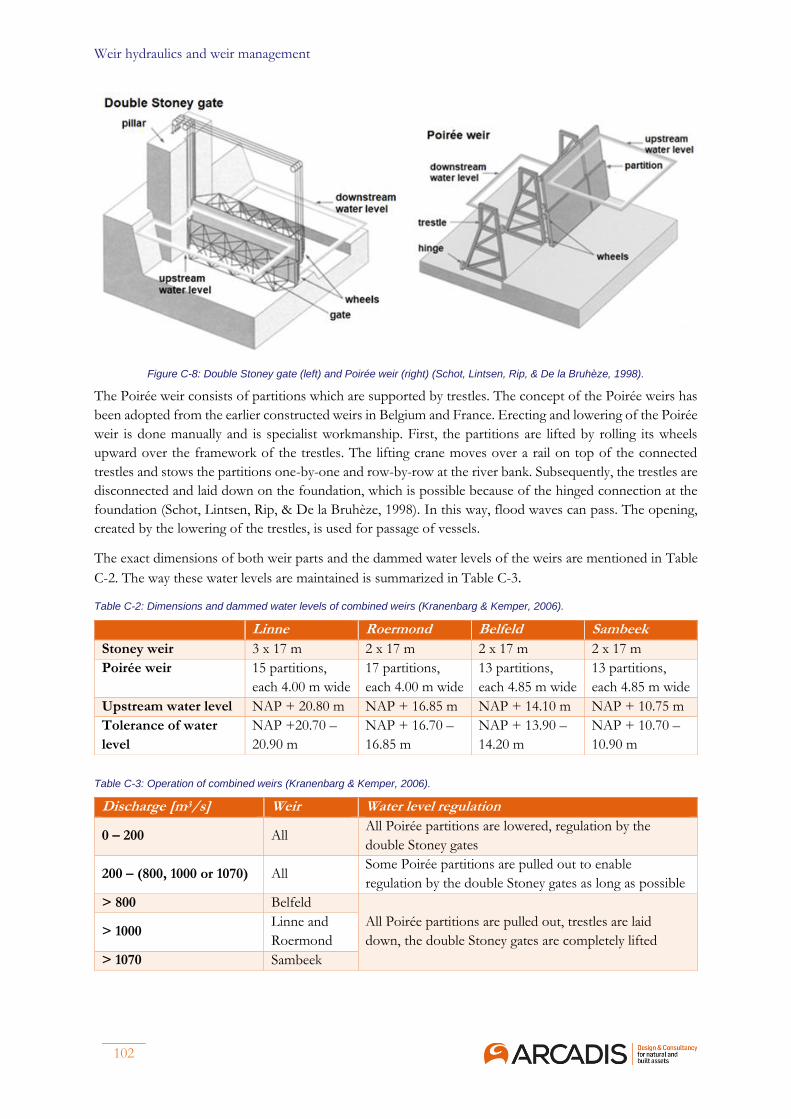
Weir hydraulics and weir management
102
Figure C-8: Double Stoney gate (left) and Poirée weir (right) (Schot, Lintsen, Rip, & De la Bruhèze, 1998).
The Poirée weir consists of partitions which are supported by trestles. The concept of the Poirée weirs has
been adopted from the earlier constructed weirs in Belgium and France. Erecting and lowering of the Poirée
weir is done manually and is specialist workmanship. First, the partitions are lifted by rolling its wheels
upward over the framework of the trestles. The lifting crane moves over a rail on top of the connected
trestles and stows the partitions one-by-one and row-by-row at the river bank. Subsequently, the trestles are
disconnected and laid down on the foundation, which is possible because of the hinged connection at the
foundation (Schot, Lintsen, Rip, & De la Bruhèze, 1998). In this way, flood waves can pass. The opening,
created by the lowering of the trestles, is used for passage of vessels.
The exact dimensions of both weir parts and the dammed water levels of the weirs are mentioned in Table
C-2. The way these water levels are maintained is summarized in Table C-3.
Table C-2: Dimensions and dammed water levels of combined weirs (Kranenbarg & Kemper, 2006).
Table C-3: Operation of combined weirs (Kranenbarg & Kemper, 2006).
Discharge [m3/s] Weir Water level regulation
0 – 200 All All Poirée partitions are lowered, regulation by the
double Stoney gates
200 – (800, 1000 or 1070) All Some Poirée partitions are pulled out to enable
regulation by the double Stoney gates as long as possible
> 800 Belfeld
All Poirée partitions are pulled out, trestles are laid
down, the double Stoney gates are completely lifted > 1000
Linne and
Roermond
> 1070 Sambeek
Linne Roermond Belfeld Sambeek
Stoney weir 3 x 17 m 2 x 17 m 2 x 17 m 2 x 17 m
Poirée weir 15 partitions,
each 4.00 m wide
17 partitions,
each 4.00 m wide
13 partitions,
each 4.85 m wide
13 partitions,
each 4.85 m wide
Upstream water level NAP + 20.80 m NAP + 16.85 m NAP + 14.10 m NAP + 10.75 m
Tolerance of water
level
NAP +20.70 –
20.90 m
NAP + 16.70 –
16.85 m
NAP + 13.90 –
14.20 m
NAP + 10.70 –
10.90 m

Design of an adaptive weir
103
Weir Linne is an exception, since vessels can never use the weir opening, since the cyclist bridge still spans
the opening created by the erection of the Poirée weir and limits the air clearance in high water conditions.
All weir complexes include a fish passage. On top of that, the weir complex of Linne includes a hydropower
station (Antea Group, 2014).
Grave At Grave, the weir is combined with an important river crossing which connects the cities of ‘s
Hertogenbosch and Nijmegen. The weir is a reversed version of the Poirée weir, see Figure C-9. Using
standard trestles and partitions was not possible, because of the large water level difference (3.50 m). The
trestles are substituted by stiles, which rotate around a horizontal hinge axis at the bridge deck, although it
can move vertically a little. To dam the river, the stiles rotate downwards in opposite direction of the flow.
When in vertical position, a small vertical downward translation ensures that the stiles are supported by the
abutment blocks on the riverbed. The partitions are lowered by cables between the stiles, with a maximum
of three partitions above each other. The bridge weir at Grave is divided into 20 segments, which means
that at most, during low water levels, 60 partitions are employed to maintain the upstream water level. The
costs of service and maintenance are high because of the many partitions. In wet periods, the stiles rotate
to their upward horizontal position at the bottom side of the bridge deck to create a navigable opening,
although the air clearance is limited by the stiles (Schot, Lintsen, Rip, & De la Bruhèze, 1998).
Figure C-9: Reversed Poirée weir (Kranenbarg & Kemper, 2006).
The water level upstream of weir Grave is maintained at NAP +7.50 m with a small tolerance of 0.05 m.
The weir operation is summarized in Table C-4. Because lowering and lifting of partitions takes a long time,
the weir operation is based on the operation of the first upstream weir Sambeek. As long as the bottom row
is located at the sill, overflow conditions occurs. If the discharge is even larger, the bottom row is partially
lifted and the water flow underneath the partitions as well (Joustra, Muller, Van Asselt, & Verheij, 2018).
Table C-4: Operation of weir Grave (Kranenbarg & Kemper, 2006).
Discharge [m3/s] Water level regulation
0 – 800 Partitions are lifted one by one, row by row. Each partition of the top
row lifted out of the water results in a discharge increase of 20 m3/s.
>1650 All stiles are rotated to the bottom of the bridge deck.
The weir of Grave is accompanied by a fish passage and a lock complex. The lock dimensions are smaller
than at the upstream weirs, since large vessels use the Maas-Waal Canal to navigate to Rotterdam and
therefore not have to pass weir Grave.
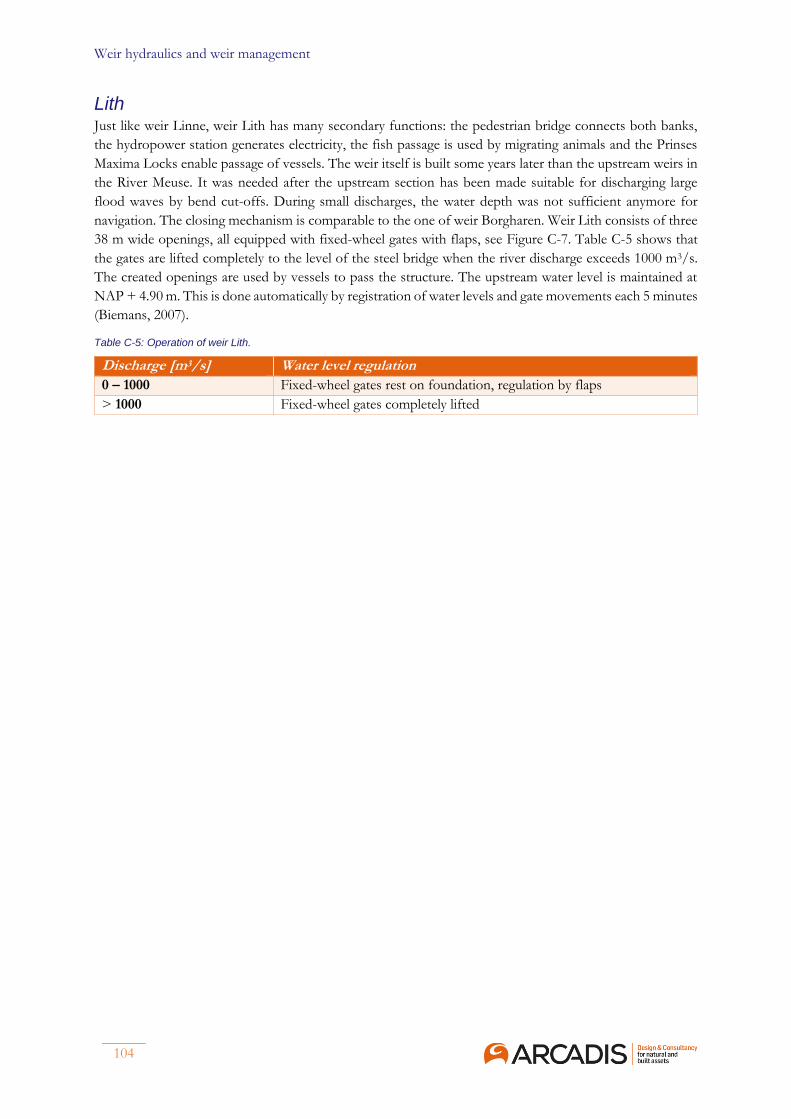
Weir hydraulics and weir management
104
Lith Just like weir Linne, weir Lith has many secondary functions: the pedestrian bridge connects both banks,
the hydropower station generates electricity, the fish passage is used by migrating animals and the Prinses
Maxima Locks enable passage of vessels. The weir itself is built some years later than the upstream weirs in
the River Meuse. It was needed after the upstream section has been made suitable for discharging large
flood waves by bend cut-offs. During small discharges, the water depth was not sufficient anymore for
navigation. The closing mechanism is comparable to the one of weir Borgharen. Weir Lith consists of three
38 m wide openings, all equipped with fixed-wheel gates with flaps, see Figure C-7. Table C-5 shows that
the gates are lifted completely to the level of the steel bridge when the river discharge exceeds 1000 m3/s.
The created openings are used by vessels to pass the structure. The upstream water level is maintained at
NAP + 4.90 m. This is done automatically by registration of water levels and gate movements each 5 minutes
(Biemans, 2007).
Table C-5: Operation of weir Lith.
Discharge [m3/s] Water level regulation
0 – 1000 Fixed-wheel gates rest on foundation, regulation by flaps
> 1000 Fixed-wheel gates completely lifted
Design of an adaptive weir
105
Appendix D
Reference projects
In other countries, weirs are also approaching the end of their lifetime. In this appendix, the deficiencies of
these weirs are mentioned. More important, the approach of upgrading of these structures is addressed.
This gives a clear overview of the methods applied in neighbouring countries to maintain the functions of
the weirs.
France The canalization of the River Meuse in France took place 50 years before the canalization in the Netherlands.
The weirs in this area are completely replaced now. Just like the Dutch Poirée weirs, the French weirs are
operated manually; this operation takes much time and money. The 29 weirs in the River Meuse and the
River Aisne are replaced by inflatable rubber weirs. The operation is updated to a modern, automated and
reliable system. The large replacement project is used to install some hydropower plants as well. Besides,
attention is given to fish migration by the construction of fish traps (Chapital, 2015).
Germany A joint venture worked on the maintenance and upgrading of the weirs in the River Main. The project
started with material analyses, inspections and recalculations just like is done in the Netherlands within the
national replacement programme. In the end, five weirs in this river have been prioritised. The locations of
the weirs has been revised, but a new layout of the river system with relocated weirs or removal of weirs
was not thought to be feasible. At the oldest one, weir Viereth, the upgrade has been started already. The
gates of the 80-year-old weir have been replaced by modern gates to regulate the water levels more
accurately. Refurbishment of the old gates was economically disproportionate, because the lifetime of the
gate was almost reached. The ability to discharge flood waves during execution has been a tough
requirement, since all weir openings are needed for this. With the help of an innovative, floatable gate it was
possible to discharge a considerable amount of water via the building pit.
At Würzburg, the weir, finished in 1954, has been combined with a monumental bridge, which complicates
the renovation activities and upgrade of the weir (Würzburg Weir and Lock, n.d.). As at weir Viereth, a new
modern gate has been constructed. At weir Limbach, only repair works have been done, since the gate has
been damaged by a ship collision.
15 years ago, in the River Rhine on the border of Switzerland, the weir of Rheinfelden has been completely
substituted by a new one, 130 m downstream. The old weir of Rheinfelden had been constructed in the end
of the nineteenth century and thus was the oldest weir in the upper section of the River Rhine (Fust & Reif,
2015). Also the hydropower station has been renewed, although it still uses the same inlet canal. After
construction of the new weir was finished, the old weir has been dismantled.
In the River Weser, in total 5 weirs have been addressed. As in the River Main, the project has been focussed
on the weir complexes itself starting with structural and material inspections. Due to their old age and
degraded status of the structures, replacement of the gates has been proposed. For one weir, already
renovated 25 years ago, adaptations to the design have been proposed to eliminate the vibrations.
Last, the Horkheim and Neckarsulm weir in the River Neckar have been replaced. Like the other projects
mentioned before, the gates were in need of complete renewal. Feasibility studies regarded the complete
replacement of the weir gates and a new construction of the weir. At weir Horkheim, built in the same

Reference projects
106
period as the weirs in the River Meuse, a modern gate type has been installed and new monitoring equipment
and structural reinforcements have been added to the structure to be able to check and catch up the
deterioration of the elements. At Neckarsulm, a new weir structure just upstream of the present one has
been proposed, because the mechanical elements have been replaced in 1950 and the gate vibrations cannot
be eliminated by a renovation (Krebs+Kiefer, 2019).
Belgium The waterway network in Belgium is, just like in the Netherlands, very extensive. Currently, a project on a
new connection between the River Scheldt and River Seine is going on. 7 waterways, which form the
connection between the waterway network in Belgium and the Netherlands and the network in northern
France, are extended to accommodate larger vessels. The first plans have been developed at the end of the
20th century; nowadays execution has been started. In contrast to the replacement projects in Germany,
within this project the focus lies more on the improvement of the total network, including the natural values
of the area, the adjacent cities, the local economy and recreational activities. To improve the inland
navigation, the canals are widened and deepened, air clearances are enlarged and new locks are constructed,
as well as weirs and fish passages. More than 70 activities can be identified at dozens of locations. Most of
the improvements are required because of structural degradation and increase of navigation since the
construction of the network.
Relatively little activities deal with weirs, since most of the waterways are canals. In the Upper-Scheldt, three
weirs are renewed to increase the reliability of this waterway. In the past, an undesirable sequence of small
adaptations have been applied to these weirs. In the River Leie, an old weir is replaced by a new one. The
most feasible location turned out to be the current location. Before removal of the current weir and
construction of the new weir, a temporary weir is built to take over the water level regulation for the
execution period of the project. The opportunity of a new weir is taken to include a hydropower station
into the structure (De Vlaamse Waterweg nv, 2019).
Austria In a suburb of Vienna, a weir has been built in 1872 as part of the improvement of the River Danube and
the Danube Canal. A floating gate was used to protect the Danube Canal against ice and floods. Even before
the start of the 20th century, this gate type has been replaced by a needle weir, like the Poirée weirs. Moreover,
a lock has been added during this gate replacement. The locks and weirs lasted thereafter for approximately
75 years. By then, a second gate replacement took place; two radial gates have been installed, which are still
operative nowadays. From 2005 on, a hydropower plant uses the water head to generate electricity
(ANDRITZ Hydro GmbH, 2013).
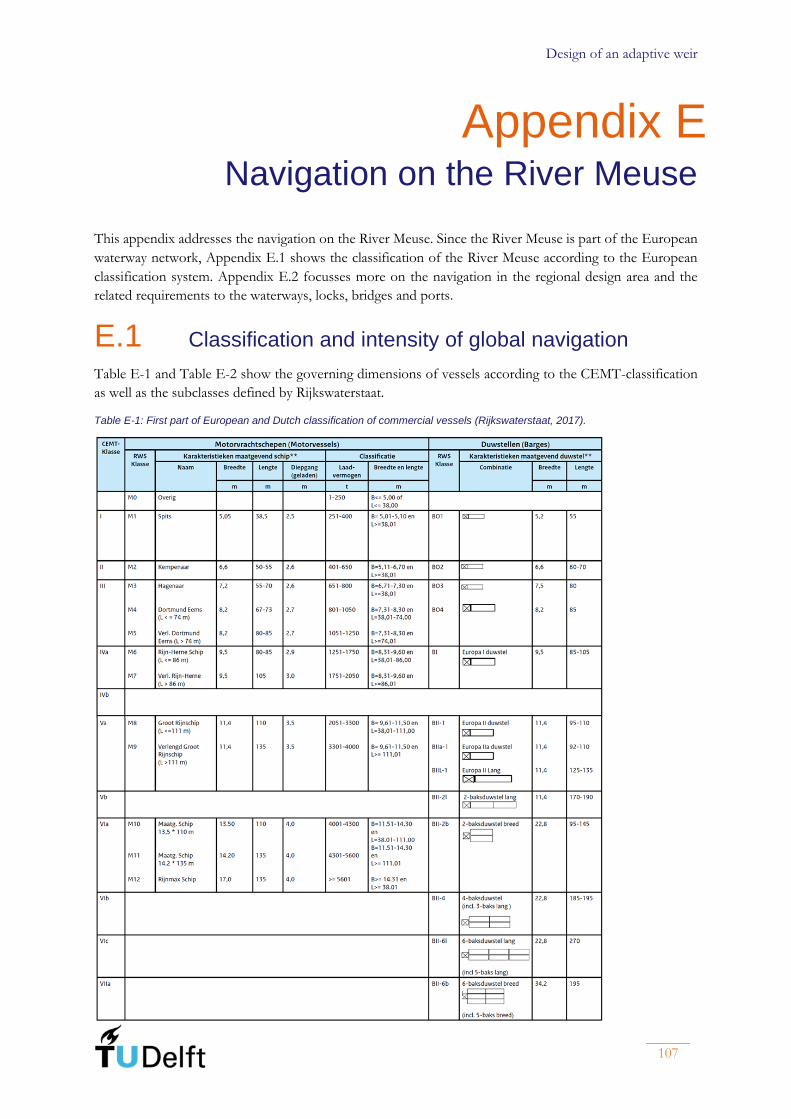
Design of an adaptive weir
107
Appendix E Navigation on the River Meuse
This appendix addresses the navigation on the River Meuse. Since the River Meuse is part of the European
waterway network, Appendix E.1 shows the classification of the River Meuse according to the European
classification system. Appendix E.2 focusses more on the navigation in the regional design area and the
related requirements to the waterways, locks, bridges and ports.
E.1 Classification and intensity of global navigation
Table E-1 and Table E-2 show the governing dimensions of vessels according to the CEMT-classification
as well as the subclasses defined by Rijkswaterstaat.
Table E-1: First part of European and Dutch classification of commercial vessels (Rijkswaterstaat, 2017).

Navigation on the River Meuse
108
Table E-2: Second part of European and Dutch classification of commercial vessels (Rijkswaterstaat, 2017).
On basis of this vessel classification, waterways have been classified as well, see Figure E-1 on the left. The
classification of the waterway is equal to the largest CEMT-Class of vessels that is allowed on that waterway.
The right part of Figure E-1 shows the vessel intensity at each location per CEMT-Class. The coloured
circle diagrams show the distribution of the passing vessels over the CEMT-Classes in terms of load
capacity. Data are used to generate these diagrams; some deviations from reality are possible, since
• the number and size of vessels in the Maas-Waal Canal is counted at lock Weurt, which is the lock
which connects the Maas-Waal Canal with the River Waal. Part of the counted vessels is sailing
towards the inland port of Nijmegen along the canal and therefore does not really contribute to the
navigation intensity on the River Meuse.
• in contrast to all other counts, the counts in Maastricht are not performed at a lock, but at a bridge.
At all other locations the average of the counts from 2005 until 2008 is used; in Maastricht data is
missing. Also, recreational vessels have not been counted here. Eventually, the total number of
commercial vessels is taken as two-third of the number counted at lock Born (Zomer, Harmsen,
Buter, & Schilt, 2007).

Design of an adaptive weir
109
• the counted vessels are only classified by their load capacity. Based on this information and the help
of Table E-1 and Table E-2, these data have been converted to the CEMT-classification. This might
involve some additional deviations, but the dimensions of the vessels using the waterways can
thereby be related more easily to the dimensions of the waterways.
Figure E-1: Classification (left) and intensity (right) of the waterways in the global design area.
E.2 Regional navigation and limitations
Since the ports of Born and Stein are the main destinations and origins of the Class Va vessels using the
Maasroute between Belfeld and Heel, the activities in these ports involve the requirements to this navigation
route. The port of Born was opened to transport coal products, but after the mines were closed the port of
Born made a transition to a logistical node. Multimodal transport of goods is facilitated by good connections
via road and a barge and rail terminal, which was opened in the 90s. This terminal has grown to one of the
largest inland terminals of the Netherlands. The local petrochemical industry Chemelot, the car
manufacturer NedCar and other industry using bulk products use the port intensively. Besides, the waterway
connections with the ports of Antwerp and Rotterdam are used for container transport. Daily, hundreds of
containers are transported from and to these sea ports, see Figure 3-3 as well (Rijkswaterstaat, 2009). The
port of Stein is largely owned by Chemelot. The port supplies dry and liquid bulk for the production of
chemical products. The bulk is transported by road, rail and pipe lines to the right factory (Kortweg &
Kuipers, 200).
As mentioned earlier, the characteristics of the Maasroute are limiting the navigation sector. The water depth
is governing for the bulk transport, the air clearance for the container transport. This appendix deals with
both aspects in Sections E.2.1 and E.2.2.

Navigation on the River Meuse
110
E.2.1 The required water depth for commercial navigation
The water depth has been addressed earlier in Appendix C.1, in which the hydraulic model is set up. In this
model, the water depth equals the difference between the water level and the bed level. Therefore, this
appendix first addresses the bed level simultaneously with the water depth requirements for navigation. The
bed level in the calibrated model of ARCADIS is not right, so other data are applied to find out the bed
level.
The present elevation of lock sills is presented in Table E-3.
Table E-3: Present elevation of lock sills (Geerling, Buijse, & Van Kouwen, 2010).
Lock sill Elevation
[NAP + m]
Dammed water level
[NAP + m]
Water depth [m]
Belfeld upstream +7.25 +14.10 6.85
Roermond upstream +11.90 +16.85 4.95
Roermond downstream +10.70 +14.10 3.40
Heel downstream +10.00 +14.10 4.10
Linne downstream +13.40 +16.85 3.45
Nowadays, all these locks accommodate Class Va vessels of 3.0 m draught maximum. After the upgrade of
the Maasroute, the CEMT-Class is enlarged to Class Vb with a maximum draught of 3.5 m. The
corresponding minimum dimensions are different for a cross-section in a waterway, in a lock and in an
inland port. Since weirs dam the water level, Figure E-2 shows only the minimum required water depth in
relation to the vessel’s draught. Table E-4 applies these requirements to the locks and waterways in the
Maasroute (Rijkswaterstaat, 2017).
Figure E-2: The water depth requirements in a commercial navigation waterway in a cross-section of a river (left), a lock (middle) and an inland port (right) (Rijkswaterstaat, 2017).
Table E-4: The minimum required water depths for various vessel’s draughts (Rijkswaterstaat, 2017).
CEMT-
Class
Maximum draught [m] Minimum water depth in
waterway [m]
Minimum water depth at
lock sill [m]
Va 3.00 4.20 3.70
Vb 3.50 4.90 4.20
Comparing Table E-4 with the last column of Table E-3, it stands out that the locks of Roermond and
Linne do not meet the national guideline. The use of these locks is restricted in periods of low discharge
(Rijkswaterstaat, 2019). Taking into account the keel clearance of 0.70 m, the maximum draught is equal
2.70 m at lock Roermond and 2.75 m at lock Linne in a zero-discharge situation. The restriction only holds
if the river discharge is low; in the current way of damming, if the discharge increases, water levels increase
and vessels of larger draught are allowed to use these locks.
It is assumed that the present bed levels of the waterway do not restrict the maximum draught more than
lock sills do. Thus, near lock Belfeld and lock Heel, the bed level is elevated 0.50 m lower than the lock sill,

Design of an adaptive weir
111
since this is the difference of the minimum water depths in the first row of Table E-4. The current bed level
near lock Linne is calculated in the same way with the following formula:
= + + − , ( 0.7) 1.4b sill lockz D D (D.1)
The results are summarized in Table E-5. The bed level near lock Roermond is not calculated, since it
follows after interpolation of the bed level from the upstream and downstream locks. The bed slope of the
Lateral Canal and the lock canals is negligible and taken as zero.
Table E-5: Calculation of the current bed elevation.
Location Maximum draught [m] Elevation of the lock sill
[NAP + m]
Current bed elevation [m]
Belfeld 3.00 +7.25 +6.75
Heel 3.00 +10.00 +9.50
Linne 2.75 +13.40 +13.00
The calculated bed level near lock Heel corresponds with the current bed level of the Lateral Canal found
in literature (Douben & Maris, 1994).
The current bed level is, however, not necessarily starting point of this project. The Maasroute is upgraded
in these years to a Class Vb waterway. In literature is found that the dredging of the summer bed is not
needed for this upgrade (De Vries, 2000). Setup of the dammed water level is not discussed as well. These
findings do not agree if one applies the current bed levels as presented above. For example, the water depth
in the Lateral Canal is 4.60 m, but, for a Class Vb waterway, this has to be 4.90 m. The water depth at the
downstream sill of lock Heel is also just not sufficient. Since the upgrade of the Maasroute is finished before
the weirs are replaced, in this project, deepening of the Lateral Canal and lock Heel is taken as starting point.
In this way, the water depth is just sufficient for Class Vb vessels without a change of the dammed water
level. The locks of Linne and Roermond stay untouched, since they are not part of the Maasroute. Figure
E-4 shows the bed level along the River Meuse from weir Belfeld to weir Linne after the upgrade to a Class
Vb waterway.
Figure E-3: Bed level along the River Meuse from weir Belfeld (x = 0 km) to weir Linne (x = 29 km).
Besides the locks and waterways part of the Maasroute, the regional project area encompasses a commercial
port. The bed of the Willem-Alexanderport is situated at NAP +13.25 m (Rijkswaterstaat, 2019); according
to the national guidelines a keel clearance of 1.00 m is taken into account in commercial ports. Assuming
that the port meets the national guidelines, the maximum allowable draught of vessels calling this inland
port is then 2.60 m.

Navigation on the River Meuse
112
E.2.2 Required air clearance for container transport
The required air clearance for container transport depends on the loading of container vessels and the
dimensions of the stacked containers. Conventional 20 and 40 ft containers have a height of 8 ft and 6 inch,
high-cubes are 9 ft and 6 inch high. The difference of approximately 30 cm results in a higher container
vessels. In this appendix, the target value stated in the SVIR (Structuurvisie Infrastructuur en Ruimte) (in
English: Strategy Infrastructure and Spatial Planning) is compared with three other methods in this appendix
for three-layered and four-layered container vessels. These methods include new calculations, measurements
and high-cubes. Table E-6 shows the minimum air clearance for all of these methods, all including a safety
margin of 30 cm. An averagely loaded container vessel is loaded to 65% of its capacity, of which 65% of
the containers is loaded and 35% empty (Brolsma, Rapportage containerhoogtemetingen, 2013).
Table E-6: Minimum air clearance for 3- and 4-layered container vessels and several determining methods (Brolsma, Rapportage containerhoogtemetingen, 2013) (Brolsma, Corridoranalyse containers, 2015).
Method Three layers of
conventional
containers
Three layers of
high-cube
containers
Four layers of
conventional
containers
Four layers of
high-cube
containers
Target according to
SVIR 7.00 m - 9.10 m -
Calculation: average
loading 7.06 m 7.88 m 9.20 m 10.29 m
Calculation: 100%
empty containers 7.51 m 8.43 m 9.88 m 11.10 m
Measurements 2012:
10% exceedance 8.50 m 10.85 m
Note that the minimum air clearances apply to the water level which is exceeded 1% of the time. Since weirs
are open in this situation, this situation is less important for this project. Therefore, in the subsequent, the
minimum air clearances in Table E-6 are applied to the zero-discharge situation.
The required air clearances are compared with the bridge clearances on the Maasroute, without taking into
account the high-cubes. Table E-7 mentions the limiting bridges per section with its air clearance from the
Maas-Waal Canal to the port of Born, which contains the large container terminal. The rail bridge
Buggenum, Hornerbridge and the bridge over lock Heel are situated within the weir section of Belfeld.
Bridges over the Juliana Canal, north of port Born, have been heightened in the past to accommodate 4-
layered container vessels, taking into account the translation waves in the canal. Translation waves in canals
are not considered in this project.
Table E-7: Limiting bridges on the Maasroute unto the port of Born (Vreeker & Heijster, 2016).
Bridge Elevation
[NAP + m]
Dammed water level
[NAP + m]
Air clearance [m]
Lowest bridge over Maas-Waal
Canal
+17.46 +7.50 9.96
Rail bridge Mook +17.49 +7.50 9.99
Lowest bridge near Venlo +22.10 +10.75 11.35
Rail bridge Buggenum +24.80 +14.10 10.70
Hornerbridge (road N280) +25.60 +14.10 11.50
Bridge lock Heel +24.90 +14.10 11.00
Bridge Wessem (road A2) +30.13 +20.80 9.33
Lowest bridge over Juliana Canal +40.43 +33.30 10.03

Design of an adaptive weir
113
It is concluded that the bridges over the Maasroute do just fulfil the target value according to the SVIR and
the calculated air clearance with average loading in the zero-discharge situation. In the current waterway
network, vessels with four layers of containers which are all empty, cannot sail to the port of Born. The air
clearance of bridge Wessem (9.33 m) is smaller than required height (9.88 m). If high cubes come into play,
the air clearance of multiple bridges is too small to accommodate four-layered container vessels.
E.2.3 Classification and requirements to recreational waterways
Like for commercial navigation, classes have been set for the recreational navigation. Distinction is made
between waterways only accessible for motor vessels and waterways accessible for motor vessels as well as
sailing vessels. Sailing vessels require more water depth and ideally a very large air clearance, as can be seen
in Table E-8. The large air clearance is only achieved at a so-called standing mast route. At all other
waterways, the height on a waterway is restricted by some bridges and the height of motor vessels is
governing for the waterway design.
Table E-8: Classification of recreational vessels (Waterrecreatie Nederland, 2019).
As mentioned in the main report, the Maasplassen area is classified as Class BZM waterway with a restricted
air clearance. The counts of recreational vessels at lock Linne and Roermond, see Figure 3-3, approximately
20,000 passing recreational vessels per year, show that recreational navigation in this area is of normal
intensity. A waterway is classified as high intensity recreational waterway if more than 30,000 recreation
vessels pass the locks per year.
The depth and air clearance requirements on a recreational waterway differ from waterways suited for
commercial navigation. In general, as shown in Figure E-4, the keel clearance is smaller, except in
recreational lakes, at which a margin of 30 cm is added to compensate for wind set-up and waves.
Figure E-4: The water depth requirements in a normal-intensity recreational navigation waterway in a cross-section of a river (left), a navigation channel in a recreation lake (middle) and a lock (right) (Rijkswaterstaat, 2017).
The air clearance of sailing routes has to be 30.0 m. Since this is not feasible for the Afgesneden Maas, the
air clearance is based on the air clearance needed for recreation motor vessels, which is 4.0 m.

Navigation on the River Meuse
114
(This page is intentionally left blank)
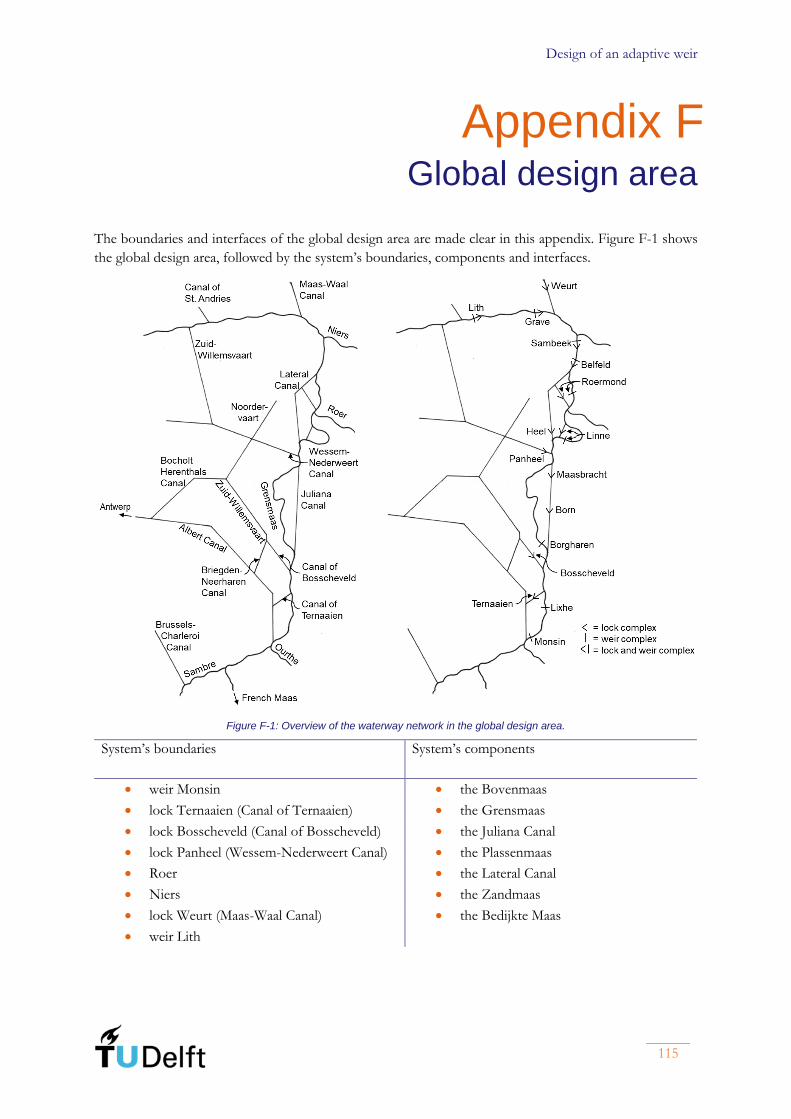
Design of an adaptive weir
115
Appendix F Global design area
The boundaries and interfaces of the global design area are made clear in this appendix. Figure F-1 shows
the global design area, followed by the system’s boundaries, components and interfaces.
Figure F-1: Overview of the waterway network in the global design area.
System’s boundaries
System’s components
• weir Monsin • the Bovenmaas
• lock Ternaaien (Canal of Ternaaien) • the Grensmaas
• lock Bosscheveld (Canal of Bosscheveld) • the Juliana Canal
• lock Panheel (Wessem-Nederweert Canal) • the Plassenmaas
• Roer • the Lateral Canal
• Niers • the Zandmaas
• lock Weurt (Maas-Waal Canal) • the Bedijkte Maas
• weir Lith

Global design area
116
System’s external interfaces
System’s internal interfaces
• confluence of Canal of Ternaaien and
Bovenmaas
• bifurcation of Juliana Canal and
Grensmaas
• bifurcation of Canal of Bosscheveld and
Bovenmaas
• confluence of Juliana Canal and
Grensmaas
• bifurcation of Wessem-Nederweert Canal
and Plassenmaas
• bifurcation of Lateral Canal and
Plassenmaas
• confluence of Roer and Plassenmaas • confluence of Lateral Canal and
Plassenmaas • confluence of Niers and Zandmaas
• bifurcation of Maas-Waal Canal and
Zandmaas
Design of an adaptive weir
117
Appendix G
Global design:
requirements analysis
This appendix elaborates the requirements analysis, which is done as proposed by H.G. Tuin in his thesis
(Tuin, 2013). Not all steps are important by definition on this scale level, so only the useful steps are
presented in this appendix.
Customer expectations Rijkswaterstaat, the executive agency of the Ministry of Infrastructure and Water Management, is
responsible for the functioning of the waterway network. Rijkswaterstaat has to provide a water system
which has been adjusted to the users of this system. Starting point is a cooperation between Rijkswaterstaat,
local governments and users to obtain a flexible system which adapts to the changing circumstances and
new opportunities.
The main tasks of Rijkswaterstaat have been derived from inter(national) legislation. In the Netherlands, the
Articles of the European Directives have been implemented in national legislation. In Figure G-1 the main
European Directives are shown on top. The Waterwet (in English: Water Act), the Wet Milieubeheer (in
English: Environmental Protection Act) and Scheepvaartverkeerswet (in English: the Ships Act) are the
three most important national acts concerning the quantity and quality of water. The Waterwet is an
assembly of former acts on groundwater, water management, water pollution and flood protection. The
Scheepvaartverkeerswet regulates the traffic on water, addressing safety, pollution and maintenance of
waterways. Especially the Waterwet and the Wet Milieubeheer include the relevant Articles from European
legislation (Kenniscentrum InfoMil, n.d.).
The national acts are not that specific to obtain directly the main tasks of Rijkswaterstaat. Concrete measures
of the national acts can be found in the underlying documents. For the Waterwet this can be found in the
Waterbesluit (in English: Water Decree) and the Waterregeling (in English: Regulations governing Water).
These address the application of permits, the distribution of management activities over Rijkswaterstaat and
local administrators and the procedure and framework of the national management plan. In the management
plan of national waters, the main tasks of Rijkswaterstaat are mentioned. These have been taken over into
Figure G-1. The tasks are numbered with a reason: the first task is the most important, the fifth one the
least. Rijkswaterstaat first focusses on the most important tasks and, if possible, extra functions to the system
are added, in consultation with local authorities and investors (Rijkswaterstaat, 2015).
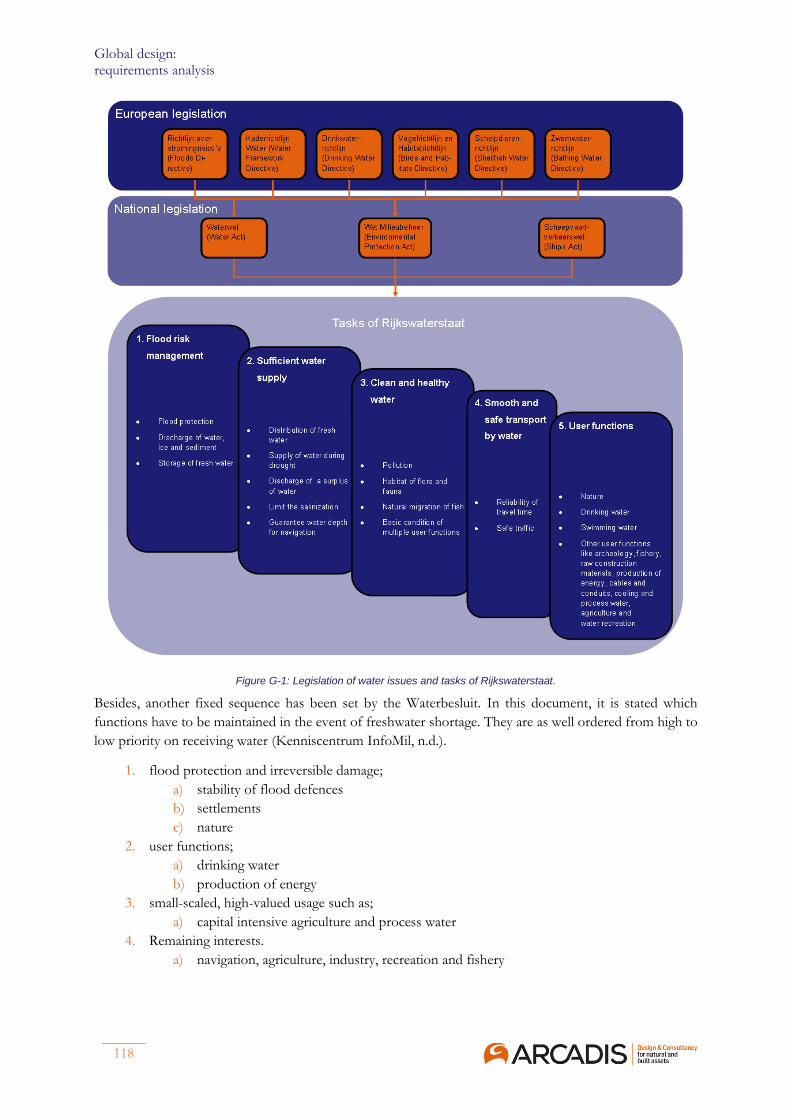
Global design: requirements analysis
118
Figure G-1: Legislation of water issues and tasks of Rijkswaterstaat.
Besides, another fixed sequence has been set by the Waterbesluit. In this document, it is stated which
functions have to be maintained in the event of freshwater shortage. They are as well ordered from high to
low priority on receiving water (Kenniscentrum InfoMil, n.d.).
1. flood protection and irreversible damage;
a) stability of flood defences
b) settlements
c) nature
2. user functions;
a) drinking water
b) production of energy
3. small-scaled, high-valued usage such as;
a) capital intensive agriculture and process water
4. Remaining interests.
a) navigation, agriculture, industry, recreation and fishery

Design of an adaptive weir
119
The water supply in low water periods is regulated by the sequence above and the agreement between the
Netherlands and Belgium. Since 1996 this bilateral agreement has not been changed. The starting point of
the agreement is an equal distribution of fresh water over Dutch and Flemish use. The discharge of the
Grensmaas is a common responsibility of both countries. The main items, addressing the water distribution,
are listed below (Koninkrijk der Nederlanden, Vlaams Gewest, 1995):
• At Maastricht at least 8 m3/s is directed towards Flanders via the intake structure at Bosscheveld.
• At most 10 m3/s flows via the Zuid-Willemsvaart back towards the Netherlands.
• If there is shortage of water, the two first bullet points do not apply. In these periods the starting
point is an equal distribution of water over both areas. More specific, three phases are defined:
• The start-up phase: discharge between 60 and 100 m3/s. Maximum water use in the
Netherlands and Flanders each is 25 m3/s. The surplus is discharged via the Grensmaas
downstream.
• The alarm phase: discharge between 30 and 60 m3/s. The minimum discharge of the
Grensmaas is 10 m3/s. This requirement is combined with a reduction of discharge
variations which is important from the viewpoint of ecology and water quality of the
Grensmaas. Water savings in both countries are even in this phase.
• The crisis phase: discharge below 30 m3/s. The requirement of minimum discharge of the
Grensmaas is cancelled. The available discharge is equally distributed over the Grensmaas
and the users in Flanders and the Netherlands.
Constraints The system of waterways includes a couple of constraints which are imposed by either external or internal
factors. The internal constraints are a result of the present system and decisions in the past. Recalling these
constraints is only possible with a complete change of the system and/or cancellation of agreements. This
is beyond the scope of this project, so for this study the layout of the system and the weirs itself is restricted
by them. They are listed below:
• internal constraints;
• the bilateral agreement on the distribution of water over Flanders and the Netherlands and
the discharge of the Grensmaas for several discharge volumes.
• external constraints.
• the discharge of water, ice and sediment. The main inflow takes place at Monsin; by
tributaries (of which the Roer and the Niers are the largest) the discharge is increased a
little. Water, ice and sediment exits the project area downstream at Lith.
• the water supply to connected canals. This is of great importance to the freshwater supply
of the sandy areas in the Province of Noord-Brabant (Rijkswaterstaat, 2015).
Operational scenarios The scenarios, considered in the global design level, only address the changes of the discharge volumes. The
other developments, important for the adaptive design, come into play in the lower scale levels.
The development of the peak discharge of flood waves has been analysed with help of the historical
discharge data. This is done to make a long-term prediction of flood waves and low water periods. Climate
change is one of the main contributors to the development of the discharge. Historically, the average
discharge of the River Meuse does not change significantly. Figure G-2 shows that in the spring the
discharges slightly increase; in the autumn a slight decrease is observable.

Global design: requirements analysis
120
Figure G-2: Average monthly discharge of the River Meuse in the first and second half of the 20th century (De Wit, Buiteveld, & Van Deursen, 2007).
If the average discharge development, however, is analysed more accurately, three periods of approximately
30 years can be distinguished. The first 30 years of measurements after 1911 is characterized by many flood
waves. The period thereafter until 1980 shows less flood waves, the period after 1980 again shows many
flood waves. This variation can be caused by natural variation and/or climate change, but currently this
pattern is thought to be a natural variation with a period of 30 years. The numerical increase of flood waves
since 1980 is not caused by climate change (De Wit, Buiteveld, & Van Deursen, 2007).
The current numerical models predict an increase of the peak discharge of the normative flood wave.
Nowadays, this normative flood wave, with a return period of 1,250 years, has a peak discharge of 3,800
m3/s. Table G-1 shows the peak discharges in 2050 and 2100 for each scenario. These are calculated
according the KNMI’14 climate scenarios which already change from the KNMI’06 scenarios. This indicates
that the mentioned numbers, especially for 2085, contain large uncertainty. The last two columns show the
change of the discharge during dry periods. The deviation between the scenarios is remarkable; they do not
even agree on an increase or decrease (Klijn, Hegnauer, Beersma, & Sperna Weiland, 2015).
Table G-1: Long-term development of peak discharges of normative flood waves and 7-days lowest discharge (Bruggeman, et al., 2011) (Klijn, Hegnauer, Beersma, & Sperna Weiland, 2015).
Scenario Peak discharge
of normative
flood wave in
2050 [m3/s]
Peak discharge
of normative
flood wave in
2100 [m3/s]
7-days lowest
discharge in 2050
[relative to 2017]
7-days lowest
discharge in 2085
[relative to 2017]
DRUK 3,900 4,000 +5% +3%
STOOM 4,100 4,600 -45% -60%
RUST 3,900 4,000 +5% +3%
WARM 4,100 4,600 -45% -60%
Design of an adaptive weir
121
Appendix H
Global design:
synthesis and verification
This appendix presents the synthesis and verification on the global design level. For each weir in the Dutch
part of the River Meuse, the modifications are treated in the same sequence as set in the main report:
1. removal of a weir and replacing the first downstream weir by a new, higher weir;
2. replacing a current weir by a new weir at a different location; either for several kilometres or to a
preceding or subsequent section of Figure 3-4.
a. downstream
b. upstream
3. replacing a current weir at the same location by a new weir with a differing height.
a. lowering
b. heightening
Borgharen At weir Borgharen the boundary conditions from the Belgian weirs are most influential. One of these
conditions considers the peak discharges on the Bovenmaas. These have to be flattened to avoid negatively
effects to the ecological value of the Grensmaas (see Section 3.3). The current weir section of Borgharen
takes this indispensable function. Furthermore, weir Borgharen dams up the water level to NAP +44.00 m
in the Bovenmaas and the southern part of the Juliana Canal, both part of the Maasroute.
1. If weir Borgharen is removed, the water level cannot be dammed by weir Linne; the height
difference between these locations is that large that this causes permanent flooding of
embankments. Moreover, in this way, the water level (variation) in the Grensmaas is modified,
which is not conform the bilateral agreement.
2.
a. Replacing weir Borgharen by a new weir some kilometres downstream does not meet the
requirements, since the water level (variation) in part of the Grensmaas is modified.
b. Construction of a new weir upstream meets the requirements. It forms, however, a new
obstacle in the Maasroute. As additional measure, a new canal has to connect the new weir
section and the Juliana Canal; the additional lock lengthens the travel time. Enabling north-
south navigation of Class Vb vessels via the Briegden-Neerharen Canal, Zuid-Willemsvaart
and Wessem-Nederweert Canal is thought to be infeasible within a construction time of
10 years. Moreover, it lengthens the travel time significantly and the accessibility of the
ports at the Juliana Canal is questionable, since the locks of Born have to withstand a
reversed water level difference.
3.
a. Replacement by a lower weir at the same location does not meet the requirements, since it
limits the navigational depth of the Bovenmaas and the southern part of the Juliana Canal.
b. Replacement by a higher weir could contribute to the storage of fresh water for prolonged
periods of small discharge. But then, less buffer is left to flatten the discharge peaks
resulting from the hydropower station of weir Lixhe. The risk on ecological damage in the
Grensmaas is increased by this modification.
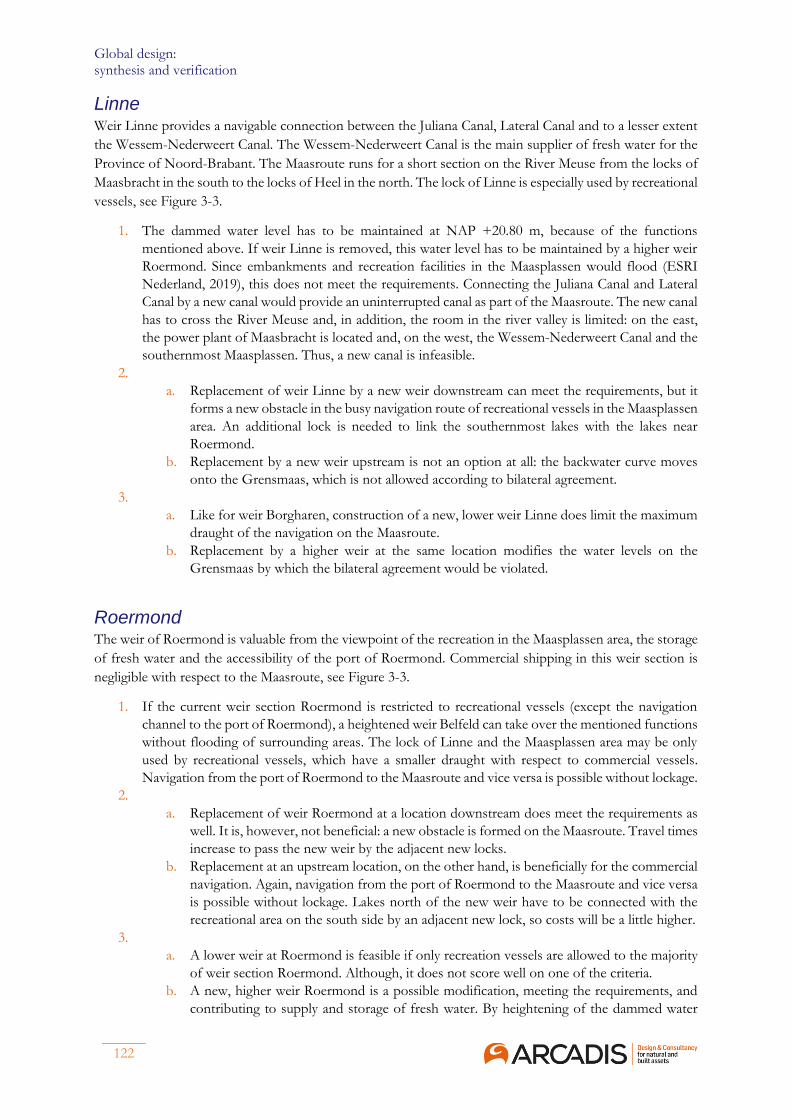
Global design: synthesis and verification
122
Linne Weir Linne provides a navigable connection between the Juliana Canal, Lateral Canal and to a lesser extent
the Wessem-Nederweert Canal. The Wessem-Nederweert Canal is the main supplier of fresh water for the
Province of Noord-Brabant. The Maasroute runs for a short section on the River Meuse from the locks of
Maasbracht in the south to the locks of Heel in the north. The lock of Linne is especially used by recreational
vessels, see Figure 3-3.
1. The dammed water level has to be maintained at NAP +20.80 m, because of the functions
mentioned above. If weir Linne is removed, this water level has to be maintained by a higher weir
Roermond. Since embankments and recreation facilities in the Maasplassen would flood (ESRI
Nederland, 2019), this does not meet the requirements. Connecting the Juliana Canal and Lateral
Canal by a new canal would provide an uninterrupted canal as part of the Maasroute. The new canal
has to cross the River Meuse and, in addition, the room in the river valley is limited: on the east,
the power plant of Maasbracht is located and, on the west, the Wessem-Nederweert Canal and the
southernmost Maasplassen. Thus, a new canal is infeasible.
2.
a. Replacement of weir Linne by a new weir downstream can meet the requirements, but it
forms a new obstacle in the busy navigation route of recreational vessels in the Maasplassen
area. An additional lock is needed to link the southernmost lakes with the lakes near
Roermond.
b. Replacement by a new weir upstream is not an option at all: the backwater curve moves
onto the Grensmaas, which is not allowed according to bilateral agreement.
3.
a. Like for weir Borgharen, construction of a new, lower weir Linne does limit the maximum
draught of the navigation on the Maasroute.
b. Replacement by a higher weir at the same location modifies the water levels on the
Grensmaas by which the bilateral agreement would be violated.
Roermond The weir of Roermond is valuable from the viewpoint of the recreation in the Maasplassen area, the storage
of fresh water and the accessibility of the port of Roermond. Commercial shipping in this weir section is
negligible with respect to the Maasroute, see Figure 3-3.
1. If the current weir section Roermond is restricted to recreational vessels (except the navigation
channel to the port of Roermond), a heightened weir Belfeld can take over the mentioned functions
without flooding of surrounding areas. The lock of Linne and the Maasplassen area may be only
used by recreational vessels, which have a smaller draught with respect to commercial vessels.
Navigation from the port of Roermond to the Maasroute and vice versa is possible without lockage.
2.
a. Replacement of weir Roermond at a location downstream does meet the requirements as
well. It is, however, not beneficial: a new obstacle is formed on the Maasroute. Travel times
increase to pass the new weir by the adjacent new locks.
b. Replacement at an upstream location, on the other hand, is beneficially for the commercial
navigation. Again, navigation from the port of Roermond to the Maasroute and vice versa
is possible without lockage. Lakes north of the new weir have to be connected with the
recreational area on the south side by an adjacent new lock, so costs will be a little higher.
3.
a. A lower weir at Roermond is feasible if only recreation vessels are allowed to the majority
of weir section Roermond. Although, it does not score well on one of the criteria.
b. A new, higher weir Roermond is a possible modification, meeting the requirements, and
contributing to supply and storage of fresh water. By heightening of the dammed water
Design of an adaptive weir
123
level in weir section Roermond, pumping water to the weir section of Linne becomes more
affordable. The new pumping station can play an important role in the freshwater supply
to Noord-Brabant and the Juliana Canal, in combination with the pumping stations of
Maasbracht and Panheel. Reservoirs in Germany guarantee a minimum discharge of the
Roer of 10 m3/s, which is why the water shortage of weir section Roermond is less severe
than of weir section Linne (Rijkswaterstaat, 1992) (Rijkswaterstaat, 1994). On top of that,
by a higher weir at Roermond, the large area of the Maasplassen is used to store a
considerable amount of fresh water.
Belfeld The River Meuse near Belfeld is part of the Maasroute. Weir Belfeld dams up the water level of the Lateral
Canal and part of the River Meuse to NAP +14.10 m. Via lock Heel in the south and the locks next to weir
Belfeld navigation on the Maasroute is enabled.
1. If weir Belfeld is removed, the navigation depth on the Maasroute has to be maintained by weir
Sambeek. The needed dammed water level of weir Sambeek in this case leads to permanent flooding
of the lowest terraces on both sides of the Zandmaas (ESRI Nederland, 2019). Thus, removal of
weir Belfeld does not meet the requirements.
2. Replacement of weir Belfeld by a new weir at a different location always has to involve the
construction of a new lock to facilitate navigation on the Maasroute.
a. Replacement at a downstream location is feasible, but does not include advantages related
to the criteria.
b. Replacement at an upstream location causes dehydration of the environment (Heijkoop,
Wils, & Van de Kerk, 2008), since the water levels fall over the entire length of
displacement. Thus, it does not meet the requirements.
3.
a. Replacing weir Belfeld by a lower weir does not meet the requirements, since the dammed
water levels are lowered in a sandy area and navigation on the Maasroute has to be
facilitated.
b. Replacing weir Belfeld by a higher weir meets the requirements. It is needed if weir
Roermond is removed and it provides more freshwater storage, too.
Sambeek The analysis of weir Sambeek is very similar to the weir of Belfeld. The weir section Sambeek is part of the
Maasroute and does not contain any confluence or bifurcation.
1. Weir Grave cannot take over the dammed water levels if weir Sambeek is removed, because it leads
to permanent flooding of the floodplains (ESRI Nederland, 2019).
2.
a. Replacement by a new weir downstream is feasible, but does not include advantages related
to the criteria.
b. Replacement by a new weir upstream causes dehydration of the environment (Heijkoop,
Wils, & Van de Kerk, 2008), since the water levels fall over the entire length of
displacement. Thus, it does not meet the requirements.
3.
a. A lower weir Sambeek does not meet the requirements, since the dammed water levels are
lowered in a sandy area and navigation on the Maasroute has to be facilitated.
b. A higher weir Sambeek meets the requirements. It provides more freshwater storage for
prolonged periods of small discharge.
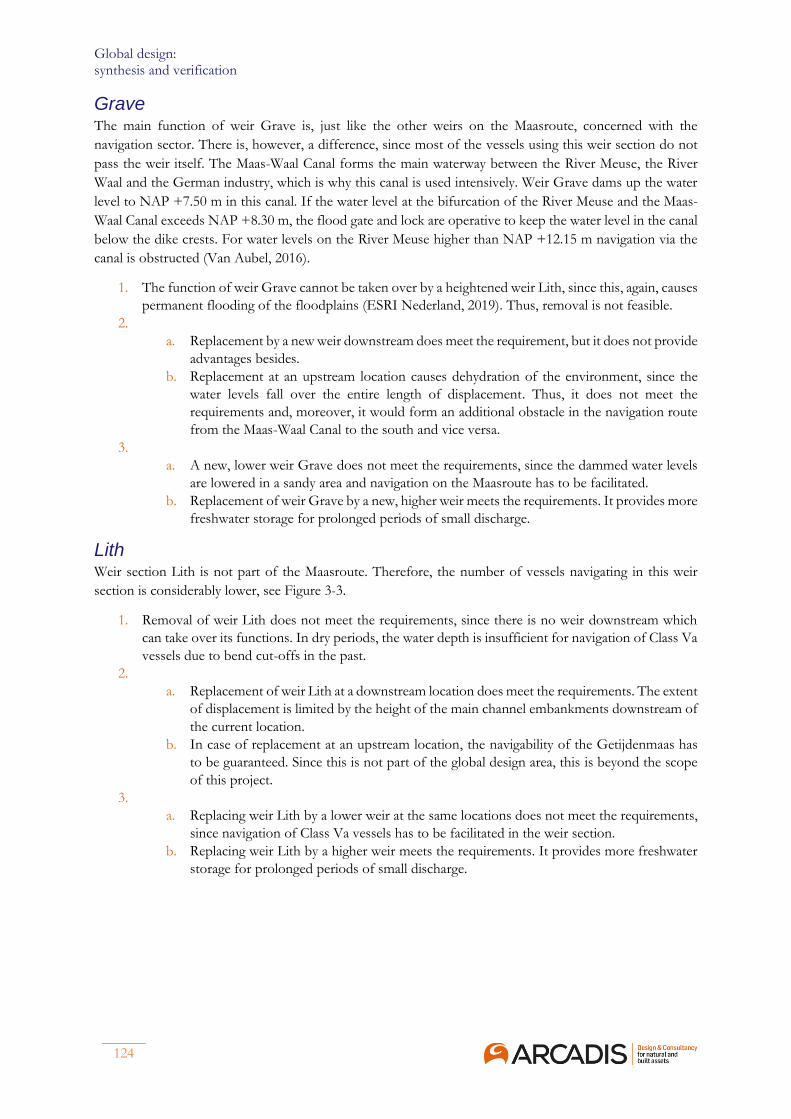
Global design: synthesis and verification
124
Grave The main function of weir Grave is, just like the other weirs on the Maasroute, concerned with the
navigation sector. There is, however, a difference, since most of the vessels using this weir section do not
pass the weir itself. The Maas-Waal Canal forms the main waterway between the River Meuse, the River
Waal and the German industry, which is why this canal is used intensively. Weir Grave dams up the water
level to NAP +7.50 m in this canal. If the water level at the bifurcation of the River Meuse and the Maas-
Waal Canal exceeds NAP +8.30 m, the flood gate and lock are operative to keep the water level in the canal
below the dike crests. For water levels on the River Meuse higher than NAP +12.15 m navigation via the
canal is obstructed (Van Aubel, 2016).
1. The function of weir Grave cannot be taken over by a heightened weir Lith, since this, again, causes
permanent flooding of the floodplains (ESRI Nederland, 2019). Thus, removal is not feasible.
2.
a. Replacement by a new weir downstream does meet the requirement, but it does not provide
advantages besides.
b. Replacement at an upstream location causes dehydration of the environment, since the
water levels fall over the entire length of displacement. Thus, it does not meet the
requirements and, moreover, it would form an additional obstacle in the navigation route
from the Maas-Waal Canal to the south and vice versa.
3.
a. A new, lower weir Grave does not meet the requirements, since the dammed water levels
are lowered in a sandy area and navigation on the Maasroute has to be facilitated.
b. Replacement of weir Grave by a new, higher weir meets the requirements. It provides more
freshwater storage for prolonged periods of small discharge.
Lith Weir section Lith is not part of the Maasroute. Therefore, the number of vessels navigating in this weir
section is considerably lower, see Figure 3-3.
1. Removal of weir Lith does not meet the requirements, since there is no weir downstream which
can take over its functions. In dry periods, the water depth is insufficient for navigation of Class Va
vessels due to bend cut-offs in the past.
2.
a. Replacement of weir Lith at a downstream location does meet the requirements. The extent
of displacement is limited by the height of the main channel embankments downstream of
the current location.
b. In case of replacement at an upstream location, the navigability of the Getijdenmaas has
to be guaranteed. Since this is not part of the global design area, this is beyond the scope
of this project.
3.
a. Replacing weir Lith by a lower weir at the same locations does not meet the requirements,
since navigation of Class Va vessels has to be facilitated in the weir section.
b. Replacing weir Lith by a higher weir meets the requirements. It provides more freshwater
storage for prolonged periods of small discharge.

Design of an adaptive weir
125
Appendix I
Regional design area
This appendix gives an overview of the regional project area. First, all lakes, structures, creeks, bifurcations
and confluences are listed in Table I-1.
Table I-1: Location of objects in the regional design area.
Object Type Distance to weir
Belfeld [km]
Zandmaas
Weir Belfeld Hydraulic structure 0.0
Bifurcation River Meuse and
lock canal Belfeld
Bifurcation 0.9
Schelkensbeek Creek 3.0
Marina WSV Poseidon Marina 3.3
Tasbeek Creek 4.2
Old riverbend Desolated river course 4.8
Port of Kessel Marina 5.7
Huilbeek Creek 6.8
Sand extraction Kessel-Eik Lake 7.8
Rijkelse Bemden Lake 9.8
Snepheiderbeek Creek 9.9
Dode Maasarm Lake 10.9
Marina WH Hanssum Marina 11.1
Neerbeek Creek 11.3
Sand extraction Heel Lake 11.3
Swalm Tributary 11.9
Asseltse Plassen Lake 13.2
Drainage channel of power
plant Buggenum
Drainage channel 14.5
Lateral Canal
Confluence River Meuse and
Lateral Canal
Confluence 14.8
Rail bridge Buggenum Bridge 15.4
Power plant Buggenum Port 15.8
Confluence lock canal
Roermond and Lateral Canal
Confluence 16.0
Hornerbridge (N280) Bridge 18.6
Bridge Heel Bridge 22.5
Lock Heel Hydraulic structure 22.7

Regional design area
126
Object Type Distance to weir
Belfeld [km]
Afgesneden Maas
Confluence River Meuse and
Lateral Canal
Confluence 14.8
Rail bridge Buggenum Bridge 15.4
Weir Roermond Hydraulic structure 17.0
Bifurcation River Meuse and
lock canal Roermond
Bifurcation 17.8
Prins Willem-Alexanderport Port 18.0
Doevesbeemd +
Doncker Nack
Lake 18.3
Louis Raemaekersbridge
(N280)
Bridge 18.4
Roer Tributary 18.5
La Bonne Aventure Marina 19.2
De Rosslag Marina 20.3
Noorderplas + Plas Hatenboer
Nieuwe Nack + Zuidplas
Lake 20.8
Ooldergreend Lake 22.3
Isabellegreend Lake 22.6
Confluence canal lock Linne
and Loop of Linne
Confluence 23.5
Lock Linne Hydraulic structure 24.1
Oolderplas Lake 24.4
Gerelingsplas + Spoorplas Lake 25.7
Weir Linne Hydraulic structure 29.0
The last column is applied as input in the hydraulic model described in Appendix C.1. With this model, the
water level at each location can be calculated for various discharges. To simplify the model, not all objects
are taken into account and simplifications have been made, among which:
• The characteristics of the weir section Belfeld and weir section Roermond are based on a calibrated
model of ARCADIS (ARCADIS, 2015). The used parameters are (for both weir sections):
= 130 B m
= 50 /C m s
Both parameters are independent of the water level, which is not the case in reality.
• The bed level in the calibrated model is not right, so other data have been applied to obtain the
right level. The bed level is based on the current navigation in the regional design area; the resulting
bed level as shown in Figure I-1 is derived in Appendix E.2. Two sections of constant bed slope
are identified: the boundary is located at the confluence of the Lateral Canal and the River Meuse.
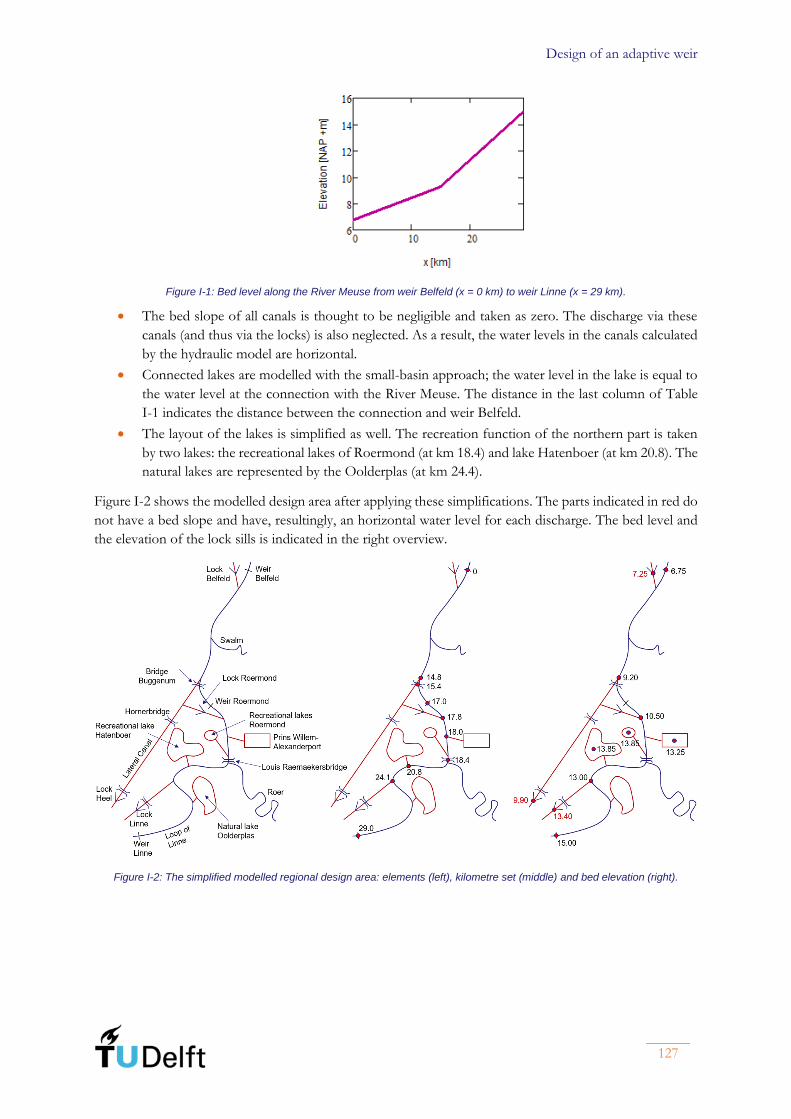
Design of an adaptive weir
127
Figure I-1: Bed level along the River Meuse from weir Belfeld (x = 0 km) to weir Linne (x = 29 km).
• The bed slope of all canals is thought to be negligible and taken as zero. The discharge via these
canals (and thus via the locks) is also neglected. As a result, the water levels in the canals calculated
by the hydraulic model are horizontal.
• Connected lakes are modelled with the small-basin approach; the water level in the lake is equal to
the water level at the connection with the River Meuse. The distance in the last column of Table
I-1 indicates the distance between the connection and weir Belfeld.
• The layout of the lakes is simplified as well. The recreation function of the northern part is taken
by two lakes: the recreational lakes of Roermond (at km 18.4) and lake Hatenboer (at km 20.8). The
natural lakes are represented by the Oolderplas (at km 24.4).
Figure I-2 shows the modelled design area after applying these simplifications. The parts indicated in red do
not have a bed slope and have, resultingly, an horizontal water level for each discharge. The bed level and
the elevation of the lock sills is indicated in the right overview.
Figure I-2: The simplified modelled regional design area: elements (left), kilometre set (middle) and bed elevation (right).

Regional design area
128
(This page is intentionally left blank)

Design of an adaptive weir
129
Appendix J Regional water management
This appendix focusses on the exchange of River Meuse water with water volumes perpendicular to the
streamwise direction. Section J.1 focusses on the interaction of the river with groundwater flow. The model
which is applied to calculate the effects of a changed dammed water level on the groundwater table is
elaborated. Furthermore, Section J.2 elaborates on the interaction between the River Meuse and the
connected creeks and tributaries.
J.1 Geohydrology
A modification of the dammed water levels of the River Meuse involves a direct change of the groundwater
table in the surroundings of the river. In this subsection, the extent of this change is addressed.
Groundwater flow is described by Darcy’s law; water flows from high potential to low potential. The
discharge is dependent on the flow area, the potential difference, the distance between these potentials and
the permeability of the soil k. The general law of Darcy is applicable in multiple situations, for which,
depending on the situation, the formula simplifies. In the regional project area, the top layers of soil consist
of sand and gravel layers. Groundwater data show that the shallow groundwater table fluctuates in these
layers (Waterschap Limburg, 2019). As earlier mentioned, the deep groundwater table in the area is of large
importance as well. The deep aquifer is supplemented by rainfall and the effect of a modification of the
dammed water levels to the groundwater flow in this layer is assumed to be negligible. The focus in this
appendix lies on the shallow groundwater flow.
In general the groundwater table in the surrounding of the River Meuse lies higher than the dammed water
levels in the river itself. This means that groundwater flows towards the River Meuse, which acts as a drain.
Schematically, the River Meuse is a long chain of drains in sequence. The groundwater flow is dealt with per
meter width; a cross-section of the River Meuse and the groundwater is shown in Figure J-1.
Figure J-1: Schematisation of the groundwater flow.

Regional water management
130
A volume balance is set up for this area.
= −0 LN L q q (I.1)
To quantify the influence of the dammed water levels in the River Meuse, it is important to find out unto
which distance a modification of the dammed water level has effect on the groundwater table. This influence
length is indicated with L. As a first indication, L is equal to the distance from the river to the location where
the groundwater flow qL is equal to zero (grootte intrekgebied, 2019). This means that all rain water
infiltrated, in the Netherlands approximately 0.001 m/day (Bakker, 2019), in the influence area flows
towards the River Meuse via the aquifer.
The groundwater flow at each location is calculated with Darcy’s law:
= − GWLy aquifer
dq k D
dy (I.2)
At y=L, the groundwater flow is zero; at y=0, the groundwater flow is maximum. The course of the
groundwater flow is described by the corresponding differential equation:
=ydq
Ndy
(I.3)
Combining equation (I.2) and (I.3) leads to the differential equation for the elevation of the groundwater
table.
= −
2
2
GWL
aquifer
d N
k Ddy (I.4)
Since this is a non-homogeneous differential equation, the solution is a combination of a particular solution
and the solution to the homogeneous solution.
−= − + + +
2 ( ) (0)( ) ( ) (0)
2 2
GWL GWLGWL GWL
aquifer aquifer
LN Ny y L y
kD kD L (I.5)
The groundwater level elevation is a parabolic function of y, the perpendicular distance to the River Meuse.
The data in Table J-1, retrieved by groundwater surveys at four different locations, are applied to find the
best parabolic fit at each location. The locations of Belfeld, Neer, Heel and Roermond are selected, since
recent data (summer 2018) was available at various distances to the River Meuse. The average elevation of
the groundwater table in summer is presented in the table below; choosing this time period excludes
significant changes in dammed river water level, wherein the systems reaches (or approaches) a steady-state.
Table J-1: Retrieved groundwater data (Waterschap Limburg, 2019).
In Figure J-2 the best parabolic fit at each location is shown. The groundwater table is plotted from y=0, at
the River Meuse, unto y=L. At the latter location, the groundwater table is horizontal; the potential head
Belfeld Neer Heel Roermond
y [m] ηGWT
[NAP + m]
y [m] ηGWT
[NAP + m]
y [m] ηGWT
[NAP + m]
y [m] ηGWT
[NAP + m]
40 15.2 - - - - 0 16.9
270 17.7 550 15.3 300 15.1 230 17.3
700 20.2 1700 19.3 1050 17.1 550 18.1
1900 24.0 2400 21.0 1700 18.3 3300 22.0

Design of an adaptive weir
131
difference and the discharge are zero. The influence length of the River Meuse ranges between 1.9 and 4.7
kilometres.
Figure J-2: Best parabolic fit of the groundwater data at four locations.
Validation To validate the fit, the parabolic fit is compared with equation (I.5). From the graphs in Figure J-2 the
influence length L, ηGWL(0) and ηGWL(L) can be retrieved; the only unknowns of equation (I.5) are the
horizontal permeability k and saturated thickness Daquifer of the aquifer. These two parameters multiplied
results in the transmissivity of the aquifer, a measure for the amount of water which is transmitted
horizontally to a drain. At each data location, the transmissivity is found by equalizing the graph resulting
from equation (I.5) and the parabolic fit. The obtained transmissivity is compared with the results of the
REGIS II model in Table J-2. The REGIS II model gives a global overview of the transmissivity of soil
layers with the help of bore hole data. The wide range of transmissivity of the REGIS II model is caused by
the uncertainty within a layer and the appearance of multiple aquifers above each other. The transmissivity
of the theoretical fit lies within the boundaries of the REGIS II model, so they are applied to quantify the
effects of a changed dammed water level.
Table J-2: Transmissivity of the aquifer (Ondergrondmodellen, n.d.).
Method Belfeld Neer Heel Roermond
Theoretical fit
[m2/day]
200 1000 850 1900
REGIS II model
[m2/day]
100-500 250-1000 >500 >1000
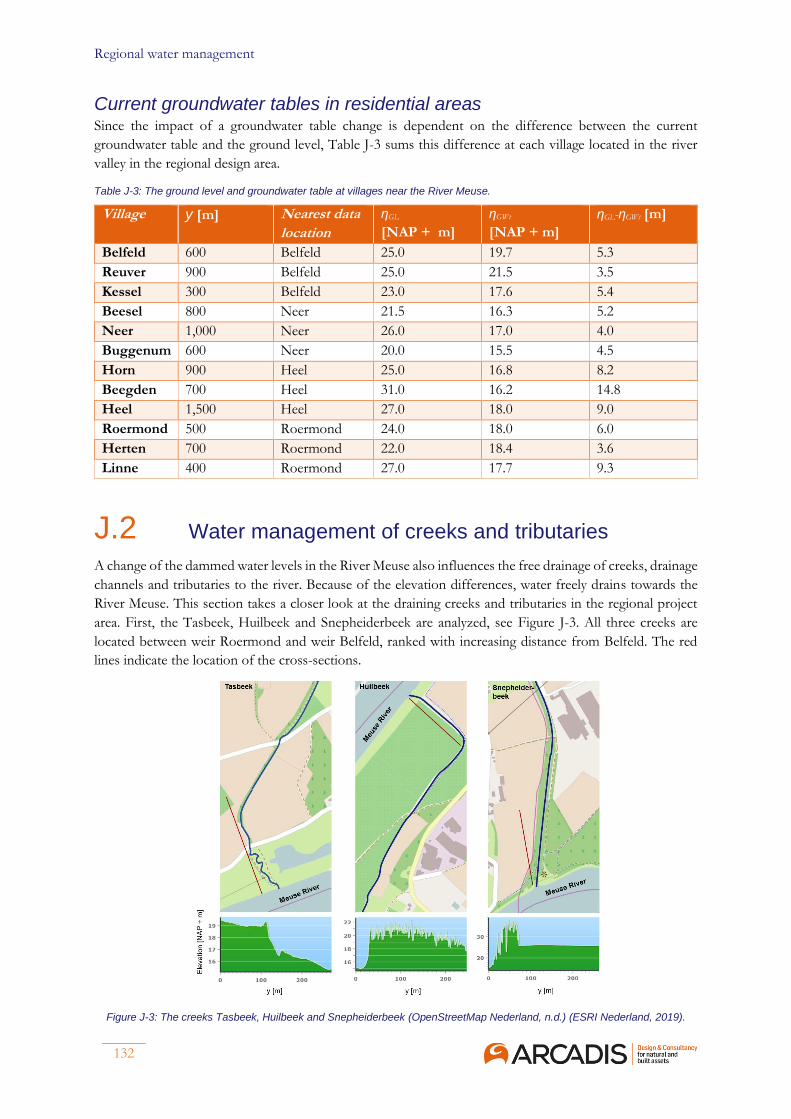
Regional water management
132
Current groundwater tables in residential areas Since the impact of a groundwater table change is dependent on the difference between the current
groundwater table and the ground level, Table J-3 sums this difference at each village located in the river
valley in the regional design area.
Table J-3: The ground level and groundwater table at villages near the River Meuse.
Village y [m] Nearest data
location
ηGL
[NAP + m]
ηGWt
[NAP + m]
ηGL-ηGWt [m]
Belfeld 600 Belfeld 25.0 19.7 5.3
Reuver 900 Belfeld 25.0 21.5 3.5
Kessel 300 Belfeld 23.0 17.6 5.4
Beesel 800 Neer 21.5 16.3 5.2
Neer 1,000 Neer 26.0 17.0 4.0
Buggenum 600 Neer 20.0 15.5 4.5
Horn 900 Heel 25.0 16.8 8.2
Beegden 700 Heel 31.0 16.2 14.8
Heel 1,500 Heel 27.0 18.0 9.0
Roermond 500 Roermond 24.0 18.0 6.0
Herten 700 Roermond 22.0 18.4 3.6
Linne 400 Roermond 27.0 17.7 9.3
J.2 Water management of creeks and tributaries
A change of the dammed water levels in the River Meuse also influences the free drainage of creeks, drainage
channels and tributaries to the river. Because of the elevation differences, water freely drains towards the
River Meuse. This section takes a closer look at the draining creeks and tributaries in the regional project
area. First, the Tasbeek, Huilbeek and Snepheiderbeek are analyzed, see Figure J-3. All three creeks are
located between weir Roermond and weir Belfeld, ranked with increasing distance from Belfeld. The red
lines indicate the location of the cross-sections.
Figure J-3: The creeks Tasbeek, Huilbeek and Snepheiderbeek (OpenStreetMap Nederland, n.d.) (ESRI Nederland, 2019).

Design of an adaptive weir
133
The Tasbeek and Huilbeek are small creeks of limited length. Only the Tasbeek includes some meanders
and a small nature site along the River Meuse. At the bottom part of Figure J-3, the elevation along the
creeks is shown; the terraces of the Zandmaas are clear. The irregularities in these graphs are caused by the
wooded landscape. For both the Tasbeek and Huilbeek applies that heightening of the River Meuse’s water
level does not induce floods. It is also assumed that drainage of these small creeks will not be a problem. If
the River Meuse’s water level is lowered, these creeks could fall dry. A sluice gate prevents this.
The Snepheiderbeek differs from the previous two creeks since it forms a connection between the
Noordervaart and the River Meuse. Via the Snepheiderbeek, part of the Natura 2000 site De Peel drains
water to the River Meuse (Ministerie van Landbouw, Natuur en Voedselkwaliteit, n.d.). The ecological value
in the creek itself is small, but the creek plays a considerable role in the water management of the protected
nature site. If a changed dammed water level affects this management negatively, an intake facility in the
Snepheiderbeek is a possibility to counteract this. The manager of this intake facility can adjust this intake
facility to stimulate ecology in De Peel.
In this project, the change of these three creeks are out of scope, since the effects are limited or can be
reduced on a local scale.
The Neerbeek and Schelkensbeek are shown in Figure J-4. Both creeks do drain in the weir section Belfeld
as well, but they are larger than the previous three creeks and have more ecological value as well. The
Neerbeek is a confluence of the creeks Leubeek, Zelsterbeek and Haelensche beek. The several creeks and
the surrounding natural environments form the Natura 2000 site Leudal (Ministerie van Landbouw, Natuur
en Voedselkwaliteit, n.d.). Despite that Leudal lies closer to the River Meuse than De Peel, the influence via
the Neerbeek is negligible. As can be seen in Figure J-4 a mill with a sluice gate is located approximately 1.5
kilometre upstream of the mouth. The River Meuse’s water level does only influence the downstream part
if the water level rises above the top of the sluice gate at NAP +17.10 m (Waterschap Limburg, 2019).
Otherwise, the water level upstream of the mill is controlled by the sluice gate and changes of the dammed
water levels in the River Meuse do have negligible effects on Leudal. Hereby, it is assumed that the sluice
and mill are able to withstand a larger water head or are easily strengthened in case of lowered dammed
water levels in the River Meuse.
Figure J-4: The creeks Neerbeek and Schelkensbeek (OpenStreetMap Nederland, n.d.) (ESRI Nederland, 2019).
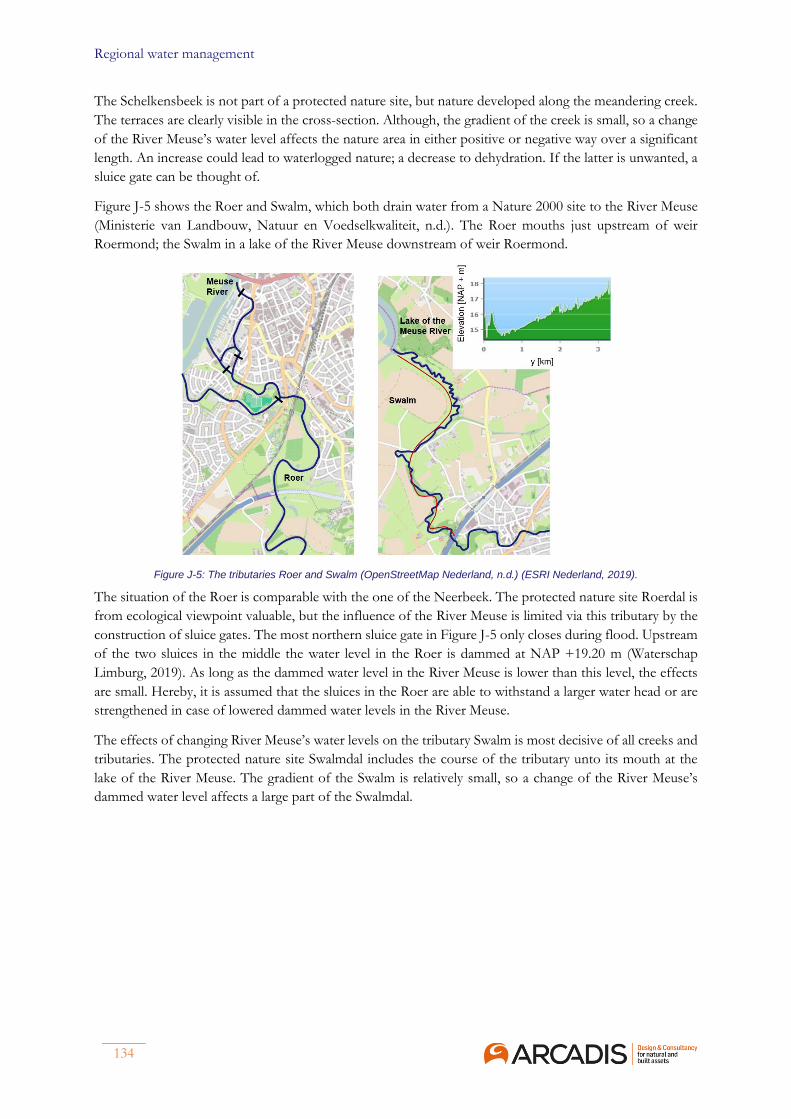
Regional water management
134
The Schelkensbeek is not part of a protected nature site, but nature developed along the meandering creek.
The terraces are clearly visible in the cross-section. Although, the gradient of the creek is small, so a change
of the River Meuse’s water level affects the nature area in either positive or negative way over a significant
length. An increase could lead to waterlogged nature; a decrease to dehydration. If the latter is unwanted, a
sluice gate can be thought of.
Figure J-5 shows the Roer and Swalm, which both drain water from a Nature 2000 site to the River Meuse
(Ministerie van Landbouw, Natuur en Voedselkwaliteit, n.d.). The Roer mouths just upstream of weir
Roermond; the Swalm in a lake of the River Meuse downstream of weir Roermond.
Figure J-5: The tributaries Roer and Swalm (OpenStreetMap Nederland, n.d.) (ESRI Nederland, 2019).
The situation of the Roer is comparable with the one of the Neerbeek. The protected nature site Roerdal is
from ecological viewpoint valuable, but the influence of the River Meuse is limited via this tributary by the
construction of sluice gates. The most northern sluice gate in Figure J-5 only closes during flood. Upstream
of the two sluices in the middle the water level in the Roer is dammed at NAP +19.20 m (Waterschap
Limburg, 2019). As long as the dammed water level in the River Meuse is lower than this level, the effects
are small. Hereby, it is assumed that the sluices in the Roer are able to withstand a larger water head or are
strengthened in case of lowered dammed water levels in the River Meuse.
The effects of changing River Meuse’s water levels on the tributary Swalm is most decisive of all creeks and
tributaries. The protected nature site Swalmdal includes the course of the tributary unto its mouth at the
lake of the River Meuse. The gradient of the Swalm is relatively small, so a change of the River Meuse’s
dammed water level affects a large part of the Swalmdal.
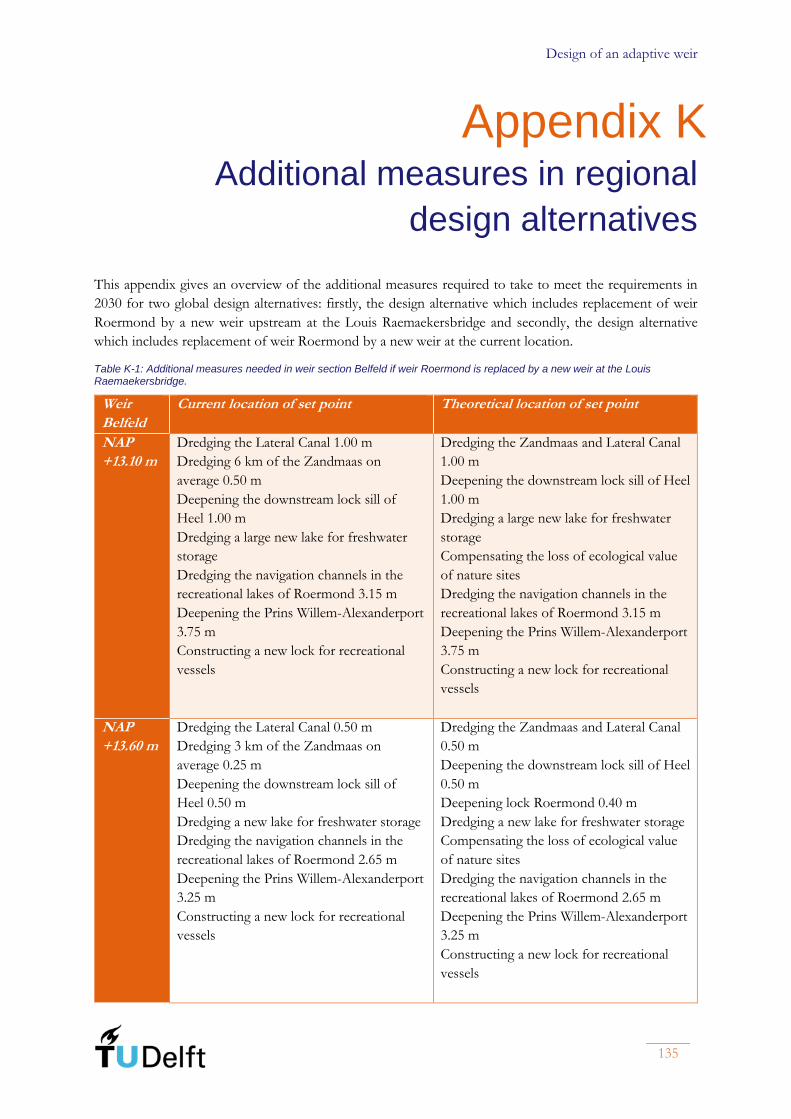
Design of an adaptive weir
135
Appendix K Additional measures in regional
design alternatives
This appendix gives an overview of the additional measures required to take to meet the requirements in
2030 for two global design alternatives: firstly, the design alternative which includes replacement of weir
Roermond by a new weir upstream at the Louis Raemaekersbridge and secondly, the design alternative
which includes replacement of weir Roermond by a new weir at the current location.
Table K-1: Additional measures needed in weir section Belfeld if weir Roermond is replaced by a new weir at the Louis Raemaekersbridge.
Weir
Belfeld
Current location of set point Theoretical location of set point
NAP
+13.10 m
Dredging the Lateral Canal 1.00 m
Dredging 6 km of the Zandmaas on
average 0.50 m
Deepening the downstream lock sill of
Heel 1.00 m
Dredging a large new lake for freshwater
storage
Dredging the navigation channels in the
recreational lakes of Roermond 3.15 m
Deepening the Prins Willem-Alexanderport
3.75 m
Constructing a new lock for recreational
vessels
Dredging the Zandmaas and Lateral Canal
1.00 m
Deepening the downstream lock sill of Heel
1.00 m
Dredging a large new lake for freshwater
storage
Compensating the loss of ecological value
of nature sites
Dredging the navigation channels in the
recreational lakes of Roermond 3.15 m
Deepening the Prins Willem-Alexanderport
3.75 m
Constructing a new lock for recreational
vessels
NAP
+13.60 m
Dredging the Lateral Canal 0.50 m
Dredging 3 km of the Zandmaas on
average 0.25 m
Deepening the downstream lock sill of
Heel 0.50 m
Dredging a new lake for freshwater storage
Dredging the navigation channels in the
recreational lakes of Roermond 2.65 m
Deepening the Prins Willem-Alexanderport
3.25 m
Constructing a new lock for recreational
vessels
Dredging the Zandmaas and Lateral Canal
0.50 m
Deepening the downstream lock sill of Heel
0.50 m
Deepening lock Roermond 0.40 m
Dredging a new lake for freshwater storage
Compensating the loss of ecological value
of nature sites
Dredging the navigation channels in the
recreational lakes of Roermond 2.65 m
Deepening the Prins Willem-Alexanderport
3.25 m
Constructing a new lock for recreational
vessels

Additional measures in regional design alternatives
136
NAP
+14.10 m
Dredging the navigation channels in the
recreational lakes of Roermond 2.15 m
Deepening the Prins Willem-Alexanderport
2.75 m
Constructing a new lock for recreational
vessels
Compensating the loss of ecological value
of nature sites
Dredging the navigation channels in the
recreational lakes of Roermond 2.15 m
Deepening the Prins Willem-Alexanderport
2.75 m
Constructing a new lock for recreational
vessels
NAP
+14.50 m
Raising embankments of the Zandmaas
0.40 m
Dredging the navigation channels in the
recreational lakes of Roermond 1.75 m
Deepening the Prins Willem-Alexanderport
2.35 m
Constructing a new lock for recreational
vessels
Compensating the loss of ecological value
of nature sites
Dredging the navigation channels in the
recreational lakes of Roermond 1.75 m
Deepening the Prins Willem-Alexanderport
2.35 m
Constructing a new lock for recreational
vessels
NAP
+15.10 m
Raising embankments of the Zandmaas
1.00 m
Raising rail bridge Buggenum 0.60 m
Raising bridge Heel 0.50 m
Dredging the navigation channels in the
recreational lakes of Roermond 1.15 m
Deepening the Prins Willem-Alexanderport
1.75 m
Constructing a new lock for recreational
vessels
Compensating the loss of ecological value
of nature sites
Raising rail bridge Buggenum 0.60 m
Raising bridge Heel 0.50 m
Dredging the navigation channels in the
recreational lakes of Roermond 1.15 m
Deepening the Prins Willem-Alexanderport
1.75 m
Constructing a new lock for recreational
vessels
Table K-2: Additional measures needed in weir section Roermond if weir Roermond is replaced by a new weir at the Louis Raemaekersbridge.
Weir
Belfeld
Current location of set point Theoretical location of set point
NAP
+13.10 m
Dredging the Lateral Canal 1.00 m
Dredging 6 km of the Zandmaas on
average 0.50 m
Deepening the downstream lock sill of
Heel 1.00 m
Deepening the downstream lock sill of
Roermond 0.90 m
Dredging a large new lake for freshwater
storage
Dredging the Zandmaas and Lateral Canal
1.00 m
Deepening the downstream lock sill of Heel
1.00 m
Deepening the downstream lock sill of
Roermond 0.90 m
Dredging a large new lake for freshwater
storage
Compensating the loss of ecological value
of nature sites
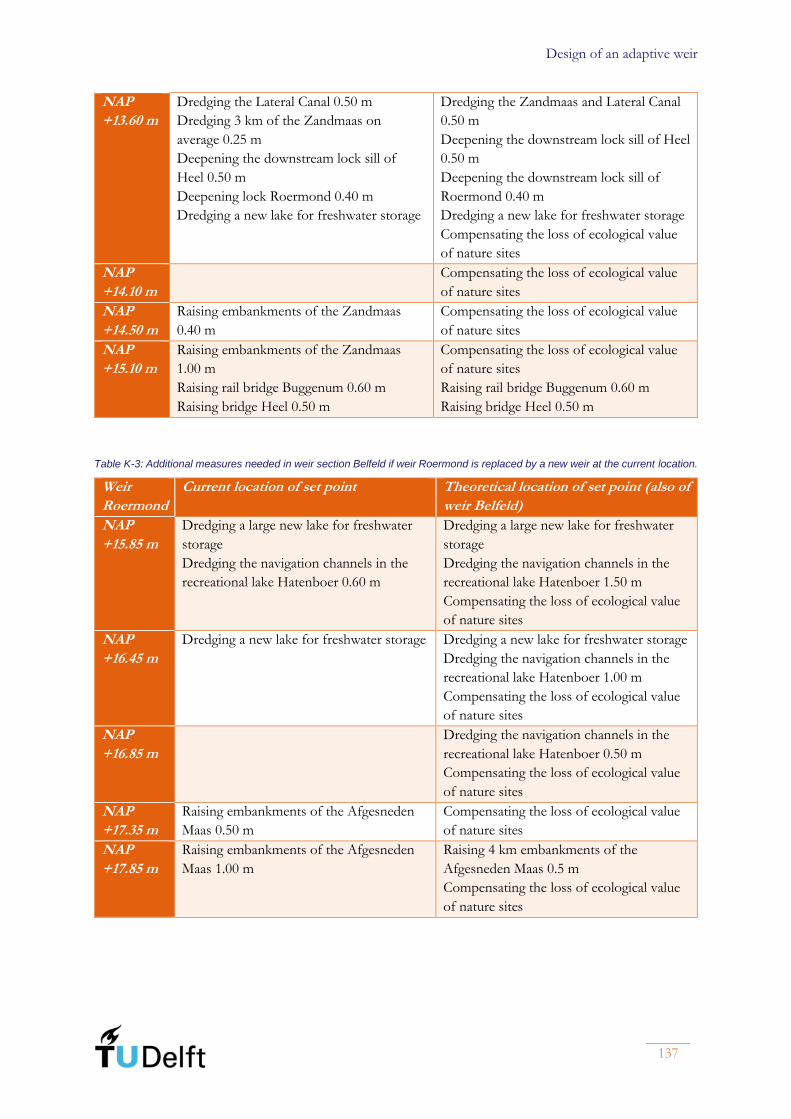
Design of an adaptive weir
137
NAP
+13.60 m
Dredging the Lateral Canal 0.50 m
Dredging 3 km of the Zandmaas on
average 0.25 m
Deepening the downstream lock sill of
Heel 0.50 m
Deepening lock Roermond 0.40 m
Dredging a new lake for freshwater storage
Dredging the Zandmaas and Lateral Canal
0.50 m
Deepening the downstream lock sill of Heel
0.50 m
Deepening the downstream lock sill of
Roermond 0.40 m
Dredging a new lake for freshwater storage
Compensating the loss of ecological value
of nature sites
NAP
+14.10 m
Compensating the loss of ecological value
of nature sites
NAP
+14.50 m
Raising embankments of the Zandmaas
0.40 m
Compensating the loss of ecological value
of nature sites
NAP
+15.10 m
Raising embankments of the Zandmaas
1.00 m
Raising rail bridge Buggenum 0.60 m
Raising bridge Heel 0.50 m
Compensating the loss of ecological value
of nature sites
Raising rail bridge Buggenum 0.60 m
Raising bridge Heel 0.50 m
Table K-3: Additional measures needed in weir section Belfeld if weir Roermond is replaced by a new weir at the current location.
Weir
Roermond
Current location of set point Theoretical location of set point (also of
weir Belfeld)
NAP
+15.85 m
Dredging a large new lake for freshwater
storage
Dredging the navigation channels in the
recreational lake Hatenboer 0.60 m
Dredging a large new lake for freshwater
storage
Dredging the navigation channels in the
recreational lake Hatenboer 1.50 m
Compensating the loss of ecological value
of nature sites
NAP
+16.45 m
Dredging a new lake for freshwater storage
Dredging a new lake for freshwater storage
Dredging the navigation channels in the
recreational lake Hatenboer 1.00 m
Compensating the loss of ecological value
of nature sites
NAP
+16.85 m
Dredging the navigation channels in the
recreational lake Hatenboer 0.50 m
Compensating the loss of ecological value
of nature sites
NAP
+17.35 m
Raising embankments of the Afgesneden
Maas 0.50 m
Compensating the loss of ecological value
of nature sites
NAP
+17.85 m
Raising embankments of the Afgesneden
Maas 1.00 m
Raising 4 km embankments of the
Afgesneden Maas 0.5 m
Compensating the loss of ecological value
of nature sites
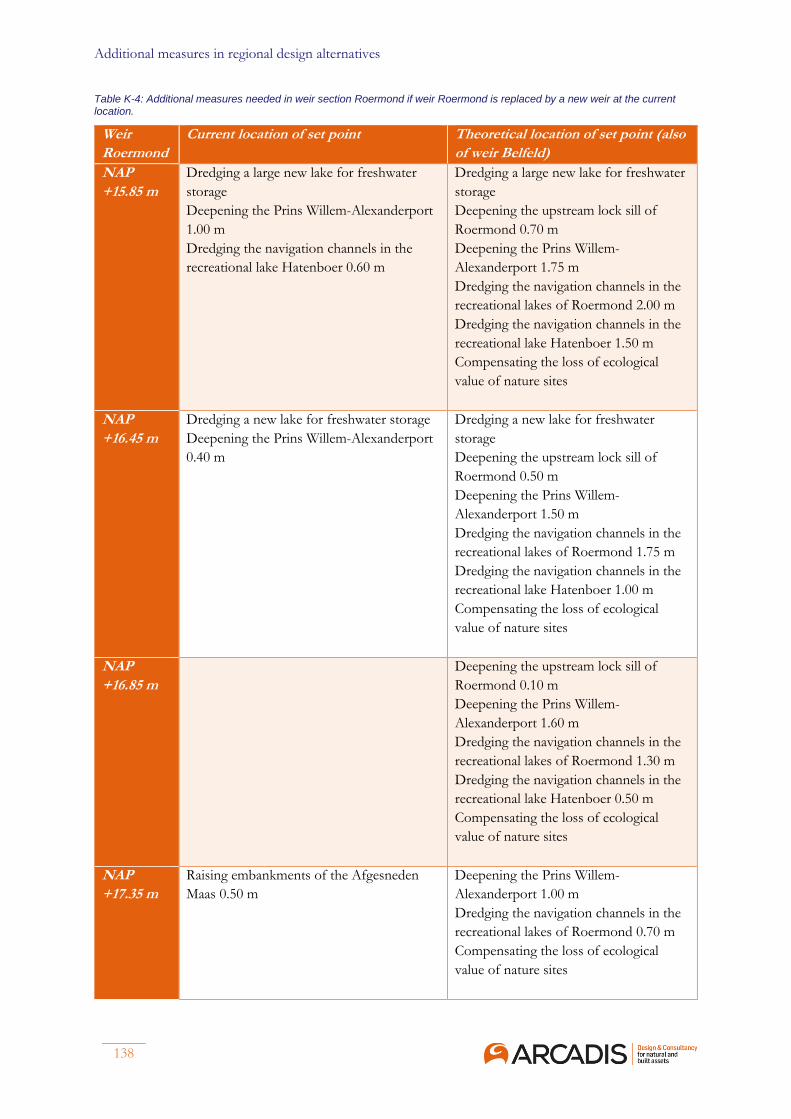
Additional measures in regional design alternatives
138
Table K-4: Additional measures needed in weir section Roermond if weir Roermond is replaced by a new weir at the current location.
Weir
Roermond
Current location of set point Theoretical location of set point (also
of weir Belfeld)
NAP
+15.85 m
Dredging a large new lake for freshwater
storage
Deepening the Prins Willem-Alexanderport
1.00 m
Dredging the navigation channels in the
recreational lake Hatenboer 0.60 m
Dredging a large new lake for freshwater
storage
Deepening the upstream lock sill of
Roermond 0.70 m
Deepening the Prins Willem-
Alexanderport 1.75 m
Dredging the navigation channels in the
recreational lakes of Roermond 2.00 m
Dredging the navigation channels in the
recreational lake Hatenboer 1.50 m
Compensating the loss of ecological
value of nature sites
NAP
+16.45 m
Dredging a new lake for freshwater storage
Deepening the Prins Willem-Alexanderport
0.40 m
Dredging a new lake for freshwater
storage
Deepening the upstream lock sill of
Roermond 0.50 m
Deepening the Prins Willem-
Alexanderport 1.50 m
Dredging the navigation channels in the
recreational lakes of Roermond 1.75 m
Dredging the navigation channels in the
recreational lake Hatenboer 1.00 m
Compensating the loss of ecological
value of nature sites
NAP
+16.85 m
Deepening the upstream lock sill of
Roermond 0.10 m
Deepening the Prins Willem-
Alexanderport 1.60 m
Dredging the navigation channels in the
recreational lakes of Roermond 1.30 m
Dredging the navigation channels in the
recreational lake Hatenboer 0.50 m
Compensating the loss of ecological
value of nature sites
NAP
+17.35 m
Raising embankments of the Afgesneden
Maas 0.50 m
Deepening the Prins Willem-
Alexanderport 1.00 m
Dredging the navigation channels in the
recreational lakes of Roermond 0.70 m
Compensating the loss of ecological
value of nature sites

Design of an adaptive weir
139
NAP
+17.85 m
Raising embankments of the Afgesneden
Maas 1.00 m
Raising 4 km embankments of the
Afgesneden Maas 0.50 m
Deepening the Prins Willem-
Alexanderport 0.50 m
Dredging the navigation channels in the
recreational lakes of Roermond 0.15 m
Compensating the loss of ecological
value of nature sites

Additional measures in regional design alternatives
140
(This page is intentionally left blank)
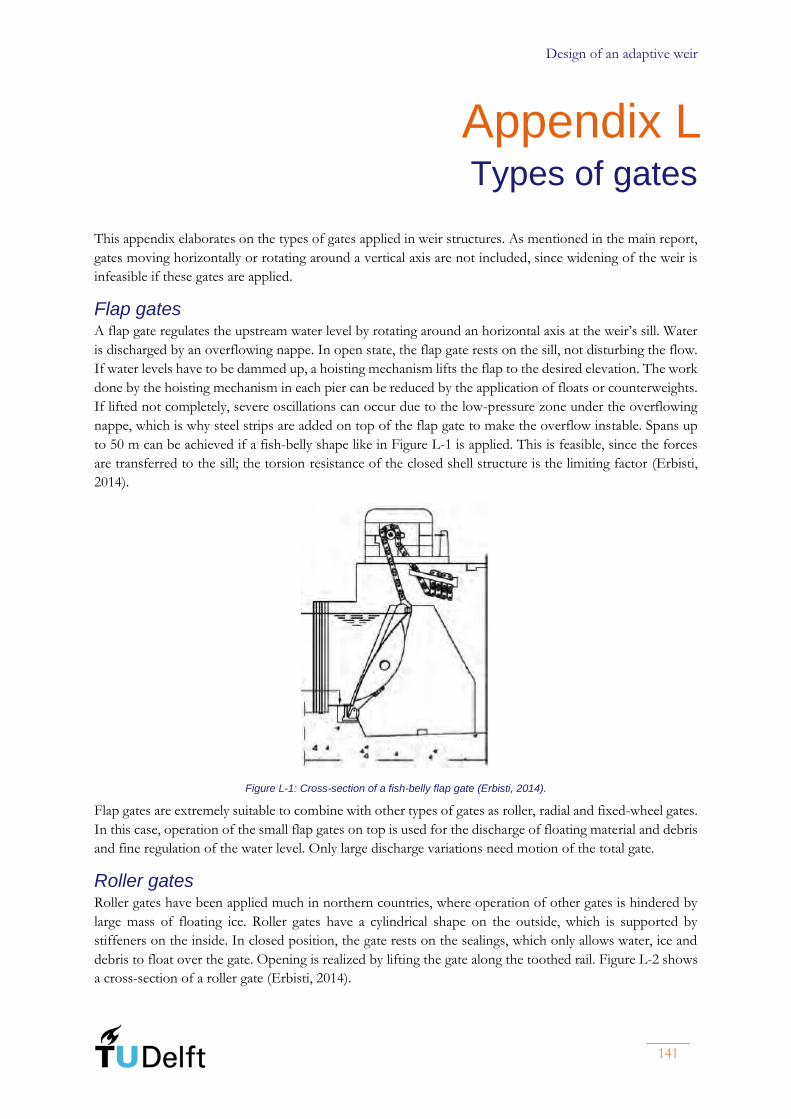
Design of an adaptive weir
141
Appendix L Types of gates
This appendix elaborates on the types of gates applied in weir structures. As mentioned in the main report,
gates moving horizontally or rotating around a vertical axis are not included, since widening of the weir is
infeasible if these gates are applied.
Flap gates A flap gate regulates the upstream water level by rotating around an horizontal axis at the weir’s sill. Water
is discharged by an overflowing nappe. In open state, the flap gate rests on the sill, not disturbing the flow.
If water levels have to be dammed up, a hoisting mechanism lifts the flap to the desired elevation. The work
done by the hoisting mechanism in each pier can be reduced by the application of floats or counterweights.
If lifted not completely, severe oscillations can occur due to the low-pressure zone under the overflowing
nappe, which is why steel strips are added on top of the flap gate to make the overflow instable. Spans up
to 50 m can be achieved if a fish-belly shape like in Figure L-1 is applied. This is feasible, since the forces
are transferred to the sill; the torsion resistance of the closed shell structure is the limiting factor (Erbisti,
2014).
Figure L-1: Cross-section of a fish-belly flap gate (Erbisti, 2014).
Flap gates are extremely suitable to combine with other types of gates as roller, radial and fixed-wheel gates.
In this case, operation of the small flap gates on top is used for the discharge of floating material and debris
and fine regulation of the water level. Only large discharge variations need motion of the total gate.
Roller gates Roller gates have been applied much in northern countries, where operation of other gates is hindered by
large mass of floating ice. Roller gates have a cylindrical shape on the outside, which is supported by
stiffeners on the inside. In closed position, the gate rests on the sealings, which only allows water, ice and
debris to float over the gate. Opening is realized by lifting the gate along the toothed rail. Figure L-2 shows
a cross-section of a roller gate (Erbisti, 2014).

Types of gates
142
Figure L-2: Cross-section of a roller gate (Erbisti, 2014).
Thanks to the large stiffness of the steel cylinder spans up to 50 m and gate heights up to 8 m are feasible.
In comparison with all other gate types, the roller gates are the heaviest and most expensive. This last, and
since discharge of large floating ice masses is not a primary function of the weir at Belfeld, the application
of roller gates is not further researched.
Visor gates Visor gates are a more rare type of gate, but in the Netherlands experience has been gained by the installation
of these gates in the Nederrijn and Lek. A visor gate has a semi-cylindrical shape, see Figure L-3, to prevent
bending moments in the gate structure. The higher water level on the concave side pushes the gate outward,
only causing tension. The forces are transferred from the gate to the sill and the piers. The gate is opened
by rotation around a horizontal axis. The hoisting mechanism, located at the top of the piers, pulls the gate
upward via the connected wire ropes. Completely lifting the gates creates a navigable opening on the
intensely used navigation route.
By the absence of bending moments, the amount of material is more efficiently used. This makes this type
of gate really competitive to other gate types for large spans. For small spans, the advantage of this gate type
is less, since the length of the semi-circle is significantly longer than a flat gate and bending moments in flat
gates are much smaller for small spans. In the Nederrijn and Lek, the navigable opening is 48 m wide; in
the River Meuse this has to be only 35.40 m (Erbisti, 2014). Therefore, it is assumed that a visor gate is not
competitive in the River Meuse.

Design of an adaptive weir
143
Figure L-3: Top view and cross-section of a visor gate (Erbisti, 2014).
Radial gates Radial gates dam the water level by a curved skin plate supported by vertical and horizontal stiffeners. On
the sides of both piers a radial truss structure transfer the forces from the skin plate and beams to the bearing
points. Opening of radial gates is done by rotation around a horizontal axis which intersects with the bearing
points. Radial gates rotate upward if the weir has to be opened as in Figure L-4; submersible radial gates
rotate downward into the designed recess chamber in the sill as in Figure L-5.
Figure L-4: Cross-section of a radial gate (Erbisti, 2014).
Figure L-5: Cross-section of a submersible radial gate (Erbisti, 2014).
By designing the curvature of the skin plate such that the resultant force of the water head passes through
the rotation axis, the resulting moment on the entire gate is zero; there is no tendency of the gate to open
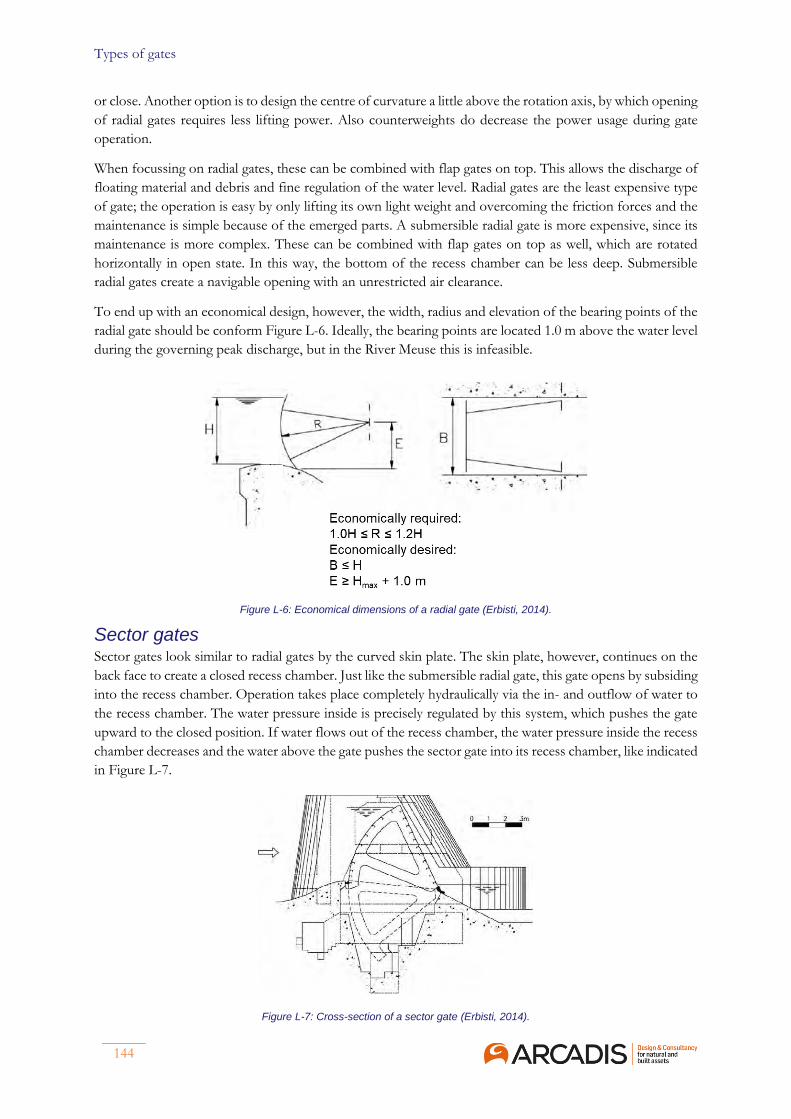
Types of gates
144
or close. Another option is to design the centre of curvature a little above the rotation axis, by which opening
of radial gates requires less lifting power. Also counterweights do decrease the power usage during gate
operation.
When focussing on radial gates, these can be combined with flap gates on top. This allows the discharge of
floating material and debris and fine regulation of the water level. Radial gates are the least expensive type
of gate; the operation is easy by only lifting its own light weight and overcoming the friction forces and the
maintenance is simple because of the emerged parts. A submersible radial gate is more expensive, since its
maintenance is more complex. These can be combined with flap gates on top as well, which are rotated
horizontally in open state. In this way, the bottom of the recess chamber can be less deep. Submersible
radial gates create a navigable opening with an unrestricted air clearance.
To end up with an economical design, however, the width, radius and elevation of the bearing points of the
radial gate should be conform Figure L-6. Ideally, the bearing points are located 1.0 m above the water level
during the governing peak discharge, but in the River Meuse this is infeasible.
Figure L-6: Economical dimensions of a radial gate (Erbisti, 2014).
Sector gates Sector gates look similar to radial gates by the curved skin plate. The skin plate, however, continues on the
back face to create a closed recess chamber. Just like the submersible radial gate, this gate opens by subsiding
into the recess chamber. Operation takes place completely hydraulically via the in- and outflow of water to
the recess chamber. The water pressure inside is precisely regulated by this system, which pushes the gate
upward to the closed position. If water flows out of the recess chamber, the water pressure inside the recess
chamber decreases and the water above the gate pushes the sector gate into its recess chamber, like indicated
in Figure L-7.
Figure L-7: Cross-section of a sector gate (Erbisti, 2014).
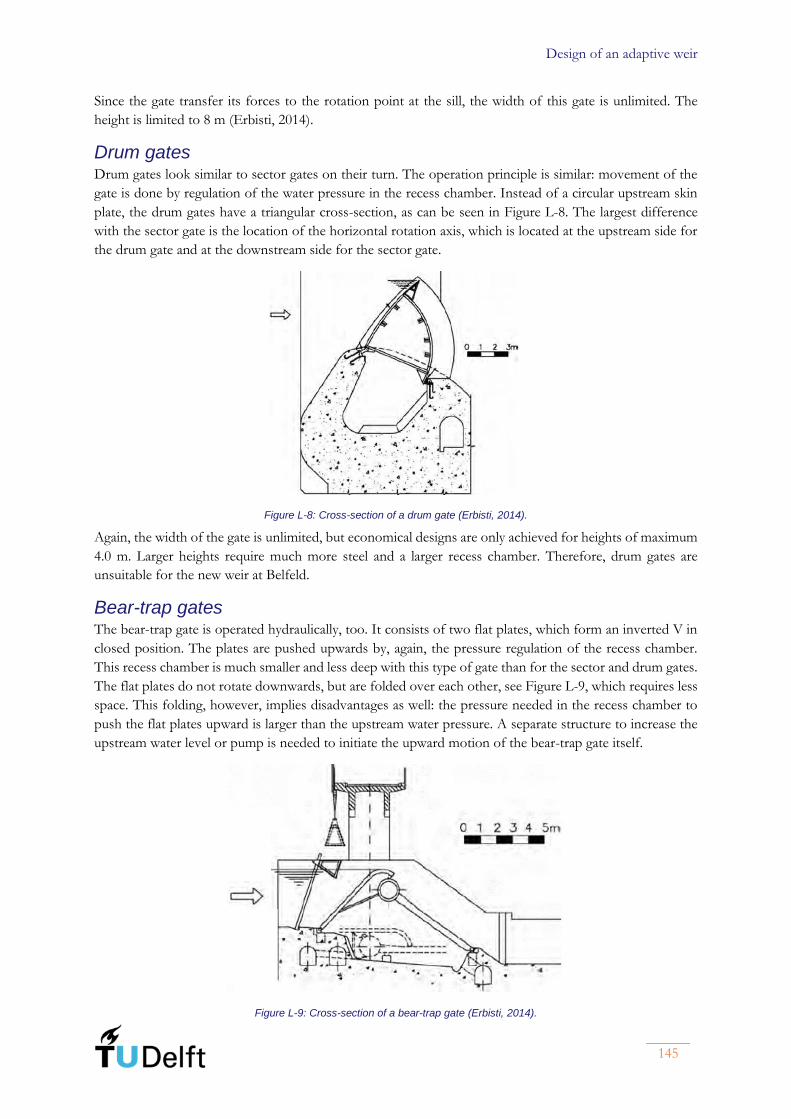
Design of an adaptive weir
145
Since the gate transfer its forces to the rotation point at the sill, the width of this gate is unlimited. The
height is limited to 8 m (Erbisti, 2014).
Drum gates Drum gates look similar to sector gates on their turn. The operation principle is similar: movement of the
gate is done by regulation of the water pressure in the recess chamber. Instead of a circular upstream skin
plate, the drum gates have a triangular cross-section, as can be seen in Figure L-8. The largest difference
with the sector gate is the location of the horizontal rotation axis, which is located at the upstream side for
the drum gate and at the downstream side for the sector gate.
Figure L-8: Cross-section of a drum gate (Erbisti, 2014).
Again, the width of the gate is unlimited, but economical designs are only achieved for heights of maximum
4.0 m. Larger heights require much more steel and a larger recess chamber. Therefore, drum gates are
unsuitable for the new weir at Belfeld.
Bear-trap gates The bear-trap gate is operated hydraulically, too. It consists of two flat plates, which form an inverted V in
closed position. The plates are pushed upwards by, again, the pressure regulation of the recess chamber.
This recess chamber is much smaller and less deep with this type of gate than for the sector and drum gates.
The flat plates do not rotate downwards, but are folded over each other, see Figure L-9, which requires less
space. This folding, however, implies disadvantages as well: the pressure needed in the recess chamber to
push the flat plates upward is larger than the upstream water pressure. A separate structure to increase the
upstream water level or pump is needed to initiate the upward motion of the bear-trap gate itself.
Figure L-9: Cross-section of a bear-trap gate (Erbisti, 2014).
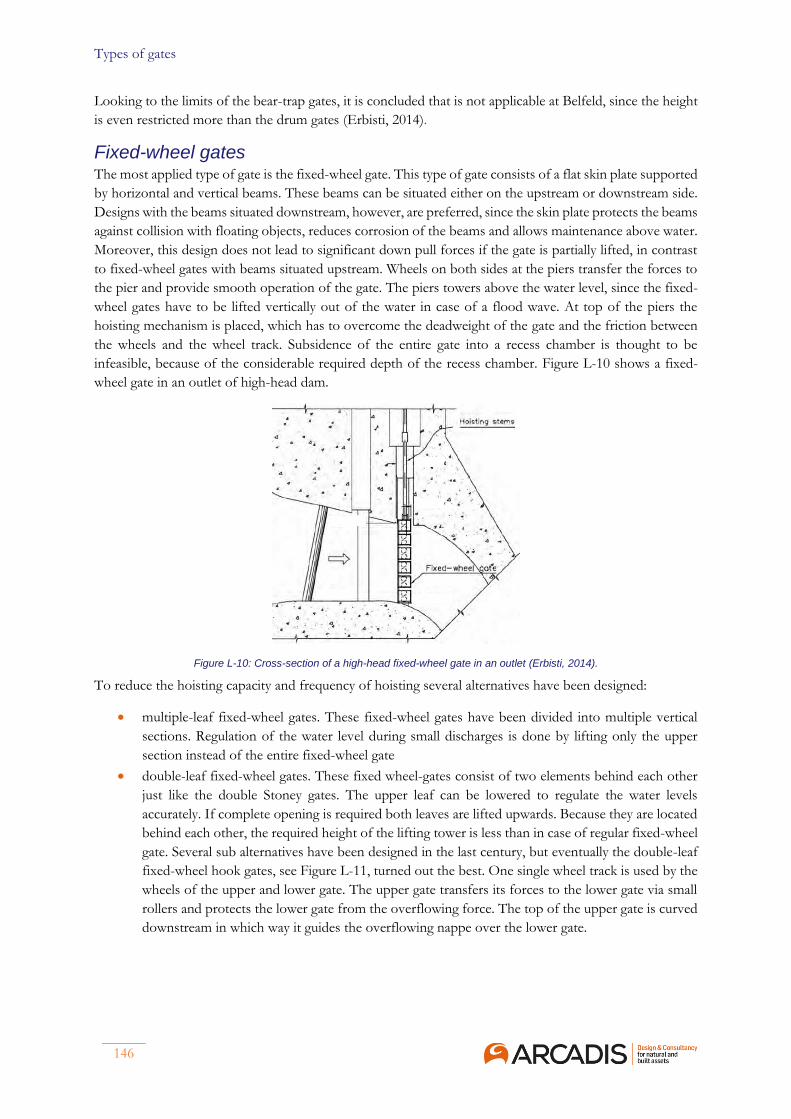
Types of gates
146
Looking to the limits of the bear-trap gates, it is concluded that is not applicable at Belfeld, since the height
is even restricted more than the drum gates (Erbisti, 2014).
Fixed-wheel gates The most applied type of gate is the fixed-wheel gate. This type of gate consists of a flat skin plate supported
by horizontal and vertical beams. These beams can be situated either on the upstream or downstream side.
Designs with the beams situated downstream, however, are preferred, since the skin plate protects the beams
against collision with floating objects, reduces corrosion of the beams and allows maintenance above water.
Moreover, this design does not lead to significant down pull forces if the gate is partially lifted, in contrast
to fixed-wheel gates with beams situated upstream. Wheels on both sides at the piers transfer the forces to
the pier and provide smooth operation of the gate. The piers towers above the water level, since the fixed-
wheel gates have to be lifted vertically out of the water in case of a flood wave. At top of the piers the
hoisting mechanism is placed, which has to overcome the deadweight of the gate and the friction between
the wheels and the wheel track. Subsidence of the entire gate into a recess chamber is thought to be
infeasible, because of the considerable required depth of the recess chamber. Figure L-10 shows a fixed-
wheel gate in an outlet of high-head dam.
Figure L-10: Cross-section of a high-head fixed-wheel gate in an outlet (Erbisti, 2014).
To reduce the hoisting capacity and frequency of hoisting several alternatives have been designed:
• multiple-leaf fixed-wheel gates. These fixed-wheel gates have been divided into multiple vertical
sections. Regulation of the water level during small discharges is done by lifting only the upper
section instead of the entire fixed-wheel gate
• double-leaf fixed-wheel gates. These fixed wheel-gates consist of two elements behind each other
just like the double Stoney gates. The upper leaf can be lowered to regulate the water levels
accurately. If complete opening is required both leaves are lifted upwards. Because they are located
behind each other, the required height of the lifting tower is less than in case of regular fixed-wheel
gate. Several sub alternatives have been designed in the last century, but eventually the double-leaf
fixed-wheel hook gates, see Figure L-11, turned out the best. One single wheel track is used by the
wheels of the upper and lower gate. The upper gate transfers its forces to the lower gate via small
rollers and protects the lower gate from the overflowing force. The top of the upper gate is curved
downstream in which way it guides the overflowing nappe over the lower gate.
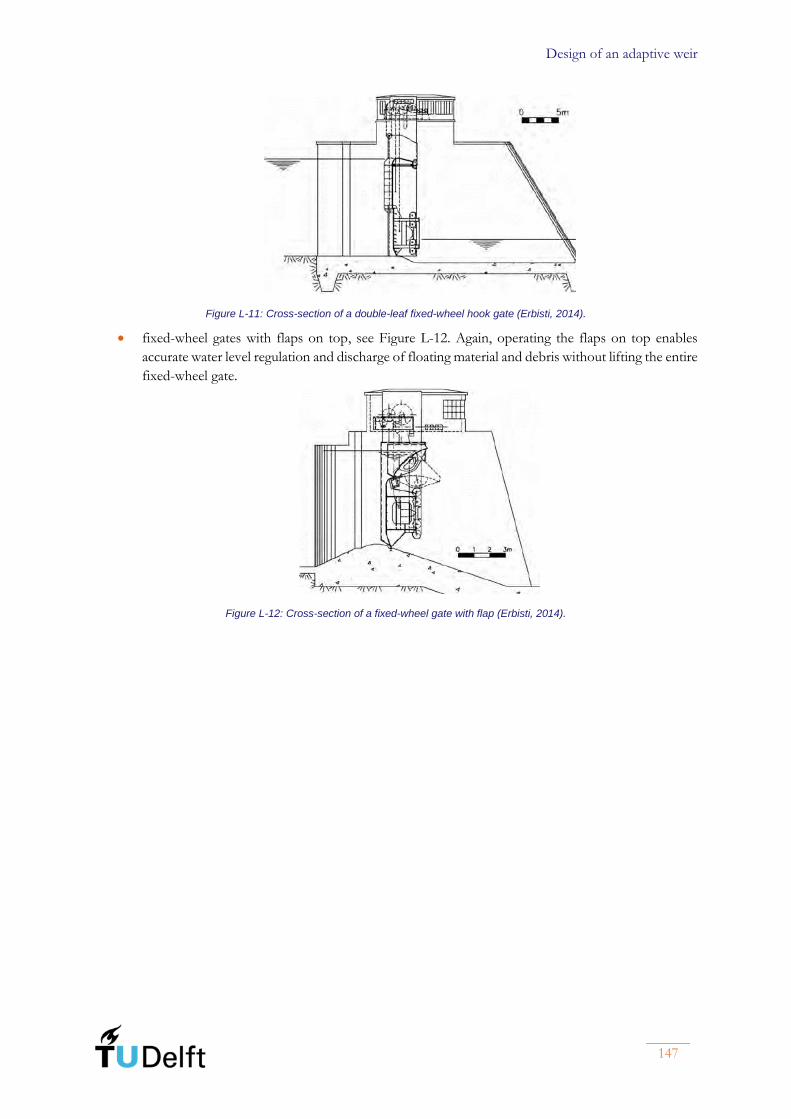
Design of an adaptive weir
147
Figure L-11: Cross-section of a double-leaf fixed-wheel hook gate (Erbisti, 2014).
• fixed-wheel gates with flaps on top, see Figure L-12. Again, operating the flaps on top enables
accurate water level regulation and discharge of floating material and debris without lifting the entire
fixed-wheel gate.
Figure L-12: Cross-section of a fixed-wheel gate with flap (Erbisti, 2014).

Types of gates
148
(This page is intentionally left blank)
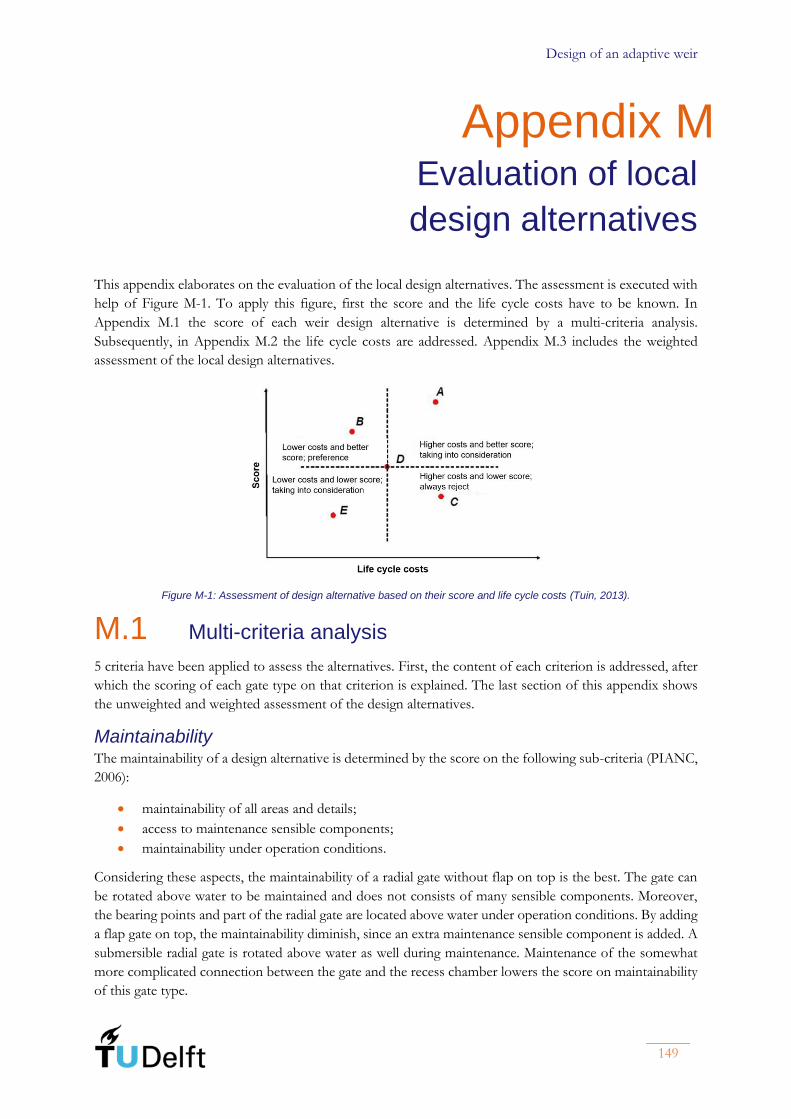
Design of an adaptive weir
149
Appendix M
Evaluation of local
design alternatives
This appendix elaborates on the evaluation of the local design alternatives. The assessment is executed with
help of Figure M-1. To apply this figure, first the score and the life cycle costs have to be known. In
Appendix M.1 the score of each weir design alternative is determined by a multi-criteria analysis.
Subsequently, in Appendix M.2 the life cycle costs are addressed. Appendix M.3 includes the weighted
assessment of the local design alternatives.
Figure M-1: Assessment of design alternative based on their score and life cycle costs (Tuin, 2013).
M.1 Multi-criteria analysis
5 criteria have been applied to assess the alternatives. First, the content of each criterion is addressed, after
which the scoring of each gate type on that criterion is explained. The last section of this appendix shows
the unweighted and weighted assessment of the design alternatives.
Maintainability The maintainability of a design alternative is determined by the score on the following sub-criteria (PIANC,
2006):
• maintainability of all areas and details;
• access to maintenance sensible components;
• maintainability under operation conditions.
Considering these aspects, the maintainability of a radial gate without flap on top is the best. The gate can
be rotated above water to be maintained and does not consists of many sensible components. Moreover,
the bearing points and part of the radial gate are located above water under operation conditions. By adding
a flap gate on top, the maintainability diminish, since an extra maintenance sensible component is added. A
submersible radial gate is rotated above water as well during maintenance. Maintenance of the somewhat
more complicated connection between the gate and the recess chamber lowers the score on maintainability
of this gate type.
Evaluation of local design alternatives
150
The maintainability of (double-leaf) fixed-wheel gates is good as well: the gates can be lifted out of the water
for maintenance. In comparison with radial gates, the maintainability is a little more complicated due to the
maintenance of the wheels and wheel tracks. By setting the downstream side dry, the lower gate of the
double-leaf fixed-wheel can be maintained under operation conditions.
Flap gates score the worst on maintainability of the involved gate types. The rotation axis and sealing is
located at the top of the sill, which complicates the accessibility of these maintenance sensible components.
The gate cannot be lifted out of the water, so maintenance under operation conditions is impossible.
The maintainability of each local design alternative is based on the maintainability of the gates part of the
alternative.
Operationality The operationality of a design alternative is determined by the score on the following sub-criteria (PIANC,
2006):
• capacity and accuracy of river control;
• unavailability for operation due to maintenance;
• convenience of operation.
The capacity and accuracy of river control is not a distinctive sub-criterion of the design alternatives, since
all alternatives include an overflow gate by which the water level is controlled accurately. The second sub-
criterion is dependent on the layout of the entire weir. If a function of the weir, like water level control or
navigability, is only realized by one gate, this function is just partially or not realized during maintenance of
this gate. Therefore, accurate water level control by multiple weir gates score better on this sub-criterion.
The same is true for alternative with two navigable openings instead of one.
The convenience of operation of the radial gates is the best by the small gate weight and small friction.
Hydrodynamic forces are absent during operation. The operation of (double-leaf) fixed-wheel gates is
comparable with that of the radial gates. Again, hydrodynamic forces are absent, since the skin plate is
located at the upstream side. The weight of these gates is somewhat larger than the weight of radial gates.
The operation of a flap gate can involve some inconvenience: vibrations when the weir is in an intermediate
position are not unlikely.
Reliability The reliability of a design alternative is determined by the score on the following sub-criteria (PIANC, 2006):
• vulnerability to sediments, floating debris and ice;
• sensitivity to malfunctions, human errors and ship collision;
• vulnerability to foundation distortions.
Just like for the criterion operationality, the first sub-criterion is not distinctive, since all local design
alternatives are a combination of over- and underflow gates. The second sub-criterion is partially dependent
on the layout of the entire weir. The probability of a ship collision is thought to be larger if the alternative
includes a navigable opening.
The sensitivity to malfunctions and vulnerability to foundation distortions is closely related to the type of
gates. Two factors are decisive for the score on these sub-criteria: opening of the gate under or above water
and the connection between the gates and the piers and/or foundation. Opening of the gates under water,
as submersible radial gates and flap gates, involve a smaller reliability, since the recess chamber can be
obstructed by sediments or other not observable objects. By distortions of the lateral slots and wheel tracks,
the transfer of forces of fixed-gate wheels can be significantly distorted. The total force can be redistributed

Design of an adaptive weir
151
and concentrated at only a part of the wheels, which makes these fixed-wheel gates more vulnerable to
foundation distortions as radial and flap gates, which do not include wheel tracks.
Social impact The criterion social impact includes the following two sub-criteria:
• aesthetics;
• possibility to add a river crossing.
The aesthetics of the new weir are determined by the presence of lift towers. These become remarkable
elements in the environment, which is experienced as visual pollution by the inhabitants and users of the
area.
Addition of a river crossing is possible for all local design alternatives without a navigation opening. If it
includes a navigation opening, it must not limit the air clearance. The river crossing, therefore, has to be
elevated on top of the lift towers. If lift towers are absent, a river crossing at large height is infeasible.
Navigability The navigability of the design alternatives is not directly dependent on the gate type, but on:
• number of navigation openings;
• availability of the navigation openings.
The number of navigation openings of the local design alternatives ranges from zero to two. Of course,
alternatives including two navigation openings score the best. Alternatives with only one navigation opening
can create some delay to the individual vessels, since encounters have to be prevented in the stretch of the
weir by communication means and local regulations, like an overtake prohibition.
A limited air clearance and water depth can reduce the availability of the navigation openings. It is assumed
that lift towers are constructed sufficiently high to not limit the air clearance when the weir is about to open.
During a large flood wave, however, the water level still raises after opening of the navigable opening and
fixed-wheel gates do restrict the height of container vessels. On the other hand, a high elevated sill limits
the maximum draught of the vessels when the weir is about to open. This limitation plays a role particularly
if the location of the set point is located at the theoretical location, since the weir opens in this case at a
lower water level.
Unweighted scoring of local design alternatives Based on the Sections above, the design alternatives have been assessed. The scores on the criteria range
from 1 to 5; a high score indicates a good performance of the design alternative on that criterion. The score
of all design alternatives is shown per criterion in Table M-1. In the unweighted assessment all design criteria
are equally important. The total score only has to be divided by the number of criteria to end up with the
unweighted score of the design alternative.
Table M-1: Score of the design alternatives per design criterion.
Design alternative 1 2 3 4 5 6 7 8 9 10
Maintainability 3 5 1 5 3 5 4 2 4 1
Operationality 2 4 1 4 2 4 3 4 5 2
Reliability 4 5 4 5 3 5 4 2 3 1
Social impact 5 5 3 2 3 3 2 2 3 3
Navigability 1 1 1 1 3 4 3 4 5 4
Total 15 20 10 17 14 21 16 14 20 15
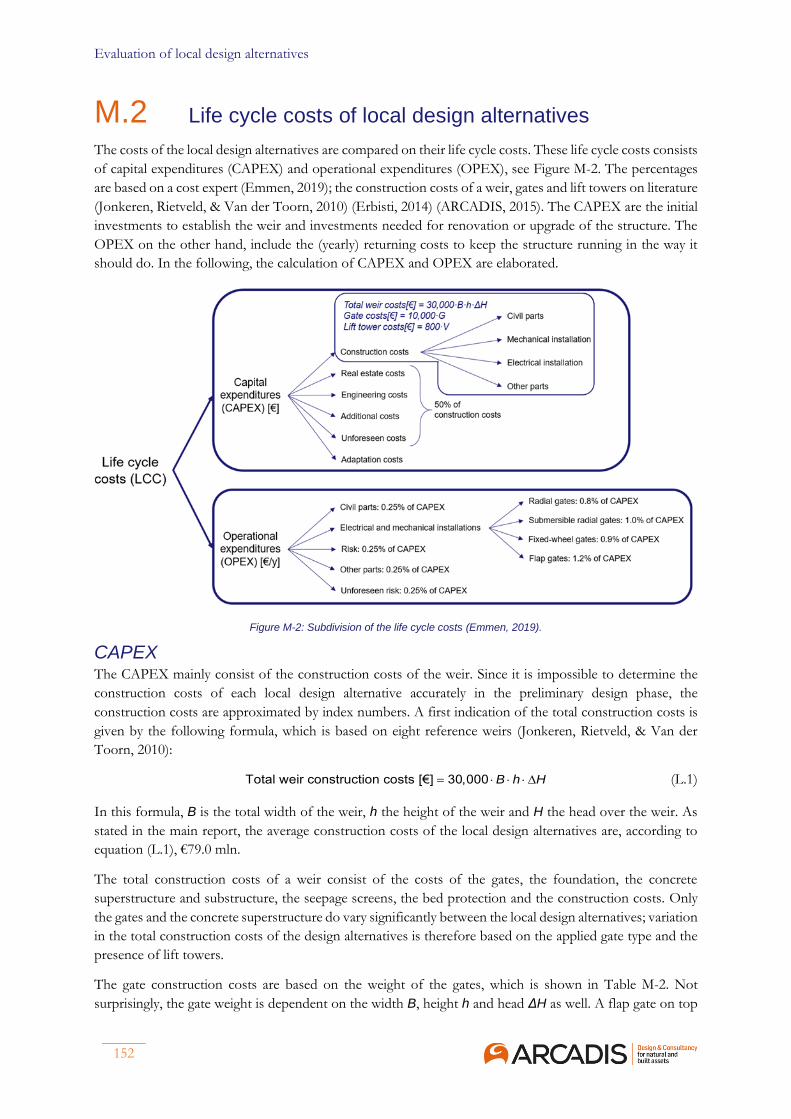
Evaluation of local design alternatives
152
M.2 Life cycle costs of local design alternatives
The costs of the local design alternatives are compared on their life cycle costs. These life cycle costs consists
of capital expenditures (CAPEX) and operational expenditures (OPEX), see Figure M-2. The percentages
are based on a cost expert (Emmen, 2019); the construction costs of a weir, gates and lift towers on literature
(Jonkeren, Rietveld, & Van der Toorn, 2010) (Erbisti, 2014) (ARCADIS, 2015). The CAPEX are the initial
investments to establish the weir and investments needed for renovation or upgrade of the structure. The
OPEX on the other hand, include the (yearly) returning costs to keep the structure running in the way it
should do. In the following, the calculation of CAPEX and OPEX are elaborated.
Figure M-2: Subdivision of the life cycle costs (Emmen, 2019).
CAPEX The CAPEX mainly consist of the construction costs of the weir. Since it is impossible to determine the
construction costs of each local design alternative accurately in the preliminary design phase, the
construction costs are approximated by index numbers. A first indication of the total construction costs is
given by the following formula, which is based on eight reference weirs (Jonkeren, Rietveld, & Van der
Toorn, 2010):
= Total weir construction costs [€] 30,000 B h H (L.1)
In this formula, B is the total width of the weir, h the height of the weir and H the head over the weir. As
stated in the main report, the average construction costs of the local design alternatives are, according to
equation (L.1), €79.0 mln.
The total construction costs of a weir consist of the costs of the gates, the foundation, the concrete
superstructure and substructure, the seepage screens, the bed protection and the construction costs. Only
the gates and the concrete superstructure do vary significantly between the local design alternatives; variation
in the total construction costs of the design alternatives is therefore based on the applied gate type and the
presence of lift towers.
The gate construction costs are based on the weight of the gates, which is shown in Table M-2. Not
surprisingly, the gate weight is dependent on the width B, height h and head ΔH as well. A flap gate on top
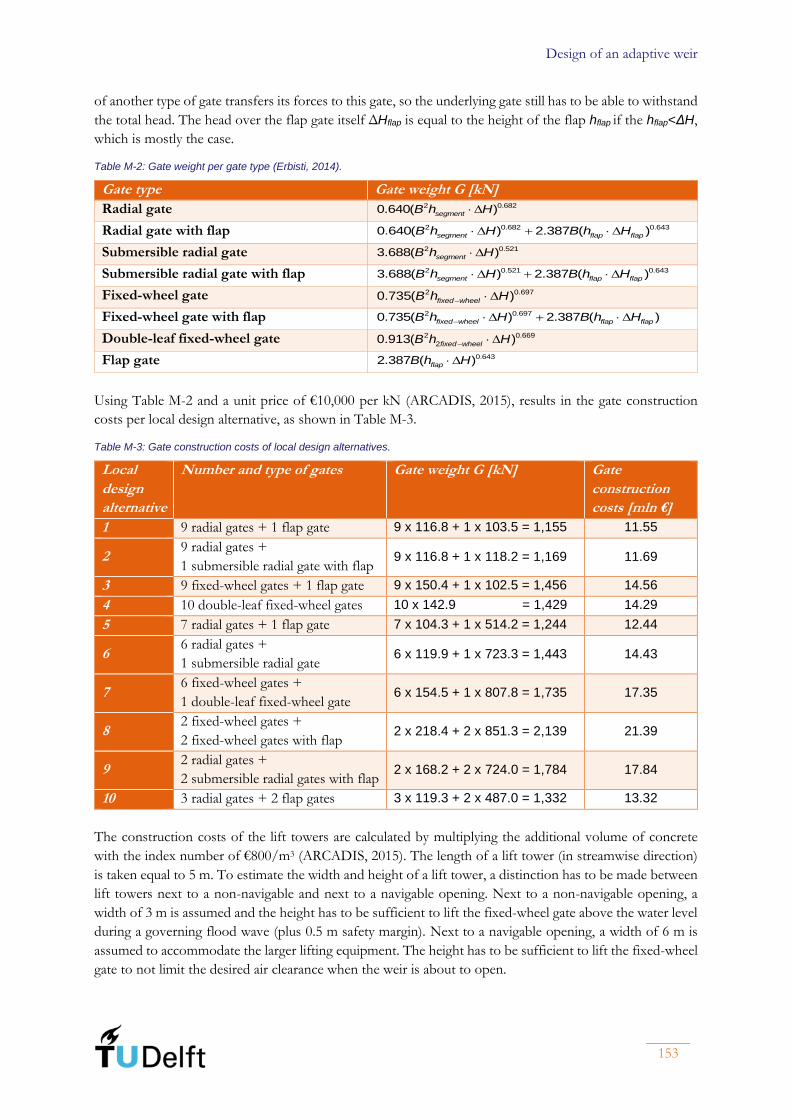
Design of an adaptive weir
153
of another type of gate transfers its forces to this gate, so the underlying gate still has to be able to withstand
the total head. The head over the flap gate itself ΔHflap is equal to the height of the flap hflap if the hflap<ΔH,
which is mostly the case.
Table M-2: Gate weight per gate type (Erbisti, 2014).
Gate type Gate weight G [kN]
Radial gate 2 0.6820.640( )segmentB h H
Radial gate with flap + 2 0.682 0.6430.640( ) 2.387 ( )segment flap flapB h H B h H
Submersible radial gate 2 0.5213.688( )segmentB h H
Submersible radial gate with flap + 2 0.521 0.6433.688( ) 2.387 ( )segment flap flapB h H B h H
Fixed-wheel gate −
2 0.6970.735( )fixed wheelB h H
Fixed-wheel gate with flap − + 2 0.6970.735( ) 2.387 ( )fixed wheel flap flapB h H B h H
Double-leaf fixed-wheel gate −
2 0.669
20.913( )fixed wheelB h H
Flap gate 0.6432.387 ( )flapB h H
Using Table M-2 and a unit price of €10,000 per kN (ARCADIS, 2015), results in the gate construction
costs per local design alternative, as shown in Table M-3.
Table M-3: Gate construction costs of local design alternatives.
Local
design
alternative
Number and type of gates Gate weight G [kN] Gate
construction
costs [mln €]
1 9 radial gates + 1 flap gate 9 x 116.8 + 1 x 103.5 = 1,155 11.55
2 9 radial gates +
1 submersible radial gate with flap 9 x 116.8 + 1 x 118.2 = 1,169 11.69
3 9 fixed-wheel gates + 1 flap gate 9 x 150.4 + 1 x 102.5 = 1,456 14.56
4 10 double-leaf fixed-wheel gates 10 x 142.9 = 1,429 14.29
5 7 radial gates + 1 flap gate 7 x 104.3 + 1 x 514.2 = 1,244 12.44
6 6 radial gates +
1 submersible radial gate 6 x 119.9 + 1 x 723.3 = 1,443 14.43
7 6 fixed-wheel gates +
1 double-leaf fixed-wheel gate 6 x 154.5 + 1 x 807.8 = 1,735 17.35
8 2 fixed-wheel gates +
2 fixed-wheel gates with flap 2 x 218.4 + 2 x 851.3 = 2,139 21.39
9 2 radial gates +
2 submersible radial gates with flap 2 x 168.2 + 2 x 724.0 = 1,784 17.84
10 3 radial gates + 2 flap gates 3 x 119.3 + 2 x 487.0 = 1,332 13.32
The construction costs of the lift towers are calculated by multiplying the additional volume of concrete
with the index number of €800/m3 (ARCADIS, 2015). The length of a lift tower (in streamwise direction)
is taken equal to 5 m. To estimate the width and height of a lift tower, a distinction has to be made between
lift towers next to a non-navigable and next to a navigable opening. Next to a non-navigable opening, a
width of 3 m is assumed and the height has to be sufficient to lift the fixed-wheel gate above the water level
during a governing flood wave (plus 0.5 m safety margin). Next to a navigable opening, a width of 6 m is
assumed to accommodate the larger lifting equipment. The height has to be sufficient to lift the fixed-wheel
gate to not limit the desired air clearance when the weir is about to open.

Evaluation of local design alternatives
154
During estimation of the construction costs, it is assumed that the height of the lift towers cannot be adapted
easily in the future. The height constructed in 2030 has to be sufficient for the entire lifetime, including all
uncertainties in each scenario. Furthermore, it is assumed that the top of the piers of design alternatives
without lift towers are elevated at NAP +15.60 m, which is equal to the elevation of the top of the lock
walls. Then, the height of the lift towers can be calculated by equation (L.2).
= + + −
= + + + + −
, max
, max max
( ) 20.5 15.6 for a non-navigable opening
( ) 11.1 (14.1 ) 15.6 for a naviga
lifttower gate initial adaptation
lifttower gate initial adaptation adaptation
h h h
h h h h ble opening
(L.2)
The height of lift towers of double-leaf fixed-wheel gates is less, because the smaller of the two gates can
be adapted without requiring a larger lifting height. as l construction costs of the lift tower have been
specified per local design alternative in Table M-4.
Table M-4: Construction costs of lift towers of local design alternatives.
Local
design
alternative
Number of lift towers Volume V [m3] Construction costs
of lift towers
[mln €]
1 0 0 0
2 0 0 0
3 10 next to a non-navigable opening 10 x (5 x 3 x 12.4) = 1,860 1.49
4 11 next to a non-navigable opening 11 x (5 x 3 x 9.65) = 1,592 1.27
5 0 0 0
6 0 0 0
7 6 next to a non-navigable opening +
2 next to a navigable opening
6 x (5 x 3 x 13.95) +
2 x (5 x 6 x 18.35) = 3,612 2.89
8 2 next to a non-navigable opening +
3 next to a navigable opening
2 x (5 x 3 x 13.95) +
3 x (5 x 6 x 21.65) = 2,165 1.89
9 0 0 0
10 0 0 0
On average, the construction of the gates and the lift towers costs €15.4 mln. This means that the constant
costs of weir Belfeld are €63.6 mln. To end up with the CAPEX, the real estate costs (like land reclamation),
the engineering costs of the engineering firm and contractor, additional costs like piping and cables and
unforeseen costs, which are all together approximately equal to 50% of the construction costs, have to be
added. The adaptation costs are left out at first instance, since these are highly variable on the adaptation
path. The capital expenditures for weir establishment per design alternative are shown in Table M-5.
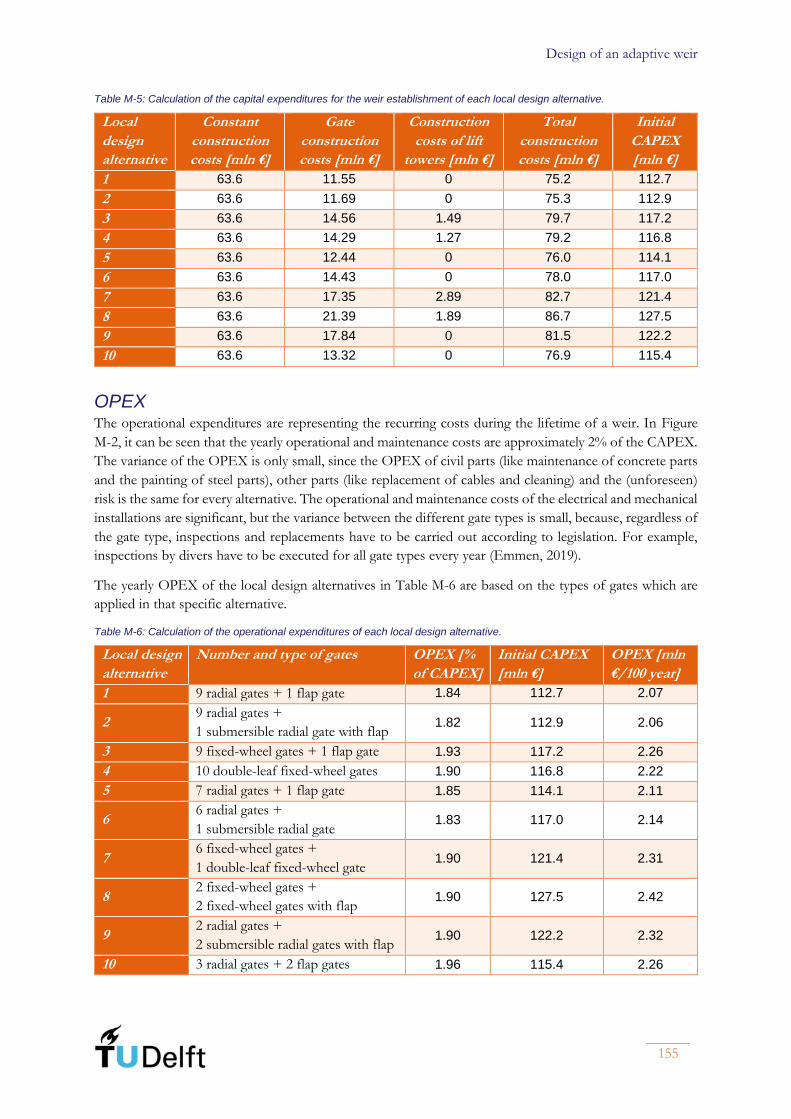
Design of an adaptive weir
155
Table M-5: Calculation of the capital expenditures for the weir establishment of each local design alternative.
Local
design
alternative
Constant
construction
costs [mln €]
Gate
construction
costs [mln €]
Construction
costs of lift
towers [mln €]
Total
construction
costs [mln €]
Initial
CAPEX
[mln €]
1 63.6 11.55 0 75.2 112.7
2 63.6 11.69 0 75.3 112.9
3 63.6 14.56 1.49 79.7 117.2
4 63.6 14.29 1.27 79.2 116.8
5 63.6 12.44 0 76.0 114.1
6 63.6 14.43 0 78.0 117.0
7 63.6 17.35 2.89 82.7 121.4
8 63.6 21.39 1.89 86.7 127.5
9 63.6 17.84 0 81.5 122.2
10 63.6 13.32 0 76.9 115.4
OPEX The operational expenditures are representing the recurring costs during the lifetime of a weir. In Figure
M-2, it can be seen that the yearly operational and maintenance costs are approximately 2% of the CAPEX.
The variance of the OPEX is only small, since the OPEX of civil parts (like maintenance of concrete parts
and the painting of steel parts), other parts (like replacement of cables and cleaning) and the (unforeseen)
risk is the same for every alternative. The operational and maintenance costs of the electrical and mechanical
installations are significant, but the variance between the different gate types is small, because, regardless of
the gate type, inspections and replacements have to be carried out according to legislation. For example,
inspections by divers have to be executed for all gate types every year (Emmen, 2019).
The yearly OPEX of the local design alternatives in Table M-6 are based on the types of gates which are
applied in that specific alternative.
Table M-6: Calculation of the operational expenditures of each local design alternative.
Local design
alternative
Number and type of gates OPEX [%
of CAPEX]
Initial CAPEX
[mln €]
OPEX [mln
€/100 year]
1 9 radial gates + 1 flap gate 1.84 112.7 2.07
2 9 radial gates +
1 submersible radial gate with flap 1.82 112.9 2.06
3 9 fixed-wheel gates + 1 flap gate 1.93 117.2 2.26
4 10 double-leaf fixed-wheel gates 1.90 116.8 2.22
5 7 radial gates + 1 flap gate 1.85 114.1 2.11
6 6 radial gates +
1 submersible radial gate 1.83 117.0 2.14
7 6 fixed-wheel gates +
1 double-leaf fixed-wheel gate 1.90 121.4 2.31
8 2 fixed-wheel gates +
2 fixed-wheel gates with flap 1.90 127.5 2.42
9 2 radial gates +
2 submersible radial gates with flap 1.90 122.2 2.32
10 3 radial gates + 2 flap gates 1.96 115.4 2.26
Evaluation of local design alternatives
156
Weir adaptation costs The weir adaptation costs highly depend on the adaptation path. The weir adaptation costs are only
calculated for ten distinctive adaptation paths for the design alternative 2 and 6. To calculate the weir
adaptation costs, some starting point have been taken into account:
• To calculate the weir adaptation costs, the same equations as shown in Figure M-2 have been
applied.
• It is assumed that during the establishment of the weir, investments in the concrete sub- and
superstructure of the weir are done to prepare the structure for a larger water head ΔH. The size of
this investment is adjusted to the maximum adaptivity of the gates. Thus, if the gates are more
adaptive, the investment in 2030 in the non-adaptive weir parts has to be larger.
• If the discharge capacity of the weir has to be increased to discharge a larger flood wave, the weir
is widened by constructing an additional weir opening. This weir opening is as wide as and the sill
is elevated as deep as the existing non-discharging and/or non-navigable weir openings. In this way,
an identical, reserve weir gate can be placed to close off the additional weir opening. The concrete
sub- and superstructure is also as strong and high as the existing weir. The dimensions of the non-
discharging weir openings of both alternatives are approximately the same, so the required widening
is equally dependent on the changing requirement:
▫ Enlarging the discharge capacity 0-10%: 1 additional weir opening
▫ Enlarging the discharge capacity 10-20%: 2 additional weir openings
▫ Enlarging the discharge capacity: 20-30%: 3 additional weir openings
• If the dammed water level has to heightened, the water head ΔH and height h increase. Both
parameters result in larger gate adaptation costs. The adaptation costs of the concrete
superstructure only consist of investments in the height, since investments to withstand the larger
water head are done in 2030 (see bullet 2 of this summation).
• The operational expenditures are calculated with help of the percentages in Table M-6. The applied
value of the CAPEX is the summation of the initial investments and the adaptation costs.
The ten adaptation paths are selected such that a wide range of desired adaptivity is created. The adaptation
paths are allocated to the most logical of the four delta scenarios. An adaptation path can also occur in other
scenarios than the scenario to which it is allocated. If the adaptivity of the weir is insufficient to meet the
desired adaptivity of that adaptation path, regional adaptation measures are needed. These are not taken into
account, since these regional adaptation measures have possibly already been executed for other purposes,
before these measures are needed according to the adaptation path.
The ten adaptation paths are shown in Figure M-3 to Figure M-6, including the life cycle costs of the design
alternatives 2 (orange) and 6 (pink) for each adaptation path. The life cycle costs are split into the initial
investment for the establishment of the weir, the adaptation costs, the gate replacement cost and the
operational expenditures. If the bar in the diagram is only outlined, the weir adaptivity is insufficient the
meet the evolved requirements. The costs of regional adaptation measures have to be added to end up with
the life cycle costs in the entire regional design area.
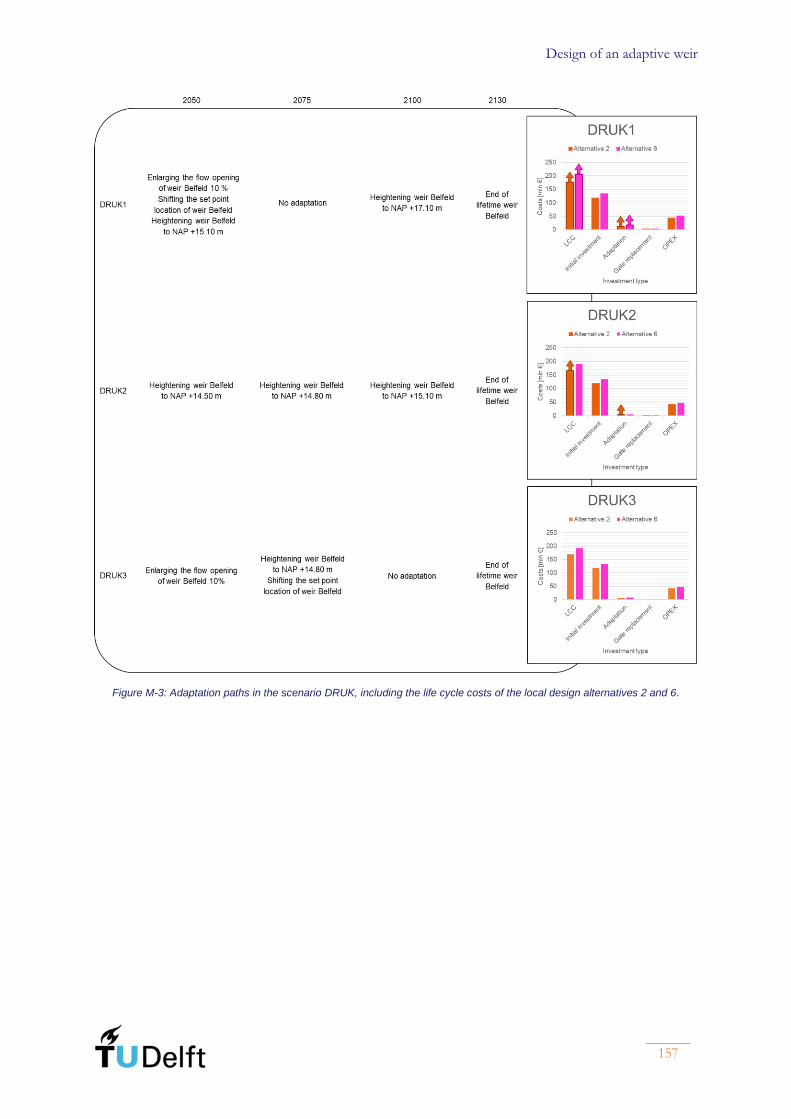
Design of an adaptive weir
157
Figure M-3: Adaptation paths in the scenario DRUK, including the life cycle costs of the local design alternatives 2 and 6.
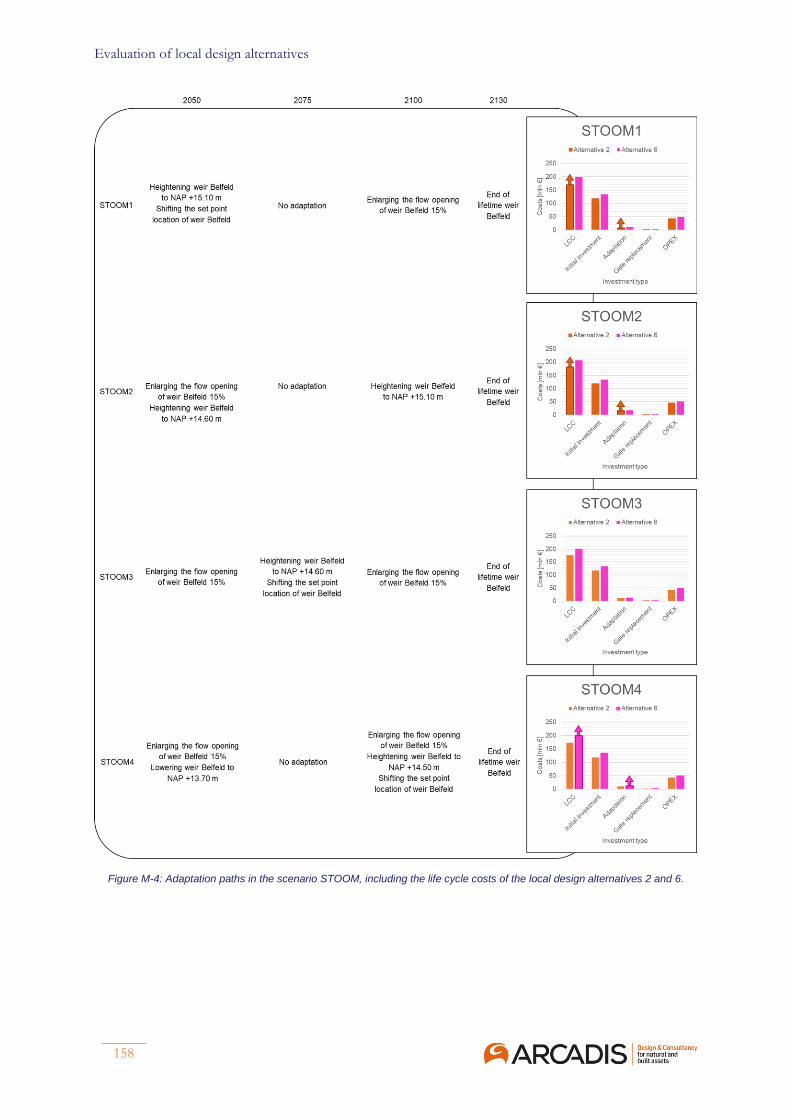
Evaluation of local design alternatives
158
Figure M-4: Adaptation paths in the scenario STOOM, including the life cycle costs of the local design alternatives 2 and 6.

Design of an adaptive weir
159
Figure M-5: Adaptation paths in the scenario RUST, including the life cycle costs of the local design alternatives 2 and 6.
Figure M-6: Adaptation paths in the scenario WARM, including the life cycle costs of the local design alternatives 2 and 6.
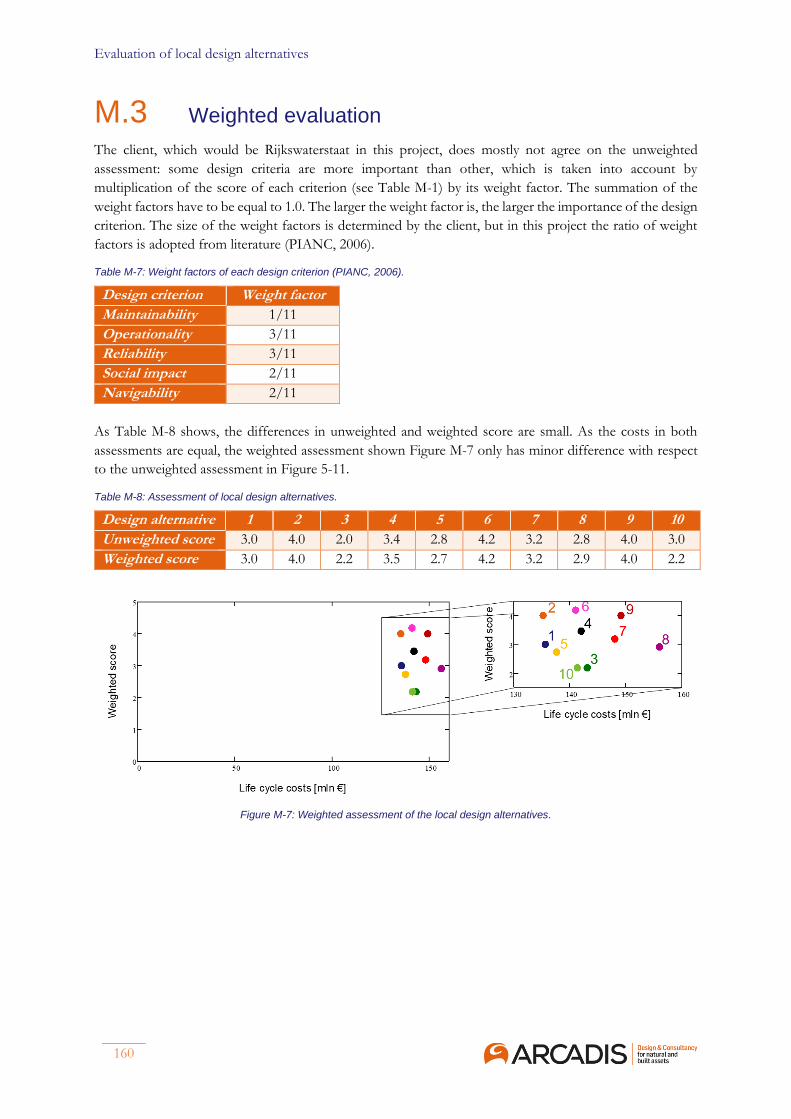
Evaluation of local design alternatives
160
M.3 Weighted evaluation
The client, which would be Rijkswaterstaat in this project, does mostly not agree on the unweighted
assessment: some design criteria are more important than other, which is taken into account by
multiplication of the score of each criterion (see Table M-1) by its weight factor. The summation of the
weight factors have to be equal to 1.0. The larger the weight factor is, the larger the importance of the design
criterion. The size of the weight factors is determined by the client, but in this project the ratio of weight
factors is adopted from literature (PIANC, 2006).
Table M-7: Weight factors of each design criterion (PIANC, 2006).
Design criterion Weight factor
Maintainability 1/11
Operationality 3/11
Reliability 3/11
Social impact 2/11
Navigability 2/11
As Table M-8 shows, the differences in unweighted and weighted score are small. As the costs in both
assessments are equal, the weighted assessment shown Figure M-7 only has minor difference with respect
to the unweighted assessment in Figure 5-11.
Table M-8: Assessment of local design alternatives.
Design alternative 1 2 3 4 5 6 7 8 9 10
Unweighted score 3.0 4.0 2.0 3.4 2.8 4.2 3.2 2.8 4.0 3.0
Weighted score 3.0 4.0 2.2 3.5 2.7 4.2 3.2 2.9 4.0 2.2
Figure M-7: Weighted assessment of the local design alternatives.

Design of an adaptive weir
161
(This page is intentionally left blank)
Evaluation of local design alternatives
162