Forecasting the incoming flows - TU Delft Repositories
196
Forecasting the incoming flows Identifying and understanding the incoming logistical flows at the Logistics Center KLM E&M with a supply chain perspective. KLM Engineering & Maintenance Jan-Hoite van Hees 25 June 2009 Master Thesis Research Systems Engineering, Policy Analysis and Management Delft University of Technology
-
Upload
khangminh22 -
Category
Documents
-
view
0 -
download
0
Transcript of Forecasting the incoming flows - TU Delft Repositories

Forecasting the incoming flows
Identifying and understanding the incoming logistical flows at the Logistics Center KLM E&M with a supply chain
perspective.
KLM Engineering & Maintenance Jan-Hoite van Hees 25 June 2009 Master Thesis Research Systems Engineering, Policy Analysis and Management Delft University of Technology

MSc Thesis Jan-Hoite van Hees ii

iii
Master Thesis Research Project:
“Forecasting the incoming flows” Company KLM Engineering and Maintenance Initiator KLM Dhr. E. Rijnbeek (Operational Manager CS Logistics) Applicant Jan-Hoite van Hees Student number 1193341 E-Mail [email protected]; [email protected]; [email protected] Study Master of Science: System Engineering, Policy Analysis
and Management University Delft University of Technology Faculty of Technology, Policy and Management Graduation committee Professors Prof. Dr. G.P. van Wee
Prof. Dr. Ir. L.A. Tavasszy (Transport Policy & Logistics’ Organization)
1st Supervisor TU Delft Drs. J.H.R. van Duin (Transport Policy & Logistics’ Organization)
2nd Supervisor TU Delft Dr. J. Barjis (Systems Engineering)
External supervisor J. Schilder MSc (KLM Engineering and Maintenance, CS Logistics)

MSc Thesis Jan-Hoite van Hees iv

Preface
“Forecasting the incoming flows” v
Preface This research, with the subject to provide future insight in the incoming flows at the logistics center of KLM Engineering & Maintenance (E&M), has been the final assignment of the master programme "Systems Engineering, Policy Analysis and Management" at the faculty of Technology, Policy and Management at the Delft University of Technology. The performed research was commissioned by the logistics department of KLM E&M. Thankfully for reaching this final milestone of my student career and on the doorstep of my first steps in the 'real world' I’d like to take the opportunity to thank several people to reach this point in my life. First of all, my supervisors at the Delft University of Technology, Ron van Duin, Joseph Barjis and Bert van Wee deserve an acknowledgment for providing the support, trust and confidence to let me choose my own research direction and critically guard the research process. A special thank-you goes out to Lori Tavasszy who was so kind to step in at the latest possible moment to enable my graduation. At KLM E&M my grate goes out to the members of the management team of the CS logistics department, Jasper Schilder, Leo Vennik, Yung-Li Sie and Ed Rijnbeek, who all provided their own individual input which made this research as complete as possible from the logistics point of view. They all contributed significantly to the eventual quality of this report. Furthermore, I'd like to thank Martin Monsees, Willy Eckstein, Farried Kassim and all other expedition employees at the logistics center for their endless patience and hospitality to show me their daily working processes and to provide me with very valuable feedback from the daily operational point of view. Most of all, I’d like to thank my family and friends in absorbing my mood swings and providing me with the space and distractions so badly needed in times of stress regarding the deadlines (I missed) and the pitfalls (I ended up in)! So Bianca, Myrthe-Joy and Amber-Lynn: This one is for the three of you! I hope you enjoy reading my report, With kind regards, Jan-Hoite April 2009

MSc Thesis Jan-Hoite van Hees vi

Summary
“Forecasting the incoming flows” vii
Summary KLM Engineering and Maintenance (E&M) is, besides KLM Passengers and KLM Cargo, one of three core businesses of KLM NV (www1, 07/04/2009). Its primary operation is the maintenance of aircrafts. The organization has approximately 5.000 employees and is mainly located at the Schiphol-Oost area of Amsterdam Airport Schiphol. KLM E&M is the largest technical organization in the Netherlands and together with Air France Industries (AFI) the company ranks among the world largest providers of maintenance, repair and overhaul services for aircraft. To reduce logistics costs and improve the logistics service level, a logistics center was designed and implemented last year (Schilder, 2007) at the Schiphol-Oost area where the majority of the KLM E&M buildings are located. All incoming and outgoing KLM E&M good flows are routed through this logistics center. All good flows are part of the KLM E&M supply chain. This KLM E&M supply chain is determined by the ‘rotable cycle’, in which components (aircraft parts which can be repaired) rotate between customer, vendor and warehouse. Expendable parts (aircraft parts for which the cost of repair are higher than the costs of a new item) only follow a part of the component supply chain because they practice a more conventional one-way path from vendor to warehouse to customer (or directly from vendor to customer). The supply chain determines the incoming flows in the logistics center. Because the LC is the logistical hub within KLM E&M, most flows pass the LC. So the LC can be pictured in the supply chain between all supply chain stakeholders (Figure 1):
Figure 1 KLM E&M supply chain including Logistics Center The manager of the logistics center has requested a research to improve the insight in the incoming flows at the logistics center. This lack of insight was experienced as troublesome because it hindered the development of a planning and distribution of resources over time. The goal of the request was to improve the insight in the incoming flow such that a better estimation could be made about whether or not off days- and holiday requests should be granted or not. Furthermore the improved insight would make future abnormalities in the flow visible and thus counteractive resource management possible. Because of these goals the research question was defined as follows:
“What is needed for KLM E&M to improve their insight in the incoming flow at the Logistics Center and how can this be realized?”
In order to provide an answer to this question the research was executed in two sequential parts:
Part I ~ Analysis of the current situation Part II ~ Development of a forecast module
Part I ~ Analysis of the current situation Goal of Part I of the research was to thoroughly analyze the current situation to develop a complete picture of incoming flows at the logistics center, involved parties, involved IT applications and the processes involved. Also the performance of these processes has been analyzed. The incoming flows at the logistics center can be divided into two categories (visualized in Figure 2):
o Incoming Internal flows o Incoming External flows

Summary
MSc Thesis Jan-Hoite van Hees viii
The incoming internal flows are originated by internal E&M parties such as hangars or repair shops. These internal flows are brought in by an electric vehicle which makes its run once every hour, or by trucks which are used to pick up goods which aren’t allowed to transport in the electric vehicle. The incoming external flows are originated by external parties such as customers (e.g. Atlas Air, Garuda Indonesia or Kenya Airways) or vendors (such as Boeing, General Electric or Honeywell). These goods are shipped by KLM Cargo, which is hired by KLM E&M as their logistics agent. Furthermore, there is an extensive goods flow between AirFrance Industries and KLM E&M which is transported once a day in a shuttle truck. The involved parties with respect to the incoming flows can also be divided into two groups: internal E&M stakeholders and external stakeholders. Internal stakeholders are the different KLM E&M maintenance units which execute their maintenance operations and rely on the logistics departments for the availability of the right material at the right place at the right time. The internal stakeholders can be distinguished per physical location:
o VOC (Line Maintenance Schiphol Center) o H14 (Base Maintenance Wide Body and Base Maintenance Support Shops) o H11 (Base Maintenance Wide Body) o H10 (Base Maintenance Narrow Body) o Engine Services (Power plant maintenance) o Avionics and Accessories (Component maintenance)
External stakeholders are divided in the role the have within the KLM E&M supply chain: o Customers (Fellow airlines purchasing maintenance services by KLM E&M) o Vendors (Manufacturers or repair agents delivering new or repaired aircraft part to KLM
E&M The involved IT applications with respect to the incoming flows can also be divided in two groups:
o Logistical supportive IT applications: Tracking and Scarlos o Maintenance supportive IT applications: SAP and Crocos
Tracking and Scarlos are used by respectively KLM E&M and KLM Cargo to monitor logistic flows. Both systems are based on the labelling of packages with stickers. All stickers, and thus all packages, contain a unique barcode which is scanned twice with every physical movement of the package (pick up and drop). Furthermore Scarlos and Tracking provide additional information about the packages such as the originating party and destination. Tracking and Scarlos are both ‘feeded’ with input data from the SAP and Crocos system. SAP is a very extensive software package which in use by KLM E&M. SAP is the projected system of the future and current projects are running to replace ‘old’ systems by SAP functionalities. Currently KLM E&M is in a ‘transitional’ phase in which some functionalities are already performed by SAP, while others are still performed by other systems. SAP already is in use for the purchasing of new material and the financial administration regarding external repairs. These SAP procedures (with physical good movement as outcome) also include interfaces with Tracking and Scarlos to handle the physical logistics execution.
Figure 2 Incoming flows at the logistics center
Logistics Centre
Extern
Intern
1
2.1
2.2
1.1
1.2
1.2.3
1.2.2
1.2.1
2
KLM directed
Not KLM directed
Air France Truck
Electric “Train”
Netherlands flow
Europe flow
Outside Europe flow
Trucks
1.3

Summary
“Forecasting the incoming flows” ix
Crocos is a system which is in place for the administration of rotable components of the components services department of KLM E&M. It is used for the requests and storing of components and logs the whereabouts of every single component. Movements of components are entered in Crocos, after which a connection with Tracking and Scarlos is made and the logistical information is ready for the users in the supply chain. The process which is in place handling the incoming flows at the logistics center are (on a meta-level) part of the E&M-AFI process “to provide operational logistics”. In detail, the process of handling the incoming flows at the logistics center can be separated in four sub processes:
o Report component received at LC (TCOV) – this is an administrative procedure in Crocos which acknowledges the receipt of the component. This process step does only apply to CS components.
o Label goods with Tracking Sticker – goods without a logistics label have to be labelled with a Tracking sticker before sending to their next location.
o Sort Incoming flows – Labelled goods are sorted based on their final destination. o Transport Incoming sorted goods
In a performance analysis these involved flows, parties, IT applications and processes have been analyzed on two levels: strategically and operationally. Strategic performance analysis: In order to analyze the inbound flow as a whole, representatives of all involved parties were invited for a joint examination of the experienced key issues. Based on these issues, criteria and potential solutions were brainstormed. The results of the session give a good insight in structural experienced issues in the inbound supply chain:
o Lack of 1 IT-system for the whole supply chain o (Un)reliability master data in all systems o Packages which are accepted without meeting the KLM E&M logistics input rules
Solutions which were identified are: o Improvement of the teamwork between the strategic purchasing and operational business units
with regard to contract and supplier management. o Joint development and implementation of unambiguous and mutually accepted key
performance indicators (KPI’s). o Confronting vendors and customers with their faults. o Minimization of the number of needed IT systems, with optimization of the interfaces between
them. These improvement suggestions have been communicated within the KLM E&M organization. Operationally, the performance analysis has been more concrete and has been focused on practically applicable improvement suggestions. Improvement areas which are identified are the logging and communication of IT-failures and input-rule violations as well as the realization of sufficient facilities at the department to execute the processes as efficient as possible. Also, there is an insight lacking in historic and future inbound flows. This lack of insight hinders an efficient resource planning as well as proper evaluation of the performance. The latter problem was subject to part II of the research. Part II ~ Development of a forecast module Part II of the research has been the development of a forecast module to gain future insight in the incoming flows at the logistics center. This development has been executed in four consecutive steps:
o Conceptualization o Specification o Validation & Verification o Implementation
In the conceptualization phase IT application Tracking was identified as the data source for the forecast module. However, due to the earlier described ongoing system configuration changes, Tracking will most probably be replaced by a SAP module within the coming 5 years. Therefore two conceptualization researches has been conducted: one study for a forecast model based on the Tracking system in the current system configuration and a second study for a forecast module based on the SAP module. The latter study has been conducted as a systems engineering research and its output is formed by functional requirements and constraints which can be used when such a SAP module is designed.

Summary
MSc Thesis Jan-Hoite van Hees x
Forecast Flow Expeditie LC
625
576 587
634
703
222 232
649 631657
679640
221 232
645603 606
659707
214 220
587 583
697
761
590
218201
0
100
200
300
400
500
600
700
800
Monday
Tuesd
ay
Wednes
day
Thursd
ayFrid
ay
Saturda
y
Sunda
y
Monday
Tuesd
ay
Wednes
day
Thursd
ayFrid
ay
Saturda
y
Sunda
y
Monday
Tuesd
ay
Wednes
day
Thursd
ayFrid
ay
Saturda
y
Sunda
y
Last week current week Next week
# of
uni
que
pack
ages
at t
he
expe
ditio
n of
the
LC
Planning Actual
The conceptualization study for the forecast model based on Tracking identified the importance of the differentiation of three parameters: origins of the flows (parameter 1) within an overview of number of incoming packages (parameter 2) per timeframe (parameter 3). In the specification phase, these parameters were thoroughly developed. The originating parties were specified (all E&M locations + extern + unknown) and a query was build to subtract the data from the business intelligence module which is in use for Tracking data evaluation, Business Objects XI. This query resulted in an overview of the total flow which is processed at the expedition of the logistics center (Figure 3). The data has been used to test two alternative forecast methods. The forecast methods (simple moving average and exponentially moving weighted average) resulted in eight alternatives which were evaluated based on their statistical accuracy. An exponentially moving weighted average model with an alpha-value of 0.1 was found to be the most accurate although the differences between the models were statistically very small.
As verification and validation of the model, the model input parameters have been checked, a sensibility analysis has been performed, experts working in the inbound flow have been consulted about the accuracy of the data and the comparison of the different forecast alternatives has been validated by analysis of a second data group. This analysis confirmed the choice for the exponentially weighted moving average method, but suggested for a slightly bigger alpha value. In the implementation phase, the model (Figure 4) and the weekly working procedure were secured within the KLM E&M organization. The result of part II is, except the forecast model, also an overview of the historic weekly processed volume
Figure 3 Tracking data output
Figure 4 Forecast model

Summary
“Forecasting the incoming flows” xi
(Figure 3), an overview of the percentage of scans per hour and an overview of the destination of the packages incoming with the external flow. These additional graphs were identified as necessary by interviewing the involved KLM employees. Conclusions and recommendations This research has shown that the insight in the incoming flows at the logistics center of KLM Engineering & Maintenance (E&M) has been improved by the evaluation of data which is collected by the logistics IT application Tracking. To realize future insight in the incoming flows a forecast model has been developed and implemented in the business operation. Due to system configuration changes which are scheduled within five years, this model may become unavailable due the replacement of the Tracking application by the SAP IT application. Anticipating on this development, requirements for a SAP forecast module has been developed. These requirements can be used for designing a SAP based forecast module, which can be placed is use when the Tracking system will be shut down. This enables a future insight in the incoming flows at the logistics center of KLM Engineering and Maintenance for years to come. The forecast model should be re-evaluated by every major process change in the handling of the incoming flows, because these changes could affect the reliability of the model. Furthermore the future SAP forecast module should, within the framework of the suggested requirements, be developed in close cooperation with the operational business departments to prevent a mismatch between functionality and expectations from occurring. The efficiency of the handling of the incoming flow could be improved by setting up a registration framework for IT application hick-ups and input rule violations. This framework should enable back-office departments to follow through on experienced failures and improve the handling of the incoming flows structurally. Furthermore, to enable better measurement of the expedition departments’ performance, it would be advisable to measure the exact moment of entrance of external goods at the logistics center.

Table of Content
MSc Thesis Jan-Hoite van Hees xii

Table of Content
“Forecasting the incoming flows” xiii
Table of Content Preface......................................................................................................................................................v Summary ................................................................................................................................................vii Chapter 1 Introduction..............................................................................................................................1
1.1 Problem Description ......................................................................................................................1 1.2 Research Scope..............................................................................................................................2
1.2.1 Research Goals.......................................................................................................................2 1.2.2 Research Questions ................................................................................................................2
1.3 Research approach .........................................................................................................................3 1.4 Data acquisition: Interviews ..........................................................................................................4 1.5 Report Outline ...............................................................................................................................5
Part I ~ Analysis of the current situation .............................................................................................6 Chapter 2 The Incoming flows at the Logistics Center ............................................................................9
2.1 Background information: Aircraft maintenance operation executed by KLM Engineering and Maintenance.........................................................................................................................................9
2.1.1 Aircraft Maintenance operation at KLM E&M....................................................................10 2.1.2 Aircraft Maintenance logistics .............................................................................................13 2.1.3 Geographical lay-out............................................................................................................14
2.2 Identification of the incoming flows............................................................................................16 2.2.1 E&M supply chain ...............................................................................................................16 2.2.2 External incoming flows ......................................................................................................18 2.2.3 Internal incoming flows .......................................................................................................19 2.2.4 Overview incoming flows....................................................................................................19
2.3 Analysis of the incoming flows ...................................................................................................20 2.3.1 Analysis of the external incoming flows..............................................................................21 2.3.2 Analysis of the internal incoming flows ..............................................................................22
2.4 Involved IT applications and Material management departments E&M .....................................24 2.4.1 IT application SAP...............................................................................................................24 2.4.2 IT application Scarlos ..........................................................................................................25 2.4.3 IT application Crocos...........................................................................................................25 2.4.4 IT application Tracking........................................................................................................25 2.4.5 Material management E&M................................................................................................26
2.5 Summary Chapter 2 The incoming flows at the logistics center..................................................27 Chapter 3 KLM E&M Logistics Processes.............................................................................................29
3.1 KLM E&M Global Supply Chain Processes ...............................................................................29 3.2 KLM E&M Logistics Center Expedition Processes “Handling incoming flows” .......................31
3.2.2 External incoming flows ......................................................................................................31 3.2.1 Internal incoming flows .......................................................................................................32
3.3 Summary Chapter 3 KLM E&M Logistics Processes .................................................................32 Chapter 4 Performance Analysis ............................................................................................................33
4.1 Strategic logistics performance analysis ......................................................................................34 4.1.1 Used Method – Collaborative Decision Making..................................................................34 4.1.2 Identified problems ..............................................................................................................35 4.1.3 Identified criteria..................................................................................................................36 4.1.4 Identified solutions...............................................................................................................36 4.1.5 Conclusion and recommendations strategic logistics analysis .............................................36
4.2 Operational logistics performance analysis .................................................................................38 4.2.1 Used Method........................................................................................................................38 4.2.2 Process analysis ...................................................................................................................39 4.2.3 Physical lay out ....................................................................................................................39 4.2.4 IT system lay out..................................................................................................................40 4.2.5 Resource planning................................................................................................................40 4.2.6 Conclusion and recommendations operational logistics analysis.........................................40

Table of Content
MSc Thesis Jan-Hoite van Hees xiv
4.3 Conclusions and recommendations Chapter 4 performance analysis ..........................................41 Chapter 5 Conclusions part I ..................................................................................................................42
5.1 Conclusions..................................................................................................................................43 5.2 Recommendations........................................................................................................................43
Part II ~ Development of a forecast module.......................................................................................45 Chapter 6 Conceptualization ..................................................................................................................47
6.1 Conceptualization – Current system configuration (Tracking & Crocos)....................................47 6.1.1 Included flows......................................................................................................................47 6.1.2 Geographical demarcation ...................................................................................................48 6.1.3 Forecast parameters..............................................................................................................48
6.2 Conceptualization – Future system configuration (SAP).............................................................48 6.2.1 Design Boundaries ...............................................................................................................49 6.2.2 Opportunity ..........................................................................................................................50 6.2.3 Measures of effectiveness ....................................................................................................52 6.2.4 Need identification...............................................................................................................52 6.2.5 Operational Concept ............................................................................................................53 6.2.6 Requirements Analysis ........................................................................................................53
6.3 Summary Chapter 6 Conceptualization .......................................................................................54 Chapter 7 Specification, data sources and model development..............................................................55
7.1 Characterization of the needed data .............................................................................................55 7.2 Data source ..................................................................................................................................56
7.2.1 Tracking ...............................................................................................................................58 7.2.2 Business Objects XI .............................................................................................................59
7.3 Data analysis output.....................................................................................................................60 7.3.1 Monthly analysis ..................................................................................................................60 7.3.2 Weekly analysis ...................................................................................................................61 7.3.3 Daily analysis.......................................................................................................................61
7.4 Forecasting tool ...........................................................................................................................62 7.4.1 Forecasting methods ............................................................................................................62 7.4.2 Forecasting alternative models.............................................................................................62
7.5 Summary Chapter 7 Specification, data sources and model development...................................65 Chapter 8 Verification and Validation....................................................................................................67
8.1 Verification ..................................................................................................................................67 8.1.1 Input and output variables....................................................................................................67 8.1.2 Model logic ..........................................................................................................................68
8.2 Validation ....................................................................................................................................69 8.2.1 Expert Validation .................................................................................................................69 8.2.2 Validation by data group 2...................................................................................................69
8.3 Summary Chapter 8 verification and validation ..........................................................................70 Chapter 9 Forecast output and implementation in the business operation..............................................71
9.1 Forecast output.............................................................................................................................71 9.2 Implementation in the business operation....................................................................................74 9.3 Summary Chapter 9 Forecast output and implementation in the business operation...................75
Chapter 10 Conclusions part II ...............................................................................................................76 10.1 Conclusions................................................................................................................................76 10.2 Recommendations......................................................................................................................77
Chapter 11 Conclusions and recommendations......................................................................................78 11.1 Conclusions................................................................................................................................78 11.2 Recommendations......................................................................................................................80 11.3 Reflection...................................................................................................................................81
References ..............................................................................................................................................82

Table of Content
“Forecasting the incoming flows” xv
List of Appendices ................................................................................................................................86 Appendix I. Organizational Structure KLM Engineering and Maintenance. .........................................87 Appendix II: Maintenance costs .............................................................................................................88 Appendix III Sodexo Transport Schedule ..............................................................................................89 Appendix IV KLM E&M process schemes “Operational logistics and Material resources” .................98 Appendix V SADT process map of current process ‘Handling Incoming flows’ at Logistics Center of KLM E&M. ..........................................................................................................................................108 Appendix VI. Forecast data sheets .......................................................................................................111 Appendix VII. Interview summaries ....................................................................................................135 Appendix VIII Agenda Group Support System Session.......................................................................141 Appendix IX Evaluation GSS Session .................................................................................................144 Appendix X “Forecast methods compared in a logistics case study.....................................................164 Appendix XI. IT support systems in active use by KLM E&M. ..........................................................174 Appendix XII Tracking interfaces with SAP and Crocos.....................................................................179
XI.1 Tracking interfaces with SAP..................................................................................................179 XI.2 Tracking interfaces with Crocos..............................................................................................180


Chapter 1 Introduction
“Forecasting the incoming flows” 1
Chapter 1 Introduction In April 2008 the new Logistics Center (LC) of KLM Engineering & Maintenance (KLM E&M) has become operational. The LC is designed to be the only entrance and exit point for goods at KLM E&M. This centralization enables a logistical chain with one point for import and export custom formalities, administrative incoming goods handling, administrative external repair formalities and a warehouse for aircraft components (Bron, 2007) The realization of the LC was a big stepping stone for the E&M organization to professionalize its logistics (Schilder, 2007). KLM E&M targets to improve the level of service even further with implementing and anchoring optimized logistics operations in the business processes (Rijnbeek, 2008). Taking this step requires the organization to adapt processes, change the working procedures and get insight in the performance and workload. This research will elaborate on the incoming flows at the LC with a supply chain perspective.
1.1 Problem Description Last April the Logistics Center (LC) of KLM Engineering & Maintenance became operational (KLM E&M, 2008). This logistical center aims to be ‘the gateway to KLM E&M’. All goods sent to and from KLM E&M pass through this logistical hub (Figure 5).
Logistics Centre
‘Unservicealbe’ flow in
‘Serviceable’ flow in
KLM E&M Internally
External parties‘Unserviceable’ flow out
Conceptual view of the position Logistics Centre in KLM E&M physical material flows.
KLM intern
Externe partijen
KLM intern
Externe partijen
‘Serviceable’ flow outKLM intern
Externe partijen
1.6
1.7
1.8
1.9
KLM E&M Internally
External parties
KLM E&M Internally
External parties
KLM E&M Internally
External parties
Figure 5 Conceptual view of the position Logistics Center in KLM E&M physical material flows. One of the biggest advantages of this Logistics Center is the centralization of several logistical activities on one location: The administrative custom formalities (import and export), the administrative formalities sending and receiving rotable aircraft components and the storage of aircraft components. This centralization removes physical transport steps (and the corresponding time loss) in the supply chain (Schilder, 2007). The location of the LC (just outside the secured ‘Technische Areaal Oost’) also avoids the 100% personal ID Checks for drivers, which would require a lot of time. During the first phases of operational implementation of the LC some problems have surfaced. One of these problems is the lack of insight on the amount of physicals goods in the incoming flows which causes peaks in the workload. This lack of insight hinders optimal resource planning and the possibility to achieve lean processes, which is one of the explicit goals of the KLM E&M management (KLM, 2008). More importantly, this sub-optimal resource planning causes a delay in the supply chain which increases the process duration time of outsourced ‘unserviceable’ (operationally non-available) aircraft components into ‘serviceable’ (operationally available) as well as the total delivery time for the cross-docking goods (expendable aircraft parts enter the LC, to be stored elsewhere on the Schiphol area). When a component is not available for the operation, there might be a loaning or leasing of that component. The costs of the loans are currently $ 1.200.000 per year (Meetpiramide, week 40). With these problems in mind, this research has been initiated.

Chapter 1 Introduction
MSc Thesis Jan-Hoite van Hees 2
1.2 Research Scope In order to finish the research within a reasonable timeframe it was crucial to define the boundaries of the project. The geographical boundaries of the project have been the KLM E&M properties at the Schiphol area (see also Figure 16). The research was focused exclusively on the incoming flows at the Logistics center of KLM E&M. Concerning these incoming flows, IT applications, organizational structures and procedures are elaborated upon. There has been no attention for the geographical location of the LC itself, or the processes within the LC (except for the expedition).
1.2.1 Research Goals The research has as subject to: realize forward visibility in the quantity and type of incoming flows at the logistics center. To realize this participated problem areas have been addressed carefully to analyze the possibilities for improving insight in the incoming flows. To do so, knowledge had to be obtained. This knowledge was triggered by the research questions which are presented in the next section.
1.2.2 Research Questions In the previous chapter the problem of a lacking insight in incoming flows at the Logistics Center KLM E&M is identified. The main question which this research had to answer is the following: “What is needed for KLM E&M to improve their insight in the incoming flows at the logistics Center and how can this be realized?” To answer this question several sub-research question are presented in Figure 6:
Figure 6 Research questions

Chapter 1 Introduction
“Forecasting the incoming flows” 3
1.3 Research approach The followed research approach is presented in Table 1. The most left column presents the research question as introduced in the previous section. The middle column presents the used method to come to an answer on the research question. The most right column depicts the chapter in which the specific research question is elaborated upon. Research Question: Method: Corresponding
Chapter
Interviewing/field research. The incoming flows have been identified with interviews with logistical experts within KLM. Subsequently field research has been conducted in the LC to check and complement the overview of incoming flows.
2
Desk research/Interviewing. Involved parties have been identified with two methods. First a desk research has been done, identifying the formally involved parties by organization charts and internal KLM published documents. To check and complement this overview involved KLM personnel has been interviewed.
2
Desk research/Interviewing. Involved IT systems have been identified with two methods. First a desk research has been done, identifying the formally involved IT systems by organization charts and internal KLM published system overviews. To check and complement this overview involved KLM personnel has been interviewed.
2
Desk research/Interviewing. Based on the findings in the research flows, parties and IT applications have been matched. In case of any obscurities, the involved contact persons have been interviewed again for additional information.
2
Desk research/Interviewing. Based on obtained knowledge in the interviews and internal KLM documents the processes have been conceptually depicted.
3
Interviewing/Collaborative Decision Making/Field Research. The current performance level has been determined by observations, interviewing employees who are responsible for the execution of the operational processes and by a GSS session.
4
Interviewing/Data Analysis/Desk research/Collaborative Decision Making. The improvement alternatives of the current performance level has been determined by analysis of the current performance, desk research based on internal performance related documents, interviews with the
4

Chapter 1 Introduction
MSc Thesis Jan-Hoite van Hees 4
involved employees and by a GSS session.
Desk research/Business Intelligence. With the obtained relevant literature knowledge alternatives has been developed which are described as suited for the data which has be derived from databases with business intelligence software.
6 & 7
Desk research/literature search. With the knowledge obtained by interviewing involved persons, criteria can be developed. Also, criteria to validate the alternatives were sought in literature sources.
7
Desk research. The alternatives has been evaluated and ranked with the validated criteria 7 & 8
Case Study. The chosen alternative has been worked out and secured in the KLM E&M operational business processes.
9
Table 1 Research Methods
1.4 Data acquisition: Interviews An important share of the necessary data has been collected by interviewing involved experts. This is because a lot of information about logistical related issues at KLM E&M is available however much of this information is not documented, but stored in the minds of many experts working in different departments of KLM. This tacit knowledge will be of invaluable importance for the research. Both for selecting the proper written information sources (because an enormous amount of data available, some guidance to relevant information sources is much needed) and for the answering of the Why-questions as a supplement of the What questions (which are often addressed to in written documentation). The data collection from interviews will be done in a structured and well-documented manner to secure the appropriateness for scientific research. The interviews are written down in reports. Subsequently these interview reports are approved by the interviewed experts. These reports are included in appendix VII at page 135. The interviews will be custom made for different actors, and for different phases of the research. Because of the characterization of the questions (open and complex) an oral interview was very suitable (Baarda, 2006). Literature and scientific knowledge regarding logistical systems have been available through the ‘normal sources’ for scientific knowledge, like books, articles and papers.

Chapter 1 Introduction
“Forecasting the incoming flows” 5
1.5 Report Outline The outline of the report (Figure 7) is characterized by two ‘separate’ parts: “Part I ~ Analysis of the current situation” and “Part II ~ Development of a forecast module”. The split in the research has been made to underline the difference in research methods in the two parts. Part I primarily focuses on the current situation and to gather information about the current situation methods like interviewing, group decision sessions and literature research has been done. Part II has a different approach: a development approach. Methods like literature research, business intelligence, data analysis but also interviewing have been used to develop the forecast modules as presented. The two parts of the research are directly linked to the research questions presented in Figure 6. Part I answers research questions 1 to 7, which all are related to the ‘current (problem) situation’. Part II provides the answers on the research questions 8 to 11 which are related to the development of a forecast model and its implementation. Furthermore, a paper has been written about the choice between different forecast methods in this particular case. This paper is added in appendix X and can be found at page 164 of this report.
Figure 7 Thesis Outline

Part I ~ Analysis of the current situation
MSc Thesis Jan-Hoite van Hees 6
Part I ~ Analysis of the current situation Chapter 1 has introduced the research and the context in which the research is conducted. The goal of the research is to “realize forward visibility in the quantity and type of incoming flows at the logistics center”. To reach this goal the current situation will be thoroughly analyzed for a complete picture of the logistics system of KLM Engineering & Maintenance (E&M). Doing so, a good insight in the business logistics system, the performance of the business logistics system and the environment in which the system is performing has been created. This knowledge of the current situation is important because it enables a better understanding of the wants and needs of KLM E&M; the understanding of the background of the problem is essential in the achievement of the eventual solution which meets the requirements of KLM E&M (Dym & Little, 2003). Building on this gained insight, possible obstructions for an optimal operational performance are identified. To develop this insight a work-centered analysis (WCA) framework (Figure 8) has been used. This framework is based on the work of Alter (Alter, 2002). The WCA framework aims to describe the main business processes of the system and thereby identify the most important information and context characteristics.
Figure 8 Graphical representation of the concepts within the WCA framework (Atler, 2002) The WCA framework centralizes on the business processes to create insight in the business system. In coherence with the business processes five other concepts are defined:
o Customers. The customers are the involved parties who, within the framework, make use of the products and/or services which are produced by the business processes.
o Products/Services. The product is the ‘output’ of the business process. o Business Process. A business process is a mixture of activities in which resources are
used to produce a product/service which is offered to the customer. o Involved Parties. The involved parties who are directly involved with the development of
the product. o Information. Information used in the execution of the business processes. o Technology. Technologies which are used within the business processes.
All of these topics will be addressed to in this part of the research: Part I ~ Analysis of the current situation with the ultimate goal to provide a (part of the) answer to the main question of the research, presented in the previous chapter:

Part I ~ Analysis of the current situation
“Forecasting the incoming flows” 7
“What is needed for KLM E&M to improve their insight in the incoming flow at the logistics Center and how can this be realized?”
Because the first part of the research will focus on the analysis of the current situation this part of the research has the following objective:
A thorough analysis of the current situation to develop a complete picture of incoming flows at the logistics center, involved parties, involved IT applications and the processes involved.
In the process of reaching this objective, the concepts from the WCA have been linked to the following sub-questions which will be answered in this part of the research (Figure 9):
3. Which IT applications can be identified with respect to incoming logistical flows?
7. How could the level of performance of the Logistics Center with respect to the processing of the incoming flows be
improved?
6. What is the current level of performance of the Logistics center with respect of the
processing of the incoming flows?
1. Which unique incoming flows at the Logistics Center can be identified?
2. Which involved parties can be identified with respect to incoming flows at the Logistics
Center?
4. How are the incoming flows, involved parties and involved IT application
interrelated?
5. Which logistics processes are executed with respect to the incoming flows at the
Logistics Center?
Chapter 2 The incoming flows at the Logistics Center
Page 9 - 28
Chapter 3KLM E&M Logistics Processes
Page 29 - 32
Chapter 4Logistics performance analysis
Page 33 - 41
Research Question which will be answered in:
Chapter 5Conclusions and Recommendations Part I
Page 42 - 43
WCA
Products/Services
Customers &Involved Parties
Information &Technology
Processes
Figure 9 WCA concepts, research questions and outline of Part I ~ Analysis of the current situation In Chapter 2 the incoming flows in the logistics center will be presented and ordered based upon the flow origin. Subsequently these flows will be linked with the involved parties and involved IT applications and information flows. Chapter 3 will identify the processes which are in place to perform the logistics tasks within KLM E&M. Chapter 4 will relate the process to the flows and its characteristics and give insight in the logistics performance of KLM E&M. This chapter will

Part I ~ Analysis of the current situation
MSc Thesis Jan-Hoite van Hees 8
specifically focus on the ‘handling incoming goods’ processes at the logistics center. Furthermore there will be elaboration on the more structural issues which are experienced in the KLM E&M supply chain. Chapter 5 will conclude this part of the research by the presentation of the most import conclusions and recommendations following from this part of the research.

Part I ~ Analysis of the current situation
“Forecasting the incoming flows” 9
Chapter 2 The Incoming flows at the Logistics Center As introduced in the introduction of part I, the analysis of the current situation regarding the incoming flows has been executed using the WCA framework. Five of the six concepts introduced in the WCA framework will be elaborated upon in this chapter (Figure 10). These concepts are linked to three of the four research questions which are answered in this chapter. Research question 1 (identification of the incoming flows) has been elaborated upon in section 2.2, while section 2.3 focuses on research question 2 (the involved parties). Research question 3 (about the IT applications) will also be answered in section 2.3, added by a more detailed description of the involved IT applications in section 2.4. Section 2.5 will conclude this chapter with an overview of the interrelationships between the flows, parties and IT applications presented in the foregoing sections. To provide some background information regarding aircraft maintenance and KLM Engineering & Maintenance, this section starts with section 2.1 before elaborating on the research questions in the next sections.
Figure 10 WCA-concepts and research questions elaborated upon in chapter 2.
2.1 Background information: Aircraft maintenance operation executed by KLM Engineering and Maintenance The next paragraphs will elaborate on the operational and the logistical aspects of aircraft maintenance to offer understanding of the business KLM E&M is operating in. Because this research has been focused on the logistics activities surrounding the aircraft maintenance operation, special attention has been paid to the aircraft maintenance logistics in section 2.1.2. Section 2.1.1 describes the functional operational areas of aircraft maintenance and the related KLM E&M maintenance units. The provided information in this section, although limited and superficial, offers enough detail for readers to understand the background of this research and how its outcomes should be placed in this context. Readers interested in more detailed information about the aircraft maintenance operation could for instance read the work of Aubin (2004). The geographical lay-out of KLM E&M is elaborated upon in section 2.1.3 to make it able to get a ‘physical feeling’ for the location of the several KLM E&M buildings and the logistics flows in between.

Chapter 2 The Incoming flows at the Logistics Center
MSc Thesis Jan-Hoite van Hees 10
2.1.1 Aircraft Maintenance operation at KLM E&M KLM E&M is, besides KLM Passengers and KLM Cargo, one of three core businesses of KLM NV (www1, 22/10/2008) and its core business is the maintenance of aircrafts. The organization has approximately 5.000 employees and is primarily located at the Schiphol-Oost area. The organization of KLM E&M consists of four major operational departments (Figure 11): Hangar Maintenance, Platform Maintenance (together: Aircraft Maintenance), Engine Services and Component Services (www2, 22/10/2008). Besides these maintenance units, E&M is formed out of several staff units. For a complete organization chart, please see consult appendix I at page 87. Together with Air France Industries (AFI) KLM E&M ranks among the world largest providers of maintenance, repair and overhaul services. Moreover KLM E&M is the largest technical organization in the Netherlands. Due to the low dollar exchange rate during the past fiscal year the turnover and the profitability of the Engineering and Maintenance division are under pressure. Still, E&M holds a strong market position partly because AFI and E&M are providing complementary services and enjoying exchange of knowledge and expertise. Further integration of activities is being pursued (KLM, 2008). KLM E&M performs its maintenance activities not only for their ‘own’ fleet but also for customers. These customers are fellow airlines flying on Schiphol airport, for instance Atlas Air, Garuda Indonesia or Great Wall Airlines. The maintenance industry is an important part of the airline business: mistakes in aircraft maintenance can cost lives! (Dingle and Tooley, 2004). Besides the necessity for airlines to seriously take care of the maintenance of their fleet, aircraft maintenance is also a very costly aspect: The average block flight costs for a Boeing 747 consists for 24% of maintenance costs (Friend, 1992). Overall airlines spend 16% of their total operating costs on maintenance (Aubin, 2004). These statistics are presented in appendix II at page 88. The maintenance units of KLM E&M have been determined by the operational maintenance functions (Aubin, 2004) displayed in Table 2. The following subsections will shortly introduce these functions and the corresponding KLM E&M maintenance units. Maintenance Function KLM E&M Maintenance Unit Line Maintenance Aircraft Maintenance Platform Base Maintenance Aircraft Maintenance Hangar Power plant maintenance Engine Services Component and accessory maintenance Component Services Table 2 Maintenance function in relation with KLM E&M Maintenance Units (Schilder, 2007) Maintenance function “Line Maintenance” – KLM Maintenance Unit “Aircraft Maintenance Platform” (Based on information
retrieved from www4 at 23/10/2008)
Line maintenance is the most minimal form of aircraft maintenance. It is a relatively short operation performed between flights. During a turnaround only routine check up of the critical parts (failure or degradation of these parts may affect the safety of the flight) is performed, these critical parts are
Platform maintenance
Line Maintenance Narrow Body
Cabin Maintenance & Technical Services
Line Maintenance International
Logistics Line Maintenance
Figure 12 Organizational structure platform maintenance (www4)
KLM E&M
Hangar Maintenance
Platform Maintenance Engine Services Component
Services
Figure 11 KLM E&M and its maintenance units (www1)

Part I ~ Analysis of the current situation
“Forecasting the incoming flows” 11
described in the Minimum Equipment List (MEL) provided by the aircraft manufacturer (Aubin, 2004). Eventual failures are repaired and the aircraft is refuelled. During an overnight stay a more thoroughly check is performed. The aircraft is also cleaned, supplied with food and beverage and cabin maintenance is performed. Line maintenance is performed as close to the location of normal operation as possible. In the daily routine this means that the maintenance activities are preferably performed at the airport platform. KLM Line maintenance is performed by the department “Platform Maintenance” (see Figure 12 for an organogram) at Schiphol center but also at several out-stations. KLM has over 50 out stations which perform line maintenance all over the world. Maintenance function “Base Maintenance” – KLM Maintenance Unit “Aircraft Maintenance Hangar” (Based on information retrieved from www4 at 23/10/2008)
Base maintenance is the more exhaustive work on the aircraft performed in a hangar. Besides the unexpected repairs after line maintenance inspections at the pier, most of the activities in the base maintenance operations can be divided in 3 categories:
• A-Check • C-Check • D-Check
These checks have a mandatory interval, determined by the Civil Aviation Authority (CAA) and the European Aviation Safety Agency (EASA), which are presented in Table 3. Interval Flight Hours/ Fixed interval Ground Time A Check 200 to 500 hours/ 1 week 8 to 16 hours C Check 2000 to 5000 hours 48 hours and more D Check 4 years 4-8 weeks Table 3 Mandatory checks, interval and ground time (Gobbar, 2006) An A-check consists of a visual inspection of all main systems such as engines, landing gear and control interfaces. C checks require, in addition to a thorough visual inspection, the lubrication of all moving parts and structural repairs. For the D-checks the aircraft is almost totally disassembled for an internal structural inspection, it also includes repainting, cabin refurbishment, control service replacement and modifications of the aircraft, bringing the aircraft up to date (Gobbar, 2006 and Schilder, 2007) KLM department “hangar maintenance” (see Figure 13 for an organogram of the department) performs base maintenance. These maintenance activities are almost always carried out in a hangar. KLM E&M offers several services for several aircraft types, as pictured in Table 4. All base maintenance activities are performed in 4 hangars at the Schiphol-Oost area (see Figure 17 for a situational sketch). Hangar 14 and Hangar 11 perform the base maintenance on wide body aircrafts. Hangar 11 performs the A checks while Hangar 14 performs the C and D checks. Hangar 10 performs all maintenance on narrow body aircrafts.
Table 4 Base Maintenance services offered by KLM E&M (● = available, * = on request, - = not available)
Hangars Maintenance
Hangar 10 Logistics Maintenance Hangars Hangar 11 & 12 Hangar 14
Figure 13 Organizational Structure Hangar Maintenance (www4)

Chapter 2 The Incoming flows at the Logistics Center
MSc Thesis Jan-Hoite van Hees 12
Maintenance function “Power plant maintenance” – KLM Maintenance Unit “Engine Services”
(Based on information retrieved from www5 at 23/10/2008)
Power plant maintenance (maintenance to the aircrafts engines) is separately performed from base maintenance. The engine services department performs maintenance services to KLM engines as well as engines from third party customers. The types of the engines which are maintained are the gas turbine engines of General Electric (see also Figure 14): CF6-50, CF6-80a, CF60-80C2 and the CF6-80E1 (which are part the following aircrafts: Boeing 747, Airbus A330 and the MD-11. Besides these CF6 engines, the smaller CF M56-7b series engine is maintained. This motor is used by the Boeing 737 Next Generation fleet. Except the complete overhauling, engine services also performs maintenance to motor- and aircraft components. The engine services maintenance unit is located in 4 different buildings all located on the Schiphol-Oost area. The main location of Engine Services (ES) however is building 410, indicated as building “ES” in Figure 17.
Figure 14 Engine Services Capabilities (downloaded from www1 23/10/2008) (● = available, * = on request, - = not available) Maintenance function “Component and accessory maintenance” – KLM Maintenance Unit “Component Services” (Based on information retrieved from www3 at 23/10/2008)
Component and accessory maintenance is done by Component Services within KLM E&M. This maintenance unit provides the support activities for both aircraft maintenance and power plant maintenance (Aubin, 2004). Component Services guards the availability of components for aircraft maintenance, engine services and third parties. To do so, the so-called ‘rotable cycle’ is being controlled. This rotable cycle will be elaborated upon in the next section of this chapter. Components which are available for the operation to use are called ‘serviceable’. This means that the component is inspected and the correct administrative permits and licenses are available and included with the component. Contrary, a component which comes of an airplane and has to be inspected, repaired or overhauled is called ‘un-serviceable’. Components Services is formed by four divisions (Figure 15):
• Component Management
Component management is responsible for the availability of the components in the pool. The
Figure 15 Organizational Structure CS (www3)
Component Services
Component Management A&A BMSS Logistics

Part I ~ Analysis of the current situation
“Forecasting the incoming flows” 13
availability performance is subject to agreements between component management and the customer. Component management supervise the availability of serviceable components by determination of the optimal stock levels and takes the lead in the supply chain management. This supply chain includes the loan and exchange of components, vendor management and the supply to customers.
• Avionics & Accessories. Avionics & Accessories (A&A) performs maintenance of components and calibration services. Examples of components are computers, indicators, air data, bottles and galleys. Furthermore, A&A performs maintenance to electric, mechanical and hydraulical tools and equipments which are used by Aircraft Maintenance and Engine Services.
• Base Maintenance Support Shops. Base Maintenance Support Shops (BMSS) performs the maintenance to a range of aircraft components. Examples of components are toilets, kitchen, flight controls, painting, doors, nosecones, seats, emergency equipment, wheels and breaks
• Logistics Logistics is a fairly new division which is mainly located in the Logistics Center (LC). Logistics is in charge of the logistic services between the stakeholders in the E&M supply chain. Logistics operates on also on other locations, like the dangerous goods warehouse, the Boeing warehouse and the expedition departments of A&A and BMSS. Logistics is also in charge of all international flows. Further elaboration on the activities of the logistics’ department continues in the next section.
2.1.2 Aircraft Maintenance logistics The logistics of KLM E&M are totally dedicated to the services of the customer: KLM E&M itself (the mechanic at the hangar or shop) or the contracted third party who buys a service from KLM E&M. Like every logistical operation, the objective is to deliver the right part, at the right place, at the right time. Because of the large number of parts which an aircraft is made of (for example a Boeing 747 is build up from over 4,5 million parts, (aubin, 2004)), the logistics organization is a complex business process. The aircraft parts can be divided in 4 categories, decreasing in comparative unit costs these are: rotable components, repairable components, recoverables and expendables (Gobbar, 2006).
• Rotable components A rotable component is an aircraft part or assembly of aircraft parts. Components have their own individual serial number. When components are removed from an aircraft they are generally not written off, but repaired. (In some cases the repair of a component can be declared Beyond Economical Repair (BER), in such cases a component will be written off (scrapped)) As introduced in the previous section rotable components follow the rotable cycle. After a used (unserviceable) component is replaced by a serviceable component, the unserviceable component is sent for repair. Some component types are repaired within the KLM E&M organization in the BMSS or A&A shops, other components are sent for repair at an external vendor. Therefore besides BMSS and A&A, there is a third shop: Shop VC. Shop VC performs the necessary administrative actions (i.e. making the repair order and checking the presence of the obligatory permits) before an unserviceable component can be sent to an external vendor. When a component returns from a vendor it is always checked by Shop VC before getting approved and stored at the warehouse for components (the MLC) or sent back to the customer. Shop VC and the MLC are both located inside the Logistics Center. The life-expectancy is around the life-expectancy of the aircraft or engine is it constructed for. (la Fontaine and Dekker, 2005) This means that a component (generally) will be not be replaced be a new component and scrapped, but always be repaired and made available for operational use again.
• Repairable components
Repairable parts are, like components, aircraft parts or assemblies of aircraft parts which can be repaired. The major difference between repairables and rotables is the life-expectancy: a repairable component has a life-expectancy which is shorter than

Chapter 2 The Incoming flows at the Logistics Center
MSc Thesis Jan-Hoite van Hees 14
the life expectancy of the aircraft or engine which it is constructed in. Repairable components follow the same rotable cycle as rotable components. (Schilder, 2007)
• Recoverable parts
Recoverables have no detailed parts breakdown and can only be economically reconditioned for a few times (i.e. by refurbishing services like filling, charging or content replacements). (Schilder, 2007)
• Expendable parts
Expendables are parts for which the costs of repair are higher than the costs of a new item. Used item are written off and new ones are installed. Expendables are also called consumables. (Gobbar, 2006)
2.1.3 Geographical lay-out This section will elaborate on the geographical location of KLM E&M and the current logistical procedures. This section’s only intention is to give the reader a broad overview of the situation. Further and more detailed elaboration on the current situation can be found in the following sections of this chapter. Schiphol. KLM E&M is mainly located at the Schiphol-Oost area. As mentioned in section 2.1.1 (page 9) the only part of the KLM E&M organization which is located outside the Schiphol-Oost area are the line maintenance stations. These stations are located on Schiphol center and 50 other out station all over the world. Schiphol-Oost.
LC H11
H12 A&A (CS)
H10ES
H14
Figure 17 Situational Scetch of the Schiphol-Oost area
Figure 16 Security area 2008 (Schiphol Group, ACP, 2007)

Part I ~ Analysis of the current situation
“Forecasting the incoming flows” 15
The Schiphol-Oost area (Figure 17) is divided in two separate sectors which have different security levels. Schiphol-Oost Stationsplein has no special security level. Next to stationplein, the Technisch-Areaal Oost (TAO) (the ‘orange part’ of the map in Figure 16) area is situated. This area facilitates most KLM E&M buildings, including all hangars and shops. Technisch-Areaal Oost (TAO) is 100% secured on personal level. Every person entering the TAO needs to show a special ID-card. Guest has to be registered at the gate. Their ID is also registered. Next to the TAO the Anthony Fokker Business Park (AFBP) is situated. The security level lies between the stations-plein area and the TAO area. The area is accessible for anyone, but they have to pre registered their name by a contact person at the AFBP. The logistics center of KLM E&M is located on the AFBP. Logistics Center The logistics center has been divided in several areas (Figure 18). Most of these areas are already mentioned in previous sections of this chapter. This section will elaborate on the sequence and operational activities of the departments within the Logistics Center. The description of these departments will follow the possible routes goods follow within the LC. Expedition, all goods enter and leave the building through the expedition. The expedition performs the transport within the LC. A majority of the incoming goods have a final destination which is not in the LC. These products are directly, sometimes after import clearance activities, cross docked for transport. Expedition employees make sure every package entering the LC keeps moving or is placed the correct waiting zone’s for further transport. Import, incoming custom clearance goods are first handled by the import department. After these custom clearance administrative activities, the goods are offered to the expedition for (internal LC) transport. Shop VC¸ Shop VC performs the administrative activities required to send and receive components for/from external repair. Shop VC outbound ensures the right documentation and the right vendor information for goods to be send to vendors. Shop VC inbound inspects all incoming components (new, internally repaired and externally repaired) for the correct permits and licenses after which the components are declared serviceable. When finishing their processes, the goods are offered to the expedition for internal LC transport. MLC, the MLC (Warehouse Logistics Center) is the only KLM E&M component warehouse in the Schiphol-Oost area. Ordered components are picked, administratively booked out the warehouse and offered to the expedition for internal LC transport. Export, outbound goods with a destination outside the European Union are custom cleared for export and pick up by KLM Cargo.
Figure 18 Situational sketch of the Logistics center
• Export Track
• Transport
Expedition
Shop VC
Inbound
Outbound Logistic Adm
Export
MLC
Import

Chapter 2 The Incoming flows at the Logistics Center
MSc Thesis Jan-Hoite van Hees 16
2.2 Identification of the incoming flows In order to answer the main research question “What is needed for KLM E&M to improve their insight in the incoming flows at the logistics Center and how can this be realized?” identification of these incoming flows is a first requirement. This triggered the first research question (Figure 19) to address to these incoming flows:
Figure 19 Research Question 1 This section will answer this question by providing information about the incoming E&M flow by elaborating on the E&M supply chain (section 2.2.1), the different incoming flows (section 2.2.2 and 2.2.3) and providing an overview of the incoming flows at the logistics center in section 2.2.4.
2.2.1 E&M supply chain The goods which are delivered at the logistics center are all part of the KLM E&M supply chain. This KLM E&M supply chain (Figure 20) is formed by the ‘rotable cycle’, in which components rotate between customers (the parties who use the aircraft parts), repair shops (the internal parties who repair the aircraft parts), vendors (the external parties who repair and produce aircraft parts) and the warehouses (the locations where the aircraft parts are stored). Expendable aircraft parts usually follow a one-directional path from vendor through warehouse to customer. The supply chain is important for the determination of the incoming flows at the logistics center (LC); the LC is the logistical hub within KLM E&M, so almost all flows pass the LC. The LC can be pictured in the supply chain between all stakeholders.

Part I ~ Analysis of the current situation
“Forecasting the incoming flows” 17
Customer Shop Vendor
Warehouse
LCLC
LC
LC
LC
Customer Shop Vendor
Warehouse
+LC
KLM E&M Supply Chain
KLM E&M Supply Chainincluding the Logistics Center
Figure 20 KLM E&M supply chain As pictured in Figure 20 the logistics center is present in all flows between stakeholders in the KLM E&M supply chain. Important to note is that exceptions on this visualization occur in all flows. An example of such a flow is the flow from an internal customer to a repair shop: this flow will be direct without routing via the LC. Also, the warehouse for components is situated within the LC so components will stay within the LC as long as they’re stored. Based on the supply chain four groups of incoming flows at the logistics center can be differentiated (Figure 21, Figure 22, Figure 23 and Figure 24):
Figure 21 The incoming flow from the customer
Shop
LC
Shop
LC
&
Figure 22 The incoming flows from the repair shop

Chapter 2 The Incoming flows at the Logistics Center
MSc Thesis Jan-Hoite van Hees 18
Figure 26 Externally incoming flows LC
Figure 23 The incoming flow from the vendor
Figure 24 The incoming flow from the warehouse These four flow groups can be further grouped in two groups when using a more general division parameter, namely whether or not the flow has its origin with an external party:
o The incoming flow from external parties From (external) customer (Figure 21) From vendor (Figure 23)
o The incoming flow from KLM E&M internally From (internal) customer (Figure 21) From repairs shop (Figure 22) From warehouse (Figure 24)
This division in two groups, presented in Figure 25, is selected for further analysis for the research because of the differences in used method with which the flows are delivered at the logistics center: Major differences exists in the way external incoming flows are brought in and processed compared with transport methods and handling processes in place for the internal incoming flows. The supply chain division of four incoming flow groups indicates which flows can be found in the internal and external flow groups. These two flow groups will be elaborated upon in the following sections 2.1.2 and 2.1.3.
2.2.2 External incoming flows The flows from and to external parties are, due to shipping instructions which are a part of contractual agreements with external customers and vendors, completely KLM E&M directed. Subsequently KLM E&M has hired KLM Cargo as their agent to direct all these incoming and outgoing flows. Based on these contractual agreements the assumption can be made that all incoming flows from external parties are KLM Cargo directed. Nonetheless, it happens now and then that external parties send their KLM E&M destined packages with other logistical services providers (Figure 26). However, this ‘not-KLM directed’ flow is marginal compared with the KLM directed flows. The KLM Cargo directed flow from external parties can be geographically separated in three different flows:
o The incoming flow from external parties located within Europe (Figure 27)
o The incoming flow from external parties located outside Europe (Figure 28)
o The incoming flow from Air France Industries (Figure 29) External incoming flow originated within Europe (Figure 27) The incoming flow with goods from vendors and customers located in Europe is directed by KLM Cargo. KLM Cargo has made agreements with DHL logistics to perform the transport for them. Picked up packages are consolidated in one of DHL’s internal warehouses. Once a day, the goods are delivered at the LC.
Logistics Centre
Extern
Intern
1
2
Figure 25 Incoming flows LC
Extern
1.1
1.2
KLM directed
Not KLM directed
Figure 27 External incoming flow originated within Europe
1.2.2
KLM directedEurope flow

Part I ~ Analysis of the current situation
“Forecasting the incoming flows” 19
Air France TruckExtern
1.3
External incoming flows originated outside Europe (Figure 28) The incoming flow with goods from vendors and customers located outside Europe transported to Schiphol by KLM Cargo air transport. After the unloading of the aircrafts, KLM Cargo has contracted Sodexo to perform the transport from the KLM Cargo buildings (located at Schiphol Center) to the logistics Center. A big share of the ‘outside’ Europe flow is originated in the United States because the vast amount of vendors who are located there. Examples are for instance Boeing, General Electric and Honeywell. KLM Cargo uses an agent for inland logistics in the United States: Proservices. This party consolidates all incoming goods at hubs at Los Angeles and New York. Overnight transport from and to vendors to Proservices in the United States is performed by FedEx. AirFrance Incoming flow (Figure 29) Transport between KLM E&M and Air France Industries has intensified since the merge of the two companies. The transport between KLM and Air France is directed by Air France, but they contracted KLM Cargo to do the actual transport. The shuttle truck between Air France and KLM is a daily service which comes in 5 days a week (Tuesday – Saturday).
2.2.3 Internal incoming flows Internal KLM E&M transport is transport within the Schiphol Area between the logistics center and other KLM buildings. This transport is contracted to Sodexo. For the transport between the LC and the hangars and shops located on the Technisch Areaal Oost area, an electric train is used. This train makes its ‘milk run’ once per hour (weekdays between 7 AM and 5 PM) and is limited for packages with a maximum weight of 23 kilograms. The size is limited to the size of the carriages, which is approximately 1 by 2 meters. Transport from other locations, such as Schiphol Center/Rijk, transport in the evenings or weekends for transport of heavy goods or goods with inappropriate sizes trucks are used. Sodexo operates according to a strict schedule, which has been added to this report in appendix III at page 89.
2.2.4 Overview incoming flows Section 2.1 had the objective to provide an answer to research question 1 (Figure 31):
Figure 31 Research Question 1 To provide an answer on this question first a division has been made in the different incoming flow groups identifiable in the KLM E&M supply chain. Hereafter these flow groups have been merged in two division:
o The incoming flows from external parties o The incoming flows from internal parties
These two groups can be physically divided in several incoming flows (pictured and numbered in Figure 32):
o External incoming flows (arrow 1):
Logistics CentreIntern
2.1
2.22
Electric “Train”
Trucks
Figure 30 Internal incoming flows at the logistics Center
Figure 28 External incoming flow originated outside Europe
1.2.3
KLM directed
Outside Europe flow
Figure 29 Incoming flow from Airfrance

Chapter 2 The Incoming flows at the Logistics Center
MSc Thesis Jan-Hoite van Hees 20
Not KLM Cargo directed (arrow 1.1) KLM Cargo directed (arrow 1.2)
Incoming by DHL truck (arrow 1.2.1/2 ) Incoming by Sodexo truck (arrow 1.2.3)
Incoming by AirFrance Shuttle truck (arrow 1.3) o Internal incoming flows (arrow 2):
Incoming flow by truck (arrow 2.1) Incoming flow by electric vehicle (arrow 2.2)
Figure 32 Incoming flows at the logistics center
2.3 Analysis of the incoming flows In section 2.1 two groups of incoming flows were identified. The distinction between these groups has been based on the origin of the flows: internal or external. This chapter provides a further analysis of these flows and will elaborate explicitly on the involved parties and IT support systems connected with the flows providing an answer to research question 2 and 3 (Figure 33).
Figure 33 Research Question 2 and 3

Part I ~ Analysis of the current situation
“Forecasting the incoming flows” 21
In doing so, section 2.3.1 will focus on the internal flows and section 2.3.2 on the external flows.
2.3.1 Analysis of the external incoming flows External transport (Figure 34) is contracted to KLM Cargo. KLM Cargo executes only the Airport-to-Airport transport and has subcontracted national and European transport to DHL and USA inland overnight transport to FedEx. The containers from the airfreight are daily delivered at the LC around 10AM (Origin: New York) and 2PM (Origin: Los Angeles). . Involved parties The origin of the external flow is threefold: vendors sent repaired components or new parts. External customers sent unserviceable or serviceable components to KLM for repair or as return for an earlier component loan. KLM out-station also sent components through this flow back to Schiphol. External customers represent a large amount of colleague airlines, for example Surinam Airways, Transavia and Kenia airways, relying on one or more services from KLM E&M. These services range from ‘total aircraft care’ (where all maintenance related activities are performed by KLM E&M) to component availability pools (where a customer is guaranteed availability of components when needed). Where every flow in the supply chain is initiated by the customer, many of these flows physically start at the vendors. Some vendors, like General Electronics and Boeing, have almost continuous physical flows from and to KLM E&M. Others are only ‘used’ incidentally. Most vendors only sell products to KLM, where others also (or only) repair components. The AirFrance flow is originated AirFrance Industries departments and brought in by trucks (for more information please consult section 2.1.3 at page 19). The transport is executed by Air France Industries. AirFrance Industries has subsequently contracted KLM Cargo to perform the shuttle service between Paris Charles-de-Gaulle and KLM E&M. This truck arrives daily at 7AM. The flows are monitored by Flow Control/Material Management departments of the different maintenance units. Please consult section 2.4.5 at page 26 for a more detailed elaboration on these departments. Involved IT systems The external flow is triggered by SAP or Crocos. Every material movement is administratively processed in one of these applications. Purchase or repair orders are placed in SAP. When external customers sent components to KLM, movements are registered in Crocos. Furthermore, all goods which are transferred between AFI and E&M in the shuttle are also registered in Tracking. See section 2.3 for more detailed information regarding the IT applications.
Logistics Centre
Extern
1
1.1
1.2
1.2.3
1.2.2
1.2.1
KLM directed
Not KLM directed
Netherlands flow
Europe flow
Outside Europe flow 1.3
Air France Truck
Figure 34 External incoming flows at the Logistics Center

Chapter 2 The Incoming flows at the Logistics Center
MSc Thesis Jan-Hoite van Hees 22
Overview External Flows (Table 5) Customers Vendors Carriers Flow/Material Control' departments
IT:
External KLM Cargo VO ES CS
Hol
land
x x x x x x
Euro
pe
x x x x x x
KL
M D
irec
ted
not-E
urop
e
x x x x x x
Scarlos
Not
K
LM
di
rect
ed
x x x x x
Ext
erna
l
Air
Fr
ance
T
ruck
x x x x x
Tracking
IT: SAP, Crocos SAP, Crocos SAP, Crocos
Table 5 Overview of the characteristics of the incoming external flows: originated by external customers and vendors, controlled by VO, ES or CS material management departments and transported under control of KLM Cargo.
2.3.2 Analysis of the internal incoming flows The internal flows are originated by KLM E&M departments and brought to the logistics center by the electric ‘train’ or trucks (section 2.2.2 at page 18). Internal transport is contracted to Sodexo. Sodexo performs all transport of goods between the different KLM buildings within the Schiphol area. For the most common transport between the LC and the maintenance units at Schiphol-Oost (Hangars, 10, 11 and 14, Engine Services and A&A) an electrical vehicle is used. For large, heavy goods and transport to Schiphol-center, trucks are used. Sodexo operates according to a fixed schedule which is included in
appendix III. Involved parties The ‘customers’ of the KLM E&M supply chain are the parties which ‘consume’ the products/services that flow through this supply chain. The supply chain provides storage and transport of physical goods, as well as information about the whereabouts of these goods. The availability of aircraft parts is also part of the supply chain, but is not in control of the logistics department. Therefore the choice has been made, to assume these ‘material planners’ as a customer of the supply chain too, instead of a part of the supply chain. The customers can be split into two different groups of customers: the internal customer and the external customers. For the internal flows, only the internal customers are relevant. Internal customers are the operational maintenance units within KLM E&M. They are located on the Schiphol area. Internal customers can be divided in groups based on their functional role in the organization.
• Aircraft Maintenance o Base Maintenance – Base Maintenance operations (Hangars 10, 11 and 14) use
components and expendables for the execution of the maintenance they perform. The main flow originated by base maintenance locations are parts that are sent from the expendable warehouses to other hangars or VOC. Another aspect of the flow from the hangars is components. Unserviceable components are sent to the shop for a shop visit, unused serviceable components are sent back to the MLC for storage.
Logistics CentreIntern
2.1
2.22
Electric “Train”
Trucks
Figure 35 Internal incoming flows at the logistics Center

Part I ~ Analysis of the current situation
“Forecasting the incoming flows” 23
o Line Maintenance – The flow originated by VOC (Aircraft maintenance Schiphol Center) is almost identical to the flow originated by the hangars. It mostly contains serviceable and unserviceable components. (For more information about aircraft maintenance: section 2.1.1 at page 10 and further.)
• Engine Services o Engine Services works preferably with the return-to-known-engine concept, which
means that they try to inspect and repair components within the overhaul duration of the engine. Goal is to return an engine to the customer with the same components as it came with. Expendables and components are both stored within the Engine Services building. Engines Services mostly control their own vendors and have far less interaction with component services as aircraft maintenance. Therefore the only flow which is originated by Engine Services contains components sent to vendors for external repair. (For more information about Engine Services see section 2.1.1 at page 10 and further.)
• Component Services o Components Services (CS) manages the availability of components for internal
(aircraft maintenance and engine services) and external customers. To do so, they control the stock levels, the repair processes and new acquisitions. In BMSS and A&A, CS has two internal repair shops. Components which are not repaired (due to no capabilities or capacity) at these shops are send to external vendors via Shop VC (which is located within the logistics center). The flow originated by the shops contains serviceable components to be stored in the MLC and unserviceable components which are sent to external vendors for repair. (For more information about Component management see section 2.1.1 at page 10 and further.)
• Other KLM departments o Other KLM departments which are served by the supply chain are for example the
head office, Transavia, Martinair, KLM Cityhopper and the Engineering department, which receive material send by AirFrance with the daily shuttle between the KLM E&M logistics center and the AirFrance Industries logistics center (at Paris Charles-de-Gaulle). These parties rarely sent packages to the logistics center; therefore they fall outside the scope of this research.
The flows are monitored by Flow Control/Material Management departments of the different maintenance units. Please consult section 2.4.5 at page 26 for a more detailed elaboration on these departments. Involved IT systems The internal flow is triggered by either SAP or Crocos; every material movement is administratively processed in one of these applications. For logistics purposes the internal flow is labelled with a Tracking sticker. The Tracking sticker is automatically filled with information from other applications like SAP or Crocos. See following section 2.3 for more detailed information regarding the IT applications. Overview Internal Flows (Table 6)
Customers Shops Carriers
Flow/Material Control' departments
IT:
Internal
VO ES CS BMSS A&A Sodexo VO ES CS
Tra
in
x x x x x x x x x
Inte
rnal
Tru
cks
x x x x x x x x x
Tracking
IT: SAP, Crocos SAP, Crocos SAP, Crocos
Table 6 Overview of the characteristics of the internal incoming flows: originated by internal customers (VO, ES, CS), shops (BMSS and A&A), controlled by their material management departments and transported by Sodexo.

Chapter 2 The Incoming flows at the Logistics Center
MSc Thesis Jan-Hoite van Hees 24
2.4 Involved IT applications and Material management departments E&M The previous section (2.3) identified the involved parties and involved IT applications with regard to the incoming flows at the logistics center. This section provides more insight on the IT applications SAP, Scarlos, Crocos and Tracking respectively in sections 2.4.1, 2.4.2, 2.4.3 and 2.4.4. Furthermore section 2.4.5 offers additional information regarding the material management departments of the maintenance units within KLM E&M. Doing so, this section provides additional information a more detailed answer on research questions 2 and 3 (Figure 33) and is supplementary to the information provided in section 2.3. KLM E&M has a lot of IT systems to support the daily processes. Currently, more than 150 applications are in active use (to find a complete list, please see appendix XI at page 174). As was identified in the analysis in the previous sections four main systems are used to support the supply chain activities which lie within the scope of this research.
2.4.1 IT application SAP SAP is a system used in many businesses and by many companies to manage their administration. Within KLM E&M SAP is used by Engine Services, Aircraft Maintenance and Shop VC and BMSS of Component Services. The ‘version’ of SAP which ES uses is a different version than the SAP application which in use at the other departments of KLM E&M. In may 2009 whole E&M will get updated to the SAP 6.0 application. Up to this moment, the logistical functionalities of SAP are not activated yet. SAP is already used for the financial and requisition administration as the first step of implementation of the “IT-master plan” in which SAP will perform as the primary IT support system (Interview: van Leeuwen, 2008). Eventually the logistics functionalities of SAP will take over current functionalities which are covered by other systems (as described below): Crocos and Tracking. To do so, SAP needs to be adjusted to the current processes. Or, the processes will be altered in a SAP-compatible way. At this moment, these IT-master plan steps are still under influence of technical and organizational changes. Therefore it is not completely clear what the eventual SAP logistics module will look like, what functionalities it will perform, how SAP will be integrated in the operational processes or when these changes will be accomplished. The current SAP logistics functionalities are quite limited. SAP has different formats to assign a material order:
• Shop orders • Purchase orders • Repair orders • Warranty orders • Material documents
Interfaces connect these orders to Tracking, thus providing the link between the administrative procedure and the logistics procedure. A complete list of the interface between SAP and Tracking is included in appendix XII.1 at page 179. In the SAP orders which are sent to or delivered from external parties, SAP displays several logistics measure points which are interfaced from Scarlos (see section 2.4.2 below). Per order data can be found about different logistics moments:
• DV: Date and Time stamp product delivered at Vendor (for Repair parts) • PV: Date and Time stamp product picked up at Vendor. • CR: Date and Time stamp product cleared for (inbound) customs • DM: Date and Time stamp product delivered at KLM E&M logistics center. • GR: Date and Time stamp “goods received” by the KLM E&M department which placed the
order To connect a package to a specific SAP order, the SAP order number should also be included in the package. For logistics purposes it is required that the SAP order number is also placed on the outside of the package. Following this procedure, the content of a package (as well as its origin and destination) can be determined without opening the package.

Part I ~ Analysis of the current situation
“Forecasting the incoming flows” 25
2.4.2 IT application Scarlos Scarlos is a system used by KLM Cargo to ‘plan’ a route for a package. Scarlos defines the origin and destination of a package and registers defined measure points. Through an interface with as well DHL as FedEx, Scarlos registers arrival and pick up moments at the customer and the arrival and pick up moments at the vendor. Moreover, all logistics ‘handshakes’ in between these steps are also measured. Through an interface with SAP, Scarlos is automatically loaded with purchase orders which are created in SAP. To scan the whereabouts of the packages, the packages are labelled with a “phyttol” sticker. This sticker has a reference which is unique for the package and is scanned throughout the logistics process. This unique phyttol code enables customers of KLM Cargo to access the whereabouts information of the package, which is processed with a 24 hours delay. A phyttol code number is always connected to one or more SAP order numbers. Scarlos has no interface with Tracking.
2.4.3 IT application Crocos Crocos is the system used by Component Services to registers the whereabouts of the components in the component cycle as introduced in section 2.2. Components are either in use, in repair, on shelf or in a logistics process between two of these three steps. Every component has its own part- and serial number which are unique for that particular component. The information in Crocos is very extensive. It also has a logistics application which is based on manual registrations at certain points in the chain. A component is booked in the system when it is send and accepted at points in the process, this way whereabouts of the component should always be available. Crocos provides also warehouse management functions, as it registers where components are placed in the warehouse. Furthermore, Crocos is capable to perform some aerospace-specific checks on components. Such as an alarm when a component which hasn’t been used for a specific amount of time, has to be tested again to keep its serviceable certificate. The logistical functionality of Crocos is integrated in the maintenance functionality: when a component is removed from an aircraft, requested from a warehouse or sent for storage it automatically generates a registration in the movement screen. The movements of a component are always labelled by the same label number, which is unique per component. Crocos communicates the label number and corresponding latest known destination with Tracking (All movements which interface with Tracking are listed in appendix XII at page 180). Therefore the label number should always be visibly attached to the outside of the component package.
2.4.4 IT application Tracking Tracking is a logistics track and trace system which is based upon information provided by interfaces with other IT systems. The interfaces with Crocos and SAP provide the Tracking system with information about the destination and origin of the package. The interface with SAP is the SAP order number. The interface with Crocos is the label number. A user can enter one of these reference numbers in the Tracking system and Tracking will provide the user with a sticker with the package’s destination on it. Tracking provides also a barcode on the sticker. This barcode is scanned with every logistics movement at every location within KLM E&M to bring insight in the whereabouts of the package. Every time the package is moved it is scanned twice, once the pick-up at the start location and once the drop at the following location. Followers of the package will only need the barcode of the Tracking sticker or the reference (e.g. the SAP order number or Crocos label number) to consult the whereabouts of the package via the internet. Tracking is web based and the whereabouts information is available as soon as the portable scanners are synchronized with a docking station. The interfaces with other systems are described in the earlier paragraphs of this section. These interfaces are one-directional. Tracking doesn’t communicate with the other systems, but only absorbs data which is send in. The Tracking data is accessible for analysis through a business intelligence module. (Business Objects XI).

Chapter 2 The Incoming flows at the Logistics Center
MSc Thesis Jan-Hoite van Hees 26
2.4.5 Material management E&M Flow management departments are responsible for vendor control, customer relations and material management. They purchase new materials, claim warranties, maintain relationship with customers and vendors and controls deliveries.
o Component Services Component Services has one department which is concerned with all flow management related issues: component management. Within this department, the unit Customer Interface manages the relations with internal and external customers and the material flow from and to customers, Vendor Control manages the relations with shops and vendors and the material flow from and to these parties and Pool management occupies with the purchasing and selling of new, modified or phased-out components.
o Engine Services Engine Services has one department which is concerned with the physical and strategic material flows and vendor performance: material management.
o Aircraft Maintenance Aircraft maintenance has a logistical department for both base maintenance and line maintenance. These departments are responsible for the availability of expendable aircraft parts for the operation as well as the transport of aircraft parts within the hangars.

Part I ~ Analysis of the current situation
“Forecasting the incoming flows” 27
2.5 Summary Chapter 2 The incoming flows at the logistics center Because this research has as a goal to improve insight on the inbound flows, it is imperative that these inbound flows should be analyzed carefully as indicated in the introduction of this chapter at page 9. To structure the analysis, research questions have been developed. 4 Research questions were answered in this chapter.
Figure 36 WCA concepts and research questions elaborated upon in chapter 2 In the analysis the flows have been described and linked with the involved parties as well as the involved IT applications. The findings are displayed in Table 7 of the next page, which provides an overview of the interrelations between the incoming flows, IT applications and parties involved (and thus provides an answer to research question 4). The table pictures the two incoming flows (research question 1 was addressed to in section 2.2) on the rows (internal and external with a distinction for sub flows), while the involved parties (research question 2 was addressed upon in section 2.3) are pictured in the columns (Customers/Vendors/Shops/Carriers/Flow Control). The utmost right column indicates the IT applications (research question 3 was addressed upon in sections 2.3 and 2.4) used for the specific (sub) flows, and the lowest row indicates the IT applications used per involved party. The first conclusion that can be drawn from this schedule is the clear distinction between the 2 categories of IT applications. For the administration of the flows (logistics purposes) Scarlos and Tracking are in place, while the more maintenance specific information of the stakeholders is gathered in the SAP and Crocos systems. These IT systems have been further elaborated upon in section 2.4. A second conclusion is the major involvement of the flow control/material management departments in the inbound flows. These departments have access to all information regarding their orders and can influence them throughout the supply chain. Because of their central position in the supply chain these parties are very influential stakeholders whose support will be crucial for the succeeding of possible future process / structural processes. These departments have been further elaborated upon in section 2.4.5.

Chapter 2 The Incoming flows at the Logistics Center
MSc Thesis Jan-Hoite van Hees 28
Table 7 displays the characteristics of the incoming flows at the logistics center identified in the previous sections of this chapter. A further elaboration on this table can be found on the previous page.
Customers Vendors Shops Carriers Flow/Material Control' departments
Internal
VO ES CS External BMSS A&A Sodexo KLM Cargo VO ES CS
IT:
Hol
land
x x x x x x
Euro
pe
x x x x x x
KL
M D
irec
ted
not-E
urop
e
x x x x x x
Scarlos
Not
K
LM
di
rect
ed x x x x x
E
xter
nal
Flow
s
Air
Fr
ance
T
ruck
x x x x x
Trackin
g
Tra
in
X x x x x x x x x
Inte
rnal
Flo
ws
Tru
cks
X x x x x x x x x
Tracking
IT: SAP, Crocos SAP, Crocos SAP, Crocos SAP, Crocos SAP, Crocos
Table 7 Overview of the characteristics of the incoming flows with the incoming flows on the rows and the involved parties in the columns, the involved IT applications are indicated in the most right column and in the last row.

Part I ~ Analysis of the current situation
“Forecasting the incoming flows” 29
Chapter 3 KLM E&M Logistics Processes As a framework for the analysis of the current situation regarding the incoming flows at the logistics center of KLM Engineering & Maintenance (E&M) the Work Centered Analysis (WCA) framework has been used (see page 6). This WCA framework introduces six concepts in which a business system can be divided and described. Subsequent to the previous chapter, which focused on five WCA-concepts, this chapter will conclude the elaboration on the WCA concepts by focusing on the processes involved in the logistics system of KLM E&M. Doing so, this chapter will provide an answer to research question number five: “Which logistics processes are executed with respect to the incoming flows at the logistics center?” (Figure 37)
Figure 37 WCA concept and research question elaborated upon in chapter 3 Chapter 3 provides a global insight in the logistics (supply chain) processes within KLM E&M in section 3.1. These processes have a high level focus and are therefore rather abstract. The goal of this section is to provide a picture of the position of the more concrete (operational) processes in the total logistics process plan of KLM E&M. These operational processes are elaborated upon in section 3.2. This section explains the position of the logistics center expedition processes as a part of the supply chain processes as well as elaborating in detail on these expedition processes. Furthermore, the flows identified and described in chapter 2 are related to the operational processes. As method to describe the processes, SADT has been used. This Structured Analysis and Design Technique is used for detailed process mapping (den Hengst, 2003; Godwin et al, 1989; Rensburg and Zwemstra, 1995). SADT enables physical processes and elements to be modelled in combination with information flows (Yin, 1994), which is one of the most important reasons to use the SADT as a method for this research. The other favourable aspect of SADT is the possibility of SADT to model hierarchy in the processes. Both to these aspects are used to provide a thorough analysis of the KLM E&M logistics processes.
3.1 KLM E&M Global Supply Chain Processes All processes which are executed inside the logistics center are part of the KLM E&M ‘operational logistics and material availability’ (A0) process (Figure 38). While this process contains far more sub-processes than only these which have a link with the LC, a basic process analysis has been done for this process. This analysis can be found in appendix IV (page 98). As can be seen in the figure, the SADT of the high level processes haven’t been worked out with the highest level of detail. This work-
To realize material and logistic services
To provide component maintenance
To provide operational logistics
To provide material resources
To provide operational logistics and Material
resources
A 0
A 1
A 2
A 3
A 4
Figure 38 High level logistics process overview: "To provide operational logistics and material resources"

Chapter 3 KLM E&M Logistics Processes
MSc Thesis Jan-Hoite van Hees 30
out however is believed to show the hierarchy of the processes which are elaborated upon in the next section. The logistics center is influenced by all actions which are taken in the high level process (A0), but is not able to control all of these actions. All departments of KLM E&M as well as the behaviour of external parties are involved in this process because of the constant need for new and repaired materials for the maintenance activities. The logistics center is highly dependable on the process behaviour of these parties, because the incoming flows are triggered in these processes. However one of these sub processes is controlled by the (management of) the Logistics Center; the sub process “To provide operational logistics” (A3), highlighted red in Figure 38 and pictured in more detail in Figure 39. This process executes the storing, issuing, receiving, sending and transport of material within KLM E&M. Of these five ‘sub-sub’ processes, two (highlighted in red in Figure 39) can be directly associated to the incoming flows at the logistics center:
o “To receive serviceable material” (A3.2) o “To execute reverse logistics” (A3.3)
The SADT schemes of these processes have been included in this report (respectively page 103 and page 104) and are both linked to the incoming flows because they represent two groups of incoming flows at the logistics center. Although the division is not exactly the same as was made in the previous chapters of this report (internal vs. external), the division can be identified as nearly similar: a vast majority of external incoming flows are serviceable aircraft parts while the majority of the internal incoming flows can be regarded as reverse logistics. For a detailed work out of the processes involved at the expedition department of the logistics center, the further hierarchical level has been analyzed: The first sub processes of A3.2 and A3.3, are similar and named “To accept delivery of the material” (A3.2.1and A3.3.1). These processes mostly
cover the expedition operational processes, however because the name of the process suggests an “acceptance activity” which isn’t in place currently at the expedition department, the choice (in this report) has been made to name these operational processes slightly different: “Handling incoming flows” (Figure 40). This process has been worked out to the most detailed level and has been described in the next section.
To provide operational logistics
To store and issue material
To receive serviceable material
To execute reverse logistics
To transport
To execute and monitor express logistics services
A 3
A 3.1
A 3.2
A 3.3
A 3.4
A 3.5
Figure 39 Process "To provide operational logistics" (A3)
To accept delivery of the material +
A 3.2.1
To accept delivery of the material
A 3.3.1
Handling Incoming flows
A0
Figure 40 Processes 3.2.1 and 3.3.1 are renamed to 'Handling incoming flows'

Part I ~ Analysis of the current situation
“Forecasting the incoming flows” 31
3.2 KLM E&M Logistics Center Expedition Processes “Handling incoming flows” The operational and concrete work processes at the expedition department of the logistics center depend on the characteristics of the incoming flow(s). These process scheme have validated by several members of the CS logistics management team: Jasper Schilder, Leo Vennik, Yung-Li Sie and Ed Rijnbeek. The “handling incoming flows” process contains four basic process steps (Figure 41), for which the first two are not obligatory for all incoming flows. These four steps are:
A1. Report component received at LC (TCOV) – this is an administrative procedure in Crocos which acknowledges the receipt of the component. This process step does only apply to CS components.
A2. Label goods with Tracking sticker – Non stickered goods have to be stickered before sending to their next location. In the daily operation, this sub process is needed for all incoming external flows.
A3. Sort incoming flows – Labelled goods are sorted
based on their final destination.
A4. Transport Incoming sorted goods The process steps A2 “Label goods with Tracking sticker” and A4 “Transport incoming sorted goods” are modelled in more detail and are added in to this report in appendix V at respectively on page 109 and page 110. Based on this process map, the processes can be assigned to the characteristics of the flows. This has been done in section 3.2.1 for the external incoming flows and in section 3.2.2 for the incoming internal flows.
3.2.2 External incoming flows The external incoming flows have to be divided in two groups (CS components and other) because of the extra process step for CS components. These components have to be
Handling Incoming flows
A0
Sort Incoming flows
A3
Transport Incoming sorted
goodsA5
Label goods with Tracking Sticker
A2
Stickered goods dropped and scanned at destination
within LC
TrolleyHandtruckFork-lift TruckExpedition Employee
External Incoming
Components CS
Tracking Sticker
TrolleyHandtruckFork-lift TruckExpedition EmployeeScanner
Report component received at LC
(TCOV)A1
Compas Order number
CROCOS Expedition Employee
Package reported in SAP and Crocos
OrdernumberLabelnumber
Tracking (software)Expedition EmployeeSticker PrinterScanner
Tracking Stickered goods
Incoming Goods flows
Tracking stickerCompas Order NumberSAP Order Number Label number
Expedition EmployeeTrolleyHandtruckFork-lift TruckSAPCROCOSTrackingSticker PrinterScanner
Other non-stickered
incoming goods
Sorted and Stickered goods
Stickered incoming flow
Stickered goods dropped and scanned at destination
within LC
Figure 41 Process 'handling incoming flows” (see also page 93)
Sort Incoming flows
A3
Transport Incoming sorted
goodsA5
Label goods with Tracking Sticker
A2
Stickered goods dropped and scanned at destination
within LC
TrolleyHandtruckFork-lift TruckExpedition Employee
External Incoming
Components CS
Tracking Sticker
TrolleyHandtruckFork-lift TruckExpedition EmployeeScanner
Report component received at LC
(TCOV/00)A1
Compas Order number
CROCOS Expedition Employee
Package reported in SAP and Crocos
OrdernumberLabelnumber
Tracking (software)Expedition EmployeeSticker PrinterScanner
Tracking Stickered goods
Other non-stickered
incoming goods
Sorted and Stickered goods
Figure 42 Expedition processes for the external incoming flows

Chapter 3 KLM E&M Logistics Processes
MSc Thesis Jan-Hoite van Hees 32
declared TCOV (unserviceable receipt) or 700 (new receipt) when coming in. After these administrative procedures the components (and all other incoming goods from external parties) are labelled with Tracking stickers because the external flows are not labelled with a Tracking sticker when coming in. The generated stickers display the destination, after which the goods are sorted and distributed (SADT scheme external incoming flows: Figure 42).
3.2.1 Internal incoming flows When internal departments send goods to the logistics center, they have to label the product with a Tracking sticker. This sticker is automatically generated by entering the reference number (this can be a SAP purchase order number/Crocos label number/or some other existing reference numbers). Because the Tracking sticker displays the destination of the package, the processing of the internal incoming flows is short and easy. The packages are scanned, sorted and distributed (SADT scheme internal incoming flows: Figure 43).
3.3 Summary Chapter 3 KLM E&M Logistics Processes With the knowledge of the involved processes for the acceptance of the identified incoming flows, for a short recapitulation see Figure 44, the performance of the logistics departments can be elaborated on. This performance analysis will identify possible improvement area’s and has been done in the next chapter. .
5. Which logistics processes are executed with respect to the incoming flows at the
Logistics Center?
Research Question answered in: WCA
Processes(section 3.1)The operational concrete processes at the expedition departement of the logistics center can be derived from the high level “To provide operational logistics” process.
(section 3.2)External incoming CS components have to be entered in Crocos. Subsequently a tracking label has to be printed, which has to be done for all incoming external flows. The third step is the ordering of the packages per destination, which accounts for all incoming flows. Fourth, the incoming goods are transported to the next destination.
Figure 44 WCA concepts and research questions elaborated upon in chapter 3
Sort Incoming flows
A3
Transport Incoming sorted
goodsA5
Stickered goods dropped and scanned at destination
within LC
TrolleyHandtruckFork-lift TruckExpedition Employee
TrolleyHandtruckFork-lift TruckExpedition EmployeeScanner
Sorted and Stickered goods
Stickered incoming flow
Tracking S
ticker
Tracking S
ticker
Figure 43 Expedition Processes for internal incoming flows

Part I ~ Analysis of the current situation
“Forecasting the incoming flows” 33
Figure 45 The WCA-framework has been used as a method to identify the current situation
Products/Services
Receiving and redistributing all incoming goods at the KLM E&M Logistics Center
CustomersKLM E&M
Maintenance Units
ProcessHandling the
incoming flows
Involved parties
Vendors,External customers andCarriers
InformationSAP order numbersCrocos label numberTrack&Trace information Scarlos/Tracking
TechnologySAP Crocos TrackingScarlos
Chapter 4 Performance Analysis This chapter elaborates on the strategic and operational performance characteristics of the handling of the KLM E&M incoming flows. To come to a thorough insight in the current situation, the WCA framework (Figure 45) has been used to identify six characteristics of the current situation:
• The customers • The products • The process • The involved parties • The information • The technology
This chapter will proceed on the current situation and describe the performance of the process. The performance of the process will be used to identify possible improvement areas. These improvement area’s have been sought in two different ‘dimensions’ to fully cover the complexity of the current situation; the processes in the KLM E&M supply chain are heavily interrelated and therefore (because this research is particularly focusing to one process in the supply chain) all significant changes in the current process setting would cause a domino-effect in which other processes in the KLM E&M supply chain should be altered too. This approach would clearly exceed the scope of this research, therefore there has been chosen for a group brainstorm session with stakeholders from the whole KLM E&M supply chain to address to the logistics processes on a strategic level. This session didn’t cost as much time and effort as analyzing the KLM E&M supply chain as a whole in detail, but none the less provided the research with strategic improvement suggestions. This collaborative decision making session will be addressed upon in section 4.1 Section 4.2 has addressed to the more operational performance improvement of the “handling incoming flows” process. Within the existing process there has been looked for ‘(quick) wins’ to improve the process efficiency and effectiveness. Section 4.3 provides an overview of the findings and recommendations and answers the involved research questions. By addressing to the strategic and operational logistics performance, chapter 4 provides answers to research questions 6 and 7 (Figure 46).
7. How could the level of performance of the Logistics Center with respect to the processing of the incoming flows be improved?
6. What is the current level of performance of the Logistics center with respect of the processing of the incoming flows?
Figure 46 Research question addressed to in Chapter 4

Chapter 4 Performance Analysis
MSc Thesis Jan-Hoite van Hees 34
4.1 Strategic logistics performance analysis As addressed to in the previous chapter, KLM E&M operates in a supply chain with many parties (internal and external) who all have their own goals and ambitions. To analyze the functioning of this complex supply system, all parties should be involved to get a complete and sufficient overview. During the research all parties were interviewed and consulted, but the need was felt to organize a collaborative meeting with all internal KLM parties to identify possible improvement points and possible solution directions. This meeting had as subject to identify the possible area’s of improvement (as an answer to research question 6 “What is the current level of performance of the logistics center with respect of the processing of the incoming flows?”) and subsequently give substance to these improvement area’s by brainstorming for solutions (and answering research question 7 “How could the level of performance of the logistics center with respect to the processing of the incoming flows be improved?”). This section has been divided in 5 paragraphs. In the first, 4.1.1, the used method will be elaborated upon, while the second, third and fourth paragraphs (4.1.2-4.1.4) will present the results of the meeting. Respectively the identified problems, criteria and solutions will be elaborated upon in these paragraphs. This section will conclude with paragraph 4.1.5 with some conclusions and recommendations derived from the meeting.
4.1.1 Used Method – Collaborative Decision Making For the supply chain analysis a group meeting with representatives of all involved parties in the KLM E&M supply chain has been organized. As a method there was chosen to perform a Group Support System (GSS) meeting because, in the writing of Briggs and Nunamaker (1994), people must work in teams and collaborate when no one person has all the experience, insight, information or resources to accomplish a goal alone. “Through the process of interaction amongst group members, complementary ideas and knowledge can be utilised to achieve different (and normally greater) value than it would be possible to achieve though individual isolated efforts” (Hlupic and Qureshi, 2003). GSS is a set of software tools for structuring and focusing the efforts of teams working toward a goal. with GSS, people share, organize and evaluate concepts, make decisions, and plan for action. (De Vreede et al, 2003) Many different types of organizations have explored using GSS technology to improve many aspects of business decision-making (Fjermestad and Hiltz, 2000). Using a group support system has several advantages over a ‘normal’ meeting (Kolfschoten, 2003):
• Parallel working: In an oral meeting only one person can speak while others listen. GSS enables parallel working on ideas.
• Anonymous: All ideas and results are listed without referring to the person who entered it. This removes any social or hierarchical barriers participant may feel to brainstorm freely.
• Structured and focused: A GSS session is very structured and focused because of the requirements set by the software. The software setting ensures a certain level of preparation and sets up a structured meeting
• High data processing capacity: The software is capable of processing all entered data immediately. No minutes of meeting need to be developed afterwards and voting or rating results can immediately by evaluated.
• Highly efficient: All above mentioned steps ensure maximum efficient use of the time participants make free for attending the meeting.
For a successful GSS session, preplanning is critical to avoid the pitfalls illustrated in the cases. Facilitators themselves agree this is the single most critical success factor for GSS meetings (Bostrom et al, 1993). Also, that preplanning should focus on clearly defining the meeting goals. (De Vreede et al 2003) identified in their research that problems regarding the meeting goals are related to all the symptoms for GSS failures that were recorded in their study. Obviously, to avoid the earlier identified pitfalls in collaboration sessions, the GSS session was carefully planned with help of a facilitator. In planning the session, ThinkLets were used: The thinkLet is a codified facilitation technique that creates a predictable pattern of collaboration. “Because thinkLets produce a predictable pattern of interactions among people working together toward a goal they can be used as snap-together building blocks for team process designs” (Kolfschoten et al, 2003 and Briggs et al, 2003). The exact planning of the GSS session and the used thinkLets are added to the report in appendix VIII at page 141. An important part of the preplanning of the GSS session was the determination of the projected goals of the session and the projected outcome, which results in the selection of the participants needed to fulfil the projected goals and to achieve the projected outcome.

Part I ~ Analysis of the current situation
“Forecasting the incoming flows” 35
The projected goals of the session were the following: • Create common understanding between involved parties concerning logistics issues • Develop criteria to validate/rate alternatives, • Develop solution alternatives • Create common insight into the physical and logistics information flows.
Combined with the projected outcomes: • Criteria on which alternatives can be validated • Solution alternatives • Common understanding and respect between different stakeholders
Based on the projected goals and outcomes all involved parties concerning logistics issues were selected: the meeting would include representatives of the following parties (all internal KLM):
• The customers • The logistics center • The shops • The warehouses • Carriers • Flow control departments
In the next three paragraphs the results of the session are presented. These paragraphs give a short and bullet wise representation of the most important session results. The complete report of the GSS session has been added to the report in appendix IX at page 144. Paragraph 4.1.5 elaborates on the most important recommendations which are derived from the GSS session.
4.1.2 Identified problems In the GSS session 3 problems were identified as most stringent (see also Figure 47):
• Lack of 1 IT-system for the whole supply chain • (Un)reliability master data in all systems • Packages which are accepted without meeting the KLM E&M logistics input rules.
Figure 47 Key issue voting results (this figure has Dutch text elements because the GSS session was carried out in Dutch)

Chapter 4 Performance Analysis
MSc Thesis Jan-Hoite van Hees 36
4.1.3 Identified criteria Most important criteria derived from the session:
• A solution must always be customer focused • A solution must always be supported and paid attention to by higher management. • A solution must always be in line with structural process improvement and contributing to
improving the KLM system performance • A solution should only be implemented with enough funds available for proper
implementation.
4.1.4 Identified solutions Highest ranked solution alternatives (Figure 48):
• Improvement of the teamwork between the strategic purchasing and operational business units with regard to contract and supplier management.
• Joint development and implementation of unambiguous and mutually accepted key performance indicators (KPI’s).
• Confronting vendors and customers with their faults. • Minimization of the number of needed IT systems, with optimization of the interfaces between
them.
Figure 48 Solution alternative voting results (this figure has Dutch text elements because the GSS session was carried out in Dutch)
4.1.5 Conclusion and recommendations strategic logistics analysis This paragraph elaborates on the evaluation of the GSS session based on the projected goals and outcomes introduces in paragraph 4.1.1. The most important conclusions and outcomes are also presented. Short evaluation on the result of the session per goal:
• Create common understanding between involved parties concerning logistics issues: All involved parties reached a much better common understanding of the key logistics issues by brainstorming about the current logistics processes and the experienced/projected issues. Through oral discussion about the relative importance of the issues, involved parties came to a better common understanding of the logistics issues as well. They are in better understanding of the issues which are experienced by other stakeholders and have identified ‘language problems’ with respect to the use of logistical

Part I ~ Analysis of the current situation
“Forecasting the incoming flows” 37
terms: stakeholders are using the same terms with different meanings (e.g. with respect to deliverance times).
• Develop criteria to validate/rate alternatives: Criteria to validate the alternatives were brainstormed by the group. Although some ideas cannot be used as a criteria, most contributions were suitable (some with minor alterations) to evaluate alternatives.
• Develop solution alternatives: Through the key problems identification, a focused solution brainstorm and evaluation of the most promising solution alternatives has been done by the group. These alternatives can be a start for the participants to develop structural process improvements.
• Create common insight into the physical and logistics information flows: This goal has not been completely reached. Because of the detailed level of knowledge of the participants, not reaching these goals did not affect the effectiveness of the session with respect to the projected outcomes. It seemed like all involved participants had enough (common) knowledge about physical and logistics information flows. This goal was included as a sub-goal of the session and functioned as a warm-up task for the participants.
Short evaluation on the result of the session per result: • Criteria on which alternatives can be validated upon:
As described in the previous section, the free brainstorm has resulted in some very useful criteria which can be used for the evaluation of solution alternatives. Because of the high-level overview on the logistics activities, majority of the criteria are general (not scientifically measurable) and too vague for direct use. However, these ‘general criteria’ can be used as a guideline for developing more specific and project-focused criteria per problem.
• Solution alternatives: As described in the previous section, the build-up of the session contributed to the development of actual solutions for key issues. For some stakeholders these solutions will not be surprising, for others they might be new. The most promising aspect of these solutions is that they are evaluated by representatives from the whole inbound logistics chain, which makes the level of acceptance of the solutions higher. With this improved level of acceptance, the chance of success in case of implementation has been increased.
• Common understanding and respect between different stakeholders: The most important outcome of this session is the common understanding between different parties, because they do not have the opportunity to work together with all involved stakeholders. This outcome had been reached at a reasonable level with the session itself. Using the ThinkLets and different techniques to work with the group helped them to create their own vision of the selected issues and to create a common understanding between various parties.
Conclusions and recommendations based on the sessions results Based upon the sessions result, the following conclusions and recommendations can be identified: the most important issues experienced by the stakeholders in the KLM E&M supply chain are the lack of 1 IT-system for the whole supply chain, the unreliability of the master data in all systems and the acceptance of packages which do not meet the KLM E&M logistics input rules. As solutions for these issues several solutions were identified: Improvement of the teamwork between the strategic purchasing and operational business units with regard to contract and supplier management, Joint development and implementation of unambiguous and mutually accepted key performance indicators (KPI’s), Confronting vendors and customers with their faults and the minimization of the number of needed IT systems, with optimization of the interfaces between them. These solutions are, although general, a good starting point for the development of new strategic business developmental planning. During the session some general criteria were also identified to assess the goodness of fit for possible improvement alternatives: A solution must always be customer focused, supported and paid attention to by higher management, in line with structural process improvement, contributing to improving the KLM system performance and only be implemented with enough funds available for proper implementation.

Chapter 4 Performance Analysis
MSc Thesis Jan-Hoite van Hees 38
4.2 Operational logistics performance analysis The operational processes which will be focused on in this section are the “Handling incoming flows” processes in the Logistics Center (LC) described in chapter 2 and 3. The expedition of the logistics center is responsible for these processes. Because of a delay in the transition of activities from other location to the logistics center (such as the inspection of incoming goods for A&A and BMSS), the current operational activities are different than designed before the opening of the logistics center. After the transition of these activities to the logistics center in march 2009, the process will be reconsidered with a “Kaizen” session (for more information on the Lean/Six Sigma method, of which the Kaizen is a tool, see for instance Shah et al, 2008). Because the outcome of this session is still unsure, this report wills only advice some general remarks which could be applicable in all possible process lay-outs.
4.2.1 Used Method As presented in the introduction of this section at page 33, this chapter provides the answer on research question six and seven (Figure 49).
Figure 49 Research questions addressed to in chapter 4 This section will focus on the operational process “handling the incoming flows” as being executed at this moment. Ideally the performance of the process would be measured in quantifiable performance indicators. However, because of the many changes in the logistics processes last year, these performance indicators (ideally the time packages spend in the expedition process per flow) can not be measured for the external incoming flow: the moment of delivery is not registered. A measuring point is in place for this instant in the form of the DM-measurement point in Scarlos, but this measurement is currently not executed at the moment of delivery. With this measurement in place, the calculation would still require some more research because this measurement is registered in Scarlos and subsequently in SAP while the moment packages leave the expedition process is only recorded in Tracking. None the less, the effort seems to be worth it because of the insight these figures would provide about the service level and performance of the expedition department. The additional advantage of re-establishing the correct measurement of the DM measurement point in Scarlos would be that this would enable the calculation of the total process time of packages for the whole logistics center or even to calculate the total process time for a package from the delivery at the logistics center to the final E&M destination. So the performance level of the expedition department could not be measured with help of KPI data. Therefore the method used to investigate the performance level was interviewing of involved employees. The direct involved employees have been frequently interviewed, during planned interviews, but a majority of the interviews were conducted in an informal setting during their working days. Furthermore, the operational managers and members of the management team of the logistics department were interviewed for a thorough insight in the operational performance of the expedition department. The most important interview results are added to this report in appendix VII at page 135. These interviews have resulted in insight and improvement suggestions in four different aspects of the operation:
• The process itself • The physical lay-out of the process • The IT-application lay-out of the process • The resource planning within the process
These four aspects are elaborated upon in the next paragraphs.

Part I ~ Analysis of the current situation
“Forecasting the incoming flows” 39
INBOUND
/third partie
s
4.2.2 Process analysis As explained in the previous section, there is a great difference in the designed process map and the current process map. Goods from external parties will have to be split out and re-distributed to the business units of KLM E&M. In the designed process map, a special team of ‘accepters’ would be responsible for the administrative procedures in SAP/Crocos and for the recognition of the destination of the incoming packages. The expedition would be responsible only for the movement from and to this section. In the current process map, the expedition is responsible for the acceptance procedures and the recognition of the destination of packages. Because of the necessity of consulting and editing several systems (Crocos + Tracking) the expedition employees are performing activities which are more complex than would be in the original process plans. Therefore it would be advisable to remove or split this “sub-process” step from the other sub-processes. How this could be implemented should be further researched.
4.2.3 Physical lay out Due to the fact that the above described ‘administrative acceptance and redistribution’ of incoming goods is now done by the expedition employees, the physical location of this process has been changed too. This is also caused by the implementation of the ‘shop VC’ processes in the LC. Originally the plans were developed to implement one ‘lane’ for inbound E&M products and one ‘lane’ for outbound E&M products:
The situation at this moment is that the ‘inbound’ and ‘outbound’ lanes can be understood as respectively ‘Shop VC serviceable’ and ‘Shop VC unserviceable’. The accepting and redistribution processes are all executed on the expedition area (near the orange dot).
Figure 50 Original physical lay out plan: external incoming flows are transported to the entrance of the INBOUND lane (red dots) and internal incoming flows are picked up at the expedition floor (orange dot).

Chapter 4 Performance Analysis
MSc Thesis Jan-Hoite van Hees 40
4.2.4 IT system lay out In the current processes map, expedition employees are forced to work with 4 systems: Tracking, Crocos, Scarlos and SAP. In the original plans only the use of Tracking was planned. Because of incoming packages which do not comply with the KLM E&M input rules, additional systems need to be accessed to contain the needed information about the destination of the package. Observations and interviews have shown that the additional process time needed is sometimes up to factor 20! Additionally, because of the process map change in the previous section, the expedition employees need to administer the TCOV. To do so, computer facilities need to be in place. Moreover frequent malfunctioning of Tracking (an entered valid reference is not recognized by Tracking) causes extra process time, because the sticker needs to be manually created. The increase of this additional work is measured to be at least 200% of the normal processing time at several observations.
4.2.5 Resource planning Developing a tight resource planning seems to be a difficult job because there is no insight in (projected or historic) workloads. Therefore, the expedition works with a fixed resource schedule with a fixed amount of employees on specific time gaps. Evaluation of the workload pressure is difficult because the measurement of all flows processed by the expedition is hard. The duration of the flows in the processes can not (and therefore isn’t) measured. Also, performance indicators for these processes have not been in brought in place yet. Forecasting the workload could be a ‘first step’ in a more data driven resource planning. Nonetheless, before a resource planning can be developed based on a forecast, performance indicators for the expedition employees should be known. E.g. how many packages per hour from the internal flow should one employee be able to handle?
4.2.6 Conclusion and recommendations operational logistics analysis The labelling of the packages with the Tracking stickers is taking more time at the moment than would be if the Tracking system would run perfectly. Observations have shown that the creation time for a manual sticker takes 200% of the creation time for a automatic sticker. Combined with the fact that some flows (external) take far more time than other flows (internal) to process, a sufficient insight in the incoming external flows is needed to plan the daily/weekly resources for the expedition of the logistics center. This insight is not available at this time. Additional problem is that this LC process duration time can not be analyzed at this moment because of problems with the DM procedure (the time-stamp of the acceptance of the goods between KLM Cargo and KLM E&M at the LC). This DM procedure would normally enable a calculation of the process duration time of the package from deliverance at the LC and the deliverance at the pick-up point in the LC for transport. Besides these (management) issues, several operational issues are currently hampering the efficiency of the expedition department of the LC. This is caused by the current process implementation of the logistics center. Before the realization of the logistics center, a process map was developed in which incoming flows would be sorted in a special area in which sufficient space and resources (as computers and sticker printers) would be available for the employees. During the start-up of the logistics center, the choice has been made to postpone this implementation and use the workspace for different purposes. Because of the plans of the management of the LC to implement the original process plans within 6 months, this research will not address to these issues. Most important items to improve the handling of the incoming flow are:
• Realizing insight in the incoming flows (sender/quantity/quality/spreading over time) • Realizing improvement of stickering process, problem evaluation, solution evaluation and
implementation within the business operations • Ensure enough space and facilities for expedition employees to perform their job. • Realizing sufficient capabilities (IT, process-wise) to measure total LC TAT for incoming
E&M goods (re-establishment of a correct DM measurement for all external incoming packages)
• Split the “TCOV” process step from the other expedition processes

Part I ~ Analysis of the current situation
“Forecasting the incoming flows” 41
4.3 Conclusions and recommendations Chapter 4 performance analysis The most important conclusions and recommendations follow from chapter 4 form the answering on research questions 6 and 7 of this research. They have been summarized and are presented in Figure 51.
Figure 51 Research question addressed to in Chapter 4

Chapter 5 Conclusions part I
MSc Thesis Jan-Hoite van Hees 42
Chapter 5 Conclusions part I Part I of this research elaborated on the analysis of the current situation regarding the incoming flows. In doing so, this part of the research answers sub questions 1 to 7 (Figure 52) as defined in section 1.2.2 of this report. This chapter provides some conclusions and recommendations based on the first part of the report.
Figure 52 WCA concept and research questions addressed to in part I

Part I ~ Analysis of the current situation
“Forecasting the incoming flows” 43
5.1 Conclusions This part of the report creates insight in the current situation regarding the incoming flows at the logistics center. Two incoming flow groups can be distinguished:
o Internal flow, flow originated in the KLM E&M maintenance locations at Schiphol. o External flow, flow originated by parties outside Schiphol
Many stakeholders and IT applications are involved in the execution of the processes forming the KLM E&M supply chain. These stakeholders can be divided in external and internal stakeholders. Internal stakeholders are the KLM E&M locations such as hangars and repair shops, while external stakeholders are customers and vendors. IT applications which are in place are also dividable in two categories: logistics and maintenance management. The maintenance management applications (SAP and Crocos) feed the logistics systems (Scarlos and Tracking) with information about the movement of goods, after which the logistics systems logs the movement of these goods. The internal flow is transported by Sodexo, who operates according to a fixed schedule. The external flows are brought to the logistics center by KLM cargo, but also by DHL. Internal flows are already logistically labelled with a Tracking sticker when coming in at the logistics center by the originating E&M departments and require therefore a minimum amount of effort for the expedition employees of the LC to process. These goods are sorted based on final destination and consequently distributed. External flows require some more labour to process. These goods have to be labelled by a Tracking sticker before they can be sorted and distributed. This labelling is done by entering a package reference number into the Tracking software system, after which the Tracking system automatically generates a sticker with the final destination. Observations and interviews have shown that the Tracking software isn’t always working as designed. In these cases stickers have to be manually created which costs at minimum double the time it would have taken when the sticker would have been printed automatically. Moreover packages which do not apply to the ‘reference input rule’ -which requires external partners to make sure that the KLM reference number is visible on the outside of the package- cause delays in the processing of the incoming flows. In some cases, packages need to be opened and paperwork or even aircraft parts need to be examined to give a conclusive indication of the final destination. For components registrated in the Crocos program an extra sub process needs to be completed. These components need to be registrated as received before Tracking can generate a correct sticker. This process step has to be completed in the Crocos program with help of the Crocos label number, which is also often missing on the outside of the package. This makes this sub process the most labour intensive of all. On a more strategic level additional issues experienced by involved actors are the lack of 1 IT system for the whole supply chain, the unreliability of the master data in all systems and the acceptance of packages without checking whether or not the comply with the KLM E&M input rules. Furthermore the performance of the expedition department of the logistics center can hardly be measured because lacking data about the moment of entrance in the logistics center for external goods. In general there is a lack of data in the incoming flows, this lack of data and thus insight hinders resources efficient planning on short term (on an hourly/daily basis) but also on the longer term (with holiday and off-day requests).
5.2 Recommendations Based on the analysis in this part of the research the following recommendations can be drawn:
o Split the “TCOV” process step from expedition. o Strictly employ logistics input rules. o Ensure enough space and facilities for expedition employees to perform their job. o Close monitoring of Tracking hick-ups. Measure disturbances and secure proper follow
up by responsible administrative departments. o A measurement/forecasting tool should be developed to estimate the workload o Measure the moment of entrance of incoming external goods. o Improvement of the teamwork between the strategic purchasing and operational
business units with regard to contract and supplier management. o Joint development and implementation of unambiguous and mutually accepted key
performance indicators (KPI’s).

Chapter 5 Conclusions part I
MSc Thesis Jan-Hoite van Hees 44
o Confronting vendors and customers with their faults. o Minimization of the number of needed IT systems, with optimization of the interfaces
between them.

Part II ~ Development of a forecast module
“Forecasting the incoming flows” 45
Part II ~ Development of a forecast module The research encompasses a study to forward visibility in the incoming flows at the logistics center of KLM Engineering & Maintenance (E&M). Part I elaborated on the current situation. Two flow groups were introduced:
• The external incoming flows • The internal incoming flows
Furthermore several conclusions and recommendations on operational and strategic level were presented. One of these recommendations is the following: “Resource planning: The projected workload is not clear; there is no insight in the volume of the incoming flows. A measurement/forecasting tool would help to estimate the workload. This forecasting tool should be combined with workload measurements to be able to translate the forecasting results to concrete daily/hourly employee workload schedules”. Although the other recommendations and conclusions would also be suited for further research, a choice has been made to elaborate on this specific recommendation. It is believed that the development of a forecasting tool complies the most with the assignment for the research issued by KLM E&M. Furthermore it forms a realistic target for the research to complete, contrary to some of the other (strategic) recommendations. System change processes are currently in motion within KLM E&M: the IT systems of Crocos and Tracking will be replaced by SAP. The exact characteristics of these changes are not known yet, but the projection is that also some of the involved processes will be changed at the same time in the coming five to ten years. Because of the uncertainty about the exact characteristics of the future situation, a corresponding forecast model can not yet be developed. Therefore the choice has been made for a dual development for a forecast model suited for the current system configuration and forecast system engineering requirements suited for the future situation. Chapter 6 will elaborate on both of these issues, while the subsequent chapters will be focused on the development of the forecast model in the current situation. Part II of this report will provide answers to several research questions (Figure 53). In doing so, part II of the research will describe the development of a forecast model and its implementation. The structure in which the development of the model and its implementation has been described has been derived from the work of Dym and Little (2003), van Daalen and Thijssen (2004) and Verbraeck and Heijnen (2004).

Part II ~ Development of a forecast module
MSc Thesis Jan-Hoite van Hees 46
Figure 53 Research goals and questions addressed to in Part II ~ Development of a forecast module Part II contains five chapters. Chapter 6 will elaborate on the conceptualization of the situation, mainly addressing to the analysis results from part I of the report. Chapter 7 will present the exact characteristics of the model, specification of the used parameters and the source of the data. Chapter 8 will elaborate on the verification and validation of the model while Chapter 9 presents the results (output) of the forecast model and describe the implementation of the model within the KLM E&M business operation. Chapter 13 concludes part II of the report with the conclusions.

Part II ~ Development of a forecast module
“Forecasting the incoming flows” 47
Chapter 6 Conceptualization Chapter 6 will elaborate on the conceptualization for the development of a forecast module to provide future insight in the incoming flows at the logistics center of KLM Engineering and Maintenance (E&M). Doing so, this chapter will provide the answer on research question 8 (Figure 54).
Figure 54 Research question 8 addressed to in chapter 6 and 7 As indicated in the introduction of this part of the research on the previous page, scheduled system configuration changes within the KLM E&M organization make the development of this module complex. IT application Tracking will most probably be replaced by a SAP module within the coming 5 years. Therefore two conceptualization researches has been conducted: one study for a forecast model based on the Tracking system in the current system configuration and a second study for a forecast module based on the SAP module. The latter study has been conducted as a systems engineering research and its output is formed by functional requirements and constraints which will be used when designed such a SAP module. Section 6.1 elaborates on the conceptualization in the current system configuration and summarizes part I of this research briefly. The following chapters will continue with the elaboration on the development of this model. Section 6.2 will focus on the development of a SAP forecast module in the future system configuration. Because the exact characteristics of this future configuration are not yet known, the section has been focused on describing the requirements and constraints of the future module. These requirements and constraint can be used for the design and development of the future SAP module.
6.1 Conceptualization – Current system configuration (Tracking & Crocos) The forecast model based on the current system configuration must be developed considering a couple of requirements. These requirements are developed by dhr Rijnbeek, operational manager of the logistics center and the commissioner of this research. Requirements:
• The model should consider all incoming flows at the logistics center • The model should be able to predict incoming package quantities. • The model should be able to predict on a daily level • The model should be able to ‘learn’ from past trends • The model should reach a reasonable certainty level (80-90%) on a weekly basis at this
moment. Sections 6.1.1 and 6.1.2 will demarcate the ‘dimensions’ of the model, while section 6.1.3 will elaborate on the objects (parameters) which will have to be predicted.
6.1.1 Included flows As identified in part I of this report the incoming flows can be divided in two categories: internal incoming flows and external incoming flows (Figure 55). The model includes both of these categories. In case of high-urgency matters, the normal procedures sometimes are ignored in order to minimize the time loss. These flows do not need to be involved in the model: The model will only give insight to the regular (non/low urgency) inbound flows.
Logistics Centre
Extern
Intern
1
2
Figure 55 Involved flows

Chapter 6 Conceptualization
MSc Thesis Jan-Hoite van Hees 48
The choice has been made to include all packages scanned at the expedition. This means that there will be one flow added to the incoming flows: the origin-LC flow, these packages are shipped from the logistics center and form in fact an outbound flow. The argument to include this flow in the analysis is to give a complete picture of the
workload of the expedition. Still the inbound flows at the LC can be strictly separated from the outbound flows; the LC-originated flow should then be ignored and not be included for further analysis.
6.1.2 Geographical demarcation The model will only focus on the packages which go through the logistics center (Figure 56). Within the logistics center the model will only focus on the packages processed by the expedition employees (Figure 57). Logistics procedures make sure this is almost 95% of the KLM E&M inbound flow (Interviews with Leo Vennik, 2009). Exceptions like vendors who deliver special packages and dangerous goods at other E&M
locations on Schiphol-Oost (e.g. seat cushions at Hangar 14) will not be included in the model.
6.1.3 Forecast parameters The model will have to have a scope of at least one week (but preferably two weeks) in front and give one week feedback on the forecast results. Because of the difference in operational processes for the internal and the external inbound flows, it will be imperative to distinct the origin of the packages in the forecast model. Aside from the origin, the model has to indicate the amount of packages with the day of arrival it calculates (Figure 58)
6.2 Conceptualization – Future system configuration (SAP) The main result of this research is the analysis of the current situation and a forecast model suited for the current system configuration. Due to system change processes within KLM E&M the use of the Tracking system will probably only last until the complete implementation of the SAP logistics module. Because the data origin of the forecast model for the current system configuration is the Tracking database, a solution has to be found for a forecast system after this implementation. Due to the fact that all E&M logistics systems will be replaced by SAP, the most reasonable option seems to be to use this application for the future forecast model. The exact future logistics system lay-out of SAP is currently not yet known. SAP implementation specialists and business development experts of KLM E&M are still working on the specification for the SAP functional replacement of several logistics systems (Interviews with Chan and van Leeuwen, 2009). At this moment the latest insights are that the Crocos system seems to be the most difficult system to replace. This difficulty is caused by the very specific KLM E&M design of Crocos (because
Figure 56 Inbound LC packages
Figure 57 Inbound Expedition packages
Forecast
Origin Quantity Day of arrival
Figure 58 Forecast parameters

Part II ~ Development of a forecast module
“Forecasting the incoming flows” 49
it was designed, build and developed by KLM E&M itself) which cannot be replaced easily by standard SAP components. Until the exact system configuration will be completed, a final design for a forecast model in SAP cannot be developed. Therefore this part of this research will not focus on the design of a forecast model, but focus on design requirements. To do so, there has been made use of scientific work of White, 1999; Dym and Little, 2003; Ostrofsky, 1994 and Brill, 1999 summarized in lecture material of Drs. Ir. M.W. Ludema for the course “Transport, Infrastructure and Logistics Systems Engineering”(Figure 59) at faculty Technique, Policy and Management at the Delft University of Technology.
Figure 59 System engineering stepping stones (www6) The structure of this section has been determined according to the stepping stones presented in Figure 59: paragraph 6.2.1 will focus on the design boundaries, paragraph 6.2.2 will present the opportunity of the design of the SAP forecast module. After which paragraph 6.2.3 will present the measures of effectiveness. Paragraph 6.2.4 will focus on the need identification statement, 6.2.5 on the operational concept and paragraph 6.2.6 will conclude this section with the system operational requirements.
6.2.1 Design Boundaries The design of the forecast system will be build using several sub- and aspect systems. These sub- and aspect systems will define the boundaries of the design. Likewise, the definition of the phase systems will elaborate on the time window the design will have to function in (Figure 60). The demarcation of this system design will be slightly different than the used demarcation in section 6.1 for the forecast model design. This is caused by the fact that SAP contains far more data with much more complexity, which enables the forecaster to use more data to enhance the
functionality of the SAP forecast module (e.g. the forecast could be developed as well on basis of collie’s as on basis of
Figure 60 Relationship between the sub-, phase- and aspect systems

Chapter 6 Conceptualization
MSc Thesis Jan-Hoite van Hees 50
purchase orders, or the forecast could make use of contractual delivery agreements etc). Tracking is not able to offer these kinds of possibilities. Subsystems The subsystems of the forecast will be the locations where the packages will be delivered within KLM E&M. Including all those locations as subsystems will enable a forecast for all specific locations and for combinations of those (what will end up as a forecast for logistics hubs like the logistics center). The characteristics in SAP, in particular the differentiation in order types, enables the forecast to shift from shipping location (origin) to final destination because the need of the origin is less important if the order type can be distinguished. Destination Locations:
• VOC • Hangar 10 • Hangar 11 • Hangar 14 • Engine Services • Dangerous goods warehouse • Avionics & Accessories • Base Maintenance Support Shops • Component warehouse logistics center
Aspect systems The aspect systems will indicate the processes which drive the packages through the logistics systems. Based on these processes a rather ‘raw’ categorization has been made:
• Components Serviceable • Components Unserviceable • Expendables
Based on these aspects forecasts will be able to be processed for a location per aspect. For example, it will be possible for A&A to develop two different forecasts: one for the expendables and one for the incoming unserviceable components. This will enable a better forecast of the workload, because the underlying processes for components and expendables are quite different. Phase systems The phase system indicates the timeframe in which the forecast model should function. The earliest moment of implementation will be with the completion of the logistics system configuration change and the activation of the SAP logistics module. When the forecast model should be withdrawn from daily operational use is the moment a (better) system will replace the functionality of the model, or when the functionality of the forecast model is not needed anymore.
• From: full implementation SAP logistics module • To: replacement by another system or in case of a lack of demand for the output of the
model.
6.2.2 Opportunity In the opportunity statement (Figure 61), the opportunity to realize a system is identified. In this case the opportunity statement will focus on the IT master plan. The opportunity statement is used to create a common understanding what the opportunity is, and to agree on the next steps by means of a structured dialogue towards alignment, commitment and common understanding (www6).
Figure 61 "Understanding the opportunity" (www6); the opportunity statement provides an answer to these three questions.

Part II ~ Development of a forecast module
“Forecasting the incoming flows” 51
Real opportunity The real opportunity for the development for a SAP forecast model is the implementation of the IT master plan (supply chain visibility) in which SAP will replace several logistics systems like Tracking and Crocos. Stakeholders The stakeholders involved in using the forecast models are the logistical departments of the several KLM E&M locations mentioned in section 6.2.1. For a more detailed description of these stakeholders see section 2.1 of this report at page 5. Value drivers The value drivers of the forecast model will be the forward visibility in the workload of the departments. The forecast results can be used to analyze possible peaks or dips in the inbound goods flow. By getting this information several weeks in advance, operational managers at the several E&M locations will be able to schedule their resources in the most optimal manner. This will enable the logistics managers to perform the services with high efficiency while maintaining a high service level to the operational maintenance units. Furthermore, the forecast can also be used to adjust the transport schedule in case of expected peaks or dips in the goods volumes. Besides the value added for the logistics department at the various locations, there will also be added value for the transport agent (Haughton, 2009). Besides these operational advantages, the forecasts will give the management of E&M a structured and clear view into the logistics good flow coming into their respective departments and make relevant and informed managerial decisions if needed. Risks The risk of the design of a forecast model is twofold: On the one hand SAP must be compatible for the addition of a forecast function in the required set up within reasonable costs. So the risk of the system design requirements is that the forecast module will be skipped and not implemented due to too high development and/or maintenance costs. On the other hand forecast models give often risk to wrong use (De Vreede et al, 2003). A forecast is sometimes used as if it is the actual reality. Users of the model should always be aware of the fact that the model only calculates a forecast based on the model design and that deviation from the forecasted volumes can always occur. Targets Targets which should be reached by the forecast model are based on the reliability of the model: users should be able to trust the model within certain boundaries:
• Percent Mean Absolute Deviation: at most 10%. (The mean absolute percentage deviation of the model is no more than 10%: the mean reliability of the model should be higher than 90%).
• Peak absolute Deviation: at most 25 %. (The peak deviation values should not be bigger than 25% or -25%. Bigger deviations will make the risks for the operational process to big.)
Opportunity statement The opportunity statement for a SAP forecast model: “Forecast functionality in SAP implemented within the IT-master plan implementation project to facilitate efficient logistics resource planning with forward visibility for maintenance unit logistics departments as well as the transport service providers to perform their services with a high service level against minimum costs.” This chapter will offer several important parameters which will need to be taken into account by the eventual developers of the forecast module. To develop these measures of effectiveness (in the end these measures can be used to measure the performance of the module), the need identification (what is really needed and asked for by the stakeholders) and the systems operational requirements (the combination of the measures of effectiveness and the need identification lead to a set of requirements which the forecast module will be able to fulfil to meet the expectations of the stakeholders) extensive meetings have taken place with several direct involved KLM employees. Their direct input has been

Chapter 6 Conceptualization
MSc Thesis Jan-Hoite van Hees 52
collected and verified by their co-workers to be the exact requirements for the system needed. (Vennik, 2009 and Rijnbeek, 2009)
6.2.3 Measures of effectiveness Measures of effectiveness (MOE’s) are standards against which the competence of a solution can be evaluated, to meet the needs of a problem. These standards are specific properties that any potential solution must possess. MOE’s are independent of any solution and do not specify performance of criteria (www6). These MOE’s can be used as criteria when designing and building the forecast module, also the MOE’s can be used after the implementation the evaluate the working of the module.
• The model should focus on inbound E&M goods • The model should be able to give forecasts for all E&M locations • The model should be able to produce a forecast for two weeks in front • The model should be able to give insight in past performances • The model should be able to produce a forecast with a mean absolute deviation of 90% • The model should be available for all logistics employees of KLM E&M • The model should be weekly refreshed • The models output should be able to forecast the number of collie’s and the number of orders.
6.2.4 Need identification “A need refers to the desired end and is separate from whatever means may be available to meet this end” (www6) The need identification can be used to develop a good sight of the wishes of the eventual clients (users) of the forecast module. Given the problem definition, a need analysis must be performed with the objective of translating a broadly defined “want” into a more specific system-level requirement. To do so seven questions regarding the need of the client are answered:
• What is required of the system in ‘functional’ terms? The model should be able to forecast the inbound E&M flow two weeks in front for all E&M locations.
• What functions must the system perform? o Analyze all inbound E&M flows o Analyze all E&M destinations o Analyze the forecast performance o Calculate a forecast based upon historic values and SAP parameters o Present the forecast for all destination o Present the forecast in collie’s o Present the forecast in order amounts o Present the forecast to all logistics employees o Give historic insight in the achieved logistics performance o Give historic insight in the achieved forecast performance o Give a clear display of the parameters with no room for misinterpretation
• What are the “primary” functions? o Calculate a forecast based upon historic values and SAP parameters o Give a clear display of the parameters with no room for misinterpretation o Present the forecast to all logistics employees
• What are the “secondary” functions? o Analyze all inbound E&M flows o Analyze all E&M destinations o Analyze the forecast performance o Present the forecast for all destination o Present the forecast in collie’s o Present the forecast in order amounts o Give historic insight in the achieved logistics performance o Give historic insight in the achieved forecast performance
• What must be accomplished to alleviate the stated deficiency? o Completion of SAP logistics module o Development of the forecast module
Analysis of the forecast input parameters Development of the forecast logic

Part II ~ Development of a forecast module
“Forecasting the incoming flows” 53
Analysis of the forecast output parameters Development of the forecast output display.
• When must this be accomplished? o Before the shut down of the Tracking system.
• How many times and at what frequency must this be accomplished? o Initial development: once o In case of relevant SAP configurations: incidental.
6.2.5 Operational Concept This paragraph contains the identification of the prime mission of the module and alternate or secondary missions. The operational concept is used to answer the following two questions regarding the forecast module:
• What is the module to accomplish? • How will the module accomplish its objectives?
• Mission definition
o Prime Mission “Forecast the inbound goods flow for all E&M locations” o Secondary Missions “Forecast the flows in collie’s and in order quantity” “Forecast two week in advance” “Forecast output accessible for all logistics employees” “Forecast based on historic parameter values and real time SAP parameter values”
• Performance and physical parameters o The forecast should be available for all logistics employees o The forecast should be updated weekly o The forecast should have a good reliability (90%)
• Operational life cycle o Equal to the SAP life cycle
• Utilization requirements o Availability of the forecast: 100% of the SAP availability.
• Environment o Interfacing with MS office applications. Forecast should be accessible with a
standard KLM workplace.
6.2.6 Requirements Analysis The requirements analysis is a summary of the preceding paragraphs and concludes this section. The requirement analysis has as a function to provide an overview of the requirements to which the future module will be subject. It provides developers a quick but complete overview of the most important requirements for the module by the eventual users: the logistics center and the maintenance units.
• Logistics Center o The forecast should indicate the inbound flow in collie’s o The forecast should indicate the total external LC inbound flow o The forecast should be available for all LC employees o The forecast should predict two week in advance o The forecast should be reliable (min 90%) o The forecast should be differentiated per process
• Maintenance locations E&M o The forecast should indicate the inbound flow per maintenance location o The forecast should indicate the total external inbound flow per maintenance location o The forecast should be available for all logistics employees o The forecast should indicate the inbound flow in order quantities. o The forecast should be differentiated per process
Using these requirements a valid forecast module can be developed based on the current processes and insights of the involved employees. However, there should always be interaction with the future users of the model to secure the synchronization with the processes and wants and needs as in place at that particular moment.

Chapter 6 Conceptualization
MSc Thesis Jan-Hoite van Hees 54
6.3 Summary Chapter 6 Conceptualization Chapter six has provided a part of the answer on research question 8. This answer is presented in Figure 62.
Figure 62 Research question 8 addressed to in chapter 6 and 7

Part II ~ Development of a forecast module
“Forecasting the incoming flows” 55
Chapter 7 Specification, data sources and model development Chapter 7 will continue with the specification of the forecast objects in the current system configuration identified in chapter 6 (section 6.1). The chapter will focus on the specification of the forecast parameters, the IT applications which could be functioning as a data sources for the forecast model, the different forecast methods and the comparison between these methods. These steps are taken with the goal to provide the most accurate and complete forecast model as possible in the current system configuration, and are based upon the work of Verbraeck and Heijnen (2004). This chapter will answer research question number 8, 9 and 10 (Figure 63). The first three sections (7.1 – 7.3) are solely subject to the development of forecast alternatives by determining the proper specifications for the model building. The source of the data (Tracking track-and-trace data) will be elaborate on in section 7.2. The output following from the data analysis will be presented in section 7.3. The latter section of this chapter (7.4) is focused on the presentation of 8 forecast solution alternatives based on 2 forecasting methods (7.4.1). Subsequently (in section 7.4.2) these alternatives are compared and a choice for one forecast alternative has been made. This model and its underlying logic has been verified and validated in the next chapter.
9. Which criteria can be identified for validation of the forecast alternatives?
10. Which developed forecast alternative is best suited for the KLM E&M situation?
8. Which forecast alternatives can be developed to gain insight in the incoming flows at the Logistics Center?
Figure 63 Research questions 8, 9 and 10 are addressed upon in chapter 7
7.1 Characterization of the needed data As identified in the conceptualization in section 6.1.3 at page 48, three objects are needed in the forecast model:
• Origin of the package • Quantity per origin • Moment of arrival

Chapter 7 Specification, data sources and model development
MSc Thesis Jan-Hoite van Hees 56
For these objects the characteristics and value ranges have been determined (Table 8). This provides complete insight in the data characteristics which needs to be kept in notion with the model building. The origin is a nominal value and can be indicating 10 location codes (see also Table 9 for an overview and further specification). The quantity of the incoming flows can be any value between 0 and 999999, while the moment of arrival can be every single moment between Monday 00:00h and Sunday 23:59h. Origin Quantity Moment of Arrival Data characteristic: Nominal Ratio Ratio
Value range:
Extern, ES, H10, H11, H14, 425, MGS, VOC, Unknown, LC
0-999999
Monday-Sunday 0:00 – 23:59 h
Table 8 Characteristics of the forecast objects The origin location codes indicate the following locations (Table 8): Origin Detailed Description Extern All packages which are sent to KLM E&M from outside the Schiphol area ES Engine Services (ES)-- Building 410 (TAO (Technisch Areaal Oost)) H10 Hangar 10 (TAO) H11 Hangar 11 (TAO) H14 Hangar 14 (TAO) 425 Avionics & Accessories -- Building 425 (TAO) MGS Dangerous Goods warehouse -- Building 216 (TAO) VOC Line Maintenance Schiphol Center (Schiphol Center) Unknown Origin unknown.
LC
Logistics Center: packages that are also scanned by the expedition on their way out of the logistics center. (included in the analysis to give a more complete view of the workload of the expedition). This flow has to be ignored when only analyzing incoming flows.
Locations
Please check figure 5 at page 15 for the locations of the E&M buildings in the TAO-area.
Figure 64 Geographical boundaries Table 9 Specification of the origins parameter
7.2 Data source After the evaluation of the data needed for the model in section 7.1, this section elaborates on the source of this data. The data can be derived from several systems which are used within the logistics domain. Section 2.4 elaborates on these four systems (page 24 and further):
• SAP

Part II ~ Development of a forecast module
“Forecasting the incoming flows” 57
• Crocos • Scarlos • Tracking
The following table (Table 10) shows the suitability of the software for this model, based on the requirements for the needed data. This suitability has been indicated by a colour indication: Green (Perfectly suitable), Yellow (not perfectly suitable, but acceptable) or Red (not suitable and not acceptable) for four criteria:
1. All Flows? – Does the application contain data about all incoming flows at the logistics center?
2. Package quantities? – Does the application contain data about the package quantities of all incoming flows at the logistics center?
3. Day of arrival? – Does the application contain a time stamp of the day of arrival of the incoming packages at the logistics center?
4. Data availability? – Is enough historic data available in the application for the development of a forecast model?
All flows? Package Quantities? Day of Arrival?
Data availability?
SAP
No, all internal CS component flows are not registered in SAP. . . .
No, SAP only registrates the number of orders and not the number of packages . .
Yes. ….
SAP contains enough historic data ….
Crocos No, only CS component flows …..
Yes. ….
Yes. ….
Crocos contains enough historic data ….
Scarlos No, only external flows …..
Yes. ….
Yes. ….
Scarlos contains enough historic data ….
Tracking Yes ….
Yes. ….
Yes ….
Tracking only contains data starting from June 2008 . .
Table 10 Selection of the data source among the involved IT applications As can be concluded from Table 10 the IT-application Tracking proves to be the best candidate for the source of the needed data. SAP as a source for a model that counts and predicts package numbers is not possible at the moment, so SAP is not suited. Crocos, as well as Scarlos, is a system which only follows one part of the flows which enter the logistics center: Crocos only contains the data about the CS components, while Scarlos only contains data about the external incoming flows. This leaves Tracking. Tracking has one minor hitch: it was implemented June 2008 and is fully operational since September 2008. This limits the amount of historic data available for (trend) analysis. The data obtained by the Tracking application are stored in a database (TerraData, which is in possession of AirFrance). This data can be gained by entering query through the business intelligence software program Business Objects XI. Section 7.2.1 will be shortly elaborating on the Tracking system, after which section 7.2.2 will provide some more detailed information about Business Objects XI.

Chapter 7 Specification, data sources and model development
MSc Thesis Jan-Hoite van Hees 58
7.2.1 Tracking Compared with the other systems which are used in the logistics domain, Tracking has proven to be the system with the most fitting data output for a forecast model. Tracking is a logistics Track-and-Trace systems which is used to tag all logistics flow within KLM E&M. Section 2.4.4 of this report (page 25) provided basic information on the functionality of the application. This section will only provide further elaboration on the items important for the forecast model. Forecast parameter 1: Flows The internal and external flows are both labelled with Tracking stickers (see Figure 65 for an example). The internal flow is labelled at the shipping location (Ship Loc on the sticker, in this example “440”) and sent to a destination which is pictured big on the sticker: in this case SPL H14 2141 which stands for “Schiphol” “Hangar 14” “location 2141”. The sticker is scanned twice for every movement, a pick scan before the movement and a drop scan after the movement. Afterwards these movements can be tracked using internet (Figure 66).
Figure 66 Barcode Tracking This way the exact moment of scanning at a certain location can be tracked down using the sticker barcode or the Tracking reference as query entries. Internal flows are labelled at the moment the packages has to be offered for internal transport, while external flows are labelled at the moment they enter the KLM E&M domain: at the expedition department of the logistics center. From that point on, all their movements will be visible in the Tracking software as well. Forecast parameter 2: Package quantities Every package receives a unique barcode. So every unique barcode represents one package. Forecast parameter 3: Day of arrival
Figure 65 Tracking sticker

Part II ~ Development of a forecast module
“Forecasting the incoming flows” 59
This logging of the exact scan moment ensures and creates the possibility to analyze the exact moment of arrival at every location where the package has been scanned.
7.2.2 Business Objects XI To allow more extensive data analysis with the track-and-trace data from the Tracking-system, the database has been connected with business intelligence software “Business Objects XI”. This software allows analysis of the available data in several ways. This model requires track and trace data at the expedition, resulting in quantities per sender per time unit. This section describes the development of the query used to obtain the required data for the development of the forecast model. The first step to generate the required data is to define a query:
The parameters entered in the query determine which data is analyzed and which data is left out. The first important query filter is to select the data owner. Because there is no need to evaluate AirFrance data for this model, only KLM (kl) data is selected (middle bar of Figure 67).
Secondly, the subject was to evaluate the scan data of the expedition of the logistics center. For that reason the value “44001” (This is the location code
for the expedition LC) is selected from all scanning points (most below bar of Figure 67). Finally, the model has to be able to select the
scan data at the location expedition logistics center over a predetermined time frame. Therefore, time parameters are added to the query (Figure 68). The user of this query can choose to evaluate per month, per day or per week by entering the requested value in the respective fields. Besides choosing a query to limit the data which is going to be analyzed, Business objects XI requires
the user to select which parameters will be presented as output after the data search (Figure 69). Because the package quantities will be determined based upon the number of unique scanned barcodes, the barcode of the packages will have to be included. Furthermore, the origin of the packages is not yet known, so the shipping location of the packages is also added for analysis. Together this query and this output parameters will be presenting the data that is required for de forecast model: an overview of the number of packages passing the expedition of the logistics center per origin per timeframe.
Business objects presents the (Dutch) output of the analysis in a table (Figure 70):
Figure 67 Business Objects query (location) filters used to obtain the required tracking data
Figure 68 Business objects query (time) filters to obtain the required tracking data
Figure 69 Business objects output objects

Chapter 7 Specification, data sources and model development
MSc Thesis Jan-Hoite van Hees 60
Figure 70 Business objects XI output (in Dutch) This data output is transferred to Microsoft Excel for further analysis which will be elaborated on in the next sections 7.3 and 7.4.
7.3 Data analysis output With the track-and-trace data subtracted from the Tracking database with use of the business objects software, analysis can be done regarding the number of packages which are scanned at the expedition sorted per origin location and per timeframe. For several analysis and managerial purposes the output should cover not only daily reports, but also comparisons of the inbound flow per week or even per year. This creates a picture of the magnitude of the workload of the expedition. This section presents overviews of the workload of expedition per month (7.3.1), the workload per week (7.3.2) and the average workload per weekday (7.3.3). For more detailed information regarding the origin location please inform section 7.1.
7.3.1 Monthly analysis The monthly analysis of the expedition department’s workload is displayed in Figure 71. The graph shows the significant difference between the flow coming in from external parties and the other incoming flows. Although this graph will not be able to help with any operational resource planning issues, it is useful management information about the trend of the incoming flows over a longer period. Especially in these times were KLM-AirFrance are forced to be very aware and focused to possible cost-reducing decisions (www7), this monthly graph can be used as an indicator for possible flow drops and reason for a resource cut. On the other hand, the graph can also be used to prove an increase of the volume of the incoming flows and therefore that a cut in resources is not justifiable based on these figures.
Figure 71 Expedition workload per origin per month

Part II ~ Development of a forecast module
“Forecasting the incoming flows” 61
7.3.2 Weekly analysis The weekly projection of the workload (Figure 72) of the expedition department displays the workload trend over the last 12 weeks. The graph makes a distinction in the origin of the flows. This graph could be used to identify ‘outlier’ weeks, to adjust the resource planning for coming years. The weeks could be for instance the weeks around Christmas and New Year with significant drops in incoming flow quantities, but also the week following the Easter weekend and the summer holiday period.
Figure 72 Expedition workload per origin per week
7.3.3 Daily analysis The weekday analysis graph (Figure 73) displays the average value of the flows per origin per weekday. It clearly indicates the difference between the midweek and the weekends, which can be explained because of the closure of several maintenance locations at the weekends.
0
100
200
300
400
500
600
Aver
age
num
ber o
f inc
omin
g pa
ckag
es
Monday Tuesday Wednesday Thursday Friday Saturday SundayWeekday
Workload expedition department LC average per weekday
VOC
MGS
LC
H14
H11
H10
425
Extern
ES
Unknown
Figure 73 Average workload expedition per origin per weekday

Chapter 7 Specification, data sources and model development
MSc Thesis Jan-Hoite van Hees 62
7.4 Forecasting tool The data analysis has resulted in overviews of the number of packages which are being scanned (transferred) by the expedition of the logistics center in a certain timeframe displayed per originating party. However, the data still doesn’t predict anything for the period still to come. This section will elaborate on the development of a forecast model for the workload of the expedition of the logistics center. For the development of this model the data analysis output will be used as a source. The forecast model is going to be based on historic data. For this kind of forecast models, a couple of techniques (or methods) exist. All these methods use the historic data different to come to a forecast. Section 7.4.1 will present 2 possible methods to develop a forecast model and, based on these 2 methods, 8 possible forecast alternatives. In section 7.4.2 these forecasts methods will be developed, tested and compared to select the final forecast model.
7.4.1 Forecasting methods The selection of the forecast methods to be included in this research is based on earlier performed research on forecasting the level of a time series. The characteristics of the incoming logistics flows at the logistics center are without seasonality of growth, this time series form is called “steady state model” (SSM) and observations are represented as being “random perturbations around an unknown mean, which, through time, undergoes a random walk”. (Boyland et al, 1999). An exponentially weighted moving average (EWMA) is a frequently used methodology to estimate the current level of a time series (Muth, 1960, Harrison, 1967, Boyland et al, 1999, Reid and Sanders, 2007, Fildes et al, 2009). In addition the use of the simple moving average (SMA) methodology has become more obvious. Simple moving average was recognized as the most familiar and most used quantitative forecasting technique in US corporations (Sanders and Mandrodt, 1994, Cattani and Hausman, 2000, Reid and Sanders, 2007). The simple moving average uses the current mean value as estimation for future levels (1).
(1)
S(t) = the forecast for a time series value developed at moment t in time. The previous values of the series x are combined and divided by the number of values k of x. When calculating successive values, a new value x(t) comes into the sum and an old value x(t-k) drops out, meaning a full summation each time is unnecessary. X(t) = value of the time series at moment t in time K = number of values x(t). The exponentially weighted moving average is formed by the formula (2):
(2)
α = the smoothing factor, and 0 < α < 1. st = a simple weighted average of the latest observation xt and the previous smoothed statistic st−1. X(t) = value of the time series at moment t in time
7.4.2 Forecasting alternative models In order to compare the selected forecasting methods for this specific case, several measures of accuracy have been developed. Cattani and Hausman state in this respect “typical metrics for aggregate forecast performance include mean average deviation (MAD), mean square error (MSE), and mean absolute percentage error (MAPE) (Cattani and Hausman, 2000). The latter being generally used within company settings (Fildes and Goodwin, 2007) although the measurement of forecasting

Part II ~ Development of a forecast module
“Forecasting the incoming flows” 63
accuracy has been regarded a controversial topic (Armstrong and Fildes, 1995; Clements and Hendry, 1995) because of the “well-known disadvantages” (Fildes et al, 2009). In particular, these measures were qualified as being sensitive to extremes (Armstrong and Collopy, 1992). In order to minimize the influence of these disadvantages the comparison of the forecast methods will make use of all three measures of accuracy in a multi-criteria analysis. These kind of analyses can give a clear overview by placing the alternatives and the multiple criteria in one table; making the comparisons and decisions very transparent. The score card method is such a MCA; it compares alternatives using both qualitative and quantitative criteria, without giving an opinion on the alternatives as such. This method was already used by Rijkswaterstaat in 1975 and is described in The handbook of Systems Analysis, by Miser and Quade, 1996. Furthermore, because of the sensibility for extreme values, the forecast results for the last week of 2008 and the first week 2009 have not been used for the comparison because of the disadvantage of the measures to be to sensitive for extreme values: A steep decline in the quantity of the logistics flows, all forecast methods resulted in mean absolute percentage errors of around 25% (week 52) and 55% (week 1). This is while the mean absolute percentage error of the other weeks (47-51 and 2-9) lies around the 5%. All measures of accuracy for forecast models are based on the difference (3) between the predicted value and the actual value.
(3)
E(t) = the difference between the actual value Y(t) (also indicated as A(t)) and the forecasted value F(t) over time period (t). Y(t) = actual value over period t F(t) = predicted value over period t The three measures of accuracy are used for the comparison between the forecast methods: • MAPE (Mean Absolute Percentage Error) (4). • MAD (Mean Absolute Deviation), also indicated as Mean Absolute Error (MAE) (5). • MSE (Mean Square Error) (6).
(4)
Mean Absolute Percentage Error (MAPE): The average of n deviation percentages of the Error E(t) (= A(t) – F(t)) divided by the actual value A(t). The MAPE value indicates the mean absolute percentage error of the forecast over time.
(5)
Mean absolute deviation/error (MAD/MAE): The sum of N forecast errors E(t) over time period (t) divided by the number N of errors summated.
(6)
Mean Square Error (MSE): The sum of N squared forecast errors E(t) over time period (t) divided by the number N of errors summated. Two forecasting methods will be compared for this case study: the simple moving average (SMA) and the exponentially weighted moving average (EWMA). Both methods contain a parameter which can be fitted to the specific data to improve the forecast accuracy. Therefore, the comparison will be made featuring 8 forecasting models: 2 SMA models and 6 EWMA models.

Chapter 7 Specification, data sources and model development
MSc Thesis Jan-Hoite van Hees 64
The parameter which can be chosen within the SMA method is the time horizon k. The first model, forecast model 1, has a k-value of 4 weeks. So it will use the data of the 4 most recent weeks to calculate a prediction for the next week. (E.g. the forecast of week 11 is based on the mean values of week 6, 7, 8 and 9, the forecast of week 12 is based on the mean values of week 7,8,9 and 10 etc)
• Forecast model 1: SMA with k = 4. The second SMA model has a variable k-value because of a lack of historic data. For comparison reasons there has been chosen for a large k-value (about one year k=52) but the data is only available from week 39 on. Therefore the k-value increases with 1 every week for the second SMA model: Forecast 2. The forecast for the first week (week 47) has a k-value of 7 (based on all weeks between week 39 and 45), the forecast of the last week (week 9) has a k-value of 19 weeks (based on all weeks between week 39 and week 7 excluding week 52 and week 1).
• Forecast model 2: SMA with k = 7-19 The variable parameter of the EWMA method is the smoothing factor α. The α-value indicates the relative weight which is allocated to the actual value as a basis for the prediction for the next period. The α value has a minimum of 0 and a maximum of 1. To explore the whole range of the EWMA method, 6 forecast models were developed with the α value varying from 0.9 to 0.1. (e.g. with an α-value of 0.3 the prediction for week 11 is based on 0.3*the actual value of week 9 summated with 0.7*the predicted value of week 9, the prediction for week 12 is based on 0.3*the actual value of week 10 summated with 0.7*the predicted value of week 10 etc.)
• Forecast model 3: EWMA with α = 0.9 • Forecast model 4: EWMA with α = 0.7
• Forecast model 5: EWMA with α = 0.5
• Forecast model 6: EWMA with α = 0.3
• Forecast model 7: EWMA with α = 0.2
• Forecast model 8: EWMA with α = 0.1
To enable validation of the forecast comparison, the data has been divided in two groups. The first group (Tracking data over week 47 – week 3) will be used for the comparison. The second group of forecast data (Tracking data over week 4 – 9) will be used for validation of the outcomes of the first group in the next chapter. Only the scores of the methods on the selected criteria are presented in this section. The complete data sheets are added in the Appendix VI. The results of the first group (presented in Table 11) indicate the most accurate forecast model is forecast model 8, followed by forecast model 7 (both exponentially weighted moving averages) and forecast model 2 (simple moving average). The other EWMA models score average (forecast models 5 and 6) and worse than average (forecast 3 and 4) while forecast model 1 scores worst. The MAPE scores are graphically pictured in Figure 74 to picture the difference between the forecast models. week 47 - 3 Forecast 1 Forecast 2 Forecast 3 Forecast 4 Forecast 5 Forecast 6 Forecast 7 Forecast 8 Alpha-value n.a. n.a. 0.9 0.7 0.5 0.3 0.2 0.1
Mov Ave Ave Smooth1 Smooth2 Smooth3 Smooth 4 Smooth 5 Smooth 6
MAPE 8.61% 6.82% 8.50% 8.00% 7.47% 6.94% 6.74% 6.63%
MAD 299.04 230.77 294.93 275.33 255.73 236.13 228.78 224.69
MSE 116,883.31 67,768.39 114,166.62 101,073.75 87,941.25 75,794.78 70,677.80 66,523.94
worst worse Average better best Table 11 Forecast method comparison score card week 47-3 (week 52 & 1 excluded)

Part II ~ Development of a forecast module
“Forecasting the incoming flows” 65
Mean Percent Error week 47 - 3 (excl week 52 & 1)
-20.00%
-15.00%
-10.00%
-5.00%
0.00%
5.00%
10.00%
15.00%
20.00%
47 48 49 50 51 2 3
Week
Mea
n P
erce
nt E
rror
Forecast 1Forecast 2Forecast 3Forecast 4Forecast 5Forecast 6Forecast 7Forecast 8
Figure 74 Mean percent error forecast models week 47 - 3 (week 52 & 1 excluded)
Based on the results of the comparison of the forecast models, the choice would be made for the best scoring model on all three criteria: forecast model 8. This model is an exponentially weighted moving average model with an α value of 0.1. The performance of the second- and third best scoring methods although is not far behind. Forecast method 7 (also an EWMA model) scores second best on the MAPE and MAD values. Based on these results the EWMA clearly has an advantage over the SMA models.
7.5 Summary Chapter 7 Specification, data sources and model development Subsequent to the results presented in chapter 6 and 7, final answers on research questions 8 and 9 can be presented (Figure 75). Also a provisional answer on research question 10 is presented by this figure, this result is only temporary because the selected model has to be verified and validated in the next chapter.

Chapter 7 Specification, data sources and model development
MSc Thesis Jan-Hoite van Hees 66
9. Which criteria can be identified for validation of the forecast alternatives?
10. Which developed forecast alternative is best suited for the KLM E&M situation?
Chapter 7Specification, data sources and model
development(Chapter 6 and 7)
Based on data about the origin, quantity and moment of arrival of the incoming flows, subtracted from the Tracking application, 2 forecast methods “Simple Moving Average”
and “Exponentially Weighted Moving Average” have formed 8 forecast alternatives.
(Section 7.4) The eight forecast alternatives are compared using three
statically measures of accuracy which are generally accepted by forecast professionals:
- Mean Absolute Percentage Error (MAPE)- Mean Absolute Deviation/Error (MAD/MAE)
-Mean Square Error (MSE)
(Section 7.4) This conclusion is provisional and still subject to change based on the verification and validation in next chapter.
The best forecast alternative based on the data from week 47-3 (with exclusion of weeks 52 and 1 because of the holiday period) is the Exponentially Weighted Moving
Average with an alpha value of 0.1.
8. Which forecast alternatives can be developed to gain insight in the incoming
flows at the Logistics Center?
Figure 75 Research questions 8, 9 and 10 are addressed upon in chapter 7

Part II ~ Development of a forecast module
“Forecasting the incoming flows” 67
Chapter 8 Verification and Validation In the previous chapter forecast alternatives have been developed and one has been selected as the most accurate. The forecast model alternatives are based on historic values. To double check the logic of the model and the ability of the model to represent the ‘real world’ this chapter describes the verification and validation of the model. Verification will address to the control of the input and the output parameters and the logic of the model (section 8.1), Validation will bring the ‘reality factor’ of the model to test (section 8.2). This chapter will provide, combined with the results from section 7.4, an answer to research question 10 (Figure 76).
Figure 76 Research question 10 is addressed upon in chapter 7 and 8
8.1 Verification
8.1.1 Input and output variables The input variables for the forecast model are the number of unique barcodes which are scanned at Tracking location point 44001. The exact measurement contains “the number of unique barcodes which are scanned during a certain timeframe at the Tracking location 44001”. Although the procedure is to label the packages with unique barcodes, observations showed that occasionally multi-package orders are will be labelled with multiple stickers with the same barcode. To verify the trend of the output (Figure 78) a similar model (Figure 77) was build with slightly other input variables (number of barcode scans, instead of the number of unique barcodes). The graphs of the weekday workload indicate a similar trend in the two different models (only available in Dutch):
Expeditie werkdruk per afzender per weekdag
0
100
200
300
400
500
600
700
800
900
1000
maand
ag
dinsd
ag
woens
dag
dond
erda
g
vrijda
g
zater
dag
zond
ag
weekdag
Aan
tal p
er a
fzen
der
VOCMGSLCH14H11H10425ExternESOnbekend
Figure 77 Model output with input variable "Number of barcode scans"
Expeditie werkdruk per afzender per weekdag
0
100
200
300
400
500
600
700
maandag dinsdag woensdag donderdag vrijdag zaterdag zondagweekdag
Aan
tal p
er a
fzen
der
VOCMGSLCH14H11H10425ExternESOnbekend
Figure 78 Model output with input variables "Unique barcodes"

Chapter 8 Verification and Validation
MSc Thesis Jan-Hoite van Hees 68
The input variable “unique barcodes” has been checked several times for one hour in a weekday (600/16 operational hours = an average of 40 packages per hour). From this measurements (50, 35, 42 and 45, Figure 79) the conclusion is drawn the input variable “unique barcodes” gives a valid value for the workload of the expedition.
Counted incoming packages per hour vs Model average
0
10
20
30
40
50
60
11 february 2009 19 february 2009 24 february 2009 5 march 2009
Observation days
Num
ber o
f inc
omin
g pa
ckag
es p
er h
our
Number of incoming packagesModel average
Figure 79 Counted incoming packages per hour versus the models average
8.1.2 Model logic The model logic is primarily focused on the identification of the shipping location of the packages. The shipping location, generated in Tracking is input from the main data systems like SAP or Crocos. This shipping location is a specific location in a specific building. Because the output of the forecast is specified per building, the different shipping locations per building have to be combined for an overview per building in the model logic. Due to the system configuration, a shipping location entry is not required with the manual creation of a sticker. This causes a rather large portion of packages with an unknown shipping location in the Business objects output (see for example Figure 72: the blue bar -incoming packages with an unknown origin- averages 300 per week). Over the last six months 11% of the total flow of 77551 (9343 packages) packages which passed the expedition had a Tracking label without a shipping location or with a shipping location which was not recognized in the model logic. As long as the shipping location has not been entered with the creation of the sticker, this is a unavoidable consequence of the system configuration. However, the packages with a shipping location which is not recognized in the model logic form an avoidable error. Therefore it’s imperative to verify that these missing shipping locations in the model logic form a (very) small part of the total flows. This data has been subtracted from the Tracking database and is presented in Figure 80.: From the 9343 packages registered in the model with an unknown origin, 85 had a ‘known’ shipping location which is not allocated to a specific building in the model logic. This is 0.1% of the total flow.
Percentage of shipping locations not added in the forecast model
89% 11%
0.1%
Total number of incoming packages last 6 months Unknown shipping location in forecast modelNo shipping location on sticker: Shipping location not added in the forecast model
Figure 80 Percentage of shipping locations not added in the forecast model logic

Part II ~ Development of a forecast module
“Forecasting the incoming flows” 69
8.2 Validation
8.2.1 Expert Validation Several involved KLM logistics employees have made their comments on the measured logistics performance data and the forecast model. To validate the forecast model parameters, expedition employees have been involved in the development of the model. Moreover, they have given their input regarding the reliability of the model (see interview summaries in appendix VII at page 135). They’ve indicated that the model shows proper results for scanning quantities. This is not the same as the incoming quantity flow, because the model registers the packages at the moment of processing. An example of this difference is that the airfreight container from Los Angeles (coming in with flight KL602) gets delivered too late for processing the same day in the weekends. This results in a peak in the model the next day, often a peak on Sunday which is actually the container of Saturday afternoon. The coming period the results will be monitored by the expedition employees to signal abnormalities in the forecast behaviour of the model. Currently, all peaks and dips in the data could be logically explained with valid reasons (e.g. skipped flights from the US, late container deliveries etc).
8.2.2 Validation by data group 2 To validate the conclusions of chapter 7, a second data group has been tested with a similar methodology (Table 12 and Figure 81 display the result). Forecast model 8 is no longer the best model (this time only average). Nonetheless the EWMA models still score better than the SMA models. The best scoring model this time is forecast model 6 (α value of 0.3) with forecast model 5 and 6 scoring second best. Forecast 8 and 1 (the best SMA model in this group) score average while forecast model 4 and 2 score worse than average and forecast model 3 scores worst this time. Although the scorecard highlights the differences in performances of the forecast models, the scores lay close to each other. Considering the worst model shows a mean deviation of 4.2%, which is a mean reliability of 100 – 4.2 = 95.8%, all models score above average values of 95% reliability. week 4 - 9 Forecast 1 Forecast 2 Forecast 3 Forecast 4 Forecast 5 Forecast 6 Forecast 7 Forecast 8 Alpha-value n.a. n.a. 0.9 0.7 0.5 0.3 0.2 0.1
Mov Ave Ave Smooth1 Smooth2 Smooth3 Smooth 4 Smooth 5 Smooth 6
MAPE 3.73% 4.07% 4.23% 3.86% 3.33% 2.97% 3.07% 3.39%
MAD 136.39 148.64 151.67 139.04 121.08 108.73 112.34 123.89
MSE 26,650.82 27,132.27 27,484.05 23,519.65 20,906.03 19,465.99 19,685.73 21,232.70
worst worse average better best Table 12 Forecast method comparison score card week 4-9

Chapter 8 Verification and Validation
MSc Thesis Jan-Hoite van Hees 70
Mean Percent Error Week 4 - 9
-15.00%
-10.00%
-5.00%
0.00%
5.00%
10.00%
15.00%
20.00%
25.00%
4 5 6 7 8 9
Week
Mea
n P
erce
nt E
rror
`
Forecast 1Forecast 2Forecast 3Forecast 4Forecast 5Forecast 6Forecast 7Forecast 8
Figure 81 Mean percent error forecast models week 4 - 9 Though the EWMA is scoring better than the SMA models, the accuracy differences are rather small. (Similar results were reported by Sanders and Manrodt (1994) and Sani and Kingsman (1997).) Nonetheless the choice for the definitive value of α remains open. The first data group showed the best results for forecast model 8 (α value of 0.1), while this results was not validated by the second data group. In this group, forecast model 6 (α value of 0.3) scored best on the performance criteria while scoring only average in the comparison with data group 1. Forecast model 7 scores the best average performances over the two groups and therefore the α value of 0.2 is selected for the final model.
8.3 Summary Chapter 8 verification and validation The elaboration on the verification and validation of the forecast alternative selected in section 7.4 in this chapter leads to the following answer on research question 10 (Figure 82):
Figure 82 Research question 10 is addressed upon in chapter 7 and 8

Part II ~ Development of a forecast module
“Forecasting the incoming flows” 71
Chapter 9 Forecast output and implementation in the business operation This chapter is the final chapter of this research report before the conclusion chapters 10 and 11. It describes the output of the development of the forecast module and its implementation in the business operation. Although these two items may seems subsequently executed, because of the presentation in this report (Figure 83) with section 9.1 describing and presenting the forecast output followed with section 9.2 describing the implementation in the business operation, this was a iterative process with constant feedback from the direct involved E&M employees. In special, Ed Rijnbeek, who commissioned the research as operational manager, was constantly involved. Also Leo Vennik, in his position as Flow Control Manager, Willy Eckstein and Farried Kassim as expedition employees were constantly involved in giving feedback and thereby giving shape to the final forecast output.
Figure 83 Research question 11 is addressed upon in chapter 9
9.1 Forecast output The forecast output is formed out of 4 graphical sheets which are updated weekly. With the development of the final output, long term historic information was presented as addition to the forecast model over the coming two weeks. Special information was requested about the workload per day so a graph about the average scans per hour was added to the output as third graph. Also a special request for the insight in the flow directions has been done; the destinations of the packages which enter the logistics center with the external flows. This information was added to the output in the form of a pie-shaped graph. The output of the forecast project therefore has become a weekly report with four graphs:
1. The forecast over the coming two weeks, with including the actual values over the last week. (Figure 84)
2. The historic incoming flow volumes over the last twelve weeks (Figure 85) 3. The distribution of the amount of scans over the working day (Figure 86 ) 4. The distribution of the destinations of the packages from the external incoming flows. (Figure
87)

Chapter 9 Forecast output and implementation in the business operation
MSc Thesis Jan-Hoite van Hees 72
Forecast Flow Expeditie LC
625
576 587
634
703
222 232
649 631657
679640
221 232
645603 606
659707
214 220
587 583
697
761
590
218201
0
100
200
300
400
500
600
700
800
Monday
Tuesd
ay
Wednes
day
Thursd
ayFrid
ay
Saturda
y
Sunda
y
Monday
Tuesd
ay
Wednes
day
Thursd
ayFrid
ay
Saturda
y
Sunda
y
Monday
Tuesd
ay
Wednes
day
Thursd
ayFrid
ay
Saturda
y
Sunda
y
Last week current week Next week
# of
uni
que
pack
ages
at t
he
expe
ditio
n of
the
LC
Planning Actual
Figure 84 Output Graph 1: Forecast output. It pictures the predicted volume of
the incoming flows per day for three weeks (the last week, the current week and the next week) with the blue line. Also it pictures the actual volume of the incoming flows of last week with in pink line. This visualization enables a quick overview over the volumes expected, the difference in incoming volume between weekdays and weekends and difference in the predicted and actual values.
Figure 85 Output Graph 2: Expedition workload per origin per week. This graph pictures the incoming flows per origin over the last twelve weeks. It gives a good inside in the trend of the incoming flows over the last 2,5 months.

Part II ~ Development of a forecast module
“Forecasting the incoming flows” 73
Figure 86 Output graph 3: Scan per hour expedition LC. This graph pictures the distribution of the total number of scans over the day. It provides insight in the peak hours on the day.
Figure 87 Output graph 4: Percentage of the incoming external flows based on final destination. This graph pictures the distribution of incoming external packages based on their final distribution. This enables the managers to distinguish the ‘cross-docking’ flows from the ‘logistics center’ flows and internal transport volumes.

Chapter 9 Forecast output and implementation in the business operation
MSc Thesis Jan-Hoite van Hees 74
9.2 Implementation in the business operation The previous section (9.1) has presented the final output of the forecast model, with additional graphs requested by the daily involved employees. This output has been implemented in the business operation according to the list of “the more important aspects of the transition from project to integrated operation that must be considered when the project functions are distributed” ( Meredith and Mantel, 2006). This list of aspects has been used in several big projects, and because this project was a rather small one (in terms of budget, manpower and facilities) some points on the list are not applicable for this project.
1. Personnel. Due to the fact that the project was carried out by only one person as a thesis project, there is no such thing as a project team. There is though, work which was executed by the student which needed to be assigned to regular KLM staff. This work (the weekly updating of the forecast output) has been distributed among two departments of KLM E&M. The department “SPL/IK” Reporting and Analysis has agreed to take over the possession of the queries in Business objects. They provide a weekly output of the queries on a public network disk drive and perform all necessary maintenance to the query to secure proper output. Furthermore this department can be consulted for additional information requests regarding the historic Tracking data about the expedition flows. The forecast model is made in excel, which is done by the logistics department “SPL/VS”. They secure a weekly update on the forecast models (using the Business objects output as input) and take care of the communication of the output.
2. Manufacturing. The working procedures to develop the forecast output has been secured in the working procedures of as well SPL/IK as SPL/VS. Manuals have been provided to the departments in such a way, that every single member of the department will be able to perform the necessary work without any experience or help.
3. Accounting/Finance. No accounts/financial administration was involved in this project 4. Engineering. All manuals provided were agreed upon by the two involved parties. There have
been trainings with the procedures and employees have practiced under supervision of the developer of the forecast model. All procedures are understood by the involved employees. The requirements following from the systems engineering design analysis (section 6.2) for the SAP forecast module have been communicated by the Business development and IT departments (SPL/TX) of KLM Engineering and Maintenance. The involved employees have indicated that SAP is already able to perform functionalities that meet some of the requirements and that more complex queries are already developed for the Engine Services department which should be expanded for a KLM E&M scope. Conclusionary they stated that the requirements are realistic and that they will be taken into account with the further SAP development, although other projects (such as the replacement of Crocos) is far more complex and has all the priority at the moment.
5. Information Systems/Software. The forecast model has thoroughly been tested and has been verified and validated. Only known obstacle is the occurrence of failures by the business objects software, which happens once in a while. These failures are repaired by the AirFrance IT departments, after which the system is fully available to the users again.
6. Marketing. No marketing aspects were involved in this (internal) project. 7. Purchasing, Distribution, Legal, etc. None of the staff departments like these mentioned
have been informed about the model, the business development office “SPL/TX” as well as the IT department are kept on line during the project and will be invited for a final presentation about the project.
8. Risk identification and Management. The risk for failure of the implementation lies in the discipline of the involved departments to execute the weekly activities to update the output. When this isn’t been done, there will be no output whatsoever.

Part II ~ Development of a forecast module
“Forecasting the incoming flows” 75
9.3 Summary Chapter 9 Forecast output and implementation in the business operation Based on the elaboration in this chapter research question 11 can be answered, presented in Figure 88:
Figure 88 Research question 11 has been addressed to in chapter 9

Chapter 10 Conclusions part II
MSc Thesis Jan-Hoite van Hees 76
Chapter 10 Conclusions part II Part II of this research elaborated on the development of a forecast module to provide in future insight in incoming flows. In doing so, this part of the research answers sub questions 8 to 11 (Figure 89) as defined in section 1.2.2 of this report. This chapter provides some conclusions and recommendations based on the second part of the report.
Figure 89 Research goals and questions addressed to in part II
10.1 Conclusions The forecast module complies with the requirements which were defined by the problem owner, the operational manager of the logistics center. Because of ongoing IT system configuration changes, two parallel conceptualization studies have been performed: one based on data provided by the Tracking IT application and a second one based on data provided by the SAP IT application (which is scheduled to replace the Tracking system before 2014). The SAP based conceptualization study has focused on the functional requirement and constraints for a future SAP forecast module. The opportunity statement for the module is: “Forecast functionality in SAP implemented within the KLM E&M IT-master plan project to facilitate efficient logistics resource management with forward visibility for maintenance unit logistics departments as well as the transport service providers to perform their services with a high service level against minimum costs.” The primary functions of the module will be to:
o Calculate a forecast based upon historic values and SAP parameters o Give a clear display of the parameters with no room for misinterpretation o Present the forecast to all logistics employees
To do so the module will have meet the following requirements: o The model should focus on inbound E&M goods o The model should be able to give forecasts for all E&M locations o The model should be able to produce a forecast for two weeks in front o The model should be able to give insight in past performances o The model should be able to produce a forecast with a percent mean absolute deviation of
90% o The model should be available for all logistics employees of KLM E&M

Part II ~ Development of a forecast module
“Forecasting the incoming flows” 77
o The model should be weekly refreshed o The models output should be able to forecast the number of collie’s and the number of orders
The Tracking based conceptualization study has been used to advance in the model development for the current system configuration. The forecast model uses Tracking data (extracted from the Tracking database with an query build with business intelligence software) to give insight in the flows handled by the expedition employees of the logistics center. Specifically, the origin and quantity of the flows are displayed per time unit selected by the user (e.g. per day, week or month). To generate future insight using this historic data collection, eight configurations of Simple Moving Average (SMA) and Exponentially Weighted Moving Averages (EWMA) forecast models were applied to the case and ranked based on their scores on three statistical criteria, generally accepted measures of accuracy for forecasting models. These measures of accuracy are the mean absolute percentage error (MAPE), the mean absolute deviation (MAD) and the mean square error (MSE). Based on the overall results of the 8 (2 SMA and 6 EWMA) compared models, the forecast results were above average with mean absolute percentage errors between the 5 and 9 %. The data was split in two groups to be able to validate the results of the first measurement with the other group. This validation group acknowledged the slightly better performance level of the EWMA method. As α value, 0.2 scored the best over the two groups aggregated, which leads to the advice to use this α value. Furthermore the models results were validated with experts who are involved in the daily operation. Implementation of the two forecast module studies has been part of this research. The SAP forecast module requirements have been communicated with the business development office of KLM E&M, owner of the IT master plan implementation. The Tracking based model is already in operational use and the weekly updating of the forecast data has been secured with two responsible KLM E&M departments. The first department, “Reporting and Analysis” (SPL/IK), takes care of the functioning of the business intelligence query and provides the weekly output, while the operational logistics department (SPL/VS) uses this data for the weekly forecast calculations.
10.2 Recommendations Additionally to the forecast model and the forecast module requirements that has been developed in this part of the research some requirements are presented.
o The functioning of the forecast model is dependant on the operational processes as in place dec 2008 – april 2009; major changes in these processes could cause the model to be less reliable for a period of time. Therefore in case of major process changes, the model should be validated again.
o The system configuration change which will terminate the use of Tracking within KLM E&M will also stop the forecasting abilities of the forecast model based on the data provided by Tracking: therefore the SAP forecast module should be in place before the Tracking system is shut down.
o The SAP forecast module requirements provide a framework for the development of a more sophisticated forecast functionality. Eventual model designs and output results will always have to be realized in collaboration with the operational departments to avoid any mismatches between capabilities, functionalities and presentation of the module and the expectations of the business departments.

Chapter 11 Conclusions and recommendations
MSc Thesis Jan-Hoite van Hees 78
Chapter 11 Conclusions and recommendations This closing chapter presents the final conclusions and recommendations of the research; also a reflection on the research process and methods is given.
11.1 Conclusions At the beginning of the research the following main research question was formulated:
“What is needed for KLM E&M to improve their insight in the incoming flows at the logistics Center and how can this be realized?”
This research has shown that the insight in the incoming flows at the logistics center of KLM Engineering & Maintenance (E&M) has been improved by the evaluation of data which is collected by the logistics IT application Tracking. To realize future insight in the incoming flows a forecast model has been developed and implemented in the business operation. Due to system configuration changes which are scheduled within five years, this model may become unavailable due to the replacement of the Tracking application by the SAP IT application. Anticipating on this development, requirements for a SAP forecast module has been developed. These requirements can be used for designing a SAP based forecast module, which can be placed is use when the Tracking system will be shut down. This enables a future insight in the incoming flows at the logistics center of KLM Engineering and Maintenance for years to come. In order to come to this answer on the main research question a number of sub-questions were formulated in paragraph 1.2.2. The main question can be divided into two parts; developing insight in the current situation regarding the incoming flows at the logistics center and development of a model to develop future insight. This led to a division of the research in two parts, both with their own objective, where the second part uses the conclusions of the first part as point of departure:
o Part I: Realizing insight in the current situation regarding the incoming flows at the KLM E&M logistics Center
o Part II: Development of a forecast module. Both parts of the research answered a number of sub-questions which eventually led to the answer on the main research question. The sub-questions were answered elaborately in the conclusion chapters of their respective research parts, chapters 5 and 10. Here a recapitulation of these conclusions is given. Recapitulation of Part I This part of the report creates insight in the current situation regarding the incoming flows at the logistics center. Two incoming flow groups can be distinguished:
o Internal flows, flows originated at the KLM E&M maintenance locations at Schiphol. o External flows, flows originated by parties outside Schiphol
Many stakeholders and IT applications are involved in the execution of the processes forming the KLM E&M supply chain. These stakeholders can be divided in external and internal stakeholders. Internal stakeholders are the KLM E&M locations such as hangars and repair shops, while external stakeholders are customers and vendors. IT applications which are in place are also dividable in two categories: logistics and maintenance management. The maintenance management applications (SAP and Crocos) feed the logistics systems (Scarlos and Tracking) with information about the movement of goods, after which the logistics systems registrates the movement of these goods. The internal flows are transported by Sodexo, who operates according to a fixed schedule. The external flows are brought to the logistics center by KLM cargo, but also by DHL. Internal flows are already logistically labelled with a Tracking sticker by the originating E&M departments and require therefore a minimum amount of effort for the expedition employees of the LC to process at arrival. These goods are sorted based on final destination and consequently distributed. External flows require some more labour to process. These goods have to be labelled by a Tracking sticker before they can be sorted and distributed. This labelling is done by entering a package reference number into the Tracking software system, after which the Tracking system automatically generates a

Chapter 11 Conclusions and recommendations
“Forecasting the incoming flows” 79
sticker with the final destination. Observations have shown that the Tracking software isn’t always working as designed. In these cases stickers have to be manually created which costs at minimum double the time it would have taken when the sticker would have been printed automatically. Moreover packages which do not apply to the ‘reference input rule’ -which requires external partners to make sure that the KLM reference number is visible on the outside of the package- cause delays in the processing of the incoming flows. In some cases, packages need to be opened and paperwork or even aircraft parts need to be examined to give a conclusive indication of the final destination. For components registrated in the Crocos program an extra sub process needs to be completed. These components need to be registrated as being received before Tracking can generate a correct sticker. This process step has to be completed in the Crocos program with help of the Crocos label number, which is also often missing on the outside of the package. This makes this sub process the most labour intensive of all. On a more strategic level additional issues experienced by involved actors are the lack of 1 IT system for the whole supply chain, the unreliability of the master data in all systems and the acceptance of packages without checking whether or not the comply with the KLM E&M input rules. Furthermore the performance of the expedition department of the logistics center can hardly be measured because lacking data about the moment of entrance in the logistics center for external goods. In general there is a lack of data insight in the incoming flows, this lack of data and thus insight hinders resources efficient planning on short term (on an hourly/daily basis) but also on the longer term (with regard to holiday and off-day requests). Recapitulation of Part II The forecast module complies with the requirements which were defined by the problem owner, the operational manager of the logistics center. Because of ongoing IT system configuration changes, two parallel conceptualization studies have been performed: one based on data provided by the Tracking IT application and a second one based on data provided by the SAP IT application (which is scheduled to replace the Tracking system before 2014). The SAP based conceptualization study has focused on the functional requirement and constraints for a future SAP forecast module. The opportunity statement for the module is: “Forecast functionality in SAP implemented within the KLM E&M IT-master plan project to facilitate efficient logistics resource management with forward visibility for maintenance unit logistics departments as well as the transport service providers to perform their services with a high service level against minimum costs.” The primary functions of the module will be to:
o Calculate a forecast based upon historic values and SAP parameters o Give a clear display of the parameters with no room for misinterpretation o Present the forecast to all logistics employees
To do so the module will have meet the following requirements: o The model should focus on inbound E&M goods o The model should be able to give forecasts for all E&M locations o The model should be able to produce a forecast for two weeks in front o The model should be able to give insight in past performances o The model should be able to produce a forecast with a mean absolute percentage error of 90% o The model should be available for all logistics employees of KLM E&M o The model should be weekly refreshed o The models output should be able to forecast the number of collie’s and the number of orders
The Tracking based conceptualization study has been used to advance in the model development for the current system configuration. The forecast model uses Tracking data (extracted from the Tracking database using a query build with business intelligence software) to give insight in the flows handled by the expedition employees of the logistics center. Specifically, the origin and quantity of the flows are displayed per time unit selected by the user (e.g. per day, week or month). To generate future insight using this historic data collection, eight configurations of Simple Moving Average (SMA) and Exponentially Weighted Moving Averages (EWMA) forecast methods were applied to the case and ranked based on their scores on three statistical criteria, generally accepted measures of accuracy for forecasting models. These measures of accuracy are the mean absolute percentage error (MAPE), the mean absolute deviation (MAD) and the mean square error (MSE). Based on the overall results of the 8 (2 SMA and 6 EWMA) compared models, the forecast results were above average with mean absolute percentage errors between the 5 and 9 %. The data was split in

Chapter 11 Conclusions and recommendations
MSc Thesis Jan-Hoite van Hees 80
two groups to be able to validate the results of the first measurement with the other group. This validation group acknowledged the slightly better performance level of the EWMA method. As α value, 0.2 scored the best over the two groups aggregated, which leads to the advice to use this α value. Furthermore the models results were validated with experts who are involved in the daily operation. Implementation of the two forecast module studies has been part of this research. The SAP forecast module requirements have been communicated with the business development office of KLM E&M, owner of the IT master plan implementation. The Tracking based model is already in operational use and the weekly updating of the forecast data has been secured with two responsible KLM E&M departments. The first department, “Reporting and Analysis” (SPL/IK), takes care of the functioning of the business intelligence query and provides the weekly output, while the operational logistics department (SPL/VS) uses this data for the weekly forecast calculations.
11.2 Recommendations Also recommendations were already determined for the two parts of the research separately in chapters 5 and 10 respectively. Therefore again a recapitulation of these recommendations is given. Recapitulation of Part I Based on the analysis in part I of the research the following recommendations can be drawn:
o Remove GR/TCOV process step from expedition. o Strictly employ logistics input rules. o Ensure enough space and facilities for expedition employees to perform their job. o Close monitoring of Tracking hick-ups. Measure disturbances and secure proper follow
up by responsible administrative departments. o A measurement/forecasting tool should be developed to estimate the workload o Improvement of the teamwork between the strategic purchasing and operational
business units with regard to contract and supplier management. o Joint development and implementation of unambiguous and mutually accepted key
performance indicators (KPI’s). o Confronting vendors and customers with their faults. o Minimization of the number of needed IT systems, with optimization of the interfaces
between them. Recapitulation of Part II Additionally to the forecast model and the forecast module requirements that has been developed in part II of the research some requirements are presented.
o The functioning of the forecast model is dependant on the operational processes as in place dec 2008 – april 2009; major changes in these processes could cause the model to be less reliable for a period of time. Therefore in case of major process changes, the model should be validated again.
o The system configuration change which will terminate the use of Tracking within KLM E&M will also stop the forecasting abilities of the forecast model based on the data provided by Tracking: therefore the SAP forecast module should be in place before the Tracking system is shut down.
o The SAP forecast module requirements provide a framework for the development of a more sophisticated forecast functionality. Eventual model designs and output results will always have to be realized in collaboration with the operational departments to avoid any mismatches between capabilities, functionalities and presentation of the module and the expectations of the business departments.

Chapter 11 Conclusions and recommendations
“Forecasting the incoming flows” 81
11.3 Reflection In this section some reflections on the research project are given. Project process The process approach for this project had one goal: finish the project in a reasonable timeframe. This forced the project in a timeframe which was realistic, although quite ambitious. However, through personal circumstances the goal has not been met, and sticking with the planning although the project was falling behind was, in hindsight, the wrong choice. So although the process planning provided the research with ‘action power’ (because of the ever looming deadlines) speed and structure through the carefully developed plans of action, adjusting the process planning proved just as important. This was one of the most important lessons learned in the research about the process planning. Furthermore, the use of scientific methods contributes to the outcome of the project; it makes the research more structured and can give clear insight in the results. However it can also slow the process down. Businesses are not always patient enough to wait for scientific results, but sometimes already act on preliminary results or suggestions. Methods The research approaches for the two parts, the WCA-framework and the model development approach, were very helpful tools for the design of the research and the structurizing of this report. Also the GSS method for collaborative decision making proved to be effective and generating really positive and concrete improvement points for KLM E&M. The systems engineering method used for the development of design requirements for a SAP forecast module were useful, although they are better fitted for design projects on a larger scale. Therefore some steps of the requirements development method were skipped to avoid endless repitition of the same arguments. In bigger, more complex projects with more parties with different objectives, the method will probably come more to it’s full extend. The business intelligence method used to extract data from the Tracking database was extremely helpful in selecting the right data for this case. Although this query development sometimes seems very straightforward, it proved to be a very extensive process with numerous iterations. Academic reflection Although the research objective itself was very operational stated, the use of various scientific methods and tools has structurized and improved the research with great extend. The scientific methods helped to structure the analysis and guarded the completeness of the work. Due to a scientific mindset, there was not only looked at a forecast method on a small scope and within short term as was the objective. The whole incoming supply chain was analyzed with help of involved employees, and possible obstruction in the years to come were identified and subsequently addressed upon. Cooperation During the research it became apparent that within KLM E&M many different interests exists, some of which conflicting. Subject like automation, process changes and shifting the logistical responsibilities were sensitive subjects and talking about this sometimes raised opposition. Gaining all available information from the involved employees therefore proved to be a challenge; however in almost all cases the parties in the end were enthusiastic and fully willing to cooperate. This resulted in a very satisfying Group Support System (GSS) session which resulted in very concrete, abstract and positive points of action which potentially could improve the KLM E&M logistics performance significantly.

References
MSc Thesis Jan-Hoite van Hees 82
References Alter, S. (2002). Information Systems, A Management Perspective. Prentice Hall, fourth
edition, 2002. Armstrong, J. S. and Collopy, F. (1992). Error measures for generalizing about forecasting methods –
empirical comparisons. International Journal of Forecasting 8: 69-80. Armstrong, J. S. and Fildes, R. (1995). On the selection of error measures for comparisons among
forecasting methods. Journal of Forecasting 14: 67-71. Aubin B.R. (2004). Aircraft Maintenance: the art and science of keeping aircraft safe. SAE
international, Warrendale, Pennsylvania, USA. Baarda, D.B., Goede, M.P.M. de (2006) Basisboek Methoden en Technieken,Uitgeverij Stenfert
Kroese, Groningen Bostrom, R.P., Anson, R. and Clawson, R.K. (1993) Group facilitation and group support systems.
Group Support Systems—New Perspectives. L.M. Jessup and J.S. Valacich, Eds. Macmillan, New York, NY, 1993.
Boyland, J.E., Johnston, F.R., Meadows, M. and Shale, E. (1999). Some properties of a simple
moving average when applied to forecasting a time series. Journal of the Operational Research Society 50: 1268-1271.
Briggs, R.O., Nunamaker, J.F. Jr. (1994). Getting a grip on groupware , in: Lloyd, P. (ed.),
Groupware in the 21st Century, London: Adamantine Press Limited., 61-72. Briggs, R.O., Vreede, G.J. de and Nunamaker, J.F. Jr. (2003). Collaboration Engineering with
ThinkLets to Pursue Sustained Success with Group Support Systems. Journal of Management Information Systems 19(4): 31–64.
Brill, J. H. (1999). System Engineering – A Retrospective View, Journal of Systems Engineering. John
Wiley & Sons. Bron, E.J. (2007), Welkom in het nieuwe Logistiek Centrum. Internal presentation for KLM employees.
KLM Component Services, Logistics. December 2007. Cattani, K. and Hausman, W. (2000). Why are forecast updates often disappointing? Manufacturing
& Service Operations Management 2(2): 119-127. Clements, M. P. and Hendry, D. F. (1995). On the selection of error measures for comparisons
among forecasting methods – reply. Journal of Forecasting 14: 73-75 Daalen, C. van and Thijssen, W.A.H. (2004). Continue modellen. Faculty of Technology, Policy and
Management, TU Delft. Dingle L., Tooley M. (2004). Aircraft Engineering Principles. Butterworth Heinemann, Surray, UK. Dym, C.L. and Little, P. (2003). Engineering Design; a project based introduction (second edition),
Wiley. Fjermestad, J. and Hiltz, S. R. (2000). Group Support Systems: A Descriptive Evaluation of Case and
Field Studies. Journal of Management Information Systems 17 (3): 115–159 Fildes, R. and Goodwin, P. (2007). Against your better judgement? How organizations can improve
their use of management judgement in forecasting. Interfaces 37: 570-576

References
“Forecasting the incoming flows” 83
Fildes, R, Goodwin, P., Lawrence, M. and Nikolopoulos, K. (2009). Effective forecasting and judgmental adjustments: an empirical evaluation and strategies for improvements in supply-chain planning. Internaltional Journal of Forecasting 25: 3-23.
Fontaine, G. la and Dekker, M. (2005), Component Management Poolmanagement. Internal
Component Services presentation, 29/11/2005. Friend, C.H. (1992). Aircraft maintenance management. Longman Scientific and technical, Essex, UK. Ghobbar, A.A. (2006). Maintenance, Engineering and Management. TU Delft: Faculty of Aerospace
Engineering, Delft. Godwin A.N., Gleeson J.W., Gwillian D. (1989) An Assessment of the IDEF Notations as descriptive
Tools, lnformation Systems 14: 13-28 Harrison, P.J. (1967). Exponential smoothing and short-term sales forecasting. Management of
Science 13: 821-842 Haughton, M.A. (2009). Distortional Bullwhip Effects on carriers. Transportation Research Part E 45:
172-185. Hengst, M. den (2003), Analyse van bedrijfssystemen. Faculteit TBM, Technische Universiteit Delft.
Oktober 2003. Hlupic, V. and Qureshi, S. (2003). What causes value to be created when it did not exist before? A
Research Model for Value Creation. Proceedings of the 36th Hawaii International Conference on System Sciences – 2003.
KLM (2008). Towards Smart Leadership, Annual Review 2007-2008. KLM, Amstelveen. KLM E&M (2008-5), Component Services Mei 2008, KLM, Amstelveen. Kolfschoten, G.L., Briggs, R.O., Vreede, G.J. de, Jacobs, P.H.M. and Appelman, J.H. (2006). A
conceptual foundation of the thinkLet concept for Collaboration Engineering. International Journal of Human-Computer studies 64: 611-621.
Meetpiramide (week 40, 2008), Internal Component Services performance management tool. Meredith, J.R. and Mantel, S.J. Jr (2006). Project Management. John Wiley & Sons, Hoboken NJ. Miser, J.M. and Quade, E.S. (1996). Handbook of Systems Analysis. John Wiley & Sons, Hoboken
NJ. Muth, J.F. (1960). Optimal properties of exponentially weighted forecasts. Journal of the American
Statistical Association 55: 299-306. Ostrofsky, B. (1994). Design, Planning and Development Methodology, Prentice-Hall. Reid, R.D. and Sanders, N.R (2007). Operations Management. Hoboken, New Jersey: John Wiley &
sons. Rensburg A. and Zwemstra N. (1995) Implementing IDEF Techniques as Simulation Modelling
Specifications, Computers ind. Engng. 29: 467-471 Rijnbeek, E. (2008), Interviews with mr E Rijnbeek, Operational Manager Logistics KLM E&M. 8 en
26 September 2008. Sanders, N.R. and Manrodt K.B. (1994). Forecasting practices in US corporations: survey results.
Interfaces 24(2): 92-100.

References
MSc Thesis Jan-Hoite van Hees 84
Sani, B. and Kingsman, B.G. (1997). Selecting the best periodic inventory control and demand forecasting methods for low demand items. Journal of the Operational Research Society 48: 700-713.
Schiphol Group (2007). Airport Capacity Plan 2008-2012 (ACP), Schiphol
Schilder J. (2007). Redesign Logistic System Schiphol Oost, TU Delft: Faculty of Technology, Policy
and Management, Faculty of Mechanical, Maritime and Materials Engineering and Faculty for Civil Engineering & Geosciences, Delft.
Shah, R., Chandrasekaran A. and Linderman, K. (2008). In pursuit of implementation patterns: the
context of Lean and Six Sigma. International Journal of Production Research 46(23): 6679-6699.
Verbraeck, A. and Heijnen, P.W. (2004). Discrete modellen deel 2. Faculty of Technology, Policy
and Management, TU Delft. Vreede, G.J. de, Davison, R.M. and Briggs, R.O. (2003). How a silver bullet may lose its shine.
Communications of the ACM 46(8): 96-102. White, K.P. (1999). System Design Engineering, Journal of Systems Engineering, John Wiley & Sons. Yin R.K. (1994) Case study research: design and methods, Sage publishing, Thousand Oaks [www1]. KLM Engineering & Maintenance Profile. Date of visit: September 24th 2008.
http://www.klm.com/engineeringmaintenance/site/en/about/klm_em/index.html [www2]. KLM Engineering & Maintenance Organizational structure. Date of visit: September 24th
2008. http://www.klm.com/engineeringmaintenance/site/en/about/organisation_structure/index.html
[www3] KLM Engineering & Maintenance Component Services. First date of visit: 22/10/2008.
https://www.klm.com/wps/portal/!ut/p/kcxml/04_Sj9SPykssy0xPLMnMz0vM0Y_QjzKLN4g3dPezBMmB2QZ-gfqR6KKOSEK-Hvm5qfpBQKlIc5CYr5uTflheflEu0EBv_QD9gtzQiHI_E0cAobgVLw!!/delta/base64xml/L3dJdyEvd0ZNQUFzQUsvNElVRS82XzBfMUhDUg!!
[www4] KLM Engineering & Maintenance Airframes. First date of visit: 23/10/2008.
http://www.klm.com/engineeringmaintenance/site/en/products_services/airframes/index.html [www5] KLM Engineering & Maintenance Engine Services. First date of visit: 23/10/2008.
http://www.klm.com/engineeringmaintenance/site/en/products_services/engines/index.html [www6]. Transport Infrastructure and Logistics System Engineering. Lecture Slides. Date of visit:
April 22, 2009. http://blackboard.tudelft.nl/webapps/portal/frameset.jsp?tab_id=_2_1&url=%2fwebapps%2fblackboard%2fexecute%2flauncher%3ftype%3dCourse%26id%3d_23388_1%26url%3d.
[www7]. BN de Stem, Airfrance-KLM moet extra bezuinigen. Publishing date: November 21, 2008.
Date of visit April 23, 2009. http://www.bndestem.nl/algemeen/economie/4080558/Air-FranceKLM-moet-extra-bezuinigen.ece

Appendices
“Forecasting the incoming flows” 85

MSc Thesis Jan-Hoite van Hees 86
Appendices
Appendices
PageSourceFunctionName
97 - 106KLM internThe SADT process schemes of the “operational logistics and materials resources”
process are added to the report to provide insight in the logistics processes in which the logistics center is operating
Appendix IX Evaluation GSS Session
175 - 179
Research product
The list gives a complete overview of the IT support systems currently in active use by KLM E&M. It is added to the report to give an indications of amount of systems
which KLM E&M is working with
Appendix X “Forecast methods compared in a logistics case study 165 - 174
GSS software
Based on the research a scientific paper has been written about the selection of a forecast method in this particular case. The paper forms an obligatory part of the MSc
SEPAM thesis assignment (SPM 5910)
Appendix XI. IT support systems in active use by KLM E&M
145 - 164
Research product
The GSS software generated a very detailed and complete evaluation document of the session. It was added to the report to give insight in the development of the session.
Appendix VIII Agenda Group Support System Session 142 - 144
KLM intranet
The GSS agenda was used in the planning of the GSS session. It indicates the structure of the session and the used ThinkLets.
Appendix VI. Forecast data sheets
136 - 141InterviewsDuring the research a number of interviews were done in order to gather information
and use the tacit knowledge of several parties and policymakers involved. Interviewed persons and most important findings are presented in this appendix
Appendix VII. Interview summaries
112 - 135Research productThe data sheets are added to give a thorough and complete insight in the comparison data which were used to select an alternative
Appendix V SADT process map of current process ‘Handling Incoming
flows’ at Logistics Center of KLM E&M107 - 111Interviews/Observations
The SADT process schemes of the “ Handling incoming flows” process were developed to give a thorough and detailed insight in the processes of the expedition
department of the Logistics Center with regard to the incoming flows.
Appendix IV KLM E&M process schemes “Operational logistics and
Material resources”
88 - 96KLM internThe Sodexo transport schedule is incorporated in the report to provide a thorough view of the internal logistics system of KLM E&M and the corresponding in- and outbound logistics movements at the logistics center.
Appendix III Sodexo Transport Schedule
87Friend (1992) and Aubin (2004)
These graphs indicate the costs which are related to the maintenance of aircraft for airlines.Appendix II: Maintenance costs
86Www2. downloaded 09/04/2009)
This graph pictures the organizational structure of KLM Engineering & Maintenance from a high level. It is added to the report to give an indication of the position of the
involved departments in the organization.
Appendix I. Organizational Structure KLM Engineering and Maintenance.
180 - 181The interfaces between Tracking on the one hand and SAP and Crocos on the other
hand give insight in the logistical movement types which occur in the logistics processes and trigger a physical good movement.
Appendix XII Tracking interfaces with SAP and Crocos
Business Development Office KLM E&M
(SPL/TX)

Appendices
“Forecasting the incoming flows” 87
Appendix I. Organizational Structure KLM Engineering and Maintenance.
Figure 90 Organizational structure KLM E&M (source: www2 downloaded 09/04/2009)

Appendix II: Maintenance costs
MSc Thesis Jan-Hoite van Hees 88
Appendix II: Maintenance costs These graphs indicate the costs which are related to the maintenance of aircraft for airlines.
Figure 91 Direct costs per flight hour for B747 (Friend, 1992)
Figure 92 Total operating cost for airlines (Aubin, 2004)

Appendices
“Forecasting the incoming flows” 89
Appendix III Sodexo Transport Schedule The Sodexo transport schedule is incorporated in the report to provide a thorough view of the logistics system of KLM E&M and the in- and outbound logistics movements at the logistics center.
Dayshift
1. Between the Maintenance units Monday t/m sunday Dayshift Location: Description: Time: LC Start shift + pick-up LP 07.30 H14 Pick-up/Dlvr Oost 07.45 ES Pick-up/Dlvr Oost 08.10 H10 Pick-up/Dlvr Oost 08.30 H11 Pick-up/Dlvr Oost 08.45 A&A Pick-up/Dlvr Oost 09.00 216 Pick-up/Dlvr Dangerous Goods 09.15 LC Pick-up/dlvr oost 09.30 H14 Pick-up/Dlvr Oost 09.45 ES Pick-up/Dlvr Oost 10.00 H10 Pick-up/Dlvr Oost 10.30 H11 Pick-up/Dlvr Oost 10.45 A&A Pick-up/Dlvr Oost 11.00 LC Break 11.15 Break LC Pick-up Oost + Dangerous Goods 11.55 216 Pick-up/Dlvr Oost 12.15 H14 Pick-up/Dlvr Oost 12.30 ES Pick-up/Dlvr Oost 12.45 H10 Pick-up/Dlvr Oost 13.00 H11 Pick-up/Dlvr Oost 13.15 A&A Pick-up/Dlvr Oost 13.30 LC Pick-up/dlvr oost 13.45 H14 Pick-up/Dlvr Oost 14.00 H10 Pick-up/Dlvr Oost 14.15 H11 Pick-up/Dlvr Oost 14.30 A&A Pick-up/Dlvr Oost 14.45 ES Pick-up/Dlvr Oost + pick-up LP for LC 15.00 Drop off oost 216 Pick-up/Dlvr Oost 15.30 LC Sign over truck 15.45 End shift 16.00
LP = Large parts

Appendix III Sodexo Transport Schedule
MSc Thesis Jan-Hoite van Hees 90
2. Center – Large Parts (LP) – Schiphol Rijk Monday t/m Friday Day shift Location: Description: Time: LC Start shift - pick-up VOC 7.00 VOC Delivery & Pick-up LC 7.45 LC Delivery VOC & Pick-up Rijk 8.30 EPCOR DLvr/ Pick 8.45 BOEING DLvr/ Pick 9.00 LC Delivery Rijk & Pick-up VOC 9.30 VOC Delivery & Pick-up LC 10.15 (D49 Pick-up North-west 10.30 ) LC Delivery VOC & Pick-up LP 11.05
Break LC Departure to Oost 11.45 ES Delivery & Pick-up LP 12.00 H14 Delivery & Pick-up LP 12.15 H10 Delivery & Pick-up LP 12.30 H11 Delivery & Pick-up LP 12.45 LC Delivery LP & Pick-up VOC 13.10 EPCOR DLvr/ Pick 13.25 BOEING DLvr/ Pick 13.40 LC Delivery Rijk & Pick-up VOC 14.00 VOC Delivery & Pick-up LC 14.30 (D49 Pick-up North-west 14.40 ) LC Delivery VOC & Pick-up Rijk 15.15 LC Sign over truck 15.15
End of Shift 15.30

Appendices
“Forecasting the incoming flows” 91
3. Cargo Shuttle Monday t/m Friday Dayshift Location: Description: Time: LC Start shift 7.00 Atlas/snipweg Pick-up/delivery 7.30 CGO Pick-up/delivery 7.45 LC Pick-up/delivery 8.30 CGO Pick-up/delivery 9.15 LC Pick-up/delivery 10.00 CGO Pick-up/delivery 10.45 LC delivery 11.30
Break LC Pick-up 12.00 CGO Pick-up/delivery 12.45 LC Pick-up/delivery 13.30 CGO Pick-up/delivery 14.15 LC Pick-up/delivery 15.00
End Shift 15.30

Appendix III Sodexo Transport Schedule
MSc Thesis Jan-Hoite van Hees 92
4. Transportshuttle Cargo Centrum (CC) Monday-friday
Shuttle to cgo customer en outstations + Transport on request Location: Description: Time: LC Start shift 07.45 CGO Load Bell* & anderen 08.00 Bell Unload Bell * 08.30 H32/ Martinair Load en unload H5/ Transavia Unload Boeing Load en unload D49/ NW Load 10.00 KES Unload CGO Load en unload Buitenloodsen Unload LC Pauze 11.15 Pauze CGO Load Bell & anderen 12.00 Bell Unload 12.30 H32/ Martinair Load en unload Boeing Load en unload D49/ NW Load 14.00 CGO Load en unload Buitenloodsen Unload LC Einde Deinst 16.15

Appendices
“Forecasting the incoming flows” 93
5. Pick up service Temporarily on demand
6. Electric Vehicle Temporarily once every hour. With sufficient capacity expedition, 2 services per hour and no pick up service. Af 3 o’clock the service is performed by AOG runners.
Departure LC A&A H11 H10 ES H14 ES H10 H11 A&A
Return LC
715 720 725 730 735 740 745 750 755 800 805
815 820 825 830 835 840 845 850 855 900 905
915 920 925 930 935 940 945 950 955 1000 1005
1015 1020 1025 1030 1035 1040 1045 1050 1055 1100 1105
1145 1150 1155 1200 1205 1210 1215 1220 1225 1230 1235
1245 1250 1255 1300 1305 1310 1315 1320 1325 1330 1335
1345 1350 1355 1400 1405 1410 1415 1420 1425 1430 1435
1445 1450 1455 1500 1505 1510 1515 1520 1525 1530 1535
1545 1550 1555 1600 1605 1610 1615 1620 1625 1630 1635
1645 1650 1655 1700 1705 1710 1715 1720 1725 1730 1735

Appendix III Sodexo Transport Schedule
MSc Thesis Jan-Hoite van Hees 94
Nightshift
16.� Center- Large parts- Extern dienst mon-fri Location: Description: Time: LC Start shift – pick-up VOC 15.15 VOC DLvr/ Pick 16.00 LC Delivery VOC & Pick-up LP 16.30 ES pick-up/dlvr Intermu + LP LC 16.45 H10 pick-up/dlvr Intermu + LP LC 17.00 H11 pick-up/dlvr Intermu + LP LC 17.15 A&A pick-up/dlvr Intermu + LP LC 17.30 H14 pick-up/dlvr Intermu + LP LC 17.45 LC Delivery LP + Intermu 18.00
Break LC Pick-up LP + Intermu 18.45 H14 pick-up/dlvr Intermu + LP LC 19.15 H10 pick-up/dlvr Intermu + LP LC 19.30 H11 pick-up/dlvr Intermu + LP LC 20.00 A&A pick-up/dlvr Intermu 20.15 ES pick-up/dlvr Intermu + LP LC 20.30 LC LP delivery/pick-up 21.00 H14 pick-up/dlvr Intermu + LP LC 21.30 H10 pick-up/dlvr Intermu + LP LC 21.45 H11 pick-up/dlvr Intermu + LP LC 22.00 A&A pick-up/dlvr Intermu 22.30 ES pick-up/dlvr Intermu + LP LC 22.45 OOST Drop off intermu LC dlvr LP 23.30
End shift 23.45

Appendices
“Forecasting the incoming flows” 95
2. Regulier vervoer : OCE A Mon-Friday
Location: Description: Time: LC Start shift pick-up Rijk 15.15 Epcor Pick-up/delivery 15.40 Boeing Pick-up/delivery 16.00 LC Pick-up/delivery 16.30 Atlas/snipweg Pick-up/delivery 17.00 CGO Pick-up/delivery 17.15 LC Pick-up/delivery 18.00
Pauze LC Pick-up/delivery 18.30 CGO Pick-up/delivery 19.00 LC Pick-up/delivery 20.00 VOC Pick-up/delivery 20.45 LC Pick-up/delivery 21.30 CGO Pick-up/delivery 22.00 LC Delivery 22.45
LC End shift 24.00
3. Transportshuttle Cargo 69 mon-friday Shuttle to cgo customers and outstation + transport on request. To be developed by CGO (central goods acceptance)

Appendix III Sodexo Transport Schedule
MSc Thesis Jan-Hoite van Hees 96
Weekend Dayshift
1. Intermu. See intermu week Dayshift
2. Shuttle VOC/CGO Location: Description: Time: LC Start shift 7.30 CGO Pick-up/delivery 8.15 LC Pick-up/delivery 9.00 VOC Pick-up/delivery 9.30 LC Pick-up/delivery 10.15 CGO Pick-up/delivery 11.00 Martinair Pick-up/delivery 11.30 LC Pick-up/delivery 11.45
Break LC Pick-up/delivery 12.30 VOC Pick-up/delivery 13.00 LC Pick-up/delivery 13.45 CGO Pick-up/delivery 14.15 LC Pick-up/delivery 15.00 Boeing Pick-up/delivery 15.20 LC Op aanvraag tot end shift 15.40
End shift 16.00
3. Veegdienst/ Treintje Temporary pick up service on request. .

Appendices
“Forecasting the incoming flows” 97
Weekend nightshift
1. Shutlle to all destinations Location: Description: Time: LC Pick-up VOC 15.00 VOC Deliver VOC & Pick-up LC 15.30 LC Deliver LC & Pick-up Oost 16.15 H14 Pick-up & delivery 16.30 ES Pick-up & delivery 16.45 H10 Pick-up & delivery 17.00 H11/12 Pick-up & delivery 17.15 LC Delivery Oost & pick-up CGO 17.30 CGO Pick-up & delivery 17.45 Martinair Delivery CGO 18.00 LC Delivery CGO & pick-up VOC 18.20
Break LC Departure to VOC 19.15 VOC Pick-up & delivery 20.00 LC Deliver LC & Pick-up Oost 20.30 CGO Delivery & pick-up LC 21.00 LC Delivery CGO & pick-up Oost 21.30 H14 Pick-up & delivery 22.00 ES Pick-up & delivery 22.15 H10 Pick-up & delivery 22.30 H11/12 Pick-up & delivery 22.45 LC Delivery Oost 23.00
End shift 23.30

Appendix IV KLM E&M process schemes “Operational logistics and Material resources”
MSc Thesis Jan-Hoite van Hees 98
Appendix IV KLM E&M process schemes “Operational logistics and Material resources”
To realize material and logistic services
To provide component maintenance
To provide operational logistics
To provide material resources
To provide operational logistics and Material
resources
A 0
A 1
A 2
A 3
A 4
Figure 93 A0-scheme "To provide operational logistics and material resources

Appendices
“Forecasting the incoming flows” 99
To realize material and logistic services
To identify and analyse customer’s services needs
and design solutions
To integrate and implement the services
To secure and monitor the services
To provide and monitor express services
A 1.1
A 1.2
A 1.3
A 1.4
A 1
Figure 94 Scheme A1- To realize material and logistics services

Appendix IV KLM E&M process schemes “Operational logistics and Material resources”
MSc Thesis Jan-Hoite van Hees 100
To provide component maintenance
To plan and assign Component Maintenance
To perform Component Maintenance
A 2.2
A 2.1
A 2
Figure 95 Scheme A2 - to provide component maintenance

Appendices
“Forecasting the incoming flows” 101
Figure 96 Scheme A3 - To provide operational logistics

Appendix IV KLM E&M process schemes “Operational logistics and Material resources”
MSc Thesis Jan-Hoite van Hees 102
To store and issue material
To accept delivery of the material
To check material and documents
To manage storage
To manage and solve nonconformity
To acknowledge receipt of material
To process request and to issue material
A 3.1.1
A 3.1.2
A 3.1.3
A 3.1.4
A 3.1.5
A 3.1.6
A 3.1
Figure 97 Scheme A3.1 - To store and issue material

Appendices
“Forecasting the incoming flows” 103
Figure 98 Scheme A3.2 – To receive serviceable material

Appendix IV KLM E&M process schemes “Operational logistics and Material resources”
MSc Thesis Jan-Hoite van Hees 104
Figure 99 Scheme A3.3 - To execute reverse logistics

Appendices
“Forecasting the incoming flows” 105
Figure 100 Scheme A3.4 - To transport

Appendix IV KLM E&M process schemes “Operational logistics and Material resources”
MSc Thesis Jan-Hoite van Hees 106
To provide material resources
To assess and manage material phase-in
To manage and to control Materials availability for
maintenance requirements
To manage materials availability for modification
activities
To manage material phase-out
A4
A 4.1
A 4.2
A 4.3
A 4.4
Figure 101 Scheme A4 - To provide material resources

Appendices
“Forecasting the incoming flows” 107

Appendix VI. Forecast data sheets
MSc Thesis Jan-Hoite van Hees 108
Appendix V SADT process map of current process ‘Handling Incoming flows’ at Logistics Center of KLM E&M.
Figure 102 Scheme A0 - Handling Incoming flows

Appendices
“Forecasting the incoming flows” 109
Label goods with Tracking sticker
A2Enter ordernumber or
labelnumber
Print Sticker
A23
‘Drop’ scan Sticker
A24
Tracking Stickered goods
Expedition Employee
OrdernumberLabelnumber
Order known in Tracking Tracking Sticker
Tracking (Software)
Sticker Printer
OrdernumberLabelnumber
External Incoming flow CS Components
Tracking (software)Expedition EmployeeSticker PrinterScanner
Tracking Stickered goods
Sorted Goods without tracking sticker
Manually create sticker
Order not known in Tracking
OrdernumberLabelnumberFinal Destination knowledge
Sticker created in Tracking
Scanner
A21
A22
Other non-stickered incoming goods
OrdernumberLabelnumber
Tracking sticker
Figure 103 Scheme A2 – Label goods with Tracking sticker

Appendix VI. Forecast data sheets
MSc Thesis Jan-Hoite van Hees 110
Figure 104 Scheme A4 - Transport sorted goods

Appendices
“Forecasting the incoming flows” 111
Appendix VI. Forecast data sheets Forecast Model 1 Week: Monday Tuesday Wednesday Thursday Friday Saturday Sunday Total
Forecast 47 586 573 632 645 626 180 292 3533
Actual 47 447 560 620 616 551 205 251 3250 8.71%
Absolute deviation -139 -13 -12 -29 -75 26 -41 -283 283
Percentage deviation -23.72% -2.23% -1.86% -4.46% -12.02% 14.21% -14.04% -8.71% 80089
Forecast 48 517 569 614 573 588 168 280 3308
Actual 48 503 601 558 561 527 156 256 3162 4.61%
Absolute deviation -14 32 -56 -12 -61 -12 -24 -146 146
Percentage deviation -2.71% 5.62% -9.12% -2.01% -10.34% -6.87% -8.57% -4.61% 21243
Forecast 49 476 561 603 568 581 173 266 3227
Actual 49 588 661 613 722 688 307 269 3848 16.14%
Absolute deviation 112 101 11 154 108 134 3 621 621
Percentage deviation 23.59% 17.93% 1.74% 27.06% 18.52% 77.20% 1.13% 16.14% 385952
Forecast 50 470 567 600 542 580 170 265 3194
Actual 50 606 574 590 691 724 181 190 3,556 10.19%
Absolute deviation 137 7 -10 149 144 11 -75 362 362
Percentage deviation 29.07% 1.19% -1.67% 27.49% 24.77% 6.63% -28.30% 10.19% 131225
Forecast 51 479 630 609 583 596 205 245 3346
Actual 51 588 552 709 619 636 191 233 3,528 5.16%
Absolute deviation 109 -78 100 36 40 -14 -12 182 182
Percentage deviation 22.69% -12.38% 16.47% 6.22% 6.71% -6.72% -4.70% 5.16% 33124
Forecast 52 536 599 595 648 623 212 242 3454
Actual 52 633 623 650 251 180 252 132 2,721 26.94%
Absolute deviation 97 24 55 -397 -443 40 -110 -733 733
Percentage deviation 18.10% 4.01% 9.20% -61.24% -71.08% 18.73% -45.34% -26.94% 537289
Forecast 1 571 597 618 648 644 209 237 3524
Actual 1 469 470 399 182 458 160 183 2,321 51.81%

Appendix VI. Forecast data sheets
MSc Thesis Jan-Hoite van Hees 112
Absolute deviation -102 -127 -219 -466 -186 -49 -54 -1203 1203
Percentage deviation -17.90% -21.27% -35.38% -71.92% -28.85% -23.35% -22.78% -51.81% 1446006
Forecast 2 571 597 618 648 644 209 237 3524
Actual 2 419 438 531 647 607 223 264 3,129 12.61%
Absolute deviation -152 -159 -87 -1 -37 14 27 -395 395
Percentage deviation -26.65% -26.63% -14.01% -0.19% -5.71% 6.83% 11.39% -12.61% 155630
Forecast 3 571 597 618 648 644 209 237 3524
Actual 3 623 615 577 661 637 265 250 3,628 2.88%
Absolute deviation 52 18 -41 13 -7 56 13 105 105
Percentage deviation 9.06% 3.02% -6.56% 1.97% -1.05% 26.95% 5.49% 2.88% 10920
Forecast 4 538 521 610 652 656 198 229 3404
Actual 4 535 640 588 637 687 194 139 3,420 0.46%
Absolute deviation -3 119 -22 -15 31 -4 -90 16 16
Percentage deviation -0.50% 22.76% -3.61% -2.35% 4.78% -2.18% -39.30% 0.46% 245
Forecast 5 543 535 606 642 627 226 249 3428
Actual 5 550 663 672 606 680 139 223 3,533 2.96%
Absolute deviation 7 128 66 -36 53 -87 -26 105 105
Percentage deviation 1.23% 23.93% 10.95% -5.66% 8.51% -38.59% -10.44% 2.96% 10955
Forecast 6 541 561 601 641 642 218 222 3426
Actual 6 692 605 581 559 758 226 186 3,607 5.01%
Absolute deviation 151 44 -20 -82 116 8 -36 181 181
Percentage deviation 27.85% 7.80% -3.37% -12.79% 18.11% 3.55% -16.03% 5.01% 32671
Forecast 7 532 589 592 638 653 205 219 3428
Actual 7 758 630 612 695 625 246 159 3,725 7.99%
Absolute deviation 226 41 20 57 -28 41 -60 298 298
Percentage deviation 42.55% 6.96% 3.38% 8.98% -4.25% 19.85% -27.40% 7.99% 88506
Forecast 8 600 631 605 616 691 206 200 3547
Actual 8 713 545 609 591 690 293 257 3,698 4.08%
Absolute deviation 113 -86 5 -25 -1 87 58 151 151
Percentage deviation 18.83% -13.59% 0.74% -4.02% -0.07% 42.23% 28.82% 4.08% 22801

Appendices
“Forecasting the incoming flows” 113
Forecast 9 634 635 613 624 688 201 177 3571
Actual 9 643 583 666 713 551 230 254 3,640 1.89%
Absolute deviation 9 -52 53 89 -137 29 77 69 69
Percentage deviation 1.46% -8.12% 8.60% 14.22% -19.85% 14.29% 43.71% 1.89% 4727

Appendix VI. Forecast data sheets
MSc Thesis Jan-Hoite van Hees 114
Forecast Model 2 Week: Monday Tuesday Wednesday Thursday Friday Saturday Sunday Total
Forecast 47 627 465 594 676 592 226 303 3484 Actual 47 447 560 620 616 551 205 251 3250 7.20%
Absolute deviation -180 95 26 -60 -41 -21 -52 -234 234 Percentage deviation -28.69% 20.40% 4.35% -8.89% -6.99% -9.41% -17.20% -7.20% 54815
Forecast 48 596 552 600 646 596 217 291 3497 Actual 48 503 601 558 561 527 156 256 3162 10.60%
Absolute deviation -93 49 -42 -85 -69 -61 -35 -335 335 Percentage deviation -15.59% 8.80% -7.06% -13.11% -11.52% -28.07% -11.88% -10.60% 112393
Forecast 49 579 553 603 642 591 216 286 3470 Actual 49 588 661 613 722 688 307 269 3848 9.83%
Absolute deviation 9 108 10 80 97 91 -17 378 378 Percentage deviation 1.50% 19.48% 1.73% 12.40% 16.48% 42.42% -5.98% 9.83% 143052
Forecast 50 572 558 598 634 584 210 283 3439 Actual 50 606 574 590 691 724 181 190 3,556 3.29%
Absolute deviation 34 16 -8 57 140 -29 -93 117 117 Percentage deviation 6.00% 2.87% -1.35% 8.96% 23.91% -13.65% -32.89% 3.29% 13689
Forecast 51 573 567 599 642 594 218 282 3476 Actual 51 588 552 709 619 636 191 233 3,528 1.47%
Absolute deviation 15 -15 110 -23 42 -27 -49 52 52 Percentage deviation 2.59% -2.71% 18.27% -3.61% 7.12% -12.57% -17.32% 1.47% 2685
Forecast 52 576 568 599 646 605 215 274 3483 Actual 52 633 623 650 251 180 252 132 2,721 28.00%
Absolute deviation 57 55 51 -395 -425 37 -142 -762 762 Percentage deviation 9.91% 9.70% 8.57% -61.16% -70.23% 17.03% -51.85% -28.00% 580390
Forecast 1 577 567 607 644 607 213 271 3486 Actual 1 469 470 399 182 458 160 183 2,321 50.21%
Absolute deviation -108 -97 -208 -462 -149 -53 -88 -1165 1165 Percentage deviation -18.70% -17.06% -34.28% -71.75% -24.55% -25.05% -32.47% -50.21% 1357942

Appendices
“Forecasting the incoming flows” 115
Forecast 2 577 567 607 644 607 213 271 3486 Actual 2 419 438 531 647 607 223 264 3,129 11.42%
Absolute deviation -158 -129 -76 3 0 10 -7 -357 357 Percentage deviation -27.36% -22.71% -12.54% 0.44% 0.00% 4.47% -2.58% -11.42% 127669
Forecast 3 577 567 607 644 607 213 271 3486 Actual 3 623 615 577 661 637 265 250 3,628 3.91%
Absolute deviation 46 48 -30 17 30 52 -21 142 142 Percentage deviation 8.00% 8.52% -4.97% 2.62% 4.94% 24.14% -7.75% 3.91% 20077
Forecast 4 566 558 602 644 607 214 271 3461 Actual 4 535 640 588 637 687 194 139 3,420 1.19%
Absolute deviation -31 83 -14 -7 80 -20 -132 -41 41 Percentage deviation -5.41% 14.80% -2.28% -1.14% 13.18% -9.41% -48.61% -1.19% 1663
Forecast 5 623 615 577 661 637 265 250 3628 Actual 5 550 663 672 606 680 139 223 3,533 2.69%
Absolute deviation -73 48 95 -55 43 -126 126 -95 95 Percentage deviation -11.72% 7.80% 16.46% -8.32% 6.75% -47.55% 50.40% -2.69% 9025
Forecast 6 567 566 599 645 614 216 261 3469 Actual 6 692 605 581 559 758 226 186 3,607 3.83%
Absolute deviation 125 39 -18 -86 144 10 -75 138 138 Percentage deviation 21.99% 6.84% -3.06% -13.32% 23.48% 4.60% -28.74% 3.83% 19130
Forecast 7 566 572 604 643 618 212 259 3472 Actual 7 758 630 612 695 625 246 159 3,725 6.78%
Absolute deviation 192 58 8 52 7 34 -100 253 253 Percentage deviation 33.87% 10.15% 1.39% 8.15% 1.17% 16.30% -38.55% 6.78% 63771
Forecast 8 573 574 602 638 626 212 255 3480 Actual 8 713 545 609 591 690 293 257 3,698 5.90%
Absolute deviation 140 -29 7 -47 64 81 2 218 218 Percentage deviation 24.38% -5.02% 1.11% -7.37% 10.30% 37.99% 0.89% 5.90% 47548
Forecast 9 583 577 603 641 626 214 250 3493 Actual 9 643 583 666 713 551 230 254 3,640 4.04%

Appendix VI. Forecast data sheets
MSc Thesis Jan-Hoite van Hees 116
Absolute deviation 60 6 63 72 -75 16 4 147 147 Percentage deviation 10.30% 1.09% 10.48% 11.23% -11.91% 7.42% 1.73% 4.04% 21655

Appendices
“Forecasting the incoming flows” 117
Forecast Model 3 Week: Monday Tuesday Wednesday Thursday Friday Saturday Sunday Total
Forecast 47 627 465 594 676 592 226 303 3484
Actual 47 447 560 620 616 551 205 251 3250 7.20%
Absolute deviation -180 95 26 -60 -41 -21 -52 -234 234
Percentage deviation -28.69% 20.40% 4.35% -8.89% -6.99% -9.41% -17.20% -7.20% 54815
Forecast 48 465 551 617 622 555 207 256 3273
Actual 48 503 601 558 561 527 156 256 3162 3.52%
Absolute deviation 38 50 -59 -61 -28 -51 0 -111 111
Percentage deviation 8.18% 9.17% -9.62% -9.81% -5.07% -24.68% -0.08% -3.52% 12413
Forecast 49 465 551 617 622 555 207 256 3273
Actual 49 588 661 613 722 688 307 269 3848 14.93%
Absolute deviation 123 110 -4 100 133 100 13 575 575
Percentage deviation 26.46% 20.07% -0.71% 16.07% 23.93% 48.22% 4.99% 14.93% 330151
Forecast 50 499 596 564 567 530 161 256 3173
Actual 50 606 574 590 691 724 181 190 3,556 10.77%
Absolute deviation 107 -22 26 124 194 20 -66 383 383
Percentage deviation 21.39% -3.68% 4.62% 21.85% 36.65% 12.34% -25.79% 10.77% 146581
Forecast 51 576 650 613 712 675 297 268 3791
Actual 51 588 552 709 619 636 191 233 3,528 7.44%
Absolute deviation 12 -98 96 -93 -39 -106 -35 -263 263
Percentage deviation 2.14% -15.07% 15.58% -13.06% -5.74% -35.69% -12.97% -7.44% 68928
Forecast 52 595 576 587 679 705 179 197 3518
Actual 52 633 623 650 251 180 252 132 2,721 29.28%
Absolute deviation 38 47 63 -428 -525 73 -65 -797 797
Percentage deviation 6.33% 8.12% 10.66% -63.01% -74.45% 40.77% -32.86% -29.28% 634753
Forecast 1 587 562 699 628 640 202 236 3554
Actual 1 469 470 399 182 458 160 183 2,321 53.13%
Absolute deviation -118 -92 -300 -446 -182 -42 -53 -1233 1233

Appendix VI. Forecast data sheets
MSc Thesis Jan-Hoite van Hees 118
Percentage deviation -20.07% -16.34% -42.95% -71.03% -28.42% -20.64% -22.61% -53.13% 1520916
Forecast 2 587 562 699 628 640 202 236 3554
Actual 2 419 438 531 647 607 223 264 3,129 13.59%
Absolute deviation -168 -124 -168 19 -33 21 28 -425 425
Percentage deviation -28.59% -22.04% -24.08% 2.98% -5.14% 10.61% 11.64% -13.59% 180841
Forecast 3 587 562 699 628 640 202 236 3554
Actual 3 623 615 577 661 637 265 250 3,628 2.03%
Absolute deviation 36 53 -122 33 -3 63 14 74 74
Percentage deviation 6.17% 9.47% -17.51% 5.20% -0.45% 31.45% 5.72% 2.03% 5438
Forecast 4 436 450 548 645 610 221 261 3172
Actual 4 535 640 588 637 687 194 139 3,420 7.27%
Absolute deviation 99 190 40 -8 77 -27 -122 248 248
Percentage deviation 22.77% 42.10% 7.33% -1.26% 12.57% -12.16% -46.79% 7.27% 61740
Forecast 5 619 610 589 658 637 259 249 3621
Actual 5 550 663 672 606 680 139 223 3,533 2.48%
Absolute deviation -69 53 83 -52 43 -120 -26 -88 88
Percentage deviation -11.20% 8.75% 14.04% -7.86% 6.70% -46.26% -10.31% -2.48% 7678
Forecast 6 525 621 584 638 679 197 151 3395
Actual 6 692 605 581 559 758 226 186 3,607 5.87%
Absolute deviation 167 -16 -3 -79 79 29 35 212 212
Percentage deviation 31.79% -2.58% -0.51% -12.36% 11.58% 14.90% 23.00% 5.87% 44879
Forecast 7 557 658 664 611 676 151 226 3542
Actual 7 758 630 612 695 625 246 159 3,725 4.92%
Absolute deviation 201 -28 -52 84 -51 95 -67 183 183
Percentage deviation 36.10% -4.21% -7.79% 13.72% -7.51% 62.95% -29.51% 4.92% 33576
Forecast 8 675 607 581 567 750 223 183 3586
Actual 8 713 545 609 591 690 293 257 3,698 3.03%
Absolute deviation 38 -62 28 24 -60 70 74 112 112
Percentage deviation 5.58% -10.16% 4.77% 4.25% -8.02% 31.35% 40.80% 3.03% 12585

Appendices
“Forecasting the incoming flows” 119
Forecast 9 738 633 617 687 630 236 166 3707
Actual 9 643 583 666 713 551 230 254 3,640 1.83%
Absolute deviation -95 -50 49 26 -79 -6 88 -67 67
Percentage deviation -12.86% -7.86% 7.91% 3.84% -12.55% -2.75% 53.33% -1.83% 4446

Appendix VI. Forecast data sheets
MSc Thesis Jan-Hoite van Hees 120
Forecast Model 4 Week: Monday Tuesday Wednesday Thursday Friday Saturday Sunday Total
Forecast 47 627 465 594 676 592 226 303 3484
Actual 47 447 560 620 616 551 205 251 3250 7.20%
Absolute deviation -180 95 26 -60 -41 -21 -52 -234 234
Percentage deviation -28.69% 20.40% 4.35% -8.89% -6.99% -9.41% -17.20% -7.20% 54815
Forecast 48 501 532 612 634 563 211 267 3320
Actual 48 503 601 558 561 527 156 256 3162 5.00%
Absolute deviation 2 69 -54 -73 -36 -55 -11 -158 158
Percentage deviation 0.41% 13.07% -8.86% -11.52% -6.47% -26.20% -3.99% -5.00% 25039
Forecast 49 501 532 612 634 563 211 267 3320
Actual 49 588 661 613 722 688 307 269 3848 13.72%
Absolute deviation 87 129 1 88 125 96 2 528 528
Percentage deviation 17.38% 24.36% 0.12% 13.87% 22.11% 45.23% 0.88% 13.72% 278533
Forecast 50 502 580 574 583 538 173 259 3209
Actual 50 606 574 590 691 724 181 190 3,556 9.74%
Absolute deviation 104 -6 16 108 186 8 -69 347 347
Percentage deviation 20.62% -1.06% 2.74% 18.54% 34.59% 4.86% -26.70% 9.74% 120082
Forecast 51 562 622 613 696 651 278 268 3690
Actual 51 588 552 709 619 636 191 233 3,528 4.58%
Absolute deviation 26 -70 96 -77 -15 -87 -35 -162 162
Percentage deviation 4.65% -11.28% 15.70% -11.01% -2.25% -31.37% -13.15% -4.58% 26138
Forecast 52 575 576 585 659 668 178 211 3452
Actual 52 633 623 650 251 180 252 132 2,721 26.87%
Absolute deviation 58 47 65 -408 -488 74 -79 -731 731
Percentage deviation 10.10% 8.19% 11.06% -61.89% -73.06% 41.19% -37.37% -26.87% 534421
Forecast 1 580 573 680 642 640 217 244 3577
Actual 1 469 470 399 182 458 160 183 2,321 54.09%
Absolute deviation -111 -103 -281 -460 -182 -57 -61 -1256 1256

Appendices
“Forecasting the incoming flows” 121
Percentage deviation -19.16% -17.98% -41.33% -71.65% -28.48% -26.33% -24.87% -54.09% 1576284
Forecast 2 580 573 680 642 640 217 244 3577
Actual 2 419 438 531 647 607 223 264 3,129 14.30%
Absolute deviation -161 -135 -149 5 -33 6 20 -448 448
Percentage deviation -27.78% -23.57% -21.93% 0.78% -5.21% 2.67% 8.38% -14.30% 200257
Forecast 3 580 573 680 642 640 217 244 3577
Actual 3 623 615 577 661 637 265 250 3,628 1.42%
Absolute deviation 43 42 -103 19 -3 48 6 51 51
Percentage deviation 7.38% 7.32% -15.16% 2.96% -0.53% 22.01% 2.63% 1.42% 2652
Forecast 4 467 479 576 645 617 221 258 3263
Actual 4 535 640 588 637 687 194 139 3,420 4.58%
Absolute deviation 68 161 12 -8 70 -27 -119 157 157
Percentage deviation 14.48% 33.75% 2.13% -1.32% 11.34% -12.32% -46.10% 4.58% 24570
Forecast 5 610 602 608 655 638 251 248 3613
Actual 5 550 663 672 606 680 139 223 3,533 2.25%
Absolute deviation -60 61 64 -49 42 -112 -25 -80 80
Percentage deviation -9.86% 10.06% 10.54% -7.52% 6.58% -44.55% -10.11% -2.25% 6328
Forecast 6 515 592 584 640 666 202 175 3373
Actual 6 692 605 581 559 758 226 186 3,607 6.49%
Absolute deviation 177 13 -3 -81 92 24 11 234 234
Percentage deviation 34.45% 2.27% -0.57% -12.59% 13.81% 11.78% 6.49% 6.49% 54768
Forecast 7 568 645 653 621 667 172 231 3557
Actual 7 758 630 612 695 625 246 159 3,725 4.51%
Absolute deviation 190 -15 -41 74 -42 74 -72 168 168
Percentage deviation 33.44% -2.30% -6.25% 11.95% -6.35% 42.61% -31.03% 4.51% 28269
Forecast 8 639 601 582 583 730 219 183 3537
Actual 8 713 545 609 591 690 293 257 3,698 4.36%
Absolute deviation 74 -56 27 8 -40 74 74 161 161
Percentage deviation 11.61% -9.31% 4.64% 1.34% -5.53% 33.88% 40.75% 4.36% 25988

Appendix VI. Forecast data sheets
MSc Thesis Jan-Hoite van Hees 122
Forecast 9 701 634 624 673 638 224 180 3675
Actual 9 643 583 666 713 551 230 254 3,640 0.95%
Absolute deviation -58 -51 42 40 -87 6 74 -35 35
Percentage deviation -8.28% -8.11% 6.69% 5.99% -13.60% 2.70% 40.75% -0.95% 1194

Appendices
“Forecasting the incoming flows” 123
Forecast Model 5 Week: Monday Tuesday Wednesday Thursday Friday Saturday Sunday Total
Forecast 47 627 465 594 676 592 226 303 3484
Actual 47 447 560 620 616 551 205 251 3250 7.20%
Absolute deviation -180 95 26 -60 -41 -21 -52 -234 234
Percentage deviation -28.69% 20.40% 4.35% -8.89% -6.99% -9.41% -17.20% -7.20% 54815
Forecast 48 537 513 607 646 572 216 277 3367
Actual 48 503 601 558 561 527 156 256 3162 6.49%
Absolute deviation -34 88 -49 -85 -45 -60 -21 -205 205
Percentage deviation -6.32% 17.25% -8.08% -13.17% -7.82% -27.66% -7.61% -6.49% 42051
Forecast 49 537 513 607 646 572 216 277 3367
Actual 49 588 661 613 722 688 307 269 3848 12.50%
Absolute deviation 51 148 6 76 116 91 -8 481 481
Percentage deviation 9.51% 28.96% 0.98% 11.75% 20.34% 42.37% -2.91% 12.50% 231301
Forecast 50 520 557 583 604 549 186 267 3265
Actual 50 606 574 590 691 724 181 190 3,556 8.20%
Absolute deviation 86 17 7 87 175 -5 -77 291 291
Percentage deviation 16.55% 3.09% 1.28% 14.49% 31.79% -2.59% -28.71% 8.20% 84954
Forecast 51 562 587 610 684 630 261 273 3608
Actual 51 588 552 709 619 636 191 233 3,528 2.25%
Absolute deviation 26 -35 99 -65 6 -70 -40 -80 80
Percentage deviation 4.54% -5.93% 16.22% -9.51% 0.98% -26.91% -14.66% -2.25% 6325
Forecast 52 563 565 586 647 637 183 228 3410
Actual 52 633 623 650 251 180 252 132 2,721 25.33%
Absolute deviation 70 58 64 -396 -457 69 -96 -689 689
Percentage deviation 12.44% 10.19% 10.87% -61.22% -71.73% 37.40% -42.17% -25.33% 475087
Forecast 1 575 569 660 652 633 226 253 3568
Actual 1 469 470 399 182 458 160 183 2,321 53.72%
Absolute deviation -106 -99 -261 -470 -175 -66 -70 -1247 1247

Appendix VI. Forecast data sheets
MSc Thesis Jan-Hoite van Hees 124
Percentage deviation -18.47% -17.46% -39.50% -72.07% -27.64% -29.25% -27.67% -53.72% 1554425
Forecast 2 575 569 660 652 633 226 253 3568
Actual 2 419 438 531 647 607 223 264 3,129 14.02%
Absolute deviation -156 -131 -129 -5 -26 -3 11 -439 439
Percentage deviation -27.16% -23.08% -19.49% -0.69% -4.10% -1.40% 4.34% -14.02% 192515
Forecast 3 575 569 660 652 633 226 253 3568
Actual 3 623 615 577 661 637 265 250 3,628 1.66%
Absolute deviation 48 46 -83 9 4 39 -3 60 60
Percentage deviation 8.30% 8.01% -12.51% 1.46% 0.64% 17.17% -1.19% 1.66% 3628
Forecast 4 497 504 595 649 620 225 259 3348
Actual 4 535 640 588 637 687 194 139 3,420 2.09%
Absolute deviation 38 136 -7 -12 67 -31 -120 72 72
Percentage deviation 7.62% 27.06% -1.22% -1.89% 10.81% -13.62% -46.23% 2.09% 5129
Forecast 5 599 592 618 656 635 246 252 3598
Actual 5 550 663 672 606 680 139 223 3,533 1.84%
Absolute deviation -49 71 54 -50 45 -107 -29 -65 65
Percentage deviation -8.20% 11.96% 8.69% -7.66% 7.09% -43.40% -11.34% -1.84% 4210
Forecast 6 516 572 592 643 653 209 199 3384
Actual 6 692 605 581 559 758 226 186 3,607 6.18%
Absolute deviation 176 33 -11 -84 105 17 -13 223 223
Percentage deviation 34.09% 5.80% -1.80% -13.08% 15.99% 7.98% -6.42% 6.18% 49644
Forecast 7 575 628 645 631 657 192 237 3565
Actual 7 758 630 612 695 625 246 159 3,725 4.28%
Absolute deviation 183 2 -33 64 -32 54 -78 160 160
Percentage deviation 31.93% 0.38% -5.14% 10.12% -4.94% 27.93% -32.98% 4.28% 25459
Forecast 8 604 588 586 601 706 218 192 3496
Actual 8 713 545 609 591 690 293 257 3,698 5.47%
Absolute deviation 109 -43 23 -10 -16 75 65 202 202
Percentage deviation 18.04% -7.38% 3.87% -1.67% -2.23% 34.62% 33.59% 5.47% 40967

Appendices
“Forecasting the incoming flows” 125
Forecast 9 666 629 629 663 641 219 198 3645
Actual 9 643 583 666 713 551 230 254 3,640 0.14%
Absolute deviation -23 -46 37 50 -90 11 56 -5 5
Percentage deviation -3.49% -7.28% 5.96% 7.53% -14.07% 4.95% 28.20% -0.14% 27

Appendix VI. Forecast data sheets
MSc Thesis Jan-Hoite van Hees 126
Forecast Model 6 Week: Monday Tuesday Wednesday Thursday Friday Saturday Sunday Total
Forecast 47 627 465 594 676 592 226 303 3484
Actual 47 447 560 620 616 551 205 251 3250 7.20%
Absolute deviation -180 95 26 -60 -41 -21 -52 -234 234
Percentage deviation -28.69% 20.40% 4.35% -8.89% -6.99% -9.41% -17.20% -7.20% 54815
Forecast 48 573 494 602 658 580 220 288 3414
Actual 48 503 601 558 561 527 156 256 3162 7.97%
Absolute deviation -70 107 -44 -97 -53 -64 -32 -252 252
Percentage deviation -12.20% 21.76% -7.29% -14.75% -9.14% -29.06% -10.96% -7.97% 63447
Forecast 49 573 494 602 658 580 220 288 3414
Actual 49 588 661 613 722 688 307 269 3848 11.28%
Absolute deviation 15 167 11 64 108 87 -19 434 434
Percentage deviation 2.64% 33.92% 1.84% 9.71% 18.62% 39.61% -6.43% 11.28% 188454
Forecast 50 552 526 589 629 564 201 278 3338
Actual 50 606 574 590 691 724 181 190 3,556 6.12%
Absolute deviation 54 48 1 62 160 -20 -88 218 218
Percentage deviation 9.80% 9.16% 0.22% 9.86% 28.35% -9.83% -31.67% 6.12% 47384
Forecast 51 577 544 605 677 612 246 282 3544
Actual 51 588 552 709 619 636 191 233 3,528 0.46%
Absolute deviation 11 8 104 -58 24 -55 -49 -16 16
Percentage deviation 1.83% 1.51% 17.15% -8.60% 3.85% -22.37% -17.36% -0.46% 260
Forecast 52 568 540 589 648 612 195 252 3404
Actual 52 633 623 650 251 180 252 132 2,721 25.09%
Absolute deviation 65 83 61 -397 -432 57 -120 -683 683
Percentage deviation 11.41% 15.31% 10.34% -61.24% -70.59% 29.36% -47.54% -25.09% 465977
Forecast 1 581 546 636 660 619 230 267 3539
Actual 1 469 470 399 182 458 160 183 2,321 52.49%
Absolute deviation -112 -76 -237 -478 -161 -70 -84 -1218 1218

Appendices
“Forecasting the incoming flows” 127
Percentage deviation -19.22% -13.96% -37.30% -72.42% -26.07% -30.29% -31.53% -52.49% 1484218
Forecast 2 581 546 636 660 619 230 267 3539
Actual 2 419 438 531 647 607 223 264 3,129 13.11%
Absolute deviation -162 -108 -105 -13 -12 -7 -3 -410 410
Percentage deviation -27.83% -19.82% -16.56% -1.94% -2.01% -2.84% -1.22% -13.11% 168334
Forecast 3 581 546 636 660 619 230 267 3539
Actual 3 623 615 577 661 637 265 250 3,628 2.45%
Absolute deviation 42 69 -59 1 18 35 -17 89 89
Percentage deviation 7.30% 12.58% -9.33% 0.18% 2.83% 15.46% -6.46% 2.45% 7870
Forecast 4 532 514 605 656 616 228 266 3416
Actual 4 535 640 588 637 687 194 139 3,420 0.11%
Absolute deviation 3 126 -17 -19 71 -34 -127 4 4
Percentage deviation 0.54% 24.57% -2.77% -2.89% 11.57% -14.75% -47.80% 0.11% 14
Forecast 5 593 567 619 660 625 240 262 3566
Actual 5 550 663 672 606 680 139 223 3,533 0.93%
Absolute deviation -43 96 53 -54 55 -101 -39 -33 33
Percentage deviation -7.30% 16.95% 8.64% -8.20% 8.85% -42.12% -14.91% -0.93% 1082
Forecast 6 533 552 600 650 637 217 228 3417
Actual 6 692 605 581 559 758 226 186 3,607 5.26%
Absolute deviation 159 53 -19 -91 121 9 -42 190 190
Percentage deviation 29.83% 9.67% -3.12% -14.04% 18.97% 3.91% -18.46% 5.26% 35971
Forecast 7 580 596 635 644 641 210 250 3556
Actual 7 758 630 612 695 625 246 159 3,725 4.54%
Absolute deviation 178 34 -23 51 -16 36 -91 169 169
Percentage deviation 30.62% 5.75% -3.56% 7.93% -2.54% 17.25% -36.49% 4.54% 28551
Forecast 8 581 568 594 623 673 220 215 3474
Actual 8 713 545 609 591 690 293 257 3,698 6.05%
Absolute deviation 132 -23 15 -32 17 73 42 224 224
Percentage deviation 22.79% -3.99% 2.51% -5.12% 2.47% 33.15% 19.27% 6.05% 50070

Appendix VI. Forecast data sheets
MSc Thesis Jan-Hoite van Hees 128
Forecast 9 634 606 628 659 636 221 223 3607
Actual 9 643 583 666 713 551 230 254 3,640 0.91%
Absolute deviation 9 -23 38 54 -85 9 31 33 33
Percentage deviation 1.48% -3.80% 6.08% 8.16% -13.42% 4.23% 13.93% 0.91% 1108

Appendices
“Forecasting the incoming flows” 129
Forecast Model 7 Week: Monday Tuesday Wednesday Thursday Friday Saturday Sunday Total
Forecast 47 627 465 594 676 592 226 303 3484
Actual 47 447 560 620 616 551 205 251 3250 7.20%
Absolute deviation -180 95 26 -60 -41 -21 -52 -234 234
Percentage deviation -28.69% 20.40% 4.35% -8.89% -6.99% -9.41% -17.20% -7.20% 54815
Forecast 48 591 484 599 664 584 222 293 3437
Actual 48 503 601 558 561 527 156 256 3162 8.71%
Absolute deviation -88 117 -41 -103 -57 -66 -37 -275 275
Percentage deviation -14.87% 24.15% -6.89% -15.53% -9.78% -29.74% -12.54% -8.71% 75790
Forecast 49 591 484 599 664 584 222 293 3437
Actual 49 588 661 613 722 688 307 269 3848 10.67%
Absolute deviation -3 177 14 58 104 85 -24 411 411
Percentage deviation -0.49% 36.54% 2.28% 8.72% 17.78% 38.27% -8.10% 10.67% 168674
Forecast 50 573 507 591 643 573 209 285 3382
Actual 50 606 574 590 691 724 181 190 3,556 4.89%
Absolute deviation 33 67 -1 48 151 -28 -95 174 174
Percentage deviation 5.70% 13.11% -0.18% 7.38% 26.42% -13.32% -33.42% 4.89% 30193
Forecast 51 590 519 602 676 605 239 288 3519
Actual 51 588 552 709 619 636 191 233 3,528 0.24%
Absolute deviation -2 33 107 -57 31 -48 -55 9 9
Percentage deviation -0.39% 6.26% 17.76% -8.39% 5.14% -20.09% -19.09% 0.24% 73
Forecast 52 580 521 591 653 603 203 266 3417
Actual 52 633 623 650 251 180 252 132 2,721 25.58%
Absolute deviation 53 102 59 -402 -423 49 -134 -696 696
Percentage deviation 9.17% 19.63% 10.01% -61.56% -70.15% 23.98% -50.43% -25.58% 484405
Forecast 1 590 526 623 664 611 229 277 3521
Actual 1 469 470 399 182 458 160 183 2,321 51.71%
Absolute deviation -121 -56 -224 -482 -153 -69 -94 -1200 1200

Appendix VI. Forecast data sheets
MSc Thesis Jan-Hoite van Hees 130
Percentage deviation -20.49% -10.64% -36.00% -72.60% -25.06% -30.26% -33.93% -51.71% 1440365
Forecast 2 590 526 623 664 611 229 277 3521
Actual 2 419 438 531 647 607 223 264 3,129 12.53%
Absolute deviation -171 -88 -92 -17 -4 -6 -13 -392 392
Percentage deviation -28.96% -16.73% -14.83% -2.61% -0.68% -2.80% -4.69% -12.53% 153783
Forecast 3 590 526 623 664 611 229 277 3521
Actual 3 623 615 577 661 637 265 250 3,628 2.95%
Absolute deviation 33 89 -46 -3 26 36 -27 107 107
Percentage deviation 5.62% 16.92% -7.45% -0.50% 4.23% 15.51% -9.74% 2.95% 11416
Forecast 4 556 508 605 661 610 228 274 3443
Actual 4 535 640 588 637 687 194 139 3,420 0.66%
Absolute deviation -21 132 -17 -24 77 -34 -135 -23 23
Percentage deviation -3.72% 25.89% -2.80% -3.61% 12.57% -14.96% -49.34% -0.66% 516
Forecast 5 596 544 614 664 616 237 272 3543
Actual 5 550 663 672 606 680 139 223 3,533 0.27%
Absolute deviation -46 119 58 -58 64 -98 -49 -10 10
Percentage deviation -7.79% 21.92% 9.42% -8.69% 10.33% -41.23% -17.89% -0.27% 91
Forecast 6 552 535 602 656 626 221 247 3438
Actual 6 692 605 581 559 758 226 186 3,607 4.68%
Absolute deviation 140 70 -21 -97 132 5 -61 169 169
Percentage deviation 25.47% 13.15% -3.42% -14.80% 21.16% 2.12% -24.79% 4.68% 28501
Forecast 7 587 568 626 652 629 217 262 3541
Actual 7 758 630 612 695 625 246 159 3,725 4.95%
Absolute deviation 171 62 -14 43 -4 29 -103 184 184
Percentage deviation 29.09% 10.99% -2.19% 6.57% -0.64% 13.35% -39.28% 4.95% 33997
Forecast 8 580 549 597 637 652 222 235 3472
Actual 8 713 545 609 591 690 293 257 3,698 6.11%
Absolute deviation 133 -4 12 -46 38 71 22 226 226
Percentage deviation 23.01% -0.69% 1.93% -7.18% 5.81% 31.84% 9.34% 6.11% 51102

Appendices
“Forecasting the incoming flows” 131
Forecast 9 621 580 623 661 628 223 241 3577
Actual 9 643 583 666 713 551 230 254 3,640 1.72%
Absolute deviation 22 3 43 52 -77 7 13 63 63
Percentage deviation 3.49% 0.50% 6.91% 7.91% -12.29% 3.22% 5.27% 1.72% 3907

Appendix VI. Forecast data sheets
MSc Thesis Jan-Hoite van Hees 132
Forecast Model 8 Week: Monday Tuesday Wednesday Thursday Friday Saturday Sunday Total
Forecast 47 627 465 594 676 592 226 303 3484
Actual 47 447 560 620 616 551 205 251 3250 7.20%
Absolute deviation -180 95 26 -60 -41 -21 -52 -234 234
Percentage deviation -28.69% 20.40% 4.35% -8.89% -6.99% -9.41% -17.20% -7.20% 54815
Forecast 48 609 475 597 670 588 224 298 3461
Actual 48 503 601 558 561 527 156 256 3162 9.45%
Absolute deviation -106 126 -39 -109 -61 -68 -42 -299 299
Percentage deviation -17.39% 26.63% -6.49% -16.28% -10.42% -30.41% -14.07% -9.45% 89229
Forecast 49 609 475 597 670 588 224 298 3461
Actual 49 588 661 613 722 688 307 269 3848 10.06%
Absolute deviation -21 186 16 52 100 83 -29 387 387
Percentage deviation -3.43% 39.27% 2.73% 7.74% 16.95% 36.96% -9.71% 10.06% 149992
Forecast 50 598 487 593 659 582 217 294 3431
Actual 50 606 574 590 691 724 181 190 3,556 3.52%
Absolute deviation 8 87 -3 32 142 -36 -104 125 125
Percentage deviation 1.29% 17.80% -0.48% 4.82% 24.37% -16.72% -35.32% 3.52% 15665
Forecast 51 607 493 598 675 598 232 295 3499
Actual 51 588 552 709 619 636 191 233 3,528 0.81%
Absolute deviation -19 59 111 -56 38 -41 -62 29 29
Percentage deviation -3.10% 11.91% 18.49% -8.34% 6.31% -17.83% -21.03% 0.81% 816
Forecast 52 599 496 593 662 596 214 283 3443
Actual 52 633 623 650 251 180 252 132 2,721 26.55%
Absolute deviation 34 127 57 -411 -416 38 -151 -722 722
Percentage deviation 5.67% 25.62% 9.69% -62.11% -69.82% 17.92% -53.42% -26.55% 521800
Forecast 1 605 499 609 670 602 228 289 3502
Actual 1 469 470 399 182 458 160 183 2,321 50.90%
Absolute deviation -136 -29 -210 -488 -144 -68 -106 -1181 1181

Appendices
“Forecasting the incoming flows” 133
Percentage deviation -22.47% -5.84% -34.53% -72.82% -23.92% -29.92% -36.64% -50.90% 1395463
Forecast 2 605 499 609 670 602 228 289 3502
Actual 2 419 438 531 647 607 223 264 3,129 11.93%
Absolute deviation -186 -61 -78 -23 5 -5 -25 -373 373
Percentage deviation -30.73% -12.25% -12.87% -3.39% 0.83% -2.32% -8.60% -11.93% 139351
Forecast 3 605 499 609 670 602 228 289 3502
Actual 3 623 615 577 661 637 265 250 3,628 3.46%
Absolute deviation 18 116 -32 -9 35 37 -39 126 126
Percentage deviation 2.99% 23.22% -5.32% -1.30% 5.81% 16.08% -13.44% 3.46% 15801
Forecast 4 586 493 602 667 603 228 286 3465
Actual 4 535 640 588 637 687 194 139 3,420 1.31%
Absolute deviation -51 147 -14 -30 84 -34 -147 -45 45
Percentage deviation -8.75% 29.81% -2.26% -4.56% 14.02% -14.83% -51.46% -1.31% 2022
Forecast 5 607 511 606 669 606 232 285 3515
Actual 5 550 663 672 606 680 139 223 3,533 0.51%
Absolute deviation -57 152 66 -63 74 -93 -62 18 18
Percentage deviation -9.35% 29.82% 10.86% -9.39% 12.30% -40.08% -21.74% 0.51% 329
Forecast 6 581 508 600 664 611 224 272 3460
Actual 6 692 605 581 559 758 226 186 3,607 4.06%
Absolute deviation 111 97 -19 -105 147 2 -86 147 147
Percentage deviation 19.07% 19.16% -3.20% -15.86% 24.06% 0.72% -31.52% 4.06% 21471
Forecast 7 601 526 613 663 613 223 279 3517
Actual 7 758 630 612 695 625 246 159 3,725 5.59%
Absolute deviation 157 104 -1 32 12 23 -120 208 208
Percentage deviation 26.11% 19.79% -0.12% 4.90% 1.96% 10.48% -42.96% 5.59% 43397
Forecast 8 592 517 598 654 626 225 263 3475
Actual 8 713 545 609 591 690 293 257 3,698 6.03%
Absolute deviation 121 28 11 -63 64 68 -6 223 223
Percentage deviation 20.39% 5.33% 1.79% -9.61% 10.28% 30.48% -2.30% 6.03% 49674

Appendix VI. Forecast data sheets
MSc Thesis Jan-Hoite van Hees 134
Forecast 9 617 536 613 666 614 225 267 3538
Actual 9 643 583 666 713 551 230 254 3,640 2.82%
Absolute deviation 26 47 53 47 -63 5 -13 102 102
Percentage deviation 4.26% 8.70% 8.70% 7.09% -10.29% 2.22% -4.79% 2.82% 10504

Appendices
“Forecasting the incoming flows” 135
Appendix VII. Interview summaries During the research a number of interviews were done in order to gather information and use the tacit knowledge of several parties and policymakers involved. These interviews can be divided into a number of clusters with similar knowledge and outcomes. For every cluster the interviewed persons and their function are given and the date on which the interview was held. Furthermore the most important findings from these interviews are described per cluster. The following clusters will be discussed:
Component Services Aircraft Maintenance Business Development Office SPL/TX KLM Cargo
Maintenance Unit Component Services
Rijnbeek, E Logistics Operational Manager multiple occasions
Vennik, L Logistics Flow Control Manager multiple occasions
Sie, YL Logistics Project Manager multiple occasions
Schilder, J Logistics Project Manager multiple occasions
Kassim, F Logistics expedition employee multiple occasions
Eckstein, W Logistics expedition employee multiple occasions
Monsees, M Logistics expedition employee multiple occasions
Bron, E (Former) Logistics Project Manager 27-10-2008
Kool, W. (Former) Logistics manager A&A 25-09-2008
Belangrijkste bevindingen: Ed indicates that the tool that has to be developed should give insight on the incoming flow (at
the Logistics Center) of packages. This insight will be used to plan resources more easily and to get an idea for the workload
distribution on a weekly basis.
Ed indicates that the tool wouldn’t definitely have great forecasting ability’s now, as long as it’s able to enhance the reliability of the forecast over time.
Ed indicates that the tool that has to be developed should give insight on the incoming flow (at
the Logistics Center) of packages. This insight will be used to plan resources more easily and to get an idea for the workload
distribution on a weekly basis.
Ed indicates that the tool wouldn’t definitely have great forecasting ability’s now, as long as it’s able to enhance the reliability of the forecast over time.
IT systems that are most involved in logistical flows: SAP Crocos Scarlos Tracking

Appendix VII. Interview summaries
MSc Thesis Jan-Hoite van Hees 136
Tracking is build upon ‘drop’ and ‘pick’ scan moments at every step of the physical path of
the package.
Tracking is filled with data from SAP and Crocos
SAP: reference number is the Purchase Order number.
SAP defines the final destination which is printed upon the Tracking sticker.
Crocos: reference number is the LRU (Line Replaceble Unit).
Crocos defines the final destination. Tracking was chosen based on its cost/quality rate. None the less, implementation mend
addition of yet another IT support system to the E&M range of IT support systems. 3 possible causes of non-traceability occur: Sticker not printed Scanners not read out. Non scanning VO has made the management decision not to use Tracking for internal transport matters. H11
has recently decided do rewind this decision and to start using Tracking. Link Phyttol (Scarlos) --- Tracking: There is none! Phyttol stickers are scanned with the same scanners as the Tracking stickers. Software at the
docking stations (KLMSPLIT) ensures that data about Phyttol stickers are sent to Phyttol and data about Tracking stickers is sent to Tracking.
Sodexo treintje rijdt 4 keer per dag. ( 1 x per 2,5 a 3 uur)
Sommige goederen vanuit BMSS (bedoeld voor Export) komen binnen zonder Tracking
sticker, SAP staat ook niet goed waardoor uitdraaien geautomatiseerde Tracking sticker niet mogelijk is (levert een Tracking sticker terug naar H14 op)
Circa 30% van de goederen waarvoor een Tracking sticker uitgedraaid moet worden door
Expeditie LC, levert geen/foutieve Tracking sticker op waarna handmatig een andere sticker moet worden aangemaakt. (doorlooptijd product verdriedubbelt)
Procesverstorende goederen (bijvoorbeeld bovengenoemde vanuit BMSS of van externe
klanten zonder duidelijke adressering) worden wel behandeld maar momenteel ontbreekt een terugkoppeling naar de verzender dat niet de goede procedure gevolgd wordt.
Motivatie medewerkers / leidinggevenden expeditie laag. Er lijkt een soort berusting te zijn in
het niet-optimaal functioneren van de operatie. Het onderlinge vertrouwen is minimaal.
Alle goederen worden voorzien van een Tracking sticker. Wordt ook gescand.
Shop VC inbound stickert nog steeds stickers met MGD H10… terwijl deze goederen het MLC in moeten. Dit levert verwarring op bij de expeditie.
Bulk stickers lijken niet goed te werken: stickers die onder een bulk sticker ‘gehangen’ worden staan op de pakbon ineens niet meer vermeld. Dit gebeurt op het oog willekeurig. Bij de ene bulk sticker gaat het wel goed, bij de andere mist 25-50%...
Dangerous goods are delivered straight to the warehouse dangerous goods. All regular flows with all components/expendables will go through the LC

Appendices
“Forecasting the incoming flows” 137
Boeing building koolhovenlaan has two sections: ADC (Warehouse with boeing 737 parts) CSP (partnership AirFrance-KLM with Boeing.) Components Services programme. 3 shuttles a day between KLM and Boeing Sight on their incoming goods: Pre-alerts when goods are already arrived.. (!) CSP (no sight) External customers (MAPAG Maintenance Pool Agreement): two flows: Exchange (US in, then SE out) Forward Exchange (SE out, then US in) Forecast/information possibilities: KLM internally: Flow SE MLC out means same flow US MLC in.
Monitoring vendors Repair & availability management Vendor performance: 60% within contractual period. A&A has its own warehouse for expendables and does the IIG at its expedition. Triggered by Crocos (poolcomponents) and SAP (Tied components) A&A are 17 shops Expedition A&A and BMSS is scheduled to move to LC October 2008 Incoming flow A&A = 800 packages per week.
Maitenance Unit Aircraft Maintenance
Stokman, R senior planner SPL/VG 10-09-08
Wolf, F vd Business analyst VOC Multiple occasions
Boesten, B Logistics Manager WB 14-09-08
Zwetsloot, H Logistics Manager NB 14-09-08
Belangrijke bevindingen:
Long term Forecast Mostly consumables (90%) Determining the correct order quantities and stock levels for consumables Modification management: Modification comes in request to operations for the check date
Forecast of deliveries. Most order are booked in SAP but SAP can’t deal with complex processes. Big modifications do have a order time of sometimes a couple of years but small parts (like
bolts and screws) often have an order time of only a week. Most flows are predictable but are not communicated with the LC. Also there is a (rather small) flow of rotables (often with specific partnumbers) which are
requested for specific maintenance checks/modifications. Furthermore there is a flow of immediate requests during the check of the aircraft. StocklevelForecast on basis of historical data 3 important flows:
regular (‘normal’) flow triggered by the stock levels thru SAP immediate flow for replacement parts with immediate need: on stock at
TAO. (no shuttle, but speed service) immediate flow for replacement part with immediate need: NOT on stock
within KLM. : AOG (Aircraft On Ground). Hangar 10: Check’s on Narrow Body Hangar 11&12: A Check’s on Wide Body Hangar 14: C&D Check’s on Wide Body Material Forecast: Availability and determining optimal stocklevels.

Appendix VII. Interview summaries
MSc Thesis Jan-Hoite van Hees 138
Flow 1.4 triggered by VOH:: Shelf (Forecast departement driven) Recovery: (Material centers)
Logistical Analysts would be nice to meet (via Timothy Bakker.) Meeting with Hans Zwetsloot Same story: additional flows:
Drop shipments Textile Returnflows: Unserviceable Serviceable Repairables Warranty Ad hoc stroom.
Business Development Office SPL/TX
Leeuwen, A van Business Analyst 25-09-2008
Chan, M Business Analyst 23-10-2008
Belangrijke bevindingen: Flow overview is not that complex.. All flows external are registrated with a purchase order Sometimes these purchase order have a different tag as repair order or loan order. (but all are
purchase orders!) SAP generates a pre call in SCARLOS when an order is generated. With a.o. Partnr, Quantity
and final destination. Scarlos is interfaced with Cargoal. ( no relevance) Some extional flows: Unserviceable flow outstations Equipmentflow (SPL/TT) Sap is a very extensive software package which, generally spoken, is capable to perform any
wanted capability Situation Now: Scarlos has an interface with SAP Scarlos does the DM (Delivered at Maintenance Unit) declaration. Inspector Incoming Goods does the GR (Goods Received) declaration. After the GR declaration, a status declaration will follow Status = ok: good is send to next destination Status = not ok: good will be held in quarantine. (many procedure can follow, ie warranty or
scrap, which are not included in SAP CS. But are in SAP ES) KLM does not follow the SAP Supply Chain Management procedure Business requiresments will have to form the framework for a system development Systems will be able to meet the business’ requirements one way or another Interfaces will have to be developed, which will cost money, manpower, maintenance and
control Maybe RFID will provide a better interface with SAP. All depends on the willingness to adapt the business processes to IT or the willingness to pay
the money to change the IT to the business processes. Inschatting wat de kosten zijn voor een SAP logistieke applicatie kan niet worden
afgeven. De weg (IT masterplan) die we zijn ingegaan verder gaan uitvoeren: Trace, Crocos vervangen. Module WMS bij ES uitrollen en de technische upgrade op
SAP uitvoeren. Hierna kijken of WMS voor de rest E & M kan worden uitgerold en kijken naar SAP
SCM. De gedachten gaan uit naar GLOBAL Supply Chain management samen met AFI.

Appendices
“Forecasting the incoming flows” 139
KLM Cargo Business Unit Aerospace Logistics (BUAL)
Kraus, J KLM Cargo Business Unit Aerospace Logistics 14-10-2008 & 20-10-2008
Poll, F vd KLM Cargo Business Unit Aerospace Logistics 14-10-2008
Bos, C KLM Cargo Business Unit Aerospace Logistics 20-10-2008
Belangrijke bevindingen: KLM Cargo serves as a logistics agent for KLM E&M.
KLM Cargo guarantees 48 hour delivery. Pick up at Vendor to Delivered at LC.
Discussion between E&M and Cargo about the DM (Delivered at LC) call.
Logistics events of importance:
Order intake AMS transport Export bills Air transport Import Vendor delivery
BUAL Logistics are monitored in SCARLOS. SCARLOS was about to be replaced by another
system, but this project has been cancelled.
Interesting would be the synchronization of SCARLOS/TRACKING.
KLM Cargo takes care of all logistics of E&M-owned goods.
Origin of the inbound E&M goods (raw estimation): Northern America: 60% United Kingdom: 20% Europe: 10 % Other: 10% (i.e. Singapore)
Within Europe, KLM Cargo makes use of the services of DHL.
Within the United States KLM Cargo makes use of the services of FedEx and agent Pro
Services Forwarding Co., INC. Goods come to AMS trough 2 major gateways: New York and Los Angeles. (Also Seattle,
Houston and Chicago)
Most occurring process disturbing issues: -Purchasing department do not include the standard logistic agreement in the contract (they are
finally fixing this) KLM Cargo Aerospace logistics is in the lead of this instruction! -Vendor orders wrong transport product from FedEx. (Priority 2nd day delivery or 3rd day
delivery iso P1 next day delivery) -Vendor orders wrong transport product for weekend deliveries (Saturday delivery when
shipment is Friday) -Incomplete packing lists.
Relationship Cargo <–> E&M <–> Vendor: Cargo has no contact with Vendor whatsoever. ( through our local QI organisation we do have
contact with the vendors or Aerospace Logistic Flow control department) Except when vendor follows a wrong transport procedure.

Appendix VII. Interview summaries
MSc Thesis Jan-Hoite van Hees 140
Vendor Control (CS/ES) maintains all contact with the vendor.
Vendors ES are under stricter control than the CS vendors.
KLM shipping instructions (developed by Cargo and E&M) are sent to vendors when a
contract is agreed upon. Vendors are expected to respect these instructions. (instructions are taylor made for customers like Garuda, Martin Air etc. And have to be sent out by the customers to the vendors)
Scarlos is the logistics IT application of KLM Cargo which ‘plans’ the supply chain. Orders are created in SAP and than communicated with Scarlos. Scarlos is filled with POA’s and POD’s from FedEx/DHL /Pro Services/ Airline and the
Freight Building. The DM (Delivered at Maintenance Unit) is currently done at the LC. These POA and POD moments are subsequently communicated to SAP.
Customs Clearance is done while the goods are still ‘in the air’.
Currently 6 trucks a day are driving between Logistics Center and KLM Cargo. (Intention: 1 truck every hour).
Tracking and Scarlos don’t communicate.

Appendices
“Forecasting the incoming flows” 141
Appendix VIII Agenda Group Support System Session Length Time Activity Question/Assignment Result ThinkLet & Pattern
20 10.00-10.20
Introduction. Explain Goal of Session, Agenda and Scope. Introduce and Introduction round participants. Why GSS?
Goal: Identification of problem areas, criteria and alternatives.
Commitment to the goals, know each other. -
15 10.20-10.35 Brainstorm activities/processes within the supply chain
What activities and steps are in the supply chain A list of activities LeafHopper
15 10.35-10.50 Reduction of activities Goal: eliminate redundant activities A clean list of activities, the elements are transferred to smartboards
FastFocus
15 10.50-11.05 Draw 'own' supply chain Goal: Draw your own vision of the whole supply chain, your role in it (10 min) and information flows (5).
Identification of each parties own perspective on logistics/supply chain
Smartboards
15 11.05-11.20 Define common KLM E&M supply chain
Goal: Construct the common KLM E&M supply chain
Identification of the complexity of the supply chain Smartboards
10 11.20-11.30 Presentation
30 11.30-12.00 Brainstorm - Define critical problems in the system / set
Goal: identify problems in the logistics system Identification of critical problems Leafhopper
15 12.00-12.15 Reduction to key problems Goal: define/summarize key problemsin your bucket
A short list of non-redundant problems FastFocus
10 12.15-12.25 Evaluation of problems Goal: to reduce the number of problems to ~8 key issues The most critical problems StrawPoll (1 to 5)
20 12.25-12.45 Lunchbreak
45 12.45-13.30 Brainstorm solutions in pairs Goal: identify solutions for the problems, always come up with a better one
Theoretical solutions for the problems LeafHopper

Appendix VIII Agenda Group Support System Session
MSc Thesis Jan-Hoite van Hees 142
20 13.30-13.50 Reduction and clarification among solutions
Goal: identify and reformulate the most important solutions in the list
Complete but short list of solutions FastFocus
20 13.50-14.10 Brainstorm advantages / disadvantages / challenges of solutions
Goal: to find out more about the solutions
A list of pros and cons about the solutions FreeBrainstorm
10 14.10-14.20 Brainstorm criteria Goal: identify criteria of a high quality logistics system A list of criteria FreeBrainstorm
15 14.20-14.35 Coffee break
10 14.35-14.45 Evaluation of alternatives Goal: a set of evaluated alternatives Evaluate alternatives StrawPoll (1 to 10)
45 14.45-15:30 Build consensus Discussion about issues where the group has low consensus
Prioritized list of items, shared understanding of the reasons behind differences of opinion within the group
Crowbar
15 15.30-15.45 Wrap up Reflect on the result, compare it with the goal in the beginning
Insight in the arguments and positions -
15 15.45-16.00 Slack time

Appendices
“Forecasting the incoming flows” 143

Appendix IX Evaluation GSS Session
MSc Thesis Jan-Hoite van Hees 144
Appendix IX Evaluation GSS Session
Recapturing flow control Session Details:
Start: 2009.01.14 10.00 End: 2009.01.14 16.00 Location: TU Delft, TPM
Session Leader:
Login Name Email [email protected] student4 student4 [email protected]
Session Participants:
Login Name Email 1 101 102 103 104 105 106 107 108 109 2 3 4 5 6 7 CDE03 ernst ivan jerry student04 wouter

Appendices
“Forecasting the incoming flows” 145
Session Documents:
Name Description File Name/URL ThinkTank Generated Report
This report was generated by ThinkTank and is a report on this session. SessionReport.doc
ThinkTank Generated Report
This report was generated by ThinkTank and is a report on this session. SessionReport.doc
Agenda:
Introduction Free Supply Chain Brainstorming Smartboard activity Brainstorm critical problems Determine Key Issues Lunchbreak Brainstorm for solution alternatives per key issue Criteria Brainstorm Coffee Break Evaluation of alternatives Elaboration on ranked key solutions Wrap up Drinks/Snacks
1. Introduction Introduction by Jan-Hoite and Ivan
1. Introduction Task Grid # Tasks
2. Introduction Tasks with Comments
2. Free Supply Chain Brainstorming We will generate ideas about the issue using a method known as brainstorming -- a non-judgmental way to rapidly generate and build upon the group's ideas. 1. Storage
1.1. opslag regels 1.2. Issuing material 1.3. Wat komt er binnen 1.4. Order pikken 1.5. aanvragen via het systeem 1.6. ruimte 1.7. shopfindings 1.8. Order verzamelen 1.9. verpakkings regels 1.10. materiaal inspecteren 1.11. surplus bewaking
2. Pipeline

Appendix IX Evaluation GSS Session
MSc Thesis Jan-Hoite van Hees 146
2.1. Shipping material 2.2. Intern transport 2.3. Extern transport 2.4. Tracing 2.5. inslag van materialen 2.6. package 2.7. security doorgangen 2.8. scannen 2.9. Status update 2.10. RFID 2.11. input rules 2.12. Repair action 2.13. meting tat van pijplijnen 2.14. definitie pipeline, waar begint/eindigt pipeline, maak kreet pipeline
tastbaar waar in de keten is het onderdeel 2.15. tracebility van leveringen 2.16. onduidelijkheid hoe, wanneer welk transport aan te sturen
3. User
3.1. Order material 3.2. communication 3.3. tracing van bestellingen 3.4. nul voorraad 3.5. alternative beschikbaarheid 3.6. exchange 3.7. order expedite
4. Supplier
4.1. Processing incoming material orders 4.2. order bevestiging 4.3. Order ontvangst en order bevestiging 4.4. verschuiven van leverdatum 4.5. verzendgereed maken 4.6. vendor management processen 4.7. AOG procedure 4.8. transport rules (standard rules) 4.9. Verzendinformatie (vb. AWB-nrs) 4.10. tat tbv quote approvals 4.11. Aanmaak handmatige pro forma invoices 4.12. piecepart problematiek 4.13. procesafstemming met kritieke leveranciers 4.14. Samenwerking (vb. consignment) 4.15. prioriteitstelling bij supplier tbv tijdige beschikbaarheid
5. focus bucket
5.1. deadline 5.2. Laden/lossen 5.3. forecast 5.4. Track & Trace 5.5. communication

Appendices
“Forecasting the incoming flows” 147
5.6. wat is de prioriteit 5.7. voorraad controlle 5.8. opslag unserviceable material tbv uitbesteding/afvoer uit omloopvoorraad 5.9. pop-up melding bij overschrijding van deze verwachting, aktie flow-
control 5.10. escalatie traject inkoop (contract) 5.11. Betrouwbaarheid standaard / afgesproken levertijd 5.12. Leverkwaliteit (geen fouten in invoice, aantal, documentatie, ect) 5.13. vaststellen van verwachte levertijd 5.14. feedback proces over levertijden 5.15. het versturen van de order (vooral buiten spec2000) 5.16. materiaal aanvraag procedure 5.17. 1 Systeem 5.18. eenduidigheid in procedures 5.19. vaste afspraken 5.20. transport-mode keuze 5.21. prioriteit bepalen 5.22. identificatie van onderdelen/orders naar bestemming 5.23. overstock bewaking 5.24. beperkte opslagcapaciteit in magazijnen (nieuwe storage locations) 5.25. verwachting beschikbaarheid zichtbaar afhankelijk van de interne KPI's 5.26. inventory control: hoeveel?wat?waar? 5.27. monitor & control
3. Smartboard activity
1. Smartboard activity Task Grid # Tasks
2. Smartboard activity Tasks with Comments
4. Brainstorm critical problems Define the critical problems in the selected processes 6. Information handling (data flow)
6.1. deadline info 6.2. interne flow(tijden) zichtbaar maken 6.3. weet niet wat er op ons af komt op dag/week basis waarbij we slecht
mankracht kunnen plannen 6.4. duidelijke info laadadres (adres, postcode, contactpersoon,
telefoonnummer) 6.5. idem afleveradres 6.6. openingstijden 6.7. Scandichtheid te laag 6.8. Vendorgegevens incorrect 6.9. In de totale flow die binnenkomt is geen onderscheidt in prioriteit 6.10. orderacknowledgement

Appendix IX Evaluation GSS Session
MSc Thesis Jan-Hoite van Hees 148
6.11. quote approval 6.12. Van Diverse zendingen is de eind af lever lokatie niet duidelijk 6.13. er zitten gaten in de informatieketen van vraag tot levering 6.14. afhandelen van urgente/AOG zendingen 6.15. dagelijkse informatie verkrijgen 6.16. feedback bij foutmeldingen 6.17. vervuiling IT systemen 6.18. snelle en accurate Tracking information 6.19. Vervoerafspraak niet altijd bekend/duidelijk 6.20. Beheren interfaces tussen verschillende IT systemen (SAP, Tracking,
Scarlos) 6.21. correcte lijst met namen wie een probleem moet oplossen 6.22. De informatie over order ontvangst wordt niet altijd verstuurd/ vastgelegd 6.23. Informatie overdracht tussen diverse IT systemen 6.24. verschillende systemen voor verschillende onderdelen ( verbruiksartikelen-
ruilartikelen-gereedschappen-opslag BMérs) 6.25. kennis van de diverse computersystemen 6.26. ontbreken van aanspreekpunten ivm missing orders/pakketten
7. Physical transportation
7.1. vermiste zendingen 7.2. niet voldoen aan ingangs eisen (verpakking, stickers, documenten) 7.3. levertijden 7.4. interne levertijden onbetrouwbaar (vraag tot levering) 7.5. betrouwbare dienstregeling 7.6. gebruik van verkeerde data op Tracking stickers 7.7. (te veel)expeditiepunten zorgen voor vertraging 7.8. kloppen maten en gewichten vs gegevens in systeem 7.9. aanwezigheid juist materieel 7.10. gebrek aan info in de diverse systemen om een goede Tracking & tracing
te kunnen doen 7.11. Er wordt in het proces teveel gebulked/vastgehouden, geen one-piece flow 7.12. eenduidig transportsysteem 7.13. Afspraken over lokaties heen zijn moeilijk controleerbaar 7.14. wirwar van transportmogelijkheden. 7.15. Teveel stickers op package 7.16. doorbelasten transport voor het zoek raken van zendingen 7.17. normtijden voor interne leveringen niet duidelijk of niet mee haalbaar 7.18. Veel interne transportstromen 7.19. Missen van afmelden van gebruik van het materiaal (terugkoppeling) 7.20. te veel last-minute 7.21. Diverse Expeditiepunten niet eenduidig ingericht 7.22. te veel wachttijd 7.23. Geen fysieke aanwezigheid bij laden/lossen op verscchillende expedities 7.24. Doorlooptijden voor sommige bestemmingen te lang 7.25. transport in weekenden 7.26. Piekvorming door achterliggende processen
8. Inbound logistics processes
8.1. Oplossen quarantaine items

Appendices
“Forecasting the incoming flows” 149
8.2. incomming rules 8.3. beter gegevens of data 8.4. Bepalen prioriteit in afwerken inkomende goederenstroom 8.5. Probleem oplossend vermogen ingeperkt 8.6. Kwaliteitsverschil tussen diverse inbound locaties 8.7. documentatie niet aanwezig/niet eenduidig 8.8. onvoorspelbaarheid vraag 8.9. indentificatie van inkomende orders --> in welke goederenstroom (wplh of
mag) horen ze thuis 8.10. wie lost problemen op 8.11. wie heeft de eind verantwoordelijkheid? 8.12. teveel werkpleken
9. communication
9.1. Wie moet men bellen over de status van een zending 9.2. Hoe zoekt men in de diverse systemen naar de status van het onderdeel, en
hoe krijgen we dit breed gedragen, eenduidigheid 9.3. Teveel contactadressen voor retourstromen 9.4. geen vooraankondiging 9.5. onduidelijk waar zending zich bevind zodra op schiphol 9.6. inconsequent scannen 9.7. De vastlegging van de communicatie (diverse (klachten) systemen) 9.8. actief terugkoppelen van lopen acties 9.9. leverancier niet altijd op de hoogte van de prioriteit van een bestelling 9.10. De vele overlegstucturen om de communicatie te delen maakt de kans op
miscommnicatie groter 9.11. performance op kwaliteit (juiste bestemming) niet inzichtelijk 9.12. AOG procedure 9.13. procedure rond vermissingen onduidelijk 9.14. gebrek aan kennis 9.15. orderstatusreport 9.16. single point of contact 9.17. duidelijkheid over zendingdetails (partnr. , stickernummer etc) 9.18. praten over verschillende informatie(bronnen) 9.19. Communicatie kanalen 9.20. responsetijd van leveranciers op informatieverzoeken is niet altijd goed 9.21. Bescherming / openheid van gegevens. 9.22. terugmelding wijzigingen
10. Focus bucket problems
10.1. ontbreken van eenduidige KPI's 10.2. Ontbreken eenduidige definities voor logistieke termen 10.3. Ontbreken duidelijke (meetbare) logistieke afspraken met toeleveranciers 10.4. Zendingen die niet voldoen aan de ingangseisen 10.5. beperkte authorisatie (beperking oplossend vermogen) 10.6. Meerdere werkwijzen inbound logistics 10.7. Gebrek aan discipline in uitvoering afspraken/processen 10.8. Veel overdrachtsmomenten 10.9. identificatie bestemming artikel 10.10. (On)betrouwbaarheid masterdata alle systemen

Appendix IX Evaluation GSS Session
MSc Thesis Jan-Hoite van Hees 150
10.11. Afwezigheid 1 IT-systeem voor hele supply chain 10.12. Gebrek inzicht karakteristieken binnenkomende stromen (prio, #) 10.13. Handmatige aanmaak Tracking sticker 10.14. Onduidelijkheid over (eind)verantwoordelijkheid per proces 10.15. Gebrek aan operationele eenduidigheid van de diverse expeditiepunten 10.16. Te veel interne en externe transport modussen
5. Determine Key Issues
1. Determine Key Issues Totals
Determine Key Issues Totals Criteria: key issue? Voting Method: SlidingScale Weight: 1.00
# Ballot Items Weighted Total Total Avg.
Score 1. ontbreken van eenduidige KPI's 6.86 6.86 6.86 6.86
2. Ontbreken eenduidige definities voor logistieke termen 6.71 6.71 6.71 6.71
3. Ontbreken duidelijke (meetbare) logistieke afspraken met toeleveranciers 6.14 6.14 6.14 6.14
4. Zendingen die niet voldoen aan de ingangseisen 7.14 7.14 7.14 7.14

Appendices
“Forecasting the incoming flows” 151
5. beperkte authorisatie (beperking oplossend vermogen) 4.64 4.64 4.64 4.64
6. Meerdere werkwijzen inbound logistics 5.57 5.57 5.57 5.57
7. Gebrek aan discipline in uitvoering afspraken/processen 6.57 6.57 6.57 6.57
8. Veel overdrachtsmomenten 5.36 5.36 5.36 5.36 9. identificatie bestemming artikel 5.64 5.64 5.64 5.64
10. (On)betrouwbaarheid masterdata alle systemen 8.00 8.00 8.00 8.00
11. Afwezigheid 1 IT-systeem voor hele supply chain 8.43 8.43 8.43 8.43
12. Gebrek inzicht karakteristieken binnenkomende stromen (prio, #) 5.14 5.14 5.14 5.14
13. Handmatige aanmaak Tracking sticker 3.36 3.36 3.36 3.36
14. Onduidelijkheid over (eind)verantwoordelijkheid per proces 5.71 5.71 5.71 5.71
15. Gebrek aan operationele eenduidigheid van de diverse expeditiepunten 5.50 5.50 5.50 5.50
16. Te veel interne en externe transport modussen 4.43 4.43 4.43 4.43
Voting Details Criteria Statistic: Mean. Votes Cast: 14, Abstained: 0
2. Determine Key Issues Criteria: key issue? Vote Method: SlidingScale
Determine Key Issues Criteria: key issue?
Vote Distribution
# Ballot Items 1 2 3 4 5 6 7 8 9 10 Avg. Score Total STD Votes
1. ontbreken van eenduidige KPI's 1 - 2 1 1 - - 3 4 2 6.86 96.00 3.01 14
2. Ontbreken eenduidige definities voor logistieke termen - 2 - 1 1 1 1 5 2 1 6.71 94.00 2.55 14
3. Ontbreken duidelijke (meetbare) 2 1 - - 2 2 2 2 - 3 6.14 86.00 3.11 14

Appendix IX Evaluation GSS Session
MSc Thesis Jan-Hoite van Hees 152
logistieke afspraken met toeleveranciers
4. Zendingen die niet voldoen aan de ingangseisen - 1 - 1 1 2 2 3 1 3 7.14 100.00 2.38 14
5. beperkte authorisatie (beperking oplossend vermogen) 4 1 1 3 - 1 - 1 - 3 4.64 65.00 3.54 14
6. Meerdere werkwijzen inbound logistics - 1 2 2 3 1 3 - - 2 5.57 78.00 2.44 14
7. Gebrek aan discipline in uitvoering afspraken/processen - 2 1 - 2 1 3 1 - 4 6.57 92.00 2.90 14
8. Veel overdrachtsmomenten 2 1 2 1 2 - 2 1 1 2 5.36 75.00 3.18 14 9. identificatie bestemming artikel 2 1 1 3 - - 2 2 - 3 5.64 79.00 3.32 14
10. (On)betrouwbaarheid masterdata alle systemen - - - 1 1 - 4 2 1 5 8.00 112.00 1.96 14
11. Afwezigheid 1 IT-systeem voor hele supply chain - - 2 - - 1 - 1 2 8 8.43 118.00 2.56 14
12. Gebrek inzicht karakteristieken binnenkomende stromen (prio, #) 1 3 1 1 1 2 2 1 1 1 5.14 72.00 2.88 14
13. Handmatige aanmaak Trackingsticker 2 5 1 3 2 - - - - 1 3.36 47.00 2.34 14
14. Onduidelijkheid over (eind)verantwoordelijkheid per proces
- 1 3 1 3 2 - 1 - 3 5.71 80.00 2.79 14
15. Gebrek aan operationele eenduidigheid van de diverse expeditiepunten
1 2 1 3 - - 2 3 1 1 5.50 77.00 2.95 14
16. Te veel interne en externe transport modussen 3 2 2 - 2 1 - 3 1 - 4.43 62.00 2.95 14
Voting Details Criteria Statistic: Mean. Votes Cast: 14, Abstained: 0
3. Determine Key Issues Ballot Items with Comments 1. ontbreken van eenduidige KPI's 2. Ontbreken eenduidige definities voor logistieke termen 3. Ontbreken duidelijke (meetbare) logistieke afspraken met toeleveranciers 4. Zendingen die niet voldoen aan de ingangseisen 5. beperkte authorisatie (beperking oplossend vermogen) 6. Meerdere werkwijzen inbound logistics 7. Gebrek aan discipline in uitvoering afspraken/processen 8. Veel overdrachtsmomenten 9. identificatie bestemming artikel 10. (On)betrouwbaarheid masterdata alle systemen 11. Afwezigheid 1 IT-systeem voor hele supply chain 12. Gebrek inzicht karakteristieken binnenkomende stromen (prio, #) 13. Handmatige aanmaak Tracking sticker 14. Onduidelijkheid over (eind)verantwoordelijkheid per proces 15. Gebrek aan operationele eenduidigheid van de diverse expeditiepunten 16. Te veel interne en externe transport modussen

Appendices
“Forecasting the incoming flows” 153
6. Lunchbreak
7. Brainstorm for solution alternatives per key issue 11. Ontbreken van eenduidige KPI's
11.1. Meetsysteem aanpassen/creeeren voor voeden KPI's 11.2. Samen met zijn allen een de afspraak maken. Misschien input vanuit AFI. 11.3. vanuit 1 IT systeem data genereren en op hoogste level de KPI's definieren 11.4. helemaal niets meten en bijhouden 11.5. leveranciers zelf laten meten en kpi laten bepalen
11.6. Focus 1 Ontbreken van eenduidige KPI's 11.6.1. KPI-boom inrichten. High end klanteis als basis voor de verdere proces
KPI's 11.6.2. Samen opstellen van eenduidige en onderling geaccodeerde KPI's 11.6.3. De KPI's moeten meetbaar en beinvloedbaar zijn
12. Ontbreken van eenduidige definities voor logistieke termen
12.1. Iedere discipline heeft zijn eigen norm 12.1.1. norm en definitie niet verwarren. eenduidige definitie met
locatie/processafhankelijek norm invoeren 12.2. Afspraken maken tussen betrokken partijen voor iedere logistieke term 12.3. Tevens proberen allignment te krijgen met AFI 12.4. 1 Taal afspreken vwt terminologie 12.5. decentraal regelen van logistiek dus in maintenance units 12.6. logistieke prioriteitstermen tov financiele consequenties vastleggen
12.7. Focus 2 Ontbreken van eenduidige definities voor logistieke termen 12.7.1. Duidelijkheid creeeren door vertaling en definities logistieke termen naar
meetbare doorlooptijden 12.7.2. Bestaande termen bekend maken op myklm.org (domein logistiek)
13. Ontbreken duidelijke (meetbare) logistieke afspraken met toeleveranciers
13.1. Samen met Inkoop duidelijke afspraken maken voor de te leveren materialen/diensten door leveranciers
13.2. Vastleggen afspraken, meten , rapporteren en corrigeren 13.3. Bepalen welke informatie de supplier moet verstrekken --> deze informatie
vragen bij de suppliers 13.3.1. dit geldt ook de andere kant op: wij moeten de suplier de info geven die ze
nodig hebben 13.4. Duidelijkheid scheppen voor verkoop- en inkoop contracten ten aanzien
van wensen/mogelijkheden intern KLM. Dus meer betrokkenheid sales en purchasing bij procesinrichting
13.5. Focus 3. Ontbreken duidelijke (meetbare) logistieke afspraken met
toeleveranciers 13.5.1. Working procedure aan contracten hangen 13.5.2. Samenspel tussen business en inkoop/contract management verbeteren

Appendix IX Evaluation GSS Session
MSc Thesis Jan-Hoite van Hees 154
14. Zendingen die niet voldoen aan de ingangseisen
14.1. Duidelijk (meetbare) ingangs eisen 14.1.1. Duidelijk naar leverancier communiceren wat wij (KLM) van ze
verwachten 14.2. eenduidige afspraken over inganseisen voor iedere stap van de supply
chain 14.2.1. deze afspraken gezamenlijk maken en helder communiceren naar alle
partners in de keten 14.3. sanctiebeleid richting toeleveranciers 14.3.1. met stroop vang je meer vliegen 14.4. awareness bij betrokken medewerkers ten aanzien van eigen processen 14.5. gewoon binnenmelden mogelijk maken en aanpassen order in sap 14.5.1. levert meer werk op dan je bespaart
14.6. Focus 4. Zendingen die niet voldoen aan de ingangseisen 14.6.1. Zorgen voor een goed workflow systeem waarmee fouten preventief (voor
inbound) opgelost kunnen worden 14.6.1.1. Zorgen voor een eenzijdige afhandeling van de workflow door de
verantwoordelijke persoon 14.6.2. Aanspreken van toeleveranciers op fouten 14.6.3. Bijhouden welke fouten er aangetroffen worden (logistiek rapportage
systeem) 14.6.4. Naar leveranciers toe duidelijk aangeven wat wij (KLM) van hen
verwachten (qua papierwerk, certificaten, insturen nota's, etc) 15. Gebrek aan discipline in uitvoering afspraken/processen
15.1. Beloning/boete stelsel opzetten 15.2. Mensen confronteren met gevolgen 15.2.1. het "Waarom" van een werkwijze moet bij mensen duidelijk zijn. 15.3. betrokkenheid van medewerkers vergroten 15.4. Zorgen voor acceptatie van (nieuwe)Processen en procedure 15.5. klm cultuur veranderen
15.6. Focus 5 Gebrek aan discipline in uitvoering afspraken/processen 15.6.1. Mensen aanspreken op verantwoordelijkheden en gedrag (begin bij jezelf) 15.6.1.1. In alle lagen van de organisatie 15.6.2. trainen van leiderschap bij alle managementlevels 15.6.3. Eerst moeten de afspraken/ processen duidelijk en meetbaar zijn, voordat
je mensen kunt aanspreken op de discipline 15.6.3.1. Dit moet gelden voor alle afdelingen. Daarnaast moeten afdelingen
met dezelfde werkzaamheden dezelfde procedures en afspraken volgen 16. (On)betrouwbaarheid masterdata alle systemen
16.1. Beter regelen autorisaties voor opvoeren / wijzigen masterdata 16.1.1. verkleinen van het aantal bevoegde personen 16.2. Kennis van de gevolgen van een handeling vergroten 16.3. Zorgen voor een eenduidig systeem 16.3.1. Nu zijn er diverse systemen die niet met elkaar communiceren 16.4. Discipline!

Appendices
“Forecasting the incoming flows” 155
16.5. Vaststellen van de regels van Master data 16.6. Opnieuw beginnen van scratch af aan 16.7. lager delft niveau bij de KLM 16.7.1. dan hadden we hier niet gezeten
16.8. Focus 6. (On)betrouwbaarheid masterdata alle systemen 16.8.1. error-proof maken van invoeren van masterdata 16.8.2. Duidelijkheid over feedback-loop bij materdata fouten/problemen 16.8.2.1. Foutrapportage die personen die fouten maken zichtbaar maken, zodat
ze erop aangesproken (getraind) kunnen worden 16.8.3. Kennis vergroten bij medewerkers van systemen 16.8.3.1. Cursus laten aansluiten op dagelijkse praktijk 16.8.3.2. Kennis zit vaak in 1 systeem en er is geen kennis van het effect op
elkaars systemen 16.8.3.3. Cursus ook voor tijdelijk personeel om gevolgen te verkleinen 16.8.4. Juiste authorisaties voor de juist opgeleide mensen
17. Afwezigheid 1 IT systeem voor hele supply chain
17.1. Interface tussen de verschillende systemen 17.2. Implementeren transport/Cargo module in SAP 17.3. Gebruiken van SAP als leading base, anderen systemen kunnen deze
wellicht voeden 17.4. Inrichten van dedicated logistiek IT systeem voor alle partijen in de Supply
Chain 17.5. Kennis vergroten bij alle werknemers van bestaande systemen 17.6. Vertalen Crocos, trace en scarlos naar SAP 17.7. Investeren in goede IT consultants en niet aan TX overlaten 17.7.1. goed plan 17.8. IT systemen vanuit processen ontwikkelen, proces is leading 17.9. Ander systeem dan SAP proberen
17.10. Focus 7. Afwezigheid 1 IT systeem voor de hele supply chain 17.10.1. Minimaliseren benodigde systemen, daarbij interfaces optimaliseren
8. Criteria Brainstorm Free Brainstorm for criteria to evaluate possible solutions 18. 1
18.1. Support en aandacht van het hogere management 18.2. Voldoende budget voor oplossing 18.3. Laten we duidelijkheid krijgen van het hoger management wat hun willen.
19. 2
19.1. Investeren in een goed logistiek systeem (UPS/Albert heijn) 19.2. goed punt: leren van bedrijven die erg goed zijn in logistiek 19.3. UPS werkt niet op p/n niveu iets wat wij wel doen 19.4. Iets moet van A naar B met of zonder P/N
20. 3

Appendix IX Evaluation GSS Session
MSc Thesis Jan-Hoite van Hees 156
20.1. verbeteren van efficienty 21. 4
21.1. Medewerkers moeten het gevoel hebben mee te mogen denken met het beleid op de afdeling. Dit zorgt voor meer betrokkenheid bij wat er van hen verlangd wordt.
21.2. Er moeten ook managers zijn met een visie 22. 5
22.1. Gebruik van 1 IT systeem voor logistiek en maak 1 discipline binnen KLM (bv Cargo) verantwoordelijk voor de vulling van de data in dat systeem
22.2. eens als het gaat om materiaalstromen, niet ens als het gaat om vendormanagement/inventory control.
22.3. SPL/TX opheffen en IT door externe partij laten doen 22.4. in antwoord op punt 2 : geldt voor logistiek systeem, thanks :)
23. 6
23.1. focus moet altijd klantgericht blijven 23.2. Mee eens, maar er moet ook gekeken worden naar de capaciteit en
capabilities binnen een afdeling. Bij afsluiten van contracten met klanten moeten alle partijen betrokken worden.
24. 7
24.1. Klanttevredenheid is leidend! 24.2. indien het winstgevende business kan worden 24.3. Dan stoppen met vliegtuigonderhoud 24.4. En engine services 24.5. Nee punt 4 Engine Services maakt nog steeds winst!!!!! 24.6. Line maintenance ook!
25. 8
25.1. mensen niet ongestraft laten voor de fouten die ze hebben begaan. 25.2. dan ook belonen bij goed presteren 25.3. extra toezicht naar het managment toe voor de daadwerkelijke akties. 25.4. het beste uit iemand halen qua prestatie en kennis delen 25.5. ben het er mee eens dat het belonings/"straffings" systeem aangescherpt
mag worden binnen KLM (m.n. E&M) 26. 9
26.1. goedkeuring krijgen van hoger managment om de problemen nu eindelijk optelossen want nu blijven we dingen verzinen die niet opgelost worden
27. 10
27.1. Materiaal behoefte (met prio) moet vastgelegd worden in een systeem bij voorkeur SAP. Dit zou kunnen door SAP anders in ter richten. Een criteria is wel dat aanwezige voorraad beschikbaar moet zijn voor het eerst/ belangrijkste project (check). Dus voorraad moet niet gealloceerd worden voor een project over 2 jaar
27.2. Master Data opschoning / controle. Een criteria is wel dat Master Data altijd snel opgevoerd moet kunnen worden, want het proces/productie mag

Appendices
“Forecasting the incoming flows” 157
geen vertraging oplopen. Dit is mogelijk door autorisatie niet te beperken, maar vervuing te analyseren en de vervuilers aan te speken op hun gedrag
28. 11
28.1. we moeten de keten structureel onder controle krijgen 28.2. punt: spreiding in performance verminderen 28.3. we draaien nu op ervaring van mensen, niet op goed ingerichte processen
29. 12
29.1. investeer in IT 29.2. nee, regel je IT zo dat de processen van het bedrijf goed werken. IT is een
hulpmiddel, geen doel 29.3. Klopt eerst beleid, dan processen en als laatste IT die alles ondersteund
30. 13
30.1. Centrale regie desk voor aan/bijsturen logestieken stroom 30.2. bij engine services werkt centrale regie niet
31. 14
31.1. Support from management 31.2. and workvloer 31.3. 1 taal per vakje aub
32. 15 33. 16 34. 17 35. 18 36. 19 37. 20
9. Coffee Break
10. Evaluation of alternatives
1. Evaluation of alternatives Totals

Appendix IX Evaluation GSS Session
MSc Thesis Jan-Hoite van Hees 158
Evaluation of alternatives Totals Criteria:
Feasibility solutions
Voting Method: SlidingScale Weight: 1.00
# Ballot Items Weighted Total Total Avg.
Score
1. KPI-boom inrichten. High end klanteis als basis voor de verdere proces KPI's 7.08 7.08 7.08 7.08
2. Samen opstellen van eenduidige en onderling geaccodeerde KPI's 8.17 8.17 8.17 8.17
3. De KPI's moeten meetbaar en beinvloedbaar zijn 7.08 7.08 7.08 7.08
4. Duidelijkheid creeeren door vertaling en definities logistieke termen naar meetbare doorlooptijden
5.75 5.75 5.75 5.75
5. Bestaande termen bekend maken op myklm.org (domein logistiek) 4.33 4.33 4.33 4.33
6. Working procedure aan contracten hangen 7.83 7.83 7.83 7.83
7. Samenspel tussen business en inkoop/contract management verbeteren 8.33 8.33 8.33 8.33
8. Zorgen voor een goed workflow 6.67 6.67 6.67 6.67

Appendices
“Forecasting the incoming flows” 159
systeem waarmee fouten preventief (voor inbound) opgelost kunnen worden
9. Aanspreken van toeleveranciers op fouten 7.92 7.92 7.92 7.92
10. Bijhouden welke fouten er aangetroffen worden (logistiek rapportage systeem) 6.92 6.92 6.92 6.92
11.
Naar leveranciers toe duidelijk aangeven wat wij (KLM) van hen verwachten (qua papierwerk, certificaten, insturen nota's, etc)
6.83 6.83 6.83 6.83
12. Mensen aanspreken op verantwoordelijkheden en gedrag (begin bij jezelf)
7.50 7.50 7.50 7.50
13. trainen van leiderschap bij alle managementlevels 6.42 6.42 6.42 6.42
14.
Eerst moeten de afspraken/ processen duidelijk en meetbaar zijn, voordat je mensen kunt aanspreken op de discipline
5.92 5.92 5.92 5.92
15. error-proof maken van invoeren van masterdata 6.83 6.83 6.83 6.83
16. Duidelijkheid over feedback-loop bij materdata fouten/problemen 6.75 6.75 6.75 6.75
17. Kennis vergroten bij medewerkers van systemen 7.25 7.25 7.25 7.25
18. Juiste authorisaties voor de juist opgeleide mensen 7.17 7.17 7.17 7.17
19. Minimaliseren benodigde systemen, daarbij interfaces optimaliseren 7.92 7.92 7.92 7.92
Voting Details Criteria Statistic: Mean. Votes Cast: 14, Abstained: 0
2. Evaluation of alternatives Criteria: Feasibility solutions Vote Method: SlidingScale

Appendix IX Evaluation GSS Session
MSc Thesis Jan-Hoite van Hees 160
Evaluation of alternatives Criteria: Feasibility solutions
Vote Distribution
# Ballot Items 1 23 4 5 6 7 8 9 10 Avg. Score Total STD Votes
1. KPI-boom inrichten. High end klanteis als basis voor de verdere proces KPI's
1 - - - 2 2 1 1 3 2 7.08 85.00 2.64 12
2. Samen opstellen van eenduidige en onderling geaccodeerde KPI's - - - - - 1 4 2 2 3 8.17 98.00 1.40 12
3. De KPI's moeten meetbaar en beinvloedbaar zijn 1 1 - - 2 - 1 2 1 4 7.08 85.00 3.18 12
4. Duidelijkheid creeeren door vertaling en definities logistieke termen naar meetbare doorlooptijden
1 11 1 2 1 - 3 1 1 5.75 69.00 2.90 12
5. Bestaande termen bekend maken op myklm.org (domein logistiek) 4 - - 1 1 4 1 1 - - 4.33 52.00 2.64 12
6. Working procedure aan contracten hangen - - 1 - 1 2 1 1 1 5 7.83 94.00 2.41 12
7. Samenspel tussen business en inkoop/contract management verbeteren
- - - - 1 1 - 4 3 3 8.33 100.00 1.56 12
8.
Zorgen voor een goed workflow systeem waarmee fouten preventief (voor inbound) opgelost kunnen worden
- - - - 3 5 1 1 - 2 6.67 80.00 1.78 12
9. Aanspreken van toeleveranciers op fouten - - - 1 - 2 2 1 3 3 7.92 95.00 1.93 12
10. Bijhouden welke fouten er aangetroffen worden (logistiek rapportage systeem)
- - - 1 3 1 1 4 1 1 6.92 83.00 1.88 12
11.
Naar leveranciers toe duidelijk aangeven wat wij (KLM) van hen verwachten (qua papierwerk, certificaten, insturen nota's, etc)
- - 1 2 - 1 3 3 - 2 6.83 82.00 2.25 12
12. Mensen aanspreken op verantwoordelijkheden en gedrag (begin bij jezelf)
- - - 1 2 2 2 - - 5 7.50 90.00 2.35 12
13. trainen van leiderschap bij alle managementlevels - 11 - 2 2 3 - 1 2 6.42 77.00 2.50 12
14.
Eerst moeten de afspraken/ processen duidelijk en meetbaar zijn, voordat je mensen kunt aanspreken op de discipline
1 21 1 1 - - 2 2 2 5.92 71.00 3.42 12
15. error-proof maken van invoeren van - - - 3 2 - 2 1 2 2 6.83 82.00 2.37 12

Appendices
“Forecasting the incoming flows” 161
masterdata
16. Duidelijkheid over feedback-loop bij materdata fouten/problemen - - 1 1 1 3 2 1 1 2 6.75 81.00 2.22 12
17. Kennis vergroten bij medewerkers van systemen - - - - 1 4 3 1 1 2 7.25 87.00 1.66 12
18. Juiste authorisaties voor de juist opgeleide mensen 2 - - - 1 1 1 2 - 5 7.17 86.00 3.35 12
19. Minimaliseren benodigde systemen, daarbij interfaces optimaliseren 1 - - - - 3 - 1 2 5 7.92 95.00 2.75 12
Voting Details Criteria Statistic: Mean. Votes Cast: 14, Abstained: 0
3. Evaluation of alternatives Ballot Items with Comments 1. KPI-boom inrichten. High end klanteis als basis voor de verdere proces KPI's 2. Samen opstellen van eenduidige en onderling geaccodeerde KPI's 3. De KPI's moeten meetbaar en beinvloedbaar zijn 4. Duidelijkheid creeeren door vertaling en definities logistieke termen naar meetbare doorlooptijden 5. Bestaande termen bekend maken op myklm.org (domein logistiek) 6. Working procedure aan contracten hangen 7. Samenspel tussen business en inkoop/contract management verbeteren 8. Zorgen voor een goed workflow systeem waarmee fouten preventief (voor inbound) opgelost kunnen worden 9. Aanspreken van toeleveranciers op fouten 10. Bijhouden welke fouten er aangetroffen worden (logistiek rapportage systeem) 11. Naar leveranciers toe duidelijk aangeven wat wij (KLM) van hen verwachten (qua papierwerk, certificaten, insturen nota's, etc) 12. Mensen aanspreken op verantwoordelijkheden en gedrag (begin bij jezelf) 13. trainen van leiderschap bij alle managementlevels 14. Eerst moeten de afspraken/ processen duidelijk en meetbaar zijn, voordat je mensen kunt aanspreken op de discipline 15. error-proof maken van invoeren van masterdata 16. Duidelijkheid over feedback-loop bij materdata fouten/problemen 17. Kennis vergroten bij medewerkers van systemen 18. Juiste authorisaties voor de juist opgeleide mensen 19. Minimaliseren benodigde systemen, daarbij interfaces optimaliseren
11. Elaboration on ranked key solutions Oral discussion between the participants about the evaluation of the key solutions
1. Elaboration on ranked key solutions Task Grid # Tasks
2. Elaboration on ranked key solutions Tasks with Comments
12. Wrap up Wrap up by Jan-Hoite and Ivan
1. Wrap up Task Grid # Tasks

Appendix IX Evaluation GSS Session
MSc Thesis Jan-Hoite van Hees 162
2. Wrap up Tasks with Comments
13. Drinks/Snacks

Appendices
“Forecasting the incoming flows” 163

Appendix IX Evaluation GSS Session
MSc Thesis Jan-Hoite van Hees 164
Appendix X “Forecast methods compared in a logistics case study
Forecast methods compared in a logistics case study. J H van Hees* Student in Systems Engineering, Policy Analysis and Management at the faculty of Technology, Policy and Management, TU Delft. Abstract: Forecast methods simple moving average and exponential smoothing
are extensively described in literature. These methods were tested in a case study within KLM Engineering and Maintenance to predict the inbound logistics flow for the logistics center on a daily basis. The methods are compared with each other using the MAPE (Mean Absolute Percent Error), the MAD (Mean Absolute deviation) and the MSE (Mean Square Error) as measures of accuracy. The exponential smoothing methodology proves to be the best forecasting tool in this case study, although the differences between the methods are fairly little.
Keywords: Forecasting methods, Forecast accuracy measures, forecasting logistic flows, logistics case study, KLM Engineering and Maintenance.

Appendices
*The author can be reached at [email protected] or by phone: +31 6 2827 0192
1 INTRODUCTION In April 2008 the new Logistics Center of KLM Engineering & Maintenance (KLM E&M) has become operational. The Logistics Center is designed to be the only entrance and exit point for goods at KLM E&M. This centralization enables a logistical chain with one point for import and export custom formalities, administrative incoming goods handling, administrative external repair formalities and a warehouse for aircraft components (Bron, 2007) The realization was a big stepping stone for the E&M organization to professionalize its logistics (Schilder, 2007). KLM E&M targets to improve the level of service yet further with implementing and anchoring optimized logistics operations in the business processes (Rijnbeek, 2008). To achieve an optimal logistics and cost effective operational execution, the manager of the logistics center aims to synchronize the resources better with the workload which is formed by the incoming flows of the goods. To realize such a synchronization, a forecast of this incoming flows is needed (Rijnbeek, 2008). To development the most accurate forecast tool, several forecast methods are investigated, tested and compared. The methods are compared using the measures of accuracy MAPE (Mean Absolute Percent Error), MAD (Mean Absolute Deviation) and MSE (Mean Square Error). Chapter 2 of this paper will describe the different forecasting methods which are presented in scientific sources. Chapter 3 will elaborate of the specific logistics situation of KLM E&M. Chapter 4 will introduce the measures of accuracy also obtained from scientific sources. Chapter 5 will present the comparison of the forecast methods for the KLM E&M situation and using the earlier presented measures of accuracy. This paper will be concluded with the final remarks in chapter 6.
2 FORECASTING METHODS The selection of the forecast methods to be included in this research is based on earlier performed research on forecasting the level of a time series. The characteristics of the incoming logistics flows at the logistics center seem to be without seasonality of growth, this time-series form is called “steady state model” (SSM) and observations are represented as being “random perturbations around an unkown mean, which, through time, undergoes a random walk”. (Boyland et al, 1999). Exponentially weighted moving averages (EWMA) is a frequently used methodology to estimate the current level of a time series (Muth, 1960, Harrison, 1967, Boyland et al, 1999, Reid and Sanders, 2007, Fildes et al, 2009). In addition the use of the simple moving average (SMA) methodology has become more obvious. Simple moving average was recognized as the most familiar and most used quantitative forecasting technique in US corporations (Sanders and Mandrodt, 1994, Cattani and Hausman, 2000, Reid and Sanders, 2007). The simple moving average uses the current mean value as an estimation for future levels.
(1)
S(t) is the forecast for a time series value developed at moment t in time. The previous values of the series x are combined and divided by the number of values k of x. When calculating successive values, a new value x(t) comes into the sum and an old value x(t-k) drops out, meaning a full summation each time is unnecessary. The exponentially weighted moving average is formed by the formulas:
(2)
where α is the smoothing factor, and 0 < α < 1. In other words, the smoothed statistic st is a simple weighted average of the latest observation xt and the previous smoothed statistic st−1.

Appendix X “Forecast methods compared in a logistics case study
MSc Thesis Jan-Hoite van Hees 166
3 CASE DESCRIPTION: LOGISTICS CENTER OF KLM ENGINEERING AND MAINTENANCE KLM E&M is, besides KLM Passengers and KLM Cargo, one of three core businesses of KLM NV (www1, 22/10/2008) and its primary operation is the maintenance of aircrafts. The organization has approximately 5.000 employees and is mainly located at the Schiphol-Oost area of Amsterdam Airport Schiphol. KLM E&M is the largest technical organization in the Netherlands and together with Air France Industries (AFI) the company ranks among the world largest providers of maintenance, repair and overhaul services for aircraft. To reduce logistics costs and improve the logistics service level, a logistics center was designed and implemented (Schilder, 2007). All incoming and outgoing KLM E&M goods flows are routed through the logistics center. All good flows are part of the KLM E&M supply chain. This KLM E&M supply chain is determined by the ‘rotable cycle’, in which components (aircraft parts which can be repaired (Gobbar, 2006)) rotate between customer, vendor and warehouse (Figure 105).
Figure 105 KLM E&M supply chain Expendable parts (aircraft parts for which the cost of repair are higher than the costs of a new item) follow only a part of the component supply chain because these parts practice a more conventional one-way path from vendor to warehouse to customer (or directly from vendor to customer). The supply chain determines the incoming flows in the logistics center. Because the LC is the logistical hub within KLM E&M, most flows pass the LC. So the LC can be pictured in the supply chain between all supply chain stakeholders (Figure 106):
Figure 106 KLM E&M supply chain including Logistics Center As pictured in Error! Reference source not found. the logistics Center is present in all flows between stakeholders in the KLM E&M supply chain. Important to note is that exceptions on this visualization occur in all flows. An example of such a flow is the flow from an internal customer to a shop: this flow will be direct from the hangar to the shop without routing via the LC. Also, the warehouse for components is situated within the LC so components will stay within the LC as long as they’re stored. On the highest level the physical flow into the LC can be differentiated into two incoming flows (Figure 107):
• The incoming flow from KLM E&M internally
Logistics Centre
Extern
Intern
1
2
Figure 107 Incoming flows LC

Appendices
167
• The incoming flow from external parties The incoming flows from E&M internally are originated by internal E&M customers. These internal customers are located within the Schiphol area. The incoming flows from external parties is formed by a flow from customers and vendors, mostly located outside the Schiphol area. The manager of the logistics center has requested a research to improve the insight in these incoming flows. The Forecast and distribution of resources over time was experienced as troubled by a lack of this insight. The goal of the request was to improve the insight in the incoming flow such that a better estimation could be made about whether or not off days- and holiday requests should be granted or not. Furthermore the improved insight would make future abnormalities in the flow visible and thus counteractive resource management possible. The research was executed in two sequential parts:
1. Provide historic insight in the incoming flows of the logistics center of KLM E&M 2. Provide insight in the incoming flows of the logistics center of KLM E&M in the near future
The first part of the research was completed with help of the track-and-trace system which is in use within KLM E&M: Tracking. This system is able to track all internal goods with help of logistics labels (barcode stickers) and handheld scanners for all logistics employees. Tracking data provided the incoming flow data (ordered per originating party) pictured in Figure 108. This figure displays also the internal LC outbound flows, because of the desire to provide a complete overview of the work executed by the logistics employees of the logistics center, and is therefore called a ‘workload overview’ of the expedition of the logistics center. With this part of the research completed, the forecast methods could be tested. First, however, the measures of accuracy were selected . These measures of accuracy will be elaborated upon in the next chapter, after which chapter 5 will elaborated on the forecast methods tested and used for this specific case.
Figure 108 Workload expedition logistics center per week
4 FORECASTING MEASURES OF ACCURACY In order to compare the selected forecasting methods for the specific case, several measures of accuracy have been developed. Cattani and Hausman state in this respect “typical metrics for aggregate forecast performance include mean average deviation (MAD), mean square error (MSE), and mean absolute percentage error (MAPE) (Cattani and Hausman, 2000). The latter being generally used within company settings (Fildes and Goodwin, 2007) although the measurement of forecasting accuracy has been regarded a controversial topic (Armstrong and Fildes, 1995; Celments and Hendry, 1995) because of the “well-known disadvantages” (Fildes et al, 2009). In particular, these measures were qualified as being sensitive to extremes (Armstrong and Collopy, 1992).

Appendix X “Forecast methods compared in a logistics case study
MSc Thesis Jan-Hoite van Hees 168
In order to minimize the influence of these disadvantages the comparison of the forecast methods will make use of all three measures of accuracy in a multi-criteria analysis. These kind of analyses can give a clear overview by placing the alternatives and the multiple criteria in one table; making the comparisons and decisions very transparent. The score card method is such a MCA; it compares alternatives using both qualitative and quantitative criteria, without giving an opinion on the alternatives as such. This method was already used by Rijkswaterstaat in 1975 and is described in The handbook of Systems Analysis, by Miser and Quade (Bots, 2003). Furthermore, because of the sensibility for extreme values, the forecast results for the last week of 2008 and the first week 2009 have not been used for the comparison. Because of a steep decline in the quantity of the logistics flows, all forecast methods resulted in mean absolute percentage errors of around 25% (week 52) and 55% (week 1). This is while the mean absolute percentage error of the other weeks (47-51 and 2-9) lie around the 5%. All measures of accuracy for forecast models are based on the difference between the predicted value and the actual value.
(3)
E(t) = the difference between the actual value Y(t) (also indicated as A(t)) and the forecasted value F(t) over time period (t). The three measures of accuracy are used for the comparison between the forecast methods: • MAPE (Mean Absolute Percentage Error) (4). • MAD (Mean Absolute Deviation), also indicated as Mean Absolute Error (MAE) (5). • MSE (Mean Square Error) (6).
(4)
Mean Absolute Percentage Error (MAPE): The average of n deviation percentages of the Error E(t) (= A(t) – F(t)) divided by the actual value A(t). The MAPE value indicates the mean absolute percentage error of the forecast over time.
(5)
Mean absolute deviation/error (MAD/MAE): The sum of N forecast errors E(t) over time period (t) divided by the number N of errors summated.
(6)
Mean Square Error (MSE): The sum of N squared forecast errors E(t) over time period (t) divided by the number N of errors summated.
5 COMPARISON OF THE FORECASTING METHODS BASED ON THE CASE STUDY Two forecasting methods will be compared for this case study: the simple moving average (SMA) and the exponentially weighted moving average (EWMA). Both methods contain a parameter which can be fitted to the specific data to improve the forecast accuracy. Therefore, the comparison will be made featuring 8 forecasting models: 2 SMA models and 6 EWMA models. The parameter which can be chosen within the SMA method is the time horizon k. The first model, forecast model 1, has a k-value of 4 weeks. So it will use the data of the 4 most recent weeks to calculate a prediction for the next week. (e.g. the forecast of week 11 is based on the mean values of week 6, 7, 8 and 9, the forecast of week 12 is based on the mean values of week 7,8,9 and 10 etc)
• Forecast model 1: SMA with k = 4.

Appendices
169
The second SMA model has a variable k-value because of a lack of historic data. For comparison reasons there has been chosen for a large k-value (about one year k=52) but the data is only available from week 39 on. Therefore the k-value increases with 1 every week for the second SMA model: Forecast 2. The forecast for the first week (week 47) has a k-value of 7 (based on all weeks between week 39 and 45), the forecast of the last week (week 9) has a k-value of 19 weeks (based on all weeks between week 39 and week 7 excluding week 52 and week 1).
• Forecast model 2: SMA with k = 7-19 The variable parameter of the EWMA method is the smoothing factor α. The α-value indicates the relative weights which is allocated to the actual value as a basis for the prediction for the next period. The α value has a minimum of 0 and a maximum of 1. To explore the whole range of the EWMA method, 6 forecast models were developed with the α value varying from 0.9 to 0.1. (e.g. with an α-value of 0.3 the prediction for week 11 is based on 0.3*the actual value of week 9 summated with 0.7*the predicted value of week 9, the prediction for week 12 is based on 0.3*the actual value of week 10 summated with 0.7*the predicted value of week 10 etc.)
• Forecast model 3: EWMA with α = 0.9 • Forecast model 4: EWMA with α = 0.7
• Forecast model 5: EWMA with α = 0.5
• Forecast model 6: EWMA with α = 0.3
• Forecast model 7: EWMA with α = 0.2
• Forecast model 8: EWMA with α = 0.1
To enable validation of the forecast comparison, the data has been divided in two groups. The first group (week 47 – week 3) will be used for the comparison. The second group of forecast data (week 4 – 9) will be used for validation of the outcomes of the first group. Only the scores of the methods on the selected criteria are presented in this section. The complete data sheets are available via the author. The results of the first group (presented in Table 13) indicate the most accurate forecast model is forecast model 8, followed by forecast model 7 (both exponentially weighted moving averages) and forecast model 2 (simple moving average). The other EWMA models score average (forecast models 5 and 6) and worse than average (forecast 3 and 4) while forecast model 1 scores worst. The MAPE scores are graphically pictured in Figure 109 to picture the difference between the forecast models. week 47 - 3 Forecast 1 Forecast 2 Forecast 3 Forecast 4 Forecast 5 Forecast 6 Forecast 7 Forecast 8 Alpha-value n.a. n.a. 0.9 0.7 0.5 0.3 0.2 0.1
Mov Ave Ave Smooth1 Smooth2 Smooth3 Smooth 4 Smooth 5 Smooth 6
MAPE 8.61% 6.82% 8.50% 8.00% 7.47% 6.94% 6.74% 6.63%
MAD 299.04 230.77 294.93 275.33 255.73 236.13 228.78 224.69
MSE 116,883.31 67,768.39 114,166.62 101,073.75 87,941.25 75,794.78 70,677.80 66,523.94
worst worse Average better best Table 13 Forecast method comparison score card week 47-3

Appendix X “Forecast methods compared in a logistics case study
MSc Thesis Jan-Hoite van Hees 170
Mean Percent Error week 47 - 3 (excl week 52 & 1)
-20.00%
-15.00%
-10.00%
-5.00%
0.00%
5.00%
10.00%
15.00%
20.00%
47 48 49 50 51 2 3
Week
Mea
n P
erce
nt E
rror
Forecast 1Forecast 2Forecast 3Forecast 4Forecast 5Forecast 6Forecast 7Forecast 8
Figure 109 Mean percent error forecast models week 47 - 3 (week 52 & 1 excluded)
Based on the results of the comparison of the forecast models, the choice would be made for the best scoring model on all three criteria: forecast model 8. This model is a exponentially weighted moving average model with an α value of 0.1. The performance of the second- and third best scoring methods although is not far behind. Forecast method 7 (also an EWMA model) scores second best on the MAPE and MAD values. Based on these results the EWMA clearly has an advantage over the SMA models. To validate this conclusion, the second data group has been tested with a similar methodology (Table 14 and Figure 110 display the result). Forecast model 8 is no longer the best model (this time only average). Nonetheless the EWMA models still score better than the SMA models. The best scoring model this time is forecast model 6 (α value of 0.3) with forecast model 5 and 6 scoring second best. Forecast 8 and 1 (the best SMA model in this group) score average while forecast model 4 and 2 score worse than average and forecast model 3 scores worst this time. Although the scorecard highlights the differences in performances of the forecast models, the scores lay close to each other. Considering the worst model shows an mean deviation of 4.2%, which is a mean reliability of 100 – 4.2 = 95.8%, all models score above average values of 95% reliability.
week 4 - 9 Forecast 1 Forecast 2 Forecast 3 Forecast 4 Forecast 5 Forecast 6 Forecast 7 Forecast 8 Alpha-value n.a. n.a. 0.9 0.7 0.5 0.3 0.2 0.1
Mov Ave Ave Smooth1 Smooth2 Smooth3 Smooth 4 Smooth 5 Smooth 6
MAPE 3.73% 4.07% 4.23% 3.86% 3.33% 2.97% 3.07% 3.39%
MAD 136.39 148.64 151.67 139.04 121.08 108.73 112.34 123.89
MSE 26,650.82 27,132.27 27,484.05 23,519.65 20,906.03 19,465.99 19,685.73 21,232.70
worst worse average better best Table 14 Forecast method comparison score card week 4-9

Appendices
171
Mean Percent Error Week 4 - 9
-15.00%
-10.00%
-5.00%
0.00%
5.00%
10.00%
15.00%
20.00%
25.00%
4 5 6 7 8 9
Week
Mea
n P
erce
nt E
rror
`
Forecast 1Forecast 2Forecast 3Forecast 4Forecast 5Forecast 6Forecast 7Forecast 8
Figure 110 Mean percent error forecast models week 4 - 9 Though the EWMA is scoring better than the SMA models, the accuracy differences are rather small. (Similar results were reported by Sanders and Manrodt (1994) and Sani and Kingsman (1997).) Nonetheless the choice for the definitive value of α remains open. The first data group showed the best results for forecast model 8 (α value of 0.1), while this results was not validated by the second data group. In this group, forecast model 6 (α value of 0.3) scored best on the performance criteria while scoring only average in the comparison with data group 1. Forecast model 7 scores the best average performances over the two groups and therefore the α value of 0.2 is selected for the final model.
CONCLUSION Several configurations of Simple Moving Average (SMA) and Exponentially Weighted Moving Averages (EWMA) forecast models were applied to a logistics KLM E&M case study and ranked based on their scores on three statistical criteria, generally accepted measures of accuracy for forecasting models. These measures of accuracy are the mean absolute percentage error (MAPE), the mean absolute deviation (MAD) and the mean square error (MSE). Based on the overall results of the 8 (2 SMA and 6 EWMA) compared models, the forecast results were above average with mean absolute percentage errors between the 5 and 9 %. The data was split in two groups to be able to validate the results of the first measurement with the other group. This validation group acknowledged the slightly better performance level of the EWMA method. As α value, 0.2 scored the best over the two groups aggregated, which leads to the advice to pick this α value as the final α value. To be sure of an optimal performance of the model, the α value could be tested and compared once in a while to check the optimum again. This is, however, not completely necessary because of the small performance differences between the model with α values of 0.1 – 0.3. To improve the forecast further, additional research could be done to enhance the forecast with real time parameters to influence the forecast (Haughton, 2009), the judgmental adjustments by involved stakeholders (Fildes et al, 2009) or the implementation of a forecast update step (Cattani and Hausman, 2000).

Appendix X “Forecast methods compared in a logistics case study
MSc Thesis Jan-Hoite van Hees 172
REFERENCES Armstrong, J. S. (2001). Principles of Forecasting: A Handbook for Researchers and Practitioners. (Evaluating
and Selecting Forecasting Methods). Norwelll, Mass.: Kluwer Academic Publishers. Armstrong, J. S. and Collopy, F. (1992). Error measures for generalizing about forecasting methods –
empirical comparisons. International Journal of Forecasting 8: 69-80. Armstrong, J. S. and Fildes, R. (1995). On the selection of error measures for comparisons among forecasting
methods. Journal of Forecasting 14: 67-71. Bots, P. W. G. (2003). Inleiding technische bestuurskunde: een praktische handleiding voor systematisch
probleem oplossen. Dictaat SPM 1110, TU Delft: Faculty Technology, Policy and Management, Delft. Boyland, J.E., Johnston, F.R., Meadows, M. and Shale, E. (1999). Some properties of a simple moving
average when applied to forecasting a time series. Journal of the Operational Research Society 50: 1268-1271.
Bron, E.J. (2007), Welkom in het nieuwe Logistiek Centrum. Internal presentation for KLM employees. KLM
Component Services, Logistics. December 2007. Cattani, K. and Hausman, W. (2000). Why are forecast updates often disappointing? Manufacturing & Service
Operations Management 2(2): 119-127. Clements, M. P. and Hendry, D. F. (1995). On the selection of error measures for comparisons among
forecasting methods – reply. Journal of Forecasting 14: 73-75 Fildes, R. and Goodwin, P. (2007). Against your better judgement? How organizations can improve their use of
management judgement in forecasting. Interfaces 37: 570-576 Fildes, R, Goodwin, P., Lawrence, M. and Nikolopoulos, K. (2009). Effective forecasting and judgmental
adjustments: an empirical evaluation and strategies for improvements in supply-chain Forecast. Internaltional Journal of Forecasting 25: 3-23.
Ghobbar, A.A. (2006). Maintenance, Engineering and Management. TU Delft: Faculty of Aerospace
Engineering, Delft. Harrison, P.J. (1967). Exponential smoothing and short-term sales forecasting. Management of Science 13:
821-842 Haughton, M.A. (2009). Distortional Bullwhip Effects on carriers. Transportation Research Part E 45: 172-185. Muth, J.F. (1960). Optimal properties of exponentially weighted forecasts. Journal of the American Statistical
Association 55: 299-306. Reid, R.D. and Sanders, N.R (2007). Operations Management. Hoboken, New Jersey: John Wiley & sons. Rijnbeek, E. (2008), Interviews with mr E Rijnbeek, Operational Manager Logistics KLM E&M. 8 en 26
September 2008. Sanders, N.R. and Manrodt K.B. (1994). Forecasting practices in US corporations: survey results. Interfaces
24(2): 92-100. Sani, B. and Kingsman, B.G. (1997). Selecting the best periodic inventory control and demand forecasting
methods for low demand items. Journal of the Operational Research Society 48: 700-713. Schilder J. (2007). Redesign Logistic System Schiphol Oost, TU Delft: Faculty of Technology, Policy and
Management, Faculty of Mechanical, Maritime and Materials Engineering and Faculty for Civil Engineering & Geosciences, Delft.

Appendices
173
[www1]. KLM Engineering & Maintenance Profile. Date of visit: September 24th 2008.
http://www.klm.com/engineeringmaintenance/site/en/about/klm_em/index.html

Appendix XI. IT support systems in active use by KLM E&M.
MSc Thesis Jan-Hoite van Hees 174
Appendix XI. IT support systems in active use by KLM E&M.
ID Name Fullname
4160
3649 01 PC Software (EWS 2.1) PC Software list (EWS 2.1)
3627 02 End User Computing End User Computing list
3337 ACAS Aircraft Analytical System
3447 ADREM Airworthiness Directive Report Monitoring.
4071 Aeroxchange Aeroxchange, AeroBuy, AeroRepair, AeroAOG, AeroComponent
3906 Airbus Online Airbus Online
4159 Airman Airman
3607 ALARM Airline Loan And Request Management
3435 AMICAL Aircraft Maintenance Integrated Computer Aided Logistics
3553 AMS Authorisation Mainframe System
3873 APT E&M Application Portfolio Tool E&M
3359 ARAMIS Accounts Receivable And Management Information System
4104 ARIS ARIS IDS scheer
3567 ARROWS AiRcraft ROuting and Work Scheduling
3815 ARTEMIS ARTEMIS Project Management (Project View)
3982 ASAP Accelerated SAP / Value SAP
4140 Autocad Autocad
3355 BEALG Kosten Engineering menu-programma's.
3356 BECOS Kosten Engineering - Computerized Orderregistration System
3357 BECOWINS Kosten Engineering - Contract and Workorder Information System
3358 BESUB Kosten Engineering - Subroutines
1712 BETHA BE algemeen
3805 Bill of Work THBOW - BOW - Bill of Work
3568 BOB Beheer Onderdelen Buitenlandse Maatschappijen.
3754 CARMA Computerized Audit Reporting & Management Archive
4173 CASTING Chargement Analyse et Simulation des Tarifs avant INTeGration in Legacy System
3425 CCALG Narrowbody and Aircraft Engineering Algemene programma’s
3470 CDDOC Information System for Vendor documentation
3426 CDMRI Maintenance Requirement Item.
3475 CEONEW Engineering Order Registration System (For New Orders Replaced By THMOC)

Appendices
175
3436 CEPERS Central engineering personeelsgegevens
3438 CETEK Central engineering tekening registratie
3427 CETIM Central Engineering Time
3491 CFM56-3/7B - Engine Manuals Manual Engine type CFM56-3 or 7B
3428 CGALG - APUTREND Trend APU 737 Engine Engineering Algemeen
3492 CGALG - CGCTP Change Techn. Publ. Change of Technical Publications
3551 COGNOS COGNOS inpromptu / powerplay
3608 COMPASS Computerized Material Procurement And Supply System.
3609 CROCOS Computerized Rotable Control System
55 Daisy Decentral Accounting Information System
3338 DOCS OPEN Document system
3877 Documentum (WDK en Desktop) Documentum 4i Enterprise Content Management Suite
4163 E&M VPN Inbellen E&M VPN Inbellen
4164 e-ATL e-ATL
3453 EASY Engineering Authorisation System;
3478 EB (CEALG) Engineering Bulletins Registration System For Engineering Bulletins
3875 Engineering Templates (word) Engineering Templates
3570 FLASH Fleet Assignment Handling
3455 FOTOBOEK FOTOBOEK of Engine Picture Manual Editing and Development System
3469 GEAE New Horizons Manuals GEAE New Horizons Manuals
3456 GRAF Graphical Replay and Analysis Facility
3678 Guardess 4.2 Laboratory Information Management system Client GUI
3879 Help & Manual Help & Manual
3457 HGS Handboek Gevaarlijke Stoffen
3526 HUMARES Human Resources
3540 IM-INFO Information Management Informationsystem
4020 Information management word templates TC template
3610 JETFORMS Join Aviation Authorities Form
3688 Klmtemplates 2.0 MS Office document templates
3441 KORREKT Korrektie formulieren registratie (onderdeel van THALG)
3691 Lightspeed 2.5 WANG terminal emulator
3642 Manuals voor Derden - Costumer manuals Verschillende digitale manuals van verschillende klanten
3527 MARS Medewerkers Autorisatie Registratie Systeem
3460 MATADOR Maintenance And Technical Documentation Registration -system
3524 Mbox Enigma V8

Appendix XI. IT support systems in active use by KLM E&M.
MSc Thesis Jan-Hoite van Hees 176
4122 Mercator Mercator v.4.8
3771 MetaDB Document management using remote database on internet server.
3340 MILIEUREGISTER
Milieuregister, inventarisatie van milieubelastende processen binnen de TD om zodoende milieuvergunn
4158 Minitab Minitab
3461 MIRA Environmental Information Registration Administration
3806 MO-KIT Modificatie Order KIT-administration
3432 MOCO Multi Order Controlling Operative
4098 ModinUse (CEALG) Modify Report in Use
3860 MOOMI / MOOII Maintenance Overview Open Moco Items / Maintenance Overview Open Insp. Items
3995 MPM MPM
3698 MPS Handboek HelpLinker 5.02/1.1 MPS Handboek HelpLinker 5.02/1.1
3528 MPStd Maintenance and Forecast of Shifts
3699 MPSTM 4.02 Maintenance and Forecast of Shifts Engine Service
3571 MSF Maintenance Support Facilities
4162 MXI Maintenix v6.2.6 Maintenix
4138 My Boeing Fleet My Boeing Fleet
3583 OMT GS Onboard Maintenance Terminal Ground Station
3499 OMT MR1.0 Onboard Maintenance Terminal
3814 PAVI Proper Artemis Views Interface
3530 PEOPLEtd Human resourse management system
3573 PERMIT Engine test run registration system
3559 Personal menu Personal menu
3545 PL1 batchjobs E&M PL1 batchjobs E&M
3574 PLANBORDtd Planbord (short term SPL/C)
4166 POE 2.1 Planification Operationelle des Equipments
3529 PRISMA Personel Registration and managenment Information system.
3339 PRODAMAS Procurement Data Management System
3817 PROPER Project Performance
4146 Quickplace Quickplace
3768 REGISTRAR Administration of course related information
3442 RRG Rotable reference guide registratie
4110 RUPT Free format text uplink program
3464 SAGE System for Analysis of Gasturbine Engines
3523 Sage EGTHDM Sage EGTHDM
3350 SAP Engine Systems, Applications and Products for Engine Services

Appendices
177
3729 sapgui32 4.5b SAP Client GUI
3730 SAPGUI32 4.6D SAP client Software
3638 SAS / QMF EUC SAS known End user computing
3752 Sas PC 6.12 SAS development environment for PC
3547 SAS/QMF E&M Statistical Analysis System/Query Management Facility Engineering and Maintenance
53 Scarlos Service Cargo Logistic System
3548 SDW Software Development Workbench
3578 Squas+ Services Quality Analys System Plus
3579 Stationlog Web application for LMI outstations for administering handlings
3564 STI/KUK Short Term Items / korte Uren Krant
3444 TDADR Airworthiness registratie
3531 TDBEH IT Beheer Wang en Wang omgeving
3556 TDINL WANG INLOG
4165 TDSEARCH (e&m formulieren / werkplek instructies)
3532 TDSNA IT Beheer van faciliteiten met mainframe middels SNA
3533 TDSUB IT beheer algemene in te linken routines met Mainframe
3534 TDTLX Telex berichten Technische Dienst
3582 Telex MessageReader Telex message reader
3580 TELMA TELex MAnager
4073 Test Director Domain: KLM-Eng_Maint Mercury TestDirector
3565 TFALG Buitenstation Algemeen
3566 TFDEP Buitenstations Detachering
3423 THALG Work preperation department general program menu.
3807 THLEV Levellen
3433 THMRI Maintenance Requirement Items
3808 THNKJ Non KLM Jobcards
3812 THTLW Time Limited Work
3434 THWRK Workorder (Outgoing) registration program
4136 TimeWize E&M TimeWize E&M
3336 TQSOR Contract services Shop Order Registratie
3597 TRABP Aanschaf Beheer Productiemiddelen
3598 TRACE REPA Tracking and Control Expert
4174 TRACKING Tracking Distribution modules
4137 Tridion Tridion 5.0
3599 TRSGM REPA Speciaal Gereedschap beheer
3424 TVALL Algemene vliegtuig- en onderhoudsgegevens
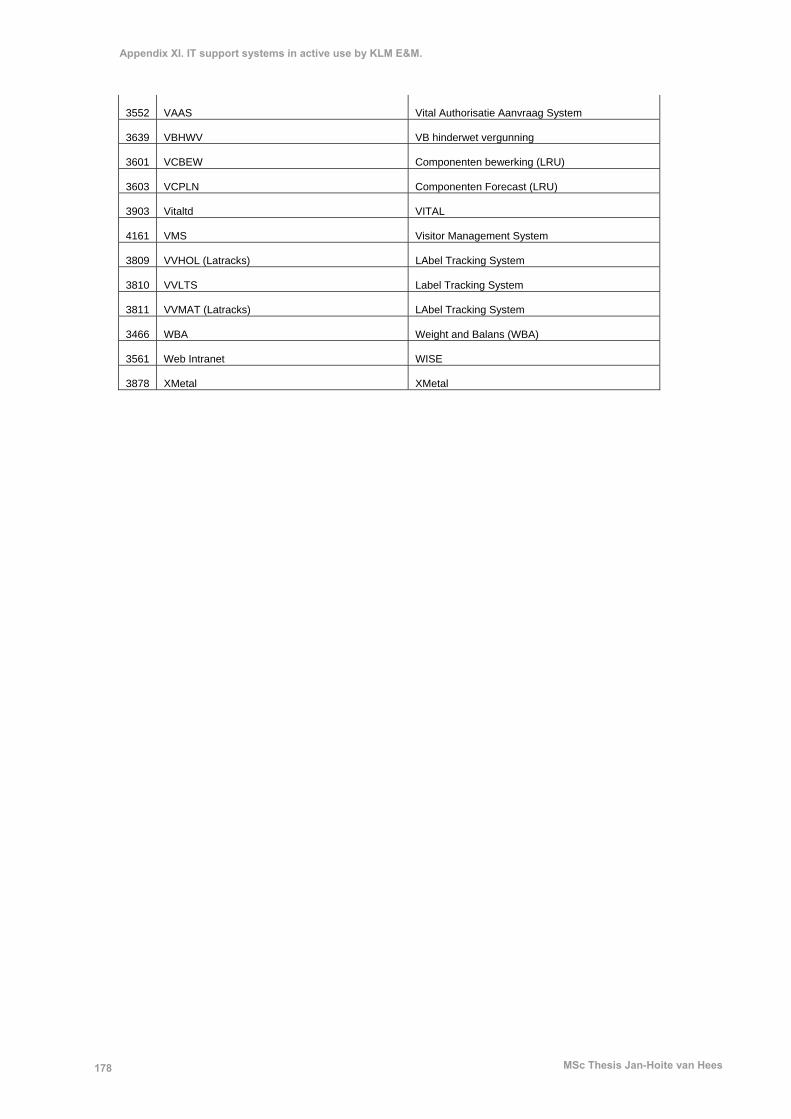
Appendix XI. IT support systems in active use by KLM E&M.
MSc Thesis Jan-Hoite van Hees 178
3552 VAAS Vital Authorisatie Aanvraag System
3639 VBHWV VB hinderwet vergunning
3601 VCBEW Componenten bewerking (LRU)
3603 VCPLN Componenten Forecast (LRU)
3903 Vitaltd VITAL
4161 VMS Visitor Management System
3809 VVHOL (Latracks) LAbel Tracking System
3810 VVLTS Label Tracking System
3811 VVMAT (Latracks) LAbel Tracking System
3466 WBA Weight and Balans (WBA)
3561 Web Intranet WISE
3878 XMetal XMetal

Appendices
179
Appendix XII Tracking interfaces with SAP and Crocos.
XI.1 Tracking interfaces with SAP Mvt Transactions used 101 MB01 101 MB0A 101 Z270E 101 MB01 201 MB1A / Z270E 201 MB1A / Z270E 261 Z180C 261 MB1A / Z270E 261 MB1B / Z270E 261 MB1A / Z270E
311 MB1B 313 MB1B / Z270M / Z130A /
Z270E 313 Z270E 351 MB1B / Z270E 351 Z270E 502 MB0A 541 ADSUBCON 551 MB1A 553 MB1A 652 MB1B / Z270E 913 MB1B / Z270E 913 MB1B / Z270E 915 MB1A 917 MB1B / Z270E / Z270M 917 MB1B / Z270E 919 Z230B/ Z270E 931 MB1A 932 MB1A 933 MB1A 934 MB1A 967 MB1B / Z270E 281Q Z180C 313/15 MB1B 344/43 MB1B
344B Z270F 344K

Appendix XII Tracking interfaces with SAP and Crocos.
MSc Thesis Jan-Hoite van Hees 180
502K 553K 913b MB1B / Z270E 917b MB1B / Z270E 944-49 MB1B
XI.2 Tracking interfaces with Crocos TB510 TMAS Magazijn Afgifte Schoon TB511 TMAV Magazijn Afgifte Vuil TB512 TMOV Magazijn Ontvangst Vuil TB514 TVUM Vuil Melding Magazijn TB515 TBA Bevestiging Afgifte pickingslip TB520 TWA Werkplaats Afgifte schoon TB522 TUS Uitbouw Sub werkplaats TB523 TWAV Werkplaats Afgifte Vuil TB528 TAS(U) Uitbouw Sub RA TB532 TVB Verwisselmelding Buiten SPL TB533 TMB Mutatie Buiten SPL TB535 TOK Opvoeren KIT RA TB560 TCOS CGO Ontvangst Schoon TB561 TCOV CGO Ontvangst Vuil TB590 TVS / TVC Verwisselmelding SPL/O / SPL/C TB631 TMDH Afgifte Magazijn Donkere Hoek