Micro – Thruster Development - TU Delft Repositories
192
` Micro – Thruster Development Propulsion System for the DelFFi Mission I. Krusharev AE5810: Master of Science Thesis Delft University of Technology
-
Upload
khangminh22 -
Category
Documents
-
view
2 -
download
0
Transcript of Micro – Thruster Development - TU Delft Repositories

`
Micro – Thruster Development
Propulsion System for the DelFFi Mission
I. Krusharev
AE5810:
Mast
er
of Sci
ence
Thesi
s
Delft U
niv
ers
ity o
f Tech
nolo
gy


Page | III
Micro – Thruster Development
Propulsion System for the DelFFi Mission
By
I. Krusharev
AE5810 – Thesis Space
in partial fulfilment of the requirements for the degree of
Master of Science
in Aerospace Engineering
at the Delft University of Technology,
to be defended publicly on August 19, 2015 at 13:00.
Supervisor: Ir. B. T. C. Zandbergen, TU Delft
Thesis committee: Dr. A. Cervone, TU Delft
Ir. M.C. Naeije, TU Delft
An electronic version of this thesis is available at http://repository.tudelft.nl/.

Page | IV
The universe is probably littered with the one-planet
graves of cultures which made the sensible economic decision
that there’s no good reason to go into space—each
discovered, studied, and remembered by the ones who made
the irrational decision.
Randall Munroe

Page | V
Abstract
The format and size specifications of the CubeSat platform require highly miniaturized
subsystems, one of the most challenging ones being the propulsion system. Up to date,
according to the authors' knowledge, only two CubeSats have successfully operated a
propulsion system in space: CanX-2 in 2008 and Defil-n3Xt in 2013. The importance of a
miniaturized propulsion system becomes even more apparent when taken into consideration
that most, if not all, of the CubeSats launched to date, due to budget constraints, have
been piggybacking their launches into space and therefore they may end up in a non-
optimal orbit. As a next step, a formation flying technology demonstration mission is
planned by the Delft University of Technology (DelFFi), as part of the QB50 project.
This thesis gives an outline of the present development status of micro-propulsion
systems at Delft University of Technology. The main design driving criteria are provided
by the DelFFi satellites requirements. Keeping in mind the educational environment in
which the work is performed, safety drives the requirements: thus, propellants have to be
non-toxic and easy to handle. Additionally, present requirements aim at a thrust level in
the range of 1 to 10 [mN] and a total ΔV of 15 [m/s] or more. Wet mass, when installed in
triple-unit CubeSats, shall be less than 450 [g], and peak power consumption less than
10 [W].
A number of Commercial-Off-The-Shelf (COTS) systems have been investigated to find
suitable candidates that fulfil these minimum requirements. However, it has been concluded
that all presently available systems have low Technology-Readiness-Level (TRL) or their
performance is out of the required range. It was thus necessary to start working at custom
designed system. The design process and decisions made will be presented in this thesis.
Furthermore for testing purposes also a test setup and an engineering model propulsion
system was made. A general test program using LabVIEW was made that can automate
the testing process of the thruster. The system was then tested and from the results,
recommendations and conclusions were made for the next iteration of the thruster.

Page | VI
We do not see any borders from space. We just see a
unique planet with a thin, fragile atmosphere, suspended in a
vast and hostile darkness. From up here it is crystal clear
that on Earth we are one humanity, we eventually all share
the same fate.
Alexander Gerst

Page | VII
List of Publications
I. Krusharev, R. Poyck, Q. Bellini, B. Zandbergen, A. Cervone, "CubeSat Micro
- Propulsion Systems for Extending the Capabilities of Academic Projects" in
65th International Astronautical Congress, Toronto, 2014
R. Poyck, I. Krusharev, Q. Bellini, B. Zandbergen, A. Cervone, "A Water-Fed
Micro-Resistojet for the DelFFi Formation Flying Mission" in 65th
International Astronautical Congress, Toronto, 2014

Page | VIII
Curious that we spend more time congratulating people
who have succeeded than encouraging people who have not.
Neil deGrasse Tyson

Page | IX
Acknowledgments
While this thesis is a personal accomplishment, completing it would not have been
possible without the guidance and support of several key individuals. Therefore I would like
to acknowledge this help I have received in the past period.
I would like to start by thanking my supervisor ir. Barry Zandbergen. With his
comments, questions and input he pushed me to work harder and look deeper in the
problems at hand. Next I would like to thank Dr. A. Cervone, my second supervisor for his
guidance and providing input where necessary to complete the given task and his extensive
input for writing the publications for the IAC conference. Furthermore I would like to
thank Marc Naeije for taking the time to review my work and ask the critical questions.
Special thanks go to Nuno Baltazar dos Santos for his help and patience during the testing
phase. His insight in electronics and the test equipment made my task at hand a lot easier.
Immense gratitude also goes to John Stals for his help and guidance during the more
turbulent times of my studies and helping me stay at university when others said this was
impossible.
Next I would like to thank my fellow students and friends at the Space Engineering
chair with whom I have had plenty of discussions and help on the content of this thesis and
my friends outside the Aerospace Faculty that have helped me keep my mind off the thesis.
Finally I would like to thank my parents Pavle and Nadica and the rest of my family
for their unconditional support both emotional and financial without which completing this
journey would be inconceivable.

Page | X
I love deadlines. I love the whooshing noise they make as
they go by.
Douglas Adams

Page | XI
Table of Contents
List of Figures ............................................................................................................ XVII
List of Tables ............................................................................................................... XXI
List of Acronyms ....................................................................................................... XXIII
List of Symbols ......................................................................................................... XXIV
1. Introduction.............................................................................................................1
1.1. Need Statement ..............................................................................................2
1.2. Research Objective .........................................................................................2
1.3. Research Methodology ....................................................................................4
1.4. Report Outline ................................................................................................5
2. Literature Review ....................................................................................................7
2.1. Market Research .............................................................................................7
2.1.1. COTS Systems Overview .........................................................................7
2.1.2. COTS System Trade – Off ......................................................................8
2.2. Design Tools and Method ...............................................................................9
2.2.1. Ideal Rocket Theory .............................................................................. 10
2.2.2. Computation Fluid Dynamics Theory .................................................... 10
2.2.3. Computational Fluid Dynamics Models ................................................. 12
2.3. Production Methods ...................................................................................... 13
2.3.1. Micro – Machining................................................................................. 13
2.3.2. Additive Fabrication (3D Printing) ....................................................... 16
2.4. Testing Facilities .......................................................................................... 18
2.4.1. AE-TB-50M Test Bench ........................................................................ 18
2.4.2. AE-TB-5M Test Bench .......................................................................... 19
2.5. Literature Study Conclusion ......................................................................... 20
3. Conceptual System Design and Concept Selection ................................................. 22
3.1. T3µPS+ ........................................................................................................ 22
3.1.1. Thruster Design ..................................................................................... 25
3.1.2. Performance Analysis ............................................................................ 29

Table of Contents
Page | XII
3.1.3. System Design ....................................................................................... 33
3.2. TU Delft in-house designs ............................................................................. 34
3.2.1. Water Resistojet with Cold Gas Generator ............................................ 35
3.2.2. Water Resistojet with Nitrogen Gas ...................................................... 35
3.3. Thruster ....................................................................................................... 36
3.4. Concept Trade – Off ..................................................................................... 38
4. Thruster Requirements Analysis ............................................................................ 41
4.1. Thruster Requirements ................................................................................. 41
4.1.1. Valve Requirements ............................................................................... 43
4.1.2. Nozzle Requirements ............................................................................. 44
4.1.3. Heater Requirements ............................................................................. 44
4.1.4. Mechanical Interface Requirements ........................................................ 45
4.2. PCB and Electrical Interface Requirements .................................................. 45
4.3. Interface Requirements for Testing ............................................................... 50
4.3.1. Thruster Test Bench AE-TB-5M ........................................................... 50
4.3.2. Thruster Test Bench AE-TB-50M ......................................................... 51
5. Thruster Design and Component Selection ............................................................ 52
5.1. Valve Selection ............................................................................................. 52
5.1.1. Flight Model Valve ................................................................................ 52
5.1.2. Engineering Model Valve ....................................................................... 54
5.1.3. Valve Control Circuit ............................................................................ 56
5.2. Porous Media Selection ................................................................................. 57
5.3. Heating Element Selection ............................................................................ 60
5.3.1. Elstein T-MSH/20 [57] .......................................................................... 61
5.3.2. HotSet HotRod [58] ............................................................................... 62
5.3.3. Watlow Firerod [59]............................................................................... 62
5.3.4. Heater Trade – Off ................................................................................ 63
5.4. Chamber ....................................................................................................... 64
5.4.2. Trade – Off ........................................................................................... 68
5.5. Nozzle ........................................................................................................... 68
5.5.1. CFD Analysis Set-Up ............................................................................ 71
5.5.2. Design Performance and Comparison ..................................................... 73
5.5.3. Design Analysis ..................................................................................... 75

Table of Contents
Page | XIII
5.6. Thruster Performance Summary and Comparison ......................................... 78
6. Description of Engineering Model Propulsion System............................................. 80
6.1. Feed System ................................................................................................. 80
6.1.1. Filling Branch ....................................................................................... 81
6.1.2. Tank ..................................................................................................... 81
6.1.3. Hexagon adapter ................................................................................... 82
6.1.4. Feed Line to Valve ................................................................................ 82
6.2. Valve ............................................................................................................ 83
6.2.1. MINSTAC ............................................................................................. 84
6.2.2. Valve Control Circuit ............................................................................ 85
6.2.3. Lee Valve VHS Starter Kit .................................................................... 86
6.3. Heating Elements .......................................................................................... 87
6.4. Porous Media ................................................................................................ 89
6.5. Chamber ....................................................................................................... 90
6.6. Nozzle ........................................................................................................... 91
6.7. Thrust Bench Interface and Assembly .......................................................... 92
7. Test Setup ............................................................................................................. 94
7.1. Test Bench Trade – Off ................................................................................ 94
7.2. Load Cell ...................................................................................................... 94
7.3. Propellant storage and feed system ............................................................... 95
7.4. Vacuum Chamber ......................................................................................... 99
7.5. Power Supply ............................................................................................. 100
7.6. Control, Data acquisition and Logging ........................................................ 101
7.6.1. Valve control block .............................................................................. 102
7.6.2. Heater control block ............................................................................ 104
7.6.3. Monitoring block ................................................................................. 105
7.6.4. Software block ..................................................................................... 107
7.7. LabVIEW Software ..................................................................................... 108
7.7.1. Power Supply Tab ............................................................................... 108
7.7.2. Multimeter Tab ................................................................................... 110
7.7.3. Multi-functional DAQ Card Tab ......................................................... 111
7.7.4. Mettler Toledo Scale Tab .................................................................... 113
7.7.5. Thermocouple DAQ Cards Tab ........................................................... 115

Table of Contents
Page | XIV
7.7.6. Setup and Control Tab ........................................................................ 116
8. Test Campaign .................................................................................................... 119
8.1. Heater Testing ............................................................................................ 120
8.1.1. Test Setup and Procedure ................................................................... 120
8.1.2. Test Results and Deliverables .............................................................. 121
8.2. Valve Testing ............................................................................................. 122
8.2.1. Test Setup and Procedure ................................................................... 123
8.2.2. Test Results and Deliverables .............................................................. 123
8.3. Feed System and Thruster Assembly Inspection ......................................... 125
8.4. Leak Test.................................................................................................... 125
8.4.1. Test Setup and Procedure ................................................................... 126
8.4.2. Test Results ........................................................................................ 127
8.5. Heating Test ............................................................................................... 131
8.5.1. Test Setup and procedure .................................................................... 131
8.5.2. Test Results ........................................................................................ 132
8.6. Mass Flow Test .......................................................................................... 134
8.6.1. Test Setup and procedure .................................................................... 134
8.6.2. Test Results ........................................................................................ 134
8.7. Thrust bench calibration ............................................................................. 135
8.7.1. Test Setup and procedure .................................................................... 136
8.7.2. Test Results ........................................................................................ 137
8.8. Thrust measurement ................................................................................... 138
8.8.1. Test Setup and Procedure ................................................................... 139
8.8.2. Test Results ........................................................................................ 140
8.9. Pressure Drop Test ..................................................................................... 141
8.10. Post Test Inspection ................................................................................... 141
9. Lessons Learned ................................................................................................... 144
9.1. Electronic Circuit Engineering Model .......................................................... 144
9.2. Result Analysis ........................................................................................... 145
10. Conclusions & Recommendations ......................................................................... 147
10.1. Conclusions ................................................................................................. 147
10.2. Recommendations ....................................................................................... 149

Table of Contents
Page | XV
Bibliography ................................................................................................................. 150
Appendix ...................................................................................................................... 157
Appendix A: Project Planning and Management .................................................. 157
Appendix B: Technical Drawings ......................................................................... 160
Appendix C: Quotations and Invoices .................................................................. 162

Table of Contents
Page | XVI

Page | XVII
List of Figures
Figure 1: TRL Description [12] ...................................................................................... 3
Figure 2: Propulsion System Definition and Task Distribution ...................................... 4
Figure 3: Potential COTS Thrusters [8] [15] [16] [17] [18] [19] [20] ................................. 8
Figure 4: CFD Analysis Main Elements [30] ................................................................ 11
Figure 5: Turning Machine (Lathe) and Turning Product [35] ..................................... 14
Figure 6: Milling Machine and Milling Product [35] ..................................................... 15
Figure 7: AE-TB-50M Test Bench [39] ........................................................................ 18
Figure 8: AE-TB-5M Test Bench [40] .......................................................................... 20
Figure 9: Cool Gas Generator New Design ................................................................... 23
Figure 10: Velocity Budget Attainable with CGGs ...................................................... 24
Figure 11: Expansion Ratio vs. Specific Impulse for Nitrogen at 300 [K] ...................... 27
Figure 12: Expansion Ratio vs. Specific Impulse for Nitrogen at 700 [K] ...................... 28
Figure 13: Nitrogen Resistojet Performance vs. Time................................................... 32
Figure 14: Nitrogen Cold Gas Performance vs. Time ................................................... 32
Figure 15: Propulsion System Concept with CGGs [20] ............................................... 33
Figure 16: Thruster Concept Design ............................................................................ 34
Figure 17: Ideal Nozzle for Nitrogen Fed Thruster ....................................................... 34
Figure 18: CGG + Water tank design ......................................................................... 35
Figure 19: Water Resistojet pressurized with Nitrogen Gas ......................................... 36
Figure 20: Power required to heat water ...................................................................... 37
Figure 21: Nozzle Cross Section ................................................................................... 37
Figure 22: OBC PCB profile ........................................................................................ 46
Figure 23: Thruster Requirements Flow Down Chart .................................................. 49
Figure 24: IEP Valve Series (mm in brackets) ............................................................. 53
Figure 25: EPSV Valve power consumption [49] .......................................................... 53
Figure 26: INKX0511400AA5 VHS Solenoid Lee Valve (mm in brackets) .................... 54
Figure 27: Temperature range for Common Elastomeric Materials [51] ........................ 55
Figure 28: Spike and Hold Driver Schematic ................................................................ 57
Figure 29: Heat - Transfer phases in channel flow [54] ................................................. 58
Figure 30: Mixing Design Methods [54] ........................................................................ 59
Figure 31: Recemat Metal Foam .................................................................................. 60
Figure 32: Elstein MSH/20 (dimensions in mm) .......................................................... 62
List of Figures
Page | XVIII
Figure 33: HotRod HotSet Cartridge Heater ................................................................ 62
Figure 34: Watlow C1A-9602 Cartridge Heater ............................................................ 63
Figure 35: Design Chamber 1....................................................................................... 65
Figure 36: 3D Printed Design ...................................................................................... 66
Figure 37: FEM Chamber 2 ......................................................................................... 66
Figure 38: Chamber Design 2....................................................................................... 67
Figure 39: Chamber Design 3....................................................................................... 67
Figure 40: Nozzle Shapes [60]....................................................................................... 68
Figure 41: Conical Nozzle Geometry Parameters ......................................................... 69
Figure 42: MEMS Nozzle Cross – Section [61].............................................................. 69
Figure 43: Boundary layer thickness for nozzles of different thrust levels [24] .............. 70
Figure 44: Nozzle Shapes ............................................................................................. 72
Figure 45: Velocity Magnitude [m/s] Contour .............................................................. 74
Figure 46: Velocity Vectors obtained by the CFD simulations [m/s]. ........................... 76
Figure 47: Pressure contour obtained by the CFD simulations [Pa] ............................. 76
Figure 48: Temperature contour obtained by the CFD simulations [K] ........................ 77
Figure 49: Water 3 - Phase Diagram ........................................................................... 77
Figure 50: Feed System Schematic ............................................................................... 80
Figure 51: Filling Branch ............................................................................................. 81
Figure 52: Swagelok Tank 304L-HDF4-150 .................................................................. 82
Figure 53: Hexagon adapter ......................................................................................... 82
Figure 54: Feed System ............................................................................................... 83
Figure 55: Valve Assembly .......................................................................................... 84
Figure 56: MINSTAC Connection [48] ......................................................................... 84
Figure 57: 062 MINSTAC Fitting System [48] ............................................................. 85
Figure 58: Lee Company Spike and Hold Driver with TTL Signal Circuit ................... 86
Figure 59: VHS Starter Kit.......................................................................................... 87
Figure 60: Elstein MSH/20 (dimensions in mm) .......................................................... 88
Figure 61: Watlow C1A-9602 Cartridge Heater............................................................ 88
Figure 62: Recemat Metal Foam .................................................................................. 89
Figure 63: Chamber Assembly ..................................................................................... 90
Figure 64: Produced Chamber ..................................................................................... 90
Figure 65: EM Nozzle Design (Left) and Produced (Right) .......................................... 91
Figure 66: EM Nozzle Produced .................................................................................. 92
Figure 67: Nozzle Size .................................................................................................. 92

List of Figures
Page | XIX
Figure 68: Thruster + Bracket Assembly ..................................................................... 93
Figure 69: AE-TB-50M Thrust Bench ......................................................................... 96
Figure 70: Propellant storage and feed system ............................................................. 96
Figure 71: Nitrogen Tank and Pressure Regulator ....................................................... 98
Figure 72: Feed system inside the Vacuum chamber .................................................... 98
Figure 73: Vacuum Chamber Pressure Drop ................................................................ 99
Figure 74: Agilent E3631A......................................................................................... 100
Figure 75: ES030-5/10 Power Supply ......................................................................... 101
Figure 76: Spike and Hold circuit connection diagram ............................................... 102
Figure 77: Functional diagram of Valve circuit .......................................................... 102
Figure 78: Propulsion System electronic interfaces ..................................................... 103
Figure 79: TTL Signal Generator Schematic .............................................................. 103
Figure 80: Spike and Hold TTL Signal Generator ...................................................... 104
Figure 81: RS-1316 (Left) and NI USB-9211A (Right) TC DAQ Card ....................... 105
Figure 82: NI USB-6008 on the left and HP 34401a on the right ............................... 105
Figure 83: Scaime CPJ Rail Signal Amplifier ............................................................. 106
Figure 84: Tenma 72-8395 Oscilloscope ...................................................................... 106
Figure 85: Mettler Toledo PB8001-S/FACT Scale ..................................................... 107
Figure 86: Complete Test Setup ................................................................................ 107
Figure 87: LabVIEW Program UI .............................................................................. 108
Figure 88: Power Supply Control UI .......................................................................... 109
Figure 89: Multimeter Control UI .............................................................................. 110
Figure 90: DAQ Card Tab ......................................................................................... 111
Figure 91: DAQ Card Program .................................................................................. 112
Figure 92: DAQ Assistant.......................................................................................... 112
Figure 93: DAQ Assistant Connection Diagram ......................................................... 113
Figure 94: Scale Tab .................................................................................................. 114
Figure 95: Scale LabVIEW Program .......................................................................... 114
Figure 96: TC DAQ Card Tab .................................................................................. 115
Figure 97: TC DAQ Card Program ........................................................................... 116
Figure 98: Setup and Control Tab ............................................................................. 117
Figure 99: Heater Test Setup Schematic .................................................................... 121
Figure 100: Example Elstein Test Data ..................................................................... 121
Figure 101: Example Watlow Test Data .................................................................... 122
Figure 102: Valve Test Setup Schematic .................................................................... 123

List of Figures
Page | XX
Figure 103: Oscilloscope Capture ............................................................................... 124
Figure 104: Valve Test Results .................................................................................. 124
Figure 105: Bison High Temperature Silicone ............................................................ 125
Figure 106: Nozzle Inspection .................................................................................... 125
Figure 107: Leak Test - Test Setup............................................................................ 127
Figure 108: Feed System Leak Test 1 ........................................................................ 128
Figure 109: Feed System Leak Test 2 ........................................................................ 128
Figure 110: Thruster with silicon applied ................................................................... 129
Figure 111: Thruster Leak Test ................................................................................. 129
Figure 112: Thruster Leak Test Results ..................................................................... 130
Figure 113: Thruster Leak Test Result Section .......................................................... 130
Figure 114: Heating Test - Test Setup ....................................................................... 132
Figure 115: Watlow Heating Profile at 12 [Vdc]......................................................... 133
Figure 116: Elstein Heating Profile at 5 [Vdc] ............................................................ 133
Figure 117: Valve Mass Flow at 6 [Bar] ..................................................................... 135
Figure 118: Mass Flow vs Pressure ............................................................................ 135
Figure 119: Thrust Bench Calibration Setup ............................................................. 136
Figure 120: Load Calibration Raw Data .................................................................... 138
Figure 121: Load Cell Calibration Line ...................................................................... 138
Figure 122: Thrust Measurement Test Setup ............................................................. 139
Figure 123: Thruster Leakage during Testing ............................................................ 140
Figure 124: Water Condensation inside the Vacuum Pump ....................................... 141
Figure 125: Thruster Post Testing Inspection ............................................................ 142
Figure 126: Nozzle Post Testing Inspection................................................................ 142
Figure 127: Post Testing Chamber Inspection ............................................................ 143
Figure 128: Post Testing Heater Inspection ............................................................... 143
Figure 129: Electronics Block Diagram ...................................................................... 144
Figure 130: Proposed FM Thruster Design (Concept) ................................................ 146

Page | XXI
List of Tables
Table 1: Propulsion System Requirements Summary [10] .............................................. 3
Table 2: Potential COTS Propulsion Systems [8] [14] [15] [16] [17] [18] [19] [20] ............ 8
Table 3: Machining Process Comparison [35] ............................................................... 15
Table 4: Additive Fabrication Process Comparison [37] ............................................... 17
Table 5: Propulsion System Limit Conditions .............................................................. 23
Table 6: Nitrogen Gas Properties [42] .......................................................................... 25
Table 7: Ideal Propellant Performance ......................................................................... 26
Table 8: Preliminary Thruster Geometry ..................................................................... 29
Table 9: Thruster Performance Summary ................................................................... 30
Table 10: Thruster Design Summary ........................................................................... 30
Table 11: Water Properties.......................................................................................... 38
Table 12: Thruster Specifications ................................................................................. 38
Table 13: Propulsion System Concepts Trade - Off...................................................... 39
Table 14: Thruster Subsystem Requirements ............................................................... 41
Table 15: IEP Valves ................................................................................................... 53
Table 16: VHS Valves ................................................................................................. 54
Table 17: Metal Foam Characteristics ......................................................................... 60
Table 18: Heater Requirements .................................................................................... 61
Table 19: Heater Trade-Off ......................................................................................... 64
Table 20: Chamber Design Trade - Off ........................................................................ 68
Table 21: Fluid Properties used in Ansys Fluent ......................................................... 72
Table 22: Boundary conditions used in Ansys Fluent................................................... 72
Table 23: CFD Nozzle Results ..................................................................................... 73
Table 24: Nozzle Trade - Off ....................................................................................... 75
Table 25: Thruster performance with water as propellant ............................................ 78
Table 26: Thruster performance with nitrogen as propellant ........................................ 78
Table 27: Comparison between ideal rocket theory (IRT) and CFD results ................. 79
Table 28: Comparison between COTS and MEMS thruster performance ..................... 79
Table 29: Test Bench Trade - Off ................................................................................ 94
Table 30: Futek LF400 Specifications .......................................................................... 95
Table 31: Feed System Components ............................................................................ 97
Table 32: Vacuum Chamber Characteristics .............................................................. 100
Table 33: Power Supply Specifications ....................................................................... 101

List of Tables
Page | XXII
Table 34: Heater Test Results ................................................................................... 122
Table 35: Thermocouple Position............................................................................... 131
Table 36: Heater Test Results ................................................................................... 132
Table 37: Valve Mass Flow ........................................................................................ 134
Table 38: Load Cell Calibration Data ........................................................................ 137
Table 39: Expected EM Thruster Specification .......................................................... 148

Page | XXIII
List of Acronyms
3U 3-Unit
ADC Analog to Digital Converter
ADCS Attitude Determination and Control Subsystem
AWG American Wire Gauge
BFSL Best Fit Straight Line
BSP British Standard Pipe
CFD Computational Fluid Dynamics
CGG Cool Gas Generator
COM Communication Port
COTS Commercial Off The Shelf
DAQ Data Acquisitioning System
DC Direct Current
DIY Do It Yourself
DNS Direct Numerical Simulations
DOT Design Option Tree
EBM Electron-Beam Melting
EDM Electrical Discharge Machining
EEE Electrical, Electronic, Electromechanicical
EM Engineering Model
EPDM Ethylene Propylene Diene Monomer
EPS Electric Power System
FDM Fused Deposition Modeling
FEM Finite Element Method
FKM Flurocarbon
FM Flight Model
H2O Water
IO Input Output
IRT Ideal Rocket Theory
LEO Low Earth Orbit
LOM Laminated Object Manufacturing
MEMS Micro Electro Mechanical Systems
MEOP Maximum Expected Operating Pressure
N2 Nitrogen

List of Symbols
Page | XXIV
NC Nickel Chromium
NCAX Nickel Chromium Aluminium
NI National Instruments
Ni Nickel
NPT National Pipe Thread
NTC Negative Temperature Coefficient
O.D. Outer Diameter
OBC On Board Computer
PC Personal Computer
PCB Printed Circuit Board
PEEK Polyether Ether Ketone
PPT Pulsed Plasma Thruster
PS Power Supply
R.O. Rated Output
RANS Reynolds-Averaged Navier-Stokes
SLA Stereolithogrpahy
SLM Selective Laser Melting
SLS Selective Laser Sintering
SST Shear Stress Transport
TBC To Be Confirmed
TBD To Be Determined
TC Thermo-Couple
TRL Technology Readiness Level
TTL Transistor – Transistor Logic
UI User Interface
UNF Unified Fine Thread
USB Universal Serial Bus
UV Ultra Violet
VISA Virtual Interface Software Architecture
VKI Van Karman Institute
List of Symbols
pc Chamber Pressure

List of Symbols
Page | XXV
ΔV Change of Velocity
c* Characteristic Velocity
Ø Diameter
ε Dissipation Rate
ΔH Enthalpy Change
Ae Exhaust Area
Me Exhaust Mach Number
pe Exhaust Pressure
pa Exhaust Pressure
w Exhaust Velocity
g0 Gravitational Acceleration
Q Heat
cp Heat Capacity at Constant Pressure
cv Heat Capacity at Constant Volume
M0 Initial Mass
ṁ Mass Flow
λ Nozzle Efficiency Factor
α Nozzle Half Angle
P Power
p Pressure
Mp Propellant Mass
γ Ratio of Specific Heats
ao Sonic Velocity
ω Specific Dissipation Rate
R Specific Gas Constant
Isp Specific Impulse
T Temperature
ΔT Temperature Change
At Throat Area
Dt Throat Diameter
F Thrust Force
t Time
κ Turbulent Kinetic Energy
Vdc Voltage DC
V Volume

List of Symbols
Page | XXVI

Page | 1
1. Introduction
Due to recent trends in miniaturization of electronics and production techniques
allowing the creation of smaller components, there has been new trend in the space domain.
Instead of designing and building big, monolithic and expensive satellites that have
numerous capabilities, scientists and engineers explore the possibility to use smaller,
cheaper satellites that are capable to perform some of the more simple functions of
traditional satellites by themselves or work together in a formation to perform more
complex tasks. This could potentially provide great risk reduction in single point failure
and easier and cheaper global coverage due to the ability to launch many satellites at low
cost [1] [2] [3].
One of the most promising platforms for small satellites is the CubeSat platform, which
represents a set of standardized specifications. Combining this with a lot of Commercial Off
The Shelf (COTS) technology allows Nano-Satellites to be designed and built at low cost.
Therefore over the last decade, CubeSats have become increasingly popular [4]. While most
of the CubeSats launched to date have been university projects aiming to provide valuable
learning experience while maintaining the cost at minimum, some large corporations and
agencies like NASA and Boeing have also taken part and many more are interested [5] [6].
The format and size specifications of the CubeSat platform require highly integrated
and miniaturized subsystems. One of the most challenging subsystems has proved to be the
propulsion system. This is proved by the fact that up to date only two CubeSat have been
launched with a propulsion system, CanX-2 in 2008 [7] [8] and Delfi-n3Xt in November
2013. The importance of a miniaturized propulsion system becomes even more apparent
when taken into consideration that most, if not all, of the CubeSats launched to date, due
to budget constraints, have been piggybacking their launches into space and therefore they
may end up in a non-optimal orbit. Having a propulsion system onboard the spacecraft
would allow the operator to control the satellite velocity which could be used for orbit
control and maintenance and attitude control. Finally considering traveling beyond LEO,
for a satellite mission like the OLFAR, propulsion system is needed to provide the required
ΔV.

Need Statement
Page | 2
1.1. Need Statement
For performing tasks where satellites would need to fly in a formation, a propulsion
system is a must. One such planned mission by the Delft University of Technology is the
DelFFi mission which is a formation flying demonstration of two 3U CubeSats in LEO. The
DelFFi satellites, called 'Delta' and 'Phi', are based on the Delfi-n3Xt bus platform which
will be enhanced by an improved propulsion system, relative navigation and onboard
algorithms. They will be a part of the QB50 project where 50 CubeSats will be launched
together and make in situ measurements in the lower thermosphere (90 – 320 [km]) and
study the re-entry process by comparing predicted and actual CubeSat trajectories and
orbital lifetimes, a project that is possible only due to the low building cost and fast
development time of CubeSats [9]. For this mission there is a need for a CubeSat
propulsion system capable of delivering at least 15 [m/s] ΔV to a 3.6 [kg] satellite. [10]
1.2. Research Objective
Currently at the Delft University of Technology several students are committed to
research topics related to the propulsion system of the DelFFi satellites. For this mission
there is a need for a propulsion system capable of delivering at least 15 [m/s] ΔV to a 3.6
[kg] satellite. The most important requirements are summarized in Table 1 in their up-to-
date version at the time of writing this report. The thrust range is given such that at the
maximum thrust level, the ADCS system should still be able to compensate the disturbance
torques produced due to the thrust vector misalignment. The minimum thrust level is
based on the expected drag force on the satellites. The maximum expected operating
pressure (MEOP) is limited to 10 [Bar] and this only applies when non energetic fluid is
used, such as water or nitrogen otherwise additional testing and waiver from the launch
provider / CalPoly may be necessary. Given that the satellite is scheduled for launch in
January 2016, the TRL should be higher than 6 since the propulsion system should be
ready for integration in less than 2 years (Figure 1). The full list of requirements and their
rationales can be found in [10] [11]. It is important to note that no specific requirement was
given for cost and the budget for the system ranged at times from € 10.000 – 100.000.

Introduction
Page | 3
Figure 1: TRL Description [12]
Table 1: Propulsion System Requirements Summary [10]
Parameter Value Unit
Thrust 0.5 – 10 mN
∆V ≥ 15 m/s
MEOP ≤ 10 Bar
Power Usage ≤ 10 W
Mass ≤ 469 g
Volume ≤ 90x90x80 mm
TRL ≥ 6 -
Per earlier definition given in [13], the thruster is defined as the blue part given in
Figure 2. The goal of this thesis is to provide a flight model (FM) thruster design and
confirm the concept by testing an engineering model (EM) which should be comparable to
the FM design functionally wise but preferably at reduced cost.

Research Methodology
Page | 4
Figure 2: Propulsion System Definition and Task Distribution
1.3. Research Methodology
In order to achieve the goals given in Section 1.2 the following research questions need
to be answered:
Can the fluid be sufficiently heated with less than 10 [W] of power input to
achieve the required thrust?
o What kind of fluid should be used?
o What is the minimum heating efficiency required?
o Is there a COTS heater available or custom design is needed?
o What is the optimal heating time?
o Can a specific impulse of higher than 100 [s] be achieved?
What production technique should be used for the thruster?
o Can the thruster be made using micro – machining?
o How does it compare against a MEMS thruster both cost and
performance wise?
o What is the optimum cost of production vs. estimated performance of
the thruster?
Can the propulsion system be made within the volume requirements?
o How much propellant is needed to fulfill the requirements?
o What kind of packing and level of integration is necessary?
Can the thruster be characterized with the facilities and equipment available at
the chair of Space Engineering?
o Can the thrust level be measured?
Propellant
Storage
Valve and
Mounting
InterfaceNozzle
Chamber with heater and
porous media
Sensors
PCB
Electronics
Feed
System

Introduction
Page | 5
o What is the required resolution and accuracy of the measurements?
To answer the research questions given previously the following task list was generated:
1. Make a Trade – off between different propulsion system design concepts
2. Generate a design of the flight model thruster subsystem
3. Determine production methods and companies capable of producing the
different components
a. Nozzle
b. Heater
c. Valve
d. Support Structure and interfaces
4. Generate a comparable engineering model of the propulsion system
5. Procure all the components
6. Assemble the propulsion system
7. Prepare Test Setup and Test Plan
8. Test the propulsion system as to make sure the requirements are fulfilled
9. Analyze the results and verify that the requirements as given in [10] have been
met.
The envisioned timeline of the project is represented by a Gantt Chart given in
Appendix A.
1.4. Report Outline
The report follows the events in the thesis in chronological manner. Before starting the
thesis a literature study was made. A short recap of this literature study is given in
Chapter 2. Next with a good knowledge base about the topic set, different propulsion
system concepts where investigated in Chapter 3 and a concept selection was made. With
the propulsion system design set, a requirements flow down was made in Chapter 4,
starting from the system requirements going down to the thruster requirements including
the different components in the thruster. Having the requirements clearly set allowed for
the design phase to start. In Chapter 5 component selection based on the previously set
requirement was done and components where designed where needed. Emphasis was made
on the nozzle design as that component was where the design had the most freedom. For
the thruster to be tested a propellant storage and feed system was needed and supporting
electronics for sensing and control. Thus an engineering model propulsion system was made

Report Outline
Page | 6
which is described in Chapter 6. Having the complete system ready a test setup including
both hardware and software was made and it is given in Chapter 7 followed by the test
plan and test results given in Chapter 8. Finally the results are analyzed in Chapter 9 and
the lessons learn are given including a proposed flight model design. Finally in Chapter 0
the conclusions of the thesis are presented together with the recommendations for the
future work on this project.

Page | 7
2. Literature Review
Before the work on the thesis start, students are required to do a literature study on
the topic. In this chapter a short recap of the literature study [13] is given which was used
as a starting point for this thesis. The first step in the literature study was to make a
market research and get insight in the currently available COTS propulsion systems, a
short recap of which is given in Section 2.1. Next, the optimal design approach was
investigated and the required tools and setting identified, which can also be seen in Section
2.2. With the design tools and approach set, different possible manufacturing methods
where considered which are of interested and potential partners for the thruster production
where identified. A short summary is given in Section 2.3. Next the current test facilities
where investigated and two potential test benches where identified of which a short
description is given in Section 0. Finally a summary of the decisions made during the
literature study is given in Section 2.5.
2.1. Market Research
In order to avoid unnecessary developments and reduce production time and costs it is
wise to look into what is currently available. An overview is given of the current COTS
CubeSat propulsion systems, their technology readiness level (TRL) and whether they
fulfill the requirements given in [10]. Unfortunately little or no information is available on
the thruster component of the COTS propulsion systems and therefore they are evaluated
as a whole.
2.1.1. COTS Systems Overview
A good overview of COTS propulsion systems are given in [8] and [14]. These are fairly
recent studies made in 2012 and 2010 respectively and give a rather complete overview of
the state of the propulsion systems developed specifically with CubeSats in mind, the
technology readiness level (TRL) and the specifications of the CubeSats. The most
important requirements that the propulsion systems must satisfy are given in Table 1. The
TRL should be higher than 6 since the propulsion system should be ready for integration in
less than 2 years. All the potential candidates that fulfill most of the requirements given in
Table 1, are summarized in Table 2 and updated data is given where available. Since ∆V
information for most propulsion systems is not available, total impulse is used instead. For

Market Research
Page | 8
a 3.6 [kg] satellite like the DelFFi satellites a total impulse of at least 54 [Ns] is needed [8].
All the potential systems are pictured in Figure 3.
Table 2: Potential COTS Propulsion Systems [8] [14] [15] [16] [17] [18] [19] [20]
Propulsion
System Propellant
Thrust
[mN]
Total
Mass
[g]
Specific
Impulse
[s]
Volume
[mm3]
Total
Impulse
[Ns]
Max
Power
[W]
TRL
Tank
Pressure
[Bar]
VACCO Isobutane 55 456 53 25x100x100 34 1 9 3
T3µPS Nitrogen 1-100 119 69 94x94x18 0.8 10.5 8 NA
µPPT Teflon 0.04 210 590 90x90x27 42 0.5 8 NA
MPS - 110 Nitrogen - - - 100x100
x110 36 < 10 6 -
HYDROS Water 600 300 < 1U 325 10 6 NA
T3µPS+ Nitrogen 9.5 443 69-100 90x90x80 36 - 60 10.5 6 NA
2.1.2. COTS System Trade – Off
From Table 2 it can be seen that no system in the current state fulfills all the
requirements as given in Table 1. Therefore it is clear that if any of the propulsion systems
are chosen, modification will be necessary. Two subsystems seem the most promising,
namely the µPPT from Clyde Space and the T3µPS, which is a development of TU Delft
and TNO.
Figure 3: Potential COTS Thrusters [8] [15] [16] [17] [18] [19] [20]
The µPPT from Clyde Space would need about 16*105 pulses to achieve the 15 [m/s]
∆V and since it has a firing frequency in the range of 0.1 -10 [Hz] that means it would need

Literature Review
Page | 9
between 2 and 185 days of continuous thrusting [21]. Since the total mission life time is 90
days and the thruster would only operate while the satellite is in the view of the Sun, the
µPPT would need to be able to have a continuous firing frequency of at least 0.6 [Hz]
which would mean the µPPT would operate continuously for at least a quarter of the
mission life time (circa 31 days). However Clyde Space specifies a total impulse of 42 [Ns]
which is insufficient to satisfy the requirements given in [10] and it is currently unclear if
the amount propellant can be increased. Furthermore there are the typical concerns with
PPTs such as non – uniform and late time ablation and electromagnetic interference [8].
Finally the current PPT has been tested of up to 15E5 pulses. If Clyde Space can clear
these doubts, this PPT would be a possible option. The quoted price of the µPPT
propulsion system is $18,850 [22].
The T3µPS+ is a development of TU Delft and TNO with which there have been
numerous collaborations. While the current T3µPS design has very low total impulse, it has
a very promising technology for propellant storage that satisfies all the requirements,
namely the Cool Gas Generator (CGG). This technology uses nitrogen stored in solid form
in cartridges which can be ignited on demand to release nitrogen gas ready to be used as
propellant [20]. As it is shown in [8] the main issue with propellant storage in a CubeSat is
not the mass but volume budget. A significant improvement needs to be done to the CGGs
to be able to store enough propellant to achieve the baseline mission of 15 [m/s]. As an
alternative, the specific impulse of the system could be increased. This can be done by
integrating a heater in the T3µPS and heating the nitrogen which is the concept of the
T3µPS+ [20].
In conclusion two propulsion systems are promising for the DelFFi mission, namely
Clyde Space’s µPPT and the modified T3µPS+ design. The µPPT from Clyde Space is a
ready product which is likely to satisfy all propulsion system requirements with some
modifications. However as stated before some doubts remain which need to be clarified with
Clyde Space.
2.2. Design Tools and Method
In this chapter the design methodology will be given. The starting point of the design is
Ideal Rocket Theory (IRT). This was more in-depth covered in [13]. A short recap will be
given in 2.2.1. Since manufacturing of the nozzle is both labor and time expensive,
Computational Fluid Dynamics (CFD) is used to provide higher certainty of the design.
The theory of CFD is given in Section 2.2.2 and the different models are explained in 2.2.3.

Design Tools and Method
Page | 10
2.2.1. Ideal Rocket Theory
A relatively standard thruster design approach is given in [23]. Using Ideal Rocket
Theory (IRT) and assuming no losses in the system and ideal expansion a preliminary
sizing of the thruster can be made such that it fits the requirements. The design starts by
sizing the nozzle for the desired thrust level and then working back to thru the chamber all
the way to the propellant storage tanks. For more realistic results quality coefficients are
introduced from statistics and simulations done on similar designs. These quality
coefficients cover the loss of performance due to not having ideal expansion, boundary layer
effects, manufacturing irregularities etc. and are covered more in depth in [13] and [24]. For
big rocket engines, such as the ones used on launchers, the divergence between IRT and
test data is in the order of 1 – 10 [%] [25], however for micro – thrusters where boundary
layer effects cannot be neglected and manufacturing imperfections play important roles the
difference can be 20 – 30 [%] and even more than 50 [%] for non – optimal design [26] [24]
[27]. Therefore for greater confidence in the results and final optimization of the design
CFD simulations can be used.
However unlike a propulsion system with nitrogen, for a propulsion system with liquid
water as propellant, the available power to heat the water is the limiting factor. This
determines the maximum mass flow allowable in steady state operation and from that the
maximum throat area can be calculated. From the rest the design procedure follows the one
as given in [23] and [28].
2.2.2. Computation Fluid Dynamics Theory
CFD is a numerical method of simulating the behavior of systems involving fluid flow,
heat transfer, and other related physical processes such as chemical reactions in combusting
flows. The physical characteristics of the fluid motion are solved using equations of fluid
flow (in a special form) over a region of interest, with specified (known) conditions on the
boundary of that region. [29] These equations that govern the process of interest are often
called governing equations in CFD. A complete CFD analysis consists of three main
elements, namely pre-processor, solver and post-processor which are inter connected as
shown in Figure 4 [30].

Literature Review
Page | 11
Figure 4: CFD Analysis Main Elements [30]
For all flow types, Fluent solves the equations for conservation of mass and momentum.
In addition to those the equation for energy conservation is solved for compressible flows or
flows that have heat transfer. Since the whole principle of the thruster is to compress the
propellant to achieve Mach 1 in the throat, all these 3 equations will be used throughout
the CFD simulation. When the flow is turbulent, additional transport equations are solved
as well.
Examples of governing equations being solved by Fluent are the Navier-Stokes
equations for compressible flow. The continuity equation which describes the conservation
of mass is given, the momentum conservation equation and the energy conservation
equation are given by (2.1) [30].
0
r
o
o c
Vt
VV V T b
t
ee V T V q q V b q
t
(2.1)

Design Tools and Method
Page | 12
2.2.3. Computational Fluid Dynamics Models
The majority of all flows of engineering interest are turbulent [31]. Turbulence is the
three-dimensional unsteady random motion observed in fluids at moderate to high
Reynolds numbers [29].
While turbulence is, in principle, described by the Navier-Stokes equations, using Direct
Numerical Simulations (DNS) is not feasible since the computing power required far
exceeds what is available today. Therefore the Navier-Stokes equations are averaged which
filters out all or part of the turbulent flow. The most widely applied averaging procedure is
Reynolds-averaging (which, for all practical purposes is time-averaging) of the equations,
resulting in the Reynolds-Averaged Navier-Stokes (RANS) equations [29]. However, by
averaging new, additional unknowns are introduced in the system of equations. Choosing
the proper turbulence model and meshing grid greatly affects the quality of the simulation
Unfortunately different turbulence models have different applications and a single,
universal turbulence model does not exist. The choice of the turbulence model used depends
on the problem at hand, the level or accuracy required and the computational power
available.
Two equation models are historically the most commonly used RANS models, which
solve two transport equations and model the Reynolds Stresses using the Eddy Viscosity
approach [32]. They provide relatively high accuracy while significantly reducing the
computation time. The models available in Fluent are the k-ε and the k–ω. The k-ε models
solves for the k equation and dissipation rate equation ε. The k-ω models and its variants
solve for ω instead, which is the specific dissipation rate. In this literature study the
standard k-ε model and the standard k-ω model will be covered and their variants briefly
mentioned.
κ – ε Model 2.2.3.1.
The standard k – ε model in Fluent is considered the workhorse of practical engineering
flow calculations. It is a semi-empirical model based on model transport equations for the
turbulence kinetic energy (k) and its dissipation rate (ε). The model transport equation for
k is derived from the exact equation, while the model transport equation for ε is obtained
using physical reasoning. In the derivation of the k – ε model, the assumption is that the
flow is fully turbulent, and the effects of molecular viscosity are negligible. The standard k
– ε model is therefore valid only for fully turbulent flows [29].

Literature Review
Page | 13
The advantages of the k – ε is that it is simple and affordable computation wise and it
is reasonably accurate for a wide variety of flows that do not have flow separation. The
cons of the k – ε is that it is overly diffusive, it lacks universality and it is not accurate in
the region close to the wall. To overcome these problems few variants of the k – ε model
have been introduced. In Fluent in addition to the standard k – ε model the RNG k – ε
model and the realizable k – ε model are also available. When opting for a k – ε model in
Fluent it is always recommended to use the realizable k – ε model in combination with
Enhanced Wall Treatment. However for situation where flow separation occurs k – ε model
are not recommended.
κ – ω Model 2.2.3.2.
The k – ω model has been developed from when it became apparent that most of the
drawbacks of the k – ε models are due to the modeling of the ε equation which is neither
accurate nor easy to solve (ε has a local extreme close to the wall) [33]. The standard k – ω
model in Fluent is based on the Wilcox k – ω model which incorporates modifications for
low-Reynolds number effects, compressibility and shear flow spreading [29].
By using the ω-equation, this model offers several advantages when compared to the k –
ε models with the most prominent being better boundary layer modeling and more robust
Enhanced Wall Treatment. The disadvantage of the standard k – ω model is that the
solution is sensitive to the free stream conditions. Therefore the Shear – Stress Transport
(SST) k – ω was developed by Menter [29]. It basically blends the robustness and accuracy
of the k – ω model in the near wall region with the free stream independence of the k – ε.
Therefore for the CFD results it was decided this model to be used.
2.3. Production Methods
In this section a summary of the different production methods is given. The processes of
interest for producing the thruster are Micro – Machining, Additive Fabrication (3D
Printing) and Electroforming. More in-depth information and additional manufacturing
techniques are available in [34].
2.3.1. Micro – Machining
Machining is defined as the process in which material is removed with a cutting tool in
from a work piece in a controlled manner such that a desired final shape is achieved. There
are many different processes that have this common trait which are collectively known as

Production Methods
Page | 14
subtractive manufacturing processes. Micro – Machining is the same process done on a very
small scale. The processes that are of interest for producing the thruster components are
the traditional single point (Turning) and multi-point cutting processes (Milling and
Drilling) and also non-conventional thermal machining like EDM (Electrical Discharge
Machining).
Turning is a machining process in which the cutting tool is fixed and the work piece is
rotating and lathes are the principal machine tools used in turning. They are used to
produce rotational, typically axi - symmetrical parts which can have various futures such as
holes, grooves, threads etc. A typical turning machine and turning product are given in
Figure 5 and typical tolerances and surface finish values are given in Table 3. Advantages
of turning operations are very good tolerances and relatively short lead times while
disadvantages are that products are limited to rotational parts (axi – symmetric), tool wear
is significant and several operations may be required to achieve the desired shape. This
process would be interesting if axi – symmetric chamber is used, and for the nozzle as well
if the small diameters are achievable.
Figure 5: Turning Machine (Lathe) and Turning Product [35]

Literature Review
Page | 15
Table 3: Machining Process Comparison [35]
Turning Milling EDM
Typical Feasible Typical Feasible Typical Feasible
Part Size [mm] Ø 0.5 - 2E3 1 – 1.8E3 [L,W] -
Surface Finish
Ra [µm] 0.4 – 3.2 0.05 – 6.3 0.8 – 3.2 0.2 – 12.5 1.2 – 3.8 0.2 – 6.3
Tolerance [µm] ± 25 ± 5 ± 25 ± 12 ± 12 ± 4
In contrast to turning, in milling the work piece is fixed and the cutting tool is rotating
and the principal machines are called milling machines or mills. Milling is typically used to
produce parts that are not axi – symmetrical and may have many different features
including 3D surface contours. A typical milling machine and milled product are given in
Figure 6 and typical tolerances and surface finish values are given in Table 3. Advantages
of milling operations are very good tolerances and relatively short lead times while
disadvantages are that products complexity is limited, tool wear is significant and several
operations may be required to achieve the desired shape. Milling would be used if non axi –
symmetric chamber is used and potentially also for interface brackets used to attach the
thruster to the thrust bench or the structure of the satellite.
Figure 6: Milling Machine and Milling Product [35]
Drilling is machining operation in which holes are cut into a work piece. Drilling
operations are done primarily in drill presses but sometimes also on lathes or mills. Hole
diameters can be as small as 50 [µm] with a ± 2 [µm] tolerance. This method would be
useful for simpler, primitive nozzle production.

Production Methods
Page | 16
EDM is the process of machining electrically conductive materials by using precisely
controlled sparks that occur between an electrode and a work piece in the presence of a
dielectric fluid [36]. The electrode may be considered the cutting tool.. The advantages of
EDM is that I can form complex shapes and fine details, it have excellent tolerances and
low labor cost. The disadvantages are that the material has to be electrically conductive, it
has very low production rate and high tooling and equipment cost. EDM is typically
applied for production of dies and honeycomb structures. Typical tolerances and surface
finish values are given in Table 3. With micro machining both critical components such as
the nozzle and bulkier components like the structure can be produced. Companies capable
of doing all conventional machining processes on the small scale as needed for the DelFFi
thruster is “MICRO PRECISION PARTS MANUFACTURING LTD.” from the USA and
the internal workshop “DEMO” from Delft University of Technology.
2.3.2. Additive Fabrication (3D Printing)
Additive fabrication or more commonly referred as 3D printing is a process in which a
part is produced by adding layers of material upon one another. These fabrication processes
are inherently different from both machining processes which are a subtractive in nature
and consolidation processes such as injection molding since no product specific tooling or
molding is required.
There are different additive fabrication methods available, which differ both in the
method of layer deposition and the type of materials used. These can be split in 3 main
groups, namely liquid-based processes, powder-based processes and solid-based processes.
Liquid-based additive fabrication typically uses photo-curable polymer resins and
Stereolithography (SLA) is the most common process. These photo-curable polymers
however have poor mechanical properties that degrade over time and therefore are not of
interest for the manufacturing of the DelFFi thruster but can be useful for interface testing.
As the name suggest, in powder-based additive fabrication, powdered material is melted
or sintered to form each part layer. This allow not only polymers but also metals and
ceramics to be used and the mechanical properties of powder-based processes are more
attractive and stable when compared to liquid-based processes. The processes that are of
interest for producing the thruster components are Selective Laser Melting (SLM), Direct
Metal Laser Sintering (DMLS), Selective Laser Sintering (SLS) and Electron-Beam Melting
(EBM).

Literature Review
Page | 17
Solid-based processes use a variety of solid, non-powder, materials and each process
differs in how it builds the layers of a part. Most solid-based processes use sheet-stacking
methods, in which very thin sheets of material are layered on top of one another and the
shape of the layer is cut out. The processes that are of interest for producing the thruster
components are Laminated Object Manufacturing (LOM) and Fused Deposition Modeling
(FDM).
Each of the previously mentioned methods has its own advantages and drawbacks, and
the design of the part and the desired characteristics need to be taken into account when
choosing the best production method for each thruster component. Typical characteristics
for different additive fabrication processes are given in Table 5. More information can be
found in [37]
Table 4: Additive Fabrication Process Comparison [37]
FDM SLS DMLS LOM
Part Size [cm] 91x61x91 56x56x76 25x25x22 81x56x51
Min Feature
Size [mm] 0.13 0.13 0.13 0.20
Min Layer
Thickness
[mm]
0.13 0.10 0.03 0.05
Surface
Finish Rough Average Average Rough
Tolerance
[mm] ±0.13 ±0.25 ±0.25 ±0.10
Applications
Form/fit testing,
Functional testing, Rapid
tooling patterns, Small
detailed parts,
Presentation models,
Patient and food
applications, High heat
applications
Form/fit testing,
Functional testing,
Rapid tooling patterns,
Less detailed parts,
Parts with snap-fits &
living hinges, High heat
applications
Form/fit testing,
Functional testing,
Rapid tooling, High
heat applications,
Medical implants,
Aerospace parts
Form/fit
testing, Less
detailed parts,
Rapid tooling
patterns
Numerous companies are available where you can send you CAD drawing and they will
produce a prototype. While current 3D printing technology lacks the precision and surface
finish quality to produce the nozzle, it is a viable production method for the structure of
the thruster, reducing the number of components and making assembly easier.

Testing Facilities
Page | 18
2.4. Testing Facilities
In this chapter the currently available thruster test benches at the chair of Space
System Engineering are presented. In Section 2.4.1 a 50 [mN] called AE-TB-50M is
presented, with its characteristics, current state and modifications necessary to be used for
testing the DelFFi thruster are given. A test bench currently under development called AE-
TB-5M is presented in Section 2.4.2, with its predicted performance, current development
status and modifications necessary to be used for testing the DelFFi thruster are given.
Finally a decision is made, which test bench is going to be used in the testing campaign of
the DelFFi thruster. The information in this chapter is extracted from [38], [39] and [40].
2.4.1. AE-TB-50M Test Bench
The name of this test bench, AE-TB-50M, stands for Aerospace Engineering Thrust
Balance 50 [mN]. Originally designed and built in 2009 by Stef Janssens, in its default
configuration it can measure forces of up to 50 [mN] and it has been used for the
development and testing of the T3µPS micro propulsion system. The design is shown in
Figure 7 with the T3µPS mounted on the test bench.
Figure 7: AE-TB-50M Test Bench [39]
In principle the TB-50M is a horizontal balance with direct force measurement where
the detector provides the restoring force and measures force instead of displacements. The
construction is made out of BOIKON 20x20 mm aluminum profiles which allow simple
assembly of the stand and easy mounting of the detector, thrusters and feed system. It uses

Literature Review
Page | 19
low-friction ball bearing in the pivot. The maximum mass of the thruster (including the
mounting bracket) that the TB-50M supports is 360 [g]. The measurement range is 0.5 – 50
[mN] with and accuracy of 0.5 [mN] and the force is measured by a FUTEK LRF400 load
cell. Furthermore the thrust stand has mounting spots for both the feed system and
propellant tank. To reduce the influence of the changing mass in the propellant tank on the
dynamics and balance of the stand, the tank should be mounted above the pivot. Parasitic
forces caused by the power feed lines are reduced by using thin copper wires that are
protected by a thin film and suspended above the engine, minimizing their influence on the
measured thrust.
In 2009 Krister de Ridder has undertaken the task to make the test stand operational
again and modify the design such that the signal noise is reduced, however no
documentation is available of this effort.
2.4.2. AE-TB-5M Test Bench
In 2010 Daniel Pérez Grande designed a test bench named AE-TB-2M which can
measure thrust in range of 10 - 2000 [µN] for engines with a total mass of less than 300 [g]
with an accuracy of less than 2 [µN]. The AE-TB-2M design in principle was a direct
displacement measurement pendulum which is supported on two stands using a blade and
spike support to minimize friction. The configuration of the thrust stand is shown in Figure
8. The counter mass is used to amplify the moment caused by the weight of the engine,
while the torsion spring provides the restoring force required in the pendulum. To damp
environmental vibrations, a heavy aluminum baseplate is used on which the test stand is
mounted and parasitic forces are reduced by having the propellant tanks mounted on the
test stand itself. Additional advantage of this thrust bench is that it can be calibrated
remotely using electromagnet thus calibration can be done in vacuum instead of ambient
conditions.
In 2013 Roy Bijster took over the task from Daniel Perez Grande thereby incorporating a
number of improvements. The goal was set to enable trust measurements in the 1 [µN] to 5
[mN] and impulse bits in the 1 [µNs] to 1 [mNs] range. The test bench was accordingly
renamed to AE-TB-5M. However, recent results have shown that the range can be
extended to 10 [mN] with no or small modifications to the test stand such as changing the
torsion spring.

Literature Study Conclusion
Page | 20
Figure 8: AE-TB-5M Test Bench [40]
2.5. Literature Study Conclusion
At the beginning of this literature study a large number of CubeSat propulsion systems
were investigated. It has been concluded that most of the COTS propulsion systems are
either too immature or their performance is too low / high to be considered for the DelFFi
mission. Two systems however are able to fulfill all the requirements. The first is a µPPT
from Clyde Space and the second one is the T3µPS+ from TNO and TU Delft. The µPPT
quite possibly can be just integrated in the satellite and fulfill the mission requirements of
15 [m/s] ∆V. However some doubts exist about the thruster pulse rate, non – uniform and
late time ablation and possible electromagnetic interference with the rest of the DelFFi
systems. It can be ordered from Clyde Space for $17,250. This option however has not been
investigated further due to lack of funds, manpower and interest of the project manager.
The T3µPS+ would need a heater capable of heating the Nitrogen gas to 1000 [K] to
fulfill the requirements of 15 [m/s] ∆V. It will however require further development from
TNO on the CGG side and from TU Delft on the thruster side. The advantage of a
resistojet is that in a case the CGGs from TNO underperform, alternative propellants such
as water or butane can also be used.
To manufacture the nozzle and the thruster structure a number of production methods
alternative to MEMS have been investigated. Injection molding, electroforming and micro –

Literature Review
Page | 21
machining look like promising, cheaper alternative to MEMS, while providing equivalent or
better tolerances and surface quality. To produce the chamber and mechanical interfaces an
additive fabrication technique such as injection molding or 3D printing instead of
machining is expected to simplify the assembly and reduce the number of parts of the
thruster.

Page | 22
3. Conceptual System Design and Concept
Selection
In this chapter the preliminary design process and sizing of the propulsion system is
done. This design process focuses on fulfilling the performance requirements as set in [10]
and obtaining initial size information. First an initial design is made using ideal expansion
and then iteration is made such that the thruster would be able to fulfill the requirements
working both in cold gas and in resistojet mode.
For the initial sizing the following assumptions are made:
No losses in the feed system
No pressure and mass losses in the nozzle and boundary layer effects are
neglected
Isentropic flow from the tank to the heater inlet in resistojet mode or nozzle
exit in the cold gas mode
Intermittent operation of the propulsion system which allows the propellant in
the tank and feed system to be isothermal at the midpoint of the operational
temperature range – 300 [K]
Operation in vacuum, meaning ambient pressure is 0 [Bar]
Blow down system with the propellant stored as gas
No chamber filling effects. Steady state conditions at all time.
3.1. T3µPS+
In this section the performance of the propulsion system is calculated taking into
consideration the concept given in [20]. First of all the limit conditions are defined. It has
been stated in Chapter 1 that the thrust range of the thruster should be between 0.5 [mN]
and 9.5 [mN]. The propulsion system should provide at least 15 [m/s] ∆V. The maximum
expected propellant pressure is 10 [bar] and the wet mass of the DelFFi satellites is
estimated to be 3.6 [kg]. Finally the operating temperature range of the propulsion system
is from – 20 to 80 [°C] and the power consumption limited to 10 [W]. These values are
summarized in Table 5.

Conceptual System Design and Concept Selection
Page | 23
Table 5: Propulsion System Limit Conditions
Limit Conditions
Minimum Thrust 0.5 [mN]
Maximum Thrust 9.5 [mN]
Minimum ∆V 15 [m/s]
Maximum Propellant Pressure 10 [Bar]
Satellite Wet Mass 3.6 [kg]
Maximum Power Consumption 10 [W]
Maximum Operating Temperature 353.15 [K]
Minimum Operating Temperature 253.15 [K]
Figure 9: Cool Gas Generator New Design
As it was mentioned earlier in Section 2.1 a significant improvement needs to be made
to CGGs for them to be significant. TNO has proposed a new design of the CGGs shown in
Figure 9. It has a diameter of 16 [mm], height of 80 [mm] and produced 4.2 [g] of N2 gas.
Furthermore it requires a minimum clearing of about 4 [mm] above the CGG and 5 [mm]
below the CGG. It immediately becomes clear that using this CGG design will result in a
propulsion system with a height of at least 90 [mm]. The project manager accepted the
possibility to have the volume budget extended but asked for an alternative design as well.
Therefore TNO proposed a smaller 60 [mm] high CGG that would produce 30 [%] less gas

T3µPS+
Page | 24
or 2.9 [g]. Taking this into account and the fact that the maximum number of CGGs that
can be placed in the given volume is 14 due to clearance for mounting rods and other
components, a graph was made showing the attainable ΔV budget for nitrogen heated at
different temperatures (Figure 10).
Figure 10: Velocity Budget Attainable with CGGs
As it can be seen, 15 [m/s] is not attainable with the 60 [mm] CGGs even with a heater
capable of heating the gas to 1000 [K] and a gas temperature of at least 600 [K] is needed
to achieve this goal when using the 80 [mm] CGGs. Taking into account that losses are not
taken into account and that a previous MEMS thruster has been able to achieve a specific
impulse of 110 [s] and an operational temperature of 700 [K] [41] in this calculation 700 [K]
was taken as the gas temperature of the Nitrogen. The nominal storage pressure for the
nitrogen was taken from the preliminary study in [20] to be 7 [Bar]. For simplicity single
phase, gaseous flow is assumed with uniform temperature. The gas properties for Nitrogen
at both temperatures are given in Table 6. As it can be seen the ratio of specific heats and
the specific gas constant both are mostly dependent on temperature and not pressure.
0 5 10 15 20 250
20
40
60
80
100
120
140
Velocity Budget [m/s]
Pro
pella
nt
Mass [
gra
ms]
T = 300 [K] / Isp = 72 [s]
T = 400 [K] / Isp = 84 [s]
T = 500 [K] / Isp = 94 [s]
T = 600 [K] / Isp = 103 [s]
T = 700 [K] / Isp = 111 [s]
T = 800 [K] / Isp = 118 [s]
T = 900 [K] / Isp = 126 [s]
T = 1000 [K] / Isp = 132 [s]
80 [mm] CGGs
60 [mm] CGGs

Conceptual System Design and Concept Selection
Page | 25
Therefore an intermediate value for both of them is taken, namely the average of the
maximum and minimum.
Table 6: Nitrogen Gas Properties [42]
P [Bar] T [K] cv [J/g*K] cp [J/g*K] γ [-] R [J/kg*K]
7 300 0.74 1.05 1.41 306.4
7 700 0.80 1.10 1.37 298.0
5 300 0.74 1.05 1.41 303.7
5 700 0.80 1.10 1.37 297.7
1 300 0.74 1.04 1.40 298.1
1 700 0.80 1.10 1.37 297.0
3.1.1. Thruster Design
The sonic velocity of both gases is given by (3.1) and the characteristic velocity by (3.2)
The specific impulse is given by (3.3) and assuming ideal expansion in vacuum ( 0e cp p )
it reduces to (3.4). It should be noted that ideal expansion would require infinitely long
nozzle in vacuum and this is physically impossible, however the following relations are only
used as a starting point for the design and later iteration is made taking into consideration
the actual expansion ration and specific impulse.
0 · ·a RT (3.1)
1
*
2 2
0
2
1
ac
(3.2)
0
1
11 2* 12 2
11 1
esp
c
pcI
g p
(3.3)
1
0
1 2* 12 2
1 1sp
cI
g
(3.4)
From the specific impulse and the maximum thrust, the maximum mass flow can be
calculated using (3.5). Logically the mass flow will vary with the tank pressure in a blow

T3µPS+
Page | 26
down system. The maximum mass flow is interesting to see if with the current power
budget the propellant can be heated up to the desired temperature in the resistojet working
mode. This is done using (3.6). For initial sizing it is assumed that 50 [%] of the heater
power is transferred to the fluid. Finally the total propellant mass required is calculated
using (3.7)
0 sp
Fm
g I
(3.5)
PQ m C T (3.6)
0
0 1 sp
total
V
I g
pM M e
(3.7)
The results are summarized Table 12. Furthermore even with 50 [%] heater efficiency
the power requirement is within the limit. How the performance differs with a finite
expansion ratio is given in the next section.
Table 7: Ideal Propellant Performance
Cold Gas Resistojet
Nitrogen Nitrogen 700 [K]
γ [-] 1.41 1.37
R [J/kg*K] 303.6 297.7
a0 [m/s] 358 534
c* [m/s] 439 672
Isp [s] 80.6 126.6
PCp [W] - 6.73
Mp [g] 45.3 28.9
For the preliminary design ideal expansion is not anymore considered. As has been
shown in [13] the critical point is not the mass of the propulsion system but the volume.
Therefore low propellant mass and thus high specific impulse is crucial. To start the design
first a design point needs to be chosen. This is done by plotting the specific impulse for
different expansion ratios and comparing it to the ideal specific impulse. The exhaust Mach
number as function of the expansion ratio is given in (3.8). With the Mach number know
the pressure ratio over the nozzle can be calculated using (3.9) and finally the specific
impulse is calculated using (3.3).

Conceptual System Design and Concept Selection
Page | 27
2
1
2 21 2 11
1 2
ee
t e
AM
A M
(3.8)
1
211
2
ee
c
pM
p
(3.9)
The specific impulse vs. the expansion ratio for Nitrogen in the cold gas case is given in
Figure 11. A nozzle efficiency of 100 [%] is assumed. It can be seen that 90 [%] of maximum
theoretical value is achieved already at expansion ration of 18 and 95 [%] at expansion ratio
of 92. Due to the small scale of the nozzle, an area ratio of 92 should be easily achievable
and therefore this was chosen as the design point. This would result in Isp of about 76.9 [s].
For the resistojet case 90 [%] of maximum theoretical value of Isp is achieved at expansion
ratio of 30 and 95 [%] at expansion ratio of 145 (Figure 12). At an expansion ratio of 92 as
in the cold gas case the Isp of the thruster would be around 119 [s]. At this point the actual
expansion ratio is taken into account but quality factors are not.
Figure 11: Expansion Ratio vs. Specific Impulse for Nitrogen at 300 [K]
0 10 20 30 40 50 60 70 80 90 1000
10
20
30
40
50
60
70
80
Area Ratio
Specific
Im
puls
e [
s]
Theoretical
Design Point
90% Ideal Isp
95% Ideal Isp

T3µPS+
Page | 28
Figure 12: Expansion Ratio vs. Specific Impulse for Nitrogen at 700 [K]
With the area ratio of the nozzle set for both cases, the next step is to define the throat
area such that the maximum thrust is in compliance with the requirements as given in
Table 5. With the newly calculated Isp values the maximum mass flow is once again
calculated with (3.5). Next the throat area is calculated using (3.10). Assuming an
axisymmetric nozzle the diameter is calculated using basic algebra.
*
t
c
m cA
p
(3.10)
The chamber pressure cp in (3.10) is same as the tank pressure for both the cold gas
and the resistojet case. For simplicity reasons, the gas is assumed to behave as ideal gasses.
Since the heating is isobaric the throat area will remain unchanged from the cold gas case
and only the mass flow will differ. The results are given in Table 8, where the value for the
throat diameter in the resistojet case is for isobaric heating. With the geometry defined, in
the next section the thruster performance over time is investigated.
0 20 40 60 80 100 120 140 160 180 2000
20
40
60
80
100
120
Area Ratio
Specific
Im
puls
e [
s]
Theoretical
Design Point
90% Ideal Isp
95% Ideal Isp

Conceptual System Design and Concept Selection
Page | 29
Table 8: Preliminary Thruster Geometry
Cold Gas Resistojet
e tA A [-] 92 92
Isp [s] 76.9 119.2
Dt [µm] 100 100
3.1.2. Performance Analysis
To calculate the performance of the propulsion system, a basic feed and tank storage
system is modeled. As previously mentioned it is assumed that the Nitrogen is stored at 7
[Bar]. The tank temperature is assumed to be constant at 300 [K]. In both the cold gas case
and the resistojet case the camber pressure is assumed to be same as the tank pressure (
tank chamberp p ). Seeing as the feed system has to be compact and the feed system will be
made as short as possible it is expected that pressure losses will be negligible. Furthermore
the thermal mass of the tank is much larger than the rest of the system thus it is expected
that the temperature variations will be much smaller than the rest of the satellite.
Next a nozzle efficiency factor λ is introduced. Federico La Torre in his research has
come to the conclusion that in the 1 – 10 [mN] range a nozzle efficiency of 88 - 92 [%] is
achievable with optimal design choices [24]. These are explained in more detail later in the
report. Assuming that the nozzle is in the middle of this range, a nozzle efficiency of 90 [%]
is assumed. The thrust is then given by (3.11) [43].
1
11 2
12 21
1 1
et c e a e
c
pF A p p p A
p
(3.11)
The pressure ratio is calculated from (3.9) and since vacuum is assumed ap is 0 [Pa].
The throat diameter is sized such that at MEOP the thrust is 9.5 [mN]. From the
previously calculated area ratio given in Table 8 the throat area and exit area can be
calculated. With the thrust known and the mass flow calculated with (3.12), the specific
impulse of the thruster accounting for the efficiency of the nozzle can be calculated using
(3.13). Since the specific impulse is constant throughout the thrust and pressure range the
propellant mass required can once again be calculated using (3.7). The volume of the tank

T3µPS+
Page | 30
is sized such that the propellant storage pressure is in compliance with the previously
mentioned assumptions.
*
t cA pm
c
(3.12)
0
sp
FI
g m
(3.13)
With the thruster at 0t characterized equations (3.14) are calculated over time until
the thrust is below the required 0.5 [mN] or there is no propellant left in the tank. As
previously mentioned isothermal expansion is assumed due to the intermittent operation of
the propulsion system which allows the propellant in the tank and feed system to be
isothermal at the midpoint of the operational temperature range. The results are given in
Figure 13 for the resistojet case and in Figure 14 for the cold gas case. All the data is
summarized in Table 9 and Table 10. As it can be seen the results are different than the
ones in Table 7 mainly due to the introduction of the nozzle quality factors.
Table 9: Thruster Performance Summary
Cold Gas Resistojet
700 [K]
Fmax [mN] 8.6 8.8
Total ∆V [m/s] 10.5 16.4
Isp [s] 70.2 109.6
Tgas [K] 300 700
Mp [g] 58.8 58.8
Table 10: Thruster Design Summary
e tA A [-] 92
Dt [µm] 100
λ 0.9
ptank [Bar] 7
As it was previously mentioned since exact part production at this scale is rather
difficult a sensitivity analysis has been made w.r.t. the throat diameter because it is the
driving parameter in the thruster performance. The exit diameter just changes the
expansion ratio and with it the specific impulse however as it can be seen in Figure 11 and
Figure 12 the design point is far on the right side where the trend becomes nearly

Conceptual System Design and Concept Selection
Page | 31
horizontal. This means that the thruster performance is almost unaffected by inaccuracy of
the exit diameter. Finally the convergent and divergent angle and the surface quality will
affect the nozzle efficiency but the effect cannot be calculated using IRT and CFD analysis
is needed to investigate these effects.
It should be noted that Figure 11 and Figure 12 are modelled under the assumption
that all the propellant is available as gas in the beginning and no CGG firing is taken into
account. In reality by using CGGs, the tank volume will be much smaller and the change
in pressure much faster. If this concept is chosen and once the tank design is finalized the
CGG firing sequence will be incorporated into the simulation.
( ) ( 1) ( )
( )
( ) ( )
( )
( )
( )( )
( ) ( ) ( )
( )
( )
( )
1
11 2
1
0
*
2 21
1 1
i i i
i
i i
i
i
ii
i i i
i
i
i
p p
p t t
c t
t
t c
ee c
c
et c e e
c
sp
M M m t
M R Tp p
V
A pm
c
pp p
p
pF A p p A
p
FI
g m
( )
( )
0
0
ln
i
total
i
i
i e e
i
i
i
p p
F p Aw
m
MV w
M M M
(3.14)

T3µPS+
Page | 32
Figure 13: Nitrogen Resistojet Performance vs. Time
Figure 14: Nitrogen Cold Gas Performance vs. Time
0 1 2 3
x 104
0
2
4
6
8
Time [s]
Cham
ber
Pre
ssure
[bar]
Chamber Pressure vs. Time
0 1 2 3
x 104
0
0.005
0.01
0.015
Time [s]
Mass F
low
[g/s
]
Mass Flow vs. Time
Designed Dt
Dt + 15[%]
Dt - 15[%]
0 1 2 3
x 104
0
5
10
15
20
Time [s]
Delta -
V [
m/s
]
Delta - V vs. Time
0 1 2 3
x 104
0
5
10
15
Time [s]
Thru
st
[mN
]
Thrust vs. Time
0 0.5 1 1.5 2
x 104
0
2
4
6
8
Time [s]
Cham
ber
Pre
ssure
[bar]
Chamber Pressure vs. Time
0 0.5 1 1.5 2
x 104
0
0.005
0.01
0.015
0.02
Time [s]
Mass F
low
[g/s
]
Mass Flow vs. Time
Designed Dt
Dt + 15[%]
Dt - 15[%]
0 0.5 1 1.5 2
x 104
0
5
10
15
Time [s]
Delta -
V [
m/s
]
Delta - V vs. Time
0 0.5 1 1.5 2
x 104
0
5
10
15
Time [s]
Thru
st
[mN
]
Thrust vs. Time

Conceptual System Design and Concept Selection
Page | 33
3.1.3. System Design
The pressure in the tank when nitrogen is stored as gas can be calculated using (3.15).
If all the propellant is available as gas, as in the previous simulation, this leads to a
pressure in the tank of 160 [Bar] for propellant mass of 58 [g]. This is clearly above the
requirements as stated in Table 14 and thus it is not a feasible solution.
tank prop
tank
tank
R T MP
V
(3.15)
However if CGGs are used, one CGG has a volume of about 16 [cm3] and produces 4.2
[g] of propellant. Taking 14 CGGs as baseline the total volume used for propellant storage
is about 350 [cm3] which is in compliance with the space available. The design given in [20]
actually has 16 CGGs however later it became apparent that 2 CGG diagonally needs to
removed such that there is enough space for the mounting roods and supports. The CGG
propulsion system concept is shown in Figure 15.
Figure 15: Propulsion System Concept with CGGs [20]
A conceptual design of the thruster in cold gas mode (without heater) is shown in
Figure 16.

TU Delft in-house designs
Page | 34
Figure 16: Thruster Concept Design
Figure 17: Ideal Nozzle for Nitrogen Fed Thruster
3.2. TU Delft in-house designs
In addition to the design that would be made with TNO, two in-house designs have
been considered, both use liquid water as propellant but the pressurization method differs.

Conceptual System Design and Concept Selection
Page | 35
One design option uses CGGs for pressurization and another uses N2 gas. The thruster is
interchangeable to either concept.
3.2.1. Water Resistojet with Cold Gas Generator
This design option would use the existing CGGs as used in Delfi – n3Xt. While they
provide only about 0.1 [g] of N2 gas, this is sufficient for pressurization of the water. This
will significantly reduce development costs of the propulsion system, as the CGGs are
readily available for purchase. Depending on the tank size 1 – 3 CGGs should be sufficient.
The ignition circuit for the CGGs however still comes at a significant cost. The system
would work in blow-down mode with pressure ranging between 10 and 1 [Bar]. The
conceptual design of the tank is show in Figure 18. The water and the nitrogen gas need to
be separated to prevent mixing and to ensure pressurization of the water. This can be done
by using piston, membrane or other separation mechanism.
Figure 18: CGG + Water tank design
3.2.2. Water Resistojet with Nitrogen Gas
This design option would use N2 gas to pressure the water, meaning the system will
also be pressurized during launch. This simplifies the design significantly, but it introduces
additional constraints in terms of regulations and additional testing and safety margins
that need to be satisfied such that the propulsion system is allowed on-board the launch
vehicle. In terms of performance, they will be the same as the other design option since the
performance is driven by the thruster and not the propellant storage and feed system. The
conceptual design is shown in Figure 19.

Thruster
Page | 36
Figure 19: Water Resistojet pressurized with Nitrogen Gas
3.3. Thruster
The maximum input power is 10 [W]. Assuming a maximum heating efficiency of 70%,
it follows that 7 [W] is available for heating. Taking into consideration the enthalpy change
for heating water from 300 [K] to 550 [K] of 2900 [J/g] [42] the maximum mass flow that
can be heated to 550 K can be calculated using (3.16) to be 2.4 [mg/s]. The power required
for heating water from 300 [K] to different temperatures and different mass flows is given in
Figure 20.
2.4 P mg
msH
(3.16)
With this the maximum throat diameter for an axi-symmetrical nozzle can be
calculated to be 65 [µm] using (3.17). For the production 60 [µm] was chosen as the next
smallest available drill size.
*
c tp Am
c
(3.17)
To reduce the risk of water droplets condensing in the nozzle exhaust the area ratio
should be kept low and thus an area ratio of 25 was selected. Finally the convergence and
divergence angle are set to 20° and 30° respectively to make the manufacturing process
easier. The whole nozzle has a length of 0.9 [mm] and a diameter of 2 [mm]. It has a M2
thread such that it can easily be screwed in the chamber and the performance of different

Conceptual System Design and Concept Selection
Page | 37
nozzle geometries can be investigated during the testing phase. The nozzle cross section is
shown in Figure 21.
Figure 20: Power required to heat water
Figure 21: Nozzle Cross Section
0 0.5 1 1.5 2 2.5 30
2
4
6
8
10
12
Mass Flow [mg/s]
Pow
er
[W]
T = 550 [K]
T = 650 [K]
T = 750 [K]
T = 850 [K]
Limit Power

Concept Trade – Off
Page | 38
From [42] for water at 550 [K] and 7 [Bar] the following properties are valid (Table 11).
Table 11: Water Properties
Parameter Value Unit
Cp 2.1056 [J/g*K]
Cv 1.5858 [J/g*K]
R 519.8 [J/kg*K]
γ 1.328 -
With these the results in Table 12 are obtained. Propellant mass was taken to be 50 [g]
and ideal nozzle is assumed.
Table 12: Thruster Specifications
Parameter Value Unit
Thrust 3.5 – 0.5 [mN]
Pressure 7 – 1 [Bar]
Specific Impulse 141 [s]
Mass flow 2.5 – 0.4 [mg/s]
Power Needed 7.2 – 1.2 [W]
Propellant Mass 50 [g]
ΔV 18.7 [m/s]
3.4. Concept Trade – Off
The trade – off was done on the basis of the criteria given in Table 13. Since this is an
academic project the cost and producibility have the highest impact on the project. Next in
line is the performance of the thruster since while achieving the requirements is sufficient
one should strive for higher performing and more efficient system. Finally the volume and
the mass have the lowest weight since their budget is fixed and if a system satisfies it, it
should be good enough. Development time is expected to be the same for all systems and
therefore was not taken into account.
During the time of the trade – off there were significant updates from both TNO and
VKI as the project leader of the QB50 mission. In retrospect the time line of the events are
given below:
- First meeting with TNO October 2013: It is estimated by TNO Total cost for the
two units is € 100k with a risk level comparable to that for the T3-mps system.
Schedule for development is very tight. TNO is unable to contribute funds.

Conceptual System Design and Concept Selection
Page | 39
- Second meeting in November 2013 leading to an initial request for proposal to
TNO. On request of DelFFi systems engineer the number of systems requested is
increased to three.
- January 2014: Third meeting with TNO leading to a new cost estimate of €145k.
- January 23rd: DelFFi systems engineer indicates the cost is simply too high and
alternative solutions need to be found
- End January 2014: Confirmation of VKI that water is allowed on board of DelFFi.
It is not considered to endanger the launch or others. Decision is made in
agreement with systems engineer that the propulsion group will start designing an
alternative propulsion system based on the assumption that a maximum pressure
of 10 [Bar] is allowed during all mission phases.
Thus due to the fact that the cost estimate provided by TNO is prohibitively high for
this project and the relaxation in the constraints in terms of pressurized system onboard it
has been decided that Delft University of Technology will continue designing, building and
testing the DelFFi propulsion system independently. As it can be seen a propulsion system
with water as propellant and gaseous nitrogen as pressurant gas was set as baseline.
Table 13: Propulsion System Concepts Trade - Off
Criteria + Weight T3µPS+ H2O + CGG H2O + N2
Cost 5 1 3 5
Performance 3 5 4 4
Producibility 4 5 3 3
Volume 1 1 4 5
Mass 1 1 4 5
Pressurization 2 5 5 1
TRL 4 3 1 1
Score 64 61 66
Due to the fact that all the components will be done in-house and no complicated
ignition circuit or CGGs are needed the H2O + N2 scores highest in the Cost category.
Performance wise the T3µPS+ can provide the highest thrust and sufficient ΔV while the
concepts using water have much lower thrust. Producibility wise the water concepts score
lower due to the smaller nozzle needed which complicates the nozzle production. Volume
wise the T3µPS+ is outside the initial bounds given by the system engineer while the in-
house designs require much smaller tank size. Furthermore the T3µPS+ has much higher
mass due to the support needed for the CGGs and the left-over “dead weight” that they

Concept Trade – Off
Page | 40
have (components such as casing, igniter etc.). Finally since both the T3µPS+ and the H2O
+ CGG concept are unpressurized during launch they score the highest in this category
while the H2O + N2 will be at MEOP during launch. TRL wise the for the T3µPS+,
smaller CGGs have been proved to work in Space, but these need to be enlarged
significantly while a water resistojet at this performance spectrum hasn’t been
demonstrated in Space.

Page | 41
4. Thruster Requirements Analysis
In this chapter the requirements analysis for the thruster design is given. The thruster
has been defined in [13] and Section 1.2 as everything from the valve to the nozzle,
including the valve to chamber connection, but excluding the valve to feed system and tank
connection
There are 2 groups of requirements. The main requirements (Section 4.1) are the
mission specific system requirements coming from the DelFFi and QB50 Mission [10] [11] ,
from which a flow down is made such that the thruster requirements are obtained in
Section 4.1. Furthermore requirements from the interface to the thrust bench (Sections 4.3)
are also considered since they will be of importance during the testing phase of the
thruster.
4.1. Thruster Requirements
In this section the thruster subsystem requirements are given that flow down from the
previously given propulsion system requirements. The rationale for each requirement is
given in the sections below. The flow down chart is given in Figure 23 and the summary of
the most important requirements are given in Table 14.
Table 14: Thruster Subsystem Requirements
Thruster
Total Thruster Mass < 25 [g]
Total Volume 70 x Ø16 [mm]
Propellant Type Compatible with H2O (Liquid) and N2
(Gas)
Specific Impulse > 100 [s]
Thrust Range 0.5 - 9.5 [mN]
Total Power Consumption < 8 [W]
Response Time < 2 [s]
Valve
Mass < 10 [g]
Volume 30 x Ø16 [mm]
Leak Rate < 10E-5 [scc/sec] GN2
Power Consumption < 1 [W] Continuous
Lifetime > 5000 Cycles
MEOP 10 [Bar] (TBC)

Thruster Requirements
Page | 42
Heater
Mass < 10 [g]
Volume 50 x Ø16 [mm]
Operating Temperature 550+ [K]
Power Consumption < 9.5 [W] Continuous
Lifetime > 5000 Cycles
THR-SYS-101: The total thruster subsystem mass shall be less than 25 [g].
Rationale: Follows from PROP-SYST-100. Estimate given in [20] taking into as a
baseline the old T3µPS and added extra mass for heating element.
THR-SYS-102: The thruster volume shall be less than 70 x Ø16 [mm].
Rationale: Follows from PROP-SYST-200 and the fact that there is an antenna board
infront of the propulsion system. The thruster needs to protrude through the antenna board
(about 10 [mm] thick) until the end of the satellite giving about 20 [mm] of extra volume.
THR-SYS-105: The subsystem shall be able to operate in the temperature range 4
[°C] and +80 [°C].
Rationale: Follows from PROP-SYST-710 and the fact liquid water is going to be used
plus a thermal margin.
THR-SYS-106: The thruster shall be able to withstand pressure of at least 10 [Bar]
Rationale: Follows from PROP-SYST-600
THR-SYS-107: The thruster shall be able to withstand the operating temperatures of
at least 550 [K]
Rationale: Follows from the analysis done in Chapter 3.
THR-SYS-108: The thruster shall be leak tight (<TBD N2/ssc) and resistant to
water corrosion
Rationale: Due to the low mass flow rate any leakage will have adverse effect on the
produced thrust. Furthermore since water is used as propellant the thruster needs to be
water resistant.

Thruster Requirements Analysis
Page | 43
4.1.1. Valve Requirements
THR-VLV-100: The maximum leak rate shall be 10E-5 GN2 (TBC) [scc/s] at
maximum operating pressure.
Rationale: From analysis the maximum allowable propellant lost over the designed life
time of 1 year (PRO-PERF-400) should be calculated and contamination to other
components in the system. Current result from [8]
THR-VLV-101: Minimum Lifetime of 5000 Cycles.
Rationale: Follows from PRO-PERF-400 and PRO-PERF-410.
THR-VLV-102: The valve shall operate at the satellite bus voltage of 12 [VDC]
Rationale: From PROP-SYST-720 and [44] this is 12 [V].
THR-VLV-103: The valve response time shall be faster than 2 [ms].
Rationale: Follows from the total reaction time of the system PROP-PERF-300.
THR-VLV-104: The valve shall be able to operate in the pressure range from 0 bars
to 10 [Bar].
Rationale: The valve should be able to withstand all operating pressures of the system.
10 [Bar] is the highest expected MEOP with 7 [Bar] MEOP being the more likely [20] [10]
[44].
THR-VLV-105: The valve shall have a normally closed configuration.
Rationale: For safety reasons, if there is no power, or there is a sudden cut-off the
valve should remain closed or close if it was open to prevent loss of propellant.
Furthermore since for the majority of the time the valve will be closed, this operation
method is more efficient.
THR-VLV-106: The valve continuous power consumption when open (hold power)
shall be less than 1 W.
Rationale: Follows from PROP-SYST-310 and the valve in the current design of T3µPS
as given in [45]. TBC at a later stage.

Thruster Requirements
Page | 44
THR-VLV-107: The valve mass shall be lower than 10 [g].
Rationale: Follows from PROP-SYST-200 and the T3µPS+ estimate as given in [20].
TBC at a later stage.
THR-VLV-108: The valve volume shall be smaller than 30 x Ø16 [mm].
Rationale: Follows from PROP-SYST-600 and the valve in the current design of T3µPS
as given in [45]. TBC at a later stage.
4.1.2. Nozzle Requirements
THR-NZL-100: The nozzle should be designed such that the thruster provides thrust
in the 0.5 – 9.5 [mN] range
Rationale: Follows from PRO-PERF-200 and PRO-PERF-205. The throat diameter is
defined from this requirement.
THR-NZL-103: The nozzle should be designed such that the thruster has a minimum
specific impulse of at least 100 [s].
Rationale: Follows from PRO-PERF-100 and analysis of propellant storage space
available. The expansion ratio is defined by this requirement.
THR-NZL-104: The nozzle mass should be less than 1 [g].
Rationale: Follows from PROP-SYST-200 and the T3µPS+ estimate as given in [20].
TBC at a later stage.
4.1.3. Heater Requirements
THR-HTR-102: The heater shall have an operating temperature of at least 550 [K].
Rationale: Follows from analysis in Chapter 3.
THR-HTR-103: The heater continuous power consumption when active shall be less
than 9.5 [W].
Rationale: Follows from PROP-SYST-310 and the power budget left after the power
usage is deducted for actuating ( ≈ 3 [W] for less than 1 [ms] peak / 0.36 [W] average) the

Thruster Requirements Analysis
Page | 45
valve and sensing electronics (0.07 [W]) in the current T3µPS design [46]. TBC at a later
stage.
THR-HTR-104: The heater mass shall be lower than 10 [g].
Rationale: Follows from PROP-SYST-200 and the T3µPS+ estimate as given in [20].
TBC at a later stage.
THR-HTR-105: The heater volume shall be smaller than 50 x Ø16 [mm].
Rationale: Follows from PROP-SYST-600. TBC at a later stage.
4.1.4. Mechanical Interface Requirements
THR-STR-100: The structural support should be such that it will allow connection of
the thruster to the propellant storage and feed system and integration into DelFFi satellite.
Rationale: Follows from PRO-SYST-400 and PRO-SYST-410. The actual interface
design is TBD at a later stage.
THR-STR-101: The structural support should be such that it will withstand the
launch loads.
Rationale: Follows from PRO-SYST-500s
THR-STR-103: The tubing from the valve to the thruster will be kept as short as
possible and have a diameter of TBD [mm] as to provide the required mass flow to the
thruster.
Rationale: Short tubing result in lower pressure drop. Furthermore shorter tubing will
result in less residual propellant stuck after the valve is closed.
4.2. PCB and Electrical Interface Requirements
In this section the PCB requirements are given and their rationale. These requirements
are made in the early stage of the project development thus may be incomplete and subject
to change. The PCB dimensions and profile is given in Figure 22, the important being the
total dimensions and the size and positions of the cut outs and mounting holes.

PCB and Electrical Interface Requirements
Page | 46
Figure 22: OBC PCB profile
THR-PCB-100: The PCB shall have dimensions of 90 x 90 and will closely follow the
layout of the OBC PCB given in Figure 22.
Rationale: Needs to fit in the satellite
THR-PCB-101: The PCB shall have PC104 connector
Rationale: Standard connector used for interfacing in the satellite
THR-PCB-102: The EEE components on the PCB shall have operating temperature
range of 4°C to +80°C and non-operating temperature range of -20°C to +80°C
Rationale: The electronic circuitry shall have the same operation and non-operating
temperature range as the rest of the propulsion system
THR-PCB-103: The EEE components and the PCB shall have mass lower than 50 [g]
Rationale: This is approximately 10% of the total mass budget

Thruster Requirements Analysis
Page | 47
THR-PCB-104: The PCB will be able to convert to 12 [Vdc] locally and the circuit
shall be able to provide up to 10 [W] for 600 [s] and 20 [W] for up to 2 [ms]
Rationale: Heater (TBC) and valve work at 12 [V] and the maximum power
consumption is 10 [W] for about 600 [s]
THR-PCB-105: The PCB will be able to convert to 1.6 [Vdc] locally and the circuit
shall be able to provide up to 20 [W] for up to 2 [ms].
Rationale: The valve spike voltage is 1.6 [Vdc] and the spike duration is up to 2 [ms].
From [47] a 20[W] power supply is recommended.
THR-PCB-106: The PCB shall have a Spike and Hold that functions as given in
Chapter 7 and [47]
Rationale: Necessary for normal operation of the valve.
THR-PCB-107: The PCB shall have a logic circuit capable of controlling the spike
and hold circuit and provide pulsing signals of up to 1000 [Hz] if necessary.
Rationale: TTL signal needed to control the spike and hold circuit and pulsing may be
necessary for limiting the mass flow to the chamber. 1000 [Hz] is the maximum pulse rate.
THR-PCB-108: The PCB shall have a control circuit for the heater capable of
turning it on and off and pulsing the on / off signal up to 1000 [Hz] if necessary.
Rationale: Control is necessary for turning the heater on and off and pulsing may be
necessary for maintain a certain goal temperature.
THR-PCB-109: The PCB shall provide power and sensing leads for a pressure and a
temperature sensor in the tank.
Rationale: Necessary for normal operation of the sensors.
THR-PCB-1010: The PCB shall provide a Thermocouple conditioning unit and
connection for the integrated TC in the heater.
Rationale: The COTS thruster will have a TC integrated in the heater to monitor the
temperature. A TC conditioning unit is necessary for correct read-out of the TC.

PCB and Electrical Interface Requirements
Page | 48
THR-PCB-111: The PCB shall be able to provide feedback of the voltage level of the
DC/DC convertors, heater and the sensing line of the tank pressure and temperature sensor
and the current going through the heater.
Rationale: Necessary for monitoring purposes during EM Testing. This may be omitted
for the FM model (TBC)
THR-PCB-112: The PCB shall be able to log and store the values of the voltages and
current being monitored either locally or remotely to a different subsystem.
Rationale: Used to simulate FM conditions where data is first stored locally and then
transmitted to the Ground Station during a pass.
THR-PCB-113: The PCB shall be able to control all the different components, store
and communicate with them either with a local control unit or remotely through the OBC.
Rationale: The PCB needs to be able to be controlled remotely, like when sending a
command from the Ground Station, and to be able to communicate with the rest of the
satellite.

Thruster Requirements Analysis
Page | 49
Thruster Requirements
Valve Heater Nozzle Structure
Heading
PROP-PRF
Performance
DellFi Mission Requirements
PROP-SYST
Interface
PROP-PRF-100
Total ∆V > 10 m/s
PROP-PRF-200
Maximum Thrust
9.5 mN
PROP-PRF-300
Response Time of
Propulsion System
< 2 s
PROP-PRF-400
Lifetime > 1 year
PROP-PRF-410
>5000 On-Off
Cycles
THR-VLV-103
Response Time of
Valve TBD ms
THR-HTR-101
Response Time of
Heater TBD ms
Able to Operate
on DelFFi Bus
PROP-SYST-400 /410
Install in C.U.
perpendicular to
the larger face
THR-STR-100
Able to Integrate
to DelFFi
Propulsion System
TBD Mechanical
Interface
PROP-SYST
Budgets
PROP-SYST-200
Total Volume
90x90x80 mm
PROP-SYST-100
Total Wet Mass of
Propulsion System
< 459 g
PROP-SYST-310
Total Power
Consumption
<10W
PROP-SYST-320
Total Energy
Consumption
<100 kJ per Day
PROP-PRF-210
Maximum Vector
Misalignment TBD
PROP-PRF-205
Minimum Thrust
0.5 mN
THR-SYS-100
Lifetime > 1 year
THR-VLV-100
Maximum
Leakage Rate
TBD ssc /s
THR-VLV-101
Minimum Lifetime
of 5000 cycles
THR-NZL-100
Thrust Range of
0.5 – 9.5 mN
THR-NZL-103
Minimum of TBD s
Specific Impuse
THR-HTR-100
Minimum Lifetime
of 5000 cycles
THR-HTR-102
Minimum Heater
Temperature of
TBD K
THR-NZL-101
Maximum Vector
Misalignment TBD
THR-VLV-106
Total Power
Consumption <1W
THR-HTR-103
Total Power
Consumption <7W
THR-VLV-107
Valve Mass < 5 g
THR-HTR-104
Heater Mass < 10
g
THR-NZL-104
Nozzle Mass < 1 g
THR-STR-101
Structure Mass
< 10 g
THR-SYS-101
Total Thruster Mass < 25 g (TBC)
THR-SYS-102
Total Volume < 100 x Ø 16 [mm] (TBC)
THR-VLV-108
Valve Volume
< 30 x Ø 16 [mm]
THR-HTR-105
Heater Volume
< 50 x Ø 16 [mm]
THR-NZL-105
Nozzle Volume
< 20 x Ø 16 [mm]
PROP-SYST
Safety
PROP-SYST-620
Non Hazardous
Propellant
PROP-SYST-600
Internal Pressure
< TBD [Bar]
THR-VLV-104
MEOP = 10 [Bar]
(TBC)
PROP-SYST-710
Temperature
Range -30 to 80°C
THR-SYS-105
Operating Temperature Range -30 to 80°C
THR-VLV-105
Normally Closed
Configuration
`
PROP-SYST-720 THR-VLV-102
Operate at 12VDC
(TBC)
Figure 23: Thruster Requirements Flow Down Chart

Interface Requirements for Testing
Page | 50
4.3. Interface Requirements for Testing
Prior to integrating the thruster in the DelFFi satellites it should be testable at one of
the TU Delft’s thruster test benches. Currently there are 2 test benches available.
Depending on the test bench used, an interface between the thruster and the test bench
needs to be made. The requirements imposed by the two test benches are given in the
subsequent sections.
4.3.1. Thruster Test Bench AE-TB-5M
The AE-TB-5M that is currently in development imposes the following requirements on
the thruster. The rationales behind these requirements are given in [38].
Thrust
PROP-TEST-100: The maximum thrust measureable by the AE-TB-5M test bench
in the current set-up is 5 [mN]. With modifications 10 [mN] is possible
PROP-TEST-105: The minimum thrust measureable by the AE-TB-5M test bench in
the current set-up is 1 [μN].
Mass
PROP-TEST-200: The maximum mass of the thruster including the mounting
bracket is 300 [g].
Volume
PROP-TEST-300: The maximum height of the thruster including the mounting
bracket is 40 [mm] and the maximum width is 110 [mm].
Installation
PROP-TEST-400: The thruster shall have a TBD interface such that it can be
installed on the AE-TB-5M test bench.
PROP-TEST-405: The mounting bracket shall have TBD dimensions.

Thruster Requirements Analysis
Page | 51
4.3.2. Thruster Test Bench AE-TB-50M
The second test bench that is currently in the inventory of the Delft University of
Technology Space Engineering department is the AE-TB-50M. It imposes the following
requirements on the thruster. Their rationales can be found in [39]
Thrust
PROP-TEST-100: The maximum thrust measureable by the AE-TB-50M test bench
is 50 [mN].
PROP-TEST-105: The minimum thrust measureable by the AE-TB-50M test bench
is 2 [mN].
Mass
PROP-TEST-200: The maximum mass of the thruster including the mounting
bracket is 360 [g].
Volume
PROP-TEST-300: The maximum height of the thruster is TBD [mm] and width is
TBD [mm].
Installation
PROP-TEST-400: The thruster shall have a TBD interface such that it can be
installed on the AE-TB-50M test bench.
PROP-TEST-405: The mounting bracket shall have TBD dimensions.

Page | 52
5. Thruster Design and Component
Selection
In this chapter the thruster is designed and components are selected. As given in Figure
2, the thruster can be separated in 4 components:
Valve with interface to the feed system
Heating chamber containing:
o Heater
o Porous Media
Nozzle
Supporting Electronics and PCB
Since nitrogen is no longer used as propellant the valve cannot be incorporated in the
tank as in [20] but will have to be outside of it or incorporated in the thruster module. Two
thruster designs are being produced in parallel. The first concept is using an advanced
MEMS manufacturing technique, while the second concept concentrates on using
traditional manufacturing techniques and components wherever possible. The two thrusters
need to be interchangeable with their last common link being the valve. The second
thruster is covered in this thesis report.
5.1. Valve Selection
A large number of valves have been investigated during the course of the literature
study and the thesis project. The driving requirements for the valve, as given in Chapter 4,
are the pressure rating, power consumption, operating temperature and size. After careful
consideration the best candidate was chosen to be a valve produced by the Lee Company
and coming from their IEP specialty valve series. The Lee Company produces a wide array
of miniature solenoid valves and their distributor in the Benelux is Denis de Ploeg BV.
5.1.1. Flight Model Valve
The IEP Series solenoid valves have maximum operating pressure of up to 55 [Bar] and
maximum operating temperature of up to 135 [°C] while having mass of less than 6 [g].
This makes them really good candidates for the flight model where wider operating
temperature ranges and pressures may be necessary. The valve is shown in Figure 24 and
the characteristics are given summarized in Table 15 [48]. This valve is rated to work with
gasses as well as fluids and different sealant materials are possible.

Thruster Design and Component Selection
Page | 53
Table 15: IEP Valves
MEOP 55 [Bar]
Operating Temperature Up to 135 [°C]
Operating Voltage 12 [Vdc]
Sealing Materials EPDM, FKM
Cost €840 excluding Tax and Shipping
Lead Time 2 - 10 weeks
Figure 24: IEP Valve Series (mm in brackets)
Figure 25: EPSV Valve power consumption [49]
A similar valve has also been used in the T3µPS propulsion system on-board Delfi –
n3Xt called EPSV Valve. During testing it had a peak power consumption of 3 [W] and
cumulative average power consumption of 0.35 [W] (Figure 25). Seeing as the valve is
similar in size and specifications it is safe to assume that the power consumption will be
similar. This however needs to be confirmed during the flight model testing. This valve is
however expensive and comes with stainless steel pipe that needs to be welded to the rest
of the propulsion system. Furthermore due to lack of experience in operating and testing

Valve Selection
Page | 54
this kind of valves a cheaper alternative is deemed necessary for the engineering model and
initial testing.
5.1.2. Engineering Model Valve
More affordable equivalents of the IEP valves described in Section 5.1.1 are the VHS
valves. The VHS solenoid valve series are used in both medicine and high-tech industry,
they have normally closed configuration and have fast opening times (as fast as 0.25 [ms]),
MEOP of up to 120 [PSIG] (circa 7 [Bars] in vacuum) and 250 million cycles as life-time
minimum [48]. They are currently one of the smallest on the market, weighting 1.8 [g] and
having an internal volume of 35 [µL]. Furthermore they have different inlet and outlet
configurations and different orifices can be installed on the valve if necessary.
To guarantee proper functioning of the valves proper filtration is required. System
filtration of 12 microns or less is recommended. In addition, last chance PEEK filters are
available that can be threaded directly into valves with MINSTAC inlet ports. These are
however last chance screens and are not intended to replace system filters. Failing to
provide proper filtration can result in damaged valve and leakage due to contamination of
the sealing surface.
Figure 26: INKX0511400AA5 VHS Solenoid Lee Valve (mm in brackets)
The configuration of interest for the EM, features MINSTAC inlet and outlet and is
shown in Figure 26 and the characteristics are given in [48]. The reason why a valve with 2
MINSTAC ports was chosen is that it gives the best flexibility in connecting and
positioning the valve. The specifications are also summarized in Table 16 and as it can be
seen, different sealing materials are available.
Table 16: VHS Valves
MEOP 120 [PSIG] / 8.3[Bar] in ambient / 7.3
[Bar] in vacuum

Thruster Design and Component Selection
Page | 55
Operating Temperature 4 – 49 [°C]
Operating Voltage 12 / 24 [Vdc]
Sealing Materials EPDM, FKM
Cost €250 – 270 excluding Tax and Shipping
Lead Time 2 weeks
Ethylene Propylene Diene Monomer (EPDM) is a synthetic rubber that has widespread
application on sealing. It has excellent resistance to heat, water, steam, ozone and UV light
while still retaining very good low temperature flexibility. Furthermore it has excellent
thermal aging and good wear resistance but is not suitable for use mineral oil products. [50]
EPDM has minimum service temperature of -50 [°C].
Figure 27: Temperature range for Common Elastomeric Materials [51]
Fluorocarbon (FKM) elastomers are highly fluorinated, carbon backboned polymers
used in applications to resist harsh chemical and ozone attack. It has excellent resistance to
high temperatures, ozone, oxygen, mineral oil, synthetic hydraulic fluids, fuels, aromatics
and many organic solvents and chemicals. Low temperature resistance is normally not

Valve Selection
Page | 56
favorable and for static applications is limited to approximately -26 [°C] [51]. The
applicable temperature ranges of both seals are shown in Figure 27. Since EPDM has lower
operating temperature range and it is better suited for water and steam, while FKM is
better for oil and hydraulic fluids, EPDM was chosen as the better sealing material for the
valve used in water resistojet.
The model numbers of the valves of interest are INKX0511400AA5 and
INKX0514300AA4 with the only difference being the operating voltage level of 12 and 24
[Vdc] respectively. Both these valves feature MINSTAC ports on both ends, EPDM sealing,
operating temperature range is 4 – 49 [°C].
5.1.3. Valve Control Circuit
Both the IEP and VHS valves require a spike and hold circuit for proper operation. The
valve initially requires a 12 or 24 [Vdc] (model dependent spike voltage) pulse for a
minimum of 0.3 [ms] to actuate the valve, and then the voltage through the coil needs to be
reduced to 1.6 or 3.2 [Vdc] (model dependent hold voltage) to keep the valve open. If the
voltage is not reduced to the model dependent hold voltage level, the coil will overheat and
the valve will be destroyed.
An example spike and hold driver schematic is shown in Figure 28. The control signal
input is 5V TTL control signal, V1 is the valve spike voltage and V2 is the valve hold
voltage. Vcc is the input supply voltage for the NE555V which is between 5 and 15 [Vdc]
[52]. The spike duration is calculated using equation 5.1. For example with a capacitor of
0.047 [µF] and a 100 [kΩ] variable resistor, the spike duration would be between 0.5 – 5
[ms].
1 11.1pulset R C (4.1)

Thruster Design and Component Selection
Page | 57
Figure 28: Spike and Hold Driver Schematic
5.2. Porous Media Selection
Common occurrence in water resistojets is spitting of the thruster, namely not
vaporized water droplets entering in the nozzle. This was observed in both TU Delft’s own
DUR [53] thrusters, which resulted in an 80 [%] lower thrust than the theoretical
calculations, and also in other thruster designs [54]. This has been attributed to the so
called “boiling crisis”.
During the boiling of a fluid flowing through a channel, several heat-transfer regimes
are encountered. A typical case is illustrated in Figure 29. The liquid water enters the
channel and is heated in the liquid phase to the point where bubble nucleation first occurs.
Nucleate boiling continues until enough vapor is generated such that the resulting increase
in velocity is sufficient to suppress nucleation. Beyond this point, heat is added to a thin
liquid film and vaporization occurs at the liquid vapor interface. Throughout these boiling
regimes, liquid is being entrained in the vapor core. In spite of any re-deposition of liquid

Porous Media Selection
Page | 58
from the core to the film, at some point there is no longer sufficient liquid to wet the wall
and the liquid film breaks down. This results in a large reduction in heat transfer
coefficient, often more than an order of magnitude. This transition has been termed
"boiling crisis". This film breakdown is generally followed by a transitional regime wherein
a considerable amount of liquid remains on the wall. Eventually, only a few droplets remain
on the wall, and most of the heat added through the wall goes into heating the vapor. It
then becomes difficult to vaporize the remaining droplets and when they reach the nozzle,
spitting occurs. [54]
Figure 29: Heat - Transfer phases in channel flow [54]
Prediction of this pattern is complicated due to the wide variety of possible two-phase
flow regimes and by the various thermodynamic inequilibria. Therefore it has become
apparent that for a coupled system, that needs to both evaporate the water and heat it to
high temperature, a turbulent flow is needed so that the liquid is forced to mix with gas,
increasing the “stay time” in the heating chamber and increasing the heating efficiency.
In the past numerous methods have been investigated and the most promising options
for small satellites are given in Figure 30. Since using heated tubes has been unsuccessful in
previous designs (eg. DAR) and option 3 (Figure 30 flow swirling induced by geometry) has
shown to work well in engineering models but has had problems in microgravity conditions
[53] [54]. Therefore porous media (packed beds) has been chosen to be used for the flight
model. However instead of packed beds, metal foam will be used expecting that better
heating uniformity will be achieved and no hotspots will be present. Furthermore the metal
foam has good thermal properties and it’s resistant to thermal cycling [55]. Since pressure
drop and flow instabilities in porous media are rather complicated to calculate accurately
even with CFD, the characteristics will be determined experimentally.

Thruster Design and Component Selection
Page | 59
Figure 30: Mixing Design Methods [54]
The porous media selected for the thruster is open type metal foam produced by
Recemat BV, with a high porosity (up to 95 [%]) and a small pore size, but a rather brittle
nature [55]. The Nickel foam (Ni) has excellent properties for battery and electrolysis
applications, due to its good electrical and thermal conductivity. Other stronger alloys such
as Nickel-Chromium (NC), Nickel-Chromium with extra chromium (NCX) and Nickel-
Chromium-Aluminum (NCAX) are also options, with a better corrosion resistance and
oxidation resistance but a higher cost. For all these reasons, the foam presently selected for
the thruster is made of the Nickel alloy NI-4753. The cost is about €400 per [kg] for the
basic Ni foam however with a maximum average density of about 0.6 [g/cm3] the price of
the material required for the chamber is expected to be less than €50. Foam with different
pore sizes is available and if time allows the difference between different types of foam
should be investigated. Recemat provided two different samples for testing for free. Their
characteristics are given in Table 17 and one sheet is pictured in Figure 31.

Heating Element Selection
Page | 60
Table 17: Metal Foam Characteristics
Parameter Ni-2733 Ni-4753
Grade = number of pores/inch 27 . . . 33 47 . . . 53
Estimated average pore (Ø mm) 0.6 0.4
Density average ( g/cm3) 0.3 … 0.6 0.3 … 0.6
Relative density (foam / solid Ni ) 4.8 % 4.8 %
Porosity (100% - rel. density) 95.20% 95.20%
Specific Surface (m2/m3) 2800 5400
Specific Surface Area Density (Kg / m2) 0.152 0.079
Sheet length (mm) 900 900
Sheet width (mm) 600/500 600/500
Figure 31: Recemat Metal Foam
5.3. Heating Element Selection
At TU Delft there have been a number of resistojet designs investigated and produced
in the past. The first resistojet design was made by Robert Hoole in 1990 which used a
spirally wound tube, made out of stainless steel as a heater [56]. In more recent history
Rodrigo Ferreira designed a water resistojet named the DUR – 1 thruster [53]. Another
concept is MEMS Heater as done by M. Tittu in [26].
While designing your own heater can provide better results and higher heating
efficiency, using COTS heater would reduce the complexity of the design and the workload
and would reduce the uncertainty in the design. There are lots of different COTS heaters
available but they are mainly 2 types that are of interest for the resistojet, namely coil

Thruster Design and Component Selection
Page | 61
heaters and cartridge heaters. These can either directly heat up the propellant or indirectly
heat up a porous which in turn will heat the propellant.
After a vast amount of heaters investigated [13] and during the course of this thesis,
only 3 where identified that are within power, size and budget constraints as given in
Chapter 4 and [10] and that have distributors in The Netherlands enabling direct contact
and support and faster lead time. For convenience the requirements are given in Table 18.
Table 18: Heater Requirements
Mass < 10 [g]
Volume 50 x Ø16 [mm]
Operating Temperature 550+ [K]
Power Consumption < 9.5 [W] Continuous
Lifetime > 5000 Cycles
5.3.1. Elstein T-MSH/20 [57]
The Elstein T-MSH/20 is a ceramic infrared heater with integrated thermocouple. It is
rated up to 860 [°C] operating temperature and surface ratings up to 100 [kW/ m²]. MSH
micro system heaters are used in applications, which require partial heating or drying of
small goods and areas. It has power rating of 55 [W] at 12 [Vdc] which would translate to
9.5 [W] at 5 [Vdc] (Equation (4.2)) which is what makes this heater particularly attractive.
Namely this would allow the heater to work below the rated maximum power consumption
of 10 [W] connected directly to the EPS 5 [Vdc] line without the need of a local DC-DC up
conversion circuit on the propulsion system PCB. Although ceramics are not commonly
susceptible to corrosion, the manufacturer has issued a concern that this might happen if
the T-MSH/20 is immersed in water for extended period of time. Furthermore since it’s
ceramic and not metal there are concerns w.r.t. to the mounting, namely will the ceramic
heater and leads be able to connect in a leak-proof manner. The Elstein MSH/20 (same
dimensions but without thermocouple and 2 instead of 4 leads) is shown in Figure 32. The
price of the Elstein T-MSH/20 is €45 per piece excluding tax and shipping and it has a
lead time of 1 week. The distributor in the Netherlands is Wilmod Heating & Systems. The
invoice and price quotation is given in Appendix C.
2
2actual rateactu
e
dal
rat d
VP P
V (4.2)

Heating Element Selection
Page | 62
Figure 32: Elstein MSH/20 (dimensions in mm)
5.3.2. HotSet HotRod [58]
HotSet is a water repellent cartridge heater manufacturer from Germany and their
distributor in the Netherlands is also Wilmod Heating & Systems. Wilmod has offered a
modification of their standard 5210404 heater (Figure 33). The modified version has a
diameter of 6.5 [mm] and length of 40 [mm]. At 12 [Vdc] is rated at 7 [W] and has a build
in “J” type thermocouple. Furthermore it is offered with a 25 [mm] connection tube + extra
890 [mm] stainless steel protection hose. The minimum order size however is 4 heaters and
the price is €170 per piece for a lot of 4 and €129 per piece for a lot of 5 with a lead time
of 5 weeks.
Figure 33: HotRod HotSet Cartridge Heater
5.3.3. Watlow Firerod [59]
Watlow is a US electrical heater company with Kurval BV being its local distributor. In
their portfolio of heaters they have a water immersion heater with a power rating of 30 [W]
at 24 [Vdc] resulting in a power rating of 7.5 [W] at 12 [Vdc] with a model number C1A-

Thruster Design and Component Selection
Page | 63
9602. It has a diameter of 1/8 [Inch] and a length of 1 [Inch] without a thermocouple.
There is also a thermocouple variant, bearing the part number C1J-9769, which has an
integrated K type thermocouple at the tip of the heater and it’s 1.5 [Inch] long. The
standard heater C1A-9602 has a lead time of 2 weeks and a price of € 36.70, while C1J-
9769 is priced at €73.55 and has a lead time of 5 – 6 weeks. The minimum order size for
both is 3 units. The heater is shown in Figure 34 and the price quotation and invoice can
be found in Appendix C.
Figure 34: Watlow C1A-9602 Cartridge Heater
5.3.4. Heater Trade – Off
With the different heaters available, a trade-off needs to be made. The trade-off will be
made on several criteria, namely cost, lead time, power level, compatibility with water, easy
for mounting and the ability to monitor the temperature of the heater. The most important
criteria are the power level to be as close as possible to 9.5 [W] and preferably at 3.3 [Vdc]
or 5 [Vdc], to be able to be mounted with relative ease in a leak-proof manner and to have
thermal monitoring. Furthermore important criteria are cost, since DelFFi has limited
budget and compatibility with liquid water. Finally the lead time is the least important
criteria that still needs to be taken into account. The trade-off is given in Table 19. In the
end it was decided that 2 heaters will be ordered, namely the Elstein T-MSH/20 and the
Watlow C1J-9769. The C1J-9769 seems to be the best heater overall, however if the
mounting issue can be solved for the T-MSH/20 it has the best technical characteristics.
The HotRod was deemed to be too expensive and the Watlow C1A-9602 although the
cheapest, it is lacking the ability to have the thermal monitoring.

Chamber
Page | 64
Table 19: Heater Trade-Off
Criteria Weight T-MSH/20 HotRod C1A-9602 C1J-9769
Cost 3 5 1 5 3
Lead Time 1 5 1 3 1
Power Level 5 5 3 4 4
Water Compatibility 3 3 3 5 5
Mounting 5 1 5 5 5
Thermal Monitoring 5 5 3 0 5
Score 84 68 78 95
5.4. Chamber
The Chamber is used to house the heater and the porous media. It should also have low
emissivity coefficients such that the heat is contained inside of it and not radiated in the
satellite. Furthermore choosing a material and design that minimizes thermal capacitance
will allow the chamber to be quickly heated and cooled and not have power wasted by
heating up the whole structure. Finally even though it is out of the scope of this thesis it is
important to mention that a crucial parameter to increase the heating efficiency of the
design is to keep the thermal conduction between the tank and the thruster as low as
possible, otherwise energy and heat is wasted in heating up the whole tank instead of only
the propellant in the chamber. For both time and cost efficiency the chamber is to be
produced within Delft University of Technology using either the Aerospace Faculty
workshop or the central university workshop DEMO. The workshop costs € 400 per day
excluding material costs.
As it was shown in Section 5.3, 2 heaters are to be considered for the flight model. For
maximum heating efficiency, the chamber should be designed to encapsulate the heater,
thus different chamber designs will be needed for the 2 heaters. This however was
immediately rejected by the project management for the engineering model due to cost
concerns and it was decided to have one design that will incorporate both heaters.
Having to house both heaters would mean that no matter the design, the chamber will
be largely oversized. This can potentially result in the chamber not reaching steady state
operations until it fills up and furthermore with the excessively large volume and low
mass-flow involved the valve opening time will definitely not correspond to the thruster
operation time.

Thruster Design and Component Selection
Page | 65
Therefore designs where only considered w.r.t. to the mechanical properties. Aluminum
was chosen as the material and the chamber should be designed such that it can withstand
a pressure difference of 10 [Bar] with a safety factor of 2. Different designs where
considered. Once a heater has been chosen, a specific chamber design will be made to that
heater for the flight model thruster
Chamber Design 1 5.4.1.1.
The first chamber design goal is to minimize the volume and mass and provide compact
packaging of both heaters. It would have a sliding contact between the two halves and the
sliding contact is made such that upon pressurization one half is pushed again the other
providing better leak proof contact. To keep the design as compact as possible, soldering or
welding of the two halves is recommended. This means that re-assembly is not possible and
an inspection post testing will render the chamber useless. The chamber is shown in Figure
35. A plastic 3-D printed version of the chamber was made to check if there would be
sufficient clearance for both the heaters and the valve and nozzle connection (Figure 36)
which proved that the design was good and there was sufficient clearance for all the
components. However upon inspection by the DEMO workshop this design was told to be
rather expensive for production with traditional manufacturing techniques and additive
manufacturing such as SLS 3D printing was recommended.
Figure 35: Design Chamber 1

Chamber
Page | 66
Figure 36: 3D Printed Design
Chamber Design 2 5.4.1.2.
The second chamber design was made to be easily producible at the DEMO workshop
and have easy assembly. It has a simple rectangular shape and a screw-able side. It also
features a port for a pressure sensor on the side. Due to the rectangular shape and the thin
wall thickness of only 2 [mm] there was a concern if there was enough threaded area for the
screws to hold the chamber together and the amount of screws needed to ensure the
chamber doesn’t fail at 10 [Bar]. Therefore a FEM analysis of the design was made. The
load case was 10 [Bar] internal pressure and caution was made that throughout the
chamber and the thread included the stress on the material was half of the Aluminum 6061
– T6 yield stress or about 140 [MPa]. A cut out of the FEM analysis is shown in Figure 37
and the results have shown that at least 10 screws are necessary to satisfy this criterion.
Figure 37: FEM Chamber 2

Thruster Design and Component Selection
Page | 67
A concern is how leak proof the connection would be by using just screws. The DEMO
workshop is confident that O-Ring would not be necessary for small pressures. The design
is shown in Figure 38. Furthermore this is the bulkiest design and would be least efficient
when heating.
Figure 38: Chamber Design 2
Chamber 3 5.4.1.3.
The third chamber design is a combination of both the first and the second design. The
goal of the design is to minimize volume and mass while maintaining the rectangular design
and also to be able to reassemble change the cap if necessary (for example if no leak tight
connection can be made with the Elstein heater). The design is shown in. Upon inspection
by the DEMO workshop they said however they are not able to produce this design
Figure 39: Chamber Design 3

Nozzle
Page | 68
5.4.2. Trade – Off
The trade-off and its criteria are given in Table 20. Since this is an engineering model
the cost is the most important criteria. Having the design producible at the DEMO
workshop at TU Delft is advantageous due to the short lead time and direct contact. The
internal volume while not crucial is advisable to be as small as possible otherwise when
filling the chamber with cold water and boiling it with the heater, the pressure from the
steam (as in an electric kettle) may rise above the 10 [Bar] MEOP and the chamber may
fail structurally. Finally the mass will affect the thermal efficiency only but since there is
ample power available in the lab this can be compensated by delivering more than the 10
[W] required during testing. As it can be seen, design 2 is the best design and there-fore it
was produced by the DEMO workshop.
Table 20: Chamber Design Trade - Off
Criteria Weight Design 1 Design 2 Design 3
Producibility 3 3 5 1
Cost 5 1 5 1
Mass 1 5 1 3
Internal Volume 3 5 1 3
Score 34 44 20
5.5. Nozzle
At the µm scale used in the present micro-propulsion concept, two nozzle shapes are
practically possible: axi–symmetrical conical nozzle and a slit nozzle.
Figure 40: Nozzle Shapes [60]

Thruster Design and Component Selection
Page | 69
The conical nozzle is considered the simplest axi – symmetrical nozzle type (Figure 40).
It has conical convergent and divergent parts which are characterized by the cone half-
angles and respectively (Figure 41). At the scale of DelFFi thruster it would still be
difficult to produce and would require advanced micromachining techniques and micro
turning machines, however it is by far the simplest traditional nozzle type to produce. A
disadvantage is that the flow momentum losses are higher due to flow divergence so
generally they have lower efficiency. And while at this scale it is not crucial, conical nozzles
tend to be longer and heavier than bell or plug type nozzles [25].
Figure 41: Conical Nozzle Geometry Parameters
Figure 42: MEMS Nozzle Cross – Section [61]
Another extremely popular nozzle type in micro – propulsion is the slit nozzle. It can be
produced using micro – milling or using MEMS technology which can produce miniaturized
mechanical and electro-mechanical elements or even fully functional systems and devices
such as valves. Since the basic principle of MEMS production is etching in silicone

Nozzle
Page | 70
substrate traditional axisymmetric shapes cannot be produced, but instead a rectangular
cross – section are made (Figure 42). This means that the width of the channel is
additional variable. Due to the fact that the height of the channel is constant, careful
designing and optimization is necessary to minimize the boundary layer effects and high
aspect ratios are required (Channel Height to Channel Width) [61]. This same nozzle type
was used in in the previous version of micro resistojet designed by Mathew Tittu [26].
While using MEMS production techniques, features can be made in the order of [µm], the
surface roughness and accuracy of the channel is rather low, with more advanced
techniques having an accuracy of ±10 [%] [26] and less advanced as high as ±50 [%] [62]
for a throat diameter of 10 [µm].
An extensive research of gas flow in miniaturized nozzles has been done in [24]. It has
been concluded that the efficiency of these nozzles is strongly geometry and size dependent.
Furthermore, for thrusters in the 1-10 [mN] range, viscous effects cannot be neglected due
to the large surface to volume ratio, and viscous boundary layers and surface roughness are
the two main contributors to efficiency losses in the nozzle, contributing up to about 10 –
15 [%] each. The thickness of the viscous boundary layer and the resulting decrease of the
effective nozzle expansion ratio for nozzles of different thrust levels are shown in Figure 43.
It can be seen that for a 10 [mN] nozzle the boundary layer thickness is 10-20[%] of the
total local radius, while for the 1 [mN] nozzle it is 20-30[%] of it.
Figure 43: Boundary layer thickness for nozzles of different thrust levels [24]
Furthermore it was found that having a sharp nozzle throat, a converging angle of 15°
and a diverging angle of 20° leads to an optimum geometry. The difference however
between the most and least optimal solution is about 4 [%]. A much more prominent
impact on performance is given by the surface roughness, which can account to losses up to

Thruster Design and Component Selection
Page | 71
20 [%]. Therefore to improve the certainty of the design the nozzle will be modeled and
designed using CFD.
5.5.1. CFD Analysis Set-Up
The CFD analysis has been done using ANSYS Fluent v14.5. For modelling the flow in
the nozzle, the SST k–ω model was used with corrections for Low Reynolds numbers and
compressibility effects. This model was chosen because by using the ω-equation, it offers
several advantages when compared to the k–ε models. It incorporates modifications for low-
Reynolds number effects, compressibility and shear flow spreading [32]. This allows for
better boundary layer modelling and more robust Enhanced Wall Treatment. Furthermore,
since the flow is compressible, the energy equation was also used but to simplify the
simulation heat exchange between the solid and the fluid region has been neglected. Given
the small thermal mass of the thruster and the long heating time it is safe to assume that
the wall temperature will be the same or close to the flow temperature. Furthermore
simulations have shown that for a 3D micro nozzle, thrust output increases as the wall
temperature decreases since as heat is removed from the supersonic flow it is further
accelerated and performance increases (Rayleigh flow) [63]. Finally single phase flow was
used since modeling multi-phase flow in Fluent is rather complex and normally CFX is
recommended for these kinds of flows. The choice of the program was made before water
propellant was introduced as an option thus it was too late to change it at this time.
Using Ansys Fluent, 3 different nozzle types (2 axi – symmetrical and 1 slit type)
producible by 3 different manufacturers will be investigated and compared to the ideal
nozzle geometry as proposed by La Torre in [24]. The nozzles geometries are shown in
Figure 44. The MEMS nozzle height of the channel is not shown in the figure and it’s 100
[µm]. When modelling the fluid region in the nozzle, the straight channel was cut to save
computational time. The PM, DEMO and IDEAL nozzles where modelled in 2D using an
axi-symmetric space. The MEMS nozzle was modeled in 3D. The fluid properties are given
Table 21 and the boundary conditions are given in Table 22.

Nozzle
Page | 72
Figure 44: Nozzle Shapes
Table 21: Fluid Properties used in Ansys Fluent
Parameter Value Unit
Fluid Material Water Vapor -
Density Real-gas-SRK -
Cp Piecewise-polynomial -
Thermal Conductivity 0.0261 [W/m-s]
Viscosity 1.34E-05 [kg/m-s]
Wall Surface Smooth -
Table 22: Boundary conditions used in Ansys Fluent
Parameter Value Unit
Ambient Pressure 0 [Pa]
Inlet Pressure 7x10⁵ - 1x10
5 [Pa]
Inlet Temperature 550 [K]
Outlet Pressure 4000 – 800 [Pa]
Backflow Total Temperature 300 [K]
For comparison of the different nozzle, 3 points where taken, namely 7 [Bar] which
would be the MEOP of the EM, 5 [Bar] which is the pressure mid-point from the
requirements and 1 [Bar] which is expected lowest pressure in the system while the
temperature of the fluid at the intake was taken to be 550 [K] for all cases. Smooth wall
surface was used for the simulation, however once the nozzle is produced, the surface can
be scanned using an electronic microscope, and the surface roughness can be incorporated
and the flight nozzle design optimized accordingly.

Thruster Design and Component Selection
Page | 73
5.5.2. Design Performance and Comparison
The results for the different nozzles are summarized in Table 23. As it can be seen there
are significant changes in the mass flow and thus the thrust produced for the different
nozzles, while the exhaust velocity and specific impulse are rather similar for the axi–
symmetrical nozzles. Still all axi-symmetrical designs are clearly superior to a slit nozzle.
Specific impulse is reduced by about 20 [%] and this is mainly due to the much larger
boundary layers in the MEMS nozzle in the exhaust and the throat of the nozzles
effectively reducing the throat area and expansion ratio. This can be clearly seen in Figure
45 where the boundary layer for the IDEAL and DEMO nozzle design account for about 15
- 20 [%] of the exit diameter, about 30 [%] of the PM nozzle and almost 40 [%] for the
MEMS nozzle. It is interesting to note that the velocity profile of the DEMO nozzle looks
almost like a bell nozzle. Furthermore looking at the significantly lower specific impulse of
the MEMS nozzle, a more optimal height to width ratio could be used than the current
design as proposed by DEMO and used for the MEMS thruster in [64].
Table 23: CFD Nozzle Results
Water 7 [Bar]
Design Ideal DEMO PM MEMS
Mass Flow [mg] 2.65 2.43 2.18 2.28
Exhaust Velocity [m/s] 1147.73 1107.09 1069.56 970.94
Thrust [mN] 3.04 2.69 2.33 2.22
Isp [s] 117.00 112.85 109.03 98.97
Water 5 [Bar]
Design Ideal DEMO PM MEMS
Mass Flow [mg] 1.88 1.72 1.55 1.63
Exhaust Velocity [m/s] 1135.83 1092.81 1065.26 930.44
Thrust [mN] 2.13 1.88 1.65 1.52
Isp [s] 115.78 111.40 108.59 94.85
Water 1 [Bar]
Design Ideal DEMO PM MEMS
Mass Flow [mg] 0.37 0.30 0.30 0.32
Exhaust Velocity [m/s] 995.99 935.12 946.03 554.25
Thrust [mN] 0.74 0.57 0.57 0.35
Isp [s] 101.53 95.32 96.44 56.50

Nozzle
Page | 74
Figure 45: Velocity Magnitude [m/s] Contour
With the performance of the different nozzles available a comparison is made between
the designs. Since this is an engineering model the main criteria will be the producibility of
the nozzle and the ease of integration within the thruster. Next in the hierarchy are the
lead time and the performance since the nozzle should be available when the thruster is
ready and the performance should be comparable to what would be used on the flight
model. Finally cost is considered the least important criteria since the fraction cost of the
nozzle to the whole system is rather small.
Performance wise it is clear that the DEMO offers the best and the MEMS nozzle the
worst performance. The cost of the DEMO nozzle was estimated at about € 750, the PM
workshop costs $ 400 per day excluding shipping costs and they estimate they would need
at least 3 days to produce the design while the MEMS nozzle is already being produced for
the MEMS thruster so it will be technically for free.
Producibility wise the DEMO and PM workshops are confident that they can produce
the design but cannot guarantee the accuracy of the dimensions and especially the angles

Thruster Design and Component Selection
Page | 75
while DIMES is confident they can easily produce the MEMS nozzle. However the
advantage of the machined nozzles are that they can be machined on a rod which can also
have a thread and be easily screw-able in the chamber while the MEMS nozzle needs
requires a more complex integration method.
Finally the lead time is the best for the DEMO nozzle with the estimate being 2 weeks
and there is no shipping time since the workshop is located on campus. The PM workshop
is in the USA and they recon they will need at least 4 weeks before the nozzle is delivered
to us. Finally although DIMES is also on campus, their lab will undergo renovation in the
near future and they are not certain if they will be able to deliver the MEMS parts before
that thus the lead time may be as much as 4 months. This reasoning is reflected in Table
24 where it can be seen that the DEMO nozzle is the clear winner.
Table 24: Nozzle Trade - Off
Design Weight DEMO PM MEMS
Performance 3 5 3 1
Cost 1 5 3 5
Producibility 5 3 3 5
Integration 5 5 5 1
Lead Time 3 5 3 1
Total 75 61 41
5.5.3. Design Analysis
With the nozzle design chosen a more in-depth analysis can be made of both the design
and the model. The velocity vectors are shown in Figure 46. It can be seen that vortices
occur after the nozzle throat and at the transition between the expanding and the straight
part of the duct. This is due to the sudden large expansion angle which is due to the drill
tip. However as it was shown in the previous section this does not affect the performance of
the nozzle drastically.
In Figure 47 and Figure 48, the pressure and temperature contours are shown. As it can
be seen the temperature of the flow drops down to 100 [K] and the pressure down to 600
[Pa] in the nozzle exhaust. Since multi-phase flow is not taken into consideration, the CFD
analysis still treats it as gas, however in reality solid ice particles will likely form (Figure
49), so condensation and even solidification of the water in the exhaust is still a concern to
be further analyzed during the test phase

Nozzle
Page | 76
Figure 46: Velocity Vectors obtained by the CFD simulations [m/s].
Figure 47: Pressure contour obtained by the CFD simulations [Pa]

Thruster Design and Component Selection
Page | 77
Figure 48: Temperature contour obtained by the CFD simulations [K]
Figure 49: Water 3 - Phase Diagram

Thruster Performance Summary and Comparison
Page | 78
5.6. Thruster Performance Summary and Comparison
The thruster performance is summarized in Table 25. As it can be seen, there are quite
some differences from the ideal rocket theory results. The reason is mainly the effect of
boundary layers and non – optimal geometry.
Table 25: Thruster performance with water as propellant
Parameter Value Unit
Thrust 2.7 – 0.6 [mN]
Pressure 7 – 1 [bar]
Target Temperature 550 [K]
Exhaust velocity 1100 [m/s]
Specific Impulse 112 [s]
Propellant Mass 50 [g]
ΔV 15.4 [m/s]
Mass Flow 2.4 – 0.3 [mg/s]
Furthermore since the thruster should still be able to operate with nitrogen as
propellant, the performance from the CFD simulation when using nitrogen at 700 [K] are
given in Table 26. As it can be seen, the same thruster with the same nozzle and with the
heater operating at 700 [K] it would still be able to fulfill the requirements as given in [10].
The power needed to heat up Nitrogen from 300 to 700 [K] is only about 1.2 [W] therefore
the power requirement is also within the power budget.
Table 26: Thruster performance with nitrogen as propellant
Parameter Value Unit
Thrust 5.3 – 0.6 [mN]
Pressure 7 – 1 [bar]
Target Temperature 700 [K]
Exhaust velocity 970 [m/s]
Specific Impulse 99 [s]
Propellant Mass 58 [g]
ΔV 15.7 [m/s]
Mass Flow 2.7 – 0.4 [mg/s]
In Table 27 a comparison is provided between the results obtained by the ideal rocket
theory and the CFD simulations. As it can be seen in the table, the difference in thrust is
rather large, namely 30 [%] at a chamber pressure of 7 bar. Furthermore, the specific
impulse is also 28 [%] less and the total ΔV is thus also reduced. It should be noted that in
the current CFD analysis surface irregularities and phase change have not been taken into

Thruster Design and Component Selection
Page | 79
account, which are expected to further affect performance with additional losses of up to 20
[%].
Table 27: Comparison between ideal rocket theory (IRT) and CFD results
Parameter CFD IRT Unit Diff.[%]
Thrust 2.7 – 0.6 3.5 – 0.5 [mN] up to 30
Pressure 7 – 1 7 – 1 [bar] -
Specific Impulse 112 141 [s] 28
ΔV 15.4 18.7 [m/s] 23
Mass flow 2.4 – 0.3 2.5 – 0.4 [mg/s] up to 33
In Table 28 a comparison is made between the COTS and the MEMS thruster at their
operating conditions. As it can be the COTS thruster produces more thrust at the same
chamber pressure, but for the rest the performance is comparable. What needs to be taken
into account though is that the COTS thruster is expected to have much lower heater
efficiency when compared to the MEMS heater. The reason for this is because the mass of
the heater itself and the surrounding structure is much larger, thus a significant amount of
power will be lost in heating up the heater, porous media and chamber. The MEMS
thruster, on the other hand, with its suspended heaters and compact structure will lose less
heat. However still good packaging and mounting method is needed, as to avoid losing heat
from the thruster to the mounting PCB and the rest of the structure.
Table 28: Comparison between COTS and MEMS thruster performance
Parameter COTS MEMS Unit Diff.[%]
Thrust 2.7 – 0.6 2.1 – 0.3 [mN] 30 - 200
Pressure 7 – 1 7 - 1 [Bar] -
Temp. 550 773 [K] -
Specific
Impulse
112 111 [s] -
ΔV 15.4 15.2 [m/s] -
Mass flow 2.4 – 0.3 1.9 – 0.2 [mg/s] 25 - 50

Page | 80
6. Description of Engineering Model
Propulsion System
Before making a flight model thruster, a common practice is to validate the design and
proof of concept by making an engineering model thruster. The engineering model should
be as representable as possible performance wise but does not have to adhere to the volume
and mass budget given in [10]. Furthermore since there was no feed system and tank
available at the time, this also needs to be designed and build functionally wise. In this
chapter the engineering model will be described and the different components and
connections explained.
6.1. Feed System
The feed system is composed of mainly Swagelok parts and custom manufactured
components where needed. It can be separated into 4 parts:
Filling Branch
Tank
Hexagon adapter and sensors
Feed Line to valve
Pressurized Tank
Pressure Sensor
Temperature Sensor
Swagelok Filter
Lee Filter
Lee ValveH2O
N2
Quick ReleaseGas Filling Port
Water Filling Port
Figure 50: Feed System Schematic

Description of Engineering Model Propulsion System
Page | 81
6.1.1. Filling Branch
The filling branch is composed of Swagelok quick release connector used as gas filling
port (Figure 51 on the right) and a pneumatic push-in hose connector and valve used as
water filling port (Figure 51 on the left). Using the quick release connector allows easy
connection of the feed system to the pressurant gas feed. Furthermore disconnection the
quick release connector closes that port and allows the system to be used in blow-down
mode. The pneumatic push-in hose can connect leak tight to a syringe and precise water
quantities can be injected into the tank. Then disconnection the syringe and connecting the
push in valve allows for the system to be leak tight.
Figure 51: Filling Branch
6.1.2. Tank
The tank used in the engineering model is Swagelok 304L-HDF4-150 (Figure 52). It’s
double ended cylinder made of stainless steel, has a volume of 150 [cm3] and it’s rated of up
to 1800 [psig] or 124 [bar] in atmospheric conditions. On both ends there are female ¼ NPT
connectors. The tank will be installed in vertical position since in that manner, separation
between water and nitrogen is guaranteed due to gravity.

Feed System
Page | 82
Figure 52: Swagelok Tank 304L-HDF4-150
6.1.3. Hexagon adapter
The hexagon adapter is a custom made brass adapter and its shown in Figure 53. The
female connectors are all ¼ BSP (number 1), the left male connector (number 2) is 3/8 BSP
and the right male connector (number 3) is 1/8 – 27 NPT. The tank is connected to the
top using a Swagelok ¼ Male NPT to ¼ Male BSP connector. The second female hole is used
for the temperature sensor and the third is unused and closed-off with a plug. The pressure
sensor is connected to the 1/8 – 27 NPT connector using female to female 1/8 – 27 NPT
connector and the feed piping to the valve is connected to the 3/8 BSP connector using 3/8
female BSP to ¼ Swagelok pipe adapter.
Figure 53: Hexagon adapter
6.1.4. Feed Line to Valve
The feed line to the valve consists of ¼ Swagelok pipes, a brass in-line filter of 15µm
with part number Swagelok B-4F-15 (Note that 12µm or smaller filter is recommended for
VHS Valves but these were unavailable at the time) and conversion pieces that go from ¼

Description of Engineering Model Propulsion System
Page | 83
Swagelok pipe to 0.250-28 unf-2a thread. This in turn connects to Lee Company boss
TMDA3212950Z that goes from 0.250-28 unf-2b to 062 MINSTAC connection and then to
1m Lee Company Teflon tube with part number. TUTC3216910D. Finally a small in-line
peek safety screen of 12µm (INMX0350000A) is connected between the Teflon tube and the
Lee Valve. The feed system (without the water filling branch and the Teflon tube and
valve) is shown in Figure 54.
Figure 54: Feed System
6.2. Valve
The valve used for the EM model was described in Section 5.1. As it was said
previously, the VHS solenoid valve series are used in both medicine and high-tech industry,
they have normally closed configuration and have fast opening times (as fast as 0.25 [ms]),
MEOP of up to 120 [PSIG] (circa 7 [Bars] in vacuum) and 250 million cycles as life-time
minimum. To guarantee proper functioning of the valves proper filtration is required.
System filtration of 12 microns or less is recommended. In addition, last chance PEEK

Valve
Page | 84
filters are available that can be threaded directly into valves with MINSTAC inlet ports.
The configuration chosen for the EM, features MINSTAC inlet and outlet and has EDPM
seal. Two versions where delivered with the difference being one has an operating voltage of
24 [Vdc] and the other of 12 [Vdc]. The valve together with the PEEK filter and the Teflon
hose is pictured in Figure 55.
Figure 55: Valve Assembly
6.2.1. MINSTAC
The MINSTAC coupling system is a unique Collet-Lock system developed by the Lee
Company, which provides a leak proof connection by threading chamfered Teflon tubing
into specially designed boss. The connection is shown in Figure 56. The coupling nut is
screwed in the boss and presses the collet which in turn presses the chamfered Teflon tube
against an opposite chamfered opening in the boss. Therefore (as it was later realized in
this thesis) making a tube with the correct thread will not provide leak proof connection
but a specially designed boss is required. Standard tubing assemblies with fittings and
bosses are available for order at Lee Company or alternatively for larger number,
production kits can be also purchased [48].
Figure 56: MINSTAC Connection [48]

Description of Engineering Model Propulsion System
Page | 85
The 062 MINSTAC fitting system, used on the VHS valves, is shown in Figure 57. It
uses 0.062 [Inch] (1.57 [mm]) O.D. Teflon tubing and a 0.138-40 UNF threaded fitting (left
in Figure 57) and a special 062 MINSTAC boss. The coupling nut acts like a compression
fitting and presses the chamfered end of the tubing against one end of the ferrule. The
other end of the Ferrule is pressed against the sealing surface in the boss by the coupling
screw. The ferrule is colored blue and the sealing surface red in in Figure 57.
Figure 57: 062 MINSTAC Fitting System [48]
6.2.2. Valve Control Circuit
As it was mentioned earlier the VHS valves require special circuit to operate properly.
The valve initially requires a 12 or 24 [Vdc] (model dependent spike voltage) pulse for a
minimum of 0.3 [ms] to actuate the valve, and then the voltage through the coil needs to be
reduced to 1.6 or 3.2 [Vdc] (model dependent hold voltage) to keep the valve open. If the
voltage is not reduced to the model dependent hold voltage level, the coil will overheat and
the valve will be destroyed.
Fortunately the Lee Company also offers a readymade Spike and Hold Driver
(IECX0501350A) that provides the proper waveform for safe operation of the VHS and IEP
valves by using a 5 [Vdc] TTL control signal. The driver (pictured in Figure 58) only
requires that the user connect the TTL signal, spike voltage supply, hold voltage supply
and the valve itself and set the spike duration using the potentiometer. The duration of the
spike can be monitored using a oscilloscope. More details can be found in [47] and later in
this report.

Valve
Page | 86
Figure 58: Lee Company Spike and Hold Driver with TTL Signal Circuit
6.2.3. Lee Valve VHS Starter Kit
Considering all the different components needed to support the valve, a good initial
investment would be the VHS Starter Kit (Part Number IKTX0322000A). It includes the
following components:
• 1 - VHS Dispensing valve
• 1 – Instructional CD
• 3 - MINSTAC Nozzles
• 1 - MINSTAC Atomizing nozzle
• 1 - Spike and hold driver circuit
• 1 - 062 MINSTAC Teflon tubing and fittings
• 1 - Lee 062 MINSTAC 12 micron PEEK Safety Screen
• 1 - 8” Long high retention lead wire assembly with 24 AWG PTFE lead wires
• 1 – MINSTAC Nozzle Torque Wrench
• 1 – Mounting Clip
The kit is shown in Figure 59 and more information about the VHS starter kit can be
found in [47]. The price is €685 and it has a lead time of 2 – 4 weeks. In order to have the
system connected both to the feed system and the thruster however another set of Teflon

Description of Engineering Model Propulsion System
Page | 87
tubing with fittings and a boss is needed. Since DIY boss and hose kits are about€700 –
800 and that budget was not considered adequate for the feed system of the EM propulsion
system it was decided to purchase just another pre-made Teflon tube and a pair of boss
connectors. A 1 [m] 062 MINSTAC Teflon tube with fittings (Part number
TUTC3216910D) is €79.5, a 0.250-28 UNF-2B flat bottom boss to 062 MINSTAC (Part
number TMDA3212950Z) is €24.54 and will be used to connect to the EM thruster
discussed in this report and 0.250-28 UNF-2A flat bottom boss to 062 MINSTAC (Part
number TMDA3204950Z) is €17.38 and will be used to connect the VHS valve to the
MEMS thruster. All the invoices and price quotations can be found in Appendix C.
Figure 59: VHS Starter Kit
6.3. Heating Elements
The heaters that will be used for the EM model where described in Section 5.3. As it
was said the Elstein T-MSH/20 is a ceramic infrared heater with integrated thermocouple.
It is rated up to 860 [°C] operating temperature and surface ratings up to 100 [kW/ m²].

Heating Elements
Page | 88
MSH micro system heaters are used in applications, which require partial heating or drying
of small goods and areas. It has power rating of 55 [W] at 12 [Vdc] which would translate
to 9.5 [W] at 5 [Vdc] which is what makes this heater particularly attractive. Namely this
would allow the heater to work below the rated maximum power consumption of 10 [W]
connected directly to the EPS 5 [Vdc] line without the need of a local DC-DC up
conversion circuit on the propulsion system PCB. The actual heater is shown in Figure 60.
The second heater is produced by Watlow and it’s bearing the model number C1J-9769.
It is a water immersion heater with a power rating of 30 [W] at 24 [Vdc] resulting in a
power rating of 7.5 [W] at 12 [Vdc]. It has a diameter of 1/8 [Inch] and a length of 1.5
[Inch] without a thermocouple and it’s shown in Figure 61.
Figure 60: Elstein MSH/20 (dimensions in mm)
Figure 61: Watlow C1A-9602 Cartridge Heater

Description of Engineering Model Propulsion System
Page | 89
6.4. Porous Media
The porous media is used to make sure the flow is turbulent in the heating chamber and
that the liquid water is vaporized completely. The porous media selected for the thruster is an
open type metal foam produced by Recemat BV, with a high porosity (up to 95 [%] ) and a
small pore size, but a rather brittle nature [55]. The Nickel foam (Ni) has excellent properties
for battery and electrolysis applications, due to its good electrical and thermal conductivity.
Foam with different pore sizes is available and if time allows the difference between
different types of foam should be investigated. Recemat provided two different samples for
testing for free and their properties where given in Section 5.2 and they are shown in
Figure 62. The block will be cut in the same footprint as the inside of the chamber and
stacked inside.
Figure 62: Recemat Metal Foam

Chamber
Page | 90
6.5. Chamber
The Chamber is used to house the heater and the porous media. It was produced from
aluminum by the DEMO workshop at TU Delft. It consists of two parts, chamber which
has a port for the valve connection, cartridge heater, pressure sensor port and the nozzle
and a cap that has connection for the ceramic heater. The assembly is shown in Figure 63
and the actual chamber in Figure 64.
Figure 63: Chamber Assembly
Figure 64: Produced Chamber

Description of Engineering Model Propulsion System
Page | 91
6.6. Nozzle
The design process for the nozzle was given in more detail in Section 5.5. The nozzle
was to be manufactured using wire EDM by DEMO. However after 4 weeks and many
unsuccessful attempts, the design was simplified to being drilled with a 60 [µm] and 300
[µm] drill from one side (the exhaust of the nozzle as to have good alignment), and a 300
[µm] drill from the other side which probably ended up as the nozzle in Figure 65 on right.
The produced nozzle is shown in Figure 66. The top is the throat diameter and the bottom
is the exit / inlet diameter with the left side being as looked from the nozzle exit and the
right side being as looked from the nozzle inlet. The difference in sizes is due to the tapper
angle of the drill meaning drilling deeper makes the diameter of the hole larger. The actual
size of the nozzle is shown in Figure 67.
Figure 65: EM Nozzle Design (Left) and Produced (Right)

Thrust Bench Interface and Assembly
Page | 92
Figure 66: EM Nozzle Produced
Figure 67: Nozzle Size
6.7. Thrust Bench Interface and Assembly
The thruster also needs to be able to interface with the thrust bench. For this an
interface place has been designed and can be seen in Appendix B. The opening on one side

Description of Engineering Model Propulsion System
Page | 93
is where screws from the chamber need to protrude such that the thruster itself is leveled
on the surface. The thruster will be held in place with a bracket that can also house the
valve. The whole assembly is pictured in Figure 68. To avoid conducting heat from the
chamber to the thrust bench and the rest of the structure, thermal insulator should be
placed between the bracket and the thrust bench.
The thruster has a total mass of 48 [g] with the lead wires and the valve and 30 [g]
without the heater leads and valve. This is slightly higher than the mass budget as set in
Chapter 4, however considering that the chamber is bulky and houses 2 heaters, it is
reasonable to assume that a small chamber with only 1 heater will be well within the mass
budget.
Figure 68: Thruster + Bracket Assembly

Page | 94
7. Test Setup
In this chapter the test setup will be presented including both the hardware and
software used. First a choice is made on the thrust test bench to be used. Next the load cell
is presented in Section 7.2. The feed system together with the sensing components is given
in Section 7.3 and the vacuum chamber in Section 7.4. The different power supplies used
are given in Section 7.5 and the control and data acquisitioning electronics are given in
Section 7.6. Finally in Section 7.7 the LabView program that controls and logs all other
components is described with its different modules.
7.1. Test Bench Trade – Off
The 2 test benches where shown in Section 0, [38] and [13]. In Table 29 the performance
and status of both test benches are summarized. Since this thruster is only engineering
model and a proof of concept the AE-TB-50M is the better choice. While it has lower
accuracy, all the components are readily available and no lead time or funds are necessary
to purchase the load cell. Furthermore having experience in testing with this test bench
gives advantage in the test setup. For the flight model however the AE-TB-5M is still
recommended as it will provide more accurate results.
Table 29: Test Bench Trade - Off
AE-TB-50M AE-TB-5M
Specifications Acceptable Specification Acceptable
Thruster mass [g] < 360 Yes < 300 Yes
Thrust Range [mN] 0.5 – 50 Yes 0.01 – 5 (10) Yes
Accuracy [mN] ± 0.1 Yes 0.001 Yes
Status Operable Yes Inoperable No
Documentation
Available Partial Yes Yes Yes
Testing Experience Yes Yes No No
Cost 0 Yes 1000+ No
7.2. Load Cell
The load cell used in combination with the thrust bench AE-TB-50M is the Futek
LRF400 Tension and Compression load cell. It has a capacity of 10 [g] or 100 [mN]. The
specifications of the load cell are given in Table 30. The output of the voltage of the load
cell depends on both the load and the input voltage due to the Wheatstone Bride. The

Test Setup
Page | 95
maximum voltage is 5 [V] resulting in a ± 5 [mV] output for 100 [mN]. Since the expected
thrust in the order of 1 – 2 [mN] the actual output voltage would more likely be in the ±
10 [µV] range. The linearity and repeatability of the load cell have been verified by Q.
Bellini. For best results the arm and the screw connecting on the load cell need to have 90°
angle as shown in Figure 69.
Table 30: Futek LF400 Specifications
Rated Output 1 𝑚𝑉/𝑉 nom.
Zero Balance ±3% of R.O.
Excitation 5 𝑉𝑑𝑐 max
Non Linearity ±0.1% of R.O.
Hysteresis ±0.1% of R.O.
Non Repeatability ±0.1% of R.O.
Creep ±0.2% of Load
Temp. Shift Zero ±0.1% of R.O./°C
Operating Temp. -50 °𝐶 to 93 °𝐶
Capacity 0.1 𝑁
Safe Overload 22.2 𝑁
Weight 140 𝑔
7.3. Propellant storage and feed system
A schematic of the propellant storage and feed system is given in Figure 70. The small
tank is pressurized by N2 using manual pressure regulator. The propellant tank is Swagelok
304L-HDF4-150, the pressure sensors are Omega PX181-200G5V and the temperature
sensor used to sense the fluid temperature in the feed system is AB Elektronik Sachsen 94-
099. The Swagelok filter is 15 [µm] filter with part number B-4F-15 and Lee Company filter
is used as a last resort to safe the valve from particles using a finer 12 [µm] mesh. The VHS
Lee valve is controlled by a spike and hold circuit which in turn is operated by the
workstation using LabVIEW. In the chamber the voltage, current and temperature of the
two heaters are constantly monitored and all the data is acquired and stored using NI DAQ
USB 6008 and LabVIEW in the workstation. The specifications of all the parts are
summarized in Table 31. The Nitrogen tank and pressure regulator used for pressurizing
the water are shown in Figure 71 and the feed system together with the water filling port
inside the vacuum chamber is shown in Figure 72.

Propellant storage and feed system
Page | 96
Figure 69: AE-TB-50M Thrust Bench
Figure 70: Propellant storage and feed system

Test Setup
Page | 97
Table 31: Feed System Components
COMPONENTS CHARACTERISTIC
Nitrogen Tank High pressure (≅ 150 𝑏𝑎𝑟)
Pressure Regulator Manual Regulator
(0-15 𝑏𝑎𝑟)
Shut-Off Valve Manual Valve
Relief Valve Rotary valve
Swagelok Water Tank
Double-Ended Stainless Steel Cylinder
Connection Type : Two 1/4 𝑖𝑛. 𝐹𝑁𝑃𝑇
Volume : 150 𝑐𝑚3 (150 𝑔 𝑜𝑓 𝑤𝑎𝑡𝑒𝑟)
Max Pressure : 1800 𝑝𝑠𝑖𝑔 (124 𝑏𝑎𝑟)
Pressure Sensor
OMEGA PX181-200G5V
Excitation : 12-25 𝑉𝑑𝑐
Accuracy : ±0.3% 𝐵𝐹𝑆𝐿
Operable T. Range : - 40 𝑡𝑜 105°𝐶
Range : 0 𝑡𝑜 200 𝑝𝑠𝑖𝑔 (0 -13.8 𝑏𝑎𝑟)
Output : 1 𝑡𝑜 5 𝑉𝑑𝑐
Sensitivity : 3.4 𝑏𝑎𝑟/𝑉
Port : 1/8-27 𝑁𝑃𝑇 stainless steel fitting
Temperature Sensor
AB Elektronik Sachsen
GmbH 94 099
NTC Sensor
Nominal Resistance : 2251 Ω (25°𝐶),
153 Ω (100°𝐶)
Temperature Range : - 40 𝑡𝑜 150°𝐶
Thread : 𝑀12 𝑥 1.5
Filter
Brass in-line particulate filter
1/4 𝑖𝑛. Swagelok Tube Fitting
15 𝑚𝑖𝑐𝑟𝑜𝑛 pore size
Lee Valve
Lee VHS Micro-Dispensing
Valve
Input : 12 𝑉
Pressure : 120 𝑝𝑠𝑖 (8.3 𝑏𝑎𝑟)
Ports : 0.062 Lee Minstac Boss
NC valve

Propellant storage and feed system
Page | 98
Figure 71: Nitrogen Tank and Pressure Regulator
Figure 72: Feed system inside the Vacuum chamber

Test Setup
Page | 99
7.4. Vacuum Chamber
The vacuum chamber used is the Heraeus Vacutherm VT-6060M and the vacuum is
created by Vacuubrand MD-1 diaphragm pump. After 30 minutes of operation of the
vacuum pump a pressure level of about 10 [mBar] is achieved and after about 1 hour a
minimum of 6 [mBar] can be achieved (Figure 73). Once the vacuum pump is switched off
the pressure starts increasing by about 0.2 [mBar] per minute. The pressure in the vacuum
tank is constantly monitored using an Omega Engineering PXM209-006A10V pressure
sensor. The characteristics are given in Table 32. Furthermore in the vacuum chamber 9 K-
Type thermocouples, 7 banana plugs and 4 DB9 connectors are available for temperature
measurements and signal feed through.
Figure 73: Vacuum Chamber Pressure Drop

Power Supply
Page | 100
Table 32: Vacuum Chamber Characteristics
COMPONENT CHARACTERISTIC
Vacuum Chamber
Inside dimensions : 50 𝑥 50 𝑥50 𝑐𝑚
Volume : 0.125 𝑚3
Temperature : Up to 200 °𝐶
Ultimate Pressure : 6 𝑚𝑏𝑎𝑟 in one hour
Leak Rate : 0.2 𝑚𝑏𝑎𝑟/𝑚𝑖𝑛
Omega PXM209-006A10V
Pressure Sensor
Accuracy : 0.25% 𝐵𝐹𝑆𝐿
Excitation : 10 𝑉𝑑𝑐
Output : 0 𝑡𝑜 10 𝑉𝑑𝑐
Sensitivity : 600 𝑚𝑏𝑎𝑟/𝑉
Absolute pressure sensor
7.5. Power Supply
The power is supplied by Delta Electronic power supplies. The test setup uses 4 Delta
Elektronika ES030-5 / ES030-10 and 1 Agilent E3631A. The Agilent E3631A is a dual
voltage power supply (Figure 74) and it is used for the powering the Lee Valve Spike and
Hold Circuit. The 5 Delta Elektronika ES030s (Figure 75) are used for powering the 2
pressure sensors of the propulsion system (chamber + tank pressure), pressure sensor of the
vacuum chamber, one for each heater in the thruster and 1 for the load cell. Since the
Agilent E3631A is constantly in use at the same voltage levels it is not being controlled by
the PC, the DE ES030s on the other hand are controlled using RS-232 connection by the
main PC. The specifications are summarized in Table 33.
Figure 74: Agilent E3631A
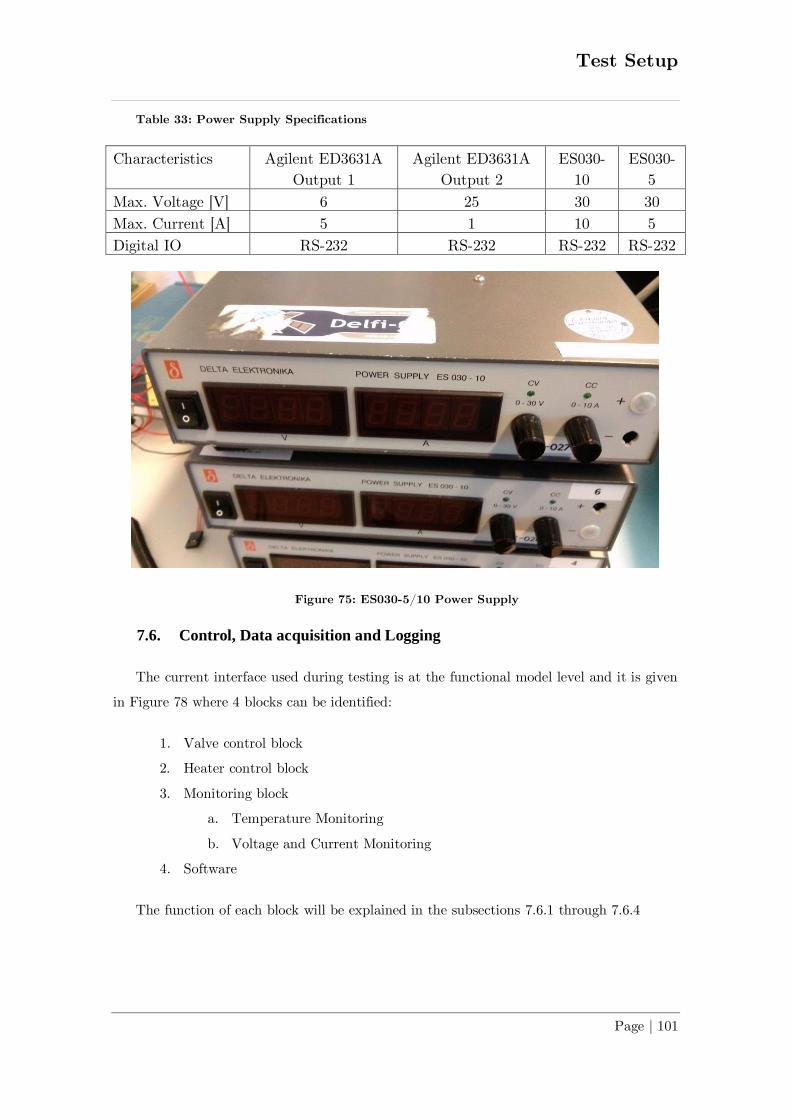
Test Setup
Page | 101
Table 33: Power Supply Specifications
Characteristics Agilent ED3631A
Output 1
Agilent ED3631A
Output 2
ES030-
10
ES030-
5
Max. Voltage [V] 6 25 30 30
Max. Current [A] 5 1 10 5
Digital IO RS-232 RS-232 RS-232 RS-232
Figure 75: ES030-5/10 Power Supply
7.6. Control, Data acquisition and Logging
The current interface used during testing is at the functional model level and it is given
in Figure 78 where 4 blocks can be identified:
1. Valve control block
2. Heater control block
3. Monitoring block
a. Temperature Monitoring
b. Voltage and Current Monitoring
4. Software
The function of each block will be explained in the subsections 7.6.1 through 7.6.4

Control, Data acquisition and Logging
Page | 102
7.6.1. Valve control block
As the name states this control block is dedicated to the valve. The valve requires 2
voltage levels to operate, a spike and a hold voltage level which differ if a 12 [Vdc] or a 24
[Vdc] version of the valve is being used. The spike and hold circuit is provided by the Lee
Company. The connection diagram is shown in Figure 76. It requires 2 power supplies to be
connected, one for each voltage level and a TTL control signal which tells the circuit when
to open and close the valve. Furthermore on the circuit itself there is a mechanical spike
timer set with a potentiometer. In Figure 77 the functional diagram of the valve control
block is given. The function of the timer is to change between the spike and hold voltage
such that the valve is not damaged from overheating.
The TTL signal is sent using the 5 [Vdc] analog port on the NI USB-6008 DAQ card
and the circuit diagram shown in Figure 79 and the circuit itself shown in Figure 80.
Figure 76: Spike and Hold circuit connection diagram
Figure 77: Functional diagram of Valve circuit
Spike Timer

Test Setup
Page | 103
Pressurized Tank
Pressure Sensor
Temperature Sensor
Swagelok Filter
Lee Filter
Lee Valve
Chamber + Heaters
Pressure Sensor
Nozzle
V
A
DC
a11
a22
3a3
4a4
b15
DAQ Workstation
S1
S4
D
C4C1 ENB
DC
DC
SPIKE AND HOLD PCB
Valve Control
Heater Control
Monitoring
Software
Figure 78: Propulsion System electronic interfaces
DC24V
DC3.5V
VALVE
82R 3W
NI – 6008 USB
IRF3707Z
Figure 79: TTL Signal Generator Schematic

Control, Data acquisition and Logging
Page | 104
Figure 80: Spike and Hold TTL Signal Generator
7.6.2. Heater control block
The heater control block monitors and control the 2 heaters installed within the
chamber. This block can switch both heaters independently on and off, control the voltage
level of the two heaters, and monitor the actual (vs. set) voltage level and the current going
through the heaters. Furthermore it has a thermocouple conditioning unit that can sense
the thermocouple integrated within each heater and thus provide temperature information
on the chamber and heaters.
The thermocouples used in the test setup are all K-type thermocouples. They are
monitored using a RS-1316 temperature data logger and DHTherm 1.6 for PC interface or
NI USB-9211A DAQ Card in combination with LabVIEW. The RS-1316 will be used for
standalone temperature tests and it can monitor up 2 thermocouples at the time. All the
specifications can be found in [65]. The USB-9211A is 4 channel 24 [Bit] thermocouple
input devices, thus 2 are needed for a total of 8 thermocouples. The USB-9211A has wire
terminals as input so female thermocouple connectors are needed. Both the RS-1316 and
the NI USB-9211A are shown in Figure 81.

Test Setup
Page | 105
Figure 81: RS-1316 (Left) and NI USB-9211A (Right) TC DAQ Card
7.6.3. Monitoring block
The monitoring block currently at this phase consists of 3 NI DAQ Card, namely the
NI USB-6008 which has 12-bit ADC and is capable of logging of 10 [kS/s] and two NI USB-
9211. The USB-6008 can log single ended voltages from 0 – 10 [Vdc] or differential voltages
from -1 – 1 [Vdc] up to -10 to 10 [Vdc]. The DAQ card monitors the voltages of the
different sensors, power supplies and heaters. Since the voltage of the load cell is in the
order of ± 50 [µV] a more precise multimeter was used for its output, namely a HP 34401a
digital multimeter which can also be controlled and monitored with LabVIEW using an
RS-232 port.
Figure 82: NI USB-6008 on the left and HP 34401a on the right
Furthermore, as a redundancy, the load cell output is also monitored by the USB-6008
using a Scaime CPJ Rail strain gauge conditioner (Figure 83). This is a signal amplifier
that can be adjusted such that the output of the load cell is in a 0 – 5 [Vdc] range which is
easily measurable by the DAQ card. Note however the amplifier is both is prone to both
drift with time and temperature thus those results are purely there as an extra. To monitor
the effect of the spike and hold circuit and the power consumption of the valve an

Control, Data acquisition and Logging
Page | 106
oscilloscope is needed. For this a Tenma 72-8395 was used with a USB interface.
Unfortunately it as was not possible to make a driver that will successfully interface with
this oscilloscope, however a software was found that can communicate and control the
oscilloscope and save graphs directly to the main PC. Finally for monitoring the mass flow
or mass change of the system a digital scale was used. The model is Mettler Toledo
PB8001-S/FACT and it has RS-232 to communicate with the PC. Unfortunately there
were no drivers for this scale in LabVIEW, however using the command list a driver was
built from the ground up such that the scale can be controlled and logged using the main
PC. The scale is shown in Figure 85 and the complete test setup in Figure 86.
Figure 83: Scaime CPJ Rail Signal Amplifier
Figure 84: Tenma 72-8395 Oscilloscope

Test Setup
Page | 107
7.6.4. Software block
The software block currently consists of LabVIEW program capable of communicating,
controlling and monitoring all the different components. It is currently using RS-232
interface to communicate with the different power supplies, valve control block, multimeter
and DAQ Cards.
Figure 85: Mettler Toledo PB8001-S/FACT Scale
Figure 86: Complete Test Setup

LabVIEW Software
Page | 108
7.7. LabVIEW Software
To control all the hardware and to log the data LabVIEW 2013 was used. Using
LabVIEW a program was made that can control up to 4 ES030-5/10 power supplies, a HP
34401a digital multimeter, Mettler Toledo PB8001-S/FACT Scale, one multi-functional
DAQ card such as the USB-6008 and up to 2 thermocouple DAQ cards such as the USB-
9211A. While some of the components are optional, for the program to run at least a multi-
functional DAQ card and the multimeter need to be connected. In the background, the
program runs 2 blocks in parallel, one controlling all the power supplies and another
controlling all the other components and logging the data. The program was made in such
manner due to the fact that the power supply control loop is much slower than the rest of
the components used in the test setup and if run coupled with the second block it makes
precise data logging impossible. The user interface of the program is shown in Figure 87.
The left side (block 1) is used for setting up everything and controlling all the components
and the right side (block 2) is used for real time monitoring of different values. Next the
different tabs of the LabVIEW program will be explained.
Figure 87: LabVIEW Program UI
7.7.1. Power Supply Tab
The user interface for the power supplies is shown in Figure 88 and it’s identical in all 4
tabs. As it was stated previously, up to 4 power supplies can be connected and controlled
at the same time. Block 1 in Figure 88 needs to set up for successful communication with
the power supplies. The Com port needs to respond to the port connected to the power

Test Setup
Page | 109
supply that needs to be controlled and the bit rate and channel to the hardware switches
on the ES030-5/10 power supply being controlled. More information about setting up the
ES030-5/10 power supplies for remote control can be found in [66]. Once that and all the
other parameters have been set-up, the program waits until all the power supplies are
enabled or disabled and all tabs are confirmed (Block 2 - Figure 88). When all tabs have
been confirmed the program tries to establish contact with the power supply. If successful
in Block 3 the light will light up green, and the maximum voltage and current supported
by the power supply will be detected and the dials in block 4 will adjust accordingly.
Block 4 is also used to control and monitor the voltage and current output. The dials are
used for setting the voltage and current output and the digital displays show the actual
current and voltage output.
Figure 88: Power Supply Control UI
If the connection is unsuccessful an error message will appear in block 5. Furthermore
block 5 is used as a debugging block and will report if any problems are detected with the
power supply. Finally block 6 is used to monitor if all control block are in sync and the
time (in milliseconds) it takes for one block to be executed. It was noticed due to the
nature of the power supply drivers, the more power supplies used the longer the loop would

LabVIEW Software
Page | 110
take to run. Therefore it is recommended that only power supplies that have to be
controlled on the fly (such as power supplies used to power the heaters) be controlled using
the LabVIEW program.
7.7.2. Multimeter Tab
The next tab (Figure 89) is for setting up the HP 34401A multimeter. The multimeter
runs in parallel with the scale, the multi-functional DAQ and the thermocouple DAQs and
will not start running until confirming the scale tab. The settings in Block 1 need to be
correctly setup before confirming as they will be read only once (except of the loop time).
Figure 89: Multimeter Control UI
The VISA Resource Name should be set to the correct Com port where the multimeter
is connected and the serial port settings need to be correspond to the settings set on the
HP 34401A. The rest of the settings depend on the type of measurements that are desired
and more information about them can be found in [67]. Note if auto resolution and scale is
used the time between measurements is slower thus this is recommended to be used only if

Test Setup
Page | 111
the measured values can have wide range. The loop time is the minimum time between
measurements, as the maximum time is depended on the settings themselves. It is
recommended that the loop times of the multimeter, DAQ cards and the scale be equal. In
the array in block 2 the last measurement is shown and block 3 is used for debugging and
to display error messages.
Figure 90: DAQ Card Tab
7.7.3. Multi-functional DAQ Card Tab
The multi – functional DAQ card is shown in Figure 90. The front end of this tab is
basic since most of the setting up is done in the back end. If the same test setup is
preserved the only setting that needs to be done is making sure if the device name (Box 1)
is the actual multi – functional DAQ card used and connected and not another DAQ card
(example the DAQ cards used for the thermocouples). In Box 2 the raw values will be
shown of the voltage read at the connected analog inputs and in Box 3 the feed system and
vacuum chamber pressure will be calculated using previously established equations.
If the previous test setup has been changed or the calibrated values of the sensors are
not valid anymore the user needs to change values in the program. Box 2 in Figure 91
converts the voltage values of both pressure sensors to a pressure value from a calibration
curve previously established. The current equations used are given in(4.3). Note that this is
only for display purposes to ease operations and the values are saved in the raw output
from the sensors (In the current setup that is Volts).

LabVIEW Software
Page | 112
Figure 91: DAQ Card Program
[ ] [ ]
3.391 2.369
0.594 0
bar volts
feed
vacuum
P V A B
P V
P V
(4.3)
Figure 92: DAQ Assistant
Furthermore if the sensors are connected differently, or different sensors or DAQ card is
used the DAQ Express Assistant needs to be activated again (Box 1) to complete the initial
setup. Double clicking on the DAQ Assistant block will show a window as given in Figure
92 where every channel can be setup by giving it a name, type of measurement, range and
acquisition model. Furthermore if unsure about how to connect the hardware or to double
check if everything is connected correctly, the connection diagram can be used (Figure 93).

Test Setup
Page | 113
Depending on the channel and the type of measurement used the DAQ Assistant
connection diagram will show which outputs of the DAQ card should be connected and in
what manner. It is a very useful tool incorporated into LabVIEW.
Figure 93: DAQ Assistant Connection Diagram
7.7.4. Mettler Toledo Scale Tab
The Scale tab is shown in Figure 94. Except for the power supplies all other tabs will
wait for the scale tab to be confirmed before starting. This was done since if the scale is to
be used it needs to do internal calibration and zeroing which takes about 30 [s] and could
render otherwise the scale block out of sync with the rest of the blocks. If the scale is not
being used in the current test setup then just by pressing confirm in Block 2, all other
settings are ignored and the program continues. If the scale needs to be used, Block 1 needs
to be set-up first such that it corresponds to the correct COM port where the Mettler
Toledo scale is connected and the same port settings as set on the scale. For how to check
the current settings of the serial port on the scale and set them as needed please refer to
the manual [68]. Once the settings have been set the scale can be enabled and the choice
needs to be confirmed in Block 2. When the choice has been confirmed the scale will
undergo internal calibration and zeroing. Note that no mass should be placed before the
internal calibration and zeroing has completed. After the initial setup the scale makes
measurements in grams equal to the sensing time set for all the loops and this is displayed
in Block 3. If zeroing is needed (because of putting some mass for example), the zero switch

LabVIEW Software
Page | 114
can be pressed and the scale will return zero on the next measurement and measure the
change in mass from that zero point.
Due to the nature of the measurements and the potential high sensing rate (in the order
of few hundred milliseconds) by default the program uses the SI command (send current
net value regardless of balance stability [69]). This means that vibration, jolts or
movements of the components or table where the scale is set can momentarily affect the
measured mass as well. The program has a simple option of making a change if the stable
weight (command S) or unstable weight (command SI) is required, namely in the program
the value in Block 1 Figure 95 needs to be 0 for SI or 1 for S. The drivers had to be written
from the ground up so if different commands needs to be sent or additional options are
required please refer to [69] for all the available commands. With some understanding of
LabVIEW, the current command block can be used as a baseline and with just changing
the command send, in theory, new functionally can be added.
Figure 94: Scale Tab
Figure 95: Scale LabVIEW Program

Test Setup
Page | 115
7.7.5. Thermocouple DAQ Cards Tab
The LabVIEW program has the capability to interface with up to 2 thermocouple DAQ
cards. Using 2 NI USB-9211A cards, which are available at the MeetShop of TU Delft, up
to 8 thermocouples can be logged at the same time which has been considered adequate for
these tests. If more than 8 thermocouples are required, either the program needs to be
expanded with more TC DAQ card block (which can be done fairly easy with just copying
the current blocks) or a DAQ card with more TC terminals should be used. The TC DAQ
Card tab is shown in Figure 96. As with the multi – functional DAQ card tab given in
Section 7.7.3 the cards are configured using the DAQ Express Assistant. DAQ Assistant 3
corresponds to TC DAQ 1 and DAQ Assistant 4 corresponds to TC DAQ 2 (Figure 97).
The default measurement type is on demand in Kelvin and K-Type thermocouples are
measured. Once again using the DAQ assistants the type of thermocouples and
measurements needs to be set if changed from the default. In the tab one must ensure if the
device address corresponds to the actual address of the TC DAQ Card (Block 1 in Figure
96). In Block 2 the value of the thermocouples are displayed. If a TC is not connected or
broken an abnormally high temperature value will be displayed. For example when set to
K-type TC a value of 2358 [K] was displayed on an open port.
Figure 96: TC DAQ Card Tab

LabVIEW Software
Page | 116
Figure 97: TC DAQ Card Program
7.7.6. Setup and Control Tab
The last tab in the LabVIEW program is used for setting up the data-logging and
controlling the thruster and it is shown in Figure 98. In Block 1, the sensing time of every
component and the logging time can be set. Note that this is the minimum sensing time
and some components may take longer (depending on the settings). If synchronous
measurements are to be guaranteed, the minimum sensing time should be set higher than
the slowest components. The sensing time of all components is displayed in Block 3.
Furthermore in Block 1, a test name can be assigned which will be displayed in the logged
file and file path to specify where the file is to be saved. The saving of the data starts once
the save data button is pressed and the saving data led lights up green. Once the saving
starts the saved data points and the elapsed time is also shown in Block 1.
In Block 2 the valve and different power supplies can be controlled. The valve is
controlled using the thrust switch and the thrust time. First the thrust time is set to the
desired time the valve should be open and the thrust switch is toggled. The multi –
functional DAQ Card the sends a signal to the circuit shown in Figure 80 which in turn
turns on the spike and hold circuit and the valve is actuated. Obviously the spike and hold
circuit needs to be powered separately as explained earlier in Section 7.6.1 for the valve to

Test Setup
Page | 117
open. Sometimes there can be a difference of few milliseconds until the circuit reacts and
close the valve therefore the actual elapsed time is also shown. While the valve is open the
Thrusting led will be lit up green.
Figure 98: Setup and Control Tab
The heating of the thruster is also controlled in this tab by controlling the power
supplies in Block 2. First the correct power supply needs to be chosen using the knob with
1 to 4 corresponding to power supply (PS) 1 to 4 respectively. Next the desired heating
voltage is set and the heating time. When ready the heating is started by toggling the
heating switch. As mentioned earlier the power supplies can have up to few seconds delay
before receiving and acknowledging the command. When the power supply actually
acknowledges the command and sets the desired voltage level, the heating led will lit up
green and the elapsed heating timer will start counting. There can be difference between
the desired and actual heating time by up to few seconds but this is not considered crucial
for the testing since the heating time is normally in the order of few hundred seconds.
Finally if the temperature is gets too high or for some reason the thrusting or heating needs

LabVIEW Software
Page | 118
to be aborted immediately there is an abort button that will close the valve and turn off
the power supply straightaway.
Initially a control loop was also envisioned that would modulate the voltage level or the
power supply on-off automatically as to achieve a desired temperature. However due to
time constraints this was not possible to be incorporated in the current version of the
LabVIEW program and therefore if the operator wants to maintain a certain temperature
level for longer period of time, the power supply or voltage level will need to be changed
manually.

Page | 119
8. Test Campaign
In this chapter the test plan and specific changes to the test setup are given for each
planned test. For the test campaign of the EM thruster the following tests are planned:
Components Test
o Heater
o Valve
Feed System and Thruster Assembly and Inspection
Propulsion System Test
o Leak test
Feed System
Thruster
o Mass Flow Test
o Heating test
o Calibration of thrust bench
o Thrust test
o Pressure drop test
o Post inspection of the thruster
The engineering model of the propulsion system has two components that can be tested
separately, namely the valve and the heaters. Testing the components separately will allow
better characterizing them and checking if there are any differences between the specified
and actual performance.
When all the components are tested the thruster and feed system need to be assembled
and integrated and inspection should be made of the assembly. The first test to confirm a
good assembly and integration is to have both the feed system and the thruster leak tested.
Next the mass flow through the valve at different pressures is tested. This will useful to
know later in the thrust test to know how much water has been injected in the chamber.
Following the mass flow test is the heating test which will provide data on the temperature
achieved in the chamber and heating and cooling time required using different mediums
(empty, nitrogen gas or water) and at different power levels. Following logical flow of the
different tests, the next test would be the pressure drop test in the chamber due to the
porous media. However since the thruster needs to have a connector exchanged for this

Heater Testing
Page | 120
test, which may damage the thruster (and render the leak data generated earlier useless_
this test is left for last. Instead the thrust bench is first calibrated and then the thruster is
tested for thrust levels at different pressures and power levels. When the thrust test is
completed the pressure drop test is made as to have all the information available to
calculate the efficiency of the nozzle. Finally a post testing inspection is made of the
thruster.
8.1. Heater Testing
The heaters will be tested to verify if there are any deviations from the stated
specifications, to check the heating and cooling time required and the temperature that can
be achieved. They will be tested at 2 power levels, namely at their maximum power level
and the power level at which they would be used in the satellite. The goal of this test is to
gain experience with the testing equipment and find the set and actual voltage level and
the resulting input power of the heaters. Furthermore a heating and cooling graph will be
obtained which while not representable for when the heater will be incorporated in the
thruster it will give first indication of the each heater performance.
8.1.1. Test Setup and Procedure
For this test since only temperature measurements where required, the RS-1316 was
used in combination with DHTherm 1.6. The heaters where placed inside the vacuum
chamber and tested in both ambient and vacuum conditions. The test was done in the
following manner:
Start logging every 2 seconds
Log for 1 minute at ambient conditions, heater unpowered
Turn on heater at desired power level for 10 minutes or when
Turn of the power supply after 10 minutes and wait until the heater has
reached < 30 [°C] or 10 minutes has passed (whatever comes first).
The test setup is shown in Figure 99. Due to the long wires from the power supply to
the heater inside the heater chamber, a significant voltage drop was observed. Therefore a
feedback loop was made as to monitor the set vs actual voltage. Furthermore due to the
large currents of the Elstein heater at 12 [V] and the possibility of overheating the wires
when in vacuum, the current had to be split by using to cables in parallel.

Test Campaign
Page | 121
Power Supply
D-Sub D-Sub
Banana Plugs
Banana Plugs
ResistiveHeater
VVolt
Meter
Vacuum Chamber
Figure 99: Heater Test Setup Schematic
8.1.2. Test Results and Deliverables
Two example test results are shown in Figure 100 and Figure 101. Since the Elstein is
an IR heater, a lot more heat was lost in the environment and the heater itself achieved a
lower temperature for the same power level. The Watlow heater on the other hand
achieved much higher temperature but it is expected that the stay time of the water should
be increased in the chamber to have this extra heat effectively transferred to it. The results
are given in Table 34
Figure 100: Example Elstein Test Data
0
20
40
60
80
100
120
140
1 101 201 301 401 501 601
Tem
pera
ture
[C
]
Datapoint
Elstein 5V Ambient
Internal TK
External TK
dT

Valve Testing
Page | 122
Figure 101: Example Watlow Test Data
Table 34: Heater Test Results
Heater Vset [Vdc] Vread[Vdc] Power [W]
Watlow 12.2 12 7
Watlow 24.8 24 28
Elstein 5.6 5 8
Elstein 13.8 12 45
This test was deemed successful since the different power levels and voltage levels were
determined for both heaters and the functionality of the test setup, thermocouple data
loggers and DAQ Cards.
8.2. Valve Testing
The valve will be tested to check if it can hold pressures up to MEOP, the opening
current, voltage spike and spike time required will be investigated at MEOP. The valve
tested will be the INKX0514300AA4 which is the 24 [Vdc] version of the valve. The reason
why this valve was chosen is that there are currently 2 in inventory, whereas only 1
INKX0514300AA5 is available and if the valve were to get damaged during testing there is
a replacement. If the test setup and equipment prove to be benign the INKX0514300AA5
can easily be re-tested as to give an impression of what sort of requirements the flight
model valve would impose to the EPS and electronics of the DelFFi satellite. The goal of
this test is to determine spike time required to open the valve at MEOP and voltage levels
for the spike and hold circuit. Furthermore it will validate that the TTL signal generator
circuit and the LabView program are correctly made.
0
50
100
150
200
250
300
350
400
450
2 102 202 302 402 502 602 702 802 902
Tem
pera
tire
[°C
]
Time [s]
Watlow Heater 12V Ambient
Watlow Heater

Test Campaign
Page | 123
8.2.1. Test Setup and Procedure
For this test the Tenma 72-8395 was used. The probes have to be connected to both
pins of the valve coil and the ground. The system is pressurized up to 8 [Bar] and then the
spike time is increased until the valve opens reliability at least 3 times for a period of 1 [s].
The test setup is shown in Figure 102.
Spike and Hold Circuit
Oscilloscope
Pressure Sensor
Filter
Pressurized Feed System
Valve
Figure 102: Valve Test Setup Schematic
8.2.2. Test Results and Deliverables
The results of a test performed at 8 [Bar] is given in Figure 103 and Figure 104 . It can
be seen that the valve is powered for 0.6 [ms] at 24 [V] and then the valve remains open at
3.2 [V]. The minimum spike time for the valve to reliably open was found to be 0.3 [ms]
but during testing a margin was added (safety factor of 2) to ensure that the valve will
have enough power to open every time. The test was deemed successful because the
minimum spike time was successfully determined and TTL signal generator circuit and the
test setup was validated.

Valve Testing
Page | 124
Figure 103: Oscilloscope Capture
Figure 104: Valve Test Results

Test Campaign
Page | 125
8.3. Feed System and Thruster Assembly Inspection
With the components tested, next the feed system and thruster where assembled and
inspected. Teflon tape was used on every thread except of the MINSTAC. The temperature
sensor for the liquid was installed by the DEMO workshop due to the thread being not
manufactured correctly. For the leak test a M2 screw was inserted into the threaded hole
for the nozzle. After the leak test the nozzle was installed. Due to the small size, it was not
possible to use Teflon tape but high temperature silicon rated up to 300 [°C] (Figure 105)
was used to make sure the connection is leak tight. The nozzle was inspected under a
microscope to ensure that the throat is clear from obstructions (Figure 106).
Figure 105: Bison High Temperature Silicone
Figure 106: Nozzle Inspection
8.4. Leak Test
Next a Leak Test will be done to both the feed system and the thruster. The feed
system will be tested using only nitrogen and after the initial identification of leaks will be

Leak Test
Page | 126
tested inside the vacuum chamber. For convenience the leak test of the thruster was done
in atmospheric conditions as it is easier to inspect it. It was decided to leave 1 [Bar] margin
when testing the valve due to reports that the previous valve may have been damaged.
When the thruster and the feed system are tested in ambient a caution will be made that
instead of MEOP, they are pressurized at MEOP + 1 or 7 [Bar] as to have the same
pressure difference as when used at MEOP in vacuum. Two leak rates will be investigated,
namely gas leak rate and liquid leak rate with the latter being more important. For the gas
leak rate the chamber is filled using nitrogen, and for the liquid leak rate the chamber is
filled using demineralized water and pressurized with nitrogen.
The goal of this test is to determine the leak rate of both the feed system and the
thruster. Ideally the leak rate of the feed system should be lower than the requirement of
the valve given in Section 4.1.1 and the leak rate of the thruster should be an order of
magnitude lower than the mass flow as calculated in Section 5.5. This is to ensure that the
majority of the propellant will flow through the nozzle and not leak into the environment
and thus render the thrust measurements unusable.
8.4.1. Test Setup and Procedure
The feed system was tested up to and including the valve. When the gas leak rate was
tested the water filling branch was closed, the system was pressurized and the quick release
connection disconnected. The valve was unpowered, thus closed and measurements were
taken over the course of several hours. For the liquid leak rate the system was first filled
with predetermined amount of water and then pressurized.
When measuring the thruster leak test, the thruster was completely shut by screwing a
M2 screw in the threaded hole intended for the nozzle. The valve was removed from the
feed system as to avoid being powered and open for an extended period of time. Again both
gas leak rate and liquid leak rate where tested. The test setup is shown in Figure 107.

Test Campaign
Page | 127
Figure 107: Leak Test - Test Setup
8.4.2. Test Results
The feed system was first tested in ambient pressure. After it was left overnight a
pressure drop was detected in the system (Figure 108). Upon inspection this was due to a
bad connection between the plug and the hexagon. This was fixed and in a later test done
in vacuum where after setting the initial pressure to 6.34 [Bar] after 14 hours the total
pressure drop was only 40 [mbar] down to 6.30 [Bar]. These results are shown in Figure
109.
The first test of the thruster was a complete failure. The thruster was not able to hold
pressure even for few minutes and was leaking from the whole contact surface between the
cap and the chamber. Therefore silicon was applied throughout the connection area with
the thruster ending up looking as shown in Figure 110

Leak Test
Page | 128
Figure 108: Feed System Leak Test 1
Figure 109: Feed System Leak Test 2
.
0
1
2
3
4
5
6
7
8
1 2 3 4 5 6 7 8 9 10 11 12 13 14 15 16 17
Pre
ss
ure
[B
ar]
Time [Hours]
Feed System Pressure
0
1
2
3
4
5
6
7
1 2 3 4 5 6 7 8 9 10 11 12 13 14
Pre
ss
ure
[B
ar]
Time [Hours]
Feed System Pressure

Test Campaign
Page | 129
Figure 110: Thruster with silicon applied
Never the less there was still gas coming out from the leads of the Elstein heater. After
several unsuccessful tries to stop the leak this test was abandoned and a water leak test
was made. However the same happened again but at a much slower rate. Water was still
dripping through the leads as it can be seen in Figure 111. The results from the test are
given in Figure 112.
Figure 111: Thruster Leak Test

Leak Test
Page | 130
Figure 112: Thruster Leak Test Results
Figure 113: Thruster Leak Test Result Section
It is interesting to note the shape of the pressure drop when zoomed in. One can see
that it looks like stairs which is due to the pressure overcoming the vicious forces of the
0
1
2
3
4
5
6
7P
res
su
re [
Bar]
Time [Hours]
Chamber Pressure
5.7
5.8
5.9
6
6.1
6.2
6.3
Pre
ssu
re [
Bar]
Time [Seconds]
Chamber Pressure

Test Campaign
Page | 131
water in the heater leads. Once again after many tries, the leak was not able to be mended
and it was accepted the fact that thrust measurements may not be possible at all.
8.5. Heating Test
Due to the silicon used in the assembly of the thruster for improving the leak tightness,
the structure temperature is limited to about 300 [°C]. To avoid complicated control loops
and power modulation of the supplies the heating up phase will be controlled with timed
pre-heating. In this test a series of heating up and cooling down will be made and
temperature will be monitored on key components of the chamber, namely:
Heater temperature
Chamber temperature (using 2nd heater thermocouple)
Wall temperature on 4 sides (temperature distribution)
Temperature of the valve connector (limited due to PEEK nut)
The test will be done in vacuum due to the fact that a lot of heat will be lost in the air
from convection. The test will be done interchangeably with both heaters as to characterize
the heating up phase and the temperature distribution and power consumption of each
heater.
8.5.1. Test Setup and procedure
In this section the test setup and procedure of the testing are outlined. The heaters
where connected the same as given in Figure 99. The thermocouples where connected to
different positions as given in Table 35. The setup is shown in Figure 114.
Table 35: Thermocouple Position
TC1 TC2 TC3 TC4 TC5 TC6 TC7 TC8
Thruster
Top
Valve
Connection
Watlow
TK
Elstein
TK
Thruster
Bottom
Thruster
Front
Side
Watlow
Side
Elstein

Heating Test
Page | 132
Figure 114: Heating Test - Test Setup
8.5.2. Test Results
In this section the test results are given. The temperatures reached by the heaters at
different level are given in Table 36. With the temperature profile for the Watlow at 7 [W]
and Elstein at 8.5 [W] given in Figure 115 and Figure 116 respectively. It can immediately
be seen while the Watlow heater reaches much higher temperature the chamber heats up
significantly less than when the Elstein heater is used. This is due to the fact that the
Elstein ceramic heater releases more heat to the environment, however with the current
chamber even with 10 [W] the desired temperature of 550 [K] cannot be reached. The
Watlow heater exceeds this requirements but careful chamber design is needed to ensure
that this heat is transferred to the fluid.
Table 36: Heater Test Results
Heater Temperature [C] Power [W] Voltage [Vdc]
Watlow 303 7 12
Watlow > 300 10 14.4
Watlow > 300 30 24
Elstein 187 8.5 5
Elstein 214 10 5.5
Elstein > 300 45 12

Test Campaign
Page | 133
Figure 115: Watlow Heating Profile at 12 [Vdc]
Figure 116: Elstein Heating Profile at 5 [Vdc]
0
50
100
150
200
250
300
350
0 300 600 900 1200 1500 1800 2100 2400
Tem
pera
ture
[°C
]
Time [s]
TC1
TC2
TC3
TC4
TC5
TC6
TC7
TC8
0
20
40
60
80
100
120
140
160
180
200
0 300 600 900 1200 1500 1800 2100 2400
Tem
pera
ture
[°C
]
Time [s]
TC1
TC2
TC3
TC4
TC5
TC6
TC7
TC8

Mass Flow Test
Page | 134
8.6. Mass Flow Test
The Mass Flow Test is used to determine the flow through the valve at different
pressures levels. The test will be done from 6 [Bar] to 2 [Bar] at 1 [Bar] steps to simulate 5
to 1 [Bar] in vacuum. The results from this stage can be used in a later stage of the testing
to relate the necessary opening time of the valve to the thrusting time of the thruster.
Given the similar size and dimensions of the VHS and IEP valves it is expected that this
data can be correlated also for the flight thruster.
8.6.1. Test Setup and procedure
As it was said previously the test was done from 6 [Bar] to 2 [Bar] in 1 [Bar] steps. The
valve was set to discharge the fluid in a tank that is placed on a scale. Three thrusts of 5
and 10 seconds each will be made and the average will be taken for the mass flow per
second
8.6.2. Test Results
The results are summarized in Table 38 and an example test result is given in Figure
117. Given the calculated mass flow through the nozzle of 2.4 [mg/s] this means that
opening the valve for 1 [s] at 6 [Bar] overpressure, enough propellant will go through the
valve for the thruster to thrust for more than 500 [s]. Therefore pulsing or valve – thrusting
circuit logic is highly recommended for the flight model. Furthermore it can be seen in
Figure 118 that the mass flow is fairly linear w.r.t. to the pressure.
Table 37: Valve Mass Flow
Pressure [Bar] Mass Flow [g/s]
6 1.29
5 1.09
4 0.91
3 0.68
2 .44

Test Campaign
Page | 135
Figure 117: Valve Mass Flow at 6 [Bar]
Figure 118: Mass Flow vs Pressure
8.7. Thrust bench calibration
While not directly related to the test campaign of the EM thruster, the calibration of
the test bench will be used to verify the results obtained by Q. Bellini in a previous
attempt and to get accustomed in using the thrust bench. Furthermore the results from the
0
10
20
30
40
50
60
0 20 40 60 80 100 120
Ma
ss
[g
]
Time [s]
y = 0.211x + 0.038 R² = 0.9967
0
0.2
0.4
0.6
0.8
1
1.2
1.4
0 2 4 6 8
Ma
ss
Flo
w [
g/s
]
Pressure [Bar]
Mass Flow
Linear (Mass Flow)

Thrust bench calibration
Page | 136
calibrations can be used later in the test campaign if successful thrust measurements are to
be made.
Ideally multiple calibration runs should be made as to minimize the effect of differences
of the test setup, pulley friction etc. however due to time constraints only one calibration
run was made.
8.7.1. Test Setup and procedure
In this section the test setup and procedure of the testing are outlined. The trust bench
was assembled the pulley was installed on the mounting plate. Next using spider silk rope a
pulley system was attached to the chamber. It is important to keep the rotating arm as
straight as possible as to avoid creating a moment of the load cell instead of pure tension /
compression force. The setup is shown in Figure 119. Before calibrating, the thrust bench
had to be leveled using a spirit.
The testing procedure is as follows. First of all the thrust bench at rest is defined. Next
the pulley is attached and left for 60 [s] to stabilize to define the new zero and the amplifier
was zeroed. Afterwards weights of 10, 20, 20, 50, 100, 200, 200 and 500 [mg] where added
on the pulley for about 60 [s] each and then they were taken out in reverse order.
The load cell output will be monitored both directly with the HP Multimeter and with
the NI DAQ card using the signal amplifier.
Figure 119: Thrust Bench Calibration Setup

Test Campaign
Page | 137
8.7.2. Test Results
In this section the test results are given. The raw graph data is given in Figure 120 and
the data is summarized in Table 38. Unfortunately due to a coding error in the program
not enough significant digits where saved to make use of the data as logged by the HP
Multimeter so only the output connected to the signal amplifier was available. Once this
became apparent the code was fixed but the test setup has already been dismantled and
thus re-calibrating was not possible.
As it can be seen from the graph and the tables the displacement and thus the output
of the load cell is not the same when loading and unloading the load cell. Furthermore for
mass changes lower than 100 [mg] the output change is not consistent. This can be due to
both friction of the pulley or the arm bearing and the fact that 10 [mg] corresponds to only
1 [%] of the full scale load. Given that the expected thrust of the chamber if no leakage is
present was between 0.5 and 2.5 [mN] it is uncertain if significant measurements could be
made. The calibration line is given in Figure 121.
Table 38: Load Cell Calibration Data
Action Time [s] Output [mV]
Attach Pulley 70 6039.6
Zero Amplifier 190 97.6
Add 10 [mg] 270 99.9
Add 20 [mg] 330 155.6
Add 20 [mg] 390 183.0
Add 50 [mg] 455 248.9
Add 100 [mg] 522 362.6
Add 200 [mg] 580 608.5
Add 200 [mg] 640 812.8
Add 500 [mg] 715 1411.3
Remove 500 [mg] 800 612.6
Remove 200 [mg] 880 540.8
Pulley Stuck 960 -
Remove 200 [mg] 1024 241.3
Remove 100 [mg] 1110 22.6
Remove 50 [mg] 1210 -7.5
Remove 20 [mg] 1290 -71.9
Remove 20 [mg] 1360 -118.9
Remove 10 [mg] 1430 -105.3
Remove Pulley 1510 -2550.6

Thrust measurement
Page | 138
Figure 120: Load Calibration Raw Data
Figure 121: Load Cell Calibration Line
8.8. Thrust measurement
Following the calibration of the thrust bench a thrust measurement will be done. The
thrust will be measured in vacuum and with the pressure port in the chamber closed. The
thrust will be once again measured at pressures from 1 [Bar] to 5 [Bar] in 1 [Bar] steps.
-4
-2
0
2
4
6
8
10V
olt
ag
e [
V]
Time [s]
y = 1.2686x + 8.7707 R² = 0.9335
-200
0
200
400
600
800
1000
1200
1400
1600
0 500 1000 1500
Ou
tpu
t [m
V]
Mass [mg]
Excitation
Linear (Excitation)

Test Campaign
Page | 139
Furthermore also blow-down mode to simulate conditions in space was envisioned but this
was not done due to the high leak rate of the thruster. Temperature of the heater, chamber
and walls will also be constantly measured and also the power used by the heaters.
8.8.1. Test Setup and Procedure
For the thrust measurement the same settings where kept on the signal amplifier as to
have the previous calibration data obtained valid for analysis of the result. The test setup
is given in Figure 122. As it can be seen a large number of wires and thermocouples run
over the arm. This poses a concern as they may cause interference with the thrust
measurement by not enabling the thrust arm to move freely.
As previously mentioned the planned procedure is to do thrust measurements at
different pressure levels and at power level of 7 [W] for the Watlow and 8.5 [W] for the
Elstein heater to simulate real world application. However if no thrust measurement is
made the power level can be increased up to the maximum of each heater respectively or
even both can be used together for maximum power.
Figure 122: Thrust Measurement Test Setup

Thrust measurement
Page | 140
8.8.2. Test Results
Unfortunately after many different tries no conclusive results could be extrapolated
from the test. Even when using both heaters at the same time, no change was observed in
the load cell signal. Furthermore since as previously said the data from the HP Multimeter
which was directly connected to the load cell was rendered useless only the data logged by
the DAQ card and the signal amplifier was used which was prone to both time and
temperature drift. This made analysis of the data simply impossible.
Furthermore water leaking of the thruster was observable on the chamber cold plate
and fogging of the inside of the window as well which meant that water vapor was present
inside (Figure 123). In addition there was water pumped out by the vacuum pump which
lead to water condensation inside the pump and expelled in the clean room (Figure 124).
The vacuum pump used is not rated to be used with water and does not include a water
catching cup therefore for future testing is recommended to incorporate one before the
pump itself.
Figure 123: Thruster Leakage during Testing

Test Campaign
Page | 141
Next the thruster was taken outside the chamber to be able to inspect it while in
operation and to avoid damaging the vacuum pump. At full power of the heater definitely
hot gas was observed coming out from the nozzle with minimal or no spitting but again no
thrust measurement was made by the thrust bench. Finally during one of the high power
test, chamber failure occurred due to quite possibly big pressure build up inside the
chamber. Unfortunately no chamber pressure information was available however the
pressure was definitely higher than the feed system pressure because reverse flow was
observed when opening the valve.
Figure 124: Water Condensation inside the Vacuum Pump
8.9. Pressure Drop Test
This test is to determine the pressure of the chamber as a function of the pressure in
the tank. The test was envisioned to be done in ambient with sufficient power to gasify the
water or vacuum with a fixed power level. However due to the imminent clean room
renovation there was not enough time for this test to be completed.
8.10. Post Test Inspection
After testing the thruster was inspected. Even though demineralized water was used
significant mineral deposits were found on the thruster (Figure 125) and when inspecting
the nozzle under the microscope it can be seen that the throat was also affected (Figure
126) and while not clogged the diameter has been significantly reduced. This could in
theory also affect the lack of proper thrust measurements. The inside of the thruster and

Post Test Inspection
Page | 142
the heaters are shown in Figure 127 and Figure 128. As it can be seen there have been also
significant mineral deposits and corrosion. This means that either the water used has in
fact been normal tap water or due to mineral deposits on the feed system components
which have not been cleaned properly.
Figure 125: Thruster Post Testing Inspection
Figure 126: Nozzle Post Testing Inspection

Test Campaign
Page | 143
Figure 127: Post Testing Chamber Inspection
Figure 128: Post Testing Heater Inspection

Page | 144
9. Lessons Learned
With the testing campaign finished, in this chapter the results will be analyzed and the
lessons learned will be given. First in Section 9.1 a block diagram of the electronics required
for the propulsion system will be given. Next the results will be analyzed and a proposed
thruster flight model design will be given in Section 9.2.
9.1. Electronic Circuit Engineering Model
The engineering model of the electronics needs to combine all the different blocks and
components used during testing. The block diagram of the electronics needed is given in
Figure 129. For the engineering and flight model of the propulsion system the voltage needs
to be converted locally, thus the need for DC / DC converters locally on the PCB.
Furthermore only one heater will be used in the final thruster. There are a large number of
voltages monitored in the current diagram, which will be rather useful for the engineering
model testing but if deemed necessary may be omitted of the flight model PCB. The
requirements where previously given in Section 1.3.
3.3V1
5V2
GND
0
EPS
12 V1
1.6 V2
3TTL
4GND
Valve
Valve
5
6
Timer
0
Spike and Hold
DC – DC up 12V
DC – DC down 1.6V
Open / Close valve
controller
Logging Block
TC Conditioning
Block
Heater
Valve
TCs
V
A
V
V
Log all V (5) and A (1)
Pressure Sensor
Temperature Sensor
V
VControl, communicate and
store data
Heater Controller
Figure 129: Electronics Block Diagram

Lessons Learned
Page | 145
9.2. Result Analysis
Looking at Chapter 8 it can be clearly seen that the testing was far from a complete
success. It was not possible to sanitize the leakage from the Elstein heater and the thrust
measurement was inconclusive even after many different attempts. This could have been
avoided if 2 separate chambers where made for both heaters. Furthermore due to both time
constraints and not being able to measure thrust and thus to have a meaningful
comparison, the effect of the different porous media was not investigated Finally with the
impending clean room renovation and the fact that another student also needed the testing
facilities there was no time to complete the chamber pressure test and thus the pressure
drop caused by the porous media and feed system is currently unknown.
Never the less a lot of experience was gained from the testing and some rather
important conclusions can be drawn. Furthermore a general test setup and LabView
program was made that can be used not only for propulsion system testing but also other
systems. A completely different system was tested using the same setup and program by
another student after only a brief introduction to the setup and the program. Still there are
some improvements that can be incorporated in the program with the main one being a
temperature control loop that will maintain a target temperature and a thrust to valve
open time loop that using the information about the mass flow thru the valve at different
temperatures can extrapolate the required opening time to match the desired thrust time.
Regarding the heaters, it was concluded that the Elstein heater is very difficult to
integrate and to make a leak tight connection with the thruster is nearly impossible. The
Watlow heater achieves higher temperature but radiates less heat thus stay time and
contact area with the water needs to be maximized. In the next design to improve the
connection, in addition to thread, a flange should also be welded and a high temperature
silicon O-ring can be used to ensure leak tight assembly. It is also recommended that
temperature control loop with variable voltage output (or to demonstrate real flight
operation on / off cycling of the heater) is added for reduced power consumption when a
temperature is reached and better control and repeatability of tests.
Regarding the valve the VHS valves have proved to be reliable and usable in the
system therefore the IEP valve should be ordered ASAP due to the long lead time. Due to
the order of magnitude of difference between the mass flow through the valve and the
nozzle pulsing or really short valve openings times are needed. Otherwise as it was observed

Result Analysis
Page | 146
pressure will build up and the structural integrity of the chamber may come in question
(long opening times lead to the chamber acting like a water cooker / boiler).
The proposed design for the flight model using the Watlow heater and the IEP valve is
given in Figure 130. Given the simple cylindrical shape it is expected that this chamber will
be cheap to be produced and thus more can be made as to test different porous materials.
The thruster and the valve are to be welded together and this can also be done with the
heater and the chamber as well. The chamber should be made out of steel as to have
material compatibility with the piping from the IEP valve and also for heater when
welding. Steal also has lower heat capacity than aluminum thus the heating efficiency of
the thruster should increase. Finally the same nozzle can be used as made for the
engineering model.
Figure 130: Proposed FM Thruster Design (Concept)
Regarding the test equipment there is a concern that the TB-50m is not able to
measure these thrust levels reliably because even though water vapor flow was observed
during testing, nothing was measured by the load cell. This can either be due to the large
number of stiff wires that prevented rotation of the arm of the thrust bench or the thrust
levels being too low for the test bench to register them. Furthermore it is recommended
that the whole system is purged and cleaned before the next use. Mineral residue was
observed on the nozzle throat and exit even thou demineralized water was being used
during testing. Due to the small throat diameter this can lead to clogging of the nozzle.

Page | 147
10. Conclusions & Recommendations
The format and size specifications of the CubeSat platform require highly miniaturized
subsystems, one of the most challenging ones being the propulsion system. The importance
of a miniaturized propulsion system becomes even more apparent when taken into
consideration that most, if not all, of the CubeSats launched to date, due to budget
constraints, have been piggybacking their launches into space and therefore they may end
up in a non-optimal orbit. Having a propulsion system onboard the spacecraft would allow
the operator to control the satellite velocity which could be used for orbit control and
maintenance and attitude control. The aim of this thesis was to design a thruster that will
satisfy the design criteria following from the DelFFi satellites requirements. In this chapter
the conclusions and recommendations from this research project are given. Additional
recommendations regarding the project management are given in Appendix A.
10.1. Conclusions
In Chapter 2, a number of Commercial-Off-The-Shelf (COTS) systems have been
investigated to find suitable candidates that fulfil these minimum requirements. However, it
has been concluded that currently no existing system fulfills completely the main
requirements and that a new propulsion system needs to be designed. A system trade – off
was made in Chapter 3 and a water resistojet pressurized by Nitrogen was chosen as the
winning concept.
Next with the thruster requirements set the design phase commenced in Chapter 5. It
was decided to procure a Commercial off the Shelf (COTS) valve, porous media and two
different heaters. Furthermore since an EM model was being made and due to budget
constrains it was decided that instead of two separate chambers, one chamber to house
both heaters. Finally 3 different nozzle types where investigated using CFD and Ansys
Fluent and based on different criteria a winning design was chosen. Both the chamber and
the nozzle where produced by DEMO. The resulting thruster design has the specifications
summarized in Table 39.
Due to the lack of a feed system, one had to be designed and made which was described
in Chapter 6. Furthermore a general test setup and program was made that it can be used
for testing different systems. It can communicate with different equipment and allows
remote valve control, monitoring pressure and temperature sensors and log data. The same

Conclusions
Page | 148
program and similar setup was also used later by another student to test the DelFFi
Thermal Subsystem.
Table 39: Expected EM Thruster Specification
Parameter Value Unit
Thrust 2.7 – 0.6 [mN]
Pressure 7 – 1 [bar]
Target Temperature 550 [K]
Exhaust velocity 1100 [m/s]
Specific Impulse 112 [s]
Propellant Mass 50 [g]
ΔV 15.4 [m/s]
Mass Flow 2.4 – 0.3 [mg/s]
Mass < 48 [g]
Power Consumption < 9.5 [W]
With the design setup finished the testing phase could start. The test plan and results
are presented in Chapter 8. Due to the time spent on designing, refining and tweaking the
test setup and the LabVIEW program and the scheduled renovation of the clean room not
all planned tests where completed.
During the testing, the heaters and valve where characterized. It was found that the
heaters satisfy the power requirement but the Elstein heater does not achieve the target
temperature. The valve was found to need a minimum spike time of 0.3 [ms] and have
much higher mass flow rate resulting in filling up the chamber with water. Next a leak test
was performed. While the feed system had no significant leaks the thruster did. After
numerous tries sanitation of the leak was not successful and it was attributed to the Elstein
heater. Therefore it was concluded that he Elstein heater is very difficult to integrate and
to make a leak tight connection with the thruster is nearly impossible. The Watlow heater
achieves higher temperature but radiates less heat thus stay time and contact area with the
water needs to be maximized. It was decided the Watlow heater to be used for the FM.
However during the thrust testing no useful data was acquired. Since the thrust was not
measured the performance of the thruster could not be verified. Never the less a lot of
experience was gained from the testing and some rather important conclusions where
drawn. Furthermore a general test setup and LabVIEW program was made that can be
used not only for propulsion system testing but also other systems. A completely different
system was tested using the same setup and program by another student after only a brief
introduction to the setup and the program.

Conclusions & Recommendations
Page | 149
10.2. Recommendations
In the next design to improve the connection between the Watlow heater and the
chamber, in addition to thread, a flange should also be welded and a high temperature
silicon O-ring can be used to ensure leak tight assembly. It is also recommended that
temperature control loop with variable voltage output (or to demonstrate real flight
operation on / off cycling of the heater) is added for reduced power consumption when a
temperature is reached and better control and repeatability of tests. Regarding the valve
the VHS valves have proved to be reliable and usable in the system therefore the IEP valve
should be ordered ASAP due to the long lead time. Due to the order of magnitude of
difference between the mass flow through the valve and the nozzle pulsing or really short
valve openings times are needed. Otherwise as it was observed pressure will build up and
the structural integrity of the chamber may come in question (long opening times lead to
the chamber acting like a water cooker / boiler).
Regarding the test equipment there is a concern that the TB-50m is not able to
measure these thrust levels because even though water vapor flow was observed during
testing, nothing was measured by the load cell. This can either be due to the large number
of stiff wires that prevented rotation of the arm of the thrust bench or the thrust levels
being too low for the test bench to register them. Therefore the TB-5m should be used for
testing the FM. Furthermore it is recommended that the whole system is purged and
cleaned before the next use. Mineral residue was observed on the nozzle and chamber even
thou demineralized water was being used during testing. Due to the small throat diameter
this can lead to clogging of the nozzle.

Page | 150
Bibliography
[1] A. Marinan, A. Nicholas and K. Cahoy, "Ad Hoc CubeSat Constellations: Secondary
Launch Coverage and Distribution," Massachusetts Institute of Technology,
Cambridge, USA, 2013.
[2] D. Selva and D. Krejci, "A survey and assessment of the capabilities of Cubesats for
Earth observation," Acta Astronautica, pp. 51 - 67, 9 December 2011.
[3] A. J. Mannucci, J. Dickson, C. Duncan and K. H. , "GNSS Geospace Constellation
(GGC): A Cubesat Space Weather Mission Concept," Jet Propulsion Laboratory,
California Institute Of Technology, 2010.
[4] L. David, "Cubesats: Tiny Spacecraft, Huge Payoffs," Space.comn, 08 September
2004. [Online]. Available: http://www.space.com/308-cubesats-tiny-spacecraft-huge-
payoffs.html. [Accessed 11 December 2013].
[5] NASA, "CubeSat Launch Initiative (CSLI)," 18 November 2013. [Online]. Available:
http://www.nasa.gov/directorates/heo/home/CubeSats_initiative.html. [Accessed 11
December 2013].
[6] R. Villanueva, "Boeing Successfully Completes CubeSat Mission," Boeing, 16 August
2007. [Online]. Available: http://boeing.mediaroom.com/2007-08-16-Boeing-
Successfully-Completes-CubeSat-Mission-to-Advance-Nano-Satellite-Technology.
[Accessed 11 December 2013].
[7] C. Scharleman, M. Tajmar, I.Vasiljevich, N. Buldrini, D. Krejci and B. Seifert,
"Propulsion for Nanosatellites," 2011.
[8] B. Zandbergen, "Micropropulsion Systems for Cubesats," Delft University of
Technology, Delft, 2013.
[9] M. V. Fernández, "Mission analysis of QB50, a nanosatellite intended to study the
lower thermosphere," University of Liège, 2011.
[10] A. Cervone, "Propulsion System Requirements for the Delffi Satellites," Delft
University of Technology, Delft, May 2013.
[11] F. Singarayar, "System Requirements and Recommendations," von Karman Institute
for Fluid Dynamics, February 2013.
[12] J. C. Mankins, "TECHNOLOGY READINESS LEVELS - A White Paper," NASA,

Bibliography
Page | 151
April 6, 1995.
[13] I. Krusharev, "Literature Study: Micro - Thruster Design and Development," Delft
University of Technology, Delft, December 2013.
[14] J. Mueller, "Survey of propulsion Technologies applicable to Cubesats," 2010.
[15] J. M. Cardin, "A Cold Gas Micro-Propulsion System for CubeSats," VACCO
Industries, 2003.
[16] A. Migliaccio, "Vacuum Testing of a Micropropulsion System Based on Solid
Propellant Cool Gas Generators," in 61st International Astronautical Congress,
Prague, 2010.
[17] Clyde Space Ltd., "CubeSat uPulse Plasma Thruster," 2011.
[18] D. Schmuland, C. Carpenter, R. Masse and J. Overly, "New Insights Into Additive
Manufacturing Processes: Enabling Low-Cost, High-Impulse Propulsion Systems," in
27th Annual AIAA/USU Conference on Small Satellites, 2013.
[19] L. Paritsky, V. Ethier, T. Moser, J. Slostad and R. Hoyt, "Development of a CubeSat
Water Electrolysis Propulsion System - HYDROS," in 27th AIAA/USU Conference
on Small Satellites, 2013.
[20] F. T. Nardini, "Advanced Cold Gas Propulsion System," TNO, Rijswijk, 2011.
[21] S. Ciarali, M. Coletti and S. B. Gabriel, "µ-PPTs diagnostics: a high accuracy
impulsive thrust balance," in The 33rd International Electric Propulsion Conference,
The George Washington University, USA, 2013.
[22] Clyde Space, "CubeSat Pulse Plasma Thruster," Clyde Space, 2013. [Online].
Available: http://www.clyde-space.com/cubesat_shop/propulsion/303_cubesat-pulse-
plasma-thruster. [Accessed 20 September 2013].
[23] A. D. Ketsdever and M. M. Micci, Micropropulsion for Small Spacecraft, American
Institute of Aeronautics and Astronautics.
[24] F. La Torre, "Gas Flow in Miniaturized Nozzles for Micro - Thrusters," Delft
University of Technology, Delft, Netherlands, 2011.
[25] B. Zandbergen, "Thermal Rocket Propulsion," Delft University of Technology, Delft,
2010.
[26] T. V. Mathew, "Design of a MEMS Micro-Resistojet," Delft, June 2011.
[27] F. Valente, Development and verification of test set up for microthrusters testing,
Delft: Delft University of Technology, 2009.

Bibliography
Ivan Krusharev
Page | 152
[28] I.Krusharev, "Literature Study: Micro - Thruster Development," Delft University of
Technology, Delft, 2013.
[29] ANSYS, "Ansys 14.5 Help System," 2013.
[30] K. K. .. Quintao, "Design Optimization of Nozzle Shapes for Maximum Uniformity of
Ex it Flow," Florida International University, 2012.
[31] G. Eggenspieler, "Turbulence Modeling," ANSYS, 2013.
[32] J. Tu, G. H. Yeoh and C. Liu, Computational Fluid Dynamics: A Practical Approach,
Butterworth-Heinemann, 2007.
[33] Stanford University, Simulation of Turbulent Flows, 2011.
[34] I. Krusharev, "Literature Study: Micro - Thruster Design and Development," Delft
Unviersity of Technology, December 2013.
[35] CustomPartNet, "Machining," 2013. [Online]. Available:
http://www.custompartnet.com/wu/machining. [Accessed 21 November 2013].
[36] E. C. Jameson, Electrical Discharge Machining, SME, January 2001.
[37] CustomPartNet, "Additive Fabrication," 2013. [Online]. Available:
http://www.custompartnet.com/wu/additive-fabrication. [Accessed 22 November
2013].
[38] R. Bijster, "Microthruster Characterization Using Thrust Benches," Delft University
of Technology, March 2013.
[39] S. Janssens, "Desing of a Micro Propulsion Test Bench," Delft University of
Technology, 2009.
[40] D. Perez-Grande, "Design and Development of a nano-propulsion," Delft University of
Technology, Delft, Netherlands, 2010.
[41] A. Cervone, B. Zandbergen, J. Guo and E. Gill, "Application of an Advanced Micro-
Propulsion System to the DelFFi Formation Flying Demonstration Within the QB50
Mission," in IAC-12-C4.6.2, Naples, Italy, 2012.
[42] National Institute of Standards and Technology, "Thermophysical Properties of Fluid
Systems," 2011. [Online]. Available: http://webbook.nist.gov/chemistry/fluid/.
[Accessed September 2013].
[43] R. Humble, G. Henry and W. Larson, Space propulsion analysis and design, McGraw-
Hill, 1995.
[44] J. Guo, "Phase B Study on Formation Flight Within QB50," Delft University of

Bibliography
Page | 153
Technology, April 2013.
[45] C. Schuurblers, "T3uPS Qualification Model Design Documentation," TNO, Delft,
2009.
[46] J. Bouwmeester, "Interface Control Document T3uPS," TNO, Rijswijk, May 2011.
[47] The Lee Company, "Micro-Dispensing Application Development Kit - IKTX0322000A
C," 2007.
[48] The Lee Company, Electro-Fluidic Systems Handbook, Westbrook, Connecticut
06498-0424 U.S.A., 2013.
[49] L. Oehen, "Electronic Design PCB v1," TNO, 2009.
[50] Minnesota Rubber and QMR Plastics, Elastomers and Thermoplastics Engineering
Design Guide, 2013.
[51] Parker Hannifin Corporation, Parker O-Ring Handbook, 2007.
[52] Texas Instruments, "xx555 Precision Timers," Dallas, Texas 75265, September 2014.
[53] R. Ferreira, "Development and Testing of a Water Microresistojet," Delft University
of Technology, Delft, September 2008.
[54] T. J. Lawrence, "Research into Resistojet Rockets for Small Satellite Applications,"
University of Surrey, 1998.
[55] R. v. d. Boom, "Recemat Metaalschuim," 2009.
[56] R. Hoole, "Resistojet Demonstration Model," TU Delft, October 1990.
[57] Elstein, "MSH Ceramic Infrared Radiators," 2011.
[58] P. Bula, "HotRod Cartrdige Heaters," HotSet, 2013.
[59] Watlow, "Cartrdidge Heaters," 2013.
[60] D. K. Huze and D. H. Huang, Design of Liquid Propellant Rocket Engines, National
Aeronautics and Space Admnistration, 1967.
[61] R. L. Bayt, "Analysis, fabrication and testing of a MEMS based micropropulsion
System," Massachusetts Institue of Technology, Cambridge, 1999.
[62] R. L. Bayt and K. S. Breuer, "Viscous Effects In Supersonic Mems-Fabricated
Micronozzles," in 3rd ASME Microfluids Symposium, Anaheim, CA, November 1998.
[63] W. F. Louisos and D. Hitt, "Heat Transfer & Viscous Effects in 2D & 3D Micro-
Nozzles," in 37th AIAA Fluid Dynamics Conference, Miami, Florida, 2007.
[64] R. Poyck, "Design, manufacturing and characterisation of a water fed CubeSat micro-

Bibliography
Ivan Krusharev
Page | 154
resistojet," Delft University of Technology, Delft, 2014.
[65] RS, "RS-1316 Instruction Manual".
[66] Delta Elektronika, "ES 300 Series DC Power Supplies," 2015.
[67] Agilent Technologies, "Agilent 34401A User Guide," 2001.
[68] Mettler Toledo GmbH, "Operating Instructions B-S Line of Balances," Switzerland .
[69] Mettler Toledo, "Standard Interface Command Set - Reference Manual," Switzerland,
2003.
[70] J. R. .. W. J. Larson, Space Mission Analysis and Design, Microcosm Press and
Kluwer Academic Publishers, 2005.
[71] M. S. P. E. T. L. Vadim Zakirov, "Specifics of Small Satellite Propulsion: Part 1,"
2001.
[72] M. J. T. Morris, "Study of an electrostatic micropropulsion system for nanosatellites,"
Canadian Aeronautics and Space Journal, 2011.
[73] K. Sathiyanathan, "YUsend-1 Solid Propellant Microthruster Design, Fabrication and
Testing," 2010.
[74] C. T. Ryan Pahl, "Design, Test, and Validation of a Refrigerant-Based Cold-Gas
Propulsion System for Small Satellites," 2010.
[75] P. Rangsten, "MEMS Micropropulsion Components for Small Spacecraft," NanoSpace
AB, 2011.
[76] P. Rangsten, "Advanced MEMS Components in Closed-loop Micro Propulsion
Applications," NanoSpace AB, 2012.
[77] J. Mueller, "Thruster options for Microspacecraft; A Review and Evaluation of State
of," Jet Propulsion Laboratory, Pasadena, 2000.
[78] G. Moore, "3D Printing and MEMS Propulsion for the RAMPART 2U CUBESAT,"
2010.
[79] M. Mihailovic, "MEMS Silicon-Based Resistojet Micro-Thruster For Attitude Control
Of Nano-Satellites," Delft University of Technology, Delft, 2011.
[80] P. M. Matthew Dushku, "Additively Manufactured Propulsion System," 2012.
[81] T. V. Mathew, "A Silicon-Based Mems Resistojet For Propelling Cubesats," Delft
University of Technology, Delft, 2011.
[82] R. M. C. S. Derek Schmuland, "Hydrazine Propulsion Module for CubeSats," in Small
Satellite Conference, 2011.

Bibliography
Page | 155
[83] C. Clark, "An Off-the-shelf Electric Propulsion System for CubeSats," 2011.
[84] T. S. Chris Biddy, "Monopropellant Micropropulsion System for CubeSats," Stellar
Exploration Inc., 2009.
[85] R. Munakata, "CubeSat Design Specifications," California Polytechnic State
University, August 2008.
[86] A. Cervone, B. Zandbergen, J. Guo and E. Gill, "Application Of An Advanced Micro-
Propulsion System To The Delffi Formation Flying Demonstration Within The QB50
Mission," in IAC-12-C4.6.2, Naples, Italy, 2012.
[87] M. M. Micci and A. D. Ketsdever, Micropropulsion for Small Spacecraft, Progress in
Astronautics and Aeronautics Volume 187, June 2000.
[88] NanoSpace, "MEMS Flow Control Valve," March 2011.
[89] P. Galambos, J. Lantz, M. S. Baker, J. McClain, G. R. Bogart and R. J. Simonson,
"Active MEMS Valves for Flow Control in a High-Pressure Micro-Gas-Analyzer,"
Journal Of Microelectromechanical Systems, vol. 20, no. 5, October 2011.
[90] C. Baker, M.-A. Schwab, R. Moseley, R. Syms and E. Yeatman, "Monolithic Mems
Vacuum Valves For Miniature Chemical Preconcentrators," Microsaic Systems Ltd.,
April 2010.
[91] Committee of Experts on the Transport of Dangerous Goods and on the globally
Harmonized System of Classifications and Labelling of Chemicals, "Model Regulations
on the Transport of Dangerous Goods," United Nations, Geneva, 2006.
[92] B. J. McBride and S. Gordon, "Computer Program for Calculation of Complex
Chemical Equilibrium Compositions and Applications - User Manual and Program
Description," NASA, Cleveland, Ohio, June 1996.
[93] A. Ponomarenko, "Rocket Propulsion Analysis User Manual," Cologne, Germany,
2013.
[94] R. H. Todd, Manufacturing Processes Reference Guide, Idustrial Press, 1994.
[95] Ceradyne, "Ceramic Injection Modeling," 2013. [Online]. Available:
http://www.ceradyne.com/products/medical/ceramic-injection-molding.aspx.
[Accessed 20 November 2013].
[96] CustomPartNet, "Injection Molding," 2013. [Online]. Available:
http://www.custompartnet.com/wu/InjectionMolding. [Accessed 20 November 2013].
[97] CustomPartNet, "Metal Injection Molding," 2013. [Online]. Available:

Bibliography
Ivan Krusharev
Page | 156
http://www.custompartnet.com/wu/metal-injection-molding. [Accessed 20 November
2013].
[98] W. H. Cubberly and R. Bakerjian, Tool and Manufacturing Engineers Handbook,
Society of Manufacturing Engineers, 1989.
[99] Elektroform, "Micro Structures," 2013. [Online]. Available:
http://www.elektroform.eu/content.php?nav_id=141. [Accessed 4 December 2013].
[100] G. K. Fedder, "MEMS Fabrication," Department of Electrical and Computer
Engineering, Carnegie Mellon University, Pittsburgh, 2003.
[101] MNX, "What is MEMS Technology?," 2013. [Online]. Available:
https://www.memsnet.org/about/what-is.html. [Accessed 18 November 2013].
[102] MEMSnet, "Fabricating MEMS and Nanotechnology," MEMS and Nanotechnology
Echange (MNX), 2013. [Online]. Available:
https://www.memsnet.org/about/fabrication.html. [Accessed 18 November 2013].
[103] M. Sargento, "Electroforming Schematic," 02 June 2008. [Online]. Available:
http://upload.wikimedia.org/wikipedia/commons/7/7b/Eformschematic.svg.
[Accessed 20 November 2013].
[104] P. Sundaramoorthy, E. Gill, C. Verhoeven and J. Bouwmeester, "Two CubeSats with
Micro-Propulsion in the QB50 Satellite Network," 2010.
[105] MINCO, "Flexible Heater Design Guide," 2007.
[106] Nexthermal, "Nexthermal Coil Heaters," 2012.
[107] Rotfil, "Ultramax: High Power-Density Cartridge Heaters," 2006.

Page | 157
Appendix
Appendix A: Project Planning and Management

Appendix
Page | 158
Since it is outside of the scope of the thesis in the appendix I would like to reflect
shortly in what should be done in my opinion in order to improve project knowledge
transfer and project management:
Introductory course to LabVIEW (maybe even as an elective / practical)
o I have had experience but other students have not and I have been
asked to show LabVIEW to few students.
Encourage students to make more general test setups, labview programs and
connections and keep clear overview of the components used such that they can
be used by others and time is not wasted “re-inventing” the wheel
o Spent few days going to every different Swagelok part
o Spent 2-3 weeks preparing the chamber and all test setup even though
similar things have been done in the past
o A student with a completely different project has been able to use my
test setup and program
Better overview of components, tools and apparatus in the chair and inventory
should be kept in the future not just boxes of parts
o Can avoid ordering double parts as now the SSE chair has 3 valves and
2 spike and hold circuits or about 800 euros wasted
Workshops about the clean room and the gear available there (oscilloscope, ni
card available, microscope, power supplies etc.)
Enable students when needed to install programs and change settings so they
don’t have to resort to “creative” workarounds bypassing the user restrictions
such as:
o Installing newest version of LabView
o Installing DHThermo
o Adding internet connection to the Clean Room pc because its blocked
by ICT
o Finding old COM PCI addon cards in piles of hardware to extend the
connection capabilities of the clean room PC
o All this leads to wasted time and effort to things other than the thesis
itself
Remove 150 pages limit
o Arbitrary number, not taking into account the circumstances, thesis
length and scope. Should be phrased as a guideline or recommendation

Appendix
Page | 159
Thesis topics involving hardware development rarely seem feasible in 7 months.
Students either need much more time or no hardware is delivered at the end of
the 7 month period
Support staff such as Nuno Santos is highly appreciated and ideally more
should be available

Appendix
Page | 160
Appendix B: Technical Drawings

Appendix
Page | 161

Appendix
Page | 162
Appendix C: Quotations and Invoices

Appendix
Page | 163

Appendix
Page | 164

Appendix
Page | 165

Appendix
Page | 166