
Netcentric Information Orchestration - TU Delft Repositories
297
-
Upload
khangminh22 -
Category
Documents
-
view
0 -
download
0
Transcript of Netcentric Information Orchestration - TU Delft Repositories

Netcentric Information Orchestration
Assuring information and system quality in public safety networks
Proefschrift
ter verkrijging van de graad van doctor aan de Technische Universiteit Delft,
op gezag van de Rector Magnificus prof.ir. K.C.A.M. Luyben; voorzitter van het College voor Promoties
in het openbaar te verdedigen op maandag 24 januari 2011 om 15:00 uur door
Nitesh BHAROSA ingenieur in de technische bestuurskunde
geboren te Paramaribo, Suriname

ii
Dit proefschrift is goedgekeurd door de promotor: Prof.dr. Y.H. Tan Copromotor: Dr. ir. M.F.W.H.A. Janssen Samenstelling promotiecommissie: Rector magnificus, voorzitter Prof. dr. Y.H. Tan, Technische Universiteit Delft, promotor Dr. ir. M.F.W.H.A. Janssen, Technische Universiteit Delft, copromotor Prof. dr. B.J.M. Ale, Technische Universiteit Delft Prof. dr. F.J.H. Mertens, Technische Universiteit Delft Prof. dr. ir. L.J.M. Rothkrantz, Nederlandse Defensie Academie Prof. dr. H.R. Rao, The State University of New York Dr. B.A. van de Walle, Tilburg University

iii
For Dew, my inspiration, my hero, my father…

iv
Colophon
Authored and distributed by:
Nitesh Bharosa Delft University of Technology
Phone + 31 06 4275 1870
Kerkmeesteerstraat 137 Faculty of Technology, Policy & Management
2645LJ Delfgauw PO Box 5015, 2600 GA Delft
The Netherlands The Netherlands
Cover design and printing by: Proefschriftmaken.nl || Printyourthesis.com Published by: Uitgeverij BOXPress, Oisterwijk Keywords: disaster response, netcentric orchestration, information quality, system quality, design science research ISBN: 978-90-8891-231-3 Copyright © 2011 by Nitesh Bharosa All rights reserved. No part of this publication may be reproduced, stored in a re-trieval system, or transmitted, in any form or by any means, electronic, mechanical, photocopying, recording or otherwise, without the prior permission from the au-thor.

Table of contents
v
Table of contents
Preface and acknowledgements ........................................................... vii
1 Assuring information and system quality ....................................... 11
1.1 Introduction ............................................................................................................... 11
1.2 Defining disasters and disaster response.................................................................. 14
1.3 Four levels of obstacles for multi-agency information management ...................... 17
1.4 The increasing use of IT in Public Safety Networks ................................................ 25
1.5 Information quality and system quality during disaster response ......................... 27
1.6 Main research question ............................................................................................. 31
1.7 Outline of this dissertation ....................................................................................... 32
2 Research approach ........................................................................ 33
2.1 Introduction .............................................................................................................. 33
2.2 Research philosophy ................................................................................................. 34
2.3 Design science research strategy .............................................................................. 36
2.4 Rigor cycle: construction of the knowledge base ..................................................... 38
2.5 Relevance cycle: empirical analysis using field research ........................................ 40
2.6 Design cycle: synthesizing a design theory .............................................................. 47
2.7 Evaluation cycle: prototyping and quasi-experimentation ..................................... 49
2.8 Summary ................................................................................................................... 59
3 Knowledge base: kernel theories for assuring IQ and SQ .............. 61
3.1 Introduction ............................................................................................................... 61
3.2 Information Quality .................................................................................................. 62
3.3 System Quality .......................................................................................................... 67
3.4 Conventional methods for assuring IQ and SQ ....................................................... 69
3.5 Pathways from coordination theory .......................................................................... 71
3.6 Pathways from Network Centric Operations ............................................................ 81
3.7 Summary ................................................................................................................... 89
4 Empirical foundation: exploring three public safety networks ...... 91
4.1 Introduction ............................................................................................................... 91
4.2 Background on public safety networks in the Netherlands .................................... 92
4.3 Field study #1: The Port of Rotterdam ..................................................................... 93
4.4 Field study #2: VIKING ........................................................................................... 110
4.5 Field study #3: Delfland ......................................................................................... 120
4.6 Cross-field study findings and conclusions ............................................................ 129
4.7 Summary .................................................................................................................. 137
5 Expert interviews: capitalizing design experiences ..................... 139
5.1 Introduction ............................................................................................................. 139
5.2 Interview procedure ................................................................................................ 140
5.3 Data management and analysis using ATLAS.ti ..................................................... 141
5.4 Findings from interviews: experiences and current practices ............................... 143
5.5 Shaping pathways: suggested measures for assuring IQ and SQ .......................... 147
5.6 Summary .................................................................................................................. 150

Table of contents
vi
6 Netcentric information orchestration: a design theory ................ 151
6.1 Introduction ............................................................................................................. 151
6.2 Principle-based design ............................................................................................. 152
6.3 Drawing on the theoretical and empirical foundations.......................................... 154
6.4 A framework for information orchestration capabilities ....................................... 156
6.5 Synthesizing design principles ............................................................................... 160
6.6 Summary .................................................................................................................. 166
7 DIOS: A prototype for netcentric information orchestration....... 167
7.1 Introduction ............................................................................................................. 167
7.2 Stage 1: the establishment of prototyping objectives .............................................168
7.3 Stage 2: functionality selection................................................................................ 169
7.4 Stage 3: prototype construction and support environment ................................... 172
7.5 DIOS version 2.0 ...................................................................................................... 175
7.6 Stage 4: Prototype evaluation .................................................................................. 183
7.7 Summary ..................................................................................................................184
8 Evaluation: A quasi-experimental gaming-simulation ................. 185
8.1 Introduction ............................................................................................................. 185
8.2 Situational setting .................................................................................................... 185
8.3 Master of disaster game .......................................................................................... 188
8.4 Qualitative data collection and findings ................................................................. 195
8.5 Quantitative data collection and findings ...............................................................198
8.6 Summary ................................................................................................................. 205
9 Conclusions ................................................................................. 207
9.1 Research question 1: establishing the knowledge base ......................................... 208
9.2 Research question 2: demystifying information system architectures in PSNs .... 215
9.3 Research question 3: netcentric information orchestration as a design theory ... 223
9.4 Research question 4: quasi-experimental gaming-simulation ............................. 226
10 Epilogue .................................................................................... 233
10.1 Implications of netcentric information orchestration ........................................... 233
10.2 Reconsidering the scientific and societal contributions ........................................ 236
10.3 Reflection on our research strategy........................................................................ 238
10.4 A research agenda ................................................................................................... 242
References ......................................................................................... 247
Summary ........................................................................................... 269
Samenvatting (summary in Dutch) .................................................... 275
Appendices ......................................................................................... 283
Appendix A: List of abbreviations ...................................................................................... 283
Appendix B: Field study protocol ....................................................................................... 284
Appendix C: Interviewees ................................................................................................... 285
Appendix D: Survey questions ............................................................................................ 286
Appendix E: Publications by the author ............................................................................. 292
Curriculum Vitae ............................................................................... 295

Preface
vii
Preface and acknowledgements
“The PhD or Philosophiæ Doctor is the very highest accomplishment that can be sought by students. It signals that its recipient is now ready, eligible, indeed obli-gated, to make the most dramatic shift in roles: from student to teacher, from ap-
prentice to master, from novice to independent scholar and leader”.
Walker et al., The Formation of Scholars (2008, p.10) I read the above stated definition of what a PhD is during my holidays, just two months before my defense. This definition intrigued me because it specifies the roles that come with earning a PhD. Walker and colleagues add that “responsibili-ties associated with the degree include, knowing and doing, understanding and dis-covering, absorbing and creating, innovating and conserving, and become agents of change”.
While I wish I had read their book, ‘The Formation of Scholars’, four years earlier, I am not sure whether I would have been able to understand what is meant by a “dramatic shift in roles” when I started my PhD research. Moreover, reading these roles and responsibilities in my job description could even have deterred me from ever starting with a PhD research. Yet, after ‘four years of knowing and doing, understanding and discovering, absorbing and creating, innovating and conserv-ing’, I do belief that I have become a steward of my discipline and an agent of change. The reader will quickly discover what my discipline is and what kind of change I propose.
Nevertheless, growing into these roles and mastering the associated re-sponsibilities was not an easy process. Writing this dissertation and conducting the research forced me to push out several boundaries. The past four years were like continuously conducting a SWOT (strengths, weaknesses, opportunities and threats) analysis on me. While analysis process sometimes led to short-term frus-tration, the long-term result is that I have become more self-aware and confident. I have come to accept my strengths and weaknesses and I know now how to deal with them. In additions, I have become aware of what motivates me and what dis-courages me, and I believe that increased level of confidence and self-awareness will bring me much comfort in future endeavors.
This dissertation is a collection of results gained from drawing on discus-sions and interactions between several others and myself. Accordingly, I would like to express my gratitude to these persons whom have contributed to this disserta-tion. First and foremost, I would like to thank Marijn Janssen, who acted as my coach before and during the project. Since this project started, Marijn worked hard in assuring that this project would continue regardless of the funding and position-ing problems at our university. While Marijn was no expert on disaster manage-ment, after every meeting with him I felt as if I had just consulted some kind of ‘Guru’. I will never forget the advice Marijn kept giving me whenever my work did not progress: “give it some hands and feet”. In hindsight, this advice was the key to my progress, pushing me to think deeper about the implications of my thoughts.

Preface
viii
Putting myself in Marijn’s shoes, I suppose that this was not an easy task, especially since the primary initiator of this project, Prof.dr. René Wagenaar passed away at the beginning of this project. René, now I truly understand why you thought that this research was necessary, thank you for initiating it! I am very grateful to Prof.dr. Yao-Hua Tan for fulfilling the quintessential role of promotor and assuring that this project could reach the level that it did. Since Yao-Hua got involved in the final stage of this project, he did not have much opportunity to comment. Yet, the few comments he made were the ones that improved the quality of this disserta-tion. One could say that this is the trademark of a ‘Chief Guru’.
As a member of the Faculty of Technology, Policy and Management, I had the privilege to correspond with some very intelligent people. ‘Methodology-guru’, Harry Bouwman for instance has supported me in assuring the rigor of my re-search. I will remeber the lessons Harry! I have also spent many hours with ‘Prac-tice-guru’ and ‘Calvinist’ Arre Zuurmond who has helped me in assuring the rele-vance of research. In the evaluation cycle of this research, I received valuable sup-port from “Gaming-guru” Sebastiaan Meijer. The moment I had some doubts on my progress and capabilities, I could always consult Jolien Ubacht. In the hallway, I could always have a safety or security related discussion with Jan van den Berg. Whenever I needed some help, Jo-Ann and Eveline were always ready to listen and to help. I would also like to express my gratitude to colleagues Anne-Fleur, Bram, Ralph, Mark, Sietse, Janneke, Devender, Fatimeh, Andreas and Donna who have proofread this dissertation. Thanks everyone!
Thanks to Jaco Appelman, I was able to find the right contacts in the field of public safety networks. Jaco’s analogy of mixing the police (blue team), fire de-partment (red team) and medical services (white team) inspired me to choose the color purple for the cover of this dissertation. Without the support of contacts such as Wim de Rooij, Daan van Gent and Martijn Korpel, I would never be able to col-lect so much empirical data. Thanks for your support gentlemen!
I also had the privilege to work with some very smart students during this research project. Satiesh Bajnath, Dave Daas, Jalal Bani Hashemi, Victor den Bak and Bart van Zanten were not always easy to supervise students since they seemed to know more about a specific subject than I did. Therefore, it is only fair to say that I have also learned a lot from them. Even though some stories from other PhD stu-dents may suggest otherwise, I have managed to retain most of my friends and fam-ily during the ‘four years of solitude’.
Good friends such as Vikash Mohan, Laurens Waling, Roy Dulam and Ashwien Bisessar have helped me to forget my work and enjoy ‘the moment’. After the mental exhaustion from writing papers, Thijs Padmos and Bob Susser were al-ways very happy to help me get physically exhausted from lifting heavy weights in the gym. Whenever I returned to Paramaribo, my friends Krisna Gajapersad, Don-novan Asmus, Dinesh Hardien and Henry Akodi enabled me to refuel for the Neth-erlands.
My parents Dew & Nanda have always encouraged and empowered my brothers, my sister and myself to study hard. My dad’s saying “do your best in school if you do not want to wrestle with metal and grease like I do” has always fueled me to work hard. Dad and Mom, I am proud and grateful for everything you have done for me. Studying abroad was lonesome, seeing pictures of my siblings growing up so far away was difficult. I would like to thank my ‘foster family’ Mangre-Bharosa, whom have always helped me to relax and put things in perspec-

Preface
ix
tive. I will never forget that my journey in the Netherlands started with their sup-port. While I have kept missing my family and friends in Suriname, Ashok, Hilda, Navin & Ryan have always reduced the feeling of solitude.
Last, but certainly not the least, I would like to thank my life partner Shailiena Sardjoesingh. As witness to the countless nights and weekends of work that went into this dissertation, she still was always very kind, patient and support-ive. Even though she had to work and study as well, I could always count on her for a warm meal and a cup of coffee. I know this process was hard on her especially when our weekend started to look like normal working days. Yet, she always found some way to keep me motivated. It was not always easy for her having somebody around the house who was still thinking about his work. Thanks for everything!
Nitesh Bharosa, Delfgauw

x

Introduction
11
1 Assuring information and system quality
“Indeed, research is often guided by the desire to improve practice”
-Andreas Faludi, Professor Spatial Policy Systems
1.1 Introduction
In 2005, an advisory committee to the Dutch Ministry of Internal Affairs and King-dom Relations (ACIR, 2005) revealed two major problems in public safety net-works: (1) having access to correct and complete information and (2) sharing in-formation between the agencies. Three years later, the ‘All Hands on Deck’ work-shop for government officials and relief agency commanders, concluded that in-formation management in Public Safety Networks (PSNs) is still a major problem in the Netherlands (ASE, 2008). Today’s PSNs do not only include the traditional relief agencies such as the fire brigade, police department and medical services, but also includes local municipalities, military, governmental departments, companies, infrastructure operators and citizens (Scholtens, 2007). The most recent investiga-tion by the Dutch Inspection for Public Safety (IOOV, 2010) has yet again conclud-ed that most PSNs still perform poorly when it comes to information management during multi-agency disaster response. This means that relief workers (also known as emergency personnel or rescuers) still do not have access to the right infor-mation at the right time and in the right format, resulting in problematic and even lethal situations for relief workers and citizens. In the light of Faludi’s words, this research is guided by the desire to improve information management in PSNs .
In this context, information management refers to a cycle of processes that support the learning activities of relief workers, including the identification of in-formation needs, acquiring information, organizing and storing information, de-veloping information products and services, distributing information, and using information (c.f., Choo, 2000). In a PSN, information management takes place on several levels, including the individual, agency, team and echelon (i.e., strategic, tactical and operational) level. Poor information management is not only a problem for PSNs in the Netherlands. Evaluation studies of disaster management efforts around the globe have reported similar issues (e.g., Chen, Sharman, Rao, & Upadhyaya, 2008; Dawes, Creswell, & Cahan, 2004). For instance, The National Institute of Standards and Technology (2005, p. 174) concludes that “a preponder-ance of evidence indicates that emergency responder lives were likely lost at the World Trade Center resulting from the lack of timely information-sharing between agencies”. The National Commission on Terrorist Attacks upon the United States explains, “Information that was critical to informed decision-making was not shared among agencies. Chiefs of the fire department that morning told that they were hampered by a lack of information from the New York police department avi-ation” (Keen et al., 2004, p. 321). In the response to the 2004 Indian Ocean Tsu-nami, “mostly, the information was incomplete, yet conclusions had to be drawn immediately” (Samarajiva, 2005, p. 737). “During the response to Hurricane Katri-na, the federal government lacked the timely, accurate, and relevant ground-truth

Chapter 1
12
information necessary to evaluate which critical infrastructures were damaged, in-operative, or both”(Townsend et al, 2006, p. 61). Next to these examples of poor information quality (IQ), researchers have also reported information system quality (SQ) issues. The 9/11 case for instance shows that access to data across agency lines also needs to be improved to support interagency coordination (Comfort & Kapucu, 2006). “In some cases, needed information existed but was not accessible” (Dawes, et al., 2004, p. 57). Other examples of poor SQ include high response times (Horan & Schooley, 2007), inflexible applications (Comfort & Kapucu, 2006) and non-interoperable information systems (Bui & Sankaran, 2001).
These and other examples of poor IQ and SQ provided in this dissertation represent just ‘a tip of the iceberg’, since statistics indicate that in 2007, 414 natural disasters were documented killing 16847 persons, affecting more than 211 million others and caused over 74.9 US$ billion in economic damages (Scheuren, Waroux, Below, & Guha-Sapir, 2008). Compared to other problems in disaster management such as decision-making (Boin, 't Hart, Stern, & Sundelius, 2005), bounded human cognition (Stern, 2001), sense-making (Weick, 1993) and high uncertainty (Argote, 1982), assuring IQ and SQ in PSNs is an relatively uncharted research topic. While there is some research on addressing IQ and SQ issues in stable business environ-ments (see for instance English, 1999; Eppler, 2006), contributions on assuring IQ and SQ in PSNs were non-existent at the time we started this research.
PSNs can be characterized as ‘hastily-formed’ (Denning, 2006) networks of many heterogeneous and incompatible public and private agencies that temporarily need to share information under dynamic conditions (Comfort, Ko, & Zagorecki, 2004). These characteristics pose specific challenges for assuring IQ and SQ. Tak-ing occurrences of IQ and SQ problems as empirical drivers for this research; the theoretical driver is the lack of directly applicable theories for designing infor-mation systems that assure IQ and SQ in public safety networks. Previous research does provide two kernel (partially applicable) theories that we can draw upon for measuring and assuring IQ and SQ. These kernel theories include Network Centric Operations (NCO) and Coordination Theory and are explained in Chapter 3. Ac-cordingly, the objective of this dissertation is as follows: Research Objective: drawing on NCO and coordination theory, synthesize and evaluate information system design principles that assure higher levels of infor-mation and system quality for relief workers during multi-agency disaster re-sponse
The research objective is formulated from a socio-technical perspective (Bostrom & Heinen, 1977a) on assuring IQ and SQ in PSNs. This perspective rec-ognizes the importance of human roles, their tasks and capabilities while emphasiz-ing the role of information technology (IT) as enabling tools within an information system (IS). We share the view that enhancing disaster management requires at-tention to technological, organizational and social factors and depends on a solid understanding of disaster management as well as the ISs. The literature is awash with definitions and scope of what constitutes an IS. One such definition from a leading IS Journal stood out, as it resonated with the authors’ own personal views of what constitutes an IS. Paul (2007) explains that: “An information system is what emerges from the usage that is made of the IT delivery system by the users (whose strengths are that they are human beings not machines)”(p. 194). What is

Preface
13
important when extrapolating from this definition of what constitutes an infor-mation system is that there is a significant ‘human’ dimension that underpins its appropriate and successful use, resulting benefits, costs and risk. Accordingly, our conceptualization of an IS includes the human roles, standards, policies and IT ap-plications needed to manage information effectively within and between relief agencies. We take this socio-technical perspective since we argue that the social and technical subsystems in PSNs are interdependent and must be jointly analyzed, designed and evaluated in order to assure IQ and SQ. Moreover, we expected that this perspective would allow us to gain a holistic understanding of the complex and unpredictable interactions between agencies and supporting technologies in PSNs.
Proceeding with how to achieve the objective stated above, this research employs a prescription driven design science approach. This approach (Chapter 2) consists of four cycles: (1) the rigor cycle (construction of a theoretical knowledge base in Chapter 3), (2) the relevance cycle (empirical analysis in chapters 4 and 5), (3) the design cycle (theory development in Chapter 6), and (4) the evaluation cycle (prototyping and evaluation in Chapters 7 and 8).
Each cycle contributes to existing research on assuring IQ and SQ in PSNs. The first two cycles contribute in understanding IQ and SQ issues in practice and theoretical pathways for finding design principles. A pathway is a specific progres-sion of one or more concepts in the evolution of a theory. Each pathway is a dynam-ic and developmental process, which may include several stages. Following these pathways allows for the synthesis of design principles that are meant to guide IS architects from various relief agencies towards the assurance of IQ and SQ. Next to these pathways, we present qualitative and quantitative data collected from obser-vations, interviews and surveys during our field studies in PSNs. Consolidating the findings from the first two cycles, the latter two cycles contribute an evaluated de-sign theory for assuring IQ and SQ. We call this design theory ‘netcentric infor-mation orchestration’ since it draws upon the pathways of netcentricity and IT-enabled orchestration. While these pathways are gaining increasing interest for scholars and policy makers, research on translating these pathways into design principles for practitioners and IS architects is non-existent. Accordingly, this re-search is the first to contribute a set of evaluated design principles (translated in a prototype) that assure higher levels of IQ and SQ. We evaluated the resulting set of principles using a quasi-experimental gaming-simulation with professional relief workers.
Chapter 2 discusses the four cycles of this research more extensively. The remainder of this chapter focuses on demarcating the research focus and explain-ing the main research concepts as a prelude to the remaining nine chapters. First, we discuss the characteristics of disasters in the next section. Then, the obstacles for multi-agency information management are explained together with the rise of IT for addressing these obstacles. After we present some examples of IQ and SQ issues in PSN, we conclude this chapter with explaining the main research question and the relevance of this research. Parts of this chapter were published in the pro-ceedings of the Information Systems for Crisis Response and Management Confer-ence (Bharosa, Appelman, & de Bruijn, 2007) and the Information Systems Fron-tiers Journal (Bharosa, Lee, & Janssen, 2010).

Chapter 1
14
1.2 Defining disasters and disaster response
The term disaster often suggests images of extreme events such as earthquakes, tidal waves, floods, hurricanes, and explosions, and yet it is difficult to define a dis-aster by physical manifestations alone (Auf der Heide, 1989). This means that we need to take a more critical stance towards what a disaster is and how it is different from incidents, hazards and so forth. In the literature the term ‘disaster’ is inter-changeably used with terms such as ‘incident’, ‘hazard’, ‘crisis’, and ‘emergency’ (e.g., Boin, 2004; Farazmand, 2001; O'Connor, 1987). Even though we did not find any universal distinction between these terms in the literature, there seems to be some distinctive factors such as the scale and type of event. For instance, Pauchant and Mitroff (1992) differentiate an incident from a crisis using the words ‘minor’ and ‘major’. According to these authors, an incident is as minor, localized disrup-tion that can be resolved without harming the larger organizational routine. The term incident is more common for denoting industrial accidents (e.g. construction collapse, toxic gas leak) and product/service failure (e.g. machine failure, commu-nications failure). Yet, such incidents are sometimes also referred to as ‘technologi-cal’ disasters (Grunewald, 2003). Even though incidents can also escalate into ma-jor events with many casualties, the term incident usually suggest small-scale events with some level of predictability and prior preparation (e.g. in the actors in-volved, risks and outcomes).
According to Landesman et al., (2005) hazards present the probability of the occurrence of a disaster caused by a natural phenomenon (e.g., earthquake, tropical cyclone), by failure of manmade sources of energy (e.g., nuclear reactor, industrial explosion), or by uncontrolled human activity (e.g., conflicts, overgraz-ing). A crisis on the other hand has the potential to disrupt or affect the entire or-ganization Coombs (1999). The term crisis is often used from a political science perspective to denote a critical point or state of affairs: a military crisis, govern-ment policy at the crossroad (Rosenthal, ‘t Hart, & Charles, 1989), or an economic (financial) crisis. From a managerial perspective, the term ‘emergency’ is more commonly used to describe such situations, as it is also frequently used by relief agencies such as the police and medical staff. The term emergency puts emphasis on the seriousness of the situation, the unexpected manner of occurrence, and the need for immediate action. Alternatively, the term disaster emphasizes the scale or severity of the event causing the emergency. Compared to emergencies, disasters such be regarded as ‘extreme’ events having a low probability. Extreme events are occurrences that are notable, rare, unique and profound, in terms of their impacts, effects, or outcomes.
In extreme events, standard procedures cannot be followed and they re-quire a dynamic system to adapt to unanticipated and rapidly changing conditions. Extreme events trigger a greater density of communication and interaction among organizations that stimulates collective action. When extreme events occur at the interface between natural, social and human systems, they are often called “disas-ters”. Acknowledging the existence of many extensive definitions provided in the literature (i.e., Fritz, 1961), we adopt the concise definition provided by Quarantelli and Dynes (1977, p. 32), who define disaster as the “disruption to society after the extreme event”. According to this definition, it is not the extreme event (i.e., flood or earthquake) that is the disaster, but the extreme stress on society that it causes. While we prefer this definition because it allows us to capture a wider range of ex-treme events under the notion of a disaster, we do not aim to extend existing defini-

Preface
15
tions. Instead, we are looking to understand the characteristics of a disaster that shape the environment in which relief workers share and manage information. Ta-ble 1-1 adapted from Auf der Heide (1989) outlines some key characteristics of an emergency in comparison with a disaster.
Table 1-1: Characteristics of emergencies versus disasters (adapted from Auf
der Heide, 1989) Emergency response Disaster response
Interaction with familiar faces Interaction with unfamiliar faces
Familiar tasks and procedures Unfamiliar tasks and procedures
Intra-organizational coordination needed Intra- and inter-organizational coordination
needed
Roads, telephones, and facilities intact
Roads may be blocked or jammed, telephones
jammed or non- functional
Communications frequencies adequate for
radio traffic
Radio frequencies often overloaded
Communications primarily intra-
organizational
Need for inter-organizational information
sharing
Use of familiar terminology in communi-
cation
Communication with persons who use differ-
ent terminology
Need to deal mainly with local press Hordes of national and international reporters
Management structure adequate to coor-
dinate the number of resources involved
Resources often exceed management capacity
In table 1-1, the column on the right outlines some of the main characteris-
tics of disaster response. Note that in practice, the exact characteristics may not be so clear-cut as listed in this table. This means that one or more of the characteris-tics of emergencies may also be apparent in disaster response and vice versa. Espe-cially when we consider the fact that some disasters actually start as (a combination of) smaller incident(s) and evolved into a disaster (e.g., a small fire in one isolated room of a building with fifteen floors may end up collapsing the entire building and requiring area-wide evacuations). This means that what is a disaster at t=2 (where t is the time), may have been an emergency at t=1. Also, some scholars suggest that almost every disaster involves a high level of novelty to deal with the unexpected under uncertainty and time pressure (i.e., Shaluf, 2007; Shen, Zhao, & Huang, 2008). Hence, it is difficult to sustain that every incident or emergency represents a routine when being well known for each relief worker. In our view, the characteris-tic that truly distinguishes disasters from emergencies is the configuration of re-sponse agencies. Incidents and emergencies can often be handled by a single relief agency, while disasters require the collective resources of multiple agencies. Disas-ter management usually requires several autonomous public- and private agencies to collaboratively mitigate, prepare, respond, and recover from heterogeneous and dynamic sets of hazards to society (Kapucu, Augustin, & Garayev, 2009). Moreover, incidents and emergencies do not require activation of the strategic and tactical echelons in PSNs, instead activating one or more operational teams (field units) is sufficient for dealing with the situation at hand. While aware of the ongoing de-bates on the definitions and usage of the terms “disaster,” “emergency,” and “crisis”

Chapter 1
16
B) Preparedness
A) Prevention/ Mitigation
C) Response
D) Recovery & lessons learned
Disaster Management
Figure 1-1: Disaster management cycle: focus on response
(see for instance Gundel, 2005; Pearson & Clair, 1998; Shaluf, 2007), we use the term disaster throughout this dissertation to refer to the immediate aftermath of a (single or combination of) extreme event(s) threatening public safety that cannot be properly handled by the regular capability of a single local response agency. Therefore in a PSN, a number of response agencies have to coordinate its efforts to effectively deal with the outcomes of a disaster. While we have discussed some dis-tinctions between terms and the characteristics of disaster, we still need to define the process after a disaster in relation to the need for multi-agency information management. Figure 1-1 illustrates the processes in a disaster management cycle.
Figure 1-1 illustrates the activities or phases in disaster management. The
basic phases of disaster management include: (A) mitigation or prevention, (B) preparedness, (C) response, (D) recovery and lessons learned. Prevention and mit-igation refer to pre-disaster actions taken to identify risks, reduce these and thus reduce the negative effects of the identified type of disaster event on human life and personal property.
Preparedness refers to the actions taken prior to a possible disaster that enable the emergency managers and the public to be able to respond adequately when a disaster actually occurs.
The response phase starts when avoidance efforts fail and events trigger a crisis. At this point, organizations shift their resources and efforts to minimizing damage to the environment, facilities and people. Over time, the risk of additional direct damage subsides, and organizations enter the final phase of the disaster management cycle, recovery.
Recovery involves attempts to learn from the event internally and “handle” the event externally. While recognizing the importance of every phase in the disas-ter management cycle, this dissertation focuses on the disaster response phase, es-pecially since most of the IQ and SQ issues reported in the literature have occurred in this phase.
Throughout these four phases, the main goal of relief agencies is to reduce, or avoid the potential losses from hazards, assure prompt and appropriate assis-tance to victims of disaster, and achieve rapid and effective recovery. Taking the previously stated characteristics of disasters into consideration, we define disaster response as:

Preface
17
Disaster response is a complex and partly unpredictable series of multi-agency processes demanding rapid information management within and between echelons in order to support collective decision-making and ac-tion in temporary public safety networks
This definition highlights our focus on the inter-agency (horizontal) and in-
ter-echelon (vertical) information management process as a prerequisite for deci-sion-making and action. Williams (1957) found that the amount of information that must flow through existing channels greatly increased during these phases of a dis-aster. We proceed with discussing the process of multi-agency information man-agement in the following section.
1.3 Four levels of obstacles for multi-agency information management
Information management, including the tasks of collecting, distributing, processing and presenting disaster-related information, is essential for the coordination of disaster response activities (Ryoo & Choi, 2006). Both experimental and field study research suggests that the way in which information is managed within a team af-fects its performance (Artman, 1999). The content and scope of information man-agement has been under scrutiny by researchers and practitioners from several fields (i.e., business and management, organization research, public administra-tion, communication) for a long time. Consequently, scholars have proposed sever-al definitions and frameworks for information management (e.g., Checkland & Holwell, 1993; Choo, Deltor, Bergeron, & Heaton, 2006). Similar to the process of disaster management, information management is often considered to entail a cy-cle of activities. Choo (2000) for instance defines information management as “a cycle of processes that support the organization’s learning activities: identifying information needs, acquiring information, organizing and storing information, de-veloping information products and services, distributing information, and using information" (p. 14).
For supporting each of these activities, information managers can employ IT applications depending on the services they provide (supply) and their infor-mation needs (demand). Often, this way of information management works fine in a single organization, operating in a slowly changing environment and with a pre-dictable information supply and demand. However, during disaster response, the information supply and demand change continuously and are only partly predicta-ble, requiring information managers to adapt resources and flows in order to keep decision-makers informed. Put differently, if an information manager fails to attain and transmit the required information, the whole response system will likely fail to adapt to the requirements of the risk environment in which it operates (Celik & Corbacioglu, 2009; Comfort, Ko, et al., 2004). Previous work has highlighted sev-eral obstacles that make multi-agency information management so difficult during disaster response. The explanations can be categorized in four levels: the tasks or work-environment), the community, the agency, and the individual level. We dis-cuss the obstacles on each level in the following sub-sections.

Chapter 1
18
1.3.1 The work-environment level: complex and unpredictable pro-cesses
Various scholars (e.g., Auf der Heide, 1989; Kapucu, 2006) suggest that infor-mation management is so complex because the disaster response environment in which multiple groups of professionals need to collaborate is so unpredictable, dy-namic and complex. Bigley and Roberts (2001) state that responding to a disaster, either natural (e.g., floods, earthquakes) or induced by human action (e.g., terrorist attacks) is an extremely complex process in terms of the number of organizations, information systems and the interactions between actors and information systems. Comfort refines this statement by suggesting that disaster response is a very com-plex process because it requires many, and often unprecedented, interactions with-in and between multiple relief agencies forming a public safety network (Comfort, Ko, et al., 2004). Here, the term ‘complex’ can have multiple meanings, especially since there is no universally accepted definition for this term (Morel & Ramanujam, 1999). In many cases, the term complex is used to refer to the number of elements in a task, the degree to which a task is programmable, the number of exceptions in the processes and so on (Scott, 1992).
Systems are complex when they have intricate interdependencies among their various elements and many variables operating at the same time (Longstaff, 2005). The relief agencies involved in disaster response can thus be seen as ele-ments, as can their often-divergent points of view and objectives, or the instru-ments they have available. Consequently, the complexity of a system can be cap-tured using multiple scales, including the number of actors, systems and their in-teractions changing over time. If we take the non-linear dynamics perspective, a PSN can be viewed as a complex system that is able to learn from its environment and change its internal structure and organization over time, thereby changing the behavior of individual elements (Paraskevas, 2005). We need to keep in mind that, in non-disaster situations, many of the agencies involved operate independently of each other. During disaster response, complexity arises from a variety of elements, systems, processes and actors, and it is hard to get a clear picture of the entire situ-ation within the timeframe of a disaster (McEntire, 2002). In this dissertation, complexity not only refers to the number of actors in the network, but also to the many interactions between them at the various organizational levels (Rao, Chaudhury, & Chakka, 1995). Such interactions are necessary for achieving mutual adjustment and collective mindfulness (Weick & Sutcliffe, 2001). At the community level, information needs to flow in a coordinated fashion through a multi-organizational and multi-level grid, which means that the functioning of the organ-izations involved not only depends on their internal interactions, but on the inter-actions with other agencies as well. There may be no central coordinating authority at this level (Denning, 2006). Instead, several, pre-agreed agency leaders at various response echelons coordinate the agencies involved. Many inter-organizational de-pendencies may not always be clearly visible. These dependencies and the resulting interactions are of crucial importance, as demonstrated by the disorganized multi-agency response to the 9/11 attacks, where police and fire departments were unable to share information (Kean & Hamilton, 2004).
Another often provided explanation in the literature is the high level of un-certainty inherent to disaster response processes. As a complex system, PSNs often exhibit unpredictable or surprising behavior when several forces interact in the sys-tem (Longstaff, 2005). The more uncertainty, the greater the number of possible

Preface
19
developments you would have to anticipate. Hence, uncertainty has come to mean the absence of information (Daft & Lengel, 1986). Galbraith defined uncertainty as "the difference between the amount of information required to perform the task and the amount of information already possessed by the organization" (Galbraith, 1973, p. 4). Organizations that face high uncertainty have to ask a large number of questions and acquire more information to learn the answers. The important as-sumption underlying this approach, perhaps originating in the psychology labora-tory, is that the organization and its managers work in an environment where ques-tions can be asked and answers obtained (Daft & Lengel, 1986). Particulary in dis-aster response situations, this assumption may not hold since answers (in the form of information) may only be available in a later stage of the disaster management process (unfolding events). Moreover, some answers cannot be attained because of the many factors that are related to the cause of the disaster. Morgan and Henrion (1992) claim that there are usually multiple sources for uncertainty that need to be dealt with, including subjective judgment, disagreement, variability and unpredict-ability. Literature (Meijer, Hekkert, Faber, & Smits, 2006; Walker et al., 2003) suggest multiple dimensions of uncertainty, including nature uncertainty (epistem-ic/variability), location uncertainty (context/model/input), magnitude of uncer-tainty (high/low), and the source of uncertainty. Each of these dimensions poses major challenges for relief workers during multi-agency disaster response. For in-stance, coordinated response is particularly difficult to achieve with threats such as hazardous materials in which the general vulnerability is known, but the specific time, location and magnitude of the threatening event are uncertain (Comfort, Sungu, Johnson, & Dunn, 2001). Even though there are many definitions of uncer-tainty, the majority of the definitions commonly highlight the implication dealing with incomplete information (Argote, 1982). Therefore, uncertainty, in combina-tion with severe time pressure and limited cognitive attention, makes it difficult for relief workers understand how to improve overall group-level response effective-ness with their supporting activities (Ahituv, Igbaria, & Sella, 1998).
1.3.2 The community level: interdependent agencies
Responding to a disaster involves dealing with many hazards and risk, requiring the collaborative resources and capabilities of several relief agencies. Not one single agency involved "has all the necessary resources", nor does any single person pos-sess the expertise in handling all types of extreme events. Therefore, governments have allocated the responsibility of disaster response to Public Safety Networks (PSNs). Also known as a hastily-formed network (Denning, 2006), a PSN refers to a varying set of responding agencies that temporarily need to exchange information in order to deal with the effects of a disaster. In a PSN autonomous agencies collab-orate by forming multi-agency (or multidisciplinary) teams that include the per-sonnel of a similar rank and authority of agencies such as the police, fire depart-ment, and medical services. In this form of horizontal collaboration, no single per-son or agency is in command of all others (Mertens, Jochoms, & Zonneveld, 2009). Depending on the country, such teams can be centralized, distributed, or combina-tions of both. For instance, in the Netherlands the configuration of PSNs is to a large extend predicated by law and follows an hierarchical structure with teams on a strategic, tactical, and operation level (Bharosa, Lee, et al., 2010). The agencies involved in such a network are usually public agencies (i.e., police, fire department, ambulance services), yet the participation of privately owned organizations (i.e.,

Chapter 1
20
security companies, airlines carriers, seaport companies) is not uncommon. While some of these agencies are organized as classic, top down hierarchies, others are organized as more flexible adhocracies.
Organizational researchers, noticeably contingency theorists, argue that there is no one right organizational design and that the right design depends on the specific task at hand (see for example Baligh & Burton, 1981; Lawrence & Lorsch, 1967). Since the various agencies in PSN cover a wide range of tasks, PSNs include a wide range of organizations with varying coordination structures, resources and information needs. PSNs are a unique category of complex organizational networks since they include elements from traditional command and control hierarchies and elements of temporal (hastily-formed) actor networks. For instance, police officers responding to the effects of disasters that they cannot solve on their own (i.e., fires and human casualties), require enough discretion and flexibility, and need to be active problem-solving participants in a variety of cooperation types with relief workers from other agencies (i.e., fire department and medical services). At the same time, they need to work efficiently and exercise hierarchy (“maintaining law and order”). As such, PSNs form a mixture of military hierarchy and network atti-tudes when responding to disasters. Their complexity can be viewed from many different perspectives, each emphasizing some factors and neglecting others.
1.3.2.1 Elements of hierarchical command and control
According to Simon (1996) the classical approach to solving complex problems has been to organize work involving multiple agents and tasks hierarchically. Hierar-chical and layered information flows is the style of information management based on the ideal type of bureaucracy developed by the German sociologist Max Weber. This ideal type is based on authority, clear division of tasks, rules, rationality and objectivity. This was the main approach that public sector organizations applied until it became contested in the 1970s. Hierarchies depend on clear boundaries, uniformity and an inflexible structure, which restricted the options of public man-agers when dealing with complex societal problems. In particular, hierarchies are viewed as emerging, at least in part, as a response to distributed or specialized in-formation (Cohen, 1962). Moreover, it was suggested that advantages accrued to the organization when such divisions exist include a decreased loss of time due to changing jobs, an increased efficiency at doing a subtask (due to learning), and an increased ability to develop machines to help or do parts of the job. In their daily operations, relief agencies work independently in a more or less hierarchy oriented organizational structure (Bigley & Roberts, 2001). Hierarchy is used to establish control, specify tasks, allocate responsibilities and reporting procedures, and pre-sumably gain reliability and efficiency in workflow. This reflects the belief that the most effective repression operations are carried out under rigid control, exercised convergent with intra-agency authority structures. The major decisions are made at the highest (strategic) echelon and are filtered down and more detail is added as they pass through to the lower tactical and operational echelons (top-down/bottom-up principle). In a hierarchy, the flow of information is coordinated through adjacent steps, by controlling and directing information to the higher and subordinate echelons (Malone et al. 1987). Important characteristics of a hierar-chical structure are centralized decision-making and authorized (sequential) in-formation sharing (Schraagen, Huis in 't Veld, & de Koning, 2010). The advantage of this coordination approach is that the number of interactions and interdepend-

Preface
21
encies between relief workers is often limited since the linkages are based on long-lasting relationships and procedures. The hierarchical approach to information management is criticized particularly because it is rigid, inefficient with respect to information sharing and has limited flexibility (Drabek & McEntire, 2003). Waugh & Streib (2006) suggest that “a lack of understanding of emergency management is likely one reason why officials suggest that the nation’s response to disasters needs a stronger command and control system”( p.131).
1.3.2.2 Elements of a temporal (hastily-formed) actor network
When disaster threatens a community, it requires responses from several mono-disciplinary organizations at different locations to set aside prior activities and fo-cus time effort and attention to one common goal (Comfort, et al., 2001). The point of departure is that modern society is characterized by the dispersion of effective problem-solving capacity between different private and public actors with special-ized tasks and limited competence. The result is interdependence between different actors, which exchange resources and negotiate collective problem-solving through organizational networks. The ability to form multi-organizational networks rapidly is crucial to humanitarian aid, disaster relief, and large urgent projects (Denning, 2006). Such a network is not only complex, unpredictable and difficult to coordi-nate; it is also subject to some organizational issues. Moreover, many researchers have noted that networks reflect a qualitatively different form of governance struc-ture than the bureaucratic hierarchies (Powell, 1990). Autonomous agencies that need to spontaneously coordinate information in a network have different charac-teristics compared to organizations that operate in isolation. From this perspective, PSNs can be understood as webs of relatively stable and ongoing relationships be-tween relief agencies connected by resource dependency, and where information, goals and resources can be exchanged in interactions, so that collective action can be orchestrated towards the solution of common policy (Kickert, Klijn, & Koppenjan, 1999). We use the four characteristics suggested by De Bruijn & Ten Heuvelhof (2000) in order to understand the characteristics of PSNs: pluriformity, interdependency, closedness and dynamics.
Pluriformity implies a high level of variety or diversity, meaning that the actors who form a network are different in many ways, including size, means of power, information processing capabilities and so forth. Major disasters involve multiple autonomous organizations (governmental, NGOs, individuals, communi-ties, and industry). This leads to a diversity of interests, compounded by the fact that many of the data sources and data consumers are neither information technol-ogy specialists nor have experience in data management. With the extensive array of participating response agencies, decision-making authority is vested in multiple agencies. Several different organizations play an important role in different areas, but all of them work independently. While there are usually some roles such as Mayor or Minister that on paper have the overall levels of command, there is no single agency that has been identified (and accepted by the others) as a central command and control body responsible for the collective response efforts. As such, there is no single agency that plans, coordinates, controls all aspects of response. Moreover, command and control is usually fragmented by the legal jurisdiction of the different agencies (local, state, federal) and the mandate with which they have been entrusted, their geographic locations, and the overlapping nature of their re-

Chapter 1
22
sponsibilities. This can lead to a vast store of information residing among different agencies and committees, and insufficient sharing of that information taking place. In a multi-actor setting, there is also the issue of interdependency. The interde-pendency between actors suggests that in a network are mutually dependent and these dependencies can be expressed in multiple units, including authority and in-formation. The types of interdependency can vary depending on the context, for instance single-multiple, bilateral-multilateral, synchronous-asynchronous, simul-taneously-sequentially and static-dynamic(De Bruijn & Ten Heuvelhof, 2000).
The closedness of the participating agencies means that the actors involved are not by definition sensitive to external interventions. Therefore, agencies may not always openly share all information, as they are uncertain of what impact a spe-cific policy, solution, or artifact will have. Prior to the response to the 9/11 attacks, some agencies were reluctant to share information with other agencies in the first place due to security reasons (De Bruijn, 2006). It is well known that individuals under severe stress often forget their recent training and regress to old, ingrained habits (Weick, 1995, p. 102). Richard Strozzi Heckler (1993) call these old habits ‘conditioned tendencies’. The old habit is likely to be inappropriate for the current situation and even makes matters worse. In his Masters’ thesis, Joseph Pfeifer, a deputy assistant chief in the New York City Fire Department, provides a detailed example of conditioned tendencies instilled by disaster response agencies, which paradoxically can render them incapable of effective response in an emergency (Pfeifer, 2005). Pfeifer was among those responding to the 9/11 disaster in the World Trade Center. His explanation for non-communicative behavior was that organizational bias, referring to ingrained social habits of the separate organiza-tions, prevented emergency personnel from talking to one another. One of these biases is organizational social identity that prefers sharing information within the group but not with outsiders. Under stress, the group members do not think of col-laborating or sharing information outside the group, or to take personal responsi-bility for the welfare of members of other groups (Ibid.).
Finally, PSNs are dynamic meaning that as the disaster evolves, new agen-cies and individuals can join the network. In a disaster environment, new requests are made as the dynamics of a situation unfold. An example is the navigation in a factory is based on static signs. In case of a disaster, routes (doors, staircases and corridors) can be blocked and the static routing system breaks down. In a dynamic environment both the information sources and their content can change over time, potentially creating uncertainty and hampering decision-making. Since disaster response efforts may take days and include different shifts of relief agency person-nel, supporting the transfer of information under chaotic conditions is a major challenge for information systems.
Concluding, the composition of these PSNs is often fluid and fluctuates de-pending on the needs of the organizations involved. Such reconfigurable networks are typically supported by a myriad of ITs that facilitate information sharing across heterogeneous contexts. Since PSNs are based on a recognition of key interdepend-encies across disciplines and agencies and thus on the need for multi-disciplinary information management to respond to disasters, they also require effective mobi-lization and utilization of many available community resources (i.e., personnel, equipment, ITs), both public and private.

Preface
23
1.3.3 The agency level: organizational silo’s and routine workflows
When looking at the agency level, it becomes clear that responding to an extreme event requires collaboration and transparency on the part of various agencies with different cultures and organizational structures (Mendonça, Jefferson, & Harrald, 2007). Even though many scholars (e.g., Auf der Heide, 1989; Comfort & Kapucu, 2006) view the organizational structures of relief agencies as military style, hierar-chical command and control structures, they are, in fact, not completely similar because various relief agencies face different kinds of challenges under normal cir-cumstances. Some relief agencies are highly disciplined, others disorderly; some have a highly hierarchical structure, while others are more informal and egalitari-an; in some cases, authoritarian decision-making prevails, while others tend to adopt a more democratic approach (Granot, 1997). Every relief agency focuses on a different set of challenges in its daily operations and has developed distinct and tailored roles, procedures and capabilities designed to address these challenges. Under normal circumstances, the organizational structures of the separate agencies pose no major problems. However, when disaster strikes, coordination becomes much more difficult, simply because a disaster is more than merely a big emergen-cy (Quarantelli, 1982). So, under the urgent, dynamic conditions of disaster, such hierarchy-oriented organizations (or teams when referring to military organiza-tions) are forced to collaborate and share information in a more network-oriented structure, simply because no single agency has the knowledge and resources neces-sary for dealing with the wide range of risks emerging during a disaster (cf. Petak, 1985). Accordingly, PSNs are different from military organizations since several, more or less hierarchy-based, yet autonomous organizations need to share infor-mation instead of a single hierarchy-based organization with multiple teams. As such, autonomous relief agencies need to rapidly, yet temporarily transform into an interdependent network of agencies.
1.3.4 The individual level: bounded rationality & ad-hoc decision mak-ing
Finally, the entire information management process needs to support a highly dy-namic decision making process. Decision-making is the cognitive process of select-ing one option out of a set of possible options. The process begins when the deci-sion maker detects that there is a need to do something but does not know what that should be. It ends when the decision maker has selected an option. The deci-sion maker can be an individual (e.g. the relief agency commander) or a team (e.g. the multi-agency team). Decision-making can be rational, naturalistic, or irrational, and decisions may be based on explicit and/or tacit knowledge. Moreover, the deci-sion-making processes that unfold in such a multi-agency disaster response setting are very information intensive. March and Simon (1958) found that stress and time pressure impede crisis decision makers’ search for information. Scholars have sug-gested a range of contextual, organizational and technical factors to explain why this type of decision-making process is so difficult to support. Consequently, schol-ars have proposed several descriptive models for describing decision-making pro-cesses. Examples include the situational awareness model (Endsley, 1988), the nat-uralistic decision making model (Zsambok & Klein, 1997), muddling through (Lindblom, 1959), and the recognition primed decision-making model (Klein, 1998). Another often cited model is the sense-making model which emphasizes a

Chapter 1
24
collaborative process of creating shared awareness and understanding out of differ-ent individuals' perspectives and varied interests (Weick, 1995).
Among the similarities between the different generic models (normative and descriptive) of decision making, all seem to agree that the identification and implementation of a decision follows the perception of information from the envi-ronment and its analysis and understanding. These phases are compatible with the ones included in the classical version of the Boyd’s OODA loop. Boyd (1996) identi-fies four processes: Observe–Orient–Decide–Act, organized into a loop. The OODA loop has been extremely used to represent C2 activities typical of military decisions or of other complex high-risk time-stressed activities like aircraft piloting or fire-fighting. It has the benefit of simply representing the decision cycle. It also provides taxonomy of the different phases included in the decision-making process. As ex-plained by Klein and Klinger (1991), disaster response is one of those domains in which rational decision making does not work and is not applied because: goals are ill-defined and shifting, the environment is highly dynamic, information is incom-plete, decision makers are under time pressure, and stakes are high. Note that we are not investigating the most complete or accurate model for describing decision-making processes during disaster response. Instead, this section aims to capture the main characteristics of the decision-making process that information systems need to facilitate during disaster response. As discussed later in Chapter 4, the characteristics are important for preparing our field study observations.
There is no shortage of literature on the obstacles decision makers face dur-ing this process. Smart & Vertinsky (1977) underline the ad-hoc group decision-making environment in which response teams have to operate. Deciding and acting during disaster response is a challenging process for each individual, because eve-ryone is faced with severe time-pressure and a flood of information that may be inaccurate or outdated by the time a decision or action takes place. Such a complex, intense and information-rich environment can easily result in cognitive overload at an individual level (Greef & Arciszewski, 2007), because a decision-maker’s mental capacity (due to the extended time to concentrate and the sheer number of availa-ble alternatives to consider) is limited (Lindblom, 1968; March, 1988). This cogni-tive overload is related to a human limitation that is known as ‘bounded rationality’ (Simon, 1982) and that constitutes a well-known bottleneck in human information processing. Cognition is related to role performance or, in other words, the execu-tion of a set of behaviors that an individual is expected to be able to perform (Mendonca, Jefferson, & Harrald, 2007).
This negative relationship between information requirements and cognitive capacity (Galbraith, 1977) exists at the individual level, resulting in a performance level that may not correlate with the amount of information available (Rao, et al., 1995). As such, it is important to determine how much information people need and can be exposed to at an individual level with regard to disaster management. In addition, the task environment is often extremely complex since there are many agencies and systems involved that interact in unpredictable ways (Celik & Corbacioglu, 2009). Moreover, there is a tremendous urgency and time pressure surrounding the decision-makers (Boin, et al., 2005). Also uncertainty pertaining subsequent events, risks, resources and hazards, dominate the entire decision-making process (Bui & Sankaran, 2001; Chen, Sharman, Rao, & Upadhyaya, 2007). Combined, all these factors require disaster response processes, including decision-making and information management processes, to adapt to changes in the re-

Preface
25
sponse environment. In this way, information management processes may both support or impede decision-making adaptability. Often, relief agency commanders are primarily responsible for making many decisions and, therefore, do not have much time to devote to systematic information management.
1.4 The increasing use of IT in Public Safety Networks
Driven by the conclusions of various disaster evaluation reports, both scholars and practitioners are showing an increasing interest in the development and use of in-formation technology (IT) for addressing the obstacles mentioned in the previous section. Some scholars have even argued that IT is essential to improving infor-mation sharing and decision making for emergency responders (i.e., Graves, 2004). In addition to traditional channels for information sharing such as telephone, face-to-face meetings, and memorandums, IT-based solutions such as electronic mail, digital maps, bulletin boards, computerized conferencing systems, electronic meet-ing systems, document delivery systems, and workflow management systems are increasingly being used during disaster response (van de Walle & Turrof, 2008). Table 1-2 outlines a crude classification of these technologies based on the func-tions they provide for relief agencies.
According to Stephenson and Anderson (1997), IT developed primarily by
defense departments or universities has been introduced in the field of public dis-aster management since the late 1970s. In the period between the 1970s and 1980s, the development of the microprocessor enhanced the computing capacity of many public agencies. In this period, designers focused on the development of standalone applications driven by functionality. Evernden & Evernden (2003) characterize this period as the first generation of information architectures based on simple frame-
Table 1-2: IT innovations for disaster response
Function Information technology Contributions
Location, naviga-
tion and tracking
Geographic Information Systems Van Oosterom et al. (2005),
Kelmelis et al. (2006)
Geo-Collaborative tools (Geo-
CSCW)
Cai, MacEachreen, Brewer,
McNeese (2005)
Information forag-
ing and sharing
Smart Dust, Wireless Sensor Net-
works, Wearable Computing
Lorincz et al. (2004); Kumar
et al. (2004); Randell (2008)
Risk management Risk calculation and simulation
technology
Berghman (2008), Berrogi &
Wallace (1995)
Coordination and
feedback
Collaborative virtual workplaces Collins et al. (2008)
Agent-based systems Lui (Liu, 2004)
Decision-making Decision support systems (DSS) French & Turoff (2007)
Intelligent mobile systems Deltor & Yuan (2005)
Knowledge reposi-
tories
Shared data spaces Larson, Metzger, Cahn
(2006)
Content Management Systems &
Knowledge Systems
Atoji, Koiso & Nishida
(2000), Raman, Ryan & Olf-
ma (2006)
Citizen/Community
participation
Community response grids, WIKIs,
social networks, micro blogging
Jaeger et al. (2007), Palen,
Hiltz & Lui (2007)
Chapter 1
26
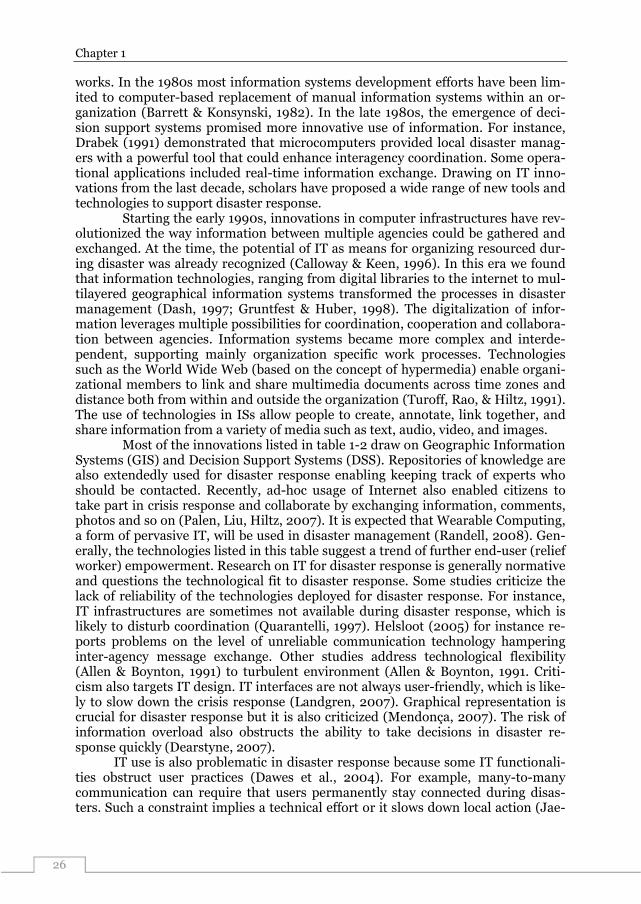
works. In the 1980s most information systems development efforts have been lim-ited to computer-based replacement of manual information systems within an or-ganization (Barrett & Konsynski, 1982). In the late 1980s, the emergence of deci-sion support systems promised more innovative use of information. For instance, Drabek (1991) demonstrated that microcomputers provided local disaster manag-ers with a powerful tool that could enhance interagency coordination. Some opera-tional applications included real-time information exchange. Drawing on IT inno-vations from the last decade, scholars have proposed a wide range of new tools and technologies to support disaster response.
Starting the early 1990s, innovations in computer infrastructures have rev-olutionized the way information between multiple agencies could be gathered and exchanged. At the time, the potential of IT as means for organizing resourced dur-ing disaster was already recognized (Calloway & Keen, 1996). In this era we found that information technologies, ranging from digital libraries to the internet to mul-tilayered geographical information systems transformed the processes in disaster management (Dash, 1997; Gruntfest & Huber, 1998). The digitalization of infor-mation leverages multiple possibilities for coordination, cooperation and collabora-tion between agencies. Information systems became more complex and interde-pendent, supporting mainly organization specific work processes. Technologies such as the World Wide Web (based on the concept of hypermedia) enable organi-zational members to link and share multimedia documents across time zones and distance both from within and outside the organization (Turoff, Rao, & Hiltz, 1991). The use of technologies in ISs allow people to create, annotate, link together, and share information from a variety of media such as text, audio, video, and images.
Most of the innovations listed in table 1-2 draw on Geographic Information Systems (GIS) and Decision Support Systems (DSS). Repositories of knowledge are also extendedly used for disaster response enabling keeping track of experts who should be contacted. Recently, ad-hoc usage of Internet also enabled citizens to take part in crisis response and collaborate by exchanging information, comments, photos and so on (Palen, Liu, Hiltz, 2007). It is expected that Wearable Computing, a form of pervasive IT, will be used in disaster management (Randell, 2008). Gen-erally, the technologies listed in this table suggest a trend of further end-user (relief worker) empowerment. Research on IT for disaster response is generally normative and questions the technological fit to disaster response. Some studies criticize the lack of reliability of the technologies deployed for disaster response. For instance, IT infrastructures are sometimes not available during disaster response, which is likely to disturb coordination (Quarantelli, 1997). Helsloot (2005) for instance re-ports problems on the level of unreliable communication technology hampering inter-agency message exchange. Other studies address technological flexibility (Allen & Boynton, 1991) to turbulent environment (Allen & Boynton, 1991. Criti-cism also targets IT design. IT interfaces are not always user-friendly, which is like-ly to slow down the crisis response (Landgren, 2007). Graphical representation is crucial for disaster response but it is also criticized (Mendonça, 2007). The risk of information overload also obstructs the ability to take decisions in disaster re-sponse quickly (Dearstyne, 2007).
IT use is also problematic in disaster response because some IT functionali-ties obstruct user practices (Dawes et al., 2004). For example, many-to-many communication can require that users permanently stay connected during disas-ters. Such a constraint implies a technical effort or it slows down local action (Jae-

Preface
27
ger et al., 2007). Likewise, this functionality also creates a dependency to technolo-gy that may be risky: lack of data or loss of access to information bewilders organi-zations during disasters (Hutchins, 1991).
Carver & Turoff, (2007) explain, “…technology is vital in extending our hu-man capabilities to cope with either natural or man-made disasters, but we forget the human role at our peril. This means the human as part of the system, the com-puter as part of the team, and both the computer and the human working with oth-er people and other computer systems in other agencies, sharing information and working together to manage the emergency, mitigate its effects, and to support the victims after the event” (p.34). This fits the socio-technical perspective and defini-tion of ISs discussed in the introduction. Studies in this area have also concluded that the use of ITs increase participation and result in better quality decisions since decisions are made by consensus and not by domination (Hiltz & Turoff, 1993). ISs based on advanced ITs seem to facilitate relief workers in recognizing, understand-ing, defining, investigating, evaluating, and solving a problem as a team (van de Walle & Turrof, 2008). This promotes greater learning and understanding of both internal and external issues during disasters. IT allows the joint construction and distribution of experiences and insights. ITs can also support feedback and review mechanisms among team members. Thus, they not only support communication but also collaboration. Yet, the use of IT and the effects of the use on performance can greatly vary from one response situation to another (Hiltz & Turoff, 1993).
1.5 Information quality and system quality during disaster response
The previous section presented some advances in the use of IT in PSNs. In spite of these developments, two major symptoms resulting from information management practices still pose significant challenges for relief workers: the information quality and the system quality. Taking IQ and SQ problems as the empirical driver for this research, the theoretical driver is the lack of theories for designing information systems assuring IQ and SQ in PSNs. We introduce both concepts in the following sub-sections; a more detailed discussion on these concepts follows in Chapter 3.
1.5.1 The characteristics of information as a product
During the process of multi-agency disaster response, information is one of the es-sential needs of relief workers (Helsloot, 2005). Fisher and Kingma (2001) reveal that one main factor behind the explosion of the NASA space shuttle Challenger on 28 January 1986, and the shooting of an Iranian Airbus by the US Navy Cruiser USS Vincennes on 3 July 1988, was poor quality information. Given how fast in-formation can become outdated, information management during the actual re-sponse is critical in order to continuously have the most recent information at one’s disposal. Emergency managers have learned that accurate and timely information is as crucial as rapid and coherent coordination among the responding agencies (van de Walle & Turoff, 2007). Moreover, because disaster response processes are information-intensive (De Bruijn, 2006), the effectiveness of relief agencies largely depends on the quality of the information they have available (Davenport & Prusak, 1998). Table 1-3 lists some of the IQ dimensions and related issues mentioned in the literature on disaster response efforts.

Chapter 1
28
Table 1-3: Examples of IQ issues mentioned in the literature
IQ
dimension
Description of IQ issues mentioned in the literature
Accuracy “In disaster management, information about technical conditions may be
ambiguous and unreliable” (Kontogiannis, 1996, p. 76). “Disasters start
out with a lack of information, which then turns into large amounts of
imprecise information” (Manoj & Hubenko Baker, 2007, p. 52).
Timeliness “Sending us very stale situation report info that has already been updated
(earlier) is not as helpful. Is there a way to coordinate the info flow so we
don’t waste time receiving such old data and you folks don’t waste time
sending us stuff?” (Christopher & Robert, 2006, p. 197).
Relevance Relevant information, that is information suited to its intended use, was
needed to support emergency and recovery operations of all kinds
(Dawes, et al., 2004).
Quantity When a large-scale disaster happens, a great deal of information occurs in
a short period of time (Atoji, et al., 2000), resulting in too much infor-
mation to process (Jenvald, Morin, & Kincaid, 2001) and straining the
capacity of the emergency management and communication systems
(Manoj & Hubenko Baker, 2007).
Completeness In the response to the 2004 Tsunami, “mostly, the information is incom-
plete, yet conclusions must be drawn immediately”(Samarajiva, 2005, p.
733). During Katrina, the federal government lacked the timely, accurate,
and relevant information necessary to evaluate which critical infrastruc-
tures were damaged, inoperative, or both (Townsend et al, 2006).
Format During the response to 9/11, valuable information necessary for re-
establishing normal operations in non-emergency organizations had been
kept only on paper, such as legal files for cases in the process of litigation.
This information was either destroyed or made inaccessible due to the
closure of buildings that needed thorough inspection or repair before they
could be re-occupied (Dawes, et al., 2004).
Security Sharing information during an emergency is challenged by trust and secu-
rity issues (Manoj & Hubenko Baker, 2007), because of the need to pro-
tect potential misuse of information; however, excessive regulation ham-
pers responders from getting useful information from other agencies
(Kim, Sharman, Rao, & Upadhyaya, 2007).
Consistency Firefighters rushing to the Schiphol Detention Complex received incon-
sistent information about the available gates to the area and were delayed
in finding the right gate (Van Vollehoven et al, 2006). If several infor-
mation systems suggest different location coordinates, this inconsistency
delays decision making (Fisher & Kingma, 2001).
Availability During Katrina, access to information was seriously limited, resulting in a
severe lack of information as a basis for decision making in this urgent,
uncertain, swiftly moving context (Comfort & Kapucu, 2006). In response
to the 2004 tsunami, many response agencies stationed further of the
coast lacked information warning them about the floods and hazards
(Samarajiva, 2005).

Preface
29
Table 1-3 indicates that IQ is a multi-dimensional concept, describing properties of the information received, capturing a wide range of variables such as accuracy, timeliness, completeness, consistency, relevance and quantity (Wang & Strong, 1996). Miller (1996) adds format, compatibility, security, and availability of information as important variables for measuring IQ. The examples provided in Table 1-3 are not exhaustive and are based on the reports of scholars and investiga-tors. Accordingly, other IQ issues may have occurred during the respective disas-ters.
The multi-disciplinary and specialist character of the work relief workers are involved in poses special requirements for interdisciplinary information ex-changes. For instance, the relevance of information is hard to assess for all relief workers in the PSN, leading to situations where all information is exchanged (just in case), or situations where relevant information is held back caused by the inabil-ity to assess the relevance of all information for all actors. Moreover, certain events, when viewed in isolation, may at first appear irrelevant during disaster response, but when analyzed collectively may identify a potential threat (Adam et al., 2007). Chapter 4 continues with a more elaborate discussion of the dimensions of IQ.
1.5.2 System quality: the characteristics of the information system
In the context of disaster management, both the information demand and supply keep changing over time. As a result, flexibility and interoperability are particularly important requirements for decision-support applications. Information systems that integrate data from diverse sources can improve organizational decision-making, and flexibility allows decision makers to easily modify applications as their information needs change (Gray and Watson 1998; Sakaguchi and Frolick 1997). Compared to information quality (IQ), system quality (SQ) refers to the quality of the information system (as a producing system) and not of the information (as a product) (Delone & McLean, 1992). As agencies have their own information sys-tems, information sources are usually heterogeneous and require standardization for compatibility (Bui et al., 2000).
Sawyer (2007) indicates that there is great variety in types of information systems being developed under the umbrella of “public safety network” and the types of services delivered. This variety includes technological feature sets, organi-zational arrangements, governance practices, jurisdictional scope, and institutional environment. One key commonality is that all involve multiple agencies, meaning they may span governmental levels (i.e., federal, provincial, local), functions (e.g., police, fire, justice), or geographies (i.e., municipalities, regions or communities). In such a setting, the lack of SQ can have significant impacts on the response ef-forts. For instance, the lack of interoperability between communication equipment used by different public safety agencies and jurisdictions plagued rescue teams and relief workers during disasters (Portman & Pirzada, 2008). The 9/11 commission report for instance noted that a patchwork of incompatible IT and the uncoordinat-ed use of frequency bands were the main reasons for nonexistent or poor inter-agency communication during emergency response and recovery operations (Kean & Hamilton, 2004). Shouting, waving signs, and runners with hand-written mes-sages were often the only primitive alternative (Ibid.). While these forms of ‘primi-tive’ information sharing do allow for the continuation of disaster response efforts, they do not provide information management capabilities necessary to share more complex types of information (e.g., geographic maps with ship locations) to be

Chapter 1
30
shared, enriched and validated across a large network of physically distributed agencies. In order to avoid the fallback to such preferred forms of information shar-ing, stakeholders (e.g., information system architects, relief workers and policy makers) actively solicit for means that help assuring SQ during disaster response (ACIR, 2005; ASE, 2008; National Research Council, 2007; Townsend et al, 2006). Table 1-4 lists some of the SQ dimensions and related issues mentioned in the liter-ature on disaster response efforts.
Table 1-4: Examples of SQ issues mentioned in the literature
SQ
dimension
Description of SQ issues mentioned in the literature
Accessibility The 9/11 case shows that access to data across agency lines also needs to
be improved to support interagency coordination (Comfort & Kapucu,
2006). “In some cases, needed information existed but was not accessible”
(Dawes, et al., 2004, p. 57).
Response time If there was a comprehensive plan to quickly communicate critical infor-
mation to the emergency responders and area residents who needed it, the
mixed messages from Federal, State, and local officials on the re-entry
into New Orleans could have been avoided (Townsend et al, 2006).
Reliability “…responding to disaster situations, where every second counts, requires
reliable, dedicated equipment. Public safety officials cannot depend on
commercial systems that can be overloaded and unavailable; experience
has shown that these systems are often the most unreliable during critical
incidents when public demand overwhelms the systems” (National
Research Council, 2007, p. 86).
Flexibility “A catastrophic incident has unique dimensions/ characteristics requiring
that response plans/strategies be flexible enough to effectively address
emerging needs and requirements” (National Research Council, 2007, p.
123). “The lack of such capacity at the regional level that includes munici-
palities, counties and special districts, as well as nonprofit and private
institutions that serve a metropolitan region, was evident in the effort to
mobilize response to the 9/11 events” (Comfort & Kapucu, 2006, p. 313).
Integration
(inter-
operability)
. “…given the number of organizations that must come together to cope
with a major disaster, the interoperability of communications and other
IT systems is often cited as a major concern” (National Research Council,
2007). “The inability to connect multiple communications plans and ar-
chitectures clearly impeded coordination and communication at the Fed-
eral, State, and local levels” (Townsend et al, 2006, p. 56).
Similar to Table 1-3, Table 1-4 is not exhaustive and is meant to give an im-
pression of the type of SQ issues relief workers have struggled with during real dis-asters. These examples emphasize the need to correct decades of isolated, ad-hoc, and poorly supported IT development practices among and within relief agencies. Having introduced the concepts of IQ and SQ, the next section presents the main research question of this dissertation.

Preface
31
1.6 Main research question
The previous sections conclude that the assurance of IQ and SQ is both necessary and complicated. The absence of principles for assuring IQ and SQ in previous work drives this dissertation. As a coherent package of ITs, human roles, standards and procedures, scholars have demonstrated the information systems can improve disaster response efficiency and effectiveness. Yet, literature provides little guid-ance to stakeholders (e.g., information system architects, policy makers, software vendors) when it comes to assuring IQ and SQ during disaster response. Since this dissertations aims to guide these stakeholders on assuring IQ and SQ, we employed the prescription oriented design science research approach (Hevner & Chatterjee, 2010). Chapter 2 provides a more detailed description of this approach.
Following the design science research approach also allowed us to start this investigation based on a first hunch about the problem and solution space. Scholars such as Simon (1973) and Verschuren & Hartog (2005) advocate starting from a first hunch when investigating unstructured or ‘wicked’ problems with several problem aspects and solutions spaces (see discussion in Chapter 2). Our first hunch was that the disaster driven aggregation of heterogeneous ISs does not leverage the necessary information management capabilities for assuring IQ and SQ across a network of agencies. Instead, inter-agency and inter-echelon information manage-ment activities need to be coordinated in concert. This hunch led us to study coor-dination theory. As discussed in Chapter 3, this theory holds several pathways that helped us to synthesize principles for assuring IQ and SQ. A pathway is a specific progression of one or more concepts in the evolution of a theory. Each pathway is a dynamic and developmental process, which may include several stages.
Another theory that provides such pathways is Network Centric Operations (NCO). This theory originating from the design of ISs for military purposes, has also captured the interest of policy makers and IS architects in PSNs (see chapter 5). While scholars such as Stanovich (2006) have considered the transformation of existing command and control based hierarchies to network centric based struc-tures, literature on the implementation and evaluation of NCO was absent at the start of this research. Compared to the well-established knowledge base on coordi-nation theory, NCO was still an ill-studied set of concepts. Nevertheless, the path-ways provided in this theory invited us to consider it as a kernel theory. In line with the research objective (page 12) the main question guiding this research asked: Which information system design principles assure higher levels of information quality and system quality for relief workers in public safety networks during multi-agency disaster response?
Chapter 2 further decomposes this main research question discussed the re-search instruments taken to answer the sub questions. The formulated research question suggests that the main deliverable of this dissertation is a set of design principles. When treating ISs as socio-technical systems the notions of IS architec-tures and guiding principles can be used to conceptualize and specify the IS design (Richardson, Jackson, & Dickson, 1990). While an IS architecture conceptualizes the object or artifact of design, principles embody the generic prescriptions for the design and implementation of IS (Housel, El Sawy, & Donovan, 1986). Chapter 6 explains the use of principles in the design of information systems in more detail. The next section outlines the chapters in this dissertation.

Chapter 1
32
1.7 Outline of this dissertation
Figure 1-2 depicts the relation between the various chapters in this dissertation.
This dissertation proceeds by presenting the research approach in Chapter
2. Chapter 3 presents the theoretical foundation of this research. Chapters 4 and 5 present the empirical foundation of this research. Drawing on the theoretical and empirical foundations, Chapter 6 presents our design theory, which we later evalu-ate in Chapters 7 and 8. After discussing the main findings of this research in Chap-ter 9, Chapter 10 concludes this dissertation with a reflection on the main findings and research approach, followed by some avenues for future research.
Questions and instruments
Reflection
Findings
Design principles
Evaluation
Design
Research problem & objective
Chapter 1 Introduction
Chapter 4 Field studies: Exploring three Public safe-
ty networks
Chapter 6 Design Theory: Netcentric Information Orchestration
Chapter 8 Quasi-experimental gaming-
simulation
Chapter 7 DIOS: A Prototype for Netcentric
Information Orchestration
Chapter 10 Epilogue
Chapter 2 Research design
Empirical foundation
Observations & survey findings, cross-case findings, best practices
Pathways for assuring IQ & SQ
Chapter 3 Knowledge base: ker-nel theories for assur-
ing IQ & SQ
Chapter 5 Interviews with IS architects
Theoretical foundation
Chapter 9 Conclusions
Figure 1-2: Outline of chapters
IQ & SQ assessment instruments

Research approach
33
2 Research approach
Scientists try to identify the components of existing structures, while design-ers try to shape the components of structures (Christopher Alexander, 1969).
Design science researchers try to combine both (this dissertation).
2.1 Introduction
As we have discussed in the previous chapter, the objective of this research is to synthesize and evaluate information system design principles that assure infor-mation quality (IQ) and system quality (SQ) for relief workers during multi-agency disaster response. Achieving this objective is difficult for three reasons. First, there is little empirical data on the design of information systems for disaster response. The scarcity of data in this domain can in part be attributed to the fact that disas-ters are unplanned and dangerous events, limiting the opportunity for researchers to collect data on site (Killian, 2002). The majority of research in this domain con-sists of ex-post investigations describing and explaining the process and outcomes of disaster management efforts. Second, there are no directly applicable theories on assuring IQ and SQ that we can apply and evaluate (for instance through hypothe-sis formulation and data analysis). Finally, assuring IQ and SQ for relief workers is a ‘wicked’ or ill-structured problem (cf. Checkland, 1981; Simon, 1973). This means that there are several stakeholders, problem components (e.g., organizational, technical, institutional), and potential solution spaces (e.g., rules, network struc-ture, technologies) that need to be considered when examining the information systems in Public Safety Networks (PSNs).
Ill-structured problems are complex and nonlinear. This means that small changes in input can create massive changes in outcome, and the same action per-formed at different times may create entirely different results. Ill-structured prob-lems have no “stopping rule” or end state and limitations of time and resources terminate this infinite search. Rather, the researcher must seek a “good enough” solution based on maintaining equilibrium around some acceptable conditions (i.e., IQ and SQ values). Understanding the problem and conceiving a solution are iden-tical and simultaneous cognitive processes. Therefore, it is vital that problem-solving processes are structured and facilitated so that the best solution is achieved within pre-established limits. Rowe (1987) states that human problem solvers are rarely in a position to identify all the possible solutions to a design problem and settle for choices that satisfy the problem definition at a certain point in time. Si-mon (1969) refers to this search for solutions as “satisficing” (p. 64). Addressing ill-structured problems require that the researchers grasps, or achieves a new under-standing of, the problem structure or the relations of aspects within a problem (Dominowski & Dallob, 1995, p. 38). Alternatively, it could be said that researchers require a creative approach (Finke, Ward, & Smith, 1992, p. 169). One coherent research methodology that allows researchers to understand and solve ill-structured problems in a creative yet rigorous manner is the design

Chapter 2
34
science research approach. This approach implements Kurt Lewin’s proposition: "if you want truly to understand something, try to change it" (Lewin, 1958, p. 201). This approach is not simply about changing, but also improving an environment. While the origins of this approach can be traced as far to Simon (1969), this ap-proach really took off after the seminal publication by Hevner, March & Park in 2004. We use this recently revived approach in the information systems domain since it allows us to focus on structuring the problem under investigation (i.e., in-formation systems for multi-agency information management in PSNs), prescrib-ing a satisficing solution (i.e., set of design principles) and evaluating the solution. Moreover, this approach provides researchers an opportunity to go beyond expla-nation, towards research that generates design knowledge relevant for practition-ers, which is implicitly a driver for conducting this research. This chapter continues with an elaboration on our design science research approach, including the re-search philosophy, research questions and instruments. Part of this chapter was published in (Bharosa, Bouwman, & Janssen, 2010).
2.2 Research philosophy
A research philosophy consists of all the ontological, epistemological and axiologi-cal assumptions made by a researcher pursuing an intellectual endeavor (Gregg, Kulkarni, & Vinze, 2001). It determines the boundaries of the knowledge that is obtainable and the limits of the obtained knowledge. Since a research philosophy guides a researcher when choosing a research strategy and research instruments, we need to define our research philosophy. In doing so, we first need to briefly dis-cuss the three dominant research philosophies used in research on information systems: positivism, interpretivism and design. Positivists claim that reality can be observed objectively and described using measurable properties without interfering with the phenomenon being studied. Orlikowski & Baroudi (1991) classify infor-mation systems research as positivist if there is evidence of formal propositions, quantifiable measures of variables, hypothesis testing and the drawing of infer-ences about a phenomenon from a sample to a stated population. In the infor-mation systems community, one of the main critiques on the positivistic research paradigm is that it neglects the complexity of information systems. As stated in the first chapter, we consider information systems as socio-technical systems, covering the interaction between human actors (i.e., relief workers) and technology compo-nents (e.g., software application). Information systems, particularly those that need to be operated in a multi-agency environment, are complex, artificial and purpose-fully designed. They are composed of people, structure, technologies and work sys-tems (Alter, 2003). Hence, technology and human behavior are not dichotomous and are inseparable in an information system. An increasing awareness of the complexity of information systems has prompted researchers in this field to accept interpretivism as a valid approach to guide their research. Interpretivists adopt a relativistic ontology that states that reality is a subjective construction of the mind, that socially transmitted concepts and names direct how reality is observed as do language and culture (Gregg, et al., 2001) and that it is possible to have multiple interpretations of reality. The main critique for the interpretive approach is that this approach is more suited in a pre-liminary or heuristic stage, which takes place before the actual research (using sta-tistical hypothesis testing) takes place (i.e., Kaplan & Duchon, 1988; Trauth & Jessup, 2000). At the extreme, positivism would hold that any field of study, in or-

Research approach
35
der to qualify as scientific, must be nomothetic and therefore work towards the ide-al of discovering universal or general laws; at the same time, interpretivism would hold that the goal of universal laws is inappropriate in the study of human affairs because individuals, groups, and other social units are all unique and therefore demand idiographic theorizing instead (Lee & Baskerville, 2003). An idiographic approach is based on what Kant described as a tendency to specify, and is ex-pressed in the social sciences. It describes the effort to understand the meaning of contingent, accidental, and often subjective phenomena.
In ‘History and Natural Science’ (Windelband & Oakes, 1980) , the neo-Kantian Wilhelm Windelband proposes a distinction between the study of the gen-eral in the form of the natural law (nomothetic sciences) or the particular in the historically determined form (idiographic sciences). They consider in one part the ever-enduring form and in the other part the unique content, determined within itself, of an actual happening (Babbie, 2009). The one comprises sciences of law, the other sciences of events; the former teaches what always is, the latter what once was. A paradigm recently gaining a lot of interest in the field of information system research is the design science paradigm (Hevner & Chatterjee, 2010). Design sci-ence is a more “creative” paradigm, since it is a research perspective that involves analyzing the use and performance of designed artifacts to understand, explain, and, very frequently, to improve on the behavior of aspects of information systems (Vaishnavi & Kuechler Jr., 2008). The following table outlines the philosophical differences between the three major paradigms.
Table 2-1: Dominant research philosophies (Vaishnavi & Kuechler Jr., 2008)
Research perspective
Basic belief Positivist Interpretive Design
Ontology A single reality,
knowable,
probabilistic
Multiple reali-
ties,
socially
constructed
Multiple, contextually
situated alternative
world-states,
socio-technologically
enabled
Epistemology Objective; dispas-
sionate
Detached observer
of truth
Subjective (i.e.,
values and
Knowledge
emerge from the
researcher-
participant
interaction)
Knowing through
making (i.e., prototyping),
objectively constrained,
construction within
a context, iterative circum-
scription reveals meaning
Methodology Observation;
quantitative,
statistical
Participation;
qualitative.
Hermeneutical,
dialectical
Developmental, measure
artifactual impacts on the
composite system
Axiology: what
is of value
Truth: universal
and beautiful;
prediction
Understanding:
situated and
description
Control, creation, progress
(i.e., improvement), under-
standing
While positivism and interpretivism are useful paradigms for numerous
types of studies, both are more concerned with theory testing in a specific organiza-

Chapter 2
36
tional setting than with developing or extending new theories and technologies. We agree with Gregg et al., (2001) who argue that the positivist and interpretive re-search paradigms do not consider software or system development as part of build-ing required knowledge processes. For the purpose of our study, we need to follow a paradigm that allows us to extend the boundaries of information management capabilities by creating new and innovative artifacts. This purpose guided our in-terest towards the ‘relatively new’ design science paradigm. We say relatively new because this approach has its roots in the early work of Herbert Simon (1969), it has only gained significant attention (1541 hits in Google Scholar) since the seminal MIS Quarterly publication by Alan Hevner and colleagues in 2004. Drawing from Kuhn (1970) and Lakatos (1978), research can be very generally defined as an activ-ity that contributes to the understanding of a phenomenon. In the case of design research, all or parts of a phenomenon may be created as opposed to naturally oc-curring (Vaishnavi & Kuechler Jr., 2008). We continue elaborating on this research strategy and choice of instruments following in the next section.
2.3 Design science research strategy
Design science has its roots in engineering and the science of the artificial (Simon, 1969). It can be considered as a problem-solving paradigm (cf. Sol, 1982) ) with the emphasis on the end products and the solution (Rossi & Sein, 2003). Design re-search is a normative science that focuses on creating an artifact (e.g., organization, information system) to obtain given goals. According to Simon (1969), design "is concerned with how things ought to be, with devising structures to attain goals" (p.133). The prescriptive design research paradigm should result in “a prescriptive design theory which integrates normative and descriptive theories into design paths intended to produce more effective information systems” (Walls, Widmeyer, & El Sawy, 1992, p. 41). Hevner et al. (2004) argue that the end products of a de-sign science cycle may include: (1) constructs or concepts, e.g., vocabulary and symbols, that define the terms used when describing an artifact, (2) models, e.g., abstractions and representations, that are used to describe and represent the rela-tionship among concepts, (3) methods, e.g., algorithm and practices, that are used to represent algorithms or approaches on how to do a certain task, and (4) instanti-ations, e.g., implemented or prototyped systems, that are used to realize the arti-fact. Following this approach the researcher starts with a relevant problem and de-signs by an iterative search process and by building identifiable artifacts (construct, method, model, system) followed by evaluation (utility and efficacy must be evalu-ated rigorously).
Figure 2-1 outlines the main research cycles, research questions (RQ), units of analysis and measurement instruments in accordance with the design science framework by Hevner et al. (2007). Three cycles are emphasized in this framework, a relevance cycle, a rigor cycle, and a design cycle. Good design science research often begins by identifying and representing opportunities and problems in an ac-tual application environment (Hevner & Chatterjee, 2010, p. 17). Thus, the rele-vance cycle initiates design science research with an application context that not only provides the requirements as inputs for the research (e.g., the opportunity/ problem to be addressed) but also defines acceptance criteria for the ultimate eval-uation of the research results. Translated to this research, the application context is disaster response in PSN and the acceptance criteria are the set of IQ and SQ varia-bles deemed important (see chapter 1). An important question here is, does the de-
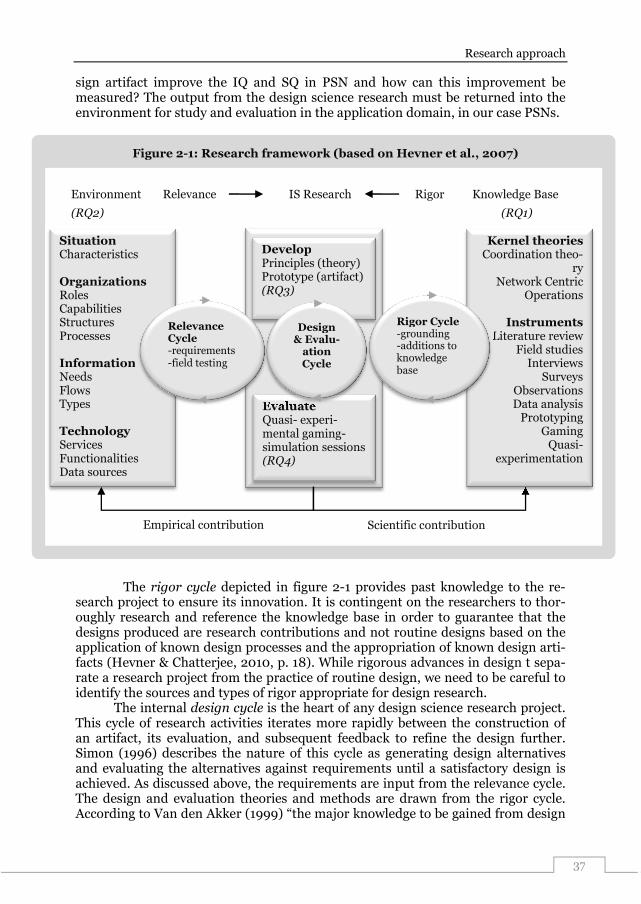
Research approach
37
sign artifact improve the IQ and SQ in PSN and how can this improvement be measured? The output from the design science research must be returned into the environment for study and evaluation in the application domain, in our case PSNs.
The rigor cycle depicted in figure 2-1 provides past knowledge to the re-
search project to ensure its innovation. It is contingent on the researchers to thor-oughly research and reference the knowledge base in order to guarantee that the designs produced are research contributions and not routine designs based on the application of known design processes and the appropriation of known design arti-facts (Hevner & Chatterjee, 2010, p. 18). While rigorous advances in design t sepa-rate a research project from the practice of routine design, we need to be careful to identify the sources and types of rigor appropriate for design research.
The internal design cycle is the heart of any design science research project. This cycle of research activities iterates more rapidly between the construction of an artifact, its evaluation, and subsequent feedback to refine the design further. Simon (1996) describes the nature of this cycle as generating design alternatives and evaluating the alternatives against requirements until a satisfactory design is achieved. As discussed above, the requirements are input from the relevance cycle. The design and evaluation theories and methods are drawn from the rigor cycle. According to Van den Akker (1999) “the major knowledge to be gained from design
IS Research Environment Knowledge Base
Situation Characteristics Organizations Roles Capabilities Structures Processes Information Needs Flows Types Technology Services Functionalities Data sources
Develop Principles (theory) Prototype (artifact) (RQ3)
Evaluate Quasi- experi-mental gaming-simulation sessions (RQ4)
Relevance Rigor
Empirical contribution Scientific contribution
(RQ2) (RQ1)
Kernel theories Coordination theo-
ry Network Centric
Operations
Instruments Literature review
Field studies Interviews
Surveys Observations Data analysis
Prototyping Gaming
Quasi-experimentation
Relevance Cycle -requirements -field testing
Rigor Cycle -grounding -additions to knowledge base
Design & Evalu-
ation Cycle
Figure 2-1: Research framework (based on Hevner et al., 2007)

Chapter 2
38
research is in the form of (both substantive and methodological) ‘design’ principles to support designers in their task. Obviously those principles cannot guarantee suc-cess, but they are intended to select and apply the most appropriate knowledge for specific design and development tasks” (p. 9). We return to the value of principles in section 2.6.
Considering these three cycles, we can conclude that design science research emphasizes the interplay between theory, methodology and empirical data. The benefits of this interplay is clearly phrased by Blumer (1954, p. 1): “Theory, inquiry and empirical fact are interwoven in a texture of operation with theory guiding in-quiry, inquiry seeking and isolating facts, and facts affecting theory. The fruitful-ness of their interplay is the means by which an empirical science develops.” The selection of research instruments in each cycle depends on the amount of existing theory available, on the nature of the research (i.e. the problem type), the research objective and on the types of research questions (March & Smith, 1995). In accord-ance with figure 2-1, three research cycles can be expected: (1) construction of a knowledge base, (2) empirical analysis of the problem, and (3) theory (i.e., design principles) development and evaluation. While Hevner et al. (2007) also refer to a separate evaluation cycle; they do not consider evaluation as separate cycle. In-stead, evaluation they consider evaluation as an integral part of the design cycle. Acknowledging the tight coupling between design and evaluation, we consider our evaluation approach as a separate cycle. We elaborate on the cycles in the next sub-sections.
2.4 Rigor cycle: construction of the knowledge base
The main activity in the rigor cycle is the construction of the knowledge base. The knowledge base contains the accumulated body of knowledge pertaining the phe-nomena of interest, the existing artifacts aimed at achieving the given purpose, and their evaluations, which are based on previous research. It contains the results of prior design research in the form design ideas, techniques and tools (Hevner, et al. 2004). Considering that the objective of this dissertation is to prescribe evaluated design principles for assuring IQ and SQ, we need to establish two foundations in our knowledge base. The first foundation is on defining and measuring IQ and SQ. Studies that have investigated major disaster response efforts mention several ex-amples of poor IQ and SQ. Yet, since these studies focused on the performance of relief agencies, investigators have left both constructs ill-defined and without as-sessment measures. Even though we intuitively knew what IQ and SQ mean, we still need a framework that allowed us to investigate IQ and SQ issues in PSNs sys-tematically. This framework should include tested dimensions and measurement items that allow us to assess IQ and SQ in practice. Accordingly, we formulated the first sub-question (1a) as:
(RQ1a): What are tested assessment instruments provided in the literature for
studying information quality and system quality in public safety networks?
Answering the above stated question requires us to analyze literature on
assessment instruments for IQ and SQ. Chapter 4 presents such assessment in-struments. The second foundation we needed to establish in our knowledge base is on pathways for assuring IQ and SQ from existing kernel theories. Kernel theories

Research approach
39
are theories from natural and social sciences governing the design requirements or the processes arriving at them. This can be either an academic and scholarly formu-lated set of concepts or statements, or practitioners’ “theory-in-use” which is made explicit through hermeneutic process of codification (Walls, et al., 1992). A kernel theory enables to formulate testable predictions of a class of solutions and their behaviors, or the associated design process. Therefore, the knowledge base pro-vides the clues from and through which design artifacts are constructed and evalu-ated. Our first hunch was that the disaster driven aggregation of heterogeneous information systems does not leverage the necessary information management ca-pabilities for assuring IQ and SQ across a network of agencies. Instead, inter-agency and inter-echelon information management activities need to be coordinat-ed in concert. This hunch led us to investigate literature on Coordination theory. As discussed in Chapter 3, this theory holds several pathways that could help us in synthesizing principles for assuring IQ and SQ. A pathway is a specific progression of one or more concepts in the evolution of a theory. Each pathway is a dynamic and developmental process, which may include several stages. Another theory that provides such pathways is Network Centric Operations (NCO). Stating a first hunch is quite common in design and prescription oriented research since it allows the researchers to focus, review literature more thoroughly and state expectations ear-lier in the research (Verschuren & Hartog, 2005). Drawing on this first hunch, we formulated question 1b as:
(RQ1b): Which pathways do coordination theory and netcentric operations theory
provide for assuring IQ and SQ in public safety networks?
This dissertation considers pathways as routes or streams in theories that help scholars in purposefully navigating through the existing body of knowledge on a specific theory. As such, a pathway is a specific progression of one or more con-cepts in the evolution of a theory. Each pathway is a dynamic and developmental process, which may include several stages. We regarded NCO and Coordination theory as kernel theories since a preliminary analysis of both theories revealed that they do not directly provide applicable design principles for assuring IQ and SQ. Instead, we expected that these theories would provide ‘pathways’ that, when navi-gated with our empirical knowledge, would allow us to synthesize design principles.
We investigated these two sub- questions using literature review. The liter-ature review allowed us to develop an understanding of the status of the theory on IQ, SQ, and information management, particularly in the context of disaster re-sponse. Since this dissertation aims to prescribe design principles, we also surveyed the literature for any statements of ‘design’, ‘principles’, or ‘guidelines’. The litera-ture review allowed us to reflect on the availability and capability of current state-of-the-art concepts, methods, technology, and applications that have been devel-oped to address IQ and SQ issues in disaster response networks. We used the Sco-pus, Science Direct (Elsevier), IEEE, SpringerLink (Springer), ACM Portal (ACM), JSTOR and InterScience (Wiley) portals to query electronic databases from Janu-ary 2007 until September 2009.
Based on the literature review, we were able to identify the dimensions and definitions of IQ and SQ. The primary key terms we used were ‘coordination’, ‘in-formation management’, ‘information quality’ and ‘system quality’. By analyzing literature, we started to search for (partially) useful or kernel theories that could

Chapter 2
40
help us to synthesize design principles (discussed later). As we found more frame-works and dimensions for IQ and SQ, we started using these to look for in-depth studies on the individual dimensions of both constructs. In addition, we used the ‘snowballing’ technique to find additional papers. Chapter 3 presents the results of the rigor cycle.
2.5 Relevance cycle: empirical analysis using field research
Equipped with the instruments for assessing IQ and SQ, as well as theoretical pathways for assuring IQ and SQ, we started with the second cycle of this research. The main activity of the relevance cycle is empirical analysis and data collection through field studies. Scholars have suggested the use of field studies when investi-gating contemporary problems that lack empirical descriptions in the literature (Paul & McDaniel, 2004; Snow & Thomas, 1994). Not that a field study is a ‘meth-odology’, whereas the instruments employed for data collection are referred to as research ‘methods’ (Yin, 2003). In this cycle, we focus on investigation of the se-cond research question. We divided this question in three sub-questions, each in-vestigated with a different research method as part of the field study methodology. The research methods we employed are observations, surveys, and interviews.
2.5.1 Observing information management in practice: three field studies
Since literature is somewhat superficial on the design and configuration of existing information systems used in practices, the first sub-question asks:
RQ2a: How do relief agencies in practice manage information between agencies
(horizontal) and echelons (vertical) during disaster response?
We asked ourselves this question because we wanted to gain insights in the
configurations (or architectures) of existing information systems. In order to gain in depth understanding of how relief agencies manage information in practice and which IQ and SQ issues are predominant, we need to study relief workers during disaster response situations. However, investigating this research question de-manded an instrument beyond literature review or case studies, especially since academic contributions on how relief agencies manage information during real dis-asters are scarce. The few scientific contributions available (Comfort & Kapucu, 2006; Dawes, et al., 2004) focus on a single disaster type and do not provide an in depth analysis of IQ and SQ issues. One practical reason for this may lie in the fact that it is difficult to collect empirical data during a real disaster, as the situation is unforeseen, dangerous, and researchers are not welcome near the disaster site. Moreover, multiple contexts, events, scope, control, and time related problems make it difficult to collect data in disaster field studies (Killian, 2002). Even if relief workers allowed us to study information management during real disasters, it would be difficult to plan for data collection since they would not have the time to be interviewed or surveyed. Since collecting data from real disasters was unfeasible, we decided to study relief workers during disaster training exercises. For this pur-pose, we decided to employ the field study approach. We studied several relief agencies during training exercises in the Netherlands. We selected the field studies based on the following criteria:

Research approach
41
• A network of relief agencies and workers (unit of observation) as part of a safety region;
• Readiness of the organizations to cooperate and share information prior, during and after each exercise (i.e., about the scenario, participants, com-puter log-files etc.);
• The possibility of observation and administrating surveys amongst the par-ticipants;
• Information management during disasters situations is crucial for resolv-ing the situation;
• There must already be some kind of information system in place at the lo-cation (no green field);
Based on the above stated field study selection criteria, we selected three field study sites in the Netherlands. Acknowledging that the number of field studies needed to capture the entire spectrum of different information system architectures in PSN is difficult to establish beforehand, we expected that three field studies would sufficiently capture some of the heterogeneity and differences in PSN. The following table outlines the main characteristics of our field studies.
Table 2-2: Overview of explorative field studies in public safety networks
Delfland Gelderland Rotterdam
Number of exer-
cises observed
1 x Full day 3 x Full day 18 x half day exer-
cises
Focus Intra-agency International, inter-
agency
Interagency
IT applications
used during ex-
ercise
No computer based
IS, use of white-
boards
Several (FLIWAS,
ARCMAP,
GROOVE)
Single (CEDRIC)
Survey admin-
istration
On paper, at the
exercise location
On paper, at the
exercise location
Web-based (invita-
tion link via email)
Number of sur-
vey respondents
24 (77% response
rate)
47 (90% response
rate)
83 (59% response
rate)
Field study peri-
od
2010 (1 day) 2009 (3 days) 2007,2008
Type of scenario Flooding Flooding, chemical
spills
Several types of
industrial accidents
Table 2-2 provides an overview of our field studies. Note that the Delfland
field study took place in the latter stages of this research, eventually raising the question whether or not the field study is still ‘explorative’. In contrast to the other field studies, we did not plan this field study at the start of this research. However, when invited to conduct this field study, we did not hesitate to do so since it was a unique opportunity to study the effects of information management using non-IT applications (whiteboards). We observed 22 training exercises, including six prior exercises observed in the winter of 2006, which we used to fine-tune our data col-lection instruments. The focus lies on selected IQ and SQ dimensions and infor-mation management processes, and the perspective is that of the relief worker.

Chapter 2
42
Since each field study can be treated as a case study, the embedded case study de-sign is chosen instead of a holistic case study design (Yin, 2003, pp. 42-43). Em-bedded case studies involve more than one unit or object of analysis (in this re-search, the IQ and SQ dimensions, roles, information flows and IT applications are units of analysis).Although these were training exercises, they were serious and costly activities, leaving few opportunities for interruptions (e.g., interviews during exercises). As such, before each of the field studies, we had to undertake several rounds of negotiation with the exercise organizers. It took a significant amount of talks and negotiations before trainers allowed us to study the relief workers during training exercises. The negotiation rounds were necessary to establish terms on which we studied the training exercises and what instruments we were allowed to use for data collection purposes.
In order to be able to generalize from field studies the description of the in-formation systems has to be both comprehensive and detailed. This requires trian-gulation: Any finding or conclusion in a case study is likely to be more convincing and accurate if it is based on several different methods and data sources that are all used to analyze the research questions (Yin, 2003, p. 98). The instruments and da-ta types used during the field studies include participatory observations, surveys, in-depth semi-structured interviews of key informants, internal and external doc-uments and discussions with exercise organizers. We discuss the instruments em-ployed during the field studies next.
2.5.2 Observation of information management in practice
The first data collection instrument employed for the field studies was observation. Observation is an ethnographic method that involves observing people in a natural setting over a prolonged period, and talking and listening to them (Hammersley & Atkinson, 1995). Observation was necessary because the research focused on the meanings and interpretations of exercise participants (Spradley, 1980). Without observing the information management activities of relief workers, we could not have gained understanding of the significance of information management from the perspective of the participants. Depending on the date of the training exercises and the availability of colleagues and students, the author observed the exercises together with one or two persons. Observations were conducted using a predefined observation protocol (in Appendix-B) in order to create structure in observation notes and improve inter-observer reliability through comparison. The observation protocol was extended and fine-tuned using based on the findings of the first six exercises we observed prior to the actual field studies. As we observed, we took notes and when possible, complemented these notes by taking pictures or record-ing specific interactions on video. We have recorded the observations of relief workers using these predefined observation protocols. Analyzing these protocols involved several iterative steps associated with grounded theory (Strauss & Corbin, 1990), including devising and attaching categories to the data in the protocols, making connections between and among categories, revising the categories, and recoding the notes. We chose to present this material as a "realist tale," which Van Maanen defined as "[a third person] description and something of an explanation for cer-tain specific, bounded, observed (or nearly observed) practices" (1988, p. 45). Prior to the training exercises, the exercise organizers explained our role as researchers to the participating relief workers and we agreed to disguise all individual and or-

Research approach
43
ganizational names with pseudonyms. During our observations, we focused on three types of interactions amongst relief workers. First, we observed the face-to-face interactions between relief workers from different agencies (e.g., police, fire-fighters.). The aim was to find out which information is necessary for each team in the context of a disaster response situation, which information is exchanged during the team meetings, which software applications were used, etc. We observed the team meetings because they are the manifestations of interactions between differ-ent relief workers and thus showed several viewpoints. Second, we observed face-to-face interactions between the relief workers of the same agency. Third, we ob-served the information flows between a team and external information sources (such as the emergency control room). We did this by sketching data flow diagrams and by tallying information request and response during the team meetings. We counted and recorded occurrences and potential causes every time the requested information was not directly available to the team. This allowed us to get insight on the external dependencies.
2.5.3 Survey administration among relief workers
Observing relief workers in action provides the researcher with very rich data. This form of data collection allows the researcher to collect information on all levels of the object under investigation (the network, agency, process and individual level discussed in chapter 1). Even though the observations provided in depth insights on information management activities and flows, it remained difficult to judge the IQ and SQ experienced by relief workers. Participant observation is a poor method for generating statistical results, but its use was essential to address the topic of this study. In order to deal with this limitation, we decided to use surveys that could measure the IQ and SQ issues perceived by the participating relief workers. A sur-vey is a means of "gathering information about the characteristics, actions, or opin-ions of a large group of people, referred to as a population" (Tanur, 1982, p. 295).
According to Pinsonneault & Kraemer (1993) surveys conducted for re-search purposes have three distinct characteristics: (1) to produce quantitative de-scriptions of some aspects of the study population , (2) the main way of collecting information is by asking people structured and predefined questions, (3) infor-mation is generally collected about only a fraction of the study population (a sam-ple) but it is collected in such a way as to be able to generalize the findings to the population. There are primarily two forms of survey: (a) cross-sectional survey and (b) longitudinal survey (Rindfleisch, Malter, Ganesan, & Moorman, 2008). Cross-sectional surveys involve observation of the population or a representative subset at a defined time. In contrast, longitudinal surveys involve repeated observations of the same items over a period, often over decades. Since we wanted to measure the IQ and SQ levels resulting from the use of specific information systems during an exercised disaster scenario, cross-sectional surveys, we decided to use cross-sectional surveys. Drawing on this understanding of what a survey is, the second sub-question asks: RQ2b: Considering the various information system architectures in practice, which levels of IQ and SQ do these architectures assure for relief workers during disaster response?

Chapter 2
44
Asking this question is necessary for gaining insights on the impact of spe-cific information systems have on the IQ and SQ for relief workers. IQ and SQ rep-resent the dependent constructs of this research, whereas the information system used by relief agencies for inter-agency and inter-echelon information management is the main unit of observation on which data we collected data. Following sugges-tions in previous research (Lee, Strong, Kahn, & Wang, 2002), we employed both online (electronic) and paper based surveys, depending on the availability of the relief workers after the training exercises. As a result, we received 83 (59%) com-pleted surveys from the Rotterdam case, 47 (90 %) completed surveys from the Gelderland case and 24 (77%) completed surveys from the Delfland Case. In line with expectations in the literature (e.g., Kaplowitz, Hadlock, & Levine, 2004) we experienced that the response rate to paper surveys was significantly higher than to online surveys. The results of these surveys were analyzed using descriptive statis-tics in SPSS 17.0. Chapter 5 presents the findings from the survey data analysis.
An important decision that we needed to make before surveying relief workers was on the selection of the appropriate IQ and SQ measures. As we discuss in sections 4.1 and 4.2, both constructs consist of a wide range of different dimen-sions that can be measured using one or more survey items (questions). Moreover, experts on employing statistical data analysis techniques (Field, 2005; Hair, Anderson, Tatham, & Black, 1995) suggest that each dimension or variable should be measured with at least three items in order to safeguard construct validity (three items per construct rule). While we generally prefer to adhere to this rule, we were bounded by the time we had to survey relief workers. Especially in the Gelderland and Delft field studies, trainers provided us a short period (10 minutes maximum in Gelderland and 15 minutes maximum in Delft) to survey relief workers on the spot directly after the exercise. As such, the paper based surveys needed to be short, containing a limited set of questions on IQ and SQ. In the Rotterdam field study, we had the opportunity to send out electronic surveys. The advantage of this form of surveying was that they allowed us to include a wider range of IQ and SQ varia-bles and adhere to the three items per construct rule. Considering the trade-off that needs to be made in the number of data points and the time available to survey re-lief workers, the selected IQ and SQ variables were measured in three steps.
The first step was to search for IQ and SQ variables mentioned in disaster evaluation reports. The results of this first steps are outlined in tables 1-3 and 1-4 in chapter one. This set of IQ and SQ dimensions provided us with a first ‘rough’ sam-ple of items for our survey. This long-list includes IQ and SQ dimensions that proved to be problematic during disaster management. The second step was to pre-test the long-list in a survey with two exercise organizers and one relief worker, both related to the initial field studies in Rotterdam. In order to conduct this pre-test, we first needed to translate the IQ and SQ survey items provided by Lee, Strong, Wang & Kahn (2002) from English to Dutch (see section 4.3 for the reasons we used these predefined survey items). The pre-test with the exercise organizers and the field worker was useful in three ways. First, we were able to contextualize the set of items in the survey, in order to make them easier to relate to the exercise context, roles and IT-applications. Second, the organizers and relief workers point-ed out some confusing and, in their view, overlapping IQ and SQ dimensions. IQ-accuracy for instance, was a dimension they could not relate to, especially when there were also questions regarding the completeness of information. Third, the

Research approach
45
pre-test also pointed out some semantic problems with the survey items, some of which we can attribute to the conversion from English to Dutch.
The final step we undertook to ‘fine-tune’ our IQ and SQ measurement in-strument was to reflect on the data analysis after the first round of surveys in the Rotterdam field study in 2007. The data analysis showed that some of the ques-tions related to the IQ and SQ dimensions were left blank, or in contrast with the previous answers. In such cases, we either reformulated the item or deleted it com-pletely. The final set (or shortlist) of IQ and SQ measurement items used in the surveys is provided in Appendix-D.
2.5.4 Interviews with information architects
The investigation of the previous sub-questions would leave us with a deeper un-derstanding of existing information system architectures and the type of IQ and SQ problems that occur when using these architecture designs. What we still missed from observing disaster response exercises and surveying relief workers was an un-derstanding of current best practices information system architects employ for as-suring IQ an SQ in practice. Moreover, we were curious on whether information system architects had already considered the pathways provided in theory (Chapter 3), albeit in a different form. As such, the final sub-question we focused on in the second cycle of this research asked:
RQ2c: What are the existing best practices of information system architects for
assuring IQ and SQ?
This question was asked because we were convinced that IS architects not
only have a better understanding of existing information systems than we have, but also that they would be the best judges of the potential pathways we found in the literature. The interviews allowed us to find out what technologies, standards and best practices the architects employ to address IQ and SQ issues in practice. In to-tal, we interviewed sixteen information system architects. Three main criteria guid-ed the selection process:
• The respondents needed to have at least five years of experience with de-signing information systems for disaster management;
• The respondents must occupy a senior position in either the development or use of information systems for multi-agency disaster management;
• Taken together, the sample should represent the main relief agencies and government departments in the Netherlands that are likely to be involved during a major disaster.
In interview studies, sample size is often justified by interviewing partici-pants until reaching 'data saturation' (Mason, 2002). In our case, we did not expect to gain any ‘new’ insights after we conducted the sixteenth interview. We conducted the sixteen interviews in the second half of 2008. Respondents were interviewed in person at their office for approximately one and a half hour. Prior to the interviews, we e-mailed the objectives of this research and the type of information we were in-terested in (see Chapter 5) to the respondents, to ensure that all the interviews ad-hered to the same general format. The interviews were guided by an interview pro-

Chapter 2
46
tocol containing open-ended and closed questions. The interview protocol was pre-tested through test interviews with students of the faculty of Technology, Policy and Management at Delft University of Technology in The Netherlands. During each interview, we discussed two main topics: (1) the occurrence of IQ-related problems (when necessary, led by the examples of IQ-related problems from the case sur-veys) and (2) ways in which architects try to overcome such problems in their de-sign (i.e., which principles do they use).
Exploring the experiences of the architects in their particular environment made it possible to gain a richer and more comprehensive understanding of IQ problems and potential solutions. Moreover, reflecting on specific IQ-related prob-lems together with the respondents proved conducive to a creative process of prin-ciple “shaping”. The interviews were recorded on tape so as to minimize data loss. After each interview, the interview notes were first transcribed in MS Word and e-mailed to the respondents, who were asked to validate them within two weeks. In this case, validation means that the respondents checked the transcripts of the in-terviews for inconsistencies and determined whether the transcripts were a truthful account of the interviews or not. Interviews were analyzed by relying on established methods for handling qualitative data (Miles & Huberman, 1994). To compare the results of the various interviews, we used the text analysis application ATLAS.ti (www.atlasti.com). AT-LAS.ti is designed to offer qualitative-oriented social researchers support in their activities concerning the interpretation of text (Muhr, 1991), including the capacity to deal with large amounts of text, as well as managing annotations, concepts, and complex structures, including conceptual relationships that emerge in the process of interpretation. With linear textual data, such as transcribed interviews, as a starting point, segmentation and coding ("textual phases") of the text alternates with the building of conceptual networks and hyper textual structures ("conceptual phase").
Another important reason for using this tool is its ability to generate net-work views that visualize relationships among IQ and SQ variables and potential solutions. Using ATLAS.ti, the researcher can draw actual "conceptual maps" con-sisting of boxes and connecting lines that depict the connections between concepts in the form of as a network. Within these network views, different codes and their mutual relationships can be visualized, generating an overview of relationships be-tween the key concepts of the interview, both individually and in combination. To establish construct validity, we matched interviewees’ descriptions with the theo-retical characterizations of each construct. For example, if interviewee referred to a specific information related issue as a complicating factor for multi-agency disaster response, this issue would be labeled as an IQ dimension.
The results of the relevance cycle should help us in understanding the hur-dles for assuring IQ and SQ and explore the pathways identified in the previous cycle. Moreover, by observing the information management structures, roles, sce-narios and issues in practice, this cycle should also help us to specify a more realis-tic IS evaluation approach in evaluation cycle. First, we continue by elaborating on the design cycle of this research in section 2.6.

Research approach
47
2.6 Design cycle: synthesizing a design theory
The third cycle of this research draws on the findings from the previous two cycles. In this cycle, we investigated the third research question, formulated as:
RQ3: Which design principles can we synthesize from the knowledge base and
empirical data for assuring IQ and SQ during multi-agency disaster response?
The objective here is to synthesize and specify a design theory for IQ and
SQ assurance in public safety networks. Here, we need to be more specific on the structure of a design theory. Since the publication of Walls et al. (1992) the term “IS design theory” has been used in a specific sense. Design is interpreted in a broad sense, involving “solving problems, creating something new, or transforming less desirable situations to preferred situations” (Friedman, 2003, p. 507). Accordingly, design theory refers to a set of concepts, beliefs, conjectures and generalized scien-tific laws (both natural and social) by which designers map design problems to so-lutions for a special class of IS problems. These theories are aimed to give knowledge support to design activities and can be considered as theorized practical knowledge (Goldkuhl, 2004). Such bundles of knowledge encapsulate and organize three interrelated elements (Markus, Majchrzak, & Gasser, 2002): (1) a set of re-quirements for a family of design problems, (2) a set of methods or capabilities (drawn from integrating theory and practices) that meet these requirements, and (3) a set of principles deemed effective for guiding the design process so that a set of system features is selected and implemented that meets a given set of require-ments. Table 2-3 captures the main elements of our design theory.
Table 2-3: Elements of a design theory (after Markus et al., 2002)
Requirements/
goals
A set of IQ and SQ requirements that need be assured under
certain conditions and with consideration of the characteristics
of public safety networks.
Socio-technical
system capabilities
Measures (can be IT enabled) for achieving the set of require-
ments or goals.
Design principles
Knowledge (a codification of procedures) which, when applied,
increase the likelihood of assuring IQ and SQ in public safety
networks. These procedures are derived logically from kernel
theories and empirical field studies and can be used for creating
other instances of artifacts that belong to the same class.
Gregor (2006) explains how design theory can be seen as the fifth in five classes of theory that are relevant to IS: (1) theory for analyzing, (2) theory for explaining, (3) theory for predicting, (4) theory for explaining and predicting, and (5) theory for design and action. The distinguishing attribute of theories for design (or design theory) is that they focus on “how to do something.” Design theories also give pre-scriptions for the architecture of specific applications (i.e., information sharing ap-plications). Moreover, a design theory provides prescriptions on how to assure a goal in practice, with the implicit expectation that the prescribed methods are "bet-

Chapter 2
48
ter" than alternatives. Consequently, design theories are normative theories in the sense that they are prescriptive and evaluative, rather than solely descriptive, ex-planatory, or predictive (Markus, et al., 2002). We adopt a broad view of theory, congruent with Gregor (2006), which means that the term theory encompasses what might be termed elsewhere principles, guidelines, models, patterns, frame-works, or bodies of knowledge, terms that are used in connection with design sci-ence by many authors. As discussed by Walls et al. (1992), this type of theory is specifically means to provide guidance to practitioners.
The main result of the design cycle is a prescriptive design theory for inter-agency and inter-echelon information management in PSNs based on the theoreti-cal pathways (questions 2) and the empirical findings (question 3). We denote the prescriptive design theory as “netcentric information orchestration” since it sug-gests an alternative IS architecture for information management in disaster re-sponse networks. The netcentric information orchestration framework proposes several principles that enable ISs to leverage the capabilities necessary for assuring IQ and SQ. As depicted in Figure 2-2., the design principles are synthesized from the data we collected from three sources.
The Open Group define design principles as “general rules and guidelines,
that are intended to be enduring and seldom amended, that inform and support the way in which an organization sets about fulfilling its mission” (TOGAF, 2004). Principles are particularly suited for solving ill-structured or ‘complex’ problems, referring to problems that cannot be formulated explicitly and quantitatively, and that cannot be solved by known and feasible computational techniques (Simon, 1996). Since principles are generic, they propose a goal driven configuration of IS architectures, without explicitly referring to (technical) solutions. Rather than sug-gesting a specific technical solution, principles can be translated to both organiza-tional capabilities (i.e., adaptation to changing conditions) and technical function-
Deduction
Prototyping
Synthesis
Field study findings: hurdles
Partially useful/kernel the-ories: pathways
Design theory: Netcentric Information
Orchestration
DIOS prototype
Design principles
Interviews with archi-tects: design experiences
Figure 2-2: Synthesis of a design theory: principle-based design

Research approach
49
alities (i.e., simulation of events and information needs) which in turn can be trans-lated to a prototype information system. This degree of freedom is particularly im-portant when a designed information system is to be operated in a multi-agency network in which every agency has its own preferred standards and technologies.
Alongside the empirical data, the synthesis of principles relies on existing kernel theories that are applied, tested, modified, and extended through the experi-ence, creativity, intuition, and problem solving capabilities of the researcher (Markus, et al., 2002). Even if the source of principles (i.e., kernel theories, experi-ence and field study findings) is strong, the principles themselves are difficult to evaluate in a direct way. A general, domain independent reason for this is that principles are often generic and therefore difficult to falsify (Clegg, 2000).
Since principles are generic and difficult to evaluate in a direct way, we de-veloped a prototype software system of the proposed design theory (Chapter 6). This prototype is denoted as DIOS, which is an abbreviation for Disaster Infor-mation Orchestration System. DIOS is an early version of a system that exhibits the essential features of the future operational system (in case practitioners would adopt the prototype). We need to underline that even though our design theory (in the form of principles) resides in DIOS, this prototype is a tool and not the goal of our research. DIOS is only a physical implementation of the design principles that can assist in representing the theory both as an expository tool and for purposes of testing. Accordingly, our prototype is tentative and its purpose is to demonstrate the design principles and facilitate their evaluation in a quasi-realistic setting. The DIOS box and arrow towards this box are dashed since DIOS is considered just one of the possible materializations of our design theory. Chapter 8 presents the de-tailed design of DIOS.
2.7 Evaluation cycle: prototyping and quasi-experimentation
The final cycle of this research involves an evaluation of the proposed design theo-ry. Our prescriptive design theory must be evaluated with respect to the utility for relief workers when it comes to assuring IQ and SQ. Evaluation is an assessment process, which enables the design science researcher to understand the problem addressed by the artifact and the feasibility of the approach for its solution (Nunamaker Jr, Chen, & Purdin, 1990). Accordingly, we formulated the fourth and final research question of this dissertation as: RQ4: to what extent do the proposed design principles assure higher levels of IQ and SQ for relief workers when compared to information systems in practice?
Following Twidale et al. (1994), we view evaluation as an assessment of whether the principles embodied in the prototype have been proved to be superior to an alternative, where that alternative is frequently the current approach to in-formation management in PSNs. There are several methodologies for evaluating an artifact (Verschuren & Hartog, 2005). We choose the use a prototype for this pur-pose. Evaluating any solution for problems during a real disaster is difficult since the prototype, if not functioning correctly, may seriously harm relief operations. We first considered the use of computer based simulation models, an approach fre-quently employed for theory evaluation purposes (see for instance Gonzalez, 2010). Simulation involves creating a computational representation of the underlying the-oretical logic that links constructs together within these simplified settings. Schol-

Chapter 2
50
ars than code these representations into software that they run repeatedly under varying experimental conditions (e.g., alternative assumptions, varied construct values) in order to obtain results. While the use of computer simulation has some advantages (i.e., low cost, easy to build and replicated runs), there are some major concerns when using simulation. Davis et al. (2007) for instance sum up several limitations of simulation, suggesting that simulations are “toy models of actual phenomena, in that they either replicate the obvious or strip away so much realism that they are simply too inaccurate to yield valid theoretical insights” (p.480). Computer based simulation models are unable to capture the complex social and behavioral interactions that affect information management in practice. Moreover, simulations either require a vast amount of empirical data or theoretically rendered data on IQ, SQ and information management (e.g., frequency of occurrences, dura-tions etc.). As stated in the previous sections, this type of data is difficult to obtain.
Based on these limitations, we opt for evaluating the proposed prototype resulting from the design cycle using a quasi-experimental gaming-simulation. We consider the quasi-experimental gaming-simulation as part of our design science research approach. In this way, we could re-use some of the data collection instru-ments developed for the field studies, including the observation protocols and sur-vey. Moreover, we employed the experience gained from observing several disaster response exercises in the relevance cycle for developing an evaluation session that resembled the training exercises familiar to the professional relief workers. In this way, we reduced the time needed to prepare professionals for the gaming-simulation. Before discussing our quasi-experimental gaming-simulation, we first discuss the series of pre-tests we conducted in order to fine-tune our design.
2.7.1 Series of pre-tests
Although the prototype was complete in the sense that it provided specific func-tionalities that we deemed necessary for IQ and SQ assurance, we still needed to pre-test the prototype before we could actually evaluate the underlying principles with professional relief workers. We considered the first series of pre-tests as less authentic testing activities meant to eliminate gross system errors in a more eco-nomical manner. If those errors remain until the actual gaming-simulation, not only will the delay mean that the errors are more difficult (and costly) to rectify, but the gross errors will completely swamp the interaction, making it unlikely that more subtle but still significant system errors will be observed at all, as shown in Figure 2-3.
As illustrated in figure 2-3, our approach to evaluating DIOS includes to three pre-tests. Note that the lines indicating the number of errors and omissions in the prototype are neither accurate nor quantifiable, they just represent our ex-pectations of finding fewer errors as the evaluation rounds progressed. The first series of pre-tests the application developers (author and two graduate students) undertook authentic tasks such as information collection and rating using the DIOS prototype. The user interface design was still fluid as the functionality was the main object of testing. This series of pre-testing revealed some problems, including a lack of functionality, which were rectified. The second series of pre-testing involved end-users increasingly remote from the development group, including project members not involved in systems development, graduate computing students, and undergraduates with less computer experience. The advantage of this approach is that it does not take a large number of subjects to reveal problems with a develop-

Research approach
51
ing system, and so one can discover what is wrong quickly and cheaply. The major activities here include functionality, interface (presentation tier) and stress testing (performance).
The final series of pre-testing included a testing sessions with a group of 24
graduate students. Here, we wanted to pre-test the prototype in an environment of users similar to the one relief workers operate in. This means that we tested all tiers of the prototype (presentation, application logic and data). The group of under-graduate students was divided in four teams, similar to a disaster response net-work. We provided each student with a specific role and set of tasks, similar to the ones we observed during the field studies (see Chapter 4). While prototype testing was one of the main objectives of the pretest with graduate students, this session also allowed us to test our preliminary gaming-simulation design. We discuss the gaming-simulation design next.
2.7.2 A quasi-experimental gaming-simulation
Following the dialectical relation between the “context of discovery” and the “con-text of justification” (Kuhn, 1970), we argue that theory should be both generated from empirical data and tested against empirical data. For empirically evaluating our proposed design theory, we developed and employed a quasi-experimental gaming- simulation. Gaming-simulations present participants with a setting that generates real-life experiences. Using this instrument, we “recreated” two disaster situations, one per round of gaming, according to a quasi-experimental setup. In
1) Simple test cases by developers
2) More complex test cases by colleagues
3) Advanced test cases by students
Time and number of testers
Figure 2-3: Stages and scope of the prototype pretest sessions
# Errors & omissions
in the prototype (Discussed in chapter

Chapter 2
52
this way, each round resembled the training exercises we observed during our field studies. This chapter is limited to explaining our motivation for employing these instruments and discusses their strengths and weaknesses. We present the specific content and process of gaming-simulation in Chapter 8.
2.7.3 Gaming-simulation for evaluation purposes
Duke and Geurts (2004) define a gaming-simulation as “a special type of model (that uses gaming techniques to model and simulate a system. A gaming-simulation is an operating model of a real-life system in which actors in roles partially recreate the behavior of the system” (p.36). Gaming-simulations are a simplification and condensation of a real system, allowing real participants to experiment safely with (future) information system designs, and reflect on the outcomes whatever type of simulation is used (Meijer, Hofstede, Omta, & Beers, 2008). Often, the distinction between simulations and games is blurred and the two terms are often used inter-changeably (Kleiboer, 1997). According to Greenblatt (1988), games reflect players characteristics (goals, activities, constraints on what can be done and payoffs) and player decisions are important. As discussed by Klabbers (2008), games are often used for explaining the future. Games are usually intended to let the individual par-ticipants gain certain insights and skills, within or outside a specific context. Sys-tematic feedback to participants is a crucial aspect of gaming, especially when they are used for teaching, training, and planning purposes. Simulations, on the other hand, are operating models reflecting the core features of a real or proposed sys-tem, process or environment (Greenblatt, 1988). Simulation can be defined as “a conscious endeavor to reproduce the central characteristics of a system in order to understand, experiment with and/or predict the behavior of that system” (Duke, 1980, p. 23). Hence, simulations can entail virtual participants, since they are in-tended to generate output values related to different choices. Gaming, however, always entails real participants (Ibid.).
Kleiboer (1997) mentions that two types of distinctions are relevant when designing simulations for research in the domain of disaster management. The first distinction involves the research objectives for which simulations are used. Re-searchers can use simulations for theory development or for more practical, applied problem solving. The second distinction concerns the methodological strategy. Here, simulations in which researchers explore phenomena in order to arrive at potentially relevant hypotheses (exploratory simulations) should be distinguished from simulations designed to test existing hypotheses (testing simulations). In the-se types of simulations, analysts attempt to probe aspects of crises by simulating them under controlled conditions in a laboratory. By systematically holding some conditions constant and manipulating others in successive runs of a simulation, the analyst can observe and measure the assumed relationship between selected varia-bles. Based on above stated characteristics of games and simulations we can con-clude that not all simulations are games and not all games are simulations, in the sense that they are not necessarily designed to epitomize part of the real world.
Previous research on disaster information systems has already used gam-ing-simulation. For example, Kraus et al. (1992) have developed the so-called Hos-tage Crisis Simulation to test hypotheses in crisis decision making. Their ultimate objective was the creation of a prototype of an automated negotiator based on a strategic model of negotiations. Over the years, gaming-simulations have taken dif-ferent forms, yielding various blends of human actors and software applications.

Research approach
53
Starting from a baseline scenario (t = 0), gaming-simulations confront participants with a series of inter-related sequences including developments and problems that require decisions and actions on their part at times t = 1, t = 2, . . . t = n. These oc-casions for decision are fed to participants by the controllers (researchers) of the gaming-simulations according to a more or less fixed script. Each new input into the gaming-simulation serves a particular purpose and were the focal points for observations, analysis and post-exercise feedback on the part of the controllers. The participants in gaming-simulations are usually enacting roles. As a group, they may be called upon to place themselves in the position of an individual or team operat-ing in the given disaster context. The elements of a gaming-simulation (i.e., roles, rules, objectives and constraints) are used to define the structure of the gaming-simulation itself. The following figure illustrates the main elements of a gaming- simulation design.
The roles in a gaming-simulation include roles for participants and roles
for game facilitators. Apart from these elements, there are also specific session el-ements, i.e. load and situation. Loads can be defined as the values of all variables in the design of the gaming-simulation (Meijer, 2009). The inputs are known and can be controlled. The uncontrolled variable is the group of participants, but their se-lection can be structured. Rules in a gaming-simulation can limit the behavior of participants in order to control the environment. In addition, rules shape the be-havior as they define what is allowed or forbidden during the gaming-simulation. The load of a gaming-simulation includes the scenario, process script and “starting values” for a session. We discuss these elements in detail in Chapter 8.
2.7.4 Addressing pitfalls in gaming-simulation
In hindsight, there were four pitfalls that could influence the outcomes and need to be circumvented. First, simulations based on scenarios always differ from reality. Real disaster situations pose more problems and dilemmas than a simula-tion designer can imagine. Consequently, gaming-simulations cannot fully reenact
Roles
Rules
Objectives
Constraints
Session (quasi-experiment)
Load (scenario input, script, etc.)
Participants
Prototype
Output (IQ and SQ score com-parison)
Figure 2-4: Gaming-simulation framework (based on Meijer, 2009)
Gaming-
simulation design

Chapter 2
54
the dramatics of real life-or-death decisions. In other words, the distinction be-tween major and minor issues is therefore always a bit more difficult to detect in simulations. By mimicking the observed training exercises, we attempted to reduce the gap with real disaster as much as possible.
The second pitfall of gaming-simulations is that they follow fixed or prede-termined scenarios. From the very beginning, it is clear that the situation will esca-late no matter what participants decide. An overload of pre-formulated messages and pre-designed interventions by the simulation staff almost guarantees that the participants will act and decide in accordance with the preconceived outcome of the scenario. When doing so, participants cannot in any way affect the final outcome, maybe even leaving them to belief that their efforts are a total waste of time. This rigidity in format can easily undermine the success of the simulation, as partici-pants begin to act in a resigned or lethargic manner as yet another disaster is im-posed on them. We circumvented this pitfall by continuously monitoring the flow of the game and the motivation of the participants. Whenever necessary, less mes-sages and events were simulated and distributed, even when this meant that the disaster scenario would not fully mature.
The third pitfall is getting a valid set of relief workers to ‘voluntarily’ partic-ipate in a time consuming gaming-simulation. While we had established a good relation with the exercise organizers from our field studies, dedicating one of their training exercises for our evaluation purposes was ‘too much to asks’. Not only were the planned training exercises very costly, they were also deemed too important in terms of training disaster response protocols. After a number of ‘orientating’ talks with trainers, we have concluded that we needed to emphasize ‘the what’s in it for me’ part of our gaming-simulation, me referring to the relief worker. Accordingly, we circumvented this pitfall by actively soliciting in PSNs and advertising the ad-vantages of participating in our gaming-simulation. Looking back, the old saying by Confucius, 450 B.C: “Tell me, and I will forget. Show me, and I may remember. In-volve me, and I will understand” really helped us in getting people existed to partic-ipate in the gaming-simulation. In the end this helped us to gain a half day slot in a training class for relief workers, yielding a perfect sample of participants.
The final pitfall is the lack of control of the preferences and motivation of selected participants. In contrast to more controlled evaluation approaches, gam-ing-simulation requires broad and active stakeholder involvement. The use of such a participant dependent approach and the adoption of users’ satisfaction as a key evaluative measure may question the hypothesis that there exists a strong relation-ship between participants’ satisfaction and system effectiveness. Consequently, a good IS design perceived as poor by the participants becomes a poor design. If the purpose of the game is to reach general conclusions rather than to train people, then human participation may even create much noise. For instance, a player can show inferior performance not because he is supplied with poor information but because he lacks the feeling of being involved, gets bored, is confronted with supe-rior opponents, etc. We circumvented this pitfall in two ways. First, we tried not to make the gaming rounds too long, in order to avoid people getting bored. Second, we stated at the start of the exercise that the observers would also act as judges and that the most active players in each team would win a small prize (a chocolate bar), hoping this would at least trigger participant to compete. These measures worked to some extent, especially the prizes created some smiles. Yet, we were unable to fully avoid everyone from getting bored or annoyed during our gaming-simulation.

Research approach
55
Two participants were very critical about the game, and what was in it for them. They also did not put much effort in completing the surveys. Still, we kept request-ing them to finish the quasi-experiment and promised the feedback session at the end of the game would discuss some important principles that they may benefit from in practice.
2.7.5 Quasi-experimental configuration
Since the final research question asked to compare the levels of IQ and SQ assured by an information system based on netcentric information orchestration versus information systems in practice, we designed the gaming-simulation as a quasi-experiment. This means that we divided the game in two comparable rounds: one without the design principles and one that included them. Campbell and Stanley consider an experiment as “that portion in research in which variables are manipu-lated and their effects upon other variables are observed” (Campbell & Stanley, 1969, p. 2). In other words, an experiment can be used to determine cause and af-fect relationships between variables. The common attribute to all experiments is control of treatment. Experiments require (1) variation in treatment, (2) post-treatment measures of outcomes, (3) at least one unit on which observation is made, and (4) a mechanism for inferring what the outcome would have been with-out treatment (counterfactual inference) (Shadish, Cook, & Cambell, 2002).
The design of experiments is usually in line with the goal of finding wheth-er one operationalization of a construct (an independent variable) causes a change in another operationalization of a construct (a dependent variable)—holding every-thing else constant. There are two types of experiments a researcher can choose to test cause and effect relationships: (1) natural or true experiments and (2) quasi-experiments. A true experiment is characterized by the following aspects: more than one purposively created group, common measured outcome(s), and random assignment (Gribbons & Herman, 1997). True experiments do have some draw-backs: they are often expensive, time-consuming and in several cases not doable because it is nearly impossible to fully control all important variables that could influence the experiment (Gribbons & Herman, 1997). These restrictions also apply for the current study. Moreover, full control over all variables that could influence a disaster would reduce the level of realism the current study strives for in the evalu-ation cycle. Moreover, since comparison was the main objective of the evaluation cycle, a quasi-experimental configuration of the gaming-simulation was preferred.
Though not strictly true experiments, quasi-experiments are explanatory designs that can provide valid and reliable evidence about the relative effectiveness of an intervention compared with another intervention or no intervention. Quasi-experimental methods are useful when you do not have the capacity to apply ran-dom assignment, or when doing so would be unethical. The use of quasi-experiments is an attempt to ensure that the right conditions are available to allow researchers to infer a presumed causal relationship between independent and de-pendent variables. The conditions are (Campbell & Stanley, 1963):
• The causal factor occurs before the observed effects
• The causal factor co-varies with, or is related to, the observed effect
• Alternative explanations for the observed effect have been ruled out

Chapter 2
56
In quasi-experiments, the cause is manipulated and occurs before the effect is measured. This differs from a true experiment because in true experiments the cause cannot be manipulated. Since we needed to evaluate the design principles embodied in our prototype, we needed to be able to manipulate the cause (e.g., in-formation collection capabilities, roles, tasks, flows between echelons.) prior to measuring the effects of this interventions. Hence, quasi-experimentation was a more suitable option for this research. By definition, quasi-experiments lack ran-dom assignment. Assignment to conditions is by means of self-selection, by which units can choose treatments for themselves or by means of administrator selection who decides which unit should get which treatment. The researcher has to enumer-ate alternative explanations one by one, decide which are plausible and then use logic, design and measurement to assess whether each one is operating in a way that might explain any observed effect. The strength of experimentation is its abil-ity to illuminate causal inference (Shadish, et al., 2002). Compared to true-experiments, the weakness of quasi-experimentation is doubt about the extent to which the causal relationship can be generalized creating less compelling support for counterfactual inference (Ibid.).
The quasi-experimental design has several possible variations, each with their own strengths and weaknesses (Campbell & Stanley, 1963). One distinction is whether there are one or two groups of participants. The field studies made us aware of the difficulties of getting relief workers to participate in research initia-tives. Since we wanted to include at least two disaster response echelons (strategic and tactical) consisting of relief workers from the main relief agencies (police, fire department and ambulance services), we needed between 20 and 30 relief workers for the gaming-simulation (see explanation in Chapter 8). In order to make it inter-esting for relief workers to participate, the gaming-simulation should also provide some value for them. In contrast to double group quasi-experiments, single group experiments allow participants to learn because participants experience sessions with and without treatments. As such, we selected a single group design. A second distinction is how often measurements are taken and when (prior to or after inter-ventions). Since our goal was to evaluate the effects of the design principles on IQ and SQ, we needed a pre-treatment measurement and a post-treatment measure-ment (posttest). Therefore, we decided to conduct a single group pretest-posttest quasi-experiment. Figure 2-5 illustrates the configuration of the quasi-experiment.
As illustrated in figure 2-5, each quasi-experimental gaming-simulation
consisted of two rounds. The treatment, in this case information management
Figure 2-5: Quasi-experimental configuration
Single group pretest-posttest quasi experiment
G O
1 G X O
2
Round 1 Round 2
G= Group of relief workers X=Experiment change/treatment O=Observation

Research approach
57
based on the design principles of netcentric information orchestration, was only provided in the second round of the gaming-simulation (see Chapter 8). We con-ducted toe quasi-experiments, one with master students and one with profession-als. The quasi-experiment with master students functioned as a proof of concept, allowing us to test both the design of our gaming-simulation (e.g., the role descrip-tions and scenario’s) and the prototype allowing for netcentric information orches-tration (see Chapter 7).
During the session with the professionals, the participants were non-randomly assigned because they are invited to play in their own role (the role they fulfill in practice) in order to capitalize the practical expertise the participants have. We opted for this because we wanted to mimic the conditions of a real disaster as much as possible. We conducted our gaming-simulation with a group of 24 profes-sional relief workers. The main reason for this number is that we want to mimic the real life PSN as much as possible, and for this, we needed at least 20 different roles spanning three main disaster relief organizations (police, fire department and am-bulance services). After each round, we requested participants to fill in surveys re-garding IQ and SQ measures. Appendix-D presents the survey questions. We rec-orded both sessions on video such that we could trace missing information after-wards. Each session took approximately 4 hours. Finally, we used observational data and video recordings to corroborate the survey data, as part of the evaluation methodology, and data analysis in an effort to provide triangulation of the data and therefore minimize threats to validity, an issue we elaborate on next.
2.7.6 Validity of the evaluation instrument
As for any type of academic research, validity of the research approach is a key is-sue. Regarding the validity of the research instrument, three types of validity need to be addressed: psychological, structural and process validity (Peters, Vissers, & Heijne, 1998). The psychological validity refers to the degree that the gaming-simulation provided an environment that seems realistic to the participants. In our session with professional relief workers, the participants were from different geo-graphical regions and relief agencies, and had different levels of experience with disaster response. Consequently, it was difficult to assure a high level of realism across such a heterogeneous group of participants. We tried to deal with this issue by using as much materials from actual disasters as possible. For instance, we used video footage from relief agencies traveling to a real disaster in order to generate a common feeling of urgency. Since the game was conducted in a gaming-simulation suite of the Police Academy, we were also able to tweak variables such as room temperature, lighting and sound in order to proximate real disaster situational conditions. Since we expected that the contingency factors, referring to the com-plexity, dynamics and uncertainty of the scenarios used could act as disturbing fac-tors, we kept these factors constant by using comparable scenarios.
Structural validity refers to the degree that the structure of the gaming-simulation (the theory and assumptions on which it draws) was isomorphic to that of the reference system (i.e., a PSN in practice). The structure of our gaming-simulation was in accordance with the coordination structure for multi-agency dis-aster response (see Chapter 4) and the training exercises we observed during the field studies. This structure dictates the way in which relief agencies collaborate in a predefined authority structure. The main advantage of structuring the gaming-simulation in accordance to the GRIP authority structure (see Chapter 4) was that

Chapter 2
58
the relief workers were familiar with this structure, reducing the time we needed to introduce the gaming-simulation.
Process validity refers to the degree that the processes observed in the gaming-simulation were isomorphic to those observed in the reference system. As-suring process validity in disaster response is difficult, if not impossible. Relief workers often act and decide in reaction to the hazards and events facing them and not in accordance to a predictable set of processes. The high level of unpredictabil-ity surrounding events and decisions makes it hard to predefine the exact flow of disaster responses matching with our quasi-experimentation.
2.7.7 Generalizability of research findings
The generalization or external validity refers to what extend the findings from this study can be generalized and transferred to other cases or agencies in other do-mains and settings. Cook and Campbell (p.39, 1979) define external validity as “ap-proximate validity with which conclusions are drawn about the generalizability of a causal relationship to and across populations or persons, settings, and times”. One can find several definitions and conceptions of generalizability in information sys-tems research. The Oxford English Dictionary defines to generalize as “to form general notions by abstraction from particular instances,” generalizable as “capable of being generalized,” and generalizability as “the fact or quality of being general-izable.” Conceptualized in this way, generalizability need not have a quantitative or statistical dimension. This is in contrast to the positivistic research that generalizes based on statistical power. In contrast, the philosophical tradition of interpretivism places no particular emphasis on generalizability or the striving for universally ap-plicable theories. In interpretivism, a theory is only relevant to the setting where it was developed (i.e., the Netherlands) would not detract from its validity or scien-tific status. At the same time, interpretivism would not prohibit the researcher from extending his or her theory to additional settings.
Usually, generalization involves extrapolation into a domain or setting not represented in one’s sample (Campbell & Stanley, 1969). Such extrapolation is made by assuming one knows the relevant conditions. We did not attempt generali-zation by guessing at laws and checking out some of these generalizations in other equally specific but different conditions. Moreover, every solution to a wicked prob-lem is a “one-shot operation”, because there is little opportunity to learn by trial and error, every attempt counts significantly. In this research, we collected empiri-cal data from three field studies and tested our design theory with professionals. The gathering of additional data can indeed be beneficial to the reliability of our study.
However, as pointed out by Lee & Baskerville (2003) this is distinct from any increase in the generalizability of a sample to its population. An increase in sample size is beneficial, but the benefits take the form of improved reliability of the sampling procedure, rather than improved generalizability of a sample to its population. Reliability refers to the extent to which the same or a different re-searcher can, at least in principle, reapply the same procedure when making anoth-er observation or measurement (e.g., observing the average of another random sample of the same size taken from the same population) and expect it to lead to the same result as before (Ibid.). We agree with Lee & Baskerville (2003) that a theory may never be generalized to a setting where it has not yet been empirically tested and confirmed. Nevertheless, we strived to maximize the opportunities to
Research approach
59
transfer the findings (i.e., principles) from our study directly to the real world, real-izing that our artificial gaming-simulation and the real situation are all but une-quivocal. Along the same lines, neither an increase in the sample size in a statistical study nor an increase in the number of field studies or gaming-simulations would be an indicator of greater generalizability of a theory to new settings.
2.8 Summary
This chapter elaborated on the philosophy and methodological approach that guid-ed us throughout the research project. We explained why we chose to employ the design science research approach. Based on the research objective (synthesize and evaluate information system design principles that assure higher levels of infor-mation and system quality for relief workers during multi-agency disaster re-sponse), this chapter introduced four research questions. Following the design sci-ence research approach, our research consisted of four cycles: (1) a rigor cycle, (2) a relevance cycle, (3) a design cycle and (4) a evaluation cycle. Each of these cycles focuses on answering a different research question. In addition, each cycle required us to employ different research instruments, including literature analysis, observa-tions, surveys, interviews, prototyping and gaming. Chapter 3 proceeds by present-ing the results of the rigor cycle, the theoretical foundation, of this research.

60

Theoretical foundation
61
3 Knowledge base: kernel theories for assuring IQ and SQ
“Even for practical purposes theory generally turns out the most important thing
in the end".
Sir Oliver Wendell Holmes, American professor (1809-1894)
3.1 Introduction
This thesis aims to contribute design principles that assure higher information quality (IQ) and system quality (SQ) for relief workers in public safety networks (PSNs). As one of the foundation needed for achieving this goal, this chapter covers the first two research questions of this study: (RQ1a): What is a useful and tested framework provided in the literature for studying information quality and system quality in public safety networks? In addition (RQ1b): What pathways do coordi-nation theory and netcentric operations theory provide for assuring IQ and SQ in public safety networks?
Investigating these two questions draws heavily on existing literature and results in the knowledge base of this research. As discussed in chapter two, estab-lishing a knowledge base is a critical stage when conducting design science re-search. The result of investigating the first question is in a coherent framework de-scribing the various dimensions of IQ and SQ and provides an accompanying as-sessment instrument for measuring IQ and SQ. We view both information and in-formation system related problems as symptoms of the underlying information sys-tem architectures used in PSNs. Since defining and testing measures for IQ and SQ are not part of our research objective, we decided to employ well defined and tested (i.e., on construct validity) constructs provided in the literature. The resulting as-sessment instrument is a prerequisite for empirical data collection (Chapter 4).
Investigating the second question leads to the ‘state of the art’ concepts and pathways for assuring IQ and SQ. As we have explained in chapter 1, a pathway is a specific progression of one or more concepts in the evolution of a theory. Each pathway is a dynamic and developmental process, which may include several stag-es. The resulting pathways help us to understand the limitations in existing infor-mation system architectures and identify opportunities (i.e., design principles) for assuring IQ and SQ (chapter 6).
This chapter elaborates on some frameworks for studying IQ and SQ, fol-lowed by some pathways from Coordination theory and Network Centric opera-tions than can lead to principles for assuring IQ and SQ. Parts of this chapter were published in the proceedings of the Sixth ISCRAM conference (Bharosa, Van Zanten, Zuurmond, & Appelman, 2009) and the Decision Support Systems Journal (Lee, Bharosa, Yang, Janssen, & Rao, 2010).

Chapter 3
62
3.2 Information Quality
3.2.1 Distinguishing information from data and knowledge
Before we can measure IQ, we first need to specify our definition of information and how information differs from data and knowledge. Previous studies dealing with information quality (see for example, Strong et al., 1997) and more recent studies such as the book by Wang et al. (2005), use information quality (IQ) and data quality (DQ) interchangeably. Moreover, numerous disaster evaluation studies (e.g.,Commission, 2002; Samarajiva, 2005; Townsend et al, 2006) mix up prob-lems regarding data, information, knowledge and intelligence in their analysis. In order to avoid conceptual confusion, it is necessary to define information, especial-ly in relation to data and knowledge. Attempts to define these concepts are numer-ous and produced slightly different results, depending on which discipline is look-ing at them. Many of the contributions in the knowledge management area propose a data–information–knowledge hierarchy to explain the nature of knowledge (see Daft, 2001; Davenport & Prusak, 1998; Ramesh & Tiwana, 1999). Meadow et al. (2000) refer to data as a "string of elementary symbols, such as digits or letters" (p.35). Whereas data designates ‘raw,’ unconnected, quantitative or qualitative items, the term information relates to answers to questions or statements about situations or facts (Eppler, 2006). Data in this sense becomes information when it we relate it to other data or data that we have organized in a manner that gives them meaning for the recipient. Wiig (1999) defines information as “facts and data organized to characterize a particular situation and knowledge as a set of truths and beliefs, perspectives and concepts, judgments and expectations, methodologies and know-how” (p.3). Therefore, information can be seen as data made meaningful by being put into a context, while knowledge can be seen as data made meaningful through a set of beliefs about the causal relationships between actions and their probable consequences, gained through either inference or experience (Mitchell, 2000).
Ramesh and Tiwana (1999) stipulate that knowledge is actionable infor-mation. We interpret this as stating that knowledge is a special type of information, which endows agencies with the capability to perform actions. Davenport and Prusak (1998) add that knowledge is information constructed by an agency – by abstraction, deduction, induction or abduction. As such, knowledge differs from information in that it is predictive and can be used to guide action while infor-mation merely is data in context. For example, if the is thermometer outside shows 2 degrees centigrade (raw data), then information would be it is 2 degrees centi-grade outside, and knowledge would be that 2 degrees centigrade is cold and one must dress warmly. In other words, knowledge is closer to action, while infor-mation is a documentation of pieces of knowledge. In the context of this research, we look at information as potential knowledge. Drawing on the definitions of the previously cited scholars, we view information as data presented in a form that is useful for multi-agency teams during disaster response. Information is valuable for the relief worker when it reduces uncertainty and increases knowledge about a par-ticular area of concern (e.g., hazards, equipment, emergency personnel etc.). Ac-cording to this view, data are facts or figures in raw form that are unprocessed by the information system and in most cases are the result of the data gathering stage in the information management cycle. Data represent the measurements or obser-vations of objects and events. To become useful to a relief worker, information sys-
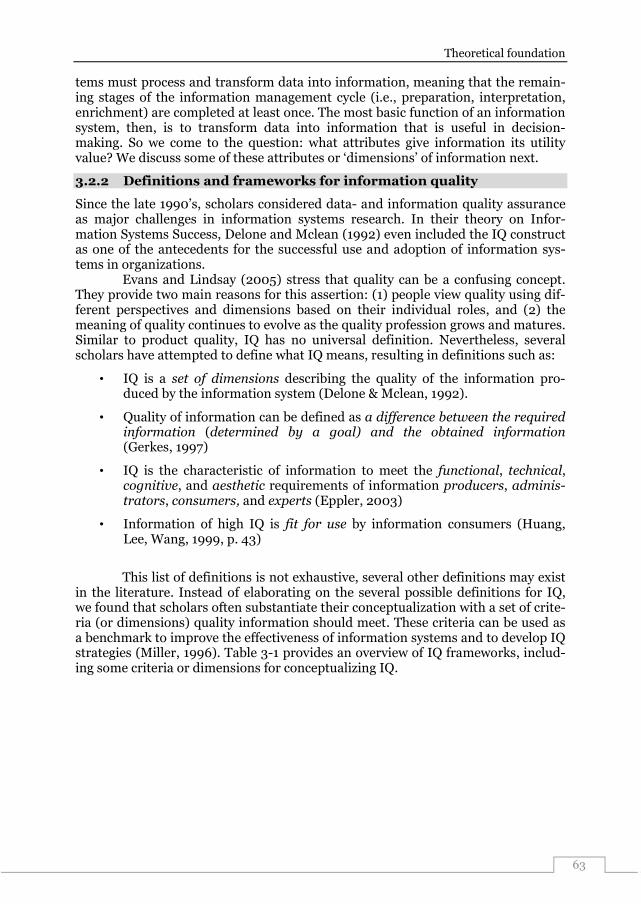
Theoretical foundation
63
tems must process and transform data into information, meaning that the remain-ing stages of the information management cycle (i.e., preparation, interpretation, enrichment) are completed at least once. The most basic function of an information system, then, is to transform data into information that is useful in decision-making. So we come to the question: what attributes give information its utility value? We discuss some of these attributes or ‘dimensions’ of information next.
3.2.2 Definitions and frameworks for information quality
Since the late 1990’s, scholars considered data- and information quality assurance as major challenges in information systems research. In their theory on Infor-mation Systems Success, Delone and Mclean (1992) even included the IQ construct as one of the antecedents for the successful use and adoption of information sys-tems in organizations.
Evans and Lindsay (2005) stress that quality can be a confusing concept. They provide two main reasons for this assertion: (1) people view quality using dif-ferent perspectives and dimensions based on their individual roles, and (2) the meaning of quality continues to evolve as the quality profession grows and matures. Similar to product quality, IQ has no universal definition. Nevertheless, several scholars have attempted to define what IQ means, resulting in definitions such as:
• IQ is a set of dimensions describing the quality of the information pro-duced by the information system (Delone & Mclean, 1992).
• Quality of information can be defined as a difference between the required information (determined by a goal) and the obtained information (Gerkes, 1997)
• IQ is the characteristic of information to meet the functional, technical, cognitive, and aesthetic requirements of information producers, adminis-trators, consumers, and experts (Eppler, 2003)
• Information of high IQ is fit for use by information consumers (Huang, Lee, Wang, 1999, p. 43)
This list of definitions is not exhaustive, several other definitions may exist
in the literature. Instead of elaborating on the several possible definitions for IQ, we found that scholars often substantiate their conceptualization with a set of crite-ria (or dimensions) quality information should meet. These criteria can be used as a benchmark to improve the effectiveness of information systems and to develop IQ strategies (Miller, 1996). Table 3-1 provides an overview of IQ frameworks, includ-ing some criteria or dimensions for conceptualizing IQ.

Chapter 3
64
Table 3-1: Some frameworks for conceptualizing IQ in the literature
Scholars Model of IQ Constructs (Strong, Lee & Wang, 1997)
A Conceptual Framework for Data Qual-ity Elements: » 4 Categories » 16 Dimen-sions
Category IQ dimension
Intrinsic IQ Accuracy, Objectivity, Believabil-ity, Reputation
Accessibility IQ
Accessibility, Security, Relevan-cy, Value-Added, Timeliness,
Contextual IQ
Completeness, Amount of Info, Interpretability, Ease of Under-standing,
Representational IQ
Concise Representation, Con-sistent Representation
(Zhu & Gauch, 2000)
Quality met-rics for information retrieval on the WWW Summary: » 6 Quality Metrics
Assessment class
IQ Criterion
Currency Measured as the time stamp of the last modification of the doc-ument
Availability Calculated as the number of bro-ken links on a page divided by the total numbers of links it con-tains.
Information-to-Noise-Ratio
Computed as the total length of the tokens after preprocessing divided by the size of the docu-ment
Authority Based on the Yahoo Internet Life (YIL) reviews, which assigns a score ranging from 2 to 4 to a reviewed site
Popularity Number of links pointing to a Web page
Cohesiveness Determined by how closely re-lated the major topics in the Web page are
(Naumann & Rolker, 2000)
Classification of IQ meta-data criteria elements: » 3 Assess-ment Classes » 22 IQ Crite-rion
Assessment class
IQ Criterion
Subject Criteria Believability, Concise represen-tation, Interpretability, Relevan-cy, Reputation, Understandabil-ity, Value-Added
Object Criteria Completeness, Customer Sup-port, Documentation, Objectivi-ty, Price, Reliability, Security, Timeliness, Verifiability
Process Criteria Accuracy, Amount of Data, Availability, Consistent repre-sentation, Latency, Response Time

Theoretical foundation
65
Table 3-1 outlines three different frameworks for investigating the quality of information. We included these frameworks in the table because of their level of detail compared to other frameworks. Each of the selected frameworks suggests taking a different perspective on information as input or output of an information system. One of the things we can conclude from this table is that IQ is a multidi-mensional construct. This means that we need to assess the quality of information based on multiple attributes or dimensions. Several researchers have attempted to identify the dimensions of IQ. For instance, Wang et al. (1995) list 26 IQ dimen-sions, which in turn are classified into either internal view (design operation) or external view (use and value). Wang and Strong (1996) conducted an empirical two-phase sorting study and have provided the most comprehensive list of IQ at-tributes. Their initial list includes 118 attributes. These 118 attributes were later reduced to 20 dimensions, which in turn are grouped into four categories: accura-cy, relevancy, representation, and accessibility. Later, Strong, Lee & Wang (1997) re-examine their four initial categories and re-labeled the first two categories and the four categories to become: intrinsic, contextual, representation, and accessibil-ity.
1. Intrinsic information quality means the information has quality in its own right.
2. Contextual information quality refers to the fact that information is used to perform a task and that information has to be relevant, timely, complete, and appropriate in order to add value.
3. Representational information quality means the information must be read-able, understandable, and clear in order to be useful.
4. Accessibility information quality refers to information systems that store and provide access to information.
While IQ as the quality of the information product implies data quality (DQ) or the quality of its raw material data, the reverse is not always true. Good IQ implies good DQ and poor DQ causes poor IQ. However, a good DQ may not neces-sarily lead to good IQ. Errors within the processes of transforming data into infor-mation can lead to poor IQ. A researcher or analyst may collect accurate, complete and timely data but may conclude from them poor quality information. Having elaborated on our view of IQ, we proceed with discussing instruments for assessing IQ in the next section.
3.2.3 Measuring Information Quality
The framework proposed by Strong et al. (1997) is the only framework that is evolved and refined over the years and proposes empirically tested items for IQ measurement (see Lee, et al., 2002). This is the main reason for adopting this framework for studying IQ issues in PSNs. The following table outlines the various measurement items for the IQ dimensions proposed by Lee et al. (2002).

Chapter 3
66
Table 3-2: IQ categories, dimensions, and measures (Lee et al. 2002)
Category Dimension Measurement items Intrinsic IQ Accuracy The extent to which information represents
the underlying reality Objectivity The extent to which information is unbiased,
unprejudiced, and impartial Believability The extent to which information is regarded
as true and credible Reputation The extent to which information is highly
regarded in terms of its source or content Accessibility IQ Accessibility The extent to which information is available,
or easily and quickly retrievable Access Security The extent to which access to information is
restricted appropriately to maintain its secu-rity
Contextual IQ Relevancy The extent to which information is applicable and helpful for task execution
Value added The extent to which information is beneficial and provides advantages from its use
Timeliness The extent to which information is sufficiently up to date for task execution
Completeness The extent to which information is not miss-ing and is of sufficient breadth and depth for task execution
Appropriate amount of data
The extent to which the volume information is appropriate for task execution
Representational IQ
Interpretability The extent to which information is appropri-ate languages, symbols and units and the def-initions are clear
Concise represen-tation
The extent to which information is composed-ly represented
Consistent repre-sentation
The extent to which information is presented in the same format
Understandability The extent to which information is easy com-prehended
Table 3-2 lists fifteen different dimensions of IQ and provides metrics for
measuring the dimensions. Individuals have different ways of considering the qual-ity of information as they have different wants and needs and, hence, different quality standards which lead to a user-based quality perspective (Evans & Lindsey, 2005). This perspective is consistent with the Juran definition of quality which de-fines quality as “fitness for intended use” (Juran & Godfrey, 1999, p. 22). Thus, in-formation is of high quality when it is fit for its intended use in operations, deci-sion-making and planning. Literature shows that, when it comes to IQ measure-ment, questionnaires are commonly used (see for instance Lee, et al., 2002; Winkler, 2004). Because disasters are very context and user sensitive, we focus on assuring IQ rather than DQ. More specifically, we aim to measure a set of IQ di-mensions during disaster management exercises. Since the IQ dimensions listed in the table are well tested, we use them for preparing the observation protocol and surveys as part of our field studies (Chapter 4).

Theoretical foundation
67
3.3 System Quality
3.3.1 Definitions and frameworks
Similar to a product manufacturing system, an information system is sequential in that the output from a certain stage in the information management cycle becomes data for the next stage. From this perspective, we can use the term information to refer to both data and information (Strong et al., 1997). Information system quality (SQ) is a concept used to evaluate multiple dimensions of information systems that are required to produce information (Delone & McLean, 1992). SQ is focused on the characteristics of the information system itself rather than on the characteris-tics of its product (Delone & McLean, 1992). The dimensions of SQ represent user perceptions of interaction with the system over time. Delone and McLean (1992) have identified multiple variables for system quality, including system flexibility, accessibility, ease of use, integration, efficiency, and response time. Overall, SQ has received less formal and coherent treatment than IQ in the Information Systems literature. While scholars have studied SQ dimensions in isolation and in detail, there are relatively view studies which threat these requirements as a coherent set of SQ characteristics (one example is Nelson, Todd, & Wixom, 2005).
Traditionally, scholars have related SQ dimensions to technical engineering requirements such as infrastructure reliability, maintainability and availability (up time). As technical systems became more tightly coupled and industries needed to be more agile, scholars also included requirements such as flexibility and adapta-bility in their SQ analysis. Particularly in the case of information systems where user support and satisfaction have become important in the design of such systems, scholars have also included requirements such as ‘each of use’ and ‘user friendli-ness’ for assessing SQ. In the late 90ths when systems were considered to be carri-ers for services, SQ requirements were often closely related to ease of use (Nelson, et al., 2005). Constructs such as Media Quality (Eppler & Muenzenmayer, 2002), Software Quality (Zeist & Hendriks, 1996) and Service Quality (Kahn, Strong, & Wang, 2002) have been proposed to capture similar dimensions. These interrela-tionships make it even more important to ensure conceptual clarity in the specifica-tion and distinction of constructs. Table 3-3 outlines a number of SQ related frameworks in the literature.
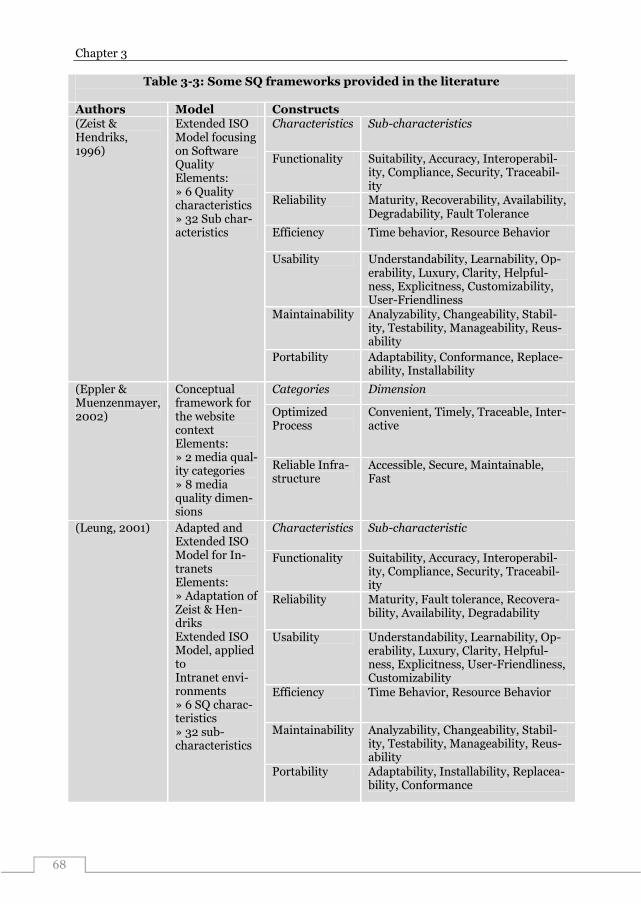
Chapter 3
68
Table 3-3: Some SQ frameworks provided in the literature
Authors Model Constructs (Zeist & Hendriks, 1996)
Extended ISO Model focusing on Software Quality Elements: » 6 Quality characteristics » 32 Sub char-acteristics
Characteristics Sub-characteristics
Functionality Suitability, Accuracy, Interoperabil-ity, Compliance, Security, Traceabil-ity
Reliability Maturity, Recoverability, Availability, Degradability, Fault Tolerance
Efficiency Time behavior, Resource Behavior
Usability Understandability, Learnability, Op-erability, Luxury, Clarity, Helpful-ness, Explicitness, Customizability, User-Friendliness
Maintainability Analyzability, Changeability, Stabil-ity, Testability, Manageability, Reus-ability
Portability Adaptability, Conformance, Replace-ability, Installability
(Eppler & Muenzenmayer, 2002)
Conceptual framework for the website context Elements: » 2 media qual-ity categories » 8 media quality dimen-sions
Categories Dimension
Optimized Process
Convenient, Timely, Traceable, Inter-active
Reliable Infra-structure
Accessible, Secure, Maintainable, Fast
(Leung, 2001) Adapted and Extended ISO Model for In-tranets Elements: » Adaptation of Zeist & Hen-driks Extended ISO Model, applied to Intranet envi-ronments » 6 SQ charac-teristics » 32 sub-characteristics
Characteristics Sub-characteristic
Functionality Suitability, Accuracy, Interoperabil-ity, Compliance, Security, Traceabil-ity
Reliability Maturity, Fault tolerance, Recovera-bility, Availability, Degradability
Usability Understandability, Learnability, Op-erability, Luxury, Clarity, Helpful-ness, Explicitness, User-Friendliness, Customizability
Efficiency Time Behavior, Resource Behavior
Maintainability Analyzability, Changeability, Stabil-ity, Testability, Manageability, Reus-ability
Portability Adaptability, Installability, Replacea-bility, Conformance

Theoretical foundation
69
Table 3-3 lists a range of variables for assessing SQ. Since information sys-tems are socio-technical systems including human roles, procedures and technical artifacts (see Chapter 1), the variables also cover a range of characteristics on the interfaces between the social and technical components of information systems. We discuss some measures for SQ in the next section.
3.3.2 Measuring System Quality
SQ reflects the more engineering-oriented performance characteristics information systems. In contrast to assessing IQ, one will find less guidance for assessing SQ in the literature. Based on the measures proposed in Nelson et al (2005), we outline some instruments for assessing in table 3-4.
Table 3-4: SQ dimensions and measurement items (adapted from Nel-son et al, 2005)
Dimension Measurement items
Accessibility The degree to which a system and the system-related infor-
mation it contains can be accessed with relatively low effort
Reliability The degree to which a system is dependable (e.g., technically
available) over time
Response
time
The degree to which a system offers quick (or timely) responses
to requests for information or action
Flexibility The degree to which a system can adapt to a variety of user needs
and to changing conditions
Integration The degree to which a system facilitates the combination of in-
formation from various sources to support business decisions
Table 3-4 outlines some tested measurement items for SQ dimensions.
Compared to IQ dimensions which can only be indicated by end users (i.e., relief workers), the majority of SQ dimensions (except flexibility) can also be measured by information system architects, operators or observers. Since the SQ dimensions listed in the table are well tested, we use them for preparing the observation proto-col and surveys as part of our field studies (Chapter 4). The next section discusses kernel theories from which we surface pathways towards the assurance of IQ and SQ in PSNs.
3.4 Conventional methods for assuring IQ and SQ
This study is not the first to consider methods for assuring IQ and SQ, albeit re-search on assuring IQ and SQ during multi-agency disaster response is almost ab-sent. Factors that complicate the quality assurance process are abundant in the lit-erature. Kwon and Zmud (1987) for instance have classified factors affecting IQ into individual, task-related, innovation-related, organizational, and environmental characteristics. Tornatzky and Fleischer (1990) have also suggested that the extent of IQ is affected by technological, organizational, and environmental context. Oth-er, more recent studies (e.g., Patterson, Grimm, & Corsi, 2003) indicated that IQ is also affected by organizational size, structure, and performance, supply chain strat-egy, transaction climate, supply chain member pressure, and environmental uncer-tainty. Moreover, studies (e.g., Russell & Hoag, 2004) have concluded that specific

Chapter 3
70
features of organizations themselves, including structures, climates, and cultures of organizations, will influence IQ. When we consider measures to assure IQ and SQ, Tsai and Ghoshal (1998) suggest that an organization will have better information when knowledge is shared more easily within the organization. Teece (1996) pre-dicts that the cumulative nature of technologies influences the resulting IQ. Others (e.g., Grant, 1996) have also concluded that an organization with rich experience in the application or adoption of related technologies will be more able to assure IQ. Amabile (1988) suggested that enhancing management skills, organizational en-couragement for information sharing, and support of information resources would help the improvement of IQ within the organization. Tornatzky and Fleischer (1990) claim that informal linkages among employees, human resource quality, top manager’s leadership behavior, and the amount of internal slack resources would significantly influence the training IQ assurance capabilities. Considering all these factors, quality assurance in multi-agency settings is a wicked or ill-structured problem with many variable causes and alternative solutions (see chapter 2 for fur-ther explanation of wicked problems).
Scholars focusing on more stable business environments and single organi-zations propose some specific methods for assuring IQ and SQ. Often, these meth-ods are grounded in analogies between information and typical manufacturing products and analogies between information systems and production processes. According to (Al-Hakim, 2007) the analogy between information and typical prod-ucts enables organizations to apply the classic principles and foundations of prod-uct quality management to quality management of data and information products from an engineering point of view. As a result several conventional methods are proposed in the literature for assuring IQ and SQ. Methods provided in the litera-ture include data cleansing & normalization (Hernandez & Stolfo, 1998) & Stolfo, 1998), data tracking and statistical process control (Redman, 1995), data steward-ship (English, 1999), dimensional gap analysis (Kahn, Strong, & Wang, 2002). The-se approaches employ control techniques (e.g., edit checks, database integrity con-straints) to assure data quality. Usually, these methods involve four steps: (1) pro-filing and identification of data quality problems, (2) reviewing and characteriza-tion of expectations in business rules, (3) instrument development and measure-ment and (4) solution proposition and implementation. While conventional methods have proven to assure higher levels of data qaulity in less dynamic and single organizational environments, these methods are not suitable for addressing the IQ and SQ challenges during multi-agency disaster response. While most of the stated methods focus on well-defined data quality op-timization within a single organization, multi-agency information management involves a different set of challenges, including unpredictable information needs, heterogeneous data sources and rapidly changing information objects. Another rea-son for arguing that these conventional approaches are not suited for achieving our research objective is that they tend to neglect the context of use. “Clearly, the no-tion of information quality depends on the actual use of information” (Huang, Lee, Wang, 1999, p.17). Similar to the previously mentioned methods for assuring IQ, conventional methods for SQ put little emphasis on the information management in a multi-agency context. Most of the SQ assurance methods in mentioned in the literature focus on IT infrastructure enhancement, for instance by adding hardware for increased performance, speed and reliability. There are also an increasing num-ber of methods focusing on improving technical interoperability and mobility

Theoretical foundation
71
(Miller, Granato, Feuerstein, & Ruffino, 2005). Literature also provides methods for on reducing information overload, including information filtering (Atoji, Koiso, Nakatani, & Nishida, 2004) and context dependent interface adaptation (Chen & Dahanayake, 2006). The cited studies acknowledge that quality assurance is a complex process, in which the difference between costs and required quality de-pends on the context of use and organizational requirements.
To conclude this section on the conventional methods for IQ and SQ assur-ance, we underline the need for considering the multi-actor environment and the dynamic information demand and supply that characterize multi-agency disaster response. Previous studies have also underlined this need (Petak, 1985; Turoff, Chumer, Van De Walle, & Yao, 2004). The discussed methods firmly rest upon technical optimization algorithms and solely focus on addressing isolated IQ or SQ variables such as correctness and overload. Consequently, the conventional meth-ods suggest comprehensive, costly, and lengthy technical interventions instead of socio-technical principles that are easier to understand and implement before and during disaster response. Moreover, the intra-organizational focus of these meth-ods do not allow organizations to optimize the effectiveness of their IQ and SQ ini-tiatives in a network scope, and therefore lack the necessary commitments from all stakeholders. All of these commitments must be oriented to avoid some kinds of potholes that can generate serious problems such as invalidated information, barri-ers to information accessibility, or no information sharing across a network of agencies. Having discussed the strengths and limitations of the conventional ap-proaches, we elaborate on two kernel theories for assuring IQ and SQ next. These theories are grounded in the socio-technical perspective, meaning that they include both technical and non-technical pathways for assuring IQ and SQ. Finally, the scope of these two theories extends beyond the organization, recognizing the inter-dependencies between organizations operating in a network.
3.5 Pathways from coordination theory
As discussed in the introduction, coordination theory is one of the theories that provide pathways for assuring IQ and SQ. This section proceeds by presenting some background on coordination theory. This section concludes with four path-ways that can help us to design information systems that assure higher levels of IQ and SQ for relief workers.
3.5.1 Background on coordination theory
Coordination Theory suggests identifying the dependencies between the tasks the different group members are carrying out and the coordination mechanisms the group use to coordinate their work and then considering alternative mechanisms (Crowston, Rubleske, & Howison, 2006). Numerous scholars from various research domains (e.g., economics, public administration and information systems) have studied the construct of coordination (e.g., Grote, Weichbrodt, Gunter, Zala-Mezo, & Kunzle, 2009; Ren & Fussell, 2008). Generally, people intuitively know what ‘co-ordination’ means; yet have trouble in agreeing what it really is. In general, coordi-nation in organizations refers to the alignment of individuals’ actions (Heath & Staudenmayer, 2000). The need for coordination is a consequence of the division of labor; division of labor leads to specialization and concentration which is ex-pected to result in higher productivity, efficiency, and, ultimately, competitive ad-vantage (Adam Smith, 1776). The other side of the coin is that division of labor

Chapter 3
72
causes interdependence among organizational tasks and members that need to be integrated or coordinated. In other words, coordination and interdependence are intertwined. This linkage is clearly expressed in the definition of coordination by Malone and Crowston (1994), who define coordination as “managing interdepend-encies” (p. 87), between actors, goals, and activities by means of various mecha-nisms”. The need for resources is “the most important factor that stimulates inter-organizational coordination” (Van de Ven and Walker, 1984, p. 617). Coordination has traditionally been defined from an organizational-design perspective where rules, modalities, and structures are used to meet the information-processing de-mands of the environment (Faraj & Xiao, 2006). Previous research (e.g., March & Simon, 1958; Van de Ven, Delbecq, & Koenig, 1976) on coordination emphasize the management of resources (e.g., information, technology, personnel) through well-understood administrative coordination mechanisms (e.g., task assignment, re-source allocation, input integration). Table 3-5 outlines some coordination mecha-nisms provided in Larsson (1990).
Table 3-5: Several ‘classic’ coordination mechanisms (adapted from Larsson, 1990, p. 7)
Author(s) Coordination mechanism(s)
March & Simon (1958) Standardization
Planning
Feedback
Thompson (1967) Standardization
Planning
Mutual adjustment
Galbraith (1973) Rules, programs & procedures
Hierarchies of authority
Goal setting
Slack resources
Self-contained structure
Vertical information systems
Lateral relations
Mintzberg (1979) Mutual adjustment (individual work)
Direct supervision
Standardization of work
Standardization of outputs
Standardization of skills
Mutual adjustment
McCann & Galbraith (1981) Hierarchies of authority
Rules, programs & feedback
Interactive planning
Spatial-physical strategies
Lateral control
According to Table 3-5, scholars have proposed various modes for imple-
menting and measuring coordination, including coordination by program or feed-back (March & Simon, 1958), impersonal versus mutual adjustment (Van de Ven, et al., 1976) and formal versus informal mechanisms (Kraut & Streeter, 1995). Taking

Theoretical foundation
73
an contingency perspective, Thompson (1967) defines three types of coordination: standardized, planned, and mutual adjustment. Under standardization, there are established rules or routines for how people should coordinate their activity. As with traffic rules, standardization improves performance per unit cost, by reducing coordination costs in both financial and cognitive terms, because rules remove many uncertainties about how people should coordinate their behaviors. In some task environments, team members must plan their coordination processes in relation to the immediate tasks that that they need to perform. They will estab-lish task-dependent schedules, work assignments and milestones. When the task environment is not easily standardized or planned, team members have to coordi-nate through continuous mutual adjustments to each other’s activities. This re-quires constant communication to make sure that coordination requirements (and expectations) are clear and that team members perform activities with minimal confusion and maximum utility. If a team coordinates through mutual adjustment, for instance during disaster response, team members will need to identify with whom to connect, notify them when they sent information, transmit and identify the nature of the information, confirm that the information has been received and any subsequent synchronization of when to respond to it. In contrast, if they can standardize on a shared database, with a standardized schema, with synchronized postings, additional human actions for connection, notification, confirmation and synchronization can be virtually eliminated. Hence, IT (in this case a shared infor-mation management application) can facilitate moving from the more costly mutu-al adjustment behaviors to less expensive (and faster) standardization.
Thompson (1967) also identified three general types of task processes: long-linked, mediating, and intensive. Long-linked processes require the comple-tion of various task activities over time, like an assembly line. A general assembly line process is a long-linked process because collection must precede analysis, which precedes production. Mediating processes link together individuals or groups that want to be interdependent for their mutual benefit, such as a broker mediating between those who to buy and sell stock. Intensive task processes are directed at changing an object, where the specific actions taken depend on feedback from the object. Disaster management operations are intensive processes, where the next operation against a target depends on the effects of earlier operations. At this point, one can see a relationship between the type of coordination and task processes (long-linked and standardization, intensive and mutual adjustment). This relationship is not deterministic, implying that scholars should also consider other organizational and environmental dimensions. Moreover, information tech-nology can change this relationship as well.
Drawing on the information processing perspective, Galbraith (1973), pos-tulates that in order for organizations to achieve coordination across and between its contingencies, organizations need to process information. Yet, information is costly, so organizations must balance their need to process information with their ability to do so. Whenever this match is not present, meaning, whenever the organ-ization processes too much information or too little information, the organization is misaligned; there is a misfit between its contingencies.
Taking a more process-centric perspective, Malone and Crowston propose a “coordination theory” that emphasizes the management of interdependencies among resources and activities and define coordination as ‘managing dependencies between activities’ (1994b, p. 90). These authors characterize various interdepend-

Chapter 3
74
encies on the process level and a variety of coordination mechanisms that are use-ful as building blocks to solve information management problems in organizations or to design novel organizational processes. According to this process centric view of coordination, a process consists of three types of elements: resources, activities, and dependencies. A resource is produced and/or consumed during a process. For example, a software application used during disaster information management is a resource. Equivalently, specification documents, maps, sensors and experts are re-sources in an information management process. An activity is a partitioned action that produces and/or consumes resources; for example, ‘collecting information’ is an activity. Activities are themselves processes and we use the two terms inter-changeably. A dependency is a relation among activities mediated by producing or consuming resources; for example, there is a dependency between ‘collecting in-formation’ and ‘disseminating information’. This state is characterized more or less by symmetry among the parties to the relationship. Connections between the or-ganizations involved are non-random. However, there is no implication of subordi-nate status for any of them (Chisholm, 1992, p. 42).
Thompson (1967) mentions three general types of interdependence among unit personnel and organizational units: pooled, sequential, and reciprocal. In pooled interdependence, each team provides a discrete contribution to the whole by collating (or pooling) its obtained information and knowledge. In sequential inter-dependence, however, the product of one team depends on the output of another. The responding agency takes no action unless they receive a request and the re-questing agency cannot proceed until its request is fulfilled. Finally, in reciprocal interdependence, teams pose critical contingencies for each other that have to be resolved before taking action. Disaster management operations often have a recip-rocal interdependence. Whether or not different operations can be undertaken de-pends on the availability of certain resources and, in turn, the availability of those resources depends on previous and planned operations.
From a process centric perspective, Malone and colleagues (1994) distin-guish three basic types of dependencies: flow, sharing, and fit. A flow dependency occurs when one activity produces a resource that another activity uses. A sharing dependency occurs when multiple activities all use (or could use) the same re-source. A fit dependency occurs when multiple activities jointly produce a single resource. Using these three basic types, any process can be decomposed into a structure of activities and dependencies. The strength of this view on coordination is its recognition of the complexity of interdependencies in organizational work. Scott (1992) notes that greater interdependence is associated with more elaborate coordination structures. He suggests that higher levels of interdependence necessi-tate more extensive and complicated coordination mechanisms. On the other hand, a weakness of this view is the assumption that the environment is predictable enough to characterize existing interdependencies and that architects can predefine mechanisms for dealing with various contingencies. In disaster management envi-ronments, we need to acknowledge that not all relevant information is known, and that previously known conditions may be in a state of flux (Kapucu, 2006).
The central problem arising from a state of interdependence is to reduce uncertainty (particularly that which threatens the organization) to an acceptable level by ordering the behaviors of all relevant organizations to lessen the extent to which they impinge on each other's behavior and increase the benefits from their behaviors (Chisholm, 1992). Organizations attempt to reduce uncertainty in vari-

Theoretical foundation
75
ous ways through expansion and merger, consolidation and centralization, gov-ernment regulation and coordination. Here, ‘uncertainty’ refers to the lack of in-formation about future events so that alternatives and their outcomes are unpre-dictable, where ‘events’ are understood as actions by other organizations in the fo-cal organization's environment
3.5.2 Concerns regarding hierarchical coordination in public safety networks
Relief agencies have been noted to take on a more military type hierarchical struc-ture when multi-agency disaster response is necessary (Bigley & Roberts, 2001). “A hierarchy of information and communication coincides with a functional hierarchy. Lower-level operatives are briefed on a very limited ‘need to know’ basis and are often oblivious to the wider context and significance of their actions” (’t Hart et al. 1993: p. 18). This reflects the belief that PSNs carry out the most effective repres-sion operations under rigid control, exercised convergent with intra-agency author-ity structures. In such hierarchy-based PNSs, subordinates only share information with their commanders. The major strategic decisions are made at the highest echelons and are filtered down and more detail is added as they pass through to the lower echelons (top-down/bottom-up principle). Throughout this flow of infor-mation, an asymmetry of information load is maintained, often resulting in frag-mented situation awareness (cf. Militello, Patterson, Bowman, & Wears, 2007). In a hierarchy, the flow of information is coordinated through adjacent steps, by con-trolling and directing information to the higher and subordinate echelons (Malone, Yates, & Benjamin, 1987). The advantage of this coordination approach is that the number of interactions and interdependencies between relief workers is often know and limited since the linkages are based on long lasting relationships and proce-dures. In many public service domains, hierarchical coordination was embraced from the start and has been intensified because of the demand for stability, trans-parency and accountability in the public sector. Yet, the characteristics of hierar-chical coordination do not leverage high IQ and SQ during disaster response.
The traditional critique here is that “as organizations face requirements of urgent decision-making and immediate response, they cannot rely on formal, time-consuming policy procedures” (t' Hart, 1993, p. 14). Central coordinating schemes do work effectively under conditions where the task environment is known and un-changing, where it can be treated as a closed system (Chisholm, 1992, p. 10). How-ever, disaster situations are notorious for the increased uncertainty, a greater den-sity of communication and the rapid rate of decision-making (Kapucu, 2006). Ac-cordingly, several authors have demonstrated the limitations of hierarchical coor-dination in PSNs (e.g., Argote, 1982; Auf der Heide, 1989; Comfort, Dunn, Johnson, Skertich, & Zagorecki, 2004). Herbst describes four assumptions of hier-archical organizations that do not match with complex, dynamic environments: (1) a task can nearly always be decomposed into smaller and smaller independent parts, (2) an organization has a simple inflexible structure which can be visualized in an organogram with lines of responsibility, (3) organizations are of a uniform type, and (4) organizational units have a single, exclusive boundary (1976, pp. 28-33). When it comes to disaster response, the model of hierarchically coordinating resources and information is often criticized for not being flexible and not support-ing emergent events and processes (Drabek & McEntire, 2003). The basic assump-tion underlying hierarchical structures is that if the problem is well defined, if the

Chapter 3
76
rules of operation are clearly specified, and if systems can be closed to outside in-terference and disturbance, they can function without error. Another assumption is that the hierarchy of agencies is in command of all activities and resources and can control all other disturbances. The strength of such systems is that they function well in stable environments. Their weakness is that they do not function well in dy-namic and changing conditions of a disaster environment. Worse, personnel in hi-erarchical structures, trained to follow the rules, might have difficulty devising strategies of action that will work when the rules no longer apply. Such organiza-tions often are unable to respond effectively to urgent, time-critical demands (Comfort, 1999).
Traditional coordination theory emphasizes the how (i.e., the mode) of co-ordination as opposed to the what (content) and when (circumstances) of coordina-tion (Thompson, 1967). This distinction becomes increasingly important in com-plex and dynamic environments where there is less reliance on formal structure, interdependencies are changing and work is primarily performed in heterogeneous teams. Faraj and Xiao (2006) challenge much of the traditional approach to coor-dination and suggest that in settings where work is contextualized and non-routine (e.g., during disaster response), traditional models of coordination are insufficient to explain coordination as it occurs in practice. These scholars mention two condi-tions under which the traditional coordination theory fails: (1) when expertise is distributed and work is highly contextualized and (2) when it is crucial to avoid er-ror under time pressure. Both of these conditions apply to disaster response (Comfort, Ko, et al., 2004).
3.5.3 Focusing on the coordination of information management activ-ities
Through literature review, we found that coordination theory is a well-studied and applied theory in the information systems domain. While several constructions and operationalization’s of coordination theory exist in the literature, the most common construction in the IS field is the management of interdependencies between ac-tors, goals, and activities by means of various mechanisms (Malone & Crowston, 1994a). While this definition is clear on what is to be coordinated (interdependen-cies), it did not help us to find principles for assuring IQ and SQ. A more detailed examination of this and other definitions for coordination led us to conclude that several resources (i.e., humans, equipment and information) and processes (i.e., resource allocation, rescue operations and information management) can be coor-dinated via different roles (i.e., team leader, information manager and IT operator) and objects (i.e., uniforms, standards and IT).
Based on this perspective on coordination, our research focuses on the co-ordination of information (as a resource) and information management (as a pro-cess) through roles and objects. Often regarding the combination of roles and ob-jects as mechanisms for designing coordination structures, scholars have long de-bated on the level of centralization or decentralization of these mechanisms as im-portant steering instruments for coordination. Centralization has often been asso-ciated with benefits such as accountability, control and economic efficiency, where-as decentralization has often been associated with benefits such as flexibility, re-dundancy and speed. King (1983) has brought some clarity in this debate by identi-fying three dimensions to the centralization issue: (1) concentration of decision-making power, (2) physical location, (3) function or the position of an activity or

Theoretical foundation
77
responsibility. We use these dimensions to navigate the large body of knowledge on coordination. In the spectrum of archetypical organizational designs (Mintzberg, 1980), hierarchies are fully centralized for all dimensions, whereas networks are fully decentralized for all dimensions. However, as stated in chapter 1, PSNs are a special type of design that includes a hybrid form of these dimensions. On the first dimension, there is little design space. As discussed in Chapter 4, decision-making power in PSNs is grounded in the multi-agency teams that are activated on the strategic, tactical and operational echelons. Reallocating decision-making power is beyond the scope of this dissertation. The second dimension contains more design space since PSNs include several, physically distributed teams with varying infor-mation management capabilities. The third dimension also contains some design space, especially when looking for ways to decentralize and distribute information management activities and capabilities in concert. The second and third dimension led us to four pathways for assuring IQ and SQ from coordination theory. We dis-cuss these pathways next.
3.5.4 The pathway of Orchestration
The first pathway provided in Coordination Theory is IT enabled orchestration. Scholars such as Powell (1990) and later Clemons et al. (1993), have studied ways to coordinate organizations other than hierarchal and emphasized the need for in-ter-organizational information sharing. Moreover, they have discussed the possibil-ities for hybrid forms of coordinating activities that are suited for dealing with dif-ferent conditions. In Drucker (1988) we found some interesting, proposed proto-types for organizations of the future stating that “companies will resemble universi-ties, hospitals and symphony orchestras” (p. 5). In these three prototypical agen-cies, knowledge and responsibility are disseminated across the whole agency, and yet the agency wide goals are achieved through orchestration. In this view, infor-mation management responsibilities can be centralized (as occurs, for example, in a symphony orchestra, where we have the figure of the conductor as a general co-ordinator), but control is distributed and we find high levels of autonomy at all lev-els of the agency.
Whereas there is no single and universally accepted definition or frame-work for orchestration, scholars seem to agree on the goal of orchestration. Draw-ing on the example of a music orchestra with a variety of musical instruments, the goal of orchestration is to facilitate a variety of roles and objects to function in con-cert (i.e., a coherent way that serves the purpose of all stakeholders). As such, this pathway enables us to find ways of maximizing the benefits of decentralization, while retaining the benefits of centralization.
The first mentioning of the term Orchestration can be traced back to the work of Otto Neurath. While Neurath already hinted towards the concept of orches-tation in papers such as “On the classification of systems of hypotheses” (1916), his latter paper “The Orchestration of the Sciences by the Encyclopedism of Logical Empiricism” (1946) was the first to explain this concept in more detail. Neurath spoke of a ‘mosaic’, an ‘aggregation’, an interdisciplinary ‘orchestration’ of the sci-ences as ‘systematization from below’ rather than a ‘system from above’, especially (Neurath, 1983). In this vision, knowledge transfer was the main process that re-quired orchestration. One of the assumptions of Neurath was that humans only possess partial information (Mertens, 2007, p. 34). According to encyclopedism, science is a hybrid of ‘high’ knowledge, i.e., global and theoretical knowledge in the

Chapter 3
78
traditional sense, and ‘low’ knowledge, i.e., local and practice-oriented knowledge. In contrast to virtually all traditional philosophical currents, Neurath’s encyclope-dism was not afraid of the ambiguities and lack of homogeneity in knowledge. Neu-rath proposed that one should do justice to all the often diverging currents of knowledge by means of appropriate orchestration, leading to what he called “the democratisation of knowledge” (Neurath, 1983). Later, other scholars have studied and extended the concept of orchestration for other domains such as value chains (Hinterhuber, 2002), business services (Sadiq & Racca, 2004), e-government (Janssen, Gortmaker, & Wagenaar, 2006) and business networks (Busquets, 2010). Accordingly, scholars have proposes multiple types of orchestrators including pro-cess orchestrators, workflow orchestrators and web service composition orchestra-tors. The difference between an orchestrator and an architect is that the latter de-signs something static, such as a house, a bridge or a landscape, that is, something that does not vary in time. The architect designs only the deliverable, not the pro-cess used to deliver it. An orchestrator designs a delivery of music rendered in time, in the harmony and tempo needed to achieve a desired effect.
When it comes to the structure of orchestration based information systems, scholars often use hybrid, mix mode (Holland & Lockett, 1997) or ‘heterarchical’ architectures. The term heterarchical indicates that there is no hierarchy of infor-mation managers. Heterarchical control structures have distributed locally auton-omous entities that communicate with other entities without the master/slave rela-tionship found in a hierarchical architecture. According to Dilts et al., (1991) the field of distributed computing is a source for a number of justifications for the prin-ciples of heterarchical control architectures. Implying the decentralized function of information management in a decentralized and physically distributed network structure, orchestration is not about the first dimension of King (1983), it’s pri-marily about the position of the information management capabilities in a PSN. As such, orchestration does not require hierarchical organizations (i.e., police, fire de-partment, and medical services) to fully centralize authority and decision-making when forming a public safety network, and yet decentralize information manage-ment activities such that the IQ and SQ can be assured beyond organizational boundaries. This special form of coordination appealed to our interest since it does not dictate the destruction of variety in the current IS landscape of PSNs. Drawing on Ashby’s law of ‘requisite variety’ (Ashby, 1958), we argue that some variety in roles and objects is necessary, especially when dealing with complex and unpre-dictable situations such as disasters. Hence, we argue that stakeholders (e.g., in-formation system architects) should only pursue uniformity when the definite and universal solution is available for all sorts of disasters. This does not mean that or-chestration does not require any standardization. While demanding some level of standardization in message exchange (for instance using web-services), orchestra-tion allows for co-existing of several (proprietary, legacy, or preferred) information system components and technologies.
A final component we should elaborate on when it comes to orchestration is its enablement through IT. Fulfilling the role of orchestrator within and between agencies requires highly modular and flexible IT. Scholars have advocated the de-velopment of Service Oriented Architectures (SOA) for this purpose. SOA provides integration and virtualized IT services (Bieberstein, Bose, Walker, & Lynch, 2005). SOA is the trend for a distributed computing grid where applications are refactor-ing into highly accessible, loosely coupled, discrete business services (Pereira,

Theoretical foundation
79
2009). Accordingly, each service is built only once, and when upgraded all user ap-plications and systems receive the upgrade. Following Khalaf et al., (2006), the purpose of SOA is to provide application functions as a service offered on the In-ternet, in an environment that is characterized by being distributed, heterogeneous, and very dynamic and where boundaries of both system and organizations are passed over. Thus, we can consider SOA as a style of designing an information sys-tem architecture that enables the creation of applications built by effectively com-bining loosely coupled and interoperable services. From a SOA perspective, orches-tration is about the integration of two or more services (Emmerich, Butchart, Chen, Wassermann, & Price, 2006). The most common technology used for establishing SOA is web services. Web services provide a simple programmatic interface imple-mented on standard Web protocols and are addressable by a URL. The study by Shen et al., (2007) indicates that the Web Services pattern is becoming the domi-nant form of distributed computing.
3.5.5 The pathway of Boundary Spanning
The second pathway provided in Coordination Theory is boundary spanning. Early on, the innovation literature identified the significance of environmental infor-mation gathering and assimilation to organizational renewal (Lindgren, Andersson, & Henfridsson, 2008). Such information gathering and assimilation is associated with specific boundary-spanning roles at different stages in the innovation process (Tushman, 1977). On a general level, boundary spanning can be seen as the activity of making sense of peripheral information that is perceived relevant to expand the knowledge at the center of a given organizational context (Lindgren, et al., 2008). So-called boundary spanners perform this activity, i.e. individuals who operate at the periphery or boundary of an organization, relating the organization with ele-ments outside it (Tushman, 1977). Essentially, these individuals scan the environ-ment for new information, attempting to determine its relevance vis-à-vis infor-mation already assimilated in the organization. In this boundary-spanning process, the individual, the organization and the environment are parts of a network of in-teractions and organizational knowledge creation (Cohen & Levinthal, 1990). Therefore, roles that link their organizations with others are referred to as bounda-ry spanners (Aldrich & Herker, 1977; Thompson, 1967). Drawing on this under-standing, scholars such as Levina & Vaas (2005) consider boundary spanning as an competence in practice.
As a disaster evolves, relief agencies operate more distributed and dynamic and the PSN will be increasingly populated by multiple functional, geographical, hierarchical and professional boundaries. The inherent complexity of such settings makes it essential for relief agencies to leverage their boundary-spanning practices. It is therefore necessary to develop capabilities for combining multiple sources of expertise (Kogut & Zander, 1992) and establishing boundary-spanning practices (Levina and Vaas, 2005). In this context, capabilities are dynamic, referring to “learned and stable patterns of collective activities through which the organization systematically generates and modifies its operating routines in pursuit of improved effectiveness” (Zollo & Winter, 2002, p. 339).
Using various theoretical lenses, researchers have explored the nature of boundaries as the demarcation between an organization and its environment (Scott, 1992). After examining existing work, we found that boundary spanners should possess knowledge of the relevance between various pieces of information

Chapter 3
80
and the organizations they link together and make decisions concerning the distri-bution of gathered information. Boundary spanners influence the linkages between the various agencies in a network and at the same time represent the perceptions, expectations, and values of their own agencies to those groups (Friedman & Podolny, 1992). For humans to perform the tasks of boundary spanning, scholars have underlined the importance of information technologies (ITs) acting as ‘boundary objects’ (Levina & Vaast, 2005; Lindgren, et al., 2008). In particular, IT artifacts have been recognized as having the potential to be adapted to local needs, while at the same time providing a source of common identity across boundaries.
Star & Griesemer (1989) specify boundary objects as “objects that are plas-tic enough to adapt to local needs and constraints of the several parties employing them, yet robust enough to maintain a common identity across sites” (p. 389). Boundary objects may include physical product prototypes, design drawings, shared IT applications, engineering sketches, standardized reporting forms or even shared abstract constructs such as product yield. Boundary objects act as ‘brokers’ between interactions with other organizations, but at the same time they act as gatekeepers, selecting and filtering information. For boundary spanning to emerge, a new joint field of practice must be produced (Levina and Vaas, 2005), which can be a shared IT-application. In the work practice literature, the notion of boundary object has been used to capture this potential and to advance the idea of IT as an important resource for boundary spanners in establishing practices that bridge communities-of-practice (Lindgren, et al., 2008). Therefore, boundary spanning, i.e., the roles of boundary spanners and boundary objects, become extremely im-portant in PSNs where a large number of heterogeneous agencies have to develop a common operational picture and jointly respond to the effects of a disaster. This boundary spanning approach (for instance via orchestrators) can also solve the problem of trying to establish a relationship between relief agencies and a private companies by adjudicating passwords to all relief workers.
3.5.6 The pathways of Advanced Structuring and Dynamic Adjustment
The third and fourth pathways provided in Coordination Theory come from the contribution of Gosain, Malhortra and El Sawy (2005). The work of these scholars is grounded in the seminal work of March and Simon (1958) who suggest that co-ordination can be based on pre-established schedules (coordination by plan) and coordination that involves transmission of new information (coordination by feed-back). This coordination framework has been investigated in interpersonal coordi-nation in organizational settings (Van de Ven, et al., 1976). Drawing on March and Simon’s work, Gosain et al. (2005) provide two pathways for our research: (1) ad-vance structuring of inter-organizational processes and information exchange that allows collaborating organizations to be loosely coupled, and (2) IT-supported dy-namic adjustment that allows organizations to quickly sense change and adapt their network linkages. The former refers to things you do up-front to reduce the information processing needed to cope with change. The latter refers to increased information processing capabilities that allow for “on-the-fly” adaptation.
The rationale behind these pathways is that organizations (i.e., relief agen-cies) operating in dynamic environments, need to seek to consciously lay out pre-scribed activities by planning in advance, while at the same time they need to sup-plement these with spontaneous ongoing adjustment to cope with unforeseen sce-narios (Beekun & Glick, 2001). While the literature (e.g., Tan & Sia, 2006) is

Theoretical foundation
81
somewhat inconclusive on the results of these pathways, we concluded that these pathways emphasize the development of specific information management capabil-ities. In this light, advance structuring suggests the development of preemptive and protective capabilities prior to a disaster. Loose coupling is an example of a preemptive capability, whereas dependency diversification is an example of a pro-tective capability.
The idea here is that the upfront development of information management capabilities will require fewer efforts to assure IQ and SQ during disaster response. Following this pathway, relief agencies can equip themselves with the dexterity re-quired for preemptive capabilities before the events that take place during a disas-ter, consciously creating a range of information management capabilities before they are needed. Relief agencies can also use redundancy mechanisms, such as in-formation or resource buffers, as a protective measure to guard against a potential-ly damaging situation and to allow a strategy to remain viable in spite of changes in the environment. Complementary to this pathway, the pathway of dynamic adjust-ment suggests the creation of exploitative and corrective capabilities. Environmen-tal scanning is an example of an exploitative capability and reactive adaptation is an example of a corrective capability. Ex-post information management capabilities exploit or capitalize on information beyond the organizational boundaries through constant scanning of (external) data sources and social networks, and the ability to recover from infliction and ameliorate the impacts of technology failures and mis-takes are also critical to information coordination efforts in PSNs.
Gosain et al. (2005) provide three examples of design principles that have been found from the advanced structuring pathway: (1) standardize process and content interfaces, (2) modularize interconnected processes by breaking up com-plex processes into sub-processes that are performed by different organizations independently and, (3) structure data connectivity in order to exchange structured transaction data and content with another enterprise in electronic form. Following the dynamic adjustment pathway, the coordinating entities learn to adjust quickly to diverse information structures across partners or over time. It is also expected to improve the ability of an enterprise in a supply chain relationship to continuously ‘morph’ in changing environments (Rindova & Kotha, 2001). Dynamic adjustment requires making changes ‘on-the-fly’ as necessitated by the business environment. As an example, in the face of a disruption, the supply chain processes need to be dynamically reconfigured so that different supply chain players remain in sync (Gosain, et al., 2005). Cherns (1987) calls this ‘variance control’ that can achieved by equipping an information architecture recursively (i.e., the agency components, the components’ components, etc.) with the capability to monitor the environment and the autonomy to update their work routines accordingly.
3.6 Pathways from Network Centric Operations
The previous section presented four pathways from coordination theory that can help us to design information systems that assure higher levels of IQ and SQ for relief workers. We return to these pathways in chapter 6. This section elaborates on network centric operations (NCO) theory, a relatively new theory (compared to co-ordination theory). This chapter concludes with three pathways derived from NCO theory.

Chapter 3
82
3.6.1 Background on Network Centric Operations
Before the ‘discovery’ of organizational networks and the mechanisms of different types of coordination, social coordination was considered to take place in two dis-tinct forms: hierarchies and markets (Meuleman, 2008, p. 33). Market coordina-tion was the second ideal type that was described after Weber’s bureaucratic ideal type (Weber, 1952) had become the prototype for a classical hierarchy. Networks were, for a long time, considered a hybrid form of these ideal-types. Early work by Thorelli (1986) already argued that the network form is a distinct form of societal coordination, and not ‘just’ a hybrid form that combines hierarchy and markets. The network concept has become so popular, that in some domains, a new dichot-omy emerges, namely hierarchy versus networks, while scholars neglect market governance (Meuleman, 2008). This is particularly true for the domain of Public Safety, in which network based coordination has caught the attention of various stakeholders.
Here, we refer to the concept of Network-Centric Operations” (NCO) (also known as “Network-Centric Warfare”) that has been developed by David Alberts, Art Cebrowski, and John Gartska who are researchers of the U.S. Department of Defense. These scholars coined the concept of NCO in a series of the Command and Control Research Program (CCRP) articles starting in 1996. Defense scholars from other countries have also suggested similar concepts such as Network Enabled Ca-pability (NEC) in the United Kingdom and Network Based Defense in Sweden. While several definitions that have been proposed for NCO (e.g., Stanovich, 2006; Van de Ven, Van Rijk, Essens, & Frinking, 2008), one definition that stands out is “military operations that exploit state-of-the-art information and networking technology to integrate widely dispersed human decision makers, situational and targeting sensors, and forces and weapons into a highly adaptive, comprehensive system to achieve unprecedented mission effectiveness”, (Anon, 2000, p. 3). This definition stands out because of the emphasis on employing IT for NCO. Netcen-tricity emphasizes horizontal information sharing among peers rather than vertical information sharing among commanders and subordinates. In theory, the small-unit soldier who can access information and intelligence from all collection sources will be able to employ combat assets such as air support, artillery, and electronic warfare with much more precision, timeliness, and effectiveness than what was possible with past capabilities (Stanovich, 2006).
In this study, a network refers to a group of agencies who exchange infor-mation and undertake joint activities, while organizing themselves in such a way that their individual autonomy remains intact. Important aspects of this definition are that the activities must be voluntary, mutual or reciprocal, and that belonging to the network does not affect autonomy or independence of the members (Tap-scott et al., 2000). From a policy perspective, networks are portrayed as sets of in-terdependent organizations which have to exchange resources to realize their goals (Marsh & Rhodes, 1992, p. 11). Following this perspective, scholars characterize interdependencies within networks by their power-dependent nature. In a network, power is not concentrated, but distributed horizontally as well as vertically. The policy network approach requires recognition of the complexity of the interactions between different organizations involved in the policy-making arena. The network approach is based on a few important assumptions: 1) actors and their actions are viewed as interdependent, 2) relational ties between actors are channels for trans-fer of resources (material and/or nonmaterial), 3) network models focusing on in-

Theoretical foundation
83
dividuals view the network structural environment as providing opportunities for or constraints on individual action, and, 4) network models conceptualize structure as lasting patterns of relations among actors (Wasserman & Faust, 1994). Conform-ing to these assumptions, the present study uses the network concept as a way to describe the multi-agency interdependencies among relief agencies. Accordingly, we use the term network as a metaphor to describe partnerships in which more than one agency is dependent on another to perform tasks effectively.
3.6.2 Assumed advantages of Network Centric Operations
Generally, scholars and practitioners advocate network based coordination ap-proaches for several reasons (e.g., Powell, 1990; Thompson, Rances, Levacic, & Mitchel, 1996; Thorelli, 1986). Meuleman (2008) for instance, suggests that net-works work well in knowledge-rich environments because they have superior in-formation-processing capabilities; they are also more adaptable and flexible than hierarchies because of their loose coupling and openness to information (p. 163). Network forms of organization, unlike hierarchies or marketplaces, are agile and are constantly adapting as new links are added and dysfunctional ones are dropped (Contractor, Wasserman, & Faust, 2006). By fully utilizing the range of human and technical capabilities across a network of agencies, this coordination approach ena-bles higher levels of adaptability. Perrow (1984) strongly advocates the adaptability of a loosely coupled system as a great advantage, especially in situations in which the system should be able to adjust to environmental changes. NCO harnesses the autonomy of individuals and seeks to empower the individuals (i.e., relief workers) in their ability to adapt to changing circumstances. The underlying tenets or hy-potheses already hint towards assumed (untested) advantages over hierarchy based coordination models (Alberts, et al., 2002):
• A robustly networked force improves information sharing.
• Information sharing and collaboration enhance the quality of information and shared situational awareness.
• Shared situational awareness enables self-synchronization, and enhances sustainability and speed of command.
• These, in turn, dramatically increase mission effectiveness.
Drawing on these hypotheses, scholars have mentioned several expected benefits when adopting NCO. Table 3-6 presents a list of expected benefits when following the NCO approach to information sharing instead of the traditional hierarchical approach. The main premise behind this research is that the network-centric ap-proach as used in the military domain could be useful in disaster situations, be-cause both are multi-actor, complex situations with short decision-making time. Accordingly, in the public safety domain, the ‘force’ mentioned in table 3-6 would refer to an crisis management organization consisting of multiple governmental agencies, including municipalities, police departments, fire departments, ambu-lance services. However, we do not know how to leverage the outlined benefits of NCO and whether or not NCO can lead to higher IQ and SQ compared to hierarchy based information management.

Chapter 3
84
Table 3-6 Benefits expected from NCO capability development
Expected benefits Explanation
Empowerment and
user autonomy (Alberts
& Hayes, 2007)
A network-centric organization has a decentralized organiza-
tional structure. Because of this decision making and responsi-
bilities are shifted to lower levels in the organization empower-
ing individual soldiers in their work.
Robust information
sharing (Peer 2 Peer)
(Gonzales et al., 2005)
In a network-centric environment, the various units (teams)
operate fairly independent of each other. This means that failure
in one unit does not (necessarily) have effect on other units.
High situational
awareness (Alberts &
Hayes, 2007)
Parts of the organization cooperate to produce actionable infor-
mation, fusing many separate facts into a common picture of the
battle space.
Flexible information
systems (NESI, 2008)
Provide flexible information systems that can swiftly adapt to
the information demands of a particular operational scenario.
This is necessary because information needs are difficult to pre-
dict.
Rapid feedback on in-
formation sent
(Gonzales, et al., 2005)
The independence and distributions of organizational units ena-
bles feedback on information sent between units.
Real time information
flow support (Alberts &
Hayes, 2007)
Information flow within NCO is synchronous, meaning that
senders and receivers of information can only exchange infor-
mation when both have contact which each other.
Enhanced quality of
information (Alberts &
Hayes, 2007)
Information superiority, which includes creating and maintain-
ing a continuous, high quality information flow throughout the
force helps to ensure a clear and common understanding of the
situation.
Until now, academic contributions regarding NCO are scarce. Therefore,
the theoretical pathways in this theory remained on a conceptual level. In addition, scholars have not yet evaluated NCO on the assumed benefits outlined in table 3-6. Moreover, metrics for evaluating the level of netcentricity (i.e., zero netcentricity versus full netcentricity) are lacking. Yet, relief agency managers are showing in-creasing interest in the concepts behind NCO, particularly as responders prepare for an increasingly complex threat spectrum in a post-9/11 world (Stanovich, 2006). While we acknowledge that the relief agencies in PSNs deal with complex, hazardous and highly unpredictable events comparable to military missions, we need to underline that the heterogeneity in public safety networks may be a hurdle when seeking to leverage the advantages of NCO. Depending on the type and scale of a disaster, public safety networks consist of a variable set of agencies, each em-ploying their own information coordination procedures and technologies (Bharosa, Lee, et al., 2010). Considering the characteristics of public safety networks, we ex-press some concerns when adopting NCO as main approach for configuring infor-mation management architectures in the next section.

Theoretical foundation
85
3.6.3 The pathway of Self-synchronization
The first pathway we provided in the NCO literature is self-synchronization. The pathway of self-synchronization was introduced by Cebrowski and Gartska (1998) in their seminal article “Network-Centric Warfare: Its Origin and Future”. Alberts, Gartska, and Stein (1999) use this term to describe the operation of entities in the absence of traditional hierarchical mechanisms for command and control. Accord-ing to the tenets of NCO, self-synchronization is the link between shared situational awareness and mission effectiveness. In their book “Understanding Command and Control” Albert and Hayes (2006) highlight that: “The magic of NCW is the emer-gence of self-synchronizing behavior” (Albert & Hayes, 2006, p. 2). In a later publi-cation, Alberts and Hayes (2007) suggest that “self-synchronization leads to dra-matic increases in both force agility and effectiveness” (p. 2). Often, self-synchronization is associated with visions of modern warfare in which individual soldiers are equipped with advanced digital headpieces. Drawing on its initial de-scription in the literature, we developed a more PSN related understanding of what self-synchronization means and what it could leverage for relief workers. Firstly, we do not associate any specific technical features with this pathway. Instead, we fo-cused on unlocking the potential of allowing every relief worker in the PSN to have access to the same information in the same format. Secondly, we considered self-synchronization as a way of empowering the relief workers to directly collect, use, update and distribute information anytime and anywhere in the PSN. Our under-standing of this pathway draws upon the idea that subordinates have superior local knowledge, and if they understand the goals (commander’s intent), rules of en-gagement, and plans (orders) of an operation, they can produce results superior to the centrally controlled organization. Figure 3-1 sketches the maturity path organi-zations need to follow before self-synchronization can be leveraged.
3
4
Mode of operation
Developing Situational Awareness
1
2
0
Shared Awareness
Information Sharing
Organic Sources
Traditional
Collaboration
Self-synchronization
Figure 3-1: The netcentric maturity model (based on Alberts, Garstka, & Stein, 2002)

Chapter 3
86
Figure 3-2 illustrates five consecutive stages of maturity in NCO. Level 0 represents a traditional or hierarchical approach to command and control which, for the most part, is based upon information from organic sensors and systems. Organic here refers to the assets of the agencies and teams in a network. Thus, in Level 0, information is not shared outside of pre-existing stovepipes and point-to-point flows. Moving to Level 1 involves a “post before use” strategy and a shift from push to pull that makes information far more widely available. Moving to Level 2 involves moving from a passive sharing of information to a collaborative process focused on understanding the information (putting it into context) and the situa-tion to develop a higher quality of awareness. Moving to Level 3 involves discus-sions (collaborations) that go beyond what the information is and draw on the shared awareness through extensive interaction and collaboration. Finally, a move to Level 4 entails the adoption of a command approach rooted in the concept of self-synchronization. This figure suggest that the highest level of maturity is estab-lished when individuals (i.e., soldiers or relief workers) are empowered to synchro-nize themselves with the information available throughout the network.
3.6.4 The pathway of Reachback
The second pathway provided in the NCO literature is reachback. While self-synchronization refers to abilities of an individual or team of persons, reachback is associated with technology and is defined as “the electronic ability to exploit organ-ic and non-organic resources, capabilities and expertise, which by design are not located in the theater” (Neal, 2000, p. 4). In general, reachback refers to a situation where resources, capabilities and expertise are at a physical distance from the area of interest, supporting the people in the area to perform their tasks. This pathway draws on the idea that higher headquarters enjoy larger staffs and larger reservoirs of knowledge, experience, and information management capabilities. This pathway suggest that the individual soldier, or in our case the relief workers, should have access to all information sources in the network, including experts and external (nonmilitary) data bases without the mediation of other individuals (i.e., com-manders and control rooms). Therefore, we can consider reachback as a prerequi-site for self-synchronization.
Given the advancement in information technology (higher connectivity at lower cost), reachback is becoming easier to implement. However, from a socio-technical perspective, we consider reachback as a pathway that goes beyond the implementation of technology alone. Following Custer (2003), reachback also rais-es questions regarding information access levels, sharing policies, and dissemina-tion of sometimes security sensitive information in a network of agencies. This means that we need to be careful in selecting roles that that have full reachback. Moreover, since disasters are low frequency events, the level of reachback needs to be regulated to minimize the chances of improper use. This strengthened our view that reachback is not only an ability, but can also be a strategic choice to accom-plish the goals of a PSN. As such, we have extended the understanding of reachback from a technical capability (no reachback versus full reachback) to a strategic capa-bility (different levels of reachback for different roles at different moments) that stakeholders need to implement cautiously for security reasons.

Theoretical foundation
87
3.6.5 The pathway of Information Pooling
The third pathway provided in the NCO literature is information pooling. Infor-mation pooling is not a new idea and has been coined by scholars in the area of So-cial Phycology and group decision support in the early eighties (Stasser & Titus, 1985). In later publications on NCO, this pathway for sharing information from various human and data sources in teams has regained attention. We consider task-related information known by all members of a multi-agency disaster response as ‘shared information’, while the information held only by one or few team members is ‘unshared information’. Both types of information play important roles in team decision-making: e.g., shared or redundant knowledge may help establish a com-mon situational picture and allow for swift decision-making.
On the level of information, NCO aims to empower relief workers to collect information anywhere at any time. In the Netherlands, this notion inspired the commanders of relief agencies to sketch a data pool as illustrated in Figure 3-2.
Figure 3-21 visualizes the aspired open and collective (netcentric) infor-mation sharing as a data pool. The data pool needs to be a ‘national single window’ or information market providing information that is accessible by all authorized relief agencies. The information in the data pool is the result of interconnecting various data sources in a PSN. The idea of using a data pool requires stakeholders to predefine arrangements on who delivers and maintains the data. After publica-tion of the ASE rapport, there were no follow up publications demonstrating how to redesign existing information systems in accordance with the NCO vision sketched in Figure 3-2.
1 Illustration by Huib Jans, reprinted with permission.
Figure 3-2: NCO as a data pool (ASE, 2008)
Exactly the information that I needed
No Swimming

Chapter 3
88
The collection of task-relevant information known by every member is termed the pool and thus information pooling is the process of creating and enlarg-ing the pool of shared information through group discussion. Information sampling is the process by which team members introduce task related information into a discussion by recalling and mentioning it. One of the important factors that give a team of relief workers an advantage over individual relief workers is the amount and diversity of relevant information held by the team due to its members’ differing roles, responsibilities, training and experience. The team therefore is more likely to make informed and high quality decisions. However, in order to utilize their infor-mational resources, team members must discuss and exchange them. Moreover, the categorization of information in the pool in accordance with the preferences of the various relief workers in diverse, cross-functional or distributed teams is a ma-jor challenge.
3.6.6 Concerns regarding network-based information management
Like any form of coordination, network based information management has it weaknesses that can raise concerns amongst stakeholders. In general, weaknesses such as low transparency, instability and the need for trust have been discussed exhaustively in previous work (e.g., Meuleman, 2008; Meyer & Baltes, 2003). Bar-nett (1999), and later Groh (2006) have outlined major concerns specifically on netcentricity in warfare, including “ignoring the human dimension” and the “over-emphasis on technology”. For the domain of disaster management, we postulate three major concerns regarding the (re)design of information system architectures in accordance with the netcentric approach. The first concern is the threat of information overload that may overcome relief workers when they are able to receive information from a large number of network nodes (i.e., other relief workers and sensors). Here, information overload refers to “a cascade of data that exceeds the finite limits of information that can be processed and acted upon by a human being in a stressful and complex multi-tasking environment” (Stanovich, 2006). In existing hierarchical information ar-chitectures, information overload is mentioned as a problem for relief workers (e.g., Atoji, et al., 2000; Jenvald, et al., 2001; Manoj & Hubenko, 2007). Yet, we are concerned that having a far larger number of nodes participate in the information coordination process as dictated by netcentric coordination, information overload may occur more often than is the case with hierarchical coordination. A network of nodes is generally incapable of deciding and semantically filtering who needs what and when (Atoji, et al., 2004). In addition, when each individual relief worker is able to access to databases directly (instead of querying information via the control room or other agency), the tasks of discovering and filtering information from a large dataset may even increase the time needed to access relevant information. The change of distraction created by peripheral and irrelevant information is high and often has the effect of slowing down the decision-making process, as relief workers must process large amounts of obfuscating and sometimes contradicting information. Moreover, some nodes in the network may actually reduce the overall quality of the information in the network, for instance when contributing infor-mation of low quality (e.g., outdated, irrelevant or incorrect information). There-fore, information overload may not only delay the relief worker in making timely and effective decisions, it may also make it difficult for the relief worker to filter the right, high quality information from noise.

Theoretical foundation
89
The second concern regarding netcentric information coordination is the dilution of decision-making and responsibility boundaries (an advantage of hierar-chical coordination) when every relief worker has access to all information in the network. This means that relief agency commanders (strategic echelon) may inter-fere in decisions and actions on the operational level of response, just because the commanders think they know what is happening on the field. As observed by Sta-novich (2006), the availability of such a plethora of near-real time information of-ten creates the false impression among commanders that they have the same solid and accurate grasp of conditions and situational awareness as the local responders that deal with the incident at the scene.
The third concern is that of bottom up ‘renegade freelancing’. Renegade free-lancing is generally defined as ‘illegitimate improvisation’, which is not working toward the goals of strategic level commanders (Mendonca, Pina e Cunha, Kavo-Oja, & Ruff, 2004). Stanovich (2006) explains that freelancing is less of a problem in hierarchical settings where subordinates receive piecewise information (e.g., sta-tus information, decisions and instructions). In this context, freelancing due to the availability of the ‘big picture’ or shared situational overview can be considered as a deviation from higher intent that is both unpredictable and unexpected, and such activity presents serious problems to a unified response effort. Even though free-lancing can also occur in hierarchy-based information systems, the self-synchronization capabilities in netcentric environments can encourage its occur-rence and amplify its impact in the PSN.
3.7 Summary
This chapter presents our knowledge base and is the result of the investigation of two research questions (1a), what are useful and tested instruments provided in the literature for studying information quality and system quality in public safety networks? and 1b, what pathways are provided in coordination theory and netcentric operations theory for assuring IQ and SQ in public safety networks? Asking both questions is an important step in our design science approach since it allows us to prepare for empirical data collection and the synthesis of design prin-ciples for assuring IQ and SQ. We reflect on the answers in the conclusions chapter (Chapter 10).
The first part of Chapter 3 presents items for assessing IQ and SQ during disaster response. These items are included in surveys that we later used to meas-ure the perceived levels of IQ and SQ among relief workers (see Chapter 4). The second part of this chapter elaborates on seven pathways derived from two kernel theories that help synthesize design principles for assuring IQ and SQ. The path-ways provided in coordination theory are boundary spanning, orchestration, ad-vance structuring, and dynamic adjustment. We discuss the translation of pathways and ideas presented in this chapter into testable principles in Chapter 6.

90
Empirical foundation
91
4 Empirical foundation: exploring three public safety networks
"In theory, there is no difference between theory and practice. But in practice, there is."
- Yogi Berra (Baseball player)
4.1 Introduction
The previous chapter dealt with several information quality (IQ) and system quality (SQ) issues and discussed some theoretical pathways for assuring IQ and SQ. As a progression of thoughts within a theory, these pathways still required further un-derstanding of the context of use (multi-agency information management) before we could move on towards the synthesis of design principles. This chapter reports on the third phase of this research, which we consider as our empirical foundation since it provides an in depth analysis of multi-agency information management in public safety networks (PSNs). The construction of this empirical foundation was led by two research questions: 2a: How do relief agencies manage information during disaster response?, and 2b: Considering the various information system architectures in practice, what level of IQ and SQ do these architectures assure for relief workers during disaster response?
In search of answers, we studied information management practices and IT applications in three different PSNs in the Netherlands. In light of RQ2b, we have also measured the resulting IQ and SQ for relief workers managing information by means of a specific information system. Each field study allowed us to investigate different information system architecture and their respective effects on the IQ and SQ for relief workers. In the first field study in the Port of Rotterdam, relief workers used a single, echelon expanding information technology (IT) application for in-formation management purposes. In the second field study in Gelderland, relief workers used four IT applications for information management purposes. In the third field study in Delft, relief workers used ‘whiteboards’ for information man-agement purposes instead of any particular IT application.
As discussed in chapter two, we conducted the field studies using a combina-tion of four research instruments. Firstly, we observed relief workers, IT applica-tions and information management practices during disaster response exercises. Here, observation refers to the on-site note taking based on a predefined observa-tion protocol. Whenever physically possible (i.e., when space was available for us in training rooms), we observed in teams of two or three. Secondly, we examined sev-eral documents related to the disaster response exercise, including the exercise script, events, and roles (prior to the exercises). Thirdly, we administered surveys after each observed disaster response exercise in order to measure the level of IQ and SQ perceived by the respective relief workers. These surveys include empirical-ly tested items for assessing IQ and SQ. Appendix-D provides an overview of the survey items used. Finally, during and directly after the exercises, we conducted ad-hoc, opportunistic interviews with relief workers, for instance requesting them to

Chapter 4
92
explain the perceived IQ and SQ problems in more detail (see chapter 2 for more detail on the field study approach). This chapter elaborates on the general structure of PSNs in the Netherlands. This elaboration is a necessary prelude to the field study data. Then, this chapter presents the qualitative and quantitative data col-lected during each of the field studies. This chapter concludes with some cross-field study findings. Parts of the chapter were published in Bharosa et al. (2007), Bharo-sa et al. (2009), Bharosa et al. (2009), Bharosa et al. (2010), Bharosa & Janssen (2010), and Lee, Bharosa et al. (2010).
4.2 Background on public safety networks in the Netherlands
Policy makers in the Netherlands have arranged the procedures and configurations of PSNs in the act ‘Wet Veiligheidsregio’s. The act as passed on February 11, 2010 resulting from the Dutch Parliament’s objective to improve the administrative and operational strength of PSNs. To date, the majority of municipalities have not yet organized their PSN in accordance to this act. However, since many of the munici-palities are in the process of transforming their PSNs in accordance to this act, we take the prescriptions of this act as baseline in this dissertation.
The main idea underlying this act was that although safety eminently is a local responsibility, many municipalities are too small and possess insufficient re-sources to manage a disaster. By joining up the fire service, medical services and police departments on a regional level, this act aims to increase the strength, but also unity, clarity and simplicity of PSNs. When we focus on disaster response, the Wet Veiligheidsregio’s dictates the activation of three echelons of response: the strategic echelon, the tactical echelon, and the operational echelon. Each echelon can include on or more single agency and multi-agency response teams. These echelons are activated in a hierarchical manner (first operational, then tactical and then strategic) depending on the severity of the disaster. The process of activation is predefined in the Gecoördineerde Regionale Incidentbestrijdings Procedure (GRIP) procedure. The GRIP levels indicate the severity and span of the disaster and can range from level 0 to level 4, see Table 4-1. .
Table 4-1: Disaster severities and dictated response echelons
Coordination alarm
Span of disaster effects Activated response teams
GRIP 0 Normal daily operations (e.g., small fire, traffic accidents)
-Motor hood meeting
GRIP 1 Cause repression (e.g., medium-large fires, public shooting)
-Commando Place Incident Team (COPI)
GRIP 2 Cause and effect repression (e.g., gas leaks, oil spills)
-COPI -Regional Operational Team (ROT)
GRIP 3 Harm to the well-being of large populations of the society (e.g., floods, toxic gas clouds)
-COPI -ROT -Municipality Policy Team (GVS)
GRIP 4 Hazards beyond one municipali-ty with changes of resource scarceness (e.g., airplane crash, terrorist attacks)
-COPI -ROT -GVS -Regional Policy team (RBT)

Empirical foundation
93
Level 0 represents (routine) incidents requiring no collective decision-making between responding organizations. These are normal accidents that can be handled by a single organization, for instance a small traffic accident. GRIP level 1 events entail small scale disaster requiring collaboration between multiple stake-holders. GRIP level 2 suggests regional cooperation and the strategic repression of the source of the disaster. The Wet Veiligheidsregio’s considers GRIP levels 3 and 4 as large-scale disasters in which the municipality majors are required to take stra-tegic decisions. Starting from GRIP 1, different decision-making teams are activat-ed. Each decision-making team has a different focus in the overall response pro-cess. The ROT for instance focuses on strategic issues, such as the mitigation of the source of the disaster. On the other hand, the COPI decides upon more immediate (tactical) issues, for instance evacuating victims and repressing effects. In doing so, the COPI members also consider/follow the strategies formulated by their superi-ors on the REGOT level. The operational level (the actual first responders) execute the tactics from the COPI level. The GRIP level is set by the highest commanding level at the time. For instance, if a GRIP 1 situation cannot be repressed by the Commando Place Incident Team (COPI), this team’s leader can decide to escalate the situation to a GRIP 2, in which the Regional Operational Team (ROT) will get the highest decision making responsibility. When there is a change to GRIP 3, teams such the Municipal Safety Team (GVS) are activated. As leader of the GVS, the Mayor is informed by the leader of the ROT, who in turn is informed by the COPI leader. As subordinates, the second in command officers should provide in-formation to their commanding officers.
Considering the GRIP structure, we conclude that the formation of PSNs rest firmly upon the hierarchical command and control based form of coordination, which we have discussed in chapter four. Similar to for instance the structures in Spain (O’Riordan, 2004), London (Fitzgerald & Russo, 2005) and the United States (Bigley & Roberts, 2001), the GRIP structure dictates a authority based activation of decision making and information management during disaster response. Having elaborated on this general coordination structure for PSNs in the Netherlands, we proceed by discussing our field study findings next.
4.3 Field study #1: The Port of Rotterdam
Amongst the world’s largest seaports, the Port of Rotterdam (PoR) is about 10500 ha (see www.portofrotterdam.com). Over sixteen thousand companies operate in this major harbor area. Every day, companies import, store, transfer and export enormous quantities of chemicals and other hazardous. Storing and transferring these dangerous materials implies potential catastrophes for humans and infra-structure in the area. Obviously, when a disaster unfolds in such a large and haz-ard-prone area, consequences can only repressed by efficient and effective disaster management. To ensure local disaster management organizations are prepared, the Veiligheidsregio Rotterdam-Rijnmond (VRR) stimulates (e.g., through funding and accommodation) recurrent disaster management exercises in the port area. Annu-ally, the VRR organizes three types of multi-agency exercises for relief workers in the Rotterdam-Rijnmond PSN, that is:
1. Exercises for the strategic response echelon. These exercises focus on training either the Gemeentelijke Veiligheidsstaf (Municipal Safety Board) or the Regionale Beleids Team (Regional Policy Team). The participants on

Chapter 4
94
this echelon include relief agency commanders, including the Mayor of the municipality the exercise is conducted in. In total, VRR organizes 28 exer-cises of this type each year, which is in accordance to the number of munic-ipalities in the Rotterdam-Rijnmond region. This type of exercise takes around four hours and includes seven to ten participants (depending on the availability of the relief agency commanders).
2. Exercises for the tactical response echelon. These exercises focus on train-ing the Commando Plaats Incident Team (Commando Place Incident Team). The participants on this echelon include the second and third per-sons in command of the various relief agencies. This type of exercise is of a larger scale compared to the exercises for the strategic echelon. As such, these exercises demand more human and financial resources than exercises for the strategic response echelon. Each year, VRR organizes eight exercis-es of this type. Compared to the strategic echelon, the exercises for this echelon require more trainers and resources, for instance a COPI team at the exercise location. This type of exercise takes around four hours and in-cludes ten to fifteen participants (depending on the availability of the relief agency commanders). The trainers manage to organize at least two of these exercises each day, training a total of twenty to thirty different relief work-ers each day.
3. Exercises for the operational echelon. These exercises focus on the first re-sponders to disaster situations. The participants on this echelon include the field unit officers of the various relief agencies. This type of exercise is of a larger scale compared to the exercises for the strategic echelon and tac-tical echelons. As such, these exercises demand more human and financial resources than exercises for the strategic and tactical echelons. VRR organ-izes no more than two of these exercises each year.
During the three types of exercises mentioned above, the trainers simulate the
remaining echelons on paper. This means that, for instance, during a tactical eche-lon exercise, relief workers from the strategic and the operational echelon are not present. The decisions and actions taken by the other echelons are brought into the exercise in the form of messages.
Since the objective of this research project is to develop and evaluate design principles that assure IQ and SQ for multi-agency disaster response teams, we fo-cused on studying strategic and tactical echelon exercises. Another reason for fo-cusing on the strategic and tactical level exercises is the opportunity for relief agen-cy commanders to employ information systems in their practices. These echelons are activated in case of medium to large-scale emergencies (see figure 4.1). Since the operational echelon exercises often only employ radio or mobile communica-tions and do not manage information using IT applications, these exercises were outside the scope of our research.
Table 4-2 outlines the training exercises we observed as part of our field study in the Port of Rotterdam.

Empirical foundation
95
Table 4-2: Initial observations in Rotterdam-Rijnmond
Date Municipality Echelon trained
Number of observations
24/11/2006 Vlaardingen Tactical/COPI 3 observers x 2 observations 01/12/2006 Vlaardingen Tactical/COPI 2 observers x 2 observations 02/05/2007 Koolhaven Strategic/ROT 2 observers x 1 observation 27/11/2007 Vlaardingen Tactical/COPI 1 observer x 1 observation 15/04/2008 Rotterdam Airport Operational 4 observers x 1 observation
Table 4-2 outlines the initial training exercises that we observed in the Rot-
terdam-Rijnmond field study. The objective of these preliminary field observations was to gain understanding of how multi-agency information management takes place in practice. This understanding was also needed in order to develop under-standable and context specific data collection instruments (i.e., observation proto-col and surveys). We tried to observe every exercise in teams of two to three per-sons, allowing us to capture a wider range of the exercise and corroborate our ob-servations. In addition, most of the COPI exercises included two round of exercises one a single day, allowing for two observations per observer. Different relief work-ers participated during the different exercises. The organizers and exercise facilita-tors were the same throughout the different exercises. During the tactical echelon exercises, the organizers used two different scenarios: A gas leak (morning session) and an explosion on a cruise ship (afternoon session). During the strategic echelon exercise, the organizers used a slightly different scenario involving the collision of two ships. The operational level exercise involved an airplane crash at the Rotter-dam Airport. The following table provides an overview of these scenarios.
Table 4-3: Examples of scenarios exercised in Rotterdam-Rijnmond
Gas leek Explosion on a cruise ship
Collision of two ships
Airplane crash landing
Description Disturbance of public order combined with a possible toxic spill producing a gas cloud at Uni-lever premises
An explosion on an unknown ship deck loca-tion, members of the royal family are on board and re-quire evacuated
Two ships col-lide in a diffi-cult to pinpoint location. One ship was an oil tanker, the oth-er included chemical cargo
A medium sized aircraft signals a failing motor and crashes during landing
Disaster elements
Toxic gas, possi-ble hostile peo-ple on premises, evacuation
Fire, VIPs, sur-rounding ships and inhabited areas
Inconsistent ship locations, potential oil spill, unknown chemicals
Unknown num-ber of passen-gers on board, collateral dam-age
Table 4-3 outlines the disaster scenarios that trainers used during multi-
agency disaster response in the Rotterdam-Rijnmond area. Each scenario started as a GRIP level 1 disaster, triggering the activation of a multi-agency COPI team. Ultimately, each exercise reached GRIP level 3, avoiding the activation of a nation-wide disaster coordination team. The exercises included events and uncertainties

Chapter 4
96
Multi-agency team (7-11 persons)
Counter play (simulating field units, events etc.)
(4-6 persons)
Emergency control room (ECR) Police | Fire | Medical | RPA
(3-4 persons)
Figure 4-1: Typical exercise configuration
comparable to each other. The following subsections elaborate on the actors, in-formation flows, and IT applications used during the observed exercises. While at-tempting to give a general impression on these aspects, we sometimes give exercise specific examples from our observations in order to be explicit on our findings. The following figure outlines a typical configuration of actors during one of the ob-served COPI and GVS exercises.
Figure 4-1 illustrates the choreography of the multi-agency teams (i.e.,
GVS, COPI and ROT) and the number of actors during such exercise. The exact number of participant can differ for each disaster scenario and the availability of the relief workers on that particular day. The following subsection provides a more detailed description on the participating actors.
4.3.1 Actors and coordination structure
Multi-agency disaster response requires several public and private organizations to respond in concert. Collective learning and adaptation of partnerships in dynamic context depends upon valid and reliable information and timely feedback among organizations In accordance with the GRIP procedure mentioned in section 4.2, representatives from both public and private organizations collaborate and share information in multi-agency teams. In accordance with the disaster management handbook of the VRR, the training exercises involved multi-agency teams with a fixed and optional set of agencies. The fixed set includes representatives of the fire department, police department and ambulance services. In the Rotterdam-Rijnmond area, the Rotterdam Port Authority (RPA) is also part of the fixed con-figuration of actors.
The optional/variable list of actors consists of more specialized relief work-ers (i.e., hazardous materials experts and company representatives) depending on the disaster at hand. Examples of optional representatives in the multi-agency team include a Supply Manager of Unilever R&D and a fleet manager of a Cruise Ship Company (Cruise ship explosion scenario). The following table outlines the roles and actors we observed across the training exercises in the Rotterdam-Rijnmond field study.

Empirical foundation
97
Table 4-4: List of roles and actors in the multi-agency decision-making teams
Role(s) Actor in GVS Actor in COPI
Process leader, team captain, communication to
external parties
Mayor Commander of the
Fire department
Allocation of police resources, focus on law and or-
der, Information manager
Chief of police Second in com-
mand of the police
department
Allocation of fire department resources, focus on
mitigation of fire and evacuation of victims
Chief of fire de-
partment
Second in com-
mand of the fire
department
Allocation of ambulance services, focus on the
treatment of victims on the spot and transport to
nearby hospitals
Chief of ambu-
lance services
Second in com-
mand of the ambu-
lance
Information manager: 1) receiver of external situa-
tion reports, 2) generation of internal team situation
reports, 3) projection of situation reports
Secretary of the
Mayor
Police officer
Provision of municipal plans and resources pertain-
ing risk and crisis management
Municipal
emergency co-
ordinator
Municipal emer-
gency officer
Press officer: information sharing to the press Police officer Police officer
Support in terms of legal affairs and provide advice
on legislation and procedures
Department of
Justice officer
-
The roles in table 4-4 are not substitutable or interchangeable with each
other, as each role represents a specific set of resources and responsibilities. The following figure visualizes one possible coordination structure that comprises the aforementioned roles. The arrows represent the information flows between the var-ious teams.
Note that figure 4-2 rests upon our observations of the coordination struc-ture in the Rotterdam-Rijnmond Safety Region. Other safety regions are still in the process of redesigning their coordination structure in line with the GRIP prescrip-tion in the Wet Veiligheidsregio’s. One institution not included in figure 4-2 is the supporting Emergency Response Center (ERC), an organization similar to the Pub-lic Safety Answering Point in the USA (a.k.a. 9-1-1 emergency dispatch center), be-cause this center has a facilitating rather than a hierarchical role. Each ECC acts as an information center for just one of the relief agencies. For the case of the Rotter-dam Harbor, the ERCs of the Police, Fire brigade, GHOR and RPA are physically collocated on the same floor in the World Port Center. This should allow for more information sharing, at least on the level of the control rooms. In reality, the ERCs of each column support their own organization on all levels of decision-making. On the other hand, each of the ERC’s gets their information from multiple sources, in-cluding interaction with the other levels.

Chapter 4
98
Regional Operational Team Leader Regional Operational Team (>=GRIP 2)
COPI Leader
Commando Place Incident Team (>=GRIP 1)
Field units (operational response)
Police, Fire department, Ambulance Services, RPA (>=GRIP 0)
Action Center of the field units (>=GRIP 1)
Mayor (GVS leader)
Supporting staff of the municipality (>=GRIP 3)
Regional Policy Team Leader
Supporting staff of the region (GRIP 4)
Commissioner of the Queen
Provincial disaster management staff (GRIP 4)
Commissioner to the Queen
National crisis coordination center (NCC) (GRIP 4)
Political coordination Operational coordination
Figure 4-2: Coordination structure in Rotterdam-Rijnmond
Empirical foundation
99
The coordination structure in Figure 4-2 dictated all of the exercises in the Rotterdam-Rijnmond field studies. The structure complies with the recently intro-duced law on the Safety regions discussed in section 4.2. The fixed (regular) relief agencies involved in Rotterdam field studies included the police departments, the fire departments, the RPA, municipality officials, and the ambulance services in the region. The support staff in each decision making team consisted of subordinate officials with tasks such as information management, public relations and control room communication. The action centers of the field units are usually hosted in on-site physical containers, similar to the ones used by COPI. These action centers are also known as the ‘low control’ or action centers of the three major relief agencies (police, fire department and ambulance services) and serve as control rooms for the respective agency commanders after each COPI meeting.
Depending on the scenario trained, the multi-agency teams also include roles such as chemical/toxic advisers, representatives of nearby businesses, public infrastructure managers, and representatives of shipping/cargo companies in the region. During these meetings, the representatives of the various agencies take turn in sharing the information they have with the team. The team functions as a verbal pool of information. The following section elaborates on how information is man-aged within such teams.
4.3.2 Information management practices
Rotterdam-Rijnmond is one of the first safety regions in the Netherlands that em-ploys information managers for sharing situation reports between the multi-agency teams (ROT, GVS and COPI). When we conducted the field studies, the role of in-formation manager (IM) was still very basic: taking notes of the information shared in the decision-making rounds and sending these as situation reports to the other multi-agency teams. The role of IM was usually fulfilled by a police officer (in the COPI and ROT) or personal assistant of the Mayor (in the GVS) who had received some basic instructions on using CEDRIC, an application used form intra-team information sharing during disaster response. In 2008, CEDRIC replaced Multi-team for intra-agency information sharing. These applications provide a web-based template for sending situation reports and are operate by an Information Manager (IM). We elaborate on these applications in section 4.3.4.
Using the observation protocol (Appendix B), we found that some infor-mation needs and flows were common for each of the observed exercises, while other information needs only held for a specific exercise. Note that we did not study the various types of information that relief agencies need during disaster response. In order to develop such a categorization, we would have to study a wider range of disasters than we do in this dissertation. Instead, we have included a categorization provided in the ACIR investigation (ACIR, 2005) in our observation protocol. The following table outlines some of the information objects that were collected and shared during the observed training exercises.

Chapter 4
100
CoPI teams collaborate in face-to-face settings supported by relatively
sparse access to information sources. The main networks used are radio Porto phones and mobile phone networks that connect the different members of the team to their respective command and control centers. This is vulnerable and inefficient, access to information sources directly would allow for more rapid retrieval. Moreo-ver, the team leader often requested the team members to switch off all forms of voice communication during team meetings. This precaution avoids too much dis-traction and interruption of team meetings.
Besides the information needs listed above, we observed the need for vary-ing information during the disaster exercises in the Rotterdam harbor. Each sce-nario exercised brought its own disaster response challenges and generated differ-ent information needs in the multi-agency teams. We listed some of the main spe-cific information needs in the following table.
Table 4-5: Generic information objects shared during Rotterdam field studies
Category Description Examples
Object/source
information
Information pertaining the source of a
disaster, including the cause of events
Source of a fire, source of an
explosion, size of a building
Geographic
information
One of the first decisions relief agencies
make is to establish the disaster source
and affect area
Coordinates of a building,
buildings in the area, naviga-
tion routes
Victim and
bystander
information
One of the priorities of relief workers is to
rescue victims and secure the area. In
order to do so, relief workers need infor-
mation (e.g., numbers, location, state) on
victims and bystanders in the area
Number of deaths, number
of wounded, number of by-
standers
Hazards and
risks infor-
mation
The agencies responding to disasters cope
with “shared risk.” This information is
necessary in order to take precautions,
for instance, scale up the GRIP level
Amount of oil stored in
tanks, chemicals in a factory,
toxic level of a leaked gas
Weather
(meteo)
information
Depending on the type of disaster, infor-
mation on the weather conditions in the
area can influence both the disaster and
the response process
Wind speed, direction and
strength of the wind, hu-
midity, changes of rain
Plan-
information
Often, relief workers want to know which
plans (e.g., etc.) were already available.
Plans often form the basis of deploying
resources during the response process
Factory safety procedures,
contingency plans, guide-
lines, safety regulations,
evacuation plans
Capacity in-
formation
Information on the human and physical
resourced available, needed or already at
the disaster location
Number of officers, fire
trucks with foam tanks

Empirical foundation
101
Table 4-6: Scenario specific information needs
Scenario Specific Information needs
Gas Leak -Information on the people leading the unanticipated demonstration outside
the Unilever building.
-Information on the chemicals and their explosiveness stored in the factory
-Information on the barrels outside the area with presumed dangerous
chemical material in the area
Cruise
Ship
-Traffic information in the area as news on the royal family at the spot at-
tracted much attention.
-Update on the status of the evacuation of royal family
-Information on the blueprint of the ship and the location of the explosion.
-Information on surrounding hotels and hospitals in the area in order to allo-
cate the cruise ship passengers.
Ship
collision
-Two different coordinates of the ships were received in the collocated emer-
gency control rooms: which one was correct?
-Is there any oil spilled? How much and where?
-The details on the chemicals located in one of the ships: “are they flammable
or toxic?”
-How many members did the crews of both ships contain?
The focus of a CoPI team is to construct a joint operational picture and to
establish appropriate actions according to the constructed operational picture. The information manager is responsible for sharing the constructed operational picture with the other echelons (in case these are activated). Each team member has a mo-bile phone and some, e.g., chemical advisors carry books with them. The joint op-erational picture is codified in flip-overs attached to a wall. Detailed maps of the area are available in the local command center. Sometimes, team leaders post a list of actions that commanders should complete after the meeting. When resuming the meeting, some of the leaders systematically check mark the actions that were com-pleted. Figure 4-3 illustrates the IS architecture observed during the exercises in Rotterdam-Rijnmond. This figure shows the information flows between the various teams and ECC during disaster response. This figure also depicts the information sources available to each team.

102
GV
S
RO
T
CO
PI
A
ctio
n
Cen
ters
F
ield
un
its
Po
lice
Fie
ld
un
its
Fir
e-
dep
t.
Fie
ld
un
its
Med
.
serv
ices
Fie
ld
un
its
Po
rt
Au
tho
rity
Sit
ua
tio
n d
e-
pen
den
t se
r-
vic
es (
e.g
.,
ha
zma
t, A
rmy
) C
on
tro
l R
oo
m
inci
den
tal
ser-
vic
es
Proximity to incident site Near Far
Reg
ion
al
risk
s m
ap
s
A
gen
cy d
ata
-
ba
ses
Po
lice
dep
t.
Fir
e
dep
t.
Med
ica
l
serv
ices
Po
rt
au
tho
rity
Dy
na
mic
in
form
ati
on
so
urc
es
Sta
tic
info
rma
tio
n s
ou
rce
s
Co
-lo
cate
d E
mer
ge
ncy
Co
ntr
ol
Ro
om
Inco
min
g e
mer
ge
ncy
(11
2)
call
s
Tex
t
Co
nti
ng
ency
pla
ns
& p
roto
cols
Sit
rep
s
Fig
ur
e 4
-3:
Info
rm
ati
on
sy
ste
m a
rc
hit
ec
ture
in
Ro
tte
rd
am
-Rij
nm
on
d
Sit
rep
s
Chapter 4

Empirical foundation
103
Figure 4-4: Screenshot of the CEDRIC used in Rotterdam-Rijnmond
Figure 4-3 illustrates the IS architecture observed during the exercises in Rotterdam-Rijnmond. The ECC in the Rotterdam-Rijnmond region was among the first to combine the control stations of the police department, fire brigade, ambu-lance services and harbor police (RPA) in the same physical location (World Port Center). In spite of this, there is still no formal arrangement with regard to the co-ordination of cross-agency information flows in the control room. As a result, we found that little information was actually shared between the co-located ECC even though the control room facilities and infrastructure were being shared.
4.3.3 Multi-agency information management applications
Alongside the agency-specific IT applications, one IT application was dedicated for multi-agency information sharing between the autonomous agencies. This IT appli-cation is known as CEDRIC. CEDRIC is a Web-based communication tool that al-lows information managers to share situation reports about the disaster (in a mes-saging or e-mail style) in such a way that members of different echelons if activated can view it (COPI, ROT, GVS, GBT). In essence, CEDRIC is an extended mailing application that allows relief workers to e-mail situation reports across agencies. As such, the main functionality of this application is the generation, exchange and storage of situation reports across multiple teams. Other functionalities (some add-ed in later versions) include document storage, search (in the internal databases and phonebook), and area plot (map) viewing. Figure 4-4 illustrates the CEDRIC user interface.

Chapter 4
104
The screenshot illustrates a situation report in the CEDRIC application. This report can be printed and shared with other relief workers when necessary. Architects have organized CEDRIC similar to Microsoft Outlook with the active navigation panels on the left and the main panel at the center of the screen. On the left hand side of the screen, some of the functionalities of CEDRIC are displayed. The information manager is the only operator of the CEDRIC application in each multi-agency team. The purpose of the CEDRIC is to allow information managers to access, generate, store and send documents and messages across multiple teams on the strategic and tactical echelons. This application started bottom up as a pilot initiative of four municipalities surrounding the Harbor region. In fact, this appli-cation functions as a message and document library with mailing functionalities between the police, fire department, and medical services. This application not only allows situation report exchange, but also document exchange (like an e-mail sys-tem). An address book of participants (roles) is already part of the system and it is possible to send individual, group or broadcast messages. In latter versions of CEDRIC (version 2.0), a geographic plotting functionality was integrated, allowing the IM to view a dynamic map of the Harbor area.
The connection between the client (IM with touch screen laptop) and the server was established using a mobile connect UMTS data card. The connection allowed for a variable internet speed, varying between a maximum of 384 Kbps downlink, and 64 Kbps uplink. This connection was not always stable. In case of failure, the IM was unable to continue writing a situation report. We observed that some more experienced IM used Microsoft Word as a workaround for the connec-tivity problem. First, the IM typed a situation report in Microsoft Word, which did not need an internet connection. When they were done, they simply copy pasted their text into the appropriate fields of the CEDRIC situation report template.
4.3.4 Qualitative data: observed IQ and SQ issues
During the Rotterdam field studies, we observed several recurring IQ and SQ is-sues. For instance, the exact location of the disaster was often a point of discussion and confusion within the multi-agency teams. The commanders of the relief agen-cies often get the coordinates of the location via their agency operator in the ECC. We even observed two situations in which the commanders of the fire brigade, po-lice, and medical services all had three inconsistent coordinates of the disaster. Consequently, the information manager was forced to mention all three locations in the situation report. This issue was resolved by requesting the commanders to double-check the coordinates with their subordinates after the meeting.
Another often-occurring IQ issue is on the number of casualties. While the casualty count is something the commander of the ambulance services should be aware, we observed several cases in which the count was unavailable, outdated and incorrect. Regarding the SQ, the most occurring issue we observed was the high response time, defined as the delay between an information request and response. This was often the case for information that was beyond the reach of the infor-mation manager or the ECC. Examples include information about hazardous mate-rials stored in buildings, the cargo stored in specific containers and the blueprint of the area or ship. Occasionally we observed some infrastructure reliability issues causing CEDRIC to ‘hang’ and freeze the situation report typed by the information manager. A workaround used for this is typing the situation report in Microsoft Word and copy pasting the text in the online situation reporting software.

Empirical foundation
105
As stated in Chapter 2, the surveys also contained open questions regarding IQ and SQ experienced during the exercise. The following table outlines some of the translated examples of IQ and SQ issues provided by relief workers.
Table 4-7: IQ and SQ issues experienced by the relief workers
Statements provided by the relief workers IQ dimension SQ dimension
“there was no timely information sharing about affect-
ed area and dangers, including hazardous materials
and victims, we did not look further for missing per-
sons and just assumed that they would be on the ship”
Timeliness Accessibility,
Response time
“in the second exercise we did not know where the
rescue units were stationed”
Completeness Accessibility
“regarding the ship, we did not know about its size,
type, structure etc.”
Completeness Accessibility
“it often took too long before we found out which haz-
ardous materials we had to deal with”
Timeliness Response time
“the exact time at which the wind would turn against
us was unavailable” (scenario alpha)”
Completeness Accessibility
“there were different location maps circulating, which
led to confusion about the ship location and affected
area. After 3 meetings, we found the right location”
Consistency Interoperability
“for the common operational picture, it would be nice
if we could project a graphical image of the incident
starting the first COPI meeting. This would help form-
ing the first COPI team”
Format Interoperability
“we did not receive information about the hazardous
materials on time”
Completeness Response time
“all information should be verified before it is put into
CEDRIC”
Correctness -
“in most situations information access problems oc-
curred, However, I can not specify one immediately”
- Accessibility
“rapid escalation of the incident could barely be shared
with other agencies before the activation of the COPI”
Relevancy Interoperability
Table 4-7 lists some of the IQ and SQ issues experienced by the relief work-
ers themselves. Some of these are more related to CEDRIC and the information manager than others. The next section discusses the overall scores for the IQ and SQ as experienced by the relief workers.
4.3.5 Quantitative data: survey findings
While we used the first six series of exercises in Rotterdam-Rotterdam to obtain insights in the information system architecture and information management prac-tices, we used the second round of exercises to survey relief workers on their per-ceived IQ and SQ during the exercise. The survey employed includes the items for assessing IQ and SQ that we have discussed in Chapter 3. An overview of survey items can be found in Appendix-D. Note that the exact survey sent out was adapted
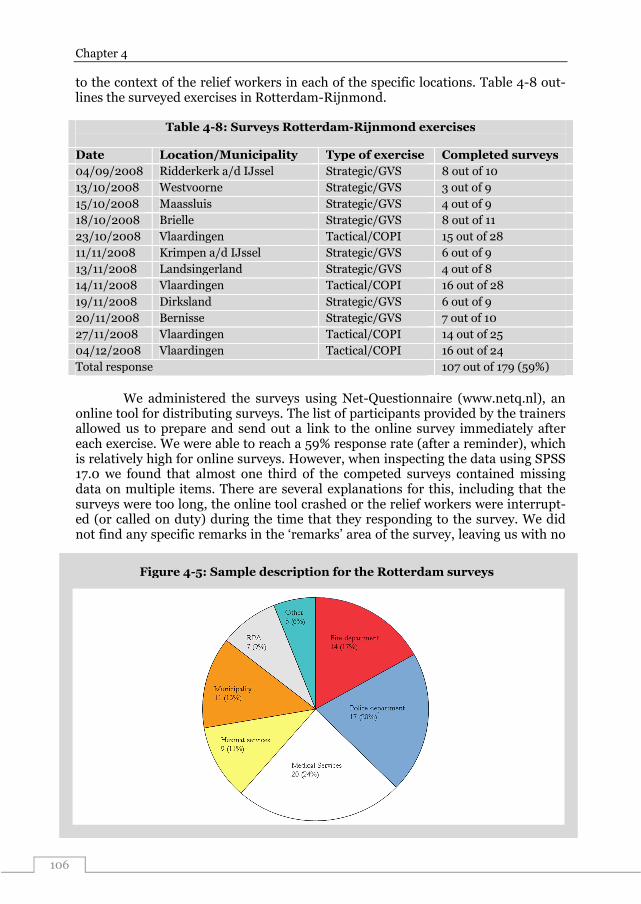
Chapter 4
106
Figure 4-5: Sample description for the Rotterdam surveys
to the context of the relief workers in each of the specific locations. Table 4-8 out-lines the surveyed exercises in Rotterdam-Rijnmond.
Table 4-8: Surveys Rotterdam-Rijnmond exercises
Date Location/Municipality Type of exercise Completed surveys
04/09/2008 Ridderkerk a/d IJssel Strategic/GVS 8 out of 10
13/10/2008 Westvoorne Strategic/GVS 3 out of 9
15/10/2008 Maassluis Strategic/GVS 4 out of 9
18/10/2008 Brielle Strategic/GVS 8 out of 11
23/10/2008 Vlaardingen Tactical/COPI 15 out of 28
11/11/2008 Krimpen a/d IJssel Strategic/GVS 6 out of 9
13/11/2008 Landsingerland Strategic/GVS 4 out of 8
14/11/2008 Vlaardingen Tactical/COPI 16 out of 28
19/11/2008 Dirksland Strategic/GVS 6 out of 9
20/11/2008 Bernisse Strategic/GVS 7 out of 10
27/11/2008 Vlaardingen Tactical/COPI 14 out of 25
04/12/2008 Vlaardingen Tactical/COPI 16 out of 24
Total response 107 out of 179 (59%)
We administered the surveys using Net-Questionnaire (www.netq.nl), an
online tool for distributing surveys. The list of participants provided by the trainers allowed us to prepare and send out a link to the online survey immediately after each exercise. We were able to reach a 59% response rate (after a reminder), which is relatively high for online surveys. However, when inspecting the data using SPSS 17.0 we found that almost one third of the competed surveys contained missing data on multiple items. There are several explanations for this, including that the surveys were too long, the online tool crashed or the relief workers were interrupt-ed (or called on duty) during the time that they responding to the survey. We did not find any specific remarks in the ‘remarks’ area of the survey, leaving us with no

Empirical foundation
107
clear indication what caused the missing data. After list-wise deletion, the total number of useful surveys for data analysis was reduced to 83.
Figure 4-5 shows that the majority of the 83 respondents to our online sur-vey were relief workers from the medical services. The second largest groups of re-spondents were police officers. The group of ‘other’ consists of respondents from the Department of Justice, National Army. The next subsection discusses how the data was prepared and analyzed.
4.3.5.1 Data preparation and reliability analysis
The data collected from the web surveys were prepared and analyzed in SPSS 17.0. The Netquestionaire tool provided us the data in a pre-structured format that we could import directly in SPSS. Since we used multiple items to measure a single construct, we were able to conduct a reliability analysis prior to calculating the av-erage scores and standard deviations (discussed in the next section). Table 4-9 out-lines the findings of the reliability analysis.
Table 4-9: Reliability analysis for Rotterdam survey items
Dimension IQ/SQ Items Cronbach’s α IQ_TIMELINESS IQ_TIMELINESS_A
IQ_TIMELINESS_B IQ_TIMELINESS_C_REC
.898
IQ_CORRECTNESS IQ_CORRECTNESS_A IQ_CORRECTNESS_B_REC (discarded) IQ_CORRECTNESS_A
.689
IQ_COMPLETENESS IQ_COMPLETENESS_A IQ_COMPLETENESS_B IQ_COMPLETENESS_C
.892
IQ_RELEVANCY IQ_RELEVANCY_A IQ_RELEVANCY_B IQ_RELEVANCY_C
.843
IQ_RELIABILITY IQ_RELIABILITY_A IQ_RELIABILITY_B IQ_RELIABILITY_C_REC (discarded)
.873
SQ_RESPONSETIME SQ_RESPONSETIME_A SQ_RESPONSETIME_B
.220
SQ_ACCESSIBILITY SQ_ACCESSIBILITY_A SQ_ACCESSIBILITY_B SQ_ACCESSIBILITY_C SQ_ACCESSIBILITY_D
.812
SQ_SATISFACTION SQ_SATISFACTION_A SQ_SATISFACTION_B
.761
SQ_FLEXIBITY SQ_FLEXIBITY_A SQ_FLEXIBITY_B SQ_FLEXIBITY_C (discarded)
.556
SQ_RELIABILITY SQ_RELIABILITY_A (discarded) SQ_RELIABILITY_B_REC SQ_RELIABILITY_C_REC
.637
Table 4-9 presents the values for the Cronbach’s Alpha, which is a measure
for the internal reliability of a scale used for each construct. Note that this table does not include the constructs that we measured using one item (i.e., IQ overload,

Chapter 4
108
Figure 4-6: Information quality assessment for the Rotterdam-Rijnmond field study (n=83)
IQ consistency). In addition to the Cronbach’s Alpha value for each construct, the SPSS Statistics Syntax editor provides some suggestions for enhancing the Cronbach’s Alpha by discarding one or more items. The items we discarded in or-der to obtain a higher Cronbach’s Alpha are labeled with ‘discarded’ in the table. George and Mallery (2003) suggest that the following norms for interpreting the Cronbach’s Alpha coefficient: > 0.9 is considered: excellent; > 0.8: good; > 0.7: Ac-ceptable; > 0.6: questionable; > 0.5: meager, and < 0.5: unacceptable. Note that these norms assume a large data set (over 100 cases), whereas our data set contains 83 cases. Considering the norms, the Cronbach’s Alpha for SQ_RESPONSETIME is definitely unacceptable, pointing towards a low internal reliability for this con-struct. The second Cronbach’s Alpha that raises some concerns about the items we used is the Cronbach’s Alpha for the SQ_FLEXIBILITY (.556), which we interpret as meager, even when deleting SQ_FLEXIBILITY_C. The remaining constructs have an ‘acceptable’ or even ‘good’ Cronbach’s Alpha (in some cases after one of the item scales is discarded). The following section discusses the IQ and SQ averages, after the items that reduced the scale reliability were discarded.
4.3.5.2 IQ and SQ averages
As part of the field study in Rotterdam-Rijnmond, we requested the participants of the training exercises to rate the IQ and SQ experienced during the exercise. Using three different questions (formulated as propositions) for each IQ and SQ dimen-sion, we asked the relief workers to indicate the level of quality on a 7-point Likert-Scale. When analyzing the data, we were particularly interested in the average mean and standard deviation for each of the IQ and SQ dimensions. The following graph provides the scores for the different IQ dimensions throughout the field studies in Rotterdam-Rijnmond. Note that each IQ dimension was measured using three questions.

Empirical foundation
109
Figure 4-7: System quality assessment for the Rotterdam-Rijnmond field study (n=83)
The average scores presented in the figure above indicate that the relief workers perceived the overall quality of information as ‘moderate’ with the excep-tion of the understandability of information (low score). The highest score we can deduce from the data is that for the relevancy of information (5,14): relief workers perceived the information provided to them (either via the ECC or IM) as fairly rel-evant for their tasks. Figure 4-6 also shows that information overload (too much information) was not a problem for the relief workers, even though the standard deviation was over 1,3. The standard deviation of the consistency of information seems to be the largest from this data set (1,54), while the respondents seem to dis-agree less on the mean for the timeliness of information. The following figure out-lines the average score for the information system quality in the Rotterdam-Rijnmond field study.
The average scores in Figure 4-7 indicate that there are some differences
for the perceived system quality among the relief workers. While relief workers per-ceived the accessibility of information as moderate, the response time was rated relatively poor (3,53). This indicates that while information was generally available via the IM or ERC, it sometimes took too long before relief workers received this information. Note that the standard deviations for both the response time (1,84) and accessibility (1,35) dimensions are relatively high. Figure 4-7 indicates a rela-tively low score for the satisfaction with the information system.
Note that the IM and ECC were included as elements of the information sys-tem in the questions provided to the relief workers. Generally, the surveyed relief workers were not satisfied about the performance of the IM and ECC in terms of information collection and sharing. Finally, relief workers find the flexibility of the information system to be relatively low (3,39), even though the standard deviation for this dimensions is very high (2,07). When we consider one of the propositions

Chapter 4
110
presented to the relief workers on the flexibility of the information system (the in-formation system also provided me with information that were beyond my regular information needs), we can conclude that the information system in Rotterdam-Rijnmond failed in this respect.
4.4 Field study #2: VIKING
The Gelderland-Zuid Safety Region in the Netherlands was our second field study. We observed three ROAR exercises of the VIKING program, cross-border collabo-ration between the Netherlands and Germany. These exercises aimed to prepare multiple relief agencies on both sides for a flood in the region. In contrast to the training exercises in the Rotterdam-Rijnmond field study, the ROAR program in-cluded three consecutive disaster response exercises, including the training of first responders (field units) echelon, the operational echelon and the strategic (policy) echelon. Figure 4-8 visualizes the exercise echelons we observed.
The studied exercises (labeled ROAR) took place in spring 2008 as a part
of Program VIKING, an international flood/high-water management project be-tween the Netherlands and Germany. Together the province of Gelderland (the Netherlands) and the province of Nordrhein-Westfalen (Germany) designed and hosted these exercises. The risk of major flooding is particularly high in two prov-inces where the Rhine River flows through Germany into the Netherlands. The ex-plicit goals of the exercises, as formulated by the exercise leader, were to improve multi-agency collaboration between DM agencies on different echelons of response (i.e., strategic, tactical, and operational), information sharing between the Dutch and German DM agencies, information provisioning to the operational units during floods, and skills in using IS for flood control.
The exercise participants were required to respond to a disaster situation as specified in a scenario. Trainers had written the scenario in script format. Partic-ipants were stimulated to act via personalized (role specific) instructions and short
Strategic echelon (Decision-making)
Regional operational echelon (Information sharing en coordination)
Field unit echelon (Operational response)
April 24, 2008
April 17, 2008
April 10, 2008
Figure 4-8: Exercise echelons in the Gelderland field studies

Empirical foundation
111
messages during the exercise. The scenario simulated a GRIP 4 level disaster, which is the highest-level disaster according to the Dutch classification system (see section 4.1). The scenario contained multiple incidents including dike breaks along-side the Rhine River and a shipwreck spilling unknown toxic chemicals into the river. Trainers underlined the level of uncertainty into the scenario by including an unknown number of civilians and livestock present in the area as well as the time it would take before the entire region would be flooded. The first exercise was for field units primarily focusing on operational echelon response activities. The next exercise was the tactical echelon, which picked up where the field units (operational echelon) left off.
Finally, the strategic echelon exercise picked up where the tactical echelon left off. Hence, the trainers used the information output of each exercise as input for the next higher echelon in the exercise. In this way, each exercise was depend-ent on the information provided by the preceding one. During each exercise, the trainers also provided counter play to the echelon in training. For example, during the training of the tactical echelon, the counter play communicated decisions of the strategic echelon and information needs of the operational echelon. The exercise participants were not familiar with the exercise plot. They took the exercise serious-ly and were committed to achieve the exercise goals even though they knew a real disaster situation might develop in a completely different way.
We collected data by observing how relief workers use information systems and how relief agencies share information for decision-making. The second in-strument is document analysis (prior to and after the exercises). Using reports on the exercise setting, objectives, IT applications, and participating agencies we were able to generate a field study protocol prior to the observations (see Appendix-B). In addition, we used some of these documents to triangulate the findings from the observations. The third research instrument is a survey that we administered dur-ing an exercise of the tactical echelon.
Generally, the disaster response exercises are not evaluated immediately after the exercise, apart from a collective briefing (not more than 5-10 minutes) in which the chiefs of the participating agencies reflect on the exercise. In our view, this evaluation approach is necessary but does not result in a more detailed under-standing of the hurdles for IQ and SQ. Moreover, the briefing process is generally quite diverging in nature and the majority of participants do not get an opportunity to reflect on the exercise. Hence, we proposed to hand out a short one-page survey, specifically on IQ and SQ issues.
4.4.1 Actors and coordination structure
This section focuses on actors and coordination structure the operational level of disaster management. Hence, this chapter continues with a detailed elaboration of the tactical echelon exercise. Since we were not able to collect data from the Ger-man side of the exercise, we focus on the Dutch coordination structure. The follow-ing schema represents the coordination during the operational level exercise.

Chapter 4
112
The coordination structure during the VIKING exercise emphasizes the
role of the Water boards and Rijkswaterstraat in the disaster response process. This is due to the high risk of major flooding in the Gelderland region. In addition, the municipal crisis coordination staff and the municipal crisis management teams also play an important role. In this field study, we focus on the Regional Operational Team (ROT). The following table outlines the type and number of relief agencies observed in the tactical level exercise.
Table 4-10: List of agencies participating in the disaster response exercise Disaster management agency Participants #
Fire department 9
Police department (plotters) 4
Police department 6
Municipality services 4
Fire department 5
Ambulance services 5
Regional flood control board 6
Public Relations, Press 5
National army 1
National water management institute (Rijkswaterstaat) 3
Exercise organization 3
Total 51
Regional policy team
Emergency Re-sponse Center
COPI
Rijskwaterstaat
Municipal crisis coordination staff
Water boards
Regional Operational Team
National Coordi-nation Centre
Municipal crisis
management team
Figure 4-9: Coordination structure in the Gelderland field studies
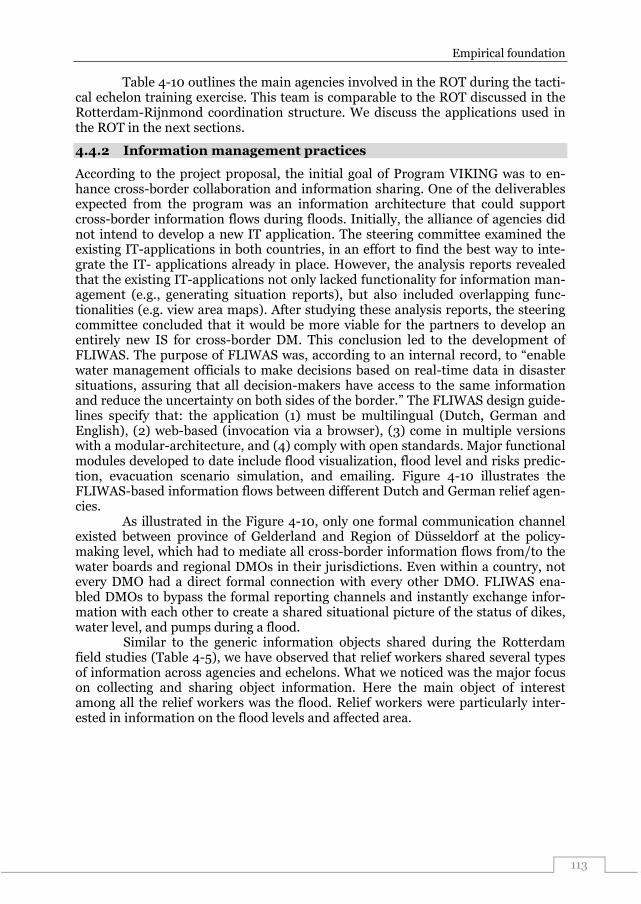
Empirical foundation
113
Table 4-10 outlines the main agencies involved in the ROT during the tacti-cal echelon training exercise. This team is comparable to the ROT discussed in the Rotterdam-Rijnmond coordination structure. We discuss the applications used in the ROT in the next sections.
4.4.2 Information management practices
According to the project proposal, the initial goal of Program VIKING was to en-hance cross-border collaboration and information sharing. One of the deliverables expected from the program was an information architecture that could support cross-border information flows during floods. Initially, the alliance of agencies did not intend to develop a new IT application. The steering committee examined the existing IT-applications in both countries, in an effort to find the best way to inte-grate the IT- applications already in place. However, the analysis reports revealed that the existing IT-applications not only lacked functionality for information man-agement (e.g., generating situation reports), but also included overlapping func-tionalities (e.g. view area maps). After studying these analysis reports, the steering committee concluded that it would be more viable for the partners to develop an entirely new IS for cross-border DM. This conclusion led to the development of FLIWAS. The purpose of FLIWAS was, according to an internal record, to “enable water management officials to make decisions based on real-time data in disaster situations, assuring that all decision-makers have access to the same information and reduce the uncertainty on both sides of the border.” The FLIWAS design guide-lines specify that: the application (1) must be multilingual (Dutch, German and English), (2) web-based (invocation via a browser), (3) come in multiple versions with a modular-architecture, and (4) comply with open standards. Major functional modules developed to date include flood visualization, flood level and risks predic-tion, evacuation scenario simulation, and emailing. Figure 4-10 illustrates the FLIWAS-based information flows between different Dutch and German relief agen-cies. As illustrated in the Figure 4-10, only one formal communication channel existed between province of Gelderland and Region of Düsseldorf at the policy-making level, which had to mediate all cross-border information flows from/to the water boards and regional DMOs in their jurisdictions. Even within a country, not every DMO had a direct formal connection with every other DMO. FLIWAS ena-bled DMOs to bypass the formal reporting channels and instantly exchange infor-mation with each other to create a shared situational picture of the status of dikes, water level, and pumps during a flood.
Similar to the generic information objects shared during the Rotterdam field studies (Table 4-5), we have observed that relief workers shared several types of information across agencies and echelons. What we noticed was the major focus on collecting and sharing object information. Here the main object of interest among all the relief workers was the flood. Relief workers were particularly inter-ested in information on the flood levels and affected area.
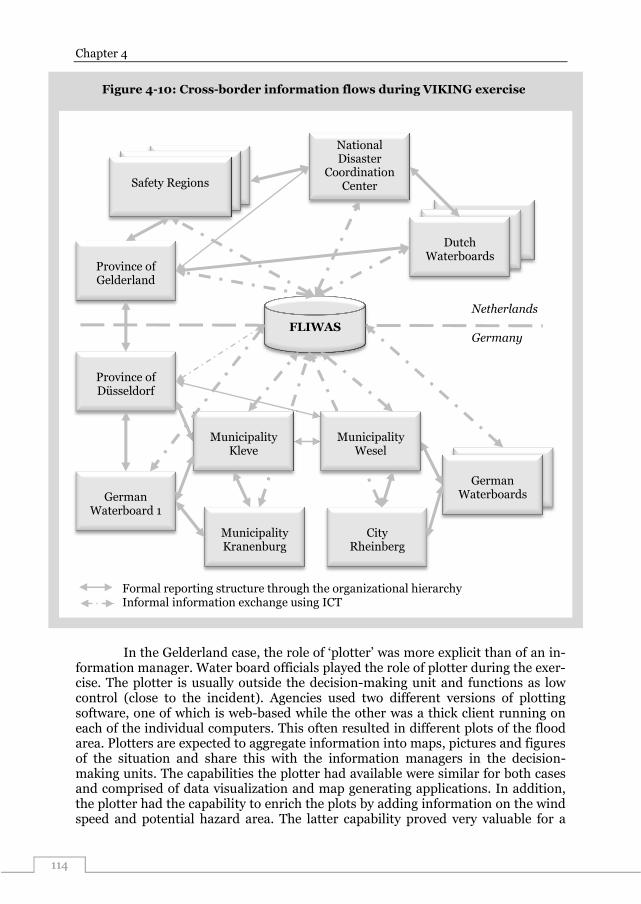
Chapter 4
114
In the Gelderland case, the role of ‘plotter’ was more explicit than of an in-
formation manager. Water board officials played the role of plotter during the exer-cise. The plotter is usually outside the decision-making unit and functions as low control (close to the incident). Agencies used two different versions of plotting software, one of which is web-based while the other was a thick client running on each of the individual computers. This often resulted in different plots of the flood area. Plotters are expected to aggregate information into maps, pictures and figures of the situation and share this with the information managers in the decision-making units. The capabilities the plotter had available were similar for both cases and comprised of data visualization and map generating applications. In addition, the plotter had the capability to enrich the plots by adding information on the wind speed and potential hazard area. The latter capability proved very valuable for a
Safety Regions
FLIWAS
Netherlands
Germany
Dutch
Waterboards Province of Gelderland
National Disaster
Coordination Center
Formal reporting structure through the organizational hierarchy Informal information exchange using ICT
Province of Düsseldorf
German
Waterboard 1
German
Waterboards
Municipality Kranenburg
City
Rheinberg
Municipality
Kleve
Municipality
Wesel
Figure 4-10: Cross-border information flows during VIKING exercise

Empirical foundation
115
number of the exercises in Gelderland, were the commanders of the relief agencies needed to develop a common operation picture on the area that would be flooded.
In Gelderland, the decision-making unit on the strategic level did have two beamers that could project plots and situation reports on the wall. This capability allowed the chair to structure the information sharing process according to the plots and situational information and synchronize the situational awareness of the agency commanders. In the back-office, we did observe some problems with syn-chronizing the situation reports on the central beamers in the room. The reason for this is that the same information manager who was responsible for situation report generation in the front office (during the decision-making rounds) was responsible for updating the situation report on the shared screen in the back office. Because of time pressure and task-overload, this information did not change the situation re-port in the back office. After a while, the agents in the back office did not look at the screens, as they knew the information it displayed was outdated. This lack of capa-bility hampered the creation of shared awareness in the back office.
4.4.3 Multi-agency information management applications
In contrast to the Rotterdam-Rijnmond field studies, the Gelderland training exer-cises included three different applications for multi-agency information sharing. All of the participants of this exercise made use of one of the four applications for mul-ti-agency information sharing, which was not the case in the other exercises. The following table provides a brief description of these IT-applications.
Table 4-11: Overview of IT applications used for multi-agency information management
Application Purpose and functionalities
CCS
Relief workers could use CCS for messaging and situation report commu-
nication. This application is a customized version of Microsoft Groove. We
observed that some relief workers also refer to this application as “sittext”,
which is short for text on the situation. Only the information manager can
edit and share information using CCS.
ARCmap In order to visualize geographic information, ARCmap is used. The main
result of this application is also referred to as sitplot. There are multiple
versions of this application used. The latest version (1.0) used in Gelder-
land Zuid is web-based and the previous version used in Gelderland Mid-
den (0.9) is stand-alone (running on the client machine).
FloodAtlas This stand-alone application allowed agencies to simulate flooding and
waterlevels and project this information on various maps of the region.
FLIWAS
Flood Information and Warning System (FLIWAS) is a high water infor-
mation application build from Dutch German cooperation and is funded by
the EU. The purpose of this application is to optimize the exchange of in-
formation during (threatening) high water situations within and between
water management and calamity management organizations. This applica-
tion is build using generic components (e.g. communication with data-
bases, internal and external communication, import provider, plan module
and web mapping). Relief agencies employed multiple versions during the
exercises, including FLIWAS-Light and FLIWAS comfort.

Chapter 4
116
Figure 4-11: Screenshot of the FLIWAS application (light version)
It is no exception that emergency responders interact with multiple ITs, di-rectly or indirectly through an intermediary (e.g., dedicated operator). Such ITs are often developed by different disaster management application development initia-tives, and some of the ITs may be integrated, redeveloped, and/or repackaged later by another initiative, making it very difficult to draw a clear boundary of IS in a DM situation. However, from an insider’s perspective any IT supported in a disaster management situation was perceived as a part of a disaster management infor-mation system. For this particular PSN, a disaster management information system is an ad hoc combination of IT applications providing functionalities such as flood simulators, messaging, document sharing applications, geographical maps, etc. In order to provide a common reference frame, we listed the names of the four main IT applications supported in the exercise (FLIWAS, ARCmap, CCS and Floodatlas) at the beginning of the questionnaire. We asked respondents to indicate each of the IT-applications they used and/or name the application if it was not one of the ma-jor applications listed.
The screenshot above illustrates some of the functionalities of the FLIWAS
application for cross-border information sharing. Functionalities include flood monitoring, situation report generation, and sharing attachments (e.g., documents, photos etc.). Similar to CEDRIC, the mailbox section of FLIWAS follows a Mi-crosoft Outlook design. Note that the depicted FLIWAS version is the web-based ‘light’ version of this application. The original version needs to be pre-installed on the user desktop or laptop.

Empirical foundation
117
4.4.4 Qualitative data: observed IQ and SQ issues
Regarding the motivation to use one of the four IT-applications, the effects of task support and the group value were evident in interview responses, although the strong mediating effect of the attitude concept (i.e., user satisfaction) was not obvi-ous. For example, we observed that some exercise participants who were expected to share information using FLIWAS did not do so. When asked why, they often re-sponded, “I have a lot of other stuff to worry about and do not see the direct ad-vantage of using FLIWAS for my own tasks.” On the other hand, some frequent us-ers of FLIWAS indicated that they used this application because “the system might contain valuable information for our [the participant’] organization and our col-leagues on the other side of the border might need the information we have.” The interviews with the exercise leaders and information system architects were very helpful in understanding the design principles and roles of information technologies in cross-border disaster response. As mentioned earlier, Program VI-KING aimed to improve emergency responses to large-scale floods that often span across the Dutch-German border. Consequently, most ROAR exercise participants shared the idea that helping others in the larger community of same faith is helping themselves. An IS architect emphasized this as “Cross-border crisis management requires collaboration of several relief agencies from both countries. … It has been two years since we have developed an IT application (i.e., FLIWAS) that can sup-port relief agencies collaborating on both sides of the borders.” Nevertheless, need for and capability of an IT application do not guarantee acceptance, especially in a time crunching, life-threatening situation. As this architect noted “Each of these [participating] relief agencies has its own preference for using a specific IT applica-tion [for its own responsibilities], and it is difficult to enforce a single standardized application.” An exercise leader also added, “Despite the expected value of FLIWAS for the participating agencies, we still need to gain the support of policy makers and individual emergency responders in utilizing FLIWAS for cross-border information sharing. These cross-border exercises are meant to demonstrate the value to the disaster management community [around the flood-prone region].” Some other interviewees also pointed out that it was far more difficult to encourage the tactical and operation level emergency responders to use FLIWAS because they usually have limited scope and understanding of the situation. One respondents complained, “They [tactical & operational level emergency responders] only focus on intra-organization information sharing instead of inter-organizational or cross-border,” even though their commanders on both sides acknowledged the value of using FLIWAS.
As observers we found that the most visible IQ issue was the inconsistency of information shared using the various applications (i.e., FLIWAS, CCS, ARCmap). Since relief agencies were allowed to use their own IT applications for intra-agency information management while also using of FLIWAS, CCS or ARCmap for inter-agency information sharing, multi-channel management was a major challenge. Often, the inconsistencies of information in the various systems was only apparent during the ROT team meetings, after which each commander returned to the sta-tions with either request for medications (in the existing dataset) or clarifications (e.g., where exactly is the ship located?).
Another IQ issue we observed was the outdated information on the central screen in the ROT. The person responsible for depicting the most recent (updated) situation report on this screen was busy with other tasks. While several relief work-

Chapter 4
118
Figure 4-12: Sample description for the Gelderland surveys
ers did consult the situation report at the start of the training exercise, the number of views gradually reduced after relief workers started to understand that the in-formation was outdated. Regarding the SQ, the most pressing issue we observed was the accessibility of information about the hazardous cargo of the ship. Since it was an international ship, it was difficult for the relief agency commanders to get access to the cargo registration list of this ship. Consequently, some decisions re-garding the evacuation of residents near the river (in case of toxic gases) were re-currently delayed due to the lack of information. Finally, we observed some minor start-up issues for FLIWAS and ARCmap.
4.4.5 Quantitative data: survey findings
Immediately after the exercise, we requested the still present relief workers to fill in a survey. We obtained a 90% response, as almost 47 of the 51 relief workers partici-pated in the survey. The following pie chart shows the DM agencies and the num-ber of emergency responders from each of the agencies participated in the surveyed (tactical echelon) exercise.
The majority of participants in the ROT exercise were from the regional po-
lice department. The second largest group of participants represented the regional fire department. One representative of the national army was also present. In total 46 out of the 51 participants responded to our short paper survey. This high re-sponse rate (90%) was because the exercise organizers encouraged the participants to fill in the surveys on our request. Similar to the survey administrated in the Rot-terdam-Rijnmond field studies, we formulated questions as propositions regarding the IQ and SQ experienced during the exercise. In contrast to the Rotterdam-Rijnmond surveys, the surveys we used here only included one item per construct (as opposed to three). The main reason for this is that the exercise organizers in-
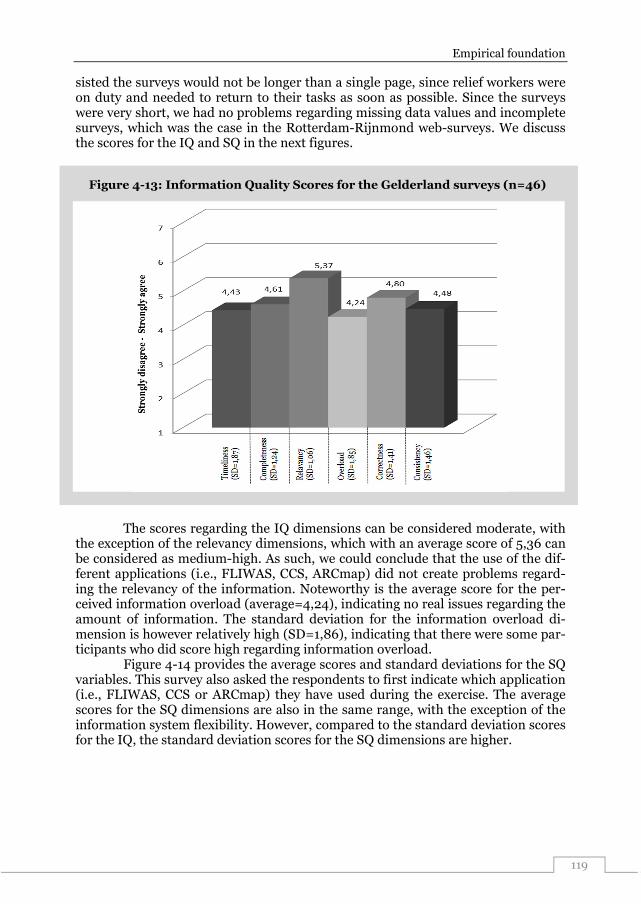
Empirical foundation
119
Figure 4-13: Information Quality Scores for the Gelderland surveys (n=46)
sisted the surveys would not be longer than a single page, since relief workers were on duty and needed to return to their tasks as soon as possible. Since the surveys were very short, we had no problems regarding missing data values and incomplete surveys, which was the case in the Rotterdam-Rijnmond web-surveys. We discuss the scores for the IQ and SQ in the next figures.
The scores regarding the IQ dimensions can be considered moderate, with
the exception of the relevancy dimensions, which with an average score of 5,36 can be considered as medium-high. As such, we could conclude that the use of the dif-ferent applications (i.e., FLIWAS, CCS, ARCmap) did not create problems regard-ing the relevancy of the information. Noteworthy is the average score for the per-ceived information overload (average=4,24), indicating no real issues regarding the amount of information. The standard deviation for the information overload di-mension is however relatively high (SD=1,86), indicating that there were some par-ticipants who did score high regarding information overload.
Figure 4-14 provides the average scores and standard deviations for the SQ variables. This survey also asked the respondents to first indicate which application (i.e., FLIWAS, CCS or ARCmap) they have used during the exercise. The average scores for the SQ dimensions are also in the same range, with the exception of the information system flexibility. However, compared to the standard deviation scores for the IQ, the standard deviation scores for the SQ dimensions are higher.

Chapter 4
120
Figure 4-14: System Quality Scores for the Gelderland surveys (n=46)
Figure 4-14 allows us to conclude that the participants were satisfied with the applications they have used (average: 4,72) and found the respective applica-tions very useful in supporting their tasks (average=5,13). The average score for the information system flexibility is relatively low (average=3,43), indicating that the application used could not sufficiently provide information which was not antici-pated beforehand. In addition, the standard deviation for this dimensions is rela-tively high (SD=1,75), indicating some spread in the scores of the participants. Since we only used one item per construct in the survey for this field study, we were unable to conduct a reliability analysis.
4.5 Field study #3: Delfland
Our third and final field study entails the management of information within a sin-gle agency during a disaster. We observed a full day exercise at the Hoogheemraadschap Delfland (HHD), which is the water management board in the The Hague region. The exercise we observed took place on March, 25th, 2010 in Delft and was titled “Waterbreuk”, indicating the effects of a flood in the densely populated Delft area. This exercise involved 40 participants, the majority of which were on duty during the exercise. The main goals of this exercise were to train the response procedures of the HDD and information management within the agency. Particularly, this exercise caught our attention since the HHD does not employ electronic information systems for disaster response. Instead, the HHD employs traditional means such as whiteboards and paper based situation reports for intra-agency information sharing. Similar to the previous two field studies, we had built up a mutually beneficial relationship with the exercise leaders, enabling us to col-

Empirical foundation
121
lect data in exchange for our findings. We discuss the actors and coordination structure during this exercise next.
4.5.1 Actors and coordination structure
The exercise included 41 players (31 participants and 10 counter players). In the counter playing teams, individuals push information to the actual participants by representing the outside environment. The majority of participants were active in the supporting sections of the HHD. The supporting sections represented specific departments, each responsible for a different aspect of water management, includ-ing water filtering and infrastructure maintenance. Noteworthy was that as a water management agency, the HDD followed a somewhat different disaster coordination structure than the GRIP structure discussed in section 4.1.
The coordination of actors during this exercise was similar to the ones in the previously mentioned exercises. Again, trainers simulated three echelons of decision-making: the strategic, tactical, and operation echelon. Figure 4-17 illus-trates these echelons.
Relief workers Counter play
Policy team (4 persons)
Operational team
(6 persons)
Operational response
(2 persons)
Strategic response (2 persons)
Supporting sections (21 persons)
Press & Media (3 persons)
Field Units (3 persons)
OL VL
WK ZB VW
DF
Figure 4-15: Actors and coordination structure in HHD exercise

Chapter 4
122
Figure 4-16: Information flows in HHD exercise
Supporting sections (21 persons)
OL VL
WK ZB VW
DF
During disasters, the response structure of the HHD is dictated by three coordination levels: 1, 2, and 3. Basically, these numbers represent the echelon that needs to be activated in order to combat the effects of an incident. In level 1, the supporting sections lead the response, in level 2 the operational team leads the re-sponse and in level 3 the policy team leads the response. Nevertheless, the trainers also explained the GRIP levels in a presentation prior to the exercise. It seems that both coordination structures exist and are used, 3 levels for intra-agency coordina-tion and GRIP for interagency coordination.
4.5.2 Information management practices
The information flows during the exercise were in accordance with the coordina-tion structure depicted in figure 4-18. The decision-making teams sat in three sepa-rate rooms in the same building. The majority of participants active in the support-ing sections sat in the main room. The following figure outlines the information flows in the HHD exercise.
The HHD also uses situation reports (similar to Rotterdam-Rijnmond) to
share information between the echelons. In addition, the policy team and the oper-ational team regularly met during the exercise in order to share information and make decisions on combating the flood. Each team included someone who used a
Situation reports
Information coordinator
Situation reports
Separate rooms
Information flows
Policy team
Operational team
Whiteboards (5x)

Empirical foundation
123
Figure 4-17: Whiteboards for information management
laptop for developing a situation report. The assistance in each echelon generated situation reports on a laptop and emailed these to the assistants in the other eche-lon. Since most of the members did not have the means to check their email during the exercise, assistants often printed situation reports on paper and handed these to the other members of their team. The main room contained five large white-boards for inter-departmental information management. The following picture (Figure 4-17) gives an impression of the whiteboards used during the exercise. The structure of the whiteboards contained a comprehensive categorization of infor-mation and action, more than what we have observed in the Rotterdam and Gelder-land field studies. Similar to the generic information objects shared during the Rot-terdam field studies (Table 4-5), we have observed that these whiteboards included several types of information across departments. While we again noticed the focus on collecting and sharing object information (object here is flood), the whiteboards also contained much risk-objects and planning information.
In total, exercise trainers employed five whiteboards for information man-
agement. The trainers had numbered the whiteboards and predefined categories for information posting. Even though the whiteboards functioned as inter-departmental information system, they provided no (active) functionality beyond the presentation of information posted by the operator. Only one specific role, the ‘information coordinator’ (IC) was allowed to manage information using the white-boards. This means that IC was the only relief worker allowed to add or remove information from the whiteboards. Naturally, the handwriting of the IC was not clear to everyone. The IC had several colored whiteboard markers to his disposal

Chapter 4
124
and started the exercise with the intention to use a different color marker each time he would write new information in the same category. The idea here is that the use of different colors would highlight new from old information.
4.5.3 Qualitative data: observed IQ and SQ issues
During the HHD field study, we also observed several IQ and SQ issues. First, there was the repeating issue of understandability regarding the text posted on the whiteboards (see figure 4-19). This issue refers to the format of information, as an IQ dimension. Sometimes two or three relief workers actually stared at the whiteboards for several minutes trying to figure out what the IC had written. A se-cond issue we noticed was the inconsistency between the situation reports distrib-uted between the teams. While some of the supporting sections did have some kind of template for typing situation reports (in Microsoft Word), other sections started from scratch. As a resulted, we observed that the situation reports shared contained different fields of information.
Another issue we observed was the role of the IC. The IC had an assistant, called the ‘assistant information coordinator’. This role is supposed to aid the IC in his tasks. However, throughout the exercise we did not observe much interaction between the IC and his assistant. Moreover, we observed that the IC was often in discussion with the leaders of the different supporting sections. As a result, we ob-served a steady reduction in the addition of information on the whiteboards. This also led to some problems regarding the timeliness of the information on the whiteboards: is the information posted an hour ago still up-to-date? Similar to the field studies in Rotterdam, we were also able to survey relief workers to state what kind of IQ and SQ issues they experienced during the exercise. The following table outlines some of these IQ and SQ issues. We translated these statements from Dutch to English without any modifications to their original meaning.

Empirical foundation
125
Table 4-12: IQ and SQ issues experienced by the relief workers
Statements provided by the relief workers IQ dimen-sion
SQ dimen-sion
“it was not clear to me to whom to send the information that I possessed”
Relevancy Interoperability
“it was not clear who the right contact points in the sup-porting sections were”
- Accessibility
“we need to verify and validate our situation reports in order to be clear on what has been decided and what is pending”
Correctness -
“it was unclear when an what new information was posted on the whiteboards”
Timeliness -
“the whiteboards were not user friendly. The text was too small difficult to understand”
Format User-friendliness
“we need better geographic information tools and facili-ties”
Format Interoperability
“our section leader was too caught up in all kinds of meet-ings. As a result, our team lacked information”
- Response time
“there was some confusion about the GRIP level (1 or 3) and the delayed reaction from the operational and policy team made the situation even worse”
Consistency Interoperability
“we did not share sufficient information within our team” Amount - “some frequently asked questions demanded more time for answering them”
- Response time
“some questions were hanging for too long and were ever answered”
- Response time
“there was some confusion regarding the communication stop to the press and our organization’s strategy on deal-ing with this”
Consistency Interoperability
“the information coming from the operational team and policy team should have reached us faster”
Timeliness Response time
“it was unclear on the whiteboards what the messages were, what the questions were and what the instructions were”
Format User-friendliness
“we experienced some difficulties in dealing with new information coming from the operational team and policy team”
Timeliness Response time
“we had to wait to long for some input and output regard-ing the Q&A section of our website”
Timeliness Response time
“i had to share information much quicker, including the provision of some answers to the questions of some of my colleagues”
Timeliness Response time
“the information coordinator went beyond his role….he started giving instructions and asked some questions”
Completeness -
“the situation reports did not include the most recent in-formation because the situation reports were send too late”
Timeliness Response time
“much information was too difficult to access, for instance about the dikes”
Completeness Accessibility
The table above lists some of the IQ and SQ issues experienced by the relief
workers themselves. Some of these are more about the whiteboards and infor-

Chapter 4
126
mation coordinator (IC) compared to others. We also see some issues regarding the unclear text on the whiteboards and the situation reports we mentioned earlier. The next section presents the overall scores for the IQ and SQ as experienced by the relief workers.
4.5.4 Quantitative data: survey findings
Similar to the Gelderland field study, exercise trainers allowed us to distribute pa-per-based surveys immediately after the exercise. The actual participants of the exercise and not the counter playing roles completed the surveys. This reduces our sample to 31 participants. We received 24 completed surveys, leveraging a response rate of 77%. Since the exercise organizers did not specifically request us to reduce our survey to a certain page length, we were again able to use three items for some of the constructs. We discuss the preparation and reliability of these items in the next subsection.
4.5.4.1 Data preparation and reliability analysis
The data collected from the paper surveys were prepared and analyzed in SPSS 17.0. Since we used multiple items to measure a single construct, we were able to conduct a reliability analysis prior to calculating the average scores and standard deviations (discussed in the next section). The following table outlines the findings of the reliability analysis.
Table 4-13: Reliability analysis for HHD survey items
Dimension IQ/SQ Items Cronbach’s α IQ_TIMELINESS C_IQ_TIMELINESS_A
C_IQ_TIMELINESS_B_REC C_IQ_TIMELINESS_C_REC
.788
IQ_CORRECTNESS C_IQ_TIMELINESS_A C_IQ_CORRECTNESS_B_REC C_IQ_CORRECTNESS_C_REC
.789
IQ_COMPLETENESS C_IQ_COMPLETENESS_A C_IQ_COMPLETENESS_B_REC C_IQ_COMPLETENESS_C_REC
.803
IQ_OVERLOAD C_IQ_OVERLOAD_A C_IQ_OVERLOAD_B_REC C_IQ_OVERLOAD_C (discarded)
.471
IQ_RELEVANCY C_IQ_RELEVANCY_A C_IQ_RELEVANCY_B_REC C_IQ_RELEVANCY_C_REC
.736
IQ_CONSISTENCY C_IQ_CONSISTENCY_A C_IQ_CONSISTENCY_B_REC C_IQ_CONSISTENCY_C_REC
.845
SQ_RESPONSETIME D_SQ_RESPONSETIME_A D_SQ_RESPONSETIME_B D_SQ_RESPONSETIME_C_REC
.556
SQ_ACCESSIBILITY D_SQ_ACCESSIBILITY_A D_SQ_ACCESSIBILITY_B (discarded) D_SQ_ACCESSIBILITY_C
.754
SQ_SATISFACTION D_SQ_SATISFACTION_1 D_SQ_SATISFACTION_2
.868

Empirical foundation
127
Figure 4-18: Information Quality Scores for the Delfland surveys
The table presents the values for the Cronbach’s Alpha which is a measure for the internal reliability of a scale used for each construct. Note that the con-structs that were only measured through one item (i.e., SQ ease of use and SQ digi-talization) are not listed in the table. As discussed in section 4.3.6.1, the following norms for interpreting the Cronbach’s Alpha coefficient: > 0.9 is considered: excel-lent; > 0.8: good; > 0.7: Acceptable; > 0.6: questionable; > 0.5: meager, and < 0.5: unacceptable. Note that these norms assume a large data set (over 100 cases), whereas our data set contains 24 cases. Considering the norms, the Cronbach’s Al-pha for SQ_OVERLOAD (.471) is definitely unacceptable even when deleting SQ_OVERLOAD_C, pointing towards a low internal reliability for this construct. The second Cronbach’s Alpha that raises some concerns about the items we used is the Cronbach’s Alpha for the SQ_RESPONSETIME (.556), which we interpret as meager. The remaining constructs have an ‘acceptable’ or even ‘good’ Cronbach’s Alpha (in some cases after one of the item scales is discarded). The following sec-tion discusses the IQ and SQ averages, after we discarded the items that reduced the scale reliability.
4.5.4.2 Average IQ and SQ scores
Similar to the relief workers in Rotterdam and Gelderland, we requested the relief workers in Delft to reflect on the IQ and SQ dimensions after the training exercise. For this purpose, we employed paper-based surveys that we administered immedi-ately after the exercise. The following figures outline the averages scores for the perceived IQ and SQ during the exercise.

Chapter 4
128
Figure 4-19: System Quality Scores for the Delfland surveys
Noteworthy is the relatively low score for information overload (aver-
age=2,79), indicating that the relief workers experienced low information overload during the exercise. We can explain this by considering the use of whiteboards dur-ing the exercise. The whiteboards are well categorized and do not send/distribute information actively (as opposed to CEDRIC or FLIWAS). As a result, relief work-ers forage information on their own behalf. While the average score for the com-pleteness of information (average=4,06) can be classified as moderate, the average score for the relevancy of information (average 5,22) indicates that the information shared, albeit incomplete, was often correct. The standard deviation for complete-ness (SD=1,98) does however indicate some spread in the scores of the relief work-ers. Also noteworthy is that the relevance of information to be relatively high in the analysis emerges. This means that most respondents found that the information shared with them was relevant for performing their tasks. Apart from propositions on the IQ, we also requested respondents to state their agreement on some proposi-tions regarding the information system quality in our survey. Prior to these propo-sitions, we explicitly referred to the whiteboards and information coordinator as components of the information system in question. The following figure outlines the average scores for the SQ.
The first thing noticeable in figure 4-19 is the relatively low scores for flexibility (average=3,09) and response time (average=3,35). The low average score for flexi-bility can be attributed to the fixed set of functionalities provided by the white-boards. The whiteboards for instance do not support the exchange of multimedia information formats such as images and videos. The low average score for response

Empirical foundation
129
rate indicates that the participants experienced some delay between their request for information and the time that that information became available. The depend-ence on the IC for information can be an explanation for the low response time. Notice the low average score of the reliability (average= 3,96) of the information system. This indicates that the participant could not always count on the combina-tion of information coordinator and whiteboards for information. Nevertheless, the participants were relatively satisfied (average=4,41). This can be partly explained by considering the score for the ease of use (average=4,74). This could mean that the participants found the use of whiteboards (moderated by the information coor-dinator) as relatively easy way to share information. Yet, the majority of respond-ents agreed with the proposition that the information on the whiteboards should be presented in a digital manner. We asked this question on the digitalization of the whiteboards because there is a discussion within the HDD on employing a digital (online) application for information sharing.
4.6 Cross-field study findings and conclusions
The chapter reports our main findings from conducting three field studies in the Netherlands. The field studies provide valuable insights on the information man-agement architectures currently used in public safety networks. These insights are a prerequisite for designing information systems that ensure IQ and SQ for relief workers, something we continue with in chapter 6. We did not set out to compare the findings from the three field studies because we were aware of the differences in relief workers, their level of training, the available resources and the scenarios trained. In addition, even though we employed the same set of data collection in-struments for the three field studies, the data collection opportunities (e.g., sample sizes, paper vs. electronic surveys) were different. However, while aware of these differences, to some extend comparison between field studies is possible since the field studies were complementary in terms of information system architectures (e.g., applications, roles, and information flows). In the remainder of this chapter, we discuss cross-field study findings in the form of general observations induced from the field studies. First, we discuss some results from an ANOVA test in the final section of this chapter that compares the means between the three field stud-ies.
4.6.1 Analysis of variance between field studies
While the main goal of the field studies was to explore information systems and information management capabilities in practice, the quantitative data we collected also provides the opportunity for ‘comparison’. Here, comparison refers to the analysis of variance (ANOVA) between the data collected from the three field stud-ies. While the field studies are not equal in respondents, coordination structures and information management practices, we can compare the IQ and SQ scores col-lected from the three field studies. ANOVA tells us whether three or more means are the same, so it tests the hypothesis that all group means are equal (null-hypothesis). The following table outlines the findings from the ANOVA test in SPSS 17.0.

Chapter 4
130
Table 4-14: ANOVA results
Sum of Squares df Mean Square F Sig.
IQ_Timeliness: the information was up to date
Between Groups ,984 2 ,492 ,318 ,728
Within Groups 232,376 150 1,549
Total 233,359 152
IQ_Correctness: the information was with-out error
Between Groups ,690 2 ,345 ,220 ,803
Within Groups 232,217 148 1,569
Total 232,908 150
IQ_Completeness: the information was com-plete
Between Groups 11,406 2 5,703 3,967 ,021
Within Groups 215,632 150 1,438
Total 227,038 152
IQ_Consistency: the information system provided consistent info
Between Groups 6,043 2 3,021 1,435 ,241
Within Groups 313,779 149 2,106
Total 319,822 151
IQ_Relevancy: the in-formation provided was relevant
Between Groups 1,607 2 ,804 ,746 ,476
Within Groups 161,540 150 1,077
Total 163,147 152
IQ_Reliability: The information provided was reliable
Between Groups 25,178 2 12,589 16,610 ,000
Within Groups 112,932 149 ,758
Total 138,110 151
SQ_Accessibility: The IS was accessible
Between Groups 33,243 2 16,622 8,600 ,000
Within Groups 287,974 149 1,933
Total 321,218 151
IQ_Overload: Use of the IS leads to infor-mation overload
Between Groups 46,481 2 23,240 9,992 ,000
Within Groups 346,572 149 2,326
Total 393,053 151
SQ_ResponseIime: the IS provided me rapidly in my information needs
Between Groups 18,599 2 9,299 3,024 ,052
Within Groups 461,284 150 3,075
Total 479,882 152
SQ_Satisfaction: I am satisfied with the IS
Between Groups 24,914 2 12,457 4,290 ,015
Within Groups 429,722 148 2,904
Total 454,636 150
Table 4-13 outlines the results of the ANOVA between three groups. Here,
groups refer to the relief workers in Rotterdam-Rijnmond, Gelderland and Delfland. ANOVA has the advantage that it can be used to analyze situations in which there are several independent variables (Field, 2005; p.309). Independent variables include the IS application used, the type of information management roles, and the coordination structure. Since we did not have control over the exper-imental conditions in each of the exercises, we cannot determine the effect of the

Empirical foundation
131
individual independent variables on the dependent variables (i.e., IQ and SQ di-mensions). For this purpose, our observations were critical. We can however con-sider the set of independent variables as a specific ‘information management archi-tecture’ and reflect on the effects of the information management architecture on the dependent variables across the three groups using the ANOVA results.
For each dimension, the rows in the table are divided in between-group ef-fects and within-group effects. Important indicators for this table are the F-ration and the Significance value. The F-ratio compares the amount of systematic variance in the data to the amount of unsystematic variance. However, this ratio does not tell us where the differences between groups lie. Considering significance at the 0.05 level, the significance value for the dimensions IQ_Timeliness, IQ_Correctness, IQ_Consistency and IQ_Relevancy allow us to conclude that for these dimensions the group means are not significantly different. For the remain-ing dimensions, the means are significantly different across the groups.
The assumptions under which ANOVA is reliable is the same as for all par-ametric tests based on the normal distribution (Field, 2005; p. 324). These as-sumptions are: (1) data should be collected from a normally distributed population, (2) observations should be independent and the dependent variable should be measured on at least and interval scale and (3) the variances in each experimental condition are similar (Ibid.). While the first two assumptions also apply for this research, the third assumption requires further data analysis. For testing the vari-ances between groups, Field (2005) suggests the use of the Levens’ test for Homo-geneity of Variances. The following table presents the output of this test.
Table 4-15: Test of Homogeneity of Variances
Levene Statistic df1 df2 Sig.
IQ_Timeliness 36,505 2 150 ,000
IQ_Correctness ,566 2 148 ,569
IQ_Completeness ,008 2 150 ,992
IQ_Consistency ,306 2 149 ,737
IQ_Relevancy ,658 2 150 ,519
IQ_Reliability 8,733 2 149 ,000
SQ_Accessibility ,538 2 149 ,585
IQ_Overload 5,297 2 149 ,006
SQ_ResponseTime 2,331 2 150 ,101
SQ_Satisfaction 1,359 2 148 ,260
From the above listed homogeneity test, we can conclude that for the dimensions IQ_Timeliness, IQ_Reliability and IQ_Overload, the variances are not significantly different. This means that the ANOVA results for these dimensions should be in-terpreted with caution.
4.6.2 Information management based on the theoretical pathways
We elaborate on the cross-field study characteristics observed in line with the pathways derived in Chapter 3. The following table outlines our cross-field study

Chapter 4
132
observations. Table 4-16 reflects on the extent to which the theoretical pathways we observed in practice.
Table 4-16: Cross-case observations
Pathways provid-ed in literature
Delfland Gelderland Rotterdam-Rijnmond
Boundary spanning roles and boundary objects (e.g., IT-applications)
Partly, inter-departmental boundary spanning via the infor-mation coordinator and the whiteboards
Partly, inter-agency boundary spanning via the information man-ager and the CCS and ARCmap ap-plications
Partly, inter-echelon boundary spanning via the information manager and the CEDRIC application
Orchestration capa-bilities (e.g., push and pull information between agencies, teams and echelons)
Partly, the information coordinator only pulled information based on predefined categories
Partly, the information managers shared the notes from the team meetings in the form of situation reports
Advance structuring (e.g., through loose coupling and de-pendency diversifica-tion)
Partly, multiple boundary objects (i.e., whiteboards, situation reports) are independent and convey similar information
Yes, the different IT-applications are independent and include redundant information access and processing functionalities
No, information access via CEDRIC is limited to infor-mation already stored in its data-base.
Dynamic adjustment (e.g., through proac-tive scanning)
Partly based on the information categories in the boundary objects, fol-lowed by reactive information collection based on events and infor-mation needs for the tasks at hand
Reachback (e.g., di-rect access to infor-mation in external databases)
No clear means for reachback, use of infor-mal contacts
No, full dependence on the ECC for infor-mation that is not available in the decision-making teams
Self-synchronization (e.g., capabilities for accessing infor-mation directly)
No, full dependence on the information coordi-nator
Information pooling (e.g., via a dynamic portal or single win-dow)
Partly, the whiteboards contained the aggregated information across de-partments.
No central infor-mation pooling, instead, several information pools emerged
Partly, only the in-formation captured in the situation re-ports could be re-trieved
Table 4-16 represents both the opportunities and hurdles for our design
(Chapter 6). In the Rotterdam-Rijnmond field studies, the information manager (IM) was an important role in the entire information management process, similar to the information coordinator (IC) role in de Delfland field study. While the IM role was fulfilled by relief workers that are available (and when possible, have some experience with using CEDRIC), the IC role required a relief worker with some ex-perience in information coordination during disasters. We found that there are no clear guidelines and criteria for selecting and training relief workers for fulfilling the roles of IM and IC. Next to these roles, the ECC also played in important role in

Empirical foundation
133
pushing (broadcasting) information when possible and fulfilling information re-quest from individual relief workers.
Although the IM role is focused on the generation of situation reports, we also observed several occasion in which the IM was also requested to search, vali-date or complete information by other members of the team. In this way, the IM and ECC functioned as information brokers between the information demand and supply. The role of information coordinator (IC) in the Delfland field study was even more central since the IC was the only operator of the whiteboards. We ob-served two principles used for information pulling guiding the information sharing process: agency based (e.g., in case of a fire, the commander of the fire department is questioned first) versus event/priority based (e.g., who knows something about the victims in the area?). We see that less experienced2 information managers fully dedicate their attention to listening and typing, focusing on capturing information from the information sharing process, which is led by the chair of the decision-making team. On the other hand, the more experienced information managers are more active in the information sharing process and ask exploratory, explanatory and confirmatory questions while information is being shared. For instance, one information manager pointed out conflicting numbers on the death toll, requiring the commanders of the police and the fire department to recheck their sources. In this way, the information manager also acted as an IQ monitor.
A fire department officer (Rotterdam) or a water board official (Gelder-land) played the role of plotter during the exercises. The plotter is usually outside the decision-making team and functions as low control (close to the incident). Plot-ters are expected to aggregate information into maps or images of the situation and share this with the information managers in the decision-making teams. The capa-bilities the plotter had available were similar for both cases and comprised of data visualization and map generating applications. In addition, the plotter had the ca-pability enrich the plots by adding meta-information on the wind speed and poten-tial hazard area. The latter capability proved very valuable for a number of the ex-ercises in Gelderland, were the commanders of the relief agencies needed to devel-op a common operation picture on the area that would be flooded. In Gelderland, the decision-making team on the strategic echelon had a beamer that could project such information on the wall. In Rotterdam however, the decision-making teams on the tactical level did not have a beamer, so the chairman either sketched the sit-uation on a large paper map or on the whiteboard based on his understanding of the plot he’d seem on the laptop screen of his information manager.
We found that the various disaster management agencies particularly col-laborate and share information in multi-agency teams. Teams like for instance the COPI, ROT or GVS form the core information hubs in public safety networks, pull-ing and pushing information across agency and echelon borders. Depending on the safety region and the type of disaster at hand, the number and composition of these multi-agency teams vary. The exercises proved that it is difficult to pre-determine the exact configuration of organizations and the required information sources. The agencies participating in these teams need to rapidly transform from an ‘autono-mous’ (daily-operations) mode into an ‘interdependent’ (disaster response) mode. In this temporary transformation process (until after the disaster recovery phase), the relief workers bring their agency specific information management practices 2 we asked information managers to state their experience level prior to each exercise

Chapter 4
134
and applications within and outside these teams. Since the architects have tailored these IT applications to the information needs of the respective agencies in daily (routine) operations, they are often heterogeneous and incompatible. Within such teams, expertise about the relevant data and information pertaining to a disaster is highly distributed. This means that the knowledge required to effectively address a disaster spans multiple domains and specializations. It is likely that the expertise is distributed across many individuals and organizations. During a disaster, one chal-lenge is how to bring that distributed knowledge together. The example of the stored chemicals in the Unilever building and the chemicals manager shows the unpredictable need for a specific expertise.
We have observed that relief workers often collect information objects they need after the team meetings. This means that information collection is a reactive process, after the need for information surfaces during team meeting or events in the field (e.g., explosion of a gas tank). This while there is very little time during the team meetings to collect and interpret information since this process needs to re-sults in decisions. One example we observed was during scenario 1. As the gas leak in the Unilever R&D building developed and fire fighters needed to act, it took over 30 minutes before one the fire department subordinates mentioned that his team would need information on the chemicals stored in the building. This information was crucial for the fire fighters success, as the presence of some other chemicals could endanger their lives. Accordingly, the commander of the fire department mentioned the need for this information in the CoPI and urged the representative of Unilever in the CoPI to provide this information as soon as possible. This repre-sentative was however uncertain about the exact chemicals and toxics stored and went back to the building to collect a large dossier on the materials stored in the building. Consequently, it took almost 40 minutes before the information became available to the team.
During the exercises, we identified various information needs and flows, both across multiple levels and between multiple agencies. The information flows were ad-hoc and depended on the type of information (e.g., static information, such as location maps vs. dynamic information, such as casualty count). Although some of the information flows were formal (according to the command structure), some were informal and involved personal calls using mobile phones between relief agents. Cross-echelon information flows took place across the operational, tactical and strategic echelons of individual agencies. The ECC mediated most of the cross-echelon information flows. Noteworthy is that there the boundaries between the information demand and supply was often blurred. Relief workers that requested information at t=1 could also push information at t=2.
In each of the exercises, we found that the process of information manage-ment was a recurring yet ill-structured process. We found that the information sharing process is primarily supply driven. Similar to the OODA cycle we have dis-cussed in Chapter 1, we observed that the relief agency commanders share infor-mation when it is there turn to speak. There are no predefined checks for dealing with poor information quality. Only when information is inconsistent (for instance regarding the exact location of the disaster), the team members raise the discussion on the quality of the information and request for further checks.
The multi-agency team, the information manager in such a team and the emergency response centers are the main components of the information manage-ment architecture. This means that these components are actively involved in the

Empirical foundation
135
information management process. Information coming in or going out throughout the public safety network (focused in the COPI and GVS teams) is the primary mean of combating uncertainty. Still, we did not observe a predefined or structured information management approach at the start of an event (when every actor wants to know more about what is going on). Instead, information is shared based on the “speak when it is your turn” principle. This means that in the multi-agency team, the representatives of the different agencies share information when they get the token to speak during the various decision-making rounds.
We also observed that much information was lost through cross talk: of ac-tors focus on what information they need (pull) rather than focusing on what in-formation is provided/pushed. As the scenarios evolved, the reliability, complete-ness and the accuracy of information becomes more important. Not one single ac-tor solely has access to all the information required to independently decide or act during a disaster. Because of the various aspects of a disaster (victims, public cha-os, fire, hazardous chemicals etc.), all actors have to forage for information outside their own organization. We did observe that for some important information ob-jects (e.g. location of the disaster, hazards) decision-makers, especially the CO-PI/GVS leaders crosscheck the information as much as possible, via different media (e.g. personal contacts in mobile phones). The exercises showed that it is very hard to predict what information objects are required in the early stages of disaster re-sponse. As the disaster evolves, the decision-makers predict (routinely or intuitive-ly based on previous experience) what kind information that need. This means that the completeness of information is correlated to the time/evolution of an event. The complexity of a disaster (many events, actors, interrelations, information ob-jects) requires a high level of (individual) information processing. The introduction of technology (CEDRIC) helps relief workers in processing incoming and different data sets into useable information. The actors were however still very concerned about the usability of such technology in the field.
Situation reports were an important carrier of information between the dif-ferent teams across the three field studies. As such, these reports acted as boundary spanning object. The boundaries included organizational boundaries (inter-organizational) and echelon boundaries (intra-organizational). These situation re-ports that were generated and send over different timeframes included essential information on the status of response efforts. While there was no universal time between situations reports, information managers tried to send out situation re-ports by the hour. One major issue regarding the generation of situation reports was that some information which was shared in these reports were often outdated by the time the reports were received and consulted by the members of the receiv-ing team. Since it was not clear what information was outdated, the situation re-ports had a dangerous side effect on the receiving team. In the Rotterdam case, multiple information managers were frustrated by having to generate each situa-tion report repeatedly and not be able to update changed information in earlier re-ports. This because reporting software they used did not provide capability to label information as new and updated for instance by bolding or highlighting infor-mation in previous situation reports. Moreover, the fact that the situation reporting software they used is a thin client internet application, which frequently failed if the wireless internet connection is lost, frustrated them because they had to retype a new document and did not know which information was most timely.

Chapter 4
136
Although not mentioned in any of the handbooks for disaster management, we did observe some occasions in which the relief workers searched for information direct-ly instead of requesting the information via the ECC. A specific example is the level of hazard of a specific chemical found on board of one of the ships in Rotterdam. While the name of chemical was known and shared by the captain of the ship, the relief workers did not know for sure of this chemical was flammable. The advisor on hazardous materials borrowed the laptop of the information manager and con-ducted a Google search. In this case, we consider the laptop with internet connec-tivity within a decision-making team as a form of empowerment. Note that it is not standard practice to have such a laptop. Even though the many search results re-quired some time, the advisor was able to determine the flammability of the chemi-cal with a shorter response time then would be possible with an information re-quest via the ECC.
The field studies provide evidence of the use of different applications for in-formation management in practice. Here we see a mix of specialized (single func-tionality) and multi-purpose (several functionalities) applications. CCS, ArcMap and the whiteboards are examples of specialized applications that only provide only one single functionality for the operator. On the other hand, we observed the use of multi-purpose applications such as CEDRIC and FLIWAS which provide several functionalities including situation report generation, search, document storage, attachment sharing and situation plotting. These multi-purpose applications are developed from a centralized architecture view, dictating the one information sys-tem application provides all the functionalities (i.e., services) needed for infor-mation management in the PSN.
We found that apart from the distributed expertise, the relevant data sources were highly distributed as well. Considering all the elements in the two dif-ferent scenario’s (chemicals, demonstrations, ships, congested roads, hospital ca-pacity etc.), there were a more than six different data sources that were relevant. However, just locating these sources proved to be a significant challenge since the information relevant to a disaster was distributed over hundreds of organizations. These organizations varied between the public organizations (police, fire depart-ment, GHOR) and private organizations (Unilever, Shell etc.) in the harbor area. Both the distribution of sources and expertise during a disaster made it is difficult to plan for the type of information needed for all possible disaster. Apart for some of the public disaster management organizations, the potential participants (such as the Unilever, Shell, Hospital and Cruise Ship Operator) in the decision making process, cannot be predicted. Moreover, the information sources of the potential participants that could be crucial during disaster management cannot be deter-mined at forehand. We observed that the participants on the Cop level and espe-cially on the regional (ROT) level also changed over the course of the disaster and the phases of disaster management.
During the COPI exercises, much of the data that was integrated and dis-seminated is heterogeneous, both structurally and semantically. This is because data from a large number of different domains and organizations is needed to exe-cute disaster management processes. For instance, in the case of the COPI exercis-es; data was required about persons—both about victims and about relief person-nel. In additions, data was necessary about damages to buildings, ships, infrastruc-ture and stored materials; weather data (wind speed and direction); geographical

Empirical foundation
137
data about roads and other landmarks as well as satellite imagery that can be used for damage assessment; logistics data about vehicles, delivery times.
Something we have observed in the three field studies is the lack of ability for the multi-agency teams to access third party databases on the fly. For instance, during the flood exercise in Gelderland, a potentially dangerous chemical spilled from of the ships affected by the dike break. In order to assess the potential hazards and determine the necessary counteractions, the relief workers wanted to know what chemicals were on the ship. This data was available in the database of the shipping company, but was beyond the direct reach of the relief workers that need-ed this data for completing their tasks. Consequently, relief workers had to wait for two hours before this information was available via the ECC. In Rotterdam, we ob-served a similar case, but this time the relief workers did not use the ECC to find information but searched themselves by using Google to find information on haz-ardous materials. Even though this approach was much quicker, relief workers had some problem of filtering the information in Google using the correct search terms and could not guarantee the reliability of the information they found and used.
4.6.3 Limitations of our field studies
The interpretation of our results is subject to certain limitations. First, our empiri-cal results must be considered in the context of the particular field study locations included in this chapter. The exclusive use of Dutch respondents has the advantage of excluding unwanted confounding factors resulting from cultural differences; yet the generalizability of the results is probably reduced. Moreover, the samples of respondents only include relief workers that were present during one of the exer-cises, and do not reflect a true random sample. Second, in an effort to develop a reasonably parsimonious understanding of multi-agency management in practice, models reported in the literature could not be included. For instance, future re-search might include additional antecedents to shared information quality. Third, as with most all empirical studies, collecting similar data from more types of PSNs would have been preferable. We hope that other researcher will employ our data collection instruments in different settings. The use of more (three to five) observ-ers during each exercise would have enhanced the study. Finally, the use of field study data allows us to examine only a “snapshot” of the impact of information sys-tems on IQ and SQ. Perhaps future studies will consider the use of longitudinal da-ta, which would reveal the dynamic of this phenomenon over an extended period.
4.7 Summary
This chapter presents the findings of our field studies in the Netherlands and demonstrates the power of combined methods in analyzing complex PSNs. We dis-cussed the configuration and performance of three different information systems for disaster response. We conducted three field studies: Rotterdam-Rijnmond, Gel-derland and Delfland. Throughout these field studies, we set out to answer three sub-questions.
The first sub-question (2a) asked about how multi-agency teams manage information during disaster response in practice. As essential part of the field stud-ies, we observed 22 different disaster response exercises in the Netherlands. The exercises were observed based on an observation protocols crafted for studying the information management process, roles, capabilities and information/system qual-ity issues. We investigated this question by collecting, analyzing and triangulating
Chapter 4
138
observational data, available documentation, informal talks with relief workers during training exercises and discussions with exercise trainers before and after training exercises. We observed that that inter-agency and inter-echelon infor-mation management takes place via multiple channels (voice, text and visual). Moreover, the roles and capabilities for inter-agency and inter-echelon information sharing are designed for hierarchical operations and are non-adaptive to situational needs. In general, information is shared according to hierarchically organized command and control structure. This hierarchy of information sharing resonates with a functional hierarchy. Commander brief subordinates on a very limited ‘need to know’ basis and are often oblivious to the wider context and significance of their actions. This reflects the belief that the most effective repression operations are carried out under rigid control exercised from a hierarchical command structure. In such hierarchy-based information system architectures, subordinates should al-ways report only to their commanders and the emergency control room is limited in its capabilities to assure IQ and SQ.
Considering the various information system architectures in practice, the second sub-question (2b) asked about what level of IQ and SQ existing architec-tures assure for relief workers during disaster response. We investigated this ques-tion using surveys. The surveys included IQ and SQ items that other scholars have tested in previous studies (see Lee et al, 2002). In total, we collected 177 completed surveys, of which 153 were suitable for data analysis. We prepared and analyzed the collected survey data using SPSS. The CEDRIC application in the Rotterdam-Rijnmond case allowed us to study information management using a single applica-tion. This single application based information system architecture scored relative-ly high on IQ-consistency, IQ-relevancy and IQ-correctness, but low on IQ-timeliness, SQ-accessibility and SQ-response time. In the Gelderland case study, we observed the effects of using multiple applications of information management. The four applications used in the Gelderland case allowed us to study information management using multiple applications. This multi-application based information system architecture scored relatively high on IQ-correctness, IQ-relevancy and IQ-timeliness, but low on IQ-completeness, IQ-consistency and SQ-accessibility. Final-ly, in the Delfland field study, we collected data on the use of whiteboards as non-IT enabled means for information management. The participants rated the use of whiteboards for information management high on IQ-correctness, IQ-consistency and IQ- relevancy, but low on IQ-completeness, SQ response time and SQ-accessibility. On a cross-field study level, the survey results indicate the relief work-ers are generally satisfied with the IQ and SQ, even if accessibility, response time, reliability and information completeness were sometimes problematic.
Chapter 4 allowed us to investigate questions 2a and 2b. Question 2c is ad-dressed in Chapter 5, which presents the findings from the interviews with infor-mation system architects.
Expert interviews
139
5 Expert interviews: capitalizing design experiences
“Always listen to experts. They'll tell you what can't be done and why. Then do it.”
Robert Heinlein (American science-fiction writer, 1907-1988)
5.1 Introduction
The previous chapter elaborated on the information quality (IQ) and system quality (SQ) issues that we have observed during disaster response exercises. The quantita-tive data collected from the surveys revealed that some IQ dimensions (i.e., cor-rectness and timeliness) and SQ dimensions (i.e., accessibility and response time) were particularly hard to assure. In addition, the previous chapter reported some observed characteristics and constraints of three existing information system archi-tectures (single application, multi-application, and whiteboard based information management). The field studies also allowed us to gain some initial insights on the extent to which the dynamic capabilities proposed in the theoretical pathways (Chapter 4) are available in practice.
This chapter aims to extend this understanding and to broaden our under-standing of measures for assuring IQ and SQ in practice. While the field studies did provide us some end-user perspective on the current information systems in public safety networks (PSNs) and the resulting IQ and SQ issues for relief workers, we still need to find out which pathways would be suitable for assuring IQ and SQ. At this stage of this research, the pathways discussed in Chapter 3 were still to concep-tual for synthesizing design principles that assure IQ and SQ. Accordingly, this chapter zooms in on the third part of the second research question (2c): What are the existing best practices of information system architects for assuring IQ and SQ?In order to obtain a more in-depth understanding of current practices for IQ and SQ assurance, we decided to consult experts. With ‘experts’ we refer to senior information system architects and designers of applications for information man-agement in PSNs. Alongside academics and policy makers, these information sys-tem architects are in fact the audience of this research. We chose to employ semi-structured interviews as method for consulting the experts since this instrument allows for in-depth, qualitative data collection. In addition, the interviews allowed us to take information system architect’s perspective on IQ and SQ assurance, hence complementing the observer and end-user/relief worker perspectives taken during the field studies. Accordingly, the main objective of the interviews was to capitalize some design experiences on assuring IQ and SQ from information system architects. The strategy here was that by engaging in discussions on the occurrenc-es of IQ and SQ problems, we could capitalize on the design experiences of the ex-perts in addressing some of these problems. This chapter proceeds by discussing the interview procedure and findings. This chapter concludes with some reflections on IQ and SQ problems and design experiences. Parts of this chapter were pub-lished in the Lecture Notes on Computer Science (Bharosa, Janssen, et al., 2009) and the proceedings of the Sixth International Conference on Information Systems for Crisis Response and management (Bharosa, Van Zanten, et al., 2009).
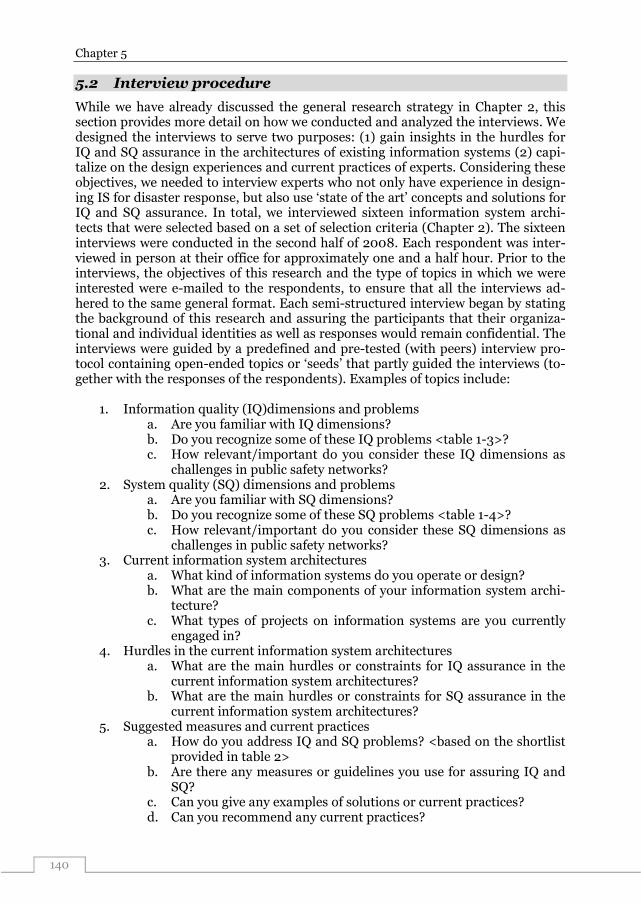
Chapter 5
140
5.2 Interview procedure
While we have already discussed the general research strategy in Chapter 2, this section provides more detail on how we conducted and analyzed the interviews. We designed the interviews to serve two purposes: (1) gain insights in the hurdles for IQ and SQ assurance in the architectures of existing information systems (2) capi-talize on the design experiences and current practices of experts. Considering these objectives, we needed to interview experts who not only have experience in design-ing IS for disaster response, but also use ‘state of the art’ concepts and solutions for IQ and SQ assurance. In total, we interviewed sixteen information system archi-tects that were selected based on a set of selection criteria (Chapter 2). The sixteen interviews were conducted in the second half of 2008. Each respondent was inter-viewed in person at their office for approximately one and a half hour. Prior to the interviews, the objectives of this research and the type of topics in which we were interested were e-mailed to the respondents, to ensure that all the interviews ad-hered to the same general format. Each semi-structured interview began by stating the background of this research and assuring the participants that their organiza-tional and individual identities as well as responses would remain confidential. The interviews were guided by a predefined and pre-tested (with peers) interview pro-tocol containing open-ended topics or ‘seeds’ that partly guided the interviews (to-gether with the responses of the respondents). Examples of topics include:
1. Information quality (IQ)dimensions and problems a. Are you familiar with IQ dimensions? b. Do you recognize some of these IQ problems <table 1-3>? c. How relevant/important do you consider these IQ dimensions as
challenges in public safety networks? 2. System quality (SQ) dimensions and problems
a. Are you familiar with SQ dimensions? b. Do you recognize some of these SQ problems <table 1-4>? c. How relevant/important do you consider these SQ dimensions as
challenges in public safety networks? 3. Current information system architectures
a. What kind of information systems do you operate or design? b. What are the main components of your information system archi-
tecture? c. What types of projects on information systems are you currently
engaged in? 4. Hurdles in the current information system architectures
a. What are the main hurdles or constraints for IQ assurance in the current information system architectures?
b. What are the main hurdles or constraints for SQ assurance in the current information system architectures?
5. Suggested measures and current practices a. How do you address IQ and SQ problems? <based on the shortlist
provided in table 2> b. Are there any measures or guidelines you use for assuring IQ and
SQ? c. Can you give any examples of solutions or current practices? d. Can you recommend any current practices?

Expert interviews
141
During each interview, we discussed the two main topics: (1) the occurrence of IQ & SQ related problems (when necessary, led by the examples of IQ & SQ re-lated problems and (2) ways in which architects try to overcome such problems in their design (i.e., which measures they take). Exploring the experiences of the ar-chitects in their particular environment made it possible to gain a richer and more comprehensive understanding of IQ and SQ problems and potential solutions. Moreover, reflecting on specific IQ & SQ related problems together with the re-spondents proved conducive to a creative process of pathway ‘shaping’. The inter-views were recorded on tape so as to minimize data loss. Detailed written notes were taken during the interviews, which were transcribed within 48 hours and then returned to the participant for review and correction. The 16 interviews yielded ap-proximately 70 pages of transcribed text. The resulting interview transcripts were then each e-mailed to the respondents, who were asked to approve them within two weeks. In this case, ‘approve’ means that the respondents checked the transcripts of the interview for inconsistencies, and determined whether the transcripts were a truthful account of the interview. An average of approximately 2% to 5% of the transcript text was modified; the majority of this modification involved removal of personal identification (such as names and locations) rather than factual errors regarding disaster events, decisions or communications. If significant changes were made, the corrected and completed transcript was returned to the participant for review. If analysis deemed it necessary, we contacted the interviewee in question by telephone to clarify a point or expand on a theme.
5.3 Data management and analysis using ATLAS.ti
We analyzed the data collected from the interviews using ATLAS.ti software, ver-sion 5.2 (www.atlasti.com). Using this software, the interview transcription and observation notes were converted into electronic versions and saved as a Herme-neutics Unit. ATLAS.ti can be classified as a qualitative text analysis application (Klein, 1997), which fits the results of the conducted semi-structured interviews with the in-the-field experts. ATLAS.ti is designed to offer support to qualitative-oriented social researchers in their activities concerning the interpretation of text (Muhr, 1991) including the capacity to deal with large amounts of text, as well as managing of annotations, concepts, and complex structures, including conceptual relationships that emerge in the process of interpretation. The use of software and data coding makes qualitative data analysis procedures more systematic and guards against information-processing biases (Miles & Huberman, 1994). The process of data analysis was retrospective, seeking to replicate findings be-tween the cases (Yin, 2003, p. 50). The interview protocol served as the preliminary coding structure for the data. However, in line with a grounded theory approach, additional codes were created as specific themes began to surface in the coding process (Strauss & Corbin, 1990). The code structure was iteratively revised until the researchers determined that all relevant themes or issues were reflected (Eisenhardt, 1989).
The data analysis was an iterative process in the sense that data were coded and the emerging themes were explored immediately after several initial data col-lection activities. Several of the interview transcripts were coded repeatedly as the final coding structure emerged. It should be noted that the text was coded accord-ing to the interpretation of the researchers, rather than through matching the code with the exact words spoken by the participants. After coding was competed, re-

Chapter 5
142
dundant codes were grouped into code ‘families’ and assigned a descriptive con-struct name. For example, the individual codes ‘correctness’, ‘relevancy’ and ‘com-pleteness’ were all grouped into a single code family, which was then assigned the construct name “information quality” due to the relative weight of that code versus all others in the family. Weights were assigned based on the total number of re-spondents to mention a specific code. In order to retain the integrity of each inter-view's meaning, and not bias the coding process of either interviewer, this process was conducted independently for each country, with the results of these efforts compared only after code families had been created.
One of the main reasons for using ATLAS.ti is that this software permits concepts in the qualitative data to be interpretively assigned into categories (Baskerville, Pawlowski, & McLean, 2000). The network feature or causal mapping functionality of this software is then used to link coding terms, as a means of sug-gesting fruitful relationships to explore until “saturation” is reached—the point where new iterations produce little change to any causal relationships between the categories, especially the core category. With the linear textual data in the interview transcripts as a starting point, segmentation and coding ("textual phases") of the text alternates with the building of conceptual maps and hyper textual structures ("conceptual phase"). Another important reason for using this tool is its ability to generate network views (see figures 1, 2, 3). Using ATLAS.ti the researcher can draw actual "conceptual maps" consisting of boxes and connecting lines that depict the aggregated linkages between concepts mentioned within each interview. Within these conceptual maps, different codes and their mutual relationships can be visu-alized, generating an overview of relationships between the key concepts of the in-terview, both individually and in combination. For example, for the quotation “many occurrences of incorrect or outdated information during disaster response could have been avoided if the data stored in the source systems would have been regularly audited”, three dyads were created including “incorrect and outdated”, “data and source systems”, and “incorrect or outdated information and audited”. These dyads were recorded for every transcript, and were aggregated based on the total number of respondent to mention each individual dyad. Christensen and Ol-son (2002) recommended the development of maps that included constructs linked by one-third to one-fourth of all respondents with Figures 1, 2 and 3 thus generated using a cut-off level of 4 or more respondents (as the sample was 16 respondents).
In order to enhance the comparative power of these maps, the total number of respondents who mentioned a link dyad was displayed in addition to the conven-tional approach of displaying these numbers with individual constructs or topics. In interpreting conceptual maps, it is suggested that the reader begin with the cen-tral topics and follow the resulting links until an end-state is reached. By doing so, those topics considered most essential would be identified first, allowing the reader to quickly grasp the emphasis and flow represented within each mental map. Link-ages between constructs represent concepts connected in the thoughts of respond-ents, thus adding greater insights into the relationships between each stand-alone idea. For example, following one of the more important thought patterns in Figure 5-3, starting with the “service oriented architecture” construct, we can derive that the development of service oriented architectures is especially important for assur-ing the flexibility of information systems (SQ) and the format of information (IQ).

Expert interviews
143
Figure 5-1: Conceptual map for the information quality requirements
is requirement for
is requirement for is requirement for
is requirement for
is requirement foris requirement for
Context awareness9
Accuracy of information15
Validation of information5
Information qualityLargest concern: 10
Timeliness of information15
Completeness of information14
Quantity/amount of information15
5.4 Findings from interviews: experiences and current prac-tices
Recall that one of the objectives of the interviews was to explore whether or not the list of IQ and SQ problems presented in chapter 1 are acknowledge as challenges for the information architects. More specifically, we wanted to know which IQ and SQ dimensions were deemed as “requirements that needed to be addressed” by the information system architects. When considering IQ and SQ dimensions (see tables 1.2 and 1.3) as information system requirements, most experts agree that the ma-jority of these dimensions are relevant issues in public safety networks. The follow-ing network view illustrates the importance of the various IQ requirements we dis-cussed with them. Note that the numbers in the boxes indicate the amount of re-spondents confirming the requirements as challengers for their information archi-tecture.
Figure 5-1 shows the confirmed IQ requirements for the total number of re-
spondents. Note that context awareness and validation of information are men-tioned by respectively five and nine respondents as requirements for IQ. Ten of the sixteen respondents regarded IQ assurance as a larger concern than SQ assurance, while four of the 16 regarded SQ assurance as largest concern. The most often men-tioned explanation is that a system that has to process low quality information can-not turn this information quality higher. Moreover, all the respondents said that IQ is relatively harder to measure than SQ. Hence, for them it remains difficult to im-prove what they cannot measure.
Figure 5-2 illustrates the confirmed SQ requirements. Note that context awareness is also considered to be an SQ dimension by five respondents, who also consider it as an IQ requirement. In addition, all sixteen respondents mention that ease of use of information systems is a critical SQ requirement, as there is not much time for learning how to use systems during a disaster.

Chapter 5
144
Figure 5-2: Conceptual map for system quality requirements
The interviewed experts do not reach a consensus on the existence and the
need of requirements for these dimensions. A frequently mentioned addition to the dimensions of system quality is the ‘robustness of the system’. Overall, experts con-sider larger problems in the organizational architecture than in the technical archi-tecture. Technically, the mono-disciplinary system can be joined easily, but there are many organizational problems among the different parties involved.
5.4.1 Hurdles: fragmented and heterogeneous information system landscape
This table of IQ and SQ problems (chapter 1) was used to introduce the architects to these problems. Next, they were asked to share their experiences with addressing these problems in practice and developments. The interviews revealed that various information system architects try to capture similar IQ-related problems, but have different experiences with IQ & SQ related problems and how to address them. When discussing the shortlist of IQ & SQ dimensions and problems, all sixteen re-spondents acknowledged the occurrence of similar problems. Even though all the respondents agreed that IQ & SQ are major concerns, not all of them shared the vision that such IQ & SQ related problems could be solved, or that the highest level of IQ (i.e., 100% relevant information) or SQ (i.e., 100 % up-time) could be guaran-teed. The most mentioned reason for this was the high level of heterogeneity in multi-agency disaster response networks.
As one of the respondents explained: “In the Netherlands, each of the relief agencies has their own IS architects, who over the years have developed all kinds of customized information systems focused on satisfying their own agency specific information needs rather that (multi-agency) IQ requirements”. Put differently, the majority of information systems used for multi-agency disaster management were actually developed for the routine operations of individual agencies. “As a re-sult, our disaster management systems are designed, developed and operated in a
is requirement for
is requirement for
is requirement for
is requirement for
is requirement for
is requirement for
is requirement for
Flexibility of the system12
Response time of the system15
Reliability of the system5
Accessibility of the system13
Context awareness5
System qualityLargest concern: 4
Interoperability of the system15
Ease of use of the system15

Expert interviews
145
very fragmented and heterogeneous way, making it difficult to address IQ-related problems that are often of a multi-agency nature”. When asked what needs to be done in order to guarantee at least an acceptable level of IQ for relief workers, this respondent suggested more technical solutions including standard message inter-faces and data exchange formats, and that, for the necessary level of IQ to be guar-anteed, some relief agencies would even have to abandon their legacy information technologies and adopt a standard set of interoperable technologies. While the oth-er respondents also acknowledged the fragmentation in the current information system landscape, they were less skeptical with regard to the possibilities for guar-anteeing IQ. As one of the respondent put it: “even though we can never assure 100% IQ, assuring IQ should become one of our main priorities, and should even be a standard or practice for everyone who has a part in the design and use of information systems.”
One respondent mentioned that the different technical instruments availa-ble for relief workers operating in the strategic, management or operational eche-lon forms a major hurdle for assuring high IQ and SQ for all echelons of response. This means that while the two higher echelons are generally stationed in well-equipped decision support rooms, first responders in the lower operational eche-lons are generally only supported by mobile phones and radio communication technology. Some respondents explicitly mentioned the importance of ‘non-technology’ driven solutions for IQ & SQ. Overall, the respondents agreed that de-sign principles aimed at guaranteeing IQ & SQ were lacking.
Another notable hurdle from the interview transcripts is that achieving high IQ and SQ is problematic because the lack of standards in the disaster man-agement domain. On the other hand, the respondents from the ministries and con-sultancy agencies say that they have proposed some standards (i.e., comply with NORA, a national reference architecture for governmental ICT systems, and use CEDRIC), yet these standards are either neglected or slowly adopted because of existing regional or agency specific standards and legacy systems.
5.4.2 Developments and current practices
There experts mentioned three developments that will directly or indirectly affect IQ and SQ in public safety networks. One of these developments is Network Centric Operations (NCO), which is originally a concept from the military. One respondent suggested that: “The essence of the network-centric approach is that by empower-ing relief workers with the information technology that allows them to collect and share information throughout the network, information management during dis-aster response can be improved.” Another respondent had a somewhat different interpretation of NCO: “we should find ways to use the network of respondents more in the IQ assurance quest. For instance, if each relief workers would be able to view, add or update certain meta-data fields of information such as its timeli-ness, completeness and priority, recipients of information would be able to judge themselves whether or not the information is of sufficient quality or should be en-riched”. In this context, enrichment would require information-processing capabili-ties such as information triangulation with other sources, or information fusion for completeness. Another respondent had ideas about a different potential of NCO and explained: “Often, when we think of NCO, we only discuss information-sharing between relief organizations, but in practice information comes from be-yond the borders of these organizations.” The bottom line is that information sys-

Chapter 5
146
tems should at least be able to capture information beyond the network or relief agencies. The majority of respondents acknowledged that the Dutch Government, which has even funded the development of a software application called CEDRIC to enable NCO, heavily favored this concept. With CEDRIC, relief workers on various response levels can digitally share information in various formats, including situa-tion reports and geographic maps (Bharosa, Janssen, et al., 2009). Nine of the re-spondents argued that using NCO would help address some IQ-related problems. The idea here is that, if everyone has the means to access and share information directly, information could flow more quickly between relief agencies, reducing the likelihood of the information becoming be outdated. However, some of the inter-viewees were very skeptical about this concept and warned, “NCO should not be considered as a single solution to all the problems regarding information man-agement and IQ assurance” and “NCO could create information mess and over-load.” Moreover, some interviewees emphasized that relief workers do not need yet another “new” technology or system in a technology landscape that is already very complex. “The pitfall for a PSN here is that they think the introduction of Cedric will suddenly solve all the information related problems. We should not forget that information management is still a human process, so we need to invest in training people.”
A more technology-related development is the evolution of Service Orient-ed Architecture (SOA), which, as a dominant architecture design style, was im-portant with regard to improving IQ. One respondent explained, “SOA allows for flexibility and interoperability without technical integration, enabling data access across relief agencies without the need for specific data formats or standards.” Often, relief workers have minimal capacity hardware devices and limited Internet connectivity, so they need lightweight but adaptable service portfolios depending on the type of disaster (context). “This is where SOA can play a significant role” one respondent explained, “We should not burden relief workers with predefined sets of applications which may or may not be appropriate for dealing with the situation at hand.” Instead, he suggested, “systems need to allow relief workers to create and adapt their own application portfolio, so they can delete or add appli-cation services whenever and wherever they need it.” However, according to some of the respondents, the benefits of “SOA may be overrated,” especially if there are no agreements on data-sharing rules and security procedures.
An organizational development aimed at assuring IQ was the introduction of an information manager function in disaster decision-making teams. The ma-jority of respondents suggested that the recently introduced role of the information manager in Rotterdam-Rijnmond is a first step in assuring information access within multi-agency teams. “This information manager should act as a boundary spanner between agencies and orchestrate information flows between demand and supply, not for all but only for crucial information needs.” Given the right set of tools and functionalities, the information manager can act as an orchestrator that determines who needs specific information and who does not, making it possi-ble to assure relevance and to minimize information flows. “For this to work, we are currently working on a pre-classification of information objects depending on the relevance of the content for a specific situation. Location information, for ex-ample, is always relevant to all agencies, whereas information on the name of gas stored in a building is only relevant to the fire department, except when this gas is known to be dangerous or explosive, in which case the information is relevant to
Expert interviews
147
everyone.” Accordingly, the information manager needs to be able to determine and handle information in different ways. The experts were not consistent on the tasks and functionalities of the information manager in the current situation. Final-ly, at least half of the respondents stated that policy-makers, operators, and fellow information system architects mainly focus on assuring IQ during a disaster itself. “We as a community also need to think about ways for assuring that information is correct before a disaster happens.” As one of the respondents explained: “many occurrences of incorrect or outdated information during disaster response could have been avoided if the data stored in the source systems would have been regu-larly audited”. Another respondent added that: “garbage in is garbage out regard-less of the advanced information technology being used, so we need to take ac-tions for IQ assurance not only during disasters, but also before they occur”. This suggests that principles should focus on assuring IQ before and during a disaster.
5.4.3 SQ is going concern, IQ is future concern
Overall, the information system architects focused on assuring SQ dimensions in-stead of IQ dimensions. “Often, we focus on improving the reliability, security and user-friendliness of current systems,” one respondent stated, acknowledging that the current focus is on SQ assurance instead of IQ assurance. One explanation for this can be found the ‘Wet Veiligheidsregio’s’, a recently accepted law governing the development of regional disaster response institutions. According to this law, relief agencies in the same geographical regions need to have interoperable information systems and policies by the end of 2010.
In order to comply with this law, information architects are required to fo-cus on either adopting a nationwide application (called CEDRIC) or advance the quality of their own application. Either way, much more emphasis is on SQ than on IQ. This kind of technology push often forces information architects to focus on the more technical characteristics and quality dimensions of their information system architecture. Another explanation is that information system architects consider SQ assurance an easier to address problem than IQ assurance. Whereas the design of the information system architecture can address some SQ challenges (i.e., re-sponse time and interoperability), the assurance of IQ requires more significant changes to the architecture of existing information system, including roles, tasks and policy changes.
5.5 Shaping pathways: suggested measures for assuring IQ and SQ
Based on the collection of interview transcripts, we could start with more advanced qualitative data analysis. Figure 5-3 outlines some of the relations found through the interview analysis software, focusing specifically on the relationship between IQ & SQ related problems. This figure also depicts some measures for assuring IQ and SQ provided by the experts. Usually, the software structures the IQ and SQ dimen-sions (as dependent variables) at the center of the conceptual maps, whereas the principles and solutions (as independent variables) are placed at its boundaries. Because principles are an abstraction of solutions, they can comply with multiple solutions. CF stands for Code Family, indicating the various problems related to IQ or SQ. The dashed lines indicate the IQ & SQ related problems in the respective code family. Note that the number between the brackets indicates the number of respondents who mentioned this issue.

Chapter 5
148
is a
ss
ocia
ted
wit
h
is d
ep
en
de
nt
of
ass
ure
s
as
su
res
is d
ep
en
de
nt
of
as
su
res
is a
ss
oc
iate
d w
ith
is a
sso
cia
ted
wit
h
ass
ure
s
as
su
res
ass
ure
s
ass
ure
sis
de
pe
nd
en
t o
f
ass
ure
s
is a
ss
ocia
ted
wit
h
ass
ure
s
ass
ure
s
as
su
res
ass
ure
sis
de
pe
nd
en
t o
f
ass
ure
s
as
su
res
is d
ep
en
de
nt
of
is d
ep
en
de
nt
of
as
su
res
as
su
res
is a
sso
cia
ted
wit
h
as
su
res
ass
ure
s
CF
:In
form
ati
on
qu
alit
y p
rob
lem
s (
16
)
Info
rma
tio
n o
ve
rlo
ad
Co
rre
ctn
ess
of
info
rma
tio
n
Tim
elin
es
s o
f in
form
ati
on
Fo
rma
t o
f in
form
ati
on
Sta
tic i
nfo
rma
tio
nD
yn
am
ic i
nfo
rma
tio
n
Ca
ptu
re d
ata
at
so
urc
e (
11
)A
ccu
rac
y o
f in
form
ati
on
Co
mp
lete
ne
ss o
f in
form
ati
on
Co
nsis
ten
cy
of
info
rma
tio
n
Re
lev
an
cy
of
info
rma
tio
n
Ex
ten
d I
M c
ap
ab
iliti
es (
13
)
Acce
ssa
bili
ty o
f in
form
ati
on
Use
ne
two
rk c
en
tric
te
ch
no
log
y (
9)B
uild
se
rvic
e o
rie
nte
d a
rch
ite
ctu
res
(7
)
Co
nd
uc
t IQ
au
dit
s (
8)
Ra
te I
Q b
efo
re s
ha
rin
g (
6)
CF
:Sy
ste
m q
ua
lity
dim
en
sio
ns (
16
)
Acc
ess
ibili
ty o
f th
e s
ys
tem
Ea
se
of
us
e o
f th
e s
ys
tem
Fle
xib
ility
of
the
sy
ste
m
Inte
rop
era
bili
ty o
f th
e s
yste
m
NO
RA
-co
mp
lian
ce
of
the
sy
ste
m
Re
sp
on
se
tim
e o
f th
e s
ys
tem
Re
liab
ility
Fig
ur
e 5
-3:
Co
nc
ep
tua
l m
ap
fo
r t
he
IQ
an
d S
Q p
ro
ble
ms a
nd
su
gg
este
d m
ea
su
re
s

Expert interviews
149
Throughout the interview transcripts, ATLAS.ti recorded several sugges-tions, including the maximization of information flows via information managers (mentioned by 9 respondents), the use of IQ audits in order to detect and remove incorrect or outdated information before a disaster (mentioned by 8 respondents), the proactive anticipation information needs (mentioned by 6 respondents) and the enrichment of information objects by adding meta-data (mentioned by 5 respond-ents). The following table summarizes the suggestions for IQ and SQ in PSNs de-rived from the interviews with the architects, thus capitalizing their design experi-ences and current practices. To date, there is no single theory (e.g., NCO) or infor-mation technology (e.g., CEDRIC) addressing all of the potential IQ and SQ issues. The brackets refer to the ID of the interviewees listed in Appendix-C.
Table 5-1: Suggestions for IQ and SQ assurance
Design experiences Targeted IQ issues Mentioned by interview-ees
Conduct annual IQ audits (garbage in is garbage out)
Incorrect, incomplete, inac-curate, and outdated infor-mation in agency data sources.
8 out of 16 (mentioned by 1, 4,5,6,8,9,11 &15)
Extend the capabilities of the information manager
Correctness, timeliness, ac-cessibility, information over-load, bridging interdepend-encies between relief agen-cies.
13 out of 16 (mentioned by 1,2,3,4,5,6,7,8,10,11,12,13 & 14)
Develop an information system with reachback capabilities
Response time, interopera-bility, reliability, accessibil-ity, timeliness
9 out of 16 (mentioned by 1,3,4,5,7,8,13,14 &16)
Build modular service oriented architectures
Information access, flexibil-ity, reliability, response time, dealing with unknowns or unprecedented infor-mation needs.
7 out of 16 (mentioned by 1,3,4,5,9,10 & 11)
Promote and train IQ as-surance as standard of practice
All IQ-related problems 16 out of 16 (mentioned by all the respondents
Capture information at the source and make the source of information re-sponsible for updating the information
Inconsistency, noise, infor-mation object version con-trol, reliability
11 out of 16 (mentioned by 2,3,4,5,6,7,9,10, 12,14,16)
Table 5-1 outlines six different suggestions for IQ and SQ assurance. Some condi-tions need to be satisfied to make these measures work. Firstly, the information infrastructure (i.e., Internet, hardware) up time should be near 100%. Secondly, the information manager should have knowledge (at least at a basic level) of the pro-cesses and information needs of the various relief agencies. Finally, private agen-cies (i.e., cargo shipping firms) should allow for role-based access to their data-bases, for instance using SOA and web-service technology.

Chapter 5
150
5.6 Summary
This chapter reports the findings of interviews that focus on answering question 2c (what are the existing best practices of information system architects for assuring IQ and SQ?). Generally, the interviewed architects recognized and confirmed the occurrence and severity of the IQ & SQ related problems discussed in the previous section. Almost all the respondents mention that the information systems are de-signed, implemented and operated in a very fragmented and heterogeneous way, making it hard to cope with IQ and SQ requirements. The reason given for this is that in the Netherlands, each of the relief agencies has their own information sys-tem architects, who over the years have developed all kinds of information systems focused on satisfying local, intra-agency requirements rather that regional or na-tional IQ and SQ requirements. In addition, some information system architects mentioned that they have designed many of the existing information systems for mono-agency and routine (predefined) information management. As such, we could explain why most of the respondents were engaged in more efforts (i.e., pro-jects) focusing on improving SQ (e.g., interoperability and ease of use) and so few efforts for improving IQ. Moreover, we noticed that some respondents assumed that improving SQ would also lead to IQ assurance. While for some cases this may be true (e.g., improved SQ response time can also lead to more IQ-timeliness), most of the respondents acknowledged that assuring IQ dimensions such as com-pleteness and relevancy would require more than technology development. Return-ing to the research question we set out to investigate in this chapter, the interview-ees indicated three main best practices: (1) network centric operation (2) service-oriented architectures (SOA) and (3) the introduction of an information manager as boundary spanner between different agencies. The interviews with the information system architects are an important prerequisite for entering the design cycle (Chapter 6). While Chapter 3 (knowledge base) and Chapter 4 (field studies) helped us in understanding the hurdles and pathways for assuring IQ and SQ, the interviews helped us to understand the best practices and needs of the information system architects, who are one of the audi-ences of this dissertation. The most important insight we gained from the inter-views is the need for developing information management capabilities that are dy-namic enough to assure IQ and SQ during disaster response. Since the architects work in a multi-actor environment lacking mature and proven technologies and full of different preferences and needs, commonly accepted and technology independ-ent, design principles would help to assure IQ and SQ over time. The next chapter proceeds by explaining principle-based design and integrates the findings of the previous three chapters in a design theory for assuring IQ and SQ.

Design theory
151
6 Netcentric information orchestration: a design theory
Society cannot afford to prepare for every eventuality, but it can create a foundation on which an effective response is quickly constructed”.
Yigal Arens & Paul Rosenbloom, Communications of the ACM, 2003
6.1 Introduction
The statement above by Arens and Rosenbloom (2003) captures the main premise of this chapter. This chapter reports on the design cycle in our design science re-search. This cycle integrates the findings from the rigor cycle (Chapter 3) and rele-vance cycle (Chapters 4 and 5) and precedes the evaluation cycle (chapters 7 and 8). As discussed in Chapter (3), the available kernel theories provided in the litera-ture do not provide directly applicable principles for assuring information quality (IQ) and system quality (SQ) in public safety networks (PSNs). Nevertheless, these kernel theories do provide some theoretical pathways that can help in synthesizing the design principles we are looking for. For instance, Coordination Theory pro-vides the pathways of advance structuring and dynamic adjustment in order to manage information flows in complex and uncertain environments. The emergence of information technology (IT) enabled orchestration of information is also a prom-ising pathway for coordinating information management activities of heterogene-ous and distributed agencies in concert. In addition, network centric operations (NCO) theory suggests the development of self-synchronization and reachback ca-pabilities when operating in turbulent environments.
However, the literature on coordination theory and NCO from which we have surfaced these pathways leave them somewhat generic, making it difficult to synthesize the concise and explicit design principles for assuring IQ and SQ. It is in this chapter that we draw on the combined findings from our theoretical founda-tion (chapter three) and empirical foundation (chapters four and five) in order to synthesize design principles. Following this process, this chapter sought to answer the fourth question of this research, which design principles can we synthesize from the knowledge base and empirical data for assuring IQ and SQ during mul-ti-agency disaster response?
In this chapter, we elaborate on the synthesized set of design principles we capture under the term ‘netcentric information orchestration’. We have chosen to coin our set of design principles in this way because the principles have their roots in both NCO and IT-enabled orchestration. This chapter proceeds by elaborating on our approach to employing principles of information system design. Next, we will discuss netcentric information orchestration as a design theory, followed by an elaboration on which IQ and SQ requirements the stakeholders (e.g., information system architects) can assure when employing the prescribed design principles. We evaluate the resulting set of design principles on their technical feasibility (Chapter 7) and their ability to assure IQ and SQ for relief workers in a quasi-experimental gaming-simulation (Chapter 8). Parts of this chapter were published in Bharosa & Janssen (2009) and Bharosa, Janssen & Tan (forthcoming).

Chapter 6
152
6.2 Principle-based design
Albert Cherns (1976) was among the first in the academic community to suggest the use of principles. Principles are particularly useful when it comes to solving ill-structured or ‘complex’ problems, which cannot be formulated in explicit and quan-titative terms, and which cannot be solved by known and feasible computational techniques (Simon, 1996). These kinds of problems are complex because they are often socio-technical in nature or because they occur in socio-technical systems (Clegg, 2000). An information system is an example of a socio-technical system, as both humans and technology are needed for the system to exist and function (Bostrom & Heinen, 1977b). In contrast to traditional computer-based systems, socio-technical systems include both human actors and software components, and normally are regulated and constrained by internal organizational rules, business processes, external laws, and regulations. This implies that the technical and social aspects of a system are interconnected, that neither should take logical precedence over the other, and that they should be designed together (Klein, 1994).
Principle-based design (PBD) can be viewed as a variation of the prescrip-tive design research paradigm that should result in “a prescriptive theory which integrates normative and descriptive theories into design paths intended to pro-duce more effective information systems” (Walls, et al., 1992). We consider PBD as a specific form of the more general design research methodology that focuses on extracting principles with regard to the elements of a system without explicitly re-ferring to solutions. This does not mean that principles need to be vague. Rather than resulting in complete and ready to implement artifacts, PBD should result in principles that purposefully and assertively support architects in a network of ac-tors with the (re-) designing and use of Information Systems (IS). Because princi-ples are generic by nature and thus do not constrain designer creativity or possible solutions, they provide architects with freedom in designing and using artifacts based on the needs of their own organization. This level of freedom is especially important when information system architects are dispersed among heterogeneous agencies within a disaster response network. In addition, PBD aims at encouraging organizations to start right away with bringing their current practices in line with the principles immediately, leaving room for continuous improvement over time. This approach emphasizes "doing the right thing" by whatever means the infor-mation system architects feel is most appropriate given the circumstances. In con-trast to requirements and constraints that keep changing over time (Gibb, 1997), principles are intended to be useful over a longer period of time, especially since they are independent of technologies actors, which do change over time.
Because PBD focuses on goal attainment rather than compliance (in the case of rules) and because the actors are free in implementing the principles, the expectation is that there will be more commitment and less resistance in multi-actor environments. As such, we argue that PBD is especially suitable for designing information systems that need to operate in task environments consisting of:
1. multi-actor organizational networks (i.e., police, fire department, ambu-
lance, etc.) where each actor has different sets of goals, processes and sup-porting IS and yet are mutually interdependent in terms of information sharing and decision-making;
2. non-routine task environments involving unfamiliar events and processes;
Design theory
153
3. multi-audience environments (principles used by architects, ICT-experts, managers and operators),
4. environments where not all the aspects of a complex problem can be pre-dicted and specified in advance, and;
5. environments where the range of (technical) solutions and alternatives is heterogeneous and dynamic in nature. Considering previous work (e.g., Bigley & Roberts, 2001; Comfort, Ko, et
al., 2004; Fisher & Kingma, 2001; Turoff, et al., 2004), we can argue that multi-agency information management during disaster response takes place under the five characteristics listed above. Having stated the context for which PBD is suited, we proceed with a discussion on principles in the next section. Principles have been defined in various ways and they have been used interchangeably with other prob-lem solving notions, including laws, patterns, rules and axioms (Maier & Rechtin, 2002). Housel et al. (1986), for instance, define principles as “generic prescriptions for the design and implementation of information systems”. From an engineering perspective, Gibb (1997) defines principles as “rules of thumb that guide the choic-es and actions of engineers”. From a MIS perspective, Richardson and Jackson de-fine principles as “the organization's basic philosophies that guide the development of their architecture.” In the area of information technology (IT), the Open Group have defined design principles as “general rules and guidelines, that are intended to be enduring and seldom amended, that inform and support the way in which an organization sets about fulfilling its mission” (TOGAF, 2004). It may be clear that, thus far, there is no uniform definition available. However, these definitions imply that principles are normative or prescriptive in nature, and that they are meant to give direction for the design of IS, which is why we define principles as ‘normative’ and ‘directive’ guidelines, formulated towards taking action by the information system architects.
Compared to principles, requirements and constraints have a different im-pact on the design process. When specifying the concept of requirement, scholars (e.g., Darke & Shanks, 1996; Gibb, 1997) usually formulate requirements as “the artifact should be or needs to” statements, while constraints are often formulated as “the artifact is allowed or not allowed to” statements. Often, requirements in-clude the explicit individual stakeholder needs, regardless of the overall system needs, while constraints cover the explicit conditions arising from general organi-zational, government and industry standards. Therefore, all requirements are in natural conflict with all other requirements in their attempt to claim common re-sources (Gibb, 1997). Principles capture prescriptive and directive guidelines that architects can use to design information systems within the framework of require-ments and constraints. Principles draw on the experience of IS architects and in-clude their ‘proven practices of the past’. Whereas requirements and constrains often involve individual systems, principles are included in an ISarchitecture to ensure that all further developments and improvements adhere to these principles (e.g., Richardson, et al., 1990).
The use of principles determines the effectiveness of an IS. As a result of their intrinsic non-contextual nature and general applicability, principles cannot provide readily available solutions to specific design problems (Hemard, 1997). Ra-ther than being offered as finished products, their articulation helps clarify where some of the gaps in our knowledge exist (Clegg, 2000). Therefore, the use of prin-

Chapter 6
154
ciples is intended to select and apply the most appropriate knowledge for specific design and development tasks (van den Akker, 1999).
6.3 Drawing on the theoretical and empirical foundations
Due to the high level of specialization and distribution of work during disaster re-sponse, relief agencies operate in a fragmented mode across multiple functional, geographical, hierarchical, and professional boundaries. In such contexts, orches-trators are necessary for the coordination of information flows and objects between multiple agencies. We define orchestrators as individuals empowered with infor-mation technology (IT) enabled capabilities for inter-agency (horizontal) and inter-echelon (vertical) information management in a network of agencies. An infor-mation system architecture consisting of orchestrators is heterarchical because it includes elements from hierarchical and network based information systems.
Scholars such as Kapucu (2003) have characterized heterarchies as a form of organization resembling a network due to the lateral coordination of organiza-tional diversity and a distributed intelligence negotiated across multiple evaluative criteria. In these types of flatter structures, the underlying assumption is that no single individual understands the whole problem, but that each member of the or-ganization likely has insight and a responsibility to act on the best knowledge avail-able. Flatter structures are able to reallocate their resources and personnel more quickly and efficiently, and move more effectively toward self-organization. The weakness of such organizations is that they depend upon fully functioning infor-mation systems with well-trained personnel who are capable of acting on their own initiative in ways that are consistent with the system’s goals (Comfort, 1999). This brings us to the first characteristic of orchestration, the high level of IT-support needed for inter-agency and inter-echelon information management. The term "heterarchical" indicates that there is no hierarchy of information managers. Het-erarchical control structures have distributed local autonomous entities that com-municate with other entities without the master/slave relationship found in a hier-archical architecture. According to Dilts et al. (1991) the field of distributed compu-ting is “a source for a number of justifications for the principles of heterarchical control architectures”.
A useful analogy for orchestration lies in the centralized market concept (Malone, 1987). “In a centralized market, buyers do not need to contact all possible sellers because a broker is already in contact with the possible sellers” (pp. 1323). This centralization of decision-making means that substantially fewer information sharing connections and messages are required compared to a decentralized mar-ket or pure network. A well-known example of a centralized market is the stock market. People who want to buy a particular stock do not need to contact all the owners of shares of that stock; they only need to contact a broker who is also in contact with people who want to sell the stock. This model for coordination resem-bles Baligh and Richartz's (1967) model of a market with a "middleman as a pure coordinator" (pp. 123). In addition to the buyers and suppliers present in a decen-tralized market, we assume that there is also a "broker" (or boundary spanner) for each type of task processor. An orchestrator can coordinate all the task processors of a given type and thus plays the role of a ‘information manager’. Like Baligh and Richartz, we assume that (1) the orchestrator has a communication link to each in-formation requestor (i.e., relief worker) and each supplier of the appropriate in-formation and (2) tasks are assigned to the "best" available supplier (i.e., update

Design theory
155
source information). This is particularly true for information systems in the disas-ter management domain since relief workers can simultaneously act as information producers and consumers of information.
Boundary spanners, i.e. individuals who operate at the periphery or boundary of an organization, relating the organization with elements outside it, can perform the tasks related to netcentric information orchestration. On a general lev-el, boundary spanning can be seen as the activity of making sense of peripheral in-formation that is perceived relevant to expand the knowledge at the center of a giv-en organizational context (Lindgren, et al., 2008). The difference with the tradi-tional form of boundary spanning lies in the high reachback (wide accessibility and geographical reach of the information technology used). As such, orchestration is an information coordination activity aimed at linking new, typically environment related information to prior knowledge for gaining situational awareness. Essen-tially, these individuals scan the environment for new information, attempting to determine its relevance vis-à-vis information already assimilated in the organiza-tion. In this boundary-spanning process, the individual, the organization and the environment are parts of a network of interactions and organizational knowledge creation (Cohen & Levinthal, 1990).
In order to maximize the benefits of orchestration, boundary spanners re-quire a high level of reachback and self-synchronization. A key prerequisite for the-se capabilities is the availability and use of information technology. As a result of the high level of reachback, team members can enjoy positive resource asymmetries (Gnyawali & Madhavan, 2001). From a structural holes perspective (Burt, 1992), the orchestrator bridges the structural holes (gaps in information flows) that exist between multiple relief agencies in a public safety network. By filling the existing structural holes orchestrators enhance their control of the information that flows between relief agencies, and hence can accrue information benefits (Gnyawali & Madhavan, 2001). For instance, the orchestrator may have access to information about the resources and capabilities of the police department, or the information needs of a fire department. A capability is a set of specific and identifiable processes (Eisenhardt & Martin, 2000). According to Tushman (1977), such information gathering and assimilation is associated with specific boundary-spanning roles at different stages in the innovation process. This allows for the fulfillment of func-tions beyond that of storage, integration, and brokering. A public safety network can have multiple information orchestrators on different levels. Each orchestrator can fulfill one or more functions and different roles (such as we have observed in the field studies, orchestrators can be information managers, plotters, or quality monitors). Some proposed IT-enabled capabilities for information orchestration include: coordination of information, information inventory and interoperation of information services (Janssen & van Veenstra, 2005).
As stated, orchestration is not a new concept. Drawing on its original char-acteristics, this research extends the notion of this concept by emphasizing what is being coordinated (information and information management processes) and where the coordination occurs (heterarchical coordination throughout echelons in the network). We define netcentric information orchestration as a heterarchical form of inter-agency and inter-echelon information management in a PSN sup-ported by a specific set of roles and IT-capabilities related to the collection, en-richment and sharing of high quality information. We discuss the IT- enabled ca-pabilities necessary for orchestration in the next section.

Chapter 6
156
6.4 A framework for information orchestration capabilities
Drawing on the pathways listed in chapter four and our field study findings, we conceptualize netcentric information orchestration as a two-stage process for as-suring IQ and SQ. The stages we use are advance structuring and dynamic adjust-ment. These stages require either offensive (preemptive and exploitative) or defen-sive (protective and corrective) capabilities for assuring IQ and SQ. Figure 6-1 illus-trates the stages of netcentric information orchestration. According to figure 6-1, advance structuring and dynamic adjustment require four set of capabilities for assuring IQ and SQ. We postulate that heterarchical form of information manage-ment will allow subordinate relief agencies to adjust and adapt quickly and easily to deal with changing situations or unforeseen events and circumstances. When em-powered with these capabilities, orchestrators can retain the strengths (defined command relationships, efficiency, and control) of a bureaucratic hierarchy, ena-bling preplanning in the more predictable aspects of disaster response, yet, also permit the adaptability needed to fulfill information needs during dynamic and unstable disaster situations.
Advance structuring refers to a-priori structuring of inter-organizational
information flows and inter-connected processes, such that relief agencies can re-duce the effort involved in adjusting to the changing task environment. As relief workers do not have to collaborate and share information during routine, non-disaster situations, there is often only a weak relationship between such agencies. Advanced structuring includes long-term relationship building amongst relief agencies prior to and during a disaster. Scholars have already underlined the need for advance structuring when it comes to disaster response. Pearson and Clair’s (1998) for instance predict the that response organizations will have greater suc-cess if prior to the crisis event focal organizations build alliances and coordinate activities by sharing information and plans with external stakeholders. Horsley and Barker (2002) made similar suggestions within their public agency model. Their
Du
rin
g a
dis
ast
er
Bef
ore
a d
isa
ster
Protective capabilities (e.g., dependency diver-sification, caching and
freezing)
Exploitative capabilities (e.g., proactive sensing,
event notification)
Corrective capabilities (e.g., boundary span-
ning, quality feedback)
Netcentric Information
Orchestration
Offensive capabilities
Defensive capabilities
Preemptive capabilities (e.g., shared info space,
reachback)
Advance structuring Dynamic adjustment
Figure 6-1: Netcentric information orchestration framework

Design theory
157
model predicts greater success if information is disseminated quickly, accurately, directly, and candidly to critical stakeholders, including the media. Advance struc-turing requires preemptive and protective capabilities for structuring inter organi-zational information flows for instance by reducing task interdependence through loose coupling (Tan & Sia, 2006), or mitigating resource dependency by diversify-ing resource allocations (i.e., creating alternative information sources). Loose cou-pling reduces the need to coordinate information exchange and flow in a dyadic relationship, while dependency diversification generates alternative options to mit-igate overdependence on critical resources. Such capabilities should result in high-er adaptability. From an information architecture perspective information orches-tration requires an extra layer is inserted the client and the server (Wiederhold & Genesereth, 1997). Examples of capabilities that can be leveraged through advance structuring include reachback (the ability to access resources that are not locally available) and caching (the ability to freeze data entry modules in applications so that information need not to be lost during (temporary) infrastructure failure.
Table 6-1: Comparing three information management ideal types
Characteristics Traditional ap-
proaches Information orches-tration
NCO
Ideal type for coor-dination
Hierarchical infor-mation coordination
Heterarchical infor-mation coordination
Peer –to- peer co-ordination
Level of centraliza-tion
High Moderate Low
Information receiv-er and sender tasks
One or multiple pre-defined individuals or groups
Role and specific infor-mation sharing and coordination
Network, everyone can push, pull and process information
Information flows Follows the hierar-chical chain of com-mand (grip levels)
Situation and need driven dissemination
Widespread dissem-ination
Network configura-tion
Hub and spoke, pub-lish and subscribe
Smart pull and smart push, information post-ing
Relational
Interdependencies Pooled Sequential Reciprocal Triggers Input/output, proce-
dures Events and demand Events
Coordination mechanisms
Coordination by standards plan, rou-tines, meetings.
Advanced structuring (e.g., information pool) and dynamic adjust-ment (e.g., feedback)
Mutual adjustment and improvisation
Information sources
Agency specific, in-tra- agency systems
Variety of information sources, inter-agency data access
All possible sources need to be accessi-ble
Service portfolio Application depend-ed, static, fixed
On the fly service com-position
Actor/agency spe-cific
Mode of operation Reactive (push re-quired information)
Proactive and protective (anticipate information needs)
Reactive
Coupling of ele-ments
Tight Tight with slack Loose

Chapter 6
158
Table 6-1 presents the differences between the three main coordination ap-proaches we discussed in this dissertation, where information orchestration is aimed at taking leveraging the advantages hierarchical information coordination (e.g., clear authority structure, standardization, specialization and formalization), and network approaches (e.g., reachback, adaptability and self-synchronization).
Complementary to advance structuring, dynamic adjustment requires the real-time reconfiguration of inter-organizational information sharing processes and resources in accordance with the changed disaster environment. The primary theoretical basis for dynamic adjustment is the learning-based sense and adapt paradigm (Haeckel, 1995). Sambamurthy et al (2003) suggest that dynamic ad-justment is achieved by enhancing feedback in a changing environment through sensing and adapting making it a two-pole strategy. In sensing capability, IT-supported orchestrators become more informed and forward-looking, and have more time to adapt, through feedback, quick learning and constant environmental scanning. Examples of capabilities that can be leveraged through dynamic adjust-ment include proactive sensing (ability to anticipate information needs) and quality feedback (ability to rate the quality of information shared). The information-processing tasks of orchestrators include accessing of appropriate resources, data selection, format conversion, bringing data to common abstraction levels, matching and integration of information from distinct sources, and preparing information and descriptive meta-information for relief worker customer’s workstations, in-cluding focusing, filtering, and summarizing. The main objective is to match the demand for information as much as possible and in accordance with the situational circumstances (e.g., if a building will collapse and the relief worker does not know this, orchestrators need to push this information to the relief worker regardless of whether or not the relief worker demanded this information). Finally, orchestrators must understand what information is pertinent, what is peripheral, and what is extraneous. They also must determine what agencies are the most reliable sources (e.g., based on their respective reputations), and how those agencies can provide that information, when it is needed, and in the format required.
According to the information-processing paradigm (Galbraith, 1973), each coordination mechanism needs to be endowed with a specific information-processing capability and must be matched to the information-processing demands of the environment or needs generated by the interdependence of work units. In order to deal with the characteristics of a disaster, information orchestrators need to have a range of capabilities in order to adapt and assure IQ. Moreover, one in-formation orchestrator would not be able to coordinate all the possible information flows in a disaster management network. Several information orchestrators may be required for any given disaster situation. The exact number of information orches-trators depends on several contingencies, including the capabilities the orchestra-tors have. In this context, capabilities are dynamic, referring to “learned and stable patterns of collective activities through which the organization systematically gen-erates and modifies its operating routines in pursuit of improved effectiveness” (Zollo & Winter, 2002, p. 339). The following table summarizes the necessary ca-pabilities for an information orchestrator in PSNs.
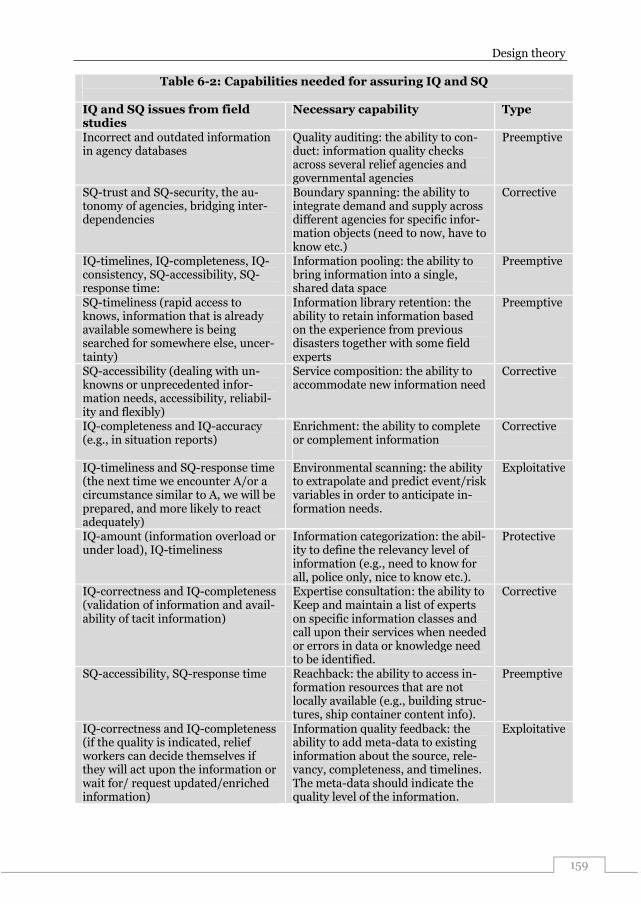
Design theory
159
Table 6-2: Capabilities needed for assuring IQ and SQ
IQ and SQ issues from field studies
Necessary capability Type
Incorrect and outdated information in agency databases
Quality auditing: the ability to con-duct: information quality checks across several relief agencies and governmental agencies
Preemptive
SQ-trust and SQ-security, the au-tonomy of agencies, bridging inter-dependencies
Boundary spanning: the ability to integrate demand and supply across different agencies for specific infor-mation objects (need to now, have to know etc.)
Corrective
IQ-timelines, IQ-completeness, IQ-consistency, SQ-accessibility, SQ-response time:
Information pooling: the ability to bring information into a single, shared data space
Preemptive
SQ-timeliness (rapid access to knows, information that is already available somewhere is being searched for somewhere else, uncer-tainty)
Information library retention: the ability to retain information based on the experience from previous disasters together with some field experts
Preemptive
SQ-accessibility (dealing with un-knowns or unprecedented infor-mation needs, accessibility, reliabil-ity and flexibly)
Service composition: the ability to accommodate new information need
Corrective
IQ-completeness and IQ-accuracy (e.g., in situation reports)
Enrichment: the ability to complete or complement information
Corrective
IQ-timeliness and SQ-response time (the next time we encounter A/or a circumstance similar to A, we will be prepared, and more likely to react adequately)
Environmental scanning: the ability to extrapolate and predict event/risk variables in order to anticipate in-formation needs.
Exploitative
IQ-amount (information overload or under load), IQ-timeliness
Information categorization: the abil-ity to define the relevancy level of information (e.g., need to know for all, police only, nice to know etc.).
Protective
IQ-correctness and IQ-completeness (validation of information and avail-ability of tacit information)
Expertise consultation: the ability to Keep and maintain a list of experts on specific information classes and call upon their services when needed or errors in data or knowledge need to be identified.
Corrective
SQ-accessibility, SQ-response time Reachback: the ability to access in-formation resources that are not locally available (e.g., building struc-tures, ship container content info).
Preemptive
IQ-correctness and IQ-completeness (if the quality is indicated, relief workers can decide themselves if they will act upon the information or wait for/ request updated/enriched information)
Information quality feedback: the ability to add meta-data to existing information about the source, rele-vancy, completeness, and timelines. The meta-data should indicate the quality level of the information.
Exploitative
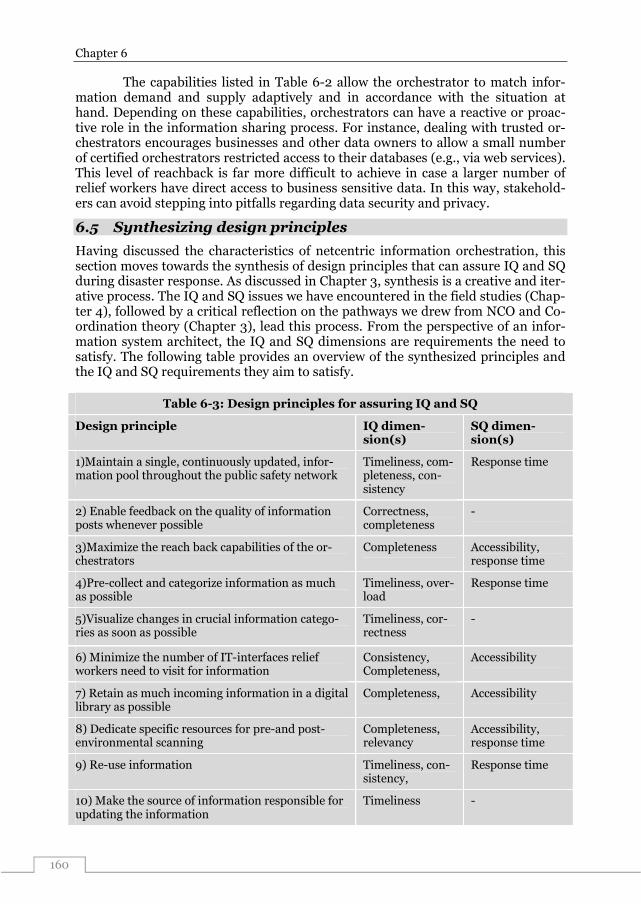
Chapter 6
160
The capabilities listed in Table 6-2 allow the orchestrator to match infor-mation demand and supply adaptively and in accordance with the situation at hand. Depending on these capabilities, orchestrators can have a reactive or proac-tive role in the information sharing process. For instance, dealing with trusted or-chestrators encourages businesses and other data owners to allow a small number of certified orchestrators restricted access to their databases (e.g., via web services). This level of reachback is far more difficult to achieve in case a larger number of relief workers have direct access to business sensitive data. In this way, stakehold-ers can avoid stepping into pitfalls regarding data security and privacy.
6.5 Synthesizing design principles
Having discussed the characteristics of netcentric information orchestration, this section moves towards the synthesis of design principles that can assure IQ and SQ during disaster response. As discussed in Chapter 3, synthesis is a creative and iter-ative process. The IQ and SQ issues we have encountered in the field studies (Chap-ter 4), followed by a critical reflection on the pathways we drew from NCO and Co-ordination theory (Chapter 3), lead this process. From the perspective of an infor-mation system architect, the IQ and SQ dimensions are requirements the need to satisfy. The following table provides an overview of the synthesized principles and the IQ and SQ requirements they aim to satisfy.
Table 6-3: Design principles for assuring IQ and SQ
Design principle IQ dimen-sion(s)
SQ dimen-sion(s)
1)Maintain a single, continuously updated, infor-mation pool throughout the public safety network
Timeliness, com-pleteness, con-sistency
Response time
2) Enable feedback on the quality of information posts whenever possible
Correctness, completeness
-
3)Maximize the reach back capabilities of the or-chestrators
Completeness Accessibility, response time
4)Pre-collect and categorize information as much as possible
Timeliness, over-load
Response time
5)Visualize changes in crucial information catego-ries as soon as possible
Timeliness, cor-rectness
-
6) Minimize the number of IT-interfaces relief workers need to visit for information
Consistency, Completeness,
Accessibility
7) Retain as much incoming information in a digital library as possible
Completeness, Accessibility
8) Dedicate specific resources for pre-and post-environmental scanning
Completeness, relevancy
Accessibility, response time
9) Re-use information Timeliness, con-sistency,
Response time
10) Make the source of information responsible for updating the information
Timeliness -

Design theory
161
Table 6-3 provides an overview of the design principles drawn from theory and practice. In accordance with the TOGAF prescriptions for communication princi-ples (TOGAF, 2004), we elaborate on the rationale underlying each design princi-ple using findings from our field studies and/or theoretical foundation. We also discuss the impact these principles will have on assuring specific IQ and SQ re-quirements. Design Principle 1. Maintain a single, dynamic and network wide situa-tion report throughout the PSN Rationale. We synthesized this principle based on the NCO reachback pathway and the observation that situation reports were often outdated. The field studies in Rot-terdam showed that information managers generate several different situation re-ports throughout the disaster response process. These situation reports acted as boundary objects between organizations carrying crucial information between mul-ti-agency teams. However, when not generated and distributed in the right way, situation reports become a source of confusion and delay. Moreover, in the case of Delfland (Chapter 3), we found that relief workers generated consecutive situation reports from inconsistent templates, creating some confusion among relief work-ers. Early research by Stasser & Titus (1985) shows that pooling information per-mits a group decision that is more informed than the decisions of members acting individually. In particular, discussion can perform a corrective function when members individually have incomplete and biased information but collectively can piece together an unbiased picture of the relative merits of the decision alterna-tives. The use of a single, continuously updated information pool would also mini-mize the lag between outdated and up-to-date information. Accordingly, we expect that this form of synchronous information sharing will lead to improved timeliness and consistency. As decision-making groups, multi-agency disaster response teams can benefit from pooling members' information, particularly when members indi-vidually have partial and biased information but collectively can compose an unbi-ased characterization of the decision alternatives. Assured IQ and SQ requirements: IQ-timeliness, IQ-completeness, IQ-consistency and SQ-response time Design Principle 2. Enable feedback on the quality of information posts whenever possible Rationale. We observed several situations in which the lack of meta-information on the quality of the information shared delayed decision-making and action. Particu-larly, information in the situation reports provided by other teams was a source of confusion in delay in the decision-making process. Sentences such as “…there might be some flammable materials” or “the school may have some chemicals stored in the chemistry lab…” created some uncertainty in further actions. Since relief workers often share such information with no indication on the level of relia-bility, the recipients experienced difficulties in establishing further actions (e.g., act or wait for information that is more accurate). In social networks with increasing numbers of users, centralizing the tasks of approving or validating information in-puts to a limited number of roles or experts will be difficult, if not impossible. Wik-ipedia and Google’s Android Market are examples of social networks that grow with hundreds of entries by the hour. In such networks, the tasks of monitoring the quality of hundreds of entries (i.e., information, apps) are broken down in a two-

Chapter 6
162
step process. First, individual information sources (relief workers or others) can give feedback in the form of quality ratings (e.g., one to five stars, score 1, 2, or 3). Based on such these ratings, dedicated experts (or orchestrators) can further vali-date (i.e., emphasize, enrich of remove) the entries. Accordingly, we propose that information providers should at least indicate the level of reliability of information. Assured IQ and SQ requirements: IQ-correctness, IQ-completeness Design Principle 3. Maximize the reach back capabilities of the orches-trators Rationale. We synthesized this principle from the NCO reachback pathway and the observation that relief workers have limited direct access to information sources. Each of the three field studies exhibited instances of poor reach back. This means that information managers were unable to access information directly for use in the multi-agency team. In Rotterdam for instance, access to container ship cargo in-formation was a recurring source of delay since information managers could not access information stored in the database of the shipping agency. Instead, relief workers themselves made several information requests by calling the emergency control room, a field level relief worker or the representative of the business or pri-vate organization. Accordingly, this principle suggests that information system ar-chitects focus on maximizing the reachback capabilities of information orchestra-tors for a variety of scenarios and respective information needs. The assumption here is that orchestrators act as trusted third parties and are aware of the sensitivity of information. Assured IQ and SQ requirements: IQ- completeness, SQ-accessibility, SQ-response time Design Principle 4. Pre-collect and categorize information as much as possible Rationale. We have observed that relief workers often collect information objects they need after the team meetings. This means that information collection is a reac-tive process, after the need for information surfaces during team meetings or events in the field (e.g., explosion of a gas tank). This while there is very little time during the response phase to collect and interpret information. Recognizing that some information objects are dynamic and change in value, the majority of the in-formation objects needed during a disaster can be pre-collected for a range of sce-narios, enabling orchestrators to pre-collect and categorize these objects prior to the team meetings (instead of searching for them after each meeting). Using such libraries, orchestrators can already collect and prepare some information objects prior to the identification of their necessity. Another purpose of this form of ad-vance structuring is to reduce the likelihood of information overload. Considering our observations of relief workers during training exercises, we argue that the changes of information overload are high when relief workers are confronted with much new and uncategorized information, for instance when (re)joining a team meeting. We expect that the upfront collection of information will not only shorten SQ response time, but also allow relief workers to find the information they need before it is too late. The categorization functionality should also allow hiding in-formation that is not of interest at a particular time. As such, we propose that the categorization of information is important for avoiding information overload. This is in line with the observations of Turoff et al (2004). A dynamic library of ‘in any

Design theory
163
case needed information’ (e.g., weather information, location coordinates) can al-ready be in place and is useable for daily operations as well. In this way, orchestra-tors can collect relevant information more rapidly. In addition, this library should contain experiences from previous disasters. Assured IQ and SQ requirements: IQ-timeliness, IQ-overload and SQ-response time Design Principle 5. Visualize changes in crucial information categories as soon as possible Rationale. During disasters, information is outdated rapidly and it is important that relief workers know when a particular information object (e.g., the number of victims) has changed. The three field studies revealed that relief workers had many difficulties in determining which information is new or changed compared to what they already knew. In the Rotterdam field studies for instance, the situation reports in CEDRIC did not provide any means of indicating new information within a sit-uation report. In Delfland, relief workers actually discussed amongst each other whether the information posted on the whiteboards was still timely. As such, we propose that changes in information should be visible as soon as possible. Assured IQ and SQ requirements: IQ-timeliness, IQ-correctness Design Principle 6. Minimize the number of IT-interfaces relief work-ers need to visit for information Rationale. The Gelderland field study is an example of what could happen when relief workers are required to work with several applications (web-based or thick clients) for collecting, enriching, validating, and sharing information in the PSN. Not only does the use of several applications burden computing power making the applications less responsive, they also create opportunities for information incon-sistency and fragmentation when using several applications. For instance, in the Rotterdam-Rijnmond case, we also observed some difficulties for relief worker try-ing to run and work with several applications at the same time. A ‘one-stop-shop’ or single window for all information needs can improve access to timely and complete information, while assuring information system reliability by means of reduced network and computing loads. This principle enables the re-use of application func-tionality, something that various scholars have emphasized in the development of service-oriented architectures. Following this principle, any application used for netcentric information orchestration needs to synthesize information from a wide range of heterogeneous information sources. These include public and private da-tabases, repositories, and digital libraries; physical sensors such as weather sensors and “social sensors” such as blogs, social networking sites, and reports from social networks of individuals who do not have direct access to the Internet; and tradi-tional broadcast media. This principle does not suggest building monolithic infor-mation architectures, but one online access point for information orchestrators. Assured IQ and SQ requirements: IQ-consistency, IQ-completeness, SQ-accessibility Design Principle 7. Retain as much incoming information in a digital library as possible Rationale. As a disaster progresses more and more information becomes available in the PSN. In the field studies, we found that there are no means for retaining in-

Chapter 6
164
formation throughout the network of agencies. The whiteboards in the HHD case do provide the capacity to post some information, however the physical size of the-se whiteboards acted as limits for retaining information. In the Rotterdam study, we observed that there were no directly exploitable libraries or information storage systems in which the information flowing in or out of the teams could be stored and organized for re-use. In other words, it was difficult to maintain and update team level memory. Therefore, some information resources were repeatedly acquired (i.e., location of the incident) leading to unnecessary utilization of the information manager or the control room. We do not consider the projected situation report (on the projection screen) as a library for two reasons: (1) they contained either incom-plete or outdated information from other teams (i.e., strategic level) for internal decisions that are being taken at the moment supreme and (2) team members were unable to exploit knowledge gained from previous (real) disasters in the area. Based on information processing theory, Galbraith (1973) suggests that a team can be made to handle higher environmental complexity if its repertoire of information is expanded continuously and its ability to exploit such repertoire is corresponding-ly improved. Lee and Bui (2000) also recognized the need for such a dynamic ca-pability and suggest that the design of any disaster response system should support some form of organizational memory component and should somehow be able to capture both tacit and explicit knowledge about how prior crisis situations were dealt with. A library of ‘in any case needed information’ (e.g., weather information, location coordinates) can already be in place and is useable for daily operations as well. In this way, orchestrators can collect relevant information more rapidly. In addition, this library should contain experiences from previous disasters. Assured IQ and SQ requirements: IQ-completeness, SQ-accessibility Design Principle 8. Dedicate specific resources for pre-and post-environmental scanning Rationale. We observed that the decision-making team was often blindsided during their meetings. Since the team leaders (e.g., mayor, chief commander) often pro-hibit mobile phone or radio communication during the team meetings, the com-manders of the respective agencies were unable to attain situational updates. As a result, they were often unaware of new developments in the environment (i.e., re-lease of asbestos) and were unable to adapt their decisions to accommodate new developments. We argue that the teams could have captured many disaster related if some of the team’s resources were dedicated to scanning the environment. Envi-ronmental scanning is the internal communication of external information about issues that may potentially influence an organization's decision-making process (Albright, 2004). The idea is that through consistent monitoring of external influ-ences, decision-making teams can shape their own internal processes to reflect necessary and effective responses. Environmental scanning includes a continuous flow of assessing the organization, adapting, developing a strategic plan and as-sessing again (Choo, 2000). Albright (Albright, 2004) adds that environmental scanning is not a stagnant process, it should be constant and ongoing in order to maintain a preparative stance as environmental influences arise. The process of understanding the match between external influences and internal responses as-sists in adjusting organizational structure and strategic plans that are designed to be more effective and flexible to changing external conditions (Choo, 2000). Sources that can be scanned include social media networks such as Twitter,

Design theory
165
YouTube, Flickr, which have proven to contain timely information during disaster situations (Plotnick, White, & Plummer, 2009). Assured IQ and SQ requirements: IQ-timeliness, IQ-relevancy, IQ-completeness, SQ-accessibility Design Principle 9. Re-use information as much as possible Rationale. We have observed several instances of repeated information request and collection efforts during the field studies. Since there is no shared information space or library, relief workers and information managers were often not aware of information already available in the PSN. Consequently, the redundant requests for information consumed the already scarce information management capacity of the information managers and control rooms. As such, we advocate that after initial validation by orchestrators or experts, information that is available in the PSNs is re-used as much as possible. The re-use of information could also assure a higher level of IQ-consistency since the same information can be shared repeatedly. Note that the danger here is also that relief workers repeatedly share the wrong infor-mation. Assured IQ and SQ requirements: timeliness, consistency, response time Design Principle 10. Make the source of information responsible for updating the information Rationale. This principle is mainly adapted from Michael Hammer (1990) who has stressed its importance in business process reengineering. The volume of infor-mation that relief workers share during a disaster is enormous. As some of this in-formation (for instance the availability of hospital beds) is subject to rapid change, it is important that the owner of that information update it as quickly as possible. In centralized information systems with for instance CEDRIC, the information managers are the responsible roles when it comes to updating the information stored in the system. In such systems, the idea is that information can be collected in advance in stored within the database of the system for eventual use during dis-aster response. However, as mentioned in Chapter 4 on the field studies, infor-mation managers and coordinators are already very busy and do not have time (and sometimes the capabilities) to update information. As such, information sys-tem architects should leave and reinforce the responsibility of updating infor-mation with the owners of that information (e.g., firms, hospitals, governmental departments, shipping companies). This principle also leaves the responsibility and cost for collecting and updating information at owners. An assumption here is that the owners update their databases for their daily business processes. Assured IQ and SQ requirements: IQ-timeliness

Chapter 6
166
6.6 Summary
We have defined and explained our design theory on netcentric information or-chestration. Key in netcentric information orchestration is that relief workers (de-mand) match the available information sources in the public safety network (sup-ply) to the needed information. This means that all teams should be able to share information with all other teams, regardless their authority level or decision-making authority. As a two stage process, netcentric information orchestration re-quires information system architects to develop IT enabled capabilities prior to (advance structuring) and during (dynamic adjustment) disaster response. These capabilities should empower orchestrators in assuring IQ and SQ during disaster response. Returning to the research question, we set out to investigate in this chap-ter (Which design principles can we synthesize from the knowledge base and em-pirical data for assuring IQ and SQ during multi-agency disaster response?) this chapter presents ten design principles for assuring IQ and SQ. Even though these design principles are more empirically driven (field study data), they rest firmly on the pathways from NCO and coordination theory. Principle number nine (re-use information as much as possible) and ten (make the source of information respon-sible for updating the information) in particular resonate with pathways suggested in previous work.
The audiences for these principles include a range of stakeholders in the public safety domain. Firstly, the principles are meant to guide information system architects in (re)designing existing architectures towards the assurance of IQ and SQ. Architects could also employ the principles provided in this research in their current practices and systematically reflect on their practices using our IQ and SQ framework. After the interviews with architects (see chapter five), we also under-stood the role of policy makers one the regional (Safety Region) and state (ministe-rial/ Dutch Department of Interior Affairs and Kingdom Relations) level. As im-portant funders of information systems for disaster response, this audience would benefit from the set of principles proposed in this dissertation. Another audience we did not anticipate in the beginning of this research consist of software vendors and IT consultants. Throughout our field studies and interviews, we have learned that an increasing number of software vendors (i.e., Microsoft, Google) and IT con-sultancy firms are trying to establish a market in PSNs. In many cases, vendors ad-vertise software products developed for different domains and purposes (i.e., busi-ness intelligence). To date, this approach has not yet led to much success for these vendors and consultancy firms. Accordingly, software vendors and IT consultancy firms could employ the empirical foundation of this dissertation to gain more un-derstanding of the opportunities and hurdles for supporting multi-agency infor-mation management during disaster response.
Having presented the design principles, the next step in this study was to evaluate these design principles. Accordingly, chapter seven elaborates on the technical feasibly of netcentric information orchestration by translating the pro-posed design principles into a prototype (DIOS).

DIOS prototype
167
7 DIOS: A prototype for netcentric information orchestra-tion
“If a picture is worth a thousand words, a prototype is worth a thousand pictures”
Anonymous
7.1 Introduction
In the previous chapter, we spent many words on introducing and explaining prin-ciples for netcentric information orchestration. In line with the statement quoted above, this chapter presents a prototype that we used for evaluating the design principles in a gaming-simulation (Chapter 8). According to Dictionary.com, the word prototype comes from the Latin words proto, meaning original, and types, meaning form or model. In software development, a prototype is a rudimentary working model of a product or information system, usually built for demonstration purposes (Smith, 1991). Prototypes present the user with a relatively realistic view of the system as it will eventually appear (Mason & Carey, 1983). A prototype typi-cally simulates only a few aspects of the features of the eventual program, and may be completely different from the eventual implementation. The purpose of the pro-totype in the present study is to embody and demonstrate the principles behind netcentric information orchestration (discussed in Chapter 6) with further (end-user evaluation by relief workers) in mind. According to Bernstein (1996), modern information system development demands the use of prototyping, because of its effectiveness in gaining understanding of the requirements, reducing the complexi-ty of the problem and providing an early validation of the system design. Prototyp-ing provides two key benefits: (1) it reduces uncertainty associated with realization of netcentric information orchestration, addressing the typical question to this de-sign theory and (2) it provides a learning opportunity by getting an early feedback on the idea from students and professionals. In addition, a prototype model can demonstrate to users what is actually feasible with existing technology, and what weaknesses exist with this technology (Martin, 2003). The users can relate what they see directly to their needs. Disadvantages of prototyping include: the fostering of undue expectations on the part of the user, what the user sees may not be what the user gets, and availability of application- generator software may encourage end-user computing (Lantz, 1986).
In accordance with Ince & Hekmatpour (1987), the stages in our prototyping process consist include: (1) the establishment of prototyping objectives, (2) func-tionality selection, (3) prototype construction and (4) prototype evaluation. This chapter proceeds by stating our choices during these stages in chronological order. Next, we discuss two versions of the prototype that we developed, including the design choices regarding the presentation, logic and data layers. Finally, we reflect on the development of the prototype and its embodiment of the design principles stated in the previous chapter.
Chapter 7
168
7.2 Stage 1: the establishment of prototyping objectives
In the first stage, it is important that both the developers know exactly what a pro-totype is aiming to achieve and the establishment of prototyping objectives is one of the first activities to be undertaken by the developers. The main objective of the prototyping stage was to develop a reliable and easy to use online application that embodied the principles behind network centric orchestration in such a way that these we could evaluate these principles using a quasi-experimental setting.
An IS prototype is an early version of a system that exhibits the essential features of the later operational system (Sprague & Carlson, 1982, p. 85). While admitting that several other definitions for prototypes also exist, the following defi-nition is adopted since it captures our understanding and purpose: “a prototype as the first embodiment of an idea” Glegg (1981, p. 89). It is tentative and its purpose is to validate or test the idea in question. Neither the prototype's form nor the ma-terials used in its construction have to be those of the final design, as long as the basic idea or concept can be tested (Ibid.). Typical characteristics of a prototype include: (1) functional after a minimal amount of effort, (2) a means for providing users of a proposed application with a physical representation of key parts of the system before system implementation, (3) flexible modifications require minimal effort and (4) not necessarily representative of a complete system (Martin, 2003).
Even though the difference between a prototype and a working model is clear in industrial sectors (i.e., scale models of cars), differentiation between soft-ware based prototypes and products is more difficult. Certainly in mechanical engi-neering, a prototype (for example, of a bridge or an aircraft) can be either a scaled-down model or a full sized version. In software engineering, however, there is no suggestion of a complete version of the system being produced since the functions will be to illustrate specific important aspects of the final system (Gray & Black, 1994). Just what aspects are to be included will vary depending on the intended function of the prototype? ISs are similar to engineering systems because they too perform transformations on (data) objects that are undergoing a change of state. The prototyping technique has a long tradition in developing engineering systems (Janson & Smith, 1985). Major differences between prototyping and the traditional systems development life cycle are the lack of tightly written systems design speci-fications and the short time period required to provide the user with an initial sys-tem for actual "hands-on" experience (Ibid.). The nature of a prototype: iterative (Type I) and throwaway (Type II), determines factors such as the design method and the amount of resource to be allocated to the prototyping stage (Lantz, 1986). In the iterative approach, the prototype is changed and modified according to user requirements until the prototype evolves into the final system. In the throwaway approach, the prototype serves as a model for the final system.
Throw-it-away prototyping involves the production of an early version of a software system during requirements analysis. Developers can use such a prototype as a learning medium between the developer and the end users during the process of requirements elicitation and specification. An important characteristic of this approach is that developers need to construct the prototype very rapidly. In doing so, developers often have to comprise some aspects of prototype (e.g., graphics and flexibility). What is crucial about throw it away prototyping is the process and not the product; almost invariably, the latter will be discarded when the developer and the users have converged to an adequate set of requirements. Since we needed to

DIOS prototype
169
develop a prototype for principle demonstration and evaluation purposes in a rela-tively short time, we decided to develop a throwaway prototype. The main objective
7.3 Stage 2: functionality selection
Considering the matrix of functionalities a prototype needs to provide, prototyping can be carried out in both a vertical or horizontal fashion (Ince & Hekmatpour, 1987). The former involves incorporating all the functions, albeit in a simplified way, in the prototype: the latter involves a selection of functions. Since our purpose with the prototype was to demonstrate the technical feasibility of the principles behind network centric orchestration and allow for quasi-experimental gaming-simulation (Chapter 8), horizontal prototyping based on a limited set of functional-ities was sufficient. The prototype needed to provide two types of functionalities: principle-related and tasks-related functionalities. Table 7-1 summarizes the prin-ciple-related functionalities that the prototype should support.
Table 7-1: Principle-related functionality selection
Design principle Required functionali-ties
Description
Maintain a single, contin-uously updated, situation report
1) Network wide situation report template and 2) automatic refresh and update
A single situation report should be retrievable by all users whenever necessary
Enable feedback on the quality of information posts whenever possible
Information quality rat-ing
Every user should be able to rate the information they share or rate the information shared by others
Categorize information as much as possible
Information filtering and prioritization
Users should be able to view and prioritize information based on their preferences (i.e., the time of posting, the sender or the type of info)
Allow changes in crucial information categories to be seen as soon as possible
Highlight information object modifications
Modifications or updates in infor-mation objects should stand out and be clearly visible
Retain as much incoming information in a library as possible
Library of shared infor-mation
Information should be stored in an centralized and easy to access li-brary
Date and time stamp The prototype should generate and show an automatic date and timestamp of each information en-try
Dedicate specific resources for environmental scan-ning
Access to external social networks
Users should be able to view post on several social media sites based on key words (e.g., Twitter, You-tube).
Re-use information as much as possible
Shared information space Information already shared by oth-ers should be visible in a shared information space
Standardize information formats as much as possi-ble
Standardized data entry and output fields
The prototype should have stand-ardized input and output forms for each information type
Re-use existing application services as much as possi-ble
Standardized message interfaces
Messages should be exchanged in standardized data formats

Chapter 7
170
Table 7-1 outlines the principle-related functionalities that the prototype would need to provide (based on the design principles listed in Chapter 6). Note that not all of the design principles are deducible in IT functionalities since some principles suggested organizational modifications to the information system archi-tecture (i.e., orchestrator role definition). Task-related functionalities include a list of functionalities that provide relief workers with the basic information necessary for their tasks. These functionalities included access to geographical and meteoro-logical information. Since these task-functionalities allow relief workers to progress in their activities independent of our netcentric information orchestration design, we were not planning to evaluate these in the quasi-experiments. The following table outlines the tasks-related functionalities the prototype should support.
Table 7-2: Tasks-related functionality selection
Tasks Required functionality Description
Log-in to the system Role based access control The system should allow a secure
login with username and password
Share visual location
information
Geographical information
plotting
Information about the location and
its area should be presented on a
digital map
Share weather infor-
mation
Meteorological information
posting and retrieval
Information about the weather condi-
tions should be post-able and retriev-
able
Share situation re-
port
Situation report generation Teams should be able to share situa-
tion reports
Request for infor-
mation
Information request The system should present a list of
information requests of users so that
others can fulfill these requests.
Share casualty in-
formation
Information posting and
retrieval on casualties
Information about the casualties
should be post-able and retrievable
Share danger-related
information
Information posting and
retrieval on hazards
Information about the dangers
should be post-able and retrievable
The table above lists the main tasks-related functionalities that we need in
our prototype. The following sections elaborate on the use cases and scenarios based on these functionalities.
7.3.1 Use cases
We have chosen to develop a use case diagram, which is part of the Unified Model-ing Language (UML) framework. The main reasons for choosing UML are that UML is easily extensible and easily understandable. A use case consists of several use cases. A use case is the description of a system’s behavior on the users input (Alexander & Maiden, 2004). In other words, what does the system do when the user interacts with the system? As we are designing a network-centric prototype, we did not separate commanders and subordinates; every relief agent can do the same with the system. Therefore, the following use case diagram (figure 7-1) only includes one role, the role of orchestrator.

DIOS prototype
171
Figure 7-1: Use case diagram for orchestrator role
Insert received information (griplevel, geo, meteo, hazard, cas-ualty, capacity) from various chan-
nels (radio, phone, meetings)
Prioritize information tables based on situational needs
Rate existing information on correctness, timeliness and
completeness
Update existing information tables when new information is
available in your team
Request information based on collective rating
Scan external environment for complementary information
Handle information request whenever possible
DIOS

Chapter 7
172
Figure 7-2: Class diagram
As depicted in figure 7-2, the primary user in this system is the orchestra-tor. The next section presents an UML class diagram that we used for configuration the database behind DIOS. In addition, this class diagram serves as a reference model for documentation of disaster specific information objects.
7.3.2 Class diagram
In software engineering, class diagrams can be used for defining the structure of classes, in case an object-oriented programming paradigm is followed (Ambler, 2009). Class diagrams depict the classes, of which an object can be an instance. Within each class, we can formulate attributes and methods. Since the use case functionalities (e.g., inserting information and selecting information) discussed in the previous section is relatively straightforward, the methods and attributes of each class are roughly the same. The figure below depicts the class diagram. We use this class diagram as a template for the network situation network discussed later.
The main class in this functional design is the situational report (sitrep). A
sitrep consists of several, predefined information objects, such as ‘Dangers’, ‘Loca-tion’ and ‘Casualties’. This is in line with the functional requirements of ‘Standard-ized Input’ and ‘Standardized Output’ as mentioned in table 7.1. Furthermore, the methods in each class are only ‘get and set’-methods. This is because the main functionalities of this system are information input and output. Notice that the use cases ‘Login’ and ‘Logout’ are not linked to this class diagram as several packages exists that offer a standardized way to implement this functionality.
7.4 Stage 3: prototype construction and support environment
Prototype construction involves the actual development process required to pro-duce the prototype. Here, the type of prototype needed influences the choices for
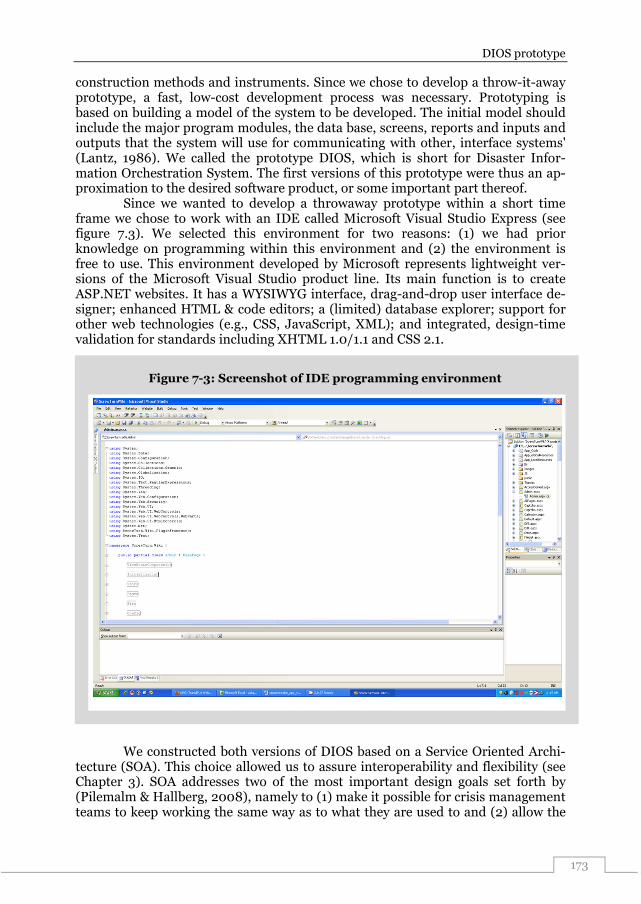
DIOS prototype
173
Figure 7-3: Screenshot of IDE programming environment
construction methods and instruments. Since we chose to develop a throw-it-away prototype, a fast, low-cost development process was necessary. Prototyping is based on building a model of the system to be developed. The initial model should include the major program modules, the data base, screens, reports and inputs and outputs that the system will use for communicating with other, interface systems' (Lantz, 1986). We called the prototype DIOS, which is short for Disaster Infor-mation Orchestration System. The first versions of this prototype were thus an ap-proximation to the desired software product, or some important part thereof.
Since we wanted to develop a throwaway prototype within a short time frame we chose to work with an IDE called Microsoft Visual Studio Express (see figure 7.3). We selected this environment for two reasons: (1) we had prior knowledge on programming within this environment and (2) the environment is free to use. This environment developed by Microsoft represents lightweight ver-sions of the Microsoft Visual Studio product line. Its main function is to create ASP.NET websites. It has a WYSIWYG interface, drag-and-drop user interface de-signer; enhanced HTML & code editors; a (limited) database explorer; support for other web technologies (e.g., CSS, JavaScript, XML); and integrated, design-time validation for standards including XHTML 1.0/1.1 and CSS 2.1.
We constructed both versions of DIOS based on a Service Oriented Archi-
tecture (SOA). This choice allowed us to assure interoperability and flexibility (see Chapter 3). SOA addresses two of the most important design goals set forth by (Pilemalm & Hallberg, 2008), namely to (1) make it possible for crisis management teams to keep working the same way as to what they are used to and (2) allow the

Chapter 7
174
use of existing resources from several agencies in a crisis situation. In order to ful-fill the service re-use and interoperability required, DIOS employs web services. The communication between web services uses Extensible Markup Language (XML), which is a commonly used standard for encoding web applications (W3C, 2010c). The services itself are described by Web Services Description Language (WSDL). WSDL is an XML format for describing network services as a set of end-points operating on messages containing either document-oriented or procedure-oriented information (W3C, 2010b). The information that is sent between services is encapsulated in envelopes with the use of the Simple Object Access Protocol (SOAP). SOAP is a lightweight protocol for exchange of information in a decentral-ized, distributed environment (W3C, 2010a). Finally, a Universal Description Dis-covery and Integration (UDDI) repository is used for registering all available ser-vices. UDDI is a platform-independent, XML-based registry for businesses world-wide to list themselves on the Internet (OASIS, 2010). By using XML, WSDL, SOAP and UDDI, relief agencies are able to operate autonomously while still using and integrating each other's services.
Apart from choosing interface and communication protocols for DIOS, it is also necessary to establish which programming language we would employ. The advantages of using the SOA approach and Web services is that the Web services can be written in any suitable language, like C#, Java, C, C++ or COBOL. We chose to program DIOS in C# because as this language makes it relatively easy to pro-gram web services and we had some prior experience with this language. On site disaster response teams (i.e., CoPI) have access to relatively fast notebooks and PCs that would opt for a language like C++ or a platform-independent language like JAVA. However, the usage of this language to program DIOS would decrease the flexibility of the system since the software should always be preinstalled. Therefore, there is opted for a server-sided web language like PHP and ASP. The advantage is that any computing device having access to the network will be able to use the sys-tem. Any device access to the internet by GPRS, UMTS or WIFI will be able to use these services. Table 7-3 summarizes the components of the prototype development environment.
Table 7-3: Prototype development environment
Component Requirement Rationale
Communication
Protocols
XML, WDSL, SOAP and
UDDI
Because DIOS needs to be interopera-
ble, web service protocols are used
Programming
Language
C# Relatively easy to program web ser-
vices in C#
Scripting
Language
ASP.NET Runs on the same framework as C#
and has built-in features for developing
web services
Application
Framework
Microsoft .NET Frame-
work 3.5 SP1
Provides a well-designed framework
for easily implementing web services
and web applications
Next to the programming language for programming the web services, we al-
so needed to script the website (presentation layer). Since we had already chosen to use C#, a logical alternative for the scripting language was ASP.NET. In addition,

DIOS prototype
175
Figure 7-4: DIOS 2.0 - Technical Architecture
both C# and ASP.NET are able to run on the same .NET framework provided by Microsoft. The drawback of this choice is of course a vendor lock-in effect, yet for this proof of principle, it was suitable enough. The choice for software components is based on the SQ requirements of flexibility and interoperability. While flexibility is assured through the possibility to re-use or modify services easily, interoperabil-ity is ensured because the use of web services enables heterogeneous applications to communicate with other services. Eventually, we opted for a complete Microsoft-based development environment because it was made easy to program web services using the .NET framework.
7.5 DIOS version 2.0
The development of DIOS 2.0 started after a pre-test with master students (see chapter 2). The development period was almost 2 months (February-March 2010). The pretest showed that the first DIOS design failed when used by several orches-trators. We revised DIOS 1.0 by adding and removing several important functional-ities. The technical architecture of DIOS 1.0 also played an important role in draw-ing up the architecture of DIOS 2.0. This three-tier architecture was a steady basis for incrementally developing the application. In addition, after each part of the presentation layer was added, testing and debugging iterations were made in which all layers were tested on consistency and error handling. The following figure illus-trates the technical architecture behind DIOS 2.0.
Considering this technical architecture, we should mention that we made
several noteworthy changes in the presentation layer compared to DIOS 1.0. The most notable changes are the removal of the wiki and the introduction of a dash-board in DIOS 2.0. The functionalities between the two versions differ significantly in all layers of the application. The main differences lie in the presentation layer of

Chapter 7
176
the application. Besides removing the wiki and inserting a dashboard, DIOS 2.0 consists of complete other technologies, such as AJAX. The table below shows the key differences, including why we chose to update DIOS 2.0 in such a way.
Table 7-4: Comparing DIOS 1.0 and DIOS 2.0 - Presentation Layer
Feature DIOS 1.0 DIOS 2.0 Rationale
Wiki Available Not available Using the wiki would take too much
time to familiarize the players of the
gaming-simulation
Logging
in/out
Available Not available Given the strict timeframe of rede-
signing DIOS, the Login feature
could not be implemented
Roles Explicitly
specified
Implicitly specified
(users can indicate
who they are when
posting infor-
mation)
There was too little time to imple-
ment roles for each player
Refresh Rate Full Page
Refresh each
10 seconds
Partial Page Refresh
using AJAX
AJAX makes the user experience
better and more intuitive
Wiki Search
Function
Included Excluded No wiki was installed, therefore no
search function was made
Use of
Google Maps
Yes, in POI
Web Service,
but not fully
operational
No, made use of a
static map
For the purpose of a gaming-
simulation, a static map was suffi-
cient
Dashboard Yes, but not
generic
Yes, generic and for
every user accessi-
ble
A dashboard can give users the lat-
est update of the situation in one
eye catch
Collapsible
Panels
No Yes, for information
tables
Collapsible Panels can prevent in-
formation overload by not showing
all available information
Rating in-
formation
Done with a
scale (1-5)
and colors
(green-
orange-red)
Done with 1 reliabil-
ity indicator with a
scale (Low-
Medium-High)
Easy to implement and easy to un-
derstand for users. However, the
colors and 1-5 scale could be rec-
ommended for further develop-
ment.
External
information
Implicitly
visible
Explicitly visible as
a Tab in the Input
The role of external information
can be of significance in disasters,
so an explicit notion seems im-
portant
There are no real changes made in the application layer, except for calling the web services. In DIOS 1.0, a web service was invoked by using a "fixed link web service": a static URL that points to the web service. In DIOS 2.0, calling web services is im-plemented differently: by using JavaScript, a copy of the web service is created on the web server and that copy is called first. Only when that copy becomes corrupt-

DIOS prototype
177
Figure 7-5: DIOS 2.0 - Map and Weather Information
ed, the real web service (the ‘Fixed Link Web Service’) is invoked. It makes a differ-ence in efficiency to call web services using JavaScript because operations (like in-serting and selecting data) can be implemented more quickly. Although certain as-pects of DIOS 2.0 are more advanced than those of DIOS 1.0, the insights and some features of DIOS 1.0 remain important in the further development of this system. DIOS 2.0 has one main website (DIOS.aspx) which consists of 4 distinct parts:
1. Map and Weather information: in the first part, the map of the disaster scene can be loaded together with the current time and weather infor-mation (see figure 7-5).
2. Dashboard: the dashboard shows the latest information concerning rele-vant information for disasters including. casualties, bystanders, dangers and information requests (see figure 7-6).
3. Input: this part of the website gives the user the possibility to input data in-to the system. This is done in a structured manner where several tabs are used for several different information objects (see figure 7-7).
4. Information Tables: whereas the dashboard only shows the latest infor-mation available for each type of information, the information tables keep track of all information entries into the system, providing a full “infor-mation system memory” for each disaster (see figure 7-8).
The screenshots below represent each part of the presentation layer in DI-OS 2.0. As the gaming-simulation took place at the Police Academy of the Nether-lands, we decided to code DIOS 2.0 Dutch. Therefore, the screenshots below show the use of Dutch instead of English. The first functionalities relief workers see in DIOS 2.0 are the disaster area map services and the meteorological information service (Figure 7-5).

Chapter 7
178
Figure 7-6: DIOS 2.0 – Dashboard
Figure 7-6 depicts the dashboard functionality in DIOS 2.0. This dashboard visualizes the most recently shared information in DIOS 2.0.
Scholars in the domains of strategic management (e.g., Adam & Pomerol,
2008; Clarke, 2005) have proposed the use of dashboards as instruments for both the clustering and visualization of performance indicators. A dashboard is “a visual display of the most important information needed to achieve one or more objec-tives, consolidated and arranged on a single screen so the information can be moni-tored at a glance” (Few, 2006, p. 34). Dashboards can be designed and tailored to many specific purposes depending on the task to be supported, the context of use and the frequency of use (Few, 2006).
Moreover, the various data and purposes that dashboards can be used for are worth distinguishing, as they can demand differences in visual design and func-tionality. The factor that relates most directly to a dashboard's visual design in-volves the role it plays, whether strategic, tactical, or operational. The design char-acteristics of the dashboard can be tailored to effectively support the needs of each of these roles. In line with Morrissey (2007), our process of tailoring dashboard content consisted of three phases: (1) identifying the main stakeholders; (2) identi-fying goals and establishing baseline capability for each stakeholder; and (3) select-ing strategic, tactical, or operational dashboard content aligned with these goals.

DIOS prototype
179
Figure 7-7: DIOS 2.0 - Information input functionality
Figure 7-7 depicts the information sharing functionality in DIOS. Using the information sharing functionality, orchestrators can share different types of infor-mation and indicate the level of reliability of the information shared.
Note that none of the fields in the information-sharing table is mandatory
since we wanted to prevent system failures. Figure 7-8 illustrates the various tables containing the information shared. In addition to changes in the structure of the website in DIOS 1.0, an additional technology set was used in DIOS 2.0 to automat-ically refresh the information tables and the dashboard. This technology set is called AJAX and stands for Asynchronous JavaScript and XML. AJAX is actually a set of several technologies that can be used in enriching web applications (Garrett, 2005).
AJAX is also a key component of Web 2.0 applications such as Flickr, now part of Yahoo!, 37signals' applications basecamp and backpack, as well as other Google applications such as Gmail and Orkut (O'Reilly, 2007). AJAX technology allows a web application to be more interactive by enabling partial-page updates, which means that parts of a webpage can be updated without having to refresh the whole page, which is usually done by pressing the F5 button. This enhancement gives the user a much richer experience with web applications (Garrett, 2005). A well-known example of web pages that use AJAX is Google.com: each time you type in a search question, Google comes up with suggestions of what the search question might be. DIOS 2.0 uses AJAX technology to enable real-time updates for the Dashboard and Information tables of this prototype.

Chapter 7
180
Figure 7-8: DIOS 2.0 – AJAX based information Tables
Furthermore, AJAX also allowed DIOS 2.0 to hide information tables and
prevent information overload for the user. In addition, AJAX allows for near real time web services invocation by using direct JavaScript calls instead of using the SOAP protocol. The application layer of DIOS 2.0 also consists of several web ser-vices that can be used for modifying, inserting or selecting data. Table 7-5 provides an overview of the web services used in DIOS 2.0. These web services are similar to set of web services employed in DIOS 1.0.

DIOS prototype
181
Table 7-5: DIOS 2.0 - Web Service Definitions
Web Service Explanation Web Service Meth-
ods
GRIP_WS Inserting and Showing GRIP values
(GRIP is an indication used in the Neth-
erlands that tells how severe a disaster
is)
InsertGRIP()
ShowGRIP()
Casualties_WS Information provision and entry con-
cerning casualties (Deceased, Heavily
Wounded, Lightly Wounded)
InsertCasualty()
ShowDeceased()
ShowHeavilyWounded()
ShowLightlyWounded()
InformationReq_WS Users can post an information request
when they need information on some-
thing
InsertInfoRequest()
ShowInfoRequests()
Location_WS Insert and Show updates of a Location
(usually the disaster scene)
InsertLocation()
ShowLocations()
Capacity_WS This web service is used for inserting and
showing the capacity, expressed in vehi-
cles or officers, of each relief agency
InsertCapacity()
ShowCapacity()
Bystanders_WS Information concerning bystanders who
are at the disaster scene
InsertBystanders()
ShowBystanders()
Dangers_WS Users can post and see information con-
cerning several dangers on the disaster
scene, such as a collapsing danger, a tox-
ic danger or an explosion danger
InsertDanger()
ShowDangers()
Weather_WS Weather information can be assessed
and modified using this web service
InsertWeather()
ShowWeather()
In DIOS 2.0, the data layer consists of a Microsoft SQL Server, which oper-
ates separately next to the web server. The SQL Server contained 1 database with all specific data of DIOS. There was no use of third-party data during the “Master of Disaster” gaming-simulation, as it was too risky to depend on relatively unknown service providers during the simulation. Yet, the use of third-party data in DIOS 2.0 was also easily possible due to the use of web services in the application layer. However, in the gaming-simulation, we simulated third-party data by saving this data locally in the MS SQL Server Database (the tables are HazardousMaterials and ShelterLocations). MS SQL Server 2008 Express Edition was chosen as the data-base management system for DIOS 2.0 because it is free to use, easy to install and extremely easy to integrate with web services written in C#. The Integrated Devel-opment Environment (IDE) used in DIOS 2.0 was Microsoft Visual Web Developer 2008, which ships with a free edition of MS SQL Server 2008. This IDE made it easier to use a MS SQL database in combination with web services because of the pre-defined classes for retrieving and inserting data. The database diagram below shows which database tables we drafted and which elements we used to make up each table.
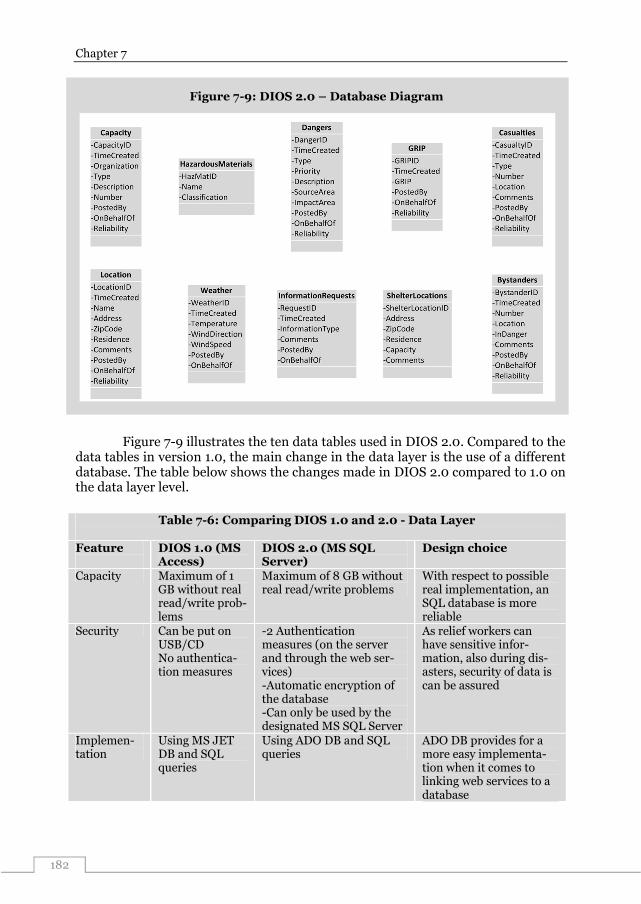
Chapter 7
182
Figure 7-9: DIOS 2.0 – Database Diagram
Figure 7-9 illustrates the ten data tables used in DIOS 2.0. Compared to the
data tables in version 1.0, the main change in the data layer is the use of a different database. The table below shows the changes made in DIOS 2.0 compared to 1.0 on the data layer level.
Table 7-6: Comparing DIOS 1.0 and 2.0 - Data Layer
Feature
DIOS 1.0 (MS Access)
DIOS 2.0 (MS SQL Server)
Design choice
Capacity Maximum of 1 GB without real read/write prob-lems
Maximum of 8 GB without real read/write problems
With respect to possible real implementation, an SQL database is more reliable
Security Can be put on USB/CD No authentica-tion measures
-2 Authentication measures (on the server and through the web ser-vices) -Automatic encryption of the database -Can only be used by the designated MS SQL Server
As relief workers can have sensitive infor-mation, also during dis-asters, security of data is can be assured
Implemen-tation
Using MS JET DB and SQL queries
Using ADO DB and SQL queries
ADO DB provides for a more easy implementa-tion when it comes to linking web services to a database
DIOS prototype
183
The migration from MS Office Access to MS SQL Server was a relatively easy process. Since both database management systems use the same query language (SQL - Structured Query Language), only changing the engine (JET DB to ADO DB) was difficult. Yet, an easy transition took place where no genuine problems oc-curred.
7.6 Stage 4: Prototype evaluation
Prototype evaluation is probably the most important step in the prototyping pro-cess and one for which there is little knowledge. Users of a prototype require proper instructions prior to its use. It is important that the prototype becomes a learning medium for both the developer and the customer and the latter should have confi-dence that the time-consuming activities involved are actually converging to a sta-ble set of requirements. Normally the evaluation process takes a number of cycles until this happens and requires timely feedback for productive learning.
We organized two user tests (other than the development team) for evaluating the DIOS versions. First, we evaluated DIOS with a number of master students from Delft University of Technology on February 16th 2010. As part of their regular course load, we requested master students to participate in a gaming-simulation experiment, which also functioned as the pre-test for the gaming-simulation with professionals (see Chapter 8 for more details). During this pre-test, it appeared that DIOS 1.0 had crashed on the web server just after we started with the second round of the gaming-simulation. This was of course unfortunate; however, this pre-test did reveal the main shortcomings of our prototype. After the prototype failure, we started developing DIOS 2.0.
We tested DIOS 2.0 using a team of eight PhD students and four master stu-dents using computers within and outside of the university network. We asked the twelve testers to work simultaneously with DIOS 2.0 as intensively as possible, so a thorough error handling could be done subsequently. The duration of the test was 30 minutes. The result of the test was positive; DIOS 2.0 did not crash and was still functioning afterwards. Still, there were some improvements made to DIOS 2.0 including:
1. Error handling for special characters: characters like question marks, brackets and exclamation marks were entered during the test session and this resulted in errors. After the test, a small character handler was built so that no errors were generated
2. Error handling for script attacks: two testers also entered a short HTML script in DIOS, resulting in several errors. The information fields were re-programmed afterwards, so that HTML and JavaScript scripts could not generate errors in DIOS
The pre-test has shown that testing an information system application is an ex-
tremely important step in the development process. Error handling and user friendliness of a system contribute greatly to the usefulness of the prototype.
Chapter 7
184
7.7 Summary
This chapter reports on the technical feasibility for netcentric information orches-tration. Based on the principles proposed in Chapter 6, we constructed a prototype for netcentric information orchestration. The prototype allows all available data on the situation, decisions, progress and results of each stage of the response phase to be concentrated in a central information space in real time. In addition, the proto-type allows the available information to be processed as quickly as possible to a dy-namic overview of the incident, the impact and progress of the response efforts that is continuously updated and continuously accessible to authorized relief workers.
The first version of the prototype, DIOS 1.0 failed during a pre-test with master students. This prompted us to construct the second version of the proto-type, DIOS 2.0. DIOS 1.0 had a number of technology-enabled features not found in version 2.0, such as logging in and out, a personalization of the functionalities visible to each role and partial implementation of Google Maps. Furthermore, be-cause of the full-page refreshing feature of DIOS 1.0, we could not say that DIOS 1.0 was a full netcentric application, because after every 30 seconds users had to wait two seconds until information this application unfreezed the user interface. In a time-critical situation such as a disaster response, every second counts, so be-cause of the full-page refreshing trait and the database failure during the pretest with master students, we decided to further develop DIOS and make version 2.0. Consequently, the main difference between DIOS 1.0 and 2.0 is that refreshing (presenting updated information fields) occurs seamlessly by using AJAX technol-ogy. The user does not see a whole page refresh, only parts of the page (e.g. one ta-ble) are refreshed immediately when an update is posted. In addition, we decided that every user sees the same screen as everyone else, thereby removing the per-sonalization feature of DIOS 1.0.
We chose to employ a single network wide situation report for shared situa-tional awareness, where everyone has immediate access to the same information. Eventually it became clear that several trade-offs had to be made between a num-ber of requirements (e.g. personalization vs. shared situational awareness) in order to have a stable netcentric information orchestration prototype. In the end, we pre-ferred a stable and dependable prototype to a prototype that contains all of the functionalities possible. This because the prototype was just a tool (and not a goal) embodying the design principles to be evaluated with professionals. We discuss this evaluation in the next chapter.
Evaluation
185
8 Evaluation: A quasi-experimental gaming-simulation
“Tell me and I'll forget; show me and I may remember; involve me and I'll under-
stand.”
Confucius 551–479 BC
8.1 Introduction
This chapter reports on the results of the gaming-simulation with professional re-lief workers. We quoted Confucius in our invitation to professionals, asking them to participate in our quasi-experimental gaming-simulation. In return, the gaming-simulation provided participants with a flavor of what network-based information management approaches look like in practice and what the effects would be for in-ter-agency (horizontal) and inter-echelon (vertical) information management. The main objective of this session with professionals was to evaluate the extent to which the principles of netcentric information orchestration could better assure infor-mation quality (IQ and SQ) than hierarchy-based information systems for disaster response.
Accordingly, the gaming-simulation was the main research methodology for investigating the final research question in this dissertation, which asked, to what extent do the proposed design principles assure higher levels of IQ and SQ for re-lief workers when compared to information systems in practice? We started by first simulating disaster response based on a hierarchical information management architecture (round one of the gaming-simulation). Afterwards, we simulated dis-aster response based on a netcentric information orchestration architecture (round two of the gaming-simulation). The gaming-simulation was called “Master of Dis-aster” and was pre-tested with master students at the Delft University of Technolo-gy. Chapter 2 has already provided a detailed description of gaming-simulation as a research methodology. Considering chapter 2 as a prelude, this chapter proceeds by presenting the results gained from applying this methodology.
8.2 Situational setting
The situational setting includes all variables that surround the gaming-simulation session, but are not part of the design (Meijer, 2009). One can think of the venue, the participants and the space in which the gaming-simulation is hosted. We conducted two gaming-simulation sessions: session 1 (pre-test with master stu-dents) and the sessions 2 with professionals. The professionals were participating as part of their training at the Police Academy and they had some experience with disaster response (see section 8.5). Table 8-1 outlines the situational setting for both gaming-simulation sessions. Note that the pre-test with master students was shorter than the game with professionals. The reason for this is that we were re-stricted to a two-hour class with the students. As a result, the two debriefing ses-sions with the students were shorter than with the professionals

Chapter 8
186
Figure 8-1: Overview of phases in the Master of Disaster Game
Table 8-1: Situational Setting
Variable Pre-test with students Game with professionals Date Tuesday 16 February 2010 Friday 12 March 2010 Duration 13:30-15:30 13:30 – 16:30 Location Faculty TPM, Delft University of
Technology, Delft, The Nether-lands
Gaming Suite, Police Academy, Ossendrecht, The Netherlands
Participants 26 Master students 24 Policy Academy Students Motivation for participants
Mandatory part of their course hours
Demonstration of a Netcentric orchestration system, gain under-standing in netcentricity
Figure 8-1 below outlines the subsequent phases in the Master of Disaster
Game.
Both the pre-test with master students and the session with professionals
consisted of eight sequential phases. We briefly discuss each phase in the following subsections. Introduction (15 minutes) During the introduction, the facilitators informed the participants about the objec-tives of the gaming-simulation, the activities, rules and constraints. Participants could find their role description in the participant manual, a booklet that we had already distributed amongst the participants before the gaming-simulation. These manuals contained role-specific information for each participant. For the pre-test, we randomly assigned students to each role. For the gaming-simulation with pro-fessionals, we matched the roles in the game with the functions of the participants in accordance to their daily practices. The participant manual also consisted of in-formation about the simulated safety region (see section 8.3). The introduction ended with a short movie clip that introduced the disaster situation with video and
Introduction Game Round 1
Game Round 2
Ending and awards
Survey Round 2
Debriefing Round 1
Survey Round 1
Debriefing Round 2
Observation and video recording
Evaluation
187
audio. After the short film, we requested the participants to take their seat and start with the task assigned to their role. Round 1: Disaster response with hierarchical information coordination (45 minutes) The gaming-simulation started with recreating a disaster situation and it was up to the participants to manage this disaster effectively and efficiently. The main goal of the first round was to simulate hierarchical information coordination and to evalu-ate the effects on IQ and SQ. Similar to practice, participants were required to min-imize the number of casualties and physical damage as a result of the disaster. In order to do so, participants needed to collect and share information for instance about the situation on the field, the hazards and the resources they have available. Each disaster response team had an information manager. In round one, the in-formation managers were able to use Microsoft Word for generating situational reports during the team meetings. They also could mail these situational reports to the other teams, similar to what we observed in the Rotterdam and HHD field stud-ies. In line with the hierarchical information coordination architecture, information sharing would take place at two levels: (1) in the multi-agency team (inter-agency), (2) within the echelons of the respective relief agencies (intra-agency information flows between strategic, tactical, and field echelon). Here, participants used situa-tion reports and information request forms to share information between teams. Survey round 1 (10 minutes) After round 1, participants were requested to fill in a short paper survey on their experiences regarding IQ and SQ during the first round. As such, the survey includ-ed questions on several IQ and SQ dimensions, the use of situation reports and the role of the information orchestrators. The survey for round 1 was included in the participant manual. Debriefing session 1 (5 minutes in the pre-test, 30 minutes in the game with professionals) In the first debriefing session, the participants were requested to comment on the information management activities during round 1 and state any IQ and SQ related issues they noticed. Two facilitators moderated this session. The participants were encouraged to take notes and state comments in their participant manual. Round 2: Disaster response with DIOS (45 minutes) In round 2, we introduced a slightly different game scenario to the participants. In this round, each team had one role who could orchestrate information horizontally (between agencies) and vertically (between echelons) using the DIOS prototype (see Chapter 7). We allowed the information managers in each team to use DIOS for information management. In line with the netcentric information orchestration architecture discussed in chapter 6, information management would take place on three levels: (1) in the multi-agency team (inter-agency), (2) within the echelons of the respective relief agencies (strategic, tactical, and field echelon) and (3) within the entire public safety network, including the emergency control rooms using the DIOS prototype.

Chapter 8
188
Figure 8-2: Overview of gaming-simulation elements
Context variables
Sitraps
Output variables Input variables
Information Request Information
request
Gaming simulation (process)
Hierarchical infor-mation architecture
(Load A)
Netcentric orches-tration architec-
ture (Load B)
Start info
Role/tasks descriptions
Rules Messages Interventions
Loads (scenarios, events, hazards, in-formation flows)
Context (Safety region)
Instructions Steering variables (for facilitators)
IQ en SQ scores
Survey round 2 (10 minutes) Subsequent to round 2, the participants were requested to fill in a second survey on their experience with DIOS. This survey contained the same questions on IQ and SQ as the survey in round 1 and had some additional questions on the DIOS proto-type and the role of the orchestrators. The survey for round 2 was also included in the participant manual. Debriefing session 2 (5 minutes in the pre-test, 30 minutes with professionals) In the second debriefing session, we again requested the participants to comment on the information management activities during round two and state any IQ and SQ related issues they noticed. Two facilitators moderated this session. The partici-pants were encouraged to take notes and state comments in their manual. Ending and awards (5 minutes) At the end of the debriefing session, the facilitators thanked the participants for their cooperation and a small present (chocolate bar) was awarded to the most ac-tive and outstanding participant in each team. We requested the participants to return their participant manual since it included their notes and response to the surveys. This chapter proceeds by discussing the scenarios, inputs and outputs of the game, followed by the means for collecting data.
8.3 Master of disaster game
Using gaming-simulation as a research method requires careful upfront planning of four types of variables: input, context, output and steering variables. The following diagram provides an overview of the main elements of the gaming-simulation.

Evaluation
189
Figure 8-3: Map of Seefland
The diagram depicted in Figure 8.2 outlines the various elements of the gaming-simulation, including the context, input, steering and output variables. The two experiments are depicted at the center of the diagram. The remainder of this section elaborates on each of the elements.
8.3.1 Context of the game
The disaster situations we simulated in round 1 and 2 occurred in the fictional safe-ty region called “Seefland”. Officially, the Netherlands is divided in 25 safety re-gions. Safety regions are governmental organizations, responsible for disaster preparation and response. In such organizations, the regional police, fire depart-ment and ambulance services work together to effectively prevent and repress a disaster. Safety regions usually consist of three to eight municipalities in a region. Figure 8.3 shows a map of the fictitious safety region Seefland.
As depicted in Figure 8-3, we divided Safety Region Seefland in four mu-nicipalities, including the city of Rampendam. This map was also included in the participant manual alongside other information on the safety region, including size, number of inhabitants and risks objects such as an airport and a seaport. We chose to develop our own fictitious safety region, instead of an existing safety region, for the following reasons:
1. Participants of the gaming-simulation are professionals working in differ-ent safety regions in the Netherlands. Hence, using an existing safety re-

Chapter 8
190
gion might benefit some of the participants familiar with that safety region. Using a fictitious safety region unknown to all guarantees the same level of context or load information throughout all the participants.
2. When using an existing safety region, some participants that work in this existing safety region might feel represented and others working in a dif-ferent safety region may not feel represented.
3. A fictitious safety region allows the designers of the gaming-simulation to control load conditions for experimental purposes. For instance, we can simulate a hospital and a university in the same safety region without any discussion on whether this is realistic or not.
The next subsection discusses the actors and roles in the gaming-simulation.
8.3.2 Actors and roles
The roles in a gaming-simulation can be divided into roles for participants and roles for game facilitators (Meijer, 2009). In accordance with the roles ob-served in the field studies, we divided the roles for participants into 4 multi-agency teams with each team having a specific priority in this gaming-simulation.
Table 8-2: Master of Disaster Game – Roles
Team Roles Explanation Emergency Control Room (ECR)
1. ECC – Police (2x) 2. ECC – Paramedics (2x) 3. ECC – Fire Department (2x)
The ECC is the first point of contact for reporting a disaster. They need to coordinate information requests from relief agencies.
Commando Place Incident (CoPI)
1. CoPI – Chairman 2. CoPI – Information Manager 3. CoPI – Police Commander 4. CoPI – Paramedics Commander 5. CoPI – Fire Commander 6. CoPI – Local Representative
The CoPI is responsible for the effi-cient coordination of the field workers on a tactical level so that the disaster can be repressed ac-cordingly
Municipal Crisis Center (GVS)
1. ROT – Mayor 2. ROT – Information Manager 3. ROT – Police Commander 4. ROT – Paramedics Commander 5. ROT – Fire Commander 6. ROT – Municipal Crisis Manag-er
The ROT is responsible for efficient coordination of relief workers on a strategic and responsible for in-forming the press.
Field Workers (Field)
1. Field – Police Officers (2x) 2. Field – Paramedics (2x) 3. Field – Fire Fighters (2x)
The field units need to share infor-mation with their commanders so that the disaster can be repressed as much as possible.
Table 8.2 outlines 18 roles. Note that some of the roles indicated with (2x) were fulfilled by two relief workers, bringing the total of players to 24. The hand-book we made available to each person prior to the game provided the role descrip-tion for each participant.
In contrast with common gaming-simulations, the participants are initially not motivated to “win” or to finish first place as this gaming-simulation was not intended for that purpose. “Master of Disaster” wanted to mimic the information

Evaluation
191
management processes in a disaster setting and wants to experiment with a new type of information management system. As motivation, we announced prior to the gaming-simulation that the best player of each team would be awarded with a small prize, based on the judgment of the observers. Therefore, participants still had an incentive to do their best. The objective of each participant is framed as: ‘complete a situational report (Sitrep) with the highest information quality possible’. In or-der to achieve this objective, participants had to engage in the processes of infor-mation management including the following: information collection (within your team and between teams), information validation, enrichment, and information sharing (when requested by others). Next to the roles of the participants, facilita-tors also had to fulfill some roles during the gaming-simulation. The following table outlines these roles.
Table 8-3: Roles for facilitators
Roles Tasks
Mailman The mailman will deliver messages between several roles in round 1. This
is part of the representation of an information management system
where communication is going by mail.
Message coor-
dinator
The message coordinator times the progress of the game and distributes
predefined messages to the various teams (via the mailman).
Journalist The journalist wants to bring the news for their corporation as quickly as
possible. For this purpose, he/she wants to gain as much relevant infor-
mation on the disaster as possible.
Observers (6x) The main task of the six observers was to observe the participants as good
as possible with help of an observation protocol. The observers also were
briefed before the game in answering some basic questions that might
arise during the game.
As outlined in table 8.3, nine persons helped in facilitating the gaming-
simulation. The facilitators included university staff, PhD students, graduate stu-dents, and undergraduate students. Someone who had some experience in the field of journalism fulfilled the role of journalist.
8.3.3 Choreography
The roles and teams in the gaming-simulation were physically configured in such as way that they were familiar to the participants and in accordance with our field study findings (see chapter 4). The chorography of both rounds was quite similar, except for the use of beamers that displayed the DIOS screens. The following figure depicts the choreography of round two in more detail.

Chapter 8
192
Figure 8-4: Game choreography - round 2
Figure 8.4 depicts the choreography of the relief workers participating in
the quasi-experimental gaming-simulation. We spread the eight teams in six differ-ent rooms. Walls separated each room. The major difference between round one and round two was that there were no beamers visualizing the DIOS user interface in round 1. We discuss some rules and constraints communicated to the players in the next subsection.
8.3.4 Rules and constraints
Rules in a gaming-simulation can limit the behavior of participants in order to con-trol the environment. Also, rules shape the behavior as they define what is allowed or forbidden (Meijer, 2009). Moreover, rules are necessary in order to replicate the conditions of a real disaster as much as possible and safeguard the quasi-experimental nature of the gaming-simulation. Accordingly, we established some general rules and constraints prior to the gaming-simulation. The role descriptions of the participants include role specific rules and constraints. Some general rules for all the participants in the Master of Disaster Game included:
• All communication between teams should be done using Sitrep forms, in-
formation request-response forms (in round 1) or the DIOS system (in
round 2)

Evaluation
193
• Forms should be put in mailboxes (outbox). The outgoing forms will be de-
livered by the mailman (only in round 1)
• Everyone is expected to play the same role in the second round. This can of
course lead to a learning effect amongst the participants. However, due to
time constraints and a slightly different scenario it is more efficient for the
participants to play the same role in both rounds
• Participants have to write only in capital letters on each form (for assuring
readability)
• Participants are not allowed to walk to other rooms and teams and com-
municate with them
• Participants need to turn off their mobile phones in order not to disrupt the
meetings (similar to what we observed in the field studies)
Next to these general rules, constraints are those design elements that limit the
range of actions possible in a gaming-simulation. In contrast to rules, which define what is allowed or forbidden; constraints shape the minimum/maximum value of time, punishments, points and other variables (Meijer, 2009). The constraints of the Master of Disaster Game sessions included three major constraints.
• A meeting in the CoPI and ROT can have a maximal duration of 15 minutes
• The number of participants is limited to 25
• The time of the gaming-simulation in total cannot exceed 4 hours
The rules and constraints were stated in our opening presentation and were al-so repeated in the participant manuals. Having stated these rules and constraints, the next sub-section elaborates on the loads we developed for both rounds.
8.3.5 Experimental loads and scenarios
Experimental loads can be defined as the values of all variables in the design of the gaming-simulation (Meijer, 2009). A load also includes a scenario and script. In the paragraphs below, two experimental loads are discussed: Load A (for round 1) and Load B (for round 2). For both loads, a fictional setting is designed set in the safety region Seefland. In this safety region, we chose the city of Rampendam as the location where the disasters will take place. For comparability purposes, both sce-narios took place in the city of Rampendam. However, there were some differences between the two loads regarding the contents of each disaster. In the following sub-sections, both loads and their contents are discussed in more detail.
8.3.5.1 Experiment A: Fire outbreak in a warehouse complex
Experiment A is about a fire at a warehouse complex in Rampendam. This ware-house complex includes two do-it-yourself stores situated: Gamma and Leen-Bakker. These shops have explosive and toxic material in their warehouses, which can lead to disastrous consequences for the environment surrounding Rampen-dam. In this load, participants have to work without DIOS as an information man-

Chapter 8
194
agement system. Communication between teams is done with the use of forms and a mailman.
All participants already received their start information (startSitrep) in the par-ticipant manual. The Emergency Control Room employees receive the following message:
• 13:41:22 – 12-03-2010 – 87 FIRE - PRIORITY 1 – 3122 – FIRE BUSI-
NESS COMPLEX
• 13:41:29 – 12-03-2010 – 87 AMBU - PRIORITY 1 – 3122 - FIRE BUSI-
NESS COMPLEX
• 13:41:45 – 12-03-2010 – 87 POLI - PRIORITY 1 – 3122 - FIRE BUSI-
NESS COMPLEX
8.3.5.2 Experiment B: Fire on a university campus
Experiment B includes a scenario in which the architecture faculty of the University of Rampendam is on fire. The great danger of this fire is that it borders on the chemistry lab of the Faculty of Chemistry. In this lab, there are many poisonous and explosive materials stored. There is also a collapsing danger of the Faculty of Architecture. In this load, participants have to work with DIOS as an information management system. All participants already received their start information and the ECC operators receive the following message:
• 15:41:22 – 12-03-2010 – 87 FIRE - PRIORITY 1 – 3122 – FIRE FACUL-
TY OF ARCHITECTURE
• 15:41:29 – 12-03-2010 – 87 AMBU - PRIORITY 1 – 3122 - FIRE FAC-
ULTY OF ARCHITECTURE
• 15:41:45 – 12-03-2010 – 87 POLI - PRIORITY 1 – 3122 - FIRE FACULTY
OF ARCHITECTURE
Even though the events in the loads are roughly the same, there are some dif-
ferences between the loads, mainly due to the use of DIOS as the new information management system in Load B. The main difference is the way of coordinating in-formation management processes in disaster situations. Table 8.4 provides an overview of differences between load A and B. The design principles proposed in chapter 6 and embodied in the prototype (see chapter 7) reside in Experiment B. This includes the role of orchestrators (instead of information managers), DIOS instead of Word-based situation reports, information rating capabilities and net-work wide reach back and information request (using DIOS).

Evaluation
195
Table 8-4: Some differences between Experiment A and Experiment B
Variable Experiment A Experiment B
Type of Sitreps Team Sitrep
Column Sitrep
Network Sitrep: everyone can
contribute to the same Sitrep
Sitrep-form Team Sitrep in MS WORD
Column Sitrep on paper forms
Network Sitrep in DIOS
Information Syn-
chronization
Asynchronous information
sharing thru paper Sitreps
Synchronous information sharing
using DIOS: everyone can see the
same information immediately
Facilitator Roles Mailman
Journalist
DIOS Assistants (4x)
Journalist
Rating of Infor-
mation
None, not required Available in DIOS
Memory of Infor-
mation
Fragmented in paper Sitreps Aggregated in DIOS
Location maps On paper (large map on table) Projection in DIOS
Information supply Through the Mailbox, on paper Real Time supply in DIOS
Reachback Inter and intra-agency Network
Location of disaster Warehouse Complex University Campus
Tasks of the Infor-
mation Manager
(round 1) versus the
Information Or-
chestrator (round 2)
Generate paper Sitrep and
send to other teams via MS
WORD and Gmail
Orchestrate Sitrep in DIOS, prior-
itize and handle info request di-
rectly using DIOS, communicate
and rate the reliability of the in-
formation in DIOS
Table 8-4 lists some of the main differences in the experimental loads of
both rounds. In the following section, we discuss the data collection process, the results and the findings of the gaming-simulation session with professionals.
8.4 Qualitative data collection and findings
As discussed in chapter 2, our strategy was to collect both qualitative and quantita-tive data from our gaming-simulation. As such, we employed three instruments for data collection purposes including:
1) Observational notes. Prior to the gaming-simulation, we briefed a team of six observers. The observers knew about the scenario of the game and knew some examples of IQ and SQ issues that might occur. The observers were each dedicated to a specific team. The observers were equipped with a predefined observation protocol, identical to the one we used during the field studies (see Appendix-B).The observers were also equipped with a photo camera allowing them to capture some impressions during the game. As a result, we ended with 12 (6 times 2) completed observational notes. 2) Video recording. Before the start of the gaming-simulation, we installed six video cameras, one in each room. The video cameras also captured voice con-versations and narratives. We told the participants about us filming them for research purposes. As such, the cameras videotaped the interactions in each

Chapter 8
196
team allowing us to look back on these interactions whenever necessary. In the end, we collected approximately 18 hours (6 x 3 hours) of video. This was al-most 36 gigabytes of video material (approximately 6 gigabytes per team). 3) Participant notes. The participants each had a manual, which included am-ple space for note taking during the rounds and during the debriefing sessions. Since we encouraged the participants to take notes and return the manuals af-ter the gaming-simulation, the participant notes were a significant source of qualitative data. Also, we were able to recollect most of the messages and in-formation request-response forms send in round 1. Especially the later form contained some information we could relate to the IQ and SQ issues in round 1.
We discuss the results of the qualitative data collection in section 8.5. First, we
discuss the surveys used for quantitative data collection
8.4.1 Round 1
In round one, three of the six observers noted some confusion on the exact location of the warehouse (Gamma) and on which floor the fire was (first floor or ground level) (t=14:01). After watching the video recordings, we found that the confusion existed in the control room of the fire department, the COPI and the GVS. The vid-eo recordings also show that the confusion was settled after some conversations between field unit officers (a kind of ‘motorkap overleg’) and information exchange (via the paper forms). Later, the observer focused on the field units also noticed some confusion about the decided affected (source) area, something that should have been decided by the GVS (t=14:03). It seems this information did not reach the field units. Another issue noted by the observer focused on the field units was the asymmetry in the information they received from the respective commanders in the COPI. For instance, the police department received instructions to help evacu-ate the warehouse 9 minutes after the fire department had received this infor-mation. Consequently, the fire department had already started to evacuate, without the assistance and knowledge of the police department (t=14:07).
A noteworthy example of incomplete information was observed in COPI team. The commander of the medical services shared information he received from his field units on the death toll. He mentioned that eight fatalities were counted (t=14:08). What was missing here is the time that these counts were made and how these people died (because of the smoke or heat from the fire?). Moreover, the commander of the fire department had not received any information on this issue. In addition, the COPI was quite interested about any chemicals or toxic that might have been in the warehouse and whether or not they are flammable. The video re-cordings show that a request for this information was send to the field units of the fire department (t=14:11). Yet, since the respondents on the field level did not have this information and were not able to contact the store manager, this information was never send back. The observer in the GVS noted (t=14:13) that the commander of the medical services had received very little information from her subordinate in the COPI. The video recordings also show that the leader of the GVS (the Mayor) started to get a bit nervous (t=14:18) because he had so little info on the exact situa-tion on the field while he was expected to speak to the press soon. The observer in the COPI also noted that no response was given to the information request send to

Evaluation
197
Figure 8-5: Impressions of ECC Operators (left) and GVS members (right) using DIOS
the fire department regarding the potential of asbestos being released because of the fire (t=14:22).
8.4.2 Round 2
All of the observers noted that there were far less discussions in round two com-pared to round one. The video recordings showed that the first minutes of round two were dominated by the introduction of DIOS and the interactions between the orchestrator and this prototype (t=14:46). The relief workers were particularly cu-rious about the information displayed in DIOS and the functionalities provided by this prototype. Some comments from the participants in the COPI included that the user interface was simple and intuitive. The observer in the GVS noted that after some general reelections on the prototype, the Mayor insisted the team moved on with deciding on how to repress the disaster at the University Campus. The follow-ing pictures illustrate the use of DIOS.
The observer at the field units noted that the police officers were content with the information request functionality in DIOS and explained that this was faster than via the radio (situation in practice). A noteworthy statement by the commander of the police in the GVS is that using DIOS everyone made less redun-dant information requests. He explains to his team that he has experienced many redundant information requests, both on an intra-agency level and on the various echelons (t=14:57). The observer at the emergency response center of the fire department not-ed that the officers felt that there was much information in DIOS, but much of it was not directly relevant for them (t=15:01). Instead, this participant would rather use an application displaying information that was only relevant for his agency. Around 15:07 the observer in the GVS noted that the GRIP level was increased to level 3 by the field units of the fire departments. This resulted to some agitation within the GVS since the commanders there felt that it was not up to the field units to decide on the grip level. Around the same time, the notes of the observer in the emergency response center of the medical services indicate that the operators were not satisfied with the way their information response was handled in DIOS. They

Chapter 8
198
seem to have made a request for information regarding the number of ambulances on site and have not received any response, even after repeating the request.
The observer in the emergency response center of the police department noted some discussion on the rated information (about the number of casualties). One of the participant explained that rating information was a nice idea, but that relief workers need to be critical on what that rating means since information that is rated low could also be important (t=15:09). A noteworthy situation reported by the observer in the GVS was the frustration of the Mayor with all the new infor-mation coming in DIOS on a continual basis. The Mayor mentioned that to some extent, the application distracted the decision-making process. While the Mayor acknowledges that all real-time updates were interesting, he reminded the team that they were activated not to monitor information updates but to take decisions, albeit based on information that was already out of date (t=15:16). The Mayor fur-ther explained that such an application should not dictate the structure of the deci-sion-making process in a multi-agency team.
8.5 Quantitative data collection and findings
This section reports on the quantitative data collected during the gaming-simulation with professionals. This section splits into three subsections. First, we discuss the data collection using surveys. Then we discuss how the data was pre-pared and analyzed. This section concludes with some findings obtained from the quantitative data.
8.5.1 Data collection
As part of our quantitative data collection approach, we used surveys as an instru-ment to assess the IQ and SQ values perceived by the participants after each round. The surveys used for the gaming-simulation are based on the same items used for the field studies in chapter 4. Where necessary, we modified items in order to match to context, experimental load, and structure of the gaming-simulation. The table below shows the components of both surveys.
Table 8-5: Parts of the survey
Part Description R1 R2 A. General Questions Demographics of the respondents X B. Evaluation of the Game Round 8-10 questions concerning the gaming-
simulation itself X X
C. Evaluation of Information Quality
20 questions on the assessment of infor-mation quality
X X
D. Evaluation of System Quality 19 questions on the assessment of system quality
X X
E. Evaluation of DIOS functional-ities
12 questions on the assessment of the propositions of DIOS
X
F. Suggestions and Comments Open fields for comments X X
The survey included six parts. As mentioned, both surveys for round 1 and
2, were included in the participant manuals. Appendix-D provides the total set of items in the survey. The surveys were identical, except for a few general items and extra items in the second survey. Furthermore, several system functionalities are evaluated in part E of the survey. In part B, C, D and E, we again used a 7-point

Evaluation
199
Likert scale (similar to the field studies) to measure the opinion of the participants with respect to the formulated statements. The next subsection will elaborate on the data preparation.
8.5.2 Data Preparation
The first step in the data preparation process was to create a codebook. The code-book shows how questions from the surveys are translated into variables, what val-ues these variables can have, which value labels are assigned and what measure-ment level each variable has. For analyzing the data derived from the experiment, we used two software packages:
1. SPSS Statistics 17.0: we used this data-analysis tool for performing several
statistical analyses. We performed the reliability analysis and the Wilcoxon
Signed Rank Test with this software tool.
2. MS Office Excel 2007: we used Excel 2007 for generating descriptive ta-
bles, histograms and pie charts.
Since we included three different statements for some of the IQ and SQ dimensions in our survey, a reliability analysis was required for checking whether statements that initially belong together still measure the same construct. For each set of items, the SPSS reliability analysis returns a value for Cronbach’s Alpha. Cronbach’s Alpha is a measure for the internal reliability of a scale. There are sev-eral rules of thumb available for the Cronbach’s Alpha coefficient, > 0.9 is consid-ered: Excellent; > 0.8: Good; > 0.7: Acceptable; > 0.6: Questionable; > 0.5: Mea-ger, and < 0.5: Unacceptable (George & Mallery, 2003). We adhere to these rules when interpreting the reliability scores below. The tables below show the results of reliability analysis for dimensions of both round 1 and 2.
Table 8-6: Reliability analysis - Round 1
IQ/SQ Dimension IQ/SQ Statements Cronbach’s Alpha IQ_TIMELINESS R1_IQ_TIMELINESS_1
R1_IQ_TIMELINESS_3_REC .804
IQ_CORRECTNESS R1_IQ_CORRECTNESS_2_REC R1_IQ_CORRECTNESS_3_REC
.534
IQ_COMPLETENESS R1_IQ_COMPLETENESS_1 R1_IQ_COMPLETENESS_2_REC
.682
IQ_OVERLOAD Scale could not be constructed Negative alpha IQ_RELEVANCY R1_IQ_RELEVANCY_1
R1_IQ_RELEVANCY_2_REC R1_IQ_RELEVANCY_3_REC
.766
IQ_CONSISTENCY R1_IQ_CONSISTENCY_2_REC R1_IQ_CONSISTENCY_3_REC
.506
SQ_RESPONSETIME Scale could not be constructed .222 SQ_ACCESSIBILITY R1_SQ_ACCESSIBILITY_1
R1_SQ_ACCESSIBILITY_3 .613
SQ_SATISFACTION R1_SQ_SATISFACTION_1 R1_SQ_SATISFACTION_2
.859

Chapter 8
200
The table above shows the results for the reliability analysis for round one. The items in italic indicate that the set of items used scored low in terms of reliabil-ity. The table below outlines the results of the reliability analysis for round two.
Table 8-7: Reliability Analysis - Round 2
IQ/SQ Dimension IQ/SQ Statements Cronbach’s Alpha IQ_TIMELINESS R2_IQ_TIMELINESS_2_REC
R2_IQ_TIMELINESS_3_REC .713
IQ_CORRECTNESS R2_IQ_CORRECTNESS_2_REC R2_IQ_CORRECTNESS_3_REC
.637
IQ_COMPLETENESS R2_IQ_COMPLETENESS_2_REC R2_IQ_COMPLETENESS_3_REC
.657
IQ_OVERLOAD Scale could not be constructed .208 IQ_RELEVANCY R2_IQ_RELEVANCY_2_REC
R2_IQ_RELEVANCY_3_REC .726
IQ_CONSISTENCY R2_IQ_CONSISTENCY_1 R2_IQ_CONSISTENCY_2_REC R2_IQ_CONSISTENCY_3_REC
.514
SQ_RESPONSETIME R2_SQ_RESPONSETIME_1 R2_SQ_RESPONSETIME_2_REC
.730
SQ_ACCESSIBILITY R2_SQ_ACCESSIBILITY_2 R2_SQ_ACCESSIBILITY_3
.815
SQ_SATISFACTION R2_SQ_SATISFACTION_1 R2_SQ_SATISFACTION_2
.599
The scores in italics are definitely unacceptable. The other scales are in the range of .506 - .859. This range of values is not unacceptable and therefore, these scales are used for showing the results in the next paragraph. We can however not use the following scales when interpreting the results since these have proven to be unreliable:
1. Round 1: IQ_OVERLOAD
2. Round 1: SQ_RESPONSETIME
3. Round 2: IQ_OVERLOAD
The next subsections will discuss the quantitative results of the gaming-simulation session at the Police Academy. These results are based on scales that were defined in the previous section. First, the next subsection presents some background information on the sample of participants.
8.5.3 Background of the participants
Part A of the survey employed for round one asked some questions on the background of the participants. Participants were asked which organization they worked for, how long they worked there and how often they have been involved in responding to a serious disaster situation (GRIP 1 or higher). We had a sample size of 22 respondents since two respondents have not returned useful survey respons-es. Figure 8-7 shows some figures on demographic data of the respondents. What we can conclude with respect to the sample is that we had a very heterogeneous group of relief workers that participated in this quasi-experiment

Evaluation
201
Figure 8-7: Experience of the participants (N=22)
Figure 8-6: Organizations represented in sample (N=22)
The heterogeneity in relief workers makes the results regarding the IQ and SQ
dimensions even more interesting as this group of relief workers is a fair represen-tation of relief workers that are present during disaster response in the Nether-lands. The following figure presents the work experience of the participants that were involved in our gaming-simulation.
Figure 8-8 above shows that our sample of relief workers included some con-
siderable experience in working at their organization. The majority of participants have more than 5 years of experience. Of course, one cannot immediately state that they also have a lot of experience with disaster situations, we can however say that this sample consists of relatively experienced relief workers, who are probably al-ready much familiarized with the way of working in their own organization. The

Chapter 8
202
Figure 8-8: Number of GRIP situations encountered by participants (N=22)
following graph does however give some numbers on the level of experience in dealing with disaster response.
Figure 8-9 shows that most participants already encountered a GRIP situation of GRIP 1 or higher. Only two out of the twenty-two participants had no prior expe-rience with multi-agency disaster management. As such, we can conclude that we had a representative sample of relief workers participating in our gaming-simulation. In the next sections, we elaborate on the results with respect to IQ and SQ dimensions in round 1 and 2.
8.5.4 Quantitative results – IQ dimensions
In this section, the results of IQ dimensions of both round 1 and 2 are portrayed. We focus on the means and standard deviations (SD). In section 8.5.6 we discuss whether the differences between the means of both round are statistically signifi-cant using the Wilcoxon Signed Rank Test. First, the table below outlines the scores on the IQ dimensions for round 1 and 2.
Table 8-8: Results - IQ Dimensions (N=22)
Round 1 Round 2
Mean SD Mean SD
Timeliness 3.80 1.53 4.29 1.44
Correctness 4.33 0.94 5.00 1.19
Completeness 3.46 1.23 3.71 1.20
Relevancy 3.71 1.44 3.78 1.35
Consistency 4.63 1.31 4.00 0.89
Format 2.55 1.36 3.70 1.58

Evaluation
203
When comparing the means over both rounds we can conclude that round two
shows higher scores for the measured IQ dimensions, except for IQ-Consistency. Note that the standard deviation for this dimension has also decreased in the se-cond round. The fact that inconsistent information is easier to spot in DIOS might explain the slight decrease in IQ-Consistency. The numbers show that the infor-mation shared in round 2 was more up-to-date then the information in round 1. Another noteworthy number is the increase in the average scores for IQ-Format and IQ-Correctness. It seems that the participants perceived the information post-ed in DIOS to be in a more adequate format and more correct than was the case in round one.
8.5.5 Quantitative results – SQ dimensions
The following table outlines the average scores and standard deviations for the SQ dimensions.
Table 8.9 shows higher differences between means for the SQ dimensions than
table 8.8 showed for the means regarding the IQ-dimensions. Based on these num-bers, we could conclude that the impact of netcentric information orchestration on the SQ dimensions was more apparent to the participants than the impact on the IQ dimensions. The numbers indicate that in round two, information was more accessible. We also see a relatively high difference for the SQ-response time over both rounds, which could also explain the higher value for the IQ-Timeliness in the previous table. The DIOS prototype also did better in information sharing support, notification of changes and providing feedback on the quality of the information shared.
8.5.6 The functionalities of DIOS
In the final part of the second survey, we requested the relief workers to reflect on some statements about the functionalities of DIOS. Functionalities of DIOS includ-ed the categorization of information, rating information and the dashboards. We included these statements in the questionnaire since we wanted to obtain some ad-ditional data on how the participants valued the functionalities provided by DIOS. The list of statements can be found in Appendix-D. The following figure presents the results of the evaluation of the DIOS features.
Table 8-9: Results - SQ Dimensions (N=22)
Round 1 Round 2
Mean SD Mean SD
Accessibility 2.47 1.03 4.53 1.33
Satisfaction 2.53 1.40 3.41 1.35
Response time 2.15 1.22 3.75 1.61
Info Sharing Support
2.98 1.33 4.15 1.22
Notification 2.42 1.06 3.89 1.34
Feedback 4.20 1.27 4.78 1.63

Chapter 8
204
Figure 8-9: DIOS features evaluation (N=22)
The numbers shown in the figure 8-10 are quite moderate, relief workers did
not really favor the DIOS functionalities, nor did they dislike or disapprove of them. One exception could be the categorization of information in DIOS, it seems that on average, this functionality was not sufficiently valued by the participants. An expla-nation for this may be found in the fact that DIOS includes all information for all relief agencies while some participants have indicated that the rather have an over-view of information directly relevant for their own agency (see section 8.4.4). Sur-prisingly, we did not find a high average score for the extensive reach-back capa-bilities provided in DIOS (i.e., access to social networks and third party data). The respondents have scored the network-sitrep functionality and the dashboard func-tionality more positively than the other functionalities.
8.5.7 Wilcoxon signed rank test
The Wilcoxon Signed Rank Test is a non-parametric statistical test in which the median difference of a pair of variables is tested (Crichton, 2000). As Wilcoxon states in his article, we can use ranking methods to ‘obtain a rapid approximate idea of the significance of the differences in experiments of this kind’ (Wilcoxon, 1945). The Wilcoxon-test has a parametric alternative called the Student-t paired samples test. However, this parametric student-t test requires that the data follows a normal distribution and a sample size beyond 30 cases (Hair, et al., 1995). This is not the case in this dataset, and because of the low sample size (N=22) we cannot approximate a normal distribution by using the Central Limit Theorem (to do so, a minimum of N = 30 is necessary). Therefore, a non-parametric alternative was the only alternative for this dataset.
Table 8-10 presents the results of the Wilcoxon-test. For each pair of di-mensions (round 1 and round 2), a significance level is provided in the table, telling us whether the mean in round 1 significantly differs from the mean in round 2. In case the significance level is <=0.05, the difference between round one and two is statistically significant. This is the case for IQ – Timeliness, IQ – Correctness, IQ – Consistency, SQ – Accessibility and SQ-Response time. The other pairs do not have a significant difference; this tells us that the difference can be coincidence. This however does not mean that there is no observable difference for these dimensions as illustrated in figure 8.11. Concluding this section, we can now state that there is a positive significant difference between round 1 (hierarchical approach) and round 2

Evaluation
205
(netcentric orchestration approach) on the dimensions: IQ-Timeliness, IQ-Correctness, SQ-Accessibility and SQ-response time.
Table 8-10: Wilcoxon Signed Rank Test
Dimension Z P-value
In
form
ati
on
Qu
ali
ty
Timeliness -1.017a .009**
Correctness -1.805a .041*
Completeness -.966a .334
Relevancy -.543b .587
Consistency -1.962b .050
Format -1.699a .096
Sy
stem
Qu
ali
ty
Accessibility -3.268a .001***
Satisfaction -1.716a .086
Response time -1.022a .027*
Info sharing support -.813a .399
Notification -.623b .589
Feedback -.877a .433
We can also conclude that there is a negative significant difference on the
IQ-Consistency dimension. In other words, to answer the last sub-question of this research, netcentric information orchestration has a positive effect on the dimen-sions IQ-Timeliness (3.80 � 4.29), IQ-Correctness (4.33 � 5.00), SQ-Accessibility (2.47 � 4.52) and SQ-Response time (3.75 � 2.15) compared to using a hierar-chical approach. However, sharing information in based on a netcentric orchestra-tion architecture has a statistically significant negative effect on the dimension IQ-Consistency (4.63 � 4.00).
8.6 Summary
This chapter discussed the results of our quasi-experimental gaming-simulation with professionals. Our goal was to evaluate the extent to which the principles be-hind netcentric information orchestration would assure higher levels of IQ and SQ for relief workers during disaster response. For this purpose, we used for a particu-lar type of quasi-experiment, called a single group pretest posttest quasi experi-ment. Following this setup, we divided the gaming-simulation to in two rounds. In the first round, we simulated information sharing based on the currently used hier-archical approach to information management.
In the second round, relief workers tried to resolve a different disaster and shared information based on the netcentric information orchestration approach presented in Chapter 6. The principles behind netcentric information orchestration were embodied in DIOS and in the role of the information orchestrator. During the gaming-simulation, we collected both qualitative and quantitative data based on observation notes, video recording, and survey data. The analysis of the survey data shows a positive and statistically significant improvement on the scores of IQ-Timeliness, IQ-Correctness, SQ-Accessibility and SQ-Response time. Interestingly, the data also reveals that the dimensions IQ-Overload (this dimension had however no statistically constructed scale; we observed the values of the statements sepa-rately) and IQ-Consistency deteriorated in particular.

Chapter 8
206
Apart from the quantitative results on IQ and SQ dimensions, we also not-ed some interesting issues regarding the attitude and experiences of the relief workers during the session. We observed that several relief workers had a some-what negative stance towards network-centric operation in general, even before the gaming-simulation session. This may be the result of the active imposition and promotion of CEDRIC as a netcentric information system by the Ministry of Inter-nal Affairs of the Netherlands.
Conclusions
207
9 Conclusions
“Reasoning draws a conclusion, but does not make the conclusion certain, unless
the mind discovers it by the path of experience.”
Roger Bacon, English philosopher (1214-1294)
This dissertation presents tested design principles for assuring information quality (IQ) and system quality (SQ) during disaster response. The societal driver for con-ducting this research is rooted in the many disaster evaluation reports that reveal problems regarding IQ and SQ in public safety networks (PSNs). Committees that have investigated the response to disasters repeatedly concluded that relief workers did not have the right, relevant and up-to-date information during disaster re-sponse. Such reports have also revealed problems regarding the quality of infor-mation systems (IS) used, including their response time, reliability and information access capabilities. Together, poor IQ and SQ have significantly hampered relief workers in their response efforts, sometimes leading to dangerous situations for relief workers and civilians. From a societal perspective, this research was required not only because of the alarming number of IQ and SQ related problems costing time, money and human lives during disasters, but also because stakeholders (i.e., relief workers, IS architects, policy makers and software vendors) were previously left unguided in finding tested solutions for these issues.
The theoretical driver for this research stems from the lack of design theo-ries (i.e., guiding principles) for assuring IQ and SQ in PSNs. In addition, insights on the configuration of IS architectures in practice are scarce, demanding some demystification through empirical analysis. Two theories providing pathways to assuring IQ and SQ surface from literature. These two theories are coordination theory and Network Centric Operations (NCO). A pathway is a specific progression of one or more concepts in the evolution of a theory. Each pathway is a dynamic and developmental process, which may include several stages. We treat the two theories as ‘kernel theories’ since they originate from domains other than disaster response and are not directly applicable in the context of PSNs. While the applica-tion of coordination theory is growing, NCO has become a buzzword amongst IS architects and policy makers in PSNs, despite the lack of scientific research on the implications and limitations of NCO. Based on the stated societal and theoretical drivers, the main objective of this dissertation is to synthesize and evaluate IS de-sign principles that assure IQ and SQ in PSNs during disaster response. As a dissertation from the faculty of Technology, Policy, and Management of the Delft University of Technology, we conducted this research from a socio-technical perspective. As stated in Chapter 1, this perspective recognizes the im-portance of human roles, their tasks and capabilities while emphasizing the role of information technology (IT) as enabling tools in multi-agency information man-agement processes. This perspective resonates with our position that the social and

Chapter 9
208
technical subsystems in PSNs are interdependent and must be jointly analyzed, designed and evaluated in order to assure IQ and SQ. Moreover, this perspective allows us to gain a holistic understanding of the complex and unpredictable inter-actions between several agencies and supporting technologies in PSNs. This chap-ter proceeds by presenting the conclusions of this dissertation. The conclusions are clustered in accordance to the four research questions discussed in Chapter 2.
9.1 Research question 1: establishing the knowledge base
In accordance with the research objective stated earlier, we needed to establish two foundations in our knowledge base. The first foundation is on defining and measur-ing IQ and SQ. Studies that have investigated disaster response efforts mention several examples of poor IQ and SQ. However, since previous studies were mainly focused on the performance of relief agencies, both constructs were often left unde-fined and not operationalized (a construct is a variable that is not directly observa-ble and must be observed through its indicators). Even though we intuitively knew what IQ and SQ mean, scientific research requires a framework that allows for the systematic measurement of IQ and SQ issues. This framework needed to not only capture a wide range of IQ and SQ dimensions, it also needed to provide tested in-dicators (items) for measuring IQ and SQ in practice. Accordingly, the first sub-question (1a) asked: What is a useful and tested framework provided in the litera-ture for studying information quality and system quality in public safety net-works? By means of literature research, we have found a considerable number of scientific publications on defining and measuring IQ and SQ. As a scientific con-struct, the construct of quality has come a long way since first coined by Frederic Taylor (1947, originally 1911). Since then, the quality construct has expanded from a ‘hard’, production and technology related construct, to a ‘soft’ construct that also captures the experience of customers and employees. With the rise of information as a ‘resource’ and information technology (IT), it was only natural that the quality of information and the supporting IT would become a subject of scientific interest. Consequently, there are several perspectives, frameworks and definitions of IQ and SQ, some of which are included in Chapter 4. In was not until the seminal work by Delone and Mclean (1992) that the constructs of IQ and SQ were brought together in a single theoretical model. As foundation of the Information System Success Theory, this model treats IQ and SQ as antecedents for the success of ISs in firms. In this model, both constructs are multi-dimensional and entail dozens of varia-bles, not all of them being mutually exclusive. We found that both constructs entail a mix of objective and subjective scales, some of which can be assessed only by in-formation users (e.g., relief workers). Timeliness of information, for instance, can be measured using an objective time measurement instrument such as a stopwatch, whereas the subject (i.e., relief worker) in question is the only person that can say something about the relevancy of a particular information object. This conclusion emphasized the need to collect empirical data (on IQ and SQ issues) directly from relief workers and in the context of a disaster. It also meant that our evaluation cy-cle would demand the incorporation of real (as opposed to artificial) relief workers.
Since the paper by Delone and Mclean (1992), multiple scholars have adapted and extended IQ and SQ as antecedents for ISs success. Remarkably, scholars again studied IQ and SQ separately, probably because these constructs are too comprehensive to study in a single paper. Therefore, several frameworks are

Conclusions
209
provided in the literature for studying IQ and SQ, none of which providing a single framework for studying IQ and SQ. Nevertheless, striving to answer question 1a, we developed our own framework consisting of IQ and SQ dimensions that were tested in other studies. This framework relies heavily on Lee et al. (2002) and Nelson et al., (2005) whom have provided items for assessing IQ and SQ and have tested the-se items using empirical data. Therefore, as an answer to question 1a, our frame-work includes IQ dimensions such as correctness, completeness, timeliness, rele-vancy, consistency and SQ dimensions such as response time, accessibility, satis-faction and reliability. We used this framework during our empirical research dis-cussed in chapters 4 and 5. Note that we were not aiming to contribute to the defi-nition and measurement of IQ and SQ, especially since there are already several contributions that have focused on this. Instead, we were in search of a framework, including clearly defined and empirically tested IQ and SQ assessment items that would allow us to measure IQ and SQ issues in PSNs. The second foundation we needed to establish in our knowledge base was on pathways for assuring IQ and SQ. Our ‘first hunch’ was that the literature on NCO and Coordination Theory would provide pathways for assuring IQ and SQ in PSNs. Here, we consider a pathway as a stream in a specific theory that helps scholars in purposefully navigating through the existing body of knowledge on that specific theory. As such, a pathway is a specific progression of one or more concepts in the evolution of a theory. Each pathway is a dynamic and developmental process, which may include several stages. We regarded NCO and coordination theory as kernel theories since a preliminary analysis of both theories did not reveal explicit design principles for assuring IQ and SQ. Instead, we expected that these theories would provide ‘pathways’ that, when navigated with our empirical knowledge, would allow us to synthesize design principles. Stating a first hunch is quite com-mon in design and prescription oriented research since it allows the researchers to focus, review literature more thoroughly and state expectations earlier in the re-search (Verschuren & Hartog, 2005). Drawing on this first hunch, question 1b asks which pathways are provided in coordination theory and netcentric operations theory for assuring IQ and SQ in public safety networks? Based on our examina-tion of both kernel theories, we found seven pathways. We reflect on the pathways provided in both kernel theories in the following sub-sections.
9.1.1 Pathways from coordination theory
Through an extensive literature review, we found that coordination theory is a well-studied and applied theory in IS and other domains. Acknowledging that several constructions and operationalizations of coordination theory exist in the literature, the most common construction in the IS field is the management of interdepend-encies between actors, goals, and activities by means of various mechanisms (Malone & Crowston, 1994a). While this definition was clear on what is to be coor-dinated (interdependencies), it did not help us to understand how information can be coordinated in such a way that IQ and SQ can be assured. A more detailed exam-ination of this and other definitions for coordination led us to conclude that several resources (i.e., humans, equipment and information) and processes (i.e., resource allocation, rescue operations and information management) can be coordinated via different roles (i.e., team leader, information manager and IT operator) and objects (i.e., uniforms, standards and IT). Based on this perspective on coordination, our

Chapter 9
210
research focuses on the coordination of information (as a resource) and infor-mation management (as a process) through roles and objects. Often regarding the combination of roles and objects as mechanisms for designing coordination structures, scholars have long debated the level of centrali-zation or decentralization of these mechanisms as important steering instruments for coordination. Centralization has often been associated with benefits such as ac-countability, control and economic efficiency whereas decentralization has often been associated with benefits such as flexibility, redundancy and speed. King (1983) has brought some clarity in this debate by identifying three dimensions to the centralization issue: (1) concentration of decision-making power, (2) physical location, (3) function or the position of an activity or responsibility. These dimen-sions proved to be very useful for us in navigating the large body of knowledge on coordination. In the spectrum of archetypical organizational designs (Mintzberg, 1980), hierarchies are fully centralized for all dimensions, whereas networks are fully decentralized for all dimensions. However, as stated in chapter 1, PSNs are special type of design that includes a hybrid form of these dimensions. Considering the first dimension, we were not looking for pathways on the centralization or de-centralization of decision-making power since we had little design space for this dimension. As discussed in chapter four, decision-making power in PSNs is hierar-chically centralized in multi-agency teams activated on the strategic, tactical and operational echelons. Considering the second dimension, we also have little design space since PSNs include several, physically distributed teams. Considering the third dimension, we were looking for pathways on decentralizing information man-agement activities and responsibilities in PSNs. The field studies discussed in Chapter 5 reveal that the information management capabilities are currently cen-tralized in the emergency control rooms in PSNs, leaving the multi-agency teams with very few capabilities for directly collecting and sharing information. Using these three dimensions, we were able to find, led us to four pathways for assuring IQ and SQ from coordination theory. The first pathway we drew from coordination theory is orchestration. Whereas there is no single and universally accepted definition or framework for orchestration, scholars seem to agree on the goal of orchestration. Drawing on the example of a music orchestra with a variety of artist instruments, the goal of or-chestration is to facilitate a variety of roles and objects to function in concert (a co-herent way that serves the purpose of all stakeholders). As such, this pathway routes us to finding ways to maximize the benefits of decentralization, while retain-ing the benefits of centralization. The first mentioning of orchestration can be traced back to Neurath (1946). As argued in chapter three, orchestration is a hybrid and heterarchical form of coordination already studied in several areas, including e-government, supply chains and business networks orchestration. We use the term ‘heterarchical’ because there is no hierarchy of information managers as or-chestrating units. Heterarchical control structures have distributed locally autono-mous entities that communicate with other entities without the master/slave rela-tionship found in a hierarchical architecture. According to Dilts et al., (1991) the field of distributed computing is a source for a number of justifications for the prin-ciples of heterarchical control architectures. Implying the decentralized function of information management in a decentralized and physically distributed network structure, orchestration is not about the first dimension of King (1983), it’s pri-marily about the position of the information management responsibilities in a PSN.

Conclusions
211
As such, orchestration does not require hierarchical organizations (i.e., police, fire department and medical services) to fully centralize authority and decision-making when forming a public safety network, and yet decentralize information manage-ment activities such that the IQ and SQ can be assured beyond organizational boundaries. This special form of coordination appealed to our interest since it does not dictate the destruction of variety in the current IS landscape of PSNs. Resting on Ashby’s law of ‘requisite variety’ (Ashby, 1958), we argue that some variety in roles and objects is necessary, especially when dealing with complex and unpre-dictable situations such as disasters. Hence, we argue that uniformity should only be pursued when we have definitely found that single solution that always works for all sorts of disasters. This does not mean that orchestration does not require any standardization. While only demanding some level of standardization in message exchange (for instance using web-services), orchestration allows for co-existing of several (proprietary, legacy or preferred) IS components and technologies. The second pathway we drew from coordination theory is boundary span-ning. Boundary spanning refers to the activity of making sense of information to expand the knowledge of a given organizational context (Lindgren, et al., 2008). Roles and objects that link their organizations with others are referred to as bound-ary spanners (Aldrich & Herker, 1977; Thompson, 1967). Given the fact that PSNs emerge from several organizations with no dependency prior to disasters, boundary spanning appealed to our interest as a pathway for assuring IQ and SQ. After exam-ining existing work, we found that boundary spanners should possess knowledge of the relevance between various information and their linked organizations and make decisions concerning the distribution of gathered information. They convey influence between the various groups and at the same time represent the percep-tions, expectations, and values of their own organizations to those groups (Friedman & Podolny, 1992). In addition to boundary spanners, information sys-tems acting as “boundary objects” have also been hailed as a critical enabler of boundary spanning (Levina & Vaast, 2005). Star & Griesemer (1989) specify boundary objects as “objects that are plastic enough to adapt to local needs and constraints of the several parties employing them, yet robust enough to maintain a common identity across sites.” The term has also been used to refer to the potential of ISs to facilitate boundary spanning (i.e., Lindgren et al., 2008) in the IS field. Accordingly, boundary objects may include physical product prototypes, design drawings, shared IT applications, engineering sketches, standardized reporting forms, or even shared abstract constructs such as product yield. Boundary objects act as ‘brokers’ between interactions with other organizations, but at the same time they act as gatekeepers, selecting and filtering information. For boundary spanning to emerge, a new joint field of practice must be produced (Levina and Vaas, 2005), which can be a shared IS. Many ISs do not become boundary objects in practice, as human agents do not see their local usefulness or fail to establish a common identi-ty for them across sites. Therefore, boundary spanning, thus the roles of boundary spanners and boundary objects as well, become extremely important in PSNs where a large number of heterogeneous agencies have to develop a common opera-tional picture and respond jointly to the effects of a disaster.
The third and fourth pathway we drew from Coordination Theory come from March and Simon (1958). These pathways are ‘advanced structuring’ and ‘dy-namic adjustment’. The rationale behind these pathways is that organizations (i.e., relief agencies) that operate in dynamic environments, need to seek to consciously

Chapter 9
212
lay out prescribed activities by planning in advance, while at the same time need to supplement these with spontaneous ongoing adjustment to cope with unforeseen scenarios (Beekun & Glick, 2001). Coordination may thus be based on advanced structuring, or coordination by plan, and dynamic adjustment, or coordination by feedback. While literature (i.e., Tan & Sia, 2006) is somewhat inconclusive on the results of these pathways, we concluded that these pathways emphasized the devel-opment of specific IS capabilities. In this light, advance structuring suggests the development of preemptive and protective capabilities prior to a disaster. Loose coupling is an example of a preemptive capability, whereas dependency diversifica-tion is an example of a protective capability. The idea here is that the upfront de-velopment of IQ and SQ assurance capabilities will require fewer efforts to assure IQ and SQ during disaster response. Following this pathway, relief agencies can equip themselves with the dexterity required for preemptive capabilities before the nature of the disaster is known, consciously creating a range of information coordi-nation services before they are needed. Relief agencies can also use redundancy mechanisms, such as information or resource buffers, as a protective measure to guard against a potentially damaging situation and to allow a strategy to remain viable in spite of changes in the environment. Complementary to this pathway, the pathway of dynamic adjustment suggests the creation of exploitative and corrective capabilities. Environmental scanning is an example of an exploitative capability and reactive adaptation is an example of a corrective capability. Ex-post IS capabil-ity to exploit or capitalize on information beyond the organizational boundaries through constant scanning of (external) data sources and social networks, and the ability to recover from infliction and ameliorate the impacts of IS failures and mis-takes are also critical to information coordination efforts in PSNs. While these pathways have demonstrated their value in improving supply chain flexibility (Gosain, et al., 2005) and outsourcing (Tan & Sia, 2006), the impact on IQ and SQ were still not clear at the start of this research. Moreover, we still needed to shape these pathways to the conditions of PSNs and disaster response, in order to synthe-size explicit principles. Accordingly, we come back on examples when we reflect on the third research question (section 9.1.3).
9.1.2 Pathways from NCO
When looking to understand NCO one will find a handful of electronic documents, most of them authored by the founders of NCO: Alberts, Garstka and Stein (1999). In a series of four documents, these researchers from the US Department of De-fense have stressed the importance of sharing information more swiftly and intelli-gently in military networks. Their work does not provide a set of propositions or hypothesis related to NCO. Instead, NCO is explained through a set of four ‘tenets’ emphasizing that real-time information sharing capabilities (through netcentricity) will lead to improved mission effectiveness and efficiency during ad-hoc and hostile military operations (see Chapter 3).
Compared to the first kernel theory (coordination theory), theory on NCO is definitely still in the process of development. If we were to adhere to the strict criteria of Bacharach (1989) on what a theory actually is, NCO would be more a construct than a theory since it lacks clear propositions and hypothesizes. In a lat-ter publication, Alberts and Hayes (2005) support our observation by stating “we may agree that moving to a more network-centric organization is required, but the specifics in terms of new approaches to command and control, organization, doc-
Conclusions
213
trine, processes, education, training, and even the capabilities we require have yet to be developed adequately” (p.1). As a result, NCO does not yet provide many pathways for assuring IQ and SQ. Nevertheless, including this kernel theory in our research next to coordination theory was not by accident. IS architects and policy makers in PSNs are increasingly mentioning NCO as means of improving disaster management on various levels. Even though there was no scientific evidence on the merits and limitations NCO in PSNs, stakeholders in this domain seemed to be set on introducing it. One explanation for the high level of empirical enthusiasm may lie in the fact that NCO focuses on empowering individuals (i.e., soldiers). Since coordination theory focuses more on managing the interaction between individu-als, we viewed NCO as a necessary and complementary kernel theory that we could include in our knowledge base. Acting both as an empirical driver (interests of stakeholders) and a theoretical driver (scarce scientific research), we decided to include NCO as a kernel theory in our research. The existing literature on NCO led to three pathways for assuring IQ and SQ.
The first pathway we drew from the NCO literature is self-synchronization. Self-synchronization has been present in NCO literature since Cebrowski and Gartska (1998) introduced the construct in their seminal article “Network-Centric Warfare: Its Origin and Future.” Alberts, Gartska, and Stein (1999) use this term to describe the operating of entities in the absence of traditional hierarchical mecha-nisms for command and control. According to the tenets of NCO (see Chapter 3), self-synchronization is the link between shared situational awareness and mission effectiveness. In a later publication, Alberts and Hayes (2007) suggest that “self-synchronization leads to dramatic increases in both force agility and effectiveness” (p. 2). Often, self-synchronization is associated with visions of modern warfare in which individual soldiers are equipped with advanced digital headpieces.
Drawing on its initial description in the literature, we have developed a more PSN specific understanding of what self-synchronization means for relief workers and what it could mean for assuring IQ and SQ. Firstly, we do not associate any specific technical features with this pathway. Instead, we focused on unlocking the potential of allowing every relief worker in the PSN to have access to the same information in the same format. Secondly, we considered self-synchronization as a way of empowering the individual relief worker in their need to directly collect, use, update and distribute information anytime and anywhere in the PSN. Our under-standing of this pathway rests firmly upon the idea that subordinates have the most up-to-date, accurate, relevant and correct local information, and if they understand the goals (commander’s intent) and plans (orders) of an operation, they can pro-duce results superior to the centrally and hierarchically coordinated organization.
The second pathway we drew from the NCO literature is reachback. While self-synchronization refers to abilities of the individual, reachback is associated with technology and is defined as the ability to electronically exploit organic and non-organic resources, capabilities and expertise, which by design are not located in the theater (Neal, 2000). In general, reachback refers to a situation where re-sources, capabilities and expertise are at a physical distance from the area of inter-est, supporting the people in the area to perform their tasks. This pathway rests firmly upon the idea that higher headquarters enjoy larger staffs and larger reser-voirs of knowledge, experience, and information management capabilities. This pathway suggests that the individual soldier (relief worker), should have access to all information sources in the network, including experts and external (nonmili-

Chapter 9
214
tary) data bases without the mediation of other individuals (i.e., commanders and emergency control rooms). In this way, reachback is a prerequisite for self-synchronization. Given the advancement in information technologies (higher con-nectivity at lower cost) reachback is becoming easier to implement.
However, from a socio-technical perspective, we consider reachback as a pathway that goes beyond the implementation of technology alone. Following Cus-ter (2003), reachback also raises questions regarding information access levels, sharing policies, and dissemination of sometimes security sensitive information in a network of agencies. This means that we need to be careful in selecting roles that that have full reachback. Moreover, since disasters are low frequency events, the extent of reachback may need to be regulated to minimize the changes of improper use. This strengthened our view that reachback is not only a capability, but can also be a strategic choice to accomplish the goals of a PSN. As such, we have extended the understanding of reachback from a technical capability (no reachback versus full reachback) to a strategic capability (different levels of reachback for different roles in different situations) requiring cautions implementation.
The third pathway we drew from the NCO literature is information pooling. Information pooling is not a new idea and has been coined by scholars in the area of Social Phycology and group decision support in the early eighties (Stasser & Titus, 1985). In the later publications on NCO, this pathway for sharing infor-mation from various human and data sources in teams has regained attention. Task-related information known by all members of a multi-agency disaster re-sponse is termed shared information, while information held only by one or few team members is considered unshared. Both types of information play important roles in team decision-making: e.g., shared or redundant knowledge may help es-tablish a common situational picture and allow for swift decision-making. The col-lection of task-relevant information known by every member is termed the pool and thus information pooling is the process of creating and enlarging the pool of shared information that is developed and maintained through group discussion. Information sampling is the process by which team members introduce task related information into a discussion by recalling and mentioning it. One of the important factors that give a team of relief workers an advantage over individual relief work-ers is the amount and diversity of relevant information held by the team due to its members’ differing roles, responsibilities, training and experience. The team there-fore is more likely to make informed and high quality decisions. However, in order to utilize their informational resources, team members must discuss and exchange them. Based on literature, we knew that when following this pathway, the categori-zation of information in the pool in accordance with the preferences of the various relief workers in diverse, cross-functional, or distributed teams would be a major obstacle. We return on how we addressed this challenge in section 10.2.
Concluding, the answer to question 1b (which pathways are provided in co-ordination theory and netcentric operations theory for assuring IQ and SQ in public safety networks?) includes the seven pathways which we have outlined above. In hindsight, our first hunch did pay off. Drawing on these pathways, we had enough means to enter the field studies and synthesize principles for IQ and SQ assurance. Yet, having surfaced four pathways from coordination theory and three pathways from NCO, we could dwell on the question whether or not more pathways can be found in these theories. For coordination theory the answer would be yes, while for NCO we belief to have surfaced its main pathways. Compared to NCO, coordination

Conclusions
215
theory covers a wider range of constructs, variables and prescriptions. Given the massive body of publications on coordination theory and its many applications is various research areas, one could conclude that this theory still holds more poten-tial pathways. An example of such a pathway that we have left unexplored is event-driven coordination (Overbeek, Klievink, & Janssen, 2009). Event-driven coordina-tion architectures hold the promise to supplement the netcentric information or-chestration (section 9.1.3) through further decentralization of intelligence to or-chestrate information across a network of public agencies, without compromising the individual agencies' autonomy. As such, we consider this an avenue for further research. Section 9.4 presents some other avenues for further research.
9.2 Research question 2: demystifying information system ar-chitectures in PSNs
A considerable part of this research project took place outside the walls of the Uni-versity. We considered this fun and necessary: fun because it allowed us to observe relief workers in action, necessary because of the ‘mystification’ of IS architectures in PSNs. While the majority of literature underlines the complexity of disaster re-sponse processes and systems, compounded by the unpredictability of information needs and roles, literature provides brief descriptions of such IS architectures. Such brief descriptions lead to the mystification of IS architectures for disaster response. Since there are few contributions available on the design of IS for disaster response (with the exeptions of Kapucu, 2006; Meissner, Luckenbach, Risse, Kirste, & Kirchner, 2002; Turoff, et al., 2004) we decided to conduct field studies. Chapter 2 presents three other reasons for choosing field studies over other data collection methods. The field studies included observing multi-agency disaster response exer-cises and surveying participating relief workers on the experienced IQ and SQ. In addition, we also tried to capitalize on the design experience of the IS architects by means of interviews. We designed the field studies to answer three sub-questions.
The first sub-question (2a) asked how do multi-agency teams manage in-formation during disaster response in practice? Answering this question required us to study various configurations of IS architectures in practice. We sought for an-swers by triangulating observational data, informal talks with relief workers during training exercises and discussions with exercise organizers before and after training exercises. We formulated the second sub-question (2b) as considering the various information system architectures in practice, which levels of IQ and SQ do these architectures assure for relief workers during disaster response? We asked our-selves this question because we wanted to know what kind of impact an particular IS architecture has on the level of IQ and SQ for relief workers. We answered this question using surveys. The survey questions included IQ and SQ items that were tested in previous studies (see Lee et al., 2002). The third and final sub-question (2c) asked what are the existing best practices of information system architects for assuring IQ and SQ? This question was asked because we were convinced that IS architects not only have a better understanding of existing IS architectures than we did, but also that they would be the best judges of the pathways we had derived from literature. We investigated this question using semi-structured interviews with experienced IS architects. .Criteria for selecting the architects can be found in Chapter 2. We discuss the findings for each of the sub questions in the following sub-sections.

Chapter 9
216
9.2.1 Question 2a: how do multi-agency teams manage information in PSNs?
Based on the field study criteria (e.g., GRIP > 1, different IT applications and roles) discussed in Chapter 2, we decided to include the PSNs in Rotterdam-Rijnmond, Gelderland and Delfland as field study cases. Each of these cases included different IS architectures used for information management during disaster response. We observed 22 training exercises (18 in Rotterdam, 3 in Gelderland and 1 in Delfland), including six initial exercises observed in the winter of 2006, which we used to fine-tune our data collection instruments. We observed these exercises us-ing a predefined observation protocol crafted for studying the information man-agement process, roles, IT applications and IQ and SQ dimensions.
In Rotterdam, multi-agency information management took place using a single IT application. The Rotterdam-Rijnmond region is regarded as one of the ‘front runners’ when it comes to the development and adoption of innovative IT solutions for safety and security. One of the reasons for this position is the fact that this region hosts one of the largest Seaports in the World, making this region highly prone to disasters. When we started the first series of observations in the winter of 2006, Multi-Team was the main ICT application for inter-agency and inter-echelon information management. This tool allowed teams to share information, in the form of electronic situation reports between the tactical and strategic echelons and the collocated emergency control room. Situation reports were electronic forms containing predefined input fields such as location, weather conditions, hazards, casualties and actions.
During the second series of observations in the winter of 2007, trainers had replaced Multi-Team with CEDRIC (version 1.0). Similar to its predecessor, CEDRIC is based on a thin (client-server) architecture. While the main functionali-ty of this IT application was again to enable the generation and sharing of situa-tional reports, this application also included other functionalities such a emailing, chatting and a phone directory. Moreover, there were ongoing discussions on ex-panding the functionalities provided in CEDRIC, for instance by including port charts, maps and navigation services. A main hurdle at the time was the relatively low internet connection bandwidth provided by the wireless UMTS connection. Alongside the introduction of CEDRIC, trainers introduced the role of ‘information manager’ as operator of CEDRIC in the various teams. The role of the information manager includes two simple tasks: (1) generate a situation report during team meetings and (2) send the situation report to the other teams (i.e., COPI, ROT, GVS). Immediately, this decomposition already struck us as insufficient in terms of assuring IQ and SQ. Instead of acting as a boundary spanner, the IM acted as a note taker. It was here that we came to understand the importance of situation re-ports during multi-agency disaster response. Teams could use situation reports for synchronizing the level of situational awareness between the various multi-agency teams. Yet, the way in which these ‘boundary spanning objects’ were used in prac-tice, led us to conclude that they do not assure information symmetry across teams. Instead, since teams did not share the situation reports in real-time, they usually contained outdated information. Having experienced this, relief workers did not regularly consult, situation reports, the information manager and CEDRIC, even though these were essential elements of the IS architecture. We found that the in-formation manager role was unable to meet the changing information needs of team members or other individuals in the network beyond the information in-
Conclusions
217
putted in the consecutive situation reports. As such, we consider this role very basic with no capabilities of assuring IQ and SQ.
As second field study, we observed multi-agency information management in three cross-border training exercises in Gelderland. These exercises included relief workers from the Netherlands and Germany and focused on training the cross-border response to major floods. In Gelderland, information was managed using four different IT-applications FLIWAS, CSS, FloodAtlas and ARCmap. Such a heterogeneous IS architecture is considered to be the common practice in most of the PSNs in the Netherlands. Each of these applications provided a specialized and evolved set of functionalities (i.e., geographic data plotting, flood simulation and message exchange). Relief workers also used these applications in the multi-agency teams on the tactical and strategic level of response. While some of the functionali-ties across the applications were redundant (e.g., area maps and message ex-change), the relief agencies preferred to keep using the four applications rather than one single or integrated application. Next to these four IT applications, we also observed two different roles that were active in inter-agency and inter-echelon information management. Observed roles included the information manager and plotter. In this case, the information manager role was similar to the one we ob-served in Rotterdam. What was different from Rotterdam was the lower level of reliance on the situation reports in Microsoft Groove. Using this application, teams were able to create a shared workspace allowing information managers to distrib-ute files and folders throughout the PSN. However, many of the agencies did not use this application, partly because it does not support all the specific functionali-ties required by the agencies. Instead of focusing on a single situation report, relief workers focused on the information that was coming in via the application that they were using. However, since these applications are neither integrated nor interoper-able, we observed several instances of inconsistent information sharing. Yet, this did not mean that relief workers were aware of the fact that their comrades from other agencies had different/inconsistent information.
The final field study was conducted at the Hoogheemraadschap Delfland where multi-departmental information flows were managed using whiteboards, so without any software or electronic applications. Here we need to state that this field study was less comprehensive than the previous two in terms of number of exercis-es and participants. Moreover, this field study focused on intra-agency disaster in-formation management, whereas the other two field studies focused on information management between multiple agencies. The water management agency in Delfland uses whiteboards for inter-departmental and inter-echelon information management. In this field study, teams shared information using five large white-boards. While the water management agency is considering electronic means for information management during disasters (e.g., FLIWAS), this agency still uses whiteboards as a mean to convey information within their organization. The idea is that the whiteboards retain the most relevant and up-to-date information to all re-lief workers. An information coordinator role is used to manage the information on the whiteboards. The information coordinator was the only role allowed to put or remove information on the whiteboards (using markers). In contrast to the role of the informer manager in Rotterdam and Gelderland, the role of information coor-dinator included a broader range of tasks. The information coordinator was not only responsible for pulling information from the various departments, but also for posting and updating this information on the whiteboards. As elaborated in section

Chapter 9
218
4.5.5, we observed that this role was quite busy during the disaster, and was less able to update information on the whiteboards as the disaster situation progressed. This resulted in several examples of outdated information. Another problem with this approach was that the handwriting of the information coordinator was not clear to everyone. This resulted in situations where relief workers were trying de-crypt the handwriting of the busy information coordinator.
Considering the qualitative field study findings, our answer to question 2a (how is information managed in public safety networks during disaster re-sponse?) is that information is managed using a mix of both IT and non-IT applica-tions, boundary objects (e.g, situation reports) and roles (e.g., information manag-er, coordinator and plotter). Therefore, we conclude that various types of IS archi-tectures exist. Common to the investigated IS architectures is the focus on top-down (vertical) flow of information between the echelons of a specific agency. This form of information management firmly rest on the hierarchical authority structure of the individual agencies. The only time information is formally shared horizontal-ly (between agencies) is during the tactical and strategic echelon team meetings. We found that the trainers and agencies in the studied PSNs are looking for ‘one best’ way of coordinating information. In Gelderland, trainers are still in the pro-cess of evaluating the use of the four different IT applications, whereas the PSN in Rotterdam has decided to work with a single IT-application. In both Rotterdam and Gelderland we recorded instances of ‘reinventing the wheel’, indicating that information which was already available somewhere else in the network was re-quested and searched for again. In contrast to the whiteboards used in Delfland, the ISs in the other field studies did not have the ability to retain or buffer infor-mation. In the examined PSNs, stakeholders are still exploring the boundary-spanning pathway, meaning that the roles of the information manager and infor-mation coordinator are still in the process of refinement. Compared to the white-boards, the IT applications used in Rotterdam and Gelderland enable the operators to act as boundary spanners, albeit with very few capabilities to assure the IQ and SQ. The three field studies show the lack of empowerment of relief workers, espe-cially the ones that should act as boundary spanners. The information manager role (Rotterdam and Gelderland cases) consists of far too simple task and is ill support-ed when it comes to reach-back and synchronization capabilities. On the other hand, the information coordinator role (Delfland case) is too complex, demanding far too much time from a single person. Therefore, we conclude that the tendency to centralize information and information related roles, compounded by the low level of empowerment (i.e., through reachback and self-synchronization) has nega-tive impacts on the IQ and SQ for relief workers. Another important conclusion we came to in this phase was that relief workers mainly focused on their individual information needs. Instead of sharing, relief workers focused on pulling infor-mation that they thought was relevant for their own tasks, without any considera-tion for the information needs on a network level. Examples included police officers not sharing information on the victims that they have rescued with the fire brigade and ambulatory services not sharing information about victims that have reported smelling some kind of gas to firefighters. As relief workers are trained on complet-ing their own set of processes during a disaster, they do not reflect on the infor-mation that is not directly important to their tasks, even though this information could be of critical importance to the relief workers of other agencies.
Conclusions
219
9.2.2 Question 2b: which levels of IQ and SQ do existing information systems assure?
We investigated question 2b using surveys. After the training exercises in Rotter-dam-Rijnmond, Gelderland and Delfland, we requested relief workers to indicate the levels of IQ and SQ during the exercise. Besides some background questions, the surveys mainly contained propositions based on tested questionnaire items (Lee, et al., 2002). Using a standard 7-point Likert-scale respondents could indi-cate to what extent they agreed with the propositions (1= totally disagree and 7= totally agree). In total, we received 153 completed surveys (83 from Rotterdam, 46 from Gelderland and 24 from Delfland). We found that each of the investigated IS architectures leverage different levels of IQ and SQ for relief workers.
We collected the first set of quantitative data from the Rotterdam-Rijnmond field study. The single IT application based IS architecture leveraged moderate (score ≈ 4) scores for IQ-timeliness (4,32), IQ-completeness (4,84), IQ-correctness (4,82) and IQ-consistency (4,93). With an average score of 5,14 and SD of 0,99 the IQ-relevancy dimension stands out, indicating that most relief workers found the information shared with them to be relevant for their tasks. The relative-ly high standard deviation (SD) for IQ-consistency (SD=1,54) hints to some disa-greement on whether the information shared was consistent or not. In addition, the level of IQ-information overload was low (3,15), indicating that the relief workers usually did not receive too much information. When considering the SQ dimen-sions, this IS architecture leveraged moderate scores for SQ-accessibility (4,72) and SQ-reliability (4,57), but low scores for SQ-response time (3,53), SQ-satisfaction (3,93) and SQ-flexibility (3,39). This not only indicates that the relief workers were not very satisfied with the IS architecture used, but also that this IS architecture resulted in long waiting times for information and adapted poorly to the changed information needs. Note that the standard deviations for SQ-response time (SD=1,84), SQ-satisfaction (SD=1,80) and SQ-flexibility (SD=2,07) were relatively high, indicating some spread and disagreement on the perceived score for these dimensions.
We collected the second set of quantitative data from the Gelderland field study. Trainers allowed us to administer short paper surveys directly after one of the training exercises. The paper-based survey was a shortened version of the online survey administered in Rotterdam-Rijnmond. Due to time restrictions im-posed by the trainers, we were only able to use one item per IQ and SQ dimension (instead of 3 items such as in the Rotterdam-Rijnmond case). The multi-IT applica-tion based IS architecture in Gelderland leveraged moderate scores for IQ-timeliness (4,43), IQ-completeness (4,61), IQ-correctness (4,80) and IQ-consistency (4,48). With an average score of 5,37 and moderate SD (1,06), the IQ-relevancy dimension stands out. Another interesting number from the data analysis is the average score of 4,24 for IQ-information overload, which when considered in relation to the high SD for this dimension (SD=1,85) leads us to conclude that there were some issues regarding the amount of information relief workers needed to deal with. When considering the SQ dimensions, the multi-IT application based IS architecture leveraged moderate scores for SQ-accessibility (4,37), SQ-reliability (4,87), SQ-timeliness (4,24) and SQ-satisfaction (4,72). The lowest average score was attributed to SQ-flexibility (3,43) indicating that the four IT applications adapted poorly to the changed information needs. When we look at the standard deviations for SQ-response time (SD=1,77), SQ-satisfaction (SD=1,60) and SQ-
Chapter 9
220
flexibility (SD=1,75) we can conclude that there is some spread and disagreement on the perceived levels for these SQ dimensions. An additional SQ-construct we used in this field study was SQ-usefulness. This construct operationalized in a sin-gle item (the IT was very useful for completing my tasks) received a high average score from the participants (5,13). One explanation for this is that the various IT applications in Gelderland were more tailored to the tasks and information needs of the different relief agencies.
We collected the third set of quantitative data from the Delfland field study. Similar to the Gelderland field study, trainers allowed us to administer paper sur-veys immediately after a training exercise. Since these surveys were subject to less strict constraints than in Gelderland, we decided to use three items per construct similar to the Rotterdam-Rijnmond questionnaires. The whiteboard centered IS architecture in Delfland leveraged moderate scores for IQ-timeliness (4,53), IQ-completeness (4,06), and IQ-consistency (4,71). With an average score of 5,22 the IQ-relevancy dimension stands out. In addition, IQ-correctness also received a rel-atively high average score (5,00). Another interesting number from the data analy-sis is the average score of 2,79 for IQ-information overload, which when considered together with the moderate SD for this dimension (1,50) leads us to conclude that overall, there were no major issues regarding the amount of information relief workers needed to deal with. When considering the SQ dimensions, this IS archi-tecture leveraged moderate scores for SQ-satisfaction (4,41) and SQ-ease of use (4,74). We have included an item on SQ-ease of use due to a request of the exercise organizers whom wanted to know how easy to use the whiteboards were. The data analysis revealed lower average scores for SQ-accessibility (3,93), SQ-reliability (3,96) and SQ-timeliness (3,35), indicating that relief workers using the whiteboard based IS architecture had some issues with getting rapid access to information. An-other interesting average score is that of IS-digitalization. We added this dimension as a way to measure the preference to digitalize the existing whiteboards. Based on the average score of 5,48 and the standard deviation of 1,69 we can conclude that the majority of relief workers would prefer to share information via electronic whiteboards.
It was not our initial intention to compare the average scores for the meas-ured IQ and SQ across the field studies, mainly because the characteristics the field studies (e.g., type of IT used, scenarios trained and training exercise design) were very different. Moreover, we were also restricted in the number of survey con-structs and items we could use, further complicating cross-field study comparabil-ity. Acknowledging of these constraints, we thought it would be interesting to com-pare the average scores for the measured IQ and SQ across the field studies. First, the quantitative data allows us to conclude the IT supported IS architectures (Rot-terdam and Gelderland) outperform the whiteboard based IS architecture on IQ-completeness, SQ-timeliness and SQ-accessibility. This being the case, the white-boards did not leverage unacceptable levels of IQ-relevancy and IQ-correctness, and even scored better on IQ-information overload. We even found it to be some-what contra-intuitive that the average scores for IQ-correctness (5,00) and the IQ-relevancy (5,22) of the information shared via the whiteboards in Gelderland was higher compared to the Rotterdam and Gelderland field average scores. One expla-nation for this may be that the information posted on the whiteboards were select-ed on its relevancy and filtered on its correctness by the information coordinator.

Conclusions
221
Another interesting finding is that the perceived level of IQ-information overload was lower (2,79) when compared to the Rotterdam-Rijnmond and Gelder-land field studies. The information on the whiteboards was also rated as fairly con-sistent (4,71). This is not strange when considering that the information coordina-tor was the only person allowed to post and remove information from the white-boards. On the other hand, SQ-timeliness (3,35) and SQ-accessibility (3,93) scored lower in Delfland than in the other two field studies. We also found that IQ-consistency was slightly higher when using one single and integrated IT application (Rotterdam) and whiteboards (Delfland) than when using multiple IT applications (Gelderland). The use of multiple IT applications also had a negative effect on IQ-overload (higher), something that can be expected when team members get (some-times redundant) information from multiple sources at the same time.
Interesting is that the scores for the IQ-relevancy and IQ-correctness were higher for Gelderland than the scores in Rotterdam. We attribute this to the use of more specialized software applications that assure higher IQ-relevancy and IQ-correctness than information management using less specialized software (i.e., CEDRIC). Since the Analysis of Variance indicates that there is no strong statisti-cally significant difference between the Rotterdam and Gelderland scores for IQ-relevancy and IQ-accuracy, we cannot defend this argument based on the collected data. Noteworthy is that the relief workers in Gelderland did experience a statisti-cally significant higher level of IQ-information overload (4,24) than the relief work-ers in Rotterdam (3,15). The reason for this can be attributed to several factors, in-cluding the presentation of information. In CEDRIC, information was presented in a standardized and easy to navigate screen, whereas the information presented in the Gelderland applications was less standardized. Based on this generic compari-son, we can conclude that the use whiteboards for information management within a single agency assure moderate levels of correct, consistent and relevant infor-mation, yet does not provide information quickly enough.
9.2.3 Question 2c: what are the existing best practices of information system architects for assuring IQ and SQ?
We investigated sub-question 2c using sixteen semi-structured interviews with IS architects. The results indicate that there are no commonly shared principles in use. While NCO and service oriented architectures (SOA) are surfaced as future ‘good’ practices, the current practices converge on assuring SQ-interoperability and SQ-response. The interviewees were senior level IS architects from various relief agencies in the Netherlands. The criteria for selecting these interviewees are dis-cussed in chapter 2.5. In retrospect, the interviews with the sixteen IS architects discussed in Chapter 5 formed a valuable part of our research. Not only did the in-terviews allow us to better understand the design of existing IS architectures, they also provided insights on the occurrence of IQ and SQ issues and the existing means of dealing with these issues. In addition to understanding existing IS archi-tectures, the interviewees helped us to further explore and shape the seven path-ways provided in NCO and Coordination theory before entering the design cycle and evaluation cycle of this research.
While not agreeing on the importance of all the presented dimensions, the interviewees acknowledged the occurrence of IQ and SQ issues in current PSNs. Related to question 2c, the interviewees agreed that assuring IQ is a major chal-lenge that needs to be addressed collectively. However, most of the interviewees

Chapter 9
222
declared that they are currently focusing on assuring SQ, particularly focusing on improving the technical interoperability of existing IT applications. This means that the current efforts of policy makers and IS architects in several PSNs are con-centrated on developing IT-applications that provide specific functionalities (e.g., geographic maps and hazards zone indication) and on making existing applications more interoperable (e.g., using middleware and web services). As such, assuring SQ is the going concern, while assuring IQ might be the focus in five or ten years. While one of the reasons for neglecting IQ lies in its subjectivity, the main reason for the focus on SQ according to the interviewees is the increased pressure of the national government on relief agencies, requiring them to collaborate on a regional level (see the discussion on the development of Safety Regions in Chapter 4.1). We found that the current IT landscapes in PSN are fragmented and can best be de-scribed as a unstructured combination of IT ‘silos’, where each silo is originally de-signed to serve the internal and predefined (routine) information needs of the own agency.
The interviewees revealed the rise of two, to some extent opposing, devel-opments that may become shared best practices in PSNs. First is the increasingly mandatory introduction of CEDRIC, a centralized IT application that BZK (Minis-try of Internal Affairs and Kingdom Relations) often associates with NCO. Similar to our field study observations, we see a tendency to centralize information, infor-mation related functions and responsibilities. We are not sure where this tendency comes from, an explanation may be that agencies prefer to have control over the developed IT. While most of the architects do not view CEDRIC as the only way to materialize NCO, they argue that NCO can lead to improved information sharing in terms of speed and connectivity. The debate here is whether CEDRIC enables the true intentions of NCO or not, being network wide reachback, self-synchronization and information pooling. The second development pointed out by the interviewees is the increasing adoption of SOA as a way of organizing future IS architectures. Suggested advantages of using SOA include modularity, flexibility and most im-portant from a SQ perspective, technical interoperability. Developing SOA based IS could also enable NCO, but is the opposite direction of adopting CEDRIC. As one of the technical means for enabling orchestration, SOA does not require the destruc-tion of variety through uniformity. Instead, SOA allows for the technical interoper-ability of various, previously incompatible, applications via standardized message containers (e.g., web services). This is in line with the pathway of orchestration. Since NCO and SOA were opposing developments, the majority of interviewees raised their concerns about the current policies in PSN and the lack of nationally accepted reference architectures or principles for developing IS for disaster re-sponse. In the light of these developments, some of the interviewees applauded our research efforts on developing and evaluating design principles, whereas others had mixed feelings about the impact our work would have in this field. These mixed feelings were fuelled by the increasing number of technologies (see section 1.4 for an overview) that are being developed for disaster response, while, in the view of the interviewees, many of these technologies do not resonate with the context of use and processes of relief workers.
Before starting the field studies, we did not know what to expect regarding IS architectures in PSNs, especially since literature on their configuration was scarce. Moreover, previous contributions have to some extent ‘mystified’ infor-mation management in disaster response as a process, claiming that there is no

Conclusions
223
form of predictability and structure whatsoever. Our field studies help in demysti-fying IS architectures for disaster response in practice. We found that to some ex-tent, stakeholders could anticipate the information flows and information needs across several types of disasters. The information categories listed in situation re-ports prove that relief workers are already moving from total unpredictability to a moderate level of anticipation. Perhaps the Pareto rule (also known as the 80%-20% rule) may be an appropriate analogy for this demystification, meaning that 80% of information management during disaster response can be predicted and prepared for (advanced structuring), whereas 20% depend on a too wide range of factors that are impossible to prepare for. To conclude, the reported field studies constitute a crucial part of this research by equipping us with knowledge on IS ar-chitectures and current practices for assuring IQ and SQ. The knowledge gained in this cycle was a prerequisite for starting the third cycle of this research that we re-flect on next.
9.3 Research question 3: netcentric information orchestration as a design theory
Equipped with the knowledge gained from theory and practice, we entered the de-sign cycle of our research. The research question we addressed in this cycle asked which design principles can we synthesize from the knowledge base and empirical data for assuring IQ and SQ during multi-agency disaster response? It is in this phase that we aimed to synthesize a design theory for assuring IQ and SQ in PSNs. We first expected that answering question 3 would only require that we induce principles by integrating the seven pathways provided in the two kernel theories with the knowledge gained from the three field studies. However, this inductive process did not directly result in the set of principles we were aiming for, mainly because we were unable to relate the pathways directly to the IQ or SQ dimensions. We still needed an important stepping-stone before we could synthesize principles. Based on our interviews with the IS architects, we came to the insight that since we were investigating ISs, we first needed to establish the capabilities that were need-ed to assure the dimensions of IQ and SQ. As such, we first needed to deduce de-tailed capabilities that would function as stepping-stones towards the induction of more generic principles. Here, capabilities refer to IT-enabled competencies that agencies or multi-agency teams constitute, employ and adapt during disaster re-sponse.
In the process of capability deductions, advanced structuring and dynamic adjustment proved to be more than pathways, they also helped in categorizing the capabilities needed in time (before and after a disaster) and nature (offensive and defensive capabilities). Capabilities under the advance-structuring category pro-mote the empowerment of relief workers through information pooling, self-synchronization and reachback capabilities, while diversifying information sources for redundancy and triangulation purposes. On the other hand, capabilities under the dynamic structuring category promote active environmental scanning and in-formation quality feedback by means of validation and rating. When utilizing these capabilities, orchestrators (advancements of the information manager and coordi-nator roles) are expected to fulfill a spectrum of information coordination roles, including information foragers, boundary spanners, quality monitors, environmen-tal scanners and enrichers (completing information or adding value to infor-mation).

Chapter 9
224
Section 6.5 presents the set of ten principles in conjunction with the IQ and SQ dimensions they assure. We have dedicated an entire section (6.2) on the defini-tion, meaning and implications of principles in the context of principle-based de-sign. In short, principles are normative and directive guidelines related to one or more architectural components that need to be (re)designed by IS architects in or-der to achieve one or more network level goals. Here, IQ and SQ are considered as network level goals. Some of the stated principles are more theory driven, while other principles firmly rest on the field study. In accordance with the guidelines for communicating design principles provided by The Open Group Architecture Forum (TOGAF), we elaborate on the pathways each principle rests upon, the rationale behind the principles and the expected implications for the IQ and SQ next. We come back on whether our expectations were satisfied or not in section 10.3.
The first design principle is ‘maintain a single, continuously updated in-formation pool throughout the PSN’. This principle rests upon two pathways (boundary spanning and information pooling) and is driven by the field study ob-servation that situation reports are powerful, yet ill-designed boundary objects. From the field studies, we found that relief workers needed the ability to dynami-cally integrate information supply and demand. By proposing the replacement of several, immediately outdated situation reports, we expected that this principle would assure IQ-timeliness, IQ-completeness and SQ-response time.
The second design principle is ‘maximize feedback on the quality of shared information’. This principle is rooted in our observation that relief workers lacked the capability to validate the quality of the information they had received or collect-ed. We expected that the ability to determine the quality of information, for in-stance using an information rating capability, would help relief workers to judge whether to use the shared information or not. We expected that this principle would assure IQ-correctness and IQ-reliability.
The third design principle is ‘maximize the reachback of orchestrators’. This principle is rooted in the NCO reachback pathway and our observation that information managers and coordinators lacked information access capabilities. We expected that the ability to directly access information (without first having to con-tact the emergency control room) form agency and external (third party) data sources would assure IQ-completeness, SQ-accessibility and SQ-response time.
The fourth design principle is ‘categorize information as much as possible’. This principle rests mainly upon the observation that relief workers avoid infor-mation overload through categorization. This principle is consistent with one of the premises of Turoff et al., (2004) whom also suggest that the ability to (automatical-ly) categorize information would avoid IQ-overload.
The fifth design principle is ‘notify changes in information as soon as pos-sible’. This principle is rooted in the NCO self-synchronization pathway and the observation that relief workers were often unaware of changes in information ob-jects (i.e., on the direction of the wind or the number of hazards). While someone in the PSN did have information needed, the lack of capabilities to synchronize infor-mation objects over the network led to decision-making and action based on in-complete information. We expect that the ability to obtain changes in critical in-formation objects in real-time would assure IQ-timeliness, IQ-correctness, IQ-relevancy and SQ-response time.
The sixth design principle is ‘provide a single window for all information needs’. This principle is rooted in the observation that the use of several IT-

Conclusions
225
applications (Gelderland field study) increases information asymmetry between teams and agencies across the PSN. Following the orchestration pathway from co-ordination theory, this principle promotes the re-use of services and functionalities across applications. We expect that the ability to find all relevant information via a one stop shop would assure IQ-timeliness, IQ-completeness, IQ-relevancy and SQ-response time.
The seventh design principle is ‘retain as much information as possible’. This principle is rooted in the advanced structuring pathway and the observation that much information is lost during disaster response. We expected that the ability to buffer information, view the history of information and re-use information, for instance in libraries, would assure higher IQ-completeness and IQ-relevancy.
The eighth design principle is ‘dedicate specific resources for environmen-tal scanning’. This principle is rooted in the dynamic adjustment pathway and the observation that relief workers lack the ability to scan the entire PSN and the out-side environment for information. Here, we expected that the ability to scan infor-mation sources throughout and beyond the PSN (e.g., via Twitter, YouTube) would help orchestrators to find complementary information, thus assuring higher levels of IQ-timeliness, IQ-completeness and SQ-response time.
The ninth design principle is ‘re-use information as much as possible’. This principle is rooted in the observations of repeated information requests and collec-tion efforts during the field studies. Since there is no shared information space or library, relief workers and information managers were often not aware of infor-mation already available in the PSN. Consequently, the redundant requests for in-formation consumed the already scarce information management capacity of the information managers and control rooms. As such, we advocate that after initial validation by orchestrators or experts, relief workers re-use information that is available in the PSNs as much as possible.
The tenth design principle is ‘make the owner of information objects re-sponsible for updating their own information’. This principle is rooted in the obser-vation that an enormous amount of information is shared during a disaster, where-as the responsibility of updating the information is not explicit, resulting in confu-sion about the timeliness of information. In contrast to making the information manager or coordinator responsible for collecting and maintaining up-to-date in-formation in CEDRIC or MS Groove, we advocate that the source of information should be responsible for updating information in the information pool. Consistent with Hammer (1990), we expected that this principle would assure IQ-timeliness.
In retrospect, we expected at least a dozen principles as outcome of the de-sign cycle, partly because of the smaller number of principles provided in other, smaller studies (Garfein, 1988; Richardson, et al., 1990). While we did not aim for any specific number of principles, at first, ten principles seemed to be too few. Still, after scrutinizing each design principle and pondering on its impact in practice, we belief that this set of ten design principles forms an appropriate answer to the third research question stated above. Stretching the notion of ‘design theories’ (Gregor & Jones, 2007), we propose the combined set of design principles as a design theory for assuring IQ and SQ in PSNs. We call this design theory ‘netcentric information orchestration’ since it rest firmly on the pathways provided in Coordination theory and NCO. The framework is probably more empirically driven, but the insights are consistent with the theoretical arguments in coordination theory (March and Si-mon, 1958; Gosain et al., 2004) and NCO (Alberts and Hayes, 2006). From this

Chapter 9
226
framework (see section 6.3), netcentric information orchestration can be under-stood as a network wide, decentralized and distributed way of managing infor-mation through empowered information managers with IT enabled capabilities. We discuss the evaluation of this design theory in the next section.
9.4 Research question 4: quasi-experimental gaming-simulation
“The proof of the pudding is in the eating.” As design science researchers, we firmly believe in this adage. Accordingly, the final cycle in our design science research was the evaluation of the proposed design theory. The question leading this phase asked to what extent do the proposed design principles assure higher levels of IQ and SQ for relief workers when compared to existing information sys-tems? It is in this phase that we wanted to evaluate the extent to which the design principles behind netcentric information orchestration assure higher levels of IQ and SQ compared to existing, hierarchy based IS architectures without empowered information managers. The evaluation cycle consisted of two steps: (1) prototyping and (2) quasi-experimental gaming-simulation.
We chose to develop a prototype based on the ten design principles for two reasons. First, the prototype itself would be a proof of technical feasibility: the ex-tent to which we could translate our design principles into a tool for relief workers. Secondly, we would use the prototype, as embodiment of the design theory, when evaluating the proposed design theory. Thanks to our field studies and examination of IT applications for information sharing, we had sufficient knowledge about the environment and setting in which the prototype needed to operate. We called this prototype DIOS, an abbreviation for Disaster Information Orchestration System. We elaborate on the nuts and bolts of this prototype in Chapter 7.
After completing the first version of the DIOS prototype, we were able to start developing gaming-simulation sessions. Since we had gained some experience on training relief workers from the observed training exercises, we decided to em-ploy this knowledge in the form of a gaming-simulation with relief workers. Thanks to our involvements in other research projects beyond the scope of this research (Bharosa, Meijer, Janssen, & Brave, 2010), we had also gained some experience in designing gaming-simulations for evaluation purposes and expected that this method would allow for a more in depth, valid and interactive evaluation of our design theory. As we explained in Chapter 2, gaming-simulations combine tradi-tional forms or role-playing games with quasi-experimentation. While gaming is the main form in which disaster response scenarios are simulated, quasi-experimentation refers to the structure of the gaming session, which in our case was divided in two rounds (with and without our design principles).
Before the evaluation session with professional relief workers, we conduct-ed a pre-test with twenty-four graduate students at the Delft University of Technol-ogy. The pretest paid-off, we became aware of one problem in our game design and two problems in the DIOS version 1 prototype. The problem in our game design was that we had too few messages to keep the players focused. Looking back, we thought that a few messages and events would be complex enough to keep the flow of the game going. The pre-test taught us that we needed to have more scenario related events in the form of messages ready. Reflecting on the prototype, the Mi-crosoft Access database we used in DIOS version 1 was unable to handle the num-ber of simultaneous entries during the game. While we were aware of the limited

Conclusions
227
capacity of such a database, we did not expect that eight orchestrators would al-ready be too much. The MySQL data employed in DIOS version 2 had no problem in dealing with eight simultaneous entries. A second problem with DIOS version 1 was the graphical user interface. According to the students who used the prototype, the hierarchical, wiki-based navigation structure of DIOS version 1 was too compli-cated and difficult to use. The pre-test revealed that we needed to simplify the user interface even more, and adhering to the sixth principle, minimize the number of screens and views in the prototype. The resulting DIOS version 2 prototype was expected to be more robust and easy to use. After the pre-test with graduate stu-dents, we evaluated netcentric information orchestration as design theory using a quasi-experimental gaming-simulation with professional relief workers. Here, ‘quasi-experimental’ means that the gaming-simulation consisted of two rounds, one with DIOS and one without. The main difference between both rounds was the use of DIOS for information management all other factors were kept constant in order to avoid other causal interferences. This simple, yet most commonly applied way of quasi-experimentation allowed us to collect data on the effects of DIOS on IQ and SQ. In order to collect qualitative data, the gaming-simulation sessions were observed using observation protocols and were recorded on video. Quantitative data on IQ and SQ was collected using paper based surveys.
As with any form of experimentation, we had some expectations of the re-sults. These expectations surfaced from the field study observations and the find-ings from the pre-test with students. First, we expected that the design principles would not assure all of the IQ and SQ dimensions and that some trade-offs would emerge from the evaluation cycle. For instance, while we expected that rating the quality of information before sharing (design principle 2) would assure higher lev-els of IQ-correctness and IQ-relevancy, we were uncertain about the effects of this principle on the IQ-completeness and SQ-response time. We also expected that DIOS would perform well and would improve IQ timeliness and SQ-response time, but would become the main goal of the evaluation (from the perspective of the par-ticipants) instead of being just a ‘tool’ that materialized the design principles. Moreover, we expected that the professionals would be very satisfied with netcen-tric information orchestration. In addition, we expected that there would be some concerns about the scenarios of the gaming-simulation. Finally, considering the warnings issued by Stanovich (2006), we expected that netcentric information or-chestration would have some ‘side-effects’ since the participating relief workers were not yet adequately trained in coordinating information in this way.
Given these expectations, let us first reflect on the quantitative data collect-ed during the gaming-simulation with professional relief workers. Similar to the field studies, we employed a survey consisting of propositions on a selection of IQ and SQ variables. In order to assure construct reliability, we used the three items per construct rule. While adherence to this rule made our paper based survey long-er, we did not expect any complaints from the participants since they were aware of the goal of the gaming session. We did however still receive a few complaints, but managed to circumvent these by underlining the importance of the survey data for our research. In the end, we received and analyzed twenty-two surveys for each round. Using SPSS we analyzed the data and calculated average scores and stand-ard deviations for all the IQ and SQ dimensions. When comparing the IQ dimen-sions over round 1 (without DIOS) and round 2 (with DIOS), the data shows im-provements in IQ-timeliness (3,80 versus 4.29), IQ-correctness (4.33 versus 5.00),

Chapter 9
228
IQ-completeness (3.46 versus 3,71), IQ-relevancy (3.71 versus 3.78) and IQ-format (2.55 versus 3.70). The only IQ dimension that was lower in round 2 than in round 1 was IQ-consistency (4.63 versus 4.00). When comparing the SQ dimensions over round 1 and round 2, the data shows improvements in SQ-accessibility (2.47 versus 4.53), SQ-satisfaction (2.53 versus 3.41), SQ-response time (2.15 versus 3.75), SQ-information sharing support (2.98 versus 4.15), SQ-notification (2.42 versus 3.89) and SQ-feedback (4.20 versus 4.78). When we consider the quantitative data, most IQ and SQ scores indicated by the relief workers are higher for netcentric infor-mation orchestration (round 2) than hierarchical information coordination (round 1). As expected, netcentric information orchestration resulted in more timely in-formation at lower response times. While the compared average scores indicate that netcentric information orchestration improves most of the measured IQ and SQ dimensions, a test of the statistical significance of the apparent differences be-tween requires us to interpret the quantitative results more carefully. When adher-ing to such strict rules for statistical significance, we can say that regarding the IQ, netcentric information orchestration assured higher levels of IQ-correctness and IQ-timeliness. Regarding the SQ, netcentric information orchestration assured higher levels of SQ-accessibility and SQ-response time (indicating a lower response time).
Having discussed the quantitative data, we proceed by reflecting on the ex-tent to which each principle assured higher levels of IQ or SQ when comparing the results of both rounds. Here we mean both qualitative results (gained from obser-vation notes, video recordings and debriefing sessions) and quantitative results (gained from surveys). As such, this reflection process triangulates the data collect-ed using the different instruments. The first principle (maintain a single, continu-ously updated information pool throughout the PSN) proved to have the most im-pact on the IQ and SQ. The result of this principle is that everyone possessed the most up-to-date and complete situation report, partially accounting for the higher IQ-timeliness and IQ-completeness in round 2. The relief workers were able to share a wider range of information more quickly and over the same platform. Shar-ing information in this way almost immediately revealed inconsistencies in the in-formation shared between teams. This may be the main reason why IQ-consistency was actually lower in round 2. When information is coordinated hierarchically, it is more difficult to spot inconsistent information from the position of the individual relief worker. Another noteworthy finding regarding this principle is the lack of responses to the information requests in DIOS. Everyone saw the information re-quests, and yet we observed that most of the requests did not attract a response. One explanation for this may be the tendency of the teams to move on with deci-sion-making instead of replying to information request. We also observed situa-tions in which relief workers made decisions outside their mandate, just because they had the ability to do so in DIOS. Literature (see Stanovich, 2006) has already warned us for this type of ‘renegade freelancing’. With the high level of empower-ment achieved by using DIOS comes the concern that subordinates will step out of their tasks description and may conflict with the intentions of commanders. We argue that if the full potential of network based coordination solutions is to be uti-lized, stakeholders need to address this issue of freelancing. Further research may want to consider the development of an ‘overruling’ functionality or rules for deal-ing with information posted by relief workers that do not have the authority to de-cide on that particular type of information.

Conclusions
229
The second design principle (maximize feedback on the quality of shared information) increased the speed in which relief workers navigated through the information shared in DIOS. Borrowing the idea of information rating from open source networks such as Wikipedia and Google Android Market, we have material-ized this design principle as a rating functionality in the DIOS prototype. During the gaming-simulation, we requested the participants to rate information that they or others have shared as much as possible. For all the participants, it was the first time that they saw how relief workers from other agencies reacted to the infor-mation they shared through feedback or information requests. This principle helped relief workers in determining the reliability and correctness of information, probably leading to the high average score for SQ-feedback. The final discussion round with the relief workers revealed that relief workers were often unaware of the impact rating had on the information management process and that this was some-thing that was not trained in current practices. While acknowledging the potential of this principle, some of the participants questioned the effects of information rat-ings on the information management and decision-making process. Questions from participants included “what do we do with information that is rated as unreliable but may still be very important in terms of the impact that it may have on the entire disaster response process? The example of information (there may be some explo-sive chemicals stored nearby a fire on a university campus) that was first rated as unreliable, created some hesitation amongst some of the relief workers on acting upon receiving this information. Questions from participants such as “is it an ex-pert rating?” invite further research on the type of rating that relief workers prefer and the effects the ratings may have on decision-making and action in PSNs. As such, further research needs to determine the right scales and rating procedures.
The third design principle (maximize the reachback of orchestrators) proved to be more difficult to maintain in the gaming-simulation than we first ex-pected. The increase in SQ-accessibility in the quantitative data indicates that the relief workers understood that netcentric information orchestration provided more reachback capabilities to the teams. Even though we presented and explained the enhanced reachback capabilities of the orchestrator before round 2, relief workers seemed to hold on to the initial role of the information manager (as played in round 1), and infrequently utilized the advanced reachback capabilities of the orchestra-tors. This means that information from external sources such as Google, Twitter, Wikipedia and the University Website was often not consulted. While to some de-gree this issue can be remedied through more training with DIOS, we argue that the person fulfilling the role of an orchestrator should be more proactive in adver-tising the reachback capabilities available within the team. Nevertheless, we still expect that after more training, this principle will help assuring IQ-timeliness, SQ-accessibility and SQ-response time.
The fourth design principle (categorize information as much as possible) proved to be a mixed blessing when it comes to assuring IQ and SQ. The format in which information was shared (IQ-format) was rated higher for round 2 than for round 1, indicating some improvement in how the information was presented to the relief workers. Still, we observed that some of the relief workers quickly noticed the information categories in DIOS, while others had more difficulty in finding what they were looking for. This did not necessarily mean that there was any IQ under- or overload (IQ-amount). Note that we did not include survey questions on IQ-amount, mainly because we did not find any evidence for information overload or
Chapter 9
230
under load in the field study data. Even though the categorization we used in DIOS was rooted in the categories of information we found in the situation reports from our field studies, the debriefing session after round 2 showed that our categoriza-tion still did not meet the expectations and needs of all the different types of agen-cies and relief workers. Therefore, we conclude that more research is required on finding and filtering the right information categories that cater the need of a multi-agency team. We expect that only then, this principle will significantly assure high-er IQ-amount and SQ-ease of use.
The fifth design principle (notify changes in information as soon as possi-ble) proved to have a positive impact on SQ-notification. Changes, for instance in the near real-time weather conditions were displayed in the DIOS dashboard sec-tion. We had decided to implement this principle in a relatively modest way, mean-ing that the changes lacked ‘flashy’ and eye-catching graphics and colors. This was a conscious decision; we expected that too much graphics would unnecessarily dis-turb the team meeting and decision-making process. Acknowledging that ‘too sub-tle’ change notifications could miss the entire purpose of this principle, our obser-vations show that our choice was justified. An important condition for the success of this principle is that the relief workers trust the IT application on portraying the latest information.
The sixth design principle (provide a single window for all information needs) proved to assure higher levels for IQ-timeliness and SQ-accessibility. Some of the participants indicated that they were used to employing multiple applications for collecting the information they needed, but the use of a single window was defi-nitely more convenient and time saving. However, we also observed some com-plaints in dealing with irrelevant information in a single window and heard re-quests for more agency and role specific information displays. As expected, re-spondents often commented on the presentation layer of DIOS as if it was the goal of the evaluation session, and commented on its color, user interface and other, non-principle related features. This may partly explain the relatively low increase in SQ-satisfaction compared to round 1. Accordingly, we often had to request them to treat DIOS as prototype and comment on the underlying principles. Similar to the previous principle, this principle can also have a negative impact on assuring IQ-relevancy, if not implemented correctly.
The seventh design principle (retain as much information as possible) did not have the high impact on the IQ dimensions we expected before the gaming-simulation. Only three of the observers noted instances in which relief workers consulted the ‘older’ information automatically stored in the dynamic library in DIOS. Here, older does not necessarily mean outdated, information that was not relevant at t=1 can still be up-to-date at t=3 (assuming the information has become relevant at t=3). In retrospect, perhaps the relatively short duration of the disaster scenario we used in the gaming-simulation did not require relief workers to employ the library in DIOS. In practice, disaster response can take several hours and even days, increasing the likelihood of situations in which relief workers need to consult information libraries. Moreover, in contrast to some of the exercises in the Rotter-dam case and the Gelderland case, there was no need for ‘hand-overs’ between con-secutive teams of relief workers. We expect that when sharing information during a real disaster, with hand-overs between shifts of relief workers, would be a better test for this principle than our gaming-simulation.

Conclusions
231
The eighth design principle (dedicate specific resources for environmental scanning) helped teams in getting information beyond their traditional reach. Or-chestrators that consulted information sources beyond the PSN helped assuring higher levels of IQ-relevancy, IQ-completeness and SQ-accessibility. While we ob-served that all eight of the orchestrators only briefly scanned the environment (e.g., Twitter, chemical database and news site) for additional information, we doubt whether one person per team (i.e., orchestrator) may be enough to implement this principle. The orchestrators were very busy throughout the decision-making pro-cess and had little time to scan the environment. As such, further research needs to experiment with two or more roles that scan the environment for relevant infor-mation.
The ninth design principle (re-use information as much as possible) is one of the foundations of the DIOS prototype, allowing orchestrators to re-use infor-mation whenever possible. During the gaming-simulation with professionals, we have observed less instances of repeated information request when using DIOS. Since DIOS provided a shared information space or library, orchestrators could quickly determine if members of another team already shared the information they or members of their team were looking for. While the re-use of information reduces the SQ-response time and increased IQ-consistency, we need to underline that re-using information also increases the risks of re-using incorrect or outdated infor-mation. As such, orchestrators need to complement information re-use by quality rating and validation activities. Since some team or agency specific information may be more difficult to access for other teams, this design principles also improves the accessibility of information throughout the PSN. Therefore, this design princi-ple helped in assuring IQ-timeliness, IQ-consistency, SQ-accessibility and SQ-response time.
The tenth and final design principle (make the owner of information ob-jects responsible for updating its own information) helped assuring IQ-timeliness and IQ-correctness. Implemented as a task description for the orchestrators (when updates for an information object entered by yourself become available, update this object immediately), this principle made sure that information is updated at the source. We made clear that the information in the external sources (e.g., chemical database) was updated at the source, so that relief workers did not have to worry about the timeliness of that information. In addition, we noticed fewer discussions on the timeliness of the information in DIOS than in round 1. Yet, the way in which this principle is implemented and evaluated does not capture the original intention of this principle. This principle would require both public and private agencies col-laborating during a disaster to take the responsibility for updating information. Because of the limited scope of the gaming-simulation in terms of participating agencies and data sources, we were unable to evaluate the impact of this principle to a full extend.
Returning to the last research question (do the proposed design principles assure higher levels of IQ and SQ for relief workers compared to a hierarchical in-formation system) we conclude that following these principle assures higher levels for most, but not all IQ and SQ dimensions. From the start, we did not aim to eval-uate the ‘absolute’ but the relative (compared) contribution of these design princi-ples for assuring IQ and SQ. Overall, the data collected in the round 2 shows that the principles behind netcentric information orchestration assure higher levels of IQ-timeliness, IQ-correctness IQ-completeness, IQ-relevancy and IQ-format. When

Chapter 9
232
we consider SQ, the design principles assure higher levels of SQ-accessibility, SQ-satisfaction, SQ-response time, SQ-information sharing support, SQ-notification and SQ-feedback. While the principles significantly assured dimensions such as IQ-timeliness and SQ-accessibility, dimensions such as IQ-correctness and IQ-relevancy proved to be more difficult to assure. Here, we also need to keep in mind that we did not include all the possible dimensions of IQ and SQ available in the literature. As discussed in Chapter 4, we left some dimensions of both constructs out of the scope of this research.
As we recounted, our quasi-experimental evaluation approach contributed useful information concerning the effectiveness of netcentric information orches-tration. Side effects such as renegade freelancing indicate that the benefits of netcentric information orchestration are not without concessions. In the course of this study, we became increasingly conscious of the limitations of sharing infor-mation in a netcentric mode. Most importantly, the scope and design of the gam-ing-simulation did not always permit us to evaluate the full potential of each prin-ciple. Acknowledging that some principles are more difficult to implement and evaluate than others, the chosen gaming-simulation approach definitely influenced the results of the evaluation. We come back on this issue in the final chapter of this dissertation.

Epilogue
233
10 Epilogue
“Follow effective action with quiet reflection. From the quiet reflection will come even more effective action”
Peter F. Drucker (American educator and writer)
This statement by Peter Drucker captures the intention of this epilogue. In this fi-nal chapter, we reflect on three aspects of the research reported in this dissertation. Having discussed our research findings and conclusions extensively in the previous chapter, we first take some distance from the collected data and findings and ask ourselves what this research actually implies and contributes to science and society. Secondly, we reflect on the strengths and limitations of the taken design science research approach. Finally, we revisit the role of IT and the human factor in PSNs and conclude with avenues for further research.
10.1 Implications of netcentric information orchestration
Following a series of steps (i.e., empirical analysis, design and evaluation) and em-ploying a combination of research instruments (i.e., observations, questionnaires and gaming) this dissertation presents ten design principles that have proven to assure higher levels of IQ and SQ for relief workers during disaster response. These principles are the cornerstones of our design theory, which we have labeled netcen-tric information orchestration. Netcentric information orchestration is a response to the observation that existing information systems (ISs) used for information management, do not satisfy the information needs of the variety of emergency ser-vices operating in PSNs. The existing IS architectures are characterized by top-down information flows which are connected to the authority structure, mono-disciplinary information management, and the generation of several static and agency specific operational pictures.
As a design theory, netcentric information orchestration suggest the rede-sign of existing information systems in such a way that collective intelligence can be orchestrated in real time throughout the entire network of agencies, without losing the benefits of existing (hierarchy based) decision-making and authority structures. While this design theory suggest some flattening of the hierarchical (vertical) IS architecture, we argue that the current three tier echelon authority structure (stra-tegic, tactical and operational) needs to be retained, even when orchestrating in-formation in a netcentric mode. As we have learned from our field studies, the three-tier echelon structure is a mixed blessing. One the one hand, the physical dis-tance of teams operating on the strategic and tactical echelons allows commanders to remain calm and make decisions rapidly and free of emotions. On the other hand, the commanders have limited means to gather real-time information. There-fore, instead of flattening the three-tier echelon, netcentric information orchestra-tion strives to provide an information platform empowering involved emergency services to be connected wherever and whenever necessary. This platform can sup-plement (and not replace) traditional channels of information sharing via radio

Chapter 10
234
communication and can be used for establishing a dynamic common operational picture throughout the PSN.
As cornerstones of our design theory, the suggested design principles are intended to help stakeholders (e.g., IS architects, trainers, software vendors and policy makers) working on the design of IS for public safety and disaster response. These stakeholders have to consider a difficult tension in their design activities. During normal/non-crisis situations, there exist a need for tight structuring, formal coordination and top-down decision making to assure a clear division of responsi-bilities, formalized procedures and accountability. While these characteristics can be considered as the advantages of hierarchical information management, there is a competing need to rely on network-centric structures, enabling adaptive infor-mation flows, network wide information access (reachback) and ad-hoc infor-mation sharing during a disaster situation. Even though network based IS architec-tures promise some benefits over hierarchical approaches (e.g., higher adaptability, faster information distribution and shared situational awareness) the realization of such approaches in practice is still missing. Reasons for this include the major technical, organizational and training investments needed to leverage the promised benefits of netcentricity, whereas little scientific evidence exists on the effectiveness of this approach. Much of previous research has treated both modes of coordina-tion separately or even as two extremes. The design principles presented in this dissertation helps to bridge both extremes by making an explicit distinction be-tween information management and decision-making. In contrast to existing hier-archical IS architectures, netcentric information orchestration can start prior to the activation of decision-making teams and can become a continuous process (also taking place between the decision-making rounds).
Looking back in 2007, the former minister of Dutch Department of Interior Affairs and Kingdom Relations (BZK) stated that her department would have “re-solved issues in disaster management within two years”. If we look at conclusions of the recently published report on the Turkish Airline Crash in 2009, we can con-clude that this goal has not yet been achieved. In the meantime, ISs for disaster response are gaining increasing interest of policy makers, relief workers and soft-ware vendors. Over the last five years, software vendors such as Microsoft and Google have launched several ‘off the shelf’ IT-applications for information sharing during disasters, including Microsoft GROOVE and Google WAVE. The growing number of proposed IT applications indicates that software vendors foresee a mar-ket in this domain. During our research, we observed that BZK is also taking some steps towards the implementation of an IT application (CEDRIC), which in their view is a netcentric information system. Similar to the Incident Commander In-formation System used in the United States, BZK is opting for a standardized na-tionwide information system for disaster management. Hence, several debates are currently taking place on whether a single IT application should be implemented across the Netherlands or not, what this should cost and how emergency services need to discard their existing IT applications. We see that many emergency services are still holding on to their current practices, sometimes being non-digital infor-mation tools such as whiteboards (e.g., Delfland field study). Since these debates are moving into a deadlock, this dissertation comes at a timely moment.
Considering the characteristics of PSNs (e.g., autonomy and pluriformity) and those of disasters (i.e., complexity and unpredictability), we strongly advocate principle-based design (see Chapter 6) as alternative to top-down information sys-

Epilogue
235
tem implementation (the strategy followed by BZK). In contrast to single, central-ized solutions designed to share information in accordance to the hierarchy of deci-sion-making (i.e., CEDRIC), netcentric information orchestration does not require all relief agencies to discard their current IT applications. Instead, netcentric in-formation orchestration fosters the existing variety in the IT-landscape. Avoiding a single point of failure, netcentric information orchestration proposes on demand and event driven information collection, enrichment and distribution in PSNs. As such, information ownership is left to the respective public and private organiza-tions, which are also responsible for updating their data. We argue that this reten-tion of ownership is a prerequisite for organizations, which have commercially sen-sitive information, to share this information with relief agencies.
We should not forget the lessons learned from the top-down implementa-tion of C2000, the national communication infrastructure in the Netherlands, mandatory for all emergency services since 2004. In September 2010, the national council of fire departments has again sent an official letter of complaint about C2000, emphasizing its poor SQ during incident response. Similar to the develop-ment and implementation of C2000, the central government again attempts to im-pose as single, uniform IT application for disaster response called CEDRIC. When browsing through CEDRIC brochures and user manuals, one will definitely notice the emphasis on a single, uniform system with a uniform (fixed) set of functionali-ties. As we learned from the Rotterdam field studies, this ‘one size fits all’ approach cannot avoid the IQ and SQ issues reported in this and other studies. Again, we see an attempt to move towards full centralization and standardization as means to abandon the current variety in the IT landscape. While the second version of CEDRIC has just been released and architects are working on the third version to be released in 2011, we expect that the centralized client-server architecture will be a major bottleneck for assuring IQ and SQ in PSNs. One of the reasons for this is that information that will be pulled into CEDRIC becomes the responsibility of the CEDRIC operators (information managers). We assume that this shift of responsi-bility is a barrier for organizations owning commercially or security sensitive in-formation (i.e., Shell, KLM, Unilever) to share this information with relief agencies.
Getting CEDRIC adopted in all safety regions in the Netherlands does not only require a solid financing model, but also requires CEDRIC to perform well in terms of IQ and SQ. While a centralized IT solution such as CEDRIC is regarded by many as the current best practice in the Netherlands, the architecture of this appli-cation only satisfies the sixth principle (single window) and, partly the seventh principle (information library) proposed in this research. For this application to be successful in assuring IQ and SQ, the other principles presented in this research also need to be implemented. On an organizational level, this for instance means that the role of the information manager needs to be extended from ‘note taker’ to orchestrator (see Chapter 6). On a technical level, IS architects need to consider moving away from the traditional client server architecture to more flexible service oriented architecture implemented via state-of-the-art technologies (e.g., AJAX, Web Services). Our field studies also show that much work needs to be done on training information managers and coordinators. In many cases, the actors ful-filling these crucial tasks are not trained in recognizing and handling IQ and SQ issues.

Chapter 10
236
10.2 Reconsidering the scientific and societal contributions
10.2.1 Scientific contribution
While applauding the steady increase of contributions on designing ISs for PSNs, design principles for assuring IQ and SQ were lacking in previous research. This research is the first to explore the theoretical pathways of netcentricity and orches-tration. Accordingly, we are also the first to propose design principles for assuring IQ and SQ in a coherent way, despite the many IQ and SQ issues reported in disas-ter evaluation studies. In line with the classification of theoretical contributions provided by Gregor (2006), our theoretical contribution is type 5 (design and ac-tion theory). This type of theory says how to do something and gives explicit pre-scriptions (e.g., methods, techniques, principles of form and function) for con-structing an artifact (i.e., prototype) needed for achieving specified goals. In light of our theoretical contribution, it is important to reflect on the ‘seminal’ scientific con-tributions provided in previous work. Four contributions can be considered semi-nal in this regard. First, is the vigorously cited paper by Delone and Mclean (1992) on IS Success theory (cited 3275 times in Google Scholar). Their work was im-portant since it was the first to illuminate the importance of IQ and SQ. While these authors have made an important contribution on understanding the factors that make an IS successful within an organization, they are silent on pathways and prin-ciples for assuring IQ and SQ in a network of organizations. Our design theory, par-ticularly the set of principles, can be regarded as an extension of the Information Systems Success theory by Delone and Mclean. Note that we have only tested our design theory in the context of disasters and PSNs. Since Information System Suc-cess theory is developed based on data from the business domain, we would first need to test our theory in that domain as well before we can claim to have contrib-uted to this theory.
The second seminal contribution that we need to recall is the book on Or-ganizations by March and Simon (1958). While the first print of their book is diffi-cult to find, the reprint of this book (1993) is cited 11075 times in Google Scholar. Filled with ideas about the design of organizations, their work was a cradle for many theories in the management and organization sciences. Nevertheless, their work only focused on coordinating interactions within a single organization and did not prescribe any principles for assuring IQ and SQ in organizational networks. Moreover, many of their ideas remained ideas, without any further materialization (e.g., in a prototype) and evaluation of the impact they would have. By extending the concepts of advance structuring and dynamic adjustment from March and Si-mon, we were able to shape and categorize our design theory. Via our prototype, we demonstrate how these concepts can be implemented as means for assuring IQ and SQ in PSNs.
The third seminal contribution that was relevant for this research was the book by Alberts, Garstka & Stein (1999) on NCO. Cited 738 times in Google Schol-ar, their work introduced a vision of empowered soldiers and network wide infor-mation sharing. Drawing on the tenets of NCO, our work is the first that has deep-ened, demonstrated and evaluated the pathways of NCO in relation to IQ and SQ. By providing design principles to stakeholders (e.g., IS architects and policy mak-ers), this research aims to contribute in assuring IQ and SQ in PSN, and ultimately improved disaster response. Acknowledging that other factors (e.g., cognitive capa-bilities, training etc.) are also crucial factors when it comes to improving disaster

Epilogue
237
response, these are considered outside the scope of this research, as is the effect of IQ and SQ on the efficiency and effectiveness of disaster response activities. If we were to step outside the boundaries of this dissertation, we assert that the proposed designed principles are a first step to fully enabling sense-making (Weick 1995) as ideal type of group decision-making. The concept of sense-making as a more accu-rate and realistic decision-making model under time pressure (for instance com-pared to the Observe, Orient, Decide and Act model discussed in Chapter 1), rests upon the assumption of information symmetry between individuals. Since having the same input information is one of the assumptions of sense- making, a network wide information pool, such as the one described in this dissertation, can be con-sidered as a prerequisite for sense-making.
The fourth seminal contribution, orchestration, is a concept that cannot be attributed to a single author, book or paper. Since the earliest mentioning of this concept in Neurath (1946, originally 1916) various scholar have gradually expanded our understanding of this concept, often as a vision for coordinating a variety of specialized resources in concert. While this idea has been around longer than the other contributions mentioned earlier, no single paper or book has been able to capture essence and implications of orchestration in a broader, socio-technical con-text. Instead, we see that scholars investigating technical means for coordinating processes and web-services in supply chains have taken up this concept. Consider-ing existing literature, we are the first to have materialized this vision in relation to IQ and SQ and in the context of public safety. By relating orchestration to some concepts from coordination theory (e.g., boundary objects and mediation), we have extended this vision as a pathway for assuring IQ and SQ and have specified the capabilities needed to orchestrate information in a network of organizations.
Before this research, there was little empirical data on the type of applica-tions used, the information flows between agencies and the roles developed for multi-agency information sharing. Also, there was no prior investigation conducted on the type of IQ and SQ issues experienced in PSNs. Looking back, it was not strange that our publications containing rich empirical data received a ‘warm wel-come’ in various scientific communities (see reference list). From a scientific per-spective, this dissertation provides rich empirical data on the design of information system architectures in practice. This dissertation also shares data on the IQ and SQ issues experienced by relief workers in practice. We consider these sets of em-pirical data ‘rich’ since we collected these data sets using several instruments (i.e., surveys, observations and interviews). Using these instruments, we have described several components of information system architectures used in disaster response situations. The empirical data is also rich because it is both qualitative and quanti-tative in nature. Scholars can use the presented empirical data for further research purposes.
10.2.2 Societal contribution: guiding stakeholders in PSNs
Every researcher, especially the ones focusing on design and prescription, should ask themselves: who is waiting for this dissertation? In retrospect, we have asked ourselves this question several times during this research, and every time, the an-swer included a different set of actors.
At the start of this research, we considered that our work would help socie-ty in general and relief workers in specific. During our field studies, it became clear to us that exercise organizers and trainers were the ones shaping the relief workers

Chapter 10
238
of tomorrow. Therefore, we expected that they would benefit from the systematic evaluation on IS architectures and the impact on IQ and SQ provided in this re-search, especially since this has never been done before. Trainers could also use our observation protocol and survey to expand their exercise evaluation instruments beyond individual and team performance measurement.
When starting the interviews with IS architects, we realized that they were also very important stakeholders when it comes to information management dur-ing disaster response. As designers of IS architectures, they were the ones that could truly help in assuring IQ and SQ for relief workers. Architects could for in-stance employ the principles provided in this dissertation in their current practices and systematically reflect on their practices using the IQ and SQ dimensions. Dur-ing the interviews, we also understood the role of policy makers on the local (mu-nicipality), regional (Safety region) and state (ministerial/ Dutch Department of Interior Affairs and Kingdom Relations) level. As important funders of IS for disas-ter response, these public officials would benefit from our analysis of existing PSNs and set of principles stated in this dissertation.
Another audience we did not anticipate in the beginning of this research consists of software vendors and IT consultants. Throughout our field studies and interviews, we have learned that an increasing number of software vendors (e.g., CityGIS, Microsoft and Google) and IT consultancy firms are trying to establish a market in PSNs. In many cases, software products developed for different domains and purposes (e.g., business intelligence and group collaboration) are advertised, to date without much success. Accordingly, software vendors and IT consultancy firms could employ the empirical foundation of this dissertation for a better under-standing of information management, IQ and SQ in the domain of disaster re-sponse.
10.3 Reflection on our research strategy
10.3.1 Design science research
The choice of a methodological approach in a research project influences not only which explanations we may find, but also which mechanisms we may tend to ne-glect. Considering the scarce knowledge on assuring IQ and SQ, as well as our ob-jective to prescribe principles, the prescription-oriented design science research approach was quite appealing to us when we started this research. Perhaps only a few novice researchers can neglect the lure of “the ability to balance rigor and rele-vance,” a benefit one can deduce from most papers on design science. Design sci-ence research has come a long way since first coined by Herbert Simon in “Sciences of the Artificial,” 1969. Simon discussed design science in the contexts of econom-ics, psychology of cognition, and planning and engineering design, but not ISs. It took some time before Simon’s ideas filtered through to ISs community and they are still not widely accepted in this discipline. It is only since the seminal paper by Hevner et al., (2004) that this approach ‘revived’ within the ISs community. While some proponents of this approach consider it as a completely different paradigm when it comes to conducting research, we experienced that this approach is far from being a paradigm. Instead, this research strategy is still in its early stages and needs to mature on at least two aspects before it can be labeled a ‘paradigm’.
These aspects include (1) ironing out the relationships between theoretical knowledge and empirical findings and (2) the many degrees of freedom on how to

Epilogue
239
formulate a design theory and on what basis to draw conclusions. Because design science allows researchers to collect both qualitative and quantitative data using a combination of research instruments, we found it difficult to decide upon which data we would actually draw our conclusions. While we took some distance from using solely positivistic or quantitative methods in Chapter 2, the conclusions in this dissertation still rest firmly on the quantitative data collected from the surveys. While acknowledging this ‘positivistic tendency’ in the evaluation cycle, the empiri-cal and design cycles rest firmly on the qualitative data. While the many degrees of freedom was a nightmare for the author as a starting PhD level researcher, it proved to be more facilitating once the author gained experience in its application.
Since design science research emphasizes the need for constructing solu-tions to complex socio-technical problems, we argue that this approach allows scholars to make a more equally balanced contribution to science and society, something that is difficult when following only the positivist or interpretive para-digms. However, balancing rigor and relevance is one of the tensions inherent in design science research. Often this is a false dichotomy and the two are not mutual-ly exclusive. It is important in a dissertation to carry out rigorous systematic re-search underpinned by an appropriate epistemology or theory. This does not mean that your dissertation cannot address a practical problem. It does mean that you have to have a theoretical framework to explain your theory of change.
In retrospect, the key to applying the design science research is to trans-cend the epistemological debate and understand the results of every cycle in light of other forms of theory. The article by Gregor (2006) formed an important basis for conducting design science research. Gregor provides a useful categorization of the-ories that considers design theory as a ‘category five’ theory or theory for design and action. Based on the completion of four cycles in design science research (rigor, relevance, design and evaluation) we now advocate the importance of pathways in kernel theories, empirical grounding, triangulation of data and the continuous re-finement of data collection instruments. When considering existing contributions on how to implement design science research (see Chapter 2), we argue that our way of adapting and executing this approach can guide others interested in the ap-plication of design science research.
10.3.2 Gaming-simulation
In our quest to evaluate the proposed design principles under conditions that re-semble a disaster, we chose to apply the gaming-simulation methodology. While scholars and practitioners have employed this methodology for educational pur-poses, it is only recently that scholars have started using this methodology for eval-uation purposes. Compared to other IS evaluation methodologies (code testing, surveys and case studies), gaming-simulation allows for controlling contextual in-terferences and ruling out alternative explanations as prerequisites for construct and external validity.
In contrast to other evaluation methods such as case studies and surveys, gaming-simulations are versatile and can be executed as quasi-experiments. Com-pared to case studies and surveys, gaming-simulations offer a relatively large de-gree of control for researchers. For instance, when planning subsequent rounds in a gaming-simulation, each round can entail different scenarios, loads, resources (i.e., information technology) and data collection instruments, enabling a controlled is-sue of a specific treatment (e.g., design principles). The controlled conditions can
Chapter 10
240
be shaped in such a way as to resemble the characteristics deemed salient in the reference situation. For evaluation purposes, all the internal validity criteria are relevant, and have to be considered when interpreting the results of the gaming-simulation. In addition, for researchers, gaming-simulations can be very helpful in bridging the proverbial gap between theory (e.g., in the form of principles) and practice. Both the creation and the execution of gaming-simulations can provide researchers with new and additional insights with regard to disaster response relat-ed processes, including decision-making and information management.
Finally, this research is one of the few contributions that demonstrate the use of gaming-simulation for evaluating design theories. While scholars such as Meijer (2009) have demonstrated the value of gaming-simulations for evaluating design theories in the context of supply chain management, this research shows how this approach can be applied in the context of disaster management. As such, we provide an explicit set of experimental variables in order to evaluate a design theory, including roles, rules, activities, scenarios and data collection instruments. We consider this as a contribution since previous work is silent on the evaluation of design principles. Configured as a quasi-experiment with professional relief work-ers, our gaming-simulation allowed us to investigate the effects of netcentric in-formation orchestration on IQ and SQ during disaster situations.
10.3.3 The importance of empirical grounding and working practices
Even though we only conducted one quasi-experiment with professionals, our find-ings show some promising results on assuring higher levels of IQ and SQ for relief workers. Considering the external validity of our findings, does this mean that netcentric information orchestration will assure higher levels IQ and SQ during future disasters? Our answer is perhaps, but only when some conditions are in place.
We argue that significant doubt must be cast on the notion that we can ‘val-idate’ an IS architecture at a given point in a research if we accept that the use of an IS architecture is not completely determined by the principles it is based on. This means that the external validity of the proposed netcentric information orchestra-tion principles depends, at least in part, on the success or failure of new working practices. As discussed by Venkatesh (2003) there are a vast range of reasons why IS usage in practice may vary from research settings, even within a single organiza-tion. ISs put implemented in practice may initially fail because they do not resonate with existing work practices, policies or professional cultures. Moreover, inade-quate training programs, the prevalence of ‘fear and loathing’, and the breakdown of new organizational processes may all affect the speed with which systems be-come ‘usable’. Equally, tested and trusted information systems may begin to fail as changes in the organizational and work environments begin to have impact upon them. As Davenport (1993) points out, changes in work activity may take years to become manifest, and the impact may not, even if apparent, be straightforwardly measurable. If this is true, it indicates that evaluation must be extended not only into the whole of the conventional design process, but also well into the system’s useful lifecycle. That is to say, evaluation work will have to be conceived of not as something separate from other stages in the design process, but as a necessary fea-ture of all design work.
Furthermore, substantial re-conceptualization of the notion of ISs and its boundaries will be necessary if we are to be serious in our attempts to evaluate IS

Epilogue
241
use. Similar to solutions developed for risks aversive sectors with high failure cost (e.g., airline industry, nuclear power plants), further IS evaluation using live pilot-ing is difficult in public safety networks. Accordingly, we suggest that the main challenge for future research is to investigate supporting and impeding factors for ‘grounding’ netcentric and IT-enabled information orchestration in existing hierar-chical information management architectures.
10.3.4 Limitations of this research
This research is not without its limitations. We highlight two sets of limitations in this section. The first set of limitations is rooted in our field study approach. We heavily draw on data collected from training exercises and fictitious disaster re-sponse scenarios. While these training exercises were set up in such a way that they closely resembled real disasters, we cannot rule out disturbing factors that may emerge during real disasters. The fact that the exercises were fictitious also adds some bias to our quantitative data. The relatively small number of field studies can also be regarded as limitation. Moreover, the number of observers was small (two, sometimes three observers), limiting the number of information flows we could observe. While the three field studies have provided us with rich (qualitative and quantitative) data, we cannot say that our sample is representative for all of the existing PSNs in the Netherlands or in other countries. Moreover, because we only studied PSNs in the Netherlands, the external validity of our results is limited to the Netherlands.
The second set of limitations is rooted in our quasi-experimental gaming-simulation approach. Firstly, we have only tested our design principles with a sin-gle group of graduate students and a small set of professionals. Admitting that the evaluation of our design theory during a real disaster would count as the most real-istic form of evaluation, gaming-simulation allowed us to compare the effects of netcentric information orchestration to hierarchical information sharing in a safe and controlled environment. Generic conclusions require repeated runs with the gaming-simulation. Perhaps repeated sessions with larger groups of relief workers will improve the (statistical) reliability of our results. However, repeated sessions of three to four hour gaming-simulations are expensive and difficult to organize be-cause the work schedules of relief workers provide few options for experimentation. Moreover, repeated runs are not completely comparable since the players show learning, fatigue and so on.
Secondly, while we had a perfect fit of respondents (professional relief work-ers) in our quasi-experiment, twenty-four participants result in a small data set for quantitative analysis. Such small sample sizes do not cancel out individual biases in the data and prohibit researchers from applying more advance data analysis tech-niques (e.g., structural equation modeling and path analysis). On the other hand, the relatively small sample size was well manageable and allowed for more focused qualitative data collection with a limited team of observers.
Finally, the two scenarios we used during the gaming-simulation sessions were quite comparable and included a limited range of events, hazards and risks. As main component of the two experimental loads, the scenarios needed to be comparable in their complexity. In addition, complex scenarios such as terrorist attacks and floods require longer rounds of gaming and more explanation (i.e., events and messages) towards the participants.

Chapter 10
242
10.4 A research agenda
10.4.1 Revisiting the role of IT
Disaster researchers such as Quarantelli and Comfort have frequently underlined that IT should not be viewed as a panacea for all problems during disaster re-sponse. Reducing the impact of disasters requires an adaptable, and partly unpre-dictable, mix of technical and social components, and no single scientific discipline can provide all the answers. While IT may help getting the right information to the right person on the right time, we argue that the right use of information by relief workers is at least as important for assuring IQ and SQ. While we foresee further adoption of ITs in PSNs, the future of ITs in this domain depends on the right mix of supporting roles, capabilities and training procedures. As such, we applaud the gradual shift in the research community on information systems for disaster re-sponse (ISCRAM). Having visited three consecutive ISCRAM conferences, we ob-served that more and more scholars are investigating the development of IT from a socio-technical perspective, promising valuable and directly useable results for pro-fessionals and policy makers.
Drawing on our field study observations, we conclude that there is a low level of trust in IT amongst the relief workers. Quoting one of the leaders of a COPI team in the Rotterdam-Rijnmond field study who purposefully neglected the IS (CEDRIC) and used a whiteboard: “a hundred years ago we also did it like this and it always worked, I refuse to use anything that sometimes does not work”. This re-lief agency commander explained his disappointing experience with electronic means for communication (C2000) and was dedicated in avoiding the use of IT in disaster response. Some extra questions however led us to conclude that this very experienced relief worker was not very advanced in the use of electronic means for information sharing, indicating a low level of IT-readiness (defined as the ability to employ IT for tasks execution).
From this interview and other observations, we concluded that a low level of trust in existing IT due to previous IT failures, combined with a low level of IT-readiness, reinforces the reluctant attitude towards the adoption of IT in this do-main. This is not necessarily a ‘bad thing’. Disaster response is a hazardous and very important task, so there needs to be zero tolerance for IT failure. This however does not mean we need to turn our heads away from IT innovations that hold the potential to radically improve information sharing during disaster response and ultimately safe lives. If we were to draw a spectrum of disaster types, ranging from often occurring incidents (e.g., a fire or car accident) to almost never occurring to-tal devastation (e.g., atomic bomb), IT would be able to cover a wide range of this spectrum. Moreover, we see significant efforts from the private sector and the aca-demic community to further increase the capacity and resilience of existing IT in-frastructures, for example via the role out of fiber optics and next generation mo-bile platforms such as HSPDA. Research on for instance ‘graceful degradation’ and multi-tolerant systems (i.e., Gariel, 2010) also shows promising results towards retaining some minimal IT service levels after infrastructure failure. Thanks to such advancements, we expect that future IT-based IS for disaster response will be even more resilient and less susceptive to infrastructure failures. Nevertheless, there are still several challenges requiring further research. We discuss some of these chal-lenges in the next subsection.

Epilogue
243
Recommendation 1: Conduct research on training programs that prepare relief workers for the ef-fective employment of the capabilities provided by netcentric information systems
Recommendation 2: Conduct research on ways in which citi-zen and media generated data can be pro-actively used for assuring information quality in multi-agency teams
10.4.2 Six recommendations for further research
While reflecting on the findings of this research, six main avenues surfaced for fur-ther research. These recommendations are more generic (not principle related) and complementary to the recommendations provided in the final section of Chapter 9. We present these avenues as recommendations for scholars, practitioners, software vendor and policy makers since we expect that their collaborative efforts will lead to the most useful results.
The first avenue for further research is on preparing relief workers to utilize the capabilities provided by network based information systems. While we have extensively discussed the technical and organizational requirements behind this way of information management in Chapter 7, we have not investigated how to prepare relief workers to decide and act in an envi-ronment with advanced in-formation management ca-pabilities such as reachback and information rating. The quasi-experimental gaming-simulation revealed that not all of the participants knew how to employ the functionalities provided by DIOS. As a result, some of the participants were not fully able to deal with the amount of information that was suddenly available (compared to the first round). Furthermore, we noticed that not everyone was comfortable with the idea that the information they shared can be viewed by everyone in the network. We noticed that for some participants, it was part of their routine to disclose information from others within their own agency and outside their agency. In addition, from what we have observed in our field studies and gaming-simulation, relief workers often think about themselves as rep-resentatives of their agency and focus on retrieving the information they and their agency needs. However, in order to fully utilize the capabilities and benefits of netcentric IS architectures, relief workers need to understand that they are part of a network and think about the information that others beyond there agency may need. While this form of boundary spanning is to some extend assured through the role of the orchestrator, further research needs to investigate instruments for help-ing relief workers through this transformation. In addition, we predict the need for developing norms for information orchestrators. These norms, both qualitative (e.g., are consistency checks executed) and quantitative (e.g., time needed to vali-date information), can further help orchestrators to learn and improve their pro-cesses.
A second research avenue surfaced from this research is the potential of us-ing citizen and media generated information to supplement information in multi-agency teams. Practitioners such as O’Reilly (2007) have already analyzed the pow-er of harnessing the “wisdom of the crowds” and Web 2.0 in business environ-ments. The 2009 Turkish Airline Crash in the Netherlands is just one of the exam-ples in which relief agencies could have benefited from data in social networks such
as Twitter (e.g., for triangulating the exact loca-tion of the plane crash). While we
have included some basic functionalities for accessing information from social net-
Chapter 10
244
Recommendation 3: Conduct research on dynam-ic information access/viewing and posting con-trols and policies for network based information management approaches.
works (e.g., Twitter), this research has tapped upon the potential of using citizen-and media-generated data from social networks during disaster response. As we have learned during our field studies, the increasing mediatization of disaster holds both opportunities and challenges for emergency services since the media covers both facts and rumors. Often, but not always, the media arrives on the disaster site at the same time relief agencies arrive. While relief agencies focus on how to re-spond to the events that occur, the media focuses on pulling information from by-standers, witnesses and sometimes even victims. As such, the media is often con-sidered as a nuisance to the response process. While the DIOS platform does allow for harnessing collective intelligence, we opt that this platform can be extended in such a way that the media and citizens can also be employed as sensors for infor-mation. Some of the collected information from the media (e.g., about the source of the disaster) and citizens (e.g., exact location of a gas tank) could add to the com-mon operational picture that relief agencies are trying to create. Despite these po-tentials, we have observed that the information gathered by the media and citizens is often not intentionally captured by relief agencies. We have even observed situa-tions in which a mayor speaking to the press is confronted with information from the media that his team was actually looking for, leading to a somewhat embarrass-ing press conferences. Accordingly, we suggest that further research focuses on how to capture high quality information from the citizens and the media. One example we can think of here is to dedicate orchestrators to the triangulation of data from various internal and external sources while focusing on low rated IQ quality scores for specific information objects (e.g., about the location of a disaster, number of casualties etc.). This for instance could lead to an real time and two-way ‘architec-ture of participation’ allowing relief workers to remix data from multiple sources (e.g., individual citizens active on Twitter or personal Weblogs, news sites etc.), while some disaster related information available in the PSN is provided in a form that allows remixing by journalist and citizens creating extensive network effects.
A third avenue that surfaced from this research is the emergence of ‘rene-gade freelancing’ by relief workers acting on their own interpretation (and conse-quently ignoring the guidance from higher command). As discussed in Chapter 8 on the quasi-experimental gaming-simulation, subordinates having access to in-formation beyond their re-sponsibility are enabled to make decisions out of sync with the commanders in-tend. This kind of deviation from higher intent is both unpredictable and unexpected, may present serious problems to a unified response effort and is perhaps one of the most dangerous side effects of network based in-formation sharing and reachback. Since we have only briefly discussed this phe-nomenon, we opt that further research looks into ways of dealing with this issue, for instance, through the implementation of dynamic (context dependent) infor-mation viewing and posting controls.
A fourth avenue is on fallback options in case of IT and infrastructure deg-radation. The use of IT is increasingly becoming a goal, instead of a tool for infor-mation management during disasters. This trend has a dangerous flipside. What if the infrastructures (e.g., electricity, internet, mobile network, hardware etc.) fail? This question should remain on the agenda of policy makers, relief agency com-

Epilogue
245
Recommendation 4: Conduct research on developing and training easy to learn and non-IT based fallback ap-proaches for information management in case of infra-structure failure
Recommendation 5: Conduct research on how to keep the interface between information technology and relief workers as stable and familiar as possible while the portfolio of services keep adapting to changing circumstances
manders and architects and exercise organizers. Since infrastructure failure during disasters is not uncommon, we need to develop and retain not IT based infor-mation management skills and resources. While acknowledging that our back-ground in IT makes us advocates for using IT, we acknowledge that the dependency
on any IT solution (e.g., CEDRIC, DIOS) needs to be as low as possible. This research has neither studied the
fallback options in case of electricity, internet or hardware failures, nor in the case of the total destruction of infrastructures. Even though we are convinced that ‘high tech” information system applications such as DIOS are able to assure higher levels of IQ and SQ for relief workers, fallback on ‘low tech’ pen and paper (or white-board) solutions are still required. While fallback may not be necessary in many cases because of the precautions taken by relief agencies (e.g., mobile radio towers on trucks, backup electricity generators in COPI rooms and hospitals), devastating disasters such as tsunamis and earthquakes may still require that relief workers share information using pen and paper. Since we did not come across any research that investigates procedures or principles needed to guide relief workers in the transition from high tech solutions to low tech solutions, we strongly encourage scholars to conduct research on this topic.
A fifth avenue for further research concerns the development of stable in-terfaces for adaptive IT. There are an increasing number of scholars focusing on developing adaptive ITs for several domains, including PSNs. Anticipated contribu-tions include adaptive user interfaces, changing functionality portfolios and situa-tion dependent visualizations. The general idea is that ITs needs to be more intelli-gent and software agents need to fulfill more tasks instead of humans. While ap-plauding these research efforts, our experience from observing relief workers in their opera-tions is that they prefer interfaces and function-alities that they know by heart and are used to, instead of changing user interfaces and ‘new’ functionalities depending on the situation. When almost everything in their environment seems to be subject to change, relief workers prefer to hold on to their standard procedures and routines, so they can react immediately instead of having to first understand the technology in front of them. While we have also tried to balance adaptation with routine and well known interfaces (i.e., using AJAX technology), we have not investigated means to minimalize interface changes through service portfolio adap-tation. Therefore, we pose this recommendation as a challenge for the scholars who are working on adaptability and adaptive IT.
The sixth avenue for further research surfaced from this research is about the right use of information on the individual level. A well-known ‘mantra’ in the domain of information systems for disaster management is ‘getting the right in-formation to the right people at the right moment.’ We have read this mantra, both as a challenge and as an advertisement in several reports. As we progressed in this

Chapter 10
246
Recommendation 6: Conduct research on principles that can guide relief workers towards the right use of infor-mation as extension to getting the right information to the right person at the right time and in the right format
research we have also come across research on the adding a fourth ‘right’ to this mantra, information the right format. Having completed this research, we belief that a fifth right is still to be studied: the right use of information. The right use of information is not captured in the IQ and SQ constructs of this research. Independ-ent of the quality of information available to an individual or team, wrongful inter-pretation and use of information may significantly affect decision-making process-
es during disaster response. While we have studied the use of infor-mation on the lev-el of team infor-mation manage-
ment, we have not thoroughly investigated the use of information on the individual level. Recently, a disaster in Amsterdam reminded us of what happens when ‘no one thought about it’. After an explosion in an apartment building on the 25th of July 2010, the neighbors had been informed the day after the explosion that was a possibility that asbestos was released and that they should evacuate the area. Of course, this information was shared too late. While the official investigation report still needs to be released, we can assume that no one remembered to discuss whether information on asbestos release should be shared or not. In the hectic and stressful time of a disaster, relief workers tend to be blindsided and focus on the immediate mitigation of the disasters. The movie “World Trade Center” released in 2006, allows one to get an impression of the level of stress, time pressure and des-peration dominating every second of the disaster response process. Here, we should not forget that time pressure can decrease the performance levels of less experienced decision-makers even in the presence of complete information (Ahituv, Igbaria, and Sella, 1998). As a result, obvious and trained protocols some-times do not come to mind. Our field studies showed that simple checklist have been replaced by comprehensive disaster response handbooks and manuals. Alter-native means, such as the information library in DIOS could help in collectively and systemically browse through information needs quickly while having access to the knowledge gained from previous disaster response efforts.

References
247
References
A
ACIR. (2005). De Vrijblijvendheid Voorbij. Op naar een effectieve multidisciplinaire informatievoorziening bij grootschalig gezamenlijk optreden in onze gedecentraliseerde eenheidsstaat. Retrieved from www.minbzk.nl.
Adam, F., & Pomerol, J. C. (2008). Developing Practical Decision Support Tools Using Dashboards of Information. In F. Burstein & C. W. Holsapple (Eds.), Handbook on Decision Support Systems 2 (pp. 151-173). Berlin Heidelberg: Springer.
Adam, N., Janeja, V. P., Paliwal, A. V., Shafiq, B., Ulmer, C., Gersabeck, V., et al. (2007). Approach for Discovering and Handling Crisis in a Service-Oriented Environment. Paper presented at the IEEE International Conference on Intelligence and Security Informatics (ISI 2007).
Ahituv, N., Igbaria, M., & Sella, A. (1998). The effects of time pressure and completeness of information on decision making. Journal of Management Information Systems, 153-172(15), 2.
Al-Hakim, L. (2007). Information quality management: theory and applications. Hershey: IDEA Group.
Alberts, D., & Hayes, R. (2007). Planning: complex endeavors. Washington, DC: DoD Command and Control Research Program.
Alberts, D. S., Garstka, J. J., & Stein, F. P. (1999). Network Centric Warfare (2 ed.).
Alberts, D. S., Garstka, J. J., & Stein, F. P. (2002). Network-Centric Warfare: Developing and Leveraging Information Superiority (2nd ed. Vol. 2.): CCRP Publication Series.
Alberts, D. S., & Hayes, R. (2005). Campaigns of Experimentation: Pathways to Innovation and Transformation.
Albright, K. S. (2004). Environmental Scanning: Radar for Success. Information Management Journal, 38(3), 38-45.
Aldrich, H., & Herker, D. (1977). Boundary Spanning Roles and Organization Structure. The Academy of Management Review, 2(2), 217-230.
Alexander, C. (1969). Notes on the Synthesis of Form. Boston: Harvard University Press.
Alexander, I., & Maiden, N. (2004). Scenarios, Stories, Use Cases: Wiley.
Allen, B., & Boynton, A. (1991). Information architecture: in search of efficency and flexibility. MIS Quarterly, 15(4), pp.435-445.
Amabile, T. M. (1988). A model of creativity and innovation in organizations. In B. M. Staw & L. L. Cummings (Eds.), Research in organizational behavior. Chicago: Aldine Publishing Company.
Ambler, S. W. (2009). UML 2 Class Diagrams. Retrieved 20 June, 2010, from http://www.agilemodeling.com/artifacts/classDiagram.htm
Anon. (2000). Network-centric naval forces: a transition strategy for enhancing operational characteristics: US Naval Studies Board.

References
248
Arens, Y., & Rosenbloom, P. (2003). Responding to the unexpected. Communications of the ACM, 46(9), pp. 33 - 35.
Argote, L. (1982). Input Uncertainty and Organizational Coordination in Hospital Emergency Units. Administrative Science Quarterly, 27(3), pp. 420-434.
Artman, H. (1999). Situation awareness and co-operation within and between hierarchical units in dynamic decision making. Ergonomics, 42(11), 1404-1417.
ASE. (2008). Alle Hens on Deck: ASE Veiligheid. Retrieved from www.minbzk.nl.
Ashby, R. W. (1958). Requisite variety and its implications for the control of complex systems. Cybernetica, 1(2), 83-99.
Atoji, Y., Koiso, T., Nakatani, M., & Nishida, S. (2004). An Information Filtering Method for Emergency Management. Electrical Engineering in Japan, 147(1).
Atoji, Y., Koiso, T., & Nishida, S. (2000). Information filtering for emergency management. Paper presented at the IEEE International Workshop on Robot and Human Communication
Auf der Heide, E. (1989). Disaster Response: Principles of Preperation and Coordination. Toronto: C.V. Mosby Company.
B
Babbie, E. R. (2009). ”Idiographic and Nomothetic Explanation,” The Practice of Social Research (12 ed.): Cengage Learning.
Bacharach, S. B. (1989). Organizational Theories: Some Criteria for Evaluation. The Academy of Management Review, 14(4), pp. 496-515.
Baligh, H. H., & Burton, R. M. (1981). Describing and Designing Organizational Structures and Processes. International Journal of Policy Analysis and Information Systems, 5(4), 251-266.
Barnett, T. P. (1999). Seven Deadly Sins of Network-Centric Warfare. Paper presented at the USNI Proceedings.
Barrett, S., & Konsynski, B. (1982). Inter-Organization Information Sharing Systems. MIS Quarterly, Special Issue, pp.93-105.
Baskerville, R., Pawlowski, S., & McLean, E. (2000). Enterprise resource planning and organizational knowledge: patterns of convergence and divergence. Paper presented at the Twenty first International Conference on Information Systems.
Beekun, R. I., & Glick, W. H. (2001). Organization Structure from a Loose Coupling Perspective: A Multidimensional Approach. Decision Sciences, 32(2), 227 - 250.
Berghmans, P. H. (2008). A Systems Perspective on Security Risk Identification Methodology and Illustrations from City Council. Paper presented at the 5th International ISCRAM Conference.
Bernstein, L. (1996). Importance of Software Prototyping. Joumal of Systems Integration, 6, 9-14.
Beroggi, G. E. G., & Wallace, W. A. (1995). Real-Time Decision Support for Emergency Management: An Integration of Advanced Computer and Communications Technology. Journal of Contingencies and Crisis Management, 3(1), 18-26.
Bharosa, N., Appelman, J., & de Bruijn, P. (2007). Integrating technology in crisis response using an information manager: first lessons learned from field exercises in the Port of Rotterdam. Paper presented at the Proceedings of 4th International

References
249
Conference on Information Systems for Crisis Response and Management ISCRAM2007, Delft.
Bharosa, N., Bouwman, H., & Janssen, M. (2010). Ex-ante evaluation of disaster information systems: a gaming-simulation approach. Paper presented at the 7th International Conference on Information Systems for Crisis Response and Management (ISCRAM), Seatlle, USA.
Bharosa, N., & Janssen, M. (2009). Reconsidering information management roles and capabilities in disaster response decision-making units. Paper presented at the Proceedings of the 6th International Conference on Information Systems for Crisis Response and Management (ISCRAM), Gothenburg, Sweden.
Bharosa, N., & Janssen, M. (2010). Extracting principles for information management adaptability during crisis response: A dynamic capability view. Paper presented at the 43th Annual Hawaii International Conference on System Sciences, Hawaii.
Bharosa, N., Janssen, M., Groenleer, M., & Van Zanten, B. (2009). Transforming crisis management: field studies on network-centric operations. Paper presented at the 8th International Conference on E-Government, DEXA EGOV 2009, Lintz, Austria.
Bharosa, N., Lee, J., Janssen, M., & Rao, H. R. (2009). A Case Study of Information Flows in Multi-Agency Emergency Response Exercises. Paper presented at the Proceedings of the10th annual International Conference on Digital Government Research, Puebla, Mexico.
Bharosa, N., Lee, Y., & Janssen, M. (2010). Challenges and Obstacles in Information Sharing and Coordination during Multi-agency Disaster Response: Propositions from field exercises. Information Systems Frontiers, 12(1), 49-65.
Bharosa, N., Meijer, S., Janssen, M., & Brave, F. (2010). Are we prepared? Experiences from developing dashboards for disaster preparation. Paper presented at the 7th International Conference on Information Systems for Crisis Response and Management (ISCRAM2010), Seatlle, USA.
Bharosa, N., Van Zanten, B., Zuurmond, A., & Appelman, J. (2009). Identifying and confirming information and system quality requirements for multi-agency disaster management. Paper presented at the Proceedings of the 6th International Conference on Information Systems for Crisis Response and Management (ISCRAM).
Bieberstein, N., Bose, S., Walker, L., & Lynch, A. (2005). Impact of service-oriented architecture on enterprise systems, organizational structures, and individuals. IBM Systems Journal, 44(4), 691-708.
Bigley, G. A., & Roberts, K. H. (2001). The incident command system: High reliability organizing for complex and volatile task environments. Academy of Management, 44(6), pp.1281-1300.
Blumer, H. (1954). What is wrong with social theory? American Sociological Review, 19, 3-10.
Boin, A., 't Hart, P., Stern, E., & Sundelius, B. (2005). The Politics of Crisis Management: Public Leadership Under Pressure: Cambridge University Press.
Boin, R. A. (2004). Lessons from Crisis Research. International Studies Review, 6(1), 165-174.
Bostrom, R. P., & Heinen, J. S. (1977a). MIS Problems and Failures: A Socio-Technical Perspective, Part 1: The Causes. MIS Quarterly, 1(3), pp.17-32.

References
250
Bostrom, R. P., & Heinen, J. S. (1977b). MIS Problems and Failures: A Socio-Technical Perspective, Part II: The Application of Socio-Technical Theory. MIS Quarterly, 1(4), pp.11-28.
Boyd, J. (1996). The Essence of Winning and Losing.
Bui et al. (2000). A Framework for Designing a Global Information Network for Multinational Humanitarian Assistance/Disaster Relief. Information Systems Frontiers, 1(4), pp:427 - 442.
Bui, T. X., & Sankaran, S. R. (2001). Design considerations for a virtual information center for humanitarian assistance/disaster relief using workflow modeling. Decision Support Systems, 31(2), 165-179.
Burt, R. S. (1992). Structural Holes. Cambridge: Harvard University Press.
Busquets, J. (2010). Orchestrating Smart Business Network dynamics for innovation. European Journal of Information Systems, forthcomming paper.
C
Cai, G., MacEachren, A., Brewer, I., McNeese, M., Sharma, R., & Fuhrmann, S. (2005). Map-Mediated GeoCollaborative Crisis Management. Paper presented at the Intelligence and Security Informatics.
Calloway, L. J., & Keen, P. G. (1996). Organizing for crisis response. Journal of Information Technology, 11(1), 13-26.
Campbell, D. T., & Stanley, J. C. (1969). Experimental and Quasi-experimental designs for research. Chicago: Rand McNally.
Cebrowski, A., & Garstka, J. (1998). Network-Centric Warfare: Its Origin and Future. Paper presented at the United States Naval Institute.
Celik, S., & Corbacioglu, S. (2009). Role of information in collective action in dynamic disaster environments. Disasters, forthcoming issue.
Checkland, P. (1981). Systems Thinking, Systems Practice. Chichester: Wiley.
Checkland, P., & Holwell, S. (1993). Information management and organizational processes: an approach through soft systems methodology. Information Systems Journal, 3(1), 3-16.
Chen, N., & Dahanayake, A. (2006). Personalized Situation Aware Information Retrieval and Access for Crisis Response. Paper presented at the 3th International Conference on Information Systems for Crisis Response and Management (ISCRAM2006), Newark, NJ, USA.
Chen, R., Sharman, R., Rao, H. R., & Upadhyaya, S. (2007). Design Principles for Emergency Response Management Systems. Journal of Information Systems and e-Business Management, 5(3), 81-98.
Chen, R., Sharman, R., Rao, R., & Upadhyaya, S. (2008). An Exploration of Coordination in Emergency Response Management. Communications of the ACM, 51(5), 66-73.
Cherns, A. (1976). Principles of Socio-Technical Design. Human Relations, 29(8), pp.783-792.
Cherns, A. (1987). Principles of socio-technical design revisited. Human Relations, 40(3), pp.153-162.
Chisholm, D. (1992). Coordination Without Hierarchy: Informal Structures in Multiorganizational Systems. Berkeley: University of California Press.

References
251
Choo, C. W. (2000). Information Management for the Intelligent Organization. The Art of Scanning the Environment (third ed.). Medford, New Jersey: Information Today/Learned Information
Choo, C. W., Deltor, B., Bergeron, P., & Heaton, L. (2006). Working with information: Information management and culture in a professional service organization. Journal of Information Science 32(6), 491-510.
Christensen, G., & Olson, J. (2002). Mapping consumers' mental models with ZMET. Psychology & Marketing, 19(6), 477-502.
Christopher, C., & Robert, B. (2006). Disaster: Hurricane Katrina and the Failure of Homeland Security: Macmillan Publishers.
Clarke, S. (2005). Your Business Dashboard: Knowing When to Change the Oil. The Journal of Corporate Accounting & Finance, 16(2), 51-54.
Clegg, C. W. (2000). Sociotechnical principles for system design. Applied Ergonomics, 31(463-477).
Clemons, E., Reddi, S., & Row, M. (1993). The Impact of Information Technology on the Organization of Economic Activity: The "Move to the Middle" Hypothesis. Journal of Management Information Systems, 10(2), 9-35.
Cohen, A. M. (1962). Changing Small-Group Communication Networks. Administrative Science Quarterly, 6, 443-462.
Cohen, W. M., & Levinthal, D. A. (1990). Absorptive capacity: a new perspective on learning and innovation. Administrative Science Quarterly, 35, pp.128-152.
Collins, L. M., & Powell, J. E. (2008). Emergency Information Synthesis and Awareness Using E-SOS. Paper presented at the 5th International ISCRAM Conference, Washinton D.C, USA.
Comfort, L. (1999). Shared risk: complex systems in seismic response. New York: Pergamon Press.
Comfort, L., Dunn, M., Johnson, D., Skertich, R., & Zagorecki, A. (2004). Coordination in Complex Systems: increasing efficiency in disaster mitigation and response. International Journal of Emergency Management, 2(2), 63- 80.
Comfort, L., & Kapucu, N. (2006). Inter-organizational coordination in extreme events: The World Trade Center attacks, September 11, 2001 Natural Hazards, 39(2), pp. 309-327.
Comfort, L., Ko, K., & Zagorecki, A. (2004). Coordination in Rapidly Evolving Disaster Response Systems: the role of information. American Behavioral Scientist, 48(3), pp. 295-313.
Comfort, L., Sungu, Y., Johnson, D., & Dunn, M. (2001). Complex Systems in Crisis: Anticipation and Resilience in Dynamic Environments. Journal of Contingencies and Crisis Management, 9(3), pp.144-159.
Commission. (2002). Final Report of the National Commission on Terrorist Attacks Upon the United States, Official Government Edition Available from www.9-11commission.gov/report/911Report.pdf
Contractor, N. S., Wasserman, S., & Faust, K. (2006). Testing Multitheoretical, Multilevel Hypotheses about Organizational Networks: An Analytic Framework and Empirical Example. Academy of Management Review, 31(3), 681-703.
References
252
Cook, T., & Cambell, D. (1979). Quasi-Experimentation: Design & Analysis Issues for Field Settings. Boston: Houghton Mifflin.
Coombs, W. T. (1999). Ongoing crisis communication: Planning, managing, and responding. Thousand Oaks, CA: Sage.
Crichton, N. (2000). Information Point: Wilcoxon Signed Rank Test. Journal of Clinical Nursing, 9, 574-584.
Crowston, K., Rubleske, J., & Howison, J. (2006). Coordination theory: A ten-year retrospective. In P. Zhang & D. Galletta (Eds.), Human-Computer Interaction in Management Information Systems: M.E. Sharpe, Inc.
D
Daft, R., & Lengel, R. (1986). Organizational Information Requirements, Media Richness and Structural Design. Management Science, 32(5), 554-571.
Daft, R. L. (2001). Organization Theory and Design (7 ed.): Thomson.
Darke, P., & Shanks, G. (1996). Stakeholder Viewpoints in Requirements Definition: A Framework for Understanding Viewpoint Development Approaches. Requirements engineering, 1(88-105).
Dash, N. (1997). The use of disaster information systems in disaster research. International Journal of Mass Emergencies and Disasters, 15(1), pp. 135-146.
Davenport , T. H., & Prusak, L. (1998). Working Knowledge, How Organizations Manage What They Know. Boston, MA: Harvard Business School Press.
Davenport, T. H., & Prusak, L. (1998). Working Knowledge, How Organizations Manage What They Know. Boston: Harvard Business School Press.
Davis, J. P., Eisenhardt, K., & Bingham, C. B. (2007). Developing theory through simulation methods. Academy of Management Review, 32(2), 480-499.
Dawes, S., Creswell, A., & Cahan, B. (2004). Learning from Crisis: Lessons in Human and Information Infrastructure from the World Trade Center Response. Social Science Computer Review, 22(1), pp.52-66.
De Bruijn, H. (2006). One Fight, One Team: The 9/11 Commision Report on Intelligence, Fragmentation and Information. Public Administration, 84(2), pp. 267-287.
De Bruijn, J. A., & Ten Heuvelhof, E. (2000). Networks and Decision Making. Lemma.
Dearstyne, B. (2007). The FDNY on 9/11: Information and decision making in crisis. Government Information Quarterly, 24(1), 29-46.
Delone, W., & McLean, E. (1992). Information Systems Succes: the quest for the dependent variable. Information Systems Research, 3(1), pp.60-95.
Denning, P. J. (2006). Hastily Formed Networks. Communications of the ACM, 49(4), 15-20.
Detlor, B., & Yuan, Y. I. (2005). Intelligent Mobile Crisis Response Systems. Communications of the ACM, 48(2), 95-98.
Dilts, D. M., Boyd, N. P., & Whorms, H. H. (1991). The evolution of control architectures for automated manufacturing systems. . Journal of Manufacturing Systems, 10(1), 79-93.
Dominowski, R. L., & Dallob, P. (1995). Insight and Problem Solving. In R. J. Sternberg & J. E. Davidson (Eds.), The Nature of Insight. . Cambridge: MIT Press.

References
253
Drabek, T. (1991). Microcomputers in emergency management. Implementation of computer technology. Boulder, CO: Institute of Colorado.
Drabek, T., & McEntire, D. (2003). Emergent phenomena and the sociology of disaster: lessons, trends and opportunities from the research literature Disaster Prevention and Management 12(2), pp. 97 - 112
Drucker, P. F. (1988). The coming of the new organization. Harvard Business Review, 66(1), 45-53.
Duke, R. D. (1980). A Paradigm for Game Design. Simulation & Gaming, 11, 364-377.
Duke, R. D., & Geurts, J. (2004). Policy games for strategic management. Amsterdam, The Netherlands: Dutch University Press.
Dynes, R., & Quarantelli, E. (1977). Organizational Communications and Decision Making in Crises. Columbus, OH: Disaster Research Center, University of Delaware.
E
Eisenhardt, K. M. (1989). Building theories from case study research. . The Academy of Management Review, 14(4), pp. 532-551.
Emmerich, W., Butchart, B., Chen, L., Wassermann, B., & Price, S. L. (2006). Grid service orchestration using the business process execution language (BPEL). Journal of Grid Computing, 3, 283-304.
Endsley, M. (1988). Situation Awareness Global Assesment Technique (SEGAT). Paper presented at the IEEE National Aerospace and Electronics Conference, Dayton, USA.
English, L. (1999). Improving data warehouse and business information quality. New York: Wiley & Sons.
Eppler, M. (2003). Managing Information Quality: Increasing the Value of Information in Knowledge-intensive Products and Processes: Springer.
Eppler, M., & Muenzenmayer, P. (2002). Measuring information quality in the web context: A survey of state-of-the-art instruments and an application methodology. Paper presented at the 7th International Conference on Information Quality.
Eppler, M. J. (2006). Managing Information Quality: Increasing the Value of Information in Knowledge-intensive Products and Processes (2 ed.). Berlin Heidelberg: Springer.
Evans, J. R., & Lindsay, W. M. (2005). The management and control of quality (6 ed.). Cincinnati, OH: Thomson Learning.
Evernden, R., & Evernden, E. (2003). Third Generation Information Architectures. Communications of the ACM, 46(3), pp. 95-98.
F
Faraj, S., & Xiao, Y. (2006). Coordination in Fast-Response Organizations. Management Science, 52(8), pp. 1155-1169.
Farazmand, A. (2001). Handbook of crisis and emergency management. NY: Marcel Dekker.
Few, S. (2006). Information Dashboard Design: The Effective Visual Communication of Data: O’Reilly Media, Inc.
Field, A. (2005). Discovering Statistics Using SPSS (2 ed.): SAGE Publications.

References
254
Finke, R. A., Ward, T. B., & Smith, S. M. (1992). Creative Cognition. Theory, Research and Applications. Cambridge: MIT Press.
Fisher, C. W., & Kingma, B. R. (2001). Criticality of data quality as exemplified in two disasters. Information and Management, 39(2), 109-116.
Fitzgerald, G., & Russo, N. L. (2005). The turnaround of the London Ambulance Service Computer-Aided Despatch system (LASCAD). European Journal of Information Systems, 14, 244–257.
French, S., & Turoff, M. (2007). Decision support systems. Communications of the ACM, 50(3), pp.39-40.
Friedman, K. (2003). Theory construction in design research: criteria, approaches and methods. Design Studies, 24(6), 507-522.
Friedman, R. A., & Podolny, J. (1992). Differentiation of Boundary Spanning Roles: Labor Negotiations and Implications for Role Conflict. Administrative Science Quarterly, 37, 28-47.
Fritz, C. E. (1961). Disasters. In R. Merton & R. A. Nisbett (Eds.), Contemporary Social Problems. New York: Harcourt.
G
Galbraith, J. (1973). Designing complex organizations. Reading MA: Addison- Wesley.
Galbraith, J. R. (1977). Organization Design. Reading, Massachusetts: Addison-Wesley.
Garfein, R. T. (1988). Guiding Principles for Improving Customer Service. Journal of Services Marketing, 2(2), 37-41.
Gariel, M. (2010). Toward a graceful degradation of air traffic management systems. Georgia Institute of Technology.
Garrett, J. J. (2005). Ajax: A new approach to web applications. Adaptive Path, 1-5
George, D., & Mallery, P. (2003). SPSS for Windows step by step: A simple guide and reference. 11.0 update (4th ed.).
Gerkes, M. (1997). Information Quality Paradox of the Web. Retrieved 23-12-2006
Gibb, T. (1997). Towards the Engineering of Requirements. Requirements engineering, 2, 165-169.
Glegg, G. L. (1981). The Development of Design. Cambridge, England: Cambridge University Press.
Gnyawali, D. R., & Madhavan, R. (2001). Cooperative networks and competitive dynamics : a structural embeddeness perspective. Academy of Management Review, 26(3), 431-445.
Goldkuhl, G. (2004). Design theories in information systems - a need for multi-grounding. Journal of Information Technology Theory and Application, 6(2), 59-72.
Gonzales, D., Johnson, M., McEver, J., Leedom, D., Kingston, G., & Tseng, M. (2005). Network-Centric Operations Case Study. The Stryker Brigade Combat Team
Gonzalez, R. (2010). A framework for ICT-supported coordination in crisis response. Unpublished doctoral dissertation, Delft University of Technology, Delft.
Gosain, S., Malhotra, A., & El Sawy, O. (2005). Coordinating for Flexibility in e-Business Supply Chains. Journal of Management Information Systems, 21(3), 7 - 45.

References
255
Granot, H. (1997). Emergency inter-organisational relationships. Disaster Prevention and Management, 6(5), pp.305-310. .
Grant, R. M. (1996). Prospering in Dynamically-competitive Environments: Organizational Capability as Knowledge Integration. Organization Science, 7(4), 375-387.
Graves, R. (2004). Key Technologies for Emergency Response. Paper presented at the First International Workshop on Information Systems for Crisis Response and Management ISCRAM2004, Brussels.
Gray, D. E., & Black, T. R. (1994). Prototyping of computer-based training materials. Computers & Education, 22(3), 251-256.
Greef, T., de, & Arciszewski, H. (2007). A Closed-Loop Adaptive System for Command and Control Foundations of Augmented Cognition, Lecture Notes in Computer Science (pp. 276-285). Berlin/Heidelberg: Springer.
Greenblatt, C. S. (1988). Designing Games and Simulations. Newbury Park: Sage.
Gregg, D., Kulkarni, U., & Vinze, A. (2001). Understanding the philosophical underpinnings of software engineering research in information systems. Information Systems Frontiers, 3(2), 169-183.
Gregor, S. (2006). The nature of theory in Information Systems. MIS Quarterly, 30(3), pp.611-642.
Gregor, S., & Jones, D. (2007). The Anatomy of a Design Theory. Journal of the Association for Information Systems, 8(5), 312-335.
Gribbons, B., & Herman, J. (1997). True and quasi-experimental designs. Practical Assessment, Research & Evaluation, 5(14).
Groh, J. L. (2006). Network-centric Warfare: Just About Technology? In J. B. Bartholomees (Ed.), U.S. Army War College Guide to National Security Policy and Strategy (2 ed., pp. 373-391): Department of National Security and Strategy.
Grote, G., Weichbrodt, J. C., Gunter, H., Zala-Mezo, E., & Kunzle, B. (2009). Coordination in high-risk organizations: the need for flexible routines. Cognition, Technology & Work, 11, 17-27.
Grunewald, F. (2003). Putting Crisis Management at the Center of Development: A New Paradaigm to link Emergency and Development. Paper presented at the Catastrophes in the age of globalisation, Tel Aviv.
Gruntfest, E., & Huber, C. (1998). Internet and emergency management:Prospects for the future. International Journal of Mass Emergencies and Disasters, 16, pp.55-72.
Gundel, G. (2005). Towards a New Typology of Crises. Journal of Contingencies and Crisis Management, 13(3), 101-109.
H
Haeckel, S. H. (1995). Adaptive Enterprise: Creating and leading sense-and-respond organizations Harvard Business School Press.
Hair, J., Anderson, R., Tatham, R., & Black, W. (1995). Multivariate Data Analysis: Prentice Hall.
Hammer, M. (1990). Reengineering work: don’t automate, obliterate. Harvard Business Review, 68(4), 104-112.
Hammersley, M., & Atkinson, P. (1995). Ethnography: Principles in Practice. London: Routledge.

References
256
Heath, C., & Staudenmayer, N. (2000). Coordination neglect: How lay theories of organizing complicate coordination in organizations. Research in Organizational Behavior, 22, pp. 53-191.
Heckler, R. S. (1993). Anatomy of Change (2 ed.): North Atlantic Books.
Helsloot, I. (2005). Bordering on Reality: Findings on the Bonfire Crisis Management Simulation. Journal of Contingencies and Crisis Management, 13(4), pp.159-169.
Hemard, D. P. (1997). Design principles and guidelines for authoring hypermedia language learning applications. Systems, 25(1), 9-27.
Herbst, P. G. (1976). Alternatives to hierarchies. Leiden: Martinus Nijhoff.
Hernandez, M., & Stolfo, S. (1998). Real-world Data is Dirty: Data Cleansing and The Merge/Purge Problem. Data Mining and Knowledge Discovery, 2(1), 9-37.
Hevner, A., & Chatterjee, S. (2010). Design Research in Information Systems (Vol. 22): Springer.
Hiltz, S. R., & Turoff, M. (1993). The Network Nation: Human Communication via Computer. Cambridge, MA: MIT Press.
Hinterhuber, A. (2002). Value Chain Orchestration in Action and the Case of the Global Agrochemical Industry. Long Range Planning 35(6), 615-635.
Holland, C. P., & Lockett, A. G. (1997). Mixed Mode Network Structures: The strategic use of electronic communication by organizations. Organization Science, 8(5), 475-488.
Horan, T., & Schooley, B. (2007). Time-critical information services. Communications of the ACM, 50(3), pp.73-78.
Housel, T. J., El Sawy, O., & Donovan, P. F. (1986). Information Systems for Crisis Management: Lessons from Southern California Edison MIS Quarterly, 10(4), 389-400.
Hutchins, E. (1991). Organizing work by adaptation. Organization Science, 2(1), 14-39.
I
Ince, D. C., & Hekmatpour, S. (1987). Software prototyping - prospects and progress. Information and Software Technology, 29(1), 8-14.
IOOV. (2010). De Staat van de Rampenbestrijding.
J
Jaeger, P. T., & Shneiderman, B. (2007). Community response grids: E-government, social networks, and effective emergency management. Telecommunications Policy, 31(10), 592-604.
Janson, M. A., & Smith, L. D. (1985). Prototyping for Systems Development: A Critical Appraisal. MIS Quarterly, 9(4), 305-316.
Janssen, M., Gortmaker, J., & Wagenaar, R. W. (2006). Web service orchestration in public administration : Challenges, roles, and growth stages. Information systems management 23(2), pp.44-55.
Janssen, M., & van Veenstra, A. (2005). Stages of growth in e-Government: an architectural approach. The Electronic Journal of e-Government, 3(4), pp.193-200.

References
257
Jenvald, J., Morin, M., & Kincaid, J. P. (2001). A framework for web-based dissemination of models and lessons learned from emergency-response exercises and operations. International Journal of Emergency Management, 1(1), 82-94.
Juran, J. M., & Godfrey, A. B. (1999). Juran’s Quality Handbook (5 ed.). NY: McGraw-Hill.
K
Kahn, B. K., Strong, D. M., & Wang, R. Y. (2002). Information quality benchmarks: product and service performance. Communications of the ACM, 45(4), 184 - 192.
Kaplan, B., & Duchon, D. (1988). Combining qualitative and quantitative methods in IS research: a case study. MIS Quarterly, 12(4), 571-587.
Kaplowitz, M. D., Hadlock, T. D., & Levine, R. (2004). A Comparison of Web and Mail Survey Response Rates. Public Opinion Quarterly, 68(1), 94-101.
Kapucu, N. (2006). Interagency Communication Networks During Emergencies: boundary spanners in multiagency coordination. American Review of Public Administration, 36(2), 207-225.
Kapucu, N., Augustin, M., & Garayev, V. (2009). Interstate Partnerships in Emergency Management: Emergency Management Assistance Compact in Response to Catastrophic Disasters. Public Administration Review, 69(2), 297-313.
Kean, T. H., & Hamilton, L. H. (2004). The 9/11 Report. New York: St. Martin's Press.
Keen, T. H., Hamilton, H., Veniste, H., Gortton, M., Kerry, C., & Fielding, F. (2004). The National Commission on Terrorist Attacks Upon the United States.
Kelmelis, J. A., Schwartz, L., Christian, C., Crawford, M., & King, D. (2006). Use of Geographic Information in Response to the Sumatra-Andaman Earthquake and Indian Ocean Tsunami of December 26, 2004. Photogrammetric Engineering & Remote Sensing, 862-875.
Khalaf, R., Keller, A., & Leymann, F. (2006). Business processes for Web Services: Principles and applications. IBM Systems Journal, 45, 425-446.
Kickert, W., Klijn, E. H., & Koppenjan, J. (1999). Managing Complex Networks. London, Thousand Oaks, New Delhi: Sage publications.
Killian, L. M. (2002). An Introduction to Methodological Problems of Field Studies in Disasters. In R. A. Stallings (Ed.), Methods of Disaster Research (pp. 49-93). Philadelphia: PA: Xlibris.
Kim, J. K., Sharman, R., Rao, H. R., & Upadhyaya, S. (2007). Efficiency of critical incident management systems: Instrument development and validation. Decision Support Systems, 44(1), 235-250.
King, J. L. (1983). Centralized versus decentralized computing: organizational considerations and management options. ACM Computing Surveys 15(4), 319-349.
Klabbers, J. H. G. (2008). The magic circle: principles of gaming & simulation (2 ed.). Rotterdam: Sense Publishers.
Kleiboer, M. (1997). Simulation Methodology for Crisis Management Support. Journal of Contingencies and Crisis Management, 5, 198-206.
Klein, G., & Klinger, D. (1991). Naturalistic Decision Making. Human Systems IAC Gateway, 11(3), 16-19.
Klein, G. A. (1998). Sources of Power: How People Make Decisions. Cambridge, Massachusetts: MIT Press.

References
258
Klein, H. (1997). Classification of Text Analysis Software. Paper presented at the 20th Annual Conference of the Gesellschaft für Klassifikation, Berlin - Heidelberg: .
Klein, L. (1994). Sociotechnical/organizational design. In W. Karwowsk & G. Salvendy (Eds.), Organization and Management of Advanced Manufacturing (pp. 179-222). New York: Wiley.
Kogut, B., & Zander, U. (1992). Knowledge of the firm, combinative capabilities, and the replication of technology. Organization Science, 3, 383-397.
Kontogiannis, T. (1996). Stress and operator decision making in coping with emergencies. International Journal of Human - Computer Studies, 45, 75-104.
Kraus, S., Wilkenfield, J., Harris, M. A., & Blake, E. (1992). The Hostage Crisis Simulation. Simulation & Gaming, 23(4), 398-416.
Kraut, R. E., & Streeter, L. A. (1995). Coordination in software development. Communications of ACM, 38(3), 69-81.
Kuhn, T. S. (1970). The structure of scientific revolutions (2 ed.). Chicago University of Chicago Press.
Kumar, V., Rus, D., & Singh, S. (2004). Robot and sensor networks for first responders. IEEE Pervasive Computing, 3(4), 24 - 33
Kwon, T. H., & Zmud, R. W. (1987). Unifying the fragmented models of information systemsimplementation. In R. J. Boland & R. A. Hirschheim (Eds.), Critical issues in information systems research. New York: John Wiley & Sons Ltd.
L
Lakatos. (1978). The Methodology of Scientific Research Programmes (Vol. 1). Cambridge: Cambridge University Press.
Landesman, L. J., Malilay, J., Bissel, R. A., Becker, S. M., Roberts, L., & Asher, M. (2005). Roles and responsibilities of public health in disaster preparedness and response. In L. F. Novick & G. P. Mays (Eds.), Public Health Administration.
Landgren, J. (2007). Investigating the Tension between Information Technology Use and Emergency Response Work. Paper presented at the European Conference of Information Systems, Galway, Ireland.
Lantz, K. (1986). The prototyping methodology: designing right the first time. Computerworld, 20, 69-74.
Larson, R. C., Metzger, M. D., & Cahn, M. F. (2006). Responding to Emergencies: Lessons Learned and the Need for Analysis. Interfaces, 36(6), 486-501.
Larsson, R. (1990). Coordination of action in mergers and acquisitions. Interpretive and systems approaches towards synergy. Lund: Lund University Press.
Lawrence, P., & Lorsch, J. (1967). Differentiation and Integration in Complex Organizations. Administrative Science Quarterly 12, 1-30.
Lee, A. S., & Baskerville, R. L. (2003). Generalizing generalizability in information systems research. Information systems research, 14(3), 221-243.
Lee, J., Bharosa, N., Yang, J., Janssen, M., & Rao, H. R. (2010). Group Value and Intention to Use - A Study of Multi-Agency Disaster Management Information Systems for Public Safety. Decision Support Systems, forthcomming.

References
259
Lee, J., & Bui, T. (2000). A Template-based Methodology for Disaster Management Information Systems. Paper presented at the 33rd Hawaii International Conference on System Sciences.
Lee, Y. W., Strong, D. M., Kahn, B. K., & Wang, R. Y. (2002). AIMQ: a methodology for information quality assessment. Information and Management,, 40, 133-146.
Leung, H. K. N. (2001). Quality metrics for intranet applications. Information & Managemen, 38(3), 137-152.
Levina, N., & Vaast, E. (2005). The emergence of boundary spanning competence in practice: implications for implementation and use of information systems. MIS Quarterly, 29(2), 335-363.
Lewin, K. (1958). Group Decision and Social Change. New York: Holt, Rinehart and Winston.
Lindblom, C. E. (1959). The Science of Muddling Through. Public Administration Review, 19, 79-88.
Lindblom, C. E. (1968). The Policy-Making Process. New Jersey: Prentice-Hall, Englewood Cliffs.
Lindgren, R., Andersson, M., & Henfridsson, O. (2008). Multi-contextuality in boundary-spanning practices. Information Systems Journal, 18(6), 641-661.
Liu, K. (2004). Agent-based resource discovery architecture for environmental emergency management. Expert Systems with Applications, 27(2004), pp. 77-95.
Longstaff, P. H. (2005). Security, Resilience, and Communication in Unpredictable Environments Such as Terrorism, Natural Disasters, and Complex Technology Available from http://pirp.harvard.edu/pubs_pdf/longsta/longsta-p05-3.pdf
Lorincz, K., Malan, D. J., Fulford-Jones, T. R. F., Nawoj, A., Clavel, A., Shnayder, V., et al. (2004). Sensor Networks for Emergency Response: Challenges and Opportunities. IEEE Pervasive Computing, 3(4), 16-23.
M
Maier, M. W., & Rechtin, E. (2002). The art of systems architecting. Boca Renton: CRC Press.
Malone, T., & Crowston, K. (1994a). The Interdisciplinary Study of Coordination. ACM Computing Surveys, 26(1), pp. 87-119.
Malone, T., Yates, J., & Benjamin, R. (1987). Electronic markets and electronic hierarchies. Communications of the ACM, 30, 484-497.
Malone, T. W., & Crowston, K. (1994b). The interdisciplinary study of coordination. ACM Computing Surveys, 26(2), 87-119.
Manoj, B. S., & Hubenko, A. H. (2007). Communication Challenges in Emergency Response. Communications of the ACM, 50(3), 51-53.
Manoj, B. S., & Hubenko Baker, A. (2007). Communication challenges in emergency response. Communications of the ACM, 50(3), 51-53.
March, J., & Simon, H. (1958). Organizations. New York: Wiley.
March, J. G. (1988). Decisions and Organizations. Oxford: Blackwell.
March, S., & Smith, G. F. (1995). Design and natural science research on information technology. Decision Support Systems, 15, 251-266.

References
260
Markus, M. L., Majchrzak, A., & Gasser, A. (2002). Design Theory for Systems that Support Emergent Knowledge Processes MIS Quarterly, 26(3), 179-212.
Marsh, D., & Rhodes, R. A. W. (1992). Policy Networks in British Government. Oxford: Oxford University Press.
Martin, M. P. (2003). Prototyping. Encyclopedia of Information Systems, 3, 565-573.
Mason, J. (2002). Qualitative Interviewing: Asking, Listening and Interpreting. In T. May (Ed.), Qualitative Research in Action (pp. 225-241). London, Thousand Oaks and New Delhi: Sage Publications.
Mason, R. E., & Carey, T. T. (1983). Prototyping interactive information systems. Communications of the ACM, 26(5), 347-354.
McEntire, D. A. (2002). Coordinating multi organisational responses to disaster. Disaster Prevention and Management, 11(5), 369-379.
Meadow, C. T., Boyce, B. R., & Kraft, D. H. (2000). Text information retrieval systems (2 ed.). San Diego, CA: Academic Press.
Meijer, I., Hekkert, M., Faber, J., & Smits, R. (2006). Perceived uncertainties regarding socio-technological transformations: towards a framework. International Journal of Foresight and Innovation Policy,, 2(2), pp.214-240.
Meijer, S. M. (2009). The organisation of transactions: Studying supply networks using gaming simulation. Wageningen University, Wageningen, The Netherlands.
Meijer, S. M., Hofstede, G. J., Omta, S. W. F., & Beers, G. (2008). The organization of transactions: research with the Trust and Tracing game. Journal on Chain and Network Science, 8, 1-20.
Meissner, A., Luckenbach, T., Risse, T., Kirste, T., & Kirchner, H. (2002). Design Challenges for an Integrated Disaster Management Communication and Information System. Paper presented at the The First IEEE Workshop on Disaster Recovery Networks, New York.
Mendonça, D. (2007). Decision support for improvisation in response to extreme events: Learning from the response to the 2001 World Trade Center attack. Decision Support Systems, 43(3), 952-967.
Mendonca, D., Jefferson, T., & Harrald, J. (2007). Collaborative adhocracies and mix-and-match technologies in emergency management. Communications of the ACM, 50(3), pp. 45-49.
Mendonça, D., Jefferson, T., & Harrald, J. (2007). Collaborative adhocracies and mix-and-match technologies in emergency management. Communications of the ACM, 50(3), 44-49.
Mendonca, S., Pina e Cunha, M., Kavo-Oja, J., & Ruff, F. (2004). Wild cards, weak signals and organisational improvisation. Futures, 36(2), 201-218
Mertens, F. (2007). Otto Neurath en de maakbaarheid van de betere samenleving. Den Haag: SCP.
Mertens, F., Jochoms, T., & Zonneveld, M. (2009). Leiderschap: wat gebeurt er? Situaties uit de actuele praktijk: Police Academy of the Netherlands.
Meuleman, L. (2008). Public Management and the Metagovernance of Hierarchies, Networks and Markets. Berlin: Springer.

References
261
Meyer, W., & Baltes, K. (2003). Network failures. How realistic is durable cooperation in global governance. Paper presented at the Conference on the human dimensions of global change.
Miles, M. B., & Huberman, E. M. (1994). Qualitative data analysis. An Expanded Sourcebook (2nd ed.). London: Sage.
Militello, L. G., Patterson, E. S., Bowman, L., & Wears, R. (2007). Information flow during crisis management: challenges to coordination in the emergency operations center. Cognition, Technology and Work, 9, 25–31.
Miller, H. (1996). The multiple dimensions of information quality. Information Systems Management, 13(2), 79 - 82.
Miller, H., Granato, R., Feuerstein, J., & Ruffino, L. (2005). Toward interoperable first response. IEEE IT Professional, 7(1), pp. 13-20.
Mintzberg, H. (1980). Structure in 5's: A Synthesis of the Research on Organization Design. Management Science, 26(3), pp.322-341.
Mitchell, K. D. (2000). Knowledge management: the next big thing. Public Manager, 29(2), 57-60.
Morel, B., & Ramanujam, R. (1999). Through the Looking Glass of Complexity: The Dynamics of Organizations as Adaptive and Evolving Systems. Organization Science, 10(3), 278-293.
Morgan, M., & Henrion, M. (1992). Uncertainty: A Guide to Dealing with Uncertainty in Quantitative Risk and Policy Analysis Cambridge: Cambridge University Press.
Morrissey, R. (2007). Tailoring Performance Dashboard Content. Business Intelligence Journal, 12(4).
Muhr, T. H. (1991). ATLAS/ti: A prototype for the support of text interpretation. Qualitative Sociology, 14(4), 349-337.
N
National Institute of Standards and Technology. (2005). Federal Building and Fire Safety Investigation of the World Trade Center Disaster: The Emergency Response Operation.
National Research Council. (2007). Improving Disaster Management: The Role of IT in Mitigation, Preparedness, Response and Recovery. Washington, DC: National Academic Press.
Naumann, F., & Rolker, C. (2000). Assessment Methods for Information Quality Criteria. Information Quality, pp.148-162.
Neal, J. M. (2000). A Look at Reachback. Military Review, 5, 3-9.
Nelson, R. R., Todd, P. A., & Wixom, B. H. (2005). Antecedents of Information and System Quality: An Empirical Examination Within the Context of Data Warehousing Journal of Management Information Systems 21(4), 199 - 236.
NESI. (2008). Net-Centric Implementation Framework: Net-Centric Enterprise Solutions for Interoperability.
Neurath, O. (1946). The Orchestration of the Sciences by the Encyclopedism of Logical Empiricism. Philosophy and Phenomenological Research, 6, 496-508.

References
262
Neurath, O. (1983). Otto Neurath: philosophical papers. In R. S. Cohen & M. Neurath (Eds.), The orchestration of the sciences by the encyclopedism of logical empiricism. Reidel.
Nunamaker Jr, J. F., Chen, M., & Purdin, T. D. M. (1990). Systems development in information systems research. Journal of Management Information Systems, 7(3), 89-106.
O
O'Connor, J. (1987). The meaning of crisis: A theoretical introduction. Oxford: Basil Blackwell.
O'Reilly, T. (2007). What Is Web 2.0: Design Patterns and Business Models for the Next Generation of Software. Communications and Stategies, 65(1), 17-37.
O’Riordan, P. (2004). Information and Lessons Learned from the Actions Taken After the Terrorist Attack of 11th March in Madrid. Paper presented at the The HeBE major emergency planning project,Conference report.
OASIS. (2010). OASIS UDDI Specifications TC - Committee Specifications. Retrieved 15 April, 2010, http://www.oasis-open.org/committees/uddi-spec/doc/tcspecs.htm
Orlikowski, W., & Baroudi, J. (1991). Studying information technology in organizations. Information Systems Research, 2, pp. 1-28.
Overbeek, S., Klievink, B., & Janssen, M. (2009). A Flexible, Event-Driven, Service-Oriented Architecture for Orchestrating Service Delivery. IEEE Intelligent Systems, 24(5), 31-41.
P
Palen, L., Hiltz, S. R., & Liu, S. (2007). Citizen participation in emergency preparedness and response. Communications of the ACM, 50(3), 54-59.
Paraskevas, A. (2005). Crisis Response Systems through a Complexity Science Lens. Paper presented at the Complexity, Science and Society Conference, Liverpool, UK.
Patterson, K. A., Grimm, C. M., & Corsi, T. M. (2003). Adopting new technologies for supply chain management. Transportation Research, 39, 95-121.
Pauchant, T., & Mitroff, I. (1992). Transforming the Crisis-Prone Organization. San Francisco,CA: Jossey-Bass, Inc.
Paul, D. L., & McDaniel, R. (2004). A field study of the effect of interpersonal trust on virtual collaborative relationship performance. MIS Quarterly, 28(2), 183-227.
Paul, R. J. (2007). EDITORIAL: Challenges to information systems: time to change. European Journal of Information Systems, 16(3), 193-195.
Pearson, C. M., & Clair, J. A. (1998). Reframing Crisis Management Academy of Management Review, 23(1), pp. 59-76.
Pereira, J. V. (2009). The new supply chain’s frontier: Information management. International Journal of Information Management, 29, 372–379.
Petak, W. J. (1985). Emergency Management: A Challenge for Public Administration. Public Administration Review, 45(Special Issue: Emergency Management: A Challenge for Public Administration), 3-7.
Peters, V., Vissers, G., & Heijne, G. (1998). The validity of games. Simulation & Gaming, 29(1), 20-30.

References
263
Pfeifer, J. (2005). Command Resiliency: An Adaptive Response Strategy For Complex Incidents. Unpublished Master thesis, Naval Postgraduate School.
Pilemalm, S., & Hallberg, N. (2008). Exploring Service-Oriented C2 Support for Emergency Response for Local Communities. Paper presented at the
Proceedings of ISCRAM 2008, Washington DC, USA.
Pinsonneault, A., & Kraemer, K. L. (1993). Survey research methodology in management information systems: An assessment. Journal of Management Information Systems, 10(2), 75-105.
Plotnick, L., White, C., & Plummer, M. M. (2009). The Design of an Online Social Network Site for Emergency Management: A One Stop Shop. Paper presented at the Fifteenth Americas Conference on Information Systems (AMCIS), San Francisco, California.
Portman, M., & Pirzada, A. A. (2008). Wireless Mesh Networks for Public Safety and Crisis Management Applications. IEEE Internet Computing, 12(1), 18-25.
Powell, W. W. (1990). Neither Market nor Hierarchy: Network Forms of Organization. In B. Slaw (Ed.), Research in Organizational Behaviour (Vol. 12, pp. 295-336). Greenwich: JAI.
Q
Quarantelli, E. (1982). Social and organisational problems in a major emergency. Emergency Planning Digest, 9(1), 7-10.
Quarantelli, E. L. (1997). Problematical aspects of the information/ communication revolution for disaster planning and research: ten non-technical issues and questions. Disaster Prevention and Management, 6(2), pp.94 - 106.
R
Raman, M., Ryan, T., & Olfma. (2006). Knowledge Management System for Emergency Preparedness: An Action Research Study. Paper presented at the 39 Hawaii International Conference on System Sciences.
Ramesh, B., & Tiwana, A. (1999). Supporting Collaborative Process Knowledge Management in New Product Development Teams. Decision Support Systems, 27, 213-235.
Randell, C. (2008). Wearable computing application and challenges. In P. E. Kourouthanassis & G. M. Giaglis (Eds.), Pervasive information systems (Vol. 100, pp. 165-179). Armonk, N.Y: M.E. Sharpe.
Rao, H. R., Chaudhury, A., & Chakka, M. (1995). Modeling team processes: Issues and a specific example. Information Systems Research, 6(3), 255-285.
Redman. (1995). Improve Data Quality for Competitive Advantage. Sloan Management Review, 36(2), 99-107.
Ren, Y., Kiesler, S, & Fussell, S. R. (2008). Multiple Group Coordination in Complex and Dynamic Task Environments: Interruptions, Coping Mechanisms, and Technology Recommendations Journal of Management Information Systems, 25(1), 105 - 130.
Richardson, G. L., Jackson, B. M., & Dickson, G. W. (1990). A principles-based enterprise architecture: Lessons from Texaco and Star Enterprise. MIS Quarterly, 14(4).
Rindova, V. P., & Kotha, S. (2001). Continuous “morphing”: Competing through dynamic capabilities, form, and function. Academy of Management Journal, 44(6), 1263-1280.

References
264
Rosenthal, U., ‘t Hart, P., & Charles, M. (1989). The world of crisis and crisis management. In U. Rosenthal, ‘t Hart, P. & Charles, M (Ed.), Coping with Crisis (pp. pp.3-36). Springfield.
Rossi, M., & Sein, M. K. (2003). Design Research Workshop: A Proactive Research Approach.
Rowe, P. G. (1987). Design Thinking. Cambridge, MA: MIT Press.
Russell, D. M., & Hoag, A. M. (2004). People and information technology in the supply chain: Social and organizational influences on adoption. International Journal of Physical Distribution & Logistics Management, 34(1), 102-122.
Ryoo, J., & Choi, Y. B. (2006). A comparison and classification framework for disaster information management systems. International Journal of Emergency Management, 3(4), 264 - 279.
S
Sadiq, W., & Racca, F. (2004). Business Services Orchestration: The Hypertier of Information Technology. Cambridge: Cambridge University Press.
Samarajiva, R. (2005). Mobilizing information and communications technologies for effective disaster warning: Lessons from the 2004 tsunami. New Media and Society, 7(6), 731-747.
Sambamurthy, V., Bharadwaj, A., & Grover, V. (2003). Shaping Agility through Digital Options: Reconceptualizing the Role of Information Technology in Contemporary Firms. MIS Quarterly, 27(2), pp. 237-263.
Sawyer, S., Fedorowicz, J., & Tyworth, M. (2007). A Taxonomy for Public Safety Networks. Paper presented at the 8th Annual International Digital Government Research Conference.
Scheuren, J.-M., Waroux, J.-M., Below, R., & Guha-Sapir, D. (2008). The Numbers and Trends 2007. Annual Disaster Statistical Review, 2(2). Retrieved from http://www.emdat.be/Documents/Publications/.
Scholtens, A. (2007). Samenwerking in crisisbeheersing-overschat en onderschat: Police Academy of the Netherlands.
Schraagen, J. M., Huis in 't Veld, M., & de Koning, L. (2010). Information Sharing During Crisis Management in Hierarchical vs. Network Teams. Journal of Contingencies and Crisis Management, 18(2), 117-127.
Scott, R. W. (1992). Organizations: Rational, Natural and Open Systems. NJ: Prentice Hall.
Shadish, W. R., Cook, T., D, & Cambell, D., T. (2002). Experimental and Qausi-experimental design for generalized causal inference. Boston, MA: Houghton Mifflin Company.
Shaluf, I. M. (2007). Disaster Types. Disaster Prevention and Management, 16(5), 704-717.
Shen, H., Zhao, J., & Huang, W. (2008). Mission-Critical Group Decision-Making: Solving the Problem of Decision Preference Change in Group Decision-Making Using Markov Chain Model. Journal of Global Information Management, 16(2), 35-42.
Shen, J., Grossmann, G., Yang, Y., Stumptner, M., Schrefl, M., & Reiter, T. (2007). Analysis of business process integration in Web service context. Future Generation Computer Systems, 23, 283-294.
Simon, H. (1969). The Sciences of the Artificial (1 ed.). Cambridge: MIT Press.

References
265
Simon, H. (1973). The Structure of Ill Structured Problems. Artificial Intelligence, 4, 181-201.
Simon, H. A. (1982). Models of Bounded Rationality (Vol. 2). Cambridge, Mass: MIT Press.
Simon, H. A. (1996). The Sciences of the Artificial (3 ed.). MIT Press,Cambridge: MA.
Smart, K., & Vertinsky, I. (1977). Designs for Crisis Decision Units. Administrative Science Quarterly, 22(4), pp. 640-657.
Smith, M. F. (1991). Software Prototyping: Adoption, Practice and Management. London: McGraw-Hill.
Snow, C. C., & Thomas, J. B. (1994). Field research methods in strategic management: contributions to theory building and testing. Journal of Management Studies, 31, 457-480.
Sol, H. (1982). Simulation in Information Systems Development. Unpublished Doctoral, University of Groningen, Groningen, The Netherlands.
Spradley, J. S. (1980). Participant observation. New York: Holt.
Sprague, R. H., & Carlson, E. D. (1982). Building Effective Decision Support Systems. Englewood Cliffs, N.J: Prerltice-Hall.
Stanovich, M. (2006). Network-centric emergency response: The challenges of training for a new command and control paradigm. Journal of Emergency Management, 4(2), 57-64.
Star, S. L., & Griesemer, J. R. (1989). Institutional ecology, ‘translations’ and boundary objects: amateurs and professionals in Berkeley’s museum of vertebrate zoology, 1907-1939. Social Studies of Science, 19, 387-420.
Stasser, G., & Titus, W. (1985). Pooling of Unshared Information in Group Decision Making: Biased Information Sampling During Discussion. Journal of Pereonality and Social Psychology 48(6), 1467-1478.
Stephenson, R., & Anderson, P. (1997). Disasters and the Information Technology Revolution. Disasters, 21(4), pp. 305-334.
Stern, E. K. (2001). Crisis Decisionmaking: A Cognitive-Institutional Approach. Stockholm: Copy Print.
Strauss, A., & Corbin, J. (1990). Basics of Qualitative Research. Newbury Park: Sage.
Strong, D. M., Lee, Y. W., & Wang, R. Y. (1997). Data Quality in Context. Communications of the ACM, 40(5), pp.103-110.
T
t' Hart, P., Rosenthal, U., Kouzmin, A. (1993). Crisis Decision Making: The Centralization Thesis Revisited. Administration & Society., 25(1), pp.12-45.
Tan, C., & Sia, S. (2006). Managing Flexibility in Outsourcing. Journal of the Association for Information Systems, 7(4), pp. 179-206.
Tanur, J. M. (1982). Advances in methods for large-scale surveys and experiments, Part 2. In R. Mcadams, N. J. Smelser & D. J. Treiman (Eds.), Behavioral and Social Science Research: A National Resource. Washington, DC: National Academy Press.
Thompson, G. J., Rances, R., Levacic, J., & Mitchel, J. C. (1996). Markets, hierarchies and networks: the coordination of social life. London: Sage.
References
266
Thompson, J. D. (1967). Organizations in Action. New York: McGraw-Hill.
Thorelli, H. B. (1986). Networks: Between markets and hierarchies. Strategic Management Journal, 7, 37-51.
TOGAF. (2004). The Open Group Architecture Framework. Version 8.5, Enterprise Edition.
Tornatzky, L. G., & Fleischer, M. (1990). The process of technological innovation. Lexington, MA: Lexington Books.
Townsend et al. (2006). The Federal Response to Hurricane Katrina: Lessons Learned. Retrieved from http://www.whitehouse.gov/reports/katrina-lessons-learned.pdf
Trauth, E. M., & Jessup, L. M. (2000). Understanding computer-mediated discussions: Positivist and interpretive analyses of group support system use. MIS Quarterly, 24(1), 43-79.
Tsai, W., & Ghoshal, S. (1998). Social Capital and Value Creation: The Role of Intrafirm Networks. The Academy of Management Journal, 41(4), 464-476.
Turoff, M., Chumer, M., Van De Walle, B., & Yao, X. (2004). The Design of a Dynamic Emergency Response Management Information System (DERMIS). Journal of Information Technology Theory and Application (JITTA), 5(4), pp. 1-35.
Turoff, M., Rao, U., & Hiltz, S. R. (1991). Collaborative hypertext in computer mediated communications. Paper presented at the Twenty-Fourth Annual Hawaii International Conference on System Sciences.
Tushman, M. L. (1977). Special boundary roles in the innovation process. Administrative Science Quarterly, 22, 587-605.
Twidale, M., Randall, D., & Bentley, R. (1994). Situated evaluation for cooperative systems. Paper presented at the ACM Conference on Computer Supported Cooperative Work, Chapel Hill, North Carolina, United States.
V
Vaishnavi, V. K., & Kuechler Jr., W. (2008). Design Science Research Methods and Patterns: Innovating Information and Communication Technology Auerbach Publications, Taylor & Francis Group.
Van de Ven, A. H., Delbecq, A. L., & Koenig, R., Jr. (1976). Determinants of coordination modes within organizations. American Sociological Review, 41, 322-338.
Van de Ven, J., Van Rijk, R., Essens, P., & Frinking, E. (2008). Network Centric Operations in Crisis Management. Paper presented at the 5th International ISCRAM Conference, Washington, DC, USA.
van de Walle, B., & Turoff, M. (2007). Emergency Response Information Systems: Emerging Trends and Technologies. Communications of the ACM, 50(3), 29-31.
van de Walle, B., & Turrof, M. (2008). Decision support for emergency situations Information Systems and E-Business Management, 6(3), 295-316.
van den Akker, J. (1999). Principles and methods of development research. In J. van den Akker, R. Maribe Branch, K. Gustafson, N. Nieveen & T. Plomp (Eds.), Design approaches and tools in education and training. Dordrecht, the Netherlands: Kluwer Academic Publishers.
Van Maanen, J. (1988). Tales of the Field: On Writing Ethnography: The University of Chicago Press.

References
267
van Oosterom, P., Zlatanova, S. & Fendel, E. (2005). Geo-Information for Disaster Management. Berlin: Springer.
Van Vollehoven et al. (2006). Brand Cellencomplex Schiphol-Oost. Den Haag: Onderzoeksraad Voor Veiligheid.
Verschuren, P., & Hartog, R. (2005). Evaluation in Design-Oriented Research. Quality & Quantity, 39, pp.733-762.
W
W3C. (2010a). SOAP. Retrieved 17 April, 2010, from http://www.w3.org/TR/soap/
W3C. (2010b). WDSL. Retrieved 15 April, 2010, from http://www.w3.org/TR/wdsl/
W3C. (2010c). XML. Retrieved 15 April, 2010, from http://www.w3.org/TR/xml/
Walker, W. E., Harremoes, P., Rotmans, J., van der Sluijs, J. P., van Asselt, M. B., Janssen, M. P., et al. (2003). Defining Uncertainty- A Conceptual Basis for Uncertainty Management in Model-Based Decision Support. Integrated Assessment, 4(1), pp.5-17.
Walls, J. G., Widmeyer, G. R., & El Sawy, O. A. (1992). Building an Information System Design Theory for Vigilant EIS. Information Systems Research, 3(1), pp. 36-59.
Wang, R. Y., Pierce, E. M., Madnick, S. E., & Fisher, C. W. (2005). Information quality. Armonk, NY: M.E. Sharpe.
Wang, R. Y., Storey, V. C., & Firth, C. P. (1995). A framework for analysis of data quality research. IEEE Transactions Knowledge and Data Engineering, 7(4), 623-640.
Wang, R. Y., & Strong, D. M. (1996). Beyond accuracy: what data quality means to data consumers. Journal of Management Information Systems, 12(4), 5-33.
Wasserman, S., & Faust, K. (1994). Social Network Analysis. Cambridge: Cambridge University Press.
Waugh, W. L., & Streib, G. (2006). Collaboration and leaderschip for effective emergency management. Public Administration Review, 66(131-140).
Weber. (1952). The essentials of bureaucratic organization: An ideal-type construction. In R. Merton (Ed.), Reader in Bureaucracy. New York: Free Press.
Weick, K. (1995). Sensemaking in Organizations: Sage Publications.
Weick, K. E. (1993). The Collapse of Sensemaking in Organizations: The Mann Gulch Disaster. Administrative Science Quarterly, 38(4), 628-652.
Weick, K. E., & Sutcliffe, K. M. (2001). Managing the Unexpected: Assuring High Performance in an Age of Complexity. San Francisco: Jossey-Bas.
Wiederhold, G., & Genesereth, M. (1997). The Conceptual Basis for Mediation Services. IEEE Expert, 12(5), pp. 38-47.
Wiig, K. M. (1999). Introducing knowledge management into the entreprise. In J. Liebowitz (Ed.), Knowledge management handbook (pp. 1-41). New York: CRC Press.
Wilcoxon, F. (1945). Individual Comparisons by Ranking Methods. Biometrics Bulletin, 1(6), 80-83.
Windelband, W., & Oakes, G. (1980). History and Natural Science. History and Theory, 19(2), 165-168.

References
268
Winkler, W. E. (2004). Methods for evaluating and creating data quality. Information Systems, 29(7), 531-551.
Y
Yin, R. K. (2003). Case Study Research: Design and Methods (Third edition ed.). Thousand Oaks, CA: Sage.
Z
Zeist, R. H. J., & Hendriks, P. R. H. (1996). Specifying software quality with the extended ISO model Software Quality Journal, 5, 273-284.
Zhu, X., & Gauch, S. (2000). Incorporating quality metrics in centralized/distributed information retrieval on the World Wide Web. Paper presented at the 23rd annual international ACM SIGIR conference on Research and development in information retrieval, Athens, Greece.
Zollo, M., & Winter, S. G. (2002). Deliberate Learning and the Evolution of Dynamic Capabilities. Organization Science, 13(3), 339-351.
Zsambok, C. E., & Klein, G. (1997). Naturalistic Decision Making. Mahwah, NJ: Lawrence Erlbaum Associates.

Summary
269
Summary
Introduction Recent response efforts to large disasters, such as the 2009 Polderbaan plane crash, reveal that inter-agency (horizontal) and inter-echelon (vertical) information management remain major challenges in public safety networks (PSNs). Currently, the various relief agencies (e.g., police departments, fire departments and medical services) manage information independently (in silos) and in accordance with their daily routines and hierarchical organization structure. From the perspective of each relief agency, their hierarchy-based information systems perform sufficiently dur-ing daily, non-disaster situations. However, the ad-hoc combinations of such in-formation systems often fail in assuring information quality (IQ) and system quali-ty (SQ) for multi-agency teams during disaster response. Yet, literature provides little guidance for stakeholders (e.g., information system architects, policy makers, software vendors and trainers) when it comes to assuring IQ and SQ during disas-ter response. The objective of this dissertation is to synthesize and evaluate design principles that assure higher levels of IQ and SQ for multi-agency teams. The pre-scription oriented Design Science research approach led this research, and required us to complete four cycles: a rigor cycle (drawing on theory), a relevance cycle (drawing on empirical data), a design cycle (synthesis of design principles) and a evaluation cycle (prototyping and quasi-experimentation). The design cycle draws on the findings from the rigor and relevance cycle, and introduces “netcentric in-formation orchestration,” a design theory for assuring IQ and SQ during disaster response. The evaluation cycle revealed that netcentric information orchestration assures higher levels for most IQ and SQ dimensions compared to hierarchy based information systems.
The hurdles for assuring IQ and SQ in public safety networks Assuring IQ and SQ in complex, ad-hoc and unpredictable environments such as disaster response is major challenge. Not only are the response conditions stressful and hazardous, the agencies involved in the PSNs are also heterogeneous and in-compatible on several aspects. During disaster response, several public and private agencies team up in a PSN with the collective objective of protecting civilians from the hazards brought by a disaster. In such a network of agencies, inter-agency and inter-echelon information management are crucial for the performance of multi-agency teams. In this context, information management is a cycle of activities in-cluding the collection, preparation, storage, validation, enrichment and distribu-tion of information. These activities need to take place between different agencies (inter-agency) and between the strategic, tactical and operational echelons (inter-echelon). Recently, policy makers have introduced legislation on PSNs in order to correct decades of isolated, ad-hoc, and poorly supported IT development practices among and within relief agencies. However, our analysis of the professional and academic literature, as well as empirical field research, indicates that there is great variety in types of information systems being developed under the umbrella of “public safety” systems. This variety spans technological feature sets, organization-al arrangements, governance practices, jurisdictional scope, and institutional envi-

Summary
270
ronments. One key commonality is that PSNs involve several agencies, meaning they may span governmental levels (i.e., federal, provincial, local), functions (e.g., police, fire, justice) or geographies (i.e., municipalities, regions or communities).
As the severity of a disaster increases, PSNs unfold in three echelons: stra-tegic, tactical and operational (field units). In accordance to this hierarchical organ-ization structure, both multi-agency and mono-agency teams are activated. While the output of these teams includes decisions and actions, the input for these teams includes a situation dependent mix of information, actions and events. However, the multi-agency information management process is often hampered due to the capabilities embedded in the design of the underlying information system architec-tures. Here, information system architectures represent the blueprint and configu-ration of both social and technical components of an information system. As such, information system architectures dictate the information management capabilities that can be developed prior to or during disaster response.
One will find multiple hurdles when studying the social and technical com-ponents of information system architectures. First, each relief agency has its own specialization and information needs and therefore they “join up” their individual IT standards, policies and applications for the purpose of inter-agency (horizontal) and inter-echelon (vertical) information management. In practice, the compounded information systems of the various relief agencies are incompatible, hampering in-ter-agency and inter-echelon information management. Secondly, both the infor-mation supply and demand are scattered throughout the network of agencies and are difficult to determine in advance. Thirdly, the information supply and demand are fluid and are difficult to demarcate since a relief worker can be both the source and receiver of information objects. Finally, the uncertainty inherent to disasters makes it difficult to pre-establish flows and pre-determine information needs. Since the information systems of the individual relief agencies are designed to sup-port daily, routine and intra-agency information needs, they often fail to assure IQ and SQ throughout a network of agencies. Rigor cycle: measurement instruments and pathways for IQ and SQ In the first cycle, we constructed the theoretical foundation of this research by re-viewing literature on IQ, SQ, coordination theory and network centric operations (NCO) theory. In this phase, we investigated two sub questions. The first sub ques-tion (1a) asked what a useful and tested framework provided is for studying IQ and SQ. We found that IQ is a well-studied construct covering over thirty dimensions, including relevancy, timeliness, completeness, accuracy, consistency, amount and format. SQ on the other hand is a less coherently studied concept that includes five key dimensions including accessibility, response time, flexibility, reliability and interoperability. Even though the Information System Success Theory emphasizes the importance of IQ and SQ for information systems success, this theory is silent on principles for assuring IQ and SQ. Accordingly, we formulated sub-question 1b as, what pathways are provided in coordination theory and netcentric operations theory for assuring IQ and SQ in public safety networks? Based on our examina-tion of both kernel theories, we derived seven pathways, four from coordination theory and three from NCO. Pathways from coordination theory include advance structuring, dynamic adjustment, boundary spanning and IT-enabled orchestra-tion. Pathways from NCO theory include reachback, self-synchronization and in-formation pooling. While these pathways formed the theoretical basis for our de-

Summary
271
sign theory, we still needed to gain more insights on information system architec-tures, IQ and SQ issues in practice. Relevance cycle: field studies and empirical data collection Equipped with the IQ and SQ assessment instruments from literature and knowing the pathways from theory, we entered the second cycle of this research. This cycle focused on investigating the empirical context of inter-agency and inter-echelon information management during disaster response. Since previous work did not provide much description on existing information management systems and prac-tices, we decided to conduct exploratory field studies. We conducted three field studies: Rotterdam-Rijnmond, Gelderland and Delfland. Throughout these field studies, we set out to answer three sub-questions.
The first sub-question (2a) asked about how multi-agency teams manage information during disaster response in practice. As essential part of the field stud-ies, we observed 22 different disaster response exercises in the Netherlands. The exercises were observed based on an observation protocols crafted for studying the information management process, roles, capabilities and information/system qual-ity issues. We investigated this question by collecting, analyzing and triangulating observational data, available documentation, informal talks with relief workers during training exercises and discussions with exercise trainers before and after training exercises. Our observations reveal that inter-agency and inter-echelon in-formation management takes place via multiple channels (voice, text and visual). Moreover, the roles and capabilities for inter-agency and inter-echelon information sharing are designed for hierarchical operations and are non-adaptive to situational needs. In general, information flows according to the hierarchy based command and control structure. This architecture for information sharing resonates with a functional hierarchy. This means that commanders brief subordinates on a very limited ‘need to know’ basis and are often oblivious to the wider context and signif-icance of their actions. This reflects the belief that the most effective disaster re-sponse is carried out under rigid control exercised from a hierarchical command structure. In such hierarchy-based information systems, subordinates should al-ways report only to their commanders and teams, including the emergency control room, are limited in their capabilities for assuring high levels of IQ and SQ.
Considering the various information system architectures in practice, the second sub-question (2b) asked about which levels of IQ and SQ existing architec-tures assure for relief workers during disaster response. We investigated this ques-tion using surveys. The surveys included IQ and SQ items that other scholars have tested in previous studies (see Lee et al., 2002; Nelson et al., 2005). In total, we collected 177 completed surveys, of which 153 were suitable for data analysis. We prepared and analyzed the collected survey data using SPSS. The CEDRIC applica-tion in the Rotterdam-Rijnmond case allowed us to study information management using a single IT application. This single IT application based information system scored relatively high on IQ-consistency, IQ-relevancy and IQ-correctness, but low on IQ-timeliness, SQ-accessibility and SQ-response time. In the Gelderland case study, we observed the effects of using multiple IT applications for information management. This multi-IT application based information system scored relatively high on IQ-correctness, IQ-relevancy and IQ-timeliness, but low on IQ-completeness, IQ-consistency and SQ-accessibility. Finally, in the Delfland field study, we collected data on the use of whiteboards as non-IT based information

Summary
272
system. The participants rated the use of whiteboards for information management high on IQ-correctness, IQ-consistency and IQ- relevancy, but low on IQ-completeness, SQ response time and SQ-accessibility. On a cross-field study level, the survey results indicate the relief workers are generally satisfied with the IQ and SQ, despite the fact that accessibility, response time, reliability and information completeness were sometimes problematic.
The third sub-question (2c) asked about what the existing best practices of information system architects are for assuring IQ and SQ. This question was asked because we were convinced that information system architects not only have a bet-ter understanding of existing IS architectures than we had, but also that they would be the best judges of the pathways we had surfaced from literature. We investigated this question by interviewing sixteen senior information system architects working at various relief agencies in the Netherlands. After conducting the interviews and checking the transcripts with the interviewees, we coded and analyzed the tran-scripts using ATLAS.ti for advanced qualitative data analysis. Generally, the infor-mation architects felt that SQ, especially creating interoperability across agency databases is currently the priority whereas IQ is a future concern. In addition to understanding existing information system architectures, the interviewees helped us to further explore and shape the seven pathways provided in NCO and Coordi-nation theory. While the interviews surfaced NCO and service oriented architec-tures (SOA) as future ‘good’ practices that may assure IQ, the current practices converge on assuring SQ-interoperability and SQ-response. Design cycle: redesigning information systems for IQ and SQ assurance Equipped with the pathways derived from theory, as well as empirical data collect-ed from practice, we entered the design cycle of this research. The research ques-tion (question 3) we addressed in this cycle asked about which design principles could assure IQ and SQ during multi-agency disaster response. This question invit-ed the main theoretical contribution of this dissertation and challenged the author to synthesize design principles, that when applied by stakeholders would assure higher levels of IQ and SQ than existing, hierarchy based information systems. Drawing on the kernel theories (coordination theory and NCO), as well as our field study findings, we advocate a more decentralized approach for inter-agency and inter-echelon information management during disaster response. We call this ap-proach netcentric information orchestration, a design theory based on ten design principles, including the re-use of information and information rating.
Netcentric information orchestration proposes the development of dynam-ic information management capabilities prior to (advance structuring) and during disasters (dynamic adjustment). Advance structuring promotes maximizing reach-back capabilities and diversifying information sources for triangulation purposes. This pathway suggests preemptive and protective measures for structuring inter organizational information flows. Advanced structuring involves reducing task in-terdependence through loose coupling, and mitigating resource dependency by di-versifying resource allocations (e.g., creating alternative information sources). On the other hand, dynamic structuring promotes active environmental scanning and information quality feedback by means of rating. The primary theoretical basis is the learning based sense and adapt paradigm. In this way, the orchestrator sup-plements the emergency control center, which only pushes information and does not monitor the quality of information. Avoiding a single point of failure, netcentric

Summary
273
information orchestration proposes the alternative of real-time, demand based and event driven information management between agencies and echelons in PSNs. Here, information ownership is left to the respective public and private organiza-tions, which are left responsible for updating their data. This retention of responsi-bility is an important prerequisite for organizations that possess commercially or security sensitive information and, in case of a disaster, need to share this infor-mation with relief agencies. Furthermore, the netcentric information orchestration approach is scalable since there is no limit to the number of orchestrators that can join different multi-agency teams on the spot.
As cornerstones of our design theory, the suggested design principles are intended to help stakeholders (e.g., IS architects, trainers, software vendors and policy makers) working on the design of IS for public safety and disaster response. The ten design principles for netcentric information orchestration allow stakehold-ers to harness existing diversity in the various information system architectures used in PSNs. Diversity refers to the different software applications, roles, infor-mation objects and policies. In contrast to uniformity, (‘one size fits all’ information system), diversity caters a wider information supply and allows for dynamic ad-justment during disaster response. Netcentric information orchestration does not require that stakeholders use the same IT application and discard their current IT-applications. Instead, technical standards such as XML allow for loosely coupled information sharing between public and private organizations. By promoting the development of a single window, enabled via standardized interfacing technologies between agency specific IT applications, netcentric information orchestration fos-ters the existing technology diversity. We assert that we only need to abandon di-versity for uniformity when we have found the single best way to share information in PSNs. Evaluation cycle: prototyping and gaming-simulation The final cycle in this research focused on the evaluation of our design theory (i.e., the design principles for network centric information orchestration). The question leading this cycle asked to what extent the proposed design principles assure higher levels of IQ and SQ for relief workers when compared to existing hierarchical archi-tectures. We evaluated the design principles in two stages. The first stage was to evaluate the technical feasibility of netcentric information orchestration. For evalu-ating the technical feasibility, we developed a prototype. We called this prototype DIOS (Disaster Information Orchestration System). We developed two versions of DIOS in this research. First, we developed DIOS 1.0 system, a Wiki-based online application embodying the design principles listed in Chapter 6. DIOS 1.0 had a number of technology-enabled features not found in version 2.0, such as logging in and out, a personalization of the functionalities visible to each role and partial im-plementation of Google Maps. However, a major disadvantage of DIOS 1.0 was that this system used full-page refreshing. Consequently, the web application refreshed completely every 30 seconds. The user-experience was therefore relatively poor. Because of the full-page refreshing issue and the database failure during the pretest with master students, we decided to redevelop DIOS and make version 2.0. Conse-quently, the main difference between DIOS 1.0 and 2.0 is that refreshing (present-ing updated information fields) occurs seamlessly by using AJAX technology. The user does not see a whole page refresh, only parts of the page (e.g. one table) are refreshed immediately when an update is posted. In addition, we decided that every
Summary
274
user sees the same screen as everyone else, thereby removing the personalization feature of DIOS 1.0. We made the choice to employ a single network wide situation report for shared situational awareness, where everyone has real-time access to the same information. Eventually it became clear that several trade-offs had to be made between a number of requirements (e.g. personalization vs. shared situational awareness) in order to have a stable netcentric information orchestration proto-type. In the end, we preferred a stable and dependable prototype to a prototype that contains all of the possible functionalities. The second stage of evaluation included a quasi-experimental gaming-simulation. The DIOS 2.0 prototype was an important prerequisite for this form of evaluation with end-users (i.e., professional relief workers). The game was set up as a quasi-experiment, including two rounds of gaming. The first round of gaming simulated existing hierarchy based information management (without the design principles). The second round simulated network centric based information orches-tration (based on the principles embodied in DIOS). After a pre-test with 24 master students, we conducted this quasi-experimental gaming-simulation with 24 profes-sional relief workers. During the gaming-simulation, we collected qualitative data (based on observations and video recording) and quantitative data using surveys. The qualitative data collected from the two rounds of gaming revealed several ad-vantages and weaknesses of netcentric information orchestration compared to hi-erarchical information management. Relief workers were more relaxed and yet quicker in their information management activities using the DIOS prototype. On the other hand, we observed situations in which relief workers made decisions out-side their mandate, just because they had the ability to do so in DIOS. Stanovich (2006) had already warned us for this type of ‘renegade freelancing’. We have also observed some difficulties in dealing with so much information in a single window and heard request for more agency and role specific information displays. Moreo-ver, we also observed a low level of IT-readiness (defined as the willingness and ability to employ IT for tasks execution) amongst the participants, something we have also seen throughout our field studies. In addition, some of the participants were locked-in their current practices and had difficulties in embracing any solu-tions that might modify their known (and trained) practices. While the low level of IT-readiness may be a non-issue for future generations of relief workers, we are more concerned about the observed professional culture of the relief workers to-wards information sharing in a network setting. When we consider the quantitative data, most average IQ and SQ scores provided by the relief workers were higher for netcentric information orchestration than hierarchical information management. However, a test of the statistical significance of the apparent differences between both information system architectures requires us to interpret the quantitative re-sults more carefully. When adhering to such strict rules for statistical significance, we can say that regarding the IQ, netcentric information orchestration assures higher IQ-correctness and IQ-timeliness, SQ- accessibility and SQ-response time.

Samenvatting
275
Samenvatting (summary in Dutch)
Inleiding Recente rampen over de gehele wereld hebben opnieuw aangetoond dat informa-tiemanagement in publieke veiligheidsnetwerken (Public Safety Networks, PSN) een probleem is. Informatiemanagement, gedefinieerd als een cyclus van informa-tieverzameling, opslag, validatie, verrijking en verspreiding vindt veelal nog mono-disciplinair (hulpdienst specifiek) en langs hiërarchische lijnen plaats. De huidige, op hiërarchie gebaseerde informatiesystemen die het informatiemanagement pro-ces moeten ondersteunen falen vooral in het waarborgen van de informatiekwaliteit (Information Quality, IQ) voor hulpverleners. Als gevolg hiervan nemen hulpverle-ners vaak cruciale beslissingen op basis van onjuiste, onvolledige en verouderde informatie. Daarnaast hebben rampen zoals de Polderbaan crash in 2008 laten zien dat de kwaliteit van de huidige informatiesystemen (System Quality, SQ) niet op orde is. Bovendien tonen evaluatieverslagen een aantal voorbeelden van lage SQ aan, zoals hoge responstijden, beperkte toegang tot benodigde informatie en in-flexibele informatiestromen. Vaak worden de lage IQ en SQ toegeschreven aan de kenmerken van rampen (complex en onvoorspelbaar) en de aard van veiligheids-netwerken (veel actoren met onzekere informatie behoeften). In dit onderzoek be-handelen we IQ en SQ niet als problemen, maar als symptomen van gebrekkige informatiesystemen.
Los van enkele theoretische paden, biedt de bestaande literatuur echter weinig begeleiding aan belanghebbenden (informatiesysteem architecten, beleids-makers en softwareleveranciers) bij het waarborgen van de IQ en SQ tijdens ram-pen. Dit proefschrift beoogt daar verandering in te brengen. Het doel is om te on-derzoeken welke ontwerpprincipes voor informatiesystemen een hogere mate van IQ en SQ kunnen waarborgen dan de huidige, op hiërarchie gebaseerde informatie-systemen. Door het gebruik van de design science onderzoeksstrategie is dit onder-zoek ingedeeld in vier cycli: een relevantiecyclus (gebruikmakend van veldonder-zoek), een theoriecyclus (gebruikmakend van paden in bestaande theorieën), een ontwerpcyclus (combineren van empirische en theoretische inzichten) en een eva-luatiecyclus (aan de hand van een prototype en een quasi-experimentele spelsimu-latie met hulpverleners). De ontwerpcyclus integreert de bevindingen van de rele-vantiecyclus en de theoriecyclus tot een ontwerptheorie: netcentrische informatie-orkestratie, bestaande uit een tiental ontwerpprincipes. De evaluatiecyclus laat zien dat netcentrische informatie-orkestratie een hogere mate van IQ en SQ waarborgt voor hulpverleners dan traditionele (hiërarchie gebaseerde) informatiesystemen. De horden voor het waarborgen van IQ en SQ in de veiligheidsketen Tijdens de rampenbestrijding moeten opeens tal van openbare en particuliere or-ganisaties samenwerken als één veiligheidsnetwerk. Deze vorm van samenwerking is nodig aangezien geen enkele hulpdienst of private organisatie over alle middelen en expertise beschikt om de diverse aspecten van een ramp te kunnen beheersen. Rampenbestrijding is voor geen enkele organisatie een primair proces of een kern-taak, rampen komen immers niet vaak voor. Met de focus op het ondersteunen van de interne en dagelijkse processen, hebben hulpdiensten hun eigen informatiesys-

Samenvatting
276
temen ontwikkeld. Deze informatiesystemen zijn vaak niet flexibel en niet bedoeld om informatiebehoeften te ondersteunen die buiten de grenzen van de eigen hulp-dienst vallen. Naarmate de omvang en ernst van een ramp toeneemt, ontvouwen PSN’s zich in drie echelons: strategisch, tactisch en operationeel. In overeenstem-ming met deze hiërarchische gezagsstructuur worden verschillende mono- en mul-tidisciplinaire crisisteams geactiveerd. De output van deze teams omvat besluiten en acties, terwijl de input voor deze teams een situatie afhankelijke mix van infor-matie, protocollen en gebeurtenissen omvat. In veel gevallen worden inter-organisatorische- en inter-echelon informatiemanagement processen beperkt door de mogelijkheden en capaciteiten die door de afzonderlijke (hulpdienst specifieke) informatiesystemen worden geboden. Daarnaast zijn er nog andere belemmeringen die bij het bestuderen van de sociale en technische componenten van informatie-systemen naar voren komen.
Ten eerste heeft elke hulporganisatie haar eigen specialisatie en daarbij ho-rende informatiebehoefte. In de praktijk zijn de informatiesystemen van de ver-schillende hulporganisaties onverenigbaar, waardoor informatiemanagement tus-sen organisaties en tussen bestuurlijke lagen lastig is. Ten tweede is vraag en aan-bod van informatie verspreid over het netwerk en moeilijk vooraf te bepalen. Een hulpverlener kan op tijdstip t=0 zowel een bron als een afnemer van informatie zijn. Tenslotte maakt de onzekerheid die inherent is aan rampen het moeilijk om vooraf vast te stellen welke informatiestromen zullen optreden en welke informa-tiebehoefte zich zal manifesteren gedurende een ramp. Aangezien de informatiesys-temen van de individuele hulporganisaties zijn ontworpen om dagelijkse processen op organisatorisch niveau te ondersteunen, bieden deze slechts beperkte onder-steuning aan informatiemanagement op een multidisciplinair (netwerk) niveau.
Onderzoeksvraag en onderzoeksstrategie Aangezien er geen rechtstreeks toepasbare theorieën zijn voor het waarborgen van IQ en SQ tijdens een crisisrespons, volgt dit proefschrift een design science onder-zoeksstrategie. Design science onderzoek is ingegeven door de wens om de maat-schappij te verbeteren met behulp van nieuwe en innovatieve artefacten. Deze aan-pak stelde ons in staat om dit onderzoek te starten vanuit een eerste vermoeden over een mogelijke oplossing. Ons eerste vermoeden was dat de louter samenvoe-ging van afzonderlijke, hulpdienst-specifieke informatiesystemen tijdens een crisis onvoldoende mogelijkheden biedt voor het waarborgen van IQ en SQ in een net-werk van publieke en private organisaties. Daarnaast suggereerden de coördinatie-theorie en de Network Centric Operations (NCO) theorie al aan het begin van dit onderzoek een aantal theoretische paden waarlangs ontwerpprincipes voor IQ en SQ konden worden afgeleid. Op basis van dit eerste vermoeden, formuleerden we de centrale onderzoeksvraag als: voortbordurend op de coördinatietheorie en de NCO-theorie, welke ontwerpprincipes waarborgen een hogere IQ en SQ tijdens een crisisresponse? Deze hoofdvraag valt uiteen in een viertal deelvragen, waarbij iede-re deelvraag leidend is bij één van de design science cycli. We vatten vervolgens de bevindingen van elke cyclus samen. De theoriecyclus: het meten en waarborgen van IQ en SQ Voorafgaand aan de relevantiecyclus hebben wij in de theoriecyclus literatuuron-derzoek verricht naar instrumenten voor het meten van IQ en SQ. Daarnaast heb-ben wij de coördinatietheorie en de NCO-theorie verder onderzocht voor paden in

Samenvatting
277
de relevantiecyclus en ontwerpcyclus die gevolgd kunnen worden voor het afleiden van ontwerpprincipes. De deelvraag die leidend was in de theoriecyclus is tweele-dig: (1a) welke instrumenten worden in de literatuur aangereikt voor het meten van IQ en SQ?, en (1b) welke paden worden in de coördinatietheorie en de NCO theorie beschreven voor het waarborgen van IQ en SQ?
Het antwoord op vraag 1a bestaat uit een tweetal raamwerken die elk in-strumenten bevatten waarmee wij IQ en SQ kunnen meten. Uit de literatuur valt op te maken dat IQ en SQ multi-dimensionele constructen zijn die afhankelijk van de perspectief op informatie (als product of proces) langs verschillende dimensies en instrumenten kunnen worden geëvalueerd. Zowel de dimensies als instrumenten zijn al geëvalueerd in onderzoek van derden. Aangezien IQ en SQ subjectieve con-structen zijn, is het van belang dat wij deze meten via de gebruiker van informatie, in dit geval de hulpverlener. De raamwerken met meetinstrumenten voortkomend uit de theoriecyclus waren noodzakelijk voor het starten van de relevantiecyclus.
Het antwoord op vraag 1b valt uiteen in een zevental theoretische paden, vier uit de coördinatietheorie en drie uit de NCO-theorie. De paden uit de coördina-tietheorie zijn ‘boundary spanning’ (rollen en objecten over de grenzen van organi-saties), orkestratie (afstemming van variëteit), ‘advance structuring’ (vooraf ont-wikkelen van vaardigheden) en ‘dynamic adjustment’ (aanpassen van mogelijkhe-den gedurende een ramp). De paden uit de NCO-theorie zijn ‘reachback’ (direct toegang tot externe informatiebronnen), ‘zelfsynchronisatie’ (van individuen en groepen in een netwerk) en ‘informatiepooling’ (single window tot benodigde in-formatie). Hoewel deze paden een doelgerichte evolutie binnen de genoemde theo-rieën beschrijven, bieden deze paden afzonderlijk nog onvoldoende houvast voor het ontwikkelen van ontwerpprincipes. Om de mogelijkheden en beperkingen van deze paden in te kunnen schatten moet eerst de relevantiecyclus worden doorlopen. De relevantiecyclus: veldonderzoek en empirische data collectie Uitgerust met de IQ en SQ meetinstrumenten uit de literatuur en bewust van de paden uit de theorie begonnen wij aan ons veldonderzoek. Het veldonderzoek vond plaats in drie Nederlandse regio’s: Rotterdam-Rijnmond, Gelderland en Delfland. Deze regio’s zijn geselecteerd op een aantal criteria, waaronder het gebruik van ver-schillende informatiesystemen gedurende een crisisrespons. Het veldonderzoek was bedoeld om de tweede onderzoeksvraag te beantwoorden. Deze vraag is driele-dig. De eerste deelvraag (2a) luidt: op welke wijze wordt in de praktijk informatie gemanaged binnen en tussen multidisciplinaire teams? We stellen deze vraag om inzicht te krijgen in de rollen, taken, informatiestromen en informatietechnologie (IT) applicaties binnen de huidige informatiesystemen. Aangezien er geen uitge-breide beschrijvingen van informatiesystemen voor de crisisresponse bestaan in de huidige literatuur, hebben wij de vraag voornamelijk beantwoord aan de hand van observaties in de praktijk. In teams van één tot vier personen hebben wij ruim 22 verschillende crisisrespons-oefeningen geobserveerd. Observaties vonden plaats op basis van vooraf gedefinieerde observatieprotocollen. Deze observaties resulteer-den in een drietal uitgebreide beschrijvingen van informatiesystemen voor crisis-respons. Opvallend is de verscheidenheid in rollen en IT applicaties die deel uitma-ken van de huidige informatiesystemen. Onze waarnemingen tonen aan dat on-danks dat er langs meerdere kanalen (radio, emailberichten en digitale kaarten) informatie wordt gedeeld, de informatiestromen primair binnen de diensten en langs de hiërarchische lijnen plaatsvinden. Veel informatie wordt gedeeld volgens

Samenvatting
278
een hiërarchisch georganiseerde commando- en controlestructuur. De informatie, die vaak versnipperd is over het gehele netwerk, wordt hierdoor onvoldoende geag-gregeerd tot een gedeeld (multidisciplinair) beeld van de crisissituatie. Bovendien zijn de rollen en IT-applicaties voor inter-team en inter-echelon informatiemana-gement gefixeerd op het opstellen van situatierapporten en bieden weinig moge-lijkheden voor het waarborgen van IQ en SQ. Deze hiërarchie van informatie-uitwisseling resoneert met een functionele hiërarchie. Commandanten informeren hun officieren op een beperkte, ‘need to know’-basis en zijn zich vaak niet bewust van de bredere context en betekenis van deze informatie voor de andere hulpdien-sten.
Gelet op de verscheidenheid aan informatiesystemen in de praktijk ont-staat de tweede deelvraag (2b): welke niveaus van IQ en SQ worden gewaarborgd door de huidige informatiesystemen? We onderzochten deze vraag met behulp van enquêtes. De enquêtes bestaan uit IQ en SQ stellingen die zijn getoetst in eerdere studies. De verzamelde onderzoeksgegevens zijn gecodeerd en geanalyseerd met behulp van SPSS (een software applicatie voor geavanceerde kwantitatieve data-analyse). Na een controle op de volledigheid en betrouwbaarheid van de 177 inge-vulde enquêtes, bleven 153 over voor data-analyse. De data-analyse resulteert in de volgende conclusies. Het op één IT-applicatie gebaseerde informatiesysteem in Rotterdam-Rijnmond scoort volgens de geënquêteerde hulpverleners hoog op IQ-consistentie, IQ-relevantie en IQ-correctheid, maar laag op IQ-tijdigheid, SQ-toegankelijkheid en SQ-responstijd. In Gelderland observeerden we de effecten van het gebruik van meerdere (vier) IT-applicaties voor informatiemanagement. Dit op multi-applicatie gebaseerde informatiesysteem scoort volgens de geënquêteerde hulpverleners hoog op IQ-correctheid, IQ-relevantie en IQ-actualiteit, maar laag op IQ-volledigheid, IQ-consistentie en SQ-toegankelijkheid. Tenslotte hebben wij in Delfland hulpverleners geënquêteerd over de IQ en SQ die wordt gewaarborgd bij het gebruiken van statusborden tijdens een crisisresponse. Dit niet IT-gebaseerde informatiesysteem scoort volgens de geënquêteerde hulpverleners hoog op IQ-correctheid, IQ-consistentie en IQ-relevantie, maar laag op IQ-volledigheid, SQ- responstijd en SQ-toegankelijkheid.
De derde deelvraag (2c) gaat in op de bestaande best practices van infor-matiesysteem architecten als het gaat om het waarborgen van IQ en SQ. Deze vraag werd gesteld, omdat we ervan overtuigd waren dat informatiesysteem architecten niet alleen een beter begrip van de bestaande informatiesystemen hebben als wij, maar ook omdat de architecten een goede jury vormden voor de mogelijkheden en beperkingen van de theoretische paden die wij uit de literatuur hebben afgeleid. We onderzochten deze vraag aan de hand van interviews met zestien senior informatie- systeem architecten die werkzaam zijn voor verschillende hulporganisaties in Ne-derland. Na het uitvoeren van de interviews en het controleren van de transcripten met de geïnterviewde architecten, hebben we de transcripten gecodeerd en geana-lyseerd met behulp van ATLAS.ti (een software applicatie voor geavanceerde kwali-tatieve data-analyse). De interviewresultaten laten zien dat op dit moment SQ, met name het creëren van interoperabiliteit tussen diverse databases, een hogere priori-teit geniet dan het waarborgen van IQ. Hoewel de architecten het belang van IQ ook beamen, vinden zij het waarborgen van IQ een zorg voor de toe-komst. Tenslotte stellen de architecten dat er geen nationaal gedragen principes bestaan voor het ontwerpen van informatiesystemen voor een crisisrespons. Ont-wikkelingen op het gebied van NCO en ‘service oriented architectures’ (SOA) zijn

Samenvatting
279
volgens de architecten de trends die het landschap van informatiesystemen zullen bepalen. De ontwerpcyclus: netcentrische informatie-orkestratie als ontwerp-theorie Voortbouwend op de resultaten van de theorie- en relevantiecyclus, zijn wij begon-nen aan de ontwerpcyclus in dit onderzoek. De vraag die wij in deze cyclus beant-woorden is, welke ontwerpprincipes kunnen een hogere IQ en SQ waarborgen tij-dens een crisisresponse? Deze deelvraag levert de belangrijkste theoretische bijdra-ge van dit proefschrift. Ons doel was om ontwerpprincipes te synthetiseren, die na toepassing een hogere mate van IQ en SQ waarborgen dan de bestaande, op hiërar-chie gebaseerde informatiesystemen. Na de integratie van de paden uit de theorie-en (coördinatietheorie en NCO) en onze veldstudie bevindingen pleiten wij voor een meer gedecentraliseerde en real-time gedreven vorm van inter-agency en inter-echelon informatiemanagement tijdens een cisisrespons. We noemen deze aanpak netcentric informatie-orkestratie en werken deze uit als een ontwerptheorie be-staande uit een tiental ontwerpprincipes, waaronder ‘hergebruik informatie’, ont-wikkel een netwerk informatie pool als situatie-overzicht’ en ‘ontwikkel functionali-teiten voor het beoordelen van informatie’.
Netcentric informatie-orkestratie vraagt om de ontwikkeling van netwerk-brede orkestratie mogelijkheden voorafgaand aan (advance structuring) en tijdens een crisisrespons (dynamic adjustment). Vooraf structureren bevordert het maxi-maliseren van ‘reachback’ mogelijkheden en diversificatie van informatiebronnen voor datatriangulatie. Dit traject resulteert in preventieve en beschermende maat-regelen voor het structureren van de organisatie onder informatiestromen. Dyna-mische structureren bevorderen onder andere het proactief scannen van interne- en externe informatiebronnen (zoals Twitter en Youtube) en het continu reflecteren op de kwaliteit van de gedeelde informatie. Netcentric informatie-orkestratie vraagt om een gedreven herinrichting van de bestaande, op hiërarchie gedreven informa-tiesystemen waarbij hulpverleners worden versterkt (empowered) in hun vermogen om zichzelf van de meest recente en gevalideerde informatie te voorzien. Deze her-inrichting is schaalbaar, aangezien meerdere orkestratoren kunnen worden geacti-veerd naarmate de omvang van de crisis toeneemt.
Netcentric informatie-orkestratie zorgt ervoor dat de huidige diversiteit (verschillende IT-applicaties) in de bestaande PSN’s niet verloren gaat (in tegen-stelling tot het verplichten van één IT-applicatie voor alle hulpdiensten). Door mo-derne technologie standaarden zoals XML te gebruiken, kunnen informatie objec-ten uit diverse IT-applicaties en databases worden geput zonder dat de applicaties een directe koppeling met elkaar moeten hebben. Via orkestratie proberen we de variëteit te benutten in de verschillende informatiesystemen die momenteel ge-bruikt worden in de verschillende PSN’s. Variëteit verwijst hier naar de verschil-lende, soms overlappende softwareapplicaties, rollen, objecten en procedures. In tegenstelling tot uniformiteit (‘one size fits all’ informatiesysteem), waarborgt vari-eteit het ondersteunen van een ruimer informatieaanbod tijdens onvoorspelbare rampen. Wij zijn van mening dat het pad van variëteit alleen dan moet worden ver-laten zodra de beste manier om informatie te delen is gevonden. Onze analyse van de literatuur laat zien dat de huidige informatiesystemen vooral zijn ontwikkeld om routinematige processen binnen de hiërarchie van de eigen hulpverleningsorgani-saties te ondersteunen. Deze op hiërarchie gebaseerde informatiesystemen voldoen

Samenvatting
280
vaak aan de informatiebehoefte tijdens normale, dagelijkse omstandigheden (geen crisis). Deze informatiesystemen kunnen echter de netwerk brede en onvoorspelba-re informatiebehoefte die ontstaat tijdens multidisciplinaire rampenbestrijding onvoldoende ondersteunen, met als gevolg dat hulpverleners actie moeten onder-nemen op basis van informatie die onjuist, niet compleet of verouderd is. In plaats van het volledig opgeven van de huidige informatiesystemen, biedt orkestratie de mogelijkheid om de huidige informatiesystemen te versterken met een specifieke reeks van dynamische capaciteiten die nodig zijn voor het waarborgen van IQ en SQ. Deze zogenaamde ‘dynamic capabilities’ zijn onder andere: netwerk brede toe-gang tot informatie, real-time informatie-uitwisseling en informatiewaardering aan de hand van kwaliteitsfeedback. De evaluatiecyclus: orkestratie prototype en quasi-experiment De laatste cyclus van dit onderzoek omvatte de evaluatie van de ontwerptheorie (de ontwerpprincipes voor netcentrische informatie-orkestratie). We evalueerden de ontwerptheorie in twee opeenvolgende stappen. Allereerst evalueerden wij de tech-nische realiseerbaarheid van de ontwerpprincipes door middel van een prototype. De constructie van het prototype, een online ‘single window’ IT-applicatie, werd geleid door de principes van netcentrische informatie-orkestratie. Daarnaast was het prototype ook nodig om later de ontwerpprincipes samen met hulpverleners te evalueren in een spel. Dit prototype heet DIOS (Disaster Information Orchestration System) en moest ervoor zorgen dat informatie tussen verschillende hulpdiensten, multidisciplinaire teams en echelons kon worden gedeeld via het internet. De eer-ste versie van dit prototype (DIOS 1) werd gerealiseerd in een online, Wikipedia-achtige omgeving die gebruikers de mogelijkheid bood om informatie uit diverse interne- en externe databases te verzamelen op basis van web-services. DIOS 1 faalde echter bij een proefspelsimulatie met studenten. Op basis van de waargeno-men beperkingen van DIOS 1 (o.a. een beperkte database en hoge screen refresh rate), zijn we gestart met het ontwikkelen van DIOS 2. De tweede versie van DIOS is ontwikkeld als een Dashboard met daarin uitklapbare informatievelden die dankzij AJAX-technologie en een SQL-database het scherm niet steeds ververste bij het binnenkomen van nieuwe informatie. Een stresstest laat zien dat DIOS 2 niet faalt bij het simultaan gebruik over het internet. DIOS 2 toont dat de ontwerpprin-cipes in ieder geval technisch realiseerbaar zijn. Naast de technische realiseerbaarheid, omvatte de evaluatiecyclus ook een evaluatie van de ontwerpprincipes met hulpverleners uit de praktijk. De deelvraag die hierbij centraal staat is in welke mate netcentrische informatie- orkestratie leidt tot het beter waarborgen van IQ en SQ vergeleken met een op hiërarchie gebaseer-de informatiesysteem. Deze deelvraag werd onderzocht door middel van een spel-simulatie (rollenspel) met hulpverleners. Deze spelsimulatie is opgezet als een qua-si-experiment met twee spelronden. In de eerste spelronde gebruikten de hulpver-leners een op hiërarchie gebaseerd informatiesysteem voor het management van informatie gedurende een fictieve ramp. In de tweede spelronde gebruikten dezelf-de hulpverleners het DIOS prototype voor netcentrische informatie-orkestratie ge-durende een fictieve ramp. Door de spelsimulatie op te zetten als quasi-experimenten, kunnen wij de verzamelde data over beide spelronden vergelijken. In totaal hebben 24 hulverleners van verschillende organisaties deelgenomen aan ons spel. Deze spelsimulatie werd eerder al gespeeld met studenten om zodoende te toetsen of de verschillende elementen van de spelsimulatie (scenario’s, rolbeschrij-

Samenvatting
281
vingen, berichten etc.) duidelijk en uitvoerbaar waren. Na de pre-test met 24 stu-denten, voerden we deze quasi-experimentele spelsimulatie met 24 professionele hulpverleners. Tijdens de spelsimulatie met hulpverleners, verzamelden we kwali-tatieve gegevens (gebaseerd op observaties en video-opname) en kwantitatieve ge-gevens met behulp van enquêtes.
De kwalitatieve gegevens die wij hebben verzameld over de twee spelrondes onthullen een aantal voordelen en zwakke punten van netcentrische informatie-orkestratie in vergelijking met hiërarchisch informatiemanagement. Hulpverleners waren meer ontspannen en sneller in hun informatiemanagement activiteiten via het DIOS prototype. Aan de andere kant hebben we situaties waargenomen waarin hulpverleners beslissingen namen buiten hun mandaat, omdat ze in DIOS hiertoe de mogelijkheid kregen dit te doen. Literatuur op NCO had al gewaarschuwd voor deze vorm van ‘renegade freelancing’. We hebben ook gezien dat enkele hulpverle-ners aan het begin van de tweede ronde wat moeite hadden met de relatief grote hoeveelheid aan informatie in een informatiesysteem. We kregen tevens enkele verzoeken om de informatie in DIOS beter te clusteren naar de specifieke rollen en hulpdiensten die van het informatiesysteem gebruik kunnen maken. Tenslotte heb-ben een tweetal hulpverleners ook zorgen geuit over de implementatie van dit soort systemen in de praktijk, mede omdat deze niet in lijn was met hun voorgaande training en procedures.
Wanneer we de kwantitatieve gegevens overwegen, blijkt dat netcentrische informatie-orkestratie hoger scoort over bijna alle IQ en SQ variabelen dan het ge-val bij hiërarchisch informatiemanagement. Alleen de gemiddelde waarden voor IQ-consistentie en IQ-relevantie waren lager voor netcentrische informatie-orkestratie. Echter, een test naar het statistische significantie van de kwantitatieve verschillen tussen beide informatiesystemen noodzaken ons om deze resultaten met enig voorbehoud te interpreteren. Zelfs bij het naleven van dergelijke strenge regels voor statistische significantie kunnen we concluderen dat netcentrische in-formatie-orkestratie leidt tot het beter waarborgen van IQ-correctheid, IQ-actualiteit, SQ-toegankelijkheid en SQ-response-tijd. Conclusies en aanbevelingen Dit proefschrift introduceert: ‘Netcentrische informatie-orkestratie’, een ontwerp-theorie voor het waarborgen van IQ en SQ tijdens multidisciplinaire rampenbe-strijding. Deze ontwerptheorie bestaat uit een tiental ontwerpprincipes, die ge-stoeld zijn op theoretische paden en empirische inzichten. De ontwerpprincipes zijn in dit proefschrift getoetst op technische realiseerbaarheid (in een prototype) en de mate waarin zij bijdragen aan het waarborgen van de IQ en SQ voor hulpver-leners (aan de hand van een quasi-experimentele spelsimulatie met hulpverleners). Het quasi-experiment laat zien dat netcentrische informatie-orkestratie een hogere mate van IQ en SQ waarborgt voor hulpverleners dan traditionele (hiërarchie geba-seerde) informatiesystemen. Door op basis van de tien aangereikte ontwerpprinci-pes informatie te orkestreren tussen multidisciplinaire teams en tussen coördina-tielagen, krijgen hulpverleners sneller de juiste informatie die zij nodig hebben voor het uitvoeren van hun taken. Dit onderzoek reikt zes aanbevelingen voor ver-volgonderzoek aan.
De eerste aanbeveling is om vervolgonderzoek te verrichtten naar instru-menten die helpen in het aanpassen van de huidige houding van hulpverleners je-gens netwerk gebaseerde informatiesystemen. Om daadwerkelijk de voordelen van

Samenvatting
282
netcentrische systemen te kunnen benutten, is het van belang dat hulpverleners begrijpen dat zij niet alleen lid zijn van een hulpdienst, maar tevens een bron zijn van informatie in een netwerk van publieke en private organisaties. Een tweede aanbeveling is om vervolgonderzoek te verrichten naar het proactief benutten van media- en burgerinformatie. Ondanks het feit dat hulpverleners zich vaak bewust zijn van de waarde van media- en burgerinformatie, bieden huidige informatiesys-temen te weinig middelen om deze informatie gevalideerd en tijdig te kunnen be-nutten. Hoewel het DIOS prototype hulpverleners toegang biedt tot informatie in sociale netwerken zoals Twitter en Youtube, benutten wij tot dusver slechts een fractie van de potentie die dit soort participatieve en interactieve platformen te bie-den hebben. Een derde aanbeveling is om vervolgonderzoek te verrichten naar het voorkomen van ‘renegade freelancing’. Dit zijn situaties waarbij hulpverleners be-slissingen nemen die buiten hun bevoegdheden vallen en niet in lijn zijn met de doelstellingen van de besluitvormers. Hoewel ‘renegade freelancing’ ook plaats-vindt in op hiërarchie gebaseerde informatiesystemen, liet het quasi-experiment ons zien dat onbegrensde toegang tot informatie de kans op dit fenomeen versterkt. Een vierde aanbeveling is om vervolgonderzoek te verrichten naar simpele doch robuuste systemen waarop hulpverleners kunnen terugvallen, indien ICT hen in de steek laat.
Ondanks het feit dat ICT infrastructuren steeds minder uitval vertonen en er veel onderzoek wordt verricht naar het voorkomen van infrastructuur falen, zijn er nog situaties denkbaar waarbij hulpverleners moeten terugvallen op systemen gebaseerd op pen en papier voor het delen van informatie. Tot dusver is er weinig onderzoek verricht naar wanneer en hoe terug te vallen op pen en papier systemen gedurende rampen. Een vijfde aanbeveling is om vervolgonderzoek te verrichten naar het verbergen van de adaptiviteit in ICT. Waar er nog veel onderzoek wordt gedaan naar ICT systemen die zich automatisch kunnen aanpassen aan de omge-ving en behoefte van gebruikers gedurende een ramp, hebben wij herhaaldelijk het verzoek gekregen van hulpverleners om systemen te ontwikkelen die voor hen be-kend zijn. De uitdaging voor verder onderzoek is om de gebruikersinterface (pre-sentatie laag) van systemen zo stabiel mogelijk te houden, terwijl de achterliggende techniek zich aanpast aan de veranderende situatie. Tenslotte stelt dit proefschrift dat er verder onderzoek nodig is naar het op de ‘juiste’ manier gebruiken van in-formatie gedurende een rampenbestrijding. Waar de betrokken partijen vaak stre-ven naar ‘het delen van de juiste informatie, op het juiste moment en tussen de juiste personen’, is er nog weinig onderzoek verricht naar voorschriften voor het op de juiste manier gebruiken van informatie in een netwerk van organisaties.

Appendices
283
Appendices
Appendix A: List of abbreviations
AJAX Asynchronous Javascript And XML
ARB Ambternaar Rampenbestrijding
BW Brandweer (fire department)
COPI Commando place incident team
DCMR Dienst Chemische stoffen en Milieu Rijnmond
ECR Emergency Control Center
GHOR Geneeskundige Hulpverlening bij Ongevallen en Rampenbestrijding
GIS Geographic information systems
GMS Gemeenschappelijk Meldkamer Systeeem
GRIP Coordinated incident response procedure
GVS Gemeentelijke Veiligheids Staf/Municipal Crisis Center (MCC)
HCC Harbor Coordination Center
HHD Hoogheemraadschap Delfland
IC Information Coordinator
ICT Information & Communication Technology
IM Information Manager
IQ Information Quality
IS(s) Information System(s)
IT Information Technology
KMNI Koninklijk Nederlands Meteorologisch Instituut
NCO Network Centric Operations
POR Port of Rotterdam
PSN Public Safety Network
ROT Regional Operational Team
RPA Rotterdam Port Authority
SD Standard Deviation
Sitreps Situation reports
SOA Service Oriented Architecture
SQ System Quality
XML Extensible Markup Language
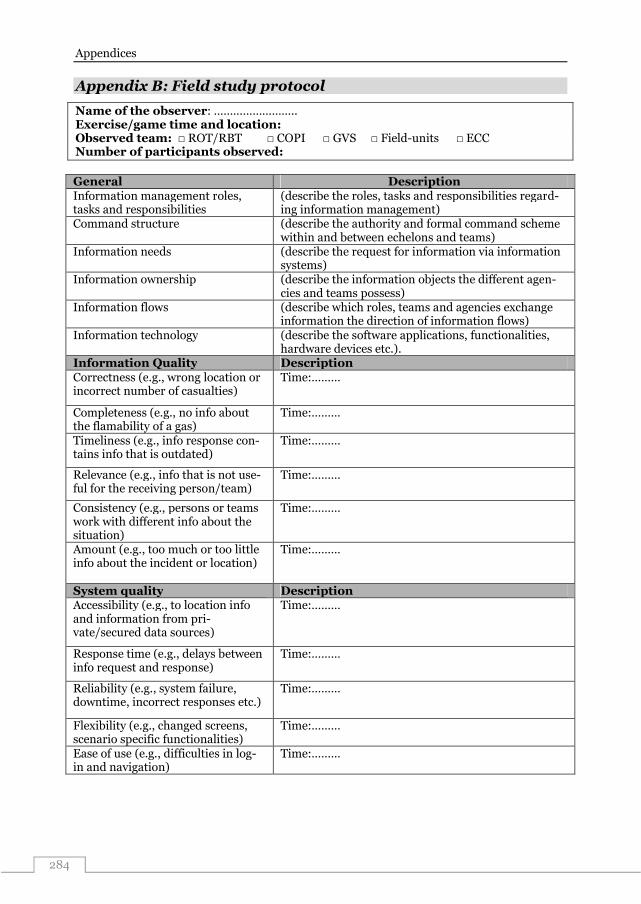
Appendices
284
Appendix B: Field study protocol
Name of the observer: …………………….. Exercise/game time and location: Observed team: □ ROT/RBT □ COPI □ GVS □ Field-units □ ECC Number of participants observed:
General Description Information management roles, tasks and responsibilities
(describe the roles, tasks and responsibilities regard-ing information management)
Command structure (describe the authority and formal command scheme within and between echelons and teams)
Information needs (describe the request for information via information systems)
Information ownership (describe the information objects the different agen-cies and teams possess)
Information flows (describe which roles, teams and agencies exchange information the direction of information flows)
Information technology (describe the software applications, functionalities, hardware devices etc.).
Information Quality Description Correctness (e.g., wrong location or incorrect number of casualties)
Time:………
Completeness (e.g., no info about the flamability of a gas)
Time:………
Timeliness (e.g., info response con-tains info that is outdated)
Time:………
Relevance (e.g., info that is not use-ful for the receiving person/team)
Time:………
Consistency (e.g., persons or teams work with different info about the situation)
Time:………
Amount (e.g., too much or too little info about the incident or location)
Time:………
System quality Description Accessibility (e.g., to location info and information from pri-vate/secured data sources)
Time:………
Response time (e.g., delays between info request and response)
Time:………
Reliability (e.g., system failure, downtime, incorrect responses etc.)
Time:………
Flexibility (e.g., changed screens, scenario specific functionalities)
Time:………
Ease of use (e.g., difficulties in log-in and navigation)
Time:………

Curriculum vitea
285
Appendix C: Interviewees
The following table provides an overview of the interviewed information system architects. Only their first name of each respondent is listed in order to maintain anonymity.
Table Appendix C-1: Overview of interview respondents
Id Respondent Organization Background/expertise 1 Wim Police Former police squad commander, current
head of the multi-agency disaster re-sponse training department
2 Anton Rotterdam Port Authority
Emergency control room systems, com-munication technologies
3 Peter Geo-technology provider
Geographic information technologies for disaster management
4 Daan Port Authority Port-officer squad commander 5 Leo Ministry of Internal
Affairs and King-dom Relations, Department of Safety and Crisis Management
Development and implementation of ad-vanced disaster management technolo-gies, Network Centric Operations expert
6 Ralph Chemical services Chemical materials, codes, standards and technologies.
7 Vincent Fire department Fire squad manager, information man-agement
8 Ton Ambulance Ser-vices
Ambulance tracking systems, victim monitoring systems
9 Willem-Jan Fire department ICT support, organisational information-sharing
10 Martijn Hazmat services Hazardous materials registration, risk communication and data sharing
11 Sander Police Information architectures, application manager
12 Mark Ambulance Information management 13 Leo Police ICT architect, registration systems 14 Marcel Fire department Information management 15 Kees Infrastructure ser-
vices Disaster displays, communication systems architect
16 Jan-Willem Application provid-er
Crisis response systems, service-oriented architectures

Appendices
286
Appendix D: Survey questions
In this appendix, the surveys used in this research are presented. The items in the survey are in Dutch. Note that the survey used for gaming-simulation included all parts, while only parts C, D and F were included in the surveys for the field studies.
Beste respondent, Wij willen u vragen om deze vragenlijst invullen, als onderdeel van deze spelronde. De resultaten van deze vragenlijst zullen alleen worden gebruikt voor verder weten-schappelijk onderzoek naar de knelpunten voor informatie- en systeemkwaliteit tijdens rampenbestrijding. Alvast bedankt voor het willen invullen van de vragen-lijst! Deel A. Algemene vragen 1. Voor welke organisatie werkt u? □ a. Brandweer □ d. Politie □ b. Gemeente □ e. Waterschappen □ c. GHOR □ f. Anders,namlijk……………………… 2. Hoeveel jaar werkt u al voor deze organisatie? □ a. 0 tot 1 jaar □ d. 5 tot 10 jaar □ b. 1 tot 3 jaar □ e. 10 tot 20 jaar □ c. 3 tot 5 jaar □ f. meer dan 20 jaar 3. In welke van de volgende teams heeft u in de praktijk deelgenomen? □ a. Regionale Beleids Team □ d. Gemeentelijke Veiligheidstaf □ b. COPI (COmmando Plaats Incident) □ e. Meldkamer □ c. Veld □ f.Anders, namelijk 4. Hoe vaak hebt u al meegedaan tijdens een daadwerkelijke GRIP situatie in de praktijk (GRIP 1 en hoger)? □ a. 0 keer □ d. 10 tot 15 keer □ b. 1 tot 5 keer □ e. 15 tot 20 keer □ c. 5 tot 10 keer □ f. meer als 20 keer 5. In welke van de volgende teams nam u deel gedurende het spel? □ a. COPI (COmmando Plaats Incident) □ e. Veld - GHOR □ b. GVS (Gemeentelijke Veiligheidsstaf) □ f. Meldkamer - Brandweer □ c. Veld - Brandweer □ g. Meldkamer - Politie □ d. Veld- Politie □ h. Meldkamer –GHOR

Appendices
287
Deel B. Evaluatie van de eerste spelronde
De volgende vragen betreffen de eerste spelronde en zijn geformuleerd als stellin-gen. In hoeverre bent u het eens met de volgende stellingen?
Totaal Oneens
(omcirkel uw keuze)
Totaal Eens
1. De eerste spelronde was goed georganiseerd. 1 2 3 4 5 6 7
2. Het scenario van de eerste spelronde was rea-listisch.
1 2 3 4 5 6 7
3. De structuur (volgorde) van de eerste spelron-de was duidelijk.
1 2 3 4 5 6 7
4. Ik kon op basis van mijn rolbeschrijving mijn taken in het spel goed vervullen.
1 2 3 4 5 6 7
5. Mijn rolbeschrijving in het spel komt overeen met mijn dagelijkse rol.
1 2 3 4 5 6 7
6. Mijn spelersboekje gaf mij voldoende informa-tie voor het kunnen deelnemen aan de eerste spelronde.
1 2 3 4 5 6 7
7. Het gebruiken van Sitraps om informatie te delen tussen de verschillen teams komt overeen met de werkelijkheid.
1 2 3 4 5 6 7
8. De afhankelijkheden tussen de deelnemende teams werd conform de realiteit in het spel nage-speeld.
1 2 3 4 5 6 7
9. De organisatoren hebben op een realistische wijze de informatie uitwisselingsprocessen tij-dens crisissituaties gesimuleerd.
1 2 3 4 5 6 7
10. Over het algemeen was de eerste spelronde leerzaam.
1 2 3 4 5 6 7
Deel C. Evaluatie van de informatiekwaliteit Tijdens de eerste ronde van het spel heeft u aan de hand van situatie rapporten in-formatie van anderen ontvangen en informatie naar anderen verstuurd. U kunt de kwaliteit van de ontvangen informatie bepalen aan de hand van verschillende in-formatie kwaliteit dimensies, zoals de juistheid, volledigheid en tijdigheid. In hoe-verre bent u het eens met de volgende stellingen omtrent de informatie kwaliteit tijdens de eerste spelronde?

Appendices
288
Totaal Oneens
(omcirkel uw keuze)
Totaal Eens
1. Over het algemeen was de informatie die met mij werd gedeeld up-to-date. <IQ timeliness1>
1 2 3 4 5 6 7
2. Over het algemeen was de informatie die met mij werd gedeeld correct. <IQ correctness1>
1 2 3 4 5 6 7
3. Over het algemeen was de informatie die met mij werd gedeeld volledig. <IQ completeness1>
1 2 3 4 5 6 7
4. Ik kreeg teveel informatie van de anderen. <IQ over-load1>
1 2 3 4 5 6 7
5. De informatie die ik van anderen ontving was rele-vant (direct bruikbaar voor de uitvoering van mijn taken). <IQ relevancy1>
1 2 3 4 5 6 7
6. Die informatie die ik van anderen ontving was con-sistent (niet in tegenstelling tot de informatie die ik al had). <IQ consistency1>
1 2 3 4 5 6 7
7. De Kolom-sitrap bevatte verouderde informatie. <IQ timeliness2>
1 2 3 4 5 6 7
8. De Kolom-sitrap bevatte foutieve informatie. <IQ correctness2>
1 2 3 4 5 6 7
9. De Kolom-sitrap bevatte onvolledige informatie. <IQ completeness2>
1 2 3 4 5 6 7
10. Ik ontving onvoldoende (niet genoeg) informatie. <IQ overload2>
1 2 3 4 5 6 7
11. Door de steeds veranderende situatie ontving ik informatie die niet meer actueel was. <IQ timeliness3>
1 2 3 4 5 6 7
12. Veel van de informatie die ik had ontvangen was onjuist. <IQ correctness3>
1 2 3 4 5 6 7
13. Vaak ontbrak het nodige detail in die informatie die anderen met mij deelden. <IQ completeness3>
1 2 3 4 5 6 7
14. In verhouding met wat ik aan informatie nodig had was de hoeveelheid informatie die anderen met mij deelden te veel. <IQ overload3>
1 2 3 4 5 6 7
15. Ik ontving informatie die ik niet nodig had voor het uitvoeren van mijn taken. <IQ relevancy2>
1 2 3 4 5 6 7
16. Ik ontving overbodige informatie. <IQ relevancy3> 1 2 3 4 5 6 7
17. De informatie die ik had was inconsistent met de informatie van de anderen in mijn team <IQ consisten-cy2>
1 2 3 4 5 6 7
18. Ik zou graag van anderen willen weten hoe be-trouwbaar de informatie is die ze met mij delen. <Func_ feedback 1>
1 2 3 4 5 6 7
19. Het was voor mij onduidelijk of de informatie die ik had ontvangen betrouwbaar was. <Func_feedback2>
1 2 3 4 5 6 7
20. Ik had het gevoel dat de overige deelnemers over andere informatie beschikten dan ik <IQ_consistency2>.
1 2 3 4 5 6 7

Appendices
289
Deel D. Evaluatie van de systeemkwaliteit In de eerste ronde heeft u gebruik gemaakt van een hiërarchisch informatie sys-teem om informatie te kunnen ontvangen en delen. Dit informatie systeem valt te ontleden in een tweetal hoofdcomponenten: (1) formulieren, (2) een postbode (als vervanger voor C2000). U kunt u de kwaliteit van dit informatie systeem op basis van diverse kwaliteitsindicatoren beoordelen. In hoeverre bent u het eens met de volgende stellingen betreffende de systeemkwaliteit?
Totaal oneens
(omcirkel uw keuze)
Totaal eens
1. Het informatiesysteem gaf mij onmiddellijk alle informatie die ik nodig had. <SQ Responsetime1>
1 2 3 4 5 6 7
2. Via het informatiesysteem kon ik snel aan de in-formatie komen die ik nodig had. <SQ_InfoAccesability1>
1 2 3 4 5 6 7
3. Ik moest te lang wachten op informatie ik had aangevraagd. <SQ Responsetime3>
1 2 3 4 5 6 7
4. Ik kon rekenen op het informatiesysteem voor informatie. <SQ reliability1>
1 2 3 4 5 6 7
5. Het informatie systeem was eenvoudig te gebrui-ken. (SQ Ease of use1)
1 2 3 4 5 6 7
6. Het informatiesysteem bood mij toegang tot in-formatie (bijv. opvanglocaties) die buiten het bereik van mijn organisatie ligt. <SQ_InfoAccesability1
1 2 3 4 5 6 7
7. Via het informatie systeem had ik direct toegang tot de informatie die ik nodig had. <Func_accesability2
1 2 3 4 5 6 7
8. Het informatiesysteem notificeerde mij indien veranderingen in de crisissituatie waren opgetreden <Func_ eventNotification1>.
1 2 3 4 5 6 7
9. Dankzij het informatiesysteem had ik continu een totaal overzicht van alle informatie die ik nodig had. <Func_ aggregation2>
1 2 3 4 5 6 7
10. Veranderingen in basisinformatie (geo, meteo etc) waren onmiddellijk te zien in het informatiesys-teem. <Func_ eventNotification2>.
1 2 3 4 5 6 7
11. Het informatiesysteem gaf mij inzicht in de be-trouwbaarheid van informatie. <Func_ feedback 3>
1 2 3 4 5 6 7
12. Het informatie systeem bood mij een geaggre-geerd (totaal) beeld van de crisissituatie. <Func_ aggregation1>
1 2 3 4 5 6 7
13. Het informatie systeem liet real-time (onmiddel-lijk) de veranderingen in de crisissituatie zien <Func_EventNotification3>.
1 2 3 4 5 6 7
14. Met dit informatie systeem was het eenvoudig om de geheugen (opgebouwde kennis van de situa-tie) te behouden <Func_ Memory1>.
1 2 3 4 5 6 7
15. Met dit informatie systeem was het eenvoudig om foto’s of andere kaartinformatie te delen <Func_ Multi-mediaexchange>.
1 2 3 4 5 6 7

Appendices
290
16. Met dit informatie systeem kon ik eenvoudig al mijn collega’s (ook van de andere kolommen) van informatie voorzien <Func_Infosharing1>
1 2 3 4 5 6 7
17. Met dit informatie systeem kon ik eenvoudig al mijn collega’s (ook van de andere kolommen) om informatie verzoeken. <Func_Infosharing2>
1 2 3 4 5 6 7
18. Ik ben tevreden over het huidige informatiesys-teem. <SQ_Satisfaction1>
1 2 3 4 5 6 7
19. Ik vind het prima om dit hiërarchische informa-tiesysteem te blijven gebruiken in crisissituaties. <SQ_Satisfaction2>
1 2 3 4 5 6 7
Deel E. Evaluatie van de systeemfunctionaliteiten DIOS kent enkele specifieke functionaliteiten die de informatiekwaliteit en sys-teemkwaliteit moeten waarborgen. Voorbeelden van deze functionaliteiten zijn het kunnen beoordelen van de informatie betrouwbaarheid en het opbouwen van een dynamische situatie beeld. In hoeverre bent u het eens met de volgende stellingen betreffende de systeemfunctionaliteiten?
Totaal oneens
(omcir-kel uw keuze)
Totaal eens
1. De manier waarop informatie in DIOS is ge-categoriseerd behoedt mij voor informatie overload (Func_category�IQ info amount)
1 2 3 4 5 6 7
2. Het kunnen opzoeken van derde par-tij/externe informatie via DIOS versnelde het informatiedelings proces (Func_thirdparty1�info sharing speed)
1 2 3 4 5 6 7
3. Het dashboardoverzicht van laatst toege-voegde informatie in DIOS versnelde het in-formatiedelings proces (Func_dashboard�info sharing speed)
1 2 3 4 5 6 7
4. Met DIOS kon ik sneller informatie delen binnen mijn team (infosharingspeed_team level)
1 2 3 4 5 6 7
5. Met DIOS kon ik sneller informatie delen met mijn kolom (infosharing-speed_organizational level)
1 2 3 4 5 6 7
6. Doordat iedereen in het netwerk alle infor-matie in DIOS konden zien hadden wij snel-ler een gedeeld beeld van de situatie (Func_NetworkSitrap� Situational Aware-ness)
1 2 3 4 5 6 7
7. Via DIOS zijn wij sneller gekomen tot een gedeeld beeld van de situatie (Situational Awareness)
1 2 3 4 5 6 7
8. Dankzij de vermelde betrouwbaarheid van de geplaatste informatie in DIOS konden wij als team sneller door de veelheid aan informatie (Funct_Rating� IQ infosharingSpeed)
1 2 3 4 5 6 7

Appendices
291
9. Ik zou graag de door anderen geplaatste in-formatie willen beoordelen op de betrouw-baarheid (Func_Rating)
1 2 3 4 5 6 7
10. De opgebouwde bibliotheek van informatie DIOS zorgde ervoor dat we geen belangrijke informatie kwijtraakten (Func_Memory�IQ relevancy)
1 2 3 4 5 6 7
11. De real-time veranderingen in de informatie-velden van DIOS zorgen ervoor dat ik op de hoogte bleef van veranderingen in de crisis situatie (Funct_eventNotification � Situati-onal awareness)
1 2 3 4 5 6 7
12. Met DIOS kon ik alle belangrijke informatie terugvinden. (Func_Memory)
1 2 3 4 5 6 7
Deel F. Indien u nog andere suggesties of opmerkingen heeft naar aanleiding van de informatie- en systeemkwaliteit, kunt u die hieronder opschrijven. Indien u een samenvatting van dit onderzoek wenst te ontvangen, kunt u hieronder uw e-mailadres opschrijven.

Appendices
292
Appendix E: Publications by the author
2011
• Bharosa, N., Janssen, M., & Tan, Y. (forthcoming). Netcentric information orchestration. Journal of Cognition, Technology and Work.
• Lee, J., Bharosa, N., Yang, J., Janssen, M. & Rao, H. (2011) Group value and intention to use — A study of multi-agency disaster management in-formation systems for public safety. Decision Support Systems. 50 (2) pp. 404-414.
• Bharosa, N, Janssen, M., & Bajnath, S. (in press). Deriving Principles for Guiding Service Encounters: A Participative Design Research Approach. International Journal of Information Systems in the Service Sector (IJISSS).
• Bharosa, N., Janssen, M., Bajnath, S., Klievink, B., Overbeek, S. & van Veenstra, A.-F. (forthcoming) Service Delivery Principles: Deriving Princi-ples Using a Role-Playing Game. The Electronic Journal of e-Government.
2010
• Bharosa, N., Janssen, M., Meijer, S., and Brave, F. (2010). Designing and Evaluating Dashboards for Multi-agency Crisis Preparation: A Living Lab. EGOV 2010, LNCS 6228, pp. 180–191 (Paper nominated for “The most promising practical concept” Award).
• Bharosa, N., Bouwman, H. & Janssen, M. (2010). Ex-ante evaluation of disaster information systems: a gaming-simulation approach. In Proceed-ings of the 7th International Conference on Information Systems for Crisis Response and Management (ISCRAM2010), Seatlle, USA.
• Bharosa, N., Meijer, S., Janssen, M. & Brave, F. (2010). Are we prepared? Experiences from developing dashboards for disaster preparation. In Pro-ceedings of the 7th International Conference on Information Systems for Crisis Response and Management (ISCRAM2010), Seatlle, USA.
• Bharosa, N. & Janssen., M. (2010). Extracting principles for information management adaptability during crisis response: A dynamic capability view. Proceedings of the [43th] Annual Hawaii International Conference on System Sciences, Hawaii.
• Bharosa, N., Lee, Y. and Janssen, M. (2010). Challenges and obstacles in information sharing and coordination during multi-agency disaster re-sponse: Propositions from field exercises. Information Systems Frontiers, 12(1), pp 1-7.
• Bajnath, S., Janssen, M., Bharosa, N., Both, C., Klievink, B., Overbeek, S. & van Veenstra, A.-F. (2010) Service Delivery Principles: Deriving Principles Using a Role-Playing Game. In Proceedings of the 10th European Confer-ence on e-Government (ECEG),University of Limerick, Ireland.
• Janssen, M., Lee, J., Bharosa, N. and Cresswell, A. (2010). Introduction to special issue advances in inter-organizational disaster management, In-formation Systems Frontiers 12(1), pp 49-65.

Appendices
293
2009
• Bharosa, N. and Janssen, M. (2009). Reconsidering information manage-ment roles and capabilities in disaster response decision-making units. In Proceedings of the 6th International Conference on Information Systems for Crisis Response and Management (ISCRAM2009) Gothenburg, Swe-den. Received the Best Paper Award.
• Bharosa, N., Lee, J., Janssen, M. and Rao, H. R. (2009). A case study of in-formation flows in multi-agency emergency response exercises. In Pro-ceedings of the10th annual International Conference on Digital Govern-ment Research, ACM digital library’s ACM International Conference Pro-ceedings Series, Puebla, Mexico. Nominated for the Best Paper Award.
• Bharosa, N., Van Zanten, B., Zuurmond, A. & Appelman, J. (2009). Identi-fying and confirming infor-mation and system quality requirements for multi-agency disaster management. In Proceedings of the 6th Internation-al Conference on Information Systems for Crisis Response and Manage-ment (ISCRAM2009).
• Gonzalez, R. & Bharosa, N. (2009). A framework linking information quali-ty dimensions and coordination challenges during interagency crisis re-sponse. In Proceedings of the [42th] Annual Hawaii International Confer-ence on System Sciences, Hawaii.
• Bharosa, N., van Zanten, B, Janssen, M., & Groenleer, M. (2009). Tran-forming crisis management agencies to network centric organizations. Lec-ture Notes on Computer Science 5693, pp. 65–75, 2009. Springer-Verlag Berlin Heidelberg.
• Bharosa, N., (2009). (Re)-Designing information systems for disaster re-sponse: principles for assuring information quality for relief workers. In Proceedings of the 5th Risk and Design Symposium, Delft, The Nether-lands.
2008
• Bharosa, N., Feenstra, R., Gortmaker, J., Klievink, A. & Janssen, M. (2008). Rethinking service-oriented government: Is it really about ser-vices? In Let a thousand flowers bloom (Bouwman, H. and Bons, R. and Hoogeweegen, M. and Janssen, M. and Pronk, H., Eds), pp 237-254, IOS Press, Amsterdam.
• Bharosa, N. & Janssen, M. (2008). Adaptive information orchestration: Ar-chitectural principles improving information quality. In Proceedings of the 5th International Conference on Information Systems for Crisis Response and Management ISCRAM2008 (Fiedrich, F. and Van De Walle, B., Eds), pp 556-565, Washington, DC.
2007
• Bharosa, N., Janssen, M. & Wagenaar, R. (2007). Enterprise architecture evaluation. In Proceedings of the 2007 IRMA International Conference (Khosrow-Pour, M., Ed), pp 834-838, Idea Group Inc., Vancouver, CA.

Appendices
294
• Bharosa, N., Appelman, J. & De Bruijn, P. (2007). Integrating technology in crisis response using an information manager: First lessons learned from field exercises in the port of Rotterdam. In Proceedings of 4th Inter-national Conference on Information Systems for Crisis Response and Management (ISCRAM2007), (Van De Walle, B. and Burghardt, P. and Nieuwenhuis, K., Eds), pp 63-70, Delft.
• Bharosa, N. & Janssen, M. (2007) Informatie-orkestratie voor crisisma-nagement. Informatie, pp 56-60.

Curriculum vitea
295
Curriculum Vitae
Nitesh Bharosa was born in Paramaribo, Suriname on the 1st of March, 1983. After finishing the secondary school in Paramaribo, he moved to the Netherlands in 2001 to start with the Systems Engineering, Policy Analysis and Management program at the Delft University of Technology. In this period he was active in several commu-nities and boards including the faculty student board and the inter-faculty educa-tional board. In 2005 he received the ECHO Award for his personal and academic achievements. Since then he served as an ambassador for the ECHO foundation (expertise center for diversity and foreign talent), dedicated to empowering mi-grant talent in the Netherlands. After completing his master thesis in 2006 he started with a PhD research at the Faculty of Technology, Policy and Management. His research interests include information quality, coordination and orchestration, particularly in complex and heterogeneous networks such as public safety. During his research, he has supervised over fourteen students in obtaining their degree. Nitesh has served as session chair during multiple international conferences in-cluding ISCRAM and HICSS and has acted as co-editor for the Information Sys-tems Frontiers Journal. His research has been published in several journals and conferences including Decision Support Systems, Information Systems Frontiers and the Journal of Cognition, Technology and Work. During the ISCRAM 2008 conference in Goteborg (Sweden) he received the Best Paper Award for his work on Information orchestration in public safety networks. His work on designing dash-boards for disaster preparation was also nominated for the Outstanding Paper Award in the category “the most promising practical concept” during the 2010 EGOV conference. As a research associate, Nitesh continues to do research on Na-tional Single Windows and Standard Business Reporting at the Delft University of Technology.

During daily operations, relief agencies such as police, fire brigade
and medical services manage information in accordance with their
respective processes and organization structure. When disaster
strikes, the ad-hoc combinations of such hierarchy based information
systems fail to assure high information quality (IQ) and system
quality (SQ) for relief workers. Disaster such as 9/11, Katrina and the
Polderbaan-crash have taught us that poor IQ and SQ significantly
hamper disaster response efforts and can be lethal for relief workers
and citizens. Drawing on empirical data (field studies) and pathways
in ‘state of the art’ theories, this dissertation presents ten design
principles for assuring IQ and SQ in public safety networks. These
principles are the cornerstones of a design theory coined as
‘Netcentric Information Orchestration’ and are meant to guide
information system architects, practitioners, software vendors and
policy makers in the (re)design of information systems for disaster
response. We evaluated the design principles on their technical
feasibility (using prototyping) and on their ability to assure IQ and
SQ for relief workers (using quasi-experimental gaming-simulation).
Findings indicate that the proposed design principles assure higher
levels for most IQ and SQ dimensions.
Keywords: netcentric operations, disaster management, information
orchestration, system quality, information quality
Nitesh Bharosa works as a researcher at the Delft University of
Technology. For more information regarding his academic activities
and publications, please visit: www.bharosa.nl
ISBN: 978-90-8891-231-3