Addressing the Mismatch - TU Delft Repositories
156
• • • • • • • • • • • • • • • • • • • • • • • • • • • • • • • • • • • • • • • • • • • • • • • • • • • • • • • • • • • • • • • • • • • • • • • • • • • • • • • • • • • • • • • • • • • • • • • • • • • • • • • • • • • • • • • • • • • • • • • • • • • • • • • • • • • • • • • • • • • • • • • • • • • • • • • • • • • • • • • • • • • • • • • • • • • • • • • • • • • • • • • • • • • • • • • • • • • • • • • • • • • • • • • • • • • • • • • • • • • • • • • • • • • • • • • • • • • • • • • • • • • • • • • • • • • • • • • • • • • • • • • • • • • • • • • • • • • • • • • • • • • • • • • • • • • • • • • • • • • • • • • • • • • • • • • • • • • • • • • • • • • • • • • • • • • • • • • • • • • • • • • • • Addressing the mismatch: A strategy for creating adaptable office buildings and adding value for corporations Part A: Thesis Yiannos Mexis 4600924 29/06/2020 TU DELFT © Ioannis Mexis, 2020
-
Upload
khangminh22 -
Category
Documents
-
view
1 -
download
0
Transcript of Addressing the Mismatch - TU Delft Repositories
• • • • • • • • • • • • • • •
• • • • • • • • • • • • • • •
• • • • • • • • • • • • • • •
• • • • • • • • • • • • • • •
• • • • • • • • • • • • • • •
• • • • • • • • • • • • • • •
• • • • • • • • • • • • • • •
• • • • • • • • • • • • • • •
• • • • • • • • • • • • • • •
• • • • • • • • • • • • • • •
• • • • • • • • • • • • • • •
• • • • • • • • • • • • • • •
• • • • • • • • • • • • • • •
• • • • • • • • • • • • • • •
• • • • • • • • • • • • • • •
• • • • • • • • • • • • • • •
• • • • • • • • • • • • • • •
• • • • • • • • • • • • • • •
• • • • • • • • • • • • • • •
• • • • • • • • • • • • • • •
• • • • • • • • • • • • • • •
• • • • • • • • • • • • • • •
• • • • • • • • • • • • • • •
Addressing the mismatch:A strategy for creating adaptable office buildings and adding value for corporations
Part A: Thesis
Yiannos Mexis4600924
29/06/2020TU DELFT
© Ioannis Mexis, 2020

• • • • • • • • • • • • • • •
• • • • • • • • • • • • • • •
• • • • • • • • • • • • • • •
• • • • • • • • • • • • • • •
• • • • • • • • • • • • • • •
• • • • • • • • • • • • • • •
• • • • • • • • • • • • • • •
• • • • • • • • • • • • • • •
• • • • • • • • • • • • • • •
• • • • • • • • • • • • • • •
• • • • • • • • • • • • • • •
• • • • • • • • • • • • • • •
• • • • • • • • • • • • • • •
• • • • • • • • • • • • • • •
• • • • • • • • • • • • • • •
• • • • • • • • • • • • • • •
• • • • • • • • • • • • • • •
• • • • • • • • • • • • • • •
• • • • • • • • • • • • • • •
• • • • • • • • • • • • • • •
• • • • • • • • • • • • • • •
• • • • • • • • • • • • • • •
• • • • • • • • • • • • • • •
© Ioannis Mexis, 2020
TitleAddressing the mismatch: A strategy for creating adaptable office building and adding value for corporations.
Master Thesis Date: 29th June, 2020
Part A: ThesisPart B: Strategy implementationPact C: Interview transcripts
Personal detailsIr. Ioannis (Yiannos) Mexis Student number: 4600924Phone number: XXAlternative Phone number: XXEmail: [email protected]
Delft University of TechnologyFaculty of Architecture and the Built EnvironmentMSc Architecture, Urbanism and Building SciencesTrack: Management in the Built Environment 1st Mentor: Hilde Remøy2nd Mentor: Philip Koppels
• IAddressing the mismatch
© Ioannis Mexis, 2020
• • • • • • • • • • • • • • •
• • • • • • • • • • • • • • •
• • • • • • • • • • • • • • •
• • • • • • • • • • • • • • •
• • • • • • • • • • • • • • •
• • • • • • • • • • • • • • •
• • • • • • • • • • • • • • •
• • • • • • • • • • • • • • •
• • • • • • • • • • • • • • •
• • • • • • • • • • • • • • •
• • • • • • • • • • • • • • •
• • • • • • • • • • • • • • •
• • • • • • • • • • • • • • •
• • • • • • • • • • • • • • •
• • • • • • • • • • • • • • •
• • • • • • • • • • • • • • •
• • • • • • • • • • • • • • •
• • • • • • • • • • • • • • •
• • • • • • • • • • • • • • •
• • • • • • • • • • • • • • •
• • • • • • • • • • • • • • •
• • • • • • • • • • • • • • •
• • • • • • • • • • • • • • •
© Ioannis Mexis, 2020
I would like to express my gratitude to my two supervi-sors, Hilde Remøy and Philip Koppels for a pleasant and constructive collaboration, their valuable assistance in writing this essay, their support and motivation throughout this journey and sharing their interest for my topic, while constantly pushing me and giving me inspiring ideas to enhance my work.
In addition, I would like to thank the interviewees for participating in this research, for their time, for sharing their experiences and providing me with valuable input. Their interest in my topic was a driver for setting higher goals and acknowledging the value of my work.
Finally, I would like to thank my family, friends, and espe-cially my flatmates for their support and advice throughout my studies.
Acknowledgements
• IIIAddressing the mismatch
© Ioannis Mexis, 2020

• • • • • • • • • • • • • • •
• • • • • • • • • • • • • • •
• • • • • • • • • • • • • • •
• • • • • • • • • • • • • • •
• • • • • • • • • • • • • • •
• • • • • • • • • • • • • • •
• • • • • • • • • • • • • • •
• • • • • • • • • • • • • • •
• • • • • • • • • • • • • • •
• • • • • • • • • • • • • • •
• • • • • • • • • • • • • • •
• • • • • • • • • • • • • • •
• • • • • • • • • • • • • • •
• • • • • • • • • • • • • • •
• • • • • • • • • • • • • • •
• • • • • • • • • • • • • • •
• • • • • • • • • • • • • • •
• • • • • • • • • • • • • • •
• • • • • • • • • • • • • • •
• • • • • • • • • • • • • • •
• • • • • • • • • • • • • • •
• • • • • • • • • • • • • • •
• • • • • • • • • • • • • • •
© Ioannis Mexis, 2020
Purpose: The purpose of this research is to address the mismatch between the constant change of users’ demands and the static nature of the built environment (supply).
Aim: The development of a strategy for creating adapt-able office buildings, highlighting the relation between the actions proposed and the value they can deliver to the corporations that implement them. The large scale ambi-tion of this strategy is to assist actors in understanding the value of adaptability and sustainability, and consequently contribute in stimulating the markets interest towards a more sustainable and future-proof future.
Research Question: How can adaptability strategies be applied in the development of new office buildings to add value for corporations and address the mismatch over time between buildings and users’ demands?
Methodology: A qualitative approach has been followed, supported by quantitative data in order to answer the pa-per’s research question and achieve its aim. Conducting an empirical study, through literature review, provided background knowledge on the topics of adaptability and added value, which constituted the basis for developing the preliminary strategy. Continuing, for the second part of the thesis a research by design approach was adopted. Qualitative data were collected from a series of case stud-ies – via documentary analysis and interviews - providing insights from practice which were then used to formulate findings and synthesize a definitive and concrete final strategy.
Finding: : The increasing pace the world is changing, has resulted in the market’s gradual shift towards adaptabil-ity. Though, actor’s inability to understand adaptability’s long-term and indirect value, constitutes a boundary for the development of responsive real estate. The creation of this paper’s strategy – “The value of adaptability”, illus-trates the links between a number of adaptability related strategies and tactics with different forms of added value. In addition, the significance, risk, impact & risk assessment and life expectancy of each tactic is presented, providing the implementers more criteria for choosing which tactics best fit their objectives. Despite the significance of adapt-ability in order to reduce the mismatch between the dy-namic environment and the static nature of the built envi-ronment, the shift towards adaptability requires time. The strategy formulated, can assist actors into understanding the benefits of adaptability, and stimulate the shift to-wards a future-proof and sustainable environment where adaptability will become a standardised requirement.
Limitations of the research: This being the first attempt of linking adaptability with the different forms of added value, the findings were based on qualitative research and in a limited amount of cases. Expanding the research in more cases and the collection of quantitative data can provide more generalised input and strengthen the strat-egy.
Practical implications: The strategy developed through this research can assist: real estate managers in the cre-ating adaptable office buildings based on the core busi-ness and objectives of their organisation, developers and investors whose goal is to construct adaptable projects – as adaptability has started to impact real estate financial value- and finally by architects and related engineers, in order to create more adaptable buildings for their clients. The strategy provides the implementer the potential of tailoring it in order to it to fit their goals and objectives.
Originality/ value: This thesis addresses the shortage of future proof real estate, by presenting a comprehensive strategy that can assist the development of adaptable buildings, something that according to Estaji (2007), and Gosling, Naim, Sassi, Iosif and Lark (2008) is still lacking. Real estate constitutes a significant component of corpo-rations. Despite this, combining strategies of adaptabil-ity, with the corporate real estate management view and models of added value comprises an unexplored field in scientific research.
Keywords: Adaptability, flexibility, strategy, design, cor-porate, real estate management, added value, competi-tive advantage, development, architecture
Abstract
• V Addressing the mismatch
© Ioannis Mexis, 2020

1. Introduction
Living in an ever-evolving environment, where the pace of societal, economical, technological and environmen-tal changes is rapidly increasing, has impacted the way people live and work (Julistiono, Hosana, Liemansetyo & Wijaya, 2017; Remøy, Rovers & Nase, 2019). Such chang-es, challenge corporations to find ways of adapting their businesses to the new environments in order to support their core objectives (Lindholm & Leväinen, 2006). As explained by Joroff (1993), real estate constitutes one of the five resource that contribute in companies’ goals fulfilment, delivering value to the organisations and en-hancing their competitive advantage (Jylhä, Remøy & Arkesteijn, 2019; Lindholm & Gibler, 2005). Therefore, the term ‘added value’ entails the alignment of real estate strategies with the corporation’s core business and objec-tives (Lindholm et al., 2006). Buildings are consequently regarded not as ends but as means, whose purpose is to strengthen organisations’ performance, by optimizing the relationship between the facilities provided and their us-ers (Blakstad, 2001).
Operating within a complex setting, businesses are re-garded as dynamic systems who constantly have to address the evolving exogenous and endogenous de-mands, heightening the risks and uncertainties they phase (Schmidt III, Austin & Brown, 2009). Considering the strong relationship between the work and environment, office buildings are regarded products of their time (Blak-stad, 2001). As a result, time constitutes a significant as-pect of how businesses function and the way buildings ac-commodate their owners’ and users’ demands (Schmidt III, 2014). Therefore, in order to cope with the evolution, corporations are challenged to increase the level of ef-ficiency and adaptability in their portfolio management (Batbileg et al., 2018; Schmidt III et al., 2009). This entails that enhanced building-user relationship performance is one of the most important reasons to increase adaptability (Blakstad, 2001).
As a result, the creation of an adaptable built environment that can constantly respond to the companies’ objectives has become a challenge for professionals of the field, whether these are developers, architects or corporate real estate organisations. When the buildings are not flexible enough to support dynamic demands of organisations, and their functional is smaller than their technical lifespan, then they become obsolete (Blakstad, 2001; Langston, Wong, Hui, & Shen, 2008). The buildings’ incapacity to meet users’ quantitative (e.g. available square meters) and qualitative (e.g. quality standards) requirement, im-pacting not only their owners’ capital but the environment as well (Geraedts, 2008). This circumstance reflects the lack of long-term thinking and poor use of buildings de-spite the high energy and material requirement for their construction (Nakib, 2010). Specifically, the construction
industry consumes 40% of the energy produced, 50% of primary resources and is responsible for 40% of waste and 45% greenhouses gases produced (Deloitte, 2019; Remøy, 2016). Aiming to address the environmental issues, gov-ernments and the European Union have introduced en-vironmental goals for the upcoming years regarding the energy & raw materials consumption, as well as CO2 emis-sions. As a result, new sustainable solutions are needed in the real estate environment in order to cope with new demands (Batbileg et al., 2018; PWC, 2018). Following the increase of the future’s uncertainty and us-ers’ constantly changing demands, organisations need to become more dynamic, resulting in adaptable buildings having a greater value within corporate portfolios (Arge, 2005; Wilkinson, & Remøy, 2011; Remøy, de Jong & Schenk, 2011). In addition, such buildings have a wider societal im-pact, constituting an essential component of sustainable environments, the preservation of their context’s identity and avoiding areas’ deterioration, technical decay and be-coming unattractive for future developments (Remøy & Van der Voord, 2009). Though the relevance and significance of adaptability for the construction field are not clear to all actors involved. Many parties have short-term goals which contradict the long-term perspective of adaptability (Lind-holm & Gibler, 2005). Therefore, not being able to identify the benefits and value of adaptability, such actors act as boundaries in shifting towards a future-proof environment.
Despite the significance of this topic, according to many researchers, there is a lack in the research field of a com-prehensive strategy for developing adaptable office build-ings that can address the mismatch between the built en-vironment and the users’ demands, and at the same time illustrate the value they deliver (Estaji, 2017; Gosling, Naim, Sassi, Iosif & Lark 2008; Van der Voordt, 2016; Lindholm et al, 2006). Therefore, this research contributes to the body of knowledge about adaptability strategies for new office buildings, providing a more comprehensive approach and linking it to the perspective of corporate real estate man-agement and specifically the owners and users of buildings.
How can adaptability strategies be applied in the development of new office buildings
to add value for corporations and address the mismatch over time
between buildings and users’ demands?
The focus of this research is on creating a strategy that will assist actors in developing buildings which can respond to their users’ change of demands and support the de-cision making process of corporate real estate managers and related actors. Consequently this strategy can pre-vent buildings from becoming obsolete and contribute to the development of a dynamic portfolio for corporations and consequently in an adaptable and sustainable built environment.
Executive Summary
VI • Executive Summary
© Ioannis Mexis, 2020

2. Methodology
The main research approach that was adopted in this the-sis can be classified as qualitative research, as this method is more appropriate for addressing unexplored topics in literature and gaining deeper understanding from prac-tice (Jylhä, 2019). Consequently for this research, a com-prehensive literature review was conducted followed by a series of case studies. The literature review focused on the topics of adaptability and added value, aiming to gain a comprehensive overview of existing approaches and link the two topics in the form of a preliminary strategy (Gos-ling et al., 2008; Estaji, 2017).
Subsequently, three case-studies were conducted on Dutch adaptable office buildings, constituting of docu-mentary data collection and a series of six interviews, with experts from the fields of architecture, real estate and de-velopment. The three cases analysed is the Timmerhuis (Municipality of Rotterdam, Rotterdam, The Netherlands), Rijnstraat 8 (Central Government Real Estate Agency, The Hague, NL) and The Edge (OVG Real Estate & Deloitte, Amsterdam, NL). The focus of this method was the collec-tion of in-depth qualitative data aiming to evaluate and strengthen the preliminary strategy, and formulate find-ings based on the experiences of the interviewees. The second part of the interviews was based on quantitative data collection, used as input for the research’s strategy. Finally, after synthesizing the final strategy and defining the implementation plan, two interviews were conducted in order to evaluate it and identify any areas for further research and improvements.
Cross-case conclusions
Develop final strategy
Building REMArch.
Cas
e 1
Building REMArch.
Cas
e 2
Building REMArch.
Cas
e 3
Prepare, co
llect & analyze
Analyze &
conclud
eD
efine & d
esign
Adaptability
Strategy implementation
Added value
Develop theory Preliminary strategy
Case selection
Data collection protocol
REM Arch.
Fig. 1 (Chapter 5, Fig. 5.1.2)Multi case study process
• VII Addressing the mismatch
© Ioannis Mexis, 2020

3. Literature review
• Adaptability The uncertainty underlying the future -stimulated by the pace the world is evolving - has resulted in the increased demand for adaptable solutions (Geraedts & Prins, 2015). Considering the diversity of factors and complexity that underlie the built environment, in order to understand how adaptability can be implemented in the development of office buildings, one first needs to comprehend the meaning of the term. In literature, four characteristics are commonly used when defining adaptability and its prop-erties: capacity of change, reduction of mismatches, value and time (Geraedts et al., 2014; Blakstad, 2001). On the same line, when designing for adaptability, time, change, buildings and context are concepts need to be taken into account. The addition of time, in the building develop-ment process, makes them susceptible to change, plac-ing architecture in context (Schmidt III, 2014). The context results in mismatches between the buildings and their users, evoking strategies that will accommodate these demands, keeping the building fit for purpose and of val-ue. Therefore, one can understand that the building-user relationship- defining how well buildings serve the user organisations- is one of the main drivers of adaptability (Blakstad, 2001; Geraedts, 2016). The more adaptable the buildings are, the longer they can remain responsive to their owners’ and users’ demands, prolonging their func-tional lifecycles (Gijsbers & Lichtenberg, 2012; Sadafi et al., 2014). Within the office sector where the changes are more frequent, the demand for adaptability has increased, allowing corporations to maintain their performance and competitiveness in the market (Geraedts & Van der Voor-dt, 2003; Harris, 2015).
Throughout literature, adaptability is often defined as flexibility. Though, flexibility refers to small scale chang-es which are usually initiated by bottom-up approaches (users of the space), compared to adaptability that entails buildings’ long-term capacity to large scale changes ini-tiated not only by internal but also external factors (e.g. crisis) (Gosling et al., 2008; Geraedts & Prins, 2016; Blynth & Worthington, 2000; Wilkinson & Remøy, 2011). There-fore, buildings cannot be seen as static objects, but as a dynamic interplay between form and context. The ad-aptability and flexibility potential of buildings define their adaptive capacity and enable them to respond to chang-es in requirements and circumstances, in a sustainable and economic profitable manner, reducing the gap be-tween the functional and their technical lifecycles (Man-ewa, 2012). Considering the environmental challenges of our era, sustainability and consequently adaptability have become significant components of judging the value and future of buildings (Geraedts & Prins, 2015).
On the other hand, certain characteristics such as the in-creased initial investments together with the long-term ben-efits constrain actors with short-term perspective -such as investor and developers- from implementing adaptability in new projects. Therefore, when evaluating the implications of adaptability one needs to consider buildings’ lifecycle costs, as in most cases after the first renovation cycle the adapt-ability costs are recouped (Geraedts, 2008; Slaughter, 2001). In addition, assessing the impact that adaptable measures have on the financial performance of an investment, studies indicated that such buildings are less than 3% more expen-sive compared to standard buildings (Remøy, 2011). Current-ly, when it comes to corporations, adaptable buildings can be mainly found in their core portfolios. In general, due to sustainability demands and market trends, a shift in the de-mand of adaptable buildings has been initiated.
Short-term thinking and actors’ inability to understand the benefits of adaptability, results in buildings that lack the ca-pacity to support the evolving users and societal demands. Such buildings have low adaptive capacity and the mis-match between their functional and technical lifecycles can potentially lead to obsolescence (Remøy, 2010). Buildings that are functionally or technically outdated constitute sig-nificant public and economic problems to the society and their owners (Remøy & van der Voordt, 2009).
What can be concluded is that adaptable solution are im-plemented as a method to provide the potential to stabi-lise the dynamic equilibrium in the relationship between users and space, in a sustainable and economic profitable manner, maximizing the building’s value throughout its li-fecycle. The creation of thorough and concrete strategies that indicate to implementers the benefits they entail, is required in order to assist and stimulate in the application of such solutions.
Layers: Social StuffSpace planServices
StructureSkinSurroundings Site
Fig. 2 (Chapter 3, Fig. 3.2.4)Revised building layers model (adapted from Schmidt III, 2014).
VIII • Executive Summary
© Ioannis Mexis, 2020
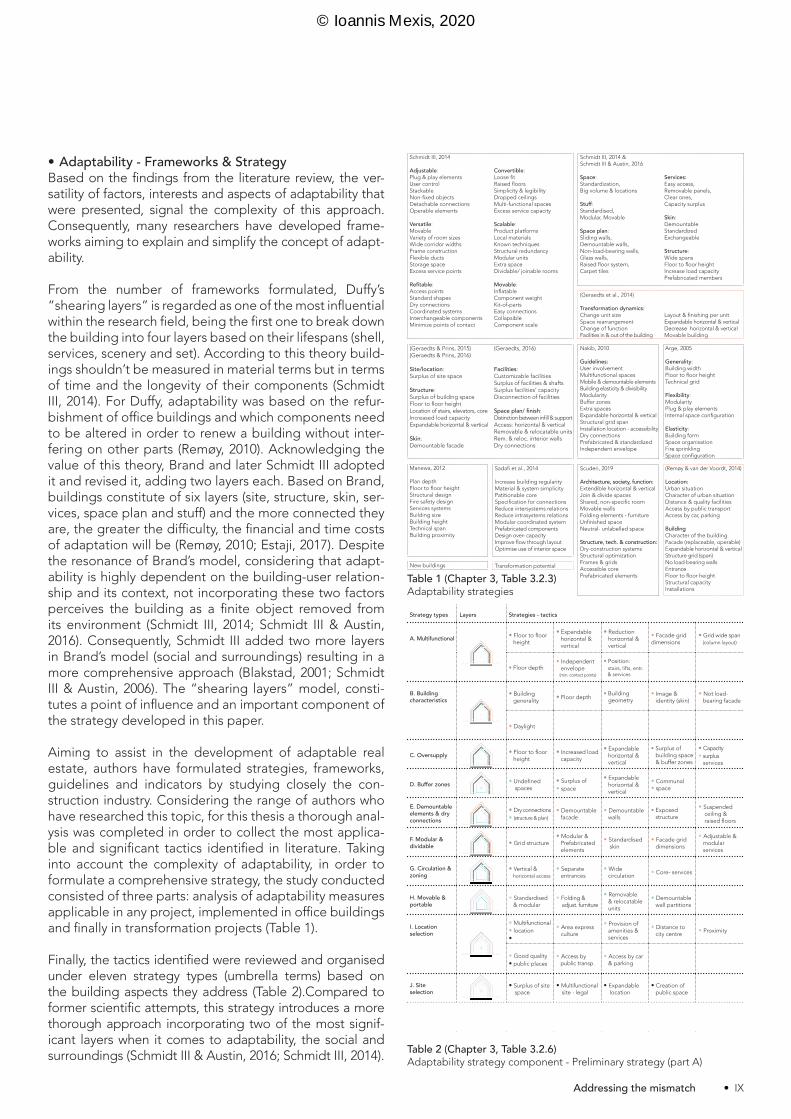
• Adaptability - Frameworks & StrategyBased on the findings from the literature review, the ver-satility of factors, interests and aspects of adaptability that were presented, signal the complexity of this approach. Consequently, many researchers have developed frame-works aiming to explain and simplify the concept of adapt-ability.
From the number of frameworks formulated, Duffy’s “shearing layers” is regarded as one of the most influential within the research field, being the first one to break down the building into four layers based on their lifespans (shell, services, scenery and set). According to this theory build-ings shouldn’t be measured in material terms but in terms of time and the longevity of their components (Schmidt III, 2014). For Duffy, adaptability was based on the refur-bishment of office buildings and which components need to be altered in order to renew a building without inter-fering on other parts (Remøy, 2010). Acknowledging the value of this theory, Brand and later Schmidt III adopted it and revised it, adding two layers each. Based on Brand, buildings constitute of six layers (site, structure, skin, ser-vices, space plan and stuff) and the more connected they are, the greater the difficulty, the financial and time costs of adaptation will be (Remøy, 2010; Estaji, 2017). Despite the resonance of Brand’s model, considering that adapt-ability is highly dependent on the building-user relation-ship and its context, not incorporating these two factors perceives the building as a finite object removed from its environment (Schmidt III, 2014; Schmidt III & Austin, 2016). Consequently, Schmidt III added two more layers in Brand’s model (social and surroundings) resulting in a more comprehensive approach (Blakstad, 2001; Schmidt III & Austin, 2006). The “shearing layers” model, consti-tutes a point of influence and an important component of the strategy developed in this paper.
Aiming to assist in the development of adaptable real estate, authors have formulated strategies, frameworks, guidelines and indicators by studying closely the con-struction industry. Considering the range of authors who have researched this topic, for this thesis a thorough anal-ysis was completed in order to collect the most applica-ble and significant tactics identified in literature. Taking into account the complexity of adaptability, in order to formulate a comprehensive strategy, the study conducted consisted of three parts: analysis of adaptability measures applicable in any project, implemented in office buildings and finally in transformation projects (Table 1).
Finally, the tactics identified were reviewed and organised under eleven strategy types (umbrella terms) based on the building aspects they address (Table 2).Compared to former scientific attempts, this strategy introduces a more thorough approach incorporating two of the most signif-icant layers when it comes to adaptability, the social and surroundings (Schmidt III & Austin, 2016; Schmidt III, 2014). Table 2 (Chapter 3, Table 3.2.6)
Adaptability strategy component - Preliminary strategy (part A)
Table 1 (Chapter 3, Table 3.2.3)Adaptability strategies
New buildings Transformation potential
Nakib, 2010
Guidelines:User involvementMultifunctional spacesMobile & demountable elementsBuilding elasticity & divisibility ModularityBuffer zonesExtra spacesExpandable horizontal & verticalStructural grid spanInstallation location - accessibilityDry connections Prefabricated & standardizedIndependent envelope
(Geraedts & Prins, 2015)(Geraedts & Prins, 2016)
Site/location: Surplus of site space Structure: Surplus of building spaceFloor to floor heightLocation of stairs, elevators, coreIncreased load capacityExpandable horizontal & vertical
Skin:Demountable facade
(Geraedts, 2016)
Facilities: Customizable facilitiesSurplus of facilities & shaftsSurplus facilities’ capacityDisconnection of facilities
Space plan/ finish: Distinction between infill & supportAccess: horizontal & verticalRemovable & relocatable unitsRem. & reloc. interior walls Dry connections
Schmidt III, 2014
Adjustable: Plug & play elements User control Stackable Non-fixed objects Detachable connections Operable elements Versatile: MovableVariety of room sizesWide corridor widthsFrame construction Flexible ducts Storage spaceExcess service points
Refitable:Access pointsStandard shapes Dry connections Coordinated systems Interchangeable components Minimize points of contact
Convertible: Loose fitRaised floorsSimplicity & legibilityDropped ceilings Multi-functional spacesExcess service capacity Scalable: Product platformsLocal materialsKnown techniques Structural redundancy Modular units Extra space Dividable/ joinable rooms
Movable:Inflatable Component weight Kit-of-partsEasy connections CollapsibleComponent scale
Schmidt III, 2014 & Schmidt III & Austin, 2016
Space: Standardization, Big volume & locations
Stuff: Standardised, Modular, Movable
Space plan:Sliding walls, Demountable walls, Non-load-bearing walls, Glass walls, Raised floor system, Carpet tiles
Services: Easy access, Removable panels, Clear ones, Capacity surplus
Skin:DemountableStandardizedExchangeable
Structure: Wide spansFloor to floor heightIncrease load capacityPrefabricated members
(Geraedts et al., 2014)
Transformation dynamics: Change unit sizeSpace rearrangementChange of function Facilities in & out of the building
Layout & finishing per unitExpandable horizontal & verticalDecrease horizontal & verticalMovable building
Arge, 2005
Generality: Building width Floor to floor height Technical grid Flexibility: Modularity Plug & play elements Internal space configuration
Elasticity:Building form Space organisation Fire sprinkling Space configuration
Sadafi et al., 2014
Increase building regularityMaterial & system simplicityPatitionable coreSpecification for connectionsReduce intersystems relationsReduce intrasystems relations Modular coordinated systemPrefabricated components Design over- capacityImprove flow through layoutOptimise use of interior space
Manewa, 2012
Plan depthFloor to floor heightStructural design Fire safety designServices systemsBuilding sizeBuilding height Technical spanBuilding proximity
Scuderi, 2019
Architecture, society, function:Extendible horizontal & verticalJoin & divide spacesShared, non-specific roomMovable wallsFolding elements - furnitureUnfinished spaceNeutral- unlabelled space
Structure, tech. & construction: Dry-construction systems Structural optimizationFrames & grids Accessible corePrefabricated elements
(Remøy & van der Voordt, 2014)
Location:Urban situationCharacter of urban situationDistance & quality facilitiesAccess by public transportAccess by car, parking
Building Character of the buildingFacade (replaceable, operable)Expandable horizontal & verticalStructure grid (span)No load-bearing wallsEntranceFloor to floor heightStructural capacityInstallations
Strategy types Layers Strategies - tactics
A. Multifunctional • Floor to floor height
• Expandable horizontal & vertical
• Reduction horizontal & vertical
• Facade grid dimensions
• Grid wide span (column layout)
• Floor depth• Independent envelope (min. contact points)
• Position: stairs, lifts, entr. & services
B. Building characteristics
• Building generality
• Floor depth• Building geometry
• Image & identity (skin)
• Not load- bearing facade
• Daylight
C. Oversupply • Floor to floor height
• Increased load capacity
• Expandable horizontal & vertical
• Surplus of building space & buffer zones
• Capacity • surplus services
D. Buffer zones • Undefined spaces
• Surplus of • space
• Expandable horizontal & vertical
• Communal • space
E. Demountable elements & dry connections
• Dry connections • (structure & plan)
• Demountable facade
• Demountable walls
• Exposed structure
• Suspended ceiling & raised floors
F. Modular & dividable • Grid structure
• Modular & Prefabricated elements
• Standardised skin
• Facade grid dimensions
• Adjustable & modular services
G. Circulation & zoning
• Vertical & horizontal access
• Separate entrances
• Wide circulation
• Core- services
H. Movable & portable
• Standardised & modular
• Folding & adjust. furniture
• Removable & relocatable units
• Demountable wall partitions
I. Location selection
• Multifunctional • location•
• Area express culture
• Provision of amenities & services
• Distance to city centre
• Proximity
• Good quality • public places
• Access by public transp.
• Access by car & parking
J. Site selection
• Surplus of site space
• Multifunctional site - legal
• Expandable location
• Creation of public space
K. Human factor• User involvement
• • • • • • •
• IX Addressing the mismatch
© Ioannis Mexis, 2020

• Added valueReal estate constitutes a vital resource for accommodating firms‘ operations. In order to fully utilise the potential of the available facilities over time, contributing to their per-formance and supporting their core business, firms need to optimise the relationship between users and the buildings. (Lindholm et al., 2006; Blakstad, 2001). Due to changes in organisations’ demands and real estate deterioration, a mismatch is created between the supply (buildings) and de-mand (users) sides. Within the office sector, corporate real estate management focuses in addressing this mismatch, providing sufficient accommodation, at the required loca-tion, quality, time and cost (De Vries et al., 2008).
Realising the impact of real estate on firms’ profitability, productivity and competitive advantage, more emphasis is given on real estate portfolio management (Riratanaphong, van der Voordt & Sarasoja, 2012; Harris & Cooke, 2019). As the pace of change increases, in order for corporations to utilize the maximum potential of their facilities, the de-mand for adaptable, efficient, innovative and productive work environment has increased (Gibson, 2000; Remøy et al., 2019). Consequently, market’s interest is gradually shift-ing from cost reduction to value delivery (Jylhä et al.,2019).
Real estate strategies must therefore be aligned with the business goals, providing efficient and responsive environ-ments for the needs of the occupiers, in order to create val-ue for the firm (Lindholm et al., 2006; Lindholm & Leväinen, 2006a). This alignment is achieved by understanding and contributing optimally to the firm’s and users’ demands at a strategic, tactical and operational level (Lindholm, 2008b; Voordt & Jensen, 2018). Focusing on the core portfolio, ad-aptable buildings are of great importance for corporations, as they support them for a longer period of time, adding value throughout their functional lifecycles (Gibson, 2001). When a firm’s objectives are not sufficiently attained, in-terventions on the facilities provided need to take place, which is also reflected in the increased demand for inno-vative, productive and adaptive work environments (Lind-holm et al., 2006; Voordt & Jensen, 2018; Lindholm, 2008b).
Despite its significance, many organisations find it hard to understand how can real estate add value to their opera-tions (Gibler & Lindholm, 2012). This can be explained as real estate can have both direct (short- term & tangible) and indirect (long term & hard to quantify) influence, which is hard to measure (Lindholm, 2008a; De Vries et al., 2008).
Corporations’ gradual shift towards value delivery in addition to the complexity of the concept has stimulated research towards the creation of models explaining how strategic ap-proaches contribute to the value of the firm. From a thorough analysis in existing literature twelve forms of added value were identified, out of which for this research eight were selected, which will be linked to the adaptability strategy types on the next section, formulating the preliminary strategy.
Values Relations between values
Final selection
1. Control risk 2 - 3 - 4 -10- 11 Adaptability
2. Increase real estate value
7 - 9 - 10 - 11Increase real estate value
3. Reduce costs 5 - 9 - 10 - 11Improve quality
Env SustainabilityAdaptability
4. Productivity 5 - 6 - 7 - 8 - 10 Productivity
5. Improve quality of space
2 - 4 - 6 - 8 - 11 Adaptability
6. User satisfaction
2 - 4 - 5 - 9 - 10User
satisfaction
7. Stimulate collaboration
4 - 8 - 10 - 11Stimulate innovation
8. Stimulate innovation
4 - 7 - 10 - 11Stimulateinnovation
9. Environmental sustainability
2 - 3 - 4 - 610 - 11 - 12
Environmental sustainability
10. Adaptability1 - 2 - 3 - 4 - 56 - 9 - 11 - 12
Adaptability
11. Support image & culture
5 - 6 - 9 - 10 - 12Support
image & culture
12. Social responsibility
9 - 10 - 11Social
responsibility
Table 3 (Chapter 3, Table 3.3.2)Final selection of added value parameters - Preliminary strategy (part B)
X • Executive Summary
© Ioannis Mexis, 2020

4. Findings
• Case studies The empirical research was focused on the collection of data through the three aforementioned case studies (Chapter 5.2-5.4). The first case, the Timmerhuis is a highly adaptable building that was designed following a strict rec-tangular grid that could accommodate both offices spaces and dwellings. Through this project, the client’s (Municipal-ity of Rotterdam) ambition was to illustrate that adaptability does not have a negative impact on quality and price. Rijn-straat 8 is a transformation project that houses office func-tions of the Municipality of The Hague and was designed with the capacity to remain responsive over short and long-term changes. Finally, The Edge is a private project where the developer and client acknowledged the value of ad-aptability for their operation and companies’ identities and decided to increase their investments, creating a building the can remain functional for the next 50-100 years. Inves-tigating these three cases of highly adaptable buildings –each with different properties and client ambitions- pro-vided input for formulating the papers’ strategy and further research findings.
• Strategy “The Value of Adaptability” The findings from the three cases were compared and an-alysed through cross—case analysis and later synthesized with the literature review findings (Chapter 6.1). Using as a base the preliminary strategy, the empirical findings provid-ed input, formulating the paper’s final strategy “The Value of Adaptability” (Chapter 6.3 & 6.5; Fig. 3). The strategy illustrates the value that eleven adaptability strategy types can deliver–each comprised of a number of design meas-ures (Chapter 6.5; Fig. 4.). In addition, a number of addi-tional selection criteria were incorporated reflecting the significance, risk, impact & risk assessment and longevity of each adaptability measure, resulting in a more thorough, comprehensive and flexible tool that actors could use to develop adaptable real estate. From the strategy types provided, it is important to mention that the ones that were regarded as the most significant for the development of adaptable buildings were the ones that focus on the long lasting layers, having a larger impact in building’s adaptive capacity.
Considering the uniqueness of every project, one can un-derstand that the concept of a generic strategy which is applicable for any case does not exist. Taking this into ac-count, one of the most important benefits of the strategy formulated is the flexibility it provides to its implementers to tailor it in order to perfectly fit their requirements.
• Interview findings Apart from the strategy developed through this research, a number of additional findings were collected from the in-terviews conducted. These findings address the following topics: the impact of adaptability on actors’ identity, devel-oper & investments, the future of adaptability, BREEAM & determinant parties, risks of adaptability, technology & ad-aptability; along with some secondary findings: the impact of a crisis on adaptability, development process & users, quality of buildings, and adaptability on an international context. These findings provide a larger overview of qual-itative data framing the strategy developed in the context we live in based on market actors’ perception.
Strategy type
Tactics
Signifi
canc
e
Risk
Impa
ct &
Risk
asse
ssm
ent
Life
expe
ctan
cy
Incr
ease
real
esta
te va
lue
Prod
uctiv
ity
User
sa
tisfa
ctio
n
Stim
ulate
inno
vatio
n
Envir
onm
enta
l su
stain
abilit
y
Adap
tabi
lity
Imag
e &
cultu
re
Socia
l re
spon
sibilit
y
A. Multifunctional 4.4 1.6 2.8 >20 • • • • • • • •Floor to floor height
4.8 1.2 4.1 >30 • • • • • •Expandable horiz. & vertical
4.5 2.7 1.7 >30 • • • • •Reductionhoriz.& vertical
3.0 2.0 1.5 >30 • • • • •Facade grid dimensions
4.2 1.2 3.6 >20 • • • • •Grid wide span 4.5 1.2 3.9 >30 • • • • •Floor depth 4.5 1.8 2.5 >30 • • • • •Independent envelope
4.5 1.5 3.0 >20 • • • •Position: stairs, el-evators, entrances & services
4.8 1.2 4.1 >30 • • • • •
Strategy types
Signifi
canc
e
Risk
Impa
ct &
Risk
asse
ssm
ent
Life
expe
ctan
cy
Incr
ease
real
esta
te va
lue
Prod
uctiv
ity
User
sa
tisfa
ctio
n
Stim
ulate
inno
vatio
n
Envir
onm
enta
l su
stain
abilit
y
Adap
tabi
lity
Imag
e &
cultu
re
Socia
l re
spon
sibilit
y
A. Multifunctional 4.4 1.6 2.8 >20 • • • • • • • •B. Building characteristics 4.4 1.6 2.7 >20 • • • • • • • •C. Oversupply 4.3 2.6 1.6 >7 • • • • • •D. Buffer zones 4.2 2.2 1.9 >3 • • • • • • • •E. Demountable elements & dry connections
4.3 1.4 3.1 >3 • • • • • •F. Modular & dividable 4.2 1.7 2.5 >7 • • • • • •G. Circulation & zoning 4.6 1.7 2.8 >3 • • • • • •H. Movable & portable 4.5 1.5 3.1 3< • • • • • • •I. Location selection 4.8 1.4 3.5 / • • • • • • • •J. Site selection 4.3 1.5 2.8 / • • • • • • • •K. Technology 4.0 3.2 1.3 5< • • • • • •
Fig. 4 (Chapter 6, Table 6.3.1 & 6.5.1)Final Strategy “The value of adaptability” - Strategy Breakdown
Fig. 3 (Chapter 6, Table 6.3.1 & 6.5.1)Final Strategy “The value of adaptability”
• XI Addressing the mismatch
© Ioannis Mexis, 2020

5. Conclusions
The purpose of this research is to address the mismatch between the built environment’s static nature and the constant changes in user’s demand, stimulated by the pace the world is changing. As both the literature review and empirical research indicated, adaptability constitutes an answer to this problem. Buildings who have the inher-ent capacity to respond to short and long-term changes can withstand time and remain functional for a longer pe-riod of time, reducing the risk of obsolescence causing problems not only to their owners but to the general so-ciety as well. On the other hand, the higher initial invest-ments, short-term perspectives, uncertainty of the future and most importantly actors’ inability to understand the short and long-term benefits of adaptability, constitute barriers for shifting into more adaptable and sustainable constructions.
In order to address these boundaries, this thesis focused on creating a scientifically valid strategy that can assist and stimulate the development of future-proof projects. Con-sequently the value underlying adaptable solution was a major concern of this paper. Based on the theoretical and empirical research findings the research the author identi-fied what form of added value can be delivered by each of the adaptability measures presented in the strategy. De-pending on the nature of each party their objectives can highly vary, and consequently the forms of added value that they focus on. Whether the stakeholders involved are public or private parties, setting high goals, having long-term interest and being committed to the project are key aspects of delivering future-proof buildings that add val-ue to their clients, users and the wider society. Illustrating the added value of adaptability measures in real estate, the strategy created through this research constitutes a highly flexible tool which reflects the bene-fits of adaptability and can stimulate the development of a future-proof environment and consequently a sustaina-ble future.
Although the strategy formulated in this paper can as-sist in the development of responsive buildings one of the most important aspects in order for this shift to take place, is people and the time they need to adapt to new scenarios and methods. Considering the unprecedented crisis we are currently experiencing no one can be certain about the impact it will have in our society and especially in the real estate environment. Though what one can ex-pect is that this crisis can assist in the transition towards a more responsive environment that can withstand changes and adapt in new demands.
6. Limitations
Considering the short time-frame that this research had to be completed in, the main limitation underlying the find-ings and strategy developed is the constrained number of cases explored. In order to increase their validity future researchers could expand the amount of cases analysed resulting in a more effective strategy. Though, this being the first scientific attempt of creating such strategy in ad-dition to the aforementioned constraint, can justify this limitation. In support of this argument, despite the small amount of cases studied, the similarities noticed in the interviewees’ answers reflect the validity of the findings.
Taking into account the pace the world is changing, a sig-nificant remark about the strategy created is that it would need to be updated every few years as certain tactics such as technology related ones would at some point become outdated. Consequently, one can understand that “The value of adaptability” does not entail a fixed strategy but comparably to its title, a strategy that needs to be adapt-ed to match the contemporary methods used in the con-struction industry.
7. Recommendations
The strategy developed in this thesis constitutes the first attempt of linking adaptability with the different forms of added value. Therefore, one can expect that there is still room for enhancing the strategy and expand the research to related topics. The strategy created indicates whether there is a link or not between the presented tactics and the different forms of added value. This could be more elaborate by indicating the magnitude of the link (low, medium, high).
The strategy was mainly based on qualitative data, there-fore only six interviewees and three case studies were conducted. By increasing the number of samples, profes-sion of interviewees and cases investigated, along with a more quantitative approach could provide more precise results, increasing the validity of the strategy and captur-ing the perspective of different professions.
Finally related topics that could be investigated can focus on the boundaries and future of adaptability. Researches could also conduct a qualitative analysis on developers’ short term objectives or explore the relation between technology and adaptability; as despite the significance, of both of these research fields, there is a lack of scientific research available.
XII • Executive Summary
© Ioannis Mexis, 2020

• XIIAddressing the mismatch
© Ioannis Mexis, 2020

This section presents a list of key definitions and abbre-viations that will be used in the research, aiming to assist readers in understanding the topics discussed.
Adaptability“The capacity to change the building’s built-environment in order to respond and fit to the evolving demands of its users/ environment maximizing value throughout its life-cycle”(Schmidt III, Eguchi, Austin & Gibb, 2009)
Adaptive capacity “Adaptive capacity of a building includes all character-istics that enable it to keep its functionality during the technical lifecycle in a sustainable and economic profita-ble way withstanding changing requirements and circum-stances.” (Geraerts, Remøy, Hermans & Rijn, 2014a)
Added value “The contribution of real estate to organisational perfor-mance and the attainment of organisational objectives.” (De Vries, 2007 & Den Heijer, 2011 in Van der Voordt, 2016).
Building’s longevity“Building’s longevity is its ability to sustain cultural integ-rity over a long time period as well as maintaining desira-bility in terms of its functionality and style.” (Macozoma, 2002)
Corporate Real Estate (CRE)“All properties held or used by an organisation for its own operational purposes.”(Krunn, 2001)
Corporate Real Estate Management (CREM)“CREM is the management of the real estate portfolio of a corporation by aligning this portfolio to the needs of the core business, in order to obtain maximum added value for the business and to contribute optimally to the overall performance of the organisation.”(Dewulf, Krumm & de Jonge, 2000)
Durability“Durability is defined by the nature of the building’s re-action to various conditions to which it is exposed over time.”(Sadafi, Zain & Jamil, 2014)
Flexibility“Flexibility is perceived as an adaptive response to envi-ronmental uncertainty. More specifically, it is a reflection of the ability of a system to change or react with little pen-alty in time, effort, cot or performance” (Upton, 1994 in Gosling, Naim, Sassi, Iosif & Lark, 2008)
Functional lifecycle“The time in which a facility, or part of a facility, serves the functional requirements of its users and owners.”(Blakstad, 2001)
Long-term utility value“A building that can accommodate different types of us-ers during its whole life cycle. Long-term utility value is a crucial precondition of sustainability.”(Geraedts & Prins, 2015)
Performance“The degree to which a building or other facility serves its users and fulfils the purpose for which it was built or acquired; the ability of a facility to provide the shelter and service for which it is intended.”(Iselin and Lemer, 1993).
Portfolio - Core“High ownership level in an organisation’s real estate portfolio.”(Remøy, Rovers & Nase, 2019)
Portfolio - Periphery“High lease level in an organisation’s real estate portfolio.”(Remøy, Rovers & Nase, 2019)
Resilience“A measure which shows the ability of these systems to absorb and cope with changing circumstances.”(Aytac, Arslan & Durak, 2016)
Sustainable development“A development that meets the needs of present without compromising the ability of future generations to meets their needs.” (Remøy, 2010)
Technical lifecycyle“The time it takes for a buildings, subsystem, or compo-nent to wear out or fail .The “time period after which a fa-cility can no longer perform its function because increas-ing physical deterioration has rendered it useless.”(Blakstad, 2001; Iselin & Lemer, 1993)
CRECorporate real estate
CREMCorporate real estate management
Glossary
XIV •
© Ioannis Mexis, 2020

In order to investigate the themes of adaptability and added value, and formulate a strategy that would assist and stimulate the development of adaptable real estate, a thorough research has been conducted structured in eight sections as presented below:
1.0 IntroductionPresentation of the preliminary literature findings, the problem statement, the relevance and applicability of the research, and framing the research by proposing the goals, research questions and conceptual model.
2.0 Research methodologyAnalysing the research methods that will be followed in this research in order to derive to a concrete result.
3.0 Theoretical research Analysis of existing literature, providing background knowledge on the topics of adaptability and added value, aiming to create the foundation for the next section.
4.0 Synthesis - Preliminary strategy The findings of the theoretical framework will be synthe-sized in order to investigate the relations between adapt-able strategies and added value. The preliminary strategy will be developed.
5.0 Empirical research Motivating the use of case studies as a data collection method and the case studies selection criteria. Following this section the analysis of the three selected cases will be presented.
6.0 Synthesis – Final strategy Analysis of the empirical research findings. Based on the empirical research findings, the preliminary strategy will be reviewed, in order to formulate the final strategy.
7.0 Conclusion Conclusions of the research by providing answers to the paper’s sub-questions and main research questions
8.0 Discussion This section focuses on presenting the authors perception on the research process and findings, and discusses the research limitations along with recommendations for fur-ther research and for practice.
Structure of the thesis
• XV Addressing the mismatch
© Ioannis Mexis, 2020

• • • • • • • • • • • • • • •
• • • • • • • • • • • • • • •
• • • • • • • • • • • • • • •
• • • • • • • • • • • • • • •
• • • • • • • • • • • • • • •
• • • • • • • • • • • • • • •
• • • • • • • • • • • • • • •
• • • • • • • • • • • • • • •
• • • • • • • • • • • • • • •
• • • • • • • • • • • • • • •
• • • • • • • • • • • • • • •
• • • • • • • • • • • • • • •
• • • • • • • • • • • • • • •
• • • • • • • • • • • • • • •
• • • • • • • • • • • • • • •
• • • • • • • • • • • • • • •
• • • • • • • • • • • • • • •
• • • • • • • • • • • • • • •
• • • • • • • • • • • • • • •
• • • • • • • • • • • • • • •
• • • • • • • • • • • • • • •
• • • • • • • • • • • • • • •
• • • • • • • • • • • • • • •
© Ioannis Mexis, 2020
Abstract Executive summary Glossary Structure of paper
1.0 Introduction 031.1 Introduction1.2 Problem definition 1.3 Societal relevance1.4 Applicability 1.5 Scientific relevance1.6 Personal motivation1.7 Research objectives1.8 Research questions1.9 Conceptual model
2.0 Research methodology 112.1 Type of research 2.2 Research method
2.2.1 Literature review2.2.2 Case studies2.2.3 Documentary data2.2.4 Interviews2.2.5 Synthesis
• PHASE 1
3.0 Theoretical research 153.1 Adaptability
3.1.1 Adaptability3.1.2 Flexibility3.1.3 Adaptive capacity3.1.4 Sustainability3.1.5 Change3.1.6 Obsolescence3.1.7 Cost & benefits of adaptability3.1.8 Conclusions
3.2 Adaptability - Frameworks & Strategy3.2.1 Frameworks3.2.2 Types of adaptability3.2.3 Adaptability strategies3.2.4 Adaptability in office buildings3.2.5 Preliminary strategy3.2.6 Strategy types3.2.7 Conclusions
3.3 Added value 3.3.1 Added value3.3.2 Forms of added value3.3.3 Final selection of ad. value parameters3.3.4 Conclusion
4.0 Synthesis - Preliminary strategy 494.1 Preliminary strategy
• PHASE 2
5.0 Empirical research 535.1 Case studies
5.1.2 Case selection5.1.3 Data collection analysis
5.2 Timmerhuis5.3 Rijnstraat 85.4 The Edge Amsterdam
6.0 Synthesis: Final strategy & Findings 796.1 Findings - Tables6.2 Findings - Interview questions6.3 Final strategy “The value of adaptability”6.4 Implementation plan6.5 Final strategy -Breakdown6.6 Final strategy- Interviewees evaluation
7.0 Conclusions 95
7.1 Adaptability7.2 Added value 7.3 Main research question 7.4 Strategy application7.5 General conclusions
8.0 Discussion 1018.1 Discussion on research design8.2 Discussion on research findings8.3 Research limitations8.4 Recommendations for practice8.5 Recommendations for further research
9.0 References 106
10.0 Appendix -A 11310.1 Preliminary strategy- Breakdown10.2 - 10.10 Interview analysis - Tables
Table of Contents
• 1 Addressing the mismatch
© Ioannis Mexis, 2020

© Ioannis Mexis, 2020

1.0 Introduction
© Ioannis Mexis, 2020

“Buildings don’t adapt well. They’re designed not to adapt; also budgeted
and financed not to, constructed not to, administered not to, maintained not to,
regulated and taxed not to, even re-modelled not to. But all buildings adapt
anyway, however poorly, because the usages in and around them are chang-
ing constantly.”
(Stewart Brand, 1994)
1.1 Introduction
Living in an ever-evolving environment, where the pace of societal, economical, technological and environmen-tal changes is rapidly increasing, has impacted the way people live and work (Julistiono, Hosana, Liemansetyo & Wijaya, 2017; Remøy, Rovers & Nase, 2019). Such chang-es, challenge corporations to find ways of adapting their businesses to the new environments in order to support their core objectives (Lindholm & Leväinen, 2006). As explained by Joroff (1993), real estate constitutes one of the five resource that contribute in companies’ goals fulfilment, delivering value to the organisations and en-hancing their competitive advantage (Jylhä, Remøy & Arkesteijn, 2019; Lindholm & Gibler, 2005). Consequent-ly, real estate actions are strongly linked to organisations’ strategic goals and their core business (Lindholm, Gibler & Levainen, 2006). Buildings are therefore regarded not as ends but as means, whose purpose is to strengthen firms’ performance, by optimizing the relationship between the facilities provided and their users (Blakstad, 2001). To meet changing business needs in order to gain optimal perfor-mance and efficiency, organisations seek for increased adaptability in their real estate (Batbileg, Fritzsche & Le-queux, 2018). This entails that enhanced building-user re-lationship performance is one of the most important rea-sons to increase adaptability (Blakstad, 2001).
Adaptability therefore constitutes an important aspect of the built environment and a core concept of this research. As observed through literature, adaptability is often men-tioned as flexibility, though when considering the concept of scale and time these terms are different (Schmidt III, 2014). Compared to flexibility which indicates the capac-ity of physical re-arrangements and short-term changes, adaptability refers to a building’s long-term capacity to respond to the changing demands (Gosling, Naim, Sassi, Iosif, Lark, 2008) (fig. 1.1).
Operating within a complex setting, businesses are re-garded as dynamic systems who constantly have to address the evolving exogenous and endogenous de-mands, heightening the risks and uncertainties they phase (Schmidt III, Austin & Brown, 2009). Considering the strong relationship between the work and environment, office buildings are regarded products of their time (Blak-stad, 2001). As a result, time constitutes a significant as-pect of how businesses function and the way buildings ac-commodate their owners’ and users’ demands (Schmidt III, 2014). Therefore, in order to cope with the evolution, corporations are challenged to increase the level of ef-ficiency and adaptability in their portfolio management (Batbileg et al., 2018; Schmidt III et al., 2009)
1.0 Introduction
4 • 1.0 Introduction
© Ioannis Mexis, 2020
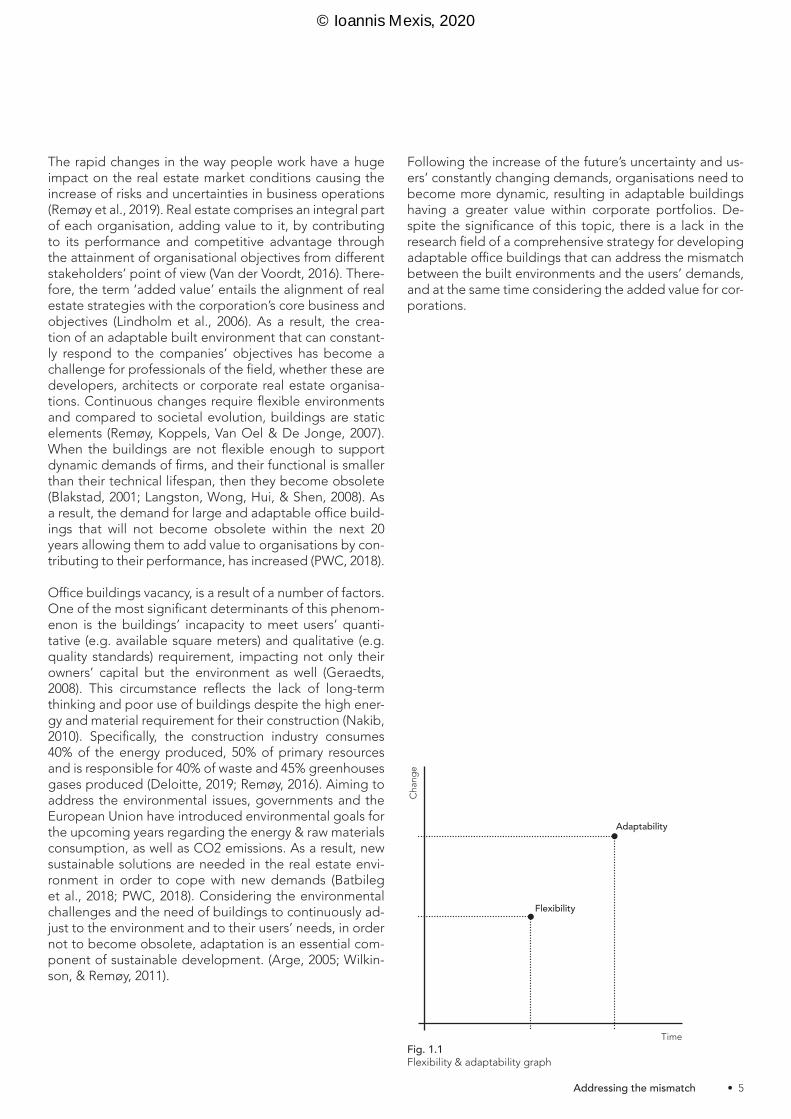
The rapid changes in the way people work have a huge impact on the real estate market conditions causing the increase of risks and uncertainties in business operations (Remøy et al., 2019). Real estate comprises an integral part of each organisation, adding value to it, by contributing to its performance and competitive advantage through the attainment of organisational objectives from different stakeholders’ point of view (Van der Voordt, 2016). There-fore, the term ‘added value’ entails the alignment of real estate strategies with the corporation’s core business and objectives (Lindholm et al., 2006). As a result, the crea-tion of an adaptable built environment that can constant-ly respond to the companies’ objectives has become a challenge for professionals of the field, whether these are developers, architects or corporate real estate organisa-tions. Continuous changes require flexible environments and compared to societal evolution, buildings are static elements (Remøy, Koppels, Van Oel & De Jonge, 2007). When the buildings are not flexible enough to support dynamic demands of firms, and their functional is smaller than their technical lifespan, then they become obsolete (Blakstad, 2001; Langston, Wong, Hui, & Shen, 2008). As a result, the demand for large and adaptable office build-ings that will not become obsolete within the next 20 years allowing them to add value to organisations by con-tributing to their performance, has increased (PWC, 2018).
Office buildings vacancy, is a result of a number of factors. One of the most significant determinants of this phenom-enon is the buildings’ incapacity to meet users’ quanti-tative (e.g. available square meters) and qualitative (e.g. quality standards) requirement, impacting not only their owners’ capital but the environment as well (Geraedts, 2008). This circumstance reflects the lack of long-term thinking and poor use of buildings despite the high ener-gy and material requirement for their construction (Nakib, 2010). Specifically, the construction industry consumes 40% of the energy produced, 50% of primary resources and is responsible for 40% of waste and 45% greenhouses gases produced (Deloitte, 2019; Remøy, 2016). Aiming to address the environmental issues, governments and the European Union have introduced environmental goals for the upcoming years regarding the energy & raw materials consumption, as well as CO2 emissions. As a result, new sustainable solutions are needed in the real estate envi-ronment in order to cope with new demands (Batbileg et al., 2018; PWC, 2018). Considering the environmental challenges and the need of buildings to continuously ad-just to the environment and to their users’ needs, in order not to become obsolete, adaptation is an essential com-ponent of sustainable development. (Arge, 2005; Wilkin-son, & Remøy, 2011).
Following the increase of the future’s uncertainty and us-ers’ constantly changing demands, organisations need to become more dynamic, resulting in adaptable buildings having a greater value within corporate portfolios. De-spite the significance of this topic, there is a lack in the research field of a comprehensive strategy for developing adaptable office buildings that can address the mismatch between the built environments and the users’ demands, and at the same time considering the added value for cor-porations.
Fig. 1.1Flexibility & adaptability graph
Flexibility
Adaptability
Cha
nge
Time
• 5 Addressing the mismatch
© Ioannis Mexis, 2020

1.2 Problem definition
In order to illustrate the problem that will be addressed through this research, the DAS (Design Accommodation Strategy) framework will be used. The model is based on two dimensions: time (current/ future) and market (de-mand/ supply). The combination of these two dimensions generates four positions, current demand, current supply, future demand, future supply- and five intermediate phas-es that correspond to ‘matches’ or ‘gaps’ (De Jonge et al., 2009).
Location has been one of the main factors of organisa-tion’s competitive advantage in the market. Therefore, there is a large demand for central locations from a large number of corporations (Current Demand). Amsterdam, whose vacancy rate is lower than 7%, constitutes an ex-ample of such areas (PWC, 2018; PWC 2019; Bouwinvest, 2018). Similar to Amsterdam, in other central locations too, there is lack in the supply of large office buildings (Current Supply) (PWC, 2019). In addition, corporations as well as investors are looking for flexible buildings that will not become obsolete for the next 15 years (Current De-mand) (PWC, 2019).
The need for flexible buildings stems from emerging trends causing societal, environmental, technological and economic changes (Future Demand). The impact that these trends have to the market can be understood by comparing the present need for large office buildings to ten years ago, where such buildings had the highest va-cancy rate in the Netherlands (Remøy & van der Voordt).Such changes, as explained earlier, have an impact on the way people live and work, constantly altering the users’ and organisations’ demands for working styles and con-sequently in the real estate environment (Future Demand) (Deloitte, 2019). In contrary, the majority of buildings are static and were developed considering only the short-term benefits, making it hard or even impossible for them to follow the users’ needs, resulting in obsolete buildings (Current Supply) (Blakstad, 2001; O’Neil, 2010). Therefore, even if buildings (supply) match perfectly the present de-mands, it does not entail they will continue to do so in the future. In addition, the static character of buildings is contrasting sustainability goals imposed by government and the European Union (Gosling et al., 2008).
Consequently, one can understand the existence of a gap between the future demands and the current supply and the negative impact that it can have for different actors and the society. Such problems result in the urgent need for sustainable strategies that can address the constant mismatch (Determine Future Match) between static office stock and the dynamic changes of employees’ and organ-isations’ demands.
Determine Current Match
CURRENT Supply
CURRENT Demand
Weigh &Select
Alternative(s)
FUTURESupply
FUTUREDemand
DetermineFutureMatch
Exploring Changing Demand
2
4
31
Step by StepPlan
Companies want to be located in city centres
-Lack of building that can easily adapt to their needs
-Lack of large offices
Need for sustainable solutions
Existing- old buildings become vacant
Need for Real Estate that can adapt to changes
How can adaptability strategies be applied in the development of new office buildings making them
future proof to the rapid change of demands.
Existing buildings cannot cope with demand changes
Market Trends
Cause rapid changes
Changing work practice
Impact on Real Estate
Fig. 1.2Problem statement diagram
Fig. 1.3DAS Framework; Own illustration from De Jonge et al., 2009
1. Current Situation2. Future Demand3. Future Supply4. Transformation Process
6 • 1.0 Introduction
© Ioannis Mexis, 2020
1.3 Societal relevance The constant societal, economical, technological and environmental changes have a direct impact on users’ preferences when it comes to their work environments. Corporations need to cope with the new demands and provide an efficient work environment which adds value for them and their users. Therefore this paper aims in pro-moting the construction of adaptable environments as a way to cope with the rapid change in our societies.
Buildings constitute important components of our envi-ronments. Due to their image, presence in their context or functions they house, they form the identity of areas, and their preservation adds value to their context (Lang-ston et al., 2008). On the other hand, buildings with low adaptable capacity, are hard and expensive to maintain and adjust to new needs or even transform them in order to respond to societal problems such as shortage of hous-ing (Remøy, de Jong & Schenk, 2011). As a result, when they do not support their users’ objectives anymore they become vacant. Static and obsolete building constitute a problem, for users, as they cannot fulfil their demands, for owners-investors, due to loss of income, for the soci-ety, causing areas’ deterioration, with rising risk, vandal-ism and technical decay and finally for the market as the devaluation of buildings creates an unhealthy and unat-tractive context for new developments (Remøy & van der Voordt , 2009). As a solution to this problem, adaptable strategies can assist in prolonging buildings’ lifecycle.
The impact that the construction industry has caused on the environment, being accountable for half of the green-house gas emissions produced and resources consumed, has resulted in sustainability becoming a major concern (Remøy & Wilkinson, 2012; Remøy, 2016; Geraedts, 2008). As a result, sustainability measures are imposed by gov-ernments in order to reduce the environmental issues caused by the built environment. According to literature, adaptability and flexibility contribute to a sustainable con-struction agenda, assisting in the development of a more sustainable and healthier environment (Gosling et al., 2008; Geraerts, Remøy, Hermans & Rijn, 2014a). In align-ment with the sustainability demands, the creation of a strategy for adaptable office buildings is highly relevant as it addresses a major societal problem.
Users constitute a very significant aspect of the work envi-ronment and therefore of this thesis. Providing employees responsive workplaces that are optimised to their needs, has an impact to their satisfaction, job performance and consequently to the company’s productivity and wealth (Lindholm et al., 2006). On the same line, the supply of quality, efficient and sustainable environment is a ma-jor factor of attracting and retaining workers (Jylhä et al.,2019).
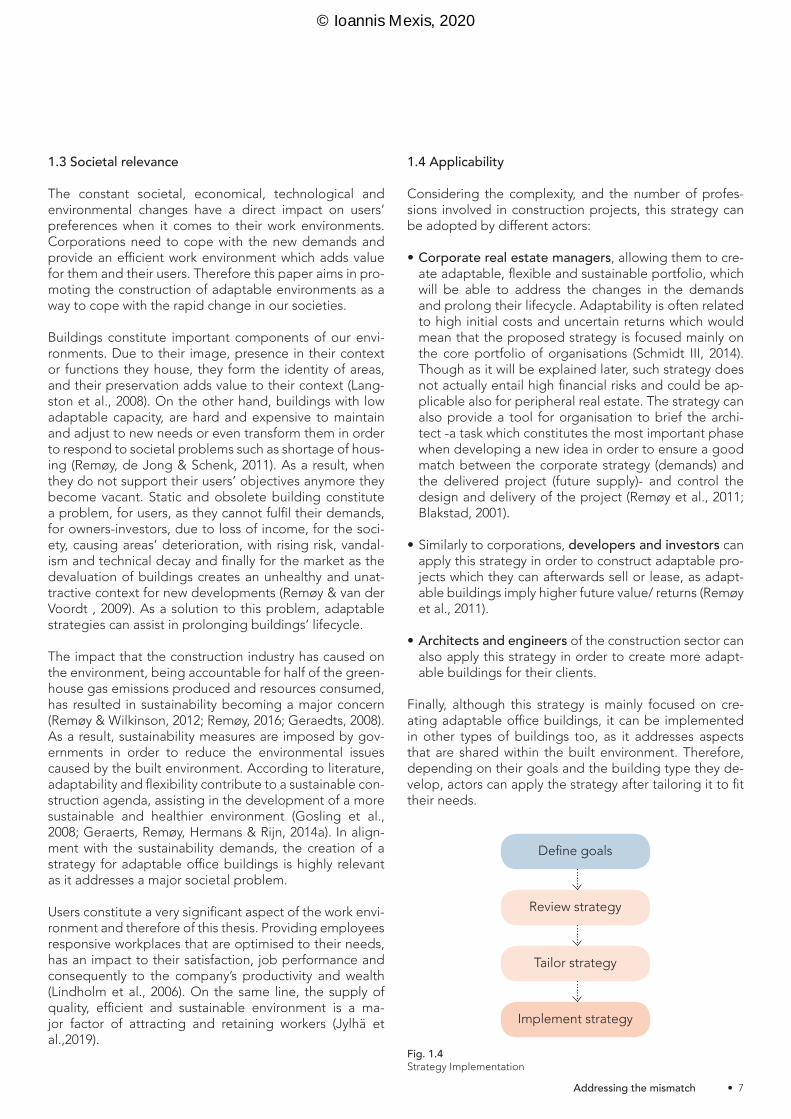
1.4 Applicability
Considering the complexity, and the number of profes-sions involved in construction projects, this strategy can be adopted by different actors:
• Corporate real estate managers, allowing them to cre-ate adaptable, flexible and sustainable portfolio, which will be able to address the changes in the demands and prolong their lifecycle. Adaptability is often related to high initial costs and uncertain returns which would mean that the proposed strategy is focused mainly on the core portfolio of organisations (Schmidt III, 2014). Though as it will be explained later, such strategy does not actually entail high financial risks and could be ap-plicable also for peripheral real estate. The strategy can also provide a tool for organisation to brief the archi-tect -a task which constitutes the most important phase when developing a new idea in order to ensure a good match between the corporate strategy (demands) and the delivered project (future supply)- and control the design and delivery of the project (Remøy et al., 2011; Blakstad, 2001).
• Similarly to corporations, developers and investors can apply this strategy in order to construct adaptable pro-jects which they can afterwards sell or lease, as adapt-able buildings imply higher future value/ returns (Remøy et al., 2011).
• Architects and engineers of the construction sector can also apply this strategy in order to create more adapt-able buildings for their clients.
Finally, although this strategy is mainly focused on cre-ating adaptable office buildings, it can be implemented in other types of buildings too, as it addresses aspects that are shared within the built environment. Therefore, depending on their goals and the building type they de-velop, actors can apply the strategy after tailoring it to fit their needs.
Define goals
Implement strategy
Review strategy
Tailor strategy
Fig. 1.4Strategy Implementation
• 7 Addressing the mismatch
© Ioannis Mexis, 2020
1.5 Scientific relevance
The demand for sustainable solutions and the rapid in-crease in the way society evolves -leading in constant change of demands- have resulted in adaptability being a major theme in the field of scientific research. Though the increase of obsolete buildings and the shortage of ad-aptable and flexible real estate, signifies that despite the research on this topic, there is still gap that needs to be addressed in order to stimulate the supply of future proof buildings.
Reviewing the existing literature, many authors have de-veloped tools or proposed actions dealing with adapt-able solutions. Though based on Estaji (2017) had stated, there is a lack of a comprehensive and thorough strategy addressing the matter.
One of the frameworks that is still being used by au-thors when writing about adaptable solutions is Brand’s “6 S-Building layers” framework (Brandt, 1994). Though Schmidt III (2014), stated that according to him, two fac-tors were missing from the framework. These are the sur-roundings (location) and the social factor (human factor – owners and users). Despite that observation, no author has created a strategy for adaptable solutions consider-ing these two principles.
In addition, as Gosling et al. (2008) had stated, develop-ing a guidance for enhancing the adaptability of new and existing buildings in order to create life-long buildings is a gap in literature that needs to be addressed.
Real estate is of major importance to organisations as it supports and contributes to the operations and value cre-ation of corporations (Van der Voordt, 2016; Lindholm et al., 2006). Thus, when designing a strategy for the devel-opment of adaptable office buildings, in order to make it comprehensive, one needs to consider how the proposed actions add value to the organisation by supporting its core business. Yet, combining strategies for adaptabil-ity, with the corporate real estate management view and models of added value comprises an unexplored field of scientific research.
Therefore, this research contributes to the body of knowl-edge about adaptability strategies for new office build-ings, providing a more comprehensive approach and linking it to the perspective of corporate real estate man-agement.
1.6 Personal motivation
The built environment is a complex and multifaceted field which combines creativity and science in a unique way, while requiring the coordination of multiple disciplines and professions. Acknowledging that, having a plain-ly architectural education, was not enough to become a holistic professional and understand how to address challenges from different perspectives. Graduating from the Heritage and Architecture studio from TU Delft, I was fascinated by the significance of creating buildings that can last in time, both for environmental as well as societal reasons. This fascination, was one of the starting points for this thesis project.
Studying the literature, I was intrigued by the number of authors emphasizing the static nature of the built environ-ment and its inability to respond to the rapid change of user’s demands, resulting in buildings to become obsolete and eventually be demolished (Remøy et al., 2007). There-fore, on the one hand understanding the importance of the creating future proof building and on the other the problems caused by buildings’ inflexibility were the two starting points for the selecting the theme of this thesis.
Through this thesis, my ambition is to expand my knowl-edge on the built environment from the perspective of real estate management. Considering the creative na-ture of my architectural background, my aim is to create a tangible strategy addressing challenges of our society, implementing both new and knowledge I have gained through my educational and professional experiences. In-vestigating the topic from different perspectives can allow me to derive to more concrete and holistic conclusions.
8 • 1.0 Introduction
© Ioannis Mexis, 2020
1.7 Research objectives
This research is focusing on assisting the creation of build-ings that can respond to their users’ change of needs. The main goal of this paper, is to provide a strategy that can result in the development of a dynamic and adaptable portfolio for corporations, managing the risk of buildings becoming obsolete due to their low built-in adaptive ca-pacity.
The strategy will explore how the proposed actions can add value for corporations. Depending on their core busi-ness objectives, corporate real estate managers can tailor and apply components of the strategy, while expecting the added value for the real estate portfolio and conse-quently the impact they will have on their organisation’s performance and goals (Van der Voordt, 2016). In that sense, the strategy can support the decision making pro-cess of corporate real estate managers regarding their firms’ future accommodation strategies. Objectives:
• Create a design strategy for adaptable office buildings • Present the benefits of adaptable environments • Assist corporations and developers in making informed
decisions on their investments and portfolio manage-ment
• Identify the added value of the strategy for corporations• Create a strategy that can be implemented by different
actors, such as corporate real estate managers, devel-opers, architects and construction engineers
1.8 Research questions Considering the problem description and the research objectives, formulated through a preliminary literature review, this paper’s main research question is defined as:
How can adaptability strategies be applied in the development of new office buildings
to add value for corporations and address the mismatch over time
between buildings and users’ demands?
This research question addresses two main themes, ad-aptability which constitutes the paper’s primary focus and added value. Aiming to get a better understanding of the paper’s main topics, answer the paper’s main research question and achieve the research objectives the follow-ing sub-questions will be addressed:
Literature review - Part 1:• What is adaptability?• What is flexibility?• Why is the demand for adaptable real estate increasing?• What is the impact of adaptable buildings on their users
and the environment?
Literature review - Part 2:• What strategies are currently used to create adaptable
buildings? • What strategies have been used in transformation pro-
jects? How can these provide input for strategies on new adaptable buildings?
Literature review - Part 3:• What is added value?• What forms of added value can be delivered to corpo-
rations through real estate?
Synthesis:• How do adaptable solution add value for the organisa-
tion and users of the buildings?
Empirical research:• What adaptability strategies are applied in practice? • How can adaptability contribute to a project’s success?• What are the risks underlying adaptability?• What is the future of adaptability in the built environ-
ment?• What is the added value of adaptable buildings for cor-
porations and their users as well as their suppliers- ar-chitects ?
• 9 Addressing the mismatch
© Ioannis Mexis, 2020

1.9 Conceptual model
The conceptual model (fig. 1.5) illustrates the main themes that will be addressed in this paper. Corporations’ main goal is to maximize their shareholder’s wealth (Lindholm & Leväinen, 2006). This can be achieved by providing build-ings that can support their employees’ activities (users) and demands, highlighting the importance of real estate’s contribution in a company’s core business activities.
The fast pace of societal, economical, technological and environmental changes have resulted in the constant emergence of new trends affecting the users and con-sequently their workplace demands. On the other hand, buildings are also impacted by the rise of sustainability demands, caused by the environmental challenges we are currently phasing; and therefore they need to respond both to their users’ and contextual demands. Equating the dynamic context with the static nature of real estate, one can understand the presence of a constant mismatch be-tween the users’ demands and the buildings (supply). This mismatch can have negative impact for the users (reduce satisfaction and productivity), for the organisations (loss of income) and for society (deteriorate the area’s image)
As a result, adaptable solutions are needed in order to create more responsive and future proof environments, improving the dialogue between the users and the build-ings and creating value for organisations. The exploration of the aforementioned concept, will create the founda-tions for developing a thorough and concrete strategy for the creation of a future-proof environment
Support
Demands for Building
Impact on
Constant mismatch
Value creation
SustainabilityDemands
Trends
ADAPTABILITY
CREM
Users Buildings
Fig. 1.5Conceptual model
10 • 1.0 Introduction
© Ioannis Mexis, 2020

2.0 Methodology
© Ioannis Mexis, 2020
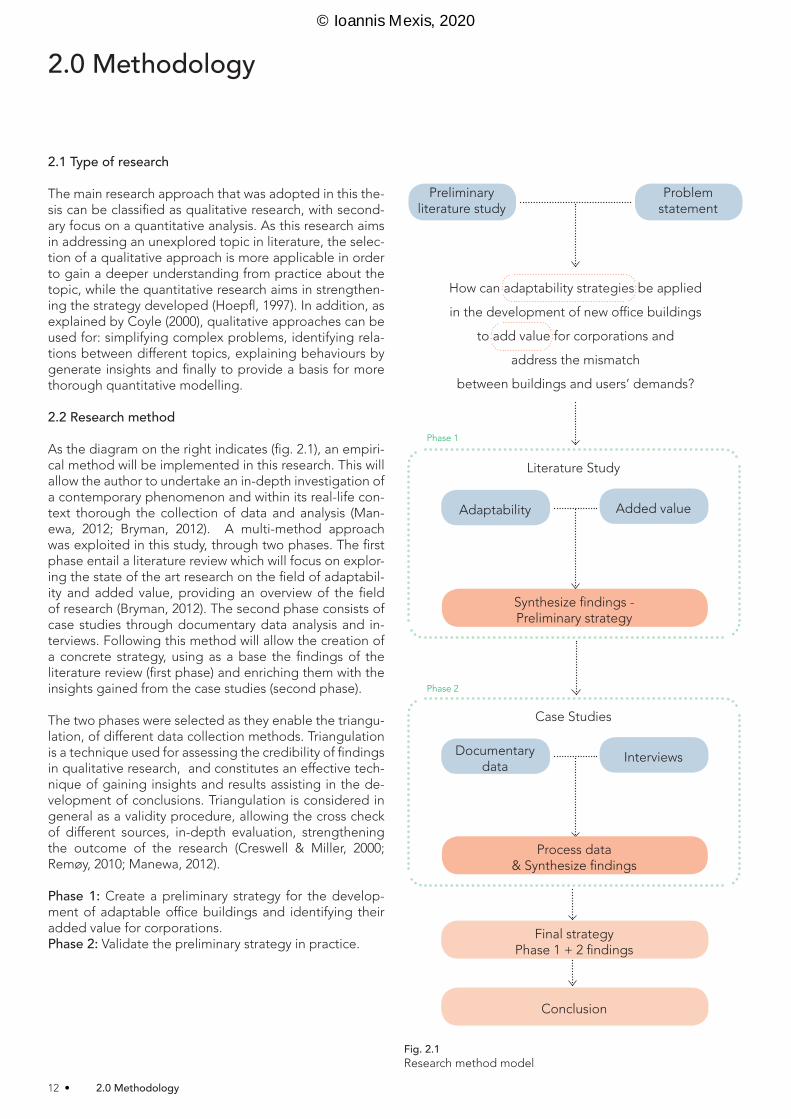
2.1 Type of research
The main research approach that was adopted in this the-sis can be classified as qualitative research, with second-ary focus on a quantitative analysis. As this research aims in addressing an unexplored topic in literature, the selec-tion of a qualitative approach is more applicable in order to gain a deeper understanding from practice about the topic, while the quantitative research aims in strengthen-ing the strategy developed (Hoepfl, 1997). In addition, as explained by Coyle (2000), qualitative approaches can be used for: simplifying complex problems, identifying rela-tions between different topics, explaining behaviours by generate insights and finally to provide a basis for more thorough quantitative modelling.
2.2 Research method As the diagram on the right indicates (fig. 2.1), an empiri-cal method will be implemented in this research. This will allow the author to undertake an in-depth investigation of a contemporary phenomenon and within its real-life con-text thorough the collection of data and analysis (Man-ewa, 2012; Bryman, 2012). A multi-method approach was exploited in this study, through two phases. The first phase entail a literature review which will focus on explor-ing the state of the art research on the field of adaptabil-ity and added value, providing an overview of the field of research (Bryman, 2012). The second phase consists of case studies through documentary data analysis and in-terviews. Following this method will allow the creation of a concrete strategy, using as a base the findings of the literature review (first phase) and enriching them with the insights gained from the case studies (second phase).
The two phases were selected as they enable the triangu-lation, of different data collection methods. Triangulation is a technique used for assessing the credibility of findings in qualitative research, and constitutes an effective tech-nique of gaining insights and results assisting in the de-velopment of conclusions. Triangulation is considered in general as a validity procedure, allowing the cross check of different sources, in-depth evaluation, strengthening the outcome of the research (Creswell & Miller, 2000; Remøy, 2010; Manewa, 2012).
Phase 1: Create a preliminary strategy for the develop-ment of adaptable office buildings and identifying their added value for corporations.Phase 2: Validate the preliminary strategy in practice.
Literature Study
Case Studies
Final strategyPhase 1 + 2 findings
Conclusion
Phase 1
Phase 2
How can adaptability strategies be applied
in the development of new office buildings
to add value for corporations and
address the mismatch
between buildings and users’ demands?
Adaptability
Documentary data
Added value
Interviews
Synthesize findings -Preliminary strategy
Preliminary literature study
Problem statement
Process data& Synthesize findings
Fig. 2.1Research method model
2.0 Methodology
12 • 2.0 Methodology
© Ioannis Mexis, 2020

2.2.1 Literature reviewThe process will start by conducting a literature review (Phase 1). This section consists of two parts. The first part focuses on adaptability and strategies applied in the de-velopment of adaptable buildings. The second part inves-tigates the added value of real estate for corporations. The aim of the literature review is to present a compre-hensive overview of the most important aspects underly-ing adaptability and create a thorough knowledge base on the field (Jylhä et al.,2019). Studying multiple sources will reduce biased and one-sided information, and gain a comprehensive overview of the present situation. The literature studied for this thesis was conducted using the snowball method (expanding literature from the available sources), in order to find the most relevant, recent and reliable sources (Manewa, 2012). The goal of this section is to synthesize the information gained and create a pre-liminary strategy for the development of adaptable office buildings. This strategy will be composed by adaptability measures that can be applied and they will be linked to the value they can deliver for the corporations that imple-ment them. The relation between the components of the proposed strategy with added value, will allow organisa-tions depending on their objectives and core business, to determine which parts of the strategy they should adopt. Data source: Academic journals, reports, booksOutput: Preliminary strategy
2.2.2 Case studiesIn the second part of the thesis a research by design ap-proach will be utilized. This part is mainly focused on the collection of qualitative and secondly quantitative data based on a series of case studies, through analysing doc-uments and data, and conducting interviews. The findings of the literature review will provide a framework-input for the aspects that need to be investigated through the in-terviews. Case studies allow the acquisition of a holistic view by analysing realised projects as well as the identi-fication of links and differences between them (Bryman, 2012). The case studies will focus on adaptable new build-ing as well as the transformation of existing buildings. Through this process the adaptability strategies that have been adopted in practice aiming to create dynamic build-ings will be studied. Transformation and reuse are meth-ods that prolong a building’s lifetime and thus constitute significant topics of analysis. Transformation projects, can provide input for the creation of proactive actions that can be implemented in order to avoid the emergence of po-tential future risks that can make buildings more static. Data source: Documentary data, InterviewsOutput: Insights from practice, feedback on preliminary strategy
2.2.3 Documentary dataThe first part of the case studies will be conducted through the analysis of documentary data. For this study, the key sources of documentary data are building drawings, for-mer studies, books and on-site investigations (Manewa, 2012). This method will be used to gain case-specific in-formation and knowledge on the tactics that were used, and will also provide input for the next part of the case studies, the interviews.
2.2.4 InterviewsThe second part of the case studies entails a series of in-terviews with the architects and real estate managers in-volved in the project. The aim of these interviews is to generate rich data, insights and in depth knowledge from practice by addressing themes, the significance of adapt-ability and the value it has for the users and corporations (Petrulaitiene & Jylhä, 2015). This process will allow the enrichment of the preliminary strategy in order to make it more concrete. In addition, interviewees will be asked to reflect on the preliminary strategy and provide feedback for the researcher in order to improve it.
2.2.5 SynthesisFollowing the analysis of the findings from the case stud-ies, the results of the two phases will be synthesized. The preliminary strategy which was based on the findings from literature will be revised, in order to create a more thor-ough and concrete strategy for adaptable office buildings. Data source: Literature review, case studiesOutput: Final strategy
• 13 Addressing the mismatch
© Ioannis Mexis, 2020

© Ioannis Mexis, 2020
3.0 Theoretical research
3.1 Adaptability3.2 Adaptability - Frameworks & Strategy3.3 Added value
• Phase 1 •
© Ioannis Mexis, 2020
“You cannot step twice into the same river”. Heraclitus c. 544-483 BC. The
“river” is always there, even though the water constantly flows. We relate to the river as an artefact that is constant, at
least during a lifetime. Buildings are also often treated as constants, although both man-made and possibly altered
and adapted by man. But buildings will, like rivers, undergo continuous chang-es, even though they appear to be the same. In a world where more and more
people start to realise the truth in Heraclitus’ saying, the way we deal with
change will receive more attention.”
(Blakstad, 2001)
Adaptability constitutes a highly significant topic within the field of research, however it is not a new concept. Since the 1960s’ adaptability can be found within the construc-tion agenda and especially on office developments (Pinder, Schmidt III, Austin, Gibb & Saker, 2017). Though, at present the approach towards the theme and its significance have changed. Due to the effects that internal and external fac-tors can have to organisations, their users and eventually their buildings, the aspect of time has been introduced in the design, as a means to portray buildings’ performance and the evolving demands that have to be accommodated (Schmidt III et al., 2009; Aytac, Arslan & Durak, 2016). There-fore the focus is now on buildings’ long -term performance, and new adaptable concepts that can be introduced to ex-tend their useful lives (Sadafi, Zain & Jamil, 2014). In order to do so, innovation in the development of new office build-ings needs to take place (Manewa, Pasquire, Gibb, Ross & Siriwardena, 2013). Such aspects, are reflected through the increase in demand for adaptable, flexible and sustainable spaces (Geraedts & Prins, 2016).
Adaptability and flexibility are terms that have been exten-sively used in literature as synonyms, despite them mean-ing different things. The common ground between them is the concept of change, resulting in them being used when authors refer to buildings’ ability to change (Pinder et al., 2017). On the other hand, according to authors, time and scale constitute the main factors of difference between them. Adaptability (3.1.1 Adaptability) focuses on large-scale changes taking place on the macro level whereas flex-ibility focuses on small-scale alterations taking place on the micro level (3.1.2 Flexibility) (Manewa, 2012; Pinder, et al., 2017).
Buildings are used in order to accommodate their users’ dynamic functions and demands. Influenced by external and internal factors, the pace that these demands change is increasing, resulting in a more uncertain future (3.1.5 Changes) (Geraedts, 2009). On the other hand, buildings need to be adaptable and perform well in future scenari-os, ensuring durability and prolong their functional lifecy-cle (3.1.3 Adaptive capacity) (Geraedts, 2009; Gijsbers & Lichtenberg, 2012); something which is also reflected in the need for a sustainable built environment (3.1.4 Sustain-ability) (Sadafi et al., 2014). When buildings lack adaptive capacity, and they cannot fulfil their occupiers’ demands, they may become vacant and eventually obsolete (3.1.6. Obsolescence) (Geraedts & van der Voordt, 2003; Remøy et al., 2007). Finally, applying adaptability strategies can have different costs and benefits for various actors (3.1.7. Costs & benefits of adaptability).
Aiming to create a strategy for the development of new ad-aptable office buildings, the theme of adaptability, its un-derlying topics, significance and impact on buildings, users and owners will be explored in this chapter.
3.1 Adaptability
16 • 3.1 Adaptability
© Ioannis Mexis, 2020

3.1.1 Adaptability
“The future is uncertain- the present must be adapt-able. Any built environment solution must be adaptable. Buildings have to be able to adapt to the ever-changing needs of the user during the whole life cycle. Buildings must remain efficient places to live and work to ensure real life-cycle value. The market demand for multi-pur-pose buildings also asks for buildings that can adapt to
changing circumstances.” (Geraedts, 2009)
The uncertainty that future entails has resulted in the increased demand for adaptable solutions (Geraedts & Prins, 2015). Considering the diversity of factors and complexity that underlie the built environment, in order to understand how adaptability can be implemented in the development of office buildings, one first needs to comprehend the meaning of the term. In literature, four characteristics are commonly used when defining ad-aptability and its properties. The first one is “capacity of change” describing buildings’ physical responsiveness to internal and external changes (Geraerts et al., 2014). The second characteristic focuses on the ability to “reduce mismatches” between the building (supply) and the us-ers (demand), allowing buildings to remain fit for purpose (Blakstad, 2001). “Value” is the third characteristic which refers to the aim of maximizing buildings’ productive use to fit both the context and their stakeholders’ demands, at a minimum cost. The last aspect is “time”, which has a twofold meaning, referring to both the speed of change and secondly changes through life (future & long-term) (Schmidt III, 2014).
Following these characteristics, Schmidt III (2014) defined adaptability based on the concepts of time, change, building and context. When designing for adaptability, time constitutes a critical dimension as one needs to con-sider both the predictable and unpredictable forces that can emerge. Change, recognises that nothing is static and this should also be reflected in buildings. Buildings, constitute a system of components, created by a unique combination of resources and their users’ requirements, whose value is judged based on their ability to continually redefine their spatial-functional relationship. The last con-cept, context refers to the forces (political, financial, cul-tural etc.) that interact with the physical buildings. Com-bining the characteristics found in literature and the four concepts of Schmidt III, what can be concluded is that, through the addition of time, buildings become suscep-tible to change, placing architecture in context and evok-ing strategies in order to accommodate the diverse cycles of its constituting parts – aiming to keep the building ‘fit for purpose’ and of ‘value’. Adaptability therefore is im-plemented as a manner to provide the potential to stabi-lise the dynamic equilibrium in the relationship between use and space affected by the interplay of the evolving contextual forces (Schmidt III, 2014).
Based on the aforementioned concepts, the aim of ad-aptability is to extend buildings’ lifecycle by continuously meeting users’ demands, reflecting the strong relation-ship between users and buildings (Blakstad, 2001). In the building-user relationship, building are not ends, they are means, whose purpose is to contribute to organisations’ performance. In this perspective, buildings’ performance will be defined by how well it serves the user organisation (Remøy, 2010). Due to the static nature of the buildings and the dynamic demands of users, a mismatch in this relationship is always evident. The application of adapt-ability measures, enriches buildings with the built-in ca-pacity to adjust to changes through spatial, functional and technical alterations with minor effects to other building parts, causing limited disruption to the ongoing activi-ties and the environment, while being financially feasible (Gijsbers & Lichtenberg, 2012). Adaptability is therefore implemented as a strategic approach to facilitate the fit between buildings and users (Blakstad, 2001; Geraedts, 2016).
Being able to respond to the users’ demands, increases buildings’ longevity allowing them to extend their func-tional lifecycle (Sadafi et al., 2014; Geraedts, 2016). Func-tional lifespan is directly related to the state, service life and overall technical attributes of a building (Blakstad, 2001). Thus, adaptability allows buildings to perform bet-ter in future scenarios, by improving their usability and du-rability and prolonging their lifespan, stimulating a more sustainable environment (Gosling et al., 200; Remøy et al., 2011; Remøy, 2010).
Adaptability has been promoted as a design strategy for a wide range of building types as it increases their per-formance and consequently their users’ performance (Gosling et al., 2008; Pinder et al., 2017). In the office sector, the implementation of adaptability measures provide the agility to respond to unpredictable business demands, allowing corporations to remain responsive and competi-tive (Geraedts & van der Voordt, 2003; Harris, 2015). Con-sidering adaptability from early design stages can assist in the development of resilient habitats, with larger scale benefits providing economically, socially and environmen-tally sustainable solutions (Aytac et al., 2016; Manewa et al., 2013).
Aiming to clarify the complex character of adaptability while incorporating the main concepts it underlies, the definition of adaptability that will be adopted in this pa-per is:
“The capacity to change the building’s built-environment in order to respond and fit to the evolving demands of its users/ environment maximizing value throughout its lifecycle”(Schmidt III, Eguchi, Austin & Gibb, 2009)
• 17 Addressing the mismatch
© Ioannis Mexis, 2020
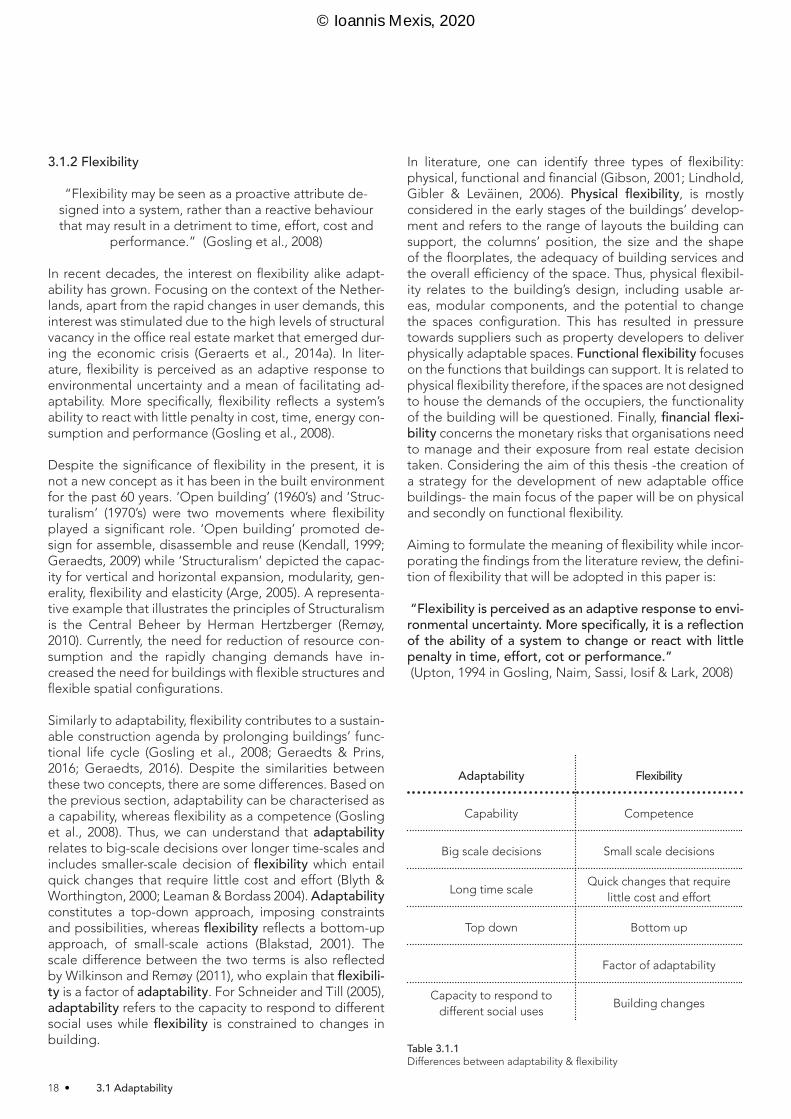
3.1.2 Flexibility
“Flexibility may be seen as a proactive attribute de-signed into a system, rather than a reactive behaviour that may result in a detriment to time, effort, cost and
performance.” (Gosling et al., 2008)
In recent decades, the interest on flexibility alike adapt-ability has grown. Focusing on the context of the Nether-lands, apart from the rapid changes in user demands, this interest was stimulated due to the high levels of structural vacancy in the office real estate market that emerged dur-ing the economic crisis (Geraerts et al., 2014a). In liter-ature, flexibility is perceived as an adaptive response to environmental uncertainty and a mean of facilitating ad-aptability. More specifically, flexibility reflects a system’s ability to react with little penalty in cost, time, energy con-sumption and performance (Gosling et al., 2008).
Despite the significance of flexibility in the present, it is not a new concept as it has been in the built environment for the past 60 years. ‘Open building’ (1960’s) and ‘Struc-turalism’ (1970’s) were two movements where flexibility played a significant role. ‘Open building’ promoted de-sign for assemble, disassemble and reuse (Kendall, 1999; Geraedts, 2009) while ‘Structuralism’ depicted the capac-ity for vertical and horizontal expansion, modularity, gen-erality, flexibility and elasticity (Arge, 2005). A representa-tive example that illustrates the principles of Structuralism is the Central Beheer by Herman Hertzberger (Remøy, 2010). Currently, the need for reduction of resource con-sumption and the rapidly changing demands have in-creased the need for buildings with flexible structures and flexible spatial configurations.
Similarly to adaptability, flexibility contributes to a sustain-able construction agenda by prolonging buildings’ func-tional life cycle (Gosling et al., 2008; Geraedts & Prins, 2016; Geraedts, 2016). Despite the similarities between these two concepts, there are some differences. Based on the previous section, adaptability can be characterised as a capability, whereas flexibility as a competence (Gosling et al., 2008). Thus, we can understand that adaptability relates to big-scale decisions over longer time-scales and includes smaller-scale decision of flexibility which entail quick changes that require little cost and effort (Blyth & Worthington, 2000; Leaman & Bordass 2004). Adaptability constitutes a top-down approach, imposing constraints and possibilities, whereas flexibility reflects a bottom-up approach, of small-scale actions (Blakstad, 2001). The scale difference between the two terms is also reflected by Wilkinson and Remøy (2011), who explain that flexibili-ty is a factor of adaptability. For Schneider and Till (2005), adaptability refers to the capacity to respond to different social uses while flexibility is constrained to changes in building.
In literature, one can identify three types of flexibility: physical, functional and financial (Gibson, 2001; Lindhold, Gibler & Leväinen, 2006). Physical flexibility, is mostly considered in the early stages of the buildings’ develop-ment and refers to the range of layouts the building can support, the columns’ position, the size and the shape of the floorplates, the adequacy of building services and the overall efficiency of the space. Thus, physical flexibil-ity relates to the building’s design, including usable ar-eas, modular components, and the potential to change the spaces configuration. This has resulted in pressure towards suppliers such as property developers to deliver physically adaptable spaces. Functional flexibility focuses on the functions that buildings can support. It is related to physical flexibility therefore, if the spaces are not designed to house the demands of the occupiers, the functionality of the building will be questioned. Finally, financial flexi-bility concerns the monetary risks that organisations need to manage and their exposure from real estate decision taken. Considering the aim of this thesis -the creation of a strategy for the development of new adaptable office buildings- the main focus of the paper will be on physical and secondly on functional flexibility.
Aiming to formulate the meaning of flexibility while incor-porating the findings from the literature review, the defini-tion of flexibility that will be adopted in this paper is:
“Flexibility is perceived as an adaptive response to envi-ronmental uncertainty. More specifically, it is a reflection of the ability of a system to change or react with little penalty in time, effort, cot or performance.” (Upton, 1994 in Gosling, Naim, Sassi, Iosif & Lark, 2008)
Adaptability Flexibility
Capability Competence
Big scale decisions Small scale decisions
Long time scaleQuick changes that require
little cost and effort
Top down Bottom up
Factor of adaptability
Capacity to respond to different social uses
Building changes
Table 3.1.1Differences between adaptability & flexibility
18 • 3.1 Adaptability
© Ioannis Mexis, 2020

3.1.3 Adaptive capacity
“The importance of adaptability in office buildings has increased during the past years mostly due to factors like rapid change, both in private and public organisations,
new and innovative work place designs and growing environmental concerns about building redundancy.“
(Arge, 2005)
Adaptable buildings consist of properties and qualities that allow them to remain functional during their techni-cal lifecycle, while responding to requirements on a sus-tainable and economically feasible manner (Geraert et al., 2014; Geraedts & Prins, 2016). These properties de-fine the buildings’ adaptive capacity. In the case of office buildings, adaptive capacity does not only benefit corpo-rations and their users, but from a societal perspective it adds future and social value as buildings constitute an inseparable element of our societies (Geraert et al., 2014).
Adaptive capacity provides the potential to apply reuse strategies aiming to revitalize buildings by introducing new functions (Aytac et al., 2016; Gijsbers & Lichtenberg, 2012). When considering a building’s adaptive capacity, the main focus is on its future value and not on the present or short-term value (Geraedts & Prins, 2015). Therefore it represents buildings’ long-term utility value, acting as an attractive force for next generation users, allowing chang-es of the functions that can be accommodated (Geraedts & Prins, 2015). Currently most buildings are not equipped to fulfil the ever-changing user demands, resulting in them having smaller functional cycles, and being able to respond to only short business cycles (Manewa, 2012). On the other hand, adaptable buildings have longer func-tional lifecycles and can therefore respond to longer busi-ness cycles, reducing the mismatch between a building’s technical and functional lifecycles. Functional can be also related to economic lifecycles, which signify the time span during which an asset remains responsive and useful for its owner (fig. 3.1.1 & fig. 3.1.2) (Remøy, 2010; Langston et al., 2008). A building’s ability to retain its functionality and extend its lifespan is vital for the creation of a future-proof environment (Manewa, 2012; Aytac et al., 2016).
According to Kincaid (2002), within the real estate market, office buildings have the highest potential of transform-ing into other functions (49%), residential being the most favourable amongst them (Kincaid, 2002). Adaptive reuse constitutes a sustainable way of creating new environ-ments, as by preserving the existing setting, the capital destruction and the resource consumption will decrease and consequently the negative externalities towards the environment will do too (Aytac et al., 2016). Adaptive ca-pacity is nowadays a crucial component when evaluating the sustainability of the real estate stock, and especially in office buildings where the changes are more frequent (Geraedts, van der Voordt, & Remøy, 2017).
Based on the findings from the literature, the definition of adaptive capacity that will be used in this paper is:
“Adaptive capacity of a building includes all character-istics that enable it to keep its functionality during the technical life-cycle in a sustainable and economic prof-itable way withstanding changing requirements and cir-cumstances.” (Geraerts et al., 2014a)
Fig 3.1.1Building cycles (Adapted from Schmidt III et al., 2009)
Distributed at Changing Roles Conference, Rotterdam 10/09
MAGNITUDE OF CHANGE
FREQUENCYOF CHANGE
HIGH
HIGHLOW
LOW
LOCATION
TASK
strategy is defined by a type of change which allows for a decision maker and built environment scale to be associated with each strategy. In general, the strategies operate on different cycles and affect different layers of the building. The magnitude and frequency of the types of changes tend to act inversely (Figure 4).
Specifity (figure 5) shows varying levels of specificity driving a building to be a specific response each time. The levels move from Level 1 (all enclosed spaces) to Level 5 (a very individual response). The industry operates with a tendency to build for a specific use, client, and site each contributing and moving further away from a set of general principles. The more specific a building becomes to a particular set of demands at a fixed point in time the more limited its capacity to respond to changes.
Figure 4: Changemeter
level 01
level 02
level 03
level 04
level 05
A F
A
A
A
A
B C D F
G
Building(all buildings;
enclosed space)
Use Range(a similar range of
building demands)
Specific Use(use type)
Specific Client(client specific needs)
Specific Site(adapted to site
conditions)
K L O
E
1 2
1a
Unique
Common
Specific
General
Tens
ion
betw
een
two
cont
iniu
ms
Buildingcycle
BusinesscycleBusiness
cycleBusiness
cycleBusiness
cycle
Buildingcycle
Buildingcapacity
Buildingcapacity
(FIT AT LEVEL 05)(FIT AT LEVEL 02)
Figure 5: Specficity
Figure 6: Landscape
Figure 7: Scales
Figure 8: Influencers
Scales (figure 7) lays out the varying levels of our built and organizational environments as a reference for understanding at what level and to what extent the dimensions operate at.
Influencers (figure 8) is a diagram we are using to attempt to capture who/ what influences the decision making process for a building. For example, how much influence does the designer have with his own set of beliefs and experiences. How much impact/ push does the client or society have on the finished product?
Many uses have a similar range of physical requirements which can classify them into use ranges (level 2 in Figure 5) which could allow convertability within that range. We also tend to associate a sense of uniqueness with specificity, where a more generic design tends to have less value and get labeled common. The evolution of a new built form is inevitable, but the capacity of that form to accommodate change dictates the forms performance ability and ultimately the length of its life - Land-scape (figure 6). The two lines represent varia-tions on the cycles of the built stock or land-scape. One indicates a building fit at level 2 and the other level 5 displaying a shorter cycle because of a limited capacity to respond to a single business cycle. On the other hand, the level 02 fit building can respond to three business cycles.
Designer Practice Industry Society
ORGANIZATIONAL SCALEMICRO MACRO
Component Neighborhood RegionPart Building CityAssemblySystem
BUILT-ENVIRONMENT SCALEMICRO MACRO
Industry Client
Society(government, global
communities, future generations)
(owner, funder, occupier, developer, local community)
(designers, manufactuers, consrructors)
Distributed at Changing Roles Conference, Rotterdam 10/09
MAGNITUDE OF CHANGE
FREQUENCYOF CHANGE
HIGH
HIGHLOW
LOW
LOCATION
TASK
strategy is defined by a type of change which allows for a decision maker and built environment scale to be associated with each strategy. In general, the strategies operate on different cycles and affect different layers of the building. The magnitude and frequency of the types of changes tend to act inversely (Figure 4).
Specifity (figure 5) shows varying levels of specificity driving a building to be a specific response each time. The levels move from Level 1 (all enclosed spaces) to Level 5 (a very individual response). The industry operates with a tendency to build for a specific use, client, and site each contributing and moving further away from a set of general principles. The more specific a building becomes to a particular set of demands at a fixed point in time the more limited its capacity to respond to changes.
Figure 4: Changemeter
level 01
level 02
level 03
level 04
level 05
A F
A
A
A
A
B C D F
G
Building(all buildings;
enclosed space)
Use Range(a similar range of
building demands)
Specific Use(use type)
Specific Client(client specific needs)
Specific Site(adapted to site
conditions)
K L O
E
1 2
1a
Unique
Common
Specific
General
Te
nsi
on
be
twe
en
tw
o c
on
tin
ium
s
Buildingcycle
BusinesscycleBusiness
cycleBusiness
cycleBusiness
cycle
Buildingcycle
Buildingcapacity
Buildingcapacity
(FIT AT LEVEL 05)(FIT AT LEVEL 02)
Figure 5: Specficity
Figure 6: Landscape
Figure 7: Scales
Figure 8: Influencers
Scales (figure 7) lays out the varying levels of our built and organizational environments as a reference for understanding at what level and to what extent the dimensions operate at.
Influencers (figure 8) is a diagram we are using to attempt to capture who/ what influences the decision making process for a building. For example, how much influence does the designer have with his own set of beliefs and experiences. How much impact/ push does the client or society have on the finished product?
Many uses have a similar range of physical requirements which can classify them into use ranges (level 2 in Figure 5) which could allow convertability within that range. We also tend to associate a sense of uniqueness with specificity, where a more generic design tends to have less value and get labeled common. The evolution of a new built form is inevitable, but the capacity of that form to accommodate change dictates the forms performance ability and ultimately the length of its life - Land-scape (figure 6). The two lines represent varia-tions on the cycles of the built stock or land-scape. One indicates a building fit at level 2 and the other level 5 displaying a shorter cycle because of a limited capacity to respond to a single business cycle. On the other hand, the level 02 fit building can respond to three business cycles.
Designer Practice Industry Society
ORGANIZATIONAL SCALEMICRO MACRO
Component Neighborhood RegionPart Building CityAssemblySystem
BUILT-ENVIRONMENT SCALEMICRO MACRO
Industry Client
Society(government, global
communities, future generations)
(owner, funder, occupier, developer, local community)
(designers, manufactuers, consrructors)
Distributed at Changing Roles Conference, Rotterdam 10/09
MAGNITUDE OF CHANGE
FREQUENCYOF CHANGE
HIGH
HIGHLOW
LOW
LOCATION
TASK
strategy is defined by a type of change which allows for a decision maker and built environment scale to be associated with each strategy. In general, the strategies operate on different cycles and affect different layers of the building. The magnitude and frequency of the types of changes tend to act inversely (Figure 4).
Specifity (figure 5) shows varying levels of specificity driving a building to be a specific response each time. The levels move from Level 1 (all enclosed spaces) to Level 5 (a very individual response). The industry operates with a tendency to build for a specific use, client, and site each contributing and moving further away from a set of general principles. The more specific a building becomes to a particular set of demands at a fixed point in time the more limited its capacity to respond to changes.
Figure 4: Changemeter
level 01
level 02
level 03
level 04
level 05
A F
A
A
A
A
B C D F
G
Building(all buildings;
enclosed space)
Use Range(a similar range of
building demands)
Specific Use(use type)
Specific Client(client specific needs)
Specific Site(adapted to site
conditions)
K L O
E
1 2
1a
Unique
Common
Specific
General
Ten
sio
n b
etw
een
tw
o c
on
tin
ium
s
Buildingcycle
BusinesscycleBusiness
cycleBusiness
cycleBusiness
cycle
Buildingcycle
Buildingcapacity
Buildingcapacity
(FIT AT LEVEL 05)(FIT AT LEVEL 02)
Figure 5: Specficity
Figure 6: Landscape
Figure 7: Scales
Figure 8: Influencers
Scales (figure 7) lays out the varying levels of our built and organizational environments as a reference for understanding at what level and to what extent the dimensions operate at.
Influencers (figure 8) is a diagram we are using to attempt to capture who/ what influences the decision making process for a building. For example, how much influence does the designer have with his own set of beliefs and experiences. How much impact/ push does the client or society have on the finished product?
Many uses have a similar range of physical requirements which can classify them into use ranges (level 2 in Figure 5) which could allow convertability within that range. We also tend to associate a sense of uniqueness with specificity, where a more generic design tends to have less value and get labeled common. The evolution of a new built form is inevitable, but the capacity of that form to accommodate change dictates the forms performance ability and ultimately the length of its life - Land-scape (figure 6). The two lines represent varia-tions on the cycles of the built stock or land-scape. One indicates a building fit at level 2 and the other level 5 displaying a shorter cycle because of a limited capacity to respond to a single business cycle. On the other hand, the level 02 fit building can respond to three business cycles.
Designer Practice Industry Society
ORGANIZATIONAL SCALEMICRO MACRO
Component Neighborhood RegionPart Building CityAssemblySystem
BUILT-ENVIRONMENT SCALEMICRO MACRO
Industry Client
Society(government, global
communities, future generations)
(owner, funder, occupier, developer, local community)
(designers, manufactuers, consrructors)
Distributed at Changing Roles Conference, Rotterdam 10/09
MAGNITUDE OF CHANGE
FREQUENCYOF CHANGE
HIGH
HIGHLOW
LOW
LOCATION
TASK
strategy is defined by a type of change which allows for a decision maker and built environment scale to be associated with each strategy. In general, the strategies operate on different cycles and affect different layers of the building. The magnitude and frequency of the types of changes tend to act inversely (Figure 4).
Specifity (figure 5) shows varying levels of specificity driving a building to be a specific response each time. The levels move from Level 1 (all enclosed spaces) to Level 5 (a very individual response). The industry operates with a tendency to build for a specific use, client, and site each contributing and moving further away from a set of general principles. The more specific a building becomes to a particular set of demands at a fixed point in time the more limited its capacity to respond to changes.
Figure 4: Changemeter
level 01
level 02
level 03
level 04
level 05
A F
A
A
A
A
B C D F
G
Building(all buildings;
enclosed space)
Use Range(a similar range of
building demands)
Specific Use(use type)
Specific Client(client specific needs)
Specific Site(adapted to site
conditions)
K L O
E
1 2
1a
Unique
Common
Specific
General
Tens
ion
betw
een
two
cont
iniu
ms
Buildingcycle
BusinesscycleBusiness
cycleBusiness
cycleBusiness
cycle
Buildingcycle
Buildingcapacity
Buildingcapacity
(FIT AT LEVEL 05)(FIT AT LEVEL 02)
Figure 5: Specficity
Figure 6: Landscape
Figure 7: Scales
Figure 8: Influencers
Scales (figure 7) lays out the varying levels of our built and organizational environments as a reference for understanding at what level and to what extent the dimensions operate at.
Influencers (figure 8) is a diagram we are using to attempt to capture who/ what influences the decision making process for a building. For example, how much influence does the designer have with his own set of beliefs and experiences. How much impact/ push does the client or society have on the finished product?
Many uses have a similar range of physical requirements which can classify them into use ranges (level 2 in Figure 5) which could allow convertability within that range. We also tend to associate a sense of uniqueness with specificity, where a more generic design tends to have less value and get labeled common. The evolution of a new built form is inevitable, but the capacity of that form to accommodate change dictates the forms performance ability and ultimately the length of its life - Land-scape (figure 6). The two lines represent varia-tions on the cycles of the built stock or land-scape. One indicates a building fit at level 2 and the other level 5 displaying a shorter cycle because of a limited capacity to respond to a single business cycle. On the other hand, the level 02 fit building can respond to three business cycles.
Designer Practice Industry Society
ORGANIZATIONAL SCALEMICRO MACRO
Component Neighborhood RegionPart Building CityAssemblySystem
BUILT-ENVIRONMENT SCALEMICRO MACRO
Industry Client
Society(government, global
communities, future generations)
(owner, funder, occupier, developer, local community)
(designers, manufactuers, consrructors)
Distributed at Changing Roles Conference, Rotterdam 10/09
MAGNITUDE OF CHANGE
FREQUENCYOF CHANGE
HIGH
HIGHLOW
LOW
LOCATION
TASK
strategy is defined by a type of change which allows for a decision maker and built environment scale to be associated with each strategy. In general, the strategies operate on different cycles and affect different layers of the building. The magnitude and frequency of the types of changes tend to act inversely (Figure 4).
Specifity (figure 5) shows varying levels of specificity driving a building to be a specific response each time. The levels move from Level 1 (all enclosed spaces) to Level 5 (a very individual response). The industry operates with a tendency to build for a specific use, client, and site each contributing and moving further away from a set of general principles. The more specific a building becomes to a particular set of demands at a fixed point in time the more limited its capacity to respond to changes.
Figure 4: Changemeter
level 01
level 02
level 03
level 04
level 05
A F
A
A
A
A
B C D F
G
Building(all buildings;
enclosed space)
Use Range(a similar range of
building demands)
Specific Use(use type)
Specific Client(client specific needs)
Specific Site(adapted to site
conditions)
K L O
E
1 2
1a
Unique
Common
Specific
General
Tens
ion
betw
een
two
cont
iniu
ms
Buildingcycle
BusinesscycleBusiness
cycleBusiness
cycleBusiness
cycle
Buildingcycle
Buildingcapacity
Buildingcapacity
(FIT AT LEVEL 05)(FIT AT LEVEL 02)
Figure 5: Specficity
Figure 6: Landscape
Figure 7: Scales
Figure 8: Influencers
Scales (figure 7) lays out the varying levels of our built and organizational environments as a reference for understanding at what level and to what extent the dimensions operate at.
Influencers (figure 8) is a diagram we are using to attempt to capture who/ what influences the decision making process for a building. For example, how much influence does the designer have with his own set of beliefs and experiences. How much impact/ push does the client or society have on the finished product?
Many uses have a similar range of physical requirements which can classify them into use ranges (level 2 in Figure 5) which could allow convertability within that range. We also tend to associate a sense of uniqueness with specificity, where a more generic design tends to have less value and get labeled common. The evolution of a new built form is inevitable, but the capacity of that form to accommodate change dictates the forms performance ability and ultimately the length of its life - Land-scape (figure 6). The two lines represent varia-tions on the cycles of the built stock or land-scape. One indicates a building fit at level 2 and the other level 5 displaying a shorter cycle because of a limited capacity to respond to a single business cycle. On the other hand, the level 02 fit building can respond to three business cycles.
Designer Practice Industry Society
ORGANIZATIONAL SCALEMICRO MACRO
Component Neighborhood RegionPart Building CityAssemblySystem
BUILT-ENVIRONMENT SCALEMICRO MACRO
Industry Client
Society(government, global
communities, future generations)
(owner, funder, occupier, developer, local community)
(designers, manufactuers, consrructors)
Fig. 3.1.2Technical & functional lifecycle
Technical lifecycle
Functional lifecycle - non adaptable
Functional lifecycle - adaptable
Economic lifecycle - adaptable
• 19 Addressing the mismatch
© Ioannis Mexis, 2020

3.1.4 Sustainability
A sustainable building is not that must last forever, but one that can easily adapt to change.
(Graham, 2005)
The uncertainty underlying our environment and the avail-able resources, in addition to the environmental impact the construction industry has caused, consuming 50% or primary resources and 40% of energy produced, and producing 50% of greenhouse gases, have stimulated the need for sustainable solutions (Remøy & Wilkinson, 2012; Remøy, 2016). Such solutions should address the present as well as the future, while taking into account the ma-terials and the energy consumption during construction, maintenance, operation phases and disposal of the build-ings (Gosling et al., 2008; Sadafi et al., 2014). Sustainable solution comprise developments that meet the needs of the present without compromising the ability of fu-ture generations to meet their own needs (Remøy, 2016). On the same line, sustainable buildings have the built-in ability to adjust to evolving circumstances and technolo-gies without excessive conflicts, financial costs and waste (Sadafi et al., 2014; Manewa et al., 2013).
One of the preconditions for sustainability is buildings’ long-term utility value. The longer a building can main-tain its functional life cycle, instead of becoming obsolete, the more sustainable it will be (Geraedts et al., 2014; Ger-aedts, 2016). As adaptability and flexibility are factors of buildings’ functional lifecycle, they constitute important assessment criteria of sustainable buildings (Geraedts, 2009; Aytac et al., 2016; Manewa et al., 2013). Therefore, adaptable buildings are sustainable buildings (Geraedts & Prins, 2015). Buildings are used for fulfilling needs, they are expected to have longevity and be more durable, al-lowing them to sustain structural integrity for a long pe-riod of time as well as maintain attractiveness in terms of their style and functionality (Sadafi et al., 2014). Adaptable buildings, can accommodate better the rapidly changing user preferences, reducing the waste production and en-ergy consumption (Remøy, 2010).
The significance of sustainability for real estate develop-ments, and the benefits it entails not only for the gener-al public, but for the occupiers, users and developers of buildings, have resulted in it being an important element of the real estate agenda. Regardless of time and market perspective, sustainability is a major criterion for judg-ing the value and the future of buildings (Manewa, 2012; Geraedts & Prins, 2015). On the same line, adaptable strategies not only address the unsustainable nature of traditional constructions, but are also less expensive than demolishing and rebuilding, and reduce the downturn during this transitional phase (Wilkinson & Reed, 2011). With that said, adaptable strategies have great implica-tions on sustainability.
“The current push to develop more sustainable places to live and work must consider buildings not as finished works of perfection removed from time, but as imperfect objects whose forms evolve to fit shifts in society through
time” (Schmidt III, Eguchi, Austin & Gibb, 2009)
The relation between sustainability, adaptability and the concept of time, can be expressed through the term fu-ture-proof developments, indicating long-term efficiency and the capacity to accommodate future needs. In that sense, buildings cannot be viewed as definite objects re-moved from time, but as imperfect works that are continu-ously evolving to fit the technical, functional and aesthetic evolution of their context.
Fig. 3.1.3Adaptable approaches integrated with sustainable building life cycle approach (adapted from Aytac et all., 2016).
Materials & transportation
End of life
RecycleDesign &
construction
Use
UnderuseDisuse
Adaptive reuse
20 • 3.1 Adaptability
© Ioannis Mexis, 2020

3.1.5 Change
“The importance of adaptability in office buildings has increased during the past years mostly due to factors like rapid change, both in private and public organisations,
new and innovative work place designs and growing environmental concerns about building redundancy.“
(Arge, 2005)
Architecture exists in time. Consequently, buildings op-erate within an affluence of change, where nothing stays still. Changes are inevitable making them one of the most powerful drivers of design. Though all changes are not the same, they vary from small to radical while most of them are a result of accumulations of incremental changes. In every case, the frequency (high or low), nature (routine or non-routine), magnitude (small or large), distinctiveness (visible or not) and position (internal- controllable or ex-ternal- outside of control) of changes will differ. Based on these factors the impact that changes have on buildings can greatly vary (Schmidt III, 2014; Schneider & Till, 2007; Slaughter, 2001).
These changes can be a result of many factors, the most common being: environmental consideration, innovation in technology, planning & policy changes, social require-ments, policy forces and economic considerations (Mane-wa et al., 2013). Focusing on the office sector, in the past century a large variety of different layouts and types of of-fice buildings have been developed. These different types are a result of a number of drivers such as: new types of work, technological innovations, legislation and changes in the real estate market, design and construction indus-tries. Despite the pace of change in office buildings being faster than any other sector, literature discusses that this pace is expected to increase exponentially the upcom-ing years, resulting in growth of unpredictability and un-certainty of future conditions (Blakstad, 2001; Arge, 2005; Finch, 2009).
In order to respond to these changes, physical alterations are not always required as some can be accommodated through organisational interventions. Though, social shifts often call for physical reactions, which can then stimulate the mismatch in the relationship between the users (de-mand) and the buildings (supply) (Blakstad, 2001; Schmidt III, 2014). Focusing on the ones that call for physical ad-justments, these may result in changes in the functions accommodated, in the load and volume capacity, in the environment (air and sunlight) and people flow (in and around the building) (Slaughter, 2001; Schmidt III, 2014).
Following the contextual changes and the organisations’ nature, corporations’ and users’ demands constantly change. For example, companies grow and shrink faster, and this is reflected in their office layout. Altering static spaces can be an expensive and lengthy process. This has given rise in the demands for flexible and adaptable buildings (Blakstad, 2001). Evaluating the present office real estate context, the application of proactive solutions that can respond to changes are rare. As a result buildings become prematurely obsolete (Manewa et al., 2013).
Hertzberger, a Dutch architect and supporter of the ‘Structuralism’ movement, puts forth that buildings are designed for a certain moment in time, and that their context will always change. Thus there is not one absolute solution when developing buildings, while they cannot be regarded as complete and static objects (Schmidt III, 2014).
“The inclusion of time and the unravelling of change can now begin to envision a building not as a static object but as part of a dynamic interplay between form (build-
ing) and context (users, environment)”. (Schmidt III, 2014)
• 21 Addressing the mismatch
© Ioannis Mexis, 2020

3.1.6 Obsolescence
“The current office market condition, where the office user has extensive accommodation options, has high-
lighted the significance of attaining a good fit with user preferences. An office building may become obsolete
and remain vacant when its features do not meet current user’s demands”. (Remøy, & van der Voordt, 2014)
As users’ demands constantly change, buildings need to be able to respond to them; though, their rigid nature does not always allow them either because it is technically or financially unfeasible (Geraedts, 2009; Manewa, 2012). This inability can be defined as the mismatch between real estate’s technical and functional lifespan, and is the main cause of vacancy (Remøy, 2010; Langston et al., 2008).
This mismatch can lead to vacancy which can be a result of multiple building and location related factors (Remøy, 2010; Remøy, & van der Voordt, 2014). Location factors that can be linked with vacancy are: access by car and public transport, image of the area, geographic location, multi/mono-functionality, visibility of location, presence of clients and suppliers and parking space. On the other hand, building factors that can be linked to vacancy are: external appearance, entrance visibility, interior quality, layout flexibility, overall real estate quality, identity of the building (Remøy, 2010; Remøy, & van der Voordt, 2014). Not complying with a number of these factors, being func-tionally or technically outdated, and not able to adapt to the users’ needs, can lead to buildings being vacant for a long period of time. If buildings do not have the prospect of future tenancy and their vacancy period lasts longer than three years then the building is considered to be structurally vacant and consequently obsolete (Schmidt III, Austin & Brown, 2009; Remøy & van der Voordt, 2006). The relation between the mismatch and obsolescence is illustrated on figure 3.1.4, signifying the direct relation be-tween the two values.
Focusing on the building scale, there are three building qualities that can highly impact the potential of obsoles-cence: external appearance, entrance hall & common parts (psychological and visual impact), internal specifi-cations (quality and quantity of finishes and services) and technology progress (buildings need to be sufficiently flexible to accommodate these). The lack of adaptability in buildings constitutes a major source of functional and technical obsolescence, as the demands of the market evolve. Though the impact of obsolescence can be min-imized if the source can be cured. Therefore there is an increasing demand for buildings that are adaptable and flexible regarding the three aforementioned qualities. This is caused as adaptability reduces the risk of irrevers-ible and major depreciation- the reduction in buildings’ market value (Baum, 1994).
Depreciation can be categorised in two types, curable and incurable. Curable depreciation is mostly caused by internal specification problems and is associated with adaptability and flexibility. Incurable depreciation is pri-marily caused by configuration problems. Accordingly, buildings that have a good plan layout are least prone to incurable depreciation (Baum, 1994).
Vacancy can cause public and economic problems, to so-ciety and the owners of the building accordingly. Owners will face economic problems as they will have a loss of income (Remøy & van der Voordt, 2006; Remøy & van der Voordt , 2009). On the society level, vacancy can cause depreciation and have a negative influence on the mar-ket, deteriorate an area’s image and increase the levels of criminality and vandalism (Remøy & van der Voor-dt , 2009; Remøy & Van der Voordt, 2007a; Wilkinson, & Remøy, 2011). Therefore, one can understand the bene-fits for both the owner and the society by developing fu-ture-proof buildings.
Fig. 3.1.4Mismatch & obsolescence graph
Ob
sole
scen
ce
Mismatch
22 • 3.1 Adaptability
© Ioannis Mexis, 2020
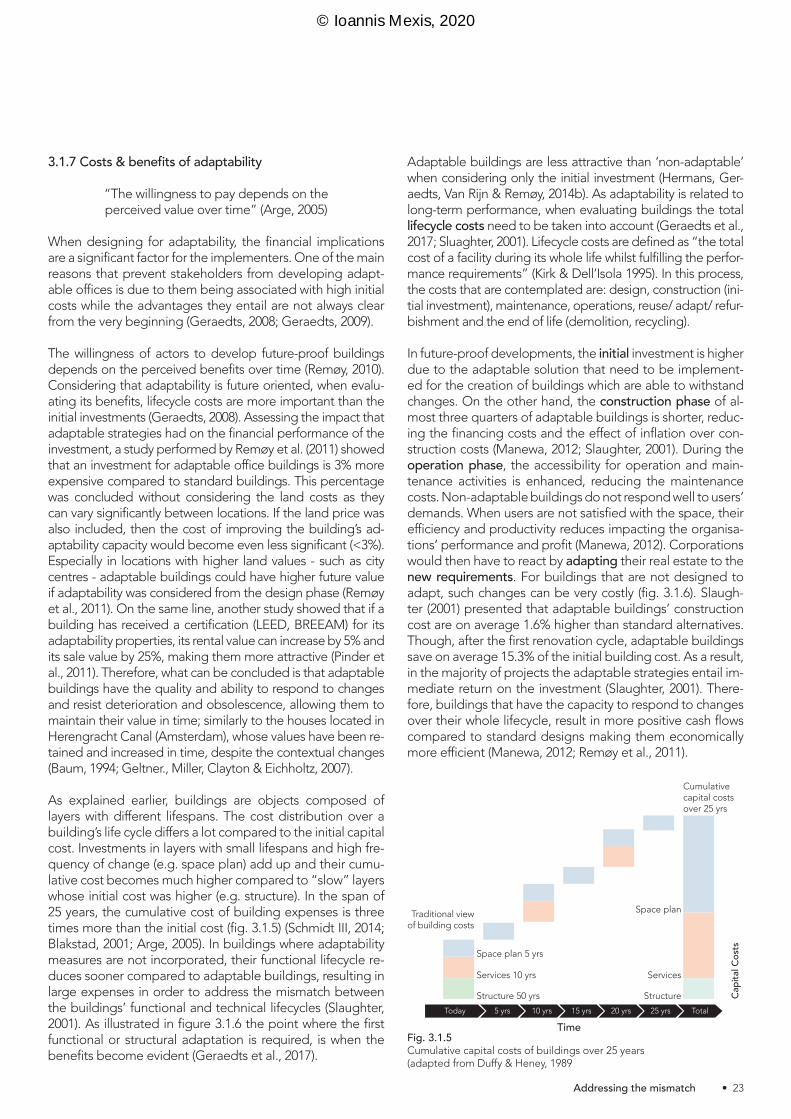
3.1.7 Costs & benefits of adaptability
“The willingness to pay depends on the perceived value over time” (Arge, 2005)
When designing for adaptability, the financial implications are a significant factor for the implementers. One of the main reasons that prevent stakeholders from developing adapt-able offices is due to them being associated with high initial costs while the advantages they entail are not always clear from the very beginning (Geraedts, 2008; Geraedts, 2009).
The willingness of actors to develop future-proof buildings depends on the perceived benefits over time (Remøy, 2010). Considering that adaptability is future oriented, when evalu-ating its benefits, lifecycle costs are more important than the initial investments (Geraedts, 2008). Assessing the impact that adaptable strategies had on the financial performance of the investment, a study performed by Remøy et al. (2011) showed that an investment for adaptable office buildings is 3% more expensive compared to standard buildings. This percentage was concluded without considering the land costs as they can vary significantly between locations. If the land price was also included, then the cost of improving the building’s ad-aptability capacity would become even less significant (<3%). Especially in locations with higher land values - such as city centres - adaptable buildings could have higher future value if adaptability was considered from the design phase (Remøy et al., 2011). On the same line, another study showed that if a building has received a certification (LEED, BREEAM) for its adaptability properties, its rental value can increase by 5% and its sale value by 25%, making them more attractive (Pinder et al., 2011). Therefore, what can be concluded is that adaptable buildings have the quality and ability to respond to changes and resist deterioration and obsolescence, allowing them to maintain their value in time; similarly to the houses located in Herengracht Canal (Amsterdam), whose values have been re-tained and increased in time, despite the contextual changes (Baum, 1994; Geltner., Miller, Clayton & Eichholtz, 2007).
As explained earlier, buildings are objects composed of layers with different lifespans. The cost distribution over a building’s life cycle differs a lot compared to the initial capital cost. Investments in layers with small lifespans and high fre-quency of change (e.g. space plan) add up and their cumu-lative cost becomes much higher compared to “slow” layers whose initial cost was higher (e.g. structure). In the span of 25 years, the cumulative cost of building expenses is three times more than the initial cost (fig. 3.1.5) (Schmidt III, 2014; Blakstad, 2001; Arge, 2005). In buildings where adaptability measures are not incorporated, their functional lifecycle re-duces sooner compared to adaptable buildings, resulting in large expenses in order to address the mismatch between the buildings’ functional and technical lifecycles (Slaughter, 2001). As illustrated in figure 3.1.6 the point where the first functional or structural adaptation is required, is when the benefits become evident (Geraedts et al., 2017).
Adaptable buildings are less attractive than ‘non-adaptable’ when considering only the initial investment (Hermans, Ger-aedts, Van Rijn & Remøy, 2014b). As adaptability is related to long-term performance, when evaluating buildings the total lifecycle costs need to be taken into account (Geraedts et al., 2017; Sluaghter, 2001). Lifecycle costs are defined as “the total cost of a facility during its whole life whilst fulfilling the perfor-mance requirements” (Kirk & Dell’Isola 1995). In this process, the costs that are contemplated are: design, construction (ini-tial investment), maintenance, operations, reuse/ adapt/ refur-bishment and the end of life (demolition, recycling).
In future-proof developments, the initial investment is higher due to the adaptable solution that need to be implement-ed for the creation of buildings which are able to withstand changes. On the other hand, the construction phase of al-most three quarters of adaptable buildings is shorter, reduc-ing the financing costs and the effect of inflation over con-struction costs (Manewa, 2012; Slaughter, 2001). During the operation phase, the accessibility for operation and main-tenance activities is enhanced, reducing the maintenance costs. Non-adaptable buildings do not respond well to users’ demands. When users are not satisfied with the space, their efficiency and productivity reduces impacting the organisa-tions’ performance and profit (Manewa, 2012). Corporations would then have to react by adapting their real estate to the new requirements. For buildings that are not designed to adapt, such changes can be very costly (fig. 3.1.6). Slaugh-ter (2001) presented that adaptable buildings’ construction cost are on average 1.6% higher than standard alternatives. Though, after the first renovation cycle, adaptable buildings save on average 15.3% of the initial building cost. As a result, in the majority of projects the adaptable strategies entail im-mediate return on the investment (Slaughter, 2001). There-fore, buildings that have the capacity to respond to changes over their whole lifecycle, result in more positive cash flows compared to standard designs making them economically more efficient (Manewa, 2012; Remøy et al., 2011).
Fig. 3.1.5Cumulative capital costs of buildings over 25 years (adapted from Duffy & Heney, 1989
Time
Capi
tal C
osts
Cumulative capital costs over 25 yrs
Structure
Services
Structure 50 yrs
Services 10 yrs
Space plan 5 yrs
Space plan
Today 5 yrs 10 yrs 15 yrs 20 yrs 25 yrs Total
Traditional view of building costs
• 23 Addressing the mismatch
© Ioannis Mexis, 2020

The three main actors that are interested in office devel-opments are owners-users, leaseholders and developers who are interested in selling or renting out the property. The first group invests more on adaptability, as they see value into buildings that are able to change fast and at low cost. Although many would expect them to over-spe-cialise their properties, knowing their business needs they consider the long-term potential of change (Arge, 2005; Pinder et al., 2011). In addition, adaptability increases a building’s value, making it easier for the owner to sell/ rent it if required (Pinder et al., 2011). The second group, is mainly interested for properties with flexible contracts and interiors (Gibson, 2003). Leaseholders have usually short-term objectives and therefore the majority is not interest in paying premiums that come with adaptable buildings (Lindholm & Gibler, 2005). The latter group has short-term interests in the properties they develop. Therefore, they are concerned that the benefits from adaptability will fall to another party, a barrier defined as split incentive. De-spite this, the increase in attractiveness for adaptability can boost prices through premiums, allowing them to benefit from it. In addition, for developers the reduction of alteration time and cost between tenants is important (Arge, 2005; Pinder et al., 2017; Pinder et al., 2011). There-fore adaptability can be capitalized through the rental and sale value of the property, due to the reduction of operat-ing and maintenance costs, and through the ease of small and large scale changes (e.g. change of use) (Pinder et al., 2011). Thus one can understand that both the demand and supply side parties can have financial benefits from developing adaptable office buildings (fig. 3.1.7). A fourth group who shows interest in adaptable buildings are the local authorities, whose aim is to reduce building relat-ed energy, material consumption as well as greenhouse emissions (Geraedts & Prins, 2015).
Therefore, one can understand that adaptable solutions entail a number of benefits and obstacles. The potential benefits are: reduction in the amount of new construc-tion, energy and resources, activation of vacant real es-tate, ease of change and disassembly, prolonged useful building lifetime, reduction of downtime, management of risks and uncertainties, improvement of buildings’ quali-ty and character and higher financial returns (Schmidt III, 2014; Remøy et al., 2007). On the other hand, the main ob-stacles identified in literature are the additional costs and short-term business models Schmidt III & Austin, 2016).
Real estate has a major role in corporations’ performance. Corporations’ demands for adaptable buildings and flex-ible solutions are rooted in the need for more responsive working environments and productivity increase. Corpo-rations’ portfolios are divided into two types, core (35% of total) and periphery (65% of total), and for each part they have different flexibility demands. Core portfolios -which are the main focus of this paper- need to have long-term value for organisations, and therefore need to be func-
tionally flexible and adaptable to changes throughout their lifecycles. Considering the long-term commitment and benefits, investing in adaptable offices only makes sense in locations where functional adaptation is possi-ble, therefore in dynamic mix-use locations (Remøy et al., 2011). On the other hand, periphery portfolio needs to be contractual flexible, allowing organisations to easily ac-quire and dispose space, responding to economic pres-sures and opportunities (Gibson, 2003; Lindholm ,2008).
Considering the benefits of adaptability, Schmidt III and Austin (2016) developed an idealised conceptual model of the industry, depicting how could the development of adaptable buildings be stimulated. Developers need to change attitude and start creating more adaptable real estate, as they attract higher prices from investors, who would then also understand that future-proof buildings are more attractive to a wider range of users, as they are easier to adapt to specific requirements. Valuators should contemplate the benefits of adaptability in their apprais-als and industry bodies should encourage adaptability consideration in the design, procurement and construc-tion process. Local authorities can encourage developers to construct such buildings by giving them more favour-able interests. Finally, the higher education system can assist by teaching future professionals the importance of ‘valuing the future’ (Schmidt & Austin, 2016).
Fig. 3.1.6Expected life cycle of facilities and potential impact of design to accom-modate change (Gosling et al., 2008).
facility can improve the value of the facility to the ownerand reduce disruptions and downtime for the occupants(Figure 1).
This research addresses this concern through a theoreticalapproach to the nature of change in built facilities, and anempirical analysis of change implementation in existingbuildings. In addition, the research analyses speci�c designstrategies used on particular projects that can decrease thetime and cost required to incorporate new components andsystems into a building to meet new or changed requirements(Maury, 1999; Keymer, 2000).
Several studies have examined and characterized theinteractions among the systems and their componentsduring operation (Alexander, 1982; Lion, 1982; Rush, 1986;Merritt and Ambrose, 1990; Reid, 1990; Slaughter et al.,1997). Several recent studies analyse a facility over a longtime period to examine the types of changes it can easilyincorporate (Habraken, 1972; Lees and Smith 1984; Pessiki etal., 1995; Gann and Barlow, 1996; Bordass and Leaman, 1997;Patterson, 1998). While many of the issues and approachesdiscussed in these analyses focus on speci�c usage categories,these approaches can form the basis for a comprehensiveapproach to analysing potential changes over a facility’s lifefor all possible usage categories.
The evaluation of the relative costs and bene�ts from thespeci�c design strategies are analysed using commonmethodological approaches, and building on recent empiricalwork. Life cycle cost analyses can provide an initial basisfor understanding the immediate and long-term bene�tsfrom increasing the capacity to accommodate change(Dell’Isola and Kirk, 1983; Riggs and Jones, 1990; Neely andNeathammer, 1991; Bull, 1993). For example, life cycle datafor bridges have been incorporated into proactive bridgemanagement programmes that seek to extend the useful lifeof existing bridges. An emerging issue in life cycle costingapproaches is the need to address signi�cant changes thatoccur over the time period, such as in loads, conditions orgeneral usage.
Theoretical frameworkThe framework for this research is the building systemsand their interactions, coupled with a speci�cation of thedifferent types of changes that can be expected over the longterm. A built facility can be examined as a set of functionalsystems; that is, the structure, exterior enclosure, servicesand interior �nish systems. The physical characteristics ofthese systems and their con�gurations form the basis inwhich to analyse the capacity of speci�c buildings toef�ciently accommodate changes over time.
Figure 1 Expected life cycle of facilities and potential impact of design to accommodate change
Design strategies to increase building ¯exibility
209
Fig. 3.1.7Financial value loss, traditional vs adaptable buildings. (Adapted from Engel & Browning, 2008)
Valu
e $
Time
Lifetime value of building
Lifetime value loss
Upgrades
Design
Traditional Adaptable
Desired value by stakeholders
24 • 3.1 Adaptability
© Ioannis Mexis, 2020
3.1.8 Conclusions
This section of the thesis focused on providing back-ground knowledge on the topic of adaptability and re-lated concepts found in literature. When designing for adaptability, time, change, buildings and context are concepts that need to be taken into account. The addi-tion of time, in the development process makes buildings susceptible to change, placing architecture in context. Contextual changes result in mismatches between the buildings and their users, evoking strategies that will ac-commodate these demands, keeping the building fit for purpose and of value. Therefore, one can understand that the building-user relationship- defining how well buildings serve the user organisations- is one of the main drivers of adaptability. The more adaptable buildings are, the more responsive to their users’ demands they will be, allowing them to extend their functional- lifecycles and avoid the danger of becoming obsolete. In the office sector, where the changes are more frequent, the demands for adapt-ability has increased, allowing corporations to maintain their performance and competitiveness in the market.
Adaptability is often defined in literature as flexibility. Though, flexibility refers to small scale changes that re-quire little costs and are initiated by bottom-up approach-es (users-workers). Literature defines three types of flex-ibility, physical, functional and financial. This thesis will focus on the first two as they address the physical form of the building and the functions it supports based on the user’s demands.
The adaptability and flexibility potential of buildings de-fine their adaptive capacity, their inherent characteristics that enable them to keep their functionality during their technical lifecycle and respond to changes in require-ments and circumstances, in a sustainable and economic profitable manner. Depending on the degree of adapt-ability, buildings functional lifecycle can be prolonged, as-sisting in the development of a more sustainable environ-ment. Taking into account the environmental challenges of our era, sustainability and therefore adaptability have become significant components of judging the value and future of buildings.
Considering that buildings are products of time, they are influenced by many external and internal drivers. Living in an ever evolving environment, contextual changes in-fluence organisations’ and users’ demands. In order for organisations to maintain their performance within the competitive market, they need to supply their employees environments that fit their demands, allowing them to work efficiently. Therefore, buildings should not be seen as static objects, but as a dynamic interplay between form and context.
Buildings with low adaptive capacity, cannot support change. This inability can be defined as the mismatch be-tween their functional and technical lifecycles, which can lead to obsolete buildings. Buildings that are functionally or technically outdated constitute significant public and economic problems to the society and their owners.
When designing for adaptability, the financial implication are a significant topic that can constrain actors for imple-menting such solutions. Adaptability entails higher initial investments and long-term benefits. Therefore, when evaluating the implications of adaptability one needs to consider a building’s lifecycle costs, as in most cases after the first renovation cycle the adaptability costs are recouped. Currently, when it comes to corporations, ad-aptable buildings can be mainly found in their core port-folios. Though due to sustainability demands and market trends, a shift in the demand of adaptable buildings has been initiated.
What can be concluded is that adaptable solution are im-plemented as a method to provide the potential to stabi-lise the dynamic equilibrium in the relationship between users and space, in a sustainable and economic profitable manner, maximizing the building’s value throughout its li-fecycle. The creation of thorough and concrete strategies that indicate to implementers the benefits they entail, is required in order to assist and stimulate in the application of such solutions.
• 25 Addressing the mismatch
© Ioannis Mexis, 2020

“With the addition of time the building becomes susceptible to change which situates architecture in context and evokes strategies
to accommodate the diverse cycles of its constituting parts –
in an effort to keep the building ‘fit for purpose’ and of ‘value’.”
(Blakstad, 2001)
The previous section highlighted the significance of ad-aptability for the built environment and specifically for office buildings. The versatility of factors, interests and aspects of adaptability that were investigated, signal the complexity of this approach. As a result, this has led many authors to develop theories and frameworks aiming to simplify and structure the concept of adaptability. Having developed a concrete base of knowledge on adaptabil-ity (3.1 Adaptability), studying these frameworks (3.2.1 Frameworks) and existing literature on adaptability strat-egies (3.2.2 Types of adaptability - 3.2.4 Adaptability in office buildings) will provide input and assist in structuring the preliminary strategy (3.2.5 Preliminary strategy & 3.2.6 Strategy types).
3.2.1 Frameworks
Adaptability as a mean of extending buildings’ functional lifespan and increasing usability has been investigated in the field of architecture and the built environment since the 1960s’. Researchers and architects have formulated different frameworks and approaches to adaptability. In 1972 through his book ‘Support an Alternative Mass Housing’, Habraken criticized the large scale post-war mass-housing for the lack of adaptability and quality, and users’ ability to influence their own houses. Based on these problems, Hebraken claimed that buildings’ struc-ture should be separated from internal fittings (Hebraken, 1972). Following Hebraken, Gordon (1974), developed his ‘triple L’ concept, referring to long life, loose fit and low energy buildings, aiming to increase buildings’ lifespan while reducing the energy use within the construction in-dustry. Since then, more authors have researched the ap-plicability of adaptable buildings (Brand 1994; Duffy, 1998; Leupen, 2006; Remøy et al., 2011).
During the same year, Frank Duffy studied the buildings from a different perspective, acknowledging that they are composed of different layers based on their lifespans (Schmidt III, 2014). Duffy’s work was mainly focused on of-fice buildings and their capacity to adapt to their users’ needs, resulting in robust environments. In 1990, he pre-sented the first theory on the rate of change in buildings ‘Shearing Layers’ where he defined them as a system of four layers: shell (permanent structure and façades of the building), service (mechanical parts e.g. heating & cool-ing), scenery (fitting out components accommodating a particular use) and set (furniture and equipment) (Estaji, 2017). For Duffy, adaptability was based on the refurbish-ment of office buildings and which components need to be altered in order to renew the building without influ-encing other parts (Remøy, 2010). Based on his theory, buildings should not be measured in material terms but in terms of time and the longevity of the built components (skin can last up to 50 years, services up to 15 years etc.) (Schmidt III, 2014).
3.2 Adaptability - Frameworks & Strategy
26 • 3.2 Adaptability - Frameworks & Strategy
© Ioannis Mexis, 2020
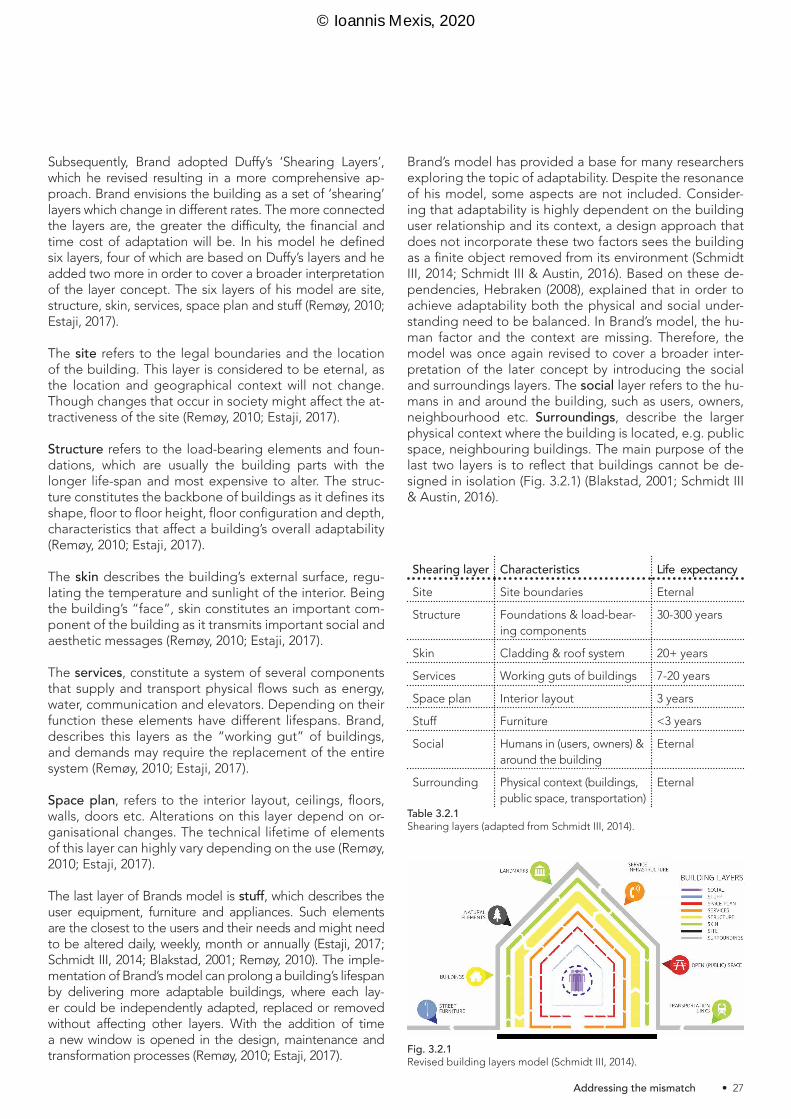
Subsequently, Brand adopted Duffy’s ‘Shearing Layers’, which he revised resulting in a more comprehensive ap-proach. Brand envisions the building as a set of ‘shearing’ layers which change in different rates. The more connected the layers are, the greater the difficulty, the financial and time cost of adaptation will be. In his model he defined six layers, four of which are based on Duffy’s layers and he added two more in order to cover a broader interpretation of the layer concept. The six layers of his model are site, structure, skin, services, space plan and stuff (Remøy, 2010; Estaji, 2017).
The site refers to the legal boundaries and the location of the building. This layer is considered to be eternal, as the location and geographical context will not change. Though changes that occur in society might affect the at-tractiveness of the site (Remøy, 2010; Estaji, 2017).
Structure refers to the load-bearing elements and foun-dations, which are usually the building parts with the longer life-span and most expensive to alter. The struc-ture constitutes the backbone of buildings as it defines its shape, floor to floor height, floor configuration and depth, characteristics that affect a building’s overall adaptability (Remøy, 2010; Estaji, 2017).
The skin describes the building’s external surface, regu-lating the temperature and sunlight of the interior. Being the building’s “face”, skin constitutes an important com-ponent of the building as it transmits important social and aesthetic messages (Remøy, 2010; Estaji, 2017).
The services, constitute a system of several components that supply and transport physical flows such as energy, water, communication and elevators. Depending on their function these elements have different lifespans. Brand, describes this layers as the “working gut” of buildings, and demands may require the replacement of the entire system (Remøy, 2010; Estaji, 2017).
Space plan, refers to the interior layout, ceilings, floors, walls, doors etc. Alterations on this layer depend on or-ganisational changes. The technical lifetime of elements of this layer can highly vary depending on the use (Remøy, 2010; Estaji, 2017).
The last layer of Brands model is stuff, which describes the user equipment, furniture and appliances. Such elements are the closest to the users and their needs and might need to be altered daily, weekly, month or annually (Estaji, 2017; Schmidt III, 2014; Blakstad, 2001; Remøy, 2010). The imple-mentation of Brand’s model can prolong a building’s lifespan by delivering more adaptable buildings, where each lay-er could be independently adapted, replaced or removed without affecting other layers. With the addition of time a new window is opened in the design, maintenance and transformation processes (Remøy, 2010; Estaji, 2017).
Brand’s model has provided a base for many researchers exploring the topic of adaptability. Despite the resonance of his model, some aspects are not included. Consider-ing that adaptability is highly dependent on the building user relationship and its context, a design approach that does not incorporate these two factors sees the building as a finite object removed from its environment (Schmidt III, 2014; Schmidt III & Austin, 2016). Based on these de-pendencies, Hebraken (2008), explained that in order to achieve adaptability both the physical and social under-standing need to be balanced. In Brand’s model, the hu-man factor and the context are missing. Therefore, the model was once again revised to cover a broader inter-pretation of the later concept by introducing the social and surroundings layers. The social layer refers to the hu-mans in and around the building, such as users, owners, neighbourhood etc. Surroundings, describe the larger physical context where the building is located, e.g. public space, neighbouring buildings. The main purpose of the last two layers is to reflect that buildings cannot be de-signed in isolation (Fig. 3.2.1) (Blakstad, 2001; Schmidt III & Austin, 2016).
Fig. 3.2.1Revised building layers model (Schmidt III, 2014).
Shearing layer Characteristics Life expectancySite Site boundaries Eternal
Structure Foundations & load-bear-ing components
30-300 years
Skin Cladding & roof system 20+ years
Services Working guts of buildings 7-20 years
Space plan Interior layout 3 years
Stuff Furniture <3 years
Social Humans in (users, owners) & around the building
Eternal
Surrounding Physical context (buildings, public space, transportation)
Eternal
Table 3.2.1Shearing layers (adapted from Schmidt III, 2014).
• 27 Addressing the mismatch
© Ioannis Mexis, 2020

3.2.2 Types of adaptability
The growing demand for the design of new buildings that would have the capacity to adapt, has stimulated re-searchers in developing strategies that can address this demand. Such strategies determine how would the build-ing respond to changes over time, by providing a plan of actions (Manewa, 2012; Manewa et al, 2013).
Authors developed different types of strategies that could be implemented in buildings. From a wide range of frameworks found in literature, the one which is distin-guished due to its comprehensiveness was developed by Schmidt et al. (2010) within the Adaptable Futures pro-ject (Manewa, 2012; Pinder, et al., 2017). The ‘Framecycle model’, presents a theoretical framework for adaptability which consists of six strategies (types of change): adjust-able, versatile, refitable, convertible, scalable and mova-ble (fig. 3.2.2). These strategies are organized based on the frequency of their occurrence, from the most frequent (adjustable) to the least (movable).
Adjustability, relates to the ability of buildings to change tasks, considering alterations in furniture, coordinated connections and modular systems. Such changes can take place daily and the decision makers are the users. In relation to Brand’s layers, adjustability relates to stuff (Manewa et al., 2013; Manewa, 2012; 34; Schmidt III, 2014).
Versatility, indicates the ability to alter a building’s interior spaces (change dimensions of spaces- partitions), which is dependent on the change of users’ activities. Similar-ly to adjustability, the users are the decision makers and such changes can take place daily or monthly. In relation to Brand’s layers, versatility relates to stuff and space, but depending on the changes’ magnitude one can also ar-gue that it might have an impact on the services, struc-ture and the skin (Manewa et al., 2013; Manewa, 2012; 34; Schmidt III, 2014).
Refitable, describes the potential to change a building’s performance through intervening on its components. The decision level of these changes are the users and own-ers of the building, which can take place every 5-10 years. Refitable is associated with the space, services and skin of Brand’s layers (Manewa et al., 2013; Manewa, 2012; 34; Schmidt III, 2014).
Convertible, refers to changes in buildings’ functions, de-cisions that can be taken by both the users and owners of the building. The frequency of such changes is low, taking place once or twice through a building’s lifetime (or every 15 years). In relation to Brand’s layers, convertible relates to the space, services, skin and sometimes structure of the building (Manewa et al., 2013; Manewa, 2012; 34; Schmidt III, 2014).
Fig. 3.2.2Revised framecycle model (Schmidt III, 2014).
Type of adaptability
Type of change Frequency of change
Adjustable Changing of task/ user - configuration of spacee.g. alter furniture type
Very high(Daily, weekly, monthly)
Versatile Changing the dimensions of a spacee.g. moveable partitions
High (Daily, monthly)
Refitable Changing the building’s performancee.g. detachable elements
Moderate (every 7 years)
Convertible Changing the use/ func-tion of a buildinge.g. floor to floor height that allows residential conversion
Low (once or twice in a building’s lifetime)
Scalable Changing the size of the buildinge.g. over-sized founda-tions to accommodate extensions
Low (once or twice in a building’s lifetime)
Moveable Changing the location of a buildinge.g. modular pods that enable disassembly/ deconstruction
Very low (rarely)
Table 3.2.2Six types of adaptability in buildings(adapted from Schmidt III et al., 2010).
28 • 3.2 Adaptability - Frameworks & Strategy
© Ioannis Mexis, 2020

Scalable, also referred to as ‘expandable’ reflects a build-ing’s ability to change its size and the loads it carries. Considering the magnitude that such change can have for a building, the owners are the decision makers. Such changes can take place once or twice within a building’s lifetime (or every 15 years). Scalable is associated with the space, services, skin and structure of Brand’s layers and in some occasions with the site (Manewa et al., 2013; Mane-wa, 2012; 34; Schmidt III, 2014).
Finally, movable is a strategy which is implemented very rarely, and refers to the ability to change locations. This strategy stimulates the implementation of standard com-ponents, product families and prefabricated systems. The owner is the decision maker for such changes, and it can be directly or indirectly applied to all of Brand’s layers (Manewa et al., 2013; Manewa, 2012; 34; Schmidt III, 2014).
Aiming to present the link between the six strategies and Brand’s building layers, their frequency of occurrence and the stakeholders that can be associated with these de-cision, Schmidt et al. (2010) presented the ‘adaptability linking table’. The table was later updated in Schmidt’s III doctoral thesis in order to represent in a more detailed manner the effect of the strategies. The probability of im-pacting a building’s layers as well as the involved stake-holders -enabler, benefactor and funder- of each strategy, were aspects that were incorporated in the new model (Schmidt III, 2014) (fig 3.2.3).
344
10.1.2.4. Crossover
M10. Linking model
Figure 10.18 Linking model
The heart of the linking model (Figure 10.18) is the relationships between adaptability types (M6, Figure 10.12)
and building layers (M1, Figure 10.2) which have been modified to reflect the evinced relationships from the
data (section 9.3, Table 9.25). In addition, a finer granularity has been added to the model in regards to the
types of change – separating cause (social) and effect (physical). Moreover, the identification of a stakeholder
in relationship to each adaptability type has been stratified to reflect a distinction between enabler, benefactor
and funder. This reflects the realisation of the often cited gap between who pays for adaptability and who
benefits from it (e.g. stakeholder influence M22, Figure 10.17). Further research could expand the table to
include economic costs (e.g. initial capital cost and downstream cost; see Figure 10.9). Lastly for clarification,
the links under the building layers are separated as two types indicated by the key – coloured boxes are
probable; while lower, white boxes are possible (lesser chance).
M23. Supply/Demand Paths
These three models (Figures 10.19, 10.20 and 10.21) link the supply (design strategies, C3) and demand
(adaptability types, C2) entry points to three elements of the theory. They are a product of the links
established in Appendix L - the table produced from the design solutions of the primary case studies.6
The first model (Figure 10.19) links the design strategies (DS) and adaptability types (AT) to the building
characteristics (CARs) - obtaining the desired building characteristics can be seen as a central goal of a
project and link adaptability to other design desires. As noted earlier the relationship between the design
strategies and building characteristics is nested (1 to many), while the adaptability types is categorical
(many to many) and are distinguished between primary links (solid line) and secondary links (dotted line).
The second model (Figure 10.20) links both to the building layers (M1, Figure 10.2) and the third model
(Figure 10.21) does the same for the design guidelines (sub-categories, Table 3.6).
6 Additional evidential tables are provided as Appendix AA.
Fig. 3.2.3Revised linking model (Schmidt III, 2014).
• 29 Addressing the mismatch
© Ioannis Mexis, 2020

3.2.3 Adaptability strategies
Aiming to create more tangible strategies, authors focused on developing adaptable solutions through frameworks, guidelines, tactics and indicators, by studying closely the construction industry. Such solutions cover a broad spec-trum of levels and scales were adaptability can be imple-mented.
Aiming to provide input for the creation of this paper’s strategy, findings from the literature are presented on ta-ble 3.2.3. Due to its comprehensiveness, Schmidt’s strat-egies and actions presented in the ‘Framecycle model’ (3.2.2 Adaptability strategies), constitute significant input for this paper’s strategy. Apart from this model, Schmidt III presented more tactics that can be applied, which he structure based on Brand’s layers (Schmidt III, 2014; Schmidt III & Austin, 2016).
Geraedts, another researcher who contributed on this field of study, stated that adaptability should be consid-ered from early project stages (Geraedts, 2009). In addi-tion, Geraedts developed model FLEX 2.0 which he later updated (FLEX 3.0 & FLEX 4.0), presenting a list of flexibility indicators to assess the adaptive capacity of buildings, who similarly to Schmidt III, structured them following Brand’s layers (Geraedts & Prins, 2015; Geraedts & Prins, 2016; Ger-aedts, 2016). The indicators presented through Geraedts’ research, can also provide input for this paper’s strategy.
Other researchers such as Arge (2005) developed a broad-er approach to the subject, identifying measures based on three concepts of adaptability: generality, flexibility and elasticity. Generality allows buildings to be designed for multi-functionality. Flexibility measures provide the poten-tial to rearrange, add or remove elements of the buildings depending on the users’ needs. Elasticity implies the po-tential of dividing or extending the building (Arge, 2005). Nakib, presented six guidelines addressing the topic of adaptability from different perspectives: social, economic, structural, technical, spatial & functional and façade (Na-kib, 2010). Through her PHD, Manewa presented a num-ber of design parameters that could influence buildings’ adaptability potential (Manewa, 2012). Scuderi, proposed a series of adaptable strategies addressing the architec-ture, society and function factors as well as the structure, technology and construction factors (Scuderi, 2019). Based on finding collected from existing literature, Sadafi et al. (2014), also indicated a number of adaptability strategies.
The strategy developed on this paper is mainly directed towards corporations’ core portfolio. Though, consider-ing the uncertainties that underlie our environment, the changes demanded might require more radical responses such the change of function accommodated, something that should also be taken into account. Consequently, transformation solutions were also taken into account.
Remøy and van der Voordt, have conducted an extensive research on the topic of office building transformations (Remøy & Van der Voordt, 2006; Remøy & Van der Voor-dt, 2007a; Remøy & Van der Voordt, 2009). Through their papers, a number of location (e.g. character of area, mul-tifunctional environment etc.) and building characteristics (e.g. structural grid capacity, entrance, expansion poten-tial etc.) are presented, which can highly impact buildings’ transformation potential. Considering the financial costs that adaptability requires, Remøy, de Jong and Schenk (2011), indicate that location constitutes a decisive factor and therefore such strategies should only take place in poly-functional areas where there is potential for function-al adaptability. Finally, Geraedts et al. (2014), introduced seven transformation dynamic indicators for building owners and users (e.g. change of unit size & functions accommodated) structured depending on the type of flexibility they address (rearrange, extension, rejection). Incorporating the aforementioned research findings can assist in the creation of a holistic and effective strategy, increasing the adaptive capacity of office buildings.
30 • 3.2 Adaptability - Frameworks & Strategy
© Ioannis Mexis, 2020
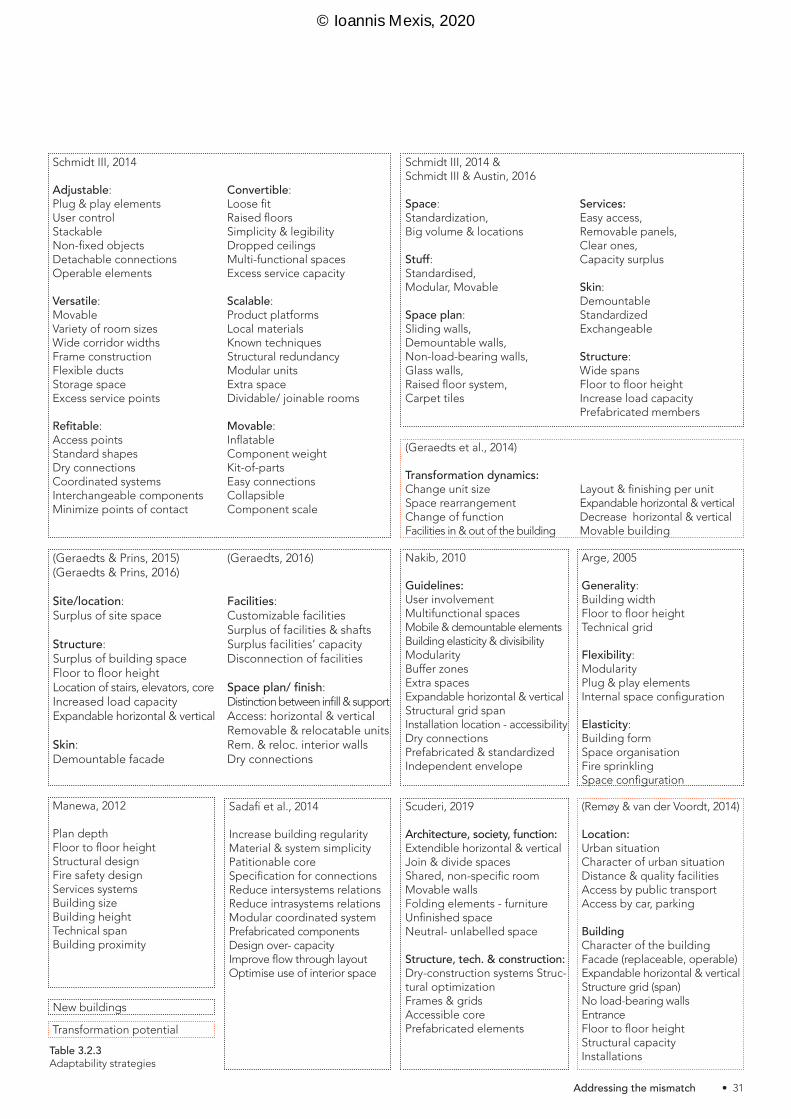
New buildings
Transformation potential
Table 3.2.3Adaptability strategies
Nakib, 2010
Guidelines:User involvementMultifunctional spacesMobile & demountable elementsBuilding elasticity & divisibility ModularityBuffer zonesExtra spacesExpandable horizontal & verticalStructural grid spanInstallation location - accessibilityDry connections Prefabricated & standardizedIndependent envelope
(Geraedts & Prins, 2015)(Geraedts & Prins, 2016)
Site/location: Surplus of site space Structure: Surplus of building spaceFloor to floor heightLocation of stairs, elevators, coreIncreased load capacityExpandable horizontal & vertical
Skin:Demountable facade
(Geraedts, 2016)
Facilities: Customizable facilitiesSurplus of facilities & shaftsSurplus facilities’ capacityDisconnection of facilities
Space plan/ finish: Distinction between infill & supportAccess: horizontal & verticalRemovable & relocatable unitsRem. & reloc. interior walls Dry connections
Schmidt III, 2014
Adjustable: Plug & play elements User control Stackable Non-fixed objects Detachable connections Operable elements Versatile: MovableVariety of room sizesWide corridor widthsFrame construction Flexible ducts Storage spaceExcess service points
Refitable:Access pointsStandard shapes Dry connections Coordinated systems Interchangeable components Minimize points of contact
Convertible: Loose fitRaised floorsSimplicity & legibilityDropped ceilings Multi-functional spacesExcess service capacity Scalable: Product platformsLocal materialsKnown techniques Structural redundancy Modular units Extra space Dividable/ joinable rooms
Movable:Inflatable Component weight Kit-of-partsEasy connections CollapsibleComponent scale
Schmidt III, 2014 & Schmidt III & Austin, 2016
Space: Standardization, Big volume & locations
Stuff: Standardised, Modular, Movable
Space plan:Sliding walls, Demountable walls, Non-load-bearing walls, Glass walls, Raised floor system, Carpet tiles
Services: Easy access, Removable panels, Clear ones, Capacity surplus
Skin:DemountableStandardizedExchangeable
Structure: Wide spansFloor to floor heightIncrease load capacityPrefabricated members
(Geraedts et al., 2014)
Transformation dynamics: Change unit sizeSpace rearrangementChange of function Facilities in & out of the building
Layout & finishing per unitExpandable horizontal & verticalDecrease horizontal & verticalMovable building
Arge, 2005
Generality: Building width Floor to floor height Technical grid Flexibility: Modularity Plug & play elements Internal space configuration
Elasticity:Building form Space organisation Fire sprinkling Space configuration
Sadafi et al., 2014
Increase building regularityMaterial & system simplicityPatitionable coreSpecification for connectionsReduce intersystems relationsReduce intrasystems relations Modular coordinated systemPrefabricated components Design over- capacityImprove flow through layoutOptimise use of interior space
Manewa, 2012
Plan depthFloor to floor heightStructural design Fire safety designServices systemsBuilding sizeBuilding height Technical spanBuilding proximity
Scuderi, 2019
Architecture, society, function:Extendible horizontal & verticalJoin & divide spacesShared, non-specific roomMovable wallsFolding elements - furnitureUnfinished spaceNeutral- unlabelled space
Structure, tech. & construction: Dry-construction systems Struc-tural optimizationFrames & grids Accessible corePrefabricated elements
(Remøy & van der Voordt, 2014)
Location:Urban situationCharacter of urban situationDistance & quality facilitiesAccess by public transportAccess by car, parking
Building Character of the buildingFacade (replaceable, operable)Expandable horizontal & verticalStructure grid (span)No load-bearing wallsEntranceFloor to floor heightStructural capacityInstallations
• 31 Addressing the mismatch
© Ioannis Mexis, 2020

3.2.4 Adaptability in office buildings
The level of adaptability required in each building is de-pendent on a combination of factors such as the function it accommodates, the specific users’ and owners’ needs (internal) and the market demands (external) (Aytac et al., 2016). Such factors need to be taken into account when formulating the research’s strategy. This section the thesis will focus on presenting strategies, actions and indicators for creating future-proof office buildings.
When analysing the demand for adaptable solution, the different forms of obsolescence that underlie office devel-opments (as presented on section 3.1.6) need to be con-sidered. Therefore the identified adaptability strategies should also equip buildings with the potential to with-stand the different types of obsolescence. Aiming to show the link between the different forms of obsolescence and building’s physical life, Langston et al. (2008) developed the ‘useful life’ (Lu) formula; where Lp indicates the physi-cal lifecycle (in years), and Oi the seven different forms of obsolescence: physical, economic, functional, technical, social, environmental and legal. Therefore one can under-stand that the more adaptable a building is, the longer its useful lifecycle will be and the less likely is it to become obsolete.
The increased demand for adaptable office buildings has stimulated the interest of many researchers on the topic. Similarly to the previous section, the findings from liter-ature are presented on table 3.2.4. Through research on office building transformations, Remøy (2010) presented building and location characteristics that reduce office buildings’ vacancy potential and enhance their adaptive capacity. Focusing on the organisations and user pref-erences, Remøy and Van der Voordt (2014) indicated a number of push and pull factors based on building and location characteristics for the accommodation of their business. Considering the obstacles that underlie ad-aptations in vacant office building, Remøy, de Jong and Schenk (2011) presented tactics that could be considered in order to anticipate and respond to future changes. These tactics addressed location, structure, façades, en-trances, installations and functional characteristics.
Within the FLEX 3.0 model, Geraedts & Prins (2016) listed flexibility indicators for office buildings found in literature, structuring them based on Brand’s six layers. Studying the office market demands, Geraedts and Van der Voor-dt (2003), presented a list of location and building factors that affect corporations’ accommodation decisions. In his PHD research, Blakstad (2001), addressed the signifi-cance of functional structures within the adaptable office agenda presenting ways of how this can be achieved. Re-searching the trends within the office sector, Harris (2015) indicated some of the main characteristics that firms in-corporate in their buildings. Researching the meaning of adaptability in the office real estate portfolio, Pinder et al. (2017) presented design tactics of different scales (from structural capacity to standardized rooms) that are utilized to provide buildings the potential to react to changes.
Conducting a series of case studies on office buildings, Schmidt III (2014) presented tactics that were proceeded for the creation of adaptable buildings. Following a sim-ilar method, Schmidt III and Austin (2016) investigated a number of projects and identified the types of changes that can take place. They then related these changes to the types of adaptability from Schmidt’s III (2014) ‘Frame-cycle’ model, and presented design tactics that were im-plemented to allow buildings to change in a technically, functionally and financially feasible manner. From this re-search, versatile, refitable, convertible and scalable were found to be the most commonly adaptability types in of-fice buildings.
a 20% reduction. Interim scores are also possible, withbalanced rent and ownership receiving a 10% reduction.
Legal obsolescence can be measured by the quality of theoriginal design. Useful life is effectively reduced if buildingsare designed and constructed to a low standard. A scale isdeveloped such that buildings of high quality receive a 0%reduction, while buildings of low quality receive a 20%reduction. Interim scores are also possible, with averagequality receiving a 10% reduction.
Useful life is determined from Eq. (1). The form of theequation applies the notion that useful life is indeeddiscounted physical life, and uses the long-establishedmethod of discount as its basis, where the ‘discount rate’ istaken as the sum of the obsolescence factors per annum(i.e. factors are divided by Lp).
Useful life ðLuÞ ¼Lp
1þP6i¼1
Oi
� �Lp, (1)
where Lp denotes physical life (years); O1, physicalobsolescence (% as decimal p.a.); O2, economic obsoles-cence (% as decimal p.a.); O3, functional obsolescence (%as decimal p.a.); O4, technical obsolescence (% as decimalp.a.); O5, social obsolescence (% as decimal p.a.) and O6
denotes legal obsolescence (% as decimal p.a.).Using this approach, a building receiving the maximum
reduction for each type of obsolescence will have a usefullife calculated at about one-third of its physical life.
An index is calculated that prioritises buildings accordingto their potential for adaptive reuse, and expresses thispotential as a percentage. Buildings with a high index possessthe highest potential, while buildings with a zero index haveno potential. The algorithm is summarised in Fig. 1.
Values for ELu (effective useful life), ELb (effectivebuilding age) and ELp (effective physical life) are,
respectively, determined by multiplying Lu, Lb and Lp by100 and dividing by Lp, which enables a maximum scale forx and y axes of 100. Lb is defined as the current age of thebuilding (in years).The feasible zone for the ARP is defined by the shaded
area under the curve (where x is in the range 0–100) asdefined by Eq. (2), and takes the form of a negativeexponential.
y ¼ 100� x2
100. (2)
The line of increasing ARP and the line of decreasingARP are given by Eq. (3) and (4), respectively.
ARPðincreasingÞ ¼ 100� ðEL2u=100ÞELu
� ELb, (3)
ARPðdecreasingÞ ¼ 100� ðEL2u=100Þ
100� ELu� ð100� ELbÞ, (4)
where ELu stands for effective useful life (years) ELb foreffective building age (years).Values of ARP above 50 are considered to have high
potential for adaptive reuse, while values in the range20–49 show moderate potential, and values in the range1–19 show low potential. An ARP value of zero has nopotential. When ELu and ELb are equal, the maximumARP value possible for that stage of the building’s life cycleis generated. Values above 85 would suggest strongly thatplanning activities should commence.
5. Discussion
The ARP model provides a reasonable straightforwardmethod for accessing effective useful life and ARP inexisting buildings. While different frameworks and algo-rithms can be invented to address this matter, the one
ARTICLE IN PRESS
0
10
20
30
40
50
60
70
80
90
100
0 10 15 20 25 30 35 40 45 50 55 60 65 70 75 80 85 90 95 100
effective life (years)
ELu (maximum
potential)
AR
P %
5
ELb
increasing
potential
decreasing
potential
ELp (minimum
potential)
Fig. 1. ARP model concept.
C. Langston et al. / Building and Environment 43 (2008) 1709–17181714
32 • 3.2 Adaptability - Frameworks & Strategy
© Ioannis Mexis, 2020
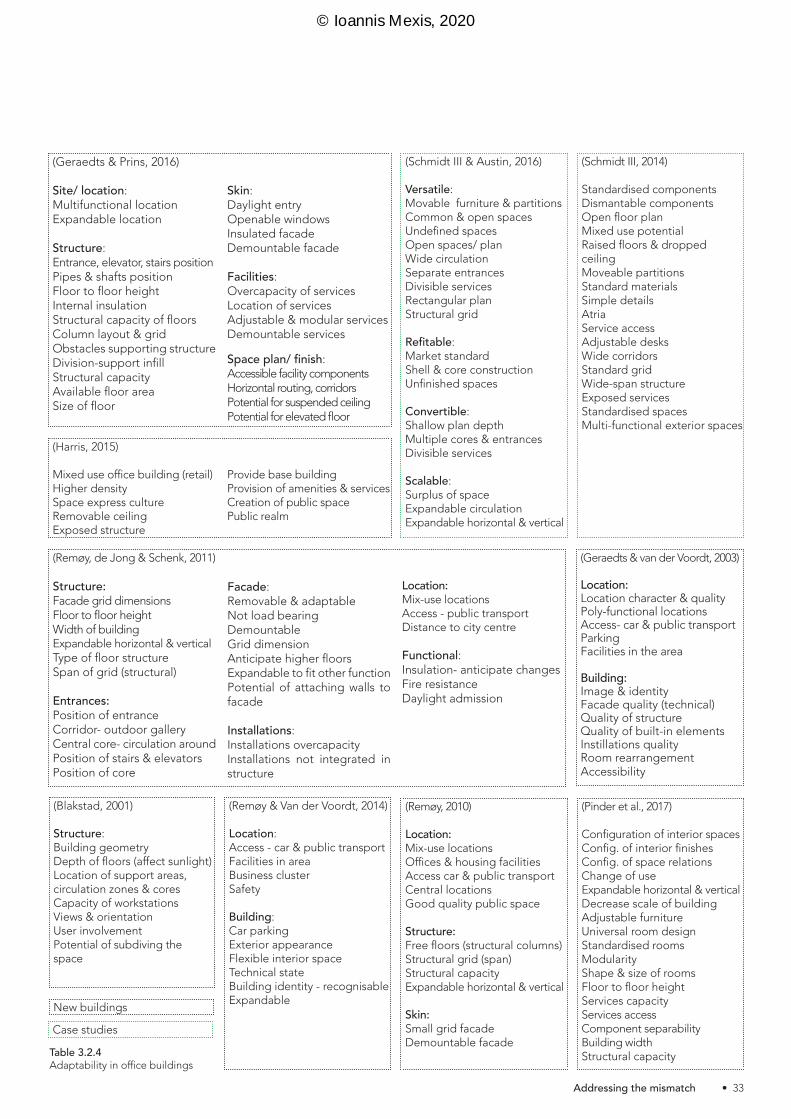
New buildings
Case studies
Table 3.2.4Adaptability in office buildings
(Remøy, de Jong & Schenk, 2011)
Structure: Facade grid dimensions Floor to floor height Width of building Expandable horizontal & verticalType of floor structureSpan of grid (structural)
Entrances:Position of entrance Corridor- outdoor galleryCentral core- circulation aroundPosition of stairs & elevatorsPosition of core
Facade:Removable & adaptable Not load bearing Demountable Grid dimension Anticipate higher floorsExpandable to fit other functionPotential of attaching walls to facade
Installations: Installations overcapacityInstallations not integrated in structure
Location: Mix-use locations Access - public transport Distance to city centre
Functional: Insulation- anticipate changesFire resistanceDaylight admission
(Geraedts & van der Voordt, 2003)
Location: Location character & qualityPoly-functional locationsAccess- car & public transportParking Facilities in the area
Building: Image & identityFacade quality (technical) Quality of structure Quality of built-in elementsInstillations qualityRoom rearrangementAccessibility
(Geraedts & Prins, 2016)
Site/ location: Multifunctional locationExpandable location Structure: Entrance, elevator, stairs position Pipes & shafts positionFloor to floor heightInternal insulationStructural capacity of floors Column layout & gridObstacles supporting structureDivision-support infillStructural capacityAvailable floor areaSize of floor
Skin:Daylight entryOpenable windowsInsulated facade Demountable facade
Facilities: Overcapacity of servicesLocation of servicesAdjustable & modular servicesDemountable services
Space plan/ finish: Accessible facility componentsHorizontal routing, corridorsPotential for suspended ceilingPotential for elevated floor
(Harris, 2015)
Mixed use office building (retail)Higher density Space express cultureRemovable ceilingExposed structure
Provide base building Provision of amenities & servicesCreation of public spacePublic realm
(Remøy & Van der Voordt, 2014)
Location: Access - car & public transportFacilities in areaBusiness clusterSafety
Building: Car parkingExterior appearanceFlexible interior spaceTechnical stateBuilding identity - recognisableExpandable
(Blakstad, 2001)
Structure: Building geometry Depth of floors (affect sunlight)Location of support areas, circulation zones & coresCapacity of workstations Views & orientation User involvementPotential of subdiving the space
(Remøy, 2010)
Location: Mix-use locations Offices & housing facilitiesAccess car & public transportCentral locations Good quality public space
Structure: Free floors (structural columns)Structural grid (span)Structural capacity Expandable horizontal & vertical
Skin: Small grid facadeDemountable facade
(Pinder et al., 2017)
Configuration of interior spaces Config. of interior finishesConfig. of space relations Change of use Expandable horizontal & verticalDecrease scale of buildingAdjustable furnitureUniversal room design Standardised rooms ModularityShape & size of rooms Floor to floor heightServices capacity Services accessComponent separability Building widthStructural capacity
(Schmidt III & Austin, 2016)
Versatile:Movable furniture & partitionsCommon & open spacesUndefined spacesOpen spaces/ planWide circulationSeparate entrancesDivisible servicesRectangular plan Structural grid
Refitable: Market standardShell & core construction Unfinished spaces
Convertible: Shallow plan depthMultiple cores & entrancesDivisible services
Scalable: Surplus of spaceExpandable circulation Expandable horizontal & vertical
(Schmidt III, 2014)
Standardised componentsDismantable componentsOpen floor plan Mixed use potentialRaised floors & dropped ceiling Moveable partitionsStandard materials Simple details Atria Service accessAdjustable desks Wide corridors Standard grid Wide-span structureExposed servicesStandardised spacesMulti-functional exterior spaces
• 33 Addressing the mismatch
© Ioannis Mexis, 2020

3.2.5 Preliminary strategy
“The concept of universal adaptability is a myth, it ‘is both technically and economically unachievable”
(Finch, 2009).
The dynamic environment we live in, is influencing the pace that new and innovative workplaces emerge. As a result corporations need to frequently adapt their real estate in order to maintain their performance within the competitive context they operate in. Changes can take place on the different layers (site, skin, structure, services, space plan, stuff, social, surroundings) of office buildings throughout their lifecycles, resulting in high cumulative costs (Manewa, 2012).
The previous two sections of the paper presented a num-ber of actions that could be implemented in order to as-sist the creation of future-proof office buildings. When creating adaptable buildings, the golden rule is consid-ered to be the reduction of the dependencies between building elements and components as much as possible (Manewa, 2012).
This section presents the strategies/ tactics found in lit-erature after reviewing and restructuring them (tables 3.2.3 & 3.2.4), as some of them are overlapping or do not contribute to the paper’s objectives. Then, following Manewa’s (2012) golden rule, the tactics will be structured based on Schmidt’s III revised version of Brand’s six layers, the eights building layers: site, structure, skin, services, space plan, stuff, social and surroundings (fig. 3.2.4).
The outcome of this process is presented on table 3.2.5. Due to the range of factors underlying adaptability, the strategies that were incorporated in the table cover dif-ferent scales, from structural capacity to folding and ad-justable furniture. Compared to former strategies found in literature, this paper introduces a more thorough strategy incorporating two of the most important layers when it comes to adaptability, the social and surround-ings (Schmidt III & Austin, 2016; Schmidt III, 2014). Existing strategies tend to focus on technological measures and design features for increasing adaptability and transfor-mation capacity, without considering user preferences or drivers that cause requirements to change over time. By creating a strategy which formally incorporates the users, aims to bridge the gap between user demands and tech-nical solutions (Gijsbers & Lichtenberg, 2012).
The social layer is not a technical layer, but refers to the or-ganisation and individuals that occupy the building. End users mainly interact with the stuff level, while organisa-tions interact with the higher levels of the hierarchy. Build-ings are affected by souls (people and organisations), and vies versa. This is the essence of the dynamic building – user relationship (Blakstad, 2001).
The presented strategies address both corporations (top-down) and user (bottom-up) perspectives. Although in many cases the boundaries between the two are not clear, as a general principle, the strategies of the space plan, stuff and social layers are mainly associated with the user perspective whereas the other layers with the top-down perspective.
Table 3.2.5 presents the starting point for the creation of this paper’s strategy. Its structure, allows the understand-ing of the specific layer that each tactic would affect. On the other hand it does not show the links between the different strategies. Therefore, the next step is to struc-ture and group the different “sub-strategies” presented based on the field they address (e.g. oversupply, location, circulation etc.), making it more functional and easy-to-use for the readers and implementers.
Layers: Social StuffSpace planServices
StructureSkinSurroundings Site
Fig. 3.2.4Revised building layers model (adapted from Schmidt III, 2014).
34 • 3.2 Adaptability - Frameworks & Strategy
© Ioannis Mexis, 2020
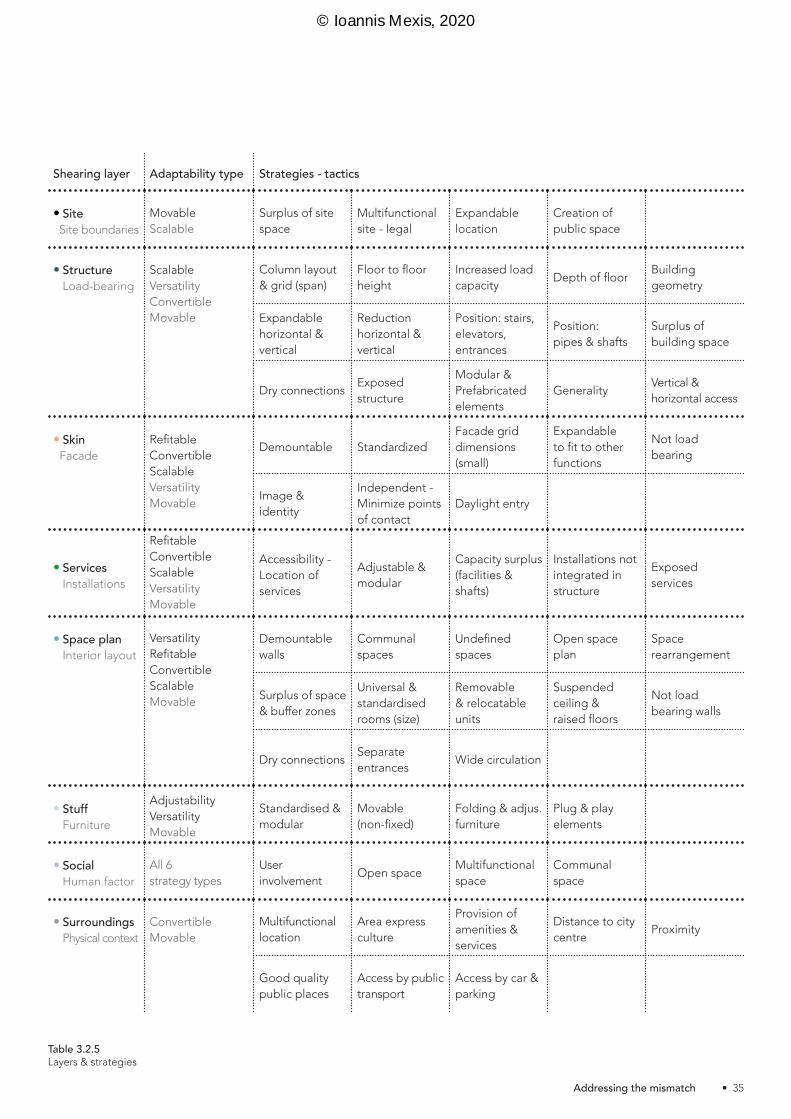
Shearing layer Adaptability type Strategies - tactics
• Site Site boundaries
MovableScalable
Surplus of site space
Multifunctional site - legal
Expandable location
Creation of public space
• Structure Load-bearing
ScalableVersatilityConvertible Movable
Column layout & grid (span)
Floor to floor height
Increased load capacity
Depth of floorBuilding geometry
Expandable horizontal & vertical
Reductionhorizontal & vertical
Position: stairs, elevators, entrances
Position: pipes & shafts
Surplus of building space
Dry connectionsExposed structure
Modular & Prefabricated elements
GeneralityVertical & horizontal access
• Skin Facade
RefitableConvertibleScalableVersatilityMovable
Demountable StandardizedFacade grid dimensions (small)
Expandable to fit to other functions
Not load bearing
Image & identity
Independent - Minimize points of contact
Daylight entry
• Services Installations
RefitableConvertibleScalableVersatilityMovable
Accessibility - Location of services
Adjustable & modular
Capacity surplus (facilities & shafts)
Installations not integrated in structure
Exposed services
• Space plan Interior layout
VersatilityRefitableConvertibleScalableMovable
Demountable walls
Communal spaces
Undefined spaces
Open space plan
Space rearrangement
Surplus of space& buffer zones
Universal & standardised rooms (size)
Removable & relocatable units
Suspended ceiling & raised floors
Not load bearing walls
Dry connectionsSeparate entrances
Wide circulation
• Stuff Furniture
AdjustabilityVersatilityMovable
Standardised & modular
Movable(non-fixed)
Folding & adjus.furniture
Plug & play elements
• Social Human factor
All 6 strategy types
Userinvolvement
Open spaceMultifunctional space
Communal space
• Surroundings Physical context
ConvertibleMovable
Multifunctional location
Area express culture
Provision of amenities & services
Distance to city centre
Proximity
Good quality public places
Access by public transport
Access by car & parking
Table 3.2.5Layers & strategies
• 35 Addressing the mismatch
© Ioannis Mexis, 2020

3.2.6 Strategy types
The strategies/ tactics presented on the former table (3.2.5) were re-structured under eleven strategy types (umbrella terms) based on the building aspects they ad-dress, as presented on table 3.2.6. For example: unde-fined spaces, surplus of space, expandable horizontal & vertical, communal space contribute to the Buffer Zone strategy type, and are therefore grouped under this type)
• • Multifunctional: Adaptable buildings need to provide a responsive envi-ronment both for the first user and for the next ones too, as well as accommodate alternative functions. Therefore, one needs to take into account aspects such as, the height of the space (e.g. >2.8 m), the position of the columns and the grid span (<7m) in order to have the capacity to accommodate different layouts and functions (Schmidt III, 2014; Arge, 2005; Remøy & van der Voordt, 2014; Geraedts, 2016). Buildings’ depth should allow sunlight throughout the whole area. The façade should also func-tion independently from the rest of the building, and be composed of small grid dimensions so that it can be easily replaced. The position and number of elements such as: stairs, elevators, entrances and services, which are hard to relocate and also restrict the number of people and func-tions that can be accommodated in the building need to be taken into account (more entrances and vertical circu-lation zones in different parts of the building increase its adaptability)(Geraedts & Prins, 2016; Remøy et al., 2011; Schmidt III & Austin, 2016). Finally, considering the impact that economic upturns and downturns can have for corpo-rations, the building should be able to expand or reduce its size both on the horizontal and vertical axes (Remøy, 2010; Pinder et al., 2017; Geraedts et al., 2014).
• • Building characteristics: In order to be adaptable, buildings should not be over-specified, as changes would be harder to imple-ment (Arge, 2005). The floor depth should be enough to accommodate different layouts (cell offices & open plan offices) and other functions (dwellings) without wasting space (Manewa, 2012; Schmidt III & Austin, 2016; Blak-stad, 2001). Building’s geometry is another major factor of adaptability. Depending on their identity, corporations might want to be housed in buildings with unique or com-plicated geometries. Though complicated geometries are hard to adapt. Buildings and especially their exterior, have a significant role in shaping firms’ identity. Therefore, when designing a strategy for organisations’ core portfo-lio, which entail buildings that are meant to be occupied for long periods, the façades need to be able to change in a financial and structural feasible manner (Blakstad, 2001). Although such changes do not happen often, adaptable buildings should be able to accommodate them. In ad-dition, in case the first occupier leaves the building the next one needs to be able to change the façades based on the new needs or functions (Geraedts & van der Voor-dt, 2003). Such an option makes buildings more attractive to future tenants (e.g. curtain walls of office buildings are always preferable for dwellings) (Remøy & van der Voordt, 2014).
Fig. 3.2.5Multifunctional
Fig. 3.2.6Building characteristics
36 • 3.2 Adaptability - Frameworks & Strategy
© Ioannis Mexis, 2020

Table 3.2.6Adaptability strategy component - Preliminary strategy (part A)
Strategy types Layers Strategies - tactics
A. Multifunctional • Floor to floor height
• Expandable horizontal & vertical
• Reduction horizontal & vertical
• Facade grid dimensions
• Grid wide span (column layout)
• Floor depth• Independent envelope (min. contact points)
• Position: stairs, lifts, entr. & services
B. Building characteristics
• Building generality
• Floor depth• Building geometry
• Image & identity (skin)
• Not load- bearing facade
• Daylight
C. Oversupply • Floor to floor height
• Increased load capacity
• Expandable horizontal & vertical
• Surplus of building space & buffer zones
• Capacity • surplus services
D. Buffer zones • Undefined spaces
• Surplus of • space
• Expandable horizontal & vertical
• Communal • space
E. Demountable elements & dry connections
• Dry connections • (structure & plan)
• Demountable facade
• Demountable walls
• Exposed structure
• Suspended ceiling & raised floors
F. Modular & dividable • Grid structure
• Modular & Prefabricated elements
• Standardised skin
• Facade grid dimensions
• Adjustable & modular services
G. Circulation & zoning
• Vertical & horizontal access
• Separate entrances
• Wide circulation
• Core- services
H. Movable & portable
• Standardised & modular
• Folding & adjust. furniture
• Removable & relocatable units
• Demountable wall partitions
I. Location selection
• Multifunctional • location•
• Area express culture
• Provision of amenities & services
• Distance to city centre
• Proximity
• Good quality • public places
• Access by public transp.
• Access by car & parking
J. Site selection
• Surplus of site space
• Multifunctional site - legal
• Expandable location
• Creation of public space
K. Human factor• User involvement
• • • • • • •
• 37 Addressing the mismatch
© Ioannis Mexis, 2020
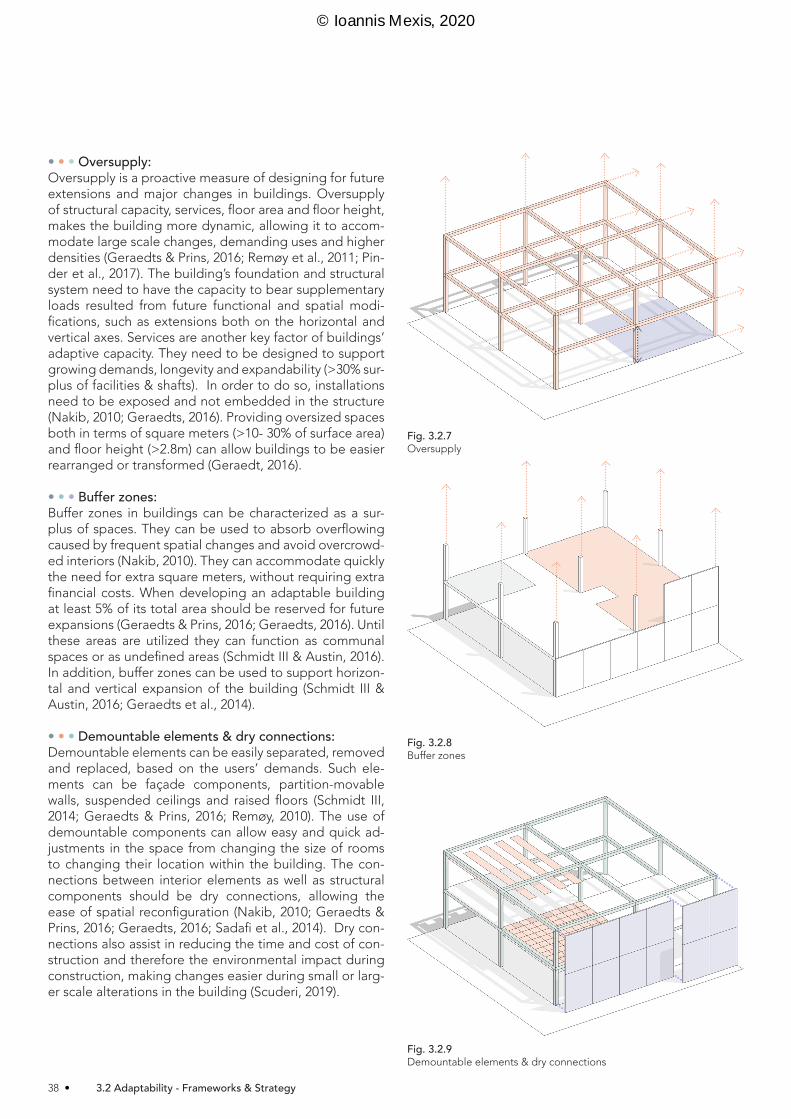
• • • Oversupply:Oversupply is a proactive measure of designing for future extensions and major changes in buildings. Oversupply of structural capacity, services, floor area and floor height, makes the building more dynamic, allowing it to accom-modate large scale changes, demanding uses and higher densities (Geraedts & Prins, 2016; Remøy et al., 2011; Pin-der et al., 2017). The building’s foundation and structural system need to have the capacity to bear supplementary loads resulted from future functional and spatial modi-fications, such as extensions both on the horizontal and vertical axes. Services are another key factor of buildings’ adaptive capacity. They need to be designed to support growing demands, longevity and expandability (>30% sur-plus of facilities & shafts). In order to do so, installations need to be exposed and not embedded in the structure (Nakib, 2010; Geraedts, 2016). Providing oversized spaces both in terms of square meters (>10- 30% of surface area) and floor height (>2.8m) can allow buildings to be easier rearranged or transformed (Geraedt, 2016).
• • • Buffer zones: Buffer zones in buildings can be characterized as a sur-plus of spaces. They can be used to absorb overflowing caused by frequent spatial changes and avoid overcrowd-ed interiors (Nakib, 2010). They can accommodate quickly the need for extra square meters, without requiring extra financial costs. When developing an adaptable building at least 5% of its total area should be reserved for future expansions (Geraedts & Prins, 2016; Geraedts, 2016). Until these areas are utilized they can function as communal spaces or as undefined areas (Schmidt III & Austin, 2016). In addition, buffer zones can be used to support horizon-tal and vertical expansion of the building (Schmidt III & Austin, 2016; Geraedts et al., 2014).
• • • Demountable elements & dry connections: Demountable elements can be easily separated, removed and replaced, based on the users’ demands. Such ele-ments can be façade components, partition-movable walls, suspended ceilings and raised floors (Schmidt III, 2014; Geraedts & Prins, 2016; Remøy, 2010). The use of demountable components can allow easy and quick ad-justments in the space from changing the size of rooms to changing their location within the building. The con-nections between interior elements as well as structural components should be dry connections, allowing the ease of spatial reconfiguration (Nakib, 2010; Geraedts & Prins, 2016; Geraedts, 2016; Sadafi et al., 2014). Dry con-nections also assist in reducing the time and cost of con-struction and therefore the environmental impact during construction, making changes easier during small or larg-er scale alterations in the building (Scuderi, 2019).
Fig. 3.2.7Oversupply
Fig. 3.2.8Buffer zones
Fig. 3.2.9Demountable elements & dry connections
38 • 3.2 Adaptability - Frameworks & Strategy
© Ioannis Mexis, 2020

• • • Modular & dividable: Incorporating modular and dividable components in build-ings allows the ease of altering (e.g. expand, divide) the space without affecting other layers or functions of the building (Sadafi et al., 2014; Pinder et al., 2017). Using a grid both for as a structural system and for the façades, mini-mizes the number of columns in the interior and the need for load bearing walls, allowing the use of different spatial layouts. Prefabricated elements and modularity can also fa-cilitate reconfiguration, subdivision and easy arrangement of spaces, assisting the building’s evolution in time (Nakib. 2010; Scuderi, 2019). Modular façade system, support the replacement, update and integration of new technological features that suit present demands (Nakib, 2010). Services should also be modular and avoid embedding them in the structure, in order to be easily adjustable based on the de-mands and for maintenance purposes (Nakib, 2010).
• • Circulation & zoning: Circulation is important for adaptable buildings as it can highly impact the layout and flexibility of the space. When designing the internal circulation it should be seen as part of the overall architectural concept allowing the accom-modation of different activities and users. A building’s interior circulation can be organised in two ways to maxi-mize flexibility. It can be a fluid and continuous space or it can be designed around the cores of the building, while avoiding narrow and dead end corridors (Nakib, 2010). Placing the services within a building’s core, can increase its adaptability, creating more flexible interior spaces that can be easily rearranged and accommodate different functions. Arranging different work units within the central cores, makes easier to rearrange and transform the spac-es (Scuderi, 2019). Finally, incorporating more entrances in different parts of the building, provides the potential to house more groups of users/functions, increasing build-ings’ transformation potential (Remøy & van der Voordt, 2014; Schmidt III & Austin, 2016; Scuderi, 2019; Remøy et al., 2011).
• • Movable & portable:This strategy type deals with the adaptability of buildings’ interior spaces, allowing users to regularly move elements around the space. Movable walls can be quickly and eas-ily rearranged and re-configured for new functions on a daily basis. The wall panels should be able to disappear in open configuration providing a more flexible space (Scu-deri, 2019; Geraedts, 2016). In office buildings, corpora-tions are moving towards more open-plan layouts includ-ing some additional enclosed units. These units should be demountable allowing them to be relocated within the building and finding the best layout for their operation and needs (Nakib, 2010; Scuderi, 2019; Schmidt III, 2014; Geraedts, 2016; Pinder et al., 2019). In order to accom-modate this strategy, efficient circulation and zoning is required.
Fig. 3.2.10Modular & dividable
Fig. 3.2.11Circulation & zoning
Fig. 3.2.12Movable & portable
• 39 Addressing the mismatch
© Ioannis Mexis, 2020
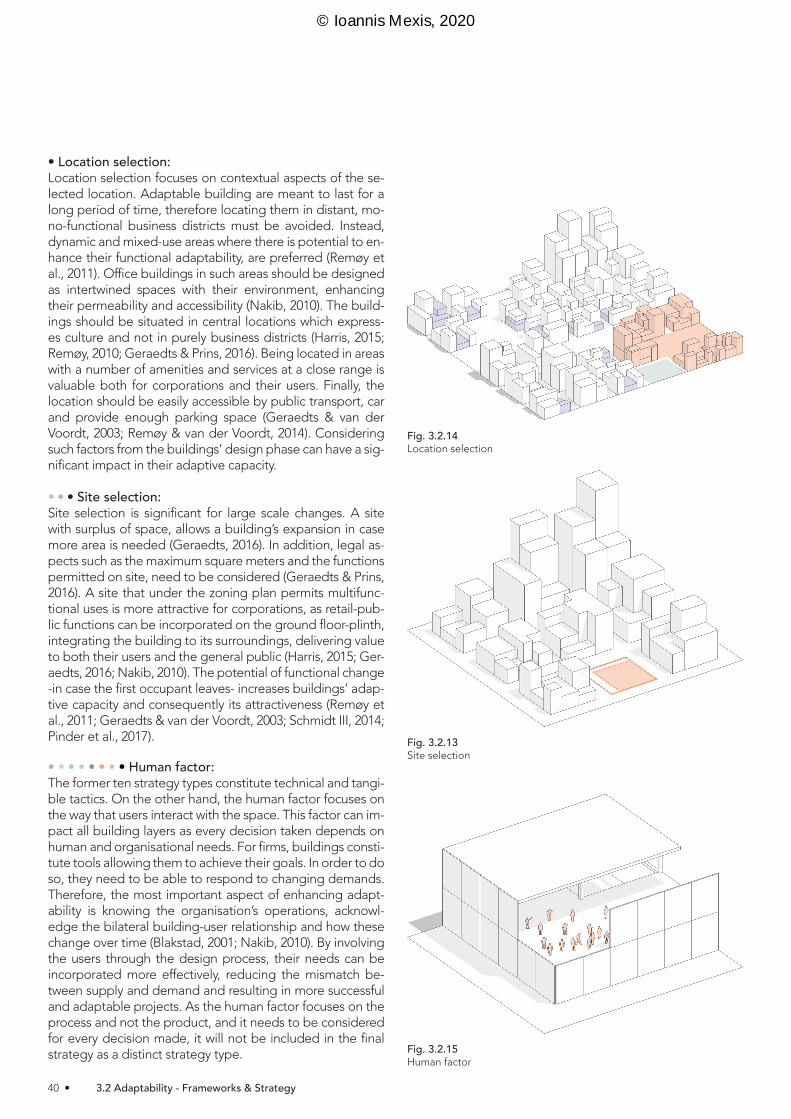
• Location selection: Location selection focuses on contextual aspects of the se-lected location. Adaptable building are meant to last for a long period of time, therefore locating them in distant, mo-no-functional business districts must be avoided. Instead, dynamic and mixed-use areas where there is potential to en-hance their functional adaptability, are preferred (Remøy et al., 2011). Office buildings in such areas should be designed as intertwined spaces with their environment, enhancing their permeability and accessibility (Nakib, 2010). The build-ings should be situated in central locations which express-es culture and not in purely business districts (Harris, 2015; Remøy, 2010; Geraedts & Prins, 2016). Being located in areas with a number of amenities and services at a close range is valuable both for corporations and their users. Finally, the location should be easily accessible by public transport, car and provide enough parking space (Geraedts & van der Voordt, 2003; Remøy & van der Voordt, 2014). Considering such factors from the buildings’ design phase can have a sig-nificant impact in their adaptive capacity.
• • • Site selection: Site selection is significant for large scale changes. A site with surplus of space, allows a building’s expansion in case more area is needed (Geraedts, 2016). In addition, legal as-pects such as the maximum square meters and the functions permitted on site, need to be considered (Geraedts & Prins, 2016). A site that under the zoning plan permits multifunc-tional uses is more attractive for corporations, as retail-pub-lic functions can be incorporated on the ground floor-plinth, integrating the building to its surroundings, delivering value to both their users and the general public (Harris, 2015; Ger-aedts, 2016; Nakib, 2010). The potential of functional change -in case the first occupant leaves- increases buildings’ adap-tive capacity and consequently its attractiveness (Remøy et al., 2011; Geraedts & van der Voordt, 2003; Schmidt III, 2014; Pinder et al., 2017).
• • • • • • • • Human factor:The former ten strategy types constitute technical and tangi-ble tactics. On the other hand, the human factor focuses on the way that users interact with the space. This factor can im-pact all building layers as every decision taken depends on human and organisational needs. For firms, buildings consti-tute tools allowing them to achieve their goals. In order to do so, they need to be able to respond to changing demands. Therefore, the most important aspect of enhancing adapt-ability is knowing the organisation’s operations, acknowl-edge the bilateral building-user relationship and how these change over time (Blakstad, 2001; Nakib, 2010). By involving the users through the design process, their needs can be incorporated more effectively, reducing the mismatch be-tween supply and demand and resulting in more successful and adaptable projects. As the human factor focuses on the process and not the product, and it needs to be considered for every decision made, it will not be included in the final strategy as a distinct strategy type.
Fig. 3.2.13Site selection
Fig. 3.2.14Location selection
Fig. 3.2.15Human factor
40 • 3.2 Adaptability - Frameworks & Strategy
© Ioannis Mexis, 2020

3.2.7 Conclusions
This section focused on frameworks, concepts, strategies and tactics that can be implemented in order to create adaptable office buildings. Starting off by identifying and analysing some of the most comprehensive frameworks found in literature, the layer’s framework (Brand, 1994; Schmidt III, 2014) and the framecycle model (Schmidt III, 2014) provided input for general principles that can be incorporated in this paper’s strategy.
Continuing, a large number of design strategies/ tactics used to enhance adaptability in buildings (general), in of-fice buildings (specific) and buildings’ transformation po-tential, were identified from literature. After studying dif-ferent authors, the findings were presented in two tables (3.2.3, 3.2.4), which were then reviewed, removing any overlapping or unrelated tactics (table 3.2.5). The last part of this section focused on grouping the strategies-tactics into ‘strategy types’ (3.2.6), based on their properties and impact they can have on adaptability, resulting in a list of ten tangible and one intangible strategy types that can be applied (table 3.2.6). Each of these ‘strategy types’ ad-dresses different building components, creating a com-prehensive and versatile strategy.
As it was explained in literature, every project is unique. Projects are created to respond to a specific set of re-quirements. They are designed to be located in a unique context, have unique owners, users and clients, each of them with their own demands. Therefore the proposed strategy cannot be implemented by simply applying all the proposed actions. The components of the strategy presented are not a final product. They are flexible and should be adapted to fit the clients’ specific demands and goals, in order to add value for the owners, the users and the society. That being said, the next part of the thesis will focus on understanding how each component of this strategy can add value for corporations and their employ-ees.
• 41 Addressing the mismatch
© Ioannis Mexis, 2020

“Firms are faced with many real estate decisions besides tenure choice.
They must choose locations, select specific buildings and design workspac-
es on an ongoing basis. Real estate decisions have direct financial impacts on corporate performance as well as
indirect influences through accommo-dating core business activities. If a firm undertakes a strategic approach to its
real estate decisions, then its choices are more likely to support the core business
strategy efficiently and effectively.”
(Gibler & Lindholm, 2012)
Organisations and their employees need real estate to accommodate their activities. In order to fully utilise the potential of the available facilities over time, they need to optimise the relationship between users and buildings. In this relationship, buildings constitute means, whose pur-pose is to contribute to firms’ performance by support-ing their core business (Lindholm et al., 2006; Blakstad, 2001). In this perspective, building performance is de-fined by how well it serves the user organisation (De Vries, de Jonge & van der Voordt, 2008). Due to changes in the organisations’ demands and real estate deterioration, a mismatch is created between the supply (buildings) and demand (users) sides. In the context of the office built en-vironment, corporate real estate management focuses in addressing this mismatch, providing sufficient accommo-dation, at the required location, quality, time and cost (De Vries et al., 2008). Based on literature, corporate real es-tate management (CREM) may be defined as: “the man-agement of the real estate portfolio of a corporation by aligning this portfolio to the needs of the core business, in order to obtain maximum added value for the business and to contribute optimally to the overall performance of the organisation”. (Dewulf, Krumm & de Jonge, 2000)
Realising the significance that real estate can have for companies’ profitability, productivity and competitive ad-vantage, corporations have started to pay more emphasis on the management of their real estate portfolio (Riratan-aphong, van der Voordt & Sarasoja, 2012; Harris & Cooke, 2019). Unlike real estate, organisations are fundamentally fluid and dynamic entities who can evolve with response to the ever-changing environment (Gibson, 2001). The faster they evolve the more likely it is for them to survive and succeed. Hence, as the pace of change increases, in order for corporations to utilize the maximum potential of their facilities and gain competitive advantage, the de-mand for adaptable, efficient, innovative and productive work environment has increased (Gibson, 2000; Remøy et al., 2019). Acknowledging the importance that such fac-tors can have for their performance, corporations’ interest is gradually shifting from cost reduction to value delivery (Jylhä et al.,2019). Considering the long-term perspective of adaptability, value delivery does not only comprise of solutions to current problems, but also ways to capture the added value of preventing future problems (Jylhä et al.,2019).
This section will focus on understanding the principle and different forms of added value in the context of corpo-rate real estate (CRE). This study will be then linked to the preliminary strategy for adaptable offices -presented on the previous section- aiming to illustrate how each of the strategy’s components can add value to the corporation and users of the space.
3.3 Added value
42 • 3.3 Added value
© Ioannis Mexis, 2020

3.3.1 Added value
“The contribution of real estate to organisational perfor-mance and the attainment of organisational objectives.” (De Vries, 2007 ; Den Heijer, 2011 in Van der Voordt, 2016).
Real estate together with human capital are the two main resources supporting their goals and core business (Lind-holm, 2008b). Human capital and its ability to contribute to a company’s turnover and profitability, is dependent on the supplied facilities, highlighting the significance of real estate for a firm’s performance (Macmillan, 2006). In the real estate sector, performance refers to the efficiency (input: capital reduction, space optimization) and effec-tiveness (output: quality, satisfaction, flexibility, sustaina-bility etc.) of activities undertaken and the resources used to support these activities (Anker Jensen, van der Voor-dt, Coenen & Sarasoja, 2014; Riratanaphong et al., 2012). Organisations’ primary goal is to maximize the wealth of their shareholders (Lindholm & Gibler, 2005; Lindholm, 2008b). When corporate real estate strategies, business strategies and objectives are aligned, then value is add-ed to the organisation’s core business, enhancing its performance and competitive advantage in the long run (Jylhä et al.,2019; Lindholm, Gibler & Leväinen, 2006).
Considering that both the CRE and organisational strat-egies are dependent on internal and external contextual factors, in order to achieve their optimum alignment dif-ferent components need to be taken into account. These components are: planet (sustainability & corporate social responsibility), position (analysis of business environ-ment), purpose (company mission & strategy), procure-ment (freehold or leasehold), place (location, property, space & work environment), paradigm (company culture & values), processes (organisational activities) and people (Haynes, 2012).
Real estate strategies must therefore be aligned with the business goals, providing efficient and responsive environments for the needs of the occupiers, in order to create value for the firm (Lindholm et al., 2006; Lindholm & Leväinen, 2006a). This alignment is achieved by under-standing and contributing optimally to the firm’s and us-ers’ demands at a strategic, tactical and operational level (Lindholm, 2008b; Voordt & Jensen, 2018; Jensen, Saraso-ja, Van der Voordt & Coenen, 2013). Compared to inves-tors who have short-term income objectives, for corpo-rations, real estate has long-term value as it allows them to operate and grow in time (Geltner, Miller, Clayton, & Eichholtz, 2001). Focusing on the core portfolio, adapt-able buildings are of great importance for corporations, as they support them for a longer period of time, adding value throughout their functional lifecycles (Gibson, 2001). When the firm’s objectives are not sufficiently attained, in-terventions on the facilities provided need to take place, (Voordt & Jensen, 2018; Lindholm, 2008b).
Despite its significance, many organisations find it hard to understand how can CRE add value to their opera-tions, contributing to their goals and overall performance (Gibler & Lindholm, 2012). Real estate can have both di-rect and indirect influence on an organisation’s perfor-mance (Lindholm, 2008a; Lindholm, 2008b; De Vries et al., 2008). Direct influence mainly refers to short-term, tangible results which are easy to quantify and are mainly related to financial matters, such as cost reduction and revenue increase (e.g. as a result of desk sharing). On the other hand, real estate strategies mainly result in indirect and long-term (lagged) effects (Gibler & Lindholm, 2012; Lindholm & Gibler, 2005; Lindholm, 2008b). These are re-lated to the supply of effective and efficient spaces stim-ulating employee productivity, satisfaction and morale (Gibler & Lindholm, 2012; Lindholm, 2008b). Consequent-ly, the realisation of both tangible and intangible assets are important to successfully support the core business.
Gradually, corporations’ interest is shifting from cost re-duction to performance enhancement, aiming to improve effectiveness and efficiency through higher productivity and employee satisfaction, in other words, balancing ben-efits and costs (Petrulaitiene & Jylhä, 2015). However, due to the complexity of quantifying the real estate strategies’ effects and isolating their impact from other aspects such as human resources, technology and capital, corporations phase difficulties in identifying the added value. As a re-sult they mainly consider only the financial implications, neglecting all the factors that impact the organisation’s performance (Petrulaitiene & Jylhä, 2015; De Vries et al., 2008; Macmillan, 2006).
• 43 Addressing the mismatch
© Ioannis Mexis, 2020
3.3.2 Forms of added value
Corporations’ gradual shift towards value delivery in ad-dition to the underlying complexity of this concept, has stimulated research towards the creation of models that explain how strategic approaches contribute to the value of the firm. It is imperative for firms to understand how their corporate real estate strategies and operating deci-sions are related to the core business strategy, to ensure that firms are pursuing complementary objectives that will contribute the highest value for the firm in the long-run (Lindholm, 2008a; Gibler & Lindholm, 2012). This section focuses on presenting the different forms of added value found in literature (Table 3.3.1). Due to overlaps between certain values, a final list is presented on table 3.3.2. The identified forms will be linked in the next chapter to the adaptability strategies- defined on the previous chapter- in order to create the preliminary strategy.
1. Control risk Amongst the risks that can emerge in office real estate, technical, functional and external risks need to be care-fully monitored to ensure that the firm’s primary opera-tions are not hindered. Corporate real estate managers need to maintain at least the minimum quality level in the workplace environment, to support the users’ activi-ties (Den Heijer, 2011). Retaining flexible and responsive real estate, located in suitable locations and having con-trol over the value development of the portfolio as well as environmental aspects (e.g. regulation changes) and labour conditions can assist corporation into controlling potential risks (Den Heijer, 2011; Voordt & Jensen, 2018; Manganelli, 2015; Lindholm, 2008b).Related with: increase real estate value, reduce costs, productivity, support image & culture, adaptability
2. Increase real estate valueBuildings can be also viewed as capital assets which can be managed to optimize their financial contribution to the organisation. Corporate real estate managers’ objectives are to maximize the portfolio’s financial value or ensure that the best cost alternative is selected considering short and long-term costs (Lindholm & Leväinen, 2006; Macmil-lan, 2006; Lindholm, 2008b). This value is related to corpo-rations’ core portfolio, which is referred to as a property’s book value. Maximizing an asset’s value can be achieved through branding, attractiveness, adaptive capacity, dura-bility or location selection (Voordt & Jensen, 2018; Pinder et al., 2011; Anker et al., 2014; Remøy et al., 2019; Kop-pels, Remøy, de Jonge & Weterings, 2009). In addition, the demand for sustainable buildings is also reflected in sustainable buildings’ book value (Remøy, & van der Voor-dt, 2014).Related with: stimulate innovation, support image & cul-ture, environmental sustainability, adaptability
3. Reduce costsCost reduction such as such as higher production efficien-cy, reduction of operating costs and reduction of employ-ee absence, can have direct and indirect impact on the firm’s performance (Lindholm & Leväinen, 2006). This can be achieved through efficient and effective use of space, by occupying sustainable buildings (energy savings) and choosing locations based on governmental incentives (Anker et al., 2014; Lindholm et al., 2006; Gibler & Lind-holm, 2012). Maintenance costs can also have an impor-tant impact on the firm’s expenses. Increasing a building’s quality can impact the need and duration of maintenance, leading to the reduction of costly repairs and capital ex-penditures (Lindholm & Gibler, 2005; Macmillan, 2006).Related with: improve quality of space, support image & culture, environmental sustainability, adaptability
4. ProductivityProductivity is a value directly linked to firms’ performance (Riratanaphong et al., 2012; De Vries et al., 2008). Real estate decisions regarding location selection, spatial de-sign and the buildings’ ability to respond to users’ needs, maintaining optimal operation levels can have a direct im-pact on the functionality of the space, allowing employ-ees to work effectively and efficiently (Lindholm, 2008b; Lindholm et al., 2006; Lindholm, 2008a). Sustainable build-ings, can result in pleasant environments, contributing positively to users’ wellbeing and productivity (Gibler & Lindholm, 2012). Responsive spaces that can support user activities and the core business through time, reduce the mismatch between the dynamic demands and the static supply, increasing user satisfaction and consequently their efficiency and productivity (Gibler, Black & Moon, 2002; Petrulaitiene & Jylhä, 2015; Lindholm, 2008b; Den Heijer, 2011). User involvement constitutes one of the main fac-tors in delivering productive spaces, as users are the ones who best know their needs (Gibler et al., 2002). That being said, productivity can be linked with adaptability, satisfac-tion, collaboration and quality of space. Related with: increase real estate value, reduce costs, productivity, support image & culture, adaptability
44 • 3.3 Added value
© Ioannis Mexis, 2020

Values De Vries et al., 2008
Macmilan, 2006 Gibler & Lindholm, 2012
Den Heijer, 2011
Jensen, Nielsen & Nielsen, 2008
Voordt & Jensen, 2018
1. Control risk Control risk Reliability Risk
2. Increase real estate value Exchange
Increase value of organisation’s real estate assets
Increase real estate value
Cost Value of assets
3. Reduce costs CostReduce real estate cost
Reduce costs Reduce cost Cost
4. Productivity ProductivityIncrease efficiency & productivity
Support user activities
Productivity Productivity
5. Improve quality of space
Improve quality of place
Spatial
6. User satisfaction Satisfaction Use
Increase user well-being & satisfaction
Increase user satisfaction
Satisfaction Satisfaction
7. Stimulate collaboration
Stimulate collaboration
8. Stimulate innovation Innovation
Support innovation & creativity
Stimulate innovation
Innovation & creativity
9. Environmental sustainability Environmental
Support environmental sustainability
Reduce footprint
Environmental Sustainability
10. Adaptability FlexibilityIncrease flexibility
Increase flexibility
Adaptability Adaptability
11. Support image & culture Image & culture Image& culture
Promote marketing, sale & brand
Support imagePromote marketing & sale
Image
12. Social responsibility Social Social
Corporate social responsibility
Table 3.3.1Added value parameters
• 45 Addressing the mismatch
© Ioannis Mexis, 2020

5. Improve quality of spaceOperating in a competitive environment, corporations are applying strategies to enhance the quality of the space, to satisfy users and enhance the firm’s competitive advan-tage in attracting and retaining employees. The spatial and overall building quality is also significant as it mirrors the image and identity of the organisation to its workers and customers (Den Heijer, 2011). Job performance, user satisfaction, wellbeing and consequently their productiv-ity is also impacted by the quality of the supplied space, reflecting the relation between design, work and employ-ees’ performance (Gibler & Lindholm, 2012; Lindholm et al., 2006; Kwon, Remøy & Van Den Dobbelsteen, 2019). Finally, the quality of the space will be echoed in the fi-nancial value of the property, as the higher the quality, the higher the book and market value (Den Heijer, 2011; Baum, 1994).Related with: increase real estate value, productivity, user satisfaction, stimulate innovation, support image & cul-ture
6. User satisfactionEmployee satisfaction constitutes a major factor of corpo-rations’ performance. It highly depends on the real estate facilities provided, and decisions concerning site selec-tion, workplace design and quality, sustainability meas-ures and amenities provided (Lindholm et al., 2006). The responsiveness of the building -allowing users to have control over it- can also have a positive influence over their well-being and satisfaction (Anker et al., 2014). Sat-isfaction is linked with efficiency and productivity; mean-ing that the more satisfied the employees are, the more productive and efficient they will be, adding value to the firm by increasing its performance (Lindholm & Leväinen, 2006; Anker et al., 2014; Khanna, Van der Voordt & Kop-pels, 2013). In order to supply an environment that sat-isfies the users’ needs, users need to be involved in the design process (Khanna et al., 2013).Related with: increase real estate value, reduce costs, productivity, support image & culture, adaptability
7. Stimulate collaborationCollaboration can highly impact the organisations’ over-all performance and competitiveness, as it improves employees’ efficiency, productivity, supports knowledge sharing which and can stimulate innovation (Harris, 2015; Macmillan, 2006; Den Heijer, 2011; O’Neil, 2010). In order to prompt collaboration, corporations need to supply the appropriate spatial layout, which usually entails a combi-nation of open flexible spaces supported by concentra-tion spaces (Khanna et al., 2013; Harris, 2015; Appel-Meu-lenbroek, Groenen & Janssen, 2011).Related with: productivity, stimulate innovation, support image & culture, adaptability
8. Stimulate innovationMany firms are knowledge businesses, operating in com-petitive environments, where innovation constitutes a key value for their survival and growth. These firms need to provide workplaces that support innovative working, thinking and collaboration (Lindholm et al., 2006; Lind-holm & Leväinen, 2006). Spaces should be open and flex-ible in order to stimulate interaction which can lead to innovation (Voordt & Jensen, 2018). Apart from the phys-ical attributes of the building, location selection is also a factor of innovation. Selecting locations where talented labour is concentrated (e.g. Eindhoven, location of Voda-fone innovation hub), can add value to the firm, enhanc-ing its image, employees productivity and increasing its competitive advantage and performance (Khanna et al., 2013).Related with: productivity, stimulate collaboration, sup-port image & culture, adaptability
9. Environmental sustainabilityWith the rise of environmental concerns, the emphasis on sustainability in real estate has increased. Corporate real estate management can have a major influence on organ-isations’ environmental impact, by implementing sustain-ability approaches to their portfolio, reflecting their social responsibility (Remøy, & van der Voordt, 2014; Gibler & Lindholm, 2012). Sustainability can also result in indirect benefits such as increased performance and profitability due to the reduction of operation costs, greater finan-cial returns, improvement of the firms’ image, increased employee satisfaction and higher productivity (Gibler & Lindholm, 2012; Jylhä et al.,2019). Sustainability principles entail adaptability and flexibility, providing responsive en-vironments that can last a long period of time, reducing the buildings’ ecological footprint (Macmillan, 2006).Due to its significance, neglecting sustainability is not an op-tion for corporations anymore (Jylhä et al.,2019). Related with: improve quality of space, user satisfaction, environmental sustainability, adaptability, social responsi-bility
46 • 3.3 Added value
© Ioannis Mexis, 2020

10. AdaptabilityAdaptability or flexibility -as referred by many research-ers- has become an important value for corporations’ real estate portfolios. Having the potential to respond through time to the business needs, continuously supporting a firm’s core strategy can add value to the firm (Lindholm et al., 2006). Adaptability provides the potential to: antic-ipate and resolve problems quickly, change the organisa-tion’s culture, image and core activities and allows firms to explore different layouts that could affect collaboration, satisfaction and innovation (Lindholm et al., 2006; Lind-holm, 2008a; Gibler et al., 2002). Having the potential to explore different workplace concepts, can allow firms to optimize the space to correspond to their objectives, val-ues, activities and management style (Anker et al., 2014; Lindholm, 2008b). The ability of buildings to respond to their users’ needs can impact their satisfaction, well-be-ing, productivity and overall performance (Petrulaitiene & Jylhä, 2015). Adaptability adds value to firms especially within the core part of their portfolio. Core portfolio, is used to accommodate organisations’ core activities and reflect their image (Lindholm, 2008b). Therefore as adapt-ability value is a sustainability measure it can reflect firms’ social responsiveness (Remøy et al., 2019)Related with: control risk, increase real estate value, re-duce costs, productivity, improve quality of space, user satisfaction, support image & culture, environmental sus-tainability, social responsibility
11. Support image & culturePortfolio constitutes a communication instrument for a corporation’s image and values, reinforcing its competi-tive position in the market (Singer, Bossink & Vande Putte, 2007; Lindholm, 2008b). This can be achieved through buildings’ physical design, site selection, workplace strat-egy and overall portfolio management (Khanna et al., 2013). Location, accessibility and visibility are considered to be key parameters for attracting customers and increas-ing revenues (Lindholm et al., 2006). A building’s physical attributes shape companies’ image amongst internal and external stakeholders (suppliers, employees, customers and investors), constituting an indirect way off adding val-ue to the organisations (Lindholm et al., 2006; Lindholm, 2008b; Den Heijer, 2011). Depending on the goals and the image a firm wants to reflect, different strategies can be applied (value based, standardisation, incremental) (Sing-er et al., 2007; Khanna et al., 2013). Focusing on the core portfolio, such buildings need to be strategically located, constitute a landmark for the organisation’s identity, re-flect an innovative character and have high degree of ad-aptability, highlighting the firm’s social responsibility and sustainability concerns (Anker et al., 2014).Related with: improve quality of space, user satisfaction, environmental sustainability, adaptability, social responsi-bility
12. Social responsibilityBuildings are environments that connect with people -whether they are users or neighbours- creating and en-hancing opportunities for social interaction and reinforc-ing social identity (Macmillan, 2006). Due to their presence and longevity, buildings shape the identity of their con-text. Therefore, in order to preserve the social value and identity, buildings should be able to last in time (Nakib, 2010). In the corporate environment, buildings’ image, re-flects and shapes companies’ identities (Macmillan, 2006). The environmental problems that have emerged and the rapid pace of change, has increased corporations’ demands for sustainable real estate, as it reflects social responsibility, strengthening their identity (Khanna et al., 2013). Not being able to cope with the present demands, can lead to demolishing and re-constructing which could negatively impact a corporation’s social responsibility and character (Remøy et al., 2019). Therefore social responsi-bility constitutes a significant factor for attracting talented employees and customers, having an indirect impact in a firm’s performance and profit (Voordt & Jensen, 2018).Related with: support image & culture, environmental sustainability, adaptability
• 47 Addressing the mismatch
© Ioannis Mexis, 2020
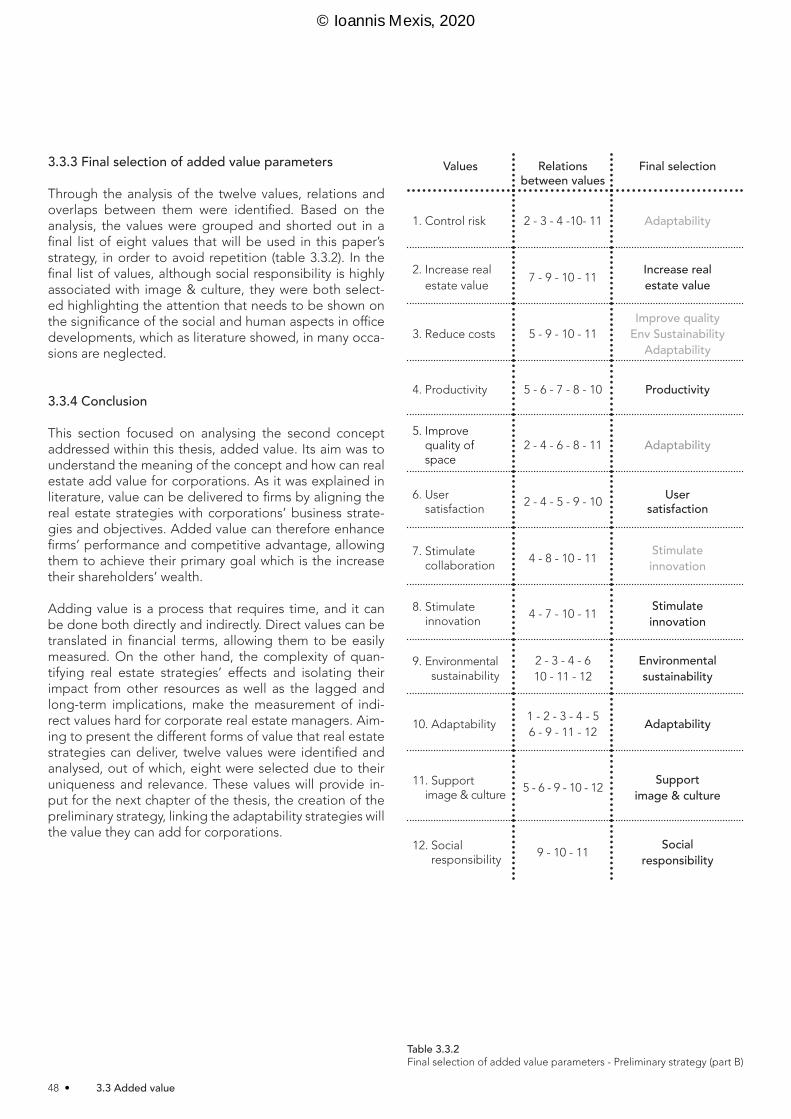
3.3.3 Final selection of added value parameters
Through the analysis of the twelve values, relations and overlaps between them were identified. Based on the analysis, the values were grouped and shorted out in a final list of eight values that will be used in this paper’s strategy, in order to avoid repetition (table 3.3.2). In the final list of values, although social responsibility is highly associated with image & culture, they were both select-ed highlighting the attention that needs to be shown on the significance of the social and human aspects in office developments, which as literature showed, in many occa-sions are neglected.
3.3.4 Conclusion
This section focused on analysing the second concept addressed within this thesis, added value. Its aim was to understand the meaning of the concept and how can real estate add value for corporations. As it was explained in literature, value can be delivered to firms by aligning the real estate strategies with corporations’ business strate-gies and objectives. Added value can therefore enhance firms’ performance and competitive advantage, allowing them to achieve their primary goal which is the increase their shareholders’ wealth.
Adding value is a process that requires time, and it can be done both directly and indirectly. Direct values can be translated in financial terms, allowing them to be easily measured. On the other hand, the complexity of quan-tifying real estate strategies’ effects and isolating their impact from other resources as well as the lagged and long-term implications, make the measurement of indi-rect values hard for corporate real estate managers. Aim-ing to present the different forms of value that real estate strategies can deliver, twelve values were identified and analysed, out of which, eight were selected due to their uniqueness and relevance. These values will provide in-put for the next chapter of the thesis, the creation of the preliminary strategy, linking the adaptability strategies will the value they can add for corporations.
Values Relations between values
Final selection
1. Control risk 2 - 3 - 4 -10- 11 Adaptability
2. Increase real estate value
7 - 9 - 10 - 11Increase real estate value
3. Reduce costs 5 - 9 - 10 - 11Improve quality
Env SustainabilityAdaptability
4. Productivity 5 - 6 - 7 - 8 - 10 Productivity
5. Improve quality of space
2 - 4 - 6 - 8 - 11 Adaptability
6. User satisfaction
2 - 4 - 5 - 9 - 10User
satisfaction
7. Stimulate collaboration
4 - 8 - 10 - 11Stimulate innovation
8. Stimulate innovation
4 - 7 - 10 - 11Stimulateinnovation
9. Environmental sustainability
2 - 3 - 4 - 610 - 11 - 12
Environmental sustainability
10. Adaptability1 - 2 - 3 - 4 - 56 - 9 - 11 - 12
Adaptability
11. Support image & culture
5 - 6 - 9 - 10 - 12Support
image & culture
12. Social responsibility
9 - 10 - 11Social
responsibility
Table 3.3.2Final selection of added value parameters - Preliminary strategy (part B)
48 • 3.3 Added value
© Ioannis Mexis, 2020

4.0 Synthesis - Preliminary strategy
© Ioannis Mexis, 2020

“Any strategic real estate model must recognize that corporate real estate man-
agement has traditionally focused on meeting the continuous need for accom-modation, providing the facilities for the firm’s production and delivery of goods
and services. However, to meet their biggest challenges in today’s fast-paced competitive business environment, firms need flexible, efficient, innovative,and
productive work environments.”(Lindholm et al., 2006)
The previous chapter focused on investigating the prin-ciples of adaptability and added value, highlighting their importance within the corporate real estate context. Giv-en the rapidly evolving environment that firms operate in, there is a demand for adaptable solutions that allow them to continuously optimise the space they operate in (Lind-holm, 2008b).
In order for a real estate strategy to add value to the or-ganisation -both directly and indirectly- it needs to be aligned with its core business objectives and strategy (Lindholm et al., 2006; Lindholm & Leväinen, 2006). Direct values usually entail financial aspects which are easy to calculate and determine. On the other hand, indirect val-ues are harder to identify. As a result, firms still find it hard to understand the value of real estate strategies for their businesses (Lindholm & Gibler, 2005). This problem has been especially noted in the development of adaptability strategies, as they mainly entail long-term benefits and consequently indirect values.
The concept of generic strategy does not exist; one can-not develop a strategy which is applicable for any corpo-ration (Petrulaitiene & Jylhä, 2015). Corporate real estate strategies need to be aligned to organisational objectives and goals, ensuring that resources are used efficiently and effectively to support a sustainable competitive advan-tage and consequently the firm’s performance (Gibler & Lindholm, 2012). In order to do so, a top-down approach needs to be adopted. The first step of applying a real es-tate strategy is to clearly define the corporate strategy, vision and objectives. Based on these, firms need to iden-tify and assess the values that real estate can deliver to them, and in continuation link them to tangible real estate design tactics (Khanna, Van der Voordt & Koppels, 2013; Nase & Arkesteijn, 2018).
4.1 Preliminary strategy - table 4.1
The preliminary strategy was developed by synthesizing the adaptability strategies introduced on section 3.2 (Ta-ble 3.2.6) with the added values identified on section 3.3 (Table 3.3.2). The outcome of this process is presented in table 4.1. As explained earlier, the aim of this strategy was to investigate and illustrate the links between the adapt-ability strategies and the values they can deliver for the implementers.
Table 4.1 illustrates the preliminary strategy. The Y - axis presents the 10 strategy types identified in literature that can be applied for creating adaptable office buildings. The X - axis consists of the 8 forms of added value that each strategy can potentially deliver to the implementers. The degree of relation between the two axes is indicated by the colour of the balls, depending on the impact that a strategy can have on a specific form of added value (high- blue, medium - orange, small - light blue).
As it was described in the former chapter (Table 3.2.6), each of the ten strategy types consists of a number of strategies-tactics. Therefore, the relation and impact (large - medium - small) of the strategy types and the add-ed value was determined by identifying the links between the tactics and the added values, as presented on tables 10.1 (Appendix section)
The process of identifying the links (tables 10.1), was im-portant in order to increase the validity of the strategy and reduce the incidental errors caused by the authors’ subjective view. Therefore, the tables were filled in eight times with intervals between them, ensuring that each time the results were corresponding. Linking the values that real estate can add, with the proposed actions in-creases the strategy’s overall effectiveness, allowing cor-porations to tailor it by assessing what components of the strategy would be the most effective for them based on their objectives.
4.0 Synthesis - Preliminary strategy
50 • 4.0 Synthesis - Preliminary strategy
© Ioannis Mexis, 2020
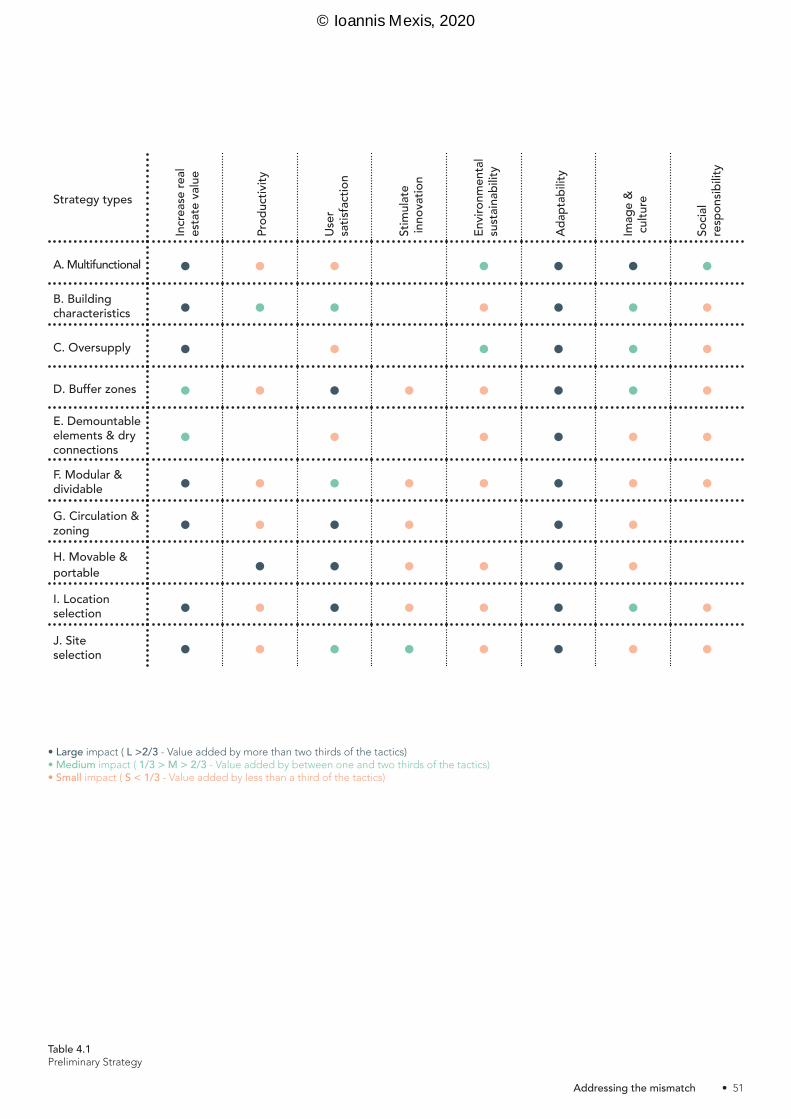
Table 4.1Preliminary Strategy
• Large impact ( L >2/3 - Value added by more than two thirds of the tactics)• Medium impact ( 1/3 > M > 2/3 - Value added by between one and two thirds of the tactics)• Small impact ( S < 1/3 - Value added by less than a third of the tactics)
Strategy typesIn
crea
se re
al es
tate
value
Prod
uctiv
ity
User
sa
tisfa
ctio
n
Stim
ulate
inno
vatio
n
Envir
onm
enta
l su
stain
abilit
y
Adap
tabi
lity
Imag
e &
cultu
re
Socia
l re
spon
sibilit
y
A. Multifunctional • • • • • • •B. Building characteristics • • • • • • •C. Oversupply • • • • • •D. Buffer zones • • • • • • • •E. Demountable elements & dry connections • • • • • •F. Modular & dividable • • • • • • • •G. Circulation & zoning • • • • • •H. Movable & portable • • • • • •I. Location selection • • • • • • • •J. Site selection • • • • • • • •
• 51 Addressing the mismatch
© Ioannis Mexis, 2020

© Ioannis Mexis, 2020

5.0 Empirical research
• Phase 2 •
5.1 Case studies5.2 Timmmerhuis5.3 Rijnstraat 85.4 The Edge
© Ioannis Mexis, 2020

Case studies was adopted as a research method to pro-vide input from practice, in order to increase the effective-ness and validity of the preliminary strategy, developed in the previous chapter. This chapter focuses on the col-lection of qualitative data through those cases. After pre-senting the type of case studies that will be conducted (boundaries, context, units), the selection criteria and the data analysis methods that were utilised, the chapter will focus on presenting each case and in the end conducting cross case analysis, presenting the main findings of the process.
5.1 Case studies
As the aim of this thesis is to create a strategy that can be implemented in practice, studying real-life cases is important for its feasibility (Lindholm, 2008b; Blakstad, 2001). Case studies’ ability towards analytical general-isation is poor. Therefore a multiple-case (embedded) design strategy is selected, assisting in generalising and strengthening the strategy by identifying patterns and understanding the dynamics of the specific setting (Yin, 1989; Eisenhardt, 1989).Completing three case studies, using different data collection methods, allows the sub-ject’s investigation from different perspectives and the triangulation of the collected data in order increase the credibility of the findings and their transferability to the readers (Saunders, Lewis & Thornhill, 2007; Creswell & Miller, 2000; Bryman, 2016).
Considering the objectives of the research, the context, themes and units of analysis need to be defined before selecting the cases (Yin, 2009; Lindholm, 2008b). The con-text is “adaptability as added value for corporation”. The themes that will be researched, are adaptability strategies that have been applied and the value they deliver for the corporations. Based on the identified themes, the units that will be investigated are adaptability and added value (fig. 5.1.1). The case studies will be conducted implement-ing two data collection methods. The theme of adaptabil-ity will be investigated through data collection, analysis of the buildings, and interviews with their architects. The concept of added value, will be investigated by interview-ing corporate real estate managers.
The research methodology adopted in this thesis relates to a creative iterative process between the preliminary strategy and the cases, but also between the three case studies (Taylor, Fisher & Dufresne, 2002). This process is illustrated on figure 5.1.2. After conducting the three case studies, a cross-case analysis and two more interviews fo-cusing on the strategy implementation will be followed, to evaluate and strengthen the preliminary strategy, in or-der to develop the final strategy and draw findings and conclusions.
Context:Adaptability as added value for corporation
Case
Real estatemanager
Architect
Building
Data collection
Interview
Documentary data
Interview
Cross-case conclusions
Develop final strategy
Building REMArch.
Cas
e 1
Building REMArch.
Cas
e 2
Building REMArch.
Cas
e 3
Prepare, co
llect & analyze
Analyze &
conclud
eD
efine & d
esign
Adaptability
Strategy implementation
Added value
Develop theory Preliminary strategy
Case selection
Data collection protocol
REM Arch.
Fig. 5.1.1Case analysis
Fig. 5.1.2Multi case study process
5.1 Case studies
54 • 5.1 Case studies
© Ioannis Mexis, 2020
5.1.2 Case selection
As a multiple-case study design strategy is followed in this thesis, the selection of appropriate cases is impor-tant for deriving concrete results that can add value to the research. As Eisenhardt (1989) proposed, only a cer-tain amount of cases are eligible to for each study and can illuminate the theoretical proposition of the case (Yin, 2009). Therefore, criteria definition is fundamental for es-tablishing conditions for the selection of cases that can contribute to the research the most.
The case selection criteria for this research are:
Location: The selected cases need to be located in the Netherlands and more specifically in large cities, such as Amsterdam, The Hague and Rotterdam. The country se-lection is important for having easier access to the build-ings, information required and people that worked in the project. Through literature, the location selection was considered an important factor for both adaptability and added value, in both cases highlighting the advantages of adaptable office building being located in city centres.
Function of building: This thesis focuses on creating a strategy for adaptable office buildings. Therefore the se-lected cases must accommodate office functions.
Designed for adaptability: Investigating adaptable build-ings is key for this research. Though, such buildings need to be designed with the intention to make them adapt-able from an early stage. Meaning, that buildings which turned out to be adaptable and flexible after completion are excluded from this study.
Branded as sustainable building: Adaptable buildings are sustainable buildings. Considering the rising demand and significance for sustainability within the corporate real es-tate context, only buildings that are branded as sustaina-ble will be investigated.
Date of completion: The use phase is an important stage for assessing the success of the project, performance of the building and evaluating how the building contributes in the corporation’s performance. Selecting a three-year minimum since completion, is a time-frame that corpora-tion can generate the required information.
Size of building: The size of the building can be highly related to the strategies adopted in its design. Investigat-ing buildings of similar size is significant for the validity of this study.
5.1.3 Data collection and analysis
The theoretical research and the preliminary strategy serve as a foundation for the empirical research. As explained earlier, the data collection process is divided in three parts whose aim is to capture the adaptability strategies imple-mented in real life and the value they deliver for corpora-tions. The first part is the documentary data process fol-lowed by a series of interviews, allowing the collection of rich data across the three cases (Newton, 2010). Adopting a multi-method approach, provides more concrete findings through triangulation between the data collected from the different sources and cases (Manewa, 2012).
Documentary data method: Documentary evidence is collected by studying a range of literature and documents. The purpose of this method is to gain general knowledge on the case, be better prepared for the interviews and identify what adaptability strategies were implemented in the buildings’ design and for what reasons. The findings of this method will be then com-pared to the preliminary strategy to determine any differ-ences between the two.
Interview method: Each interview has two parts. In the first part, the data will be collected through semi-structured interviews, as they provide more flexibility in the interviewees’ responses, while being structured enough to guide the direction of the questions ensuring their relevance to the topic (Petru-laitiene & Jylhä, 2015). The second part of the interview, focuses on evaluating and improving the preliminary strat-egy. In order to do so, the interviewees are asked to fill in some table which will be later analysed by the author.
Two sets of interviews will be conducted for each case, one with an architect (focusing on adaptability strategies) and the second with a corporate real estate manager (focus-sing on added value), all of who should have an active po-sitions in the project. The aim is to conduct all interviews face-to-face allowing more direct contact and the ease of providing clarifications if required (Manewa, 2012; Petrulai-tiene & Jylhä, 2015). (The detailed interview questions can be found in Thesis Part C).
Analysis: Following each interview, the data collected will be re-viewed and analysed within a short time interval, while they are still recent and the author inspired by them. The anal-ysis will take place in three phases. In the first phase the interviews are analysed and related to the documentary data and the preliminary strategy. The second phase focus-es on the comparing the findings across the cases. Finally, the third phase entails the formulation of findings, and the development of the final strategy.
• 55 Addressing the mismatch
© Ioannis Mexis, 2020
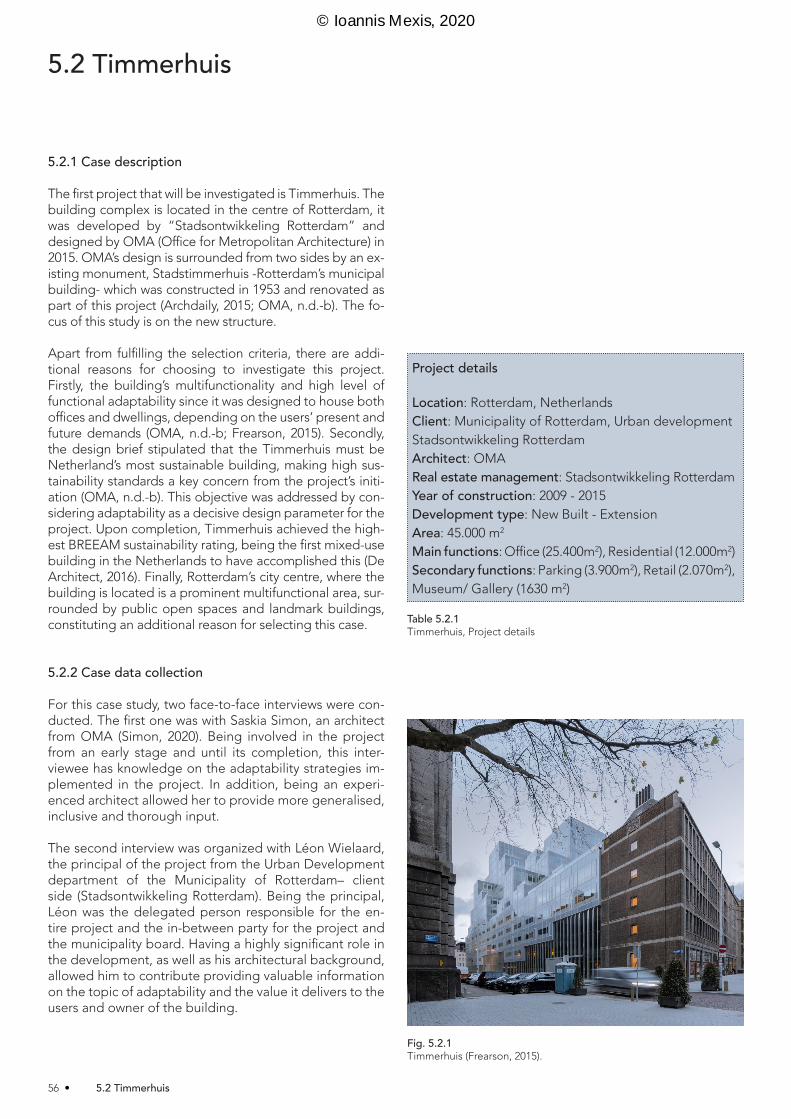
5.2.1 Case description
The first project that will be investigated is Timmerhuis. The building complex is located in the centre of Rotterdam, it was developed by “Stadsontwikkeling Rotterdam” and designed by OMA (Office for Metropolitan Architecture) in 2015. OMA’s design is surrounded from two sides by an ex-isting monument, Stadstimmerhuis -Rotterdam’s municipal building- which was constructed in 1953 and renovated as part of this project (Archdaily, 2015; OMA, n.d.-b). The fo-cus of this study is on the new structure.
Apart from fulfilling the selection criteria, there are addi-tional reasons for choosing to investigate this project. Firstly, the building’s multifunctionality and high level of functional adaptability since it was designed to house both offices and dwellings, depending on the users’ present and future demands (OMA, n.d.-b; Frearson, 2015). Secondly, the design brief stipulated that the Timmerhuis must be Netherland’s most sustainable building, making high sus-tainability standards a key concern from the project’s initi-ation (OMA, n.d.-b). This objective was addressed by con-sidering adaptability as a decisive design parameter for the project. Upon completion, Timmerhuis achieved the high-est BREEAM sustainability rating, being the first mixed-use building in the Netherlands to have accomplished this (De Architect, 2016). Finally, Rotterdam’s city centre, where the building is located is a prominent multifunctional area, sur-rounded by public open spaces and landmark buildings, constituting an additional reason for selecting this case.
5.2.2 Case data collection
For this case study, two face-to-face interviews were con-ducted. The first one was with Saskia Simon, an architect from OMA (Simon, 2020). Being involved in the project from an early stage and until its completion, this inter-viewee has knowledge on the adaptability strategies im-plemented in the project. In addition, being an experi-enced architect allowed her to provide more generalised, inclusive and thorough input.
The second interview was organized with Léon Wielaard, the principal of the project from the Urban Development department of the Municipality of Rotterdam– client side (Stadsontwikkeling Rotterdam). Being the principal, Léon was the delegated person responsible for the en-tire project and the in-between party for the project and the municipality board. Having a highly significant role in the development, as well as his architectural background, allowed him to contribute providing valuable information on the topic of adaptability and the value it delivers to the users and owner of the building.
Fig. 5.2.1Timmerhuis (Frearson, 2015).
Table 5.2.1Timmerhuis, Project details
Project details
Location: Rotterdam, NetherlandsClient: Municipality of Rotterdam, Urban development Stadsontwikkeling RotterdamArchitect: OMAReal estate management: Stadsontwikkeling RotterdamYear of construction: 2009 - 2015Development type: New Built - Extension Area: 45.000 m2
Main functions: Office (25.400m2), Residential (12.000m2)Secondary functions: Parking (3.900m2), Retail (2.070m2), Museum/ Gallery (1630 m2)
5.2 Timmerhuis
56 • 5.2 Timmerhuis
© Ioannis Mexis, 2020

5.2.3 Findings
• Adaptability strategies & tacticsAdaptability is one of the fundamental concepts adopt-ed in the Timmerhuis. Aiming to respond to the need for housing, accommodate the municipality’s employees and considering that the number of employees is constantly changing, OMA in collaboration with the client applied a number of measures enhancing the building’s adaptive capacity. This section focuses on presenting the adapt-ability tactics that were implemented in the project, struc-turing them following the ten strategy types identified in the preliminary strategy (the overview of the implement-ed tactics can be found in the appendix section 10.2).
A. MultifunctionalThe majority of the multifunctionality related tactics iden-tified in the preliminary strategy were implemented in Timmerhuis. Precisely determining the dimensions and position of the structural steel grid, both in terms of verti-cal (floor to floor height 3.6 m) and horizontal span (7.2 x 7.2m), provides the building the flexibility to adapt to its users’ needs, and a structure that can house offices, res-idential units, retail functions and parking spaces (OMA, n.d.–b; Frearson, 2015; Simon, 2020). The use of a wide grid span, modular units and independent façade panels that are proportional to the grid’s dimension, allows the building to be expanded and downsized (De Architect, 2016; Archello, n.d.-a). On the other hand, due to the can-tilevered parts of the structure, the building’s expansion potential is limited only to certain areas (Simon, 2020). In-corporating two large atriums that are connected to the building’s climate system, act like lungs providing sunlight in the deepest parts of the floor plan, creating a healthy environment for present and future functions (Archdaily, 2015). Finally, incorporating multiple entrances, as well as five vertical circulation cores (two in the new and three in the existing part of the complex) allow the building to be organised in different internal configuration, and accom-modate multiple functions and users (Simon, 2020).
B. Building characteristicsTaking into account the wider (city scale) and immediate context’s crowded composition of architectural styles, Timmerhuis’ form comprised of modular square units, constitutes a subtle and well integrated intervention in the city’s urban fabric (Stevens, 2015). The rectangular cells (regular geometry), the uninterrupted and wide interior spaces, and the independent envelope, form a building with generic characterises allowing it to be architecturally and functionally adaptable (OMA, n.d.-b; Simon, 2020).
C. OversupplyCompared to the other adaptability strategy types, “over-supply” was not thoroughly implemented in Timmerhuis. Although the building was designed with enough height space between the floors, the structural load capacity (due to the cantilevered parts of the structure) restricts the potential for vertical expansion, allowing only central parts of the building to be vertically extended (Archello, n.d.-a; De Architect, 2016). In addition -despite not imple-menting them- the architect highlighted the significance of the increased load capacity and the surplus of services (currently there is no surplus but there is potential to en-hance them) in the development of adaptable buildings, and at the same time acknowledged the risk underlying them due to increased financial investments they require (Simon, 2020).
D. Buffer zonesBuffer zones can be very significant for a building as they allow it to respond to small scale changes mainly relat-ed to the spatial configuration, without requiring large investments or lengthy downturns. The office section of Timmerhuis was designed incorporating undefined spaces, communal spaces and a surplus of area. Imple-menting these actions allowed the building to house ad-ditional workstations since its completion, following the rising demand for workspaces (Simon, 2020). In addition, three types of communal spaces were incorporated in the building: a garden on the fourth floor accessible to the users of the building (residents & employers) and on the ground floor a public passage, and retail and museum spaces (Simon, 2020).
Fig. 5.2.2Floor plan - office 2nd floor (adapted from OMA, n.d.-b)
• Structural grid
• Vertical circulation zones 0 7.23.6
• 57 Addressing the mismatch
© Ioannis Mexis, 2020

E. Demountable elements & dry connectionsThe use of an exposed steel frame structure, dry connec-tions, as well as demountable façade glass panels and in-terior-partition walls allow the Timmerhuis’ exterior form and interior configuration to adapt to the users’ demands (BMIAA, 2015). In addition, utilizing suspended ceilings both in the office (highly flexible steel bar panels, incorpo-rating lighting and ventilation services) and the residential areas (plaster board) make services easily accessible (Ar-ch2O, n.d.; Simon, 2020).
F. Modular & dividableFollowing the dimensions of the grid structure both in the building’s interior spaces and façades, allow the use of modular and standardised components (units, skin & services), increasing the building’s adaptability properties (Archdaily, 2015; OMA, n.d.-b; Simon, 2020). The build-ing’s façades consist of only two types of panels which are determined by the function housed behind them. The residential units’ façades can fully open-up whereas the offices’ have smaller openings (Fig. 5.2.3). The use of modular façade panels allows them to be replaced in case the building’s function or the occupant’s demands change (Simon, 2020).
G. Circulation & zoning Both in the existing and the new sections of the build-ing, one can find five cores (two new & three existing), supplying the vertical circulation. OMA’s design forms two peaks, each facilitated by a different service and circula-tion core, out of which, the circulation core has the ca-pacity to serve more functions and users than the present requirements (OMA, n.d.-b; .BMIAA, 2015; Simon, 2020). This also allows the building’s functions to follow a vertical configuration if required in the future, reflecting the de-sign’s adaptability capacity. The zoning of the office spac-es, incorporating both open-plan and enclosed (confined units) configurations, constitute a flexible environment al-lowing it to adapt to changes without impacting the entire plan layout (OMA, n.d.-b; Simon, 2020).
H. Movable & portableFocussing on the building’s interior, using standardised and modular components (interior walls, ceiling and fur-niture), demountable wall partitions and relocatable units enhances its spatial flexibility. Such measures allow the building and specifically the workplace to adapt to not only large scale changes but to frequent changes in user’s demands as well (Simon, 2020).
I. Location selection
Correspondingly to the literature, the interviewee high-lighted the building’s location as one of the key charac-teristics of its adaptability characteristics. Located in the centre of Rotterdam, in a culturally rich and multifunc-tional area with quality facilities, parks and landmarks in a close proximity (Markthal), positions the building in a live-able and secure location (Simon, 2020). In addition, being easily accessible by train (Rotterdam Blaak) and car, and providing parking facilities for its users, constitute a highly attractive location, enhancing the building’s adaptability capacity allowing it to respond to small and large scale changes (Archdaily, 2015; Frearson, 2015).
J. Site selectionFocusing on the site-related characteristics, Timmerhuis cannot be horizontally extended as the site is fully con-structed and not expandable, limiting the building’s ad-aptability capacity. On the other hand, the location’s limit-ed legal boundaries allow the accommodation of multiple functions and vertical expansion (up to 70 meters) (Simon, 2020). Finally, incorporating public spaces on the build-ing’s ground floor, such as the passage, the exhibition and other retail functions, enhance the building’s adaptability potential.
Fig. 5.2.3Steel structure grid & atrium (Archdaily, 2015).
58 • 5.2 Timmerhuis
© Ioannis Mexis, 2020
• Adaptability in Timmerhuis Adaptability constitutes a key concept in the develop-ment and design of Timmerhuis. Based on the findings from both the documentary data analysis and the inter-views, the majority of adaptability tactics identified in the preliminary strategy were implemented in Timmerhuis, providing it the capacity to respond to changes.
Since its initiation phase in 2009, sustainability, adaptabil-ity and upgrading the area constitutes the main ambitions for the project. With the development of Timmerhuis, the Municipality of Rotterdam wanted to showcase that sus-tainability can fit within the budget and the architectural ambitions of a project (Wielaard, 2020-a). In alignment with that goal, the demands for housing and the need to accommodate their employees – whose number was con-stantly decreasing- adaptability became another major starting point for Timmerhuis (Wielaard, 2020-a). Current-ly, half of the building is owned and used by the munic-ipality (1st – 4th floor), and the rest is used for housing (5th – 14th floor), retail and museum spaces (ground floor) (BMIAA, 2015). Despite the present functional division, the building’s adaptive capacity allows it to accommo-date different uses, configurations and tenants (Wielaard, 2020-a). The main restriction in the building’s flexibility is posed by the capacity of the services, which could still be enhanced by additional investments (Simon, 2020).
The building’s central location was one of the key reasons for the municipality’s long-term interest in the project -knowing that they will always want to be located in that building- and its will to invest in adaptability. In gener-al, municipalities’ visions focus more on having a societal impact than making a profit. Therefore, the alignment of the long-term commitment, vision and high sustainability and adaptability goals, resulted in the development of a highly sustainable mix-use project, with the flexibility to fit users’ demands for the upcoming 50 years and have the capacity to respond to drastic changes (Wielaard, 2020-a; Simon, 2020).
• Changes applied on project since completionTimmerhuis has only been in use for five years. During that time no major changes have been requested by the users. Regarding the office section -due to the use of flexible office spaces- working stations were provided for 80% of the employees. Shortly after completion, the number of employees increased and consequently the need for ex-tra working spaces, utilizing the available surplus of area (Simon, 2020). These changes affected only the “stuff” and “space plan” layers, and were easily fulfilled without distracting the operations of the building (Simon, 2020; Wielaard, 2020-a).
• Project successThe vision for Timmerhuis comprised a project that would have a societal impact and illustrate the importance of sus-tainability in real estate. In order to do so, the Municipality of Rotterdam aimed at developing the most sustainable office building, showing that such an ambition would not influence the architectural quality or the budget. Part of the success of this goal was reflected in Timmerhuis being the first mix-use building in the Netherlands to achieve the highest BREEAM sustainability rating (Frearson, 2015).
The ambitions and sustainability goals resulted in the creation of a highly adaptable building, designed to ac-commodate multiple functions, without requiring large alternation and financial investments. Currently the office section is only used by the municipality, but it could be easily used by more tenants. On the other hand, com-pared to the upper levels (residential 5th – 14th) the deep-plan of the office levels can perplex the accommodation of alternative functions. In addition, although the ambi-tion of creating a mix-use building was achieved, accom-modating four functions where each of these has different needs (e.g. in terms of natural lighting) can sometimes pose complications to their operations. This constitutes an area for improvement in the development mix-use real estate (Simon, 2020; Wielaard, 2020-a).
Focusing on the building’s overall adaptive capacity, the majority of measures identified in the preliminary strategy were incorporated in Timmerhuis, illustrating its capacity to respond to small and large scale changes. Up to this point, the changes realised affected only the “stuff” and “space plan” layers, while both interviewees think that no large scale changes will be requested anytime soon. On the other hand, they also expressed their confidence in the building’s capacity to respond to large scale chang-es in the future such as change of tenants and functions housed (Simon, 2020; Wielaard, 2020-a). Valuing the suc-cess of the project, since completion a number of inves-tors have showed interest in purchasing the building from the municipality (Wielaard, 2020-a). From this case, one can understand the significance that ambitious clients can have in project development and the achievement of suc-cessful results.
• 59 Addressing the mismatch
© Ioannis Mexis, 2020
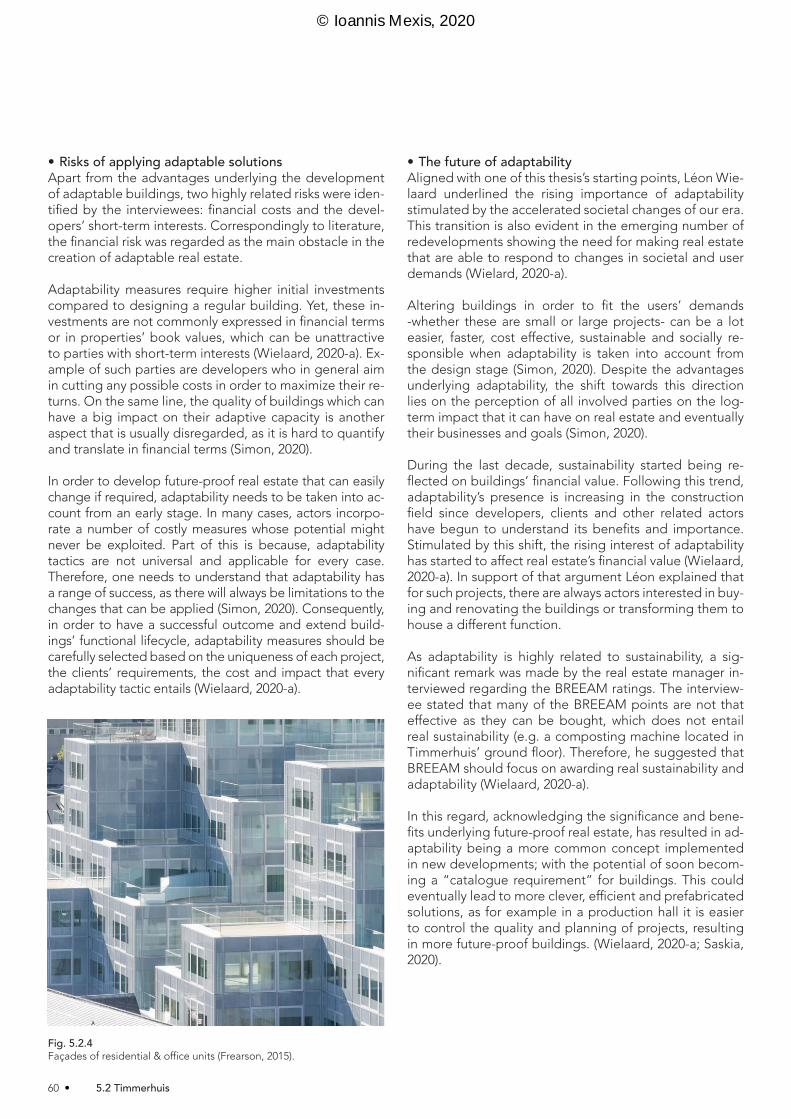
• Risks of applying adaptable solutionsApart from the advantages underlying the development of adaptable buildings, two highly related risks were iden-tified by the interviewees: financial costs and the devel-opers’ short-term interests. Correspondingly to literature, the financial risk was regarded as the main obstacle in the creation of adaptable real estate.
Adaptability measures require higher initial investments compared to designing a regular building. Yet, these in-vestments are not commonly expressed in financial terms or in properties’ book values, which can be unattractive to parties with short-term interests (Wielaard, 2020-a). Ex-ample of such parties are developers who in general aim in cutting any possible costs in order to maximize their re-turns. On the same line, the quality of buildings which can have a big impact on their adaptive capacity is another aspect that is usually disregarded, as it is hard to quantify and translate in financial terms (Simon, 2020).
In order to develop future-proof real estate that can easily change if required, adaptability needs to be taken into ac-count from an early stage. In many cases, actors incorpo-rate a number of costly measures whose potential might never be exploited. Part of this is because, adaptability tactics are not universal and applicable for every case. Therefore, one needs to understand that adaptability has a range of success, as there will always be limitations to the changes that can be applied (Simon, 2020). Consequently, in order to have a successful outcome and extend build-ings’ functional lifecycle, adaptability measures should be carefully selected based on the uniqueness of each project, the clients’ requirements, the cost and impact that every adaptability tactic entails (Wielaard, 2020-a).
• The future of adaptabilityAligned with one of this thesis’s starting points, Léon Wie-laard underlined the rising importance of adaptability stimulated by the accelerated societal changes of our era. This transition is also evident in the emerging number of redevelopments showing the need for making real estate that are able to respond to changes in societal and user demands (Wielard, 2020-a).
Altering buildings in order to fit the users’ demands -whether these are small or large projects- can be a lot easier, faster, cost effective, sustainable and socially re-sponsible when adaptability is taken into account from the design stage (Simon, 2020). Despite the advantages underlying adaptability, the shift towards this direction lies on the perception of all involved parties on the log-term impact that it can have on real estate and eventually their businesses and goals (Simon, 2020).
During the last decade, sustainability started being re-flected on buildings’ financial value. Following this trend, adaptability’s presence is increasing in the construction field since developers, clients and other related actors have begun to understand its benefits and importance. Stimulated by this shift, the rising interest of adaptability has started to affect real estate’s financial value (Wielaard, 2020-a). In support of that argument Léon explained that for such projects, there are always actors interested in buy-ing and renovating the buildings or transforming them to house a different function.
As adaptability is highly related to sustainability, a sig-nificant remark was made by the real estate manager in-terviewed regarding the BREEAM ratings. The interview-ee stated that many of the BREEAM points are not that effective as they can be bought, which does not entail real sustainability (e.g. a composting machine located in Timmerhuis’ ground floor). Therefore, he suggested that BREEAM should focus on awarding real sustainability and adaptability (Wielaard, 2020-a).
In this regard, acknowledging the significance and bene-fits underlying future-proof real estate, has resulted in ad-aptability being a more common concept implemented in new developments; with the potential of soon becom-ing a “catalogue requirement” for buildings. This could eventually lead to more clever, efficient and prefabricated solutions, as for example in a production hall it is easier to control the quality and planning of projects, resulting in more future-proof buildings. (Wielaard, 2020-a; Saskia, 2020).
Fig. 5.2.4Façades of residential & office units (Frearson, 2015).
60 • 5.2 Timmerhuis
© Ioannis Mexis, 2020

• Added valueConsidering that adaptability is implemented in order to make future-proof real estate, the benefits of such strat-egy are fully utilized in the long-term. On the same line, when assessing a building for the value it delivers to its users, one cannot only consider the short-term benefits.
In the development of Timmerhuis, the client’s ambi-tions focused on architecture, sustainability and the city. Through this project, the goal was to show that sustaina-ble and adaptable solutions (sustainability) can fit within the budget while maintaining a high architectural quality (architecture) and at the same time revitalize the area (city) (Wielaard, 2020-a; OMA, n.d.-b). In comparison to private parties, municipalities mainly focus on having a societal impact rather than making a profit, delivering value not only its direct users (owner, tenants, residents & employ-ees) but to the society (general public & the construction field) as well (Wielaard, 2020-a).
That being said, it was clear that the municipality and the involved stakeholders had high ambitions for Timmerhu-is. Being awarded as the most sustainable mix-use build-ing in the Netherlands, illustrated the successful accom-plishment of the project goals and that ambitious clients can have a big impact, adding value to both the directly and indirectly involved parties. Quality was regarded as another major factor of delivering value to both the users and the building, as it entails a more pleasant and dura-ble environment, prolonging the building’s lifecycle and enhancing users’ satisfaction and well-being (Wielaard, 2020-a).
Regarding the “society” aspect of the municipality’s ambi-tions, apart from enhancing the area and providing public spaces, they also aimed in addressing the large demand for housing. In order to do so, Timmerhuis housed not only offices but also residential units, retail and museum functions, delivering societal value and enhancing the im-age and identity of the municipality (Wielaard, 2020-a).
Finally, based on the analysis of the tables focusing on added value (Appendix 10.6 & 10.8), both interviewees regarded “movable & portable” and “location selection” as the two strategy types that can have the largest im-pact on value delivery. In addition “multifunctional” and “building characteristics” were regarded as highly signifi-cant. On the other hand, “buffer zones” and “modular & dividable” were regarded as the strategies that can have the smallest impact on value delivery (Simon, 2020; Wie-laard, 2020-a).
5.2.4 Conclusions
Based on the analysis of Timmerhuis, the project can be regarded as a success in terms of its adaptive capacity and the value it delivers to the clients, users and society.
Timmerhuis was developed by the municipality of Rotter-dam, aiming to deliver value not only the internal stake-holders but to the society as well. Through the successful outcome of this project, the municipality municipality’s objectives of upgrading the area and showcasing that sustainability and adaptability can fit within the budget and architectural quality of the building, were achieved. In order to do so, and create a highly sustainable build-ing that can adapt to different configurations, tenants and functions, out of the 46 unique adaptability tactics identi-fied in the preliminary strategy, OMA applied 38 fully and 6 partially.
Considering the drivers of the development of Timmerhu-is, the accelerating societal changes which led to the in-crease of redevelopment projects, resulted in the demand for a highly adaptable and sustainable project. Gradually the market has started to acknowledge the importance of future-proof real estate, though the implementation of such measures is highly dependent on the actors’ long and short-term interests.
Similarly to the findings from the literature review, devel-opers’ short-term interests along with the additional in-vestments required for adaptability -whose exploitation is not guaranteed- can constitute boundaries in the im-plementation of such solutions. Despite these risks, the prevailing benefits of adaptable real estate have started to be translated in financial terms, increasing the value of buildings.
Apart from the financial value, adaptability can deliver both directly and indirectly value to the owners (identity, financial value) and users (pleasant environment, well-be-ing, satisfaction, productivity) of the space as well as the general public (social responsibility, example for future projects), illustrating the importance and benefits under-lying such developments.
The success of the project, signifies that the alignment of ambitious parties with long-term interests along with high sustainability and adaptability goals can result into a successful project with the capacity to respond to users and societal demands for the upcoming 50 years. Such projects, can stimulate the development of future-proof real estate, with the ambition that one day adaptability becomes a catalogue requirement.
• 61 Addressing the mismatch
© Ioannis Mexis, 2020

5.3.1 Case description
The second case that will be studied in this thesis is the Rijnstraat 8. This project is located in the centre of The Hague, it was developed by “Rijksvastgoedbedrijf, The Hague” (Central Government Real Estate Agency of The Hague) and designed by OMA in 2017. The Rijnstraat is a transformation and renovation project, and is the first large-scale implementation of the Dutch government’s of-fice accommodation masterplan, which focuses on increas-ing the efficiency in the design, maintenance, financing and operations of its office real estate portfolio (OMA, n.d.-a; Nicolaas, 2020-a; Voncken, 2020). The existing building was constructed in 1992 by Jan Hoogstad; it housed govern-mental institutions, and represented an innovative office ty-pology and a leading example of sustainability for its time (OMA, n.d.-a; Rijksvastgoedrijf, n.d.). Despite its success, 25 years after its completion the building did not offer any longer the flexibility and openness required for contem-porary offices, initiating the demand for its transformation (OMA, n.d.-a, Nicolaas, 2020-a).
Rijnstraat 8 was not only chosen as part of this thesis for ful-filling the selection criteria, but primarily for being a trans-formation and renovation project that has the capacity to cope well with changes for the upcoming 25 years and be suitable to accommodate different functions, despite the constraints that an existing building might pose (Rijksvast-goedrijf, 2017- a; Giele, 2017; Nicolaas, 2020-a). In addition, the success of OMA’s intervention is also reflected in the A+++ energy rating that the building received, which is un-precedented low for renovation projects of that scale (Rijks-vastgoedrijf, 2017- b). Finally, the long-term interest of the municipal parties that own and use Rijnstraat 8, the build-ing’s prominent location and connection to its context, are additional criteria for including Rijnstraat 8 in this research.
5.3.2 Case data collection
For this case study, two interviews were conducted. The first interview was with Bart Nicolaas, a senior architect from OMA (Nicolaas, 2020-a). Bart was closely involved in the whole project development and is still following its operation, allowing him to have knowledge on the adapt-ability strategies implemented; and due to his profession-al experience, a more generalised view on the concept of adaptability.
The second interview was carried-out with Maurits Vonck-en, member of the real estate management department of the Rijksvastgoedberdijf (Voncken, 2020). Since brief-ing and up until today, Maurits was closely involved in the project. During the project he defined the brief and the requirements. He had the role of the consultant and project manager, making him a highly experienced and knowledgeable interviewee.
Fig. 5.3.1Rijnstraat 8 (Archdaily, 2017).
Table 5.3.1Rijnstraat 8, Project details
Project details
Location: The Hague, NetherlandsClient: Rijksvastgoedbedrijf, The HagueCentral Government Real Estate Agency of The HagueArchitect: OMAReal estate management: RijksvastgoedbedrijfYear of construction: 2012 - 2017Date of existing building: 1992Development type: Transformation & renovationArea: 90.913 m2
Main functions: Office Secondary functions: Retail (ground floor)Former functions: Ministry for Social Housing, Spatial Planning and Environment (VROM)
5.3 Rijnstraat 8
62 • 5.3 Rijnstraat 8
© Ioannis Mexis, 2020

5.4.3 Findings
• Adaptability strategies & tactics Adaptability was a fundamental concepts in the transfor-mation of Rijnstraat 8. This project was stimulated by the existing building’s inability to respond to the frequency of changes in governmental decisions and ways people work -despite its short lifespan (Nicolaas, 2020-a). There-fore, OMA working closely with the client and the con-tractor (DBFMO contract), they incorporated a number of measures enhancing the building’s adaptive capacity. Compared to new-built developments, as one can under-stand, in redevelopment projects the existing building has a major impact on the flexibility of the final outcome. This section focuses on presenting the adaptability tactics that were implemented in the project, structuring them following the ten strategy types identified in the prelim-inary strategy (the overview of the implemented tactics can be found in the appendix section 10.2)
A. MultifunctionalBased on the interview with the architect, multifunctional-ity was identified as one of the most important strategies for enhancing a building’s adaptive capacity, underlined by relatively low risk. Despite this project being a transfor-mation and not a new-built, it provides all the measures of this strategy type identified in the preliminary strategy. As this strategy type is based on buildings’ long lasting layers (structure and skin), the majority of the “multifunctional” related measures were applied by the building’s original architect, Jan Hoogstad. The floor-to-floor height which commonly poses constraint in redevelopments is 3.3m, enough to accommodate a variety of functions (OMA, n.d.-a). The building has multiple double-height spaces, all of which have the potential and structural capacity to accommodate an extra floor in-between densifying and making the space more efficient. The building is organ-ised on a five-wing configuration following the wide grid span of the existing structure, providing a large column free spaces for the users (Rijksvastgoedrijf, n.d.; Voncken, 2020). The wide depth of the floors allows the accom-modation of different public functions (Archdaily, 2017). Having five independent cores -one per wing- provides the building with the flexibility to house multiple tenants. Finally, the façades are free standing and follow the struc-tural grid allowing them to be replaced if required in the future (Nicolaas, 2020-a).
B. Building characteristics“Building characteristics” was regarded by the architect as a significant strategy type for the development of ad-aptable buildings, underlined by low risk. Transformation projects can pose restrictions to the applicable meas-ures of this strategy type, since it focuses on the build-ing’s long lasting layers (structure and skin). Though this was not the case in Rijnstraat 8, which can be explained considering that it was a leading example of sustainabil-ity when first developed (OMA, n.d.-a). The wing/comb configuration of the building, separated by large atriums that allow enough daylight to the deep parts of the plan, compose geometry-wise a simple rectangular building (Rijksvastgoedrijf, n.d.). Apart from the building’s exterior, creating a generic interior that can easily accommodate different configurations, tenants or functions, was one of the key tactics implemented (Poort Centraal, n.d.; Vonck-en, 2020). The aforementioned tactics were concentrat-ed with the structure of the building which based on the “shearing layer” concept, can last for 30-300 years. On the other hand, buildings’ façades are designed to last for more than 20 years. Being already 20 years old, and considering the high sustainability demands of the client, Rijnstraat’s skin was replaced during its transformation, using free-standing façade panels that follow a 1.8 meter grid. (Nicolaas, 2020-a).
• Structural grid
• Vertical circulation zones 0 2 5 10 20
Fig. 5.3.2Floor plan - 6th floor (adapted from Archdaily, 2017).
• 63 Addressing the mismatch
© Ioannis Mexis, 2020
C. OversupplyAccording to the architect, oversupply is one of the most significant strategy types for allowing large scale chang-es to take place in the building, but at the same time is underlined with high risk due to the large additional in-vestments required. Once again, dealing with an existing building did not restrict the implementation of the over-supply measures identified in the preliminary strategy. The south glazed-section of the building constitutes an extension volume composed of single and double-height spaces, creating a more pleasant and diverse environment (OMA, n.d.-a). The structure of this part of the building has the capacity to support extra floors -if required by the users- to densify the space and become more efficient. Considering the building’s flexibility to house different spatial configurations (office desks or meeting rooms) and functions (office, library etc.), the architects incorporated a 10% overcapacity in the services (MEP) allowing the ease of small and large scale changes in the building, avoiding future renovation on the service layer of the building. On the other hand, considering the need for efficiency there is only a small amount of surplus of space incorporated in the Rijnstraat, restricting the potential for small scale changes in the square meters required by the users (Nico-laas, 2020-a).
D. Buffer zonesBuffer zones constitute a vital strategy type implement-ed in the Rijnstraat for responding to changes in users’ workplace demands. In order to accommodate more than 6,000 employees in the building, the architects designed 3,000 work spots and 6,000 meeting and lounge spac-es (De Wilde, 2018). Throughout the 16-storey building one can find many undefined and communal areas ded-icated for users to interact, and create a pleasant and flexible open-plan environment (Archdaily, 2017). These areas-zones are mainly located in between the working clusters and can be also utilized for different tasks (Ri-jksvastgoedrijf, 2017-a; Voncken, 2020). Apart from the communal spaces offered on each level, the top floor is a communal area where every employee of the building -despite their organisation- can work from. In alignment with the rest of the interviewees, the architect regarded these measures of high risk due to the extra costs they are associated with (Nicolaas, 2020-a).
E. Demountable elements & dry connectionsAiming to allow the ease of disassembly, replacement and extension, demountable elements such as façade panels and interior walls were used (Archdaily, 2017; Voncken, 2020). All of these components, as well as the exposed structure of the building were assembled using dry con-nections providing flexibility for future alternations. Final-ly, raised floors are used on the top-communal floor and a highly adjustable ceiling-system has been applied in all levels, allowing the ease of changes and accommodation of different plan layouts (Nicolaas, 2020-a).
F. Modular & dividableThe building’s rectangular shape and floor plan is organ-ised following the grid of the existing and new sections of the building. The structural grid is also reflected on the building’s skin where prefabricated and standardised steel and curtain-wall panels have been used following a 1.80m grid –a dimension multiple of the structural grid’s. This al-lows them to be easily replaced if required. The services used in the building -apart from the built-in 10% overca-pacity- are also adjustable, providing users the ease for alterations based on their demands, floor layout, number of employees and functions accommodated (Nicolaas, 2020-a).
G. Circulation & zoning Circulation constitutes one of the most significant ad-aptability measures applied in Rijnstraat 8. The building consists of five wings-clusters each with an independent service and circulation core. These five cores allow the building to be divided both horizontally (more functions/ tenants on each floor) and vertically (different functions/ tenants per floor). In addition to the cores, having two main entrances and secondary side entrances allow the building to be responsive in large scale changes by be-ing easily divided in sections -despite its large size- and accommodate multiple tenants and functions (Archdaily, 2017; Giele, 2017). Finally, the open-plan office layout, the wide circulation zones and the new walkways spanning the entire length of the building, improve the circulation and sense of direction in the building, creating a pleas-ant environment for the users (Archdaily, 2017; Nicolaas, 2020-a).
64 • 5.3 Rijnstraat 8
© Ioannis Mexis, 2020
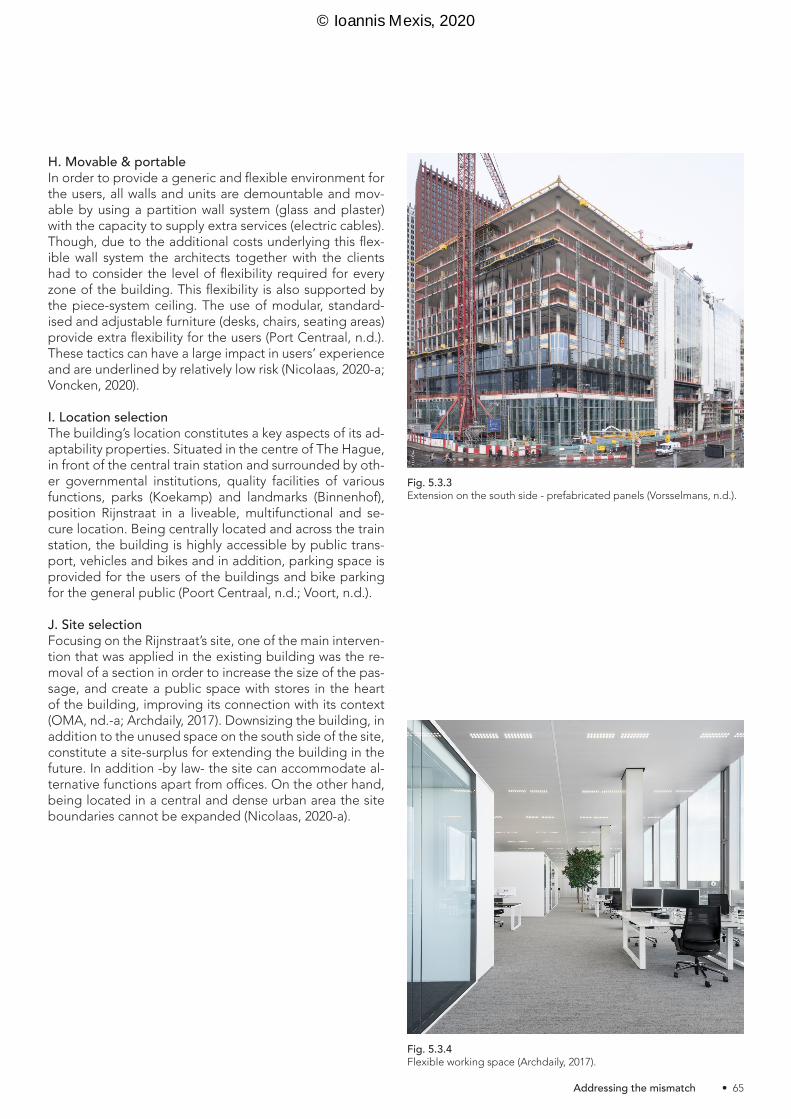
H. Movable & portableIn order to provide a generic and flexible environment for the users, all walls and units are demountable and mov-able by using a partition wall system (glass and plaster) with the capacity to supply extra services (electric cables). Though, due to the additional costs underlying this flex-ible wall system the architects together with the clients had to consider the level of flexibility required for every zone of the building. This flexibility is also supported by the piece-system ceiling. The use of modular, standard-ised and adjustable furniture (desks, chairs, seating areas) provide extra flexibility for the users (Port Centraal, n.d.). These tactics can have a large impact in users’ experience and are underlined by relatively low risk (Nicolaas, 2020-a; Voncken, 2020).
I. Location selectionThe building’s location constitutes a key aspects of its ad-aptability properties. Situated in the centre of The Hague, in front of the central train station and surrounded by oth-er governmental institutions, quality facilities of various functions, parks (Koekamp) and landmarks (Binnenhof), position Rijnstraat in a liveable, multifunctional and se-cure location. Being centrally located and across the train station, the building is highly accessible by public trans-port, vehicles and bikes and in addition, parking space is provided for the users of the buildings and bike parking for the general public (Poort Centraal, n.d.; Voort, n.d.).
J. Site selectionFocusing on the Rijnstraat’s site, one of the main interven-tion that was applied in the existing building was the re-moval of a section in order to increase the size of the pas-sage, and create a public space with stores in the heart of the building, improving its connection with its context (OMA, nd.-a; Archdaily, 2017). Downsizing the building, in addition to the unused space on the south side of the site, constitute a site-surplus for extending the building in the future. In addition -by law- the site can accommodate al-ternative functions apart from offices. On the other hand, being located in a central and dense urban area the site boundaries cannot be expanded (Nicolaas, 2020-a).
Fig. 5.3.3Extension on the south side - prefabricated panels (Vorsselmans, n.d.).
Fig. 5.3.4Flexible working space (Archdaily, 2017).
• 65 Addressing the mismatch
© Ioannis Mexis, 2020

• Adaptability in Rijnstraat 8 Working with existing buildings can pose boundaries to their transformation and their capacity to adapt to future demands. Though, that was not the case in Rijnstraat 8, as the architects managed to implement the majority of ad-aptability measures identified in the preliminary strategy, developing a responsive and future-proof building.
Buildings are constructed to last for many years. On the other hand the tenants and functions they accommodate can change frequently. Every 20-30 years the government redefines its portfolio strategy, following the elections the ministries’ accommodation strategies are altered, and every 5-10 years the way people work changes. Such changes result in frequent renovation projects, which re-quire time and additional investments, stimulating the need for making Rijnstraat a highly adaptable building. In addition, being a governmental building and the first development of the new masterplan, the municipality of Hague wanted Rijnstraat to be an example of sustainabili-ty for future projects (Poort Centraal, n.d.; Nicolaas, 2020-a; Voncken, 2020).
In Jan Hoogstad’s existing design, the long-lasting layers (surrounding, site, structure) were already following some of the most determinant measures of adaptable buildings such as the: floor to floor height, floor depth, wide grid, cores’ positions and the five-wing configuration, provid-ing OMA the foundation for developing a future-proof project. Considering that Rijnstraat was already 25 years old, OMA’s proposal focused on the skin, services, space-plan and stuff layers of the building. The main strategy OMA applied for making Rijnstraat responsive was de-signing a generic layout and environment. This interven-tion, in combination with the five-wing configuration are the two main principles that provide Rijnstraat the capac-ity to accommodate different configuration, tenants and functions such as a university, library or a hotel (Nicolaas, 2020-a; Voncken, 2020).
Governmental organisations usually have long-term inter-ests in projects and make decisions based on a vision and not on profit (Nicolaas, 2020-a; Voncken, 2020). The im-portance of sustainability and efficiency in the new mas-terplan stimulated adaptability as one of the project’s key ambitions, allowing it to respond to small and large scale changes. The alignment of the municipality’s sustainabil-ity vision with the frequency of changes in their portfolio strategies, governing parties and the way people work, resulted in the development of a highly adaptable build-ing.
• Changes applied on project since completionCompared to the other two cases, Rijnstraat is a redevel-opment project of a 25 year old building. Considering Schmidt’s shearing layers, OMA’s proposal focused on the layers whose life expectancy is less than 25 years (skin, services, space plan and stuff). The present design has only been in operation for the past three years. During that time changes have only been applied to the space plan and stuff layers. Such changes consisted of enlarging and adding new rooms, walls –for security reasons- and mainly furniture alternations. The later took place due to the amount of underutilised lounge areas, which were lat-er transformed to communal and working spaces. When changes are requested, the order of potential solution that can be provided are: changing the furniture, relo-cating within the building and changing the floor layout (Nicolaas, 2020-a; Voncken, 2020).
Due to the building’s adaptive capacity, all changes re-quested were easy to apply. One of the main reasons behind them was the absence of sufficient contact from early stages with the users of the space in order to make a building that fits well their requirements, as well as the time people need to adapt to new environments (Nico-laas, 2020-a; Voncken, 2020).
Fig. 5.3.5Atrium & steel structure (Archdaily, 2017).
66 • 5.3 Rijnstraat 8
© Ioannis Mexis, 2020

• Project successRijnstraat was the first project of the government’s new office accommodation masterplan. Therefore the success of the project was of great significance for showcasing the ambitions and setting standards for future develop-ments. Acknowledging the pace that the world is chang-ing, the objectives for this project was the creation of a highly sustainable and adaptable building that can cope well with small and large scale changes. Part of the pro-ject’s success is reflected through the sustainability rating it achieved (Nicolass, 2020-a; OMA, n.d.-a).
The sustainability and future-oriented ambitions for Rijn-straat resulted in the development of a highly adaptable building that can accommodate alternative configura-tions, tenants and functions, without large financial and time investments. Focusing on the building’s adaptive ca-pacity, almost all adaptability measures identified in the preliminary strategy were applied, echoing the buildings competence to respond to future needs. Since OMA’s intervention, only small changes have been applied to the building, all of which have been completed without causing any complications. Although Rijnstraat’s adap-tive capacity has not been utilized yet, due to the success of OMA’s design both interviewees are confident about its potential to respond to drastic changes and that no functional changes will take place in the next 25-30 years (Nicolaas, 2020-a; Voncken, 2020).
Despite the success of the project the interviewees high-lighted areas for improvement. Project development is a lengthy process and considering the pace our world is changing, by completion the users’ demands have already changed. Therefore, involving the users more during the briefing and design phases will diminish such mismatch-es. On the same line, transitioning from a regular office building to an adaptable open-plan space is a big shift for users and therefore requires preparation time. Finally, the architect mentioned that the implementation of tech-nology related measures could have made the building smarter, more efficient and responsive to users’ demands; though for privacy reasons they could not apply them (Nicolaas, 2020-a; Voncken, 2020).
The success of the project is a result of the clients’ inno-vative vision supported by their long-term commitment, stimulating their will to invest on a building that will be highly sustainable and adaptable for the upcoming years. This shows that in the development of adaptable real estate, one cannot have a short-term perspective as the whole project lifecycle is significant for deciding the approach and measures that need to be implemented. Finally, when talking about success in such projects, fa-cility management, technology and communication are aspects that need to be aligned and coordinated with the goals and the design in order to achieve the actor’s objec-tives (Nicolaas, 2020-a; Voncken, 2020).
• Risks of applying adaptable solutionsAdaptability has become a significant concept in the construction field due to the advantages it entails. At the same time, the interviewees identified five risks underly-ing the development of such buildings: financial costs, the developers’ short-term interests, quality, location, and the evolving environment (Nicolaas, 2020-a; Voncken, 2020).
Adaptability is a strategy that needs to be considered from the very beginning of the development process and its application entails additional investments. On the same line, one of the principles for achieving successful results, is actors’ willingness to invest “all the way”, ad-dressing all the requirements for developing future-proof structures. Therefore, the involved stakeholders need to make smart investments implementing effective meas-ures in an efficient manner (Nicolaas, 2020-a).
This constitutes a risk and consequently a discouraging factor, as apart from knowing the present demands, one needs to anticipate the future changes while taking into account any uncertainties that this entails. This is really hard to do considering the pace the environment is evolv-ing. As a result, buildings that are now regarded as ad-aptable, in 10 years’ time might not have the capacity to respond to the new demands. In the case of Rijnstraat, when actors faced similar problems they had to carefully consider their needs, and decide whether it is worth in-vesting -for example- in making all interior walls flexible or only the ones who have high probability of changing. In addition, due to external drivers, organisational demands can change from the briefing phase until the project com-pletion, illustrating the need to involve the users through the process. The uncertainties underlying the future, dis-courage actors from investing in such measures, prompt-ing them to develop buildings considering only the short-term perspective (Nicolaas, 2020-a; Voncken, 2020).
Based on both the interviewees and the literature, an example of actors with short-term perspective are the developers. As developers mainly care about making a profit, and adaptability is still not commonly expressed in financial terms, lifecycle costing and the adaptive capacity of buildings are in conflict with their short-term interests. This can result in the development of projects in wrong lo-cations, or low quality and consequently without any value for the users, eroding their functional lifecycle (Nicolaas, 2020-a; Voncken, 2020).
Taking into account the risks underlying adaptability, one can understand that actors who decide to pursue that direction need to be committed to it, understand their present and future needs, have the will to invest and have a long-term interest in the project.
• 67 Addressing the mismatch
© Ioannis Mexis, 2020
• The future of adaptabilityIn line with the literature as well as the rest of the case studies, Maurits Voncken accentuated the rising signifi-cance of adaptability and flexibility as a response to the uncertainties underlying the future due to the pace that the environment is evolving (Voncken, 2020). The interest in adaptability is gradually increasing especially during the recent years as the number of redevelopment projects is constantly rising, and actors have started to understand the impact that such solutions can have for their business-es (Nicolaas, 2020-a; Voncken, 2020).
Rijnstraat constitutes an example of this shift considering that it was redeveloped with the objective to showcase the significance of sustainable and future-proof real es-tate. Talking about building’s capacity to remain func-tional, a big difference is evident between old and recent developments. Despite their age, buildings such as the canal houses in Amsterdam have managed to remain functional. On the other hand, the Rijnstraat had to be transformed only 25 years after its completion. This is also happening in a number of recently built offices, which be-come vacant due to their poor quality or unattractive lo-cation. Currently, new developments such as parking lots, are constructed with the capacity to house other functions too, considering the decreasing demands for cars. Such ideas were not evident 10-20 years ago, showing the mar-ket’s gradual shift towards adaptability. In addition, Bart mentioned that technology related measures will start becoming more present in adaptable buildings, making them more efficient, responsive and future-proof (Nico-laas, 2020-a; Voncken, 2020).
Starting to understand the added value and financial ben-efits that adaptability entails -such as: better quality, ef-ficiency, lower operation and intervention costs, smaller downturns and sustainability- has stimulated the interest of actors’ with long-term objectives. As a result, adapt-ability measures have also started to be have a positive impact on building’s monetary value. Following the same direction, stakeholders such as investors and developer who mainly have short-term goals are also transitioning towards adaptable solutions, though in a slower pace. Being involved in international projects, Bart noted that this transition is happening faster in wealthier countries, where people tend to build more efficient, sustainable and adaptable projects (Nicolaas, 2020-a; Voncken, 2020).
With that said, acknowledging the pace the world is changing and its short and long-term benefits, has in-creased actors’ awareness and interest in adaptable solu-tions; resulting in future-proof real estate being the an-swer to the uncertain future (Voncken, 2020).
• Added valueAdaptability constitutes one of the primary objectives and concepts adopted in the redevelopment of Rijnstraat. The delivered product was regarded as a success adding both direct and indirect value to its users, owners and the soci-ety. In order to understand the full impact of this project, investigating both the direct and indirect as well as short and long-term impact is key.
Through the redevelopment of Rijnstraat, the municipali-ty’s goal was to set an example of sustainable and efficient buildings, illustrating the ambitions for the government’s new office accommodation masterplan (Poort Centraal, n.d.; Voncken, 2020). Public parties’ goal are more vision oriented -focusing on having societal impact- than prof-it oriented, adding value to both the parties directly in-volved to the project and the society. Being awarded as the most sustainable renovated project of its time in the Netherlands in addition to its efficiency and adaptive ca-pacity, Rijnstraat became an example for future develop-ments, adding value to the municipality’s identity and to the society.
Being a major factor of sustainability and adaptability, quality was another requirement for the project. Quality entails more durable, responsive and healthy environ-ments, adding value to the users’ well-being, satisfaction and productivity (Voncken, 2020). In construction projects, clients and especially users can have a crucial role in the outcome. The building’s generic character wasn’t some-thing that all users were familiar with leading to alterna-tions. This showed that involving the users earlier in the project the building can fit better their demands adding value to them. On the same line, the architect noted that the implementation of technology can make buildings more efficient and responsive, impacting both to the us-ers of the space (well-being) and the owners (cost efficient & identity) (Nicolaas, 2020-a; Voncken, 2020).
Based on the analysis of the added value related tables (Appendix 10.6 & 10.8), both interviewees agreed that “multifunctional”, “building characteristics” and “loca-tion selection” are the strategy types that can have the biggest impact on added value. On the other hand, “oversupply” and “demountable elements & dry connec-tions” were regarded as the strategies with the smallest effect on value delivery.
68 • 5.3 Rijnstraat 8
© Ioannis Mexis, 2020
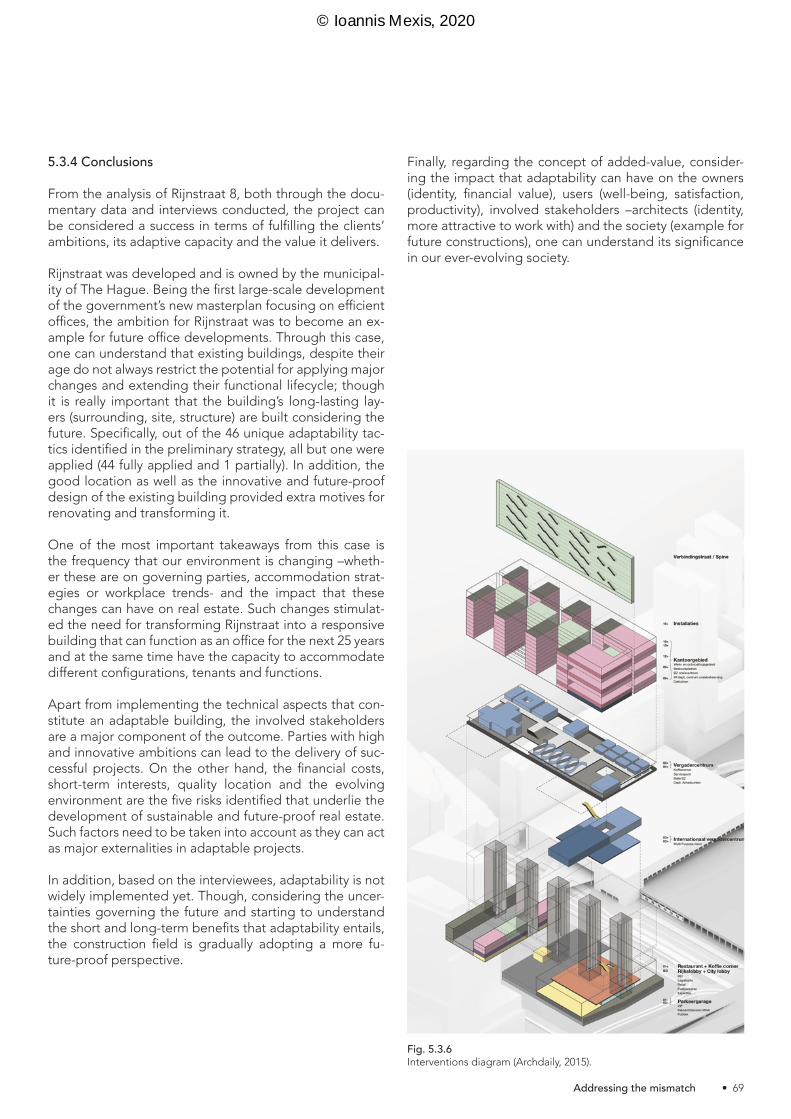
5.3.4 Conclusions
From the analysis of Rijnstraat 8, both through the docu-mentary data and interviews conducted, the project can be considered a success in terms of fulfilling the clients’ ambitions, its adaptive capacity and the value it delivers.
Rijnstraat was developed and is owned by the municipal-ity of The Hague. Being the first large-scale development of the government’s new masterplan focusing on efficient offices, the ambition for Rijnstraat was to become an ex-ample for future office developments. Through this case, one can understand that existing buildings, despite their age do not always restrict the potential for applying major changes and extending their functional lifecycle; though it is really important that the building’s long-lasting lay-ers (surrounding, site, structure) are built considering the future. Specifically, out of the 46 unique adaptability tac-tics identified in the preliminary strategy, all but one were applied (44 fully applied and 1 partially). In addition, the good location as well as the innovative and future-proof design of the existing building provided extra motives for renovating and transforming it.
One of the most important takeaways from this case is the frequency that our environment is changing –wheth-er these are on governing parties, accommodation strat-egies or workplace trends- and the impact that these changes can have on real estate. Such changes stimulat-ed the need for transforming Rijnstraat into a responsive building that can function as an office for the next 25 years and at the same time have the capacity to accommodate different configurations, tenants and functions.
Apart from implementing the technical aspects that con-stitute an adaptable building, the involved stakeholders are a major component of the outcome. Parties with high and innovative ambitions can lead to the delivery of suc-cessful projects. On the other hand, the financial costs, short-term interests, quality location and the evolving environment are the five risks identified that underlie the development of sustainable and future-proof real estate. Such factors need to be taken into account as they can act as major externalities in adaptable projects.
In addition, based on the interviewees, adaptability is not widely implemented yet. Though, considering the uncer-tainties governing the future and starting to understand the short and long-term benefits that adaptability entails, the construction field is gradually adopting a more fu-ture-proof perspective.
Finally, regarding the concept of added-value, consider-ing the impact that adaptability can have on the owners (identity, financial value), users (well-being, satisfaction, productivity), involved stakeholders –architects (identity, more attractive to work with) and the society (example for future constructions), one can understand its significance in our ever-evolving society.
Fig. 5.3.6Interventions diagram (Archdaily, 2015).
• 69 Addressing the mismatch
© Ioannis Mexis, 2020
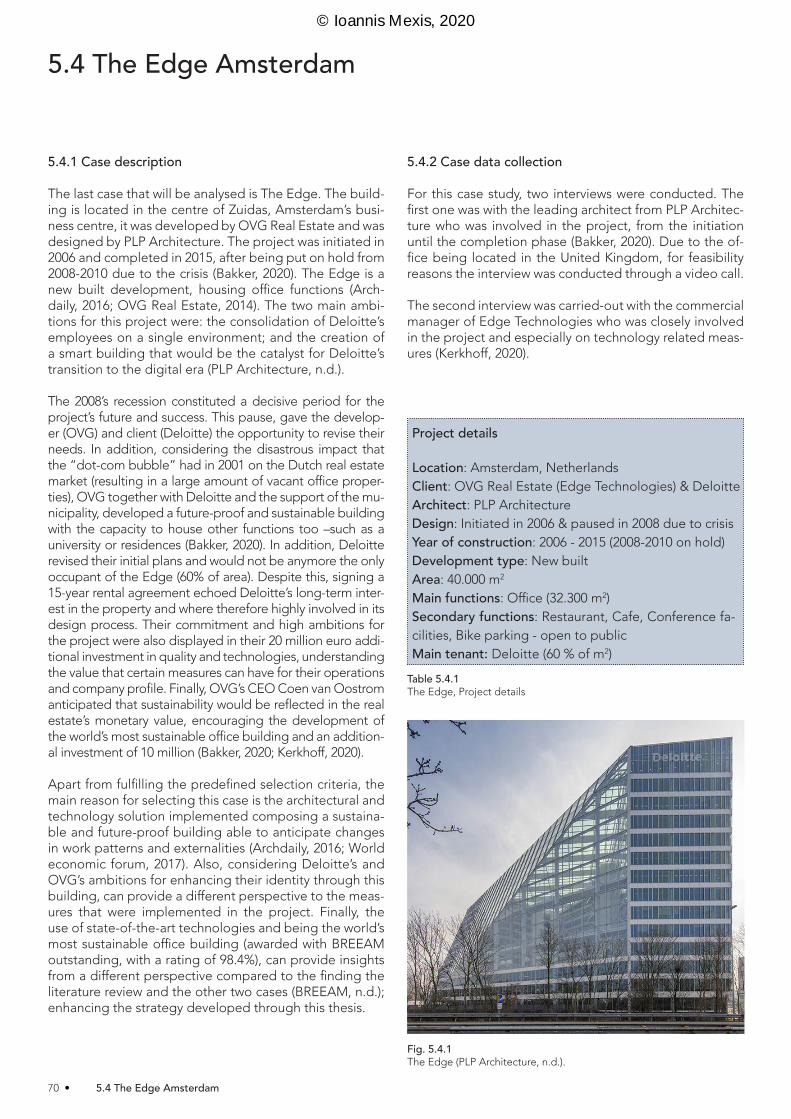
5.4.1 Case description
The last case that will be analysed is The Edge. The build-ing is located in the centre of Zuidas, Amsterdam’s busi-ness centre, it was developed by OVG Real Estate and was designed by PLP Architecture. The project was initiated in 2006 and completed in 2015, after being put on hold from 2008-2010 due to the crisis (Bakker, 2020). The Edge is a new built development, housing office functions (Arch-daily, 2016; OVG Real Estate, 2014). The two main ambi-tions for this project were: the consolidation of Deloitte’s employees on a single environment; and the creation of a smart building that would be the catalyst for Deloitte’s transition to the digital era (PLP Architecture, n.d.).
The 2008’s recession constituted a decisive period for the project’s future and success. This pause, gave the develop-er (OVG) and client (Deloitte) the opportunity to revise their needs. In addition, considering the disastrous impact that the “dot-com bubble” had in 2001 on the Dutch real estate market (resulting in a large amount of vacant office proper-ties), OVG together with Deloitte and the support of the mu-nicipality, developed a future-proof and sustainable building with the capacity to house other functions too –such as a university or residences (Bakker, 2020). In addition, Deloitte revised their initial plans and would not be anymore the only occupant of the Edge (60% of area). Despite this, signing a 15-year rental agreement echoed Deloitte’s long-term inter-est in the property and where therefore highly involved in its design process. Their commitment and high ambitions for the project were also displayed in their 20 million euro addi-tional investment in quality and technologies, understanding the value that certain measures can have for their operations and company profile. Finally, OVG’s CEO Coen van Oostrom anticipated that sustainability would be reflected in the real estate’s monetary value, encouraging the development of the world’s most sustainable office building and an addition-al investment of 10 million (Bakker, 2020; Kerkhoff, 2020).
Apart from fulfilling the predefined selection criteria, the main reason for selecting this case is the architectural and technology solution implemented composing a sustaina-ble and future-proof building able to anticipate changes in work patterns and externalities (Archdaily, 2016; World economic forum, 2017). Also, considering Deloitte’s and OVG’s ambitions for enhancing their identity through this building, can provide a different perspective to the meas-ures that were implemented in the project. Finally, the use of state-of-the-art technologies and being the world’s most sustainable office building (awarded with BREEAM outstanding, with a rating of 98.4%), can provide insights from a different perspective compared to the finding the literature review and the other two cases (BREEAM, n.d.); enhancing the strategy developed through this thesis.
5.4.2 Case data collection
For this case study, two interviews were conducted. The first one was with the leading architect from PLP Architec-ture who was involved in the project, from the initiation until the completion phase (Bakker, 2020). Due to the of-fice being located in the United Kingdom, for feasibility reasons the interview was conducted through a video call.
The second interview was carried-out with the commercial manager of Edge Technologies who was closely involved in the project and especially on technology related meas-ures (Kerkhoff, 2020).
Fig. 5.4.1The Edge (PLP Architecture, n.d.).
Table 5.4.1The Edge, Project details
Project details
Location: Amsterdam, NetherlandsClient: OVG Real Estate (Edge Technologies) & DeloitteArchitect: PLP ArchitectureDesign: Initiated in 2006 & paused in 2008 due to crisisYear of construction: 2006 - 2015 (2008-2010 on hold)Development type: New builtArea: 40.000 m2
Main functions: Office (32.300 m2)Secondary functions: Restaurant, Cafe, Conference fa-cilities, Bike parking - open to publicMain tenant: Deloitte (60 % of m2)
5.4 The Edge Amsterdam
70 • 5.4 The Edge Amsterdam
© Ioannis Mexis, 2020

5.4.3 Findings
• Adaptability strategies & tacticsAdaptability constitutes a major principle for the Edge. The architects in collaboration with the developer and client, have applied a series tactics in order to enhance the building’s adaptive capacity addressing all layers of the building. This section focuses on presenting the tac-tics that were implemented in the project, structuring them following the adaptability strategy types identified in the preliminary strategy. Compared to the former cas-es and literature review, technology is a decisive factor of the Edge’s adaptive capacity. Therefore, “Technology” is introduced as the eleventh strategy type of the strate-gy developed. Ron Bakker, refers to technology as a new building layer which enhances the Edge’s adaptability, ef-ficiency and sustainability (Tilman, 2015) (the overview of the implemented tactics can be found in the appendix section 10.2).
A. MultifunctionalMultifunctionality was considered by the architect, as one of the most important strategy types for developing adaptable buildings. Designing enough space between floors (3.6m) and large floor depth supported by a wide structural grid (>10m), provides the users of The Edge a large column-free space that can accommodate different functions and spatial configurations (Bakker, 2020). The position of circulation zones and cores was highlighted by the interviewee as one of the most significant tactics for creating a future-proof building. Therefore, the circulation and cores of the building were strategically positioned to allow the accommodation of multiple tenants and func-tions. Considering the potential of an increased demand for space, the building has the capacity to be vertically expanded; a significant adaptability factor though under-lined by the risk of never been utilized despite the extra investment. Finally in comparison to the literature where the “vertical & horizontal reduction” is presented as an adaptability measure, the interviewee disagreed about its significance explaining that it’s hard and rare buildings to be reduced in size (Bakker, 2020).
B. Building characteristicsRegarding the “Building characteristics” strategy type the interviewee (architect) elaborated on the “building gen-erality” and “geometry” tactics stating that the form and dimensions of the building are very important for its ad-aptability and highlighted the risks that an iconic-shaped building can pose (Rendall, 2015; Bakker, 2020). The Edge was shaped and oriented based on the sun, resulting in a U-shaped arrangement around a 15-story atrium to allow enough daylight in all spaces, enhancing its potential to house different functions and configurations (PLP Archi-tecture, n.d.). On the other hand, the building’s sloped roof can pose restrictions in the building’s adaptability ca-pacity. The Edge’s façades consist of prefabricated glazed (North) and concrete panels (South-East- West) allowing them to be replaced. Though the load-bearing concrete façades, make their alternation process tougher (Archdai-ly, 2016; Bakker, 2020).
C. OversupplySimilarly to the former cases, the majority of the “over-supply” adaptability tactics were not implemented. Al-though the interviewee characterised them all as very significant for adaptability, they also require higher in-vestments increasing the risk for the owners’ and users’ returns. In addition, despite their importance, providing a surplus of space and services would result into losing BREEAM points, discouraging the implementation of these measures. This can be interpreted as contradicto-ry to BREEAM’s sustainability principles. In addition, the available floor to floor height, increased load capacity and building’s extension competence, allow the building to undergo large scale changes (Bakker, 2020).
• Structural grid
• Vertical circulation zones 5 5 100
Fig. 5.4.2Floor plan - 6th floor (adapted from Tilman, 2015).
• 71 Addressing the mismatch
© Ioannis Mexis, 2020

D. Buffer zonesAs in the former cases, considering their significance for small-scale interventions due to users’ changing de-mands, “buffer zone” related tactics were implemented in The Edge too. Although surplus of space was not in-corporated in the building –due to high costs and loss of BREEAM points- 25% of the building’s area is dedicated to undefined and communal spaces, such as coffee cor-ners, sitting area, exhibition spaces and most important-ly the 15-storey atrium which functions as the building’s heart where everyone meets (Garofalo, n.d.; Tilman, 2015; Bakker, 2020). Based on the interview with the architect, providing undefined areas and surplus of space are rela-tively risky measures as they require extra investments but at the same time are very significant for both the build-ing’s flexibility and user’s well-being (Bakker, 2020).
E. Demountable elements & dry connectionsThe use of demountable structural component, façade panels and dry connection allow the building’s form and skin to be altered, providing Edge the capacity to adapt to large scale changes such as expanding the size of the building or changing the façades depending the func-tion housed in the building and the panel’s technical li-fecycle (20 years) (Bakker, 2020). In the building’s interior, demountable walls and ceiling are used allowing regu-lar changes in the floors’ layout (Tilman, 2015; Archello, n.d.-c). Such tactics are very significant and at the same time are of low risk as they do not require large invest-ments, constituting critical factors of the building’s short and long-term responsiveness (Bakker, 2020).
F. Modular & dividableThe Edge is organised following the prefabricated con-crete grid structure, supplying a flexible floor space for its users (Jalia, Bakker & Ramage; 2014). The façades con-sist of modular and prefabricated, glazed and concrete panels (south-east-west) and a prefabricated curtain wall (north & roof), whose dimensions are multiples of the structural grid’s making them easier to change and adapt to new needs (Archello, n.d.-c). The ease of assembling the façades was evident considering that only three work-ers were required during their construction, showing the impact this measure can have in reducing the construc-tion time and therefore the costs. In addition, using ad-justable and modular services assists in readjusting them if the user’s requirements change (Bakker, 2020).
G. Circulation & zoning Circulation was considered by the architect as one of the most significant and less risky aspects to incorporate in adaptable buildings; as similarly to the structural and ser-vice capacity, circulation can be a catalyst of the amount of people and type of functions that can be housed in a building. That being said, Edge has two main circula-tion cores and there is potential to add more lifts in the atrium that would use the existing lift lobbies, increasing the number of people the building can accommodate (Bakker, 2020). Another major adaptability tactic, is incor-porating multiple entrances. Apart from the building’s main entrance, there is the potential to add one more on the south-east corner of the building. In this part of Edge, the first floor has a built-in “soft-spot” which can be removed to create a double height entrance space. The two entrances in addition to the position and capacity of lifts, allow the U-shaped floor plates to be divided into two large autonomous sections (Bakker, 2020). Finally, the wide circulation zones around the atrium and the open-plan configuration, allow the building to respond to small scale changes (De Architect, 2015; Mapiq, n.d.).
H. Movable & portableAiming to provide a highly responsive environment -apart from the façades and cores- all other walls in The Edge such as partition and glazed walls, as well as units are de-mountable and movable (Archello, n.d.-c; Tilman, 2015). Such tactics in addition to the use of standardised walls and furniture, enhance the building’s capacity to respond to large but especially frequent small-scale changes and do not require high investments making them of low risk (Bakker, 2020).
I. Location selectionIn alignment with the former cases, the architect noted the significance and low risk underlying the “location se-lection” for creating adaptable real estate. The Edge is located in the centre of Amsterdam’s business district, an area currently occupied mainly by offices. Despite the ar-ea’s present state not being attractive to other functions, ones the city’s new masterplan is implemented it will be transformed into a multi-functional location. The main fo-cus of the masterplan is on culture, residential buildings, additional amenities and services, and good quality public spaces, enhancing the liveability, attractiveness and even-tually functional adaptability of the area (Bakker, 2020). In addition, the building is highly accessible by both public transport -which will be further enhanced connecting the area with London- and by car. The building also provides two underground levels of parking space, which –accord-ing to the architect- despite their significance for the pres-ent, they are rather risky measures as they require high investments, car-use is gradually decreasing and such spaces cannot accommodate other functions (Metz, 2016; Build Up, 2012; Bakker, 2020).
72 • 5.4 The Edge Amsterdam
© Ioannis Mexis, 2020
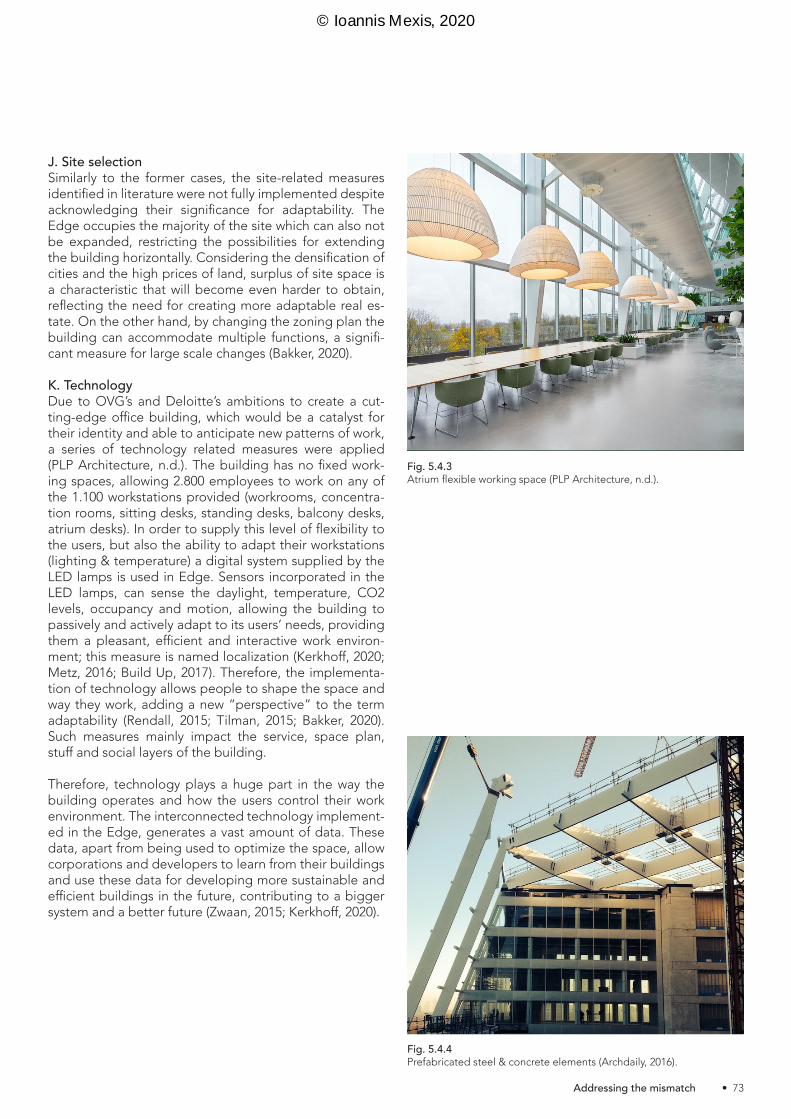
J. Site selectionSimilarly to the former cases, the site-related measures identified in literature were not fully implemented despite acknowledging their significance for adaptability. The Edge occupies the majority of the site which can also not be expanded, restricting the possibilities for extending the building horizontally. Considering the densification of cities and the high prices of land, surplus of site space is a characteristic that will become even harder to obtain, reflecting the need for creating more adaptable real es-tate. On the other hand, by changing the zoning plan the building can accommodate multiple functions, a signifi-cant measure for large scale changes (Bakker, 2020).
K. TechnologyDue to OVG’s and Deloitte’s ambitions to create a cut-ting-edge office building, which would be a catalyst for their identity and able to anticipate new patterns of work, a series of technology related measures were applied (PLP Architecture, n.d.). The building has no fixed work-ing spaces, allowing 2.800 employees to work on any of the 1.100 workstations provided (workrooms, concentra-tion rooms, sitting desks, standing desks, balcony desks, atrium desks). In order to supply this level of flexibility to the users, but also the ability to adapt their workstations (lighting & temperature) a digital system supplied by the LED lamps is used in Edge. Sensors incorporated in the LED lamps, can sense the daylight, temperature, CO2 levels, occupancy and motion, allowing the building to passively and actively adapt to its users’ needs, providing them a pleasant, efficient and interactive work environ-ment; this measure is named localization (Kerkhoff, 2020; Metz, 2016; Build Up, 2017). Therefore, the implementa-tion of technology allows people to shape the space and way they work, adding a new “perspective” to the term adaptability (Rendall, 2015; Tilman, 2015; Bakker, 2020). Such measures mainly impact the service, space plan, stuff and social layers of the building.
Therefore, technology plays a huge part in the way the building operates and how the users control their work environment. The interconnected technology implement-ed in the Edge, generates a vast amount of data. These data, apart from being used to optimize the space, allow corporations and developers to learn from their buildings and use these data for developing more sustainable and efficient buildings in the future, contributing to a bigger system and a better future (Zwaan, 2015; Kerkhoff, 2020).
Fig. 5.4.4Prefabricated steel & concrete elements (Archdaily, 2016).
Fig. 5.4.3Atrium flexible working space (PLP Architecture, n.d.).
• 73 Addressing the mismatch
© Ioannis Mexis, 2020
• Adaptability in the EdgeConsidering the number of adaptability measures that are implemented in the Edge, one can understand the build-ing’s inherent capacity to withstand changes and last in time. Though, the majority of adaptability related tactics that were implemented, were only considered after 2008’s financial crisis, when the project was restarted.
The crisis gave rise to a large amount of vacant office buildings, which required change of use in order to fit the new requirements and not become obsolete. Aiming to create a building that can withstand such scenarios, the project team started looking at various aspects that could make the building more future-proof. Due to the large in-vestments required for the Edge, it was designed with the potential to be phased in order to be able to finance it. In addition, the municipality of Amsterdam was also en-gaged in the project and had a significant role promoting the perspective of future changeability and trying to as-sist the project team in identifying alternative functions for the Edge. Eventually, the Edge was designed having the capacity to accommodate residential and university functions, if required in the future (Bakker, 2020; Bakker, 2014; Kerkhoff, 2020).
Sustainability was one of the project’s key ambitions, re-flecting the need for a flexible building that has the ca-pacity to respond to small and large scale changes. Con-sidering that our world is rapidly changing and that in 50 years-time the demands for office buildings might be totally different, the structure and massing of the build-ing are suitable to house other functions too, whereas all other building layers have the capacity to be replaced (Bakker, 2020).
• Changes applied on project since completionA building’s adaptive capacity can be thoroughly evalu-ated after major changes occur in the users’ or societal demands. Up to now, considering that the Edge has been only in use for five years there was still no need to apply any large scale alterations in the building. Since its com-pletion, only changes in the building’s “stuff” and “space plan” layers have been made, in order to adjust the space to the user’s daily activities. Such interventions were easily applied without distracting the users’ operations (Bakker, 2020).
• Project successIn the economy, a recession is underlined by negative ef-fects. Despite this, in the case of Edge, 2008’s crisis can be regarded as one of the main reasons behind the pro-ject’s success. OVG being a young –at the time- compa-ny had very high ambitions for the Edge, and together with Deloitte shared the goal of enhancing their identity through the development of this project, understanding the commercial advantages that such direction can have for their businesses (Kerkhoff, 2020; Jalia et al., 2014). The two-year pause caused by the crisis, allowed the clients to revise and set even higher sustainability and quali-ty goals for the project, resulting in the Edge becoming highly adaptable and the world’s most sustainable office building (Bakker, 2015; OVG, 2014; Bakker, 2020). As part of the revised project plans, technology related measures were implemented aiming to increase the building’s re-sponsiveness. Despite the capabilities this system offers adding a new dimension-layer on the building’s adaptive capacity, it was noted that users require time to take full advantage of the potential of this innovative system (Kerk-hoff, 2020).
Regarding the building’s adaptive capacity, almost all re-lated measures that were identified in the literature review were also implemented in the Edge, reflecting the build-ing’s capacity to cope with small and large scale changes in the societal and user demands. Until this point, apart from changes in the building’s interior (stuff, space plan) no other alterations have been applied. Therefore, al-though the Edge’s potential to respond to changes has not been tested yet, the interviewees expressed their confidence in the building’s adaptive capacity (Bakker, 2020; Kerkhoff, 2020).
74 • 5.4 The Edge Amsterdam
© Ioannis Mexis, 2020
• Risks underlying adaptabilityDespite the project’s success in terms of its adaptability capacity, two risks were identified by the interviewees in the development of such buildings: financial costs, quality and location selection. Aligned with the findings of the literature review, adaptability measures entail higher in-vestments, rendering financial costs as the main risk of applying such measures.
The application of adaptability related measures entails high investments and should therefore always be justified. In addition, considering that the investments are recov-ered in the long-term is contradictory to the short-term financial objectives that certain corporations, developers and investors might have. On the other hand, the Edge showcases a turning point in the way actors invest on ad-aptability, sustainability and technology of their real es-tate. OVG and Deloitte, identified the benefits that such measures can have for their operations, portfolio and identity, prevail the risks, leading to additional invest-ments on the project. Deloitte had calculated that their investments can be recovered within a 10-year period, while they can also be justified considering their 15-year lease which displays their long-term interest in the project (OVG Real Estate, 2014; Bakker, 2015). In 2014, before the building was completed, OVG sold it to a German inves-tor fund who paid higher value for the building as they wanted to invest in sustainable real estate; this was the first case in the Netherlands where financial value was at-tached to sustainability (Bakker, 2020).
Quality is the second risk identified in this case, and is highly related to the first risk. The commercial manager of Edge addressed the importance of using high quality materials considering that the building will need to last a long time and be able to change whenever it is required. In aligned with this, the architect explained that users are more keen to like and consequently look after qual-ity buildings, prolonging their lifecycle (Bakker & Zwaan, 2015). Therefore, utilizing materials with shorter expectan-cy life –for financial purposes- can risk a building’s adap-tive capacity (Kerkhoff, 2020).
Finally, both participants mentioned that location selec-tion is key for the development of adaptable building, es-pecially in order to make them attractive for future users (Kerkhoff, 2020). In support of this argument, the architect referred to the “dot-com bubble” saying that the wrong location selection and low building quality construction were two of the main reasons resulting in many vacant buildings (Bakker, 2020).
• The future of adaptabilityIn correspondence to the finding from the literature, Ron Bakker highlighted the increase in the significance of ad-aptability in the built environment due to the pace that our world is changing - such as the density of the cities and the way people work (Bakker, 2020). During the last decade, corporations’, developers’ and investors’ interest has shifted towards sustainable real estate. This is illustrat-ed in the Edge by the clients’ and developers’ willingness to invest more on sustainability and adaptability, and the confirmation of Coen van Oostrom’s prediction that sus-tainability measures would be reflected in the real estate’s financial value (Bakker, 2015; Bakker, 2020; Kerkhoff, 2020).
In the Edge adaptability entails also a series of technol-ogy related measures, providing the building the capac-ity to respond to the users’ daily demands and create a healthy and productive environment. One of the biggest advantages that technology tactics can offer are the data generated through the sensors. These data can be used to make the Edge and future developments more respon-sive and adaptable to users, adding a new dimension to the concept of adaptability (Kerkhoff, 2020; Bakker, 2014; Zwaan, 2015).
One of the most important finding from this case was the architect’s comment on BREEAM. BREEAM is used in the built environment as a sustainability assessment method. On the other hand, no points are awarded to buildings for their adaptive capacity and points can be deducted for providing a surplus of space or services, although these are considered as some of the most significant meas-ures for creating buildings that can respond to changes (Bakker, 2020).
That being said, considering the fast pace that our en-vironment evolves, adaptability is gradually becoming a more important requirement of new developments, add-ing value to both corporations and their users (Bakker, 2020; Kerkhoff, 2020).
• 75 Addressing the mismatch
© Ioannis Mexis, 2020

• Added valueAdaptability is one of the primary concepts implemented in the Edge and a significant factors of its success. Though in order to fully understand the impact that adaptability has for the involved parties, one needs to take into ac-count both the direct and indirect as well as short and long-term consequences. In the development of The Edge, OVG’s and Deloitte’s who were both devoted to innovation, and set new stand-ards for office design in multiple areas, including sustain-ability, adaptability, workplace design, technology and engineering (Archdaily, 2016). Both of these parties had high ambitions for the project, understanding the value this building can have for their companies’ identity. OVG, was a young –at the time- firm who believed in the rising importance of sustainability and wanted to distinguish themselves in the competitive market. For Deloitte, the Edge would be a catalyst for the company’s growth, evo-lution and profile, resulting in them increasing their finan-cial contributions and becoming a decisive factors of the project’s success.
As interpreted by Deloitte and OVG, sustainability is not just about receiving a great rating. Creating a sustainable work environment, by providing a healthy, efficient, com-fortable and responsive space, constitutes a critical factor of the users’ well-being, satisfaction and consequently productivity (BREAAM, n.d.; Archdaily, 2016; Kerkhoff, 2020). Furthermore, a healthy and innovative environment can be a major factor for attracting talent. For Deloitte, that was of great value, compared to the additional in-vestments that such measures require (Bakker & Zwaan, 2015). Involving the users in order to make them feel more engaged with the project, was really important in order to achieve this goal (Bakker, 2020).
The Edge is a project that impacted not only the direct-ly involved stakeholders and users of the building, but the city of Amsterdam and the wider construction field as well. Following the recession which resulted in the in-creased number of vacant building, the municipality of Amsterdam showed interest in the project, supporting the future changeability perspective and investigating po-tential functions that the building could house in the fu-ture (Bakker, 2020). This stimulated the creation of a highly adaptable building adding value to the society. Focusing on the building’s value for the construction field, the tech-nology related measured implemented in the project pro-duced data that could be analysed and provide valuable information for future developments (Kerkhoff, 2020).
As it was identified in both the literature and the inter-viewees, costs can be a major boundary for investing in sustainability and adaptability measures. On the other hand, this case proved that being ambitious and inno-vative, can overcome those risks and have a big impact on the result, delivering direct and indirect value to both the involved parties and the society as well. OVG’s and Deloitte’s investments resulted in the development of a highly sustainable and future-proof building for the up-coming hundred, fulfilling their ambitions for the project.
Based on the analysis of the tables focussing on the added value (Appendix 10.6 & 10.8), both interviewees regarded “location selection”, “multifunctional” and “movable & portable” as the strategies that can add most value to the users and owners of a building. In addition, “technology” which is a new strategy type introduced in the preliminary strategy, was also regarded as a highly valuable one. On the other hand, “oversupply”, “movable & dividable” and “demountable elements & dry connections” were the strategies regarded to have the smallest impact on value delivery (Bakker, 2020; Kerkhoff, 2020).
Fig. 5.4.5Flexible working spaces (PLP Architecture, n.d.).
76 • 5.4 The Edge Amsterdam
© Ioannis Mexis, 2020

5.4.4 Conclusions
Based on the analysis of The Edge -through the documen-tary data and the interviews- the projects is considered a success with regard to the adaptive capacity and the value it delivers to the involved actors and the society.
The Edge was developed by OVG and Deloitte, two very ambitious parties, whose aim was to strengthen their iden-tity in the market, transition into the digital era, and set new standards for office developments in terms of sustain-ability, adaptability, workplace design and technology. The project was developed during the 2008’s crisis. Considering the effects of the crisis on the real estate market, additional objectives were incorporated in the design of The Edge, aiming to develop a building that can respond to small and large scale changes, such as furniture alternations or change of functions and tenants housed. In order to do so, from the 46 unique adaptability measures identified in the preliminary strategy, 38 were fully implemented and 2 were partially. In addition, OVG and Deloitte being ambitious firms, resulted in the introduction of a number of technol-ogy related measures, making the building highly respon-sive to users’ daily activities and efficiency of the building.
In the development of The Edge the crisis was a major fac-tors of the project’s outcome. Considering the rapid pace that the environment is changing and the uncertainties that this entails, the long-lasting layers of the building were de-signed to accommodate other functions while the rest of the layers can be easily replaces, providing Edge the ca-pacity to last for more than 50 years. Therefore, one can expect that adaptability will gradually become a necessary requirement in the built environment, followed up by tech-nology related measures.
On the other hand, due to risks it entails adaptability is still not widely implemented in the construction field. Accord-ing to the interviewees these risks are financial costs, quali-ty and location selection. Though the success of The Edge reflects that ambitious and innovative actors along with the benefits underlying adaptable solutions, can prevail such risks.
In addition, a strong motive for developing future-proof buildings can be the acknowledgment of the direct and indirect values they can deliver. Based on this case, ad-aptability can add value to the owner-developer (identity), users (identity, satisfaction, well-being, productivity, attract talent), society (example for future developments, provide data input for other projects), reflecting its significance in the uncertain environment we live in.
Fig. 5.4.6The atrium (PLP Architecture, n.d.).
• 77 Addressing the mismatch
© Ioannis Mexis, 2020

© Ioannis Mexis, 2020

6.0 Synthesis: Findings & Final strategy
© Ioannis Mexis, 2020

Following the analysis of the three individual cases, this chapter will focus on the cross-case analysis and the de-velopment of the final strategy. The analysis will be divid-ed in two sections depending on the subject of study. The first part will be based on the analysis of the tables used in the interviews, while the second part will concentrate on the findings from the interview questions. Finally, the findings from both parts of the interviews will assist in the development of the final strategy and the implementation plan.
6.1 Table findings
6.1.1. Application (Appendix 10.2)Aiming to investigate the applicability and relevance of the tactics identified in the preliminary strategy, the first part of this study was to investigate which of these were actually implemented in real projects, and if not, why?
From the 10 strategy types identified, “F. Modular & di-vidable”, “H. Movable & portable” and “I. Location se-lection” were fully implemented in all cases. On the other hand, “Expandable location” (J. Site selection) was the only measure not implemented, which can be explained considering that all cases are located in dense areas. As discussed before, in the Edge an eleventh adaptability strategy type was introduced: “K. Technology”. Although not applied in the other cases, the architect of “Rijnstraat 8” acknowledged the benefits that technology can bring in the optimization and efficiency of buildings’ operations as well as the construction field in general.
Comparing the application of adaptability measures in the three cases, in “Rijnstraat 8” were applied most of the tactics identified in the preliminary strategy, despite it be-ing a transformation project. Regardless of the number of measures implemented, all interviewees regarded the projects as a success in terms of their adaptive capacity.
Considering that all –but one- measures of the preliminary strategy were implemented in the three cases and that apart from the “Technology” strategy, no other measures were identified in any of the cases that were not taken into account, reflects the comprehensiveness of the strategy developed.
6.1.2 Significance (Appendix 10.3 & 10.5)Valuing the significance of the tactics identified for the de-velopment of adaptable real estate was important in or-der to provide the strategy implementers a criterion they can use to assess and prioritise the measures they want to incorporate in their buildings. Therefore, all interviewees were asked to assess the significance of these tactics.
All interviewees graded the tactics with a minimum of 3 showing that they are all important for the development of adaptable buildings. Based on the average gradings of the tactics and strategy types, it was concluded that “I. Location selection” is regarded as the most significant strategy amongst all interviewees (lowest standard devi-ation), confirming the findings from the literature review. The significance of this strategy type is also reflected in it being fully implemented in all cases.
Following the location selection, strategy types that fo-cus on the interior (G. Circulation & zoning, H. Movable & portable) as well as the buildings’ long lasting layers (B. Building characteristics, A. Multifunctional), were re-garded as highly significant due to the capacity they pro-vide to buildings to respond from small and frequent, to large scale changes. In addition, focusing on the tactics, the ones with the highest gradings (>4.8) mainly focus on buildings’ location and components that impact large scale changes (floor to floor height, position of circulation zones, multifunctional location, distance to city centre, proximity, access by public transport).
Comparing the ratings based on the interviewees’ profes-sions, no major differences were noted. Though, in gen-eral architects’ gradings were slightly higher, which can be explained due to their expertise and knowledge over the subject.
6.1 Findings - Tables
80 • 6.1 Findings - Tables
© Ioannis Mexis, 2020
6.1.3 Risk (Appendix 10.3 & 10.5)As it was discussed in the literature review, costs were one of the main boundaries for the implementation of adaptable solutions. Therefore, as part of the interviews, the participants were asked to grade the risk of the tactics identified based on the cost over the possibility of taking advantage of each tactic’s inherent adaptive capacity.
Based on this study, the strategy types that were grade with the highest risk are: “C. Oversupply” and “D. Buff-er zones”, which can be explained due to the high costs required for the supply of additional components and properties such as: services, square meters, and structural capacity. The risk associated with these two strategies is also reflected by them being the least implemented tac-tics in all three cases. “Technology” –although rated by only two interviewees- was regarded as the riskiest strat-egy due to the high costs it entails, the time it needs for users to start utilizing them and implementers to un-derstand their full capacity for making buildings more re-sponsive.
On the other hand, strategies that have minimal impact on the costs or focus on frequent changes, such as “I. Lo-cation selection”, “E. Demountable elements & dry con-nections” and “H. Movable & portable”, were regarded as the least risky ones.
On the contrary to the significance related ratings, real estate managers’ gradings were slightly higher from the architects’, which can be explained as they are the ones that are mostly concerned and rigorous when it comes to financial related aspects.
6.1.4 Ranking (Appendix 10.3, 10.4 & 10.5)In order to compare the ratings of the eleven strategy types, a table taking into account the significance, risk, impact and risk assessment (significance over the risk) and ranking of the significance of the strategies, was created.
The only strategy type that received the highest ranking in all ratings was “I. Location selection”, reflecting once again the importance of this parameter. Following this strategy, “H. Movable & portable”, “A. Multifunction-al” and “B. Building characteristics” were given the next highest rankings, rendering the importance of buildings’ capacity to remain responsive to changing demands.
On the other hand, the high risks underlying “D. Buffer zones”, “C. Oversupply”, “F. Modular & dividable” and “Technology”, resulted in them being the least favoured strategies in the total ranking. Though, such strategies should never be disregarded as it was proven that they are all highly significant for a building’s adaptive capacity and depending on the demands of each client they might be of higher value.
6.1.5 Added value (Appendix 10.6, 10.7, 10.8 & 10.9)The last part of the interview table analysis focused on the value delivered by the adaptability tactics, aiming to evaluate the links between the two concepts identified in the preliminary strategy. The main part of this analysis was based on the interviews with the demand side, while the architects’ input was used as a form of clarification in case of large discrepancies between the interview findings and the preliminary strategy.
From the tables on section 10.6, one can see that the ma-jority of links identified in the preliminary strategy were also confirmed by the interviewees. From the predefined links, only 7 were not confirmed, while 31 additional links were identified by the interviewees. Table 10.7 presents the summary of the findings from this analysis.
The 7 links that were not identified and confirmed were disregarded from the final strategy as this indicates that the value added by these tactics was either too indirect or had small to no-impact at all. On the other hand, the 31 “new links” were cross-analysed with the architects’ an-swers and the findings of the literature. Based on these three sources, the majority of these links were taken into account in the development of the final strategy. Table 10.9 illustrates the changes the preliminary strategy high-lighting the source of each change.
From the results of this analysis, one of the most surpris-ing and at the same time promising findings was the ac-tors’ ability to identify how adaptability tactics can add value to corporations and users of the space- when pro-vided with a tools that helps them in this process. On the other hand, considering the literature references stat-ing the opposite and that not all answers were shared by the interviewees, indicates that the creation of this thesis’ strategy can be of great value assisting multiple profes-sionals in the development of adaptable real estate and understanding the value they deliver.
• 81 Addressing the mismatch
© Ioannis Mexis, 2020
6.2 Interview questions findings
The second part of the interviews, focused on questions aiming to gain insights on the topic of adaptability. This section presents a number of main and secondary find-ings from the interviewees categorized based on different themes they address.
• Main findings:
6.2.1 Identity“If you imagine what it means to Deloitte to attract talent into their building, that is not even part of the equation,
that it 2-3-4 times as expensive and as valuable for a company like Deloitte than is the running costs of the
building.” (Bakker, 2020)
One of the main takeaways from all three cases is that the value that adaptability has for an organisation’s identity can be a significant driver for such developments. In all three cases, whether the client was a public (Municipal-ity of Rotterdam & The Hague) or a private party (OVG & Deloitte), having high ambitions contributed to the project’s success. For public parties, the development of adaptable buildings aimed to illustrate the benefits and stimulate the market’s shift towards such developments (Wilaard, 2020; Voncken, 2020; Nicolaas, 2020-a). On the other hand, for private parties (corporations, developers & architects) important drivers for implementing adapt-ability were: strengthening their identity, adding commer-cial value and attracting talent (Bakker, 2020; Kerkhoff, 2020). Therefore, one can understand that the value delivered to actors from showcasing innovative and fu-ture-proof ideas in their real estate can be a significant driver for them to proceed towards such solution, and overcome the risks that adaptability entails.
• Type of information: Confirming the literature & New information
6.2.2 Developers & investments“But if you do that, it only makes sense if you do that over a sort of “all the way” …. But then try to invest as much as possible in a smart way, in making this an office building
for the next twenty five years.” (Nicolaas, 2020-a)
Based on the cases investigated, municipalities and in general public parties mainly focus on a vision where-as developers on costs and profit, constituting a major boundary for the development of a sustainable and ad-aptable environment (Simon, 2020; Nicolaas, 2020-a). De-velopers’ short-term objectives and their goal to reduce costs, contradict the long-term perspective of adaptabil-ity, resulting in a large number of low quality and wrong-ly located buildings that have no value for the users and consequently require large renovations in order to remain functional, even within a small timeframe from their com-pletion (Nicolaas, 2020-a; Voncken, 2020).
On the other hand, when creating adaptable projects ac-tors need to be committed to their decision and invest efficiently and in smart way without trying to cut down costs (Nicolaas, 2020-a). Example of such perspective and contradicting the norm of “developers’ short-term interests”, is the Edge. OVG and Deloitte decided to in-crease their investments in order to make the building fu-ture-proof, acknowledging the direct (e.g. responsive to users’ daily operations and demands) and indirect (e.g. reputation, image, increase productivity, efficiency) bene-fits that this would have for their companies (Bakker, 2020; Kerkhoff, 2020).
Therefore, one can understand that ambitious develop-ers and clients –whether these are private or public par-ties- that are committed to the project, can have a big impact on the project success and the creation of quality buildings that people will love and care about allowing the building to last longer in time (Nicolaas, 2020-a; Von-cken, 2020; Bakker, 2020; Kerkhoff, 2020).
• Type of information: Confirming the literature & New information
6.2 Findings - Interview questions
82 • 6.2 Findings - Interview questions
© Ioannis Mexis, 2020

6.2.3 The future of adaptability “There can be small to big changes, and therefore adapt-ability and flexibility are becoming much more important. The time we built for just one moment is over. Everything is changing faster and faster, and so I think that adaptabil-
ity is part of the answer to this.” (Voncken, 2020).
The rising importance of adaptability was a shared conclusion amongst all seven interviewees. This shift is stimulated by the pace the world in changing and the emergence of new patterns of work altering the current workplace demands (e.g. the evolving nature of banks) and leading to a constant mismatch between supply and demand (Wielaard, 2020; Archdaily, 2016; Bakker, 2020). Therefore, designing for adaptability is a concept that has attracted attention during the last two decades and has still a lot of room for experimentation and growth. On the same line, technology is regarded as a significant principle in the future of adaptability (Nicolaas, 2020-a; Bakker, 2020; Kerkhoff, 2020).
Contributing to a more sustainable and efficient world, adaptability is expected to follow the same pattern that sustainability did a decade ago. During that time banks’ focus shifted on financing sustainable projects, munici-palities began to impose new regulations and clients to set sustainability requirements (OVG, 2014; Interviewee G, 2020). As most of the interviewees discussed, organ-isations’ rising interest for adaptability has started to impact the market, buildings’ financial values and con-sequently spark developers’ and investors’ interest to-wards future-proof investments (Wielaard, 2020-a; Von-cken, 2020; Bakker, 2020). Nevertheless, we are still in the very beginning of a long transition period, which at some point might lead in adaptability becoming a catalogue-re-quirement for buildings (Wielaard, 2020-a; Bakker, 2020).
“I hope that in the future you see it more…It’s already there and its improving and we hope in a few a few
years, it becomes kind of a catalogue-requirement for buildings.“ (Wielaard, 2020-a)
• Type of information: Confirming the literature & New information
6.2.4 BREEAM & determinant parties“… There is no BREEAM point for architectural quali-ty and it’s kind of weird cause if you make really good
buildings that people like, people love, people will look after them better, they will last the test of time.” (Bakker
& Zwaan, 2015)
BREEAM certifications have stimulated actors’ interest towards sustainability, as they have begun to understand the value underlying such developments, especially for their companies’ profile (Interviewee G, 2020). Conse-quently, one can understand that leading organisations can have a large impact on market demands and the con-struction industry. On the other hand, some interviewees noted that quality or adaptability are not awarded and at the same time points can be deducted for supplying additional services and square meters for future needs – despite the significance of such measures for a building’s adaptive capacity and the relation between adaptability and sustainability. In addition, it was indicated that cer-tain criteria might be interesting on paper while others can be just bought without having a real impact. There-fore , it was argued that there should be more focus on awarding quality and adaptability, factors that can have a significant impact on sustainability (Wielaard, 2020-a; Bakker, 2020).
Following these remarks an interview was conducted with a BREEAM expert, who agreed that BREEAM awards could be more effective. As explained, the main issue resulting in adaptability not being awarded, is that its benefits are future-oriented and hard to quantify, where-as BREEAM focuses on direct environmental benefits. In addition, the expert discussed that after a grade is given there is no further control of how the building is operated, leading to potential unsustainable use (LED lights always on) (Interviewee G, 2020).
In conclusion, despite the benefits underlying BREEAM there is still room for improving the rating method and making it more comprehensive and future-oriented in or-der to stimulate the development of not only sustainable but also adaptable projects. On the same line, one can understand the impact that leading parties can have on market’s demands, making them determinant factors for stimulating and promoting innovative solution.
“If the building is very sustainable, very adaptable, the use will be longer and therefore it will be more sustaina-ble” (Interviewee G, 2020).
• Type of information: New information
• 83 Addressing the mismatch
© Ioannis Mexis, 2020

6.2.5 Risks“… Financial, it’s always an investment and you have to
have a reason to invest.” (Bakker, 2020)
Despite the significance of adaptability a number of risk factors were identified hindering the implementation of such measures. The main risk discussed is the higher in-itial investments required, which aligned with the pace the environment is evolving makes the future unpredict-able, and therefore every investment made needs to be well considered (Bakker, 2020). On the same line, there is always the risk that the adaptive capacity of the measures invested in, will never be exploited. Therefore, actors need to make smart decisions on where to invest (Wie-laard, 2020-a; Nicolaas, 2020-a).
The second most discussed risk is actors’ short-term ob-jectives, and especially developers’ and investors’. Such parties mainly focus on profit and do not care about long-term benefits, contradicting adaptability which is the fu-ture-oriented (Simon, 2020; Nicolaas, 2020-a; Voncken, 2020). On the other hand, considering the market’s grad-ual shift towards adaptability and sustainability, according to the interviewees it is expected that adaptability will start to be reflected in properties’ financial value, reduc-ing the financial risks and stimulating actors into broad-ening their interest into more long-term objectives.
• Type of information: Confirming the literature & New information
6.2.6 Technology“…This is possible thanks to a sophisticated data system
that adds a new layer to the building and makes it the most sustainable in the world.” (Tilman, 2015)
Considering the direction our world is moving towards and the rising interest for innovative solutions, technolo-gy constituted a significant aspect in the design, adaptive capacity and consequently the success of Edge (Kerkhoff, 2020). The implementation of such measures resulted in a building which is highly responsive to users’ daily demands, composing a healthy and productive environ-ment, and adding a new layer to the building (Tilman, 2015). Such approach within the field of adaptability was unprecedented for the time. Therefore, technology can be established as the ninth building layer, updating Schmidt’s eight-layer model (fig. 6.2.1).
Technology entails a number of benefits for the users. Though, similarly to any workplace related change, peo-ple require time to get used to innovative measures and fully utilize them (Kerkhoff, 2020; Nicolaas, 2020-a). This constraint in addition to the higher financial investments required, can become discouraging factors for the imple-mentation of technology related adaptability measures.
Apart from the direct benefits that technology has for the owners and users of the building, indirect benefits in the form of data generated can contribute both to buildings’ optimization, as well as to a bigger system, where build-ings learn from each other (Kerkhoff, 2020; Zwaan, 2015). Therefore, data constitute a valuable asset of nowadays, despite the uncertainty of how they can be fully exploited for the present and the future (Bakker, 2015).
“…Building generates enormous amount of data and we are only really starting to understand how can these
be used, and eventually create better workplaces”. (Bakker, 2014)
• Type of information: New information
Layers: Social StuffSpace planServices
TechnologyStructureSkinSurroundings Site
Fig. 6.2.1Revised building layers model (adapted from Schmidt III, 2014).
84 • 6.2 Findings - Interview questions
© Ioannis Mexis, 2020
• Secondary findings:
6.2.7 Crisis“I think we need one good crisis more to convince peo-ple that if you have properties that you can switch easily between function, if they are adaptable then it becomes
handier.” (Interviewee G, 2020)
Despite the rising demand for adaptability, there are still many actors –such as developers and investors- who are not convinced about its importance and the benefits it un-derlies. Experiencing one more crisis with drastic impact on the real estate market could assist in stimulating the shift towards adaptable developments. Living in 2020, corona-virus could become a crisis that can act as turning points in the development of adaptable and flexible real estate (Interviewee G, 2020). Despite the early stages of this crisis, changes have already been noted, such as the rising vacancy in the retail sector and the -temporary- mo-bile working. Although the magnitude of this crisis cannot be predicted yet, one important take-away is that the built environment will need to be more flexible and adaptable in order to quickly respond to such situations and avoid the results of the “dot-com bubble” or the 2008’s financial crisis (Bakker, 2020). This finding can be also supported considering the positive effects that the crisis in the de-velopment of the Edge. • Type of information: New information
6.2.8 Development process & users“I think everybody, people as well, have to be a little bit
flexible and adaptable” (Voncken, 2020)
The pace the world is changing is affecting projects’ de-velopment in many aspects and stages. Considering the time required for completing a project, one can under-stand that upon delivery clients’, organisations’ and us-ers’ demands will have already changed, resulting in a mismatch between supply and demand (Nicolaas, 2020-a; Voncken, 2020). In order to avoid such issues, and cre-ate more efficient and responsive buildings, users need to be more actively involved throughout the process and especially on early stages (Nicolaas, 2020-a). In gen-eral, a successful and adaptable building is the result of a well-coordinated relationship between an organisation, its users and the project suppliers (Voncken, 2020). This finding reflects the importance of the human factor in buildings’ development process as well as the signifi-cance and value of the strategy formulated for illustrat-ing the links between the demand (added value) and sup-ply side (adaptability tactics).
• Type of information: Confirming the literature & New information
6.2.9 Quality – Existing buildings“I’m always jealous of the old buildings, they are able
to be refurbished…or extreme changes that have been able to take place in very old buildings.” (Simon, 2020).
Focusing on the importance of quality for buildings’ adaptive capacity, one can understand its magnitude considering the longevity of existing buildings, such as the canal houses in Amsterdam. Despite such buildings not meeting the sustainability and efficiency standards of present developments, being able to last in time for hun-dreds of years and adapt to the changing needs of each era, reflects the significance of quality for buildings’ func-tional lifecycles. Therefore, one can understand that qual-ity, adaptability and sustainability are proportional and highly related concepts. Unfortunately, the short-term interest of many actors nowadays has resulted in the lack of quality buildings that can respond to users’ demands (Simon, 2020; Voncken, 2020; Interviewee G, 2020).
• Type of information: New information
6.2.10 Adaptability abroad“And also we are international so we see it also in differ-
ent countries on a different level”. (Nicolaas, 2020-a)
The ongoing worldwide changes, have resulted in the growing significance and interest for adaptable solutions, not only within the context of the Netherlands, but in oth-er cities such as London, Munich and Paris too (Interview-ee G, 2020). On the same line, Bart Nicolaas having expe-rience from international projects, noted that in countries where money is less of an issue, actors invest more in adaptability and sustainability (Nicolaas, 2020-a). This re-flects once again actors’ focus on short-term objectives and the unawareness of the long-term value and financial benefits underlying adaptability.
• Type of information: New information
• 85 Addressing the mismatch
© Ioannis Mexis, 2020

6.3 Final Strategy
Having as a foundation the preliminary strategy developed -based on the literature review (Section 4.1) - the findings from the case studies were used as input for synthesizing the final strategy, “The value of adaptability”. The outcome of this process is presented in table 6.3.1, while the strategy breakdown tables constituting this final table can be found on section 6.5.
Comparing the final to the preliminary strategy, a num-ber of changes can be noticed. On the Y-axis, an eleventh adaptability type is added -K. Technology. Based on the interview findings four new parameters (columns) were in-troduced on the X-axis: “significance” (for the buildings’ adaptive capacity), “risk” (cost over the possibility of tak-ing advantage of each tactic’s inherent adaptive capacity), “impact & risk assessment” (significance over risk ratio) and “life expectancy” (longevity of built components in years). These parameters were added in order to assist im-plementers in choosing on what to invest on. As a result, compared to just having the different forms of added value as selection criteria, adding four more makes the strategy more thorough and concrete, allowing actors to tailor it based on their objectives.
In the strategy type selection process, “Life expectancy” should be a major selection criterion, as building layers’ lifespan is a determinant factor of a building’s overall adap-tive capacity. Consequently, actors should focus on invest-ing in strategies that impact the long lasting layers, such as “A. Multifunctionality”, “B. Building characteristics”, “I. Location” and “Site selection”. The importance of these strategy types is also reflected in the “significance” and “impact & risk assessment” gratings.
The degree of relation/ impact (small- medium- large) be-tween the strategy types and the eight forms of added value is indicated by the colour of the ball (blue, orange, green). Each of the eleven strategy types consists of a num-ber of adaptability tactics which can be found on section 6.5 (6.5.1 Final strategy breakdown A-K). The amount of links between the tactics and the forms of added value –as identified in section “6.1.4 Added value”- determine the impact between the two axes of the final strategy.
The strategy consists of a large number of tactics. Although some of them might only deliver one form of added value, based on the interview findings they are all very important for the creation of adaptable real estate (achieved a signif-icance grade of more than 3). Therefore none of them can be excluded from the matrix and should all be assessed by the implementers -during the briefing and design pro-cess- based on the significance, risk and value they add for them.
As every project is unique, there is no one universal strat-egy that can fit all projects. In order for the strategy to be a successful the aim was to provide the maximum level of flexibility for interested parties, allowing them tailor it in order to fit their goals.
6.3 Final strategy - “The value of adaptability”
86 • 6.3 Final strategy - “The value of adaptability”
© Ioannis Mexis, 2020

Table 6.3.1Final strategy “The value of adaptability”
• Large impact ( L >2/3 - Value added by more than two thirds of the tactics)• Medium impact ( 1/3 > M > 2/3 - Value added by between one and two thirds of the tactics)• Small impact ( S < 1/3 - Value added by less than a third of the tactics)
Strategy types
Signifi
canc
e
Risk
Impa
ct &
Risk
asse
ssm
ent
Life
expe
ctan
cy
Incr
ease
real
esta
te va
lue
Prod
uctiv
ity
User
sa
tisfa
ctio
n
Stim
ulate
inno
vatio
n
Envir
onm
enta
l su
stain
abilit
y
Adap
tabi
lity
Imag
e &
cultu
re
Socia
l re
spon
sibilit
y
A. Multifunctional 4.4 1.6 2.8 >20 • • • • • • • •B. Building characteristics 4.4 1.6 2.7 >20 • • • • • • • •C. Oversupply 4.3 2.6 1.6 >7 • • • • • •D. Buffer zones 4.2 2.2 1.9 >3 • • • • • • • •E. Demountable elements & dry connections
4.3 1.4 3.1 >3 • • • • • •F. Modular & dividable 4.2 1.7 2.5 >7 • • • • • •G. Circulation & zoning 4.6 1.7 2.8 >3 • • • • • •H. Movable & portable 4.5 1.5 3.1 3< • • • • • • •I. Location selection 4.8 1.4 3.5 / • • • • • • • •J. Site selection 4.3 1.5 2.8 / • • • • • • • •K. Technology 4.0 3.2 1.3 5< • • • • • •
• 87 Addressing the mismatch
© Ioannis Mexis, 2020
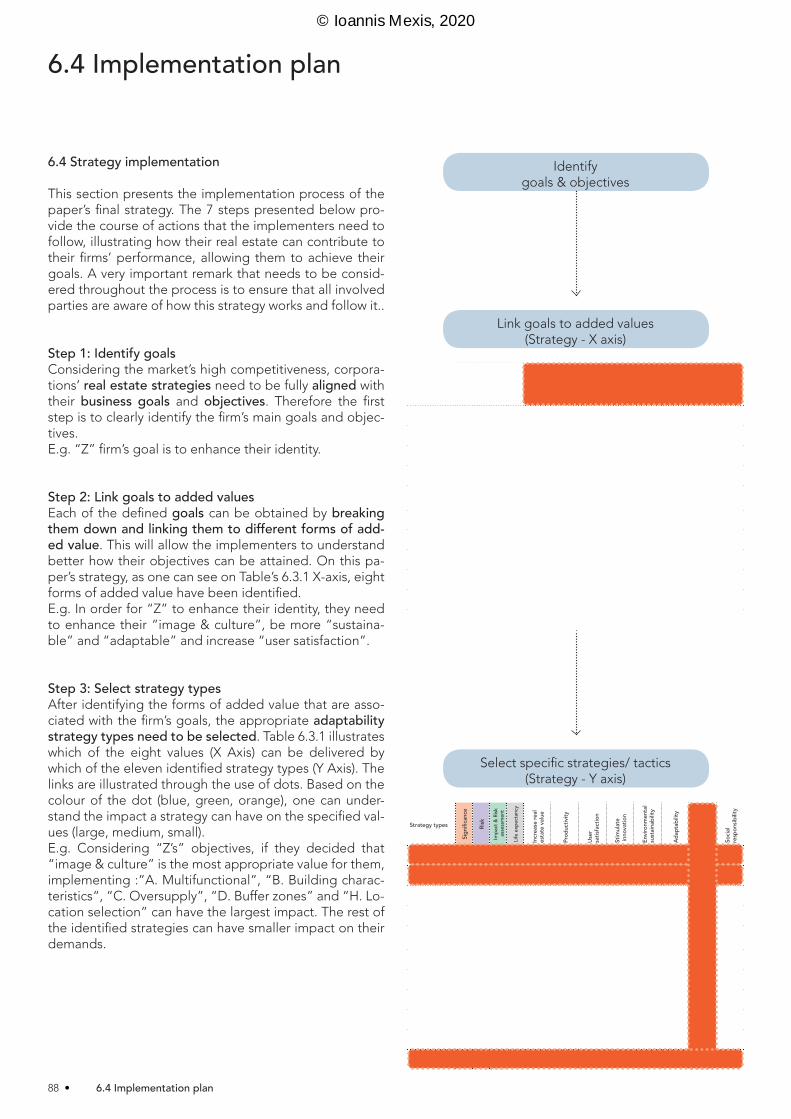
6.4 Strategy implementation
This section presents the implementation process of the paper’s final strategy. The 7 steps presented below pro-vide the course of actions that the implementers need to follow, illustrating how their real estate can contribute to their firms’ performance, allowing them to achieve their goals. A very important remark that needs to be consid-ered throughout the process is to ensure that all involved parties are aware of how this strategy works and follow it..
Step 1: Identify goals Considering the market’s high competitiveness, corpora-tions’ real estate strategies need to be fully aligned with their business goals and objectives. Therefore the first step is to clearly identify the firm’s main goals and objec-tives.E.g. “Z” firm’s goal is to enhance their identity.
Step 2: Link goals to added values Each of the defined goals can be obtained by breaking them down and linking them to different forms of add-ed value. This will allow the implementers to understand better how their objectives can be attained. On this pa-per’s strategy, as one can see on Table’s 6.3.1 X-axis, eight forms of added value have been identified. E.g. In order for “Z” to enhance their identity, they need to enhance their “image & culture”, be more “sustaina-ble” and “adaptable” and increase “user satisfaction”.
Step 3: Select strategy typesAfter identifying the forms of added value that are asso-ciated with the firm’s goals, the appropriate adaptability strategy types need to be selected. Table 6.3.1 illustrates which of the eight values (X Axis) can be delivered by which of the eleven identified strategy types (Y Axis). The links are illustrated through the use of dots. Based on the colour of the dot (blue, green, orange), one can under-stand the impact a strategy can have on the specified val-ues (large, medium, small). E.g. Considering “Z’s” objectives, if they decided that “image & culture” is the most appropriate value for them, implementing :”A. Multifunctional”, “B. Building charac-teristics“, “C. Oversupply”, “D. Buffer zones” and “H. Lo-cation selection” can have the largest impact. The rest of the identified strategies can have smaller impact on their demands.
Identify goals & objectives
Select specific strategies/ tactics (Strategy - Y axis)
Strategy types
Signifi
canc
e
Risk
Impa
ct &
Risk
asse
ssm
ent
Life
expe
ctan
cy
Incr
ease
real
esta
te va
lue
Prod
uctiv
ity
User
sa
tisfa
ctio
n
Stim
ulate
inno
vatio
n
Envir
onm
enta
l su
stain
abilit
y
Adap
tabi
lity
Imag
e &
cultu
re
Socia
l re
spon
sibilit
y
A. Multifunctional 4.4 1.6 2.8 >20 • • • • • • • •B. Building characteristics 4.4 1.6 2.7 >20 • • • • • • • •C. Oversupply 4.3 2.6 1.6 >7 • • • • • •D. Buffer zones 4.2 2.2 1.9 >3 • • • • • • • •E. Demountable elements & dry connections
4.3 1.4 3.1 >3 • • • • • •F. Modular & dividable 4.2 1.7 2.5 >7 • • • • • •G. Circulation & zoning 4.6 1.7 2.8 >3 • • • • • •H. Movable & portable 4.5 1.5 3.1 3< • • • • • • •I. Location selection 4.8 1.4 3.5 / • • • • • • • •J. Site selection 4.3 1.5 2.8 / • • • • • • • •K. Technology 4.0 3.2 1.3 5< • • • • • •
Link goals to added values (Strategy - X axis)
Strategy types
Signifi
canc
e
Risk
Impa
ct &
Risk
asse
ssm
ent
Life
expe
ctan
cy
Incr
ease
real
esta
te va
lue
Prod
uctiv
ity
User
sa
tisfa
ctio
n
Stim
ulate
inno
vatio
n
Envir
onm
enta
l su
stain
abilit
y
Adap
tabi
lity
Imag
e &
cultu
re
Socia
l re
spon
sibilit
y
A. Multifunctional 4.4 1.6 2.8 >20 • • • • • • • •B. Building characteristics 4.4 1.6 2.7 >20 • • • • • • • •C. Oversupply 4.3 2.6 1.6 >7 • • • • • •D. Buffer zones 4.2 2.2 1.9 >3 • • • • • • • •E. Demountable elements & dry connections
4.3 1.4 3.1 >3 • • • • • •F. Modular & dividable 4.2 1.7 2.5 >7 • • • • • •G. Circulation & zoning 4.6 1.7 2.8 >3 • • • • • •H. Movable & portable 4.5 1.5 3.1 3< • • • • • • •I. Location selection 4.8 1.4 3.5 / • • • • • • • •J. Site selection 4.3 1.5 2.8 / • • • • • • • •K. Technology 4.0 3.2 1.3 5< • • • • • •
6.4 Implementation plan
88 • 6.4 Implementation plan
© Ioannis Mexis, 2020
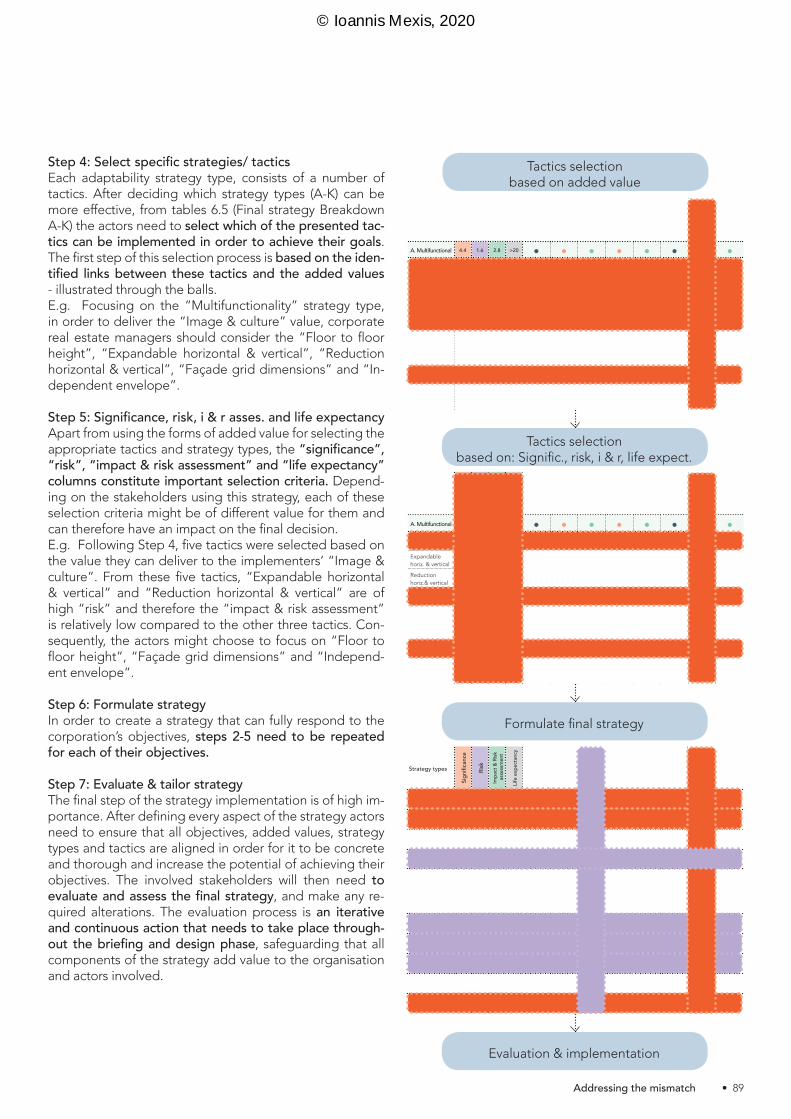
Step 4: Select specific strategies/ tacticsEach adaptability strategy type, consists of a number of tactics. After deciding which strategy types (A-K) can be more effective, from tables 6.5 (Final strategy Breakdown A-K) the actors need to select which of the presented tac-tics can be implemented in order to achieve their goals. The first step of this selection process is based on the iden-tified links between these tactics and the added values - illustrated through the balls.E.g. Focusing on the “Multifunctionality” strategy type, in order to deliver the “Image & culture” value, corporate real estate managers should consider the “Floor to floor height”, “Expandable horizontal & vertical”, “Reduction horizontal & vertical”, “Façade grid dimensions” and “In-dependent envelope”.
Step 5: Significance, risk, i & r asses. and life expectancyApart from using the forms of added value for selecting the appropriate tactics and strategy types, the “significance”, “risk”, “impact & risk assessment” and “life expectancy” columns constitute important selection criteria. Depend-ing on the stakeholders using this strategy, each of these selection criteria might be of different value for them and can therefore have an impact on the final decision. E.g. Following Step 4, five tactics were selected based on the value they can deliver to the implementers’ “Image & culture”. From these five tactics, “Expandable horizontal & vertical” and “Reduction horizontal & vertical” are of high “risk” and therefore the “impact & risk assessment” is relatively low compared to the other three tactics. Con-sequently, the actors might choose to focus on “Floor to floor height”, “Façade grid dimensions” and “Independ-ent envelope”.
Step 6: Formulate strategyIn order to create a strategy that can fully respond to the corporation’s objectives, steps 2-5 need to be repeated for each of their objectives.
Step 7: Evaluate & tailor strategyThe final step of the strategy implementation is of high im-portance. After defining every aspect of the strategy actors need to ensure that all objectives, added values, strategy types and tactics are aligned in order for it to be concrete and thorough and increase the potential of achieving their objectives. The involved stakeholders will then need to evaluate and assess the final strategy, and make any re-quired alterations. The evaluation process is an iterative and continuous action that needs to take place through-out the briefing and design phase, safeguarding that all components of the strategy add value to the organisation and actors involved.
Evaluation & implementation
Tactics selectionbased on added value
Strategy type
Tactics
Signifi
canc
e
Risk
Impa
ct &
Risk
asse
ssm
ent
Life
expe
ctan
cy
Incr
ease
real
esta
te va
lue
Prod
uctiv
ity
User
sa
tisfa
ctio
n
Stim
ulate
inno
vatio
n
Envir
onm
enta
l su
stain
abilit
y
Adap
tabi
lity
Imag
e &
cultu
re
Socia
l re
spon
sibilit
y
A. Multifunctional 4.4 1.6 2.8 >20 • • • • • • • •Floor to floor height
4.8 1.2 4.1 >30 • • • • • •Expandable horiz. & vertical
4.5 2.7 1.7 >30 • • • • •Reductionhoriz.& vertical
3.0 2.0 1.5 >30 • • • • •Facade grid dimensions
4.2 1.2 3.6 >20 • • • • •Grid wide span 4.5 1.2 3.9 >30 • • • • •Floor depth 4.5 1.8 2.5 >30 • • • • •Independent envelope
4.5 1.5 3.0 >20 • • • •Position: stairs, el-evators, entrances & services
4.8 1.2 4.1 >30 • • • • •
Tactics selectionbased on: Signific., risk, i & r, life expect.
Strategy type
Tactics
Signifi
canc
e
Risk
Impa
ct &
Risk
asse
ssm
ent
Life
expe
ctan
cy
Incr
ease
real
esta
te va
lue
Prod
uctiv
ity
User
sa
tisfa
ctio
n
Stim
ulate
inno
vatio
n
Envir
onm
enta
l su
stain
abilit
y
Adap
tabi
lity
Imag
e &
cultu
re
Socia
l re
spon
sibilit
y
A. Multifunctional 4.4 1.6 2.8 >20 • • • • • • • •Floor to floor height
4.8 1.2 4.1 >30 • • • • • •Expandable horiz. & vertical
4.5 2.7 1.7 >30 • • • • •Reductionhoriz.& vertical
3.0 2.0 1.5 >30 • • • • •Facade grid dimensions
4.2 1.2 3.6 >20 • • • • •Grid wide span 4.5 1.2 3.9 >30 • • • • •Floor depth 4.5 1.8 2.5 >30 • • • • •Independent envelope
4.5 1.5 3.0 >20 • • • •Position: stairs, el-evators, entrances & services
4.8 1.2 4.1 >30 • • • • •
Formulate final strategy
Strategy types
Signifi
canc
e
Risk
Impa
ct &
Risk
asse
ssm
ent
Life
expe
ctan
cy
Incr
ease
real
esta
te va
lue
Prod
uctiv
ity
User
sa
tisfa
ctio
n
Stim
ulate
inno
vatio
n
Envir
onm
enta
l su
stain
abilit
y
Adap
tabi
lity
Imag
e &
cultu
re
Socia
l re
spon
sibilit
y
A. Multifunctional 4.4 1.6 2.8 >20 • • • • • • • •B. Building characteristics 4.4 1.6 2.7 >20 • • • • • • • •C. Oversupply 4.3 2.6 1.6 >7 • • • • • •D. Buffer zones 4.2 2.2 1.9 >3 • • • • • • • •E. Demountable elements & dry connections
4.3 1.4 3.1 >3 • • • • • •F. Modular & dividable 4.2 1.7 2.5 >7 • • • • • •G. Circulation & zoning 4.6 1.7 2.8 >3 • • • • • •H. Movable & portable 4.5 1.5 3.1 3< • • • • • • •I. Location selection 4.8 1.4 3.5 / • • • • • • • •J. Site selection 4.3 1.5 2.8 / • • • • • • • •K. Technology 4.0 3.2 1.3 5< • • • • • •
• 89 Addressing the mismatch
© Ioannis Mexis, 2020
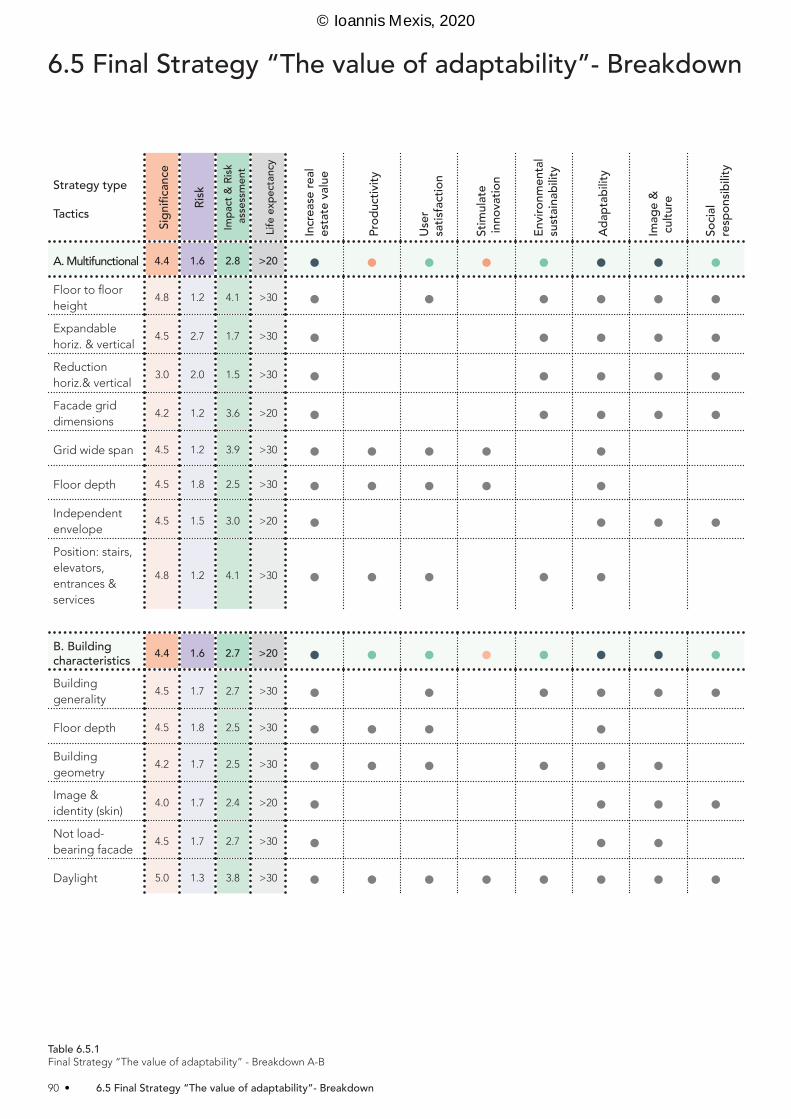
B. Building characteristics 4.4 1.6 2.7 >20 • • • • • • • •Building generality
4.5 1.7 2.7 >30 • • • • • •Floor depth 4.5 1.8 2.5 >30 • • • •Building geometry
4.2 1.7 2.5 >30 • • • • • •Image & identity (skin)
4.0 1.7 2.4 >20 • • • •Not load- bearing facade
4.5 1.7 2.7 >30 • • •Daylight 5.0 1.3 3.8 >30 • • • • • • • •
Strategy type
Tactics
Signifi
canc
e
Risk
Impa
ct &
Risk
asse
ssm
ent
Life
expe
ctan
cy
Incr
ease
real
esta
te va
lue
Prod
uctiv
ity
User
sa
tisfa
ctio
n
Stim
ulate
inno
vatio
n
Envir
onm
enta
l su
stain
abilit
y
Adap
tabi
lity
Imag
e &
cultu
re
Socia
l re
spon
sibilit
y
A. Multifunctional 4.4 1.6 2.8 >20 • • • • • • • •Floor to floor height
4.8 1.2 4.1 >30 • • • • • •Expandable horiz. & vertical
4.5 2.7 1.7 >30 • • • • •Reductionhoriz.& vertical
3.0 2.0 1.5 >30 • • • • •Facade grid dimensions
4.2 1.2 3.6 >20 • • • • •Grid wide span 4.5 1.2 3.9 >30 • • • • •Floor depth 4.5 1.8 2.5 >30 • • • • •Independent envelope
4.5 1.5 3.0 >20 • • • •Position: stairs, elevators, entrances & services
4.8 1.2 4.1 >30 • • • • •
Table 6.5.1Final Strategy “The value of adaptability” - Breakdown A-B
6.5 Final Strategy “The value of adaptability”- Breakdown
90 • 6.5 Final Strategy “The value of adaptability”- Breakdown
© Ioannis Mexis, 2020
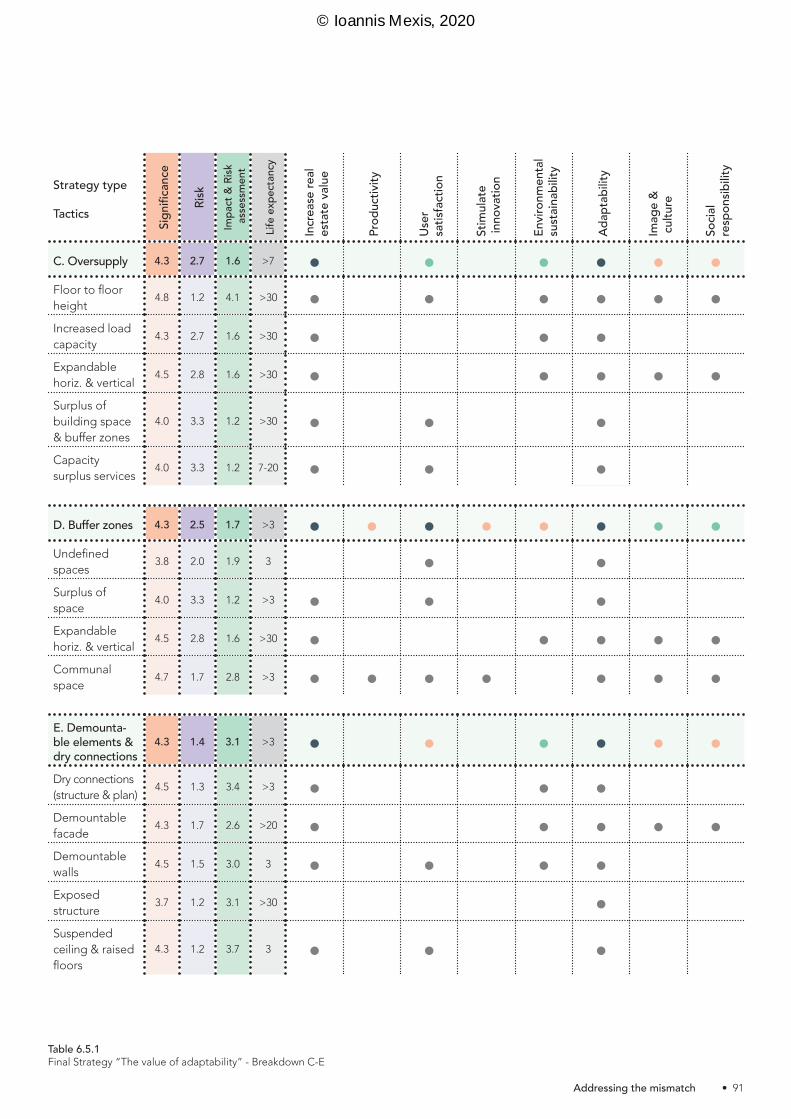
D. Buffer zones 4.3 2.5 1.7 >3 • • • • • • • •Undefined spaces
3.8 2.0 1.9 3 • •Surplus of space
4.0 3.3 1.2 >3 • • •Expandable horiz. & vertical
4.5 2.8 1.6 >30 • • • • •Communal space
4.7 1.7 2.8 >3 • • • • • • •
E. Demounta-ble elements & dry connections
4.3 1.4 3.1 >3 • • • • • •Dry connections (structure & plan)
4.5 1.3 3.4 >3 • • •Demountable facade
4.3 1.7 2.6 >20 • • • • •Demountable walls
4.5 1.5 3.0 3 • • • •Exposed structure
3.7 1.2 3.1 >30 •Suspended ceiling & raised floors
4.3 1.2 3.7 3 • • •
Strategy type
Tactics
Signifi
canc
e
Risk
Impa
ct &
Risk
asse
ssm
ent
Life
expe
ctan
cy
Incr
ease
real
esta
te va
lue
Prod
uctiv
ity
User
sa
tisfa
ctio
n
Stim
ulate
inno
vatio
n
Envir
onm
enta
l su
stain
abilit
y
Adap
tabi
lity
Imag
e &
cultu
re
Socia
l re
spon
sibilit
y
C. Oversupply 4.3 2.7 1.6 >7 • • • • • •Floor to floor height
4.8 1.2 4.1 >30 • • • • • •Increased load capacity
4.3 2.7 1.6 >30 • • •Expandable horiz. & vertical
4.5 2.8 1.6 >30 • • • • •Surplus of building space & buffer zones
4.0 3.3 1.2 >30 • • •Capacity surplus services
4.0 3.3 1.2 7-20 • • •
Table 6.5.1Final Strategy “The value of adaptability” - Breakdown C-E
• 91 Addressing the mismatch
© Ioannis Mexis, 2020
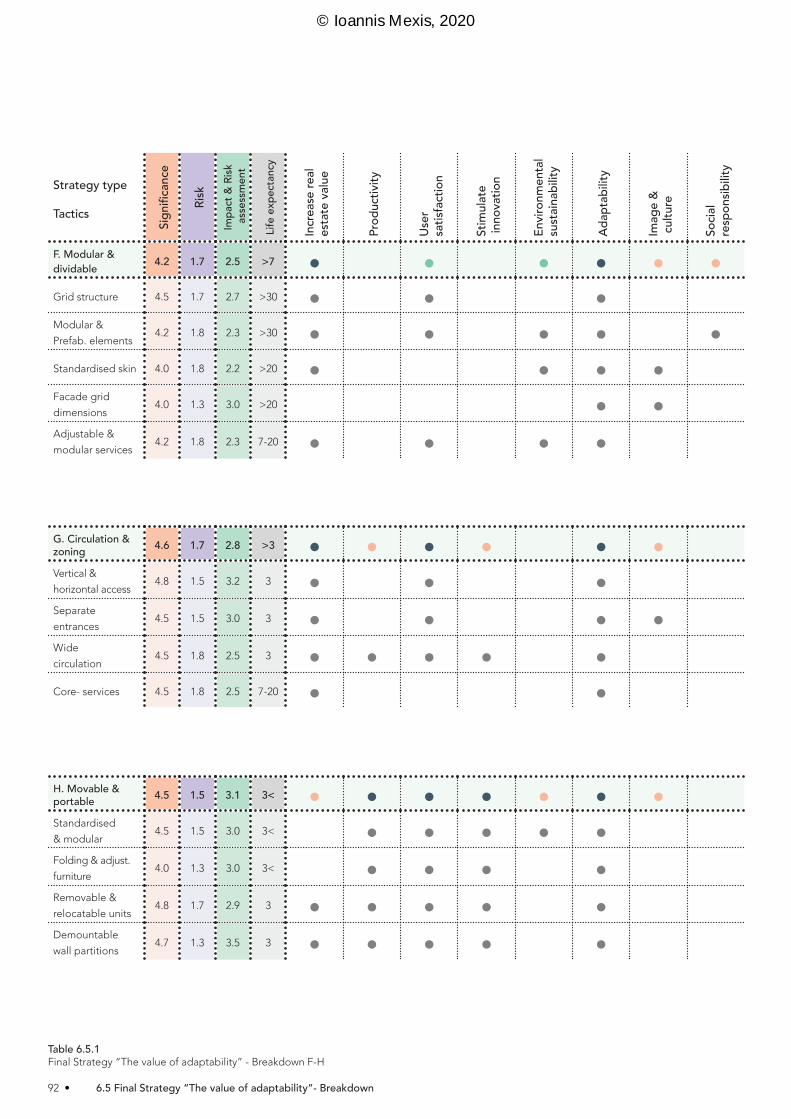
G. Circulation & zoning 4.6 1.7 2.8 >3 • • • • • •Vertical &
horizontal access4.8 1.5 3.2 3 • • •
Separate
entrances4.5 1.5 3.0 3 • • • •
Wide
circulation4.5 1.8 2.5 3 • • • • •
Core- services 4.5 1.8 2.5 7-20 • •
Strategy type
Tactics
Signifi
canc
e
Risk
Impa
ct &
Risk
asse
ssm
ent
Life
expe
ctan
cy
Incr
ease
real
esta
te va
lue
Prod
uctiv
ity
User
sa
tisfa
ctio
n
Stim
ulate
inno
vatio
n
Envir
onm
enta
l su
stain
abilit
y
Adap
tabi
lity
Imag
e &
cultu
re
Socia
l re
spon
sibilit
y
F. Modular & dividable 4.2 1.7 2.5 >7 • • • • • •Grid structure 4.5 1.7 2.7 >30 • • •Modular &
Prefab. elements4.2 1.8 2.3 >30 • • • • •
Standardised skin 4.0 1.8 2.2 >20 • • • •Facade grid
dimensions4.0 1.3 3.0 >20 • •
Adjustable &
modular services4.2 1.8 2.3 7-20 • • • •
H. Movable & portable 4.5 1.5 3.1 3< • • • • • • •Standardised
& modular4.5 1.5 3.0 3< • • • • •
Folding & adjust.
furniture4.0 1.3 3.0 3< • • • •
Removable &
relocatable units4.8 1.7 2.9 3 • • • • •
Demountable
wall partitions4.7 1.3 3.5 3 • • • • •
Table 6.5.1Final Strategy “The value of adaptability” - Breakdown F-H
92 • 6.5 Final Strategy “The value of adaptability”- Breakdown
© Ioannis Mexis, 2020
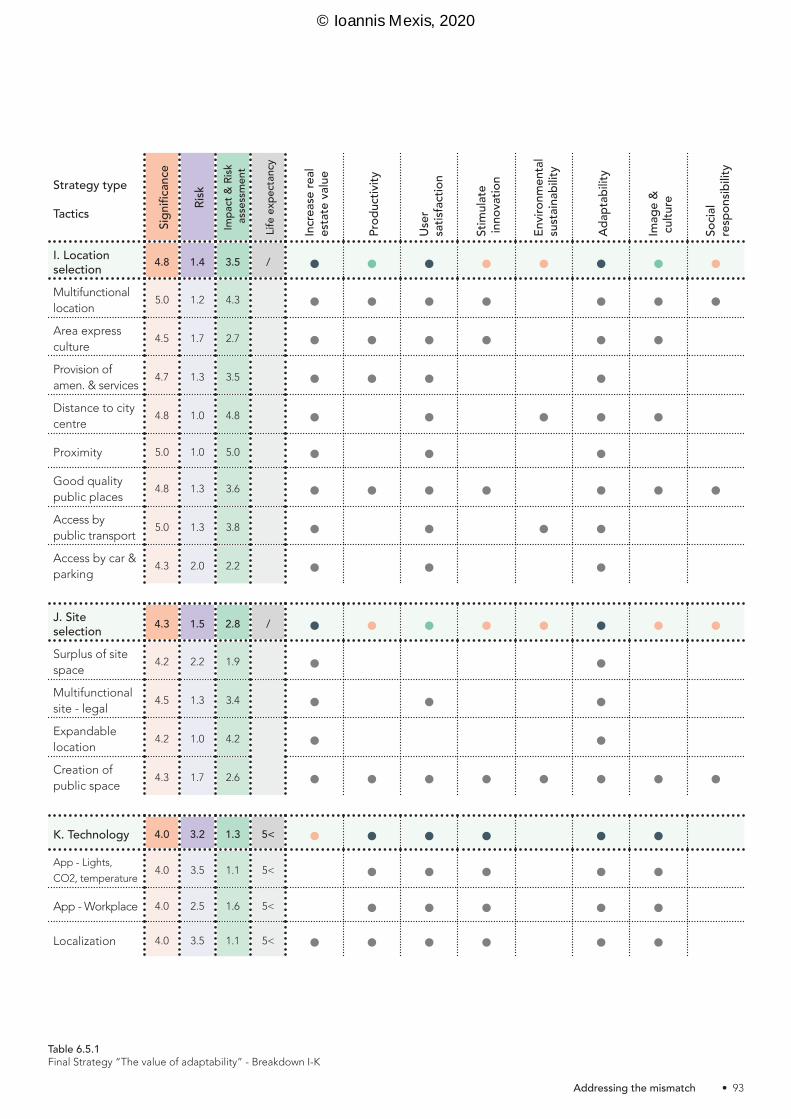
Strategy type
Tactics
Signifi
canc
e
Risk
Impa
ct &
Risk
asse
ssm
ent
Life
expe
ctan
cy
Incr
ease
real
esta
te va
lue
Prod
uctiv
ity
User
sa
tisfa
ctio
n
Stim
ulate
inno
vatio
n
Envir
onm
enta
l su
stain
abilit
y
Adap
tabi
lity
Imag
e &
cultu
re
Socia
l re
spon
sibilit
y
I. Location selection 4.8 1.4 3.5 / • • • • • • • •Multifunctional location
5.0 1.2 4.3 • • • • • • •Area express culture
4.5 1.7 2.7 • • • • • •Provision of amen. & services
4.7 1.3 3.5 • • • •Distance to city centre
4.8 1.0 4.8 • • • • •Proximity 5.0 1.0 5.0 • • •Good quality public places
4.8 1.3 3.6 • • • • • • •Access by public transport
5.0 1.3 3.8 • • • •Access by car & parking
4.3 2.0 2.2 • • •
J. Site selection 4.3 1.5 2.8 / • • • • • • • •Surplus of site space
4.2 2.2 1.9 • •Multifunctional site - legal
4.5 1.3 3.4 • • •Expandable location
4.2 1.0 4.2 • •Creation of public space
4.3 1.7 2.6 • • • • • • • •
K. Technology 4.0 3.2 1.3 5< • • • • • •App - Lights,
CO2, temperature4.0 3.5 1.1 5< • • • • •
App - Workplace 4.0 2.5 1.6 5< • • • • •Localization 4.0 3.5 1.1 5< • • • • • •
Table 6.5.1Final Strategy “The value of adaptability” - Breakdown I-K
• 93 Addressing the mismatch
© Ioannis Mexis, 2020
“It’s the awareness. In advance you can create a space in your project, or the possibility to be able to react to
changing situations. And this matrix is going to help you to do it in the very beginning of the project.”
(Wielaard, 2020-b)
In order to evaluate the final strategy, it was presented to two of the interviewees from the case studies, an archi-tect and a real estate manager. Both interviewees found the strategy and the implementation plan very clear and acknowledged the benefit and flexibility it provides to the users allowing them to tailor the strategy based on their objectives (Wielaard, 2020-b; Nicolaas, 2020-b).
Considering the four new columns introduced, the inter-viewees agreed that the “significance”, “risk”, “impact & risk assessment” and “life expectancy” are valuable fac-tors for selecting which tactics to implement, resulting in a more comprehensive strategy. The real estate manager was initially sceptical about the number of unique adapt-ability tactics, but after explaining that they could not be removed due to their significance for the development of future-proof projects, he acknowledged their value for the final strategy.
In addition, both interviewees addressed that one of the biggest advantages of the strategy is its ability to create awareness from an early stage, constituting a tool that can be used to make responsive buildings and better architecture. They also specified that it can be useful for architects, real estate managers, developers, related en-gineers, and also for consultants assisting clients in defin-ing their brief. Demand-side actors can use this strategy as a tool to help them understand their projects require-ments, whereas supply-side actors can use it as a means of addressing these demands (Wielaard, 2020-b; Nico-laas, 2020-b).
Despite the advantages of the strategy, some risks were also indicated. For Wielaard, there is a high risk regarding the strategy’s role throughout the project development. As projects progress and teams grow it is likely that the strategy might be gradually left out. In order to avoid such risk, he specified that it is important for the client/ imple-menters to formally introduce the strategy in the very beginning of the project and repeat the process on each phase, aiming to highlight its value for the project while preserving it to the agenda of the project team (Wielaard, 2020-b). On the other hand, for Nicolaas the highest risk concerns the actors who implement the strategy. De-pending on the implementers and their perspective on the project –short or long-term- the results might highly differ. Consequently for companies that develop build-ings for their own operations, the strategy is more likely to be effective (Nicolaas, 2020-b).
This being the first scientific attempt to join the concepts of adaptability and added value, one can expect that there are areas of improvement. For Wielaard, costs could be an important selection factor (Wielaard, 2020-b). On the other hand, for Nicolaas costs are a much more com-plicated parameter as they include initial investments, operation costs, and replacement costs at the end the components lifecycle. Therefore, for him life expectancy is a more significant selection factor. For future improve-ments, Nicolaas suggested that including “packages” with the most effective tactics for certain types of added value could assist inexperienced actors in applying the strategy (Nicolaas, 2020).
Finally, Wielaard indicated that the strategy could be val-uable tool for a project he currently participates in, as it can assist the team in defining the brief and implement the concept of adaptability. Similarly, Nicolaas argued that this strategy can assist in the development of more adaptable and future-proof real estate and consequently to better buildings, architecture and overall living environ-ment.
The interviewees’ positive evaluation, reflects that despite the strategy being the first scientific attempt in linking ad-aptability with added value it can be regarded as a suc-cess.
“You are more certain that the building you own,you have in your portfolio or you are using
or you develop for your company, is a much better building in a way,
it’s much easier to adapt, it would be better for your employees,
would be better for surroundings, for people living around it.
So it should lead to a better building, better architecture.”
(Nicolaas, 2020-b)
6.6 Final strategy - Interviewees evaluation
94 • 6.6 Final strategy - Interviewees evaluation
© Ioannis Mexis, 2020

7.0 Conclusions
© Ioannis Mexis, 2020

The purpose of this thesis is to address the mismatch be-tween the static nature of the built environment and the constant changes in users’ demands stimulated by the pace our world evolves. In order to tackle this problem, and contribute to the society and scientific field, a strat-egy was created acting as a tool to assist and stimulate the development of adaptable and future-proof real es-tate. Following the completion of the cross-case analysis and the synthesis of the findings and the final strategy, this section focuses on presenting the main conclusions of this thesis.
This section is structured following the paper’s sub-ques-tions and the two themes they address: adaptability and added value. Using input from both the literature review and the empirical research findings, these answers will be synthesized and contribute in answering the paper’s main research question, providing concrete and comprehen-sive conclusions.
7.1 Adaptability
• What is adaptability?Adaptability constitutes the first main theme addressed in this thesis. In order to answer this question, an extensive literature review was conducted, based on which adapt-ability entails buildings’ long-term capacity to respond to changing demands stimulated by societal drivers. When talking about adaptability the four main concepts that one needs to consider are: time, context, change and build-ings. From the variety of definitions provided by different authors the most comprehensive one that was adopted in this research is: “the capacity to change the building’s built-environment in order to respond and fit to the evolv-ing demands of its users/ environment maximizing value throughout its lifecycle”.
• What is flexibility?Similarly to adaptability, flexibility contributes to a sustain-able and future-proof environment. Despite the relations between the two concepts, flexibility is oriented towards short-term changes such as physical re-arrangements which require a small amount of time and investments, and are mainly initiated by bottom-up approaches (us-ers). Due to the scale of changes that it entails, flexibility is regarded as a factor of adaptability. From the defini-tions found in literature, the most inclusive that was used in this research is: “Flexibility is perceived as an adaptive response to environmental uncertainty. More specifically, it is a reflection of the ability of a system to change or re-act with little penalty in time, effort, cot or performance”.
• Why is the demand for adaptable real estate increasing?Based on literature and confirmed by all interviewees, the pace the world is changing is increasing due to a number of facts such as the technological innovations and envi-ronmental awareness, heightening the uncertainty for the future. Such changes, affect the way people live and work, and consequently their demands for space. The static na-ture of real estate contradicts the dynamic environment and changes in users’ demands, resulting in buildings be-coming vacant and potentially obsolete. In order to avoid such issues, and starting to understand the indirect bene-fits of sustainability and adaptability, construction is grad-ually shifting towards adaptable buildings with longer functional lifecycles.
• What is the impact of adaptable building for their us-ers and the environment?
The uncertainty underlying our environment and the avail-ability of resources, aligned with the environmental exter-nalities caused by the construction industry, have stimu-lated market’s interest for sustainable solutions. Adopting a sustainable approach allows buildings to meet present demands without compromising the ability of future gen-erations to meet theirs’. Adaptability’s capacity to address not only the present (short-term demands) but most im-portantly the future (long-term ambitions), results in more responsive real estate with longer functional lifecycles. This reduces vacancy rates, the need for new buildings and the use of resources, consequently leading to a more sustainable future. Adaptable buildings’ long-term value -due to their capacity to respond to longer business cy-cles reducing the mismatch between functional and tech-nical lifecycles- acts as an attractive force for actors and especially for corporations who require frequent changes in their portfolio.
• What strategies are currently used to create adaptable buildings?
The rising significance of adaptability has attracted re-searchers’ and actors’ attention during the last decades. From the literature and case studies a multiple adaptabil-ity tactics were identified (tables 3.2.3 & 3.2.4). Based on their significance and relevance to the paper’s goals, a number of them were selected and grouped under eleven strategy types. One of the main concepts from literature used in the tactics analysis and the development of the paper’s final strategy is the “shearing layers”- the bene-fits of which were also acknowledged by the interviewees. Introducing the concept of time by analysing the building in layers, depending on the life expectancy of its compo-nents provides the ease of applying changes in the build-ing, increasing its adaptive capacity. Based on the case studies, “Technology” was introduced as a ninth layer to Schmidt’s model.
7.0 Conclusions
96 • 7.0 Conclusions
© Ioannis Mexis, 2020
• What strategies have been used in transformation pro-jects? How can these provide input for strategies on new adaptable buildings?
Despite the market’s increasing interest on adaptability during the latest decades, redevelopments have been taking place for a long time. Considering that existing and especially old buildings –such as the canal houses in Amsterdam- could be more durable and adaptable al-lowing them to last in time, compared to low quality con-structions built by parties with short-term objectives such as developers, the past can be used to improve present buildings and make them more responsive. Therefore, apart from the adaptability tactics used in new projects, in order to create a thorough strategy, considering tactics implemented in redevelopment projects and including a transformation case in the empirical research was impor-tant (table 3.2.3).
• What adaptability strategies are applied in practice?The strategy developed in this thesis consists of 46 unique adaptability tactics identified in literature and confirmed through the empirical research. From the empirical part all of the identified tactics were proven to be important for the development of adaptable real estate, while tech-nology –consisting of 3 new measures- was introduced as a new adaptability type. Considering the present trends and the impact technology had for The Edge’s respon-siveness and success, this strategy is expected to be more significant and widely implemented in future projects. The final list of adaptability strategy types used in practice are: “Multifinctional”, “Building characteristics”, “Over-supply”, “Buffer zones”, “Demountable elements & dry connections”, “Modular & dividable”, “Circulation & zon-ing”, “Movable & portable”, “Location selection”, “Site selection” and “Technology”.
• How can adaptability contribute to a project’s success?According to the empirical part of the research, adapt-ability was proven to be a strategy implemented by ac-tors that aim to have a larger societal impact, by creat-ing future-proof real estate and contributing to a more sustainable future. In general, when public parties with long-term objectives are involved adaptability is easier to implement. On the other hand, the case of Edge showed that setting high goals and aiming to make a statement through the building, can have successful results for pri-vate projects too. Therefore, in order to create highly ad-aptable projects, having high ambitions and being fully committed to the project are key parameters.
• What are the risks underlying adaptability?Apart from the benefits underlying adaptability there are also risks that one needs to take into consideration. Both through the literature review and the case studies, the main risk of adaptability is considered to be the increased financial costs required. Considering the pace the world is changing, there is the uncertainty and risk of whether the adaptive capacity provided by the measures applied will be utilized. On the same line, the additional initial invest-ments required and adaptability’s future-oriented per-spective contradict actors’ short-term goals –such as de-velopers and investors- acting as a boundary for shifting towards this direction. In addition, from the tactics used in the strategy the ones that focus on layers with longer lifespans –such as “location selection”, “site selection”, “multifunctional” and “building characteristics” were re-garded as highly significant for developing future-proof real estate. Not doing so, can risk buildings’ capacity to remain functional.
• What is the future of adaptability in the built environment? Based on both the literature review and the empirical research, the uncertainties underlying the future due to the pace that the world is changing as well as the con-struction industry’s environmental impact, have stimulat-ed the creation of responsive real estate. This “trend” is also supported by innovative actors who are gradually starting to understand the long-term and indirect bene-fits that adaptability entails for them and their employees. Though, similarly to the built environment, people need to become more flexible and adaptable in order for this shift to be realised, something which can require a long time. Although we are still on an early stage, the empir-ical research findings indicated that actors are optimistic about the transition towards adaptability and it becoming a standard requirement for future projects.
• 97 Addressing the mismatch
© Ioannis Mexis, 2020
7.2 Added value
• What is added value? Added value constitutes the second main theme ad-dressed in this thesis. In order to understand this concept, a thorough literature review was conducted. In the context of real estate, value is added when real estate strategies, business strategies and corporations’ core objectives are aligned. From the definitions presented in literature, the most comprehensive one that was adopted in this the-sis is: “The contribution of real estate to organisational performance and the attainment of organisational objec-tives”.
• What forms of added value can be delivered to corpo-rations through real estate strategies?
Real estate delivers mainly indirect values which com-pared to direct ones, are harder to quantify and identi-fy due to their long-term and lagged effect. In literature, many different forms of added value have been identified. After analysing them, eight of them were selected for this thesis: increase real estate value”, “productivity”, “user satisfaction”, “stimulate innovation”, “environmental sus-tainability”, “adaptability”, “support image & culture” and “social responsibility”.
• What is the added value of adaptable buildings for corporations and their users as well as their suppliers- architects?
Identifying the added value of adaptability is a compli-cated process, mainly due to it being future-oriented and the complexity of isolating the impact from other strate-gies implemented. Depending on the nature of each par-ty their objectives can highly vary, and consequently the forms of added value that they focus on. From the case studies, the ambition to enhance their identity and have a larger societal impact, aiming to stimulate the application of adaptability and sustainability in a wider context, was one of the reasons for implementing adaptability both by the demand and supply sides. Focusing on the value de-livered to the directly involved parties, adaptable build-ings constitute responsive and quality environments that enhance users’ satisfaction, stimulating productivity and innovation. Whether the stakeholders involved are public or private parties, setting high goals, having long-term in-terest and being committed to the project are key aspects of delivering future-proof buildings that add value to their clients, users and the wider society.
7.3 How can adaptability strategies be applied in the de-velopment of new office buildings to add value for cor-porations and address the mismatch over time between buildings and users’ demands?
Illustrating the added value of adaptability measures in real estate, the strategy created through this research
constitutes a highly flexible tool which reflects the benefits of adaptability and can stimulate the develop-ment of a future-proof environment and consequently
a sustainable future.
Living in a highly dynamic environment affected by dif-ferent external factors has impacted the way people live and work increasing the risks and uncertainties of the fu-ture. Focusing on the working sector, corporations are challenged to respond to these changes in order to attain their objectives, remain productive and competitive in the market. On the contrary, the built environment is static, resulting in a constant mismatch between the users’ de-mands and the buildings supplied. In order to respond to the ever-changing environment, adaptable real estate have a greater value for both their owners and their users.
The higher initial investments, short-term perspectives, uncertainty of the future and most importantly actors’ in-ability to understand the short and long-term benefits of adaptability, constitute barriers for shifting into more ad-aptable and sustainable constructions.
In order to address these boundaries, this thesis focused on creating a scientifically valid strategy that can assist and stimulate the development of future-proof projects. Taking into account that buildings are developed based on clients’ objectives, one can understand the uniqueness of each project and that creating one ideal strategy that would ap-ply on every case is not feasible. Consequently, rather than providing a fixed framework that one needs to follow, “The value of adaptability” strategy constitutes a comprehen-sive tool that implementers can tailor in order to perfectly fit their needs and develop responsive buildings that add value for the owners and users of the building. Compared to existing scientific frameworks, this strategy links the concepts of adaptability and added value. Spe-cifically, the strategy comprises of 11 strategy types each consisting of tactics that can be implemented for the de-velopment of buildings able to respond to small and large scale changes. These tactics are linked to eight different forms of added value depending on the influence they have for the owners and users of the buildings. Therefore, providing a tool that illustrates the direct and indirect benefits of adaptability, can have a significant societal and scientific impact, contributing in the development of a fu-ture-proof and sustainable built environment.
98 • 7.0 Conclusions
© Ioannis Mexis, 2020
7.4 Strategy application
Compared to existing frameworks one of the biggest advantages of “The value of adaptability” is that it is a highly flexible strategy which can be tailored to fit the im-plementers’ requirements.
The strategy can be used by different actors and profes-sions, out of which the main parties are: (corporate) real estate managers, architects, developers and investors. For corporate real estate managers, this strategy can be used in order to understand how their objectives can be obtained through real estate. On the same line, they can brief the architects and have control during the design process, ensuring that the outcome will fit their ambitions.
For investors and especially developers, this strategy il-lustrates the benefits of adaptable buildings, which can contribute in shifting their focus towards the long-term. Understanding the long-term and indirect value of ad-aptability, such actors can gradually impact the market’s general interest towards this direction, which can conse-quently be reflected in financial terms, aligning with their profit-oriented core objective.
Focusing on the supply side, architects and related en-gineers can implement this strategy in order to translate their clients objectives to tangible measures and create buildings that can remain responsive in time. Collabora-tion between the involved stakeholders throughout the design process is key for delivering projects that fit the client’s requirements.
Finally, the absence of restriction for the measures that one needs to implement, provides to actors the flexibility to use this strategy up to any level and extend they want, as the authors intention was to formulate a tool that be used by different stakeholders and has the potentially of becoming a universal strategy for the development of ad-aptable buildings.
7.5 General conclusions
According to both the literature and the empirical re-search findings, stimulated by the constantly evolving context, the market’s interest for adaptability is gradual-ly increasing. In addition, considering the market’s shift towards sustainability the last decade, due to its relation with adaptability, it is expected that adaptability will soon follow a similar pattern.
Exploring the wider construction field, one can understand that in order for this transition to take place, many things need to change first. Taking as an example BREEAM, which is the world’s leading sustainability assessment method, one would expect that they support adaptabil-ity. Nevertheless, BREEAM not only does not value and award adaptability, but it can even deduct sustainability points by applying certain tactics. Considering the impact that BREEAM had in the market’s interest in sustainability, including adaptability in their award criteria could stim-ulate and encourage actors to invest in future-proof de-velopments. This example was not provided aiming to criticize BREEAM, but in order to illustrate the scale of change that needs to take place, considering that even parties who are strong supporters of sustainability have not yet moved towards more effective and future-proof measures. Similarly to BREEAM, other organisations’, ac-tors’ and most importantly the general public’s percep-tion needs to gradually change.
Taking into account the changes that first need to take place, adaptability still requires time before becoming a standard requirement within the construction field. Con-sequently the aim of this thesis is to contribute to this tran-sition, by illustrating the benefits of adaptability in order to stimulate actors’ interest and assist in the development of a future-proof future environment.
• 99 Addressing the mismatch
© Ioannis Mexis, 2020

© Ioannis Mexis, 2020

8.0 Discussion
© Ioannis Mexis, 2020

This section focuses on discussing the research findings and the process followed both for the literature review and the qualitative sections. In addition, the research lim-itations are presented along with recommendations for practice and for further study.
8.1 Discussion on research design
• Literature reviewThis research is concentrated on two topics, adaptability and added value. Due to the rising significance of adapt-ability and the complexity underlying the concept of add-ed value, there was enough scientific literature available for both themes. However, up to this point no attempts have been made to link the two topics- constituting the scientific gap that this thesis aimed to address. In order to increase the validity of the research and decrease the risk of biased information, an extensive literature review was conducted. During this analysis, a variety of different approaches and frameworks were studied which also pro-vided the foundation for developing the paper’s strategy. As there were no former attempt to link adaptability and added value, a significant part of the preliminary strategy would be based on the authors view. Acknowledging the subjectivity underlying this task and potential errors, the tables were filled in eight different times over the course of two weeks. In addition, although the initial plan was that the empirical research would focus on the collection of qualitative data and the evaluation of the preliminary strategy, the lack of quantitative data in literature, was also addressed.
• Empirical research- Case studiesThe case studies analysis was conducted through doc-umentary data collection and a series of interviews. The former took place prior to the interviews in order to gath-er information about the adaptability tactics implement-ed and formulate questions depending on each case. The interviews were divided in two parts, the qualitative and quantitative. The qualitative part provided insights on ad-aptability related tactics, drivers, risks, and future expec-tations. The quantitative part focuses on enhancing the preliminary strategy, resulting in the addition of four new highly significant parameters (selection criteria). Despite the extensive length of the tables provided, all of the in-terviewees were engaged throughout the process and wanted to elaborate on each answer.
• Empirical research- InterviewsOverall, the interviews were proven to be an effective method of gathering the required information. Focusing on highly significant topics for the present and especially the future, the interviewees seemed to be interested by the subjects addressed and the interview process. This was reflected by the feedback provided, the duration of certain interviews and the willingness of some interview-ees to participate for a second time in order to evaluate the strategy developed. When interviewing actors who participated in projects they were involved in, one can expect that their answers might be biased. Despite the relatively small sample size –due to feasibility reasons- it was sufficient for this research, providing valuable insights from different perspectives, which were used to evaluate the literature findings and formulate new ones. Overall, considering the information collected, both the docu-mentary data and the interviews conducted were proven to be effective methods that addressed the objectives of the empirical research.
• Findings evaluation- InterviewsThe strategy developed in the paper was formulated by synthesizing the literature review with the interview find-ings. Considering the uniqueness of this thesis’ approach, in order to review the strategy, its validity and applicability two more interviews were conducted. This process was very crucial for ensuring that the strategy developed is clear for actors to understand and be able to implement.
8.0 Discussion
102 • 8.0 Discussion
© Ioannis Mexis, 2020
8.2 Discussion on research findings
In this research two categories of findings and conclusions were presented: the general findings based on the liter-ature review and empirical research, and the strategy de-veloped.
“The value of adaptability” strategy, is a tool created to stimulate the development of adaptable office buildings, by presenting tactics that can be implemented and assist actors such as real estate managers, developers, archi-tects and related engineers in understanding the value of adaptability for the owners and users of the space. Based on the literature, one of the main reasons for not imple-menting adaptability in construction is actors’ inability to understand its long-term and indirect value. On the con-trary to what was expected, the interviewees were able to identify the different forms of added value delivered by each adaptability tactic and agree to the majority of their answers. This indicates that when provided with the ap-propriate tools and guidance, actors can understand the concept of added value despite its subjective and com-plicated nature. Evaluating and enriching the preliminary strategy with the answers of the interviewees, resulted in a more comprehensive outcome.
Comparing the delivered strategy to the initial objec-tives which was the development of a strategy that would only illustrate the links between adaptability and added value (qualitative) - the end product was more thorough and concrete as it also includes four additional selection criteria (quantitative – significance, risk, impact & risk as-sessment, life expectancy). Based on literature one could suggest that the inclusion of costs as a distinct parameter –and not as part of the risks- could add value to the strat-egy. Though, Nicolaas commented on this proposal stat-ing that it would be very hard and complicated to include them as this would entail the initial investment, operation, maintenance and replacement costs, all of which will vary in time (Nicolaas, 2020-b).
Apart from the positive aspects of the strategy devel-oped, the author has identified some potential complica-tions. Although the strategy is intended to be used by dif-ferent actors, professionals who are not experienced with the concepts addressed might require time and further assistance in order to effectively implement the strategy. Acknowledging this potential matter, an additional book-let (Part B) has been created which explains thoroughly everything one needs to know in order to apply the strat-egy.
In addition to the strategy developed, the qualitative findings from the interview questions also provided valu-able input on the topics of adaptability and added value. These findings either confirmed the literature (e.g. 6.2.2 Development process & users), enhanced it (e.g. 6.2.8 The future of adaptability) or were unprecedented (e.g. 6.2.10 BREEAM). The diversity, significance of the findings, both from the table and interviews analysis, add value to the thesis and create opportunities for further research, re-flecting the success of the research methods adopted.
For feasibility reasons, both the number of cases studies and interviews that could be conducted were restricted. Therefore, studying cases whose nature was not identi-cal, and interviewing actors from both the demand and supply side was important in order to gain insights from a larger spectrum. As a result the projects selected were both public and private, as well as new built and rede-velopment cases, enriching the research findings with di-verse and valuable input.
The findings from both the literature review and the em-pirical research indicate the rising significance of adapt-ability, reflecting the value of this research for the present and especially the future. Though as discussed by the ma-jority of interviewees, we are still only in the beginning of the transition. Aligned with one of the thesis findings (6.2.9 Crisis), the unanticipated impact of coronavirus for our society, the work environment (e.g. the “1.5 Meter Dutch Economy” - 1.5m distance between desks) and the potential crisis that this will lead to, makes this thesis even more relevant (Kraaijenbrink, 2020). The author’s predic-tion for the future, is that the real estate field and espe-cially the workplace strategies implemented will have to be reconsidered and become more responsive and resil-ient to rapid and unanticipated changes. This could po-tentially accelerate the shift towards adaptability.
Finally, the interviewees’ positive feedback on the strate-gy reflect its importance and that this topic can be further explored by future researchers inspired by this topic and with the ambition to contribute to a significant societal matter. Being the first attempt of illustrating the benefits and added value of adaptability, this thesis and the strate-gy developed, constitute additional tools which have the capacity to stimulate actors’ interest and contribute to the shift towards a more adaptable and sustainable built en-vironment.
• 103 Addressing the mismatch
© Ioannis Mexis, 2020

8.3 Research limitation
The timeframe that this thesis had to be completed in, posed some limitations to the process followed and find-ings of the research. “The value of adaptability” strate-gy constitutes a tool, which was developed based on the context of the Netherlands. Although the long-term in-tention of the strategy is to be implemented in different geographical settings too, actors would need to take into account the location that the research was conducted in, as some components of the strategy may vary.
On the same line, focusing on the validity of the findings, increasing the amount of cases analysed could result in a more effective strategy. Though taking into account that this is the first scientific attempt of creating such strategy and the aforementioned constraint can justify this limita-tion. In addition, despite the small amount of cases stud-ied, the similarities noticed in the interviewees’ answers reflect the validity of the findings.
The projects analysed in the case studies were recently completed and therefore, at the time the research was conducted no major redevelopments/ changes had taken place. Therefore the buildings’ actual adaptive capacity could not be thoroughly evaluated. Due to the dynamic character of the environment and eventually the construc-tion field, studying older cases could provide outdated results that would not be valuable for this research. Ac-knowledging this limitation, the case of “Rijnstraat 8” was investigated, providing input on existing buildings’ capacity to change and important factors that need to be taken into account.
Considering the pace the world is changing, the strategy would need to be updated every few years as certain tac-tics such as technology related ones would at some point become outdated. Consequently, one can understand that “The value of adaptability” does not entail a fixed strategy but comparably to its title, a strategy that needs to be adapted to match the contemporary methods used in the construction industry.
8.4 Recommendations for practice
From the research conducted, two types of recommen-dations are proposed: strategy related and general ones. “The value of adaptability” is a strategy which as men-tioned earlier can be used by real estate managers, devel-opers, consultants, architects and related engineers, as-sisting them in the development of adaptable buildings. Following the implementation plan provided (6.4 Imple-mentation plan) is not enough for achieving successful results.
As buildings are created to accommodate users’ opera-tions, involving the actual users of the space from early design stages is important to understand the need and create efficient buildings. Considering the constant con-textual changes, it is likely that users’ demands will have changed by the time the building is completed. There-fore, users’ should be actively involved in the project’s li-fecycle until the construction phase.
Legal parameters have a significant role in the construc-tion industry. All tactics constituting the thesis’ strategy are highly dependent on the regulation of the country, province or area the building is developed. Consequent-ly, the implementers are obliged to consider the legal re-strictions of the project’s exact location when applying the strategy.
As mentioned earlier, it is important to emphasise that when implementing the strategy, or in general develop-ing adaptable real estate, especially the long-lasting lay-ers such as location selection, should be future-proof as they highly impact building’s technical lifecycle. On the same line, investing in quality and creating buildings that respond well to their occupiers’ demands, then users will love them, care for them and eventually will last longer; highlighting ones again the significance of users in the concept of adaptability.
Finally, in order for the shift towards adaptability to take place, actors need to develop a future-oriented mind-set focusing on the long-term benefits. Within the context of the Netherlands, where sustainability is highly valued, market actors can take advantage of this mentality and accelerate this transition.
104 • 8.0 Discussion
© Ioannis Mexis, 2020

8.5 Recommendations for further research
The strategy developed in this thesis constitutes the first attempt of linking adaptability with the different forms of added value. Therefore, one can expect that there is still room for enhancing the strategy and expand the research to related topics.
The strategy created indicates whether there is a link or not between the presented tactics and the different forms of added value. This could be more elaborate by indi-cating the magnitude of the link (low, medium, high). In addition, although the financial aspect of adaptability is very complicated, finding an effective way to include costs in the strategy, could strengthen it and make it more ap-pealing to the market, especially to actors who are mainly concerned with monetary matters. Including these two suggestions in the proposal, or any others that researches consider as valuable could enhance the strategy and sup-port the decision-making process.
The strategy was mainly based on qualitative data, there-fore only six interviewees and three case studies were conducted. By increasing the number of samples and cases investigated, along with a more quantitative ap-proach could provide more precise results, increasing the validity of the strategy. On the same line, considering the amount of different professions participating in construc-tion projects and the actors that can use this strategy, this research could be expanded to capture the perspective of different professions. For example, interviewing the users could provide input about their view on the value of adaptability in their work and wellbeing. In addition, expanding the research in other countries, could indicate if the geographical context impacts actors’ perception on adaptability and if any changes are required in order to apply the strategy in different environments.
As presented in the research findings, both from the liter-ature and the interviewees, developers’ short-term objec-tives are a major boundary of adaptability. Conducting a qualitative research on their perspective on adaptability and sustainability, could provide insights on this problem that researchers could use in order to address.
The relation between technology and adaptability was one of the research findings that was not addressed at all in literature. Considering the increasing significance and presence of technology in our world, this could be a very interesting topic to explore.
“According to Van Eyck, you should not draw a circle with a compass, but with a dish. After all, in the first case, the com-
pass points in the centre of the circle creates a cross that breaks the circle into segments. With the saucer you can ap-proach the perimeter of the circle and
the space within the circle is full of pos-sibilities, options and future. For Bakker, that’s what architecture is about: creat-
ing potential.”(Tilman, 2015)
“.. Volgens Van Eyck moet je een cirkel niet met een passer, maar met een scho-tel tekenen. Immers in het eerste geval ontstaat door de passerpunt in het mid-den van de cirkel een kruis dat de cirkel doet uiteenvallen in segmenten. Met de
schotel kun je de omtrek van de cirkel be-naderen en is de ruimte binnen de cirkel vol mogelijkheden, opties en toekomst. Voor Bakker is dat waar architectuur over
gaat: het creëren van potenties.”
• 105 Addressing the mismatch
© Ioannis Mexis, 2020

9.0 References
© Ioannis Mexis, 2020
• Anker Jensen, P., J.M. van der Voordt, T., Coenen, C. & Sarasoja, A. (2014), Reflecting on future research concern-ing the added value of FM, Facilities, Vol. 32 No. 13/14, pp. 856-870. https://doi.org/10.1108/F-09-2012-0070
• Appel Meulenbroek, R., Groenen, P. & Janssen, I. (2011), An end user’s perspective on activity based office con-cepts, Journal of Corporate Real Estate, Vol. 13 No. 2, pp. 122-135. https://doi.org/10.1108/14630011111136830
• Archdaily (2015). Timmerhuis/ OMA. Retrieved February 9, 2020, from: https://www.archdaily.com/778654/timmer-huis-oma?ad_source=search&ad_medium=search_re-sult_projects
• Archdaily (2016). The Edge / PLP Architecture. Re-trieved February 9, 2020, from: https://www.archdaily.com/785967/the-edge-plp-architecture
• Archdaily (2017). RIJNSTRAAT 8 / Ellen van Loon / OMA. Retrieved February 9, 2020, from: https://www.arch-daily.com/882822/rijnstraat-8-ellen-van-loon-oma?ad_source=search&ad_medium=search_result_projects
• Archello (n.d.-a). ARC16: Timmerhuis. Retrieved February 9, 2020, from: https://archello.com/project/timmerhuis
• Archello (n.d.-c). The Edge. Retrieved February 9, 2020, from: httgs://archello.com/groject/the-edge
• Arge, K. (2005), Adaptable office buildings: theory and practice, Facilities, Vol. 23 No. 3/4, pp. 119-127. https://doi.org/10.1108/02632770510578494
• Aytac, D. O., Arslan, T. V. & Durak, S. (2016). Adaptive reuse as a strategy towards urban resilience. European Journal of Sustainable Development, 5(4), pp. 523-532.
• B. Kerkhoff (personal communication, March 06, 2020)• B. Nicolaas (personal communication, April 30, 2020-b)• B. Nicolaas (personal communication, March 13, 2020-a)• Bakker, R (2014, July). Ron Bakker talks about sustainable
building. TEDx Amsterdam, Amsterdam, Netherlands. Retrieved March 5, 2020, from: https://www.greenho-megnome.com/ron-bakker-sustainable-building/
• Bakker, R. & Zwaan, E. (2015, June). Question & answers. Presented at Green Buildings 2015, Prague, Czech Re-public. Retrieved March 5, 2020, from: https://www.you-tube.com/watch?v=xyTGvmCS1oI
• Bakker, R. (2015, June). Introduction of a unique building THE EDGE. Presented at Green Buildings 2015, Prague, Czech Republic. Retrieved March 5, 2020, from: https://www.youtube.com/watch?v=xyTGvmCS1oI
• Batbileg, B., Fritzsche, D. & Lequeux, J. (2018) A strategic approach to real estate management. Inside magazine, (18), pp. 136-141
• Baum, A. (1994), Quality and Property Performance, Jour-nal of Property Valuation and Investment, Vol. 12 No. 1, pp. 31-46. https://doi.org/10.1108/14635789410050494
• Blakstad, S. H. (2001). A Strategic Approach to Adaptabil-ity in Office Buildings, Trondheim: Doktor Ingeniør The-sis, Norwegian University of Science and Technology Fac-ulty of Architecture, Planning and Fine Arts Department of Building Technology.
• Blyth, A. & Worthington, J. (2010), Managing the brief for better design, 2nd edition, Spon Press, Abingdon.
• BMIAA, (2015). OMA’s Timmerhuis: municipal offices and Museum Rotterdam. Retrieved February 9, 2020, from: https://www.bmiaa.com/omas-timmerhuis-municipal-of-
fices-and-museum-rotterdam/• Bouwinvest. (2018), The playing field for real estate inves-
tors in the Netherlands; Trends and development on the Dutch real estate market 2019-2021. Retrieved 04 Septem-ber 2019 from: https://www.bouwinvest.com/media/3991/bouwinvest_trends-and-developments-dutch-real-es-tate-market-2019-2021.pdf
• Brand, S. (1994), How Buildings Learn; What Happens af-ter They’re Built, Viking, New York, NY.
• BREEAM (n.d.). The Edge, Amsterdam. Retrieved Febru-ary 9, 2020, from: https://www.breeam.com/case-studies/offices/the-edge-amsterdam/
• Bryman, A. (2016). Social Research Methods (5th ed.). London: Oxford University Press.
• Build Up (2017). The Edge: Amsterdam office building with highest BREEAM score to date. Retrieved Febru-ary 9, 2020, from: https://www.buildup.eu/en/practices/cases/edge-amsterdam-office-building-highest-breeam-score-date.
• Coyle, G (2005). Qualitative and quantitative modelling in system dynamics: some research questions: Systems dynamic review, 16 (3) Fall, 225-244.
• Creswell, J.W. & Miller, D.L., (2000). Determining validity in qualitative inquiry. Theory into Practice, 39(3), pp. 124-131.
• De Architect (2015). The Edge. Retrieved February 9, 2020, from: https://www.dearchitect.nl/projecten/the-edge
• De Architect, (2016). ARC16: Timmerhuis - OMA. Re-trieved February 9, 2020, from: https://www.dearchitect.nl/projecten/arc16-timmerhuis-oma
• De Jonge, H., Arkesteijn, M.H., Den Heijer, A.C., Vande Putte, H.J.M., De Vries, J.C., & Van der Zwart, J. (2009). Designing an accommodation strategy (DAS frame). Delft, the Netherlands: Delft University of Technology.
• De Vries, J., de Jonge, H. & van der Voordt, T. (2008), Im-pact of real estate interventions on organisational perfor-mance, Journal of Corporate Real Estate, Vol. 10 No. 3, pp. 208-223. https://doi.org/10.1108/14630010810922094
• De Wilde, A. (2018). Klachten over interieur Rijnstraat 8 in Den Haag door OMA. Retrieved February 9, 2020, from: https://www.dearchitect.nl/interieur/artikel/2018/06/klachten-over-interieur-rijnstraat-8-in-den-haag-door-oma-101192350
• Deloitte. (2019). A constructive view on real estate, Real estate prediction 2019. Retrieved 05 September 2019 from: https://www2.deloitte.com/content/dam/Deloitte/global/Documents/gx-nl-fsi-real-estate-rep19-full-report.pdf
• Den Heijer, A. (2011). Managing the university campus- information to support real estate decisions, PhD thesis, Eburon Academic Publishers, Delft.
• Dewulf, G. P. M. R., Krumm, P. J. M. M., & de Jonge, H. (2000). Successful corporate real estate strategies. Nieu-wegein: Arko Publishers.
• Duffy, F. (1998), Design for Change: The Architecture of DEGW, Birkha¨user, Basel.
• Eisenhardt, K. (1989), Building theories from case study research, Academy of Management Review, Arko Pub-lishers, Nieuwegein, Vol. 14 No. 4, pp. 532-550.
9.0 References
• 107 Addressing the mismatch
© Ioannis Mexis, 2020
• Engel, A., Browning, T.R. (2008). Designing systems for adaptability by means of architecture options. Systems Engineering, 11(2), pp. 125-146. https://doi.org.tudelft.idm.oclc.org/10.1002/sys.20090
• Estaji, H., (2017). A Review of Flexibility and Adaptability in Housing Design. The New Arch – International Journal of Contemporary Architecture; 4:37-49.
• Finch, E. (2009). Flexibility as a design aspiration: The fa-cilities management perspective. Ambiente Construido 9 (2): 7
• Frearson, A. (2015). OMA completes pixellated Timmer-huis complex in Rotterdam. Retrieved February 9, 2020, from: https://www.dezeen.com/2015/12/10/oma-pixellat-ed-timmerhuis-complex-rotterdam-netherlands/
• Garofalo, F. (n.d.). On “the Edge” of sustainability. Re-trieved February 9, 2020, from: https://www.lifegate.com/people/lifestyle/the-edge-amsterdam-most-sustaina-ble-building
• Geltner, D., Miller, N. G., Clayton, J., & Eichholtz, P. (2001). Commercial real estate analysis and investments. (Vol. 1):Cincinnati, OH: South-western
• Geltner, D.M., Miller, N.G., Clayton J. & Eichholtz, P. (2007). Commercial real estate, Analysis & investments (2nd ed). Mason, Ohio : Thompson South-Western.
• Geraedts, R. P. (2016). FLEX 4.0: A Practical Instrument to Assess the Adaptive Capacity of Buildings. In Energy Procedia (Vol. 96, pp. 568-579) https://doi.org/10.1016/j.egypro.2016.09.102
• Geraedts, R. P., van der Voordt, T., & Remøy, H. (2017). Conversion Meter: A new tool to assess the conversion potential of vacant office buildings into housing. In Pro-ceedings of the International Conference on Advances on Sustainable Cities and Buildings Development (SB-LAB 2017) Green Lines Institute for Sustainable Develop-ment.
• Geraedts, R.P & Van der Voordt, T. (2007) A tool to meas-ure opportunities and risks of converting empty offices into dwellings. ENHR Rotterdam 2007. Rotterdam.
• Geraedts, R.P. (2008). Design for Change; Flexibility key performance indicators. 1st International I3CON Con-ference. T. Hassan. Loughborough, UK, Loughborough University.
• Geraedts, R.P. (2009), Future value of buildings, Confer-ence: 3rd CIB International Conference on Smart and Sustainable Built Environments SASBE2009
• Geraedts, R.P., Remøy, H.T., Hermans M.H. & Van Rijn, E. (2014a) Adaptive capacity of buildings; A determination method to promote flexible and sustainable construc-tion. in UIA2014: 25th International Union of Architects World Congress “Architecture other where”, Durban, South Africa, 3- 7 August 2014.
• Geraedts, RP., & van der Voordt, T.J.M. (2003). Good buildings drive out bad buildings. In JIA. Beisi (Ed.),Dense living urban structures volume 2 (pp. 1-10). Hong Kong: Department of Architecture, the university ofHong Kong
• Gibler, M.K., & Lindholm, A.L., (2012). A test of corporate real estate strategies and operating decisions in support of core business strategies, Journal of Property Research, 29:1, 25-48, DOI: 10.1080/09599916.2011.608470
• Gibler, M.K., Black, R.T. & Moon, K.P. (2002). Time, Place, Space, Technology and Corporate Real Estate Strategy, Journal of Real Estate Research, American Real Estate Society, vol. 24(3), pages 235-262.
• Gibson, V. (2000), Property portfolio dynamics: the flexible management of inflexible assets, Facilities, Vol. 18 No. 3/4, pp. 150-154. https://doi.org/10.1108/02632770010315715
• Gibson, V. (2001), In search of flexibility in corporate real es-tate portfolios, Journal of Corporate Real Estate, Vol. 3 No. 1, pp. 38-45. https://doi.org/10.1108/14630010110811472
• Gibson, V. (2003), Flexible working needs flexible space?. Journal of Property Investment & Finance, Vol. 21 No. 1, pp. 12-22. https://doi.org/10.1108/14635780310468275
• Giele, M. (2017). Update: Verslag Projectbezoek Rijn-straat 8 met OMA. Retrieved February 9, 2020, from: https://www.dearchitect.nl/architectuur/nieuws/2017/05/verslag-projectbezoek-rijnstraat-8-met-oma-101172347
• Gijsbers, R., & Lichtenberg, J. J. N. (2012). Comparison of adaptability measures in building design - CSA Meth-od: Functionally effective and technically efficient design founded on (future) user demands. In Proceedings of the12th International Conference on Design & Decision Support Systems in Architecture and Urban Planning
• Gordon, A. (1974), Architects and resource conservation, RIBA Journal, January, pp. 9-12.
• Gosling, J., Naim, M., Sassi, P., Iosif, L., Lark, R. (2008). Flexible buildings for an adaptable and sustainable fu-ture, Cardiff, United Kingdom: Cardiff University
• Graham, P. (2005), Design for adaptability- an introduc-tion to the principles and basic strategies. The royal Aus-tralian Institute of Architect, GEN66
• Habraken, N. J. (2008) Design for flexibility. Building Re-search & Information 36 (3), pp. 290- 296.
• Habraken, N.J. (1972), Support an Alternative to Mass Housing, Architectural Press, London.
• Harris, R. & Cooke, H. (2019), Understanding organiza-tional culture through the lens of corporate real estate strategies, Strategic Direction, Vol. 35 No. 2, pp. 19-21. https://doi.org/10.1108/SD-11-2018-0223
• Harris, R. (2015), The changing nature of the workplace and the future of office space, Journal of Property Invest-ment & Finance, Vol. 33 No. 5, pp. 424-435.
• Haynes, B. (2012), Corporate real estate asset manage-ment: Aligned vision, Journal of Corporate Real Estate, Vol. 14 No. 4, pp. 286-302.
• Hermans, M., Geraedts, R.P., Van Rijn, E. & Remøy, H.T. (2014b). Determination Method Adaptive Capacity of Building to Promote Flexible Building; Bepalingsmeth-ode Adaptief Vermogen van gebouwen ter bevordering van flexibel bouwen. Leidschendam: Brink Groep.
• Hoepfl, M.C., 1997. Choosing qualitative research: A primer for technology education researchers. Journal of Technology Education, 9(1), pp. 47-63.
• Interviewee I. (personal communication, March 22, 2020)• Iselin, D.G. & Lemer, A.C. (Editors), (1993). The fourth
dimension in building: Strategies for minimizing obso-lescence. Building Research Board. National Academy Press, Washington D.C., USA.
108 • 9.0 References
© Ioannis Mexis, 2020
• Jalia, A., Bakker, R. & Ramage, M (2014).The Edge, Am-sterdam; Showcasing an exemplary IoT building. Re-trieved February 9, 2020, from: https://www.cdbb.cam.ac.uk/system/files/documents/TheEdge_Paper_LOW1.pdf
• Jensen, P.A., Nielsen, K. & Nielsen, S.B. (2008), Facilities Management Best Practice in the Nordic Countries – 36 cases, Centre for Facilities Management – Realdania Re-search, DTU Management Engineering, Technical Univer-sity of Denmark.
• Jensen, P.A., Sarasoja, A.L., Van der Voordt, T. & Coenen, C. (2013) How can Facilities Management add value to organisations as well as to society? In Jensen, P.A. (ed.), Proceedings of the CIB FM Conference Using facilities in an open world. Creating value for all stakeholders. Co-penhagen, 21-23 May 2014
• Joroff, M.L., Louargand, M., Lambert, S. & Becker. F. (1993), Strategic Management of the Fifth Resource. Re-port no. 49. Industrial Development Research Founda-tion.
• Julistiono E. K., Hosana, N., Liemansetyo F. & Wijaya I. F. (2017). Spatial and structural aspects of an adaptable building. Journal of Architecture and Built Environment, Vol. 44, No. 1, July 2017, 87-94
• Jylhä, T., Remøy, H., & Arkesteijn, M. (2019). Identification of changed paradigms in CRE research: a systematic liter-ature review 2005-2015. Journal of Corporate Real Estate, 21(1), 2-18. https://doi.org/10.1108/JCRE-07-2017-0020
• Khanna, C., Van der Voordt, T. & Koppels, P. (2013), Cor-porate real estate mirrors brand: a conceptual framework and practical applications, Journal of Corporate Real Es-tate, Vol. 15 No. 3/4, pp. 213-230. https://doi.org/10.1108/JCRE-01-2013-0003
• Kincain, D. (2002). Adapting buildings for changing uses. In: Guidelines for change of use refurbishments. London: Taylor & Francis Group.
• Kirk, S.J. & Dell’ Isola, A.J. (1995). Life cycle costing for design professionals. 2nd ed. New York, USA: McGrew Hill Book Company.
• Koppels, P.W., Remøy, H., de Jonge, H. & Weterings, A. (2009). The Added Value of Image: A Hedonic Office Rent Analysis, ERES eres2009_242, European Real Estate Soci-ety (ERES).
• Kraaijenbrink (2020), The Dutch Answer To COVID-19: The ‘1.5 Meter Economy’, Retrieved 11 May 2020 from: https://www.forbes.com/sites/jeroenkraaijen-brink/2020/04/14/the-dutch-answer-to-covid-19-the-15-meter-economy/#4e5e0dda4627
• Kwon, M., Remøy, H. & Van Den Dobbelsteen, A. (2019), User-focused office renovation: a review into user sat-isfaction and the potential for improvement, Property Management, Vol. 37 No. 4, pp. 470-489. https://doi.org/10.1108/PM-04-2018-0026
• Langston, C., Wong, F.K.W., Hui, E.C.M.& Shen, L.-Y. (2008). Strategic assessment of building adaptive re-use opportunities in Hong Kong. Build. Environ. 43 (10), 1709e1718.
• Leaman, A. & Bordass, B. (2004) Flexibility and adaptabil-ity, in Macmillan, S., Designing better buildings, Taylor & Francis, Abingdon, pp. 145-156.
• Leupen, B. (2006), Frame and Generic Space, 010 Pub-lishers, Rotterdam.
• Lindholm, A. L., Gibler, K. M., & Levainen, K. I. (2006). Modelling the value-adding attributes of real estate to the wealth maximization of the firm. Journal of Real Es-tate Research, 28(4), 443-475.
• Lindholm, A. & Leväinen, K. (2006), A framework for iden-tifying and measuring value added by corporate real es-tate, Journal of Corporate Real Estate, Vol. 8 No. 1, pp. 38-46. https://doi.org/10.1108/14630010610664796
• Lindholm, A. (2008a), A constructive study on creating core business relevant CREM strategy and performance measures, Facilities, Vol. 26 No. 7/8, pp. 343-358. https://doi.org/10.1108/02632770810877976
• Lindholm, A., & Gibler, K. M. (2005). Measuring the Add-ed Value of Corporate Real Estate Management – Be-yond Cost Minimization 12, (Hinks 2004), 1–18
• Lindholm, A.L. (2008b), Identifying and measuring the success of corporate real estate management. Doctoral Dissertation, Helsinki University of Technology.
• Loizou, P. and French, N. (2012), Risk and uncertainty in development: A critical evaluation of using the Monte Carlo simulation method as a decision tool in real estate development projects, Journal of Property Investment & Finance, Vol. 30 No. 2, pp. 198-210. https://doi.org.tudelft.idm.oclc.org/10.1108/14635781211206922
• Macmillan, S., (2006). Added value of good design, Building Research & Information, 34:3, 257-271, DOI: 10.1080/09613210600590074
• Macozoma S.D., (2002), Understanding the Concept of Flexibility in Design for Deconstruction, In: Design for Deconstruction and Materials Reuse, Chini A.R., Schult-mann F. (Eds.), CIB Publication 272, Proceedings of the CIB Task Group 39 – Deconstruction Meeting, 9 April 2002, Karlsruhe, Germany, 119-128, On line at: http://www.irbnet.de/daten/iconda/CIB947.pdf.
• Manewa, A. (2012). Economic considerations for adapt-ability in buildings. S.I.: Loughborough University
• Manewa, A., Pasquire, C., Gibb, A., Ross, A. & Siriwarde-na, M. (2013). Adaptable buildings: Striving towards a sustainable future. RMIT University, Melbourne, Australia: Global Cities Research Institute, 6-7
• Manganelli, B. (2015). Real Estate Investing. Switzerland: Springer International Publishing.
• Mapiq. (n.d.). The Edge Amsterdam. Retrieved February 9, 2020, from: https://www.mapiq.com/cases/deloitte/
• Metz, T. (2016). The Edge; The Next Wave: A smart build-ing raises the bar for technology, innovation, and sustain-ability. Retrieved February 25, 2020 from: https://www.architecturalrecord.com/articles/11804-the-edge
• Muldoon-Smith, K. (2017) Situations Vacant: A conceptual framework for commercial real estate. Delft, The Nether-lands, 24th Annual European Society (ERES) Conference.
• Nakib, F. (2010). Proceedings of the CIB 2010 World Con-gress ”Building a Better World”, Salford Quays, United Kingdom.
• Nase, I. & Arkesteijn, M. (2018), Corporate real estate strategies and organizational culture, Journal of Corpo-rate Real Estate, Vol. 20 No. 3, pp. 154-176. https://doi.org/10.1108/JCRE-10-2017-0035.
• 109 Addressing the mismatch
© Ioannis Mexis, 2020

• Newton, N. (2010), The use of semistructured interviews in qualitative research: strengths and weaknesses, Re-trieved 05 January 2020 from: https://www.academia.edu/1561689/The_use_of_semi-structured_interviews_in_qualitative_research_strengths_and_weaknesses
• OMA (n.d.-a). Rijnstraat 8. Retrieved February 9, 2020, from: https://oma.eu/projects/rijnstraat-8
• OMA (n.d.-b). Timmerhuis. Retrieved February 9, 2020, from: https://oma.eu/projects/timmerhuis
• O’Neill, M. (2010), A model of environmental control and effective work, Facilities, Vol. 28 No. 3/4, pp. 118-136. https://doi.org/10.1108/02632771011023104
• OVG Real Estate (2014). Case Study Edge. Retrieved February 12, 2020, from: https://www.breeam.nl/sites/breeam.nl/files/bijlagen/The%20Edge%20-%2029-NOP-2010%20Case%20Study.pdf
• Petrulaitiene, V. & Jylhä, T. (2015), The perceived value of workplace concepts for organisations, Journal of Corpo-rate Real Estate, Vol. 17 No. 4, pp. 260-281. https://doi.org/10.1108/JCRE-06-2015-0014
• Pinder, J., Schmidt III, R., Austin, S., Gibb, A. & Saker, J. (2017). What is meant by adaptability in buildings?. Facil-ities, 35 (1/2), pp. 2-20.
• PLP Architecture (n.d.). The Edge Amsterdam, The Neth-erlands. Retrieved February 9, 2020, from: http://www.plparchitecture.com/the-edge.html
• Poort Centraal (n.d.). The Building. Retrieved February 9, 2020, from: https://poortcentraal.nl/gebouw/
• PWC. (2018), Emerging trends in Real Estate; Reshap-ing the future, Europe 2018. Retrieved 05 September, 2019 from: https://www.pwc.com/gx/en/industries/finan-cial-services/asset-management/emerging-trends-re-al-estate/europe-2018.html
• PWC. (2019), Emerging trends in Real Estate; Reshap-ing the future, Europe 2018. Retrieved 05 September, 2019 from: https://www.pwc.com/gx/en/industries/finan-cial-services/asset-management/emerging-trends-re-al-estate/europe-2019.html
• R. Bakker (personal communication, February 26, 2020)• Randall, T. (2015). The smartest building in the world,
Inside the connected future of architecture. Retrieved February 9, 2020, from: https://www.bloomberg.com/fea-tures/2015-the-edge-the-worlds-greenest-building/
• Remøy, H. & Van der Voordt, T. J. M. (2007a). A new life - conversion of vacant office buildings into housing. Facil-ities, 25(3/4): 88-103.
• Remøy, H. & van der Voordt, T.J.M. (2009) Sustainability by adaptable and functionally neutral buildings. In: M. Verhoeven, M. Fremouw (Eds.). SASBE ‘09; 3rd CIB In-ternational Conference on Smart and Sustainable Built Environments, June 15-19, 2009, Delft, The Netherlands: 150 blz.
• Remøy, H. & van der Voordt, T.J.M. (2014). Adaptive re-use of office buildings into housing: Opportunities and risks. Building Research and Information: the internation-al journal of research, development and demonstration, 42(3), 381-390. https://doi.org/10.1080/09613218.2014.865922
• Remøy, H. & Wilkinson, S. J. (2012). Office building con-version and sustainable adaptation: A comparative study, Property Management, 30(3), 218-231.
• Remøy, H. (2010) Out of Office: A study on the cause of office vacancy and transformation as a means to cope and prevent, s.I.: IOS Press. PHD. TU Delft
• Remøy, H. (2016). Vacancy and adaptive reuse. In M. Ark-esteijn, T. van der Voordt, H. Remoy, & Y. Chen (Eds.), Dear is Durable: Liber Amicorum for Hans de Jonge. (pp. 215-221). Delft: TU Delft Open.
• Remøy, H. & van der Voordt, T.J.M. (2014), Priorities in accommodating office user preferences: impact on office users decision to stay or go, Journal of Corporate Real Es-tate, Vol. 16 No. 2, pp. 140-154. https://doi.org/10.1108/JCRE-09-2013-0029
• Remøy, H., & van der Voordt, T.J.M. (2006). A new life: Transformation of vacant office buildings intohousing. In T. I. Haugen, A. Moum, & J. Brochner (Eds.), Proceedings Trondheim international symposium(pp. 425-434). Trond-heim: NTNU, Fac. of Architecture and Fine Art.
• Remøy, H., Koppels, P.W., Van Oel, C. & De Jonge, H. (2007). Characteristics of vacant offices: A Delphi-ap-proach. In ENHR Rotterdam 2007 conference proceed-ings. Rotterdam, TU Delft.
• Remøy, H., de Jong, P. & Schenk, W. (2011), Adaptable office buildings, Property Management, Vol. 29 No. 5, pp. 443-453. https://doi.org/10.1108/02637471111178128
• Remøy, H., Rovers, S. & Nase, I. (2019), Disposal strate-gies in corporate real estate portfolios, Journal of Corpo-rate Real Estate, Vol. 21 No. 2, pp. 113-129. https://doi.org/10.1108/JCRE-10-2017-0041
• Rijksvastgoedrijf (2017-a). Rijkskantoor Rijnstraat 8 in Den Haag geopend. Retrieved February 9, 2020, from: https://www.rijksvastgoedbedrijf.nl/actueel/nieuws/2017/11/01/rijkskantoor-rijnstraat-8-in-den-haag-geopend
• Rijksvastgoedrijf (n.d.). Den Haag, Rijnstraat 8. Retrieved February 9, 2020, from: https://www.rijksvastgoedbedrijf.nl/vastgoed/vastgoed-in-beheer/den-haag-rijnstraat-8
• Riratanaphong, C., van der Voordt, T.J.M. & Sarasoja, A.L. (2012). Performance measurement in the context of CREM and FM. In PA. Jensen, DJM. van der Voordt, & C. Coenen (Eds.), The added value of facilities manage-ment: Concepts, findings and perspectives (pp. 123-145). Lyngby: Polyteknisk Forlag
• S. Simon (personal communication, February 23, 2020)• Saari, A., & Heikkilä, P. (2008). Building flexibility manage-
ment. The Open Construction and Building Technology Journal, 2, 239-242.
• Sadafi, N., Zain, M. F.M., & Jamil, M. (2014). Design cri-teria for increasing building flexibility: Dynamics and prospects. Environmental Engineering and Management Journal, 13(2), 407-417.
• Saunders, M., Lewis, P. & Thornhill, A. (2007). Research methods for business students. 4th edn. UK: Pearson Ed-ucation Ltd.
• Schmidt III, R. & Austin, S.A. (2016), Adaptable architec-ture: theory and practice. London; New York: Routledge, Taylor & Francis Group
110 • 9.0 References
© Ioannis Mexis, 2020
• Schmidt III, R. (2014). Designing for Adaptability in Archi-tecture (Doctoral dissertation). Loughborough, England: Loughborough University, School of Civil and Building Engineering
• Schmidt III, R. Eguchi, T. Austin, S. Gibb, A. (2009). Adapt-able futures: A 21st century challenge, Paper presented at Changing Roles - New Roles; New Challenges, Noord-wijk AAN ZEE, The Netherlands
• Schmidt III, R., Austin, S.A. & Brown, D. (2009) Designing adaptable buildings. 11th International DSM Conference, Greenville, South Carolina, 12-13 October 2009
• Schmidt III, R., Eguchi, T., Austin, S. & Gibb, A. (2010). What is the meaning of Adaptability in the building in-dustry?, 16th International Conference on “Open and Sustainable Building”, May 17-19 2010, Bilbao, Spain
• Schneider, T. & Till, J. (2005), Flexible housing: opportu-nities and limits, Architectural Research Quarterly, Vol. 9 No. 2, pp. 157-166.
• Schneider, T. & Till, J. (2007). Flexible Housing. 1st edn. Oxford: Elsevier Ltd.
• Scuderi, G. (2019). Designing flexibility and adaptability: The answer to integrated residential building retrofit. De-partment of Civil Engineering, HZ University of Applied Sciences: Designs 2019, 3(1), 3; https://doi.org/10.3390/designs3010003
• Singer, B., Bossink, B. & Vande Putte, H. (2007), Corpo-rate real estate and competitive strategy, Journal of Cor-porate Real Estate, Vol. 9 No. 1, pp. 25-38. https://doi.org/10.1108/14630010710742464
• Slaughter, E.S. (2001) Design strategies to increase build-ing flexibility, Building Research & Information, 29:3, 208-217, DOI: 10.1080/09613210010027693
• Stevens, P. (2015). OMA’s mixed-use Timmerhuis opens in Rotterdam. Retrieved February 9, 2020, from: https://www.designboom.com/architecture/oma-timmerhuis-rotterdam-city-hall-mixed-use-reinier-de-graaf-rem-kool-haas-10-20-2015/
• Taylor, S. S., Fisher, D. & Dufresne, R.L., (2002), The aes-thetic of management storytelling: a key to organization-al learning, Management Learning, 33:3, 313 30.
• Tilman (September, 2015). Perfecte cirkel Kantoorge-bouw The Edge, Amsterdam door PLP Architecture en Fokkema & Partners Architecten. De Architect, pp.67-79
• Van der Voordt, T. J. M. (2016) The Delft legacy of Add-ing Value by CREM, Dear is Durable: Liber Amicorum for Hans de Jonge. (pp. 215-221). Delft: TU Delft Open.
• Voncken (personal communication, March 03, 2020)• Voordt, T. & Jensen, P. (2018), Measurement and bench-
marking of workplace performance, Journal of Corpo-rate Real Estate, Vol. 20 No. 3, pp. 177-195. https://doi.org/10.1108/JCRE-10-2017-0032
• Wielaard (personal communication, March 12, 2020-a)• Wielaard (personal communication, March 20, 2020-b)• Wilkinson, S. J., & Reed, R. (2011). Examining and quan-
tifying the drivers behind alterations and extensions to commercial buildings in a central business district. Con-struction Management & Economics 29:7, 725-735 ISSN: 01446193.
• Wilkinson, S.J. & Remøy, H. (2011). Sustainability and within use office building adaptations: a comparison of Dutch and Australian practices, in Pacific Rim Real Estate Conference, January 16–19, 2011, Gold Coast, Australia.
• World Economic Forum (2017). The Edge. Retrieved Feb-ruary 12, 2020, from: https://futureofconstruction.org/case/the-edge/
• Yin, R.K. (1989), Case Study Research: Design and Meth-ods, Newbury Park, Sage.
• Yin, R.K. (2009). Case study research: Design and meth-ods (4th ed.). Thousand Oaks, CA: Sage Publications.
• Zwaan, E. (2015, June). Computer with a roof. Presented at Green Buildings 2015, Prague, Czech Republic. Re-trieved March 5, 2020, from: https://www.youtube.com/watch?v=xyTGvmCS1oI
• 111 Addressing the mismatch
© Ioannis Mexis, 2020

© Ioannis Mexis, 2020

10.0 Appendix A
© Ioannis Mexis, 2020
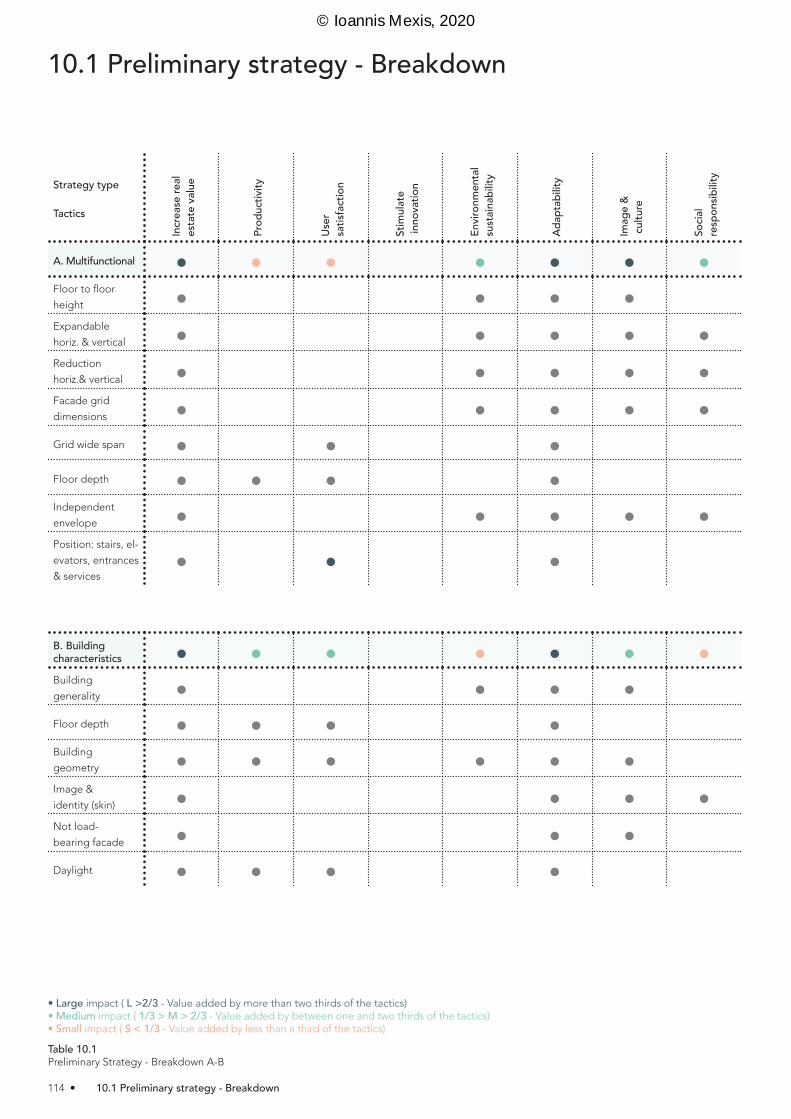
Table 10.1Preliminary Strategy - Breakdown A-B
B. Building characteristics • • • • • • •Building
generality • • • •Floor depth • • • •Building
geometry • • • • • •Image &
identity (skin) • • • •Not load-
bearing facade • • •Daylight • • • •
Strategy type
Tactics
Incr
ease
real
esta
te va
lue
Prod
uctiv
ity
User
sa
tisfa
ctio
n
Stim
ulate
inno
vatio
n
Envir
onm
enta
l su
stain
abilit
y
Adap
tabi
lity
Imag
e &
cultu
re
Socia
l re
spon
sibilit
y
A. Multifunctional • • • • • • •Floor to floor
height • • • •Expandable
horiz. & vertical • • • • •Reduction
horiz.& vertical • • • • •Facade grid
dimensions • • • • •Grid wide span • • •Floor depth • • • •Independent
envelope • • • • •Position: stairs, el-
evators, entrances
& services• • •
• Large impact ( L >2/3 - Value added by more than two thirds of the tactics)• Medium impact ( 1/3 > M > 2/3 - Value added by between one and two thirds of the tactics)• Small impact ( S < 1/3 - Value added by less than a third of the tactics)
10.1 Preliminary strategy - Breakdown
114 • 10.1 Preliminary strategy - Breakdown
© Ioannis Mexis, 2020
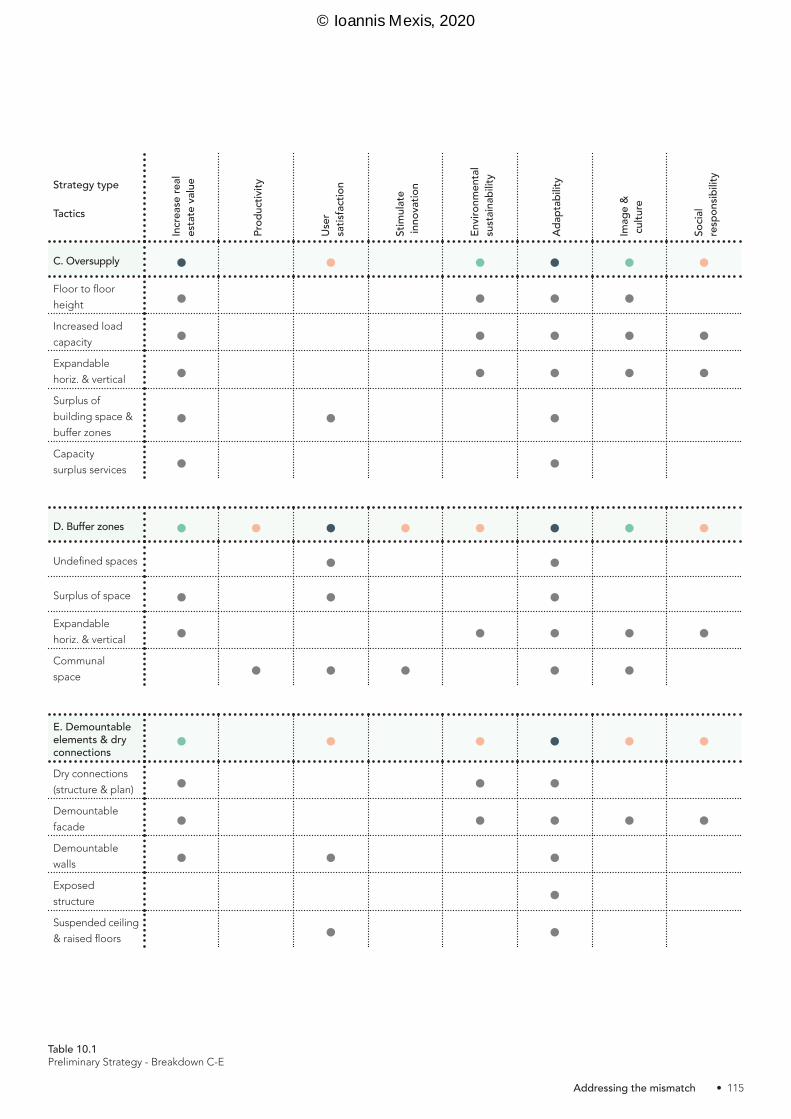
D. Buffer zones • • • • • • • •Undefined spaces • •Surplus of space • • •Expandable
horiz. & vertical • • • • •Communal
space • • • • •
Table 10.1Preliminary Strategy - Breakdown C-E
E. Demountable elements & dry connections • • • • • •Dry connections
(structure & plan) • • •Demountable
facade • • • • •Demountable
walls • • •Exposed
structure •Suspended ceiling
& raised floors • •
Strategy type
Tactics
Incr
ease
real
esta
te va
lue
Prod
uctiv
ity
User
sa
tisfa
ctio
n
Stim
ulate
inno
vatio
n
Envir
onm
enta
l su
stain
abilit
y
Adap
tabi
lity
Imag
e &
cultu
re
Socia
l re
spon
sibilit
y
C. Oversupply • • • • • •Floor to floor
height • • • •Increased load
capacity • • • • •Expandable
horiz. & vertical • • • • •Surplus of
building space &
buffer zones• • •
Capacity
surplus services • •
• 115 Addressing the mismatch
© Ioannis Mexis, 2020
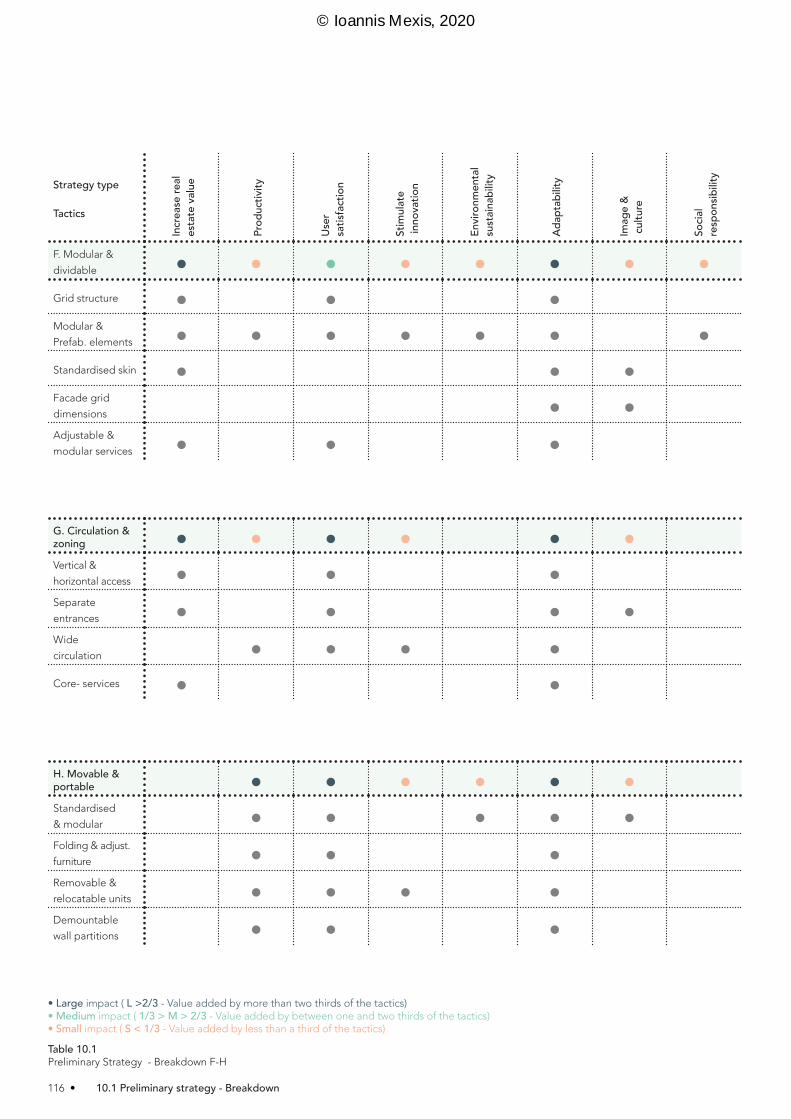
Table 10.1Preliminary Strategy - Breakdown F-H
G. Circulation & zoning • • • • • •Vertical &
horizontal access • • •Separate
entrances • • • •Wide
circulation • • • •Core- services • •
Strategy type
Tactics
Incr
ease
real
esta
te va
lue
Prod
uctiv
ity
User
sa
tisfa
ctio
n
Stim
ulate
inno
vatio
n
Envir
onm
enta
l su
stain
abilit
y
Adap
tabi
lity
Imag
e &
cultu
re
Socia
l re
spon
sibilit
y
F. Modular &
dividable • • • • • • • •Grid structure • • •Modular &
Prefab. elements • • • • • • •Standardised skin • • •Facade grid
dimensions • •Adjustable &
modular services • • •
H. Movable & portable • • • • • •Standardised
& modular • • • • •Folding & adjust.
furniture • • •Removable &
relocatable units • • • •Demountable
wall partitions • • •
• Large impact ( L >2/3 - Value added by more than two thirds of the tactics)• Medium impact ( 1/3 > M > 2/3 - Value added by between one and two thirds of the tactics)• Small impact ( S < 1/3 - Value added by less than a third of the tactics)
116 • 10.1 Preliminary strategy - Breakdown
© Ioannis Mexis, 2020
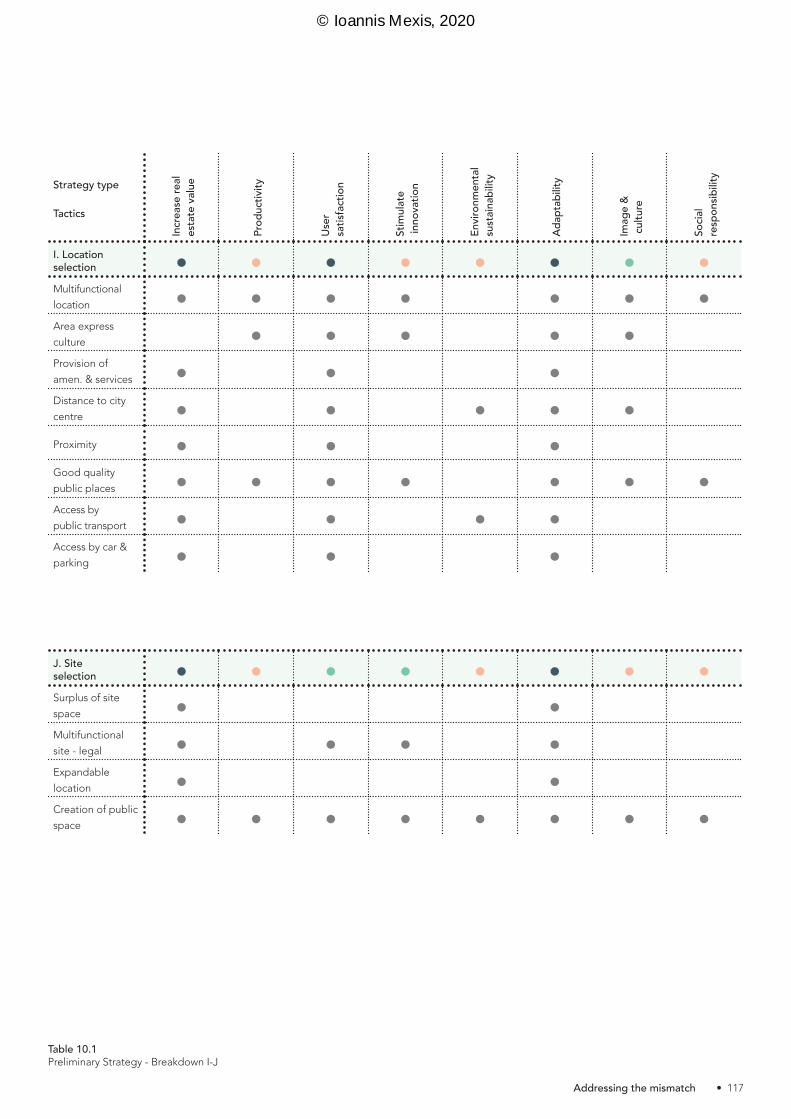
Table 10.1Preliminary Strategy - Breakdown I-J
Strategy type
Tactics
Incr
ease
real
esta
te va
lue
Prod
uctiv
ity
User
sa
tisfa
ctio
n
Stim
ulate
inno
vatio
n
Envir
onm
enta
l su
stain
abilit
y
Adap
tabi
lity
Imag
e &
cultu
re
Socia
l re
spon
sibilit
y
I. Location selection • • • • • • • •Multifunctional
location • • • • • • •Area express
culture • • • • •Provision of
amen. & services • • •Distance to city
centre • • • • •Proximity • • •Good quality
public places • • • • • • •Access by
public transport • • • •Access by car &
parking • • •
J. Site selection • • • • • • • •Surplus of site
space • •Multifunctional
site - legal • • • •Expandable
location • •Creation of public
space • • • • • • • •
• 117 Addressing the mismatch
© Ioannis Mexis, 2020

Table 10.2Adaptability Tactics implementation A-E
• Applied• Partially applied impact (value added by half of the tactics)
Strategy type
TacticsApplication
A. Multifunctional Timm Rijn. 8 Edge
Floor to floor
height • • •Expandable
horiz. & vertical • • •Reduction
horiz.& vertical • • •Facade grid
dimensions • • •Grid wide span • • •Floor depth • • •Independent
envelope • • •Position: stairs, el-
evators, entrances
& services• • •
B. Building characteristics Timm Rijn. 8 Edge
Building
generality • • •Floor depth • • •Building
geometry • • •Image &
identity (skin) • • •Not load-
bearing facade • • •Daylight • • •
Strategy type
TacticsApplication
C. Oversupply Timm Rijn. 8 Edge
Floor to floor
height • • •Increased load
capacity • •Expandable
horiz. & vertical • • •Surplus of
building space &
buffer zones• • •
Capacity
surplus services • •
D. Buffer zones Timm Rijn. 8 Edge
Undefined spaces • • •Surplus of space • •Expandable
horiz. & vertical • • •Communal
space • • •
E. Demountable elements & dry connections
Timm Rijn. 8 Edge
Dry connections
(structure & plan) • • •Demountable
facade • • •Demountable
walls • • •Exposed
structure • • •Suspended ceiling
& raised floors • • •
10.2 Interview analysis - Tactics implementation
118 • 10.2 Interview analysis - Tactics implementation
© Ioannis Mexis, 2020

Strategy type
TacticsApplication
F. Modular & dividable Timm Rijn. 8 Edge
Grid structure • • •Modular &
Prefab. elements • • •Standardised skin • • •Facade grid
dimensions • • •Adjustable &
modular services • • •
G. Circulation & zoning Timm Rijn. 8 Edge
Vertical &
horizontal access • • •Separate
entrances • • •Wide
circulation • • •Core- services • • •
H. Movable & portable Timm Rijn. 8 Edge
Standardised
& modular • • •Folding & adjust.
furniture • • •Removable &
relocatable units • • •Demountable
wall partitions • • •
Strategy type
TacticsApplication
I. Location selection Timm Rijn. 8 Edge
Multifunctional
location • • •Area express
culture • • •Provision of
amen. & services • • •Distance to city
centre • • •Proximity • • •Good quality
public places • • •Access by
public transport • • •Access by car &
parking • • •
J. Site selection Timm Rijn. 8 Edge
Surplus of site
space •Multifunctional
site - legal • • •Expandable
location
Creation of public
space • • •
K. Technology Timm Rijn. 8 Edge
App - Lights,
CO2, temperature •App - Workplace •Localization •
Table 10.2Adaptability Tactics implementation F-K
• 119 Addressing the mismatch
© Ioannis Mexis, 2020
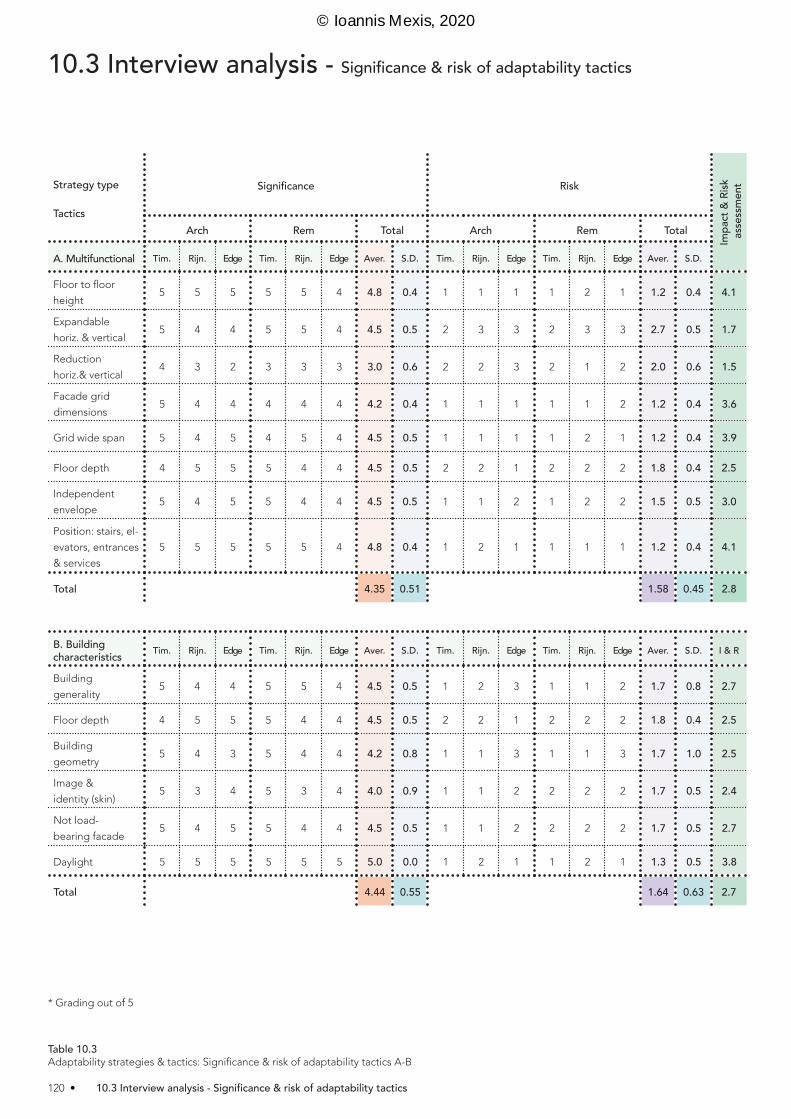
Strategy type
Tactics
Significance Risk
Impa
ct &
Risk
asse
ssm
ent
Arch Rem Total Arch Rem Total
A. Multifunctional Tim. Rijn. Edge Tim. Rijn. Edge Aver. S.D. Tim. Rijn. Edge Tim. Rijn. Edge Aver. S.D.
Floor to floor
height5 5 5 5 5 4 4.8 0.4 1 1 1 1 2 1 1.2 0.4 4.1
Expandable
horiz. & vertical5 4 4 5 5 4 4.5 0.5 2 3 3 2 3 3 2.7 0.5 1.7
Reduction
horiz.& vertical4 3 2 3 3 3 3.0 0.6 2 2 3 2 1 2 2.0 0.6 1.5
Facade grid
dimensions5 4 4 4 4 4 4.2 0.4 1 1 1 1 1 2 1.2 0.4 3.6
Grid wide span 5 4 5 4 5 4 4.5 0.5 1 1 1 1 2 1 1.2 0.4 3.9
Floor depth 4 5 5 5 4 4 4.5 0.5 2 2 1 2 2 2 1.8 0.4 2.5
Independent
envelope5 4 5 5 4 4 4.5 0.5 1 1 2 1 2 2 1.5 0.5 3.0
Position: stairs, el-
evators, entrances
& services
5 5 5 5 5 4 4.8 0.4 1 2 1 1 1 1 1.2 0.4 4.1
Total 4.35 0.51 1.58 0.45 2.8
B. Building characteristics Tim. Rijn. Edge Tim. Rijn. Edge Aver. S.D. Tim. Rijn. Edge Tim. Rijn. Edge Aver. S.D. I & R
Building
generality5 4 4 5 5 4 4.5 0.5 1 2 3 1 1 2 1.7 0.8 2.7
Floor depth 4 5 5 5 4 4 4.5 0.5 2 2 1 2 2 2 1.8 0.4 2.5
Building
geometry5 4 3 5 4 4 4.2 0.8 1 1 3 1 1 3 1.7 1.0 2.5
Image &
identity (skin)5 3 4 5 3 4 4.0 0.9 1 1 2 2 2 2 1.7 0.5 2.4
Not load-
bearing facade5 4 5 5 4 4 4.5 0.5 1 1 2 2 2 2 1.7 0.5 2.7
Daylight 5 5 5 5 5 5 5.0 0.0 1 2 1 1 2 1 1.3 0.5 3.8
Total 4.44 0.55 1.64 0.63 2.7
Table 10.3Adaptability strategies & tactics: Significance & risk of adaptability tactics A-B
* Grading out of 5
10.3 Interview analysis - Significance & risk of adaptability tactics
120 • 10.3 Interview analysis - Significance & risk of adaptability tactics
© Ioannis Mexis, 2020
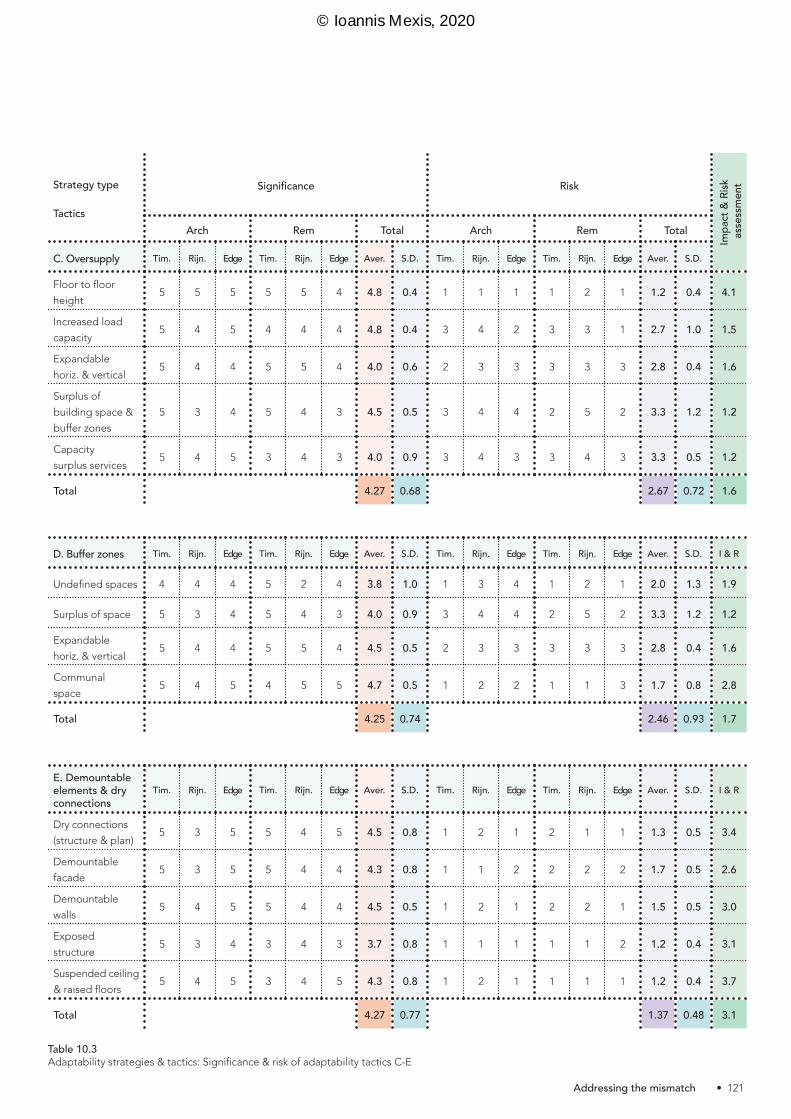
Strategy type
Tactics
Significance Risk
Impa
ct &
Risk
asse
ssm
ent
Arch Rem Total Arch Rem Total
C. Oversupply Tim. Rijn. Edge Tim. Rijn. Edge Aver. S.D. Tim. Rijn. Edge Tim. Rijn. Edge Aver. S.D.
Floor to floor
height5 5 5 5 5 4 4.8 0.4 1 1 1 1 2 1 1.2 0.4 4.1
Increased load
capacity5 4 5 4 4 4 4.8 0.4 3 4 2 3 3 1 2.7 1.0 1.5
Expandable
horiz. & vertical5 4 4 5 5 4 4.0 0.6 2 3 3 3 3 3 2.8 0.4 1.6
Surplus of
building space &
buffer zones
5 3 4 5 4 3 4.5 0.5 3 4 4 2 5 2 3.3 1.2 1.2
Capacity
surplus services5 4 5 3 4 3 4.0 0.9 3 4 3 3 4 3 3.3 0.5 1.2
Total 4.27 0.68 2.67 0.72 1.6
E. Demountable elements & dry connections
Tim. Rijn. Edge Tim. Rijn. Edge Aver. S.D. Tim. Rijn. Edge Tim. Rijn. Edge Aver. S.D. I & R
Dry connections
(structure & plan)5 3 5 5 4 5 4.5 0.8 1 2 1 2 1 1 1.3 0.5 3.4
Demountable
facade5 3 5 5 4 4 4.3 0.8 1 1 2 2 2 2 1.7 0.5 2.6
Demountable
walls5 4 5 5 4 4 4.5 0.5 1 2 1 2 2 1 1.5 0.5 3.0
Exposed
structure5 3 4 3 4 3 3.7 0.8 1 1 1 1 1 2 1.2 0.4 3.1
Suspended ceiling
& raised floors5 4 5 3 4 5 4.3 0.8 1 2 1 1 1 1 1.2 0.4 3.7
Total 4.27 0.77 1.37 0.48 3.1
D. Buffer zones Tim. Rijn. Edge Tim. Rijn. Edge Aver. S.D. Tim. Rijn. Edge Tim. Rijn. Edge Aver. S.D. I & R
Undefined spaces 4 4 4 5 2 4 3.8 1.0 1 3 4 1 2 1 2.0 1.3 1.9
Surplus of space 5 3 4 5 4 3 4.0 0.9 3 4 4 2 5 2 3.3 1.2 1.2
Expandable
horiz. & vertical5 4 4 5 5 4 4.5 0.5 2 3 3 3 3 3 2.8 0.4 1.6
Communal
space5 4 5 4 5 5 4.7 0.5 1 2 2 1 1 3 1.7 0.8 2.8
Total 4.25 0.74 2.46 0.93 1.7
Table 10.3Adaptability strategies & tactics: Significance & risk of adaptability tactics C-E
• 121 Addressing the mismatch
© Ioannis Mexis, 2020

Strategy type
Tactics
Significance Risk
Impa
ct &
Risk
asse
ssm
ent
Arch Rem Total Arch Rem Total
F. Modular & dividable Tim. Rijn. Edge Tim. Rijn. Edge Aver. S.D. Tim. Rijn. Edge Tim. Rijn. Edge Aver. S.D.
Grid structure 5 4 5 4 4 5 4.5 0.5 1 2 1 2 3 1 1.7 0.8 2.7
Modular &
Prefab. elements5 3 3 5 5 4 4.2 1.0 1 2 2 3 1 2 1.8 0.8 2.3
Standardised skin 5 3 3 5 3 5 4.0 1.1 1 2 1 2 3 2 1.8 0.8 2.2
Facade grid
dimensions5 4 3 4 4 4 4.0 0.6 1 1 1 2 2 1 1.3 0.5 3.0
Adjustable &
modular services5 4 3 5 4 4 4.2 0.8 1 1 3 1 2 2 1.8 0.8 2.3
Total 4.17 0.80 1.70 0.72 2.5
G. Circulation & zoning Tim. Rijn. Edge Tim. Rijn. Edge Aver. S.D. Tim. Rijn. Edge Tim. Rijn. Edge Aver. S.D. I & R
Vertical &
horizontal access5 4 5 5 5 5 4.8 0.4 1 2 1 1 2 2 1.5 0.5 3.2
Separate
entrances5 4 5 4 4 5 4.5 0.5 1 1 1 2 2 2 1.5 0.5 3.0
Wide
circulation4 4 5 5 4 5 4.5 0.5 1 2 2 2 1 3 1.8 0.8 2.5
Core- services 5 4 5 5 3 5 4.5 0.8 1 2 1 2 3 2 1.8 0.8 2.5
Total 4.58 0.59 1.67 0.65 2.8
H. Movable & portable Tim. Rijn. Edge Tim. Rijn. Edge Ave. S.D. Tim. Rijn. Edge Tim. Rijn. Edge Ave. S.D. I & R
Standardised
& modular5 3 5 5 4 5 4.5 0.8 1 2 1 2 1 2 1.5 0.5 3.0
Folding & adjust.
furniture4 3 5 3 4 5 4.0 0.9 1 2 2 1 1 1 1.3 0.5 3.0
Removable &
relocatable units5 4 5 5 5 5 4.8 0.4 1 2 2 2 1 2 1.7 0.5 2.9
Demountable
wall partitions5 4 5 5 4 5 4.7 0.5 1 2 1 1 2 1 1.3 0.5 3.5
Total 4.50 0.66 1.46 0.52 3.1
Table 10.3Adaptability strategies & tactics: Significance & risk of adaptability tactics F-H
122 • 10.3 Interview analysis - Significance & risk of adaptability tactics
© Ioannis Mexis, 2020

Strategy type
Tactics
Significance Risk
Impa
ct &
Risk
asse
ssm
ent
Arch Rem Total Arch Rem Total
I. Location selection Tim. Rijn. Edge Tim. Rijn. Edge Aver. S.D. Tim. Rijn. Edge Tim. Rijn. Edge Aver. S.D.
Multifunctional
location5 5 5 5 5 5 5.0 0.0 1 1 1 1 2 1 1.2 0.4 4.3
Area express
culture5 4 5 5 3 5 4.5 0.8 1 2 2 1 2 2 1.7 0.5 2.7
Provision of
amen. & services5 4 5 5 4 5 4.7 0.5 1 2 1 1 2 1 1.3 0.5 3.5
Distance to city
centre5 5 5 5 4 5 4.8 0.4 1 1 1 1 1 1 1.0 0.0 4.8
Proximity 5 5 5 5 5 5 5.0 0.0 1 1 1 1 1 1 1.0 0.0 5.0
Good quality
public places5 4 5 5 5 5 4.8 0.4 1 2 1 2 1 1 1.3 0.5 3.6
Access by
public transport5 5 5 5 5 5 5.0 0.0 1 1 2 1 1 2 1.3 0.5 3.8
Access by car &
parking5 4 5 3 4 5 4.3 0.8 1 1 3 1 3 3 2.0 1.1 2.2
Total 4.77 0.37 1.35 0.45 3.5
J. Site selection Tim. Rijn. Edge Tim. Rijn. Edge Aver. S.D. Tim. Rijn. Edge Tim. Rijn. Edge Aver. S.D. I & R
Surplus of site
space5 4 5 5 3 3 4.2 1.0 1 3 3 1 2 3 2.2 1.0 1.9
Multifunctional
site - legal5 4 5 5 5 3 4.5 0.8 1 1 2 2 1 1 1.3 0.5 3.4
Expandable
location4 4 5 5 4 3 4.2 0.8 1 1 1 1 1 1 1.0 0.0 4.2
Creation of public
space4 4 5 5 4 5 4.3 0.5 1 1 1 1 3 3 1.7 1.0 2.6
Total 4.29 0.77 1.54 0.63 2.8
K. Technology Tim. Rijn. Edge Tim. Rijn. Edge Aver. S.D. Tim. Rijn. Edge Tim. Rijn. Edge Aver. S.D. I & R
App - Lights,
CO2, temperature5 3 4.0 1.4 2 5 3.5 2.1 1.1
App - Workplace 5 3 4.0 1.4 2 3 2.5 0.7 1.6
Localization 5 3 4.0 1.4 2 5 3.5 2.1 1.1
Total 4.0 1.41 3.17 1.65 1.3
Table 10.3Adaptability strategies & tactics: Significance & risk of adaptability tactics I-K
• 123 Addressing the mismatch
© Ioannis Mexis, 2020
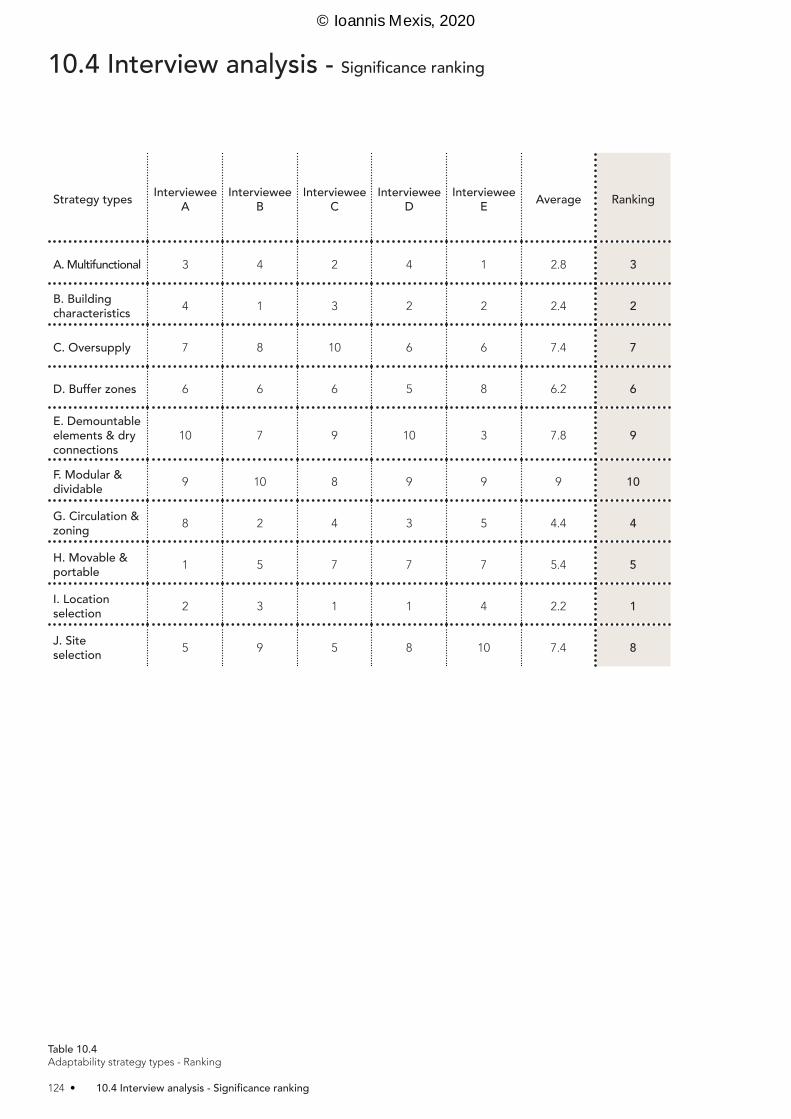
Strategy types IntervieweeA
IntervieweeB
IntervieweeC
IntervieweeD
IntervieweeE Average Ranking
A. Multifunctional 3 4 2 4 1 2.8 3
B. Building characteristics 4 1 3 2 2 2.4 2
C. Oversupply 7 8 10 6 6 7.4 7
D. Buffer zones 6 6 6 5 8 6.2 6
E. Demountable elements & dry connections
10 7 9 10 3 7.8 9
F. Modular & dividable 9 10 8 9 9 9 10
G. Circulation & zoning 8 2 4 3 5 4.4 4
H. Movable & portable 1 5 7 7 7 5.4 5
I. Location selection 2 3 1 1 4 2.2 1
J. Site selection 5 9 5 8 10 7.4 8
Table 10.4Adaptability strategy types - Ranking
10.4 Interview analysis - Significance ranking
124 • 10.4 Interview analysis - Significance ranking
© Ioannis Mexis, 2020

Table 10.5Results comparison, Significance - Risk - Impact & Risk assessment (10.3 - 10.4)
Strategy types Significance(11.3)
Risk *(11.3)
Impact & Risk assessment
(11.3)Ranking(11.4) Stand. Dev Average Final
Rank
A. Multifunctional 5 5 4 3 1.0 4.25 3
B. Building characteristics 4 6 7 2 2.2 4.75 4
C. Oversupply 7 10 10 7 1.7 8.50 9
D. Buffer zones 9 9 9 6 1.5 8.25 8
E. Demountable elements & dry connections
8 2 3 9 3.5 5.50 6
F. Modular & dividable 10 8 8 10 1.2 9.00 10
G. Circulation & zoning 2 7 6 4 2.2 4.75 5
H. Movable & portable 3 3 2 5 1.3 3.25 2
I. Location selection 1 1 1 1 0.0 1.00 1
J. Site selection 6 4 5 8 1.7 5.75 7
K. Technology 11 11 11 11 0.0 11 11
* The lowest risk is graded with 1 and highest with 11
10.5 Interview analysis - Results comparison ( Tables 10.3-10.4 )
• 125 Addressing the mismatch
© Ioannis Mexis, 2020

Table 10.6Added value of adaptability strategies & tactics A-B
B. Building characteristics • • • • • • • •Building
generality3 1 2 3 2 1
Floor depth 3 3 3 3
Building
geometry3 2 2 2 3 1
Image &
identity (skin)3 3 2 1
Not load-
bearing facade3 3 2
Daylight 3 3 3 2 1 3 1 1
Strategy type
Tactics
Incr
ease
real
esta
te va
lue
Prod
uctiv
ity
User
sa
tisfa
ctio
n
Stim
ulate
inno
vatio
n
Envir
onm
enta
l su
stain
abilit
y
Adap
tabi
lity
Imag
e &
cultu
re
Socia
l re
spon
sibilit
y
A. Multifunctional • • • • • • • •Floor to floor
height3 3 3 3 3 2
Expandable
horiz. & vertical3 2 3 1 2
Reduction
horiz.& vertical2 2 2 1 2
Facade grid
dimensions2 1 2 1 1
Grid wide span 3 2 3 1 3
Floor depth 3 3 3 1 3
Independent
envelope3 3 2 1
Position: stairs, el-
evators, entrances
& services
3 1 2 2 3
■ 1-3 Confirm - preliminary strategy■ 1-3 Additional■ 1-3 Not confirmed
• Large impact ( L >2/3 - Value added by more than two thirds of the tactics)• Medium impact ( 1/3 > M > 2/3 - Value added by between one and two thirds of the tactics)• Small impact ( S < 1/3 - Value added by less than a third of the tactics)
* Each number corresponds to link identified by one interviewee
10.6 Interview analysis - Added value of adaptability related strategies (REM)
126 • 10.6 Interview analysis - Added value of adaptability related strategies (REM)
© Ioannis Mexis, 2020
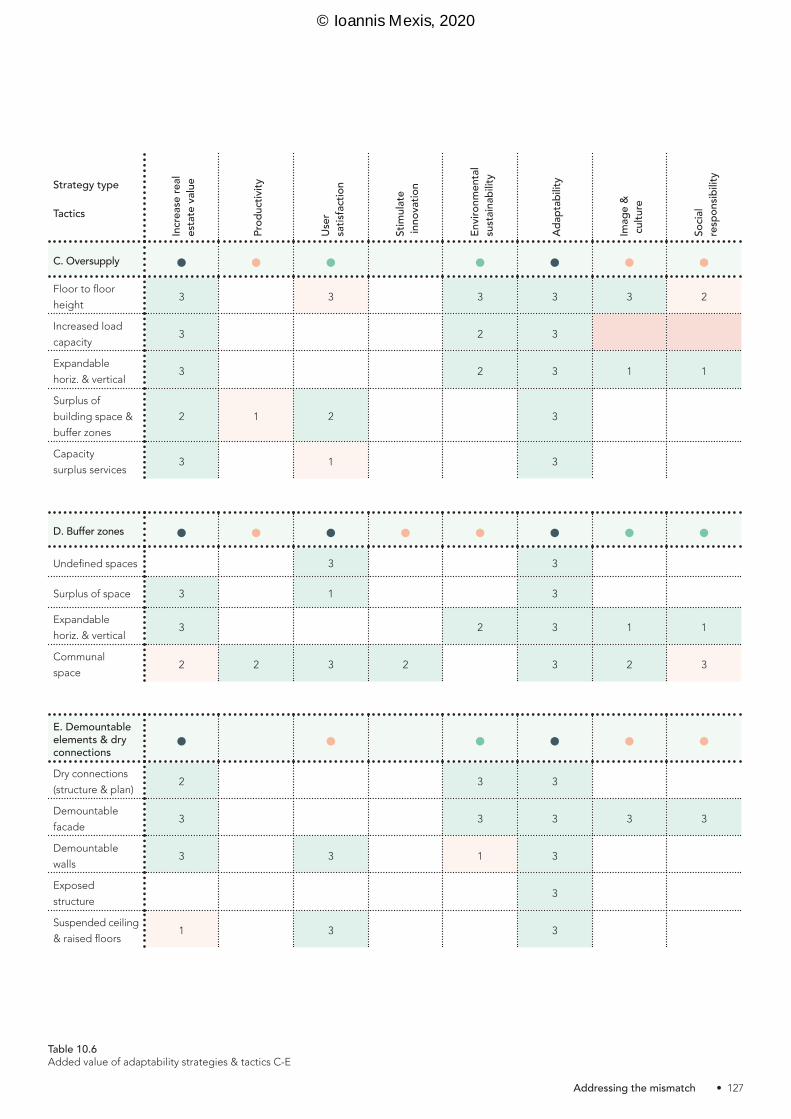
D. Buffer zones • • • • • • • •Undefined spaces 3 3
Surplus of space 3 1 3
Expandable
horiz. & vertical3 2 3 1 1
Communal
space2 2 3 2 3 2 3
Table 10.6Added value of adaptability strategies & tactics C-E
E. Demountable elements & dry connections • • • • • •Dry connections
(structure & plan)2 3 3
Demountable
facade3 3 3 3 3
Demountable
walls3 3 1 3
Exposed
structure3
Suspended ceiling
& raised floors1 3 3
Strategy type
Tactics
Incr
ease
real
esta
te va
lue
Prod
uctiv
ity
User
sa
tisfa
ctio
n
Stim
ulate
inno
vatio
n
Envir
onm
enta
l su
stain
abilit
y
Adap
tabi
lity
Imag
e &
cultu
re
Socia
l re
spon
sibilit
y
C. Oversupply • • • • • • •Floor to floor
height3 3 3 3 3 2
Increased load
capacity3 2 3
Expandable
horiz. & vertical3 2 3 1 1
Surplus of
building space &
buffer zones
2 1 2 3
Capacity
surplus services3 1 3
• 127 Addressing the mismatch
© Ioannis Mexis, 2020
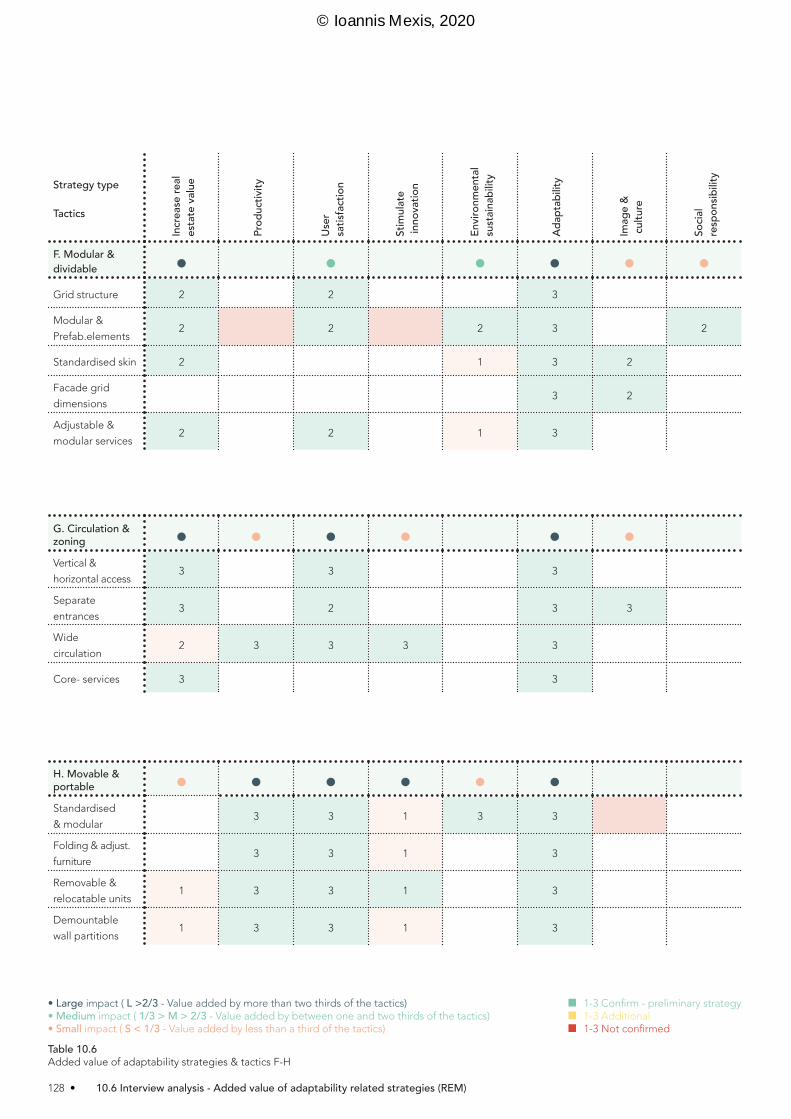
Table 10.6Added value of adaptability strategies & tactics F-H
G. Circulation & zoning • • • • • •Vertical &
horizontal access3 3 3
Separate
entrances3 2 3 3
Wide
circulation2 3 3 3 3
Core- services 3 3
Strategy type
Tactics
Incr
ease
real
esta
te va
lue
Prod
uctiv
ity
User
sa
tisfa
ctio
n
Stim
ulate
inno
vatio
n
Envir
onm
enta
l su
stain
abilit
y
Adap
tabi
lity
Imag
e &
cultu
re
Socia
l re
spon
sibilit
y
F. Modular & dividable • • • • • •Grid structure 2 2 3
Modular &
Prefab.elements2 2 2 3 2
Standardised skin 2 1 3 2
Facade grid
dimensions3 2
Adjustable &
modular services2 2 1 3
H. Movable & portable • • • • • •Standardised
& modular3 3 1 3 3
Folding & adjust.
furniture3 3 1 3
Removable &
relocatable units1 3 3 1 3
Demountable
wall partitions1 3 3 1 3
• Large impact ( L >2/3 - Value added by more than two thirds of the tactics)• Medium impact ( 1/3 > M > 2/3 - Value added by between one and two thirds of the tactics)• Small impact ( S < 1/3 - Value added by less than a third of the tactics)
■ 1-3 Confirm - preliminary strategy■ 1-3 Additional■ 1-3 Not confirmed
128 • 10.6 Interview analysis - Added value of adaptability related strategies (REM)
© Ioannis Mexis, 2020
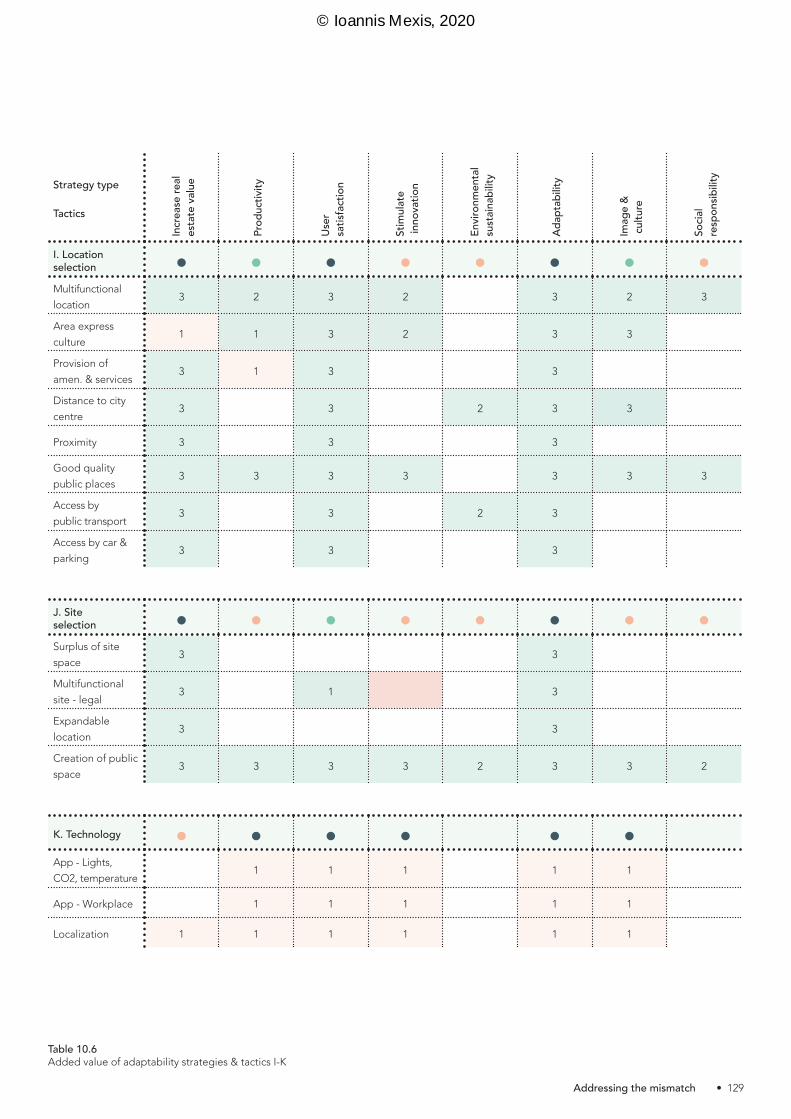
Table 10.6Added value of adaptability strategies & tactics I-K
Strategy type
Tactics
Incr
ease
real
esta
te va
lue
Prod
uctiv
ity
User
sa
tisfa
ctio
n
Stim
ulate
inno
vatio
n
Envir
onm
enta
l su
stain
abilit
y
Adap
tabi
lity
Imag
e &
cultu
re
Socia
l re
spon
sibilit
y
I. Location selection • • • • • • • •Multifunctional
location3 2 3 2 3 2 3
Area express
culture1 1 3 2 3 3
Provision of
amen. & services3 1 3 3
Distance to city
centre3 3 2 3 3
Proximity 3 3 3
Good quality
public places3 3 3 3 3 3 3
Access by
public transport3 3 2 3
Access by car &
parking3 3 3
J. Site selection • • • • • • • •Surplus of site
space3 3
Multifunctional
site - legal3 1 3
Expandable
location3 3
Creation of public
space3 3 3 3 2 3 3 2
K. Technology • • • • • •App - Lights,
CO2, temperature1 1 1 1 1
App - Workplace 1 1 1 1 1
Localization 1 1 1 1 1 1
• 129 Addressing the mismatch
© Ioannis Mexis, 2020
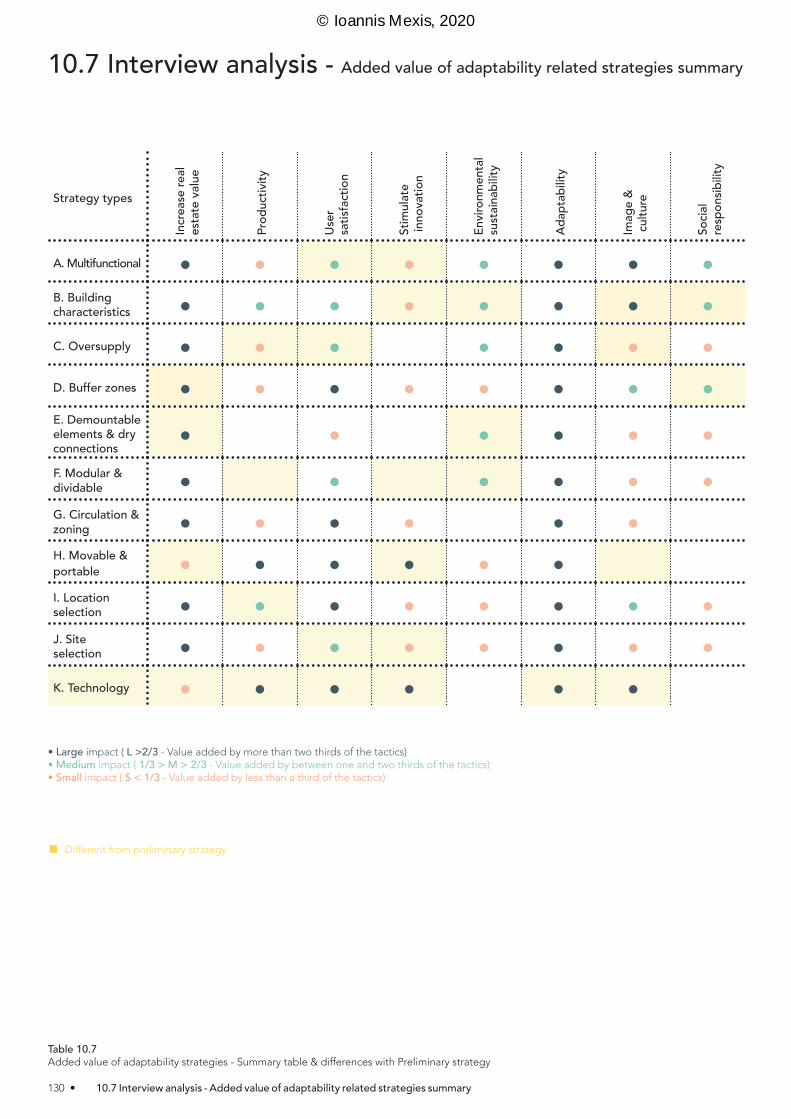
Strategy typesIn
crea
se re
al es
tate
value
Prod
uctiv
ity
User
sa
tisfa
ctio
n
Stim
ulate
inno
vatio
n
Envir
onm
enta
l su
stain
abilit
y
Adap
tabi
lity
Imag
e &
cultu
re
Socia
l re
spon
sibilit
y
A. Multifunctional • • • • • • • •B. Building characteristics • • • • • • • •C. Oversupply • • • • • • •D. Buffer zones • • • • • • • •E. Demountable elements & dry connections • • • • • •F. Modular & dividable • • • • • •G. Circulation & zoning • • • • • •H. Movable & portable • • • • • •I. Location selection • • • • • • • •J. Site selection • • • • • • • •K. Technology • • • • • •
• Large impact ( L >2/3 - Value added by more than two thirds of the tactics)• Medium impact ( 1/3 > M > 2/3 - Value added by between one and two thirds of the tactics)• Small impact ( S < 1/3 - Value added by less than a third of the tactics)
Table 10.7Added value of adaptability strategies - Summary table & differences with Preliminary strategy
■ Different from preliminary strategy
10.7 Interview analysis - Added value of adaptability related strategies summary
130 • 10.7 Interview analysis - Added value of adaptability related strategies summary
© Ioannis Mexis, 2020
• 131 Addressing the mismatch
© Ioannis Mexis, 2020

• Large impact (value added by more than half of the tactics)• Medium impact (value added by less than half of the tactics)• Small impact (value added by half of the tactics)
Table 10.8Added value of adaptability strategies (Architects)
Strategy typesIn
crea
se re
al es
tate
value
Prod
uctiv
ity
User
sa
tisfa
ctio
n
Stim
ulate
inno
vatio
n
Envir
onm
enta
l su
stain
abilit
y
Adap
tabi
lity
Imag
e &
cultu
re
Socia
l re
spon
sibilit
y
A. Multifunctional 7 3 5 3 6 9 7 4
B. Building characteristics 7 4 6 3 5 8 7 2
C. Oversupply 7 2 4 9 1 2
D. Buffer zones 7 3 7 6 2 7 2 2
E. Demountable elements & dry connections
5 2 6 9 3 1
F. Modular & dividable 7 4 4 7 2 1
G. Circulation & zoning 8 3 4 3 7 3
H. Movable & portable 3 7 8 6 3 7 2 2
I. Location selection 8 4 7 2 6 9 6 3
J. Site selection 9 2 6 3 4 7 3 3
K. Technology 2 3 3 2 2 3 2
* Grading out of 9 ** K. Technology graded out of 3
10.8 Interview analysis - Added value of adaptability related strategies
132 • 10.8 Interview analysis - Added value of adaptability related strategies
© Ioannis Mexis, 2020

Table 10.8 BAdded value of adaptability strategies (Architects) -Differences with preliminary strategy
Strategy typesIn
crea
se re
al es
tate
value
Prod
uctiv
ity
User
sa
tisfa
ctio
n
Stim
ulate
inno
vatio
n
Envir
onm
enta
l su
stain
abilit
y
Adap
tabi
lity
Imag
e &
cultu
re
Socia
l re
spon
sibilit
y
A. Multifunctional • • • • • • • •B. Building characteristics • • • • • • • •C. Oversupply • • • • • •D. Buffer zones • • • • • • • •E. Demountable elements & dry connections • • • • • •F. Modular & dividable • • • • • •G. Circulation & zoning • • • • • •H. Movable & portable • • • • • • • •I. Location selection • • • • • • • •J. Site selection • • • • • • • •K. Technology • • • • • • •
• Large impact ( L > 6 - Graded with more than 6)• Medium impact ( 6 ≥ M ≥ 4 - Graded between 4 and 6)• Small impact ( 3 > S - Graded with less than 3)
■ Different from preliminary strategy
• 133 Addressing the mismatch
© Ioannis Mexis, 2020

Strategy typesIn
crea
se re
al es
tate
value
Prod
uctiv
ity
User
sa
tisfa
ctio
n
Stim
ulate
inno
vatio
n
Envir
onm
enta
l su
stain
abilit
y
Adap
tabi
lity
Imag
e &
cultu
re
Socia
l re
spon
sibilit
y
A. Multifunctional • • • • • • • •B. Building characteristics • • • • • • • •C. Oversupply • • • • • •D. Buffer zones • • • • • • • •E. Demountable elements & dry connections • • • • • •F. Modular & dividable • • • • • •G. Circulation & zoning • • • • • •H. Movable & portable • • • • • • •I. Location selection • • • • • • • •J. Site selection • • • • • • • •K. Technology • • • • • •
• Large impact ( L >2/3 - Value added by more than two thirds of the tactics)• Medium impact ( 1/3 > M > 2/3 - Value added by between one and two thirds of the tactics)• Small impact ( S < 1/3 - Value added by less than a third of the tactics)
■ Change in the Preliminary strategy based on the findings from the Real estate managers & Architects interviews (11.6 & 11.7)■ Changes in the Preliminary strategy based on the findings from the Real estate managers interviews (11.6)
Table 10.9Developing the final strategy
10.9 Interview analysis - Developing the final strategy
134 • 10.9 Interview analysis - Developing the final strategy
© Ioannis Mexis, 2020
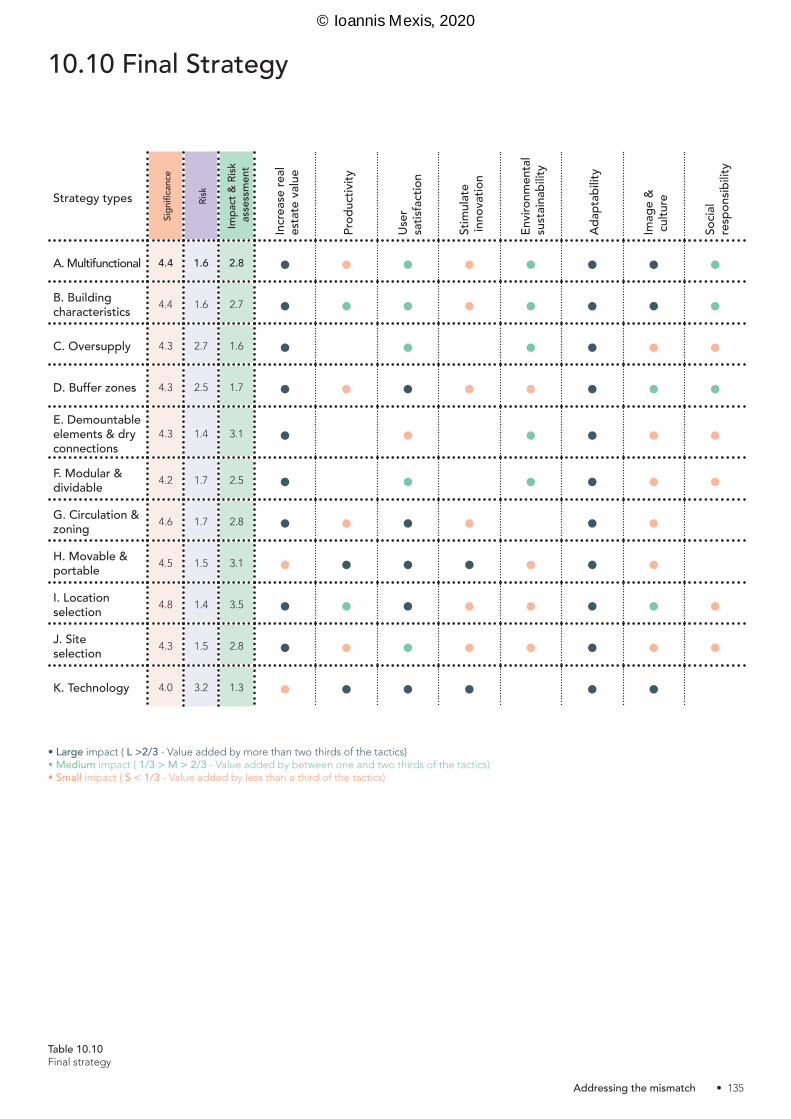
• Large impact ( L >2/3 - Value added by more than two thirds of the tactics)• Medium impact ( 1/3 > M > 2/3 - Value added by between one and two thirds of the tactics)• Small impact ( S < 1/3 - Value added by less than a third of the tactics)
Table 10.10Final strategy
Strategy types
Signifi
canc
e
Risk
Impa
ct &
Risk
asse
ssm
ent
Incr
ease
real
esta
te va
lue
Prod
uctiv
ity
User
sa
tisfa
ctio
n
Stim
ulate
inno
vatio
n
Envir
onm
enta
l su
stain
abilit
y
Adap
tabi
lity
Imag
e &
cultu
re
Socia
l re
spon
sibilit
y
A. Multifunctional 4.4 1.6 2.8 • • • • • • • •B. Building characteristics 4.4 1.6 2.7 • • • • • • • •C. Oversupply 4.3 2.7 1.6 • • • • • •D. Buffer zones 4.3 2.5 1.7 • • • • • • • •E. Demountable elements & dry connections
4.3 1.4 3.1 • • • • • •F. Modular & dividable 4.2 1.7 2.5 • • • • • •G. Circulation & zoning 4.6 1.7 2.8 • • • • • •H. Movable & portable 4.5 1.5 3.1 • • • • • • •I. Location selection 4.8 1.4 3.5 • • • • • • • •J. Site selection 4.3 1.5 2.8 • • • • • • • •K. Technology 4.0 3.2 1.3 • • • • • •
10.10 Final Strategy
• 135 Addressing the mismatch
© Ioannis Mexis, 2020

© Ioannis Mexis, 2020

© Ioannis Mexis, 2020

• • • • • • • • • • • • • • •
• • • • • • • • • • • • • • •
• • • • • • • • • • • • • • •
• • • • • • • • • • • • • • •
• • • • • • • • • • • • • • •
• • • • • • • • • • • • • • •
• • • • • • • • • • • • • • •
• • • • • • • • • • • • • • •
• • • • • • • • • • • • • • •
• • • • • • • • • • • • • • •
• • • • • • • • • • • • • • •
• • • • • • • • • • • • • • •
• • • • • • • • • • • • • • •
• • • • • • • • • • • • • • •
• • • • • • • • • • • • • • •
• • • • • • • • • • • • • • •
• • • • • • • • • • • • • • •
• • • • • • • • • • • • • • •
• • • • • • • • • • • • • • •
• • • • • • • • • • • • • • •
• • • • • • • • • • • • • • •
• • • • • • • • • • • • • • •
• • • • • • • • • • • • • • •
© Ioannis Mexis, 2020