PRESSURE OXIDATION OF SILVER - TU Delft Repositories
206
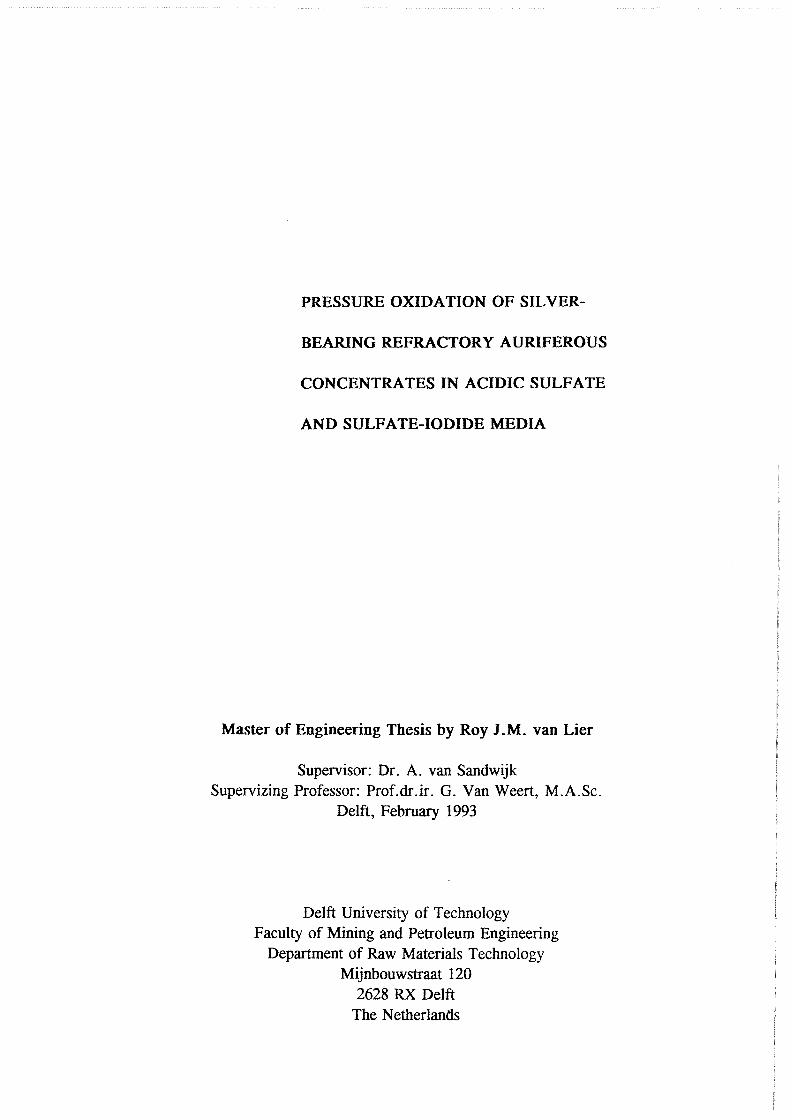
PRESSURE OXIDATION OF SILVER- BEARING REFRACTORY AURIFEROUS CONCENTRATES IN ACIDIC SULFATE AND SULFATE-IODIDE MEDIA Master of Engineering Thesis by Roy J.M. van Lier Supervisor: Dr. A. van Sandwijk Supervizing Professor: Prof.dr.ir. G. Van Weert, M.A.Sc. Delft, February 1993 Delft University of Technology Faculty of Mining and Petroleum Engineering Department of Raw Materials Technology Mijnbouwstraat 120 2628 RX Delft The Netherlanlls
-
Upload
khangminh22 -
Category
Documents
-
view
2 -
download
0
Transcript of PRESSURE OXIDATION OF SILVER - TU Delft Repositories
PRESSURE OXIDATION OF SILVER
BEARING REFRACTORY AURIFEROUS
CONCENTRATES IN ACIDIC SULFATE
AND SULFATE-IODIDE MEDIA
Master of Engineering Thesis by Roy J.M. van Lier
Supervisor: Dr. A. van Sandwijk Supervizing Professor: Prof.dr.ir. G. Van Weert, M.A.Sc.
Delft, February 1993
Delft University of Technology Faculty of Mining and Petroleum Engineering
Department of Raw Materials Technology Mijnbouwstraat 120
2628 RX Delft The N etherlanlls


Motto
Tout vient a point qui saU attendre.


Summary
SUMMARY
The effectiveness of aqueous pressure oxidation as a pretreatment of refractory gold feedstocks is reflected by the succesful startup and operation of several commercial plants. Silver, however, associated with gold, is trapped in extremely refractory silver jarosite species under the prevailing leaching conditions in the autoclave. At present, only a Sherritt Gordon hot lime treatment can be used to render silver amenable to cyanide extraction after autoclave oxidation. The silver enhancement treatment is a messy operation, which tends to make the autoclave residue unsuitable for filtration, as jarosites react to a gelatinous precipitate consisting of ferric oxide hydroxides and gypsum. The question is, of course, whether there is enough silver in the ore or concentrate to pay for the extra lime, heating, and labor required.
In this thesis work the prevention of the formation of silver jarosites during pressure oxidation of two different refractory sulfide flotation concentrates was examined. The innovative concept investigated was the introduction of potassium iodide to the autoclave. The presence of Kl in the autoclave feed shifts precipitation to (potassium) jarosite, while silver is readily precipitated as AgI (iodargyrite) in the acidic sulfate-iodide medium. Silver can then be easily recovered from the autoclave residue in the subsequent cyanidation process. Of all halides iodide was chosen because it gives the smallest solubility product of all silver halides, namely 8.51 * 10-17 at ambient conditions.
Test work on the Echo Bay Minerals Co. McCoy and Cia. Minas Buenaventura S.A. Orcopampa argentiferous flotation concentrates has been very successful. The silver recovery achieved in a direct cyanidation test on the as-received, dried McCoy concentrate was 54.0%. Cyanidation of the leach residue after regular autoclaving yielded a silver recovery of only 15 .5 % . Leaching of the residue with cyanide after autoclave oxidation in the presence of Kl (molar I/Ag-ratio 1) resulted in a recovery of 97.0%. The same silver recoveries for the Orcopampa concentrate were 11.1, 4.4 and 98.3%, respectively.
Iodargyrite indeed has excellent leaching characteristics in cyanide solutions; Orcopampa pregnant solutions contained as much as 10 grams per liter of silver. Iodargyrite precipitation was not influenced by the differences in silver contents, silver mineralogy, and the types of refractoriness represented by the two concentrates.
It was found that molar I/ Ag-ratios higher than 1 in the autoclave do not improve silver recoveries in the cyanidation circuit to any great extent. The major part of the excess iodide is oxidized and lost to a physical "iodine cycle", involving continuous formation of iodine vapor, condensation of this vapor in the colder autoclave top, dissolution of the condensate in the autoclave slurry, formation of iodine vapor, etc ..
1

Table of contents
TABLE OF CONTENTS
SUMMARY .............................................. 1
1. INTRODUCTION ...................................... 1
2. METALLURGY OF REFRACTORY PRECIOUS METAL ORES 2.1 Introduction ...................................... 4 2.2 Refractory gold and silver extraction processes ................ 5 2.3 Sherritt Gordon refractory gold technology
2.3.1 Introduction ................................. 9 2.3.2 Conceptual flowsheet ........................... 10
2.4 Cyanidation chemistry .............................. 13
3. AQUEOUS PRESSURE OXIDATION IN ACIDIC SULFATE MEDIA 3.1 Oxidation chemistry ................................ 15 3.2 Characterization of jarosite minerals and argentojarosite . . . . . . . . . . 17 3.3 Sherritt Gordon silver enhancement treatment ................ 20
4. AQUEOUS PRESSURE OXIDATION IN ACIDIC SULFATE-IODIDE MEDIA 4.1 Introduction ..................................... 21 4.2 Thermodynamic calculations for the silver-sulfur-iodine system in water 22 4.3 Qualitative description of the iodine balance ................. 23 4.4 Gold solubilization ................................. 25
5. CHARACTERIZATION OF THE TEST MATERIALS 5 .1 The McCoy mill test material . . . . . . . . . . . . . . . . . . . . . . . . . . 26 5.2 The Orcopampa concentrator test material .................. 30
6. EXPERIMENTAL WORK 6.1 Experimental procedures
6.1.1 Preparation of the autoclave feed material . . . . . . . . . . . . . . 34 6.1.2 Autoclave tests . . . . . . . . . . . . . . . . . . . . . . . . . . . . . . 34 6.1.3 Hot lime treatments ........................... 35 6.1.4 Direct cyanidation tests ......................... 36
6.2 Test results and discussion 6.2.1 Baseline leach experiments ....................... 36 6.2.2 Preacidification tests . . . . . . . . . . . . . . . . . . . . . . . . . . . 38 6.2.3 Autoclave tests in acidic sulfate media . . . . . . . . . . . . . . . . 38 6.2.4 Hot lime treatments . . . . . . . . . . . . . . . . . . . . . . . . . . . 39 6.2.5 Direct cyanidation experiments on S-series residues ........ 40 6.2.6 Autoclave tests in acidic sulfate-iodide media ............ 41 6.2. 7 Direct cyanidation experiments on I-series residues ........ 44
7. CONCLUSIONS ...................................... 46
11

Table of contents
8. RECOMMENDATIONS ................................. 47
REFERENCES AND BIBLIOGRAPHY ............................ 48
ACKNOWLEDGEMENTS .................................... 53
APPENDIXES A Analytical techniques and procedures
A. I Electron Micro Probe contour maps A.2 Wet-chemical determination of the carbonate content A. 3 Oxidimetric determination of the ferrous ion concentration A.4 Wet-chemical determination of the silver content A.5 X-ray diffraction and X-ray fluoresence
A.5.1 X-ray diffraction A.5.2 X-ray fluoresence
A.6 Argentometric determination of the free cyanide concentration B F* A *C*T computer prints C JCPDS XRD charts D Direct cyanidation test sheets
111

Chapter 1 Introduction
1. INTRODUCTION
Jarosite-type compounds are frequently encountered in the hydrometallurgical industry. On the one hand they occur as deliberately produced precipitates in the processing of most zinc and some copper-cobalt concentrates. On the other hand they are an unwelcome product in many gold pressure oxidation operations according to Sherritt Gordon technology.
Jarosite precipitation is implemented in the hydrometallurgical processing of zinc concentrates to control the level of ferric iron and other impurities. The main advantage of the jarosite process is that it is a relatively simple process yielding a precipitate with excellent filtration characteristics. At present, however, the ever increasing environmental consciousness, together with economic interest, force the disadvantages of the jarosite process to be the subject of many studies:
the formed jarosite-type compound is chemically unstable. Its heavy metal content (cadmium, lead) may be leached out and become a threat to the environment, the incorporation of valuable elements such as zinc, silver and indium, in the jarosite structure causes important economic losses.
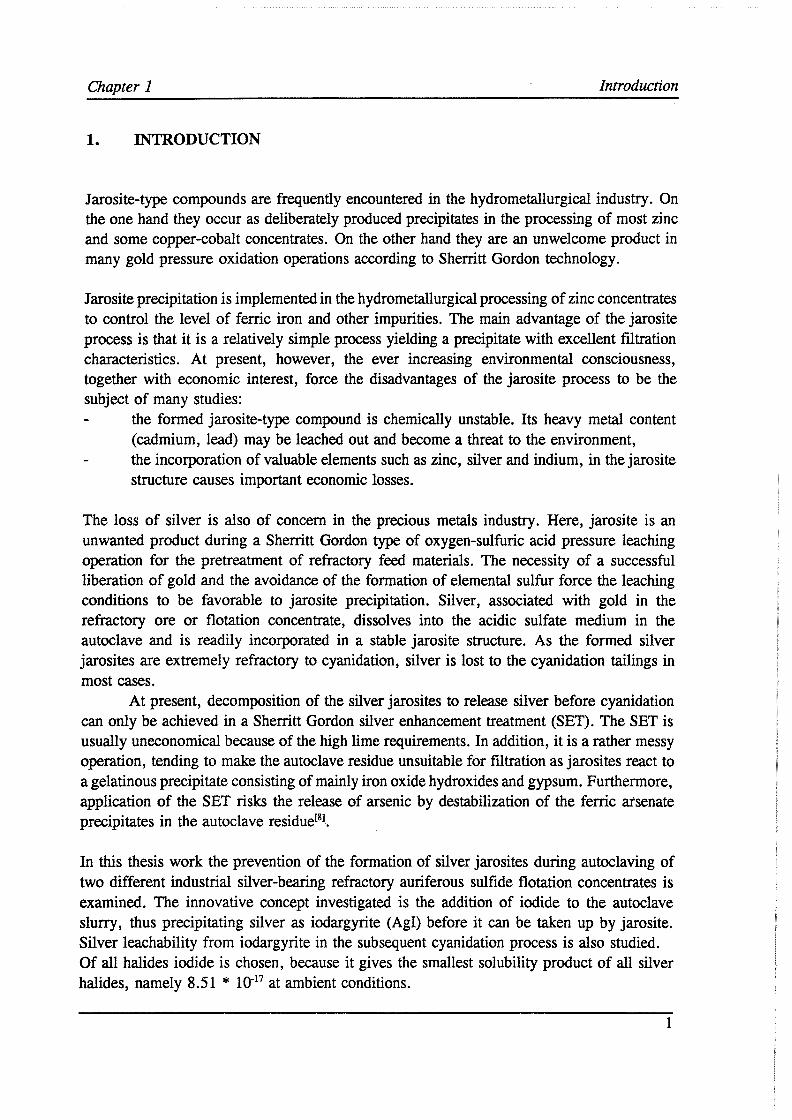
The loss of silver is also of concern in the precious metals industry. Here, jarosite is an unwanted product during a Sherritt Gordon type of oxygen-sulfuric acid pressure leaching operation for the pretreatment of refractory feed materials. The necessity of a successful liberation of gold and the avoidance of the formation of elemental sulfur force the leaching conditions to be favorable to jarosite precipitation. Silver, associated with gold in the refractory ore or flotation concentrate, dissolves into the acidic sulfate medium in the autoclave and is readily incorporated in a stable jarosite structure. As the formed silver jarosites are extremely refractory to cyanidation, silver is lost to the cyanidation tailings in most cases.
At present, decomposition of the silver jarosites to release silver before cyanidation can only be achieved in a Sherritt Gordon silver enhancement treatment (SET). The SET is usually uneconomical because of the high lime requirements. In addition, it is a rather messy operation, tending to make the autoclave residue unsuitable for filtration as jarosites react to a gelatinous precipitate consisting of mainly iron oxide hydroxides and gypsum. Furthermore, application of the SET risks the release of arsenic by destabilization of the ferric arsenate precipitates in the autoclave residuel81 .•
In this thesis work the prevention of the formation of silver jarosites during autoclaving of two different industrial silver-bearing refractory auriferous sulfide flotation concentrates is examined. The innovative concept investigated is the addition of iodide to the autoclave slurry, thus precipitating silver as iodargyrite (AgI) before it can be taken up by jarosite. Silver leachability from iodargyrite in the subsequent cyanidation process is also studied. Of all halides iodide is chosen, because it gives the smallest solubility product of all silver halides, namely 8.51 * 10-17 at ambient conditions.
1

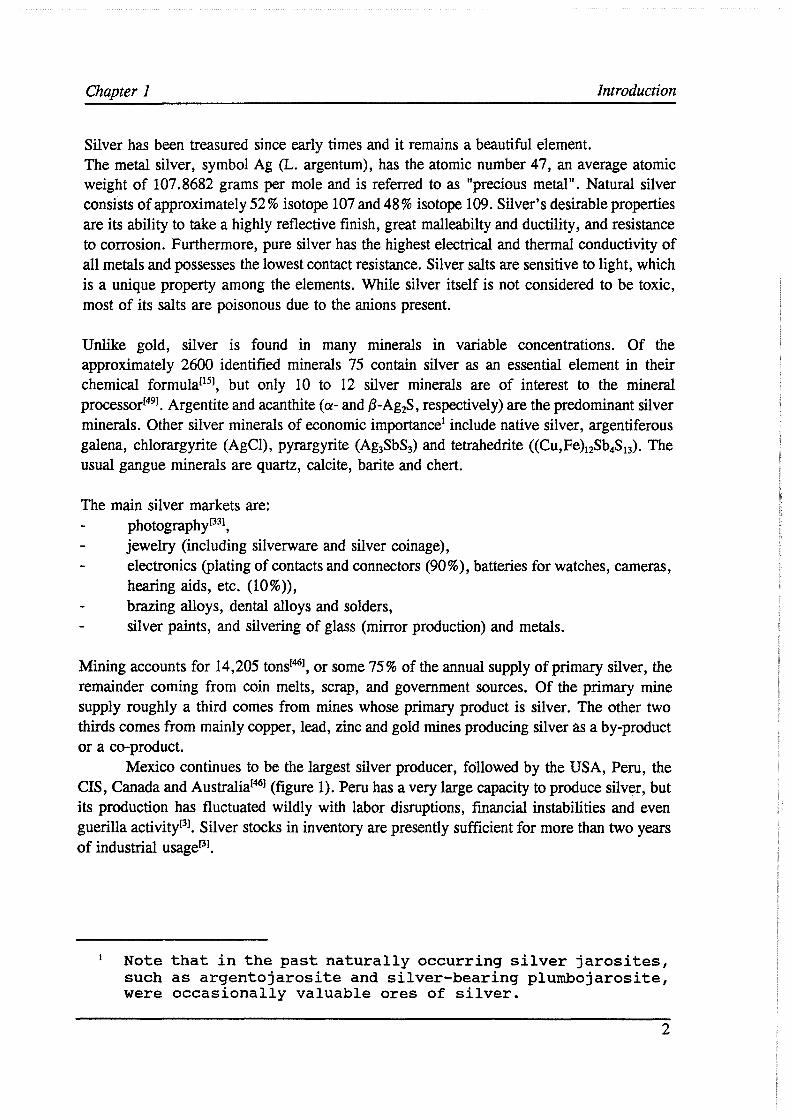
1991 Annual Mine Production of Silver, Total: 14,205 tons
CIS 9.7%
Peru 12.5%
9.0%
Australia a.S% Poland
5.9%
USA 12.8% Mexico
15.5%
Other countries
Chile Bolivia 19·3% 4.6% 2.4%
,r silver content of argentiferous concentrates included
Figure 1: annual mine production of silver in 19911461•
Chapter 1 Introduction
Silver has been treasured since early times and it remains a beautiful element. The metal silver, symbol Ag (L. argentum), has the atomic number 47, an average atomic weight of 107.8682 grams per mole and is referred to as "precious metal". Natural silver consists of approximate! y 52 % isotope 107 and 48 % isotope 109. Silver's desirable properties are its ability to take a highly reflective finish, great malleabilty and ductility, and resistance to corrosion. Furthermore, pure silver has the highest electrical and thermal conductivity of all metals and possesses the lowest contact resistance. Silver salts are sensitive to light, which is a unique property among the elements. While silver itself is not considered to be toxic, most of its salts are poisonous due to the anions present.
Unlike gold, silver is found in many minerals in variable concentrations. Of the approximately 2600 identified minerals 75 contain silver as an essential element in their chemical formula1151, but only 10 to 12 silver minerals are of interest to the mineral processor1491 • Argentite and acanthite (a- and {3-Ag2S, respectively) are the predominant silver minerals. Other silver minerals of economic importance1 include native silver, argentiferous galena, chlorargyrite (AgCl), pyrargyrite (Ag3SbS3) and tetrahedrite ((Cu,Fe)12Sb4S13). The usual gangue minerals are quartz, calcite, barite and chert.
The main silver markets are: photographyl33l,
jewelry (including silverware and silver coinage), electronics (plating of contacts and connectors (90%), batteries for watches, cameras, hearing aids, etc. (10%)), brazing alloys, dental alloys and solders, silver paints, and silvering of glass (mirror production) and metals.
Mining accounts for 14,205 tons1461, or some 75% of the annual supply of primary silver, the remainder coming from coin melts, scrap, and government sources. Of the primary mine supply roughly a third comes from mines whose primary product is silver. The other two thirds comes from mainly copper, lead, zinc and gold mines producing silver as a by-product or a co-product.
Mexico continues to be the largest silver producer, followed by the USA, Peru, the CIS, Canada and Australia1461 (figure 1). Peru has a very large capacity to produce silver, but its production has fluctuated wildly with labor disruptions, financial instabilities and even guerilla activityl31• Silver stocks in inventory are presently sufficient for more than two years of industrial usagel31•
Note that in the past naturally occurring silver jarosites, such as argentojarosite and silver-bearing plumbojarosite, were occasionally valuable ores of silver.
2
Average Annual Gold,r and Silver§ Prices Period 1987-1992
gold price in U.S.$/oz. silver price in U.S.$/oz. soo~-----------------------.8
--"--'· 7 - ~ .. ~: ~ ~ ·- - _. :' ~: ~: ._ -. ~: -.. : . : : -· ~. ~ - - ·- - - : - ~ - -: - - ~ 450
' ... . . . ..... . . .. . . . ...... . • ,•:• • • - •• '. :•-; ·• • .... ;._ • •• • • • • • ••; • • • • C ·• • •• • • -• • • C, • • ; • • • •• C C • • ; • C • • C ·.• • • • 6
400 ·-: . ....., . . . . . · ... : .. :
- - - - ... - - - . - - - - . - - - - - - ,- - - - - - - - - - - - - - - - - - - - - - - - . - - ·.· - - - - - - - - - - - - -
' .- - - - - -·- - . -.- - - - . - - -.- - - - - - _ ':'---.,., ~-~-~ ~- - - :-.~ ....... ,-..:. ...... - - - - - - - - - - . - - . - - - - - 5
350 -a-Gold
+ Silver 300..._ ___ _._ __________________ 3
1987 1988 1989 1990 1991 1992
year
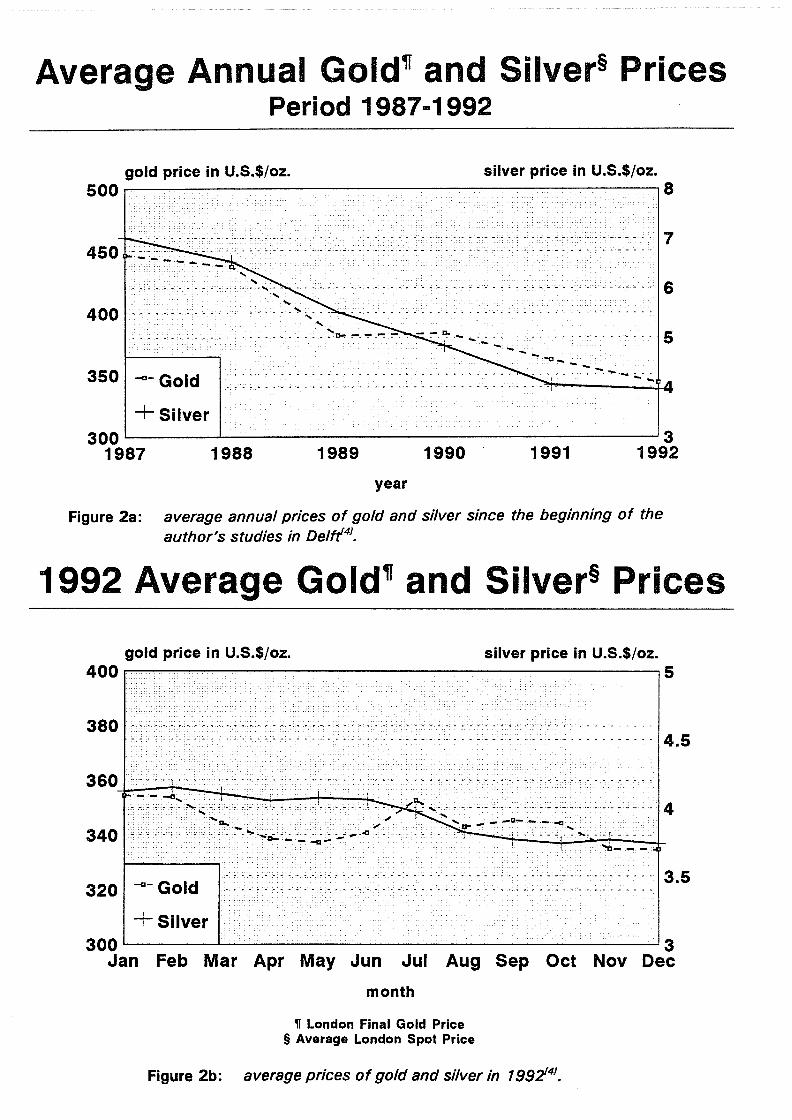
Figure 2a: average annual prices of gold and silver since the beginning of the author's studies in Delt/41
•
1992 Average Gold,r and Silver§ Prices
gold price in U.S.$/oz. silver price in U.S.$/oz. 400,...,....,,..,...,.----,-------------------~5
380 4.5
,, 340 •.:: '. :~- .. :--.;,.::..~-~---J.;..·---;.Q-:._. ---C; •• ,,...... -· -....;~~~::.,.;..:.;~:..:..:._:j_
320 -a- Gold
+ Silver 300~---'-------------------'3
Jan Feb Mar Apr May Jun Jui Aug Sep Oct Nov Dec
month
,i London Final Gold Price § Average London Spot Price
Figure 2b: average prices of gold and silver in 1992!41•
Chapter 1 Introduction
The timing of this project is abominable. Silver prices of less than $4,- per troy ounce (figures 2a and 2b) have forced many mines to reduce or cease production. The outlook for the silver industry is hopeful, however. As the price ratio of silver to gold (and platinum) continues to decrease, research increases to use silver as a substitute for more precious metals. Consumer photography is expected to grow at 5 % per year through the turn of the century. Whether silver demand will increase or decrease for jewelry is a matter of fashion, and thus impossible to predictl31•
Iodide systems are not yet common in hydrometallurgy. Although some literature is available on the application of iodide-iodine solutions as alternative lixiviants for the leaching of gold from refractory ores and concentrates, it seems that so far no effort has been made to describe the dissolution of silver in acidic sulfate-iodide media at high pressure and at elevated temperature. In this report, therefore, an attempt is made to do so on the basis of calculated potential-pH (Pourbaix) diagrams.
Chile is the second largest iodine producer in the world, the leading producer of iodide and iodate salts, and the only not to produce from brines: all iodine species are byproducts recovered from "caliche" ore. "Caliche" consists of nitrate salt beds interstratified with sand, beds of common salt, gypsum, etc., on or just under the surface. Caliche is quarried, purified and used as a source of nitrates. It occurs over immense areas in the provinces of Antofagasta and Tarapaca in Northern Chile and the neighboring parts of Bolivia. Since Chile is also the seventh largest silver producing country in the world, this silver iodide project might be of particular great interest to the hydrometallurgical processing of Chilean refractory precious metals deposits in the future.
This report consists of 8 chapters. Chapter 2 gives an overview of the relevant refractory precious metals metallurgy in a nutshell. Chapters 3 and 4 deal with aqueous pressure oxidation in acidic sulfate and sulfateiodide media, respectively. In chapter 5 the refractory McCoy and Orcopampa concentrates used for the experimental work are characterized. Chapter 6 contains a descripition of the experimental work and a discussion of the test results. Conclusions following from the literature study and the experimental work are given in chapter 7. In chapter 8 recommendations for future research are made.
3
Chapter 2 Metallurgy of refractory precious metal ores
2. METALLURGY OF REFRACTORY PRECIOUS METAL ORES
2.1 Introduction
Gold still shines, but hardly anymore as alluvial "nuggets" or free milling grains. New large scale mining projects are often orientated to the processing of refractory ores, with ever decreasing grades, for their gold and associated silver values.
Gold and silver ores are classified as refractory if they are not treatable by cyanidation without some pretreatment step, or if they require alternative extraction processes[6
•371
•
There are a variety of reasons for refractoriness[6,17•28•37•42•491:
physical lock-up: occlusion or dissemination of fine grained or submicron gold and silver within sulfide minerals, usually pyrite, arsenopyrite, or pyrrhotite. chemical lock-up: gold or silver forms part of the mineral lattice of the host mineral, or is in solid solution with the host mineral. the presence of some iron oxide coating (tarnish) on gold particles ("rusty gold"), or the presence of antimony minerals (e.g. stibnite, Sb2O3) or arsenic minerals (e.g. realgar, AsS and orpiment, As2O3) that form coatings during cyanidation through the formation of thioantimonites and thioarsenites:
[As,Sb]2S3(aq) + 2 NaOH(aq) - Na[As,Sb]S(OH)i(aq) + Na[As,Sb]Si(aq) [2.1]
coatings formed during roasting of gold and silver ores, incapsulation of precious metals in iron hydroxides, silicates and lead and antimony minerals. the presence of iron and base metal sulfides whose decomposition products from leaching (cyanicides), such as highly soluble copper cyanide complexes, plumbates, insoluble basic lead cyanides and zincates, interfere with cyanidation. association of gold with some selenides and tellurides with extremely poor leaching characteristics in cyanide solutions. the presence of carbonaceous matter with "preg-robbing" characteristics. the presence of clays capable of physically adsorbing gold and silver cyanide complexes or inhibiting penetration of cyanide solutions to the gold surface. the presence of flotation reagents in gold and silver-bearing concentrates, e.g. xanthate, which to some extent prevent contact between the gold or silver particles and the cyanide solution, thereby retarding dissolution of the precious metal.
Another reason for refractoriness, namely the formation of cyanide insoluble silver jarosites during pressure oxidation of refractory auriferous feedstocks with high silver values, is studied in more detail in this report.
4


Chapter 2 Metallurgy of refractory precious metal ores
2.2 Refractory gold and silver extraction processes
The treatment of refractory gold and silver ores depends upon the modes of occurrence of the precious metals, the type of host minerals and associations, and the causes for refractoriness. The ability to treat a specific ore or concentrate is a question of economics; ultimately the choice is made based upon the relative profitability of the various process possibilities. Process possibilities for refractory gold and silver ores are:
1) Smelting
Many refractory precious metal ores are concentrated and shipped to (custom) smelters. The costs associated with smelting have increased appreciably due to the decreasing number of domestic smelters and the added costs of environmental control. Furthermore, the acceptance limits have been decreased and penalties have been increased for arsenic and antimonyl371 •
2) Extraction with ligands different from cyanide and oxidants different from oxygen
Some alternative extraction processes utilize complexants different from cyanidel7·17
•18
•24
•25
•27
•34
•49
•1, e.g. thiocyanates, thiosulfates, and thiourea, or oxidants other than oxygen, e.g. hydrogen peroxide and bromine.
Thiourea leaching was practiced at the interesting New England Antimony Mines N.L. Hillgrove operation in New South Wales, Australial2°1• Initially the mill produced gravity gold and arsenic and antimony flotation concentrates. Afterwards thiourea leaching was employed in an intermediate processing step to extract the refractory gold from the antimony concentrate. Optimized dosage of sulfuric acid, ferric sulfate and thiourea accounted for successful leaching of the gold in less than 5 minutes in a batch operation. Refractory gold was sold as a carbon concentrate.
3) "Simple" pretreatment processes followed by cyanidation
Several "simple" methods are being used on a commercial scale to liberate gold from refractory feedstocks before cyanidation, including C6,8,16,17,24,37l:
intense (ultra-fine) grinding, preaeration, preoxidation with hypochlorite or chlorine, "flash chlorination", bacterial oxidation, whole ore roasting, or roasting of auriferous flotation concentrates.
Argentiferous concentrates containing high levels of arsenic and antimony may be pretreated by leaching with Na2S-NaOH solutions. This is practiced at the Equity Silver Mines Ltd.£371
and Sunshine Mining CoY·37•391 operations.
5
Chapter 2 Metallurgy of refractory precious metal ores
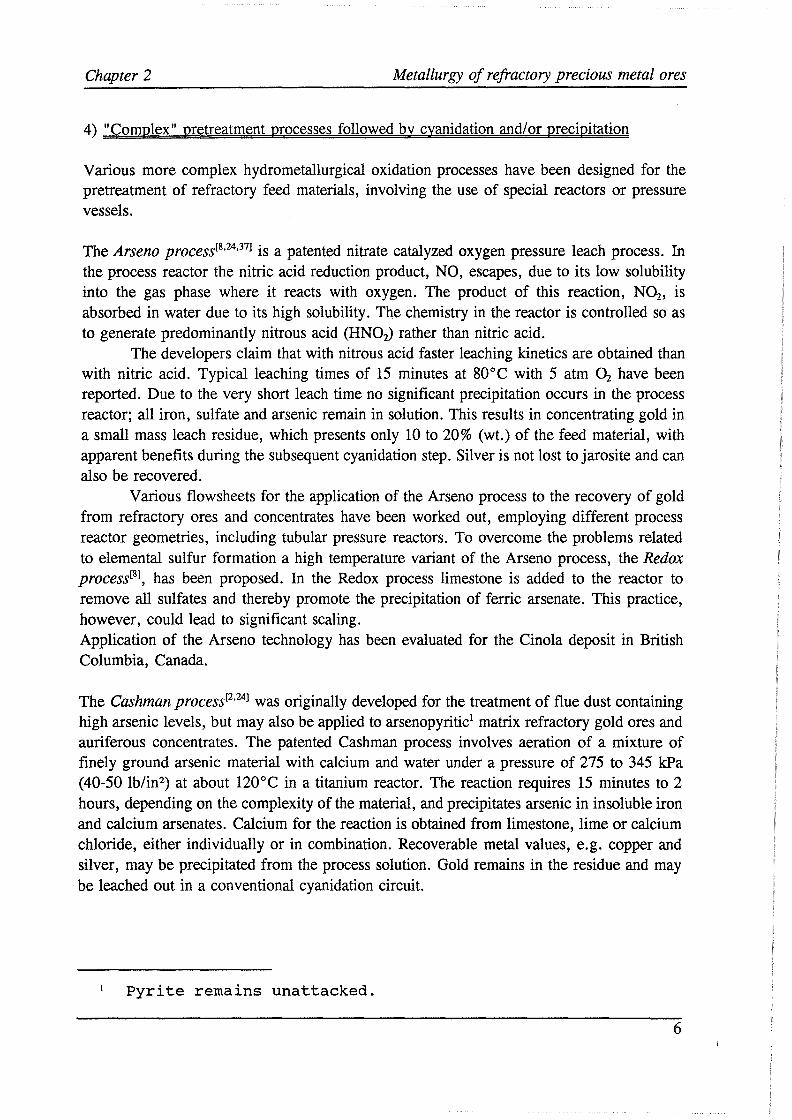
4) "Complex" pretreatment processes followed by cyanidation and/or precipitation
Various more complex hydrometallurgical oxidation processes have been designed for the pretreatment of refractory feed materials, involving the use of special reactors or pressure vessels.
The Arseno processl8•24
•311 is a patented nitrate catalyzed oxygen pressure leach process. In
the process reactor the nitric acid reduction product, NO, escapes, due to its low solubility into the gas phase where it reacts with oxygen. The product of this reaction, NOi, is absorbed in water due to its high solubility. The chemistry in the reactor is controlled so as to generate predominantly nitrous acid (HN02) rather than nitric acid.
The developers claim that with nitrous acid faster leaching kinetics are obtained than with nitric acid. Typical leaching times of 15 minutes at 80°C with 5 atm Oi have been reported. Due to the very short leach time no significant precipitation occurs in the process reactor; all iron, sulfate and arsenic remain in solution. This results in concentrating gold in a small mass leach residue, which presents only 10 to 20% (wt.) of the feed material, with apparent benefits during the subsequent cyanidation step. Silver is not lost to jarosite and can also be recovered.
Various flowsheets for the application of the Arseno process to the recovery of gold from refractory ores and concentrates have been worked out, employing different process reactor geometries, including tubular pressure reactors. To overcome the problems related to elemental sulfur formation a high temperature variant of the Arseno process, the Redox process181 , has been proposed. In the Redox process limestone is added to the reactor to remove all sulfates and thereby promote the precipitation of ferric arsenate. This practice, however, could lead to significant scaling. Application of the Arseno technology has been evaluated for the Cinola deposit in British Columbia, Canada.
The Cashman processl2•241 was originally developed for the treatment of flue dust containing
high arsenic levels, but may also be applied to arsenopyritic1 matrix refractory gold ores and auriferous concentrates. The patented Cashman process involves aeration of a mixture of finely ground arsenic material with calcium and water under a pressure of 275 to 345 kPa (40-50 lb/in2) at about 120°C in a titanium reactor. The reaction requires 15 minutes to 2 hours, depending on the complexity of the material, and precipitates arsenic in insoluble iron and calcium arsenates. Calcium for the reaction is obtained from limestone, lime or calcium chloride, either individually or in combination. Recoverable metal values, e.g. copper and silver, may be precipitated from the process solution. Gold remains in the residue and may be leached out in a conventional cyanidation circuit.
Pyrite remains unattacked.
6

Chapter 2 Metallurgy of refractory precious metal ores
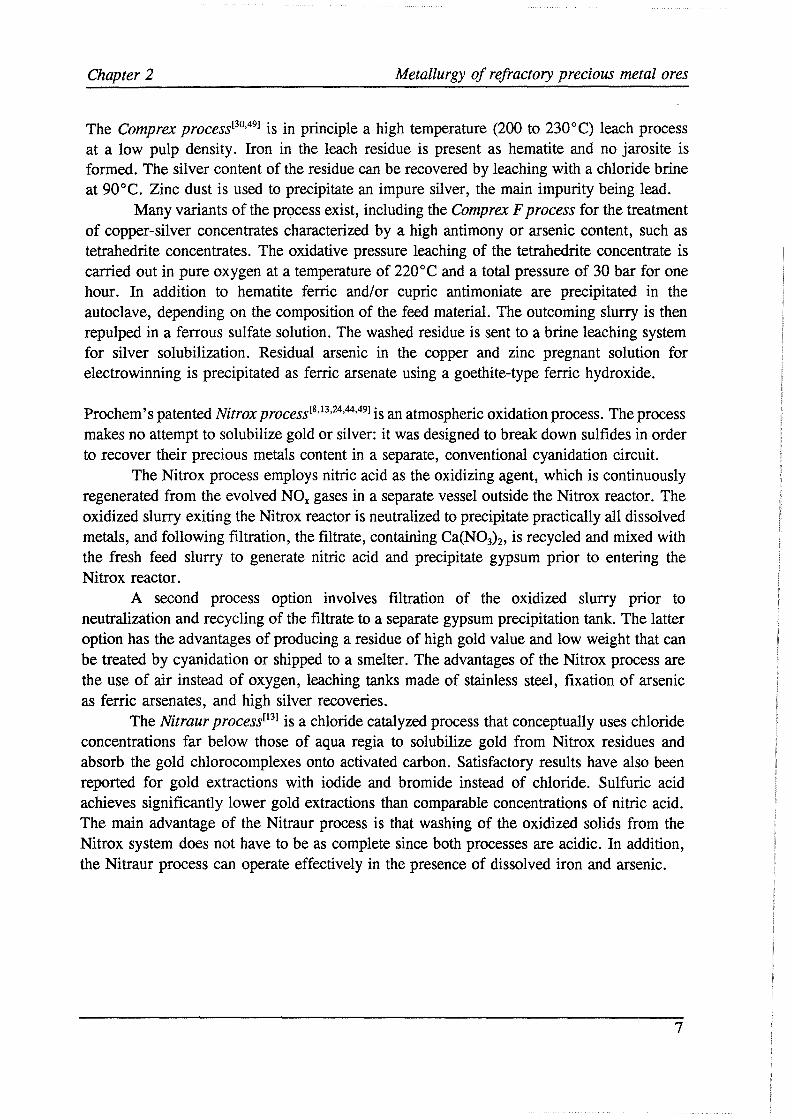
The Comprex processl30•491 is in principle a high temperature (200 to 230°C) leach process
at a low pulp density. Iron in the leach residue is present as hematite and no jarosite is formed. The silver content of the residue can be recovered by leaching with a chloride brine at 90°C. Zinc dust is used to precipitate an impure silver, the main impurity being lead.
Many variants of the process exist, including the Comprex F process for the treatment of copper-silver concentrates characterized by a high antimony or arsenic content, such as tetrahedrite concentrates. The oxidative pressure leaching of the tetrahedrite concentrate is carried out in pure oxygen at a temperature of 220°C and a total pressure of 30 bar for one hour. In addition to hematite ferric and/or cupric antimoniate are precipitated in the autoclave, depending on the composition of the feed material. The outcoming slurry is then repulped in a ferrous sulfate solution. The washed residue is sent to a brine leaching system for silver solubilization. Residual arsenic in the copper and zinc pregnant solution for electrowinning is precipitated as ferric arsenate using a goethite-type ferric hydroxide.
Prochem' s patented Nitrox processl8•13
•24
•44
•491 is an atmospheric oxidation process. The process
makes no attempt to solubilize gold or silver: it was designed to break down sulfides in order to recover their precious metals content in a separate, conventional cyanidation circuit.
The Nitrox process employs nitric acid as the oxidizing agent, which is continuously regenerated from the evolved NOx gases in a separate vessel outside the Nitrox reactor. The oxidized slurry exiting the Nitrox reactor is neutralized to precipitate practically all dissolved metals, and following filtration, the filtrate, containing Ca(NO3) 2, is recycled and mixed with the fresh feed slurry to generate nitric acid and precipitate gypsum prior to entering the Nitrox reactor.
A second process option involves filtration of the oxidized slurry prior to neutralization and recycling of the filtrate to a separate gypsum precipitation tank. The latter option has the advantages of producing a residue of high gold value and low weight that can be treated by cyanidation or shipped to a smelter. The advantages of the Nitrox process are the use of air instead of oxygen, leaching tanks made of stainless steel, fixation of arsenic as ferric arsenates, and high silver recoveries.
The Nitraur processC131 is a chloride catalyzed process that conceptually uses chloride concentrations far below those of aqua regia to solubilize gold from Nitrox residues and absorb the gold chlorocomplexes onto activated carbon. Satisfactory results have also been reported for gold extractions with iodide and bromide instead of chloride. Sulfuric acid achieves significantly lower gold extractions than comparable concentrations of nitric acid. The main advantage of the Nitraur process is that washing of the oxidized solids from the Nitrox system does not have to be as complete since both processes are acidic. In addition, the Nitraur process can operate effectively in the presence of dissolved iron and arsenic.
7
Chapter 2 Metallurgy of refractory precious metal ores
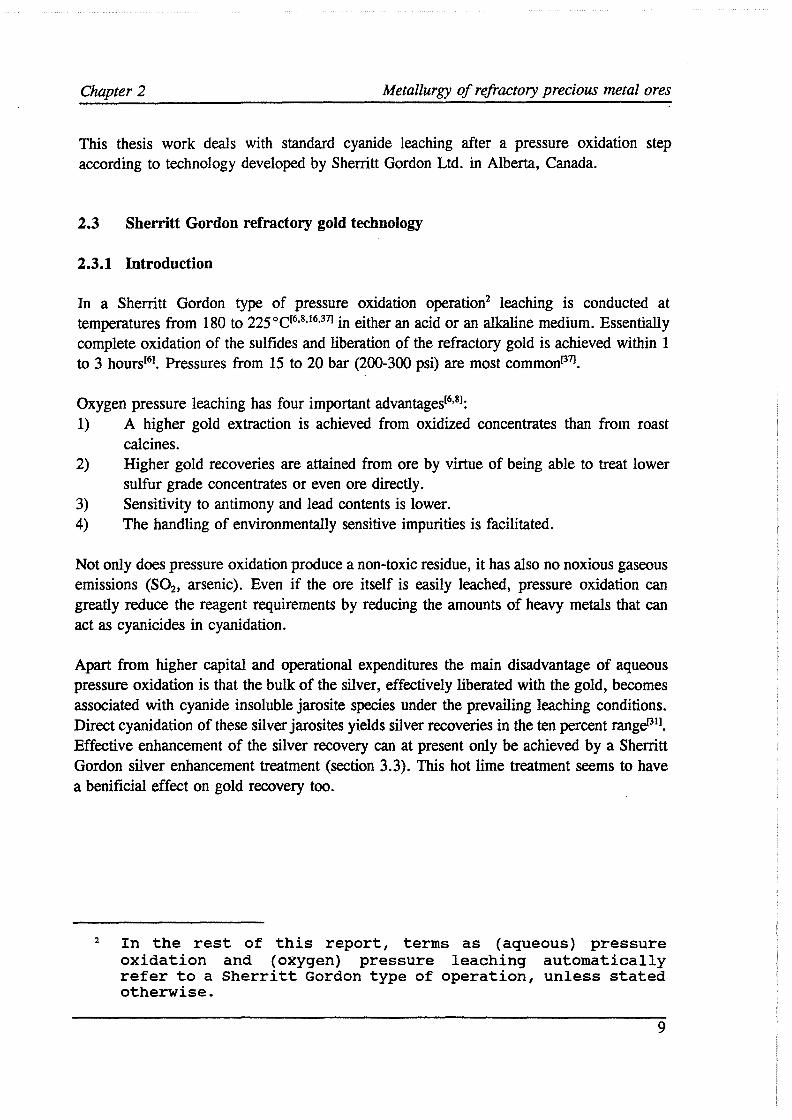
An alternative autoclave process is operated by the Sunshine Mining Co. in Kellogg, Idaho, USAf1•37
•391 , whereby autoclaves are used to recover silver instead of gold, as with the Comprex F process. At the Sunshine operation a tetrahedrite concentrate is pretreated with a hot caustic sodium sulfide solution to leach out most of the antimony. Antimony is subsequently recovered electrolytically from the soluble sodium antimonate formed in the pretreatment step. The resulting high grade copper-silver-sulfide residue is preleached to decompose carbonates. Some recycled copper solution is also added at this stage to prevent the formation of corrosive hydrogen sulfide gas.
The preleached residue is then pressure oxidized in a nitric acid catalyzed sulfuric acid environment. Once the reaction starts at 80 to 90°C it is exothermic and generates temperatures of about 150°C. The small amount of nitric acid promotes the dissolution reactions: it oxidizes the sulfide minerals and in tum produces oxides of nitrogen which are continuously regenerated in the vessel with oxygen, in the same way as in the Arseno process.
Lead, zinc, elemental sulfur, some silver jarosite and the residual antimony content remain in the leach residue, whereas silver, copper and iron are solubilized. Sulfur appears in pellet form as the reactors cool below its melting point of approximately 120°C and is simply screened off. Silver is recovered from the pregnant solution by selective precipitation as silver chloride, then precipitated as a sponge by the addition of zinc dust and cast into anodes for a standard electrolytic refining process. Copper is recovered using solvent extraction and electrowinning. Daily production of 30,000 troy ounces of silver and 8 short tons of copper make the facility one of the significant silver producers and the smallest copper electrowinning plant in the world.
A complicated multi-stage pressure leach processl25,49J has been proposed for high-grade jig
and flotation concentrates containing Ag, Cu, Co, Ni, Pb, Zn, As, Bi, Fe and S. In the first stage the raw material is leached with a mixture of nitric and sulfuric acids at l00°C and 1 bar oxygen partial pressure. In the second stage the residue of the first stage is leached with nitric acid alone at 120°C and 1 bar oxygen partial pressure. Chloride ions are introduced to both solution streams to precipitate AgCI. To produce a high purity silver metal AgCl is converted to Ag2S, then oxidized to Ag2SO4, converted to the silver diammine anion, [Ag(NH3):J+ and finally reduced at 140°C and 7 bar hydrogen partial pressure.
The ORF processl24,37J, developed by the Ontario Research Foundation, cannot be ordered in any of the aforementioned categories of refractory precious metals extraction processes. The ORF process involves oxidative acid leaching of the gold ore or gold-bearing concentrate at ambient conditions, using peroxymonosulfuric acid {H2SO5). As this acid is commonly known as Caro's acid, the ORF process is often referred to as "Caro's acid oxidation". The oxidation reaction is carried out at a pH of 1.5 and an oxidation potential of 400 to 450 m V. The greatest success of the process has been reported to be achieved in the case of gold associated with or occluded in arsenopyrite. Gold may be recovered in a subsequent cyanidation step. Pyrite is not attacked to any great extent.
8

Chapter 2 Metallurgy of refractory precious metal ores
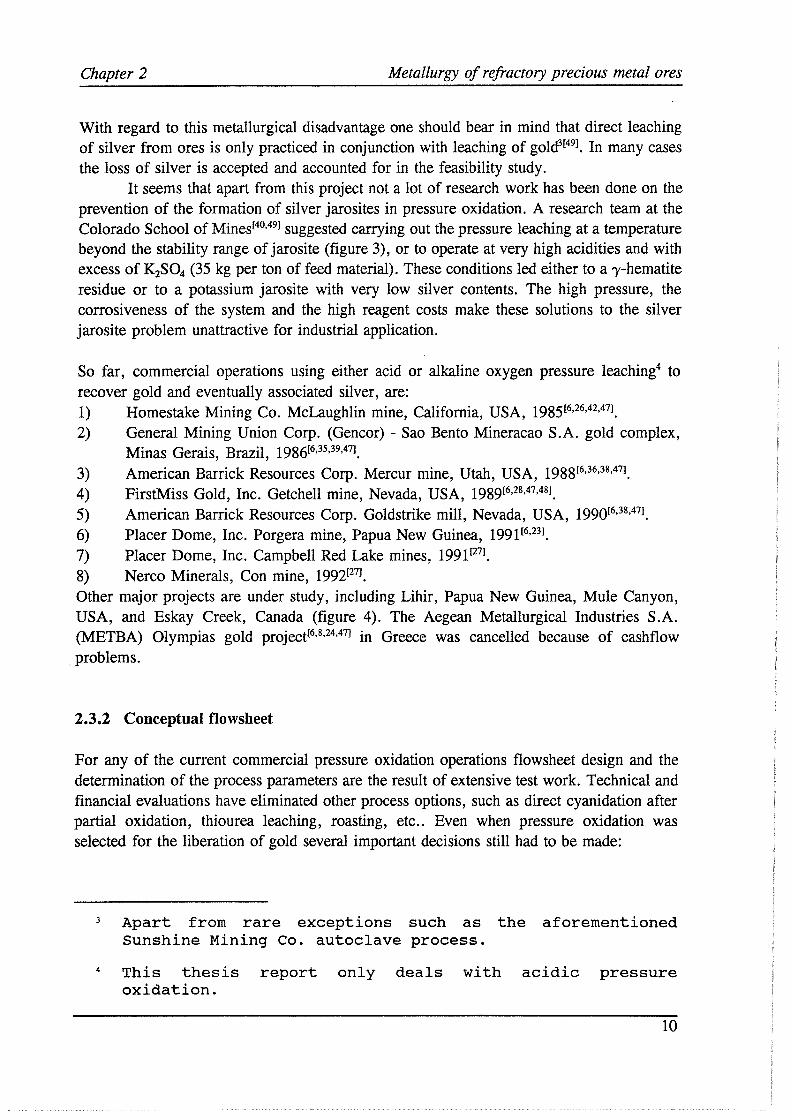
This thesis work deals with standard cyanide leaching after a pressure oxidation step according to technology developed by Sherritt Gordon Ltd. in Alberta, Canada.
2.3 Sherritt Gordon refractory gold technology
2.3.1 Introduction
In a Sherritt Gordon type of pressure oxidation operation2 leaching is conducted at temperatures from 180 to 225°C£6
•8•16
•371 in either an acid or an alkaline medium. Essentially complete oxidation of the sulfides and liberation of the refractory gold is achieved within 1 to 3 hours161• Pressures from 15 to 20 bar (200-300 psi) are most common1371•
Oxygen pressure leaching has four important advantagesl6.81:
1) A higher gold extraction is achieved from oxidized concentrates than from roast calcines.
2) Higher gold recoveries are attained from ore by virtue of being able to treat lower sulfur grade concentrates or even ore directly.
3) Sensitivity to antimony and lead contents is lower. 4) The handling of environmentally sensitive impurities is facilitated.
Not only does pressure oxidation produce a non-toxic residue, it has also no noxious gaseous emissions (SO2, arsenic). Even if the ore itself is easily leached, pressure oxidation can greatly reduce the reagent requirements by reducing the amounts of heavy metals that can act as cyanicides in cyanidation.
Apart from higher capital and operational expenditures the main disadvantage of aqueous pressure oxidation is that the bulk of the silver, effectively liberated with the gold, becomes associated with cyanide insoluble jarosite species under the prevailing leaching conditions. Direct cyanidation of these silver jarosites yields silver recoveries in the ten percent rangel311•
Effective enhancement of the silver recovery can at present only be achieved by a Sherritt Gordon silver enhancement treatment (section 3.3). This hot lime treatment seems to have a benificial effect on gold recovery too.
2 In the rest of this report, terms as (aqueous) pressure oxidation and ( oxygen) pressure leaching automatically refer to a Sherritt Gordon type of operation, unless stated otherwise.
9

(/) 200 ::,
(/) ....l w HEMATITE u
160 (/) Fe 2 0 3 w w -,:. 0:: "'f\ -(!) C9 -w 120 ul -a IJ')
w 0
0:: ~-::, 80
t.:> I- - G0ETHITE <t 0 0:: ~
w Fe0·0H a. ~ 40 w ----I- F',(0H) 3 -:----.._
0 2 4 6 8 10 12 14
pH
Figure 3: stability fields of various iron precipitates as a function of pH and temperature from a 0. 5 molar FeiSO,,,) 3 solution'391
•
NERCO CON
ESKAYCREEK (STUDY)
MERCUR
GETCHELL-J.;-----~
HOMESTAKE
LONE TREE (CONSTRUCTION)
SAO BENTO VAAL REEFS
LIHIR (STUDY)
PORGERA
GOV'T ROASTING PLANT ZIMBABWE (STUDY)
Figure 4: location map of gold pressure oxidation plants'161•
Chapter 2 Metallurgy of refractory precious metal ores
With regard to this metallurgical disadvantage one should bear in mind that direct leaching of silver from ores is only practiced in conjunction with leaching of gold31491 • In many cases the loss of silver is accepted and accounted for in the feasibility study.
It seems that apart from this project not a lot of research work has been done on the prevention of the formation of silver jarosites in pressure oxidation. A research team at the Colorado School of Minesr4o,49l suggested carrying out the pressure leaching at a temperature beyond the stability range of jarosite (figure 3), or to operate at very high acidities and with excess of K2S04 (35 kg per ton of feed material). These conditions led either to a -y-hematite residue or to a potassium jarosite with very low silver contents. The high pressure, the corrosiveness of the system and the high reagent costs make these solutions to the silver jarosite problem unattractive for industrial application.
So far, commercial operations using either acid or alkaline oxygen pressure leaching4 to recover gold and eventually associated silver, are: 1) Homestake Mining Co. McLaughlin mine, California, USA, 198516,26,42,471_
2) General Mining Union Corp. (Gencor) - Sao Bento Mineracao S.A. gold complex, Minas Gerais, Brazil, 1986f6
,35
•39
•47l.
3) American Barrick Resources Corp. Mercur mine, Utah, USA, 1988f6,36
•38
•47l.
4) FirstMiss Gold, Inc. Getchell mine, Nevada, USA, 1989£6,28•47•481.
5) American Barrick Resources Corp. Goldstrike mill, Nevada, USA, 1990f6•38
•471 •
6) Placer Dome, Inc. Porgera mine, Papua New Guinea, 1991 £6•231 •
7) Placer Dome, Inc. Campbell Red Lake mines, 1991£271 •
8) Nerco Minerals, Con mine, 1992!271 •
Other major projects are under study, including Lihir, Papua New Guinea, Mule Canyon, USA, and Eskay Creek, Canada (figure 4). The Aegean Metallurgical Industries S.A. (METBA) Olympias gold projectf6
•8•24
•471 in Greece was cancelled because of cashflow problems.
2.3.2 Conceptual flowsheet
For any of the current commercial pressure oxidation operations flowsheet design and the determination of the process parameters are the result of extensive test work. Technical and financial evaluations have eliminated other process options, such as direct cyanidation after partial oxidation, thiourea leaching, roasting, etc .. Even when pressure oxidation was selected for the liberation of gold several important decisions still had to be made:
4
Apart from rare exceptions such as the aforementioned Sunshine Mining Co. autoclave process.
This thesis report only deals with acidic pressure oxidation.
10

Chapter 2 Metallurgy of refractory precious metal ores
- Process ore or concentrate?
In the case of a refractory ore rich in carbonates it may be advantageous to separate the carbonaceous gangue minerals by flotation, to promote oxygen utilization in the autoclave train and to lower the costs of lime in the neutralization circuit. Selective flotation of pyrite or arsenopyrite might be an attractive option should gold and silver be locked up in only one of these two important host minerals for precious metals[27].
Autoclave size requirements are primarily dictated by the quantity of contained sulfur in the feed material. Therefore, the processing of a concentrate rather than an ore may not necessarily have a major impact on the autoclave train dimensions. It will, however, greatly reduce the size requirements of the other unit operations.
From a kinetic point of view a reduction of particle size decreases the retention time requirement for successful oxidation. This favors the processing of flotation concentrates. The economic benefits of a smaller autoclave train must of course be compared to the costs of preconcentration by flotation and regrinding of the concentrate, and the loss of gold to the flotation tailings.
Another factor which may favor the processing of a concentrate rather than an ore is the variability of the ore sulfur content. Although pressure oxidation can accomodate a wide range of feed sulfur grades by means of autoclave feed pulp density adjustment, most efficient operation is achieved with a relatively constant sulfur grade. This is usually more easily achieved with flotation concentrates than with ores.
Aqueous pressure oxidation of sulfide flotation concentrates presents a series of problems usually not encountered in whole ore autoclavingP91:
Excessive heat and acid generation due to high sulfide levels in the concentrates. The excessive heat makes temperature control difficult, while silver becomes more soluble at very high acid concentrations under the prevailing autoclaving conditions. This means that not all silver is precipitated as silver jarosites and that an extra downstream process is necessary to recover the soluble silver fraction. "Pellet formation" or "wetting" of unreacted sulfide minerals, which can then agglomerate, thereby preventing complete oxidation (see section 3.1).
- Accept economic consequences?
Capital and operational expenditures are high for pressure oxidation operations. Equipment is expensive because both sulfuric acid and ferric iron are corrosive. Safe operation requires skilled operators and maintenance people. In almost all cases a complete oxygen plant must be purchased as well. For the Getchell pressure oxidation operation even a Catacarb plant was installed for the removal of carbon dioxide from the autoclave vent gases and recycling of the oxygenl27·481 •
11

RUN OF MINE
CRUSHING/ GRINDING
THICKENING I • back to mill
CONDITIONING reagents STOCK
FLOTATION
THICKENING
STOCK
I • fresh acid
back to mill
1resh acid
PREACIDIFICATION
THICKENING
PREHEATING
7
I
carbonate-rich tailings
PREACIDIFICATION
THICKENING
solids recycle
Figure 5:
oxygen
PRESSURE OXIDATION
FLASHING
THICKENING
PRECIOUS METALS
RECOVERY • caustic cyanide stripping
• electrowinning
• refining
gold and tllver metal
ptional
barren slurry
regenerated
carbon
lime limestone
NEUTRALIZATION
THICKENER CIRCUIT
WASTE MANAGEMENT
pressure oxidation conceptual flowsheet for oxvgen pressure leaching of auriferous concentrates and gold ores. Thin solid lines: steam; thick solid lines: acid; dashed lines: process watel6•
16•27
•471
•
,
.J
Chapter 2 Metallurgy of refractory precious metal ores
Although every feed material is unique and demands a specific variant of the oxygen pressure leaching process, common aspects of the different gold operations can be discussed on the basis of a conceptual flowsheetf6
,16
•27
•471 (figure 5):
Feed material is treated with acid prior to autoclaving to decompose as much carbonates as possible, since these would evolve CO2 and displace oxygen in the autoclave. Preacidification not only serves to improve subsequent oxygen utilization, but also to ensure sufficient initial levels of acid and iron, to promote a rapid initial rate of oxidation to achieve the required temperature profile in the autoclave.
In the case of pressure leaching of auriferous concentrates a portion of the oxidized solids is also added to the new autoclave feed, in order to maintain a high pulp density in the autoclave to promote suspension and dispersion of any elemental sulfur formed during pressure oxidation (section 3.1). Prior cooling of this recycle slurry may be advantageous in that it will provide an additional "heat sink" for the heat of the oxidation reactions, allowing for a reduction in the autoclave cooling requirements. The recycle slurry also lowers the acid requirements for the decomposition of carbonates and, in effect, provides disproportionate solids retention time. Finally, the introduction of oxidized solids to the new autoclave feed lowers silver solubility. This suppression of silver solubility may be due to silver cementation by pyriter391•
Pretreated ore is usually preheated with steam from autoclave discharge flash tanks and with autoclave vent gases. Direct heating of the fresh material in titanium splash-flash heat exchangers is often preferred because of the danger of scale formation in indirect heating.
During pressure oxidation in the multi-compartment horizontal autoclaves lined with acid bricks, the heat generated by the sulfide oxidation is used to sustain the reaction. Steam injection may provide additional heat in the autoclaving of ores, whereas water may be added for temperature control during the pressure leaching of concentrates.
Part of the acid of the first thickener overflow is normally recycled to the acidulation stage, while the remainder proceeds to the neutralization circuit. In the two-stage thickening step cyanicides as well as aluminum, iron and magnesium, which would otherwise precipitate as slimy hydroxides, are removed. These hydroxides would increase slurry viscosity, the possibility of gold and silver losses through adsorption during cyanidation and fouling of activated carbon in the recovery circuit. High dilution of the pulp is used to promote wash efficiency and flocculant utilization.
In the thickener circuit of the neutralization step the pH is adjusted through the addition of limestone, (quick)lime, and, in the case of pressure oxidation of concentrate, flotation tailings rich in carbonates, to neutralize the acid and precipitate arsenic, metals and associated sulfate. Water from the neutralization thickener circuit is reclaimed and used in the two-stage CCD circuit for the autoclaved pulp. The washed, oxidized solids proceed to a gold recovery operation, usually cyanidation-precipitation (Merrill-Crowe process), or carbon-in-leach (CIL) or carbon-in-pulp (CIP) processing.
12


Chapter 2 Metallurgy of refractory precious metal ores
Sludge from the neutralization circuit and the barren slurry from the precious metals recovery operation are combined for deposition in a tailings area. The barren pulp from the cyanide circuit might first be detoxified by treatment with the metals containing acid stream from the wash circuit. Runoff water from the tailings area is normally recycled.
It is striking that in none of the industrial operations mentioned associated base metals such as copper and zinc are recovered. This possibility warrants consideration. Base metals, which are effectively extracted in the autoclave operation, could be selectively recovered at an intermediate stage of the neutralization circuit. In the Sunshine Mining Co. alternative pressure leaching process solvent extraction is utilized to separate copper from the leach solution preparatory to conventional electrowinning.
2.4 Cyanidation chemistry
A lot of literature is available on the dissolution of metallic gold and silver particles in cyanide solutions. In principle both precious metals show the same cyanide leaching characteristics, the rate of dissolution of silver being approximately half that of gold491 • In oxygen pressure leaching in an acidic sulfate medium the very noble gold5 remains in its metallic state6
, whereas the less noble silver is incorporated in jarosite-type compounds. None of the traditional dissolution equations, therefore, are then applicable to describe the behavior of silver in the cyanidation circuit. Little is known about the mechanism of silver dissolution from silver jarosites in cyanide solutions. Because both sample materials used in the test work contain some metallic gold, and for comparative purposes, a short description of gold dissolution is given in this section. Silver dissolution is dealt with in the presentation and discussion of the experimental work in chapter 6.
It is agreed that the rate of dissolution of gold in a dilute cyanide solution is a diffusioncontrolled process, the rate controlling factors being the diffusion rates of cyanide and, most of all, oxygen. Several different equations have been proposed to describe the dissolution of gold. Elsner's equation118
'491 :
6
4 Au(s) + 8 NaCN(aq) + Oi{aq) + 2 H2O ➔ 4 Na[Au(CN)z](aq) + 4 NaOH(aq) [2.2]
Because of their minor economic importance gold tellurides are not considered.
Gold solubilization during aqueous pressure oxidation is of some concern in acidic sulfate-iodide media (section 4.4).
13
Chapter 2 Metallurgy of refractory precious metal ores
has been generally accepted, although it solely describes the role of oxygen in the dissolution reactions. Equations proposed by Bodlander and Boonstra£49J give more fundamental descriptions of the dissolution mechanism that take into account the roles of both oxygen and hydrogen peroxide; the overall chemical reactions equal the one proposed by Elsner. The formation of hydrogen peroxide has indeed been observed.
The dissolution of gold in dilute cyanide solutions can be considered as an electrochemical process, in which electrons are exchanged between cathodic and anodic zones on the metal surface. The oxidation step involves the formation of the aurocyanide ion:
Au(s) + 2 cN-(aq) - [Au(CN):J(aq) + e- [2.3]
The reduction step is:
[2.4]
Leaching of gold ores with dilute cyanide solutions is a well established, highly automated and efficient industrial process. In practically all precious metals operations worldwide NaCN is used as the source of cyanide. The functions of lime in cyanidation are:
to maintain a high pH ( ~ 10) to prevent the formation of the lethal hydrocyanic acid through reaction with carbonic acid:
NaCN(aq) + H2COiaq) - HCN(g) t + NaHCOiaq)
and hydrolysis of NaCN:
NaCN(aq) + H2O - HCN(g) t + NaOH(aq)
[2.5]
[2.6]
to neutralize acidic compounds in the ore or acidic compounds formed by decomposition of minerals in the ore. to increase the settling rate of fine particles so that clear pregnant solution can be separated faster from cyanided ore.
14
Chapter 3 Aqueous pressure oxidation in acidic sulfate media
3. AQUEOUS PRESSURE OXIDATION IN ACIDIC SULFATE MEDIA
3.1 Oxidation chemistry
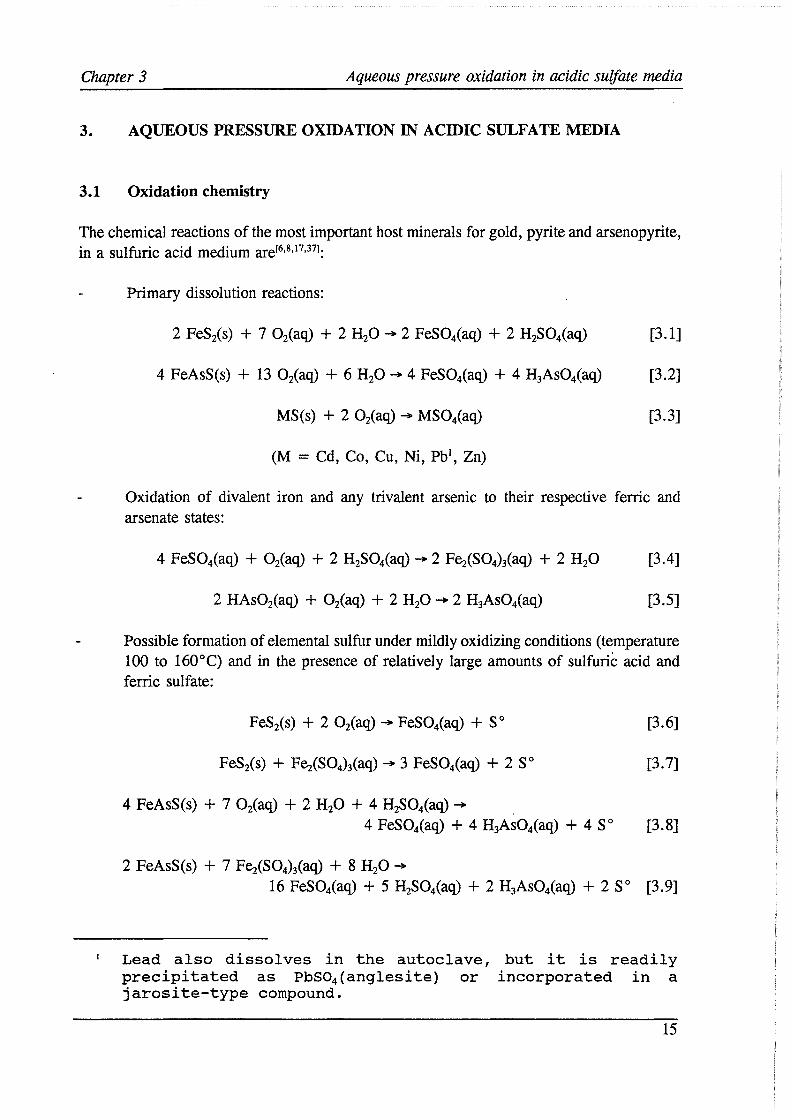
The chemical reactions of the most important host minerals for gold, pyrite and arsenopyrite, in a sulfuric acid medium are£6,8•
17•37l:
Primary dissolution reactions:
4 FeAsS(s) + 13 Oi(aq) + 6 H2O ➔ 4 FeSOiaq) + 4 H3AsOiaq) [3.2]
MS(s) + 2 Oz(aq) ➔ MSOlaq) [3.3]
(M = Cd, Co, Cu, Ni, Pb1, Zn)
Oxidation of divalent iron and any trivalent arsenic to their respective ferric and arsenate states:
Possible formation of elemental sulfur under mildly oxidizing conditions (temperature 100 to 160°C) and in the presence of relatively large amounts of sulfuric acid and ferric sulfate:
FeSz(s) + 2 Oz(aq) ➔ FeSOiaq) + S 0 [3.6]
4 FeAsS(s) + 7 Oz(aq) + 2 H2O + 4 H2SOiaq) ➔ .
4 FeSOlaq) + 4 H3AsOiaq) + 4 S 0 [3.8]
2 FeAsS(s) + 7 Fez(SO4)laq) + 8 H2O ➔ 16 FeSOlaq) + 5 H2SOiaq) + 2 H3AsOiaq) + 2 S 0 [3.9]
Lead also dissolves in the autoclave, but it is readily precipitated as PbS04 (anglesite) or incorporated in a jarosite-type compound.
15
Chapter 3 Aqueous pressure oxidation in acidic sulfate media
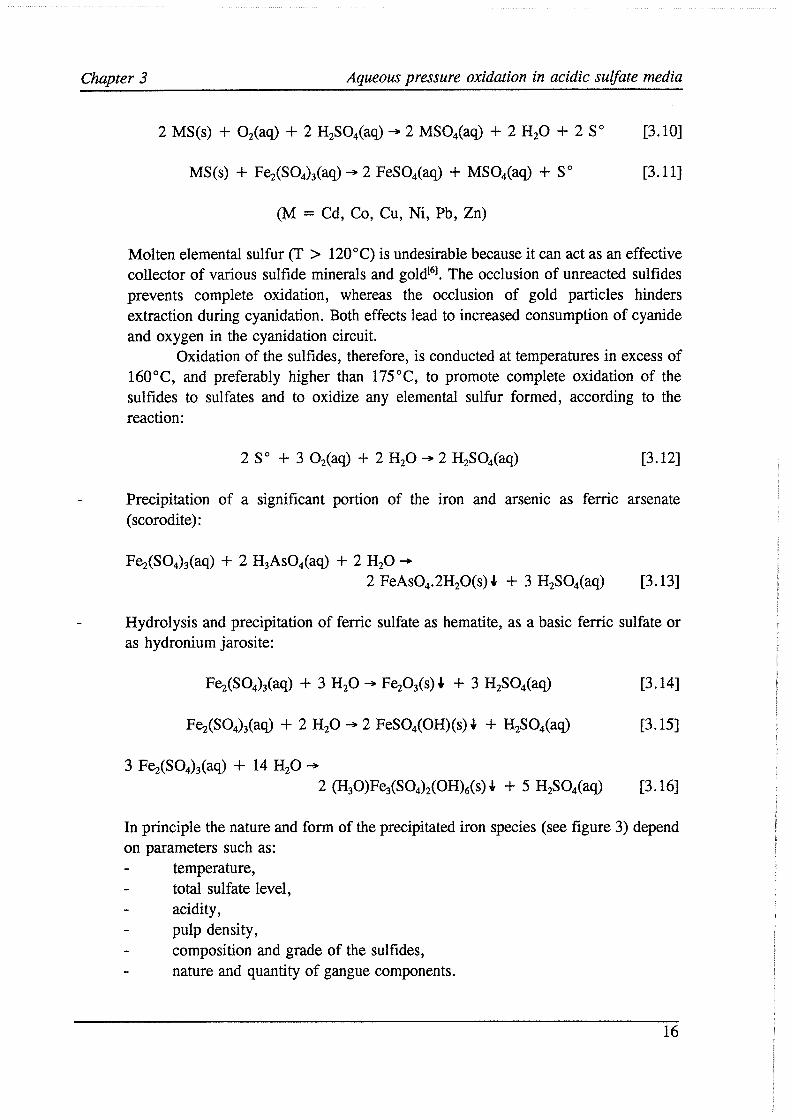
2 MS(s) + Oi(aq) + 2 H2SOlaq) -+ 2 MSOiaq) + 2 H2O + 2 S 0
(M = Cd, Co, Cu, Ni, Pb, Zn)
[3.10]
[3.11]
Molten elemental sulfur (T > 120°C) is undesirable because it can act as an effective collector of various sulfide minerals and goldf61 • The occlusion of unreacted sulfides prevents complete oxidation, whereas the occlusion of gold particles hinders extraction during cyanidation. Both effects lead to increased consumption of cyanide and oxygen in the cyanidation circuit.
Oxidation of the sulfides, therefore, is conducted at temperatures in excess of 160°C, and preferably higher than 175°C, to promote complete oxidation of the sulfides to sulfates and to oxidize any elemental sulfur formed, according to the reaction:
[3.12]
Precipitation of a significant portion of the iron and arsenic as ferric arsenate ( scorodite):
Fez(SO4)laq) + 2 H3AsOiaq) + 2 H2O-+ 2 FeAsO4.2H2O(s) I + 3 H2SOiaq) [3.13]
Hydrolysis and precipitation of ferric sulfate as hematite, as a basic ferric sulfate or as hydronium jarosite:
3 Fez(SO4)laq) + 14 H2O -2 (H3O)F~(SO4)z(OH)is) I + 5 H2SOiaq)
[3.14]
[3.15]
[3.16]
In principle the nature and form of the precipitated iron species (see figure 3) depend on parameters such as:
temperature, total sulfate level, acidity, pulp density, composition and grade of the sulfides, nature and quantity of gangue components.
16
Chapter 3 Aqueous pressure oxidation in acidic sulfate media
In practice the necessity of successful liberation of gold and the avoidance of the formation of elemental sulfur force the leaching conditions to be favorable to jarosite precipitation. Particularly in the presence of potassium and sodium, released by the dissolution of some of the gangue components, and silver, hydrolysis of a portion of the ferric sulfate to the corresponding jarosite takes place:
3 Fei(SO4)laq) + M2SOiaq) + 12 H2O -2 MF~(SO4)i(OH)is)~ + 6 H2SOiaq) [3.17]
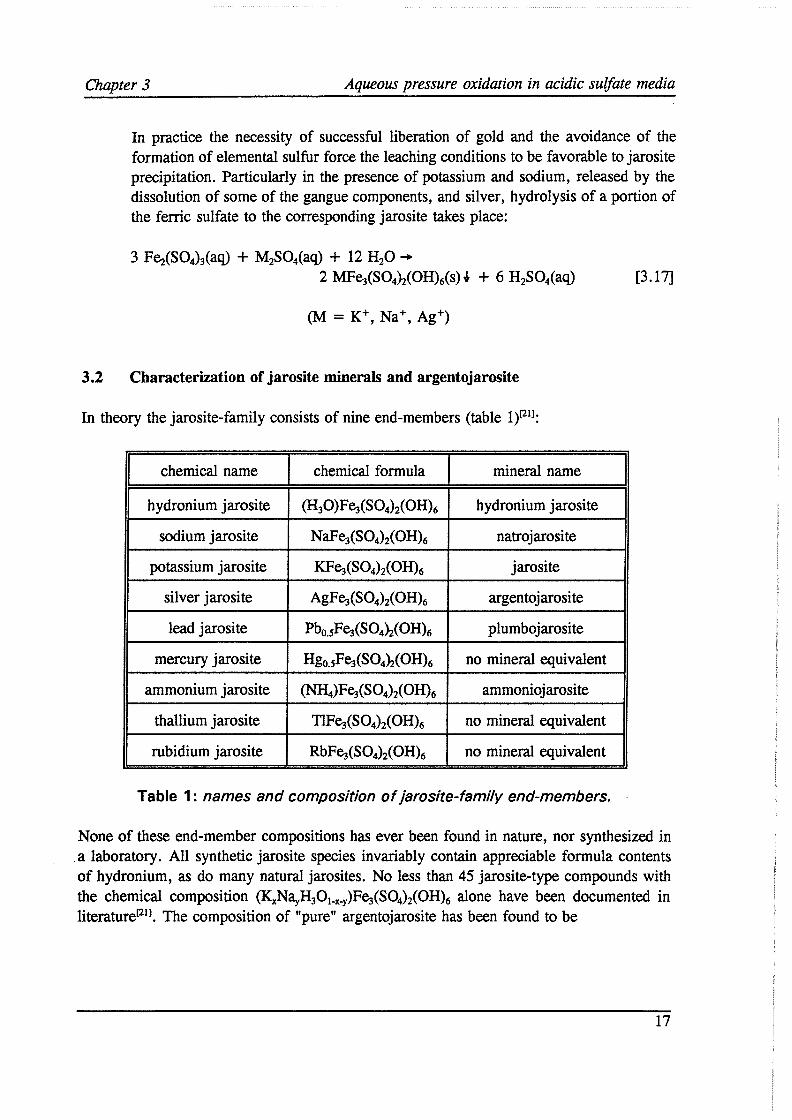
3.2 Characterization of jarosite minerals and argentojarosite
In theory the jarosite-family consists of nine end-members (table 1)1211:
\;i1emical name chemical formula mineral name
hydronium jarosite (H3O)F~(SO4)i(OH)6 hydronium jarosite
sodium jarosite NaF~(S04)i(OH)6 natrojarosite
potassium jarosite KF~(SO4)i(OH)6 jarosite
silver jarosite AgF~(SO4)i(OH)6 argentojarosite
lead jarosite Pb0.sF~(SO4)i(OH)6 plumbojarosite
mercury jarosite Hg0_sF~(SO4)i(OH)6 no mineral equivalent
ammonium jarosite ~)F~(SO4)i(OH)6 ammoniojarosite
thallium jarosite T1F~(SO4)i(OH)6 no mineral equivalent
rubidium jarosite RbF~(SO4)i(OH)6 no mineral equivalent
Table 1: names and composition of jarosite-family end-members.
None of these end-member compositions has ever been found in nature, nor synthesized in a laboratory. All synthetic jarosite species invariably contain appreciable formula contents of hydronium, as do many natural jarosites. No less than 45 jarosite-type compounds with the chemical composition (KxNayH3O1.x-y)F~(SO4)i(OH)6 alone have been documented in literature1211• The composition of "pure" argentojarosite has been found to be
17
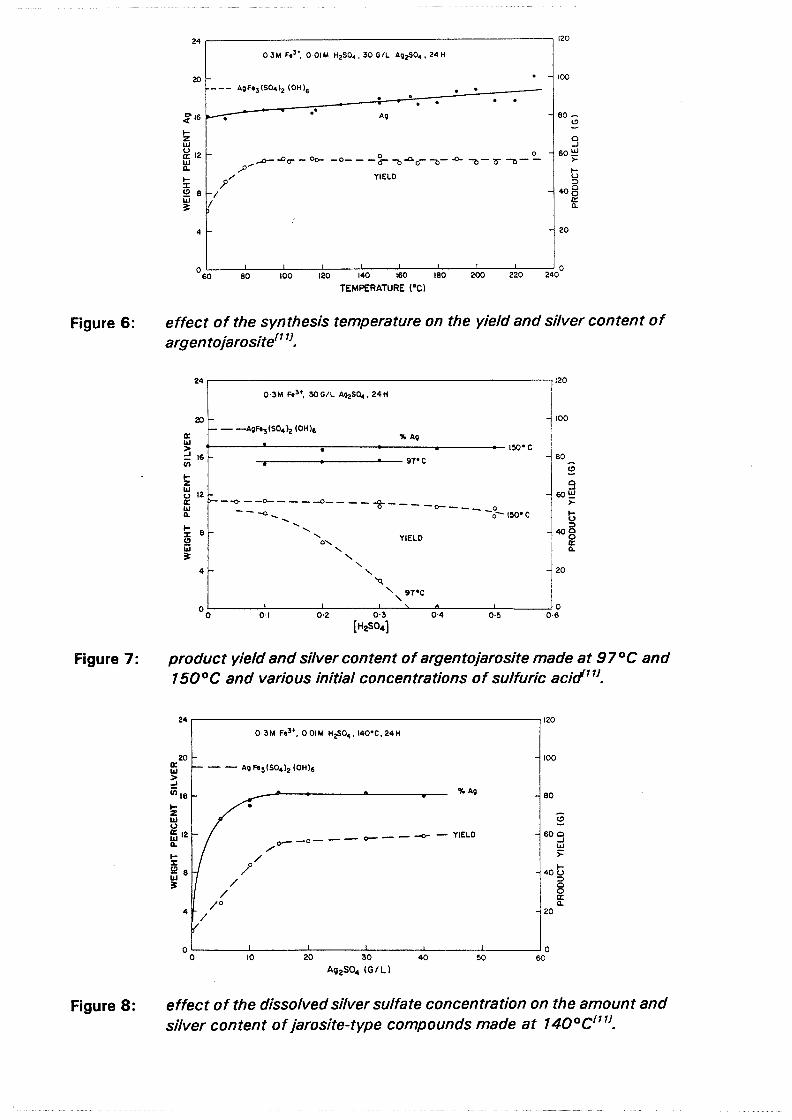
Figure 6:
Figure 7:
Figure 8:
24 ~---------------------------, 120
20 .... --- AgF1 3 (SO•lz (OH)6
.. Ag
. . • - 100
- BOC)
- 20
0 '-----'---, _ __,_ __ _._ __ ,..._ __ -'---1 -----'-'--..J• ___ ,..._, _ __, 0 w ~ ~ ~ ~ ~ ~ ~ ~ ~
TEMPERATURE (°Cl
effect of the synthesis temperature on the yield and silver content of argentojarosite1111
•
24 ,------------------------~ 120
20 100 - -AQF13(S0•l.? (0H)g
ffi t-----''------,,-------""-A_g _____ ,.__ 1!50° C ~ ~ . 80 (/) ____________ .......___ s1•c
I- ~ z 9 ~~ ro~ ffi --:--~----0-- ---%---- -o---- 0 ► a.. - -<l....._....... -o- 150•c t; ~ S -... ...._ '- YIELD 40 §
~ 4 L.. ___ ....,__ ___ ...,_o_,_,_,_,_,_"'_,___,...__.,__ ___ J....._ __ --1J 0
20 !l:
O O 0·I 0·2 0·3
,, 97•c I 0·4 0·5 0·6
[H~04)
product yield and silver content of argentojarosite made at 97°C and 150°C and various initial concentrations of sulfuric acir/111
•
24 .--------------------------120
20 a:
100
l1J :j iii 16
~ l1J 0 a: 12 ~ 1-:i::
~ 8 :=
• 80
C)
WO ..J LLI
► 40 t;
::::>
~ Cl.
20
0'----'-----''------l----1----1---_J0 0 10 20 30 40 W
A112S04 (GIL)
effect of the dissolved silver sulfate concentration on the amount and silver content of jarosite-type compounds made at 140°C1111
•
Chapter 3 Aqueous pressure oxidation in acidic sulf ate media
(A~_~3O0•1)F~(SO4)i{OH)62£11,
41•451• Probably the composition of end-member jarosite
minerals is better described by the general chemical formula {M1.Jl3OJF~(SO4)i(OH)6•
The behavior of silver during the precipitation of natrojarosite and beaverite3-plumbojarosite from synthetic mixtures of reagent-grade chemicals, in both sulfate and chloride media, has been extensively studiedl101• It was found that the incorporation of silver in the jarosite structure is a problem specific to sulfate media; experimental work on natrojarosite and plumbojarosite precipitation in chloride media showed that the concentration of structurally incorporated silver is negligible over a wide range of test conditions. The difference in the behavior of silver is attributed to the formation of anionic silver chloro-complexes in concentrated chloride media, these having unfavorable dimensions and charges for structural incorporation in jarosite-type compounds.
Factors affecting silver jarosite formation in acidic sulfate media arel111:
- Physical parameters: Precipitation is favored in a well-stirred, baffled reactor at temperatures higher than 90°C. Increasing the temperature slightly increases the silver content of the jarosite. Argentojarosite precipitates slowly even at room temperature, and it is readily formed at 60°C. The amount of argentojarosite formed increases steadily from 60°to • l 10°C and then basically remains constant to at least 230°C (figure 6). The stability of argentojarosite to elevated temperatures is notable, and is greater than that which has been observed for the common alkali and lead jarosites.
- Sulfuric acid concentration: At temperatures ranging from 97 to 150°C the silver content of the jarosite precipitate is virtually independent of the sulfuric acid concentration. At lower temperatures (97°C) the product yield falls steadily with increasing initial acid concentrations above 0.1 molar and no jarosite at all is produced at 0.3 molar. The amount of jarosite produced at 150°C begins to decline only for initial sulfuric acid concentrations higher than 0.4 molar (figure 7). The stability of argentojarosite to the initial sulfuric acid concentration is remarkable and is significantly greater than that of some of the other jarosite species, such as natrojarosite and plumbojarosite.
- Silver sulf ate concentration:
2
3
The presence of only low silver ion concentrations in the solution results in the formation of argentojarosite, although the hydronium content of the material is somewhat elevated. Also, at low silver ion concentrations, it is striking that the system precipitates smaller amounts of argentojarosite rather than producing more
In this report, for simplicity reasons, argentojarosite will be considered a stoichiometric compound with regard to silver.
Beaverite is a copper containing plumbojarosite.
18

40,-----------~,~
36 MIO
0 ---o- __ o -~ 0 14()
120 .....
20
110
40 ...... .. -;
/0 20
/ / 12 ~~-__._ _ _,__.,___. _ __, 0
0 0·1 0·2 0-3 0·4 0-5 0-6
(F1 1')
1·2 0·2M F,3•, pH• 1·6, 97'C, 24H
[ 1492S04] • [ K~(4] • 0·03M
1·0
0 0·8
~ _..,
~,~ 0·6 •
A ....... 0·4
// 0·2 ~
00 0·2 0·4 0·6 0·8 l·O
[ A:~ K] SOLUTION
1.2 --........ --~---.---or----.
1.0
0.8 Q
i :-if 0.6 c+
"' C ,__. 0.4
0.2
/ /
/
0.2 0.4 0.6 0.8
[ A9 A_! Pb 1 SOLUTION
1.0
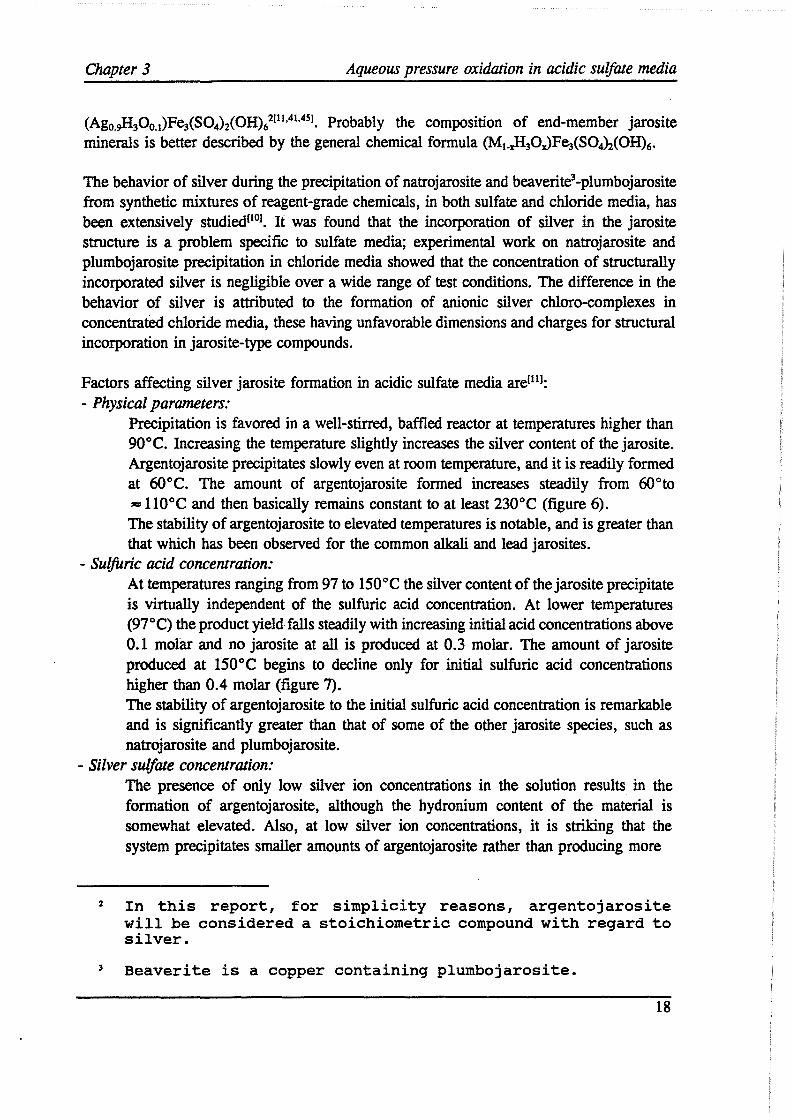
Figure 9: effect of the initial Jf-e~ · J on the yield and composition of argentojarosites formed at 155°C and at a constant ratio of Fe3 + :Ag of 1.00 g: 1.64 {/111
•
Figure 10: molar partitioning curve for Ag and K between solution and a jarosite product made at 97°d111
•
Figure 11: molar partitioning curve for Ag and Na between solution and a jarosite product made at 97°d'01
•
1.4 ,-------.----,-.--....---...----
1.2
1.0
~ 0 (I)
f 0.8
< ... ~ ..__.
0.6
0.4
0.2
0 0
1·2
l·O
e 0-0
--~ "'I~ 0·6 c:t c,, c:t .__,
0·4
0·2
0.2 M Fe ,so.>111 , pH• 1.6, 97•c [ A112S04 + Naz 5(4] • 0.03 M
• / • /
• / //
0.2 0.4 0.6 0.8
[ Ag::a ] Solution
0·3M F13', OM H~04, 155°C, 24 H
[ A92S04] + [ PbS04] • O·IM
/
/ /
1.0
0 __ ___. __ __._ __ __._ __ ....___~
0 0·2 0·4 0·6 0·8 1·0
[ A9 ] Ag + Pb SOLUTIOf!I
Figure 12a: molar partitioning curve for Ag and Pb between solution and a jarosite product made at 97°C111
•
Figure 12b: molar partitioning curve for Ag and Pb between solution and a jarosite product made at 155°C111
•
Chapter 3 Aqueous pressure oxidation in acidic sulfate media
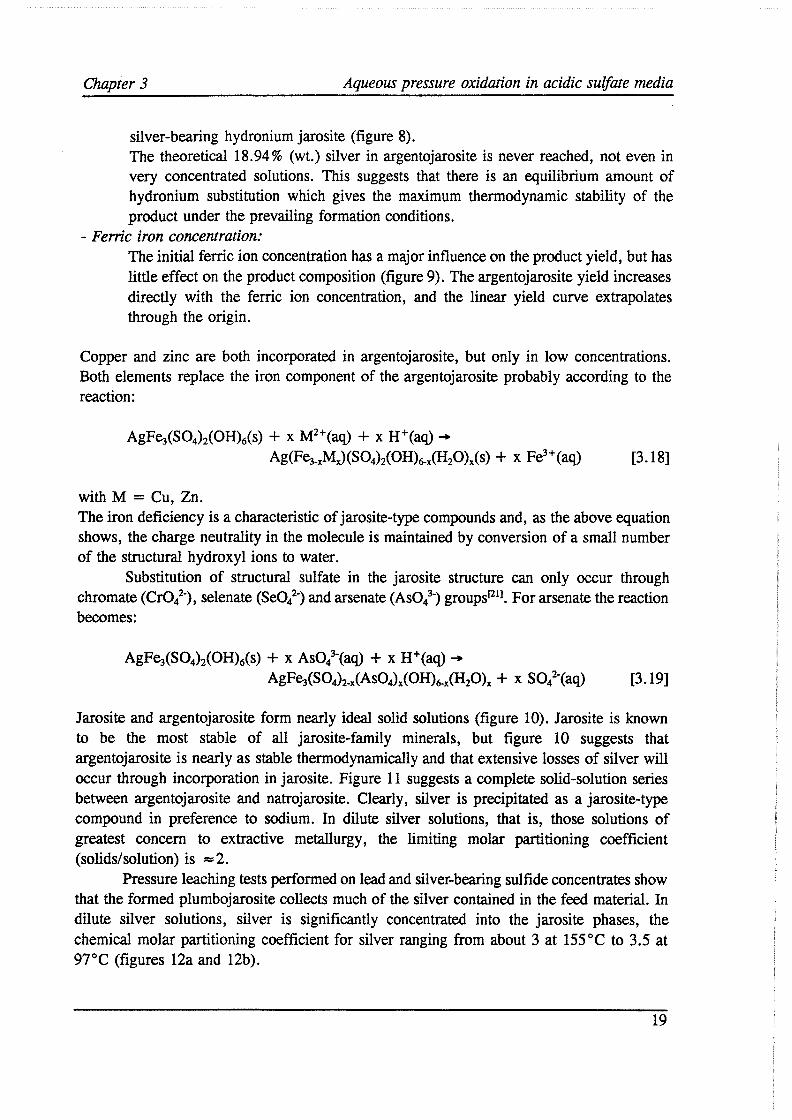
silver-bearing hydronium jarosite (figure 8). The theoretical 18.94% (wt.) silver in argentojarosite is never reached, not even in very concentrated solutions. This suggests that there is an equilibrium amount of hydronium substitution which gives the maximum thermodynamic stability of the product under the prevailing formation conditions.
- Ferric iron concentration: The initial ferric ion concentration has a major influence on the product yield, but has little effect on the product composition (figure 9). The argentojarosite yield increases directly with the ferric ion concentration, and the linear yield curve extrapolates through the origin.
Copper and zinc are both incorporated in argentojarosite, but only in low concentrations. Both elements replace the iron component of the argentojarosite probably according to the reaction:
AgF~(SO4)i(OH)is) + X M2+(aq) + X H+(aq) -Ag(F~-xMJ(SO4)i(OH)6-x(H2O)x(s) + x Fe3+(aq)
with M = Cu, Zn.
[3.18]
The iron deficiency is a characteristic of jarosite-type compounds and, as the above equation shows, the charge neutrality in the molecule is maintained by conversion of a small number of the structural hydroxyl ions to water.
Substitution of structural sulfate in the jarosite structure can only occur through chromate (CrOl), selenate (Seo/-) and arsenate (AsO/-) groupsl211• For arsenate the reaction becomes:
AgF~(SO4)i(OH)6(s) + x AsO/-(aq) + x H+(aq) -AgF~(SO4)2_x(AsO4)x(OH)6-x(H2O)x + x SO4
2·(aq) [3.19]
Jarosite and argentojarosite form nearly ideal solid solutions (figure 10). Jarosite is known to be the most stable of all jarosite-family minerals, but figure 10 suggests that argentojarosite is nearly as stable thermodynamically and that extensive losses of silver will occur through incorporation in jarosite. Figure 11 suggests a complete solid-solution series between argentojarosite and natrojarosite. Clearly, silver is precipitated as a jarosite-type compound in preference to sodium. In dilute silver solutions, that is, those solutions of greatest concern to extractive metallurgy, the limiting molar partitioning coefficient (solids/solution) is = 2.
Pressure leaching tests performed on lead and silver-bearing sulfide concentrates show that the formed plumbojarosite collects much of the silver contained in the feed material. In dilute silver solutions, silver is significantly concentrated into the jarosite phases, the chemical molar partitioning coefficient for silver ranging from about 3 at 155°C to 3.5 at 97°C (figures 12a and 12b).
19
Ca (OH)2
Gf<OUNDO<E OR CONCENTRATE
12 PRESSURE,,.._ ___ SULPHUl<IC ACID OXIDATION SOLUTION
ALKALINE
14 ---OVERFLOW
SOLUTK)N
16
PRETREATMENT 18 GOLD AND SILVER __ _ RECOVERY
GOLD AND SILVEi< TAILINGS
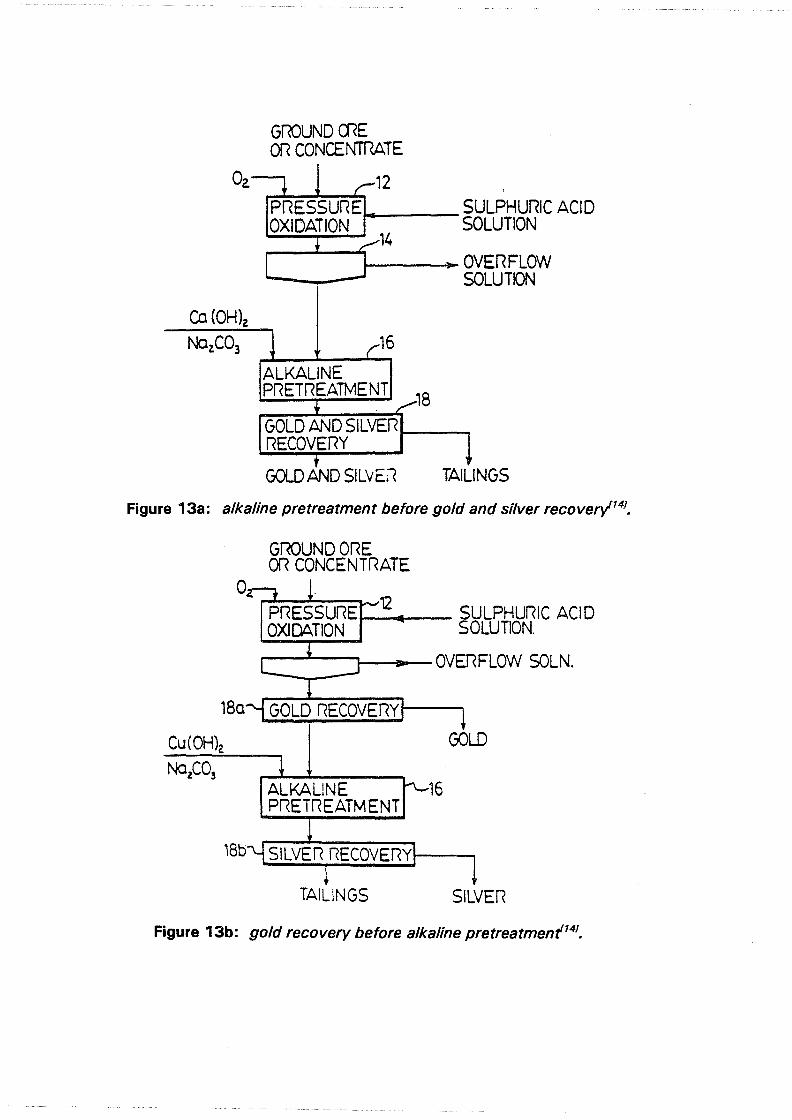
Figure 13a: alkaline pretreatment before gold and silver recover/141•
GROUND ORE OR CONCENTRATE
Oz l""""P--R-ES_S_U_RE-:_-:_'12.....,._ __ SU LPHUl<IC ACID OXIDATION SOLUTION.
r--__._-.,___._ OVERFLOW SOLN.
18a GOLD RECOVEl<Yi------.
Cu ( OH)2 GOLD
ALKALINE 16 PRETREATMENT
18b SILVER l<ECOVERYi------. i
TAILINGS SILVEI<
Figure 13b: gold recovery before alkaline pretreatmenf141•

Chapter 3 Aqueous pressure oxidation in acidic suljate media
As mentioned before, in none of the K-Ag, Na-Ag and Pb-Ag systems end-member compositions are obtained in the various syntheses, due to partial replacement of the nonferrous metals by hydronium ion. This hydronium ion substitution seems to be common to all jarosite-type compounds.
3.3 Sherritt Gordon silver enhancement treatment
Both gold and silver are effectively liberated during pressure oxidation. The bulk of the silver, however, becomes associated with refractory jarosites in the autoclave. Effective enhancement of the silver recovery can be achieved through the Sherritt Gordon hot lime treatment. In this process a slurry of the autoclave residue is made at 30-35 % solids with lime, at a temperature of at least 80°C, but advantageously above 90°C. The pH of the slurry is raised to at least about 9, but favorably to 10.5. The pulp is maintained at the "conditioning" temperature for 0.5 to 4 hours. The resultant slurry is then subjected to silver recovery treatment, preferably without prior liquid-solids separationU41• Gold may be recovered either before or after liming of the leach residue (figures 13a and 13b). To lower lime cost the pH might be adjusted from 9 or 10 to 10.5 with an alkali carbonate.
The reaction which takes place during the hot lime treatment is:
2 AgF~(SO4)i(OH)6(s) + 3 Ca(OH)i(aq) -Ag2SOiaq) + 6 FeO(OH)(s) + + 3 CaSO4.2H2O(s) + + 4 H2O [3.20]
In many cases this process is uneconomical as a result of the high lime requirements.
20
SILVER DISTRIBUTION AFTER PRESSURE OXIDATION of a synthetic mixture of Ag2S, Fe2 (S04)s and HI in water
% (wt.) Ag in iodargyrite % (wt.) Ag in argentojarosite 10n+------------~-----------,100
te
osite
80
60
, 20
---------------------------------'0 0.5 1 1.5 2 2.5 3 3.5 4 4.5 5
molar l:Ag
Ptot = 16 bar, p02 = 10 bar, T = 160°C, n = 400 rpm, t = 60 min
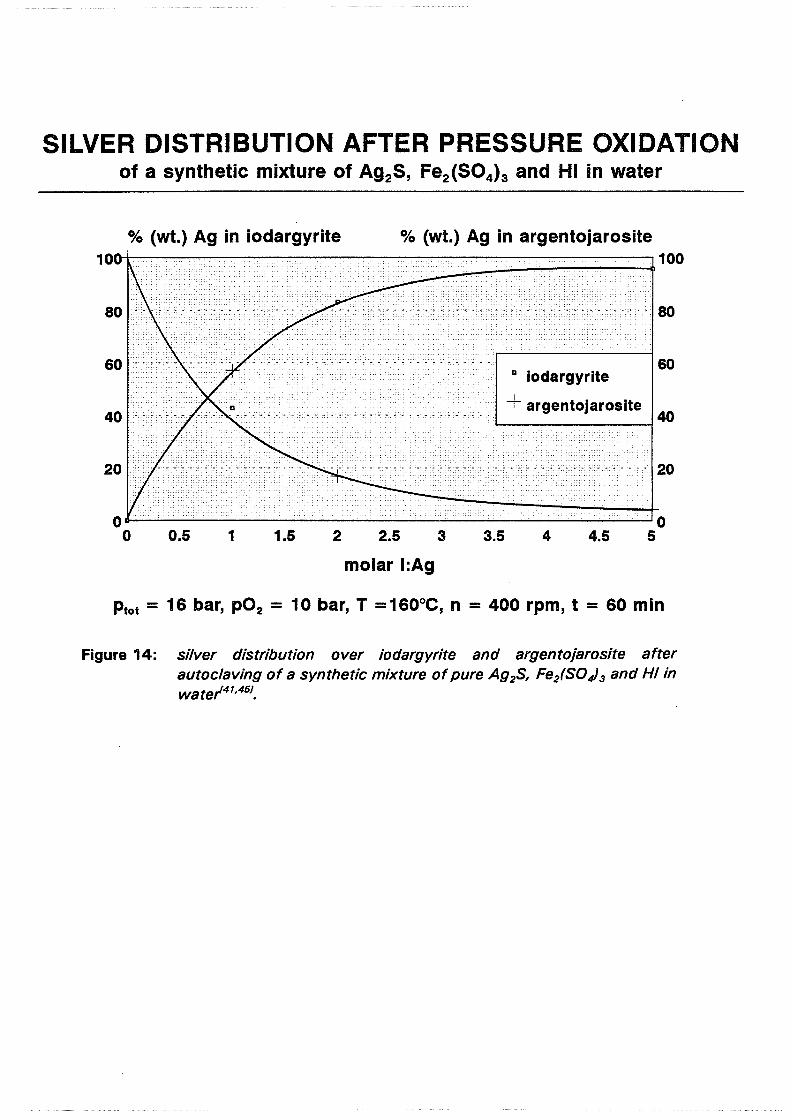
Figure 14: silver distribution over iodargyrite and argentojarosite after autoclaving of a synthetic mixture of pure Ag2S, Fe2(SO,,}3 and HI in wate/41,451.

Chapter 4 Aqueous pressure oxidation in acidic sulf ate-iodide media
4. AQUEOUS PRFSSURE OXIDATION IN ACIDIC SULFA TE-IODIDE MEDIA
4.1 Introduction
The use of iodine species is not entirely new to metallurgy. Iodine may be used in the preparation of high purity metals, e.g. titanium, hafnium and zirconium, via small scale, advanced pyrometallurgical deposition techniques132
•331
• In the field of hydrometallurgy, the inability of conventional cyanidation to effectively recover gold and silver from refractory ores has prompted the search for alternative, more powerful lixiviants such as iodine and iodide-iodine mixtures. In addition, the interest in iodine and other halogens has developed as a result of environmental risks with the use of cyanidel18
•19
•33
•34
1.
Several patented processes make use of iodide-iodine lixiviants for the recovery of gold from electronic or scrap materials. Iodide-iodine leachant mixtures are also mentioned in a few patents dealing with in situ leaching to recover gold in solution mining operations171 •
This thesis work is probably one of the first hydrometallurgical projects involving the use of iodine species at conditions different from ambient. Earlier experimental work at the Faculty141 •451 was performed with synthetic mixtures of reagent-grade chemicals. It was shown that the prevention of the formation of argentojarosite during aqueous pressure oxidation of argentiferous, refractory gold ores through the addition of iodide to the autoclave slurry, is a possible process option.
On the one hand the Agl-precipitate will not desintegrate and recrystallize as argentojarosite under industrial autoclave conditions, nor does its presence influence other reactions taking place in the autoclave. On the other hand argentojarosite will decompose and form Agl when the residence time in the autoclave is long enough and sufficiently high quantities of iodide are available.
Pressure oxidation test on slurries containing AgiS, HI and Fei(S04) 3 showed that less than 5 % (wt.) of the silver is incorporated in argentojarosite by taking the molar ratio of iodide to silver for autoclaving as 5. If a silver loss in the order of 15% (wt.) is acceptable the ratio decreases rapidly (table 2):
molar ratio I/ Ag % Ag in Agl % Ag in AgF~(S04)i(OH)6
(iodargyrite) ( argentojarosite)
1 42.9 57.1
2 83.1 16.9
5 95.7 4.2
Table 2: silver distribution for different molar iodide to silver ratios.
21
1.800 XXXXXXXXXXXXXXXXXXXXXXXXXXXXXXXXXXXXXXXXXXXXXXXXXXN 1.700 X X 1.600 X AoI03(s) X 1.500 X X 1.400 X X 1.300 X X 1.200 D X 1.100 XXXXXXXXXX X 1. 000 X Ag I ( s ) X X X X X X X X X 0 • 900 X X X X X X X X X X X X X X Q.800 X XXXXXXXXXXXXX 0~ 0.700 X XXXX 0.600 X X 0.500 X X 0.400 X X
E(vclts)= 0.300 X X 0.200 XXXXXXXXXXXX X 0 • .1.oc x xxxxxxxxxxxxxx x 0.000 H Ag(5203)2<3->(aq) XXXXXXXXXXXXXX X
-0 • .1.00 X XXXXXXXXXXXXX -0.200 X XX -0.300 X X -0.400 X H< -0.500 X X -0.600 X X -0.700 X X -0.800 X X -0.900 X X -1.000 X X -1.100 X X -1.200 XXXXXXXXXXXXXXXXXXXXXXXXX~XXXXXXXXXXXXXXXXXXXXXXXXN
I I I I I I I I 0.00 pH ---> 7 .00
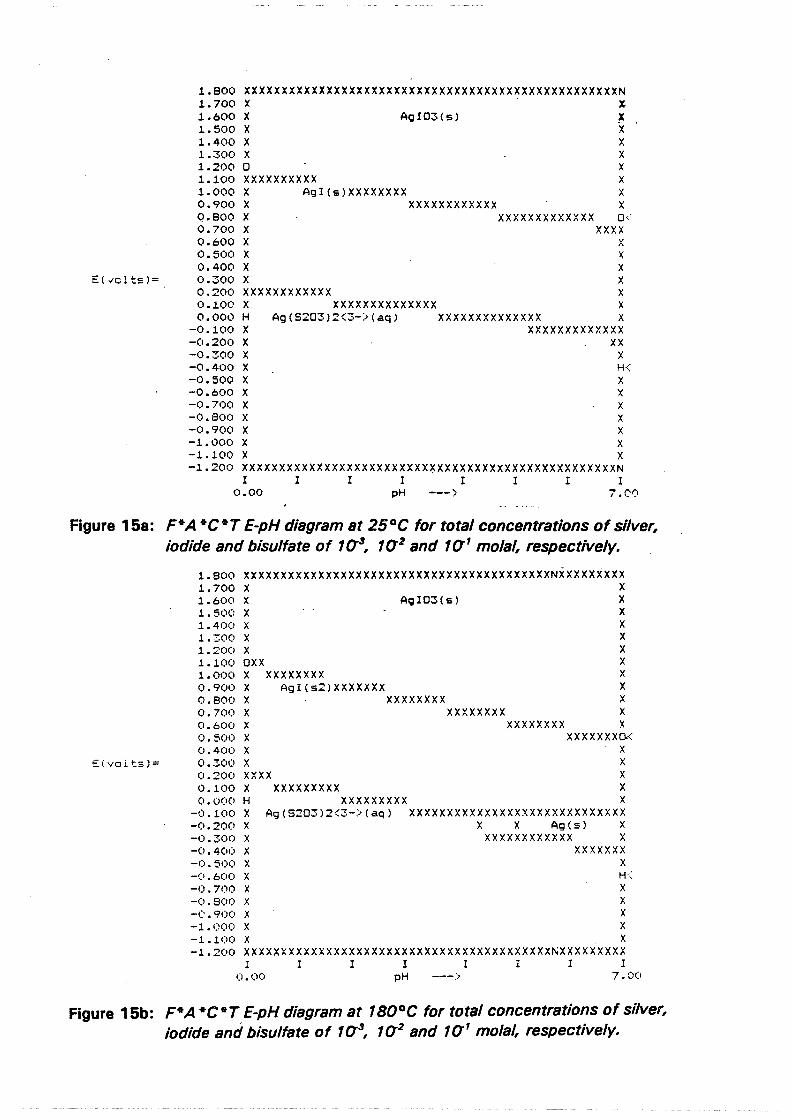
Figure 15a: F*A *C*T E-pH diagram at 25°C for total concentrations of silver, iodide and bisulfate of to-3, 1(12 and 1(11 molal, respectively.
E(voits)=
1.800 XXXXXXXXXXXXXXXXXXXXXXXXXXXXXXXXXXXXXXXXXNXXXXXXXXX 1.700 X X 1.600 X AQI03(s) X 1.500 X X 1.400 X X 1.300 X X 1.200 X X 1.100 DXX X 1.000 X XXXXXXXX X 0.900 X AgI(s2)XXXXXXX X 0 • 800 X X X X X X X X X X 0.700 X XXXXXXXX X 0.600 X XXXXXXXX X O. 500 X XXXXXXXO,< 0.400 X X 0.300 X X 0.200 XXXX X 0.100 X XXXXXXXXX X 0.000 H XXXXXXXXX X
-0.100 X Ag(5203)2<3->(aq) XXXXXXXXXXXXXXXXXXXXXXXXXXXXX -0 . 200 X X X Ag ( s ) X -0.300 X XXXXXXXXXXXX X -0.400 X XXXXXXX -0.500 X -0.600 X -0.700 X
X H< X
-0.800 X X -0.900 X X -1.000 X X -1.100 X X -1.200 xxxxxxxxxxxxxxxxxxxxxxxxxxxxxxxxxxxxxxxxx~xxxxxxxxx
I I I I I I I 1 o.oo pH 7.00
Figure 15b: F*A *C*T E-pH diagram at 180°C for total concentrations of silver, iodide and bisulfate of to-3, 1(12 and 1(11 molal, respectively.
Chapter 4 Aqueous pressure oxidation in acidic sulfate-iodide media
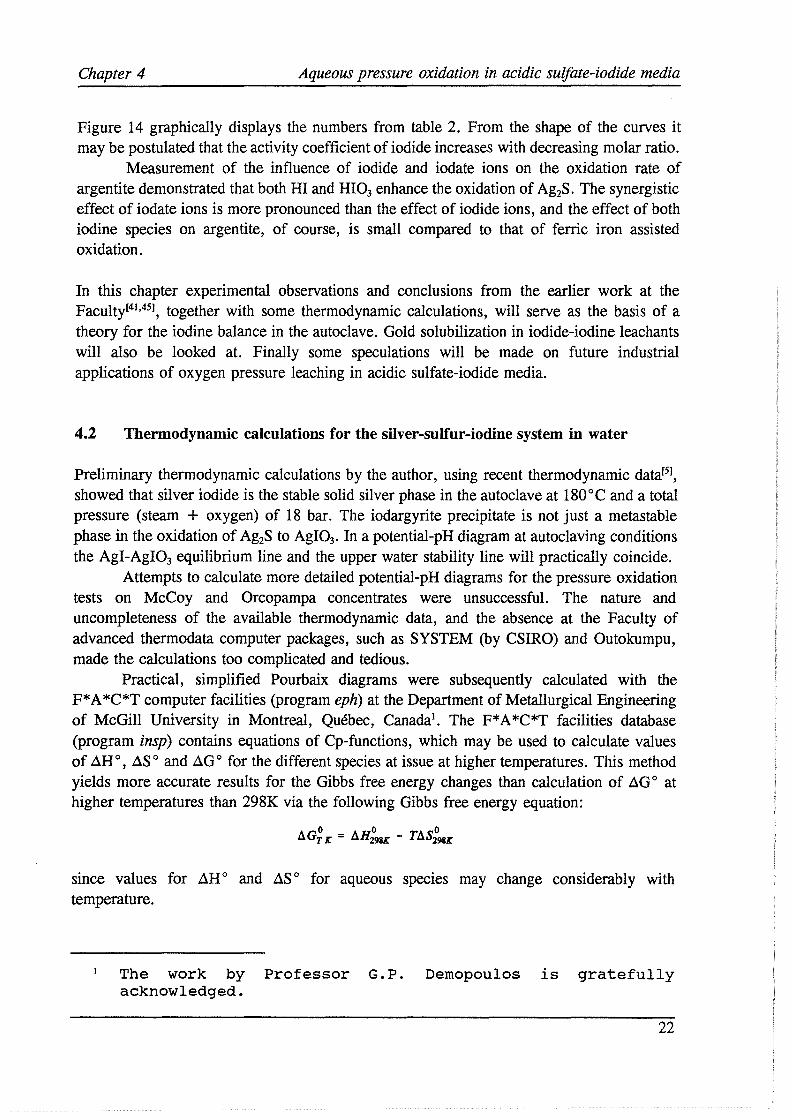
Figure 14 graphically displays the numbers from table 2. From the shape of the curves it may be postulated that the activity coefficient of iodide increases with decreasing molar ratio.
Measurement of the influence of iodide and iodate ions on the oxidation rate of argentite demonstrated that both HI and HIO3 enhance the oxidation of Ag2S. The synergistic effect of iodate ions is more pronounced than the effect of iodide ions, and the effect of both iodine species on argentite, of course, is small compared to that of ferric iron assisted oxidation.
In this chapter experimental observations and conclusions from the earlier work at the Faculty141•451 , together with some thermodynamic calculations, will serve as the basis of a theory for the iodine balance in the autoclave. Gold solubilization in iodide-iodine leachants will also be looked at. Finally some speculations will be made on future industrial applications of oxygen pressure leaching in acidic sulfate-iodide media.
4.2 Thermodynamic calculations for the silver-sulfur-iodine system in water
Preliminary thermodynamic calculations by the author, using recent thermodynamic datai51,
showed that silver iodide is the stable solid silver phase in the autoclave at 180°C and a total pressure (steam + oxygen) of 18 bar. The iodargyrite precipitate is not just a metastable phase in the oxidation of Ag2S to AgIO3• In a potential-pH diagram at autoclaving conditions the AgI-AgIO3 equilibrium line and the upper water stability line will practically coincide.
Attempts to calculate more detailed potential-pH diagrams for the pressure oxidation tests on McCoy and Orcopampa concentrates were unsuccessful. The nature and uncompleteness of the available thermodynamic data, and the absence at the Faculty of advanced thermodata computer packages, such as SYSTEM (by CSIRO) and Outokumpu, made the calculations too complicated and tedious.
Practical, simplified Pourbaix diagrams were subsequently calculated with the F* A *C*T computer facilities (program eph) at the Department of Metallurgical Engineering of McGill University in Montreal, Quebec, Canada1
• The F* A *C*T facilities database (program insp) contains equations of Cp-functions, which may be used to calculate values of .:iH 0
, .1S 0 and .1G 0 for the different species at issue at higher temperatures. This method yields more accurate results for the Gibbs free energy changes than calculation of LlG O at higher temperatures than 298K via the following Gibbs free energy equation:
0 0 0 ll.GT K = ll.HmK - Tll.S298K
since values for .1H 0 and .1S 0 for aqueous species may change considerably with temperature.
The work by Professor G.P. Demopoulos is gratefully acknowledged.
22
-2 -1 2,2
E(V)2
0
0,4 log P12==6
0,2
0 --0------0,2
-0,4
-0,6
-0,8
-1
-1,2
-1,4
-1,6
-1,8 -2 -1 0
2 3 4 6 6
------------------ -
1 2 3 4 5 6
7 8 9 10
----------
7 8 s 10
11 12 13 14 15 16
----------------
11 12 13 14
---
2,2
2
1,8
1,6
1,4
1, '2.
l
0,8
0,6
-0,4
-0,6
-0,8
-1
-l,2
-1,4
-1,6
-18 15pH16
1
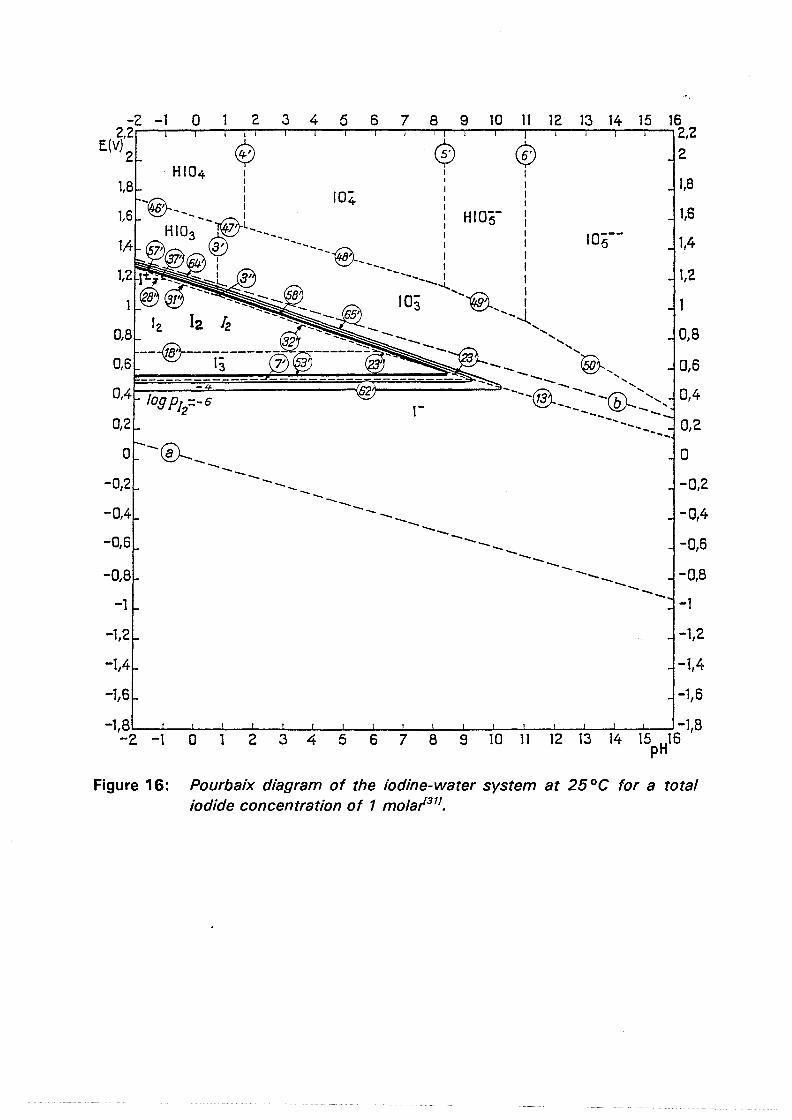
Figure 16: Pourbaix diagram of the iodine-water system at 25 °C for a total iodide concentration of 1 mola/311
•
Chapter 4 Aqueous pressure oxidation in acidic sulf ate-iodide media
Figures 15a and 15b are examples of such diagrams at temperatures of 25 and 180°C, and with total silver, iodide and bisulfate concentrations of 10-3, 10-2 and 10-1 molal, respectively. All liquid (non-aqueous) and gaseous silver species have been suppressed for the calculation of both figures. For species with insufficient data available F* A *C*T automatically takes 0 for the Cp-function. It can be seen that due to the lack of thermodynamic data in the database, figures 15a and 15b essentially confirm the result of the author's preliminary calculations: the Agl-precipitate covers almost the entire domain of water stability and conditions in the autoclave are not sufficiently oxidizing for AglO3 to be formed. Note that the iodargyrite precipitate at 180°C has undergone a phase transformation2 (Ttrf = 420K). Computer prints are taken up in appendix B.
4.3 Qualitative descripition of the iodine balance
During oxygen pressure leaching in acidic sulfate-iodide media the main iodine species present in the autoclave will be free (excess) iodide ions, tri-iodide ions, dissolved iodine, iodine vapor and condensed (liquid) iodine. In view of the acidity of the autoclave slurry and the higher oxidation potentials achieved, these are the species to be expected on examination of the potential-pH diagram for the iodine-water system at ambient conditions1311 (figure 16). It should not be overlooked, however, that the presence of metals able to form soluble complexes or precipitates with (tri-)iodide ions can have a major impact on the position of the equilibrium lines in figure 16.
Although several polyiodide complexes have been reported the tri-iodide ion is the predominant species in aqueous solutions at high acid levels and high oxidation potentialsl7•161 •
The ability of iodide to form polyiodide complexes promotes the dissolution of iodine in aqueous solutions.
Any iodine vapor formed by the oxidation of (tri-)iodide ions will condense in the colder top of the autoclave. Iodine droplets may fall back into the autoclave slurry, where they react with excess iodide ions to form anionic tri-iodide complexes via the reactions:
[4.1]
[4.2]
The so formed tri-iodide ions might be oxidized again to iodine vapor. In this way a certain percentage of the total available iodide is lost to a physical "iodine cycle". For two reasons it is virtually impossible to obtain an indication of this percentage via the vapor pressure of iodine at the leach temperature:
2 This phase transformation was found to be important to the experimental work (section 6.2.6).
23

Chapter 4 Aqueous pressure oxidation in acidic sulfate-iodide media
1) the vapor pressure of iodine is heavily influenced by the presence of other dissolved species in the slurry; Ii(aq) is a powerful oxidant which may be involved in many oxidation reactions, e.g.
[4.3]
2) the activity of dissolved iodine is probably far below 1. It is believed that the "iodine cycle" becomes more important with increasing molar iodide to silver ratios.
For the silver balance over the autoclave, iodine vapor is of no direct importance3•
Iodine vapor is probably inert and, except for redissolution, no reactions between gaseous iodine and the slurry are to be expected.
As can be derived from the results of the thermodynamic considerations in section 4.2, conditions in the autoclave, apart from some spots with anomalously high oxidation potentials, are not oxidizing enough for the formation of free iodate ions. Locally formed iodate ions would be reduced to iodide ions through the oxidation of sulfides almost immediately after their formation. Indeed a mixture of AgI, AgIO3 and Ag2S was reported for the earlier work at the Faculty141•451 when argentite and HIO3 (iodic acid) were reacted in the autoclave. The presence of AgI in the leach residue may be explained by reactions such as:
5 Ag2S(s) + 4 Oi(aq) + 4 HIOJ(aq) -3 Ag2SOlaq) + 4 AgI(s) + + 2 H2SOlaq) [4.4]
In the absence of any free iodide ions silver iodate precipitates:
[4.6]
resulting in a mixture of both AgI and AgI~, and unreacted Ag2S.
Even if iodate ions were formed in large amounts in the autoclave, it can be calculated that on the basis of the difference in their solubility products, AgI will be formed more readily than AglO3 even if the ratio of iodate to iodide ions would be 109
• This is another explanation for the findings in section 4.2.
3 This is not true for gold. See section 6.2.6.
24
2.0
1.5
Aul4
2-1.0 HAuO 3
Eh
0.5
0.0 ' Au ' ' .......
' ' ' ' ........
' ' -0.5 -2 0 2 4 6 8 10 12 14 16
pH
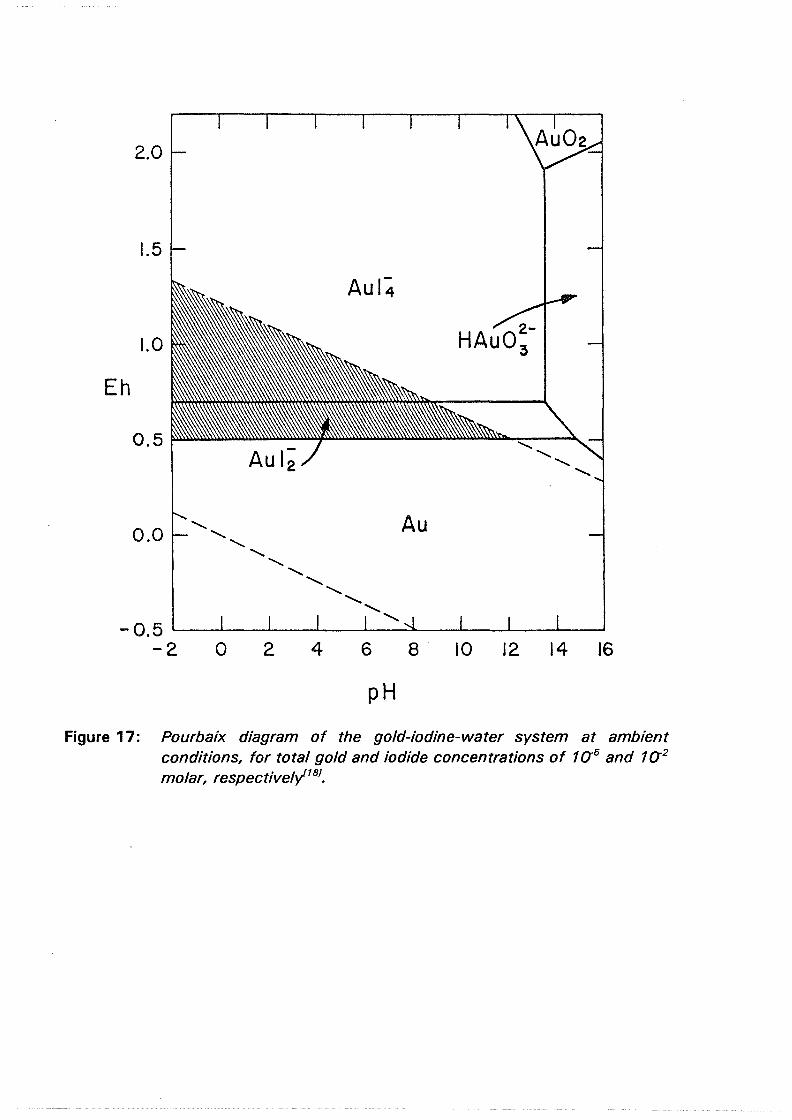
Figure 17: Pourbaix diagram of the gold-iodine-water system at ambient conditions, for total gold and iodide concentrations of 1 a5 and 1 a2
molar, respectively181•
Chapter 4 Aqueous pressure oxidation in acidic sulfate-iodide media
4.4 Gold solubilization
Metallic gold is, of course, very stable in any aqueous system unless a complexant is added that will govern its stability over a potential range within the water region. Unfortunately, in view of the aim of this project, or, fortunately, if effective use is going to be made of it, this complexant may be iodide in an iodide-iodine electrolyte. Figure 17 expresses the potential-pH behavior of the gold-iodine system in water at room temperature and atmospheric pressure for total gold and iodide concentrations of 10-5 and 10-2 molar, respectively. Metallic gold is oxidized in the presence of iodide to yield [AuI:i]• at potentials of approximately 0.51 V, and above 0.69 V [AuI4J becomes stabler181. Of the halogens the gold iodide complexes are the most stable in aqueous solutions118·191 .
For the formation of the Au(I) anionic [AuI2]"-complex the oxidation and reduction steps are!7,1s,19J:
Au(s) + 2 J-(aq) -+ [AuI:i]•(aq) + e·
The overall reaction, with iodide the ligand and tri-iodide the oxidant, then becomes:
[4.7]
[4.8]
[4.9]
At the higher oxidation potentials achieved in the autoclave, gold is more likely solubilized through the formation of the Au(III) anionic [AuI.t]"-complex:
[4.10]
The aim of this thesis project is to keep metallic gold in the residue, while precipitating silver as silver iodide, so that both precious metals can be leached out in preferably one single cyanidation step. Possible gold solubilization does not at all make this new iodide technology insignificant. On the contrary, it has not yet been demonstrated that gold actually goes into solution in the sulfate-iodide medium at 180°C. On examination of figure 17 it may be expected that at higher temperatures the domains of stability of the two anionic gold complexes will gradually migrate out of the water stability region. Should gold dissolution occur at all, it should be either suppressed, or optimized to make effective use of it. Recent studies have indicated that the adsorption of gold from iodide solutions onto activated carbon is technologically feasiblef291. Accurate control of the degree of oxidation of sulfide minerals in the autoclave slurry might offer the key to the suppression of gold solubilization. Future research projects should focus on integral monitoring of silver and gold balances, rather than concentrate on the silver balance alone as in this research project. Because of reasons that will be discussed in section 6.2.6 it is impossible to make gold balances over the tests performed for this report.
25
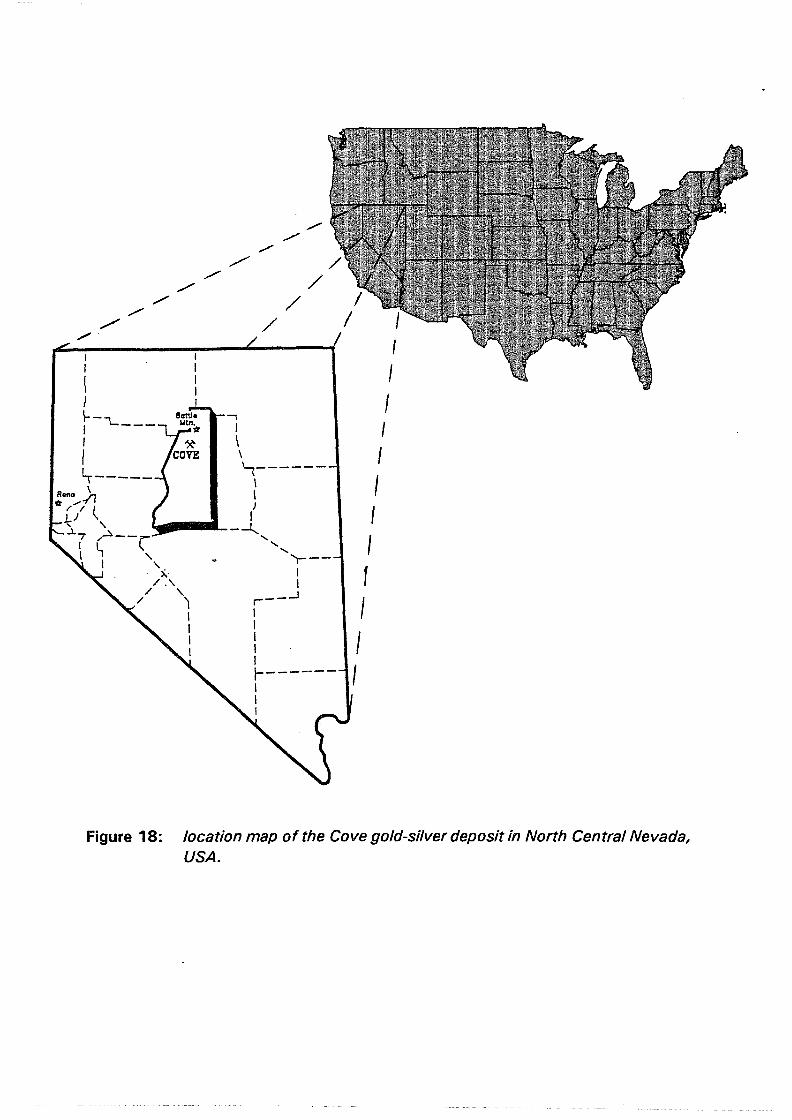
/
/ /
/
I I
I I I I I 1
I
Figure 18: location map of the Cove gold-silver deposit in North Central Nevada, USA.
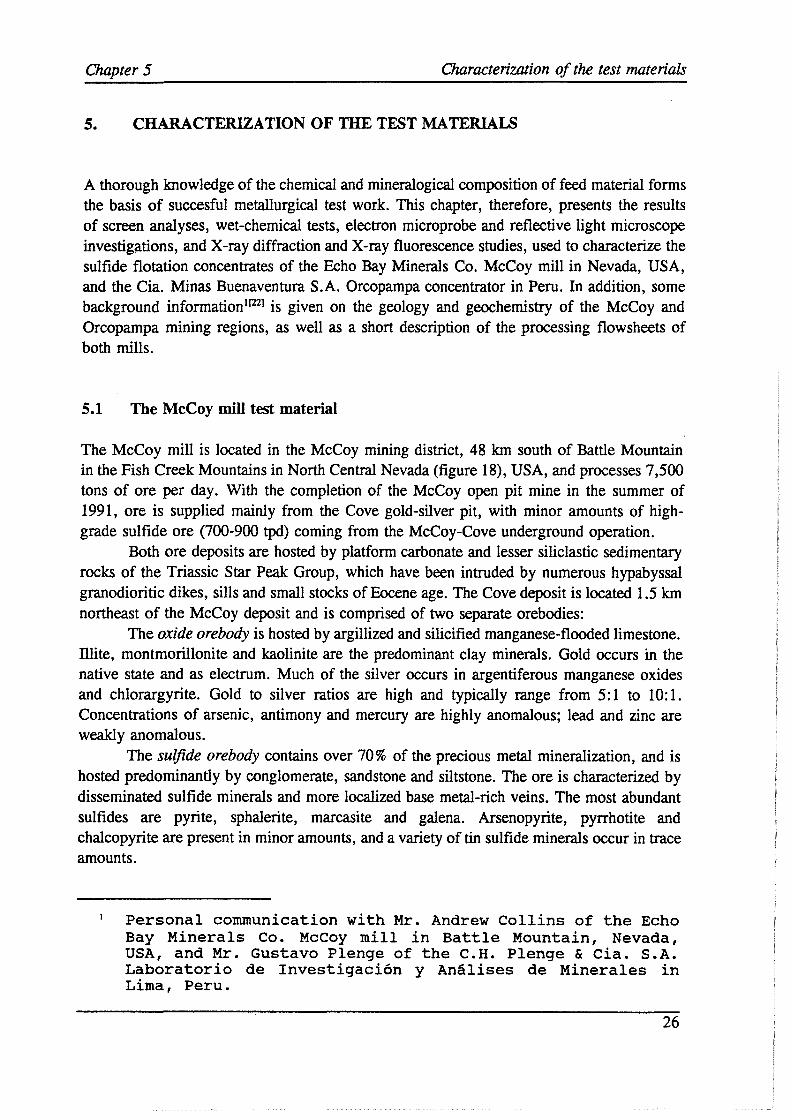
Chapter 5 Characterization of the test materials
S. CHARACTERIZATION OF THE TEST MA TERIAI..S
A thorough knowledge of the chemical and mineralogical composition of feed material forms the basis of succesful metallurgical test work. This chapter, therefore, presents the results of screen analyses, wet-chemical tests, electron microprobe and reflective light microscope investigations, and X-ray diffraction and X-ray fluorescence studies, used to characterize the sulfide flotation concentrates of the Echo Bay Minerals Co. McCoy mill in Nevada, USA, and the Cia. Minas Buenaventura S.A. Orcopampa concentrator in Peru. In addition, some background information1l221 is given on the geology and geochemistry of the McCoy and Orcopampa mining regions, as well as a short description of the processing flowsheets of both mills.
5.1 The McCoy mill test material
The McCoy mill is located in the McCoy mining district, 48 km south of Battle Mountain in the Fish Creek Mountains in North Central Nevada (figure 18), USA, and processes 7,500 tons of ore per day. With the completion of the McCoy open pit mine in the summer of 1991, ore is supplied mainly from the Cove gold-silver pit, with minor amounts of highgrade sulfide ore (700-900 tpd) coming from the McCoy-Cove underground operation.
Both ore deposits are hosted by platform carbonate and lesser siliclastic sedimentary rocks of the Triassic Star Peak Group, which have been intruded by numerous hypabyssal granodioritic dikes, sills and small stocks of Eocene age. The Cove deposit is located 1.5 km northeast of the McCoy deposit and is comprised of two separate orebodies:
The oxide orebody is hosted by argillized and silicified manganese-flooded limestone. I11ite, montmorillonite and kaolinite are the predominant clay minerals. Gold occurs in the native state and as electrum. Much of the silver occurs in argentiferous manganese oxides and chlorargyrite. Gold to silver ratios are high and typically range from 5: 1 to 10: 1. Concentrations of arsenic, antimony and mercury are highly anomalous; lead and zinc are weakly anomalous.
The sulfide orebody contains over 70% of the precious metal mineralization, and is hosted predominantly by conglomerate, sandstone and siltstone. The ore is characterized by disseminated sulfide minerals and more localized base metal-rich veins. The most abundant sulfides are pyrite, sphalerite, marcasite and galena. Arsenopyrite, pyrrhotite and chalcopyrite are present in minor amounts, and a variety of tin sulfide minerals occur in trace amounts.
Personal communication with Mr. Andrew Collins of the Echo Bay Minerals Co. McCoy mill in Battle Mountain, Nevada, USA, and Mr. Gustavo Plenge of the C.H. Plenge & Cia. S.A. Laboratorio de Investigaci6n y Analises de Minerales in Lima, Peru.
26
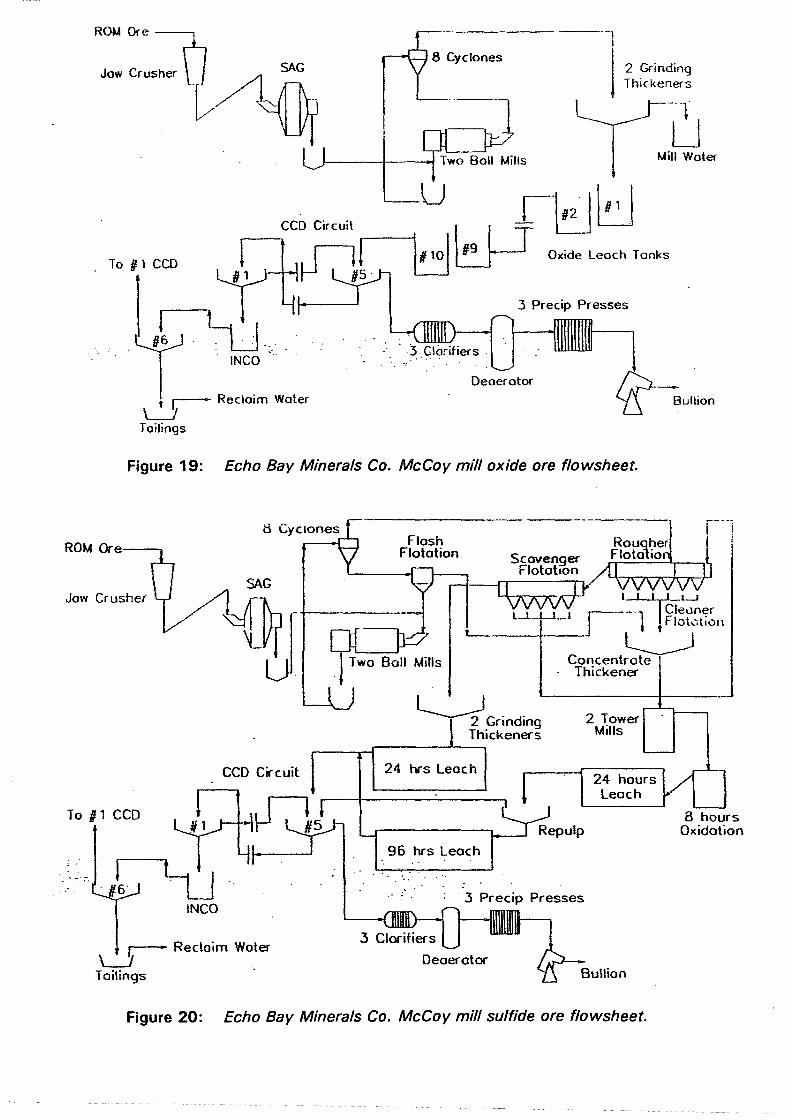
ROM Ore---,
2 Grinding Thickeners
y;--·1 I M;,h,L
u '~J~ . ' g2 ,,
RCCD ~ r---1 # IOI I 19 I T Oxide Leach fonks
To fll CCO ~ L ~L 1-, ~ ~
. l ,l I ~: fS . 3 PrecO) P<esses
~ !NCO .
! r,-- Reclaim Water \_J
Deoerotor
Bullion
Tailings
Figure 19: Echo Bay Minerals Co. McCoy mill oxide ore flowsheet.
ROM Ore---.
Jaw Crusher
CCD Circuit
To I 1 CCO
r,---- Reclaim Water \_J Tailings ·
L~_l...J J ___
1 Cleon~r
__._.._.._ 1
Flot...,11011 t__~f--.J L_J
~Grinding Thickeners
24 hrs Leach
96 hrs leach
Concentrate · Thickener
2 Tower Mills
24 hours~ Leach
· 3 Precip Presses
8 hours Oxidation
Figure 20: Echo Bay Minerals Co. McCoy mill sulfide ore flowsheet.
Chapter 5 Characterization of the test materials
Much of the gold occurs as electrum associated with pyrite. Silver occurs in silver sulfosalts, electrum, argentiferous galena and as native silver. Apart from lead and zinc, arsenic, antimony, mercury, copper and tin also occur in anomalous concentrations. Pre-mining reserves at Cove totaled 48.7 million tons with an average grade of 1.85 ppm gold and 87.1 ppm silver.
Currently the McCoy mill processes separate campaigns of oxide and sulfide ore. As the Cove pit operation progresses, the amount of sulfide ore processed through the mill will increase, and the oxide ore will gradually decrease until 1997, when it will be depleted. Recently, the Cove pit operation encountered pods of carbonaceous ore which had not previously been delineated. Metallurgical test work has indicated that this ore has "pregrobbing" characteristics (section 2.1). The carbonaceous ore is currently being stockpiled until an acceptable flowsheet has been developed.
Figure 19 shows the McCoy mill oxide ore flowsheet. Cove oxide and underground sulfide ore are ground to 80% minus 200 mesh in a SAG mill-ball mill circuit. Cyclone overflow is thickened to 44 % solids and leached with cyanide during 36 hours. The leach tailings are processed through a series of 6 CCD thickeners to rinse the leach liquor from the ore. A Merrill Crowe circuit is used to recover the precious metals from the pregnant solution. Barren solution from the cyanidation circuit is used in the grinding circuit.
Figure 20 shows the McCoy mill sulfide ore flowsheet. Cove sulfide ore is ground to 80% minus 140 mesh in a SAG mill-ball mill circuit. Cyclone underflow is processed through flash flotation in four 8.5 m3 (300 ft') Outokompu cells to prevent sliming of the sulfides in the recirculating load, whereas cyclone overflow is sent to rougher and scavenger flotation (20-28% solids). The rougher flotation circuit consists of six 42 m3 (1,500 ft') Outokompu cells. Slurry flows by gravity through the roughers into five Wemco 42 m3
scavenger cells. The scavenger tailings are thickened to 48 to 50% solids and leached in the oxide leach circuit. The pyrite scavenger flotation concentrate is pumped up to four Wemco 42 m3 cleaner cells for upgrading. Tails from the cleaner cells flow back down through the roughers as a recirculating load. The flash flotation, rougher and cleaner concentrates are combined, thickened to 44% solids, and reground to 80% minus 325 mesh in tower mills. The reground, composite concentrate is oxidized with oxygen for 8 hours, and leached in a cyanidation circuit during 24 hours. After 24 hours the concentrate is repulped with fresh barren solution and leached for another 96 hours. The repulped, cyanided, composite concentrate is then combined with the leached flotation tails and sent to the CCD circuit. As in the oxide ore flowsheet precious metals are recovered from the pregnant solution through precipitation with zinc dust.
When the McCoy mill was constructed the idea of expansion and renovation was built in. The recovery of gold and silver have been established over the course of 27 different flotation campaigns. To date 83 % gold recovery has been achieved on a consistent basis, but silver recovery has varied from 59 to 76%. Considering the average ratio of silver to gold is around 50 to 1, any increase in the silver recovery is cost beneficial and essential to the McCoy mill. Several revenue enhancing flowsheet modifications are currently evaluated, including the implementation of separate (argentiferous) galena and pyrite flotation circuits
27


Chapter 5 Characterization of the test materials
to produce concentrates, that, after cyanide leaching, could be marketed for their lead, gold and silver values, and as a fuel for a roasting or an autoclave operation, respectively. The possibility of floating a zinc concentrate is also studied.
Table 3 shows the chemical composition of the McCoy mill sulfide test material as determined by semi-quantitative XRF (appendix A.5.2):
.1 ,_ -• .. , I =b ···i .., i .., ------- ,w -- C" - ..,
Ag 0.32 K20 1.7
Al2O3 8.2 MgO 0.43
As 0.65 Mn 0.069
Au - Mo -
Bao 0.048 Ni 0.012
Br - P2Os 0.11
CaO 0.28 Pb 1.9
Cd 0.018 s 11.9
Cl - Sb 0.018
Cr2O3 0.019 Sn 0.10
Cu 0.18 SeO2 -
F - SiOi 55.4
Fe 16.4 TeO2 -
Hg - TiO2 0.29
I - Zn 2.0
Table 3: semi-quantitative composition of the McCoy concentrate.
These numbers correspond reasonably well with a McCoy mill's analysis report, except for sulfur. The true sulfur content will be in the order of 20%. It was determined as 29.8% S in a fivefold LECO-analysis on the same sample. There is no obvious reason for this 20% absolute difference in the total sulfur assays. UNIQUANT semi-quantitative XRF analyses (appendix A.5.2) usually give numbers on the low side. The LECO-analyses on the McCoy concentrate were the first ones performed with a new LECO-apparatus, and might have been affected by some start-up inaccuracies.
28

PARTICLE SIZE DISTRIBUTION McCoy concentrate.
% passing 100~----------------------,
90
80
70 ········ ... · .. • .. ····--·····-··
60 ·······················
50 .......... : d~0 = 46 microns, d80 = 95 microns
. ..... : ..... : ......... · .. ·,· .. ·,.
40L.---------------------' 10 100 1000
particle size in microns
Figure 21: particle size distribution of the McCoy test material.
Semi-quantitative silver distribution McCoy concentrate
silver content in %
0.3.
0.2 .
0.1 . o...._ __ .....__ __ ~ __ ____,,_ __ ___.__ __ ----"-__ ___. _____ ~
X
particle size fraction in mesh
Figure 22: McCoy concentrate semi-quantitative silver distribution.
Chapter 5 Characterization of the test materials
The real quartz content of the McCoy concentrate will be in the order of 48 % . The silver content was determined 0.4% by the McCoy mill, 0.35% (112.4 oz/t) by dissolution and AAS (see appendix A.4), and 0.31 % by quantitative XRF (appendix A.5.2). The moisture content of the material is only 0.43% and in preacidification tests (chapter 6) it was found not to contain any carbonate minerals.
Figure 21 shows the particle size distribution of the McCoy mill sulfide concentrate. Five hundred grams of dry concentrate were first wet screened to remove the bulk of the minus 400 mesh (37 microns) fraction. After drying of both screen products the plus 400 mesh fraction was dry screened in a RoTap machine using 100, 140, 200, 270, 325 and 400 ASTM mesh Twente sieves. Values of d50 and d80 were accurately determined on RosinRammler paper. Figure 22 shows the silver distribution over the same size fractions, as determined by semi-quantitative XRF. It can be seen that silver is rather equally distributed, with a high concentration in the + 100 mesh fraction.
An X-ray diffractogram clearly demonstrated the presence of a-quartz, pyrite, galena, anglesite and sphalerite in the McCoy concentrate. Furthermore it indicated the probable presence of arsenopyrite and some clay or mica mineral (illite or muscovite). Indeed these are the minerals to be expected from the geology and geochemistry of the Cove precious metals deposit.
Anglesite, of course, is a secondary mineral formed by oxidation of galena during storage and transport of the concentrate, or during heating in the drying stove. Microscopic investigation of several polished sections confirmed the presence of the above base metal minerals in the concentrate. Galena grains were found showing the typical "triangular pitting". Arsenopyrite grains, somewhat lighter yellowish than pyrite, but strongly anisotropic, confirmed the presence of this mineral in the McCoy sample. In addition, bright yellow chalcopyrite was found in the form of lenticular inclusions in sphalerite grains. A small amount of tetrahedrite grains was identified.
No primary silver-bearing minerals were found in the author's microscopic studies, and even in microprobe examination it proved to be difficult to locate silver or a silverbearing phase in the grains. Gold and silver contour maps covering a total area of 1.17 mm2
were made to indicate high concentrations of these metals (appendix A. l). It was found that silver is mainly present in the form of Ag2S in pyrite grains. Microscopic differentiation between argentite (a-Ag2S, cubic) and acanthite ({3-Ag2S, monoclinic) on the basis of isotropic properties was impossible, even at lO00x magnification in oil. In view of the geochemistry of the Cove deposit, probably acanthite and not argentite[43J is the main silverbearing mineral in the McCoy mill concentrate sample. This observation is interesting for two reasons: 1) Silver rarely occurs in pyrite, except for the relatively small portion that generally
accompanies gold in that case. 2) On a listing of all identified minerals in the Cove sulfide ore deposit Ag2S is
described as a trace mineral rarely found in the deposit. Gold was neither found in the polished sections studied, nor in microprobe analysis.
29
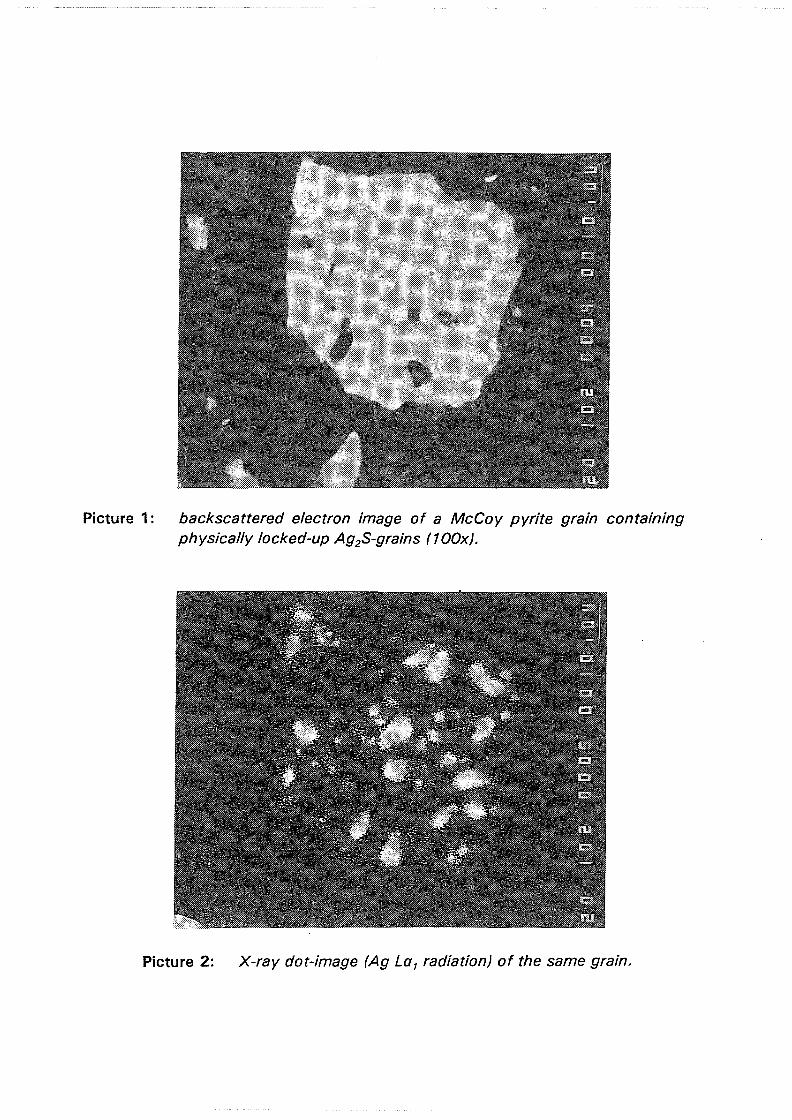
Picture 1: backscattered electron image of a McCoy pyrite grain containing physically locked-up Ag2S-grains (100x).
Picture 2: X-ray dot-image (Ag La 1 radiation) of the same grain.
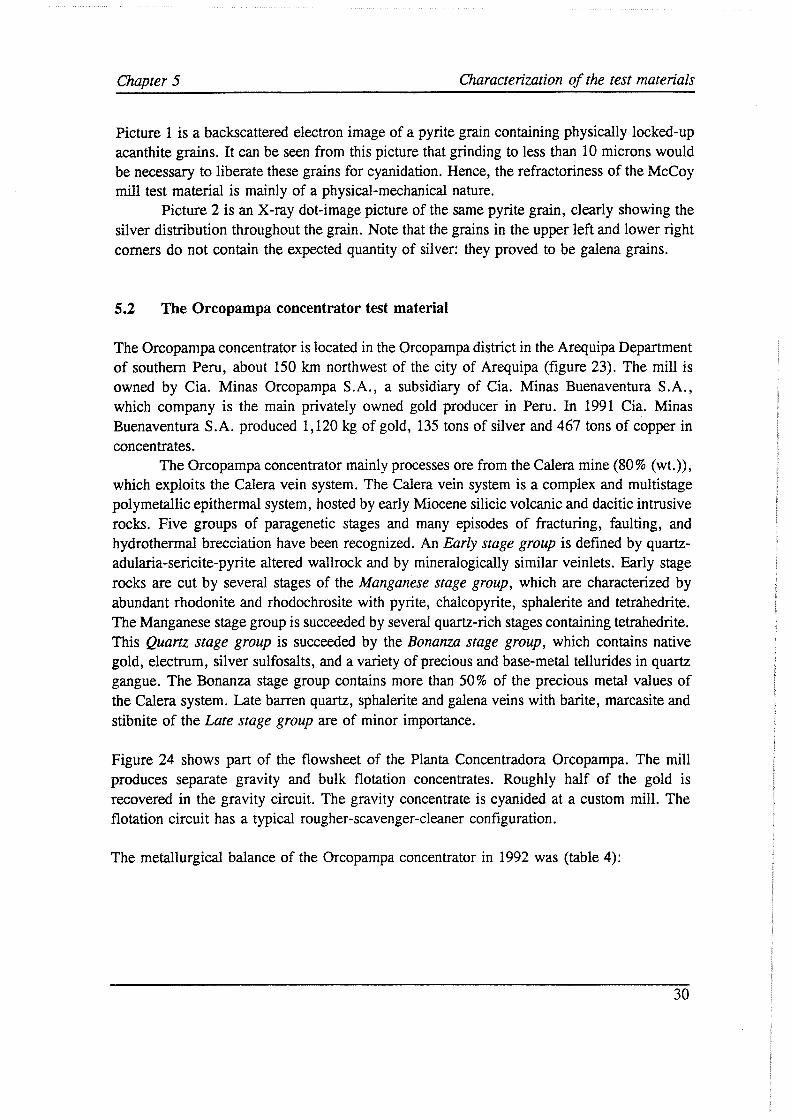
Chapter 5 Characterization of the test materials
Picture 1 is a backscattered electron image of a pyrite grain containing physically locked-up acanthite grains. It can be seen from this picture that grinding to less than 10 microns would be necessary to liberate these grains for cyanidation. Hence, the refractoriness of the McCoy mill test material is mainly of a physical-mechanical nature.
Picture 2 is an X-ray dot-image picture of the same pyrite grain, clearly showing the silver distribution throughout the grain. Note that the grains in the upper left and lower right corners do not contain the expected quantity of silver: they proved to be galena grains.
5.2 The Orcopampa concentrator test material
The Orcopampa concentrator is located in the Orcopampa district in the Arequipa Department of southern Peru, about 150 km northwest of the city of Arequipa (figure 23). The mill is owned by Cia. Minas Orcopampa S.A., a subsidiary of Cia. Minas Buenaventura S.A., which company is the main privately owned gold producer in Peru. In 1991 Cia. Minas Buenaventura S.A. produced 1,120 kg of gold, 135 tons of silver and 467 tons of copper in concentrates.
The Orcopampa concentrator mainly processes ore from the Calera mine (80% (wt.)), which exploits the Calera vein system. The Calera vein system is a complex and multistage polymetallic epithermal system, hosted by early Miocene silicic volcanic and dacitic intrusive rocks. Five groups of paragenetic stages and many episodes of fracturing, faulting, and hydrothermal brecciation have been recognized. An Early stage group is defined by quartzadularia-sericite-pyrite altered wallrock and by mineralogically similar veinlets. Early stage rocks are cut by several stages of the Manganese stage group, which are characterized by abundant rhodonite and rhodochrosite with pyrite, chalcopyrite, sphalerite and tetrahedrite. The Manganese stage group is succeeded by several quartz-rich stages containing tetrahedrite. This Quanz stage group is succeeded by the Bonanza stage group, which contains native gold, electrum, silver sulfosalts, and a variety of precious and base-metal tellurides in quartz gangue. The Bonanza stage group contains more than 50% of the precious metal values of the Calera system. Late barren quartz, sphalerite and galena veins with barite, marcasite and stibnite of the Late stage group are of minor importance.
Figure 24 shows part of the flowsheet of the Planta Concentradora Orcopampa. The mill produces separate gravity and bulk flotation concentrates. Roughly half of the gold is recovered in the gravity circuit. The gravity concentrate is cyanided at a custom mill. The flotation circuit has a typical rougher-scavenger-cleaner configuration.
The metallurgical balance of the Orcopampa concentrator in 1992 was (table 4):
30

I \ ...........
'-' -..........
oARCATA
-""--- oSUCUYTAMBO I ..... _ "
(' -- \ --0 - ----/ CAILLOMA I
ORCOPAMPA?~CALERA "'ll .1··., / MINE '--
ocoTAHUASI ( . l_ i \ I t:,. '1 ·:
\ NEVADO N/SMI
\. _ _...,_oANDAHUA J_. \
7- - "" .... !!.'VE.R ~MADRIGAL_/. I I NE.~D0 \ ► ,,,,.- · .,, \
COROPUNA ,-"- c,o'J,· ·. -..._ · · · -' \ .> _;;, l
-
-- -~RACO : l:,. · / --0.. 1 / NE.VADO AMPATO ·. \ :
CHUOUIBAMBA \ ) .· ( ·\ \ ... --./
PACIFIC OCEAN
\~···- ·-1· 1·· I_/ / / / / ,1 ( { I r
'!i'"LAO )_. V / I \ \:~ ~/ } \\~ ~- t:,. ,,I \ •.
1: cH':if'~?f. I
J ~'r N~e._,,.--- ...
~.:S.· ~~ .·
I . /
... '-- .CH'!:!_ REQUI
Figure 23: location map of the Cia. Minas Buenaventura S.A. Orcopampa concentrator in the Arequipa Department of Southern Peru.
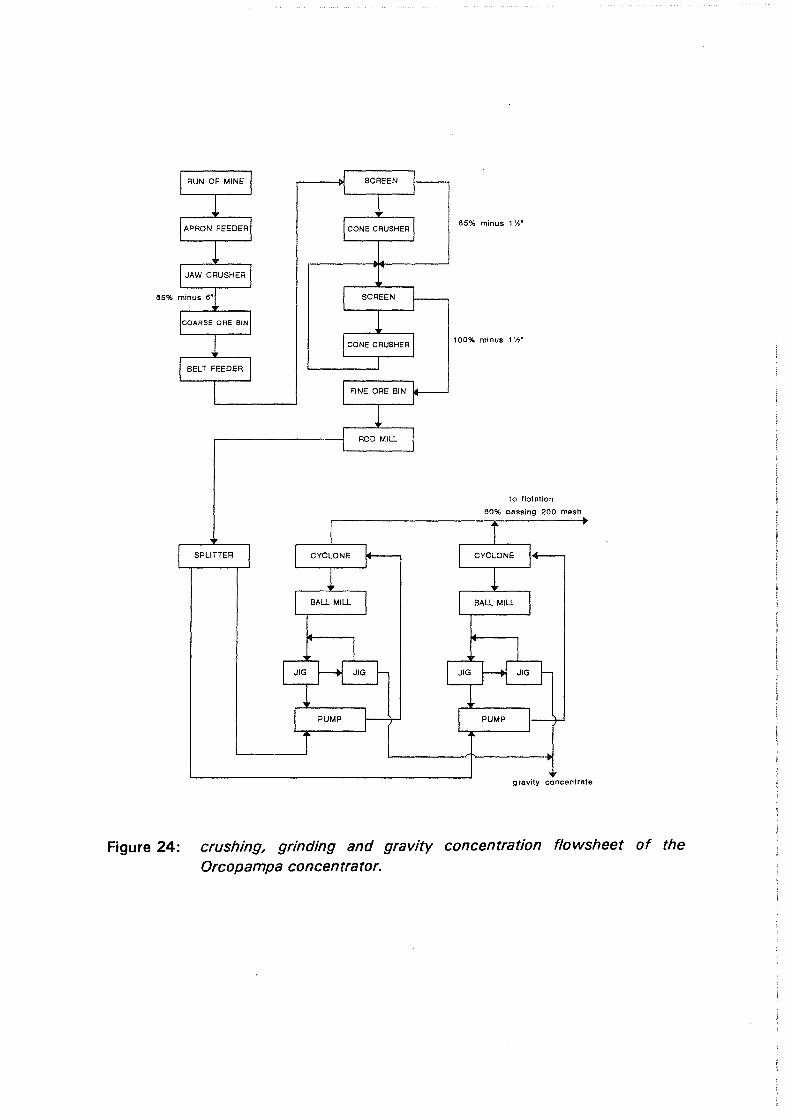
Figure 24:
RUN OF MINE SCREEN
CONE CRUSHER 85% minus 1 ½•
SCREEN
100% minus 1 ½•
ROD MILL
lo flotation
60% passing 200 mesh
SPLITTER
BALL MILL BALL MILL
gravity concentrate
crushing, grinding and gravity concentration flowsheet of the Orcopampa concentrator.

ECUADOR
PERU
UCHUC-CHACUA
•
PACIFIC OCEAN
A JULCA NI
• ORCOPAMPA
BOLIVIA
Figure 25: location map of the Cia. Minas Buenaventura S.A. milling facilities in the Peruvian Andes391
•

Chapter 5 Characterization of the test materials
Process flow Tons Grade Au in oz/t Ag in oz/t
Mill feed 21,800 0.083 8.8
Gravity concentrate 38 22.0 143.8
Flotation concentrate 660 1.097 247.6
Tailings 21,102 0.012 1.1
Table 4: metallurgical balance of the Orcopampa concentrator in 1992.
Cia. Minas Buenaventura S.A. at present produces a total of 100 tons per day of bulk sulfide flotation concentrates from three milling facilities in the Peruvian Andes, including the Orcopampa concentrator!391 (figure 25). The refractory concentrates contain significant amounts of precious metals, particularly silver, and are shipped to overseas custom smelters for further processing. Smelting costs are high due to excessive transportation costs and significant penalties incurred by elevated levels of antimony and arsenic. In addition, these costs are compounded by delayed payment periods of up to six months. The incentive to domestically recover precious metals and possibly selected base metals from these concentrates is high. A pressure oxidation pilot-plant will be built this year while metallurgical test work is being continued at the C.H. Plenge & Cia. S.A. Laboratorio de Investigaci6n y Analisis de Minerales in Lima, Peru.
Table 5 shows the chemical composition of the Orcopampa concentrator test material, as determined by semi-quantit'ltive XRF (appendix A.5.2):
. 1.~~--~••-A weight percentage element/ compound weight iK ~, ,:
Ag 1.3 K20 0.46
Al20 3 1.3 MgO 0.37
As 0.32 Mn 3.1
Au - Mo -BaO 0.023 Ni -
Br - P20s -
CaO 0.58 Pb 5.8
Cd 0.066 s 30.0
Cl - Sb 2.9
31

PARTICLE SIZE DISTRIBUTION Orcopampa concentrate
% passing 100.-----------------------,
. . . 90 ·······························'-'·· ·····················'···············
80 ·······••:••···-'··••:••·,••:••i· ·.:.•:••········:····••:••··,······•••:••···
70 · · · · · · · · ... · · · · ... · · ... · · · · · - · · · · - ... · · · · · · · · · - · · · · · - · · · · · · .,. · · · ........ · ..
60 · · · · · · · · -· · · ---· · -:· --· · · '· - ~ · ~ · · · -· · · · · · --· ·- --· · -· · · -· · · --· · · · · · .· · . . . :d;0 ::::: 42 microns, d80 = :so .mi:crons
50
40'------------1.--------------J 10 100 1000
particle size in microns
Figure 26: particle size distribution of the Orcopampa test material.
Semi-quantitative silver distribution Orcopampa concentrate
silver content in %
1.4 1.2 .
1 .
0.8. 0.6. 0.4 . - . 0.2 .
X
particle size fraction in mesh
X
Figure 27: Orcopampa concentrate semi-quantitative silver distribution.
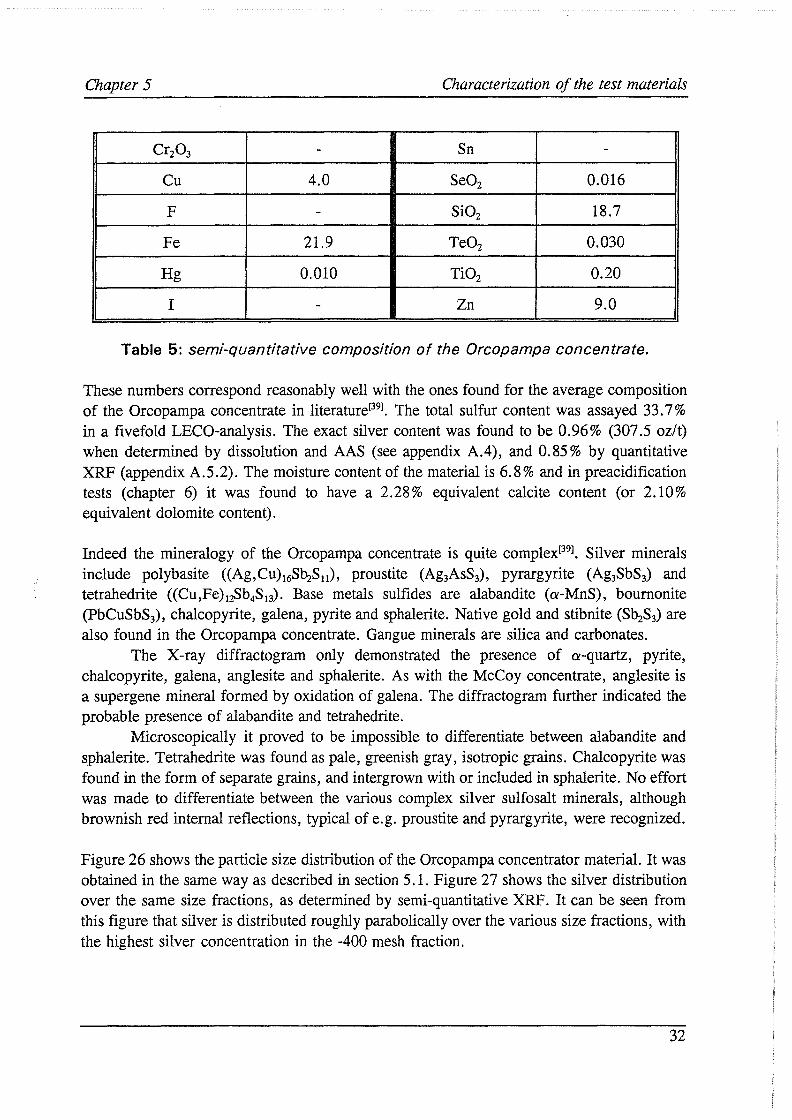
Chapter 5 Characterization of the test materials
Cr2O3 - Sn -
Cu 4.0 SeO2 0.016
F - SiO2 18.7
Fe 21.9 TeO2 0.030
Hg 0.010 TiO2 0.20
I - Zn 9.0
Table 5: semi-quantitative composition of the Orcopampa concentrate.
These numbers correspond reasonably well with the ones found for the average composition of the Orcopampa concentrate in literaturel391
• The total sulfur content was assayed 33.7% in a fivefold LECO-analysis. The exact silver content was found to be 0.96% (307.5 oz/t) when determined by dissolution and AAS (see appendix A.4), and 0.85% by quantitative XRF (appendix A.5.2). The moisture content of the material is 6.8% and in preacidification tests (chapter 6) it was found to have a 2.28% equivalent calcite content (or 2.10% equivalent dolomite content).
Indeed the mineralogy of the Orcopampa concentrate is quite complexl39J. Silver minerals include polybasite ((Ag,Cu)16SbiS11), proustite (Ag3AsS3), pyrargyrite (Ag3SbS3) and tetrahedrite ((Cu,Fe)12Sb4S13). Base metals sulfides are alabandite (a-MnS), bournonite (PbCuSbS3), chalcopyrite, galena, pyrite and sphalerite. Native gold and stibnite (SbiS3) are also found in the Orcopampa concentrate. Gangue minerals are silica and carbonates.
The X-ray diffractogram only demonstrated the presence of a-quartz, pyrite, chalcopyrite, galena, anglesite and sphalerite. As with the McCoy concentrate, anglesite is a supergene mineral formed by oxidation of galena. The diffractogram further indicated the probable presence of alabandite and tetrahedrite.
Microscopically it proved to be impossible to differentiate between alabandite and sphalerite. Tetrahedrite was found as pale, greenish gray, isotropic grains. Chalcopyrite was found in the form of separate grains, and intergrown with or included in sphalerite. No effort was made to differentiate between the various complex silver sulfosalt minerals, although brownish red internal reflections, typical of e.g. proustite and pyrargyrite, were recognized.
Figure 26 shows the particle size distribution of the Orcopampa concentrator material. It was obtained in the same way as described in section 5.1. Figure 27 shows the silver distribution over the same size fractions, as determined by semi-quantitative XRF. It can be seen from this figure that silver is distributed roughly parabolically over the various size fractions, with the highest silver concentration in the -400 mesh fraction.
32

Picture 3: backscattered electron image of a silver-bearing Orcopampa tetrahedrite grain (centre of picture, 44x).
Chapter 5 Characterization of the test materials
Electron Micro Probe gold and silver contour maps, now covering a total area of 0.49 mm2 ,
were made to indicate high concentrations of these metals (appendix A. l). Silver was found to be part of the crystal lattice of some copper-antimony-sulfur mineral, copper being an essential element in the mineral composition. Picture 3 is a backscattered electron image of that mineral, which was identified as tetrahedrite in microscopic examination. It can be concluded that the refractoriness of the Orcopampa concentrator test material is mainly of a chemical nature. Gold was not detected in the sample.
33
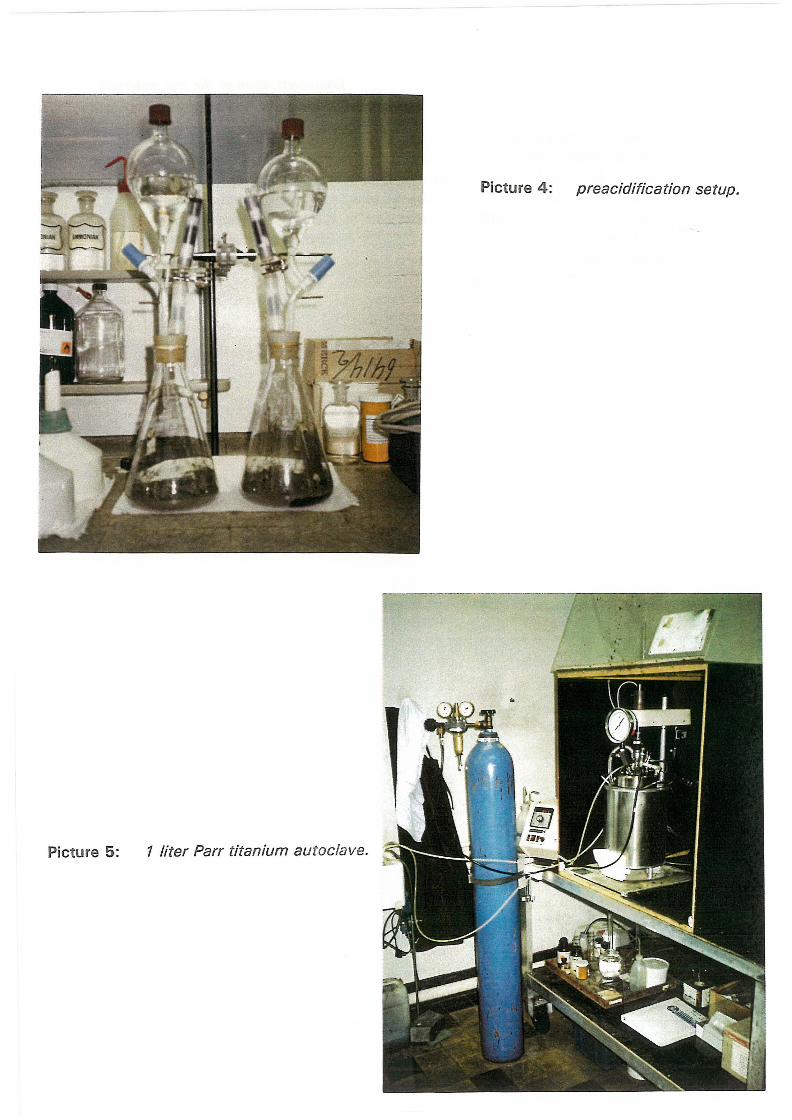
Picture 4: preacidification setup.
Picture 5: 1 liter Parr titanium autoclave. ·
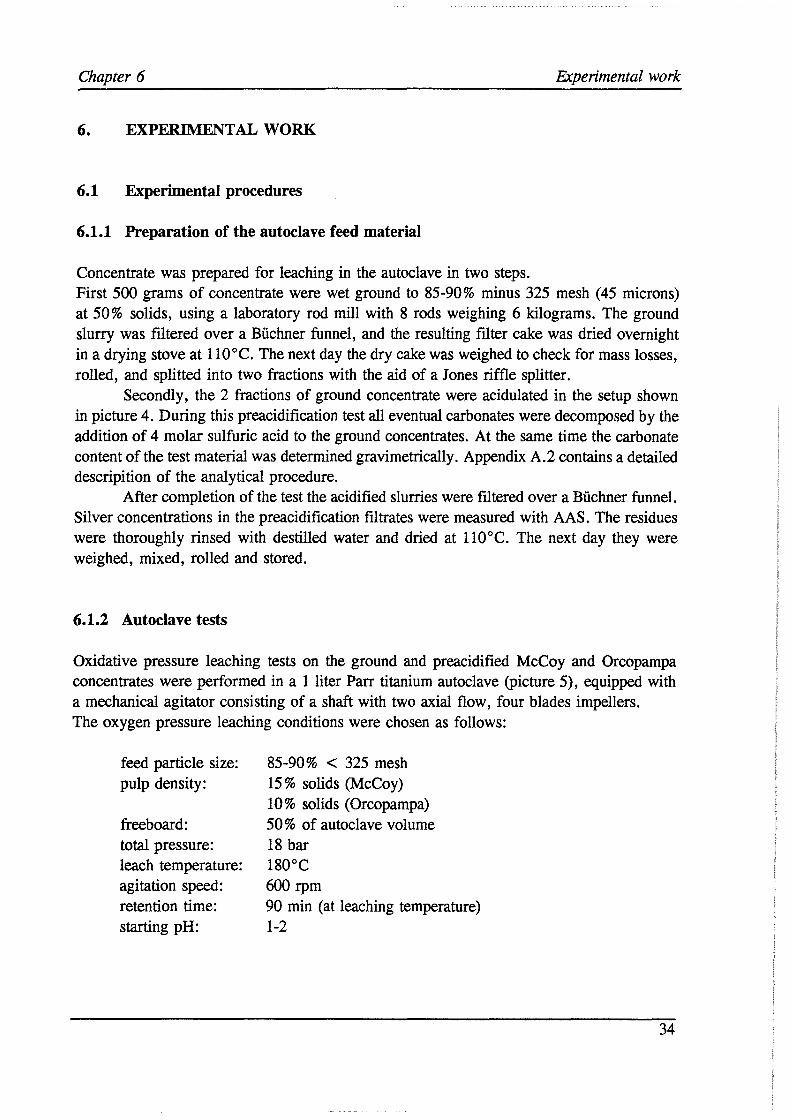
Chapter 6 Experimental work
6. EXPERIMENTAL WORK
6.1 Experimental procedures
6.1.1 Preparation of the autoclave feed material
Concentrate was prepared for leaching in the autoclave in two steps. First 500 grams of concentrate were wet ground to 85-90% minus 325 mesh (45 microns) at 50% solids, using a laboratory rod mill with 8 rods weighing 6 kilograms. The ground slurry was filtered over a Buchner funnel, and the resulting filter cake was dried overnight in a drying stove at l l0°C. The next day the dry cake was weighed to check for mass losses, rolled, and splitted into two fractions with the aid of a Jones riffle splitter.
Secondly, the 2 fractions of ground concentrate were acidulated in the setup shown in picture 4. During this preacidification test all eventual carbonates were decomposed by the addition of 4 molar sulfuric acid to the ground concentrates. At the same time the carbonate content of the test material was determined gravimetrically. Appendix A.2 contains a detailed descripition of the analytical procedure.
After completion of the test the acidified slurries were filtered over a Buchner funnel. Silver concentrations in the preacidification filtrates were measured with AAS. The residues were thoroughly rinsed with destilled water and dried at ll0°C. The next day they were weighed, mixed, rolled and stored.
6.1.2 Autoclave tests
Oxidative pressure leaching tests on the ground and preacidified McCoy and Orcopampa concentrates were performed in a 1 liter Parr titanium autoclave (picture 5), equipped with a mechanical agitator consisting of a shaft with two axial flow, four blades impellers. The oxygen pressure leaching conditions were chosen as follows:
feed particle size: pulp density:
freeboard: total pressure: leach temperature: agitation speed: retention time: starting pH:
85-90 % < 325 mesh 15% solids (McCoy) 10% solids (Orcopampa) 50 % of autoclave volume 18 bar 180°C 600 rpm 90 min (at leaching temperature) 1-2
34
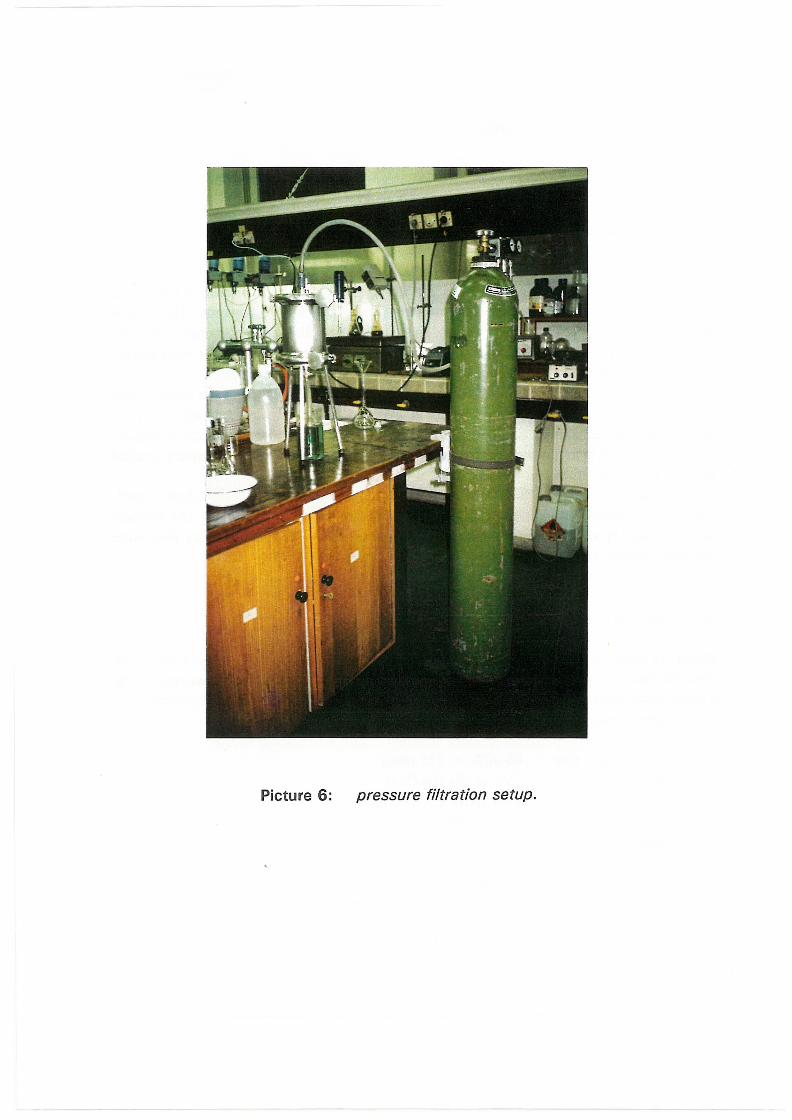
Picture 6: pressure filtration setup.
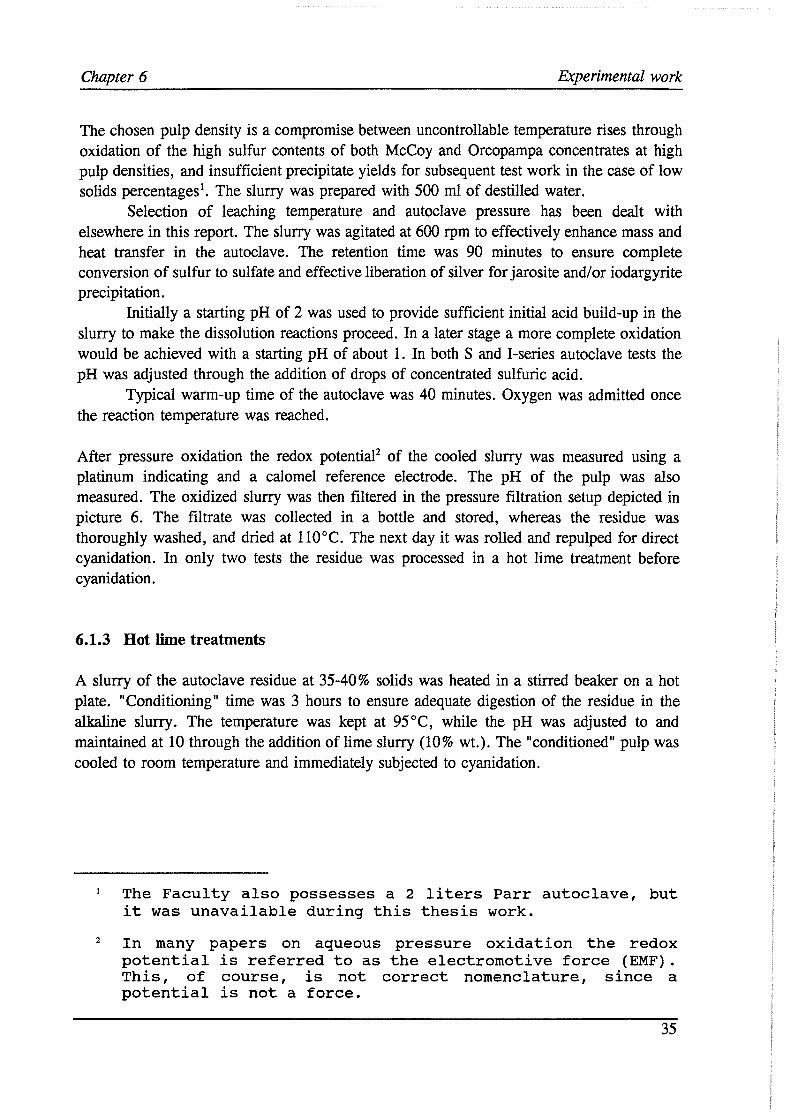
Chapter 6 Experimental work
The chosen pulp density is a compromise between uncontrollable temperature rises through oxidation of the high sulfur contents of both McCoy and Orcopampa concentrates at high pulp densities, and insufficient precipitate yields for subsequent test work in the case of low solids percentages1
• The slurry was prepared with 500 ml of destilled water. Selection of leaching temperature and autoclave pressure has been dealt with
elsewhere in this report. The slurry was agitated at 600 rpm to effectively enhance mass and heat transfer in the autoclave. The retention time was 90 minutes to ensure complete conversion of sulfur to sulfate and effective liberation of silver for jarosite and/or iodargyrite precipitation.
Initially a starting pH of 2 was used to provide sufficient initial acid build-up in the slurry to make the dissolution reactions proceed.· In a later stage a more complete oxidation would be achieved with a starting pH of about 1. In both S and I-series autoclave tests the pH was adjusted through the addition of drops of concentrated sulfuric acid.
Typical warm-up time of the autoclave was 40 minutes. Oxygen was admitted once the reaction temperature was reached.
After pressure oxidation the redox potential2 of the cooled slurry was measured using a platinum indicating and a calomel reference electrode. The pH of the pulp was also measured. The oxidized slurry was then filtered in the pressure filtration setup depicted in picture 6. The filtrate was collected in a bottle and stored, whereas the residue was thoroughly washed, and dried at l l0°C. The next day it was rolled and repulped for direct cyanidation. In only two tests the residue was processed in a hot lime treatment before cyanidation.
6.1.3 Hot lime treatments
A slurry of the autoclave residue at 35-40% solids was heated in a stirred beaker on a hot plate. "Conditioning" time was 3 hours to ensure adequate digestion of the residue in the alkaline slurry. The temperature was kept at 95°C, while the pH was adjusted to and maintained at 10 through the addition of lime slurry (10% wt.). The "conditioned" pulp was cooled to room temperature and immediately subjected to cyanidation.
2
The Faculty also possesses a 2 liters Parr autoclave, but it was unavailable during this thesis work.
In many papers on aqueous pressure oxidation the redox potential is referred to as the electromotive force (EMF). This, of course, is not correct nomenclature, since a potential is not a force.
35
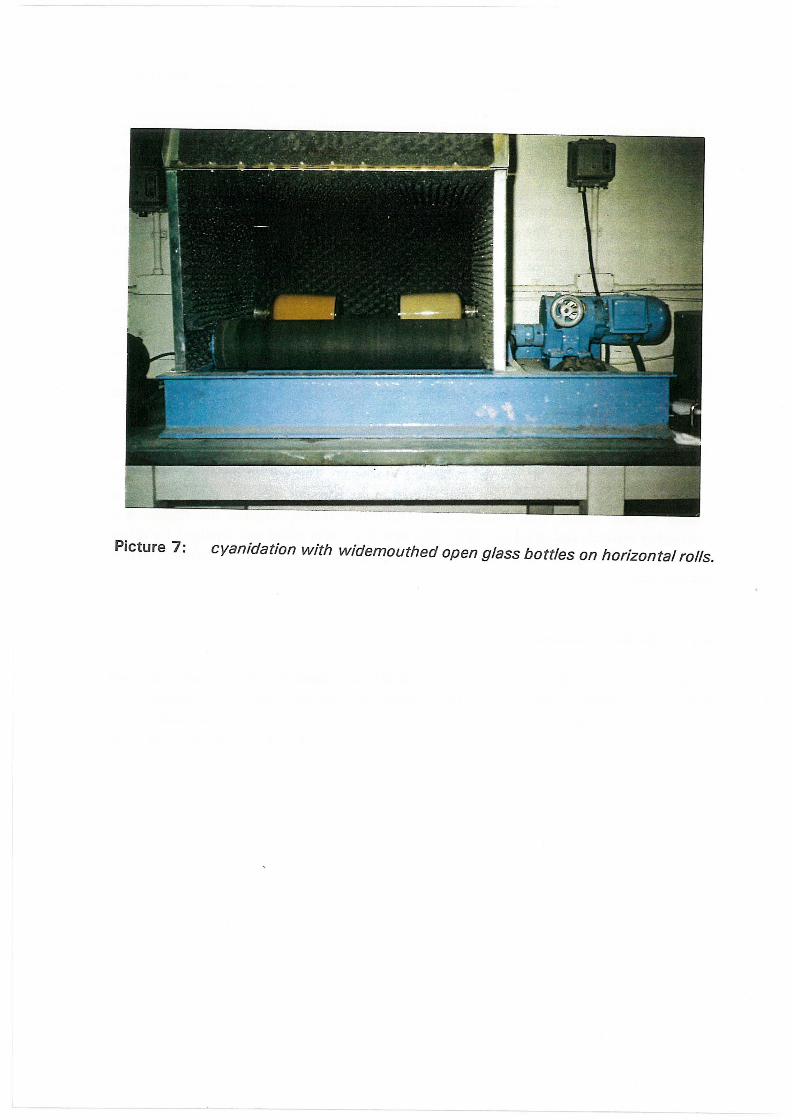
Picture 7: cyanidation with widemouthed open glass bottles on horizontal rolls.
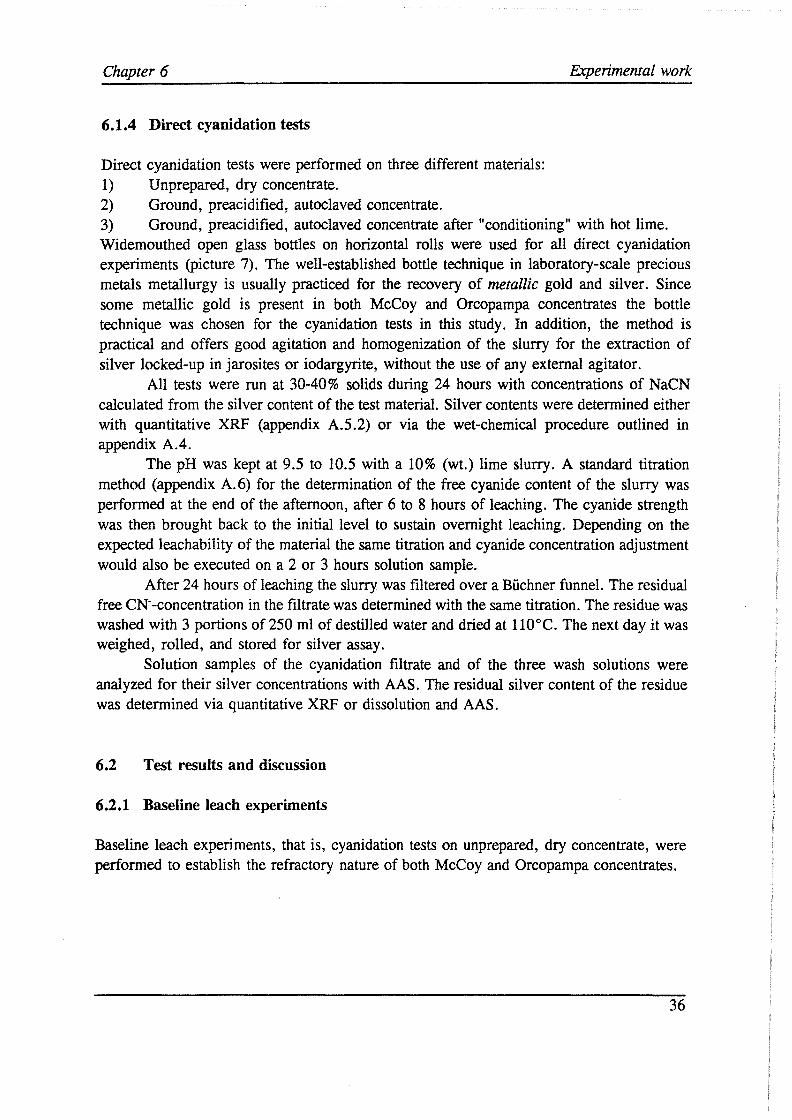
Chapter 6 Experimental work
6.1.4 Direct cyanidation tests
Direct cyanidation tests were performed on three different materials: 1) Unprepared, dry concentrate. 2) Ground, preacidified, autoclaved concentrate. 3) Ground, preacidified, autoclaved concentrate after "conditioning" with hot lime. Widemouthed open glass bottles on horizontal rolls were used for all direct cyanidation experiments (picture 7). The well-established bottle technique in laboratory-scale precious metals metallurgy is usually practiced for the recovery of metallic gold and silver. Since some metallic gold is present in both McCoy and Orcopampa concentrates the bottle technique was chosen for the cyanidation tests in this study. In addition, the method is practical and offers good agitation and homogenization of the slurry for the extraction of silver locked-up in jarosites or iodargyrite, without the use of any external agitator.
All tests were run at 30-40% solids during 24 hours with concentrations of NaCN calculated from the silver content of the test material. Silver contents were determined either with quantitative XRF (appendix A.5.2) or via the wet-chemical procedure outlined in appendix A.4.
The pH was kept at 9.5 to 10.5 with a 10% (wt.) lime slurry. A standard titration method (appendix A.6) for the determination of the free cyanide content of the slurry was performed at the end of the afternoon, after 6 to 8 hours of leaching. The cyanide strength was then brought back to the initial level to sustain overnight leaching. Depending on the expected leachability of the material the same titration and cyanide concentration adjustment would also be executed on a 2 or 3 hours solution sample.
After 24 hours of leaching the slurry was filtered over a Buchner funnel. The residual free CN--concentration in the filtrate was determined with the same titration. The residue was washed with 3 portions of 250 ml of destilled water and dried at 110°C. The next day it was weighed, rolled, and stored for silver assay.
Solution samples of the cyanidation filtrate and of the three wash solutions were analyzed for their silver concentrations with AAS. The residual silver content of the residue was determined via quantitative XRF or dissolution and AAS.
6.2 Test results and discussion
6.2.1 Baseline leach experiments
Baseline leach experiments, that is, cyanidation tests on unprepared, dry concentrate, were performed to establish the refractory nature of both McCoy and Orcopampa concentrates.
36
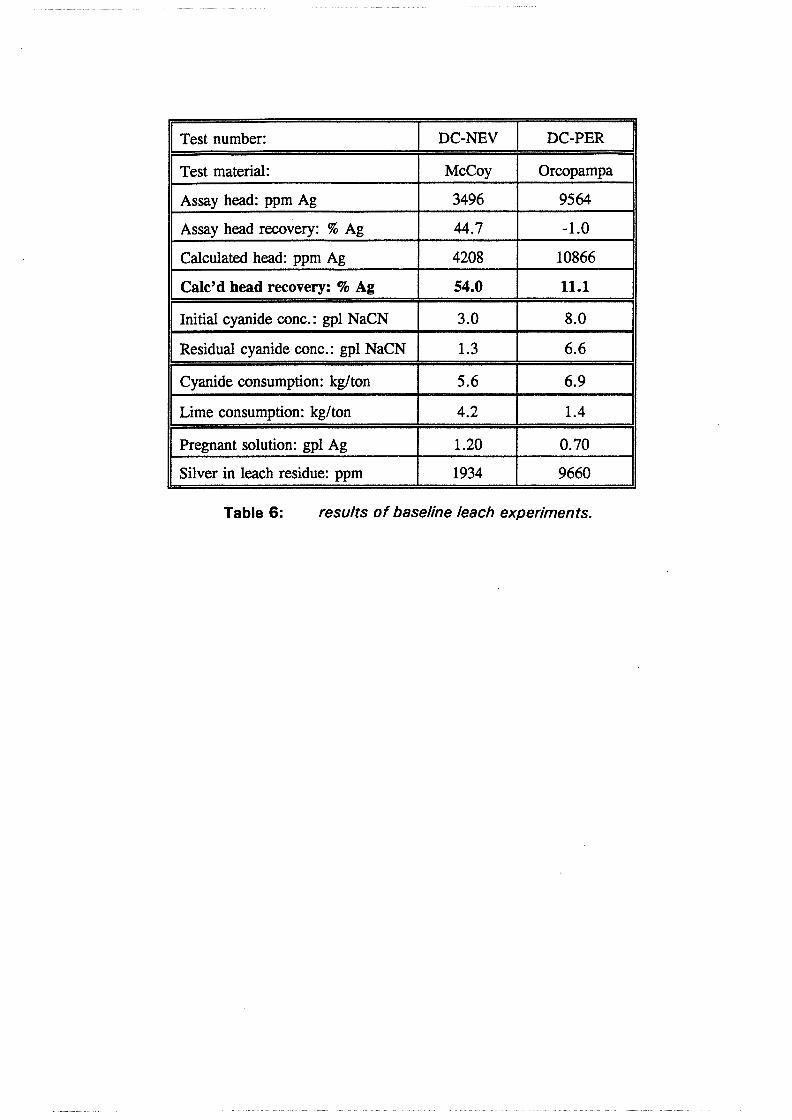
Test number: DC-NEV DC-P~ ....
Test material: McCoy Orcopampa
Assay head: ppm Ag 3496 9564
Assay head recovery: % Ag 44.7 -1.0
Calculated head: ppm Ag 4208 10866
Calc'd bead recovery: % Ag 54.0 11.1
Initial cyanide cone.: gpl NaCN 3.0 8.0
Residual cyanide cone.: gpl NaCN 1.3 6.6
Cyanide consumption: kg/ton 5.6 6.9
Lime consumption: kg/ton 4.2 1.4
Pregnant solution: gpl Ag 1.20 0.70
Silver in leach residue: ppm 1934 9660
Table 6: results of baseline leach experiments.
Chapter 6 Experimental work
Table 6 presents the results3 of baseline tests DC-NEV and DC-PER. Assay head and calculated head silver recoveries were both based on the residual silver content of the leach residue. In the calculated head, silver concentrations in pregnant and wash solutions have been accounted for. The difference in both recoveries, some 10% absolute, is explained by the fact that these silver assays were the first to be performed, with the dissolution procedure not yet optimized. In addition, it is easy to introduce errors during sampling of these inhomogeneous concentrates and leach residues for silver assay. It is therefore believed that the calculated head silver recoveries are more representative and reliable for these baseline leach experiments.
The explanation for the difference in leachability of both concentrates is directly related to the findings in chapter 5. Acanthite is fairly soluble in cyanide solutions4137
•491 according to the reaction:
Ag2S(s) + 4 NaCN(aq) - 2 Na[Ag(CN)i](aq) + Na2S(aq) [6.1]
This reaction could explain the relatively high silver recovery of 54.0% for the McCoy concentrate, and the high cyanide consumption as compared to silver extraction, since the free sulfide ions will react with cyanide to form thiocyanide ions. The McCoy test material is moderately refractory, and acceptable silver extractions may be achieved by finer grinding of the concentrate, and longer retention times in the cyanidation circuit. This is basically what is done at the McCoy mill at present (figure 20).
The leaching mechanism is completely different for the Orcopampa concentrate. The low silver recovery of 11.1 % is due to the difficult extraction of silver from the complex silver-antimony-sulfur minerals. The extreme refractoriness of the Orcopampa material is probably caused by the fact that only silver ions at the surface of these silver sulfosalt mineral crystals can react with cyanide ions in the slurry. The cyanide consumption, as compared to what would be expected on the basis of the extracted silver, is anomalously high because of the high concentrations of base metal sulfides in the concentrate, whose decomposition products interfere with cyanidation through the formation of, e.g., highly soluble complexes (Cu), insoluble basic cyanides (Pb), and thiocyanides (see section 2.1).
3
4
Detailed test sheets of all direct cyanidation tests can be found in appendix D.
The solubility of Ag2S in cyanide solutions is sensitive to the free sulfide ion concentration. A high concentration of cyanide is needed to drive reaction [6.1). Precipitation of silver with sulfides rather than with metallic zinc may be better for some silver ores.
37
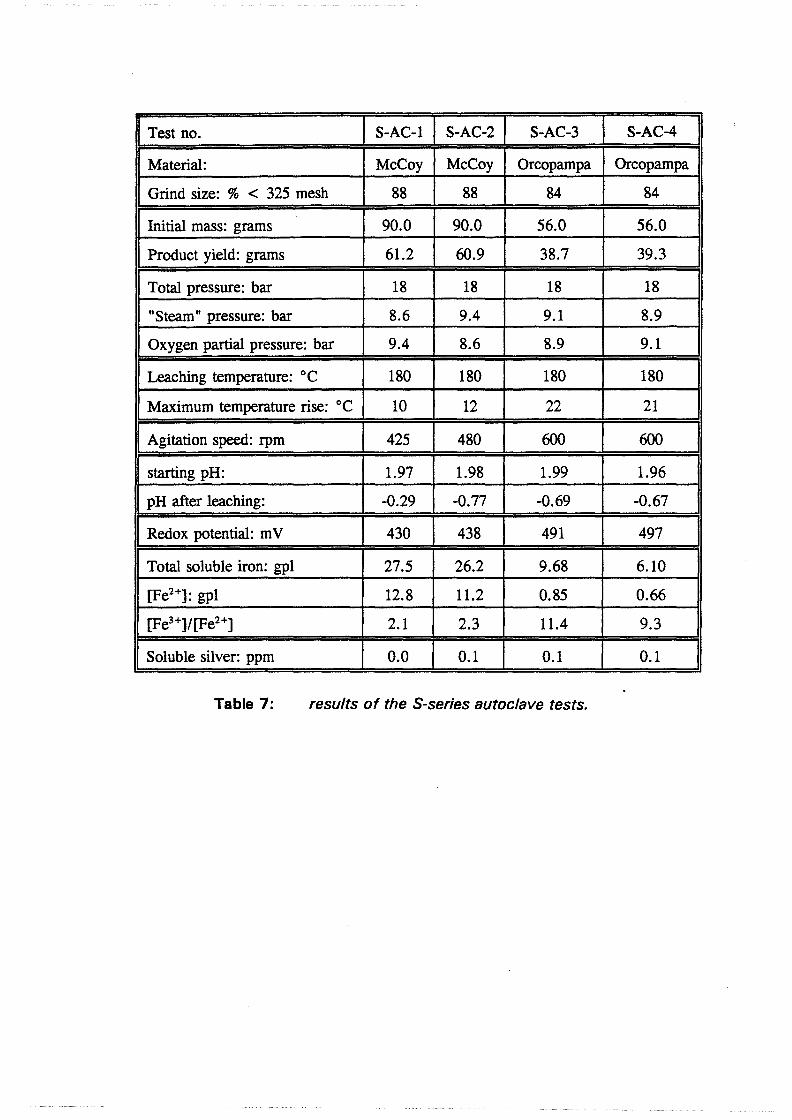
Test no. S-AC-1 S-AC-2 S-AC-3 S-AC-4
Material: McCoy McCoy Orcopampa Orcopampa
Grind size: % < 325 mesh 88 88 84 84
Initial mass: grams 90.0 90.0 56.0 56.0
Product yield: grams 61.2 60.9 38.7 39.3
Total pressure: bar 18 18 18 18
"Steam" pressure: bar 8.6 9.4 9.1 8.9
Oxygen partial pressure: bar 9.4 8.6 8.9 9.1
Leaching temperature: °C 180 180 180 180
Maximum temperature rise: °C 10 12 22 21
Agitation speed: rpm 425 480 600 600
starting pH: 1.97 1.98 1.99 1.96
pH after leaching: -0.29 -0.77 -0.69 -0.67
Redox potential: mV 430 438 491 497
Total soluble iron: gpl 27.5 26.2 9.68 6.10
[Fe2+]: gpl 12.8 11.2 0.85 0.66
[Fe3+]/[Fe2+] 2.1 2.3 11.4 9.3
Soluble silver: ppm 0.0 0.1 0.1 0.1
Table 7: results of the S-series autoclave tests.

Chapter 6 Experimental work
6.2.2 Preacidification tests
The McCoy concentrate was found not to contain any carbonate minerals, whereas the Orcopampa concentrate has a 2.28% equivalent calcite content (or a 2.10% equivalent dolomite content). Apart from escaping C02-gas through decomposition of calcite and/or dolomite, a weight reduction of some 2. 7% during acidulation was caused by dissolution of minerals such as arsenopyrite and sphalerite into the strongly acidic solution. The amount of dissolved silver in the preacidification filtrates was in the ppb-range, and thus negligible.
6.2.3 Autoclave tests in acidic sulf ate media
Table 7 shows the results of the S-series autoclave tests. It can be seen from this table that more or less duplicate test results were obtained, suggesting that sample preparation was correct and that splitting led to identical autoclave feeds. The agitation speed was low during the McCoy pressure leach tests due to technical problems with the stirring mechanism. Results of test S-AC-4 have been influenced by autoclave leakages. Oxidation reactions were more exothermic for the Orcopampa than for the McCoy tests, because of the higher sulfur content of the Orcopampa concentrate. Because of the low agitation speed and the resulting slower oxygen transfer, oxidation of the McCoy concentrate was not complete. This is shown by the high ferrous ion concentration in the filtrate and the low redox potential, and was confirmed on an X-ray diffractogram of the SAC-1 residue, which still contained some low intensity pyrite peaks. Nevertheless, high levels of acid generation were achieved, just as in the Orcopampa tests. Better oxidation results would be obtained in the I-series autoclave tests with 600 rpm and a starting pH of about 1.
X-ray diffractograms of the S-AC-1 and S-AC-3 residues showed that jarosites had indeed been formed during leaching of both concentrates. Due to the great number of cations, liberated from the concentrates during leaching, that are able to form jarosites, and the complex mechanisms of incorporation (chapter 3) X-ray diffraction could not be used to identify separate jarosite phases. Since silver concentrations in the filtrate were negligible, however, it can be concluded that the bulk of the silver has become associated with jarositetype compounds. Appendix C contains the JCPDS XRD charts of some relevant jarosite minerals, clearly showing that overlapping of diffraction lines will make any differentiation between the various jarosite phases impossible.
The weight of the residue was typically about two-thirds that of the initial concentrate weight. The residue is composed primarily of silica, alumina, PbS04 and jarosites5
• In the less acidic and colder top of the autoclave hematite precipitation occurred. This finding is in accordance with the stability regions of the various iron precipitates in figure 3.
Base metals, such as copper, manganese, nickel and zinc will dissolve in the autoclave.
38

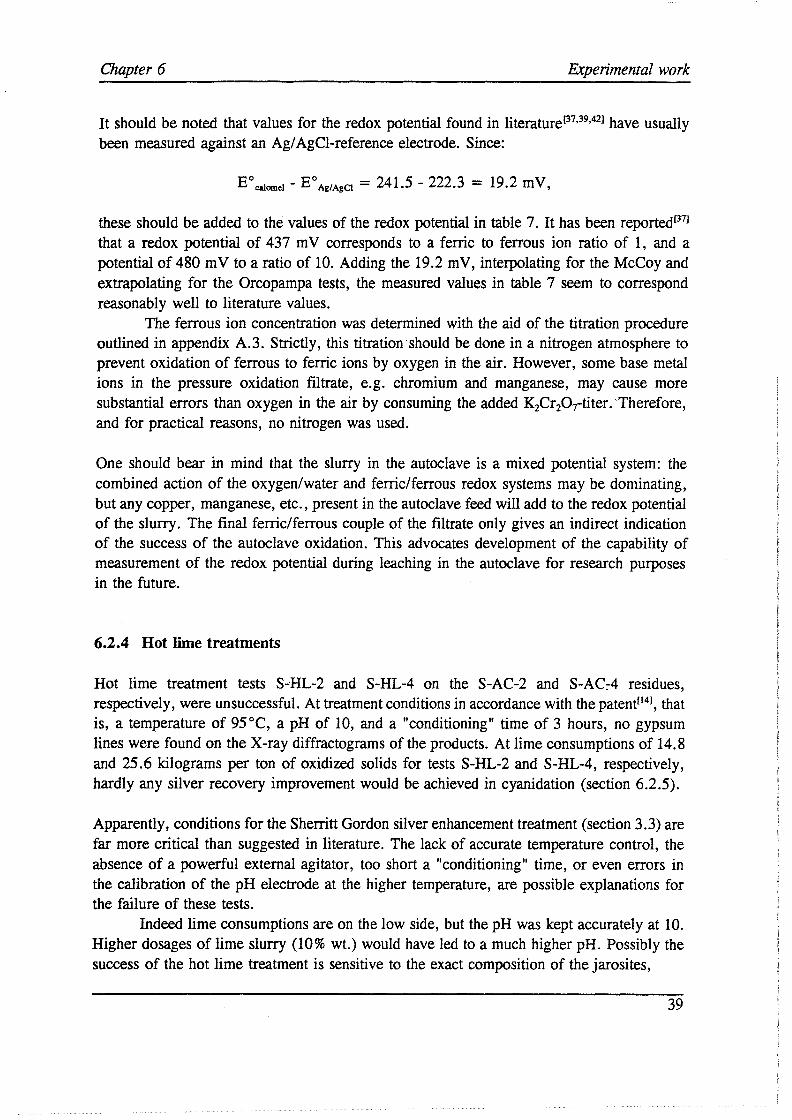
Chapter 6 Experimental work
It should be noted that values for the redox potential found in literaturel37•39
•421 have usually
been measured against an Ag/ AgCl-reference electrode. Since:
B 0 calomel - B0
Ag/AgCI = 241.5 - 222.3 = 19 .2 m V,
these should be added to the values of the redox potential in table 7. It has been reportedl371
that a redox potential of 437 m V corresponds to a ferric to ferrous ion ratio of 1, and a potential of 480 mV to a ratio of 10. Adding the 19.2 mV, interpolating for the McCoy and extrapolating for the Orcopampa tests, the measured values in table 7 seem to correspond reasonably well to literature values.
The ferrous ion concentration was determined with the aid of the titration procedure outlined in appendix A.3. Strictly, this titration ·should be done in a nitrogen atmosphere to prevent oxidation of ferrous to ferric ions by oxygen in the air. However, some base metal ions in the pressure oxidation filtrate, e.g. chromium and manganese, may cause more substantial errors than oxygen in the air by consuming the added K2Cr2O-rtiter. Therefore, and for practical reasons, no nitrogen was used.
One should bear in mind that the slurry in the autoclave is a mixed potential system: the combined action of the oxygen/water and ferric/ferrous redox systems may be dominating, but any copper, manganese, etc., present in the autoclave feed will add to the redox potential of the slurry. The final ferric/ferrous couple of the filtrate only gives an indirect indication of the success of the autoclave oxidation. This advocates development of the capability of measurement of the redox potential during leaching in the autoclave for research purposes in the future.
6.2.4 Hot lime treatments
Hot lime treatment tests S-HL-2 and S-HL-4 on the S-AC-2 and S-AC:-4 residues, respectively, were unsuccessful. At treatment conditions in accordance with the patent1141 , that is, a temperature of 95°C, a pH of 10, and a "conditioning" time of 3 hours, no gypsum lines were found on the X-ray diffractograms of the products. At lime consumptions of 14.8 and 25.6 kilograms per ton of oxidized solids for tests S-HL-2 and S-HL-4, respectively, hardly any silver recovery improvement would be achieved in cyanidation (section 6.2.5).
Apparently, conditions for the Sherritt Gordon silver enhancement treatment (section 3.3) are far more critical than suggested in literature. The lack of accurate temperature control, the absence of a powerful external agitator, too short a "conditioning" time, or even errors in the calibration of the pH electrode at the higher temperature, are possible explanations for the failure of these tests.
Indeed lime consumptions are on the low side, but the pH was kept accurately at 10. Higher dosages of lime slurry (10% wt.) would have led to a much higher pH. Possibly the success of the hot lime treatment is sensitive to the exact composition of the jarosites,
39
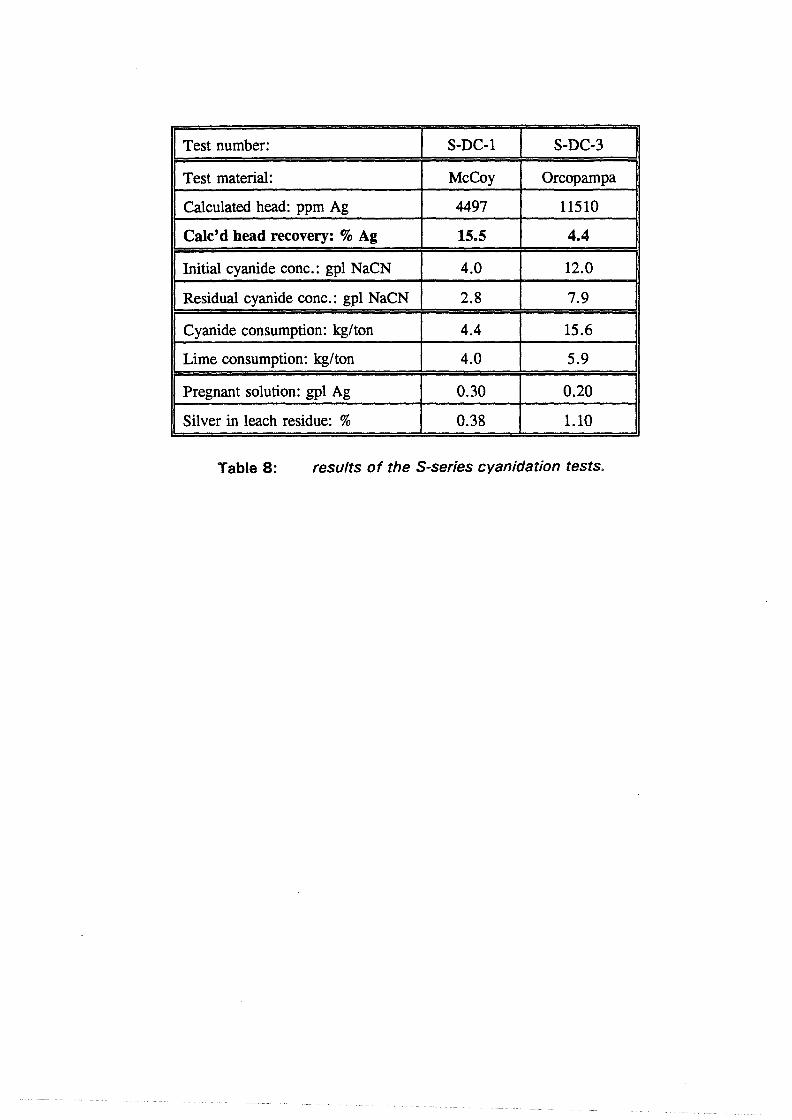
Test number: S-DC-1 S-DC-3
Test material: McCoy Orcopampa
Calculated head: ppm Ag 4497 11510
Calc'd head recovery: % Ag 15.5 4.4
Initial cyanide cone.: gpl NaCN 4.0 12.0
Residual cyanide cone.: gpl NaCN 2.8 7.9
Cyanide consumption: kg/ton 4.4 15.6
Lime consumption: kg/ton 4.0 5.9
Pregnant solution: gpl Ag 0.30 0.20
Silver in leach residue: % 0.38 1.10
Table 8: results of the S-series cyanidation tests.

Chapter 6 Experimental work
and complete decomposition of the jarosites in the S-AC-2 and S-AC-4 residues would only have taken place at a pH of 11 or 12. For the Orcopampa material successful decomposition of silver jarosites with lime has been reported elsewhere1391•
6.2.5 Direct cyanidation experiments on S-series residues
Table 8 shows the results of the direct cyanidation experiments on the S-AC-1 and S-AC-3 residues. A new technique was used for the determination of the silver content of the residue: quantitative XRF. Appendix A.5.2 summarizes this method. In view of the results of the baseline leach experiments, and because of the preliminary, comparative nature of the Sseries test results, only the calculated head silver recoveries were determined.
From table 8 it can be seen that for both test materials the silver recoveries achieved in cyanidation after aqueous pressure oxidation are considerably lower than the ones attained in the baseline leach experiments. Oxygen pressure leaching of the Orcopampa concentrate yielded a silver recovery in the 5 % range, as predicted in literature1371 • For the McCoy concentrate the recovery was somewhat higher, most likely because of a combination of incomplete autoclave oxidation of the material (section 6.2.3), and its relatively favorable leachability in cyanide solutions (section 6.2.1).
For both tests cyanide consumption was high compared to the theoretical consumption, which can be calculated on the basis of the amount of extracted silver. Indeed tests S-DC-1 and 3 were performed at higher concentrations of NaCN then necessary, because higher residue silver contents were initially expected, but the elevated cyanide levels have been accounted for in the reagent balances. A possible reason for the high NaCN consumptions is an easy liberation of base metal ions from (jarosites in) the residue.
The low silver recoveries achieved in the leaching of argentojarosite or silver-bearing jarosites can be explained in the same way as the extreme refractoriness of the Orcopampa concentrate (section 6.2.1): only silver ions in the outer crystal planes of the jarosite structure are exposed to and can react with free cyanide ions in the pulp. Earlier work at the Facultyl41
•451 showed that argentojarosite decomposes into amorphous Fe(OH)3 in concentrated
cyanide solutions, whereby some silver is solubilized.
No silver recovery improvement was achieved in test S-DC-2 on "conditioned" McCoy concentrate, whereas only some 10% higher recovery was attained during test S-DC-4 on "conditioned" Orcopampa concentrate. The cyanide consumptions during these tests were of the same order of magnitude as for tests S-DC-1 and 3, but the lime consumptions, of course, were O kg/ton.
40
Test: I-AC-1 I-AC-2 I-AC-3 I-AC-4 I-AC-5 I-AC-6 I-AC-7 I-AC-8
Material: McCoy Orcopampa McCoy Orcopampa McCoy Orcopampa McCoy Orcopampa
Grind size: 88 84 88 89 88 89 88 89 % < 325 mesh
Init. wt.: g 90.0 56.0 90.0 56.0 90.0 56.0 90.0 56.0
Product wt. : g 55.5 45.9 43.3 33.6 54.2 36.2 52.8 35.1
Added Kl: g 2.838 5.428 0.999 1.990 0.999 1.990 0.500 0.995
Kl cons.: kg/t 31.5 96.9 11.1 35.5 11.1 35.5 5.6 17.8
molar I/Ag: 5.7 5.5 2 2 2 2 1 1
pH begin: 1.98 1.99 0.75 0.92 0.92 0.96 0.93 1.00
pH end: -0.25 0.26 -0.48 0.85 0.72 0.57 1.05 0.98
"Steam" P: bar 9.5 9.3 9.2 8.9 9.2 8.9 9.0 9.0
Max . .1.T: °C 20 12 17 15 21 18 13 12
I Redox: mV I 537 I 484 I 528 I 498 I 500 I 497 I 437 I 453 I Sol. Fe: gpl 33.8 5.80 42.4 15.0 32.8 12.7 33.6 12.0
Sol. Ag: ppm 0.11 0.06 0.11 0.08 0.09 0.07 0.09 0.06
Table 9: results of the /-series autoclave tests.
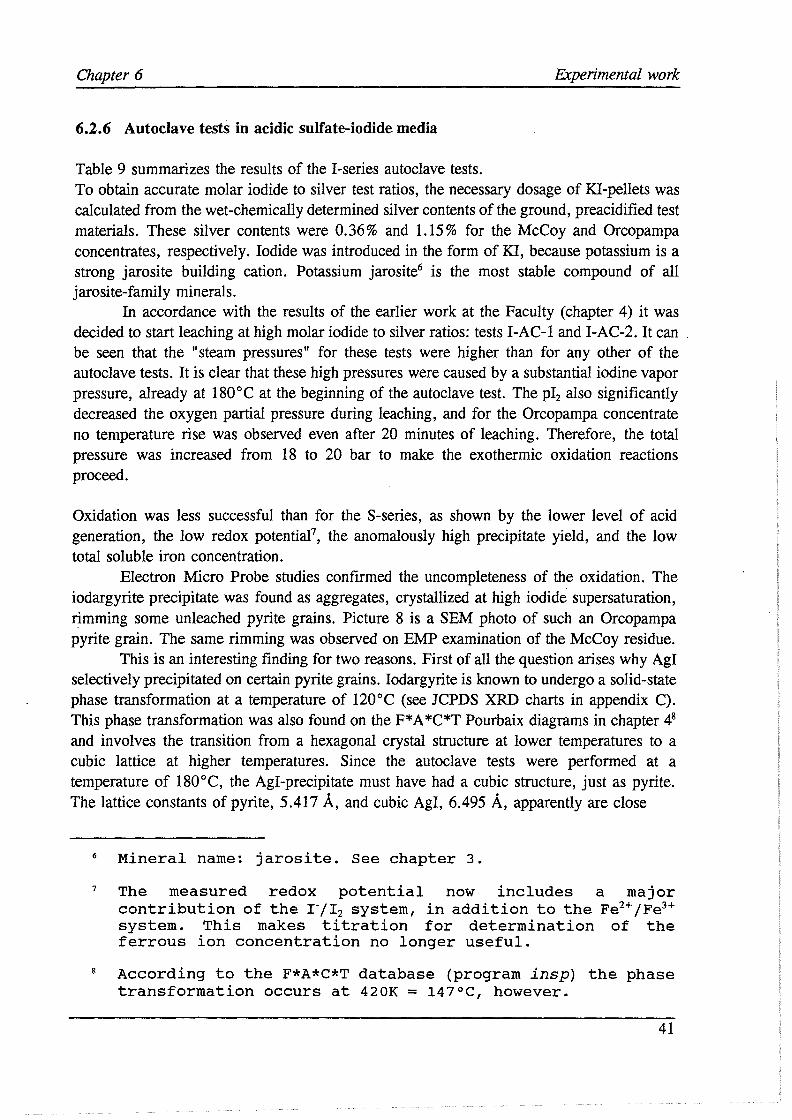
Chapter 6 Experimental work
6.2.6 Autoclave tests in acidic sulfate-iodide media
Table 9 summarizes the results of the I-series autoclave tests. To obtain accurate molar iodide to silver test ratios, the necessary dosage of Kl-pellets was calculated from the wet-chemically determined silver contents of the ground, preacidified test materials. These silver contents were 0.36% and 1.15% for the McCoy and Orcopampa concentrates, respectively. Iodide was introduced in the form of Kl, because potassium is a strong jarosite building cation. Potassium jarosite6 is the most stable compound of all jarosite-family minerals.
In accordance with the results of the earlier work at the Faculty (chapter 4) it was decided to start leaching at high molar iodide to silver ratios: tests I-AC-1 and I-AC-2. It can be seen that the "steam pressures" for these tests were higher than for any other of the autoclave tests. It is clear that these high pressures were caused by a substantial iodine vapor pressure, already at 180°C at the beginning of the autoclave test. The pI2 also significantly decreased the oxygen partial pressure during leaching, and for the Orcopampa concentrate no temperature rise was observed even after 20 minutes of leaching. Therefore, the total pressure was increased from 18 to 20 bar to make the exothermic oxidation reactions proceed.
Oxidation was less successful than for the S-series, as shown by the lower level of acid generation, the low redox potential7, the anomalously high precipitate yield, and the low total soluble iron concentration.
Electron Micro Probe studies confirmed the uncompleteness of the oxidation. The iodargyrite precipitate was found as aggregates, crystallized at high iodide· supersaturation, rimming some unleached pyrite grains. Picture 8 is a SEM photo of such an Orcopampa pyrite grain. The same rimming was observed on EMP examination of the McCoy residue.
This is an interesting finding for two reasons. First of all the question arises why AgI selectively precipitated on certain pyrite grains. Iodargyrite is known to undergo a solid-state phase transformation at a temperature of 120°C (see JCPDS XRD charts in appendix C). This phase transformation was also found on the F* A *C*T Pourbaix diagrams in chapter 48
and involves the transition from a hexagonal crystal structure at lower temperatures to a cubic lattice at higher temperatures. Since the autoclave tests were performed at a temperature of 180°C, the AgI-precipitate must have had a cubic structure, just as pyrite. The lattice constants of pyrite, 5.417 A, and cubic AgI, 6.495 A, apparently are close
6
7
Mineral name: jarosite. See chapter 3.
The measured redox potential now includes a major contribution of the r/I2 system, in addition to the Fe2+ /Fe3+ system. This makes titration for determination of the ferrous ion concentration no longer useful.
According to the F*A*C*T database (program insp} the phase transformation occurs at 420K = 147°C, however.
41

Picture 8: SEM image of iodargyrite aggregates rimming unleached pyrite grains in autoclave residue I-AC-2 (3000x).
Picture 9: insulation of the autoclave top for tests I-AC-5 and I-AC-6.
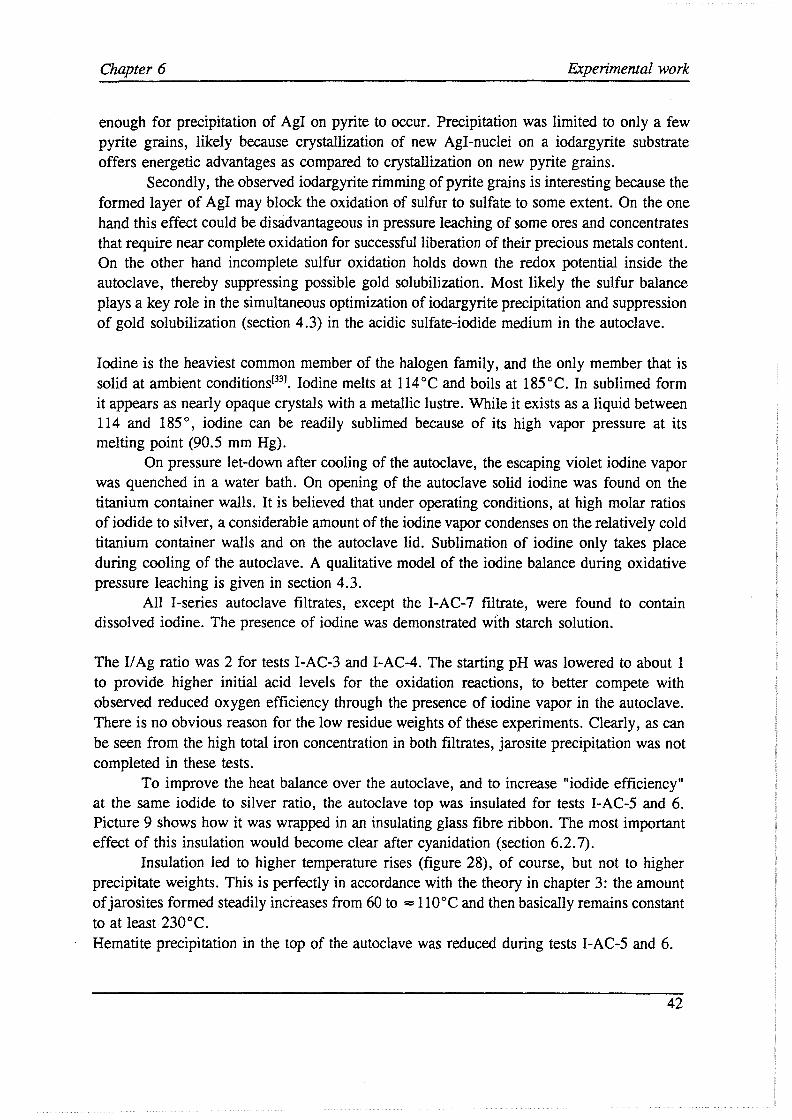
Chapter 6 Experimental work
enough for precipitation of Agl on pyrite to occur. Precipitation was limited to only a few pyrite grains, likely because crystallization of new Agl-nuclei on a iodargyrite substrate offers energetic advantages as compared to crystallization on new pyrite grains.
Secondly, the observed iodargyrite rimming of pyrite grains is interesting because the formed layer of Agl may block the oxidation of sulfur to sulfate to some extent. On the one hand this effect could be disadvantageous in pressure leaching of some ores and concentrates that require near complete oxidation for successful liberation of their precious metals content. On the other hand incomplete sulfur oxidation holds down the redox potential inside the autoclave, thereby suppressing possible gold solubilization. Most likely the sulfur balance plays a key role in the simultaneous optimization of iodargyrite precipitation and suppression of gold solubilization (section 4.3) in the acidic sulfate-iodide medium in the autoclave.
Iodine is the heaviest common member of the halogen family, and the only member that is solid at ambient conditionsf331• Iodine melts at ll4°C and boils at 185°C. In sublimed form it appears as nearly opaque crystals with a metallic lustre. While it exists as a liquid between 114 and 185°, iodine can be readily sublimed because of its high vapor pressure at its melting point (90.5 mm Hg).
On pressure let-down after cooling of the autoclave, the escaping violet iodine vapor was quenched in a water bath. On opening of the autoclave solid iodine was found on the titanium container walls. It is believed that under operating conditions, at high molar ratios of iodide to silver, a considerable amount of the iodine vapor condenses on the relatively cold titanium container walls and on the autoclave lid. Sublimation of iodine only takes place during cooling of the autoclave. A qualitative model of the iodine balance during oxidative pressure leaching is given in section 4.3.
All I-series autoclave filtrates, except the I-AC-7 filtrate, were found to contain dissolved iodine. The presence of iodine was demonstrated wfth starch solution.
The I/ Ag ratio was 2 for tests I-AC-3 and I-AC-4. The starting pH was lowered to about 1 to provide higher initial acid levels for the oxidation reactions, to better compete with observed reduced oxygen efficiency through the presence of iodine vapor in the autoclave. There is no obvious reason for the low residue weights of these experiments. Clearly, as can be seen from the high total iron concentration in both filtrates, jarosite precipitation was not completed in these tests.
To improve the heat balance over the autoclave, and to increase "iodide efficiency" at the same iodide to silver ratio, the autoclave top was insulated for tests I-AC-5 and 6. Picture 9 shows how it was wrapped in an insulating glass fibre ribbon. The most important effect of this insulation would become clear after cyanidation (section 6.2. 7).
Insulation led to higher temperature rises (figure 28), of course, but not to higher precipitate weights. This is perfectly in accordance with the theory in chapter 3: the amount of jarosites formed steadily increases from 60 to = l l0°C and then basically remains constant to at least 230°C. Hematite precipitation in the top of the autoclave was reduced during tests I-AC-5 and 6.
42
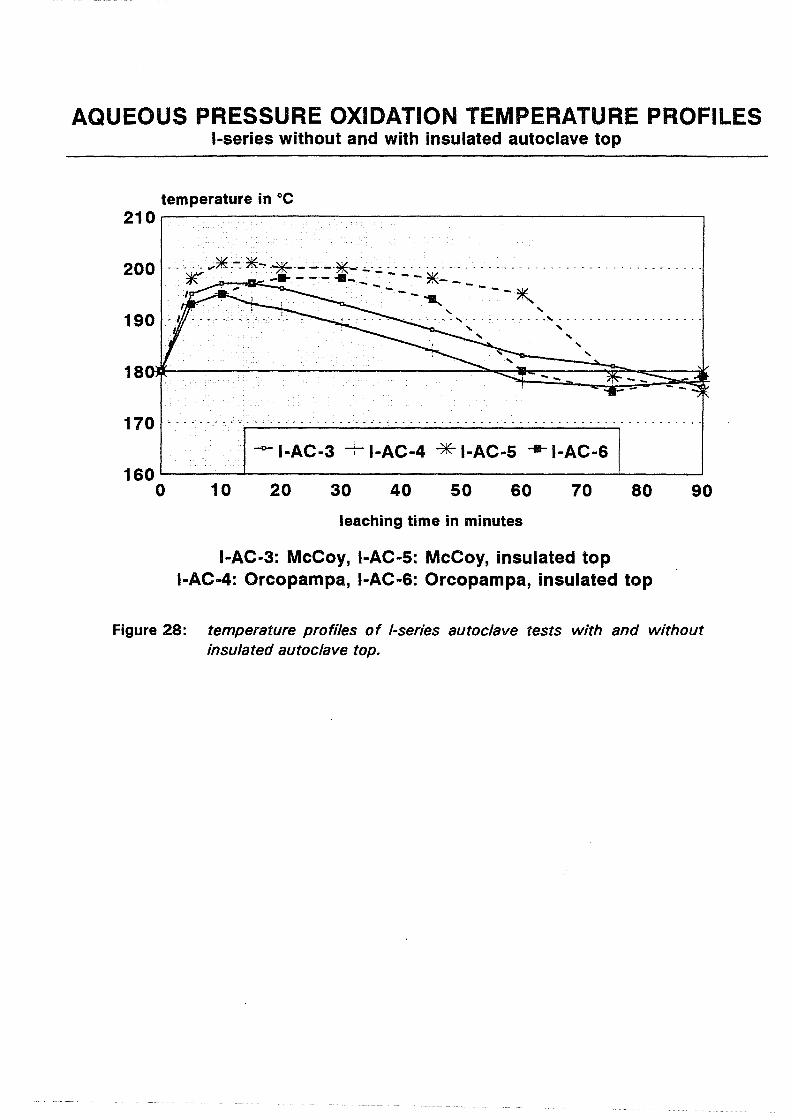
AQUEOUS PRESSURE OXIDATION TEMPERATURE PROFILES I-series without and with insulated autoclave top
temperature in °c 210~-------------------------,
200
190
170
- I-AC-3 -: I-AC-4 * I-AC-5 -11-1-AC-6 160'-----.....----------------___._ __ __,
0 10 20 30 40 50 60 70 80
leaching time in minutes
I-AC-3: McCoy, I-AC-5: McCoy, insulated top I-AC-4: Orcopampa, I-AC-6: Orcopampa, insulated top
90
Figure 28: temperature profiles of I-series autoclave tests with and without insulated autoclave top.
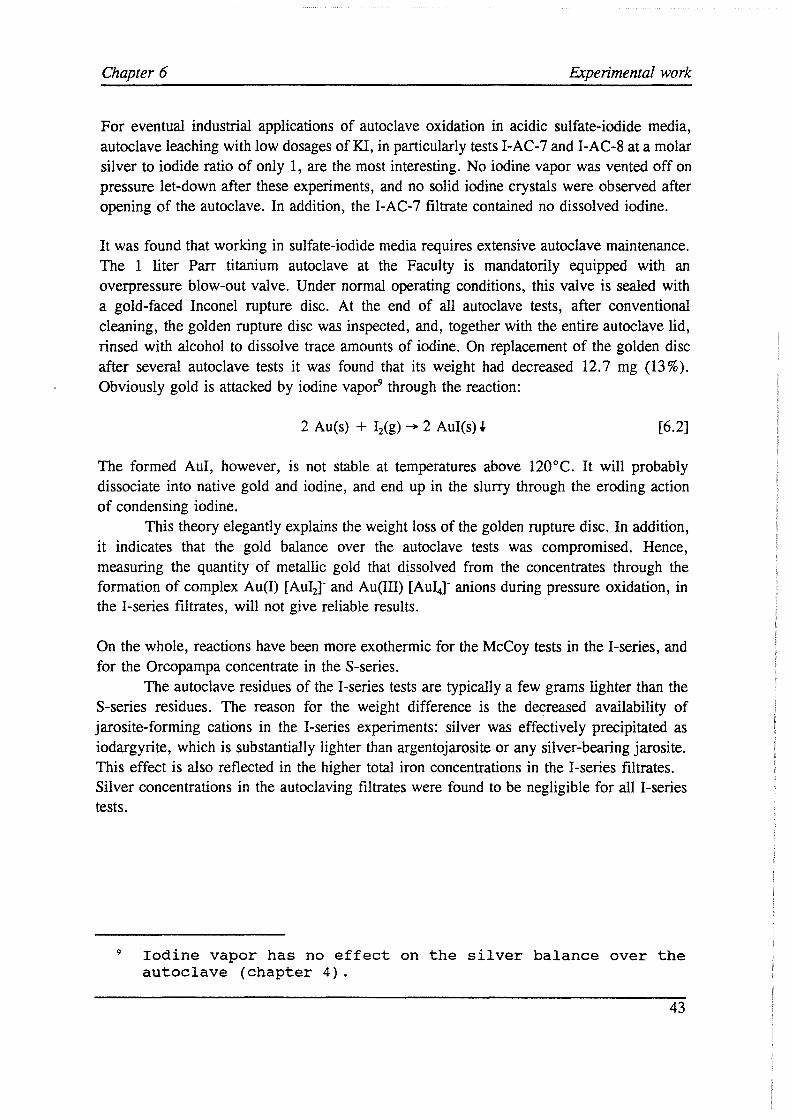
Chapter 6 Experimental work
For eventual industrial applications of autoclave oxidation in acidic sulfate-iodide media, autoclave leaching with low dosages of Kl, in particularly tests I-AC-7 and I-AC-8 at a molar silver to iodide ratio of only 1, are the most interesting. No iodine vapor was vented off on pressure let-down after these experiments, and no solid iodine crystals were observed after opening of the autoclave. In addition, the I-AC-7 filtrate contained no dissolved iodine.
It was found that working in sulfate-iodide media requires extensive autoclave maintenance. The 1 liter Parr titanium autoclave at the Faculty is mandatorily equipped with an overpressure blow-out valve. Under normal operating conditions, this valve is sealed with a gold-faced Inconel rupture disc. At the end of all autoclave tests, after conventional cleaning, the golden rupture disc was inspected, and, together with the entire autoclave lid, rinsed with alcohol to dissolve trace amounts of iodine. On replacement of the golden disc after several autoclave tests it was found that its weight had decreased 12. 7 mg (13 % ). Obviously gold is attacked by iodine vapor9 through the reaction:
2 Au(s) + Ii(g) --. 2 Aul(s) i [6.2]
The formed Aul, however, is not stable at temperatures above 120°C. It will probably dissociate into native gold and iodine, and end up in the slurry through the eroding action of condensing iodine.
This theory elegantly explains the weight loss of the golden rupture disc. In addition, it indicates that the gold balance over the autoclave tests was compromised. Hence, measuring the quantity of metallic gold that dissolved from the concentrates through the formation of complex Au(I) [Aul2l and Au(III) [Aul4l anions during pressure oxidation, in the I-series filtrates, will not give reliable results.
On the whole, reactions have been more exothermic for the McCoy tests in the I-series, and for the Orcopampa concentrate in the S-series.
The autoclave residues of the I-series tests are typically a few grams lighter than the S-series residues. The reason for the weight difference is the decreased availability of jarosite-forming cations in the I-series experiments: silver was effectively precipitated as iodargyrite, which is substantially lighter than argentojarosite or any silver-bearing jarosite. This effect is also reflected in the higher total iron concentrations in the I-series filtrates. Silver concentrations in the autoclaving filtrates were found to be negligible for all I-series tests.
9 Iodine vapor has no effect on the silver balance over the autoclave (chapter 4).
43
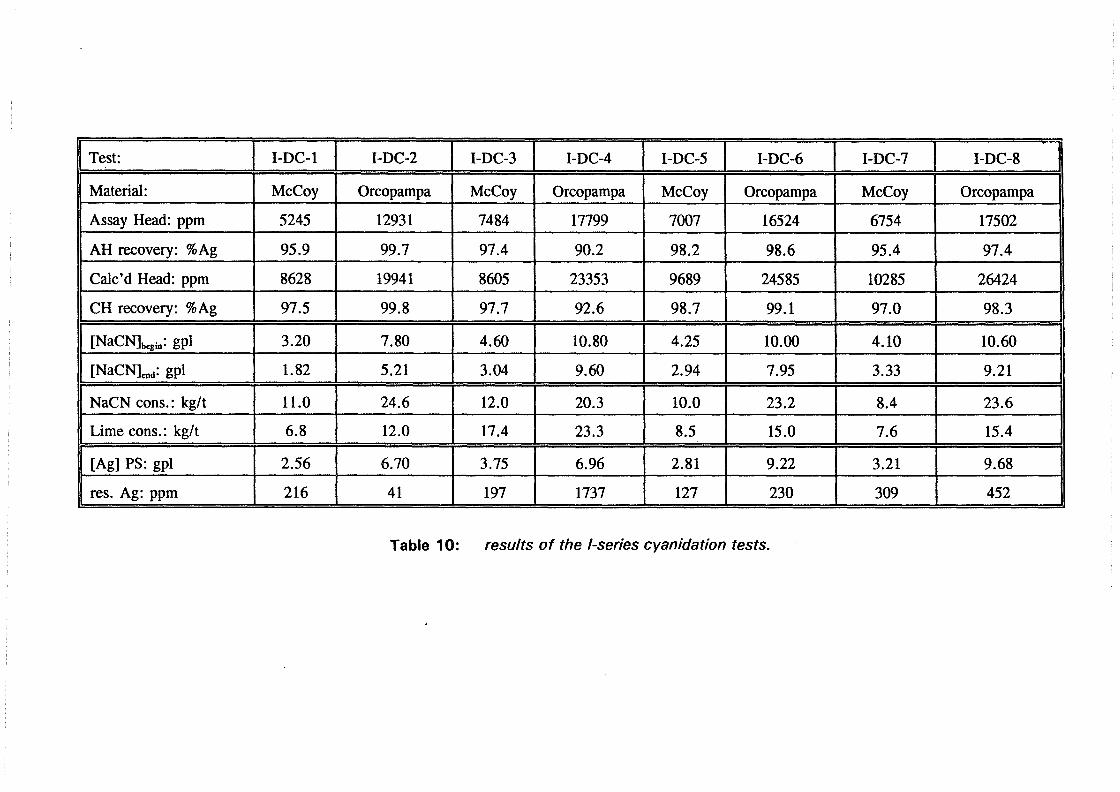
Test: I-DC-1 I-DC-2 I-DC-3 I-DC-4 I-DC-5 I-DC-6 1-DC-7 I-DC-8
Material: McCoy Orcopampa McCoy Orcopampa McCoy Orcopampa McCoy Orcopampa
Assay Head: ppm 5245 12931 7484 17799 7007 16524 6754 17502
AH recovery: % Ag 95.9 99.7 97.4 90.2 98.2 98.6 95.4 97.4
Calc'd Head: ppm 8628 19941 8605 23353 9689 24585 10285 26424
CH recovery: %Ag 97.5 99.8 97.7 92.6 98.7 99.1 97.0 98.3
[NaCN]bcgin: gpl 3.20 7.80 4.60 10.80 4.25 10.00 4.10 10.60
[NaCN]cnd: gpl 1.82 5.21 3.04 9.60 2.94 7.95 3.33 9.21
NaCN cons.: kg/t 11.0 24.6 12.0 20.3 10.0 23.2 8.4 23.6
Lime cons.: kg/t 6.8 12.0 17.4 23.3 8.5 15.0 7.6 15.4
[Ag] PS: gpl 2.56 6.70 3.75 6.96 2.81 9.22 3.21 9.68
res. Ag: ppm 216 41 197 1737 127 230 309 452
Table 10: results of the I-series cyanidation tests.
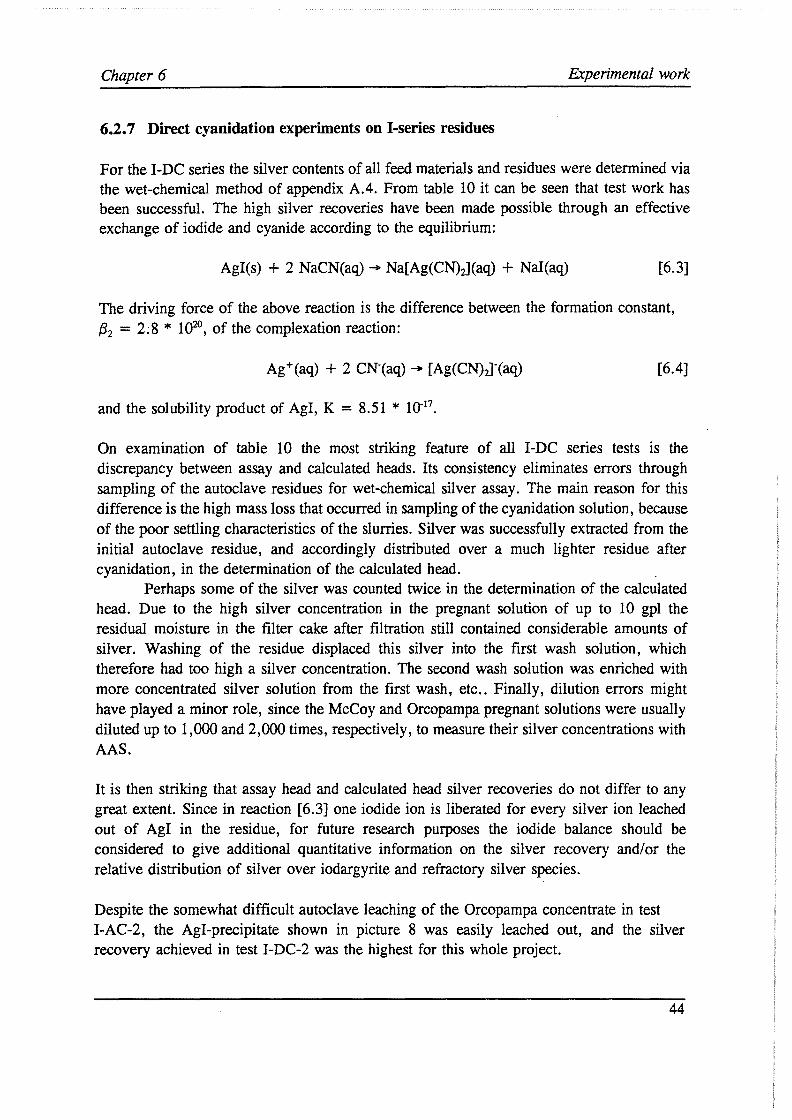
Chapter 6 F.xperimental work
6.2. 7 Direct cyanidation experiments on I-series residues
For the I-DC series the silver contents of all feed materials and residues were determined via the wet-chemical method of appendix A.4. From table 10 it can be seen that test work has been successful. The high silver recoveries have been made possible through an effective exchange of iodide and cyanide according to the equilibrium:
AgI(s) + 2 NaCN(aq) -. Na[Ag(CN):J(aq) + NaI(aq) [6.3]
The driving force of the above reaction is the difference between the formation constant, /32 = 2;8 * 102°, of the complexation reaction:
[6.4]
and the solubility product of AgI, K = 8.51 * 10-11•
On examination of table 10 the most striking feature of all I-DC series tests is the discrepancy between assay and calculated heads. Its consistency eliminates errors through sampling of the autoclave residues for wet-chemical silver assay. The main reason for this difference is the high mass loss that occurred in sampling of the cyanidation solution, because of the poor settling characteristics of the slurries. Silver was successfully extracted from the initial autoclave residue, and accordingly distributed over a much lighter residue after cyanidation, in the determination of the calculated head.
Perhaps some of the silver was counted twice in the determination of the calculated head. Due to the high silver concentration in the pregnant solution of up to 10 gpl the residual moisture in the filter cake after filtration still contained considerable amounts of silver. Washing of the residue displaced this silver into the first wash solution, which therefore had too high a silver concentration. The second wash solution was enriched with more concentrated silver solution from the first wash, etc .. Finally, dilution errors might have played a minor role, since the McCoy and Orcopampa pregnant solutions were usually diluted up to 1,000 and 2,000 times, respectively, to measure their silver concentrations with AAS.
It is then striking that assay head and calculated head silver recoveries do not differ to any great extent. Since in reaction [6.3] one iodide ion is liberated for every silver ion leached out of AgI in the residue, for future research purposes the iodide balance should be considered to give additional quantitative information on the silver recovery and/or the relative distribution of silver over iodargyrite and refractory silver species.
Despite the somewhat difficult autoclave leaching of the Orcopampa concentrate in test I-AC-2, the AgI-precipitate shown in picture 8 was easily leached out, and the silver recovery achieved in test I-DC-2 was the highest for this whole project.
44
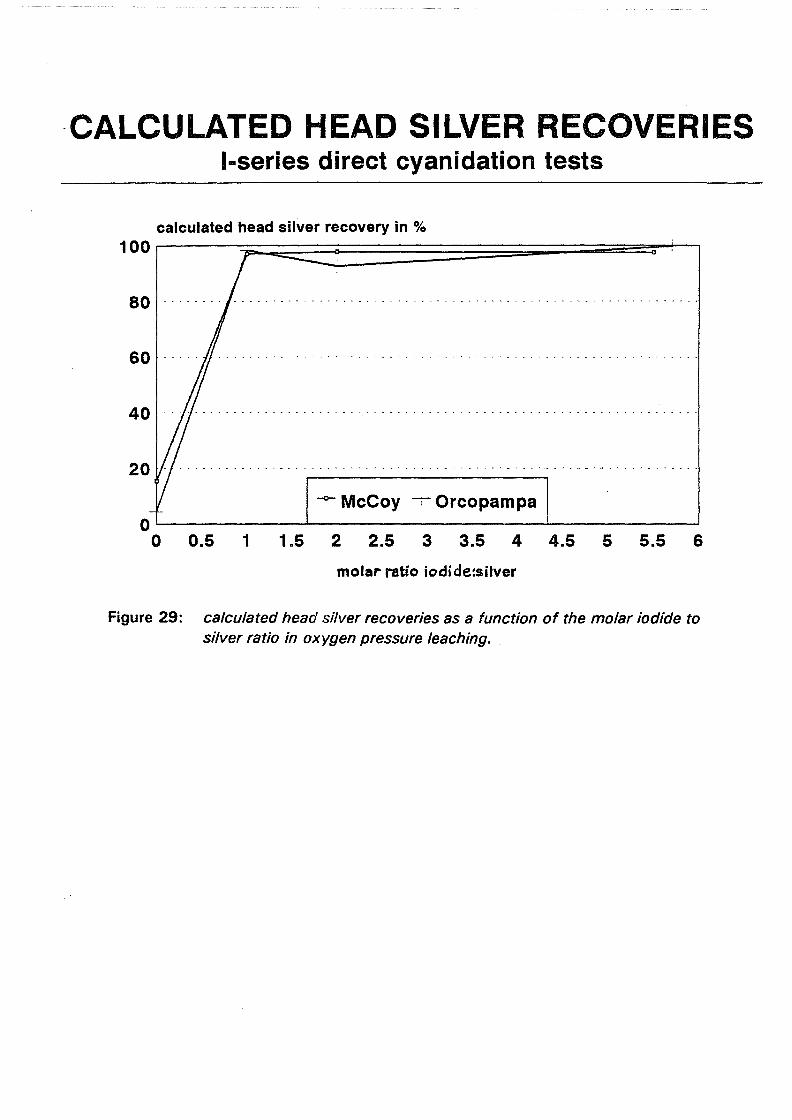
-CALCULATED HEAD SILVER RECOVERIES I-series direct cyanidation tests
calculated head silver recovery in %
100,-7;:::::;;~==========:::::::=;;;;;====-=====~1 80 ········ .. ······· ......... · ........ - - .... ········ · ....... · ...... · .. .
60
40 .. · ...... · ········ · · ...... · · · ... - ..... -......... -........ -. - - ....... .
20
- McCoy --i Orcopampa 0'-------------''------------'------------'
0 0.5 1 1.5 2 2.5 3 3.5 4 4.5 5 5.5 6
molar- ratio iodi de:silver
Figure 29: calculated head silver recoveries as a function of the molar iodide to silver ratio in oxygen pressure leaching.
Chapter 6 Experimental work
The silver recovery for test I-DC-4 is too low, since test I-DC-8 gave a better result. Dissolution of the residue in the determination of the assay head might have been incomplete.
Insulation of the autoclave top at an iodide to silver ratio of 2 led to improved silver recoveries through a higher "iodide efficiency" and a smaller "iodine cycle" (chapter 4). The recovery improvement was approximately 1 % for the McCoy concentrate in test I-DC-5 and must have been of the same order of magnitude for the Orcopampa material in test I-DC-6.
Autoclave residue of test I-AC-5 yielded the most viscous slurry of this project. All cyanided slurries, both of S and I-series, showed extremely poor settling characteristics. Solution samples could only be taken after centrifuging of a portion of the slurry, which resulted in high mass losses during cyanidation. McCoy slurries showed poor filtration characteristics, whereas the Orcopampa slurries filtered quickly.
From the I-DC-series test results, except tests I-DC-5 and 6, on the basis of the calculated head silver recoveries, in particular of the McCoy concentrate, it can be concluded that AgI is readily precipitated in the autoclave even at molar iodide to silver ratios of only 1, and that this precipitation is not affected to any great extent by pressure oxidation at higher ratios. The excess iodide in the latter case is merely lost to the physical "iodine cycle" described in chapter 4.
Since AgI-precipitation leads to high silver recoveries for both McCoy and Orcopampa concentrates, it is independent of the silver content or the reason for refractoriness of the material. Less incorporation of silver into jarosite-type compounds occurred than was to be expected from the earlier work at the Faculty, possibly because of the availability of a strong jarosite-forming cation, namely potassium, in the autoclave.
Figure 29 graphically displays the calculated head silver recoveries as a function of the molar I/ Ag-ratio. Starting points are the results of tests S-AC-1 and 3. Although pressure oxidation of concentrates at a molar I/ Ag-ratio of only 1 yields silver recoveries in the order of 98 % , autoclave oxidation at a somewhat higher ratio may be preferred in industrial _operation. It is believed that at a ratio of 1 the low redox potential of the autoclave filtrate, and hence, the low ratio of ferric to ferrous ions, would cause severe precipitation problems in the neutralization circuit.
45

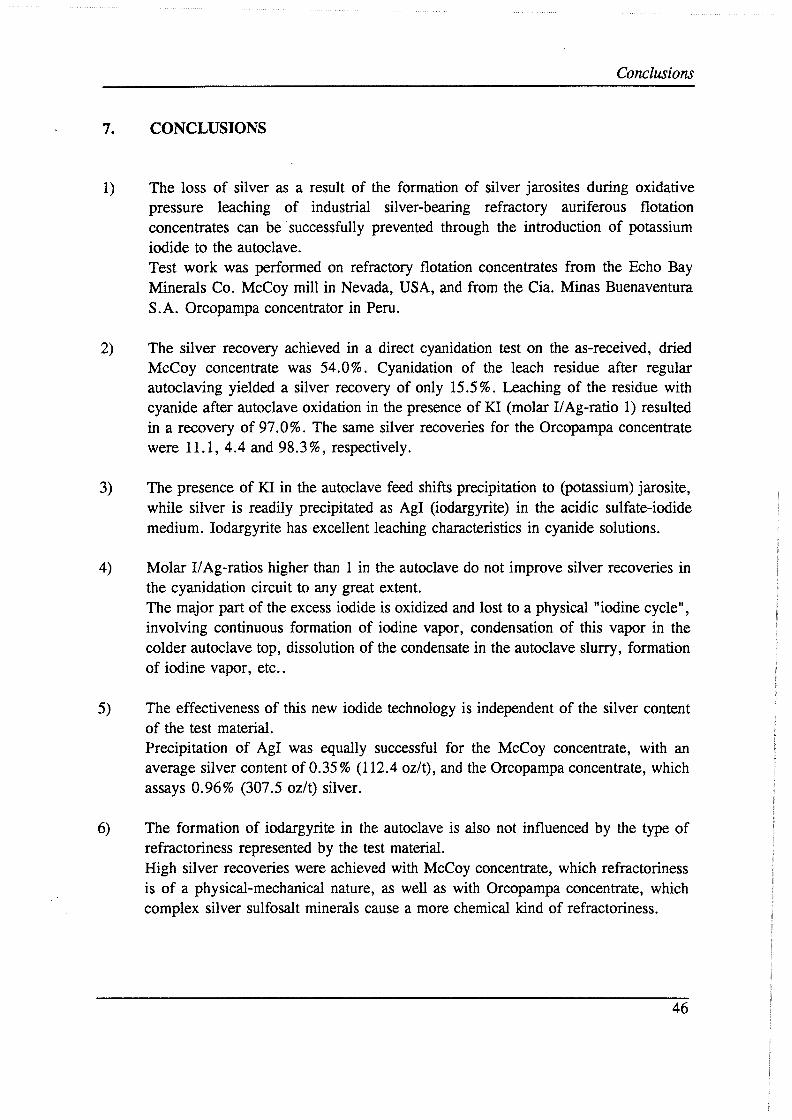
Conclusions
7. CONCLUSIONS
1) The loss of silver as a result of the formation of silver jarosites during oxidative pressure leaching of industrial silver-bearing refractory auriferous flotation concentrates can be successfully prevented through the introduction of potassium iodide to the autoclave. Test work was performed on refractory flotation concentrates from the Echo Bay Minerals Co. McCoy mill in Nevada, USA, and from the Cia. Minas Buenaventura S.A. Orcopampa concentrator in Peru.
2) The silver recovery achieved in a direct cyanidation test on the as-received, dried McCoy concentrate was 54.0%. Cyanidation of the leach residue after regular autoclaving yielded a silver recovery of only 15 .5 % . Leaching of the residue with cyanide after autoclave oxidation in the presence of Kl (molar I/ Ag-ratio 1) resulted in a recovery of 97. 0 % . The same silver recoveries for the Orcopampa concentrate were 11.1, 4.4 and 98.3%, respectively.
3) The presence of Kl in the autoclave feed shifts precipitation to (potassium) jarosite, while silver is readily precipitated as Agl (iodargyrite) in the acidic sulfate-iodide medium. Iodargyrite has excellent leaching characteristics in cyanide solutions.
4) Molar I/ Ag-ratios higher than 1 in the autoclave do not improve silver recoveries in the cyanidation circuit to any great extent. The major part of the excess iodide is oxidized and lost to a physical "iodine cycle", involving continuous formation of iodine vapor, condensation of this vapor in the colder autoclave top, dissolution of the condensate in the autoclave slurry, formation of iodine vapor, etc ..
5) The effectiveness of this new iodide technology is independent of the silver content of the test material. Precipitation of Agl was equally successful for the McCoy concentrate, with an average silver content of 0.35% (112.4 oz/t), and the Orcopampa concentrate, which assays 0.96% (307.5 oz/t) silver.
6) The formation of iodargyrite in the autoclave is also not influenced by the type of refractoriness represented by the test material. High silver recoveries were achieved with McCoy concentrate, which refractoriness is of a physical-mechanical nature, as well as with Orcopampa concentrate, which complex silver sulfosalt minerals cause a more chemical kind of refractoriness.
46


Recommendations
8. RECOMl\.fENDATIONS
1) Measurement of the redox potential in the autoclave during leaching. Actual data on (fluctuations of) the redox potential during oxidative pressure leaching would significantly improve the quality of thermodynamic models.
2) Integral monitoring of silver, gold and sulfur balances. The behavior of gold warrants attention with the new iodide technology. It should be investigated whether gold solubilizes in the acidic sulfate-iodide medium in the autoclave and if so, gold dissolution sbould either be suppressed or optimized. The sulfur balance should be monitored to judge the completeness of oxidation achieved, since this is believed to be a key parameter for controlling silver and gold iodide chemistry in the autoclave.
3) Monitoring of the iodine and base metal balances. Determination of the concentrations of the predominant iodine species in the autoclave filtrate, measurement of the quantity of produced iodine vapor in the autoclave and investigation of the effects of the iodine/iodide redox system and iodide build-up on cyanidation kinetics. Examination of the beneficial effect of potassium on the precipitation of iodargyrite. Investigation of the use of solvent extraction to selectively recover the high copper and zinc values in the Orcopampa concentrate at an intermediate stage of the neutralization circuit.
4) Economic evaluation. For eventual industrial applications of the new iodide technology, feasibility studies should point out if higher reagent costs, higher corrosion rates, etc., weigh in with the higher silver recoveries achieved in the cyanidation circuit.
5) Application of iodide technology to the zinc industry. The zinc industry already faces the problem of silver losses to jarosites. Since pressure oxidation of zinc concentrates will gradually replace the conventional roasting-leaching-electrowinning process, silver losses will become even more important in the future. Implementation of some iodargyrite precipitation step in the processing of zinc may be worthwhile to investigate.
6) Investigation of the possibility of using bromide to precipitate AgBr instead of Ag! in the autoclave. Comparison of cost estimates for industrial application of iodide and bromide systems.
47

References and bibliography
REFERENCES AND BIBLIOGRAPHY
[1] Ackerman, J.B. and Bucans, C.S., 'Plant and process startup of the Sunshine silver refinery', Minerals and Metallurgical Processing, Volume 3, Number 1, February 1986, pp. 20-32.
[2] Anon., 'Cashman process may offer key to treating arsenical ores', Engineering & Mining Journal, November 1987, pp. 55.
[3] Anon., 'Silver still shines, although not in the markets', Engineering & Mining Journal, February 1991, pp. 82.
[4] Ary, T.S., dir., United States Department of the Interior Bureau of Mines, Mineral Industry Surveys, Gold and Silver Monthly, 1988-1992.
[5] Bard, A.J., Parsons, R. and Jordan, J., eds.,'Standard potentials in aqueous solutions', IUPAC, Marcel Dekker, Inc., New York and Basel, 1985.
[6] Berezowsky, R.M.G.S. and Weir, D.R.,'Factors affecting the selection of pressure oxidation for the pretreatment of refractory gold ores', Conference Papers of the International E&MJ Gold Expo, Reno, Nevada, September 7-9, 1989, pp. 217-235.
[7] Davis, A. and Tran, T., 'Gold dissolution in iodide electrolytes', Hydrometallurgy, Volume 26, 1991, pp. 163-177.
[8] Demopoulos, G.P. and Papangelakis, V.G.,'Recent advances in refractory gold processing', CIM Bulletin, Volume 82, Number 931, November 1989, pp. 85-91.
[9] Demopoulos, G.P., Papangelakis, V .G., Buchanan, B.R. and Mainwaring, P.R., 'Direct solubilization of refractory gold by pressure chloride leaching', Extraction Metallurgy Symposium organized by the IMM, London, July 10-13, 1989, pp. 603-627.
[10] Dutrizac, J.E. and Jambor, J .L., 'Behaviour of silver during jarosite precipitation', Transactions of the IMM, Section C: Mineral Processing and Extractive Metallurgy, Volume 96, September 1987, pp. 206-218.
[11] Dutrizac, J.E. and Jambor, J .L., 'Formation and characterization of argentojarosite and plumbojarosite and their relevance to metallurgical processing', Proceedings of the Second International Congress on Applied Mineralogy in the Minerals Industry, W.C. Park et al., eds., Los Angeles, California, February 22-25, 1984, pp. 507-530.
48

.
References and bibliography
[12] Fabian, C.P. and Ryan, M.G., 'Derivation of the potential-pH diagrams for the Au-Cl-H20, Ag-Cl-H20 systems at 25°C', Golden West Refining Corp. Ltd., Australia.
[13] Fair, K.J. and Turylo, P.G.,'Dissolution of gold onto activated carbon in chloride containing nitrate media', Paper presented at the 12th International Precious Metals Conference, Boston, Massachusetts, June 5-9, 1988.
[ 14] Genik-Sas-Berezowsky, R.M. and Weir, D.R., 'Process for the recovery of silver from a residue essentially free of elemental sulphur', U.S. Patent 4,632,701, December 30, 1986.
[15] Gmelin-lnstitut, 'GmelinsHandbuch der Anorganischen Chemie (in German)', Silber, Teil A-Lieferung 1, System-Nummer 61, Verlag Chemie GmbH, Weinheim/Bergstr., Achte Auflage, 1970, pp. 36-38, 99-101.
[16] Goode, J.R., 'Refractory gold ore processing', TMS Annual Meeting, Denver, Colorado, February 21-25, 1993.
[ 17] Gundiler, I.H. and Blalock, G .A., 'Pressure oxidation of a refractory sulfide concentrate and thiourea leaching of gold and silver from the residues', SME Annual Meeting, Phoenix, Arizona, February 24-27, 1992, preprint number 92-236.
[18] Hiskey, J.B. and Atluri, V.P., 'Dissolution chemistry of gold and silver in different lixiviants', Mineral Processing and Extractive Metallurgy Review, K.N. Han et al., eds., Volume 4, Gordon and Breach Science Publishers 1988, pp. 95-134.
[ 19] Hiskey, J.B. and Qi, P.H., 'Leaching and electrochemical behavior of gold in iodide solutions, Part I: dissolution kinetics', SME Annual Meeting, Salt Lake City, Utah, February 26-March 1, .19.2Q, preprint number 90-142.
[20] Hisshion, R.J. and Waller, C.G.,'Recovering gold with thiourea', Mining Magazine, September 1984, pp. 237-243.
[21] Jansens, P.J., 'Laboratoriumprecipitatie van jarosiet (in Dutch)', Delft Uriiversity of Technology, API Laboratory for Process Equipment, Delft, Netherlands, February 1989.
[22] Kimbal, D.S., 'Sulfide ore concentration and treatment at the McCoy/Cove mine', SME Annual Meeting, Reno, Nevada, February 15-18, 1993, preprint number 93-162.
49

References and bibliography
[23] King, J .A. and Knight, D.A., 'Autoclave operations at Porgera', Hydrometallurgy, Theory and Practice, Proceedings of the Ernest Peters International Symposium, Part A, W.C. Cooper et al., eds., Reprinted from Hydrometallurgy, Volume 29 (1-3), Elsevier Science Publishers B.V., Amsterdam, 1992, pp. 493-511.
[24] Kontopoulos, A. and Stefanakis, M., 'Process selection for the Olympias refractory gold concentrate', Proceedings of the International Symposium Precious Metals '89, sponsored by TMS and IPMI, M.C. Jha et al., eds., Las Vegas, Nevada, February 27-March 2, 1989, pp. 179-209.
[25] Kunda, W., 'Treatment of complex silver arsenide concentrate in nitric acid system', The Canadian Journal oJChemical Engineering, Volume 59, June 1981, pp. 347-356.
[26] Kunter, R.S., Turney, J.R., and Lear, R.D., 'McLaughlin metallurgical development: the project, the problems, the process', International Symposium on Precious Metals, sponsored by TMS and IPMI, Los Angeles, California, February 26-March 1, 1984.
[27] Mason, P.G.,'Examining the economics of some pressure oxidation process operations', H ydrometallurgy, Theory and Practice, Proceedings of the Ernest Peters International Symposium, Part A, W.C. Cooper et al., eds., Reprinted from Hydrometallurgy, Volume 29 (1-3), Elsevier Science Publishers B.V., Amsterdam, 1992, pp. 479-492.
[28] Mason, P.G. and Nanna, R.F.,' A new beginning for the Getchell mine', Proceedings of the International Symposium Precious Metals '89, sponsored by TMS and IPMI, M.C. Jha et al., eds., Las Vegas, Nevada, February 27-March 2, 19.8.9, pp. 3-12.
[29] Meng, X. and Han, K.N., 'Adsorption of gold from iodide solution onto activated carbon', SME Annual Meeting, Reno, Nevada, February 15-18, 1993, preprint number 93-77.
[30] Nogueira, E.D., 'Recent advances in the development of hydrometallurgical processes for the treatment of base-metal sulphides', Proceedings of the International Conference Mintek 50 on Mineral Science and Technology, Volume 2, Section B, L.F. Haughton, ed., Sandton, South Africa, March 26-30, 1984, pp. 677-693.
[31] Pourbaix, M., 'Atlas d'equilibres electrochimiques (in French)', Gauthiers-Villars & Cie., Paris, France, 1963, pp. 614-626.
[32] Rolsten, F.R., 'Iodide metals and metal iodides', sponsored by The Electrochemical Society, Inc., John Wiley and Sons, Inc., New York and London, 1961.
50

References and bibliography
[33] Roskill Information Services Ud., 'The economics of iodine', Fifth Edition, February 12..82.
[34] Sergent, R.H. and Pesic, B., 'The use of halide lixiviants for the leaching of oxidized ores', SME Annual Meeting, Reno, Nevada, February 15-18, 1993, preprint number 93-78.
[35] da Silva, EJ., Haines, A.K., Carvalho, T.M., de Melo, M.P. and Doyle, B.N., 'Process selection, design, commissioning and operation of the Sao Bento Mineracao refractory gold ore treatment complex', Proceedings of the SME-AusIMM Gold Forum on Technology and Practices - 'World Gold '89', R.B. Bhappu et al., eds., Reno, Nevada, November 5-8, 12.82, Section 10, Chapter 38, pp. 322-332.
[36] St. Louis, R.M. and Edgecombe, J.M.,'Recovery enhancement in the Mercur autoclave circuit', Proceedings of the SME Gold '90 Symposium, D.M. Hausen et al., eds., Salt Lake City, Utah, February 26-March 1, 1990, Section 10, Chapter 42, pp. 443-450.
[37] Taylor, P.R., Jin, Z. and Spangler, M., 'Metallurgy of refractory gold ores - an overview', Conference Papers of the International E&MJ Gold Expo, Reno, Nevada, September 7-9, 1989, pp. 237-267.
[38] Thomas, K.G., 'New developments in gold exploitation', Lecture held at the symposium Potential Resources for the Coming Century with Regard to the Mining and Petroleum Industry, in honour of the centennial of the Dutch Mining Society, Delft, November 5-6, 1992, pp. 1-20.
[39] Thompson, P., Diaz, M. and Plenge, G., 'Pressure oxidation of silver bearing sulfide flotation concentrates', SME Annual Meeting, Phoenix, Arizona, February 24-27, 1922., preprint number 92-59.
[40] Tourre, J.M., Bull, W.R. and Spottiswood, D.J., 'Oxidative acid pressure leaching of sulfidic ores and concentrates - the control of silver losses', Proceedings of the Symposium Complex Sulfides, Processing of Ores, Concentrates and By-Products, sponsored by TMS and CIM, A.D. Zunkei et al., eds., San Diego, California, November 10-13, 1985, pp. 141.
[41] Tuinman, I.L., 'The prevention of the formation of argentojarosite during pressure oxidation of pyrite gold ores', M.Eng. Thesis, Delft University of Technology, Faculty of Mining and Petroleum Engineering, Delft, Netherlands, 1992.
51

-
References and bibliography
[42] Turney, J.R., Smith, R.J. and Janhunen Jr., W .J.,'The application of acid pressure oxidation to the McLaughlin refractory ore', Proceedings of the International Symposium Precious Metals '89, sponsored by TMS and IPMI, M.C. Jha et al., eds., Las Vegas, Nevada, February 27-March 2, 1989, pp. 25-45.
[ 43] Uytenbogaardt, W. and Burke, E.A.J., 'Tables for microscopic identification of ore minerals', Second Revised Edition, Elsevier Scientific Publishing Co., August 1973, pp. 34-35.
[44] Van Weert, G., 'Chloride and nitrate systems in hydrometallurgy - applications and opportunities', Ph.D. thesis, Delft University of Technology, Faculty of Mining and Petroleum Engineering, Delft, Netherlands, .12.8.9.
[45] Van Weert, G. and Tuinman, I.L., 'Prevention of silver jarosite formation through the addition of iodine species', SME Annual Meeting, Reno, Nevada, February 15-18, 1993, preprint number 93-59.
[46] Von Gastrow, J.-P., 'Mines et metaux, Conjoncture 1991-1992 (in French)', L'Etat du Monde, Annuaire economique et geopolitique mondial, Edition la Decouverte, 75013 Paris, France, 1993, pp. 596-602.
[47] White, L., 'Treating refractory gold ores', Mining Engineering, February 1990, pp. 168-174.
[48] Wicker, G.R. and Cole, J.A., 'The development and implementation of a pressure oxidation flowsheet for the Getchell mine', Proceedings of the SME Gold '90 Symposium, D.M. Hausen et al., eds., Salt Lake City, Utah, February 26-March 1, 1990, Section 10, Chapter 41, pp. 437-441.
[49] Wyslouzil, D.M. and Salter, R.S., 'Silver leaching fundamentals', Proceedings of Lead-Zinc '90, sponsored by TMS, T.S. Mackey et al., eds., Anaheim, California, February 18-21, 1990, pp. 87-103.
52
Acknowledgements
ACKNOWLEDGEMENTS
This research project would not have been possible without the help of a great number of people. Most of all, I would like to thank Prof.dr.ir. G. Van Weert, M.A.Sc., for his enthusiasm and encouragement throughout this study. I am also very grateful to dr. A. van Sandwijk for his indispensable advice on analytical and thermodynamical issues during this project.
I am greatly indebted to Mr. Andrew Collins of the Echo Bay Minerals Co. McCoy mill in Nevada, USA, and Mr. Gustavo Plenge of the C.H. Plenge & Cia. S.A. Laboratorio de Investigaci6n y Amilisis de Minerales in Lima, Peru, not only for sending me sample of industrial silver-bearing refractory concentrates for my test work, but also for supplying all the additional information I asked for.
Ms. Ilse Tuinman deserves many thanks for her work on this new, promising iodide technology. I also gratefully acknowledge the work by visiting Professor G.P. Demopoulos, Ph.D.Eng., of the Department of Metallurgical Engineering of McGill University in Montreal, Quebec, Canada, on the Pourbaix diagrams of the silver-sulfur-iodine system in water. I would like to express my thanks for his involvement in this project.
Many thanks are due Mr. D. Delforterie for his maintenance work on the autoclave. I would like to thank dr. J.H.L. Voncken for his assistance in the EMP and microscopic investigations, Mr. T.W. Verkroost and Miss P.M. de Koning for their work on XRD and XRF, and Mr. J.A.M. van den Berg for the LECO-analyses.
Last but not least, I am grateful to Ms. Beverley Brown for correction of this manuscript.
53

.
APPENDIX A: Analytical Techniques and Procedures

Appendix A Analytical Techniques and Procedures
A.1 Electron Micro Probe Contour Maps
The Faculty possesses a Jeol Superprobe 733 with Tracor complementary equipment. EMP contour maps (next 2 pages) were made for the McCoy and Orcopampa test materials to indicate high concentrations of gold and silver in small areas scanned by the electron beam. The contour maps are largely self-explanatory. Low silver and gold counts were designated " -", and via ciphers O through 9 and letters A through E, very high counts were displayed as "+ ". After completion of the contour maps the silver-bearing grains were located with the aid of their coordinates, and pictures were taken. Scanning areas were 1.17 mm2 for the McCoy and 0.49 mm2 for the Orcopampa concentrate.
A-i
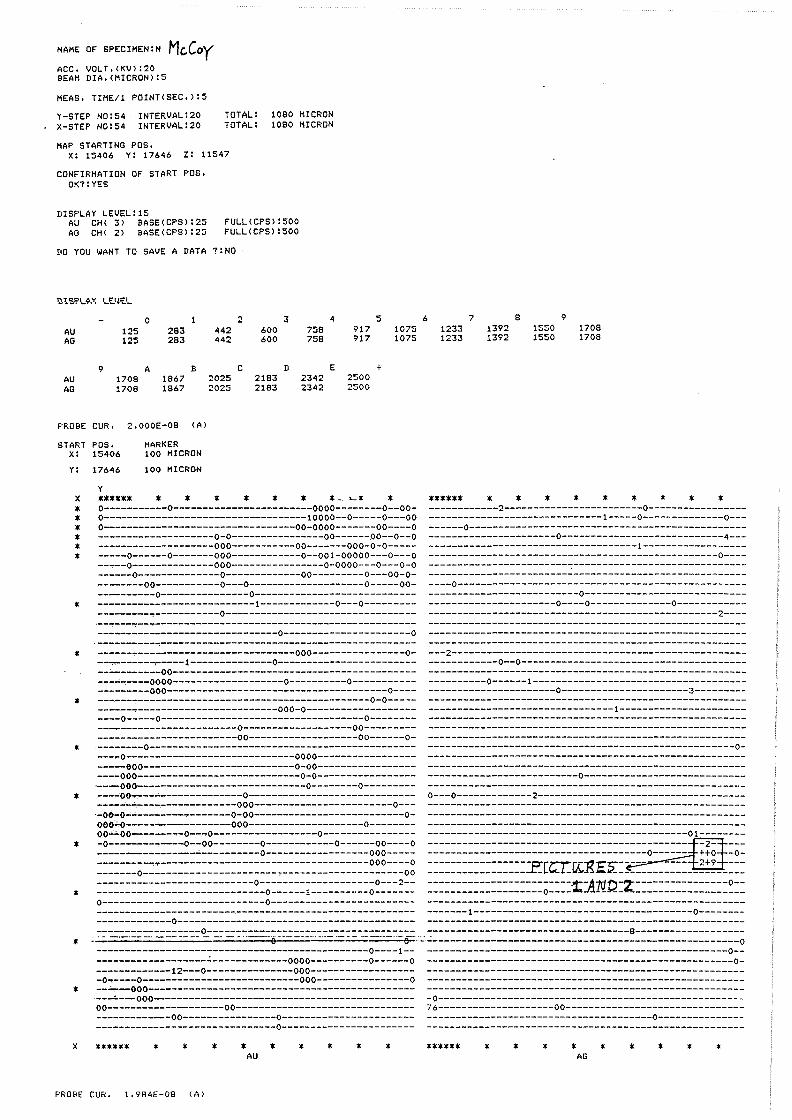
NAME oF SPECIHEN:N Mc.Coy ACC, VOLT,(KV):20 BEAM DIA,<HICRON):5
MEAS, TIHE/1 POINT<SEC,):5
Y-STEP N0:54 X-STEP NOl54
INTERVAL: 20 INTERVALl20
TOTAL: TOTAL:
1080 MICRON 1080 MICRON
MAP STARTING POS, x: 15406 y: 17646 z: 11547
CONFIRMATION OF START POS, OK?:YES
DISPLAY LEVELl15 AU CH< 3) BASE<CPS)l25 AG CH< 2) BASE(CPS)l25
FULL<CPS)l500 FULL<CPS):500
DO YOU WANT TO SAVE A DATA ?!NO
'l"i.S,,1~{1.X 1..!£!1£1~
AU AG
AU AG
PROBE
START x: Y:
X
* * * * * *
*
*
*
*
*
*
*
0 2 3 4 5 125 283 442 600 758 917 1075 125 283 442 600 758 917 1075
9 A B C D E + 1708 1867 2025 2183 2342 2500 1708 1867 2025 2183 2342 2500
CUR, 2,000E-08 <A>
POS, HARKER 15406 100 MICRON 17646 100 MICRON
y
****** * * * * * * * •· L * * o-----------o------------------------oooo--------o--ooo-----------------------------------10000--o-----o---oo 0---------------------------------00-oooo-------oo----o --------------------0-0----------------oo------.oo--o--o --------------------ooo-----------oo-------ooo-o-o----------o------o-------ooo------------0--001-ooooo---o---o --~--o--------------000----------------o-oooo---o---o-o ------o--------------o-------------oo---------o---oo-o---------00-----------0---0--------------------o-----oo----------o---------------o-------------------------------------------------------1-------------o---o--------------.-----------0---------------------------------·------.-------------------------------------------------------------------------------0----------------------o ·-- ------- ------------------------------------------------------------------------------000----------------o---. ------~----1--------------0-------------------------- ------00--------------------------------------------. ---oooo-------------------o----------o--------------------000--------------------------------------o-----. -- . ----------------------------------------0-o---------- -------------------------ooo-o-----------------------o-----0-----------------------------------o-------------------------------o-------------------oo---------------------------------00-------------------oo------o-
___ -----0-------------------------------------------------o-----------------------------oooo---------------------ooo--------------------------o-oo---------------------000----------------------------o-o---------------------000-- --------------------------0--------0------------ ·oo----·--------------0----------------------------------· ----------------000------------------------o---·-oo-o- ----- .-------0-00--------------------------oooo ·. o---------------000--------------------o-------oo · · oo------o- .-0------------------0----------------o------.---o--oo--------o------------o------oo----o -------·------·----------o------------------000------------- .T------------------------------------000----o -------0-----------------------.---------------------oo ---------------------------o--------------------0---2-------------------------------o------1----------o-------o----------------------------0-------------------------
-------------o-----------------------------------------------------------0------------------------------------·- -·-·---------
6 7 8 9 1233 1392 1SSO 1708 1233 1392 1550 1708
****** * * * * * * * * * ------------2------------------------o-----------------------------------------------1-----o--------------o---------o----------------------------------------------------------------------o----------------------------4---------------------------------------1--------------------------------------------------------------------o----
----o----------------------------------------------------------------------------0--------------------------------------------------o----o--------------o--------------------------------------------------------------2----
---2---------------------------------------------------------------o--o-------------------------------------------------o------1-----------------------------------------------------------o----------------------3---------
--------------------------------1----------------------
-----------------------------------------------------0-
--------------------------o---------------------------o---o-------------2------------------------------------
-------1--------------------------------------o--------
-----------------------------------0-------------------* -------------------------------------------------------0
-------------------.---------------------------0----1-- ----------------------------------------------------0-----------------------------------oooo----------o------o -------------12---0---------------ooo-------------------o .----o---------------------------ooo----------------o
* --· ---000------------------------------------------------ ·--ooo--------------------------------------------00-------------------oo-------------------------------------------oo----------------o------------------------------------------------------0-----------------------
X ****** * * * * * * * * * AU
PROBE CUR, l,984E-O8 <Al
-----------------------------------------------------0-
-0-----------------------------------------------------76--------------------oo---------------------------------------------------------------------o---------------
****** * * * * * * * * AG

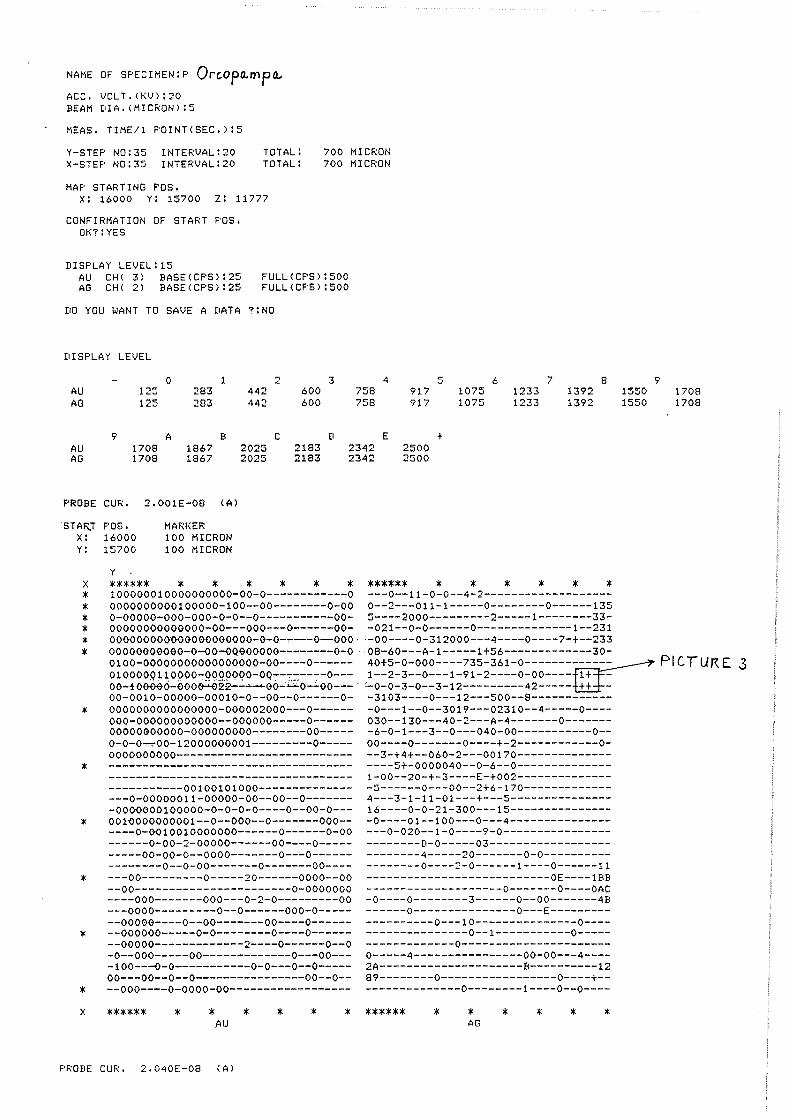
NAME oF SPECIMEN: P Orcopo.rnp~ ACC, VOLT,<KV):20 BEAM DIA,CMICRON):5
MEAS, TIME/1 POINT<SEC,):5
Y-STEP N0:35 INTERVAL:20 X-STEP N0:35 INTERVAL:20
MAP STARTING POS,
TOTAL: TOTAL:
x: 16000 y: 15700 z: 11777
CONFIRMATION OF START POS, OK?!YES
DISPLAY LEVEL:15
700 MICRON 700 MICRON
AU CHI 3) BASE(CPS>:25 AG CH< 2> BASE<CPS>:25
FULL(CPS):500 FULL(CPS>:500
DO YOU WANT TO SAVE A DATA ?lNO
DISPLAY LEVEL
0 1 AU 125 283 AG 125 283
9 A B AU 1708 1867 AG 1708 1867
PROBE CUR, 2,00lE-08 (A)
STAR.T POS. x: 16000 Y: 15700
y
MARKER 100 MICRON 100 MICRON
442 442
2025 2025
2 3 4 600 758 600 758
C D E 2183 2342 2183 2342
5 6 7 8 917 1075 1233 1392 917 1075 1233 1392
+ 2500 2500
****** * * * * * * ****** * * * * * * 100000010000000000-oo-o------------o ---o--11-o-o--4-2-------------------
9 1550 1708 1550 1708
X
* * * * * *
*
0000000000100000-100--oo--------o-oo o--2---011-1-----0--------o------135 o-ooooo-ooo-ooo-0-0--0-----------00- 5----2000---------2-----1--------33-oooooooooooooo-oo---ooo---o------oo- -021--o-o------0--------------1--231 000000000·000000000000-0-o-----o-ooo . • -oo----0-312000---4----o----7-+--233 00000000000-o-oo-0Q000000--------o-o -08-60---A-1-----1+56-------------30-0100-ooooooooooooooooo-oo---.-o------ 40+5-o-ooo----735-361-0-------~----- PI C. TUR E 3 0100000110000-0000000-oo--~-----o--- 1--2-3--0---1-91-2----o-oo---- 1+ -OO-fOOOOO--OOOH2i!..:...:.~eo-~o-.::.oo-.-.-. '-0-0-3-0--3-12---------42----- ++ -oo-0010-ooooo-00010-0--00--0------o- -3103----o---12---500--8-----------oooooooooooooooo-000002000---o------ -o---1--o--3019---02310--4-----o---ooo-oooooooooooo--oooooo-----o------ 030--130---40-2---A-4-------0-------00000000000-000000000--------00----- -6-o-1---3--o---o40-oo-----------o-o-o-o-,-oo-12000000001---------o----- oo----o-------o----+-2------------o-0000000000-------------------------- --3-+4+--060-2---00170--------------
*
*
*
*
* X
------------------------------------ ----5+-0000040--0-6--0-------------------------------------------------- 1-oo--20-+-3----E-+002-------------------------00100101000-------------- -5------o---oo--2+6-170----------------0-00000011-ooooo-oo--oo--o------- 4---3-1-11-01---+---5----------------0000000100000-o-o-o-o----o--oo-o--- 16----o-o-21-300---15---------------0010000000001--o--ooo--o-------ooo-- -o----01--100---0---4------------------o-0010010000000------o------o-oo ---0-020--1-0----9-o----------------------o-oo-2-ooooo------oo----o----- --------D-o-----03-----------------------oo-oo-o--oooo-------o---o------ --------4-----20-------0-0------------------o--o-oo-------o-------oo---- --------o----2-0------1----0------11 ---00---------0-----20------oooo--oo ---------------------------oE----lBB --oo-----------------------0-0000000 --------------------0-------0----oAc ----ooo-------000---0-2-0---------oo -o----o--------3------o--oo-------4B ---0000---------0--0------ooo-o----- ------o---------------o---E-----------00000----0--oo-------oo----o------ ----------0---10---------------0------oooooo-----o-o--------o----o------ ---------------0--1-----------0-------ooooo--~----------2----o------o--o -------------0-----------------------0--ooo-----oo-------------o---oo--- o-----4----------------oo-oo---4-----100---0-0-----------o-o---o--o----- 2A---------------------B----------12 oo---oo--0--0----------------00--0-- 89--------o-----------------o----+---ooo----o-oooo-oo------------------ --------------0--------1----0--0----
****** * * _AU
* * * * ****** * * AG
* * * *
PROBE CUR, 2,040E-08 (A)

Appendix A Analytical Techniques and Procedures
A.2 Wet-chemical determination of the carbonate content
The carbonate content is determined in the following way: Weigh in 200 to 250 grams of dry material (weight a) in a dry 1500 ml conical flask. Close the flask with a rubber stopper, that contains 2 holes for the separatory funnel and the first dessicator tube. Close the separatory funnel tap and pour in 250 ml of a 4 molar sulfuric acid solution. Screw up a cap on top of the separatory funnel and weigh the whole setup (weight b). Fix another dessicator tube with a clamp on top of the first. The first dessicator tube prevents water vapor from leaving the setup, while the second one prevents that water vapor from the surroundings enters the flask. Slightly open the separatory funnel cap, and add the sulfuric acid with a rate of approximately 50 ml/min. Close the cap when the separatory funnel is almost empty. This is done to avoid direct contact between air and the acidified slurry when there is no remaining sulfuric acid in the separatory funnel. Close the separatory funnel tap. Gently swirl the slurry round to make sure that all material is wetted by the acid. After 30 minutes remove the clamp and the second dessicator tube, and quickly weigh the whole setup ( weight c '). Refix clamp and second dessicator tube and swirl the acidified slurry again. After another 30 minutes weigh the setup in the same way as described above (weight c). This weighing procedure should be repeated until c' = c or until c is only O. 05 grams lighter than c'.
The reactions for the most abundant carbonates, calcite and dolomite, are:
CaMg(CO3)2(s) + 2 H2SOiaq) -CaSOlaq) + MgSOiaq) + 2 H2O + 2 CO2(g) t [A.2]
If no H2S-gas is formed during this carbonate decomposition procedure, and if the acidified slurry is perfectly isolated from air at all times, the mass difference b-c is only caused by escaping CO2. The equivalent calcite and dolomite contents may then be calculated in the following way:
The mass difference equals b-c grams of CO2, or (b-c)/44.01 moles of CO2. Since 1 mole of calcite forms 1 mole of CO2, (b-c) * 100.1/44.01 grams of calcite have reacted. Thus, the equivalent calcite content becomes:
A-ii

Appendix A Analytical Techniques and Procedures
b - C [calcite]..,, = 2.27 -- 100% ...,. a
For dolomite (molecular mass 184.4 g/mole) it can be found in the same way that:
[dolomite]eq. = 2.09 b-c 100% a
A.3 Oxidimetric determination of the ferrous ion concentration
(1)
(2)
This titration for the determination of the ferrous ion concentration with K2Cr201 is a slightly altered version of the one described by the Dutch Normalization Institute (NEN 3104, Fe(II).3, February 1964). Empirically it was found that the addition of some extra sulfuric acid and less hydrophosphoric acid makes the color change more distinct.
The titration is as follows: Pipet 5 ml of sample solution into a small conical flask. Add 15 ml of a 2.5% (v/v) sulfuric acid solution, 5 ml concentrated hydrophosphoric acid, and 4 drops of bifenylamine-p-sulfonate indicator. Put the flask on a magnetic stirrer and gently stir the solution. By adding a O .1 normal K2Cr 20rsolution with a piston burette, titrate until the color of the solution changes from green to purple.
The titration half-reactions are:
The overall reaction is:
The ferrous ion concentration is calculated by:
[Fe2•] = milliliters titrated . 0.1 M 5
[A.3]
[A.4]
(3)
A-iii

Appendix A Analytical Techniques and Procedures
The normality of the K2Cr2O1-solution should be regularly checked by titrating a 0.1 normal solution of FezSOiNH4)2SO4.6H2O. If the normality of the titer deviates from 0.1 calculate a correction factor to multiply all ferrous ion concentration determinations with.
A.4 Wet-chemical determination of the silver content
The oxidation/dissolution procedure as described by E. M. Donaldson1 was initially tried, but it was found that with the necessarily high sample weights required for that method, and with the high sulfur contents of both the McCoy and Orcopampa materials, sulfur oxidation was incomplete. Accordingly, the adapted, revised procedure described hereunder was used:
Wash all glassware with a =25% (v/v) ammonia solution, then rinse with destilled water. Ammonia will form complexes with silver and thus remove any residual silver physically adsorbed to the glassware. Accurately weigh in up to 0.25 gram of powdered sample, containing up to = 700 µg
of silver, into a 250 ml conical flask. Make sure that the amount of sample taken is such that the lead concentration of the final solution will not exceed = 2500 ppm. Add 5 ml of a 20% (v/v) bromine solution in carbon tetrachloride, and 10 ml of 50% (v/v) nitric acid. Cover the flask with a watch glass, gently swirl, and allow the flask to stand for about 15 minutes. Remove the watch glass and place a splash bulb on the conical flask. Heat the flask gently in the fume hood to remove the bromine and carbon tetrachloride. Cool, add 5 ml each of concentrated hydrochloric and perchloric acids, and 5 ml of 50% (v/v) sulfuric acid, and heat until fumes are evolved. Continue to heat the solution for approximately 10 minutes to dehydrate any silica present, then allow to cool to room temperature. Rinse the splash bulb with destilled water, remove it, and wash down the sides of the flask with water. If appreciable antimony is present, add 5 or 10 ml of concentrated hydrobromic acid at this stage. Carefully evaporate the solution to near dryness.
1 Donaldson, E.M.,'Determination of silver in silver, lead, zinc and copper ores and mill products', Methods for the analysis of ores, rocks and related materials, Monograph 881, Second Edition, 1982, pp. 86-87.
2 Donaldson, E.M, Mark, E. and Leaver, M.E.,'Comparison of silver results for Canadian reference ores and concentrates and zinc-processing products by acid decomposition, tribenzylamine/chloroform extraction and fire-assay combined with atomic-absorption spectrophotometry', Talanta, Volume 31, Number 1, Pergamon Press Ltd., 1984, pp. 89-91.
A-iv
Appendix A Analytical Techniques and Procedures
Cool to room temperature, and depending on the expected silver content, add sufficient 50% (v/v) hydrochloric acid for 20 ml to be present for each 50 ml of final solution. Put a splash bulb on the flask and heat gently to dissolve the salts. The only solids now remaining consist of silica3
•
Cool again, then rinse the splash bulb with 5 ml 25% (v/v) hydrochloric acid. Rinse it also with water, and, using Whatman #1 or #40 filter paper, filter the solution into a volumetric flask of appropriate size (50-200 ml), containing sufficient 10% (v/v) diethylenetriamine solution in water for 5 ml to be present for each 50 ml of final solution. Wash flask and filter paper with 5 ml portions of 25% (v/v) hydrochloric acid, and then with water. Discard the paper and dilute the solution to volume with destilled water.
The calibration solutions are made by diluting a standard 1000 ppm AgNO3-solution (titrisol) ten times to 100 ppm and then ten times to 10 ppm. From this 10 ppm silver solution 10, 30 en 50 ml are pipetted into 100 ml volumetric flasks containing 40 ml of 50% (v/v) hydrochloric acid and 10 ml 10 % (v/v) diethylenetriamine solution in water each, to yield 1, 3 and 5 ppm silver calibration solutions, respectively. The concentration of the sample solutions is measured at the 328.1 nm silver spectral line on a Varian AA-275 atomicabsorption spectrometer. The silver content of the solid sample is then calculated in the following way:
Silver content = [Ag]final IIDl'n (ppm) • V final -,z'n (ml) ppm millilial (g)
A.5 X-ray diffraction and X-ray fluorescence
A.5.1 X-ray diffraction
(4)
The Faculty uses a manual diffractometer equipped with a Philips PW 1050 goniometer. In principle, X-ray diffraction (XRD) is a powerful technique for the qualitative
determination of the mineralogical composition of a solid sample. During this project, however, two complications significantly limited the information that could be obtained from the X-ray diffractograms: 1) Overlapping of diffraction peaks.
Due to the great number of cations, liberated from the concentrates during leaching, that are able to form jarosites, and the complex mechanisms of incorporation, no separate jarosite phases could be identified.
3 To check the quality of the dissolution the silver content of the residue may be determined by dissolution of the silica in concentrated hydrofluoric acid.
A-v
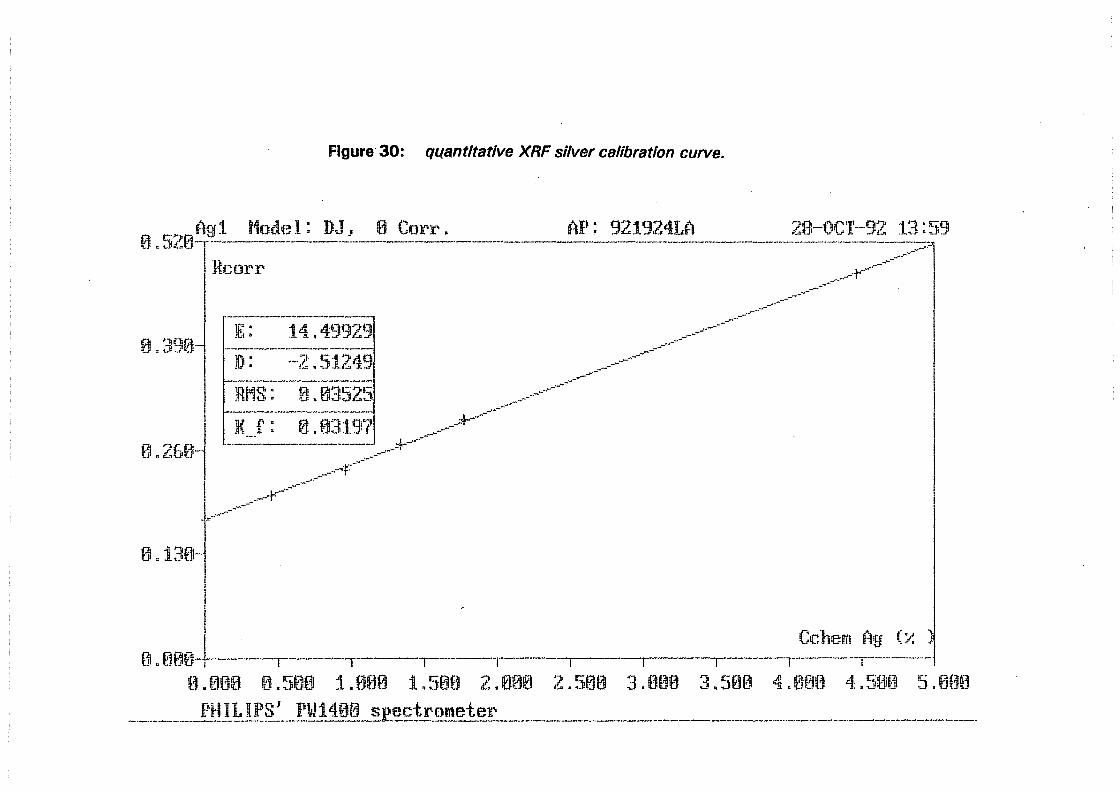
Figure 30: qu_antltatlve XRF silver calibration curve.
0. SZ0!-~~ff~1 Modf~_:!_:_ DJ J 0 Corr. {lP: 9219241.A ;l8-0~1'-~2 l~ __ :_?9
0 .39B-
0. 26f:~-
0. i.3~}-
ncorr .-t--------------..... -
t· I • 14.4'9929 ----
J{)t: ,-i, ·-1219 .. -l~: • 'fJ ;..ss• -
A-------~..¾'""_.,.----------"---RMS: i1i 035?'-IS_,F JI I a...:z.,J
]I( J:t • 0 0'119'"' A • . ,_ . . '' ·-
_______ .. --f-------
• .,,.-...... -·---... .J
--·-''t·
•.:r-·
........ -------------·· _ ...... -
_.,,,~-----~--------//
Cc hem (1g ( ~,: ., 0. 000·-t-·-----··-··---·r-----...-----.r------.-------.-----..------.-.----,.-----...-----
0. 000 0.508 1.000 1.500 2.000 2.500 3.000 3.500 4,000 4.500 5.000
_____ Jj~_ILIPS' PW140D spectrometer -----------------------·-···-·-·-····---~--
Appendix A Analytical Techniques and Procedures
2) Low silver concentrations. A mineral phase can only be detected by XRD if it is crystalline and if it amounts to at least ,::z4% (wt.) of the total sample analyzed. Hence, the presence of Agl could not be demonstrated with XRD.
Appendix C contains JCPDS XRD charts of some relevant jarosite minerals, and iodargyrite.
A.5.2 X-ray fluorescence
X-ray fluorescence (XRF) is a quick, non-destructive technique for both qualitative and quantitative determinations of chemical elements in solid mixtures and compounds, liquids and gases. Qualitative measurements are performed through identification of the characteristic lines of an emitted spectrum. Quantitative analyses are done by measuring the intensities of some characteristic lines of a certain element in a sample, and comparing these to measured intensities in several calibration samples that bracket the unknown sample concentration.
Semi-quantitative XRF
Semi-quantitative XRF is performed with the software package UNIQUANT. This PCprogram collects all types of samples into one analytical program, using the output data from the Philips PW 1400 XRF spectrometer. UNIQUANT does not require any standards or sample preparation. Elements from fluoride to uranium or their oxide compounds can be analyzed in samples of different nature and geometry, ranging from substrate layers to loose flew dust powder. The reporting is in weight percentage along with the estimated error for each element.
Quantitative XRF
The quantity of photons emitted by the sample is strongly dependent on the sample's absorption coefficient for the incident X-rays. For quantative use of XRF both sample and standards must have comparable absorption coefficients. This is usually done by the addition of a highly absorbing element, such as lanthanum, to the borate melt. For the determination of silver contents in feed materials, and autoclave and cyanidation residues, this proved to be unnecessary. The glass bead method, of course, eliminates harmful matrix effects caused by particle size and chemical bond, and minimizes interelement effects.
Samples were molten in non-wetting Pt-II crucibles into glass beads by adding Li2B40i. NaN~ was used as an oxidizing agent for sulfidic components in the melt, that would react with the crucibles. Silver standards were made of reagent quality Ag2O and SiO2.
Figure 27 is the resulting calibration curve measured at the Ag-La line at maximum intensity. Counting time was 100 seconds for silver and 10 seconds for the background readings.
A-vi


Appendix A Analytical Techniques and Procedures
Determination of the silver intensity at the Ag-Ka line proved to be too difficult. The silver Ka-line, namely, overlaps one of the characteristic rhodium anode lines. This results in nonsymmetrical background readings that can hardly be corrected for.
A.6 Argentometric determination of the free cyanide concentration
The titration procedure, based on the Liebig-Deniges theory", and employed by the Dutch Normalization Institute (NEN 3104, CN· .1, February 1964) for the determination of the total cyanide concentration, was performed during this project to monitor the free cyanide concentration in leach solution samples.
The titration is as follows: Depending on the expected free cyanide concentration, pipet a volume of ( diluted) sample solution into a 250 ml conical flask. Add 20 ml of a 1 molar NaOH-solution (pipet) and 5 ml of an indicator solution (pipet). The indicator solution is made by dissolving 0.5 grams Kl in 60 ml destilled water and 40 ml concentrated NH40H. Add water to the flask until the total solution volume approximates 200 ml. Place the flask on black paper on a magnetic stirrer and gently stir the solution. By adding a 0.01 normal AgNO3-solution with a piston burette, titrate until a permanent white suspension forms. Use powerful lighting to make the formation of the turbidity better visible.
The reactions for the titration are: (i) the formation of argentocyanide ion:
[A.6]
(ii) the formation of silver argentocyanide:
[A.7]
(iii) solubilization of silver argentocyanide by aqueous ammonia:
(iv) precipitation of silver iodide at the end-point:
4 Vogel, A. I. , 'Text-book of Quantitative Inorganic Analysis' , Longmans, Third Edition, 1961, pp. 74-75, 271.
A-vii

Appendix A Analytical Techniques and Procedures
[Ag(NH3)ij+(aq) + J-(aq) - Agl(s) + + 2 NHJ(aq) [A.9]
During the titration any silver iodide formed is kept in solution by the excess of cyanide ion present in the solution, until the equivalence point is reached:
Agl(s) + + 2 CN·(aq) - [Ag(CN)iJ(aq) + J-(aq) [A.10]
The free cyanide concentration is calculated by:
[CNl = 52_04 milliliters titrated . 0.01 R.. lfree milliliters sample solution l
(5)
It was found that the presence of iodide ions, leached from the I-series autoclave residues, does not affect the accuracy of this titration to any great extent.
A-viii

APPENDIX B: F*A*C*T Computer Prints

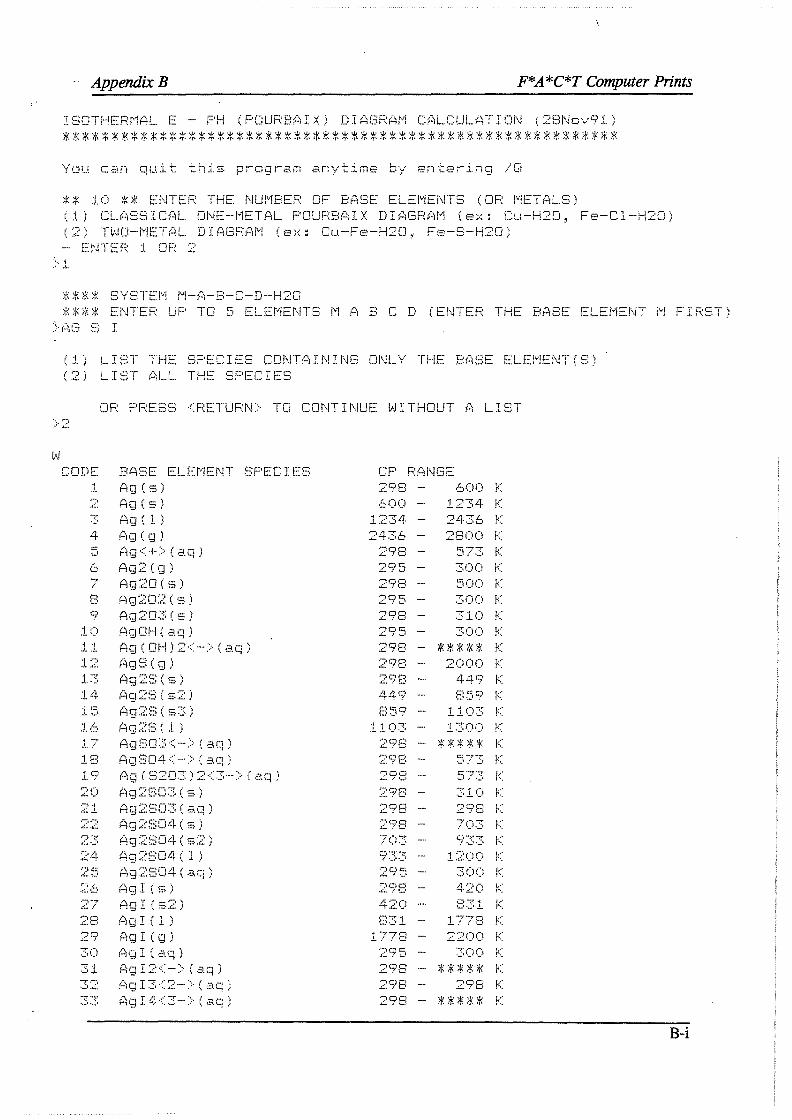
w
·· Appendix B F*A *C*T Computer Prints
ISOTHERMAL E - PH (POURBAIX) DIAGRAM CALCULATION (28Nov91)
You can quit this program anytime by entering /Q
** 10 ** ENTER THE NUMBER OF BASE ELEMENTS (OR METALS) (1) CLASSICAL ONE-METAL POURBAIX DIAGRAM (ex: Cu-H2□, Fe-Cl-H20) (2) TWO-METAL DIAGRAM (ex: Cu-Fe-H2□, Fe-S-H20)
**** SYSTEM M-A-B-C-D-H20 **** ENTER UP TO 5 ELEMENTS MA BCD (ENTER THE BASE ELEMENT M FIRST)
(1) LIST THE SPECIES CONTAINING ONLY THE BASE ELEMENT(S) (2) LIST ALL THE SPECIES
OR PRESS <RETURN> TO CONTINUE WITHOUT A LIST
CODE BASE ELEMENT SPECIES CP RAN(3E ., ,J_
3 4 C: ._,
7 8 9
10 11 12
.l c;· 20
32
Ag ( s.)
Ag ( =·) Ag(l) (-)g ( g )
?'lg<+> ( aq) Ag2 ( i;J)
(-)g20 ( s)
Ag202 ( ·=·)
Ag203(s) r'.21g OH ( c'.q ) ?'-)g(OH)2<->(aq) ?'-)gS(g) Ag2S(s) Ag2:3 ( s2) Ag2S(s3) P,g2:3 ( l ) AgS03<-> ( a.q) P,g E:Qt-1 <-· > ( -3.q)
AgCS203)2<3->Caq) Ag2S03(s) Ag2E:03 ( aq) Ag28JJ.!} ( s)
?:H;,2t::CI4 ( s2) Ag2S04(1) i·::\g2StJ4 ( .::\c~)
AgI(-s)
AgI(l) ,c)g I ( g ) r.'.:ig I ( c•.q) i::;g I2<-> ( a.q) AgI3<~:--> -:::1.q r=-~gI-~~<3-·> aq
298 600 I< ,:'.::,00 - 1234 I<
1234 - 2436 I< 2436 - 2800 ~::
298 573 ~:: 295 300 I<
295 - 300 I< 29B - 3.10 K 295 - 300 !< 298 - :1ct: * *;f. K 298 - 2000 I< 298 - 449 r-:: 4.::f9 - s5c;i I< 859 - 1103 f:::
298 ···· 573 I< 29E: - 3J.O v-::
298 - 703 K 703 - 9TS I< 933 --· 12()() I< 295 3()() t:::
420 -· 8.31 K E:31 - 1778 I<
i 77::3 -- 22r:)i:) K
2l:i8 - 2S'E:; !< 29:::J - ***** !<
B-i

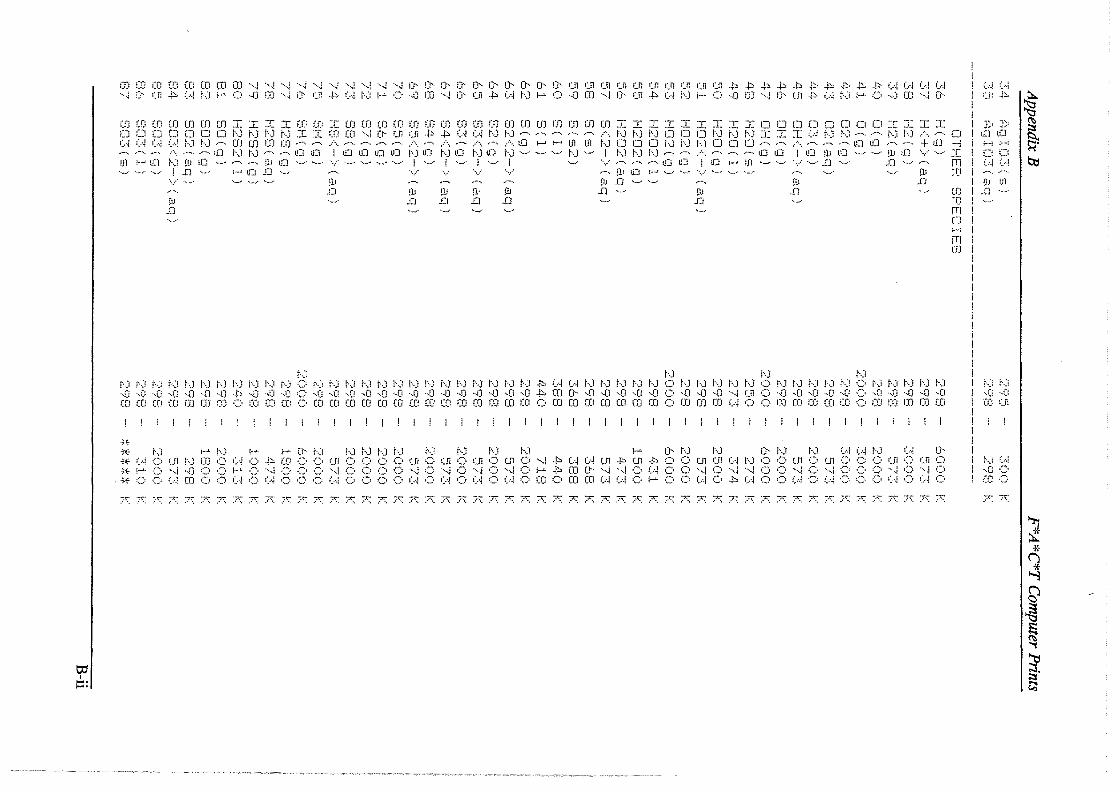
t,:::1 I
r::::
mmmmmmmm~~~~~~~~~~0~00~~0~0~u~uuuuuuu~~~~~~~~~~~wwww ~0U~WNPO~00~0~~WNPO~00~0U~WNPO~00~0U~WNPO~00~0U~WNPO~00~0
mmmmmmmIIIIOOOOioomoomoooooomooooooooooooooooooIIIIIIIIIOOOOOOOOIIII O □ OOOOONNNNII0000~0UU~~WWNN~~~~~ANNNOOONNNIIIWNN~~NNA~ □ WWWWNN~oooooooo~~A~~~~A~A~A~AUJ~-mmN □ OONNN □□ o~~A~~~u:iu:i~~+u:i~ --. ,-,. ,-... ..···.. ,··-•. ..-.. 1D f··.J f··.J •·-, ...-.. UJ 11) I Ii] UJ UJ UJ f·•.J LO t·.J UJ kl 1JJ t·.J -~ •--· --·· t·.J .._ I !··.J t·.J f··.J --- ...-.. /·.. ...-.. --. ···-· UJ U) I JJ:l !l.1 U] ---· .. _, !lJ !J:l ··./ '-' ~.[ i.ll !-·" u::: t·.) tl1 U] '·-- .. --.. .-.. !ll lJ] ---·· ---· ·...... ··-··- '·-· -·-· ·•-✓ f --✓ f --- f -~ j --✓ ·...... ..-.. -~ ---•• ,o U:l f lO ~ If! ---· --·· ....... --· D ··-· J] '··-·· --···· lli
~ID- -u:in~ ~ V V V V ~~u:i~~~v~~~ ~ ~ - ~ ~ v~ ~-~ !lJ ~ ~ ~ ~ ~D~~ ~ ~ D ... "•• D !11 !]J !ll !11 D ~ !lJ D ··-- Cfl !lt ··~ J.:1 S.:1 D D ~✓ J:'.'J ---· ··c: D ~ ~ ~ ~ ~ rn
N N N N
c:i i,..-.;
rri co
(.-~ (.·.J en .. 1:::i
I> :J> u::1 1fJ i-•-i i·"-1
Cl Cl (,.j (.•] ,.-.... ..-··-. !l.• ,.n J] .. __ ..
NNNNNNNNNNNONNNNNNNNNNNNNN~WWNNNNNONNNNNONNNNNONNNNN INN ~~~~~~~~~~~o~~~~~~~~~~~~~~~m~~~~~~o~~~~uo~~~~~o~~~~~ 1~~ mmmmmmroommmommmrorommmromrororomommcomcomcoornmmwoornmmrornommrnrnrn 1mu
i ! ! l I I
* * N PN P P0N NNNN N N N N P ~N N ~N N WWN W ~ •WOUNWOWO~moouoooououououo~~wwu~u~OOUUWNOOUOUOOOUOUO ¾PO~~OOPO~OOO~OOOO~O~O~O~OP~OO~~~owoo~o~~oo~o~ooo~o~o .• oowmoowowooowoooowowowowomommwwoPoowo~woowowooowowo TTTTT~~~~~~~~~~~T~~~~~~~~~~~~~~~~~~~~~~~~~~~~~~~~~T~
t·.J (.-.! ·-0 C• co c:, A~:,;::
t ',;'S
[ ><" b::1
~ ~ * (')
* ""'-:]
g ~
s::: ~ ""I
~ ~

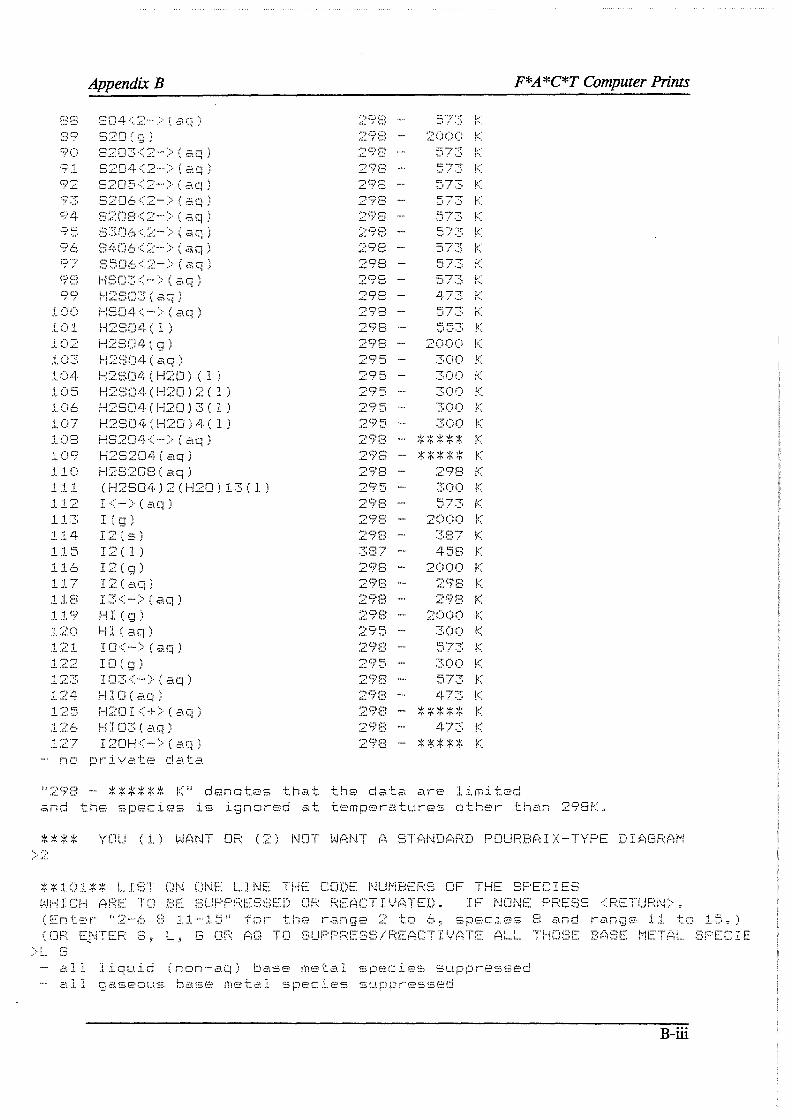
Appendix B F*A *C*T Computer Prints
00 ... .'
100 101 i()2 1()3 104 105
108 .1 () i..~~i
110 1. 1 .1 1 1 --;, ..J.,.!...::..
11::::; 114 1.1.:5 11b LL7 118 .1. 1 c;:,
1.2() 1:21
123 124 125
i .-,7 ··'-..:.. /
E:::c13<2-> ( a.q S2[!.-=~•<2-·> (-:3.q
s:~c.1s<2-> c Etq
f_:;2[!8<2-·> ( 2.q S30ll<:2-> ( a.q '.:::.:::1-[16<:2····· > ( aq S51Jt,<2-> ( a.q
HSC:::3 <-··· > ( aq) i-!2S03 ( aq ) f--ff3[iL1-(-> ( ci.q)
H2S04 ( 1;;) H2St]4 ( a.q) H2SOL1 ( H20) ( l ) H:~504 ( !-120) 2 ( l H2S!J4(H20)3(1 H2:S04 ( !-l:20) 4 ( 1 HS2D4<-> ( a.q) H2S2(]4 ( a.q ) H2S208 ( 2q ) (H2S04)2(H20)13(1) I<->(a.q) I ( g) I2(s.) I 2 ( 1 ) I2(g) I 2 ( .::1.q)
I3<->(ctq) HI(g) H 1 ( a.q) IO<->(aq) IO(g) I03<->(aq) HIO(aq) H:::o I< -f- > ( a.q ) HI03 ( 2\q)
12□H<-> ( a.q) - no private data
·-:'tOCJ- --.::.. / 1_,
29f.J -·-;\CC:• -.::.. ~· '-1
--::C1C) .::_ /' 1_1
--:;:oc, .::_ ••'\._I
29EJ -
298
295 --295 -· :295 -298 -298 --·--;'IC)O -.::...1.__,
295 -251 8 -· 29E: -
29E: -298 -298 -· 298 --
29f3 -
298 -298 -298 ---:,c:,o -.::.. -~ ,_,
573 f,:: s;::::: !< :',73 !<
573 I<
473 l<
c:.i=:.-:;· I/ . ..,, ._,._: l'•.
300 l< 3()() ~::
300 I< 300 1-:"
300 I<
* * * * :« I<
***** I< I< 300 I< :',73 I<
2000 1-:"
32,7 K 458 I<
2000 I< 298 I< 2'?8 K
2000 l< 300 I< :',73 I< 300 I< 573 r 473 I<
***** I<' 473 K
***** ~:: "292, -- ****** l<" denotes thE•.t the date, are lim.i.ted and the species is ignored at temperatures other than ,-,ool...-
..i:.. /,_,, •.. a
YOU (1) WANT OR (2) NOT WANT A STANDARD POURBAIX-TYPE DIAGRAM
**101** LIST ON ONE LINE THE CODE NUMBERS OF THE SPECIES WHICH ARE TO BE SUPPRESSED DR REACTIVATED. IF NONE PRESS <RETURN>. (EntE,1·•H 11 :?-·t:1 E~ 1.1·-·.1.~=,u ff::ii·- thE1 1--c.;_nge 2 to t:, ·5pE1C:iE1·=:. E: a.nd r-::1.1-igE· :.t1 t:::. 1~•=) ( CH·? EJ.f'fEF~ f.;, L ;i G t]F~ Pil] -rc1 SLlF1 F1 F~ESf;,./b~EP1CT I t,/1~TE i:-~LL "THCif;E F3i:'iSE: !""1ETt1L. E;F'EC~ I E
>L. G -- 2;_11 ·1iri1_11 ri ( nc;ri-a.q) b-=t·::.e n1eta.l s:-1=•ecie·=.. ·:=-i_tppri:e·::.·=:.ed -~- -::\11 \]2.':SE:c11 . ..1.·:::. b-::1.:::.(?. rni=::ta.1 ~:=-pec:.i.i~s ·-.•-•i .. 1~ if 1=-:.·••M.!::lrl
B-iii


Appendix B F*A *C*T Computer Prints
**102** THE STANDARD STATES ARE PURE LIQUIDS AND SOLIDS, GASES AT 1 AT~ AND 1 MOLAL AQUEOUS SOLUTIONS. LIST ON ONE LINE THE CODE NUMBERS OF THE BASE FI_FMFNT SPECIES WHICH ARE NOT IN THEIR STANDARD STATES.
for the range 2 to 6, species 8 and (OR ENTERS, L, G OR AQ TO CHANGE ALL THOSE SPECIES TD A COMMON VALUE)
cNl~H THE MOLALITY OF THE AQUEOUS RPFrT~R
**103** UNLESS OTHERWISE SPECIFIED, SPECIES ARE IGNORED AT TEMPERATURES OUTSIDE THEIR DEFINED CP RANGES. LIST THE CODE NUMBERS OF THE RPFrTFR WHICH CAN BE AUTOMATICALLY EXTRAPOLATED (l:::nter '!2··-·1~, 8 .:L.1--·.15 11 fc)!- the i--;2-.n!:;Ji.7:: :~ tcJ C.,, -::.~1p-,--i_r-::-.:;:\ 8 ~\rid ,--:=1.ngr::.= :1.i tcJ 15:: ~~
**** VERTICAL AXIS E(VOLTS)
**300** DEFINE LOWER AND UPPER LIMITS OF VERTICAL AXIS AND INCREMENT (if increment is undefined graphical output will be 25 lines)
diagram Hill contain 31 lines
**** HORIZONTAL AXIS PH
DEFINE LO\A.IER AND
>O 7
**700t* ENTER CONSTANT TEMPERATURE (KELVIN)
**901** CONSTANT Cl= LOG10(21) ENTER THE VARIABLE Zl (EXAMPLES: A(S*D4<-->)(AQ), P(S*D2), A(C)(Sl), P(C*D)(G)**2/P(C*D2)(G)
>{1( I<-->) (f:i1])
- ~nPri~s 112 located ENTER THE VALUE OF Cl
**902** CONSTANT C2 = LDG10(Z2) ENTER THE VARIABLE Z2 (EXAMPLES: A(S*D4<-->)(AQ), P(S*D2), A(C)(Sl), P(C*O)(Gl**2/P(C*D2) (G)
>A(H*S*D4<->)(AQ) - ~rPr1P~ 100 located ENTER THE VALUE OF C2
B-iv

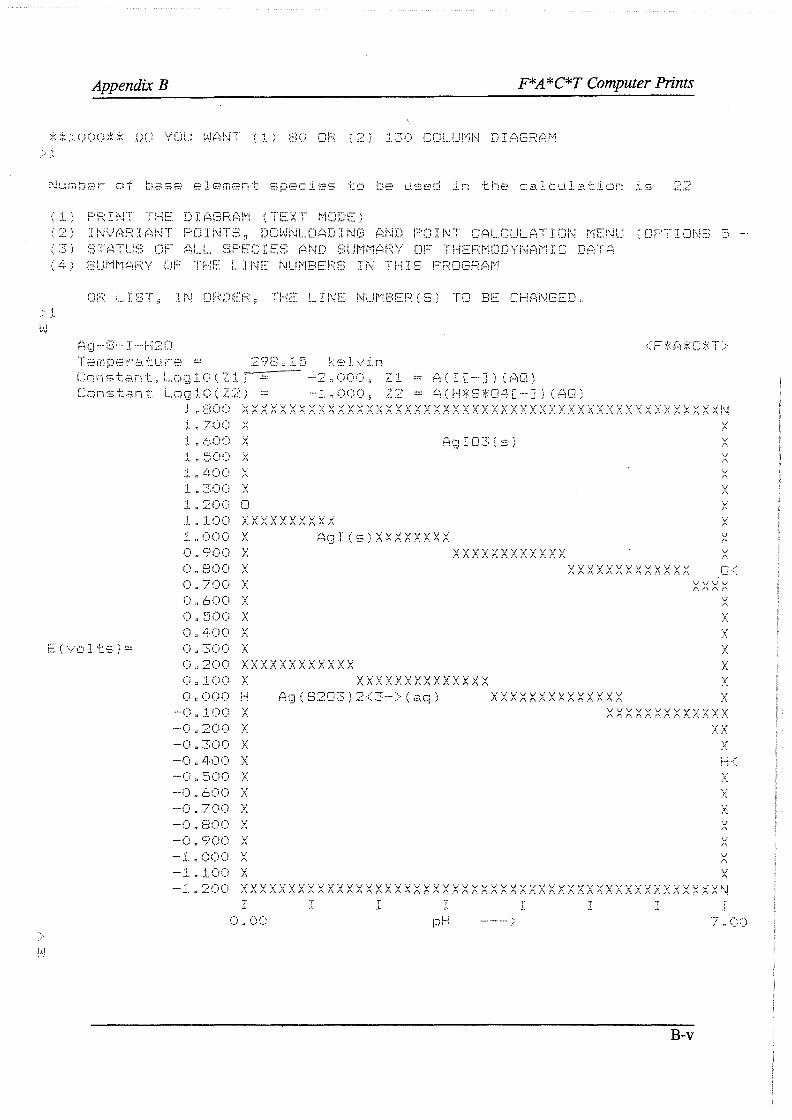
Appendix B
,.. --:, \ .::.. /
(1 PRINT THE DIAGRAM (TEXT MODE)
F* A *C*T Computer Prints
(2 INVARIANT POINTS, DOWNLOADING AND POINT CALCULATION MENU CU~llUN~ _ STATUS OF ALL SPECIES AND SUMMARY OF THERMODYNAMIC
(4 SUMMARY OF THE LINE NUMBERS IN THIS PROGRAM
>.1. OR LIST, IN ORDER, THE LINE NUMBER(S) TO BE CHANGED.
C□nstant.L□g10(Z1J = Constant Log10(Z2) =
-2.000, 21 = A(I[-J)(AQ) -1.000, 22 = A(H*S*04[-J)(AQ)
1.800 XXXXXXXXXXXXXXXXXXXXXXXXXXXXXXXXXXXXXXXXXXXXXXXXXXN
E (volt'=·)=
1. :, ()l)(, X (i" '-'?()i:) X ()" 8(>() X
c)" 5()<) X 0.400 X () :z 3(:(; X
0.200 xxxxxxxxxxxx
0.000 H -0.100 X -0.200 X
-0.400 X
--0. 600 X
-Ci r: 8(1() X -() " S:'()<) X
xxxxxxxxxxx:xxx Ag(S203)2<3->(aq)
X
X -1.200 XXXXXXXXXXXXXXXXXXXXXXXXXXXXXXXXXXXXXXXXXXXXXXXXXXN
I I T .L I
1-.Li r! ~ '
I I I ----···.
B-v

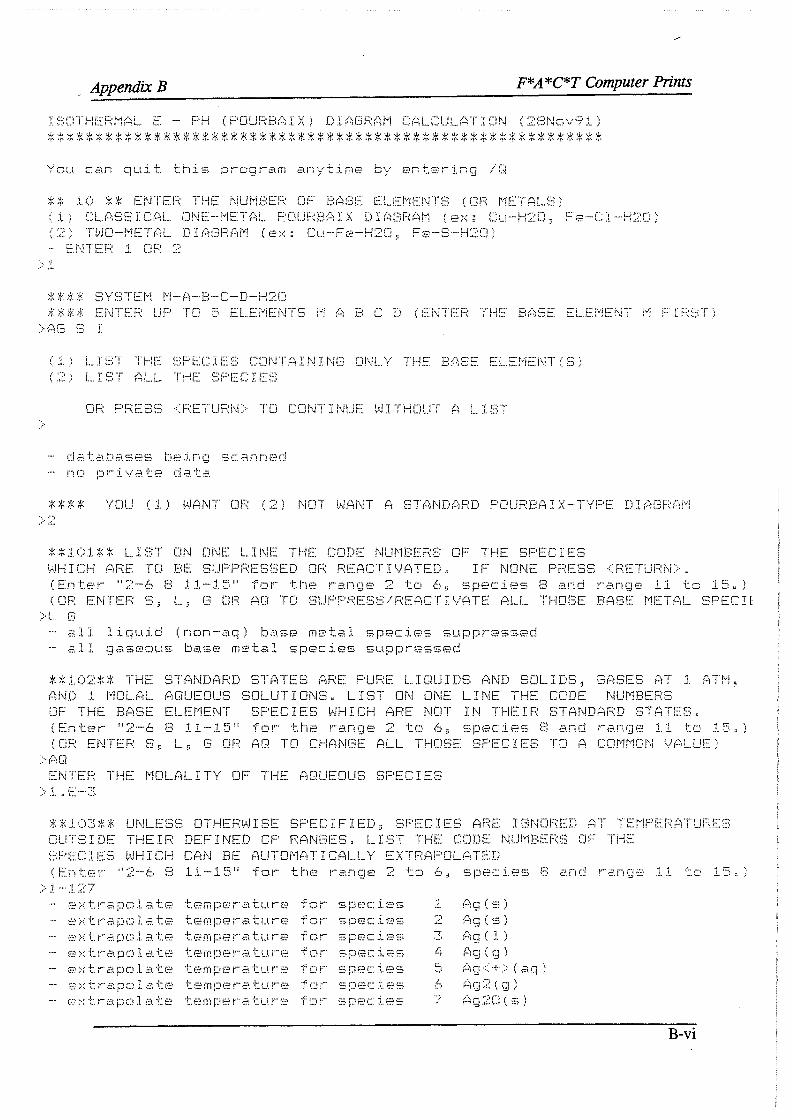
. Appendix B F*A *C*T Computer Prints
ISOTHERMAL E - PH (POURBAIX) DIAGRAM CALCULATION (28Nov91)
You can quit this program anytime by entering /Q
** 10 ** ENTER THE NUMBER OF BASE ELEMENTS (OR METALS) (ll CLASSICAL ONE-METAL POURBAIX DIAGRAM (ex: Cu-H20, Fe-Cl-H20) (2) TWO-METAL DIAGRAM (ex: Cu-Fe-H20, Fe-S-H20)
**** SYSTEM M-A-B-C-D-H20 **** ENTER UP TO 5 ELEMENTS MA BCD (ENTER THE BASE ELEMENT M FIRST)
(lJ LIST IH~ SPECIES CONTAINING ONLY THE BASE ELEMENT(S) ! TCT L ., ··-·''
DR PRESS <RETURN> TD CONTINUE WITHOUT A LIST
- databases being scanned - no private data
**** YOU (1) WANT OR (2) NOT WANT A STANDARD POURBAIX-TYPE DIAGRAM
**101** LIST ON ONE LINE THE CODE NUMBERS OF THE SPECIES WHICH ARE TD BE SUPPRESSED OR REACTIVATED. IF NONE PRESS <RETURN>. (EntE•r-· 11 :,~-6 8 11-1:::, 11 for the r-::1.nge 2 to 6, specii:;;.i::. 8 E,nd rcinge 11. tD 15.) (OR ENTERS, L, G OR AQ TO SUPPRESS/REACTIVATE ALL THOSE BASE METAL SPECIE
>L_ (3 - all liquid (non-aq) base metal species suppressed - all gaseous base metal species suppressed
tt102** THE STANDARD STATES ARE PURE LIQUIDS AND SOLIDS, GASES AT 1 ATM, AND 1 MOLAL AQUEOUS SOLUTIONS. LIST ON ONE LINE THE CODE NUMBERS OF THE BASE ELEMENT SPECIES WHICH ARE NOT IN THEIR STANDARD STATES. (F.:·:nb:.'7:r- "'.,2·-6 8 11·-15" fO!~ the 1r•a,1ge 2 to 6, species. 8 a.nd r-2-.nr.;:)i::' LL to j_:':,.) (DR ENTERS, L, G OR AQ TO CHANGE ALL THOSE SPECIES TD A COMMON VALUE)
>P1D EN.rER THE MDLALITY OF THE AQUEOUS SPECIES
**103** UNLESS OTHERWISE SPECIFIED, SPECIES ARE IGNORED AT TEMPERATURES !1!!T:3 T nF THE IF: DEF- I NED CP RAr✓GES. LI ST THE CODE NUMBERS OF THE SPECIES WHICH CAN BE AUTOMATICALLY EXTRAPOLATED
-H• 2::-:: tr.:=lpo la tE, e ;< ti·-apo l -='- te t.7:: ::-:: t r· .::~·t t=:i c: l -::i. t. e e ~< t 1-·~ =.":'i. pcJ l ~1. te:: F:_1 >:: t r· E;'i, pcJ 1 a. t£"7
i::.7 }~ t t·· -~·:1. p C) J. -:'::•. t f:2
te!TipE-::r-·Ei. tu.,·-e te\01pe ra. tu.r-t:: t.i:.-:~rnpE1 r-::=i: tLt r1?. t. (~ fn p. i2 1,... Ei. tu. r· r:.:: t i:::? ff1 p e i•- ✓-=>. t t.t r-- i::~1
teinpi:::7r--c1. tu.r-F:.:•
c., , ...... 1·· i ...... ..:,,_ - r-- -·· _,, -·--
::.'- p i-••l! ~ .: !•-l •-•.
-::;r-ipr· 1 r-:::-::;:_ -- r· -- - ··- .... -··
- extrapolate temperature Tor ~periP~
., . .t
B-vi

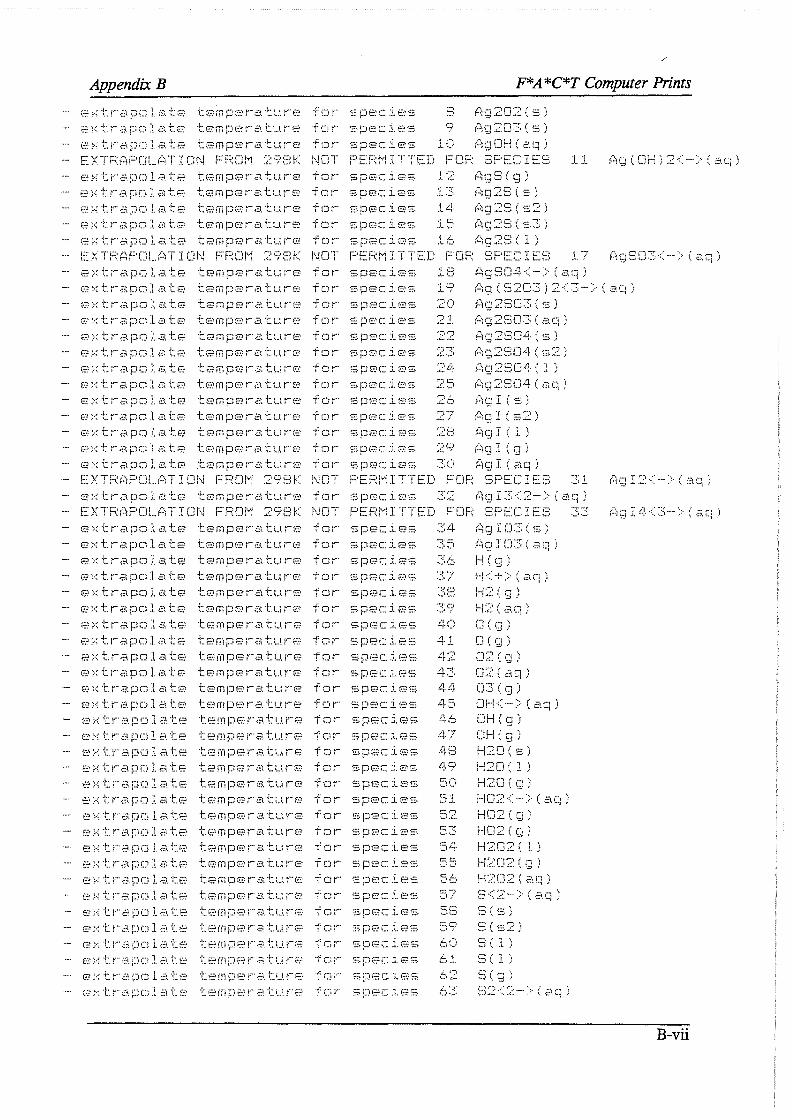
Appendix B F*A *C*T Computer Prints
Ff!::< t 1···· -:). pcJ J. ~:~•- ti:::-; -!:.:.e;•n p,~:; ir· E•. tLt r·-e -f Cir--· -••,: j;-:1 ___ ; r-., ... __ 8 A1:;J 21J:2 ( s)
extrapolate temperature for s~~~i~~ 9 Ag203(s) i"f::: ::-:: t i-·- a. pc:.]. .3_ tt:.~ t!?:"=iD pE-? 1·- .. 3. tu. 1--2 ·t-= CJ,... ½-r-i;...:L _; c.:--. .1 () ~!g O!-➔ ( ,;:1.q )
- EXTRAPOLATION FROM 298K NOT PERMITTED FOR SPECIES E·: ::-:: t ,--· -::\ pcJ 1 ate E_: >~ t ;·· <!::t p C1 J. 2, t:. E.•
f:'2 ::-:: tr .r;:.; pc.-. l f-:1. te E:': :;.:: t fr- ~::1. p C; l i~°l t. 1=;:
t i:-2 n-1 p F2 i--- a tu. r··· f,e
t ;:=,, iT1 pi:::= r-· ~1. ·!:_ u. r-· e t: i::3 !TI 1::1 (:.~ 1-· ~3. t U. r i=::
tern pe-:r a. t.u. r-,2
extrapolate temperature EXTRAPOLATION FROM 298K NOT
-=- r ;-:.7, ,- 1 f=: ·=. ·:::. n r=:, r· i ::;1 •=. --. -------::::.p\-::-:c- i r-:<=.
-...:.f1Pi- -; ,..:,:.::, -·r----··---..
i ;1 ..i.-,·
15
i:,;1~8(,~)
i:";g :2'.S ( ·:::.) P: 1:;i ::·:~ S ( ·:=. :2 )
PERMITTED FOR SPECIES extrapolate temperature for ~rPri~~ 18 AgS□4<->(aq)
E-:: >~ t r- E:"r. p C1 ]. -:?:'!. t.:. ;"::_-:• ;:.:~ ;-~ t 1- -:·;;. pcJ l 2. tt:=: f::.:.: .:-:: t: 1-··· -3. p C) J. .;:{ t E'
E• ::< '!.:-. t- a. p CJ ]. -:?. t EI
e ::-:: ·i,:', ;-- -3 p CJ J. -9. t: •"::!.• t7::• ~< t r- ·='· p CJ l -::"i. t E•
£-:~ ;{ t: l' ... :3 p C) l -:':::i. t F::1
t·:· ;-:: t l" ... :3. p c:1 l {°.:t t i:::::
E-:l ::-~ t t ... -~3. p CJ l ~:t t ·= i:::'! f-:: t i-· -~3. p CJ l .;:{. t E-?
ten-,r.::1:-::r-<::1. tu.rF2 t1=.:1T1 per· ~=1. tLt r-(?.
t £7:fn p f.::' r· et tu. rE:, teff1per-·a. tu_r .. e
t e ill p f::? 1·- \-:;;_ t U. 1--· E:_:
t i:::~ rr1 p (0:1 r-· E:1. t. Lt r-- r:.::.:
te!T1r.::.r21·- ~.::1. tu. r··e tern~)er-·a tu.r···1;:7 t e i!l l:J 1;::: r·· Ci. t: u. ,- f:.:
tt::.·rnpE·!lci t.U.t' .. f:~
·;:.-:- p E·.t L. -~- e:_, S:-
....... ! Ii"'•• 1-· -; f=- •::... - 1- - ··- ........ ··-
:.:;,1~-, '~--=. ••"r··-··-·-·----
SpeC.'i.eS. ·=. r1r-:r- ·i p-:::. ••••I""·- - .... -- ..•.
·==. ii c::: i" ·j ,r:::, ·==. -·· r ............ _., ... .
:21.
•lcl .i.::.•:::•
Ag(S203)2<3->(aqi
Pi,;::~SlJ~.) (.:::\CJ)
~fi;J ~2SCJLl- ( ~-) i:::1 !;_;i 2 t=:; C} LJ ( ·:::. :::':'. ) ;,,;; ~2f;i].tl- ( l ) ?"=·i g ::·: :31] .. q. ( -:::l q ) A(.;! I ( ·:::.) i::lg I ( -:3;~:) f~(J I ( J. )
(-:?f< tr--3.pCj .l ~.=\ tE; :te.1rnper--::.-1. tu.r-·c:, fcii··- w ... p:, .. ):: ;_1-•·=•·. :3() r::)g I ( c:1.q) - EXTRAPOLATION FROM 298K NOT PERMITTED FOR SPECIES 31 AgI2<->(aq)
extrapolate temperature for ~pPriP~ 32 AgI3<2->(aq) - EXTRAPOLATION FROM 298K NOT PERMITTED FOR SPECIES 33 AgI4<3->(aq)
e ;-:: t r !B. f-JCJ l -:3. t:.e:, (~ ::-~ t. r- C\ p C) ]. Ct. t. E·'!
E'~;< t.r-apo 1 B. -1.:e e ;{ t:. r <"=' pc:. J. ci t·.e: (--=..~ }:: t r .. . 3. pc} 1.::1. tE: E~ >~ t. r i~ p CJ 1 -:'::·t t:. f::?.'
f:? ~< tr-a pcJ l -:::1. tE.1
E!.• ;-; t. i,.. '"' po J. c<. te l::"2 }{ t 1:- 8. pi:J 1 Ci. ti::7;
E-~ ::-:: t. r- Ei. p C') ]. i::·i t. e,:,::
E,1 ::-:: t r-· .:::f. p O 1 .::,. t. {·?
f::.:: ;.1 1·· r .=i n 1-·" 1 .:::, 'I- P -- . . ... . .. .. , .. -·· - -·· ... ·-r~ >·: t 1···· 2\ f:=tCJ late £-zr ;< t:. I a p C) 1 C\ -!.:·. E:
i::? :,-; t r- -3. po 1 ,:i. te E'.! ;-:: t r- c':<. PD l c'\ tr~ <::? >~ t r·--r::,. pc1 l 2~ ·te f::.: ;.:: ·t. !r- t~"i. p C) 1 .;:\ t E:!
e }~ ·!: r-· -3. pc, 1 a. t f;;;
f:? ::,~ t i.- -:::·t p C) J. €:i. t. E::
~= ::-:: t r- ~3. pc.i l -73. tt:.: £7:1 ;-~ t i- .3. j:) C) J ~-,. t E:!
i:.-:, ;-:: t ,.-• .::::1. pc, l .;~1. t. e 2 }~ t 1·-· .;;·:i. p C:) J. -:::·;_ t iE:_:
1?2 ::-:: t i·-· E:i. p C) 1 -:·3. t E'
£·:·: ::{ t ! .... ~·:"!. p C) \ Cot t·. i:::7
t,~mpe1'·E,1. tu.re te.-:n1 ,:.1t:::.1 r E:'t tLl r-t.7!
t 1":::!mper-2l. tu.rE• tempE•r·21. tur--E' t.-2m pet-€:\ tu r·e tE•mpE·ir Et tu Y-E•
tc-2rn pet-·-=,. tu r--,:;:~
te1mpE•r€,-.. tu.rE• t: Ei 111 r:11"=? ;-- a t u. r- f.::
temper- a tu r-e t,::2mpE•r-·.::1. tur-e tern pi:.·?.• r· et tLt rE=
tE•mpE·r2:i,tur-E? tempr-:?1~E,. turf.-, t12rn~:iE::r- .:1 tLt rE.i
tern p f:?: 1-- -::1. t Lt r-1"2 tr.:?mpr.21 c;;_ tu.t-E~ t E·! in 1::i ;2 r· -:=t t Lt 1r- i::0
ternpE1 t,... ,2 .. tLt i·-E.1
t:.t~:rn per E:'1. tLt rt:: ternr.),::: r-· a. tu.12 ternpE.-!r-· C\ tu. J;?
t ,2 rn \"J ,:::: r- ~3. t 1...1. i--1=:.:
t E: rn p FI: i--· .::·t t. u. 1- F.:1
t FJ rn p (0'! t-··· .:::1. tu. r .. i:-;:~
-!:.:. i? in p r.::.-: r· B. ·!:. u. t·-- c: t.E::rn per .... =:i. tu.r-·;:::
fot-· f □ t-
fCtt
-f c:i r-
fc;r-·
fc:<r-r CJ r-
fcJr
extrapolate temperature iwr
-=. r1 ,-.:.:i 1-· t f:::: c:_
-=:_pp,-· ·i.Pc:.
-::; n 1-:::: ,-- ·; r:::, -:::. -- I -•• _,. -- .... -••
-::::. p ;:=i i- 1 r:::: ·=. c,ppr· i_pc::.
S:· J:• E'J C .i (?. ·:7.:.
-:::.. j1P,- i F,·=.
c:.p,:::,,-i ,-.,,::::. ·::::. n~r- i ;-:::.•:::. .... ,- -· -- ........ -c::.r~r.::ii ..... ·j 1:':.'!-::::,
c;.pi-~,- i [~·:;
<=.nt=,1- i ;-::::•:::. -,--··---·-··-i":.:.pt-7.lr" ·\.f.:.1•::::.
·=\ n r.::, ;-- ·1 ,-:::1 •=. -· r .... -- -· .. - ...
,.:::.p;::,,- ·i_,'='<=.
- •. rr-i1 ... _; 1....:-.
-::::. r,1-:::. ;- ·i r-..:: -:.:::.
c::.pr:::,.c- i r=:•::::.
-:::.npf- ·j 1::.:-:::. ' .
.::::_ l"'"1 P ,- i i.':.':·= . . '
.C: ·I
... ) J..
52
i.. i , __ ., ..:..
i:::1 i;J I CJ ::~ ( '::.\ ) r=-ii:J 1 c1:=: c .::;!.c:J )
t-! < + > ( c:l.Cj )
H2(g)
[) ( g )
O!-·I<··-> ( aq) OH ( •;J )
!-!2[l ( J.)
H20 ( ,;;; ) 1--10:;?<-> ( .:::tq)
HtJ2 ( g)
t-JCi2 ( t;I )
H~?lJ2 ( l ) f'"f2C):~·: ( ';J )
!4 :2 C3 :2 \: r~\ q ) :=::: < ;~-- > ( -:::'i.q )
s (].) S(g)
B-vii

Appendix B F*A *C*T Computer Prints
·- E; >~ -i.-.: ! ... ~-9. p CJ 1 \:.3. -J:: E"
E:' ::-~ t :·-· E:i. p CJ 1 -:?."i. t ;z~ e ::-:: t 1--·-::1 pcJ la. t:e= F:_:_: ::{ t. l.- C1. p Cl 1 .:;;!. t. E•
e ::-~ t f·-· -:3. pc1]. a. tc.,
f:?;{ tr·\~:1.pc:_; 1 -::i. tE-:
i:::: ;-:: i:. ,.-·-::i. pc) J. ·=''- te E~ >~ t r·- a. pc.:i la. tE~
(~?: ::{ t. rm ~:';\ j:) CJ l .:::·1. t·. (?.
e >~ t r· a. pc) l -:=;_ t1"2
E·'! >;f..:!.,.. 2:\ pc1 J. Et tE., E~ >~ t r- -:::t pc) .l ~=1. t.e f:.::, i·~ t i'- Cl. p C) 1. -:=\ t f2
e ~< t 1-~::1.pcJ la. te:•
t 1=:.\ iTt f::J E? i·- et t t..l. r- e t.i::;!rn pi:~ !r· a-. tLt t-i2
t::?.rt1per-a. tu. 1 .. -e tE:rnpE-=1- \-=\ t.u. r-e ten-1per·-.:3. tu.rt:: tE:'iTi pF::: r .;::;_ tu. i•-e ti::-:H1per-ci. tu.r--e
temper .. c\ tur-·2 temp(:::r-2-. tu.r~e tF:.•IT1 i=t2 r 2. t.Ll f·-t?
te1T1per--:::1. tu.re tF::1T1 pF,: r c:\ tu. re tf2ffi pe ,.·-c:1. tLtr-2 temper~ .;:,i tu. rE':, temper-a ture
+ ...... ~--l '--'!
fo1:f1::Jr
•=:--.pp;-- i_;::-:·=.
·:::.ppr-· j J-.lC.
c.. n r-:. r ·i f:::. ·=--=. -"r------ .. ··-.. S-i7PC ·i p-:::.
sr!PI- ·j pc:.
c;nf-:\r· i pc_ ·- ,- -- -- -- -- ··--=. ri1-:::1- 1 :=:·=. -r-------· =·Pl-·l_ 1 1.':.1 .....
LO ._, /
...., i / -"--
74
77
f;~i<:2·-> ( a.q) ~=; :=, { c·; \ ·- - \ -::1 .•
f:,.:::. ( g) C'"7 t-. ', ·-· ! ', '.::) .!
HS<->(aq) St-i ( !;J )
SH (I~)
H2S(g) H2S ( Ctq)
extrapolate temperature for ~rerie~ 79 H282(g) extrapolate temperature tor species 80 H282(1)
;::;:: :=-:: t r- !'.I pc, l -3. te E 1
::-:: t r· \~ f.-' C) l .=.·t t i:e e ;-; t r-- c':•. pc:i la tr::.,
t.:eiT1pe1 .... 21. t.u.r-r..::.1
t,=:?mper-2-.ture for-for·
spec.ie::. ·==. fJPf- i i::J•::::.
·=. npr· i ,:::-i-=. -··r .. ---·----
C:• i '....'..!.. so ( ~i)
S02 (CJ)
so:2 c 2tq)
S1J:3<2-> ( a.q) extrapolate temperature for ~periP~ 85 S03(g) extrapolate temperature for ~pPrip~ 86 803(1) EXTRAPOLATION FROM 298K NOT PERMITTED FOR SPECIES 87 S03(s) extrapolate temperature for ~pPrie~ 88 804<2->(aq) extrapolate temperature for ~reci.P~ 89 820(g) extrapolate temperature f □ r species 90 8203<2->(aq) extrapolate temperature for ~pPries 91 8204<2->(aq) extrapolate temperature for species 92 S205<2->(aq) extrapolate temperature for species 93 8206<2->(aq) extrapolate temperature for ~pPriPs 94 S208<2->(aq) extrapolate temperature for ~pPriPs 95 S306<2->(aq) f:::~ ~< t r'- -:3. p C) l :Er. t f;;.•
G': ;-:: t: 1·.:::·~ pc:r J. Ct ti2
1?. ~< t r·- -:·:71. p CJ .!. ~:1. t i:::=
E,::-:: tr·apc, la "ti::?:
e>:: ti--:::tpo l \~. ti::::• e;-: +:.rci.pol a. te
·-· , e :,-: t 1·-· c:\ po 1 E, te e;-;; t1-apc11 Et tr::: e :,-:: t :·-·apo i ate f:~1
~-:: t. r- .3. pc:i J. .::\ t. F:
1:.~ >~ t ,-~1.po 12-. ti=: e >:: t r- Et J:'.:iCJ J. CI. te
t i:.?: fD J:J f2 y-- .f~i. t Lt 1r· .:-:::
t f:.7 fft r.:i !::? 1·-· 2, tu. t- e tE-?IT! f.Je t- 2. tu. t-i::?
tt:::rn pe! t- ~:::,. t: . ..:. i--2
te111pe1·-2. tu.1-2· tr::!rr1pr.0 i·-.:::t tLt re tr:::rnpei·-.:3. tu.r-E:.i
t.i.'2mpe 1·-EJ. tu. r·0?
tern pi:::' 1-- c':1 tu n'2 ti:;;:111 p;"E: lCt tLI. ! .. -F:;
teff1pe r-· -=:i. ti_t 1·-E•
tern f.)!:-:-:, r a t:L.t. i,...E}
·fo:·-f'c:i,-
fc1r -:::-.pPr ·i pc:_
-=;. r~r i 1=-.. ·=::.
...... i 1p,_; 1:::1 ·--.
··--. ri;.,..1- ; 1:;j••-. .... 1- -· •••• ··- .... -·
sp,:=c::1.2::. ~; f")'7•f- i PC:.
c::o .•· /
.i0.1. i r-·,··-:-1 ..!.. •• _ ... 1:..
103 .i_().4
1()/::.,
S-'l[i,S<:2-> ( a.q) ~~~1[f,f)<2-· > ( CtC:{)
:-ff;(J.~:, < ·-> ( -:::i.q ) H'.:"2~)D3 ( a.q ) !-ff3!J-4<--> ( -::'tCj)
1-1::'.SC!.!.1- ( l ) H::2sc1.-:.1- ( i:;: )
H2SU4 ( a.q) l-f2SCJLf. ( H~2fJ ) ( 1 )
H:2SfJ4- ( H2C1) :3 ( 1
EXTRAPOLATION FROM 298K NOT PERMITTED FOR SPECIES 108 HS204(->(aq) EXTRAPOLATION FROM 298K NOT PERMITTED FOR SPECIES 109 H2S204(aq) e >~ tr-.:3.po l -:=1 te
-· ~; >~ t. r- a. pc1 l -:=1. tE1
F; }~ t 1-·- .::\ p C1 l E~ t f:.7:.~
E' >:: t. y- El. p C; 1 -:3. t E.:
1::;; ::-:: t: ,- ~::. f.3 Ct l ~::\ t: I=
E1 ~< tr·-a.pc:i J. -::1. tE·
t? ~-:: t. r- a. pcJ l 2. te F: ;,; t:. r- -:3. p C) J. Cl. t.: =~:! E>;,; t1····i:?..po]. .:;;.. te:
tc~rnper.:=1. tu.12 teff, p(-? r E1. tu. r·e
tF=::mper-a tu.r-e t:E•m pe 1·- c\ tu 1·-E•
t1::?m p;21.- 2-. tu r~•= t: 21T1 i=tF:! r .. -:"i. tu r-e tern pe i.- .:3. t:__1. re
f rn--
~ ;7i:::::1-· j r-:~:;
·=.pr-:--;-1.P·=.
·,5 pee i. es:. <=.pPr i.P<=.
1 j_ (J
.tl1
11 ::::: 114 11~1 i i L ..!.. .1..'-'
.1 . .1.7 i i C:1
..!...!.'.-'
!-f2:'.:)2CJE: ( .=1.q)
(H2SD4)2(H20)13(1) I<-··>(aq)
I:2 ( s)
I 2 ( l ) I::2(q)
I3<-·> aq) - extrapolate temperature for sper1P~ 119 HI(g)
B-viii

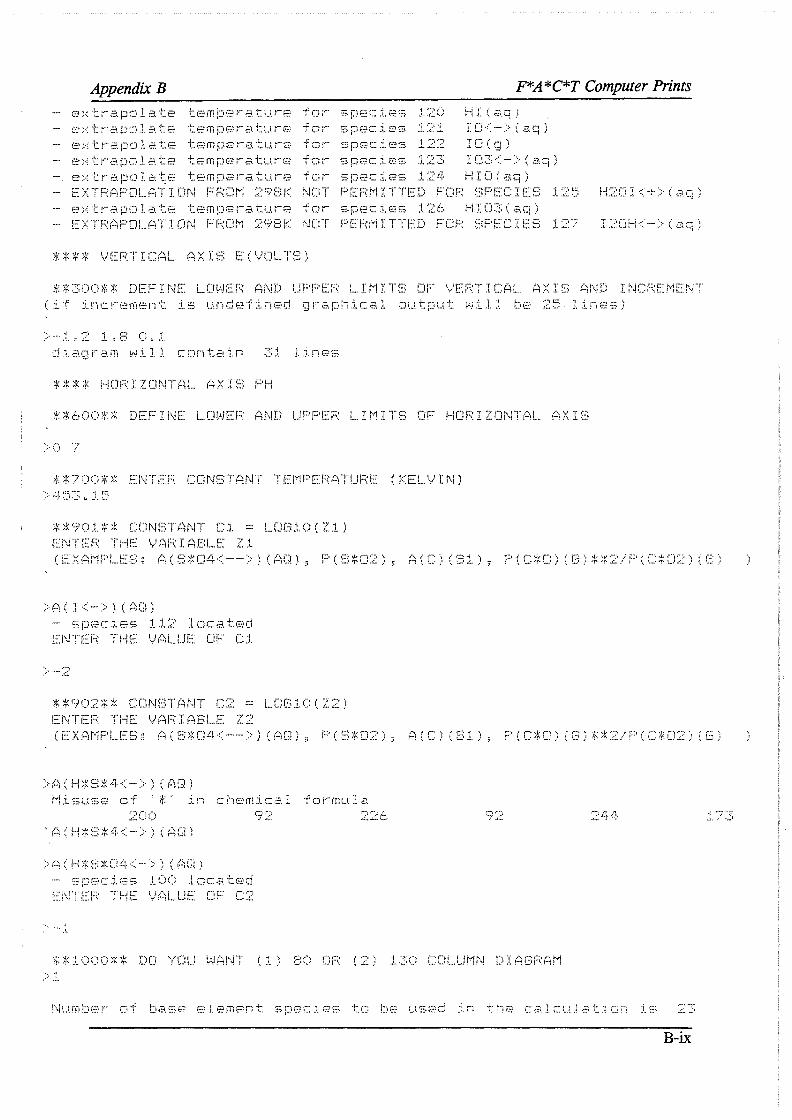
Appendix B F*A *C*T Computer Prints F= ::.:: t ,.- .2,.pc11 a. te tt7=IT1 j:1e 1·- .3 t.Lt i•-e ·f C; 1r· ·-. ,_,r .. ••= _; i;-··-. 1 ~:2() ~i I ( ~i.q ) extrapolate temperature for ~pPrie~ 121 I □ <->(aq)
extrapolate temperature for spPriP~ 122 IO(g) extrapolate temperature for ~nPriP~ 123 103<->(aq) extrapolate temperature for ~pPrie~ 124 HID(aq)
- EXTRAPOLATION FROM 298K NOT PERMITTED FOR SPECIES 125 H2DI<+>(aq) extrapolate temperature for spPriPs 1_?A HI03(aq)
- EXTRAPOLATION FROM 298K NOT PERMITTED FOR SPECIES 127 I2DH<->(aq)
**** VERTICAL AXIS E(VOLTS)
**300** DEFINE LOWER AND UPPER LIMITS OF VERTICAL AXIS AND INCREMENT (if increment is undefined graphical output will be 25 lines)
>---1.:2 1.,E: O.l diagram will contain 31 lines
**** HORIZONTAL AXIS PH
**600** DEFINE LOWER AND UPPER LIMITS OF HORIZONTAL AXIS
**700** ENTER CONSTANT TEMPERATURE (KELVIN)
**901** CONSTANT Cl= LDG10(Z1) ENTER THE VARIABLE Zl (EXAMPLES: A(S*04<-->)(AQ), P(S*02), A(C)(Sl), PCC*D)(G)**2/P(C*D2)(G)
- ~pPciP~ 112 located ENTER THE VALUE OF Cl
**902** CONSTANT C2 = LDG10(Z2) ENTER THE VARIABLE 22 (EXAMPLES: A(S*D4<-->)(AQ), P(S*D2), A(C)(Sl), P(C*D)(G)**2/P(C*D2)(G)
>Pi ( !-1*E;*·~-<->) ( ?:)C~) Misuse of '*' in chemical formula
>A(HtS*D4<->)(AQ) - ~rPriP~ 100 located ENTER THE VALUE OF C2
.I..
DD V-JANT ( 1 )
B-ix

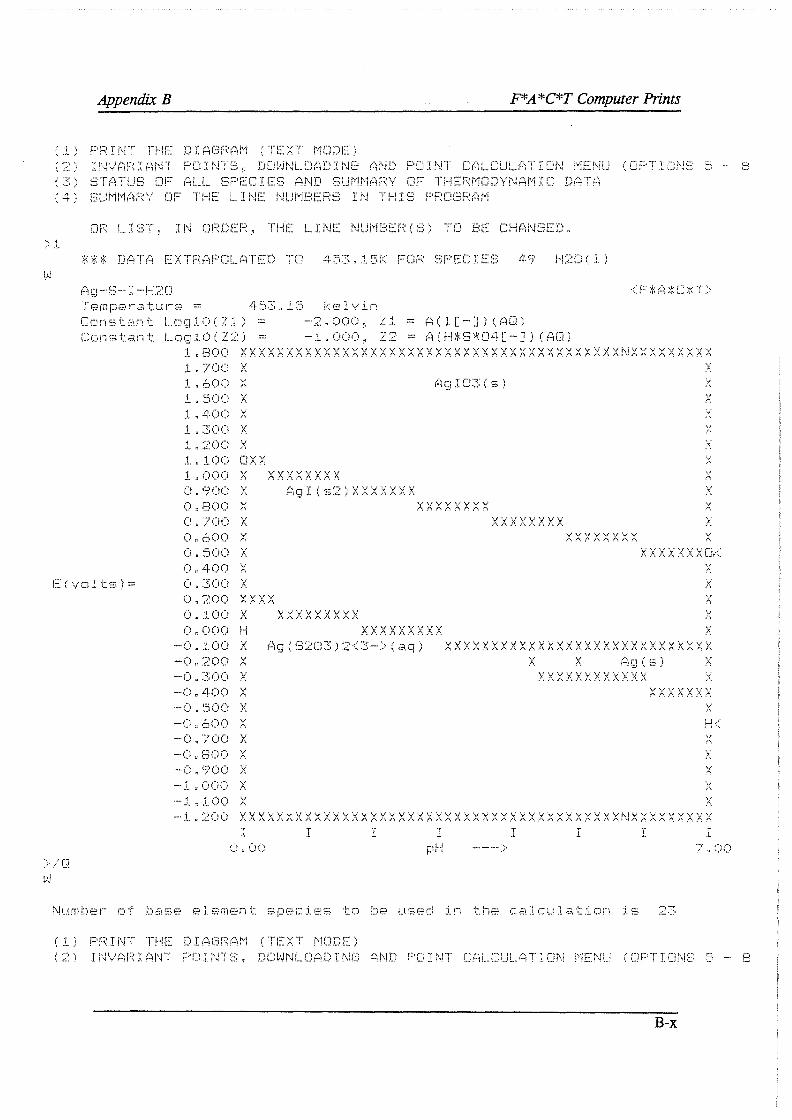
Appendix B F*A *C*T Computer Prints
PRINT THE DIAGRAM (TEXT MODE) 2 INVARIANT POINTS, DOWNLOADING AND POINT CALCULATION MENU (OPTIONS 5 3 STATUS OF ALL SPECIES AND SUMMARY OF THERMODYNAMIC DATA 4 SUMMARY OF THE LINE NUMBERS IN THIS PROGRAM
OR LIST, IN ORDER, THE LINE NUMBER(S) TO BE CHANGED.
ttt DATA EXTRAPOLATED TD 453.15K FOR RPFrTFR 49 H20(1)
Temperature - 453.15 kelvin Constant LoglO(Zl) = -2.000, 21 = A(I[-]l(AQ Constant L □g10(Z2) =
1.800 XXXXXXXXXXXXXXXXXXXXXXXXXXXXXX XXXXXXXXXXNXXXXXXXXX .1.700 X .1. ,::::,00 X .1.500 X
.1.., 3()() X
1:: 20() ><
.l" 10t) OX X 1.000 X XXXXXXXX () .. 9()() X
0.800 X
0 .. t,()() X i:)" 5<)() X c),, .lit)() X 0,, 300 :x:
xxxxxxxxx xxxxxxxx:x:
(J" .10(:i X 0 « c)(;(> H
-() = .ti:)c) X Ag(S203)2<3->(aq) -() C :;~t)() X -0. ::::-00 X -() = LJ-<)() X ·--() " ~5()() X
-·O. ,'.':,00 X -0.700 X -·0. f-300 X
I T .L
(.1) PRINT THE DIAGRAM (TEXT MODE)
I I
X
X
:X:XXXXXX>< :x:
X
X xxxxxxxxxxxxxxxxxxxxxxxxxxxxx
-·-·····> T .c
X
I I
I..J/ ! j • ••
I
(2l INVARIANT POINlB. DOWNLOADING AND POINT CALCULATION MENU (OPTIONS G - 8
B-x

APPENDIX C: JCPDS XRD Charts

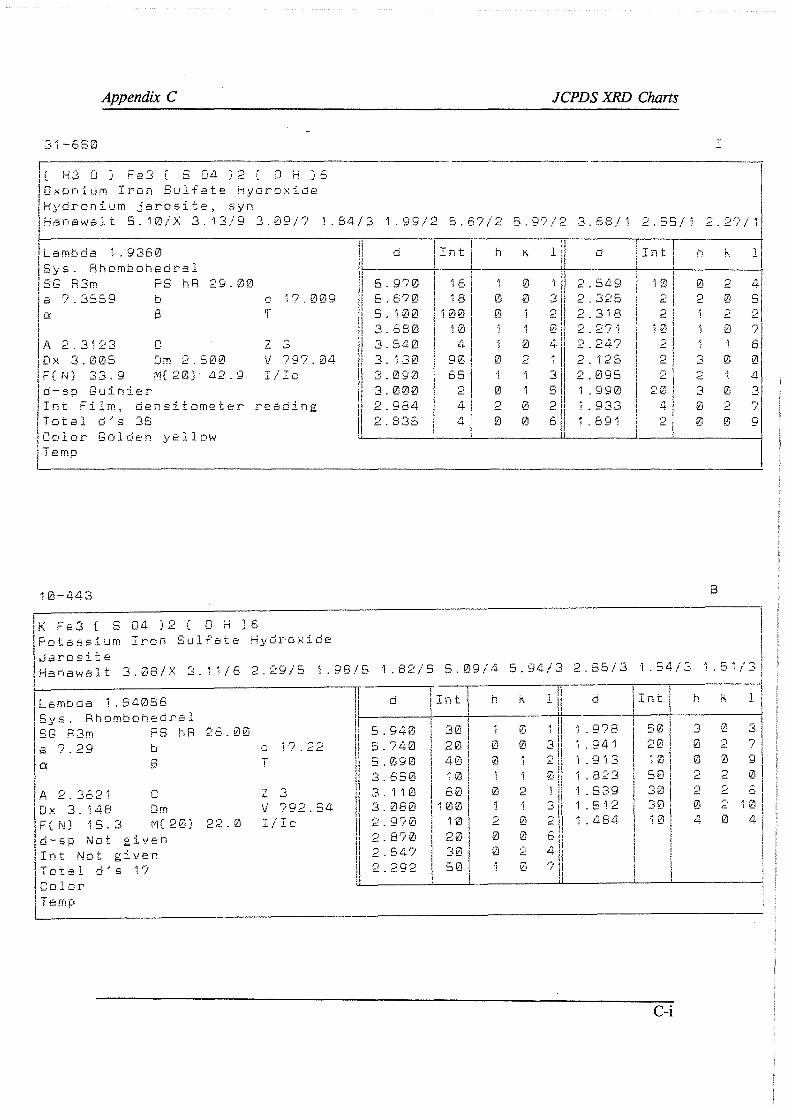
AppendixC
3l-E.S0
( H3 0 ) Fe 3 ( S D4 ) 2 ( 0 H ) 6 Oxonium Iron Sulfate Hydroxide Hydronium jarosite, syn
JCPDS XRD Charts
J.
Hanawalt S.10/X 3.13/9 3.09/? 1.84/3 1.99/2 S.67/2 S.9?/2 3.68/1 2.55/1 2.2?/1
Lambda 1.9360 Sys. Rhombohedral SG R3m PS hR a ?.3559 b 0: s
A 2.3123 C
29.00
[ix 3.005 Dm 2.500 FC N) 33. 9 d-sp Guinier
M( 20) 42. 9
Int Film, densitometer Tcital d?s 35 Colar Golden yellow Ternp
10-443
C ·1?. 009 T
Z 3 V 797.04 - 'T l. l ..!..C.:
reading
l K Fe 3 ( S 04 ) 2 ( □ H ) 6 !Potassium Iron Sulfate Hydroxide .Jarosite Hanawalt 3.08/X 3.11/6 2.29/5 1.98/5
Lambda 1.54056 Sys. Ahombohedral SG R3m PS hA 26.00 a 7.29 a
b s
C
C 1?.22 T
L 3 .A. 2. 3621 Ox 3. 148 F(N) 15.3
Orn V 792.54 M(20) 22.0 l,/J.C
d-sp Not gi\_1en Int Not given Total d·~s ·1? Color Temp
d
5.9?0 5.6?0 5. '100 3.680 3.540 3. ·130 3.090 3.000 2.964 2.835
jrnt
j ·iM I • -
I 18 100
10 4
90 65
2 4 4
h
1 0 0
0
0 •'") c..
0
0 0 i 1 0 2
0 0
2 2.318 0 2.271 4 2.24?
3 s, 2j f,I -,
l
2. ·126 2.095 1. 990 ·1. 933 l. 89 ·i
2 r; c..
2 20
4 2
1.82/5 S.09/4 5.94/3 2.55/3 1.54/3
d Int h k 1 d Int
5 940 30 0 ·1 978 50 5 740 20 0 0 3 ·1 941 20 I 5 .090 4e:, 0 2 1 .913 10 3. 660 10 1 0 ·1 .823 50 I ! 3. 1 10 60 0 2 1 539 30 3 080 H'.10 3 1 5 ·12 30 2 970 10 ,..,
c.. 0 ,-, c.. 1 484 1 0
2 870 20 0 0 6 ,; c.. 547 30 0 2 4 2 292 50 l 0 r-,
\ f
l
C-i
h
0 2
..:!
2 3 0 0
8
~1 c..
0 2 0
0
0 2 0
l
4 c;
2
6 0 4 3 ? 9
h k l
3 0 3 0 2 ? 0 0 9 2 2 0 2 2 6 0 2 10 4 0 4

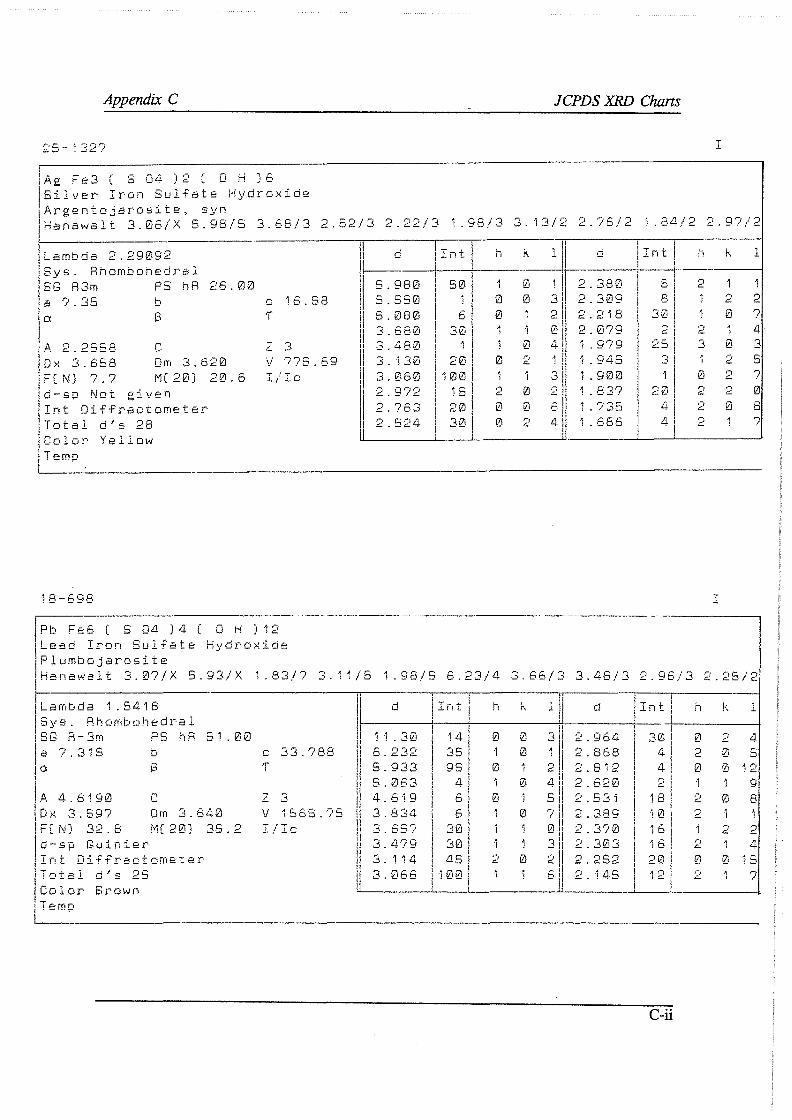
Appendu C
Ag Fe3 ( S 04 )2 ( 0 H )6 Silver Iron Sulfate Hydroxide Argentojarosite, syn
JCPDS XRD Chans
I
Hanawalt 3.06/X 5.98/5 3.68/3 2.52/3 2.22/3 1.98/3 3. 13/2 2.76/2 1.84/2 2.9?/2
Lambda 2.29092 Sys. Rh omt:, oh e d .ra l SG R3m PS hR 26. 00 a ? 35 b C 16.58 a s T
A 2.25S8 C L 3 Ox 3.658 Drr, 3.620 V ??5. F( N) ? ? M( 20) 20. 6 - 'T .i / ..!.. C
d-sp Not given Int Diffractometer Total d's 28 Color Yellow Temp
·18-698
Pb Fe6 ( S 04 ) 4 ( 0 H ) 12 Lead Iron Sulfate Hydroxide Plumbojarosite
69
I d I I I
5.980 5 .550 5.080 3.680 3.480 3. 130 3.060 2.972 2.?63 2.524
IT . I I
h k l d ! T • l h k l ! _n1: i .,_n1: i !
50 1 0 2.380 5 2 1 0 0 3 ,-,
c... 309 8 2 2 6 0 ,-,
c.. 2.218 30 0 7 30 1 i 0 2.0?9 r, 2 4 c..
0 4 ·1 .9?9 25 3 0 3 20 0 r,
c. 1 .945 3 2 5 ·100 1 3 1 .900 0 2 7
15 ,-, c.. 0 ,-,
c.. 1 837 20 2 2 0 l
I 20 0 0 6 1 .'735 4 2 0 8 30 0 2 4 1 .686 4 2 7
I
Hanawalt 3.07/X 5.93/X 1.83/? 3.11/5 1.98/5 6.23/4 3.66/3 3.48/3 2.96/3 2.25/2
Lambda 1.5418 Sys. Rhombohedral SG R-3m PS hR 51.00 a ?.315 a
A 4.6190 0:>-'. 3.597 F( N) 32. 8 d-sp Guinier
b [3
C Om 3.640 M( 20) 35. 2
Int Diffractometer Total d's 25 Coler Brown Temp
C 33.788 T
Z 3 V 1565.?5 I/Ic
d
11. 30 6.232 5.933 5.063 4.619 3.834 3.65? 3. 4'?9 3. 1 14 3.066
T _ -'- i ..!.. f! L
14 35 95
4 6 6
30 30 45
100
h
0
0
0
2
, r ..
0 0
0 ·1
0
0
3
2
d
2.964 2.868 2.812
Ll.1 2. 620 sl 2.s3,
I
?' 2.389 0 2.3?0 3 2.303 2 2.252 6 2. 145
l l
l Int? I
30 4 4 2
18 10 16 i6 20
C-ii
h
0 r, c.
0
,-, c..
2
~-1 c..
0 0
0
l
4 s
9 8
2 2 2 4 0 0 15 'J r-, c. .•

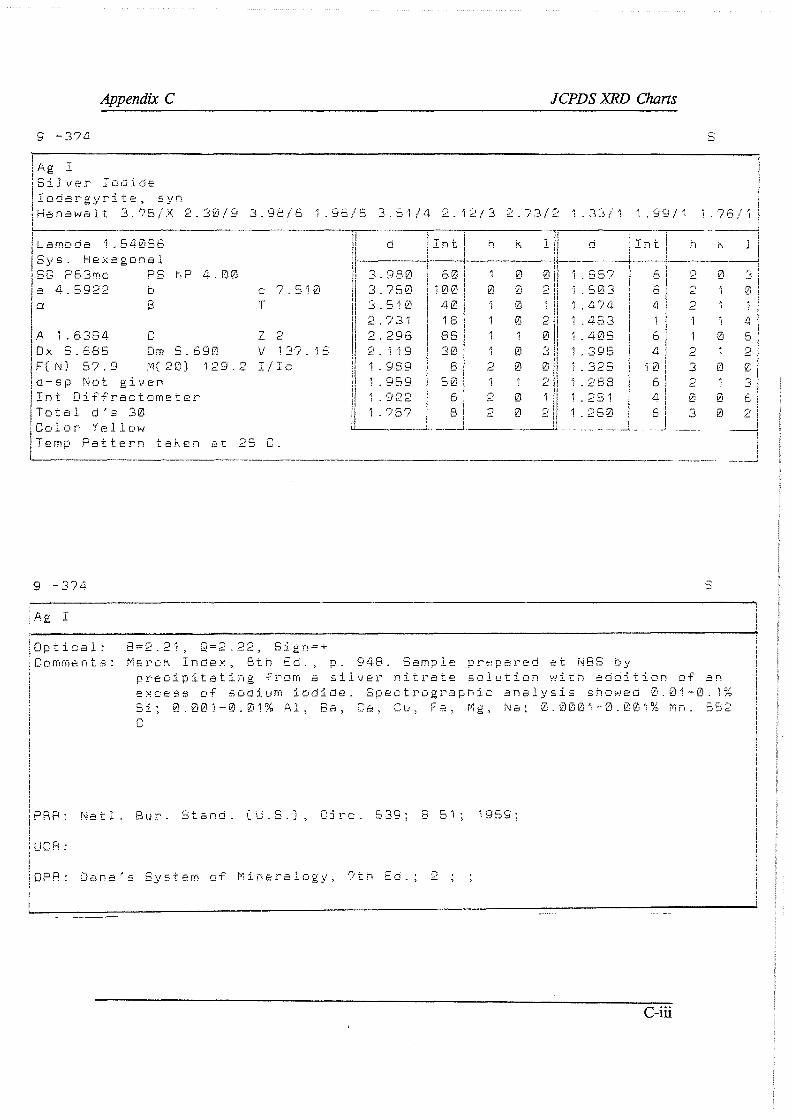
Appendix C
9 -374
Ag l Silver Iodide Iodargyri te, syn
JCPDS XRD Clwns
Hanawalt 3.76/X 2.30/9 3.98/6 1.96/5 3.51/4 2 .. ~!2/3 2.73/2 ·1.33/·1 ·1 .99i·1 1.76/'i -------------·----·-···-----,,--
Sys. HexagDnal SG P63mc PS a 4.5922 b C 7.510 a }j T
.A 1. 6354 Ox S.685 F(N) 5?.9
C L 2 Dm S.690 V 13? 16 M(20) ·129.2 j_/J.C
d-sp Not given Int DiffractDmeter Total d's 30
d
3.980 3.750 3. 510
2.296 2. 1 i 9 1 . 989 1. 959 ·j. 922 l . 75'7
! i i; i7I ' --l100
40 18 85 30
8 50
6 8
h k l ii !I ,,
0 0 11 0 0 ~I 0 !
0 2 0
0 3 2 0 0
1 r, c.
2 0 2 0 r,
,:.
Color Yellow U..----~·-· ---______ _.,_..
Temp Pattern taken at 25 C.
9 -374
:.Ag I
i O t . .
d
1. 503 1. 4?4
1. 405 1. 395 i. 325
:, · ;~~ J i. 250 - -·- - - -
6 4
i0 6 4 6
2 3 2 0 3
s
0
0 1 0
0 0
t 1p_ica1: 8=2.2·1, Q=2.22, Sign=+ Cornrr,ents: Mercf<~ Inde}! . ., 8th Ed., p. 948. Sarnple prf!pared at NBS t1 ·~/
precipitating from a silver nitrate solution with adoition of an e:~oes9 eif 5Ctdiurn ic.1 dide. Spectrograpr,ic analysis showed 0.0·1-0.1~;; Si; 0.001-0.01% Al, Be, Ca, Cu, Fe, Mg, Na; 0.0001-0.001% Mn. SS2 C
PAR: Natl. Bur. Stand. (U.S.), Cjrc. 539; 8 5·1; 19f:.9~
UCR:
OPR: Dana's System of Mineralogy, ?th co.; 2
C-iii
3 0
5

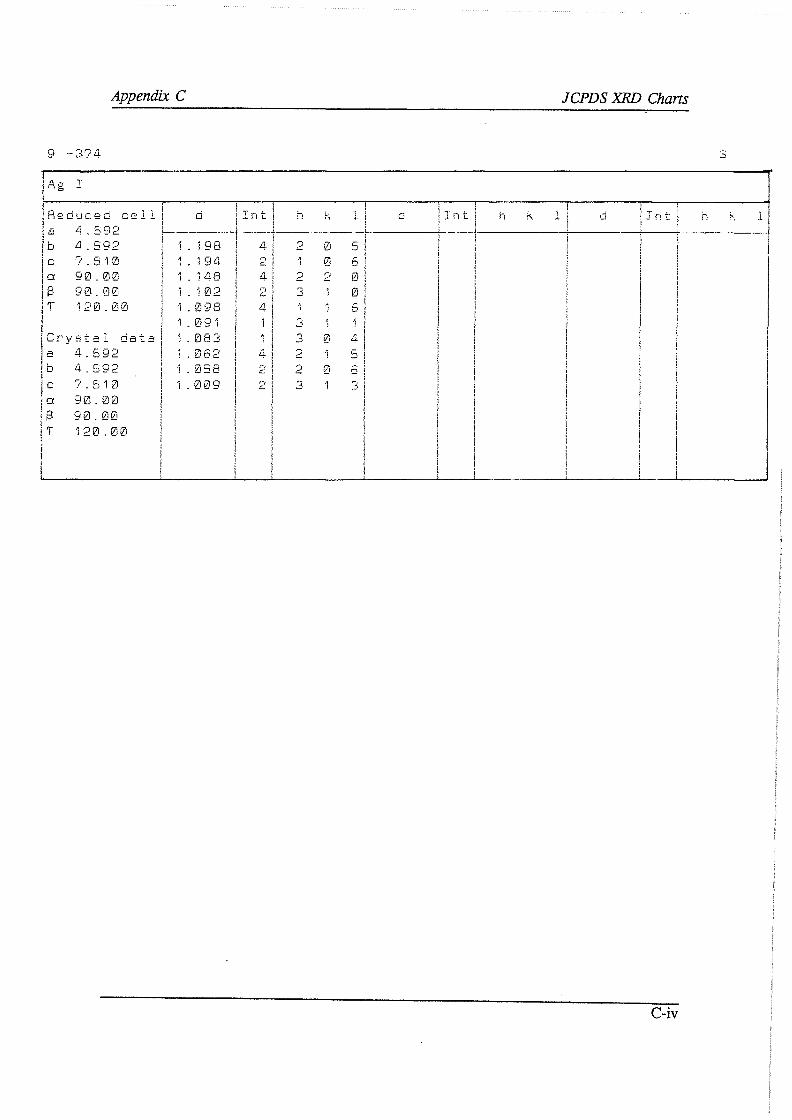
9 -374
A.g I
Reduced
Appendix C
.. -. i cell !
JCPDS XRD Chans
s
d ! T . l . . . i i
a 4.592 ! ~nr:i n r, l[ d lntj h k. l d jint
----f-------··---1--·-----· _L _____ _,_ _____ J'-------i------+----:------- ···---· ' l i l
T
4.592 7.510 90.00 90.00 120.00
Crystal data a 4.S92 b 4 592 C '? 510 a 90. 00 f3 90. 00 T 120 . e:,0
' 1 _ 198 4 I 2 0 5 i 1
2 0 6! I 1. 194 1 . 148 1 . 1 02 i. 098 1. 09 'i 1. 083 1 . 062 i. 0S8 1. 009
4
4
4 2
2 2 0 3 0
6
3 0 4
2 0 6 3 3
C-iv

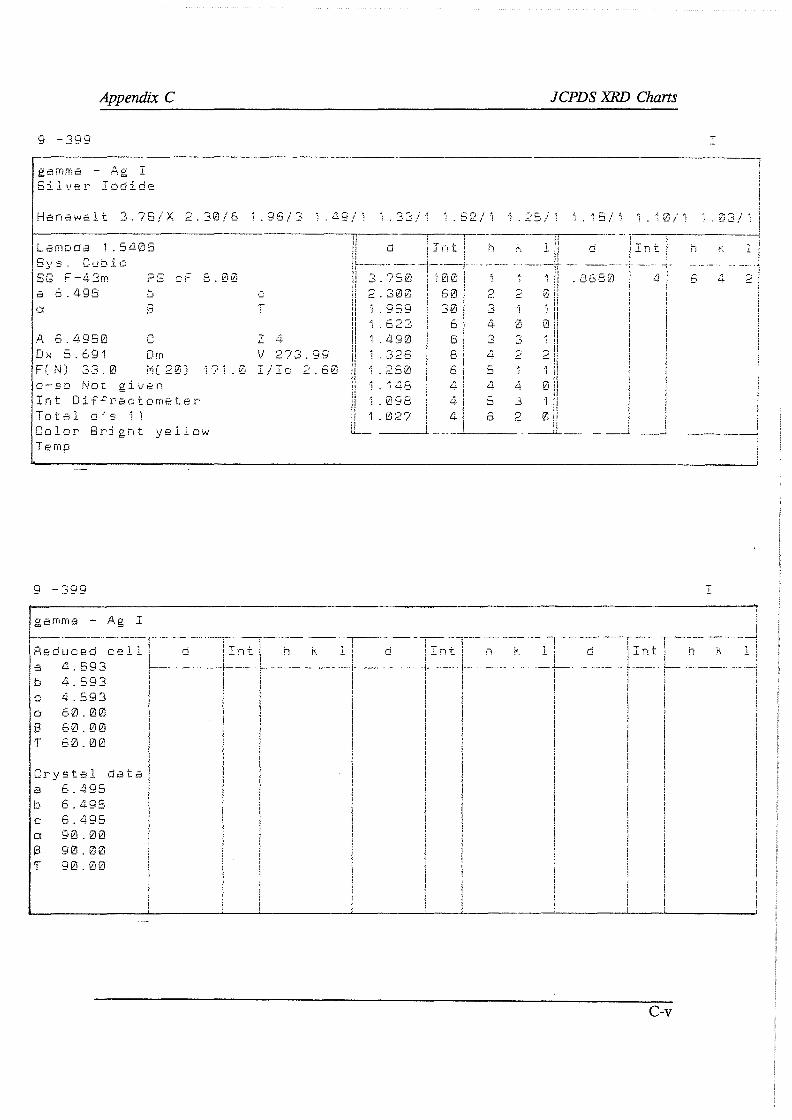
Appendb: C JCPDS XRD Chans
9 -399
gamrna - Ag I Silver Iodide
Hanawalt 2-.?S/)(_ 2.30/6 1.96/3 i .:19/1 1.33/1 ''!.62/-'"; "1.25/'1
Lamt•da 1 . 5405 S~/9. Cut1 ic SG F -43rn PS cF 8.00 a 6.495 t,
C( i3
.A 6. 4950 C Ox S.691 Dm F( N) 33. 0 d-sp Not gi•.len Int Diffractometer Total a~s ·11 Colar 8rjght yellow Temp
C
T
Z 4 V 2?3.99 I/Ic 2.60
i
i _ _j
l
'10/1 1.03/1
i _ _j
9 -399 ~
gamma - .Ag I -· ·--·- ! .. -· - - -· I 7- ·-- ·- i--·· - ·- - i---- - . - ·- -! . -· -·-·· R e d u c e d c e l l I o •r.,. n t ! h i--. l i d j I n t. h ~- l i d
, c;qr, I I , , , a 4 . ~ - - }---· - -- -- - - i - ·- -------+--· - --· t --- - . .. .. . -r- -t, 4. 593 i I ,
!! l
C 4. 593 ! I ' a 60. 00 \ I
Ii S 60.00
T 60.00 I I Crystal data 1
a 6.495 t, 6.495 C 6.495 a 90.00 8 90.00 T 90.00
---·- ·---------! T t i ' i .cn_J r, k 1
1 1 ··--· --~ \
I l
C-v

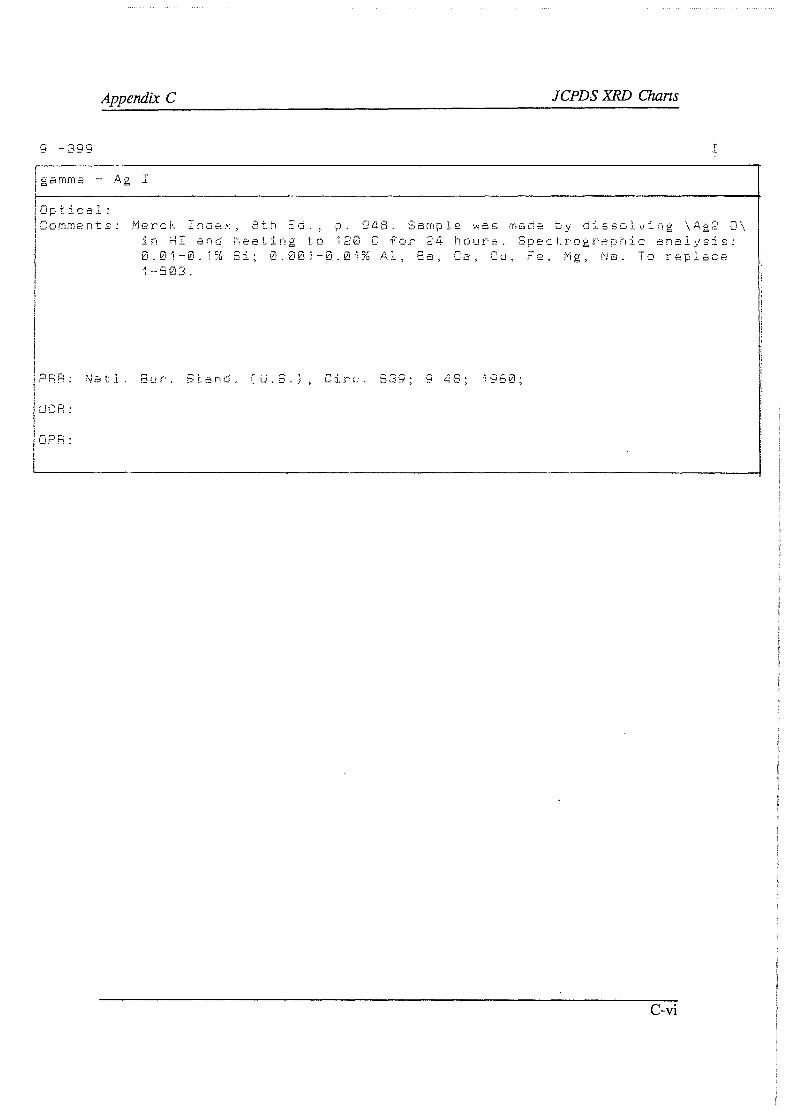
Appendix C JCPDS XRD Chans
I
t
J garnrna - fa:g .1 I
i L•n +-.;,·a 1 • ' .... - - ....., - . i ~-· . \LDmrnen1:s: t
:nn~x - .. - -- .. ,. 948. in HI and healing to 120 C for 24 hours. Spectrographic analysis: 0.01-0. ·J~;; Si; 0.00·1-0.0·i?b .Al, Ba, Ca, Cu, Fe, fv)g, Na~ To replace 1-803.
1 PRR: Natl. Bur. Stand. (U.E.), Circ. 539; 9 48; ·1960;
UCR:
OPR:
C-vi

APPENDIX D: Direct Cyanidation Test Sheets
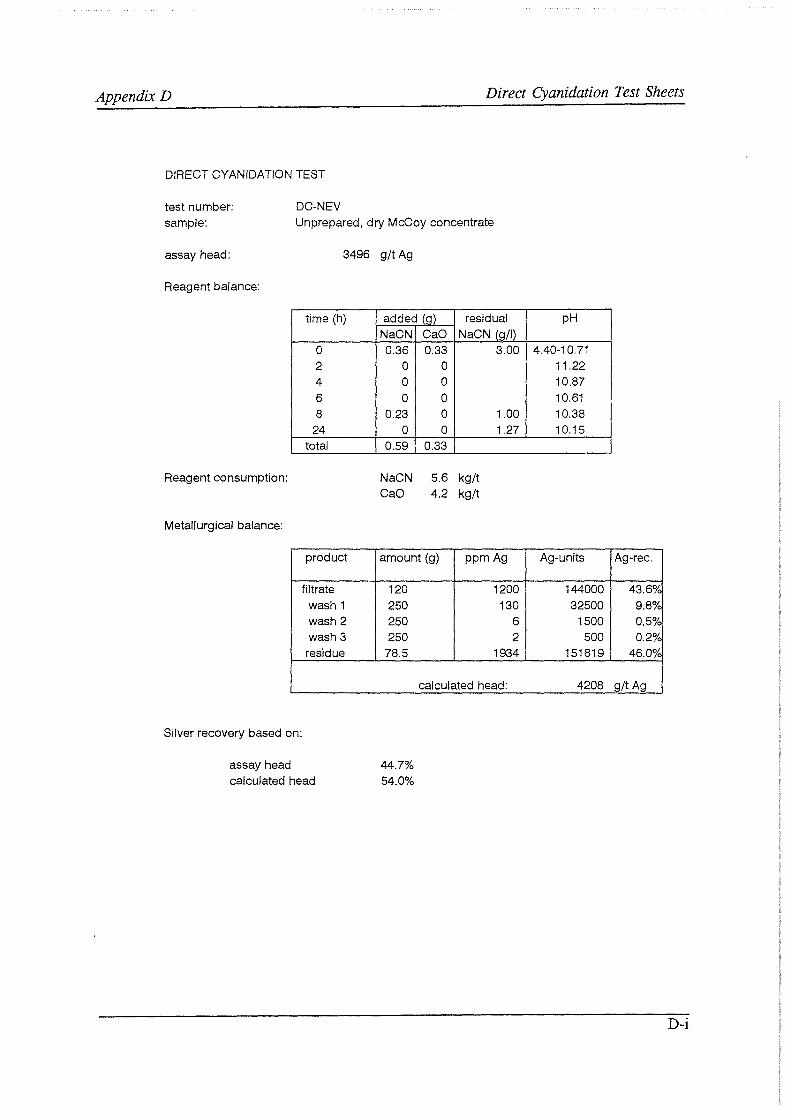
Appendix D Direct Cyanidation Test Sheets
DIRECT CYANIDATION TEST
DC-NEV test number: sample: Unprepared, dry McCoy concentrate
assay head: 3496 g/t Ag
Reagent balance:
time (h)
0 2 4 6 8
24 total
Reagent consumption:
Metallurgical balance:
product
filtrate wash 1 wash 2 wash 3
residue
Silver recovery based on:
assay head calculated head
added (a) residual NaCN CaO NaCN (g/I) 0.36 0.33 3.00
0 0 0 0 0 0
0.23 0 1.00 0 0 1.27
0.59 0.33
NaCN 5.6 kg/t cao 4.2 kg/t
amount (g) ppm Ag
120 1200 250 130 250 6 250 2
78,5 1934
calculated head:
44.7% 54.0%
pH
4.40-10.71 11.22 10.87 10.61 10.38 10.15
Ag-units Ag-rec.
144000 43.6'¾ 32500 9.8o/c
1500 0.5'¾ 500 0.2'¾
151819 46.0o/c
4208 g/t Ag
D-i

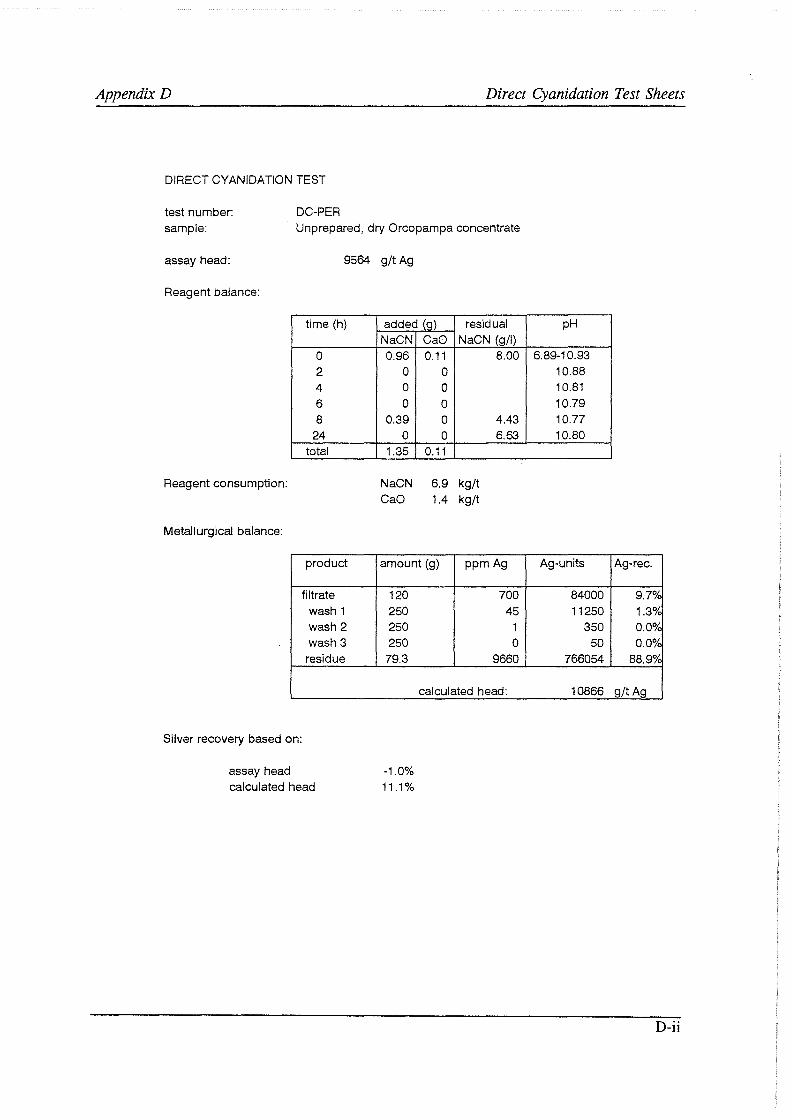
Appendix D Direct Cyanidation Test Sheets
DIRECT CYANIDATION TEST
DC-PER test number: sample: Unprepared, dry Orcopampa concentrate
assay head: 9564 g/t Ag
Reagent balance:
time (h)
0 2 4 6 8
24 total
Reagent consumption:
Metallurgical balance:
product
filtrate wash 1 wash 2 wash 3 residue
Silver recovery based on:
assay head calculated head
added (q) residual NaCN Cao NaCN (g/1) 0.96 0.11 8.00
0 0 0 0 0 0
0.39 0 4.43 0 0 6.63
1.35 0.11
NaCN 6.9 kg/t CaO 1.4 kg/t
amount (g) ppm Ag
120 700 250 45 250 1 250 0 79.3 9660
calculated head:
-1.0% 11.1%
pH
6.89-10.93 10.88 10.81 10.79 10.77 10.80
Ag-units Ag-rec.
84000 9.7'¾ 11250 1.3'¾
350 O.Oo/c 50 0.0'¾
766054 88.9'¾
10866 g/t Ag
D-ii

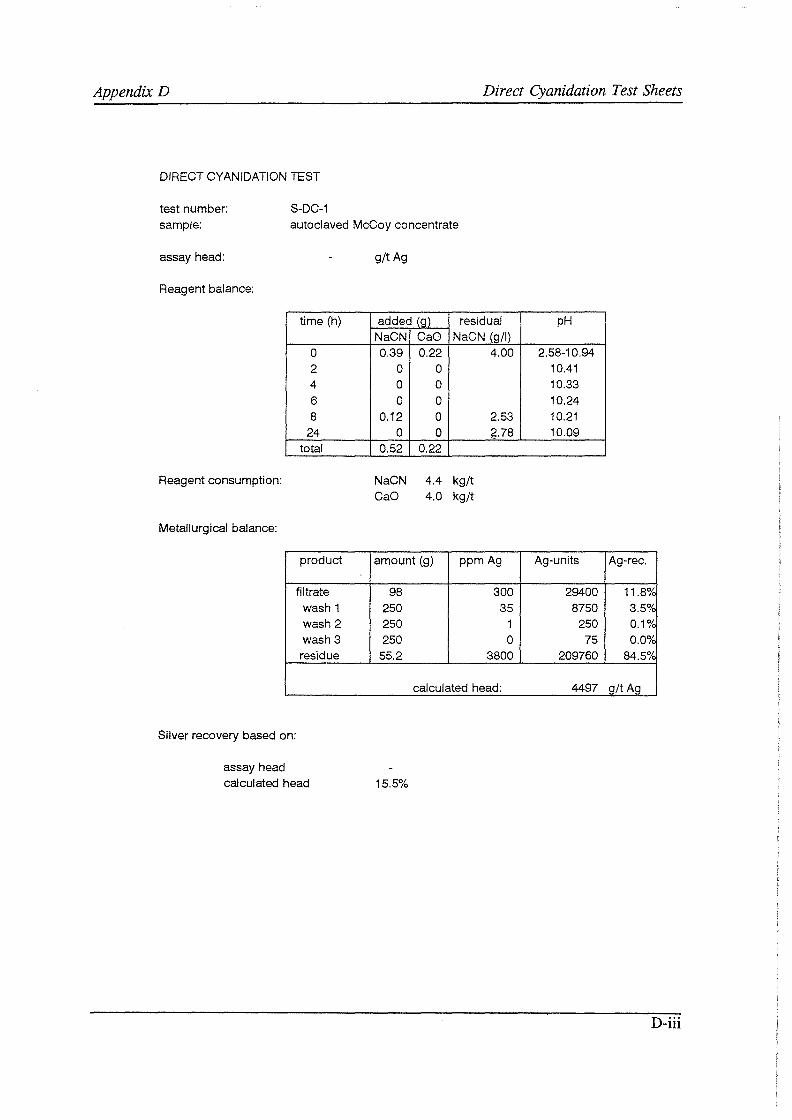
Appendix D Direct Cyanidation Test Sheets
DIRECT CYANIDATION TEST
S-DC-1 test number: sample: autoclaved McCoy concentrate
assay head:
Reagent balance:
time (h)
0 2 4 6 8
24 total
Reagent consumption:
Metallurgical balance:
product
filtrate wash 1 wash 2 wash3 residue
Silver recovery based on:
assay head calculated head
g/tAg
added (a) residual NaCN CaO NaCN (g/I) 0.39 0.22 4.00
0 0 0 0 0 0
0.12 0 2.53 0 0 g.78
0.52 0.22
NaCN 4.4 kg/t Cao 4.0 kg/t
amount (g) ppm Ag
98 300 250 35 250 1 250 0
55.2 3800
calculated head:
15.5%
pH
2.58-10.94 10.41 10.33 10.24 10.21 10.09
Ag-units Ag-rec.
29400 11.8o/c 8750 3.5%
250 0.1% 75 0.0%
209760 84.5o/c
4497 g/t Ag
D-iii

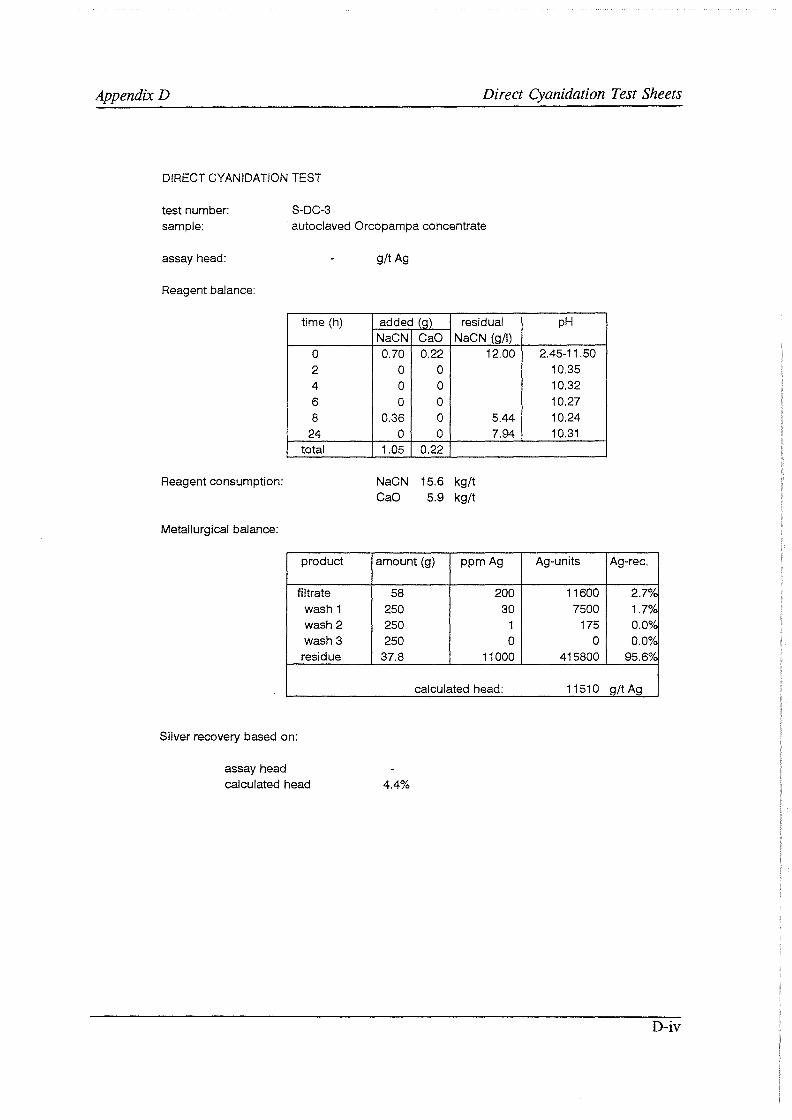
Appendix D Direct Cyanidation Test Sheets
DIRECT CYANIDATION TEST
S-DC-3 test number: sample: autoclaved Orcopampa concentrate
assay head:
Reagent balance:
time (h)
0 2 4 6 8
24 total
Reagent consumption:
Metallurgical balance:
product
filtrate wash 1 wash 2 wash3 residue
Silver recovery based on:
assay head calculated head
g/t Ag
added (a) residual NaCN CaO NaCN (g/I) 0.70 0.22 12.00
0 0 0 0 0 0
0.36 0 5.44 0 0 7.94
1.05 0.22
NaCN 15.6 kg/t Cao 5.9 kg/t
amount (g) ppm Ag
58 200 250 30 250 1 250 0
37.8 11000
calculated head:
4.4%
pH
2.45-11.50 10.35 10.32 10.27 10.24 10.31
Ag-units Ag-rec.
11600 2.7'¾ 7500 1.7%
175 O.Oo/c 0 0.0'¾
415800 95.6'¾
11510 g/t Ag
D-iv

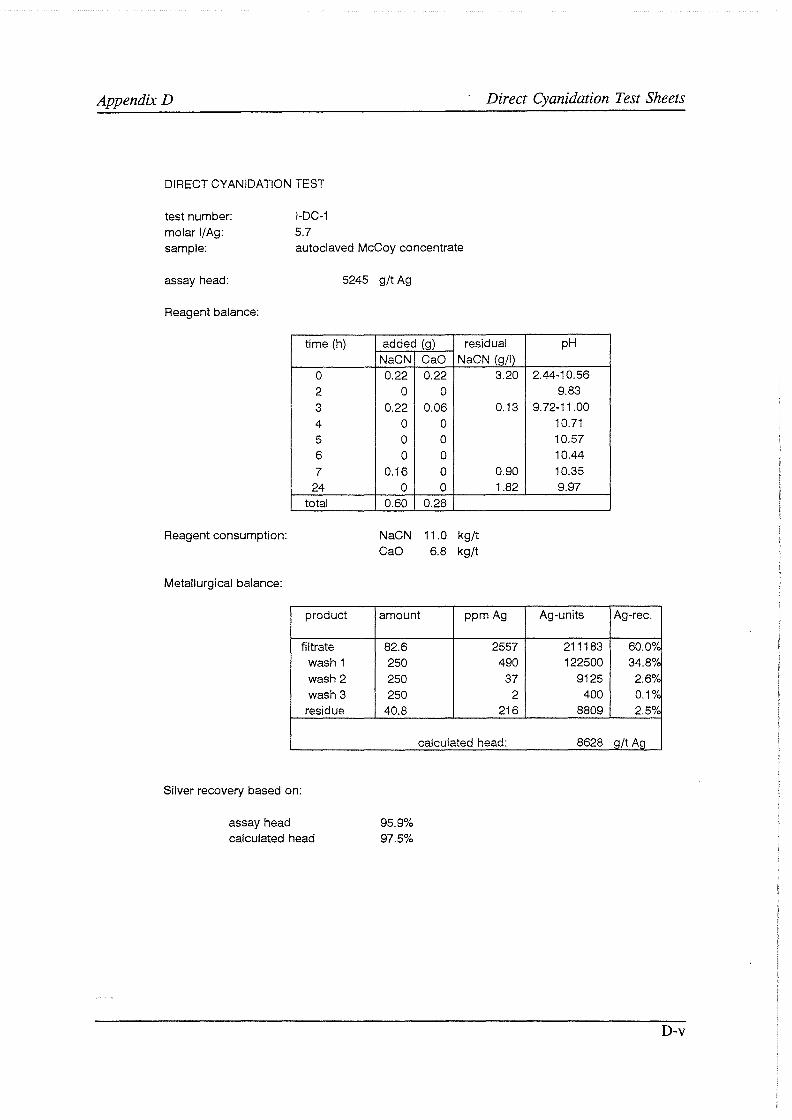
AppendixD Direct Cyanidation Test Sheets
DIRECT CYANIDATION TEST
I-DC-1 5.7
test number: molar I/Ag: sample: autoclaved McCoy concentrate
assay head: 5245 g/t Ag
Reagent balance:
time (h)
0 2 3 4 5 6 7
24 total
Reagent consumption:
Metallurgical balance:
product
filtrate wash 1 wash 2 wash 3
residue
Silver recovery based on:
assay head calculated head
added (g) residual NaCN cao NaCN (g/I) 0.22 0.22 3.20
0 0 0.22 0.06 0.13
0 0 0 0 0 0
0.16 0 0.90 0 0 1.82
0.60 0.28
NaCN 11.0 kg/t Cao 6.8 kg/t
amount ppm Ag
82.6 2557 250 490 250 37 250 2
40.8 216
calculated head:
95.9% 97.5%
pH
2.44-10.56 9.83
9.72-11.00 10.71 10.57 10.44 10.35 9.97
Ag-units Ag-rec.
211183 60.0o/c 122500 34.8%
9125 2.6o/c 400 0.1%
8809 2.5o/c
8628 a/t Aa
D-v


Appendix D Direct Cyanidation Test Sheets
DIRECT CYANIDATION TEST
I-DC-2 5.5
test number: molar I/Ag: sample: autoclaved Orcopampa concentrate
assay head: 12931 g/t Ag
Reagent balance:
time (h)
0 2 3 4 5 6 7
24 total
Reagent consumption:
Metallurgical balance:
product
filtrate wash 1 wash2 wash 3 residue
Silver recovery based on:
assay head calculated head
added (g) residual NaCN Cao NaCN (g/I) 0.48 0.33 7.80
0 0.06 0.45 0.06 0.37
0 0 0 0 0 0
0.34 0 2.29 0 0 5.21
1.27 0.44
NaCN 24.6 kg/t Cao 12.0 kg/t
amount ppm Ag
67.6 6700 250 1097 250 41 250 4
37.1 41
calculated head:
99.7% 99.8%
pH
2.40- 9.70 8.03- 9.64 9.32-11.09
10.73 10.51 10.43 10.38 10.38
Ag-units Ag-rec.
452920 61.2'¾ 274175 37.1'¾
10275 1.4'¾ 900 0.1'¾
1536 0.2'¾
19941 a/t Ao
D-vi


Appendix D Direct Cyanidation Test Sheets
DIRECT CYANIDATION TEST
I-DC-3 2
test number: molar I/Ag: sample: autoclaved McCoy concentrate
assay head: 7484 g/t Ag
Reagent balance:
time (h)
0 1 2 3 4 6 8
24 total
Reagent consumption:
Metallurgical balance:
product
filtrate wash 1 wash 2 wash3 residue
Silver recovery based on:
assay head calculated head
added (g) residual NaCN cao NaCN (g/I) 0.29 0.39 4.60
0 0.17 0.26 0 0.39
0 0 0 0 0 0
0.10 0.06 3.02 0 0 3.04
0.64 0.61
NaCN 12.0 kg/t cao 17.4 kg/t
amount ppm Ag
72.6 3750 250 58 250 33 250 · 5
35.2 197
calculated head:
97.4% 97.7%
pH
2.82- 9.83 8.74-10.03
9.71 9.78 9.62 9.53
9.51- 9.75 9.47
Ag-units Ag-rec.
272250 89.9'¼ 14375 4.7'¼ 8125 2.7'¼ 1225 0.4'¼ 6931 2.3'¼
8605 q/t Ao
D-vii


Appendix D Direct Cyanidation Test Sheets
DIRECT CYANIDATION TEST
I-DC-4 2
test number: molar I/Ag: sample: autoclaved Orcopampa concentrate
assay head: 17799 g/t Ag
Reagent balance:
time (h)
0 1 2 3 4 6 8
24 total
Reagent consumption:
Metallurgical balance:
product
filtrate wash 1 wash2 wash 3 residue
Silver recovery based on:
assay head calculated head
added (g) residual NaCN CaO NaCN (g/I) 0.51 0.50 10.80
0 0.17 0.46 0 0.98
0 0 0 0 0 0
0.13 0 8.11 0 0 9.60
1.09 0.67
NaCN 20.3 kg/t Cao 23.3 kg/t
amount ppm Ag
53.0 6960 250 942 250 52 250 4 28.6 1737
calculated head:
90.2% 92.6%
pH
2.85- 9.38 9.20-11.01
10.50 10.79 10.83 10.82 10.79 10.68
Ag-units Ag-rec.
368880 55.2'¾ 235500 35.3'¾
12950 1.9'¾ 875 0.1'¾
49687 7.4'¼
23353 aft Aa
D-viii

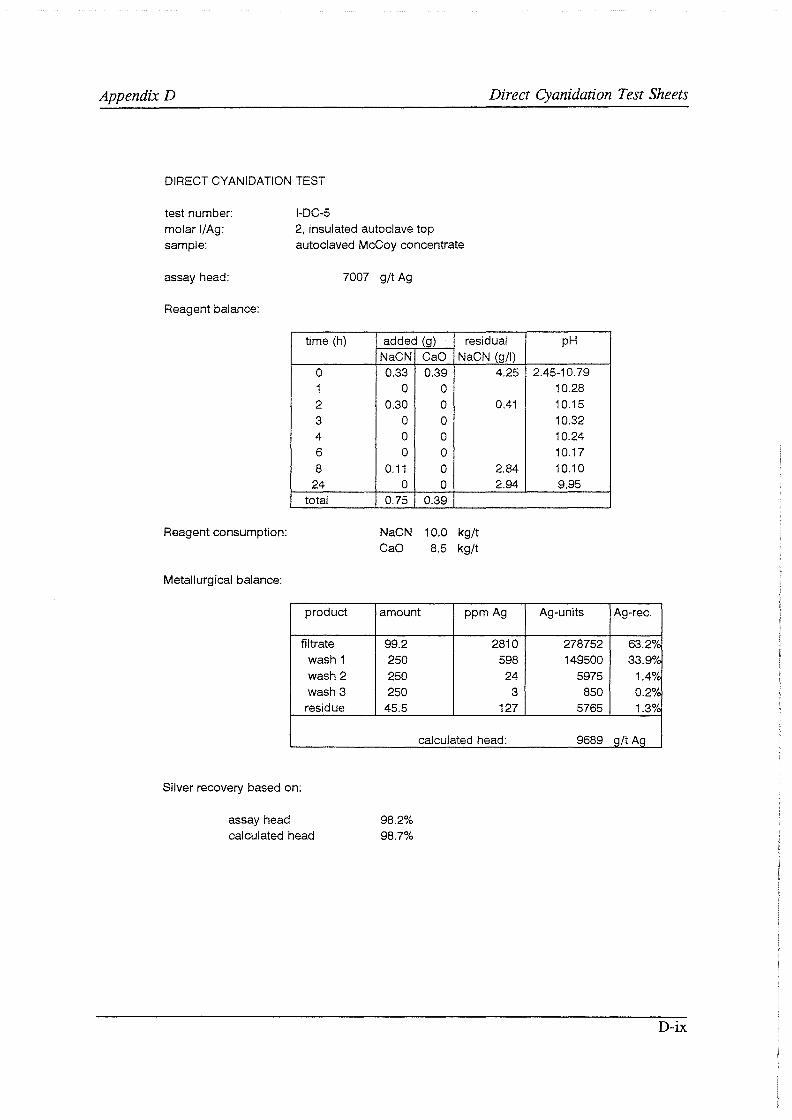
Appendix D Direct Cyanidation Test Sheets
DIRECT CYANIDATION TEST
I-DC-5 test number: molar I/Ag: sample:
2, insulated autoclave top autoclaved McCoy concentrate
assay head: 7007 g/t Ag
Reagent balance:
time (h)
0 1 2 3 4 6 8
24 total
Reagent consumption:
Metallurgical balance:
product
filtrate wash 1 wash 2 wash 3 residue
Silver recovery based on:
assay head calculated head
added (g) residual NaCN Cao NaCN (g/I) 0.33 0.39 4.25
0 0 0.30 0 0.41
0 0 0 0 0 0
0.11 0 2.84 0 0 2.94
0.75 0.39
NaCN 10.0 kg/t Cao 8.5 kg/t
amount ppm Ag
99.2 250 250 250
45.5
98.2% 98.7%
2810 598 24 3
127
calculated head:
pH
2.45-10.79 10.28 10.15 10.32 10.24 10.17 10.10 9.95
Ag-units Ag-rec.
278752 63.2'¼ 149500 33.9'¼
5975 1.4'¼ 850 0.2°/c
5765 1.3'¼
9689 aft Ao
D-ix


Appendix D Direct Cyanidation Test Sheets
DIRECT CYANIDATION TEST
I-DC-6 test number: molar I/Ag: sample:
2, insulated autoclave top autoclaved Orcopampa concentrate
assay head: 16524 g/t Ag
Reagent balance:
time (h)
0 1 2 3 4 6 8
24 total
Reagent consumption:
Metallurgical balance:
product
filtrate wash 1 wash 2 wash3 residue
Silver recovery based on:
assay head calculated head
added (g) residual NaCN Cao NaCN (g/I) 0.51 0.44 10.00
0 0
0.47 0 0.77 0 0 0 0 0 0
0.09 0 8.19 0 0 7.95
1.07 0.44
NaCN 23.2 kg/t Cao 15.0 kg/t
amount ppm Ag
47.8 9220 250 1080 250 37 250 4
29.6 230
calculated head:
98.6% 99.1%
pH
2.54- 9.94 9.84 9.78 10.64 10.79 10.77 10.66 10.39
Ag-units Ag-rec.
440716 60.6'¾ 270000 37.1'¾
9250 1.3'¾ 963 0.1'¾
6799 0.9'¾
24585 q/t Aq
D-x

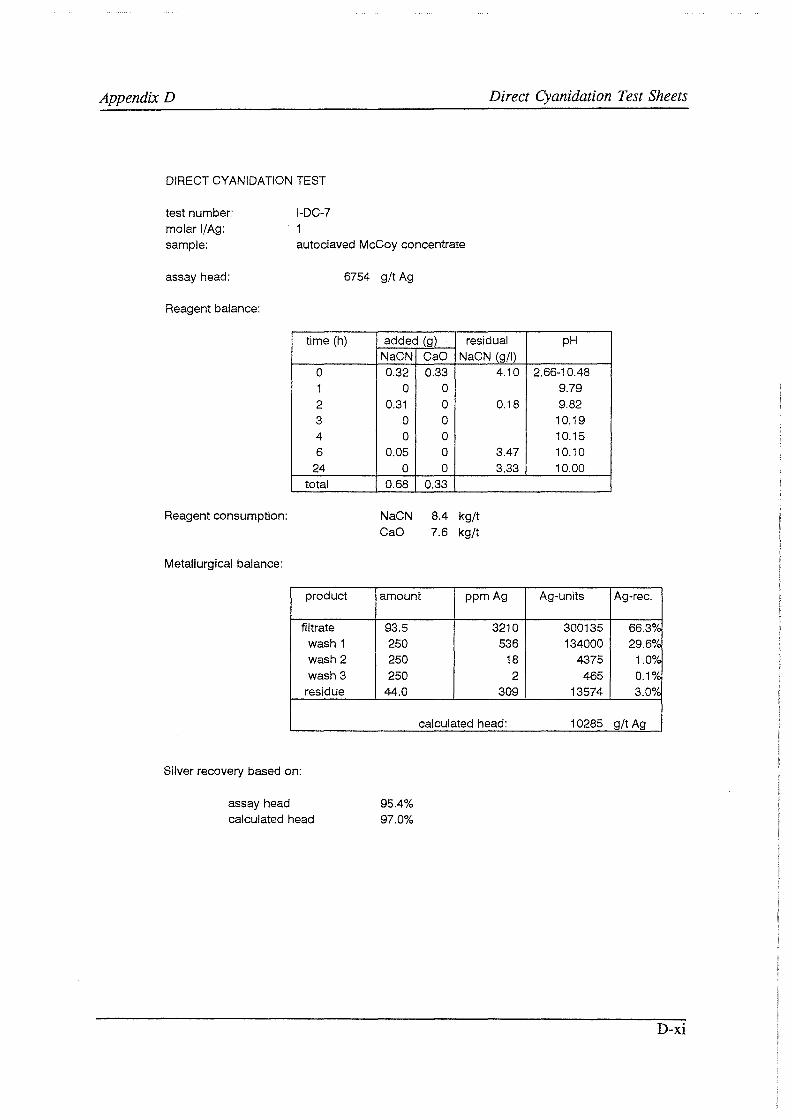
Appendix D Direct Cyanidation Test Sheets
DIRECT CYANIDATION TEST
I-DC-7 test number: molar I/Ag: sample: autoclaved McCoy concentrate
assay head: 6754 g/t Ag
Reagent balance:
time (h)
0 1 2 3 4 6
24 total
Reagent consumption:
Metallurgical balance:
product
filtrate wash 1 wash 2 wash3
residue
Silver recovery based on:
assay head calculated head
added (g) residual NaCN cao NaCN (g/I) 0.32 0.33 4.10
0 0 0.31 0 0.18
0 0 0 0
0.05 0 3.47 0 0 3.33
0.68 0.33
NaCN 8.4 kg/t Cao 7.6 kg/t
amount ppm Ag
93.5 3210 250 536 250 18 250 2
44.0 309
calculated head:
95.4% 97.0%
pH
2.66-10.48 9.79 9.82 10.19 10.15 10.10 10.00
Ag-units Ag-rec.
300135 66.3% 134000 29.6%
4375 1.0o/c 465 0.1o/c
13574 3.0o/c
10285 g/t Ag
D-xi


Appendix D Direct Cyanidation Test Sheets
DIRECT CYANIDATION TEST
I-DC-8 test number: molar I/Ag: sample: autoclaved Orcopampa concentrate
assay head: 17502 g/t Ag
Reagent balance:
time (h)
0 1 2 3 4 6
24 total
Reagent consumption:
Metallurgical balance:
product
filtrate wash 1 wash 2 wash3 residue
Silver recovery based on:
assay head calculated head
added (g) residual NaCN Cao NaCN (g/I) 0.55 0.44 10.60
0 0 0.52 0 0.61
0 0 0 0
0.09 0 8.92 0 0 9.21
1.16 0.44
NaCN 23.6 kg/t Cao 15.4 kg/t
amount ppm Ag
51.7 9680 250 970 250 29 250 2
28.9 452
calculated head:
97.4% 98.3%
pH
2.70-10.45 10.54 10.32 10.85 10.99 10.96 10.65
Ag-units Ag-rec.
500456 65.5'¾ 242500 31.8'¾
7150 0.9'¾ 488 0.1'¾
13074 1.7'¾
26424 g/t Ag
D-xii