Melt flow behaviour of liquid crystalline polymer
14
This article was downloaded by: [National Chemical Laboratory] On: 04 August 2014, At: 05:00 Publisher: Taylor & Francis Informa Ltd Registered in England and Wales Registered Number: 1072954 Registered office: Mortimer House, 37-41 Mortimer Street, London W1T 3JH, UK Molecular Crystals and Liquid Crystals Publication details, including instructions for authors and subscription information: http://www.tandfonline.com/loi/gmcl16 Melt Flow Behaviour of Liquid Crystalline Polymer A. V. Shenoy a & D. R. Saini a a Polymer Science and Engineering Group, Chemical Engineering Division , National Chemical Laboratory , Pune, 411 008, India Published online: 28 Mar 2007. To cite this article: A. V. Shenoy & D. R. Saini (1986) Melt Flow Behaviour of Liquid Crystalline Polymer, Molecular Crystals and Liquid Crystals, 135:3-4, 343-354, DOI: 10.1080/00268948608084816 To link to this article: http://dx.doi.org/10.1080/00268948608084816 PLEASE SCROLL DOWN FOR ARTICLE Taylor & Francis makes every effort to ensure the accuracy of all the information (the “Content”) contained in the publications on our platform. However, Taylor & Francis, our agents, and our licensors make no representations or warranties whatsoever as to the accuracy, completeness, or suitability for any purpose of the Content. Any opinions and views expressed in this publication are the opinions and views of the authors, and are not the views of or endorsed by Taylor & Francis. The accuracy of the Content should not be relied upon and should be independently verified with primary sources of information. Taylor and Francis shall not be liable for any losses, actions, claims, proceedings, demands, costs, expenses, damages, and other liabilities whatsoever or howsoever caused arising directly or indirectly in connection with, in relation to or arising out of the use of the Content.
-
Upload
independent -
Category
Documents
-
view
2 -
download
0
Transcript of Melt flow behaviour of liquid crystalline polymer
This article was downloaded by: [National Chemical Laboratory]On: 04 August 2014, At: 05:00Publisher: Taylor & FrancisInforma Ltd Registered in England and Wales Registered Number: 1072954Registered office: Mortimer House, 37-41 Mortimer Street, London W1T 3JH,UK
Molecular Crystals and LiquidCrystalsPublication details, including instructions forauthors and subscription information:http://www.tandfonline.com/loi/gmcl16
Melt Flow Behaviour of LiquidCrystalline PolymerA. V. Shenoy a & D. R. Saini aa Polymer Science and Engineering Group,Chemical Engineering Division , National ChemicalLaboratory , Pune, 411 008, IndiaPublished online: 28 Mar 2007.
To cite this article: A. V. Shenoy & D. R. Saini (1986) Melt Flow Behaviour of LiquidCrystalline Polymer, Molecular Crystals and Liquid Crystals, 135:3-4, 343-354, DOI:10.1080/00268948608084816
To link to this article: http://dx.doi.org/10.1080/00268948608084816
PLEASE SCROLL DOWN FOR ARTICLE
Taylor & Francis makes every effort to ensure the accuracy of all theinformation (the “Content”) contained in the publications on our platform.However, Taylor & Francis, our agents, and our licensors make norepresentations or warranties whatsoever as to the accuracy, completeness,or suitability for any purpose of the Content. Any opinions and viewsexpressed in this publication are the opinions and views of the authors, andare not the views of or endorsed by Taylor & Francis. The accuracy of theContent should not be relied upon and should be independently verified withprimary sources of information. Taylor and Francis shall not be liable for anylosses, actions, claims, proceedings, demands, costs, expenses, damages,and other liabilities whatsoever or howsoever caused arising directly orindirectly in connection with, in relation to or arising out of the use of theContent.

This article may be used for research, teaching, and private study purposes.Any substantial or systematic reproduction, redistribution, reselling, loan,sub-licensing, systematic supply, or distribution in any form to anyone isexpressly forbidden. Terms & Conditions of access and use can be found athttp://www.tandfonline.com/page/terms-and-conditions
Dow
nloa
ded
by [
Nat
iona
l Che
mic
al L
abor
ator
y] a
t 05:
00 0
4 A
ugus
t 201
4

Mol. Cryst. Liq. Cryst., 1986, Vol. 135, pp. 343-354
0 1986 Gordon and Breach Science Publishers S.A. Printed in the United States of America
0026-8941 1861 1354- 0343/$2O.O010
Melt Flow Behaviour of Liquid Crystalline Polymer? A. V. SHENOY and D. R. SAlNl Polymer Science and Engineering Group, Chemical Engineering Division, National Chemical Laboratory, Pune 41 1 008, India
(Received April 3, 198s; in final form July 1.5, 1985)
The method proposed earlier to estimate complete flow curves depicting the variation of melt viscosity over industrially relevant shear rate and temperature through the melt flow index has been extended to liquid crystalline polymer melts. The present work considers the study of the thermotropic system of the copolymer of poly(ethy1ene terephthalate) and p-hydroxybenzoic acid with different ratio of the components. A master curve is shown to exist for the system when modified viscosity function is plotted against modified shear rate. A new rheological model has been suggested to fit the master curve adequately as the curve is different from the conventional form.
During recent years, liquid crystalline polymers have attained im- mense commercial importance due to the possibility of producing ultrahigh strength and modulus fibers and plastics' - 8 from them. The exceptional physical properties of these uniquely structured systems are a direct consequence of the morphology and orientation induced into the polymers due to the flow history during processing. There- fore, an understanding of the rheology of these systems is extremely important.
Rheology of liquid crystalline polymers has received a great deal of attention in recent literature adjudging from the publication of reviews and key articles9-'* on the subject. Rheological studies have been performed for both lyotropic systems (liquid crystals which exist in solution) as well as thermotropic systems (liquid crystalline order which exists in polymer melts or undiluted polymers). There is a considerable degree of similarity between the rheological properties
tNCL Communication No. 3770.
343
Dow
nloa
ded
by [
Nat
iona
l Che
mic
al L
abor
ator
y] a
t 05:
00 0
4 A
ugus
t 201
4

344 A. V. SHENOY and D. R. SAINI
of lyotropic and thermotropic systems. The most distinguishing fea- ture of lyotropic and thermotropic systems is the sharp decrease in viscosity with the onset of liquid crystalline ~ r d e r . ~ . ' ~ ~ ' ~ J ~ In fact, it has been p o s t ~ l a t e d ' ~ - ~ ~ that the shear rate dependence of viscosity of such systems shows three distinct regions: a shear-thinning region at very low shear rates, a plateau region of nearly constant viscosity and another shear thinning region at high shear rates. Viscosity is also dependent on temperature and hence, a knowledge of the com- plete flow curve or rheogram depicting the variation of viscosity over industrially relevant range of shear rates and temperature is essential in the design of processing equipment, process optimization and trou- ble-shooting. The rheological data for constructing the rheogram are generally obtained on sophisticated scientific instruments such as the Weissenberg Rheogoniometer, the Instron Capillary Rheometer, Rheometrics Mechanical Spectrometer, etc. which are very expensive and require trained operators. Recently, Shenoy et al.23-31 have sug- gested a method for obtaining an adequate estimate of the flow be- haviour of polymer melts merely from the knowledge of the Melt Flow Index (MFI). Their method involves the generation of unified curves by coalescing rheograms of various grades of a resin at various temperatures. Unified curves have been provided for a large number of homopolymer types such as polyolefins and s t y r e n i ~ s , ~ ~ cellulos- i c ~ , ~ ~ vinyls," engineering thermoplastics26 and some speciality pol- y m e r ~ . ~ ' From these unified curves, rheograms of the polymer melts can be easily estimated from readily available or easily determinable flow parameter, namely, the MFI. The technique has been shown to be effectively applicable to filled polymer^,^^^^^ polymer blends30 and copolymers. 31
In the present paper, the unifying approach is extended to liquid crystalline melts. For thermotropic systems, there are three r e p ~ r t s ' ~ * ' ~ ~ ~ ~ giving the viscosity of copolymers of polyethylene terephthalate (PET) modified with varying amounts of p-hydroxybenzoic acid (HBA). It will be shown in the following that all the viscosity versus shear rate curves €or these systems can be coaiesced into a single curve inde- pendent of the mole percentage composition of the PET and HBA.
DATA ANALYSIS
The melt flow is a flow parameter obtained from an extrusion rhe- ometer. It is defined as the weight of the polymer in grams extruded in ten minutes through a capillary of specific diameter and length by
Dow
nloa
ded
by [
Nat
iona
l Che
mic
al L
abor
ator
y] a
t 05:
00 0
4 A
ugus
t 201
4
MELT FLOW BEHAVIOUR 345
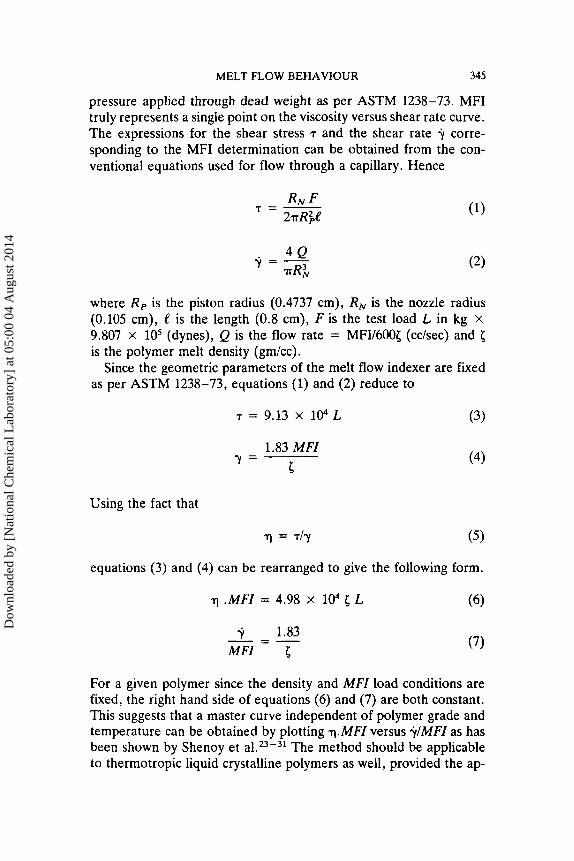
pressure applied through dead weight as per ASTM 1238-73. MFI truly represents a single point on the viscosity versus shear rate curve. The expressions for the shear stress T and the shear rate y corre- sponding to the MFI determination can be obtained from the con- ventional equations used for flow through a capillary. Hence
where R P is the piston radius (0.4737 cm), RN is the nozzle radius (0.105 cm), 4? is the length (0.8 cm), F is the test load L in kg x 9.807 x lo5 (dynes), Q is the flow rate = MFI/6005 (cckec) and 6 is the polymer melt density (gmlcc).
Since the geometric parameters of the melt flow indexer are fixed as per ASTM 1238-73, equations (1) and (2) reduce to
T = 9.13 x 10⁴ L (3)
(4) 1.83 MFI
5 Y =
Using the fact that
equations (3) and (4) can be rearranged to give the following form.
.MFI = 4.98 x 10⁴ 5 L (6)
1; 1.83 - MFI 5 (7)
For a given polymer since the density and MFI load conditions are fixed, the right hand side of equations (6) and (7) are both constant. This suggests that a master curve independent of polymer grade and temperature can be obtained by plotting q.MFI versus jIMFI as has been shown by Shenoy et al.23-31 The method should be applicable to thermotropic liquid crystalline polymers as well, provided the ap-
Dow
nloa
ded
by [
Nat
iona
l Che
mic
al L
abor
ator
y] a
t 05:
00 0
4 A
ugus
t 201
4

346 A. V. SHENOY and D. R. SAINI
d
FIGURE different I
METER ~ 0 . 0
$,Shear Rate ( s e t ' )
1 Viscosity versus shear rate curve for 80 mole percent of HBA temperatures (taken from Wissburn 18).
at six
propriate value of MFI is used. Specific test conditions for most common polymers are given in ASTM 1238-73. However, for ther- motropic systems of the type studied in the l i t e r a t ~ r e ' ~ * ' ~ . ' ~ J ~ there are no specifications given. Since the studied systems are copolyesters, it would be appropriate to choose test load conditions akin to those of poly(ethy1ene terephthalate) namely, 2.16 kg.
MASTER CURVE GENERATION
Figures 1-4 are viscosity versus shear rate curves for different com- positions of HBA/PET at various te tiiperatures. Two particular com-
Dow
nloa
ded
by [
Nat
iona
l Che
mic
al L
abor
ator
y] a
t 05:
00 0
4 A
ugus
t 201
4

MELT FLOW BEHAVIOUR 347
3 4 -7 7
I
I --t
n 9
+ Q
N
w 5 J
8
Dow
nloa
ded
by [
Nat
iona
l Che
mic
al L
abor
ator
y] a
t 05:
00 0
4 A
ugus
t 201
4

\. \
W z. P F
*,S
hea
r R
ate
(se
c')
FIG
UR
E 3
V
iscos
ity v
ersu
s she
ar r
ate
curv
e fo
r 60
mol
e pe
rcen
t of
HB
A a
t thr
ee d
iffer
ent t
empe
ratu
res
(tak
en fr
om W
issbu
rn 1
6).
Dow
nloa
ded
by [
Nat
iona
l Che
mic
al L
abor
ator
y] a
t 05:
00 0
4 A
ugus
t 201
4
MELT FLOW BEHAVIOUR 349
*,Shear R o l e ( sef ' )
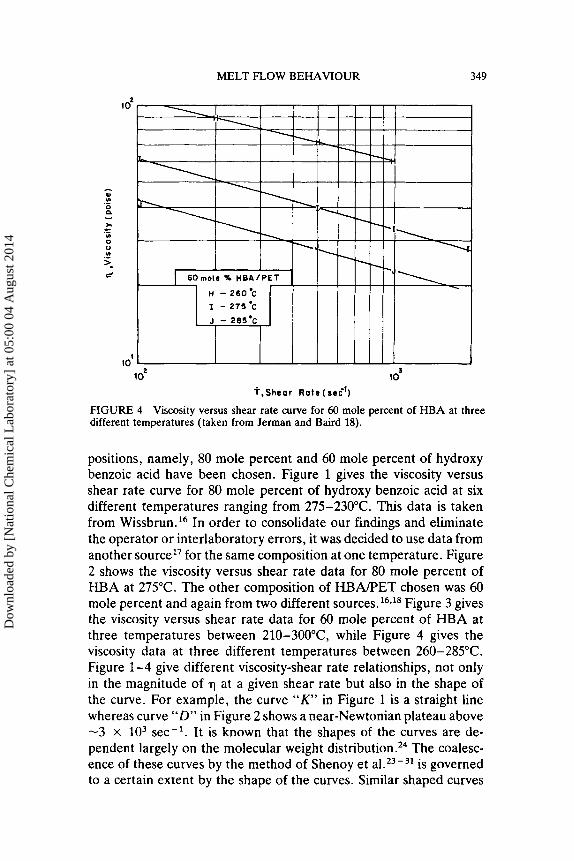
FIGURE 4 Viscosity versus shear rate curve for 60 mole percent of HBA at three different temperatures (taken from Jerman and Baird 18).
positions, namely, 80 mole percent and 60 mole percent of hydroxy benzoic acid have been chosen. Figure 1 gives the viscosity versus shear rate curve for 80 mole percent of hydroxy benzoic acid at six different femperatures ranging from 275-230°C. This data is taken from Wissbrun. l6 In order to consolidate our findings and eliminate the operator or interlaboratory errors, it was decided to use data from another source17 for the same composition at one temperature. Figure 2 shows the viscosity versus shear rate data for 80 mole percent of HBA at 275°C. The other composition of HBA/PET chosen was 60 mole percent and again from two different sources.'6*'8 Figure 3 gives the viscosity versus shear rate data for 60 mole percent of HBA at three temperatures between 210-300°C, while Figure 4 gives the viscosity data at three different temperatures between 260-285°C. Figure 1-4 give different viscosity-shear rate relationships, not only in the magnitude of -q at a given shear rate but also in the shape of the curve. For example, the curve " K ' in Figure 1 is a straight line whereas curve "D" in Figure 2 shows a near-Newtonian plateau above -3 x lo3 sec-'. It is known that the shapes of the curves are de- pendent largely on the molecular weight di~tribution.'~ The coalesc- ence of these curves by the method of Shenoy et al.23-3' is governed to a certain extent by the shape of the curves. Similar shaped curves
Dow
nloa
ded
by [
Nat
iona
l Che
mic
al L
abor
ator
y] a
t 05:
00 0
4 A
ugus
t 201
4
350 A. V. SHENOY and D. R. SAINI
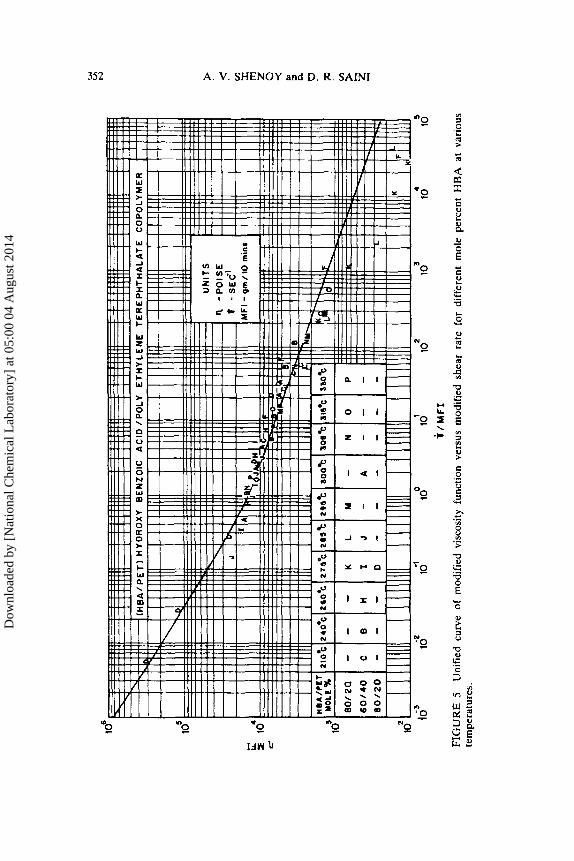
would definitely coalesce better. This can be seen from Figure 5 wherein the coalescence is excellent in the lower to middle shear rate region where the original curves had similar shapes. At higher shear rate, there is a noticeable degree of scatter. The method for coa- lescence used in the present case has been outlined below.
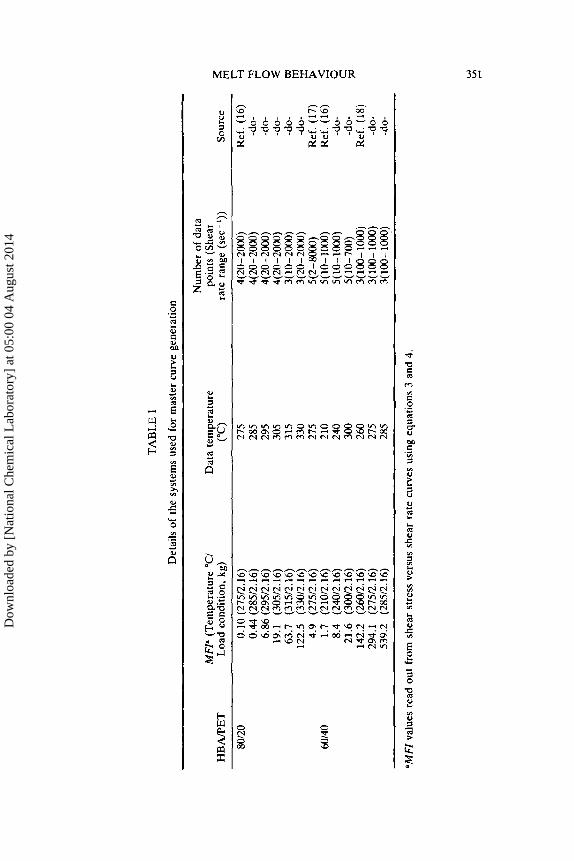
Each of the curves in Figures 1-4 were transformed into shear stress versus shear rate curves (not shown here) in order to estimate the MFI value corresponding to each curve. This was done by sub- stituting the value of the load condition 2.16 kg in equation (3) in order to get the value of shear stress corresponding to the MFI test. The shear rate corresponding to this shear stress value was found from the curves and an estimate of the MFI value was estimated from equation (4). This method of estimating MFI from known shear stress versus shear rate curves has been used successfully by Shenoy et al.23-31 and Rideal and Padget3* when the MFI of the polymer is not known through the manufacturer or too low to measure on the melt flow indexer. Details of the MFZ values calculated are given in Table I.
Using the appropriate values of MFI, each of the curves in Figures 1-4 were replotted as q .MFI versus y/MFZ. It was found that a unique curve resulted as can be seen from Figure 5. This coalesced curve contains data from thirteen different curves and the coalescence can be seen to be reasonably good. Figure 5 therefore represents the master curve for the liquid crystalline copolyester system HBA/PET. The master curve can now be used for generating the rheograms at any required temperature using the following steps.
Obtain the MFZ value for the system under load condition of 2.16 kg at the temperature of interest.
If the MFI value cannot be determined from the melt flow indexer at the temperature of interest, the MFZ value may be generated at any other temperature and then an estimate of MFI at the temper- ature of interest may be calculated through the procedure given by Saini and S h e n ~ y . ~ ~ The following equation may then be used
Using the correct value of the effective MFI, the viscosity versus shear rate curve can be obtained by mere substitution in the master curve. This step can be eliminated if the curve is fitted through a rheological model and the parameters of the model given as has been done by Shenoy and Saini” for their unified curves. This would con-
Dow
nloa
ded
by [
Nat
iona
l Che
mic
al L
abor
ator
y] a
t 05:
00 0
4 A
ugus
t 201
4
TA
BL
E I
Det
ails
of
the
syst
ems
used
for
mas
ter
curv
e ge
nera
tion
Num
ber
of d
ata
MF
P (T
empe
ratu
re "
C/
Dat
a te
mpe
ratu
re
poin
ts (
Shea
r H
BA
PE
T
Loa
d co
nditi
on, k
g)
("C
) ra
te r
ange
(se
c-I)
) So
urce
5 r
80/2
0 0.
10 (
2W2.
16)
275
4(20
-200
0)
Ref
. (16
) 4
0.44
(28Y
2.16
) 28
5 4(
20-
2000
) -d
o-
cr!
19.1
(3
0Y2.
16)
305
4(20
-200
0)
-do-
4
63.7
(3
132.
16)
315
3(10
-200
0)
-do-
W
6.86
(295
12.1
6)
295
4(20
- 20
00)
-do-
5
122.
5 (3
30/2
.16)
33
0 3(
20-2
OO
o)
-do-
E
4.9
(275
L2.1
6)
275
5(2-
8000
) R
ef. (
17)
P
1.7
(210
/2.1
6)
210
5(10
-1O
Oo)
R
ef. (
16)
0
C
8.4
(240
/2.1
6)
240
5( 1
0- 1
OOo)
-do-
21
.6
(300
/2.1
6)
300
5( 10
-700
) -d
o-
56
142.
2 (2
6012
.16)
26
0 3(
100
- 1O
OO)
Ref
. (18
) 29
4.1
(275
L2.1
6)
275
3(10
0-10
00)
-do-
53
9.2
(28Y
2.16
) 28
5 3(
100
- 1o
oO)
-do-
60/4
0
'MFI
val
ues
read
out
fro
m s
hear
str
ess
vers
us s
hear
rat
e cu
rves
usi
ng e
quat
ions
3 a
nd 4
.
Dow
nloa
ded
by [
Nat
iona
l Che
mic
al L
abor
ator
y] a
t 05:
00 0
4 A
ugus
t 201
4
352 A. V. SHENOY and D. R. SAINI
“0
*0
n 0
N 0
-0
0 s!
- ‘0
? 0
n ‘0 -
‘52 IrlW
0 “0 ”Q
Dow
nloa
ded
by [
Nat
iona
l Che
mic
al L
abor
ator
y] a
t 05:
00 0
4 A
ugus
t 201
4
MELT FLOW BEHAVIOUR 353
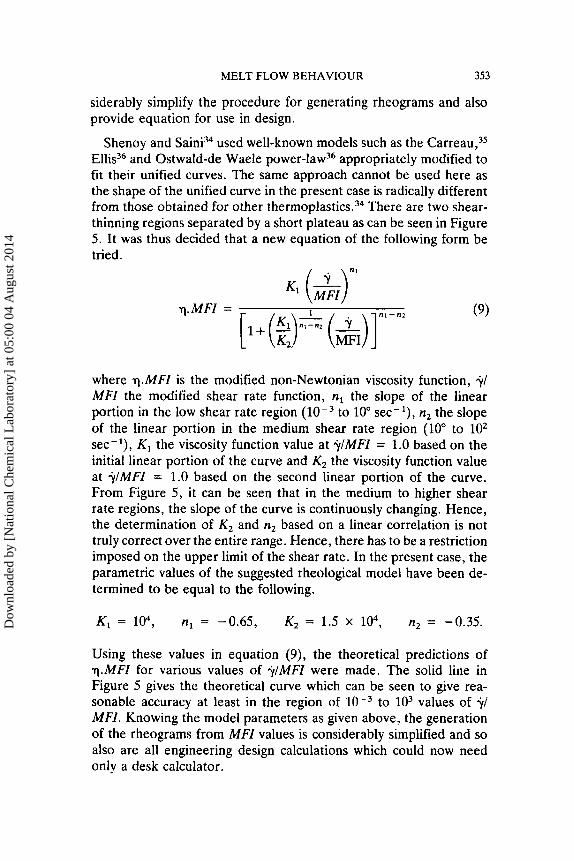
siderably simplify the procedure for generating rheograms and also provide equation for use in design.
Shenoy and Saini34 used well-known models such as the C a r r e a ~ , ~ ~ Ellis36 and Ostwald-de Waele p ~ w e r - l a w ~ ~ appropriately modified to fit their unified curves. The same approach cannot be used here as the shape of the unified curve in the present case is radically different from those obtained for other thermoplastic^.^^ There are two shear- thinning regions separated by a short plateau as can be seen in Figure 5. It was thus decided that a new equation of the following form be tried.
Kl ($I
[ l+(Z)& (A)] q , M F I = n i - n z (9)
where q. MFI is the modified non-Newtonian viscosity function, j d MFI the modified shear rate function, n1 the slope of the linear portion in the low shear rate region to 10" sec-I), n, the slope of the linear portion in the medium shear rate region (lo" to 10, sec-l), K1 the viscosity function value at jl/MFI = 1.0 based on the initial linear portion of the curve and K2 the viscosity function value at y /MFI = 1.0 based on the second linear portion of the curve. From Figure 5 , it can be seen that in the medium to higher shear rate regions, the slope of the curve is continuously changing. Hence, the determination of K , and n, based on a linear correlation is not truly correct over the entire range. Hence, there has to be a restriction imposed on the upper limit of the shear rate. In the present case, the parametric values of the suggested rheological model have been de- termined to be equal to the following.
K, = 104, n, = -0.65, K2 = 1.5 X 10⁴, n, = -0.35.
Using these values in equation (9), the theoretical predictions of q.MFI for various values of jdMFI were made. The solid line in Figure 5 gives the theoretical curve which can be seen to give rea- sonable accuracy at least in the region of to lo3 values of $/ MFI. Knowing the model parameters as given above, the generation of the rheograms from MFI values is considerably simplified and so also are all engineering design calculations which could now need only a desk calculator.
Dow
nloa
ded
by [
Nat
iona
l Che
mic
al L
abor
ator
y] a
t 05:
00 0
4 A
ugus
t 201
4
354 A. V. SHENOY and D. R. SAINI
References
1. S. L. Kwolek, U. S. Pat. 3,671, 542 (1972). 2. H. Blades, U. S. Pat. 3,767, 756 (1973). 3. G. C. Berry and C. E. Sroog, eds. “Rigid Chain Polymers: Synthesis and Prop-
4. A. Ciferri and 1. M. Ward, eds. “Ultra-High Modulus Polymers,” Applied Science
5 . A. Blumstein, ed. “Liquid Crystalline Order in Polymers,” Academic Press, New
6 . E. T. Samulski and D. B. Du Pre, “Polymeric Liquid Crystals,” in Advances in
7. E. T. Samulski, Physics Today, 2 (May 1982). 8. R. D. Gilbert and P. A. Patton, Prog. Polym. Sci., 9, 115 (1983). 9. S. P. Papkov, V. G. Kulichiphin and V. D. Kalymykova, J. Polym. Sci. Polym.
10. W. J. Jackson, Jr. and H. F. Kuhfuss, 1. Polym. Sci. Polym. Chem., 14, 2043
11. H. Aoki, Polym. Sci. and Engg. Report No. 108, University of Tennessee (1977). 12. D. G. Baird. “Rheology of Polymers with Liquid Crystalline Order,” in Liquid
Crystalline Order in Polymers, A. Blumstein, ed., Academic Press, New York (1978).
erties,” J. Polym. Sci. Polym. Symp., 65 (1978).
Publishers, London (1979).
York (1978).
Liquid Crystals, 4, G. H. Brown, ed., Academic, New York (1979).
Phys., 12, 1753 (1974).
( 1976).
13. D. G. Baird, J. Appl. Polym. Sci., 22. 2701 (1978). 14. D. G. Baird, 1. Rheol., 24, 465 (1980). 15. L. L. Chapoy and N. F. la Cour, Rheol. Acta, 19, 731 (1980). 16. K. F. Wissbrun, Br. Polym. J . , 12, 163 (1980). 17. D. G. Baird, “Rheology Vol. 3: Applications,” eds. G. Astarita, G. Marrucci and
18. R. E. Jerman and D. G. Baird, J . Rheol.. 25, 275 (1981). 19. K. F. Wissbrun, J . Rheol., 25, 619 (1981). 20. T. Asada and S. Onogi, Polym. Engg. Reviews, 3 , 323 (1983). 21. D. E. Baird, A. Gotsis and G. Viola, Polymer Preprinrs, 22, 1 (1983). 22. A. Bickel. M. T. Shaw and E. T. Samulski, J . Rheol., 28, 647 (1984). 23. A. V. Shenoy, S. Chattopadhyay and V. M. Nadkarni, Rheol. Acta, 22,90 (1983). 24. A. V. Shenoy, D. R. Saini and V. M. Nadkarni, J. Appl. Polym. Sci., 27, 4399
25. A. V. Shenoy, D. R. Saini and V. M. Nadkarni, J . Vinyl Tech., 5 , 192 (1983). 26. A . V. Shenoy, D. R. Saini and V. M. Nadkami, Rheol. Acta, 22, 209 (1983). 27. D. R. Saini and A. V. Shenoy, 1. Elastorn. Plmfics 17, 189 (1985). 28. A. V. Shenoy, D. R. Saini and V. M. Nadkami, J . Mat. Sci., IS, 2149 (1983). 29. A. V. Shenoy, D. R. Saini and V. M. Nadkami, Polym. Composites, 4,53 (1983). 30. A. V. Shenoy, D. R. Saini and V. M. Nadkarni, Inc. J. Polymeric Mad., 10, 213
31. A. V. Shenoy and D. R. Saini, Br. Polym. 1.. 17, OOO (1985). 32. G. R. Rideal and J . C. Padget, J . Polym. Sci. Symp., 57, 1 (1976). 33. D. R. Saini and A. V. Shenoy, J. Macromol. Sci. Phys., B22, 437 (1983). 34. A. V. Shenoy and D. R. Saini, Rheol. Acta, 23, 368 (1984). 35. P. J . Carreau, Trans. SOC. Rheol., 16, 99 (1972). 36. R. 9. Bird, R. C. Armstrong and 0. Hassager, Dynamics of Polymeric Liquids,
L. Nicolais, Plenum Press, 1980.
(1982).
(1984).
Vol. 1, Fluid Mechanics, John Wiley, New York (1977).
Dow
nloa
ded
by [
Nat
iona
l Che
mic
al L
abor
ator
y] a
t 05:
00 0
4 A
ugus
t 201
4