
Crystalline and magnetic structure-property relationship ... - Pure
13
Crystalline and magnetic structure-property relationship in spinel ferrite nanoparticles Henrik Lyder Andersen, a Matilde Saura-Múzquiz, a Cecilia Granados-Miralles, a,b Emmanuel Canévet, c,d Nina Lock e and Mogens Christensen a * Magnetic spinel ferrite MFe2O4 (M=Mn, Co, Ni, Zn) nanoparticles have been prepared via simple, green and scalable hydrothermal synthesis pathways utilizing sub- and supercritical conditions to attain specific product characteristics. The crystal-, magnetic- and micro-structures of the prepared crystallites have been elucidated through meticulous characterization employing several complementary techniques. Analysis of energy dispersive X-ray spectroscopy (EDS) and X-ray absorption near edge structure (XANES) data verifies the desired stoichiometries with divalent M and trivalent Fe ions. Robust structural characterization is carried out by simultaneous Rietveld refinement of a constrained structural model to powder X-ray diffraction (PXRD) and high-resolution neutron powder diffraction (NPD) data. The structural modeling reveals different affinities of the 3d transition metal ions for the specific crystallographic sites in the nanocrystallites, characterized by the spinel inversion degree, x, [M 2+ 1-xFe 3+ x] tet [M 2+ xFe 3+ 2- x] oct O4, compared to the well-established bulk structures. The MnFe2O4 and CoFe2O4 nanocrystallites exhibit random disordered spinel structures (x=0.643(3) and 0.660(6)), while NiFe2O4 is a completely inverse spinel (x=1.00) and ZnFe2O4 is close to a normal spinel (x=0.166(10)). Furthermore, the size, size distribution and morphology of the nanoparticles have been assessed by peak profile analysis of the diffraction data, transmission electron microscopy (TEM) and scanning transmission electron microscopy (STEM). The differences in nanostructure, spinel inversion and distinct magnetic nature of the M 2+ ions directly alter the magnetic structures of the crystallites at the atomic-scale and consequently the macroscopic magnetic properties of the materials. The present study serves as an important structural benchmark for the rapidly expanding field of spinel ferrite nanoparticle research. Keywords: Spinel, ferrite, MnFe2O4, CoFe2O4, NiFe2O4, ZnFe2O4, nanoparticles, hydrothermal synthesis, neutron, X- ray, powder diffraction, Rietveld refinement, inversion degree, XANES, magnetic structure. Introduction The new and fascinating properties of nanostructured magnetic materials have facilitated a wide range of state-of- the-art applications, e.g. as functionalized medicine carriers for drug delivery, 1, 2 logic gates in magnetic quantum dot computing, 3, 4 components in nanostructured permanent magnets, 5, 6 and many more. 7 Among the most important and widely used magnetic materials are the ferrites. 8 They constitute a class of iron(III) oxide based ceramic magnetic materials, which can be divided into two subgroups; the hexaferrites and the spinel ferrites. The low cost, excellent resistance to corrosion and good magnetic performance of the ferrites make them the preferred material in a large number of applications. 8 Nanosized spinel ferrite particles are currently being studied extensively for novel uses in e.g. hyperthermia cancer treatment, 9, 10 magnetic exchange-spring nanocomposites, 11, 12 MRI contrast agents, 13, 14 and magnetically recoverable nanocatalysts. 15, 16 Recently, very high room temperature magnetic saturations of 116 and 175 Am 2 /kg have been attained for nanosized and Zn substituted Ni- and Mn-ferrites, respectively. 9, 17 These observations have led to a surge of ferrite nanoparticle studies, which generally fail to attain comparable values. Therefore, a meticulous structural study of spinel ferrite nanocrystallites is urgently needed, in order to shed light onto the atomic-scale magnetic and structural features, which govern their macroscopic magnetic performance. The spinel ferrites have the chemical formula MFe 2 O 4 , where M can be a number of different divalent transition metal ions, such as Mn 2+ , Fe 2+ , Co 2+ , Ni 2+ , Zn 2+ , etc. The compounds are all soft magnets at room temperature, with the exception of CoFe 2 O 4 , which, in spite of its cubic structure, exhibits a substantial magnetocrystalline anisotropy resulting in hard magnetic properties. 6 A large number of different synthetic pathways for preparation of nanosized spinel ferrite crystallites exist, including sol-gel autocombustion, 18 microemulsion techniques, 19 thermal decomposition, 20 microwave assisted routes, 21 solvothermal synthesis, 22 and hydrothermal synthesis. 23 Of the mentioned preparation methods, the hydrothermal route has the benefit of being relatively simple, energy efficient, easily scalable and free from use of organic solvents or capping agents, i.e. environmentally friendly. 24, 25 In addition, as demonstrated by our previous studies, structural and microstructural characteristics of hydrothermally prepared ferrite nanoparticles can be tuned by varying reaction parameters such as temperature, pressure, precursor concentration, pH, and reaction time. 26-30 The spinel ferrites crystallize in the face centered cubic (fcc) spinel structure, space group Fd-3m, illustrated in Figure 1. The spinel structure consists of a cubic close-packed oxygen lattice, in which an eighth of the tetrahedral and half of the octahedral voids are occupied by the metal ions. This result in
-
Upload
khangminh22 -
Category
Documents
-
view
1 -
download
0
Transcript of Crystalline and magnetic structure-property relationship ... - Pure

Crystalline and magnetic structure-property relationship in spinel ferrite nanoparticles
Henrik Lyder Andersen,a Matilde Saura-Múzquiz,a Cecilia Granados-Miralles,a,b Emmanuel Canévet,c,d Nina Locke and Mogens Christensena*
Magnetic spinel ferrite MFe2O4 (M=Mn, Co, Ni, Zn) nanoparticles have been prepared via simple, green and scalable
hydrothermal synthesis pathways utilizing sub- and supercritical conditions to attain specific product characteristics.
The crystal-, magnetic- and micro-structures of the prepared crystallites have been elucidated through meticulous
characterization employing several complementary techniques. Analysis of energy dispersive X-ray spectroscopy
(EDS) and X-ray absorption near edge structure (XANES) data verifies the desired stoichiometries with divalent M and
trivalent Fe ions. Robust structural characterization is carried out by simultaneous Rietveld refinement of a
constrained structural model to powder X-ray diffraction (PXRD) and high-resolution neutron powder diffraction
(NPD) data. The structural modeling reveals different affinities of the 3d transition metal ions for the specific
crystallographic sites in the nanocrystallites, characterized by the spinel inversion degree, x, [M2+1-xFe3+
x]tet[M2+xFe3+
2-
x]octO4, compared to the well-established bulk structures. The MnFe2O4 and CoFe2O4 nanocrystallites exhibit random
disordered spinel structures (x=0.643(3) and 0.660(6)), while NiFe2O4 is a completely inverse spinel (x=1.00) and
ZnFe2O4 is close to a normal spinel (x=0.166(10)). Furthermore, the size, size distribution and morphology of the
nanoparticles have been assessed by peak profile analysis of the diffraction data, transmission electron microscopy
(TEM) and scanning transmission electron microscopy (STEM). The differences in nanostructure, spinel inversion and
distinct magnetic nature of the M2+ ions directly alter the magnetic structures of the crystallites at the atomic-scale
and consequently the macroscopic magnetic properties of the materials. The present study serves as an important
structural benchmark for the rapidly expanding field of spinel ferrite nanoparticle research.
Keywords: Spinel, ferrite, MnFe2O4, CoFe2O4, NiFe2O4, ZnFe2O4, nanoparticles, hydrothermal synthesis, neutron, X-
ray, powder diffraction, Rietveld refinement, inversion degree, XANES, magnetic structure.
Introduction
The new and fascinating properties of nanostructured
magnetic materials have facilitated a wide range of state-of-
the-art applications, e.g. as functionalized medicine carriers for
drug delivery,1, 2 logic gates in magnetic quantum dot
computing,3, 4 components in nanostructured permanent
magnets,5, 6 and many more.7 Among the most important and
widely used magnetic materials are the ferrites.8 They
constitute a class of iron(III) oxide based ceramic magnetic
materials, which can be divided into two subgroups; the
hexaferrites and the spinel ferrites. The low cost, excellent
resistance to corrosion and good magnetic performance of the
ferrites make them the preferred material in a large number of
applications.8 Nanosized spinel ferrite particles are currently
being studied extensively for novel uses in e.g. hyperthermia
cancer treatment,9, 10 magnetic exchange-spring
nanocomposites,11, 12 MRI contrast agents,13, 14 and
magnetically recoverable nanocatalysts.15, 16 Recently, very
high room temperature magnetic saturations of 116 and 175
Am2/kg have been attained for nanosized and Zn substituted
Ni- and Mn-ferrites, respectively.9, 17 These observations have
led to a surge of ferrite nanoparticle studies, which generally
fail to attain comparable values. Therefore, a meticulous
structural study of spinel ferrite nanocrystallites is urgently
needed, in order to shed light onto the atomic-scale magnetic
and structural features, which govern their macroscopic
magnetic performance.
The spinel ferrites have the chemical formula MFe2O4,
where M can be a number of different divalent transition
metal ions, such as Mn2+, Fe2+, Co2+, Ni2+, Zn2+, etc. The
compounds are all soft magnets at room temperature, with
the exception of CoFe2O4, which, in spite of its cubic structure,
exhibits a substantial magnetocrystalline anisotropy resulting
in hard magnetic properties.6 A large number of different
synthetic pathways for preparation of nanosized spinel ferrite
crystallites exist, including sol-gel autocombustion,18
microemulsion techniques,19 thermal decomposition,20
microwave assisted routes,21 solvothermal synthesis,22 and
hydrothermal synthesis.23 Of the mentioned preparation
methods, the hydrothermal route has the benefit of being
relatively simple, energy efficient, easily scalable and free from
use of organic solvents or capping agents, i.e. environmentally
friendly.24, 25 In addition, as demonstrated by our previous
studies, structural and microstructural characteristics of
hydrothermally prepared ferrite nanoparticles can be tuned by
varying reaction parameters such as temperature, pressure,
precursor concentration, pH, and reaction time.26-30
The spinel ferrites crystallize in the face centered cubic
(fcc) spinel structure, space group Fd-3m, illustrated in Figure
1. The spinel structure consists of a cubic close-packed oxygen
lattice, in which an eighth of the tetrahedral and half of the
octahedral voids are occupied by the metal ions. This result in

twice the amount of octahedral sites compared to tetrahedral
sites in the structure. In the normal spinel configuration, the
M2+ ions occupy the tetrahedral sites, while the octahedral
sites contain the Fe3+ ions, yielding the empirical formula
[M2+]tet[Fe3+]oct2O4. Inverse spinels, on the other hand, have all
the M2+ ions located at the octahedral sites, forcing half of the
Fe3+ ions to occupy the tetrahedral sites, in order to maintain
the total site occupation of the tetrahedral and octahedral
holes, giving the empirical formula [Fe3+]tet[M2+Fe3+]octO4.
However, the structure can also be partially inverse,
[M2+1-xFe3+
x]tet[M2+xFe3+
2-x]octO4, with a fraction of the M2+ ions,
x, called the inversion degree, occupying the octahedral sites.
Magnetically, the spinel ferrites display ferrimagnetic
ordering with the magnetic moments of the atoms at the
tetrahedral sites aligning antiparallel relative to the magnetic
moments of atoms at the octahedral sites.31 As there is twice
the amount of occupied octahedral as tetrahedral sites, this
generally leads to a net magnetization along the octahedral
moment direction. Consequently, the intrinsic magnetic
properties of spinel ferrites are directly governed by the type
of constituent cations and their distribution between
crystallographic sites in the structure. Determining the crystal
structure and spinel inversion degree of ferrite nanocrystallites
is thus essential in order to understand their macroscopic
magnetic behavior. However, this is not a straightforward task
as the scattering powers of the transition metals are very
similar in magnitude, and although conventional Rietveld
analysis of X-ray diffraction data allows refinement of the site
occupation fractions, these parameters are among the least
well-behaved in the structural modeling.32 Matters are even
further complicated by peak broadening caused by the
reduced crystallite size and large background levels due to Fe
fluorescence when using Cu radiation, which is the most
common radiation source in conventional lab diffractometers.
In order to determine the crystal structure of ferrite
nanoparticles accurately, it is thus necessary to employ
alternative characterization techniques.
Figure 1: Illustration of the cubic spinel structure (space group Fd-3m, origin choice 2).
The oxygen positions are marked in red and the tetrahedral and octahedral cation sites
shown in green and blue, respectively. Illustration made using the structure
visualization software VESTA.33
In the present study, nanosized spinel ferrite particles with
compositions MnFe2O4, CoFe2O4, NiFe2O4 and ZnFe2O4, have
been synthesized via simple, eco-friendly and scalable
hydrothermal routes. A thorough structural analysis combining
several complementary characterization techniques, namely
powder X-ray diffraction (PXRD), high-resolution neutron
powder diffraction (NPD), X-ray absorption near edge
structure (XANES), transmission electron microscopy (TEM),
high-resolution transmission electron microscopy (HR-TEM),
scanning transmission electron microscopy (STEM) and energy
dispersive X-ray spectroscopy (EDS), has been carried out in
order to elucidate the crystal-, magnetic- and micro-structures
of the prepared nanoparticles. The NPD technique is
particularly advantageous as the scattering length of neutrons
varies erratically with atomic number, making it possible to
obtain significantly higher contrast between neighboring
elements in the periodic table than with conventional X-ray
diffraction. In addition, neutrons carry a spin moment, which
scatters from the atomic magnetic moments in the material
yielding information about the magnetic structure. The PXRD
and NPD data have been analyzed by combined Rietveld
refinement of a constrained structural model, which provides a
very robust structural characterization. In addition, the
magnetic structures of the ferrites have been evaluated by
implementation of a magnetic structural model in the NPD
data refinements. Finally, the determined structural and
microstructural characteristics are related to experimentally
determined macroscopic magnetic properties of the samples.
Experimental
Sample preparation
The spinel ferrite nanoparticle samples were all prepared by
co-precipitation of iron and transition-metal hydroxides from
aqueous solutions of metal salts, followed by hydrothermal
treatment at high pressure and temperature. The general
synthesis procedure is illustrated in Figure 2 and an overview
of the employed synthesis conditions is given in Table 1. The
distinct chemical behaviors of the transition-metals
necessitated certain modifications between the synthetic
routes of the different samples in order to obtain the desired
products, which are described in detail below.
Figure 2: Schematic overview of the general synthetic pathway employed in the
preparation of nanosized MFe2O4 particles.
The CoFe2O4 and NiFe2O4 powders were prepared by a
hydrothermal autoclave (AC) batch method. A 2.0 M aqueous
solution of Fe(NO3)3·9H2O and 1.0 M aqueous solutions

Co(NO3)2·6H2O or Ni(NO3)2·6H2O (all chemicals being Sigma-
Aldrich, ≥98% purity) were mixed in the desired stoichiometric
molar amounts of 2:1. Subsequently, an excess amount of 12.0
M NaOH solution was added dropwise to the mixture under
magnetic stirring causing a viscous gel to be formed. In total,
an amount of base corresponding to 2.25 times the molar
amount of NO3- ions was added to the solution, and a final
metal-ion (Fe and Co/Ni) concentration of 0.86 M in the
precursor was obtained. Subsequently, 70 ml of the precursor
mixture were transferred to a 180 ml Teflon lined steel
autoclave and placed in a preheated convection oven, set to
200 °C, and hydrothermally treated for 1 hour.
For the MnFe2O4 sample, a different precursor preparation
approach was used, since precipitation of manganese
hydroxide using concentrated NaOH forms Mn(OH)3 rather
than the desired Mn(OH)2. Instead, a 0.6 M aqueous solution
of FeCl3·6H2O was prepared and 24.5% NH4OH was added
dropwise until a pH of 10 was attained, and a viscous Fe(OH)3
gel had formed. The gel was repeatedly washed with
demineralized water, centrifuged at 2000 rpm for 3 minutes
and decanted until the pH of the supernatant was below 8.
Subsequently, demineralized H2O was added to the suspension
to obtain a 0.6 M Fe(OH)3 gel. Subsequently, 40 ml of 0.6 M
Fe(OH)3 and 20 ml of 0.6 M aqueous MnCl2 solution were
mixed by magnetic stirring followed by dropwise addition of
24.5% NH4OH until a pH of 10 was reached. The ≈70 ml of
precursor with a metal-ion concentration of ≈0.5 M was
transferred to a 180 ml Teflon lined steel autoclave and
treated hydrothermally at 150 °C for 1 hour in a preheated
convection oven. After the syntheses, the autoclaves were
removed from the oven and left to cool at ambient
temperature.
Hydrothermal autoclave batch synthesis of ZnFe2O4 under
conditions similar to those described above yields very small
particles (< 5 nm). Due to the temperature limitation of ≈250
°C of the Teflon lined steel autoclaves, the ZnFe2O4 sample was
instead prepared by a continuous supercritical hydrothermal
flow method. The precursor was made by mixing 10 ml of 0.67
M Fe(NO3)3·9H2O with 5 ml of 0.67 M Zn(NO3)2·6H2O followed
by dilution of the mixture by addition of 181 ml of
demineralized water. Subsequently, 4.4 ml of 12.0 M NaOH
solution, corresponding to 2.0 times the molar amount of NO3-
ions, was added dropwise leading to formation of a gel
suspension with a final metal ion concentration of 0.05 M. The
final precursor mixture was filled into a 200 ml injector, which
was connected to the T-piece of the continuous hydrothermal
flow apparatus described by Hald et al.34 The system was
pressurized to 250 bar and the temperature of the reactor set
to 390 °C. The precursor was pumped at a rate of 5.0 ml/min
and the solvent at 10 ml/min.
Table 1: Summary of the employed synthesis conditions. Further details about precursor preparation and synthesis are given in the text.
Sample Base
type pH
Reactor
type
Temp.
(°C)
Pressure
(bar)
Time
(min.)
MnFe2O4 25%
NH4OH 10 AC 150 Autogenous 60
CoFe2O4 12 M
NaOH >14 AC 200 Autogenous 60
NiFe2O4 12 M
NaOH >14 AC 200 Autogenous 60
ZnFe2O4 12 M
NaOH >14 Flow 390 250 -
In all cases, the formed aqueous nanoparticle suspensions
were transferred to 500 ml centrifuge bottles, washed with
demineralized water and separated from the supernatant by
centrifuging at 2000 rpm for 3 minutes. This washing routine
was repeated three times with demineralized water before
transferring the samples to a 100 ml glass beaker and drying
them overnight at 60 °C in a vacuum oven. The powders were
then collected and agglomerates were broken in an agate
mortar. Remaining adsorbed water was removed by
subsequent drying in vacuum oven at 60 °C.
Characterization
Powder X-ray diffraction patterns of the samples at room
temperature were collected on a Rigaku SmartLab powder X-
ray diffractometer (Rigaku, Japan) using Cu Kα1,2 radiation
(λ1=1.5406 Å, λ2=1.5444 Å). The diffractometer was configured
with cross beam optics in Bragg-Brentano geometry and a
DteX/Ultra detector. A diffracted beam monochromator was
used in the receiving optics for fluorescence suppression. Data
was collected in a 2θ-range of 15° to 125° at an angular
resolution of 0.02°.
The neutron powder diffraction experiments were carried
out at the High-Resolution Powder Diffractometer for Thermal
Neutrons (HRPT) instrument at the Swiss Spallation Neutron
Source (SINQ), Paul Scherrer Institute (PSI), Villigen,
Switzerland, at 300 K using a wavelength of 1.4940 Å.35 The
HRPT instrument is based on a linear position-sensitive 3He
detector with 1600 wires at an angular separation of 0.1°. The
detector was moved between two positions to achieve a final
angular resolution of 0.05° over an angular range of 160°.
X-ray absorption spectroscopy experiments were
performed at the XAS beamline, I811, at the MAX-II
synchrotron, Lund, Sweden.36 The X-ray absorption near edge
structure data were measured in transmission mode on the
dried powders mixed with boron nitride, around the
constituent metal K-edges; Mn (6539 eV), Fe (7112 eV), Co
(7709 eV), Ni (8333 eV), and Zn (9659 eV). Data reduction was
done using the VIPER software package.37 The final spectra
were obtained by summation of 5 scans of 60 seconds with an
energy resolution of 0.076 eV. The incident X-ray energies of
the individual spectra were calibrated, based on concurrently
measured K-edge absorption data of a metallic reference foil,
prior to summation.
TEM and HR-TEM micrographs were recorded on a FEI
TALOS F200A analytical electron microscope equipped with an

X-FEG electron source and a Ceta 16M camera. Spatially
resolved elemental analysis was performed employing the
same microscope operating in scanning transmission electron
microscopy mode. STEM pictures were acquired using a high
angle annular dark field (HAADF) detector and energy
dispersive X-ray spectroscopy elemental maps obtained using
a Super-X EDS detector.
Magnetic hysteresis curves at 300 K were measured on
cold pressed pellets (diameter = 3.0 mm, height in the range
0.67-0.86 mm) using a Quantum Design Physical Property
Measurement System (PPMS) equipped with a Vibrating
Sample Magnetometer (VSM). The field dependent
magnetization of the samples was measured at room
temperature by scanning the external field between ±20 kOe.
The measurements were conducted at a frequency of 40 Hz
and an averaging time of 2 seconds.
Structural analysis
The powder diffraction patterns were analyzed by Rietveld
refinement using the Fullprof Suite software package.38 A
combined simultaneous refinement, of a constrained
structural model of MFe2O4 in the cubic Fd-3m space group
(Origin choice 2) to the PXRD and NPD patterns, was carried
out. The atomic site occupation fractions on the tetrahedral,
8a (⅛,⅛,⅛), and octahedral, 16d (½,½,½), Wyckoff sites were
refined in mutual constrain to avoid unphysical over- or under-
population of the specific sites while keeping the total
stoichiometric ratio of 1:2 between M2+ and Fe3+ (valences and
M2+ to Fe3+ ratio verified by the XANES and EDS analysis). The
atomic position of oxygen, (u,u,u), at the 32e Wyckoff site was
refined along with the lattice parameter, a, and site-specific
isotropic Debye-Waller factors. For each individual powder
diffraction pattern, a scale factor, zero shift and background,
described using a fifth degree Chebyshev polynomial, were
refined. For the NPD data, the contribution from the magnetic
scattering was refined in addition to the crystal structure. For
this, a collinear model was employed, with antiparallel
magnetic moment components refined as mean values on the
tetrahedral and octahedral sites, respectively. The weight
fraction, wt%, of phase i in the sample was calculated from the
refined parameters using the formula,
wt%i=[SiZiWiVi]/sum(j)[SjZjWjVj], where S is the refined scale
factor, Z is the number of formula units in the unit cell, W is
formula unit mass, and V is the unit cell volume.
The peak profiles were modeled using the Thompson-Cox-
Hastings formulation of the pseudo-Voigt function.39 The peak
asymmetry and the instrumental contribution to the total peak
broadening in the PXRD and NPD data were determined by
Rietveld refinement of data from a NIST LaB6 660B line profile
standard (PXRD) and a Na2Ca3Al2F14 standard (NPD), measured
with the same instrumental configurations as the samples. The
obtained instrumental resolution function was implemented in
the refinements in order to deconvolute the sample
broadening from the total peak broadening. A Lorentzian peak
shape parameter, Y, related to isotropic size broadening was
refined, assuming spherical strain-free crystallites. The values
of Y(PXRD) and Y(NPD) were constrained to yield identical
crystallite sizes taking into account the difference in
wavelengths. The crystallite sizes were calculated by the
Scherrer formula, <D>=(K·λ)/(β·cos(θ)),40 where <D> is the
mean volume-weighted size of the coherently scattering
crystalline domains, λ is the wavelength, θ is the Bragg angle, β
describes the peak broadening and K is the shape factor. Here
the peak broadening has been characterized by the full width
at half the maximum intensity and K was set to 0.829 assuming
isotropic crystallite morphology.41
Results and discussion
Crystal structure, spinel inversion and crystallite size
MnFe2O4:
Figure 3(A) and (B) show the PXRD and NPD patterns of the
hydrothermally synthesized MnFe2O4 nanocrystallite sample. The
positions and relative intensities of the observed reflections are all
in agreement with the spinel phase indicating no impurity phases to
be present. However, initial refinements of a single nanosized
MnFe2O4 phase yielded an unsatisfactory description of the peak
profiles (χ2global=7.51). A characteristic underestimation of the peak
“tails” at low q and considerable peak asymmetry at high q
indicated the presence of a broad particle size distribution (See ESI).
Consequently, a model consisting of two MnFe2O4 phases with
different crystallite sizes was implemented, yielding a significantly
improved fit (χ2global=4.11). The PXRD and NPD diffraction patterns
and resulting two-phase refinements are shown in Figure 3(A-B),
and a summary of the results can be found in Table 2. The crystal
and magnetic structures of the two refined spinel MnFe2O4 phases,
MFO1 and MFO2, were constrained to be equal while independent
lattice parameters and crystallite sizes were fitted. A sample
composition of 46(1)% of 7.4(1) nm and 54(1)% 18.6(1) nm
MnFe2O4 was obtained from the Rietveld analysis. A mean
refined crystallite size of 13.4(3) nm for the MnFe2O4 sample can be
calculated from the refined weight fractions and crystallite sizes of
the two implemented phases. The refinement of constrained site
occupation fractions yield a spinel inversion degree of 0.643(3)
which corresponds to a practically stoichiometric occupation on
both the metal sites in the structure, i.e.
[Mn0.36Fe0.64]tet[Mn0.64Fe1.36]octO4. This indicates equivalent room
temperature crystal field stabilization energy of Mn2+ and Fe3+ at
the two sites, which results in a disordered spinel structure.
MnFe2O4 is 80% inverse in the bulk,31 but the inversion degrees in
nanosized MnFe2O4 crystallites are known to differ.42, 43
In small nanoparticles a larger fraction of the constituent
atoms are located at the surface where defects and variations
in bond lengths due to interface relaxation occur. As a result, a
correlation between crystallite size and lattice parameter is
often observed.26, 27 Interestingly, the smaller phase, MFO1,
(DPXRD+NPD=7.4(1) nm) yields a significantly smaller lattice parameter
of 8.4424(7) Å compared to the larger MFO2 (DPXRD+NPD=18.6(1)
nm), which has a lattice parameter of 8.4895(1) Å. In the
literature, a relatively broad range of unit cell parameters,
which encompass both of the obtained values, are reported
for nanosized MnFe2O4 crystallites.42-45 However, the lattice
parameters show no systematic dependency on particle size.
The discrepancies could instead arise due to a combination of
the difference in ionic radii of Mn2+ and Fe3+ and variations in

spinel inversion degrees. Mn2+ has a larger effective ionic
radius than Fe3+ both in tetrahedral and octahedral
coordination, but the absolute difference in ionic radius is
larger for octahedral coordination.46 In theory, this would
mean an effective increase in unit cell volume with higher
inversion degree for MnFe2O4. In the present work, this could
indicate a distribution of spinel inversion degrees with
crystallite size with a more inverse spinel structure in the
smaller crystallites compared to the larger. Alternatively, the
result could signify a variation in the elemental composition
with crystallite size. This could be facilitated by the
introduction of vacancies as observed for the isostructural γ-
Fe2O3 and Fe3O4 compounds.47 Potentially, the smallest
particles form as defect-rich crystallites, which subsequently
grow into larger crystallites of stoichiometric composition.
CoFe2O4:
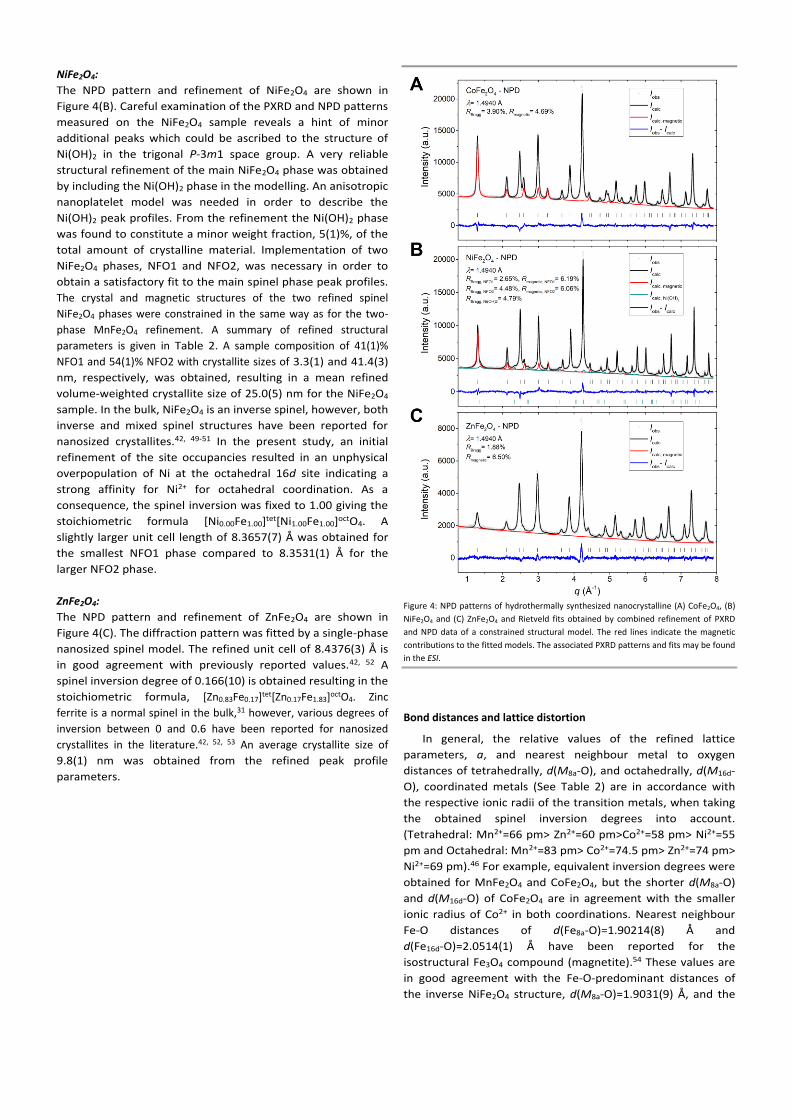
The NPD pattern of the CoFe2O4 sample and constrained
Rietveld refined structural fit to the data are shown in Figure
4(A) and a summary of the results is given in Table 2. The
pattern shows no indication of impurity phases and all
reflections can be ascribed to the spinel ferrite structure. A
unit cell length of 8.4018(1) Å is obtained from the combined
PXRD-NPD Rietveld refinement, which is in good agreement
with previously reported values for CoFe2O4 nanoparticles.42, 44,
48 In the bulk, CoFe2O4 is known to prefer the inverse spinel
structure, however, nanosized grains have been reported to
exhibit mixed spinel structures.42, 48 Here, a spinel inversion
degree of 0.660(6) is obtained resulting in the formula,
[Co0.34Fe0.66]tet[Co0.66Fe1.34]octO4, which implies an equivalent affinity
of Co2+ and Fe3+ for the two sites and a random disordered spinel
structure. From the peak profile analysis, a mean crystallite size of
13.4(1) nm is obtained, which is consistent with our earlier studies
of the employed preparation method.26, 30
Figure 3: (A) PXRD and (B) NPD patterns of the hydrothermally synthesized MnFe2O4
nanoparticles and Rietveld fits obtained by combined simultaneous refinement of a
constrained structural model. The insert in (A) illustrates the individual contributions of
two refined MnFe2O4 phases, MFO1 and MFO2, with different crystallite sizes to the
total line profile of the <311>, <222> and <400> reflections. In (B), the red line indicates
the magnetic contribution to the fitted model.
Table 2: Selected structural parameters at 294 K extracted by combined Rietveld refinement of PXRD and NPD data of the hydrothermally prepared nanosized spinel ferrites. The table contains crystalline phase weight percentages, wt%, crystallite sizes, DPXRD+NPD, unit cell parameters, a, refined oxygen position on the 32e Wyckoff site, u, transition metal to oxygen distances at the tetrahedral, d(M8a-O), and octahedral, d(M16d-O), sites, inversion degrees, x, and stoichiometric formulas. A more extensive table with additional refined structural parameters may be found in the ESI.
Sample Refined phases wt%
(%)
DPXRD+NPD
(nm)
a
(Å) u (O32e)
d(M8a-O)
(Å)
d(M16d-O)
(Å)
Inv. deg.,
x Stoichiometric formula
MnFe2O4 MFO1
MFO2
46(1)
54(1)
7.4(1)
18.6(1)
8.4424(7)
8.4895(1) 0.2577(1) 1.9513(9) 2.0591(9) 0.643(3) [Mn0.36Fe0.64]tet[Mn0.64Fe1.36]octO4
CoFe2O4
13.4(1) 8.4018(1) 0.2570(1) 1.9211(7) 2.0432(7) 0.660(6) [Co0.34Fe0.66]tet[Co0.66Fe1.34]octO4
NiFe2O4
NFO1
NFO2
Ni(OH)2
41(1)
54(1)
5(1)
3.3(1)
41.4(3)
8.3657(7)
8.3531(1)
0.2565(1)
1.9031(9)
2.0351(9)
1.00
[Ni0.00Fe1.00]tet[Ni1.00Fe1.00]octO4
ZnFe2O4
9.8(1) 8.4376(3) 0.2584(1) 1.9496(9) 2.0410(9) 0.166(10) [Zn0.83Fe0.17]tet[Zn0.17Fe1.83]octO4
NiFe2O4:
The NPD pattern and refinement of NiFe2O4 are shown in
Figure 4(B). Careful examination of the PXRD and NPD patterns
measured on the NiFe2O4 sample reveals a hint of minor
additional peaks which could be ascribed to the structure of
Ni(OH)2 in the trigonal P-3m1 space group. A very reliable
structural refinement of the main NiFe2O4 phase was obtained
by including the Ni(OH)2 phase in the modelling. An anisotropic
nanoplatelet model was needed in order to describe the
Ni(OH)2 peak profiles. From the refinement the Ni(OH)2 phase
was found to constitute a minor weight fraction, 5(1)%, of the
total amount of crystalline material. Implementation of two
NiFe2O4 phases, NFO1 and NFO2, was necessary in order to
obtain a satisfactory fit to the main spinel phase peak profiles.
The crystal and magnetic structures of the two refined spinel
NiFe2O4 phases were constrained in the same way as for the two-
phase MnFe2O4 refinement. A summary of refined structural
parameters is given in Table 2. A sample composition of 41(1)%
NFO1 and 54(1)% NFO2 with crystallite sizes of 3.3(1) and 41.4(3)
nm, respectively, was obtained, resulting in a mean refined
volume-weighted crystallite size of 25.0(5) nm for the NiFe2O4
sample. In the bulk, NiFe2O4 is an inverse spinel, however, both
inverse and mixed spinel structures have been reported for
nanosized crystallites.42, 49-51 In the present study, an initial
refinement of the site occupancies resulted in an unphysical
overpopulation of Ni at the octahedral 16d site indicating a
strong affinity for Ni2+ for octahedral coordination. As a
consequence, the spinel inversion was fixed to 1.00 giving the
stoichiometric formula [Ni0.00Fe1.00]tet[Ni1.00Fe1.00]octO4. A
slightly larger unit cell length of 8.3657(7) Å was obtained for
the smallest NFO1 phase compared to 8.3531(1) Å for the
larger NFO2 phase.
ZnFe2O4:
The NPD pattern and refinement of ZnFe2O4 are shown in
Figure 4(C). The diffraction pattern was fitted by a single-phase
nanosized spinel model. The refined unit cell of 8.4376(3) Å is
in good agreement with previously reported values.42, 52 A
spinel inversion degree of 0.166(10) is obtained resulting in the
stoichiometric formula, [Zn0.83Fe0.17]tet[Zn0.17Fe1.83]octO4. Zinc
ferrite is a normal spinel in the bulk,31 however, various degrees of
inversion between 0 and 0.6 have been reported for nanosized
crystallites in the literature.42, 52, 53 An average crystallite size of
9.8(1) nm was obtained from the refined peak profile
parameters.
Figure 4: NPD patterns of hydrothermally synthesized nanocrystalline (A) CoFe2O4, (B)
NiFe2O4 and (C) ZnFe2O4 and Rietveld fits obtained by combined refinement of PXRD
and NPD data of a constrained structural model. The red lines indicate the magnetic
contributions to the fitted models. The associated PXRD patterns and fits may be found
in the ESI.
Bond distances and lattice distortion
In general, the relative values of the refined lattice
parameters, a, and nearest neighbour metal to oxygen
distances of tetrahedrally, d(M8a-O), and octahedrally, d(M16d-
O), coordinated metals (See Table 2) are in accordance with
the respective ionic radii of the transition metals, when taking
the obtained spinel inversion degrees into account.
(Tetrahedral: Mn2+=66 pm> Zn2+=60 pm>Co2+=58 pm> Ni2+=55
pm and Octahedral: Mn2+=83 pm> Co2+=74.5 pm> Zn2+=74 pm>
Ni2+=69 pm).46 For example, equivalent inversion degrees were
obtained for MnFe2O4 and CoFe2O4, but the shorter d(M8a-O)
and d(M16d-O) of CoFe2O4 are in agreement with the smaller
ionic radius of Co2+ in both coordinations. Nearest neighbour
Fe-O distances of d(Fe8a-O)=1.90214(8) Å and
d(Fe16d-O)=2.0514(1) Å have been reported for the
isostructural Fe3O4 compound (magnetite).54 These values are
in good agreement with the Fe-O-predominant distances of
the inverse NiFe2O4 structure, d(M8a-O)=1.9031(9) Å, and the

almost completely normal ZnFe2O4 structure,
d(M16d-O)=2.0410(9) Å. Relative comparison of the NiFe2O4
and ZnFe2O4 structures shows longer nearest neighbour M-O
distances of ZnFe2O4 in both coordinations. However, a
significantly larger difference is observed between the
tetrahedral distances, since most of the Zn2+ is tetrahedrally
coordinated.
The refined atomic position parameter of oxygen, u,
provides a measure of the level of distortion of the spinel
lattice. In an undistorted lattice u=¼=0.250, while u generally is
in the range 0.255-0.260 in real ferrites.31 The refined values of
u in the four nanocrystalline ferrite structures
(0.2565(1)<u<0.2584(1)) are all within the expected range and
show only slight relative variations in lattice distortion.
Metal ion coordination and oxidation state
The X-ray absorption behaviour in the near-edge region is
very sensitive to variations in oxidation state and local
coordination chemistry of the absorbing atom.55 The
absorption edges of many elements exhibit significant shifts in
absorption energy with varying oxidation state, while the post-
edge oscillations contain information about distance and
coordination number of the nearest neighbours. Figure 5(A)
displays the normalized Fe K-edge XANES spectra of the four
nanocrystalline ferrite samples. The similar position and
appearance of the absorption edges demonstrate similar
valence and local structure of Fe in the samples. The pre-edge
features observed just below the absorption edge arise due to
electronic transitions to empty bound states, i.e. 1s→3d
(quadrupolar) and/or 1s→4p (dipolar) metal electronic
transitions.56 Figure 5(B) shows an enhancement of the 1s→3d
Fe K pre-edge features (indicated by a dashed black square in
Figure 5(A)) of the four spinel ferrite samples. The K pre-edge
peak intensity is generally large for tetrahedral coordination
and very weak for octahedrally coordinated species.57 Here,
NiFe2O4 and ZnFe2O4 have the highest and lowest pre-edge
intensities, indicating more and fewer tetrahedrally
coordinated Fe, respectively. Meanwhile, MnFe2O4 and
CoFe2O4 have very similar pre-edge features of intermediate
intensity. A qualitative evaluation of relative Fe pre-edge
intensities corroborates the spinel inversion degrees obtained
from the structural refinements of the powder diffraction
data.
The position of the Fe K pre-edge peak can be used to
quantitatively evaluate the average oxidation state of Fe in the
sample as its location generally shifts towards higher energy
for higher oxidation states.58 In order to determine the Fe K
pre-edge position of the samples, the contribution of the
background and edge jump to the pre-edge peak was
estimated by a spline interpolation, using ≈10 eV of data
immediately before and after the pre-edge feature, and
subtracted from the pre-edge spectra. The background and
white line subtracted pre-edge peaks were subsequently fitted
by a Gaussian function as shown in Figure 5 (C). In Figure 5(D),
the extracted Fe pre-edge positions are plotted relative to the
Fe2+, 7112(1) eV, and Fe3+ , 7113.5(1) eV model compound
average centroid positions reported by Wilke et al.58 The
determined Fe pre-edge position of MnFe2O4 (7113.50(3) eV),
CoFe2O4 (7113.37(2) eV), NiFe2O4 (7113.39(3) eV) and ZnFe2O4
(7113.36(5) eV) confirm an average iron oxidation state of 3+
in all the samples.
Figure 5: A) Normalized Fe K-edge XANES spectra of the nanopowder samples. The
spectra have been offset for clarity. B) Enhancement of the pre-edge region indicated
by a dashed square in (A). C) Background + white line subtracted and normalized pre-
edge spectra (circles) fitted by Gaussian functions (dashed lines). D) Fitted Fe pre-edge
positions of the spinel ferrite samples relative to the average pre-edge centroid
locations of Fe2+ and Fe3+ model compounds reported by Wilke et al.58 E) From left to
right, normalized Mn, Co, Ni and Zn K-edge XANES spectra of the MnFe2O4, CoFe2O4,
NiFe2O4 and ZnFe2O4 samples, respectively. The black arrows accentuate the presence
of pre-edge features in the MnFe2O4 and CoFe2O4 spectra.
The Mn, Co, Ni and Zn K-edge XANES spectra of MnFe2O4,
CoFe2O4, NiFe2O4, and ZnFe2O4, respectively, are shown in
Figure 5(D). Octahedrally coordinated species generally exhibit
very weak pre-edge features but for tetrahedral coordination
the 1s→3d pre-edge peak intensity is highly dependent on the
number of electrons occupying the 3d orbital. It is strong for
Mn and decreases gradually for Fe, Co and Ni due to the
progressive filling of the 3d orbitals and is thus completely
absent for Zn (full 3d orbital).57 As a result, the pre-edge
feature is observed for the disordered MnFe2O4 and CoFe2O4
spinel structures. No pre-edge is seen in the spectrum of
NiFe2O4 confirming the completely inverse spinel structure, i.e.
no tetrahedrally coordinated Ni, which is consistent with the
spinel inversion degrees from the PXRD and NPD refinements.
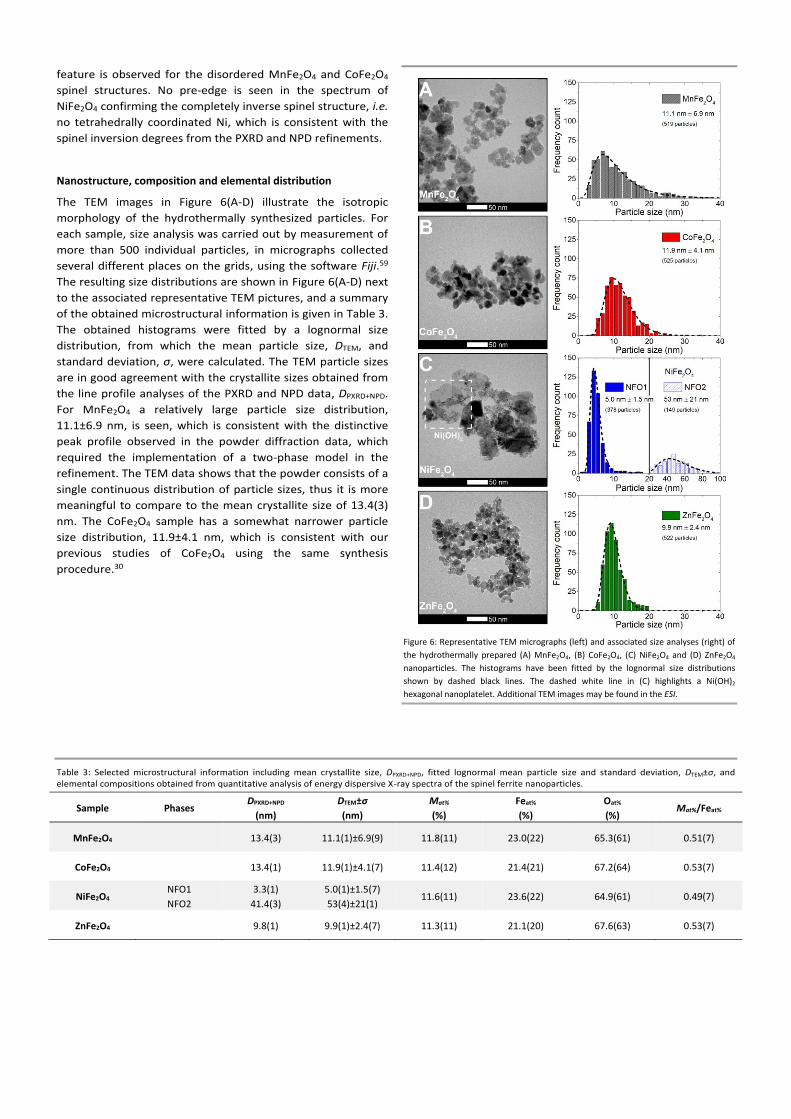
Nanostructure, composition and elemental distribution
The TEM images in Figure 6(A-D) illustrate the isotropic
morphology of the hydrothermally synthesized particles. For
each sample, size analysis was carried out by measurement of
more than 500 individual particles, in micrographs collected
several different places on the grids, using the software Fiji.59
The resulting size distributions are shown in Figure 6(A-D) next
to the associated representative TEM pictures, and a summary
of the obtained microstructural information is given in Table 3.
The obtained histograms were fitted by a lognormal size
distribution, from which the mean particle size, DTEM, and
standard deviation, σ, were calculated. The TEM particle sizes
are in good agreement with the crystallite sizes obtained from
the line profile analyses of the PXRD and NPD data, DPXRD+NPD.
For MnFe2O4 a relatively large particle size distribution,
11.1±6.9 nm, is seen, which is consistent with the distinctive
peak profile observed in the powder diffraction data, which
required the implementation of a two-phase model in the
refinement. The TEM data shows that the powder consists of a
single continuous distribution of particle sizes, thus it is more
meaningful to compare to the mean crystallite size of 13.4(3)
nm. The CoFe2O4 sample has a somewhat narrower particle
size distribution, 11.9±4.1 nm, which is consistent with our
previous studies of CoFe2O4 using the same synthesis
procedure.30
Figure 6: Representative TEM micrographs (left) and associated size analyses (right) of
the hydrothermally prepared (A) MnFe2O4, (B) CoFe2O4, (C) NiFe2O4 and (D) ZnFe2O4
nanoparticles. The histograms have been fitted by the lognormal size distributions
shown by dashed black lines. The dashed white line in (C) highlights a Ni(OH)2
hexagonal nanoplatelet. Additional TEM images may be found in the ESI.
Table 3: Selected microstructural information including mean crystallite size, DPXRD+NPD, fitted lognormal mean particle size and standard deviation, DTEM±σ, and elemental compositions obtained from quantitative analysis of energy dispersive X-ray spectra of the spinel ferrite nanoparticles.
Sample Phases DPXRD+NPD
(nm)
DTEM±σ
(nm)
Mat%
(%)
Feat%
(%)
Oat%
(%) Mat%/Feat%
MnFe2O4
13.4(3) 11.1(1)±6.9(9) 11.8(11) 23.0(22) 65.3(61) 0.51(7)
CoFe2O4
13.4(1) 11.9(1)±4.1(7) 11.4(12) 21.4(21) 67.2(64) 0.53(7)
NiFe2O4 NFO1
NFO2
3.3(1)
41.4(3)
5.0(1)±1.5(7)
53(4)±21(1) 11.6(11) 23.6(22) 64.9(61) 0.49(7)
ZnFe2O4
9.8(1) 9.9(1)±2.4(7) 11.3(11) 21.1(20) 67.6(63) 0.53(7)
The NiFe2O4 sample was found to exhibit a clear bimodal
size distribution as shown in Figure 6(C). This is consistent with
the observed peak shapes in the powder diffraction data
where implementation of a two-phase model was necessary in
order to describe the line profiles. The obtained crystallite
sizes of the two phases from the Rietveld refinement, 3.3(1)
nm and 41.4(3) nm, are in relatively good agreement with the
mean particle sizes found from the lognormal fits, 5.0±1.5 nm
and 53±21 nm. The largest NiFe2O4 particles (>40 nm) exhibit
sharper, cubic/monoclinic-like shapes, which could indicate a
size dependent morphology of the crystallites. Furthermore, in
some of the TEM micrographs a few very broad (≈100 nm) and
thin particles of hexagonal platelet-like morphology were
seen(See dashed white square in Figure 6(C)), which were
identified to be Ni(OH)2 particles by STEM-EDS elemental
mapping (see ESI). The large hexagonal Ni(OH)2 platelets were
not included in the measurements of TEM particle sizes. The
ZnFe2O4 sample exhibits a much narrower size distribution,
9.9±2.4 nm, compared to the other samples. This is likely
related to the larger heating rate and shorter reaction time
used in the supercritical hydrothermal flow method employed
in the preparation of this sample as illustrated for γ-Fe2O3 and
CoFe2O4 in our previous studies.26, 27, 30
HR-TEM measurements were performed in order to
investigate the crystallinity of the produced nanoparticles.
Selected representative HR-TEM images of the spinel ferrite
nanoparticles are shown in Figure 7A-D. Notably, a high degree
of nanoparticle crystallinity is observed for all four samples, as
illustrated by the fast Fourier transforms of selected regions
shown in the inserts.
Figure 7: Representative HR-TEM images of A) MnFe2O4, B) CoFe2O4, C) NiFe2O4 and D)
ZnFe2O4 nanocrystallites. The inserts in the images are fast Fourier transforms of the
outlined regions illustrating the crystallinity of the particles. Enlarged views of the
images and additional HR-TEM images may be found in the ESI.
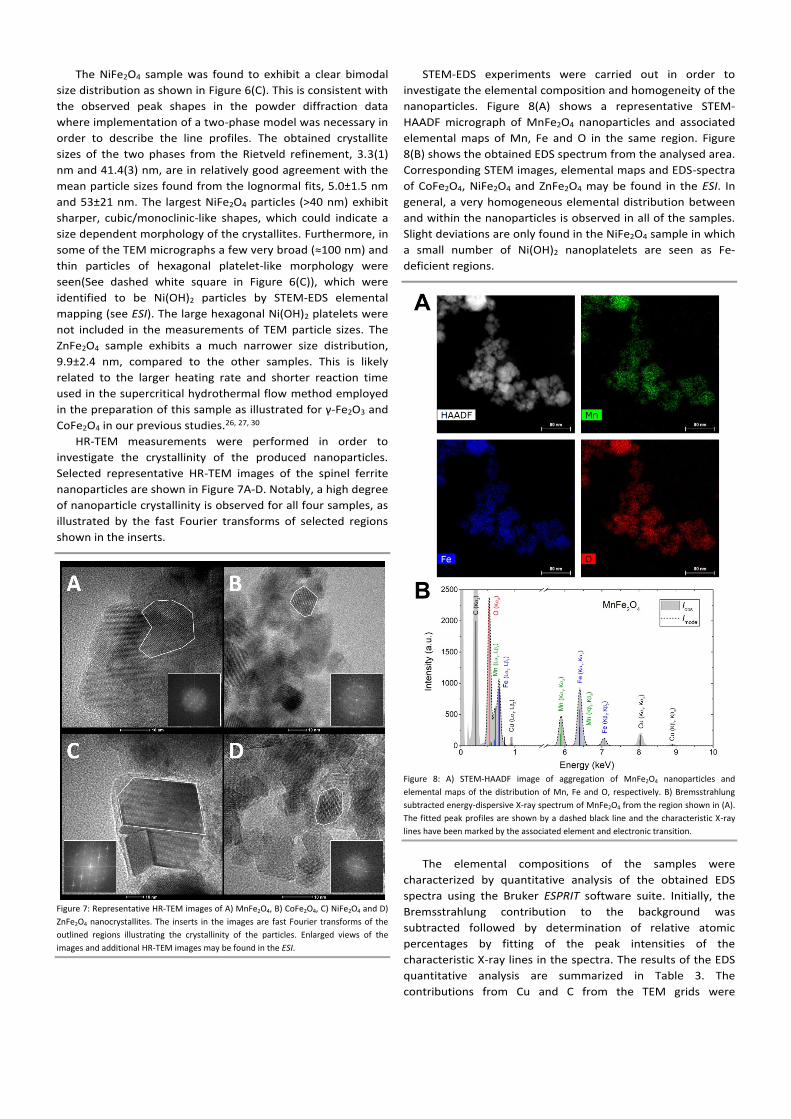
STEM-EDS experiments were carried out in order to
investigate the elemental composition and homogeneity of the
nanoparticles. Figure 8(A) shows a representative STEM-
HAADF micrograph of MnFe2O4 nanoparticles and associated
elemental maps of Mn, Fe and O in the same region. Figure
8(B) shows the obtained EDS spectrum from the analysed area.
Corresponding STEM images, elemental maps and EDS-spectra
of CoFe2O4, NiFe2O4 and ZnFe2O4 may be found in the ESI. In
general, a very homogeneous elemental distribution between
and within the nanoparticles is observed in all of the samples.
Slight deviations are only found in the NiFe2O4 sample in which
a small number of Ni(OH)2 nanoplatelets are seen as Fe-
deficient regions.
Figure 8: A) STEM-HAADF image of aggregation of MnFe2O4 nanoparticles and
elemental maps of the distribution of Mn, Fe and O, respectively. B) Bremsstrahlung
subtracted energy-dispersive X-ray spectrum of MnFe2O4 from the region shown in (A).
The fitted peak profiles are shown by a dashed black line and the characteristic X-ray
lines have been marked by the associated element and electronic transition.
The elemental compositions of the samples were
characterized by quantitative analysis of the obtained EDS
spectra using the Bruker ESPRIT software suite. Initially, the
Bremsstrahlung contribution to the background was
subtracted followed by determination of relative atomic
percentages by fitting of the peak intensities of the
characteristic X-ray lines in the spectra. The results of the EDS
quantitative analysis are summarized in Table 3. The
contributions from Cu and C from the TEM grids were

deconvoluted in the fits and excluded from the analysis, but a
substantial oxygen background signal is also present in the
spectra, which cannot be discerned from the oxygen signal of
the sample. Consequently, the determined oxygen atomic
percentages are not representative of the actual sample
oxygen content. However, the obtained transition metal to
iron atomic percentage ratios, Mat%/Feat%, of 0.51(7), 0.53(7),
0.49(7) and 0.53(7) of MnFe2O4, CoFe2O4, NiFe2O4 and
ZnFe2O4, respectively, verify the targeted 1:2 spinel ferrite
stoichiometry.
Magnetic structure and properties
The different 3d transition metals carry significantly different
atomic moments due to their varying amounts of unpaired 3d
electrons. The relative magnitudes of their spin moments at 0
K assuming high-spin electron configuration is; Mn2+ (5 µB) =
Fe3+ (5 µB) > Co2+ (3 µB) > Ni2+ (2 µB) > Zn2+ (0 µB). The orbit
moment contribution to the total spin-orbit moment is mostly
negligible due to crystal-field quenching in the 3d transition
metal structures.60 The intrinsic magnetic properties of spinel
ferrites, [M2+1-xFe3+
x]tet[M2+xFe3+
2-x]octO4, are thus directly
governed by the type of cation, M2+, and the inversion degree,
x.
The differences in magnetic structure caused by the type
and distribution of cations can be characterized by neutron
diffraction, as neutrons carry a spin, which can scatter from
the atomic magnetic moments in the structure. This is
illustrated in Figure 3(B) and Figure 4(A-C), where a gradual
decrease in the intensity of the main magnetic <111> peak at
low q is observed. This is consistent with the relative spin
moment magnitudes of the constituent M2+ cations.
In the Rietveld refinements of the present NPD data, the
magnetic structure was described by a collinear model, with
antiparallel moments on the tetrahedral and octahedral sites.
The Cartesian magnetic moment components were refined as
mean values on the tetrahedral, µtet, and octahedral sites, µoct,
respectively. The magnetic easy axis in a cubic lattice is
determined by the value of the material specific and
temperature dependent magnetocrystalline anisotropy
constant. In theory, the magnetic easy axis of a cubic structure
is along the <100> direction for materials with positive
anisotropy (hard magnets), and along the <111> direction for
materials with negative anisotropy (soft magnets).31 This in
effect means that CoFe2O4 at room temperature has an easy
magnetization axes along <100>, while the easy axes of
MnFe2O4, NiFe2O4 and ZnFe2O4 are along the <111>
crystallographic direction, as illustrated in Figure 9(A).6, 61
However, analysis of powder neutron diffraction data does not
allow discrimination between the two axis options in cubic
structures,62 i.e. changing the direction of the refined Cartesian
magnetic moment components, between <100> and <111>
produces no difference in the obtained fit quality and refined
magnetic moment magnitudes.
The magnitudes of the moments and estimated saturation
magnetization from neutron powder diffraction, Msat,NPD,
based on the refined moments and inversion degrees, are
given in Table 4. As expected from the matching electron
configurations of Mn2+ and Fe3+ ([Ar]3d5), almost equal
magnetic moments, µtet=3.76(5) µB and µoct=3.57(5) µB
(Δµ=0.18(10) µB), were refined on the tetrahedral and
octahedral sites in the MnFe2O4 structure. Similarly,
comparable moments, µtet=3.50(5) µB and µoct=3.24(4) µB
(Δµ=0.26(9) µB), were obtained for CoFe2O4, which is
consistent with the stoichiometric refined atomic occupation
fractions of Co2+ and Fe3+ on the two sites, x=0.660(6). For
NiFe2O4 a significantly larger difference (Δµ=0.82(14) µB)
between the refined mean moments on the two sites, was
obtained. This difference is in agreement with the 100%
inverse spinel structure of the NiFe2O4 crystal structure, which
implies a reduced moment on the Ni2+ rich octahedral site. For
ZnFe2O4, the combination of an almost completely normal
spinel structure, x=0.166(10), i.e. the majority of Zn2+ located
at the tetrahedral site, and zero spin moment of the Zn2+ ion
could at first impression be expected to yield a highly
optimized intrinsic magnetic performance. However, an almost
non-existing magnetic contribution to the NPD pattern is
observed for the ZnFe2O4 sample (see Figure 4(C)), which
denotes nearly absent long-range magnetic order in the
structure. The ferrimagnetic ordering in the spinel structure is
propagated via an antiferromagnetic super-exchange coupling
between the tetrahedral and octahedral sublattice spins.
However, the divalent Zn2+ ions, which occupy the majority of
the tetrahedral sites in the ZnFe2O4 spinel structure, have a full
3d-orbital ([Ar]3d10 configuration) and thus carries no spin-
orbit moment. As a result, the octahedral Fe3+ moments are
known to couple antiferromagnetically instead.31 However, in
the present ZnFe2O4 NPD data, no magnetic peaks related to
the antiferromagnetic coupling of octahedral iron spins are
present,63 and only a very low signal from the magnetic
structure is observed. In the refinement of the weak ZnFe2O4
magnetic structure, it was necessary to constrain the
tetrahedral and octahedral moments to be equal to avoid
divergence and unphysical values. A small average moment of
0.6(2) µB was obtained, which can be ascribed to a slight
magnetic order induced by the low amount of tetrahedral Fe3+.
Overall, a gradual decrease in the refined moment
magnitudes and consequently a reduction in the calculated
saturation magnetizations, Msat,NPD, is observed, as follows:
MnFe2O4 (82(3) Am2/kg)> CoFe2O4 (71(2) Am2/kg)> NiFe2O4
(50(3) Am2/kg) >ZnFe2O4 (14(10) Am2/kg). This is in agreement
with the reduction in average spin moments of the constituent
ionic M2+ species.

Figure 9: A) Refined crystal and magnetic structures of the MnFe2O4, CoFe2O4, NiFe2O4
and ZnFe2O4 ferrite nanocrystallites. The green and blue arrows indicate the relative
magnitudes and orientations of the magnetic moment components on tetrahedral and
octahedral sites, respectively, which have been refined along the <100>
crystallographic axis for CoFe2O4 and along the <111> direction for MnFe2O4, NiFe2O4
and ZnFe2O4. The magnetic vector magnitude of ZnFe2O4 has been scaled by x4 for
clarity. The refined atomic site occupation fractions of M2+ (white) and Fe3+ (black) are
illustrated on the spheres. The illustrations are made in VESTA.33 B) Room temperature
field dependent magnetization curves of the nanopowders. The insert emphasizes the
coercive field of the CoFe2O4 sample and absence of any significant hysteresis in the
three soft ferrite samples.
The measured room temperature field dependent
magnetization curves of the hydrothermally synthesized ferrite
nanopowders are shown in Figure 9(B) and the extracted
magnetic properties are summarized in Table 4 (The NiFe2O4
data has been corrected for the 5(1) wt% non-magnetic
Ni(OH)2 content). The saturation magnetizations, Msat,VSM,
obtained using vibrating sample magnometry were
determined by extrapolation using the law of approach to
saturation.64 Crystallites with sizes in the magnetic single-
domain regime should intuitively have an inherently
maximized volumetric magnetization. However, a reduced
saturation magnetization is often observed for small
nanocrystallites, which is generally ascribed to surface spin
disorder, reduced crystallinity or structural defects.65-67 In the
present study, a good agreement between the saturation
magnetizations predicted from the structural refinements,
Msat,NPD, and the measured macroscopic magnetic saturation,
Msat,VSM, is observed for CoFe2O4, NiFe2O4 and ZnFe2O4. Only
the MnFe2O4 sample shows a significant discrepancy of
22(3) Am2/kg between the determined Msat,NPD and Msat,VSM.
The room temperature saturation magnetizations of the bulk
ferrimagnetic ferrite compounds are generally
well-established, i.e. MnFe2O4 (83 Am2/kg), CoFe2O4
(75 Am2/kg), and NiFe2O4 (50 Am2/kg).6, 31 However, in the
literature, hugely varying saturation magnetizations, such as
35 Am2/kg (5.0 nm, 300K),44 48.6 Am2/kg (12 nm, 300K)68 and
up to 125 Am2/kg (15 nm, 300K)9 of MnFe2O4 nanoparticles,
are reported. The same goes for CoFe2O4, where Msat,VSM
values of e.g. 11 Am2/kg (7.2 nm, 300K)69 and as high as 130
Am2/kg (5.5 nm, 10K)70 have been reported for nanoparticles
in the same size range. The measured values of 60.5(1) Am2/kg
and 72.7(2) Am2/kg, for our MnFe2O4 and CoFe2O4
nanoparticles, thus lie well within their respective expected
ranges. Similar observations may be made for the NiFe2O4,
Msat,VSM=47.1(1) Am2/kg, and ZnFe2O4, Msat,VSM=10.8(1)
Am2/kg, samples.
As expected, only the CoFe2O4 sample exhibits a
considerable magnetic hysteresis at room temperature with a
remanence, Mr, of 15.1(2) Am2/kg and a coercive field, Hc, of
60.1(7) kA/m. As was the case for magnetic saturation values,
substantial differences in reported coercivities for CoFe2O4
nanoparticles are also seen in the literature. The coercive field
of hard magnetic nanoparticles is, however, highly dependent
on their particle size and size distribution, as a percentage of
particles in the sample may be below the superparamagnetic
blocking temperature. The MnFe2O4 and NiFe2O4 samples
exhibit typical soft ferrimagnetic hysteresis curves, while
ZnFe2O4 shows nearly paramagnetic response when subjected
to an external magnetic field in accordance with the reduced
long-range magnetic order observed in the NPD data.
Table 4: Summary of magnetic structure and properties. Refined Cartesian magnetic moment component magnitudes on the tetrahedral (µtet) and octahedral (µoct) sites, estimated saturation magnetization from the refined crystallographic moments (Msat,NPD) and measured macroscopic magnetic properties; saturation magnetization (Msat,VSM), remanence (Mr), and coercive field (Hc) at 300 K.
Sample
µtet
(µB)
µoct
(µB)
Msat,NPD
(Am2/kg)
Msat,VSM
(Am2/kg)
Mr
(Am2/kg)
Hc
(kA/m)
MnFe2O4 3.76(5) 3.57(5) 82(3) 60.5(1) 0.3(2) 1.58(5)
CoFe2O4 3.50(5) 3.24(4) 71(2) 72.7(2) 15.1(2) 60.1(7)
NiFe2O4 3.72(8) 2.90(6) 50(3) 47.1(1) 2.0(1) 4.9(2)
ZnFe2O4 0.6(2) 0.6(2) 14(10) 10.8(1) 0.006(4) 0.59(3)

Conclusions
The macroscopic performances of magnetic materials are
inherently rooted in their atomic structure. Understanding the
crystal structure is thus essential for predicting, designing and
tailoring magnetic materials with specific or optimized
properties. For spinel ferrites in particular, the choice of
divalent cation and its distribution between the tetrahedral
and octahedral sites directly determines their magnetic
behaviour.
In the present study, the crystal-, magnetic- and
micro-structures of four different types of hydrothermally
synthesized ferrite nanopowders, MnFe2O4, CoFe2O4, NiFe2O4
and ZnFe2O4, have been meticulously characterized. Analyses
of EDS and XANES data reveal the ferrites to have the desired
stoichiometries with divalent M and trivalent Fe ions.
Combined Rietveld refinement of a constrained structural
model to fluorescence suppressed PXRD and high-resolution
NPD data reveals significant differences in the affinities of the
divalent cations for the two crystallographic sites in the
structures of the nanocrystallites compared to the bulk single
crystal structures. MnFe2O4 and CoFe2O4 adopt a disordered
spinel structure, while ZnFe2O4 exhibits a 17% inversion
degree. Only the NiFe2O4 nanocrystalline sample has the
typical 100% inverse spinel structure seen in the bulk.
Refinement of a magnetic structural model to the NPD data
coupled with measurement of macroscopic magnetic
properties, illustrates how the distinct magnetic natures of the
M2+ ions and their distribution in the spinel structure directly
alter the magnetic ordering in the crystallites and
consequently the macroscopic magnetic properties of the
materials.
Conflicts of interest
There are no conflicts to declare.
Acknowledgements
This work was financially supported by the Danish National
Research Foundation (Center for Materials Crystallography,
DNRF93 and Carbon Dioxide Activation Center, DNRF118),
Innovation Fund Denmark (Green Chemistry for Advanced
Materials, GCAM-4107-00008B), the VILLUM Foundation
(VKR023449) and the Danish Center for Synchrotron and
Neutron Science (DanScatt). Affiliation with the Center for
Integrated Materials Research (iMAT) at Aarhus University is
gratefully acknowledged. The authors are grateful for the
obtained beamtimes at the HRPT beamline, SINQ, PSI, Villigen,
Switzerland and at beamline I811, MAX-lab synchrotron
radiation source, Lund, Sweden. Denis Cheptiakov and Stefan
Carlson are thanked for their support during the neutron
powder diffraction and X-ray absorption spectroscopy
experiments, respectively. Martin Schmidt, Frederik H. Gjørup,
Jakob V. Ahlburg and Marian Stingaciu are thanked for fruitful
discussions. Jacques Chevallier is thanked for his assistance
with the collection of HR-TEM images.
References
1. Q. A. Pankhurst, J. Connolly, S. K. Jones and J. Dobson, J. Phys. D: Appl. Phys., 2003, 36, R167-R181.
2. C. C. Berry and A. S. G. Curtis, J. Phys. D: Appl. Phys., 2003, 36, R198-R206.
3. A. Imre, G. Csaba, L. Ji, A. Orlov, G. H. Bernstein and W. Porod, Science, 2006, 311, 205-208.
4. D. A. Allwood, G. Xiong, C. C. Faulkner, D. Atkinson, D. Petit and R. P. Cowburn, Science, 2005, 309, 1688-1692.
5. E. F. Kneller and R. Hawig, IEEE Trans. Magn., 1991, 27, 3588-3600.
6. R. Skomski, J. Phys.: Condens. Matter, 2003, 15, R841-R896.
7. A. H. Lu, E. L. Salabas and F. Schuth, Angew. Chem. Int. Ed., 2007, 46, 1222-1244.
8. J. M. D. Coey, J. Magn. Magn. Mater., 2002, 248, 441-456. 9. J. T. Jang, H. Nah, J. H. Lee, S. H. Moon, M. G. Kim and J.
Cheon, Angew. Chem. Int. Ed., 2009, 48, 1234-1238. 10. C. A. Quinto, P. Mohindra, S. Tong and G. Bao, Nanoscale,
2015, 7, 12728-12736. 11. Q. Song and Z. J. Zhang, J. Am. Chem. Soc., 2012, 134,
10182-10190. 12. A. Quesada, C. Granados-Miralles, A. Lopez-Ortega, S.
Erokhin, E. Lottini, J. Pedrosa, A. Bollero, A. M. Aragon, F. Rubio-Marcos, M. Stingaciu, G. Bertoni, C. D. J. Fernandez, C. Sangregorio, J. F. Fernandez, D. Berkov and M. Christensen, Adv. Electron. Mater., 2016, 2, 1500365.
13. J. H. Lee, Y. M. Huh, Y. Jun, J. Seo, J. Jang, H. T. Song, S. Kim, E. J. Cho, H. G. Yoon, J. S. Suh and J. Cheon, Nat. Med., 2007, 13, 95-99.
14. H. B. Na, I. C. Song and T. Hyeon, Adv. Mater., 2009, 21, 2133-2148.
15. D. Guin, B. Baruwati and S. V. Manorama, Org. Lett., 2007, 9, 1419-1421.
16. R. Abu-Reziq, H. Alper, D. S. Wang and M. L. Post, J. Am. Chem. Soc., 2006, 128, 5279-5282.
17. S. Mukherjee, S. Pradip, A. K. Mishra and D. Das, Appl. Phys. a-Mater., 2014, 116, 389-393.
18. L. H. Ai and J. Jiang, Curr. Appl Phys., 2010, 10, 284-288. 19. D. S. Mathew and R. S. Juang, Chem. Eng. J., 2007, 129,
51-65. 20. T. Hyeon, Y. Chung, J. Park, S. S. Lee, Y. W. Kim and B. H.
Park, J. Phys. Chem. B, 2002, 106, 6831-6833. 21. E. Solano, L. Perez-Mirabet, F. Martinez-Julian, R. Guzman,
J. Arbiol, T. Puig, X. Obradors, R. Yanez, A. Pomar, S. Ricart and J. Ros, J. Nanopart. Res., 2012, 14, 1034.
22. S. H. Sun, H. Zeng, D. B. Robinson, S. Raoux, P. M. Rice, S. X. Wang and G. X. Li, J. Am. Chem. Soc., 2004, 126, 273-279.
23. W. J. Schuele and V. D. Deetscreek, J. Appl. Phys., 1961, 32, S235-S236.
24. R. I. Walton, Chem. Soc. Rev., 2002, 31, 230-238. 25. M. Yoshimura and K. Byrappa, J. Mater. Sci., 2008, 43,
2085-2103. 26. H. L. Andersen and M. Christensen, Nanoscale, 2015, 7,
3481-3490. 27. H. L. Andersen, K. M. Ø. Jensen, C. Tyrsted, E. D. Bøjesen
and M. Christensen, Cryst. Growth Des., 2014, 14, 1307-1313.

28. C. Granados-Miralles, M. Saura-Muzquiz, E. D. Bojesen, K. M. O. Jensen, H. L. Andersen and M. Christensen, J. Mater. Chem. C, 2016, 4, 10903-10913.
29. M. Schmidt, H. L. Andersen, C. Granados-Miralles, M. Saura-Muzquiz, M. Stingaciu and M. Christensen, Dalton Trans., 2016, 45, 6439-6448.
30. M. Stingaciu, H. L. Andersen, C. Granados-Miralles, A. Mamakhel and M. Christensen, CrystEngComm, 2017, 19, 3986-3996.
31. S. s. Chikazumi and C. D. Graham, Physics of ferromagnetism, Oxford University Press, Oxford ; New York, 2nd edn., 2009.
32. A. J. Blake and W. Clegg, Crystal structure analysis : principles and practice, Oxford University Press, Oxford ; New York, 2nd edn., 2009.
33. K. Momma and F. Izumi, J. Appl. Crystallogr., 2011, 44, 1272-1276.
34. P. Hald, J. Becker, M. Bremholm, J. S. Pedersen, J. Chevallier, S. B. Iversen and B. B. Iversen, J. Solid State Chem., 2006, 179, 2674-2680.
35. P. Fischer, G. Frey, M. Koch, M. Konnecke, V. Pomjakushin, J. Schefer, R. Thut, N. Schlumpf, R. Burge, U. Greuter, S. Bondt and E. Berruyer, Physica B, 2000, 276, 146-147.
36. S. Carlson, M. Clausen, L. Gridneva, B. Sommarin and C. Svensson, J. Synchrotron Radiat., 2006, 13, 359-364.
37. K. V. Klementev, J. Phys. D: Appl. Phys., 2001, 34, 209-217. 38. J. Rodriguez-Carvajal, Physica B Condens. Matter, 1993,
192, 55-69. 39. P. Thompson, D. E. Cox and J. B. Hastings, J. Appl.
Crystallogr., 1987, 20, 79-83. 40. P. Scherrer, Nachr. Ges. Wiss. Gottingen, Math., 1918,
1918, 98-100. 41. J. I. Langford and A. J. C. Wilson, J. Appl. Crystallogr.,
1978, 11, 102-113. 42. E. Solano, C. Frontera, T. Puig, X. Obradors, S. Ricart and J.
Ros, J. Appl. Crystallogr., 2014, 47, 414-420. 43. C. Liu, B. S. Zou, A. J. Rondinone and Z. J. Zhang, J. Phys.
Chem. B, 2000, 104, 1141-1145. 44. S. Yanez-Vilar, M. Sanchez-Andujar, C. Gomez-Aguirre, J.
Mira, M. A. Senaris-Rodriguez and S. Castro-Garcia, J. Solid State Chem., 2009, 182, 2685-2690.
45. C. Wende, K. Olimov, H. Modrow, F. E. Wagner and H. Langbein, Mater. Res. Bull., 2006, 41, 1530-1542.
46. R. D. Shannon, Acta Crystallogr., Sect. A: Found. Adv., 1976, 32, 751-767.
47. R. Frison, G. Cernuto, A. Cervellino, O. Zaharko, G. M. Colonna, A. Guagliardi and N. Masciocchi, Chem. Mater., 2013, 25, 4820-4827.
48. C. Liu, A. J. Rondinone and Z. J. Zhang, Pure Appl. Chem., 2000, 72, 37-45.
49. J. Jacob and M. A. Khadar, J. Appl. Phys., 2010, 107. 50. S. M. Patange, S. E. Shirsath, G. S. Jangam, K. S. Lohar, S. S.
Jadhav and K. M. Jadhav, J. Appl. Phys., 2011, 109, 053909.
51. Z. Z. Lazarevic, C. Jovalekic, A. Milutinovic, D. Sekulic, V. N. Ivanovski, A. Recnik, B. Cekic and N. Z. Romcevic, J. Appl. Phys., 2013, 113, 187221.
52. T. Slatineanu, A. R. Iordan, M. N. Palamaru, O. F. Caltun, V. Gafton and L. Leontie, Mater. Res. Bull., 2011, 46, 1455-1460.
53. V. Blanco-Gutierrez, E. Climent-Pascual, M. J. Torralvo-Fernandez, R. Saez-Puche and M. T. Fernandez-Diaz, J. Solid State Chem., 2011, 184, 1608-1613.
54. D. Levy, R. Giustetto and A. Hoser, Phys. Chem. Miner., 2012, 39, 169-176.
55. B. K. Teo, EXAFS : Basic principles and data analysis, Springer-Verlag, Berlin ; New York, 1986.
56. G. Dräger, R. Frahm, G. Materlik and O. Brummer, Phys. Status Solidi B, 1988, 146, 287-294.
57. F. W. Lytle and R. B. Greegor, Phys. Rev. B, 1988, 37, 1550-1562.
58. M. Wilke, F. Farges, P. E. Petit, G. E. Brown and F. Martin, Am. Mineral., 2001, 86, 714-730.
59. J. Schindelin, I. Arganda-Carreras, E. Frise, V. Kaynig, M. Longair, T. Pietzsch, S. Preibisch, C. Rueden, S. Saalfeld, B. Schmid, J. Y. Tinevez, D. J. White, V. Hartenstein, K. Eliceiri, P. Tomancak and A. Cardona, Nat. Methods, 2012, 9, 676-682.
60. O. Eriksson, B. Johansson, R. C. Albers, A. M. Boring and M. S. S. Brooks, Phys. Rev. B, 1990, 42, 2707-2710.
61. J. M. D. Coey, Magnetism and magnetic materials, Cambridge University Press, Cambridge, 2010.
62. G. Shirane, Acta Crystallogr., 1959, 12, 282-285. 63. A. Kremenovic, B. Antic, P. Vulic, J. Blanusa and A. Tomic,
J. Magn. Magn. Mater., 2017, 426, 264-266. 64. W. F. Brown, Phys. Rev., 1941, 60, 139-147. 65. R. H. Kodama, A. E. Berkowitz, E. J. McNiff and S. Foner,
Phys. Rev. Lett., 1996, 77, 394-397. 66. Z. Nedelkoski, D. Kepaptsoglou, L. Lari, T. L. Wen, R. A.
Booth, S. D. Oberdick, P. L. Galindo, Q. M. Ramasse, R. F. L. Evans, S. Majetich and V. K. Lazarov, Sci. Rep., 2017, 7, 45997.
67. S. Morup, E. Brok and C. Frandsen, J. Nanomater., 2013, 2013, 1-8.
68. H. M. Xiao, X. M. Liu and S. Y. Fu, Compos. Sci. Technol., 2006, 66, 2003-2008.
69. A. L. Gurgel, J. M. Soares, D. S. Chaves, D. S. Chaves, M. M. Xavier, M. A. Morales and E. M. Baggio-Saitovitch, J. Appl. Phys., 2010, 107, 09A746.
70. G. Muscas, N. Yaacoub, G. Concas, F. Sayed, R. S. Hassan, J. M. Greneche, C. Cannas, A. Musinu, V. Foglietti, S. Casciardi, C. Sangregorio and D. Peddis, Nanoscale, 2015, 7, 13576-13585.