693562-1.pdf - Pure
109
Eindhoven University of Technology MASTER Working the way the cookie crumbles? using fit in ERP migration and selection at LU General Biscuits, Kraft Foods Europe Faber, J.W. Award date: 2010 Link to publication Disclaimer This document contains a student thesis (bachelor's or master's), as authored by a student at Eindhoven University of Technology. Student theses are made available in the TU/e repository upon obtaining the required degree. The grade received is not published on the document as presented in the repository. The required complexity or quality of research of student theses may vary by program, and the required minimum study period may vary in duration. General rights Copyright and moral rights for the publications made accessible in the public portal are retained by the authors and/or other copyright owners and it is a condition of accessing publications that users recognise and abide by the legal requirements associated with these rights. • Users may download and print one copy of any publication from the public portal for the purpose of private study or research. • You may not further distribute the material or use it for any profit-making activity or commercial gain
-
Upload
khangminh22 -
Category
Documents
-
view
0 -
download
0
Transcript of 693562-1.pdf - Pure

Eindhoven University of Technology
MASTER
Working the way the cookie crumbles?using fit in ERP migration and selection at LU General Biscuits, Kraft Foods Europe
Faber, J.W.
Award date:2010
Link to publication
DisclaimerThis document contains a student thesis (bachelor's or master's), as authored by a student at Eindhoven University of Technology. Studenttheses are made available in the TU/e repository upon obtaining the required degree. The grade received is not published on the documentas presented in the repository. The required complexity or quality of research of student theses may vary by program, and the requiredminimum study period may vary in duration.
General rightsCopyright and moral rights for the publications made accessible in the public portal are retained by the authors and/or other copyright ownersand it is a condition of accessing publications that users recognise and abide by the legal requirements associated with these rights.
• Users may download and print one copy of any publication from the public portal for the purpose of private study or research. • You may not further distribute the material or use it for any profit-making activity or commercial gain

Master thesis for partial fulfillment of the requirements for the degree of Master of Science in Business Information Systems
Working the way the cookie crumbles?
Using fit in ERP migration and selection at LU
General Biscuits, Kraft Foods Europe J.W. Faber September 2010


Working the way the cookie crumbles?
Using fit in ERP migration and selection at LU General Biscuits, Kraft Foods Europe
Master Thesis Department of Mathematics and Computer Science
Date: September 2010 Student name: J.W. Faber Student registration: 0516686 R.M. Dijkman L. de Buijsscher
N. Sidorova B. Vermeulen P.O. Box 513 5600 MB Eindhoven The Netherlands
De Beukelaer-Pareinlaan 1 2200 Herentals Belgium
TU/e Department of Mathematics and Computer Science Series Master Theses Business Information Systems Keywords: ERP migration, SAP, fit, alignment, maintenance This research studies has been conducted on request of the Maintenance department of LU General Biscuits, part of Kraft Foods Europe. However, neither Kraft Foods Europe nor LU General Biscuits holds any responsibility for the correctness of the data, reviews, conclusions and recommendations, which are the sole responsibility of the author. The scenario described in this report is typical for the factory of LU General Biscuits in Herentals, Belgium and may not be applicable to other sites.


J.W. Faber
Wisdom TU/e
i
Wisdom
“If you cannot describe what you are doing as a process, you do not know what you are doing.”
W.E. Deming
“Forget goals. Value the process.” Jim Bouton
“After climbing a great hill, one only finds there are many more hills to climb” N.R. Mandela

Working the way the cookie crumbles?
TU/e Preface
ii
Preface
Right now, you are holding a document that some people had almost given up to ever see the light of day. However, after nine years it is time for me too to wrap up all the paper knowledge of the past years and work it into a thesis as a closure to my studies. Although the switch from Industrial Engineering to Computer Science was far from obvious for me, I found the topics strangely attractive and in contrast to many Industrial Engineering bachelors decided not to make the switch to either a logistics or innovation mater program. The fact that you hold this report proves it may have been a wise decision after all. Enterprise Resource Planning (ERP) systems are a hot topic in the information technology field ever since they were introduced in the 1990’s. Notorious are the implementation projects of ERP systems that never managed to be completed in both time and budget. Add to that the enormous complexity of ERP systems and it becomes quite obvious that the main public has become rather skeptical about everything related to ERP. Since those early times, things have changed slightly. It is now recognized that ERP systems are no magic. They have the power to improve companies’ ways of doing business dramatically, but are a management nightmare due to their high level of integration. I have been fascinated by the complexity of the systems and the complexity of factors contributing to their success or failure. I loved the opportunity of being so closely involved in an actual ERP system implementation. LU General Biscuits, where the research project was conducted between February and July 2010, has given me this opportunity for which I am very grateful. They have allowed me to take a look deep within their organization. By talking and observing I discovered their internal business processes and found some remarkable activities and bottlenecks. The spirit and motivation of the maintenance organization to try and keep the factory running has been amazing. It taught me a lot about commitment and teamwork, even in times where it is difficult to keep up with all the change besieging the organization. Thank you for this great opportunity! Jelmer Faber Eindhoven / Herentals September 2010

J.W. Faber
Management Summary TU/e
iii
Abstract
Although no longer the Holy Grail of information systems, Enterprise Resource Planning (ERP) systems still offer business attractive gains in terms of data integration and control. Scientific research has shown that the concept of ‘fit’ is a key determinant in the success or failure of ERP implementation. What type of fit is critical and how it can be measured before selecting an ERP system has gotten attention in the scientific literature, but remains underexposed. In this thesis a model for fit measurement is selected and described in detail. To test the applicability of the fit measurement instrument, it is applied to a case study. The outcomes of the study are an assessment of the chosen fit measurement model and a recommendation for ERP system selection based on the fit measurement tool. The research contributes to the field by applying different fit measurement techniques and assessing them. The project was commissioned by the maintenance department of LU General Biscuits in Herentals, Belgium.

Working the way the cookie crumbles?
TU/e Management Summary
iv
Management Summary
This study focuses on measurement of the fit between an ERP system and the organization it is implemented in. Many studies emphasize the importance of fit in Enterprise Resource planning (ERP) system implementation, but most stop at the conceptual description. Giving a true measurement method and results of fit are rare. Research motive The research assignment has been commissioned by LU General Biscuits. Acquired in 2007 by Kraft Foods Europe, the company faced an ERP system replacement during 2009, with a go-live in 2010. The maintenance department faced a loss of functionality in their Computerized Maintenance Management System (CMMS) due to this ERP migration project. To assess the problems occurring from this migration project and to evaluate possible replacement CMMS, the following research targets are formulated.
A. How can we measure the fit between an existing, running business and a (proposed) ERP system?
B. How well does the chosen fit measurement approach perform?
Analysis ERP systems are both loved and feared in by companies. They offer enormous theoretical benefits in terms of business integration and control. On the other hand, ERP systems are complicated and expensive. Due to their complex nature, implementation projects tended to overrun in time and thus budget, even worse than in other IT projects. These overruns have made companies more aware of the risks involved with ERP implementation. It also drew attention from the scientific field to find the root causes of these implementation problems. One of the findings since has been that companies simply implemented a system, without much attention to the peculiarities of each system. That is where the idea of fit originates from. Much like a pair of pants need to suit a consumer, so does an ERP system need to fit an organization. Fit has been defined on different levels. Strategic fit involves the ability of an ERP system to support the organization achieving its long-term goals. Process fit is the extent to which the ERP system supports current business processes. Process fit is a prominent factor, since business process reengineering (BPR) can be very disruptive to an organization. On top of that, many organizations create value through the uniqueness of their processes. When these processes were to be adapted to accommodate an ERP system, what happens to the value creation capabilities of the company? The last level is the function or task level. These forms of fit measure the support of the ERP system to employee task execution. At this level, some authors distinguish data and output fit. These forms of fit compare the current format and shape of data and output of systems to formats of the ERP system. After analysis of several fit models, a combination of models and techniques was chosen to achieve the second research target. This model has three levels: strategic, process and task. For each level a method of measuring fit is used. On a strategic level, the organization its goals are used to create goal-based use-cases. A goal is selected and it is determined what system functionality is needed to achieve that goal. This system functionality is written down as a requirement. At process level, models are made of the current business processes in the organization. These models are then compared to the reference model of the candidate ERP

J.W. Faber
Management Summary TU/e
v
systems. Where equivalent processes, or equivalent tasks exist, there is a fit between the organization and the system. At task level, two different approaches to determine fit are used. First a questionnaire was issued to measure task-technology fit (TTF). Unfortunately, this questionnaire only measures current fit and cannot be applied to candidate systems. The second fit measurement method was to elicit functional system requirements. These requirements were than compared to actual system functionality to assess the fit. Case study The proposed model was applied to a case study. The organization under consideration was the maintenance department of LU General Biscuits in Herentals, Belgium. For strategic fit, interviews with maintenance managers and the technical director were conducted and strategic plans analyzed to obtain the organizational goals. From these goals, use-cases were constructed. Based on system documentation and an implementation review the use-cases were compared with system capabilities to obtain a measure of strategic fit. After interviews with all managers and a review of the current CMMS, the processes within the maintenance department were constructed. These processes were compared to the reference model of SAP, which was the candidate system under consideration in this particular case study. The same interviews and review were used to create a list of system requirements. From system documentation and implementation analysis, each requirement was judged to be directly supported, supported through customization, supported with third party software or not supported at all. Relative scores of fit were obtained for both the current system, Coswin, and the candidate system, SAP-PM. Results The results of both strategic and task level fit were clearly in favor of SAP-PM. The main reason for this, perhaps surprising, result, is that SAP-PM is much easier to integrate with the other ERP system modules in use at LU General Biscuits. The current CMMS needs a lot of interfacing to achieve integration. SAP-PM uses the same data tables and formats as the other SAP modules and therefore does not need any interfacing. Furthermore, SAP-PM offers a similar interface as the other SAP modules. Similar interfaces accommodate ease of use of information systems. On process level, Coswin outperforms SAP-PM. Coswin is capable of a graphical production line representation that can also be used for navigation. This is a user-friendly feature that cannot be achieved in SAP-PM. Despite the better fit of SAP-PM, the advice is given not to switch CMMS yet. The organization has undergone a lot of change lately. Moreover, there are some issues that can be addressed in Coswin first, so that in a CMMS replacement project the requirements for the new system are much clearer. Finally, SAP-PM is significantly more expensive in both purchasing and licensing costs. Model performance The model produces outcomes that are useful as a measure of fit. Three levels of fit measurement are unnecessary. Because the goals at strategic level are translated to use-cases, there is quite an overlap in strategic fit and task fit measurement. Process fit analysis is unique. A drawback of the model is that the fit measure does not indicate where misfits occur. When fit is 75%, it is not directly clear which 25% is not supported by the ERP system. In that 25% some critical requirements or processes may exist. The overlap in this particular study may be caused by the fact that only one ERP system module is considered. Studying one module limits the scope to a single department in this case. Goals of a department are more operationally focused than company goals. Perhaps

Working the way the cookie crumbles?
TU/e Management Summary
vi
that the requirements elicited from company goals have less overlap with requirements at task level. The execution of the whole model does lead to a deep insight into the organization. Therefore the final advice on system replacement can be richer in nature than when only fit measures are used. The added value of TTF in the model is unclear. It did add insight into the necessity of system replacement, but not into the measure of fit itself. It can be used as a rationale for system replacement. That is, when results from the TTF indicate a lack of fit, a replacement is eligible. When there is adequate fit, replacement is unnecessary.

J.W. Faber
Contents TU/e
v
Contents
Wisdom i Preface ii Abstract iii Management Summary iv Contents v List of Figures vii List of Tables vii List of Abbreviations viii 1 Introduction 1 1.1 Problem context 1 1.2 Research targets 1 1.3 Thesis structure 3
2 Organization Context 4 2.1 Company history 4 2.2 Strategic direction 5 2.3 The maintenance department 5 2.4 Information systems support 6
3 The ERP Promise 8 3.1 ERP system origins 8 3.2 What is an ERP system? 8 3.3 Why introduce an ERP system? 9 3.4 Measuring IT implementation success 10 3.5 Considerations in achieving ERP success 12
3.5.1 Package (in)flexibility 12 3.5.2 How much will it cost? 12 3.5.3 What to do with the old stuff? 13 3.5.4 Does ERP bring competitive advantage? 13 3.5.5 ERP systems are disruptive 14
4 Measuring Fit: One Size Does Not Fit All 15 4.1 Focus of study 15
4.1.1 IT success 15 4.1.2 ERP success 16 4.1.3 Critical Success Factors 17
4.2 Level of fit 18 4.2.1 Strategic fit 18 4.2.2 Process fit 18
Working the way the cookie crumbles?
TU/e Contents
vi
4.2.3 Function fit 19 4.2.4 Task fit 19
4.3 Types of fit 20 4.3.1 Culture fit 20 4.3.2 Structure fit 20 4.3.3 Organization fit 21
4.4 Conclusion 21
5 The ERP Boottree Model 24 5.1 Strategic level 24
5.1.1 Input 24 5.1.2 Method 25
5.2 Process level 26 5.2.1 Input 27 5.2.2 Method 28
5.3 Task level 29 5.3.1 Input 29 5.3.2 Method 30
5.4 Reliability of the model 30 5.5 Validity of the model 31
6 Case study 32 6.1 Strategic level fit analysis 33
6.1.1 Input 33 6.1.2 Method 35 6.1.3 Result 35
6.2 Process level fit analysis 35 6.2.1 Input 35 6.2.2 Method 37 6.2.3 Result 37
6.3 Task level fit analysis 38 6.3.1 Input 38 6.3.2 Method 38 6.3.3 Result 38
7 Discussion & Recommendations 41 8 Conclusion & Reflection 44 8.1 Research targets 44 8.2 Limitations of the case study 45 8.3 Recommendations for further research 46
9 Epilogue 47 10 Bibliography 48 11 Appendices Index 52
J.W. Faber
List of Figures TU/e
vii
List of Figures
Figure 1 The regulative cycle by van Strien for this research project 2 Figure 2 Herentals site 4 Figure 3 LU General Biscuits executive committee 5 Figure 4 SAP R/3 architecture 7 Figure 5 Anatomy of an enterprise system 8 Figure 6 TAM 10 Figure 7 DeLone and McLean success model 11 Figure 8 Taxonomy for ERP critical factors 11 Figure 9 ERP critical success factors model 11 Figure 10 Strategic Alignment Model 15 Figure 11 Task‐Technology fit model 15 Figure 12 ERP fit model 16 Figure 13 General fit model 17 Figure 14 Incorporating country specific misfits 20 Figure 15 A model for ERP application 20 Figure 16 ERP fit as defined by 20 Figure 17 Research model 24 Figure 18 Example of a goal‐based use‐case 26 Figure 19 Process model example 27 Figure 20 EPC notation 28 Figure 21 Snapshot of Mindjet MindManager 29 Figure 22 SAP related projects and their overlap in the maintenance department 32 Figure 23 Maintenance department process grouping 36
List of Tables
Table 1 Benefits of ERP system implementation 9 Table 2 Four constructs of technology impact on work 19 Table 3 Contingency fit between ERP and organization type 21 Table 4 Comparison of fit measurement methods 23 Table 5 Score sheet and fit measure representation 27 Table 6 Strategic fit results 35 Table 7 Process fit results 37 Table 8 Function fit results 39 Table 9 Fit results 42

Working the way the cookie crumbles?
TU/e List of Abbreviations
viii
List of Abbreviations
Abbreviation Meaning BPR Business Process Reengineering CASE Computer-Aided Software Engineering CMMS Computerized Maintenance Management Software CO Coordinator CSF Critical Success Factor(s) EIS Enterprise Information System(s) EPC Event-driven Process Chains ERP Enterprise Resource Planning FLM First Line Maintenance FMT Factory Management Team GAAP Generally Accepted Accounting Principles HR Human Resources IS Information System(s) IT Information Technolog(y)(ies) KPI Key Performance Indicator ME Maintenance Expert MES Manufacturing Execution System MM Maintenance Manager MRP I Materials Requirements Planning MRP II Manufacturing Resources Planning OR Industrial Council PM Production Manager SAP Systeme, Anwendungen, Produkte in der Datenverarbeitung; ERP software system SAP-AM Fixed Asset Management Module SAP-APO Advanced Planner and Optimizer SAP-CO Controlling Module SAP-FI Financial Accounting Module SAP-HR Human Resources Module SAP-MM Materials Management Module SAP-PM Plant Maintenance Module SAP-PP Production Planning Module SAP-QM Quality Management Module SAP-SD Sales and Distribution Module SCM Supply Chain Management SMF Shift Manager Fabrication SMI Shift Manager Packaging SRM Supplier Relationship Management interface of SAP SST Social Shaping of Technology TAM Technology Acceptance Model TD Technical Director TPB Theory of Planned Behavior TQM Total Quality Management TRA Theory of Reasoned Action TTF Task-Technology Fit TV Supervisor UML Unified Modeling Language VMI Vendor Managed Inventory WO Work Order(s) WR Work Request(s) WvB Work Planner

J.W. Faber
Introduction TU/e
1
1 Introduction
The subject of this master thesis is a metric to measure the fit between Enterprise Resource Planning (ERP) systems and organizations. The commissioner of the project, the LU General Biscuits maintenance department in Herentals Belgium, faced a series of changes with regard to their information systems. Therefore, they needed an analysis and assessment of their current business processes. Next to that, they requested a recommendation with respect to the (dis)continuation of their current computerized maintenance management system. Both these questions will be answered by studying the concept of information systems fit. Since the source of change at LU General Biscuits is a change of ERP system, the topic is narrowed information systems fit to ERP systems fit. In this chapter the structure of the research project and this thesis will be explained. First the problem context is discussed, followed by the specific research targets that this thesis pursues. In the final section, the thesis structure is laid out. 1.1 Problem context The migration from one ERP system to another is not a simple flip of a switch. It is an elaborate undertaking with many consequences for an organization. It will alter the way people work and the tasks they perform on a daily basis. Current business processes will change to accommodate the new ERP system. To change these processes in a meaningful way, the current processes should act as a starting point. If you do not know what you do now, it is impossible to judge what changes need to be made to accommodate the processes needed in the new situation. The most important concept in applying new systems in existing organizations is ‘fit’. Fit is a measure of how well the system and organization go together. Both will have different assumptions about the environment, the way of doing business and the operational action for doing business. It depends on the amount and the severity of ‘misfits’ whether to change the organization, a process, or the system. The concept of fit has been used over 30 years in organizations. The scientific literature recognizes the important role of fit and different types of fit have been defined. In strategic management the fit between organizations and their processes, technology, strategy and environment has been a foundation for much research (Kanellis et al, 1999). It is widely recognized that ERP systems selection cannot be done on financial measures only, as traditionally happened in Information Technology (IT) selection (Stefanou, 2001). A broader perspective is needed in which the support that the ERP system can give to the organization is the basis for selection. To describe the extent to which a system can be supportive, the terms ‘fit’ and ‘alignment’ are used (Bendoly & Jacobs, 2004). Iivari (1992) defines fit as: “the object of design must match its context in order to be effective”. For the sake of clearance only the term fit is used in this thesis, unless term alignment is specifically used by others. Fit between system and organization ensures that the system actually supports the organization. As will be discussed later, fit can occur on multiple dimensions. If any gaps between the organization and the system are not filled, the implementation is likely to fail (Morton & Hu, 2008). Later in this thesis the subject of fit will be revisited and discussed in more detail. 1.2 Research targets From the problem context above, the following two research targets are defined. These statements reflect the operational questions of the maintenance department management, but are generalized from the LU General Biscuits maintenance department context.

Working the way the cookie crumbles?
TU/e Introduction
2
A. How can we measure the fit between an existing, running business and a (proposed) ERP system?
B. How well does the chosen fit measurement approach perform?
To answer these questions the approach as suggested by van Strien (Aken et al, 2005), is loosely followed. This methodology, called the regulative cycle, can be applied to system development projects and efficiency improvements. Both subjects play a role in this research project, which allows for the application of the framework. The framework with the corresponding chapters is shown in figure 1. Following this methodology results in the following sub-targets:
A1 What is fit and why does it matter? Before applying a concept to a business case, a definition or other description of the concept should be given. From the literature, different definitions of fit are drawn and discussed. To know what ‘fit’ is, does not mean its importance is known, therefore the implications of different fit interpretations and the context of fit is also discussed. These different types of fit are discussed in chapter four.
A2 What is an appropriate approach to determine fit? Once it is known what fit is and why and when it is important, a method needs to be found to determine fit. Another dive into the literature provides models for both general information technology and ERP success. Chapter five describes a method to determine fit.
B1 How can we apply the suggested approach to a case study and what are the results?
The method described in chapter five is applied to the LU General Biscuits maintenance department situation. The theoretical model is operationalized and a detailed case study description is given in chapter six. The results are discussed in chapter seven.
B2 How did the approach perform? A reflection will be made on the usefulness of the method in ERP system selection through the use of fit. Chapter eight contains this reflection and suggestions for improvements and further research.
Figure 1 The regulative cycle by van Strien for this research project
(Aken van, Berends, & Bij van der, 2005)
J.W. Faber
Introduction TU/e
3
1.3 Thesis structure In the next chapter the problem context will be extended by describing the organizational context of this research study. The problem and organizational context together provide the rationale why this study was performed. The organizational context also provides some background information that will be useful in chapter five, the case study. Then in the following two chapters a review will be given of scientific literature on fit and ERP systems. This review results in a comparison of several approaches determining IT success and fit. The approaches will be compared on the type of fit measured, on what level in the organization fit is measured and whether the approach has been used in studies for ERP system fit before. From this comparison a method is derived and described in detail in chapter five. All elements of the chosen model are explained and the necessary inputs described. Also the methods applied in the model to reach results are explained. In chapter six the method is applied to an organizational environment, which in this case is the maintenance department of LU General Biscuits. Here the inputs and methods as used in the case study are described and the results presented. In the next chapter the results of the case study are discussed and recommendations for the organization are given. In the final chapter a reflection on the chosen and applied method will be given, together with suggestions for alterations and suggestions for further research.

Working the way the cookie crumbles?
TU/e Organization Context
4
2 Organization Context
In this chapter, the organization where the case study will be executed is described. First, its history will be briefly addressed, followed by the organization strategy. Then the maintenance department and its position in the organization are described. This chapter ends with an explanation of the tangible problems that the maintenance department is facing. 2.1 Company history The research project was conducted at the Herentals factory of LU General Biscuits. LU is a contraction of the initials of the founders Jean-Romain Lefèvre and Pauline Utile. In 1846 Jean-Romain started a bakery and shop in Nantes with his wife and business partner Pauline. The brand name LU was created through a calendar advertisement by Firmin Bouiesset and was shown on the first poster advertisements featuring ‘le petit escolier’ or little schoolboy in 1897. The initials were embossed on the famous ‘Petit Beurre’ line of biscuits and the success of both biscuits and brand caused the company to become known as LU. Through a series of mergers and acquisitions the LU brand expanded. For a more comprehensive overview of mergers and acquisitions concerning LU General Biscuits, please refer to appendix A. The history of the Herentals facility dates back to 1870 when Edward de Beukelaer started a biscuit factory in Antwerp. In 1960 building works start at the current location in Herentals. The first biscuits produced here are the famous ‘Prince fourré’. In 1965 the General Biscuit company comes into being, combining the biscuit activities of de Beukelaer and Parein. Parein is well-known for its ‘TUC’ brand. In 1977 General Biscuits merges into the French group ‘Cérealiment-LU-Brun’ and four Dutch factories merge into General Biscuits the Netherlands. This adds the brand ‘Liga’ to the LU brand portfolio. In 1986 the Groupe Danone, then known as ‘Boussois-Souchon-Neuvesel’, takes control of the General Biscuits group. In 2001 the factory in Beveren Belgium, and all Dutch factories are closed and their production lines moved to Herentals. In 2007 Danone decides to divest their biscuit activities and focus solely on dairy. The American Kraft Foods group takes over all Danone its biscuit activities including the LU brand and factories. At this moment LU has 37 factories around Europe, of which the one in Herentals is the largest. With 1500 employees, 16 production lines and 90,000 metric tons of biscuits a year the Herentals factory is the largest biscuit factory of Europe.
LU General Biscuits, Herentals factory Number of employees 1,500 Number of production lines 16 Output in metric tons 90,000 Turnover € 351,000,000
Figure 2 Herentals site
Maintenance department Personnel Staff and management 25 Technicians 100 Personnel Budget € 8,775,000 Work Installations served 3,500 Work orders annually 20,000 Interventions annually 8,000 Warehouse Non-stock items 7,000 Stock items 7,000 Inventory value € 2,100,000 Material Budget € 2,925,000

J.W. Faber
Organization Context TU/e
5
2.2 Strategic direction After the 2007 acquisition of all Danone its biscuit activities, the Kraft Foods group left all factories as they were for two years. In 2009 it declared that it wanted to standardize its biscuit operations in Europe. Despite its rejection in 2001 of business standardization by enforced ERP platform implementation (Markus & Tanis, The Enterprise System Experience - From Adoption to Success, 2000), all biscuit companies are to use SAP R/3 as their ERP system. On top of that a reorganization plan was put into action to centralize Kraft corporate operations, such as sales, marketing, procurement, finance, invoicing, asset management, supplier management, human resources and IT. This has severe implications for the Herentals site, which will remain just a production facility. All administrative and support staff will move from the site to the Benelux and European headquarters in Mechlin and Zurich. As a production facility, the Herentals site has a clear vision for its position within the biscuits division of Kraft Foods Europe.
“We will become, with passionate teams, the model company in the biscuits industry.”
The strategy to accomplish this goal is based on four pillars. 1. Improving our competitiveness significantly in a continuous way 2. Producing the very best biscuits for our customers 3. Being an attractive employer 4. Managing sustainability
The accompanying mission of LU General Biscuits is: “I make every day delicious”, a clear continuation of Kraft Foods “Make today delicious”. 2.3 The maintenance department The production lines of LU General Biscuits are supported by a maintenance department. This department is responsible for the availability of machines by applying reactive and pro-active maintenance. The maintenance department is part of the industrial group within the organization of LU General Biscuits, before the reorganization to centralize Kraft Foods Europe. The maintenance director reports directly to the industrial director. The executive committee diagram is shown in figure 3. Similar to the other industrial departments in the Herentals plant, the maintenance department is separated in two groups. One supports the fabrication section of the factory, the other the packaging section. For building maintenance and factory wide systems, such as pressurized air, water supply, and cooling, a separate group exists. Finally, for administration
Figure 3 LU General Biscuits executive committee

Working the way the cookie crumbles?
TU/e Organization Context
6
and warehousing a fourth group is in place. The maintenance department organization diagram is shown in appendix B. In the strategy of the Herentals plant the maintenance department is explicitly included in the first pillar “Improving our competitiveness significantly in a continuous way”. More precisely, the maintenance department is involved in achieving operational excellence through lean maintenance. Preventive maintenance and technician training are the main focus points in the lean maintenance approach for the Herentals site. The maintenance department has developed its own strategic plan from the focus points identified in the overall site strategy. This plan is built on five pillars and depicted graphically in a ‘house of strategy’. A picture of this house is shown in appendix C. The five pillars for the maintenance department are:
1. Get the basics right 2. Coach and improve the maintenance organization 3. Change behavior towards and collaboration with production and engineering while
keeping a mindset for safety and quality 4. Improve the maintenance reliability sharing tasks with technical operators 5. Continue to plan and track costs and downtime
In chapter six the maintenance department strategy is discussed in more detail when placed in the developed model. 2.4 Information systems support In addition to a companywide ERP system, the maintenance department has deployed a Computerized Maintenance Management System (CMMS) to support the work registration, planning and scheduling process since the early 1990’s. In a factory of this size, such a system is necessary to manage outstanding maintenance and work in progress. On top of that, it is difficult to process any work order or work request by hand in an orderly fashion with the volume of maintenance work at the Herentals site. Finally, preventive maintenance plan management and preventive work order release is an easier job within a CMMS then without computerized support. An overview of the development of ERP systems and CMMS at the Herentals site is given in appendix D. Since the introduction of Coswin in 2008, a two-way interface has existed between Coswin and the ERP system at that time, JD Edwards (JDE). The interface updated the inventory status, i.e. all stock level changes and goods receptions, once every 24 hours in a batch process. Second, the interface synchronized the purchase requisitions and orders between the two systems. The purchase requisitions were created in Coswin, and the interface created a similar requisition in JDE. In JDE the requisition was approved and transformed into a purchase order. This order was then picked up by the interface, which created a similar purchase order in Coswin. Whereas the purchase requisitions and purchase orders in both systems were linked, between the systems this link did not exist. In Coswin a link could be established between work orders and all associated purchase requisitions and orders. Finally, once every 24 hours the interface updated the database with machines and components from JDE to Coswin. Work orders and purchase orders could be linked to any kind of installation in this database. With the introduction of SAP as ERP system, Coswin can no longer show the inventory status, purchase requisitions, and purchase orders. Also, the list of installations is no longer updated, so that changes of machine location, machine replacements, or spare part list changes are not available in Coswin anymore. This lack of information makes work order preparation and scheduling a more difficult task. Not all users of Coswin will have access to SAP to check the progress of purchase orders, inventory status of materials or exact machine details. Also the creation of work requests

J.W. Faber
Organization Context TU/e
7
and work orders will be more difficult when these are linked to an installation that Coswin has not in its database due to a lack of interfacing. Kraft Foods has already announced that it will not free funds for a new interface. An overview of information systems use at the maintenance department is given in appendix E. As mentioned earlier in this chapter, the Kraft Foods group has decided upon a European centralization of its support organization. For factory operations this should cause no difficulties. However, the close cooperation of the maintenance department with for instance purchasing and invoicing will no longer be possible due to the geographic distance and raised language barriers. Direct effects of the re-organization are that LU General Biscuits no longer is able to register machines and installations in the ERP system. The same goes for the addition of suppliers. All these tasks are now performed by the Kraft Foods office in Bratislava, Slovakia. The maintenance department of LU General Biscuits currently has no clear picture of its processes, both internal and external. Therefore it cannot yet estimate the severity of the loss of interfacing between its CMMS and the company its ERP system. The maintenance department management has therefore issued this research assignment. The assignment is twofold. First, model our internal and external processes, indicate inefficiencies and highlight those tasks that will suffer from the loss of interfacing between CMMS and ERP system. Second, if we use so many modules of the SAP R/3 system, should we not consider changing our CMMS from Coswin to SAP-Plant Maintenance (SAP-PM)?
The SAP modules that all biscuit factories of Kraft Foods will have in use after the go-live of June 14th, 2010 are:
SAP-AM Fixed Asset Management
SAP-APO Advanced Planner and Optimizer
SAP-CO Controlling
SAP-FI Financial Accounting SAP-HR Human Resources
(Kraft Foods Belgium) SAP-MM Materials Management
SAP-PP Production Planning
SAP-QM Quality Management
SAP-SD Sales and Distribution
Figure 4 SAP R/3 architecture (Bench3)

Working the way the cookie crumbles?
TU/e The ERP Promise
8
3 The ERP Promise
In this chapter the nature of ERP systems is discussed. The goal is to paint a picture of the difficulties in both general IS and specifically ERP system implementation. This picture then forms a background for the models that will be presented in the next chapter. First the origin of ERP systems is described, then the reasons for ERP system introduction and finally the problems in assessing ERP success. Section 3.3 then discusses issues in general IS implementation that lead to either success or failure and section 3.4 discusses the issues often raised against ERP system implementation. 3.1 ERP system origins Was the internet revolution the consumer frenzy of the 1990s, ERP system adoption was the one for businesses (Davenport, 1998). ERP systems can be seen as the ‘third generation’ enterprise information systems (EIS). The first generation stemming from the 1960’s was aimed at the automation of manual procedures for planning and controlling production schedules and were called material requirement planning (MRP) systems. The second generation systems were called MRP (II) systems, the abbreviation now standing for manufacturing resource planning. This second generation, introduced in the mid 1970’s, took into account some of the obvious constraints from the first generation. However, implementation of both types of systems proved to be failure prone (Al-Mashari et al, 2003). ERP blends the functionality of MRP (II) with other areas such as quality, sales, marketing, human resources, maintenance and accounting. Transactions are no longer only processed in functional departments their information system, but the application crosses functional boundaries. The first ERP systems saw the daylight in the 1990’s, realizing the one-company, one-system philosophy (Markus & Tanis, 2000; Al-Mashari et al, 2003; Sarkis & Sundarrraj, 2003; Lengnick-Hall et al, 2004). A graphical representation of ERP architecture is shown in figure 5 to show the versatility of ERP systems and the integration between modules. 3.2 What is an ERP system? An ERP system uses only one database to store all company data. Most ERP systems contain
Figure 5 Anatomy of an enterprise system
(Davenport, 1998)

J.W. Faber
The ERP Promise TU/e
9
between 8,000 and 10,000 tables (Glass, 1998; Sarkis & Sundarrraj, 2003). It offers one application and a unified user interface (Brehm et al, 2001). ERP systems are less monolithic than MRP systems due to their basis in client/server architecture. In a client/ server architecture, the server provides and receives data while the client performs operations on data. Client/server architecture offers much more flexibility than the mainframe architecture of the former MRP systems, where the server provided data and performed operations on it. On top of that, ERP systems perform transactions real-time instead of in batches (Glass, 1998; Bingi et al, 1999). The orientation along the information flow allows ERP systems to be inter-organizational as well as intra-organizational. There is a trend towards increased connectivity in Supply Chain Management (SCM), for instance, companies can have suppliers monitor their stock and automatically have orders placed when critical stock levels are reached (Murray & Coffin, 2001; Sarkis & Sundarrraj, 2003; Al-Mashari et al, 2003; Lengnick-Hall et al, 2004). Bingi et al (1999) go as far as to state that SCM integration is impossible without the use of ERP systems. To avoid ERP system becoming monolithic, process standardization over organizations causes system rigidity, they are usually componentized. The different business functions of an enterprise information system are presented as different software modules offering the benefits in multisite implementations, gradual purchase and implementation of functionality, and evolutionary change from legacy systems to the ERP system (Davenport, 1998; Sarkis & Sundarrraj, 2003). 3.3 Why introduce an ERP system? Table 1 shows some of the tangible and intangible benefits of ERP system implementation. From a business point of view, three prominent reasons for ERP introduction are organizational integration, legacy systems and corporate cleanup. The choice for an ERP system is often driven by the desire to increase organizational predictability, consistency and management control. ERP systems are therefore introduced when firms face challenges to reduce costs, need to mitigate risks, and are required to react swiftly to changes in the market (Markus & Tanis, 2000; Al-Mashari et al, 2003; Lengnick-Hall et al, 2004). The decision to implement an ERP system is an infrastructural decision. ERP does not tell you how to control and manage the organization, it only provide information (Bingi et al, 1999; Holland & Light, 1999; Pereira, 1999; Lengnick-Hall et al, 2004; Yen & Sheu, 2004). Another driver for ERP system introduction is to get rid of legacy systems. Legacy systems are the information systems that currently support the functional departments of an organization. ERP system adoption promises four operational outcomes that could not be achieved through (the interfacing of) legacy systems, according to Lengnick-Hall et al (2004). First, it provides an information portrait of an enterprise, and secondly, it provides a single comprehensive database. Two other outcomes are that ERP systems increase information
Tangible Intangible Inventory reduction Increased visibility of corporate data Personnel reduction New or improved business processes Increased productivity Improved responsiveness to customers Improvements in order management Unanticipated cost reductions Faster closing of financial cycles Tighter system integration Reduction in IT and procurement costs Standardization of computing platforms Improved cash flow management Increased flexibility Increase of revenue and profits Global information sharing Reduction in transportation and logistics cost Y2K compliance Reduction in system maintenance need Improved business performance Improvement of delivery performance Improved SCM visibility Table 1 Benefits of ERP system implementation (Al-Mashari, Al-Mudimigh, & Zairi, 2003)

Working the way the cookie crumbles?
TU/e The ERP Promise
10
transaction speed and increase connectivity. Because of its broad influence, ERP systems are regarded as strategic assets to a firm (Yen & Sheu, 2004). The strategic benefits of ERP are said to be twofold. Through the benefits of functional integration, businesses can leverage their other key resources more effectively. Moreover, an integrated information system that cuts functional and company boundaries allows a firm and its extended supply chain to act as a total enterprise system (Davenport, 1998). The third rationale for ERP system implementation is to conduct a corporate cleanup and to achieve corporate consolidation. This reason is especially strong in multinational firms that obtained growth through the acquisition of other companies, such as Kraft Foods (Glass, 1998; Bingi et al, 1999; Connolly, 1999). A corporate cleanup involves business process analysis and organization analysis. These analyses indicate redundant functions, departments and point out inefficiencies. In corporate consolidation, synchronization of organizations and their processes is the main goal. The acquired organizations are forced to adopt the way of working of the mother company through the adoption of one ERP system. 3.4 Measuring IT implementation success The multidimensional and interdependent nature of success makes success measurement difficult. This could be the reason why so much research focus has been on IT failure instead of success (Kanellis et al, 1999). Traditionally, the only method for measuring IT success was through evaluation of common business performance indicators (Baets, 1992). Popular measurement techniques of IT success are the technology acceptance model (TAM), depicted in figure 6 and its underlying methods: theory of reasoned action (TRA) (Fishbein & Ajzen, 1975) and theory of planned behavior (TPB) (Ajzen, 1985). The operationalization of the success construct in the TAM is through system usage, predicted by perceived usefulness and perceived ease-of-use. The model was modified and extended to be applied in different fields of technology and to increase its explanatory power (Davis et al 1989; Malhotra & Galleta, 1999; Venkatesh et al, 2003). A specific application of TAM in an ERP system context has been conducted by Amoako-Gyampah & Salam (2004). However, system usage may be caused by other factors than satisfaction. For instance, users have no alternatives or are forced by the organization to use a system. Therefore there is some critique against the TAM. DeLone & McLean (2003) proposed another model, which is shown in figure seven, to measure IT systems success. They divide system success in three tiers, being technical, semantic and effectiveness success. Later, they added another success measure to include service quality. This addition was meant to measure the match between user expectations of the system and user perceptions of the system using SERVQUAL (Zeithaml et al, 1990). A critique on the DeLone and McLean model is given by Seddon & Kiew (1994). They argue that usefulness would be a better measurement construct, because the question of involuntary use can be evaded. Seddon also claims that the constructs as defined by DeLone and McLean, stem from research that defined the use construct differently than they do.
Figure 6 TAM
(Davis, Bagozzi, & Warshaw, 1989)

J.W. Faber
The ERP Promise TU/e
11
Finally, Smyth (2001, 2001a) took a model for measuring the success of computer-aided software engineering (CASE) tools and tried that on ERP systems. His rationale behind the application of CASE success measurement to ERP is that they both offer a high level of theoretical benefit, which is almost never achieved. Smyth added another popular construct to his model, which is Task-Technology Fit (TTF). This construct is adopted from Goodhue & Thompson (1995) and tries to measure the match between the facilities provided through (information) technology, the tasks a user needs to perform and the skills and attitudes of that user. According to Smyth (2001, 2001a) this construct could be very useful in highlighting the challenges of ERP success. According to his research it was the complexity of the package that caused impoverished functionality (Smyth 2001a). There is a lack of empirically effective evaluation for ERP success (Tsai & Chien, 2005). They report that not even 60% of the companies they questioned had evaluated their ERP system performance. Controversially, there seem to be many problems with ERP systems and their implementation. The amount of literature available on ERP (implementation) success is extensive, but only offering conceptual models of ERP success (Al-Mashari et al, 2003; Allen, et al, 2002; Bingi et al, 1999; Holland & Light, 1999; Ngai et al, 2008; Scheer & Habermann, 2000; Smyth, 2001). Apparently, there are difficulties with measuring ERP (implementation) success, as there have been problems with measuring the success of any IT implementation project (Markus & Tanis, 2000). First, the definitions of success vary widely. Although there is consensus that success is a multidimensional construct, the focus of research has been on the relationship of a specific dimension and ERP success (Kanellis et al, 1999; Markus & Tanis, 2000; Hong & Kim, 2002; Rai et al, 2002). Further complicating the issue is that the organization where ERP is implemented is multidimensional too, increasing measurement complexity (Morton & Hu, 2008). Another problem of measuring ERP success is that most studies on success factors lack a strong theoretical foundation (Morton & Hu, 2008). Finally, success can only be judged against a company its specific goals and targets, making it hard to develop generic measurement instruments for ERP success (Markus & Tanis, 2000).
Figure 7 DeLone and McLean success model
(DeLone & McLean, 2003)
Figure 8 Taxonomy for ERP critical factors
(Al-Mashari, Al-Mudimigh, & Zairi, 2003) Figure 9 ERP critical success factors model
(Holland & Light, 1999)

Working the way the cookie crumbles?
TU/e The ERP Promise
12
3.5 Considerations in achieving ERP success Direct measurement of ERP success is rare as was discussed in the former section. However, some authors have listed critical success factors (CSF) to achieve ERP success. One such ‘taxonomy’ of CSF is proposed by Al-Mashari et al, shown in figure 8 (2003). Their identification of critical success factors is not specific to ERP system implementation, but copied from general Information Systems (IS) implementation literature. ERP implementation poses some additional difficulties on top of regular IT implementation due to the integrated and boundary crossing nature of ERP systems (Holland & Light, 1999; Ngai et al, 2008). Holland & Light (1999) make a distinction of CSF in two levels, a strategic and a tactic level, of ERP implementation (figure 9). The next sections discuss the five issues that are most prominent in ERP implementation projects: package (in)flexibility, costs, legacy systems, competitive advantage, and disruptiveness to the organization. 3.5.1 Package (in)flexibility ERP systems provide standardized architectures, frameworks, patterns and components (Glass, 1998). The growing interest in ERP systems has rekindled the discussion on software packages (Scheer & Habermann, 2000). Packaged software forces companies to adapt their ways of working to match the software package. Some packages will be incompatible with specific needs of a company or the business processes that it has deployed, making it necessary to suit the package to the user needs and requirements (Davis G. B., 1988; Lucas Jr et al, 1988; Pereira, 1999; Sarkis & Sundarrraj, 2003). Changes to the package may lead to problems in updating and maintenance, since the vendor releases are in a generic form (Brehm et al, 2001). Patching of software vulnerabilities is another activity in which the company is dependent on the vendor for updates. Changing regulations, such as the introduction of the Sarbanes-Oxley legislation for United States companies, also has consequences for the updates of ERP packages. ERP systems are more flexible than traditional software packages, but there is a pressure on vendors to be generic, so that they capture enough market share (Luo & Strong, 2004). Thus vendor and organization interests conflict (Swan et al, 1999). Configuration is the setting of parameters and will always be necessary to accommodate a company its material order policies and production planning methods. Modification is the changing of package code in any of the three system layers, presentation and communication, application, and database, to adjust the package to unique business processes. Modification is greatly discouraged and often leads to the loss of vendor support (Brehm et al, 2001). Tailoring includes configuration and modification and any forms in between, such as extension. ERP vendors try to limit even the amount of configuration needed by offering ‘industry-flavor’ ERP systems, meeting specific needs of industries (Glass, 1998; Brehm et al, 2001). 3.5.2 How much will it cost? Although the theoretical benefits of ERP are large, so are the costs and risks (Davenport, 1998). Some argue that introducing an ERP system is only detrimental to an organization, removing value instead of adding it (Al-Mashari et al, 2003). First is the acquisition of the system and user licenses, although the total implementation costs of a typical ERP system are three to five times the purchasing costs (Bingi et al, 1999). Second, the IT infrastructure has to be able to cope with the requirements of the ERP system. Where necessary, investments are necessary to fulfill these requirements. Yen & Sheu (2004) found in an research study of multinationals that ERP seems to contribute to lower information sharing among facilities in a geographically dispersed company. Facilities did not compete on being the best in class, but competed for equal treatment in terms of materials, resources and support. A similar phenomenon occurs at employee level, where fear of job loss and loss of

J.W. Faber
The ERP Promise TU/e
13
information control leads to data protectionism instead of sharing when ERP systems are implemented (Allen et al, 2002). The knowledge of system set-up, configuration and data management has to be hired. True and complete ERP system understanding is still a scarce resource, driving up ERP consultancy prices (Bingi, Sharma, & Godla, 1999). Companies may end up paying three times the amount to consultants as they spent on the purchase of the ERP system (Al-Mashari et al, 2003). Consultants should not only support the organization in configuring the system, they also play an important role in training (Bingi et al, 1999; Murray & Coffin, 2001). Training personnel in the correct use of the ERP system is crucial, since errors made ripple through the entire ERP system and cause problems throughout the organization (Bingi et al, 1999). Despite the necessity of training, it does not alter user beliefs about the system, while ERP implementation is often more about the people than either business or technology change (Abdinnour-Helm et al, 2003; Al-Mashari et al, 2003). Most important here is that the best employees are dedicated to the project, although functional departments will be hesitant to let them go. The employees should be experts in (parts of) the business processes and industry ‘best practice’ (Bingi et al, 1999). ERP consultants usually have extensive knowledge on the ERP system and the implementation process, but have no idea of the peculiarities of the organization and/or the industry (Bingi et al, 1999). A final cost factor is time. The modular structure of most ERP systems allows for a gradual implementation approach. This ‘skeleton approach’ takes more time for the overall implementation to be complete, but usually allows for better implementation control than a ‘big-bang’ implementation (Glass, 1998; Holland & Light, 1999). The amount of tailoring determines the implementation time and lifetime costs of ERP systems, especially in terms of maintenance (Brehm et al, 2001). Despite the fact that maintenance cost for software is traditionally high, it is still underexposed in the ERP system context (Glass, 1998). 3.5.3 What to do with the old stuff? An important consideration in ERP projects is what must be done with the old data and systems. The systems are obsolete, but the data is a valuable asset. It represents a historic account of events, provides a backward perspective of the business and holds much development knowledge (Sarkis & Sundarrraj, 2003). Also, legacy systems provide the best insight in the current structure and execution of business processes and the current level of IT. Not always will an entire legacy system be replaced, so that complicated interfacing with the ERP system is necessary (Pereira, 1999). How to preserve this data embedded knowledge is an important question. Data normalization and transformation to the ERP standard adds to the implementation costs substantially (Gattiker & Goodhue, 2000; Ngai et al, 2008). Because legacy systems bind current processes, they are an integral part of the implementation project. Another integration issue concerns the fact that at most 70% of functional needs are met by the best suited package. Although an ERP system can be used as a backbone to connect the legacy system functionality that is not offered, maintenance of these bolted solutions is a nightmare and the corporate cleanup ERP can offer is still not achieved (Bingi et al, 1999). 3.5.4 Does ERP bring competitive advantage? It is acknowledged that no single IS can create competitive advantage (Henderson & Venkatraman, 1993; Kathuria & Igbaria, 1997). Although ERP systems are regarded as strategic assets, the value of having an ERP system is greatly diminished by the widespread adoption of these systems. Strategic advantage sprouts from durable, not easy replicable and immobile resources (Hamel & Prahalad, 1994). ERP systems however, have now become a commonality for short-term operational improvement, rather than a distinguished way of doing business (Luftman & Brier, 1999). Moreover, ERP vendors use ‘best-practice’

Working the way the cookie crumbles?
TU/e The ERP Promise
14
approaches, thus eliminating any process variation in individual businesses and industries (Davenport, 1998). Although some argue that company similarity is unavoidable (Benders et al, 2006), the question remains when ERP systems still offer an opportunity for competitive advantage. Benders et al (2006) pose that the competitive advantage an organization can derive from an ERP system depends on the extent to which it was designed into the firm’s strategy so that ERP implementation does not force the strategy to bend around the capabilities of the software (Pereira, 1999; Bernroider, 2007). Only a unique blend of culture, human capital and complementary organizational processes can create a context in which the application of ERP is difficult to duplicate (Hamel & Prahalad, 1994). 3.5.5 ERP systems are disruptive The implementation of an ERP system shifts the company focus from a functional orientation to a process orientation (Hong & Kim, 2002). The business implications of ERP implementation are more important than the technical ones, which is described as just tedious work (Davenport, 1998; Yen & Sheu, 2004). Information processing and interaction on technology and personal levels changes fundamentally (Lengnick-Hall et al, 2004). Such changes affect organization culture through shifts of power, and general forms of resistance to change (Hammer & Stanton, 1999; Hong & Kim, 2002). Management styles in an organization are also likely to change, since ERP system introduction requires a more collaborative leadership style, and involves a redistribution of responsibilities in the organization (Hammer & Stanton, 1999). Change is welcome in ERP projects, but organizations should remain cautious not to destruct more than they try to build (Al-Mashari et al, 2003). Managing the amounts of change that employees need to deal with greatly improves the likelihood of success in ERP projects. Addressing these changes should be one of top management its main focus points (Tonder van, 2004; Luecke, 2003). The amount of change and disruption depends on starting conditions such as current competitive position, the industry the organization is in, prior experience with (software) implementation projects, and company size and structure (Markus & Tanis, 2000; Allen et al, 2002). Linking implementation plans and goals is instrumental in good implementation, making the project part of the overall company strategy (Henderson & Venkatraman, 1993; Reich & Benbasat, 1996; Markus & Tanis, 2000). The goals that are most likely to produce ERP implementation success are process standardization and streamlining, and data and practice standardization (Connolly, 1999; Gattiker & Goodhue, 2000; Gattiker & Goodhue, 2002).

J.W. Faber
Measuring fit: One Size Does Not Fit All TU/e
15
4 Measuring Fit: One Size Does Not Fit All
In this chapter the main determinant for ERP system implementation success, fit, is identified. Then, different models measuring or assessing fit are discussed. At the end of the chapter a comparison is presented of the models measuring ERP or IT implementation success using fit, including those discussed in the previous chapter. These models are assessed on their focus, which can be IT success in general, ERP success in general, or the identification of critical success factors. Then the levels of fit that are included in each model are indicated. A distinction is made between strategic, process, function, and task/ output/ data fit in order of abstraction. Strategic fit involves organization wide issues, while data fit focuses on data element level issues. Finally the type of fit is marked, when available. Here cultural, structural and organization fit are distinguished. On top of this classification the models are reviewed whether they are empirically validated, applied in an ERP context, and if the model can be applied before implementation. The quotations indicate the impact of the paper in which the model has been described. The chapter is structured according to the focus of the study, the level on which fit is measured and the type of fit that is measured. 4.1 Focus of study There are three possible focus areas of the measurement methods. First, they can be focused at IT success in general. Second, it can be ERP success focused and third, the study can be about Critical Success Factors. Some of the models for IT success in general were discussed in the previous chapter. 4.1.1 IT success The TAM by Davis et al (1989), figure 6, does not use fit explicitly. However, their measurement of perceived ease-of-use versus perceived usefulness can be interpreted as a form of fit between the user expectations and experiences with the system. The model of DeLone and McLean (1993, figure 7) does something similar. They do not use the term fit, but do measure the net benefit of IT to users to predict user intentions to use IT and actual IT use. It can be stated that when the fit of IT is higher, the net benefits to the user are higher, thus positively influencing user satisfaction and intentions to use. The model of Seddon and Kiew (1994) does something similar, but with usefulness instead of use. The first study to define a form of fit, is by Henderson and Venkatraman (1993, figure 10).
Figure 10 Strategic Alignment Model (Henderson & Venkatraman, 1993)
Figure 11 Task-Technology fit model (Goodhue & Thompson, 1995)

Working the way the cookie crumbles?
TU/e Measuring fit: One Size Does Not Fit All
16
The term they use is alignment instead of fit. The idea behind their model is that internal and external focus needs to be aligned to achieve strategic fit. That is, infrastructure and processes need to fit strategy. This goes for business strategy and IT strategy, where these two strategies need to be aligned as well. According to Henderson and Venkatraman (1993) there are four alignment perspectives with business strategy as the driver, or IT strategy as the enabler. Unfortunately, there is no single strategy or combination of activities to achieve and sustain alignment (Luftman & Brier, 1999). Burn and Szeto (2000), claim that business strategy is the driver in most cases. Still, only 50% of alignment efforts succeed. Many failures of ERP implementation are due to a lack of alignment with business needs (Davenport, 1998). In 1995, Goodhue and Thompson first introduced a model specifically aimed at measuring fit. They defined Task-Technology Fit (TTF, figure 11) since they believed it lacked in IT literature. It was developed to assess the degree to which a set of technologies assists an individual in performing his or her portfolio of tasks. TTF is the measure between the IT offering that is at an employee its disposal and the tasks he needs to perform to be successful in his function, i.e. a comparison between task and technology characteristics. Since business processes can be a source of competitive advantage which is threatened by ERP system implementation, it is worthwhile to look at the tasks in these processes. Task-fit is not regarded as a predictor of IT diffusion, but it can be a predictor for IT success, when success is defined in terms of performance (Cooper & Zmud, 1990). Kanellis, et al (1999), argue that fit measurement is a subjective exercise and thus by nature a measurement of perception. 4.1.2 ERP success Schniederjans & Kim (2003) emphasize that ERP system fit and technology fit are not the same. An ERP system should match an organization in both technology sense as well on issues such as culture and power structure. On ERP success, specifically with regard to fit, the first important paper stems from 2000. Soh et al (2000) wrote a critique on the application of ERP systems in organizations and industries for which ERP was not suited. They distinguish between company-specific, public sector-specific and country-specific (mis)fit. Furthermore, they define three levels on which fit can occur, which are data, functional and output. Their main concern is with cultural misfits, which is addressed separately later in this chapter. In 2004, Soh and Kien wrote another article about fit, but now they addressed it as package-organization misalignment. In this paper they present a model that explains the origins of misalignment, but no approach on how to measure it. The model by Smyth (2001, 2001a) is already discussed in an earlier chapter. His approach has not caught on in the scientific field. Stefanou (2000, 2001) on the other hand is regularly cited with respect to ERP evaluation, based on fit. His approach is one of the few that try to assess ERP systems before implementation to see how suited they are to the organization. His considerations and conclusions are used in further research, although his model has not caught on. The model advocates a proper requirements and business analysis to select the
Figure 12 ERP fit model
(Hong & Kim, 2002)

J.W. Faber
Measuring fit: One Size Does Not Fit All TU/e
17
right system, which can be regarded as fit analysis, but remains very rudimentary. The model offers no measurement aids. A model that shows some similarities to that of Henderson and Venkatraman (2003) comes from Al-Mashari (2003), although this model is designed especially for ERP system implementation success. Other than the insight that alignment is important, this paper unfortunately gives no aid in fit measurement either. The final model that is mentioned here is an approach that does supply ideas on how to measure fit. Wu et al (2007) developed a three layer framework which is depicted in figure 13. This three-tier approach is used in other studies, such as that of Frye and Gulledge (2007). The idea is that fit should be accomplished on three levels: strategic, scenario and activity. Strategic fit is the measure to what extent the ERP system is able to support the organization in reaching its long-term goals. Functional fit is the suitability of the ERP system to support the organization its execution of tasks, i.e. its processes. Data or output fit is the support the ERP system delivers for the current form and shape of data. The three levels defined by Frye and Gulledge (2007) are strategic, process and system. Wu et al (2007) also propose methods to come to an actual measure of fit for each level. On a strategic level, they propose using goal-based use-cases, on scenario level they propose scenario matching and on activity level they propose data analysis and modeling. 4.1.3 Critical Success Factors As mentioned in the previous chapter, some authors have not investigated one specific causal relationship between ERP success and an antecedent. These authors take a collection of prerequisites from other authors to form a collection of critical success factors (CSF). CSF descriptions can be seen as a subsample of models discussing ERP success. Due to their more holistic nature, they are discussed separately. In the previous chapter, figures 8 and 9 showed two of such collections, one by Holland and Light (1999), the other by Al-Mashari et al (2003). Two others are made by Bingi et al (1999) and Hong and Kim (2002). A much cited model on ERP implementation success stems from Hong & Kim (2002, figure 12). The
Figure 13 General fit model
(Wu, Shin, & Heng, 2007)

Working the way the cookie crumbles?
TU/e Measuring fit: One Size Does Not Fit All
18
most important determinant in their model is the ‘organizational fit of ERP’, which is the match between the ERP system and the organization in the broadest sense. This fit measure and some contingency variables together determine ERP implementation success. The paper by Bingi et al (1999) is one long list of factors that influence ERP implementation success. Fit is not one of these, but is implicitly present in the factors reengineering and integration. The lists of CSF help in understanding the importance of fit for ERP implementation success and show the bigger picture of which fit is a part. The CSF do not give hints on how to measure or achieve fit. 4.2 Level of fit The level of fit analysis indicates the abstraction in the organization on which fit is determined. Strategic fit deals with the long-term goals of the organization and how the system suits these. Process fit assesses the ability of the system to accommodate existing business processes. Function, task, output and data fit are separated by some authors, but in general, the focus of these levels of fit analysis is the activity level. Function and task are almost equivalent, whereas data and output zoom drill down deeper. 4.2.1 Strategic fit Strategic fit is the extent to which the implementation of an ERP system fits in the long term planning of an organization. From traditional IT implementations it was already known that “Integration of IT and business strategy does pay off.” (Baets, 1992). Achieving strategic fit is a process rather than a distinctive event and still a problem in many organizations (Henderson & Venkatraman, 1993; Reich & Benbasat, 1996; Luftman & Brier, 1999). Baets (1992) constructs a simple model of strategy linkage, as is shown in figure 12. Henderson & Venkatraman (1993) place strategic it into a broader perspective, stressing the multidimensionality of fit between business strategies, IT strategy, organizational infrastructure and processes. IT alignment for manufacturing firms may differ from service providers, due to the different role of IT in these firms (Kathuria & Igbaria, 1997). 4.2.2 Process fit The way business processes are accommodated in ERP is through ‘best practices’ (Bingi et al, 1999). An important criterion for ERP selection is fit between these practices and current processes in the organization (Henderson & Venkatraman, 1993; Everdingen et al, 2000). This process fit determines to a large extent the change needed in the organization or the ERP package. The best practices are constructed by ERP vendors through customer feedback, company surveys and implementation experience (Swan et al, 1999). This is a thorough, although slow approach to designing best practices, often overtaken by the speed with which organizations evolve (Soh & Kien, 2004). It is the vendor deciding what ‘best’ is, not the customer and the best solution for a company is always situation specific (Davenport, 1998; Schniederjans & Kim, 2003). Despite the critique on the best practices, many companies still implement ERP systems as it is and reengineer the processes in the organization. This is called a ‘plain vanilla’ approach and is encouraged by vendors since it eases implementation of the technology, allows for better and faster upgrading of software and helps the vendor in providing system support, thus maintaining system integrity (Hong & Kim, 2002; Abdinnour-Helm et al, 2003). It is better to reengineer processes than to customize a system to make the best of bad processes (Scheer & Habermann, 2000). However, if the company fits itself to the ERP mold, not all requirements may be met (Bingi et al, 1999). In adopting the processes from the package, organizations sometimes discard the requirements analysis process in system implementation completely (Markus & Tanis, 2000). Process modeling is a good and accepted approach to requirements analysis (Rolland & Prakash, 2000). It also provides

J.W. Faber
Measuring fit: One Size Does Not Fit All TU/e
19
insight into current business logic (Scheer & Habermann, 2000). Regardless how it is achieved, business processes should be understood fully before ERP implementation (Murray & Coffin, 2001). Implementing an ERP system will always involve some process reengineering (Bingi et al, 1999; Ng et al, 1999). This is due to the shift from a functional to a process orientation, and the tighter business function integration that comes with ERP system implementation. Not all processes in a business are optimized for cross-functional efficiency and effectiveness (Hammer & Champy, 1994). It is interesting that, in a time where IT is expected to align with the enterprise, the exact opposite is happening with ERP systems (Glass, 1998). Sneller & Bots (2007) provide a method to decide on the sort change that is necessary to accomplish fit in processes. Luo and Strong (2004) propose three degrees of process adaptation, varying from no change, via incremental change to radical change. The amount of process change a company can apply is limited, especially when an organization is part of a larger company (Gattiker & Goodhue, 2002). Caution should be taken in engaging in too much business process reengineering (BPR). To preserve the processes that distinguish an organization from competition, modification of the package is often performed. An example of measuring process fit is given by Frye and Gulledge (2007) who propose to model and document the current processes from end to end. This mapping method is also mentioned by others (Rolland & Prakash, 2000; Scheer & Habermann, 2000; Schniederjans & Kim, 2003) and basically involves a three step approach: define the AS-IS process, define a TO-BE process, and finally, define the migration path. A true fit measure is not present, although the migration path gives an indication of necessary changes. 4.2.3 Function fit This type of fit addresses the relationship between functionality demanded by the business and those available in the ERP system. Increased fit on this level should result in lower resistance against system implementation, reduced training need for employees and less organizational adaptation (Bingi et al, 1999). Sometimes function fit can be improved through bolt-on solutions, although this brings plenty of other problems along as discussed before (Brehm et al, 2001). A lack of function fit is a major reason for not adopting an ERP system (Markus & Tanis, 2000). Wu et al (2007), incorporate function fit into a more comprehensive model for misfit analysis. 4.2.4 Task fit Kositanurit et al, (2000) applied the TTF construct to ERP and found that ERP task fit is a predictor of individual performance. To further investigate the impact of information technology on work, (Torkzadeh & Doll, 1999) propose a measurement tool based on four constructs (table 2). This measurement tool tries to explain the fit of IT to work, i.e. the tasks of employees. Unlike TTF, their qualification has not caught on as massively. Efforts have been made to combine TTF and TAM, but this only leads to a clogged and overly complicated model (Dishaw & Strong, 1999). The better the fit between task and technology the better systems adoption will be also holds for ERP systems (Kositanurit et al, 2000).
Label Definition of construct Task Productivity The extent that an application improves the user’s output per unit of time. Task Innovation The extent that an application helps users create and try out new ideas in their work. Customer Satisfaction
The extent that an application helps the user to create value for internal or external customers.
Management Control
The extent that an application helps to regulate work processes and performance.
Table 2 Four constructs of technology impact on work (Torkzadeh & Doll, 1999)
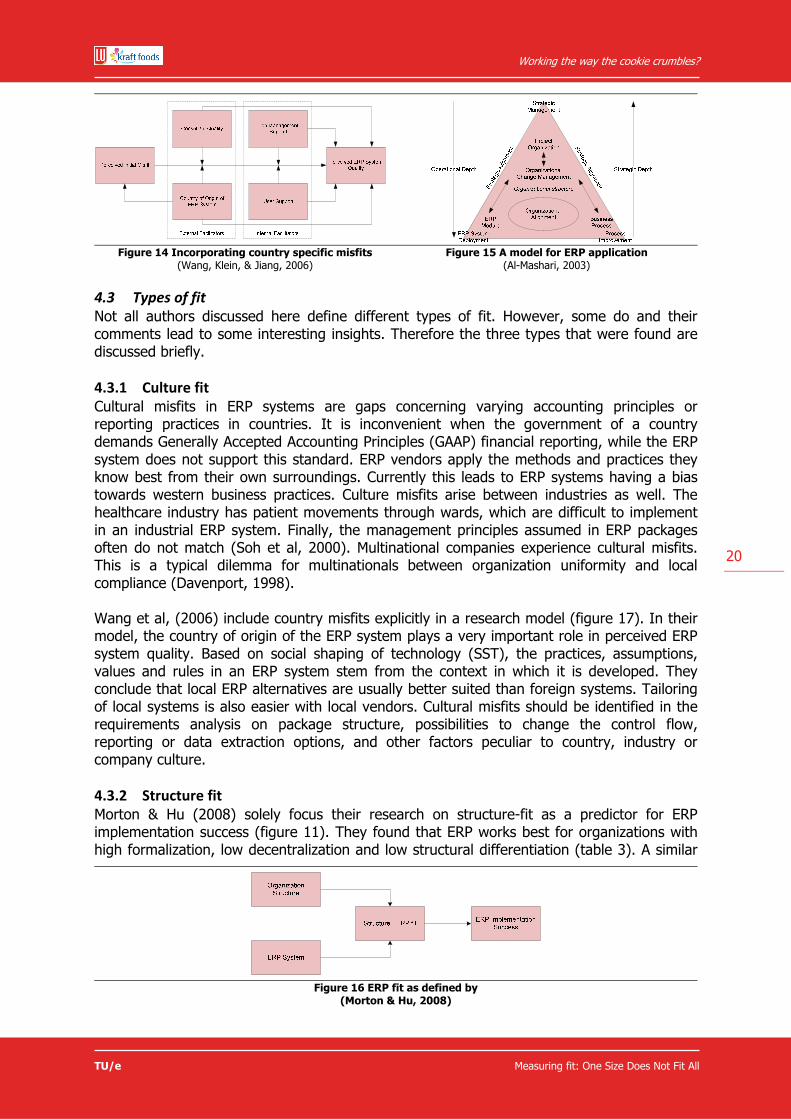
Working the way the cookie crumbles?
TU/e Measuring fit: One Size Does Not Fit All
20
4.3 Types of fit Not all authors discussed here define different types of fit. However, some do and their comments lead to some interesting insights. Therefore the three types that were found are discussed briefly. 4.3.1 Culture fit Cultural misfits in ERP systems are gaps concerning varying accounting principles or reporting practices in countries. It is inconvenient when the government of a country demands Generally Accepted Accounting Principles (GAAP) financial reporting, while the ERP system does not support this standard. ERP vendors apply the methods and practices they know best from their own surroundings. Currently this leads to ERP systems having a bias towards western business practices. Culture misfits arise between industries as well. The healthcare industry has patient movements through wards, which are difficult to implement in an industrial ERP system. Finally, the management principles assumed in ERP packages often do not match (Soh et al, 2000). Multinational companies experience cultural misfits. This is a typical dilemma for multinationals between organization uniformity and local compliance (Davenport, 1998). Wang et al, (2006) include country misfits explicitly in a research model (figure 17). In their model, the country of origin of the ERP system plays a very important role in perceived ERP system quality. Based on social shaping of technology (SST), the practices, assumptions, values and rules in an ERP system stem from the context in which it is developed. They conclude that local ERP alternatives are usually better suited than foreign systems. Tailoring of local systems is also easier with local vendors. Cultural misfits should be identified in the requirements analysis on package structure, possibilities to change the control flow, reporting or data extraction options, and other factors peculiar to country, industry or company culture. 4.3.2 Structure fit Morton & Hu (2008) solely focus their research on structure-fit as a predictor for ERP implementation success (figure 11). They found that ERP works best for organizations with high formalization, low decentralization and low structural differentiation (table 3). A similar
Figure 14 Incorporating country specific misfits
(Wang, Klein, & Jiang, 2006) Figure 15 A model for ERP application
(Al-Mashari, 2003)
Figure 16 ERP fit as defined by
(Morton & Hu, 2008)

J.W. Faber
Measuring fit: One Size Does Not Fit All TU/e
21
study has been conducted by Lengnick-Hall et al (2004), concluding that: “ERP systems fit best with mechanistic, clockwork organizations dominated by routine, highly programmed technologies and operations. The flexibility of ERP systems is inhibited because they are very tightly coupled, programmed systems. This is also why they best-fit very tightly coupled, formalized and routinized organizations.” 4.3.3 Organization fit Organization fit is the extent to which the ERP system structure matches with the company structure. The organization its functional decentralization may not match ERP decentralization for instance (Bendoly & Jacobs, 2004). A fit between ERP system structure and the company structure makes implementation easier, because no heavy adjustments to the organization are needed. A paradox exists, since ERP helps to streamline management structures, creating flatter and more flexible organizations. On the other hand, control over information is centralized and processes are standardized, which is more natural to hierarchical, controlled organizations (Davenport, 1998). Another result of ERP implementation is that power through the organization is redistributed. These shifts of power are a major reason for ERP implementation resistance (Markus, 1983). There may be a misfit between organizational power distribution and system authorization, sometimes used to change organization power structures and overhaul the organization structure (Allen et al, 2002). ERP system implementation can also lead to a knowledge and skills misfit. First, there can be a misfit between knowledge and skills required by the system and those present with the employees. Second a misfit between the employees involved in ERP implementation and those that were not can exist. Both gaps can be closed through training (Markus & Tanis, 2000). Al-Mashari (2003) proposes a model aimed at organizational alignment, which is shown in figure 16. According to him, organizational alignment can only happen after strategic alignment is achieved. 4.4 Conclusion In table 4 all the models discussed above are listed. The focus, level and type of fit are marked. Other important aspects in the consideration whether to use the model are its empirical validation and (ex-ante) application to ERP systems. The final two columns show the quotations of the paper according to Web of Science, a scientific database, and Google Scholar. The number of quotations is taken as a measure of the model its impact on the scientific community. Some care has to be taken, since older papers are more likely to be quoted more often. As expected, the earlier models are not designed to measure ERP system fit, since these systems were not as prevalent then. Some of the models are applied to ERP system environments later. Most models operate on more levels of fit, although an integrated
Organizational type Structural Dimensions Degree of fit and likelihood of ERP
implementation success Formalization Structural
Differentiation Decentralization
Machine Bureaucracy High Medium Low High Professional Bureaucracy Low High High Low Professional Bureaucracy support staff component
High Medium Low High
Divisionalized form Medium High High Low Adhocracy Low High High Low Administrative adhocracy operating component
High Medium Low High
Table 3 Contingency fit between ERP and organization type (Morton & Hu, 2008)

Working the way the cookie crumbles?
TU/e Measuring fit: One Size Does Not Fit All
22
approach that covers all business levels is not as common. Four models address strategic, process and function level, corresponding to business strategy, tactics and operation. Most others focus on either strategic fit or function fit, including task, data and output fit. Although there are many models in this list, there are only a few that actually provide measurement methods. The most comprehensive one here is that of Wu et al (2007). On top of that, fit is a multidimensional construct, and as such cannot be measured on one level of abstraction. It is necessary to consider strategic, process and task levels together as done by Wu et al (2007), Frye and Gulledge (2007), and Soh et al (2000). The different types of fit, cultural, structural, and organizational, appeared from general fit studies and do not seem to have much value as separate constructs. They are more considerations that need to be taken into account when analyzing fit on the different levels of abstraction. It is not necessary to give these a separate place in the model. As a framework, both Wu et al (2007) and Frye and Gulledge (2007) are most appealing, due to their integrated multi-level approach. Moreover, Wu et al (2007) give a good method to determine strategic fit by using goal-based use-cases. Frye and Gulledge (2007) on the other hand provide a very appealing method for process comparison by suggesting process mapping. Data and output analysis as a separate approach, as Wu et al (2007) suggest, seems to miss actual task analysis, while an IS analysis as proposed by Frye and Gulledge is too abstract. Stefanou (2001) mentioned requirements analysis as a method to measure fit. This is a better suitable method and will also include data and output analysis. Wu et al (2007) mention the use of the TTF instrument on activity level as a good measurement tool, but it cannot be found in their model. It is chosen to adopt the TTF instrument separately in the research model to get a more holistic view on current task and function fit. Unfortunately, the TTF instrument cannot be applied ex-ante. In the next chapter the model will be explained in full detail.

J.W. Faber
Measuring fit: One Size Does Not Fit All TU/e
23
Morton &
Hu
Wu, Shin, &
Heng
Frye & G
ulledge
Wang, Klein, &
Jiang
Al-Mashari, Al-M
udimigh, &
Zairi
Al-Mashari
Hong &
Kim
Stefanou
Smyth
Soh, Kien, & Tay-Yap
Holland &
Light
Bingi, Sharma, &
Godla
Goodhue &
Thompson
Seddon & Kiew
DeLone &
McLean
Henderson &
Venkatraman
Davis, Bagozzi, &
Warshaw
Authors
2008
2007
2007
2006
2003
2003
2002
2001
2001
2000
1999
1999
1995
1994
1993, 2003
1993
1989
Year
Focus of study
x x x x x IT success
x x x x x x x x x x x x ERP success
x x x x CSF
Level of fit
x x x x x x x x x x Strategic
x x x x x x x x Process
x x x x x x Function
x x x x x Task
x x x Output
x x x x x x Data
Types of fit
x x Cultural
x x Structural
x x x Organization
No
No
No
Yes
No
No
Yes
Yes
No
Yes
No
No
Yes
Yes
No
Yes
Yes
Empirically validated?
Yes
Yes
Yes
Yes
Yes
Yes
Yes
Yes
Yes
Yes
Yes
Yes
Yes
No
Yes
No
Yes
Applied to/ meant for ERP?
Yes
Yes
Yes
Yes
Yes
Yes
Yes
Yes
No
Yes
Yes
Yes
No
No
Yes
No
No
Ex-ante approach possible?
2 4 8 6 6
91
146
30
7
163
126
154
366
256
215
419
1508
Quotations (WoS)
12
14
7
34
256
32
423
89
10
518
698
693
1175
269
1308
1503
4467
Quotations (Scholar)
Table 4 Comparison of fit measurement methods

Working the way the cookie crumbles?
TU/e The ERP Boottree Model
24
5 The ERP Boottree Model
In this chapter the fit model chosen in the previous chapter will be explained in detail. For each of the levels an explanation will be given what fit measurement on that level implies and why it is important. Then is discussed what inputs are necessary, how this input is processed and how the results will be presented. The final model that will be applied in the next chapter can be found in figure 17. 5.1 Strategic level The fit assessment on strategic level compares the direction the organization or department wants to go with the support the ERP system can deliver. The added value of measuring fit on this level is to assess whether the ERP system is able to support the organization not just now, but also in the future. As discussed in the last chapter, an ERP system is an investment in information technology for the long term. If a certain ERP package is unable to support the developing organization, it misses its main purpose. Although some of the medium and long term goals will be reflected on process and task levels, some may not. It is therefore necessary to perform fit analysis on this level, to assure the selection of a system that is not obsolete too soon. 5.1.1 Input A strategy is a collection of goals that an organization wants to accomplish within a certain time span. These goals are usually explicitly stated in corporate documents, policies and procedures, or stated by stakeholders (Lamsweerde van, 2001; Kavakli, 2004). On an organizational level, the goals will be more abstract than the goals of a department, which are more operationally formulated. Other documents that can contain goals are procedural documents or procedures that demand certain functionality from an information system. An example is an ISO certification that demands certain data and task traceability. Government legislation can be a third source for long term functional demands on the information system, such as the Sarbanes-Oxley act which demands separation of concerns for decision making on investments and purchases. Besides these explicit goals, implicit goals will exist. A
Figure 17 Research model

J.W. Faber
The ERP Boottree Model TU/e
25
start is to analyze the current system to obtain the current functions. In addition, problems and deficiencies that form a list of goals for the new system that are currently not addressed will emerge (Lamsweerde van, 2001). Next to current system analysis, stakeholders of the system should be interviewed on their demands on the system. Since stakeholders have different interests with respect to system use, interviewing them will lead to a broader perspective on current system performance and desired performance, both in terms of functionality. Interviews also elicit user satisfaction with the current system and their expectations of the system for the future. The goals that the system can help to achieve can be obtained from the system vendor or consultancy firms specialized in system implementation. However, vendors are biased and predetermined to sell, making them predisposed to promise functionality by the system which it has not, or only after elaborate and expensive adaptations. Benchmarking with other implementations is another way of finding out what the system can do to achieve strategic goals and what organizational structure is underlying it. The difficulty with benchmarking is that a ‘victim’ for benchmarking has to be found. With some vendors, reference clients are available where demonstrations can be held for this benchmarking step. Another benefit of benchmarking is that former clients can provide feedback on implementation choices and problems they have encountered, which a vendor will not do. 5.1.2 Method In order to compare the organization its goals to those the system can help accomplish the goals need to be made tangible. Therefore, use-case models are used to translate goals to system requirements. Use-case models are a way of requirements elicitation. Use-cases are a way of modeling intended system behavior, without stating how this behavior should be accomplished. It is therefore very suited for the communication of requirements between domain and IT experts (Booch et al, 1999). A use-case is a description of system behavior as a result from requests from its environment. In other words, a use-case describes some action an actor wants it to perform. Actors interact with the system and are part of the model, but live outside the system and can be connected to use-cases by association. The modeling notation used for use-cases is part of the unified modeling language (UML) and can be found in appendix F . In the model of Wu et al (2007), a combination of goal-orientation and use-case modeling is proposed, developed by Lee & Xue (1999). This approach: “uses goals to derive and structure the use-cases, differs between types of goals, embeds goal information in the use-cases and analyzes interactions between requirements by investigating the relationship between goals and use-cases” (Lee & Xue, 1999). Where traditionally scenarios were used to identify use-cases in this particular application of use-cases, long term organizational goals derived from the organizations’ strategy are used to structure them (Booch et al 1999; Berre et al, 2006). The actual building of use-cases is described elaborately (Booch et al, 1999; Lee & Xue, 1999; Berre et al, 2006). Use-cases are bound to certain characteristics. First, every use-case must have a unique name and second, a use-case must describe intended or actual system behavior. A straightforward way to create use-cases is to:
1. Identify the actors by considering what groups depend on output from the system, are needed to execute the systems functions, or needed for support and maintenance. Actors can be people, other software systems or any other entity supplying data to or requesting data from the system.
2. Organize actors that are similar in a generalization/specialization hierarchy. 3. Identify the organizational goals from all available sources 4. Create use-cases that are needed to achieve the organizational goals

Working the way the cookie crumbles?
TU/e The ERP Boottree Model
26
5. Build the use-case models by associating actors with use-cases and drawing the relations between use-cases. Use-cases may be dependent upon each other by generalization, inclusion and extension.
As a use-case modeling tool, Microsoft Visio is used. Visio contains a module that allows for the modeling of UML, including use-cases. All elements to build the goal-based use-cases are available in Visio. An example is given in figure 18. This example shows a goal-based use-case for a purchasing system. The system boundaries are shown and four rigid goals, above the system boundary, and two soft goals, below the system boundaries, are defined. For all the goals the system requirements are shown inside the system boundaries. Each requirement is put in an eclipse. Relations between the requirements are shown by the generalization arrows. On the left side an actor is shown, with its relations to the relevant requirements. When the goal-based use-cases are built, a list is constructed. This list contains all the identified use-cases. For each of the use-cases it is analyzed whether the candidate can fulfill that use-case in any of four ways. ‘Supported’ indicates the requirements are fulfilled ‘out-of-the-box’. No adjustments to the software are needed to fulfill the requirement. Requirements can also be fulfilled through a third-party solution or through customization. These two methods require interface building or severe changes to system code. Finally, the system can also not support the requirement at all. When all use-cases have been analyzed, the marks per system and per category are summed, so that a score is obtained. An example of such a score sheet is in table 5. The scores on the four categories are depicted in a pie chart relative to each other. That means that the pie chart consists of four parts, each representing a category. The size of the part is an indication of the number of use-cases that are in that category. Obviously, the larger the supported part and the smaller the not-supported part, the better the fit between strategy and system. 5.2 Process level The new system should support the current activities of any organization, or the organization is unable to function properly. As described in the previous chapter, mapping the current processes in the organization to ‘best practice’ processes assumed by the Computerized Maintenance Management System (CMMS), is an appropriate way to identify process misfits. On top of that, it is a starting point for distilling functional requirements that the new CMMS should adhere to.
Figure 18 Example of a goal-based use-case
(Lee & Xue, 1999)

J.W. Faber
The ERP Boottree Model TU/e
27
5.2.1 Input In order to compare processes, process descriptions are needed. A common process description method is process modeling. Process models provide a graphical representation of the process, giving insight in the order of tasks, the systems they are performed through, the actors that are involved, and the data necessary for task execution. Process models may be maintained by the organization. In that case the models need to be verified to make sure the processes are still performed according to the models. When no process models are available, they need to be constructed. Both process verification and process elicitation start with interviewing system stakeholders. They should be questioned on the tasks they perform, the systems they use and the data they need. Another way to gain knowledge about processes is by studying business documents and following their flow through the organization. This study can be applied to purchase orders, planning documents or reports. Valuable documents to study are work instructions and procedure. These tend to be better maintained than job descriptions which are sensitive to outdating and leave out implicit work. The process modeling itself is a drawing exercise. All the activities identified are ordered according to the sequence in which they are performed. The role of information systems in the current processes is important. The modeling approach followed in this case is that of simple flow diagrams. The choice for this notation is based on its simplicity and comprehensibility. The full notation can be found in appendix G and an example process
Requirements score sheet:
Coswin SAP-PM
Goal-based use-case SUP 3RD CST NS SUP 3RD CST NS
Score 5 5 5 5 6 8 2 4
Access for Production x 1 0 0 0 x 1 0 0 0
Analyze Processes 0 0 0 x 1 0 0 0 x 1
Analyze Stock 0 0 0 x 1 x 1 0 0 0 Analyze Structural Problems 0 0 0 x 1 0 0 0 x 1
… Fit measure representation:
SUP
3RD
CST
NS
Table 5 Score sheet and fit measure representation
Figure 19 Process model example
25%
25%25%
25% 30%
40%
10%
20%

Working the way the cookie crumbles?
TU/e The ERP Boottree Model
28
model is given in figure 19. In the example a manual task, recognizable by the dotted outline, is carried out that uses data element from JDE, colored red to indicate the system of origin. After the task a decision is made. When the decision comes out positive an automated task in Coswin is executed, the light blue task with the solid outline, that needs a Microsoft Excel document as input. A negative decision triggers the dark blue task, which indicates it is executed through the Time400 system. In order to assess the suitability of the ERP system, the assumed processes of the system need to be compared to the AS-IS situation. In this case a copy of the SAP R/3 reference model was obtained. A reference model of an information system is a collection of data or process models that together form the basis of the behavior of the information system. In this thesis, the SAP R/3 reference model is a collection of process models in the Event-driven Process Chain (EPC) notation (Eindhoven University of Technology, 2009). Using ProM, a process mining tool developed at Eindhoven University of Technology, these models are displayed for analysis. An example is given in figure 20. Despite the difference in notation between simple flow charts and EPC, both notations make use of tasks, so that a comparison between the two is possible. Having a reference model of the ERP system under consideration available helps in assessing process fit. When a reference model is not available, process models of the ERP system can be constructed by interviewing ERP consultants, studying ERP documentation or asking ERP vendors. For all of these sources it has to be kept in mind that ERP means business to consultants, writers and vendors alike, so that they might paint a brighter picture of the candidate ERP system than is actually the case. 5.2.2 Method Although mapping and matching are popular terms when it comes to comparing processes, the ‘how’ of mapping and matching is only described from an AS-IS to a TO-BE situation (Rolland & Prakash, 2000; Scheer & Habermann, 2000; Schniederjans & Kim, 2003; Frye & Gulledge, 2007). How to compare processes for the identification of fits and misfits is not described in scientific literature. In this study, the following approach is taken to compare existing processes to assumed processes in the ERP system candidates. The set of AS-IS processes is modeled. After modeling, a list is created from all identified processes and the tasks they contain. Manual tasks and tasks not performed through the system under analysis can be left out. For each current process and task an equivalent is sought in the reference
Events have no direct equivalent in simple flow charts. Functions are similar to tasks and an XOR acts as a
decision. OR and AND split and joins are not explicitly modeled in simple flow charts.
Figure 20 EPC notation (SAP Reference Process: Modification of Technical Systems)

J.W. Faber
The ERP Boottree Model TU/e
29
model of the candidate ERP package. If an equivalent is present this indicates a fit, and a mark is added on the list that an equivalent process or task exists. Although a process may not have a direct equivalent in the reference model, its tasks may. Process separation is a subjective task, leading to different process names and groupings. An ordering process in an organization may be modeled from start to end, and be simply called ordering. The reference model may contain all the tasks of this process, but spread over smaller process models, such as supplier selection, order line creation, order reception, etc. In this example no direct process equivalent for the organizational process exists, but the tasks in this process are supported by the system, according to the reference model. When all processes and tasks have been checked for an equivalent, a score can be created, representing process fit. By summing all marks under ‘equivalent exists’, and doing the same for ‘no equivalent exists’ two scores are created. These results are shown relative of each other in a pie chart. 5.3 Task level The most detailed level for fit analysis is the task level. On this level we distinguish two types of fit that together make up task fit. The first type is task-technology fit (TTF), which is a measure of how well the currently offered information technology fits to the tasks of department employees. The second is function fit, which assesses the match between current demands on the ERP system and the offering of the candidate systems. Modifications to the ERP package at this level are not to be recommended, since this usually involves customization, which leads to difficulties with respect to updating as explained in previous chapters. 5.3.1 Input The outcome of the TTF measurement can be an operational rationale for information systems replacement. If the current information technology offered does not sufficiently supports managers their operational tasks, other technology must be found or current technology adapted. To measure task-technology fit, the questionnaire is presented in appendix H (Goodhue, Development and Measurement Validity of a Task-Technology Fit Instrument for User Evaluations of Information Systems, 1998). In this study, no adaptations are made to the questionnaire, since it has been used in studies concerning ERP systems (Kositanurit et al, 2000). Part of the input for the elicitation of system requirements can come from the constructed process models. The tasks in the process models are performed with certain data elements. The data elements needed by the tasks identified need to be available in the candidate systems. A second source to elicit requirements from, are the interviews held for process elicitation. During the interviews, complaints, needs or demands on the offered information technology will be issued. These issues can be translated to requirements and added to the list of requirements. From the interviews it should become clear how the different systems in use by the organization interact with each other. When desired by interviewees, the
Figure 21 Snapshot of Mindjet MindManager

Working the way the cookie crumbles?
TU/e The ERP Boottree Model
30
candidate system could take over functionality from other systems. This makes systems obsolete, thus offering cost savings, improved integration, improved data centralization, and a smaller IT landscape which is easier to manage and maintain. To create the requirements list, all subjects discussed in the interviews have to be ordered and sorted. It is possible to fully code the interviews so that they can be sorted and statistically analyzed. In this study coding has been considered, but the presence of a critique, need or desire creates a requirement, making statistical analysis unnecessary. All requirements are sorted and grouped according to the processes they relate to. For the remaining items separate groups are created in an arbitrary manner. The grouping is done in Mindjet MindManager, a software program that allows for storing and sorting of ideas. A snapshot of a MindManager tree is shown in figure 21. 5.3.2 Method To assess task-technology fit the earlier described approach from Goodhue and Thompson (1995) is used. All stakeholders should be invited to participate. As a platform for the questionnaire, www.thesistools.com is used. ThesisTools provides a free and simple web platform to design and distribute digital questionnaires. The use of an electronic questionnaire has certain benefits to written ones. With the electronic questionnaire, participants are anonymous and the researcher cannot influence the results, since he does not know when the participant fills the questionnaire out. This helps in increasing the chance that respondents fill out the questionnaire honestly and sincerely. Finally, electronic data gathering has efficiency benefits over manual data gathering, in processing and analyzing the results. For data analysis on answering frequencies and variation, PASW Statistics 18 is used. Measuring function fit is a requirements analysis and functionality comparison exercise. Kotonya & Sommerville (1998) and Soh et al, (2000) among others, propose handling functions as requirements. From the process models and interviews a list of requirements, both current and desired, is constructed. As with strategic fit analysis, the requirements are marked according to the categories ‘supported’, ‘third party’, ‘customization’, and ‘not supported’. When all requirements are marked, a summation is again performed. The results are shown in a pie diagram, as in table 5. The percentages represent the relative amount of requirements that are marked in that category compared to the total amount of requirements. 5.4 Reliability of the model In order to be able to use the model defined in this chapter, it is necessary to assess its reliability and validity. Reliability means that the model provides consistent results (Cooper & Schindler, 2003). That means that the model provides comparable results each time it is applied, no matter who applies it. Unreliability can be created from three different sources: the respondents, the instrument and the researcher. The first source, the respondent, plays a large role in this study. Respondents are relied on during the interviews and to fill out the task-technology fit questionnaire. To make the respondents answers reliable, they should not feel threatened to be sincere. To accomplish this, the interviewer has put all participants at ease before each interview, clearly stating the purpose of the interview and introducing the context of the research study. For each participant the interviews are designed around the specifications of their job. This keeps the subject close to the participants. For participation in the questionnaire anonymity is assured, minimizing risk and threat levels for participants.

J.W. Faber
The ERP Boottree Model TU/e
31
The instrument is the second possible source of unreliability. This study uses multiple instruments, that all need to be reliable for the model to be reliable. The first instrument, use-cases, is a well documented method for requirements elicitation. As such, there is no risk for unreliability, as long as the input is reliable. The reliability of the input depends on the interviews, which are discussed above, and the accuracy and currency of the company documents studied. The second instrument is process modeling. The notation used, simple flow charts, are a commonly used and well accepted form of process modeling. The reliability of the models depends on the input from the interviews. To assess the reliability of the models, they have been discussed extensively with maintenance managers and consultants in two, three hour round table meetings. In total, seven people attended the validation meetings. The final instrument used is the task-technology instrument. This instrument is extensively tested and found reliable by Goodhue (1998). Since no changes have been applied to the questionnaire, it is assumed to be reliable. Finally, a checklist instrument for system requirements is constructed. Again, the reliability depends on the input resulting from the interviews. To ensure that the requirements make sense, are complete and accurate, the requirements list has been evaluated by a maintenance planner and a maintenance manager. The reliability of the researcher is an issue in this study, since he is involved in the interviews that supply a large amount of the input to the different parts of the model. To minimize any bias during the interviews, the first were held in the presence of an S&V management consultant. The consultant checked the interview protocol used, assessed the way of asking questions and ensured all necessary topics were covered. To assess the correctness of the outcomes of the model, all results have been evaluated and discussed. Where necessary, adjustments were made. The results for the strategic analysis stem directly from corporate documents, and can be assumed reliable. As discussed earlier, the process models have been validated in round table meetings with several stakeholders. Finally, the requirements lists were validated by a maintenance planner and maintenance manager. All these checks ensure that the results of the model are reliable and force the researcher to create as reliable results as possible. 5.5 Validity of the model A model is valid when its results are in accordance with reality (Cooper & Schindler, 2003). The model validity can be separated in three types: construct, internal, and external validity. When a model has construct validity, it means that it measures what it is supposed to measure. To achieve construct validity, the model should adhere to two principles. First, the model should completely cover what it is supposed to measure. Second, the model should not contain any components that are not directly associated with what it is supposed to measure. Internal validity is the extent to which causal relations in the model can be said to be true (Aken van, Berends, & Bij van der, 2005). External validity is the extent to which the results of a particular study can be generalized to other conditions and populations. Whether the proposed model and its results are valid is hard to tell. The model is designed to measure fit, but with fit being so multi-faceted, it remains questionable whether the model covers it entirely. The multi faceted nature of fit also makes it hard to guarantee the model does not contain any components that are not directly fit related. Internal validity is not an issue here, since the model does not explain or identify any causal relationships. The results of this study are only relevant for the application in this particular case study. Results obtained here are not applicable to another case study. Another validity problem of the results is that they are only relative measures. It is not directly clear from the measure what it represents or what it means in terms of implementation success.

Working the way the cookie crumbles?
TU/e Case Study
32
6 Case study
At LU General Biscuits, the decision on ERP replacement has been made by the mother company Kraft Foods. The ERP package of choice is SAP R/3, forcing departments to change their information processing from the current systems to SAP. However, LU General Biscuits has the freedom to use any CMMS they prefer for the maintenance department. Currently in use is Coswin, a CMMS developed by Siveco, a France-based software company. Coswin is in use since 2008, see appendix D, and is used for work order management and parts purchasing mainly. Opinions differ on the completeness of the implementation and the suitability of this system in general. The LU maintenance department needs a CMMS without a question. The factory is too large to manage maintenance by hand or through ad-hoc lists and documents. Certainly with regard to reporting and performance measurements, the presence of a CMMS is a must. There are around 350 CMMS on the market (Assetivity Pty Ltd, 2009), but the candidate list for LU General Biscuits is reduced to two. First is the current application Coswin by Siveco in an extended version or a new update, second the maintenance module developed by SAP, called plant maintenance (SAP-PM). This reduction is not arbitrary, but is motivated by two reasons. First, Coswin is already in use. Despite complaints about its interfacing and limited functionality, managers and supervisors are familiar with the system. Through increased use over the past two years, managers and supervisors are now in the position where they start to develop demands for new functionality. Therefore an analysis of Coswin its capability with respect to these new requirements is appropriate. The motivation to include SAP-PM into the fit analysis is that within Kraft Foods Europe there is a movement for CMMS standardization of the larger plants. Considering the orientation on SAP as ERP supplier, it makes sense that the CMMS standard will be SAP-PM. Considering that this standardization movement may materialize in an actual implementation within two years, it would make no sense to switch from Coswin to any other system in that two year stretch considering implementation, training and acceptance issues. During the implementation of SAP R/3, the maintenance department has called on a consultancy agency. The current ERP system, JD Edwards (JDE), holds all assets and materials and this data has been maintained by the maintenance department. In the SAP implementation, the responsibility for the data transformation of assets and materials has been placed with the maintenance department as well. The consulting firm, S&V management consultants are called in to assist in prioritizing issues and to deliver specific implementation knowledge LU General Biscuits lacks. S&V management consultants (www.sv-mc.com) are based in Belgium, the Netherlands and North America. The LU
Figure 22 SAP related projects and their overlap in the maintenance department

J.W. Faber
Case Study TU/e
33
General Biscuits maintenance department receives support from the Ghent, Belgium office. This thesis fits in the implementation support through process elicitation, analysis and assessment. The SAP project and its relation to other projects are shown in figure 22. 6.1 Strategic level fit analysis 6.1.1 Input The strategic fit measurement exercise started by analyzing the LU Herentals action plan and the maintenance department action plan for 2010 (Vermeulen, 2010; Vyne van, 2010). In addition, interviews were conducted with the technical director and the three maintenance managers concerning the strategic direction of the department. From the LU Herentals action plan, three themes emerge regarding the maintenance department. First is the finalization of preventive maintenance, second is task sharing with technical operators in the packaging department, and third the continuing education of technicians. These three issues are directly reflected in the maintenance department action plan. Therefore, the action plan will be the basis for further analysis, with additional information gathered from the interviews. As a final source for strategic direction, the key performance indicators (KPI’s) of the maintenance department are reviewed and associated reporting needs addressed. As mentioned in chapter one, the action plan follows five themes, which are interdependent according to the ‘house of strategy’ (appendix C). The foundation is called ‘getting the basics right’. This is separated into four long-term goals. First, all maintenance is to be scheduled in Coswin. Then, all jobs in Coswin should be well-defined, accurately described and correctly prioritized. Third, preventive maintenance is to be fully developed, both through periodic reviews of machines and through predictive checks of component conditions. Finally, the morning meetings with production managers need to be focused on getting production levels to the defined standard. For 2010 this translates to the following operational goals: improve the use of Coswin, especially for interventions and the work request process; set up Factory Management Team (FMT) meetings in which all functional departments discuss factory operations; review the set-up of morning meetings with production and maintenance; start a pilot for predictive maintenance, or condition-based maintenance, on one of the production lines; and improve the quality and extend the number of preventive maintenance plans. On top of the foundation comes the organization. The organization needs to be changed so that there is a clearer division of tasks, a better distribution of responsibilities over roles and proper follow-up on KPI’s. Part of the organizational adjustments is shifting small maintenance and machine adjustments from the maintenance department to the production department, thus freeing technician capacity. Last theme concerning the organization is the continuous education of maintenance personnel, so that all have a similar, sufficient knowledge level on which they operate. In 2010 this has resulted in an organization overhaul whereby the functions of planner and expert are introduced. The idea is that planners take over purchasing and scheduling tasks from supervisors, freeing supervisor time for actual maintenance supervision on the factory floor. The maintenance expert has to concern himself with machine documentation, structural problem solving and the development of preventive maintenance plans. On top of the two base levels, the outer pillars are the collaboration between the maintenance, the production, and engineering departments, and a mindset for safety and quality. To promote collaboration, an internal training program called KENAZ has been deployed. This program is offered to the supervisors and maintenance managers of the maintenance department and meant to provide a “charter of behavior for technicians” (Vermeulen, 2010). The project tries to improve the participants their soft skills and promotes registration of agreements and negotiation with technicians and other

Working the way the cookie crumbles?
TU/e Case Study
34
departments. The collaboration with the production and engineering departments is also secured through the lean production initiatives 5S, and Kaizen. The 5S approach tries to eliminate any waste from the production environment, whereas the Kaizen projects are used for substantial efficiency gains and productivity improvements. The 5S stand for: sorting, setting in order, sweeping, standardizing, sustaining and safety. Both approaches use short to medium term projects to achieve their goals. With respect to safety, leading indicators are constructed and will be followed up and improved. Work orders concerning safety are subjected to a deadline and safety procedures reviewed and enhanced. A similar approach exists for quality procedures. Other quality measures taken are zero fault tolerance policies for machine startups and for product blockades due to technical errors. Finally, a scaled down 5S approach called 3S will be introduced in the workshop of the packaging department. Final collaboration issues are the assignment of key technicians per project to ease communication, better registration of technical specifications for new equipment and improved triangular communication between engineering, maintenance and production. The third pillar contains the shared maintenance approach where first level maintenance (FLM) is no longer performed by a technician, but by the machine operator. This involves training of operators and involving them in conversions. For 2010 a pilot is planned to start technical operator implementation on two production lines. Technical operators should also be able to identify recurring issues and ongoing machine performance deterioration. They will not address these issues themselves, but report these to maintenance supervisors or maintenance experts. The final pillar supporting the roof of the quality house is ongoing cost tracking and reduction. Several projects are in place to make the maintenance department more cost aware. Analyzing the maintenance processes as done in this thesis is one, as is the introduction of a vendor managed inventory (VMI). The introduction of a VMI for bearings and air-pressure components gives a more detailed report of parts usage and total costs per month. A review of the warehouse inventory is also part of the cost saving strategy, but not yet planned. A final goal is to track degraded machine performance to improve maintenance work. For data on machine performance, access to the manufacturing execution system (MES) is needed. The MES tracks production performance such as production volume, total available production time, total effective production time, amount of waste and other efficiency measures. An important performance measure for the maintenance department is the technical availability of machines and production lines. To survey the possibilities of both Coswin and SAP-PM to support the strategy of the LU General Biscuits maintenance department, both systems were studied in practice, and extensive documentation was used for support analysis. Coswin has a development implementation at LU General Biscuits, which is not open to all users. This development version has more extensive functionality. For SAP-PM an educational implementation at the Hogeschool van Amsterdam was used. Through the Eindhoven University of Technology a user profile was obtained, so that the functionality of SAP-PM could be studied. Next to the use of system implementation, documentation on both Coswin and SAP-PM was used. For Coswin this consisted of a manual constructed by Steria (Steria, 2007), for SAP-PM two books were available (Stengl & Ematinger, 2000; Hoke & Craig, 2009). On top of these analyses, two actual SAP-PM implementations were studied and their users interviewed on their experiences with the system. The first was a Kraft Foods sister factory for savory snacks in Rhisnes, Belgium and the second the chemical plant of Sabic in Geleen, the Netherlands. Both have a SAP-PM implementation, but they differ very much in the goals they want to accomplish through the system.

J.W. Faber
Case Study TU/e
35
6.1.2 Method To build the goal-based use-cases, the approach described in the previous chapter is used. The actors that are involved with the CMMS are all part of the maintenance department. The identified actors are: technical director, maintenance expert, maintenance manager, technical controller maintenance planner, maintenance supervisor, and technician. These actors are also roles in the maintenance department. Their hierarchical structure is reflected in the organization diagram in appendix B. Also the production and production planning department, as well as the technical operators are actors. In the next step, the organizational goals are identified from the inputs described above. These goals are the foundation of the use-cases in the sense that they are the rationale for each use-case. That means that a use-case exists, because it serves a certain goal. Finally, the goal-based use-cases are constructed using the actors and goals. The goal-based use-cases are grouped by their strategic focus and shown in appendix I. Since there is no distinction between soft or rigid goals, they are all considered rigid. 6.1.3 Result To get from the goal-based use-cases to a measure of fit, the use-cases were listed. Then for each use-case it was decided whether Coswin and SAP-PM supported this use-case in any way. A classification is used to mark whether a use case is directly supported by the system, supported by third party software, supported with the help of an interface or not supported at all. In some instances, both third party software and customization are needed, for instance with interfacing between the CMMS and another system. After marking, the marks were summed per category. The relative scores are presented below in table 6 through pie diagrams. The score is obtained by comparing the amount of use-cases per category to the total amount of use-cases. The diagram clearly shows that SAP-PM fits better to the strategy than Coswin. The directly supported goals and total goals supported by SAP-PM exceed those of Coswin. Main reason is the easy integration of SAP-PM with the other SAP modules. Coswin requires customization to accomplish integration with SAP. 6.2 Process level fit analysis 6.2.1 Input At the LU General Biscuit maintenance department no process models existed to serve as the
Coswin
SAP-PM
Table 6 Strategic fit results
50%
19%7%
24%
Supported
Supported through 3rd party
Supported through customization
Not supported
62%12%
8%18%
Supported
Supported through 3rd party
Supported through customization
Not supported

Working the way the cookie crumbles?
TU/e Case Study
36
input for the process fit analysis. Therefore it was needed to construct process models. There are plenty of procedural documents at LU general biscuits, but these are all very operationally oriented, dealing with food safety standards, best repair or tool use practice, and proper preparation for dangerous jobs such as welding. They are not suitable to serve as input for the process models, since these documents are written on an operational level, whereas the input needed in this case should be on a higher level of abstraction, describing the tasks before work execution. Another source that could have served as input for the process modeling exercise is job descriptions. However, the ones available at LU General Biscuits were outdated and had become irrelevant with respect to the new organizational structure. Therefore it was decided not to use them, except to validate the presence of certain tasks and responsibilities in the department, regardless of the function they were assigned to. The primary input for the process models came from semi-structured interviews. A total of 30 people were interviewed (appendix J). Participants were identified by their role in the maintenance department. The technical director, maintenance managers, maintenance controller and maintenance supervisors were all invited for an interview. In addition to those, the technical assistant was also interviewed, since many tasks of the controller were taken over by her during the SAP implementation project. After the first interviews, it was clear that some processes involved actors from other departments. Therefore two persons from the purchasing department were invited for an interview as well. The interviews lasted between one and two hours and were all completely written out. From the interviews process groups were identified. This grouping was then adjusted to the common process categories as used in CMMS. The final process grouping is shown in figure 23. This process grouping is maintained throughout the remainder of the thesis. For each process, the actors, the tasks, the documents and the systems involved were identified. According to the notation in appendix G, simple flow charts are constructed for each process. The resulting process models are shown in appendix K. For the maintenance department, an assessment of the processes was made, which is described in appendix L. To be able to compare the current processes with the processes of SAP-PM, a copy of the reference model of SAP R/3 was obtained through Eindhoven University of Technology. The reference model is a collection of all defined processed in SAP R/3. An example is given in
Figure 23 Maintenance department process grouping

J.W. Faber
Case Study TU/e
37
appendix I. The modeling notation used in this thesis and the one used by SAP differ. SAP makes use of the EPC notation instead of simple flow charts. Despite the difference, both notations make use of tasks, so that a comparison is possible. Since the current processes are supported by Coswin, the process fit analysis is solely performed for SAP-PM. Coswin has a 100% score. 6.2.2 Method After the process modeling stage, the processes and tasks were listed. Using the reference model of SAP, equivalent processes and tasks were identified. Although the SAP reference model is not flawless (Mendling et al, 2008), the models for the SAP-PM module are exceptionally correct. However, the discussion on that is outside the scope of this thesis. Moreover, the validity of the underlying process model is not of interest in this study, just the existence of an equivalent process. The search for equivalent processes is not limited to the SAP-PM module only, since some processes are part of the SAP-MM, SAP-SRM or SAP-AM module. This is especially true for the processes in the categories Machine, Material, Purchase Order and Stock. 6.2.3 Result The figure in table 7 depicts the overall relative fit measure for the processes. The individual scores per process group are depicted in appendix M. To get to these diagrams a similar approach was used as for the strategic fit measurement. In the list of processes and task, each process and task was marked for having an SAP equivalent or not. When all processes and tasks were marked, the summation of positive and negative marks leads to a relative fit measure. This score is an indication of the fit between the current processes and those supported by SAP. Naturally, Coswin has a 100 percent fit to the current situation, as explained above. SAP-PM lacks fit to some processes. These are the processes involving graphic production line representation and navigation, and the numbering methods of machines, components and inventory. Whereas Coswin can handle sequential and alpha-numerical numbering, SAP only uses sequential numbering. Coswin also offers a graphical representation of production lines that can also be used to navigate to specific machine or spare parts. SAP-PM does not support this graphical representation at all and navigation is done through tree structures only.
Coswin
SAP-PM
Table 7 Process fit results
100%
Supported in Coswin
Not supported in Coswin
86%
14%
Supported in SAP‐PM
Not supported in SAP‐PM

Working the way the cookie crumbles?
TU/e Case Study
38
6.3 Task level fit analysis 6.3.1 Input The input for the task-technology fit instrument was provided by a similar population as was approached for the interviews. All managers and supervisors involved with the CMMS and supporting applications on a daily basis were invited to fill out the questionnaire. This includes the technical director, maintenance managers, maintenance engineers, maintenance planners and maintenance supervisors. Warehouse employees were also included, since they work with the ERP system on a daily basis. Technicians were not included in the sample, since they only use a single functionality of the CMMS, creating notifications on work orders, and make no further use of information technology for maintenance management. As input for the function fit analysis, the interviews were revisited. This time however, not the tasks, data and roles were relevant, but all comments pertaining to the information systems used in the maintenance department. From these, requirements were constructed that serve as the input for the function fit measurement. Besides the input from interviews the current CMMS is reviewed for currently offered functionality, which also forms requirements, since a new CMMS should deliver at least similar functionality as the current one. 6.3.2 Method The questionnaire was offered to 29 participants, of which 27 actually started on filling it out. Three participants did not answer any question, thus reducing the number of respondents to 24. This is an 83% response rate, which suffices for valid results. The average academic research study response rate is 55.6% (Baruch, 1999). To let participants express other comments on the offered technology to do their job, a free text box was offered after the questionnaire. Two participants made use of this opportunity where one indicated that information is dispersed over information systems, which leads to a lot of data copying and data manipulation to reach meaningful results. The suggestion is to get to one information platform with a clear structure to make better data available more easily. The second comment suggests evaluating the information systems one by one, instead of overall, since questions are now not specific enough. This indicates that people have difficulties assessing the value of the systems they work with as a whole. This can be attributed to the plethora of systems the participants need to work with, or the different value they attribute to each information system. To measure function fit, a similar approached is used as for process fit. After the interviews, all comments, remarks and critiques are written down. In MindManager, these are sorted according to the process grouping explained earlier in this chapter. Comments that did not fit these were grouped and assigned to new categories. Appendix N shows the resulting tree of issues, both positive and negative, pertaining to the LU General Biscuits maintenance department and its information systems. From this issue tree, requirements for the LU General Biscuits maintenance department its information systems are created. Before the requirements were checked against Coswin and SAP-PM, they were validated by two managers from the maintenance department. 6.3.3 Result 6.3.3.1 Task‐technology fit The exact results for the task-technology questionnaire are in appendix O. A summary is given below. The opinions on data currency are very dispersed through the maintenance department. For both questions on this topic, there is an equal distribution between agreeing and disagreeing participants, with an average that indicates participants are neutral towards the currency of the data they work with. Concerning keeping the right data, participants

J.W. Faber
Case Study TU/e
39
agree there is data available to work with, but also that they lack critical data. With respect to the right level of data, the majority of participants wish for more detailed data to be kept. Most respondents answered between ‘somewhat disagree’ and ‘neutral’. On locatability, more participants disagree that it is easy to find out what data is kept and where than participants that agree. This indicates that data is not kept in a transparent way and coherent manner. The same goes for the meaning of data, showing that the meaning of data in the maintenance department may not be consistent. The results are not dramatic in the extremes, but show a clear deviation from the neutral position towards disagreement. Participants have no problem with data authorization. They can access the data they need and if not, access is arranged easily. The opinions on data compatibility between sources are stronger and more coherent. Data between sources is not consistent or compatible and thus it is hard to combine data from different sources. This is a serious issue in an organization that uses several different information systems, and where information is dispersed over those systems. The respondents are neutral to slightly positive about the timeliness of the IT department on reporting and the performance of regular jobs. This is important with respect to systems interfacing jobs, such as between the ERP system and CMMS. There is a very positive attitude towards the reliability of information systems. Systems availability is very high and the respondents do not suffer from unexpected breakdown or crashes. A similar positive attitude exists towards the ease of use of information systems and the ease to learn using them. Towards the training on information systems there is a more neutral stance, indicating that this suffices in the current situation, not lacking any training, but not excelling in it either. The relationship with the IT department is good. Some respondents regard these questions as irrelevant, indicating they are not directly involved with the IT department. The others take a neutral to positive stand. When it comes to IT assistance, the respondents answer positively. The IT department has a positive image at the maintenance department, also with regard to response times on requests. On request progress the respondents reply neutrally. If the respondents need IT assistance or consulting services again, they are very predisposed to turn to the IT department again, also because it delivers solutions as agreed and in time. As can be expected in a maintenance department, the respondents are quite
Coswin
SAP-PM
Table 8 Function fit results
55%
9%
16%
20% SUP
3RD
CST
NS
74%
2%
9%
15%
SUP
3RD
CST
NS

Working the way the cookie crumbles?
TU/e Case Study
40
often confronted with non-routine problems that require different solutions, involving input from different business functions. Finally, the respondents fully agree that computer systems are a useful aid in the execution of their duties and increasing their performance. Surprisingly, 16.3% has replied these questions were not relevant. The task-technology measurement tool cannot contribute to the measurement of the fit of SAP-PM to the maintenance department, since it only measures the current situation. Therefore, the contribution of the tool to the overall model can be questioned. However, since it does measure the current task-technology fit, with Coswin in place, the results of the tool can be used as a rationale for changing the CMMS. If current task-technology measurement shows a lack of fit, that result can be used as a reason to search for a CMMS replacement. Reasoning the other way works equally well. When the fit shows to be very good, there is no need to look for a CMMS replacement. 6.3.3.2 Function fit Getting a fit measure for function fit is similar to getting a strategic fit measure. After all the requirements were formulated, they were listed. For each requirement an analysis was carried out whether either CMMS candidate supported that requirement, according to the classification in table 5. Then the marks were summed per system and per category, resulting in the overall relative fit measure in table 8. The functional fit measure per requirements category can be found in appendix P. Clearly SAP- PM outperforms Coswin in terms of function fit. Again this is mainly due to the easy integration of SAP-PM with other modules of the SAP ERP package, although better and more flexible reporting are also a large contributor to a better function fit of SAP-PM than Coswin.

J.W. Faber
Discussion & Recommendations TU/e
41
7 Discussion & Recommendations
With regard to strategic fit, SAP-PM has a better fit than Coswin. That means SAP-PM better supports the long term vision of the LU General Biscuits maintenance department. If we look at process fit, some 14 percent of the current processes and tasks have no direct equivalent in SAP R/3. Compared to the current situation, SAP misses support for some of the processes that are currently performed. Concerning all functional requirements set for a CMMS for the maintenance department, SAP-PM also performs better than Coswin. That leads to the conclusion that SAP-PM would suit the LU General Biscuits maintenance department better. The main reason for this better fit is the integration that SAP-PM offers with the other ERP modules. Since most of these modules are also based on the SAP platform, interfaces do not have to be build and maintained separately. In SAP the different modules all make use of the same set of database tables. When two complementary modules exist, for instance plant maintenance and material management, it is easy to disclose the data of the modules so that materials can be linked to work orders for instance. For other modules, such as plant maintenance and human resource management, this integration is a little less obvious, but still easily achieved compared to building and maintaining interfaces. A PM to HRM integration would ease shift planning, overtime approval and work order assignment. The lack of interfacing is the major drawback of Coswin. Coswin offers the same reporting and registration functionality for work orders as does SAP-PM. However, all the data needed for reporting and registration are not maintained in Coswin. Therefore, extensive interfacing would be necessary to get Coswin functionality as a whole to the same level as the SAP-PM functionality. Interfacing is both expensive in design, as in maintenance and control. Are there no drawbacks to SAP-PM then? Yes there are. First, there is a difference in costs associated between both CMMS. The license costs per user for Coswin are €3,000 per year, whereas for SAP-PM this is in the region of €30,000 per year for a development license. A user license will be less, but still substantially larger. Considering that there are 30 full licenses needed for managers and supervisors, and some group accounts for technicians and technical operators to create maintenance notifications, the annual license costs for the CMMS would increase substantially. On top of that, as discussed in the chapter in ERP, purchasing costs, implementation costs and consultancy fees need to be added to this figure. Another drawback of SAP-PM is the reduced display flexibility in the package itself compared to Coswin. Coswin allows for different representations of machines and components then just a tree structure. In Coswin, production lines can be drawn graphically, linking the building blocks that represent machines to the proper database entry. This makes navigation through the machine structure more intuitive then following a tree structure. Another drawback pertaining to flexibility is that input screens, database fields and data structure for work orders and work requests in Coswin can be defined by the maintenance department itself. For instance, the interface that is now used by technicians and production personnel to create work requests or register unfinished work, will be difficult to achieve in SAP-PM. Moreover, when SAP-PM is introduced, this will happen on a European level with constraints on data structure and data input to obtain European uniformity. This has been an issue in this SAP implementation too.

Working the way the cookie crumbles?
TU/e Discussion & Recommendations
42
Strategic Coswin
Strategic SAP-PM
Process Coswin
Process SAP-PM
Function- Coswin
Function SAP-PM
Table 9 Fit results
50%
19%7%
24%
Supported
Supported through 3rd party
Supported through customization
Not supported
62%12%
8%18%
Supported
Supported through 3rd party
Supported through customization
Not supported
100%
Supported in Coswin
Not supported in Coswin
86%
14%
Supported in SAP‐PM
Not supported in SAP‐PM
55%
9%
16%
20% SUP
3RD
CST
NS
74%
2%
9%
15%
SUP
3RD
CST
NS

J.W. Faber
Discussion & Recommendations TU/e
43
A final reason not to jump on the SAP-PM train right away is that the maintenance organization has undergone plenty of change in a short time span. The organizational structure has undergone changes where new functions have been introduced and people have been shifted to different functions. On top of that, the implementation of SAP has caused change as well. Coswin is no longer used for the creation of purchases. The supplier relationship management (SRM) module of SAP is now used. This also implies a different use of Coswin, where purchase requisitions are no longer automatically transferred to the ERP system. Since purchase requisitions are manually entered in SRM, they need to be clear and well structured. Also the control on the amount of orders and the total value they represent increases due to the purchase order approval flow that comes with the use of SRM. Maintenance supervisors and managers no longer have blank checks when it comes to ordering. Introducing a period of less change, while increasing the functionality of Coswin suits the LU General Biscuits maintenance department best at this moment. Since Coswin is a familiar way of work management, it is advisable not to change to a new CMMS yet. From the task-technology fit questionnaire some issues emerged that can be addressed without introducing a new CMMS. Moreover, these issues are better tackled now, then during a CMMS migration project. The first issue is that currently data is dispersed over multiple systems. Besides that, data from different sources is difficult to combine and inconsistent. These are issues that deserve attention before considering a CMMS migration. Centralizing data and ensuring it is consistent helps the organization not just know, but will also ease the introduction of a new CMMS. Maintenance supervisors and managers now know no better than to use Coswin for work management. While recognizing the limitations of Coswin in terms of integration, they also develop other needs from the system which are possible without much effort. Uniform scheduling of work orders and personnel for instance can be achieved through Coswin. Data from different scheduling spreadsheets is then centralized and uniform. Other gains can be achieved by designing more meaningful indicators in Coswin with regard to work load management. These indicators could be linked to KPI’s so that supervisors and managers can monitor their own performance. With regard to reporting, Coswin offers plenty of opportunity to design (custom) reports that are automatically generated per time span. This limits copy and paste work to and from spreadsheets. Finally, preventive work orders should no longer be created blindly. Adding rules such as: ‘only create preventive work order X for period Y, when the one for period Y-1 is completed and validated’ or ‘start the time interval Y for periodic work order X after the validation of the one of period Y-1’ help in eliminating double work orders and reducing work load. Finally, to gain more insight into time spend on certain jobs and the length of time spent on interventions, a start could be made with registering work order start and completion times. This adds to the insight supervisors and planners have while scheduling work. Coswin is ready for this registration. It is simply not in use. In addition to functionality extensions, an overhaul of preventive plans and current work load is advised to clean the system.

Working the way the cookie crumbles?
TU/e Conclusion & Reflection
44
8 Conclusion & Reflection
In this chapter the research targets will be revisited and discussed, followed by a reflection on the described and applied model. The limitations of the case study will be discussed, followed by an analysis of the performance of the model. The chapter will be closed with recommendations for further research. 8.1 Research targets In chapter 1, the following research targets were defined, for which is discussed if they are answered and whether that answer was satisfactory.
A1 What is fit and why does it matter? From the literature several definitions of fit were found. These definitions all had the same core message, i.e. that an ERP system should fit the organization as a pair of pants should fit the teenager. This makes perfect sense, since you do not buy a pair of jeans if they do not fit you well. You would be uncomfortable in them and object to wearing them. For an ERP system the same counts. If it fits the organization badly, objection to its use will be profound among employees and the full potential of the system never achieved. A bad fit can also lead to stalling business processes or disrupted production. Some tinkering to fit is possible however. Like a pair of jeans, customization is possible. When the legs are too long, you can shorten them. In a similar sense, small adjustments to ERP systems can be made. Customization and extension with third party software are examples of ERP system tailoring.
A2 What is an appropriate approach to determine fit? Although the general message of fit was unanimous throughout the literature, the definitions differed in the context. Many different contexts of fit are distinguished. For instance, fit can be assessed on different organizational levels, such as strategic, process and operational levels. Another form of fit that appeared frequently in the literature is culture fit. Although the marketplace is increasingly global, there are profound cultural differences between continents and industries. Demands for an ERP system in a production environment differ from those in the healthcare industry. Moving spare parts is very different from moving patients through wards. A cultural difference on national scale is differing accounting principles per country or tax application demands. For all types of fit, different approaches exist to determine fit. In this thesis an integrated approach consisting of strategic, process and task fit was chosen. For each level a specific method for assessing fit was deployed and a fit measure calculated.
B1 How can we apply the suggested approach to a case study and what are the results? The integrated method is applied to a case study. The maintenance department of LU General Biscuits is involved in an ERP system change. This has severe implications for their CMMS. Therefore a fit analysis for the new situation with the current CMMS is performed and compared to a fit analysis of a replacement CMMS candidate. The results of each analysis are translated to a fit measure to make the comparison possible.
B2 How did the approach perform? The model has shown to lead to results that can be compared. For each level of fit analysis it was possible to create a fit measure. The true meaning of the fit measure

J.W. Faber
Conclusion & Reflection TU/e
45
is difficult to assess. When a fit measure is a 100%, there is no doubt the system is suitable. Problems arise when a fit measure is not 100%. The fit measure does not show what leads to the misfit. Also there is no indication of the severity of the misfit. So if a fit measure is 75%, the misfit may contain facts that are crucial to the organization. This does not show from the figure however. With respect to strategic fit can be stated that for one ERP system module the strategy of one or a few departments is leading. However, the strategy on department level is operationally oriented. Translating strategy into goals and then creating associated use-cases quickly leads to functional requirement elicitation. The benefit of use-cases is that they specify a requirement without stating how that requirement should be satisfied. The model compares functionality, regardless of how that functionality is achieved. Moreover, if it is necessary to know how functionality is achieved, this will come up during process analysis. If multiple candidate systems are involved, the order of analysis performed should be top-down. The efforts to achieve results on process and task level are too large to execute for a large sample of candidate systems. Process equivalent checking is no large effort when a reference model is present, otherwise it is. Checking a candidate system against the functional requirements is also an elaborate job that has value only for systems that have shown strategic fit. Building use-cases is a less elaborate exercise and analyzing systems for rough functionality is quicker. A top-down approach in which a larger sample of systems is narrowed down by analyzing strategic fit is more efficient than a bottom-up approach. On process fit analysis level, there are two considerations to take into account. First, the process elicitation and modeling process is time consuming. That is not a bad thing. However, if there is no reference model available, the same modeling exercise has to be undertaken to obtain process models of the candidate system. On top of that, the sources for information on ERP system processes are much harder to consult for an organization, than information on its own processes. Without a reference model of the candidate systems, applying the model will be an overly time consuming task, especially when multiple candidates are considered. On task level, the value of the TTF instrument is unclear. It gives no direct measure of fit and only emphasizes what the interviews have already brought up. It could be a better idea to apply the TTF instrument before even considering a new ERP system. The outcomes of TTF can then be used as a rationale to start the search for a new system or not. In that sense, the TTF instrument could be included in the strategic level analysis when a top-down approach is assumed. Its purpose then is to create a rationale for systems replacement.
An enormous benefit of the followed approach is the exhaustive analysis that is performed. This does not only lead to a decent fit measure, but also to deep insight in both organization and candidate systems. This insight aids in giving a good advice considering the candidate systems. It makes it possible to give a more comprehensive advice than just based on the fit measures.
8.2 Limitations of the case study This research has a few clear limitations. First, the information systems that were subjected to the fit measurement were predetermined. With a larger sample of candidate systems, the top-down discriminative power of the model was not tested. Second, since the organizational

Working the way the cookie crumbles?
TU/e Conclusion & Reflection
46
priorities were at the process modeling and analysis phase, which is where the fit analysis started. The model was not followed in a strict top-down or bottom-up approach. The added value of each level of fit analysis could thus not be assessed decently. From the analysis it became apparent that there is an overlap between fit measurement levels. The strategic level analysis resulted in functional requirements quickly. As said above this may be due to the limited scope of this study, where only one ERP module is involved. However, three levels of fit measurement as in this study is unnecessary. Performing the measurement on process and task level should be sufficient. Making goal-based use-cases can still elicit requirements that can be included at task level fit analysis. Another limitation is that only one ERP system module has been analyzed. This creates much overlap between the different fit analysis levels. With a multi-module ERP implementation, there should be more variety in the input underlying the result. In the applied model, process modeling performed using simple flow charts. The semantics are unclear and not formalized. Process mapping would be more complete if a more formal approach would be used. Then the mapping exercise could be performed through software, such as ProM, which now only has a supporting role. 8.3 Recommendations for further research Further research should be directed at the use of either top-down or bottom-up use of the model. That is, should the fit analysis be performed at strategic, then process, and then task level, or the other way around. Now the application has been somewhat ad-hoc, due to the priorities stated by the commissioning organization. Next to that, the overlap or redundancy of the fit measurement on the levels should be investigated. Besides the overlap, it should be determined on which levels the analysis is necessary and which levels can be skipped. A final suggestion for future research with regard to the levels is to compare the fit measures on the different levels instead of trying to use them in an integrated manner. The use of the TTF instrument also deserves attention. It could be placed at strategic level, outside the model, or could be discarded altogether. Third, the use of a formal process modeling notation needs to be considered. This allows for automated process mapping and cannot only assess process existence, but also process structure and content. Finally, the model should be applied to a more elaborate ERP implementation. In this case study, only one module was under consideration. This caused a lot of overlap between the fit analysis levels. When a system with broader functionality is considered, the value of the separate model component can better be assessed.

J.W. Faber
Epilogue TU/e
47
9 Epilogue
And so it ends. The fact that you made it to here hopefully indicates that I have delivered a report that was worthwhile to read. Certainly, I have not made it here myself on my own. Obviously, I want to thank LU General Biscuits for allowing me to conduct my thesis at their Herentals plant. A special thanks to Louis de Buijsscher and Benny Vermeulen, my supervisors at LU General Biscuits. I shared an office with Louis for six months and he was never too busy to answer my many questions. Benny has been very helpful in keeping oversight, arranging our visit to the factory in Rhisnes and giving feedback. Both, I want to thank for the freedom and trust they have given me. I also want to thank my university supervisor Remco Dijkman. He never stopped asking questions about the direction I was taking and the choices I made. My inability to answer his questions made me very uncomfortable at first, but it forced me to defend and rationalize my choices, which really helped going forward. It really made this my report, not a collection of executed suggestions. Thank you too, Natalia Sidorova for completing my assessment committee. I thank Sabic, and Pim Dankbaar in particular, for allowing me to discuss and review their SAP-PM implementation. I learned much about the system its functionality and shortcomings that day. This hands-on experience was a very valuable addition to the PM theory from books. For their help in the first half of this project I am much obliged towards Marleen Devoldere and Anneleen Tronquo. As S&V management consultants in the SAP project they helped me a lot with practical tips and tricks. They also kept the pressure up, pushing the project forward quickly. In my part of the SAP project I got a lot of help from the people at the LU General Biscuits maintenance department. Everyone agreed quickly to have an interview and many participated in the questionnaire. Thank you all very much! For his extensive comments on the earliest draft of this report, I would like to thank Carl Megens. It really helped getting a better document, both structurally and on content. Since we are at the friends anyway, I do have to mention Arjan, Clement, Jan, Ivo, Lex, Paul and Rogier. As the notorious futsal team T(r)ap United we have made so much fun on and off the field that I can truly say my university time would have looked very different without you guys. I can add to the list of friends almost indefinitely, so sorry for not mentioning you all. You know who you are and what you mean to me. Finally, my life would be pretty empty without the regular dinners with my parents and brothers. My parents have had to be very patient for this moment, but I thank them for that. Thanks for the critical comments on this report as well. I had not expected anything else. No one knows me quite as well as you do. Jelmer Faber Herentals, July 2010

Working the way the cookie crumbles?
TU/e Bibliography
48
10 Bibliography
Abdinnour-Helm, S., Lengnick-Hall, M. L., & Lengnick-Hall, C. A. (2003). Pre-Implementation Attitudes and Organizational Readiness for Implementing an Enterprise Resource Planning System. European Journal of Operational Research , 146 (2), 258-273. Ajzen, I. (1985). From Intentions to Actions: A Theory of Planned Behavior. In J. Kuhl, & J. Beckmann, Action Control: From Cognition to Behavior (pp. 11-39). Heidelberg: Springer-Verlag. Aken van, J. E., Berends, J. J., & Bij van der, J. D. (2005). Methodology for Business Problem Solving. Eindhoven, Netherlands: Eindhoven University of Technology. Allen, D., Kern, T., & Havenhand, M. (2002). ERP Critical Success Factors: An Exploration of the Contextual Factors in Public Sector Institutions. Proceedings of the 35th Hawaii International Conference on System Sciences. Maui, United States: IEEE. Al-Mashari, M. (2003). A Process Change-Oriented Model for ERP Application. International Journal for Human-Computer Interaction , 16 (1), 39-55. Al-Mashari, M., Al-Mudimigh, A., & Zairi, M. (2003). Enterprise Resource Planning: A Taxonomy of Critical Factors. European Journal of Operational Research , 146 (2), 352-364. Amoako-Gyampah, K., & Salam, A. F. (2004). An Extension of the Technology Acceptance Model in an ERP Implementation Environment. Information and Management , 41 (6), 731-745. Assetivity Pty Ltd. (2009). Computerized Maintenance Management Software (CMMS). Retrieved 04 02, 2010, from Plant Maintenance Resource Center: http://www.plant-maintenance.com/ Baets, W. (1992). Aligning Information Systems with Business Strategy. Journal of Strategic Information Systems , 1 (4), 205-213. Baruch, Y. (1999). Response Rate in Academic Studies; A Comparative Analysis. Human Relations , 52 (4), 421-439. Bench3. (n.d.). Functional Areas of R3 in SAP. Retrieved 07 21, 2010, from July 2009 ~ bench3: http://3.bp.blogspot.com/_68sk2PaFt3Q/SmhmF32RipI/AAAAAAAAEWg/XqgwwPVNGe8/s1600/Functional+Areas+Of+R3+In+SAP.gif Benders, J., Batenburg, R., & Blonk van der, H. (2006). Sticking to Standards; Technical and Other Isomorphic Pressures in Deploying ERP Systems. Information and Management , 43 (2), 194-203. Bendoly, E., & Jacobs, F. R. (2004). ERP Architectural/ Operational Alignment for Order-Processing Performance. International Journal of Operations and Production Management , 24 (1), 99-117. Bernroider, E. W. (2007). An Analysis of ERP Decision Making Practice and Consequences for Subsequent System Life Cycle Stages: A Case Study. In U. Kulkarni, D. J. Power, & R. Sharda, Decision Support for Global Enterprises (pp. 195-206). Springer US. Berre, A.-J., Elvesæter, B., Aagedal, J. Ø., Oldevik, J., Solberg, A., & Nordmoen, B. (2006). Component and Model-based Development Methodology. Trondheim, Norway: SINTEF ICT. Bingi, P., Sharma, M. K., & Godla, J. K. (1999). Critical Issues Affecting an ERP Implementation. Information Systems Management , 16 (3), 7-14. Booch, G., Rumbaugh, J., & Jacobson, I. (1999). The Unified Modeling Language User Guide. Redwood City, CA, USA: Addison Wesley Longman Publishing co. Brehm, L., Heinzl, A., & Markus, M. L. (2001). Tailoring ERP systems: A Spectrum of Choices and their Implications. Proceedings of the Hawaii International Conference on System Sciences. Maui, United States: IEEE. Burn, J. M., & Szeto, C. (2000). A Comparison of the Views of Business and IT Management on Success Factors for Strategic Alignment. Information and Management , 37 (4), 197-216. Chalmers, R. E. (1999). Small Manufacturers Seek Best ERP Fit. Manufacturing Engineering , 123 (4), 42-46. Connolly, J. (1999). ERP: Corporate Cleanup. Computerworld , 33 (9), 74-77. Cooper, D. R., & Schindler, P. S. (2003). Busines Research Methods. Singapore, SG: McGraw-Hill.

J.W. Faber
Bibliography TU/e
49
Cooper, R. B., & Zmud, R. W. (1990). Information Technology Implementation Research: A Technology Diffusion Approach. Management Science , 36 (2), 23-139. Davenport, T. H. (1998). Putting the Enterprise into the Enterprise System. Harvard Business Review , 76 (4), 121-131. Davis, F. D., Bagozzi, R. P., & Warshaw, P. R. (1989). User Acceptance of Computer Technology: A comparison of Two Theoretical Models. Management Science , 35 (8), 982-1003. Davis, G. B. (1988). Commentary on Information Systems: To Buy, Build or Customize? Accounting Horizons , 2 (1), 101-103. DeLone, W. H., & McLean, E. R. (2003). The DeLone and McLean Model of Information Systems Success: A Then-Year Update. Journal of Management Information Systems , 19 (4), 9-30. Dishaw, M. T., & Strong, D. M. (1999). Extending the Technology Acceptance Model with Task-Technology Fit Constructs. Information and Management , 36 (1), 9-21. Eindhoven University of Technology. (2009, 06 11). Process Mining Wiki. Retrieved 08 12, 2010, from http://prom.win.tue.nl/research/wiki/prom/start Everdingen van, Y., Hilligersberg van, J., & Waarts, E. (2000). ERP Adoption by European Midsize Companies. Communications of the ACM , 43 (4), 27-31. Fishbein, M., & Ajzen, I. (1975). Belief, Attitude, Intention and Behavior: An Introduction to Theory and Research. Reading: Addison-Weasley. Frye, D. W., & Gulledge, T. R. (2007). End-to-End Business Process Scenarios. Industrial Management and Data Systems , 107 (6), 749-761. Gattiker, T. F., & Goodhue, D. L. (2002). Software-Driven Changes to Business Processes: An Empirical Study of Impacts of Enterprise Resource Planning (ERP) Systems at the Local Level. International Journal of Production Research , 40 (18), 4799-4818. Gattiker, T. F., & Goodhue, D. L. (2000). Understanding the Plant Level Costs and Benefits of ERP: Will the Ugly Duckling Always Turn into a Swan? Proceedings of the 33rd Hawaii International Conference on System Sciences (pp. 1-10). Maui, United States: IEEE. Gattiker, T. F., & Goodhue, D. L. (2005). What Happens After ERP Implementation: Understanding the Impact of Interdependence and Differentiation on PLant-level Outcomes. MIS Quarterly , 29 (3), 559-585. Glass, R. L. (1998). Enterprise Resource Planning - Breakthrough and/or Term Problem? the DATA BASE for Advances in Information Systems , 29 (2), 13-16. Goodhue, D. L. (1998). Development and Measurement Validity of a Task-Technology Fit Instrument for User Evaluations of Information Systems. Decision Sciences , 29 (1), 105-138. Goodhue, D. L., & Thompson, R. L. (1995). Task-Technology Fit and Individual Performance. MIS Quarterly , 19 (2), 213-236. Hamel, G., & Prahalad, C. K. (1994). Competing for the Future. Boston: Harvard Business School Press. Hammer, M., & Champy, J. (1994). Reengineering the Corporation: Manifesto for Business Revolution. London: Nicholas Brealey Publishing. Hammer, M., & Stanton, S. (1999). How Process Enterprises Really Work. Harvard Business Review , 77 (6), 108-118. Henderson, J. C., & Venkatraman, N. (1993). Strategic Alignment: Leveraging Information Technology for Transforming Organizations. IBM Systems Journal , 32 (1), 4-16. Hoke, J., & Craig, L. (2009). Maximize Your Plant Maintenance with SAP. Boston, MA, USA: Galileo Press Inc. Holland, C. P., & Light, B. (1999). A Critical Success Factors Model for ERP Implementation. IEEE Software , 16 (3), 30-36. Hong, K.-K., & Kim, Y.-G. (2002). The Critical Success Factors for ERP Implementation: An Organizational Fit Perspective. Information and Management , 40 (1), 25-40. Iivari, J. (1992). The Organizational Fit of Information Systems. Journal of Information Systems , 2 (1), 3-29. Janson, M. A., & Subramanian, A. (1996). Packaged Software: Selection and Implementation Policies. INFOR , 34 (2), 133-151. Kanellis, P., Lycett, M., & Paul, R. J. (1999). Evaluating Business Information Systems Fit: From Concept to Practcial Application. European Journal of Information Systems , 8 (1), 65-76.

Working the way the cookie crumbles?
TU/e Bibliography
50
Kathuria, R., & Igbaria, M. (1997). Aligning IT Applications with Manufacturing Strategy: An Integrated Framework. International Journal of Operations and Production Management , 17 (6), 611-629. Kavakli, E. (2004). Modeling Organizational Goals: Analysis of Current Methods. Proceedings of the 2004 ACM Symposium on Applied Computing (pp. 1339-1343). Nicosia, Cyprus: ACM. Ko, D.-G., Kirsch, L. J., & King, W. R. (2005). Antecedents of Knowledge Transfer from Consultants to Clients in Enterprise System Implementations. MIS Quarterly , 29 (1), 59-85. Kositanurit, B., Ngwenyama, O., & Osei-Bryson, K.-M. (2000). An Exploration of Factors that Impact Individual Performance in an ERP Environment: An Analysis Using Multiple Analytical Techniques. European Journal of Information Systems , 15 (6), 556-568. Kotonya, G., & Sommerville, I. (1998). Requirements Engineering. Chichester, UK: John Wiley & Sons Ltd. Lamsweerde van, A. (2001). Goal-Oriented Requirements Engineering: A Guided Tour. Proceedings of the 5th IEEE International Symposium on Requirements Engineering (pp. 249-263). Toronto, Canada: IEEE. Lee, J., & Xue, N.-L. (1999). Analyzing User Requirements by Use Cases: A Goal-Driven Approach. IEEE Software , 16 (4), 92-101. Lengnick-Hall, C. A., Lengnick-Hall, M. L., & Abdinnour-Helm, S. (2004). The Role of Social and Intellectual Capital in Achieving Competitive Advantage Through Enterprise Resource Planning (ERP) Systems. Journal of Engineering and Technology Management , 21 (4), 307-330. Lucas Jr, H. C., Walton, E. J., & Ginzberg, M. J. (1988). Implementing Packaged Software. MIS Quarterly , 12 (4), 537-549. Luecke, R. (2003). Managing Change and Transition. Boston: Harvard Business School Press. Luftman, J., & Brier, T. (1999). Achieving and Sustaining Business-IT Alignment. California Managemen Review , 42 (1), 109-122. Luo, W., & Strong, D. M. (2004). A Framework for Evaluating ERP Implementation Choices. IEEE Transactions on Engineering Management , 51 (3), 322-333. Malhotra, Y., & Galleta, D. F. (1999). Extending the Technology Acceptance Model to Account for Social Influence: Theoretical Bases and Empirical Validation. Proceedings of the 32nd Hawaii International Conference on System Sciences. Maui, United States: IEEE. Markus, M. L. (1983). Power, Politics and MIS Implementation. Communications of the ACM , 26 (6), 430-444. Markus, M. L., & Tanis, C. (2000). The Enterprise System Experience - From Adoption to Success. In R. W. Zmud, Framing the Domains of IT Management (pp. 173-207). Cincinnati: Pinnaflex Educational Resources, Inc. Medling, J., Moser, M., Neumann, G., Verbeek, H. M., Dongen van, B. F., & Aalst van der, W. M. (2008). A Quantitative Analysis of Faulty EPCs in the SAP Reference Model. Data and Knowledge Engineering , 64 (1), 312-329. Morton, N. A., & Hu, Q. (2008). Implications of the Fit Between Organizational Structure and ERP: A Structural Contingency Theory Perspective. International Journal of Information Management , 28 (5), 391-402. Murray, M., & Coffin, G. (2001). A Case Study Analysis of Factors for Success in ERP System Implementations. Proceedings of the 7th Americas Conference on Information Systems (pp. 1011-1018). Boston, United States: AIS. Ng, J. K., Ip, W. H., & Lee, T. C. (1999). A Paradigm for ERP and BPR Integration. International Journal of Production Research , 37 (9), 2093-2108. Ngai, E. W., Law, C. C., & Wat, F. K. (2008). Examining the Critical Success Factors in the Adoption of Enterprise Resource Planning. Computers in Industry , 59 (6), 548-564. Orlikowski, W. J. (1992). The Duality of Technology: Rethinking the Concept of Technology in Organziations. Organization Science , 3 (3), 398-427. Pereira, R. E. (1999). Resource View Theory Analysis of SAP as a Source of Competitive Advantage to Firms. The DATA BASE for Advances in Information Systems , 30 (1), 38-46. Rai, A., Lang, S. S., & Welker, R. B. (2002). Assessing the Validity of IS Success Models: An Empirical Test and Theoretical Analysis. Information Systems Research , 13 (1), 50-69. Reich, B. H., & Benbasat, I. (1996). Measuring the Linkage between Business and Information Technology Objectives. MIS Quarterly , 20 (1), 55-81.

J.W. Faber
Bibliography TU/e
51
Rolland, C., & Prakash, N. (2000). Bridging the Gap Between Organisational Needs and ERP Functionality. Requirements Engineering , 5 (3), 180-193. Sarkis, J., & Sundarrraj, R. P. (2003). Evaluating Componentized Enterprise Information Technologies: A Multiattribute approach. Information Systems Frontiers , 5 (3), 303-319. Scheer, A.-W., & Habermann, F. (2000). Making ERP a Success. Communications of the ACM , 43 (4), 57-61. Schniederjans, M. J., & Kim, G. C. (2003). Implementing Enterprise Resource Planning Systems with Total Quality Control and Business Process Reengineering. International Journal of Operations and Production Management , 23 (4), 418-429. Seddon, P. B., & Kiew, M. Y. (1994). A Partial Test and Development of the DeLone and McLean Model of IS Success. Proceedings of the International Conference on Information Systems (pp. 99-110). Atlanta, United States: AIS. Smyth, R. W. (2001). Challenges to Successful ERP Use. The 9th Conference on Information Systems, (pp. 1227-1231). Bled, Slovenia. Smyth, R. W. (2001a). Threats to ERP Success: A Case Study. Proceedings of the 5th Pacific-Asian Conference on Information Systems, (pp. 1141-1151). Seoul, Korea. Sneller, L., & Bots, J. (2007). Ex-Ante Evaluation of ERP Systems: Design and Applicability of a Method. Communications in Dependability and Quality Management , 11 (1), 107-121. Soh, C., & Kien, S. S. (2004). An Institutional Perspective on Sources of ERP Package-Organisation Misalignments. Journal of Strategic Information Systems , 13 (4), 375-397. Soh, C., Kien, S. S., & Tay-Yap, J. (2000). Cultural Fits and Misfits: Is ERP a Universal Solution? Communications of the ACM , 43 (4), 47-51. Stefanou, C. J. (2001). A Framework for the Ex-Ante Evaluation of ERP Software. European Journal of Information Systems , 10 (4), 204-215. Stengl, B., & Ematinger, R. (2000). SAP R/3 Plant Maintenance; Making it Work for Your Business. Harlow, UK: Addison Wesley. Steria. (2007). Coswin Manual. Bruxelles: Steria Group. Swan, J., Newell, S., & Robertson, M. (1999). The Illusion of 'Best Practice' in Information Systems for Operations Management. European Journal of Information Systems , 8 (4), 284-293. Technology Evaluation Centers. (2010, 07 09). Enterprise Asset Management and Computerized Maintenance Management Systems. Montreal, Quebec, Canada. Tonder van, C. L. (2004). Organisational Change; Theory and Practice. Pretoria: Van Schaik Publishers. Torkzadeh, G., & Doll, W. J. (1999). The Development of a Tool for Measuring the Perceived Impact of Technology on Work. Omega, the International Journal of Management Science , 27 (3), 327-339. Tsai, W.-H., & Chien, S.-W. (2005). An Extension of the Updated DeLone and McLean Success Model in an ERP Implementation Environment - High Tech Manufacturing Firms in Taiwan. Proceedings of the 3rd Workshop on Knowledge Economy and Electronic Commerce, (pp. 274-287). Jonghli, Taiwan. Venkatesh, V., Morris, M. G., Davis, G. B., & Davis, F. D. (2003). User Acceptance of Information Technology: Towards a Unified View. MIS Quarterly , 27 (3), 425-478. Vermeulen, B. (2010, June 10). Actionplan 2010; Maintenance Department. Herentals, Belgium. Vyne van, J.-L. (2010, January 22). LU Herentals; Industrial Action Plan 2010. Herentals, Belgium. Wang, E. T., Klein, G., & Jiang, J. J. (2006). ERP Misfit: Country of Origin and Organizational Factors. Journal of Management Information Systems , 23 (1), 263-292. Wu, J.-H., Shin, S.-S., & Heng, M. S. (2007). A Methodology for ERP Misfit Analysis. Information and Management , 44 (8), 666-680. Yen, H. R., & Sheu, C. (2004). Aligning ERP Implementation with Competitive Priorities of Manufacturing Firms: An Exploratory Study. International Journal of Production Economics , 92 (3), 207-220. Zeithaml, V. A., Parasuraman, A., & Berry, L. L. (1990). Delivering Quality Service: Balancing Customer Perceptions and Expectations. New York: Free Press.
Working the way the cookie crumbles?
TU/e Appendices
52
11 Appendices Index
Appendix A LU History 53
Appendix B Maintenance Department Organization Chart 54
Appendix C House of Strategy Maintenance Department 54
Appendix D CMMS Evolution at LU General Biscuits 55
Appendix E Information Systems use at LU Maintenance 55
Appendix F UML Use‐Case Notation 56
Appendix G Process Modeling Notation 56
Appendix H Task‐Technology Fit Instrument 57
Appendix I Goal Based Use‐Cases 58
Appendix J Interviewees 62
Appendix K Process Models 63
Appendix L Process Assessments 81
Appendix M Process Fit Results 90
Appendix N Maintenance Department Issue Tree 91
Appendix O TTF Measurement Scores 92
Appendix P Strategic Fit Results 93

J.W. Faber
Appendices TU/e
53
Appendix A LU History

Working the way the cookie crumbles?
TU/e Appendices
54
Appendix B Maintenance Department Organization Chart
Appendix C House of Strategy Maintenance Department

J.W. Faber
Appendices TU/e
55
Appendix D CMMS Evolution at LU General Biscuits
Appendix E Information Systems use at LU Maintenance

Working the way the cookie crumbles?
TU/e Appendices
56
Appendix F UML Use‐Case Notation
Appendix G Process Modeling Notation

J.W. Faber
Appendices TU/e
57
Appendix H Task‐Technology Fit Instrument
Part A Task technology fit measures 8 final factors of TTF 21 Original dimensions of TTF Quality disagree agree Currency (Data that I use or would like to use is current enough to meet my needs.) 1 I can not get data that is current enough to meet my business needs. 0 0 0 0 0 0 0 2 The data is up to date enough for my purposes. 0 0 0 0 0 0 0 Right data (Maintaining the necessary fields or elements of data.) 3 The data maintained by the maintenance department is pretty much what I need to carry out
my tasks. 0 0 0 0 0 0 0
4 The computer systems available to me are missing critical data that would be very useful to me in my job. 0 0 0 0 0 0 0
Right level of detail (Maintaining the data at the right level(s) of detail.) 5 The department maintains data at an appropriate level of detail for my group its tasks. 0 0 0 0 0 0 0 6 Sufficiently detailed data is maintained by the department. 0 0 0 0 0 0 0 Locatability Locatability (Ease of determining what data is available and where.) 7 It is easy to find out what type of data the department maintains on a given subject. 0 0 0 0 0 0 0 8 It is easy to locate departmental data on a particular issue, even if I have not used the data
before. 0 0 0 0 0 0 0
Meaning (Ease of determining what a data element on a report or file means, or what is included or excluded in calculating it.) 9 The exact definition of data fields relating to my tasks is easy to find out. 0 0 0 0 0 0 0 10 On the reports or systems I deal with, the exact meaning of the data elements is either
obvious or easy to find out. 0 0 0 0 0 0 0
Authorization Authorization (Obtaining authorization to access data necessary to do my job.) 11 Data that would be useful to me is unavailable to me because I do not have the right
authorization. 0 0 0 0 0 0 0
12 Getting authorization to access data that would be useful in my job is time consuming and difficult. 0 0 0 0 0 0 0
Compatibility Compatibility (Data from different sources can be consolidated or compared without inconsistencies.) 13 There are times when I find that supposedly equivalent data from two different sources is
inconsistent. 0 0 0 0 0 0 0
14 Sometime it is difficult for me to compare or consolidate data from two different sources because the data is defined differently. 0 0 0 0 0 0 0
15 When it is necessary to compare or consolidate data from different sources I find that there may be unexpected or difficult inconsistencies. 0 0 0 0 0 0 0
Production timeliness Timeliness (IT meets predefined production turnaround schedules) 16 IT, to my knowledge, meets its production schedules such as report delivery and running
scheduled jobs. 0 0 0 0 0 0 0
17 Regular IT activities are completed on time. 0 0 0 0 0 0 0 Systems Reliability Systems Reliability (Dependability and consistency of access and uptime of systems.) 18 I can count on the system to be up and available when I need it. 0 0 0 0 0 0 0 19 The computer systems I use are subject to unexpected or inconvenient down times which
makes it harder to do my work. 0 0 0 0 0 0 0
20 The computer systems I use are subject to frequent problems and crashes. 0 0 0 0 0 0 0 Ease of Use/ Training Ease of use of hardware and software (Ease of doing what I want to do using the system hardware and software for submitting, accessing,
analyzing data.) 21 It is easy to learn how to use the computer systems I need. 0 0 0 0 0 0 0 22 The computer systems I use are convenient and easy to use. 0 0 0 0 0 0 0 Training (Can I get the kind of quality computer-related training when I need it?) 23 There is not enough training for me, or my staff, how to find, understand, access or use the
department computer systems. 0 0 0 0 0 0 0
24 I am getting the training I need to be able to use the department computer systems, languages, procedures and data effectively. 0 0 0 0 0 0 0
Relationship with users IT understanding of business (How well does IT understand my unit its business mission and its relation to corporate objectives?) 25 The IT people we deal with understand the day-to-day objectives of my work group and its
mission within our company. 0 0 0 0 0 0 0
26 My work group feels that IT personnel can communicate with us in familiar business terms that are consistent. 0 0 0 0 0 0 0

Working the way the cookie crumbles?
TU/e Appendices
58
IT interest and dedication (to supporting customer business needs) 27 IT takes my business group its business problems seriously. 0 0 0 0 0 0 0 28 IT takes a real interest in helping me solve my business problems. 0 0 0 0 0 0 0 Responsiveness (Turnaround time for a request submitted for IT service.) 29 It often takes too long for IT to communicate with me on my requests. 0 0 0 0 0 0 0 30 I generally know what happens to my request for IT service or assistance or whether it is
being acted upon. 0 0 0 0 0 0 0
31 When I make a request for service or assistance, IT normally responds to my request in a timely manner. 0 0 0 0 0 0 0
Consulting (Availability and quality of technical and business planning assistance for systems.) 32 Based on my previous experience I would use IT technical and business planning consultancy
services in the future if I had a need. 0 0 0 0 0 0 0
33 I am satisfied with the level of technical and business planning consultancy expertise I receive from IT 0 0 0 0 0 0 0
IT Performance (How well does IT keep its agreements?) 34 IT delivers agreed-upon solutions to support my business needs. 0 0 0 0 0 0 0 Part B Task/job characteristics measures Task Equivocality 35 I frequently deal with ill-defined business problems.
0 0 0 0 0 0 0
36 I frequently deal with ad-hoc, non-routine business problems. 0 0 0 0 0 0 0
37 Frequently the business problems I work on involve answering questions that have never been asked in quite that form before. 0 0 0 0 0 0 0
Task Interdependence 38 The business problems I deal with frequently involve more than one business function. 0 0 0 0 0 0 0 Part C Individual Performance Impact Measures Performance impact of computer systems 39 The company computer environment has a large, positive impact on my effectiveness and
productivity in my job. 0 0 0 0 0 0 0
40 IT computer systems and services are an important and valuable aid to me in the performance of my job. 0 0 0 0 0 0 0
Appendix I Goal Based Use‐Cases
Foundation

J.W. Faber
Appendices TU/e
59
Organization
Collaboration

Working the way the cookie crumbles?
TU/e Appendices
60
Safety
Quality

J.W. Faber
Appendices TU/e
61
Operators
Cost

Working the way the cookie crumbles?
TU/e Appendices
62
Appendix J Interviewees
Last name First name Function
Aert André van Maintenance Supervisor Fabrication
Baelen Eric van Maintenance Supervisor Packaging
Beylemans Michel Maintenance Supervisor Packaging
Bont Bart de Maintenance Supervisor Packaging
Bourbon Karel Maintenance Expert Fabrication
Bruyne Chris de Maintenance Expert Packaging
Buijsscher Louis de Maintenance Manager Planning, Warehouse & Administration
Claessen André Maintenance Manager Fabrication/Bulk
Daenen Guido Maintenance Expert Packaging
Dejonghe Gerrit Maintenance Supervisor Electro
Embrechts Johan Maintenance Supervisor Packaging
Exelmans Ludo Maintenance Manager Supporting Functions
Faes Marc Maintenance Supervisor Warehouse
Gaal Arnaud van Maintenance Supervisor Bulk
Glabbeek Peter van Maintenance Planner
Janssens Dirk Technical Controller
Lee Jo de Technical Warehouse
Lommel Geert van Technical Warehouse
Luyckx Raymond Maintenance Supervisor Support
Oirbans Mieke Technical Administration
Orshaegen Leo van Maintenance Planner Packaging
Peeters Dirk Technical Warehouse
Renders Peter Maintenance Expert Fabrication
Schellens Patsy Supplier Administration
Swinnen Johan Maintenance Supervisor Utilities
Thys Wim Maintenance Supervisor Electro
Vermeulen Benny Technical Director
Vervecken Sven Maintenance Supervisor Fabrication
Walraevens Hanne Assistant Sourcing & Supplier Development

J.W. Faber
Appendices TU/e
63
Appendix K Process Models
Machine

Working the way the cookie crumbles?
TU/e Appendices
64
Material

J.W. Faber
Appendices TU/e
65

Working the way the cookie crumbles?
TU/e Appendices
66
Other

J.W. Faber
Appendices TU/e
67

Working the way the cookie crumbles?
TU/e Appendices
68

J.W. Faber
Appendices TU/e
69
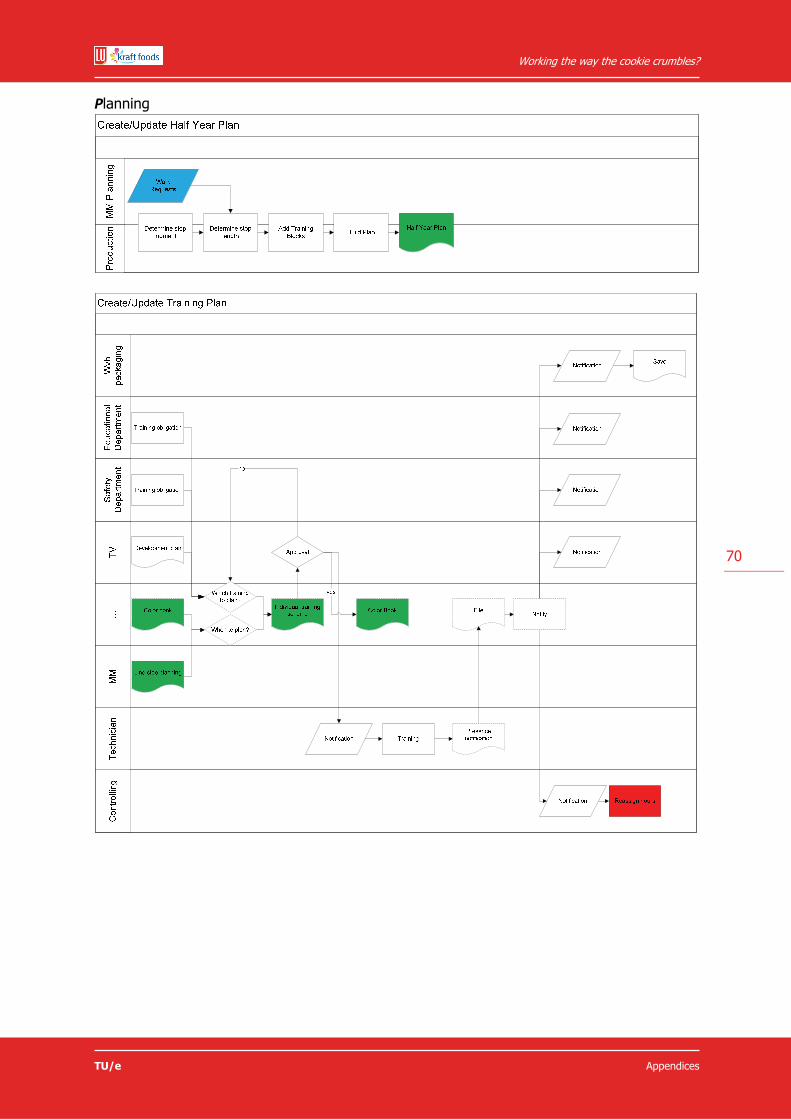
Working the way the cookie crumbles?
TU/e Appendices
70
Planning

J.W. Faber
Appendices TU/e
71

Working the way the cookie crumbles?
TU/e Appendices
72
Purchase Order

J.W. Faber
Appendices TU/e
73

Working the way the cookie crumbles?
TU/e Appendices
74

J.W. Faber
Appendices TU/e
75

Working the way the cookie crumbles?
TU/e Appendices
76
Stock

J.W. Faber
Appendices TU/e
77

Working the way the cookie crumbles?
TU/e Appendices
78
Work Order
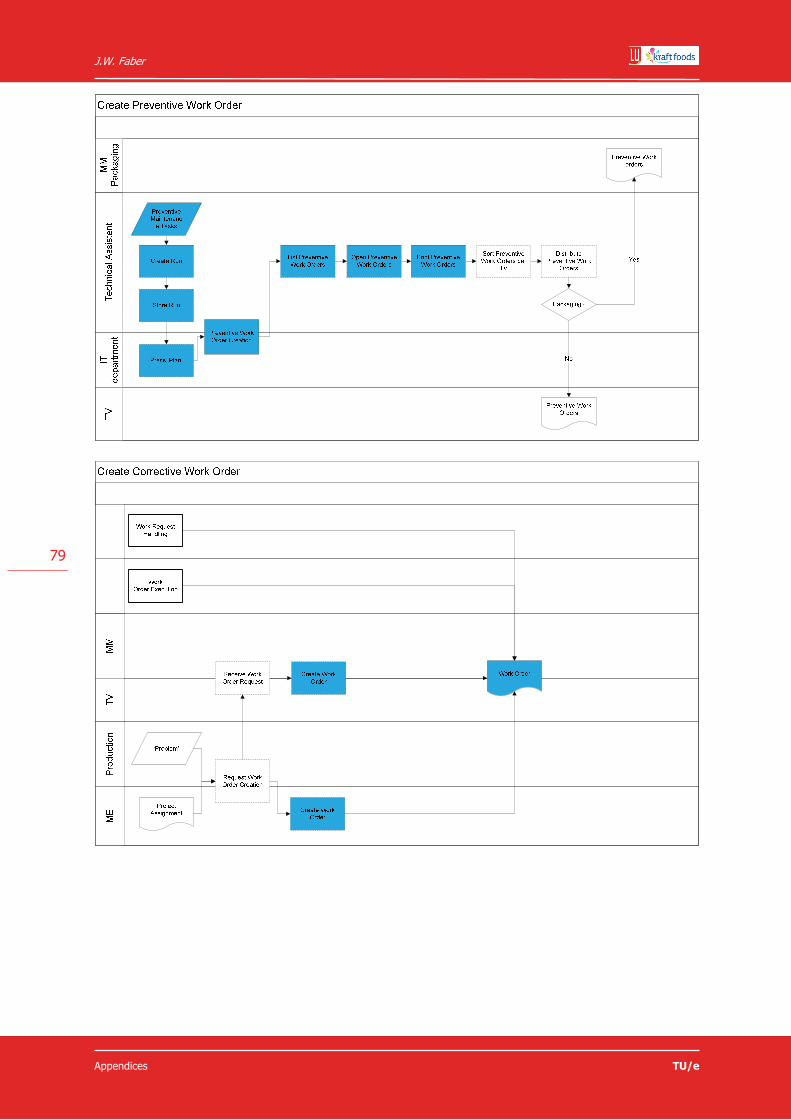
J.W. Faber
Appendices TU/e
79

Working the way the cookie crumbles?
TU/e Appendices
80

J.W. Faber
Appendices TU/e
81
Appendix L Process Assessments
In addition to a process description, LU General Biscuits requested an assessment of each process. Since this assessment is no part of the fit measurement analysis, it is discussed separately in this appendix. The processes were assessed using a ‘spider web’ tool. This spider web consists of five axes and three levels. The five dimensions are:
- Content: what should the process achieve? - Procedure: Is the process structured? - Organization: Are the right tasks performed by the right people or departments? - Tools: Are there tools in place to help a proper process execution? - Performance: Is the process achieving what it is supposed to in an efficient way?
Each dimension is scored as insufficient, sufficient or good. Insufficient indicates that immediate action is necessary to change the process, sufficient means that it is not optimized in terms of any of the dimensions, but that it performs well, and good indicates no change to the process is necessary. The assessments were extensively discussed in round table meetings with the maintenance managers, technical controller, technical director and S&V consultants. This allowed for a better assessment and made sure errors and mistakes were corrected. Overall it was concluded that many responsibilities were delegated to the wrong roles in the organization. Next to that, it was found that supervisors have many tasks that are not directly related to maintenance work. Their overhead with respect to personnel administration and personnel planning hindered their maintenance related jobs. Also, the conclusion was drawn that the production department is not pro-active when it comes to breakdowns. Any machine or line breakdown is regarded as a technology failure and thus the maintenance department is called in. Jobs such as removing crumbs from optical sensors, small adjustments to machine settings, removing skewed glued cardboard boxes and fixing skewed fed packaging film are not maintenance jobs. However, the production department is not trained to fix these problems yet or does not have the mindset to solve it themselves. The direct consequence is that technicians spend around 80% of their time fixing these small errors. This puts pressure on capacity, leading to reduced execution of preventive work and frustration with the technicians about their irrelevant work. The 80% time spent on small jobs is an estimate, since the reporting possibilities are currently insufficient. There is much data available on work orders and spare parts in the systems used, but for reporting data is sorted, selected and evaluated in Microsoft Excel primarily. This is a time consuming job that can be made more efficient by designing standard reports that are generated per time interval. A similar problem exists in personnel planning, work scheduling and work order assignment. These tasks take place mostly outside the system. Again Microsoft Excel is used for these tasks. The switching between systems and different planning files not being linked leads to reduced efficiency and a lack of transparency. Based on the AS-IS process description, a proposal was made for a set of TO-BE processes to solve issues caused by the SAP implementation. Other changes, such as the introduction of maintenance planners and reduced administration duties for supervisors were incorporated in the TO-BE design. The further development of TO-BE processes for the maintenance department for the period with SAP and the current CMMS is outside the scope of this thesis and will not be discussed here.

Working the way the cookie crumbles?
TU/e Appendices
82
Machine
Material
Assessment Content Procedure Organization Tools Performance
Remove/ Replace Machine
Clear Old/Excess Machine
Create New Machine
Create/ Update Spare Parts List
Assessment Content Procedure Organization Tools Performance
Goods Issue of Stock Material for Maintenance
Goods Issue of Stock Material for Production

J.W. Faber
Appendices TU/e
83
Other
Register Goods Issue
Create New Material
Maintain/ Update Material Master Data
Repair
Assessment Content Procedure Organization Tools Performance
Maintain Attendance Schedule
Evaluate Technician Performance

Working the way the cookie crumbles?
TU/e Appendices
84
Evaluate Manager Performance
Assign Special Hours
Distribute Payment Checks
Assign Investment Costs
Create Overview of Subcontractors
Approve Overtime Hours
Create Stickers for Warehouse Bins
N/A

J.W. Faber
Appendices TU/e
85
Planning
Mobile Phone Duty
Allocate Cost Center per Shift
Assessment Content Procedure Organization Tools Performance
Create/ Update Half Year Plan
Create/ Update Training Plan
Create Stop Plan
Create Weekly Maintenance Plan

Working the way the cookie crumbles?
TU/e Appendices
86
Purchase Order
Create Shift Plan
Assessment Content Procedure Organization Tools Performance
Resolve Non-Deliverable Material
Receive Material
Put Material in Storage
Receive Service
Verify Invoice

J.W. Faber
Appendices TU/e
87
Stock
Verify Invoice with Missing Goods Receipt
Find Delivery Document
Assessment Content Procedure Organization Tools Performance
Purchase Stock Material
Purchase Non-Stock Material
Create Purchase Requisition
Clear Old Excess Stock

Working the way the cookie crumbles?
TU/e Appendices
88
Work Order
Cycle Count
Create New Supplier
Assessment Content Procedure Organization Tools Performance
Create Preventive Maintenance Plan
Handle Work Request
Create Preventive Work Order
Create Corrective Work Order

J.W. Faber
Appendices TU/e
89
Prepare Work Order
Execute Work Order
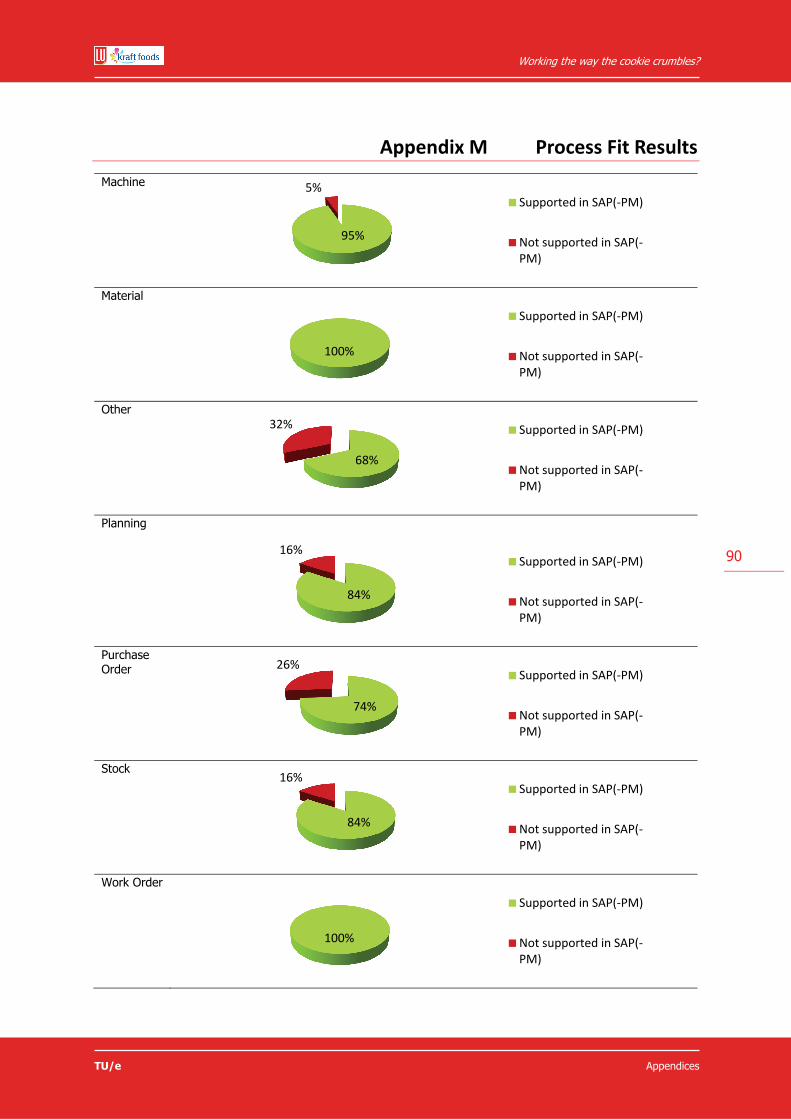
Working the way the cookie crumbles?
TU/e Appendices
90
Appendix M Process Fit Results
Machine
Material
Other
Planning
Purchase Order
Stock
Work Order
95%
5%Supported in SAP(‐PM)
Not supported in SAP(‐PM)
100%
Supported in SAP(‐PM)
Not supported in SAP(‐PM)
68%
32% Supported in SAP(‐PM)
Not supported in SAP(‐PM)
84%
16%Supported in SAP(‐PM)
Not supported in SAP(‐PM)
74%
26%Supported in SAP(‐PM)
Not supported in SAP(‐PM)
84%
16%Supported in SAP(‐PM)
Not supported in SAP(‐PM)
100%
Supported in SAP(‐PM)
Not supported in SAP(‐PM)

J.W. Faber
Appendices TU/e
91
Appendix N Maintenance Department Issue Tree

Working the way the cookie crumbles?
TU/e Appendices
92
Appendix O TTF Measurement Scores
N Frequency (%)
Question Viewed Value Missing Mean Variance Minimum Maximum 1 2 3 4 5 6 7 nvt
1 27 24 3 3,6250 3,984 1,00 7,00 16,7 20,8 16,7 4,2 20,8 12,5 8,3 ,0
2 27 24 3 4,2917 2,563 2,00 7,00 20,8 12,5 16,7 20,8 25,0 4,2 ,0
3 27 24 3 4,2083 2,868 2,00 7,00 25,0 12,5 12,5 25,0 16,7 8,3 ,0
4 27 24 3 4,9167 2,775 1,00 7,00 4,2 12,5 12,5 20,8 41,7 8,3 ,0
5 27 24 3 3,4583 2,520 1,00 7,00 4,2 29,2 20,8 29,2 4,2 4,2 8,3 ,0
6 27 24 3 3,4583 2,346 1,00 7,00 4,2 29,2 20,8 25,0 8,3 8,3 4,2 ,0
7 27 24 3 3,7500 3,152 1,00 7,00 4,2 29,2 16,7 12,5 25,0 12,5 ,0
8 27 24 3 3,4583 2,520 1,00 7,00 4,2 29,2 25,0 20,8 4,2 12,5 4,2 ,0
9 27 24 3 3,6667 2,319 1,00 6,00 4,2 25,0 16,7 25,0 12,5 16,7 ,0
10 27 24 3 3,4583 2,085 1,00 6,00 4,2 33,3 8,3 29,2 16,7 8,3 ,0
11 27 24 3 3,0000 2,957 1,00 7,00 25,0 20,8 12,5 25,0 8,3 4,2 4,2 ,0
12 27 24 3 3,6250 3,375 1,00 6,00 12,5 29,2 4,2 12,5 20,8 20,8 ,0
13 27 22 3 4,9091 2,182 1,00 7,00 4,2 4,2 4,2 12,5 33,3 25,0 8,3 8,3
14 27 22 3 4,8636 2,314 1,00 7,00 4,2 4,2 4,2 20,8 20,8 29,2 8,3 8,3
15 27 22 3 4,6818 2,323 1,00 7,00 4,2 8,3 20,8 33,3 16,7 8,3 8,3
16 27 19 3 4,3684 3,246 1,00 6,00 8,3 8,3 4,2 16,7 8,3 33,3 20,8
17 27 19 3 4,1579 2,585 1,00 6,00 4,2 12,5 8,3 16,7 16,7 20,8 20,8
18 27 24 3 5,5417 2,259 1,00 7,00 4,2 8,3 4,2 16,7 41,7 25,0 ,0
19 27 23 3 2,7391 2,656 1,00 7,00 25,0 29,2 8,3 20,8 8,3 4,2 4,2
20 27 23 3 2,7826 2,632 1,00 7,00 20,8 33,3 12,5 12,5 12,5 4,2 4,2
21 27 24 3 5,0000 2,174 1,00 7,00 4,2 4,2 4,2 12,5 37,5 25,0 12,5 ,0
22 27 23 3 4,7391 1,565 2,00 7,00 4,2 12,5 20,8 29,2 25,0 4,2 4,2
23 27 23 3 3,2174 2,451 1,00 6,00 12,5 20,8 29,2 12,5 8,3 12,5 4,2
24 27 23 3 4,5217 3,170 1,00 7,00 4,2 16,7 25,0 16,7 20,8 12,5 4,2
25 27 20 3 3,9000 2,832 1,00 7,00 4,2 12,5 20,8 20,8 8,3 8,3 8,3 16,7
26 27 21 3 4,8571 1,729 2,00 7,00 8,3 4,2 12,5 33,3 25,0 4,2 12,5
27 27 21 3 5,3810 2,148 1,00 7,00 4,2 4,2 4,2 16,7 50,0 8,3 12,5
28 27 21 3 5,4762 1,862 2,00 7,00 8,3 4,2 16,7 45,8 12,5 12,5
29 27 21 3 2,8095 3,062 1,00 7,00 25,0 20,8 12,5 16,7 4,2 4,2 4,2 12,5
30 27 21 3 4,4762 3,662 1,00 7,00 8,3 8,3 8,3 12,5 25,0 8,3 16,7 12,5
31 27 21 3 5,1429 3,429 1,00 7,00 8,3 12,5 12,5 37,5 16,7 12,5
32 27 19 3 4,6316 1,690 2,00 7,00 4,2 4,2 37,5 12,5 12,5 8,3 20,8
33 27 21 3 5,3810 1,348 3,00 7,00 8,3 12,5 12,5 45,8 8,3 12,5
34 27 20 3 4,9500 1,734 2,00 7,00 4,2 8,3 12,5 29,2 20,8 8,3 16,7
35 27 22 3 4,5909 1,968 2,00 7,00 8,3 12,5 20,8 20,8 25,0 4,2 8,3
36 27 22 3 5,2273 2,565 2,00 7,00 12,5 8,3 25,0 25,0 20,8 8,3
37 27 22 3 3,6818 2,132 2,00 6,00 33,3 4,2 20,8 25,0 8,3 8,3
38 27 22 3 5,1364 1,838 2,00 7,00 4,2 8,3 16,7 12,5 41,7 8,3 8,3
39 27 20 3 5,5500 2,576 1,00 7,00 4,2 4,2 4,2 12,5 37,5 20,8 16,7
40 27 20 3 5,6000 1,937 1,00 7,00 4,2 8,3 12,5 41,7 16,7 16,7

J.W. Faber
Appendices TU/e
93
Appendix P Strategic Fit Results
Coswin SAP-PM Machine
Material
Other
Planning
Purchase Order
Work Order
Stock
81%
6%8% 5%
86%
1%4% 9%
SUP
3RD
CST
NS
22%
25%25%
28%
75%0%
0%
25% SUP
3RD
CST
NS
52%
8%9%
31%
71%2%
3%
24% SUP
3RD
CST
NS
68%4%
4%
24%
78%0%
4%18% SUP
3RD
CST
NS
49%
10%3%
38%
79%0%
2%19% SUP
3RD
CST
NS
71%2%
9%
18%
80%
1%
6% 13% SUP
3RD
CST
NS
62%
7%
9%
22%
95%
2%3%0%SUP
3RD
CST
NS

Working the way the cookie crumbles?
TU/e Appendices
94
Analysis & KPI’s
System Specifics
48%
17%
16%
19%
54%
11%
15%
20% SUP
3RD
CST
NS
29%
9%29%
33%
67%9%
19% 5%SUP
3RD
CST
NS