Neutron scattering study of the dynamics of a polymer melt under nanoscopic confinement
11
Neutron scattering study of the dynamics of a polymer melt under nanoscopic confinement Margarita Krutyeva, 1,a Jaime Martin, 2 Arantxa Arbe, 3 Juan Colmenero, 3,4 Carmen Mijangos, 2 Gerald J. Schneider, 5 Tobias Unruh, 6 Yixi Su, 5 and Dieter Richter 1 1 Institut für Festkörperforschung, Forschungszentrum Jülich, Jülich 52425, Germany 2 Instituto de Ciencia y Tecnología de Polímeros, CSIC, 28066 Madrid, Spain 3 Centro de Física de Materiales (CSIC-UPV/EHU), Materials Physics Center (MPC), 20080 San Sebastián, Spain 4 Departamento de Física de Materiales, UPV/EHU, 20080 San Sebastián, Spain and Donostia International Physics Center, 20080 San Sebastián, Spain 5 Jülich Centre of Neutron Research (JCNS) at FRM II, Garching 85747, Germany 6 Forschungsneutronenquelle Heinz Maier-Leibnitz (FRM II), Garching 85747, Germany Received 9 June 2009; accepted 14 October 2009; published online 4 November 2009 Polyethylene oxide confined in an anodic aluminum oxide solid matrix has been studied by different neutron scattering techniques in the momentum transfer Q range 0.2 Q = Q 1.9 Å -1 . The cylindrical pores of the matrix present a diameter 40 nm much smaller than their length 150 m and are parallel and hexagonally ordered. In particular, we investigated the neutron intensity scattered for two orientations of the sample with respect to the incident beam, for which the Q direction was either parallel or perpendicular to the pores for a scattering angle of 90°. Diffuse neutron scattering at room temperature has shown that the aluminum oxide has amorphous structure and the polymer in the nanoporous matrix is partially crystallized. Concerning the dynamical behavior, for Q 1Å -1 , the spectra show Rouse-like motions indistinguishable from those in the bulk within the uncertainties. In the high-Q limit we observe a slowing down of the dynamics with respect to the bulk behavior that evidences an effect of confinement. This effect is more pronounced for molecular displacements perpendicular to the pore axis than for parallel displacements. Our results clearly rule out the strong corset effect proposed for this polymer from nuclear magnetic resonance NMR studies and can be rationalized by assuming that the interactions with the pore walls affect one to two adjacent monomer monolayers. © 2009 American Institute of Physics. doi:10.1063/1.3258329 I. INTRODUCTION The synthesis of nanocomposite materials is an inten- sively developing area of science aiming at the production of materials with novel properties. Because of their peculiar features, such as macromolecular architecture and unique viscoelastic properties, polymers are used as a basis for nanocomposites. 1 The emergence of confinement effects on the polymer dynamics in these systems motivated the study of their influence on the physical and chemical properties of polymer systems. In particular, linear polymer melts confined in straight nanoporous aluminum oxide channels can form tailored one-dimensional structures, from nanotubes to nano- rods, depending on the wetting on the surface of the pore walls. 2 Many of the final properties of these systems are determined by the dynamical properties of the polymer. With this work we contribute to these questions by investigating the influence of confinement on the dynamics of a linear polymer melt. We note that in particular the study of con- finement effects on the glass dynamics of polymers has been a much investigated topic during the last few years see, e.g., Refs. 3–6. Polymer dynamics is very rich and shows different phe- nomena depending on the temperature and length scale of observation. Close and above the glass transition temperature T g , the dynamics is dominated by the -relaxation at inter- molecular level. Increasing the temperature, chain mobility is enhanced and, at length scales larger than those correspond- ing to the statistical segment, the chain dynamics can be well described by the Rouse model. In this temperature range, the viscoelastic properties of polymers arise due to the macro- molecular character of the structural units in the system. The challenge then lays in the description of many-particle cor- relations in polymer systems which are consequence of the uncrossibility of polymer chains. The effects of these correlations—known as entanglements—become strong if the molecular mass of the polymer is larger than some criti- cal value M c . In the pioneering works of de Gennes, 7 and Doi and Edwards, 8 the successful reptation/tube theory was presented. The theory introduces the concept of a fictitious “tube” and developed the mathematical background of the model. The tube-concept looks simple and clear. The main parameter of the theory—the tube diameter—can be obtained from mechanical measurements and, microscopically, from neutron scattering experiments. 9,10 In general, the tube diam- a Electronic mail: [email protected]. THE JOURNAL OF CHEMICAL PHYSICS 131, 174901 2009 0021-9606/2009/13117/174901/11/$25.00 © 2009 American Institute of Physics 131, 174901-1 Downloaded 21 Dec 2009 to 134.94.163.117. Redistribution subject to AIP license or copyright; see http://jcp.aip.org/jcp/copyright.jsp
Transcript of Neutron scattering study of the dynamics of a polymer melt under nanoscopic confinement
Neutron scattering study of the dynamics of a polymer meltunder nanoscopic confinement
Margarita Krutyeva,1,a� Jaime Martin,2 Arantxa Arbe,3 Juan Colmenero,3,4
Carmen Mijangos,2 Gerald J. Schneider,5 Tobias Unruh,6 Yixi Su,5 and Dieter Richter1
1Institut für Festkörperforschung, Forschungszentrum Jülich, Jülich 52425, Germany2Instituto de Ciencia y Tecnología de Polímeros, CSIC, 28066 Madrid, Spain3Centro de Física de Materiales (CSIC-UPV/EHU), Materials Physics Center (MPC),20080 San Sebastián, Spain4Departamento de Física de Materiales, UPV/EHU, 20080 San Sebastián, Spain andDonostia International Physics Center, 20080 San Sebastián, Spain5Jülich Centre of Neutron Research (JCNS) at FRM II, Garching 85747, Germany6Forschungsneutronenquelle Heinz Maier-Leibnitz (FRM II), Garching 85747, Germany
�Received 9 June 2009; accepted 14 October 2009; published online 4 November 2009�
Poly�ethylene oxide� confined in an anodic aluminum oxide solid matrix has been studied bydifferent neutron scattering techniques in the momentum transfer �Q� � range 0.2�Q= �Q� ��1.9 Å−1. The cylindrical pores of the matrix present a diameter �40 nm� much smaller than theirlength �150 �m� and are parallel and hexagonally ordered. In particular, we investigated theneutron intensity scattered for two orientations of the sample with respect to the incident beam, forwhich the Q� direction was either parallel or perpendicular to the pores for a scattering angle of 90°.Diffuse neutron scattering at room temperature has shown that the aluminum oxide has amorphousstructure and the polymer in the nanoporous matrix is partially crystallized. Concerning thedynamical behavior, for Q�1 Å−1, the spectra show Rouse-like motions indistinguishable fromthose in the bulk within the uncertainties. In the high-Q limit we observe a slowing down of thedynamics with respect to the bulk behavior that evidences an effect of confinement. This effect ismore pronounced for molecular displacements perpendicular to the pore axis than for paralleldisplacements. Our results clearly rule out the strong corset effect proposed for this polymer fromnuclear magnetic resonance �NMR� studies and can be rationalized by assuming that the interactionswith the pore walls affect one to two adjacent monomer monolayers. © 2009 American Institute ofPhysics.�doi:10.1063/1.3258329�
I. INTRODUCTION
The synthesis of nanocomposite materials is an inten-sively developing area of science aiming at the production ofmaterials with novel properties. Because of their peculiarfeatures, such as macromolecular architecture and uniqueviscoelastic properties, polymers are used as a basis fornanocomposites.1 The emergence of confinement effects onthe polymer dynamics in these systems motivated the studyof their influence on the physical and chemical properties ofpolymer systems. In particular, linear polymer melts confinedin straight nanoporous aluminum oxide channels can formtailored one-dimensional structures, from nanotubes to nano-rods, depending on the wetting on the surface of the porewalls.2 Many of the final properties of these systems aredetermined by the dynamical properties of the polymer. Withthis work we contribute to these questions by investigatingthe influence of confinement on the dynamics of a linearpolymer melt. We note that in particular the study of con-finement effects on the glass dynamics of polymers has beena much investigated topic during the last few years �see, e.g.,Refs. 3–6�.
Polymer dynamics is very rich and shows different phe-nomena depending on the temperature and length scale ofobservation. Close and above the glass transition temperatureTg, the dynamics is dominated by the �-relaxation at inter-molecular level. Increasing the temperature, chain mobility isenhanced and, at length scales larger than those correspond-ing to the statistical segment, the chain dynamics can be welldescribed by the Rouse model. In this temperature range, theviscoelastic properties of polymers arise due to the macro-molecular character of the structural units in the system. Thechallenge then lays in the description of many-particle cor-relations in polymer systems which are consequence of theuncrossibility of polymer chains. The effects of thesecorrelations—known as entanglements—become strong ifthe molecular mass of the polymer is larger than some criti-cal value Mc. In the pioneering works of de Gennes,7 andDoi and Edwards,8 the successful reptation/tube theory waspresented. The theory introduces the concept of a fictitious“tube” and developed the mathematical background of themodel. The tube-concept looks simple and clear. The mainparameter of the theory—the tube diameter—can be obtainedfrom mechanical measurements and, microscopically, fromneutron scattering experiments.9,10 In general, the tube diam-a�Electronic mail: [email protected].
THE JOURNAL OF CHEMICAL PHYSICS 131, 174901 �2009�
0021-9606/2009/131�17�/174901/11/$25.00 © 2009 American Institute of Physics131, 174901-1
Downloaded 21 Dec 2009 to 134.94.163.117. Redistribution subject to AIP license or copyright; see http://jcp.aip.org/jcp/copyright.jsp
eter is found to be between 46 and 100 Å. Though in generalthe reptation predictions for a number of experimental ob-servables like viscosity or translational diffusion coefficientare qualitatively in good agreement with experiment, devia-tions are evident. To explain them, various modifications ofthe reptation theory have been proposed that mainly intend totake into account so-called “end” effects �constraint release�and fluctuations of primitive path of polymer chain �contourlength fluctuations�.8,9,11,12 Furthermore, the question aboutthe transition from unentangled Rouse behavior13 to en-tangled dynamics still remains under consideration.
The dynamics of poly�ethylene oxide� �PEO� chains un-der confinement in nanoporous matrices have recently beenstudied by field-cycling nuclear magnetic resonance �NMR�relaxometry.14 The variation of both the molecular weight ofthe polymer melt and the size of the nanoporous matrixchannel allowed exploring the dynamics at different Floryradius/pore size ratios. It was found that the dynamics of theconfined polymer was very different from that in the bulk.The most striking finding was that the confined dynamicsessentially did not depend on the molecular weight of thepolymer and the relation between Flory radius RF and size ofthe pore channel. This finding was termed “corset effect” andwas declared to appear as a consequence of the low com-pressibility of the polymer melt, uncrossibility of the poly-mer chains, and impenetrable pore walls. The estimation ofthe effective tube diameter gives the value 0.5 nm, i.e., oneorder of magnitude smaller than that obtained from neutronscattering experiments in the corresponding polymer bulk.15
It has also been reported that the effect of confinement isseen already if RF�a, where a is the confinement size. Thelast field-cycling NMR relaxation experiments claim a vis-ible difference between the dynamics of bulk polymer andthat under confinement, already at pore sizes 100 times largerthan Flory radius.16
Neutron scattering accesses dynamical properties withspace/time resolution. For polymer dynamics, this allowsseparating different dynamical regimes for different lengthscales.17 In this work we report a study of the hydrogenself-correlation function in protonated PEO confined innanoporous anodic aluminum oxide �AAO� templates. TheAAO templates are characterized by a well-defined geom-etry. The pore system consists of parallel channels of a givendiameter with narrow size distribution. The length of thechannels is much larger than their diameter, allowing to ne-glect any end effects of the external surface of the templates.The polymer dynamics has been studied by neutron scatter-ing using backscattering �BS� and time-of flight �ToF� spec-trometers. These instruments allowed to explore the timewindow from picoseconds to a few nanoseconds and valuesof moment transfer Q= �Q� � in the interval 0.17 Å−1�Q�1.9 Å−1 corresponding roughly to length scales from afew nanometers down to some tenth of a nanometer. Weaimed to explore the influence of the confinement on poly-mer dynamics and to check whether any interaction betweenthe polymer and pore walls is visible in the dynamics.
II. THEORY
A. Neutron scattering
Neutron scattering experiments measure the intensityscattered into a solid angle between � and �+�� as a func-tion of the energy difference between the incident �E� andscattered �E+�E� neutrons. For protonated samples the crosssection is dominated by the incoherent scattering from thehydrogens and the incoherent scattering function Sinc�Q� ,��is revealed. Here Q� is the momentum transfer and �=�E.Sinc�Q� ,�� is the Fourier transformation of the self-part of theVan Hove correlation function Gself�r� , t� with respect to timeand space:
Sinc�Q� ,�� �−�
� �−�
�
Gself�r�,t�exp�i�Q� r� − �t��dr�dt , �1�
where
Gself�r�,t� =1
N��i=1
N
��r� − �r�i�t� − r�i�0��� . �2�
Gself�r� , t� gives the probability to find a given nucleus iaround the position r�+dr� if it was located at r�i�0� at t=0.Thus, incoherent scattering gives information about the cor-relations between the positions of the same nucleus �usuallyhydrogen� at different times.
B. General approach to spectra analysis
In the Q-range usually explored by cold ToF and BStechniques �0.2 Å−1�Q= �Q� ��1.9 Å−1� the slow decay ofthe incoherent intermediate scattering function Sinc�Q , t� ofglass-forming systems attributed to segmental relaxationabove Tg is generally analyzed in terms of an empiricalstretched exponential or Kohlrausch–Williams–Watts�KWW� function:
SincKWW�Q,t� = A�Q�exp− t
KWW�Q,T���� , �3�
where KWW is the relaxation time that depends on Q andtemperature, 0���1 is stretching parameter, and A�Q� isthe Debye Waller factor. It has been found for different poly-mers that in the Q-regime 0.2–1 Å−1 KWW follows thepower law
KWW Q−2/�. �4�
The power law �4� is related to a Gaussian form of the self-part of Van Hove correlation function �Eq. �2��.18 Moreover,for most of the polymers, � is experimentally found to be ofthe order of 0.5 and the power law KWWQ−4 is rather wellfulfilled in the limit of low Q-values �Q�1 Å−1�.17 Athigher Q-values ��1 Å−1� deviations from Eq. �4� becomepronounced, indicating non-Gaussian dynamics at shortscales.19
C. Rouse theory
The chain dynamics of low molecular weight polymermelts can be described in terms of the Rouse model. In ad-
174901-2 Krutyeva et al. J. Chem. Phys. 131, 174901 �2009�
Downloaded 21 Dec 2009 to 134.94.163.117. Redistribution subject to AIP license or copyright; see http://jcp.aip.org/jcp/copyright.jsp
dition to the friction with the surrounding viscous mediumand the stochastic forces acting on the segment of polymerchain, this model assumes intramolecular entropic forces be-tween the neighboring segments resulting from the chainconformational entropy.13
The Rouse formalism is based on the solution of theLangevin equation for the segments of a Gaussian chain con-sisting of N segments of length l. The solution provides therelaxation spectra of the chain and the dynamical correlationfunctions. In particular, the mean squared displacement ofthe segment relative to its initial point can be expressed byfollowing way:
�r2�t� Rouse =2
��3l2� t
s, �5�
in the limit s� t� R, where s= l2�0 /3�2kBT is the segmen-tal relaxation time, R=N2 s is the longest relaxation time�the Rouse time�, and �0 is the monomeric friction coeffi-cient.
Considering Gaussian distributions for the atomic dis-placements, the incoherent scattering function is describedby the relation
Sinc�Q,t� = exp−Q2
6�r2�t� � . �6�
Substituting the result of the Rouse model �Eq. �5�� in Eq.�6�, Sinc�Q , t� takes the form of a KWW function �Eq. �3��with �=0.5 and a relaxation time defined by the formula
KWWRouse�Q,T� =
9�
Wl4Q−4, �7�
where W= � s�2�−1 is elementary Rouse frequency character-
izing the relaxation rate of the segment. So, extracting thevalue of Wl4 from the Q-dependent characteristic timescales�Eq. �7��, the temperature dependent monomeric friction co-efficient can be derived,
�0 =3kBTl2
Wl4 . �8�
We note that the Rouse model should be applicable only atsufficiently low Q-values �where the microscopic potentialscease to be important�. In practice, the crossover betweenRouse dynamics and local segmental dynamics is difficult toidentify and the understanding of the polymer dynamics atthese �intermediate� length scales is still an openquestion.17,20,21
D. Reptation theory
Dynamics of polymer melts with molecular weightlarger than a critical value essentially differs from Rousedynamics. In such case the uncrossibility effects, or entangle-ments, come into play. Reptation theory postulates that thedisplacement of polymer chain segments is effectively con-fined by a tube formed by the mutually interpenetrablechains. Following the works of de Gennes and Doi andEdwards,8 four dynamical regimes can be distinguished. Re-gime I for short times � s� t� e� characterizes the unen-
tangled Rouse dynamics where the entanglements do not yetinfluence the polymer chain dynamics �Eq. �5��. The cross-over time between unrestricted Rouse and constrained dy-namics e �entanglement time� is related to the tube diameterd:
e =1
�2
d4
Wl4 . �9�
In regime II � e� t� R� curvilinear Rouse motion of thepolymer segments along the tube �local reptation� has to beconsidered,
�r2�t� = 2dl 1
3�3
t
s�1/4
. �10�
Diffusion creep �pure reptation� along the tube, which even-tually leads to complete tube renewal, occurs in the regimeIII � R� t� d�. The mean-square displacement becomesweakly dependent on the molecular weight:
�r2�t� = 2dl 1
3�2N
t
s�1/2
. �11�
Regime III is limited by the maximal relaxation time of poly-mer chain-“disengagement” time d. It strongly depends ontemperature and the molecular weight of the polymer as d
�N3, as it has been calculated by Doi and Edwards under theassumption of fixed tube. The inclusion of constraint releaseand contour length fluctuations lead to somewhat higher ex-ponents ��3.4�.22 For long chains d may easily reach theseconds scale. Above d Fickian diffusion of polymer chainsis expected with a strong molecular weight dependence ofthe center of mass displacement �r2�t� � tN−2.
III. EXPERIMENTAL
A. Samples
1. Anodic aluminum oxide templates
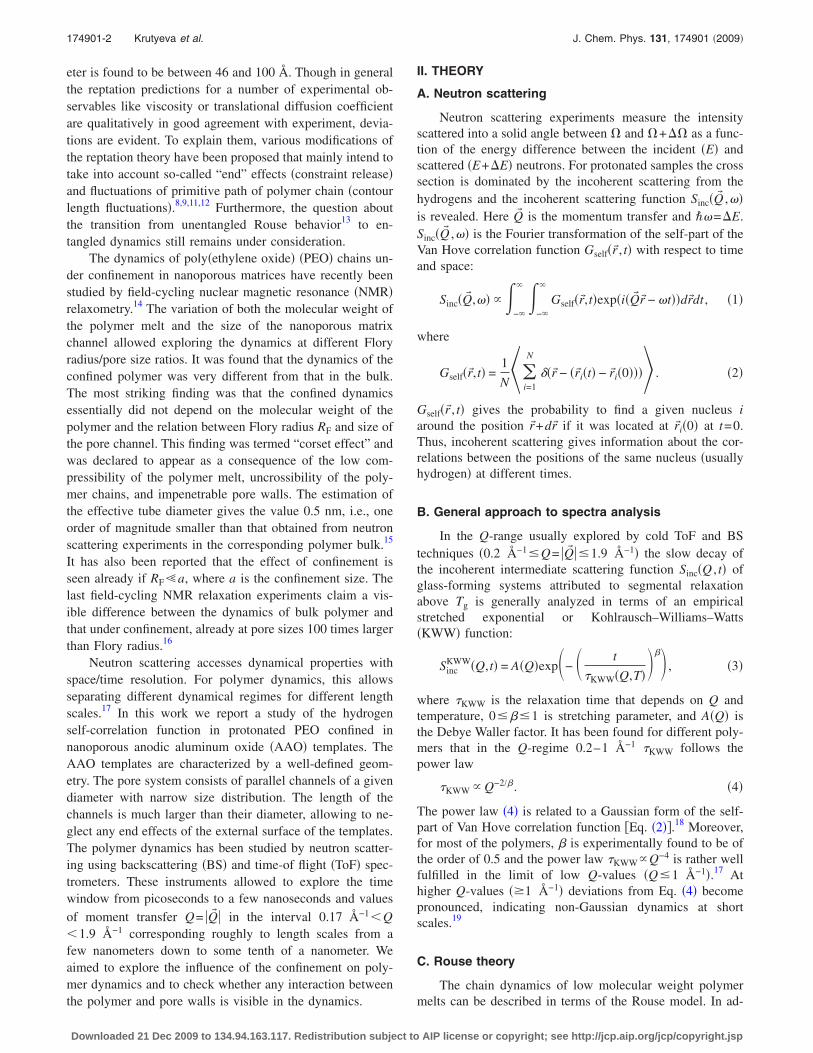
The ordered AAO templates with 40 nm pore diameterand 150 �m pore depth were prepared by a two-step anod-ization process of aluminum as described elsewhere.23 Thetemplates are comprised of a hexagonal array of parallel cy-lindrical pores oriented perpendicularly to the surface of thetemplate. The morphology of the AAO was characterized bya scanning electron microscope �SEM� �Philips XL-30ESEM� and is shown in Fig. 1.
FIG. 1. SEM micrographs of the surface �a� and cross section �b� of theAAO templates.
174901-3 Polymer dynamics under confinement J. Chem. Phys. 131, 174901 �2009�
Downloaded 21 Dec 2009 to 134.94.163.117. Redistribution subject to AIP license or copyright; see http://jcp.aip.org/jcp/copyright.jsp
2. Infiltration of poly„ethylene oxide… into thenanopores
Films of commercially available and monodisperse PEO�Polymer Source, Inc.; Mw=43 000 g mol−1; Mw /Mn=1.05�were prepared from 5 wt % solution of PEO in chloroform.The average end-to-end distance Re of PEO polymer chainswith Mw=43 000 g mol−1 can be calculated to be 19 nm.24
The melting temperature of bulk PEO is 338 K. The PEOfilms were placed onto the AAO templates in order to carryout the infiltration by the “precursor film” infiltrationmethod.25,26 In this method, a polymeric liquid precursor filmspreads over the whole surface of the AAO template, porewalls included. Since the thickness of the precursor film islarger than the pore radius, a complete filling of the nano-pores is achieved. The AAO templates with the PEO filmwere then annealed at 110 °C under N2 atmosphere for60 min. The residual PEO located outside of the pores wasmechanically removed using a blade. In order to avoid theabsorption of environmental water by the confined PEO andkeep the polymer inside the pores, the templates were sealedby aluminum sputtering. Aluminum was chosen as sputteringmaterial because of its transparency to neutrons.
B. Neutron scattering measurements
For the neutron scattering measurements, six filled tem-plates were placed in a flat aluminum container. Two differ-ent orientations of the samples with respect to the incidentbeam were investigated in all cases �45° and 135°, see insertin Fig. 6�.
1. DNS
If the incoherent scattering arises solely from spin disor-der, it flips the neutron spin with a probability of 2/3, whilecoherent scattering leaves the spin unchanged. This allows toexperimentally separate the coherent and incoherent contri-butions to the scattered intensity by using a spin polarizedneutron beam and polarization analysis.27 For this purposethe diffuse scattering spectrometer DNS of Jülich Centre ofNeutron Research �JCNS� at the FRM II has been used. Theincident wavelength was set to 4.74 Å enabling a range ofthe scattering vectors Q between 0.5 and 2.2 Å−1. The ex-periments were performed at room temperature. We mea-sured the intensities scattered by the PEO-filled AAO tem-plates as well as by the empty templates.
2. Time-of-flight
The dynamics in the picosecond region was investigatedby the ToF spectrometer TOFTOF �Ref. 28� �FRM II� with�=6.27 Å for the incident beam. We explored five differenttemperatures from 325 to 400 K. For all of them except for350 K, where measurements at 135° are missing, the twoorientations were considered. The intensity scattered by thesample at low temperature �40 K�, when all relevant dynami-cal processes are frozen, has been used as resolution. Back-ground has been taken into account by subtracting the emptyaluminum container and the empty AAO templates measure-ments. Measuring times of about 2.5 h were used at each Tand orientation.
The ToF raw data treatment was carried out with theprogram IDA.29 The data recorded by the detectors in theangular range close to the sample orientation angle were re-jected before data reduction because this region was heavilyshadowed by the sample. This affected the range 42° �2��58° for nominal 45° orientation �the angle was actuallycloser to 48.8°� and 2��132° for nominal 135° orientation�the angle was actually closer to 135.2°�. The raw data werenormalized to monitor and corrected for detector efficiency.The intensity scattered by the empty templates in the con-tainer was subtracted from the total intensity taking into ac-count the transmission of the sample �0.90�. Finally, the datawere interpolated to constant Q in order to obtain the scat-tering law S�Q ,��. Self-shielding corrections were not nec-essary since for both sample orientations the integrated totalintensities turned out to be identical �e.g., 335 K, intensityratio of reflection and transmission geometry, 1.0014�
3. Backscattering
We used the BS instrument SPHERES of the JCNS atthe FRM II. The energy window was set to −31 �eV���31 �eV. With �=6.271 Å and 15 detectors at differentangles, Q-values in the range between 0.17 and 1.84 Å−1 canbe accessed. The energy resolution of the instrument was0.65 �eV �full width at half maximum�. We investigated325, 335, and 350 K. The intensities scattered by the emptyAAO templates in the container were carefully determinedfor good background correction. The sample at low tempera-ture �close to 4 K� was used to determine the resolution. Ameasuring time of about 22 h was employed for each tem-perature and orientation.
In both TOFTOF and SPHERES experiments, data werecollected in 1 h runs in order to check that the sample did notcrystallize during the measurements. Indistinguishable re-sults within the uncertainties were obtained for the differentindividual spectra for a given temperature and orientation ofthe sample.
Previous experiments on PEO in bulk performed at dif-ferent instruments were taken as reference for comparison.They include results from the ToF spectrometer FOCUS�Paul Scherrer Institute, Switzerland� �Refs. 30 and 31� andBS spectrometers PI �former BSS spectrometer at the Fors-chungsreaktor in Jülich�32 and IN16 �ILL, Grenoble�.33
Experimental data for bulk PEO at temperatures lower than338 K were not available because of PEO crystallization.
IV. RESULTS
A. DNS
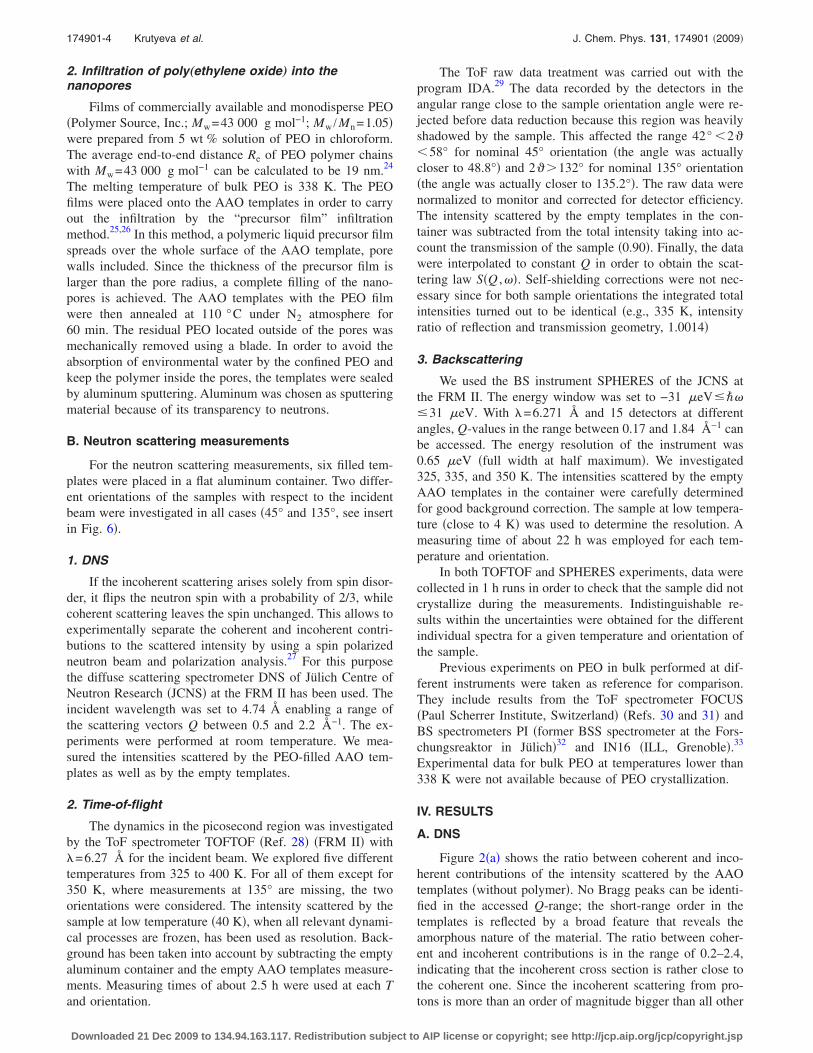
Figure 2�a� shows the ratio between coherent and inco-herent contributions of the intensity scattered by the AAOtemplates �without polymer�. No Bragg peaks can be identi-fied in the accessed Q-range; the short-range order in thetemplates is reflected by a broad feature that reveals theamorphous nature of the material. The ratio between coher-ent and incoherent contributions is in the range of 0.2–2.4,indicating that the incoherent cross section is rather close tothe coherent one. Since the incoherent scattering from pro-tons is more than an order of magnitude bigger than all other
174901-4 Krutyeva et al. J. Chem. Phys. 131, 174901 �2009�
Downloaded 21 Dec 2009 to 134.94.163.117. Redistribution subject to AIP license or copyright; see http://jcp.aip.org/jcp/copyright.jsp
cross sections, this is only possible if the hydrogen content isvery small, and, accordingly, no significant residual water ispresent in the templates. Figure 2�a� also shows that the sys-tem is isotropic at the observed length scales because nodependence on the sample orientation was detected.
The diffraction data also allowed determining the contri-butions of polymer and container to the total scattered inten-sity. The symbols in Fig. 2�b� represent the differential crosssections �coherent plus incoherent contributions� measuredfor both subsystems. The data have been corrected for detec-tor efficiency taking as reference the intensity incoherentlyscattered by the total system. This intensity was fitted to afunction of the form I0 exp�−AQ2+BQ4� accounting for in-elasticity effects. From such description, the factors for cor-recting the detector efficiency have been calculated and ap-plied to the rest of the results. In the low-Q range, thedifferential cross section of the sample is five times higherthan that of the cell and empty templates. Given the porosityof 9%, the H-density in the matrix may be estimated to be2% of that of the polymer. With increasing Q, a decrease inthe intensity due to inelasticity effects is observed for thepolymer. Nevertheless, the line shows that the overwhelmingcontribution in the whole Q-range is the incoherent contribu-tion of the polymer. Finally, the observation of Bragg peaksevidences the semicrystalline structure of PEO at room tem-perature.
B. Time-of-flight
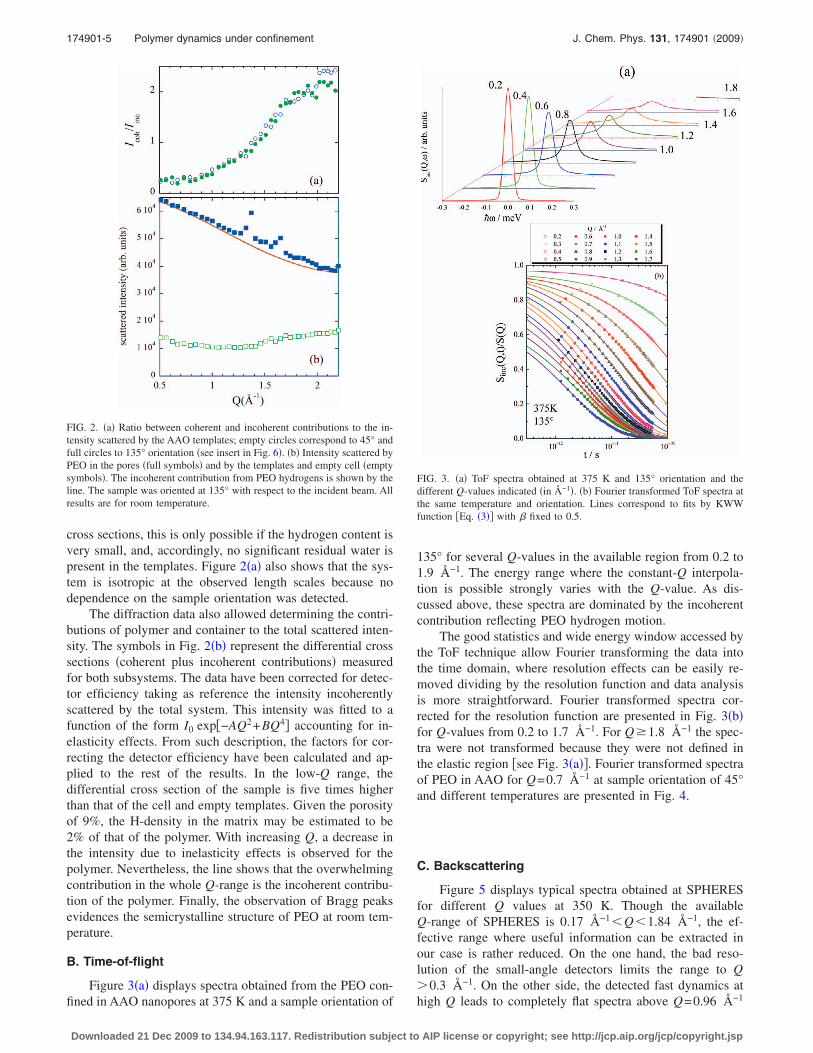
Figure 3�a� displays spectra obtained from the PEO con-fined in AAO nanopores at 375 K and a sample orientation of
135° for several Q-values in the available region from 0.2 to1.9 Å−1. The energy range where the constant-Q interpola-tion is possible strongly varies with the Q-value. As dis-cussed above, these spectra are dominated by the incoherentcontribution reflecting PEO hydrogen motion.
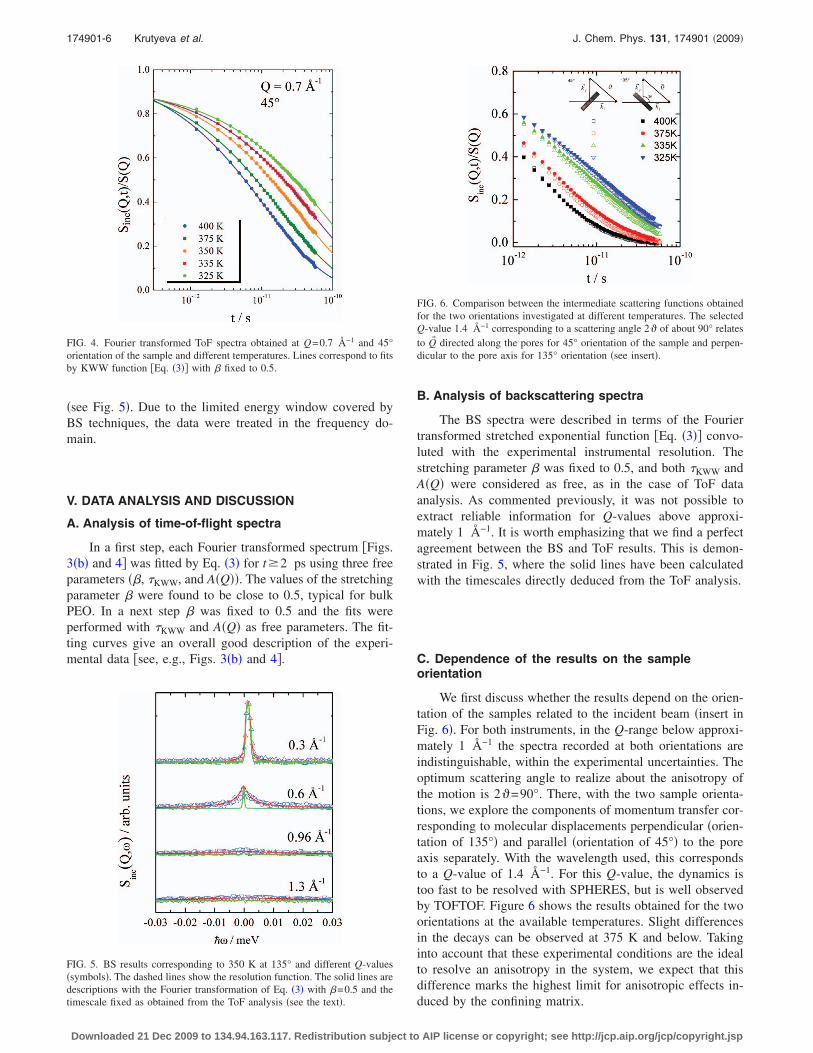
The good statistics and wide energy window accessed bythe ToF technique allow Fourier transforming the data intothe time domain, where resolution effects can be easily re-moved dividing by the resolution function and data analysisis more straightforward. Fourier transformed spectra cor-rected for the resolution function are presented in Fig. 3�b�for Q-values from 0.2 to 1.7 Å−1. For Q�1.8 Å−1 the spec-tra were not transformed because they were not defined inthe elastic region �see Fig. 3�a��. Fourier transformed spectraof PEO in AAO for Q=0.7 Å−1 at sample orientation of 45°and different temperatures are presented in Fig. 4.
C. Backscattering
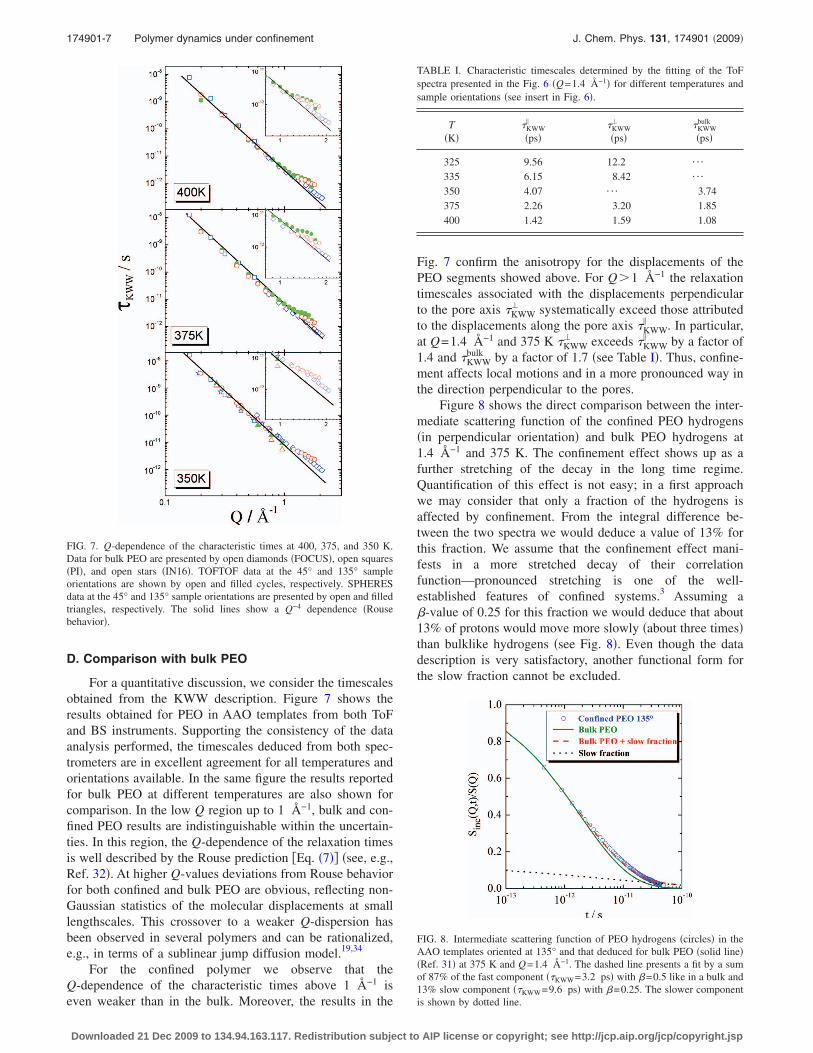
Figure 5 displays typical spectra obtained at SPHERESfor different Q values at 350 K. Though the availableQ-range of SPHERES is 0.17 Å−1�Q�1.84 Å−1, the ef-fective range where useful information can be extracted inour case is rather reduced. On the one hand, the bad reso-lution of the small-angle detectors limits the range to Q�0.3 Å−1. On the other side, the detected fast dynamics athigh Q leads to completely flat spectra above Q=0.96 Å−1
FIG. 2. �a� Ratio between coherent and incoherent contributions to the in-tensity scattered by the AAO templates; empty circles correspond to 45° andfull circles to 135° orientation �see insert in Fig. 6�. �b� Intensity scattered byPEO in the pores �full symbols� and by the templates and empty cell �emptysymbols�. The incoherent contribution from PEO hydrogens is shown by theline. The sample was oriented at 135° with respect to the incident beam. Allresults are for room temperature.
FIG. 3. �a� ToF spectra obtained at 375 K and 135° orientation and thedifferent Q-values indicated �in Å−1�. �b� Fourier transformed ToF spectra atthe same temperature and orientation. Lines correspond to fits by KWWfunction �Eq. �3�� with � fixed to 0.5.
174901-5 Polymer dynamics under confinement J. Chem. Phys. 131, 174901 �2009�
Downloaded 21 Dec 2009 to 134.94.163.117. Redistribution subject to AIP license or copyright; see http://jcp.aip.org/jcp/copyright.jsp
�see Fig. 5�. Due to the limited energy window covered byBS techniques, the data were treated in the frequency do-main.
V. DATA ANALYSIS AND DISCUSSION
A. Analysis of time-of-flight spectra
In a first step, each Fourier transformed spectrum �Figs.3�b� and 4� was fitted by Eq. �3� for t�2 ps using three freeparameters ��, KWW, and A�Q��. The values of the stretchingparameter � were found to be close to 0.5, typical for bulkPEO. In a next step � was fixed to 0.5 and the fits wereperformed with KWW and A�Q� as free parameters. The fit-ting curves give an overall good description of the experi-mental data �see, e.g., Figs. 3�b� and 4�.
B. Analysis of backscattering spectra
The BS spectra were described in terms of the Fouriertransformed stretched exponential function �Eq. �3�� convo-luted with the experimental instrumental resolution. Thestretching parameter � was fixed to 0.5, and both KWW andA�Q� were considered as free, as in the case of ToF dataanalysis. As commented previously, it was not possible toextract reliable information for Q-values above approxi-mately 1 Å−1. It is worth emphasizing that we find a perfectagreement between the BS and ToF results. This is demon-strated in Fig. 5, where the solid lines have been calculatedwith the timescales directly deduced from the ToF analysis.
C. Dependence of the results on the sampleorientation
We first discuss whether the results depend on the orien-tation of the samples related to the incident beam �insert inFig. 6�. For both instruments, in the Q-range below approxi-mately 1 Å−1 the spectra recorded at both orientations areindistinguishable, within the experimental uncertainties. Theoptimum scattering angle to realize about the anisotropy ofthe motion is 2�=90°. There, with the two sample orienta-tions, we explore the components of momentum transfer cor-responding to molecular displacements perpendicular �orien-tation of 135°� and parallel �orientation of 45°� to the poreaxis separately. With the wavelength used, this correspondsto a Q-value of 1.4 Å−1. For this Q-value, the dynamics istoo fast to be resolved with SPHERES, but is well observedby TOFTOF. Figure 6 shows the results obtained for the twoorientations at the available temperatures. Slight differencesin the decays can be observed at 375 K and below. Takinginto account that these experimental conditions are the idealto resolve an anisotropy in the system, we expect that thisdifference marks the highest limit for anisotropic effects in-duced by the confining matrix.
FIG. 4. Fourier transformed ToF spectra obtained at Q=0.7 Å−1 and 45°orientation of the sample and different temperatures. Lines correspond to fitsby KWW function �Eq. �3�� with � fixed to 0.5.
FIG. 5. BS results corresponding to 350 K at 135° and different Q-values�symbols�. The dashed lines show the resolution function. The solid lines aredescriptions with the Fourier transformation of Eq. �3� with �=0.5 and thetimescale fixed as obtained from the ToF analysis �see the text�.
FIG. 6. Comparison between the intermediate scattering functions obtainedfor the two orientations investigated at different temperatures. The selectedQ-value 1.4 Å−1 corresponding to a scattering angle 2� of about 90° relatesto Q� directed along the pores for 45° orientation of the sample and perpen-dicular to the pore axis for 135° orientation �see insert�.
174901-6 Krutyeva et al. J. Chem. Phys. 131, 174901 �2009�
Downloaded 21 Dec 2009 to 134.94.163.117. Redistribution subject to AIP license or copyright; see http://jcp.aip.org/jcp/copyright.jsp
D. Comparison with bulk PEO
For a quantitative discussion, we consider the timescalesobtained from the KWW description. Figure 7 shows theresults obtained for PEO in AAO templates from both ToFand BS instruments. Supporting the consistency of the dataanalysis performed, the timescales deduced from both spec-trometers are in excellent agreement for all temperatures andorientations available. In the same figure the results reportedfor bulk PEO at different temperatures are also shown forcomparison. In the low Q region up to 1 Å−1, bulk and con-fined PEO results are indistinguishable within the uncertain-ties. In this region, the Q-dependence of the relaxation timesis well described by the Rouse prediction �Eq. �7�� �see, e.g.,Ref. 32�. At higher Q-values deviations from Rouse behaviorfor both confined and bulk PEO are obvious, reflecting non-Gaussian statistics of the molecular displacements at smalllengthscales. This crossover to a weaker Q-dispersion hasbeen observed in several polymers and can be rationalized,e.g., in terms of a sublinear jump diffusion model.19,34
For the confined polymer we observe that theQ-dependence of the characteristic times above 1 Å−1 iseven weaker than in the bulk. Moreover, the results in the
Fig. 7 confirm the anisotropy for the displacements of thePEO segments showed above. For Q�1 Å−1 the relaxationtimescales associated with the displacements perpendicularto the pore axis KWW
� systematically exceed those attributedto the displacements along the pore axis KWW
� . In particular,at Q=1.4 Å−1 and 375 K KWW
� exceeds KWW� by a factor of
1.4 and KWWbulk by a factor of 1.7 �see Table I�. Thus, confine-
ment affects local motions and in a more pronounced way inthe direction perpendicular to the pores.
Figure 8 shows the direct comparison between the inter-mediate scattering function of the confined PEO hydrogens�in perpendicular orientation� and bulk PEO hydrogens at1.4 Å−1 and 375 K. The confinement effect shows up as afurther stretching of the decay in the long time regime.Quantification of this effect is not easy; in a first approachwe may consider that only a fraction of the hydrogens isaffected by confinement. From the integral difference be-tween the two spectra we would deduce a value of 13% forthis fraction. We assume that the confinement effect mani-fests in a more stretched decay of their correlationfunction—pronounced stretching is one of the well-established features of confined systems.3 Assuming a�-value of 0.25 for this fraction we would deduce that about13% of protons would move more slowly �about three times�than bulklike hydrogens �see Fig. 8�. Even though the datadescription is very satisfactory, another functional form forthe slow fraction cannot be excluded.
FIG. 7. Q-dependence of the characteristic times at 400, 375, and 350 K.Data for bulk PEO are presented by open diamonds �FOCUS�, open squares�PI�, and open stars �IN16�. TOFTOF data at the 45° and 135° sampleorientations are shown by open and filled cycles, respectively. SPHERESdata at the 45° and 135° sample orientations are presented by open and filledtriangles, respectively. The solid lines show a Q−4 dependence �Rousebehavior�.
TABLE I. Characteristic timescales determined by the fitting of the ToFspectra presented in the Fig. 6 �Q=1.4 Å−1� for different temperatures andsample orientations �see insert in Fig. 6�.
T�K�
KWW�
�ps� KWW
�
�ps� KWW
bulk
�ps�
325 9.56 12.2 ¯
335 6.15 8.42 ¯
350 4.07 ¯ 3.74375 2.26 3.20 1.85400 1.42 1.59 1.08
FIG. 8. Intermediate scattering function of PEO hydrogens �circles� in theAAO templates oriented at 135° and that deduced for bulk PEO �solid line��Ref. 31� at 375 K and Q=1.4 Å−1. The dashed line presents a fit by a sumof 87% of the fast component � KWW=3.2 ps� with �=0.5 like in a bulk and13% slow component � KWW=9.6 ps� with �=0.25. The slower componentis shown by dotted line.
174901-7 Polymer dynamics under confinement J. Chem. Phys. 131, 174901 �2009�
Downloaded 21 Dec 2009 to 134.94.163.117. Redistribution subject to AIP license or copyright; see http://jcp.aip.org/jcp/copyright.jsp
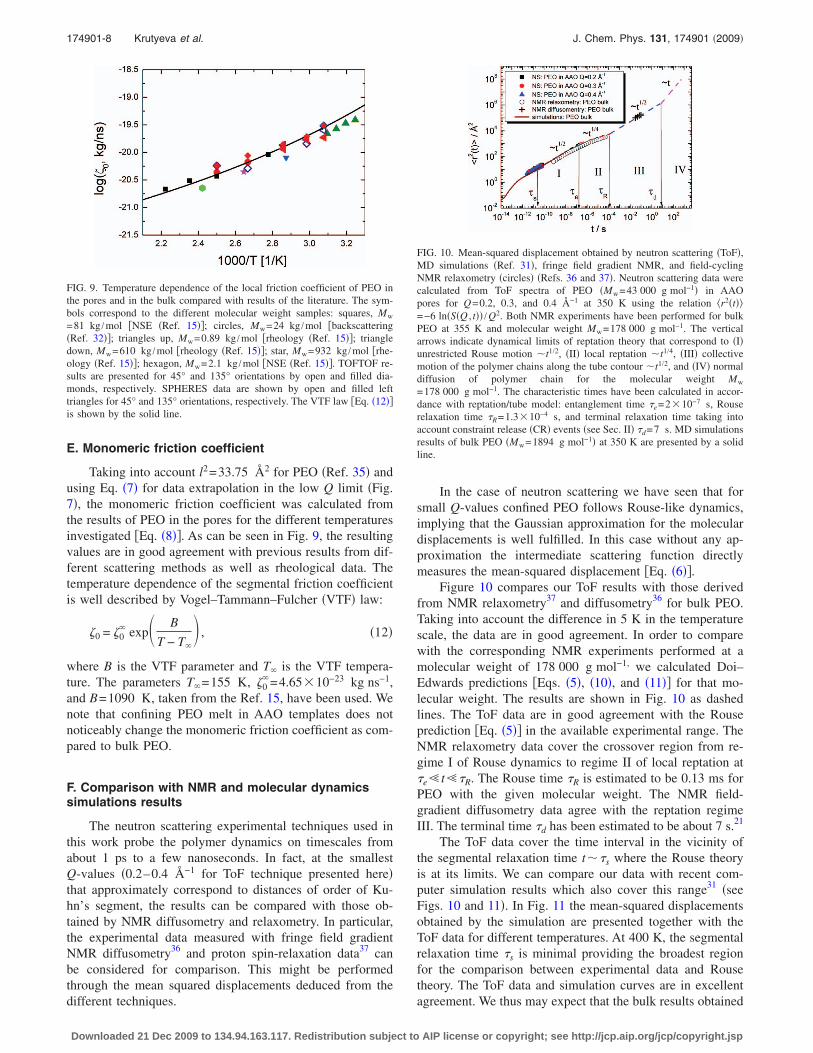
E. Monomeric friction coefficient
Taking into account l2=33.75 Å2 for PEO �Ref. 35� andusing Eq. �7� for data extrapolation in the low Q limit �Fig.7�, the monomeric friction coefficient was calculated fromthe results of PEO in the pores for the different temperaturesinvestigated �Eq. �8��. As can be seen in Fig. 9, the resultingvalues are in good agreement with previous results from dif-ferent scattering methods as well as rheological data. Thetemperature dependence of the segmental friction coefficientis well described by Vogel–Tammann–Fulcher �VTF� law:
�0 = �0� exp B
T − T�� , �12�
where B is the VTF parameter and T� is the VTF tempera-ture. The parameters T�=155 K, �0
�=4.65�10−23 kg ns−1,and B=1090 K, taken from the Ref. 15, have been used. Wenote that confining PEO melt in AAO templates does notnoticeably change the monomeric friction coefficient as com-pared to bulk PEO.
F. Comparison with NMR and molecular dynamicssimulations results
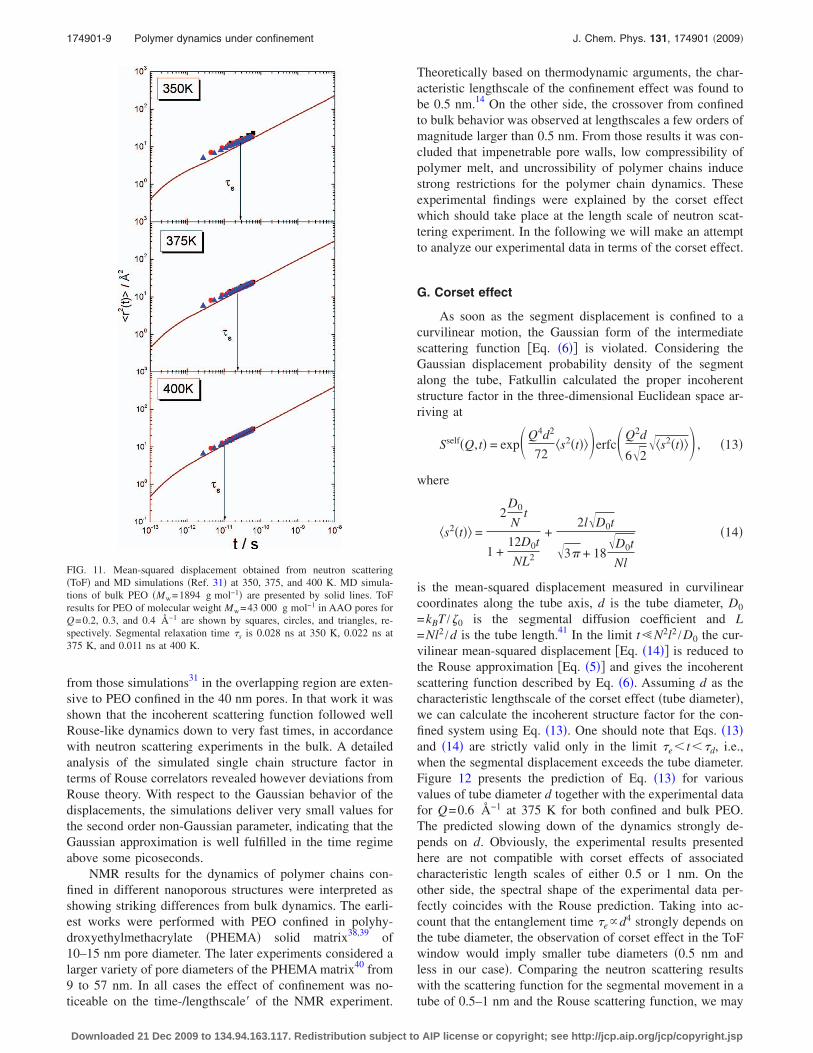
The neutron scattering experimental techniques used inthis work probe the polymer dynamics on timescales fromabout 1 ps to a few nanoseconds. In fact, at the smallestQ-values �0.2–0.4 Å−1 for ToF technique presented here�that approximately correspond to distances of order of Ku-hn’s segment, the results can be compared with those ob-tained by NMR diffusometry and relaxometry. In particular,the experimental data measured with fringe field gradientNMR diffusometry36 and proton spin-relaxation data37 canbe considered for comparison. This might be performedthrough the mean squared displacements deduced from thedifferent techniques.
In the case of neutron scattering we have seen that forsmall Q-values confined PEO follows Rouse-like dynamics,implying that the Gaussian approximation for the moleculardisplacements is well fulfilled. In this case without any ap-proximation the intermediate scattering function directlymeasures the mean-squared displacement �Eq. �6��.
Figure 10 compares our ToF results with those derivedfrom NMR relaxometry37 and diffusometry36 for bulk PEO.Taking into account the difference in 5 K in the temperaturescale, the data are in good agreement. In order to comparewith the corresponding NMR experiments performed at amolecular weight of 178 000 g mol−1, we calculated Doi–Edwards predictions �Eqs. �5�, �10�, and �11�� for that mo-lecular weight. The results are shown in Fig. 10 as dashedlines. The ToF data are in good agreement with the Rouseprediction �Eq. �5�� in the available experimental range. TheNMR relaxometry data cover the crossover region from re-gime I of Rouse dynamics to regime II of local reptation at e� t� R. The Rouse time R is estimated to be 0.13 ms forPEO with the given molecular weight. The NMR field-gradient diffusometry data agree with the reptation regimeIII. The terminal time d has been estimated to be about 7 s.21
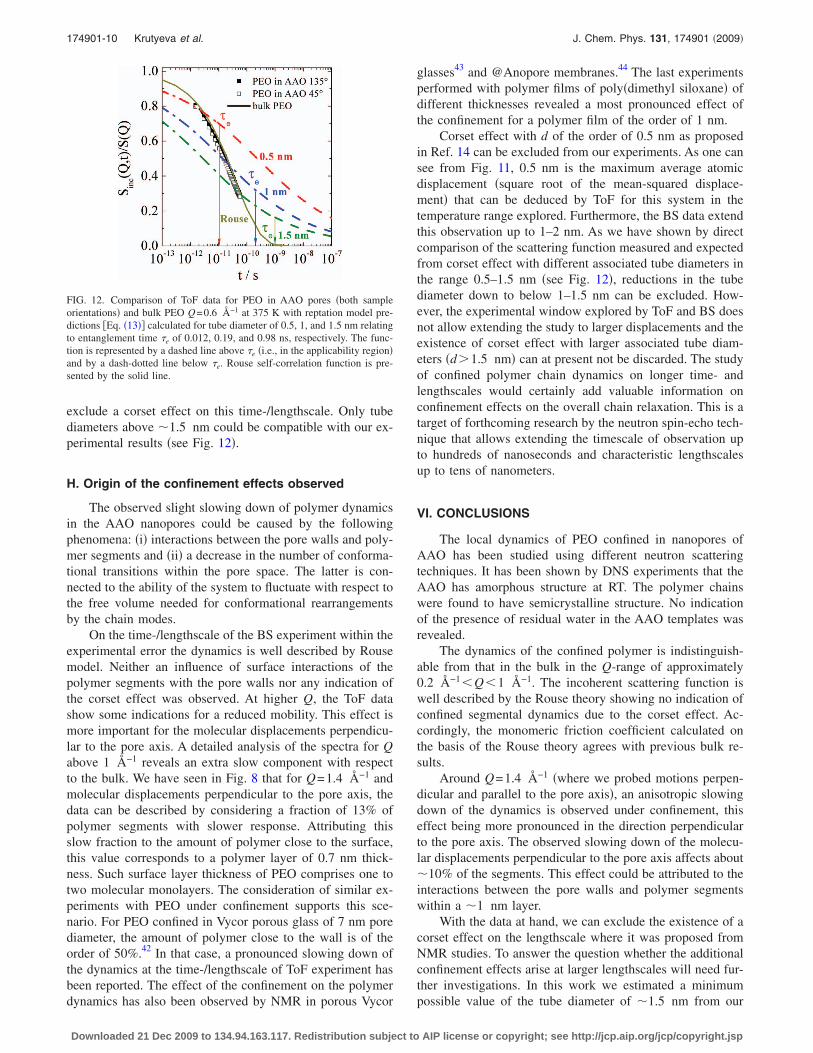
The ToF data cover the time interval in the vicinity ofthe segmental relaxation time t� s where the Rouse theoryis at its limits. We can compare our data with recent com-puter simulation results which also cover this range31 �seeFigs. 10 and 11�. In Fig. 11 the mean-squared displacementsobtained by the simulation are presented together with theToF data for different temperatures. At 400 K, the segmentalrelaxation time s is minimal providing the broadest regionfor the comparison between experimental data and Rousetheory. The ToF data and simulation curves are in excellentagreement. We thus may expect that the bulk results obtained
FIG. 9. Temperature dependence of the local friction coefficient of PEO inthe pores and in the bulk compared with results of the literature. The sym-bols correspond to the different molecular weight samples: squares, Mw
=81 kg /mol �NSE �Ref. 15��; circles, Mw=24 kg /mol �backscattering�Ref. 32��; triangles up, Mw=0.89 kg /mol �rheology �Ref. 15��; triangledown, Mw=610 kg /mol �rheology �Ref. 15��; star, Mw=932 kg /mol �rhe-ology �Ref. 15��; hexagon, Mw=2.1 kg /mol �NSE �Ref. 15��. TOFTOF re-sults are presented for 45° and 135° orientations by open and filled dia-monds, respectively. SPHERES data are shown by open and filled lefttriangles for 45° and 135° orientations, respectively. The VTF law �Eq. �12��is shown by the solid line.
FIG. 10. Mean-squared displacement obtained by neutron scattering �ToF�,MD simulations �Ref. 31�, fringe field gradient NMR, and field-cyclingNMR relaxometry �circles� �Refs. 36 and 37�. Neutron scattering data werecalculated from ToF spectra of PEO �Mw=43 000 g mol−1� in AAOpores for Q=0.2, 0.3, and 0.4 Å−1 at 350 K using the relation �r2�t� =−6 ln�S�Q , t�� /Q2. Both NMR experiments have been performed for bulkPEO at 355 K and molecular weight Mw=178 000 g mol−1. The verticalarrows indicate dynamical limits of reptation theory that correspond to �I�unrestricted Rouse motion �t1/2, �II� local reptation �t1/4, �III� collectivemotion of the polymer chains along the tube contour �t1/2, and �IV� normaldiffusion of polymer chain for the molecular weight Mw
=178 000 g mol−1. The characteristic times have been calculated in accor-dance with reptation/tube model: entanglement time e=2�10−7 s, Rouserelaxation time R=1.3�10−4 s, and terminal relaxation time taking intoaccount constraint release �CR� events �see Sec. II� d=7 s. MD simulationsresults of bulk PEO �Mw=1894 g mol−1� at 350 K are presented by a solidline.
174901-8 Krutyeva et al. J. Chem. Phys. 131, 174901 �2009�
Downloaded 21 Dec 2009 to 134.94.163.117. Redistribution subject to AIP license or copyright; see http://jcp.aip.org/jcp/copyright.jsp
from those simulations31 in the overlapping region are exten-sive to PEO confined in the 40 nm pores. In that work it wasshown that the incoherent scattering function followed wellRouse-like dynamics down to very fast times, in accordancewith neutron scattering experiments in the bulk. A detailedanalysis of the simulated single chain structure factor interms of Rouse correlators revealed however deviations fromRouse theory. With respect to the Gaussian behavior of thedisplacements, the simulations deliver very small values forthe second order non-Gaussian parameter, indicating that theGaussian approximation is well fulfilled in the time regimeabove some picoseconds.
NMR results for the dynamics of polymer chains con-fined in different nanoporous structures were interpreted asshowing striking differences from bulk dynamics. The earli-est works were performed with PEO confined in polyhy-droxyethylmethacrylate �PHEMA� solid matrix38,39 of10–15 nm pore diameter. The later experiments considered alarger variety of pore diameters of the PHEMA matrix40 from9 to 57 nm. In all cases the effect of confinement was no-ticeable on the time-/lengthscale� of the NMR experiment.
Theoretically based on thermodynamic arguments, the char-acteristic lengthscale of the confinement effect was found tobe 0.5 nm.14 On the other side, the crossover from confinedto bulk behavior was observed at lengthscales a few orders ofmagnitude larger than 0.5 nm. From those results it was con-cluded that impenetrable pore walls, low compressibility ofpolymer melt, and uncrossibility of polymer chains inducestrong restrictions for the polymer chain dynamics. Theseexperimental findings were explained by the corset effectwhich should take place at the length scale of neutron scat-tering experiment. In the following we will make an attemptto analyze our experimental data in terms of the corset effect.
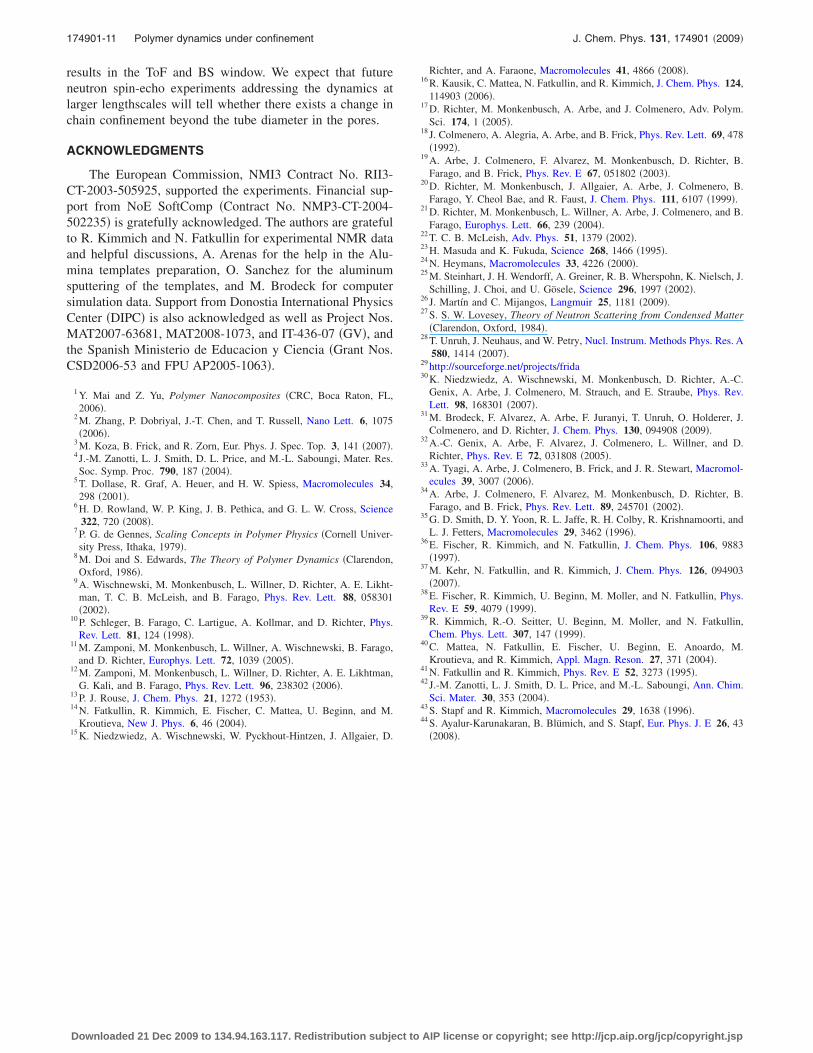
G. Corset effect
As soon as the segment displacement is confined to acurvilinear motion, the Gaussian form of the intermediatescattering function �Eq. �6�� is violated. Considering theGaussian displacement probability density of the segmentalong the tube, Fatkullin calculated the proper incoherentstructure factor in the three-dimensional Euclidean space ar-riving at
Sself�Q,t� = expQ4d2
72�s2�t� �erfcQ2d
6�2��s2�t� � , �13�
where
�s2�t� =
2D0
Nt
1 +12D0t
NL2
+2l�D0t
�3� + 18�D0t
Nl
�14�
is the mean-squared displacement measured in curvilinearcoordinates along the tube axis, d is the tube diameter, D0
=kBT /�0 is the segmental diffusion coefficient and L=Nl2 /d is the tube length.41 In the limit t�N2l2 /D0 the cur-vilinear mean-squared displacement �Eq. �14�� is reduced tothe Rouse approximation �Eq. �5�� and gives the incoherentscattering function described by Eq. �6�. Assuming d as thecharacteristic lengthscale of the corset effect �tube diameter�,we can calculate the incoherent structure factor for the con-fined system using Eq. �13�. One should note that Eqs. �13�and �14� are strictly valid only in the limit e� t� d, i.e.,when the segmental displacement exceeds the tube diameter.Figure 12 presents the prediction of Eq. �13� for variousvalues of tube diameter d together with the experimental datafor Q=0.6 Å−1 at 375 K for both confined and bulk PEO.The predicted slowing down of the dynamics strongly de-pends on d. Obviously, the experimental results presentedhere are not compatible with corset effects of associatedcharacteristic length scales of either 0.5 or 1 nm. On theother side, the spectral shape of the experimental data per-fectly coincides with the Rouse prediction. Taking into ac-count that the entanglement time ed4 strongly depends onthe tube diameter, the observation of corset effect in the ToFwindow would imply smaller tube diameters �0.5 nm andless in our case�. Comparing the neutron scattering resultswith the scattering function for the segmental movement in atube of 0.5–1 nm and the Rouse scattering function, we may
FIG. 11. Mean-squared displacement obtained from neutron scattering�ToF� and MD simulations �Ref. 31� at 350, 375, and 400 K. MD simula-tions of bulk PEO �Mw=1894 g mol−1� are presented by solid lines. ToFresults for PEO of molecular weight Mw=43 000 g mol−1 in AAO pores forQ=0.2, 0.3, and 0.4 Å−1 are shown by squares, circles, and triangles, re-spectively. Segmental relaxation time s is 0.028 ns at 350 K, 0.022 ns at375 K, and 0.011 ns at 400 K.
174901-9 Polymer dynamics under confinement J. Chem. Phys. 131, 174901 �2009�
Downloaded 21 Dec 2009 to 134.94.163.117. Redistribution subject to AIP license or copyright; see http://jcp.aip.org/jcp/copyright.jsp
exclude a corset effect on this time-/lengthscale. Only tubediameters above �1.5 nm could be compatible with our ex-perimental results �see Fig. 12�.
H. Origin of the confinement effects observed
The observed slight slowing down of polymer dynamicsin the AAO nanopores could be caused by the followingphenomena: �i� interactions between the pore walls and poly-mer segments and �ii� a decrease in the number of conforma-tional transitions within the pore space. The latter is con-nected to the ability of the system to fluctuate with respect tothe free volume needed for conformational rearrangementsby the chain modes.
On the time-/lengthscale of the BS experiment within theexperimental error the dynamics is well described by Rousemodel. Neither an influence of surface interactions of thepolymer segments with the pore walls nor any indication ofthe corset effect was observed. At higher Q, the ToF datashow some indications for a reduced mobility. This effect ismore important for the molecular displacements perpendicu-lar to the pore axis. A detailed analysis of the spectra for Qabove 1 Å−1 reveals an extra slow component with respectto the bulk. We have seen in Fig. 8 that for Q=1.4 Å−1 andmolecular displacements perpendicular to the pore axis, thedata can be described by considering a fraction of 13% ofpolymer segments with slower response. Attributing thisslow fraction to the amount of polymer close to the surface,this value corresponds to a polymer layer of 0.7 nm thick-ness. Such surface layer thickness of PEO comprises one totwo molecular monolayers. The consideration of similar ex-periments with PEO under confinement supports this sce-nario. For PEO confined in Vycor porous glass of 7 nm porediameter, the amount of polymer close to the wall is of theorder of 50%.42 In that case, a pronounced slowing down ofthe dynamics at the time-/lengthscale of ToF experiment hasbeen reported. The effect of the confinement on the polymerdynamics has also been observed by NMR in porous Vycor
glasses43 and @Anopore membranes.44 The last experimentsperformed with polymer films of poly�dimethyl siloxane� ofdifferent thicknesses revealed a most pronounced effect ofthe confinement for a polymer film of the order of 1 nm.
Corset effect with d of the order of 0.5 nm as proposedin Ref. 14 can be excluded from our experiments. As one cansee from Fig. 11, 0.5 nm is the maximum average atomicdisplacement �square root of the mean-squared displace-ment� that can be deduced by ToF for this system in thetemperature range explored. Furthermore, the BS data extendthis observation up to 1–2 nm. As we have shown by directcomparison of the scattering function measured and expectedfrom corset effect with different associated tube diameters inthe range 0.5–1.5 nm �see Fig. 12�, reductions in the tubediameter down to below 1–1.5 nm can be excluded. How-ever, the experimental window explored by ToF and BS doesnot allow extending the study to larger displacements and theexistence of corset effect with larger associated tube diam-eters �d�1.5 nm� can at present not be discarded. The studyof confined polymer chain dynamics on longer time- andlengthscales would certainly add valuable information onconfinement effects on the overall chain relaxation. This is atarget of forthcoming research by the neutron spin-echo tech-nique that allows extending the timescale of observation upto hundreds of nanoseconds and characteristic lengthscalesup to tens of nanometers.
VI. CONCLUSIONS
The local dynamics of PEO confined in nanopores ofAAO has been studied using different neutron scatteringtechniques. It has been shown by DNS experiments that theAAO has amorphous structure at RT. The polymer chainswere found to have semicrystalline structure. No indicationof the presence of residual water in the AAO templates wasrevealed.
The dynamics of the confined polymer is indistinguish-able from that in the bulk in the Q-range of approximately0.2 Å−1�Q�1 Å−1. The incoherent scattering function iswell described by the Rouse theory showing no indication ofconfined segmental dynamics due to the corset effect. Ac-cordingly, the monomeric friction coefficient calculated onthe basis of the Rouse theory agrees with previous bulk re-sults.
Around Q=1.4 Å−1 �where we probed motions perpen-dicular and parallel to the pore axis�, an anisotropic slowingdown of the dynamics is observed under confinement, thiseffect being more pronounced in the direction perpendicularto the pore axis. The observed slowing down of the molecu-lar displacements perpendicular to the pore axis affects about�10% of the segments. This effect could be attributed to theinteractions between the pore walls and polymer segmentswithin a �1 nm layer.
With the data at hand, we can exclude the existence of acorset effect on the lengthscale where it was proposed fromNMR studies. To answer the question whether the additionalconfinement effects arise at larger lengthscales will need fur-ther investigations. In this work we estimated a minimumpossible value of the tube diameter of �1.5 nm from our
FIG. 12. Comparison of ToF data for PEO in AAO pores �both sampleorientations� and bulk PEO Q=0.6 Å−1 at 375 K with reptation model pre-dictions �Eq. �13�� calculated for tube diameter of 0.5, 1, and 1.5 nm relatingto entanglement time e of 0.012, 0.19, and 0.98 ns, respectively. The func-tion is represented by a dashed line above e �i.e., in the applicability region�and by a dash-dotted line below e. Rouse self-correlation function is pre-sented by the solid line.
174901-10 Krutyeva et al. J. Chem. Phys. 131, 174901 �2009�
Downloaded 21 Dec 2009 to 134.94.163.117. Redistribution subject to AIP license or copyright; see http://jcp.aip.org/jcp/copyright.jsp
results in the ToF and BS window. We expect that futureneutron spin-echo experiments addressing the dynamics atlarger lengthscales will tell whether there exists a change inchain confinement beyond the tube diameter in the pores.
ACKNOWLEDGMENTS
The European Commission, NMI3 Contract No. RII3-CT-2003-505925, supported the experiments. Financial sup-port from NoE SoftComp �Contract No. NMP3-CT-2004-502235� is gratefully acknowledged. The authors are gratefulto R. Kimmich and N. Fatkullin for experimental NMR dataand helpful discussions, A. Arenas for the help in the Alu-mina templates preparation, O. Sanchez for the aluminumsputtering of the templates, and M. Brodeck for computersimulation data. Support from Donostia International PhysicsCenter �DIPC� is also acknowledged as well as Project Nos.MAT2007-63681, MAT2008-1073, and IT-436-07 �GV�, andthe Spanish Ministerio de Educacion y Ciencia �Grant Nos.CSD2006-53 and FPU AP2005-1063�.
1 Y. Mai and Z. Yu, Polymer Nanocomposites �CRC, Boca Raton, FL,2006�.
2 M. Zhang, P. Dobriyal, J.-T. Chen, and T. Russell, Nano Lett. 6, 1075�2006�.
3 M. Koza, B. Frick, and R. Zorn, Eur. Phys. J. Spec. Top. 3, 141 �2007�.4 J.-M. Zanotti, L. J. Smith, D. L. Price, and M.-L. Saboungi, Mater. Res.Soc. Symp. Proc. 790, 187 �2004�.
5 T. Dollase, R. Graf, A. Heuer, and H. W. Spiess, Macromolecules 34,298 �2001�.
6 H. D. Rowland, W. P. King, J. B. Pethica, and G. L. W. Cross, Science322, 720 �2008�.
7 P. G. de Gennes, Scaling Concepts in Polymer Physics �Cornell Univer-sity Press, Ithaka, 1979�.
8 M. Doi and S. Edwards, The Theory of Polymer Dynamics �Clarendon,Oxford, 1986�.
9 A. Wischnewski, M. Monkenbusch, L. Willner, D. Richter, A. E. Likht-man, T. C. B. McLeish, and B. Farago, Phys. Rev. Lett. 88, 058301�2002�.
10 P. Schleger, B. Farago, C. Lartigue, A. Kollmar, and D. Richter, Phys.Rev. Lett. 81, 124 �1998�.
11 M. Zamponi, M. Monkenbusch, L. Willner, A. Wischnewski, B. Farago,and D. Richter, Europhys. Lett. 72, 1039 �2005�.
12 M. Zamponi, M. Monkenbusch, L. Willner, D. Richter, A. E. Likhtman,G. Kali, and B. Farago, Phys. Rev. Lett. 96, 238302 �2006�.
13 P. J. Rouse, J. Chem. Phys. 21, 1272 �1953�.14 N. Fatkullin, R. Kimmich, E. Fischer, C. Mattea, U. Beginn, and M.
Kroutieva, New J. Phys. 6, 46 �2004�.15 K. Niedzwiedz, A. Wischnewski, W. Pyckhout-Hintzen, J. Allgaier, D.
Richter, and A. Faraone, Macromolecules 41, 4866 �2008�.16 R. Kausik, C. Mattea, N. Fatkullin, and R. Kimmich, J. Chem. Phys. 124,
114903 �2006�.17 D. Richter, M. Monkenbusch, A. Arbe, and J. Colmenero, Adv. Polym.
Sci. 174, 1 �2005�.18 J. Colmenero, A. Alegria, A. Arbe, and B. Frick, Phys. Rev. Lett. 69, 478
�1992�.19 A. Arbe, J. Colmenero, F. Alvarez, M. Monkenbusch, D. Richter, B.
Farago, and B. Frick, Phys. Rev. E 67, 051802 �2003�.20 D. Richter, M. Monkenbusch, J. Allgaier, A. Arbe, J. Colmenero, B.
Farago, Y. Cheol Bae, and R. Faust, J. Chem. Phys. 111, 6107 �1999�.21 D. Richter, M. Monkenbusch, L. Willner, A. Arbe, J. Colmenero, and B.
Farago, Europhys. Lett. 66, 239 �2004�.22 T. C. B. McLeish, Adv. Phys. 51, 1379 �2002�.23 H. Masuda and K. Fukuda, Science 268, 1466 �1995�.24 N. Heymans, Macromolecules 33, 4226 �2000�.25 M. Steinhart, J. H. Wendorff, A. Greiner, R. B. Wherspohn, K. Nielsch, J.
Schilling, J. Choi, and U. Gösele, Science 296, 1997 �2002�.26 J. Martín and C. Mijangos, Langmuir 25, 1181 �2009�.27 S. S. W. Lovesey, Theory of Neutron Scattering from Condensed Matter
�Clarendon, Oxford, 1984�.28 T. Unruh, J. Neuhaus, and W. Petry, Nucl. Instrum. Methods Phys. Res. A
580, 1414 �2007�.29 http://sourceforge.net/projects/frida30 K. Niedzwiedz, A. Wischnewski, M. Monkenbusch, D. Richter, A.-C.
Genix, A. Arbe, J. Colmenero, M. Strauch, and E. Straube, Phys. Rev.Lett. 98, 168301 �2007�.
31 M. Brodeck, F. Alvarez, A. Arbe, F. Juranyi, T. Unruh, O. Holderer, J.Colmenero, and D. Richter, J. Chem. Phys. 130, 094908 �2009�.
32 A.-C. Genix, A. Arbe, F. Alvarez, J. Colmenero, L. Willner, and D.Richter, Phys. Rev. E 72, 031808 �2005�.
33 A. Tyagi, A. Arbe, J. Colmenero, B. Frick, and J. R. Stewart, Macromol-ecules 39, 3007 �2006�.
34 A. Arbe, J. Colmenero, F. Alvarez, M. Monkenbusch, D. Richter, B.Farago, and B. Frick, Phys. Rev. Lett. 89, 245701 �2002�.
35 G. D. Smith, D. Y. Yoon, R. L. Jaffe, R. H. Colby, R. Krishnamoorti, andL. J. Fetters, Macromolecules 29, 3462 �1996�.
36 E. Fischer, R. Kimmich, and N. Fatkullin, J. Chem. Phys. 106, 9883�1997�.
37 M. Kehr, N. Fatkullin, and R. Kimmich, J. Chem. Phys. 126, 094903�2007�.
38 E. Fischer, R. Kimmich, U. Beginn, M. Moller, and N. Fatkullin, Phys.Rev. E 59, 4079 �1999�.
39 R. Kimmich, R.-O. Seitter, U. Beginn, M. Moller, and N. Fatkullin,Chem. Phys. Lett. 307, 147 �1999�.
40 C. Mattea, N. Fatkullin, E. Fischer, U. Beginn, E. Anoardo, M.Kroutieva, and R. Kimmich, Appl. Magn. Reson. 27, 371 �2004�.
41 N. Fatkullin and R. Kimmich, Phys. Rev. E 52, 3273 �1995�.42 J.-M. Zanotti, L. J. Smith, D. L. Price, and M.-L. Saboungi, Ann. Chim.
Sci. Mater. 30, 353 �2004�.43 S. Stapf and R. Kimmich, Macromolecules 29, 1638 �1996�.44 S. Ayalur-Karunakaran, B. Blümich, and S. Stapf, Eur. Phys. J. E 26, 43
�2008�.
174901-11 Polymer dynamics under confinement J. Chem. Phys. 131, 174901 �2009�
Downloaded 21 Dec 2009 to 134.94.163.117. Redistribution subject to AIP license or copyright; see http://jcp.aip.org/jcp/copyright.jsp