Plasma confinement using biased electrode in the TCABR tokamak
8
EX/P2-16 1 Plasma Confinement Using Biased Electrode in the TCABR Tokamak I. C. Nascimento 1), Y. K. Kuznetsov 1), J. H. F. Severo 1), A. M. M. Fonseca 1), A. Elfimov 1), V. Bellintani 1), M. Machida 2), M. V. A. P. Heller 1), R. M. O. Galvão 1), E. K. Sanada 1), J. I. Elizondo 1) 1) Laboratório de Física de Plasmas, Instituto de Física , Universidade de São Paulo, São Paulo, SP, Brazil 2) Laboratório de Física de Plasmas, Instituto de Física, Universidade Estadual de Campinas, Campinas, SP, Brazil e-mail contact of main author: [email protected] Abstract. Experimental data obtained on the TCABR tokamak (R = 0.61 m, r = 0.18 m) with an electrally polarized electrode, placed at r = 0.16 m, is reported in this paper. The experiment was performed with plasma current of 90 kA (q = 3.1), and hydrogen gas injection adjusted for keeping the electron density at 1.0x10(19) m(-3) without bias. Temporal and radial profiles of plasma parameters with and without bias were measured. The comparison of the profiles shows an increase of the density, up to a maximum factor of 2.6, while H-alpha hydrogen spectral line intensity decreases, and the CIII impurity stays on the same level. The analysis of temporal and radial profiles of plasma parameters indicates that the confined plasma entered in the H-mode regime. The data analysis shows a maximum enhanced confinement factor of 1.95, decaying to 1.5 at the maximum of the density, in comparison with predicted Neo-Alcator scaling law values. Indications of transient increase of the density gradient near the plasma edge were obtained with measurements of density profiles. Calculations of turbulence and transport at the plasma edge, using measured floating potentials and ion saturation currents, show strong decrease in the power spectra and transport. Bifurcation was not observed, and the decrease in the saturation current occurs in 50 microseconds. 1. Introduction The H-mode discovered in the ASDEX tokamak in 1982 [1] using neutral particle auxiliary heating was later obtained using also RF and ohmic heating, and electrode biasing at the plasma edge. However, it is recognized that the understanding of the complex physical phenomena underlying the transition from the standard L-mode of operation of tokamaks, to the H-mode is still not complete, and a model capable of explaining the large amount of experimental data is presently not available. On the other hand, detailed experimental data on plasma parameters with high time and space resolution is necessary for the understanding of the physical phenomena involved. Radial electric fields on the plasma edge of tokamaks play an important role in the L-H transition, and a simple method to create these fields in the tokamak edge is to use biased electrodes. This method is justified because is at the reach of small laboratories, and can provide useful data to contribute for the better understanding of the physics of H-mode. The pioneering work on biased electrode H-mode realized in 1989, in the CCT tokamak, by Taylor et al. [2] opened the way to many other experiments in TEXTOR [3], TUMAN 3 [4] and PHAEDRUS [5], and more recently in TEXTOR [6, 7], CASTOR [8], T-10 [9], and ISTTOK [10, 11]. Emissive electrodes have been used with good success for obtaining negative biased H-mode [2, 12, 13] getting sufficient electrode currents to reach the transition.
Transcript of Plasma confinement using biased electrode in the TCABR tokamak

EX/P2-16
1
Plasma Confinement Using Biased Electrode in the TCABR Tokamak I. C. Nascimento 1), Y. K. Kuznetsov 1), J. H. F. Severo 1), A. M. M. Fonseca 1), A. Elfimov 1), V. Bellintani 1), M. Machida 2), M. V. A. P. Heller 1), R. M. O. Galvão 1), E. K. Sanada 1), J. I. Elizondo 1) 1) Laboratório de Física de Plasmas, Instituto de Física , Universidade de São Paulo, São Paulo, SP, Brazil 2) Laboratório de Física de Plasmas, Instituto de Física, Universidade Estadual de Campinas, Campinas, SP, Brazil e-mail contact of main author: [email protected] Abstract. Experimental data obtained on the TCABR tokamak (R = 0.61 m, r = 0.18 m) with an electrally polarized electrode, placed at r = 0.16 m, is reported in this paper. The experiment was performed with plasma current of 90 kA (q = 3.1), and hydrogen gas injection adjusted for keeping the electron density at 1.0x10(19) m(-3) without bias. Temporal and radial profiles of plasma parameters with and without bias were measured. The comparison of the profiles shows an increase of the density, up to a maximum factor of 2.6, while H-alpha hydrogen spectral line intensity decreases, and the CIII impurity stays on the same level. The analysis of temporal and radial profiles of plasma parameters indicates that the confined plasma entered in the H-mode regime. The data analysis shows a maximum enhanced confinement factor of 1.95, decaying to 1.5 at the maximum of the density, in comparison with predicted Neo-Alcator scaling law values. Indications of transient increase of the density gradient near the plasma edge were obtained with measurements of density profiles. Calculations of turbulence and transport at the plasma edge, using measured floating potentials and ion saturation currents, show strong decrease in the power spectra and transport. Bifurcation was not observed, and the decrease in the saturation current occurs in 50 microseconds. 1. Introduction The H-mode discovered in the ASDEX tokamak in 1982 [1] using neutral particle auxiliary heating was later obtained using also RF and ohmic heating, and electrode biasing at the plasma edge. However, it is recognized that the understanding of the complex physical phenomena underlying the transition from the standard L-mode of operation of tokamaks, to the H-mode is still not complete, and a model capable of explaining the large amount of experimental data is presently not available. On the other hand, detailed experimental data on plasma parameters with high time and space resolution is necessary for the understanding of the physical phenomena involved. Radial electric fields on the plasma edge of tokamaks play an important role in the L-H transition, and a simple method to create these fields in the tokamak edge is to use biased electrodes. This method is justified because is at the reach of small laboratories, and can provide useful data to contribute for the better understanding of the physics of H-mode. The pioneering work on biased electrode H-mode realized in 1989, in the CCT tokamak, by Taylor et al. [2] opened the way to many other experiments in TEXTOR [3], TUMAN 3 [4] and PHAEDRUS [5], and more recently in TEXTOR [6, 7], CASTOR [8], T-10 [9], and ISTTOK [10, 11]. Emissive electrodes have been used with good success for obtaining negative biased H-mode [2, 12, 13] getting sufficient electrode currents to reach the transition.

EX/P2-16
2
These experiments contributed to demonstrate the importance of the radial electric field for accessing the H-mode and showed that it was necessary to include the contribution of non-ambipolar losses in the theories [14]. Bifurcation is observed in some experiments [3, 4, 5]. Nevertheless, H-mode is a very complex phenomenon, its physics is not yet completely understood and theoretical models are still not fully accepted [15]. The parameters responsible for the transition are still not uniquely identified [16], and diagnostics with better space and time resolution are needed. In this paper, the first results on the use of a biased electrode to modify the electric field in the plasma edge of the TCABR tokamak are presented. 2. Experimental Setup The experiment was performed on the TCABR tokamak [17] which has the following parameters: R = 0.615 m, minor radius, r = 0.18 m, toroidal magnetic field, BT = 1.1 T, maximum plasma current, Ip = 110 kA, maximum electron temperature 600 eV, maximum ion temperature, Ti = 200 eV and maximum line average density, n e = 4.0x10¹⁹ m-3. The movable electrode is made of hard graphite, shaped as a 20 mm diameter, 9 mm thick disk and a shaft of 30 mm length and 20 mm diameter at the tip of an alumina covered stainless steel cylinder. The power supply can provide current and voltage of up to 300 A and 750 V, respectively, with negative or positive polarities. It is composed of a large capacitor bank and a triggered programmable fast switch to set the duration of the applied bias. The rise time of the voltage is 10 microseconds. The electrode could be introduced up to 2 cm inside the plasma, without plasma disruptions for voltages up to +470 volts and −400 volts, and was located on the equatorial plane of the tokamak, 200 degrees from the limiter in the plasma current direction (counter-clockwise). The power supply is insulated from ground and from the power line. The path of the electrode current for positive electrode bias was: power supply-electrode-plasma-vessel-power supply. The limiter is connected to the vessel, which is grounded through a 180-ohm resistor. The applied electrode voltage is measured between the electrode and the vessel, a resistor of 31 miliohm is used to measure the current, and a resistor of 1 ohm is used to limit the current. The diagnostics used were: interferometer, spectroscopy, ECE radiometer, electrostatic probes, bolometer array, Mirnov coil array, and the usual electromagnetic probes. The data acquisition system of the TCABR was used to collect and
store the data. 3. Experimental Results and Data Analysis The experiment was performed with the plasma current of 90 kA (q = 3.1) and maximum electron line averaged density adjusted to 1.0x10¹⁹ m-3 with the hydrogen gas injection kept at the level necessary to keep this density constant. All measurements with the electrode were performed with its front face placed at the minor radius of 16 cm, i.e., 2 cm inside the plasma. Above 2.5 cm, the plasma showed disruption. In
-400 -200 0 200 400 -50
50
100
150
Cur
rent
[A]
Voltage [V]
1.0
2.0
3.0
n H/n
L
Figure 1. (a) Electrode current response to applied bias, (b) ratio of plasma peak densities with and without bias.
(a)
(b)

EX/P2-16
3
Fig.1(a), the electrode current response to the applied bias is shown. The maximum power supply voltages that could be used without producing plasma disruptions were +500 and −350 volts, corresponding to electrode voltages of ± 340 V and currents of 160 A and 20A, respectively. As can be seen there is a large fluctuation in the electrode current, caused by the variation of the plasma wall conditions. In this experiment only discharges with positive electrode bias were investigated and the best results were obtained with 470 V in the power supply and 330 V and 140 A in the electrode. For negative bias, the current is much lower, as expected, and in agreement with other experiments. The ratio of the plasma peak average line density with and without bias is presented in Fig.1(b), in function of the electrode voltage. The best results are represented with open circles, obtained with better conditioned vessel walls, and due to the good reproducibility some points for the same bias voltage are undistinguishable from others Results shown with squares were obtained in not so good plasma conditions. 3.1. Time Evolution of Plasma Parameters
Temporal profiles of loop voltage, plasma current, Hα , βeq and ion saturation current measured using a Langmuir probe 1 cm behind the limiter are shown in Fig.3, for the discharges 11925 and 11926, the best result so far obtained. The applied electrode voltages and the respective currents were, 330 V, 140 A, zero V, 26 A, during 20 ms, with the electrode front face kept at r = 16 cm. In these discharges the changes in plasma current and loop voltage caused by the biasing were only 3 and 7%, respectively. On the other hand, a strong increase by a factor 2.6 in the density, from 1.0x10¹⁹ m-3 to 2.6x10¹⁹ m-3 is shown while Hα stays even bellow the values with no biasing. The shape of the density profile is triangular because of the biasing duration of 20 ms, but in other discharges with duration of 30 ms, a plateau is obtained. The ion saturation current is practically suppressed, and the turbulence is strongly quenched in about 50 µs. The poloidal β temporal profile shows an increase by a factor of three, compatible with the density increase. The calculation of the average temperatures was not possible due to the uncertainty in the assumed value of the plasma internal inductance il . Since the increase in poloidal β is proportional to the
density and the change in Vloop and Ip are small, we can say that the change in the electron temperature is also small, about 15%, inferred from ECE radiometer measurements made a few milliseconds before and after the introduction of the bias. Spectroscopic measurements of the 464.74 nm spectral line intensity of CIII did not show any abnormal increase, and for the Hα hydrogen spectral line, they corroborate the ones shown in Fig.3. The radiation emitted by the plasma measured with the bolometer, not shown for this discharge, increases proportionally to the density. However, since the bremsstrahlung emitted by the plasma is
30 40 50 60
0
0.5 β p
H α (a.u.)
0
1 n SOL,18
0
2 n 19
0
2
# 11925, 11926
V L (V)
0
50
100
Electrode bias
TIME (ms)
I p (kA)
Figure3. Time evolution of plasma current, electrode bias, loop voltage, plasma density, SOL density, Hα intensity and poloidal β for a discharge with electrode biasing (full lines) and without biasing (dashed lines)

EX/P2-16
4
-0.20 -0.15 -0.10 -0.05 0.00 0.05 0.10 0.15 0.20
0.0
0.4
0.8
1.2
1.6
2.0 Shot #15178 to #15204 63ms α=(0.88±0.05)
70ms α =(0.52±0.05) 74ms α =(0.76±0.06) 86ms α =(1.03±0.11)
Nor
mal
ized
Den
sity
Radius (m)
86ms
63ms
70ms
74ms
Figure 5. Plasma density normalized radial profiles. Bias applied from 65 to 85 ms
proportional to Zeff n2 T-1/2 and, assuming that the temperature does not change appreciably, this is an indication that Zeff decreases during biasing. MHD activities were detected using a set of 22 Mirnov coils, displaced around the plasma column. The analysis, using FFT, indicates that the predominant modes are m=2 and 3, with an increase in the amplitude of the mode m = 2, with biasing and a decrease of 15% in the frequencies. 3.2. Radial Profiles Radial profiles of plasma line average density were determined using an Electron Cyclotron Emission (ECE) radiometer and one channel interferometer (150 GHz). The ECE used is a heterodyne sweeping radiometer with frequency range from 52 to 85 GHz and 50 µs per
frequency step [18]. The radial resolution varies from 1 to 2.5 cm. The interferometer measured the density along the central chord and the ECE the radial coordinate for which the cutoff occurred [19, 20]. The experimental points are shown in Fig. 4, and a best fit to the data gives the values of the exponent α of the assumed parabolic profile. For the curve with α = 0.62, shot 15126, the density increase was from 1.1 to 1.9x10¹⁹ m–3, and the experimental points were obtained at the end of the density increase produced by the application of the 300V bias. For the other curve, hydrogen gas was injected using the fast valve to obtain a similar increase of the
density and approximately the same temporal profile, with no bias applied (shot 15129). The differences were about 12%. The best fit gives α = 0.80, showing that the density radial profile with α = 0.62, obtained with the biased electrode, is broader compared to the profile with similar density time evolution.
The second measurement of plasma density radial profile was performed using a one-channel interferometer on a shot-to-shot basis. There are seven antennas installed in the TCABR tokamak, at radius of –17.0, -11.75, -6.50, -1.25, +4.0, +9.25 and +14.5, all in cm. The results of the measurements are shown in the Fig. 5 for radial profiles taken with and without bias, which was applied at 65 ms. It can be concluded that as soon as the electrode is biased, the profile broadens, but as the density increases, it tends to come back to the previous shape.
Radial profiles of the electron temperatures were measured with the ECE radiometer for the same discharges 15126 and 15129 measured with the ECE cutoff method. Measurements
Figure 4. Line average density measured by the interferometer as function of the position where the ECE cutoff occurs.

EX/P2-16
5
50 60 70 80 90
2
4
6
8 τe τAlc VASTRA Vexp
loop
(V), τ e(m
s)
time (ms)
50 60 70 80 900
1
2# 11925
b)
a) ne βexp βASTRA
β, n
e (10
13cm
-3),
(data not shown here) made 1 ms before and after the application of the bias show a flat electron temperature profile of (400±15) eV and (360±15) eV, respectively. 3.3. Transport analysis The ASTRA transport code [21] was used to evaluate the influence of the biasing on the energy confinement time τ. In TCABR, L-mode τ is well described by the Neo-Alcator scaling law. Fig. 6a) shows the time profile of the average line density for the central chord measured with the interferometer. A quasi-parabolic radial profile was adjusted to reproduce the experimental data. The time evolution of the poloidal beta was obtained by a fit to the normalized experimental values using data from the ECE radiometer for Te without biasing.
Fig.6b) shows the loop voltage Vexp and the calculated VASTRA, obtained using the plasma current, the poloidal β and adjusting Zeff (2-2.4). The decrease in the electron temperature was about 15% and the ion temperature increased from 70 eV to 200 eV. The results of the calculation are compared with those predicted by the L-mode Neo-Alcator scaling law. It can be seen that the maximum value of the enhancing factor is
95.14.46.8 == ms
msALC
eτ
τ ,
decaying to 1.5 for the peak density (2.6x1013 cm-3). This degradation of the H mode confinement is compatible with the changes of the radial profiles shown in Fig. 5. 3.4. Turbulence Spectra and Transport at the Plasma Edge
To characterize the changes in turbulence and transport at the plasma edge under the influence of the biased electrode three Langmuir probes placed at r = 0.19 m were used, two for the measurement of floating potentials, at two positions in the poloidal direction, and the other to measure the ion saturation current at a different toroidal direction. The characterization of the turbulence is based on digital correlation techniques applied to floating potential and ion saturation current fluctuations. To examine the temporal behavior of the fluctuations the data is split in segments of 1024 data points (≈1.02 ms) and the wavelet analysis [22, 23] is applied to each segment. The power
Figure 6.Analysis of the discharge #11925 with the transport code ASTRA
Figure 7 . Frequenc y pow er spec tra fo r floa ting po ten tia l fluctua tions (a t r/a= 1 .05), fo r chosen tim e in te rva ls o f 1 .02 m s of the d ischarge .

EX/P2-16
6
spectra of floating potential fluctuations is presented in the Fig. 7 for the discharge 15044 in which an increase of a factor 2 in the density was obtained with the application of 310 V to the electrode. The results show a broad spectrum up to 120 kHz, and a stronger decrease in
the power spectra for higher frequencies. The fluctuations of the floating potential measured by the poloidally-separated probes were analyzed using the S(k,f) spectrum technique [24]. The results of the calculations are presented in the Fig. 8, where the contour plots of wavelet S(k,f) show decrease of the fluctuations, transfer of the peak power to lower frequencies components and reduction of the wave-number values and, consequently,
increasing, the phase velocities. The transport at the scrape-off layer was estimated from the electrostatic fluctuations for the same shot 15044. The radial particle flux,
vn~~=Γ , driven by the density and plasma potential fluctuations, ñ and ϕp , was obtained by calculating the fluctuating radial drift velocity v = Eθ/Bt (Eθ = αϕp ). Here, the spectral analysis was used to calculate Γ from the equations:
Tr=[2k|Cñφp|sin(θñϕp)]/B (1)
∫∞
=Γ0
)( dffTr (2)
where k is the plasma potential poloidal wave number, C ñϕ p and (θ ñϕp) are the wavelet cross spectrum and phase angle between density and potential fluctuations, and Bt is the toroidal magnetic field. Fig. 9 shows the frequency transport spectra for probes at r/a=1.05, without and with DC bias application, for chosen time intervals of 1.02 ms of the discharge, the bias produces a strong decrease of the particle transport, specially for high frequency components. Fig. 10 shows the evolution of the turbulence driven particle flux, integrated in frequency, for the discharge before, during and after the DC application.
Figure 8. Contour plot of the wavelet S(k,f) for potential fluctuations.
Figure 9. Frequency transport spectra
Figure 10. Time evolution of turbulence driven transport at position 1 cm behind the limiter.
EX/P2-16
7
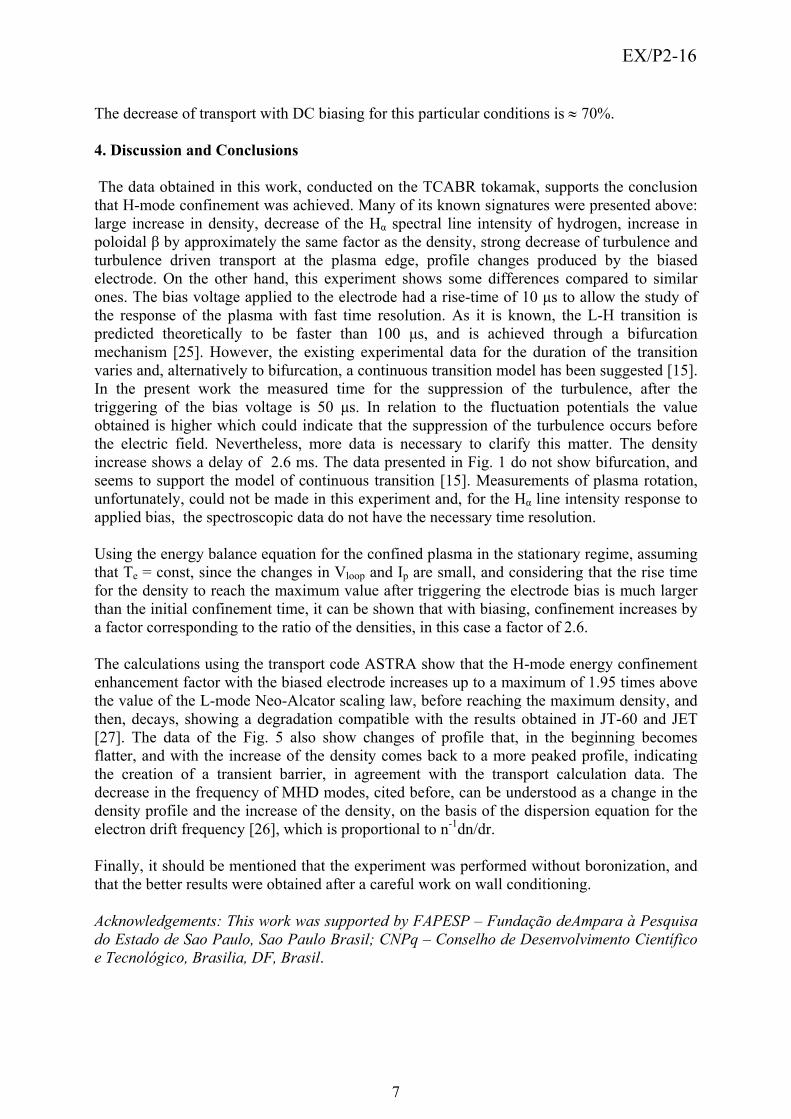
The decrease of transport with DC biasing for this particular conditions is ≈ 70%. 4. Discussion and Conclusions
The data obtained in this work, conducted on the TCABR tokamak, supports the conclusion that H-mode confinement was achieved. Many of its known signatures were presented above: large increase in density, decrease of the Hα spectral line intensity of hydrogen, increase in poloidal β by approximately the same factor as the density, strong decrease of turbulence and turbulence driven transport at the plasma edge, profile changes produced by the biased electrode. On the other hand, this experiment shows some differences compared to similar ones. The bias voltage applied to the electrode had a rise-time of 10 µs to allow the study of the response of the plasma with fast time resolution. As it is known, the L-H transition is predicted theoretically to be faster than 100 µs, and is achieved through a bifurcation mechanism [25]. However, the existing experimental data for the duration of the transition varies and, alternatively to bifurcation, a continuous transition model has been suggested [15]. In the present work the measured time for the suppression of the turbulence, after the triggering of the bias voltage is 50 µs. In relation to the fluctuation potentials the value obtained is higher which could indicate that the suppression of the turbulence occurs before the electric field. Nevertheless, more data is necessary to clarify this matter. The density increase shows a delay of 2.6 ms. The data presented in Fig. 1 do not show bifurcation, and seems to support the model of continuous transition [15]. Measurements of plasma rotation, unfortunately, could not be made in this experiment and, for the Hα line intensity response to applied bias, the spectroscopic data do not have the necessary time resolution. Using the energy balance equation for the confined plasma in the stationary regime, assuming that Te = const, since the changes in Vloop and Ip are small, and considering that the rise time for the density to reach the maximum value after triggering the electrode bias is much larger than the initial confinement time, it can be shown that with biasing, confinement increases by a factor corresponding to the ratio of the densities, in this case a factor of 2.6. The calculations using the transport code ASTRA show that the H-mode energy confinement enhancement factor with the biased electrode increases up to a maximum of 1.95 times above the value of the L-mode Neo-Alcator scaling law, before reaching the maximum density, and then, decays, showing a degradation compatible with the results obtained in JT-60 and JET [27]. The data of the Fig. 5 also show changes of profile that, in the beginning becomes flatter, and with the increase of the density comes back to a more peaked profile, indicating the creation of a transient barrier, in agreement with the transport calculation data. The decrease in the frequency of MHD modes, cited before, can be understood as a change in the density profile and the increase of the density, on the basis of the dispersion equation for the electron drift frequency [26], which is proportional to n-1dn/dr. Finally, it should be mentioned that the experiment was performed without boronization, and that the better results were obtained after a careful work on wall conditioning. Acknowledgements: This work was supported by FAPESP – Fundação deAmpara à Pesquisa do Estado de Sao Paulo, Sao Paulo Brasil; CNPq – Conselho de Desenvolvimento Científico e Tecnológico, Brasilia, DF, Brasil.

EX/P2-16
8
References [1] F. Wagner et al., Phys.Rev.Lett. 49 (1982) 1408 [2] R.J. Taylor et al., Phys. Rev. Lett. 63 (1989) 2365 [3] R.R. Weynants et al., Nucl. Fusion 32 (1992) 837 [4] L.G. Askinazi et al., Nucl. Fusion 32 (1992) 271 [5] E.Y. Wang et al., Nucl. Fusion 35 (1995) 467 [6] S. Jachmich et al., Plasma Phys. Control. Fusion 40 (1998) 1105 [7] J. Cornelis et al., Nucl. Fusion 34 (1994) 171 [8] G. Van Oost, J. Stöckel et al., J. Plasma Fusion Res. Ser. 4 (2001) 29 [9] G. S. Kirnev et al., Plasma Phys. Control. Fusion 45 (2003) 337 [10] J. A. C. Cabral et al., Plasma Phys. Control. Fusion 39 (1998) 1011 [11] J. A. C. Cabral et al., 2002 Proc. 28th EPS Conf. On Plasma Phys. Control. Fusion vol
25A (ECA) p 605 [12] D. Craig et al., Phys. Rev. Lett., 79 (1997) 1865 [13] C. Silva et al., to be published in Plasma Phys. Control. Fusion [14] T.E. Stringer, Nucl. Fusion, 32 (1992) 1421 [15] J. Hugill, Plasma Phys. Control. Fusion, 42 (2000) R75 [16] R. J. Groebner et al., Phys. Plasmas 8 (2001) 2722 [17] I. C. Nascimento et al., VII Latin American Workshop on Plasma Phys., Tandil,
Argentina, (1998) 15 [18] R. P. da Silva, A. M. M. Fonseca et al. to be published in Brazilian Journal of Physics [19] J. Lohr, Rev. Sci. Inst., 59, (1988) 1608 [20] D. C. Reddy, T. Eddington, Rev. Sci. Instr., 67, (1996) 462 [21] G.V.Pereverzev, P.N. Yushmanov, A.Yu.Dnestrovskii et al. ASTRA, An Automatic
System for Transport Analysis in a Tokamak, IPP 5/42, Max-Planck Institute fur Plasmaphysik EUROATOM Association, D-8046 Garching, Germany, Aug.1991.
[22] B. Ph. van Milligen, C. Hidalgo, E. Sanchez, M. A. Pedrosa, R. Balbin, I. García-Cortés and G. Tynan, Rev. Sci. Instr. 68, (1997) 967.
[23] A. A Ferreira, M. V. A. P. Heller and I. L. Caldas, Phys. Plasmas 7, (2000) 1. [24] T. Levinson, J. M. Beall, E. J. Powers, and R. D. Bengston, Nucl. Fusion 24, (1984) 527 [25] S.I. Itoh and K. Itoh, Phys.Rev.Lett. 60, 2276 (1988) and Nucl.Fusion 29, (1989) 1031 [26] B.B. Kadomtsev – Tokamak Plasma: A complex Physical System IOP Publishing Ltd, Techno House, Redcliffe Way, Bristol BS1 6NX, UK [27] M. Greenwald, Plasma Phys. Contr. Fusion, 44 (2002) R27