substances stimulating glucose catabolism by the oxidative ...
Upload
khangminh22Category
view
4download
0
Adsorptive Crystallization of Organic Substances in Silica Aerogels
from Supercritical Solutions
Der Technischen Fakultät der
Universität Erlangen-Nürnberg
zur Erlangung des Grades
DOKTOR-INGENIEUR
vorgelegt von
M.Sc. Babu Suresh Kumar GORLE
aus Hyderabad, Indien
Erlangen – 2009
II
Als Dissertation genehmigt von
der Technischen Fakultät der
Universität Erlangen-Nürnberg
Tag der Einreichung: 06.04.2009
Tag der Promotion: 10.06.2009
Dekan: Professor Johannes Huber
Vorsitzender: Professor Axel König
1. Berichterstatter: Professor Wolfgang Arlt
2. Berichterstatter: Professor Irina Smirnova
3. Berichterstatter: Professor Wilhelm Schwieger
weiteres prüfungsberechtigtes Mitglied: Professor Peter Wellmann

III
Acknowledgement
During my last three and half year, I worked on my PhD work at Chair of Separation and
Technology, University of Erlangen. During this time, I worked in close co-operation with many
people spent one quality time with lots of friends, whom I sincerely wish to acknowledge in this
section.
Thanks to Prof. Wolfgang Arlt for accepting me for a PhD position at his chair and for
supervising my work. His critical remarks on the research work helped me to have an eye on
finer details in the research work. His popularity in the research community always helped me to
get in contact with other research groups where I need to conduct some experiments.
Special thanks to Prof. Irina Smirnova (presently Chair of Institut für Thermische
Verfahrenstechnik, Technical University of Hamburg and Harburg), who initiated this PhD
research project and guided me through my work. I am truly indebted for her continuous
inspiration, timely appreciation and encouragement which helped me to keep going during the
three and half years of my project. Her enormous abilities of generating new ideas, discussions
and explanations lead to a new direction in the present research work ‘adsorptive crystallization’
which is presented in this work.
I would like thank Prof. Mark A. McHugh for his remarks, comments, suggestion on the PhD
work during his sabbatical at the Chair of Separation and Technology, University of Erlangen.
Interacting with him has taught me how to look at finer details of the experimental data. I cherish
long discussions and explanations of various phenomena’s with him has given a new path to the
present research work.
Thanks to Prof. Axel König for his help in performing DSC experiments. Discussion with him
always helped to understand the results of DSC. I am grateful his comments and suggestions. I
am also thankful to Prof. Wilhem Schwieger for providing me the MCM41 and Zeolite samples. I
would like thank his student; Ayyapan, Sai, Abhijeet for helping me to do some TGA/MS
experiments and also sharing me their knowledge about Zeolite and MCM41 materials.

IV
I would like to thank Detlef and Martin Drescher for their great help in built the plant for my
experiments. I would like thank Edelgard for her help in analysis all my samples and preparing
aerogels. During my work with her gave me a chance to understand the German social and
culture exposure. Thanks to Petra Kiefer for help in analysis samples and making some nice
digital pictures for my work. Thanks to Petra Koch for her help in performing BET of my aerogel
samples and also placing the chemical orders for me. Thanks to Rosa, Jorge, Jose for helping me
to make DSC analyses for me.
I would like thank the work shop team Matthias, Hans for their continuous help in solving my
experimental setup problems. I appreciate Matthias help and idea in solving the problems that
occurred during my work without his help it would not have been possible to continue to the
experimental work. I am also thanks full to Wolfgang Gäckel for his help in fixing all my
experimental problems.
Thanks to Reddy who was always free and ready to discuss my results and to share some private
talks. I am thankful to my German friends at the chair; Martin, Alexander, Florian, Sussa, Lissi,
Tanya, and Ulrike, the time I spent with them both in private and in the chair, who taught me the
German culture which includes beer. I am thankful to Dirk Weckesser for his help in solving my
computer problems. It was great to share small chats during coffee time with Jinglan, Bo-Hyun,
Liping, Mirjana, Ludmilla, Vladimar, Jose, and Jorge. Special thanks to Bo Hyun for correcting
formatting of my PhD thesis. Thanks to Ludmilla for her critical remarks on research work and
presentations. I would like thank the students who worked on my project during my work;
Fatima, Daniel, Muard, Katharina, Sudhanshu, Abhishek, Rustem.
Last but not least, I am thankful to my family members for their continuous telephone or personal
talks with me during my stay in Germany, without which I would not have realized my PhD
work.
Finally, I would like to thank all the people who were not mentioned above but have helped me
in some or the other way to complete my work successful.
V
Nomenclature
-OR Alkyl group
VOC’s Volatile organic compounds
TMOS Tetramethylorthosilicate
MEOH Methanol
BET Brunauer, Emmett, and Teller
BJH Barrett Joiner Halenda
-CH3 Methyl
CHN Carbon Hydrogen and Nitrogen
Tm Melting temperature
DSC Differential scanning calorimeter
CP1 Critical point of substance 1
CP2 Critical point of substance 2
UCEP Upper Critical Point End
LCEP Lower Critical Point End
SLG Solid Liquid Gas
TP2 Triple point of substance 2
TLCEP Temperature of LCEP
TUCEP Temperature of UCEP
Tmin Temperature minimum
XRD X- ray diffraction
m(p,T)absolute mass of solute/solvent adsorbed(g)/(g) aerogel
m(p,T)excess mass of solute/solvent adsorbed(g)/(g) aerogel
Vb Volume of basket
Vs Volume of sample (aerogel)
Vads Volume of adsorbed CO2
ρb Bulk density of CO2 or CO2 + solute
ρadsorbed density of adsorbed CO2
∆m Weight difference due to adsorbed
VI
solute/solvent
SANS Small angle neutron scattering
RESS Rapid Expansion form Supercritical Solutions
GAS Gas anti solvent
SAS Supercritical Anti Solvent
PGSS Particles from Gas Saturated Solutions
CO-RESS co-precipitation during the rapid expansion of
supercritical solutions
SCF Supercritical fluids
Table of Contents
7
1. Introduction and Objective of the work .....................................................................14
2. Theory ........................................................................................................................16
2.1 Silica aerogels...................................................................................................16
2.1.1 Synthesis of silica aerogels and their properties...................................17
2.1.2 General applications of silica aerogels .................................................23
2.1.3 Impregnation of bioactive, inorganic, and organic substances in aerogels 23
2.2 Methods of solute precipitation / crystallization from supercritical CO2 .........25
2.2.1 Supercritical fluids as solvent...............................................................25
2.2.2 High pressure binary mixture (CO2 + Solute) phase diagrams ............27
2.2.3 Different methods of SCF particle formation technologies..................30
2.3 Physical state (crystalline / amorphous form) of drugs in a carrier..................33
2.3.1 General stabilization methods and problems of amorphization ...........33
2.3.2 Characterization of amorphous state: relevant techniques ...................34
2.4 High pressure adsorption isotherms on adsorbents at supercritical conditions 35
2.4.1 Adsorption measurements using Magnetic Suspension Balance (MSB)35
2.4.2 Data analysis of MSB adsorption measurements .................................35
2.4.3 Analytical adsorption isotherms ...........................................................37
3. Materials and Methods ...............................................................................................41
3.1 Materials 41
3.1.1 Materials used for silica aerogel synthesis ...........................................41
3.1.2 Materials used for adsorption & crystallization in aerogels .................41
3.1.3 MCM 41, Zeolite NAY, Trispor glass..................................................42
3.2 Preparation methods of silica aerogels .............................................................42
3.2.1 Sol - gel process and drying methods ...................................................42
3.2.2 Methods used for hydrophobization of aerogels ..................................43
3.3 Choice of crystallization temperature...............................................................44
3.4 Experimental techniques...................................................................................44
Table of Contents
8
3.4.1 Adsorption measurements using Magnetic Suspension Balance .........45
3.4.2 Adsorption experiments using an autoclave .........................................46
3.4.3 Crystallization experiments using an autoclave ...................................47
3.4.4 Drug release experiments .....................................................................48
3.5 Characterization techniques used .....................................................................49
3.5.1 Measuring of the bulk density of aerogels............................................49
3.5.2 Nitrogen Adsorption and Desorption; BET analysis ............................49
3.5.3 Elementary Analysis.............................................................................50
3.5.4 UV - Vis Spectroscopy .........................................................................50
3.5.5 Gas Chromatography (GC)...................................................................51
3.5.6 IR spectroscopy ....................................................................................51
3.5.7 Differential Scanning Calorimeter........................................................51
3.5.8 X - Ray Diffraction...............................................................................51
3.5.9 TGA / TGA - MS analysis....................................................................52
4. Results and Discussions .............................................................................................53
4.1 Properties of aerogels synthesized and other carriers used ..............................53
4.2 Adsorption and crystallization of polar solutes in silica aerogels ....................58
4.2.1 Adsorption and crystallization of benzoic acid in silica aerogels ........58
4.2.1.1 Stability of aerogels under pressure .......................................58
4.2.1.2 CO2 adsorption on aerogels ....................................................59
4.2.1.3 Excess binary adsorption of CO2 + benzoic acid ...................62
4.2.1.4 Static adsorption of benzoic acid in silica aerogels................64
4.2.1.5 Crystallization of benzoic acid in silica aerogels by CO-RESS65
4.2.1.6 Effect of the aerogel properties on the crystallization process67
4.2.1.7 Crystallinity of benzoic acid in aerogels ................................70
4.2.1.8 Crystallization of benzoic acid in other porous carriers.........73
4.2.1.9 IR analysis of loaded benzoic acid .........................................74

Table of Contents
9
4.2.2 Adsorption of 1-menthol in silica aerogels...........................................76
4.2.2.1 Menthol adsorption in silica aerogels.....................................76
4.2.2.2 TGA of menthol - loaded, hydrophilic aerogels.....................82
4.2.2.3 TGA of menthol - loaded, hydrophobic aerogels ...................85
4.2.2.4 IR analysis of loaded menthol ................................................87
4.2.2.5 Long - term stability of menthol at room temperature ...........88
4.3 Adsorption and crystallization of moderately polar solutes in silica aerogels .91
4.3.1 Adsorption and crystallization of naphthalene in silica aerogels .........91
4.3.1.1 Excess binary adsorption of CO2 + naphthalene in aerogels..91
4.3.1.2 Static adsorption of naphthalene in aerogels ..........................92
4.3.1.3 Crystallization of naphthalene in silica aerogels by CO-RESS94
4.3.1.4 Crystallinity of naphthalene in aerogels .................................99
4.3.1.5 IR analysis of loaded naphthalene........................................101
4.3.2 Adsorption of 2-Methoxy pyrazine in silica aerogels ........................104
4.3.2.1 Methoxy pyrazine adsorption in aerogels.............................104
4.3.2.2 TGA analysis of methoxy pyrazine loaded aerogels............106
4.3.2.3 Long - term stability of methoxy pyrazine at room temperature108
4.4 Adsorption and crystallization of nonpolar solutes in silica aerogels ............110
4.4.1 Adsorption and crystallization of octacosane in silica aerogels .........110
4.4.1.1 IR analysis of loaded octacosane..........................................113
4.4.2 Adsorption of dodecane in silica aerogels ..........................................115
4.5 Summarized table of loadings, physical form of loaded solutes ....................117
4.6 Extension of the method to other porous carriers: comparison of drug release profiles 119
4.6.1 Synthesis of the MCM - 41 materials .................................................119
4.6.2 Characterization of MCM41...............................................................120
4.6.3 Loading of MCM41s with Ibuprofen .................................................121
4.6.4 Release of ibuprofen from MCM41 in the phosphate buffer solution122
Table of Contents
10
5. Conclusions ..............................................................................................................125
6. Outlook.....................................................................................................................127
7. Appendix ..................................................................................................................128
7.1 GC column data ..............................................................................................128
7.2 Stability of aerogels at CO-RESS process......................................................128
7.3 Multiple additive loading................................................................................128
7.4 Benzoic acid results ........................................................................................129
7.5 MSB adsorption..............................................................................................134
7.6 Menthol results ...............................................................................................136
7.7 Naphthalene results.........................................................................................137
7.8 Error Propagation ...........................................................................................139
8. References ................................................................................................................142
Abstract
11
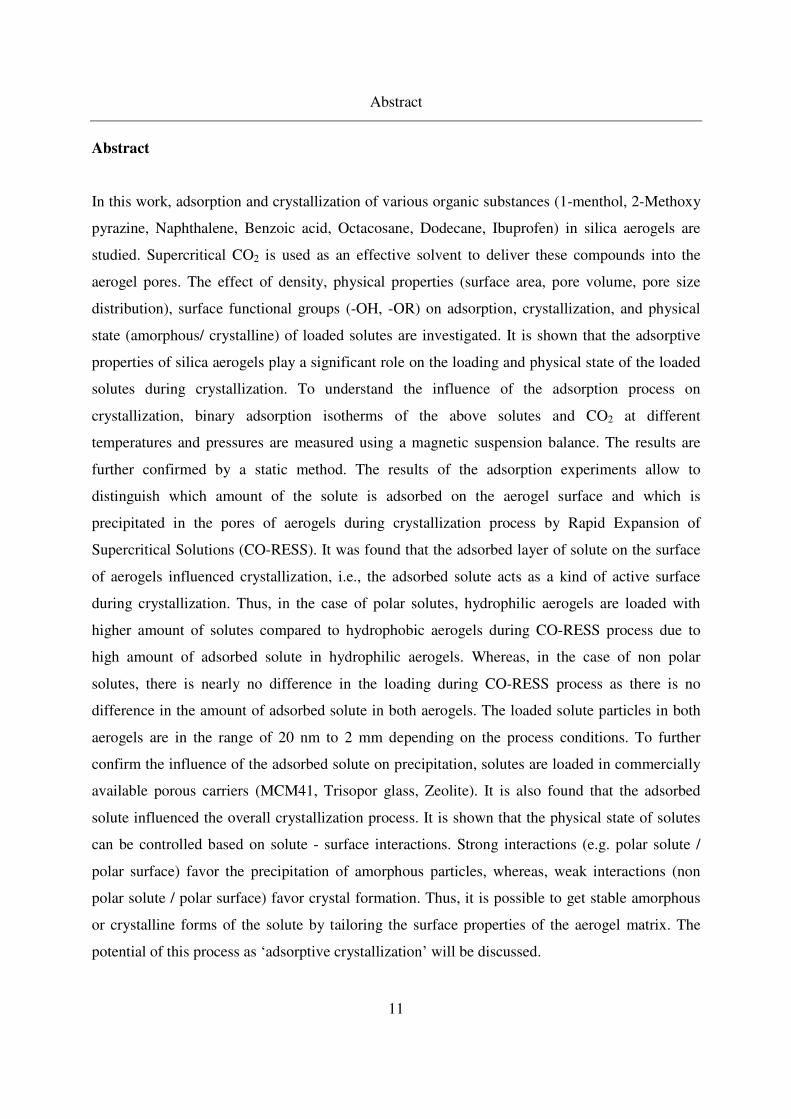
Abstract
In this work, adsorption and crystallization of various organic substances (1-menthol, 2-Methoxy
pyrazine, Naphthalene, Benzoic acid, Octacosane, Dodecane, Ibuprofen) in silica aerogels are
studied. Supercritical CO2 is used as an effective solvent to deliver these compounds into the
aerogel pores. The effect of density, physical properties (surface area, pore volume, pore size
distribution), surface functional groups (-OH, -OR) on adsorption, crystallization, and physical
state (amorphous/ crystalline) of loaded solutes are investigated. It is shown that the adsorptive
properties of silica aerogels play a significant role on the loading and physical state of the loaded
solutes during crystallization. To understand the influence of the adsorption process on
crystallization, binary adsorption isotherms of the above solutes and CO2 at different
temperatures and pressures are measured using a magnetic suspension balance. The results are
further confirmed by a static method. The results of the adsorption experiments allow to
distinguish which amount of the solute is adsorbed on the aerogel surface and which is
precipitated in the pores of aerogels during crystallization process by Rapid Expansion of
Supercritical Solutions (CO-RESS). It was found that the adsorbed layer of solute on the surface
of aerogels influenced crystallization, i.e., the adsorbed solute acts as a kind of active surface
during crystallization. Thus, in the case of polar solutes, hydrophilic aerogels are loaded with
higher amount of solutes compared to hydrophobic aerogels during CO-RESS process due to
high amount of adsorbed solute in hydrophilic aerogels. Whereas, in the case of non polar
solutes, there is nearly no difference in the loading during CO-RESS process as there is no
difference in the amount of adsorbed solute in both aerogels. The loaded solute particles in both
aerogels are in the range of 20 nm to 2 mm depending on the process conditions. To further
confirm the influence of the adsorbed solute on precipitation, solutes are loaded in commercially
available porous carriers (MCM41, Trisopor glass, Zeolite). It is also found that the adsorbed
solute influenced the overall crystallization process. It is shown that the physical state of solutes
can be controlled based on solute - surface interactions. Strong interactions (e.g. polar solute /
polar surface) favor the precipitation of amorphous particles, whereas, weak interactions (non
polar solute / polar surface) favor crystal formation. Thus, it is possible to get stable amorphous
or crystalline forms of the solute by tailoring the surface properties of the aerogel matrix. The
potential of this process as ‘adsorptive crystallization’ will be discussed.
Zussamenfassung
12
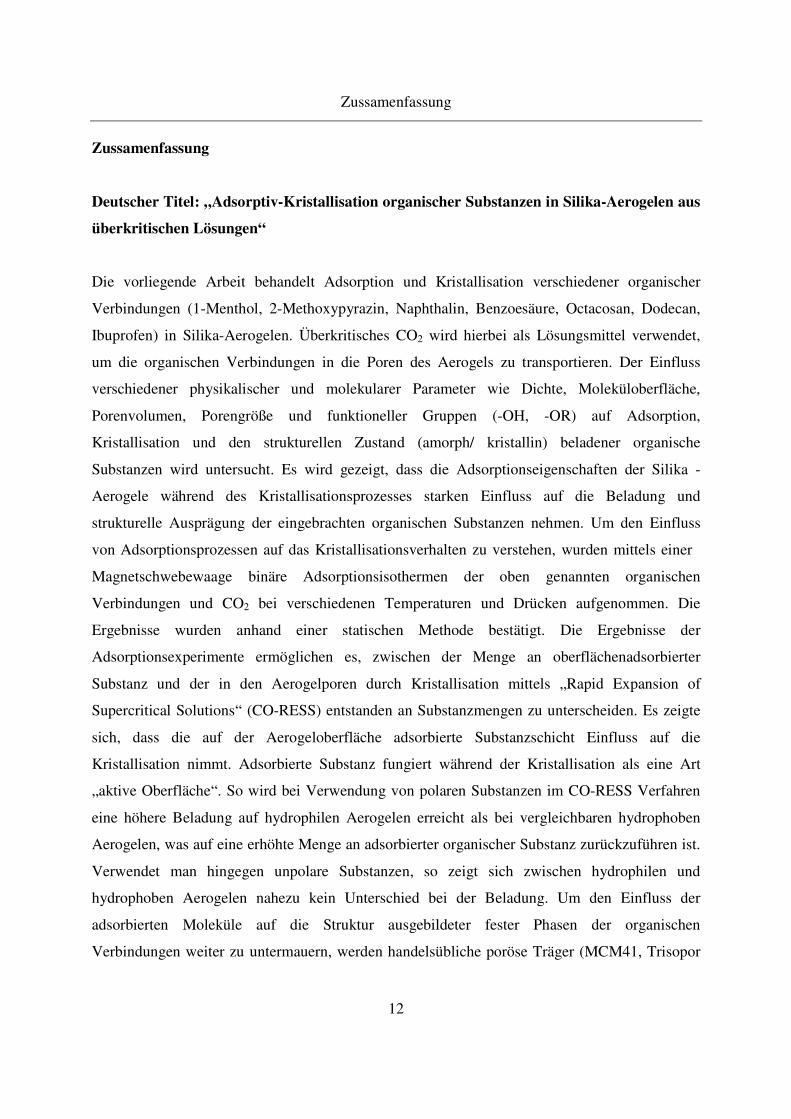
Zussamenfassung
Deutscher Titel: „Adsorptiv-Kristallisation organischer Substanzen in Silika-Aerogelen aus
überkritischen Lösungen“
Die vorliegende Arbeit behandelt Adsorption und Kristallisation verschiedener organischer
Verbindungen (1-Menthol, 2-Methoxypyrazin, Naphthalin, Benzoesäure, Octacosan, Dodecan,
Ibuprofen) in Silika-Aerogelen. Überkritisches CO2 wird hierbei als Lösungsmittel verwendet,
um die organischen Verbindungen in die Poren des Aerogels zu transportieren. Der Einfluss
verschiedener physikalischer und molekularer Parameter wie Dichte, Moleküloberfläche,
Porenvolumen, Porengröße und funktioneller Gruppen (-OH, -OR) auf Adsorption,
Kristallisation und den strukturellen Zustand (amorph/ kristallin) beladener organische
Substanzen wird untersucht. Es wird gezeigt, dass die Adsorptionseigenschaften der Silika -
Aerogele während des Kristallisationsprozesses starken Einfluss auf die Beladung und
strukturelle Ausprägung der eingebrachten organischen Substanzen nehmen. Um den Einfluss
von Adsorptionsprozessen auf das Kristallisationsverhalten zu verstehen, wurden mittels einer
Magnetschwebewaage binäre Adsorptionsisothermen der oben genannten organischen
Verbindungen und CO2 bei verschiedenen Temperaturen und Drücken aufgenommen. Die
Ergebnisse wurden anhand einer statischen Methode bestätigt. Die Ergebnisse der
Adsorptionsexperimente ermöglichen es, zwischen der Menge an oberflächenadsorbierter
Substanz und der in den Aerogelporen durch Kristallisation mittels „Rapid Expansion of
Supercritical Solutions“ (CO-RESS) entstanden an Substanzmengen zu unterscheiden. Es zeigte
sich, dass die auf der Aerogeloberfläche adsorbierte Substanzschicht Einfluss auf die
Kristallisation nimmt. Adsorbierte Substanz fungiert während der Kristallisation als eine Art
„aktive Oberfläche“. So wird bei Verwendung von polaren Substanzen im CO-RESS Verfahren
eine höhere Beladung auf hydrophilen Aerogelen erreicht als bei vergleichbaren hydrophoben
Aerogelen, was auf eine erhöhte Menge an adsorbierter organischer Substanz zurückzuführen ist.
Verwendet man hingegen unpolare Substanzen, so zeigt sich zwischen hydrophilen und
hydrophoben Aerogelen nahezu kein Unterschied bei der Beladung. Um den Einfluss der
adsorbierten Moleküle auf die Struktur ausgebildeter fester Phasen der organischen
Verbindungen weiter zu untermauern, werden handelsübliche poröse Träger (MCM41, Trisopor

Zussamenfassung
13
glass, Zeolite) mit organischen Verbindungen beladen. Auch hierbei wurde festgestellt, dass
adorbierte Substanz den Kristallisationsprozess beeinflusst. Es ergibt sich also die Möglichkeit,
die physikalische Stoffstruktur mittels der spezifischen Wechselwirkungen zwischen
Trägeroberfläche und Adsorbat zu kontrollieren. Starke Wechselwirkungen (z.B. polare Substanz
↔ polare Oberfläche) begünstigen die Bildung amorpher Partikel, wohingegen schwache
Wechselwirkungen (unpolare Substanz ↔ polare Oberfläche) vermehrt zur Entstehung von
Kristallstrukturen führen. Aus den genannten Ergebnissen wird die Möglichkeit ersichtlich,
stabile amorphe oder kristalline Stoffstrukturen mit Hilfe von Oberflächenmodifikationen der
Aerogelmatrix zu erzeugen. Das Potential dieses Verfahrens wird unter dem Begriff ‚Adsorptiv-
Kristallisation’ diskutiert.
Introduction and Objective of the work
14
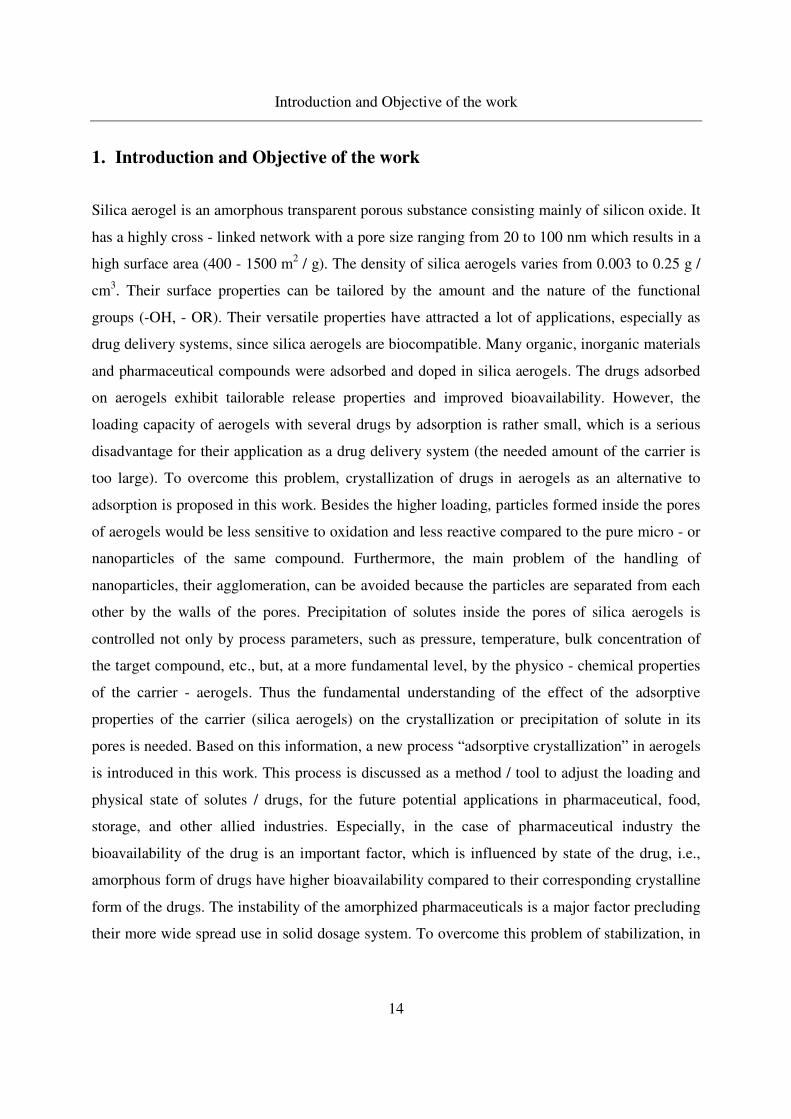
1. Introduction and Objective of the work
Silica aerogel is an amorphous transparent porous substance consisting mainly of silicon oxide. It
has a highly cross - linked network with a pore size ranging from 20 to 100 nm which results in a
high surface area (400 - 1500 m2 / g). The density of silica aerogels varies from 0.003 to 0.25 g /
cm3. Their surface properties can be tailored by the amount and the nature of the functional
groups (-OH, - OR). Their versatile properties have attracted a lot of applications, especially as
drug delivery systems, since silica aerogels are biocompatible. Many organic, inorganic materials
and pharmaceutical compounds were adsorbed and doped in silica aerogels. The drugs adsorbed
on aerogels exhibit tailorable release properties and improved bioavailability. However, the
loading capacity of aerogels with several drugs by adsorption is rather small, which is a serious
disadvantage for their application as a drug delivery system (the needed amount of the carrier is
too large). To overcome this problem, crystallization of drugs in aerogels as an alternative to
adsorption is proposed in this work. Besides the higher loading, particles formed inside the pores
of aerogels would be less sensitive to oxidation and less reactive compared to the pure micro - or
nanoparticles of the same compound. Furthermore, the main problem of the handling of
nanoparticles, their agglomeration, can be avoided because the particles are separated from each
other by the walls of the pores. Precipitation of solutes inside the pores of silica aerogels is
controlled not only by process parameters, such as pressure, temperature, bulk concentration of
the target compound, etc., but, at a more fundamental level, by the physico - chemical properties
of the carrier - aerogels. Thus the fundamental understanding of the effect of the adsorptive
properties of the carrier (silica aerogels) on the crystallization or precipitation of solute in its
pores is needed. Based on this information, a new process “adsorptive crystallization” in aerogels
is introduced in this work. This process is discussed as a method / tool to adjust the loading and
physical state of solutes / drugs, for the future potential applications in pharmaceutical, food,
storage, and other allied industries. Especially, in the case of pharmaceutical industry the
bioavailability of the drug is an important factor, which is influenced by state of the drug, i.e.,
amorphous form of drugs have higher bioavailability compared to their corresponding crystalline
form of the drugs. The instability of the amorphized pharmaceuticals is a major factor precluding
their more wide spread use in solid dosage system. To overcome this problem of stabilization, in
Introduction and Objective of the work
15
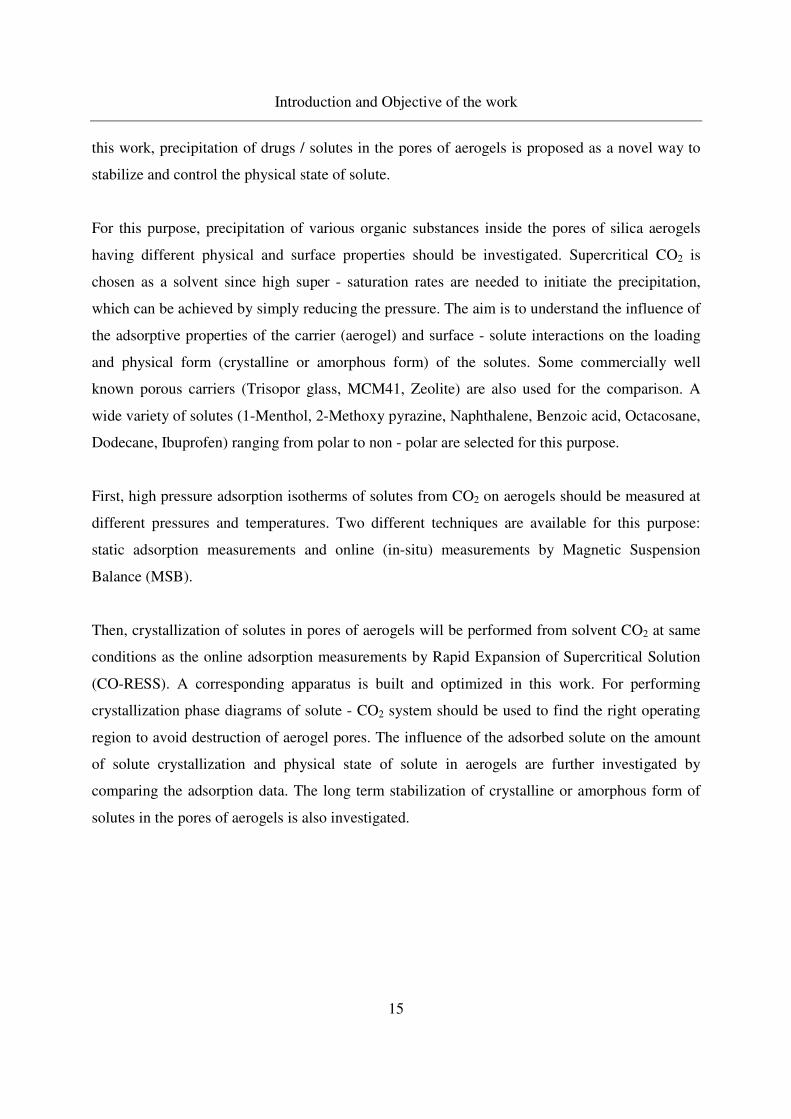
this work, precipitation of drugs / solutes in the pores of aerogels is proposed as a novel way to
stabilize and control the physical state of solute.
For this purpose, precipitation of various organic substances inside the pores of silica aerogels
having different physical and surface properties should be investigated. Supercritical CO2 is
chosen as a solvent since high super - saturation rates are needed to initiate the precipitation,
which can be achieved by simply reducing the pressure. The aim is to understand the influence of
the adsorptive properties of the carrier (aerogel) and surface - solute interactions on the loading
and physical form (crystalline or amorphous form) of the solutes. Some commercially well
known porous carriers (Trisopor glass, MCM41, Zeolite) are also used for the comparison. A
wide variety of solutes (1-Menthol, 2-Methoxy pyrazine, Naphthalene, Benzoic acid, Octacosane,
Dodecane, Ibuprofen) ranging from polar to non - polar are selected for this purpose.
First, high pressure adsorption isotherms of solutes from CO2 on aerogels should be measured at
different pressures and temperatures. Two different techniques are available for this purpose:
static adsorption measurements and online (in-situ) measurements by Magnetic Suspension
Balance (MSB).
Then, crystallization of solutes in pores of aerogels will be performed from solvent CO2 at same
conditions as the online adsorption measurements by Rapid Expansion of Supercritical Solution
(CO-RESS). A corresponding apparatus is built and optimized in this work. For performing
crystallization phase diagrams of solute - CO2 system should be used to find the right operating
region to avoid destruction of aerogel pores. The influence of the adsorbed solute on the amount
of solute crystallization and physical state of solute in aerogels are further investigated by
comparing the adsorption data. The long term stabilization of crystalline or amorphous form of
solutes in the pores of aerogels is also investigated.
Theory
16
2. Theory
2.1 Silica aerogels
Historical and industrial review of aerogels for the past 80 years
Silica aerogels are highly porous, transparent, low density foams filled with air. They are made of
primary particles of silicon oxide with diameter of 1 - 3 nm. Steven Kistler from College of
Pacific in Stockton, California, made the first wet gels of solid network [1]. After few
unsuccessful attempts to dry the wet gels at atmospheric conditions, he removed the liquid from
the wet gels by supercritical drying without damaging the solid network and proved the existence
of continuous solid network in gels. Dating back to 1931, after the invention of aerogels by
Kistler, not much progress was done until 1962. Kistler´s invention of aerogels was industrialized
by Monsanto company in 1950, but within a short time the company stopped the production due
to high cost of production which limited the wide spread applications. Renewed interest in
aerogels started after 1962 as the French government produced silica aerogels to store oxygen
and rocket fuel in their pores [2, 3, 4]. There was not much progress until 20 years in the research
area of aerogels, in 1980, potential application of aerogels as detector for Cherenkov radiation
was realized, they were produced in huge quantities in Germany by DESY (Deutsches Elektronen
Synchrotron) [5], CERN, Switzerland, University of Lund, Sweden [6]. The Swedish Company
Airglass has commercialized the production of silica aerogels in this year. BASF also
commercialized the production of silica aerogel by the name BASOGEL. In 1984, the
Microstructured Materials Group, Lawrence Berkeley National Laboratory, USA, have
contributed to the increased research efforts in the synthesis, new drying methods, application of
silica aerogels [7]. The research performed on aerogels has found applications in space programs
like NASA and in many other military programs. Many research groups have reviewed synthesis
of aerogels with many materials apart from silica, their characterization methods, gelation
process and functionalization [8, 9, 10, 11, 12, 13]. A review by Dorcheh et al. [14] in 2008
summarized the latest production methods and application of aerogels in many fields. In recent
years, many companies have commercialized aerogels production on a large scale (Aspen
Theory
17
Aerogels, Cabot Nanogels, Dunlop Aerogels, and MarceTech) due to an increased market for
aerogel applications.
2.1.1 Synthesis of silica aerogels and their properties
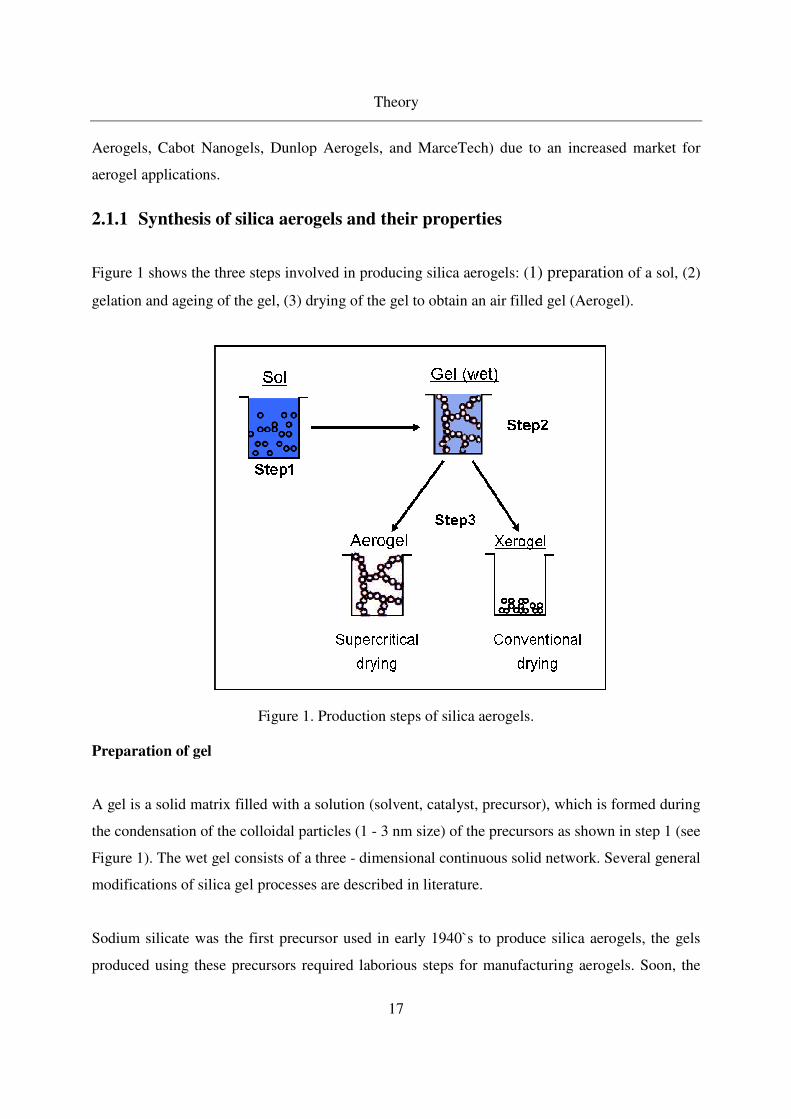
Figure 1 shows the three steps involved in producing silica aerogels: (1) preparation of a sol, (2)
gelation and ageing of the gel, (3) drying of the gel to obtain an air filled gel (Aerogel).
Figure 1. Production steps of silica aerogels.
Preparation of gel
A gel is a solid matrix filled with a solution (solvent, catalyst, precursor), which is formed during
the condensation of the colloidal particles (1 - 3 nm size) of the precursors as shown in step 1 (see
Figure 1). The wet gel consists of a three - dimensional continuous solid network. Several general
modifications of silica gel processes are described in literature.
Sodium silicate was the first precursor used in early 1940`s to produce silica aerogels, the gels
produced using these precursors required laborious steps for manufacturing aerogels. Soon, the
Theory
18
sodium precursors were replaced by silicon oxide precursors. Presently, tetraalkoxysilanes
(Si(OR)4) (R =CnH2n + 1, n = 1,2.…) are used to produce silica aerogels (also in this work). The
synthetic routes from a silicon source have produced alcogels (gels filled with alcohol), as a
result the steps of washing and drying became much simpler and efficient. The chemical
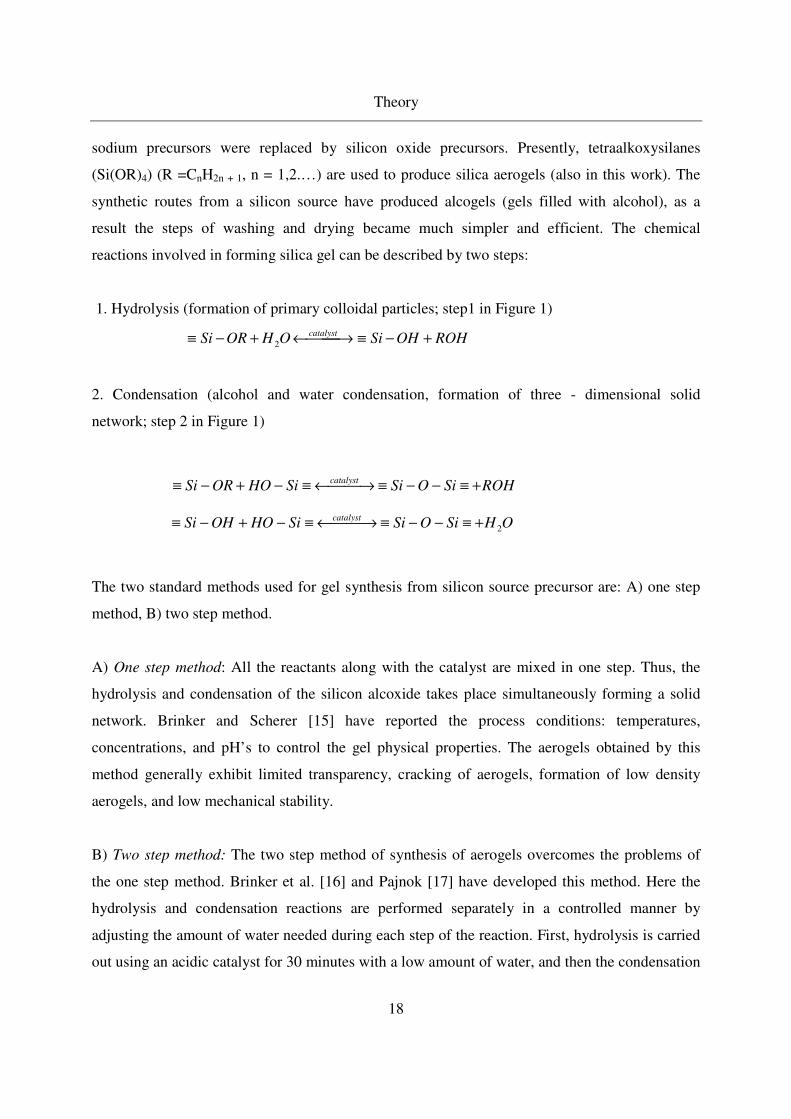
reactions involved in forming silica gel can be described by two steps:
1. Hydrolysis (formation of primary colloidal particles; step1 in Figure 1)
ROHOHSiOHORSicatalyst +−≡ →←+−≡ 2
2. Condensation (alcohol and water condensation, formation of three - dimensional solid
network; step 2 in Figure 1)
ROHSiOSiSiHOORSicatalyst
+≡−−≡ →←≡−+−≡
OHSiOSiSiHOOHSicatalyst
2+≡−−≡ →←≡−+−≡
The two standard methods used for gel synthesis from silicon source precursor are: A) one step
method, B) two step method.
A) One step method: All the reactants along with the catalyst are mixed in one step. Thus, the
hydrolysis and condensation of the silicon alcoxide takes place simultaneously forming a solid
network. Brinker and Scherer [15] have reported the process conditions: temperatures,
concentrations, and pH’s to control the gel physical properties. The aerogels obtained by this
method generally exhibit limited transparency, cracking of aerogels, formation of low density
aerogels, and low mechanical stability.
B) Two step method: The two step method of synthesis of aerogels overcomes the problems of
the one step method. Brinker et al. [16] and Pajnok [17] have developed this method. Here the
hydrolysis and condensation reactions are performed separately in a controlled manner by
adjusting the amount of water needed during each step of the reaction. First, hydrolysis is carried
out using an acidic catalyst for 30 minutes with a low amount of water, and then the condensation
Theory
19
reaction is performed by adding the desired amount of water and a basic catalyst. Even though
the process was optimized, a long gelation time is required due to presence of alcohol which
shifts the equilibrium to alkoxy groups. Tillotson and Hrubresh [18] have proposed a modified
two step method by replacing the alcohol in the gels by aprotic solvents which overcomes this
problem. The aerogel production method of Tillotson and Hrubresh is used as a standard method
of today’s silica aerogel synthesis with slighter modifications. Smirnova et al. [19] reduced the
gelation time for low density aerogels drastically by adding CO2 during the gelation process.
Ageing of silica gels
The gels formed are aged in the solution for few hours to few days depending on the gel targeted
density to attain stronger solid network of the gel. The increased strength of aged gels would
prevent the shrinkage during drying [8, 9, 15].
Drying of the gels
The gels aged need to be dried to remove the solution from the pores of gels. Two possibilities to
remove the pore fluid are: ambient drying and supercritical drying. Ambient drying of the wet
gels leads to xerogels, since the capillary pressure exerted by evaporating fluid destroys the pore
walls. Thus formed gels have an almost negligible pore volume (see step 3 in Figure 1).
Therefore, the supercritical fluid drying method is used to overcome this problem. Supercritical
fluids are the fluids which have densities like liquids and transport properties like gases, and have
nearly no surface tension above a certain critical temperature and pressure (see Figure 2). The
drying generally is performed by transforming liquid in the pores to supercritical fluids or by
extracting the pore fluid by using supercritical CO2 [9]. There are also many other ways to
perform drying, a very comprehensive review of these methods are described by Smirnova et al.
[20]. The process of drying using CO2 for extraction of the solvent from the gels is described
here. Supercritical CO2 is preferred, since CO2 is non toxic, inflammable and low critical
temperature and pressure to reach supercritical state (73.8 bar, 31°C).
The autoclave is heated to the desired temperature above critical temperature, and then gels are
placed inside the autoclave and pressurized with CO2 to a supercritical state as seen from Figure
Theory
20
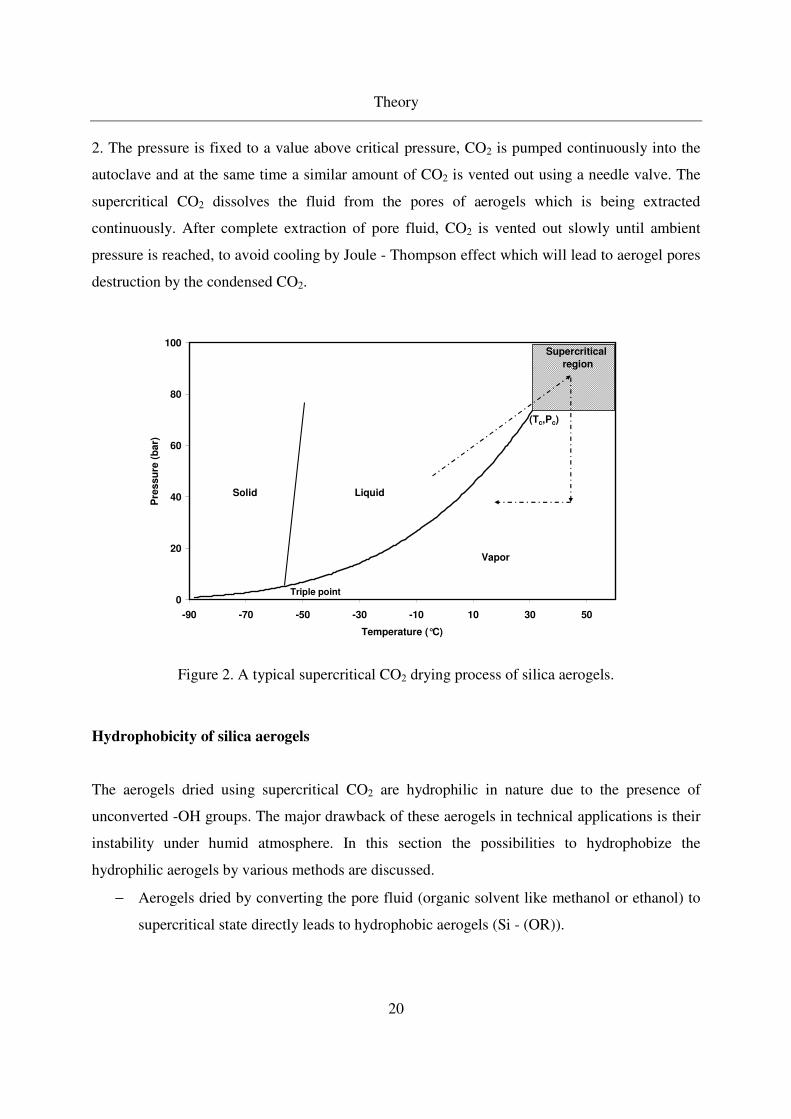
2. The pressure is fixed to a value above critical pressure, CO2 is pumped continuously into the
autoclave and at the same time a similar amount of CO2 is vented out using a needle valve. The
supercritical CO2 dissolves the fluid from the pores of aerogels which is being extracted
continuously. After complete extraction of pore fluid, CO2 is vented out slowly until ambient
pressure is reached, to avoid cooling by Joule - Thompson effect which will lead to aerogel pores
destruction by the condensed CO2.
0
20
40
60
80
100
-90 -70 -50 -30 -10 10 30 50
Temperature (°C)
Pre
ssu
re (
bar)
Solid Liquid
Vapor
Supercritical
region
Triple point
(Tc,Pc)
Figure 2. A typical supercritical CO2 drying process of silica aerogels.
Hydrophobicity of silica aerogels
The aerogels dried using supercritical CO2 are hydrophilic in nature due to the presence of
unconverted -OH groups. The major drawback of these aerogels in technical applications is their
instability under humid atmosphere. In this section the possibilities to hydrophobize the
hydrophilic aerogels by various methods are discussed.
− Aerogels dried by converting the pore fluid (organic solvent like methanol or ethanol) to
supercritical state directly leads to hydrophobic aerogels (Si - (OR)).
Theory
21
− Modification of surface functional groups can be performed via synthesis route, i.e.,
precursor like chlorotrimethylsilanes are used as reactant, which results in hydrophobic
surface of the aerogels [21]. Schwertfeger et al. produced hydrophobic aerogels using a
mixture of tetraalkoyxsilane and trimethoxysilanes [22].
− Rao et al. [23, 24, 25] produced hydrophobic aerogels by modification of surface –OH
groups by –OR groups by placing the aged gels in the solvent present with the modifiers
(TMES, TMCS, HMDS, MTMS) for 48 hours before drying.
− Lee et al. [26] have modified the surface of hydrophilic aerogels using gas phase reaction
of methanol with aerogel surface at 180°C. This method provides an opportunity to
produce aerogels of nearly similar physical properties with different surface functional
groups.
Characterization techniques
A comprehensive overview about the characterization methods of aerogels were reported by
Scherer [27, 28]. The aerogels are normally characterized using N2 adsorption / desorption to
obtain the data like surface area, pore volume, and average pore size distribution. Usually, helium
pyknometry and mercury porosimetry is used to determine the skeleton and pore volume.
Electron microscopy (SEM, TEM, STEM) are used to determine the particle size of colloidal
silica (walls) and morphology of the aerogels. Other technique like SAXS, SANS, NMR, AFM
describe the molecular and fractal dimensions of the aerogels [14]. CHN elementary analysis is
used to characterize the degree of hydrophobicity.
Properties of silica aerogels
Table 1 provides a brief overview of the important properties of the silica aerogels which makes
the aerogels interesting for many applications. These properties of silica aerogels are tuneable by
varying the synthesis routes and process conditions.
Theory
22
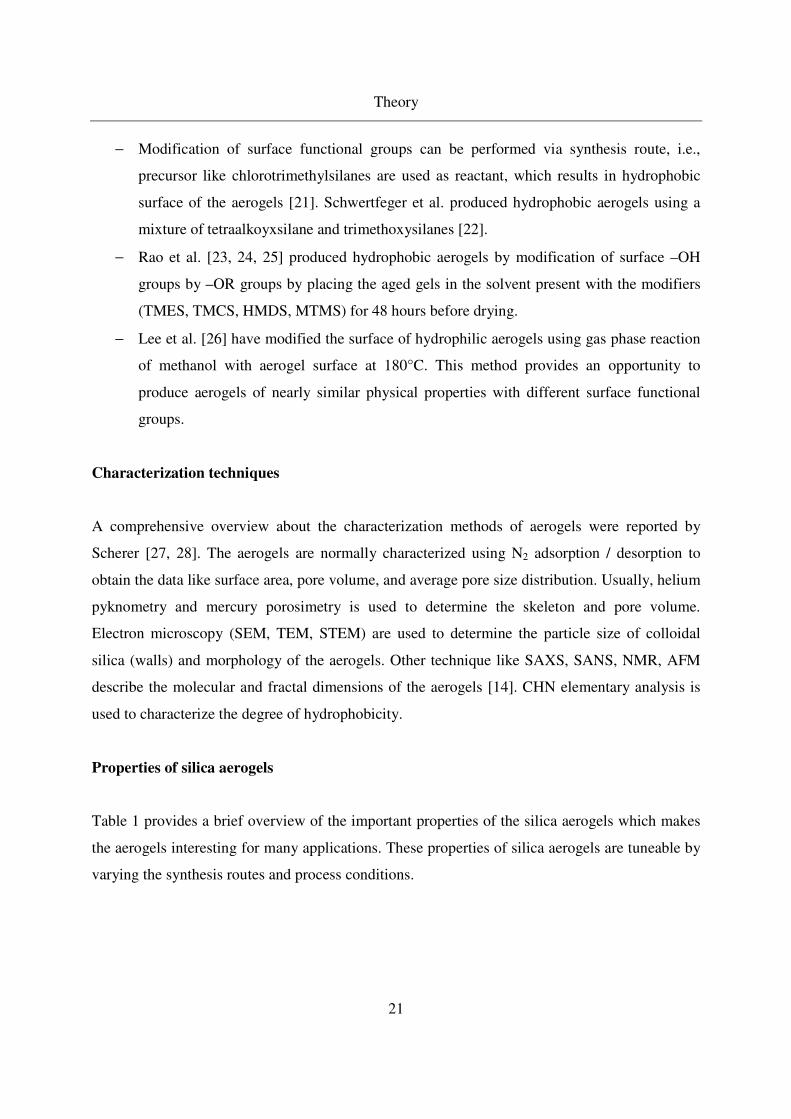
Table 1. Selected properties of silica aerogels [20].
Property Value Remark
Apparent Density 0.003 - 0.35
g/cm3
Most common density is 0.1g/cm3
Internal Surface Area 600 - 1000 m2/g
As determined by nitrogen adsorption /
desorption
% Solids 0.13 - 15% Typically 5% (95% free space)
Mean Pore Diameter 20 nm As determined by nitrogen adsorption /
desorption (varies with density)
Primary Particle
Diameter 2 - 5 nm Determined by electron microscopy
Refraction Index 1.0 - 1.05 Very low for a solid material
Thermal Tolerance To 500 °C
Shrinkage begins slowly at 500 °C,
increases with increasing temperature.
Melting point is >1200 °C
Coefficient of Thermal
Expansion 2.0 - 4.0x10
– 6 /K Determined using ultrasonic methods
Poisson's Ratio 0.2 Independent of density, similar to dense
silica.
Young's Modulus 106 - 10
7 N/m
2
Very small (<104x) compared to dense
silica
Tensile Strength 16 kPa For density = 0.1 g/cm3.
Fracture Toughness 0.8 kPa·m1 / 2
For density = 0.1 g/cm
3. Determined by 3
- point bending
Dielectric Constant 1.1 For density = 0.1 g/cm
3. Very low for a
solid material
Sound Velocity Through
the Medium 100 m/sec
For density = 0.07 g/cm3. One of the
lowest velocities for a solid material
Theory
23
2.1.2 General applications of silica aerogels
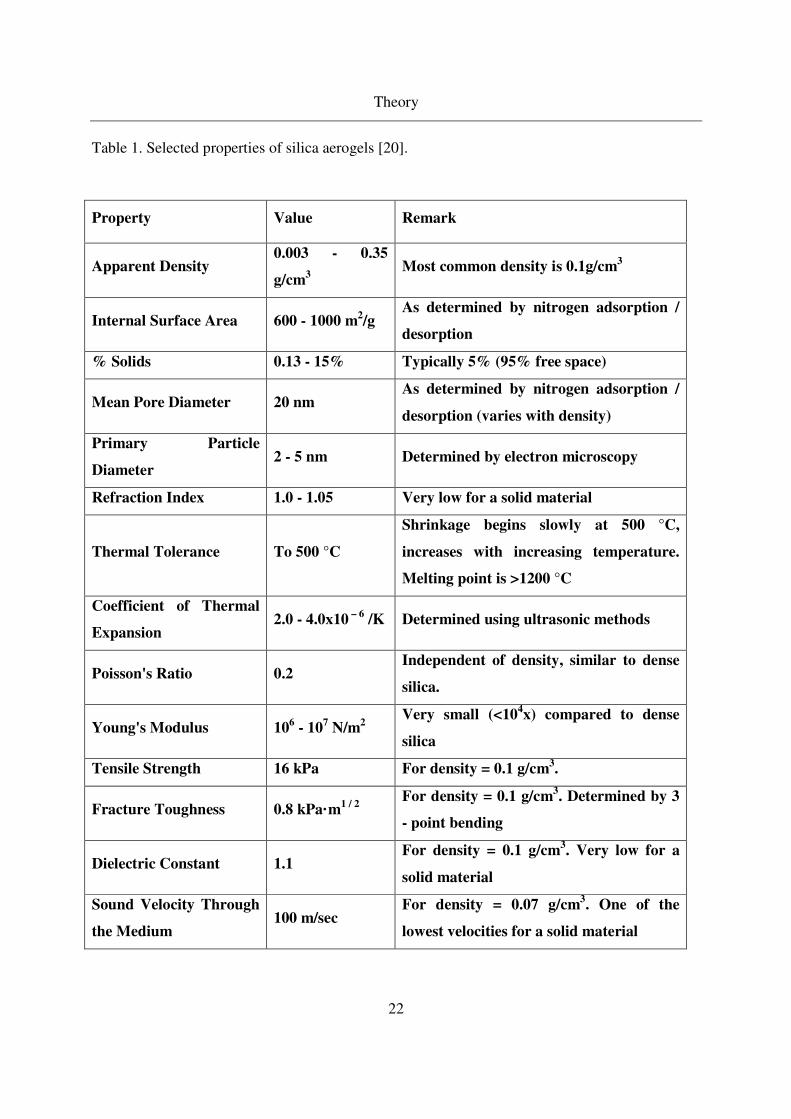
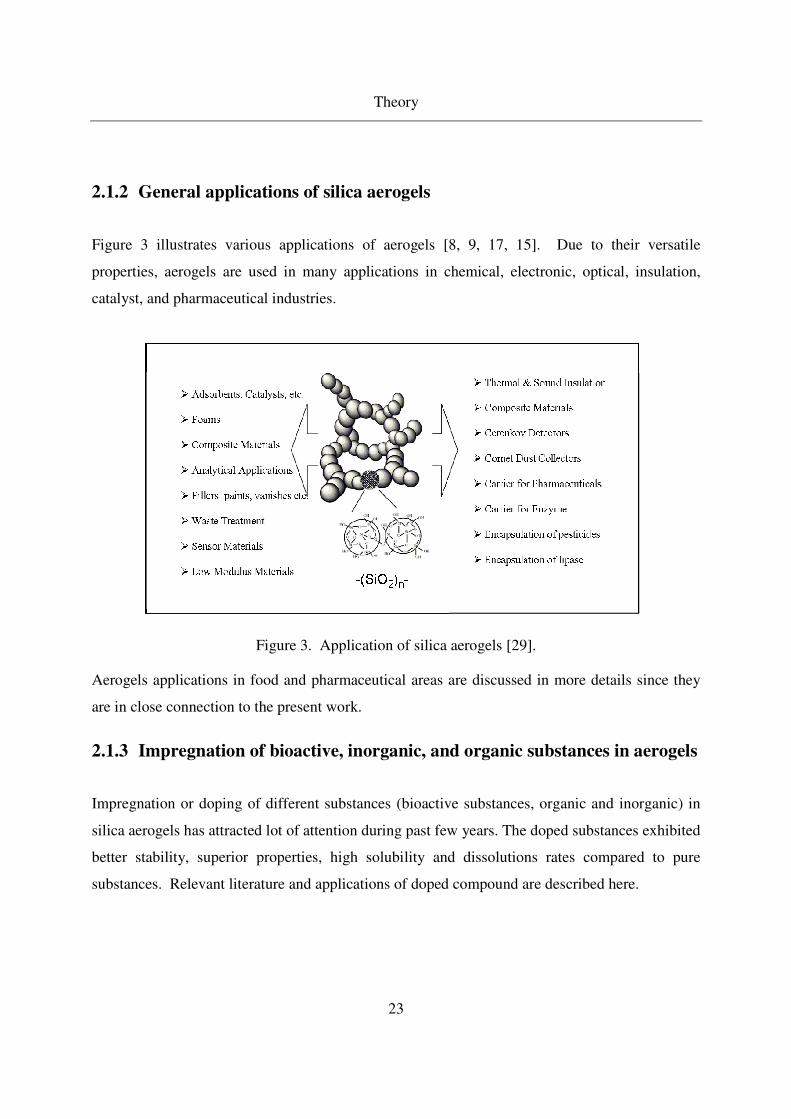
Figure 3 illustrates various applications of aerogels [8, 9, 17, 15]. Due to their versatile
properties, aerogels are used in many applications in chemical, electronic, optical, insulation,
catalyst, and pharmaceutical industries.
Figure 3. Application of silica aerogels [29].
Aerogels applications in food and pharmaceutical areas are discussed in more details since they
are in close connection to the present work.
2.1.3 Impregnation of bioactive, inorganic, and organic substances in aerogels
Impregnation or doping of different substances (bioactive substances, organic and inorganic) in
silica aerogels has attracted lot of attention during past few years. The doped substances exhibited
better stability, superior properties, high solubility and dissolutions rates compared to pure
substances. Relevant literature and applications of doped compound are described here.
Theory
24
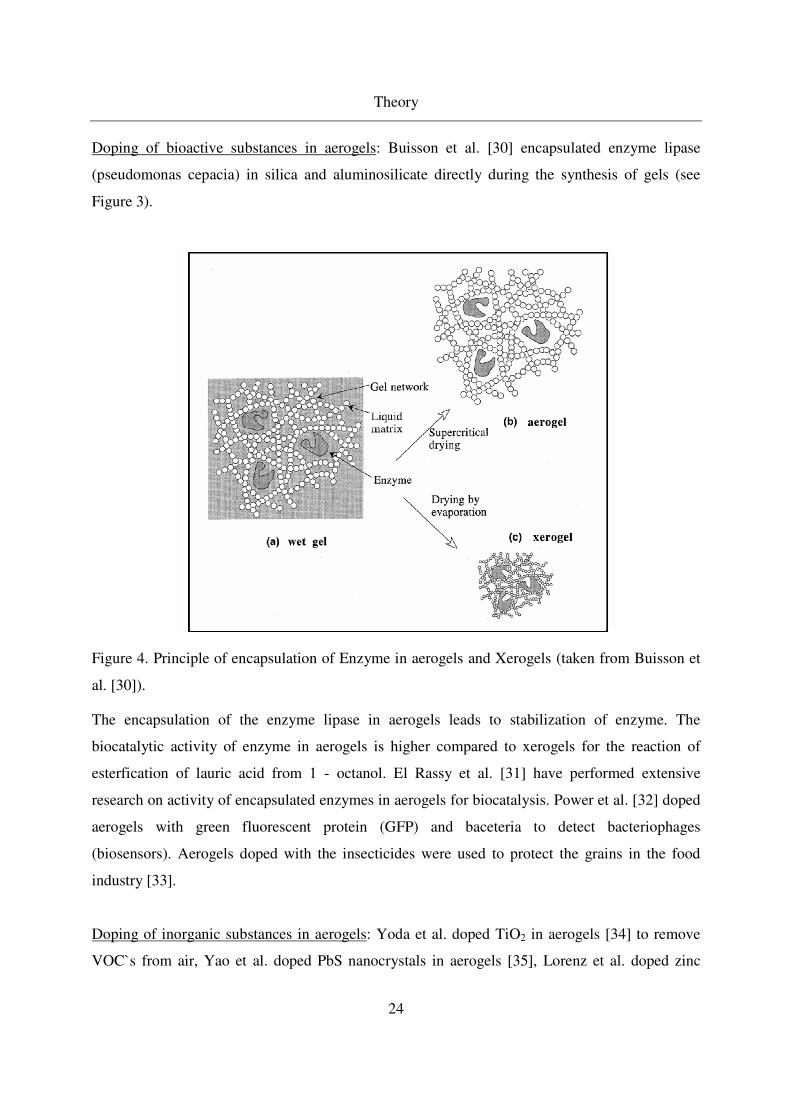
Doping of bioactive substances in aerogels: Buisson et al. [30] encapsulated enzyme lipase
(pseudomonas cepacia) in silica and aluminosilicate directly during the synthesis of gels (see
Figure 3).
Figure 4. Principle of encapsulation of Enzyme in aerogels and Xerogels (taken from Buisson et
al. [30]).
The encapsulation of the enzyme lipase in aerogels leads to stabilization of enzyme. The
biocatalytic activity of enzyme in aerogels is higher compared to xerogels for the reaction of
esterfication of lauric acid from 1 - octanol. El Rassy et al. [31] have performed extensive
research on activity of encapsulated enzymes in aerogels for biocatalysis. Power et al. [32] doped
aerogels with green fluorescent protein (GFP) and baceteria to detect bacteriophages
(biosensors). Aerogels doped with the insecticides were used to protect the grains in the food
industry [33].
Doping of inorganic substances in aerogels: Yoda et al. doped TiO2 in aerogels [34] to remove
VOC`s from air, Yao et al. doped PbS nanocrystals in aerogels [35], Lorenz et al. doped zinc
Theory
25
oxide nanocrystals in aerogels [36], Goodwin et al. doped gallium nitride in aerogels [37], Yoda
et al. doped titanium oxide in aerogels [38], Merzbacher et al. doped ruthenium oxide in aerogels
[39], and Morely et al. doped silver nano particles in aerogels [40].
Doping of drugs / organic substances in aerogels: Schwertfeger et al. [41] described the use of
inorganic aerogels (SiO2, Al2O3, ZrO2) as a drug carrier for many pharmaceutical active
compounds. Goud et al. described the use of aerogels in the inhalents due to their low bulk
density, as the aerogels float in the respiratory system [42]. Smirnova et al. reported the use of
low density silica aerogels a drug delivery system. Various pharmaceutically active compounds
were adsorbed from supercritical solutions on the surface of silica aerogels [20, 19, 29]. The
loading of drugs and the release rates are tailored by controlling the physiochemical properties of
the silica aerogels. This extensive research performed on silica aerogels as drug delivery carrier
forms the basis for the present research work.
2.2 Methods of solute precipitation / crystallization from supercritical CO2
Supercritical CO2 is used as solvent in the present work to crystallize organic substances / drugs
in silica aerogels. Therefore, in this section some relevant aspects of supercritical CO2 and phase
behavior of binary mixture solute - SCF are shortly discussed along with SCF methods for
particle formation.
2.2.1 Supercritical fluids as solvent
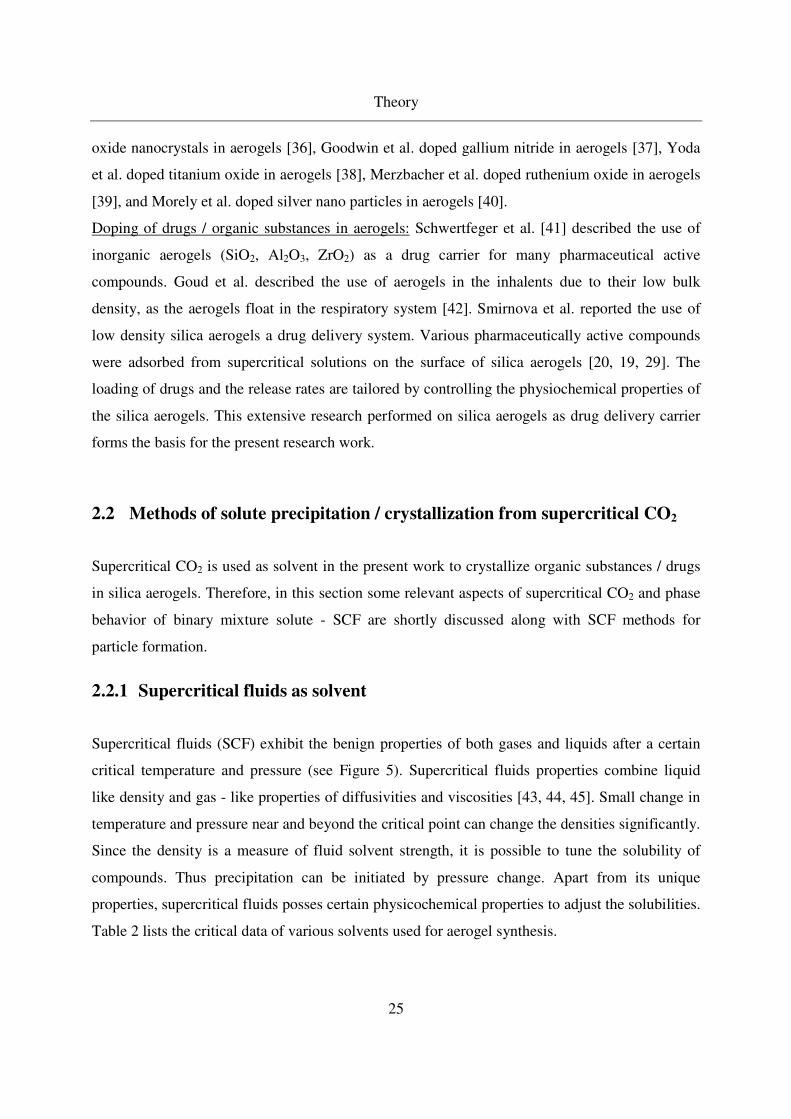
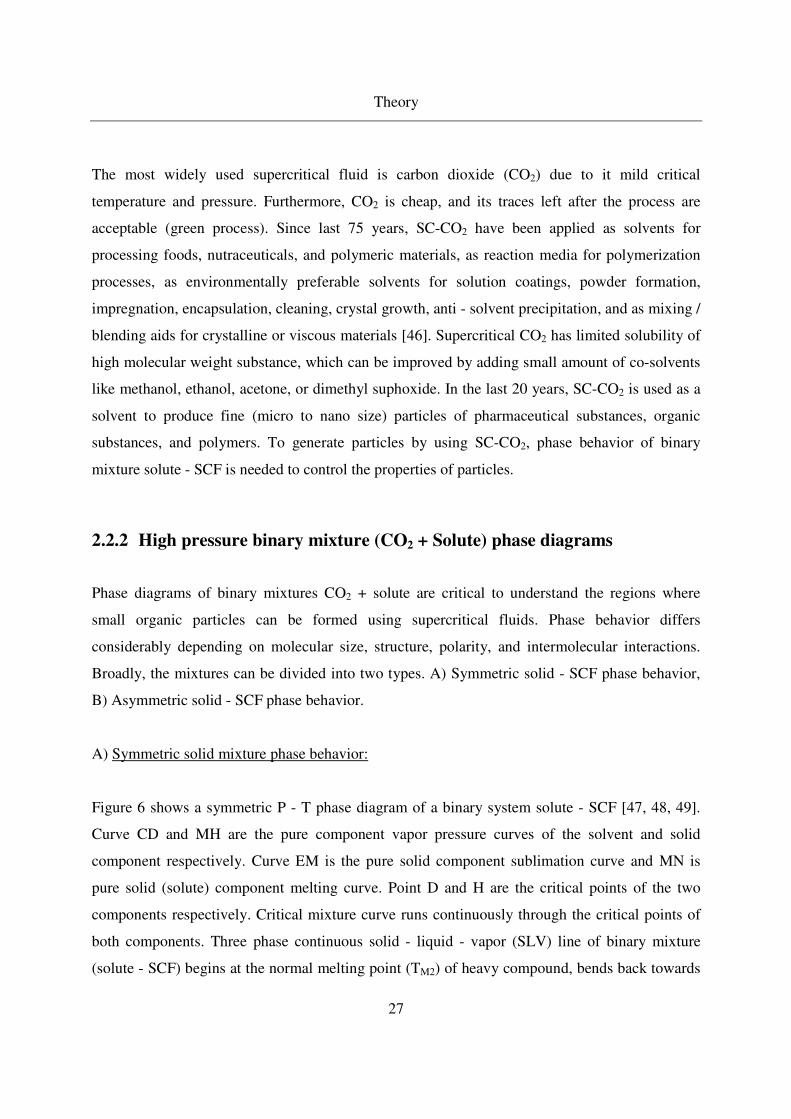
Supercritical fluids (SCF) exhibit the benign properties of both gases and liquids after a certain
critical temperature and pressure (see Figure 5). Supercritical fluids properties combine liquid
like density and gas - like properties of diffusivities and viscosities [43, 44, 45]. Small change in
temperature and pressure near and beyond the critical point can change the densities significantly.
Since the density is a measure of fluid solvent strength, it is possible to tune the solubility of
compounds. Thus precipitation can be initiated by pressure change. Apart from its unique
properties, supercritical fluids posses certain physicochemical properties to adjust the solubilities.
Table 2 lists the critical data of various solvents used for aerogel synthesis.
Theory
26
Temperature (°C)
Pre
ssu
re (
bar)
Solid Liquid
Vapor
Supercritical
region
Triple point
Tc
Pc
Figure 5. Typical P - T Phase diagram of a pure component.
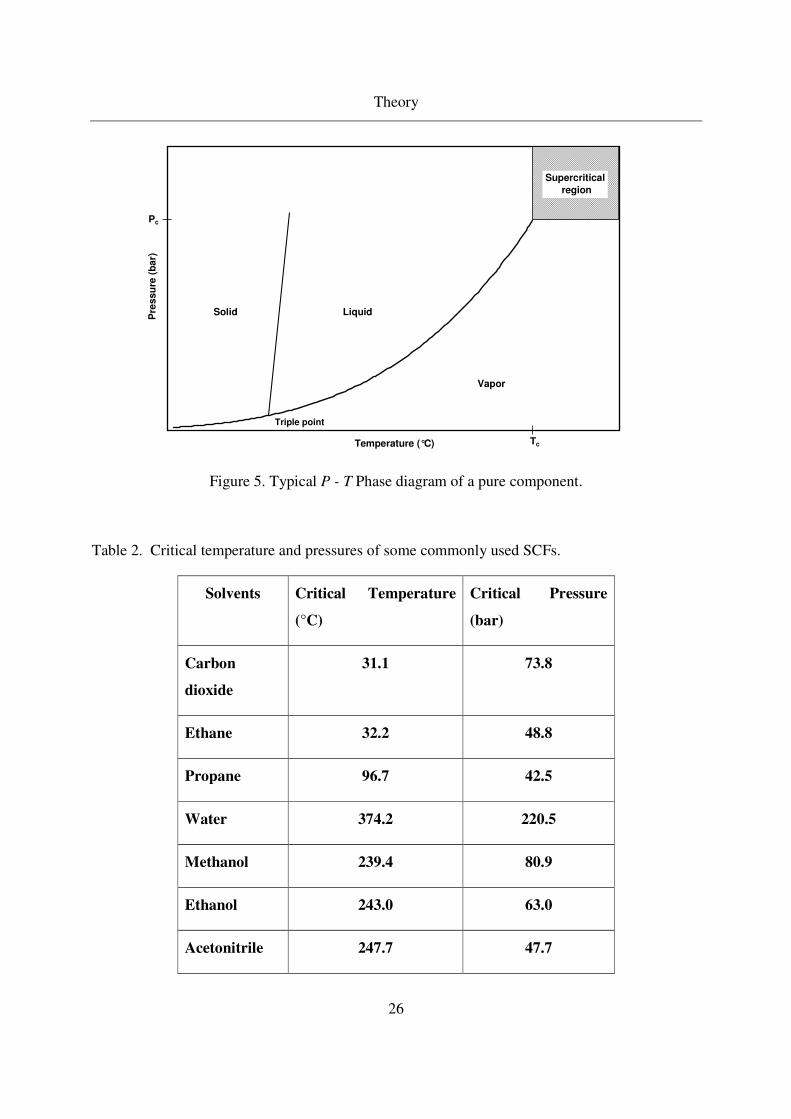
Table 2. Critical temperature and pressures of some commonly used SCFs.
Solvents Critical Temperature
(°C)
Critical Pressure
(bar)
Carbon
dioxide
31.1 73.8
Ethane 32.2 48.8
Propane 96.7 42.5
Water 374.2 220.5
Methanol 239.4 80.9
Ethanol 243.0 63.0
Acetonitrile 247.7 47.7
Theory
27
The most widely used supercritical fluid is carbon dioxide (CO2) due to it mild critical
temperature and pressure. Furthermore, CO2 is cheap, and its traces left after the process are
acceptable (green process). Since last 75 years, SC-CO2 have been applied as solvents for
processing foods, nutraceuticals, and polymeric materials, as reaction media for polymerization
processes, as environmentally preferable solvents for solution coatings, powder formation,
impregnation, encapsulation, cleaning, crystal growth, anti - solvent precipitation, and as mixing /
blending aids for crystalline or viscous materials [46]. Supercritical CO2 has limited solubility of
high molecular weight substance, which can be improved by adding small amount of co-solvents
like methanol, ethanol, acetone, or dimethyl suphoxide. In the last 20 years, SC-CO2 is used as a
solvent to produce fine (micro to nano size) particles of pharmaceutical substances, organic
substances, and polymers. To generate particles by using SC-CO2, phase behavior of binary
mixture solute - SCF is needed to control the properties of particles.
2.2.2 High pressure binary mixture (CO2 + Solute) phase diagrams
Phase diagrams of binary mixtures CO2 + solute are critical to understand the regions where
small organic particles can be formed using supercritical fluids. Phase behavior differs
considerably depending on molecular size, structure, polarity, and intermolecular interactions.
Broadly, the mixtures can be divided into two types. A) Symmetric solid - SCF phase behavior,
B) Asymmetric solid - SCF phase behavior.
A) Symmetric solid mixture phase behavior:
Figure 6 shows a symmetric P - T phase diagram of a binary system solute - SCF [47, 48, 49].
Curve CD and MH are the pure component vapor pressure curves of the solvent and solid
component respectively. Curve EM is the pure solid component sublimation curve and MN is
pure solid (solute) component melting curve. Point D and H are the critical points of the two
components respectively. Critical mixture curve runs continuously through the critical points of
both components. Three phase continuous solid - liquid - vapor (SLV) line of binary mixture
(solute - SCF) begins at the normal melting point (TM2) of heavy compound, bends back towards
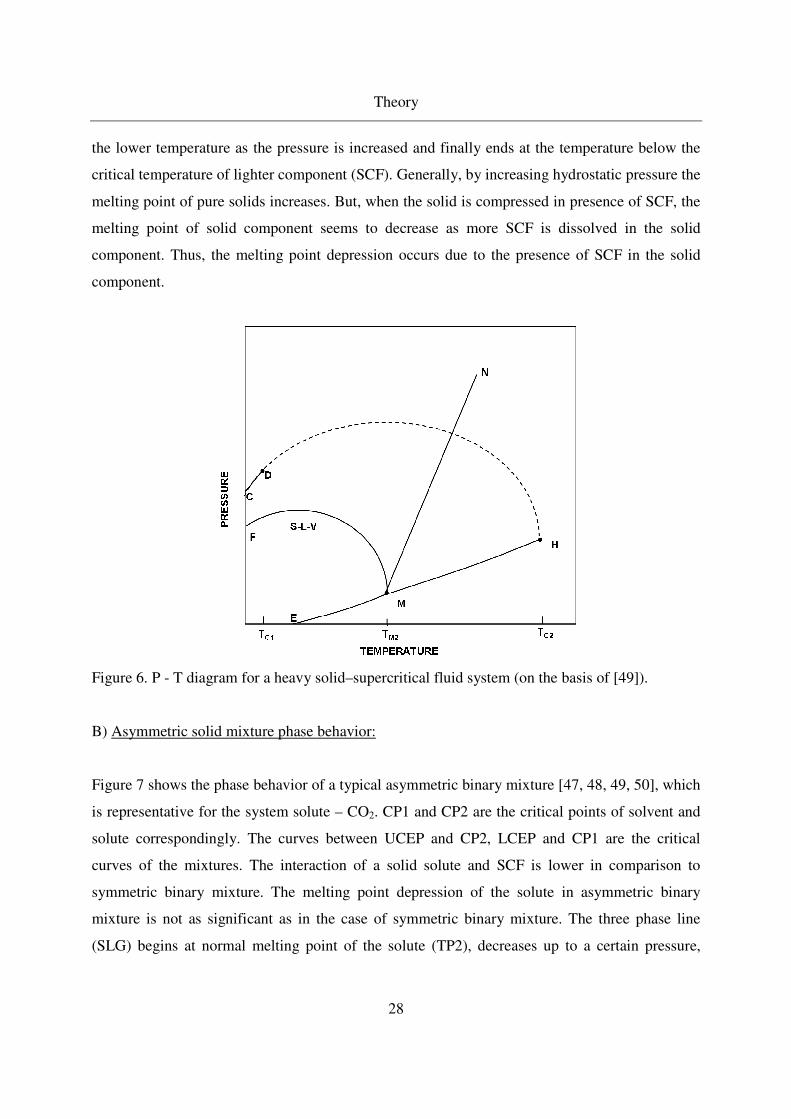
Theory
28
the lower temperature as the pressure is increased and finally ends at the temperature below the
critical temperature of lighter component (SCF). Generally, by increasing hydrostatic pressure the
melting point of pure solids increases. But, when the solid is compressed in presence of SCF, the
melting point of solid component seems to decrease as more SCF is dissolved in the solid
component. Thus, the melting point depression occurs due to the presence of SCF in the solid
component.
Figure 6. P - T diagram for a heavy solid–supercritical fluid system (on the basis of [49]).
B) Asymmetric solid mixture phase behavior:
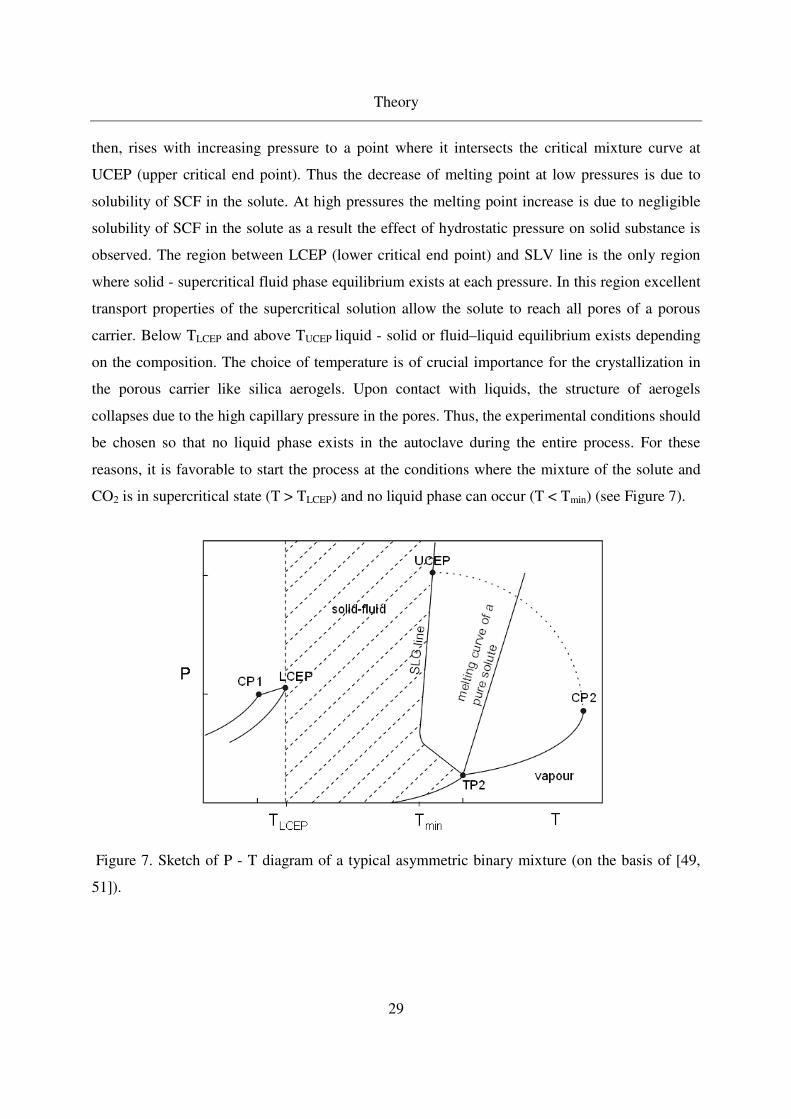
Figure 7 shows the phase behavior of a typical asymmetric binary mixture [47, 48, 49, 50], which
is representative for the system solute – CO2. CP1 and CP2 are the critical points of solvent and
solute correspondingly. The curves between UCEP and CP2, LCEP and CP1 are the critical
curves of the mixtures. The interaction of a solid solute and SCF is lower in comparison to
symmetric binary mixture. The melting point depression of the solute in asymmetric binary
mixture is not as significant as in the case of symmetric binary mixture. The three phase line
(SLG) begins at normal melting point of the solute (TP2), decreases up to a certain pressure,
Theory
29
then, rises with increasing pressure to a point where it intersects the critical mixture curve at
UCEP (upper critical end point). Thus the decrease of melting point at low pressures is due to
solubility of SCF in the solute. At high pressures the melting point increase is due to negligible
solubility of SCF in the solute as a result the effect of hydrostatic pressure on solid substance is
observed. The region between LCEP (lower critical end point) and SLV line is the only region
where solid - supercritical fluid phase equilibrium exists at each pressure. In this region excellent
transport properties of the supercritical solution allow the solute to reach all pores of a porous
carrier. Below TLCEP and above TUCEP liquid - solid or fluid–liquid equilibrium exists depending
on the composition. The choice of temperature is of crucial importance for the crystallization in
the porous carrier like silica aerogels. Upon contact with liquids, the structure of aerogels
collapses due to the high capillary pressure in the pores. Thus, the experimental conditions should
be chosen so that no liquid phase exists in the autoclave during the entire process. For these
reasons, it is favorable to start the process at the conditions where the mixture of the solute and
CO2 is in supercritical state (T > TLCEP) and no liquid phase can occur (T < Tmin) (see Figure 7).
Figure 7. Sketch of P - T diagram of a typical asymmetric binary mixture (on the basis of [49,
51]).
Theory
30
2.2.3 Different methods of SCF particle formation technologies
The versatile properties of supercritical fluids provide a possibility to produce particles ranging
from microns to nanometers. Especially, controlling of drug particle size and its morphology has
a significant importance in pharmaceutical industry. Table 3 lists the general SCF technologies
and their principles developed for producing particles. Several review articles are published
summarizing the recent development and breakthrough [49, 52, 53, 54, 157, 55] in the particle
formation by various SCF methods [56, 57, 58].
Table 5 lists the comprehensive reviews reported for last 20 years in the literature on SCF
methods of particle formation, influence of physical property of drugs, nucleation, growth rate,
characteristic polymers, various applications, operational parameters, pre - expansion
temperatures and pressures, nozzle geometry.
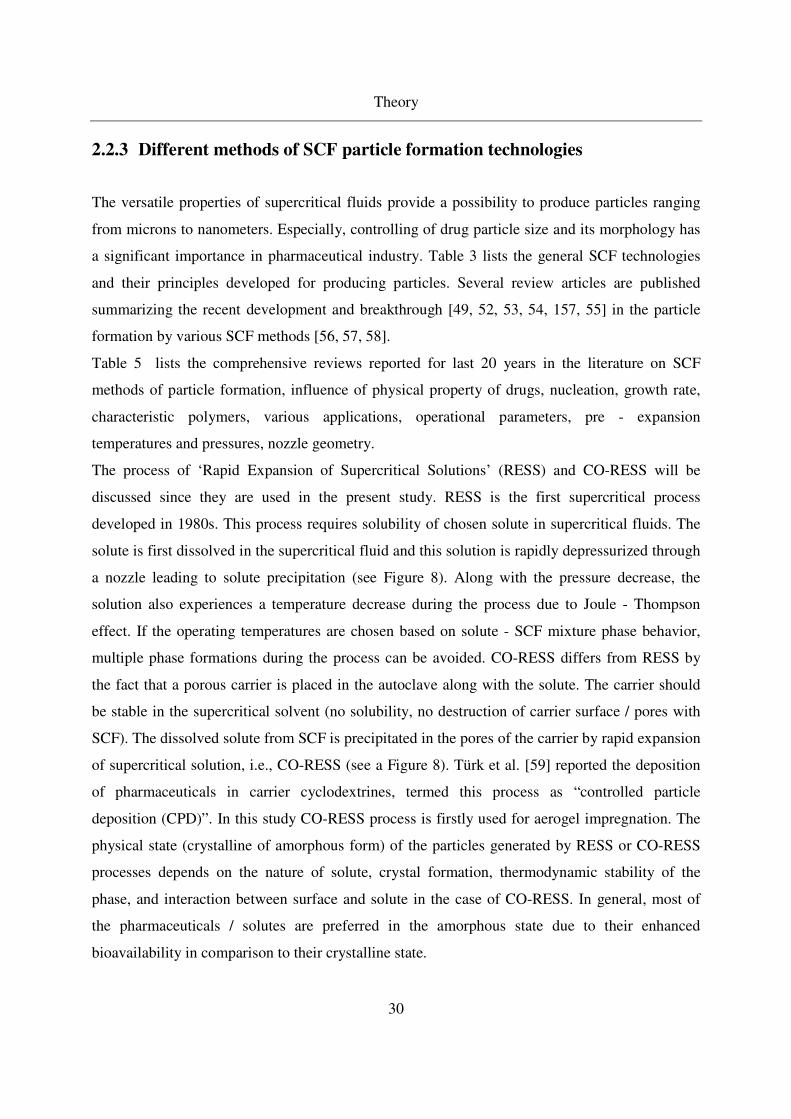
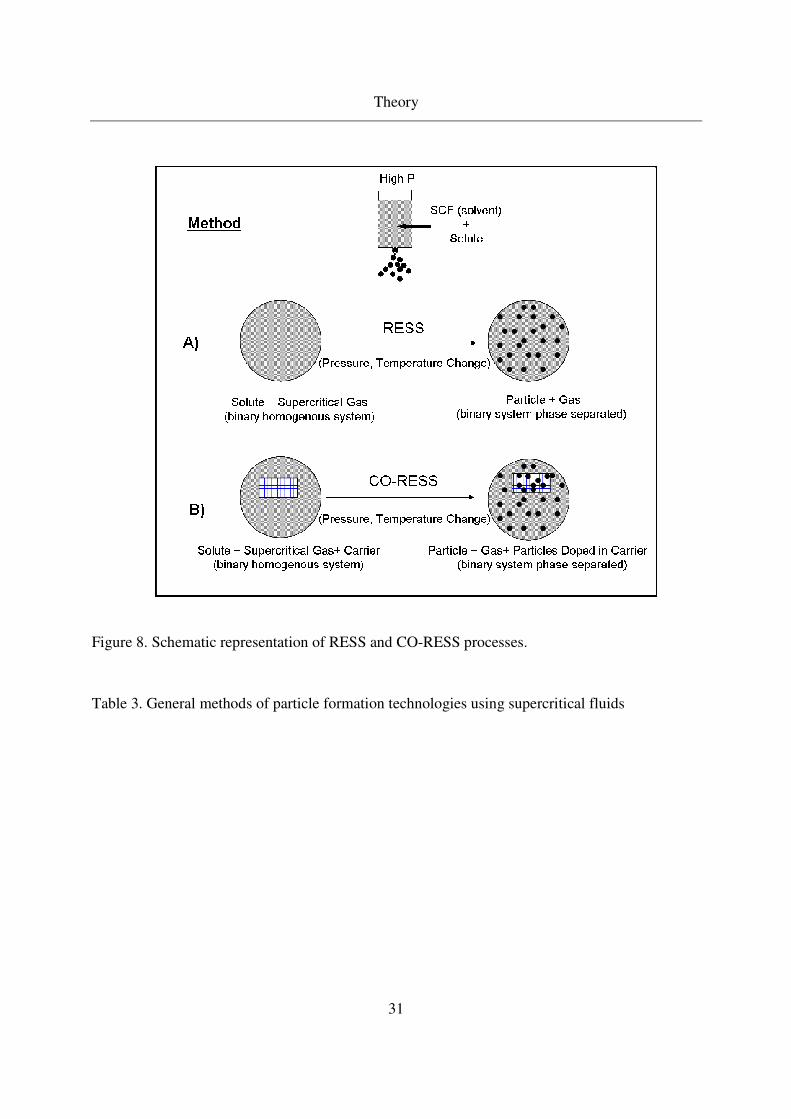
The process of ‘Rapid Expansion of Supercritical Solutions’ (RESS) and CO-RESS will be
discussed since they are used in the present study. RESS is the first supercritical process
developed in 1980s. This process requires solubility of chosen solute in supercritical fluids. The
solute is first dissolved in the supercritical fluid and this solution is rapidly depressurized through
a nozzle leading to solute precipitation (see Figure 8). Along with the pressure decrease, the
solution also experiences a temperature decrease during the process due to Joule - Thompson
effect. If the operating temperatures are chosen based on solute - SCF mixture phase behavior,
multiple phase formations during the process can be avoided. CO-RESS differs from RESS by
the fact that a porous carrier is placed in the autoclave along with the solute. The carrier should
be stable in the supercritical solvent (no solubility, no destruction of carrier surface / pores with
SCF). The dissolved solute from SCF is precipitated in the pores of the carrier by rapid expansion
of supercritical solution, i.e., CO-RESS (see a Figure 8). Türk et al. [59] reported the deposition
of pharmaceuticals in carrier cyclodextrines, termed this process as “controlled particle
deposition (CPD)”. In this study CO-RESS process is firstly used for aerogel impregnation. The
physical state (crystalline of amorphous form) of the particles generated by RESS or CO-RESS
processes depends on the nature of solute, crystal formation, thermodynamic stability of the
phase, and interaction between surface and solute in the case of CO-RESS. In general, most of
the pharmaceuticals / solutes are preferred in the amorphous state due to their enhanced
bioavailability in comparison to their crystalline state.
Theory
31
Figure 8. Schematic representation of RESS and CO-RESS processes.
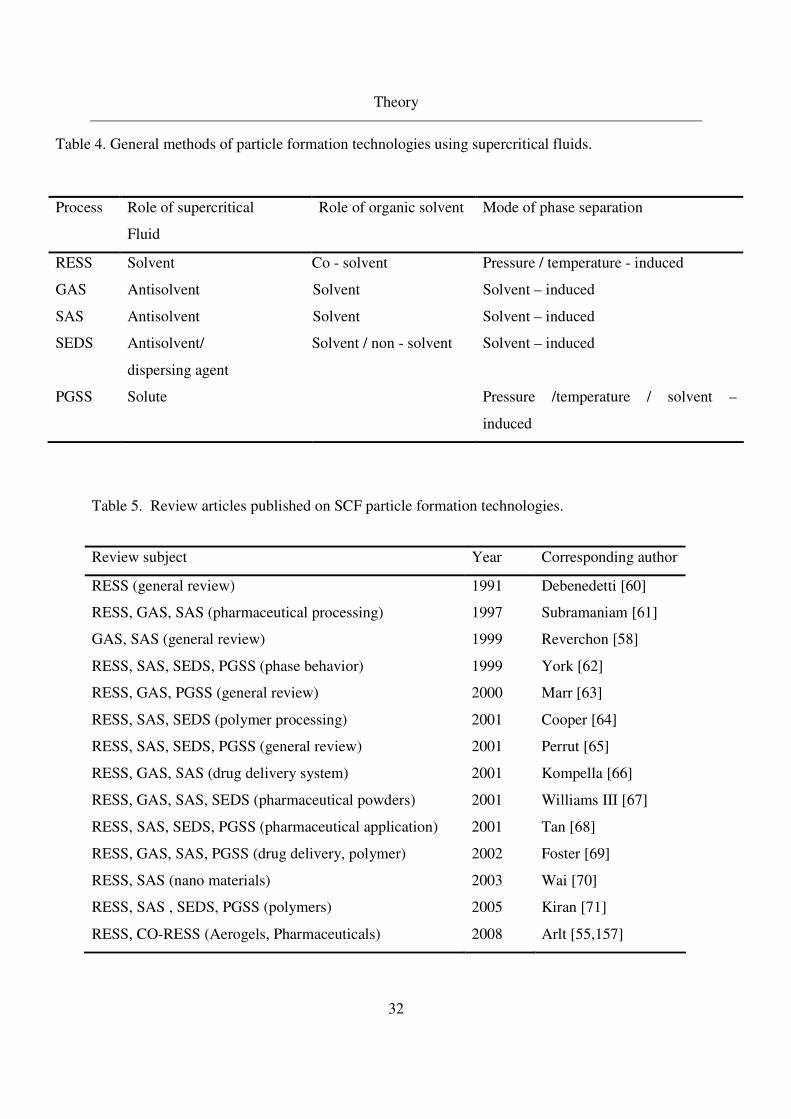
Table 3. General methods of particle formation technologies using supercritical fluids
Theory
32
Table 5. Review articles published on SCF particle formation technologies.
Review subject Year Corresponding author
RESS (general review) 1991 Debenedetti [60]
RESS, GAS, SAS (pharmaceutical processing) 1997 Subramaniam [61]
GAS, SAS (general review) 1999 Reverchon [58]
RESS, SAS, SEDS, PGSS (phase behavior) 1999 York [62]
RESS, GAS, PGSS (general review) 2000 Marr [63]
RESS, SAS, SEDS (polymer processing) 2001 Cooper [64]
RESS, SAS, SEDS, PGSS (general review) 2001 Perrut [65]
RESS, GAS, SAS (drug delivery system) 2001 Kompella [66]
RESS, GAS, SAS, SEDS (pharmaceutical powders) 2001 Williams III [67]
RESS, SAS, SEDS, PGSS (pharmaceutical application) 2001 Tan [68]
RESS, GAS, SAS, PGSS (drug delivery, polymer) 2002 Foster [69]
RESS, SAS (nano materials) 2003 Wai [70]
RESS, SAS , SEDS, PGSS (polymers) 2005 Kiran [71]
RESS, CO-RESS (Aerogels, Pharmaceuticals) 2008 Arlt [55,157]
Table 4. General methods of particle formation technologies using supercritical fluids.
Process Role of supercritical
Fluid
Role of organic solvent Mode of phase separation
RESS Solvent Co - solvent Pressure / temperature - induced
GAS Antisolvent Solvent Solvent – induced
SAS Antisolvent Solvent Solvent – induced
SEDS Antisolvent/
dispersing agent
Solvent / non - solvent Solvent – induced
PGSS Solute Pressure /temperature / solvent –
induced
Theory
33
2.3 Physical state (crystalline / amorphous form) of drugs in a carrier
Recent years, amorphization of crystalline solids received a great importance in
pharmaceutical industry, because amorphous form of substance exhibit increased solubility
and bioavailability [72, 73]. Amorphous solids have higher Gibbs free energy and entropy
than the corresponding crystals [74] and exhibit better compressibility because of lower
bonding energy.
Standard methods to produce amorphous solids are: solvent method, hot melt technology,
milling, freeze and spray drying, drying of solvated crystals, extrusion, and loading in porous
carriers. All the above amorphization techniques follow generally two routes: (1) direct
amorphization of elementary substances, (2) amorphization of drugs using crystallization
inhibitors. The most common amorphization method is the rapid cooling of substance below
its melting point (Tm), which leads to so called supercooled liquid or rubbery state. In the
“hot melt” method [75] a carrier (polymer) and drug substances are melted together above
eutectic point and then cooled down. Important prerequisite is the miscibility of the drug and
the carrier in the molten form. In solvent method [76], a drug and a carrier are dissolved in a
mutual solvent and then solvent is evaporated under vacuum to produce a solid solution [77].
Nanoconfinement of the drug in porous carrier is used to control the morphology [91, 92, 93].
Review of Szabo et al. lists the sequence of choice of correct amorphization route for API
(active pharmaceutical ingredients) [78]. Review by Hancock et al. describes the methods,
uses, and significance of amorphous state of pharmaceutical systems [79].
2.3.1 General stabilization methods and problems of amorphization
Amorphous solids can crystallize or undergo structural relaxation with respect to their
corresponding crystals. Molecular mobility and relaxation behavior is an important criteria for
the stability of amorphized drug [80]. These properties depend on the magnitude and
temperature dependence of the apparent activation energy of molecular motions of the
compounds near and above glass transition temperature (Tg) in supercooled liquids [81, 82].
To date no single method exists that allows to predict the stability of amorphous products, as
stability is governed by Tg, fragility, configurational heat capacity (generally by the
thermodynamic driving force). Storage of amorphous drug samples at Kauzmann temperature
(TK) has previously been suggested [83, 84], however it does not guarantee sufficient
Theory
34
stability over the desired shelf time, recrystallization can occur even well below the glass
transition temperature (Tg) [85, 86, 87].
Some organic compounds have remarkable conformational flexibility which leads to reduced
degree of crystallization and favors amorphization [88]. Stabilization of such substances
during processing and storage can be done by using additives, and carrier - drug interactions,
i.e., selective hydrogen bonding between stabilizing excipients and drug molecules [89]. For
instance adsorption of water decreases the Tg, since it acts as a plasticizer, increases the
molecular mobility [90] and thus retains the amorphous form of drug.
Confinement in porous host systems with strongly interacting pore walls is shown to be a
powerful method to increase the lifetime of amorphous drugs based on changes in
thermodynamic and crystallization kinetics in nano - sized systems [91, 92, 93]. This indicates
that the confined drug has spatial inhomogenous mobility and density. If the critical diameter
of the nuclei for the crystalline form is larger than pore diameter than the nuclei cannot reach
the size necessary for exergonic crystal growth, thus the amorphous state would be
thermodynamically stable [94].
2.3.2 Characterization of amorphous state: relevant techniques
General characterization techniques used for the characterization of the amorphous solids are:
DSC [95, 96], XRD [97], configurational heat capacity [98], and scanning rate dependence of
Tg (estimation of the relaxation time). Some other special methods used for characterization
are: use of gas displacement pyknometry for quantifying the amorphous content of partially
crystalline pharmaceuticals systems described by Saleki - Gerhardt et al. [99]. The most
characteristic property of the amorphous state is its viscosity, the greater free volume and
molecular disorder of an amorphous material compared to its crystalline counterpart can be
seen with the change in viscosity [100, 101, 102]. Spectroscopic techniques; NMR, IR, and
electron spin resonance [103, 104, 105, 106] are used to measure glass transition
temperatures, amorphous content, and mean molecular relaxation times.

Theory
35
2.4 High pressure adsorption isotherms on adsorbents at supercritical
conditions
2.4.1 Adsorption measurements using Magnetic Suspension Balance (MSB)
In the year 1940, Holmes [107], Clark [108], and Beams [109] were the first to design and
develop the Magnetic Suspension Balances (MSB), a balance in which the material to be
weighed is freely suspended. They used MSB for the experiments where weighing must be
carried out in an evacuated or closed cell or under a transparent liquids. The limited
sensitivity and stability of MSB balances prevented its application for many years. Since, 50
years from the first design of MSB, many researchers have designed and developed various
kind of laboratory MSB’s and reported the experimental and modeled adsorption date of pure
gases, binary, ternary mixtures on many solids adsorbents. Recently, a very accurate and
stable magnetic suspension balance was developed by the company Rubotherm (Germany) to
measure the adsorption of gases under high pressures and temperatures and density of the
bulk phase (in-situ) simultaneously during the measurements [110, 111]. A variety of high
pressure adsorption isotherms were measured using MSB. High pressure adsorption and
modeling of CO2 on activated carbon is studied by many researchers; Keller et al. [112, 113,
130], Humayun et al. [113], Vaart et al. [114], Fitzgerlad, et al [115, 116], Chen, et al. [117],
and Dreisbach et al. [122, 110, 113]. Similarly high pressure adsorption of methane, N2, H2 is
studied on activated carbon [112, 118, 110, 113, 114]. Some of the literature on high pressure
adsorption of gases on silica gel and zeolites is also reported. Adsorption of N2 and CO2 on
zeolites and silica gel is reported by Zhou et al. [119], Gao [120], and Hocker et al. [121].
Binary mixture adsorption of CO / H2 is reported by Dreisbach et al. [122]; binary and ternary
mixture of CO2 / CH4 / N2 / Ar is reported by Keller et al. [112, 113, 130], Vaart et al. [114],
Dreisbach et al. [122, 110]. The main difficulty is the analysis of the raw data obtained from
MSB. This point is addressed in the following chapter.
2.4.2 Data analysis of MSB adsorption measurements
Handling of raw data obtained from MSB
Following values are measured by MSB: p: pressure, T: temperature: ∆m: difference between
the initial weight in vacuum at respective T and weight at conditions p and T; and ρb: bulk
Theory
36
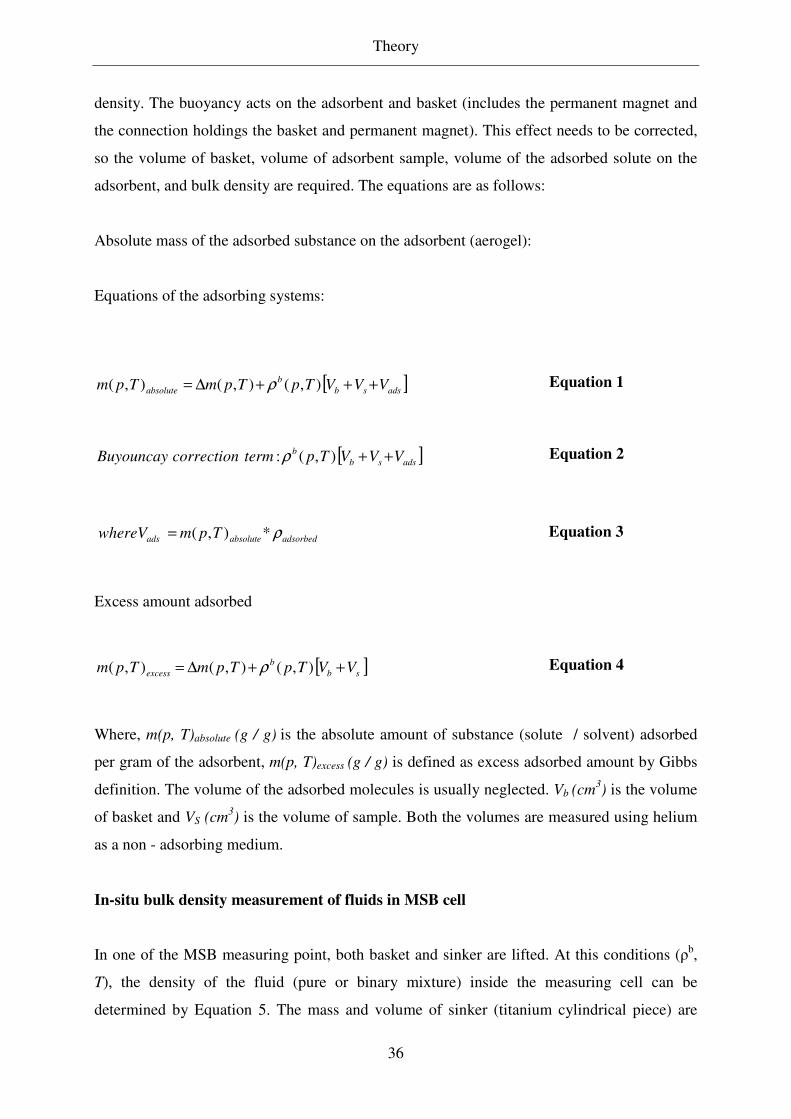
density. The buoyancy acts on the adsorbent and basket (includes the permanent magnet and
the connection holdings the basket and permanent magnet). This effect needs to be corrected,
so the volume of basket, volume of adsorbent sample, volume of the adsorbed solute on the
adsorbent, and bulk density are required. The equations are as follows:
Absolute mass of the adsorbed substance on the adsorbent (aerogel):
Equations of the adsorbing systems:
[ ]adssb
b
absolute VVVTpTpmTpm +++∆= ),(),(),( ρ Equation 1
[ ]adssb
bVVVTptermcorrectionBuyouncay ++),(:ρ Equation 2
adsorbedabsoluteads TpmwhereV ρ*),(= Equation 3
Excess amount adsorbed
[ ]sb
b
excess VVTpTpmTpm ++∆= ),(),(),( ρ Equation 4
Where, m(p, T)absolute (g / g) is the absolute amount of substance (solute / solvent) adsorbed
per gram of the adsorbent, m(p, T)excess (g / g) is defined as excess adsorbed amount by Gibbs
definition. The volume of the adsorbed molecules is usually neglected. Vb (cm3) is the volume
of basket and VS (cm3) is the volume of sample. Both the volumes are measured using helium
as a non - adsorbing medium.
In-situ bulk density measurement of fluids in MSB cell
In one of the MSB measuring point, both basket and sinker are lifted. At this conditions (ρb,
T), the density of the fluid (pure or binary mixture) inside the measuring cell can be
determined by Equation 5. The mass and volume of sinker (titanium cylindrical piece) are

Theory
37
previously calibrated and it is assumed, that there is no adsorption of gases (solute or solvent)
on sinker.
kersin
21kersin ),(),(
V
TMTMM bb
bρρ
ρ−+
= Equation 5
Thus, it provides an opportunity to measure the bulk density of fluid (pure gases and
mixtures) in-situ.
Volume (Vb, VS) determination by helium measurements
To determine the volume of the basket (Vb) and adsorbent sample (Vs), helium is used. MSB
cell with empty basket is pressurized stepwise with helium with different pressure steps to
measure the reduced weight of the basket. Applying Equation 4 with the assumption that the
adsorption of the helium on the basket (or adsorbent) is negligible (mHe(p,T)excess= 0), the
reduced mass of basket is measured at different pressures of helium. The slope of the linear
plot between reduced mass and density of pure helium gives the total volume of basket (Vs).
Later, the adsorbent is placed in the empty basket and similar procedure is repeated to obtain
the adsorbent volume. The volume obtained in the case of porous adsorbent samples is the
skeleton volume of adsorbent. Thus, the obtained volumes are used to correct the buoyancy
effects of the measured data from MSB. Therefore, the direct measurable values are the
excess adsorbed amount and the bulk density of solvent. The absolute adsorption can be
derived from the measured data by assuming an analytical form of adsorption isotherms [123,
124, 125, 126]. The experiment data of excess adsorbed amount for various densities is used
to fit the parameters of analytical adsorption isotherms along with unknown Vads or ρads.
2.4.3 Analytical adsorption isotherms
Isotherms of supercritical CO2 and both CO2 and solute on aerogels are expected to be of
IUPAC type I. The most general analytical isotherms used for the fitting of such data are as
follows: Langmuir, Toth, and UNILAN isotherms [127, 128, 129].
Theory
38
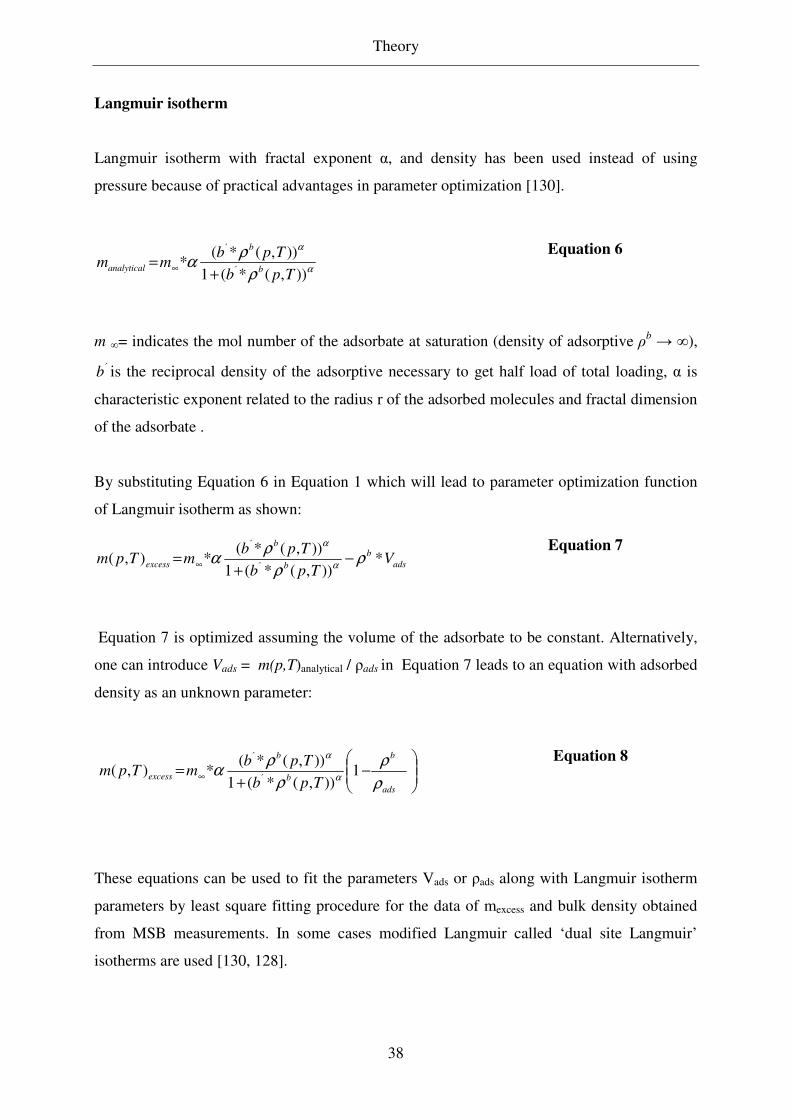
Langmuir isotherm
Langmuir isotherm with fractal exponent α, and density has been used instead of using
pressure because of practical advantages in parameter optimization [130].
α
α
ρ
ρα
)),(*(1
)),(*(* ´
´
Tpb
Tpbmm
b
b
analytical+
= ∞ Equation 6
m ∞= indicates the mol number of the adsorbate at saturation (density of adsorptive ρb → ∞),
´b is the reciprocal density of the adsorptive necessary to get half load of total loading, α is
characteristic exponent related to the radius r of the adsorbed molecules and fractal dimension
of the adsorbate .
By substituting Equation 6 in Equation 1 which will lead to parameter optimization function
of Langmuir isotherm as shown:
ads
b
b
b
excess VTpb
TpbmTpm *
)),(*(1
)),(*(*),( ´
´
ρρ
ρα
α
α
−+
= ∞ Equation 7
Equation 7 is optimized assuming the volume of the adsorbate to be constant. Alternatively,
one can introduce Vads = m(p,T)analytical / ρads in Equation 7 leads to an equation with adsorbed
density as an unknown parameter:
−
+= ∞
ads
b
b
b
excessTpb
TpbmTpm
ρ
ρ
ρ
ρα
α
α
1)),(*(1
)),(*(*),( ´
´
Equation 8
These equations can be used to fit the parameters Vads or ρads along with Langmuir isotherm
parameters by least square fitting procedure for the data of mexcess and bulk density obtained
from MSB measurements. In some cases modified Langmuir called ‘dual site Langmuir’
isotherms are used [130, 128].
Theory
39
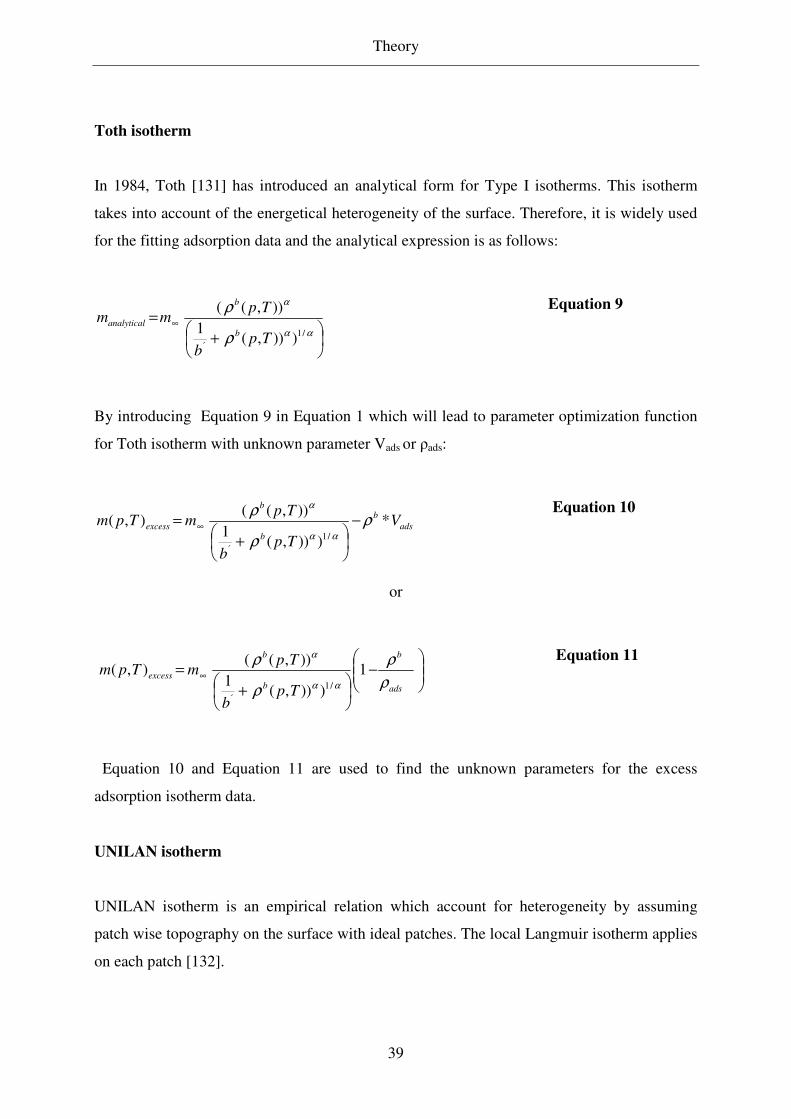
Toth isotherm
In 1984, Toth [131] has introduced an analytical form for Type I isotherms. This isotherm
takes into account of the energetical heterogeneity of the surface. Therefore, it is widely used
for the fitting adsorption data and the analytical expression is as follows:
+
= ∞αα
α
ρ
ρ
/1´
))),(1
)),((
Tpb
Tpmm
b
b
analytical Equation 9
By introducing Equation 9 in Equation 1 which will lead to parameter optimization function
for Toth isotherm with unknown parameter Vads or ρads:
ads
b
b
b
excess V
Tpb
TpmTpm *
))),(1
)),((),(
/1´
ρ
ρ
ρ
αα
α
−
+
= ∞ Equation 10
or
−
+
= ∞
ads
b
b
b
excess
Tpb
TpmTpm
ρ
ρ
ρ
ρ
αα
α
1))),(
1)),((
),(/1
´
Equation 11
Equation 10 and Equation 11 are used to find the unknown parameters for the excess
adsorption isotherm data.
UNILAN isotherm
UNILAN isotherm is an empirical relation which account for heterogeneity by assuming
patch wise topography on the surface with ideal patches. The local Langmuir isotherm applies
on each patch [132].
Theory
40
+
+=
−
∞
),(**1
),(**1
2 ´
´
TPeb
TpebLn
mm
b
b
analytical
ρ
ρ
α α
α
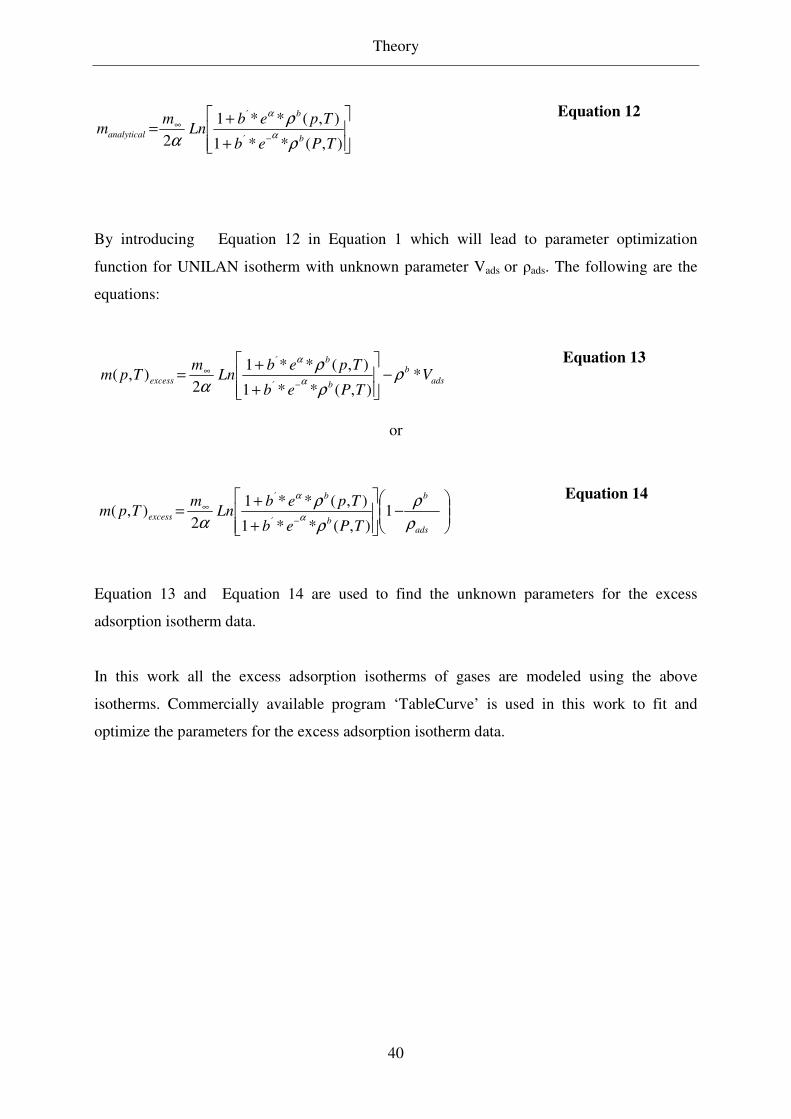
Equation 12
By introducing Equation 12 in Equation 1 which will lead to parameter optimization
function for UNILAN isotherm with unknown parameter Vads or ρads. The following are the
equations:
ads
b
b
b
excess VTPeb
TpebLn
mTpm *
),(**1
),(**1
2),(
´
´
ρρ
ρ
α α
α
−
+
+=
−
∞ Equation 13
or
−
+
+=
−
∞
ads
b
b
b
excess
TPeb
TpebLn
mTpm
ρ
ρ
ρ
ρ
α α
α
1),(**1
),(**1
2),(
´
´
Equation 14
Equation 13 and Equation 14 are used to find the unknown parameters for the excess
adsorption isotherm data.
In this work all the excess adsorption isotherms of gases are modeled using the above
isotherms. Commercially available program ‘TableCurve’ is used in this work to fit and
optimize the parameters for the excess adsorption isotherm data.
Materials and Methods
41
3. Materials and Methods
3.1 Materials
3.1.1 Materials used for silica aerogel synthesis
The chemicals used for aerogel synthesis are: Tetramethylorthosilicate (TMOS) (Fluka, ≥
98.0%), Methanol (MEOH) (Merck, ≥ 99.9%), Tetramethylethoxysilane (TMES) (Fluka, ≥
99.0%), Acetonotrile (Merck, ≥ 99.8%), Water (H2O) (distill water), Hydrochloric acid (HCL)
(0.00001 wt %), Ammonium hydroxide (NH4OH) (0.01 wt%). CO2 (Technical grade purity >
99.8%) is obtained from Linde and used for drying and loading experiments. The chemical
are used as received.
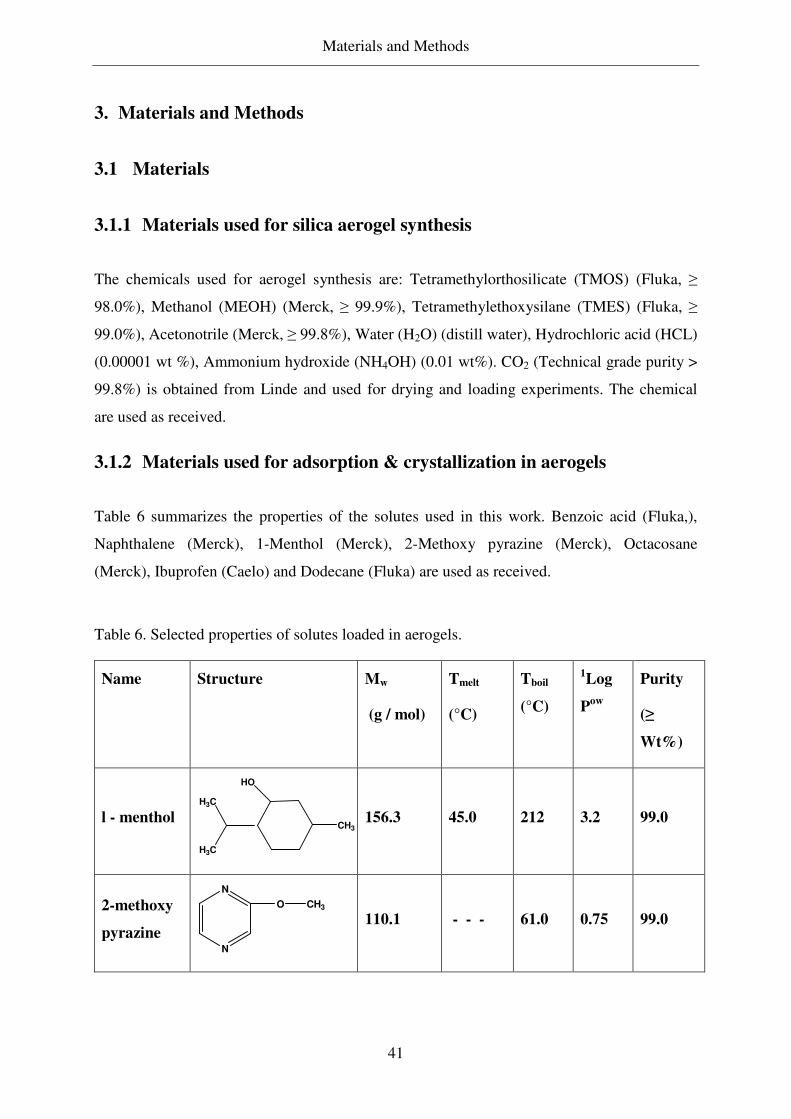
3.1.2 Materials used for adsorption & crystallization in aerogels
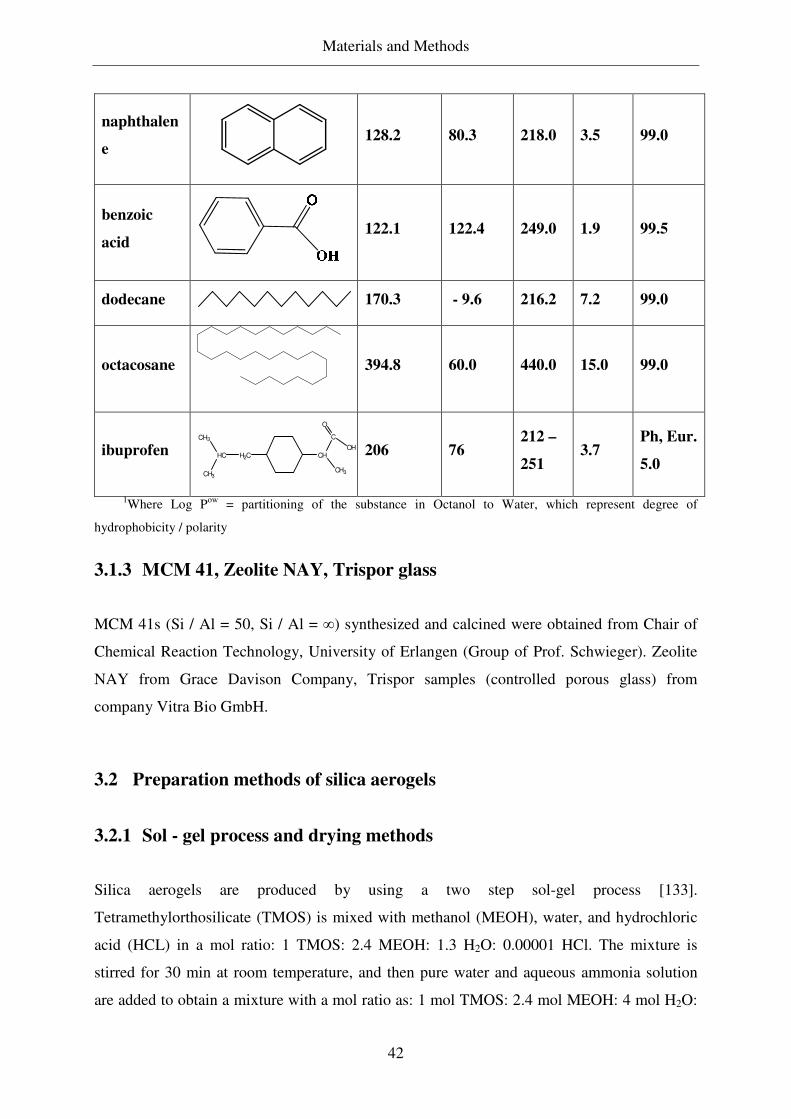
Table 6 summarizes the properties of the solutes used in this work. Benzoic acid (Fluka,),
Naphthalene (Merck), 1-Menthol (Merck), 2-Methoxy pyrazine (Merck), Octacosane
(Merck), Ibuprofen (Caelo) and Dodecane (Fluka) are used as received.
Table 6. Selected properties of solutes loaded in aerogels.
Name Structure Mw
(g / mol)
Tmelt
(°C)
Tboil
(°C)
1Log
Pow
Purity
(≥
Wt%)
l - menthol
HO
H3C
H3C
CH3
156.3 45.0 212 3.2 99.0
2-methoxy
pyrazine N
N
O CH3
110.1 - - - 61.0 0.75 99.0
Materials and Methods
42
naphthalen
e
128.2 80.3 218.0 3.5 99.0
benzoic
acid
122.1 122.4 249.0 1.9 99.5
dodecane 170.3 - 9.6 216.2 7.2 99.0
octacosane
394.8 60.0 440.0 15.0 99.0
ibuprofen H2CHC
CH3
CH3
CH
C
CH3
O
OH
206 76 212 –
251 3.7
Ph, Eur.
5.0
1Where Log Pow = partitioning of the substance in Octanol to Water, which represent degree of
hydrophobicity / polarity
3.1.3 MCM 41, Zeolite NAY, Trispor glass
MCM 41s (Si / Al = 50, Si / Al = ∞) synthesized and calcined were obtained from Chair of
Chemical Reaction Technology, University of Erlangen (Group of Prof. Schwieger). Zeolite
NAY from Grace Davison Company, Trispor samples (controlled porous glass) from
company Vitra Bio GmbH.
3.2 Preparation methods of silica aerogels
3.2.1 Sol - gel process and drying methods
Silica aerogels are produced by using a two step sol-gel process [133].
Tetramethylorthosilicate (TMOS) is mixed with methanol (MEOH), water, and hydrochloric
acid (HCL) in a mol ratio: 1 TMOS: 2.4 MEOH: 1.3 H2O: 0.00001 HCl. The mixture is
stirred for 30 min at room temperature, and then pure water and aqueous ammonia solution
are added to obtain a mixture with a mol ratio as: 1 mol TMOS: 2.4 mol MEOH: 4 mol H2O:
Materials and Methods
43
10 - 5 mol HCl: 10 - 2 mol NH4OH. Acetonitrile is added to the mixture to obtain the desired
target density of the aerogel, calculated from ρ
t arg et= m
SiO2/ V
mixture, where mSiO2 is the mass of
SiO2 in the mixture and Vmixture is the measured volume of the mixture. Five milliliters of the
mixture are transferred to a cylindrical vessel sealed with parafilm to avoid solvent
evaporation. After a fixed time, depending on the target density, a gel forms and is then aged
for 12 hours. The liquid remaining in the pores of the gel is extracted with supercritical CO2 at
40°C and 100 bar.
3.2.2 Methods used for hydrophobization of aerogels
The hydroxyl groups on hydrophilic aerogels can be divided into surface (reactive or free) and
bulk (or bound) -OH groups [134]. The hydroxyl groups of hydrophilic silica aerogels are
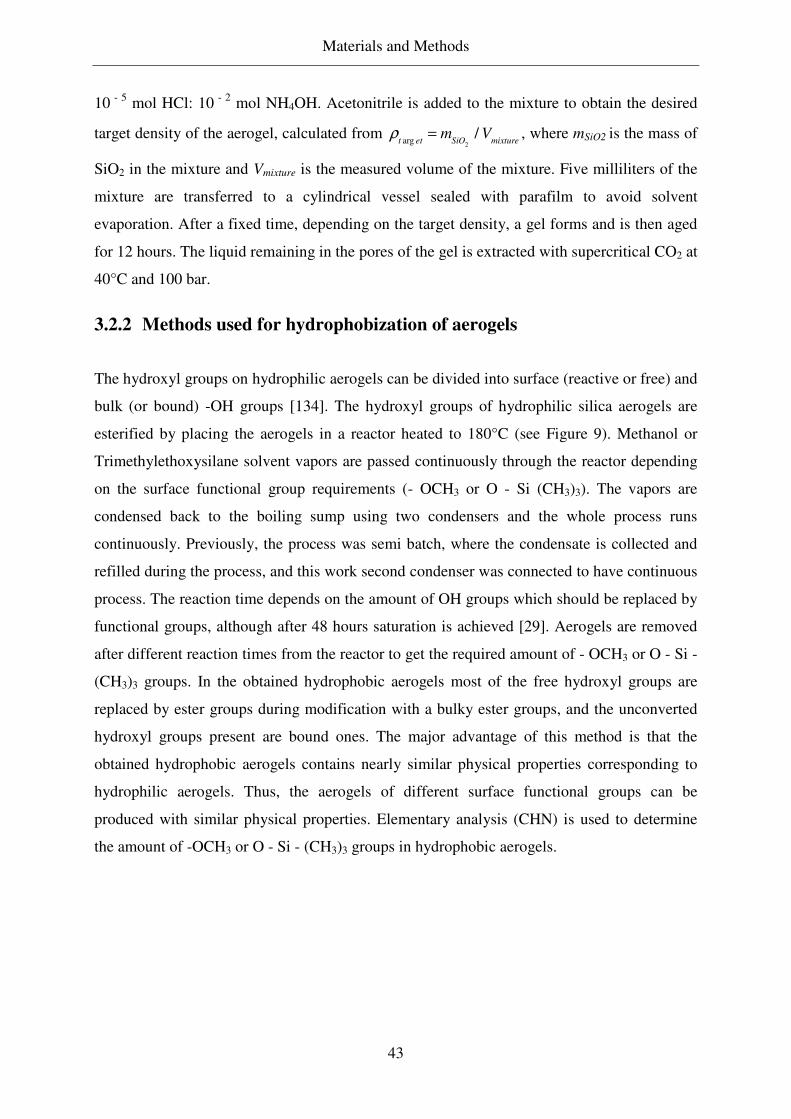
esterified by placing the aerogels in a reactor heated to 180°C (see Figure 9). Methanol or
Trimethylethoxysilane solvent vapors are passed continuously through the reactor depending
on the surface functional group requirements (- OCH3 or O - Si (CH3)3). The vapors are
condensed back to the boiling sump using two condensers and the whole process runs
continuously. Previously, the process was semi batch, where the condensate is collected and
refilled during the process, and this work second condenser was connected to have continuous
process. The reaction time depends on the amount of OH groups which should be replaced by
functional groups, although after 48 hours saturation is achieved [29]. Aerogels are removed
after different reaction times from the reactor to get the required amount of - OCH3 or O - Si -
(CH3)3 groups. In the obtained hydrophobic aerogels most of the free hydroxyl groups are
replaced by ester groups during modification with a bulky ester groups, and the unconverted
hydroxyl groups present are bound ones. The major advantage of this method is that the
obtained hydrophobic aerogels contains nearly similar physical properties corresponding to
hydrophilic aerogels. Thus, the aerogels of different surface functional groups can be
produced with similar physical properties. Elementary analysis (CHN) is used to determine
the amount of -OCH3 or O - Si - (CH3)3 groups in hydrophobic aerogels.
Materials and Methods
44
Figure 9. Schematic diagram of the hydrophobization setup of hydrophilic aerogels.
3.3 Choice of crystallization temperature
For asymmetric binary phase behavior solute - CO2 system; naphthalene - CO2, benzoic acid -
CO2, and octacosane - CO2, the operating temperatures are chosen based on the phase
diagrams. The minimum temperature of the SLG curve for naphthalene and CO2 is 60 - 62°C
[135, 136, 137], for benzoic acid and CO2 is 100 - 102°C [138, 139, 140], and for octacosane
- CO2 is 52 - 55°C [141], therefore temperatures of 58°C for naphthalene, 65°C for benzoic
acid, and 50°C for octacosane were chosen for crystallization experiments. For symmetric
binary system for solutes - CO2; menthol [142], 2-Methoxy pyrazine [143], and dodecane
[144] temperature of 50°C is used.
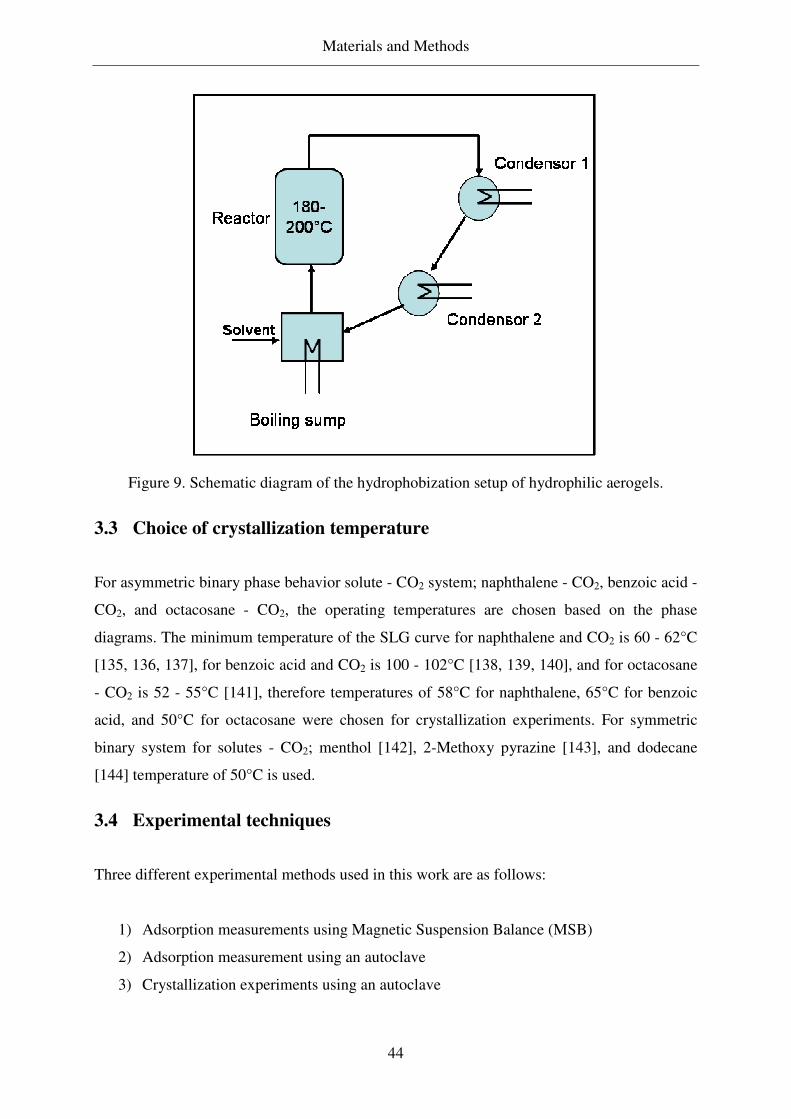
3.4 Experimental techniques
Three different experimental methods used in this work are as follows:
1) Adsorption measurements using Magnetic Suspension Balance (MSB)
2) Adsorption measurement using an autoclave
3) Crystallization experiments using an autoclave
Materials and Methods
45
3.4.1 Adsorption measurements using Magnetic Suspension Balance
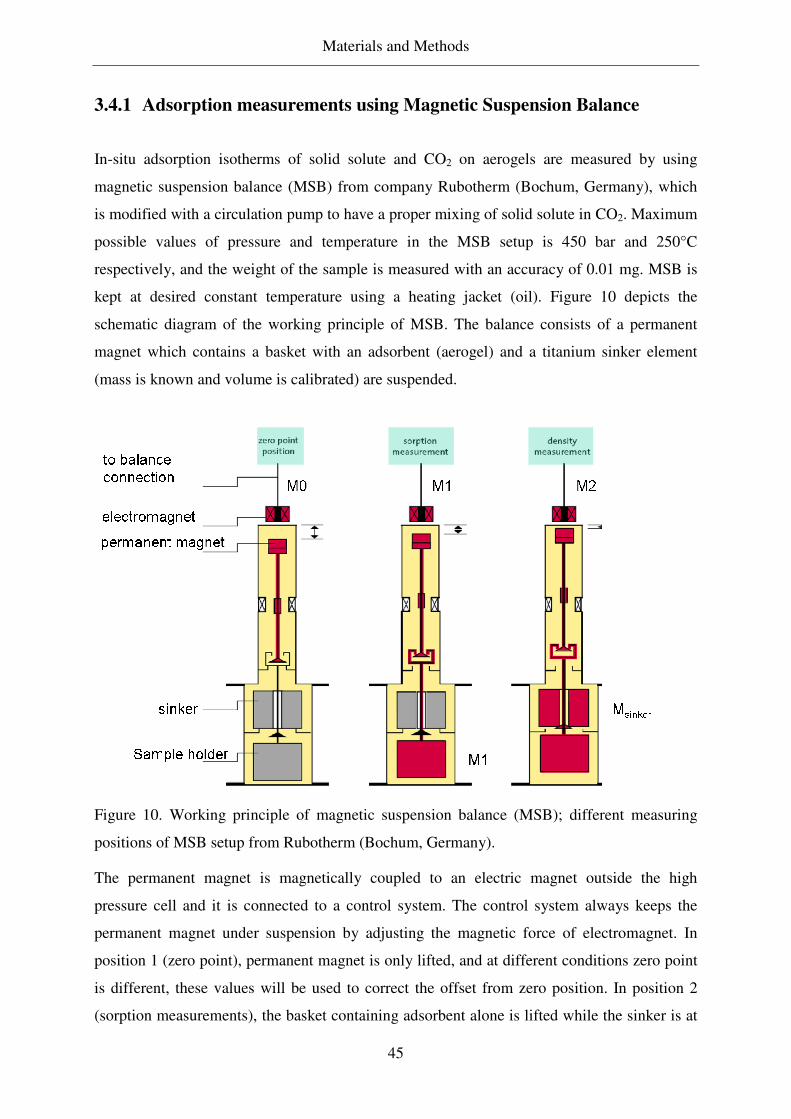
In-situ adsorption isotherms of solid solute and CO2 on aerogels are measured by using
magnetic suspension balance (MSB) from company Rubotherm (Bochum, Germany), which
is modified with a circulation pump to have a proper mixing of solid solute in CO2. Maximum
possible values of pressure and temperature in the MSB setup is 450 bar and 250°C
respectively, and the weight of the sample is measured with an accuracy of 0.01 mg. MSB is
kept at desired constant temperature using a heating jacket (oil). Figure 10 depicts the
schematic diagram of the working principle of MSB. The balance consists of a permanent
magnet which contains a basket with an adsorbent (aerogel) and a titanium sinker element
(mass is known and volume is calibrated) are suspended.
Figure 10. Working principle of magnetic suspension balance (MSB); different measuring
positions of MSB setup from Rubotherm (Bochum, Germany).
The permanent magnet is magnetically coupled to an electric magnet outside the high
pressure cell and it is connected to a control system. The control system always keeps the
permanent magnet under suspension by adjusting the magnetic force of electromagnet. In
position 1 (zero point), permanent magnet is only lifted, and at different conditions zero point
is different, these values will be used to correct the offset from zero position. In position 2
(sorption measurements), the basket containing adsorbent alone is lifted while the sinker is at
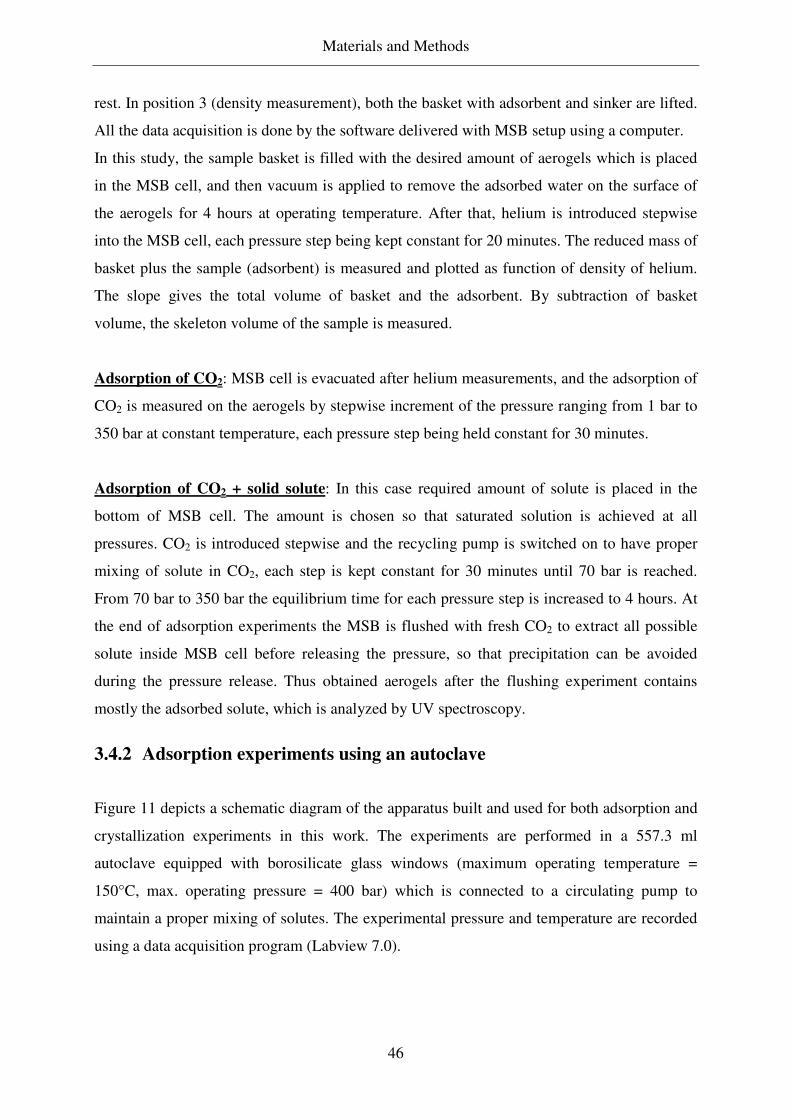
Materials and Methods
46
rest. In position 3 (density measurement), both the basket with adsorbent and sinker are lifted.
All the data acquisition is done by the software delivered with MSB setup using a computer.
In this study, the sample basket is filled with the desired amount of aerogels which is placed
in the MSB cell, and then vacuum is applied to remove the adsorbed water on the surface of
the aerogels for 4 hours at operating temperature. After that, helium is introduced stepwise
into the MSB cell, each pressure step being kept constant for 20 minutes. The reduced mass of
basket plus the sample (adsorbent) is measured and plotted as function of density of helium.
The slope gives the total volume of basket and the adsorbent. By subtraction of basket
volume, the skeleton volume of the sample is measured.
Adsorption of CO2: MSB cell is evacuated after helium measurements, and the adsorption of
CO2 is measured on the aerogels by stepwise increment of the pressure ranging from 1 bar to
350 bar at constant temperature, each pressure step being held constant for 30 minutes.
Adsorption of CO2 + solid solute: In this case required amount of solute is placed in the
bottom of MSB cell. The amount is chosen so that saturated solution is achieved at all
pressures. CO2 is introduced stepwise and the recycling pump is switched on to have proper
mixing of solute in CO2, each step is kept constant for 30 minutes until 70 bar is reached.
From 70 bar to 350 bar the equilibrium time for each pressure step is increased to 4 hours. At
the end of adsorption experiments the MSB is flushed with fresh CO2 to extract all possible
solute inside MSB cell before releasing the pressure, so that precipitation can be avoided
during the pressure release. Thus obtained aerogels after the flushing experiment contains
mostly the adsorbed solute, which is analyzed by UV spectroscopy.
3.4.2 Adsorption experiments using an autoclave
Figure 11 depicts a schematic diagram of the apparatus built and used for both adsorption and
crystallization experiments in this work. The experiments are performed in a 557.3 ml
autoclave equipped with borosilicate glass windows (maximum operating temperature =
150°C, max. operating pressure = 400 bar) which is connected to a circulating pump to
maintain a proper mixing of solutes. The experimental pressure and temperature are recorded
using a data acquisition program (Labview 7.0).
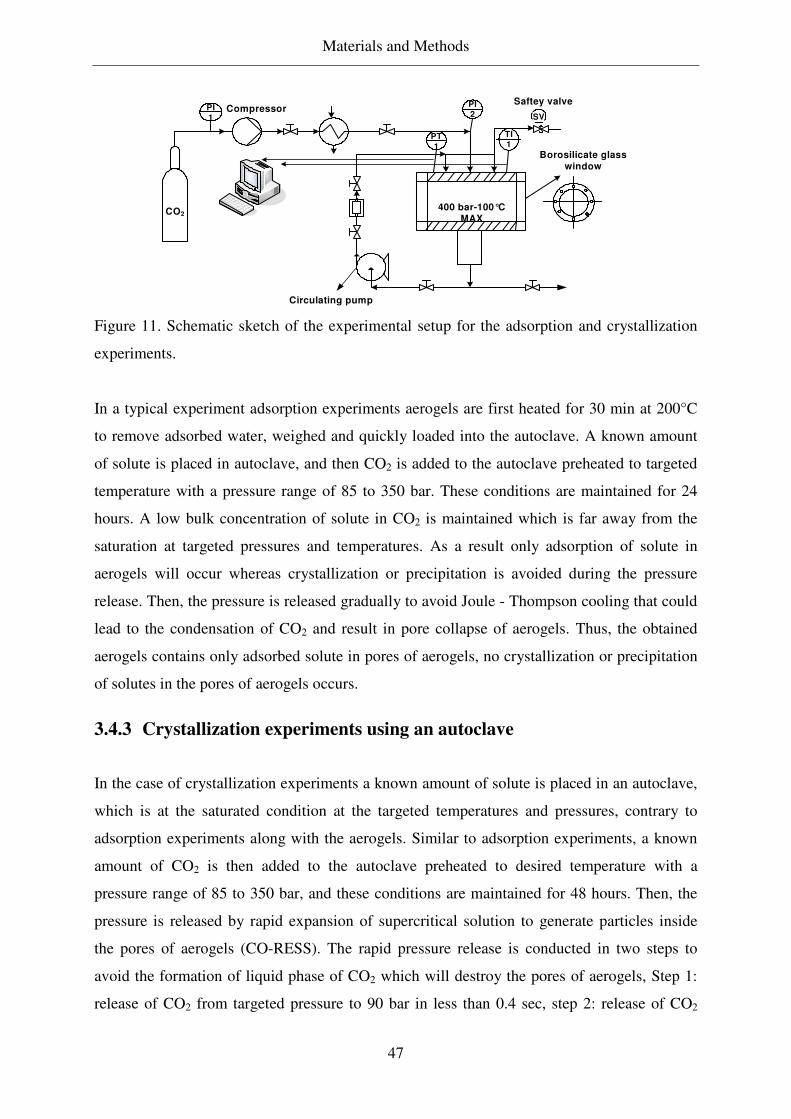
Materials and Methods
47
PI
1
400 bar-100°C
MAX
PT
1
TI
1
Borosilicate glass
window
PI
2 SV
CO2
Circulating pump
Saftey valveCompressor
Figure 11. Schematic sketch of the experimental setup for the adsorption and crystallization
experiments.
In a typical experiment adsorption experiments aerogels are first heated for 30 min at 200°C
to remove adsorbed water, weighed and quickly loaded into the autoclave. A known amount
of solute is placed in autoclave, and then CO2 is added to the autoclave preheated to targeted
temperature with a pressure range of 85 to 350 bar. These conditions are maintained for 24
hours. A low bulk concentration of solute in CO2 is maintained which is far away from the
saturation at targeted pressures and temperatures. As a result only adsorption of solute in
aerogels will occur whereas crystallization or precipitation is avoided during the pressure
release. Then, the pressure is released gradually to avoid Joule - Thompson cooling that could
lead to the condensation of CO2 and result in pore collapse of aerogels. Thus, the obtained
aerogels contains only adsorbed solute in pores of aerogels, no crystallization or precipitation
of solutes in the pores of aerogels occurs.
3.4.3 Crystallization experiments using an autoclave
In the case of crystallization experiments a known amount of solute is placed in an autoclave,
which is at the saturated condition at the targeted temperatures and pressures, contrary to
adsorption experiments along with the aerogels. Similar to adsorption experiments, a known
amount of CO2 is then added to the autoclave preheated to desired temperature with a
pressure range of 85 to 350 bar, and these conditions are maintained for 48 hours. Then, the
pressure is released by rapid expansion of supercritical solution to generate particles inside
the pores of aerogels (CO-RESS). The rapid pressure release is conducted in two steps to
avoid the formation of liquid phase of CO2 which will destroy the pores of aerogels, Step 1:
release of CO2 from targeted pressure to 90 bar in less than 0.4 sec, step 2: release of CO2
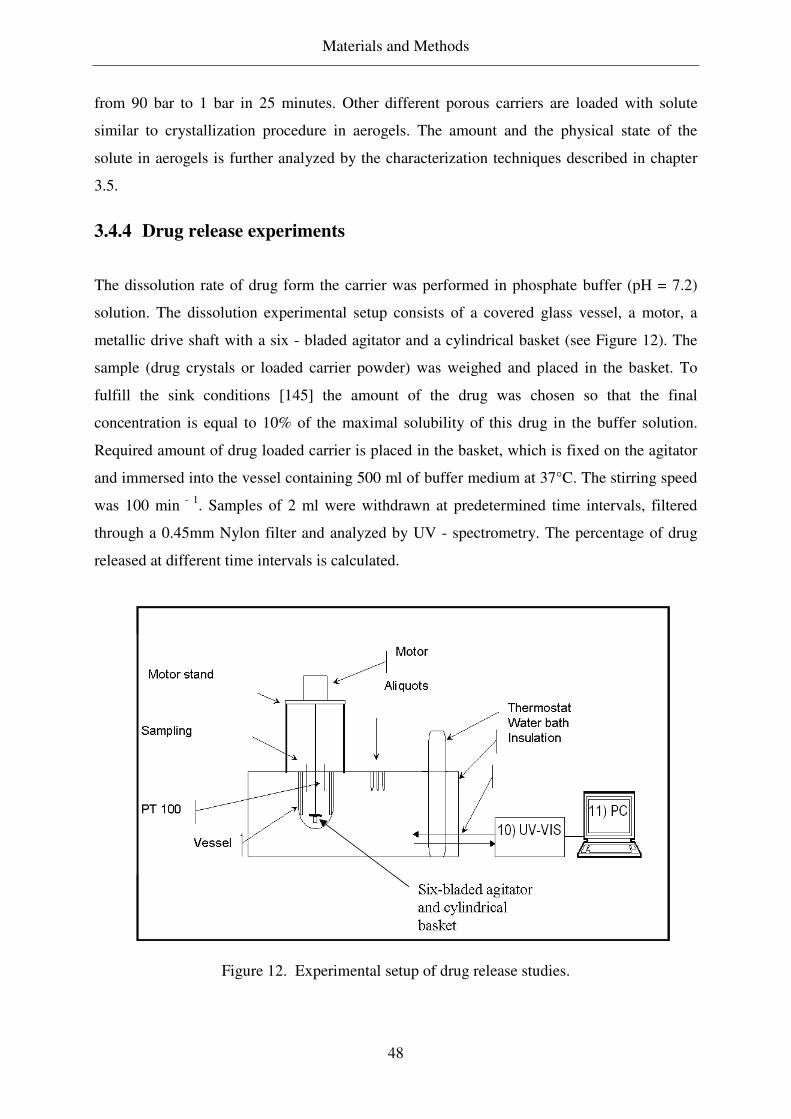
Materials and Methods
48
from 90 bar to 1 bar in 25 minutes. Other different porous carriers are loaded with solute
similar to crystallization procedure in aerogels. The amount and the physical state of the
solute in aerogels is further analyzed by the characterization techniques described in chapter
3.5.
3.4.4 Drug release experiments
The dissolution rate of drug form the carrier was performed in phosphate buffer (pH = 7.2)
solution. The dissolution experimental setup consists of a covered glass vessel, a motor, a
metallic drive shaft with a six - bladed agitator and a cylindrical basket (see Figure 12). The
sample (drug crystals or loaded carrier powder) was weighed and placed in the basket. To
fulfill the sink conditions [145] the amount of the drug was chosen so that the final
concentration is equal to 10% of the maximal solubility of this drug in the buffer solution.
Required amount of drug loaded carrier is placed in the basket, which is fixed on the agitator
and immersed into the vessel containing 500 ml of buffer medium at 37°C. The stirring speed
was 100 min - 1. Samples of 2 ml were withdrawn at predetermined time intervals, filtered
through a 0.45mm Nylon filter and analyzed by UV - spectrometry. The percentage of drug
released at different time intervals is calculated.
Figure 12. Experimental setup of drug release studies.
Materials and Methods
49
3.5 Characterization techniques used
All the characterization techniques used in this study are briefly described here. The specific
experimental procedure of the present work is reported here rather than the principles of the
analytical methods which are well known and well reported in literature [163].
3.5.1 Measuring of the bulk density of aerogels
To measure the bulk density of aerogels, the dried aerogel sample is first heated to 200°C for
30 minutes to remove any adsorbed moisture and weighed. The dimensions of the aerogels
are measured with a precision micrometer. The measurements are repeated for five times and
the average is taken as a reference.
3.5.2 Nitrogen Adsorption and Desorption; BET analysis
Nitrogen adsorption and desorption is used to characterize the properties of porous carriers
[146]. The information obtained from the analysis is: surface area, pore volume, average pore
diameter. Figure 13 shows the typical Type 4 isotherm for mesoporous substance (silica
aerogel). Hysteresis observed during desorption is due to well known bottle neck effect.
0.0
400.0
800.0
1200.0
1600.0
2000.0
2400.0
2800.0
3200.0
0.00 0.20 0.40 0.60 0.80 1.00
Relative pressure, P/P0
Volu
me
(cc/g
)
Adsorption
Desorption
Figure 13. Typical adsorption isotherm of type 4 (mesoporous solid substance) [146].
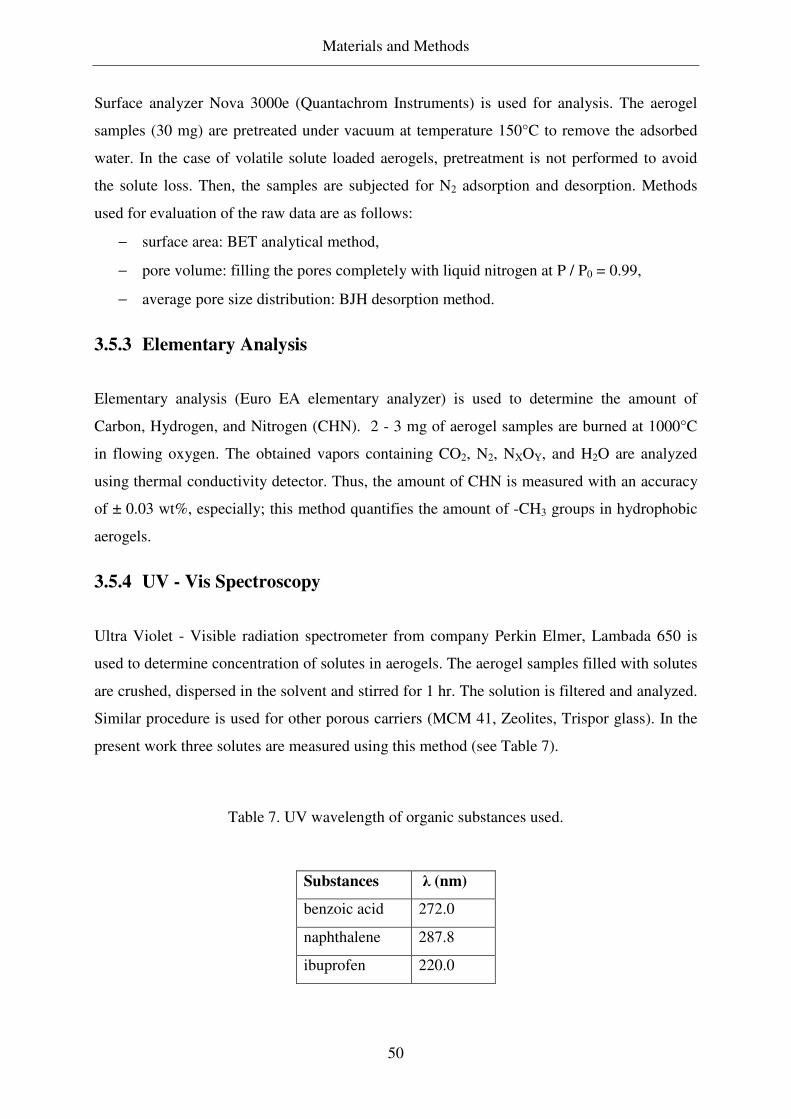
Materials and Methods
50
Surface analyzer Nova 3000e (Quantachrom Instruments) is used for analysis. The aerogel
samples (30 mg) are pretreated under vacuum at temperature 150°C to remove the adsorbed
water. In the case of volatile solute loaded aerogels, pretreatment is not performed to avoid
the solute loss. Then, the samples are subjected for N2 adsorption and desorption. Methods
used for evaluation of the raw data are as follows:
− surface area: BET analytical method,
− pore volume: filling the pores completely with liquid nitrogen at P / P0 = 0.99,
− average pore size distribution: BJH desorption method.
3.5.3 Elementary Analysis
Elementary analysis (Euro EA elementary analyzer) is used to determine the amount of
Carbon, Hydrogen, and Nitrogen (CHN). 2 - 3 mg of aerogel samples are burned at 1000°C
in flowing oxygen. The obtained vapors containing CO2, N2, NXOY, and H2O are analyzed
using thermal conductivity detector. Thus, the amount of CHN is measured with an accuracy
of ± 0.03 wt%, especially; this method quantifies the amount of -CH3 groups in hydrophobic
aerogels.
3.5.4 UV - Vis Spectroscopy
Ultra Violet - Visible radiation spectrometer from company Perkin Elmer, Lambada 650 is
used to determine concentration of solutes in aerogels. The aerogel samples filled with solutes
are crushed, dispersed in the solvent and stirred for 1 hr. The solution is filtered and analyzed.
Similar procedure is used for other porous carriers (MCM 41, Zeolites, Trispor glass). In the
present work three solutes are measured using this method (see Table 7).
Table 7. UV wavelength of organic substances used.
Substances λ (nm)
benzoic acid 272.0
naphthalene 287.8
ibuprofen 220.0
Materials and Methods
51
3.5.5 Gas Chromatography (GC)
HP 5890 Series II, Gas Chromatography (GC) is used to determine the concentration of
solutes in aerogels. The aerogels samples filled with solutes are crushed, dispersed in the
solvent and stirred for 1 hr. 1 - 3 µl of filtered extract solution is injected into the column
along with internal standard. The concentration of the solutes quantified by this method are as
follows: 1-menthol, 2-Methoxy pyrazine, octacosane, dodecane. Details of the GC used are
mentioned in Appendix.
3.5.6 IR spectroscopy
The chemical stability of the solute loaded in silica aerogels is measured using Infra - Red
(IR) spectroscopy from Company Perkin Elmer FT - IR spectrometer. IR spectroscopy helps
to qualitatively determine the characteristic peaks of particular groups of the solute and
aerogels [147]. The aerogel loaded with solutes are powdered, 2 - 5 mg of samples is mixed
with KBr and then compressed to a cylindrical tablet. The tablet is kept inside IR
spectrometry and the transmission / absorption of the IR light (450 - 4000 cm - 1) is measured.
3.5.7 Differential Scanning Calorimeter
Differential Scanning Calorimeter (DSC) from company NETZSCH (DSC 200 F3) is used to
analyze the physical state of solute loaded in the aerogels. For this, loaded aerogels samples
are powdered and 5 - 7 mg of sample is placed inside the aluminum pan and compressed. The
samples are subjected to a temperature ramp of 10 °C / minute to determine the melting peaks
of the solute in the aerogels. Different temperature rates are used to study the effect of heat
transfer limitations. The samples are heated from - 10°C to desired temperature and then
cooled back and heated again. Thus, the melting points are determined for the solutes inside
the aerogels. DSC analysis of the mechanical mixture of pure solute and pure aerogel is
performed to overcome the question of sensitivity of DSC at these concentrations.
3.5.8 X - Ray Diffraction
X - Ray Diffraction from company Philips, (XPERT - Pro, Cu Kα1) is used to analyze the
physical state of substance (crystalline or amorphous state) [148]. The crystalline substance
exhibit the diffraction of X - rays, which is the main principle in this method (Bragg’s law).
Materials and Methods
52
The powdered samples of solute loaded aerogels (100 - 200 mg) are loaded in XRD pans and
subject to X - rays at angles of 2 - 50° (2θ). Crystalline substances exhibit the characteristic
peaks and amorphous substances shows no peaks during analysis.
3.5.9 TGA / TGA - MS analysis
Thermal Gravimetric Analysis (TGA, TA instruments) is used to study the strength of solute
interaction with aerogel surface. 10 - 15 mg of solute loaded aerogel sample is placed in a
metal pan and subject to different temperature steps from 20 to 600°C with a ramp of 10°C /
minute. Each temperature step is kept constant (isothermal) for 45 - 60 minutes. The weight
loss of solute loaded in aerogels is measured. TGA combined with mass spectroscopy (MS) is
used to determine the stability of compound at elevated temperatures.
Results and Discussions
53
4. Results and Discussions
A step wise approach is followed to study the influence of adsorptive properties of carrier
(silica aerogels) on crystallization of solutes and physical state of solutes in the pores of
aerogels. To study these influences aerogels of different physical and surface functional group
are synthesized at our lab. Different solutes ranging from polar solutes (benzoic acid, 1-
menthol), moderately polar solutes (naphthalene, 2-Methoxy pyrazine), nonpolar solutes
(octacosane, dodecane) are chosen to study these effects. First adsorption of solutes in
aerogels is conducted, to further understand the influence of the adsorbed solutes precipitation
of the solutes in performed in the pores of aerogels by CO-RESS. For the liquid solutes only
adsorption is conducted to study the strength of solute - surface interactions on loadings.
Further, the influence of properties of aerogels on the physical state of the loaded solutes is
investigated. Other mesoporous carrier materials like MCM41s, Trisopor glass (which are
similar to aerogels) are also used for the comparison purpose.
4.1 Properties of aerogels synthesized and other carriers used
Table 8 summarizes the properties of the silica aerogels synthesized and used for adsorption
experiments and crystallization experiments in this study. Hydrophilic aerogels are
synthesized first and then some of them undergo the gas phase modification to produce
hydrophobic aerogels. An advantage of this post - treating method is that the pore volume,
pore size distribution, and surface area of the material do not change significantly during this
process. Hence, it is possible to study the influence of the aerogel’s functional groups on the
adsorption and crystallization by comparing hydrophilic and hydrophobic aerogels samples
having essentially the same structural properties. Aerogels of different hydrophobicity are
produced based on the reaction times from the reactor to study the influence of degree of
hydrophobcity. It should be noted that the BET analysis of hydrophilic aerogels essentially
requires the thermal treatment since samples are rather hydroscopic. In case of hydrophobic
aerogels it is not so significant. The corresponding values can be found in Table 8. The
hydrophobic aerogels have higher bulk density compared to hydrophilic aerogels. The
increase of the bulk density in case of hydrophobic aerogels is due to the replacement of –OH
groups with O - Si - (CH3)3.
Table 8. Selected properties of silica aerogels used in this study.
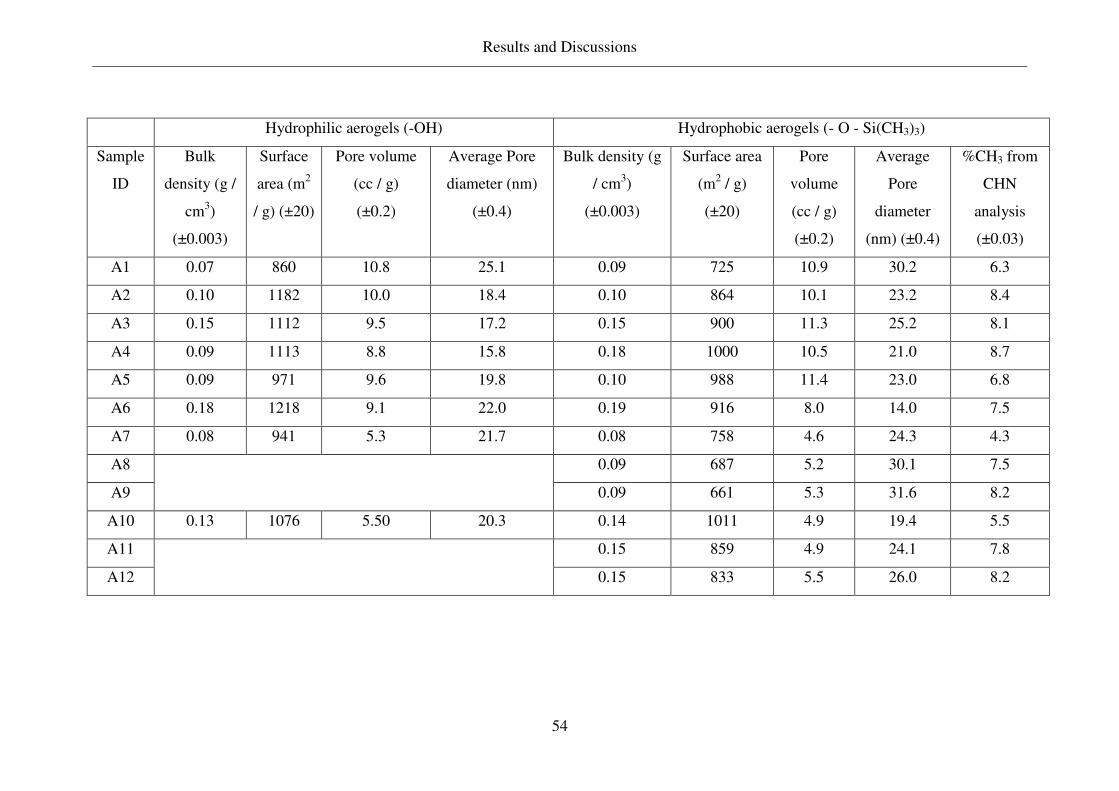
Results and Discussions
54
Hydrophilic aerogels (-OH) Hydrophobic aerogels (- O - Si(CH3)3)
Sample
ID
Bulk
density (g /
cm3)
(±0.003)
Surface
area (m2
/ g) (±20)
Pore volume
(cc / g)
(±0.2)
Average Pore
diameter (nm)
(±0.4)
Bulk density (g
/ cm3)
(±0.003)
Surface area
(m2 / g)
(±20)
Pore
volume
(cc / g)
(±0.2)
Average
Pore
diameter
(nm) (±0.4)
%CH3 from
CHN
analysis
(±0.03)
A1 0.07 860 10.8 25.1 0.09 725 10.9 30.2 6.3
A2 0.10 1182 10.0 18.4 0.10 864 10.1 23.2 8.4
A3 0.15 1112 9.5 17.2 0.15 900 11.3 25.2 8.1
A4 0.09 1113 8.8 15.8 0.18 1000 10.5 21.0 8.7
A5 0.09 971 9.6 19.8 0.10 988 11.4 23.0 6.8
A6 0.18 1218 9.1 22.0 0.19 916 8.0 14.0 7.5
A7 0.08 941 5.3 21.7 0.08 758 4.6 24.3 4.3
A8 0.09 687 5.2 30.1 7.5
A9
0.09 661 5.3 31.6 8.2
A10 0.13 1076 5.50 20.3 0.14 1011 4.9 19.4 5.5
A11 0.15 859 4.9 24.1 7.8
A12
0.15 833 5.5 26.0 8.2
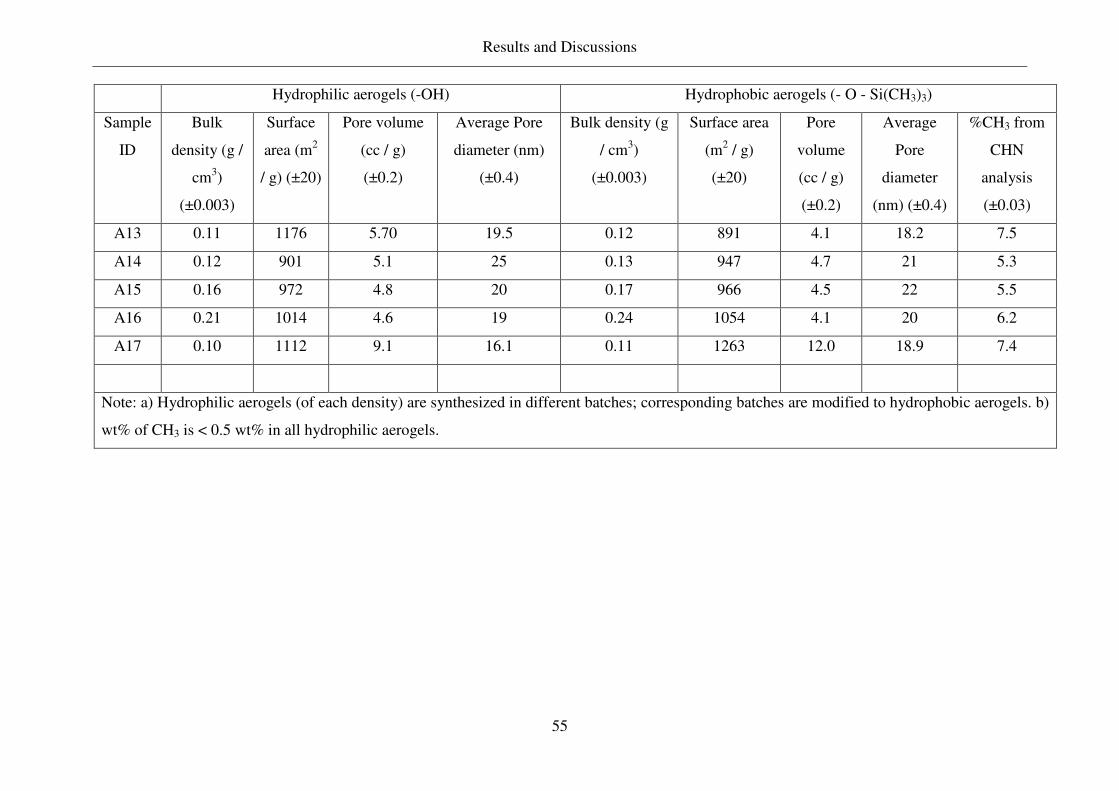
Results and Discussions
55
Hydrophilic aerogels (-OH) Hydrophobic aerogels (- O - Si(CH3)3)
Sample
ID
Bulk
density (g /
cm3)
(±0.003)
Surface
area (m2
/ g) (±20)
Pore volume
(cc / g)
(±0.2)
Average Pore
diameter (nm)
(±0.4)
Bulk density (g
/ cm3)
(±0.003)
Surface area
(m2 / g)
(±20)
Pore
volume
(cc / g)
(±0.2)
Average
Pore
diameter
(nm) (±0.4)
%CH3 from
CHN
analysis
(±0.03)
A13 0.11 1176 5.70 19.5 0.12 891 4.1 18.2 7.5
A14 0.12 901 5.1 25 0.13 947 4.7 21 5.3
A15 0.16 972 4.8 20 0.17 966 4.5 22 5.5
A16 0.21 1014 4.6 19 0.24 1054 4.1 20 6.2
A17 0.10 1112 9.1 16.1 0.11 1263 12.0 18.9 7.4
Note: a) Hydrophilic aerogels (of each density) are synthesized in different batches; corresponding batches are modified to hydrophobic aerogels. b)
wt% of CH3 is < 0.5 wt% in all hydrophilic aerogels.
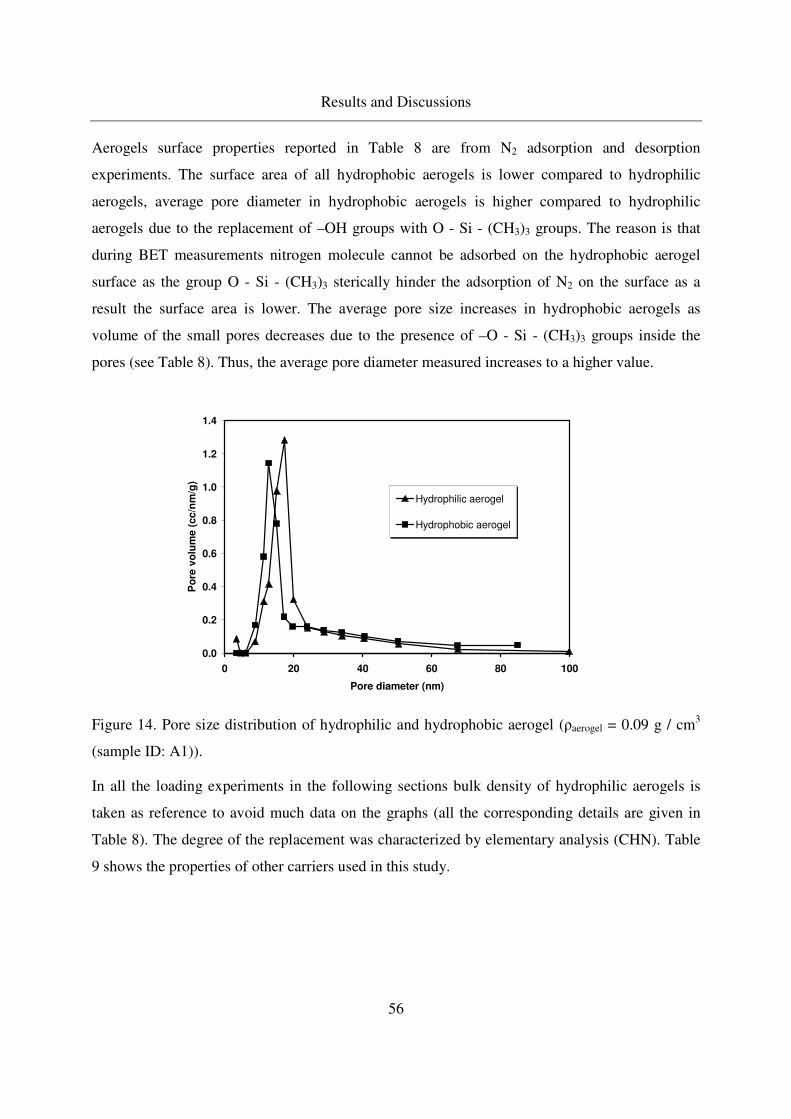
Results and Discussions
56
Aerogels surface properties reported in Table 8 are from N2 adsorption and desorption
experiments. The surface area of all hydrophobic aerogels is lower compared to hydrophilic
aerogels, average pore diameter in hydrophobic aerogels is higher compared to hydrophilic
aerogels due to the replacement of –OH groups with O - Si - (CH3)3 groups. The reason is that
during BET measurements nitrogen molecule cannot be adsorbed on the hydrophobic aerogel
surface as the group O - Si - (CH3)3 sterically hinder the adsorption of N2 on the surface as a
result the surface area is lower. The average pore size increases in hydrophobic aerogels as
volume of the small pores decreases due to the presence of –O - Si - (CH3)3 groups inside the
pores (see Table 8). Thus, the average pore diameter measured increases to a higher value.
0.0
0.2
0.4
0.6
0.8
1.0
1.2
1.4
0 20 40 60 80 100
Pore diameter (nm)
Po
re v
olu
me (
cc/n
m/g
)
Hydrophilic aerogel
Hydrophobic aerogel
Figure 14. Pore size distribution of hydrophilic and hydrophobic aerogel (ρaerogel = 0.09 g / cm3
(sample ID: A1)).
In all the loading experiments in the following sections bulk density of hydrophilic aerogels is
taken as reference to avoid much data on the graphs (all the corresponding details are given in
Table 8). The degree of the replacement was characterized by elementary analysis (CHN). Table
9 shows the properties of other carriers used in this study.
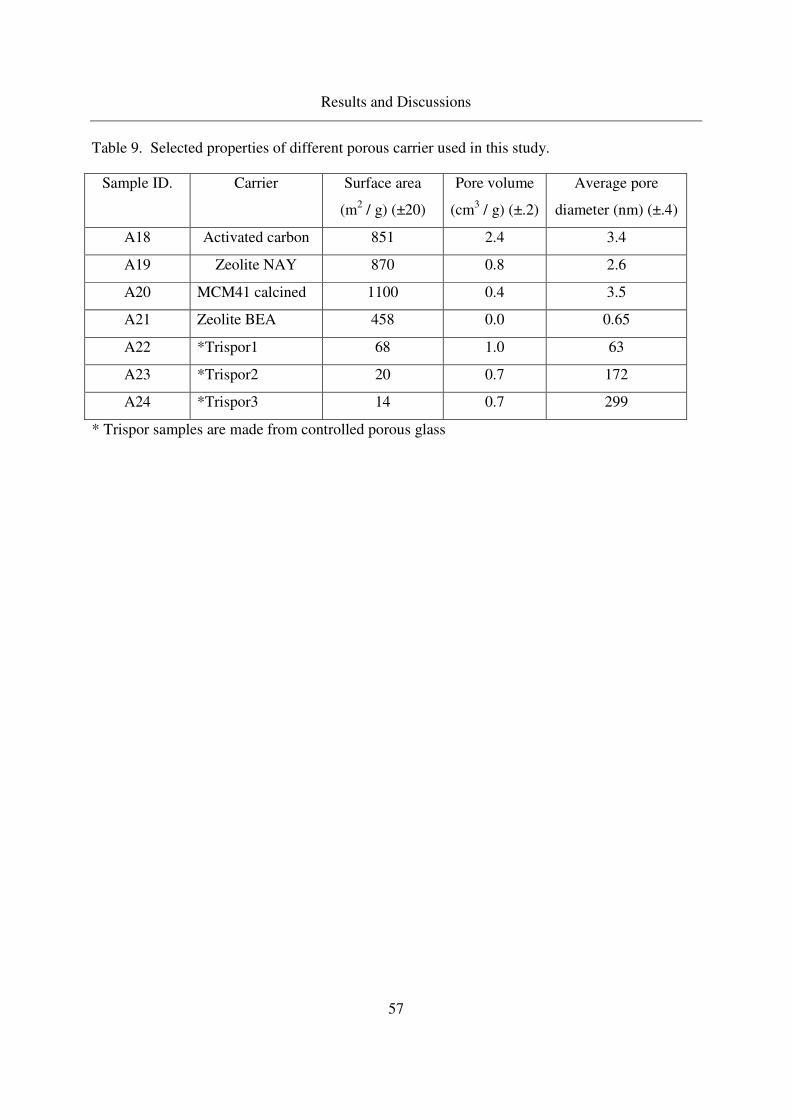
Results and Discussions
57
Table 9. Selected properties of different porous carrier used in this study.
Sample ID. Carrier Surface area
(m2 / g) (±20)
Pore volume
(cm3 / g) (±.2)
Average pore
diameter (nm) (±.4)
A18 Activated carbon 851 2.4 3.4
A19 Zeolite NAY 870 0.8 2.6
A20 MCM41 calcined 1100 0.4 3.5
A21 Zeolite BEA 458 0.0 0.65
A22 *Trispor1 68 1.0 63
A23 *Trispor2 20 0.7 172
A24 *Trispor3 14 0.7 299
* Trispor samples are made from controlled porous glass
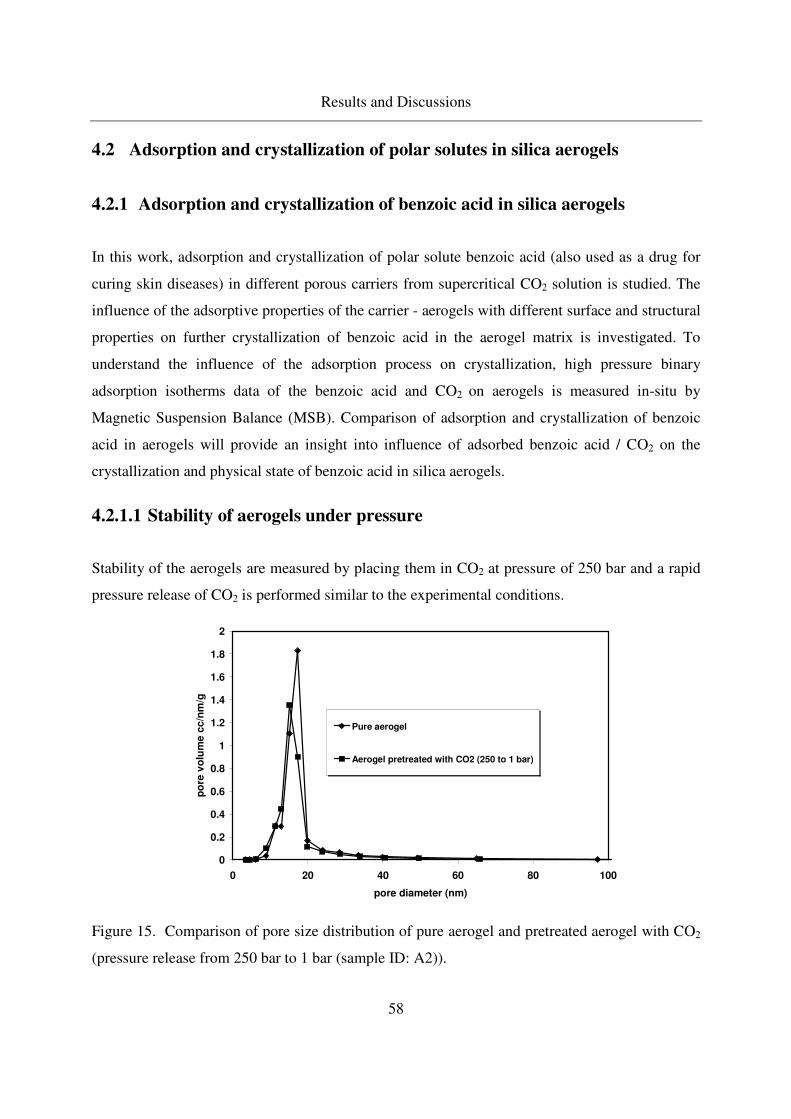
Results and Discussions
58
4.2 Adsorption and crystallization of polar solutes in silica aerogels
4.2.1 Adsorption and crystallization of benzoic acid in silica aerogels
In this work, adsorption and crystallization of polar solute benzoic acid (also used as a drug for
curing skin diseases) in different porous carriers from supercritical CO2 solution is studied. The
influence of the adsorptive properties of the carrier - aerogels with different surface and structural
properties on further crystallization of benzoic acid in the aerogel matrix is investigated. To
understand the influence of the adsorption process on crystallization, high pressure binary
adsorption isotherms data of the benzoic acid and CO2 on aerogels is measured in-situ by
Magnetic Suspension Balance (MSB). Comparison of adsorption and crystallization of benzoic
acid in aerogels will provide an insight into influence of adsorbed benzoic acid / CO2 on the
crystallization and physical state of benzoic acid in silica aerogels.
4.2.1.1 Stability of aerogels under pressure
Stability of the aerogels are measured by placing them in CO2 at pressure of 250 bar and a rapid
pressure release of CO2 is performed similar to the experimental conditions.
0
0.2
0.4
0.6
0.8
1
1.2
1.4
1.6
1.8
2
0 20 40 60 80 100
pore diameter (nm)
po
re v
olu
me c
c/n
m/g
Pure aerogel
Aerogel pretreated with CO2 (250 to 1 bar)
Figure 15. Comparison of pore size distribution of pure aerogel and pretreated aerogel with CO2
(pressure release from 250 bar to 1 bar (sample ID: A2)).

Results and Discussions
59
Figure 15 shows the change in the pore size distribution of pure and pretreated aerogels (after
pressure release). The aerogels structure remained stable at the experimental conditions, thus, the
experimental procedure will not affect the properties of the aerogels used in this study.
4.2.1.2 CO2 adsorption on aerogels
First, CO2 adsorption is performed on silica aerogels before measuring the adsorption of benzoic
acid from benzoic acid - CO2 solution. Adsorption experiments are performed in-situ by using
Magnetic Suspension Balance (MSB). MSB should be validated before conducting the adsorption
measurements on silica aerogels. The following section reports the validation of MSB.
Validation of the MSB measurements
MSB measurements were validated by comparing with the systems available in the literature.
Figure 16 A shows the excess adsorption isotherm of CO2 on activated carbon. The data are in
good agreement with those of Humayun et al. [149] and Roni et al. [150].
0
0.1
0.2
0.3
0 0.2 0.4 0.6 0.8 1
Density of pure CO2 (g/cm3)
Excess a
mo
un
t ad
so
rbed
CO
2 (
g)/
(g
)
Acti
vate
d c
arb
on
This work (~45°C)
Roni et al. 2006 (45.4°C)
Humayun et al. 2002 (45°C)
A)
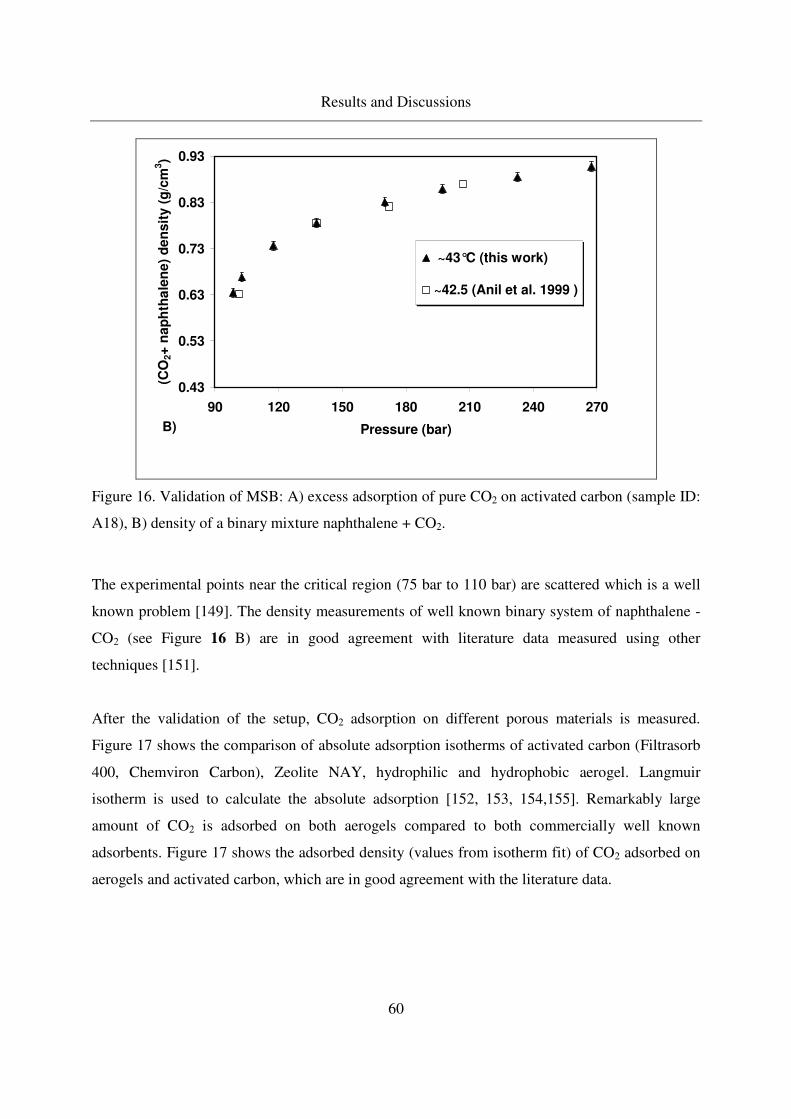
Results and Discussions
60
0.43
0.53
0.63
0.73
0.83
0.93
90 120 150 180 210 240 270
Pressure (bar)
(CO
2+
nap
hth
ale
ne)
de
nsit
y (
g/c
m3)
~43°C (this work)
~42.5 (Anil et al. 1999 )
B)
Figure 16. Validation of MSB: A) excess adsorption of pure CO2 on activated carbon (sample ID:
A18), B) density of a binary mixture naphthalene + CO2.
The experimental points near the critical region (75 bar to 110 bar) are scattered which is a well
known problem [149]. The density measurements of well known binary system of naphthalene -
CO2 (see Figure 16 B) are in good agreement with literature data measured using other
techniques [151].
After the validation of the setup, CO2 adsorption on different porous materials is measured.
Figure 17 shows the comparison of absolute adsorption isotherms of activated carbon (Filtrasorb
400, Chemviron Carbon), Zeolite NAY, hydrophilic and hydrophobic aerogel. Langmuir
isotherm is used to calculate the absolute adsorption [152, 153, 154,155]. Remarkably large
amount of CO2 is adsorbed on both aerogels compared to both commercially well known
adsorbents. Figure 17 shows the adsorbed density (values from isotherm fit) of CO2 adsorbed on
aerogels and activated carbon, which are in good agreement with the literature data.
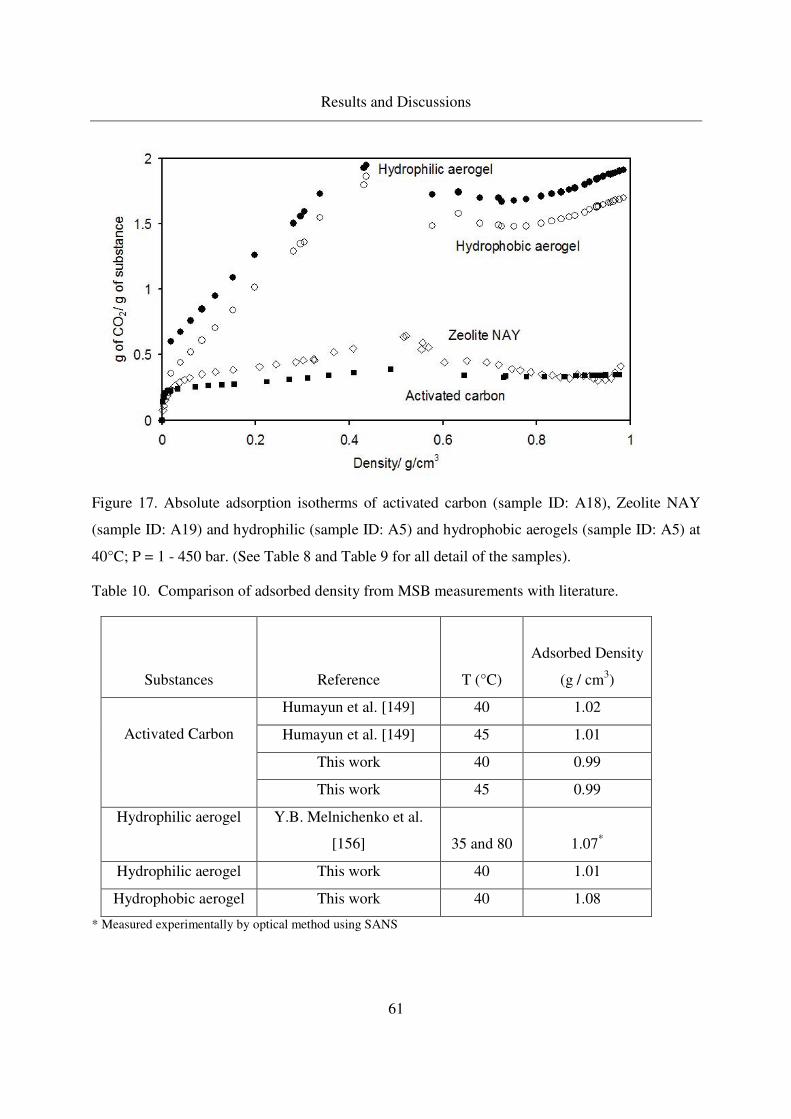
Results and Discussions
61
Figure 17. Absolute adsorption isotherms of activated carbon (sample ID: A18), Zeolite NAY
(sample ID: A19) and hydrophilic (sample ID: A5) and hydrophobic aerogels (sample ID: A5) at
40°C; P = 1 - 450 bar. (See Table 8 and Table 9 for all detail of the samples).
Table 10. Comparison of adsorbed density from MSB measurements with literature.
Substances Reference T (°C)
Adsorbed Density
(g / cm3)
Humayun et al. [149] 40 1.02
Humayun et al. [149] 45 1.01
This work 40 0.99
Activated Carbon
This work 45 0.99
Hydrophilic aerogel Y.B. Melnichenko et al.
[156] 35 and 80 1.07*
Hydrophilic aerogel This work 40 1.01
Hydrophobic aerogel This work 40 1.08
* Measured experimentally by optical method using SANS
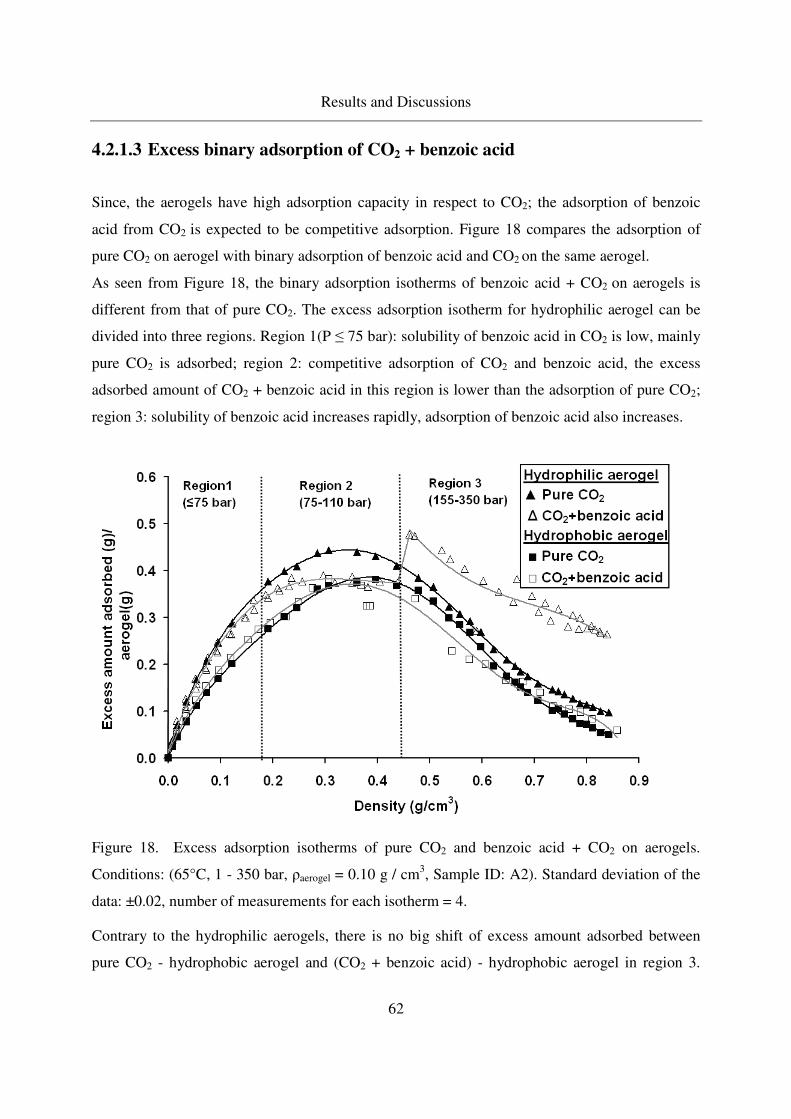
Results and Discussions
62
4.2.1.3 Excess binary adsorption of CO2 + benzoic acid
Since, the aerogels have high adsorption capacity in respect to CO2; the adsorption of benzoic
acid from CO2 is expected to be competitive adsorption. Figure 18 compares the adsorption of
pure CO2 on aerogel with binary adsorption of benzoic acid and CO2 on the same aerogel.
As seen from Figure 18, the binary adsorption isotherms of benzoic acid + CO2 on aerogels is
different from that of pure CO2. The excess adsorption isotherm for hydrophilic aerogel can be
divided into three regions. Region 1(P ≤ 75 bar): solubility of benzoic acid in CO2 is low, mainly
pure CO2 is adsorbed; region 2: competitive adsorption of CO2 and benzoic acid, the excess
adsorbed amount of CO2 + benzoic acid in this region is lower than the adsorption of pure CO2;
region 3: solubility of benzoic acid increases rapidly, adsorption of benzoic acid also increases.
Figure 18. Excess adsorption isotherms of pure CO2 and benzoic acid + CO2 on aerogels.
Conditions: (65°C, 1 - 350 bar, ρaerogel = 0.10 g / cm3, Sample ID: A2). Standard deviation of the
data: ±0.02, number of measurements for each isotherm = 4.
Contrary to the hydrophilic aerogels, there is no big shift of excess amount adsorbed between
pure CO2 - hydrophobic aerogel and (CO2 + benzoic acid) - hydrophobic aerogel in region 3.
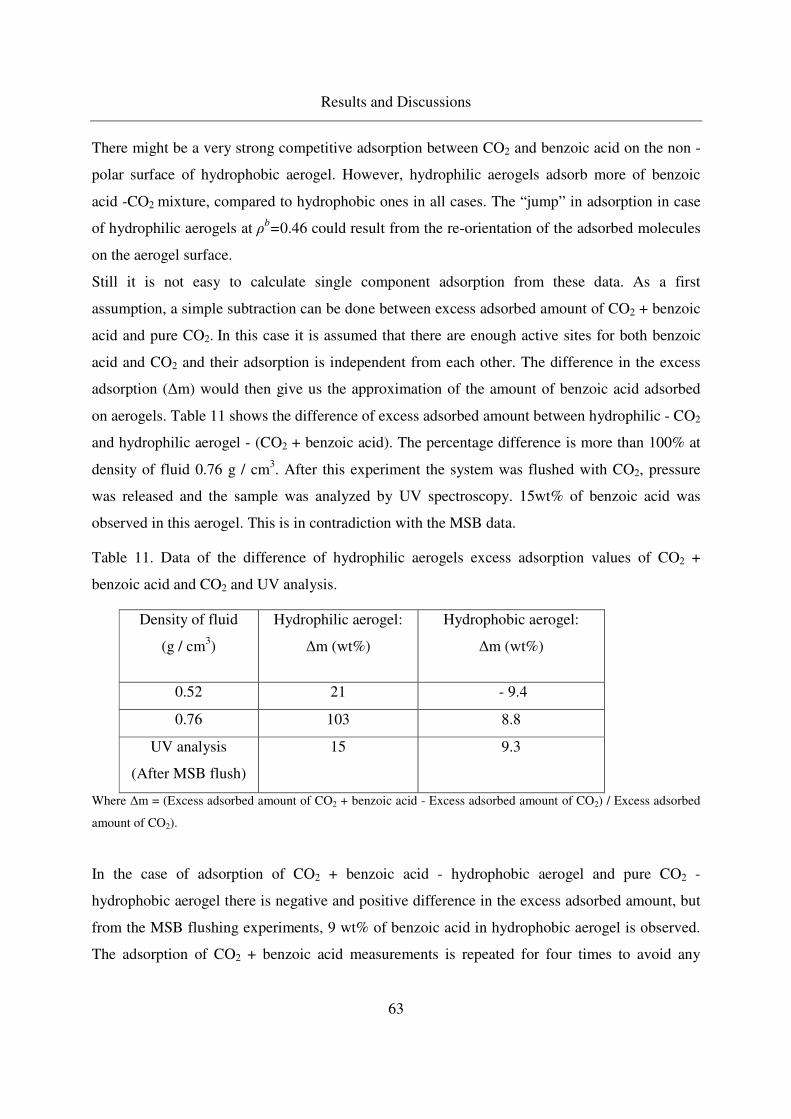
Results and Discussions
63
There might be a very strong competitive adsorption between CO2 and benzoic acid on the non -
polar surface of hydrophobic aerogel. However, hydrophilic aerogels adsorb more of benzoic
acid -CO2 mixture, compared to hydrophobic ones in all cases. The “jump” in adsorption in case
of hydrophilic aerogels at ρb=0.46 could result from the re-orientation of the adsorbed molecules
on the aerogel surface.
Still it is not easy to calculate single component adsorption from these data. As a first
assumption, a simple subtraction can be done between excess adsorbed amount of CO2 + benzoic
acid and pure CO2. In this case it is assumed that there are enough active sites for both benzoic
acid and CO2 and their adsorption is independent from each other. The difference in the excess
adsorption (∆m) would then give us the approximation of the amount of benzoic acid adsorbed
on aerogels. Table 11 shows the difference of excess adsorbed amount between hydrophilic - CO2
and hydrophilic aerogel - (CO2 + benzoic acid). The percentage difference is more than 100% at
density of fluid 0.76 g / cm3. After this experiment the system was flushed with CO2, pressure
was released and the sample was analyzed by UV spectroscopy. 15wt% of benzoic acid was
observed in this aerogel. This is in contradiction with the MSB data.
Table 11. Data of the difference of hydrophilic aerogels excess adsorption values of CO2 +
benzoic acid and CO2 and UV analysis.
Density of fluid
(g / cm3)
Hydrophilic aerogel:
∆m (wt%)
Hydrophobic aerogel:
∆m (wt%)
0.52 21 - 9.4
0.76 103 8.8
UV analysis
(After MSB flush)
15 9.3
Where ∆m = (Excess adsorbed amount of CO2 + benzoic acid - Excess adsorbed amount of CO2) / Excess adsorbed
amount of CO2).
In the case of adsorption of CO2 + benzoic acid - hydrophobic aerogel and pure CO2 -
hydrophobic aerogel there is negative and positive difference in the excess adsorbed amount, but
from the MSB flushing experiments, 9 wt% of benzoic acid in hydrophobic aerogel is observed.
The adsorption of CO2 + benzoic acid measurements is repeated for four times to avoid any
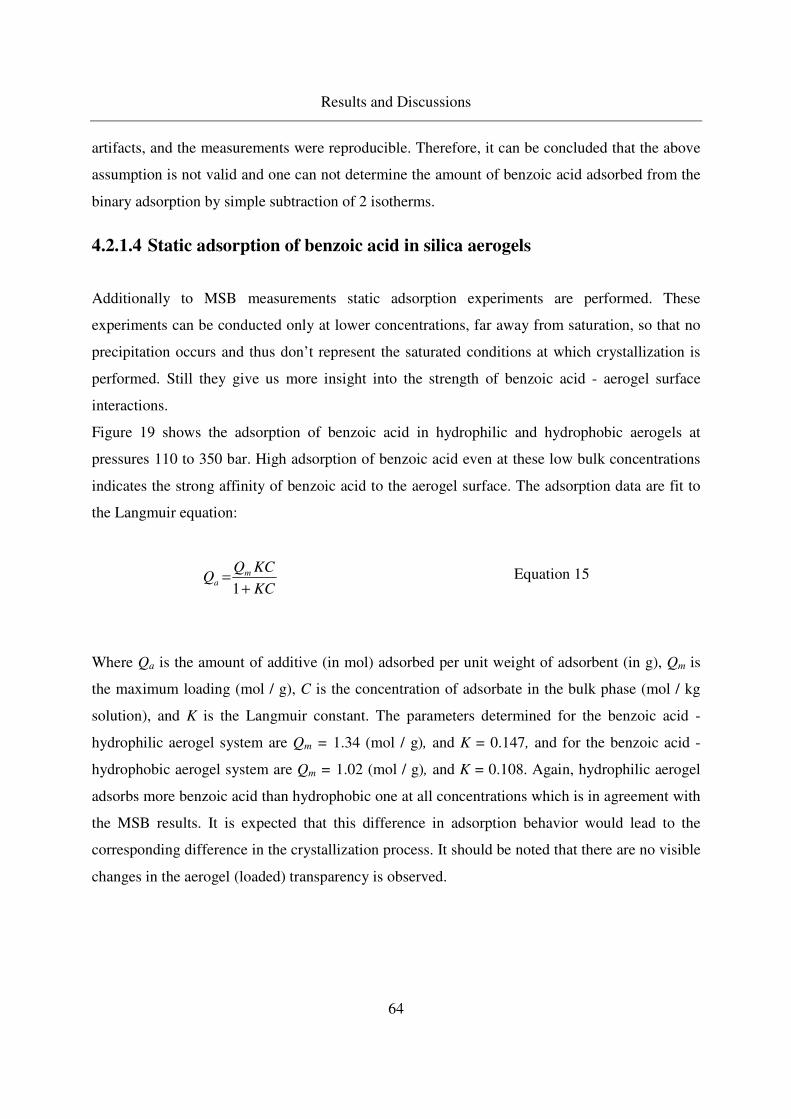
Results and Discussions
64
artifacts, and the measurements were reproducible. Therefore, it can be concluded that the above
assumption is not valid and one can not determine the amount of benzoic acid adsorbed from the
binary adsorption by simple subtraction of 2 isotherms.
4.2.1.4 Static adsorption of benzoic acid in silica aerogels
Additionally to MSB measurements static adsorption experiments are performed. These
experiments can be conducted only at lower concentrations, far away from saturation, so that no
precipitation occurs and thus don’t represent the saturated conditions at which crystallization is
performed. Still they give us more insight into the strength of benzoic acid - aerogel surface
interactions.
Figure 19 shows the adsorption of benzoic acid in hydrophilic and hydrophobic aerogels at
pressures 110 to 350 bar. High adsorption of benzoic acid even at these low bulk concentrations
indicates the strong affinity of benzoic acid to the aerogel surface. The adsorption data are fit to
the Langmuir equation:
KC
KCQQ m
a+
=1
Equation 15
Where Qa is the amount of additive (in mol) adsorbed per unit weight of adsorbent (in g), Qm is
the maximum loading (mol / g), C is the concentration of adsorbate in the bulk phase (mol / kg
solution), and K is the Langmuir constant. The parameters determined for the benzoic acid -
hydrophilic aerogel system are Qm = 1.34 (mol / g), and K = 0.147, and for the benzoic acid -
hydrophobic aerogel system are Qm = 1.02 (mol / g), and K = 0.108. Again, hydrophilic aerogel
adsorbs more benzoic acid than hydrophobic one at all concentrations which is in agreement with
the MSB results. It is expected that this difference in adsorption behavior would lead to the
corresponding difference in the crystallization process. It should be noted that there are no visible
changes in the aerogel (loaded) transparency is observed.
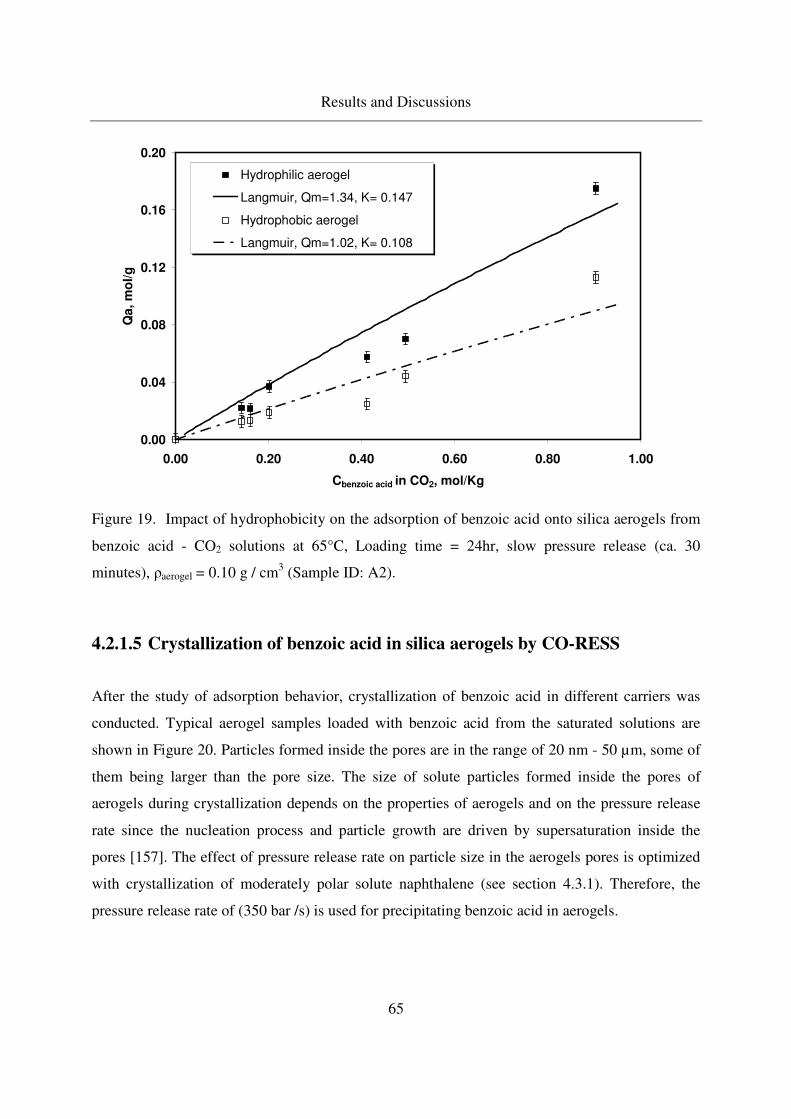
Results and Discussions
65
0.00
0.04
0.08
0.12
0.16
0.20
0.00 0.20 0.40 0.60 0.80 1.00
Cbenzoic acid in CO2, mol/Kg
Qa
, m
ol/
g
Hydrophilic aerogel
Langmuir, Qm=1.34, K= 0.147
Hydrophobic aerogel
Langmuir, Qm=1.02, K= 0.108
Figure 19. Impact of hydrophobicity on the adsorption of benzoic acid onto silica aerogels from
benzoic acid - CO2 solutions at 65°C, Loading time = 24hr, slow pressure release (ca. 30
minutes), ρaerogel = 0.10 g / cm3 (Sample ID: A2).
4.2.1.5 Crystallization of benzoic acid in silica aerogels by CO-RESS
After the study of adsorption behavior, crystallization of benzoic acid in different carriers was
conducted. Typical aerogel samples loaded with benzoic acid from the saturated solutions are
shown in Figure 20. Particles formed inside the pores are in the range of 20 nm - 50 µm, some of
them being larger than the pore size. The size of solute particles formed inside the pores of
aerogels during crystallization depends on the properties of aerogels and on the pressure release
rate since the nucleation process and particle growth are driven by supersaturation inside the
pores [157]. The effect of pressure release rate on particle size in the aerogels pores is optimized
with crystallization of moderately polar solute naphthalene (see section 4.3.1). Therefore, the
pressure release rate of (350 bar /s) is used for precipitating benzoic acid in aerogels.
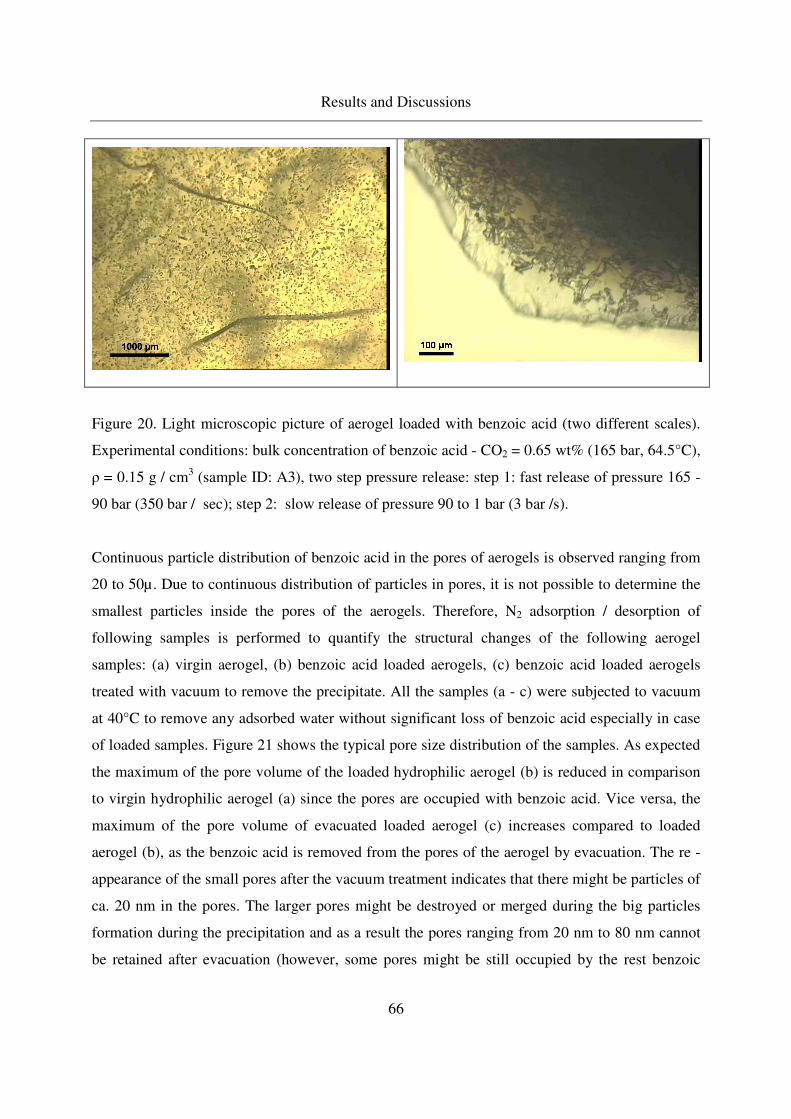
Results and Discussions
66
Figure 20. Light microscopic picture of aerogel loaded with benzoic acid (two different scales).
Experimental conditions: bulk concentration of benzoic acid - CO2 = 0.65 wt% (165 bar, 64.5°C),
ρ = 0.15 g / cm3 (sample ID: A3), two step pressure release: step 1: fast release of pressure 165 -
90 bar (350 bar / sec); step 2: slow release of pressure 90 to 1 bar (3 bar /s).
Continuous particle distribution of benzoic acid in the pores of aerogels is observed ranging from
20 to 50µ. Due to continuous distribution of particles in pores, it is not possible to determine the
smallest particles inside the pores of the aerogels. Therefore, N2 adsorption / desorption of
following samples is performed to quantify the structural changes of the following aerogel
samples: (a) virgin aerogel, (b) benzoic acid loaded aerogels, (c) benzoic acid loaded aerogels
treated with vacuum to remove the precipitate. All the samples (a - c) were subjected to vacuum
at 40°C to remove any adsorbed water without significant loss of benzoic acid especially in case
of loaded samples. Figure 21 shows the typical pore size distribution of the samples. As expected
the maximum of the pore volume of the loaded hydrophilic aerogel (b) is reduced in comparison
to virgin hydrophilic aerogel (a) since the pores are occupied with benzoic acid. Vice versa, the
maximum of the pore volume of evacuated loaded aerogel (c) increases compared to loaded
aerogel (b), as the benzoic acid is removed from the pores of the aerogel by evacuation. The re -
appearance of the small pores after the vacuum treatment indicates that there might be particles of
ca. 20 nm in the pores. The larger pores might be destroyed or merged during the big particles
formation during the precipitation and as a result the pores ranging from 20 nm to 80 nm cannot
be retained after evacuation (however, some pores might be still occupied by the rest benzoic
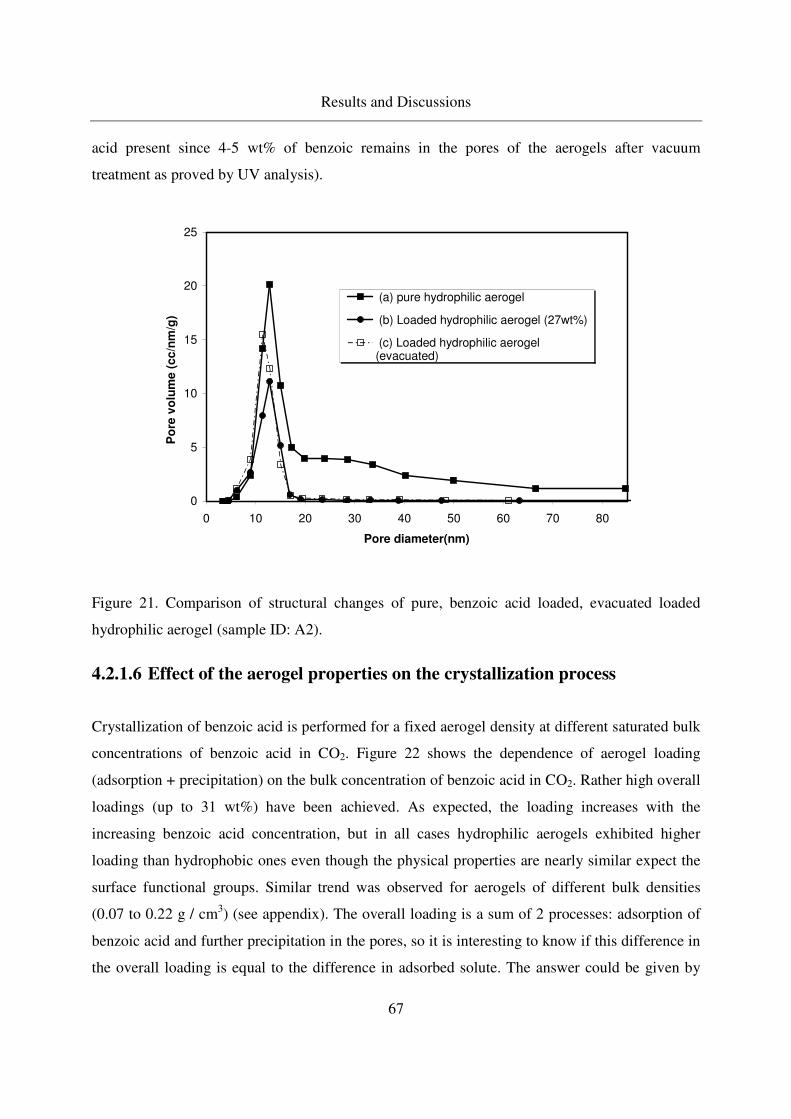
Results and Discussions
67
acid present since 4-5 wt% of benzoic remains in the pores of the aerogels after vacuum
treatment as proved by UV analysis).
0
5
10
15
20
25
0 10 20 30 40 50 60 70 80
Pore diameter(nm)
Po
re v
olu
me
(c
c/n
m/g
)
(a) pure hydrophilic aerogel
(b) Loaded hydrophilic aerogel (27wt%)
(c) Loaded hydrophilic aerogel(evacuated)
Figure 21. Comparison of structural changes of pure, benzoic acid loaded, evacuated loaded
hydrophilic aerogel (sample ID: A2).
4.2.1.6 Effect of the aerogel properties on the crystallization process
Crystallization of benzoic acid is performed for a fixed aerogel density at different saturated bulk
concentrations of benzoic acid in CO2. Figure 22 shows the dependence of aerogel loading
(adsorption + precipitation) on the bulk concentration of benzoic acid in CO2. Rather high overall
loadings (up to 31 wt%) have been achieved. As expected, the loading increases with the
increasing benzoic acid concentration, but in all cases hydrophilic aerogels exhibited higher
loading than hydrophobic ones even though the physical properties are nearly similar expect the
surface functional groups. Similar trend was observed for aerogels of different bulk densities
(0.07 to 0.22 g / cm3) (see appendix). The overall loading is a sum of 2 processes: adsorption of
benzoic acid and further precipitation in the pores, so it is interesting to know if this difference in
the overall loading is equal to the difference in adsorbed solute. The answer could be given by
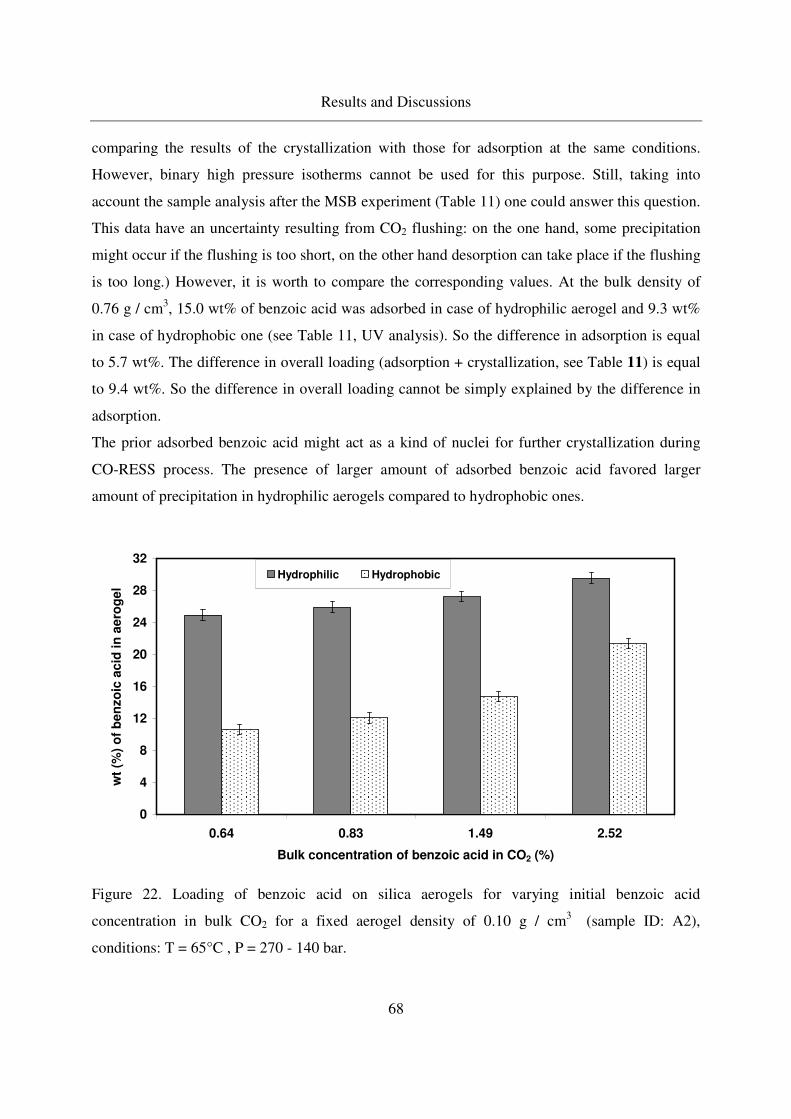
Results and Discussions
68
comparing the results of the crystallization with those for adsorption at the same conditions.
However, binary high pressure isotherms cannot be used for this purpose. Still, taking into
account the sample analysis after the MSB experiment (Table 11) one could answer this question.
This data have an uncertainty resulting from CO2 flushing: on the one hand, some precipitation
might occur if the flushing is too short, on the other hand desorption can take place if the flushing
is too long.) However, it is worth to compare the corresponding values. At the bulk density of
0.76 g / cm3, 15.0 wt% of benzoic acid was adsorbed in case of hydrophilic aerogel and 9.3 wt%
in case of hydrophobic one (see Table 11, UV analysis). So the difference in adsorption is equal
to 5.7 wt%. The difference in overall loading (adsorption + crystallization, see Table 11) is equal
to 9.4 wt%. So the difference in overall loading cannot be simply explained by the difference in
adsorption.
The prior adsorbed benzoic acid might act as a kind of nuclei for further crystallization during
CO-RESS process. The presence of larger amount of adsorbed benzoic acid favored larger
amount of precipitation in hydrophilic aerogels compared to hydrophobic ones.
0
4
8
12
16
20
24
28
32
0.64 0.83 1.49 2.52
Bulk concentration of benzoic acid in CO2 (%)
wt
(%)
of
be
nzo
ic a
cid
in
ae
rog
el
Hydrophilic Hydrophobic
Figure 22. Loading of benzoic acid on silica aerogels for varying initial benzoic acid
concentration in bulk CO2 for a fixed aerogel density of 0.10 g / cm3 (sample ID: A2),
conditions: T = 65°C , P = 270 - 140 bar.
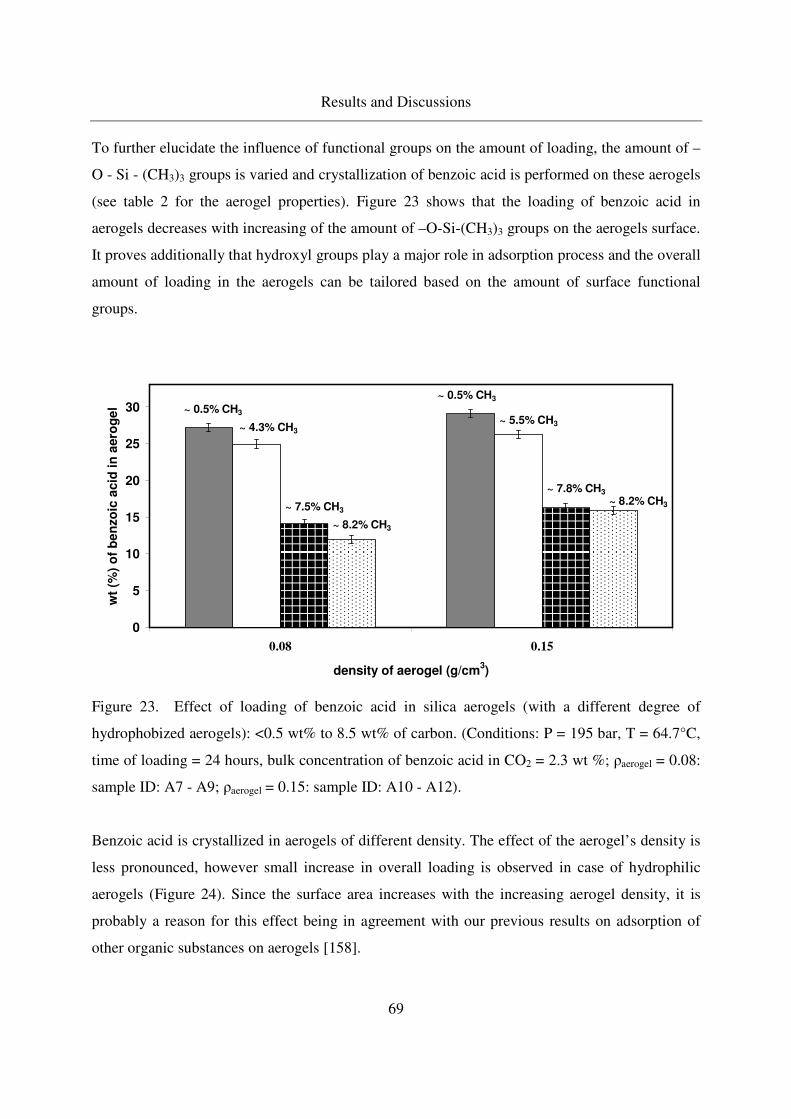
Results and Discussions
69
To further elucidate the influence of functional groups on the amount of loading, the amount of –
O - Si - (CH3)3 groups is varied and crystallization of benzoic acid is performed on these aerogels
(see table 2 for the aerogel properties). Figure 23 shows that the loading of benzoic acid in
aerogels decreases with increasing of the amount of –O-Si-(CH3)3 groups on the aerogels surface.
It proves additionally that hydroxyl groups play a major role in adsorption process and the overall
amount of loading in the aerogels can be tailored based on the amount of surface functional
groups.
0
5
10
15
20
25
30
0.08 0.15
density of aerogel (g/cm3)
wt
(%)
of
be
nzo
ic a
cid
in
aero
ge
l ~ 0.5% CH3
~ 4.3% CH3
~ 7.5% CH3
~ 8.2% CH3
~ 0.5% CH3
~ 5.5% CH3
~ 7.8% CH3
~ 8.2% CH3
Figure 23. Effect of loading of benzoic acid in silica aerogels (with a different degree of
hydrophobized aerogels): <0.5 wt% to 8.5 wt% of carbon. (Conditions: P = 195 bar, T = 64.7°C,
time of loading = 24 hours, bulk concentration of benzoic acid in CO2 = 2.3 wt %; ρaerogel = 0.08:
sample ID: A7 - A9; ρaerogel = 0.15: sample ID: A10 - A12).
Benzoic acid is crystallized in aerogels of different density. The effect of the aerogel’s density is
less pronounced, however small increase in overall loading is observed in case of hydrophilic
aerogels (Figure 24). Since the surface area increases with the increasing aerogel density, it is
probably a reason for this effect being in agreement with our previous results on adsorption of
other organic substances on aerogels [158].
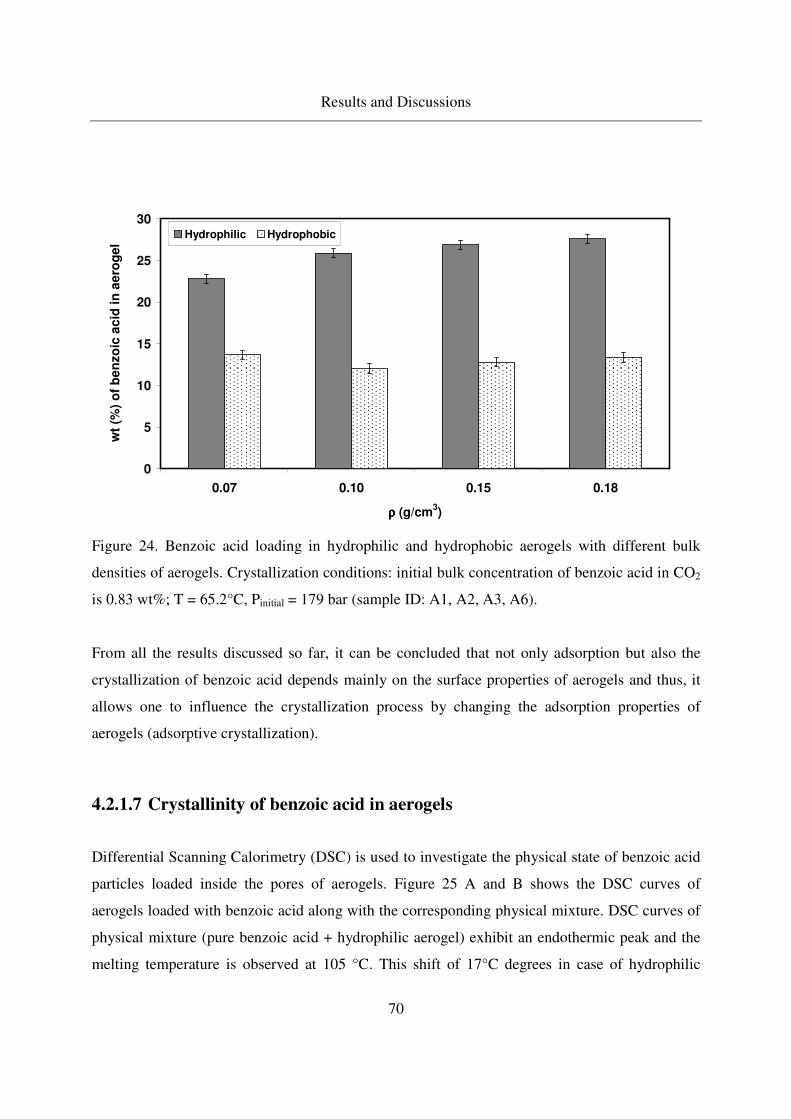
Results and Discussions
70
0
5
10
15
20
25
30
0.07 0.10 0.15 0.18
ρρρρ (g/cm3)
wt
(%)
of
be
nzo
ic a
cid
in
ae
rog
el
Hydrophilic Hydrophobic
Figure 24. Benzoic acid loading in hydrophilic and hydrophobic aerogels with different bulk
densities of aerogels. Crystallization conditions: initial bulk concentration of benzoic acid in CO2
is 0.83 wt%; T = 65.2°C, Pinitial = 179 bar (sample ID: A1, A2, A3, A6).
From all the results discussed so far, it can be concluded that not only adsorption but also the
crystallization of benzoic acid depends mainly on the surface properties of aerogels and thus, it
allows one to influence the crystallization process by changing the adsorption properties of
aerogels (adsorptive crystallization).
4.2.1.7 Crystallinity of benzoic acid in aerogels
Differential Scanning Calorimetry (DSC) is used to investigate the physical state of benzoic acid
particles loaded inside the pores of aerogels. Figure 25 A and B shows the DSC curves of
aerogels loaded with benzoic acid along with the corresponding physical mixture. DSC curves of
physical mixture (pure benzoic acid + hydrophilic aerogel) exhibit an endothermic peak and the
melting temperature is observed at 105 °C. This shift of 17°C degrees in case of hydrophilic
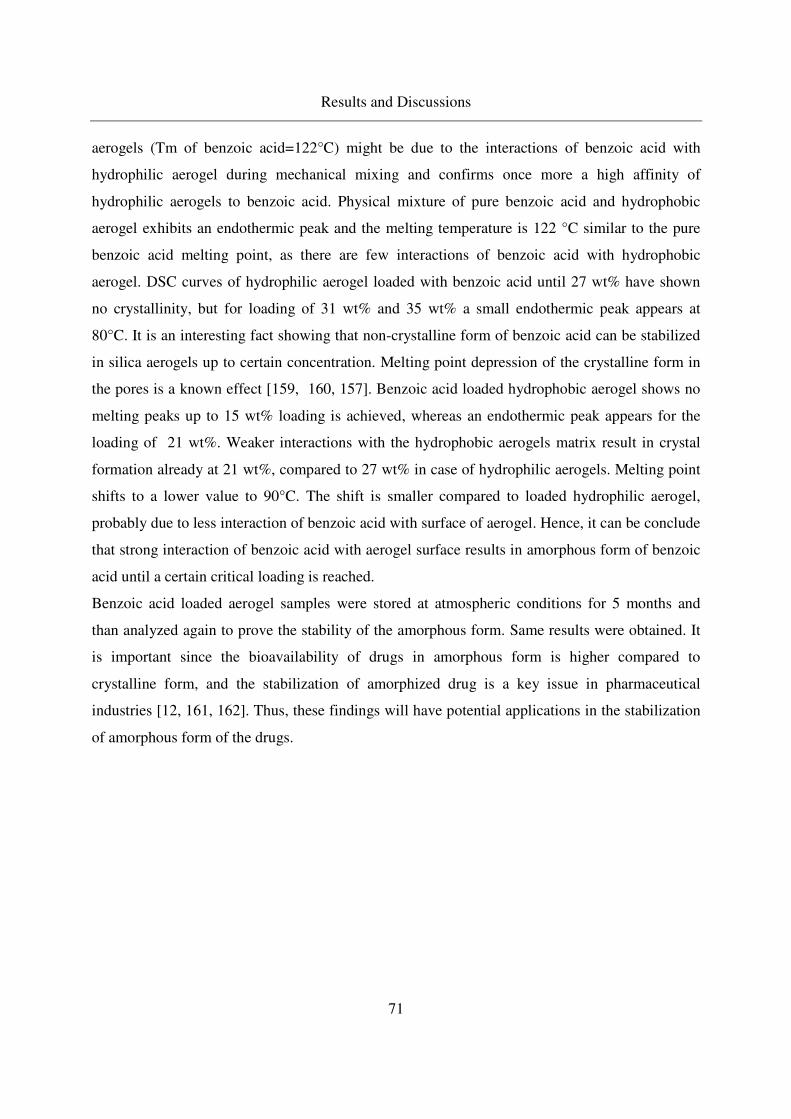
Results and Discussions
71
aerogels (Tm of benzoic acid=122°C) might be due to the interactions of benzoic acid with
hydrophilic aerogel during mechanical mixing and confirms once more a high affinity of
hydrophilic aerogels to benzoic acid. Physical mixture of pure benzoic acid and hydrophobic
aerogel exhibits an endothermic peak and the melting temperature is 122 °C similar to the pure
benzoic acid melting point, as there are few interactions of benzoic acid with hydrophobic
aerogel. DSC curves of hydrophilic aerogel loaded with benzoic acid until 27 wt% have shown
no crystallinity, but for loading of 31 wt% and 35 wt% a small endothermic peak appears at
80°C. It is an interesting fact showing that non-crystalline form of benzoic acid can be stabilized
in silica aerogels up to certain concentration. Melting point depression of the crystalline form in
the pores is a known effect [159, 160, 157]. Benzoic acid loaded hydrophobic aerogel shows no
melting peaks up to 15 wt% loading is achieved, whereas an endothermic peak appears for the
loading of 21 wt%. Weaker interactions with the hydrophobic aerogels matrix result in crystal
formation already at 21 wt%, compared to 27 wt% in case of hydrophilic aerogels. Melting point
shifts to a lower value to 90°C. The shift is smaller compared to loaded hydrophilic aerogel,
probably due to less interaction of benzoic acid with surface of aerogel. Hence, it can be conclude
that strong interaction of benzoic acid with aerogel surface results in amorphous form of benzoic
acid until a certain critical loading is reached.
Benzoic acid loaded aerogel samples were stored at atmospheric conditions for 5 months and
than analyzed again to prove the stability of the amorphous form. Same results were obtained. It
is important since the bioavailability of drugs in amorphous form is higher compared to
crystalline form, and the stabilization of amorphized drug is a key issue in pharmaceutical
industries [12, 161, 162]. Thus, these findings will have potential applications in the stabilization
of amorphous form of the drugs.
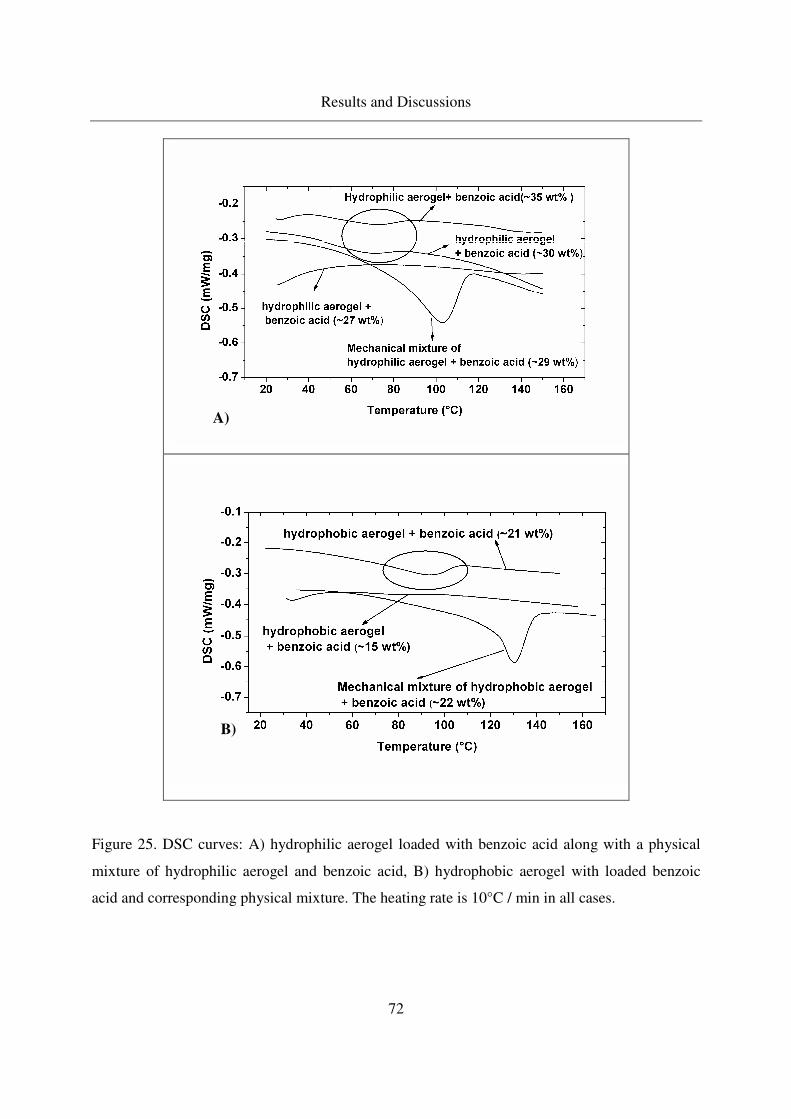
Results and Discussions
72
Figure 25. DSC curves: A) hydrophilic aerogel loaded with benzoic acid along with a physical
mixture of hydrophilic aerogel and benzoic acid, B) hydrophobic aerogel with loaded benzoic
acid and corresponding physical mixture. The heating rate is 10°C / min in all cases.
B)
A)
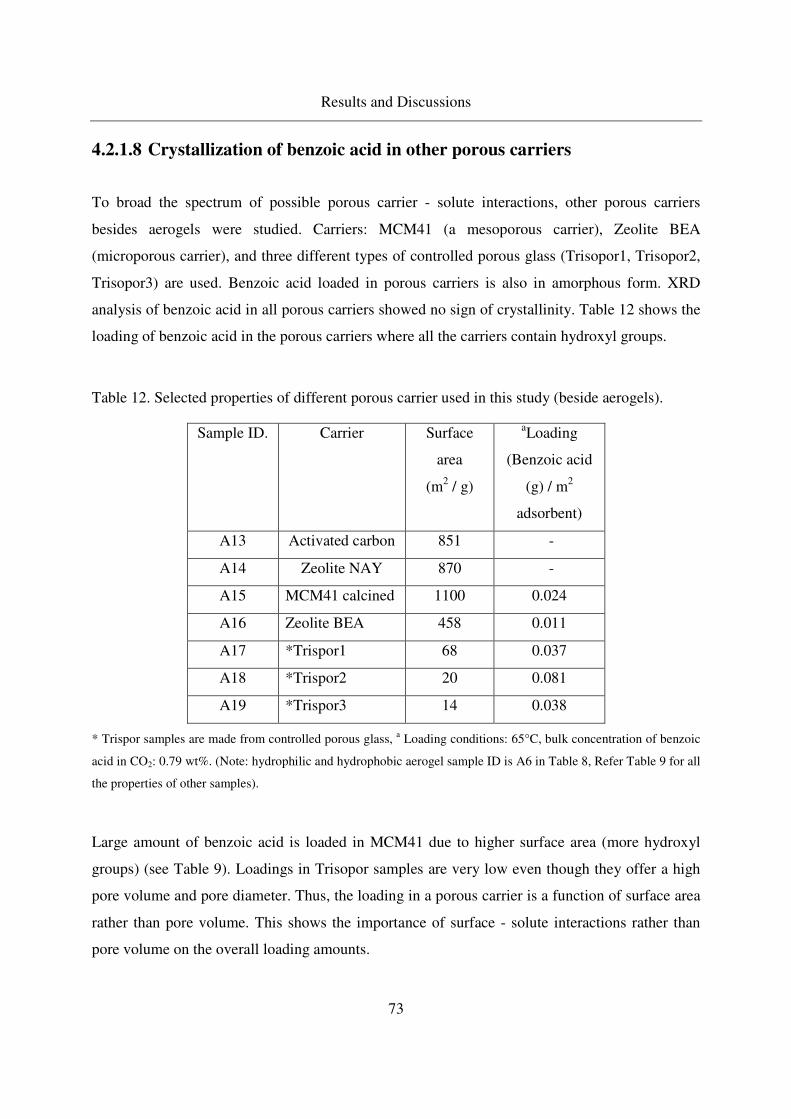
Results and Discussions
73
4.2.1.8 Crystallization of benzoic acid in other porous carriers
To broad the spectrum of possible porous carrier - solute interactions, other porous carriers
besides aerogels were studied. Carriers: MCM41 (a mesoporous carrier), Zeolite BEA
(microporous carrier), and three different types of controlled porous glass (Trisopor1, Trisopor2,
Trisopor3) are used. Benzoic acid loaded in porous carriers is also in amorphous form. XRD
analysis of benzoic acid in all porous carriers showed no sign of crystallinity. Table 12 shows the
loading of benzoic acid in the porous carriers where all the carriers contain hydroxyl groups.
Table 12. Selected properties of different porous carrier used in this study (beside aerogels).
Sample ID. Carrier Surface
area
(m2 / g)
aLoading
(Benzoic acid
(g) / m2
adsorbent)
A13 Activated carbon 851 -
A14 Zeolite NAY 870 -
A15 MCM41 calcined 1100 0.024
A16 Zeolite BEA 458 0.011
A17 *Trispor1 68 0.037
A18 *Trispor2 20 0.081
A19 *Trispor3 14 0.038
* Trispor samples are made from controlled porous glass, a Loading conditions: 65°C, bulk concentration of benzoic
acid in CO2: 0.79 wt%. (Note: hydrophilic and hydrophobic aerogel sample ID is A6 in Table 8, Refer Table 9 for all
the properties of other samples).
Large amount of benzoic acid is loaded in MCM41 due to higher surface area (more hydroxyl
groups) (see Table 9). Loadings in Trisopor samples are very low even though they offer a high
pore volume and pore diameter. Thus, the loading in a porous carrier is a function of surface area
rather than pore volume. This shows the importance of surface - solute interactions rather than
pore volume on the overall loading amounts.
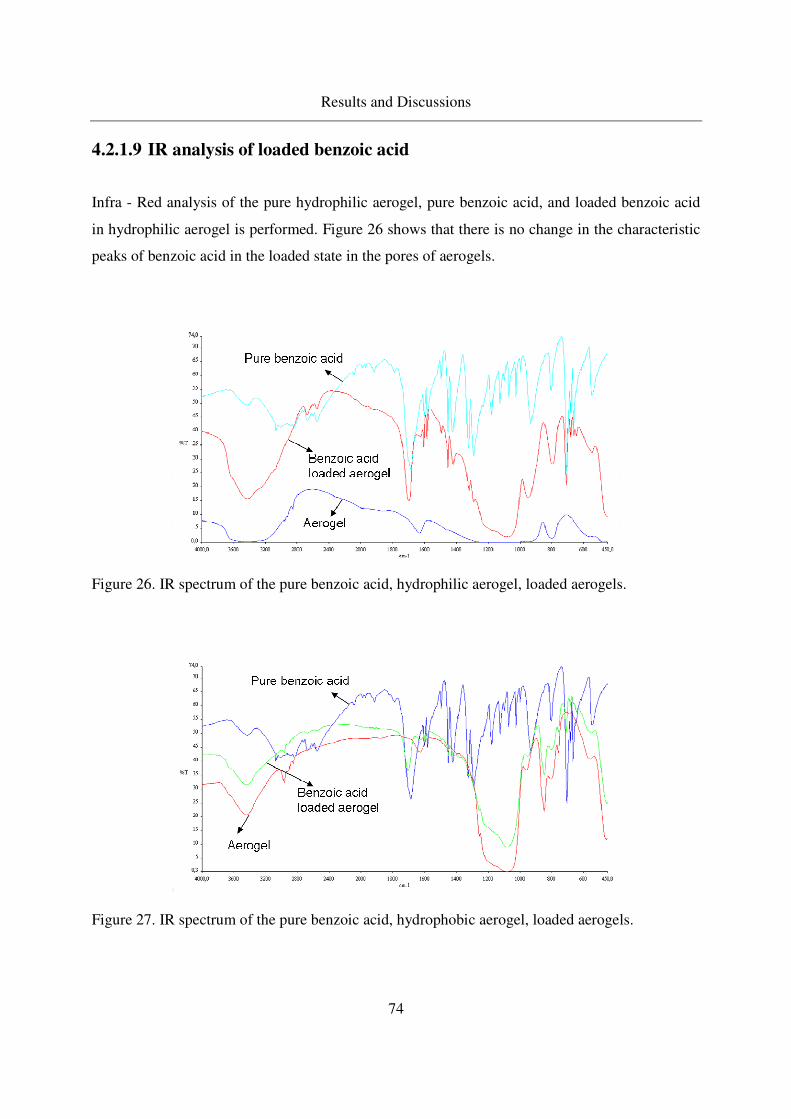
Results and Discussions
74
4.2.1.9 IR analysis of loaded benzoic acid
Infra - Red analysis of the pure hydrophilic aerogel, pure benzoic acid, and loaded benzoic acid
in hydrophilic aerogel is performed. Figure 26 shows that there is no change in the characteristic
peaks of benzoic acid in the loaded state in the pores of aerogels.
Figure 26. IR spectrum of the pure benzoic acid, hydrophilic aerogel, loaded aerogels.
Figure 27. IR spectrum of the pure benzoic acid, hydrophobic aerogel, loaded aerogels.
Results and Discussions
75
The region 3600 - 3200 cm -1 is the region where water is adsorbed on hydroxyl groups on pure
hydrophilic aerogels. In the case of benzoic acid loaded aerogel this peak is sharpened due to the
hydrogen bonding between OH groups and benzoic acid carboxylic group. Thus, the loaded
benzoic acid is stabilized in the pores of silica aerogel even though amorphized after the loading.
Similar analysis is done for hydrophobic aerogels samples. Hydrophobic aerogels contains less
hydroxyl groups, as a result, in the region (3600 - 3200 cm-1) the peak is not so wide rather sharp
(see Figure 27). The benzoic acid loaded hydrophobic aerogels has week hydrogen bonding with
benzoic acid. Therefore, the peak in this region remains almost similar without any change. In
both cases the amorphized benzoic acid is stabilized.
Hence, the overall crystallization process is influenced by the adsorptive properties of aerogels
(prior adsorbed solute) ‘adsorptive crystallization’. Based on these observations of benzoic acid
loading in aerogels, further adsorption of another polar volatile solute 1-menthol on aerogels is
investigated to study the strength of solute - surface interactions on the stabilization of loaded
solute in aerogels.
Results and Discussions
76
4.2.2 Adsorption of 1-menthol in silica aerogels
In this work, adsorption of 1-menthol is conducted from supercritical CO2 at concentrations far
away from saturation in both the aerogels, thus, only adsorption of menthol occurs. Thermal
analysis of the loaded aerogels is performed to investigate the strength of interactions of menthol
with surface of aerogels. From now onwards, 1-menthol will be addressed as menthol in this
section.
4.2.2.1 Menthol adsorption in silica aerogels
Adsorption of menthol in silica aerogels is studied by the static adsorption method described in
section 3.4.2. It takes 60 minutes to reach the equilibrium adsorption in our experiments, as
measured online at 50°C and 100 bar using a magnetic suspension balance (see appendix).
Menthol, which contains a hydroxyl group, is expected to cross associate with the hydroxyl
groups in the hydrophobic and hydrophilic aerogels via hydrogen bonding. Figure 28 shows the
effect of the aerogel’s functional groups on the loading of menthol for five different menthol -
CO2 solutions ranging from 0.05 and 1 wt% menthol, respectively. The adsorption data are fit to
the Langmuir equation:
KC
KCQQ m
a+
=1
Equation 16
Where Qa is the amount of solute (in mol) adsorbed per unit weight of adsorbent (in g), Qm is the
maximum loading (mol / g), C is the concentration of adsorbate in the bulk phase (mol / kg
solution), and K is the Langmuir constant. As expected, the hydrophilic aerogel exhibits a higher
loading of menthol in all cases compared to the hydrophobic aerogel, due to hydrogen bonds with
the free –OH groups of the silica aerogels similar to benzoic acid experiments.
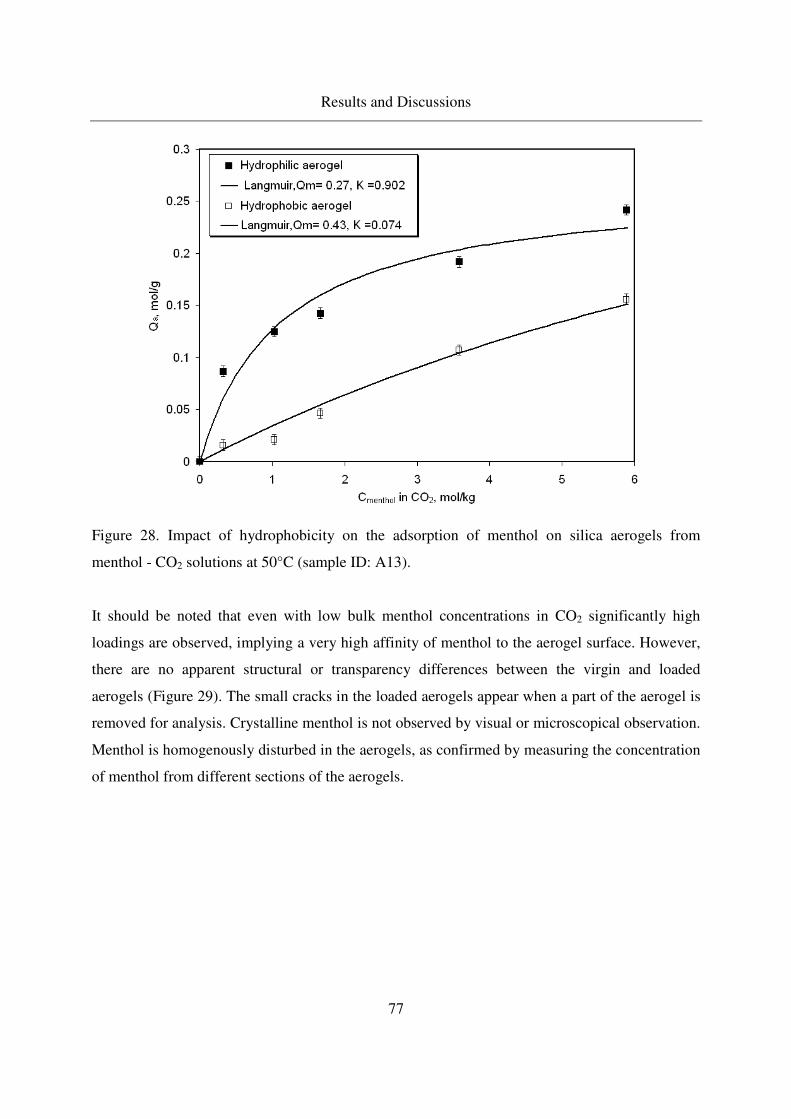
Results and Discussions
77
Figure 28. Impact of hydrophobicity on the adsorption of menthol on silica aerogels from
menthol - CO2 solutions at 50°C (sample ID: A13).
It should be noted that even with low bulk menthol concentrations in CO2 significantly high
loadings are observed, implying a very high affinity of menthol to the aerogel surface. However,
there are no apparent structural or transparency differences between the virgin and loaded
aerogels (Figure 29). The small cracks in the loaded aerogels appear when a part of the aerogel is
removed for analysis. Crystalline menthol is not observed by visual or microscopical observation.
Menthol is homogenously disturbed in the aerogels, as confirmed by measuring the concentration
of menthol from different sections of the aerogels.
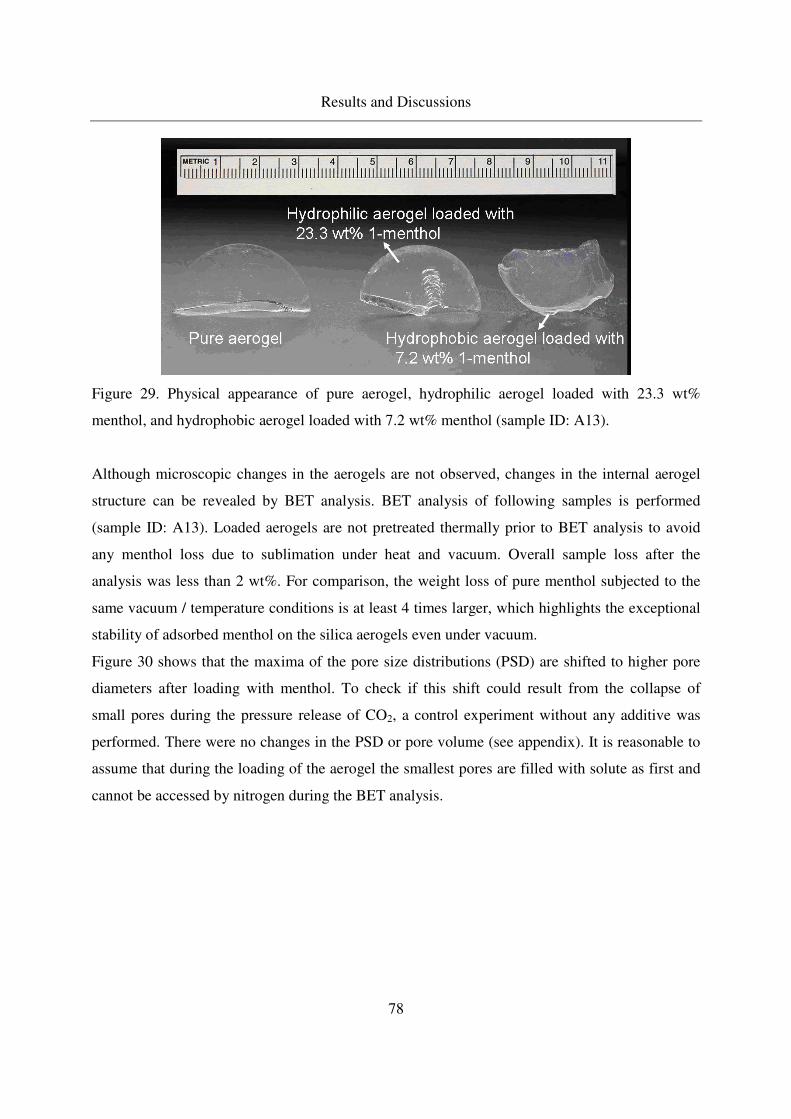
Results and Discussions
78
Figure 29. Physical appearance of pure aerogel, hydrophilic aerogel loaded with 23.3 wt%
menthol, and hydrophobic aerogel loaded with 7.2 wt% menthol (sample ID: A13).
Although microscopic changes in the aerogels are not observed, changes in the internal aerogel
structure can be revealed by BET analysis. BET analysis of following samples is performed
(sample ID: A13). Loaded aerogels are not pretreated thermally prior to BET analysis to avoid
any menthol loss due to sublimation under heat and vacuum. Overall sample loss after the
analysis was less than 2 wt%. For comparison, the weight loss of pure menthol subjected to the
same vacuum / temperature conditions is at least 4 times larger, which highlights the exceptional
stability of adsorbed menthol on the silica aerogels even under vacuum.
Figure 30 shows that the maxima of the pore size distributions (PSD) are shifted to higher pore
diameters after loading with menthol. To check if this shift could result from the collapse of
small pores during the pressure release of CO2, a control experiment without any additive was
performed. There were no changes in the PSD or pore volume (see appendix). It is reasonable to
assume that during the loading of the aerogel the smallest pores are filled with solute as first and
cannot be accessed by nitrogen during the BET analysis.

Results and Discussions
79
Figure 30. A) Pore size distributions of virgin (open circles) and 23.3 wt% menthol - loaded
(open squares) hydrophilic aerogels, B) virgin (open circles) and 7.2 wt% menthol - loaded (open
squares) hydrophobic aerogels.
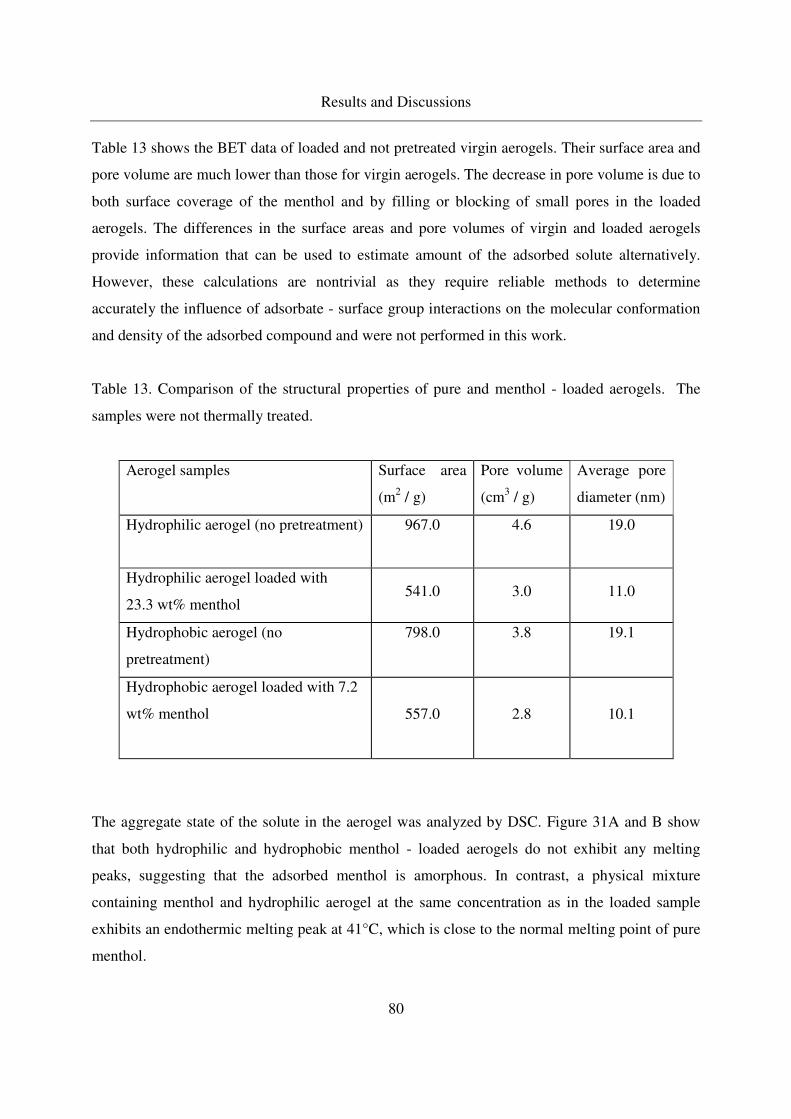
Results and Discussions
80
Table 13 shows the BET data of loaded and not pretreated virgin aerogels. Their surface area and
pore volume are much lower than those for virgin aerogels. The decrease in pore volume is due to
both surface coverage of the menthol and by filling or blocking of small pores in the loaded
aerogels. The differences in the surface areas and pore volumes of virgin and loaded aerogels
provide information that can be used to estimate amount of the adsorbed solute alternatively.
However, these calculations are nontrivial as they require reliable methods to determine
accurately the influence of adsorbate - surface group interactions on the molecular conformation
and density of the adsorbed compound and were not performed in this work.
Table 13. Comparison of the structural properties of pure and menthol - loaded aerogels. The
samples were not thermally treated.
Aerogel samples Surface area
(m2 / g)
Pore volume
(cm3 / g)
Average pore
diameter (nm)
Hydrophilic aerogel (no pretreatment) 967.0 4.6 19.0
Hydrophilic aerogel loaded with
23.3 wt% menthol 541.0 3.0 11.0
Hydrophobic aerogel (no
pretreatment)
798.0 3.8 19.1
Hydrophobic aerogel loaded with 7.2
wt% menthol
557.0 2.8 10.1
The aggregate state of the solute in the aerogel was analyzed by DSC. Figure 31A and B show
that both hydrophilic and hydrophobic menthol - loaded aerogels do not exhibit any melting
peaks, suggesting that the adsorbed menthol is amorphous. In contrast, a physical mixture
containing menthol and hydrophilic aerogel at the same concentration as in the loaded sample
exhibits an endothermic melting peak at 41°C, which is close to the normal melting point of pure
menthol.
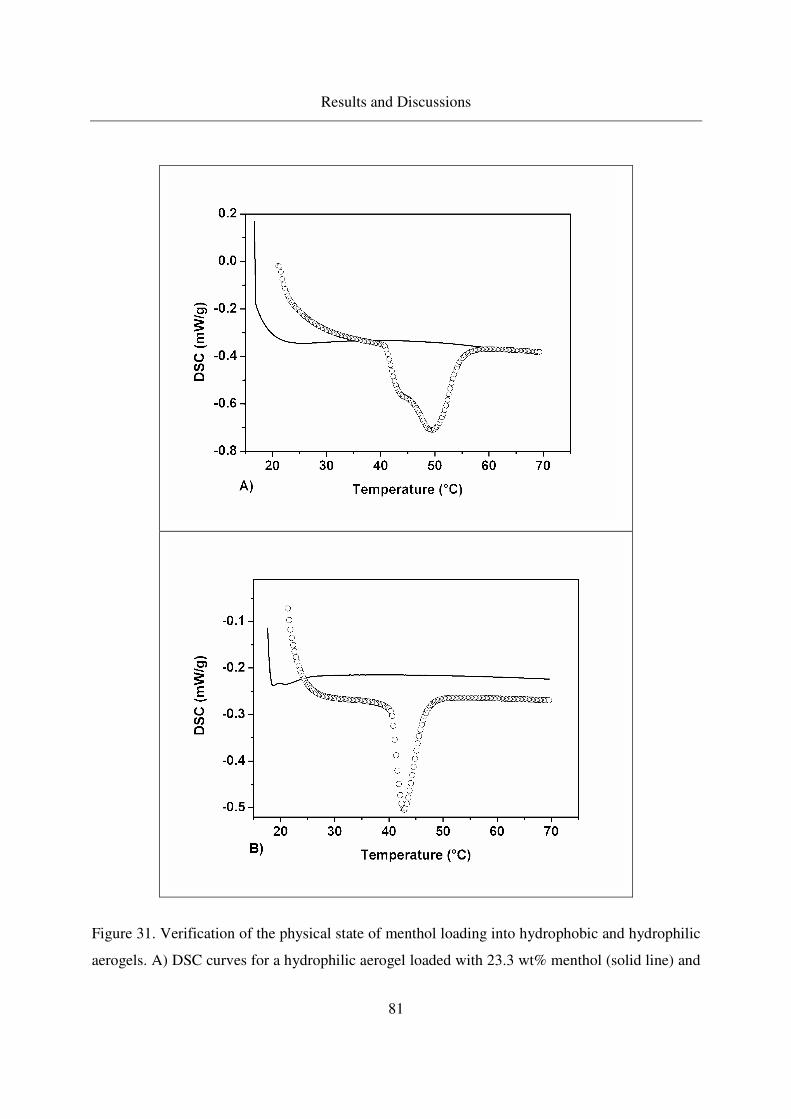
Results and Discussions
81
Figure 31. Verification of the physical state of menthol loading into hydrophobic and hydrophilic
aerogels. A) DSC curves for a hydrophilic aerogel loaded with 23.3 wt% menthol (solid line) and
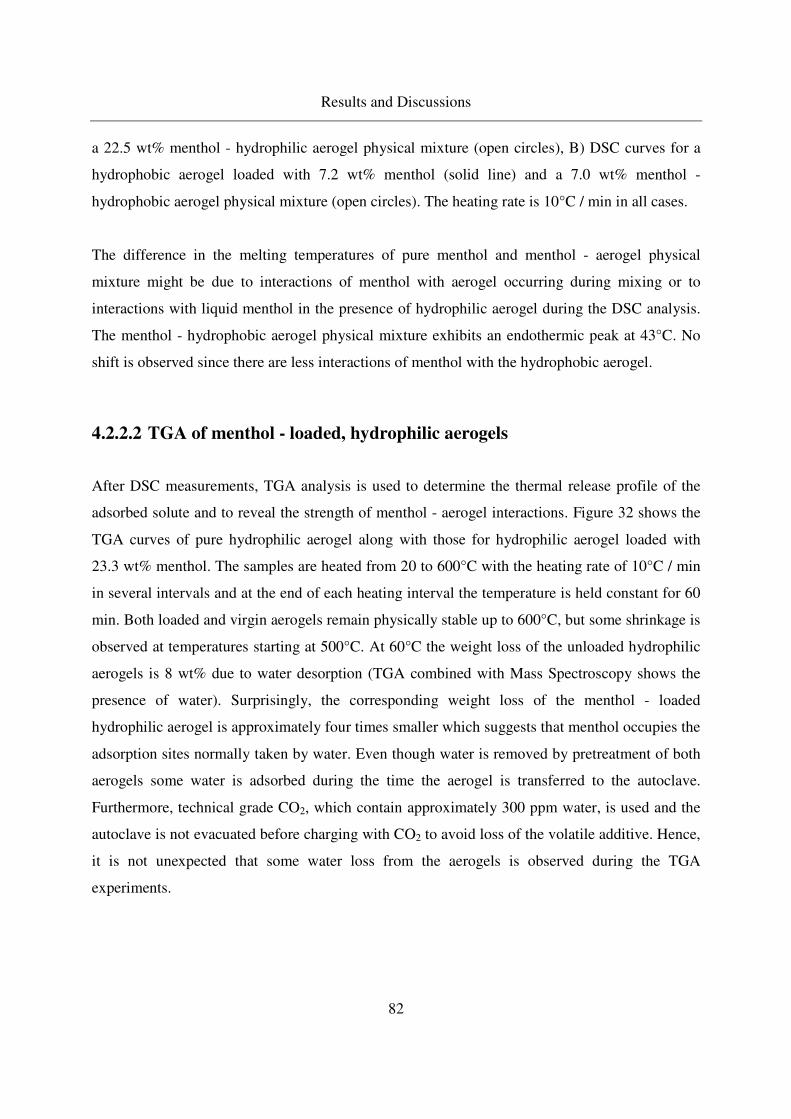
Results and Discussions
82
a 22.5 wt% menthol - hydrophilic aerogel physical mixture (open circles), B) DSC curves for a
hydrophobic aerogel loaded with 7.2 wt% menthol (solid line) and a 7.0 wt% menthol -
hydrophobic aerogel physical mixture (open circles). The heating rate is 10°C / min in all cases.
The difference in the melting temperatures of pure menthol and menthol - aerogel physical
mixture might be due to interactions of menthol with aerogel occurring during mixing or to
interactions with liquid menthol in the presence of hydrophilic aerogel during the DSC analysis.
The menthol - hydrophobic aerogel physical mixture exhibits an endothermic peak at 43°C. No
shift is observed since there are less interactions of menthol with the hydrophobic aerogel.
4.2.2.2 TGA of menthol - loaded, hydrophilic aerogels
After DSC measurements, TGA analysis is used to determine the thermal release profile of the
adsorbed solute and to reveal the strength of menthol - aerogel interactions. Figure 32 shows the
TGA curves of pure hydrophilic aerogel along with those for hydrophilic aerogel loaded with
23.3 wt% menthol. The samples are heated from 20 to 600°C with the heating rate of 10°C / min
in several intervals and at the end of each heating interval the temperature is held constant for 60
min. Both loaded and virgin aerogels remain physically stable up to 600°C, but some shrinkage is
observed at temperatures starting at 500°C. At 60°C the weight loss of the unloaded hydrophilic
aerogels is 8 wt% due to water desorption (TGA combined with Mass Spectroscopy shows the
presence of water). Surprisingly, the corresponding weight loss of the menthol - loaded
hydrophilic aerogel is approximately four times smaller which suggests that menthol occupies the
adsorption sites normally taken by water. Even though water is removed by pretreatment of both
aerogels some water is adsorbed during the time the aerogel is transferred to the autoclave.
Furthermore, technical grade CO2, which contain approximately 300 ppm water, is used and the
autoclave is not evacuated before charging with CO2 to avoid loss of the volatile additive. Hence,
it is not unexpected that some water loss from the aerogels is observed during the TGA
experiments.
Results and Discussions
83
Figure 32. TGA curves of 23.3 wt% menthol - loaded hydrophilic aerogel and virgin one.
For better understanding of loss menthol, Figure 33 is recasted from Figure 32 so that only the
loss of menthol and not the total loss (menthol + water) is presented. For comparison the
corresponding curve for pure menthol is shown. Pure menthol sublimes completely within 55
minutes at 60°C. In contrast, adsorbed menthol is released from the hydrophilic aerogel only after
the temperature reaches 400°C. Thus, the release of menthol is delayed due to the strong
hydrogen bonding of menthol with the free –OH groups on the hydrophilic aerogels.
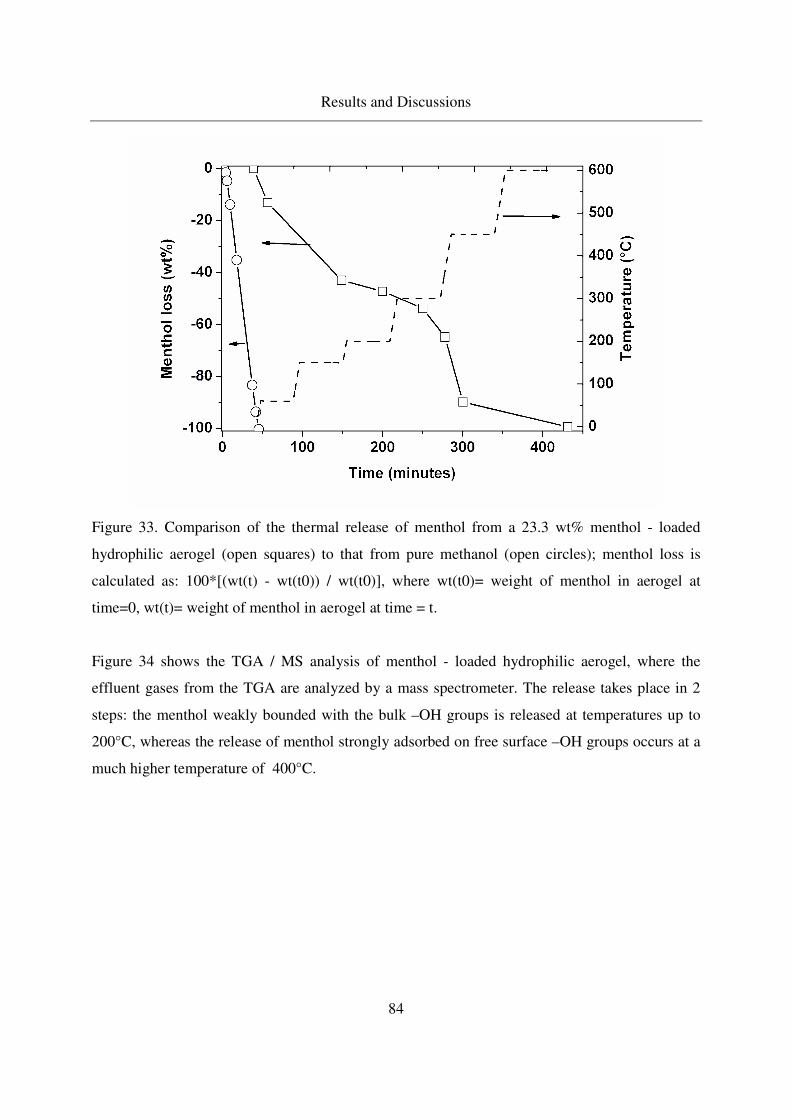
Results and Discussions
84
Figure 33. Comparison of the thermal release of menthol from a 23.3 wt% menthol - loaded
hydrophilic aerogel (open squares) to that from pure methanol (open circles); menthol loss is
calculated as: 100*[(wt(t) - wt(t0)) / wt(t0)], where wt(t0)= weight of menthol in aerogel at
time=0, wt(t)= weight of menthol in aerogel at time = t.
Figure 34 shows the TGA / MS analysis of menthol - loaded hydrophilic aerogel, where the
effluent gases from the TGA are analyzed by a mass spectrometer. The release takes place in 2
steps: the menthol weakly bounded with the bulk –OH groups is released at temperatures up to
200°C, whereas the release of menthol strongly adsorbed on free surface –OH groups occurs at a
much higher temperature of 400°C.
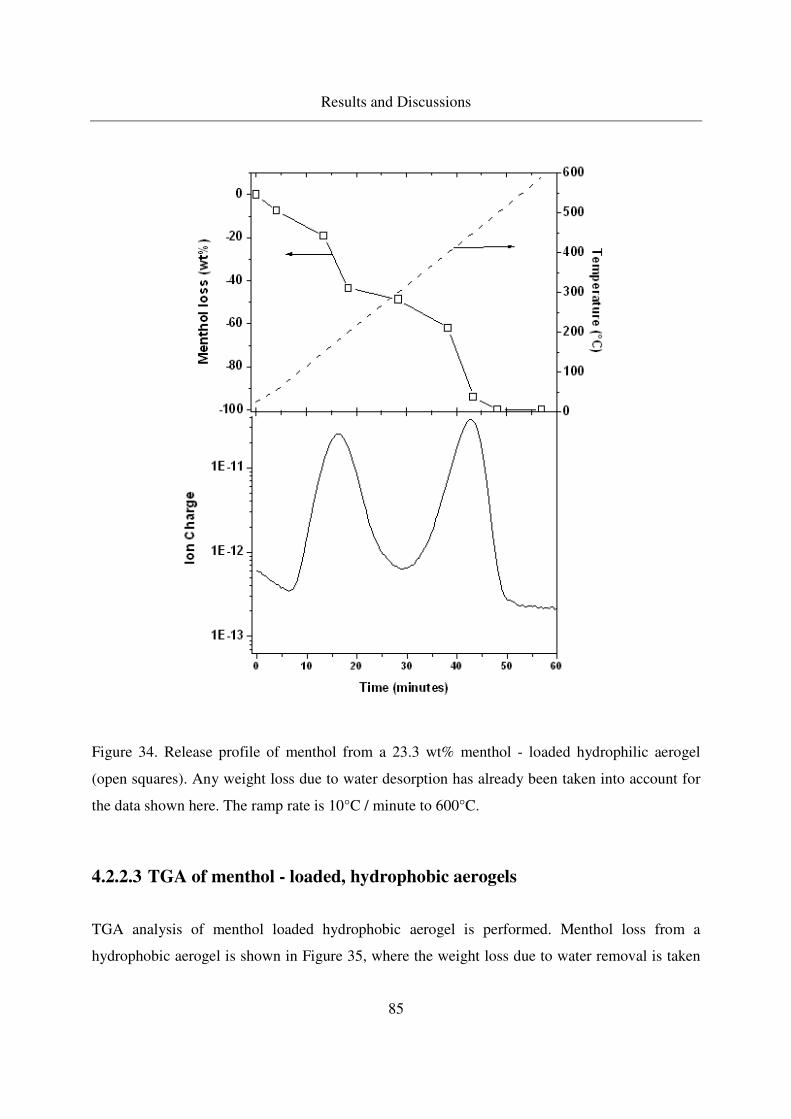
Results and Discussions
85
Figure 34. Release profile of menthol from a 23.3 wt% menthol - loaded hydrophilic aerogel
(open squares). Any weight loss due to water desorption has already been taken into account for
the data shown here. The ramp rate is 10°C / minute to 600°C.
4.2.2.3 TGA of menthol - loaded, hydrophobic aerogels
TGA analysis of menthol loaded hydrophobic aerogel is performed. Menthol loss from a
hydrophobic aerogel is shown in Figure 35, where the weight loss due to water removal is taken
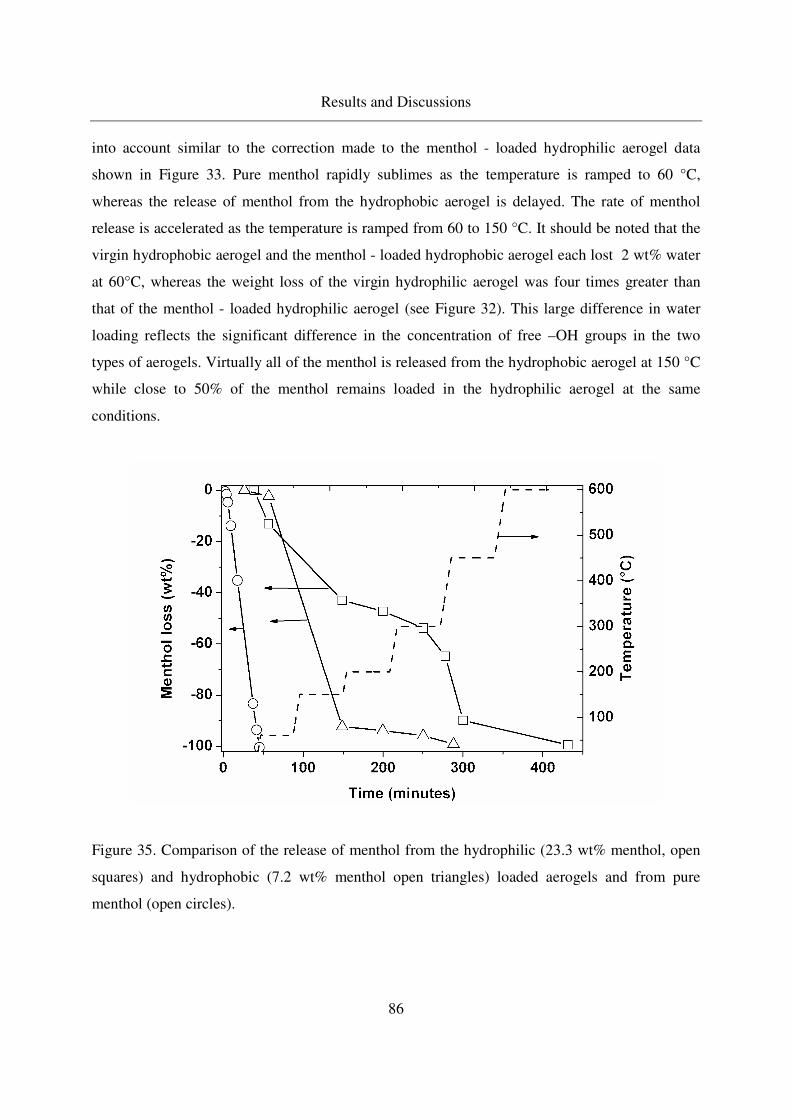
Results and Discussions
86
into account similar to the correction made to the menthol - loaded hydrophilic aerogel data
shown in Figure 33. Pure menthol rapidly sublimes as the temperature is ramped to 60 °C,
whereas the release of menthol from the hydrophobic aerogel is delayed. The rate of menthol
release is accelerated as the temperature is ramped from 60 to 150 °C. It should be noted that the
virgin hydrophobic aerogel and the menthol - loaded hydrophobic aerogel each lost 2 wt% water
at 60°C, whereas the weight loss of the virgin hydrophilic aerogel was four times greater than
that of the menthol - loaded hydrophilic aerogel (see Figure 32). This large difference in water
loading reflects the significant difference in the concentration of free –OH groups in the two
types of aerogels. Virtually all of the menthol is released from the hydrophobic aerogel at 150 °C
while close to 50% of the menthol remains loaded in the hydrophilic aerogel at the same
conditions.
Figure 35. Comparison of the release of menthol from the hydrophilic (23.3 wt% menthol, open
squares) and hydrophobic (7.2 wt% menthol open triangles) loaded aerogels and from pure
menthol (open circles).
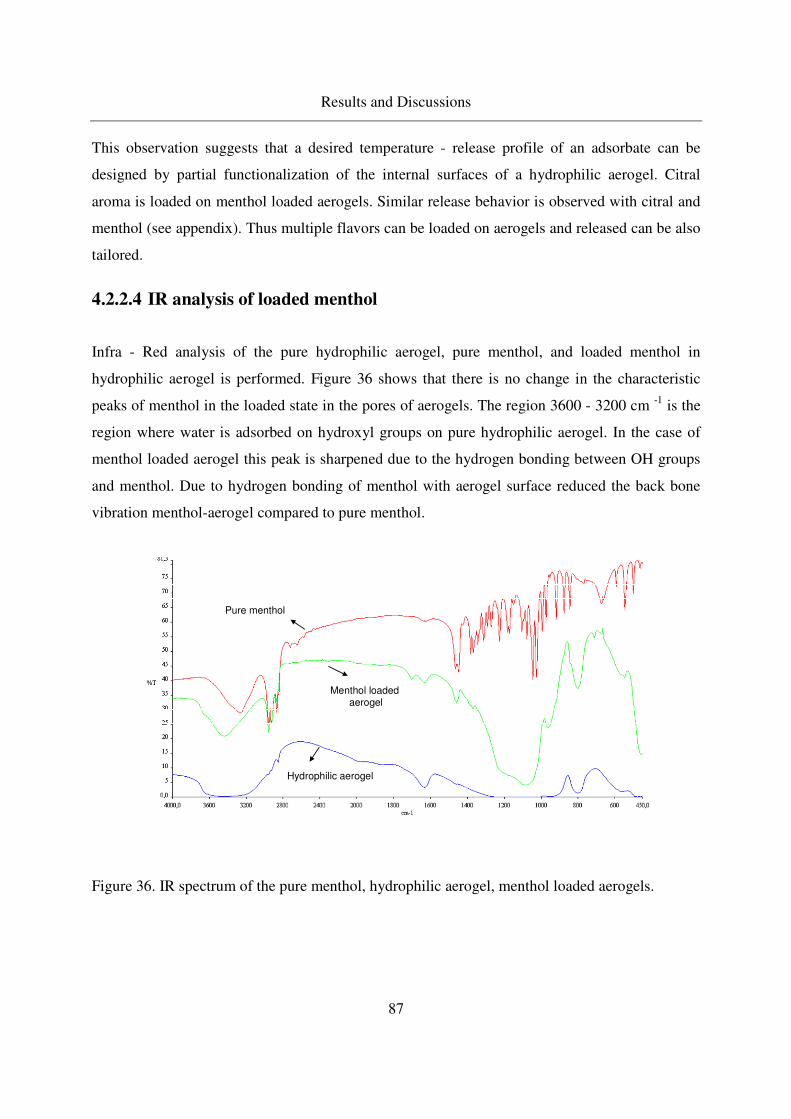
Results and Discussions
87
This observation suggests that a desired temperature - release profile of an adsorbate can be
designed by partial functionalization of the internal surfaces of a hydrophilic aerogel. Citral
aroma is loaded on menthol loaded aerogels. Similar release behavior is observed with citral and
menthol (see appendix). Thus multiple flavors can be loaded on aerogels and released can be also
tailored.
4.2.2.4 IR analysis of loaded menthol
Infra - Red analysis of the pure hydrophilic aerogel, pure menthol, and loaded menthol in
hydrophilic aerogel is performed. Figure 36 shows that there is no change in the characteristic
peaks of menthol in the loaded state in the pores of aerogels. The region 3600 - 3200 cm -1 is the
region where water is adsorbed on hydroxyl groups on pure hydrophilic aerogel. In the case of
menthol loaded aerogel this peak is sharpened due to the hydrogen bonding between OH groups
and menthol. Due to hydrogen bonding of menthol with aerogel surface reduced the back bone
vibration menthol-aerogel compared to pure menthol.
Pure menthol
Menthol loaded aerogel
Hydrophilic aerogel
Pure menthol
Menthol loaded aerogel
Hydrophilic aerogel
Figure 36. IR spectrum of the pure menthol, hydrophilic aerogel, menthol loaded aerogels.
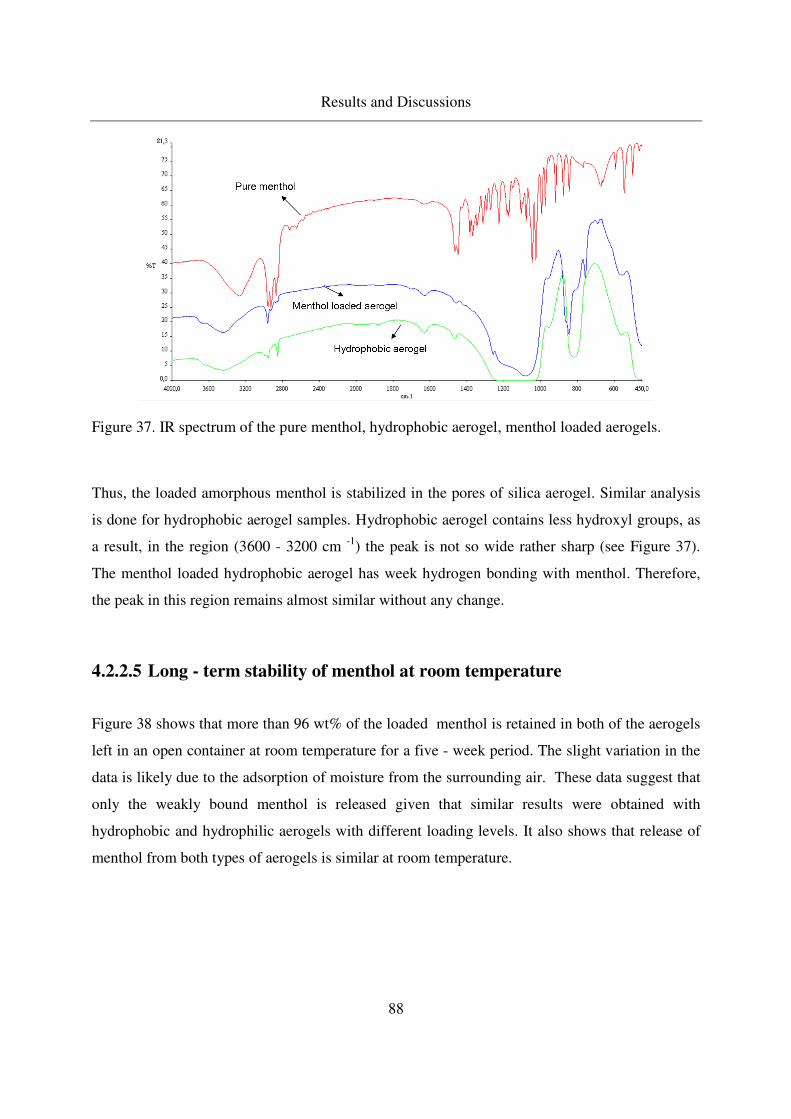
Results and Discussions
88
Figure 37. IR spectrum of the pure menthol, hydrophobic aerogel, menthol loaded aerogels.
Thus, the loaded amorphous menthol is stabilized in the pores of silica aerogel. Similar analysis
is done for hydrophobic aerogel samples. Hydrophobic aerogel contains less hydroxyl groups, as
a result, in the region (3600 - 3200 cm -1) the peak is not so wide rather sharp (see Figure 37).
The menthol loaded hydrophobic aerogel has week hydrogen bonding with menthol. Therefore,
the peak in this region remains almost similar without any change.
4.2.2.5 Long - term stability of menthol at room temperature
Figure 38 shows that more than 96 wt% of the loaded menthol is retained in both of the aerogels
left in an open container at room temperature for a five - week period. The slight variation in the
data is likely due to the adsorption of moisture from the surrounding air. These data suggest that
only the weakly bound menthol is released given that similar results were obtained with
hydrophobic and hydrophilic aerogels with different loading levels. It also shows that release of
menthol from both types of aerogels is similar at room temperature.

Results and Discussions
89
Figure 38. Weight loss of menthol from both hydrophilic and hydrophobic aerogels in an open
container at room temperature (22°C): 23.3 wt% menthol - loaded hydrophilic aerogel (open
squares) and 7.2 wt% menthol - loaded hydrophobic aerogel (open triangles).
This study shows that the internal surface area of an aerogel can be chemically tailored to control
the storage and release of highly volatile compounds. The chemical structure of the adsorbate
also has a significant effect on the release characteristics especially when the aerogel contains a
large amount of free surface hydroxyl groups available for interaction with the adsorbate. The
thermal release of menthol, revealed a two step release process where weakly bound adsorbate
that interacts with the bulk -OH groups is released first at temperatures greater than the adsorbate
normal melting temperature, and strongly bound adsorbate that interacts with free -OH groups is
released at very high temperatures, sometimes in excess of 400°C. These release temperatures
can be adjusted by changing the hydrophilic and hydrophobic content of the aerogel. Generally, it
can be concluded that menthol (volatile compound) can be stabilized in silica aerogels even at
elevated temperatures in excess of several hundred degrees in some cases.

Results and Discussions
90
It would be of scientific interest to further compare and contrast the observations made with both
polar solutes (benzoic acid and menthol) with the adsorption and crystallization on different type
of solutes in aerogels. Therefore, in the following section moderately polar substances
(naphthalene and 2-Methoxy pyrazine) are chosen to study these effects.
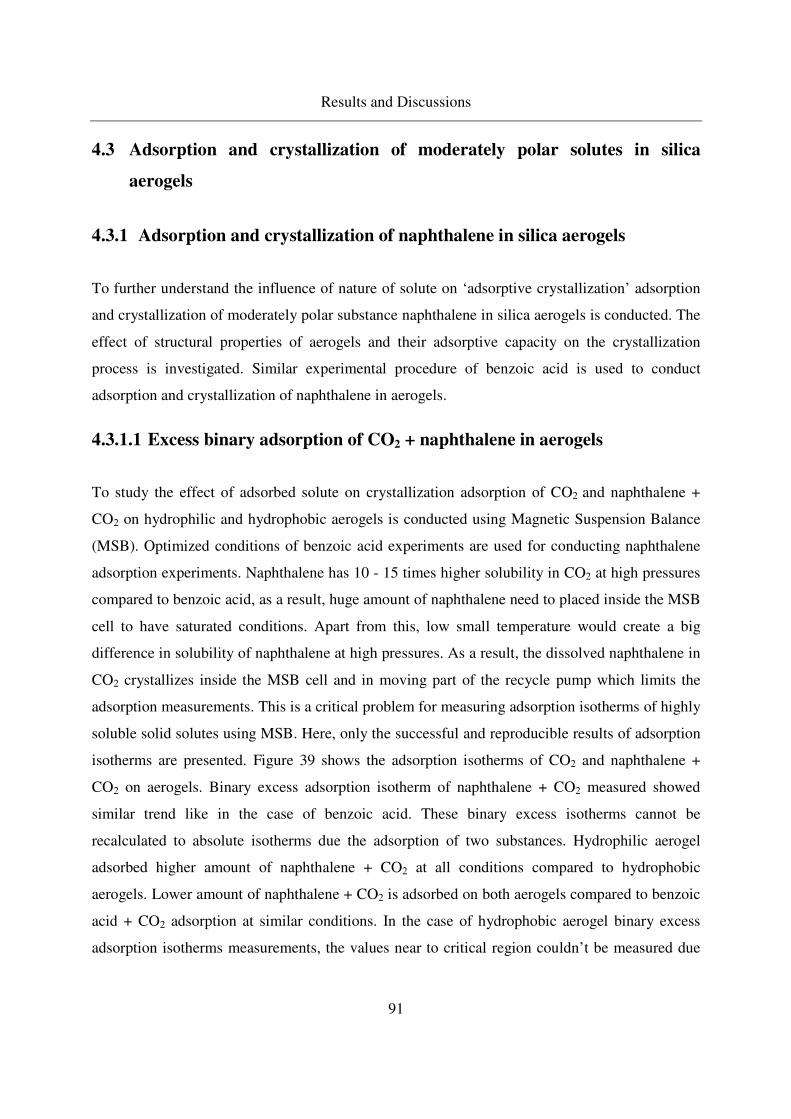
Results and Discussions
91
4.3 Adsorption and crystallization of moderately polar solutes in silica
aerogels
4.3.1 Adsorption and crystallization of naphthalene in silica aerogels
To further understand the influence of nature of solute on ‘adsorptive crystallization’ adsorption
and crystallization of moderately polar substance naphthalene in silica aerogels is conducted. The
effect of structural properties of aerogels and their adsorptive capacity on the crystallization
process is investigated. Similar experimental procedure of benzoic acid is used to conduct
adsorption and crystallization of naphthalene in aerogels.
4.3.1.1 Excess binary adsorption of CO2 + naphthalene in aerogels
To study the effect of adsorbed solute on crystallization adsorption of CO2 and naphthalene +
CO2 on hydrophilic and hydrophobic aerogels is conducted using Magnetic Suspension Balance
(MSB). Optimized conditions of benzoic acid experiments are used for conducting naphthalene
adsorption experiments. Naphthalene has 10 - 15 times higher solubility in CO2 at high pressures
compared to benzoic acid, as a result, huge amount of naphthalene need to placed inside the MSB
cell to have saturated conditions. Apart from this, low small temperature would create a big
difference in solubility of naphthalene at high pressures. As a result, the dissolved naphthalene in
CO2 crystallizes inside the MSB cell and in moving part of the recycle pump which limits the
adsorption measurements. This is a critical problem for measuring adsorption isotherms of highly
soluble solid solutes using MSB. Here, only the successful and reproducible results of adsorption
isotherms are presented. Figure 39 shows the adsorption isotherms of CO2 and naphthalene +
CO2 on aerogels. Binary excess adsorption isotherm of naphthalene + CO2 measured showed
similar trend like in the case of benzoic acid. These binary excess isotherms cannot be
recalculated to absolute isotherms due the adsorption of two substances. Hydrophilic aerogel
adsorbed higher amount of naphthalene + CO2 at all conditions compared to hydrophobic
aerogels. Lower amount of naphthalene + CO2 is adsorbed on both aerogels compared to benzoic
acid + CO2 adsorption at similar conditions. In the case of hydrophobic aerogel binary excess
adsorption isotherms measurements, the values near to critical region couldn’t be measured due
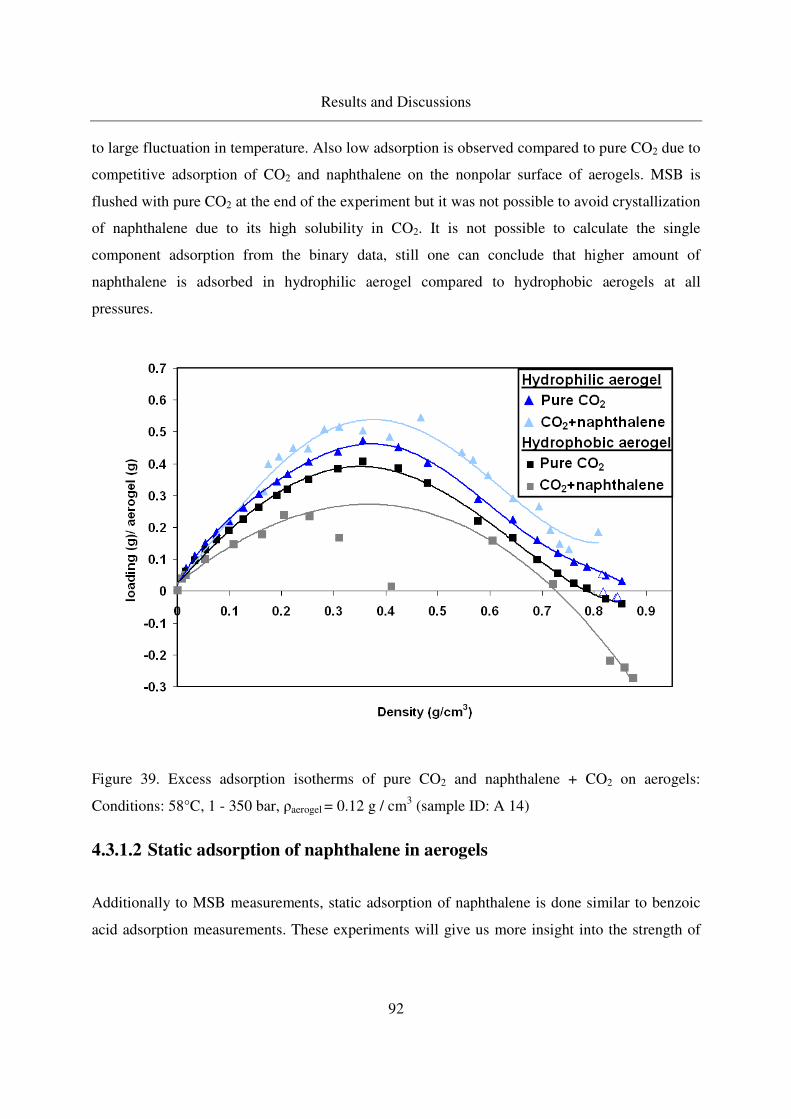
Results and Discussions
92
to large fluctuation in temperature. Also low adsorption is observed compared to pure CO2 due to
competitive adsorption of CO2 and naphthalene on the nonpolar surface of aerogels. MSB is
flushed with pure CO2 at the end of the experiment but it was not possible to avoid crystallization
of naphthalene due to its high solubility in CO2. It is not possible to calculate the single
component adsorption from the binary data, still one can conclude that higher amount of
naphthalene is adsorbed in hydrophilic aerogel compared to hydrophobic aerogels at all
pressures.
Figure 39. Excess adsorption isotherms of pure CO2 and naphthalene + CO2 on aerogels:
Conditions: 58°C, 1 - 350 bar, ρaerogel = 0.12 g / cm3 (sample ID: A 14)
4.3.1.2 Static adsorption of naphthalene in aerogels
Additionally to MSB measurements, static adsorption of naphthalene is done similar to benzoic
acid adsorption measurements. These experiments will give us more insight into the strength of
Results and Discussions
93
naphthalene - aerogel surface interactions. Loading is conducted at very low bulk concentration
of naphthalene in CO2, thus, it is expected that only adsorption of naphthalene occurs.
Figure 40 shows the adsorption of naphthalene in hydrophilic and hydrophobic aerogels at
pressures 110 to 300 bar. High adsorption of naphthalene even at these low bulk concentrations
indicates the strong affinity of naphthalene to the aerogel surface. The adsorption data are fit to
the Langmuir equation:
KC
KCQQ m
a+
=1
Equation 17
Where Qa is the amount of additive (in mol) adsorbed per unit weight of adsorbent (in g), Qm is
the maximum loading (mmol / g), C is the concentration of adsorbate in the bulk phase (mol / kg
solution), and K is the Langmuir constant. The parameters determined for the naphthalene -
hydrophilic aerogel system are Qm = 10.41 (mmol / g), and K = 0.05, and for the naphthalene -
hydrophobic aerogel system are Qm = 3.82 (mmol / g), and K = 0.103. Similar to benzoic acid
loadings, hydrophilic aerogels adsorbed higher amount of naphthalene compared to hydrophobic
aerogels. Naphthalene is normally considered as nonpolar, but due to presence of quadrapole
moment it exhibits moderately polar nature. Due to the difference in the type of interaction of
naphthalene with aerogel surface, there exists a difference in adsorption amounts between
hydrophilic and hydrophobic aerogels. Interestingly, even at these low bulk concentrations of
naphthalene in CO2 the difference in loading between aerogels exists which shows the strength of
aerogel surface - naphthalene interactions compared to solvent solubility holding strength. One
can expect this difference in loading will further influence the crystallization process by CO-
RESS.
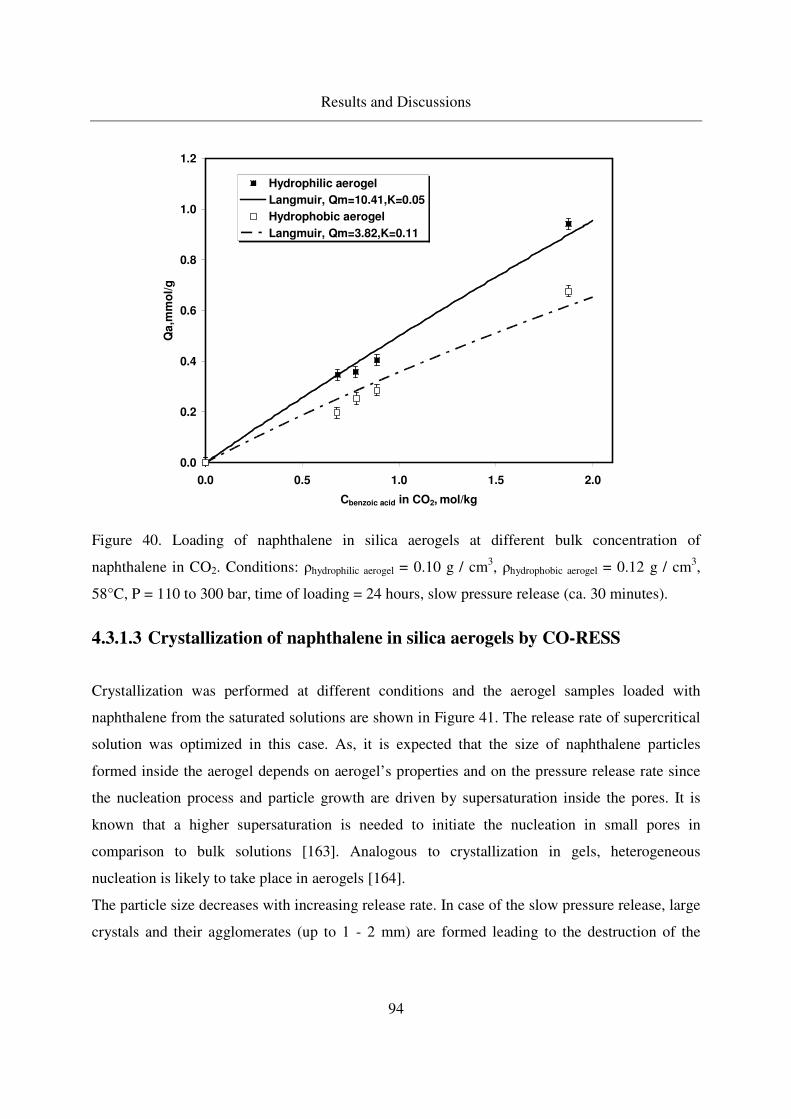
Results and Discussions
94
0.0
0.2
0.4
0.6
0.8
1.0
1.2
0.0 0.5 1.0 1.5 2.0
Cbenzoic acid in CO2, mol/kg
Qa
,mm
ol/
g
Hydrophilic aerogel
Langmuir, Qm=10.41,K=0.05
Hydrophobic aerogel
Langmuir, Qm=3.82,K=0.11
Figure 40. Loading of naphthalene in silica aerogels at different bulk concentration of
naphthalene in CO2. Conditions: ρhydrophilic aerogel = 0.10 g / cm3, ρhydrophobic aerogel = 0.12 g / cm3,
58°C, P = 110 to 300 bar, time of loading = 24 hours, slow pressure release (ca. 30 minutes).
4.3.1.3 Crystallization of naphthalene in silica aerogels by CO-RESS
Crystallization was performed at different conditions and the aerogel samples loaded with
naphthalene from the saturated solutions are shown in Figure 41. The release rate of supercritical
solution was optimized in this case. As, it is expected that the size of naphthalene particles
formed inside the aerogel depends on aerogel’s properties and on the pressure release rate since
the nucleation process and particle growth are driven by supersaturation inside the pores. It is
known that a higher supersaturation is needed to initiate the nucleation in small pores in
comparison to bulk solutions [163]. Analogous to crystallization in gels, heterogeneous
nucleation is likely to take place in aerogels [164].
The particle size decreases with increasing release rate. In case of the slow pressure release, large
crystals and their agglomerates (up to 1 - 2 mm) are formed leading to the destruction of the

Results and Discussions
95
aerogel pores (Figure 41 a, b), whereas fast pressure release results in the particles of 20 nm - 5
µm range (Figure 41c).
Figure 41. Light microscopic picture of aerogel loaded with naphthalene (background of different
color). Experimental conditions: a) 40°C, 0.01 bar / s, b) 40°C, 0.1 bar / s, c) 45°C, 1.2 bar/s, d)
58°C, 350 bar/s.
However, in case of the fast pressure release considerable shrinkage of aerogels occurred due to
the CO2 condensation in the pores as a result of the Joule - Thompson effect. Aerogels were
broken in several pieces. To avoid this, pressure was released stepwise as shown in the Figure 42:
in step 1 the pressure is decreased rapidly from 220 to 90 bar (0.45 seconds) to create
supersaturation which is needed to initialize the crystallization; after that the pressure is released
slowly to 1 bar in step 2 (within 200 - 300 seconds). A typical pressure and temperature profiles
for the first and second step of such pressure release is shown in Figure 42. For all the solutes
during CO-RESS process this strategy of two step pressure release is used.
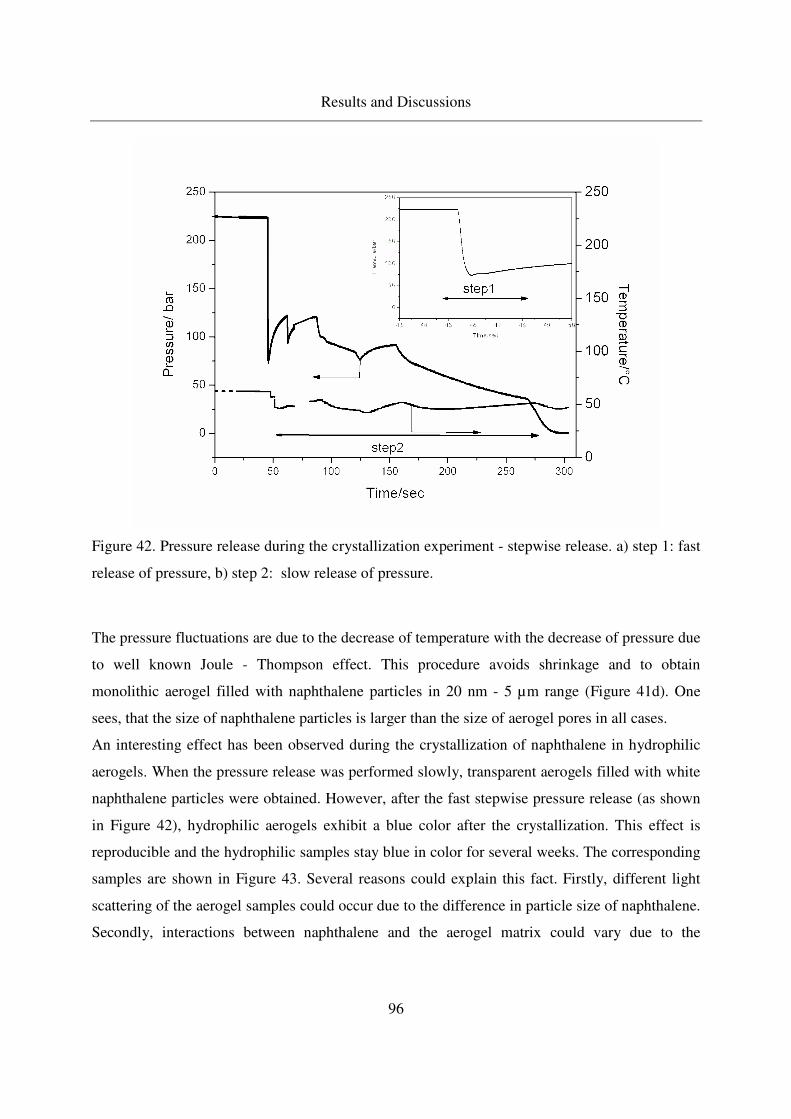
Results and Discussions
96
Figure 42. Pressure release during the crystallization experiment - stepwise release. a) step 1: fast
release of pressure, b) step 2: slow release of pressure.
The pressure fluctuations are due to the decrease of temperature with the decrease of pressure due
to well known Joule - Thompson effect. This procedure avoids shrinkage and to obtain
monolithic aerogel filled with naphthalene particles in 20 nm - 5 µm range (Figure 41d). One
sees, that the size of naphthalene particles is larger than the size of aerogel pores in all cases.
An interesting effect has been observed during the crystallization of naphthalene in hydrophilic
aerogels. When the pressure release was performed slowly, transparent aerogels filled with white
naphthalene particles were obtained. However, after the fast stepwise pressure release (as shown
in Figure 42), hydrophilic aerogels exhibit a blue color after the crystallization. This effect is
reproducible and the hydrophilic samples stay blue in color for several weeks. The corresponding
samples are shown in Figure 43. Several reasons could explain this fact. Firstly, different light
scattering of the aerogel samples could occur due to the difference in particle size of naphthalene.
Secondly, interactions between naphthalene and the aerogel matrix could vary due to the
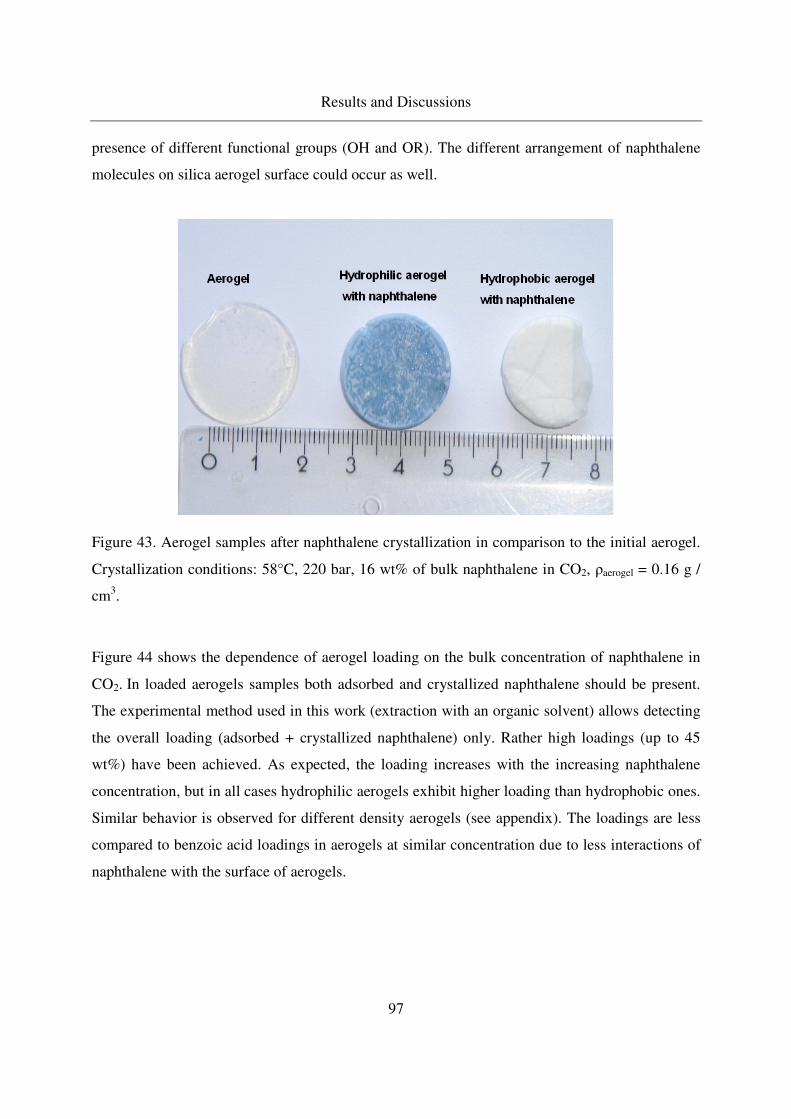
Results and Discussions
97
presence of different functional groups (OH and OR). The different arrangement of naphthalene
molecules on silica aerogel surface could occur as well.
Figure 43. Aerogel samples after naphthalene crystallization in comparison to the initial aerogel.
Crystallization conditions: 58°C, 220 bar, 16 wt% of bulk naphthalene in CO2, ρaerogel = 0.16 g /
cm3.
Figure 44 shows the dependence of aerogel loading on the bulk concentration of naphthalene in
CO2. In loaded aerogels samples both adsorbed and crystallized naphthalene should be present.
The experimental method used in this work (extraction with an organic solvent) allows detecting
the overall loading (adsorbed + crystallized naphthalene) only. Rather high loadings (up to 45
wt%) have been achieved. As expected, the loading increases with the increasing naphthalene
concentration, but in all cases hydrophilic aerogels exhibit higher loading than hydrophobic ones.
Similar behavior is observed for different density aerogels (see appendix). The loadings are less
compared to benzoic acid loadings in aerogels at similar concentration due to less interactions of
naphthalene with the surface of aerogels.
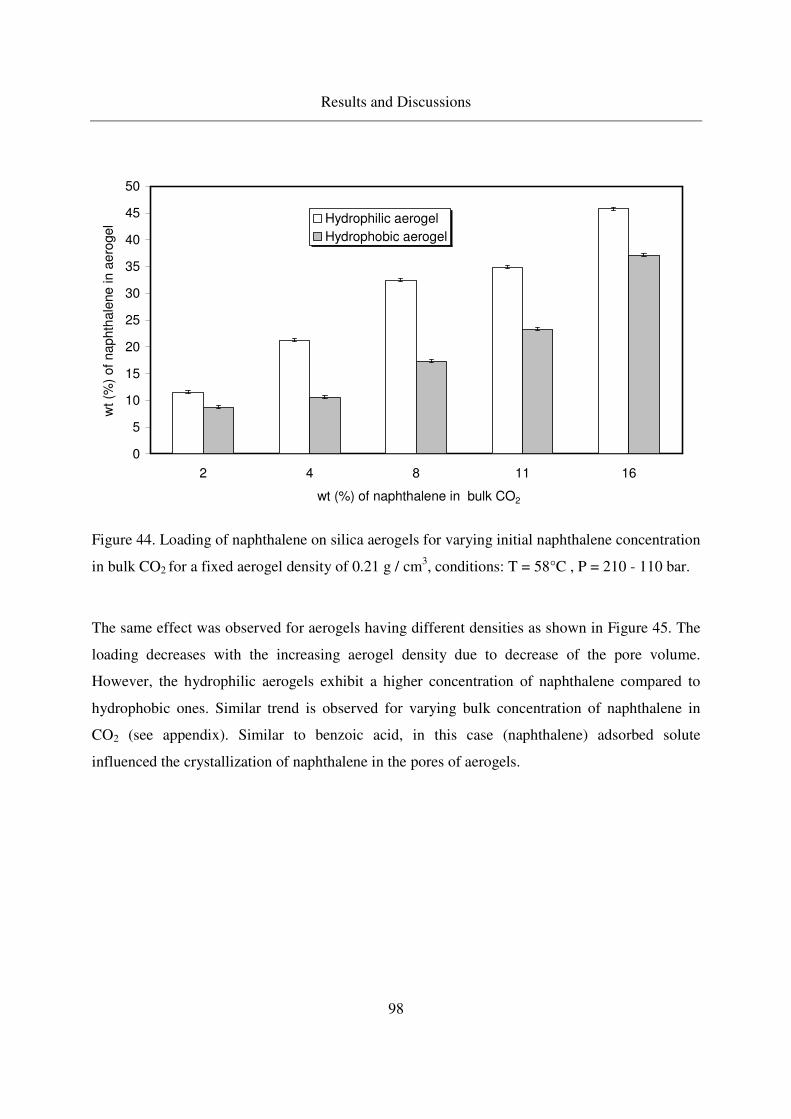
Results and Discussions
98
0
5
10
15
20
25
30
35
40
45
50
2 4 8 11 16
wt (%) of naphthalene in bulk CO2
wt (%
) of
nap
hth
ale
ne
in a
ero
gel Hydrophilic aerogel
Hydrophobic aerogel
Figure 44. Loading of naphthalene on silica aerogels for varying initial naphthalene concentration
in bulk CO2 for a fixed aerogel density of 0.21 g / cm3, conditions: T = 58°C , P = 210 - 110 bar.
The same effect was observed for aerogels having different densities as shown in Figure 45. The
loading decreases with the increasing aerogel density due to decrease of the pore volume.
However, the hydrophilic aerogels exhibit a higher concentration of naphthalene compared to
hydrophobic ones. Similar trend is observed for varying bulk concentration of naphthalene in
CO2 (see appendix). Similar to benzoic acid, in this case (naphthalene) adsorbed solute
influenced the crystallization of naphthalene in the pores of aerogels.
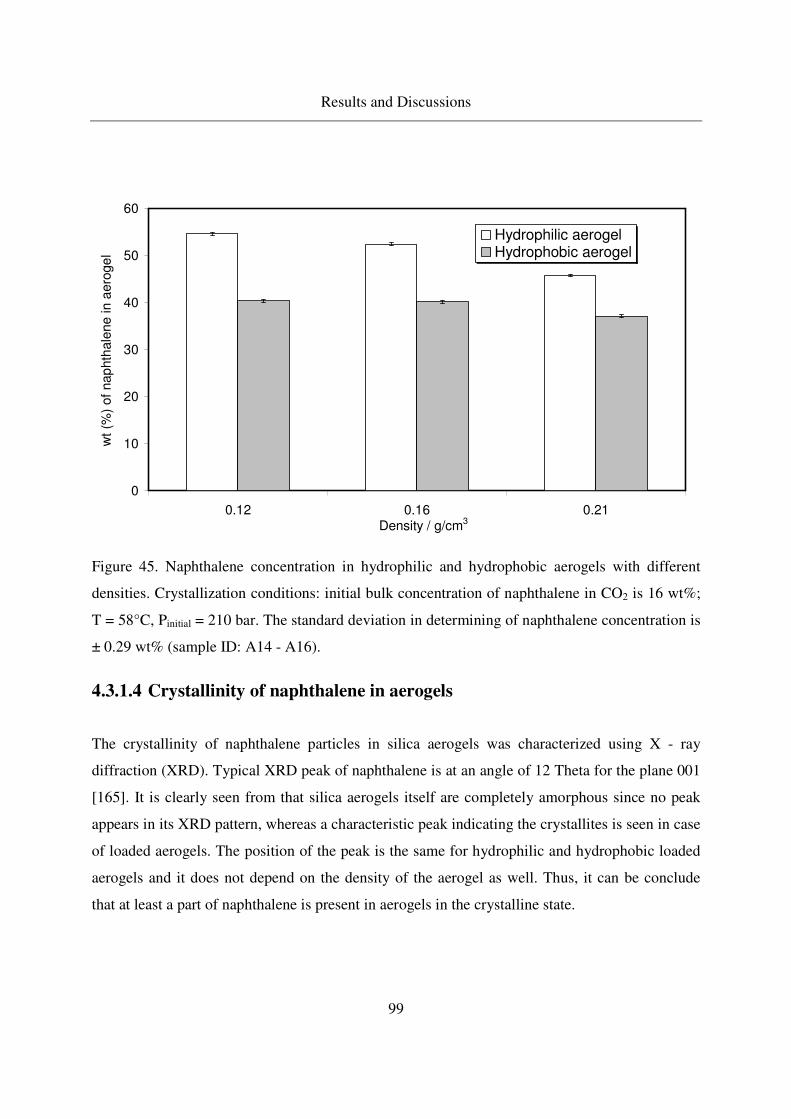
Results and Discussions
99
0
10
20
30
40
50
60
0.12 0.16 0.21Density / g/cm3
wt
(%)
of
nap
hth
ale
ne
in a
ero
ge
l
Hydrophilic aerogelHydrophobic aerogel
Figure 45. Naphthalene concentration in hydrophilic and hydrophobic aerogels with different
densities. Crystallization conditions: initial bulk concentration of naphthalene in CO2 is 16 wt%;
T = 58°C, Pinitial = 210 bar. The standard deviation in determining of naphthalene concentration is
± 0.29 wt% (sample ID: A14 - A16).
4.3.1.4 Crystallinity of naphthalene in aerogels
The crystallinity of naphthalene particles in silica aerogels was characterized using X - ray
diffraction (XRD). Typical XRD peak of naphthalene is at an angle of 12 Theta for the plane 001
[165]. It is clearly seen from that silica aerogels itself are completely amorphous since no peak
appears in its XRD pattern, whereas a characteristic peak indicating the crystallites is seen in case
of loaded aerogels. The position of the peak is the same for hydrophilic and hydrophobic loaded
aerogels and it does not depend on the density of the aerogel as well. Thus, it can be conclude
that at least a part of naphthalene is present in aerogels in the crystalline state.
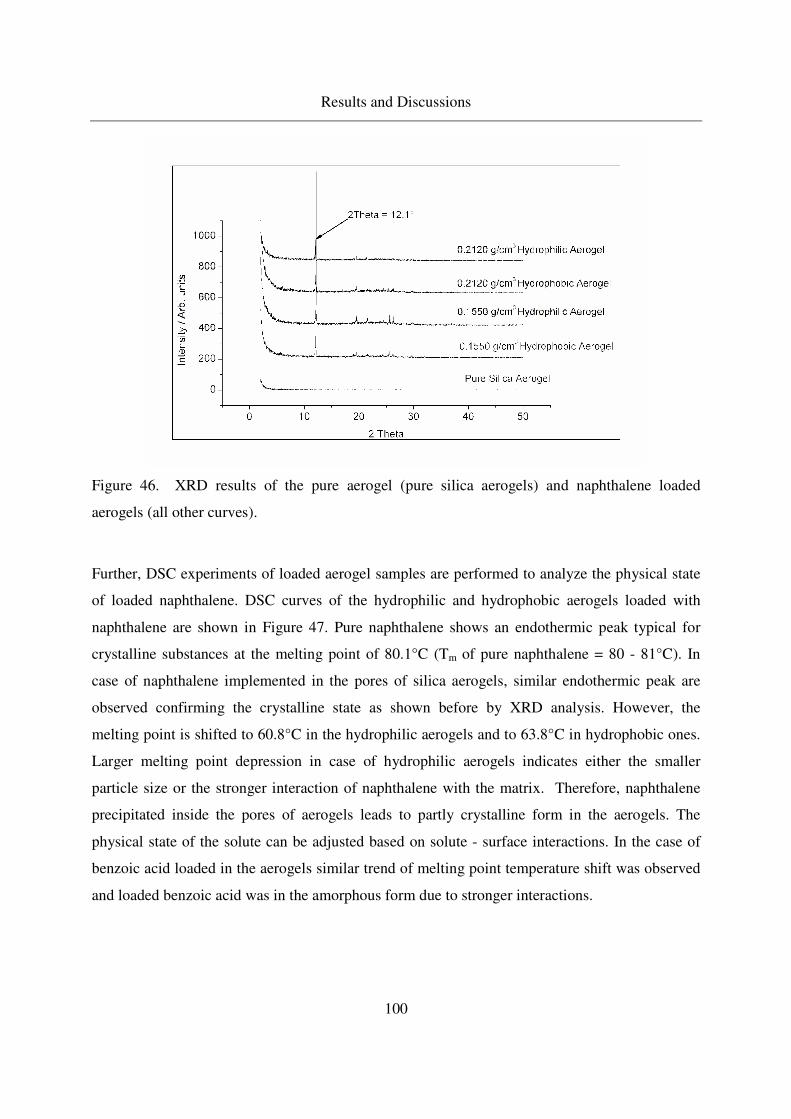
Results and Discussions
100
Figure 46. XRD results of the pure aerogel (pure silica aerogels) and naphthalene loaded
aerogels (all other curves).
Further, DSC experiments of loaded aerogel samples are performed to analyze the physical state
of loaded naphthalene. DSC curves of the hydrophilic and hydrophobic aerogels loaded with
naphthalene are shown in Figure 47. Pure naphthalene shows an endothermic peak typical for
crystalline substances at the melting point of 80.1°C (Tm of pure naphthalene = 80 - 81°C). In
case of naphthalene implemented in the pores of silica aerogels, similar endothermic peak are
observed confirming the crystalline state as shown before by XRD analysis. However, the
melting point is shifted to 60.8°C in the hydrophilic aerogels and to 63.8°C in hydrophobic ones.
Larger melting point depression in case of hydrophilic aerogels indicates either the smaller
particle size or the stronger interaction of naphthalene with the matrix. Therefore, naphthalene
precipitated inside the pores of aerogels leads to partly crystalline form in the aerogels. The
physical state of the solute can be adjusted based on solute - surface interactions. In the case of
benzoic acid loaded in the aerogels similar trend of melting point temperature shift was observed
and loaded benzoic acid was in the amorphous form due to stronger interactions.
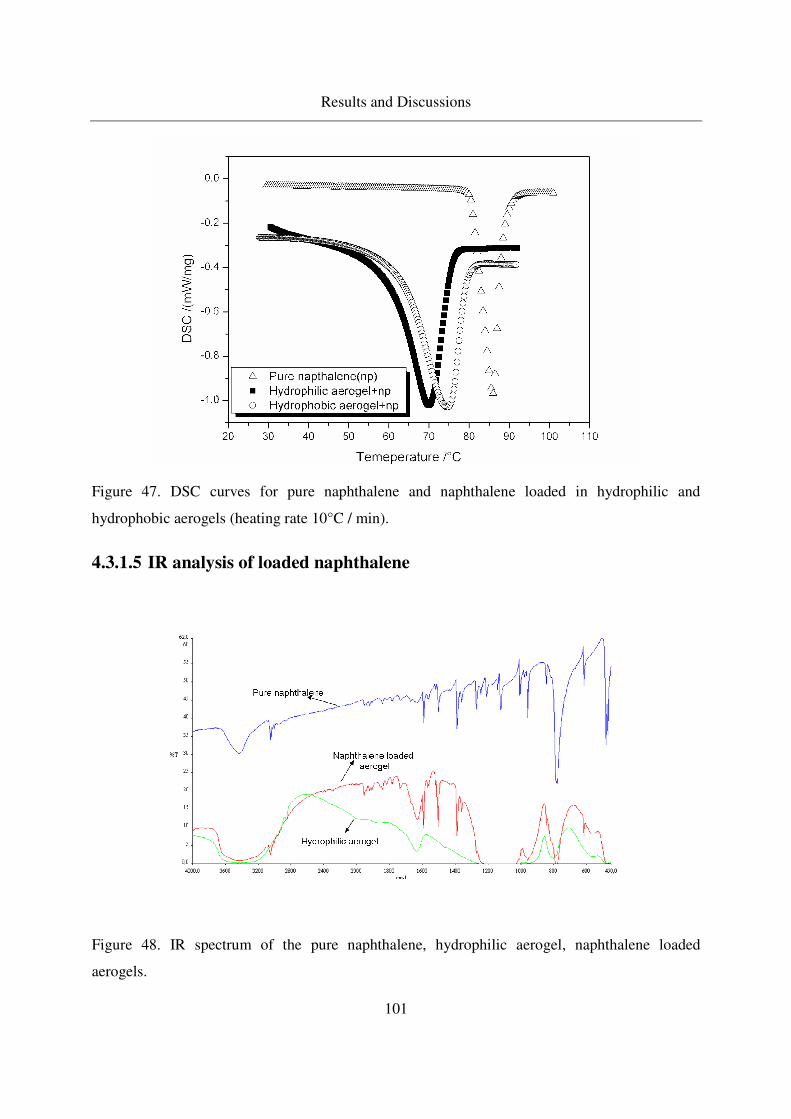
Results and Discussions
101
Figure 47. DSC curves for pure naphthalene and naphthalene loaded in hydrophilic and
hydrophobic aerogels (heating rate 10°C / min).
4.3.1.5 IR analysis of loaded naphthalene
Figure 48. IR spectrum of the pure naphthalene, hydrophilic aerogel, naphthalene loaded
aerogels.
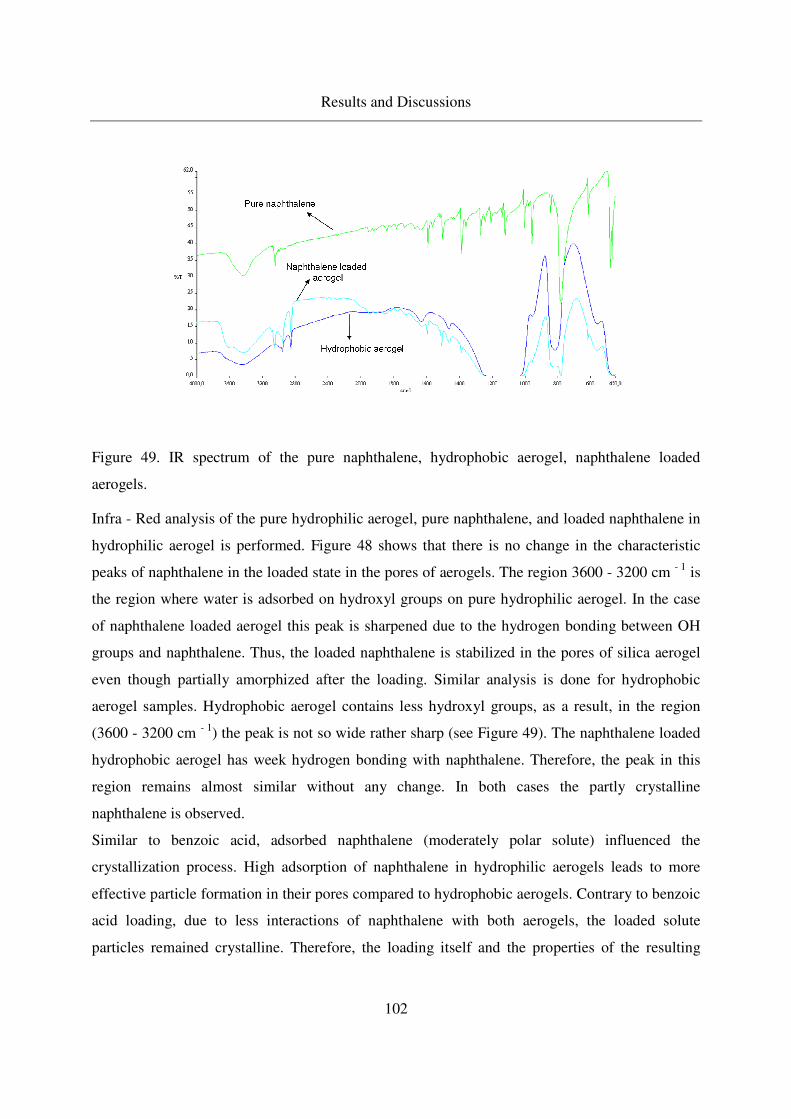
Results and Discussions
102
Figure 49. IR spectrum of the pure naphthalene, hydrophobic aerogel, naphthalene loaded
aerogels.
Infra - Red analysis of the pure hydrophilic aerogel, pure naphthalene, and loaded naphthalene in
hydrophilic aerogel is performed. Figure 48 shows that there is no change in the characteristic
peaks of naphthalene in the loaded state in the pores of aerogels. The region 3600 - 3200 cm - 1 is
the region where water is adsorbed on hydroxyl groups on pure hydrophilic aerogel. In the case
of naphthalene loaded aerogel this peak is sharpened due to the hydrogen bonding between OH
groups and naphthalene. Thus, the loaded naphthalene is stabilized in the pores of silica aerogel
even though partially amorphized after the loading. Similar analysis is done for hydrophobic
aerogel samples. Hydrophobic aerogel contains less hydroxyl groups, as a result, in the region
(3600 - 3200 cm - 1) the peak is not so wide rather sharp (see Figure 49). The naphthalene loaded
hydrophobic aerogel has week hydrogen bonding with naphthalene. Therefore, the peak in this
region remains almost similar without any change. In both cases the partly crystalline
naphthalene is observed.
Similar to benzoic acid, adsorbed naphthalene (moderately polar solute) influenced the
crystallization process. High adsorption of naphthalene in hydrophilic aerogels leads to more
effective particle formation in their pores compared to hydrophobic aerogels. Contrary to benzoic
acid loading, due to less interactions of naphthalene with both aerogels, the loaded solute
particles remained crystalline. Therefore, the loading itself and the properties of the resulting
Results and Discussions
103
microparticles are influenced by the structural and surface properties of silica aerogels, in
particular by their adsorption capacity. Hence, the crystallization process is influenced by a prior
adsorption of naphthalene on the surface of the aerogels similar to the benzoic acid loading in
aerogels. Further adsorption of moderately polar liquid solute (volatile) 2-Methoxy pyrazine is
adsorbed in silica aerogels to study solute - surface interactions and stabilization on the surface of
aerogels.
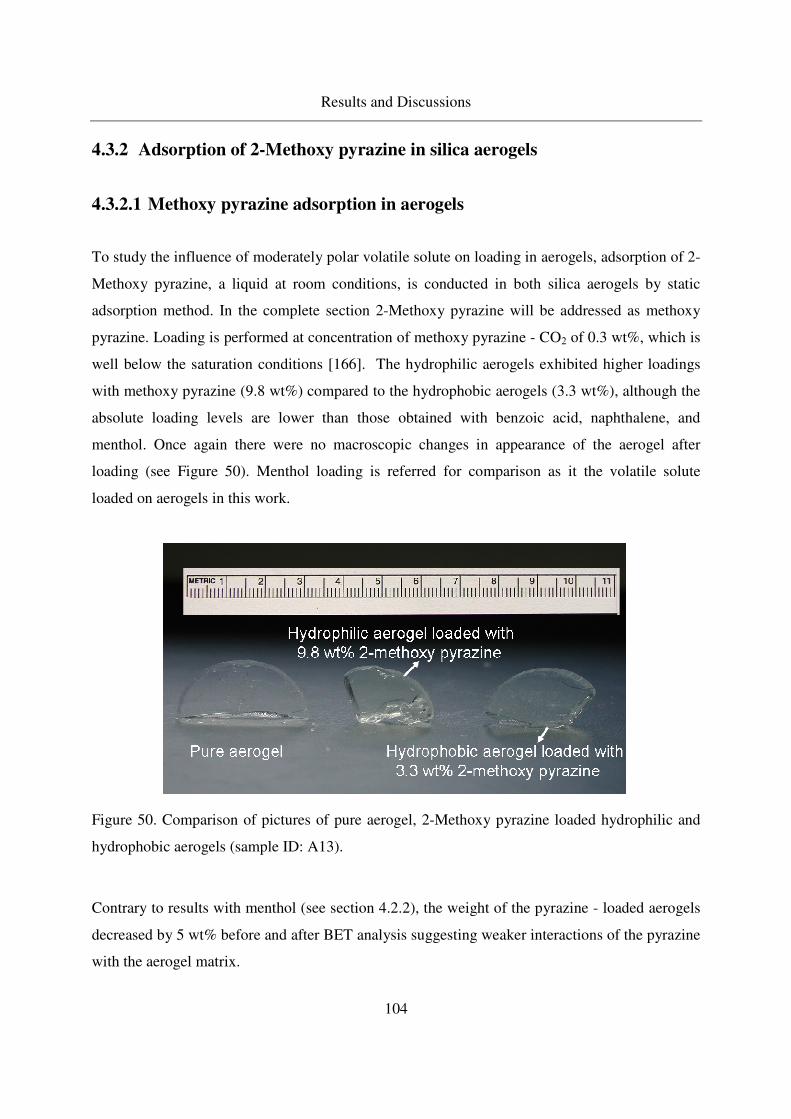
Results and Discussions
104
4.3.2 Adsorption of 2-Methoxy pyrazine in silica aerogels
4.3.2.1 Methoxy pyrazine adsorption in aerogels
To study the influence of moderately polar volatile solute on loading in aerogels, adsorption of 2-
Methoxy pyrazine, a liquid at room conditions, is conducted in both silica aerogels by static
adsorption method. In the complete section 2-Methoxy pyrazine will be addressed as methoxy
pyrazine. Loading is performed at concentration of methoxy pyrazine - CO2 of 0.3 wt%, which is
well below the saturation conditions [166]. The hydrophilic aerogels exhibited higher loadings
with methoxy pyrazine (9.8 wt%) compared to the hydrophobic aerogels (3.3 wt%), although the
absolute loading levels are lower than those obtained with benzoic acid, naphthalene, and
menthol. Once again there were no macroscopic changes in appearance of the aerogel after
loading (see Figure 50). Menthol loading is referred for comparison as it the volatile solute
loaded on aerogels in this work.
Figure 50. Comparison of pictures of pure aerogel, 2-Methoxy pyrazine loaded hydrophilic and
hydrophobic aerogels (sample ID: A13).
Contrary to results with menthol (see section 4.2.2), the weight of the pyrazine - loaded aerogels
decreased by 5 wt% before and after BET analysis suggesting weaker interactions of the pyrazine
with the aerogel matrix.

Results and Discussions
105
Figure 51. A) Pore size distributions of virgin (open circles) and 9.8 wt% methoxy pyrazine -
loaded hydrophilic aerogels (open squares), B) virgin (open circles) and 3.3 wt% methoxy
pyrazine - loaded hydrophobic aerogels (open squares).
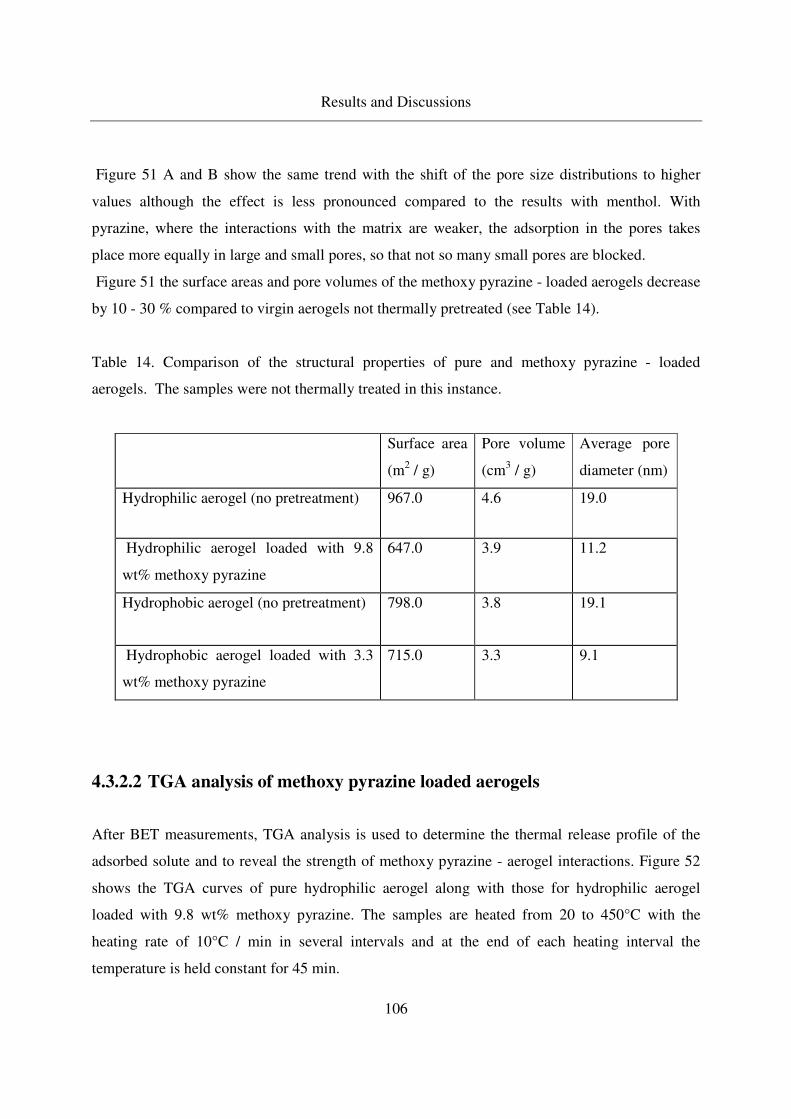
Results and Discussions
106
Figure 51 A and B show the same trend with the shift of the pore size distributions to higher
values although the effect is less pronounced compared to the results with menthol. With
pyrazine, where the interactions with the matrix are weaker, the adsorption in the pores takes
place more equally in large and small pores, so that not so many small pores are blocked.
Figure 51 the surface areas and pore volumes of the methoxy pyrazine - loaded aerogels decrease
by 10 - 30 % compared to virgin aerogels not thermally pretreated (see Table 14).
Table 14. Comparison of the structural properties of pure and methoxy pyrazine - loaded
aerogels. The samples were not thermally treated in this instance.
Surface area
(m2 / g)
Pore volume
(cm3 / g)
Average pore
diameter (nm)
Hydrophilic aerogel (no pretreatment) 967.0 4.6 19.0
Hydrophilic aerogel loaded with 9.8
wt% methoxy pyrazine
647.0 3.9 11.2
Hydrophobic aerogel (no pretreatment) 798.0 3.8 19.1
Hydrophobic aerogel loaded with 3.3
wt% methoxy pyrazine
715.0 3.3 9.1
4.3.2.2 TGA analysis of methoxy pyrazine loaded aerogels
After BET measurements, TGA analysis is used to determine the thermal release profile of the
adsorbed solute and to reveal the strength of methoxy pyrazine - aerogel interactions. Figure 52
shows the TGA curves of pure hydrophilic aerogel along with those for hydrophilic aerogel
loaded with 9.8 wt% methoxy pyrazine. The samples are heated from 20 to 450°C with the
heating rate of 10°C / min in several intervals and at the end of each heating interval the
temperature is held constant for 45 min.
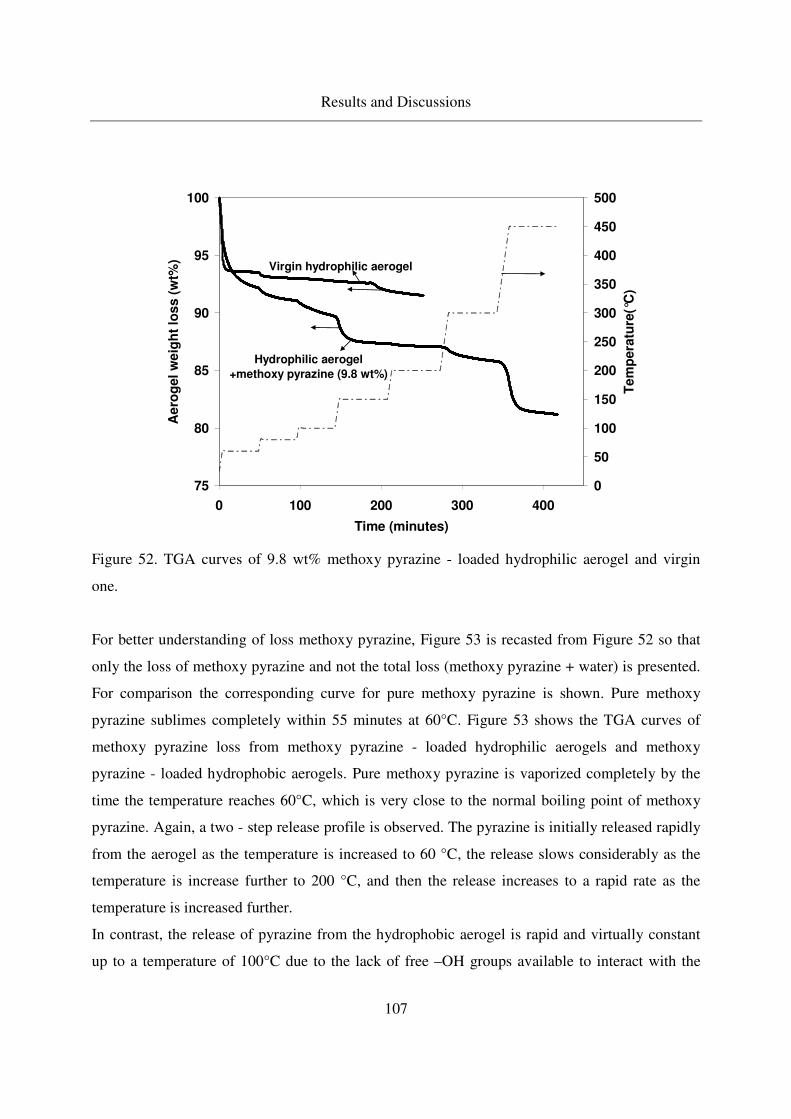
Results and Discussions
107
75
80
85
90
95
100
0 100 200 300 400
Time (minutes)
Ae
rog
el
we
igh
t lo
ss (
wt%
)
0
50
100
150
200
250
300
350
400
450
500
Te
mp
era
ture
(°C
)
Virgin hydrophilic aerogel
Hydrophilic aerogel
+methoxy pyrazine (9.8 wt%)
Figure 52. TGA curves of 9.8 wt% methoxy pyrazine - loaded hydrophilic aerogel and virgin
one.
For better understanding of loss methoxy pyrazine, Figure 53 is recasted from Figure 52 so that
only the loss of methoxy pyrazine and not the total loss (methoxy pyrazine + water) is presented.
For comparison the corresponding curve for pure methoxy pyrazine is shown. Pure methoxy
pyrazine sublimes completely within 55 minutes at 60°C. Figure 53 shows the TGA curves of
methoxy pyrazine loss from methoxy pyrazine - loaded hydrophilic aerogels and methoxy
pyrazine - loaded hydrophobic aerogels. Pure methoxy pyrazine is vaporized completely by the
time the temperature reaches 60°C, which is very close to the normal boiling point of methoxy
pyrazine. Again, a two - step release profile is observed. The pyrazine is initially released rapidly
from the aerogel as the temperature is increased to 60 °C, the release slows considerably as the
temperature is increase further to 200 °C, and then the release increases to a rapid rate as the
temperature is increased further.
In contrast, the release of pyrazine from the hydrophobic aerogel is rapid and virtually constant
up to a temperature of 100°C due to the lack of free –OH groups available to interact with the
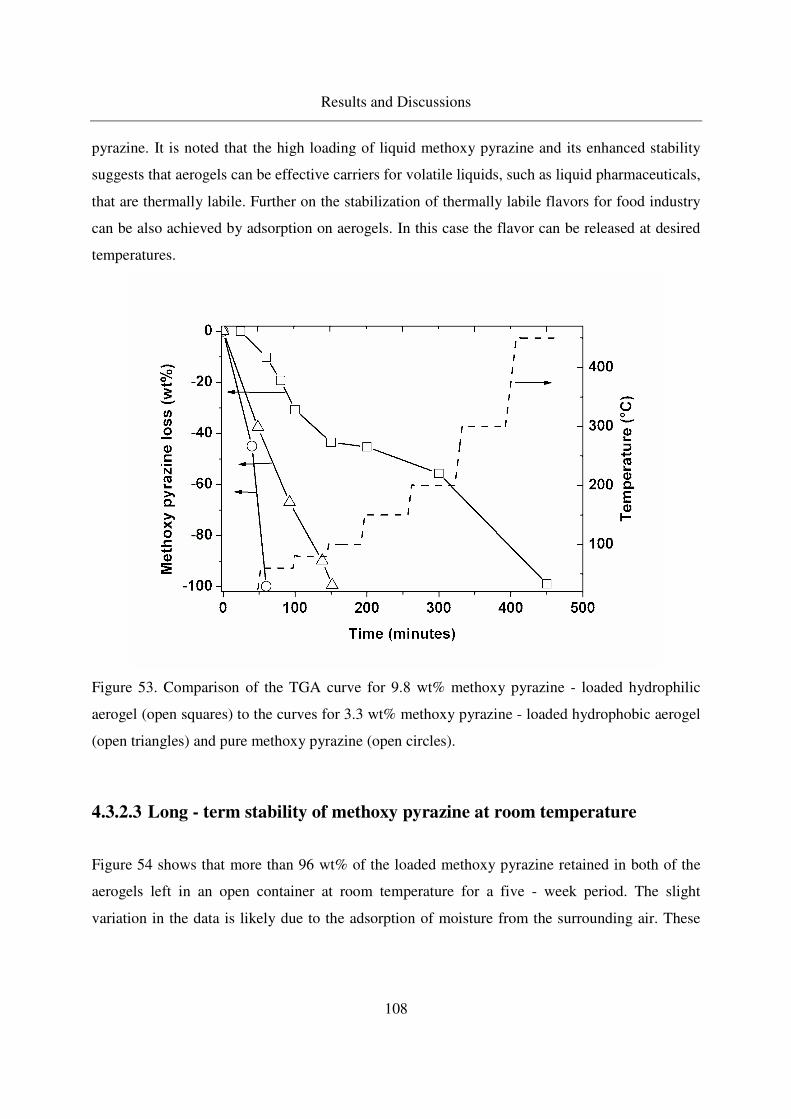
Results and Discussions
108
pyrazine. It is noted that the high loading of liquid methoxy pyrazine and its enhanced stability
suggests that aerogels can be effective carriers for volatile liquids, such as liquid pharmaceuticals,
that are thermally labile. Further on the stabilization of thermally labile flavors for food industry
can be also achieved by adsorption on aerogels. In this case the flavor can be released at desired
temperatures.
Figure 53. Comparison of the TGA curve for 9.8 wt% methoxy pyrazine - loaded hydrophilic
aerogel (open squares) to the curves for 3.3 wt% methoxy pyrazine - loaded hydrophobic aerogel
(open triangles) and pure methoxy pyrazine (open circles).
4.3.2.3 Long - term stability of methoxy pyrazine at room temperature
Figure 54 shows that more than 96 wt% of the loaded methoxy pyrazine retained in both of the
aerogels left in an open container at room temperature for a five - week period. The slight
variation in the data is likely due to the adsorption of moisture from the surrounding air. These
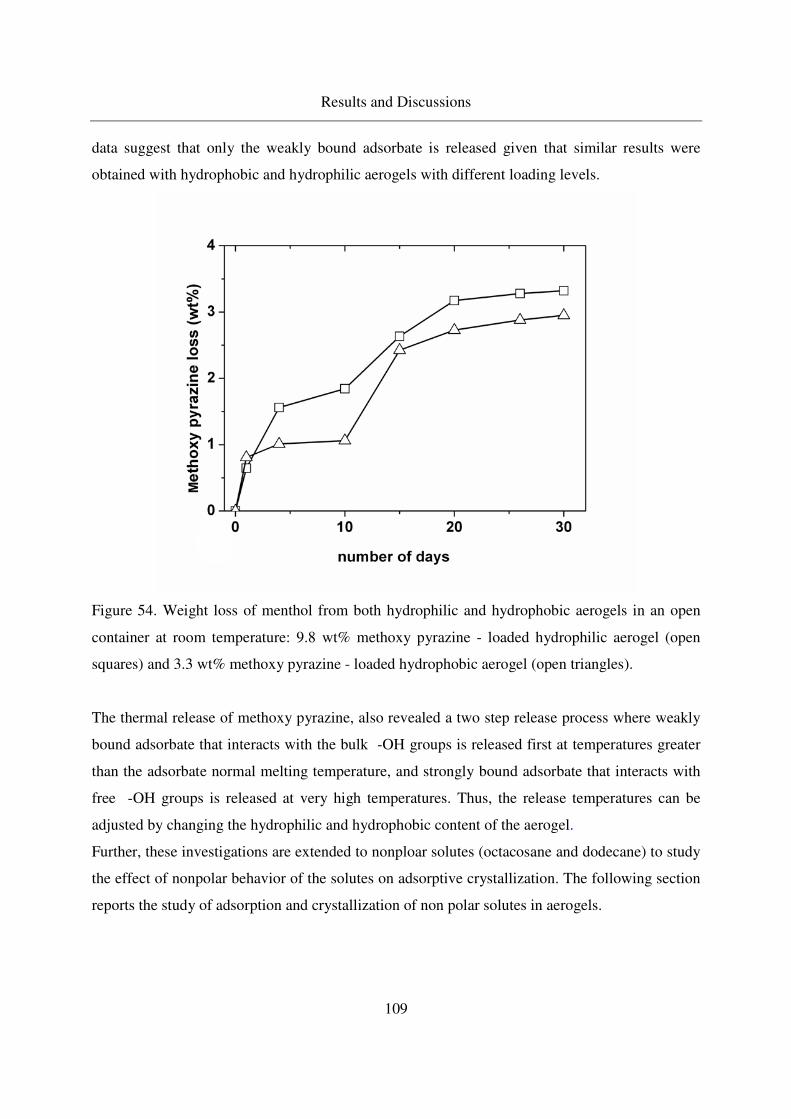
Results and Discussions
109
data suggest that only the weakly bound adsorbate is released given that similar results were
obtained with hydrophobic and hydrophilic aerogels with different loading levels.
Figure 54. Weight loss of menthol from both hydrophilic and hydrophobic aerogels in an open
container at room temperature: 9.8 wt% methoxy pyrazine - loaded hydrophilic aerogel (open
squares) and 3.3 wt% methoxy pyrazine - loaded hydrophobic aerogel (open triangles).
The thermal release of methoxy pyrazine, also revealed a two step release process where weakly
bound adsorbate that interacts with the bulk -OH groups is released first at temperatures greater
than the adsorbate normal melting temperature, and strongly bound adsorbate that interacts with
free -OH groups is released at very high temperatures. Thus, the release temperatures can be
adjusted by changing the hydrophilic and hydrophobic content of the aerogel.
Further, these investigations are extended to nonploar solutes (octacosane and dodecane) to study
the effect of nonpolar behavior of the solutes on adsorptive crystallization. The following section
reports the study of adsorption and crystallization of non polar solutes in aerogels.
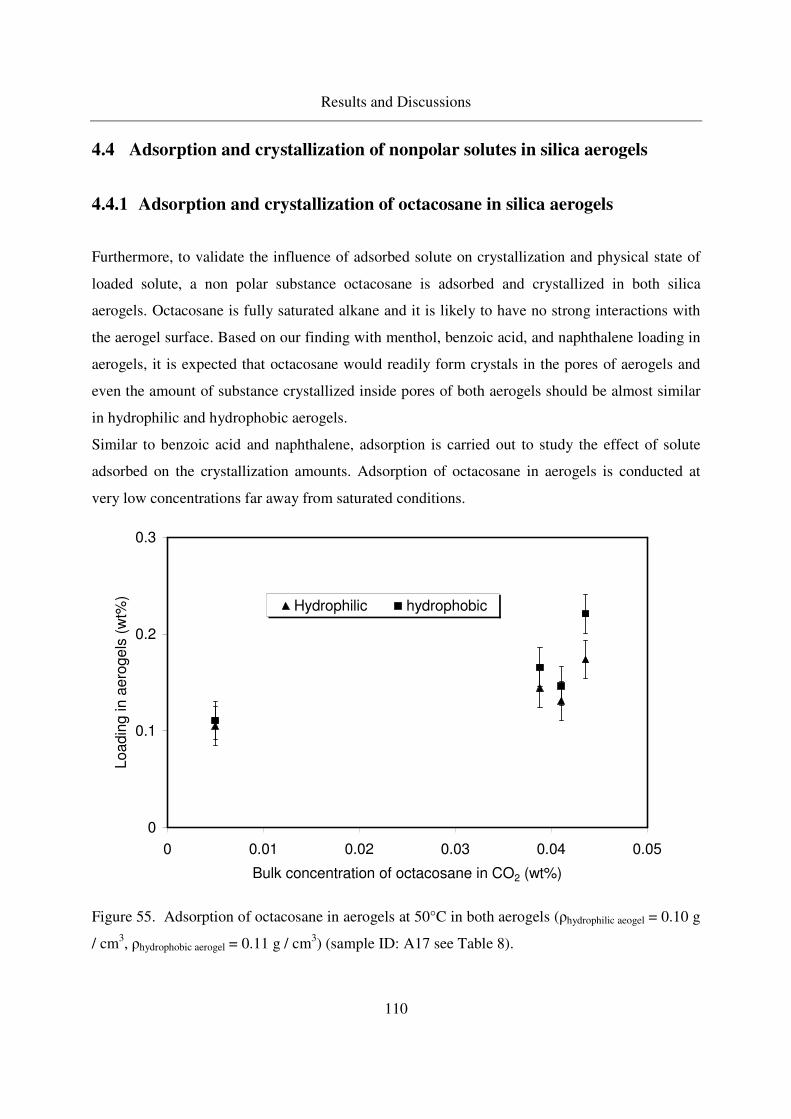
Results and Discussions
110
4.4 Adsorption and crystallization of nonpolar solutes in silica aerogels
4.4.1 Adsorption and crystallization of octacosane in silica aerogels
Furthermore, to validate the influence of adsorbed solute on crystallization and physical state of
loaded solute, a non polar substance octacosane is adsorbed and crystallized in both silica
aerogels. Octacosane is fully saturated alkane and it is likely to have no strong interactions with
the aerogel surface. Based on our finding with menthol, benzoic acid, and naphthalene loading in
aerogels, it is expected that octacosane would readily form crystals in the pores of aerogels and
even the amount of substance crystallized inside pores of both aerogels should be almost similar
in hydrophilic and hydrophobic aerogels.
Similar to benzoic acid and naphthalene, adsorption is carried out to study the effect of solute
adsorbed on the crystallization amounts. Adsorption of octacosane in aerogels is conducted at
very low concentrations far away from saturated conditions.
0
0.1
0.2
0.3
0 0.01 0.02 0.03 0.04 0.05
Bulk concentration of octacosane in CO2 (wt%)
Loadin
g in a
ero
gels
(w
t%)
Hydrophilic hydrophobic
Figure 55. Adsorption of octacosane in aerogels at 50°C in both aerogels (ρhydrophilic aeogel = 0.10 g
/ cm3, ρhydrophobic aerogel = 0.11 g / cm3) (sample ID: A17 see Table 8).
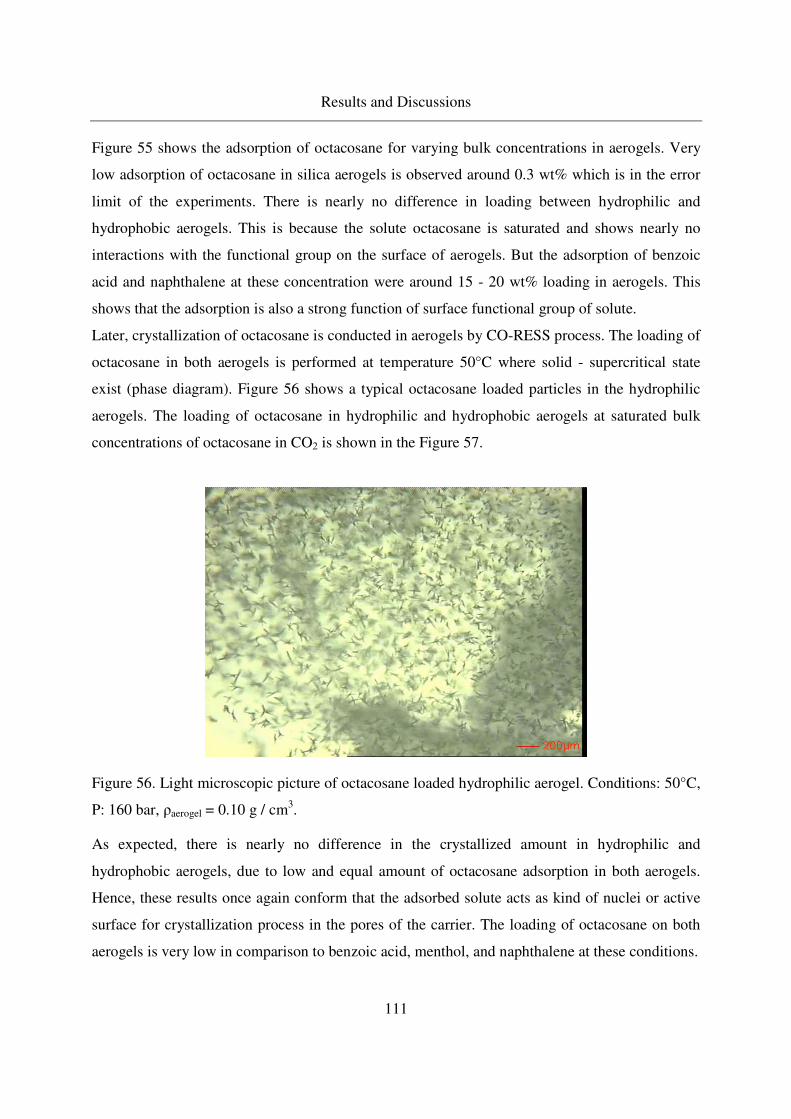
Results and Discussions
111
Figure 55 shows the adsorption of octacosane for varying bulk concentrations in aerogels. Very
low adsorption of octacosane in silica aerogels is observed around 0.3 wt% which is in the error
limit of the experiments. There is nearly no difference in loading between hydrophilic and
hydrophobic aerogels. This is because the solute octacosane is saturated and shows nearly no
interactions with the functional group on the surface of aerogels. But the adsorption of benzoic
acid and naphthalene at these concentration were around 15 - 20 wt% loading in aerogels. This
shows that the adsorption is also a strong function of surface functional group of solute.
Later, crystallization of octacosane is conducted in aerogels by CO-RESS process. The loading of
octacosane in both aerogels is performed at temperature 50°C where solid - supercritical state
exist (phase diagram). Figure 56 shows a typical octacosane loaded particles in the hydrophilic
aerogels. The loading of octacosane in hydrophilic and hydrophobic aerogels at saturated bulk
concentrations of octacosane in CO2 is shown in the Figure 57.
Figure 56. Light microscopic picture of octacosane loaded hydrophilic aerogel. Conditions: 50°C,
P: 160 bar, ρaerogel = 0.10 g / cm3.
As expected, there is nearly no difference in the crystallized amount in hydrophilic and
hydrophobic aerogels, due to low and equal amount of octacosane adsorption in both aerogels.
Hence, these results once again conform that the adsorbed solute acts as kind of nuclei or active
surface for crystallization process in the pores of the carrier. The loading of octacosane on both
aerogels is very low in comparison to benzoic acid, menthol, and naphthalene at these conditions.
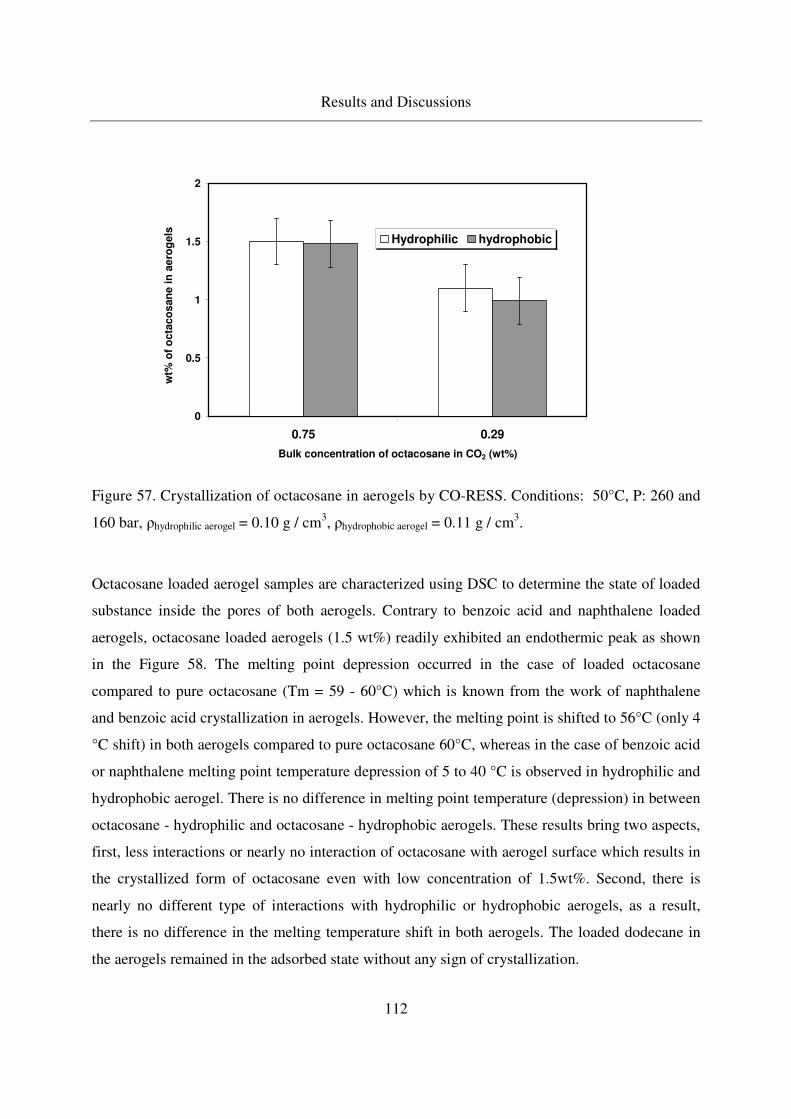
Results and Discussions
112
0
0.5
1
1.5
2
0.75 0.29
Bulk concentration of octacosane in CO2 (wt%)
wt%
of
octa
co
san
e i
n a
ero
gels
Hydrophilic hydrophobic
Figure 57. Crystallization of octacosane in aerogels by CO-RESS. Conditions: 50°C, P: 260 and
160 bar, ρhydrophilic aerogel = 0.10 g / cm3, ρhydrophobic aerogel = 0.11 g / cm3.
Octacosane loaded aerogel samples are characterized using DSC to determine the state of loaded
substance inside the pores of both aerogels. Contrary to benzoic acid and naphthalene loaded
aerogels, octacosane loaded aerogels (1.5 wt%) readily exhibited an endothermic peak as shown
in the Figure 58. The melting point depression occurred in the case of loaded octacosane
compared to pure octacosane (Tm = 59 - 60°C) which is known from the work of naphthalene
and benzoic acid crystallization in aerogels. However, the melting point is shifted to 56°C (only 4
°C shift) in both aerogels compared to pure octacosane 60°C, whereas in the case of benzoic acid
or naphthalene melting point temperature depression of 5 to 40 °C is observed in hydrophilic and
hydrophobic aerogel. There is no difference in melting point temperature (depression) in between
octacosane - hydrophilic and octacosane - hydrophobic aerogels. These results bring two aspects,
first, less interactions or nearly no interaction of octacosane with aerogel surface which results in
the crystallized form of octacosane even with low concentration of 1.5wt%. Second, there is
nearly no different type of interactions with hydrophilic or hydrophobic aerogels, as a result,
there is no difference in the melting temperature shift in both aerogels. The loaded dodecane in
the aerogels remained in the adsorbed state without any sign of crystallization.
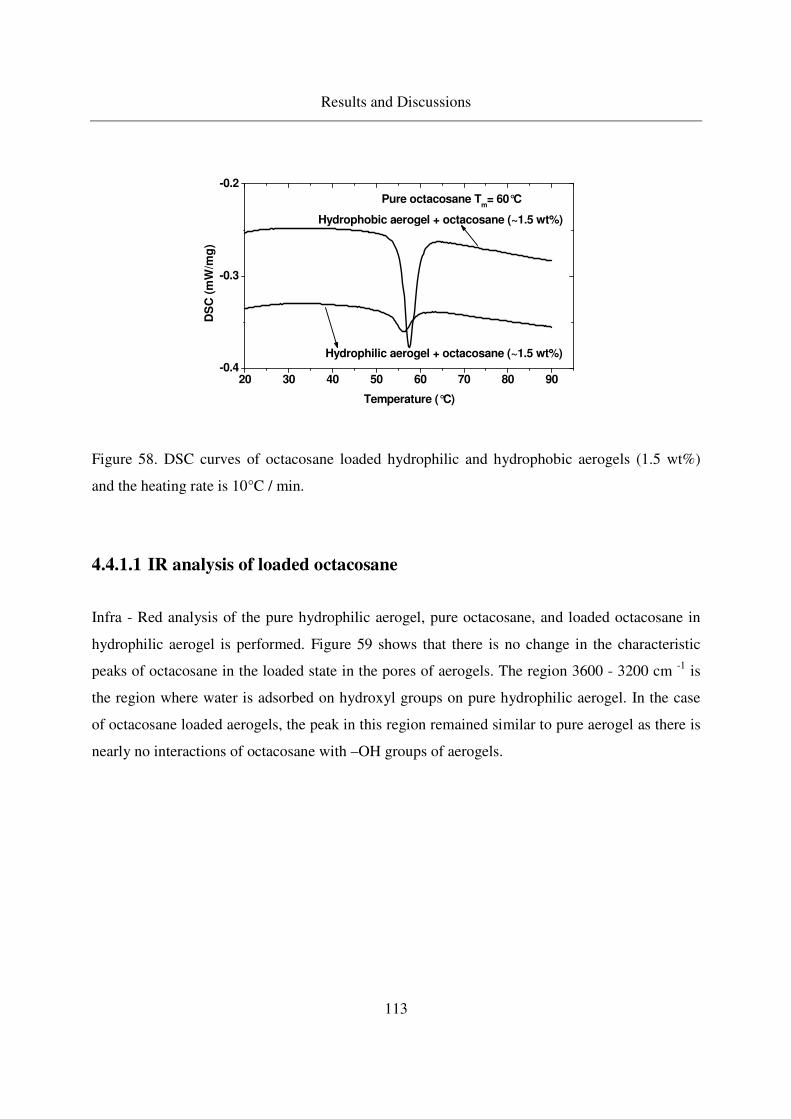
Results and Discussions
113
20 30 40 50 60 70 80 90-0.4
-0.3
-0.2
DS
C (
mW
/mg
)
Temperature (°C)
Hydrophilic aerogel + octacosane (~1.5 wt%)
Hydrophobic aerogel + octacosane (~1.5 wt%)
Pure octacosane Tm= 60°C
Figure 58. DSC curves of octacosane loaded hydrophilic and hydrophobic aerogels (1.5 wt%)
and the heating rate is 10°C / min.
4.4.1.1 IR analysis of loaded octacosane
Infra - Red analysis of the pure hydrophilic aerogel, pure octacosane, and loaded octacosane in
hydrophilic aerogel is performed. Figure 59 shows that there is no change in the characteristic
peaks of octacosane in the loaded state in the pores of aerogels. The region 3600 - 3200 cm -1 is
the region where water is adsorbed on hydroxyl groups on pure hydrophilic aerogel. In the case
of octacosane loaded aerogels, the peak in this region remained similar to pure aerogel as there is
nearly no interactions of octacosane with –OH groups of aerogels.

Results and Discussions
114
Figure 59. IR spectrum of the pure octacosane, hydrophilic aerogel, octacosane loaded aerogels.
Figure 60. IR spectrum of the pure octacosane, hydrophobic aerogel, octacosane loaded aerogels.
Thus, the crystallized octacosane is stabilized in the pores of silica aerogel. Similar analysis is
done for hydrophobic aerogel samples. Hydrophobic aerogel contains less hydroxyl groups; as a
result, in the region (3600 - 3200 cm -1) the peak is not so wide rather sharp (see Figure 60). The
octacosane loaded in hydrophobic aerogel has no interaction with the surface of aerogel.
Therefore, the peak in this region remains almost similar without any change. Thus, in both the
cases the crystallized octacosane is obtained.

Results and Discussions
115
As observed, loading of octacosane was very low in comparison to other solutes studied at
similar concentrations. Thus, to study the influence of molecular size of nonpolar solute on the
loading of aerogels, dodecane is chosen. The following section reports the adsorption of
dodecane.
4.4.2 Adsorption of dodecane in silica aerogels
To further elucidate the influence of molecular weight on the amount of loading in aerogels, a
low molecular weight non - polar solute dodecane (liquid) adsorption is conducted on the same
aerogels at similar conditions of octacosane. Figure 61 shows the loading of dodecane at different
bulk concentration of dodecane - CO2. Dodecane loading is relatively high in comparison to the
loading of octacosane in aerogels at similar concentrations (Figure 57). There is no difference in
the amount of loading between hydrophilic aerogel and hydrophobic aerogel similar to
octacosane. This shows that the molecular weight (or molecular size) plays a significant role in
the case of loading of non polar additives. Lower the molecular weight of non - polar solute
higher is the amount of loading in aerogels. Aerogel structure remained stable even though
loaded with liquid additives similar to 2-Methoxy pyrazine loadings in aerogels.
0
2
4
6
8
10
0.79 0.28
Bulk concentration of dodecane in CO2 (wt%)
Do
dec
an
e in
aero
gels
(w
t%)
Hydrophilic hydrophobic
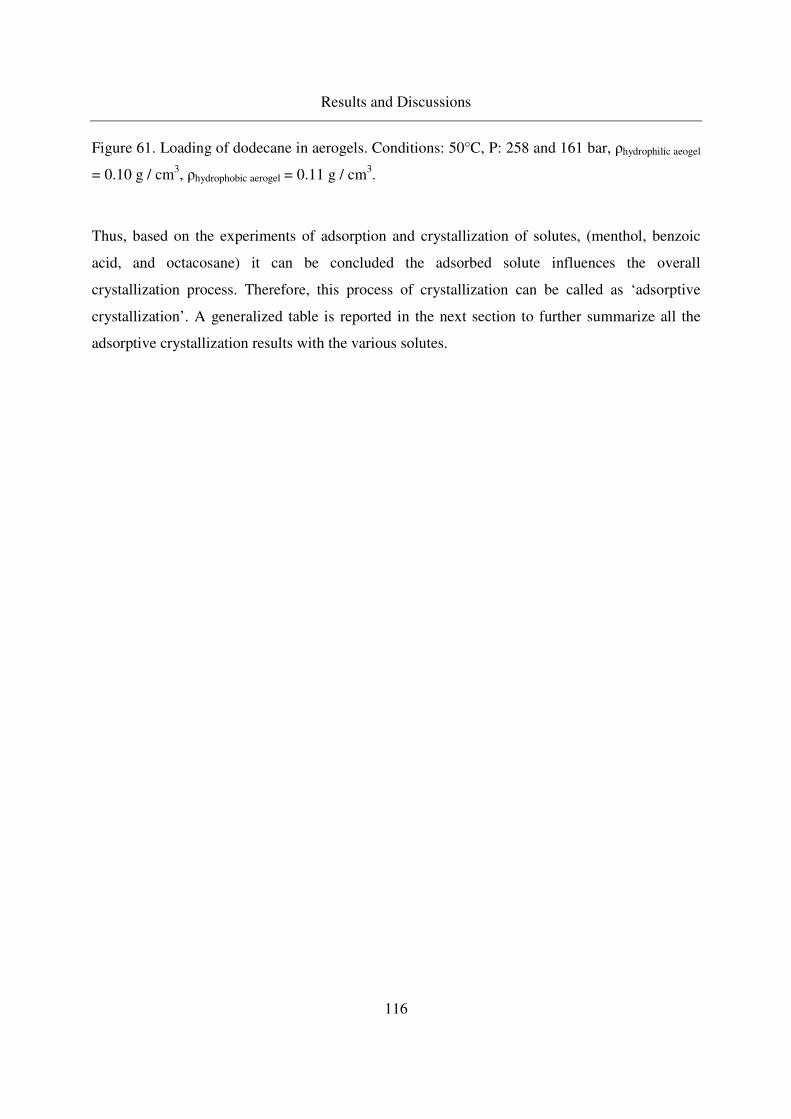
Results and Discussions
116
Figure 61. Loading of dodecane in aerogels. Conditions: 50°C, P: 258 and 161 bar, ρhydrophilic aeogel
= 0.10 g / cm3, ρhydrophobic aerogel = 0.11 g / cm3.
Thus, based on the experiments of adsorption and crystallization of solutes, (menthol, benzoic
acid, and octacosane) it can be concluded the adsorbed solute influences the overall
crystallization process. Therefore, this process of crystallization can be called as ‘adsorptive
crystallization’. A generalized table is reported in the next section to further summarize all the
adsorptive crystallization results with the various solutes.
Results and Discussions
117
4.5 Summarized table of loadings, physical form of loaded solutes
Table 15 summarizes loading of all solid solutes in hydrophilic and hydrophobic aerogels. Some
general conclusions can be drawn from the table. Higher amount of loadings are observed with
polar solutes (menthol, benzoic acid, naphthalene, ibuprofen) in hydrophilic aerogels (polar
surface). By adjusting the amount of polar surface function groups (degree of hydrophobicity) the
loading can be tailored. Not only the surface properties of the aerogel influence the loading but
also the surface groups on the solutes. The physical state of solutes can be adjusted based on type
of function groups on the aerogels. Stronger interactions of solute with aerogel surface leads to
amorphous form in the loaded state, example: menthol, benzoic acid. Weak interactions lead to
partly crystalline or complete crystalline form example: naphthalene, octacosane.
Benzoic acid remains amorphous upto 25 wt% in hydrophilic aerogels, and up to 15wt% in
hydrophobic aerogels. Moderately week interactions lead to partly crystalline form (naphthalene).
That is upto 15wt% of loadings of naphthalene remains amorphous and after these loadings,
solute loaded start to exhibit the crystalline form in the loaded state. Very week interactions lead
to crystalline form (octacosane), i.e., from 1.5 wt% onwards the crystalline state of loaded solute
in aerogels is observed. Thus, these threshold loading values observed can be used to control the
physical state of solute desired.
Apart from this, in the following section, this work is extended to other porous carrier. MCM41
were chosen as the carrier due to their adjustable properties and its structural stability in
dissolution medium. Drug ibuprofen was loaded in MCM41 and the release rate of the drug in the
liquid dissolution medium was conducted to investigate the influence of surface - solute
interactions.
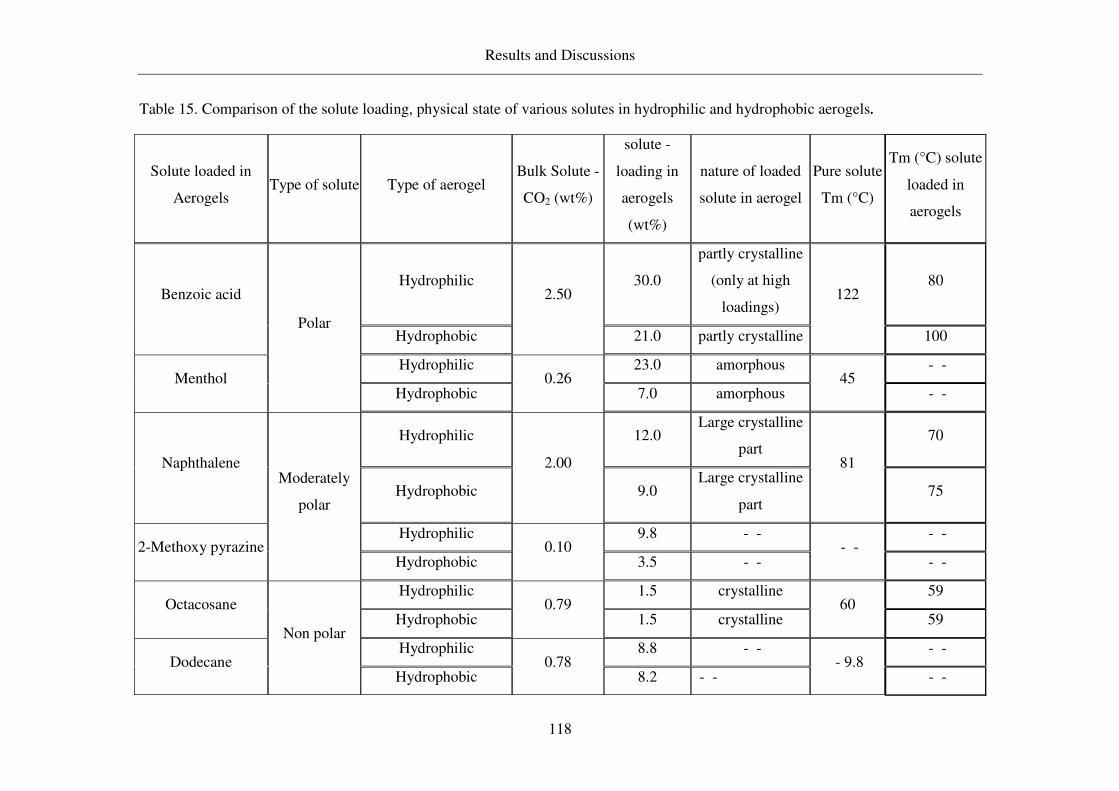
Results and Discussions
118
Table 15. Comparison of the solute loading, physical state of various solutes in hydrophilic and hydrophobic aerogels.
Solute loaded in
Aerogels Type of solute Type of aerogel
Bulk Solute -
CO2 (wt%)
solute -
loading in
aerogels
(wt%)
nature of loaded
solute in aerogel
Pure solute
Tm (°C)
Tm (°C) solute
loaded in
aerogels
Hydrophilic 30.0
partly crystalline
(only at high
loadings)
80 Benzoic acid
Hydrophobic
2.50
21.0 partly crystalline
122
100
Hydrophilic 23.0 amorphous - - Menthol
Polar
Hydrophobic 0.26
7.0 amorphous 45
- -
Hydrophilic 12.0 Large crystalline
part 70
Naphthalene
Hydrophobic
2.00
9.0 Large crystalline
part
81
75
Hydrophilic 9.8 - - - - 2-Methoxy pyrazine
Moderately
polar
Hydrophobic 0.10
3.5 - - - -
- -
Hydrophilic 1.5 crystalline 59 Octacosane
Hydrophobic 0.79
1.5 crystalline 60
59
Hydrophilic 8.8 - - - - Dodecane
Non polar
Hydrophobic 0.78
8.2 - - - 9.8
- -
Results and Discussions
119
4.6 Extension of the method to other porous carriers: comparison of drug
release profiles
The main application of the aerogels targeted in this work is the drug delivery. In the previous
work of our research group the release of different drugs from silica aerogels was studied [167,
168, 169]. Release rates of drugs from aerogels were compared to those of pure crystalline drugs,
but no comparison with other porous carriers was done. Thus, in this part of the present work, it
is extended with the loading methods (adsorption from supercritical CO2) used for aerogels to
other porous carriers. Ibuprofen is chosen as a drug, since the loading and release in silica
aerogels are investigated in detail, and these data will be used as a reference for the comparison.
MCM 41 (Mobile Crystalline Material) is used as an alternative porous carrier. It is also a
mesoporous material, however, contrary to aerogels, it is stable in liquids, so that the drug would
rather be released by diffusion. In last decades MCM41 was investigated by many researchers as
a carrier for drug delivery [170, 171, 172, 173], Maria Vallet - Regi [173] has shown the
influence of pore size on the release rate of ibuprofen loaded in MCM41. The loading is
performed by conventional method: drug is dissolved in a solvent, then MCM41 is placed inside
this solution and adsorption from the liquid phase takes place [174, 175]. Adsorption from
supercritical CO2 was not described. Therefore, in this work ibuprofen is adsorbed on MCM41
from CO2 solutions. The influence of physical properties and drug - carrier interactions on the
loading and release rate are investigated.
4.6.1 Synthesis of the MCM - 41 materials
Synthesis of MCM41 was done at lab of chemical reaction technology (group of Prof.
Schwieger). The samples are used for loading in the given form. The synthesis method is
described here. Synthesis of MCM41 with silica to alumina ratios of 50 and ∞ denoted as
MCM41-1 and MCM41-2 respectively, these samples were made by the procedure from Kresge
et al. [176] and Beck et al. [177].The typical procedure for MCM41-1 is given below:

Results and Discussions
120
(A): 1.06 g of CTAB was added to 18.0 g of distilled water and stirred for 10 minutes; then 3.0 g
of TEOS was added. (B): 0.20 g of NaOH, 0.01 g of sodium aluminate was added to 5.71 g of
water and stirred for 10 minutes.(B) was added to (A) and stirred for 45 min.
In the case of synthesis of MCM41-2, the aluminium source (sodium aluminate) was omitted.
Finally, the synthesis mixtures had the following chemical composition: 0.17 Na2O: SiO2: X
Al2O3: 0.20 CTAB: 100 H2O where X = 0.02 for MCM41-1 and 0 for MCM41-2. The pH of the
synthesized mixtures was found to be alkaline (around 12.9) and mixture was transferred to 50 ml
stainless steel autoclave and heated to 100°C for 24 h under static conditions. Then the mixture
was filtered, washed with water and dried at 100°C for 24h. The obtained MCM41 materials
were calcined at 550°C for 9h to remove the surfactant Cetyltrimethylammoniumbromide
(CTAB). CTAB contains functional groups methyl and bromide groups.
4.6.2 Characterization of MCM41
Powder X ray - Diffraction patterns of MCM41s were recorded on a Philips X - ray
Diffractometer using CuKα radiation. All the samples were scanned in the 2theta range of 1 –50°
at a scan rate of 2 min - 1. The XRD patterns of the as synthesised and calcined MCM41 materials
are shown in Figure 62, which are in agreement with the standard MCM - 41 materials. MCM41
samples labled in this text are as follows: MCM41-1 (Si / Al = 50, with template), MCM41-1 cal
(Si / Al = 50, calcined (template removed)), MCM41-2 (Si / Al = ∞, with template), MCM41 - 2
cal (Si / Al =∞, calcined (template removed)).
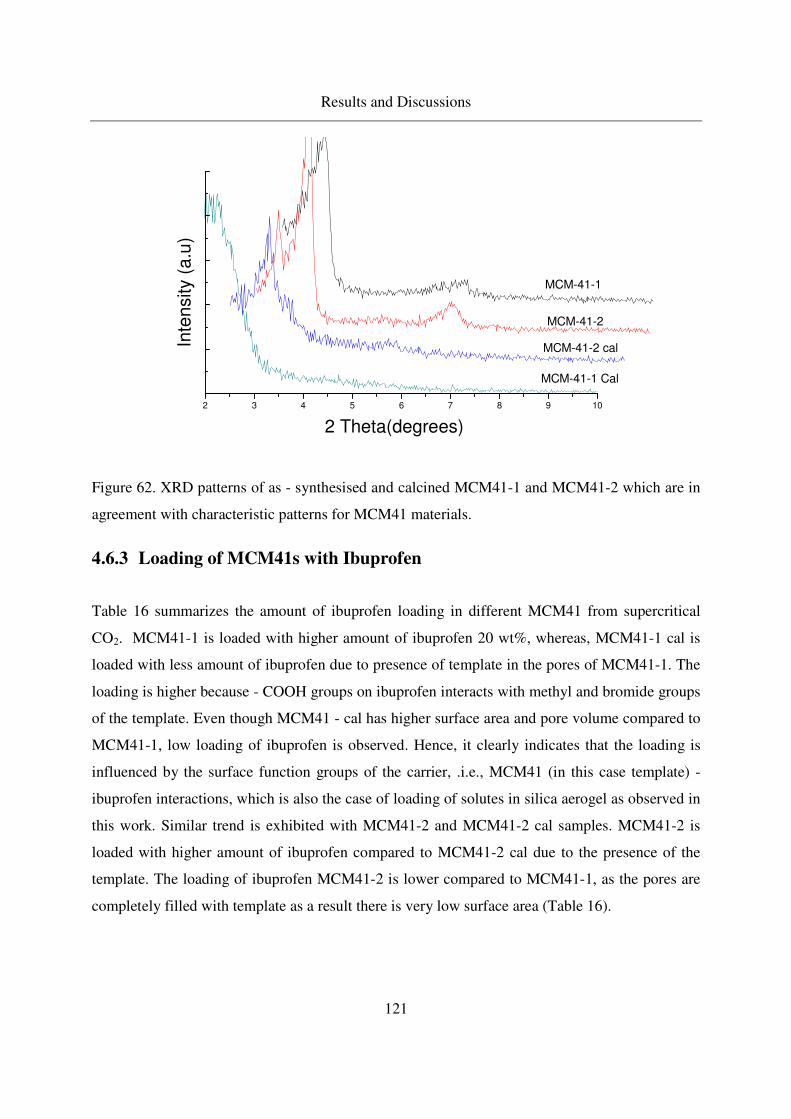
Results and Discussions
121
2 3 4 5 6 7 8 9 10
MCM-41-2 cal
MCM-41-2
MCM-41-1 Cal
In
ten
sity (
a.u
)
2 Theta(degrees)
MCM-41-1
Figure 62. XRD patterns of as - synthesised and calcined MCM41-1 and MCM41-2 which are in
agreement with characteristic patterns for MCM41 materials.
4.6.3 Loading of MCM41s with Ibuprofen
Table 16 summarizes the amount of ibuprofen loading in different MCM41 from supercritical
CO2. MCM41-1 is loaded with higher amount of ibuprofen 20 wt%, whereas, MCM41-1 cal is
loaded with less amount of ibuprofen due to presence of template in the pores of MCM41-1. The
loading is higher because - COOH groups on ibuprofen interacts with methyl and bromide groups
of the template. Even though MCM41 - cal has higher surface area and pore volume compared to
MCM41-1, low loading of ibuprofen is observed. Hence, it clearly indicates that the loading is
influenced by the surface function groups of the carrier, .i.e., MCM41 (in this case template) -
ibuprofen interactions, which is also the case of loading of solutes in silica aerogel as observed in
this work. Similar trend is exhibited with MCM41-2 and MCM41-2 cal samples. MCM41-2 is
loaded with higher amount of ibuprofen compared to MCM41-2 cal due to the presence of the
template. The loading of ibuprofen MCM41-2 is lower compared to MCM41-1, as the pores are
completely filled with template as a result there is very low surface area (Table 16).
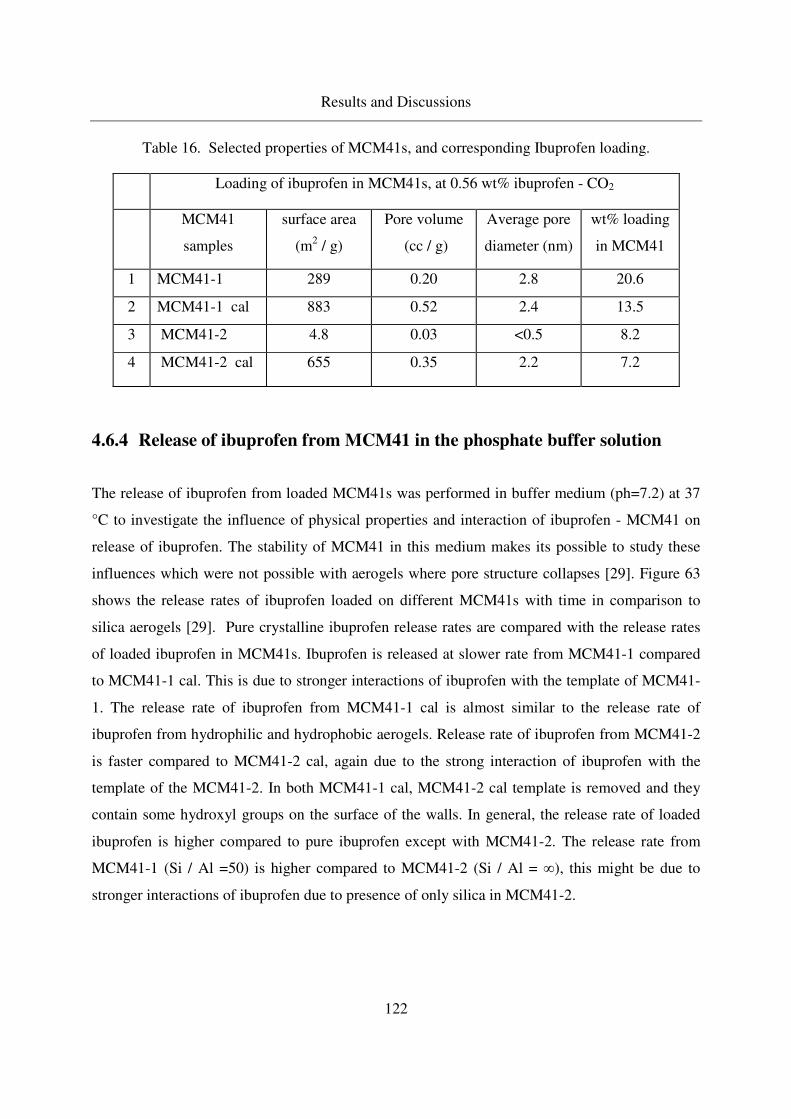
Results and Discussions
122
Table 16. Selected properties of MCM41s, and corresponding Ibuprofen loading.
Loading of ibuprofen in MCM41s, at 0.56 wt% ibuprofen - CO2
MCM41
samples
surface area
(m2 / g)
Pore volume
(cc / g)
Average pore
diameter (nm)
wt% loading
in MCM41
1 MCM41-1 289 0.20 2.8 20.6
2 MCM41-1 cal 883 0.52 2.4 13.5
3 MCM41-2 4.8 0.03 <0.5 8.2
4 MCM41-2 cal 655 0.35 2.2 7.2
4.6.4 Release of ibuprofen from MCM41 in the phosphate buffer solution
The release of ibuprofen from loaded MCM41s was performed in buffer medium (ph=7.2) at 37
°C to investigate the influence of physical properties and interaction of ibuprofen - MCM41 on
release of ibuprofen. The stability of MCM41 in this medium makes its possible to study these
influences which were not possible with aerogels where pore structure collapses [29]. Figure 63
shows the release rates of ibuprofen loaded on different MCM41s with time in comparison to
silica aerogels [29]. Pure crystalline ibuprofen release rates are compared with the release rates
of loaded ibuprofen in MCM41s. Ibuprofen is released at slower rate from MCM41-1 compared
to MCM41-1 cal. This is due to stronger interactions of ibuprofen with the template of MCM41-
1. The release rate of ibuprofen from MCM41-1 cal is almost similar to the release rate of
ibuprofen from hydrophilic and hydrophobic aerogels. Release rate of ibuprofen from MCM41-2
is faster compared to MCM41-2 cal, again due to the strong interaction of ibuprofen with the
template of the MCM41-2. In both MCM41-1 cal, MCM41-2 cal template is removed and they
contain some hydroxyl groups on the surface of the walls. In general, the release rate of loaded
ibuprofen is higher compared to pure ibuprofen except with MCM41-2. The release rate from
MCM41-1 (Si / Al =50) is higher compared to MCM41-2 (Si / Al = ∞), this might be due to
stronger interactions of ibuprofen due to presence of only silica in MCM41-2.
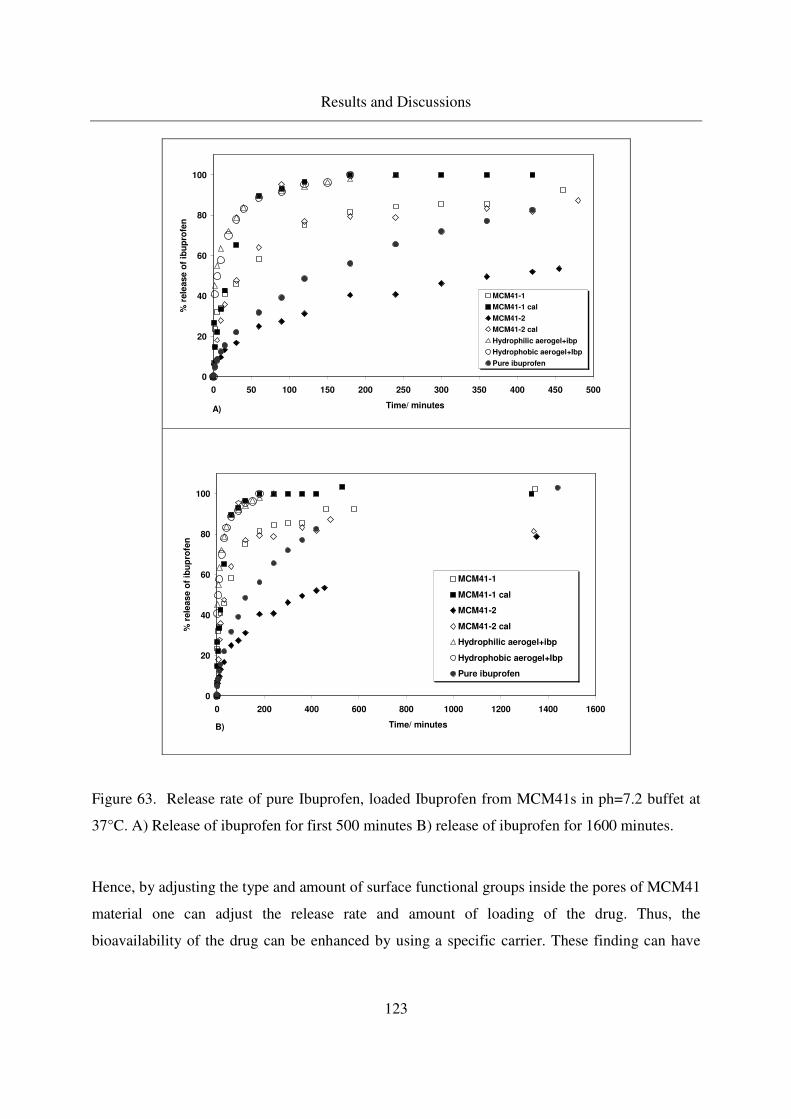
Results and Discussions
123
0
20
40
60
80
100
0 50 100 150 200 250 300 350 400 450 500
Time/ minutes
% r
ele
ase
of
ibu
pro
fen
MCM41-1
MCM41-1 cal
MCM41-2
MCM41-2 cal
Hydrophilic aerogel+ibp
Hydrophobic aerogel+Ibp
Pure ibuprofen
A)
0
20
40
60
80
100
0 200 400 600 800 1000 1200 1400 1600
Time/ minutes
% r
ele
as
e o
f ib
up
rofe
n
MCM41-1
MCM41-1 cal
MCM41-2
MCM41-2 cal
Hydrophilic aerogel+ibp
Hydrophobic aerogel+Ibp
Pure ibuprofen
B)
Figure 63. Release rate of pure Ibuprofen, loaded Ibuprofen from MCM41s in ph=7.2 buffet at
37°C. A) Release of ibuprofen for first 500 minutes B) release of ibuprofen for 1600 minutes.
Hence, by adjusting the type and amount of surface functional groups inside the pores of MCM41
material one can adjust the release rate and amount of loading of the drug. Thus, the
bioavailability of the drug can be enhanced by using a specific carrier. These finding can have
Results and Discussions
124
potential application in pharmaceutical industry in future as the bioavailability still a key and
challenging issue.
Conclusions
125
5. Conclusions
In this work ‘adsorptive crystallization’ is firstly introduced as a method to load mesoporous
carrier (aerogels, MCMs, Trispor glass) with organic substances to control the particle size and
crystallinity by adjusting the adsorptive properties of the carrier.
It was shown that the adsorptive properties of aerogels play a major role for crystallization
process: strong interactions between the aerogel surface and solutes lead to amorphous
precipitate, whereas weak interactions result in crystals inside the aerogel pores. The strength of
the interactions was quantified by TGA analysis. To investigate this, solutes of different polarity
were chosen. In case of strong adsorption (combination of polar solute - polar aerogel surface)
the absolute loading is very high and amorphous precipitate is preferably formed. This behavior
was observed for menthol and benzoic acid: upto 40 wt% amorphous menthol and 31 wt% of
amorphous benzoic acid could be stabilized in the hydrophilic (polar) aerogels. When the same
substances were adsorbed on less polar aerogels (esterified ones), benzoic acid tends to
crystallize at lower concentrations (above 15 wt% loading solute tends to be crystalline). Higher
melting point temperature shift of the loaded solutes was observed with polar aerogels compared
to less polar aerogels. Maximum melting point temperature depression of 40°C was observed.
Higher adsorption of solute prior to crystallization was observed with polar solute - polar aerogel
compared to polar solute - less polar aerogel. The adsorbed solute acted as kind of nuclei or
active surface during crystallization (CO-RESS process) i.e., higher amount of solute is
crystallized in pores of polar aerogel compared to less polar aerogel due to the presence of large
amount of the adsorbed solute.
In the case of loading of moderately polar solute in aerogels (combination of moderately polar
solute - polar aerogel surface), the absolute loading was lower compared to polar solutes, and the
solute starts to get crystalline with low loading. This is due to less interactions of naphthalene
with aerogel surface in comparison to benzoic acid. This behavior was observed for naphthalene:
upto 20 wt% amorphous form of naphthalene can be stabilized. When the same was adsorbed in
less polar aerogel, naphthalene tends to crystallize at low concentrations (from 12 wt% loading
solute tends to be crystalline). Higher melting point temperature shift of loaded naphthalene was
Conclusions
126
observed with polar aerogel compared to less polar aerogel. Maximum melting point temperature
depression of 10°C was observed. Similar to benzoic acid, higher amount of naphthalene was
adsorbed in polar aerogels compared to less polar aerogels, as a result, higher amount of
naphthalene was precipitated in the pores of aerogel during CO-RESS process. Similar trend was
observed with 2-Methoxy pyrazine adsorption experiments.
As for the loading of nonpolar solutes, (combination of nonpolar solute – polar aerogel surface)
the absolute loading of solute was very low compared with polar and moderately polar solutes
and crystalline form is obtained. This behavior was observed for octacosane: above 1.5 wt%
loading octacosane tends to be crystalline. When the same substance was loaded in less polar
aerogel same loading is observed due to similar type of interactions. Similar melting point
temperature shift of the loaded octacosane was observed in both aerogels. Melting point
depression of 3°C was observed. Due to less adsorbed octacosane on the surface of aerogel, less
amount of octacosane is precipitated in the pores of aerogel. Similar trend was observed in
adsorption of experiments of dodecane. Higher loading of dodecane was observed compared to
octacosane in aerogels.
Loading of solutes was extended to other porous carriers (MCMs, Zeolites, Trispor glass). In this
case also the adsorbed solutes influenced the precipitation of solutes in the pores. The
precipitated solute remained amorphous due to the stronger interaction with the surface of the
carrier (all these carriers have polar surface). Carrier surface - solute interaction influenced the
release rate of loaded solute in liquid medium. It was shown that the release rate can be tailored
by adjusting the adsorptive properties of the carrier. In the case of loaded volatile solutes
(menthol and methoxy pyrazine), it was shown that the thermal release of solute can be
controlled by adjusting the strength of carrier surface - solute interactions. Therefore, in this
work, it is shown with various solutes and carriers that the adsorptive properties of carrier
influence the loading and physical state of the solutes / drugs, therefore, process is termed as
‘adsorptive crystallization’. Hence, the results reported here provide an insight into the
application of porous carriers (silica aerogels, MCM41) as delivery / storage devices with
potential applications in the food, drug, flavors, catalysis (catalyst support) and other allied
industries.
Outlook
127
6. Outlook
These results forms a strong basis to further investigate adsorptive crystallization in
biodegradable gels made of natural materials like starch, algae, etc. Industrial and combined
academic interest would give much progress in this direction to further apply the engineering
theories to improve the drug delivery systems. Moreover, in the case of high pressure adsorption
isotherms reported in this work, which are the first efforts made to measure solid solute
adsorption on adsorbent, but, still modifications are needed in the MSB experimental setup to
measure the bulk concentration of solutes in-situ, like use of Optical Raman Spectrometry.
Strong thermodynamical modeling efforts are necessary to separate the solid solute and solvent
from binary adsorption isotherms.
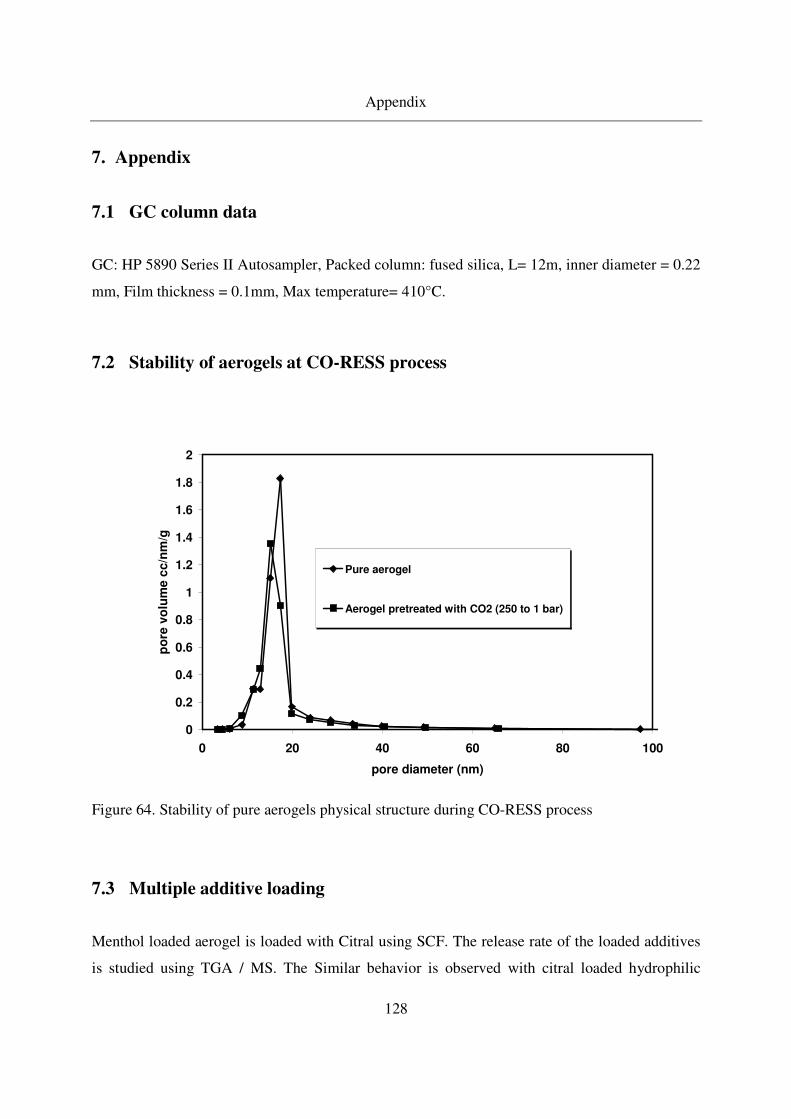
Appendix
128
7. Appendix
7.1 GC column data
GC: HP 5890 Series II Autosampler, Packed column: fused silica, L= 12m, inner diameter = 0.22
mm, Film thickness = 0.1mm, Max temperature= 410°C.
7.2 Stability of aerogels at CO-RESS process
0
0.2
0.4
0.6
0.8
1
1.2
1.4
1.6
1.8
2
0 20 40 60 80 100
pore diameter (nm)
po
re v
olu
me
cc/n
m/g
Pure aerogel
Aerogel pretreated with CO2 (250 to 1 bar)
Figure 64. Stability of pure aerogels physical structure during CO-RESS process
7.3 Multiple additive loading
Menthol loaded aerogel is loaded with Citral using SCF. The release rate of the loaded additives
is studied using TGA / MS. The Similar behavior is observed with citral loaded hydrophilic
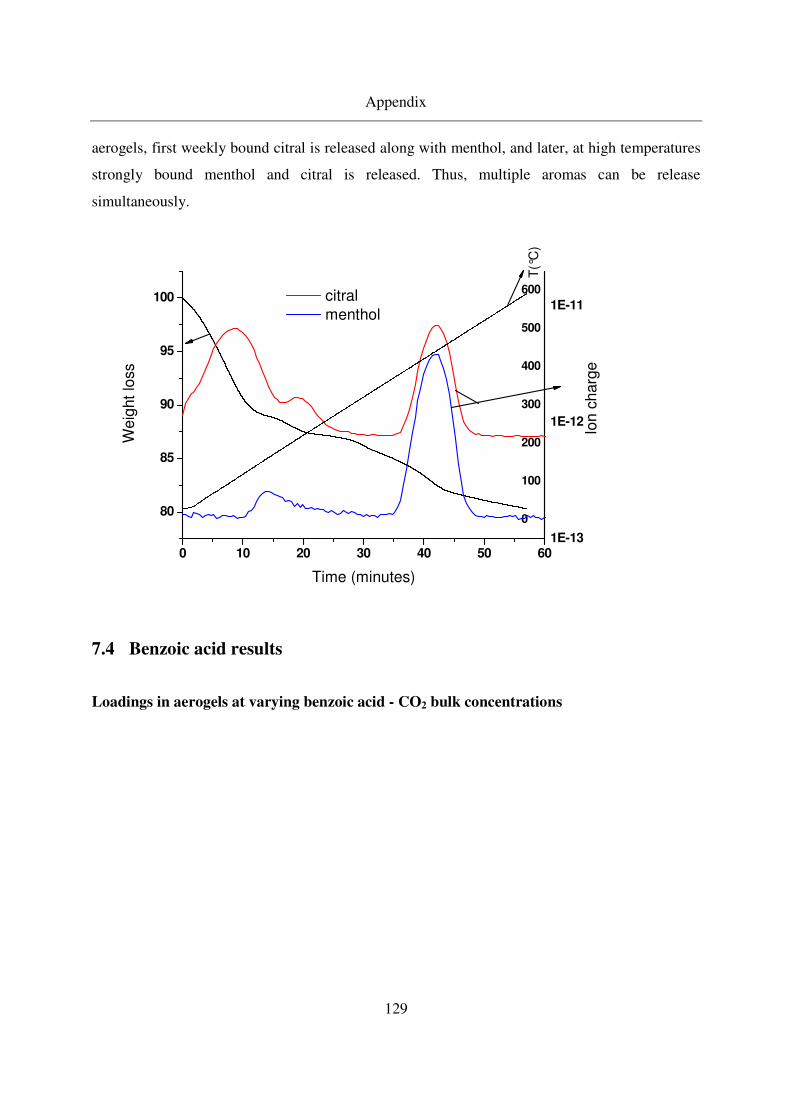
Appendix
129
aerogels, first weekly bound citral is released along with menthol, and later, at high temperatures
strongly bound menthol and citral is released. Thus, multiple aromas can be release
simultaneously.
0 10 20 30 40 50 60
80
85
90
95
100
1E-13
1E-12
1E-11
0
100
200
300
400
500
600
T(°
C)
Ion
ch
arg
e
We
ight
loss
Time (minutes)
citral
menthol
7.4 Benzoic acid results
Loadings in aerogels at varying benzoic acid - CO2 bulk concentrations
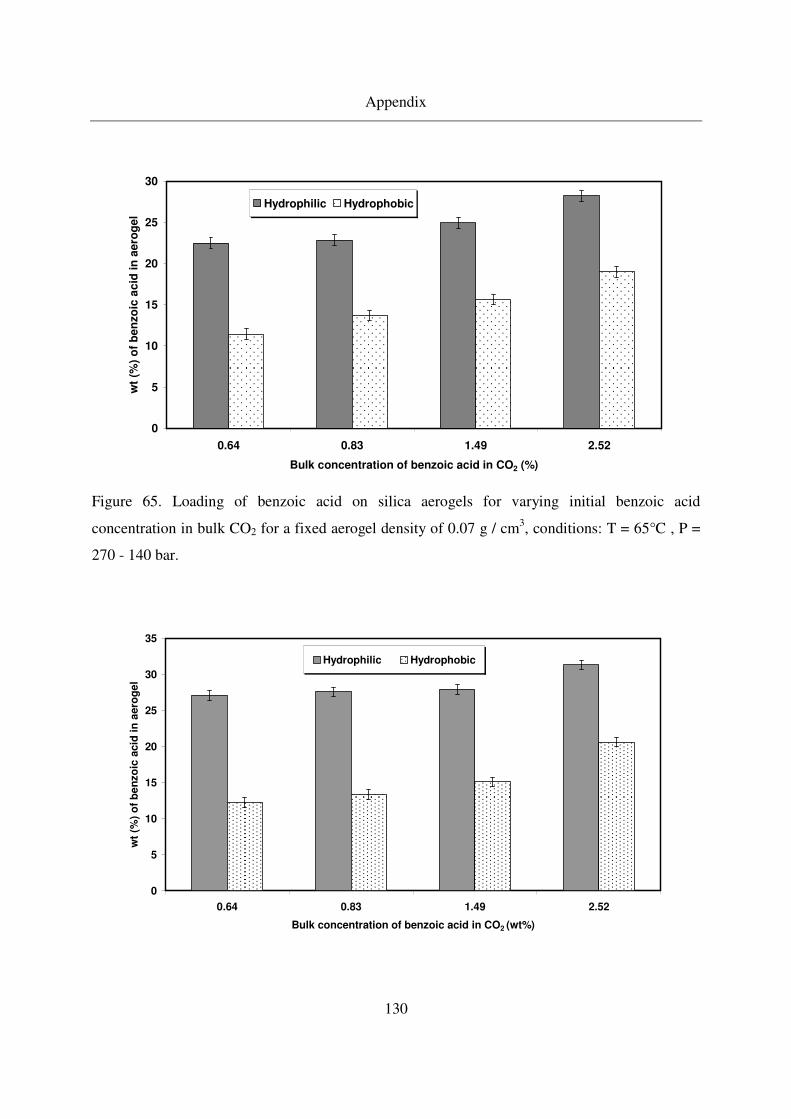
Appendix
130
0
5
10
15
20
25
30
0.64 0.83 1.49 2.52
Bulk concentration of benzoic acid in CO2 (%)
wt
(%)
of
ben
zo
ic a
cid
in
aero
gel
Hydrophilic Hydrophobic
Figure 65. Loading of benzoic acid on silica aerogels for varying initial benzoic acid
concentration in bulk CO2 for a fixed aerogel density of 0.07 g / cm3, conditions: T = 65°C , P =
270 - 140 bar.
0
5
10
15
20
25
30
35
0.64 0.83 1.49 2.52
Bulk concentration of benzoic acid in CO2 (wt%)
wt
(%)
of
be
nzo
ic a
cid
in
aero
ge
l
Hydrophilic Hydrophobic
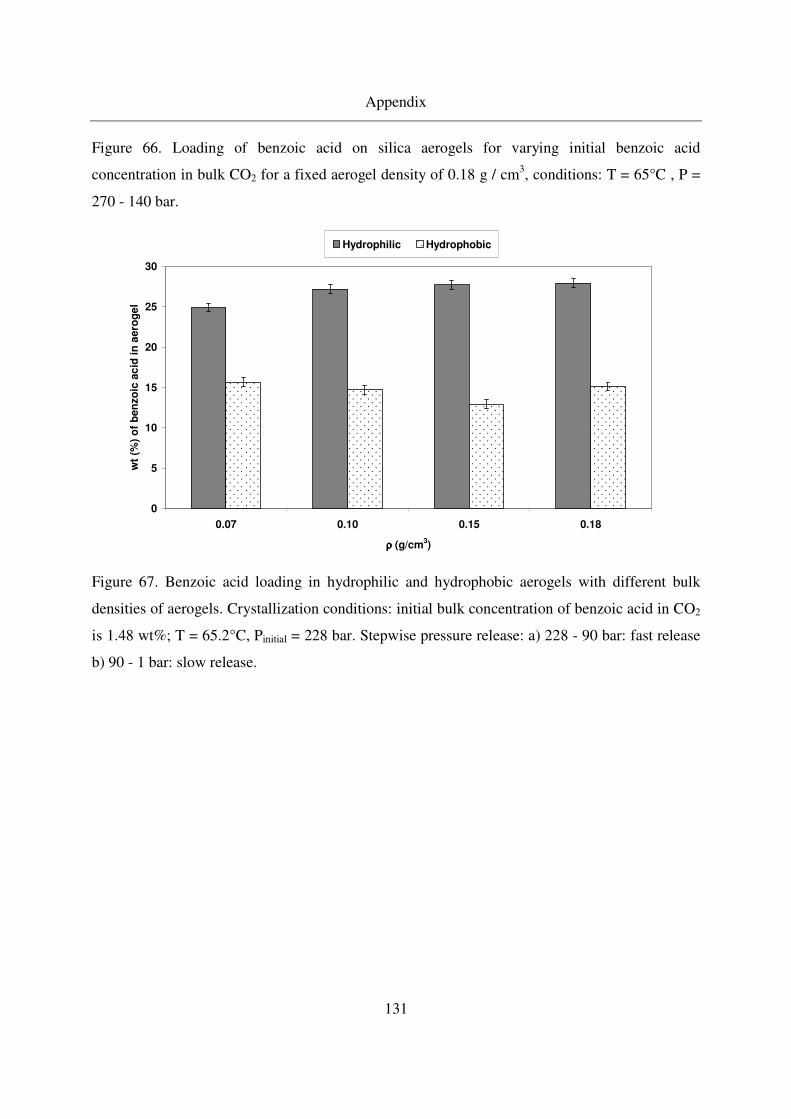
Appendix
131
Figure 66. Loading of benzoic acid on silica aerogels for varying initial benzoic acid
concentration in bulk CO2 for a fixed aerogel density of 0.18 g / cm3, conditions: T = 65°C , P =
270 - 140 bar.
0
5
10
15
20
25
30
0.07 0.10 0.15 0.18
ρρρρ (g/cm3)
wt
(%)
of
ben
zo
ic a
cid
in
aero
ge
l
Hydrophilic Hydrophobic
Figure 67. Benzoic acid loading in hydrophilic and hydrophobic aerogels with different bulk
densities of aerogels. Crystallization conditions: initial bulk concentration of benzoic acid in CO2
is 1.48 wt%; T = 65.2°C, Pinitial = 228 bar. Stepwise pressure release: a) 228 - 90 bar: fast release
b) 90 - 1 bar: slow release.

Appendix
132
0
5
10
15
20
25
30
0.07 0.10 0.15 0.18
ρρρρ (g/cm3)
wt
(%)
of
be
nzo
ic a
cid
in
aero
ge
l
Hydrophilic Hydrophobic
Figure 68. Benzoic acid loading in hydrophilic and hydrophobic aerogels with different bulk
densities of aerogels. Crystallization conditions: initial bulk concentration of benzoic acid in CO2
is 0.64 wt%; T = 65.2°C, Pinitial = 165 bar. Stepwise pressure release: a) 165 - 90 bar: fast release
b) 90 - 1 bar: slow release.
Loading at varying bulk density of aerogels for fixed benzoic acid - CO2 bulk
concentrations
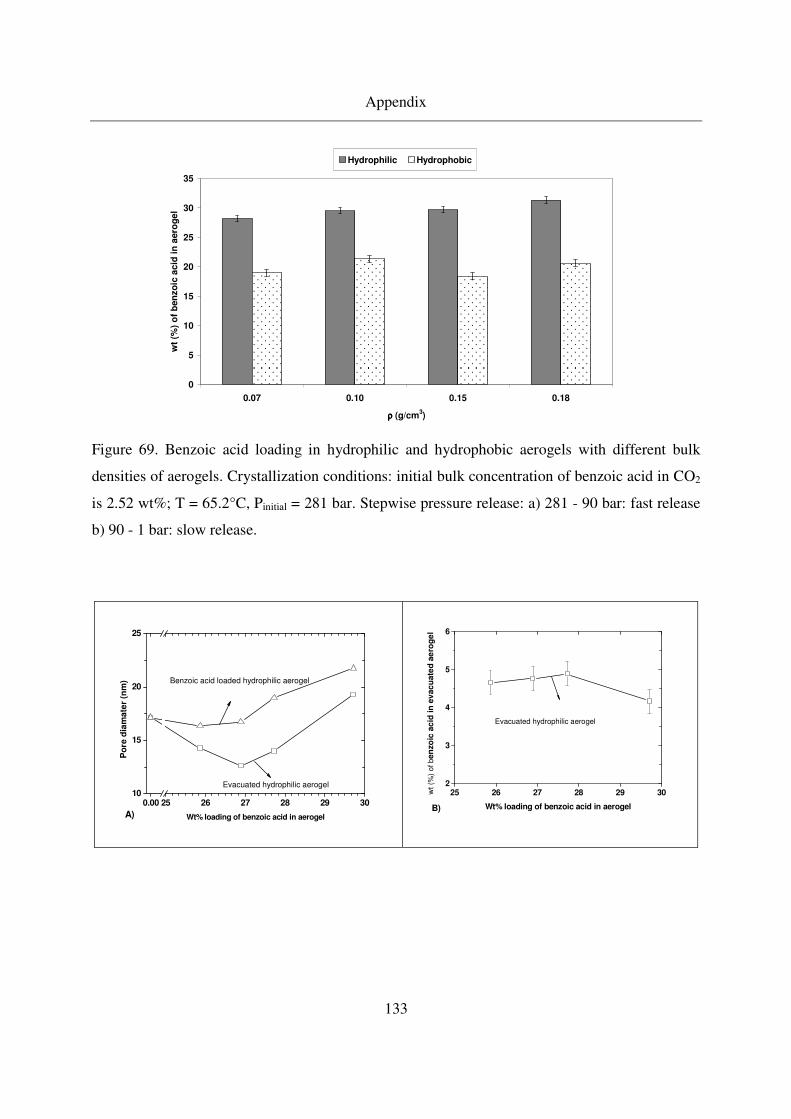
Appendix
133
0
5
10
15
20
25
30
35
0.07 0.10 0.15 0.18
ρρρρ (g/cm3)
wt
(%)
of
ben
zo
ic a
cid
in
aero
ge
l
Hydrophilic Hydrophobic
Figure 69. Benzoic acid loading in hydrophilic and hydrophobic aerogels with different bulk
densities of aerogels. Crystallization conditions: initial bulk concentration of benzoic acid in CO2
is 2.52 wt%; T = 65.2°C, Pinitial = 281 bar. Stepwise pressure release: a) 281 - 90 bar: fast release
b) 90 - 1 bar: slow release.
0.00 25 26 27 28 29 3010
15
20
25
Po
re d
iam
ate
r (n
m)
Wt% loading of benzoic acid in aerogel
Evacuated hydrophilic aerogel
Benzoic acid loaded hydrophilic aerogel
A)
25 26 27 28 29 302
3
4
5
6
B)
wt (%
) of ben
zo
ic a
cid
in
ev
ac
uate
d a
ero
ge
l
Wt% loading of benzoic acid in aerogel
Evacuated hydrophilic aerogel
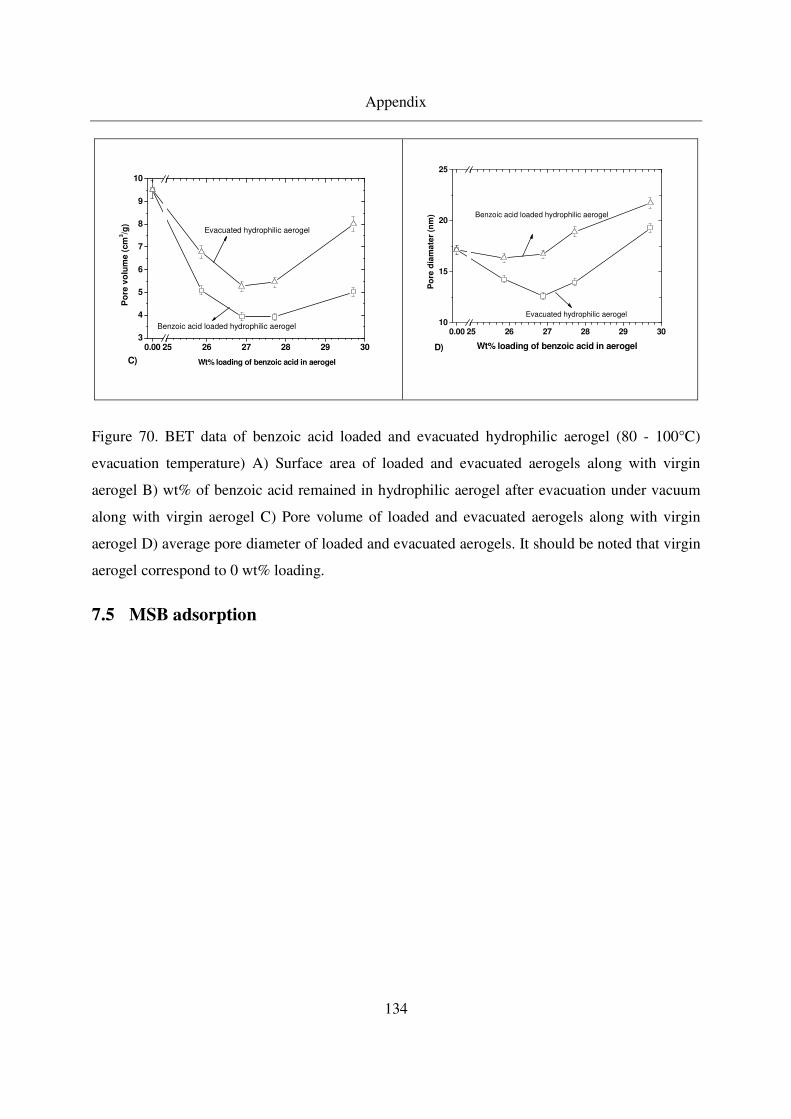
Appendix
134
0.00 25 26 27 28 29 303
4
5
6
7
8
9
10
C) Wt% loading of benzoic acid in aerogel
Po
re v
olu
me (
cm
3/g
)
Evacuated hydrophilic aerogel
Benzoic acid loaded hydrophilic aerogel
0.00 25 26 27 28 29 3010
15
20
25
Po
re d
iam
ate
r (n
m)
Wt% loading of benzoic acid in aerogel
Evacuated hydrophilic aerogel
Benzoic acid loaded hydrophilic aerogel
D)
Figure 70. BET data of benzoic acid loaded and evacuated hydrophilic aerogel (80 - 100°C)
evacuation temperature) A) Surface area of loaded and evacuated aerogels along with virgin
aerogel B) wt% of benzoic acid remained in hydrophilic aerogel after evacuation under vacuum
along with virgin aerogel C) Pore volume of loaded and evacuated aerogels along with virgin
aerogel D) average pore diameter of loaded and evacuated aerogels. It should be noted that virgin
aerogel correspond to 0 wt% loading.
7.5 MSB adsorption
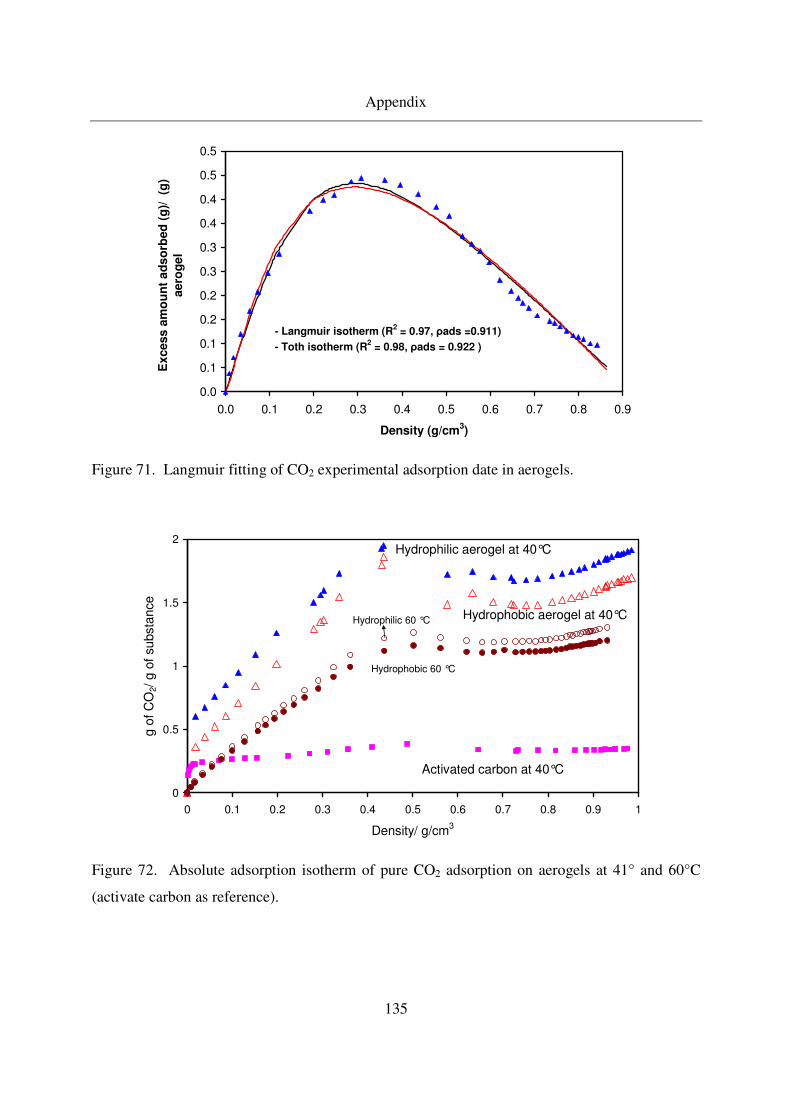
Appendix
135
0.0
0.1
0.1
0.2
0.2
0.3
0.3
0.4
0.4
0.5
0.5
0.0 0.1 0.2 0.3 0.4 0.5 0.6 0.7 0.8 0.9
Density (g/cm3)
Ex
cess
am
ou
nt
ad
so
rbed
(g
)/
(g)
aero
ge
l
- Langmuir isotherm (R2 = 0.97, ρads =0.911)
- Toth isotherm (R2 = 0.98, ρads = 0.922 )
Figure 71. Langmuir fitting of CO2 experimental adsorption date in aerogels.
0
0.5
1
1.5
2
0 0.1 0.2 0.3 0.4 0.5 0.6 0.7 0.8 0.9 1
Density/ g/cm3
g o
f C
O2/
g o
f su
bsta
nce
Hydrophilic aerogel at 40°C
Hydrophobic aerogel at 40°C
Activated carbon at 40°C
Hydrophilic 60 °C
Hydrophobic 60 °C
Figure 72. Absolute adsorption isotherm of pure CO2 adsorption on aerogels at 41° and 60°C
(activate carbon as reference).
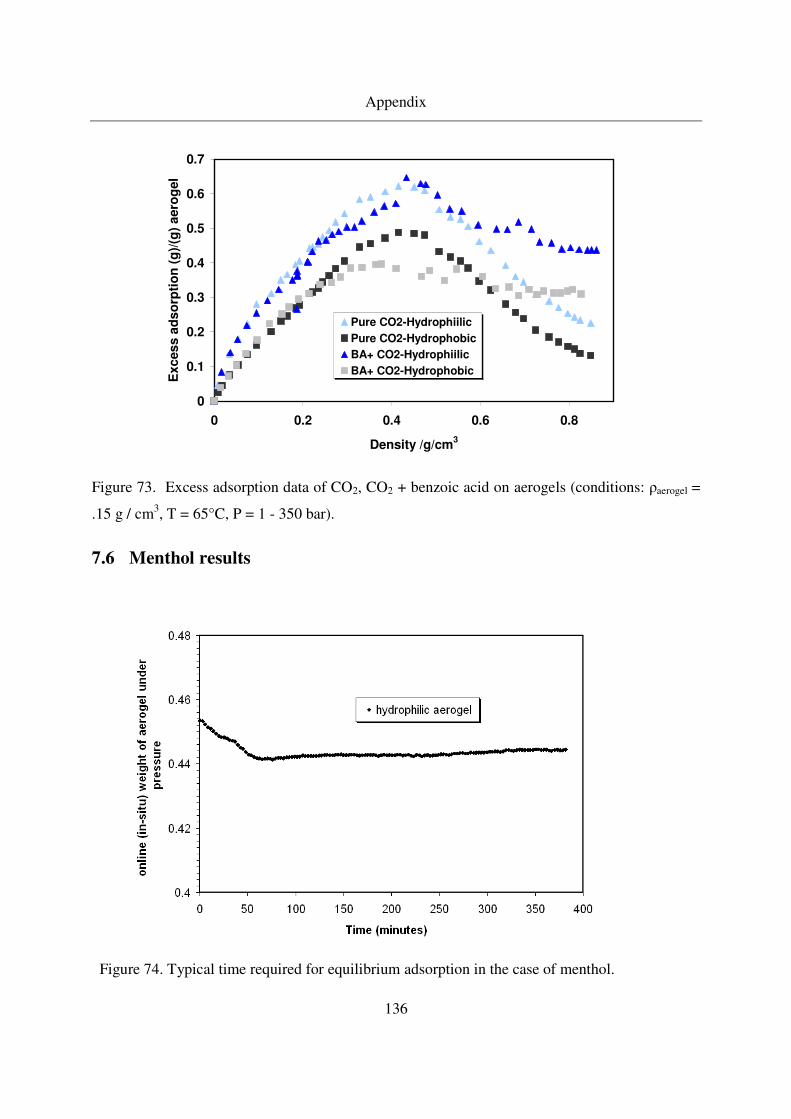
Appendix
136
0
0.1
0.2
0.3
0.4
0.5
0.6
0.7
0 0.2 0.4 0.6 0.8
Density /g/cm3
Ex
ces
s a
ds
orp
tio
n (
g)/
(g)
aero
gel
Pure CO2-Hydrophiilic
Pure CO2-Hydrophobic
BA+ CO2-Hydrophiilic
BA+ CO2-Hydrophobic
Figure 73. Excess adsorption data of CO2, CO2 + benzoic acid on aerogels (conditions: ρaerogel =
.15 g / cm3, T = 65°C, P = 1 - 350 bar).
7.6 Menthol results
Figure 74. Typical time required for equilibrium adsorption in the case of menthol.
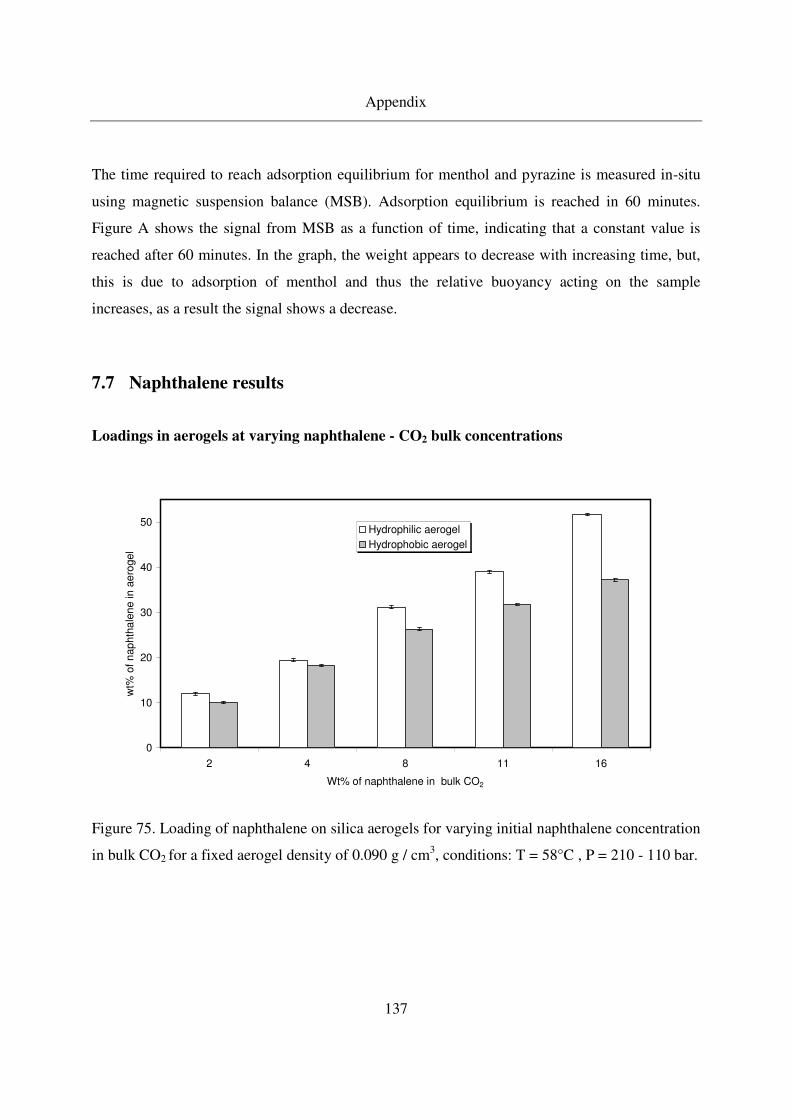
Appendix
137
The time required to reach adsorption equilibrium for menthol and pyrazine is measured in-situ
using magnetic suspension balance (MSB). Adsorption equilibrium is reached in 60 minutes.
Figure A shows the signal from MSB as a function of time, indicating that a constant value is
reached after 60 minutes. In the graph, the weight appears to decrease with increasing time, but,
this is due to adsorption of menthol and thus the relative buoyancy acting on the sample
increases, as a result the signal shows a decrease.
7.7 Naphthalene results
Loadings in aerogels at varying naphthalene - CO2 bulk concentrations
0
10
20
30
40
50
2 4 8 11 16
Wt% of naphthalene in bulk CO2
wt%
of
nap
hth
ale
ne in
ae
rogel
Hydrophilic aerogel
Hydrophobic aerogel
Figure 75. Loading of naphthalene on silica aerogels for varying initial naphthalene concentration
in bulk CO2 for a fixed aerogel density of 0.090 g / cm3, conditions: T = 58°C , P = 210 - 110 bar.
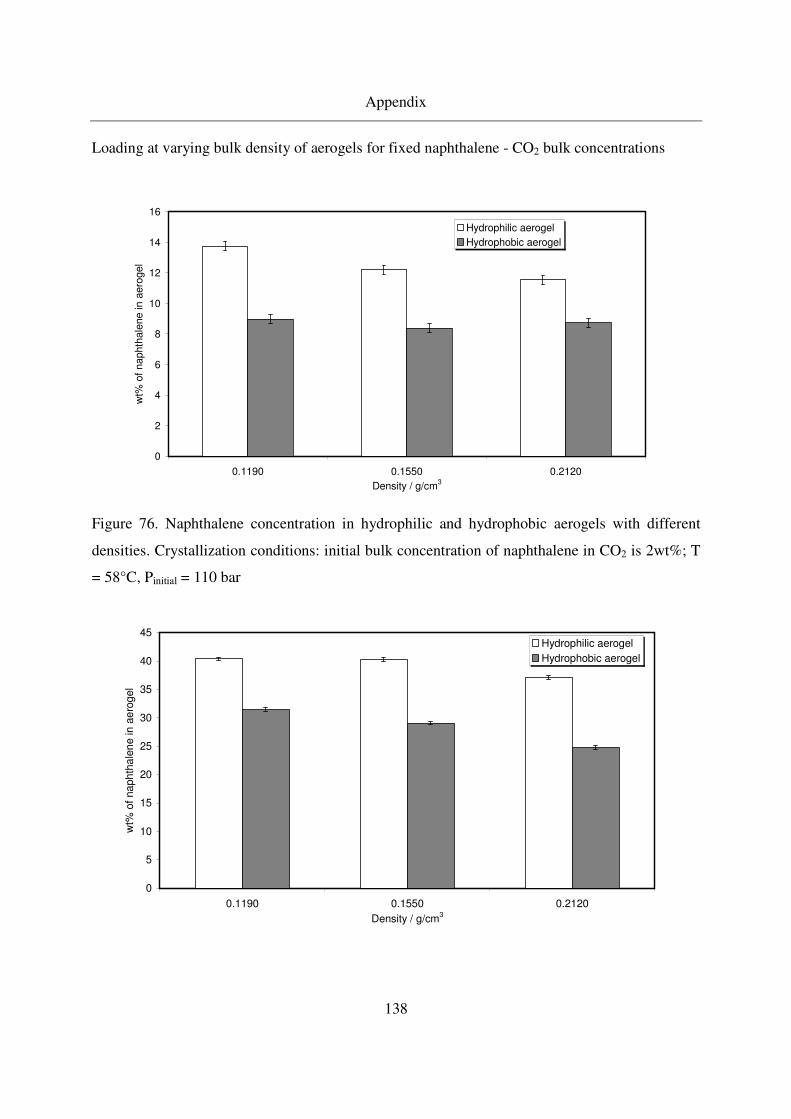
Appendix
138
Loading at varying bulk density of aerogels for fixed naphthalene - CO2 bulk concentrations
0
2
4
6
8
10
12
14
16
0.1190 0.1550 0.2120
Density / g/cm3
wt%
of
naphth
ale
ne in a
ero
gel
Hydrophilic aerogel
Hydrophobic aerogel
Figure 76. Naphthalene concentration in hydrophilic and hydrophobic aerogels with different
densities. Crystallization conditions: initial bulk concentration of naphthalene in CO2 is 2wt%; T
= 58°C, Pinitial = 110 bar
0
5
10
15
20
25
30
35
40
45
0.1190 0.1550 0.2120
Density / g/cm3
wt%
of
na
ph
tha
len
e in
ae
rog
el
Hydrophilic aerogel
Hydrophobic aerogel
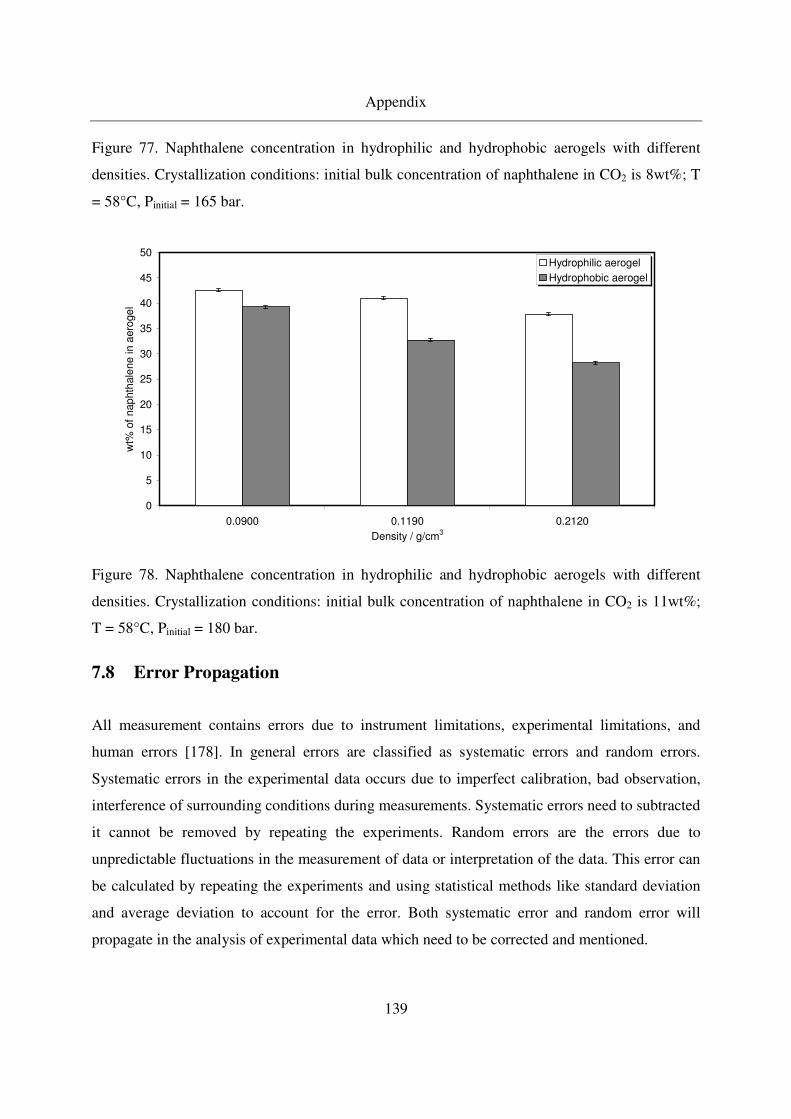
Appendix
139
Figure 77. Naphthalene concentration in hydrophilic and hydrophobic aerogels with different
densities. Crystallization conditions: initial bulk concentration of naphthalene in CO2 is 8wt%; T
= 58°C, Pinitial = 165 bar.
0
5
10
15
20
25
30
35
40
45
50
0.0900 0.1190 0.2120
Density / g/cm3
wt%
of
nap
hth
ale
ne
in a
ero
ge
l
Hydrophilic aerogel
Hydrophobic aerogel
Figure 78. Naphthalene concentration in hydrophilic and hydrophobic aerogels with different
densities. Crystallization conditions: initial bulk concentration of naphthalene in CO2 is 11wt%;
T = 58°C, Pinitial = 180 bar.
7.8 Error Propagation
All measurement contains errors due to instrument limitations, experimental limitations, and
human errors [178]. In general errors are classified as systematic errors and random errors.
Systematic errors in the experimental data occurs due to imperfect calibration, bad observation,
interference of surrounding conditions during measurements. Systematic errors need to subtracted
it cannot be removed by repeating the experiments. Random errors are the errors due to
unpredictable fluctuations in the measurement of data or interpretation of the data. This error can
be calculated by repeating the experiments and using statistical methods like standard deviation
and average deviation to account for the error. Both systematic error and random error will
propagate in the analysis of experimental data which need to be corrected and mentioned.
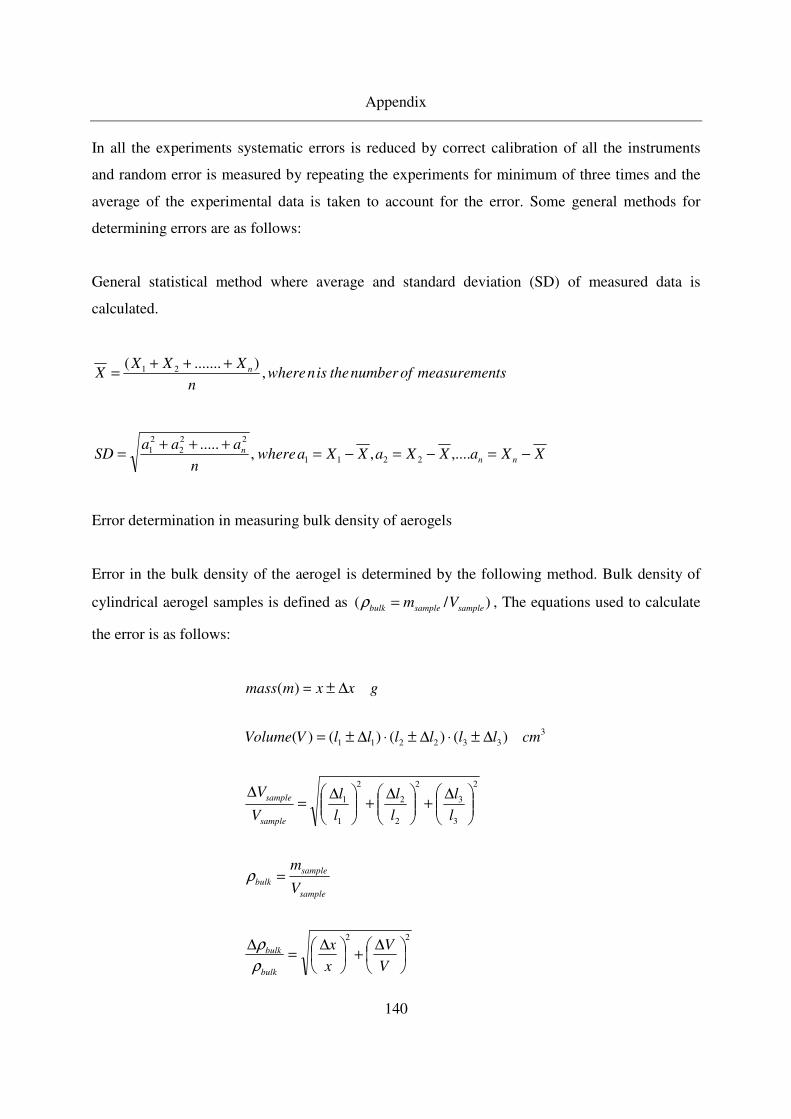
Appendix
140
In all the experiments systematic errors is reduced by correct calibration of all the instruments
and random error is measured by repeating the experiments for minimum of three times and the
average of the experimental data is taken to account for the error. Some general methods for
determining errors are as follows:
General statistical method where average and standard deviation (SD) of measured data is
calculated.
tsmeasuremenofnumbertheisnwheren
XXXX n ,
).......( 21 +++=
XXaXXaXXawheren
aaaSD nn
n −=−=−=+++
= ,....,,.....
2211
222
21
Error determination in measuring bulk density of aerogels
Error in the bulk density of the aerogel is determined by the following method. Bulk density of
cylindrical aerogel samples is defined as )/( samplesamplebulk Vm=ρ , The equations used to calculate
the error is as follows:
22
2
3
3
2
2
2
2
1
1
3332211 )()()()(
)(
∆+
∆=
∆
=
∆+
∆+
∆=
∆
∆±⋅∆±⋅∆±=
∆±=
V
V
x
x
V
m
l
l
l
l
l
l
V
V
cmllllllVVolume
gxxmmass
bulk
bulk
sample
sample
bulk
sample
sample
ρ
ρ
ρ
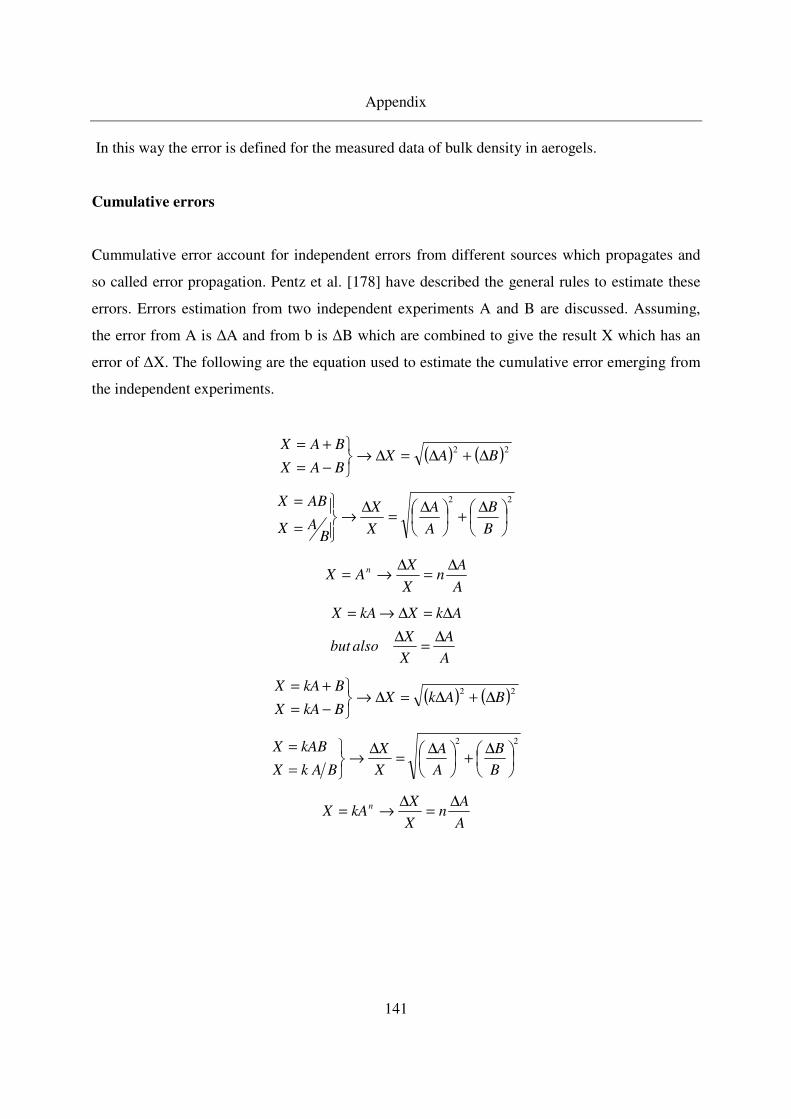
Appendix
141
In this way the error is defined for the measured data of bulk density in aerogels.
Cumulative errors
Cummulative error account for independent errors from different sources which propagates and
so called error propagation. Pentz et al. [178] have described the general rules to estimate these
errors. Errors estimation from two independent experiments A and B are discussed. Assuming,
the error from A is ∆A and from b is ∆B which are combined to give the result X which has an
error of ∆X. The following are the equation used to estimate the cumulative error emerging from
the independent experiments.
( ) ( )22BAX
BAX
BAX∆+∆=∆→
−=
+=
22
∆+
∆=
∆→
=
=
B
B
A
A
X
X
BAX
ABX
A
An
X
XAX n ∆
=∆
→=
A
A
X
Xalsobut
AkXkAX
∆=
∆
∆=∆→=
( ) ( )22BAkX
BkAX
BkAX∆+∆=∆→
−=
+=
22
∆+
∆=
∆→
=
=
B
B
A
A
X
X
BAkX
kABX
A
An
X
XkAX
n ∆=
∆→=
References
142
8. References
[1] Kistler, S.S, Aerogel synthesis, J of Phys. chem. 34, (1932), 52.
[2] Peri, J.B. Infrared study of OH and NH2 groups on the surface of a dry silica aerogel . J Phy
Chem-US. 70 (1966), 2937.
[3] Nicoloan, G.A., Contribution on l'etude des aerogels des silica. University of Lyon. 1968.
[4] Teichner, S.J., Nicoloan, G.A., US 3,672,833; Method of preparing inorganic aerogels (1972).
[5] Poelz, G., Aerogel cherenkov counters at DESY. Nucl Inst. Meth A. 248, (1986), 118.
[6] Henning, S., Svensson, L., A production facility for silica [7631-86-9] aerogel has been set up
in Lund. Aerogel is now produced in large quantities with the n of 1.03 and 1.05. The standard
block size is 18 × 18 × 3 cm3. Phys Scripta. 23, (1981), 697.
[7] Tewari, P.H., Hunt, A.J., Lofftus, K.D., Ambient-temperature supercritical drying of
transparent silica aerogels. Mater. Lett. 3, (1985), 363.
[8] Pierre, A.C., Pajonk, G.M., Chemistry of aerogels and their applications. Chem Rev. 102,
(2002), 4243.
[9] Fricke, J., Tillotson, T., Aerogels: Production, characterization, and applications. Thin Solid
Films. 297, (1997), 212.
[10] Hunt, A.J., Ayers, M.R., Cao, W., Aerogel composites using chemical vapor infiltration. J
Non-Cryst Solids. 185, (1995), 227.
[11] Hunt, A., Ayers, M. Silica Aerogels. http: //eande.lbl.gov/ECS/aerogels/satoc.htm. 1 Nov. 2
A.D.
[12] Hüsing, N., Schubert, U., Aerogels - Airy Materials: Chemistry, Structure, and Properties.
Angew Chem Int. Edit. 37, (1998), 22.
[13] Moner-Girona, M., Roig, A., Molins, E., Llibre, J., Sol-Gel route to direct formation of silica
aerogel microparticles using supercritical solvents. J Sol-Gel Sci. Techn. 26, (2003), 645.
[14]Soleimani, A., Dorcheh, M.H. Abbasi, Silica aerogel; synthesis, properties and
characterization. J Mater. process. Tech. 199, (2008), 10.
[15] Brinker, C.J., Scherer, G.W. Sol - Gel - Science. Academic Press: New York, 1990.
[16] Brinker, C.J., Keefer, K.D., Schaefer, D.W., Ashley C.S. Sol-gel transition in simple
silicates. J Non-Cryst Solids. 48, (1982), 47.
References
143
[17] Pajonk, G.M., some applications of silica aerogels. Colld. Poly. Sci. 281, (2003), 637.
[18] Tillotson, T.M., Hrubesh, L.W. Transparent ultralow-density silica aerogels prepared by a
two-step sol-gel process. J Non-Cryst Solids. 145, (1992), 44.
[19] Smirnova, I., Arlt, W., Synthesis of silica aerogels: Influence of the supercritical CO2 on the
sol-gel process. J Sol-Gel Sci Techn. 28, (2003), 175.
[20] Smirnova, I., Synthesis of silica aerogels and their applications as a drug delivery system.
Institut für Verfahrenstechnik, Fachgebiet Thermodynamik und thermische Trennverfahren,
Technische Universität Berlin. 2002.
[21] Pauthe, M., Despetis, F., Phalippou, J., Hydrophobic silica CO2 aerogels. J Non-Cryst
Solids. 155, (1993), 110.
[22] Schwertfeger, F., Frank, D., Schmidt, M. Hydrophobic waterglass based aerogels without
solvent exchange or supercritical drying. J Non-Cryst Solids. 225, (1998), 24-29.
[23] Venkateswara Rao, V., Wagh, P.B. Preparation and characterization of hydrophobic silica
aerogels. Mater Chem Phys. 53, (1998), 13-18.
[24] Venkateswara rao, A., Kulkarni, M. M., Hydrophobic properties of TMOS / TMES based
silica aerogels, Mater. Res. Bull. 37, (2002), 1667.
[25] Venkateswara rao, A., Einarsrud, E.N, M-A., Effect of precursors, methylation agents and
solvents on the physicochemical properties of silica aerogels prepared by atmospheric pressure
drying method. 22, (2001), 1223.
[26] Lee K.H., Kim S.Y., Yoo K.P. Low-density, hydrophobic aerogels. J Non-Cryst Solids. 186,
(1995), 18.
[27] Scherer, G.W., Adsorption in aerogel networks. J Non-Cryst Solids. 225, (1998), 192.
[28] Scherer, G.W. Characterization of aerogels, Adv. in Coll. Int. Sci., 76, (1998), 321.
[29] Suttiruengwong, S., Silica Aerogels and Hyperbranched polymers as drug delivery dystems,
PhD Thesis, (2005), University of Erlangen Nuremberg, Germany.
[30] Buisson, P., Hernandez, C., Pierre, M., Pierre, A.C. Encapsulation of lipases in aerogels. J
Non-Cryst Solids. 285, (2001), 295.
[31] El Rassy, H., Perrard, A., Pierre, A.C. Application of lipase encapsulated in silica aerogels to
a transesterification reaction in hydrophobic and hydrophilic solvents: Bi-Bi Ping-Pong kinetics.
J of Mol. Cat. B: Enzy. 30, (2004), 137.
References
144
[32] Power, M., Hosticka, B., Black, E., Daitch, C., Norris, P. Aerogels as biosensors: viral
particle detection by bacteria immobilized on large pore aerogel. J Non-Cryst Solids. 285, (2001),
303.
[33] Golob, P., Current status and future perspectives for inert dusts for control of stored product
insects. J Stored Prod Res. 33, (1997), 69.
[34] Yoda, S., Ohtake, K., Takebayashi, Y., Sugeta, T., Sako, T., Preparation of titania-
impregnated silica aerogels and their application to removal of benzene in air, Mater .Chem., 10,
(2000), 2151.
[35] Yao, L. Z., Ye, C. H., Mo, C. M., Cai, W. L., Zhang, L. D., Study of crystallization and
spectral properties of PbS nanocrystals doped in SiO2 aerogel matrix, J. Cryst. Growth, 216 (1),
(2000), 147.
[36] Lorenz, C., Emmerling, A., Fricke, J., Schmidt, T., Hilgendorff, M., L. Spanhel, L., Müller,
G., Aerogels containing strongly photoluminescing zinc oxide nanocrystals, J. Non-Cryst Solids,
238 (1-2), (1998), 1.
[37] Goodwin, T. J., Leppert, V. J., Smith, C. A., Risbu, S. H., Niemeyer, M., Power, P. P., Lee,
H. W. H., and Hrubesh, L. W., Synthesis of nanocrystalline gallium nitride in silica aerogels,
Appl. Phy. Lett., 69 (21), (1996), 3230.
[38]Yoda, S., Tasaka, Y., Uchida, K., Kawai, A., Ohshima, S., Ikazaki, F., SiO2-impregnated
SiO2 aerogels by alcohol supercritical drying with zeolite, J. Non-Cryst. Solids, 225 (1-3),
(1998), 105.
[39] Merzbacher, C. I., Barker, J. G., Long, J. W., Rolison, D. R., Morphology of nanoscale
deposits of ruthenium oxide in silica aerogels, Nanostr. Mater., 12 (1), (1999), 551.
[40] Morley, K .S., Marr, P.C., Webb, P.B., Berry, A. R., Allison, F. J., Moldovan, G., Brown, P.
D., and Howdle, S.M., Clean preparation of nanoparticulate metals in porous supports: A
supercritical route, J. Matter. Chem., 12, (2002), 1898.
[41] Schwertfeger, F., Zimmermann, A., and Krempel, H., US 6,280,744; Use of inorganic
aerogels in pharmacy (2001).
[42] Lee, K., Gould, G., WO02051389; Aerogel Powder Therapeutic Agents (2002).
[43] Hannay, J.B. Hogarth. J., 1879, on the solubility of solids in gases, II Proc. R. Soc. London
29, 484.
References
145
[44] Schneider, G.M., Physiochemical principles of extraction with supercritical gases, W.
Germany, Verlag Chemie, 1978.
[45] Yeob, S. Kiran, E., Formation of polymer particles with supercritical fluids: A review, J. of
Supercrit. Fluids 34, (2005), 287.
[46] McHugh, MA., Krukonis, VJ., Supercritical fluid extraction, principles and practice, 2nd ed.,
Boston, 1994.
[47] Diepen, G.A.M., F.E.C. Scheffer, on critical phenomena of saturated solutions in binary
systems, J. Am. Chem. Soc. 70, 4081, 1948.
[48] Streett, W.B. 1976, phase equilibira in gas mixtures at high pressures Icarus 29,173.
[49] McHugh MA., Krukonis VJ, Supercrit. fluid extraction, principles and practice, 2nd ed.,
Boston, 1994.
[50] Lemert, R.M., Jhonston, K. P. , Solid-Liquid Equlibria in mutlicomponent supercritical fluid
systems, Fluid Phase Equilibria, 45, (1989), 265.
[51] Türk, M., Diefenbacher, A., Upper, G., Phase behavior of organic solid solutes and
supercritical fluids with respect to particle formation process, Chapter 1.6, Supercritical Fluids as
Solvent and Reactions, Edited by G. Brunner, 2004.
[52] Tom, W., Debenedetti, P.G., Particle formation with supercritical fluids—a review, J.
Aerosol Sci. 22, (1991), 555.
[53] Subramaniam, B., Rajewski, R.A., Snavely, K., Pharmaceutical processing with supercritical
carbon dioxide, J. Pharm. Sci. 86, (1997), 885.
[54] Palakodaty, S., York, P., Phase behavioral effects on particle formation processes using
supercritical fluids, Pharm. Res. 16, (1999), 976.
[55] Gorle, B. S.K., Smirnova, I., McHugh, Mark A., Adsorption and thermal release of highly
volatile compounds in silica aerogels, J. Supercrit. Fluids 48 (1), (2009), 85.
[56] Jung, J., Perrut, M. Particle design using supercritical fluids: literature and patent survey, J.
Supercrit. Fluids 20, (2001), 179.
[57] Vemavarapu, C., Matthew J. Mollan, Lodaya. M., Thomas e. Needham,
Design and process aspects of laboratory scale scf particle formation systems, Intern. J. of pharm.
292, (2005), 1.
References
146
[58] Reverchon, E., Adamia, R., Nanomaterials and supercritical fluids, J. Supercrit. Fluids 37.
(2006), 1.
[59] Türk, M., Upper, G., Steurenthaler, M., Hussein, K., Wahl, M. A., Complex formation of
Ibuprofen and β-Cyclodextrin by controlled particle deposition (CPD) using SC-CO2, J.
Supercrit. Fluids, 39(3), (2007), 435.
[60] Tom, W. Debenedetti, P.G., Particle formation with supercritical fluids—a review, J.
Aerosol Sci. 22, (1991), 555.
[61] Subramaniam, B., Rajewski, R.A., Snavely, K., Pharmaceutical processing with supercritical
carbon dioxide, J. Pharm. Sci. 86, (1997), 885.
[62] Palakodaty, S., York, P., Phase behavioral effects on particle formation processes using
supercritical fluids, Pharm. Res. 16, (1999), 976.
[63] Marr, R., Gamse, T., Use of supercritical fluids for different processes including new
developments—a review, Chem. Eng. Proc. 39, (2000), 19.
[64] Cooper, A.I., Polymer synthesis and processing using supercritical carbon dioxide, J. Mater.
Chem. 10, (2000), 207.
[65] Jung, J., Perrut, M., Particle design using supercritical fluids: literature and patent survey, J.
Supercrit. Fluids 20, (2001), 179.
[66] Kompella, U.B., Koushik, K., Preparation of drug delivery systems using supercritical fluid
technology, Crit. Rev. Ther. Drug Carrier Syst. 18, (2001), 173.
[67] Rogers, T.L., Johnston, K.P., Williams III, R.O., Solution-based particle formation of
pharmaceutical powders by supercritical or compressed fluid CO2 and cryogenic spray-freezing
technologies, Drug Dev. Ind. Pharm. 27, (2001), 1003.
[68] Tan, H.S., Borsadia, S., Particle formation using supercritical fluids: pharmaceutical
applications, Expert Opin. Ther. Pat. 11, (2001), 861.
[69] Stanton, L.A., Dehghani, F., Foster, N.R., Improving drug delivery using polymers and
supercritical fluid technology, Aust. J. Chem. 55, (2002), 443.
[70] Ye, X., Wai, C.M., Making nanomaterials in supercritical fluids: a review, J. Chem. Educ.
80, (2003), 198.
[71] Sang-Do Yeob, Erdogan Kiran, Formation of polymer particles with supercritical fluids: A
review, J. of Supercrit. Fluids 34, (2005), 287.
References
147
[72] Watanabe, T. , et al., Int. J. Pharm. 241, (2002), 103.
[73] Huttenrauch, R. Acta Pharm. Technol., Suppl. 6, (1978), 127.
[74] Martin, A., 1993. Physical Pharmacy, fourth ed. Williams & Wilkins, Baltimore
[75] Sekiguchi, K., Obi, N., Studies on absorption of eutectic mixtures. I. A comparison of the
behavior of eutectic mixtures of sulphathiazole and that of ordinary sulphathiazole in man, Chem.
Pharm. Bull. 9, (1961), 866.
[76] Tachibana, T., Nakamura, A., A method for preparing an aqueous colloidal dispersion of
organic materials by using water-soluble polymers: dispersion of beta-carotene by
polyvinylpyrrolidone, Kolloid-Z. Polym. 203, (1965), 130.
[77] Mayersohn, M., Gibaldi, M., New method of solid-state dispersion for increasing dissolution
rates, J. Pharm. Sci. 55, (1966), 1323.
[78] Szabó-Révész, P., O. Laczkovich, R. Ambrus, A. Szts,Z. Aigner,., Protocols for
amorphization of crystalline solids through the application of pharmaceutical technological
processes. Eur. J. Pharm. Sci., 32, S1, (2007), 18.
[79] Hancock, B.C., Zografi, G., Characteristics and significance of the amorphous state in
pharmaceutical systems, J. Pharm Sci. 86, (1997), 1.
[80] Williams, M. L.; Landel, R. F.; Ferry, J. D. J. Am. Chem. Soc. 77, ( 1955), 3701.
[81] Angell, C. A. Proc. Nat. Acad. Sci., U.S.A. 92 (1995,), 6675.
[82] Angell, C. A. Science, 267,( 1995), 1924.
[83] Angell, C. A.; MacFarlane, D. R.; Oguni, M. Ann. N.Y. Acad.Sci. 1986, 484, 241.
[84] Ediger, M. D.; Angell, C. A.; Nagel, S. R. J. Phys. Chem. 100, (1996), 13200.
[85] Hancock, B.C., Shamblin, S., Zografi, G., Pharm. Res. 12, (1995), 799.
[86] Andronis, V., Zografi, G., Pharm. Res. 14, (1997), 410.
[87] Y. Aso, S. Yoshioka, S. Kojima, J. Pharm.Sci. 89, (2000), 408.
[88] Yu, L., Amorphous pharmaceutical solids: preparation, characterization and stabilization.
Adv.Drug Deliver. Rev., 48, (2001), 27.
[89] Crowe, J.H., Carpenter, J.F., Crowe, L.M., The role of vitrification in anhydrobiosis, Annu.
Rev. Physiol. 60, (1998), 73.
References
148
[90] Levine, H., Slade, L., Water as a plasticizer: Physicochemical aspects of low-moisture
polymeric systems. In Water Science Reviews; Franks, F., Ed.; Cambridge University:
Cambridge, (1987), 79.
[91] Bernstein, J., Polymorphism in Molecular Crystals; Clarendon Press: Oxford, 2002.
[92] Rengarajan, G.T., Pankaj, Enke, D., and Steinhart, M., Beiner, M., Manipulating the
Crystalline State of Pharmaceuticals by Nanoconfinement, Nano letters, 7, (2007), 1381.
[93] Rengarajan, G. T., Enke, D., Steinhartc, M., and Beiner, M., Stabilization of the amorphous
state of pharmaceuticals in nanopores, J. Mater. Chem., 18, (2008), 2537.
[94] Prasad, R., Lele, S., Philos. Mag. Lett., 70 (1994), 357 (b) Jackson, C. L., and. McKenna, G.
B., Chem. Mater., 8, (1996), 2128 (c) Alcoutlabi, M., McKenna, G. B. J. Phys. Condens. Matter,
17, (2005), R461.
[95] Sakellariou, P.; Rowe, R. C. J. Macromol. Sci., Pure Appl. Chem. A31, (1994), 1201.
[96] Fukuoka, E.; Makita, M.; Yamamura, S. Chem. Pharm. Bull. 37, (1989), 1047.
[97] Cassel, B., Twombly, B., Rapid DSC determination of polymer crystallinity, Am. Lab,
Jan.(1998), 24.
[98] Tsukushi, I.; Yamamuro, O.; Suga, H. J. Non-Cryst. Solids 175, (1994), 187.
[99] Saleki-Gerhardt, A.; Ahlneck, C.; Zografi, G. Int. J. Pharm. 101, (1994), 237.
[100] Koide, M.; Sato, R.; Komatsu, T.; Matusita, K. Phys. Chem.Glasses 36, (1995), 172.
[101] Parks, G. S.; Barton, L. E.; Spaght, M. E.; Richardson, J. W.Physics 5, (1934), 193.
[102] Hachisuka, H.; Takizawa, H.; Tsujita, Y.; Takizawa, A.; Kinoshita,T. Polymer 32, (1991),
2382.
[103] Oksanen, C. A.; Zografi, G. Pharm. Res. 10, (1993), 791.
[104] Glotin, M.; Mandelkern, L. Colloid Polym. Sci. 260, (1982), 182.
[105] Yoshimura, Y., Kanno, H. J. Solution Chem. 24,( 1995), 633.
[106] Strobl, G. R.; Hagedorn, W. J. Polym. Sci., Polym. Phys. Ed. 16,(1978), 1181.
[107] Holmes, F. T. , Rev. Sci. Inst. 8, (1937), 444.
[108] Clark, J.W. Rev. Sci. Inst. 18, (1948), 915.
[109] Beams, J. W., Rev. Sci. Inst. 21, (1950), 182,
References
149
[110] Dreisbach, F., Lösch, H.W., Harting, P., Highest Pressure Adsorption Equilibria Data:
Measurement with Magnetic Suspension Balance and Analysis with a New Adsorbent /
Adsorbate-Volume, Adsorption, 8, (2002), 95.
[111] Pinni, R., Ottiger, S., Rajendran, A., Stroi, G., Mazzoti, M., Reliable measurements of
near-critical adsorption by gravimetric method, Adsorption, 12, (2006), 393.
[112] Staudt, R., Saller, G., Tomalla, M., Keller, J.U., A note of gravimetric measurements of gas
adsorption equilibria, Ber. Bunsenges. Phys. Chem. 97, (1993), 99.
[113] Humayun, R. Tomasko, D.L., High-Resolution Adsorption Isotherms of Supercritical
Carbon Dioxide on Activated Carbon, AIChE, 46, (2000), 10.
[114] Van Der Vaart, R., Huiskes, C., Bosch, H., Reith, T., Single and mixed gas equilibria of
carbon dioxide / methane on activated carbon, Adsorption 6, (2000), 311.
[115] Fitzgerald, J.E., Sudibandriyo, M., Pan, Z., Robinson Jr., R. L., Gasem, K.A.M., Modeling
the adsorption of pure gases on coals with SLD model, Carbon 41, (2003), 2203.
[116] Sudibandriyo, M., Pan, Z., Fitzgerald, J.E., Robinson Jr., R.L, Gasem, K.A.M., Adsorption
of methane, nitrogen, carbon dioxide and their binary mixtures on dry activated carbon at 318.2
K and pressures upto 13.6 pa, Langmuir 19, (2003), 5323.
[117] Chen J. H, D. S. H. Wong, C. S. Tan, Adsorption and desorption of carbon dioxide onto
and from activated carbon at high pressures, Ind. Eng. Chem. Res. 36, (1997), 2808.
[118] Keller, J. U., Dreisbach, F., Rave, H., Staudt. R., Tomalla, M., Measurements of gas
mixture adsorption equilibria of natural gas compounds on microporous sorbents, Adsorption 5,
(1999), 199.
[119] Zhou, L., Bai, S., Zhou, Y., Yang, B., Adsorption of nitrogen on silica gel over a large
range of temperatures, adsorption 8, (2002), 79.
[120] Gao, W., Butler, D., Tomasko, D.L., High pressure adsorption of CO2 on NAY Zeolite and
model prediction of adsorption isotherms, Langmuir, 20, (2004), 8083.
[121] Hocker, T., Rajendran, A., Mazzotti, M., Measuring and modeling supercritical adsorption
in porous solids. Carbon dioxide on 13X Zeolite and on silica gel. Langmuir 19, (2003), 1254.
[122] Dreisbach F., Reza Seif A.H., H. W. Lösch, Gravimetric measurement of adsorption
equilibria of gas mixture CO / H2 with a magnetic suspension balance, Chem. Eng. Tech.
Comm., 25, (2002), 11.

References
150
[123] Myers, A.L., J.A. Calles, G. Calleja, Comparision of molecular simulation of adsorption
with experiments, Adsorption, 3, (1997), 107.
[124] Keller, J.U., F. Dreisbach, H. Rave, R. Staudt. M. Tomalla, Measurements of gas mixture
adsorption equilibria of natural gas compounds on microporous sorbents, adsorption 5, (1999),
199.
[125] Dreisbach, F., R. Staudt, J.U. Keller, Experimental investigation of the kinetics of
adsorption of pure gases and binary gas mixtures on activated carbon, fundamentals of adsorption
6(FoA6), F. Meunier (Ed.), (1999), 1219.
[126] Dreisbach, F., Lösch, H.W., Harting, P., Highest Pressure Adsorption Equilibria Data:
Measurement with Magnetic Suspension Balance and Analysis with a New Adsorbent /
Adsorbate-Volume, Adsorption, 8, (2002), 95.
[127] Specovious, J., Findenegg, G. H., Study of fluid / solid interface over a wide density range
including the critical region. I. surface excess of ethylene / graphite. Ber.Bunsen-Ges. Phys.
Chem., 84, (1980), 690.
[128] Sircar, S., Gibbsian surface excess for gas adsorption-revisited. IECR, 38, (1999), 3670.
[129] Menon. Adsorption at high pressures. Chem. Rev., 68, (1967), 277.
[130] Keller, J.U., Equation of state of adsorbents with fractal dimensions, Physica A, 166,
(1990), 180.
[131] Toth, J., Isotherm Equations for monlayer adsorption of gases on heterogenous solids
surfaces, in proceeingd of the 1st intl. Conference on fundamentals of adsorption, Germany, A. L.
Myers and G. Belfort (EDs.), 1984.
[132] Do, D.D., Adsorption analysis; Equilibria and kinetics, Imperial college press, London,
1998.
[133] Tillotson, T.M, Hrubesh, L.W., Transparent ultralow-density silica aerogels prepared by a
two-step sol-gel process, J. Non-Cryst. Solids, 145, (1992), 44.
[134] Davydov, V. Ya., Kiselev, A.V., Zhuravlev, L. T., Study of the surface and bulk hydroxyl
groups of silica by infrared spectra and D2O-exchange, Trans. Faraday Soc.,60, 504, (1964),
2254.
[135] McHugh, M.A., An experimental investigation of the high pressure fluid phase equilibrium
of highly asymmetric binary mixtures, PhD Thesis, (1981), University of Delware.
References
151
[136] Diefenbacher, A., Türk, M., Phase equilibria of organic solid solutes and supercritical
fluids with respect to the RESS process, J. Supercrit. Fluids, 22, (2002), 175.
[137] Lamb, D. M., Barbara, T. M., Jonas, J., NMR Study of solid naphthalene solubility’s in
Supercritical Carbon Dioxide near the Upper Critical End Point, Gen. Phys. Chem, 90, (1986),
4210.
[138] Fukné-Kokot, K., König, A. Kneza, Ž. Škerget, M., Comparison of different methods for
determination of the S–L–G equilibrium curve of a solid component in the presence of a
compressed gas, Fluid Phase Equilibria, 173, (2000), 297.
[139] Bertakis, E., Measurement and thermodynamic modeling of solid–liquid–gas equilibrium
of some organic compounds in the presence of CO2, J. of Supercrit. Fluids, 41, (2007), 238.
[140] Harris, R.A., High pressure vapor–liquid equilibrium measurements of carbon dioxide with
naphthalene and benzoic acid, Fluid Phase Equil. 260, (2007), 60.
[141] McHugh, M.A., Seckner, A.J., Yoga, T.J., High-pressure phase behavior of binary
Mixtures of octacosane and carbon dioxide, Ind. Eng. Chem. Fundem. 23, (1984), 493.
[142] Mukhopadhyay, M., Shyamal, K. De., Fluid phase Behavior of close molecular weight fine
chemicals with supercritical carbon dioxide, J. Chem. Eng. Data 40, (1995), 909.
[143] Shen, Z., Li, D., McHugh, M.A., Solubility of pyrazine and Its derivatives in supercritical
carbon dioxide, J. Chem. Eng. Data 51, (2006), 2056.
[144] McHugh, M.A., Andrew, S., Yogan, J., Thomas J., High-pressure phase behavior of binary
mixtures of octacosane and carbon dioxide, Ind. Eng. Che. Fundam., 23, (1984), 493.
[145] Smirnova, I., Suttiruengwong, S., Arlt, W., J of Non-Crystal Solids, 350, (2004), 54.
[146] Brunauer S., Emmett P.H., Teller E., Adsorption of Gases in Multimolecular Layers. J Am
Chem Soc. 60, (1938), 309.
[147] Mannahan S.E., Quantitative Chemical Analysis. Brooks / Cole Publishing Company:
Monterey, California, 1986.
[148] Ewing G.W. Instrumental methods of chemical analysis. McGraw-Hill Book Company:
New York, 1985.
[149] Humayun, R, Tomasko, D.L., High-Resolution Adsorption Isotherms of Supercritical
Carbon Dioxide on Activated Carbon, Adsorption, 46, (2000), 10.
References
152
[150] Pini, R., Ottiger, S., Rajendran, A., Storti, G., Mazzotti, M., Reliable measurement of near-
critical adsorption by gravimetric method, Adsorption 12, (2006), 393.
[151] Kalaga, A., Trebble, M., Density Changes in Supercritical Solvent + Hydrocarbon Solute
Binary Mixtures, J. Chem. Eng. Data 44, (1999), 1063.
[152] Myers, A.L., J.A. Calles, G. Calleja, Comparision of molecular simulation of adsorption
with experiments, Adsorption, 3, (1997), 107.
[153] Keller, J.U., F. Dreisbach, H. Rave, R. stuadt. M. Tomalla, Measurements of gas mixture
adsorption equilibria of natural gas compounds on microporous sorbents, adsorption 5, (1999),
199.
[154] Dreisbach, F., R. Stuadt, J.U. Keller, Experimental investigation of the kinetics of
adsorption of pure gases and binary gas mixtures on activated carbon, Fund. of Ads. 6, (1999),
1219.
[155] Dreisbach, F., lösch, H.W., Harting, P., Highest Pressure Adsorption Equilibria Data:
Measurement with Magnetic Suspension Balance and Analysis with a New Adsorbent /
Adsorbate-Volume, Adsorption, 8, (2002), 95.
[156] Melnichenkoa, Y. B., Wignall, G.D., Cole, D.R., Frielinghaus, H., Adsorption of
supercritical CO2 in aerogels as studied by small-angle neutron scattering and neutron
transmission techniques, The J of Chem. Phys. 124, (2006), 204711.
[157] Gorle, B. S. K., Smirnova, I., Dragan, I. M., Dragan, S., Arlt, W., Crystallization under
supercritical solutions in aerogels, J of supercrit. fluids, 44, (2008), 78.
[158] Smirnova, I., Suttiruengwong, S., Arlt, W., Aerogels: Tailor made carriers for immediate
and prolonged drug release, KONA, 23, (2005), 86.
[159] R. Goswami, P. Ryder, K. Chattopadhyay, The melting and solidi® cation of nanoscale Bi
particles embedded in a glassy and crystalline matrix, Phil. Magaz. Lett., 79, (1999), 481.
[160] Grosse, K., Ratke, L., Feuerbacher, B., Solidification and melting of succinonitrile within
the porous network of an aerogel, physical review B, 55, (1997), 2894.
[161] Roberts, C. J., DeBenedetti, P. G., AIChE J., 48,( 2002), 1140.
[162] Hancock, B. C., Parks, M., Pharm. Res., 17, (2000), 397 (b) Zhou, D., Zhang, G. G. Z.,
Grant, D. J. W., and Schmitt, E. A. , J. Pharm. Sci., 2002, 91, 1863.
[163] Scherer, G.W., Crystallization in pores, J. Non-Cryst. Solids, 155, (1999), 1347.
References
153
[164] Andreazza, P., Lefaucheux, F., Mutaftschiev, B., Nucleation in confined space: Application
to the crystallization in gels, J. of Cryst. Growth, 92 (3-4), (1988), 415.
[165] Abrahams, S.C., Monteath Robertson, J., White, J.G., The crystal and molecular structure
of naphthalene. I. X-ray Measurement, Acta Cryst. 2, (1949), 233.
[166] Shen, Z., Li, D., McHugh, M.A., Solubility of pyrazine and Its derivatives in supercritical
carbon dioxide, J. Chem. Eng. Data 51, (2006), 2056.
[167] Smirnova, I., Mamic, J., Arlt, W., Langmuir 19(20), (2003), 8521.
[168] Smirnova, I., Suttiruengwong, S., Seiler, M., Arlt, W., Pharm. Devel. Tech. 9(4), (2004),
443.
[169] Smirnova, I., Suttiruengwong, S., Arlt, W., J of Non-Crystalline Solids, 350, (2004) 54.
[170] Langer, R. Nature 392, (1998), 5.
[171] Yoshida, R. Sakai, K., Okano, T., Sakurai, Y., Adv. Drug Delivery Rev. 11, (1993), 85.
[172] Kataoka, K., Harada, A., Nagasaki, Y., Adv. Drug Delivery Rev. 47, (2001), 113.
[173] Maria Vallet-Regi Chem. Eur. J. 12, (2006), 5934.
[174] Charnay, C., Be´gu, S., Tourne´-Pe´teilh, C., Nicole, L., Lerner, D.A., Devoisselle, J.M.,
European J of Pharm. Biopharm., 57, (2004), 533.
[175] Ramila, A., Munoz, B., PEerez-pariente, J., vallet-refi,.M., J of Sol-Gel Sci. Tech. 26,
(2003), 1199.
[176] Kresge, J., et al., Nature, 359, (1992), 710.
[177] Beck, J. S., et al., J. Am. Chem. SOC., 114( 27), ( 1992), 10835.
[178] Pentz, M., Shott, M., Aprahamian F. Handeling Experimental Data. Open University
Press: London, 1988.
Copyright © 2022 FDOKUMEN