Magnesium influence on hydroxyapatite crystallization
10
A. Big.& G. Faliai, E. Foresti, M, Gazzano, A, Ripamon& and N. Roveri AB, GF, EF, AR. Dipatinto di Chimica “G. Ciumiciun, ” Univenit~ di Bologna.--MG, NR. Centro di Studio per la F&a delk Macrvmolecole, Uniuektd di Bologna X-ray diffraction, infrared absorption, and chemical investigations have been carried out on hydroxyapatite synthesized in the presence of different magnesium concentrations in solution. Magnesium inhibits the crystallization of hydroxyapatite through a reduction of Ca/P molar ratio and crystal sixes of apatite. The reduction of the crystal sixes is also very great for very low magnesium content and increases on increasing magnesium concentration in solution up to 35 Mg atom percent with respect to the total metal ions. The samples are completely amorphous between 35 and 50 Mg atom percent. For higher magnesium concentration different crystalline phases are formed. Dre results of tie x-ray powder panem &ring indicate that the HA crystal structure at most hosts magnesium amounts of about seven percent. Magnesium substitutes only the ca&um atoms which form the channels containing the hydroxyl ions. Since magnesium content is much smaller than that found in the solid phase, the greatest amount of magnesium must not be lattice bourn& Tne e&en1 0% ‘@uorpqr&te convcdton ‘u&o mqgne&um sriostiu&t ,B4&&%tm ,cinoa- phate on heat treatment appears strongly related to magnesium content of the apatitic solid phase. On the basis of these resuhs, the key role of magnesium on the crystallization, crystal growth, and thermal stability of hydroxyapatite has been used to explain the relevant properties of biols$caYi a_Da%es, JNTRODUCllON Hydroxyapatite, CaI,(P0,),(OH)2 (HA), represents a good model system for biological apatites, which are characterized by poor crystallinity and nonstoi- chiometry due to the presence of significant amounts of foreign ions [l, 21. Some of these ions are known to enter in the apatite crystal lattice; others have been Address reprint requests to: Dr. A. Bigi, Dipartimento di Chimica “G. Ciamician,” Universid di Bologna, Via Sehni, 2, 40126 Bologna, Italy. Joumal of Imrganic Biochemishy, 49,69-X8 (1993) 69 Q 1993 Elsevier Science Publishing Co., Inc., 655 Avenue of tbe Americas, NY, NY 10010 0162-0134/93/$5.00
-
Upload
independent -
Category
Documents
-
view
0 -
download
0
Transcript of Magnesium influence on hydroxyapatite crystallization

A. Big.& G. Faliai, E. Foresti, M, Gazzano, A, Ripamon& and N. Roveri
AB, GF, EF, AR. Dipatinto di Chimica “G. Ciumiciun, ” Univenit~ di Bologna.--MG, NR. Centro di Studio per la F&a delk Macrvmolecole, Uniuektd di Bologna
X-ray diffraction, infrared absorption, and chemical investigations have been carried out on hydroxyapatite synthesized in the presence of different magnesium concentrations in solution.
Magnesium inhibits the crystallization of hydroxyapatite through a reduction of Ca/P molar ratio and crystal sixes of apatite. The reduction of the crystal sixes is also very great for very low magnesium content and increases on increasing magnesium concentration in solution up to 35 Mg atom percent with respect to the total metal ions. The samples are completely amorphous between 35 and 50 Mg atom percent. For higher magnesium concentration different crystalline phases are formed. Dre results of tie x-ray powder panem &ring indicate that the HA crystal structure at most hosts magnesium amounts of about seven percent. Magnesium substitutes only the ca&um atoms which form the channels containing the hydroxyl ions. Since magnesium content is much smaller than that found in the solid phase, the greatest amount of magnesium must not be lattice bourn& Tne e&en1 0% ‘@uorpqr&te convcdton ‘u&o mqgne&um sriostiu&t ,B4&&%tm ,cinoa- phate on heat treatment appears strongly related to magnesium content of the apatitic solid phase.
On the basis of these resuhs, the key role of magnesium on the crystallization, crystal growth, and thermal stability of hydroxyapatite has been used to explain the relevant properties of biols$caYi a_Da%es,
JNTRODUCllON
Hydroxyapatite, CaI,(P0,),(OH)2 (HA), represents a good model system for biological apatites, which are characterized by poor crystallinity and nonstoi- chiometry due to the presence of significant amounts of foreign ions [l, 21. Some of these ions are known to enter in the apatite crystal lattice; others have been
Address reprint requests to: Dr. A. Bigi, Dipartimento di Chimica “G. Ciamician,” Universid di Bologna, Via Sehni, 2, 40126 Bologna, Italy.
Joumal of Imrganic Biochemishy, 49,69-X8 (1993) 69 Q 1993 Elsevier Science Publishing Co., Inc., 655 Avenue of tbe Americas, NY, NY 10010 0162-0134/93/$5.00
70 A. Bigi et al.
suggested to be only adsorbed on the apatite surface [l]. The incorporation of foreign ions can affect the crystallinity, morphology, lattice parameters, and, as a consequence, the stability of the HA structure [3-61. Furthermore, the forma- tion of the apatite phase from aqueous systems can be hindered by the presence in solution of foreign ions [7]. Among the bivalent cations, cadmium, strontium, and lead are known to replace calcium in the whole range of composition [8-101, while contradictory data are reported about magnesium incorporation into HA structure. In fact, according to some authors [ll, 12) magnesium calcium hydroxyapatite solid solutions can be prepared in the whole range of composi- tion, although the inhibiting effect of magnesium on apatite crystallization in solution should hinder the synthesis of crystalline magnesium-calcium hydroxya- patite [l, 13, 141.
Synthetic HA submitted to cyclic pH fluctuation in aqueous solution in the presence of magnesium gives rise to an apatite phase which converts into magnesium substituted /?-tricalcium phosphate (&TCMP) on heat treatment [15, 161. On this basis, the thermal conversion of biological apatites into &TCMP has been ascribed to the destabilizing role of magnesium on the apatite structure 115, 17, 181. The calcification process of the human mitral valve provides clear evidence of the effect of magnesium on the apatite structural stability: the apatite phase deposited at the beginning of the process, when there is a high magnesium relative content, converts completely into &TCMP by heat treatment at lOOOY, while no thermal conversion can be appreciated at this temperature for the apatitic pnase isolated from fully calcified valves, where magnesium relative content is very low [17].
In view of the strong influence of magnesium on the properties of biological apatites, we have carried out an accurate x-ray powder diffraction analysis of hydroxyapatites synthesized in the presence of different amounts of magnesium in solution with the aim to clarify the location of magnesium in the solid phase and its role on the crystal growth and thermal stability of hydroxyapatite.
EXPERIMENTAL
Materials
HA was synthesized by adding a 0.75 M calcium nitrate solution (56 ml) and 0.25 M ammonium dihydrogen phosphate solution W_lO ml) into a flask containing a dilute solution of ammonium hydroxide in order to maintain pH above 9 during precipitation.
Mixtures of calcium nitrate and magnesium nitrate solutions at different Mg/(Mg + Ca) molar ratios were used with the aim to prepare hydroxyapatites at different magnesium contents.
The reactions were carried out at room temperature under stirring in CO,-free atmosphere. The obtained products (200 ml) were treated in autoclave (V = 250 ml) under hydrothermal conditions at 12O”C, for 15 hr. The products were filtered off, washed with double distilled water, and dried at 120°C.
Part of the products were heat treated at different temperatures up to 1OtW’C for about 15 hr.
gTCP has been synthesized by solid state reaction of CaCO, and CaHPO,, * 2H,O at 1000°C [17]. Mechanical mixtures containing different I-IA/j%TCP ratios have been prepared.
HYDROXYAPATITE CRYST ALLIZATION 71
Methods
X-ray diffraction analysis was carried out by means of a Philips powder diic- tometer using Ni-filtered CuK radiation. The 26 range was from lo” to 65” at a scarming speed of O.S’/min. The lattice constants were determined by least- square refinements.
When patterns showed the simultaneous presence of HA and &TCP, the evaluation of their relative amounts had been obtained by comparing the ratio of the areas of the most intense diffraction maxima of HA (211) and &TCP (0 2 10) with those obtained for the I-IA/@TCP mechanical mixtures.
For x-ray powder pattern fitting more accurate data were collected in the 26 range 1580”, using a step of 0.03“ and a 30 set counting time. The refinement routine is substantially that of Immirxi [191 updated, taking into account differ- ent crystal sixes along the three crystallographic axes DO].
Using the fractional coordinates and the thermal parameters of pure HA (Space Group P6,,,) [211, we refined first the nonstructural parameters: zero correction, exponent of the Pearson VII function, background intensities, half- height width as a function of 26, and preferred orientation. In a second step, cell dimensions, crystal sixes, and metal atom occupancies were refined. The thermal parameters were not refined.
For IR absorption analysis, 1 mg of the powder samples was carefully mixed with 300 mg of KBr (infrared grade) and pelletixed under vacuum, The pellets were analyzed using a Perk&Elmer 380 IR Grating Spectrophotometer, range 4000400 cm-‘, normal slit and scannign speed of 72 cm-’ min-‘.
Calcium and magnesium content were determined using an atomic absorption spectrophotometer (Perkin-Elmer 373); the samples were diluted to an appro- priate volume with 10% lanthanum in 50% HCI.
Phosphorus content was determined spectrophotometrically as molyb- dovanadophosphoric acid [22].
RESULTS
The powder x-ray diffraction patterns of the solid products reveal that apatite can be obtained as a unique crystalline phase only for magnesium concentration in solution ranging from 0 to 30 atom percent (where Ca atoms + Mg atoms = 100). However, the broadening of the diffraction lines of the apatitic phase is highly widened by the presence of magnesium in solution and increases as a function of. magnesium concentration (see Fig. 1). The samples are named by the magnesium symbol followed by the number which indicates the magnesium concentration in solution expressed as atom of magnesium percent. This concen- tration differs significantly from that found in the solid phase only for the samples prepared in the presence of small amounts of magnesium (see Table 1). The samples from Mg 35 to Mg 50 exhibit a complete amorphous structure, while at higher magnesium concentrations the products appear constituted of crystalline magnesium phosphates, as Mg,(PO,), - 8H,O and NH, MgPG, - H *O.
The infrared absorption analysis co&ms the results of the powder x-ray diffraction investigation. In particular, in the spectra of the apatitic phase the areas of the OH- absorption bands at 3572 cm-’ e 630 cm-’ decrease as

72 A. Bigi et aL
I 10 20 JU w Xl
I 28 [‘I
FIG& 1. Powder x-ray diffraction patterns of the solid products obtained from solutio,ns containing 0 (a), 10 (b), 25 (cl, and 40 (d) Mg atom percent.
magnesium concentration increases up to Mg 20, when these bands cannot be appreciated any longer. The presence of magnesium also provokes a broadening of the absorption band characteristic of PO,‘- groups so that the definition of the spectra of samples from Mg 35 to Mg 50 is very poor in agreement with the decrease of the crystallinity.
The Ca/P molar ratio of HA is 1.68 f 0.05, against a theoretical value of 1.67. The apatitic phases obtained in the ,presence of magnesium exhibit smaller (Ca + Mg)/P molar ratios, which average around 1.5 f 0.1 for the samples from Mg 20 to Mg 50. Heat treatment above 500°C provokes a conversion into PTCMP, accompanied by an increase in the crystallinity of the remaining apatitic phase.

TA
BL
E 1
. C
ryst
allin
e Ph
ases
O
btai
ned
by h
eat
Tre
atm
ent
at D
iffe
rent
T
empe
ratu
res
of t
he S
olid
Pro
duct
s Sy
nthe
tized
in
the
Pre
senc
e of
Dif
fere
nt
Mag
nesi
um
Con
cent
ratio
n in
Sol
utio
n
Mg
Con
tent
(o
/o)
inth
e H
eat
Tre
atm
ent
Tem
pera
ture
M
g C
onte
nt
(%)
Sam
ple
Solid
Pha
se
500°
C
7oov
90
0°C
1o
wc
in
B-T
cMp’
z5
HA
(100
) H
NlO
O)
HA
WO
) H
A
0 2.
1 f
0.3
HA
W0
HA
UO
O)
HA
@O
~//3
-TcM
H2@
H
AW
/BT
cMR
15)
15
Mg
10
4.9
f 0.
3 H
A(1
00)
HA
@O
)/~T
CM
K20
~ H
A(7
o)/&
TcM
Fw~
HA
(7O
)/B
TcM
FW
) 16
W
15
14.1
f 0.
9 H
A(1
00)
HA
(75)
/B_T
cM,W
5)
BT
cMW
3O~
/HA
(u))
~
TcM
FW
HA
~15
) 17
2:
18.0
f 1.
5 H
AW
IO)
i-IA
(75)
/B_T
cMH
25)
B_T
cMp(
lOO
) B
_l-c
rvfH
100)
18
20
.4 f
1.7
HA
(100
) ~
TcI
vlF
uOO
) ~
TcM
KlO
O)
~-r
chuv
OO
) 20
The
num
bers
in
pare
nthe
ses
indi
cate
the
pe?
ntag
es
of t
he a
mou
nt o
f th
e di
iere
nt
phas
es.
’ V
alue
s ca
lcul
ated
by
adm
itti
ng th
at t
he w
hole
mag
nesi
um c
onte
nt o
f th
e so
lid
prod
ucts
ent
ers
in t
he c
ryst
al st
ruch
ue o
f B
_TC
MP.

74 A. Bigi et al.
The crystalline phases recognized in the powder x-ray diffraction patterns of the samples up to Mg 25 heat treated at diierent temperature up to 1000°C are reported in Table 1 as a function of magnesium concentration in solution. The numbers in parentheses indicate the percentages of the different phases evalu- ated from the ratio of the areas of the most intense diffraction maxima characteristic of the single phases.
The lattice constants of HA could be evaluated for all the samples heat treated at temperature higher than 500°C and containing appreciable amounts of HA. These values do not vary appreciably as a function of magnesium content and heat treatment temperature. On the contrary, the lattice constants of pTCMP obtained by conversion of the apatitic phase after heat treatment at 1000°C show an evident reduction of the unit cell with respect to that of pure PTCP [17], in agreement with a partial replacement of magnesium to calcium in the PTCP structure. In fact the unit cell volume of pure P_TCP, which is 3522(3) A3, reduces to an average value of 3445(l) A3, corresponding to a substitution of magnesium for calcium of about 13 atom percent.
X-Ray Powder Diffraction pattern Analysis
The standard deviations of the lattice constants evaluated using the least-square method are so high that they do not allow appreciation of any significant variation with to those obtained for HA which are a = 9.4170) A and c = 6.880(3) A.
respect
Since substitution of magnesium for calcium could not be appreciated from the contraction of the unit cell volume, an x-ray powder pattern fitting was carried out on samples Mg 10, Mg 15, Mg 25, and Mg 30 in order to test magnesium incorporation in the crystalline apatitic phase. HA was tested for comparison.
Table 2 shows the refined cell dimensions, magnesium content, disagreement factors, and amorphous content. The evaluation of an amorphous component in the crystalline samples was carried out by adding an amorphous contribution to the calculated pattern. The amorphous pattern of the sample Mg 40 was used for calculation. A maximum amorphous content of 8.7 percent was found for the sample Mg 30. No significant variation of the atomic parameters was observed
TABLE 2. Crystallographic Data Obtained from the X-Ray Powder Pattern Fitting
Amorphous Phase
Sample a-Axis (Al c-Axis (A) VW) kfg2+a Rb(‘w) Content (%I
HA 9.4260) 6.8810) 529.5(2) - 6.3 0 Mg 10 9.419(2) 6.8543) 526.6(4) 0 6.4 0 Iug 1.5 9.421(3) 6.831(5) 52S.1(7) 2.1(7) 7.6 3.8 MgZ 9&l(4) 6.807(6) 525.4(9) 5.5(7) 7.4 6.0 Mg 30 9.441(S) 6.78&(9) 524 (1) 6.6(9) 7.2 8.7
a Ckcu~~cy factors are referred to as Mg ‘+ ions and expressed as Mg atom percent.
“R= ohs - Lll
%bs .

HYDROXYAPATITE CRYSTALLIZATION 75
during the refinement. A comparison of the observed and calculated powder diffraction patterns for Mg 30 is reported in Figure 2. The magnesium occu- pancy results are much smaller than expected from the analytical data, in agreement with the small observed changes of the cell dimensions. Magnesium substitutes only for one of the two different crystallographic calcium atoms, that is the atom located at the 6 h special position of the space group P6,,, 1211. The refined crystal sizes result longer along the c-axis while no significant difference has been appreciated along the two other crystallographic directions. The obtained values are in agreement with those calculated from the line broadening of the (310) and (002) reflections and reported in Table 3. The D values were calculated from the width at half maximum intensity (&,J using the Sherrer equation
Kh D=
Bl,Z~S I9
where A is the x-ray wavelength and 6 the diffraction angle. K is a constant varying with crystal habit and chosen as 0.9 for the elongated apatitic crystallites [23]. The variation of the D values as a function of magnesium concentration in the solid phase strongly affected the solid phase.
DISCUSSION
indicate that the dimensions of the apatitic crystallites are by the presence of even a very small amount of magnesium in
The results of this study point out an evident inhibiting the crystallization and crystal growth of synthetic HA.
role of magnesium on
t 1 I
15 25 & .
4I5 I
Sk as ’ -/s ’ 2 8 (‘1
FIGURE 2. A comparison of the observed [curve (a)] and calculated [curve (b)l Powder diffraction patterns of Mg 30. The dotted and dashed lines are the calculated background and amorphous contribution respectively. Curve (c) is the difference profile.
76 A. Bigi et al.
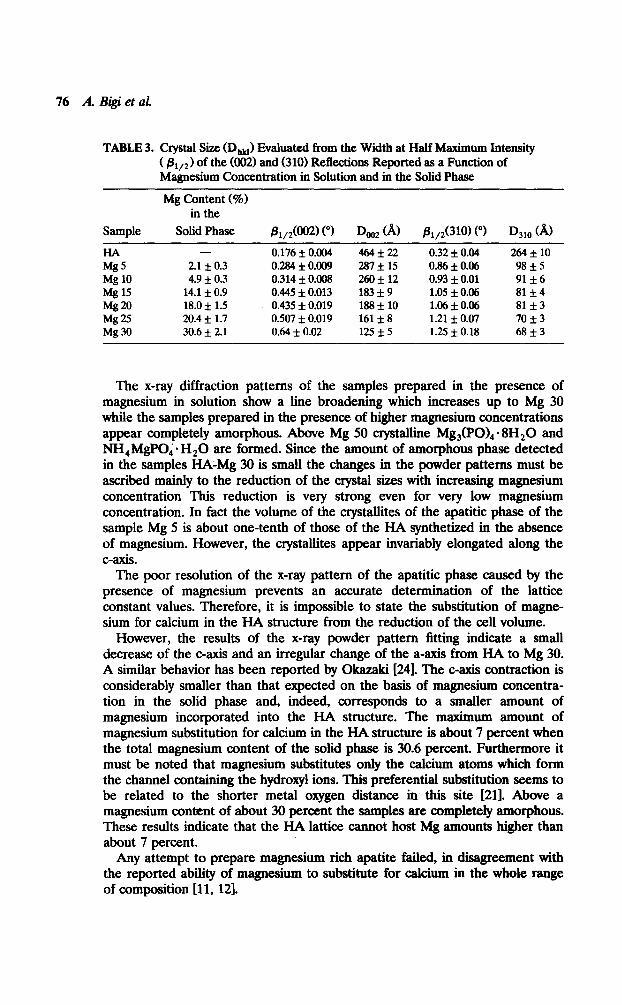
TABLE 3. Crystal Size (D,) Evaluated from the Width at Half Maximum Intensity ( /3& of the @02) and (310) Reflections Reported as a Function of Magnesium Concentration in Solution and in the Solid Phase
Mg Content (%I in the
Sample Solid Phase 81,*(002) (“1 D,, (AI &,2(3101 (“I D31, (A)
HA - 0.176 f 0.004 464 f 22 0.32 f 0.04 264*10 Miz5 2.1 * 0.3 0.284 f 0.009 287f15 0.86 f 0.06 98 f 5 Mg 10 4.9 f 0.3 0.314 f 0.008 260*12 0.93 f 0.01 91 k6 Mg 15 14.1 f 0.9 0.445 f 0.013 183 f 9 1.05 f 0.06 81+4 Mf320 18.0 f 1.5 0.435 f 0.019 188flO 1.06 f 0.06 81*3 Mtz25 20.4 f 1.7 0.507 f 0.019 161f8 1.21 f 0.07 70 f 3
Mg 30 30.6 f 2.1 0.64 f 0.02 125*5 1.25 f 0.18 68*3
The x-ray diffraction patterns of the samples prepared in the presence of magnesium in solution show a line broadening which increases up to Mg 30 while the samples prepared in the presence of higher magnesium concentrations appear completely amorphous. Above Mg 50 crystalline Mg,(PO), -8H,O and NH,MgPO,*H,O are formed. Since the amount of amorphous phase detected in the samples HA-Mg 30 is small the changes in the powder patterns must be ascribed mainly to the reduction of the crystal sixes with increasing magnesium concentration This reduction is very strong even for very low magnesium concentration. In fact the volume of the crystallites of the apatitic phase of the sample Mg 5 is about one-tenth of those of the HA synthetixed in the absence of magnesium. However, the crystallites appear invariably elongated along the c-axis.
The poor resolution of the x-ray pattern of the apatitic phase caused by the presence of magnesium prevents an accurate determination of the lattice constant values. Therefore, it is impossible to state the substitution of magne- sium for calcium in the HA structure from the reduction of the cell volume.
However, the results of the x-ray powder pattern fitting indicate a small decrease of the c-axis and an irregular change of the a-axis from HA to Mg 30. A similar behavior has been reported by Okaxaki [241. ‘Ihe c-axis contraction is considerably smaller than that expected on the basis of magnesium concentra- tion in the solid phase and, indeed, corresponds to a smaller amount of magnesium incorporated into the HA structure. The maximum amount of magnesium substitution for calcium in the HA structure is about 7 percent when the total magnesium content of the solid phase is 30.6 percent. Furthermore it must be noted that magnesium substitutes only the calcium atoms which form the channel containing the hydroxyl ions. This preferential substitution seems to be related to the shorter metal oxygen distance in this site 1211. Above a magnesium content of about 30 percent the samples are completely amorphous. These results indicate that the HA lattice cannot host Mg amounts higher than about 7 percent.
Any attempt to prepare magnesium rich apatite failed, in disagreement with the reported ability of magnesium to substitute for calcium in the whole range of composition 111, 121.

I-IYHROXYAPATITE CRYSTALLIZATION 77
These results indicate that the greatest amount of magnesium contained in the solid phase does not enter into the crystal lattice of HA. However it is impossible to establish the relative magnesium content in the amorphous phase or on the crystal surface.
Posner et al. [14] suggested that magnesium inhibits the transformation of amorphous calcium phosphate into .JIA by entering the hydroxyapatite prenuclei structures in such a way to distort them and prevents further HA growth by creating a structural mismatch. A similar mechanism can be invoked to explain the inhibiting role of magnesium on the crystallization or crystal growth of HA. However, magnesium, whatever its location into the HA structure, in the amorphous phase or super8cially absorbed on the HA crystals, provokes the conversion of HA into /3-TCMP on heat treatment. In fact, the extent of thermal conversion is closely related to magnesium relative content in the solid phase.
Biological apatites contain appreciable amounts of magnesium up to about 7 percent [17] and the extent of their thermal conversion into /3-TCMP depends on the magnesium content according to a quantitative relationship [181, which fit very well with that reported in Table 1. The /3-TCMP phases obtained by thermal conversion of synthetic HA exhibit cell parameters smaller with respect to those of @TCP, in agreement with a partial substitution of magnesium for calcium. By comparing these lattice parameters with those characteristic of &TCMP synthesized by solid state reaction at different magnesium content [17] the amounts of magnesium substituted to calcium in the &TCMP structure have been calculated to be higher than 12 magnesium atom percent for all the samples. These values are in agreement with those calculated from the magne- sium content of the solid products taking into account the relative amount of HA conversion into /3-TCMP (Table 1) and allows us to infer that the whole magnesium content of the different samples enters in the crystal structure of BTCMP.
The results of this paper allow us to interpret the data previously reported on the variation of the chemical-physical properties of biological apatite on increas- ing calcification [17, 181. In fact, the decrease in magnesium relative content observed on increasing calcification is accompanied by a simultaneous increase of apatite crystal sizes and a reduction of the extent of apatite thermal conversion into @TCMP. The relationship among these parameters is very similar to that found for synthetic HA in this paper, which clarifies the role of magnesium on the crystallization, crystal growth, and thermal stability of biologi- cal apatites.
Furthermore, this paper supports the hypothesis that in biological apatites most of the magnesium content is surface limited or in the amorphous portion and not lattice bound, in agreement with the preferential release of magnesium during the initial dissolution of enamel and skeletal apatites [2].
REFERENCES
1. G. H. Nancollas, in Biological Minemlizatin and Deminemliurtin, G. H. Nancollas, Ed., Dahlem Konferenzen, Springer, Berlin, 1982, pp. 79-99.

78 A. Bigi et aL
2. R. Z. Le Geros and J. P. Le Geros, in Phosphate Minerals, J. 0. Nriagu and P. B. Moore, Eds. Springer, New York, 1984, pp. 351-385.
3. A. Bigi, E. Foresti, A. Ripamonti, and N. Roveri, J. Znorg. Biochem. 27, 31 (1986). 4. C. A. Baud and J. M. Very, Colbque Zntemationaux C.N.R.S. 230,405 (1975). 5. R. Z. Le Geros, Z’mg. Crystal Growth Chamct. 4, 1 (1981). 6. A. Bigi, M. Gandohi, M. Gazzano, A. Ripamonti, N. Roveri, and A. Thomas, J.
Chem. Sot., Dalton Zkms., 2883 (1991). 7. R. Z. Le Geros, IU. M. Taheri, G. B. Quirolgico, and J. P. Le Geros, Pmt. 2nd Znt.
Phosphorus., Boston, IMPHOS (Paris), 1980, pp. 89-103. 8. A. Bigi, M. Gazzano, A. Ripamonti, E. Foresti, and N. Roveri, J. Chem. SOL, Dalton
Tmnr., 241 (1986). 9. H. M. Heijligers, F. C. M. Driessens, and R. M. H. Verbeck, Calcif. Trbe Znt. 29,127
(1979). 10. A. Bigi, A Ripamonti, S. Briickner, M. Gazzano, N. Roveri, and S. A. Thomas, Acta
CrystMogr., Sect. B 45, 247 (1989). 11. P. N. Patel, Z. Znorg. Nucl. Chem. 42, 1129 (1979). 12. S. V. Chiranjeevirao, J. Hemmerle, J. C. Voegel, and R. M. Frank, Znorg. Chim. Acta
67, 183 (1982). 13. M. D. Francis and N. C. Webb, Calcif. Tissue Znt. 6, 335 (1971). 14. A. S. Posner, N. C. Blumental, and F. Betts, in Phosphate Minemls, F. 0. Nriagu and
P. B. Moore, Eds., Springer, New York, 1984, pp. 330-350. 15. S. Baraveili, A. Bigi, E. Foresti, A. Ripamonti, and N. Roveri, J. ZrwqI. Biuchem. 20,
1 (1984). 16. A. Bigi, F. Marchetti, A. Ripamonti, N. Roveri, and E. Foresti, J. Znorg. &o&em. 15,
317 (1981). 17. A. Bigi, L. Campostella, A. M. Fichera, E. Foresti, M. Gazzano, A. Ripamonti, and N.
Roveri, J. Znmg. Biochem. 34,75 (1988). 18. A. Bigi, E. Foresti, R. Gregorini, A. Ripamonti, N. Roveri, and J. S. Shah, Calcif.
Tksue Znt. 50,439 (1992). 19. A. Immirzi, Acta Cryst. B 36, 2578 (1986). 20. S. Bruckner, private communication. 21. M. I. Ray, R. A. Young, A. S. Posner, Natum 204, lOS0 (1964). 22. K. P. Quinlan and M. A. De Sesa, Anal. Chem. 27,1626 (1955). 23. H. P. Klug and L. E. Alexander, X-my di@Wionpmcedks, Wiley, New York, 1959. 24. M. Okazaki, in Mechanism and Phylogeny of Minemkation in Biological Systems, S.
Suga and H. Nakahara., Eds., Springer-Verlag, New York, 1991, pp. 309-313.
Received May 12, 1992; accepted July 1, 1992