Synthesis And Characterization Of Hydroxyapatite Doped With ...
68
North Carolina Agricultural and Technical State University North Carolina Agricultural and Technical State University Aggie Digital Collections and Scholarship Aggie Digital Collections and Scholarship Theses Electronic Theses and Dissertations 2013 Synthesis And Characterization Of Hydroxyapatite Doped With Synthesis And Characterization Of Hydroxyapatite Doped With Strontium Carbonate Thin Film Coatings Strontium Carbonate Thin Film Coatings Stephen Ayodeji Ajinola North Carolina Agricultural and Technical State University Follow this and additional works at: https://digital.library.ncat.edu/theses Recommended Citation Recommended Citation Ajinola, Stephen Ayodeji, "Synthesis And Characterization Of Hydroxyapatite Doped With Strontium Carbonate Thin Film Coatings" (2013). Theses. 286. https://digital.library.ncat.edu/theses/286 This Thesis is brought to you for free and open access by the Electronic Theses and Dissertations at Aggie Digital Collections and Scholarship. It has been accepted for inclusion in Theses by an authorized administrator of Aggie Digital Collections and Scholarship. For more information, please contact [email protected].
-
Upload
khangminh22 -
Category
Documents
-
view
0 -
download
0
Transcript of Synthesis And Characterization Of Hydroxyapatite Doped With ...

North Carolina Agricultural and Technical State University North Carolina Agricultural and Technical State University
Aggie Digital Collections and Scholarship Aggie Digital Collections and Scholarship
Theses Electronic Theses and Dissertations
2013
Synthesis And Characterization Of Hydroxyapatite Doped With Synthesis And Characterization Of Hydroxyapatite Doped With
Strontium Carbonate Thin Film Coatings Strontium Carbonate Thin Film Coatings
Stephen Ayodeji Ajinola North Carolina Agricultural and Technical State University
Follow this and additional works at: https://digital.library.ncat.edu/theses
Recommended Citation Recommended Citation Ajinola, Stephen Ayodeji, "Synthesis And Characterization Of Hydroxyapatite Doped With Strontium Carbonate Thin Film Coatings" (2013). Theses. 286. https://digital.library.ncat.edu/theses/286
This Thesis is brought to you for free and open access by the Electronic Theses and Dissertations at Aggie Digital Collections and Scholarship. It has been accepted for inclusion in Theses by an authorized administrator of Aggie Digital Collections and Scholarship. For more information, please contact [email protected].

Synthesis and Characterization of Hydroxyapatite Doped with Strontium Carbonate Thin Film
Coatings
Stephen Ayodeji Ajinola
North Carolina Agricultural & Technical State University
A thesis submitted to the graduate faculty
in partial fulfillment of the requirements for the degree of
MASTER OF SCIENCE
Department: Mechanical Engineering
Major: Mechanical Engineering
Major Professor: Dr. Cynthia Kornegay Waters
North Carolina Agricultural and Technical State University
Greensboro, North Carolina
2013

i
School of Graduate Studies
North Carolina Agricultural and Technical State University
This is to certify that Master’s Thesis of
Stephen Ayodeji Ajinola
has met the thesis requirements of
North Carolina Agricultural and Technical State University
Greensboro, North Carolina
2013
Approved by:
_____________________________ ____________________________
Dr. Cynthia Waters Dr. Kumar Dhananjay
Major Professor Committee Member
_____________________________ ____________________________
Dr. Samuel Owusu-Ofori Dr. John Kizito
Department Chair Committee Member
__________________________________
Dr. Sanjiv Sarin
Dean, The Graduate School

ii
© Copyright by
Stephen Ayodeji Ajinola
2013
iii
Biographical Sketch
Stephen A Ajinola was born on September 2nd
, 1982 in Lagos, Nigeria. He received
Bachelor degree in Metallurgical and Materials Engineering from University of Lagos
(UNILAG) Akoka, Lagos, Nigeria in 2007/08. Also, he received Bachelor degree and Associates
degree in Engineering Technology both from Federal Polytechnic, Ado-Ekiti, Ekiti-State,
Nigeria in 2004/05 and 2001 respectively. He will soon complete his Master degree in
Mechanical Engineering Department at North Carolina Agricultural & Technical State
University.

iv
Dedication
This research is dedicated to Almighty God whom has helped from the inception of my
life on earth to the period of this research work and to my parents for their support and
encouragement in my quest for knowledge. This is also to the Adetunji’s family for their words
of encouragement, moral and physical support throughout the period of this program.
v
Acknowledgements
I give God the honor for the privileged and the strength he has granted me during this
research work and thank those that have contributed towards the success of this work. My
sincere appreciation goes to my advisor Dr. Cindy Waters, to Dr. Kumar Dhananjay for allowing
me free access to his laboratory equipments, to Dr. Kwadwo Mensah-Darkwa, Dr. Sudheer
Narella, Ruben Kotoka, Seyram Gbordzoe, Suhaila Abdalla, Dr. D Kumar group, Jubril Davies,
Anthony Okafor and Tunde Adebiyi for their help in making sure this research is completed in
good time.

vi
Table of Contents
List of Figures ............................................................................................................................ ix
List of Tables ............................................................................................................................xii
Abstract ...................................................................................................................................... 2
CHAPTER 1 Introduction ........................................................................................................... 3
1.1 Hydroxyapatite .................................................................................................................. 3
1.2 Titanium ............................................................................................................................ 3
1.3 Strontium/Strontium Carbonate .......................................................................................... 4
1.4 Motivations and Objectives ................................................................................................ 5
CHAPTER 2 Literature Review .................................................................................................. 6
2.1 Introduction ....................................................................................................................... 6
2.2 Anatomy of Bone ............................................................................................................... 6
2.2.1 Process of Mineralization ............................................................................................ 7
2.2.2 Mechanism of bone Mineralization.............................................................................. 7
2.2.3 Formation of bone ....................................................................................................... 9
2.2.4 Growth ........................................................................................................................ 9
2.2.5 Bone Remodeling ...................................................................................................... 11
2.3 Thin Film Techniques ..................................................................................................... 12
2.3.1 Pulsed Laser Deposition ............................................................................................ 12
2.3.1.1 Basic Operation ................................................................................................... 13
vii
2.3.1.2 Mechanism of Pulse Laser Deposition ................................................................. 13
2.3.1.3 Laser Target Interaction ....................................................................................... 13
2.3.1.4 Formation of Plume ............................................................................................. 15
2.3.1.5 Thin Film Formation ........................................................................................... 14
2.3.1.6 Advantage of Pulse Laser Deposition Technique ................................................ 16
2.3.1.7 Formation of Particulate ...................................................................................... 16
2.4 Mechanical Characterization ............................................................................................ 17
2.4.1 Nanoindentation ........................................................................................................ 17
2.5 Material Structural Characterization ................................................................................. 22
2.5.1 X-Ray Diffraction ..................................................................................................... 22
2.5.2 Scanning Electron Microscope .................................................................................. 23
2.5.3 Energy Dispersive Analysis ....................................................................................... 24
2.6 Chemical Characterization ............................................................................................... 25
2.6.1 Corrosion .................................................................................................................. 25
2.6.2 Polarization Resistance .............................................................................................. 28
2.6.3 Calculation of Corrosion Rate from Corrosion Current .............................................. 28
2.6.3 IR Compensation ....................................................................................................... 29
CHAPTER 3 Methodology ....................................................................................................... 30
3.1 Flowchart of the Experiment conducted ........................................................................... 30
3.2 Pulsed Laser Deposition Procedure .................................................................................. 31

viii
3.3 Scanning Electron Microscope Procedure ........................................................................ 32
3.4 Thickness Measurement Procedure .................................................................................. 34
3.5 Corrosion Procedure ........................................................................................................ 35
3.6 X-Ray Diffraction Procedure ........................................................................................... 37
3.7 Nanoindentation Procedure .............................................................................................. 38
CHAPTER 4 Results ................................................................................................................. 39
4.1 Results ............................................................................................................................. 39
CHAPTER 5 Discussion and Future Research ........................................................................... 47
5.1 Discussion ....................................................................................................................... 47
5.2 Future Research ............................................................................................................... 49
References ................................................................................................................................ 51

ix
List of Figures
Figure 2.1. The control of mineral balance by a cell membrane ................................................... 9
Figure 2.2. Intramembranous bone formation ............................................................................ 10
Figure 2.3. Endochrondral bone formations .............................................................................. 10
Figure 2.4. (a) Achondroplasia .................................................................................................. 11
Figure 2.4. (b) Osteoporosis ..................................................................................................... 11
Figure 2.4. (c) Osteomytsis ....................................................................................................... 11
Figure 2.5. Bone remodeling ..................................................................................................... 12
Figure 2.6. Schematics diagram of PLD ................................................................................... 12
Figure 2.7. Load against indenter displacement graph from indentation experiment................... 18
Figure 2.8. Section through an indentation showing various quantity used in the analysis ......... 20
Figure 2.9. Load versus indenter displacement of conical contact depth .................................. 22
Figure 2.10. Schematic X-ray diffraction .................................................................................. 23
Figure 2.11. Diagram showing the Energy Dispersive Spectroscopy.......................................... 24
Figure 2.12. Corrosion Processing showing Anodic and Cathodic Current Component.............. 25
Figure 2.13. Corrosion Setup .................................................................................................... 26

x
Figure 2.14. Classical Tafel Plots ............................................................................................. 27
Figure 3.1. Flowchart of the Experiment conducted ................................................................... 30
Figure 3.2. NC A&T Pulse Laser deposition.............................................................................. 32
Figure 3.3. Diagram of SEM courtesy of Iowa State University ................................................ 33
Figure 3.4. Diagram of profilometer used ................................................................................. 34
Figure 3.5. Stylus graphs (a) and (b) ......................................................................................... 34
Figure 3.6. Hitachi SU8000 Field Emission Scanning Electron Microscopes ............................ 35
Figure 3.7. Diagram of corrosion cell ....................................................................................... 36
Figure 3.8. Schematic Diagram of Experimental set-up for electrochemical corrosion testing ... 36
Figure 3.9. Diagram of NC A&T X-ray Diffraction .................................................................. 37
Figure 3.10. NC A&T MTS Nano indenter XP ......................................................................... 38
Figure 4.1. Plot of thickness against the composition ................................................................ 39
Figure 4.2. XRD results of different compositions .................................................................... 40
Figure 4.3. Microstructure of image of bare titanium substrate ................................................. 41
Figure 4.4. Microstructure of image of thin film of 0 wt Sr2CO3 % of -100 wt % HA .............. 41
Figure 4.5. Microstructure of image thin film of 2.5 wt % Sr2CO3 - 97.5 wt % HA .................. 41
Figure 4.6. Microstructure of image thin film of 100 wt % Sr2CO3 of - 0 wt % HA .................. 42
Figure 4.7. Microstructure image of titanium bare substrate after corrosion test ........................ 42
Figure 4.8. Microstructure of image of thin film of 2.5 wt% Sr2CO3 -97.5 wt % HA after
corrosion test ............................................................................................................................ 43

xi
Figure 4.9. Microstructure of image thin film of 0 wt % Sr2CO3 – 100 wt % HA after corrosion
test ........................................................................................................................................... 44
Figure 4.10. Microstructure of image corroded thin film of 100 wt % Sr2CO3 - 0 wt %HA after
corrosion test ............................................................................................................................ 44
Figure 4.11. Load against displacement for 2.5 wt % Sr2CO3 thin film ...................................... 45
Figure 4.12. (a) Plot of hardness and displacement for 2.5 wt % of Sr2CO3 (b) all compositions.45
Figure 4.13. (a) Plot of modulus against displacement 2.5 wt % of Sr2CO3 (b) all compositions.46
Figure 4.14. The tafel plot of corrosion results ......................................................................... 47

xii
List of Tables
Table 2.1 Ca: P ratios of Some of Apatite .................................................................................... 7
Table 4.1 Laser Energy, Deposition Rate, The Thickness ......................................................... 39
Table 4.2 Nanoindentation Results ........................................................................................... 44
Table 4.3 The Corrosion Results .............................................................................................. 46

2
Abstract
The main purpose of the research is to investigate the corrosion rate and mechanical properties of
thin film of strontium carbonate (Sr2CO3) doped with hydroxyapatite (HA) on titanium substrates
using DC Corrosion of Potentiodynamic and Nanoindentation respectively. The variation in the
weight percentages of strontium carbonate in hydroxyapatite on a titanium substrate was used to
investigate the beneficial effect of strontium on surface modification in biological application
such as to improve hardness of dentures and prevention of cavities, menopause bone loss and
enhancement of remodeling. The corrosion rate, the hardness and elastic moduli of different
weight percents of variation in the compositions of strontium carbonate in Sr2CO3 - HA thin
film layers deposited at 600 ºC on titanium substrates using Pulse Laser Deposition (PLD) at
high vacuum of 10-6
Torr were measured. The effect of varying Sr2CO3 in HA on the
crystallinity, on the morphology changes in the composition, on the microstructure and on film
thickness was determined using X-Ray Diffraction (XRD), Scanning Electron Microscope
(SEM) and profilometer respectively. The Sr2CO3 - HA with the composition of 2.5 wt. % of
Sr2CO3 was found to have good corrosion property with corrosion rate of less than 20 mpy, the
average film thicknesses of each composition of the film were also recorded and a favorable
hardness performance of 3.89 GPa, good peak broadening was also observed in the 2.5 wt %
composition Sr2CO3 using XRD. The variation in the composition of strontium in
Hydroxyapatite, corrosion rate, hardness and elastic moduli were reported.
3
CHAPTER 1
Introduction
This chapter describes the raw materials used in the research work namely,
hydroxyapatite, titanium substrate and strontium carbonates. It also briefly explains the
objectives and motivations for the research work.
1.1 Hydroxyapatite
Hydroxyapatite (HA) has a chemical composition of Ca10(PO4 )6(OH)2 and is mainly
known as calcium phosphate which is the main component of the mineral part of the bone and
has been extensively investigated and used in orthopedics and dentistry (Posner, 1969). It has
high composition of Calcium-Phosphorus in the bone mineral and therefore gives properties such
as good oestoconductivity and oestoinductivity (LeGeros, 2002). Implants fixation and quick
balances is also hastened by the enrichment of Calcium and Phosphorus within the vicinity of the
face of the implants and the bone thus promoting bone growth (Cheang & Khor, 1996).
The hydroxyapatite of the natural bone contains doped ions such as Sr2+
(Dahl et al.,
2001) and Mg4+
(Tsuboi et al., 1994), CO3 2- (Pellegrino & Biltz, 1968)
which make it impure.
These dopants have important functions in skeletal system in order to improve the bioactivity of
the bone (Pereiro et al., 2012).
1.2 Titanium
Titanium is the fourth most abundant element on the earth with concentrations of about
0.6%; Rutile was the first titanium mineral discovered by W. Gregor from England and Klarport
from Germany in 1790, it is very costly to extract and process (Collings, 1994). It occurs
naturally as illemenitite, titanomagnetite, anatase, brookite; illemenitite contains Fe2CO3 i.e.
haematite in which half of its iron is replaced by titanium; titanomagnetite contains magnetite
4
whose one third of its iron is replaced by titanium (Collings, 1994). If pure titanium is raised to
882.5 degree centigrade it undergoes allotropic transformation from alpha hexagonal closed
packed structure to beta body centre cubic (Collings, 1994). Titanium has great properties, vis-à-
vis; high strength/weight ratio and good corrosion resistance; it is used for aerospace structure as
airframe, skin and engine components (Collings, 1994). Also, it is used in non-aerospace
applications such as steam turbine blades, high current/field superconductor and hydrogen
storage media (Collings, 1994). Titanium is used for medical implant due to its good mechanical
properties; good corrosion properties and the biocompatibility (Fadl-allah & Mohsen, 2010). The
behavior of its compatibility in medical devices is due to very good adherence of the thin film
on the metal surface and the passivation when placed in human physiological condition and also,
a good biomechanics - called osteointegration between the bone and muscles (Sul et al., 2002),
(Fadl-allah & Mohsen, 2010).
1.3 Strontium/Strontium Carbonate
The atomic number of strontium is 38 and was discovered in 1808 and named after a
town in Scotland called strontian; strontium constitutes 0.04 percent of the earth's crust (Dean,
2004). The percentage of strontium in the earth's crust is more than carbon; which is the most
abundant trace element in seawater, the human body contains about 320mg of strontium (Dean,
2004). Most of which is found in bone and connective tissue, strontium is located in row two in
the periodic table below calcium; strontium has two positive charge in its ionic state, just like
calcium and therefore it is used to replace calcium chemical similarities in biological system, it
also replaces a small proportion of the calcium in hydroxyapatite crystals of a calcified tissues
such as bones and teeth, strontium in hydroxyapatite has been found to add strength to these
tissues; strontium also appears to draw extra calcium into bones as evidence when it is added to

5
food in rats and guinea pigs, making their bones and their teeth thicker and stronger (Dean,
2004), (Marie & Hott, 1986), (wikipedia, 2013). Strontium is used for the prevention and
treatment of osteoporosis, post menopause in women and of the bone related issues; the stable
form slowly replaces radioactive form from the body and the radioactive form is thus excreted
through the urine (Dean, 2004). Also, studies have shown that in in-vitro conditions, the presence
of strontium ion has reduced the number of osteoclast activities and increase osteoblast activities
(Pereiro et al., 2012). Strontium also increases the simulation of collagenous protein and non-
collagen protein synthesis and inhibits reabsorption of oseoclastic bone without cytoxic effect of
osteoblast and this promote bioactivity by increasing Osteointegration and preventing the
dissolution of the bone (Dean, 2004).
1.4 Motivations and Objectives
The increase in the number of people that use denture both the removal and permanent
dentures, the presence of cavities in the teeth, the bone and joint problems, the weakening of
bone despite the consumption of calcium has motivated the choice of the research. The main
objective of this research work is to investigate the effect of doping strontium carbonate with
hydroxyapatite and characterization of thin film coating on titanium substrates by fabrication of
thin film using Pulse Laser Deposition, measuring the hardness, modulus, corrosion rate and
crystallinity of the thin film coatings.
6
CHAPTER 2
Literature Review
2.1 Introduction
Over 10 million American have weak bones despite the fact that they consume most
calcium in the world while their counterpart in Japan consume half of it and one third of them
suffer fracture of the bones whereas Chinese rarely have fracture bone (Toppen, 2009). Recent
studies also show that adding little of the supplement of strontium decrease the risk of fracture
by 59%; strontium minerals are suitable for use in the prevention of bone loss and fracture, it has
also been known that it cannot be used for bone nutrient according Harvard Nurses’ health study
(Toppen, 2009).
An addition of strontium reduces the occurrence of cavities in the teeth; a research of
over 10 years by United States Navy Dental Service reviewed the teeth of about 270,000 people
that wanted to join the Navy and it was observed that only 360 of them were found to have free
cavities in their teeth, very interesting to note is that 10% of the 360 were found to come from
Rossburg Ohio where there is high concentration of strontium in water; the presence of strontium
improves cartilage metabolism in osteoarthritis and 1.7g/day of is a safe amount in preventing
osteoporosis, it should also be noted that Dr. J.Y. Reginster in 2002, one of principal researchers
on strontium, cautions that merging calcium with strontium administration reduces the
absorption of strontium (Dean, 2004), (McCaslin Jr & Janes, 1959; Toppen, 2009), (Marie &
Hott, 1986).
2.2 Anatomy of Bone
Bone anatomy is used to describe the development process, mineralization process,

7
functions and growth process of human bone. This is also used to describe how bone is being
remodeled when there is a fracture or injury in the bone.
2.2.1 Process of Mineralization. The main compositions of the bone which are
important in structure and physiology of living organisms are called APATITES (Calcium and
phosphates); its crystal forms the hard part of the mineral of the tissue e.g. bone and teeth, the
mineral includes other elements like fluoride etc, which make them impure; the most common of
the apatite is hydroxyapatite which has calcium to phosphorous ratio of 1.67 (Wilding & Mcneil,
1994).
Table 2.1
Ca: P ratios of some apatite. The solubility decreases as calcium ratio increases (Wilding &
Mcneil, 1994).
Monocalcium Phosphate 0.5
Dialcium phosphate 1.0
Octocalcium phosphate 1.3
Tricalcium phosphate 1.5
Hydroxyapatite 1.7
ACP Alkaline calcium phosphate 2.0
Living body produces Hydroxyapatite in three main stages.
1. Precipitation of calcium and phosphate ions after exceeding solubility of apatite.
2. Particulates ions are arranged in specific pattern.
3. Crystal growth.
When it is dissolved in water, 70% of its mineral is amorphous calcium phosphate (Wilding &
Mcneil, 1994).
2.2.2 Mechanism of Bone Mineralization. The mechanism has to do with deposition of
calcium and phosphate in the matrix of fibers; it is a continuous process of removal and

8
deposition of calcium phosphate from the skeleton, there are limited ways to control the
mechanism of mineralization (Wilding & Mcneil, 1994). Initially the cellular activities near the
production of vesicles especially in the connective tissues which have matrix of fibers; the
activities of bone formation and removal of bone cells are enhanced by hormones such as
parathyroid hormones, calcitonin hormones and growth (Wilding & Mcneil, 1994). Next, the
mineralization process also involves some group of enzymes which are secreted by oestoclast
named alkaline phosphate acting within the organic content upon the cell matrix of collagen,
proteoglycan, citrates, lipids and plasma; they are chemical catalyst that are involved in ‘growth
factor’ and bone remodeling (interleukins), if there is excess calcium; the cell vesicle may not
accommodate it in a place called mitochondria, so there may be need for extra cellular vesicle
(Wilding & Mcneil, 1994).
Matrix of vesicles which is about 100 nm is bounded by membranes found in organic
matrix ready to become bone, for instance, cartilage (a pre zone of calcinations) and pre-dentin.
Phosphatidylserine is a part of vesicles which is rich in acid phospholipids that have great
attraction for calcium and also contains inorganic part of tissue mineralization which has
phosphate called APL-Ca-P (acidic phospho-lipid calcium phosphate) (Wilding & Mcneil,
1994).
There is a serum level that needs to be maintained in the body; if the calcium level is too
high and not controllable, this will be removed from the tissue fluid because calcium apatite is
formed by saturation of calcium and phosphate (Wilding & Mcneil, 1994). There are some
hormones that control the level of the calcium in the body, if the amount of the calcium falls
below required level in the body they bring it back to the level and there are some situations
where the calcium is too high, they lower the amount to the required level and vice versa.
9
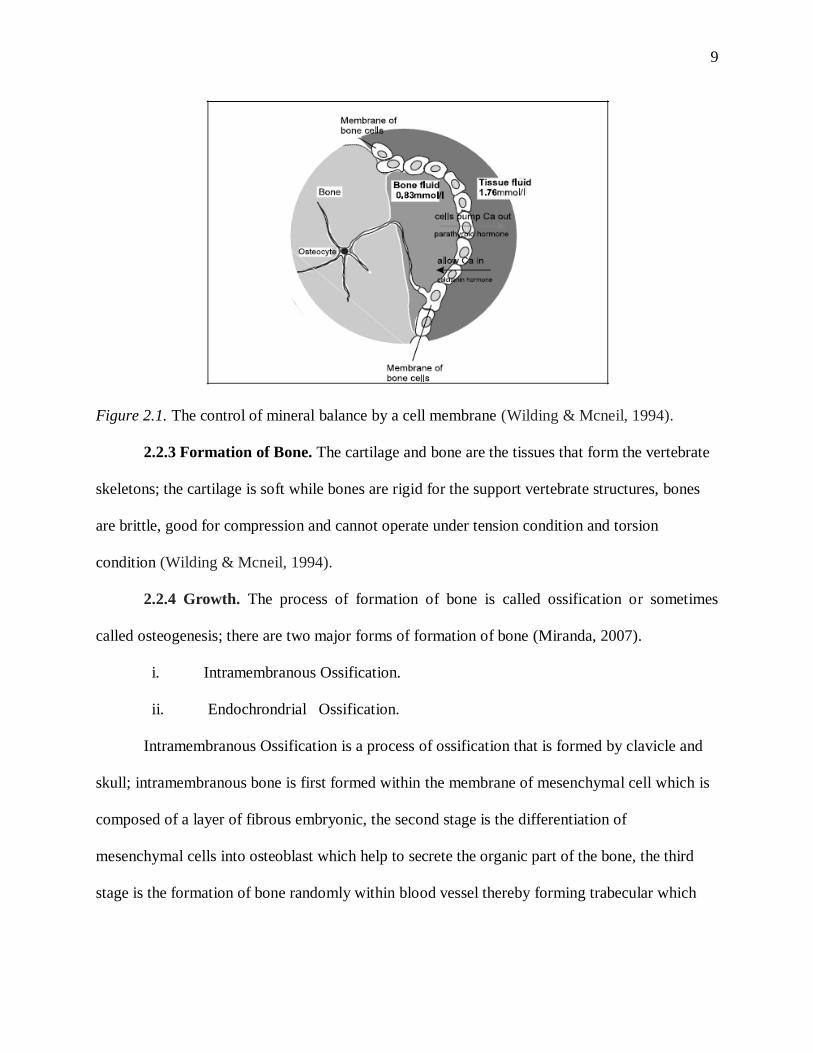
Figure 2.1. The control of mineral balance by a cell membrane (Wilding & Mcneil, 1994).
2.2.3 Formation of Bone. The cartilage and bone are the tissues that form the vertebrate
skeletons; the cartilage is soft while bones are rigid for the support vertebrate structures, bones
are brittle, good for compression and cannot operate under tension condition and torsion
condition (Wilding & Mcneil, 1994).
2.2.4 Growth. The process of formation of bone is called ossification or sometimes
called osteogenesis; there are two major forms of formation of bone (Miranda, 2007).
i. Intramembranous Ossification.
ii. Endochrondrial Ossification.
Intramembranous Ossification is a process of ossification that is formed by clavicle and
skull; intramembranous bone is first formed within the membrane of mesenchymal cell which is
composed of a layer of fibrous embryonic, the second stage is the differentiation of
mesenchymal cells into osteoblast which help to secrete the organic part of the bone, the third
stage is the formation of bone randomly within blood vessel thereby forming trabecular which

10
forms sponge bone; there is a condensation of mesenchymal cells on the outer surface to form
periosteum and lastly is the thickening of trabeculate to form compact bone (Miranda, 2007).
Figure 2.2. Intramembraneous bone formation (Miranda, 2007).
Figure 2.3. Endochrondria bone formation (Miranda, 2007).
11
There are two classifications of fracture:
i. Stress fracture: this is caused by unusual trauma on the bone.
ii. Pathological fracture: breakage in the bone by attack of the diseases. Some of
these diseases are Achondroplasia – chondrocytes do not multiply in number and
grow slowly.e.g head and trunk
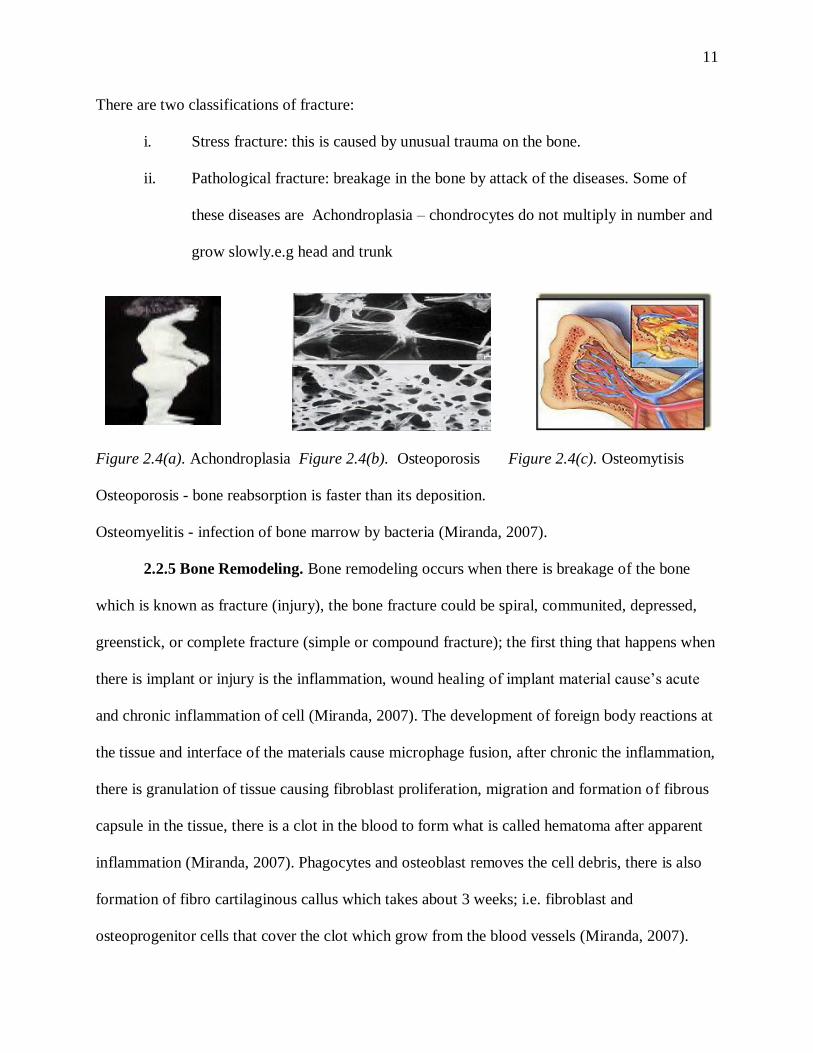
Figure 2.4(a). Achondroplasia Figure 2.4(b). Osteoporosis Figure 2.4(c). Osteomytisis
Osteoporosis - bone reabsorption is faster than its deposition.
Osteomyelitis - infection of bone marrow by bacteria (Miranda, 2007).
2.2.5 Bone Remodeling. Bone remodeling occurs when there is breakage of the bone
which is known as fracture (injury), the bone fracture could be spiral, communited, depressed,
greenstick, or complete fracture (simple or compound fracture); the first thing that happens when
there is implant or injury is the inflammation, wound healing of implant material cause’s acute
and chronic inflammation of cell (Miranda, 2007). The development of foreign body reactions at
the tissue and interface of the materials cause microphage fusion, after chronic the inflammation,
there is granulation of tissue causing fibroblast proliferation, migration and formation of fibrous
capsule in the tissue, there is a clot in the blood to form what is called hematoma after apparent
inflammation (Miranda, 2007). Phagocytes and osteoblast removes the cell debris, there is also
formation of fibro cartilaginous callus which takes about 3 weeks; i.e. fibroblast and
osteoprogenitor cells that cover the clot which grow from the blood vessels (Miranda, 2007).

12
Also, fibro cartilage, collagen and hyaline are formed to connect the bone, the third stage
is formation of bony callus, in which osteoblasts help in formation of spongy bone (trabeculate)
and joins the dead fragments and living organism, this takes about 3-4 months; the last stage is
bone remodeling which helps to remove excess bone materials for reshaping of the bone and
cavity of medullary (Miranda, 2007).
Figure 2.5. Bone remodeling (Miranda, 2007).
2.3 Thin Film Techniques
2.3.1 Pulsed Laser Deposition. Early works on laser evaporation source in the 1970s
resulted in later success of the deposition of metal-oxide in the 1980s; interaction of laser beams
on the surfaces of material has been used in the applications such as surface modification
(annealing and hardening) and material processing (drilling and welding), however the newer
technique now capitalizes on their use as a heat source for the flash evaporation of thin films
(Ohring, 2001).
Figure 2.6. Schematic Diagram of PLD (Tecnico, 2012).
13
2.3.1.1 Basic Operation. The pulse laser deposition process is shown in figure 2.6. It has
a high energy laser located outside the vacuum deposition chamber that acts as evaporation
source; which is used to evaporate target surface and is being focused by lens, the coefficients of
absorption increases at a smaller wavelength and is called reduced penetration depth, the most
common lasers used for Pulse Laser Deposition in solid state are Nd3+
: YAG (1064nm) &
excimer gas, the Nd3+
delivers ~2J/pulse at the rate of ~30Hz, Other excimer laser includes the
ArF (193nm), KrF (248nm) and XeCl (308nm) (Ohring, 2001). The limiting factors Nd3+
: YAG
(1064nm) is that it has a range of 10Hz to 30Hz (Delmdahl & Paetzel, 2008). Excitation of
targeted atoms resulting from the laser beam incident makes the absorbed beam energy to be
converted to thermal, chemical and mechanical energy and also results into ablation and
exfoliation of the surface and the plasma formation; directional plumes are formed from the
evaporant consisting of molten collections of neutral atoms, ions, electrons and molecules and
also deposited as a film, sometimes oxygen and nitrogen gas are introduced into the chamber for
surface interaction of the film and for the deposition of structured thin film the different source
must be excited by laser beam (Ohring, 2001).
2.3.1.2 Mechanism of Pulsed Laser Deposition. The pulse laser deposition involves four
major stages:
1. Laser interaction of the materials with the targets.
2. The ablation of the materials.
3. Deposition of the ablated materials.
4. Nucleation of atoms on the substrates and growth as the thin films.
2.3.1.3 Laser-Target Interaction. The interaction of laser and the target evaporation is
called thermal ablation, if the pulse width is much longer than the electron-photon time of
14
relaxation and is called non thermal ablation if the width is smaller, photo thermal ablation is
when the laser heats up the target, ablates it and causes deposition onto the substrate; in
photochemical ablation, laser energy is directly absorbed by chemical bonds (Ali, 2012). In
hydrodynamic ablation, bulk material is ablated including bulk materials and particulate; the
pulse laser parameters that influence both the temperature of irradiation of the materials and the
target parameters are: temporal power density I(t), optical reflectivity R, absorption coefficient
, thermal conductivity K of the materials, pulse duration tp , wavelength , latent heat per unit
volume, ablation temperature, thermal diffusivity;
D = K/Cv (2.1)
And the thermal diffusion length
(2Dtp) 0.5
(2.2)
is determined by laser pulse in the spread of temperature profile (Singh & Kumar, 1998). The
temperature in the target during irradiation is controlled by heat flow equation and is given as
(2.3)
The boundary conditions are considered in the formation and movement of the solid –
liquid which is known to be the direction in the plane perpendicular to the targets and t is called
the time. The second term is called the heat generation term due to absorption of incident laser
beam. If the material is highly absorbing ( ≥10^6cm^-1) to the incident laser beam, the term is
neglected (Singh & Kumar, 1998).
The laser absorption depth is the amount of material removed by a laser pulse which is
dependent on material’s optical properties and laser wavelength.
D = (4adT) ½
(2.4)
Where D is depth of heat penetration of the materials (Ali, 2012).

15
2.3.1.4 Formation of Plume. In the second stage of plasma formation, the plasma plume
moves toward substrates due to the repulsion of coulombs; the transient and luminous plasma
formed is directed and deposited with less contamination, the plume formed is dependent on the
properties of the laser used and it affects the nature of thin films that is grown; the gas affects the
film by plume parameters as a result of collision parameter attenuating, the background pressure
affects important film parameters and kinetic energy, the lower temperature will help the film
and unwanted gas substrate interaction while increase in laser will affect material and luminous
plume (Ali, 2012). The threshold evaporation is explained by the exponential increase in the
pressure of vapor and is predicted by the Clausius - Clapeyron equation.
P = A exp (- DHvap / R T) (2.5)
R = 8.3145 J mol-1
K-1
, is gas constant and the equation is called the Clausius-Clapeyron
equation gas. If P1 & P2 are the pressures at temperature T1 and T2, and DHvap is the enthalpy of
vaporization; the equation is described as:
ln (P1/P2) = (- DHvap / R)(1/T2 – 1/T1) (2.6)
The Clausius - Clapeyron equation helps to calculate the vapor pressure at other
temperature if the enthalpy of vaporization is given (Ali, 2012).
2.3.1.5 Thin Film Formation. The last stage of pulse laser deposition is nucleation and
growth; the process involved in the formation of the thin film is chemical - physical - sorption
condensation, this process depends on many factors like density, substrate, targets, energy and
ionization (Ali, 2012). Various people have worked on the surface energy between target and
substrate and are listed here.
Frank van der Merwe - layer by layer

16
Volmer-weber -Three dimensional island formation
Stranski – kranstanov - layer plus- island formation (Ali, 2012).
There are two main important parameters in the film growth (temperature and supersaturation,
m) which are defined as rate of deposition R. Re is rate at the equilibrium at temperature T, k is
Boltzmann constant (Ali, 2012). The thermodynamic driving force
Δµ=kTln(R/Re) (2.7)
Also, the diffusion rate of adatoms R:
R=p/ (2πmkBT)1/2
(2.8)
Where m is the atomic mass:
τad = νadexp (-Ead/kBT) (2.9)
τad = residence time; Ead = adsorption energy which determine the resident time, νad = specify pre-
exponential factor as an atomic frequency of vibration.
The adatom diffusion is given as: D = D0exp(-expEd/kbT) (2.10)
D0 is a constant = [v0(ad)2/4] (2.11)
It is derived from 2D diffusion coefficient (Ali, 2012).
2.3.1.6 Advantages of Pulse laser deposition. The advantages are
1. The films produced have the same composition as the one ablated from the target.
2. Multi purposes use of laser for more than one vacuum chamber.
3. Various ranges of material can be deposited at broad range of gas pressure.
4. Thin films can be grown within a short time (10 to 15 minutes).
2.3.1.7 Formation of Particulate. Particulate has three mechanisms which include
splashing a thin layer of superheat above temperature of vaporization, pressure of recoil i.e.
pressure is applied on vaporized materials of the molten targets and fracto emission – laser
thermal caused emission of micro-crack-in. Pulse Laser Deposition is known to create particulate

17
which range from sub-micron to micrometers and affect the performance in service, One of the
major draw backs is the splashing of particulates on the thin films, Splashing includes boiling of
sub surfaces, and removal of layer of liquid by shock wave of recoil pressure (Chrisey & Hubler,
1994), (Metev, Veiko, & Osgood, 1998).
2.4 Mechanical characterization
2.4.1 Nanoindentation. Nanoindentation is a mechanical technique used for masuring
the hardness of materials in a small area. Several models have been considered, procedural
analysis like Boussinesq and Hertz 19th century. Bussinesq (Boussinesq, 1985); computed the
stresses and displacement in elastic model while hertz examined different radii and elastic
constant (Hertz, 1987). Sneddon described relationship between load, displacement and the
contact area. The equation shows the relationship between load and displacement.
P=αhm ( 2.12)
h = elastic diplacement of the indenter; P= indenter load; α and m are constant and m varies
from 1,1.5 to 2 and for flat cylinder,sphere/spheroidal,cones respectively. There should be a
number of materials parameter to descibe the material behaviour and the constituive equations
are not linear (Johnson, 1987). Sensing indentations were also used in the measuring of load
against displacement for mechanical properties (Tabor & Tabor, 1948).
Also, Stillwell and Tabor examined the behavior of indenter and it becomes larger for the
indenters and presented many results (Stillwell & Tabor, 1961). Tabor presented that the shape
of unloading curve and total recovered can be related to the elastic modulus and impression size
made for both the conical and spherical indenters and also recovery from the plastic which
occurs sometimes with few loading and unloading. Lastly, a reduced modulus, Er presented the
effect of non rigid indenter on load-displacement behaviour. The equation is given as;

18
i
i
r EEE
)1()1(122
(2.13)
Where E = young ‘s modulus and v = poison’s ratio
Ei and vi are the same parameter for indenter.
Also, Bulychev, Alekhin, Shorshorov and othe coworkers used instrumented
microhardness load – displacement for indentation load-displacement data as analyzed
(Ternovskii, Alekhin, Shorshorov, Khrushchov, & Skvortsov, 1973).
(2.14)
S = dP/dh (2.15)
S is a measure of stiffness of the upper part of unloading, Er is reduced modulus, A is projected
area of elastic initial unloading stiffness. Then this can be used to calculate modulus (King,
1987).
Figure 2.7. Load against indenter displacement graph from indentation experiment (W. C. Oliver
& Pharr, 1992).
Hardness is a measure of load as a function of indented displacement. The experiment is
conducted in such a way that the tip of known geometry of the indenter is brought in contact with
AEdh
dPS r
2

19
the sample to be measured. The hardness and the area of impression are then measured. The
ratio of applied load to the area is compared with the hardness number.
In recent times, the hardness is taken as a ratio of load applied to depth of penetration.
This is used to determine mechanical properties and measuring the hardness of the thin film
deposited on the substrate; the same procedure is also used for measuring elastic modulus of the
unloading portion of the curve which gives the elastic modulus of the sample and the unloading
data is examined by deformation of half elastic and as it is related to the peak (W. C. Oliver &
Pharr, 1992).
A new method by Berkovich states that the surface is not a good description of material
behaviour using flat punch and it has been observed that conical indenter has been a good choice
of indenter because geometry has singular shape at the tip and square of the depth contact varies
as the cross sectional area (W. C. Oliver & Pharr, 1992).
Sneddon derived analytical method of solving geometry flat punches of different
geometry in addition to the flat surface (Sneddon, 1965), (Harding & Sneddon, 1945). As load
varies nonlinearly with the depth of displacement and the contact area changes continously
during unloading, justifcation is conserdered to be in obseravtion on hardness impressed formed
in the metals by conical and spherical indenter and there is also difference in the tip angle and
radii (Pharr, Oliver, & Brotzen, 1992). The mathematical description of elastic loading of the
pertubed surface is the same as that of the flat surface if the adjustment is made to geometrical
parameter describing the tip. The total displacement, h used during loading is given as
h = hc + hs (2.16)
hc is the vertical displacement along the contact and hs is the displacement of the surface at the

20
perimeter of the contact and the Pmax and hmax are the peak loads and displacements when
applied load is at its peak. The hf is the residual hardness impression.
The procedure to be used to determine the modulus and the hardness is followed by
considering various parameter like the diameter of the indenter, maximum depth of the indenter
made into the thin film deposited on titanium substates, the areaof the indenter made with the
tangential surface of the film and is shown in the diagram below .
Figure 2.8. Section through an indentation showing various quantities used in the analysis (W.
C. Oliver & Pharr, 1992).
The important parameters are:
i. Load peak (Pmax).
ii. The depth of the peak load (hmax).
iii. The initial unloading contact stiffness (Smax).
The measured stiffness, S is obtained at the Load peak, Pmax .This will be used to determine
the reduced modulus, Er using the relationship below:
Er = π
(2.17)
Er is the reduced modulus, A, contact Area, and S is measured stiffness.

21
The depth of indentation and the area of the load at the peak is used to determine the
geometry of the indenter and depth of contact, hc (Pethicai, Hutchings, & Oliver, 1983), (W.
Oliver, Hutchings, Pethica, Blau, & Lawn, 1986).
The geometry is the area function of F(h) that relates to the cross sectional area to
distance tips h can be calculated from
(2.18)
To determine the contact depth is given as
(2.19)
and hmax is measured experimentally where hs is the displacement of the surface which is
obtained from load displacement data.
(2.20)
is the geometric constant for conical indenter and is given as
22
(2.21)
The hardness is a means by which applied pressure on a material is supported by load.
This is defined by H = Pmax /A where is A is Area of contact at the load peak, H is the hardness
(W. C. Oliver & Pharr, 1992), (Bhattacharya & Nix, 1988).
There are other various methods of measuring the hardness of bulk materials in solid
form or after they are being processed into shapes like brinel hardness testl, rockwell hardness
test etc; which are used for measuring the resistance of applied load of indenter to depth of
penetration of indenter, the indenter used may vary from ball to diamond; which is hardness
substance known. The diamond has been known to penetrate more into materials than any other
materials. The indenters are usually of known loads against different materials. The depth of
penetrations are usually recorded according standard ways of recording the results.
)( chA
PH
sc hhh max

22
Figure 2.9. Load versus indenter displacement of conical contact depth (W. C. Oliver & Pharr,
1992).
2.5 Material Structural Characterization
2.5.1 X-ray diffraction. X-ray Diffraction is one of the most important nondestructive
methods for testing of material and is used to determine crystal structure of solids, lattice
parameter and orientation of crystals of thin films (Ohring, 2001). When X-ray beams are
incident on the atoms it may be absorbed by the atom or diffracted, the electron beam is
electromagnetic wave with electric vector varying sinusoidal (Warren, 1990). The X-ray
diffraction demonstrates the crystallinity of solids by comparing the spacing between the atoms
and comparing with the wavelength; when the incident ray is incident at critical diffraction
angles () the emitted beam of high intensity is detected; high diffraction occurs at a very large
angle, this is given by Bragg’s equation.
2dsin = n
23
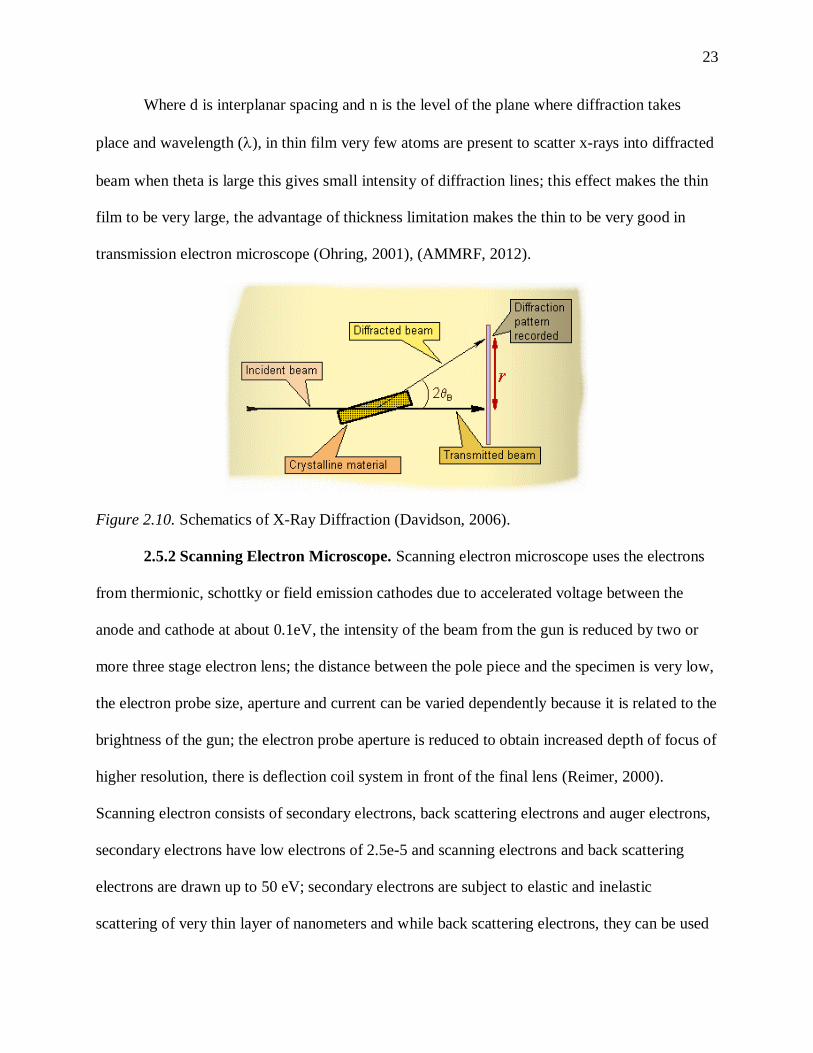
Where d is interplanar spacing and n is the level of the plane where diffraction takes
place and wavelength (), in thin film very few atoms are present to scatter x-rays into diffracted
beam when theta is large this gives small intensity of diffraction lines; this effect makes the thin
film to be very large, the advantage of thickness limitation makes the thin to be very good in
transmission electron microscope (Ohring, 2001), (AMMRF, 2012).
Figure 2.10. Schematics of X-Ray Diffraction (Davidson, 2006).
2.5.2 Scanning Electron Microscope. Scanning electron microscope uses the electrons
from thermionic, schottky or field emission cathodes due to accelerated voltage between the
anode and cathode at about 0.1eV, the intensity of the beam from the gun is reduced by two or
more three stage electron lens; the distance between the pole piece and the specimen is very low,
the electron probe size, aperture and current can be varied dependently because it is related to the
brightness of the gun; the electron probe aperture is reduced to obtain increased depth of focus of
higher resolution, there is deflection coil system in front of the final lens (Reimer, 2000).
Scanning electron consists of secondary electrons, back scattering electrons and auger electrons,
secondary electrons have low electrons of 2.5e-5 and scanning electrons and back scattering
electrons are drawn up to 50 eV; secondary electrons are subject to elastic and inelastic
scattering of very thin layer of nanometers and while back scattering electrons, they can be used

24
for large region surfaces (Reimer, 2000). The Secondary electron can be used by means of
positively biased collector grid placed on a side of specimen to low energy that can be exited
which is of few electrons and this can be collected by scintillator by accelerating to it back
scattering are not affected by the fields of electrostatics collecting fields which is mounted at
scintillators, semiconductors, the resolution is very low and can be increased by filtering of BSE
(Reimer, 2000). It is always advisable for greater working distance between the pole piece and
specimen so that free space is available for secondary and back scattered electrons for good
excitation and positioning of the specimen and good lens position of the specimen (Reimer,
2000).
2.5.3 Energy Dispersive Analysis. This is called elemental microanalysis and is mostly
used and attached to scanning electron microscope with energy dispersive lithium drifted
silicon. This allows scanning electron microscopes to be recorded with resolution of E =100-200
eV of x-ray quantum energy, energy dispersive spectrophotometers has advantages over energy
wavelength because of 0.2 -20 eV; this is used to analyze by multichannel analyzer. This
quantitative analysis is more uncertain for that specimen in homogenous composition (Reimer,
2000).
Figure 2.11. Diagram showing the Energy Dispersive Spectroscopy.

25
2.6 Chemical Characterization
2.6.1 Corrosion. Corrosion in metals usually occurs by an electrochemical process
between the surface and the solution which form the electrolyte; sometimes a few drop of water
from the solution of electrolyte starts the corrosion process (Instruments, 2011). It has been
researched that most corrosion takes place in water and corrosion involves two major reactions -
oxidation reaction and anodic reactions; they must occur simultaneously to attain equilibrium,
the inhibition of one of these reactions processes will prevent corrosion (Instruments, 2011).
Figure 2.12. Corrosion process showing anodic and cathodic current components (Instruments,
2011).
The figure 2.12 above shows the relationship between electrode potential and logarithm
of absolute current; the meeting points is where current changes from anodic to cathodic with the
sign changes and make the current to change to order six during the corrosion reaction, the two
tangential lines where the curves intersect are the current for cathode and anode reactions
(Instruments, 2011).
The current on both the cathodic and anodic are dependent on the voltage of the sample
and the anodic reaction, if the anodic reaction releases many electrons it makes electrons to shifts

26
the potential of the metal making it more negative and the reactive, a little slower and the speed
of reaction at the cathode. In electrochemical process, open circuit potential (Eoc) is first
measured to ensure that equilibrium potential is achieved and to ensure steady state has been
attained to ensure stabilization which may take minutes or hours as the case of measurement of
the material concerned; the Icorr is measured at Eoc for the anode or cathode and this is then used
to calculate corrosion of the sample. It is not easy to measure Icorr directly because Icorr and
corrosion rate depend on many factors like history of material to be measured, composition,
temperature, the state of surface of the sample to be measured and if not described but the oxide
layer is formed which may lead to further protection which is called Passivation (Instruments,
2011).
The tafel plot can be used to determine the corrosion rate using DC corrosion of
potentiodynamic polarization by measuring the corrosion current, Icorr and corrosion potential
Ecorr of the thin films (Su & Iroh, 2000). The sample to be measured is immersed in corroding
environments; additional electrodes are also immersed in electrolyte, the electrodes are then
connected to the potentiostat; the potentiostat is used to vary the potential of the measuring
instrument and the measured current when it is polarized.
Figure 2.13. Corrosion set-up (Saricimen, 2009).
27
The electrochemical reaction under the control of kinetics,
The Tafel equation is
I =Ioe (2.3(E-Eo)/β)
(2.23)
I= current resulting from reaction, Io = exchange current, E = electrode potential, Eo =
equilibrium potential, β = tafel constant for a given reaction. It has no unit. In ideal corrosion
system there are two reactions (anode and cathode reactions).
The tafel can be combined to generate Butler -Volmer Equation as
I = Ia + Ic = Icorr (e (2.3(E- Eo / βa)
- e (2.3(E-Eo / βc)
) (2.24)
Where
I = cell current (A), Icorr = corrosion current (A)
E = electrode potential, Eoc = corrosion potential, βa = beta anodic tafel constant in volts /decade
βc = beta cathodic tafel constant in volts /decade, β = beta tafel constant in volts /decade.
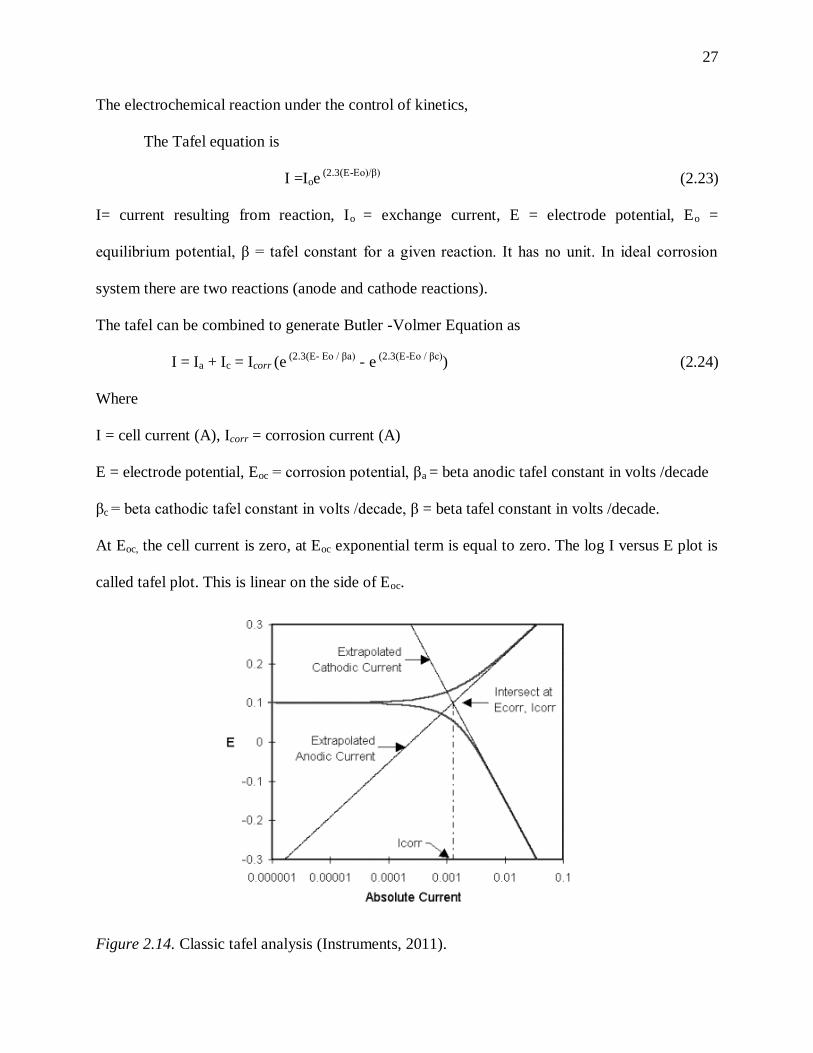
At Eoc, the cell current is zero, at Eoc exponential term is equal to zero. The log I versus E plot is
called tafel plot. This is linear on the side of Eoc.
Figure 2.14. Classic tafel analysis (Instruments, 2011).

28
There may be obstacles like:
1. Concentration polarization; the rate at which the reactants get to the surface.
2. Oxidation formation at the surface may lead to passivation.
3. Dissolution rates of one the reactants.
4. Mixing of control process where there are more than one cathodic or anodic reaction
controlling the process.
5. Effect due to the potential drop in the solution.
2.6.2 Polarization Resistance. The slope of line in tafel plot is called polarization
resistance Rp and its combined coefficient of Beta to yield corrosion current
Stern-Geary equation:
Icorr = (1/ Rp) (ac / 2.303 a + c) (2.25)
Polarization resistance is obtained from tafel plot within the electrode potential range of (+/-
10mV).The polarization resistance does not give clear description of beta coefficient
(Instruments, 2011).
2.6.3 Calculation of corrosion rate from corrosion current. The corrosion rate is
measured by the rate of penetration using the relationship below:
CR = Icorr K EW / ρA (2.26)
CR = The corrosion rate. Its units are given by the choice of K.
Icorr = The corrosion current in amps.
K = Constant that defines the units for the corrosion rate.
EW = The equivalent weight in grams/equivalent.
ρ = Density in grams/cm3.
A = Sample area in cm2.

29
The corrosion rate units is either measured in mm/year(mmpy) with the value of K
equal to 3272 or in the milli-inches /year(mpy) and the value of K as equal to 1.288 × 10⁵
(Instruments, 2011).
2.6.4 IR compensation. When current flows between two electrodes there will be two
regions of different potentials in the solution and thereby changing the overall potential of
electrode near the surface due to concentration gradient and this is called polarization resistance,
potential drop does not matter in the three electrodes, If the reference electrode is placed in the
experiment, IR compensation drops and the closer the working electrode; the higher the IR
errors; the uncompensated resistance, Ru is the portion of resistace left in the solution
uncompensated and it is aslo regarded as the difference between the flowing potential and
unflowing resistance (Instruments, 2011).

30
CHAPTER 3
Methodology
3.1 Flowchart of the Experiment
The flowchart shows the experment procedure used for the research work.
Experiment
a.) Target
preparation
b.) Sample
Preparation
c.) Mounting
d.) Pulse Laser
Deposition
e.) X-ray Diffraction
f.) Profilometer
g.) Scanning Electron
Microscope
h.)
Nanoindentation
i.) Corrosion Testing
Biological
Testing
j.) Scanning Electron
Microscope
Figure 3.1. Flowchart of the experiment conducted.

31
3.2 Pulsed Laser Deposition (PLD) Procedure
The targets that were created are composed of strontium carbonate (Sr2CO3) with ≥ 98%
purity and hydroxyapatite (HA) with ≥ 99 % purity which was purchased from Sigma Aldrich,
MO, USA. They were thoroughly mixed in the different proportions of the composition using a
250 ml mortar and pestle with help of acetone to create slurry. The proportions were
approximately 10ml of acetone to every 5 grams of powder. The mixing continued until the
acetone evaporated completely. Polyvinyl alcohol (PVA) was also added as a binding material.
The dry mix was poured in a mold of 1 inch diameter and ¼ inch thickness. The compositional
variance of targets was 0 weight %, 2.5 weight %, and 100 weight % of the total 5grams batch.
The finished powders of Sr2CO3 - HA were then pressed in carver press of maximum capacity of
22 MPa to a pressure of 16 MPa to obtain circular disk of the target. They were then sintered to
temperature of 750 centigrade for 12 hours and allowed to cool to room temperature in the
furnace. Each target was then subsequently mounted onto the carousel holder with aid of silver
paste. Polished titanium (Ti) metallic substrates of a size 10×10 × 0.5 mm were purchased from
MTI and the silicon was then masked onto the Titanium. This was done in order to be able to
measure the thickness of film deposited using a profilorimeter. The cleanliness of the substrates
is paramount for film adhesion and therefore the Titanium and Silicon substrates were first
cleaned using acetone for 10 minutes before being mounted on the heater with the aid of silver
paint. The films of the above compositions were deposited on the cleaned titanium substrates
using PLD system. The PLD system used has ultraviolent KrF excimer laser source with the
wavelength of 248 nm, pulse rate 10 Hz, pulse duration 30 ns. The reaction chamber was
vacumed to residual pressure of 4x10 -6
Torr before deposition. The films were deposited at high

32
vacuum on substrates heated to 600 oC as referred to work done by others which was 460
oC
(Pereiro et al., 2012).
The substrates were placed at a distance of about 40 mm from the target as shown in
figure 2.6. The laser energy was set to 400 mJ and laser pulses of 20,000 were selected using the
carousel software of the excel instrument. Samples were subjected to cooling in vacuum
chamber for 4-5 hours so that the temperature would fall below 50 centigrade before removing
the substrates to prevent the crack of the deposited thin film and to be easily handled.
Figure 3.2. NC A&T Pulse laser deposition.
3.3 Scanning Electron Microscope
A power field emission scanning electron microscope Hitachi SU8000 was used in
microstructural analysis. This microscope’s name implies the electron beam is created by an
emitter filament. Scanning electron microscope has semi lens objective lens with a top detector
which helps in the incident of electron beam on the sample. The maximum magnification cum
visualization was achieved by beam electron emitter of the secondary electron, low angle
backscattered electron, high angle scattered electrons. Copper tape was used to mount the
sample on the stage. The air in the chamber was vented to allow the passage of air into the
chamber. The mounted sample was put in sample holder in appropriate part of the chamber with

33
the aid of the spindle located in the chamber. The chamber was then evacuated to allow the air
out of the chamber. The open button was put on to create a closed system. The high voltage on
the SEM was pressed to allow accelerated voltage of electron into the chamber. The filament
current was also set to the appropriate current of 15 mA and accelerated voltage was used 20 kV.
The spot size was set and the distance of the sample and the stage was also set. This was all done
at low magnification. The appropriate spot size was attained by adjusting the focus, the
alignment, aperture alignment and stigma alignment. An image was captured by optimizing
brightness and focus at 50 micrometers. Next the EDS procedures were followed and icon was
set to low magnification and the voltage was set to 20 kv and 20 mA and magnification was
change 30 LM and the sample distance was changed to 15mm at low working distance was set as
the camera was put off using EDS software of the Espirit login the icon was clicked, and other
icons were clicked following appropriate procedure to the point where elements to be quantified
were obtained. The elements in the samples were exported to Microsoft word and saved.
Figure 3.3.Diagram of SEM; Courtesy of Iowa State University (purdue, 2010).

34
3.4 Thickness Measurement Procedure
The measurement of the thickness was performed on thin film deposited on the silicon
substrate which was half masked by silicon substrates mounted beside titanium substrates
mounted on a substrates holder.
The thicknesses of the various compositions were estimated using KLA alpha step IQ
surface profilometer. The film coated silicon and the uncoated silicon part were scanned with
scan length of 500 micrometer, the scan speed 50 micrometer per second, the scan frequency 50
Hz and the thicknesses of the thin film were calculated using step height analysis software.
Figure 3.4. Diagram of profilometer used.
Figure 3.5. (a) Stylus graph (Haywood, 2012). (b)

35
Figure 3.6. Hitachi SU8000 Field Emission Scanning Electron Microscope.
3.5 Corrosion Procedure
The Electrolyte used was 50 mL phosphate buffered saline (PBS) of 7.4-PH. The surface
area exposed was 0.18 cm2. The DC corrosion potentiodynamic polarization with the scanning
rate of 5mV/s; scan range ± 0.3 mV vs Eoc is 0 mV (above Eoc is anodic and below is cathodic
reaction) was used for the experiment. The set-up was comprised of three electrodes; the
working electrode was connected to the bottom of the deposited thin film coating on titanium
substrate; the reference electrode(Ag/Agcl) which had constant electrochemical potential and
the third electrode known as counter or auxiliary electrode and which was platinum electrode
to complete the cell circuit.
The open circuit potential (Eoc) took 10 minutes to come to steady state before the
commencement of the experiment. The experiment was conducted by applying various ranges of
potential as mentioned above using potentiostat of gamry instrument as shown in figure 3.7 and
using echem analyst software to analyze the tafel plot. The current was measured when the
potential of sintered sr2co3 doped with HA on titanium substrate came to equilibrium on the
potentiostat. The plot of potential (vertical axis) and logarithm of absolute current (horizontal

36
axis) was plotted. The vertical axis represents the potential and the horizontal axis represents the
logarithm of absolute current. The value of either the anodic or cathodic current at Eoc is called
the corrosion current, Icorr. The Icorr was used to calculate the corrosion rate of the thin film.
Figure 3.7. Diagram of corrosion cell.
Figure 3.8. Experimental setup for electrochemical corrosion testing.

37
3.6 X-Ray Diffraction Procedure
X ray diffraction was used to determine the orientation of crystal structures and the
crystallinity of the thin film on titanium substrates. The sample of various percentages of
strontium carbonate doped with HA on titanium substrates of deposited thin film was
investigated. A Bruker AXS D8 discover series XRD having monochromatic CuK alpha source
of wavelength of 0.1545nm and it was operated at 40 KV and 40 mA was used in the
investigation as shown in figure 3.9. The XRD was used in identifications of planes present in
strontium carbonate doped with hydroxyapatite thin film coatings.
The point scanning detector (PSD) was used to align the point between source and
detector by scanning ray of highest intensity using the z scan that was set to -0.95 to scan stage
back and front. The coupled scan was performed using a scanning range of 2 theta starting at 20
degree centigrade and finished at 80 degree centigrade, scanning speed of 0.8 (sec/step). Each
diffraction pattern and planes were compared with reference data from Joint Committee on
Powder Diffraction (JCPDS).
Figure 3.9. Diagram of NC A&T x-ray diffraction.

38
3.7 Nanoidentation Procedure
The coated thin film of various compositions of strontium carbonate doped with
hydroxyapatite on titanium substrates were mounted on a holder which was fixed with the aid of
wax. The sample was fixed on the mounting stage and placed in the mounting chamber. The
equipment used was continuous stiffness measurement (CSM) mode of MTS Nano indenter
XP. The indenter used was a berkovich indenter and it has a Poisson’s ratio is 0.17, Young’s
Modulus of 1 TPa which was quite stiff so as to be certain to indent. The strain rate was 0.05
/sec. Indentation depth used for the experiment was 1500nm. Surface approach velocity is 10
nm/sec. The number of indents made on the sample was nine at different locations so as to
perform statistics on the results. The frequency was 45 Hz and the Poisson’s ratio used was at
0.267. Berkovich tip angle of 65.3 degree.
Figure 3.10. NC A&T MTS Nanoindenter XP.

39
CHAPTER 4
Results
4.1 Results
Targets were made of different percentages of strontium carbonate doped with
hydroxyapatite of 0 %, 2.5%, 100 % of Sr2CO3 in 5 grams of hydroxyapatite and sintered to 750
oC targets with a diameter of 1 inch diameter by ¼ inch thickness were ablated at laser energy of
400 mJ at high vacuum of 10-6
Torr with the same deposition rate at a temperature of 600 oC
resulting in different thicknesses.
Table 4.1
Laser Energy, Deposition rate and the thickness.
Sample
(Weight Percentage)
Laser Energy (mJ) Deposition Pulse Thickness (nm)
0%Sr2CO3 -100HA 400 20,000 1983.400
2.5% Sr2CO3 -97.5%HA 400 20,000 1913.100
100% Sr2CO33- 0%HA 400 20000 438.380
0 20 40 60 80 100
400
600
800
1000
1200
1400
1600
1800
2000
2200
Thickness
Th
ickn
ess (
nm
)
composition (wt.)
Figure 4.1. Plot of thickness against the composition.
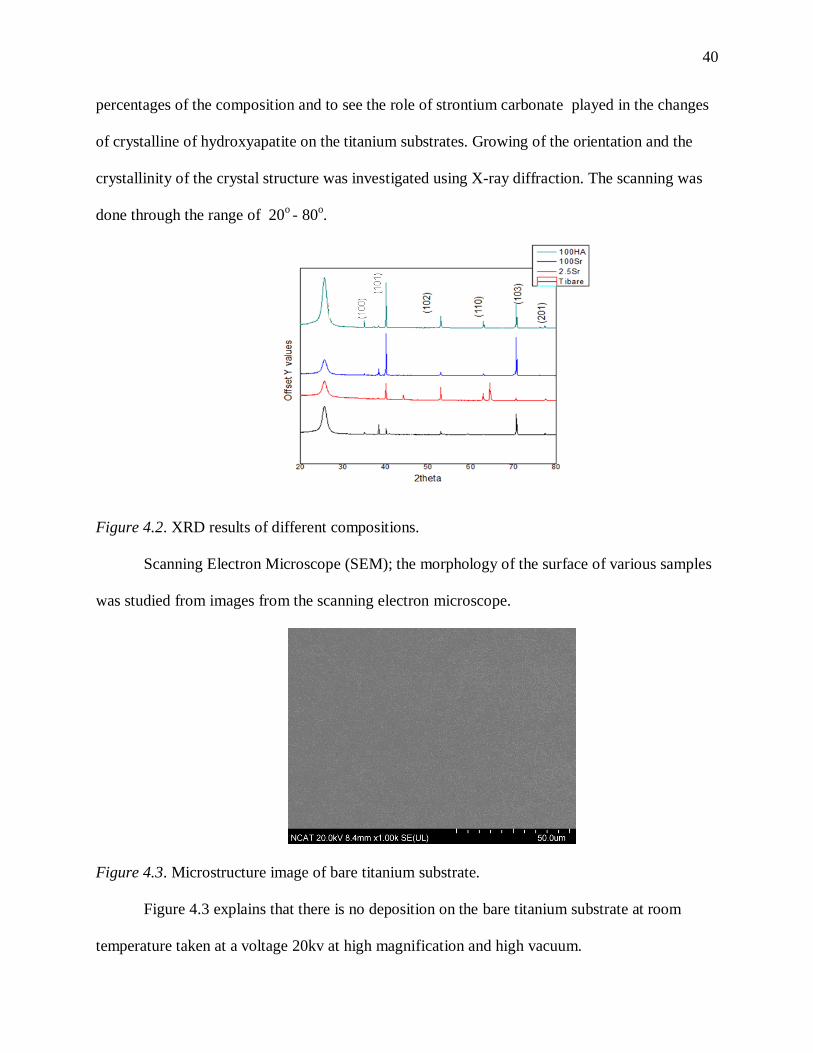
X- Ray Diffraction results; The thin films were deposited at the different weight
40
percentages of the composition and to see the role of strontium carbonate played in the changes
of crystalline of hydroxyapatite on the titanium substrates. Growing of the orientation and the
crystallinity of the crystal structure was investigated using X-ray diffraction. The scanning was
done through the range of 20o - 80
o.
Figure 4.2. XRD results of different compositions.
Scanning Electron Microscope (SEM); the morphology of the surface of various samples
was studied from images from the scanning electron microscope.
Figure 4.3. Microstructure image of bare titanium substrate.
Figure 4.3 explains that there is no deposition on the bare titanium substrate at room
temperature taken at a voltage 20kv at high magnification and high vacuum.

41
Figure 4.4. Microstructure image of thin film of 0 wt % Sr2CO3 – 100 wt % HA.
Figure 4.4 shows that there is deposition of a thin film of strontium carbonate on the
titanium substrate. This film was deposited at 600 oC at high vacuum and shows grains of
strontium carbonate doped with hydroxyapatite.
Figure 4.5. Microstructure image of thin film of 2.5 wt % Sr2CO3 - 97.5 wt % HA.
The SEM image of the thin film of 2.5 wt % Sr2CO3 - 97.5 wt % HA deposited on
titanium substrates at 600 oC at high vacuum was obtained and is shown in figure 4.5.

42
Figure 4.6. Microstructure image of thin film of 100 wt % Sr2CO3 - 0 wt % HA.
The SEM image of the thin film of 100 wt % Sr2CO3 wt - 0 wt % HA deposited at 600 oC
on titanium substrates at high vacuum was obtained and is shown in figure 4.6.
Figure 4.7. Microstructure image of bare titanium after corrosion test.
The bare titanium without deposition was corroded in the PBS solution and the
microstructure is altered as shown in figure 4.7. The bare substrate deteriorated after a corrosion
test had been carried out utilizing the gamry instrument as discussed in the procedure.
43
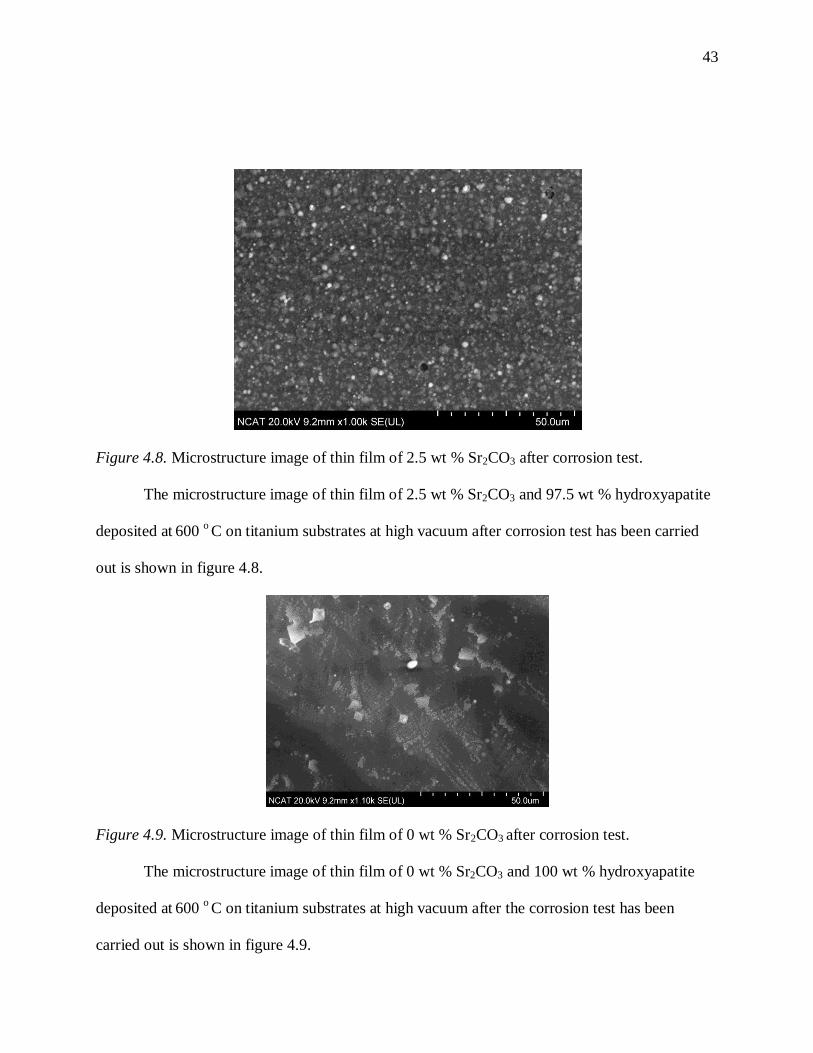
Figure 4.8. Microstructure image of thin film of 2.5 wt % Sr2CO3 after corrosion test.
The microstructure image of thin film of 2.5 wt % Sr2CO3 and 97.5 wt % hydroxyapatite
deposited at 600 o C on titanium substrates at high vacuum after corrosion test has been carried
out is shown in figure 4.8.
Figure 4.9. Microstructure image of thin film of 0 wt % Sr2CO3 after corrosion test.
The microstructure image of thin film of 0 wt % Sr2CO3 and 100 wt % hydroxyapatite
deposited at 600 o C on titanium substrates at high vacuum after the corrosion test has been
carried out is shown in figure 4.9.

44
Figure 4.10. Microstructure image of thin film 100 wt% of Sr2CO3 after corrosion test.
The nanoindentation tests were carried out on the various compositions of the samples to
obtain the hardness and elastic modulus of coated thin film at deposited temperature. The elastic
moduli of coated thin films on titanium substrates of various compositions of 0 wt % Sr2CO3 -
100 wt % HA, 2.5 wt % Sr2CO3-97.5 wt % HA, 100 wt % Sr2CO3 - 0 wt % HA are 118.3 GPa,
90.16 GPa, 66.58 GPa respectively. Also, the hardness of coated thin films on titanium substrates
of various compositions of 0% wt Sr2CO3 -100 wt.% HA, of 2.5 wt % Sr2CO3 -97.5 wt % HA,
100 wt % Sr2CO3 -0% wt HA are 6.1 GPa, 3.89 Gpa and 1.78 GPa respectively.
Table 4.1
Nano indentation results.
Sample Modulus (GPa) Hardness(GPa)
0 wt % Sr2CO3 118.300 6.100
2.5 wt % Sr2CO3 90.000 3.890
100 wt % Sr2CO3 66.580 1.780
45
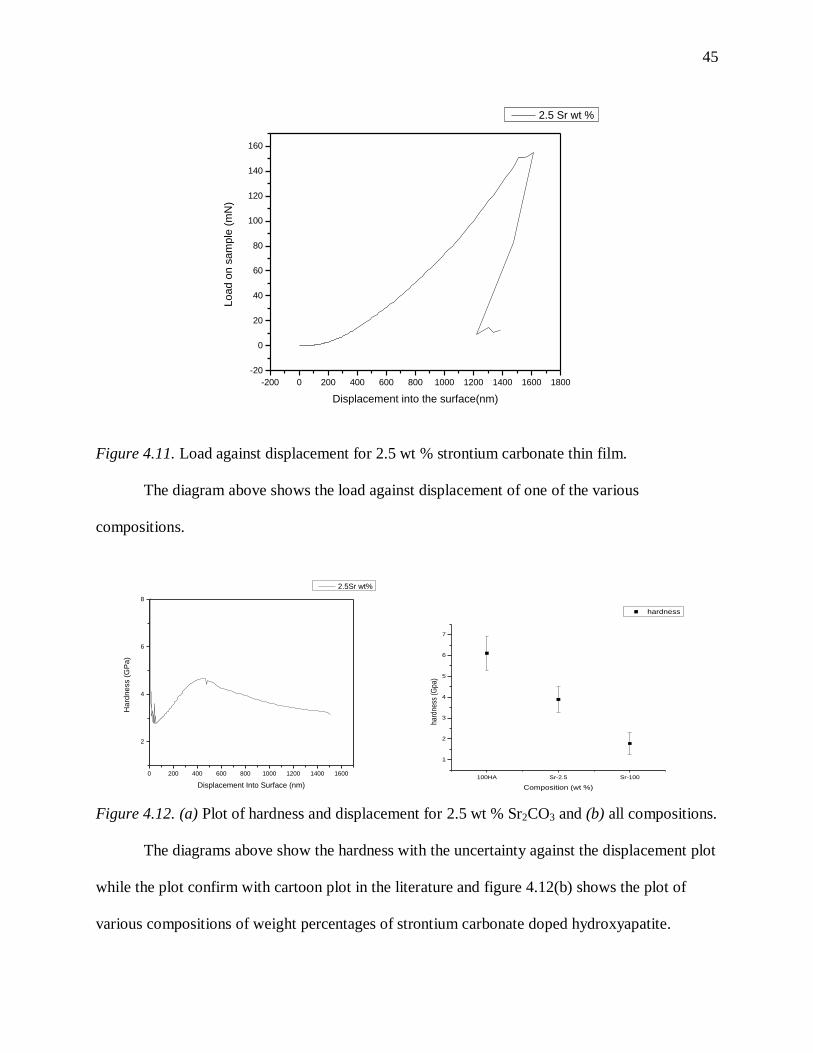
Figure 4.11. Load against displacement for 2.5 wt % strontium carbonate thin film.
The diagram above shows the load against displacement of one of the various
compositions.
Figure 4.12. (a) Plot of hardness and displacement for 2.5 wt % Sr2CO3 and (b) all compositions.
The diagrams above show the hardness with the uncertainty against the displacement plot
while the plot confirm with cartoon plot in the literature and figure 4.12(b) shows the plot of
various compositions of weight percentages of strontium carbonate doped hydroxyapatite.
-200 0 200 400 600 800 1000 1200 1400 1600 1800
-20
0
20
40
60
80
100
120
140
160
Lo
ad
on
sa
mp
le (
mN
)
Displacement into the surface(nm)
2.5 Sr wt %
0 200 400 600 800 1000 1200 1400 1600
2
4
6
8
Ha
rdn
ess (
GP
a)
Displacement Into Surface (nm)
2.5Sr wt%
100HA Sr-2.5 Sr-100
1
2
3
4
5
6
7
hardness
hard
ness
(G
pa)
Composition (wt %)

46
Figure 4.13. (a) Modulus against displacement of 2.5 % wt. Sr2CO3 and (b) all compositions.
The results give consistency in the modulus at different points of indenting on the thin
film deposited.
Potentiodynamic polarization curves results; the corrosion behavior of the coated samples
were analyzed and compared with bare titanium substrates and other percentages strontium
carbonate by DC Corrosion of potentiodynamic using tafel plot.
Results of different tests measured by applying different Voltage, Ecorr and current Icorr
are shown below. There is reduction in elastic moduli as the percentages of strontium carbonate
doped with hydroxyapatite thin film coating increases.
Table 4. 2
The corrosion results
% weight composition of
total mass of 5g Target
made
Icorr(mA) Ecorr(mV) Icorr (nA/cm2) Corrosion
Rate(mm/year x10-6
)
Ti bare 5.230 -405.000 29.060 591.260
2.5Sr-97.5HA 0.100 -87.200 0.550 14.790
100Sr -0HA 44.630 -146.000 24.440 17241.000
0Sr-100HA 1.095 -36.570 6.080 140.970
0 200 400 600 800 1000 1200 1400 1600
0
500
1000M
od
ulu
s (
GP
a)
Displacement Into Surface (nm)
2.5Sr wt%
100HA Sr-2.5 Sr-100
50
60
70
80
90
100
110
120
130
modulus
mo
du
lus (
Gp
a)
Composition (wt %)

47
1E-12 1E-11 1E-10 1E-9 1E-8 1E-7 1E-6
-0.6
-0.5
-0.4
-0.3
-0.2
-0.1
0.0
0.1
0.2
0.3
0.4
vo
lta
ge
(m
V)
current(mA)
Ti bare
2.5wt%.Sr
100wt%.Sr
0wt%.Sr
Figure 4.14. The tafel plot of corrosion results.
The figure 4.14 shows the tafel plot of the different composition of weight percenatges of
strontium carbonate doped with hydroxyapatite thin film coating on titanium substrate after they
were subjected to PBS solution which was the environment where the thin films are expected to
be subjected to fluid in the body. The potential of each thin film coating was varied and
corrosion current was measured.
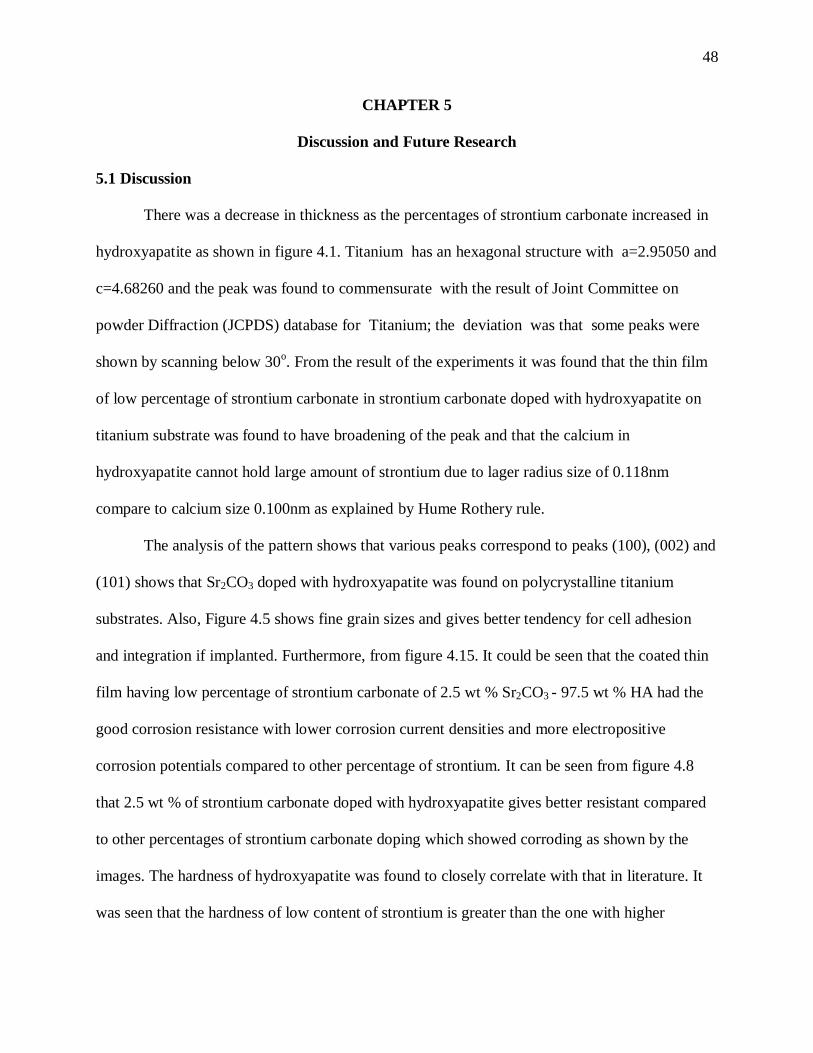
48
CHAPTER 5
Discussion and Future Research
5.1 Discussion
There was a decrease in thickness as the percentages of strontium carbonate increased in
hydroxyapatite as shown in figure 4.1. Titanium has an hexagonal structure with a=2.95050 and
c=4.68260 and the peak was found to commensurate with the result of Joint Committee on
powder Diffraction (JCPDS) database for Titanium; the deviation was that some peaks were
shown by scanning below 30o. From the result of the experiments it was found that the thin film
of low percentage of strontium carbonate in strontium carbonate doped with hydroxyapatite on
titanium substrate was found to have broadening of the peak and that the calcium in
hydroxyapatite cannot hold large amount of strontium due to lager radius size of 0.118nm
compare to calcium size 0.100nm as explained by Hume Rothery rule.
The analysis of the pattern shows that various peaks correspond to peaks (100), (002) and
(101) shows that Sr2CO3 doped with hydroxyapatite was found on polycrystalline titanium
substrates. Also, Figure 4.5 shows fine grain sizes and gives better tendency for cell adhesion
and integration if implanted. Furthermore, from figure 4.15. It could be seen that the coated thin
film having low percentage of strontium carbonate of 2.5 wt % Sr2CO3 - 97.5 wt % HA had the
good corrosion resistance with lower corrosion current densities and more electropositive
corrosion potentials compared to other percentage of strontium. It can be seen from figure 4.8
that 2.5 wt % of strontium carbonate doped with hydroxyapatite gives better resistant compared
to other percentages of strontium carbonate doping which showed corroding as shown by the
images. The hardness of hydroxyapatite was found to closely correlate with that in literature. It
was seen that the hardness of low content of strontium is greater than the one with higher

49
percentage and this can used for dental application. It was observed that the elastic moduli and
hardness measurements of 2.5 weight percent of the Sr2CO3 gives better elastic moduli
compared to the high weight percentage of strontium carbonate in the hydroxyapatite which
means that strontium carbonate can be added in low amount and still retain the hardness that is
expected for use in biological applications.
In this research work, an appropriate optimization of temperature, pressure and control of
strontium carbonate content in strontium carbonate – hydroxyapatite thin film coatings have been
found in the targets preparation. Strontium carbonate was a good source of strontium to be doped
with hydroxyapatite as evidenced by the data. Strontium carbonate doped with hydroxyapatite
retained the crystallinity of hydroxyapatite on titanium substrates after deposition and
hydroxyapatite being amorphous. This was confirmed by x-ray diffraction which showed the
broadening of peaks of the deposited sample as confirmed by JCPDS. Also, the 2.5 wt
percentage of strontium carbonate maintained the Ti substrate crystallinity. Pulsed laser
technique has been successfully used to deposit and coat the titanium substrates resulting in
excellent mechanical properties such as high elastic moduli and hardness of the coated samples.
The nanoindention test which was used to determine hardness and elastic moduli.
The corrosion resistance was also increased. The results from electrochemical impedance
spectroscopy, which used DC Corrosion potentiodynamic polarization, showed that the low
weight percentage (2.5% wt.) of strontium carbonate has good corrosion resistance compared to
the other higher percentages of strontium carbonates and the bare titanium substrate.
5.2 Future Research
Recommendation for future research is that biological tests be carried out to confirm the
biocompatibility using cell adhesion of strontium carbonates at low percentages of strontium

50
carbonate in them. Other biological tests need to be carried out such as osteocalcin and
osteopontin test to show cell growth and mineralization, in vitro cell culture experiment to show
cell proliferation and cell morphology.
Another recommendation for future research is that the other low percentages such as
350mg weight of strontium in natural bone be investigated and compared with the 2.5 wt. % of
strontium carbonates in hydroxyapatite. Other forms of stable strontium compound such as
strontium ranelate which is used in medical application can also be investigated. Furthermore,
temperatures at 700oC and 800
0C just before titanium starts undergoing transformation of crystal
structures should be investigated. In addition to the technique used for corrosion measurement
other techniques like nyquist plot and bode plot may also be used to confirm the results of the
tafel plot measurement.

51
References
AMMRF, Australian Microscopy & Microanalysis Reseach Facility. (2012).
http://www.ammrf.org.au/myscope/xrd/introduction/.
Bhattacharya, AK, & Nix, WD. (1988). Analysis of elastic and plastic deformation associated
with indentation testing of thin films on substrates. International Journal of Solids and
Structures, 24(12), 1287-1298.
Boussinesq, J. (1985). Applications des Potentiels a I'etude de equilibre
et du mouvement des solides elastiques.
Cheang, P, & Khor, KA. (1996). Addressing processing problems associated with plasma
spraying of hydroxyapatite coatings. Biomaterials, 17(5), 537-544.
Chrisey, DB, & Hubler, GK. (1994). Pulsed Laser Deposition of Thin Films. John Whiley and
Sons. New York, NY.
Collings, EW. (1994). Materials properties handbook: titanium alloys: ASM International (OH).
Dahl, SG, Allain, P, Marie, PJ, Mauras, Y, Boivin, G, Ammann, P, . . . Christiansen, C. (2001).
Incorporation and distribution of strontium in bone. Bone, 28(4), 446-453.
Davidson, Matthew J. Parry-Hill and Michael W. (2006).
www.micro.magnet.fsu.edu/primer/java/interference/index.html.
Dean, W. (2004). Strontium: Breakthrough Against Osteoporosis. World health. net. Retrieved
from: http://www. worldhealth. net/news/strontium_breakt hrough_against_osteoporo/"
htp://www. worldhealth. net/news/strontium-breakthrough-against-osteoporo/,(Accessed
on: August 05, 2011).
Delmdahl, R., & Paetzel, R. (2008). Pulsed laser deposition—UV laser sources and applications.
Applied Physics A: Materials Science & Processing, 93(3), 611-615.
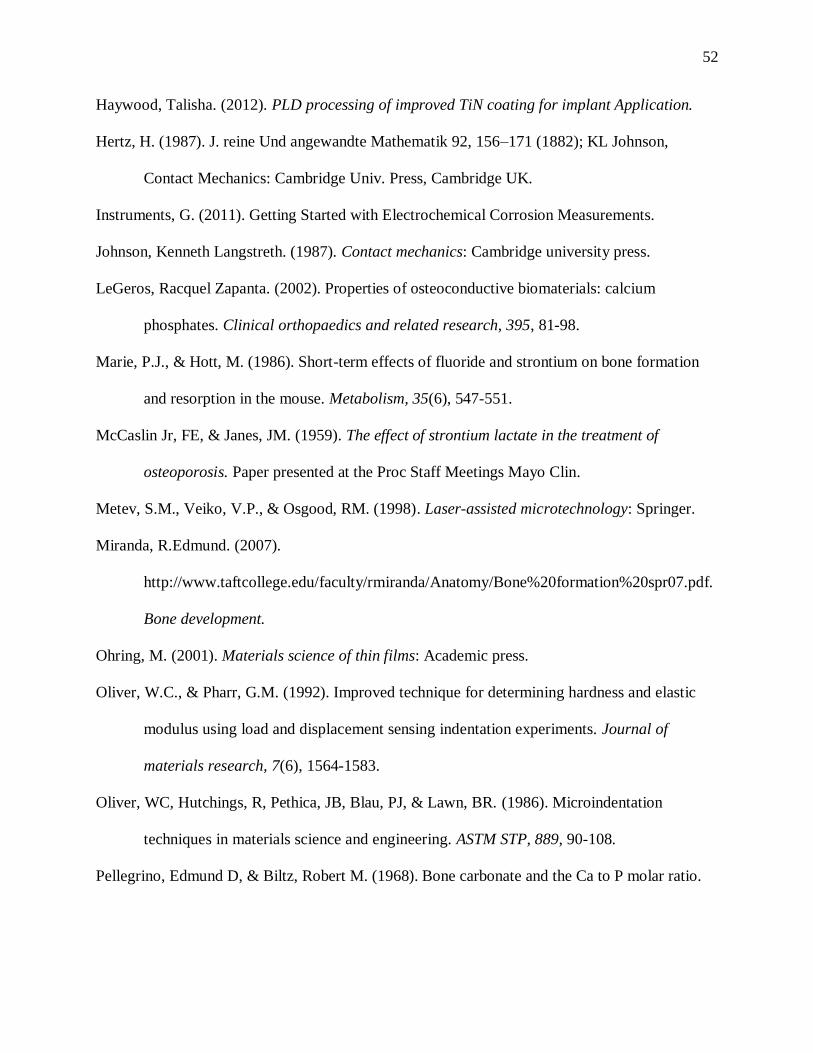
52
Haywood, Talisha. (2012). PLD processing of improved TiN coating for implant Application.
Hertz, H. (1987). J. reine Und angewandte Mathematik 92, 156–171 (1882); KL Johnson,
Contact Mechanics: Cambridge Univ. Press, Cambridge UK.
Instruments, G. (2011). Getting Started with Electrochemical Corrosion Measurements.
Johnson, Kenneth Langstreth. (1987). Contact mechanics: Cambridge university press.
LeGeros, Racquel Zapanta. (2002). Properties of osteoconductive biomaterials: calcium
phosphates. Clinical orthopaedics and related research, 395, 81-98.
Marie, P.J., & Hott, M. (1986). Short-term effects of fluoride and strontium on bone formation
and resorption in the mouse. Metabolism, 35(6), 547-551.
McCaslin Jr, FE, & Janes, JM. (1959). The effect of strontium lactate in the treatment of
osteoporosis. Paper presented at the Proc Staff Meetings Mayo Clin.
Metev, S.M., Veiko, V.P., & Osgood, RM. (1998). Laser-assisted microtechnology: Springer.
Miranda, R.Edmund. (2007).
http://www.taftcollege.edu/faculty/rmiranda/Anatomy/Bone%20formation%20spr07.pdf.
Bone development.
Ohring, M. (2001). Materials science of thin films: Academic press.
Oliver, W.C., & Pharr, G.M. (1992). Improved technique for determining hardness and elastic
modulus using load and displacement sensing indentation experiments. Journal of
materials research, 7(6), 1564-1583.
Oliver, WC, Hutchings, R, Pethica, JB, Blau, PJ, & Lawn, BR. (1986). Microindentation
techniques in materials science and engineering. ASTM STP, 889, 90-108.
Pellegrino, Edmund D, & Biltz, Robert M. (1968). Bone carbonate and the Ca to P molar ratio.
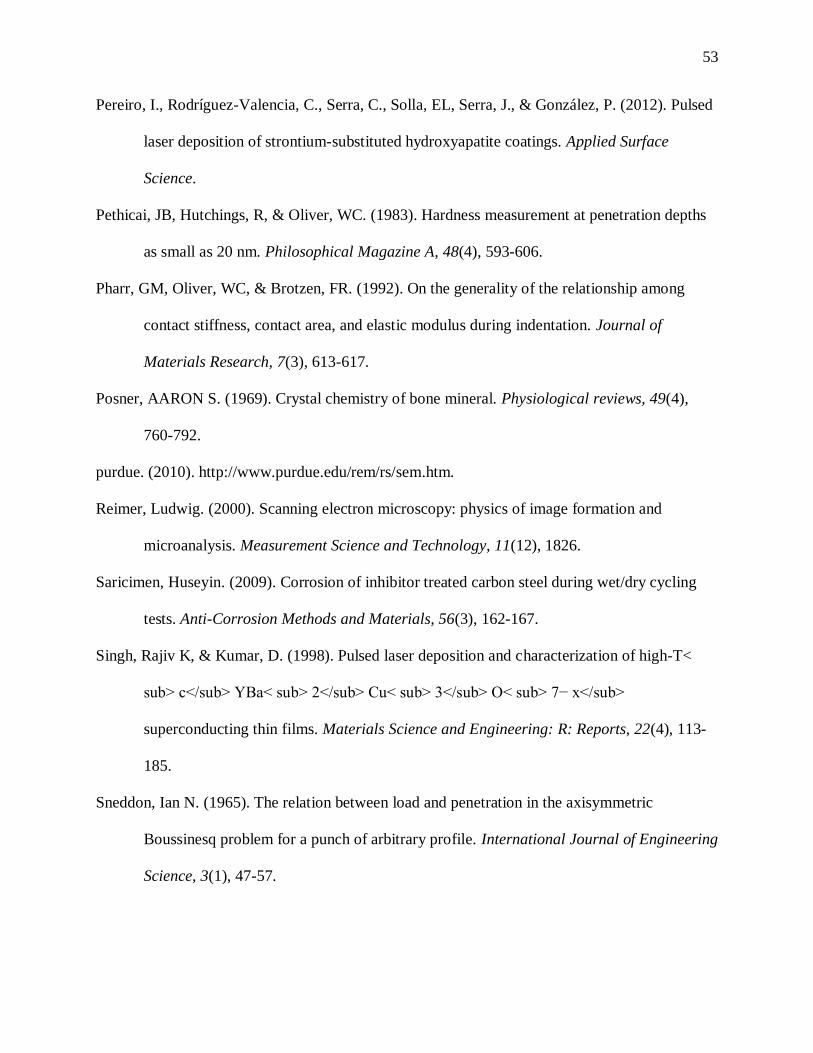
53
Pereiro, I., Rodríguez-Valencia, C., Serra, C., Solla, EL, Serra, J., & González, P. (2012). Pulsed
laser deposition of strontium-substituted hydroxyapatite coatings. Applied Surface
Science.
Pethicai, JB, Hutchings, R, & Oliver, WC. (1983). Hardness measurement at penetration depths
as small as 20 nm. Philosophical Magazine A, 48(4), 593-606.
Pharr, GM, Oliver, WC, & Brotzen, FR. (1992). On the generality of the relationship among
contact stiffness, contact area, and elastic modulus during indentation. Journal of
Materials Research, 7(3), 613-617.
Posner, AARON S. (1969). Crystal chemistry of bone mineral. Physiological reviews, 49(4),
760-792.
purdue. (2010). http://www.purdue.edu/rem/rs/sem.htm.
Reimer, Ludwig. (2000). Scanning electron microscopy: physics of image formation and
microanalysis. Measurement Science and Technology, 11(12), 1826.
Saricimen, Huseyin. (2009). Corrosion of inhibitor treated carbon steel during wet/dry cycling
tests. Anti-Corrosion Methods and Materials, 56(3), 162-167.
Singh, Rajiv K, & Kumar, D. (1998). Pulsed laser deposition and characterization of high-T<
sub> c</sub> YBa< sub> 2</sub> Cu< sub> 3</sub> O< sub> 7− x</sub>
superconducting thin films. Materials Science and Engineering: R: Reports, 22(4), 113-
185.
Sneddon, Ian N. (1965). The relation between load and penetration in the axisymmetric
Boussinesq problem for a punch of arbitrary profile. International Journal of Engineering
Science, 3(1), 47-57.
54
Su, W., & Iroh, J.O. (2000). Electrodeposition mechanism, adhesion and corrosion performance
of polypyrrole and poly (< i> N</i>-methylpyrrole) coatings on steel substrates. Synthetic
metals, 114(3), 225-234.
Sul, Y.T., Johansson, C.B., Petronis, S., Krozer, A., Jeong, Y., Wennerberg, A., & Albrektsson,
T. (2002). Characteristics of the surface oxides on turned and electrochemically oxidized
pure titanium implants up to dielectric breakdown:: the oxide thickness, micropore
configurations, surface roughness, crystal structure and chemical composition.
Biomaterials, 23(2), 491-501.
Tabor, David, & Tabor, D. (1948). A simple theory of static and dynamic hardness. Proceedings
of the Royal Society of London. Series A. Mathematical and Physical Sciences,
192(1029), 247-274.
Tecnico, Institute Superior. (2012).
http://groups.ist.utl.pt/rschwarz/rschwarzgroup_files/PLD_files/PLD.htm. Pulse Laser
Deposition.
Ternovskii, A. P., Alekhin, V. P., Shorshorov, M.Kh., Khrushchov, M. M., & Skvortsov, V.N.
(1973). Zavod. Lab. 39, 1242
Toppen, T. (2009). Strontium, Not Calcium, Builds Strong Bones.
Tsuboi, S, Nakagaki, H, Ishiguro, K, Kondo, K, Mukai, M, Robinson, C, & Weatherell, JA.
(1994). Magnesium distribution in human bone. Calcified tissue international, 54(1), 34-
37.
Warren, Bertram Eugene. (1990). X-ray Diffraction: Dover publications.
wikipedia. (2013). http://en.wikipedia.org/wiki/Strontium., 2013

55
Wilding, R.J.C., & Mcneil, Alexander. (1994). www.moorlanddentistry.com/chap7.pdf - United
Kingdom. Applied Oral Physiology - Bone Physiology.