
Removal of Ni (II) By Sol-Gel Silica Functionalized With E cient ...
Sol–gel synthesis, structural, optical and magnetic propertiesof Co-doped ZnO nanoparticles
J. El Ghoul • M. Kraini • O. M. Lemine •
L. El Mir
Received: 27 November 2014 / Accepted: 19 January 2015
� Springer Science+Business Media New York 2015
Abstract We report the synthesis of Zn1-xCoxO nano-
particles prepared by a sol–gel processing technique for x
ranging from 0 to 0.05. The structural, morphological,
optical and magnetic properties of the as-prepared nano-
particles were investigated by XRD, XPS, transmission
electron microscopy, UV measurements, photolumines-
cence and superconducting quantum interference device.
The structural properties showed that the obtained nano-
particles are single phase wurtzite structure and no sec-
ondary phases were detected which indicated that Co ions
substituted for Zn ions. The energy gap decreased gradu-
ally with increasing doping concentration of Co. The
photoluminescence spectra show a shift of the position of
the ultraviolet emission to long wavelength and the inten-
sity decreases with increasing Co. The Magnetic mea-
surements at room temperature reveal diamagnetic
behavior for sample with lower concentration and the
presence of both paramagnetic and ferromagnetic behavior
for increasing concentration.
1 Introduction
In recent years, semiconductor nanoparticles have attracted
great interest [1–3]. This is stimulated mainly by physical
probe into low-dimensional systems and potential appli-
cations for this class of materials. They always exhibit
novel optical, electrical, and mechanical properties due to
quantum confinement effects compared with their bulk
counterparts, and thus can be applied in many areas,
including luminescent devices, solar cells, chemical sen-
sors, and biological labeling and diagnostics.
Due to its excellent optical, electrical, mechanical and
chemical properties, ZnO semiconductor has attracted a
great deal of attention in the material research field. Due to
its significant optical and electronic properties, ZnO has
been widely used for fabricating various nano-optoelec-
tronic devices [4–7]. Recently, the doping of well-chosen
impurities has been extensively explored as an effective
technique to modify the properties of ZnO nanostructures
[8–12]. Transition metal doping of ZnO has become an
active research field ever since it was predicted to improve
the optical and electronic properties of the oxide material,
and particularly, lead to room-temperature ferromagne-
tism. Among these, the element of Co is considered a
potential candidate for incorporating into ZnO because of
its abundant electron states and large solubility in the ZnO
matrix [13]. Many groups have synthesized Co-doped ZnO
nanostructures and studied the altered performance upon
doping. For instance, Jones and coworkers [14] fabricated
Co:ZnO submicrometer tubes using a polymer based
template approach. They observed a 25-nm redshift in
UV–vis absorption, which originated from the narrowing
of the ZnO band gap (3.22 eV) as a result of Co doping.
Wang et al. [15] synthesized Co:ZnO nanorod arrays on a
glass substrate via a solution route. They found that Co
doping can effectively adjust the energy level in ZnO
nanorods, lead to variation in the UV emission peak
position, and enhance the luminescence performance in the
visible light region. Bahadur et al. [16] synthesized
J. El Ghoul � M. Kraini � L. El Mir
Laboratory of Physics of Materials and Nanomaterials Applied at
Environment (LaPhyMNE), Faculty of Sciences in Gabes, Gabes
University, 6072 Gabes, Tunisia
J. El Ghoul � O. M. Lemine (&) � L. El Mir
Department of Physics, College of Sciences, Al Imam
Mohammad Ibn Saud Islamic University (IMISU),
Riyadh 11623, Saudi Arabia
e-mail: [email protected]
123
J Mater Sci: Mater Electron
DOI 10.1007/s10854-015-2732-x
uniform and transparent Zn1-xCoxO films by a sol–gel spin
coating technique, and revealed that an increase in Co
content in the range 0 B x B 0.10 led to a decrease in
band gap energy as well as quenching of the near band
edge and blue emissions. Sharma et al. [17] prepared
Co:ZnO nanoparticles by a co-precipitation technique. The
obtained samples showed strong ferromagnetic behavior at
room temperature. However, at higher doping levels, the
ferromagnetic behavior was suppressed and the antiferro-
magnetic nature was enhanced. Xu and Cao [18] reported a
hydrothermal method to synthesize Zn1-xCoxO flakes, and
found that the samples exhibited obvious ferromagnetic
characteristics at room temperature. Moreover, with more
doping content of Co2?, the ferromagnetic behavior was
suppressed and paramagnetic nature was observed. Previ-
ous studies have obviously demonstrated that the physical
and chemical properties of the synthesized Zn1-xCoxO
samples are strongly sensitive to its preparative conditions
[15, 16]. Over the past few years, much effort has been
made to investigate wet chemical methods for the synthesis
of metal-ion-doped ZnO nanostructures, including the sol–
gel method [19, 20] and various hydrothermal methods
[21, 22]. Motivated by these reasons, we report in this
paper a new approach to obtain such powders based on
hydrolysis of zinc acetate in methanol followed by
supercritical drying in ethanol using modified sol–gel
process. The effect of cobalt as transition metal (TM)
doping element on structural, optical and magnetic prop-
erties of the powder is investigated for different
concentrations.
2 Experimental
Cobalt-doped ZnO nanocrystals were prepared by the sol–
gel method using 16 g of zinc acetate dehydrate as pre-
cursor in a 112 ml of methanol. After magnetic stirring at
room temperature, the appropriate amount of cobalt acetate
was added, and the solution was placed in an autoclave and
dried under supercritical conditions of ethyl alcohol.
X-ray diffraction (XRD) patterns of cobalt doped zinc
oxide nanopowder were carried out by a Bruker D5005
diffractometer, using CuKa radiation (k = 1.5418 A).
Crystallite sizes (G, in A) were estimated from the
Debye–Sherrer equation [23]:
G ¼ 0:9k=B cos hBð1Þ
where k is the X-ray wavelength (1. 5418 A), hB is the
maximum of the Bragg diffraction peak and B is the
linewidth at half maximum. The dopant content and the
chemical bonding states of cobalt ions in the Zn1-xCoxO
nanocrystallites were determined using XPS(PHI-5702).
The synthesized products were also characterized using
a JEM-200CX transmission electron microscopy (TEM).
The specimens for TEM were prepared by putting the as-
grown products in EtOH and immersing them in an ultra-
sonic bath for 15 min, then dropping a few drops of the
resulting suspension containing the synthesized materials
onto TEM grid. Room-temperature optical spectra in the
wavelength range from 200 to 2,000 nm were collected
using a Schimadzu UV-3101 PC spectrophotometer fitted
with an integrating sphere diffuse reflectance accessory.
The spectrophotometer measures reflectance relative to a
background scatterer, which was powdered BaSO4. For
photoluminescence (PL) measurements, the 337.1 nm laser
line of a Laser Photonics LN 100 nitrogen laser was used as
an excitation source. The emitted light from the sample,
collected by an optical fiber on the same side as the exci-
tation, was analyzed with a Jobin-Yvon Spectrometer
HR460 and a multichannel CCD detector (2,000 pixels).
Magnetic measurements were carried out as a function of
temperature (2–400 K) and magnetic field (0 to ± 60 kOe)
using a commercial superconducting quantum interference
device (SQUID) magnetometer (Quantum Design, MPMS
XL).
3 Results and discussion
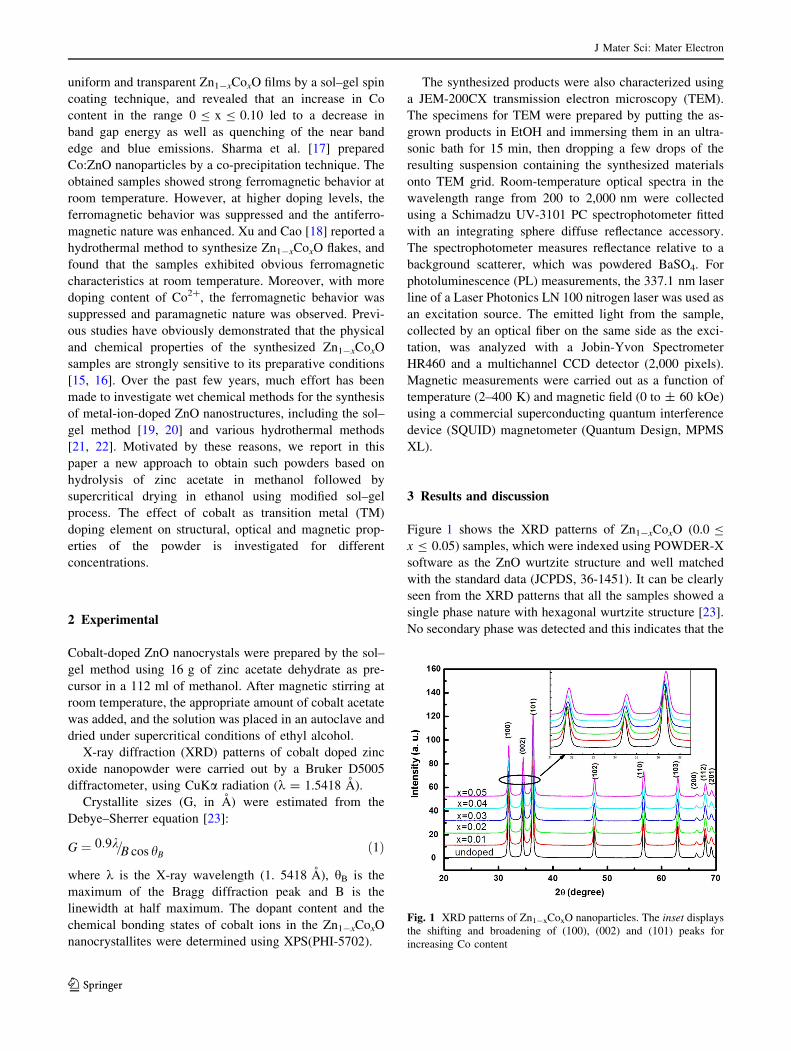
Figure 1 shows the XRD patterns of Zn1-xCoxO (0.0 B
x B 0.05) samples, which were indexed using POWDER-X
software as the ZnO wurtzite structure and well matched
with the standard data (JCPDS, 36-1451). It can be clearly
seen from the XRD patterns that all the samples showed a
single phase nature with hexagonal wurtzite structure [23].
No secondary phase was detected and this indicates that the
Fig. 1 XRD patterns of Zn1-xCoxO nanoparticles. The inset displays
the shifting and broadening of (100), (002) and (101) peaks for
increasing Co content
J Mater Sci: Mater Electron
123
Co dopant is incorporated into the lattice as a substitutional
atom. We can notice also that the peaks are very broad
which indicates the formation of very fine particles in the
nanoscale range. The average crystallite size obtained
using Debye–Scherer formula confirmed this result.
Table 1 summarizes the lattices parameters obtained for
several concentrations. It can be seen that the lattice
parameter c values of Zn1-xCoxO are smaller than the
value of undoped ZnO (c = 5.208), which is close to the
standard value [ICSD reference number: 67,848–1,993
(5.2121 A) and 67,454–1,989 (5.2071 A)]. Figure 2 shows
the evolution of the lattice parameters c calculated from the
XRD for different concentrations. We observed a decrease
in the lattice constant value with increasing concentration
of Co ions. This decrease of lattice constant with Co
contents is corroborated by the shift of the peaks position
(inset in Fig. 1), which generally indicates a decrease in the
lattice parameters. Moreover, with increasing the Co dop-
ing content, we also found that the intensity of the dif-
fraction peak decreased gradually and the width broadened,
which might be due to the increase in the lattice disorder
and strain induced by Co2? substitution. The decrease of
lattice can be explained by the fact that effective ionic
radius of Co2? (0.58 A) in tetrahedral configuration is
smaller than that of Zn2? (0.60 A) ions [24]. This reduction
in lattice parameter may also be due to a diminution in size
of the nanoparticles after doping [25]. In addition, for
x = 0.05, we observed an increase of the lattice parameters
which can be explained by the incorporation of Co3 ? ions
with significant lattice defects [26].
The average grain size was calculated from Scherer’s
formula (1) using the most intense peak (101) and the
values are summarizes in Table 1. As shown in Fig. 2, the
grain size decreases with increasing concentration of Co.
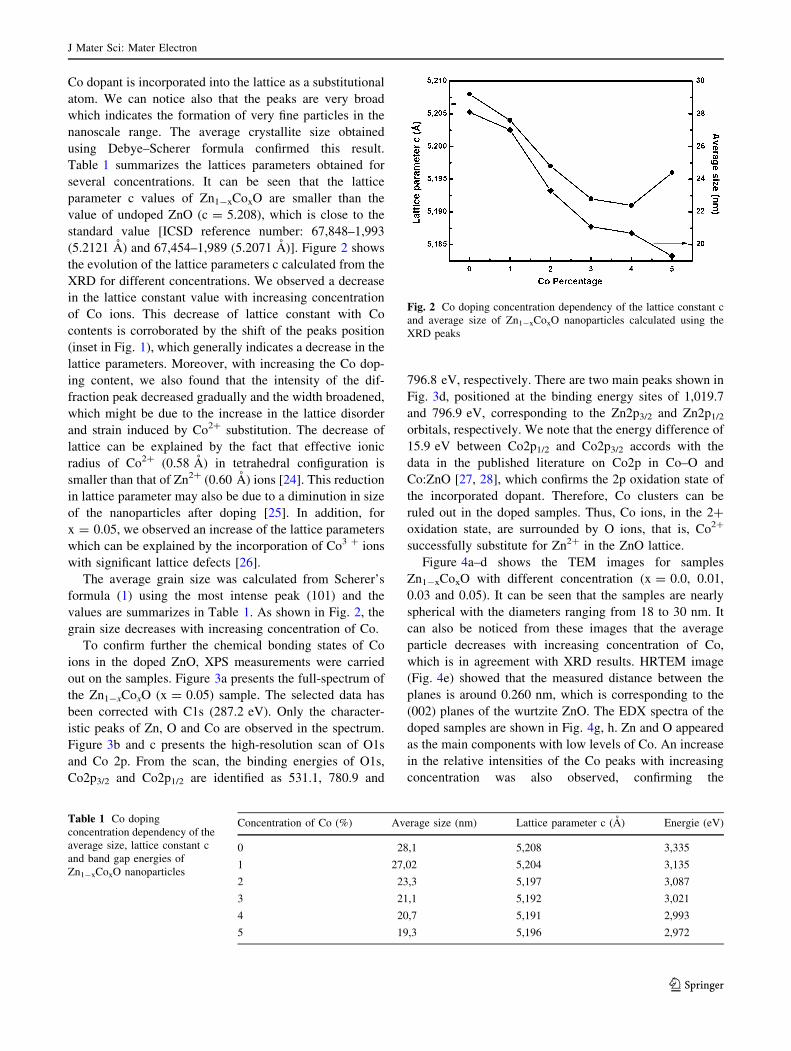
To confirm further the chemical bonding states of Co
ions in the doped ZnO, XPS measurements were carried
out on the samples. Figure 3a presents the full-spectrum of
the Zn1-xCoxO (x = 0.05) sample. The selected data has
been corrected with C1s (287.2 eV). Only the character-
istic peaks of Zn, O and Co are observed in the spectrum.
Figure 3b and c presents the high-resolution scan of O1s
and Co 2p. From the scan, the binding energies of O1s,
Co2p3/2 and Co2p1/2 are identified as 531.1, 780.9 and
796.8 eV, respectively. There are two main peaks shown in
Fig. 3d, positioned at the binding energy sites of 1,019.7
and 796.9 eV, corresponding to the Zn2p3/2 and Zn2p1/2
orbitals, respectively. We note that the energy difference of
15.9 eV between Co2p1/2 and Co2p3/2 accords with the
data in the published literature on Co2p in Co–O and
Co:ZnO [27, 28], which confirms the 2p oxidation state of
the incorporated dopant. Therefore, Co clusters can be
ruled out in the doped samples. Thus, Co ions, in the 2?
oxidation state, are surrounded by O ions, that is, Co2?
successfully substitute for Zn2? in the ZnO lattice.
Figure 4a–d shows the TEM images for samples
Zn1-xCoxO with different concentration (x = 0.0, 0.01,
0.03 and 0.05). It can be seen that the samples are nearly
spherical with the diameters ranging from 18 to 30 nm. It
can also be noticed from these images that the average
particle decreases with increasing concentration of Co,
which is in agreement with XRD results. HRTEM image
(Fig. 4e) showed that the measured distance between the
planes is around 0.260 nm, which is corresponding to the
(002) planes of the wurtzite ZnO. The EDX spectra of the
doped samples are shown in Fig. 4g, h. Zn and O appeared
as the main components with low levels of Co. An increase
in the relative intensities of the Co peaks with increasing
concentration was also observed, confirming the
Table 1 Co doping
concentration dependency of the
average size, lattice constant c
and band gap energies of
Zn1-xCoxO nanoparticles
Concentration of Co (%) Average size (nm) Lattice parameter c (A) Energie (eV)
0 28,1 5,208 3,335
1 27,02 5,204 3,135
2 23,3 5,197 3,087
3 21,1 5,192 3,021
4 20,7 5,191 2,993
5 19,3 5,196 2,972
Fig. 2 Co doping concentration dependency of the lattice constant c
and average size of Zn1-xCoxO nanoparticles calculated using the
XRD peaks
J Mater Sci: Mater Electron
123
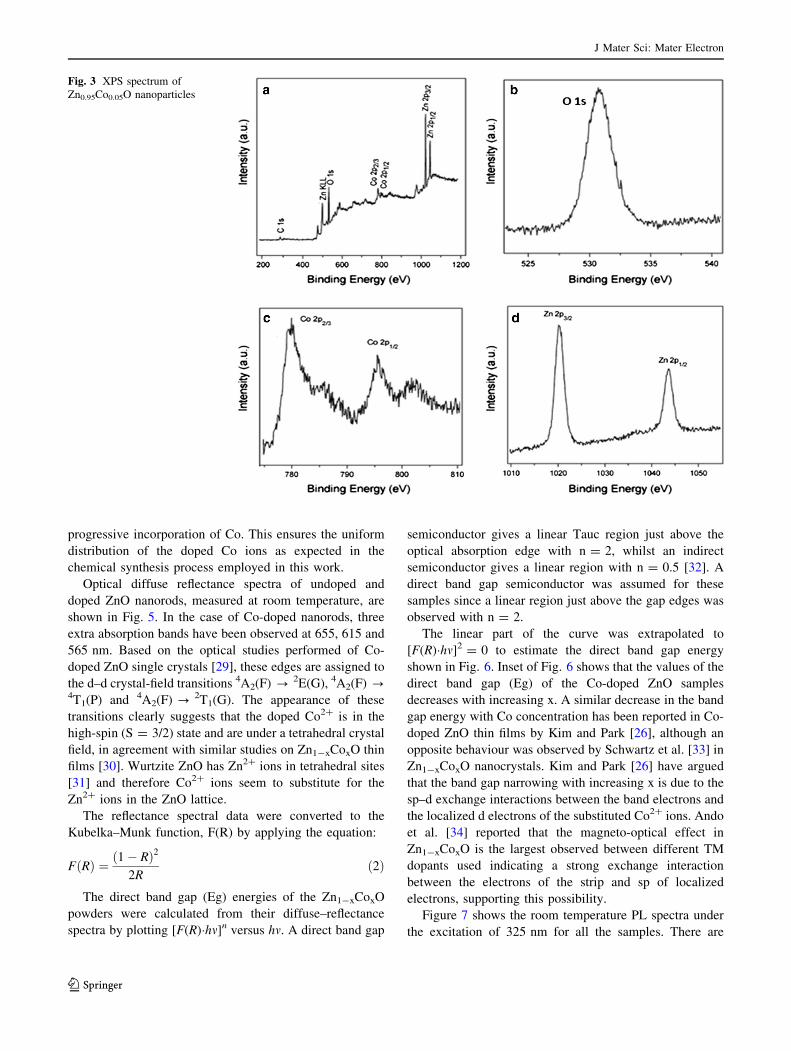
progressive incorporation of Co. This ensures the uniform
distribution of the doped Co ions as expected in the
chemical synthesis process employed in this work.
Optical diffuse reflectance spectra of undoped and
doped ZnO nanorods, measured at room temperature, are
shown in Fig. 5. In the case of Co-doped nanorods, three
extra absorption bands have been observed at 655, 615 and
565 nm. Based on the optical studies performed of Co-
doped ZnO single crystals [29], these edges are assigned to
the d–d crystal-field transitions 4A2(F) ? 2E(G), 4A2(F) ?4T1(P) and 4A2(F) ? 2T1(G). The appearance of these
transitions clearly suggests that the doped Co2? is in the
high-spin (S = 3/2) state and are under a tetrahedral crystal
field, in agreement with similar studies on Zn1-xCoxO thin
films [30]. Wurtzite ZnO has Zn2? ions in tetrahedral sites
[31] and therefore Co2? ions seem to substitute for the
Zn2? ions in the ZnO lattice.
The reflectance spectral data were converted to the
Kubelka–Munk function, F(R) by applying the equation:
FðRÞ ¼ ð1� RÞ2
2Rð2Þ
The direct band gap (Eg) energies of the Zn1-xCoxO
powders were calculated from their diffuse–reflectance
spectra by plotting [F(R)�hm]n versus hm. A direct band gap
semiconductor gives a linear Tauc region just above the
optical absorption edge with n = 2, whilst an indirect
semiconductor gives a linear region with n = 0.5 [32]. A
direct band gap semiconductor was assumed for these
samples since a linear region just above the gap edges was
observed with n = 2.
The linear part of the curve was extrapolated to
[F(R)�hm]2 = 0 to estimate the direct band gap energy
shown in Fig. 6. Inset of Fig. 6 shows that the values of the
direct band gap (Eg) of the Co-doped ZnO samples
decreases with increasing x. A similar decrease in the band
gap energy with Co concentration has been reported in Co-
doped ZnO thin films by Kim and Park [26], although an
opposite behaviour was observed by Schwartz et al. [33] in
Zn1-xCoxO nanocrystals. Kim and Park [26] have argued
that the band gap narrowing with increasing x is due to the
sp–d exchange interactions between the band electrons and
the localized d electrons of the substituted Co2? ions. Ando
et al. [34] reported that the magneto-optical effect in
Zn1-xCoxO is the largest observed between different TM
dopants used indicating a strong exchange interaction
between the electrons of the strip and sp of localized
electrons, supporting this possibility.
Figure 7 shows the room temperature PL spectra under
the excitation of 325 nm for all the samples. There are
Fig. 3 XPS spectrum of
Zn0.95Co0.05O nanoparticles
J Mater Sci: Mater Electron
123

Fig. 4 HR-TEM images and
EDX analysis of a ZnO,
b Zn0.99Co0.01O,
c Zn0.97Co0.03O,
d Zn0.95Co0.05O nanoparticles
J Mater Sci: Mater Electron
123
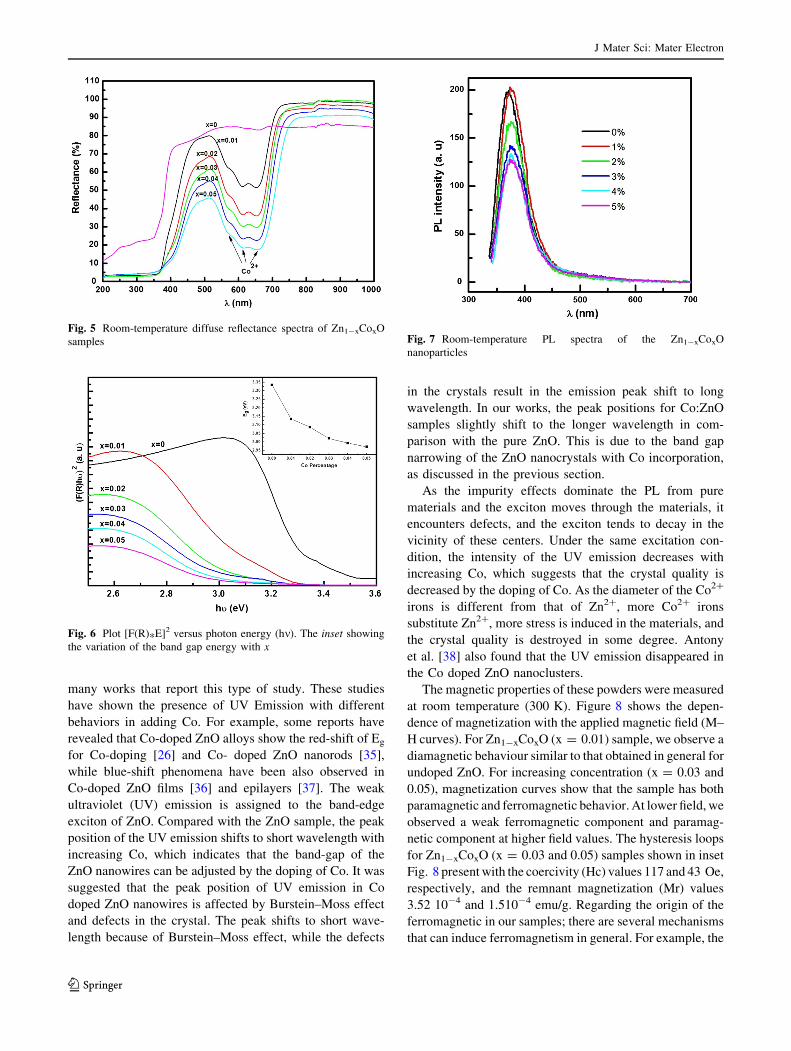
many works that report this type of study. These studies
have shown the presence of UV Emission with different
behaviors in adding Co. For example, some reports have
revealed that Co-doped ZnO alloys show the red-shift of Eg
for Co-doping [26] and Co- doped ZnO nanorods [35],
while blue-shift phenomena have been also observed in
Co-doped ZnO films [36] and epilayers [37]. The weak
ultraviolet (UV) emission is assigned to the band-edge
exciton of ZnO. Compared with the ZnO sample, the peak
position of the UV emission shifts to short wavelength with
increasing Co, which indicates that the band-gap of the
ZnO nanowires can be adjusted by the doping of Co. It was
suggested that the peak position of UV emission in Co
doped ZnO nanowires is affected by Burstein–Moss effect
and defects in the crystal. The peak shifts to short wave-
length because of Burstein–Moss effect, while the defects
in the crystals result in the emission peak shift to long
wavelength. In our works, the peak positions for Co:ZnO
samples slightly shift to the longer wavelength in com-
parison with the pure ZnO. This is due to the band gap
narrowing of the ZnO nanocrystals with Co incorporation,
as discussed in the previous section.
As the impurity effects dominate the PL from pure
materials and the exciton moves through the materials, it
encounters defects, and the exciton tends to decay in the
vicinity of these centers. Under the same excitation con-
dition, the intensity of the UV emission decreases with
increasing Co, which suggests that the crystal quality is
decreased by the doping of Co. As the diameter of the Co2?
irons is different from that of Zn2?, more Co2? irons
substitute Zn2?, more stress is induced in the materials, and
the crystal quality is destroyed in some degree. Antony
et al. [38] also found that the UV emission disappeared in
the Co doped ZnO nanoclusters.
The magnetic properties of these powders were measured
at room temperature (300 K). Figure 8 shows the depen-
dence of magnetization with the applied magnetic field (M–
H curves). For Zn1-xCoxO (x = 0.01) sample, we observe a
diamagnetic behaviour similar to that obtained in general for
undoped ZnO. For increasing concentration (x = 0.03 and
0.05), magnetization curves show that the sample has both
paramagnetic and ferromagnetic behavior. At lower field, we
observed a weak ferromagnetic component and paramag-
netic component at higher field values. The hysteresis loops
for Zn1-xCoxO (x = 0.03 and 0.05) samples shown in inset
Fig. 8 present with the coercivity (Hc) values 117 and 43 Oe,
respectively, and the remnant magnetization (Mr) values
3.52 10-4 and 1.510-4 emu/g. Regarding the origin of the
ferromagnetic in our samples; there are several mechanisms
that can induce ferromagnetism in general. For example, the
Fig. 5 Room-temperature diffuse reflectance spectra of Zn1-xCoxO
samples
Fig. 6 Plot [F(R)*E]2 versus photon energy (hm). The inset showing
the variation of the band gap energy with x
Fig. 7 Room-temperature PL spectra of the Zn1-xCoxO
nanoparticles
J Mater Sci: Mater Electron
123

lattice defects and the secondary phases could be the origin of
ferromagnetism ordering in this kind of systems. In our case,
XRD shows that the lattice parameters increase with an
increase of Co concentrations and that can affect the crystal
quality. The presence of secondary phase of Co metal clus-
ters has been ruled out by our XRD results. The ferromag-
netism behavior could be also explained by the
ferromagnetic coupling between substituting Co in the ZnO
host [39]. Another mechanism related to the concept of
bound magnetic polarons (BMPs) in connection with mag-
netic semiconductors can be introduced here to explain the
origin of the ferromagnetism in our system [40, 41]. In the
current experiment, the doping of Co impurity produced a
number of oxygen vacancies and/or interstitial zinc that may
act as shallow donor electrons and form BMPs. The over-
lapping of the polarons created a spin-split impurity band,
which can mediate the Co–Co coupling in a ferromagnetism
way, and thus, resulted in the ferromagnetic behavior of the
sample. As Co dopant increased, it is more probable for the
doped Co2? cations to occupy the next nearest lattice sites.
The nearest Co–Co pairs then coupled in an antiferromag-
netic way [17] and suppressed the magnetization [42]. This
interpretation can explained the decrease in Saturation for
sample with x = 0.05 (3.52 10-4 emu/g compared to the
value obtained for x = 0.03 (1.510-4 emu/g). We can con-
clude that the room temperature ferromagnetism in our
samples could be related to the defects and/or the coupling
between substituting Co in the ZnO host. Therefore, more
studies have to be done to understand the room-temperature
ferromagnetism in TM-doped ZnO.
Figure 9 shows the magnetization as a function of tem-
perature (T). The temperature dependent behaviors are dis-
cussed based on a simple molecular field theory. First, the
magnetization of the Zn1-xCoxO (x = 0.01) sample shows a
diamagnetic behavior. In addition, the magnetization of two
other samples diverges as the temperature approaches zero,
indicating that these samples contain a paramagnetic com-
ponent dominating. These results are in good agreement with
measurements (M–H).
4 Conclusion
Nanocrystalline Zn1-xCoxO powders have been synthe-
sized by a simple sol–gel method. The synthesis protocol is
based on a slow hydrolysis of the precursor using an
esterification reaction, followed by a supercritical drying in
EtOH. XRD results indicated that all the synthesized un-
doped and Co-doped ZnO samples had the wurtzite struc-
ture and no secondary phases was detected which indicated
that Co ions substituted for Zn ions. TEM results revealed
that the prepared Co doped ZnO nanoparticles are nearly
spherical in shape with particle size \30 nm, which is in
good agreement with the size obtained from XRD. The
band gap energy of the samples decreases from 3.33
(undoped ZnO) to 2.97 eV (5 mol% Co:ZnO), indicating
that Co doping has a crucial influence on the energy band
structure of ZnO. Furthermore, the Zn1-xCoxO samples
exhibit diamagnetic characteristics for x = 0.01 and weak
ferromagnetic with more doping content of Co2?, the fer-
romagnetic behavior is suppressed and paramagnetic nat-
ure is observed at higher field values.
References
1. A.P. Alivisatos, Science 271, 933–937 (1996)
2. D.J. Norris, N. Yao, F.T. Charnock, T.A. Kennedy, Nano Lett. 1,
429–433 (2001)
3. M. Nirmal, L. Brus, Acc. Chem. Res. 32, 407–414 (1999)
Fig. 8 Magnetization curve of Zn1-xCoxO (x = 0.01, 0.03 and 0.05)
at room temperature. Inset shows the magnified loop of Zn1-xCoxO
(x = 0.03 and 0.05)
Fig. 9 Magnetization of of Zn1-xCoxO (x = 0.01, 0.03 and 0.05) as
a function of temperature
J Mater Sci: Mater Electron
123
4. H.M. Yang, S. Nie, Mater. Chem. Phys. 114, 279–282 (2009)
5. M. Yang, Z.X. Guo, K.H. Qiu, J.P. Long, G.F. Yin, D.G. Guan,
S.T. Liu, S.J. Zhou, Appl. Surf. Sci. 256, 4201–4205 (2010)
6. S.S. Lin, J.H. Song, Y.F. Lu, Z.L. Wang, Nanotechnology 20,
365703 (2009)
7. M. Krunks, A. Katerski, T. Dedova, I.O. Acik, A. Mere, Sol.
Energy Mater. Sol. Cells 92, 1016–1019 (2008)
8. S. Rasouli, S.J. Moeen, J. Alloys Compd. 509, 1915–1919 (2011)
9. J.B. Cui, Y.C. Soo, T.P. Chen, J. Phys. Chem. C 112, 4475–4479
(2008)
10. Z. Sofer, D. Sedmidubsky, S. Huber, J. Hejtmanek, M. Marysko,
K. Jurek, M. Mikulics, J. Cryst. Growth 314, 123–128 (2011)
11. X.R. Qu, D.C. Jia, Mater. Lett. 63, 412–414 (2009)
12. Q. Chen, J.L. Wang, Chem. Phys. Lett. 474, 336–341 (2009)
13. H.B. Carvalho, M.P.F. Godoy, R.W.D. Paes, M. Mir, A.O.
Zevallos, F. Iikawa, M.J.S.P. Brasil, V.A. Chitta, W.B. Ferraz,
M.A. Boselli, A.C.S. Sabioni, J. Appl. Phys. 108, 033914 (2010)
14. F. Ochanda, K. Cho, D. Andala, T.C. Keane, A. Atkinson, W.E.
Jones, Langmuir 25, 7547–7552 (2009)
15. B.Q. Wang, X.D. Shan, Q. Fu, J. Iqbal, Y. Lv, H.G. Fu, D.P. Yu,
Phys. E 41, 413–417 (2009)
16. N. Bahadur, A.K. Srivastava, S. Kumar, M. Deepa, B. Nag, Thin
Solid Films 518, 5257–5264 (2010)
17. P.K. Sharma, R.K. Dutta, A.C. Pandey, J. Colloid Interface Sci.
345, 149–153 (2010)
18. X.Y. Xu, C.B. Cao, J. Alloys Compd. 501, 265–268 (2010)
19. J.H. Yang, L.Y. Zhao, X. Ding, L.L. Yang, Y.J. Zhang, Y.X.
Wang, H.L. Liu, Mater. Sci. Eng. B 162, 143–146 (2009)
20. M.E. Mercurio, A.W. Carbonari, M.R. Cordeiro, R.N. Saxena,
L.Z. D’Agostino, J. Magn. Magn. Mater. 322, 1195–1197 (2010)
21. X.L. Zhang, R. Qiao, J.C. Kim, Y.S. Kang, Cryst. Growth Des. 8,
2609–2613 (2008)
22. A. Singhal, S.N. Achary, J. Manjanna, S. Chatterjee, P. Ayyub,
A.K. Tyagi, J. Phys. Chem. C 114, 3422–3430 (2010)
23. J. El Ghoul, C. Barthou, L. El Mir, Superlattices Microstruct. 51,
942–951 (2012)
24. L.W. Yang, X.L. Wu, T. Qiu, G.G. Siu, P.K. Chu, J. Appl. Phys.
99, 074303-1–074303-5 (2006)
25. J. El Ghoul, C. Barthou, L. El Mir, Phys. E Low dimens. Syst.
Nanostruct. 44, 1910–1915 (2012)
26. K.J. Kim, Y.R. Park, Appl. Phys. Lett. 81, 1420–1422 (2002)
27. Ping Li, Sha Wang, Jibiao Li, YuWei. J. Lumin. 132, 220–225
(2012)
28. S. Deka, P.A. Joy, Solid State Commun. 134, 665–669 (2005)
29. D.K. Sardar, J.B. Gruber, B. Zandi, M. Ferry, M.R. Kokta,
J. Appl. Phys. 91, 4846–4852 (2002)
30. S. Ramachandran, A. Tiwari, J. Narayan, Appl. Phys. Lett. 84,
5255–5257 (2004)
31. A. Fouchet, W. Prellier, P. Padhan, Ch. Simon, B. Mercey, V.N.
Kulkarni, T. Venkatesan, J. Appl. Phys. 95, 7187–7189 (2004)
32. A.T. Kuvarega, R.W.M. Krause, B.B. Mamba, J. Phys. Chem. C
115, 22110–22120 (2011)
33. D.A. Schwartz, N.S. Norberg, Q.P. Nguyen, J.M. Parker, D.R.
Gamelin, J. Am. Chem. Soc. 125, 13205–13218 (2003)
34. K. Ando, H. Saito, Z. Jin, T. Fukumura, M. Kawasaki, Y. Mat-
sumoto, H. Koinuma, J. Appl. Phys. 89, 7284–7286 (2001)
35. Y.J. Li, C.Y. Wang, M.Y. Lu, K.M. Li, L.J. Chen, Cryst. Growth
Des. 8, 2598–2602 (2008)
36. J.H. Kim, H. Kim, D. Kim, S.G. Yoon, W.K. Choo, Solid State
Commun. 131, 677–680 (2004)
37. W. Pacuski, D. Ferrand, J. Cibert, C. Deparis, J.A. Gaj, P. Kos-
sacki, C. Morhain, Phys. Rev. B 73, 035214–035226 (2006)
38. J. Antony, S. Pendyala, A. Sharma, X.B. Chen, J. Morrison, L.
Bergman, Y. Qiang, J. Appl. Phys. 97, 10D307 (2005)
39. S. Yang, Y. Zhang, J. Magn. Magn. Mater. 334, 52–58 (2013)
40. R. Janisch, P. Gopal, N.A. Spaldin, J. Phys. Condens. Matter 17,
R657–R689 (2005)
41. J.M.D. Coey, M. Venkatesan, C.B. Fitzgerald, Nat. Mater. 4,
173–179 (2005)
42. T. Busgen, M. Hilgendorff, S. Irsen, F. Wilhelm, A. Rogalev, D.
Goll, M. Giersig, J. Phys. Chem. C 112, 2412–2417 (2008)
J Mater Sci: Mater Electron
123
Copyright © 2022 FDOKUMEN