Structural and magnetic properties of sol–gel Co2xNi0.5−x Zn0.5−xFe2O4 thin films
7
Structural and magnetic properties of sol–gel Co 2x Ni 0.5 x Zn 0.5 x Fe 2 O 4 thin films Evgeny V. Rebrov a,n,1 , Pengzhao Gao a,2 , Tiny M.W.G.M. Verhoeven a , Jaap C. Schouten a , Richard Kleismit b , Zafer Turgut c , Gregory Kozlowski b a Eindhoven University of Technology, P.O. Box 513, 5600 MB Eindhoven, The Netherlands b Physics Department, Wright State University, Dayton, OH 45435, USA c Air Force Research Laboratory, Wright-Patterson AFB, OH 45433, USA article info Article history: Received 26 April 2010 Received in revised form 19 October 2010 Available online 28 October 2010 Keywords: Sol–gel method Co–Ni–Zn ferrite Hysteresis Permittivity Microwave absorption abstract Nanocrystalline Co 2x Ni 0.5x Zn 0.5 x Fe 2 O 4 (x ¼0 0.5) thin films have been synthesized with various grain sizes by a sol–gel method on polycrystalline silicon substrates. The morphology as well as magnetic and microwave absorption properties of the films calcined at 1073 K were studied using X-ray diffraction, scanning electron microscopy, X-ray photoelectron spectroscopy, and vibrating sample magnetometry. All films were uniform without microcracks. The Co content in the Co–Ni–Zn films resulted in a grain size ranging from 15 to 32 nm while it ranged from 33 to 49 nm in the corresponding powders. Saturation and remnant magnetization increased with increase in grain size, while coercivity demonstrated a drop due to multidomain behavior of crystallites for a given value of x. Saturation magnetization increased and remnant magnetization had a maximum as a function of grain size independent of x. In turn, coercivity increased with x independent of grain size. Complex permittivity of the Co–Ni–Zn ferrite films was measured in the frequency range 2–15 GHz. The highest hysteretic heating rate in the temperature range 315–355 K was observed in CoFe 2 O 4 . The maximum absorption band shifted from 13 to 11 GHz as cobalt content increased from x ¼0.1 to 0.2. & 2010 Elsevier B.V. All rights reserved. 1. Introduction Microwave heating has become an important method for chemical reactor heating and materials processing. The concept of microwave heating enables optimal control of rate of heat transfer in a continuous reactor by eliminating conductive and/or convective heat transport resistances. In this way controlled heating of a reactor can be achieved using selective microwave absorption into a functional thin film (i.e. with thickness o1.0 mm) deposited on the reactor channel walls or via nanoparticles dispersed in a flowing liquid. Co–Ni–Zn ultrafine spinel type ferrites are possible candidates for microwave heating due to their moderate dielectric losses in the range between 2 and 15 GHz as well as large magnetic losses [1–3]. Spinel ferrites have the general molecular formula M 2+ Fe 2 3+ O 4 2 , where divalent metal cations M 2+ and Fe 3+ occupy tetrahedral (A) and octahedral (B) interstitial positions of the fcc lattice formed by O 2 2 ions, respectively. Both dielectric and magnetic properties of these oxides depend on the type of cations and their distribution among the two interstitial positions, which in turn depends on the method of synthesis and sintering conditions [4,5] as well as film density [6]. Grain size increases with increase in sintering tem- perature of Co–Ni–Zn ferrites [7,8] and dielectric constant increases when the grain grows [9]. Nanocrystalline ZnFe 2 O 4 [10,11], Ni 1 x Zn x Fe 2 O 4 [12,13], and Co 0.25 Ni 0.25 Zn 0.5 Fe 2 O 4 [14] with a grain size below 20 nm are magnetically ordered with a large magnetic moment even at high temperatures. The observed high-temperature magnetic ordering is attributed to the change in cation distribution from the normal to the mixed spinel type, where Fe 3+ and Zn 2+ ions occupy both sites [15]. NiFe 2 O 4 has a mixed spinel structure when the grain size is reduced to a few nanometers [4]. It exhibits non-collinear spin structure and the magnetic moment is appreciably lower than the value for the bulk material [16]. A model wherein the particle consists of a core with collinear spin arrangement and a surface layer with the magnetic moment inclined to the direction of magnetization has been proposed [16]. Ferrite films are usually prepared by sputtering [17], pulsed laser deposition [18], and spray coating [19] processes. On the other hand, sol–gel [12,20,21] and hydrothermal [22] routes of ferrite Contents lists available at ScienceDirect journal homepage: www.elsevier.com/locate/jmmm Journal of Magnetism and Magnetic Materials 0304-8853/$ - see front matter & 2010 Elsevier B.V. All rights reserved. doi:10.1016/j.jmmm.2010.10.031 n Corresponding author. Present address: School of Chemistry and Chemical Engineering, Queen’s University Belfast, Belfast BT9 5AG, UK. E-mail address: [email protected] (E.V. Rebrov). 1 On sabbatical leave at the Physics Department, Wright State University, Dayton, OH 45435, USA. 2 Present address: College of Materials Science and Engineering, Hunan University, Changsha 410082, China. Journal of Magnetism and Magnetic Materials 323 (2011) 723–729
-
Upload
independent -
Category
Documents
-
view
1 -
download
0
Transcript of Structural and magnetic properties of sol–gel Co2xNi0.5−x Zn0.5−xFe2O4 thin films

Journal of Magnetism and Magnetic Materials 323 (2011) 723–729
Contents lists available at ScienceDirect
Journal of Magnetism and Magnetic Materials
0304-88
doi:10.1
n Corr
Enginee
E-m1 O
Dayton,2 Pr
Univers
journal homepage: www.elsevier.com/locate/jmmm
Structural and magnetic properties of sol–gel Co2xNi0.5�x Zn0.5�xFe2O4
thin films
Evgeny V. Rebrov a,n,1, Pengzhao Gao a,2, Tiny M.W.G.M. Verhoeven a, Jaap C. Schouten a, Richard Kleismit b,Zafer Turgut c, Gregory Kozlowski b
a Eindhoven University of Technology, P.O. Box 513, 5600 MB Eindhoven, The Netherlandsb Physics Department, Wright State University, Dayton, OH 45435, USAc Air Force Research Laboratory, Wright-Patterson AFB, OH 45433, USA
a r t i c l e i n f o
Article history:
Received 26 April 2010
Received in revised form
19 October 2010Available online 28 October 2010
Keywords:
Sol–gel method
Co–Ni–Zn ferrite
Hysteresis
Permittivity
Microwave absorption
53/$ - see front matter & 2010 Elsevier B.V. A
016/j.jmmm.2010.10.031
esponding author. Present address: School
ring, Queen’s University Belfast, Belfast BT9 5
ail address: [email protected] (E.V. Rebrov).
n sabbatical leave at the Physics Departme
OH 45435, USA.
esent address: College of Materials Scienc
ity, Changsha 410082, China.
a b s t r a c t
Nanocrystalline Co2xNi0.5�xZn0.5�xFe2O4 (x¼0�0.5) thin films have been synthesized with various grain
sizes by a sol–gel method on polycrystalline silicon substrates. The morphology as well as magnetic and
microwave absorption properties of the films calcined at 1073 K were studied using X-ray diffraction,
scanning electron microscopy, X-ray photoelectron spectroscopy, and vibrating sample magnetometry.
All films were uniform without microcracks. The Co content in the Co–Ni–Zn films resulted in a grain size
ranging from 15 to 32 nm while it ranged from 33 to 49 nm in the corresponding powders. Saturation and
remnant magnetization increased with increase in grain size, while coercivity demonstrated a drop due to
multidomain behavior of crystallites for a given value of x. Saturation magnetization increased and
remnant magnetization had a maximum as a function of grain size independent of x. In turn, coercivity
increased with x independent of grain size. Complex permittivity of the Co–Ni–Zn ferrite films was
measured in the frequency range 2–15 GHz. The highest hysteretic heating rate in the temperature range
315–355 K was observed in CoFe2O4. The maximum absorption band shifted from 13 to 11 GHz as cobalt
content increased from x¼0.1 to 0.2.
& 2010 Elsevier B.V. All rights reserved.
1. Introduction
Microwave heating has become an important method forchemical reactor heating and materials processing. The conceptof microwave heating enables optimal control of rate of heattransfer in a continuous reactor by eliminating conductive and/orconvective heat transport resistances. In this way controlledheating of a reactor can be achieved using selective microwaveabsorption into a functional thin film (i.e. with thickness o1.0 mm)deposited on the reactor channel walls or via nanoparticlesdispersed in a flowing liquid. Co–Ni–Zn ultrafine spinel typeferrites are possible candidates for microwave heating due to theirmoderate dielectric losses in the range between 2 and 15 GHz aswell as large magnetic losses [1–3].
Spinel ferrites have the general molecular formula M2 +Fe23 +O4
2� ,where divalent metal cations M2 + and Fe3 +occupy tetrahedral (A)
ll rights reserved.
of Chemistry and Chemical
AG, UK.
nt, Wright State University,
e and Engineering, Hunan
and octahedral (B) interstitial positions of the fcc lattice formed byO2
2� ions, respectively. Both dielectric and magnetic properties ofthese oxides depend on the type of cations and their distributionamong the two interstitial positions, which in turn depends on themethod of synthesis and sintering conditions [4,5] as well as filmdensity [6]. Grain size increases with increase in sintering tem-perature of Co–Ni–Zn ferrites [7,8] and dielectric constantincreases when the grain grows [9].
Nanocrystalline ZnFe2O4 [10,11], Ni1�xZnxFe2O4 [12,13], andCo0.25Ni0.25Zn0.5Fe2O4 [14] with a grain size below 20 nm aremagnetically ordered with a large magnetic moment even at hightemperatures. The observed high-temperature magnetic orderingis attributed to the change in cation distribution from the normal tothe mixed spinel type, where Fe3+ and Zn2+ ions occupy both sites [15].NiFe2O4 has a mixed spinel structure when the grain size is reducedto a few nanometers [4]. It exhibits non-collinear spin structure andthe magnetic moment is appreciably lower than the value for thebulk material [16]. A model wherein the particle consists of a corewith collinear spin arrangement and a surface layer with themagnetic moment inclined to the direction of magnetization hasbeen proposed [16].
Ferrite films are usually prepared by sputtering [17], pulsedlaser deposition [18], and spray coating [19] processes. On the otherhand, sol–gel [12,20,21] and hydrothermal [22] routes of ferrite

E.V. Rebrov et al. / Journal of Magnetism and Magnetic Materials 323 (2011) 723–729724
synthesis have shown increasing importance. The advantages ofthe sol–gel process are high purity, chemical homogeneity, smalland uniform particle size, and controlled grain shape. However, theCo–Ni–Zn ferrite single phase can only be formed after calcinationat temperatures above 1100 K. The formation of microcracks inferrite films during calcination is considered to be a disadvantage,which limits application of the sol–gel method [23]. To obtaincrack-free films, vacuum extraction was applied during heattreatment [24].
The addition of Zn in the ferrite composition has also been knownto play a crucial role in lowering the firing temperature, whichimproves adhesion of thin films to the substrate. Generally, saturationmagnetization of Ni–Zn ferrites prepared by chemical routesincreases with heating temperature because of better crystallinityand increase inparticle size [12,25]. Co substitution is expected toincrease saturation magnetization as well as dielectric and magneticlosses due to the magnetic character of Co cations substitutingnon-magnetic Zn. However, there are no comprehensive studies ona structure–microwave heating relationship for the Co–Ni–Zn ferritefilms in literature. For ferrite thin films having thickness on thenanoscale, the grain size is also in the nanometer range scale, which ismuch smaller than the skin depth. Due to this unique feature, theheating behavior of ferrite thin films is different from those of bulkferrite materials.
In performing quantitative measurements of electromagneticproperties, the detailed electrostatic field configuration outside thetip is required. The probe tip and film must be considered as awhole and the solution of the electrostatic field equations atappropriate boundary conditions has to be obtained. This relatesthe tip–film distance to the relative resonant frequency shift of theresonator Df/f, the change of reciprocal quality factor D(1/Q), andphysical ferrite film properties for a given probe geometry. Tocalculate a local surface permittivity of films we use our theoreticaltwo-point model [26], which requires measurements of only twoextreme values of frequency and quality factor: one pair of f0 and Q0,when the tip is well separated from the film (not interacting withthe film) and another pair, f and Q when the tip touches the filmsurface. Our model relates the changes Df/f and D(1/Q) betweenthese two positions to the real and imaginary parts e1 and e2 of thedielectric constant (e¼e0 � ie00 ¼e0 (e1� ie2)).
In this study, magnetic and structural properties of cobalt-substituted nanocrystalline Ni–Zn ferrites prepared via sol–gelmethod have been investigated. The dielectric properties werestudied in the frequency range 2–15 GHz using a scanning eva-nescent microwave microscope as reported elsewhere [27] and theeffect of Co content on dielectric properties is discussed.
2. Experimental
2.1. Sol–gel synthesis of Co2x Ni0.5�xZn0.5�xFe2O4 (x¼0, 0.1, 0.2, 0.5)
Cobalt–nickel–zinc ferrites were prepared by the citrate precursormethod [28]. Iron (III) nitrate nonahydrate, nickel nitrate hexahy-drate, zinc nitrate hexahydrate, and cobalt nitrate hexahydrate(all from Aldrich Co., ACS grade) were used as precursors for thepreparation of the starting sol. The precursors were dissolved inethanol at a molar ratio Co:Ni:Zn:Fe¼(2x):(0.5�x):(0.5�x):2 (wherex¼0, 0.1, 0.2, 0.5). Then the former salt solution was dissolved in acitric acid solution and stirred for 2 h. This solution was titratedquantitatively by an ammonia solution to a pH of 2 to form a ferriteprecursor sol. The resulting sol was dropped on a 1�1 cm2 Si plateand spin coated for 25 s at 3500 rpm with an acceleration rateof 1250 rpm/s. A part of corresponding sols was dried to getpowders. Drying was performed in an oven at 353 K for 30 min.The coating process was repeated 6 times and then the samples were
kept at 1073 K for 1 or 3 h. The film thickness in a single depositioncycle was 160710 nm. A coating thickness of 1 mm was achieved in 6deposition cycles. The films and powders with a nominal compositionof Co2xNi0.5�xZn0.5�xFe2O4 will be referred to according to the Cocontent (x, first index) and calcination time (in hours, second index).The samples with a single index were uncalcined. For example,Co0.2Ni0.4Zn0.4Fe2O4 films calcined for 3 h will be referred to as F-1-3,while powders will be P-1-3.
2.2. Microstructure and magnetic properties characterization
Thermogravimetric analysis (TGA) was carried out in an air flow(50 cm3/min) with a heating rate of 10 K/min from room temperatureto 973 K. The initial mass of the sample was 20 mg. XRD patterns wererecorded at a scanning rate of 0.31 2y/min using an X-ray diffracto-meter (Rigaku) with nickel filtered Cu Ka radiation produced at 40 kVand 27.5 mA. The microstructure analysis was performed with ascanning electron microscope (SEM, Quanta 3D FEG, FEI) operatedat 20 kV.
XPS measurements were carried out with a Kratos AXIS ultra-spectrometer equipped with a monochromatic Al Ka X-ray source anda delay-line detector. Spectra were obtained using the aluminiumanode (Al Ka¼1486.6 eV) operating at 150 W. The backgroundpressure was 2�10�9 mbar. For quantitative analysis of the XPSdata Perkin-Elmer atomic sensitivity factors are used [29].
Hysteresis loop, saturation magnetization, and coercivity of thecomposite films were measured at 295 and 355 K by means of avibrating sample magnetometer (VSM) equipped with a 2 Telectromagnet and a furnace. Saturation magnetization (Ms),remnant magnetization (Mr), coercive force (Hc), and hystereticlosses were evaluated from hysteresis curves.
A near field evanescent microwave microscope was used tocharacterize the dielectric properties of the ferrites through frequencyshift and quality factor measurements. The relative sensitivity of themicroscope is in the range of 10�2 and the resolution is governed bythe radius of the probe tip [30]. The microwave probe consists of atuned l/4 coaxial transmission line with an end wall aperture.Transverse electromagnetic wave created by a frequency generatormoves along the coaxial probe and is totally and internally reflected atthe surface of the end wall aperture. The evanescent waves emanatefrom a sharpened tip extending concentrically through the apertureand interact with the sample. The coaxial microwave probe iscapacitively coupled to the film and to a Hewlett-Packard 8722ESnetwork analyzer through a tuning network.
The resonant frequency and quality factor data are produced bysetting the reference resonant frequency and the quality factor atapproximately 10 mm above the sample surface and moving theprobe tip in micrometer steps to the position almost touching thesurface of the film at 295, 315, 335, and 355 K. The resonantfrequency and quality factor shift data are best fitted by a method ofimages model that produces the real and complex parts ofpermittivity [31]. The extraction of data through evanescentmicrowave microscopy is described elsewhere [12].
3. Results and discussion
3.1. Thermal decomposition process of Co–Ni–Zn powder
Fig. 1 shows TG–DTG curves for as synthesized samples P-0, P-1, andP-2 in the temperature range 300�973 K. It can be seen that thedecomposition process consists of several stages. First, adsorbed wateris removed from the (N2H5)3Co0.2Ni0.4Zn0.4Fe2(N2H3COO)9 �3H2Ocitrate precursor below 393 K. This corresponds to 6% of the totalweight loss, which is in agreement with the theoretical value (5.4 wt%).The second stage at 393�533 K is related to a partial decomposition

100 3.0
80ba
c 2.4
60 1.8
40Wei
ght,
%
1.2
20c 0.6
b
ca
Der
ivat
ive
wei
ght,
% K
-1
0b
273 473 673 8730.0
Temperature, K
Fig. 1. Thermal gravimetrical (TG) analysis of (a) P-0, (b) P-1, and (c) P-2. Heating
rate¼10 K/min.
100*
(311
)
Counts
(024
)
(511
)
(400
)
(006
)
*(222
)
(220
)
(422
)
F-5-1
F-2-1
F-1-1
30 40 50 602θ, °
F-0-1
Fig. 2. XRD of ferrite films after deposition for 6 cycles. Reflections from the Si
substrate are marked with an asterisk. Reflections from Fe2O3 are given with a small
font (blue colour in on-line version).
100
(113
) (024
)
(422
)
Counts* (2
22)
(311
)
(511
)
(220
)
(018
)
(116
)
*
(400
)
*
P-5-3
P-5-1
P-2-1
P-1-1
P-0-3
P-0-1
E.V. Rebrov et al. / Journal of Magnetism and Magnetic Materials 323 (2011) 723–729 725
reaction of the citrate precursor [32]. This corresponds to 50% of thetotal weight loss. The minor weight loss in the range 533–673 K(22 wt%) corresponds to combustion of residual citric and a smallquantity of carbon. The overall weight loss of 77.4 wt% is in perfectagreement with the theoretical value (77.3 wt%). As the atomic weightsof Ni and Co are virtually the same, and only slightly lower than thatof Zn, no substantial differences were observed in the overall lossfactors. The highest weight loss temperature increased from 495 to506 K with increasing Co content. This may suggest that the micro-chemical structure evolved with Co addition. In order to get thefilms without microcracks, the films were calcined at a low heatingrate of 2 K/min below 673 K and at a high rate of 5 K/min up to1073 K.
30 40 50 602θ, °
Fig. 3. XRD of Ni–Zn, Co–Ni–Zn, and Co ferrite powders. Reflections from the Si
substrate are marked with an asterisk. Reflections from Fe2O3 are given with small
font (blue colour in on-line version).
3.2. Crystallography and SEM
The XRD patterns of the films are shown in Fig. 2. All the electrondiffraction patterns can be matched to the series of Bragg reflections
corresponding to single-phased spinels (ICSD82-1533) with a latticeconstant of 8.383 A, which contain small quantities of a-Fe2O3 (up to5 wt%) in the case of Co-substituted samples. Additional peaks can beeasily indexed to rhombohedral Fe2O3 with lattice parametersa¼5.032 A and c¼13.75 A, which are in agreement with the reportedvalues (JCPDS 86-0550). Formation of a-Fe2O3 has been attributed topreferential loss of one or more of divalent cations during washingand drying stages [33,34]. The percentage of a-Fe2O3 is known to bedependent on pH and temperature of the solution at the precipitationstage. The percentage of a-Fe2O3 estimated from the XRD spectrausing the direct comparison method for quantitative estimation ofphases is between 4% and 6%. Since the properties of samples within aseries are being compared and nearly the same quantity ofa-Fe2O3 ispresent in all the samples, the influence of a-Fe2O3 is expected to besimilar in all the samples.
An increase in grain size with increase in Co content is clearlyobserved from narrowing of XRD lines. The average crystallite size hasbeen calculated from the (3 1 1) diffraction peak using Scherrer’sformula.
The XRD patterns of the corresponding powders are shown inFig. 3. The lattice constant of P-0-1, P-1-1, and P-2-1 was 8.383,8.400, and 8.396 A, respectively. The value of lattice parameter ofNi–Co–Zn ferrite powders is higher than that of NiFe2O4 and lowerthan that of CoFe2O4, which is expected due to the bigger ionic sizeof Co2 + (0.082 nm) ion than that of the Ni2 + (0.078 nm) ion.
Spinel ferrites have the fcc structure with molecular formula ofthe type AB2O4 where A and B are cations. For the divalent cation intetrahedral (A) positions of spinel ferrites, the bigger the diameterof the cation, the lower the lattice energy and the steadier thecrystal. The cation diameter decreases in the following order:Co2 + 4Zn2 + 4Ni2 +, resulting in an increase in grain size withincreasing Co content. Superexchange interaction, another factorregulating grain size, is the exchange interaction in spinel ferriteswhere the antiparallel alignment of magnetic moments of A sitewith B site is mediated by oxygen ions. The strength of theantiparallel coupling between the metal ions depends on theA–O–B bond angle with the strength being maximum for an angleof 1801 [35]. The crystal size is found to depend on superexchangeinteraction strength. CoFe2O4 has a high magnetocrystalline ani-sotropy, which leads to high grain size.

500 nm 500 nm500 nm
Fig. 4. SEM images of the films after deposition for 6 cycles: (a) F-0-1, (b) F-1-1, and (c) F-2-1.
Table 1Elemental analysis of samples from EDS data.
Nominal composition Relative atomic ratio
Co Ni Zn Fe
E.V. Rebrov et al. / Journal of Magnetism and Magnetic Materials 323 (2011) 723–729726
The micro-pattern photographs of the films are shown in Fig. 4. Thefilms were homogeneous and compact; there were no microcracks in thefilms and also it had good adhesion with the Si substrate. A very finecrystal structure with the particle size ranging from 20 to 50 nm wasobtained. Average particle size increases with increase in Co content offilm, confirming results obtained by XRD.
Ni0.5Zn0.5Fe2O4 – 0.48 0.41 2.0
Co0.2Ni0.4Zn0.4Fe2O4 0.17 0.39 0.37 2.0
Co0.4Ni0.3Zn0.3Fe2O4 0.30 0.29 0.31 2.0
CoFe2O4 0.90 – – 2.0
Table 2Elemental analysis of samples from XPS data.
Nominal composition Relative atomic ratio
Co Ni Zn Fe
Ni0.5Zn0.5Fe2O4 – 0.14 0.17 2.0
Co0.2Ni0.4Zn0.4Fe2O4 0.17 0.22 0.31 2.0
Co0.4Ni0.3Zn0.3Fe2O4 0.28 0.12 0.19 2.0
CoFe2O4 0.64 – – 2.0
3.3. EDS and XPS analysis
The presence of Co, Zn, Ni, and Fe in the films was revealed byenergy dispersive spectroscopy (EDS) analysis (Table 1). TheCo:Zn:Ni:Fe ratio was close to the stoichiometric one for Ni andFe within the error of the EDS system, while the data suggest aslight deficiency of Co and Zn by a few atomic percents in the filmsas compared with that in the initial solution. The Ni and Fe contentswere in good agreement with the nominal composition. The surfacecomposition analyzed by XPS showed that the film surface wasenriched in iron (Table 2). The surface enrichment in iron occurreddue to different motilities of the cations in the oxygen lattice duringthe formation and growth of spinel grains. The binding energy of Fe2p3/2 was 710.5 eV in F-0-1 (Fig. 5). The presence of Fe3 + wasconfirmed by a satellite peak at around 8.0 eV above the principalpeak. It can also be concluded that the samples contain all Ni in thespinel structure as there should be a shoulder in the Ni 2p3/2 line ifNiO would be formed [12]. The binding energy of Zn2 + of 1021.5 eVconfirms the formation of a ferrite spinel structure.
3.4. Magnetic properties
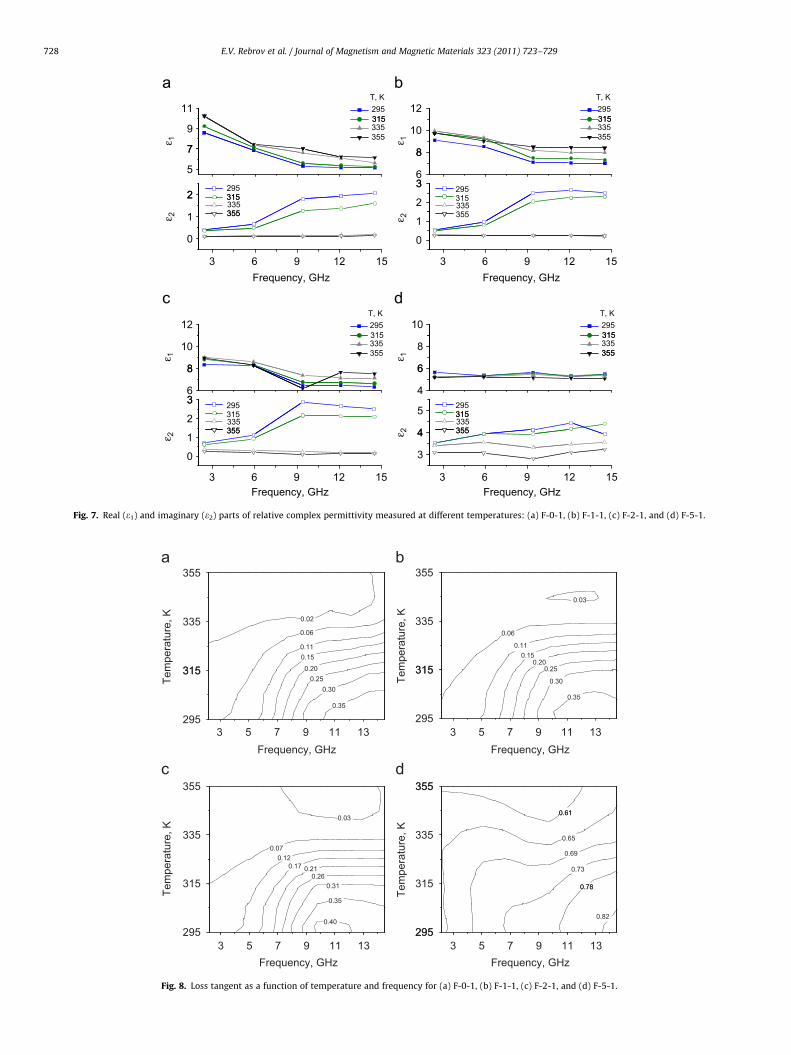
Average crystallite sizes were calculated using the Scherrerequation from the XRD peaks and were found to slightly vary from33 to 49 nm for the powder under investigation. Magnetic char-acteristics of hysteresis loop for the thin films, saturation magne-tization (Ms) and the remnant magnetization (Mr), are shown inFig. 6. Coercivity (Hc) and hysteretic loss are listed in Table 3.
It is can be seen from Fig. 6a that Ms increases with increase inaverage crystalline size for a given composition or from differentcompositions of films. However, the highest value of 47.5 J/T/kgobtained for the largest grain size in P-0-3 remains lower than thatof bulk ferrite particles (60 J/T/kg) [35]. The presence of a-Fe2O3
would lead to a decrease in the value of Ms in comparison to thesame sample without it. The magnetizing mechanism of softferrites results from spin domain rotation and domain wallsmotion. In turn, domain walls motion is affected by grain sizeand sintering density [36,37] and enhanced by increase in grain size[12,38,39]. In smaller grains, an increased surface to volume ratioleads to noncollinearity of magnetic moments on the surface[40,41]. This causes decrease in saturation magnetization withdecrease in grain dimensions.
The remnant magnetization Mr (see Fig. 6b) increases from 8.50to 9.21 J/T/kg with increase in grain size from 34.5 to 38.6 nm forCoFe2O4 and from 1.48 to 2.85 J/T/kg with increase in grain sizefrom 33.4 to 48.7 nm for Ni0.5Zn0.5Fe2O4. The highest Mr remnantmagnetization was observed in CoFe2O4 calcined for 3 h (P-5-3).The magnetic parameters obtained at 355 K temperature show thesame tendency as those measured at 295 K.
The change of average crystallite size influenced the coercivity(Hc) of the ferrite samples as we had shown in a previous study [12].Coercivity increases with the increase in particle size until itreaches a maximum value at the critical diameter of crystallites.After reaching the maximum, Hc decreases due to the transition ofmagnetic single domain to magnetic multidomain within a singlecrystallite. The critical diameters of 22 and 1.2 nm were calculatedfor Ni0.5Zn0.5Fe2O4 [12,42] and CoFe2O4 [35,43], respectively, usingthe formula derived by Kittel [44] with material properties takenfrom Ref. [35]. Despite the unrealistical small value of criticaldiameter for CoFe2O4 its average grain size in both powders andfilms corresponds to the multidomain regime.
The maximum value of coercivity Hc¼626 Oe was observed forthe CoFe2O4 thin film (1 h sintering time) with the grain sizeof 34.5 nm exceeding critical diameter for crystallites of the film.A smaller value of Hc¼558 Oe for the CoFe2O4 thin film subjected to3 h sintering time with a grain size of 38.6 nm suggests that thesefilms have grain sizes exceeding the critical value. The same type ofdependence of Hc on diameter of crystallites (33.4 nm for 1 hsintering time with Hc¼49.2 Oe and 48.7 nm for 3 h sintering timewith Hc¼42.2 Oe) is observed in Ni0.5Zn0.5Fe2O4 thin films, proving
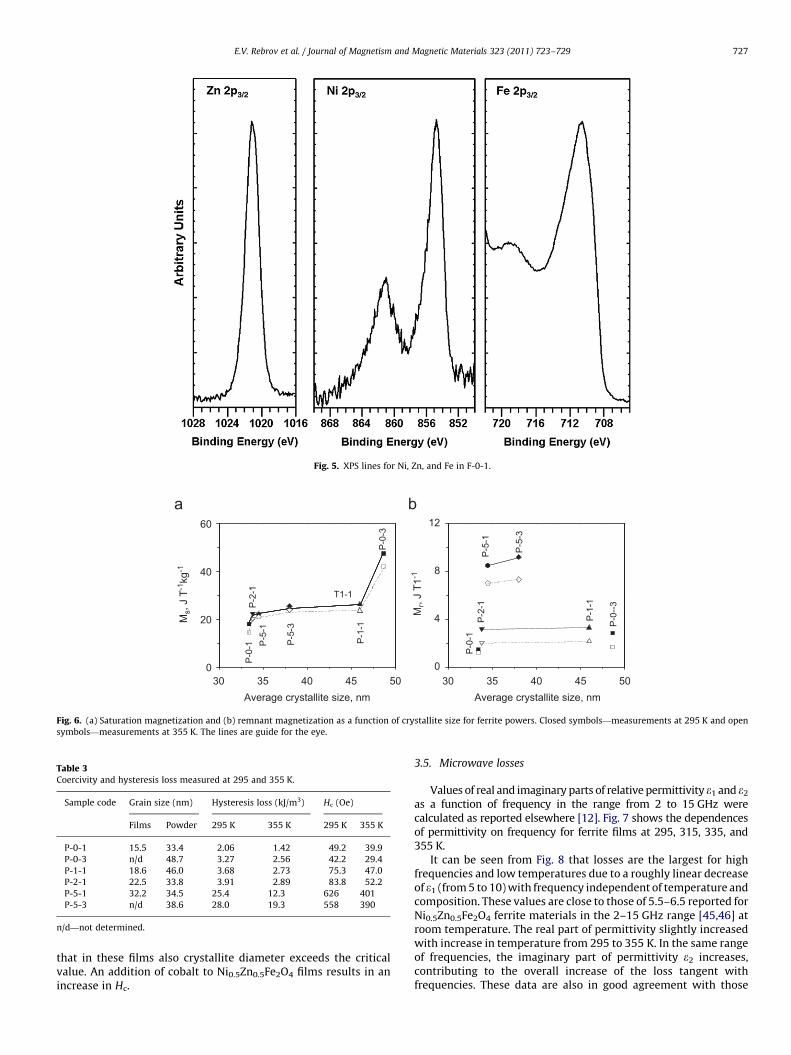
Fig. 5. XPS lines for Ni, Zn, and Fe in F-0-1.
60 12P
-5-3
P-5
-1
40 8
P-2
-1
20Ms,
J T-1
kg-1
4 P-2
-1
P-0
--3
P-1
-1
Mr,
J T1
-1
P-5
-1P
-0-1
0 030
Average crystallite size, nm Average crystallite size, nm35 40 45 50 30 35 40 45 50
T1-1
P-1
-1
P-5
-3
P-0
-3
P-0
-1
Fig. 6. (a) Saturation magnetization and (b) remnant magnetization as a function of crystallite size for ferrite powers. Closed symbols—measurements at 295 K and open
symbols—measurements at 355 K. The lines are guide for the eye.
Table 3Coercivity and hysteresis loss measured at 295 and 355 K.
Sample code Grain size (nm) Hysteresis loss (kJ/m3) Hc (Oe)
Films Powder 295 K 355 K 295 K 355 K
P-0-1 15.5 33.4 2.06 1.42 49.2 39.9
P-0-3 n/d 48.7 3.27 2.56 42.2 29.4
P-1-1 18.6 46.0 3.68 2.73 75.3 47.0
P-2-1 22.5 33.8 3.91 2.89 83.8 52.2
P-5-1 32.2 34.5 25.4 12.3 626 401
P-5-3 n/d 38.6 28.0 19.3 558 390
n/d—not determined.
E.V. Rebrov et al. / Journal of Magnetism and Magnetic Materials 323 (2011) 723–729 727
that in these films also crystallite diameter exceeds the criticalvalue. An addition of cobalt to Ni0.5Zn0.5Fe2O4 films results in anincrease in Hc.
3.5. Microwave losses
Values of real and imaginary parts of relative permittivity e1 and e2
as a function of frequency in the range from 2 to 15 GHz werecalculated as reported elsewhere [12]. Fig. 7 shows the dependencesof permittivity on frequency for ferrite films at 295, 315, 335, and355 K.
It can be seen from Fig. 8 that losses are the largest for highfrequencies and low temperatures due to a roughly linear decreaseof e1 (from 5 to 10) with frequency independent of temperature andcomposition. These values are close to those of 5.5–6.5 reported forNi0.5Zn0.5Fe2O4 ferrite materials in the 2–15 GHz range [45,46] atroom temperature. The real part of permittivity slightly increasedwith increase in temperature from 295 to 355 K. In the same rangeof frequencies, the imaginary part of permittivity e2 increases,contributing to the overall increase of the loss tangent withfrequencies. These data are also in good agreement with those
T, K T, K11
315295 12
315295
9 335315
10 335315
7355ε 1
8355ε 1
7 85
36
2295315
3 2953152
355335315 2
355335
1 355ε 2 1ε 2
0 0
3 6 9 12 15 3 6 9 12 15Frequency, GHz Frequency, GHz
T, K T, K12
315295 10
315295
10355335 8
355335315
8
ε 1
6355ε 1
8 6
36 43 295
315 5 2953152
355335
4 355335315
1355
ε 2 4 355ε 2
0 3
3 6 9 12 15 3 6 9 12 15Frequency, GHz Frequency, GHz
Fig. 7. Real (e1) and imaginary (e2) parts of relative complex permittivity measured at different temperatures: (a) F-0-1, (b) F-1-1, (c) F-2-1, and (d) F-5-1.
355355
0.03
3350.023350.060.06
0.110.110.15
0.20315
0.15
315 0.25
0.303150.20
0.25315
0.350.30
0.35
2953 5 7 9 11 13
295
Frequency, GHz3 5 7 9 11 13
Frequency, GHz
Frequency, GHz Frequency, GHz
355 355355
0.610.03
0.61
335 0.653350.07
0.12 0.69
0.17 0.21 0.730.26
0.31315 0.783150.35
0.78
2950.40
2953
295
Tem
pera
ture
, K
Tem
pera
ture
, KTe
mpe
ratu
re, K
Tem
pera
ture
, K
5 7 9 11 13 3 5 7 9 11 13
0.82
Fig. 8. Loss tangent as a function of temperature and frequency for (a) F-0-1, (b) F-1-1, (c) F-2-1, and (d) F-5-1.
E.V. Rebrov et al. / Journal of Magnetism and Magnetic Materials 323 (2011) 723–729728

370F-5-1
F-1-1
350 F-2-1
F-0-1
Si
330
Si
0 50 100 150 200 250 300310
Time, s
Tem
pera
ture
, K
Fig. 9. Heating curves at 2.4 GHz for ferrite films and a Si substrate plate used as a
reference material.
E.V. Rebrov et al. / Journal of Magnetism and Magnetic Materials 323 (2011) 723–729 729
reported in Ref. [46], where e2 values were around 0.5 and slightlyincreased at higher frequencies.
The microwave heating curves in Fig. 9 show that compositionstrongly affects the heating process. The effect of Si substrate was alsostudied. The volume and heat capacity of the Si substrate are largerthan those of ferrite films. Therefore the substrate absorbs most of thethermal energy that is converted from microwave energy. It can beseen from Fig. 9 that Co addition has a positive influence on theheating rate. The initial heating rates were 0.20, 0,35, 0.40, and 1.0 K/sfor F-0-1, F-1-1, F-2-1, and F-5-1, respectively. The F-5-1 sample withthe highest loss tangent demonstrated the highest heating rate. Theinitial heating rate of the Si substrate was 0.15 K/s.
4. Conclusions
The sol–gel process was employed to produce single-phase,highly crystalline, nanometric Co–Ni–Zn ferrite films with athickness of up to 1 mm. The films show good adhesion to the Sisubstrate. The stoichometry of the films is rather close to thenominal composition, while the films were slightly enriched iniron. The latter is attributed to the preferential loss of one or more ofthe divalent cations during the washing and drying stages. Theselosses can be further reduced by optimization of the drying step.The influence of Co on magnetic behavior has been investigated.With increase in Co content, the average size of the nanocrystallitesin the films increases from 15 to 32 nm, resulting in an increase insaturation and remnant magnetizations. Higher Co content leads toa higher loss tangent and it shifts the position of the maximum ofmicrowave absorption band from 13 to 11 GHz. The Co–Ni–Znferrite thin films can be prepared on the walls of microstructuredreactors for efficient and fast microwave heating, allowing fornon-steady state operation.
References
[1] C.S. Kim, Y.S. Yi, K.-T. Park, H. Namgung, J.-G. Lee, J. Appl. Phys. 85 (1999) 5223.[2] A.K. Srivastava, M.J. Hurben, M.A. Wittenauer, P. Kabos, C.E. Patton, R. Rameh,
P.C. Dorsey, D.B. Chrisey, J. Appl. Phys. 85 (1999) 7838.[3] M.M. Amado, M.S. Rogalski, L. Guimar~aes, J.B. Sousa, I. Bibicu, R.G. Welch,
S.B. Palmer, J. Appl. Phys. 83 (1998) 6852.[4] C.N. Chinnasamy, A. Narayanasamy, N. Ponpandian, K. Chattopadhyay,
K. Shinoda, B. Jeyadevan, K. Tohji, K. Nakatsuka, T. Furubyashi, I. Nakatani,Phys. Rev. B 63 (2001) 184108.
[5] X. Li, Q. Li, J. Alloys Compd. 458 (2008) 558.[6] J. Pattanayak, J. Mater. Sci. Lett. 10 (1991) 1461.[7] A. Dias, R.L. Moreira, N.D.S. Mohallem, J. Phys. Chem. Solids 58 (1997) 543.[8] A. Dias, N.D.S. Mohallem, R.L. Moreira, Mater. Res. Bull. 33 (1998) 475.[9] K. Iwauchi, Jpn. J. Appl. Phys. 10 (1971) 1520.
[10] T. Sato, K. Haneda, M. Seki, T. Iijima, Appl. Phys. A: Solids Surf. A 50 (1990) 13.[11] C.N. Chinnasamy, A. Narayanasamy, N. Ponpandian, K. Chattopadhyay,
H. Gueralt, J.-M. Greneche, J. Phys.: Condens. Matter 12 (2000) 7795.[12] P. Gao, E.V. Rebrov, M.W.G.M. Verhoeven, J.C. Schouten, R. Kleismit,
G. Kozlowski, J. Cetnar, Z. Turgut, G. Subramanyam, J. Appl. Phys. 107 (2010)044317.
[13] Z. Beji, L.S. Smiri, N. Yaacoub, J.-M. Greneche, N. Menguy, S. Ammar, F. Fievet,Chem. Mater. 22 (2010) 1350.
[14] N. Lakshmi, Hina Bhargava, O.P. Suwalka, K. Venugopalan, Phys. Rev. B 80(2009) 174425.
[15] H.H. Hamdeh, J.C. Ho, S.A. Oliver, R.J. Willey, G. Oliveri, G. Busca, J. Appl. Phys. 81(1997) 1851.
[16] A.H. Morrish, K. Haneda, J. Appl. Phys. 52 (1981) 2496.[17] A.T.A. Wee, J.P. Wang, A.C.H. Huan, L.P. Tan, R. Gopalakrishnan, K.L. Tan, IEEE
Trans. Magn. 33 (1997) 2986.[18] A. Lisfi, J.C. Lodder, P. de Haan, M.A. Smithers, F.J.G. Roesthuis, IEEE Trans. Magn.
34 (1998) 1654.[19] A. Takayama, M. Okuya, S. Kaneko, Solid State Ion. 172 (2004) 257.[20] A. Verma, T.C. Geol, R.G. Mendiratta, J. Magn. Magn. Mater. 208 (2000) 13.[21] R. Hochschild, H. Fuess, J. Mater. Chem. 10 (2000) 539.[22] A. Dias, R.L. Moreira, Mater. Lett. 39 (1999) 69.[23] M. Sedlar, V. Matejec, T. Grygar, J. Kadlecova, Ceram. Int. 26 (2000) 507.[24] W. Liu, J. Wu, Mater. Chem. Phys. 69 (2001) 148.[25] W.S. Chiu, S. Radiman, R. Abd-Shukor, M.H. Abdullah, P.S. Khiew, J. Alloys
Compd. 459 (2008) 291.[26] R.A. Kleismit, K. Munbodh, J.J. Boeckl, A.L. Campbell, K.K. Koziol, G. Kozlowski,
S.C. Hopkins, T.L. Peterson, J. Nanosci. Nanotechnol. 9 (2009) 1.[27] R.A. Kleismit, M. El Ashry, G. Kozlowski, M.S. Amer, M.K. Kazimierczuk,
R.R. Biggers, Supercond. Sci. Technol. 18 (2005) 1197.[28] E.E. Sileo, R. Rotelo, S.E. Jaboco, Physica B 320 (2002) 257.[29] C.D. Wagner, W.M. Riggs, L.E. Davis, J.F. Moulder, G.E. Muilenburg, Handbook of
X-ray Photoelectron Spectroscopy, Perkin-Elmer Corporation, Minnesota,1979.
[30] R.A. Kleismit, G. Kozlowski, M.K. Kazimierczuk, IEEE Trans. Appl. Supercond. 54(2006) 639.
[31] R.A. Kleismit, G. Kozlowski, R.R. Biggers, I. Maartense, M.K. Kazimierczuk,D.B. Mast, IEEE Trans. Appl. Supercond. 15 (2005) 2915.
[32] Xu Feng, Z. Xiangchun, L. Liangchao, L. Hui, J. Jing, J. Rare Earths 25 (Suppl.)(2007) 232.
[33] O. Suwalka, R.K. Sharma, V. Sebastian, N. Lakshmi, K. Venugopalan, J. Magn.Magn. Mater. 313 (2007) 198.
[34] R.V. Mangalaraja, S. Ananthakmar, P. Manohara, F.D. Gnanama, M. Awanob,Mater. Sci. Eng. A 367 (2004) 301.
[35] J. Smit, H.P.J. Wijn, Ferrites, Philips Technical Library, Eindhoven, The Nether-lands, 1959, p. 157.
[36] R.H. Kodama, A.E. Berkowitz, E.J. McNiff, S. Foner, Phys. Rev. Lett. 77 (1996) 394.[37] C. Caizer, J. Magn. Magn. Mater. 251 (2002) 304.[38] H. Zhang, Z. Ma, Ji Zhou, Z. Yue, L. Li, Z. Gui, J. Magn. Magn. Mater. 213 (2000)
304.[39] M.P. Bogdanovich, Sov. Phys. Solid State 33 (1991) 1952.[40] C. Caizer, Mater. Sci. Eng. B 100 (2003) 63.[41] K. Haneda, A.H. Morrish, J. Appl. Phys. 63 (1988) 4258.[42] K.H. Wu, Y.C. Chang, T.C. Chang, Y.S. Chiu, T.R. Wu, J. Magn. Magn. Mater. 283
(2004) 380.[43] S. Ayyappan, J. Philip, B. Raj, Mater. Chem. Phys. 115 (2009) 712.[44] C. Kittel, Rev. Mod. Phys. 21 (1949) 541.[45] Y. Hwang, Mater. Lett. 60 (2006) 3277.[46] C.-H. Peng, H.-W. Wang, S.-W. Kan, M.-Z. Shen, Y.-M. Wei, S.-Y. Chen, J. Magn.
Magn. Mater. 284 (2004) 113.