Surfactant-Induced Modification of Dopants Reactivity in Sol−Gel Matrixes
11
Surfactant-Induced Modification of Dopants Reactivity in Sol-Gel Matrixes Claudio Rottman, ² Gideon Grader, ‡ Yoram De Hazan, ‡ Sharona Melchior, ‡ and David Avnir* ,² Institute of Chemistry, The Hebrew UniVersity of Jerusalem, Jerusalem 91904, Israel, and Faculty of Chemical Engineering, Technion, Haifa 32000, Israel ReceiVed April 20, 1999 Abstract: Organically and bio-organically doped sol-gel materials have attracted much attention due to their ability to reproduce solution molecular activities within the ceramic environment. We take now this methodology one step forward and explore conditions under which the dopant properties can be modified by the matrix. Specifically we report that the co-entrapment of the surfactant cetyltrimethylammonium bromide (CTAB, the modifier) at low concentrations, with an extensive series of pH indicators representing several key molecular families (the primary dopant) within tetramethoxysilane (TMOS)-derived silica sol-gel matrixes, greatly modifies the indicating performance of the primary dopant. Thus, very large pK i shifts of up to 3-4 orders of magnitude obtained upon the co-entrapment cause methyl orange (MO) to become an indicator for higher acidities and phenolphthalein for higher basicities, compared to their solution behavior. In another example, the ΔpK i between the two indicating transitions of alizarin increased from ∼4.5 pH units in solution to ∼10.5 pH units (!) in the glass, transforming it into an indicator for both the high acidic and high basic pH ranges. In yet another example, the two indicating transitions of phenol red were shifted to a more acidic pH range, pushing the tail of the more acidic titration branch into the negatiVe pH values range. These and other effects were found to be more pronounced by the co-entrapment than by the use of CTAB solutions or of sol-gel matrixes without CTAB, pointing to a synergetic effect between the surfactant and the silica cage. The indicators also proved highly sensitive in revealing the properties of the local environment created by the surfactant. Thus, the indicator molecules were shown to migrate and reorient within the hydrophobic and the hydrophilic regions of micellar environment, according to their acquired charge upon pH changes. The concentration- dependent and humidity-dependent surfactant aggregation processes within the silica cage were probed with MO, and the results were compared with the behavior of entrapped MO in sol-gel matrixes of varying hydrophobicities, obtained by the copolymerization of CH 3 Si(OCH 3 ) 3 with TMOS at various ratios, with and without CTAB. Of practical importance have been the observations that the dopant/surfactant co-entrapment greatly improves the leaching profiles: half-lives, ranging from several months to several years, were found for MO and methyl red; and using SAXS, surface area and porosity measurements, it was shown that CTAB can be used to stabilize the microscopic structure of the material upon heat-drying. This provides a potential solution to the problem of continuing structural changes, which take place with sol-gel materials long after the completion of their synthesis. 1. Background Direct entrapment of organic and bio-organic molecules within oxide sol-gel materials 1,2 is moving fast from basic science research to useful products. Examples include the 1 million TV sets sold annually by Toshiba, the screens of which are coated with a silica/zirconia sol-gel thin films, doped with indigo dyes; 3a the organically doped sol-gel coated glassware sold by Spiegelau; 3b and the sol-gel entrapped lipase sold by Fluka. 3c Intensive R&D efforts toward many other products are strongly going on both in major industries and in many start- up companies. While dopants have been used successfully for tailoring the functionality of sol-gel-derived materials, one should take into account also the conjugated effect: Exposing the dopant to the cage environment may be used to influence its properties. Modifying the functionality by affecting the dopant properties through entrapment is an approach that is yet to be fully explored and is the topic of this report. We show here that this approach carries a potential that is at least as wide as the straightforward entrapment. (1) Some recent publications in this journal: (a) Kanti Das, T.; Khan, I.; Rousseau, D. L.; Friedman, J. M. J. Am. Chem. Soc. 1998, 120, 10268. (b) Jain, T. K.; Roy, I.; De, T. K.; Maitra, A. J. Am. Chem. Soc. 1998, 120, 11092. (c) Greaves, D. M.; Rotello, V. M. J. Am. Chem. Soc. 1997, 119, 10268. (d) Chen, Q.; Kenausis, G. L.; Heller, A. J. Am. Chem. Soc. 1998, 120, 4582. (e) Rao, M. S.; Dave, B. C. J. Am. Chem. Soc. 1998, 120, 13270. (2) For recent reviews see: (a) Avnir, D.; Klein, L. C.; Levy, D.; Schubert, U.; Wojcik, A. B. In The Chemistry of Organosilicon Compounds; Apeloig, Y., Rappoport, Z., Eds.; Wiley & Sons: Chichester, U.K., 1998; Vol. 2, Chapter 40, p 2317. (b) Blum, J.; Avnir, D.; Schumann, H. CHEMTECH 1999, 29, 32. Some additional recent publications from our research group: (c) Ramanathan, K.; Avnir, D.; Modestov, A.; Lev, O. Chem. Mater. 1997, 9, 2533. (d) Shabat, D.; Grynszpan, F.; Saphier, S.; Turniansky, A.; Avnir, D.; Keinan, E. Chem. Mater. 1997, 9, 2258. (e) Altstein, M.; Bronshtein, A.; Aharonson, N.; Avnir, D.; Turniansky, A. Chem. Mater. 1997, 9, 2632. (f) Ben-David, O.; Shafir, E.; Gilath, I.; Prior, Y.; Avnir, D. Chem. Mater. 1997, 9, 2255. (g) Schumann, H.; Hasan, M.; Gelman, F.; Avnir, D.; Blum, J. Inorg. Chim. Acta 1998, 280, 21. (h) Gelman, F.; Avnir, D.; Schumann, H.; Blum, J. J. Mol. Catal. 1999, in press. (i) Shacham, R.; Avnir, D.; Mandler, D. AdV. Mater. 1999, 11, 1544. (3) Itou, T.; Matsuda, H. Key Eng. Mater. 1998, 67, 150. (b) Schottner, G.; Kron, J.; Deichmann, K. J. J. Sol-Gel Sci. Technol. 1998, 13, 183. (c) Aldrich, Fluka, Sigma, and Supelco Chiral Products Catalog 1997; p 250. See also ref 11. 8533 J. Am. Chem. Soc. 1999, 121, 8533-8543 10.1021/ja991269p CCC: $18.00 © 1999 American Chemical Society Published on Web 09/03/1999
-
Upload
independent -
Category
Documents
-
view
0 -
download
0
Transcript of Surfactant-Induced Modification of Dopants Reactivity in Sol−Gel Matrixes

Surfactant-Induced Modification of Dopants Reactivity in Sol-GelMatrixes
Claudio Rottman,† Gideon Grader,‡ Yoram De Hazan,‡ Sharona Melchior,‡ andDavid Avnir* ,†
Institute of Chemistry, The Hebrew UniVersity of Jerusalem, Jerusalem 91904, Israel, andFaculty of Chemical Engineering, Technion, Haifa 32000, Israel
ReceiVed April 20, 1999
Abstract: Organically and bio-organically doped sol-gel materials have attracted much attention due to theirability to reproduce solution molecular activities within the ceramic environment. We take now this methodologyone step forward and explore conditions under which the dopant properties can be modified by the matrix.Specifically we report that the co-entrapment of the surfactant cetyltrimethylammonium bromide (CTAB, themodifier) at low concentrations, with an extensive series of pH indicators representing several key molecularfamilies (the primary dopant) within tetramethoxysilane (TMOS)-derived silica sol-gel matrixes, greatlymodifies the indicating performance of the primary dopant. Thus, very large pKi shifts of up to 3-4 orders ofmagnitude obtained upon the co-entrapment cause methyl orange (MO) to become an indicator for higheracidities and phenolphthalein for higher basicities, compared to their solution behavior. In another example,the∆pKi between the two indicating transitions of alizarin increased from∼4.5 pH units in solution to∼10.5pH units (!) in the glass, transforming it into an indicator for both the high acidic and high basic pH ranges.In yet another example, the two indicating transitions of phenol red were shifted to a more acidic pH range,pushing the tail of the more acidic titration branch into thenegatiVe pH values range. These and other effectswere found to be more pronounced by the co-entrapment than by the use of CTAB solutions or of sol-gelmatrixes without CTAB, pointing to a synergetic effect between the surfactant and the silica cage. The indicatorsalso proved highly sensitive in revealing the properties of the local environment created by the surfactant.Thus, the indicator molecules were shown to migrate and reorient within the hydrophobic and the hydrophilicregions of micellar environment, according to their acquired charge upon pH changes. The concentration-dependent and humidity-dependent surfactant aggregation processes within the silica cage were probed withMO, and the results were compared with the behavior of entrapped MO in sol-gel matrixes of varyinghydrophobicities, obtained by the copolymerization of CH3Si(OCH3)3 with TMOS at various ratios, with andwithout CTAB. Of practical importance have been the observations that the dopant/surfactant co-entrapmentgreatly improves the leaching profiles: half-lives, ranging from several months to several years, were foundfor MO and methyl red; and using SAXS, surface area and porosity measurements, it was shown that CTABcan be used to stabilize the microscopic structure of the material upon heat-drying. This provides a potentialsolution to the problem of continuing structural changes, which take place with sol-gel materials long afterthe completion of their synthesis.
1. Background
Direct entrapment of organic and bio-organic moleculeswithin oxide sol-gel materials1,2 is moving fast from basic
science research to useful products. Examples include the 1million TV sets sold annually by Toshiba, the screens of whichare coated with a silica/zirconia sol-gel thin films, doped withindigo dyes;3a the organically doped sol-gel coated glasswaresold by Spiegelau;3b and the sol-gel entrapped lipase sold byFluka.3c Intensive R&D efforts toward many other products arestrongly going on both in major industries and in many start-up companies. While dopants have been used successfully fortailoring the functionality of sol-gel-derived materials, oneshould take into account also the conjugated effect: Exposingthe dopant to the cage environment may be used to influenceits properties. Modifying the functionality by affecting thedopant properties through entrapment is an approach that is yetto be fully explored and is the topic of this report. We showhere that this approach carries a potential that is at least as wideas the straightforward entrapment.
(1) Some recent publications in this journal: (a) Kanti Das, T.; Khan,I.; Rousseau, D. L.; Friedman, J. M.J. Am. Chem. Soc.1998, 120, 10268.(b) Jain, T. K.; Roy, I.; De, T. K.; Maitra, A.J. Am. Chem. Soc.1998, 120,11092. (c) Greaves, D. M.; Rotello, V. M.J. Am. Chem. Soc.1997, 119,10268. (d) Chen, Q.; Kenausis, G. L.; Heller, A.J. Am. Chem. Soc.1998,120, 4582. (e) Rao, M. S.; Dave, B. C.J. Am. Chem. Soc.1998, 120, 13270.
(2) For recent reviews see: (a) Avnir, D.; Klein, L. C.; Levy, D.;Schubert, U.; Wojcik, A. B. InThe Chemistry of Organosilicon Compounds;Apeloig, Y., Rappoport, Z., Eds.; Wiley & Sons: Chichester, U.K., 1998;Vol. 2, Chapter 40, p 2317. (b) Blum, J.; Avnir, D.; Schumann, H.CHEMTECH1999, 29, 32. Some additional recent publications from ourresearch group: (c) Ramanathan, K.; Avnir, D.; Modestov, A.; Lev, O.Chem. Mater.1997, 9, 2533. (d) Shabat, D.; Grynszpan, F.; Saphier, S.;Turniansky, A.; Avnir, D.; Keinan, E.Chem. Mater. 1997, 9, 2258. (e)Altstein, M.; Bronshtein, A.; Aharonson, N.; Avnir, D.; Turniansky, A.Chem. Mater.1997, 9, 2632. (f) Ben-David, O.; Shafir, E.; Gilath, I.; Prior,Y.; Avnir, D. Chem. Mater.1997, 9, 2255. (g) Schumann, H.; Hasan, M.;Gelman, F.; Avnir, D.; Blum, J.Inorg. Chim. Acta1998, 280, 21. (h)Gelman, F.; Avnir, D.; Schumann, H.; Blum, J.J. Mol. Catal. 1999, inpress. (i) Shacham, R.; Avnir, D.; Mandler, D.AdV. Mater.1999, 11, 1544.
(3) Itou, T.; Matsuda, H.Key Eng. Mater.1998, 67, 150. (b) Schottner,G.; Kron, J.; Deichmann, K. J.J. Sol-Gel Sci. Technol.1998, 13, 183. (c)Aldrich, Fluka, Sigma, and SupelcoChiral ProductsCatalog 1997; p 250.See also ref 11.
8533J. Am. Chem. Soc.1999,121,8533-8543
10.1021/ja991269p CCC: $18.00 © 1999 American Chemical SocietyPublished on Web 09/03/1999
In general, the properties of the dopants are dictated by theinterfacial moieties of the ceramic material.4 In the case ofporous silica xerogels these moieties comprise of all types ofsilanols (isolated, geminal, vicinal),5 siloxane bridges, residualwater and alcohol molecules, and leftover of unhydrolyzedalkoxy groups and acid/base catalysts molecules.6 This immedi-ate environment of the dopant may affect and modify its opticalproperties, its chemical performance and its stability, and hencethe interest and the potential in tailoring cage properties whichare different than the native ones. One major route has been topolymerize or copolymerize monomers which carry a nonhy-drolizable residue, resulting in what has become known asOrmosils.7,8 The residue, R, can induce hydrophobicity, aproticpolarity, acidity/basicity changes, and so on. Since R isnonpolymerizable, its local concentration within the cage is high.An early example from our laboratory that describes thesuccessful application of this approach was the preparation ofreversible photochromic sol-gel materials by the entrapmentof spiropyranes in a hydrophobically modified cage.9 Interest-ingly, only by this cage modification was it possible to retainthe reversibility in the photochromism of the entrapped mol-ecule. Some more recent examples for the successful tailoringof properties by this approach are the composite sol-gel/carbonelectrodes,10 the enhancement of the activity of lipase by itsentrapment in alkylated silica sol-gel matrixes,3c,11 and thesensing of alcohols by the entrapment of the solvatochromicdye ET(30) in methylated silica sol-gel.12
The second methodology for affecting cage properties, whichis at the focus of this report, is the co-entrapment of surface-active agents (SAAs). Our preliminary interest in the study ofadded SAAs has been their use as cracking preventing agentsfor sol-gel monoliths along their drying or wetting.13,14Recentelegant studies of a dopant-surfactant co-entrapment includethe dopant photophysical studies of Lianos et al.15 and of Ogawaet al.16 It is also relevant in this context to recall that surfactants,at either low17 or very high concentrations18 (several hundredtimes higher than the concentration used in this report) provedto be useful templating agents for sol-gel-derived materials.19
The specific systems we have studied comprise a long seriesof pH indicators representing several molecular families, co-entrapped with cetyltrimethylammoniumbromide (CTAB) withinsol-gel tetramethoxysilane (TMOS)-derived silica matrixes.Since doped sol-gel glasses for sensors preparation are amongthe prime applications of these materials,20 our motivation forthis co-entrapment has been not only the basic science aspectof rational control of dopant properties but also the opening ofa new methodology for the design of properties of sensing andreactivity. In doing so, we were also able to probe the chemicalnature of the immediate environment of the dopant molecule,namely, to get some insight on the structure of low concentrationentrapped surfactants. We recall that a central feature of sol-gel entrapment has been that the doping breaks down dimersand other aggregates,21 and so a question raised has beenwhether the surfactant molecules are entrapped as isolatedmolecules or as aggregates, and if so, do the aggregates retaindistinct hydrophobic and hydrophilic regions. As alreadyindicated in the Abstract, the power of codoping to altersignificantly the properties of the primary dopant has beendemonstrated; some insight on the conditions under which lowconcentrations of surfactants are aggregated within the silicamatrix has been gained. Details follow in Sections 3 and 4.
2. Experimental Details
2.1. Chemicals.Cetyltrimethylammoniumbromide (CTAB) was fromFluka. Si(OCH3)4 and CH3Si(OCH3)3 were from Aldrich.
2.1.1. Families of Entrapped Indicators. Azo indicators (forstructures, see Scheme 1): Methyl orange (MO) (BDH), methyl red
(4) K. Dunn, B.; Zink, J.Chem. Mater.1997, 9, 2280.(5) Li, Z.; Rutan, S. C.Anal. Chim. Acta1995, 312, 127 and references
therein.(6) Brinker, J. C.; Scherer, G. W. InSol-Gel Science: The Physics and
Chemistry of Sol-Gel Processing; Academic Press: San Diego, CA, 1990.(7) Husing, N.; Schubert, U.; Misof, K.; Fratzl, P.Chem. Mater.1998,
10, 3024.(8) Mark, J. E.Heterog. Chem. ReV. 1996, 3, 307.(9) Levy, D.; Einhorn, S.; Avnir, D.J. Non-Cryst. Solids1989, 113, 137.(10) Tsionsky, M.; Gun, G.; Glezer, V.; Lev, O.Anal. Chem.1994, 66,
1747.(11) Reetz, M. T.; Zonta, A.; Simpelkamp, J.Angew. Chem., Int. Ed.
Engl. 1995, 34, 301.(12) Rottman, C.; Grader, G. S.; De Hazan, Y.; Avnir, D.Langmuir1996,
12, 5505.(13) Rottman, C.; Ottolenghi, M.; Zusman, R.; Lev, O.; Smith, M.; Gong,
G.; Kagan, M. L.; Avnir, D.Mater. Lett.1992, 13, 293. (b) Rottman, C.;Turniansky, A.; Avnir, D.J. Sol-Gel Sci. Technol.1998, 13, 17.
(14) Kraus, S. C.; Czolk, R.; Reichert, J.; Ache, H. J.Sens. Actuators, B1993, 15-16, 199.
(15) Ferrer, M.; Lianos, P.Langmuir 1996, 12, 5620. (b) Ferrer, M.;Bekiari, V.; Lianos, P.Chem. Mater.1997, 9, 2652. (c) Bekiari, V.; Ferrer,M.; Lianos, P.J. Phys. Chem.1999, in press.
(16) Ogawa, M.Langmuir1995, 11, 4639.(17) Murakata, T.; Sato, S.; Ohgawara, T.; Watanabe, T.; Suzuki, T.J.
Mater. Chem.1992, 27, 1567.(18) Goltner, C. G.; Antonietti, M.AdV. Mater. 1997, 9, 431.(19) Sellinger, A.; Weiss, P. M.; Nguyen, A.; Lu, Y.; Assink, R. A.;
Gong, W.; Brinker, C. J.Nature1998, 394, 256. (b) Tanev, P. T.; Chibwe,M.; Pinnavaia, T. J.Nature 1994, 368, 317. (c) Ramsay, J.Curr. Opin.Colloid Interface Sci.1996, 1, 208. (d) Raman, K. N.; Anderson, M. T.;Brinker, C. J.Chem. Mater.1996, 8, 1682. (e) Tolbert, S. H.; Firouzi, A.;Stucky, G. D.; Chmelka, B. F.Science1997, 278, 264. (f) Zhang, W.; Pauly,T. R.; Pannavaia, J. T.Chem. Mater.1997, 9, 2491.
(20) Wolfbeis, O. S.; Reisfeld, R.; Oehme, I. InSol Gel and ChemicalSensors; Springer: Berlin, Germany, 1996.
(21) Innocenzi, P.; Kozuka, H.; Yoko, T.J. Non-Cryst. Solids1996, 201,26. (b) Avnir, D.; Levy, D.; Reisfeld, R.J. Phys. Chem.1984, 88, 5954.
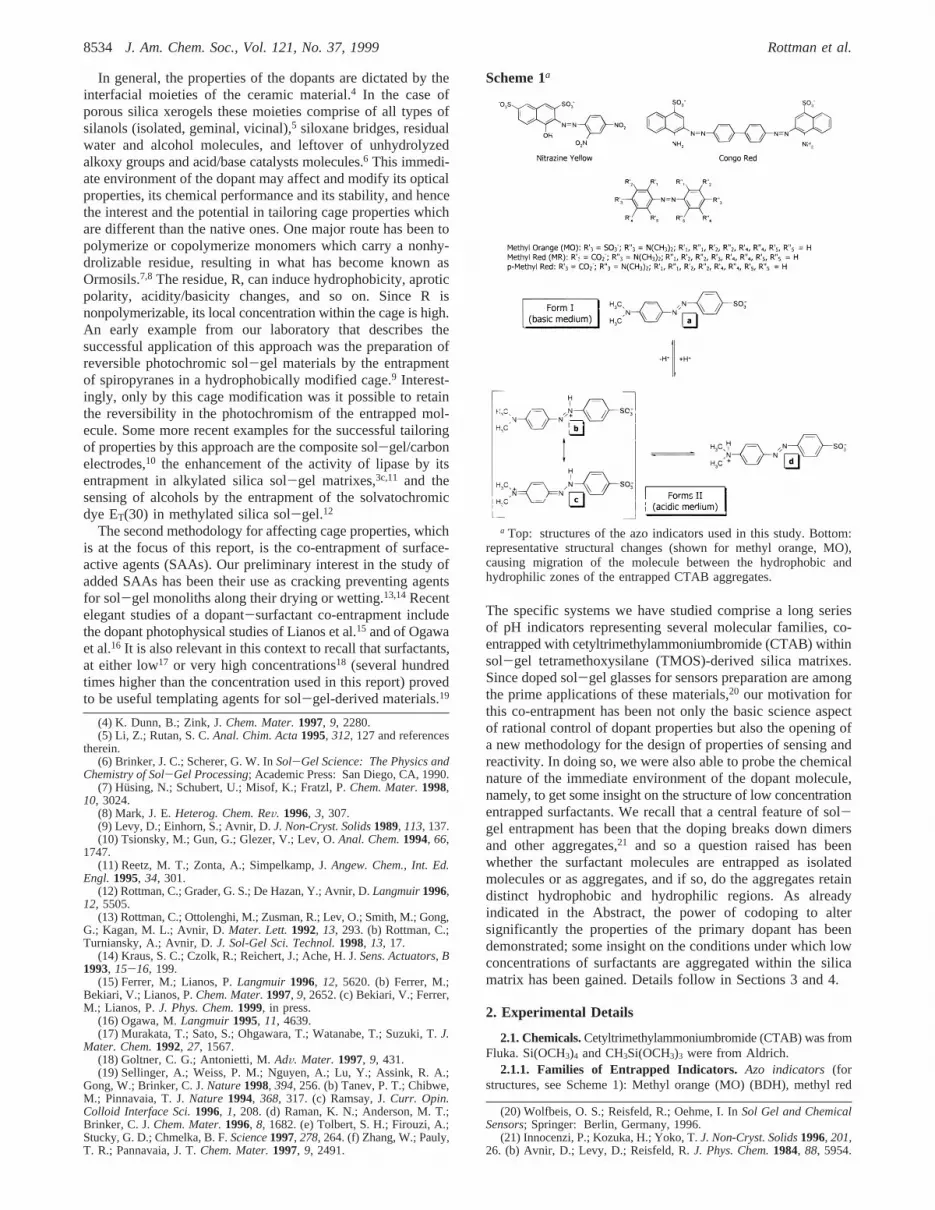
Scheme 1a
a Top: structures of the azo indicators used in this study. Bottom:representative structural changes (shown for methyl orange, MO),causing migration of the molecule between the hydrophobic andhydrophilic zones of the entrapped CTAB aggregates.
8534 J. Am. Chem. Soc., Vol. 121, No. 37, 1999 Rottman et al.

(MR) (Aldrich), p-(p-dimethylaminophenylazo)benzoic acid sodium salt(pMR) (Kodak), Congo red (Aldrich), and nitrazine yellow (Aldrich).Sulfonephthalein indicators(Scheme 2): Bromocresol green sodiumsalt (Aldrich), bromocresol purple sodium salt (Aldrich), bromophenolblue (Aldrich), bromophenol red (Fluka), bromothymol blue (Aldrich),bromoxylenol blue (Aldrich), chlorophenol red sodium salt (Aldrich),cresol red sodium salt (Aldrich), phenol red sodium salt (PR) (Aldrich),thymol blue sodium salt (Aldrich), and 3,4,5,6-tetrabromophenolsul-fonephthalein (Aldrich).Phthalein indicators(Scheme 3):R-naphthol-phthalein (Fluka), phenolphthalein (P) (Aldrich), and thymolphthalein(Aldrich). Alizarin (AL, for structure see Scheme 4) (Merck).
2.2. Entrapment Procedures. 2.2.1. The System SiO2/CTAB/pHIndicator. The following mixture was prepared in a 20 mL flask: 2.5mL of MeOH, 2.5 mL of TMOS, and 1.0 mL of an 8.2× 10⁻² Mmethanolic solution of CTAB (CTAB/Si molar ratio) 4.8× 10⁻³:1).The mixture was sonicated for 5 min, after which 2.3 mL of water(H2O/Si molar ratio) 7.6:1) and 0.1 mL of a 0.02-0.1% (by weight)solution of the indicator in either water or MeOH (varying accordingto the nature of the indicator) were added. The final mixture wassonicated for 10 more minutes and poured into a Petri dish (60 mm indiameter, 20 mm high), covered, and left at room temperature for 5days for the gelation and initial shrinkage. The wet gel was then driedfor 2 days in an oven at 45-50 °C, during which the gel shrank further(approximately 70% from the starting volume), resulting in a transparentdisk with typical dimensions of 26 mm in diameter and thickness of2.5 mm.
2.2.2. The System SiO2/CTAB/MO. The effects of the CTABconcentration were studied on MO with a series of glasses prepared asin 2.2.1, varying the molar ratio CTAB/Si from 0:1 to 4.8× 10⁻³:1.
2.2.3. The System MeTMOS/TMOS/MO.To provide proof forthe reasoning of the effects of concentration changes of CTAB, it was
interesting to follow the effects of gradually blocking the acidic silanolgroups with methyl groups. Thus, a high load of methyl groups wouldallow the entrapment of the methyl orange (MO) in its anionic form(Scheme 1) due to the lower acidity and higher hydrophobicity of thecage walls. For this purpose a series of Ormosil glasses varying themolar ratio MeTMOS/TMOS (MeTMOS) methyltrimethoxysilane)from 0.0:1.0 to 0.55:0.45 was prepared as in 2.2.1 but without addedCTAB.
2.2.4. The System MeTMOS/TMOS/CTAB/MO.On the basis oftheλmax values of the absorbance spectra of the Ormosil series preparedin 2.2.3, we selected (see below the reasoning) the molar ratio
Scheme 2a
a Top: structures of the sulfonephthaleins used in this study.Bottom: representative structural changes shown for phenol red (PR).
Scheme 3a
a Top: structures of the phthaleins used in this study. Bottom:representative structural changes, shown for phenolphthalein (P).
Scheme 4.The Structures of Alizarin (AL)
Dopants ReactiVity in Sol-Gel Matrixes J. Am. Chem. Soc., Vol. 121, No. 37, 19998535

MeTMOS/TMOS) 0.3:0.7, which contains the basic form of MO. Aseries of these Ormosils with varying molar ratios of CTAB/Si in therange 0:1 to 4.8× 10⁻³:1 was prepared using the procedure describedin 2.2.1.
2.2.5. Blank Systems.(i) MO and P were entrapped in pure silicaaccording to procedure (2.2.1) but without added CTAB. (ii) Twelvenonbuffered solutions of MO and P (3.2× 10⁻⁵M) in aqueous 0.1%(by weight) CTAB (which is approximately the concentration of CTABin the glass) at different pH values were prepared. The pH ranges were0.01-2.70 for MO and 10.6-13.5 for P. (iii) Fifteen surfactant solutionsof MO (3 × 10⁻⁵ M) at pH ) 7.02 were prepared at varying CTABconcentrations from 0 to 6 mM, following reference 22.
2.2.6. Leaching testswere carried out by 3-4 washing cycles with∼50 mL of deionized water in which the selected piece of monolithicglass was shaken for about 30 min. Static leaching tests were carriedout by placing the sol-gel glass (∼8 × 10 × 1.5 mm) in 50 mL ofwater solution of the desired pH value.
2.3. pH-Indicating Performance.pH changes were affected withnonbuffered solutions. Maximum absorption values,λmax, were deter-mined by taking full spectra within the cell of a HP 8453 diode arrayspectrophotometer. Full titration curves were obtained from the changesin λmax, after the sol-gel glass had been immersed in solutions ofdifferent pH values, and after equilibrium was reached (about 15 minafter the glass immersion). Isosbestic points were determined by takingfull spectra each 5-20 s (depending on the indicator).
2.4. SAXS, Surface Area, and Porosity Measurements.Small-angle X-ray scattering (SAXS) measurements were performed forselected samples of the series belonging to the system SiO2/CTAB/MO (entrapment procedure 2.2.2). The samples were prepared bycrushing the monoliths and placing the resulting powder into epoxysealed 1.5 mm thin-walled capillaries. The SAXS profiles of this seriesof monoliths were measured before and after a drying process in whichthe monoliths were heated at 100°C in a drying oven for 5 h. SAXSmeasurements were performed using Cu Ka radiation with a compact
Kratky camera (Phillips PIN730 sealed tube generator) having a linearposition sensitive detector system (Raytech). Sample to detector distancewas 26.4 cm. Temperature was kept at 25°C with a temperature-controlled sample holder (A. Paar Co.) during data accumulation. Slitsmeared data was analytically desmeared by subtracting 1 from thePorod slope. Specific surface area and average pore sizes for this serieswere determined from nitrogen adsorption/desorption data using aMicromeritics ASAP 2000 instrument. BET surface areas and BJHporosities are reported.
3. Results
3.1 The Effects of CTAB on the Properties of the Dopants.3.1.1. Spectral Shifts and Indicating Range Shifts.In Table1 are collected the observations made regarding the indicatingranges and the spectral characteristics of the various entrappedmolecules in CTAB micellar aggregates within the SiO2 sol-gel glass, along with comparison to solution values. It is seenthat the indicating ranges of the entrapped azo and sulfone-phthalein dyes are shifted to more acidic values, while thephthalein indicators are shifted to more basic values. We explainand rationalize this observation in the Discussion.
3.1.2. Isosbestic Points.Determination of isosbestic pointswithin the porous glass is shown in Figure 1 for representativedyes. The sharp isosbestic points of MO and PR (Figure 1, partsa and b, respectively), which are similar to the sharpness insolution, attest to the homogeneous environment that theentrapped dyes experience. The molecules with two indicatingranges, thymol blue and phenol red (PR) (Scheme 2), revealedin their entrapped form two isosbestic points, as shown forexample for PR (Figure 1b). (No isosbestic point is seen for Pin the visible because the closed lactone (Scheme 3) absorbsonly in the UV).
3.1.3. Titration Curves and pKi. Typical titration curves inthe SiO2/CTAB glass are shown in Figure 2 for P and MO, for
(22) Gehlen, M. H.; Ferreira, M.; Neumann, M. G.J. Photochem.Photobiol. A1995, 87, 55.
Table 1. Properties of the Indicators in Sol-Gel Glass and in Solution
pH indicating range λmax (nm)a
indicator in glass in solutionb color changec in glass in solution+ CTAB in solution
azo indicatorscongo red 0.0-2.0 3.0-5.2 B-R 586, 479 586, 479 580, 476nitrazine yellow 4.9-6.4 6.0-7.2 Y-B 468, 598 468, 596 465, 588methyl orange 0.0-2.0 2.9-4.6 R-Y 508, 428 510, 428 510, 466methyl red 3.9-5.6 4.2-6.2 R-Y 522, 422 518, 418 518, 436p-methyl red 0.2-1.8 1.0-3.0 RO-Y 506, 430 506, 430 510, 464
sulfonephthalein indicatorsbromocresol green 1.5-3.8 3.8-5.4 Y-B 414, 624 422, 626 445, 616bromocresol purple 3.9-5.8 5.2-6.8 Y-Pu 418, 600 418, 600 434, 588bromophenol blue 0.0-2.0 3.0-4.6 Y-B 424, 604 424, 604 438, 592bromophenol red 3.8-5.8 5.2-6.8 Y-R 430, 582 428, 588 440, 574bromothymol blue 5.3-7.0 6.0-7.6 Y-B 420, 624 420, 626 434, 616bromoxylenol blue 4.8-6.6 6.0-7.6 Y-B 414, 624 412, 624 437, 614chlorophenol red 3.8-5.8 4.8-6.4 Y-R 424, 582 422, 588 436, 574cresol red 4.0-6.0 7.0-8.8 Y-R 420, 580 418, 584 434, 572phenol red (ar)d (-2.0)-1.2 0.0-2.0 OR-Y 516, 430 514, 422 506, 432phenol red (br)d 5.0-7.0 6.8-8.2 Y-R 430, 564 422, 572 432, 5583,4,5,6-tbpspe 5.0-7.0 6.6-8.2 Y-P 434, 586 430, 588 436, 576thymol blue (ar)d (-2.0)-1.2 1.2-2.8 R-Y 556, 440 556, 440 546, 436thymol blue (br)d 4.3-5.8 8.0-9.2 Y-B 440, 602 440, 606 436, 596
phthalein indicatorsR-naphtholphthalein 9.8-11.3 7.8-9.0 PBr-B 650 648 654phenolphthalein 11.8-14.0 8.0-10.0 C-P 560 560 552thymolphthalein 12.0-14.0 8.8-10.5 C-B 592 594 598
alizarinalizarin (ar)d 1.8-4.0 4.3-6.3 Y-R 428, 526 432, 526 422, 518alizarin (br)d 13.0-14.0 9.4-12.0 R-V 526, 572 526, 572 518, 554
(604)f (618)f (594)f
a Left value, acidic form; right value, basic form.b Reference 23.c Left color, acidic form; right color, basic form; B, blue; C, colorless; O,orange; OR, orange-red; P, pink; PBr, pinkish-brown; Pu, purple; R, red; RO, reddish-orange; V, violet; Y, yellow.d ar, acidic range; br, basicrange.e 3,4,5,6-Tetrabromophenolsulfonephthalein.f Multiple λmax peaks in the basic molecular form.
8536 J. Am. Chem. Soc., Vol. 121, No. 37, 1999 Rottman et al.

which pKi values of 13.0 and 0.9 were obtained, respectively.These pKi values represent very large shifts (3 and 4 orders ofmagnitude for MO and P, respectively) compared to aqueoussolution (Figure 2). Interestingly, these shifts are larger thanthose obtained by either dissolving in CTAB aqueous solutionor entrapment in pure sol-gel silica glass without CTAB (Figure2). We return to this effect in the Discussion. The shifts forMO and P are inoppositedirections: in sol-gel, MO becomesan indicator for highly acidic solutions and P becomes anindicator for highly basic solutions; this, as we shall see in theDiscussion, conforms with the existence of micellar-like CTAB
structures and with the different pH-dependent charge changesof the two indicators.
The titration curve behavior of indicators with two transitionsat different pH values is shown in Figure 3 for entrapped PRand AL. Large pKi shifts, compared to solution, are alsoobserved here but with a special twist: the two transitions canbe shifted either to the same direction, as for PR (and for thymolblue; see Table 1), or in opposite directions, as for AL. Thereare two interesting consequences to these shifts: first, the acidicpKi shift of PR (and thymol blue also) pushes the tail of thecurve to thenegatiVepH values range, making it the most acidicsol-gel pH indicator we are aware of in this kind of matrix;and, second, the separation between the two transitions in ALincreases by a factor of 1 million from∼4.5 pH units to∼10.5pH units, transforming AL into a very interesting indicator forboth high acidity and high basicity. As seen in Table 1, largeshifts are generally typical for most indicators.
3.1.4. Stability and Response Time.The stability of thedoped silica matrixes to repeated measurement cycles and thetime needed to reach plateau readings upon pH changes werechecked. It was found that, while under neutral and acidicenvironments, the matrix is very stable; under highly basicconditions degradation is apparent, which is probably due tothe irreversible hydrolysis of siloxane bonds. Typical resultsare shown for MO and of P in Figure 4. For each point,equilibrium was assured by waiting either 15 or 30 min untilplateau was reached, depending on whether the cycle steps wereconsist with a protonation-deprotonation process at high or lowion concentration (proton or hydroxyl), respectively. Followingref 4, we ascribe this difference to the specific immediatemicroenvironment around the indicator molecules, which iscomposed of pH-dependent moieties such as silanols: Fasterresponses are associated with the higher concentration changegradients between the outside environment and the effective pHwithin the cage, while slower responses reflect mild pHgradients. It should be mentioned here that, while these responsetimes are typical for monoliths, fast response time is easilyachieved by reducing the dimensions of the doped material.24,25
(23) Bishop E.Indicators; Pergamon Press: Oxford, U.K., 1972.
Figure 1. Representative isosbestic point behavior of entrappedindicators: (a) an azo indicator (methyl orange) and (b) a sulfone-phthalein indicator (phenol red).
Figure 2. The titration curves of methyl orange (9) and phenolphthal-ein (0) in the CTAB/sol-gel glass. The pKi shifts are shown as well:Aqueous nonbuffered solution ([, ∆pKi ) 2.85; ], ∆pKi ) 3.68),sol-gel glass without CTAB (2, ∆pKi ) 2.60;4, ∆pKi ) 2.85), andaqueous CTAB solution (b, ∆pKi ) 0.38;O, ∆pKi ) 0.82). Note thelarge pKi shifts, the opposite direction of the shifts for the two indicators,and the synergetic effects of CTAB combined with that of the silicacage.
Figure 3. Phenol red (PR) and alizarin (AL) have each two indicatingtransitions (Schemes 1and 4). For PR (2) the pKis of the two indicatingregions in CTAB/sol-gel glass are 0.25 and 5.6 (vs 2.0 and 7.9 inaqueous nonbuffered solution (4)). For AL (b) the pKis of the twoindicating regions in CTAB/sol-gel glass are 2.7 and 13.5 (vs 6.4 and11.2 in aqueous nonbuffered solution (O)). Note that the separationbetween the two indicating transitions of AL increases from∼4.5 pHunits in solution, to∼10.5 pH units (!) in the glass, making it anindicator for both extreme acidic and basic conditions. Note also thatthe tail of the PR enters the range ofnegatiVe pH values.
Dopants ReactiVity in Sol-Gel Matrixes J. Am. Chem. Soc., Vol. 121, No. 37, 19998537

Another tested aspect of stability was the rate of leaching,which provided some excellent results. We reproduce for theDiscussion previous observations we made on the leachingbehavior of MO13aand of MR,13bboth in the system SiO2/CTAB(Figure 5). Following Carturan et al.26 and others,27 we use apseudo-first order analysis, from which the leaching half-lifefor MR is 1.5 years. MO shows similarly excellent stability forneutral conditions (t1/2 ) 3.5 years), good stability at pH) 2.0(t1/2 ) 3.5 months), and slow leaching at the extreme pH) 0.0(t1/2 ) 23 days; even this lifetime is sufficiently large disposablemeasurements applications).
3.2. Effects of Changes in CTAB Concentration. 3.2.1. AsProbed by Methyl Orange.At the background, let us first recallthe λmax change in behavior of MO in water solution and inCTAB water solution,22,28,29from the longest to the shortestλmax
values. The reddestλmax value of MO is obtained for its acidiczwitterionic structure (b-d in Scheme 1) at 510 nm. The basicanionic structure (a in Scheme 1) absorbs atλmax ) 466 nm(Figure 6 at zero CTAB concentration). In micellar solution atpH ) 7.0 (Figure 6), the basic anionic structure within thehydrophobic micellar environment has its shiftedλmax value at
428 nm (the plateau in Figure 6). Also shown in Figure 6 is thegradual build-up of the micelle, reaching a cmc at about 1 mMCTAB (0.9 mM in solution).29 Finally, the bluest absorption isseen as the sharp drop in theλmax from 466 nm at zero CTABconcentration toλmax) 370 nm at very low CTAB concentrationof 0.1 mM. This absorption, which apparently is due to ion-pairing and hydrophobic interactions between MO and CTAB(see Discussion), is then gradually red-shifted until the cmc isreached (Figure 6), following the transition from MO whichinteracts with CTAB pre-micelle aggregates, to the micelle itself.Having this picture in solution, let us now move on to threetypes of entrapped systems: MO in CTAB/silica; MO inmethylated (Me) hydrophobic silica; and MO in CTAB/Me-silica.
The effects of changing the CTAB concentration from zeroto beyond thecmc value on theλmax of entrapped MO(Procedure 2.2.2) are shown in Figure 7. The dried glass (Figure7a; 60 °C, 24 h) and the same glass after exposure to airhumidity (Figure 7b) show a markedly different behavior, withthe former reaching very shortλmax values of 355 nm (cf. Figure6 and Discussion). It is also seen (Figure 7a) that theλmax valueat zero CTAB, namely, 466 nm, is practically the anionic formof MO; that is, hydrogen bonds between the MO moleculesand the silanols at the interface of the pure dried silica aredeveloped in a way which resembles the interaction with water.It is also seen that, following the sharp drop to 355 nm uponthe addition of small amount of CTAB, there is then a gradualrise inλmax to 375 nm, but it never reaches theλmax value, whichis indicative of the formation of a micellar structure (cf. Figure6). The crucial role of adsorbed water for the formation of amicellar structure within the sol-gel matrix is then seen inFigure 7b, i.e., in the humidity-exposed glass: Here at the higherCTAB concentration, aλmax ) 428 nm is reached, exactly asin Figure 6. Notice also that, whereas in the dried glass at zeroCTAB concentration the interface resembles, as indicated above,neutral water (λmax of MO ) 466 nm), aλmax of 508 nm in thewet glass is that of the acidic zwitterionic form; it is corroboratedthat caged water molecules are needed in order to express theacidity of the silanols.30
3.2.2. As Probed by SAXS and Surface Area Measure-ments.The effects of CTAB on the matrix structure and on theresponse to drying (100°C for 5 h) were also probed by SAXSand by surface area/porosity measurements. We begin with theformer, for which six samples were prepared with the generalcomposition SiO2/CTAB/MO having different surfactant con-centrations of 0.0, 0.2, 0.4, 0.8, 2.0, and 10.0 mM (seeExperimental Procedure 2.2.2.). Figures 8 and 9 show the
(24) Lee, J. E.; Saavedra, S. S.Anal. Chim. Acta1994, 285, 265.(25) Butler, T. M.; MacCraith, B. D.; McDonagh, C.J. Non-Cryst. Solids
1998, 224, 249.(26) Carturan, G.; Pagani, R.; Campostrini, R.; Ceccato, R.J. Sol-Gel
Sci. Technol.1997, 8, 1115.(27) Lobnik, A.; Oehme, I.; Murkovic, I.; Wolfbeis, O. S.Anal. Chim.
Acta 1998, 367, 159.(28) Kunitake, T.; Nakashima, N.; Hayashida, S.; Yonemori, K.Chem.
Lett. 1979, 1416. (29) Nakashima, N.; Fukushima, H.; Kunitake, T.Chem. Lett.1981, 1555.
Figure 4. Reproducibility of 12 cycles of measurements for methylorange (b and9) and phenolphthalein (4).
Figure 5. Leaching behavior of methyl orange (O, 0, 4) and methylred ([) co-entrapped in sol-gel with CTAB. The pseudo first-orderhalf-lives are the following: (O) 3.5 years( 8 months at neutral pH;(0) 3.5 months( 10 days at pH 2.0; (4) 23 days( 3 days at pH 0.0;and ([) 1.5 years( 2 months at pH 0.01.
Figure 6. Spectral shifts ofλmax of methyl orange in aqueous CTABsolution (pH) 7.0) as a function of CTAB concentration.
8538 J. Am. Chem. Soc., Vol. 121, No. 37, 1999 Rottman et al.

scattering behavior for the two extremes, 0.0 and 10.0 mMCTAB, before and after drying, and Table 2 summarizes theresults for the other concentrations. As seen in Figure 8, CTABhas a marked effect on the stability of the matrix to drying:While the scattering profile in the absence of CTAB changesgreatly upon drying (Figure 8a), the profiles in the presence ofthe surfactant nearly coincide (Figure 8b). This marked effectis also evident from the distance distribution function (P(r),calculated by the inverse Fourier transform of the scatteredintensity). It is seen (Figure 9 and Table 2) that CTAB causesa decrease in the size of the electron density inhomogeneity;that the shape of the distribution function changes from broad(centered at∼13 nm) to sharp (having its peak at∼2.5 nm);and that bimodality evolves upon drying for all samples exceptthe one with the highest CTAB concentration. The parallelinfluence of CTAB on the surface area and porosity of the final,dried monoliths are also summarized in Table 2: It shows adecrease in the surface area from 670 m2/g at a zero CTAB
concentration to 513 m2/g at 10.0 mM CTAB concentration,accompanied by an increase in the average pore diameter fromvalues bellow 20 nm to a broad distribution around 34 nm. Theseobservations and their relation to the data obtained from theprobe molecule, MO, are interpreted and discussed below.
3.3. The Methylated Sol-Gel Matrixes. To strengthen theinterpretation we provide below for the possible arrangementof CTAB molecules within the silica cage, we alternativelychanged the hydrophobicity of the cage by copolymerizingTMOS with MeTMOS. As shown in Figure 10, this matrix blue-shifted theλmax of MO for the wet glass from the surface-acidic
Figure 7. The effect of CTAB concentration on theλmax of entrappedmethyl orange in the dried glass (a) and after exposure to air humidity(b).
Table 2. Effects of CTAB on Structural Properties of the PorousGlass
SAXS-P(r) beforedrying
SAXS-P(r) afterdrying adsorption dataCTAB
concn(mM)
Ia
(nm)II
(nm)I/II b Ia
(nm)II
(nm)I/II b BETc
(m2/g)BJHd
(Å)BJHe
(cc/g)
0.0 13.0 1.4 13.0 4.0 670 <20 0.130.2 11.0 1.4 22.4 0.2 610 <20 0.090.4 4.5 9.5 1.0 2.1 15.4 0.9 534 <20 0.070.8 3.0 9.5 1.3 2.1 14.7 2.1 534 <20 0.082.0 3.0 8.5 2.5 2.1 15.0 3.3 554 26 0.13
10.0 3.0 2.8 513 32 0.45
a For assignment of peaks I and II, see Figure 9b.b Peaks ratio.c BET, specific surface area.d BJH, average pore diameter.e BJH,cumulative pore volume.
Figure 8. Representative SAXS profiles for the series prepared byprocedure 2.2.2 before and after heating (100°C for 5 h): (a) Sol-gelglass without CTAB and (b) sol-gel glass prepared with 10 mM CTAB.
Figure 9. Distance distribution functions, P(r), for the samples ofFigure 9: (a) before heating and (b) after heating (100°C for 5 h).
Dopants ReactiVity in Sol-Gel Matrixes J. Am. Chem. Soc., Vol. 121, No. 37, 19998539

510 nm at zero MeTMOS (cf. Figure 7b) to 428 nm for the50% Me-silica glass. Note the striking resemblance of this valueto the value obtained by the micellar environment: MO in thishydrophobic environment “sees” the same environment withentrapped CTAB; that is, it must reside there within ahydrophobic core.
Finally, we tested the effects of changing the CTABconcentration in the environment of an Ormosil, at the MeT-MOS/TMOS) 0.43, which, as seen in Figure 11, dictates theanionic form of entrapped MO without imposing hydrophobic-ity. Indeed, as shown in Figure 11, the increase in CTABconcentration causes again the gradual shift ofλmax toward theMO-in-micelle absorption value. The telltale differences in thepremicellar zone in all four environments (water, Figure 6; driedsol-gel glass, Figure 7a; wet glass, Figure 7b; and the Ormosil,Figure 10) should be noticed.
4. Discussion
4.1. Introductory Comments. The results summarized inSection 3 point to a new direction in the design of reactive dopedsol-gel materials, which we indeed follow in subsequentreports. Thus, on one hand, we have demonstrated once againthe general property of doped sol-gel materials: Classicalsolution chemistry is transferable to the heterogeneous ceramicenvironment. On the other hand, the new step taken here is todemonstrate that the chemical performance of the dopant canbe modified by a careful control of the properties of the cagewithin which the functional molecule resides.
Since we concentrated here on CTAB as a model co-entrapped modifier, we begin the Discussion by focusing onsome of its properties needed to understand the observations.
CTAB is a single chained cationic surfactant, the main propertiesof which, like other surfactants, are derived from its amphiphilicnature. For our purpose, we highlight two of these properties.The first is the ability of the micellar aggregates to grow tomany possible variations in shape and form.31 Thus, CTABgrows anisometrically already around the cmc,32 and thisnonsphericity is a driving force for its directed growth intowormlike or rodlike flexible micelles, resembling a flexiblepolymer the structure of which isreVersible.33,34 An importantconsequence of this flexibility is the adaptability of the structureto the restrictive shape of the environment, that is, to the porenetwork of the silica sol-gel matrix.35 This picture is basedalso on other observations, such as the recent observation byAnderson et al.36 that CTAB (like other ionic and nonionicsurfactant systems)37 forms various micellar structures in thesol-gel starting reaction mixture, depending on the co-solvent(methanol) concentration.
The second property is the capability of the silica surface toadsorb CTAB molecules38 according to the following:
This adsorption, which may take the form of variouspremicellar structures such as admicelles and hemimicelles,39
has already been of important use in sol-gel-derived polymers,influencing the sol colloidal stage and the sol to gel transition40
by homogenizing it and by reducing the internal capillarypressure at the different stages of the porous glass formation.Along the sol to gel to xerogel transitions, an equilibrium existsbetween micellar-type aggregates of CTAB molecules in theliquid phase and the adsorbed aggregated species, which shiftsalong the full polymerization process. In the following Discus-sion sections we show that this picture is in keeping with theexperimental observations.
4.2. pKi and λmax Shifts of the Micellar-Entrapped Indica-tor in the Sol-Gel Matrix. In this section we interpret thevarious observed shifts of the entrapped indicators as originatingfrom their specific location within the sol-gel confined micellarphase, and from the movements of the indicators from and tothe hydrophobic zones, as their charges change with pH. Inanalyzing our observations, we also make use of the know-how that has been accumulated in the scientific literature about
(30) Miller, J. M.; Dunn, B.; Valentine, J. S.; Zink, J. I.J. Non-Cryst.Solids1996, 202, 279.
(31) Gelbart, W. M.; Ben-Shaul, A.J. Phys. Chem.1996, 100, 13169.(32) Candau, S. J.; Hirsch, E.; Zana, R.J. Phys. (Paris)1983, 45, 1263.(33) Candau, S. J.; Cates, M. E.J. Phys.: Condens. Matter1990, 2,
6869, and references therein.(34) Lin, Z.; Cai, J. J.; Scriven, L. E.; Davis, H. T.J. Phys. Chem.1994,
98, 5984.(35) Ishiwatari, T.; Shimizu, I.; Mitsuishi, M.Chem. Lett.1996, 33.(36) Anderson, M. T.; Martin, J. E.; Odinek J. G.; Newcomer, P. P.Chem.
Mater. 1998, 10, 1490.(37) Matsui, K.; Nakazawa, T.; Morisaki, H.J. Phys. Chem. 1991, 95,
976.(38) Iler, R. K. InThe Chemistry of Silica; Pergamon Press: New York,
1979.(39) Łajtar, L.; Narkiewicz-Michałek, J.; Rudzin´ski, W.; Partyka, S.
Langmuir1994, 10, 3754. (b) Fragneto, G.; Thomas, R. K.; Rennie, A. R.;Penfold, J.Langmuir1996, 12, 6036.
Figure 10. Variations in λmax of methyl orange with the Ormosilcomposition. (The indicated ratio of 0.43 is used in Figure 11).
Figure 11. Spectral shifts of methyl orange in the MeTMOS/TMOS) 0.43 Ormosil as a function of CTAB concentration.
8540 J. Am. Chem. Soc., Vol. 121, No. 37, 1999 Rottman et al.

the behavior of indicators in surfactant solutions.41-44 In thosesources one finds that the pKi changes of the indicators resultfrom a combined effect of electrostatic interactions with thesurfactant headgroup (Hartley’s “sing rule”)41 and the natureof the neutral lipid part and its packing. For each case, we shallpropose which parameter is dominant, or which of theseparameters work in concert. Of course, each one of the entrappedindicators has its own characteristic behavior and should havebeen examined separately, but we opted to provide interpreta-tions for the general trends within each family of dyes, assummarized in Table 3.
We begin with the azo-indicators, as represented by MO, thevarious species of which are shown in Scheme 1. The two maineffects observed for this family of dyes were the blue shift inthe λmax values in comparison to solution, especially for thebasic species, and the pKi shifts to the acidic range by 1-3 pHunits. These shifts can be understood by considering theorientation of the deprotonated species a and the protonatedspecies b-d (Scheme 1) in the micellar environment, asrepresented graphically in Figure 12 for one MO molecule. Thebasic form a is oriented fully within the surfactant micellarenvironment, because the negatively charged sulfonate groupof the MO associates with the positive quaternary ammoniumgroup of the CTAB, whereas the noncharged phenylamineresidue dissolves in the hydrophobic zone.22,28,29 Then, withdecreasing pH, the azophenylamine moiety becomes positivelycharged and hydrophilic, resulting in its repulsion from thehydrophobic region to the hydrophilic surroundings of themicellar phase. Indeed, the spectral shifts observed conform tothis picture. Species a experiences a hydrophobic environment,which causes a large 10-30 nm blue shift, compared to thedissolution in water and speciesd, which is largely in an acidicwater-like hydrophilic environment, shows only a 0-3 nm shiftcompared to water. The interpretation for the large bathochromicshift obtained for the basic form of MO is corroborated by aconclusion reached by Reeves et al.45 that the ground stateλmax
of the MO basic form in water solutions results from thecombination of short and long wavelength absorbing species,namely, the nonhydrated a form (Scheme 1) and the azo-hydrated form of a. The pKi shift to a more acidic value isunderstood by noticing that, as the pH decreases, the MO movesto a zone in the micellar phase which is densely charged withthe positive ammonium ions (Figure 12). This cationic environ-ment associates with the basic moiety of the indicator and buriesthe azo moiety of MO in the hydrophobic region. As aconsequence, a higher concentration of protons is required to
reach the azo functional group and the pH needed to reach thepKi situation is shifted to a higher acidic value. This behavioris shared also by MR and pMR, also azo dyes, showing similartrends in their spectral and indicating ranges (Table 1).
The behavior of the leaching profiles of MO (Figure 5) is inagreement with this interpretation: At the lower pH the MOzwitterionic species resides in the water-rich surroundings ofthe micellar region and is, therefore, relatively accessible forleaching. However, at pH) 2, the singly charged MO moleculeresides within the micelle and, protected by the hydrophobicityof this region, is also protected against leaching, with a half-life of several months. The even better leaching behavior ofMR at very low pH is ascribed to the close proximity of thenegatively charged carboxylate moiety to the positively chargedprotonated azo group, rendering this molecule more hydrophobicthan the MO at the same pH.The protection against leachingby the micellar enVironment is a key result of this study.Theappeal of direct, physical entrapment, compared to covalentattachment,13b is further strengthened in the context of designingdevices for long-term applications by this observation.
Unlike the azo family of indicators, which exhibited markedacidic shifts, the family of the phthaleins (represented by
(40) Jones, S. M.; Friberg, S. E.J. Non-Cryst. Solids1998, 224, 249.(b) Mukkamala, R.; Cheung, H. M. J. Mater. Sci.1997, 32, 4687. (c)Frieberg, S. E.; Sjo¨blom, J. InIndustrial Applications of Microemulsions;Marcel Dekker: New York, Basel, Hong Kong, 1997; p 267.
(41) Fendler, J. H.; Fendler, E. J. InCatalysis in Micellar andMacromolecular Systems; Academic Press: New York, 1975.
(42) Healy, T. W.; Lovelock, B.; Grieser, F. InSolid/Liquid Dispersions;Academic Press: London, U.K., 1987.
(43) Teisse, J.; Tocanne, J. F.; Pohl, W. G.Ber. Bunsen-Ges. Phys. Chem.1978, 82, 875.
(44) Vas, W. L. C.; Nieksch, A.; Jahnig, F.Eur. J. Biochem. 1978, 83,299.
Table 3. Summary of CTAB Effects on Dopant Properties
family of indicatorsdirection ofpKi shiftsa
range ofpKi shifts
|∆λmax| ) λmax(g) - λmax
(s)
(low-pH molecular structure)|∆λmax| ) λmax
(g) - λmax(s)
(high-pH molecular structure)
azo dyes (Scheme 1) pKi(s) > pKi
(g) 3 g ∆pKi g 0.5 5 nmg ∆λmax g 3 nm 40 nmg ∆λmax g 20 nmsulfonephthaleins (Scheme 2) pKi
(s) > pKi(g) 3.5g ∆pKi g 0.6 12 nmg ∆λmax g 5 nm 20 nmg ∆λmax g 4 nm
phthaleins (Scheme 3) pKi(s) < pKi
(g) 4 g ∆pKi g 2 colorless ∆λmax ( 5 nm
a g ) glass with CTAB; s) solution without CTAB.
Figure 12. Schematic representation of the relocation of methyl orange(MO) in the sol-gel entrapped micellar environment as a response topH changes.
Dopants ReactiVity in Sol-Gel Matrixes J. Am. Chem. Soc., Vol. 121, No. 37, 19998541

phenolphthalein, P, Scheme 3) experiences a markedbasicshiftin the pKi value upon entrapment. The main structural differenceresponsible for this variation is that, opposite of the azo dyes,in the phthaleins, an increase in pH is translated into a transitionfrom a hydrophobic noncharged lactone species (a in Scheme3) to an anionic hydrophilic one (b and e). The movementswithin the micellar environment accompanying the changes inthe molecular structure of the phenolphthalein indicator areschematically shown in Figure 13. By using this description ofthe local micellar environment, within which P is localized, weascribe the higher hydroxyl concentrations needed in order toopen the lactone form to the ion-pairing of the hydroxyl anionswith the cationic micellar interface. Since P is localized in thehydrophobic zone and the cationic micellar interface forms ionpairs with the anionic hydroxyls, P in its a-protected form mustbe exposed to higher external pH in order to be affected.
As we have seen in Section 3, particularly interesting resultswere obtained for the molecules which provide two pH-inducedtransitions. Our next family of indicators, the sulfonephthaleins(Scheme 2), is one such case because the molecules of thisfamily are indeed capable, in principle, of two protonation/deprotonation steps: From species a to b, and from b to c. Asevident from Scheme 2, the increase in pH causes an increasein the number of negative charges, 1, 2, and 3 for species a, b,and c, respectively, and all three species are hydrophilic. Theyreside, therefore, at the hydrophilic interfacial zone of the silica/micellar phase, and as a consequence, the association strengthbetween the indicator and the positively charged hydrophiliczone of the micelle increases with pH, causing an increase in
the concentration of the competing protons needed to reach thepKi. The molecules become then, as the azo dyes, indicators(IN) for higher acidities compared to solution:
For most of the sulfonephthaleins, only one of the twotransitions is seen, namely, the transition from b to c. Aninteresting example for these single transition cases is that ofCresol Red, which transforms from an indicator for mild basesin solution to an indicator for mild acids in the sol-gel matrix.The two pH transitions of PR and thymol blue are seen as insolution and, following the mechanism suggested above, indeedbothtransitions are seen to be pushed to higher acidities (Figure3 and Table 1). Again, it should be noted thatnegatiVepH valuesbecome detectable with these two indicators.
The phenomenology of CTAB/sol-gel effects is rich: Whilein PR and in thymol blue the two indicating ranges are shiftedin the same direction, in AL, as we saw (Figure 3), the shifts ofthe two ranges are inoppositedirections. This means that itbecomes more difficult both to protonate the monoanion b(Scheme 4) into a and to deprotonate it into c. Once again, thelocation where the various forms of the molecule reside andthe pairing of hydroxyls with the positively charged surfactantexplain the opposite direction of the two transitions: Thus,unlike the sulfonephthalein zwitterionic species b (Scheme 2),species b of AL is singly charged and the charge is spread outby many resonant structures, two of which are shown in Scheme4. The monoanion is therefore relatively hydrophobic and buriedinside the hydrophobic region of the micellar structure. Higherconcentrations of hydronium cations and of hydroxyls areneeded therefore to reach it, to form the neutral species a orthe dianion c, respectively. And as in the case of P, the higherpH needed for the AL dianion is also due to the competing ionpairing between the interfacial cationic charge and the hydroxyls.
Finally, we wish to comment briefly on the interestingsynergistic effect mentioned above and seen in Figure 2, namely,that the combined effect of indicator-micelle interaction withcaging in the silica matrix affects the pKi values stronger thaneach of these effects alone. As mentioned above, solution studieshave shown that the pKi is affected by the electrostaticinteractions and by the packing of the micelle);41-43 however,of special relevance here is the study of Vas et al.44 pointing tothe importance of the chargedensityin the vicinity of the probe.Thus, the enhancement of these effects in our case would seemto indicate that, within the silica cage, the CTAB moleculesare more densely packed, increasing the microscopic amphiphilicnature of the cluster, which in turn, strengthens its effects onthe indicator molecule compared to the micellar aqueoussolution. Indeed, this proposition is strengthened by severalrecent reports on the effects of adsorption of surfactants ingeneral39b,46 and of CTAB in particular47 onto silica surfaces,which have reached a similar conclusion. In the next Sectionwe are providing some indirect spectral proof for this proposi-tion.
(45) Reeves, R. L.; Kaiser, R. S.; Maggio, M. S.; Sylvestre, E. A.; Lauton,W. H. Can. J. Chem.1973, 51, 628.
(46) Kiraly, Z.; Borner, H. K.; Findenegg, G. H.Langmuir 1997, 13,3308.
Figure 13. Schematic representation of the relocation of phenolphtha-lein (P) in the sol-gel entrapped micellar environment as a responseto pH changes.
Scheme 5.The Amphiphilic Interaction between MO and theCTAB Molecules
IN- CTA+ + H+ h IN-H + CTA+
8542 J. Am. Chem. Soc., Vol. 121, No. 37, 1999 Rottman et al.

4.3. Concentration-Dependent Aggregation of CTABwithin SiO2 Sol-Gel Glass.As mentioned in Section 3, therelevant observedλmax values of MO are the acidic solutionzwitterionic 510 nm peak, the anionic 466 nm maximum insolution (Scheme 1), the 428 nm value of that species withinthe micelle (Figure 6), and the low (355-380 nm) values atthe dried glass. The crucial role of water adsorption in enablingthe formation of micellar structures within the sol-gel cageswas clearly evident in Figure 7 where, only after environmentalhumidity adsorption, the micellar 428 nm value was reached.Furthermore, this effect is even seen in the range of thepremicellar concentration values in which theλmax drops to aslow as 355 nm in the dried glass and never rises above 380 nm(Figure 7a). We attribute these highly blue-shifted values tostrong ion-pair/hydrophobic dual interaction as shown in Scheme5. Thus, by virtue of electrostatic interaction, the positivelycharged N+ of CTAB localizes the negative charge on the MOsulfonate moiety, decreasing the weight of resonance structuresof species a (Scheme 1); such restriction on resonance is knownto cause blue shifts inλmax. It is seen in Figure 7a (the driedglass) that the interaction of MO with the bare silica (466 nm)is replaced quite fast with the ion-paired interaction and thatthese ion-paired species prevail at all higher CTAB concentra-tions (Figure 7a). They seem to be the tightest (355 nm) at aCTAB concentration of 0.4 mM. Along the lines of thethermotropic behavior observed by Ogawa et al.48 for cetyltri-methylammoniumchloride (CTAC) in a silica matrix (as probedby pyrene fluorescence), we associate the blue shift to 380 nmwith an increase in the local hydrophobicity around the MOindicator which, in turn, results from the increased microvis-cosity of the micellar phase due to the drying of the matrix.We also draw attention again to the observation that the fullydried silica is a quite poor proton-donating species: Thezwitterionic form of MO (508 nm, Figure 7b) is observed onlyunder humid conditions, and the dried glass forces MO to bein its anionic form (466 nm, Figure 7a). This demonstrates thatthe role of drying on the properties of the cage of the silicamust not be underestimated.
The interpretation that the 428 nm of MO in the CTAB/sol-gel matrix results from a hydrophobic environment was nicelyproven by the experimental results obtained with MeTMOS:A sol-gel matrix, prepared from MeTMOS/TMOS) 1:1, givesfor MO in a cage rich with methyl groups the same 428 nmvalue (Figure 10). In fact, one can divide Figure 10 into tworegions: the 510-466 nm region (molar ratios 0-0.43 respec-tively), which represents mainly the increase in the blocking ofthe silanol proton donation ability to MO, up to the point wherethe concentration of the zwitterionic form is too small to bedetected and only the basic form prevails; and the 466-428nm region (molar ratios 0.43-1.0, respectively) in which MOis only in the anionic form, and thus the shift is accounted forby the increase in hydrophobicity alone.
In parallel to probing the micellar CTAB environment withMO, it was interesting to determine the effects of the changesin the surfactant low concentrations on the materials microscopicstructure17 by SAXS and BET measurements. The most practicalobservation that the SAXS measurements revealed is that, at a
CTAB concentration of 10.0 mM, the matrix becomes stableto low-heat treatment (Figure 8). It is of practical importancebecause it is known that final xerogels continue to “work” formany months. This becomes a problem when one wishes tocommercialize sol-gel-based devices and products. It nowseems that addition of CTAB can help solve this problem. Thefact that the sharp peaks in the P(r) profiles (Figure 9 and Table2) before and after heating nearly coincide helps to interpretthe appearance of the bimodality in the presence of lower CTABconcentration: It is evident from Figure 9 that CTAB isresponsible for the∼2.5 nm smaller mode and to the transitionof the population from the wide size inhomogeneity into thissmall size upon heating. The role of CTAB in forming the smallsize electron density inhomogeneities is related to its functionas a homogenizing tool in the polymerization mixture, byforming a narrow distribution of the dense silica building-blockparticles.5,6 The wider distributions of P(r) observed withoutand at low concentrations of CTAB correlate with the highersurface areas and with smaller average pore sizes (Table 2).This may be attributed to an open, less dense packing of thebasic particles, compared to a more closely packed arrangementat the 10 mM CTAB (Table 2) due to an increase in thepopulation of the CTAB micellar structures at higher surfactantconcentrations. These observations are in keeping with the setof principles set up recently by Muthukumar et al.,49 whichpointed to the effects of changing interfacial tension (bychanging surfactant concentration) on the spontaneous selectionof primary length scales in polymerization.
5. ConclusionSol-gel materials provide a new way to study the surface-
active agent concentration effects on probe molecules, whichwas not possible in solution: In solution one has sharptransitions between the surfactant monomer and its severalpossible aggregated forms, such as the classical micelle; withinthe sol-gel matrix, such transitions appear to develop in acontinuous mode. Thus, on one hand we found conditions forhaving CTAB within the matrix in an isolated, adsorbed form;then, going gradually through more and more pronouncedaggregation displaying distinct hydrophobic and hydrophilicregions, we ended in conditions where the micellar structure ofthe entrapped CTAB is fully evident.
We have shown here that the co-entrapment of a surfactantwith dopant molecules within sol-gel matrixes is a convenientway to modify cage properties and, therefore, the dopantproperties and the specific functionality of these materials. Aswe shall show in subsequent reports, this is a general methodol-ogy. We believe that, as much as nonpolymerizable substituentson the monomer proved to be very successful and are widelyused in tailoring material functionality, the horizon waiting forsurfactants in this sense is no less exciting.
Acknowledgment. We thank the Israel Ministry of Scienceand Arts for a Special Infrastructure Fund (Tashtiot), the IsraelScience Foundation, and the German-Israel Science Foundation(GIF) for supporting this study.
JA991269P
(47) Adamczyk, Z.; Patra, G.; Karwin´ski, A. Tenside, Surfactants, Deterg.1998, 4, 261.
(48) Ogawa, M.; Igarashi, T.; Kuroda, K.Chem. Mater.1998, 10, 1382.(49) Muthukumar, M.; Ober, C. K.; Thomas, E. L.Science1997, 277,
1225.
Dopants ReactiVity in Sol-Gel Matrixes J. Am. Chem. Soc., Vol. 121, No. 37, 19998543