Photodegradation of nitrite in lake waters: role of dissolved organic matter
Upload
khangminh22Category
view
2download
0
University of Kentucky University of Kentucky
UKnowledge UKnowledge
Theses and Dissertations--Plant and Soil Sciences Plant and Soil Sciences
2013
ABIOTIC NITRATE AND NITRITE REACTIVITY WITH IRON OXIDE ABIOTIC NITRATE AND NITRITE REACTIVITY WITH IRON OXIDE
MINERALS MINERALS
Prakash Dhakal University of Kentucky, [email protected]
Right click to open a feedback form in a new tab to let us know how this document benefits you. Right click to open a feedback form in a new tab to let us know how this document benefits you.
Recommended Citation Recommended Citation Dhakal, Prakash, "ABIOTIC NITRATE AND NITRITE REACTIVITY WITH IRON OXIDE MINERALS" (2013). Theses and Dissertations--Plant and Soil Sciences. 30. https://uknowledge.uky.edu/pss_etds/30
This Doctoral Dissertation is brought to you for free and open access by the Plant and Soil Sciences at UKnowledge. It has been accepted for inclusion in Theses and Dissertations--Plant and Soil Sciences by an authorized administrator of UKnowledge. For more information, please contact [email protected].

STUDENT AGREEMENT: STUDENT AGREEMENT:
I represent that my thesis or dissertation and abstract are my original work. Proper attribution
has been given to all outside sources. I understand that I am solely responsible for obtaining
any needed copyright permissions. I have obtained and attached hereto needed written
permission statements(s) from the owner(s) of each third-party copyrighted matter to be
included in my work, allowing electronic distribution (if such use is not permitted by the fair use
doctrine).
I hereby grant to The University of Kentucky and its agents the non-exclusive license to archive
and make accessible my work in whole or in part in all forms of media, now or hereafter known.
I agree that the document mentioned above may be made available immediately for worldwide
access unless a preapproved embargo applies.
I retain all other ownership rights to the copyright of my work. I also retain the right to use in
future works (such as articles or books) all or part of my work. I understand that I am free to
register the copyright to my work.
REVIEW, APPROVAL AND ACCEPTANCE REVIEW, APPROVAL AND ACCEPTANCE
The document mentioned above has been reviewed and accepted by the student’s advisor, on
behalf of the advisory committee, and by the Director of Graduate Studies (DGS), on behalf of
the program; we verify that this is the final, approved version of the student’s dissertation
including all changes required by the advisory committee. The undersigned agree to abide by
the statements above.
Prakash Dhakal, Student
Dr. Christopher J. Matocha, Major Professor
Dr. Mark S. Coyne, Director of Graduate Studies

ABIOTIC NITRATE AND NITRITE REACTIVITY WITH IRON OXIDE MINERALS
______________________________________________________________________
DISSERTATION ________________________________________________________________________
A dissertation submitted in partial fulfillment of the requirements for the degree of Doctor of Philosophy in the
College of Agriculture at the University of Kentucky
By Prakash Dhakal
Lexington, KY
Director: Dr. Christopher J. Matocha
Lexington, KY
2013
Copyright © Prakash Dhakal 2013

ABSTRACT OF DISSERTATION
ABIOTIC NITRATE AND NITRITE REACTIVITY WITH IRON OXIDE MINERALS
Under iron (Fe3+)-reducing conditions where aqueous Fe2+ and unreduced solid Fe3+-oxides commonly coexist, soil Fe2+ oxidation has been shown to be coupled with nitrate (NO3
-) reduction. One possible secondary reaction is the involvement of NO3-
and nitrite (NO2-) with Fe-oxide minerals found in many natural environments. Yet,
spectroscopic measurements and kinetic data on reactivity of NO3- and NO2
- with Fe-containing oxide minerals such as goethite (α-FeOOH), and magnetite (Fe3O4) are not found in the literature. The reactivity of goethite and magnetite with NO3
- and NO2-
was studied over a range of environmentally relevant pH conditions (5.5-7.5) with and without added Fe2+
(aq) under anoxic conditions. Laboratory experiments were conducted using stirred batch experiments and reaction products were analyzed using ion chromatography (IC), gas chromatography (GC), ultraviolet visible near infrared spectroscopy (UV-VIS-NIR), x-ray diffraction (XRD), scanning electron microscopy (SEM), Mössbauer, and Attenuated total reflection-Fourier transform infrared (ATR-FTIR) spectroscopy. Nitrate removal by goethite and magnetite was much slower when compared with NO2
-. There was a pH-dependence in the reduction of NO2-, and
the initial rate of NO2- removal was nearly 2 and 8 times faster at pH 5.5 than at pH
7.5 by magnetite and goethite, respectively. Nitric oxide (NO) and nitrous oxide (N2O) were identified as products when NO2
- has reacted with magnetite, whereas N2O is the major reaction product in the experiment with goethite. In comparison to experiments containing magnetite or goethite alone, addition of Fe2+ greatly accelerated the NO2
- removal rate. Wet chemical experiments combined with the Mössbauer study reveals that NO2
- reduction to NO and subsequently to N2O by magnetite occurs via a heterogeneous electron transfer process. ATR-FTIR and diffuse reflectance spectroscopy (DRS) results from the studies with goethite indicate that NO2
- was removed from solution by adsorption in a surface complex involving the oxygen atoms, and a portion of the nitrite is reduced to NO and N2O.

This study suggests that under anaerobic conditions soil and sediments that contain goethite, magnetite, and other Fe3+-oxides can catalyze abiotic NO2
- reduction and the kinetics data from this study can be used to predict the NO2
- removal under such conditions.
KEYWORDS: Nitrate, nitrite, reduction, magnetite, goethite
Prakash Dhakal Student’s Signature
9/16/2013 Date

ABIOTIC NITRATE AND NITRITE REACTIVITY WITH IRON OXIDE MINERALS
By Prakash Dhakal
Dr. Christopher J. Matocha Director of Dissertation
Dr. Mark S. Coyne Director of Graduate Studies
9/16/2013 Date

Dedicated to my family
vi
Acknowledgements
I owe a deep graduate to Dr. Chris Matocha for his guidance in learning intricate
path of research and writing, without whom it would not have been possible for me to get
through this far. I cannot express enough to Dr. Mark Coyne how much I have learnt
from you in and out of the lab. To Dr. Coyne, I am truly grateful for your constant
guidance, and making me feel you were always there for conversation (research or not). I
also highly value constant guidance from Dr’s. Alan Fryar, Ole Wendroth, Chris
Romanek, Elisa D’Angelo and their help for letting me use their lab facilities. I
appreciate Dr. Frank Huggins and Dr. Michael Sharkey for their help in Mössbauer and
SEM analysis respectively. I would like to thank Martin Vandiviere for his untiring help
in the laboratory, Georgia Zeigler for microbial DNA analysis, Jim Nelson for C and N
measurement , James Crutchfield for NO2-, NO3
- and NH4+ measurement, Stephanie
Clutts for SEM sample preparation, and Nancy Miller for XRD analysis.
I would like to express my sincere thanks to the University of Kentucky,
Department of plant and soil sciences for providing me with learning, teaching and
research opportunity. I would like to thank faculty, staff, and fellow graduate students of
the University of Kentucky, Department of plant and soil sciences for their support and
friendship.
I greatly acknowledge funding for this research by National Research Initiative
Competitive Grant No 2007-35107-18311for the USDA Cooperative State Research,
Education, and Extension Service. I thank Dr. Todd Pfeiffer, Chair of the Department of
plant and soil sciences of the University of Kentucky for providing me support through a
teaching assistantship.
Finally, to my family, I couldn’t have done this without you. I am blessed to have
you all in my life. Mom and dad, I am so blessed to have your constant support and
encouragement during the pursuing of my PhD. I will forever be grateful to my lovely
wife Saraswati for her support and believing in me. I am lucky to have my sister Prava,
Anusha and their family for an influential role to convince me for pursuing higher
studies.

vii
TABLE OF CONTENTS Acknowledgements ........................................................................................................... vi List of tables ...................................................................................................................... ix List of figures .......................................................................................................................x
Chapter One: Abiotic Nitrate and Nitrite Reactivity with Iron Oxide Minerals ..................1 1. Introduction ......................................................................................................................1
1.0.1 Soil Fe chemistry ............................................................................................3 1.0.2 Coupling of N and Fe cycles ...........................................................................4
1.1 Magnetite mediated NO3-/NO2
- removal .......................................................................5 1.2 Goethite mediated NO3
-/NO2- removal ..........................................................................6
1.3 Influence of surface sorbed Fe2+ in NO3-/NO2
- removal ................................................7 1.3.1 NO3
-/NO2- removal by surface sorbed Fe2+ on magnetite ..............................8
1.3.2 NO3-/NO2
- removal by surface sorbed Fe2+ on goethite .................................8 1.4 Spectroscopic study of NO3
-/NO2- reactivity with magnetite and goethite ...................9
1.5 Objectives of the present study ....................................................................................12
Chapter Two: Nitrite Reactivity with Magnetite ...............................................................18 2. Introduction ...................................................................................................................18 2.1 Experimental sections .................................................................................................20
2.1.1 Characterization of magnetite .......................................................................20 2.1.2 Nitrate and nitrite reduction studies ..............................................................21
2.1.3 Nitrite reduction in the presence of surface Fe2+ ..........................................22 2.1.4 Analysis and characterization of products ....................................................22 2.2 Results and discussion .................................................................................................24 2.2.1 Reduction of NO3
-/NO2- by magnetite ..........................................................24
2.2.2 NO and N2O emission ...................................................................................24 2.2.3 Changes in magnetite ....................................................................................25 2.2.4 Effect of pH on NO2
- reduction ....................................................................27 2.2.5 Significance of surface bound Fe2+ in NO2
- reduction ..................................28 2.3 Implications..................................................................................................................29
Chapter Three: Reaction of Nitrite with Goethite and Surface Fe2+-Goethite Complex ...45 3. Introduction ....................................................................................................................45 3.1 Materials and methods .................................................................................................47
3.1.1 Chemicals and minerals ................................................................................47 3.1.2 Goethite synthesis and characterization ........................................................48
3.1.3 Nitrite reaction with goethite experiment .....................................................49 3.1.4 Fe2+-sorption measurements .........................................................................50 3.1.5 Nitrite reactivity with Fe2+-goethite complex ...............................................51 3.1.6 Analysis and characterization of the reaction products ................................51 3.2 Results and discussion .................................................................................................52 3.2.1 Removal of NO2
- by goethite ........................................................................52 3.2.2 Impact of surface sorbed Fe2+ in NO2
- removal ............................................53 3.2.3 Characterization of reaction products ...........................................................54

viii
3.3 Environmental implications .........................................................................................56 Chapter Four: An In Situ Spectroscopic Study of Nitrite Interactions with Goethite and
Fe2+-Goethite Mineral Water Interface ..................................................................67 4. Introduction ....................................................................................................................67 Experimental sections ........................................................................................................69
4.1.1 Reagents, minerals synthesis, and characterization ......................................69 4.1.2 Nitrite interaction with goethite studies ........................................................69
4.1.3 In situ ATR-FTIR measurement ...................................................................71 4.1.4 In situ Diffuse Reflectance Spectroscopy (DRS) ..........................................71 4.2 Results and discussion .................................................................................................72 4.2.1 Theoretical IR vibration of NO2
- ...................................................................72 4.2.2 Characterization of goethite-water related ATR-FTIR spectral feature .......73 4.2.3 ATR-FTIR of NO2
-(aq) treated goethite .........................................................75
4.2.4 Effect of pH on NO2- interaction with goethite ............................................78
4.2.5 Effect of goethite and NO2- loading levels ...................................................79
4.2.6 Effect of Fe2+ addition on NO2- interaction with goethite ............................80
4.3 Conclusion ...................................................................................................................85 Chapter Five: Summary and Future Research ...................................................................95 Summary ................................................................................................................95 Future research thrust .............................................................................................96 Appendices .........................................................................................................................97 Appendix A: Calculation of magnetite stoichiometry .......................................................97 Appendix B: A back-of-the envelope calculation showing the extent of abiotic and
microbial NO2- reduction in soils K NO N
. and sediments that composes ~2%
magnetite, and 0.1% nitrite reducers per kg of soil, respectively ..........................99 Appendix C: Reactive surface sites, Fe2+ addition and potential Fe(OH)2 precipitation .........................................................................................................100 References ........................................................................................................................101 VITA ................................................................................................................................116

ix
LIST OF TABLES Table 1.1, Sequence of naturally occurring microbial terminal electron accepting process
(TEAP) in the anoxic subsurface, and corresponding standard reduction potential (Eho) .......................................................................................................................13
Table 1.2, Common iron oxides used in laboratory batch experiments to study abiotic
reduction/transformation of contaminants .............................................................14 Table 2.1, Initial rate and kobs measured for initial 0.5 mM of NO2
- (and NO3-) removal
from solution by magnetite with or without added Fe2+ at various pH .................31
Table 2.2, Fitted hyperfine parameters from Mössbauer spectra at 293K for magnetite samples, before and after reaction with NO2
- as shown in Fig. 2.8 .......................32
Table 3.1, Crystal morphology of untreated and treated goethite at pH 5.5 after 72 hr incubation ...............................................................................................................58
Table 3.2, Initial rate and kobs values measured for NO2- removal (initial concentration of
0.1 mM) from solution by goethite (2 gL-1) with or without added Fe2+ at various pH ...........................................................................................................................58
Table 4.1, Position of IR peak maxima of dissolved nitrate, nitrite, solid NaNO2, and metal-nitrite possible surface complexes ...............................................................86
Table 4.2, Differences in band position and band depth measured from the DRS spectra shown in Fig. 4.7B, and average crystal size measured from corresponding treatment obtained after 48 hr using scanning electron microscopy (SEM) image ......................................................................................................................87

x
LIST OF FIGURES Figure 1.1, A portion of the nitrogen cycle, emphasizing the transformation of
ammonium and nitrate applied to agricultural land ...............................................15 Figure 1.2, Conceptual illustration showing formation of reactive Fe2+/Fe3+ phase formed
in the presence of Fe2+(aq) and poorly crystalline iron oxide, and consequential
phase transformation ..............................................................................................16
Figure 1.3, Diagram showing redox potential (Eh) versus pH of relevant nitrogen and iron couples ...................................................................................................................17
Figure 2.1, Gel electrophoresis (GE) results showing absence of amplified microbial 16S rDNA bands from synthetic magnetite and goethite minerals used in this study .......................................................................................................................33
Figure 2.2, Plot of X-ray diffraction pattern observed from untreated magnetite and those reacted with NO2
- at pH 5.5 and 7.5 ......................................................................34
Figure 2.3, Characterization of untreated and treated magnetite by SEM .........................35
Figure 2.4, The effect of ionic strength on the ζ-potential, and electrophoretic mobility of untreated magnetite ................................................................................................36
Figure 2.5, The effect of MES buffer concentration on dissolved Fe2+ release from magnetite compared with buffer-free samples (open circles) with a magnetite concentration of 10 gL-1 at pH 5.5 .........................................................................36
Figure 2.6, Removal of (A) NO3- (at pH 5.5), and (B) NO2
- from solution by magnetite at pH 5.5 ( ), 6.5 ( ), and 7.5 ( ) (B) without and (C) with added Fe2+ .................38
Figure 2.7, Nitric oxide (A) and nitrous oxide (B) emission recorded in the experiment when 0.5 mM NO2
- was reacted with magnetite at pH 5.5 ....................................39
Figure 2.8, Room temperature Mössbauer spectrum of (A) untreated magnetite, and (B) magnetite treated with 0.5 mM NO2
- alone for 14 days at pH 5.5 .........................40
Figure 2.9, (A) The predicted surface speciation of magnetite as a function of pH ..........41
Figure 2.10, Dissolved Fe2+(aq) concentrations in the presence of 0.5 mM NO2
- as a function of pH with and without magnetite present. ..............................................42
Figure 2.11, (A) Adsorption of 0.1 mM Fe2+ on 10 gL-1 magnetite measured after 1 hr equilibrium time and (B) apparent reaction order plot (kobs) for reduction of NO2
- as a function of pH .................................................................................................43

xi
Figure 2.12, Scheme illustrating possible redox reactions mediated by electron transfer from structural Fe2+ in magnetite-NO2
- system. ....................................................44
Figure 3.1, X-ray diffraction patterns of control (untreated) goethite (GT51) in MES [2-(N-morpholino) ethane sulfonic acid] at pH 5.5 ....................................................59
Figure 3.2, Acid-base titration data for goethite (GT51) at three different ionic strengths on a surface area basis (100 and 330 m2L-1) ..........................................................60
Figure 3.3, Plot showing sorption of Fe2+(aq) onto goethite (GT51). Initially, 1.5 mM of
Fe2+(aq) was injected into reaction vials containing ~2 gL-1 (~100 m2L-1) of
goethite slurry ........................................................................................................60
Figure 3.4, Removal (%) of nitrite by goethite (GT51) at pH 5.5 ( ), 6.5 ( ), and 7.5 ( ) (A), without ( ) and with ( ) added Fe2+ at pH 5.5 ..............................................61
Figure 3.5, Nitrous oxide (N2O) emission recorded in the experiment (at pH 5.5) after adding 0.1 mM NO2
- in the reaction vessel that contained goethite slurry in the absence ( ), and presence ( ) of Fe2+
(aq) .............................................................62
Figure 3.6, Surface Fe2+ loading ( ) with respect to NO2- reduced ( ) per gram of
goethite at pH 5.5 over the span of 96 hr in a Fe2+-NO2--goethite system ............63
Figure 3.7, Plot of a powder x-ray diffraction pattern observed from untreated goethite (GT51) and that reacted with NO2
- at pH 5.5 ..........................................................64
Figure 3.8, Scanning electron micrographs (SEMs) of untreated goethite (A), goethite treated with 0.1 mM NO2
- at pH 5.5 for 72 hr (B), and Fe2+-conditioned (1.5 mM) goethite treated with 0.1 mM NO2
- at pH 5.5 for 72 hr (C & D) showing the changes in size and morphology of the goethite particles for various treatment ...65
Figure 3.9, Possible scheme showing NO2- redox transformation mediated by surface
sorbed Fe2+ on goethite-water geomedia ...............................................................66
Figure 4.1, ATR-FTIR (Thermo Nicolet 6300) set up used for collecting IR spectra in this study .......................................................................................................................88
Figure 4.2, ATR-FTIR spectrum of solid NaNO2..............................................................89
Figure 4.3, ATR-FTIR spectrum of (a) water at pH 5.5, (b) 25 mM MES buffer solution at pH 5.5, (c) goethite slurry at pH 5.5 (in MES solution), (d) MES subtracted goethite paste, and (d) a dry goethite .....................................................................90
Figure 4.4, Time series ATR-FTIR spectra obtained during the reaction of NO2- (0.1 mM)
with goethite (10 gL-1) ...........................................................................................91

xii
Figure 4.5, Time series ATR-FTIR spectra: Effect of NO2- loading (0.1, 0.5, 100 mM)
and surface sites (2 and 10 gL-1) on NO2- adsorption onto goethite ......................92
Figure 4.6, ATR-FTIR spectra: pH effect (5.5, 6.5, and 7.5) on NO2- (0.1 mM) adsorption
(1 hr) on goethite (10 gL-1) at the goethite-water interface ...................................93
Figure 4.7, ATR-FTIR spectra: (A) Effect of added Fe2+ (0.1 mM) on 0. NO2- adsorption
at goethite (10 gL-1)-water interface at pH5.5 .......................................................94

1
Chapter One: Abiotic Nitrate and Nitrite Reactivity with Iron Oxide Minerals
1. Introduction
Nitrogen (N) is an essential nutrient for all life forms. In biological cells, nitrogen
is held as a base element of nucleic acids and protein structure. Total percent of organic-
N pools in the Earth’s biosphere is significantly small (<0.1%) compared to inorganic-N
pool that includes N-in the atmosphere (~2%) and rocks (~97%) (Ehrlich, 1995). If global
N content fixed in rocks were excluded, most of the inorganic-N occurs as gases in the
atmosphere such as ammonia (NH3), dinitrogen (N2), nitrous oxide (N2O), and nitric
oxide (NO), and in the form of dissolved species in water as ammonium (NH4+), nitrate
(NO3-), and nitrite (NO2
-) (Lindsay, 1979). Of these, N2O and NO are important
greenhouse gases, and dissolved N-species are readily available to be transformed by
microbes enzymatically (Sylvia et al., 2005).
Among different N-species, N2(g) is abundant in the earth’s atmosphere (78%). Despite its
abundance, it is not readily available to plants except to those that can fix N2 from the
atmosphere in symbiotic association with N-fixing prokaryotes (Sylvia et al., 2005;
Canfield et al., 2010). Because N is a major nutrient element that limits the productivity
of plants (Vitousek et al., 2009), anthropogenic inputs of N have become an essential
agricultural practice to enhance crop production and they provide nearly 45% of the total
fixed N produced annually on Earth (Canfield et al., 2010). The principal forms of N
taken up by plants are NO3- and NH4
+ (Fig. 1.1). However, unused N applied in excess of
plant requirements can be lost to groundwater and nearby water bodies and deteriorate
water quality (Dowdell et al., 1979; Xing and Zhu, 2000). It is therefore important to
maximize crop production to meet food and energy demands of the world in a sustainable
fashion and yet, minimize N losses to the environment (Tilman, 1999; Gallagher et al.,
2011). Human health problems linked to an increase in NO3- and NO2
- loading in water
resources (Fan and Steinberg, 1996; Fewtrell, 2004) from anthropogenic fertilizer use
worldwide (Spalding and Exner, 1993; Goolsby et al., 2001; Fields, 2004; Ahrens et al.,
2008) has therefore stimulated research in understanding processes that lead to NO3-
/NO2- removal in soil environments.

2
Leaching and denitrification are two major pathways of N loss from the soil and
sediments. First, the ability of the NO3- anion to bind with soil particles, often with
negative surface charge, is very weak unless the soil contains significant pH-dependent
charged minerals (Toner et al., 1989). As a result, NO3- is highly susceptible to leaching
through the soil-pore water. The denitrification process is the sequential reduction of
NO3- to NO2
-, which further reduces to NO, N2O and finally to N2 (Tiedje, 1994). When
oxygen (O2) is depleted in the subsurface, microorganisms utilize NO3- as the next most
favorable electron acceptor (Table 1.1) and reduce it to N2 coupled to oxidation of
organic carbon (Lovley, 2001). Biological denitrification involves nitrate reductase,
nitrite reductase, nitric oxide reductase, and nitrous oxide reductase enzymes to fully
reduce NO3- to N2 as shown in scheme 1 (Tiedje, 1988; Tiedje, 1994; Canfield et al.,
2010).
Scheme 1
A global estimate of N lost via denitrification from terrestrial land is ~22%
indicating the importance of denitrification in the N cycle (Seitzinger et al., 2006). This
renders the N unavailable for plants. Where denitrification is incomplete, N2O
accumulates and its release to the atmosphere is undesirable because it plays a role as a
greenhouse gas (Mosier et al., 1998; Baggs, 2008), with a greater warming potential than
carbon dioxide (CO2) gas. Nitrous oxide emitted from agricultural soils accounts for
approximately 25% of the total N2O released on a global basis (Mosier et al., 1998).
Nitrous oxide can also be produced by nitrification (Wrage et al., 2001). Another
important intermediate N-species produced during incomplete denitrification is NO.
Another important source of NO is from industrial related fossil fuel combustion (Liu et
al., 1987; Cheng et al., 2004) and agricultural soil where N-fertilizer has been applied
(Warneck, 2000). Combined NO and N2O is commonly referred to as a single quantity
NOx that is a precursor for the photochemical formation of gaseous nitric acid (HNO3),
and thus contributes to the acidity of clouds and precipitation (Tost et al., 2007).

3
Historically, it has been assumed that biogeochemistry of N was entirely
dependent on organic carbon (OC) availability, and reduction–oxidation (redox) reactions
mediated by microbes (Seitzinger et al., 2006; Wallenstein et al., 2006). Consequently,
microbial denitrification has been linked to the carbon cycle. An environmental
conditions that stimulate anaerobic microbial denitrification include the presence of
readily usable OC, NO3- availability, and circumneutral pH (Tiedje, 1994; Seitzinger et
al., 2006). Because energy obtained from O2 is higher, microbes consume NO3-,
manganese (Mn3+/Mn4+), iron (Fe3+), sulfate (SO42-), and carbon dioxide (CO2) in
sequential order for next highest energy source only after O2 is depleted (Lovley and
Chapelle, 1995) (Table 1.1). In these terminal electron accepting processes (TEAP),
heterotrophic denitrifying microbes transfer electrons from oxidation of OC to electron
accepting oxidized species such as NO3- for their metabolic activity. These microbes can
couple denitrification to growth and energy production (Strohm et al., 2007).
1.0.1 Soil Fe chemistry
Iron (Fe) is the fourth most abundant element in the earth’s crust, and it exists in
two important oxidation states, Fe2+ and Fe3+ (Ehrlich, 1995). The valence state of iron is
primarily controlled by the ambient redox conditions. This makes Fe the most prevalent
redox-sensitive metal commonly available on the boundary between the oxidized and
reduced soil-water zones (Lovley, 1991; Lovley and Chapelle, 1995; Hiemstra and van
Riemsdijk, 2007). Iron minerals exert a significant influence on soil and sediment
geochemistry (Ponnamperuma, 1972). Under aerobic conditions, iron exists as Fe3+ in
different mineral phases ranging from poorly crystalline materials, such as ferrihydrite
(Fe(OH)3), to well crystalline minerals such as goethite (α-FeOOH), lepidocrocite (γ-
FeOOH), hematite (Fe2O3), and magnetite (Fe3O4) (Sposito, 1989; Cornell and
Schwertmann, 2003). Dissolved Fe3+-organic carbon complexes have also emerged as
important in the Fe cycle.
The microbial reduction of solid iron Fe3+-hydr(oxide) minerals is an important
biogeochemical process in soil, groundwater and sedimentary environments that
influences the cycling of nutrients and metals. Under Fe3+-reducing conditions, soil Fe3+
is reduced to Fe2+. Fe2+ can remain dissolved, adsorbed, or reprecipitate. Siderite

4
(Fe2+CO3(s)), green rust (Fe2+4Fe3+
2(OH)12SO4•4H2O(s)), and magnetite (Fe2+ Fe3+2O4(s))
are potentially precipitating Fe2+ minerals (Lovley et al., 1987; Fredrickson et al., 1998;
Peretyazhko and Sposito, 2005). Also, in anoxic environments, dissolved Fe2+(aq) can
resorb to unreduced ferrihydrite to produce magnetite, goethite, and lepidocrocite
depending on initial dissolved Fe2+(aq), ligand type, and pH (Hansel et al., 2003; Hansel et
al., 2005). The effect of Fe2+(aq) is illustrated in Figure 1.2. Low initial concentrations of
Fe2+(aq) (0.2 mM), result in lepidocrocite and goethite precipitation whereas
concentrations of 2.0 mM catalyze magnetite precipitation. The ability of reduced Fe to
adsorb and re-precipitate depends on the nature of the minerals present in the soil and the
soil solution conditions such as pH and ionic strength. Adsorbed and re-precipitated
forms of Fe2+ are more abundant than dissolved Fe2+ forms based on chemical extractions
(Peretyazhko and Sposito, 2005; Matocha and Coyne, 2007).
Microbial Fe3+-reduction coupled to oxidation of organic carbon occurs after O2 ,
NO3-, and Mn4+ reduction and before sulfate reduction based on free energy available
(Chapelle and Lovley, 1992; Lovley and Chapelle, 1995; Appelo and Postma, 2007)
(Table 1.1). Overlap of these reduction zones is not uncommon (Postma and Jakobsen,
1996), and could give rise to a biogeochemical scenario where coupling of NO3-
reduction and Fe2+ oxidation is possible.
1.0.2 Coupling of N and Fe cycles
Recent studies have indicated that the Fe2+ produced from microbial Fe3+
reduction can participate in electron transfer reactions involving nitrate reduction,
highlighting the need to look beyond OC alone (Burgin et al., 2011; Schlesinger et al.,
2011). Field and laboratory studies have shown that Fe2+ can be oxidized during NO3-
reduction (Yasuhiko et al., 1978; Obuekwe et al., 1981; DiChristana, 1992; Cooper et al.,
2003; Weber et al., 2006a; Matocha and Coyne, 2007). This process is called NO3--
dependent Fe2+-oxidation (NDIO) and it can involve both biological, abiotic, and coupled
biological/abiotic components (Coby and Picardal, 2005; Weber et al., 2006b; Matocha et
al., 2012). Abiotic reduction of nitrate can occur on time scales comparable to biological
denitrification when mineral Fe2+-forms are present such as green rust and wüstite
(Fe2+O) (Hansen et al., 1996; Rakshit et al., 2005). A coupled biological/abiotic pathway

5
might be operative in which nitrate reductase enzyme performs the first two-electron
reduction to form nitrite (Scheme 1). The resulting NO2- would then be available for
reaction with mineral Fe2+ forms such as green rust and siderite in an abiotic process
(Hansen et al., 1996; Rakshit et al., 2008). Picardal (2012) pointed out that this secondary
abiotic reaction between biologically produced NO2- and Fe2+ would be obscured in
abiotic controls, presumably due to the halting of the first step of NO3- reduction due to
sterilization . Abiotic NO and N2O emission from a lake environment was reported to
occur by an abiotic reaction coupling mineral Fe2+ oxidation to NO2- reduction (Samarkin
et al., 2010) and also in the laboratory batch studies (Kampschreur et al., 2011). Table 1.2
summarizes the literature to date on abiotic reduction of nitrate and nitrite on Fe minerals
compared with other contaminants. The role of goethite and magnetite in the reduction
of NO3-/NO2
- is not known and is the focus of this dissertation.
1.1 Magnetite mediated NO3-/NO2
- removal
In a secondary reaction, Fe2+ produced during dissimilatory reduction of poorly
crystalline ferrihydrite by iron reducing bacteria (DIRB) has shown to precipitate
magnetite (Lovley and Phillips, 1987; Fredrickson et al., 1998). The illustration in Fig.
1.2 provides a simplified diagram for the process. In addition, a magnetotactic bacterium
has also shown to precipitate as magnetite in its cell surface (Bazylinski et al., 2007).
Because Fe2+ is included in the crystalline structure, magnetite (Fe3O4) is regarded as a
mixed valence Fe2+/Fe3+ mineral which has been identified in natural environments such
as soils and sediments (Lovley et al., 1987; Maher and Taylor, 1988; Cornell and
Schwertmann, 2003). Previous studies have shown that structural Fe2+ positioned in
magnetite crystals allows it to serve as a reductant in the transformation of organic
(Gregory et al., 2004; Gorski and Scherer, 2009) and inorganic contaminants such as
chromate (White and Peterson, 1996; Peterson et al., 1997; Jung et al., 2007) and
uranium (U6+) (Das et al., 2010; Latta et al., 2012a; Singer et al., 2012). Contaminant
reducing capacity of magnetite is attributed to its ability to transfer electrons both within
the solid state and also across the solid-liquid interface (White et al., 1994; Scherer et al.,
1999).

6
Ideally, the ratio of Fe2+:Fe3+ in stoichiometric magnetite is 1:2 (Gorski and
Scherer, 2009). In general, Fe3+ occupies tetrahedral sites and both Fe2+ and Fe3+ ions
occupy octahedral sites of a magnetite spinel structure (Daniels and Rosencwaig, 1969;
Tronc et al., 1984; Gorski et al., 2010). In a condition where the magnetite stoichiometry
(x=OctFe2+/(TetFe3+ + OctFe3+) differs from 1:2, a wide range of possibilities can exist
(0<x<0.5).
In previous studies, magnetite is reported to form when NO3- is chemically
reduced by wüstite (Rakshit et al., 2005), green rust (Hansen et al., 1996), and also when
surface Fe2+- lepidocrocite is used to reduce NO2- (Sørensen and Thorling, 1991). In the
presence of continuous hydrogen (H2) flow, reduction of NO3-/NO2
- catalyzed by
monometallic Pd/Fe3O4 has recently been reported (Sun et al., 2012). However, there is
no clear evidence if NO3- or NO2
- could be reduced by magnetite. Because the role of
abiotic NO2- removal mediated by magnetite is less understood, its importance in
anaerobic cycling of NO3-/NO2
- may be underestimated. Importantly, there is a
thermodynamic driving force for NO2- reduction by magnetite because the Fe3O4/Fe2+
redox couple lies well below that of NO2-/NO and NO2
-/N2O over a wide range of pH
values (Fig. 1.3). Therefore, it is a timely pursuit to investigate abiotic reduction of NO2-
by magnetite.
1.2 Goethite mediated NO3-/NO2
- removal
Goethite has been identified as a common iron oxide mineral in many natural
environments (Cornell and Schwertmann, 2003). It can be produced under oxic
conditions, for example, when structural Fe2+ in biotite is oxidized by O2 (Essington,
2004). Goethite can also be produced under anoxic conditions. For example, microbial
reduction of poorly crystalline ferrihydrite by DIRB results in production of Fe2+(aq)
which can resorb to unreduced ferrihydrite forming goethite at both low and high
concentrations of initial Fe2+ as shown in Figure 1.2 (Glasauer et al., 2003). In addition,
nitrate-dependent iron (Fe2+) oxidizing bacteria have been discovered which produce
goethite anoxically (Senko et al., 2005; Miot et al., 2009; Larese-Casanova et al., 2010).
Photoautotrophic Fe2+ oxidizers (Kappler and Newman, 2004) have also been shown to
produce crystalline goethite as their oxidation product in the absence of oxygen. Thus,

7
goethite has been used extensively as a model iron oxide mineral in many studies carried
out to investigate sorption and reduction of contaminants (Grossl et al., 1997; Amonette
et al., 2000; Williams and Scherer, 2004; Catalano et al., 2011; Um et al., 2011).
Goethite is often written as the product of dissolved Fe2+ oxidation by NO2- and
NO3- (Picardal, 2012). Previous studies in our lab showed abiotic goethite and
lepidocrocite precipitation occurred during NO2- reduction by siderite, an Fe2+ mineral,
under anoxic conditions (Rakshit et al., 2008). Kinetic modeling of the time series data
assumed that NO2- removal from solution was entirely due to surface sites on siderite.
However, it is possible that the appearance of goethite provides reactive surface sites that
can bind anions such as NO2- and remove them from solution. A survey of the literature
reveals only one study which documented the reactivity of NO2- with goethite (Coby and
Picardal, 2005), however it was restricted to one pH value (pH 7.0) and only N2O
production was measured as the metric of reactivity.
1.3 Influence of surface sorbed Fe2+ in NO3-/NO2
- removal
The reductive dissolution of Fe3+-oxides by DIRB releases Fe2+(aq) to solution
(Fig. 1.2). The resulting Fe2+(aq), like other first row transition metals, is capable of
adsorbing to unreduced Fe3+-oxides or other mineral surfaces (Essington, 2004). In
various studies, surface complexed Fe2+- has shown to be a more effective reductant than
dissolved, hexaquo Fe2+-(Fe(H2O)6)2+ (Wehrli et al., 1989; Stumm and Sulzberger, 1992;
Strathmann and Stone, 2003; Tai and Dempsey, 2009). Increased reactivity of surface
sorbed Fe2+-species can be explained using molecular orbital theory (Luther et al., 1992).
The coordination of Fe2+ to surface hydroxyls allows electron density to be pushed
through the pi system of OH- to Fe2+ (t2g (π) orbital) to an oxidant with unoccupied
orbitals of appropriate symmetry, making electron transfer favorable. This is analogous
to the acceleration of Fe2+ oxidation by O2 whose rate increases with increasing OH-
added to solution (Luther et al., 1992). In this study, an attempt will be made to explore
how reduction of NO3-/NO2
- by surface sorbed Fe2+ on magnetite and goethite will vary
compared to the system with mineral alone.

8
1.3.1 NO3-/NO2
- removal by surface sorbed Fe2+ on magnetite
Studies have shown that adding Fe2+(aq) to a magnetite slurry enhanced the rate of
polyhalogenated methane, RDX, nitrobenzene (Pecher et al., 2002; Gregory et al., 2004;
Gorski and Scherer, 2009), and U6+ (Latta et al., 2011) reduction. In these studies, it was
observed that structural Fe2+ in magnetite participated in the electron transfer process and
reduction of contaminants. Evidence from Mössbauer spectroscopy revealed that the ratio
of Fe2+:Fe3+ in the reacted magnetite decreased (Gorski and Scherer, 2009; Latta et al.,
2011). This is a positive indication that oxidation of structural Fe2+ in magnetite
stimulated the reduction process. Further, reductions of contaminants were more favored
by stoichiometric magnetite, and the rate progressively decreased with more non-
stoichiometric magnetite (Gorski et al., 2012). Results from Fe2+ sorption experiments on
magnetite showed that less stoichiometric magnetite retained more Fe2+. With increasing
Fe2+ uptake, the ratio of Fe2+ in magnetite crystal increased. It was observed that with
added Fe2+, non-stoichiometric magnetite not only replenished oxidized Fe3+ in the
crystal arrangement, but also continued to maintain reducing capacity of the mineral
surface (Latta et al., 2011; Gorski et al., 2012). Here, we raise a question of whether
removal of NO3- and NO2
- from solution by magnetite is changed in the presence of
added Fe2+(aq). To our knowledge, this abiotic reduction of NO3
-/NO2- has not been
studied.
1.3.2 NO3-/NO2
- removal by surface sorbed Fe2+ on goethite
Compared to the system without added Fe2+, goethite-bound Fe2+ substantially
promoted the reductive transformation of CCl4 (Amonette et al., 2000), polyhalogenated
methane (Pecher et al., 2002), and 2-nitrophenol (Tao et al., 2010). Results from
laboratory studies suggest that Fe2+-bound to lepidocrocite and hydrous ferric oxide
reduced NO2- more rapidly than the system with only aqueous Fe2+ or oxide-mineral
slurry (Sørensen and Thorling, 1991; Tai and Dempsey, 2009). In anoxic subsurface
environments, where NO3- reduction and Fe2+ oxidation are potentially coupled,
biologically produced NO2- could further undergo abiotic reduction. In the presence of
Fe2+(aq) produced by DIRB , soil and sediments dominated by goethite could potentially
yield surface bound Fe2+-goethite complex that could further reduce NO2- more rapidly
than the systems with goethite alone. In addition, thermodynamic calculations suggest

9
that NO2- reduction by goethite/Fe2+ couple is feasible (Picardal, 2012) (Fig. 1.3).
However, kinetic data on NO2- reactivity with goethite and Fe2+-treated goethite are not
yet published.
1.4 Spectroscopic study of NO3-/NO2
- reactivity with magnetite and goethite
The influence of aqueous Fe2+ (Moraghan and Buresh, 1977; Kampschreur et al.,
2011) and mineral Fe2+ on NO2- reduction (Sørensen and Thorling, 1991; Rakshit et al.,
2005; Rakshit et al., 2008; Tai and Dempsey, 2009) has been studied previously. These
studies employed wet chemical methods, using changes in total nitrate and nitrite
concentration over time to understand the electron transfer process. In order to
understand mechanisms of electron transfer, spectroscopic measurements of reacted solid
phases in the presence of water (in situ) are necessary where possible. Notably,
spectroscopic data of NO3-/NO2
- reactivity with magnetite and goethite minerals are not
found in the literature. Commonly, spectroscopic techniques such as Mössbauer, Diffuse
Reflectance Spectroscopy (DRS), and Infrared (IR) Spectroscopy are used to identify
changes in surface chemical properties of reacted metal oxides.
Magnetite consists of TetFe3+ and Oct(Fe2+, Fe3+) in the crystal structure, and
stoichiometry (x= Fe2+/Fe3+) of magnetite can often vary (0<x<0.5). As stoichiometric
magnetite (x=0.5) becomes oxidized, the Fe2+/Fe3+ ratio decreases. Completely oxidized
magnetite (x=0) is known as maghemite (γ-Fe2O3). Common methods used to measure
magnetite stoichiometry include: (a) 57Fe Mössbauer spectroscopy (Daniels and
Rosencwaig, 1969; da Costa et al., 1995); and (b) complete acidic dissolution (Tamura et
al., 1974; Tronc et al., 1984; Gorski and Scherer, 2009). The iron-specific Mössbauer
spectroscopy technique utilizes detection of the 57Fe isotope. A mineral sample is
subjected to gamma rays, some of which are absorbed by the sample, resulting in nuclear
transitions. This technique is widely used in detecting changes in Fe2+/Fe3+ ratio in
mineral solids as well as hydrated mineral oxide surfaces. With careful comparison of the
Fe2+/Fe3+ ratio obtained by fitting relative peaks in a Mössbauer spectrum of reacted and
unreacted iron oxides, one can quantify changes in the Fe2+/Fe3+ ratio (Gorski and
Scherer, 2011). In this study, the role of structural OctFe2+ in magnetite for NO3-/NO2
-

10
reduction will be studied using Mössbauer spectroscopy and compared with wet chemical
(acid) dissolution.
Infrared spectroscopy (IR) is employed to probe vibrations of atoms or groups of
atoms within a molecule subject to selection rules developed in quantum mechanics
(Huheey et al., 1993). Conventional IR spectroscopy was limited by the strong
absorption of water, which complicated interpretations. Attenuated Total Reflectance
Fourier Transform Infrared Spectroscopy (ATR-FTIR) has emerged as a technique which
enables one to study reactions at the mineral-water interface, thus it offers the possibility
for in situ spectroscopic investigations. Previously, adsorption mechanisms of several
oxyanions on metal oxides such as goethite have been investigated using ATR-FTIR
spectroscopy (Peak et al., 1999; Arai and Sparks, 2001; Villalobos and Leckie, 2001;
Lefèvre, 2004). Virtually no work has been carried out to understand the NO2- sorption
mechanism and reaction intermediates using iron oxide minerals such as goethite. Nitrite
is a versatile ligand that can participate in acid/base coordination or oxygen transfer
chemistry (Hitchman and Rowbottom, 1982). Five possible modes of NO2- bonding to
metal cations (denoted by M) have been previously suggested (Scheme 2, shown below)
(Finney et al., 1981; da Cunha et al., 1996; Hadjiivanov, 2000).

11
Scheme 2
ATR-FTIR analytical techniques will be utilized to establish the nature of
coordination of NO2- with surface sites on goethite and possibly magnetite by observing
N and O bond stretching/bending vibration frequencies. These experiments will be
performed first with NO2- alone and then in the presence of Fe2+-bound onto minerals. A
close monitoring of the energy regions will be performed as a function of surface Fe2+
onto these minerals with NO2- loading as a function of pH, and ionic strength. It is
hypothesized that results from this study will help to identify possible modes of NO2-
bonding to metal cations. Such investigations will allow us to better understand the role
of chemical reoxidation of Fe2+ by NO2- in the inhibition of Fe3+ reduction by NO3
-.
In addition to ATR-FTIR, DRS within UV to NIR electromagnetic spectrum will
be used to measure electronic spectra of adsorbed Fe2+ onto goethite and obtain direct
information about ground state and the excited state of such complexes. Electronic
spectroscopy thus collected could provide evidence of electron transfer between adsorbed
Fe2+ and Fe3+OOH (goethite), and also during redox reactions of goethite, and the Fe2+-
goethite complex with NO2- .

12
1.5 Objectives of the present study
The overall aim of this research project is to investigate abiotic transformations of
NO3- and NO2
- under anoxic conditions in stirred-batch experiments containing iron
oxide slurries, in the presence and absence of added Fe2+(aq). Specifically, the objectives
are to determine:
(i) the reactivity of NO3- and NO2
- with magnetite and goethite,
(ii) the impact of surface adsorbed Fe2+ on the ability of magnetite and goethite to remove
NO2- from solution,
(iii) the changes in reacted magnetite and goethite samples by means of Mössbauer,
ATR-FTIR, and DRS techniques to elucidate mechanisms of reactivity at the mineral-
water-interface.
It is believed that this research has important implications in biogeochemical cycling of
nutrients and contaminant transport.

13
Table 1.1 Sequence of naturally occurring microbial terminal electron accepting
process (TEAP) in the anoxic subsurface, and corresponding standard reduction
potential (Eho). Calculation was performed at pH 7.0 (modified after Hall et al.
(1996); Davidson and Kingerlee (1997)).
L
ess e
nerg
y (∆
Gro ) f
or m
icro
bes
Microbes involved Redox couple Eho(V)
Aerobes/oxidizers O2/H2O 0.81
Nitrate reducers NO3-/N2 0.75
Manganese reducers MnO2(s)/Mn2+ 0.61
Iron reducers FeOOH(s)/Fe2+ 0.15
Sulfate reducers SO42-/H2S -0.22
Methanogens CO2/CH4 -0.24

14
Table 1.2 Common iron oxides used in laboratory batch experiments to study abiotic
reduction/transformation of contaminants.
Fe-Oxides Added
Fe2+(aq)
Contaminants Reduction Products Ref
Green Rust No NO3
- NH4+ , magnetite Hansen et al., 1996
No NO3- NH4
+ , magnetite Choi and Batchelor, 2008
Ferrihydrite Yes NO2- N2O, goethite, magnetite Tai and Dempsey, 2009
Wüstite No NO3
- NH4+ , magnetite Rakshit et al., 2005
Lepidocrocite Yes NO2
- N2O, magnetite Sørensen and Thorling, 1991 Yes ArNO2 ArNH2 Klausen et al., 1995
Siderite No NO2
- N2O, lepidocrocite Rakshit et al., 2008
Goethite No NO3- N2O Cooper et al., 2003
Yes 2-nitrophenol NA, reductive transformation Tao et al., 2010 Yes CCl4 chloroform, goethite Amonette et al., 2000 Yes As As3+ to As5+, goethite Amstaetter et al., 2009 Yes ArNO2 ArNH2 Klausen et al., 1995 No NO2
- N2O, goethite This study Yes NO2
-
Magnetite
Yes ArNO2 ArNH2 Gorski and Scherer, 2009 Yes Cr6+ Cr3+, oxidized magnetite Jung et al., 2007 No Cr3+, maghemite Peterson et al., 1997 No Hg2+ Hgo, oxidized magnetite Wiatrowski et al., 2009 Yes
CCl4 MNX, DNX, TNX Gregory et al., 2004
No chloroform (CHCl3), Vikesland et al., 2007 No NO3
-/NO2- NO, N2O, magnetite This study
Yes NO3-/NO2
-

15
Figure 1.1 A portion of the nitrogen cycle, emphasizing the transformation of ammonium
and nitrate applied to agricultural land. The chemical reaction illustrated in the box
indicates that there is no clear understanding of how nitrate and nitrite react with various
iron (II,III) oxides in the presence of dissolved or surface adsorbed Fe2+.

16
.
Figure 1.2 Conceptual illustration showing formation of a reactive Fe2+/Fe3+ phase
formed in the presence of Fe2+(aq) and poorly crystalline iron oxide, and consequential
abiotic phase transformation (modified from Hansel et al. ( 2003); Hansel et al. ( 2005)).
a Initial Fe2+(aq) concentration of 2.0mM.
b Initial Fe2+(aq) concentration of 0.2mM.
c dissolution and (re)precipitation Defined pathways Unknown pathways
17
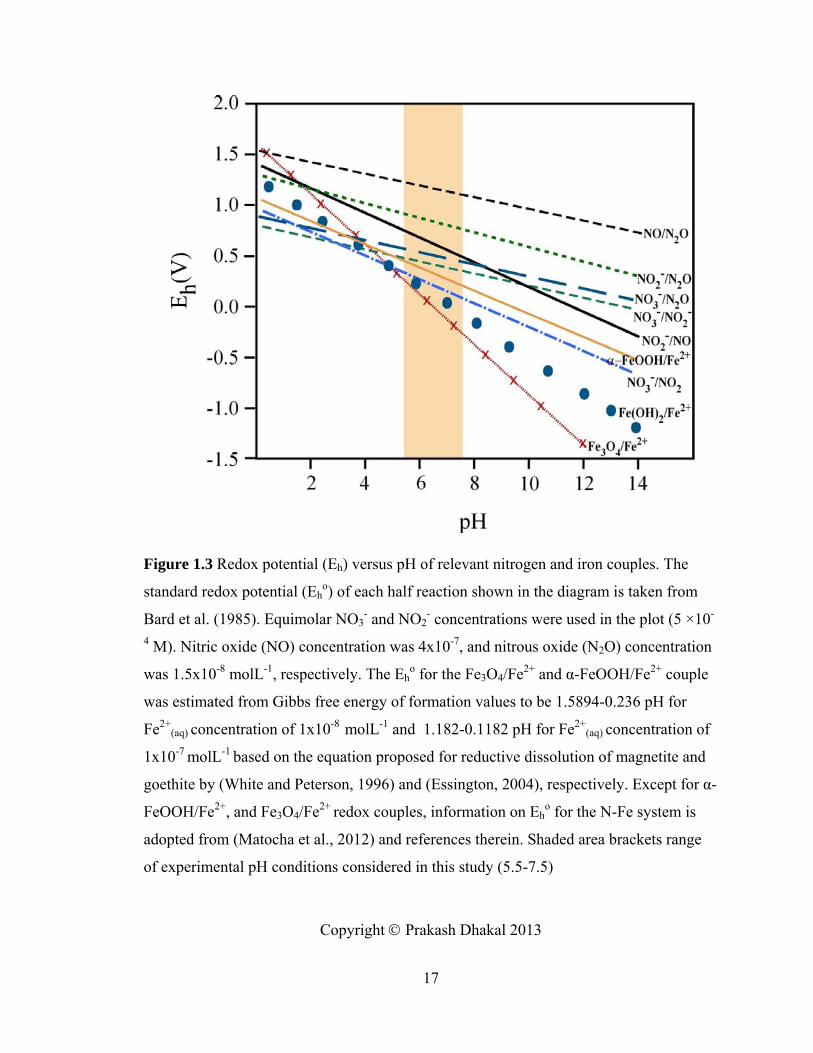
Figure 1.3 Redox potential (Eh) versus pH of relevant nitrogen and iron couples. The
standard redox potential (Eho) of each half reaction shown in the diagram is taken from
Bard et al. (1985). Equimolar NO3- and NO2
- concentrations were used in the plot (5 ×10-
4 M). Nitric oxide (NO) concentration was 4x10⁻⁷, and nitrous oxide (N2O) concentration
was 1.5x10⁻⁸ molL-1, respectively. The Eho for the Fe3O4/Fe2+ and α-FeOOH/Fe2+ couple
was estimated from Gibbs free energy of formation values to be 1.5894-0.236 pH for
Fe2+(aq) concentration of 1x10⁻⁸ molL-1 and 1.182-0.1182 pH for Fe2+
(aq) concentration of
1x10⁻⁷ molL-1 based on the equation proposed for reductive dissolution of magnetite and
goethite by (White and Peterson, 1996) and (Essington, 2004), respectively. Except for α-
FeOOH/Fe2+, and Fe3O4/Fe2+ redox couples, information on Eho for the N-Fe system is
adopted from (Matocha et al., 2012) and references therein. Shaded area brackets range
of experimental pH conditions considered in this study (5.5-7.5)
Copyright © Prakash Dhakal 2013
18
Chapter Two: Nitrite Reactivity with Magnetite
Reproduced with permission from Dhakal, P., C.J. Matocha, F.E. Huggins, and M.M. Vandiviere. 2013. Nitrite Reactivity with Magnetite. Environmental Science & Technology DOI:10.1021/es304011w. Copyright [2013] American Chemical Society.
2. Introduction
Magnetite (Fe3O4) is a mixed valence Fe2+/Fe3+ mineral which has been identified
in natural environments such as soils and sediments (Lovley et al., 1987; Maher and
Taylor, 1988; Cornell and Schwertmann, 2003). It is formed in various ways: (i) as a
product of respiration during dissimilatory reduction of poorly crystalline ferrihydrite by
Fe3+-reducing bacteria, (Lovley et al., 1987; Fredrickson et al., 1998); (ii) by
magnetotactic bacteria, (Bazylinski et al., 2007); (iii) during corrosion of metallic iron
(Lee and Wilkin, 2010; Saheb et al., 2010). Magnetite contributes to the magnetic
properties of soils and sediments and its presence is being used to reconstruct past
climates (Maher, 2009).
The structural Fe2+ in magnetite allows it to serve as a reductant in the
transformation of organic, (Gregory et al., 2004; Gorski and Scherer, 2009) and inorganic
contaminants (Peterson et al., 1997; Jung et al., 2007; Das et al., 2010; Latta et al., 2011;
Singer et al., 2012). Tetrahedral sites in the magnetite spinel structure are occupied by
Fe3+, and both Fe2+ and Fe3+ ions occupy octahedral sites (Daniels and Rosencwaig,
1969; Gorski et al., 2010) in an overall Fe2+:Fe3+ratio of 1:2 for stoichiometric magnetite.
The presence of both Fe2+ and Fe3+ ions on the same site in magnetite offers unique
electronic, structure and redox properties (Kündig and Hargrove, 1969; White et al.,
1994). It is suggested that magnetite is capable of transferring electrons both within the
solid state and also across the solid-liquid interface (White and Peterson, 1996; Scherer et
al., 1999). Magnetite stoichiometry (x=OctFe2+/(TetFe3+ + OctFe3+) can have a wide range
(0<x<0.5) due to the possible existence of solid solution between magnetite (x=0.5) and
maghemite (γ-Fe2O3) (x=0) (Tronc et al., 1984; White and Peterson, 1996; Gorski and
Scherer, 2009). Experimental results have shown that stoichiometric magnetite is more
reactive than oxidized (non stoichiometric) magnetite (Gorski and Scherer, 2009). During
reduction of hexavalent uranium (U6+), solid magnetite is transformed to maghemite,
(Das et al., 2010) or more oxidized magnetite (Latta et al., 2011). Addition of dissolved

19
Fe2+ to magnetite can recharge partially oxidized magnetite and enhance reactivity
(Gorski and Scherer, 2009; Latta et al., 2011).
Microbial denitrification involves the reduction of nitrate (NO3-) to nitrite (NO2
-),
which sequentially reduces further to nitric oxide (NO), nitrous oxide (N2O), and
eventually to dinitrogen (N2), (Tiedje, 1994). This process is usually assumed to be
mediated by organic carbon oxidation (Burford and Bremner, 1975). In anoxic
environments, however, nitrate reduction and Fe2+ oxidation are potentially coupled.
Coupling of NO3- reduction to Fe2+-oxidation is probable when NO3
- from still oxidized
soil layers penetrates into Fe3+-reducing zones. Nitrate can be abiotically reduced by
mineral Fe2+ forms such as green rust and wüstite (Hansen et al., 1996; Rakshit et al.,
2005). A second possible scenario is the biological reduction of NO3- to NO2
- and the
subsequent further reduction in abiotic reactions involving mineral Fe2+ (Chaudhuri et al.,
2001; Rakshit et al., 2008; Samarkin et al., 2010) and dissolved Fe2+ (Kampschreur et al.,
2011). Addition of Fe2+ to Fe3+-oxides results in surface-bound Fe2+ which functions as a
good reductant of NO2- (Sørensen and Thorling, 1991; Tai and Dempsey, 2009; Matocha
et al., 2012). In fact, observed N2O fluxes were attributed to abiotic mineral Fe2+- NO2-
reactions in a hypersaline lake (Samarkin et al., 2010).
Magnetite was the reaction product when NO3- was abiotically reduced by wüstite
(Rakshit et al., 2005) and green rust, (Hansen et al., 1996) and also when surface Fe2+-
lepidocrocite (Sørensen and Thorling, 1991) was used to reduce NO2-. There is a
thermodynamic driving force for NO2- reduction by Fe3O4 because the Fe3O4/Fe2+ redox
couple lies well below that of NO2-/NO and NO2
- /N2O over a wide range of pH values
(Fig. 1.3). There has been one study that evaluated the ability of structural Fe2+ in Fe3O4
to reduce NO3- and NO2
-, (Sun et al., 2012) however, the Fe3O4 was coated with a
palladium catalyst. To our knowledge, chemical reduction of NO2- by magnetite alone has
not been studied nor has the impact of added Fe2+. The aim of this study is to investigate
NO2- reactivity with magnetite at various pH values under anaerobic conditions and in the
presence of added Fe2+.

20
2.1 Experimental section
Unless otherwise indicated, all the reactions in this study were performed in an
anaerobic glove box (COY Laboratory Products, Grass Lake, MI) purged with 95:5 argon
(Ar)-H2 and equipped with palladium catalyst for O2 removal. Before transport into the
glove box, all aqueous solutions were prepared in double deionized water (18.3 MOhm
cm-1) and purged for 3hr with ultra pure Ar. Dissolved oxygen (O2) in the solution was
measured using an 782 oxygen meter (Strathkelvin Instruments, Scotland, UK) to ensure
anoxic conditions. Before use, solid magnetite, glass vials, reaction vessel, and other
experimental accessories were equilibrated for a few days inside the glove box to reduce
sorbed oxygen. To verify the solid phase only contributed to abiotic reaction paths,
magnetite solid samples were analyzed for microbial DNA. The 16S rDNA fragments
profile pattern obtained from gel electrophoresis (GE) indicate that the mineral is free of
any microbes or below the detection limit (Fig. 2.1).
2.1.1 Characterization of magnetite
Magnetite used in this study was purchased from Alfa Aesar (PURATRONIC®
powder, Ward Hill, MA) and used as received. The specific surface area was determined
by Brunauer-Emmet-Teller (BET) method with N2 adsorption to be 1.54±0.18 m2g-1. The
solid magnetite powder, both control and reacted, was characterized by x-ray diffraction
(XRD), and scanning electron microscopy (SEM). After extraction, control and treated
magnetite samples were evenly layered over a glass slide. A drop or two of Ar-degassed
glycerin was mixed with samples on the glass slide to minimize mineral Fe2+ oxidation
pending X-ray analysis. XRD scans were taken from 10 to 60o 2θ with CuKα radiation at
40 kV and 30 mA using Siemens D500 Diffractometer (Bruker AXS, Madison, WI). Data
were analyzed using the software Match!® (ver 1.11, Crystal Impact, Bonn, Germany).
X-ray diffraction (XRD) scans revealed peaks 4.84, 2.97, 2.53, 2.10, 1.71, and 1.61Å
representing diagnostic d-spacings for synthetic magnetite (Fig. 2.2).
Control and treated magnetite samples were dried inside the glove box to maintain
anaerobic conditions, and mounted on a carbon tape attached to an aluminum holder and
coated with Au/Pd for SEM analysis. A Hitachi (Tokyo, Japan) S-3200 SEM was used to
image these samples for various magnifications and a working distance of 30mm. Energy

21
dispersive x-ray spectroscopy (EDX) analysis of the magnetite was also performed with
EDX module attached to S-3200. Bulk magnetite seen under SEM micrograph showed
porous aggregate structure with an average particle size 0.85-1.1µm, and EDX analysis
showed that the chemical composition of those crystals was Fe and O (Fig. 2.3).
The estimated pH at the isoelectric point (pHIEP ) of magnetite suspensions was
6.05±0.05 as determined by measuring zeta potentials as a function of ionic strength and
pH (Fig. 2.4). The stoichiometry of untreated magnetite determined by complete
dissolution in 5 M HCl was lower (xdiss=0.45) than that of Mössbauer spectroscopy
(xMS=0.47) (see detail below).
2.1.2 Nitrate and nitrite reduction studies
Analytical stock solutions of NO3- and NO2
- were prepared from certified ACS-
grade NaNO3 and NaNO2 using deoxygenated deionized water (DDIW) inside an
anaerobic glove box.
Initial tests were performed to evaluate the potential of the biological buffer MES
[2-(N-morpholino) ethane sulfonic acid] to interact with magnetite. MES buffered to pH
5.5 was added at two different concentrations (5 mM and 25 mM) and compared with a
MES-free control in which pH was adjusted manually using HCl or NaOH over the span
of 14 days. Significant amounts of aqueous Fe2+ were detected in solution, and Fe2+
concentration steadily increased during this period (Fig. 2.5). An increase in MES
concentration in the samples had a positive effect on Fe2+ release. The amount of
aqueous Fe2+ released nearly doubled when MES concentration was raised from 5mM to
25mM in identical solid-solution conditions. Anomalous buffer interferences have been
reported in previous studies that used MES, HEPES and TAPS to buffer experimental
solution pH (Zhang and Huang, 2005 & 2006). MOPS and HEPES have also been shown
to cause substantial release of previously sorbed Fe2+ from iron oxide (Buchholz et al.,
2011). It is suggested that the organic pH buffer can potentially increase reaction rates,
vary product yield, and alter the number of available reaction sites (Danielsen et al.,
2004; Buchholz et al., 2011).
To avoid buffer interference to the reaction, all subsequent experiments were
performed by manually adjusting the pH. Stirred-batch kinetic reactions were conducted

22
in duplicate glass vials with 10 gL-1 of prehydrated magnetite over a range in pH values
(pH 5.5-7.5) at room temperature. Reactions were initiated by spiking with 0.5mM NO2-
and the batch reactors were kept shaking with an end-to-end shaker at 120 rpm to allow
complete mixing. Separate experiments were performed using 0.5 mM NO3-. Aliquots
were removed at increasing time intervals and filtered using 0.22µm filter paper (Fisher
Scientific, Hampton, NH). Part of the filtrate was immediately complexed with ferrozine
[3-(2-pyridyl)-5,6 bis(4-phenylsulfonic acid)-1,2,4-triazine, monosodium salt] for Fe2+
quantification and the remaining filtrate was used for NO3-, NO2
-, and NH4+
quantification. Slope of the line for NO3-, and NO2
- decay recorded between 0 and 168 hr
was used to calculate “initial rate” of removal and rate constants (kobs). Parallel
experiments were performed to characterize possible gaseous products of NO2- reduction
under comparable experimental conditions as described above by sampling the headspace
periodically from 30mL crimp sealed glass vials using a 1 mL syringe. This headspace
gas was injected into a gas chromatograph. Parallel experiments were performed using
NO3-.
2.1.3 Nitrite reduction in the presence of surface Fe2+
Fe2+ stock solutions were prepared from zerovalent iron (Feo) mixed with 0.1M
HCl stock solution and shaken in an end-over-end rotator for 24 hr inside an anaerobic
glove box. Residual Feo was removed from the solution with a magnet. Then, the
solutions were filtered through a 0.2µm membrane filter, and stored inside a glove box to
prevent Fe2+ oxidation. Nitrite reduction by magnetite preconditioned with added Fe2+(aq)
was investigated under similar conditions as described above (10 gL-1 magnetite, pH 5.5-
7.5). Approximately 0.1mM anoxic Fe2+(aq) solution was added to the magnetite slurry
and equilibrated for 12 hr before reacting with NO2- to study surface Fe2+ dependence on
the reaction. The sorption of Fe2+ on magnetite-alone slurries was studied under
comparable conditions at various pH values (pH 4.0-10.5).
2.1.4 Analyses and characterization of products.
The ferrozine method was used to quantify dissolved Fe2+ (Stookey, 1970) in
reacted filtrates at 562 nm wavelength using an ultraviolet-visible-near-infrared (UV-
VIS-NIR) scanning spectrophotometer (Shimadzu, UV-3101 PC, Columbia, MD). Nitrite

23
and nitrate were measured using a Model 819 ion chromatograph (IC) (Metrohm,
Switzerland) equipped with an anion exchange column with retention times 12.7 and 20
min, respectively. Following the manufacturer’s recommendation, interference due to
Fe2+ oxidation in the column was minimized by rinsing the column with 1-2% methanol
each time a sample was injected. Additionally, a 20 mM oxalic acid solution was used to
clean oxidized Fe2+ in the column every 4-5 samples. Ammonium was measured using
the indophenol-blue method and interferences expected from the presence of dissolved
Fe2+ were corrected by adding EDTA (as Fe chelator) (Ngo et al., 1982).
Nitric oxide (NO) was measured using a real time ISP-NO micro-sensor (World
Precision Instruments Inc, Sarasota, FL) in a batch reactor at 25oC following the
procedure in Zhang et al. (2000). An isothermal water bath was used to maintain constant
temperature throughout the experimental period before and after spiking the solution with
NO2-. Electrical impulses were recorded as volts for real time NO emission and
converted to concentration (nM scale) using LabScribe2® software (iWorx Systems, Inc.
NH).
Evolution of N2O was measured with increasing time intervals by analyzing
headspace gas using a 63Ni source Electron Capture Detector Gas Chromatograph (ECD-
GC-8A, Shimadzu, Columbia, MD). Samples were prepared at pH 5.5, 6.5, and 7.5 to
investigate the pH dependence of the reaction. Henry’s constant for N2O was used to
convert gas volume into concentration.
Solid phase reaction products from the reaction of magnetite and NO2- were
characterized using XRD, SEM-EDX, and 57Fe Mössbauer Spectroscopy (see below).
57Fe Mössbauer Spectroscopy. Magnetite in the presence and absence of 0.5mM
NO2- at pH 5.5 was studied using 57Fe Mössbauer spectroscopy. To minimize oxidation
by O2, reacted samples were dried inside an anoxic chamber and prepared for analysis
using a standard protocol (Kamali-M et al., 2006). Transmission (57Fe) Mössbauer
spectroscopy was performed at room temperature and spectra were collected to estimate
stoichiometry (xMS). This was compared with the wet chemical method for stoichiometry
(xdiss) whereby 5 M HCl was added to the reacted and unreacted magnetite slurries in the
glovebox to effect complete dissolution as described by Tamura et al. (1974).
24
2.2 Results and discussion
2.2.1 Reduction of NO3- / NO2
- by magnetite
Nitrite was more rapidly removed from solution than NO3- by magnetite at pH 5.5
(Fig. 2.6A, B). Initial rates of removal were 1.75±0.04×10⁻¹¹ and 8.14 ±0.4×10⁻¹⁰ M s-1
for NO3- and NO2
-, respectively (Table 2.1).The lack of microbial DNA in GE bands in
magnetite slurries prior to NO3- or NO2
- addition indicates that our reactions were strictly
abiotic (Fig. 2.1). The kinetics of nitrite removal from solution at pH 5.5 reasonably
agreed with a first order model at early reaction times (0-72 hr), with a best fit pseudo-
first order rate coefficient of 1.2 ± 0.1 × 10⁻³ hr-1, and there were slight deviations
thereafter (Fig. 2.6B and Table 2.1). In the control samples (Fe3O4 free), no significant
NO2- loss occurred at pH 5.5 during the same time frame. This agrees with previous
studies in which self decomposition of NO2- is negligible at pH >5.0 (Van Cleemput and
Baert, 1984).
The greater removal rate of NO2- by magnetite when compared with NO3
- at pH
5.5 can be rationalized on the basis of the shared charge concept and steric considerations
assuming that sorption is the mechanism of removal from solution. The shared charge of
nitrate (calculated by dividing the valence of the N atom by the number of O atoms) is
1.67 whereas that of nitrite is 1.50 (McBride, 1994). The lower the shared charge, the
greater the effective negative charge residing on each O atom, allowing NO2- to bind
more strongly to mineral surface sites on Fe3O4 than NO3-. The shared charge concept
qualitatively describes sorption behavior of other oxyanions on Fe oxide mineral surfaces
such as phosphate (McBride, 1994). Steric considerations might also play a role because
the angular molecular shape of NO2- (Shriver et al., 1994) could allow it to approach
reactive surface sites on Fe3O4 more effectively than the trigonal-planar geometry of
NO3-.
2.2.2 NO and N2O emission
It is possible that the NO2- removed from solution, presumably by sorption,
further engaged in electron transfer reactions because the NO2-/N2O and NO2
-/NO
couples lie above the Fe3O4/Fe2+ redox couple (Fig. 1.3). It was observed that
immediately after NO2- addition to the magnetite slurry at pH 5.5, NO appeared (Fig.

25
2.7A). The concentration of NO reached a plateau of ~42 nM after 1 hour followed by a
decrease to below detection. Experiments carried out with NO3- did not show detectable
NO concentrations. A control sample performed at pH 5.5 in the absence of solid
magnetite that only contained NO2- did not show detectable concentration of dissolved
NO ruling out self decomposition of NO2- to form NO. At longer time scales, N2O is
generated as a product of NO2- reduction (Fig. 2.7B). The N2O emission was detected
after 6hr and reached a plateau after 14 days. Green rust and siderite, both of which
contain structural Fe2+, were reported to reduce NO2- to N2O (Hansen et al., 1994;
Rakshit et al., 2008). Nitrite treated with dissolved Fe2+ has been shown to induce similar
NO and N2O emission with concomitant Fe2+ oxidation (Kampschreur et al., 2011). In
another study, when NO2- was reacted with Fe2+ bound to lepidocrocite, N2O was evolved
after 5hr (Sørensen and Thorling, 1991).
The sum of NO and N2O did not account for the NO2- removed from solution by
magnetite at pH 5.5. One possible explanation for this nonstoichiometry is that NO2- was
reduced all the way to N2, which was not measured in our study. We did measure NH4+
and levels were below detection (data not shown). Another possible explanation is that
some of the NO produced was immediately bound on the magnetite surface because it is
known to adsorb to mineral surfaces and to Fe2+ in enzyme active sites (Mortland, 1965;
Collman et al., 2008). Lastly, there might have been some NO2- removed from solution
to form a surface-bound complex to magnetite surface sites but it remained unreduced.
Magnetite is known to sorb anions prior to electron transfer (Cui and Eriksen, 1996).
2.2.3 Changes in magnetite
During the removal of NO2- from solution, aqueous Fe2+ concentrations were
consistently below the detection limit of ~0.5µM at pH 5.5 in NO2--magnetite and
magnetite-only slurries (inset Fig, 2.6B). Results from this study indicate that the
reaction likely occurred as a heterogeneous process, whereby aqueous NO2- reacted with
structural Fe2+ in magnetite. Magnetite is known to be quite insoluble (Walker, 1983;
Kennedy et al., 1998). Heterogeneous redox reactions have also been observed during
Cr6+ reduction by magnetite (White and Peterson, 1996). Other research studies have
shown that reduction of U6+ led to enhanced release of Fe2+ from magnetite to solution

26
(Singer et al., 2012). This latter study was performed under continuous flow conditions
rather than batch, which might explain the differences. To explore the possibility of
heterogeneous electron transfer further, we followed changes in magnetite using XRD,
Mössbauer spectroscopy, and SEM-EDX.
X-ray diffraction peaks at 4.84, 2.96, 2.53, 2.42, 2.10, 1.71, 1.61 Å represent the
diagnostic d-spacings for magnetite. Reacted solids after exposure to NO2- showed
residual magnetite peaks and subtle increases in the intensity of maghemite based on
peaks located 4.81, 2.63, 2.40, 1.702Å (Fig. 2.2).
The Mössbauer spectra of magnetite-alone and NO2- -reacted magnetite are
shown in Fig. 2.8. In magnetite, both Fe2+ and Fe3+ occupy the octahedral sites (B sites).
Electron hopping between Fe2+ and Fe3+ at room temperature in these sites is fast with
respect to the Mössbauer measurements and the ions appear to the technique to be
equivalent and have an average iron oxidation state of 2.5 (Greenwood and Gibbs, 1971).
Because these ions are also magnetically coupled, they give rise to the inner six-line
pattern (sextet). Area measured for inner six-line pattern is denoted as octFe2.5+. A second
outer sextet is present arising from Fe3+ in type A (tetrahedral) sites and is written as tetFe3+. The relative peak areas after fitting the Mössbauer spectrum of the magnetite-
alone sample indicate that the Fe2+/Fe3+ ratio, xMS, was 0.47 (Fig. 2.8, Table 2.2). After
reaction with NO2-, xMS decreased to 0.46. The decrease in magnetite stoichiometry from
0.47 to 0.46 for the unreacted and NO2-treated sample based on Mössbauer results is
within the error of the Mössbauer spectroscopic fitting technique. However, the wet
chemical data (xdiss in Table 2.2) also show a decrease in magnetite stoichiometry which
provides strong evidence of structural Fe2+ oxidation in the NO2- treated sample
(Appendix A). Theoretical calculations shown in Appendix A demonstrate NO2-
reduction via structural Fe2+ would progressively yield a less stoichiometric magnetite.
These findings agree with a recent study, which noted that structural Fe2+ in Fe3O4 can
serve as a reductant of NO2- (Sun et al., 2012), however, the results from this latter study
are not directly comparable because palladium was attached to the magnetite mineral as a
catalyst.
27
Structural Fe2+ in magnetite has been reported to reduce U6+ to U4+ and Hg2+ to
Hg0 based on decreases in Fe2+/Fe3+ ratios determined using Mössbauer spectroscopy
(Wiatrowski et al., 2009; Das et al., 2010; Latta et al., 2011). Some of the oxidized Fe2+
might have been utilized to form a trace amount of maghemite, as this reaction has been
reported to occur, (Sidhu et al., 1977; Jolivet and Tronc, 1988) and we did observe a
slight increase in diagnostic XRD peaks as noted above. Production of maghemite might
serve to passivate the magnetite surface and prevent further reduction of NO2-, which
reaches steady-state levels after 168 h (Fig. 2.6B). Chromate (Cr6+) reduction by
magnetite was initially rapid followed by a halting of the process due to passivation
(Peterson et al., 1997). This limited the capacity of the magnetite to reduce Cr6+ and a
similar phenomenon might be operative in our studies.
2.2.4 Effect of pH on NO2- reduction
There was pH-dependence in the removal of NO2- from solution by magnetite; the
initial rate was two times faster at pH 5.5 than at pH 7.5 (Fig. 2.6B). This enhancement
of the reaction rate at lower pH can be attributed to the chemical speciation of magnetite
surface sites and NO2-. The pH dependence of magnetite surface speciation is related to
the following equilibria:
≡S-OH2+ →≡S-OHo + H+ pKa1=4.4 (1)
≡S-OHo →≡S-O- + H+ pKa2=9.0 (2)
where ≡S-OH2+, ≡S-OHo, and ≡S-O- represent the fully protonated, neutral, and
deprotonated surface sites, and pKa1 and pKa2 are the intrinsic acidity constants
determined by Regazzoni et al. (1983) for magnetite. The surface speciation of magnetite
shows that positively charged sites become more important as pH is lowered (Fig. 2.9A).
The NO2- anion can protonate at lower pH values to form HNO2 (nitrous acid)
with a dissociation constant (Ka) value of 6.9x10⁻⁴, corresponding to a pKa value of 3.16
(da Silva et al., 2006). Both HNO2 and NO2- merit consideration in explaining the pH
dependence in total NO2- removal from solution. Using the approach by Yao and Millero
(1993), we calculated possible surface complexes that may form assuming precursor
surface complex formation is the rate-limiting step. The product of [≡S-OH2+] and [NO2
-

28
] ([≡S-OH2+] [NO2
-]) becomes more important as pH decreases (Fig. 2.9B). This trend
mimics the greater removal rate of total NO2- at lower pH (Fig. 2.6B and Table 2.1) and
indicates that the anionic NO2- ion is attracted to positively charged sites on magnetite.
Another important complex is the binding of NO2- to the ≡S-OHo sites ([≡S-OHo][NO2
-])
(Fig. 2.9C). This might occur if ligand exchange is the operative mechanism of NO2-
removal from solution whereby the surface hydroxyl group is replaced by NO2-. Ligand
exchange of anions is favored by a decrease in pH because OH- is released and appears
on the product side (McBride, 1994). The neutral surface site on magnetite was
implicated in a ligand exchange complexation reaction with the anionic pertechnetate
(TcO4-) ion (Cui and Eriksen, 1996). The [≡S-OH2
+] [HNO2] complex plays a role at
more acidic pH values than those employed in our study (pH<5) and the negatively
charged surface sites ([≡S-O-]) interacting with NO2- become important only at higher pH
values (Fig. 2.9D), thus these can be ruled out as possible precursor surface complexes.
The exact nature of the reactive surface species between nitrite and magnetite awaits
spectroscopic confirmation.
2.2.5 Significance of surface bound Fe2+ in NO2- reduction
Past studies have noted that addition of dissolved Fe2+ to magnetite, which has
been partially oxidized, can recharge the structural Fe2+ within the mineral and enhance
reactivity (Gregory et al., 2004; Gorski and Scherer, 2009). Added Fe2+ removed NO2-
from solution more rapidly than magnetite-alone at a given pH value. For example,
surface Fe2+ on magnetite accelerated the rates of NO2- removal by three-fold over
magnetite-alone at pH 5.5 (Fig. 2.6B,C). To account for the possible homogeneous
reaction between dissolved Fe2+ and dissolved NO2-, separate controls were run (0.1 mM
Fe2+ and 0.5 mM NO2-) without magnetite under comparable conditions. The data
indicate that there were no changes in NO2- concentration (open circles in Fig. 2.6C) nor
dissolved Fe2+ (open symbols, Fig. 2.10), thus, indicating that the homogeneous reduction
of NO2- was not operative under our experimental conditions. Our observation runs
parallel to a previous study in which NO2- reduction and Fe2+ oxidation were insignificant
in the absence of solid hydrous ferric oxide (Tai and Dempsey, 2009).

29
The rate of NO2- loss from solution where Fe2+ was added to magnetite increased
with a decrease in pH (Fig. 2.6C). The uptake of Fe2+(aq) by magnetite is strongly pH
dependent (Fig. 2.11A) and the literature indicates that reduction rates of other oxidants
increase positively with an increase in surface-bound Fe2+ (Klausen et al., 1995; Gregory
et al., 2004). In our study, however, we found that NO2- reduction rates decreased with
an increase in surface-bound Fe2+ as pH was raised (Fig. 2.11B). The slope value of the
log kobs versus log [Fe2+]ads plot was -2.2, suggesting an inverse dependence of NO2-
removal on surface Fe2+. It is difficult to assign a definite cause for this behavior,
particularly in light of the contrasting removal rates of dissolved Fe2+ with pH in the
presence of nitrite (closed symbols, Fig. 2.10). To tease out the role of pH and surface
Fe2+ loading further, additional experiments are needed by varying the surface loading at
a constant pH as described elsewhere (Gregory et al., 2004).
2.3 Implications
This study suggests that magnetite-bearing soils and sediments can catalyze
abiotic NO2- reduction with negligible reaction towards NO3
- . One might envision a
scenario in natural environments under Fe3+-reducing conditions where the first step of
NO3- reduction to NO2
- could be biologically mediated. Secondary reactions involving
NO2- and magnetite are possible and would lead to some NO and N2O production (Fig.
2.12). Back-of–the envelope calculations based on initial NO2- removal rates observed in
this study (Table 2.1) indicate abiotic NO2- reduction mediated by magnetite is
comparable or even more important to that of microbial nitrite reduction catalyzed by
nitrite reductase in anoxic soil and sediments (assuming 2% by weight magnetite)
(Appendix B). Abiotic magnetite-induced NO2- removal becomes increasingly important
when dissolved Fe2+ is present, as the rate increases to nearly 12 fold the capacity of NO2-
reducers.
Another possible environment in which this process may be observed is where
permeable reactive barriers containing metallic iron (Fe0) are utilized to treat
groundwater containing co-contaminants such as NO3- (Blowes et al., 2000). Magnetite
is a commonly identified secondary corrosion product, (Lee and Wilkin, 2010) and could
potentially engage in electron transfer reactions if NO2- appears as an intermediate.

30
Interestingly, NO3- reduction exhibits complex kinetic behavior with Feo, green rusts, and
FeO(s) in lab studies, (Hansen and Koch, 1998; Alowitz and Scherer, 2002; Rakshit et al.,
2005) perhaps due in part to secondary reactions involving Fe3O4 and NO2-.

31
Table 2.1. Initial rate and kobs measured for initial 0.5 mM of NO2- (and NO3
-)
removal from solution by magnetite with or without added Fe2+ at various pH.
NO2-
pH Treatment Ini. Rate kobs
(Ms-1) (hr-1 )
5.5 Magnetite 8.14±0.40×10⁻¹⁰ 1.2±0.14×10⁻³
Fe(II)-Magnetite 2.60±0.13×10⁻⁹ 3.2±0.19×10⁻³
6.5 Magnetite 5.20±0.23×10⁻¹⁰ 1.1±0.36×10⁻³
Fe(II)-Magnetite 2.07±0.10×10⁻⁹ 2.6±0.17×10⁻³
7.5 Magnetite 4.05±0.16×10⁻¹⁰ 6.0±0.06×10⁻⁴
Fe(II)-Magnetite 1.85±0.08×10⁻⁹ 1.2±0.21×10⁻³
NO3-
5.5 Magnetite 1.74±0.04×10⁻¹¹ 1.4±0.01×10⁻⁴

32
Table 2.2. Fitted hyperfine parameters from Mössbauer spectra at 293K for magnetite samples, before and after reaction with
NO2- as shown in Fig. 2.8. Stoichiometry of untreated magnetite and NO2
- -reacted magnetite were also analyzed by the
dissolution (xdiss) method (Tamura et al., 1974).
Tet Fe3+ (A-Parameter) Oct Fe2.5+ (B-Parameter) Sample IS QS Ho Fe IS QS Ho Fe xMS
* xdiss**
mm s-1 mm s-1 kGauss % mm s-1 mm s-1 kGauss % Untreated Magnetite 0.279 0.002 492.37 36.38 0.664 0.00 460.89 63.62 0.47 0.45±0.02 NO2
- Treated Magnetite 0.282 0.002 492.31 37.22
0.667 0.00 460.58 62.78 0.46 0.39±0.07
IS = Isomer shift QS = Quadrupole splitting Ho = Hyperfine field in kGauss Fe(%)= Relative spectral area
*Magnetite Stoichiometry by Mössbauer, xMS = .
. =0.47
** Magnetite Stoichiometry by dissolution, xdiss = 0.45

33
Figure 2.1 Gel electrophoresis (GE) results showing no microbial 16S rDNA bands from
synthetic magnetite and goethite minerals used in this study. Samples were analyzed
directly from the container as it was used for batch experiments. Results suggest that the
mineral(s) is free of any microbes or they are present below detection.

34
Figure 2.2 Plot of X-ray diffraction pattern observed from untreated magnetite and those
reacted with NO2- at pH 5.5 and 7.5. Major peak lines for a reference magnetite (Fe3O4),
hematite (Fe2O3), maghemite (γ-Fe2O3) are shown as solid lines at bottom. All peaks
correspond to magnetite. Peaks marked by green arrows (4.81, 2.63, 2.40, 1.702 Å)
observed in the residual magnetite samples treated with NO2- matched with reference
maghemite pattern.

35
Figure 2.3 Characterization of untreated and treated magnetite by SEM. (A) Untreated magnetite showing porous aggregate
structure. (B) Average size of the untreated magnetite particles. (C) Samples treated with NO2- at pH 5.5 for 14 days. (D)
Energy dispersive spectroscopy data of untreated magnetite.
(D)

36
Figure 2.4 The effect of ionic strength on the ζ-potential, and electrophoretic mobility of
untreated magnetite. Measured pHIEP of magnetite is 6.05±0.05, when solid-solution was
10 gL-1.
Figure 2.5 The effect of MES buffer concentration on dissolved Fe2+ release from
magnetite compared with buffer-free samples (open circles) with a magnetite
concentration of 10 gL-1 at pH 5.5. Error bars represent the standard deviation from the
mean for duplicate runs.

37
(A)
(B)
(C)

38
Figure 2.6 Removal of (A) NO3- (at pH 5.5), and (B) NO2
- from solution by magnetite at
pH 5.5 ( ), 6.5 ( ), and 7.5 ( ) (B) without and (C) with added Fe2+. Initial NO3-/NO2
-
and magnetite concentration were ~0.5 mM and 10 gL-1 respectively. Open circle in (B)
represents blank (magnetite free) samples at pH 5.5 whereas open circles in (C) represent
0.1 mM Fe2+ and 0.5 mM NO2- controls. Symbols indicate experimentally determined
data, and solid lines represent the kinetic model fit. Error bars represent the standard
derivation from the mean of duplicate analysis. Inset figure in (B) shows dissolved Fe2+
measured in the samples.

39
Figure 2.7 Nitric oxide (A) and nitrous oxide (B) emission recorded in the experiment
when 0.5 mM NO2- was reacted with magnetite at pH 5.5. Open circle indicate the
control samples without magnetite and open triangle represents NO emission from
sample treated with NO3-. Error bars represent the standard deviation from the mean for
duplicate runs.
(A)
(B)

40
Figure 2.8 Room temperature Mössbauer spectrum of (A) untreated magnetite, and (B)
magnetite treated with 0.5 mM NO2- alone for 14 days at pH 5.5. Open circle and solid
lines represents observed values and total fit respectively. Fitting parameters are tabulated
in Table 2.2.

41
Figure 2.9 (A) The predicted surface speciation of magnetite as a function of pH:
(⎯●⎯) ≡S-OH2+,(⎯▲⎯) ≡S-OHo, (⎯♦⎯) ≡S-O- using a total iron concentration
(10gL-1) of 43mM and experimentally derived pKa1, (=4.4) and pKa2 (=9.0) values
(Regazzoni et al., 1983). Possible precursor surface complexes calculated in terms of
reactant concentrations as a function of pH for (B) [≡S-OH2+][HNO2] and [≡S-
OH2+][NO2
-], (C) [≡S-OHo][HNO2] and [≡S-OHo][NO2-], and (D) [≡S-O-][HNO2] and
[≡S-O-][NO2-]. The HNO2 and NO2
- species distribution for various pH is derived by
using Ka=6.9x10⁻⁴ (pKa=3.16 at 25oC) (da Silva et al., 2006) and a total NO2-
concentration of 0.5 mM.

42
Figure 2.10 Dissolved Fe2+(aq) concentrations in the presence of 0.5 mM NO2
- as a
function of pH with and without magnetite present. Control samples without magnetite
were shown with open symbols. Error bars represent standard deviation calculated from
replicate samples.

43
Figure 2.11 (A) Adsorption of 0.1 mM Fe2+ on 10 gL-1 magnetite measured after 1 hr
equilibrium time and (B) apparent reaction order plot (kobs) for reduction of NO2- as a
function of pH. Linear regression of the data sets is represented by a line for varying pH.
In the top figure, symbols indicate experimental points.
0.010.020.030.040.050.060.070.080.090.0
100.0
4.0 6.0 8.0 10.0
adso
rb e
d Fe
(II)
%
pH
y = -2.2141x + 1.2001R² = 0.9709
-3
-2.9
-2.8
-2.7
-2.6
-2.5
-2.4
1.6 1.65 1.7 1.75 1.8 1.85 1.9
Log
kob
s
log[Fe(II)]ads
(B) (B)
(A)

44
Figure 2.12 Scheme illustrating possible redox reactions mediated by electron transfer
from structural Fe2+ in magnetite-NO2- system. Electron shuttling from structural Fe2+ in
magnetite possibly stimulate NO2- reduction to N2O that can concomitantly decrease
stoichiometry of the reacted magnetite by successively lowering of Fe2+/Fe3+ ratio. The
nitrogen species are drawn as Lewis structures taken from Luther (2010). Solid arrow
indicates possible reaction product/pathways that produce N-intermediates.
Copyright © Prakash Dhakal 2013

45
Chapter Three: Reaction of Nitrite with Goethite and Surface Fe2+-Goethite
Complex
3. Introduction
The microbial reduction of solid iron oxide minerals such as goethite is an
important biogeochemical process in soil, groundwater, and sedimentary environments
that influences cycling of nutrients and metal contamination. Goethite (α-FeOOH) has
been identified in many natural environments such as soils and sediments (Cornell and
Schwertmann, 2003) due to its high thermodynamic stability (Majzlan et al., 2003), and
accounts for yellowish colors of many soils (Schwertmann and Cornell, 2000; Huang et
al., 2012). Goethite is formed via abiotic secondary phase transformation when poorly
crystalline ferrihydrite, Fe(OH)3 is aged in the presence of Fe2+(aq) and certain ligand such
as chloride, sulfate and carbonate (Hansel et al., 2005), however, in many natural
environments it is formed via coupled biotic-abiotic pathways when Fe2+ produced by
dissimilatory iron reducing bacteria (DIRB) oxidizes (Fredrickson et al., 1998; Zachara et
al., 2002; Hansel et al., 2003). Goethite has been studied extensively as a model iron
oxide mineral in understanding sorption of inorganic anions such as phosphate (Kim et
al., 2011), sulfate (Peak et al., 1999), arsenate (Dixit and Hering, 2006; Catalano et al.,
2011), chromate (Grossl et al., 1997; Kim et al., 2007), and pertechnetate (Um et al.,
2011). It has also been used as the mineral for organic contaminant remediation (via
reduction) studies in which target reactant is carbon tetrachloride (CCl4) (Amonette et al.,
2000), polyhalogenated methane (Pecher et al., 2002), nitrobenzene (Williams and
Scherer, 2004), and 2-nitrophenol (Tao et al., 2010).
Due to extensive use of N fertilizer in modern agro-ecosystems, excess nitrate
(NO3-) is often leached to deeper soil layers and nearby water bodies causing a decline in
water quality (Spalding and Exner, 1993; Goolsby et al., 2001; Fields, 2004; Ahrens et
al., 2008). Where all of the O2 has been exhausted, NO3- is the next most favorable
electron acceptor (Table 1.1). Nitrate undergoes sequential biological denitrification
process where it is first reduced to nitrite (NO2-), which further reduces to nitric oxide
(NO), nitrous oxide (N2O) and finally to dinitrogen (N2) (Tiedje, 1994; Canfield et al.,
2010). Notably, nitrite is often observed in water and soil-water systems as a toxic anion

46
that occurs as an intermediate in microbial nitrification (Wrage et al., 2001) and
denitrification (Tiedje, 1994) processes. Human health problems linked to an increase in
nitrate and nitrite loading in water resources (Fan and Steinberg, 1996; Fewtrell, 2004)
from anthropogenic fertilizer use worldwide (Spalding and Exner, 1993; Goolsby et al.,
2001; Fields, 2004; Ahrens et al., 2008) has therefore stimulated research in
understanding processes that lead to NO3-/NO2
- removal.
Historically, it is assumed that biogeochemistry of N-transformation is essentially
mediated by heterotrophic and autotrophic denitrifiers (Korom, 1992; Tiedje, 1994), and
little attention was given to N-cycle mediated by other elements. In recent studies,
simultaneous reduction of NO3- and Fe3+ measured in laboratory incubations of soil
slurries (Yasuhiko et al., 1978) and pure cultures (Weber et al., 2001; Cooper et al., 2003)
have indicated strong coupling between Fe and N cycle. Further, strains of lithotrophic
microorganisms isolated from natural sediments can acquire energy by oxidizing reduced
Fe2+ concurrent with NO3- reduction (Straub et al., 1996; Weber et al., 2006c; Konhauser
et al., 2011). This process is now widely known as NO3- -dependent Fe2+-oxidation. It
contains a biological and an abiological component. An example of the abiotic process is
demonstrated by the rapid reduction of NO3- to NO2
- by mineral Fe2+ forms usually found
in Fe3+-reducing environments such as green rust (Hansen et al., 1996) and wüstite
(Rakshit et al., 2005). In such systems, a second possible chemical reaction is the
production of NO2- via biological reduction of NO3
- which can undergo further (abiotic)
reduction catalyzed by mineral Fe2+ (Rakshit et al., 2008; Tai and Dempsey, 2009;
Dhakal et al., 2013). Several studies have hypothesized this phenomenon in agricultural
soil slurries (Yasuhiko et al., 1978), activated sludge amendment (Nielsen and Nielsen,
1998) and pure cultures (Obuekwe et al., 1981; Cooper et al., 2003).
Biogenic Fe2+(aq)-produced by DIRB commonly exists in sorbed or precipitated
form (Fredrickson et al., 1998; Zachara et al., 2002). There is evidence in the literature
that structural and surface Fe2+ is more reactive towards NO2-. In an experiment
conducted to study NO2- reactivity with lepidocrocite (γ-FeOOH), Sørensen and Thorling
(1991) found that surface bound Fe2+ on lepidocrocite reduced NO2- at a faster rate than
aqueous Fe2+ (Sørensen and Thorling, 1991). In another study, Tai and Dempsey (2009)
reported that NO2- reduction by Fe2+ sorbed to hydrous ferric oxide (HFO) is roughly 4-

47
fold greater than that of surface bound Fe2+ on lepidocrocite (Tai and Dempsey, 2009).
Similarly, Coby and Picardal (2005) observed reduction of NO2- and N2O by Fe2+ sorbed
on goethite in microbial cell, however, it is inconclusive if the reaction is entirely of
abiotic origin (Coby and Picardal, 2005). In a recent study, we reported that NO2-
removal from solution by magnetite was accelerated in the presence of surface Fe2+-
treated magnetite (Dhakal et al., 2013). Goethite formation occurs during NO3- -
dependent Fe2+-oxidation (Senko et al., 2005; Weber et al., 2006a; Larese-Casanova et
al., 2010), and NO2- appears as an intermediate product. It is possible that NO2
- could
react with goethite and surface-bound Fe2+ on goethite, however, there is very little
information in this regard. Notably, thermodynamic calculations predict that under
anaerobic conditions NO2- reduction to NO and N2O would be favorable over a wide
range of environmentally relevant pH levels (Fig. 1.3). Additionally, studies have shown
that reduction potential (Eho) of surface Fe2+ on goethite is lowered well below α-
FeOOH/Fe2+ redox couple making Fe2+-goethite complex far more effective reductant
than dissolved, hexaaqua Fe(H2O)62+ (Wehrli, 1990; Strathmann and Stone, 2003).
In this study, we conducted laboratory stirred-batch experiments to investigate
NO2- reactivity with goethite at various pH values (5.5-7.5) under anaerobic conditions
and evaluated the impact of added Fe2+ (at pH 5.5). Here, we present kinetic data on
reactivity of NO2- with goethite and Fe2+-goethite complex. These results of abiotic NO2
-
removal by goethite and Fe2+- goethite have implications for the possible role of
chemodenitrification in water saturated soil and groundwater with elevated NO2-.
3.1 Materials and methods
3.1.1 Chemicals and minerals: Chemicals used in this study were analytical grade. All
the reactions were performed at room temperature inside an anoxic glove box (Coy
Laboratory Products, Grass Lake, MI) purged with 95% argon (Ar) and 5% hydrogen
(H2) mixture, and equipped with palladium (Pd) catalyst to remove trace oxygen (O2). To
eliminate O2 interference, all aqueous solutions were prepared using doubly deionized
water (18.3MOhm cm-1) that had been previously purged with ultra pure Ar for 3 hr and
was stored in the glove box. To ensure anoxic conditions, dissolved oxygen (O2) in the
solution was measured using a 782 oxygen meter (Strathkelvin Instruments, Scotland,

48
UK). Before use, solid goethite minerals, all glass vials, reaction vessel, and other
experimental accessories were equilibrated for a few days inside the glove box to reduce
sorbed oxygen. Reaction vessels used in this study were wrapped with aluminum foil to
prevent light exposure and minimize photoredox dissolution of goethite (Waite and
Morel, 1984; Waite, 1987). To isolate only abiotic reaction paths, a fraction of goethite
solid samples prepared for this study were analyzed for microbial DNA. Results obtained
from gel electrophoresis (GE) profile pattern obtained from 16S rDNA fragments
indicate that the minerals were devoid of any microbes or below the detection limit (Fig.
2.1).
Nitrite stock solution was prepared from certified ACS-grade sodium nitrite salt
(NaNO2) inside the glove box using deoxygenated doubly deionized water (DDIW).
Separate batches of 25 mM buffered solutions were prepared with [2-(N-morpholino)
ethane sulfonic acid] (MES), and (1,4-piperazine diethane sulfonic acid) (PIPES) to
buffer the pH of the experimental solution at 5.5, 6.5, and 7.5, respectively. Ionic strength
of the buffer solution was maintained by using NaCl at 0.001 M for a total ionic strength
of 0.0251 M. The Fe2+ stock solution was prepared from zerovalent iron (Feo) mixed
with 0.1 M HCl stock solutions and shaken over end-to end rotator for 24 hr inside the
anaerobic glove box. After isolating residual Feo using magnet, the suspension was
filtered through 0.22µm membrane filter and stored inside the glove box to prevent Fe2+
oxidation.
3.1.2 Goethite synthesis and characterization: Goethite (α-FeOOH) used in this study
was synthesized in the laboratory using a method proposed by (Schwertmann and
Cornell, 2000). Freshly prepared ferric chloride, FeCl3.6H2O (1 M) suspension was
rapidly titrated with KOH (5 M) until the pH reached ~12. The suspension was then
heated at 70oC for 60 hr for aging, centrifuged and transported into 7 Spectra/Por®
dialysis membranes (Spectrum Laboratories, Inc. USA). Sample contained inside the
dialysis membrane was washed several times for several days with doubly deionized
water (18.3MOhm cm-1) until the pH and conductivity of the solution containing goethite
crystals matched that of deionized water. Later, goethite crystals were freeze dried and
stored in a vacuum desiccator. The specific surface area of goethite synthesized for this
study as determined by Brunauer-Emmett-Teller (BET) method on a Tristar 3000

49
Micrometrics surface area analyzer (Micrometrics Instruments Corp., GA, USA) with N2
adsorption was 51.43±0.03 m²/g, which is occasionally abbreviated in the text as GT51.
Both control and reacted goethite samples have been characterized by x-ray diffraction
(XRD), and scanning electron microscopy energy dispersive spectroscopy (SEM-EDX).
Solids were characterized before and after reacting with nitrite (NO2-) without and
with added Fe2+. Solid samples were dried inside the glove box to maintain anaerobic
conditions after mounting on a glass slide for XRD analysis. XRD samples were prepared
by adding a drop or two of Ar-degassed glycerin over the filtered solid mounted over a
glass slide to maintain anoxic environment and prevent Fe2+ oxidation. XRD scans were
taken from 10 to 70o 2θ with CuKα radiation at 40 kV and 30 mA using Siemens D500
Diffractometer (Bruker AXS, Madison, WI). Data were analyzed using the software
Match!® (ver 1.11, Crystal Impact, Bonn, Germany).
For SEM analysis, samples were mounted on a carbon tape attached to an
aluminum holder and coated with Au/Pd. A Hitachi (Tokyo, Japan) S-3200 SEM was
used to image these samples for various magnifications at a working distance of 30mm.
Energy dispersive x-ray spectroscopy (EDX) analysis of the goethite was also carried out
with an EDX module attached to S-3200.
X-ray diffraction scans revealed peaks at 4.98, 4.19, 3.38, 2.69, 2.46, 2.25, 2.19,
1.72 and 1.45Å representing diagnostic d-spacing for unreacted synthetic goethite (Fig.
3.1). Scanning electron microscopy (SEM) with energy dispersive x-ray spectroscopy
(EDX) showed that the sample consisted of well-formed acicular goethite rods with an
average length, width, and particle size of 1.46±0.36, 0.14±0.04, and 0.79±0.23µm
respectively, and a chemical composition of Fe and O (Table 3.1, and Fig. 3.1). The
estimated pH at the point of salt effect (PZSE) of goethite suspension was 8.45±0.1 as
determined by acid-base titration method (Fig. 3.2).
3.1.3 Nitrite reaction with goethite experiment: Stirred batch kinetic reactions were
conducted in duplicate glass serum vials (30 mL) that contained ~2 gL-1 (100m2 surface
area/L) of prehydrated goethite over a range of pH values (pH 5.5, 6.5, and 7.5) at room
temperature. A Teflon coated magnetic stirrer was inserted into the reactor. To initiate the
reaction, stock NO2- was added to the reactor to reach an initial NO2
- concentration of

50
~0.1 mM then the reactor was temporarily sealed with a silicon stopper and aluminum
crimp seals (Wheaton, Milliville, NJ) and placed over a magnetic stirrer to allow
complete mixing at 200 rpm. With increasing time intervals, ranging from 15min to
7days, aliquots were removed and filtered using 0.22 µm filter paper (Fisher Scientific,
Hampton, NH). A part of the filtrate was immediately complexed with ferrozine [3-(2-
pyridyl)-5,6 bis(4-phenylsulfonic acid)-1,2,4-triazine, monosodium salt] for dissolved
Fe2+ measurement (Stookey, 1970). Remaining filtrate was used for NO3-, NO2
-, and
NH4+ quantification. Control reactors were included with NO2
- alone. The solution pH did
not deviate more than ±0.15 for the duration of the experiment.
To characterize possible gaseous product of NO2-, parallel reactors (20 mL sample
volume and 10 mL headspace) were set up under comparable experimental conditions as
described above. For nitrous oxide (N2O) measurement, headspace was sampled
periodically for 14-21 days from a permanently crimp sealed reactor vials using a 1mL
glass syringe and injected into a gas chromatograph. Nitric oxide (NO) was measured
using a real time ISP-NO micro-sensor (World Precision Instruments Inc, Sarasota, FL)
in a reactor vial at room temperature following previously suggested method (Zhang et
al., 2000).
3.1.4 Fe2+-sorption measurements: The sorption of Fe2+ onto goethite was measured
using 20 mL glass vial under anaerobic condition as a function of pH (5.5 to 7.5) and
ionic strength (1 and 10 mM NaCl). Solution pH was buffered using 25mM MES (5.5
and 6.5), and 25mM PIPES (7.5). Aliquots of stock Fe2+ were added to achieve nominal
concentration of ~1.5 mM in a glass vial containing prehydrated goethite suspension for a
solid loading of ~2 gL-1. Vials were placed over the end-over-end rotator and sampling
began at predetermined time intervals starting from 5 min. Aliquots removed from the
vials at each time intervals were filtered and measured for solution Fe2+ using the
ferrozine method as described previously. Fe2+ sorption reached equilibrium in 24 hr for
all pH conditions (Fig. 3.3). Consequently, experiments conducted to investigate NO2-
reaction with Fe2+-treated goethite were equilibrated for 24 hr before spiking with NO2-.

51
3.1.5 Nitrite reactivity with Fe2+- goethite complex: To study surface Fe2+ dependence
on NO2- reaction with goethite, approximately 1.5 mM Fe2+
(aq) solution was added to the
prehydrated goethite suspension and equilibrated for 24 hr before spiking with NO2-.
Aliquots were removed from the reactors with increasing time interval to quantify Fe2+,
NO, and N2O, and NO2-. Sorbed Fe2+ was calculated from the difference between the
initial and final Fe2+(aq) concentrations.
3.1.6 Analysis and characterization of the reaction product: Nitrite and NO3- with
retention time 12.7 and 20 min, respectively were measured in reacted filtrate by a Model
819 ion chromatograph (IC) (Metrohm, Switzerland) equipped with an anion exchange
column. The indophenol-blue method (Ngo et al., 1982) was modified by adding EDTA
(as Fe chelator) to correct for interference arising from dissolved Fe2+ to quantify
ammonium (NH4+). Dissolved Fe2+ in the reacted filtrates was quantified by the ferrozine
assay method at 562 nm wavelength with an ultraviolet-visible-near-infrared (UV-VIS-
NIR) scanning spectrophotometer (Shimadzu, UV-3101 PC, Columbia, MD).
For NO measurement, reactors were removed from the glove box and briefly
opened to insert Ar purging to sustain solution anoxia. Before NO2- injection, solution
temperature was equilibrated at 25oC by an isothermal water bath until steady
temperature was achieved and continued for the entire experiment period. Electrical
impulses acquired by volt recorder for real time NO emission were converted to
concentration using LabScribe2® software (iWrox Systems, Inc. NH). Nitrous oxide
evolution was measured at increasing intervals by analyzing headspace gas with a 63Ni
source electron capture detector gas chromatograph (ECD-GC-8A, Shimadzu, Columbia,
MD). Henry’s constant for N2O was used to convert gas volume into concentration.
Solid goethite samples treated with NO2- with or without added Fe2+, and retained
after filtering the liquid solution were partly mounted on a glass slide inside an anoxic
chamber pending XRD analysis. Remaining fraction of reacted goethite was dried and
mounted on a carbon tape attached to an aluminum holder for SEM analysis.

52
3.2 Results and discussion
3.2.1 Removal of NO2- by goethite: Nitrite removal by goethite as a function of pH (5.5-
7.5) is shown in Fig. 3.4A. Initial rates of NO2- removal were 1.06±0.2×10⁻⁹,
2.20±0.15×10⁻¹⁰, 1.25±0.05×10⁻¹⁰ Ms-1 for pH 5.5, 6.5 and 7.5, respectively (Table 3.2).
Removal of NO2- from solution at a constant goethite concentration agrees with a pseudo
first order model that can be represented by single exponential decay equation.
[1]
in which Ao is initial (t = 0) NO2- concentration (M), and k is rate coefficient (hr-1,
determined from initial rates). The integrated expression [1] for rate law is derived from
the differential rate equation by the initial rate method (Lasaga, 1981)
[2]
in which the initial rate of NO2- disappearance (Mhr-1) is represented by in
expression [2], k′ is the overall rate coefficient. Because the initial concentration of
goethite (22 mM) was much higher than nitrite (0.1 mM) k′ represent k[FeOOH].
Nitrite removal by goethite was pH dependent. Rate coefficient of NO2- removal
calculated using equation [1] decreased from 1.40±0.05×10⁻¹ to 4.80±0.15×10⁻² hr-1 as pH
increased from 5.5 to 7.5 (Table 3.2). Although there were sufficient reactive surface
sites available in goethite (Appendix C) to completely remove all of the initial NO2- (0.1
mM), only about 30% of the initial NO2- was lost from the solution at pH 5.5. No
significant NO2- loss occurred in our control samples (goethite free) (Fig. 3.4A). This
rules out self decomposition of NO2- in our samples, which has been reported as a key
NO2- loss mechanism at pH <5.0 (Van Cleemput and Baert, 1984). Furthermore, because
the reaction vessels were shieded from light exposure, and the pH of the solution was
above 5.5, photo-catalytic NO2- disappearance observed in Fe3+-NO2
- system at low pH
(Zhang and Bartlett, 2000) was minimized in our samples. Dissolved Fe2+ in the solution
extracted from the reaction vessel, for the entire experimental time span, was below
detection level (data not shown). This indicates that biological iron reduction did not
occur. In addition, lack of detectable microbial DNA in goethite slurry prior to NO2-
53
addition indicates that removal reaction was strictly abiotic (Fig. 2.1). During the first 24
hr, NO2- removal was rapid then it reached an apparent equilibrium. Nearly, 31, 20, and
9% of initial 0.1 mM NO2- was removed from the solution at pH 5.5, 6.5, and 7.5,
respectively (Fig. 3.4A). Although the calculated reactive surface sites concentration in
goethite was 0.23 mM (Appendix C) there was not an equal amount of NO2- removal.
The greater rate of NO2- removal by goethite at lower pH can be attributed to the
surface reactive sites of goethite and NO2-. Potentiometric titration data shows that
electrical charge at the goethite surface falls to zero at pHPZSE 8.45±0.1 (Fig. 3.2). This
indicates that goethite bears positive surface charges at pH < pHPZSE. Reactive surface
sites in goethite are commonly represented by singly (≡Fe-OH-0.5) and triply
(≡Fe3-OH-0.5) coordinated surface functional groups, in which ≡Fe refers to a surface site
(Sigg and Stumm, 1981; Essington, 2004). The doubly coordinated ≡Fe2-OH0 group is
predicted to be relatively inert because the coordination environment is complete.
Fraction of protonated hydroxyls, ≡Fe-OH2+0.5(and ≡Fe3-OH+0.5) increases as pH
decreases from pHPZC, and positive reactive sites progressively become more dominant,
which result in surfaces with net anion exchange capacity (Sigg and Stumm, 1981;
Essington, 2004). Thus, two possible mechanisms could be discussed to explain NO2-
loss observed in this study. First, NO2- nitrite might be binding via an anion exchange
(outer-sphere) complex with positively charged sites on goethite driven by favorable
electrostatic interactions (Essington, 2004). This might produce a complex such as ≡Fe-
OH2+0.5---NO2
- surface species at pH < pHPZSE (Sigg and Stumm, 1981; Boily et al.,
2001). Secondly, NO2- might also adsorb directly as an inner-sphere surface complex
onto the surface Fe3+ center on goethite (Yates and Healy, 1975). A spectroscopic
technique such as ATR-FTIR will be employed to investigate the exact nature of the
reactive surface species between Fe and N (see chapter 4).
3.2.2 Impact of surface sorbed Fe2+ in NO2- removal: The impact of surface bound
Fe2+ on NO2- reactivity was examined at pH 5.5. Specifically, pH 5.5 was selected to
isolate maximum NO2- removal condition as observed in earlier experiments with only
goethite. We anticipated rapid as well as complete removal of NO2- by Fe2+-treated
goethite because the NO2- removal by goethite alone was greatest at this pH (Fig. 3.4A).

54
Fig. 3.4B shows the effect of added Fe2+ on the kinetics of NO2- removal from solution
by Fe2+-goethite complex. We observed pseudo-first order rate kinetics and the rate
constants were calculated from the first 48 hr experimental data. The rate of NO2-
removal was nearly five times faster for the samples conditioned with Fe2+ than with
samples containing only goethite (Table 3.2). The effect of Fe2+ on NO2- transformation
is considerable. With added Fe2+, NO2- was reduced nearly 100% when compared to the
system without Fe2+.
It is suggested that Fe2+-minerals and sorbed Fe2+ species are more effective
reductants than dissolved Fe2+ (Stumm and Sulzberger, 1992). Sorption of Fe2+(aq) onto
iron oxide develops a reactive Fe2+-oxide surface at the mineral-water interface (Tronc et
al., 1984; Amstaetter et al., 2009). In this process, redox potential of the surface Fe2+-
goethite complex is lowered which results in increased reducing power than dissolved
Fe2+ alone (Wehrli, 1990; Strathmann and Stone, 2003; Gorski and Scherer, 2011).
Previous studies have established clear evidence that surface sorbed Fe2+on goethite
enhances reactivity compared to the system without Fe2+. Compared to the system with
goethite alone, sorption of arsenate increased nearly 10% (Catalano et al., 2011), and
reductive transformation of nitrite (Tai and Dempsey, 2009), 2-nitrophenol (Tao et al.,
2010), and carbon tetrachloride (Amonette et al., 2000) increased to nearly 100% when
goethite was treated with Fe2+(aq). Hence, results from this study where nearly 100%
NO2- removal is achieved when Fe2+-was pre-sorbed onto goethite are consistent with
previous studies.
3.2.3 Characterization of reaction products: Nitrite added to goethite alone did not
produce nitrous oxide (N2O) at pH 5.5 (Fig. 3.5), the point where the most rapid NO2-
removal was observed. This suggests that NO2- removal in the presence of goethite was
likely due to adsorption alone rather than electron transfer. In the goethite samples treated
with Fe2+ there was immediate production of N2O. In later experiments, N2O production
began within the first 15 min after adding NO2- and then continued thereafter. Production
of N2O reached a maximum at 48-72 hr and declined. Cumulative N2O emission during
the experiment reached a plateaued after 72 hr. These results agree with previous work
which shows that NO2- is reduced to N2O by mineral Fe2+ and surface Fe2+ forms

55
(Sørensen and Thorling, 1991; Hansen et al., 1994; Rakshit et al., 2008; Tai and
Dempsey, 2009). Nitrous oxide produced in this study can be accounted for by Fe2+
sorbed onto goethite (Fig. 3.4B and 3.6) and the decrease in Fe2+ concentration from
solution as NO2- was reduced. Results from these experiments clearly demonstrate that
NO2- is more rapidly reduced to N2O by surface bound Fe2+ in goethite than by Fe2+
(aq)
alone.
Nitric oxide production during abiotic NO2- reduction is thermodynamically
feasible as shown in Fig. 1.3, and also documented previously when NO2- is reacted with
Fe2+ (Kampschreur et al., 2011) and Fe2+-treated magnetite (Dhakal et al., 2013). Our
attempt to quantify NO in this study was severely impaired when goethite mineral
blocked the NO detector membrane. Production of NO during NO2- reduction in a Fe2+-
NO2--goethite system could not be verified in this study, but would be a fertile area for
further study by employing a different analytical technique.
Morphological analysis carried out using XRD and SEM images of untreated
goethite compared to reacted Fe2+ conditioned goethite indicate overlapping values,
however, there is a tendency for the particle size to increase (Table 3.1). For the same
sample weight, diagnostic d-spacing (4.98, 4.19, 3.38, 2.46, 1.72, 1.45 Ǻ) intensity,
particularly 4.19Ǻ (110), of Fe2+ treated samples have slightly increased compared to
untreated and goethite treated with NO2- alone (Fig. 3.7). Studies have shown that the 110
reflection plane in the goethite crystal is sensitive to aggregation and crystal growth
(Anderson et al., 1985; Weidler et al., 1998). Thus, one possibility is that the Fe2+ is
sorbing to goethite surface sites and promoting coagulation, reflected by the increase in
intensity of the 110 reflection. Another possibility is that addition of Fe2+(aq) to the
system stimulated electron transfer between surface sorbed Fe2+ and bulk structural Fe3+,
thus producing more goethite (Williams and Scherer, 2004; Larese-Casanova and
Scherer, 2007; Latta et al., 2012b). Specifically, if the sorbent is goethite, added Fe2+ in
the system has been shown to promote precipitation of a “goethite-like” reactive surface
(Silvester et al., 2005; Amstaetter et al., 2009; Handler et al., 2009). Spectroscopic
evidence from previously published literature indicates that reacted goethite produced
Fe3+-mineral precipitate that totally resembled untreated mineral when sorbed Fe2+on
goethite was oxidized by with concomitant NO2- reduction could precipitate goethite-like

56
phase on existing goethite nitrobenzene (Chun et al., 2006; Larese-Casanova et al., 2012).
In this study, we observed an increase in crystal length and size of the goethite treated
with Fe2+ during NO2- reduction (Table 3.1, Fig, 3.7 and 3.8). It is proposed that the
oxidation of redox- active Fe2+ surface complex surface. As a result, length and crystal
size of reacted goethite most probably have increased as observed in XRD and SEM
image compared to its unreacted counterpart.
We performed theoretical calculations to evaluate the possibility that added Fe2+
might have precipitated as Fe(OH)2 (see Appendix C) in the goethite-mineral-water
interface. These calculations indicate that our conditions were undersaturated with
respect to Fe(OH)2 precipitation.
Several studies have demonstrated that Fe2+ uptake by iron oxide is influenced by
particle size (Cwiertny et al., 2008) and aggregation (Amonette et al., 2000). Changes in
surface area of such oxide directly resulting from the differences in particle size have
shown to dramatically influence reductive dissolution (Anschutz and Penn, 2005;
Cwiertny et al., 2009), and thus reduction kinetics of nitrobenzene (Cwiertny et al., 2009)
and CCl4 (Vikesland et al., 2007). In the future, particle size effects on NO2- reduction
kinetics could shed light into predicting the influence of NO2- reactivity with goethite on
a surface area basis.
3.3 Environmental implications
Evidence is presented for the importance of goethite and the Fe2+-goethite system
in removing NO2- under anoxic conditions. Our study shows that under anaerobic
conditions, the simultaneous presence of Fe2+(aq) and goethite-bearing soil and sediments
can catalyze abiotic NO2- reduction over a range of environmentally relevant pH levels.
Goethite and other various iron oxides are common soil components, and have shown
potential in reductive transformation of pollutants. Reactivity of iron oxides is often very
low once the reactive surface sites are exhausted. However, reactivity of iron oxide such
as goethite towards NO2- can continue over long periods as Fe2+ becomes available under
iron reducing conditions. Surface sorbed Fe2+ not only enhances reducing capacity of the
system, but also continuously regenerates reactive surface sites by uptake of Fe2+(aq).

57
In nature, microbial reduction of NO3- to NO2
- by nitrate reductase is the first step
in microbial denitrification process. This could lead to secondary chemical reactions in
which NO2- reacts with goethite, and or Fe2+-goethite complex that would lead to N2O
production. Recent studies have shown that abiotic N2O production by mineral Fe2+, and
or surface sorbed Fe2+ is an important process in the Fe-N cycle (Sørensen and Thorling,
1991; Rakshit et al., 2008; Kampschreur et al., 2011; Dhakal et al., 2013). In addition,
coupling of mineral Fe2+ oxidation by NO2- reduction has shown to produce N2O via
chemical (Samarkin et al., 2010), and mixed chemical-biological pathways (Cooper et al.,
2003).
A recent study provides evidence that suggests that electron transfer between
Fe2+(aq) and goethite is severely impaired by the presence of long chain phospholipid, a
common organic molecule present in the microbial cell wall (Latta et al., 2012b).
Because electron transfer between Fe2+ and the solid oxide phase is the first step to stir
reductive transformation of contaminants, abiotic NO2- reduction by mineral Fe2+ and
surface sorbed Fe2+ could be more important where biomass loading is minimal or absent.

58
Table 3.1. Crystal morphology of untreated and treated goethite at pH5.5 after 72 hr incubation.
GT51 Untreated GT51+NO2
- GT51+Fe2+ GT51+Fe2++NO2-
Avg. length† 1.46±0.35 0.82±0.25 1.51±0.28 1.69±0.46 Avg. width† 0.14±0.05 0.08±0.02 0.13±0.02 0.13±0.03 L/W ratio 11.0±1.3 10.81±0.74 11.61±1.45 12.33±1.5 Avg. crystal size (measured)† 0.79±0.23 0.50±0.12 0.80±0.09 0.84±0.19 Avg. particle size (calculated using Scherrer equation)††
0.62 ±0.12 0.36±0.14 0.66±0.21 0.99±0.41
n > 25 † Length, width, crystal size (in µm) measured using SEM image. †† Particle size calculated from XRD using Scherrer equation (Scherrer, 1918):
Particle size (in µm)= kλ / (B Cosθ ), where B is the width or full width at half-maximum
(FWHM) of a diffraction spot (110), λ is x-ray wavelength, and θ is the Bragg angle.
Scherrer constant k is commonly cited in the literature as having a value of ~0.9.
Table 3.2. Initial rate and kobs values measured for NO2- removal (initial
concentration of 0.1 mM) from solution by goethite (2 gL-1) with or without
added Fe2+ at various pH. The kobs values were derived from a first order rate
expression.
pH Treatment Removal Rate kobs (Ms-1) (hr-1 )
5.5 Goethite 1.06±0.20×10⁻⁹ 1.40±0.05×10⁻¹
Fe2+-Goethite 5.15±0.10×10⁻⁹ 4.97±0.25×10⁻¹
6.5 Goethite 2.20±0.15×10⁻¹⁰ 7.95±0.10×10⁻²
7.5 Goethite 1.25±0.05×10⁻¹⁰ 4.80±0.15×10⁻²

59
Figure 3.1 X-ray diffraction patterns of control (untreated) goethite (GT51) in MES [2-
(N-morpholino) ethane sulfonic acid] at pH 5.5. Scanning electron micrograph (SEM) of
the control goethite is shown on top. Graph below XRD spectra shows composition
microanalysis of untreated goethite by EDX.

60
Figure 3.2 Acid-base titration data for goethite (GT51) at three different ionic strengths
on a surface area basis (100 and 330 m2L-1). Solid lines are experimental data point
connectors.
Figure 3.3 Plot showing sorption of Fe2+(aq) onto goethite (GT51). Initially, 1.5 mM of
Fe2+(aq) was injected into reaction vials containing ~2 gL-1 (~100 m2L-1) of goethite slurry.
Open and solid symbols indicate samples that have 1 and 10 mM NaCl respectively.
Equilibrium Fe2+ sorption was observed after 24 hr at pH 5.5 (open and closed circles).
pH buffer used for pH 5.5 and 6.5 samples is 25 mM MES, and for 7.5 is 25 mM PIPES.
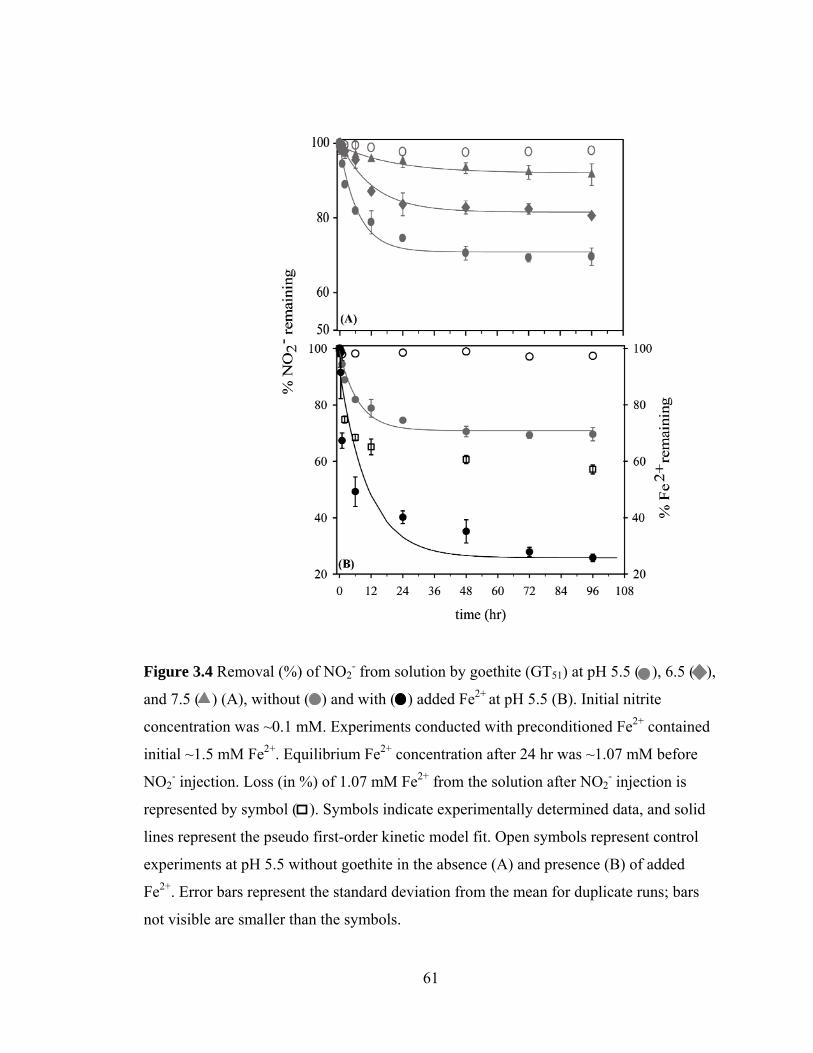
61
Figure 3.4 Removal (%) of NO2- from solution by goethite (GT51) at pH 5.5 ( ), 6.5 ( ),
and 7.5 ( ) (A), without ( ) and with ( ) added Fe2+ at pH 5.5 (B). Initial nitrite
concentration was ~0.1 mM. Experiments conducted with preconditioned Fe2+ contained
initial ~1.5 mM Fe2+. Equilibrium Fe2+ concentration after 24 hr was ~1.07 mM before
NO2- injection. Loss (in %) of 1.07 mM Fe2+ from the solution after NO2
- injection is
represented by symbol ( ). Symbols indicate experimentally determined data, and solid
lines represent the pseudo first-order kinetic model fit. Open symbols represent control
experiments at pH 5.5 without goethite in the absence (A) and presence (B) of added
Fe2+. Error bars represent the standard deviation from the mean for duplicate runs; bars
not visible are smaller than the symbols.

62
Figure 3.5 Nitrous oxide (N2O) emission recorded in the experiment (at pH 5.5) after
adding 0.1 mM NO2- in the reaction vessel that contained goethite slurry in the absence
( ), and presence ( ) of Fe2+(aq). Inset figure shows cumulative N2O evolution. Open
symbols indicate the control samples without goethite for respective experiment. Error
bars represent the standard deviation from the mean for duplicate runs; bars not visible
are smaller than the symbols. In all samples, changes in the pH, from its initial 5.5, are
within ±0.1.

63
Figure 3.6 Surface Fe2+ loading ( ) with respect to NO2- reduced ( ) per gram of
goethite at pH 5.5 over the span of 96 hr in a Fe2+-NO2--goethite system. Error bars
represent the standard deviation from the mean for duplicate runs; bars not visible are
smaller than the symbols.

64
Figure 3.7 Plot of a powder x-ray diffraction pattern observed from untreated goethite
(GT51) and that reacted with NO2- at pH 5.5. XRD spectra of the goethite samples
conditioned with added Fe2+ before treating with NO2- are stacked on the top. Standard
reference spectra for goethite, magnetite, and hematite are shown as solid lines at the
bottom of the figure. Samples treated with NO2- in the presence of added Fe2+ match with
goethite spectra, and the peak (110) intensity is larger than untreated samples (inset).
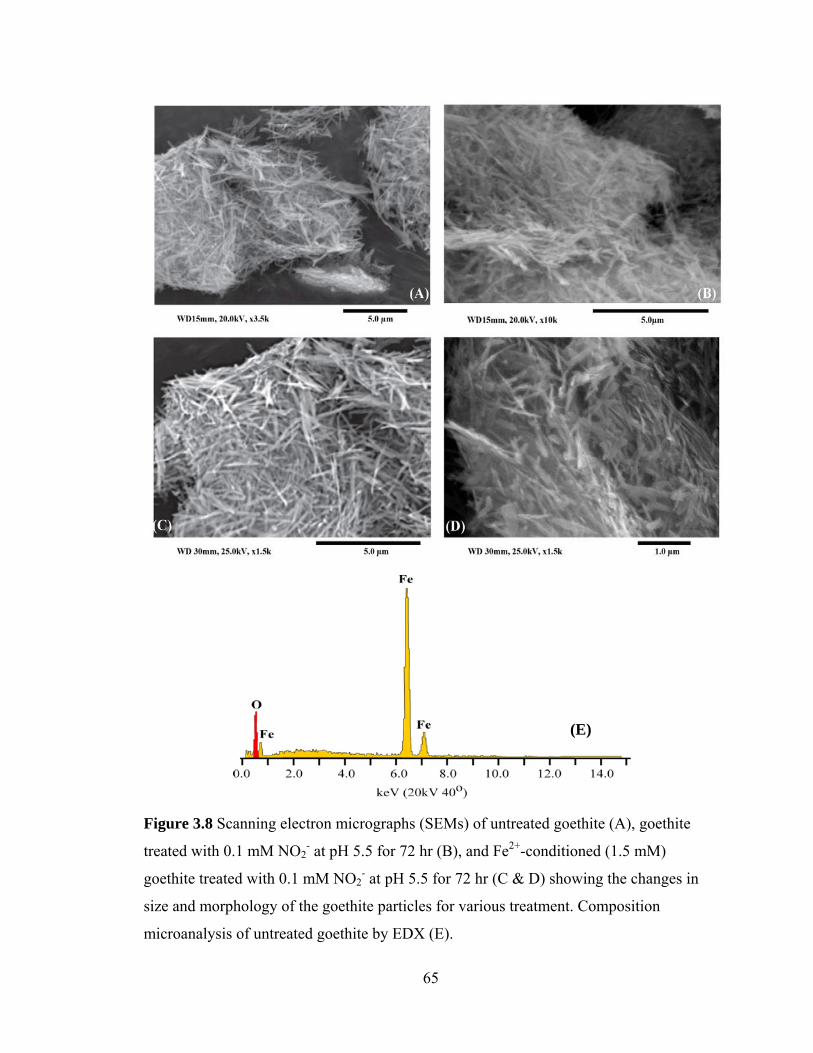
65
Figure 3.8 Scanning electron micrographs (SEMs) of untreated goethite (A), goethite
treated with 0.1 mM NO2- at pH 5.5 for 72 hr (B), and Fe2+-conditioned (1.5 mM)
goethite treated with 0.1 mM NO2- at pH 5.5 for 72 hr (C & D) showing the changes in
size and morphology of the goethite particles for various treatment. Composition
microanalysis of untreated goethite by EDX (E).
(E)

66
Figure 3.9 Possible scheme showing NO2- redox transformation mediated by surface
sorbed Fe2+ on goethite-water geomedia. Electron shuttling from Fe2+-goethite complex
possibly stimulates NO2- reduction to N2O. The nitrogen species are drawn as Lewis
structures taken from Luther (2010). Solid arrow indicates possible reaction
product/pathways that produce N-intermediates.
Copyright © Prakash Dhakal 2013

67
Chapter Four: An In Situ Spectroscopic Study of Nitrite Interaction with Goethite
and Fe2+-Goethite Mineral Water Interface
4. Introduction
Due to its ability to probe chemical bonds, Fourier transform infrared (FTIR)
spectroscopy has been applied for years to collect IR spectra of organic and inorganic
compounds. Because elemental composition and chemical bonds are unique to each
compound, IR spectra can serve as a fingerprint (Stuart, 2004). Conventional FTIR
methods involve drying the mineral of interest to remove water, which absorbs strongly
in the IR region with intense OH stretching and bending bands (Farmer, 1974). This
precludes the study of in situ surface investigations. Attenuated total reflection-Fourier
transform infrared (ATR-FTIR) spectroscopy is a modified FTIR tool which offers the
possibility for the in situ spectroscopic investigation of adsorbed oxyanions at metal
(hydr)oxide-water interfaces (Tejedor-Tejedor and Anderson, 1986). In this novel
technique, the IR beam is allowed to pass through an ATR crystal and is reflected at the
crystal-sample interface, forming an transient wave and minimizing the contribution from
the liquid (Stuart, 2004). By careful spectral subtractions, one can obtain information at
the surface-water interface (Peak et al., 1999; Arai and Sparks, 2001; Zhang and Peak,
2007).
ATR-FTIR spectroscopy is extensively being used to examine interactions of
inorganic anions with various minerals. Previously, the sorption mechanism of
phosphate (Arai and Sparks, 2001), carbonate (Villalobos and Leckie, 2001), and sulfate
(Peak et al., 1999) on goethite has been investigated using this technique. Although the
relationship between the symmetry of sulfur (S), carbon(C), and phosphorus (P)
complexes and their IR spectra is well established, virtually no work has been carried out
to understand the nitrite (NO2-) sorption mechanism and reaction intermediates using iron
oxide minerals such as goethite.
Nitrite is a versatile ambidentate ligand that can participate in acid/base,
coordination or oxygen transfer chemistry by donating a pair of electrons from either N
or O atoms (Hitchman and Rowbottom, 1982). A summary of possible modes of NO2-
bonding to metal cations (denoted by M) is shown in Scheme 1 (see below). Nitrite

68
coordination to cations and metals can occur through one or two of its oxygen atoms
(nitrito) (Scheme 1, a & b). Oxygen is the ligating atom with Mg2+ (Cerruti et al., 1974)
and Cu2+ (Hitchman and Rowbottom, 1982). Nitrite coordination with aqueous Fe2+ and
membrane bound reactive Fe2+ sites have shown to favor N-ligation (Scheme 1 e,
(Hitchman and Rowbottom, 1982; Einsle et al., 2002). These different binding modes
can be distinguished using IR spectroscopy (Hitchman and Rowbottom, 1982).
Scheme 1
Diffuse reflectance spectroscopy (DRS) in the ultraviolet-visible-near infrared
(UV-VIS-NIR) region allows one to probe metal d-d transitions, ligand-to-metal
transitions, and metal-to-ligand transitions (Burns, 1993; Figgis and Hitchman, 1999).
Previously, this technique has been used to quantify Fe-oxide minerals in soil (Scheinost
et al., 1998), aluminum substitution in goethite (Scheinost et al., 1999a) , oxidation states
of iron in sodium silicate glass (Jeoung et al., 2001), and also in the study of electron
transfer between metal and nitrite in solution (Barnes et al., 1972). The use of UV-VIS-
NIR spectroscopy on wet pastes of clay minerals reacted with nickel (Ni2+) allowed

69
Scheinost et al. (1999b) to evaluate the mechanism of Ni2+ removal from solution. They
found under certain conditions, Ni2+ formed surface precipitates on the clay minerals.
In Chapter 3, the removal of NO2- by goethite was quantified using wet chemical
(macroscopic) techniques. The rate of NO2- removal by goethite was accelerated at lower
pH and in the presence of surface Fe2+. To better understand the mechanism of NO2-
removal by goethite, spectroscopic techniques are needed to provide molecular level
information. The objective of this study is to examine the interaction of NO2- with
goethite and Fe2+-amended goethite as a function of pH (5.5-7.5), initial NO2-
concentration (0.1-100 mM), and goethite concentration (2 and 10 g/L) using in situ
ATR-FTIR and UV-VIS-NIR spectroscopies. This will provide insight in the nature of
coordination between Fe and N at mineral-water-interface.
4.1 Experimental sections
4.1.1 Reagents, minerals synthesis, and characterization: Reagent grade or better
chemicals were used as received. Nitrate and nitrite stock solutions were prepared by
certified ACS-grade sodium nitrate (NaNO3) and sodium nitrite (NaNO2) salts inside an
anaerobic glove box (Coy Laboratory Products, Grass Lake, MI) purged with 95% argon
(Ar) and 5% hydrogen (H2) mixture. All solutions were prepared using deoxygenated
doubly deionized water (DDIW) (18.3 MOhm cm-1) purged for 3 hr with ultra pure argon
(Ar) before transporting into the glove box. Solution pH was buffered using 25 mM [2-
(N-morpholino) ethane sulfonic acid] (MES) solution combined with a 0.1 mM NaCl
solution, for a total ionic strength of 25.1 mM.
Preparation, purity, size distribution, and detailed characterization of goethite (α-
FeOOH) minerals used in this study are described previously (Chapter 3). The specific
surface area of the goethite used in this study was 51.43±0.03m2/g, and occasionally
abbreviated in the text as GT51.
4.1.2 Nitrite interaction with goethite studies: A goethite suspension (2 and 10 gL-1)
was prepared at pH 5.5 in water, and pH of the solution was stabilized using 25 mM MES
solution. The suspension was well stirred in an end-to-end rotator overnight for
prehydration. Ionic strength of the solution was maintained using 0.1 mM NaCl, for a

70
total ionic strength of 26 mM. To begin sample precondition, goethite slurry (~5 µL) was
spread over the ATR crystals under Ar purging. Then, the sample was allowed to
partially evaporate excess water until a thin goethite layer was developed on the ATR
crystal. On average, goethite layer was developed from the slurry within 15-20 min.
Development of goethite layer in the form of “paste” on the ATR crystal is confirmed by
continuously monitoring IR peak at 3140, 897 and 792 cm-1 as suggested previously
(Tejedor-Tejedor and Anderson, 1986). Proper in situ pre-treatment is necessary to
produce an evenly distributed goethite layer over the ATR crystal. Even distribution of
goethite layer was tested via series of experiments using exact same volume of slurry,
and monitoring fingerprint IR peak intensity as mentioned earlier. Reaction began by
injecting ~5 µL of 0.1, 0.5, and 100 mM NO2- solution via an injection port (Fig.
4.1A,B). Infrared spectra were collected at 5, 15, 30, 45 min, 1 hr and 2 hr after
introduction of NO2- solution.
Effect of pH (5.5-7.5) on NO2- interaction at the goethite-water interface was
studied using IR measurement on nitrite treated goethite slurry. Goethite slurry (10 gL-1)
was prepared in 3 different reactor vials (10 mL) at designated pH values and prehydrated
overnight (24 hr) inside a glove box. Goethite slurry at each pH was spiked with 0.1 mM
NO2- solution, mixed thoroughly on end-over-end rotator for 1 hr, and transported out of
anaerobic glove for IR measurement (see detail below).
To study NO2- interaction with Fe2+-goethite complex using ATR-FTIR, goethite
slurry (10 gL-1) prepared in a similar method as mentioned previously was first spiked
with 1.5 mM Fe2+ at pH 5.5 and agitated inside the glove box for 24 hr. Fe2+ stock
solutions were prepared from zerovalent iron (Feo) by complete dissolution in 100 mM
HCl stock solution. After 24 hr of agitation, residual Feo fraction was retained in a
0.22µm membrane filter (Fisher Scientific, Hampton, NH) and stored inside anoxic
chamber to prevent oxidation of Fe2+. To begin experiment, sealed sample vial was
transported out of glove box and under Ar purging ~5µL of Fe2+-goethite slurry was
spread over on ATR crystal using a 10 µL syringe. Sample precondition, and IR
measurement of NO2- (0.1 mM) treated Fe2+-goethite slurry was performed in the same
manner as described earlier.

71
In addition to ATR-FTIR study, a separate experiment was conducted to study the
interaction of NO2- with Fe2+-goethite complex. In this method, goethite slurry (10 gL-1)
preconditioned with 1.5 mM Fe2+ at pH 5.5 was spiked with 0.1mM NO2-. Initially,
Fe2+(aq) was added to goethite slurry prepared in 20 mL glass vials inside the glove box
and equilibrated for 24 hr before reacting with NO2-. Reactor vials were kept inside the
glove box shaking with an end-to-end rotator at 30 rpm to allow complete mixing. With
increasing time interval, ranging from 15 min to 48 hr, aliquots were removed and
filtered through 0.22µm filter paper (Fisher Scientific, Hampton, NH). Wet sample
retained on the filter paper was immediately mounted on a glass slide pending analysis
using UV-VIS-NIR spectrophotometer (detail below).
4.1.3 In situ ATR-FTIR measurement: All IR spectra were collected by using a
Thermo Nicolet 6700 spectrometer (Thermo Electron Corp., Madison, WI) equipped with
SmartDuraScopeTM (Fig. 4.1). Spectra were collected at 8 cm-1 resolution, 200 scans, data
spacing of 3.857 cm-1, and mirror velocity of 0.66 cm-1s-1. SmartDuraScopeTM is
equipped with a 1.5mm diamond sample holder with a capacity of probing a 2 µm sample
depth at a rate of 3 reflections, and has an integrated digital magnifier (100X).
Initially, IR spectra for various concentrations of NO2-(aq) and NO3
-(aq) standard, 25
mM MES solution, dry goethite, and goethite paste prepared in 25 mM MES were
collected by spreading the solution over a diamond crystal in the SmartDuraScope. Later,
spectral data were collected for various treated and untreated goethite samples as
discussed previously. ATR-FTIR spectra obtained from experimental samples were then
subtracted for water, NO2-(aq), and MES solution for analysis. Also, IR spectra for solid
NaNO3, and NaNO2 were recorded as standards. Spectral manipulation such as baseline
correction, spectral subtraction, peak fitting, and normalization was performed using the
OMNIC 7.3 software package (Thermo Electron Corp., Madison, WI).
4.1.4 In situ Diffuse Reflectance Spectroscopy (DRS): A wet paste of Fe2+-conditioned
goethite reacted with NO2- was retrieved after filtering, mounted on a glass slide, then
immediately transferred from the glove box to an IRS 3100 integrating sphere attachment
assembled to a UV-VIS-NIR spectrophotometer (Shimadzu, UV-3101PC, Columbia,
MD) for spectral measurement. The sample port in the spectrophotometer was constantly

72
purged with ultra pure Ar to minimize oxidation. Spectra were acquired in the range of
9500-35000 cm-1 (1053-285 nm) at 2 nm increments. In addition to experimental
samples, optical spectra of Fe2+and Fe3+-oxide(s) were collected as standard for
comparison. Raw wavelength-dependent reflectance data were converted into Kubelka-
Monk remission function (Kubelka and Munk, 1931). Within the range of wavelength
investigated, assuming scattering coefficient is relatively constant, the shapes of the
Kubelka-Monk spectra are equivalent to the actual absorption spectra. Spectral analysis
was carried out using GRAMS32AI® software (Thermo Electron Corp., Madison, WI).
4.2 Results and discussion
4.2.1 Theoretical IR vibration of NO2-
Theoretically, the number of IR active bands of a nonlinear molecule is given by
3N-6, where N is the number of atoms (Huheey et al., 1993). Polyatomic nitrite exhibits
C2v symmetry and its three IR vibrational modes are IR active. Table 4.1 summarizes the
vast majority of well characterized ionic nitrites in the solid state. The three IR
vibrational modes occur in the following regions: (i) the symmetric stretching (ν1,νs =
1380-1305 cm-1) (ii) the symmetric bending (ν2, δNO2 = 845-805 cm-1) and (iii) the
asymmetric stretching (ν3, νas = 1235-1208 cm-1) (Miller and Wilkins, 1952; Weston and
Brodasky, 1957; Hitchman and Rowbottom, 1982; Nakamoto, 1986). Nitrite is unusual in
that the asymmetric stretching bond energy is lower than the symmetric one, due to the
high interaction force constant between the terminal atoms, similar to that observed in
other molecules such as ozone (O3) and OF2 molecules (Hitchman and Rowbottom,
1982) and reference therein). Complexed nitrite species, however, exhibit asymmetrical
(νas) stretching vibration at a higher energy than symmetric (νs) stretching (Hitchman and
Rowbottom, 1982; Laane and Ohlsen, 1986; Nakamoto, 1986). Notably, νs and νas band
assignment for “nitro complexes” is observed in the 1470-1250 cm-1, and 1650-1340 cm-1
region, respectively (Table 4.1 and Scheme 1e). Commonly, νs and νas band assignment in
“nitrito complex” is in the lower frequency region compared to “nitro complex”
(Nakamoto, 1986). This is because O2- impose weaker ligand-field and positioned to
lower energy regions in the spectrochemical series than N; therefore N binding with
metals is expected to occur at higher energy (Figgis and Hitchman, 1999).

73
Due to reduced NO2- symmetry in monodentate surface species, IR active
symmetric N-O and N=O stretching modes are fairly distinguishable. Commonly, weaker
N-O stretching bond is observed at lower frequency (1206-1050 cm-1) then stronger N=O
bond (1485-1375cm-1) (Nakamoto, 1986; Hadjiivanov, 2000). Although it is difficult to
discern bridging from non-bridging structure from IR data, N=O bond frequency arising
from bridging compounds are at higher energy values than those from non-bridging
compounds (Hadjiivanov, 2000). Because the chelating and the bridging bidentate
surface species (Scheme 1, c&d) preserve the structural symmetry (C2v), IR active bands
arising from such nitrito species resembles those of NO2-(aq) ion (Nakamoto, 1986).
Finally the NO2- anion can also coordinate via N atom (nitro) to a metal surface site
(Scheme 1, e) with higher N-O stretching frequencies than the corresponding vibrations
for bidentate nitrito species (Hadjiivanov, 2000).
An ATR-FTIR spectrum of solid NaNO2 shown in Fig. 4.2(A) demonstrates
three major IR bands (1324, 1229, and 825 cm-1). The broad and intense peak centered at
1229 cm-1 is assigned to a νas N-O stretch and the absorption peaks at 1324, and 825 cm-1
are assigned to a νs N-O stretch and δNO2 (N-O bending), respectively. The free aqueous
nitrite anion in ATR-FTIR mode displays an absorption band at 1232 cm-1, assigned to νas
(Fig. 4.2B). The peak at 830 cm-1 in aqueous nitrite is attributed to the δNO2 vibration
(Fig. 4.2B). The νs band was below detection in aqueous nitrite, which is not uncommon
(Cerruti et al., 1974; Hitchman and Rowbottom, 1982). These assignments for the
standards are consistent with the literature, where νas ranges from 1260-1208 cm-1 and the
range for δNO2 is 833-785 cm-1 (Weston and Brodasky, 1957; Cerruti et al., 1974;
Hitchman and Rowbottom, 1982) as summarized in Table 4.1. Where νs appears, it is
found in the range of 1335-1303 cm-1.
4.2.2 Characterization of goethite-water related ATR-FTIR spectral feature
Before studying the nitrite-goethite interface, one has to account for the effect of
the pH buffer (MES), the presence of water, and the properties of goethite in contributing
to the IR spectra. The IR absorption spectrum of liquid water alone at pH 5.5 is shown in
Figure 4.3a. There is a broad absorbance peak centered at 3289 cm-1 which is a
combination of overlapping peaks; peak deconvolution (inset Fig. 4.3) reveals peak at
74
3343 cm-1 and 3205 cm-1, assigned to asymmetric O-H and symmetric O-H stretching
vibrations (Lappi et al., 2004). The peak at 1636 cm-1 is assigned to an H-O-H bending
mode. These features are attributed to H-bonding (Lawrence and Skinner, 2003). Similar
to the spectrum (a) shown in Fig 4.3, absorption spectrum of 25mM MES (pH 5.5)
solution observed in Fig. 4.3b is also identical to spectra of liquid water reported
previously (Al-Abadleh and Grassian, 2003; Lappi et al., 2004). The O-H stretching
vibrations in goethite paste buffered at pH 5.5 with 25mM MES(aq) resulted in a slight
shift to lower energy, with a broad and strong absorption peak centered at 3243 cm-1 (Fig.
4.3c). No significant absorption peak for MES is observed, presumably due to the low
concentration.
ATR-FTIR spectra of the MES buffered goethite paste (Fig. 4.3c) display three
absorption peaks dominated by water O-H vibrations (3243, 2107, and 1636 cm-1)
(Villalobos and Leckie, 2001; Walrafen and Pugh, 2004). In addition, two sharp
absorption peaks at 885 and 784 are noted (Fig. 4.3c). These two bands can be assigned
to the bending O-H vibrations of the bulk hydroxyl group in (δOH) and out (γOH) of the
001 goethite crystallographic plane (parallel to c axis) (Cambier, 1986; Cwiertny et al.,
2009). ATR-FTIR spectra of the water-goethite paste and MES buffered goethite paste
were identical (data not shown).
Although there is a significant increase in the absorption intensity from a wet
goethite paste, spectra obtained from untreated dry (room temperature) and MES
subtracted goethite samples are similar (Fig 4.3 d&e). A strong and broad absorption
peak observed at 3243 cm-1 (H2O + O-H: overtone of O-H stretching vibration) in
goethite paste is shifted to 3101 cm-1 after subtracting with MES solution. Narrowing and
shifting of peak 3243 cm-1 could be due to decreased residual water in the surface of
water saturated goethite paste. A water-subtracted IR spectrum of goethite does not show
the broadening feature but rather emerges into strong peak at 3101cm-1. This peak is
attributed to the stretching vibration of bulk O-H in the goethite structure (νOH), similar to
the peak observed at 3124 cm-1 in dry goethite sample. Similar IR shift in water saturated
goethite paste has been reported previously (Tejedor-Tejedor and Anderson, 1986). In
fact, an absorption band at 3124 cm-1 is reportedly sensitive to dehydroxylation, and or
hydration (Ruan et al., 2002a). Similarly, decrease in peak intensity at 1636 cm-1 is due to

75
removal of excess surface water at the goethite-water interface. Because the peaks at
3124 cm-1, and 893 and 791 cm-1 were retained in the spectra subtracted from the water,
these bands are related to the bulk O-H vibration in the goethite structure and not from
surface O-H energy. The band near 634 cm-1 is due to a symmetric Fe-O stretch
(Cambier, 1986; Ruan et al., 2002b).
4.2.3 ATR-FTIR of NO2-(aq) treated goethite
Figure 4.4 shows time series ATR-FTIR data associated with goethite (10 gL-1)
that had been reacted with 0.1 mM NO2-(aq) (pH =5.5). Absorption peaks at 3099, 2091,
1633, 855, 787, and 635 cm-1, and their assignment have been discussed in the previous
sections. Within 1000- 1300 cm-1 region, reacted samples show four distinct IR
absorption peaks (1265, 1231, 1186, and 1121 cm-1). Another two peaks at 1791and 2306
cm-1 emerge, well above the water bending frequency (1633 cm-1), from samples treated
with NO2-. Absorption peak for δNO2
- observed earlier (833-785 cm-1) in NO2-(aq) standard
no longer existed, and could be hidden under OH-peak at 892-797 cm-1.
After 15 minutes of reaction time between NO2- and goethite at pH 5.5 and 10 g
goethite L-1, there was appearance of an absorption peak at 1791 cm-1 (Fig. 4.4). This
band can be assigned to a surface bound NO species. Gaseous NO has a peak near 1876
cm-1 and is red-shifted upon complexation. The presence of IR absorption at 1791 cm-1 in
our study is likely due to the νas (N=O) stretching vibration of adsorbed NO. IR studies
have confirmed that mineral surfaces provide suitable sites for NO adsorption (Mortland,
1965). This assignment is consistent with a recent study conducted at ambient room
temperatures that have shown a similar vibrational mode of adsorbed NO onto pyrite
(FeS2) (Singireddy et al., 2012). Comparable vibrational mode of gaseous NO adsorbed
on a variety of metal surfaces is found in the literature (Hadjiivanov, 2000; Davydov,
2003; Sá and Anderson, 2008). At low temperature, it is found that NO molecules tend to
dimerize, and the N-O stretching modes can fall below 1876 cm-1 due to π-back donation
with cations rich in d-electrons (Hadjiivanov, 2000). Efforts to measure NO(g) as a
reaction product from the reactor containing NO2- treated goethite slurry, as done in
Chapter 2 with magnetite, were severely impaired because the NO detector membrane
was blocked by the goethite slurry (Chapter 3).

76
Another distinct IR vibration is observed at 2306 cm-1 (Fig. 4.4). This peak is
assigned to an N-N stretching vibration from a linear N-N-O structure of dissolved or
weakly adsorbed N2O molecule at the goethite-water interface. It is noted that this
assignment is also consistent with the vibrational frequencies (cm-1) for gaseous N2O
adsorbed to various transitional metals as reported by Laane and Ohlesen (1980) and
Hadjiivanov (2000). Results from the wet chemical experiment also supports this data
where N2O(g) was measured in the headspace of reaction vessel containing NO2- and
goethite (Chapter 3). Notably, the absorption peak for NO(ads) and N2O(ads) observed in
this study is relatively stronger in the beginning (15-45 min) and tends to diminish at
longer reaction times (>2 hr). This indicates that these species are relatively unstable and
short lived. IR absorbance data presented here shows evidence of goethite mediated NO2-
reduction to N2O preceded by the production of NO (see Chapter 3).
The ATR-FTIR spectra of NO2- reacted goethite samples also show additional IR
absorption peaks in the 1000-1300 cm-1 region (Fig. 4.4). This region was isolated by
varying NO2-(aq) (0.1, 0.5, and 100 mM) and goethite (2 and 10 gL-1) loading at pH 5.5
over time (Fig. 4.5). Reaction of 2 g goethite L-1 with 0.1 mM NO2- resulted in
appearance of four IR peaks at 1256, 1221, 1192, and 1121 cm-1 (Fig. 4.5A). All four
absorption peaks intensify with longer reaction time. On the basis of behavior in relation
to the coverage these four components are related as couples at 1256, 1190 cm-1 and
1221, 1121 cm-1. NO2- adsorption onto magnesium oxide at 25oC resulted in 4 IR
absorption peaks positioned in the same wavenumber range (Cerruti et al., 1974). On
theoretical and experimental grounds, Cerruti et al. (1974) grouped these 4 peaks into
pairs and assigned them to two separately adsorbed NO2- species, specifically one for
excited and the other for ground state nitrite species.
Data indicate that NO2- ion can exhibit singlet 1B1 (νs at 1018 cm-1) and triplet 3B1
(νs at 1170 cm-1, and νas at 1124 cm-1) excited states (Sidman, 1957; Harris, 1973). Based
on electron occupancy in 6a1, and 2b1 orbitals, NO2- can be either in the ground (1A1) or
excited (1B1 & 3B1) state (Cerruti et al., 1974). In ground state, 6a1 orbital in NO2- is
doubly occupied, and in excited states electron from 6a1 orbital is split into 6a1 and 2b1.
Thus, while excited 6a1 & 2b1 orbital in NO2- is singly occupied as in the ground state of
NO22-. From steric consideration, NO2
- molecule approaching reactive surface sites such

77
as goethite or magnesium oxides could stir electronic crowding in such a way that
molecules spread to excited states forcing electron occupancy in the orbital to changed.
On the basis of spectroscopic data alone, it is often challenging to distinguish between the
species NO2- (1A1), and NO2
- (1B1 & 3B1), particularly when sensitivity of NO2- stretching
frequencies is weak. However O-N-O bond length and angles in the excited species are
greater and increase (by 9o and 15o) in the 1B1 and 3B1 states (Harris, 1973; Cerruti et al.,
1974). In fact, increase of bond length results in lowering of N-O stretching frequency as
the bond becomes unstable. This explanation justifies our assignment to absorption peak
couples at lower wavenumber to excited surface NO2-. Commonly observed νs, and νas N-
O vibrations, summarized in Table 4.1, arises from ground state, 1A1 electronic
configuration of NO2-. The stated consideration suggests that absorption peak couple at
1256, 1190 cm-1 and 1221, 1121 cm-1 can be attributable to ground and excited states of
NO2- adsorbed onto goethite surface, respectively. Assigned to surface sorbed ground
state and excited NO2- species, absorption peak couples 1256, 1190 cm-1 and 1221, 1121
cm-1 become more resolved with increasing reaction time (Fig. 4.5A). As of now it is not
clear if the IR pair 1221, 1121 cm-1 is essentially due to adsorbed excited NO2- ion, an
issue that awaits further study. IR vibration data on excited NO2- ion are the results of
extrapolation of spectroscopic data refering to dimer species Na4N2O4 and electronic and
vibrational state of nitrite ions (Gray and Yoffe, 1955; Cerruti et al., 1974). No other
study has even been reported on excited NO2- or ground NO2
2- ion species; it presents a
unique opportunity in NO2- transformation studies, and deserves further investigation.
The geometry of NO2- coordination to goethite can be analyzed on the basis of
theoretical and experimental vibrational frequencies assigned to various surface nitrite
structures. If the goethite-NO2- complex had been of the nitro type, both νs and νas should
have shifted to higher frequencies compared to the free nitrite ion (Table 4.1). This rules
out the structure e in Scheme 1 and leaves open the possibility of formation of several
different surface nitrito complexes. In nitrito complexes, the shifting of νas is expected to
lie higher and νs to lower frequencies than aqueous nitrite ions (Hitchman and
Rowbottom, 1982; Nakamoto, 1986; Hadjiivanov, 2000). Thus, we assign the peak at
1256 cm-1 as νas and the peak at 1190 cm-1 as νs. Based on this argument, it is suggested
that a nitrito-type complex is formed when NO2- reacts with goethite. Furthermore, it

78
seems very reasonable to exclude the structures a&b illustrated in Scheme 1 because
these structures have allowed IR bands for νs well above those observed in our study. In
addition, the values for νas in our study (1256-1265 cm-1) are greater than those reported
for the monodentate (structure a, Scheme 1) and bridging monodentate nitrito (structure
b, Scheme 1). On the contrary, our values for νas and νs of adsorbed NO2- fit within the
ranges of vibrational frequencies specified in Table 4.1 for structure c&d (Scheme 1).
On the basis of IR data alone, it is often difficult to distinguish between chelating
and bridging geometries; however, a further refinement of the possible nitrite surface
structure can be made by recognizing that νas for the bridging structure is IR inactive
(Table 4.1). The fact that we observed a νas band suggests that NO2- is not binding to
goethite surface sites in the geometry illustrated by structure d (Scheme 1). Therefore,
this structure can also be excluded from a potential nitrite surface species on goethite.
Thus, our IR data are most consistent with NO2- ions bound to the goethite surface
through the two oxygen atoms (structure c, chelating nitrito complex, Scheme 1). Nitrite
sorbed to magnesium oxides has also been shown to produce chelating nitrito structure
within comparable wavenumbers as reported here (Cerruti et al., 1974).
For NO2- to chelate Fe3+ atoms (denoted as M in structure c, Scheme 1) on the
goethite surface, a displacement of hydroxide or water surface functional groups would
be necessary. As the surface protonation state is pH-dependent on goethite, it might be
expected that there would be a change in the IR spectra with pH as well.
4.2.4 Effect of pH on NO2- interaction with goethite
The effect of pH on NO2- interactions at the goethite-water interface was studied
at pH 5.5, 6.5, and 7.5 after 60 minutes of reaction time (Fig. 4.6). Two important
observations can be made from these data. First, the IR peak intensities at ~1260, 1220,
1185, and 1120 cm-1 are all greater at pH 5.5 when compared with pH 6.5 and pH 7.5.
This indicates more NO2- ions are present as adsorbed species and agrees with our
macroscopic data showing greater NO2- removal from solution as the pH is lowered (see
Chapter 3). As mentioned in Chapter 3, a reactive surface site in goethite is often
represented by singly (≡Fe-OH-0.5), doubly (≡Fe2-OH0), and triply (≡Fe3-OH+0.5)
coordinated surface functional groups where singly and triply coordinated surface

79
functional group can only protonate or deprotonate. The pHPZSE of GT51 is 8.45±0.1,
thus, the electrical charge at the surface of goethite becomes progressively positive when
the pH falls below pHPZC, allowing more protonated reactive surface sites, such as
≡FeOH20.5+ to form. Nitrite can displace the OH2 group (or OH groups) and directly
bond (chelate) the Fe3+ metal in a process referred to as ligand exchange (McBride,
1994). This process would be favored at lower pH, corroborating the IR data. We cannot
rule out the possibility that some NO2- might undergo anion exchange as well, where an
electrostatic bond is formed between anionic NO2- and positively charged goethite
surface sites (Sigg and Stumm, 1981; Essington, 2004).
A second main observation is the change in spectral appearance as the pH is
increased. There is a gradual shift of the peak at 1227 cm-1 to ~1220 cm-1 and the peaks
at 1255 cm-1 and 1185 cm-1 become weak shoulders at pH 7.5 when compared with pH
5.5 (Fig. 4.6). The peak at 1121 cm-1 is red-shifted and becomes attenuated as well. This
could indicate that the speciation of adsorbed NO2- is varying with pH. Additional
experiments employing deuterium oxide (D2O) would be useful to elucidate the exact
role of H+ and OH- in the configuration of the adsorbed nitrite-goethite surface complex.
4.2.5 Effect of goethite and NO2- loading levels
The IR spectra of the goethite samples reacted with increasing NO2- concentration
at pH 5.5 are shown in Fig. 4.5. With 2 gL-1 goethite, an increase in initial NO2-
concentration (0.1, 0.5, and 100 mM) resulted in no significant changes in IR spectra
(Fig, 4.5A,C, E). Regardless of NO2- loading levels, all spectra show four well-resolved
absorption peaks which were assigned previously. This finding can be reconciled when
one calculates the reactive surface site concentration for goethite. Assuming 1.7 sites per
nm2 (Pivovarov, 1997), the reactive surface sites in 2 gL-1 were calculated to be 0.23
mM. Thus, addition of 0.5 and 100mM initial NO2- concentrations would be in excess of
the surface site concentration and likely resulted in saturation and a negligible change in
the IR spectra.
At higher goethite concentration (10 gL-1), corresponding to a surface site
concentration of 1.15 mM, the absorption peaks intensify for the 0.1 mM NO2- level
(Fig. 4.5B). The IR peaks at 1256 cm-1, 1221 cm-1, 1182 cm-1 and 1121 cm-1 are well-

80
resolved and increase in intensity over time, up to 120 min of reaction time. A similar
trend was observed where 0.5 mM NO2- was added (Fig. 4.5D). The IR spectra appeared
different upon the addition of 100 mM NO2- to 10 g L-1 goethite (Fig. 4.5E) and the
reason for this is not clear at this point. It is suggested that excited nitrite ion vibration
(1121 and 1221 cm-1) dominates at higher goethite loading. It is seen that nitrite
absorption peaks at 1121 and 1256 cm-1 increase (Fig, 4.5B, D).
These studies demonstrate that the number of active surface sites in goethite is an
important factor in nitrite-goethite complexation. When excess surface sites on goethite
are available, IR peaks corresponding to chelating nitrito surface complexes (Scheme 1c)
increase in intensity. Where initial NO2- concentrations are in excess over surface sites,
there was a negligible change in IR band intensities for the lower goethite concentration,
suggesting that saturation of surface sites was reached. These data interpretations can be
supported by results presented earlier where NO2- removal from the solution plateaus at
longer reaction times at all pH conditions (5.5-7.5) (Chapter 3).
4.2.6 Effect of Fe2+ addition on NO2- interaction with goethite
The ATR-FTIR spectra of the Fe2+-conditioned goethite (equilibrated for 24 hr)
(Fig. 4.7A) shows intensification of absorption peaks associated with νs and νas vibration
of adsorbed NO2- ions at 1191 and 1257 cm-1 overtime. However, peak vibrations
assigned to the excited state of NO2- (1121 and 1221 cm-1) observed in non-Fe2+
conditioned experiments (Fig. 4.4 and 4.5) were not seen. It is assumed that metastable
excited surface NO2- species are consumed rapidly concurrent to rapid NO2
- reduction by
Fe2+-conditioned goethite (Chapter 3). There was appearance of an IR peak at 2305 cm-1,
assigned to adsorbed N2O, which increases with increasing time. This N2O peak was
more intense than that observed in the NO2- -goethite alone experiments (see Fig. 4.4)
which suggests that more NO2- underwent electron transfer reactions when Fe2+ was
added. Formation of N2O in a Fe2+-goethite-nitrite system was higher than in a system
without added Fe2+ (Fig. 3.5, Chapter 3). In addition, the vibrational frequency assigned
to NO(ads) at 1792 cm-1 was observed after 15 min and 1 hr and was negligible after 2 hr
(Fig. 4.7A). This suggests that NO is a short lived intermediate during NO2- reduction to
N2O.

81
Optical spectra, equivalent to F(R), of hydrated goethite without added Fe2+ and
NO2- revealed five distinct absorption peaks (10448, 15212, 20162, 23995, and 29079
cm-1) in the range of 8000 to 34000 cm-1 (solid dark spectrum in Fig 4.7B). The SCF-Xα
calculation of Tossel (1978) suggests that the broad band system centered around 29079
cm-1 may be assigned to transitions between the oxygen non-bonding and metal d-orbitals
(O→Fe3+ charge transfer). All other four bands observed in the spectrum of control
goethite are analogous, and also within the molecular orbital calculations reported
previously (Strens and Wood, 1979; Sherman and Waite, 1985; Scheinost et al., 1999a).
Based on these studies, weak absorption maxima observed at 10448 cm-1 and 15212 cm-1
from untreated goethite paste in Fig 4.7B are assigned to the 6A1→ 4T1 and 6A1→ 4T2
transitions of octahedrally coordinated Fe3+ in goethite structure. Another absorption
feature at 23995 cm-1 corresponds to that of 6A1→ 4E; 4A1 ligand field transition. This
band is commonly absent in the spectra of Fe3+-minerals without magnetic coupling to
other Fe3+ ions (Sherman and Waite, 1985). The band that occurs as inflection at 20162
cm-1 can be assigned to d-d electron pair transition (EPT), (6A1+6A1) → (4T1+4T1) of a
goethite structure resulting from magnetic coupling of adjacent edge or face sharing
octahedral Fe3+ cations similar to that in Fe(O,OH)6, and ferrihydrite (Sherman and
Waite, 1985); Scheinost et al., 1998). Although discrepancy can occur from magnetic
coupling, EPT band energy is approximately the sum of two single ion Fe3+ ligand field
transitions, 2(6A1) → 2(4T1) (Sherman and Waite, 1985).
Diffuse reflectance spectrum obtained from relatively unoxidized Tutton’s salt
show splitting (10800, and 8400 cm-1) of the peak centered at ~10500 cm-1 (~950 nm)
indicate the presence of Fe2+ (Hawthorne, 1988) (Fig 4.7B). This band corresponds to the
d-d spin (d6) allowed electronic transition of 5T2g ← 5Eg in the octahedral sites of
hexaaquo Fe2+-Fe(H2O)62+ (Cotton and Meyers, 1960). Doublet structure separated by
nearly 2000 cm-1 is due to Jahn-Teller distortion associated with the orbital degeneracy of
the T2g ground term (Figgis and Hitchman, 1999). Goethite paste equilibrated with Fe2+
for 24 hr shows significant shifts at 10448, 15212, and 20162 cm-1 electron transition
bands. The band assigned to 6A1→ 4T1 (10448 cm-1) and 6A1→ 4T2 (15212 cm-1) shift to
lower wavenumber by ~150 cm-1 (green dotted spectrum in Fig 4.7B).

82
This shift of absorption band (6A1→ 4T1) towards lower energy might indicate
that Fe2+ binds on surface hydroxyls of goethite in an inner-sphere surface complex.
Because OH- and O2- ligands both lie below H2O in the spectrochemical series (Holleman
and Wiberg, 2001), absorption band shift to lower energy level when Fe2+ binds onto
these goethite surface hydroxyls. Within the experimental pH condition considered for
this study, and the first pKa (7.7) value reported for ≡Fe-OH-0.5 surface complex for
goethite (Hiemstra et al., 1989; Boily et al., 2001), it is more reasonable to propose Fe2+
binding with OH- ligand than with O2-. If Fe2+ was bound as an outer-sphere complex,
where the waters of hydration are retained upon adsorption (Essington, 2004), absorption
peak would look similar to Tutton’s salt (hexaaquo standard). Notably, band 6A1→ 4T1
shift to lower energy is less than expected based on ligand field theory. In case of
complete inner sphere complexation, the band shift should lie, at least in theory, below
8960 cm-1. Close monitoring of shifts in band position (cm-1) during Fe2+-goethite
complexation over a range of Fe2+ loading could provide more accurate estimate of metal
ligand bond distance.
Goethite samples equilibrated with Fe2+(aq) also show increase in absorption
intensity and the band (15212 cm-1) shift towards low wavenumber (15026 cm-1). This
change observed after Fe2+ addition could be attributed to the Fe2+→Fe3+ charge transfer,
also known as intervalence charge transfer (IVCT), between adjacent Fe2+ and Fe3+ ions
in edge- or face sharing goethite polyhedra as suggested previously (Burns et al., 1980).
The increased intensity indicates that Fe3+ within the octahedral sheets is being reduced
via Fe2+(ads)→Fe3+ electron transfer. Reduction of Fe3+ in octahedral structure of
nontronite mineral have shown similar band shift (Merola and McGuire, 2009). Evidence
of Fe2+(ads)→Fe3+ electron transfer have been reported in the past (Williams and Scherer,
2004; Larese-Casanova and Scherer, 2007). IVCT from Fe2+ → Fe3+ is reported to occur
at 14285 cm-1 (700 nm) in amphibole, 15384 cm-1 (650 nm) in green rust, and 13330 cm-1
(750 nm) in Fe2+-added nontronite (Hawthorne, 1988; Hansen, 1989; Merola et al.,
2006).

83
Importantly, EPT band, 2(6A1) 2(4T1) (20162 cm-1) shifts towards higher energy
values after Fe2+ addition. Shifts in EPT to higher energy are caused when magnetic
coupling between neighboring Fe3+ centers is increased in face sharing (octahedral) iron
oxide structures (Sherman and Waite, 1985). The fitting of EPT band at 20162 cm-1 was
satisfactory, and the shifts to higher wave number with added Fe2+ are in line with
spectroscopic results of (Kosmas et al., 1986). In their study, Kosmas et al (1986)
observed EPT band shift towards lower wavelength in Al-substituted goethite compared
to samples with no Al-substitution. As suggested previously by Scheinost et al (1999a),
decrease in goethite crystal symmetry as a result of Al-substitution could shift the EPT
and 6A1→ 4E; 4A1 band to higher energy levels, and a similar process might be
operational in our study after Fe2+addition. Although the electronic transition band 6A1→ 4E; 4A1 did not increase, the EPT transition to higher energy values is strong evidence to
support electron transfer between adsorbed Fe2+ and octahedral Fe3+ in goethite.
Alternatively, increase in absorbance observed in the EPT band also suggests formation
of Fe–oxyhydroxide cluster. Optical spectroscopic investigation of a neutralizing acid
mine drainage (AMD) showed progressive increase in absorbance intensity in the EPT
region while the solution was precipitating Fe-oxyhydroxide (Zhu et al., 2012). A strong
absorption feature observed in the EPT band in this study was attributed to the Fe cluster
or particles formed during AMD neutralization. Most probably, adsorbed Fe2+ species at
the goethite interface acted as a cluster to facilitate Fe2+→Fe3+ electronic transition.
Immediately after NO2- addition, there was a quick increase in EPT intensity
which then began to drop gradually at longer time intervals (Fig. 4.7B). Absorption bands
of 6A1→ 4T1, and 6A1→ 4T2 of Fe2+-goethite samples treated with NO2- are relatively
more intense than goethite alone. However, with longer reaction time, absorption
intensity decreases, and the band 6A1→ 4T1, 6A1→ 4T2 shifts towards longer wavelengths
(Table 4.2). Mean crystal size measurements tabulated in Table 4.2 indicate overlapping
values showing there is a tendency for the particle size to increase in the order: goethite
control > Fe2+-goethite control > NO2- treated Fe2+-goethite samples. This evidence
supports that goethite like Fe-(oxyhydr)oxide could precipitate during oxidation of
Fe2+(ads) by NO2
-. In the beginning, immediately after NO2- addition, oxidation of Fe2+
(ads)
could yield low crystalline Fe-(oxyhydr)oxide on goethite-water interface. As time

84
progresses, low crystalline precipitate could aggregate or grow larger. Based on previous
studies, Scheinost et al (1999a) suggested deviation in particle size from ~0.8 µm
decrease Mio scattering, and oscillation of the absorption and the diffusion efficiency.
This ultimately results in a shift in visible intensity to darkening and reddening causing
absorption intensity to decline. With increasing goethite mineral crystallinity, Williams et
al. (2002) observed shift of absorption peak towards higher energy region and decrease in
absorption intensity (Williams et al., 2002). Probably, goethite-like early precipitate
produced from Fe2+ oxidation by NO2- in our study is gradually aging and converting to
well crystallized particles, and thus causing observed shifts in band peak and depth of 6A1→ 4T1, 6A1→ 4T2 electronic transition (Table 4.2).
As the reaction progressed after NO2- addition, there was a steady drop in
absorption intensity of band 6A1→ 4E; 4A1 (23995 cm-1). Yet, the shift in peak position
was subtle, and towards low energy. Based on a study from Barnes et al (1972),
electronic transition from Fe2+-NO2- complexes is likely to occur in this region. This is
because the lowest energy allowed region for optically reducible metal (Fe2+) to NO2-
electron transfer transition is expected in the 24000-25000 wavenumber region. Although
small, energy transition observed in 23995 cm-1 absorption band suggests Fe2+(ads) binding
with NO2- via oxygen atom. If the Fe2+-NO2
- binding had been via N ligation, the
transition would have occurred at much higher energy (Barnes et al., 1972).
The absorption peak at 27079 cm-1, assigned to O→Fe3+ charge transfer, is almost
unchanged. Assuming the partially adsorbed Fe2+ in the goethite interface could have
changed to surface precipitated form, an unchanged peak position is assumed to be due to
similar Fe-O bond length of goethite and precipitated iron oxyhydroxide. Bond length of
Fe-O in poorly crystalline ferrihydrite or similar iron oxyhydroxides and goethite are
similar (Jambor and Dutrizac, 1998). Data from x-ray and scanning electron microscopy
(SEM) corroborates our spectroscopic results. Goethite and Fe2+-goethite samples
retrieved after reaction with NO2- were identical in mineralogy (Fig. 3.7 and 3.8 from
Chapter 3).
85
4.3 Conclusion
For the first time, in situ ATR-FTIR and UV-VIS-NIR spectra of NO2- treated
goethite and Fe2+-goethite complex have been presented. Spectral evidence shows that
NO2- is adsorbed and transformed in ambient temperature and pH (5.5) conditions at the
goethite, and Fe2+-goethite water interface for reaction times less than 2 hr. The
coordination of nitrite with goethite was found to be chelating in nature (nitrito structure)
whereby two oxygens of NO2- are bound to metal (surface Fe3+) cations. Thus, nitrite
adsorbs to goethite as an inner-sphere surface complex. In addition, ATR-FTIR data
indicate the presence of surface-bound NO and surface N2O species on goethite. This
novel finding might explain the nonstoichiometry between nitrite removal and N2O
production observed in Chapter 2. At higher pH conditions (6.5 and 7.5), nitrite
adsorption onto goethite is limited or low.
Although the metal-ligand bond distance could not be quantified, spectroscopic
shift in the 6A1→ 4T1, electronic transition towards lower energy suggests Fe2+ is binding
directly to surface hydroxyl sites of goethite. An electronic transition observed at 15026
cm-1 provides spectroscopic evidence for Fe2+→ Fe3+ electron transfers (IVCT). Findings
from spectroscopic study and wet chemical study suggest oxidation of Fe2+(ads) could be
reason in particle size increasing tendency of reacted goethite. The formation of surface
NO2- species and reaction product of Fe2+-goethite mediated NO2
- reduction revealed in
this study shows strong N-Fe coupling in soil and sediments under Fe2+ reducing
conditions.

86
Table 4.1 Position of IR peak maxima of dissolved nitrate, nitrite, solid NaNO2, and metal-nitrite possible surface
complexes.
Species Phase IR active band(cm-1) References ν1 (νs) ν3 (νas) ν2 (δNO2-)
+Free NO3- ion
NO3
-(aq)
1348(s), 1035-970 (m,w)
† Ref 1
+Free NO2- ion NO2
-(aq) 1335-1303(m), 1235-1208(s), 833-785(w) † Ref 1,&2
+Solid NaNO2 Ionic 1380-1305(w), 1270-1208(s), 845-805(m) † Ref 2,3,4,5,&6 M⎯O⎯N=O (monodentate nitrito)
Structure 1485-1375 (νN=O), 1206-1050 (νN-O) Ref 1,4,&7
(M2⎯O)⎯N=O (bridging monodentate nitrito)
Structure 1495-1380 (νN=O), 1235-1055 (νN-O) Ref 1,4, &7
(M⎯O2)⎯N Structural 1225-1160 (νs NO2-), 1390-1241 (νas NO2
-) Ref 1,4,5,7, &8 (chelating bidentate nitrito) ≡Surface 1192-1182 (νs NO2
-), 1261-1256 (νas NO2-)
† Ref 6
≡Surface 1121-1112 (νs NO2-), 1227-1218 (νas NO2
-)
(M⎯O)2=N (bridging bidentate nitrito)
≡Surface 1225-1192 (νs NO2-), IR inactive Ref 1,4, &9
M⎯NO2 (nitro-compound)
Structural 1365-1250 (νs NO2-), 1650-1340 (νas NO2
-), Ref 1,4,5, &7
NO and N2O ≡Surface ~1791 (N=O of NO) † Ref 10 ~2306 (N-N of N2O) † Ref 1, &11
s=strong peak; m=moderate peak; w=weak peak; + See Fig. 2A&B; Surface species proposed by Ref 1 (Table 4)
† = This Study 1= Hadjiivanov (2000) 2= Weston and Brodasky (1957) 3= Miller and Wilkins (1952) 4= Hitchman and Rowbottom (1982) 5= Nakamoto (1986) 6= Cerruti et al. (1974) 7= da Cunha et al. (1996) 8= Rima et al. (2010) 9= Davydov (2003) 10= Singireddy et al. (2012) 11= Laane and Ohlsen (1986)

87
Table 4.2 Differences in band position and absorption intensity measured from the DRS spectra shown in Fig. 4.7B, and
average crystal size measured from corresponding treatment obtained after 48 hr using scanning electron microscopy (SEM)
image.
† Band (Peak) position in cm-1 †† Absorption intensity (Kubelka-Munk) ††† Crystal size measured from 48 hr treated samples, n>25
6A1 → 4T1 6A1 → 4T2 2(6A1) → 2(4T1) †††Avg. crystal size (µm) †Max. †† Abs. Int. Max. Abs. Int. Max. Abs. Int.
GT51 paste- Ctrl 10448 0.58 15212 0.51 20162 3.0 0.79±0.23
GT51+ Fe2+ paste-Ctrl 10314 2.3 15026 1.6 21122 5.1 0.80±0.09
GT 51+ Fe2+-NO2--15 min 10468 1.7 15218 1.2 21109 5.3 -
GT 51+ Fe2+-NO2--2hr 10612 0.9 15349 0.7 21103 3.8 0.84±0.19

88
Figure 4.1 ATR-FTIR (Thermo Nicolet 6300) set up used for collecting IR spectra in this study. Inset (A) shows custom set
up built to maintain anoxic environment during data collection by continuously purging the sample with Ar. Inset (B) shows
the diamond crystal sample holder seen on digital recording magnifier before (without sample) and during experiment.

89
Figure 4.2 (A) ATR-FTIR spectrum of solid NaNO2. A solid dark line is experimental
data collected in this study, and a light grey line represents data from Hitchman and
Rowbottom (1982), reprinted by permission of Elsevier Ltd. (B) IR spectrum of aqueous
NO3- and NO2
- (0.1 and 100 mM) at pH 5.5. Scheme in the top figure illustrates the
possible structure of the assigned surface NO2- species.

90
Figure 4.3 ATR-FTIR spectrum of (a) water at pH 5.5, (b) 25 mM MES buffer solution at pH 5.5, (c) goethite slurry at pH 5.5
(in MES solution), (d) MES subtracted goethite paste, and (d) a dry goethite. Inset shows magnified portion of a deconvoluted
ATR-FTIR spectrum of water at pH 5.5.

91
Figure 4.4 Time series ATR-FTIR spectra obtained during the reaction of NO2- (0.1 mM) with goethite (10 gL-1). Spectrum (e)
is control goethite paste without NO2-, and (f) is dry goethite. Detail spectral changes observed in the region inside inset for
various NO2- goethite loading are presented in Fig. 4.5.

92
Figure 4.5 Time series ATR-FTIR spectra: Effect of NO2- loading (0.1, 0.5, 100 mM) and surface sites (2 and 10 gL-1) on
NO2- adsorption onto goethite. GT51 represents ATR-FTIR of an unreacted goethite sample.

93
Figure 4.6 ATR-FTIR spectra: pH effect (5.5, 6.5, and 7.5) on NO2- (0.1 mM) adsorption
(1 hr) on goethite (10 gL-1) at the goethite-water interface. GT51 represents ATR-FTIR of
an unreacted goethite sample.

94
Figure 4.7 ATR-FTIR spectra: (A) Effect of added Fe2+ (0.1 mM) on 0.1 mM NO2-
adsorption at goethite (10 gL-1) - water interface at pH 5.5. (B) Kubelka-Munk remission
function for a goethite (GT51) paste as control and Fe2+-conditioned goethite paste
extracted before and after reaction with NO2-. Spectrum of Tutton’s salt (dry) represents
hexaqua [Fe2+-Fe(H2O62+]-standard.
Copyright © Prakash Dhakal 2013
95
Chapter Five: Summary and Future Research
Summary
Nitrite was more rapidly removed from solution than NO3- by both magnetite and
goethite at ambient temperature and pH (5.5) conditions. In a system containing only
magnetite or goethite, NO2- removal was highest at pH 5.5. With increasing pH (6.5 and
7.5), nitrite removal gradually decreased indicating pH dependence of the reaction. At pH
5.5, initial rate of NO2- removal by only magnetite or goethite were comparable, and the
rate increased nearly three (in magnetite) and five (in goethite) fold in a system
conditioned with Fe2+. Addition of Fe2+ to magnetite or goethite slurries resulted in
adsorption and an accelerated the rate of NO2- reduction at pH values considered in this
study. Regardless of Fe2+ addition, the kinetics of NO2- removal from solution by
magnetite and goethite at pH 5.5 reasonably agreed with a first order model at early
reaction times (0-72 hr), respectively. The main products of NO2- reaction with magnetite
were N2O and NO, and a partially oxidized magnetite. The XRD pattern of oxidized
magnetite closely resembles maghemite. N2O remained the main reaction product when
NO2- was reacted with goethite amended with Fe2+.
Results from Mössbauer spectroscopy suggested that structural Fe2+ on magnetite
served as a reductant of NO2-. The ATR-FTIR study of NO2
- reactivity with goethite and
Fe2+-goethite complex revealed that NO2- is present in the surface-adsorbed species
where two oxygens of nitrite bind with metal cation via chelation. Nitric oxide and N2O
were observed as reaction products and were short-lived. Also, by observing
characteristic shifts in energy bands related to electronic transition, evidence of direct
Fe2+ binding on surface hydroxyl of goethite, and NO2- adsorption to metal was probed
using diffuse reflectance spectroscopy.
Taken together as a whole, results of the experiment presented in this study have
shown that abiotic NO2- reduction, and or removal from solution is mediated by iron
oxide(s) such as goethite and magnetite. Because magnetite and goethite are ubiquitous
iron oxide minerals found in a wide range of environmental conditions, soil and
sediments that contain these minerals can catalyze abiotic NO2- reduction with negligible
reactions towards NO3-. An example of a natural environment where this process could

96
be important would be an anoxic zone where NO3- percolated from still oxidizing layer
intersects Fe3+-reducing zone. In such a natural setting, NO3- reduction to NO2
- could be
the first step that is biologically mediated. Parallel to NO3- reduction, Fe2+ accumulated in
the solution oxidizes, and or precipitates as goethite and magnetite. Observed results from
this study provide strong evidence of secondary reactions involving NO2- and magnetite
or goethite that would further lead to some NO and N2O production. This potentially
explains why NO2- is short lived in the anoxic soil and groundwater under Fe3+-reducing
condition.
Future research thrust
A next logical step would be to follow these abiotic processes in column
experiments to investigate and compare nitrite reduction rates in natural settings. By
following relevant redox species in a goethite-coated sand-packed column with sampling
ports located at various depths would allow one to vary the redox conditions and nitrite
concentrations in water flowing through the column.
Another gap in the literature would be to study siderite (Fe2+CO3) and pyrite
(Fe2+S2) which have been shown to reduce NO2- at ambient temperature (22oC)
(Singireddy et al., 2012; Rakshit et al., 2008). In both studies, the rate of NO2- reduction
accelerated at higher temperature. Nitric oxide (NO) formed during NO2- reduction by
pyrite (Fe2+S2) slurry was measured as adsorbed species to pyrite. Based on these results,
it would not be speculative to say NO2- reduction by goethite or magnetite would be
higher at higher temperature. This could be investigated in the future in order to
understand temperature dependence of NO2- reduction by goethite and magnetite. Also,
there is a large research gap in understanding particle size control on nitrite removal rate.
This could be accomplished using macro and nano size iron oxide minerals.
Copyright © Prakash Dhakal 2013

97
Appendices
Appendix A: Calculation of Magnetite Stoichiometry
Because each magnetite molecule consists of 3 iron (Fe) atoms, total Fe for 10gL-
1 stoichiometric magnetite (Fe3O4) would be:
10 1
231.54 3
1 129.5
Ratio of Fe2+/Fe3+ for stoichiometric magnetite: 0.50
Let Fe3+ = y. Then:
129.5mM Fe = (0.5y + y)
Fe3+ = y = 86.33 mM Fe3+
Fe2+ =129.5-86.33 =43.16 mM Fe2+
For 10gL-1 stoichiometric maghemite (γ-Fe2O3)
10 1
159.69 2
1 125.25
Based on Mössbauer results, Fe2+/Fe3+ stoichiometry of the unreacted magnetite used in this study was measured as 0.47, and using the scheme proposed previously, (Gorski and Scherer, 2009; Latta et al., 2011) relative proportions of maghemite (Magh) and magnetite (Mag) are used to calculate the concentration:
Mag = fraction of Fe3O4, and Magh = Fraction of γ-Fe2O3
[Fe2+] = Mag *43.16
[Fe3+] = 125.25 * Magh + 86.33 * Mag
Mass balance: Magh + Mag = 1
[Fe3+] = 125.25 * (1- Mag) + 86.33 * Mag
[Fe3+] = 125.25 – 38.92* Mag
. . .
Rearranging for Mag:

98
. .. . .
= 0.958
[Fe2+] = Mag *43.16 = 0.958*43.16 = 41.35mM Fe2+
[Fe3+] = 125.25 – 38.92* Mag =125.25 – 38.92* 0.958 = 87.96mMFe3+
On the basis of our wet chemical data, nearly 150µM NO2- reduced in 14days at pH 5.5.
Reduction of NO2- to N2O requires 2 electrons. If structural Fe2+ in magnetite is taken as
source of electron supply for the reduction of NO2- to proceed, reduction of 150µM NO2
- would require 0.3mM e- equivalents from magnetite Fe2+.
Final x is calculated as follows:
41.35 0.387.96 0.3 0.46
Therefore, if x of the magnetite in the beginning is 0.47, reacted magnetite stoichiometry would be nearly 0.46. Stoichiometric values calculated here for untreated and treated magnetite samples is nearly identical to those obtained from Mössbauer studies.

99
Appendix B: A Back-of-the envelope calculation showing the extent of abiotic and
microbial NO2- reduction in soil
. and sediments that composes ~2%
magnetite, and 0.1% nitrite reducers per kg of soil, respectively.
Assumption:
a) Abiotic NO2- reduction rate by magnetite at pH 5.5 in the absence or presence of
Fe2+ is taken from Table 1. b) Microbial NO2
- reduction rate by mixed culture nitrite reducers in soils is assumed 0.42×10⁻⁹ (M g-1 sec-1) (Wilderer et al., 1987). A population of anaerobic NO2
- reducing bacteria was assumed to be present at a level of 109 per gram of soil. As a rule of thumb, 1 bacterium is equal to 10-12g. Therefore, ~1.0g nitrite reducers are estimated in 1Kg of soil.
c) Anoxic soil layer thickness is assumed 15 cm with density of 1.2g soil/cm3.
Case I: Kg of NO2--N removed per acre of soil per day by magnetite (abiotic) without
Fe2+
K NO N.
. X M NO F O ..
X
X . X X X , X F O .
X NO NM NO
X K NO N NO N
K NO N.
3.55
Similarly,
Case II: Kg of NO2--N removed per acre of soil per day by magnetite (abiotic) with Fe2+
K NO N.
. X M NO F O ..
X
X . X X X , X F O .
X NO NM NO
X K NO N NO N
K NO N.
11.32
Case III: Kg of NO2--N removed per acre of soil per day by mixed culture NO2
- reducers
K NO N.
. X M NO .
X
X . X X X , X
X NO NM NO
X K NO N NO N
K NO N.
0.92

100
Appendix C: Reactive surface sites, Fe2+ addition and potential for Fe(OH)2
precipitation.
Before NO2- addition, nearly 1.5mM of Fe2+ was added to goethite suspension and
equilibrated for 24 hr. Observation shows that nearly 0.6mM of Fe2+ was removed from
the reaction vessel prior to NO2- addition (Figure Fe2+ sorption). Assuming 1.7 site per
nm2 (Pivovarov, 1997) for goethite, approximately 0.23mM reactive surface area were
present in our experimental solution. This is much lower than the initial Fe2+ solution
removed (0.6mM). This indicates that Fe2+ removed from the solution was in excess of
the amount of Fe2+ needed to form complete monolayer coverage from reacted Fe2+.
Assuming one Fe2+ binding sites for each reactive sites in goethite, ratio of Fe2+ removed
by goethite results in 1:2.6 (Fe2+: Fe3+).
Importantly, removal of Fe2+ continued beyond the calculated monolayer
reference point which indicates that Fe2+ loading onto goethite is oversaturated in terms
of surface coverage. Isotopic signature from a study carried out to investigate arsenic
transformation by 57Fe2+-conditioned 56goethite indicate that nearly 95% of the added
Fe2+ removed from the solution was oxidized to goethite and 5% formed an unidentified
Fe2+ species (Amstaetter et al., 2009).
Potential for Fe(OH)2 precipitation: Assuming equilibrium reaction as follows
Fe(OH)2 (s) ↔ Fe2+ (aq) + 2OH-
Fe2+ remaining in the goethite solution after 24 hr at pH 5.5 is 0.9mM
Now, Q = [Fe2+]*[OH-] = 0.9mM * [10-8]2 = 9.0x10⁻¹⁹, and solubility constant for
Fe(OH)2 is ksp {Fe(OH)2} which is =1.0X10⁻¹⁵. Because calculated Q < ksp, the system is
undersaturated with respect to Fe(OH)2(s) at 0.9mM Fe2+ concentration at pH 5.5.
Therefore, it is unlikely that Fe(OH)2 precipitation and resulting solid phase to be a
possible reactive phase.

101
References
Ahrens, T.D., J.M. Beman, J.A. Harrison, P.K. Jewett, and P.A. Matson. 2008. A
synthesis of nitrogen transformations and transfers from land to the sea in the Yaqui Valley agricultural region of northwest Mexico. Water Resour. Res. 44:1-13.
Al-Abadleh, H.A., and V.H. Grassian. 2003. FT-IR Study of Water Adsorption on Aluminum Oxide Surfaces. Langmuir 19:341-347.
Alowitz, M.J., and M.M. Scherer. 2002. Kinetics of Nitrate, Nitrite, and Cr(VI) Reduction by Iron Metal. Environmental Science & Technology 36:299-306.
Amonette, J.E., D.J. Workman, D.W. Kennedy, J.S. Fruchter, and Y.A. Gorby. 2000. Dechlorination of Carbon Tetrachloride by Fe(II) Associated with Goethite. Environmental Science & Technology 34:4606-4613.
Amstaetter, K., T. Borch, P. Larese-Casanova, and A. Kappler. 2009. Redox Transformation of Arsenic by Fe(II)-Activated Goethite (α-FeOOH). Environmental Science & Technology 44:102-108.
Anderson, M.A., M.I. Tejedor-Tejedor, and R.R. Stanforth. 1985. Influence of aggregation on the uptake kinetics of phosphate by goethite. Environmental Science & Technology 19:632-637.
Anschutz, A., and R.L. Penn. 2005. Reduction of crystalline iron(III) oxyhydroxides using hydroquinone: Influence of phase and particle size. Geochemical Transactions 6:60.
Appelo, C.A.J., and D. Postma. 2007. Geochemistry, Groundwater and Pollution. 2nd ed. A.A. Balkema Publishers, Amsterdam, The Netherlands.
Arai, Y., and D.L. Sparks. 2001. ATR–FTIR Spectroscopic Investigation on Phosphate Adsorption Mechanisms at the Ferrihydrite–Water Interface. Journal of Colloid and Interface Science 241:317-326.
Baggs, E.M. 2008. A Review of Stable Isotope Techniques for N2O Source Partitioning in Soils: Recent Progress, Remaining Challenges and Future Considerations. Rapid Communications in Mass Spectrometry 22:1664-1672.
Bard, A.J., R. Parsons, and J. Jordan. 1985. Standard Potentials in Aqueous Solution. 1st ed. Marcel Dekker, Inc., New York.
Barnes, J.C., C.S. Duncan, and R.D. Peacock. 1972. Hexanitrometallates. Part III. Electron transfer spectra. Journal of the Chemical Society, Dalton Transactions:1875-1879.
Bazylinski, D.A., R.B. Frankel, and K.O. Konhauser. 2007. Modes of Biomineralization of Magnetite by Microbes. Geomicrobiology Journal 24:465-475.
Blowes, D.W., C.J. Ptacek, S.G. Benner, C.W.T. McRae, T.A. Bennett, and R.W. Puls. 2000. Treatment of inorganic contaminants using permeable reactive barriers. Journal of Contaminant Hydrology 45:123-137.
Boily, J.-F., J. Lützenkirchen, O. Balmès, J. Beattie, and S. Sjöberg. 2001. Modeling proton binding at the goethite (α-FeOOH)–water interface. Colloids and Surfaces A: Physicochemical and Engineering Aspects 179:11-27.

102
Buchholz, A., C. Laskov, and S.B. Haderlein. 2011. Effects of Zwitterionic Buffers on Sorption of Ferrous Iron at Goethite and Its Oxidation by CCl4. Environmental Science & Technology 45:3355-3360.
Burford, J.R., and J.M. Bremner. 1975. Relationships between the denitrification capacities of soils and total, water-soluble and readily decomposable soil organic matter. Soil Biology and Biochemistry 7:389-394.
Burgin, A.J., W.H. Yang, S.K. Hamilton, and W.L. Silver. 2011. Beyond carbon and nitrogen: how the microbial energy economy couples elemental cycles in diverse ecosystems. Frontiers in Ecology and the Environment 9:44-52.
Burns, R., D.A. Nolet, K.M. Parkin, C.A. McCammon, and K.B. Schwartz. 1980. Mixed-Valence Minerals of Iron and Titanium: Correlations of Structural, Mössbauer and Electronic Spectral Data, p. 295-336, In D. Brown, ed. Mixed-Valence Compounds, Vol. 58. Springer Netherlands.
Burns, R.G. 1993. Mineralogical Applications of Crystal Field Theory. Cambridge University Press, New York, USA.
Cambier, P. 1986. Infrared Study of Goethites of Varying Crystallinity and Particle Size: II. Crystallographic and Morphological Changes in Series of Synthetic Goethites. Clay Minerals 21:201-210.
Canfield, D.E., A.N. Glazer, and P.G. Falkowski. 2010. The Evolution and Future of Earth’s Nitrogen Cycle. Science 330:192-196.
Catalano, J.G., Y. Luo, and B. Otemuyiwa. 2011. Effect of Aqueous Fe(II) on Arsenate Sorption on Goethite and Hematite. Environmental Science & Technology 45:8826-8833.
Cerruti, L., E. Modone, E. Guglielminotti, and E. Borello. 1974. Infra-red study of nitric oxide adsorption on magnesium oxide. Journal of the Chemical Society, Faraday Transactions 1: Physical Chemistry in Condensed Phases 70:729-739.
Chapelle, F.H., and D.R. Lovley. 1992. Competitive Exclusion of Sulfate Reduction by Fe(lll)-Reducing Bacteria: A Mechanism for Producing Discrete Zones of High-Iron Ground Water. Ground Water 30:29-36.
Chaudhuri, S.K., J.G. Lack, and J.D. Coates. 2001. Biogenic Magnetite Formation through Anaerobic Biooxidation of Fe(II). Applied and Environmental Microbiology 67:2844-2848.
Cheng, W., H. Tsuruta, G. Chen, and K. Yagi. 2004. N2O and NO Production in Various Chinese Agricultural Soils by Nitrification. Soil Biology and Biochemistry 36:593-563.
Choi, J., and B. Batchelor. 2008. Nitrate reduction by fluoride green rust modified with copper. Chemosphere 70:1108-1116.
Chun, C.L., R.L. Penn, and W.A. Arnold. 2006. Kinetic and Microscopic Studies of Reductive Transformations of Organic Contaminants on Goethite. Environmental Science & Technology 40:3299-3304.
Coby, A.J., and F.W. Picardal. 2005. Inhibition of NO3- and NO2
- Reduction by Microbial Fe(III) Reduction: Evidence of a Reaction between NO2
- and Cell Surface-Bound Fe2+. Appl. Environ. Microbiol. 71:5267-5274.

103
Collman, J.P., A. Dey, Y. Yang, R.A. Decréau, T. Ohta, and E.I. Solomon. 2008. Intermediates Involved in the Two Electron Reduction of NO to N2O by a Functional Synthetic Model of Heme Containing Bacterial NO Reductase. Journal of the American Chemical Society 130:16498-16499.
Cooper, D.C., F.W. Picardal, A. Schimmelmann, and A.J. Coby. 2003. Chemical and Biological Interactions during Nitrate and Goethite Reduction by Shewanella putrefaciens 200. Appl. Environ. Microbiol. 69:3517-3525.
Cornell, R.M., and U. Schwertmann. 2003. The Iron Oxides: Structure, Properties, Reactions, Occurrences and Uses. Wiley-VCH, Weinheim, Germany.
Cotton, F.A., and M.D. Meyers. 1960. Magnetic and Spectral Properties of the Spin-Free 3d6 Systems Iron(II) and Cobalt(III) in Cobalt(III) Hexafluoride Ion: Probable Observation of Dynamic Jahn-Teller Effects. Journal of the American Chemical Society 82:5023-5026.
Cui, D., and T.E. Eriksen. 1996. Reduction of Pertechnetate by Ferrous Iron in Solution: Influence of Sorbed and Precipitated Fe(II). Environmental Science & Technology 30:2259-2262.
Cwiertny, D.M., R.M. Handler, M.V. Schaefer, V.H. Grassian, and M.M. Scherer. 2008. Interpreting nanoscale size-effects in aggregated Fe-oxide suspensions: Reaction of Fe(II) with Goethite. Geochimica et Cosmochimica Acta 72:1365-1380.
Cwiertny, D.M., G.J. Hunter, J.M. Pettibone, M.M. Scherer, and V.H. Grassian. 2009. Surface Chemistry and Dissolution of α-FeOOH Nanorods and Microrods: Environmental Implications of Size-Dependent Interactions with Oxalate. The Journal of Physical Chemistry C 113:2175-2186.
da Costa, G.M., E. de Grave, P.M.A. de Bakker, and R. Vandenberghe. 1995. Influence of Nonstoichiometry and the Presence of Maghemite on the Mössbauer Spectrum of Magnetite. Clays & Clay Minerals 43:656-668.
da Cunha, M.C.P.M., M. Weber, and F.C. Nart. 1996. On the Adsorption and Reduction of NO3
- Ions at Au and Pt Electrodes Studied by In Situ FTIR Spectroscopy. Journal of Electroanalytical Chemistry 414:163-170.
da Silva, G., E.M. Kennedy, and B.Z. Dlugogorski. 2006. Ab Initio Procedure for Aqueous-Phase pKa Calculation: The Acidity of Nitrous Acid. The Journal of Physical Chemistry A 110:11371-11376.
Daniels, J.M., and A. Rosencwaig. 1969. Mössbauer spectroscopy of stoichiometric and non-stoichiometric magnetite. Journal of Physics and Chemistry of Solids 30:1561-1571.
Danielsen, K.M., J.L. Gland, and K.F. Hayes. 2004. Influence of Amine Buffers on Carbon Tetrachloride Reductive Dechlorination by the Iron Oxide Magnetite. Environmental Science & Technology 39:756-763.
Das, D., M. Sureshkumar, S. Koley, N. Mithal, and C. Pillai. 2010. Sorption of uranium on magnetite nanoparticles. Journal of Radioanalytical and Nuclear Chemistry 285:447-454.
Davidson, E.A., and W. Kingerlee. 1997. A global inventory of nitric oxide emissions from soils. Nutrient Cycling in Agroecosystems 48:37-50.
Davydov, A. 2003. Molecular Spectroscopy of Oxide Catalyst Surfaces John WIley and Sons Ltd., Great Britain.

104
Dhakal, P., C.J. Matocha, F.E. Huggins, and M.M. Vandiviere. 2013. Nitrite Reactivity with Magnetite. Environmental Science & Technology 47:6206-6213.
DiChristana, T.J. 1992. Effects of nitrate and nitrite on dissimilatory iron reduction by Shewanella putrefaciens 200. Journal of Bacteriology 174:1891-1896.
Dixit, S., and J.G. Hering. 2006. Sorption of Fe(II) and As(III) on goethite in single- and dual-sorbate systems. Chemical Geology 228:6-15.
Dowdell, R.J., J.R. Burford, and R. Crees. 1979. Losses of nitrous oxide dissolved in drainage water from agricultural land. Nature 278:342-343.
Ehrlich, H.L. 1995. Geomicrobiology. 3 rd ed. Marcel Dekker Inc., Troy, New York. Einsle, O., A. Messerschmidt, R. Huber, P.M.H. Kroneck, and F. Neese. 2002.
Mechanism of the Six-Electron Reduction of Nitrite to Ammonia by Cytochrome c Nitrite Reductase. Journal of the American Chemical Society 124:11737-11745.
Essington, M.E. 2004. Soil and Water Chemistry An Integrative Approach. CRC Press LLC, Florida, USA.
Fan, A.M., and V.E. Steinberg. 1996. Health Implications of Nitrate and Nitrite in Drinking Water: An Update on Methemoglobinemia Occurrence and Reproductive and Developmental Toxicity. Regulatory Toxicology and Pharmacology 23:35-43.
Farmer, V.C. 1974. The Infrared Spectra of Minerals. Mineralogical Society, London. Fewtrell, L. 2004. Drinking-Water Nitrate, Methemoglobinemia, and Global Burden of
Disease: A Discussion. Environmental Health Prospective 112:1371-1374. Fields, S. 2004. Global Nitrogen: Cycling out of Control. Environmental Health
Prospective 112:A556–A56. Figgis, B.N., and M.A. Hitchman. 1999. Ligand Field Theory and Its Application. Wiley-
VCH, New York, USA. Finney, A.J., M.A. Hitchman, and C.L. Raston. 1981. Structural and Spectroscopic
Studies of Transition Metal Nitrite Complexes. I. Crystal Structures and Spectra of Trans-Bis(ethane- 1,2 diamine)dinitronickel(II), trans-Bis[N, N-dimethyl(ethane- 1,2-diamine)]dinitritonickel(II) and trans-bis[N,N'-dimethyl(ethane-1,2 diamine)]dinitronickel(II) monohydrate. Australian Journal of Chemistry 34:2047-2060.
Fredrickson, J.K., J.M. Zachara, D.W. Kennedy, H. Dong, T.C. Onstott, N.W. Hinman, and S.-m. Li. 1998. Biogenic iron mineralization accompanying the dissimilatory reduction of hydrous ferric oxide by a groundwater bacterium. Geochimica et Cosmochimica Acta 62:3239-3257.
Gallagher, M.E., W.C. Hockaday, C.A. Masiello, S. Snapp, C.P. McSwiney, and J.A. Baldock. 2011. Biochemical Suitability of Crop Residues for Cellulosic Ethanol: Disincentives to Nitrogen Fertilization in Corn Agriculture. Environmental Science & Technology 45:2013-2020.
Glasauer, S., P.G. Weidler, S. Langley, and T.J. Beveridge. 2003. Controls on Fe reduction and mineral formation by a subsurface bacterium. Geochimica et Cosmochimica Acta 67:1277-1288.
Goolsby, D.A., W.A. Battaglin, B.T. Aulenbach, and R.P. Hooper. 2001. Nitrogen Input to the Gulf of Mexico. Journal of Environmental Quality 30:329-336.

105
Gorski, C.A., and M.M. Scherer. 2009. Influence of Magnetite Stoichiometry on FeII Uptake and Nitrobenzene Reduction. Environmental Science & Technology 43:3675-3680.
Gorski, C.A., and M.M. Scherer. 2011. Fe2+ Sorption at the Fe Oxide-Water Interface: A Revised Conceptual Framework, p. 315-343, In P. G. Tratnyek, et al., eds. Aquatic Redox Chemistry, Vol. 1071. American Chemical Society, USA.
Gorski, C.A., J.T. Nurmi, P.G. Tratnyek, T.B. Hofstetter, and M.M. Scherer. 2010. Redox Behavior of Magnetite: Implications for Contaminant Reduction. Environmental Science & Technology 44:55-60.
Gorski, C.A., R.M. Handler, B.L. Beard, T. Pasakarnis, C.M. Johnson, and M.M. Scherer. 2012. Fe Atom Exchange between Aqueous Fe2+ and Magnetite. Environmental Science & Technology.
Gray, P., and A.D. Yoffe. 1955. Structure and reactivity of the nitrogen dioxide-dinitrogen tetroxide system. Quarterly Reviews, Chemical Society 9:362-390.
Greenwood, N.N., and T.C. Gibbs. 1971. Mössbauer Spectroscopy. Chapman and Hall Ltd., London.
Gregory, K.B., P. Larese-Casanova, G.F. Parkin, and M.M. Scherer. 2004. Abiotic Transformation of Hexahydro-1,3,5-trinitro-1,3,5-triazine by FeII Bound to Magnetite. Environmental Science & Technology 38:1408-1414.
Grossl, P., M. Eick, D. Sparks, S. Goldberg, and C. Ainsworth. 1997. Arsenate and Chromate Retention Mechanisms on Goethite. 2. Kinetic Evaluation Using a Pressure-Jump Relaxation Technique. Environmental Science & Technology 31:321-326.
Hadjiivanov, K.I. 2000. Identification of Neutral and Charged NxOy Surface Species by IR Spectroscopy. Catalysis Reviews 42:71-144.
Hall, S.J., P.A. Matson, and P.M. Roth. 1996. NOx Emission From Soil: Implications for Air Quality Modeling in Agricultural Regioins. Annual Review of Energy and the Environment 21:311-346.
Handler, R.M., B.L. Beard, C.M. Johnson, and M.M. Scherer. 2009. Atom Exchange between Aqueous Fe(II) and Goethite: An Fe Isotope Tracer Study. Environmental Science & Technology 43:1102-1107.
Hansel, C.M., S.G. Benner, and S. Fendorf. 2005. Competing Fe(II)-Induced Mineralization Pathways of Ferrihydrite. Environmental Science & Technology 39:7147-7153.
Hansel, C.M., S.G. Benner, J. Neiss, A. Dohnalkova, R.K. Kukkadapu, and S. Fendorf. 2003. Secondary mineralization pathways induced by dissimilatory iron reduction of ferrihydrite under advective flow. Geochimica et Cosmochimica Acta 67:2977-2992.
Hansen, H.C.B. 1989. Composition, stabilization, and light absorption of Fe(II)Fe(III) hydroxy-carbonate (green rust). Clay Minerals 24:663-669.
Hansen, H.C.B., and C.B. Koch. 1998. Reduction of Nitrate to Ammonium by Sulphate Green Rust: Activation Energy and Reaction Mechanism. Clay Minerals 33:87-101.
Hansen, H.C.B., O.K. Borggaard, and J. Sørensen. 1994. Evaluation of the free energy of formation of Fe(II)-Fe(III) hydroxide-sulphate (green rust) and its reduction of nitrite. Geochimica et Cosmochimica Acta 58:2599-2608.

106
Hansen, H.C.B., C.B. Koch, H. Nancke-Krogh, O.K. Borggaard, and J. Sørensen. 1996. Abiotic Nitrate Reduction to Ammonium: Key Role of Green Rust. Environmental Science & Technology 30:2053-2056.
Harris, L.E. 1973. The lower electronic states of nitrite and nitrate ion, nitromethane, nitramide, nitric acid, and nitrate esters. The Journal of Chemical Physics 58:5615-5626.
Hawthorne, F.C. 1988. Mossbauer Spectroscopy, p. 255-333, In F. C. Hawthorne, ed. Reviews in Mineralogy. Minerological Society of America, USA.
Hiemstra, T., and W.H. van Riemsdijk. 2007. Adsorption and surface oxidation of Fe(II) on metal (hydr)oxides. Geochimica et Cosmochimica Acta 71:5913-5933.
Hiemstra, T., J.C.M. De Wit, and W.H. Van Riemsdijk. 1989. Multisite proton adsorption modeling at the solid/solution interface of (hydr)oxides: A new approach: II. Application to various important (hydr)oxides. Journal of Colloid and Interface Science 133:105-117.
Hitchman, M.A., and G.L. Rowbottom. 1982. Transition Metal Nitrite Complexes. Coordination Chemistry Reviews 42:55-132.
Holleman, A.F., and E. Wiberg. 2001. Holleman-Wiberg's Inorganic Chemistry. Academic Press. San Diego, USA.
Huang, P.M., Y. Li, and M.E. Sumner. 2012. Hand Book of Soil Sciences: Properties and Processes. Second ed. CRC Press, USA.
Huheey, J.E., E.A. Keither, and R.L. Keiter. 1993. Inorganic Chemistry: Principles Of Structure And Reactivity. 4 ed. Pearson Education.
Jambor, J.L., and J.E. Dutrizac. 1998. Occurrence and Constitution of Natural and Synthetic Ferrihydrite, a Widespread Iron Oxyhydroxide. Chemical Reviews 98:2549-2586.
Jeoung, J.-S., W.H. Poisl, M.C. Weinberg, G.L. Smith, and H. Li. 2001. Effect of Oxidation State of Iron on Phase Separation in Sodium Silicate Glasses. Journal of the American Ceramic Society 84:1859-1864.
Jolivet, J.-P., and E. Tronc. 1988. Interfacial electron transfer in colloidal spinel iron oxide. Conversion of Fe3O4-γFe2O3 in aqueous medium. Journal of Colloid and Interface Science 125:688-701.
Jung, Y., J. Choi, and W. Lee. 2007. Spectroscopic investigation of magnetite surface for the reduction of hexavalent chromium. Chemosphere 68:1968-1975.
Kamali-M, S., T. Ericsson, and R. Wäppling. 2006. Characterization of iron oxide nanoparticles by Mössbauer spectroscopy. Thin Solid Films 515:721-723.
Kampschreur, M.J., R. Kleerebezem, W.W.J.M. de Vet, and M.C.M. van Loosdrecht. 2011. Reduced iron induced nitric oxide and nitrous oxide emission. Water Research 45:5945-5952.
Kappler, A., and D.K. Newman. 2004. Formation of Fe(III)-minerals by Fe(II)-oxidizing photoautotrophic bacteria. Geochimica et Cosmochimica Acta 68:1217-1226.
Kennedy, L.G., J.W. Everett, K.J. Ware, R. Parsons, and V. Green. 1998. Iron and Sulfur Mineral Analysis Methods for Natural Attenuation Assessments. Bioremediation Journal 2:259-276.
Kim, C., Y. Lan, and B. Deng. 2007. Kinetic study of hexavalent Cr(VI) reduction by hydrogen sulfide through goethite surface catalytic reaction. Geochemical Journal 41:397-405.

107
Kim, J., W. Li, B.L. Philips, and C.P. Grey. 2011. Phosphate adsorption on the iron oxyhydroxides goethite (α-FeOOH), akaganeite (β-FeOOH), and lepidocrocite (γ-FeOOH): a 31P NMR Study. Energy & Environmental Science 4:4298-4305.
Klausen, J., S.P. Troeber, S.B. Haderlein, and R.P. Schwarzenbach. 1995. Reduction of Substituted Nitrobenzenes by Fe(II) in Aqueous Mineral Suspensions. Environmental Science & Technology 29:2396-2404.
Konhauser, K.O., A. Kappler, and E.E. Roden. 2011. Iron in Microbial Metabolism. Elements 7:89-93.
Korom, S.F. 1992. Natural denitrification in the saturated zone: A review. Water Resources Research 28:1657-1668.
Kosmas, C.S., D.P. Franzmeier, and D.G. Schulze. 1986. Relationship among Derivative Spectroscopy, Color, Crystallite Dimensions, and Al Substitution of Synthetic Goethites and Hematites. Clay and Clay Minerals 34:625-634.
Kubelka, P., and F. Munk. 1931. Ein Beitrag zur Optik der Farbanstriche. Zeits. f.Techn. Physic 12:593-601.
Kündig, W., and S.R. Hargrove. 1969. Electron hopping in magnetite. Solid State Communications 7:223-227.
Laane, J., and J.R. Ohlsen. 1986. Characterization of Nitrogen Oxides by Vibrational Spectroscopy, p. 465-513, In S. J. Lippard, ed. Progress in Inorganic Chemistry, Vol. 27. John Wiley & Sons, Inc.
Lappi, S.E., B. Smith, and S. Franzen. 2004. Infrared spectra of H216O, H2
18O and D2O in the liquid phase by single-pass attenuated total internal reflection spectroscopy. Spectrochimica Acta Part A: Molecular and Biomolecular Spectroscopy 60:2611-2619.
Larese-Casanova, P., and M.M. Scherer. 2007. Fe(II) Sorption on Hematite: New Insights Based on Spectroscopic Measurements. Environmental Science & Technology 41:471-477.
Larese-Casanova, P., S.B. Haderlein, and A. Kappler. 2010. Biomineralization of lepidocrocite and goethite by nitrate-reducing Fe(II)-oxidizing bacteria: Effect of pH, bicarbonate, phosphate, and humic acids. Geochimica et Cosmochimica Acta 74:3721-3734.
Larese-Casanova, P., A. Kappler, and S.B. Haderlein. 2012. Heterogeneous oxidation of Fe(II) on iron oxides in aqueous systems: Identification and controls of Fe(III) product formation. Geochimica et Cosmochimica Acta 91:171-186.
Lasaga, A.C. 1981. Rate Laws of Chemical Reactions. Rev. Mineral. 8:1-68. Latta, D.E., M.I. Boyanov, K.M. Kemner, E.J. O’Loughlin, and M.M. Scherer. 2012(a).
Abiotic reduction of uranium by Fe(II) in soil. Applied Geochemistry 27:1512-1524.
Latta, D.E., J.E. Bachman, and M.M. Scherer. 2012(b). Fe Electron Transfer and Atom Exchange in Goethite: Influence of Al-Substitution and Anion Sorption. Environmental Science & Technology.
Latta, D.E., C.A. Gorski, M.I. Boyanov, E.J. O’Loughlin, K.M. Kemner, and M.M. Scherer. 2011. Influence of Magnetite Stoichiometry on UVI Reduction. Environmental Science & Technology 46:778-786.

108
Lawrence, C.P., and J.L. Skinner. 2003. Vibrational spectroscopy of HOD in liquid D2O. III. Spectral diffusion, and hydrogen-bonding and rotational dynamics. The Journal of Chemical Physics 118:264-272.
Lee, T.R., and R.T. Wilkin. 2010. Iron hydroxy carbonate formation in zerovalent iron permeable reactive barriers: Characterization and evaluation of phase stability. Journal of Contaminant Hydrology 116:47-57.
Lefèvre, G. 2004. In situ Fourier-transform infrared spectroscopy studies of inorganic ions adsorption on metal oxides and hydroxides. Adv Colloid Interface Sci 107:109-23.
Lindsay, W.L. 1979. Chemical Equlibria in Soils. Wiley-Interscience Publication, USA. Liu, S.C., M. Trainer, F.C. Fehsenfeld, D.D. Parrish, E.J. Williams, D.W. Fahey, G.
Hübler, and P.C. Murphy. 1987. Ozone Production in the Rural Troposphere and the Implications for Regional and Global Ozone Distributions. J. Geophys. Res. 92:4191-4207.
Lovley, D.R. 1991. Dissimilatory Fe(III) and Mn(IV) reduction. Microbiol. Mol. Biol. Rev. 55:259-287.
Lovley, D.R. 2001. Reduction of Iron and Humics in Subsurface Environments, p. 193-217, In J. K. Fredrickson and M. Fletcher, eds. Subsurface Microbiology and Biogeochemistry. John Wiley & Sons, Inc., Massachusetts, USA.
Lovley, D.R., and E.J.P. Phillips. 1987. Competitive Mechanisms for Inhibition of Sulfate Reduction and Methane Production in the Zone of Ferric Iron Reduction in Sediments. Applied and Environmental Microbiology 53:2636-2641.
Lovley, D.R., and F.H. Chapelle. 1995. Deep subsurface microbial processes. Reviews of Geophysics 33:365–381.
Lovley, D.R., J.F. Stolz, G.L. Nord, and E.J.P. Phillips. 1987. Anaerobic production of magnetite by a dissimilatory iron-reducing microorganism. Nature 330:252-254.
Luther, G.W. 2010. The Role of One- and Two-Electron Transfer Reactions in Forming Thermodynamically Unstable Intermediates as Barriers in Multi-Electron Redox Reactions. Aquatic Geochemistry 16:395-420.
Luther, G.W., J.E. Kostka, T.M. Church, B. Sulzberger, and W. Stumm. 1992. Seasonal iron cycling in the salt-marsh sedimentary environment: the importance of ligand complexes with Fe(II) and Fe(III) in the dissolution of Fe(III) minerals and pyrite, respectively. Marine Chemistry 40:81-103.
Maher, B.A. 2009. Rain and Dust: Magnetic Records of Climate and Pollution. Elements 5:229-234.
Maher, B.A., and R.M. Taylor. 1988. Formation of ultrafine-grained magnetite in soils. Nature 336:368-370.
Majzlan, J., K.-D. Grevel, and A. Navrotsky. 2003. Thermodynamics of Fe oxides: Part II. Enthalpies of formation and relative stability of goethite (α-FeOOH), lepidocrocite (γ-FeOOH), and maghemite (γ-Fe2O3). American Mineralogist 88:855–859.
Matocha, C.J., and M.S. Coyne. 2007. Short-term Response of Soil Iron to Nitrate Addition. Soil Sci Soc Am J 71:108-117.

109
Matocha, C.J., D. Prakash., and S.M. Pyzola. 2012. The Role of Abiotic and Coupled Biotic/Abiotic Mineral Controlled Redox Processes in Nitrate Reduction, p. 181-214, In D. L. Sparks, ed. Advances in Agronomy, Vol. 115. Academic Press, USA.
McBride, M.B. 1994. Environmental Chemistry of Soils. Oxford University Press, New York, USA.
Merola, R.B., and M.M. McGuire. 2009. Crystallographic site distribution and redox activity of Fe in nontronites determined by optical spectroscopy. Clays and Clay Minerals 57:771-778.
Merola, R.B., E.D. Fournier, and M.M. McGuire. 2006. Spectroscopic Investigations of Fe2+ Complexation on Nontronite Clay. Langmuir 23:1223-1226.
Miller, F.A., and C.H. Wilkins. 1952. Infrared Spectra and Characteristic Frequencies of Inorganic Ions. Analytical Chemistry 24:1253-1294.
Miot, J., K. Benzerara, G. Morin, A. Kappler, S. Bernard, M. Obst, C. Férard, F. Skouri-Panet, J.-M. Guigner, N. Posth, M. Galvez, G.E. Brown Jr, and F. Guyot. 2009. Iron biomineralization by anaerobic neutrophilic iron-oxidizing bacteria. Geochimica et Cosmochimica Acta 73:696-711.
Moraghan, J.T., and R.J. Buresh. 1977. Chemical Reduction of Nitrite and Nitrous Oxide by Ferrous Iron. Soil Sci Soc Am J 41:47-50.
Mortland, M.M. 1965. Nitric Oxide Adsorption by Clay Minerals. Soil Sci. Soc. Am. J. 29:514-519.
Mosier, A., C. Kroeze, C. Nevison, O. Oenema, S. Seitzinger, and O. van Cleemput. 1998. Closing the Global N2O Budget: Nitrous Oxide Emissions Through the Agricultural Nitrogen Cycle. Fertilizer Research 52:225-248.
Nakamoto, K. 1986. Infrared and Raman Spectra of Inorganic and Coordination Compounds, p. i-xi Infrared and Raman Spectra of Inorganic and Coordination Compounds, 4th ed. John Wiley & Sons, Inc.
Ngo, T.T., A.P.H. Phan, C.F. Yam, and H.M. Lenhoff. 1982. Interference in determination of ammonia with the hypochlorite-alkaline phenol method of Berthelot. Analytical Chemistry 54:46-49.
Nielsen, J.L., and P.H. Nielsen. 1998. Microbial Nitrate-Dependent Oxidation of Ferrous Iron in Activated Sludge. Environmental Science & Technology 32:3556-3561.
Obuekwe, C.O., D.W.S. Westlake, and F.D. Cook. 1981. Effect of nitrate on reduction of ferric iron by a bacterium isolated from crude oil. Canadian Journal of Microbiology 27:692-697.
Peak, D., R.G. Ford, and D.L. Sparks. 1999. An in Situ ATR-FTIR Investigation of Sulfate Bonding Mechanisms on Goethite. Journal of Colloid and Interface Science 218:289-299.
Pecher, K., S.B. Haderlein, and R.P. Schwarzenbach. 2002. Reduction of Polyhalogenated Methanes by Surface-Bound Fe(II) in Aqueous Suspensions of Iron Oxides. Environmental Science & Technology 36:1734-1741.
Peretyazhko, T., and G. Sposito. 2005. Iron(III) reduction and phosphorous solubilization in humid tropical forest soils. Geochimica et Cosmochimica Acta 69:3643-3652.
Peterson, M.L., A.F. White, G.E. Brown, and G.A. Parks. 1997. Surface Passivation of Magnetite by Reaction with Aqueous Cr(VI): XAFS and TEM Results. Environmental Science & Technology 31:1573-1576.

110
Picardal, F. 2012. Abiotic and microbial interactions during anaerobic transformations of Fe(II) and NOx. Frontiers in Microbiology 3:1-7.
Pivovarov, S. 1997. Surface Structure and Site Density of the Oxide-Solution Interface. Journal of Colloid and Interface Science 196:321-323.
Ponnamperuma, F.N. 1972. The Chemistry of Submerged Soils, p. 29-96, In N. C. Brady, ed. Advances in Agronomy, Vol. 24. Academic Press.
Postma, D., and R. Jakobsen. 1996. Redox zonation: Equilibrium constraints on the Fe(III)/SO4-reduction interface. Geochimica et Cosmochimica Acta 60:3169-3175.
Rakshit, S., C.J. Matocha, and G.R. Haszler. 2005. Nitrate Reduction in the Presence of Wüstite. Journal of Environmental Quality 34:1286-1292.
Rakshit, S., C.J. Matocha, and M.S. Coyne. 2008. Nitrite Reduction by Siderite. Soil Sci Soc Am J 72:1070-1077.
Regazzoni, A.E., M.A. Blesa, and A.J.G. Maroto. 1983. Interfacial properties of zirconium dioxide and magnetite in water. Journal of Colloid and Interface Science 91:560-570.
Rima, F., Rahman., N. Kou, S. Katsuaki, and O. Masatoshi. 2010. Surface-Enhanced Infrared Absorption Spectroscopic Studies of Adsorbed Nitrate, Nitric Oxide, and Related Compounds. 3. Formation and Reduction of Adsorbed Nitrite at a Platinum Electrode. The Journal of Physical Chemistry C 114:6011-6018.
Ruan, H.D., R.L. Frost, J.T. Kloprogge, and L. Duong. 2002(a). Infrared spectroscopy of goethite dehydroxylation: III. FT-IR microscopy of in situ study of the thermal transformation of goethite to hematite. Spectrochimica Acta Part A: Molecular and Biomolecular Spectroscopy 58:967-981.
Ruan, H.D., R.L. Frost, J.T. Kloprogge, and L. Duong. 2002(b). Infrared spectroscopy of goethite dehydroxylation. II. Effect of aluminium substitution on the behaviour of hydroxyl units. Spectrochimica Acta Part A: Molecular and Biomolecular Spectroscopy 58:479-491.
Sá, J., and J.A. Anderson. 2008. FTIR study of aqueous nitrate reduction over Pd/TiO2. Applied Catalysis B: Environmental 77:409-417.
Saheb, M., M. Descostes, D. Neff, H. Matthiesen, A. Michelin, and P. Dillmann. 2010. Iron corrosion in an anoxic soil: Comparison between thermodynamic modelling and ferrous archaeological artefacts characterised along with the local in situ geochemical conditions. Applied Geochemistry 25:1937-1948.
Samarkin, V.A., M.T. Madigan, M.W. Bowles, K.L. Casciotti, J.C. Priscu, C.P. McKay, and S.B. Joye. 2010. Abiotic nitrous oxide emission from the hypersaline Don Juan Pond in Antarctica. Nature Geosci 3:341-344.
Scheinost, A.C., D.G. Schulze, and U. Schwertmann. 1999(a). Diffuse Reflectance Spectra of Al Substituted Goethite: A Ligand Field Approach. Clays & Clay Minerals 47:156-164.
Scheinost, A.C., R.G. Ford, and D.L. Sparks. 1999(b). The role of Al in the formation of secondary Ni precipitates on pyrophyllite, gibbsite, talc, and amorphous silica: a DRS study. Geochimica et Cosmochimica Acta 63:3193-3203.

111
Scheinost, A.C., A. Chavernas, V. Barron, and J. Torrent. 1998. Use and limitations of second-derivative diffuse reflectance spectroscopy in the visible to near-infrared range to identify and quantify Fe oxide minerals in soils. Clays and Clay Minerals 46:528-536.
Scherer, M.M., B.A. Balko, and P.G. Tratnyek. 1999. The role of Oxides in Reduction Reactions at the Metal-Water Interface, p. 301-322, In D. L. Sparks and T. J. Grundl, eds. Mineral-Water Interfacial Reactions. American Chemical Society, USA.
Scherrer, P. 1918. Bestimmung der Grösse und der inneren Struktur von Kolloidteilchen mittels Röntgenstrahlen. Nachr. Ges. Wiss. Göttingen 26:98-100.
Schlesinger, W.H., J.J. Cole, A.C. Finzi, and E.A. Holland. 2011. Introduction to coupled biogeochemical cycles. Frontiers in Ecology and the Environment 9:5-8.
Schwertmann, U., and R.M. Cornell. 2000. Iron oxides in the laboratory: Preparation and characterization. 2nd ed. Wiley-VCH, New York.
Seitzinger, S., J.A. Harrison, J.K. Böhlke, A.F. Bouwman, R. Lowrance, B. Peterson, C. Tobias, and G.V. Drecht. 2006. Denitrification Across Landscapes and Waterscapes: A Synthesis. Ecological Applications 16:2064-2090.
Senko, J.M., T.A. Dewers, and L.R. Krumholz. 2005. Effect of Oxidation Rate and Fe(II) State on Microbial Nitrate-Dependent Fe(III) Mineral Formation. Appl. Environ. Microbiol. 71:7172-7177.
Sherman, D.M., and D.T. Waite. 1985. Electronic Spectra of Fe3+ Oxides and Oxide Hydroxides in the Near IR to Near UV. American Mineralogist 70:1262-1269.
Shriver, D.F., P.W. Atkins, and C.H. Langford. 1994. Inorganic chemistry. W.H. Freeman and Company, New York.
Sidhu, P.S., R.J. Gilkes, and A.M. Posner. 1977. Mechanism of the low temperature oxidation of synthetic magnetites. Journal of Inorganic and Nuclear Chemistry 39:1953-1958.
Sidman, J.W. 1957. Electronic and Vibrational States of the Nitrite Ion. II. Vibrational States. Journal of the American Chemical Society 79:2675-2678.
Sigg, L., and W. Stumm. 1981. The interaction of anions and weak acids with the hydrous goethite (α-FeOOH) surface. Colloids and Surfaces 2:101-117.
Silvester, E., L. Charlet, C. Tournassat, A. Géhin, J.-M. Grenèche, and E. Liger. 2005. Redox potential measurements and Mössbauer spectrometry of FeII adsorbed onto FeIII (oxyhydr)oxides. Geochimica et Cosmochimica Acta 69:4801-4815.
Singer, D.M., S.M. Chatman, E.S. Ilton, K.M. Rosso, J.F. Banfield, and G.A. Waychunas. 2012. U(VI) Sorption and Reduction Kinetics on the Magnetite (111) Surface. Environmental Science & Technology 46:3821-3830.
Singireddy, S., A. Gordon, A. Smirnov, M. Vance, M.A. Schoonen, R. Szilagyi, and D. Strongin. 2012. Reduction of Nitrite and Nitrate to Ammonium on Pyrite. Origins of Life and Evolution of Biospheres 42:275-294.
Sørensen, J., and L. Thorling. 1991. Stimulation by lepidocrocite (γ-FeOOH) of Fe(II)-dependent nitrite reduction. Geochimica et Cosmochimica Acta 55:1289-1294.
Spalding, R.F., and M.E. Exner. 1993. Occurrence of Nitrate in Groundwater—A Review. Journal of Environmental Quality 22:392-402.

112
Sposito, G. 1989. The chemistry of soils. Oxford University Press, Inc. New York, USA. Stookey, L.L. 1970. Ferrozine−A New Spectrophotometric Reagent for Iron. Analytical
Chemistry 42:779-781. Strathmann, T.J., and A.T. Stone. 2003. Mineral surface catalysis of reactions between
FeII and oxime carbamate pesticides. Geochimica et Cosmochimica Acta 67:2775-2791.
Straub, K., M. Benz, B. Schink, and F. Widdel. 1996. Anaerobic, Nitrate-Dependent Microbial Oxidation of Ferrous Iron. Appl. Environ. Microbiol. 62:1458-1460.
Strens, R.G.J., and B.J. Wood. 1979. Diffuse Reflectance Spectra and Optical Properties of Some Iron and Titanium Oxides and Oxyhydroxides. Mineralogical Magazine 43:347-354.
Strohm, T.O., B. Griffin, W.G. Zumft, and B. Schink. 2007. Growth Yields in Bacterial Denitrification and Nitrate Ammonification. Applied and Environmental Microbiology 73:1420-1424.
Stuart, B. 2004. Infrared Spectroscopy: Fundamentals and Applications. J. Wiley. Stumm, W., and B. Sulzberger. 1992. The cycling of iron in natural environments:
Considerations based on laboratory studies of heterogeneous redox processes. Geochimica et Cosmochimica Acta 56:3233-3257.
Sun, W., Q. Li, S. Gao, and J.K. Shang. 2012. Monometallic Pd/Fe3O4 catalyst for denitrification of water. Applied Catalysis B: Environmental 125:1-9.
Sylvia, D.M., J.J. Fuhrmann, P.G. Hartel, and D.A. Zuberer. 2005. Principles and Applications of Soil Microbiology. 2nd ed. Pearson Prentice Hall, New Jersey, USA.
Tai, Y.-L., and B.A. Dempsey. 2009. Nitrite reduction with hydrous ferric oxide and Fe(II): Stoichiometry, rate, and mechanism. Water Research 43:546-552.
Tamura, H., K. Goto, T. Yotsuyanagi, and M. Nagayama. 1974. Spectrophotometric determination of iron(II) with 1,10-phenanthroline in the presence of large amounts of iron(III). Talanta 21:314-318.
Tao, L., F. Li, Y. Wang, and K. Sun. 2010. Reductve Activity of Adsorbed Fe(II) on Iron(oxyhydr)oxide for 2-Nitrophenol-Transformation. Clays and Clay Minerals 58:682-690.
Tejedor-Tejedor, M.I., and M.A. Anderson. 1986. "In situ" ATR-Fourier transform infrared studies of the goethite (α-FeOOH)-aqueous solution interface. Langmuir 2:203-210.
Tiedje, J.M. 1988. Ecology of Denitrification and Dissimilatory Nitrate Reduction to Ammonium, p. 872, In A. J. B. Zehnder, ed. Biology of Anaerobic Microorganism. John Wiley & Sons Inc., New York, USA.
Tiedje, J.M. 1994. Denitrifiers, p. 245-267, In R. M. Weaver, et al., eds. Methods of Soil Analysis. Part 2. Microbiological and Biochemical Properties. Soil Science Society of America, Madison, WI.
Tilman, D. 1999. Global Environmental Impacts of Agricultural Expansion: The Needs for Sustainable and Efficient Practices. Proceedings of the National Academy of Sciences 96:5995-6000.
Toner, C.V., D.L. Sparks, and T.H. Carski. 1989. Anion Exchange Chemistry of Middle Atlantic Soils: Charge Properties and Nitrate Retention Kinetics. Soil Sci. Soc. Am. J. 53:1061-1067.

113
Tossell, J.A. 1978. Self-consistent-field-Xα study of one-electron energy levels in Fe3O4. Physical Review B 17:484-487.
Tost, H., P. Jöckel, A. Kerkweg, A. Pozzer, R. Sander, and J. Lelieveld. 2007. Global Cloud and Precipitation Chemistry and Wet Deposition: Tropospheric model simulations with ECHAM5/MESSy1. Atmos. Chem. Phys. 7:2733-2757.
Tronc, E., J.-P. Jolivet, J. Lefebvre, and R. Massart. 1984. Ion adsorption and electron transfer in spinel-like iron oxide colloids. Journal of the Chemical Society, Faraday Transactions 1: Physical Chemistry in Condensed Phases 80:2619-2629.
Um, W., H.-S. Chang, J.P. Icenhower, W.W. Lukens, R.J. Serne, N.P. Qafoku, J.H. Westsik, E.C. Buck, and S.C. Smith. 2011. Immobilization of 99-Technetium (VII) by Fe(II)-Goethite and Limited Reoxidation. Environmental Science & Technology 45:4904-4913.
Van Cleemput, O., and L. Baert. 1984. Nitrite: a key compound in N loss processes under acid conditions? Plant and Soil 76:233-241.
Vikesland, P.J., A.M. Heathcock, R.L. Rebodos, and K.E. Makus. 2007. Particle Size and Aggregation Effects on Magnetite Reactivity toward Carbon Tetrachloride. Environmental Science & Technology 41:5277-5283.
Villalobos, M., and J.O. Leckie. 2001. Surface Complexation Modeling and FTIR Study of Carbonate Adsorption to Goethite. Journal of Colloid and Interface Science 235:15-32.
Vitousek, P.M., R. Naylor, T. Crews, M.B. David, L.E. Drinkwater, E. Holland, P.J. Johnes, J. Katzenberger, L.A. Martinelli, P.A. Matson, G. Nziguheba, D. Ojima, C.A. Palm, G.P. Robertson, P.A. Sanchez, A.R. Townsend, and F.S. Zhang. 2009. Nutrient Imbalances in Agricultural Development. Science 324:1519-1520.
Waite, T.D. 1987. Photoredox Chemistry of Colloidal Metal Oxides, p. 426-445, In J. A. Davis and K. F. Hayes, eds. Geochemical Processes at Mineral Surfaces, Vol. 323. American Chemical Society, Washington DC.
Waite, T.D., and F.M.M. Morel. 1984. Photoreductive dissolution of colloidal iron oxides in natural waters. Environmental Science & Technology 18:860-868.
Walker, A.L. 1983. The Effects of Magnetite on Oxalate−and Dithionite-extractable Iron. Soil Sci. Soc. Am. J. 47:1022-1026.
Wallenstein, M.D., D.D. Myrold, M. Firestone, and M. Voytek. 2006. Environmental Controls on Denitrifying Communities and Denitrification Rates: Insights from Molecular Methods. Ecological Applications 16:2143-2152.
Walrafen, G.E., and E. Pugh. 2004. Raman Combinations and Stretching Overtones from Water, Heavy Water, and NaCl in Water at Shifts to ca. 7000 cm−1. Journal of Solution Chemistry 33:81-97.
Warneck, P. 2000. Chemistry of the Natural Atmosphere. Acad. Press. Weber, K.A., F.W. Picardal, and E.E. Roden. 2001. Microbially Catalyzed Nitrate-
Dependent Oxidation of Biogenic Solid-Phase Fe(II) Compounds. Environmental Science & Technology 35:1644-1650.
Weber, K.A., M.M. Urrutia, P.F. Churchill, R.K. Kukkadapu, and E.E. Roden. 2006(a). Anaerobic redox cycling of iron by freshwater sediment microorganisms. Environmental Microbiology 8:100-113.
Weber, K.A., J. Pollock, K.A. Cole, S.M. O'Connor, L.A. Achenbach, and J.D. Coates. 2006(b). Anaerobic nitrate-dependent iron(II) bio-oxidation by a novel

114
lithoautotrophic betaproteobacterium, strain 2002. Applied and Environmental Microbiology 72:686-694.
Weber, K.A., L.A. Achenbach, and J.D. Coates. 2006(c). Microorganisms pumping iron: anaerobic microbial iron oxidation and reduction. Nature Reviews Microbiology 4:752-764.
Wehrli, B. 1990. Redox Reactions of Metal Ions at Mineral Surfaces, p. 311-336, In W. Stumm, ed. Aquatic Chemical Kinetics: Reactions Rates of Procesess in Natural Waters. John Wiley & Sons, Inc, USA.
Wehrli, B., B. Sulzberger, and W. Stumm. 1989. Redox processes catalyzed by hydrous oxide surfaces. Chemical Geology 78:167-179.
Weidler, P.G., S.J. Hug, T.P. Wetche, and T. Hiemstra. 1998. Determination of growth rates of (100) and (110) faces of synthetic goethite by scanning force microscopy. Geochimica et Cosmochimica Acta 62:3407-3412.
Weston, J.R.E., and T.F. Brodasky. 1957. Infrared Spectrum and Force Constants of the Nitrite Ion. The Journal of Chemical Physics 27:683-689.
White, A.F., and M.L. Peterson. 1996. Reduction of aqueous transition metal species on the surfaces of Fe(II) -containing oxides. Geochimica et Cosmochimica Acta 60:3799-3814.
White, A.F., M.L. Peterson, and M.F. Hochella Jr. 1994. Electrochemistry and dissolution kinetics of magnetite and ilmenite. Geochimica et Cosmochimica Acta 58:1859-1875.
Wiatrowski, H.A., S. Das, R. Kukkadapu, E.S. Ilton, T. Barkay, and N. Yee. 2009. Reduction of Hg(II) to Hg(0) by Magnetite. Environmental Science & Technology 43:5307-5313.
Wilderer, P.A., W.L. Jones, and U. Dau. 1987. Competition in denitrification systems affecting reduction rate and accumulation of nitrite. Water Research 21:239-245.
Williams, A.G.B., and M.M. Scherer. 2004. Spectroscopic Evidence for Fe(II)-Fe(III) Electron Transfer at the Iron Oxide-Water Interface. Environmental Science & Technology 38:4782-4790.
Williams, D.J., J.M. Bigham, C.A. Cravotta Iii, S.J. Trainaa, J.E. Anderson, and J.G. Lyon. 2002. Assessing mine drainage pH from the color and spectral reflectance of chemical precipitates. Applied Geochemistry 17:1273-1286.
Wrage, N., G.L. Velthof, M.L. van Beusichem, and O. Oenema. 2001. Role of nitrifier denitrification in the production of nitrous oxide. Soil Biology and Biochemistry 33:1723-1732.
Xing, G.X., and Z.L. Zhu. 2000. An Assessment of N Loss From Agricultural Fields to the Environment in China. Nutrient Cycling in Agroecosystems 57:67-73.
Yao, W., and F.J. Millero. 1993. The rate of sulfide oxidation by δMnO2 in seawater. Geochimica et Cosmochimica Acta 57:3359-3365.
Yasuhiko, K., T. Masanosuke, and Y. Masuro. 1978. Participation of iron in denitrification in waterlogged soil. Soil Biology and Biochemistry 10:21-26.
Yates, D.E., and T.W. Healy. 1975. Mechanism of anion adsorption at the ferric and chromic oxide/water interfaces. Journal of Colloid and Interface Science 52:222-228.

115
Zachara, J.M., R.K. Kukkadapu, J.K. Fredrickson, Y.A. Gorby, and S.C. Smith. 2002. Biomineralization of poorly crystalline Fe(III) oxides by dissimilatory metal reducing bacteria (DMRB). Geomicrobiology Journal 19:179-207.
Zhang, G.Y., and D. Peak. 2007. Studies of Cd(II)-sulfate interactions at the goethite-water interface by ATR-FTIR spectroscopy. Geochimica et Cosmochimica Acta 71:2158-2169.
Zhang, H., and R.J. Bartlett. 2000. Light-induced disappearance of nitrite in the presence of iron (III). Chemosphere 40:411-418.
Zhang, T.C., and Y.H. Huang. 2005. Effects of Selected Good's pH Buffers on Nitrate Reduction by Iron Powder. Journal of Environmental Engineering 131:461-470.
Zhang, T.C., and Y.H. Huang. 2006. Effects of Surface-Bound Fe2+ on Nitrate Reduction and Transformation of Iron Oxide(s) in Zero-Valent Iron Systems at Near-Neutral pH. Journal of Environmental Engineering 132:527-536.
Zhang, X., L. Cardosa, M. Broderick, H. Fein, and I.R. Davies. 2000. Novel Calibration Method for Nitric Oxide Microsensors by Stoichiometrical Generation of Nitric Oxide from SNAP. Electroanalysis 12:425-428.
Zhu, M., B. Legg, H. Zhang, B. Gilbert, Y. Ren, J.F. Banfield, and G.A. Waychunas. 2012. Early Stage Formation of Iron Oxyhydroxides during Neutralization of Simulated Acid Mine Drainage Solutions. Environmental Science & Technology 46:8140-8147.

116
VITA
Prakash Dhakal
Education: Tribhuvan University (TU), B.Sc. in Geology, 1999 Tribhuvan University (TU), M.Sc. in Engineering Geology and Geoinformatics, 2002 Auburn University (AU), M.S. in Geology. 2008 University of Kentucky (UK), seeking PhD in Soil Sciences, 2009 to present Research and Professional Experience: Assistant Lecturer (10/2002-01/2004), Central Department of Geology, TU Geologist (02/2004-07/2006), Department of Mines and Geology, Kathmandu, Nepal Research Assistant (08/2006-08/2008), Department of Geology and Geography, AU
(01/2009-Present), Department of Plant and Soil Sciences, UK Teaching Assistant (05/2007-08/2007), Department of Geology and Geography, AU (08/2010-12/2010)
(01/2012-05/2012) Department of Plants and Soil Sciences, UK (01/2013-05/2013)
Referred Publications:
• Dhakal, P. and Matocha, C. J, Huggins, F., Vandiviere, M., 2013. Nitrite Reactivity with Magnetite. In Press Environmental Science and Technology. doi.org/10.1021/es304011w
• Matocha, C.J., Dhakal, P., Pyzola, S. M. 2012. The Role of Abiotic and Coupled Biotic/Abiotic Mineral Controlled Redox Processes in Nitrate Reduction. Adv. Agronomy, v.115, 181-214.
• Saunders J. A., Lee M-K., Shamsudduha M., Dhakal, P., Uddin A., Chowdury M. T., Ahmed K.M. 2008. Geochemistry and Mineralogy of Arsenic in (Natural) Anaerobic Groundwaters. Applied Geochemistry. v. 23, 3205–3214.
Other publication:
• Dhakal, P. 2008. Overview of Pore-Pressure and Carbon dioxide in Hydrocarbon Migration. Bulletin Nepal Geological Society. v. 25, 59-60

117
Presentations at International/National Meetings:
• Dhakal, P., and Matocha, C. J. 2011. Reactions of Nitrite with Goethite and Surface Fe2+-Geothite Complexes. 2011 ASA. CSSA.SSSA Annual meeting, San Antonio, TX, October 16-19. Accepted for ASA.CSSA.SSSA Abstracts with Programs No. 350, p. 171.
• Matocha, C. J., Pyzola, S. M., Dhakal, P. 2011. Transformation of Nitrate and Nitrite by Fe2+-Bearing Minerals. 2011 ASA. CSSA.SSSA Annual meeting, San Antonio, TX, October 16-19. Accepted for ASA.CSSA.SSSA Abstracts with Programs No. 282, p. 156.
• Dhakal, P., Matocha, C. J., Pyzola, S., Vandiviere, M., Grove, J. 2010. Changes in Soil Chemical Properties During Short Term Reducing Conditions Followed by Nitrogen Fertilizer Application. 2010 GSA Annual Meeting, Denver, CO, October 31- November 3. Accepted for GSA Abstract with Programs v.42(5), p. 538.
• Matocha, C. J., Dhakal, P., Vandiviere, M. 2009. Sorption of Iron (Fe2+) at the Surface of Gibbsite. 2009 ASA. CSSA.SSSA Annual meeting, Pittsburgh, PA, November 1-5. Accepted for ASA.CSSA.SSSA Abstracts with Programs. Abstract #2009-55761.
• Lee, M-K., Saunders, J., Dhakal, P., Uddin, A., Shamsudduha, M., Jean, J-S. 2008. Geochemical Modeling of Arsenic Speciation, Sorption, and Precipitation Under Changing Redox Conditions. 2008 Joint GSA.SSSA.ASA.CSSA.GCAGS.HGS Annual Meeting, Houston, TX. October 1-5. Accepted for Joint GSA.SSSA.ASA.CSSA.GCAGS.HGS Abstract with Programs, abstract #297-10.
• Dhakal, P., Saunders J., Lee M-K. 2008. Arsenic Sequestration in Arsenian Pyrite in Low Temperature Iron-bearing Groundwater Conditions: Field Bioremediations, Laboratory Investigation, and Geochemical Modeling Approaches. 2008 GSA 57th Southeastern Section Meeting, Charlotte, NC, April 10-11. Accepted for GSA 57th Southeastern Section Meeting Abstracts with Programs v.40(4) p.56.
• Dhakal, P., Saunders J., Lee M-K., Savage K. 2007 Arsenian pyrite: The Most important Solid Arsenic Phase in Groundwater Under Sulfate-Reducing Conditions. 2007 GSA Annual Meeting, Denver, CO, October 28-31. Accepted for GSA Abstract with Programs v.39(6), p. 466.
• Dhakal, P., Saunders J., Adhikary P.C. 2007. Risk Evaluation-A Case Study, Chalnakhel Landslide, Kathmandu Valley, Central Nepal. GSA Annual Meeting, Denver, CO, October 28-31. Accepted for GSA Abstracts with programs v.39(6), p.136.
• Dhakal, P. 2004. Using Geophysical Tool to Assess Hill Slope Stability. Abstract: Fourth Nepal Geological Congress, Kathmandu, Nepal, April 9-11, 2004.
Copyright © 2022 FDOKUMEN