Trombay Fertilizer - Credit 0481 - P009685 - Public Documents
Upload
khangminh22Category
view
0download
0
Louisiana State University Louisiana State University
LSU Digital Commons LSU Digital Commons
LSU Master's Theses Graduate School
2015
Integrating Soil Nitrate Level in Refining Nitrogen Fertilizer Integrating Soil Nitrate Level in Refining Nitrogen Fertilizer
Management in Louisiana Corn Production Systems Management in Louisiana Corn Production Systems
Payton Dupree Louisiana State University and Agricultural and Mechanical College
Follow this and additional works at: https://digitalcommons.lsu.edu/gradschool_theses
Recommended Citation Recommended Citation Dupree, Payton, "Integrating Soil Nitrate Level in Refining Nitrogen Fertilizer Management in Louisiana Corn Production Systems" (2015). LSU Master's Theses. 1616. https://digitalcommons.lsu.edu/gradschool_theses/1616
This Thesis is brought to you for free and open access by the Graduate School at LSU Digital Commons. It has been accepted for inclusion in LSU Master's Theses by an authorized graduate school editor of LSU Digital Commons. For more information, please contact [email protected].

INTEGRATING SOIL NITRATE LEVEL IN REFINING NITROGEN FERTILIZER MANAGEMENT IN LOUISIANA CORN PRODUCTION
SYSTEMS
A Thesis
Submitted to the Graduate Faculty of the Louisiana State University and
Agricultural and Mechanical College in partial fulfillment of the
requirements for the degree of Master of Science
in
The School of Plant, Environmental, and Soil Sciences
by Payton Dupree
B.S., University of Louisiana at Lafayette, 2011 August 2015

ii
Acknowledgements
The support I have received throughout this program has been
immeasurable. Many people were involved with this project and I will try to cover
all of them.
To my boss, major professor, and mentor Dr. Brenda Tubana, thank you
for your constant guidance, spot on advice, and seemingly endless patience with
me. You have given me more opportunities than I can count and I am truly
grateful. I could not have accomplished this without you, you believed in me
even when I didn’t believe in myself and I’ve grown in several ways thanks to the
time spent working as your associate.
To Dr. Henry “Rick” Mascagni and Dr. Josh Lofton, thank yall so much for
sharing your wisdom with me whenever you could and always checking on us
while we were in the field to see if we needed help with anything. Your
assistance with conducting the field trials was paramount and thank you for the
opportunity to “play” with some of the equipment.
To my soil fertility group, Brandon, Tapasya, Marilyn, Saoli, Daniel, Murilo,
Flavia, Wookilee, Sam, Gustavo, Lucas, Suelen, Yumiko, Ronaldo, Jessica, Anil,
Rohan, Juan, and Wesley, without yall’s constant support and putting up with the
heat, cold, and even darkness and rain to take my soil samples year round, I
could not have accomplished this feat. I will never forget your generosity and
constant smiles despite the hard times. I’m forever in your debt. Other students
that aided me in this journey were Scott Pensky, John Young, Negar Tafti, Kelly
Arceneaux, Nutifafa Adotey, and April Newman.

iii
To Michael Breithaupt, Sue Chin, and Rodney Henderson, thank you for
letting me raid your lab on a seemingly monthly basis and always sharing your
thoughts when I came seeking wisdom.
To Dr. Don Labonte, Dr. Steve Harrison, Dr. Kun-Jun Han, Dr. Chang
Jeong, Dr. Maud Walsh, Dr. Magdi Selim, Dr. Jim Wang, Connie Dubois, Jere
Townshed, Sheila Rohwer, and Becky Jolibois, thank you for your words of
encouragement and positive attitudes.
To my family, Maureen, Tim, Ryan, Bea, Fry, Lois, Jim, and Sugar, you
guys were so awesome during this time. Thank you so much for your steadfast
support when I would call or visit while losing my mind.
Thank you to the Louisiana Soybean and Small Grain Research and
Promotion Board for their funding and support.
Above all, I thank God for bringing me in contact with this group of people
I’ve spent the last 2-3 years with and challenging me in multiple ways as I’ve
worked through this program. I have felt his presence throughout this difficult
challenge and it is only through him that I am able to accomplish anything.
Finally, I would like to thank the band 311 for their positive music and
soothing vibes that would pick me up when I was struggling. “Stay positive and
love your life!”

iv
Table of Contents
Acknowledgements ............................................................................................... ii List of Tables ........................................................................................................ vi List of Figures ..................................................................................................... viii Abstract ................................................................................................................ ix Chapter 1. Introduction ......................................................................................... 1 Chapter 2. Investigating Early-Season Nitrogen Requirement of Corn Based on Soil Texture and Early-Season Soil Nitrate Level ................................................. 7 2.1 Introduction ..................................................................................................... 7 2.2 Materials and Methods ................................................................................... 9
2.2.1 Site Description, Treatment Structure, and Trial Establishment ....... 9 2.2.2 Soil Sampling .................................................................................. 13 2.2.3 Soil Analysis ................................................................................... 14 2.2.4 Grain Yield and Yield Components ................................................. 16 2.2.5 Grain Nitrogen Analysis .................................................................. 17 2.2.6 Nitrogen Use Efficiency Determination ........................................... 18 2.2.7 Statistical Analysis of Measured Parameters .................................. 18
2.3 Results and Discussion ................................................................................ 19 2.3.1 Effect of N Rate on Grain Yield ....................................................... 19 2.3.2 Effect of Different N Application Method on Grain Yield .................. 22 2.3.3 Effect of Soil Inorganic N Content on Yield ..................................... 25 2.3.4 Effect of N rate on Yield Components and N Uptake ...................... 28 2.3.5 Nitrogen Use Efficiency ................................................................... 34
2.4 Conclusions .................................................................................................. 35 2.5 References ................................................................................................... 36 Chapter 3. Documenting the Changes in Inorganic Nitrogen Level and
Distribution in Soil Profile Within and Across Cropping Seasons at Varying
Nitrogen Fertilization Levels ............................................................................... 43
3.1 Introduction ................................................................................................... 43 3.2 Materials and Methods…………………………………………………………… 44
3.2.1 Site Description, Treatment Structure, and Trial Establishment ...... 44
3.2.2 Soil Sampling .................................................................................. 49
3.2.3 Soil Analysis ................................................................................... 50
3.2.4 Grain Yield ...................................................................................... 52
3.2.5 Soil Texture Analysis ...................................................................... 53
3.2.6 Weather Data Collection ................................................................. 54 3.2.7 Statistical Analysis of Measured Parameters .................................. 55
v
3.3 Results and Discussion ................................................................................ 55
3.3.1 Texture Analysis ............................................................................. 55
3.3.2 Soil Profile Inorganic N Distribution ................................................. 55
3.3.3 Soil Inorganic N Content at V8 Leaf Stage and its Effects on
Yield ......................................................................................................... 65
3.4 Conclusions .................................................................................................. 71 3.5 References ................................................................................................... 72
Chapter 4. Conclusions ...................................................................................... 75
Appendix A. Corn Grain Ratings in 2014 for MRRS and NERS ......................... 76 Figure A.1 Corn Grain Ratings for MRRS 2014 ....................................... 76
Figure A.2 Corn Grain Ratings for NERS 2014 ........................................ 78
Appendix B. Rainfall Data for MRRS and NERS in 2013 and 2014.................... 80 Table B.1. Rainfall Data for MRRS 2013 ................................................. 80
Table B.2. Rainfall Data for MRRS 2014 ................................................. 81
Table B.3. Rainfall Data for NERS 2013 .................................................. 82
Table B.4. Rainfall Data for NERS 2014 .................................................. 83
Vita ..................................................................................................................... 84
vi
List of Tables
Table 2.1 Chemical Properties of Soil at Different Depths for Both Locations .... 11 Table 2.2 Field Activity Dates and Plot Size for MRRS and NERS for Years 2013 and 2014 ............................................................................................................ 12 Table 2.3 Treatment Description of the Field Trials Conducted in St. Joseph, LA and Winnsboro, LA in 2013 and 2014 ................................................................ 14 Table 2.4 Contrast Analyses for Early-Season Only vs Split Application of 268 kg N ha-1 for site MRRS 2013 and 2014 .................................................................. 24 Table 2.5 Contrast Analyses for Early-Season Only vs Split Application of 268 kg N ha-1 for NERS 2013 and NERS 2014 .............................................................. 24 Table 2.6 Corn Ratings for MRRS 2014 and NERS 2014 .................................. 25 Table 2.7 Average of Soil Inorganic N Distribution Across the Entire Field for Both Locations in 2013 and 2014 for Planting and Harvest Sampling Periods ... 28 Table 2.8 Effect of N Rate on Corn Yield Components in 2014 for MRRS and NERS ................................................................................................................. 31 Table 2.9 Effect of N Rate on N Uptake and Grain N Content for Site MRRS 2013 and 2014 ............................................................................................................ 32 Table 2.10 Effect of N Rate on N Uptake and Grain N Content for Site NERS 2013 and 2014 .................................................................................................... 33 Table 2.11 Nitrogen Use Efficiency for MRRS and NERS in 2013 and 2014 ..... 35 Table 3.1 Chemical Properties of Soil at Different Depths for Both Locations .... 46 Table 3.2 Field Activity Dates and Plot Size for MRRS and NERS for Years 2013 and 2014 ............................................................................................................ 47 Table 3.3 Record of Soil Sampling Dates for MRRS and NERS in 2013 and 2014 ................................................................................................................... 48 Table 3.4 Treatment Description of the Field Trials Conducted in St. Joseph, LA and Winnsboro, LA in 2013 and 2014 ................................................................ 49 Table 3.5 Particle Size Distribution for MRRS and NERS .................................. 56

vii
Table 3.6 Grain Yield and Inorganic N Distribution within 0-30 cm Soil Depth of Plots Applied with 0, 201, 403 kg N ha-1, for MRRS 2013 and 2014 .................. 70 Table 3.7 Grain Yield and Inorganic N Distribution within 0-30 cm Soil Depth of Plots Applied with 0, 201, 403 kg N ha-1, for NERS 2013 and 2014 ................... 71
viii
List of Figures
Figure 2.1Map of Louisiana Showing Tensas Parish (Purple) and Franklin Parish (Gold) Where the Two Field Trials Were Established ......................................... 10 Figure 2.2 Grain Yields of Corn Treated with Varying N Rate and Timing Applications at MRRS Site in 2013 and 2014 ..................................................... 21 Figure 2.3 Grain Yields of Corn Treated with Varying N Rate and Timing Applications at NERS Site in 2013 and 2014 ..................................................... 22 Figure 3.1 Inorganic N Distribution within the Profile of Unfertilized (0 kg N ha-1) Soil in Winnsboro, LA (MRRS) ........................................................................... 59 Figure 3.2 Inorganic N Distribution within the Profile of 201 kg N ha-1 Treated Soil in Winnsboro, LA (MRRS) .................................................................................. 60 Figure 3.3 Inorganic N Distribution within the Profile of 403 kg N ha-1 Treated Soil in Winnsboro, LA (MRRS) .................................................................................. 61 Figure 3.4 Amount and Distribution of Rainfall Measured in Chase, LA from January 2013 to December 2014 ....................................................................... 62 Figure 3.5 Inorganic N Distribution within the Profile of Unfertilized (0 kg N ha-1) Soil in St. Joseph, LA (NERS) ............................................................................ 66 Figure 3.6 Inorganic N Distribution within the Profile of 201 kg N ha-1 Treated Soil in St. Joseph, LA (NERS) ................................................................................... 67 Figure 3.7 Inorganic N Distribution within the Profile of 403 kg N ha-1 Treated Soil in St. Joseph, LA (NERS) ................................................................................... 68 Figure 3.8 Amount and Distribution of Rainfall Measured in St. Joseph, LA from January 2013 to December 2014 ....................................................................... 69
ix
Abstract
In some corn (Zea mays L.) producing regions of the US, soil testing is still
recognized as an effective decision tool for nitrogen (N) fertilizer
recommendation. This study was conducted to investigate the early-season N
requirement of corn based on early-season soil nitrate level and document the
seasonal changes of inorganic N distribution throughout the soil profile. A Gigger
silt loam soil and a Sharkey clay soil were selected to establish the trial located in
northeastern Louisiana. Treatments of varying N rates were arranged in a
randomized complete block design with four replications. Nitrogen fertilizer rates
of 0, 67, 134, 201, 268, 335, and 403 kg N ha-1 were applied at early-season VE-
V3 leaf stage. Four split application treatments of the Louisiana N
recommendation (268 kg N ha-1) were applied at early-season and midseason
V7-V9 leaf stages (0-268, 67-201, 134-134, 201-67 kg N ha-1). Grain yield and
yield components were determined. Soil inorganic N content was determined by
1 M KCl extraction procedure followed by continuous flow injection analysis.
Gigger silt loam reached a maximum yield of 13.2 Mg ha-1 when the N rate was
134-134 kg N ha-1 and soil inorganic N content was 80 kg N ha-1. Sharkey clay
achieved a maximum yield of 13.1 Mg ha-1 when 268 kg N ha-1 was applied in
early-season and soil inorganic N content was less than 60 kg N ha-1. Split N
applications optimized yield for the Gigger silt loam, but experience a yield
reduction for the Sharkey clay. The optimum N rate for the Gigger silt loam was
134-134 kg N ha-1 treatment and 201 kg N ha-1 for the Sharkey clay soil applied
only at early-season (P<0.05). Nitrogen rate had a significant effect on grain yield

x
and 100-grain weight (P<0.01) as well as N uptake and total N grain content
(P<0.05). Seasonal changes in inorganic N content occurred mostly in the 0-15
cm soil layer with decreasing variability with depth. These results show the
potential for using inorganic N content to determine N application method in
northeastern Louisiana corn production systems.

1
Chapter 1. Introduction Corn (Zea mays L.) is the most widely produced feed grain in the United
States. Roughly 32.3 million hectares of land in the US are planted to corn with
most being in the heartland region (USDA - ERS, 2013). Furthermore, the US is
the largest producer of corn accounting for 32% of the world’s corn production
and each American consumes approximately 11 kg of corn annually (NCGA,
2013). Archeological evidence suggests that the plant is as old as 80,000 years
from pollen grain found 200 foot under Mexico City (Gibson and Benson, 2002).
With the increase in technology over the last century along with research to
improve farming practices, nationwide production has increased from 1.2 Mg ha-1
in 1912 to as much as 7.7 Mg ha-1 in 2012 (NCGA, 2013). Corn can be found in
several different products such as food, drinks (in the form of corn syrup used as
a sweetener), and even plastics. It is also mixed with livestock feed, which is
what most of the US corn production is used for. It takes approximately 3 kg of
corn feed to produce 0.45 kg of beef (NCGA, 2013). It is also used in bio-fuel
production as well as bio-based plastics (Foley, 2013). With corn being such a
versatile crop, a substantial amount of research has gone into improving its yield
production, disease resistance, and nutrient quality (Saxena and Hooker, 1968;
Castleberry et al., 1984; Collins et al., 1998; Tollenaar and Lee, 2002; Wisser et
al., 2006; Amujoyegbe et al., 2007; Major et al., 2010). The corn plant is
indigenous to the western hemisphere, although the exact location where the first
corn plants emerged is not known.
2
In Louisiana, corn is the 3rd most produced grain crop, most of which is
produced in the state’s northeastern region. Planted hectares fluctuate from year
to year, but have stabilized around ~220,000 hectares over the last few years.
Although corn production has increased recently, rice (Oryza sativa) has passed
corn in planted hectares, while soybean (Glycine max) still remains as the most
planted crop in Louisiana. Price per kg ha-1 of corn produced also fluctuates
from year to year, but has remained around $6 recently (USDA-NASS, 2014).
Louisiana’s average corn yield is about 10.8 Mg ha-1 which is above the national
average of 7.7 Mg ha-1 (NCGA, 2013). Louisiana owes its high production
potential partly to the hydrology and soils unique to the area. The Mississippi
river is responsible for depositing fertile alluvial soils throughout Louisiana over
the last few thousand years. Due to frequent flooding of the area, multiple dams,
weirs, levees, etc. were constructed and subsequently, new sediment deposits
have been cutoff leading to subsidence, particularly along the coast line.
Common soils in the Mississippi river alluvial plain are Vertisols, Alfisols,
Inceptisols, and Entisols. “They are thermic soils and typically have an aquic
moisture regime that are loamy or clayey, and possess smectitic clay mineralogy”
(Weindorf, 2008). The area is known to receive a high amount of rainfall and
averages roughly 1500 to 1700 mm of rain annually (USDA-NASS, 2014) which
can compromise the nutrient value of soils (Weindorf, 2008).
Nitrogen (N) is the most yield limiting nutrient in non-leguminous irrigated
crop production systems. As a result it is the most heavily researched plant
nutrient in an effort to understand its dynamics in soil and plant systems (Krantz

3
et al., 1943; Stanley and Smith, 1956; Olsen et al., 1970; Devitt et al., 1976;
Sinclair, 1986; Smil, 1999; Ercoli et al., 1999; Zhu and Chen, 2002). Nitrogen
fertilizer application increased dramatically after World War II. As explained by
the Wessels Living History Farm (2015), N is the main component in high
explosives such as trinitrotoluene (TNT) and due to the need for explosives
during wartime, multiple chemical plants were built to keep up with the demand.
These chemical plants were then used to produce ammonia for agricultural
fertilization purposes. Since researchers, as well as producers, already had
knowledge of nutrient management as a way to help boost yields, fertilizer use
increased significantly during this time period. During the 1940s most of the
ammonia produced was applied as “ammonium nitrate pellets.” (Wessels Living
History Farm, 2015). However, this form of fertilizer is highly explosive making it
difficult to transport. After several accidents transporting the material, scientists
began working on a way to use anhydrous ammonia as a fertilizer. Anhydrous
ammonia is not explosive, but needs to be kept under pressure and refrigerated.
In 1943, researchers at the Mississippi Experimental Research Station
developed a system that uses knife like applicators to deposit the anhydrous
ammonia about 15-20 cm below the soil surface. This application was
immediately followed by a soil mixing tool that covered the hole left behind from
application of the fertilizer thereby trapping it in the ground. This method began
to replace the application of the pellet form of N fertilizers and is still used today
in the Midwest.
4
As an insurance, most producers apply N in excess amounts to maximize
yields. Unfortunately, this can have negative impacts on the environment
through groundwater and surface water contamination via leaching and runoff
(Power and Schepers, 1989; Ju et al., 2003). Excess N can also decrease
disease resistance. Long et al. (2000) reported an increase in disease incidence
of rice blast (Magnaporthe grisea) when N was applied in excess. Several
different methods have been developed over the years to improve N fertilization
conservation methods. One of which being the split application of N fertilizers in
which a portion of the field recommendation is applied early-season VE-V3 leaf
stage and the remainder applied midseason or at V7-V9 leaf stage. Abbasi et al.
(2012) reported a 14% increase in N use efficiency (NUE) when N fertilizer is
split applied for maize production. Similarly, Lopez-Bellido et al. (2005) reported
increases in NUE in wheat (Triticum aestivum) when N fertilizer was split applied
and experienced significantly increased yields when half or one-third of the N
recommendation was applied at stem elongation.
The use of optical sensors to determine N deficiency level in plants and
derive an N fertilizer recommendation is a relatively new N decision tool
undergoing research in the past decade. Raun et al. (2001) developed a system
that measures and records the crop reflectance of two parts of the N managed
field using an optical sensor: A strip of the field that has been sufficiently fertilized
and the rest of the field that has been applied with a portion of the N
recommendation for the area. The difference in these two values is called a
5
response index and can be used to calculate yield response to determine if
further N should be applied.
While the previously mentioned N decision tool is proficient in many ways,
soil testing has consistently been the best way to determine the nutrient content
of soil. However, this can be labor intensive when used in large fields as well as
financially detrimental to the producer, thus promoting the use of other methods.
Multiple soil testing methods were developed for the purpose of determining soil
N content and its impact in predicting proper fertilizer application. The first
successful method, the Pre-Sidedress Nitrate Test, was pioneered by Magdoff et
al. (1984). Samples are taken when the crop is approximately 15-30 cm tall.
Once the soil inorganic N content is known, a proper N recommendation can be
made and applied. This method only recommends N fertilizer based on soil N
concentration and the yield goal of the crop (Magdoff, 1991). Another soil testing
method, developed by Schmit and Randall (1994), takes 24 cm soil samples
before planting and determines concentration of NO3-N. With the concentrations
of NO3-N and calculating a soil N credit by “subtracting the optimum N rate,
which was measured experimentally, from the tabular N recommendation
presently used in Minnesota,” they were able to accurately determine N
recommendations for corn. The advantages of this method are that it is able to
estimate residual N from all other possible N sources that the current N
recommendation is adjusted for and it does not necessarily call for further N
applications.

6
Although extensive research has been conducted on N dynamics in
different parts of the US, very limited research has been done in Louisiana
relating soil inorganic N to corn production systems. This study was conducted
to evaluate the relationship between soil inorganic N content and corn yield as
well as to document the changes in inorganic N distribution patters throughout
the root zone and lower rooting depth within two cropping seasons on soils in
Northeastern Louisiana that are commonly grown to corn.
7
Chapter 2. Investigating Early-Season Nitrogen Requirement of Corn Based on Soil Texture and Early-Season Soil Nitrate Level. 2.1 Introduction
Corn (Zea mays L.) is the most widely produced feed grain in the United
States. Roughly 32.3 million hectares of land in the US are planted to corn with
most being in the Heartland region. Approximately 20% of the crop is exported
to other countries (USDA - ERS, 2013). Corn ranks third in planted hectares in
the state of Louisiana behind rice (Oryza sativa) (second) and soybeans (Glycine
max) (first). Planted hectares typically fluctuate from year to year, but hover
around ~220,000 ha each year with most of the crop being grown in the
northeastern region (USDA – NASS, 2014). In Louisianan, corn is often times
rotated with cotton which improves cotton (Gossypium hirsutum) lint yields
(Boquet and Coco, 1994). They found that lint yields of cotton were higher when
rotated with corn compared to continuous cotton.
Nitrogen (N) is the most limiting plant nutrient in non-leguminous irrigated
crop production systems and because of this, extensive research has been done
on understanding its effects on crop production (Broadbent et al., 1958; Fox and
Hoffman., 1981; Varvel and Peterson., 1990; Benbi et al., 1991; Arregui and
Quemada., 2008; Schmitt and Randal., 2013). Frequently, N is applied in excess
of crop requirement as a means to minimize crop N deficiencies. While this will
insure the crop will receive adequate N, it can lead to excessive vegetative
growth that may cause the crop to lodge negatively affecting yields (Basak et al.,
1962). Excess N can also cause nitrate pollution in surface waters via runoff and
ground water via infiltration (Bijay-Singh et al., 1995). Understanding N
8
dynamics within the soil profile is critical for proper N management. Soil texture
plays an important role in N behavior. Tremblay et al. (2012) reported that soil
textures (fine or medium texture) can have a large effect on N response. Crops
growing on fine texture soils such as clays, silty clays, silty clay loams, and clay
loams are more likely to have pronounced N responses than those planted on
medium texture groups such as loams, silt loams, sandy clay loams, and loamy
fine sands. A study by Ping et al. (2008) reported that corn grown on sandy soils
would require less N fertilizer than corn grown on clayey soils. Nitrogen
mineralization is less pronounced in clayey soils than soils with less clay content
(Zhu et al., 2009; Ros et al., 2011). Physical changes to the soil profile such as
compaction or water logging may lead to the development of anaerobic
conditions, which can in turn lead to a decrease in microbial activity, stimulating
ammonium (NH4-N) formation and accumulation, and causing nitrate (NO3-N)
losses by denitrification (Jansson and Person, 1982). It is because of these
dynamic transformation processes that make N one of the most challenging
nutrients to understand and adjust for in agriculture. As a result, development of
N fertilizer rate decision tools are being researched to help deliver the proper
amount of N to the crop without causing detrimental effects to the environment.
One N decision tool is the use of soil testing to determine the amount of inorganic
N present in the soil in the early-season and using this to adjust N fertilizer rates
to maximize crop yield without applying excess N. One such soil testing method
is the Magdoff Pre-Sidedress Nitrate Test (PSNT; Magdoff, 1991) for corn in
which soil samples are taken to a depth of 30 cm when the crop is 15-30 cm tall

9
and then tested for available soil NO3-N. This method uses the height of the crop
as a gauge for determining soil sampling time. According to Magdoff (1991), a
better estimate of plant available N and fertilizer recommendation can be drawn
when soil sampling is done right before or as close as possible to when the N
fertilization will be made.
Although the effects of N fertilization on crop yield has been researched
extensively, very little research has been conducted to relate soil inorganic N to
yield in Louisiana corn production systems. To better understand these concepts,
a study was conducted to determine the optimum N fertilizer rate for corn
production in northeastern Louisiana based on soil texture and early-season soil
NO3-N testing.
2.2 Materials and Methods
2.2.1 Site Description, Treatment Structure, and Trial Establishment
In 2013 and 2014, a corn research trial was established on two soils of
differing textures in northeastern LA: a Sharkey clay soil in St. Joseph, LA at the
Northeast Research Station (31°, 56’, 28.94” N, 91°, 14’, 11.43” W) and a Gigger
silt loam soil in Winnsboro, LA at the Macon Ridge Research Station (32°, 08’,
22.05” N; 91° 41’, 13.93” W). Saint Joseph is located in Tensas Parish while
Winnsboro is in Franklin Parish hereafter termed as NERS and MRRS,
respectively (Fig 2.1). Sharkey clay is classified as; very fine, smectitic, thermic
Chromic Epiaquerts (USDA - NCSS, 2013). This soil is very deep, poorly to very
poorly drained, very slowly permeable that formed in an clayey alluvium. Gigger

10
silt loam soil is classified as; fine-silty, mixed, active, thermic, Typic Frafiudalfs
(USDA - NCSS, 2003) and is described as, very deep, moderately well drained,
slowly permeable soils with fragipans that formed in a thin mantle of loess over
loamy sediments. All four site-years were established and managed under an
irrigated system. Irrigation at NERS was supplied using furrow irrigation via poly
pipe and overhead sprinkler irrigation was used at MRRS. Important field activity
dates can be found in Table 2.2. Initial chemical properties of soil from both
locations are reported in Table 2.1.
Figure 2.1 Map of Louisiana showing Tensas Parish (purple) and Franklin Parish (gold) where the two field trials were established (Family search, 2015).

11
Table 2.1 Chemical properties of soil at different depths for both locations.
‡Site *pH Organic matter
Total N
Total C
P K S Ca Mg Cu Zn
Depth, cm
% ------------------------------------------------†mg kg-1 -----------------------------------------------
MRRS
0-15 6.7 2.24 6164 41164 26 74 12 994 109 1.1 2.7
15-30 6.7 2.04 1885 10920 12 54 9 1,123 125 0.5 0.5
30-45 5.4 - 1689 8524 9 80 18 1,084 167 1.1 0.2
45-60 5.0 - 1518 7623 10 92 17 968 205 1.0 0.5
>60 4.6 - 1514 7230 13 95 18 1,042 298 1.6 0.6
NERS
0-15 6.1 5.91 1354 12661 55 454 5 4,240 890 4.5 4.4
15-30 6.6 5.95 1042 2517 32 361 2 4,780 1,005 6.2 2.9
30-45 7.2 - 1030 2051 14 349 3 5,339 1,118 6.1 1.9
45-60 7.6 - 1106 2410 11 349 4 5,446 1,151 5.8 1.9
>60 7.8 - 1072 1764 13 353 6 5,261 1,132 5.2 2.1
*10g soil:10 mL DI H20 for pH analysis procedure, equilibrate for 2 hours, then measured. †Total N and C were based on dry combustion while all other nutrients were based on Mehlich-3 procedure. ‡Site: MRRS – Macon Ridge Research Station, NERS – Northeast Research Station.

12
Table 2.2 Field activity dates and plot size for MRRS and NERS for years 2013 and 2014.
*V# = leaf collar stage of corn crop. ¶Length x width. †Site : MRRS – Macon Ridge Research Station, NERS – Northeast Research Station.
†Site-year Designation
¶Plot Size,
m Planting
*Early-Season N application
*Midseason N application
Harvest
MRRS 2013 13.76 x 4 10-Mar-13 27-Mar-13 (V3) 23-May-13
(V7-V8) 16-Aug-13
MRRS 2014 13.76 x 4 19-Mar-14 6-Apr-14 (V3) 8-May-14 (V8-V9)
19-Aug-14
NERS 2013 12.19 x 4 28-Mar-13 30-Apr-13 (V5) 20-May-13
(V8-V9) 27-Aug-13
NERS 2014 13.76 x 4 21-Apr-14 8-May-14 (V3) 27-May-14
(V8-V9) 16-Sept-14

13
Corn hybrids used were Pioneer 2088HYR and Pioneer 1319HR on Sharkey clay
and Gigger silt loam, respectively. Seeding rates were 80,000 seeds per hectare
with row spacing of 1 m. Irrigation was used when necessary via a poly pipe
irrigation system for Sharkey clay soil and an overhead sprinkler system for
Gigger silt loam soil. Eleven treatments consisted of N applications at varying N
rates and different application times (Table 2.3). One check plot (0 applied N)
was included in each replication. Nitrogen rates of 0, 67, 134, 201, 268, 335, and
403 kg ha-1 were applied at VE-V3 leaf stage, hereafter referred to as early-
season, while the Louisiana N fertilizer recommendation of 268 kg N ha-1 was
split into four applications (0-268, 67-201, 134-134, 201-67 kg ha-1) and applied
at early-season and the V8 leaf stage, hereafter referred to as midseason.
Nitrogen source for Sharkey clay was UAN-S (32-0-0-2) injected with a fertilizer
rig and granular urea (46-0-0) was broadcast by hand for Gigger silt loam.
Phosphorus (P) and Potassium (K) rates were applied in accordance with test
results performed by the LSU AgCenter Soil Testing and Plant Analysis
Laboratory to maintain sufficient nutrient levels. Weed and pest management
practices recommended by the LSU AgCenter were followed.
2.2.2 Soil Sampling
Soil samples were collected at the early-season and harvest stage with a
standard soil probe (JMC; Model No. 641-792-8285) from the two middle rows of
four-row plots. A total of eight soil cores from each plot were sampled to a depth

14
Table 2.3 Treatment description of the field trials conducted in St. Joseph, LA and Winnsboro, LA in 2013 and 2014.
of 30 cm and then divided into 15 cm sections. Soil samples were then oven-
dried (Despatch LBB series; model number LBB2-18-1) at 55°C for a minimum of
3 days, then processed using a Humboldt electric flail soil grinder, and then
sieved through a built in 2 mm sieve.
2.2.3. Soil Analysis
Inorganic N content was determined by weighing 5 g of soil into 125 mL
plastic bottles followed by the addition of 35 mL of 1 M KCl. Samples were
shaken for 1 hour on a reciprocal shaker (Eberbach; model number-E6010.00)
then filtered using No. 42 Whatman filter paper. Extracts were analyzed for NH4-
N and NO3-N/nitrite (NO2-N) content using a continuous flow injection analyzer
(Lachat QuickChem 8500 series 2), simultaneously. The method for determining
NO3-N content is similar to that outlined by Keeney and Nelson (1982). Nitrate is
reduced to NO2-N by passing through a cadmium reduction column and then
Early-Season N rate, kg ha-1
Midseason N rate, kg ha-1
0 0
67 0
134 0
201 0
268 0
335 0
403 0
0 268
67 201
134 134
201 67
15
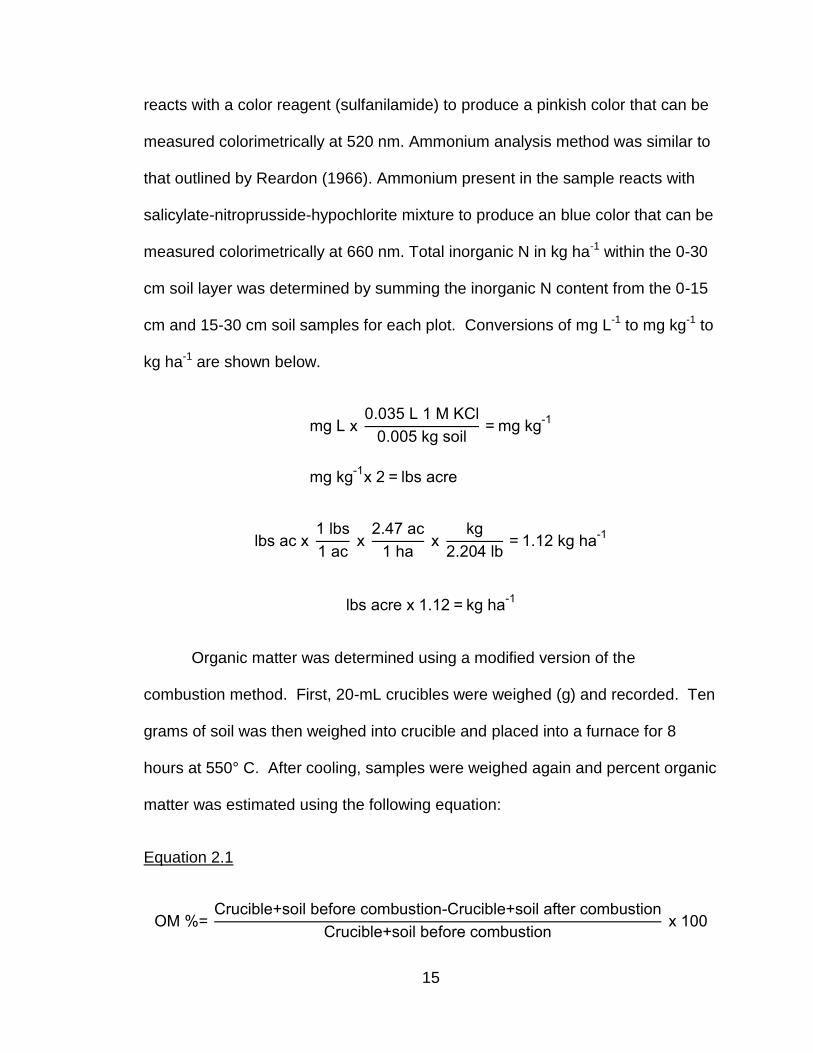
reacts with a color reagent (sulfanilamide) to produce a pinkish color that can be
measured colorimetrically at 520 nm. Ammonium analysis method was similar to
that outlined by Reardon (1966). Ammonium present in the sample reacts with
salicylate-nitroprusside-hypochlorite mixture to produce an blue color that can be
measured colorimetrically at 660 nm. Total inorganic N in kg ha-1 within the 0-30
cm soil layer was determined by summing the inorganic N content from the 0-15
cm and 15-30 cm soil samples for each plot. Conversions of mg L-1 to mg kg-1 to
kg ha-1 are shown below.
mg L x 0.035 L 1 M KCl
0.005 kg soil = mg kg
-1
mg kg-1
x 2 = lbs acre
lbs ac x 1 lbs
1 ac x
2.47 ac
1 ha x
kg
2.204 lb = 1.12 kg ha
-1
lbs acre x 1.12 = kg ha-1
Organic matter was determined using a modified version of the
combustion method. First, 20-mL crucibles were weighed (g) and recorded. Ten
grams of soil was then weighed into crucible and placed into a furnace for 8
hours at 550° C. After cooling, samples were weighed again and percent organic
matter was estimated using the following equation:
Equation 2.1
OM %= Crucible+soil before combustion-Crucible+soil after combustion
Crucible+soil before combustion x 100
16
2.2.4 Grain Yield and Yield Components
At harvest, a plot combine (Massey Ferguson 8XP) was used to collect
grains from the two middle rows of each plot. The harvester was equipped with
Harvest Master Instrumentation to determine plot weight. Sub samples were
taken to determine grain moisture and seed weight. Grain moisture for all four
site-years was determined using a grain analysis computer (Dickey-john; model
number – GAC2500 UGMA) for further analysis once plot yield was determined.
Grain moisture was adjusted to 155 g kg-1 and yield was calculated in bushels
per acre and then converted to kg ha-1 using the following equations:
Equation 2.2
Yield 155 g kg-1 moist adj. (lbs/ac)= [
Plot yield (lbs)
(Plot size (ft
2)
43560)
] x [(100-moisture content)
(100-15.5)]
Equation 2.3
Adjusted yield (bu/ac)= 155 g kg-1 moist adj. (lbs/ac)
56
Equation 2.4
Yield (kg ha-1
)=Yield (bu/ac) x 56 lbs
bux
1 kg
2.2 lbsx
2.47 ac
ha
One hundred (100) grains were counted using an Agriculex ESC-1 automated
seed counter and weighed (g). Stalk and ear counts were taken in 2014 in both
locations from the inner 3-m sections of the second and third rows of each plot.
A 3-m polyvinyl chloride (PVC) pole was used to mark the section from which
stalk and ear counts were taken. Plant population was determined by multiplying

17
stalk count by the area of 1 ha then dividing by the area that stalk counts were
measured. Kernels per ear were also determined. The equations are shown
below:
Equation 2.5
Plant population per ha=stalk ct. x 10000 m2
6.18 m2
Equation 2.6
Kernels per ear=
[ Yield kg ha
-1
Ears ha-1
(Seed wt. (kg)
100) ]
2.2.5 Grain Nitrogen Analysis
Grain subsamples taken from each plot were oven dried at 55C for a
minimum of 48 hours, processed using a WonderMill grain processor (Model No.
– WM200) and then dried again for 24 hours at 55C before analysis. Each
sample was then weighed to 20 mg and analyzed using a CN dry combustion
analyzer (Elementar Americas Inc, Vario EL Cube) to determine total N content.
Nitrogen uptake in kg ha-1 was computed using the following equation:
Equation 2.7
N Uptake (kg ha-1)=Plot Yield (kg ha-1
) x (Total N%
100)

18
2.2.6 Nitrogen Use Efficiency Determination
Nitrogen use efficiency (NUE) was calculated for all four site-years using
the difference method outlined by Pomares-Garcia and Pratt (1978). This method
calculates NUE by subtracting N uptake in kg ha-1 of the plants that were
unfertilized from N uptake of plants that were fertilized, then dividing by the rate
of N applied in kg ha-1. The equation used to determine NUE can be found
below.
Equation 2.8
NUE (%)= N uptake of fertilized crop (kg ha
-1)- N uptake of unfertilized crop (kg ha-1
)
Rate of N fertilizer applied (kg ha-1
) x 100
2.2.7 Statistical Analysis of Measured Parameters
For each site-year, measured parameters were analyzed by performing
one-way analysis of variance using PROC MIXED procedure in SAS 9.3 (SAS,
2012). Fixed variable was N treatment (rate and applications scheme) and
random variable was replication. Mean separation procedure and contrast
analysis were conducted for variables with statistically significant effect in
ANOVA. Contrast analysis between the early-season only and split applications
of the current Louisiana N recommendation of 268 kg N ha-1 was performed
using orthogonal contrast. The least significant difference (LSD) method at the
5% level of confidence was used to determine significant differences among
treatments unless otherwise indicated. Average, standard error, and standard
deviation of soil inorganic N content were computed using Microsoft Excel 2010.

19
2.3 Results and Discussion
2.3.1. Effect of N Rate on Grain Yield
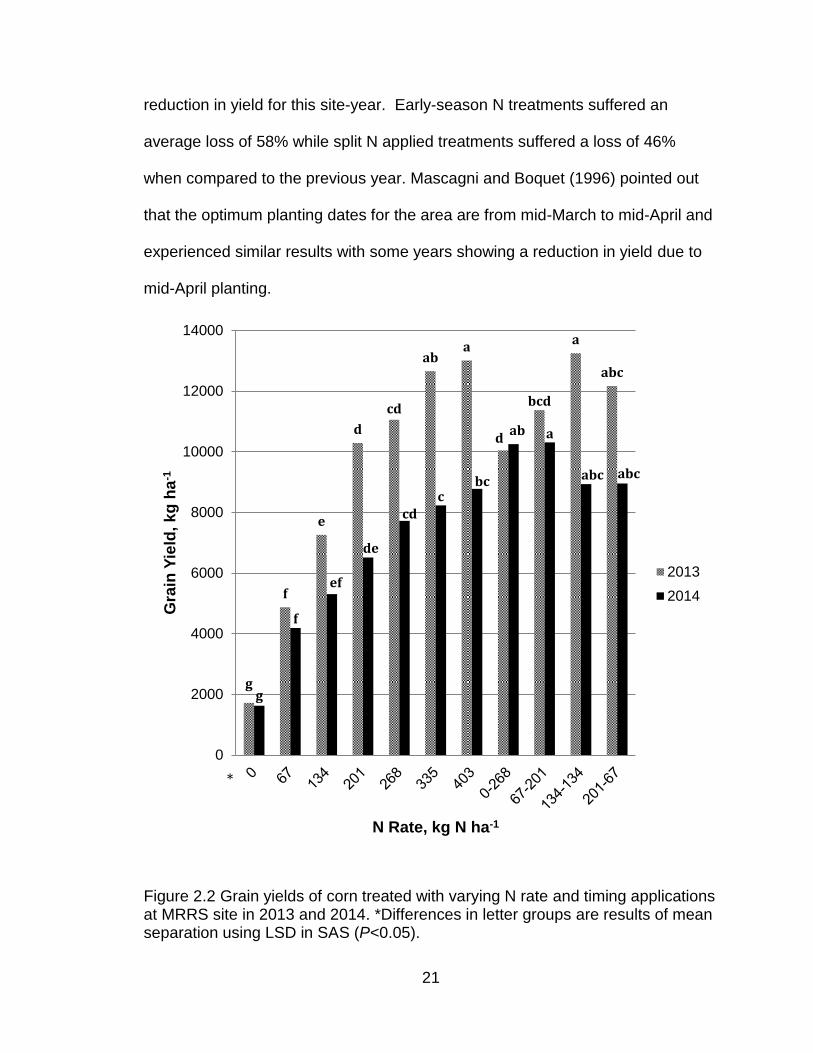
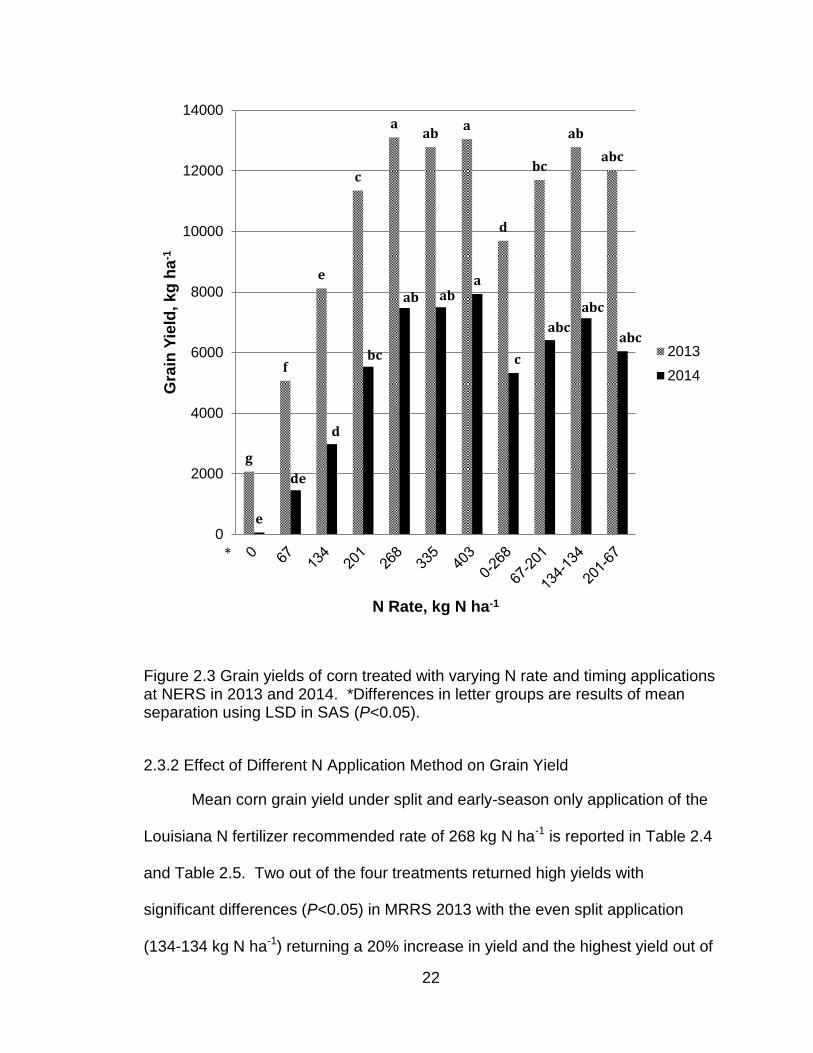
Grain yield results for MRRS 2013 and 2014 and NERS 2013 and 2014
can be found in Fig. 2.2 and Fig. 2.3, respectively. Maximum yield in 2013 was
achieved with the application of 134-134 kg N ha-1 returning the highest yield
(13.2 Mg ha-1) for MRRS (P<0.05) and 268 kg N ha-1 in early-season returning
the highest yield (13.1 Mg ha-1) for NERS (P<0.05). For MRRS in 2013, the 134-
134 kg N ha-1 split application had similar yields to single applications of 403 kg
N ha-1 (13 Mg ha-1) and 335 kg N ha-1 (12.6 Mg ha-1), despite the reduced
amount of applied N. Similarly, at NERS for 2013 the 268 kg N ha-1 treatment
had similar yield (13.1 Mg ha-1) to 403 (13 Mg ha-1) and 335 (12.7 Mg ha-1) kg N
ha-1 treatments. The only split treatment of 268 kg N ha-1 that was significantly
different was 67-201 kg N ha-1for NERS in 2013. Yields for early-season only
applications increased linearly and were significant up to 335 kg N ha-1 for MRRS
2013 and 268 kg N ha-1 for NERS 2013. Effects of increasing yield with
increasing N rates were similar to those found by Halvorson et al. (2005),
Shapiro et al. (2006), and Schlegel and Havlin (2013). These results suggest that
the optimum N rate and application timing for MRRS and NERS in 2013 are 134-
134 kg N ha-1 split application and 268 kg N ha-1 single application, respectively.
Treatments of 67-201 kg N ha-1 and 268 kg N ha-1 were the optimum N rates and
applied timings for MRRS and NERS in 2014, respectively.
The decrease in yield in 2014 compared to 2013 may be partially
attributed to heavy rainfall in the early part of the growing season. For MRRS
20
2014, shortly after N application and corn was approximately at V2-V3 leaf stage,
a heavy rain event passed through dropping ~65 mm of rain resulting in the trial
being flooded for about 24 hours. With this event, there was a high likelihood
that the N fertilizer was washed away which resulted in the trial experiencing a
yield reduction averaging 26% for early-season only applications and 16% for
split N applications compared to the previous year. These findings are consistent
with those of Singh et al. (1985) and Mukhtar et al. (1990) wherein a reduction in
grain yield was observed when the crop was exposed to flooded conditions for a
minimum of 24 hours in the early part of their growing seasons. Although a 16%
reduction in yield was a significant loss, it demonstrated the benefits of split
applying N fertilizer in that it can reduce the loss to total yield if the early-season
application of N were to be compromised by weather factors. The highest yield
that an early-season only application of N attained for MRRS 2014 was 8.7 Mg
ha-1 at 403 kg N ha-1, while the split applications of 67-201 kg N ha-1 both had
yields of 10 Mg ha-1. In addition to the heavy rainfall, what appeared to be
Diplodia ear rot (Stenocarpella maydis) was also present within the trial. Rating
of corn grain for MRRS 2014 was done to qualitatively assess possible damage
the disease had on the crop. Grain rating was also done for NERS 2014, even
though no disease was found in the crop. Ratings of corn grains for site-years
MRRS 2014 and NERS 2014 are reported in Table 2.6. Wet conditions
prevented the timely planting of corn at NERS in 2014. Planting took place in
mid-April when traditionally, planting occurs in mid-March. Due to the late
planting, the yield potential of the crop was compromised resulting in the
21
reduction in yield for this site-year. Early-season N treatments suffered an
average loss of 58% while split N applied treatments suffered a loss of 46%
when compared to the previous year. Mascagni and Boquet (1996) pointed out
that the optimum planting dates for the area are from mid-March to mid-April and
experienced similar results with some years showing a reduction in yield due to
mid-April planting.
Figure 2.2 Grain yields of corn treated with varying N rate and timing applications at MRRS site in 2013 and 2014. *Differences in letter groups are results of mean separation using LSD in SAS (P<0.05).
g
f
e
d
cd
ab a
d
bcd
a
abc
g
f
ef
de
cd c
bc
ab a
abc abc
0
2000
4000
6000
8000
10000
12000
14000
Gra
in Y
ield
, k
g h
a-1
N Rate, kg N ha-1
2013
2014
*
22
Figure 2.3 Grain yields of corn treated with varying N rate and timing applications at NERS in 2013 and 2014. *Differences in letter groups are results of mean separation using LSD in SAS (P<0.05).
2.3.2 Effect of Different N Application Method on Grain Yield
Mean corn grain yield under split and early-season only application of the
Louisiana N fertilizer recommended rate of 268 kg N ha-1 is reported in Table 2.4
and Table 2.5. Two out of the four treatments returned high yields with
significant differences (P<0.05) in MRRS 2013 with the even split application
(134-134 kg N ha-1) returning a 20% increase in yield and the highest yield out of
g
f
e
c
a ab
a
d
bc
ab
abc
e
de
d
bc
ab ab a
c
abc
abc
abc
0
2000
4000
6000
8000
10000
12000
14000
Gra
in Y
ield
, k
g h
a-1
N Rate, kg N ha-1
2013
2014
*
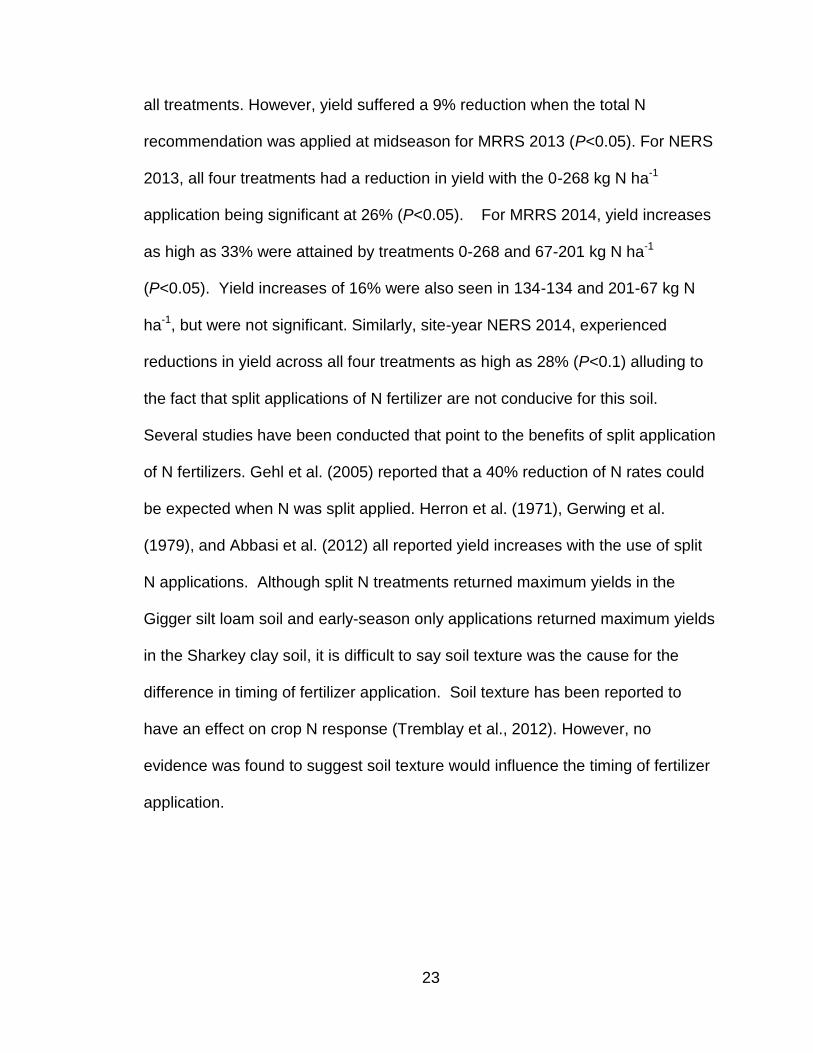
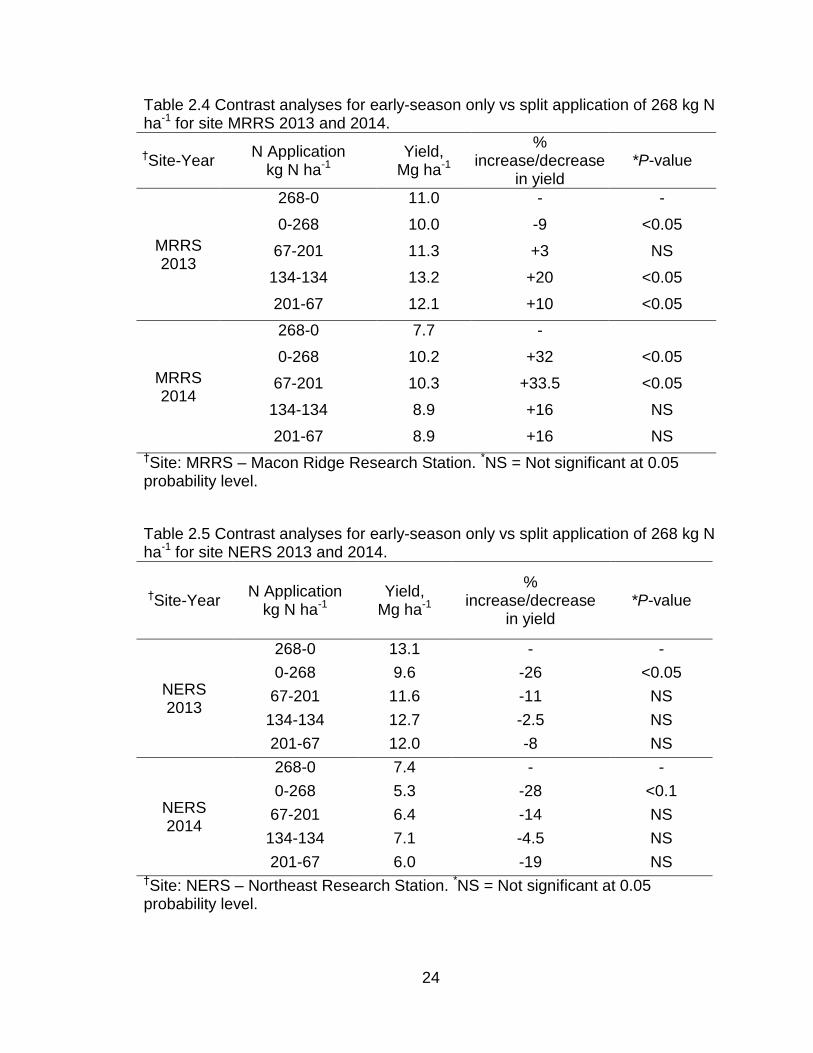
23
all treatments. However, yield suffered a 9% reduction when the total N
recommendation was applied at midseason for MRRS 2013 (P<0.05). For NERS
2013, all four treatments had a reduction in yield with the 0-268 kg N ha-1
application being significant at 26% (P<0.05). For MRRS 2014, yield increases
as high as 33% were attained by treatments 0-268 and 67-201 kg N ha-1
(P<0.05). Yield increases of 16% were also seen in 134-134 and 201-67 kg N
ha-1, but were not significant. Similarly, site-year NERS 2014, experienced
reductions in yield across all four treatments as high as 28% (P<0.1) alluding to
the fact that split applications of N fertilizer are not conducive for this soil.
Several studies have been conducted that point to the benefits of split application
of N fertilizers. Gehl et al. (2005) reported that a 40% reduction of N rates could
be expected when N was split applied. Herron et al. (1971), Gerwing et al.
(1979), and Abbasi et al. (2012) all reported yield increases with the use of split
N applications. Although split N treatments returned maximum yields in the
Gigger silt loam soil and early-season only applications returned maximum yields
in the Sharkey clay soil, it is difficult to say soil texture was the cause for the
difference in timing of fertilizer application. Soil texture has been reported to
have an effect on crop N response (Tremblay et al., 2012). However, no
evidence was found to suggest soil texture would influence the timing of fertilizer
application.
24
Table 2.4 Contrast analyses for early-season only vs split application of 268 kg N ha-1 for site MRRS 2013 and 2014.
†Site-Year N Application
kg N ha-1 Yield,
Mg ha-1
% increase/decrease
in yield *P-value
MRRS 2013
268-0 11.0 - -
0-268 10.0 -9 <0.05
67-201 11.3 +3 NS
134-134 13.2 +20 <0.05
201-67 12.1 +10 <0.05
MRRS 2014
268-0 7.7 -
0-268 10.2 +32 <0.05
67-201 10.3 +33.5 <0.05
134-134 8.9 +16 NS
201-67 8.9 +16 NS
†Site: MRRS – Macon Ridge Research Station. *NS = Not significant at 0.05 probability level.
Table 2.5 Contrast analyses for early-season only vs split application of 268 kg N ha-1 for site NERS 2013 and 2014.
†Site-Year N Application
kg N ha-1 Yield,
Mg ha-1
% increase/decrease
in yield *P-value
NERS 2013
268-0 13.1 - -
0-268 9.6 -26 <0.05
67-201 11.6 -11 NS
134-134 12.7 -2.5 NS
201-67 12.0 -8 NS
NERS 2014
268-0 7.4 - -
0-268 5.3 -28 <0.1
67-201 6.4 -14 NS
134-134 7.1 -4.5 NS
201-67 6.0 -19 NS †Site: NERS – Northeast Research Station. *NS = Not significant at 0.05 probability level.
25
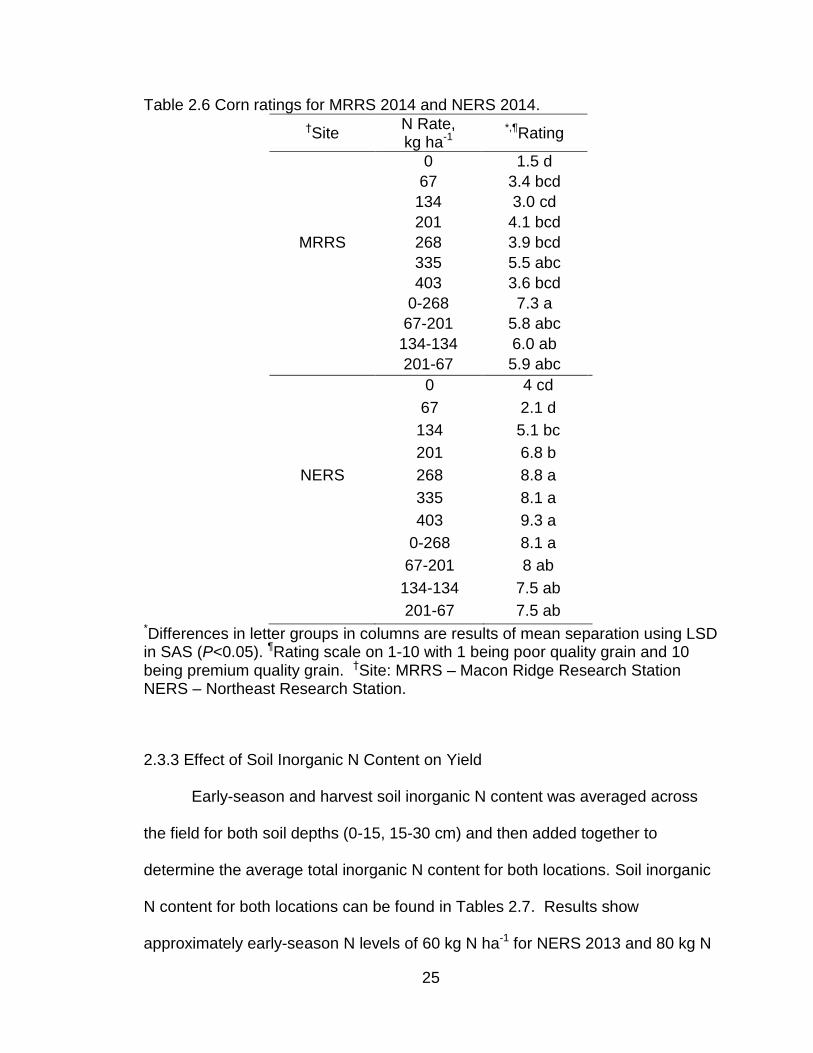
Table 2.6 Corn ratings for MRRS 2014 and NERS 2014.
†Site N Rate, kg ha-1
*,¶Rating
0 1.5 d
67 3.4 bcd
134 3.0 cd
201 4.1 bcd
MRRS 268 3.9 bcd
335 5.5 abc
403 3.6 bcd
0-268 7.3 a
67-201 5.8 abc
134-134 6.0 ab
201-67 5.9 abc
0 4 cd
67 2.1 d
134 5.1 bc
201 6.8 b
NERS 268 8.8 a
335 8.1 a
403 9.3 a
0-268 8.1 a
67-201 8 ab
134-134 7.5 ab
201-67 7.5 ab *Differences in letter groups in columns are results of mean separation using LSD in SAS (P<0.05). ¶Rating scale on 1-10 with 1 being poor quality grain and 10 being premium quality grain. †Site: MRRS – Macon Ridge Research Station NERS – Northeast Research Station.
2.3.3 Effect of Soil Inorganic N Content on Yield
Early-season and harvest soil inorganic N content was averaged across
the field for both soil depths (0-15, 15-30 cm) and then added together to
determine the average total inorganic N content for both locations. Soil inorganic
N content for both locations can be found in Tables 2.7. Results show
approximately early-season N levels of 60 kg N ha-1 for NERS 2013 and 80 kg N

26
ha-1 for MRRS 2013 even before N application. These levels were rather high
compared to unpublished data of previous years where the inorganic N content
averaged only 10-15 kg N ha-1 for NERS and 50-60 kg N ha-1 for MRRS. Site-
year NERS 2013 at harvest showed a slight increase in soil inorganic N content
from 60-67 kg N ha-1 which appeared to be the result of increasing NO3-N in the
0-15 cm soil layer. This may be due to residual NO3-N remaining from UAN
applications not taken up by the previous crop. On the other hand, there was, no
apparent change in total inorganic N content seen in the 15-30 cm soil layer from
early-season to harvest. Conversely, MRRS 2013 showed a substantial decrease
in inorganic N from 80 to 30 kg N ha-1. When looking at the breakdown of
inorganic N, a substantial reduction in NH4-N from 62 to 24 kg N ha-1 from early-
season to harvest was observed in both the 0-15 and 15-30 cm layer as the
probable cause for this drop in total inorganic N. There was a slight reduction in
NO3-N (18 to 13 kg N ha-1), but this was not as substantial as the NH4-N
reduction. Soil inorganic N reductions for 2013 appeared to occur mostly in the
0-15 cm soil layer. Site-year NERS 2014 experienced a decrease in total
inorganic soil N from 54 to 41 kg N ha-1 of which the decrease was attributed to a
reduction in NH4-N from 40 to 26 kg N ha-1 that occurred mostly in the 0-15 cm
layer. Site-year MRRS 2014 reported an early-season soil N of 25 kg N ha-1
which was substantially less than the early-season soil N of the previous year (80
kg N ha-1). At harvest, MRRS 2014 showed an increase in total inorganic soil N
from 25 to 43 kg N ha-1 with a marked increase of NO3-N in the 0-15 cm layer
and NH4-N in both the 0-15 and 15-30 cm layer.
27
For MRRS 2013 the maximum yield recorded was 13.2 Mg ha-1 from plots
with early-season soil inorganic N level of approximately 80 kg N ha-1 and if
treated with 134-134 kg N ha-1. This N application resulted in a numerically
higher yield when compared to the 403 kg N ha-1 treatment showing a yield
increase, with less N applied. The following year early-season soil N dropped to
25 kg N ha-1 and the maximum yield recorded was 10 Mg ha-1 when the split
application of 67-201 kg N ha-1 was applied. For NERS 2013, early-season soil
N was 60 kg N ha-1 and the maximum yield achieved was 13.1 Mg ha-1 when 268
kg N ha-1 was applied. The following year, the early-season soil N level only
reduced to 54 kg N ha-1, but the maximum yield was reduced to 7.9 Mg ha-1.
Again, this was most likely the cause of late planting, not the reduction in soil
inorganic N.
Soil testing could be used to determine N application rates on a field scale
or a regional scale over may site-years (Blackmer et al., 1989). It was difficult to
establish an optimal early-season soil inorganic N content level for both of these
locations given that the second year of data was affected due to climatic
conditions. In 2014, both locations had reductions in yield for different reasons:
rain washing away the applied N for MRRS and rainfall delaying planting for
NERS. Because of this, only the 2013 data can be used to estimate optimal N
rate for each location weakening the estimation. Based on the data from 2013,
the application of 134-134 kg N ha-1 when soil inorganic N is approximately 75-90
kg N ha-1 would potentially optimize yield. Likewise, application of 268 kg N ha-1
would be the optimal N rate when soil inorganic N was 55-65 kg N ha-1.

28
2.3.4 Effect of N rate on Yield Components and N uptake
Yield components for MRRS 2014 and NERS 2014 can be found in Table
2.8. Nitrogen rate effect showed significant differences in yield and 100 grain
weight for both site-years (P<0.01). Split N applications achieved higher grain
weight than all other treatments for MRRS 2014, although these increases were
not significant.
Table 2.7 Average of soil inorganic N distribution at 0-15 and 15-30 cm depth across the entire field for both locations in 2013 and 2014 for early-season and harvest sampling periods.
†Site-Year Sampling Time
Depth, cm
Ammonium, kg ha-1
Nitrate, kg ha-1
Total Inorganic N, kg ha-1
MRRS 2013 Early-Season
0-15 35 11 46 15-30 26 7 33 sum 62 18 80
0-15 13 8 22
MRRS 2013 Harvest 15-30 11 5 8
sum 24 13 29
MRRS 2014 Early-Season
0-15 13 5 18 15-30 6 1 7 sum 19 6 25
0-15 18 11 29
MRRS 2014 Harvest 15-30 12 2 14
sum 30 13 43
NERS 2013 Early-Season
0-15 29 4 34 15-30 15 11 26 sum 44 16 60
0-15 23 18 41
NERS 2013 Harvest 15-30 17 9 26
sum 40 27 67
NERS 2014 Early-Season
0-15 24 6 30 15-30 16 8 24 sum 40 14 54
0-15 15 9 24
NERS 2014 Harvest 15-30 11 6 17
sum 26 15 41
†Site: MRRS – Macon Ridge Research Station, NERS – Northeast Research Station. *n=120
29
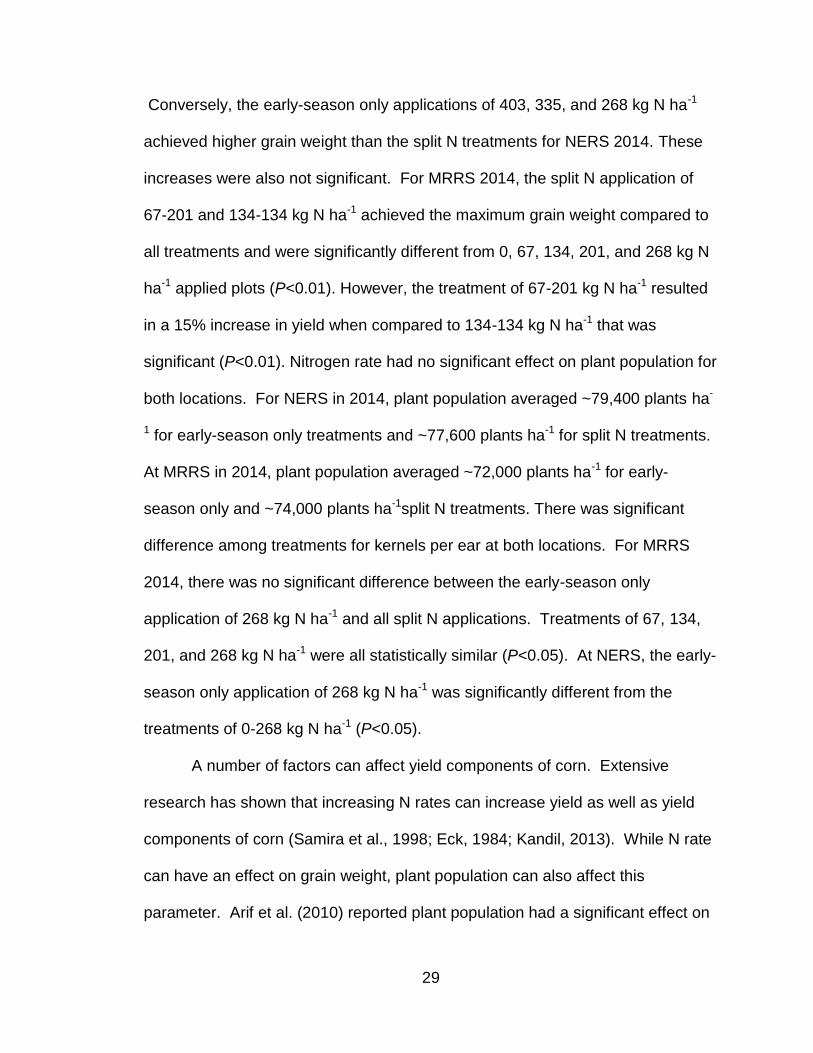
Conversely, the early-season only applications of 403, 335, and 268 kg N ha-1
achieved higher grain weight than the split N treatments for NERS 2014. These
increases were also not significant. For MRRS 2014, the split N application of
67-201 and 134-134 kg N ha-1 achieved the maximum grain weight compared to
all treatments and were significantly different from 0, 67, 134, 201, and 268 kg N
ha-1 applied plots (P<0.01). However, the treatment of 67-201 kg N ha-1 resulted
in a 15% increase in yield when compared to 134-134 kg N ha-1 that was
significant (P<0.01). Nitrogen rate had no significant effect on plant population for
both locations. For NERS in 2014, plant population averaged ~79,400 plants ha-
1 for early-season only treatments and ~77,600 plants ha-1 for split N treatments.
At MRRS in 2014, plant population averaged ~72,000 plants ha-1 for early-
season only and ~74,000 plants ha-1split N treatments. There was significant
difference among treatments for kernels per ear at both locations. For MRRS
2014, there was no significant difference between the early-season only
application of 268 kg N ha-1 and all split N applications. Treatments of 67, 134,
201, and 268 kg N ha-1 were all statistically similar (P<0.05). At NERS, the early-
season only application of 268 kg N ha-1 was significantly different from the
treatments of 0-268 kg N ha-1 (P<0.05).
A number of factors can affect yield components of corn. Extensive
research has shown that increasing N rates can increase yield as well as yield
components of corn (Samira et al., 1998; Eck, 1984; Kandil, 2013). While N rate
can have an effect on grain weight, plant population can also affect this
parameter. Arif et al. (2010) reported plant population had a significant effect on

30
corn grain weight between populations of 7.5 (33.2 g) and 9 (30.4 g) plants m2.
Furthermore, N stress can reduce the number of ears m2 (Pandey et al., 2000)
and kernels per ear (Sticker et al., 1995), thus decreasing yields.
Grain N uptake can be found in Table 2.10 and 2.11. Nitrogen grain
uptake significantly increased with N rate for all four site-years (P<0.05). Grain N
uptake of corn receiving split N applications of 134-134 and 201-67 kg N ha-1
were significantly different from those which received 268 kg N ha-1 in MRRS
2013 (P<0.05). These treatments achieved numerically higher N uptake than
335 and 403 kg N ha-1 applications, but were not significant. There was no
treatment effect observed on total N content of corn grain for MRRS in 2014.
The effects of early-season only applications of 268, 335, and 403 kg N ha-1 on N
uptake were all statistically similar in NERS 2013 and achieved numerically
higher N uptake than all split N applications. However, the N rate of 403 kg N ha-
1 was the only treatment that differed significantly (P<0.05). Plots applied with
335, 403, and 0-268 kg N ha-1 had the highest grain N content and were only
significantly different from plots applied with 0, 67, 134, and 201 kg N ha-1
(P<0.05). For MRRS 2014, no significant differences were found for grain N
content. Split N treatments that were significantly higher than the early-season
only application (with the exception of 403 kg N ha-1) were those fertilized with 0-
268 and 67-201 kg N ha-1 (P<0.05). For NERS 2014, early-season only N
applications achieved the numerically highest N uptake among the treatments,
but only 403 kg N ha-1 was significantly different from all split N applications
(P<0.05).
31
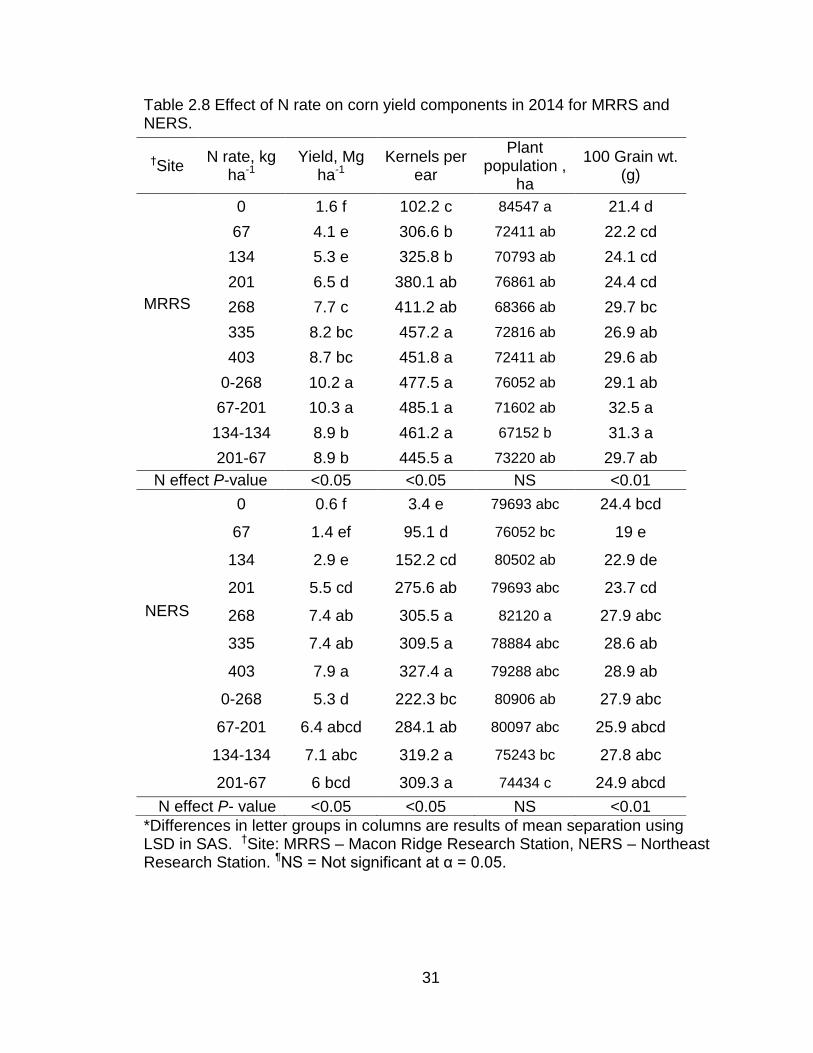
Table 2.8 Effect of N rate on corn yield components in 2014 for MRRS and NERS.
*Differences in letter groups in columns are results of mean separation using LSD in SAS. †Site: MRRS – Macon Ridge Research Station, NERS – Northeast Research Station. ¶NS = Not significant at α = 0.05.
†Site N rate, kg
ha-1 Yield, Mg
ha-1 Kernels per
ear
Plant population ,
ha
100 Grain wt. (g)
0 1.6 f 102.2 c 84547 a 21.4 d
67 4.1 e 306.6 b 72411 ab 22.2 cd
134 5.3 e 325.8 b 70793 ab 24.1 cd
201 6.5 d 380.1 ab 76861 ab 24.4 cd
MRRS 268 7.7 c 411.2 ab 68366 ab 29.7 bc
335 8.2 bc 457.2 a 72816 ab 26.9 ab
403 8.7 bc 451.8 a 72411 ab 29.6 ab
0-268 10.2 a 477.5 a 76052 ab 29.1 ab
67-201 10.3 a 485.1 a 71602 ab 32.5 a
134-134 8.9 b 461.2 a 67152 b 31.3 a
201-67 8.9 b 445.5 a 73220 ab 29.7 ab
N effect P-value <0.05 <0.05 NS <0.01
0 0.6 f 3.4 e 79693 abc 24.4 bcd
67 1.4 ef 95.1 d 76052 bc 19 e
134 2.9 e 152.2 cd 80502 ab 22.9 de
201 5.5 cd 275.6 ab 79693 abc 23.7 cd
NERS 268 7.4 ab 305.5 a 82120 a 27.9 abc
335 7.4 ab 309.5 a 78884 abc 28.6 ab
403 7.9 a 327.4 a 79288 abc 28.9 ab
0-268 5.3 d 222.3 bc 80906 ab 27.9 abc
67-201 6.4 abcd 284.1 ab 80097 abc 25.9 abcd
134-134 7.1 abc 319.2 a 75243 bc 27.8 abc
201-67 6 bcd 309.3 a 74434 c 24.9 abcd
N effect P- value <0.05 <0.05 NS <0.01

32
Table 2.9 Effect of N rate on N uptake and grain N content for site MRRS 2013 and 2014.
*Differences in letter groups in columns are results of mean separation using LSD in SAS. †Site: MRRS – Macon Ridge Research Station, NERS – Northeast Research Station. ¶NS = Not significant.
†Site-year N rate, kg ha-1 *Grain N Content, % *Grain N Uptake, kg ha-1
0 1.12 abc 19 g
67 1.04 cd 51 f
134 1.00 d 73 e
201 1.13 abc 116 cd
MRRS 2013
268 1.13 ab 125 cd
335 1.14 ab 144 ab
403 1.19 ab 155 a
0-268 1.11 bc 111 d
67-201 1.17 ab 133 bc
134-134 1.20 a 160 a
201-67 1.21 a 146 ab
N effect P - value <0.05 <0.05
0 1.21 20 f
67 1.24 52 e
134 1.29 68 de
201 1.22 80 cd
MRRS 2014
268 1.25 96 bc
335 1.17 96 bc
403 1.26 111 ab
0-268 1.30 134 a
67-201 1.31 134 a
134-134 1.20 106 b
201-67 1.24 112 ab ¶N effect P - value NS <0.05

33
Table 2.10 Effect of N rate on N uptake and grain N content for site NERS 2013 and 2014.
*Differences in letter groups of columns are results of mean separation using LSD in SAS. †Site: MRRS – Macon Ridge Research Station, NERS – Northeast Research Station.
†Site-year N Rate, kg ha-1 *Grain N Content, % *Grain N uptake, kg ha-1
0 1.13 def 23 g
67 0.98 g 50 f
134 1.05 fg 85 e
201 1.11 ef 126 d
NERS 2013
268 1.21 bcde 159 abc
335 1.29 ab 165 ab
403 1.35 a 176 a
0-268 1.28 abc 124 d
67-201 1.25 abcd 146 bc
134-134 1.21 bcde 155 bc
201-67 1.16 cde 139 cd
N effect P- value <0.05 <0.05
0 1.07 abc 1 e
67 1.07 abc 16 de
134 1.01 c 30 d
201 1.13 ab 63 bc
NERS 2014
268 1.04 bc 78 ab
335 1.05 bc 78 ab
403 1.18 a 94 a
0-268 1.05 bc 56 c
67-201 1.03 bc 66 bc
134-134 1.07 abc 76 b
201-67 1.13 ab 68 bc
N effect P- value <0.05 <0.05
34
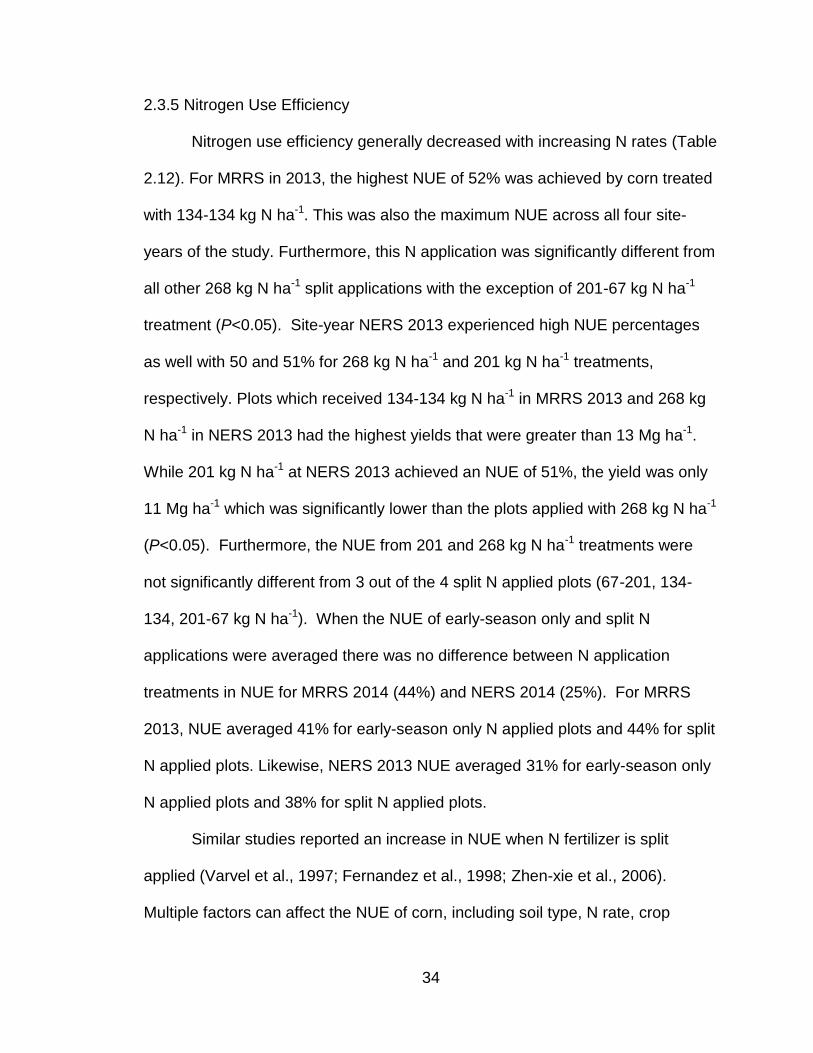
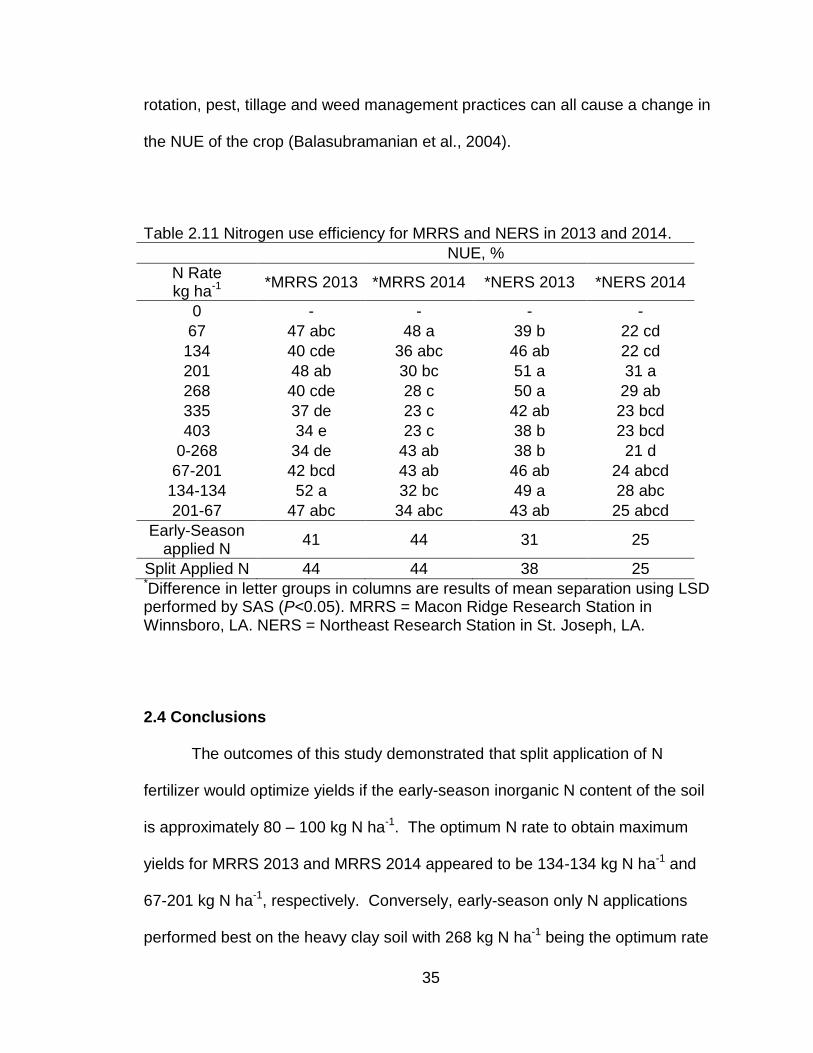
2.3.5 Nitrogen Use Efficiency Nitrogen use efficiency generally decreased with increasing N rates (Table
2.12). For MRRS in 2013, the highest NUE of 52% was achieved by corn treated
with 134-134 kg N ha-1. This was also the maximum NUE across all four site-
years of the study. Furthermore, this N application was significantly different from
all other 268 kg N ha-1 split applications with the exception of 201-67 kg N ha-1
treatment (P<0.05). Site-year NERS 2013 experienced high NUE percentages
as well with 50 and 51% for 268 kg N ha-1 and 201 kg N ha-1 treatments,
respectively. Plots which received 134-134 kg N ha-1 in MRRS 2013 and 268 kg
N ha-1 in NERS 2013 had the highest yields that were greater than 13 Mg ha-1.
While 201 kg N ha-1 at NERS 2013 achieved an NUE of 51%, the yield was only
11 Mg ha-1 which was significantly lower than the plots applied with 268 kg N ha-1
(P<0.05). Furthermore, the NUE from 201 and 268 kg N ha-1 treatments were
not significantly different from 3 out of the 4 split N applied plots (67-201, 134-
134, 201-67 kg N ha-1). When the NUE of early-season only and split N
applications were averaged there was no difference between N application
treatments in NUE for MRRS 2014 (44%) and NERS 2014 (25%). For MRRS
2013, NUE averaged 41% for early-season only N applied plots and 44% for split
N applied plots. Likewise, NERS 2013 NUE averaged 31% for early-season only
N applied plots and 38% for split N applied plots.
Similar studies reported an increase in NUE when N fertilizer is split
applied (Varvel et al., 1997; Fernandez et al., 1998; Zhen-xie et al., 2006).
Multiple factors can affect the NUE of corn, including soil type, N rate, crop
35
rotation, pest, tillage and weed management practices can all cause a change in
the NUE of the crop (Balasubramanian et al., 2004).
Table 2.11 Nitrogen use efficiency for MRRS and NERS in 2013 and 2014.
NUE, %
N Rate kg ha-1
*MRRS 2013 *MRRS 2014 *NERS 2013 *NERS 2014
0 - - - -
67 47 abc 48 a 39 b 22 cd
134 40 cde 36 abc 46 ab 22 cd
201 48 ab 30 bc 51 a 31 a
268 40 cde 28 c 50 a 29 ab
335 37 de 23 c 42 ab 23 bcd
403 34 e 23 c 38 b 23 bcd
0-268 34 de 43 ab 38 b 21 d
67-201 42 bcd 43 ab 46 ab 24 abcd
134-134 52 a 32 bc 49 a 28 abc
201-67 47 abc 34 abc 43 ab 25 abcd
Early-Season applied N
41 44 31 25
Split Applied N 44 44 38 25 *Difference in letter groups in columns are results of mean separation using LSD performed by SAS (P<0.05). MRRS = Macon Ridge Research Station in Winnsboro, LA. NERS = Northeast Research Station in St. Joseph, LA.
2.4 Conclusions
The outcomes of this study demonstrated that split application of N
fertilizer would optimize yields if the early-season inorganic N content of the soil
is approximately 80 – 100 kg N ha-1. The optimum N rate to obtain maximum
yields for MRRS 2013 and MRRS 2014 appeared to be 134-134 kg N ha-1 and
67-201 kg N ha-1, respectively. Conversely, early-season only N applications
performed best on the heavy clay soil with 268 kg N ha-1 being the optimum rate
36
for NERS 2013 and 201 kg N ha-1 for NERS 2014. This study was unable to
effectively produce a soil inorganic N content level recommendation given the
climatic challenges that took place during the course of the experiment. However,
this study showed the benefits of split application of N fertilizer when heavy rains
occurred in the early part of the growing season. The heavy rains in the early
part of the growing season may have washed the early-season applied N
fertilizer. Given this scenario, significant reductions in yield were expected due to
N deficiency, but with extra supply of N coming from midseason application of N
fertilizer this reduction in yield was minimized. Nitrogen rate showed to have a
significant impact on yield and grain weight. Further research would be required
to refine the N recommendation based on soil inorganic N content at the time of
planting. The purpose is that this information can then be used to enhance the
Louisiana N recommendation for corn production and offer some guidance on
improving fertilizer application practices.
2.5 References
Abbasi M.K., Tahir M.M., Sadiq A., Iqbal M., Zafar M. 2012. Yield and nitrogen use efficiency of rainfed maize response to splitting and nitrogen rates in Kashmir, Pakistan. Agronomy Journal 104:448-457. Amujoyegbe B.J., Opabode J.T., Olayinka A. 2007. Effect of organic and inorganic fertilizer on yield and chlorophyll content of maize (Zea mays L.) and sorghum Sorghum bicolour (L.) Moench). African Journal of Biotechnology 6:1869-1873. Arregui L.M., and Quemada M. 2008. Strategies to improve nitrogen use efficiency in winter cereal crops under rainfed conditions. Agronomy Journal 100:277-284.

37
Basak M.N., Sen S.K., Bhattacharjee P.K. 1962. Effects of high nitrogen
fertilization and lodging on rice yield. Agronomy Journal 54:477-480.
Benbi D.K., Biswas C.R., Kalkat J.S. 1991. Nitrate distribution and accumulation
in an ustochrept soil profile in a long term fertilizer experiment. Fertilizer
Researcher 28:173-177.
Bijay-Singh, Yadvinder-Singh, G.S. Sekhon. 1995. Fertilizer-N use efficiency and
nitrate pollution of groundwater in developing countries. Journal of Contaminant
Hydrology 20:167-184.
Binder D.L., Sander D.H., Walkters D.T. 2000. Maize response to time of
nitrogen application as affected by level of nitrogen deficiency. Agronomy Journal
92:1228-1236.
Blackmer A.M., Pottker D., Cerrate M.E., Wedd J. 1989. Correlations between
soil nitrate concentrations in late spring and corn yields in Iowa. Journal of
Production Agriculture 2:103-109.
Bouquet D.J., and A.B. Coco. 1994. Crop sequence effects on the productivity
and organic matter content of Mississippi River alluvial soils. P. 77-82. In P.J.
Bauer and W.J. Busscher (ed.) Proc. S. Conservation Tillage Conference for
Sustainable Agriculture., Columbia, SC. 7-9 June 1994.
Broadbent F.E., Hill G.N., Tyler K.B. 1958. Transformations and Movement of
urea in Soils. Soil Science Society of America 22:303-307.
Castleberry B.M., Crum C.W., Krull C.F. 1984. Genetic yield improvement of U.S. maize cultivars under varying fertility and climatic environments. Crop Science 24:33-36.
Collins N.C., Webb C.A., Seah S., Ellis J.G., Hulbert S.H., Pryor A. 1998. The isolation and mapping of disease resistance gene analogs in maize. Molecular Plant-microbe Interactions 11:968-978. Devitt D., Letey J., Lund L.J., Blair J.W. 2002. Nitrate-nitrogen movement through soil as affected by soil profile characteristics. Journal of Environmental Quality 5:283-288.
Eck H.V., 1984. Irrigated corn yield response to nitrogen and water. Agronomy
Journal 76:421-428.
38
Ercoli L., Mariotti M., Masoni A.,Bonari E. 1999. Effect of irrigation and nitrogen fertilization on biomass yield and efficiency of energy use in crop production of Miscanthus. Field Crops Research Journal 63:3-11. Family Search. 2015. Tensas Parish, Louisiana Genealogy. Available on-line at
https://familysearch.org/learn/wiki/en/Tensas_Parish,_Louisiana_Genealogy.
Verfied April 17, 2015.
Fernandez J., Murilo J., Moreno F., Cabrera F., Fernandez-Boy E. 1998.
Reducing fertilization for maize in southwest Spain. Communication in Soil
Science and Plant Analysis 29:2829–2840
Foley J. 2013. It’s time to rethink America’s corn system. Ensia. Available on-line at http://ensia.com/voices/its-time-to-rethink-americas-corn-system/?viewAll=1 Verified May 1, 2015. Fox R.H., and Hoffman L.D. 1981. The effect of N fertilizer source on grain yield, N uptake, soil pH, and lime requirement in no-till corn. Agronomy Journal 73:891-895. Gehl R.J., Schmidt J.P., Maddux L.D., Gordon W.B. 2005. Corn yield response to
nitrogen rate and timing in sandy irrigated soils. Agronomy Journal 97:1230-
1238.
Gerwing J.R., Caldwell A.C., Goodroad L.L. 1979. Fertilizer nitrogen distribution
under irrigation between soil, plant, and aquifer. Journal of Environmental Quality
8:281-284.
Halvorson A.D., Schweissing F.C., Bartolo M.E., Reule C.A. 2005. Corn response to nitrogen fertilization in a soil with high residual nitrogen. Agronomy Journal 97:1222-1229. Hanway J.J. 1962. Corn growth and composition in relation to soil fertility: II. Uptake of N,P, and K and their distribution in different plant parts during the growing season. Agronomy Journal 54:217-222
Herron G.M., Dreier A.F., Flowerday A.D., Colville W.L., Olson R.A. 1971.
Residual mineral N accumulation in soil and its utilization by irrigated corn (Zea
mays L.) Agronomy Journal 63, March-April.
Ju X. T., Liu X.J., Zhang F.S. 2003. Accumulation and movement of NO3-N in soil profile in winter wheat-summer maize rotation system. Acta Pedologica Sinica 40:538-546.
39
Kandil E.E.E. 2013. Response of some maize hybrids (Zea mays. L.) to different
levels of nitrogenous fertilization. Journal of Applied Sciences Research 9:1902-
1908.
Keeney D. R., and D.W. Nelson. 1982. Nitrogen-Inorganic forms. Methods of Soil Analysis 9:643-698. Krantz B.A., Ohlrogge A.J., Scarseth G.D. 1943. Movement of nitrogen in soils. Proceedings-Soil Science Society of America pp. 189-191. Long D.H., Lee F.N., TeBeest D.O. 2000. Effect of nitrogen fertilization on disease progress of rice blast on susceptible and resistant cultivars. Plant Disease 84:403-409. Lopez-Bellido L., Lopez-Bellido R.J., Redondo R. 2005. Nitrogen efficiency in wheat under rainfed mediterranean conditions as affected by split nitrogen application. Field Crops Research Journal 94:86-97. Magdoff F.R., Ross D., Amadon J. 1984. A soil test for nitrogen availability to corn. Soil Society of America Journal 48:1301-1304. Magdoff F.R. 1991. Understanding the magdoff pre-sidedress nitrate test for
corn. Journal of Production Agriculture 4:297-305.
Major J., Rondon M., Molina D., Riha S.J., Lehmann J. 2010. Maize yield and nutrition during 4 years after biochar application to a colombian savanna oxisol. Plant and Soil 333:117-128. Mascagni H.J. and Boquet D.J. 1996. Starter fertilizer and planting date effects
on corn rotated with cotton. Agronomy Journal 88:975-982.
Mukhtar S., Kanwar R.S., Baker J.L. 1990. Corn grown as affected by excess soil
water. Agricultural and Biosystems Engineering Publications (pp. 437-442)
Retrieved from http://lib.dr.iastate.edu/abe_eng_pubs/487/. Verified April 13th,
2015.
National Corn Growers Association. 2013. World of Corn. Available on-line at http://www.ncga.com/upload/files/documents/pdf/WOC%202013.pdf Verified April 30, 2015. Olsen R.J., Hensler R.F., Attoe O.J., Witzel S.A., Peterson L.A. 1970. Fertilizer nitrogen and crop rotation in relation to movement of nitrate nitrogen through soil profiles. Soil Science Society of America Journal 34:448-452.

40
Ping J.L., Ferguson R.B., Dobermann A. 2008. Site-specific nitrogen and plant
density management in irrigated maize. Agronomy Journal 100:1193-1204.
Pomares-Garcia F. and Pratt P.F. 1978. Recovery of 15N-labeled fertilizer from
manured and sludge-amended soil. Soil Science Society of America Journal
42:717-720.
Power J.F., and Schepers J.S. 1989. Nitrate contamination of groundwater in North America. Agriculture, Ecosystems, and Environment Journal 26:165-187. Raun W.R., Solie J.B., Johnson G.V., Stone M.L., Lukina E.V., Thomason W.E., Schepers J.S. 2001. In-season prediction of potential grain yield in winter wheat using canopy reflectance. Agronomy Journal 93:131-138. Reardon, J. Salicylate method for the quantitative determination of ammonia nitrogen. Patent no. 3,432,395. Filed June 8, 1966. Ros G.H., Hanegraaf E., Hoffland E., Riemsdijk W.H. 2011. Predicting soil N
mineralization: Relevance of organic matter fractions and soil properties. Soil
Biology Biochemistry 43:1714-1722.
Samira M., Hussein A., Haikel M.A., El-Masry M.A., 1998. Effect of some
preceding crops, hill spacing and nitrogen fertilization on yield attributes and
grain yield of maize under reclaimed sandy soil conditions in East Delta. Proc. 8th
Conference Agronomy, Suez Canal University. Ismailia, Egypt. 28-29 November.
pp. 174-181.
SAS. 2012. The SAS system for Windows. Version 9.3. Cary, NC: SAS Institute. Saxena K.M., and Hooker A.L. 1968. On the structure of a gene for disease resistance in maize. Proceedings of the National Academy of Sciences of the United States of America 61:1300-1305. Schlegel A.J., and Havlin J.L. 2013. Corn response to long-term nitrogen and
phosphorus fertilization. Journal of Production Agriculture 8:181-185.
Schmitt M.A., and Randall G.W. 2013. Developing a soil nitrogen test for
improved recommendations for corn. Journal of Production Agriculture 7:328-
334.
Shapiro C.A., and Wortmann C.S. 2006. Corn response to nitrogen rate, row
spacing, and plant density in eastern Nebraska. Agronomy Journal 98:529-535.
41
Sinclair T.R. 1986. Water and nitrogen limitations in soybean grain production. I. Model development. Field Crops Research Journal 15:125-141.
Singh N.T., Vig A.C., Singh R. 1985. Nitrogen response of maize under
temporary flooding. Fertilizer Research 60:111-120.
Smil V. 1999. Nitrogen in crop production: An account of global flows. Global Biochemical Cycles 13:647-662. Stanley F.A., and Smith G.E. 1956. Effect of soil moisture and depth of application on retention of anhydrous ammonia. Soil Science Society of America Journal 20:557-561. Tollenaar M., and Lee E.A. 2002. Yield potential, yield stability and stress tolerance in maize. Field Crops Research 75:161-169. Tremblay N., Bouroubi Y.M., Belec C., Mullen R.W., Kitchen N.R., Thomason
W.E., Ebelhar S., Mengel D.B., Raun W.R., Francis D.D., Vories E.D., Ortiz-
Monasterio I. 2012. Corn response to nitrogen is influenced by soil texture and
weather. Agronomy Journal 104:1658-1671.
United States Department of Agriculture - Economic Research Service. 2013. Corn Overview. Available on-line at http://www.ers.usda.gov/topics/crops/corn.aspx. Verified April 11th, 2015. United States Department of Agriculture – National Agricultural Statistics Service.
2014. Quick Stats (U.S./states). Available on-line at
http://www.nass.usda.gov/Quick_Stats/Ag_Overview/stateOverview.php?state=L
OUISIANA. Verified April 11th, 2015.
United States Department of Agriculture - National Cooperative Soil Survey. 2003. Gigger Series. Official Soil Series Description (OSD). Available on-line at https://soilseries.sc.egov.usda.gov/OSD_Docs/G/GIGGER.html. Verified April 7, 2015.
United States Department of Agriculture - National Cooperative Soil Survey. 2013. Sharkey Series. Official Soil Series Description (OSD). Available on-line at https://soilseries.sc.egov.usda.gov/OSD_Docs/S/SHARKEY.html. Verified April 7, 2015.

42
Varvel G., Schepers J.S., Francis D.D. 1997. Ability for in-season correction of nitrogen deficiency in corn using chlorophyll meter. Soil Science Society of America Journal 61:1233–1239. Varvel G. E., and Todd A.P. 1990. Nitrogen fertilizer recovery by corn in monoculture and rotation systems. Agronomy Journal 82:935-938. Weindorf D.C. 2008. An update of the field guide to Louisiana soil classification. LSU AgCenter Bulletin. 889. Louisiana Agriculture Experiment Station, Baton Rouge, LA. Wessels Living History Farm. 2015. Postwar fertilizer explodes. Written by Bill Ganzel and Claudia Reinhardt of the Ganzel Group. Available on-line at http://www.livinghistoryfarm.org/farminginthe40s/crops_04.html Verified on May 12, 2015. Wisser R.J., Balint-Kurti P.J., Nelson R.J. 2006. The genetic architecture of disease resistance in maize: A synthesis of published studies. Phytopathology 96:120-129. Zhen-xie Y., Pu W., Zhang H., Li-xia S. 2006. Effect of type and application rate of nitrogen fertilizer on development and nitrogen utilization in summer maize. Acta Agriculturae Boreali-Sinica 1:025. Zhu Q., Schmidt J.P., Lin H.S., Sripada R.P. 2009. Hydropedological processes
and their implaications for nitrogen availability to corn. Geoderma 154:111-122.
Zhu Z.L., and Chen D.L. 2002. Nitrogen fertilizer use in china-contributions to food production, impacts on the environment and best management strategies. Nutrient Cycling in Agroecosystems 63:117-127.

43
Chapter 3. Documenting the Changes in Inorganic Nitrogen Level and
Distribution in Soil Profile Within and Across Cropping Seasons at Varying
Nitrogen Fertilization Levels.
3.1 Introduction
Over application of nitrogen (N) fertilizers can have detrimental effects to
both crop production and the surrounding environment. Several studies have
been conducted to determine N movement and its impacts on crop physiology
and the environment (Krantz et al., 1943; Devitt et al., 1976; Gerwing et al., 1979;
Datta et al., 1997; Pacheco and Cabrera, 1997; Di and Cameron, 2002). Aside
from the negative physiological impacts that can occur in crops, ground and
surface waters can become polluted when excess fertilizer is applied. Today,
nitrate (NO3) is one of the top water pollutants across the globe (Spalding and
Exner, 1993). Agricultural runoff is considered to be a non-point source of NO3
pollution, but NO3 pollutions can also come from point sources such as irrigation
of land by sewage effluent (Keeney, 1986; Bouchard et al., 1992; Eckhardt and
Stackelberg, 1995; Mclay et al., 2001; Babiker et al., 2004). Since agricultural
fertilization has the potential to be a big factor in groundwater contamination, N
decision tools have begun to be developed as a means of regulating N fertilizer
applications by determining if N application will significantly increase yields. One
such tool is the Pre-Sidedress Nitrate Test developed by Magdoff et al. (1984).
This test takes into account the soil NO3-N present in the soil when the crop is
15-30 cm tall and roughly two weeks prior to in-season N application. With this
information, proper recommendations can be made to maximize yield without
over applying fertilizer N. Another N decision tool is the use of optical sensors to

44
determine if N application will boost yields. Raun et al. (2001) developed this
method which essentially determines the proper N application by measuring crop
reflectance with optical sensors of an adequately N fertilized crop and a crop that
is fertilized using a standard farmer’s practice. The difference in these two
readings is called a response index and this can be used to determine if added N
fertilizer will improve yields. The general theme for these tools is that they take
into account residual N that may have carried over from the previous year. Bundy
and Malone (1988) concluded that profile NO3-N can significantly influence corn
(Zea mays) response to applied N and may be useful on soils in humid areas. In
a study performed by Meisinger (1984), it was pointed out that soil characteristics
and precipitation data would be required to properly estimate soil NO3-N carrying
over into another cropping season. Carryover of profile NO3-N in humid regions is
dependent to a large part upon over winter precipitation (Bundy and Malone,
1988).
Although research has been conducted to determine inorganic N seasonal
patterns in the soil profile throughout the US, limited research has been carried
out in the northern Louisiana area. Therefore, this study was conducted to
document the seasonal changes in soil profile inorganic N at varying N rates on
two different soil types.
3.2 Materials and Methods
3.2.1 Site Description, Treatment Structure, and Trial Establishment
This study was conducted across all four site-years from 2013-2014. Two
soils of differing textures in Northeastern LA were selected to address the

45
objective of this study. A Sharkey clay soil in St. Joseph, LA (31°, 56’, 28.94” N,
91°, 14’, 11.43” W) and a Gigger silt loam soil in Winnsboro, LA (32°, 08’, 22.05”
N; 91° 41’, 13.93” W). St. Joseph is located in in Tensas Parish while Winnsboro
is in Franklin Parish hereafter termed as NERS and MRRS, respectively. The
Sharkey clay is a heavy textured soil classified as; very fine, smectitic, thermic
Chromic Epiaquerts. (USDA, 2013) This soil is very deep, poorly to very poorly
drained, very slowly permeable that formed in a clayey alluvium. Gigger silt loam
soil is classified as; fine-silty, mixed, active, thermic, Typic Frafiudalfs. (USDA,
2003) and is described as, very deep, moderately well drained, slowly permeable
soils with fragipans that formed in a thin mantle of loess over loamy sediments.
All four site-years were established and managed under an irrigated system. No
tillage took place for both locations throughout the 2 year study. Irrigation at
NERS was supplied using furrow irrigation via poly pipe and overhead sprinkler
irrigation was used at MRRS. Tables containing information on initial soil
chemical properties (Table 3), (Table 3.2), and soil sampling dates (Table 3.3)
are provided below. Corn hybrid varieties used were Pioneer 2088HYR and
Pioneer 1319HR on Sharkey clay and Gigger silt loam, respectively. Seeds were
80,000 seeds per hectare with spacing being 30 cm between seeds. Irrigation
was used when necessary via a poly pipe irrigation system for Sharkey clay soil
and an overhead sprinkler system for Gigger silt loam soil. This study was
superimposed from an existing trial on corn response to N rate and application
time. The treatment structure is provided in Table 3.4. The applications of 0,
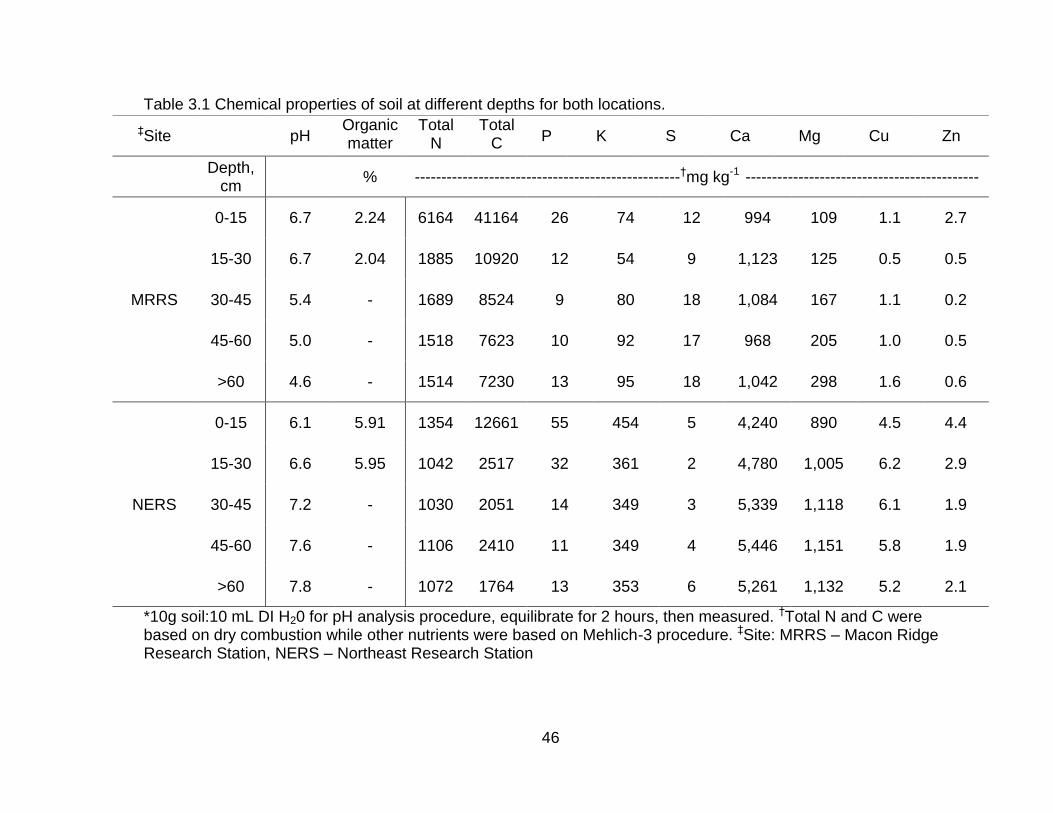
46
Table 3.1 Chemical properties of soil at different depths for both locations.
*10g soil:10 mL DI H20 for pH analysis procedure, equilibrate for 2 hours, then measured. †Total N and C were based on dry combustion while other nutrients were based on Mehlich-3 procedure. ‡Site: MRRS – Macon Ridge Research Station, NERS – Northeast Research Station
‡Site pH Organic matter
Total N
Total C P K S Ca Mg Cu Zn
Depth, cm
% --------------------------------------------------†mg kg-1 --------------------------------------------
MRRS
0-15 6.7 2.24 6164 41164 26 74 12 994 109 1.1 2.7
15-30 6.7 2.04 1885 10920 12 54 9 1,123 125 0.5 0.5
30-45 5.4 - 1689 8524 9 80 18 1,084 167 1.1 0.2
45-60 5.0 - 1518 7623 10 92 17 968 205 1.0 0.5
>60 4.6 - 1514 7230 13 95 18 1,042 298 1.6 0.6
NERS
0-15 6.1 5.91 1354 12661 55 454 5 4,240 890 4.5 4.4
15-30 6.6 5.95 1042 2517 32 361 2 4,780 1,005 6.2 2.9
30-45 7.2 - 1030 2051 14 349 3 5,339 1,118 6.1 1.9
45-60 7.6 - 1106 2410 11 349 4 5,446 1,151 5.8 1.9
>60 7.8 - 1072 1764 13 353 6 5,261 1,132 5.2 2.1

47
Table 3.2 Field activity dates and plot size for MRRS and NERS for years 2013 and 2014.
*V# = leaf collar stage of corn crop. † - length x width.
Site-year Designation
Plot Size,† m
Planting *Early-season N application
*Midseason N application
Harvest
MRRS 2013 13.76 x 4 10-Mar-13 27-Mar-13 (V3) 23-May-13
(V7-V8) 16-Aug-13
NERS 2013 12.19 x 4 28-Mar-13 30-Apr-13 (V5) 20-May-13
(V8-V9) 27-Aug-13
MRRS 2014 13.76 x 4 19-Mar-14 6-Apr-14 (V3) 8-May-14 (V8-V9)
19-Aug-14
NERS 2014 13.76 x 4 21-Apr-14 8-May-14 (V3) 27-May-14
(V8-V9) 16-Sept-14

48
Table 3.3 Record of soil sampling dates for MRRS and NERS in 2013 and 2014.
*Sampling conducted in February. ¶Sampling conducted in September at harvest due to late planting. ╒May sampling times were conducted when crop was at V8 leaf stage. ‡Sampling did not occur due to poor field conditions.
Site-Year March ╒May August October December
MRRS 2013 7-Mar-2013 22-May-2013 19-Aug-2013 26-Oct-2013 18-Dec-2013
NERS 2013 21-Mar-2013 17-May-2013 27-Aug-2013 31-Oct-2013 ‡
MRRS 2014 *18-Feb-2014 8-May-2014 19-Aug-2014 27-Oct-2014 18-Dec-2014
NERS 2014 27-Mar-2014 26-May-2014 ¶16-Sept-2014 21-Oct-2014 18-Dec-2014
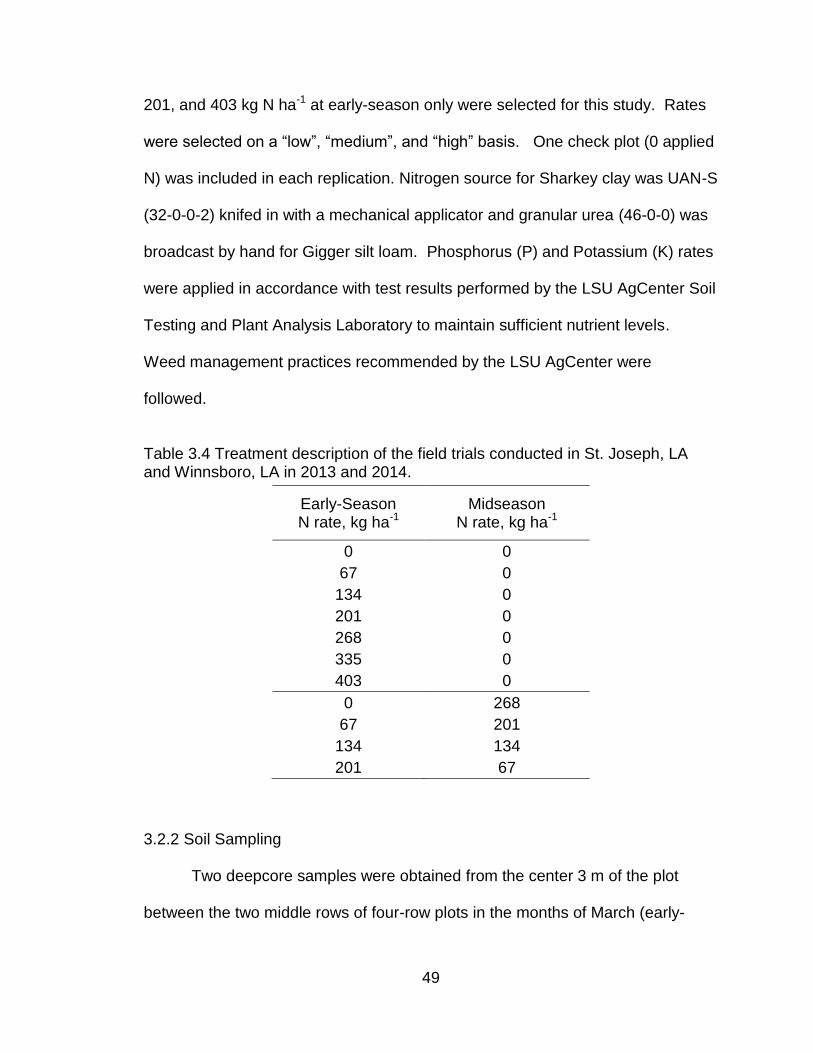
49
201, and 403 kg N ha-1 at early-season only were selected for this study. Rates
were selected on a “low”, “medium”, and “high” basis. One check plot (0 applied
N) was included in each replication. Nitrogen source for Sharkey clay was UAN-S
(32-0-0-2) knifed in with a mechanical applicator and granular urea (46-0-0) was
broadcast by hand for Gigger silt loam. Phosphorus (P) and Potassium (K) rates
were applied in accordance with test results performed by the LSU AgCenter Soil
Testing and Plant Analysis Laboratory to maintain sufficient nutrient levels.
Weed management practices recommended by the LSU AgCenter were
followed.
Table 3.4 Treatment description of the field trials conducted in St. Joseph, LA and Winnsboro, LA in 2013 and 2014.
3.2.2 Soil Sampling
Two deepcore samples were obtained from the center 3 m of the plot
between the two middle rows of four-row plots in the months of March (early-
Early-Season N rate, kg ha-1
Midseason N rate, kg ha-1
0 0
67 0
134 0
201 0
268 0
335 0
403 0
0 268
67 201
134 134
201 67
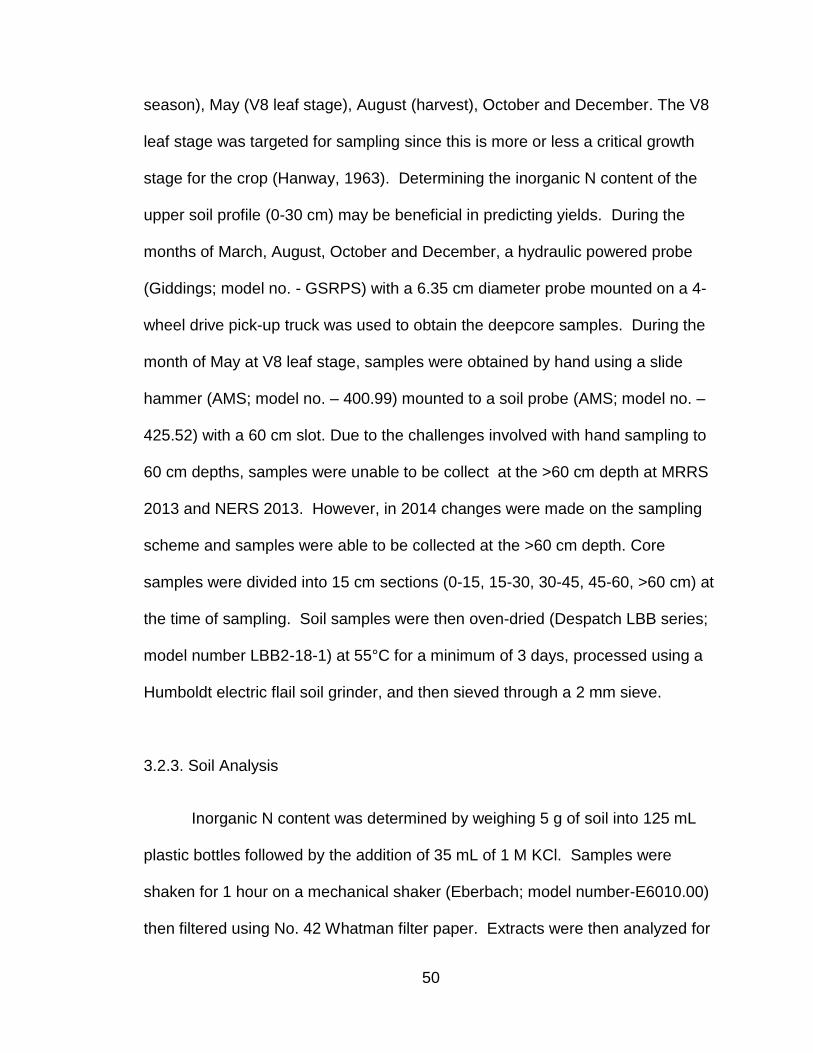
50
season), May (V8 leaf stage), August (harvest), October and December. The V8
leaf stage was targeted for sampling since this is more or less a critical growth
stage for the crop (Hanway, 1963). Determining the inorganic N content of the
upper soil profile (0-30 cm) may be beneficial in predicting yields. During the
months of March, August, October and December, a hydraulic powered probe
(Giddings; model no. - GSRPS) with a 6.35 cm diameter probe mounted on a 4-
wheel drive pick-up truck was used to obtain the deepcore samples. During the
month of May at V8 leaf stage, samples were obtained by hand using a slide
hammer (AMS; model no. – 400.99) mounted to a soil probe (AMS; model no. –
425.52) with a 60 cm slot. Due to the challenges involved with hand sampling to
60 cm depths, samples were unable to be collect at the >60 cm depth at MRRS
2013 and NERS 2013. However, in 2014 changes were made on the sampling
scheme and samples were able to be collected at the >60 cm depth. Core
samples were divided into 15 cm sections (0-15, 15-30, 30-45, 45-60, >60 cm) at
the time of sampling. Soil samples were then oven-dried (Despatch LBB series;
model number LBB2-18-1) at 55°C for a minimum of 3 days, processed using a
Humboldt electric flail soil grinder, and then sieved through a 2 mm sieve.
3.2.3. Soil Analysis
Inorganic N content was determined by weighing 5 g of soil into 125 mL
plastic bottles followed by the addition of 35 mL of 1 M KCl. Samples were
shaken for 1 hour on a mechanical shaker (Eberbach; model number-E6010.00)
then filtered using No. 42 Whatman filter paper. Extracts were then analyzed for
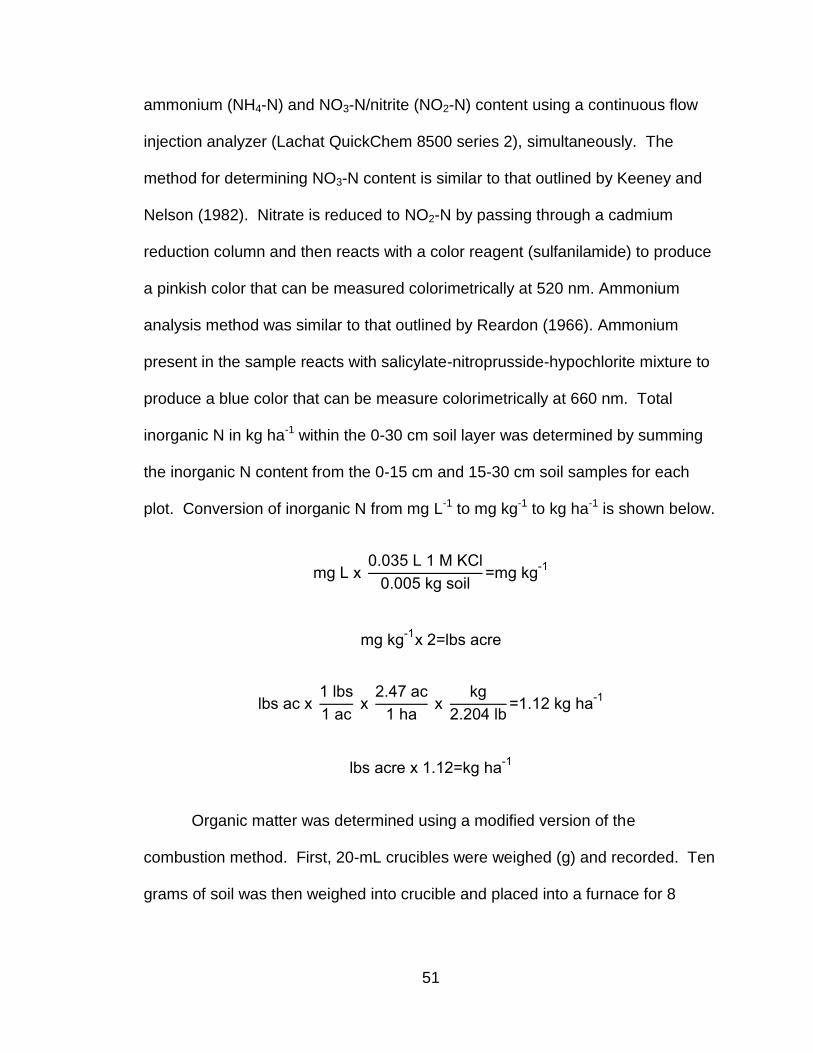
51
ammonium (NH4-N) and NO3-N/nitrite (NO2-N) content using a continuous flow
injection analyzer (Lachat QuickChem 8500 series 2), simultaneously. The
method for determining NO3-N content is similar to that outlined by Keeney and
Nelson (1982). Nitrate is reduced to NO2-N by passing through a cadmium
reduction column and then reacts with a color reagent (sulfanilamide) to produce
a pinkish color that can be measured colorimetrically at 520 nm. Ammonium
analysis method was similar to that outlined by Reardon (1966). Ammonium
present in the sample reacts with salicylate-nitroprusside-hypochlorite mixture to
produce a blue color that can be measure colorimetrically at 660 nm. Total
inorganic N in kg ha-1 within the 0-30 cm soil layer was determined by summing
the inorganic N content from the 0-15 cm and 15-30 cm soil samples for each
plot. Conversion of inorganic N from mg L-1 to mg kg-1 to kg ha-1 is shown below.
mg L x 0.035 L 1 M KCl
0.005 kg soil=mg kg
-1
mg kg-1
x 2=lbs acre
lbs ac x 1 lbs
1 ac x
2.47 ac
1 ha x
kg
2.204 lb=1.12 kg ha
-1
lbs acre x 1.12=kg ha-1
Organic matter was determined using a modified version of the
combustion method. First, 20-mL crucibles were weighed (g) and recorded. Ten
grams of soil was then weighed into crucible and placed into a furnace for 8

52
hours at 550° C. After cooling, samples were weighed again and percent organic
matter was estimated using the following equation:
Equation 3.1
% OM= Crucible+soil before combution-Cricible+soil after combustion
Crucible+soil before combustion x 100
3.2.4 Grain Yield
At harvest, a plot combine (Massey Ferguson 8XP) was used to collect
grains from the two middle rows of each plot. The harvester was equipped with
Harvest Master Instrumentation to determine plot weight. Sub samples were
taken to determine grain moisture and seed weight. Grain moisture for all four
site-years was determined using a grain analysis computer (Dickey-john; model
number – GAC2500 UGMA) for further analysis once plot yield was determined.
Grain moisture was adjusted to 155 g kg-1 and yield was calculated in bushels
per acre and then converted to kg ha-1 using the following equations:
Equation 3.2
Yield 155 g kg-1 moist adj. (lbs/ac)= [
Plot yield (lbs)
(Plot size (ft
2)
43560)
] x [(100-moisture content)
(100-15.5)]
Equation 3.3
Adjusted yield (bu/ac)= 155 g kg-1 moist adj. (lbs/ac)
56

53
Equation 3.4
Yield (kg ha-1
)=Yield (bu/ac) x 56 lbs
bux
1 kg
2.2 lbsx
2.47 ac
ha
3.2.5 Soil Texture Analysis
One soil core was taken from each site to a depth of >60 cm, divided into
15 cm sections, and analyzed to determine soil texture. Texture analysis was
performed using a modified version of the hydrometer (Humboldt; model no. –
H4241) method similar to that outlined by Kettler et al. (2001). First, 10 g of soil
were weighed and oven dried (Yamato DKN600) at 90° C for 24 hours and then
weighed again to determine the soil moisture factor (SMF). Soil samples
weighing either 30 g or 25 g (depending on clay content) were placed into 500
mL shake bottles. Twenty mL of 10% sodium hexametaphosphate was then
added followed by about 250 mL of deionized water. Samples were then shaken
(Eberbach; model number-E6010.00) over night or for about 16-20 hours. After
shaking, a USA standard test sieve No. 270 was used to sift out the sand portion
of the samples. Sand portions were then transferred to a small glass beaker of
which the weights were pre-recorded and oven dried (Yamato DKN600) for about
24 hours at 90° C and then weighed (g). Remaining mixture of silt and clay was
then transferred to a 1000 mL graduated cylinder. Deionized water was added to
make a 1000 mL suspension, mixed with a plunger, then left undisturbed for 6
hours. Clay portions were measured using the hydrometer. Hydrometer readings
were adjusted using a blank that followed the same process as the soil samples.
54
Silt portion was determined by subtracting sand and clay portions from one.
Equations used for particle size analysis can be found below.
Equation 3.5
SMF= 10 g soil-Soil weight after drying (g)
Soil weight after drying (g)+1
Equation 3.6
Oven dry Wt. = Sample Wt. Shaken
SMF
Equation 3.7
Sand %= Dried sand from sieveing (g)
Oven Dry Wt.
Equation 3.8
Clay %= (Hydrometer Reading-Hydrometer Blank)
Oven Dry Wt.
Equation 3.9
Silt %=1-Sand %-Clay %
3.2.6 Weather Data Collection
Rainfall data for MRRS was measured at a weather station located in
Chase, LA about 5 miles south of the research trial. For NERS, rainfall was
measured using a rain gauge installed at the Northeast Research Station itself
located less than one mile from the research trial.
55
3.2.7 Statistical Analysis of Measured Parameters
For each site-year, measured parameters were analyzed by performing
analysis of variance using PROC MIXED procedure in SAS 9.3 (SAS, 2012).
Fixed variable was N treatment (rate and application scheme) and random
variables were replication and year. The least significant difference (LSD)
method at the 5% level of confidence was used to determine significant
differences among treatments unless otherwise indicated. Average, standard
error, and standard deviation of soil inorganic N content were computed using
Microsoft Excel 2010.
3.3 Results and Discussion
3.3.1 Texture Analysis
Soil texture data can be found in Table 3.5. For MRRS, soil texture was a
silt loam from 0-45 cm soil layer. From 45 to >60 cm soil layer, soil texture
changed to a silty clay loam. In NERS, soil texture was clay and consistent
throughout the profile.
3.3.2 Soil Profile Inorganic N Distribution
Results for MRRS 2013 and 2014 inorganic N distribution can be found in
Figures 3.1, 3.2, and 3.3. Inorganic N content throughout the profile had its
highest level during the month of March in 2013. Inorganic N content was
highest in the 0-15 cm layer for all sampling times. As depth increased, the
lowest inorganic N level was typically found in the 15-30 cm layer. Below this
layer inorganic N content slightly increased with each successive layer.
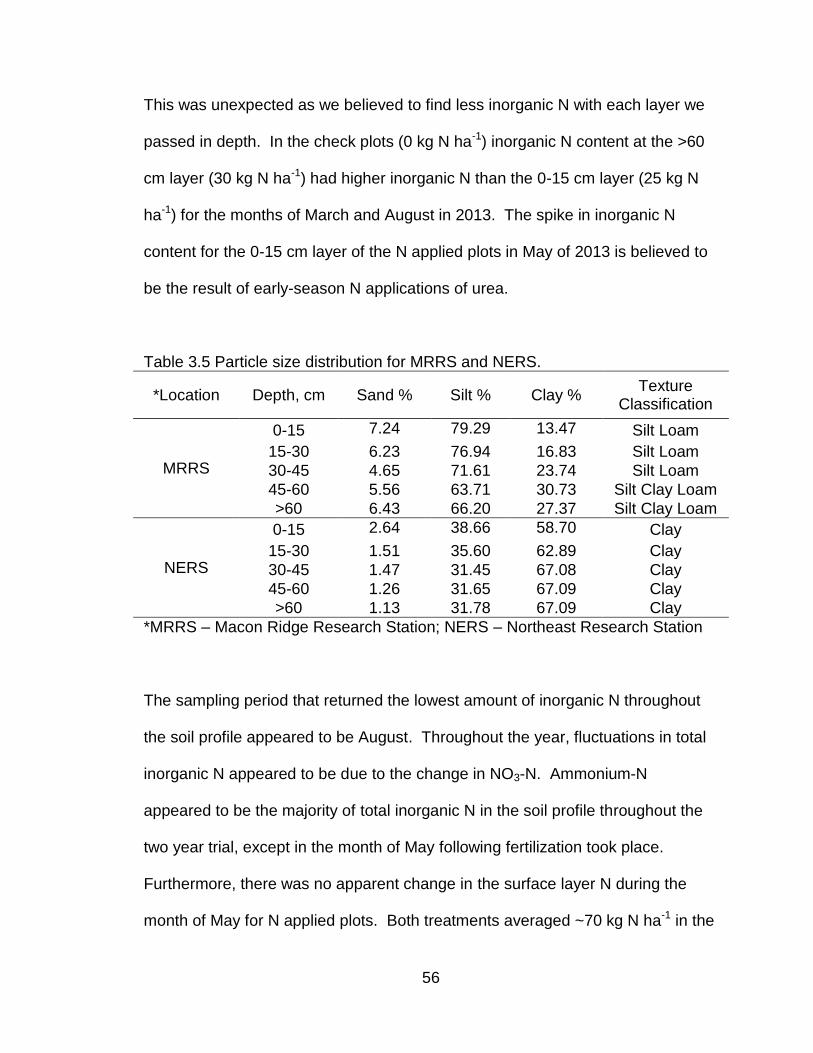
56
This was unexpected as we believed to find less inorganic N with each layer we
passed in depth. In the check plots (0 kg N ha-1) inorganic N content at the >60
cm layer (30 kg N ha-1) had higher inorganic N than the 0-15 cm layer (25 kg N
ha-1) for the months of March and August in 2013. The spike in inorganic N
content for the 0-15 cm layer of the N applied plots in May of 2013 is believed to
be the result of early-season N applications of urea.
Table 3.5 Particle size distribution for MRRS and NERS.
*Location Depth, cm Sand % Silt % Clay % Texture
Classification
MRRS
0-15 7.24 79.29 13.47 Silt Loam
15-30 6.23 76.94 16.83 Silt Loam
30-45 4.65 71.61 23.74 Silt Loam
45-60 5.56 63.71 30.73 Silt Clay Loam
>60 6.43 66.20 27.37 Silt Clay Loam
NERS
0-15 2.64 38.66 58.70 Clay
15-30 1.51 35.60 62.89 Clay
30-45 1.47 31.45 67.08 Clay
45-60 1.26 31.65 67.09 Clay
>60 1.13 31.78 67.09 Clay
*MRRS – Macon Ridge Research Station; NERS – Northeast Research Station
The sampling period that returned the lowest amount of inorganic N throughout
the soil profile appeared to be August. Throughout the year, fluctuations in total
inorganic N appeared to be due to the change in NO3-N. Ammonium-N
appeared to be the majority of total inorganic N in the soil profile throughout the
two year trial, except in the month of May following fertilization took place.
Furthermore, there was no apparent change in the surface layer N during the
month of May for N applied plots. Both treatments averaged ~70 kg N ha-1 in the

57
0-15 cm soil layer during the month of May and ~20 kg N ha-1 in the 15-30 cm
soil layer. Nitrogen rates appeared to have no effect on increasing inorganic N
content for these soil layers. The 15-30 cm soil layer reported similar inorganic N
amounts for both treatments; however, 403 kg N ha-1 applied plots showed an
increase in inorganic N content as depth increased when compared to 201 kg N
ha-1 applied plots. The high N rate plots reported a total inorganic N content of 35
kg N ha-1 with most of it being in NO3-N form (30 kg N ha-1) in the 45-60 cm soil
layer. Treatment 201 kg N ha-1 reported about 18 kg N ha-1 in total inorganic N
and 12 kg N ha-1 being in NO3-N form. This would suggest that the increased N
rate had an increasing effect on NO3-N leaching. All plots showed an increase in
inorganic N of the 0-15 cm soil layer in the month of October in 2013. The 0 and
201 kg N ha-1 treatments had values of about 28 kg N ha-1 while the 403 kg N ha-
1 treatment reported approximately 32 kg N ha-1. Rainfall during this time was
recorded as approximately 150 mm during September and 45 mm during
October in 2013.
For MRRS in 2014 soil samples were taken in February to determine if soil
inorganic N began to mineralize any sooner than March. This sampling period
returned low inorganic N levels that were less than 10 kg N ha-1 across all
treatments and less than the inorganic N content that was recorded in March
2013. Most of the inorganic N at this time was in NH4-N form. In May of 2014,
shortly after N treatments were applied, the site received ~65 mm of precipitation
within a short period followed by a period of standing water for approximately 24
hours. With this event, there is a possibility that the N fertilizer that was applied

58
was washed away leading to the reduction of inorganic N in the upper soil profile
and no spike during the 2014 growing season. A study by Shaw (1962) reported
that as much 134 kg N ha-1 of NO3-N can be removed from the upper 15 cm soil
layer by 20 cm of rain in a sandy soil. If an additional 20 cm of rain occurs, only
about 40% of the applied N remained in the 30-45 cm soil layer (Olsen et al.
1970). The trial also received rain over the course of one week from May 27,
2014 to June 2, 2014 that measured about 180 mm (Figure 3.4). Significant rain
events, which took place during the period of the trial, are shown in Figure 3.4.
August was once again a low point throughout the growing season with inorganic
N content being less than 10 kg N ha-1 across all treatments. However, increases
were noted in the 0-15 cm soil layer during the months of October and
December. Beneath the surface soil layer, inorganic N content varied little and
was less than that seen the previous year. One week prior to soil sampling in
October, the area experienced a four day rain event that dropped approximately
120 mm of rain on the trial. It is unknown if this rain event is responsible for the
reduction in inorganic N levels when compared to the previous year. The area
received a total of 2330 mm of rain throughout the year, which is much higher
than its normal total of 1650 mm. Four single rain events dropped over 80 mm of
rain throughout the year, three of which occurred during the months of
November. For MRRS 2014, approximately 915 mm of rain fell during the
growing season, which was much higher than the 560 mm of rain MRRS 2013
experienced.
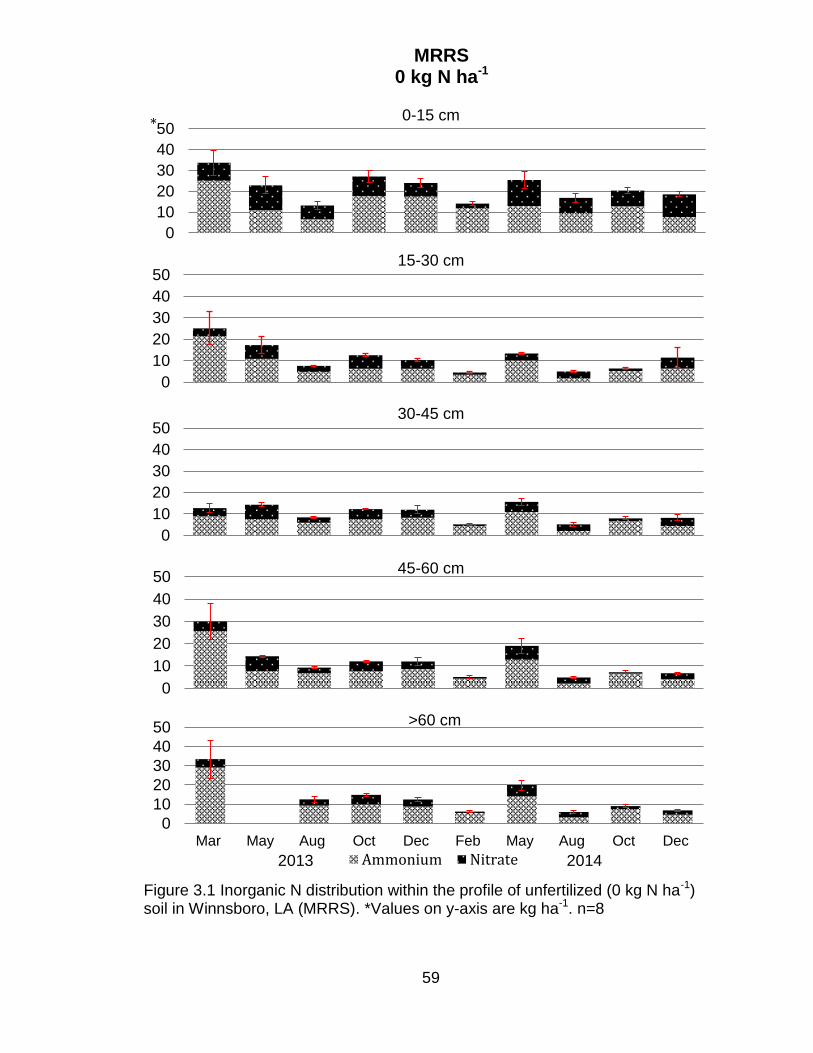
59
Figure 3.1 Inorganic N distribution within the profile of unfertilized (0 kg N ha-1) soil in Winnsboro, LA (MRRS). *Values on y-axis are kg ha-1. n=8
0
10
20
30
40
500-15 cm
0
10
20
30
40
5015-30 cm
0
10
20
30
40
5030-45 cm
0
10
20
30
40
5045-60 cm
0
10
20
30
40
50
Mar May Aug Oct Dec Feb May Aug Oct Dec
>60 cm
Ammonium Nitrate2013 2014
MRRS 0 kg N ha-1
*
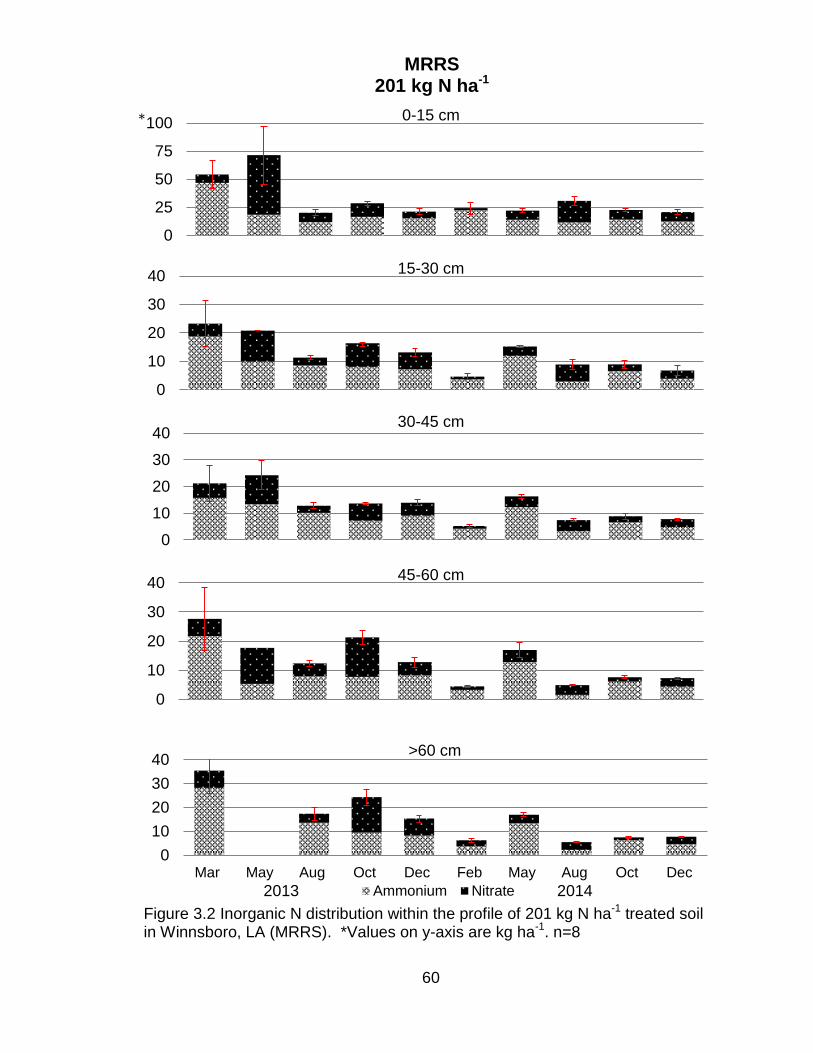
60
Figure 3.2 Inorganic N distribution within the profile of 201 kg N ha-1 treated soil in Winnsboro, LA (MRRS). *Values on y-axis are kg ha-1. n=8
0
25
50
75
1000-15 cm
0
10
20
30
4015-30 cm
0
10
20
30
4030-45 cm
0
10
20
30
4045-60 cm
0
10
20
30
40
Mar May Aug Oct Dec Feb May Aug Oct Dec
>60 cm
Ammonium Nitrate
MRRS 201 kg N ha-1
2013 2014
*
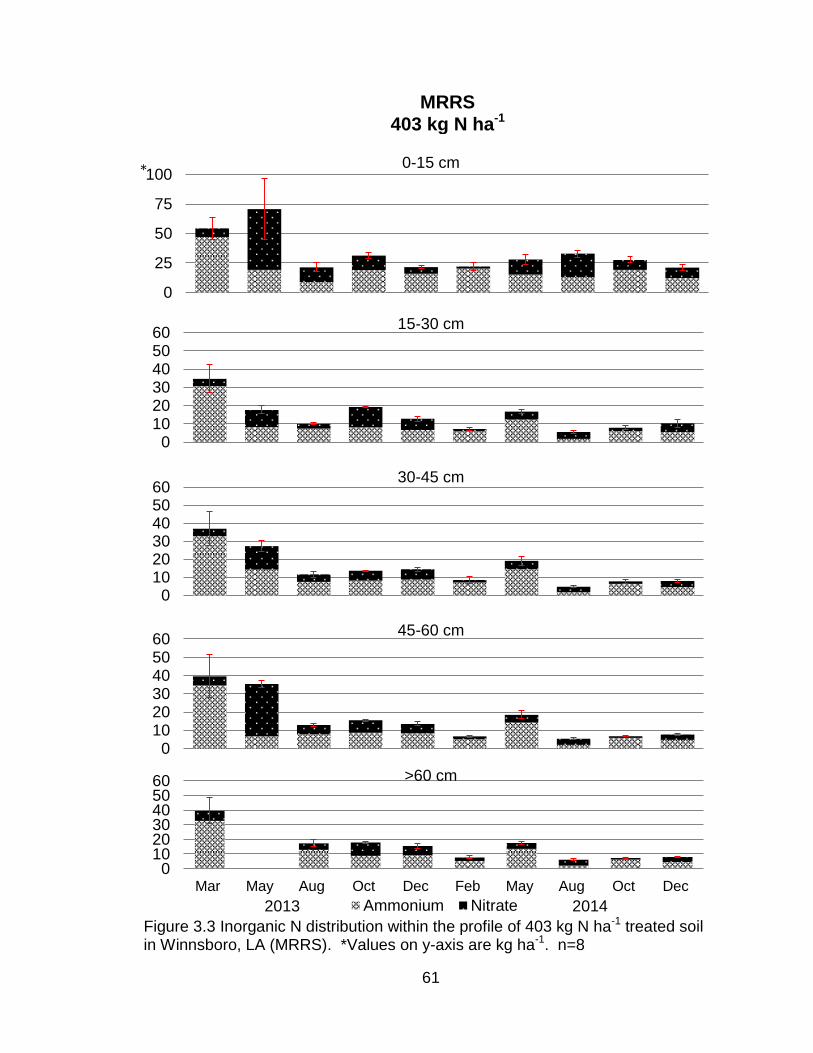
61
Figure 3.3 Inorganic N distribution within the profile of 403 kg N ha-1 treated soil in Winnsboro, LA (MRRS). *Values on y-axis are kg ha-1. n=8
0
25
50
75
1000-15 cm
0102030405060
15-30 cm
0102030405060
30-45 cm
0102030405060
45-60 cm
0102030405060
Mar May Aug Oct Dec Feb May Aug Oct Dec
>60 cm
Ammonium Nitrate2013 2014
MRRS
403 kg N ha-1
*
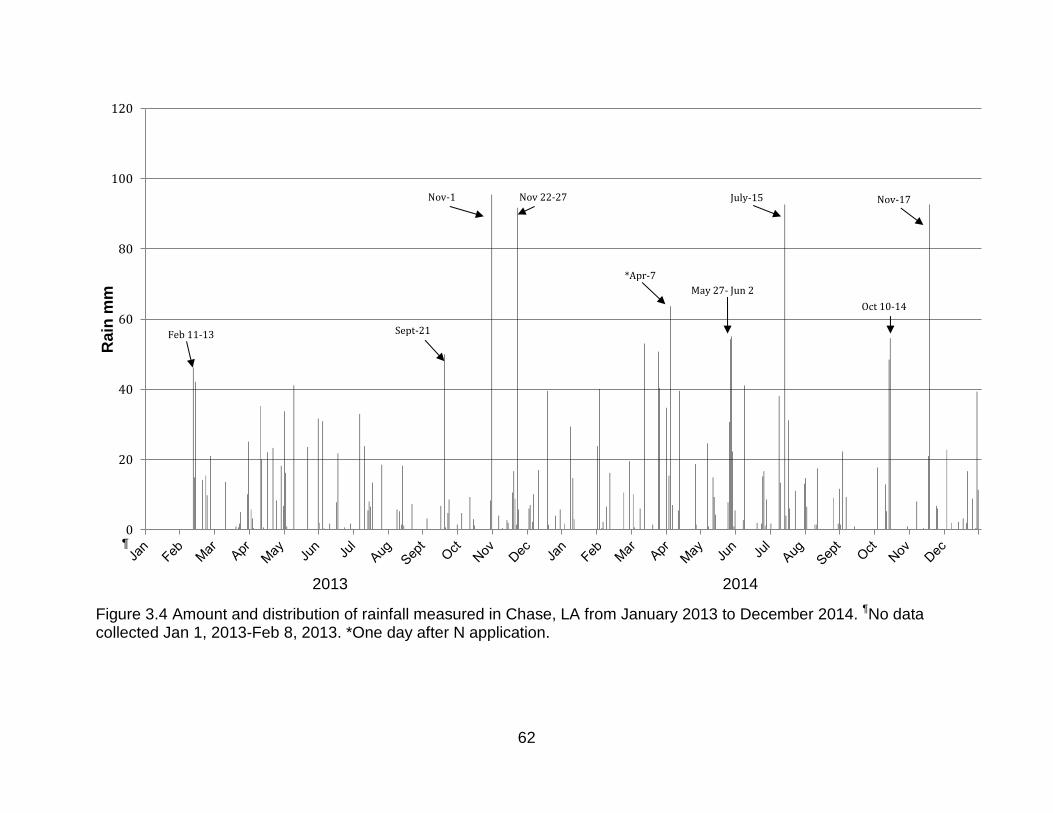
62
Figure 3.4 Amount and distribution of rainfall measured in Chase, LA from January 2013 to December 2014. ¶No data collected Jan 1, 2013-Feb 8, 2013. *One day after N application.
0
20
40
60
80
100
120R
ain
mm
Nov 22-27 Nov-1 July-15 Nov-17
*Apr-7
2013 2014
May 27- Jun 2
Oct 10-14
Sept-21 Feb 11-13
¶

63
Results for NERS 2013 and 2014 soil inorganic N distribution can be
found in Figures 3.5, 3.6, and 3.7. At NERS in 2013, reduction of inorganic N
content was more pronounced as depth increased throughout the Sharkey clay
profile. During the month of March, inorganic N content varied little across all
treatments and depths. Unlike MRRS, the month of March reported little
inorganic N content with the most being 35 kg N ha-1 in the 0-15 cm soil layer of
the check plots. In January, this location received approximately 250 mm of
within a week period (Figure 3.9). Whether this had a direct effect on the low
amount of inorganic N present in the soil by March was unclear. Similar to
MRRS, spikes in inorganic N were seen during the month of May, of which was
mostly NO3-N. This can be attributed to UAN fertilizer as the N source for this
location. Around 25% of the N in UAN fertilizers is in NO3 form (IPNI, 2015). For
both site-years, N application appeared to have an effect on increasing the soil
inorganic N content, although, only in the 0-15 cm soil layer. Inorganic N content
of this layer was ~60 kg N ha-1 for 201 kg N ha-1 treatment and ~195 kg N ha-1 for
403 kg N ha-1 treatment. At the lower depths, little variability was observed
during this sampling period with inorganic N content maintaining at ~20 kg N ha-1.
Inorganic N content for 403 kg N ha-1 treatment decreased by harvest in August
to less than 50 kg N ha-1 in the 0-15 cm soil layer and less than 20 kg N ha-1 for
soil layers; 30-45, 45-60 and >60 cm. The 201 kg N ha-1 treatment had similar
results. Similar to MRRS location, a slight increase in inorganic N content was
observed in October, potentially due to the breakdown of crop residue from

64
harvest. Unfortunately, soil sampling data for December for this site-year is not
available due to excessive moisture in the field.
Inorganic N distribution during the month of March in 2014 was similar to
the distribution patterns recorded in 2013. In May of 2014, another spike was
recorded that may potentially be due to fertilization. The 201 kg N ha-1 treatment
averaged approximately 160 kg N ha-1 with about 121 kg N ha-1 being NO3-N
while the 403 kg N ha-1 treatment averaged 205 kg N ha-1 with about 170 kg N
ha-1 being NO3-N. In both N applied treatments, soil inorganic N dropped
significantly in the 15-30 cm soil layer suggesting that most of the applied N
remained on the surface soil layer exposing it to potential loss processes such as
denitrification (Papendick and Campbell, 1981; Colbourn and Downdell, 1984;
Groffman and Tiedje, 1989). Similar to 2013, NO3-N reduced greatly by the time
of harvest and was less than 30% of total inorganic N found in the soil during the
months of October and December in 2014.
Results found in this study for this particular location are similar to those
found by Bergstrom and Brink (1985) that studied if NO3-N leaching increases
with N fertilizer rate in heavy clay soils. They found total inorganic N displayed
similar distribution patterns during September, or approximately harvesting time,
and the fallow months of October and December. Inorganic N amounts were less
than 40 kg ha-1 and decreased significantly with depth across treatments of 0,
100, and 200 kg N ha-1. However, they also found NO3-N accumulated in the 1.5
m to 3 m soil layers in the 200 kg N ha-1 treatment with NO3-N content of ~40 kg
N ha-1. Since this study only soil sampled to a depth of ~76 cm, we were unable
65
to determine if a NO3-N pooling effect was taking place in this heavy clay soil as
well. Bergstrom and Brink (1985) later concluded that applications of N over 100
kg ha-1 can increase the risk of introducing excess NO3 into the environment.
Probable causes for low residual N at the NERS location for both years may be
related to its soil texture and the climate of the area. Rainfall during the growing
season totaled approximately 725 mm. Leaching and denitrification can take
place in areas that receive high annual rainfall. In a study performed by Peterson
and Attoe (1965), retention of profile NO3-N was documented in some soils in the
humid Midwest (Bundy and Malone, 1988). Applications of large amounts of N
can certainly have an effect on the seasonal changes in profile N content
(Bergstrom and Brink, 1986).
3.3.3 Soil Inorganic N Content at V8 Leaf Stage and Its Effects on Yield
Results for soil inorganic N content in the upper 30 cm of the soil profile at
the V8 leaf stage can be found in Table 3.6 and Table 3.7. Maximum yields were
obtained for both site locations in 2013. Plots that had at least 80 kg N ha-1
produced yields of 10 Mg ha-1or more, while plots that contained less than 50 kg
N ha-1 returned yields less than 2 Mg in both locations. Conversely, 2014 showed
the opposite effect. In MRRS 2014, all plots averaged anywhere from 35 to 45
kg N ha-1, yet returned significantly different yields (P<0.001) with the highest
being the 403 kg N ha-1 treatment producing 8 Mg ha-1. For NERS 2014 despite
that the 0-30 cm soil layer had ~200 kg N ha-1 at the V8 leaf stage, yield level
was lower than the previous year. The late planting is believed to be the primary
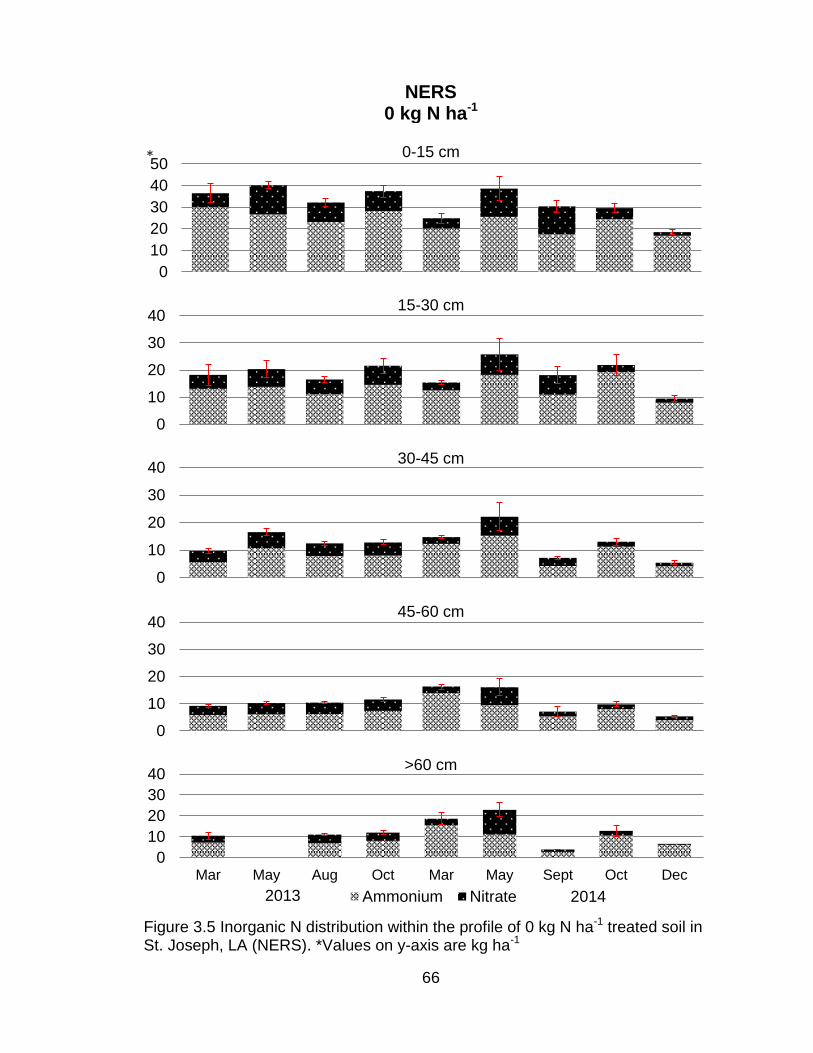
66
Figure 3.5 Inorganic N distribution within the profile of 0 kg N ha-1 treated soil in St. Joseph, LA (NERS). *Values on y-axis are kg ha-1
0
10
20
30
40
500-15 cm
0
10
20
30
4015-30 cm
0
10
20
30
4030-45 cm
0
10
20
30
4045-60 cm
0
10
20
30
40
Mar May Aug Oct Mar May Sept Oct Dec
>60 cm
Ammonium Nitrate
NERS 0 kg N ha-1
2013 2014
*

67
Figure 3.6 Inorganic N distribution within the profile of 201 kg N ha-1 treated soil in St. Joseph, LA (NERS). *Values on y-axis are kg ha-1.
0
50
100
150
2000-15 cm
0
10
20
30
4015-30 cm
0
10
20
30
40 30-45 cm
0
10
20
30
40 45-60 cm
0
10
20
30
40
Mar May Aug Oct Mar May Sept Oct Dec
>60 cm
Ammonium Nitrate
NERS 201 kg N ha-1
2013 2014
*

68
Figure 3.7 Inorganic N distribution within the profile of 403 kg N ha-1 treated soil in St. Joseph, LA (NERS). *Values on y-axis are kg ha-1.
0
50
100
150
200
2500-15 cm
0
10
20
30
40
5015-30 cm
0
10
20
30
40
5030-45 cm
0
10
20
30
40
5045-60 cm
01020304050
Mar May Aug Oct Mar May Sept Oct Dec
>60 cm
Ammonium Nitrate
NERS
403 kg N ha-1
2013 2014
*

69
Figure 3.8 Amount and distribution of rainfall measured in St. Joseph, LA from January 2013 to December 2014. *Rain recorded for 6 days, no rain Jan-13.
0
20
40
60
80
100
120
140R
ain
mm
*Jan 10-17
Nov-26
Jul-12
Sept-21
Mar-28
Apr 4-7
Aug 10-12
Aug-2
May-14
Oct-14
Nov-17
Dec-28
Jun-10
Jan-28
Nov-1 Jun-2
Apr 30-May 3
2013 2014
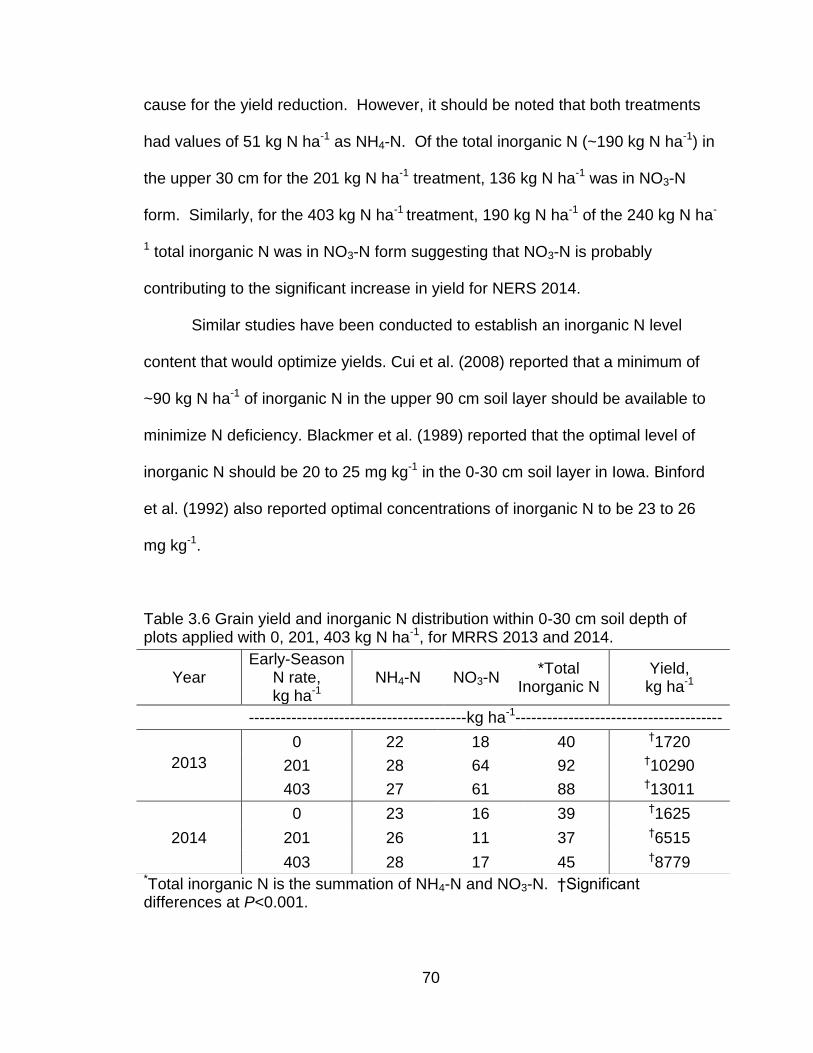
70
cause for the yield reduction. However, it should be noted that both treatments
had values of 51 kg N ha-1 as NH4-N. Of the total inorganic N (~190 kg N ha-1) in
the upper 30 cm for the 201 kg N ha-1 treatment, 136 kg N ha-1 was in NO3-N
form. Similarly, for the 403 kg N ha-1 treatment, 190 kg N ha-1 of the 240 kg N ha-
1 total inorganic N was in NO3-N form suggesting that NO3-N is probably
contributing to the significant increase in yield for NERS 2014.
Similar studies have been conducted to establish an inorganic N level
content that would optimize yields. Cui et al. (2008) reported that a minimum of
~90 kg N ha-1 of inorganic N in the upper 90 cm soil layer should be available to
minimize N deficiency. Blackmer et al. (1989) reported that the optimal level of
inorganic N should be 20 to 25 mg kg-1 in the 0-30 cm soil layer in Iowa. Binford
et al. (1992) also reported optimal concentrations of inorganic N to be 23 to 26
mg kg-1.
Table 3.6 Grain yield and inorganic N distribution within 0-30 cm soil depth of plots applied with 0, 201, 403 kg N ha-1, for MRRS 2013 and 2014.
*Total inorganic N is the summation of NH4-N and NO3-N. †Significant differences at P<0.001.
Year Early-Season
N rate, kg ha-1
NH4-N NO3-N *Total
Inorganic N Yield, kg ha-1
-----------------------------------------kg ha-1---------------------------------------
0 22 18 40 †1720
2013 201 28 64 92 †10290
403 27 61 88 †13011
2014
0 23 16 39 †1625
201 26 11 37 †6515
403 28 17 45 †8779

71
Table 3.7 Grain yield and inorganic N distribution within 0-30 cm soil depth of plots applied with 0, 201, 403 kg N ha-1, for NERS 2013 and 2014.
*Total inorganic N is the summation of NH4-N and NO3-N. † Significant differences at P<0.001.
3.4 Conclusions
Both soil types displayed different patterns of inorganic N distribution
within the soil profile between cropping seasons. Inorganic N content in the
Sharkey clay soil at NERS did not appear to change significantly, except
following fertilizer application prior to soil sampling. Across all treatments and
depths, inorganic N content in excess of 50 kg N ha-1 was only reported in the
month of May at NERS. Soil inorganic N content was generally below 50 kg N
ha-1 year round throughout the soil profile. Similar results were reported in the
Gigger silt loam soil in both MRRS site-years. Except the only time inorganic N
content reached >50 kg N ha-1 levels was in March of 2013 when the trial was
established and May of 2013, due to fertilization weeks prior to soil sampling.
Furthermore these amounts of greater than 50 kg N ha-1 inorganic N were only
Year Early-Season
N rate, kg ha-1
NH4-N NO3-N *Total
inorganic N Yield, kg ha-1
------------------------------------------kg ha-1---------------------------------------
0 40 20 60 †2070
2013 201 42 40 82 †11348
403 83 113 196 †13047
0 44 21 64 †60
2014 201 51 136 187 †5532
403 51 189 240 †7933

72
found in the 0-15 cm soil layer. In the 15-30 cm soil layer to >60 cm soil layer,
inorganic N content was generally below 40 kg N ha-1.
Inorganic N variability occurred mostly in the 0-15 soil layer. Some
variability occurred in the 15-30 cm soil layer, but from there to the >60 cm soil
layer, variability decreased. Soil inorganic N content appeared to follow a
seasonal pattern of reduced content during the winter months and increased
content during summer months. This study demonstrated the potential use of
soil testing to help manage N fertilization and increase information on N
dynamics for these two soil types. However, we were unable to establish a
specific optimal inorganic N level for this region.
3.5 References
Babiker I.S., Mohammed A.A.M., Terao H., Kikuo K., Ohta K. 2004. Assessment of ground water contamination by nitrate leaching from intensive vegetable cultivation using geographical information system. Environmental International 29:1009-1017. Bergstrom L., and Brink N. 1986. Effects of differentiated applications of fertilizer N on leaching losses and distribution of inorganic N in the soil. Plant and Soil 93:333-345. Binford G.D., Blackmer A.M., Cerrato M.E. 1992. Relationships between corn yields and soil nitrate in late spring. Agronomy Journal 84:53-59. Blackmer A.M., Pottker D., Cerrato M.E., Webb J. 1989. Correlations between soil nitrate concentration in late spring and corn yields in Iowa. Journal of Production Agriculture 2:103-109. Bouchard D.C., Williams M.K., Surampalli R.Y. 1992. Nitrate combinations of groundwater sources and potential health effects. Journal of American Medical Association 7:85-90.
73
Bundy L.G., and Malone E.S. 1988. Effect of residual profile nitrate on corn response to applied nitrogen. Soil Science Society of America Journal 52:1377-1383. Colbourn P., and Downdell R.J. 1984. Dentrification in field soils. Plant and Soil 76:213-226. Cui Z., Zhang F., Miao Y., Sun Q., Li F., Chen X., Li J., Ye Y., Yang Z., Zhang Q., Liu C. 2008. Soil nitrate-N levels required for high yield maize production in the north china plain. Nutrient Cycling in Agroecosystems 82:187-196. Datta P.S., Deb D.L., Tyagi S.K. 1997. Assessment of groundwater contamination from fertilizers in the Delhi area based on 18O, NO3
- and K+ composition. Journal of Contaminant Hydrology 27:249-262. Devitt D., Letey J., Lund L.J., Blair J.W. 2002. Nitrate-nitrogen movement through soil as affected by soil profile characteristics. Journal of Environmental Quality 5:283-288. Di H.J., and Cameron K.C. 2002. Nitrate leaching in temperate agroecosystems: sources, factors and mitigating strategies. Nutrient cycling in agroecosystems 46:237-256. Gerwing J.R., Caldwell A.C., Goodroad L.L. 1979. Fertilizer nitrogen distribution under irrigation between soil, plant, and aquifer. Journal of Environmental Quality 8:281-284. Groffman P.M., and Tiedje J.M. 1989. Denitrification in north temperate forest soils: spatial and temporal patterns at the landscape and seasonal scales. Soil Biology and Biochemistry 21:613-620. Groffman P.M., and Tiedje J.M. 1991. Relationship between dentrification, CO2 production and air-filled porosity in soils of different texture and drainage. Soil Biology and Biochemistry 23:299-302. Hanway J.J. 1963. Growth stages of corn (Zea mays, L.). Agronomy Journal 55:487-492. International Plant Nutrition Institute. 2015. Nutrient source specifics. Available online at-http://www.ipni.net/publication/nss.nsf/0/5BB8639163BB14E3852579AF0075540B/$FILE/NSS-07%20Urea%20Ammonium%20Nitrate.pdf Verified June 4, 2015. Keeney D. R., and D.W. Nelson. 1982. Nitrogen-Inorganic forms. Methods of Soil Analysis 9:643-698.
74
Keeny D. 1986. Sources of nitrate to groundwater. CRC Critical Reviews in Environmental Control 16:257-304. Kettler T.A., Doran J.W., Gilbert T.L. 2001 Simplified method for soil particle-size determination to accompany soil-quality analyses. Soil Science Society of America Journal 65:849-852. Krantz B.A., Ohlrogge A.J., Scarseth G.D. 1943. Movement of nitrogen in soils. Proceedings-Soil Science Society of America pp. 189-191. Magdoff F.R., Ross D., Amadon J. 1984. A soil test for nitrogen availability to corn. Soil Science Society of America Journal 48:1301-1304. McLay C.D.A., Dragten R., Sparling G., Selvarajah N. 2001. Predicting groundwater nitrate concentration in a region of mixed agricultural land use: a comparison of three approaches. Environmental Pollution 115:191-204. Meisinger J.J. 1984. Evaluating plant-available nitrogen in soil-crop systems. Nitrogen in crop production (nitrogeninicropp), 391-416. Olsen R.J., Hensler R.F., Attoe O.J., Witzel S.A., Peterson L.A. 1970. Fertilizer nitrogen and crop rotation in relation to movement of nitrate nitrogen through soil profiles. Soil Science Society of America Journal 34:448-452. Pacheco J.A., Cabrera A.S. 1997. Groundwater contamination by nitrates in the yucatan peninsula. Hydrogeology Journal 5:47-53. Papendick R.I., and Campbell G.S. 1981. Theory and measurement of water potential. in water potential relations in soil microbiology. Water Potential in Soil Microbiology 3:1-22. Reardon, J. Salicylate method for the quantitative determination of ammonia nitrogen. Patent no. 3,432,395. Filed June 8, 1966. Schmitt M.A., and Randall G.W. 1994. Developing a soil nitrogen test for improved recommendations for corn. Journal of Production Agriculture 7:328-334. Shaw K. 1962. Loss of mineral nitrogen from soil. Journal of Agricultural science 58:145-152. Spaulding R.F., and Exner M.E. 1993. Occurrence of nitrate in groundwater-A Review. Journal of Environmental Quality 22:392-402.
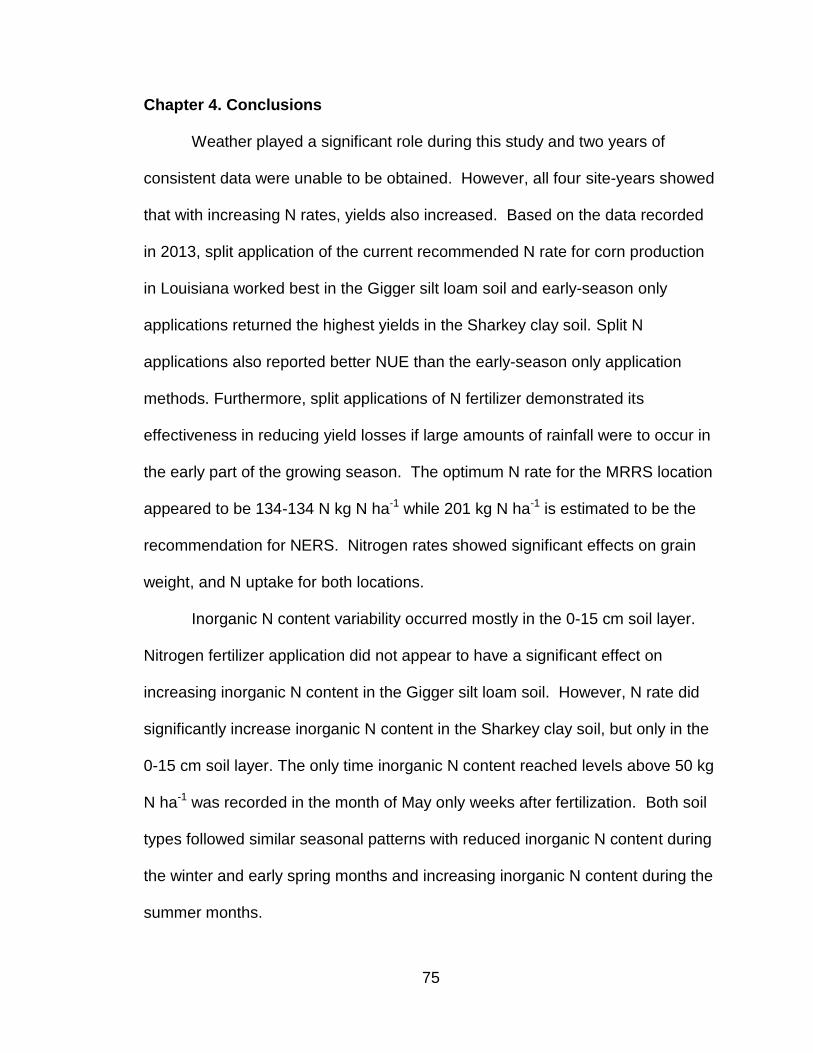
75
Chapter 4. Conclusions
Weather played a significant role during this study and two years of
consistent data were unable to be obtained. However, all four site-years showed
that with increasing N rates, yields also increased. Based on the data recorded
in 2013, split application of the current recommended N rate for corn production
in Louisiana worked best in the Gigger silt loam soil and early-season only
applications returned the highest yields in the Sharkey clay soil. Split N
applications also reported better NUE than the early-season only application
methods. Furthermore, split applications of N fertilizer demonstrated its
effectiveness in reducing yield losses if large amounts of rainfall were to occur in
the early part of the growing season. The optimum N rate for the MRRS location
appeared to be 134-134 N kg N ha-1 while 201 kg N ha-1 is estimated to be the
recommendation for NERS. Nitrogen rates showed significant effects on grain
weight, and N uptake for both locations.
Inorganic N content variability occurred mostly in the 0-15 cm soil layer.
Nitrogen fertilizer application did not appear to have a significant effect on
increasing inorganic N content in the Gigger silt loam soil. However, N rate did
significantly increase inorganic N content in the Sharkey clay soil, but only in the
0-15 cm soil layer. The only time inorganic N content reached levels above 50 kg
N ha-1 was recorded in the month of May only weeks after fertilization. Both soil
types followed similar seasonal patterns with reduced inorganic N content during
the winter and early spring months and increasing inorganic N content during the
summer months.
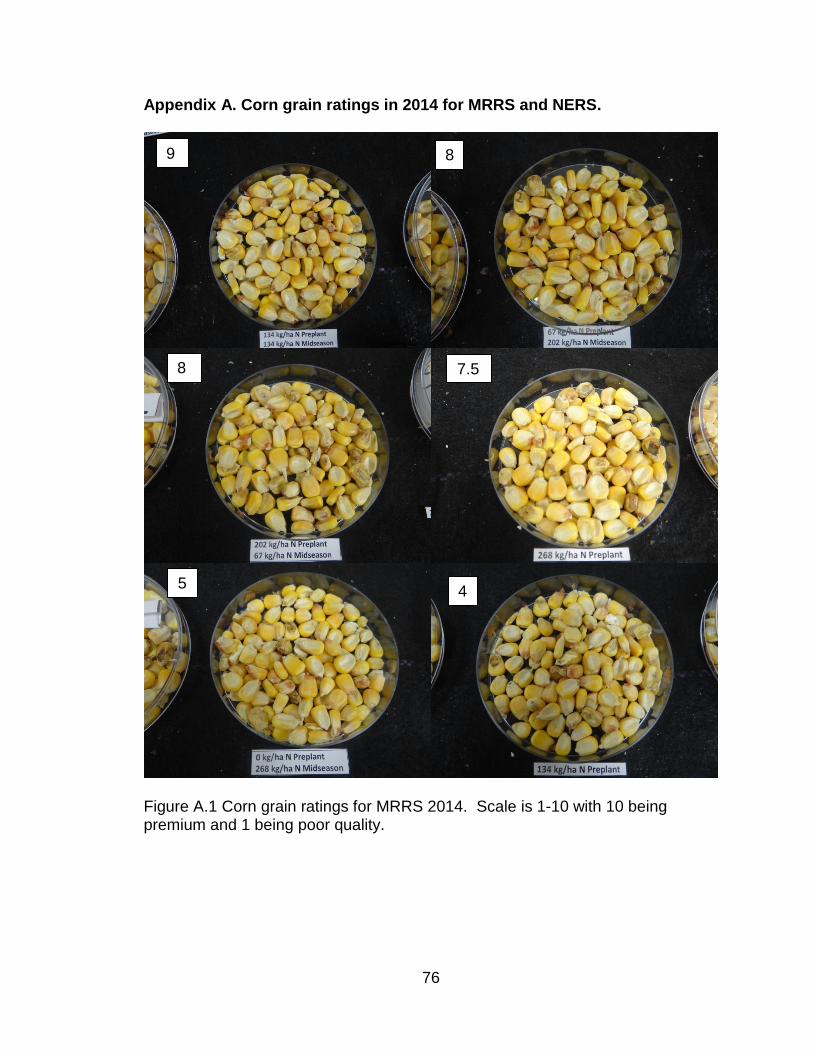
76
Appendix A. Corn grain ratings in 2014 for MRRS and NERS.
Figure A.1 Corn grain ratings for MRRS 2014. Scale is 1-10 with 10 being premium and 1 being poor quality.
9 8
8 7.5
5 4
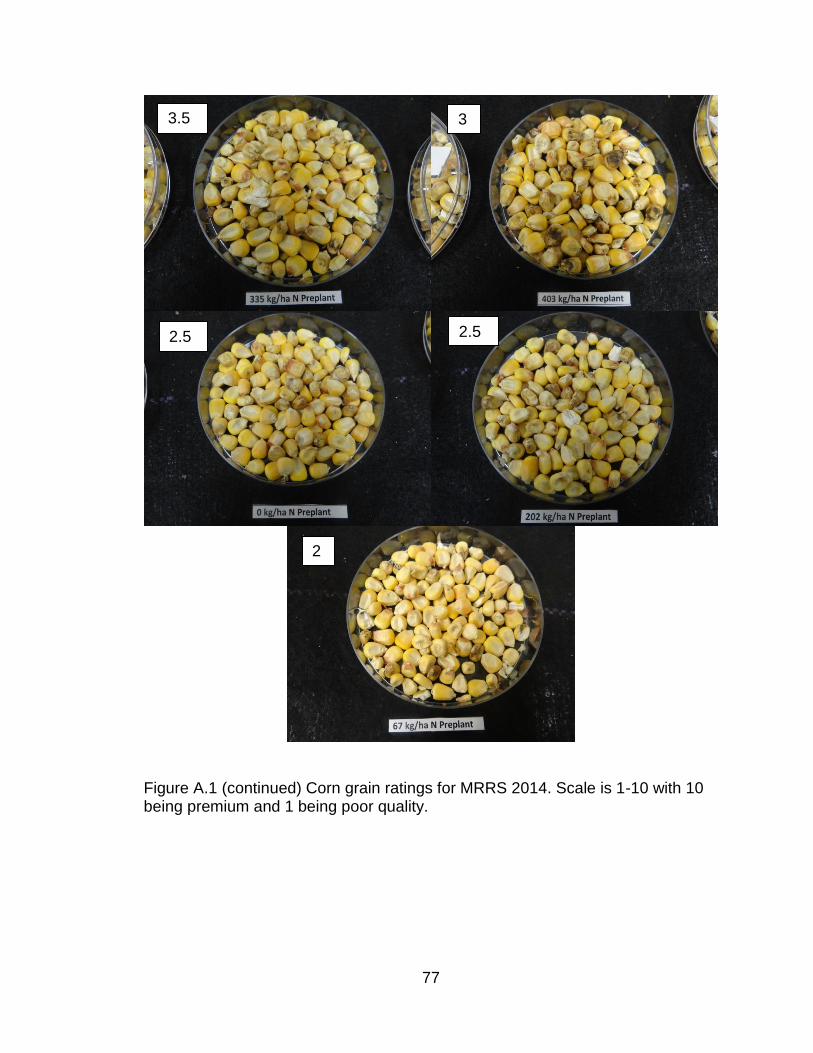
77
Figure A.1 (continued) Corn grain ratings for MRRS 2014. Scale is 1-10 with 10 being premium and 1 being poor quality.
2
3.5 3
2.5 2.5
78
Figure A.2 Corn grain ratings for NERS 2014. Scale is 1-10 with 10 being premium and 1 being poor quality.
10 9.5 9
9 8 8
201-67 kg N ha-1
403 kg N ha-1
201 kg N ha-1 0-268 kg N ha-1
134-134 kg N ha-1 268 kg N ha-1
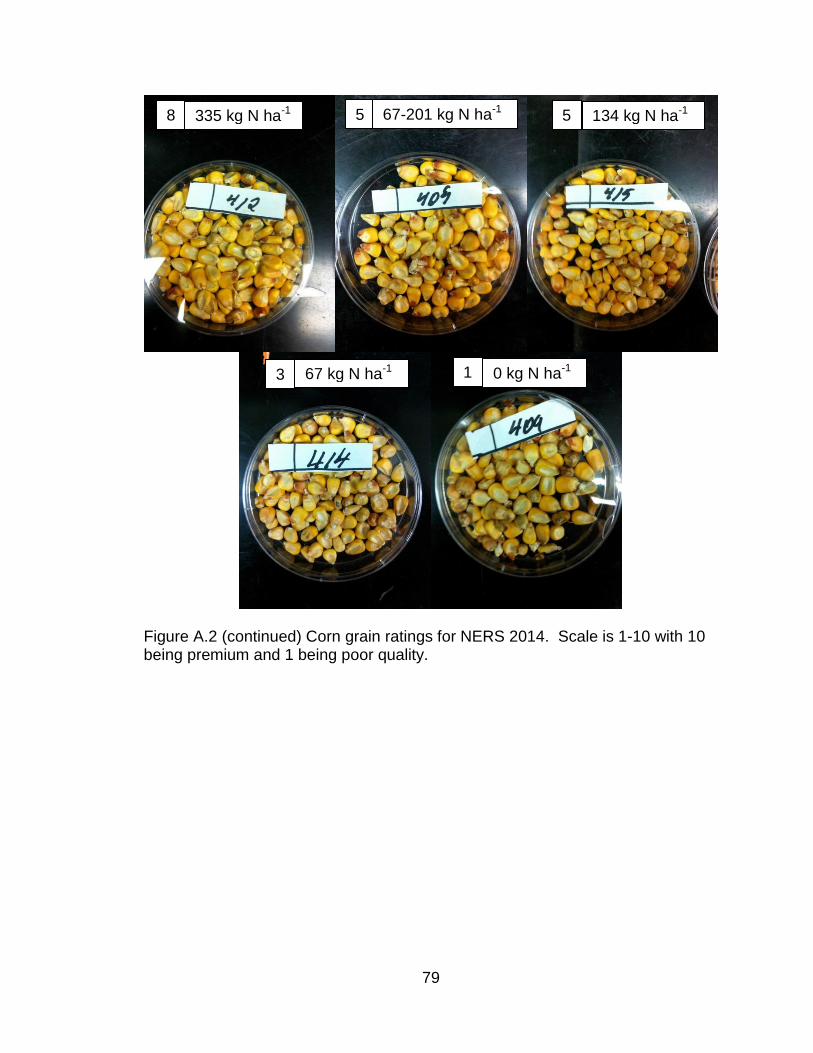
79
Figure A.2 (continued) Corn grain ratings for NERS 2014. Scale is 1-10 with 10 being premium and 1 being poor quality.
8 5 5
3 1 0 kg N ha-1 67 kg N ha-1
134 kg N ha-1 67-201 kg N ha-1 335 kg N ha-1
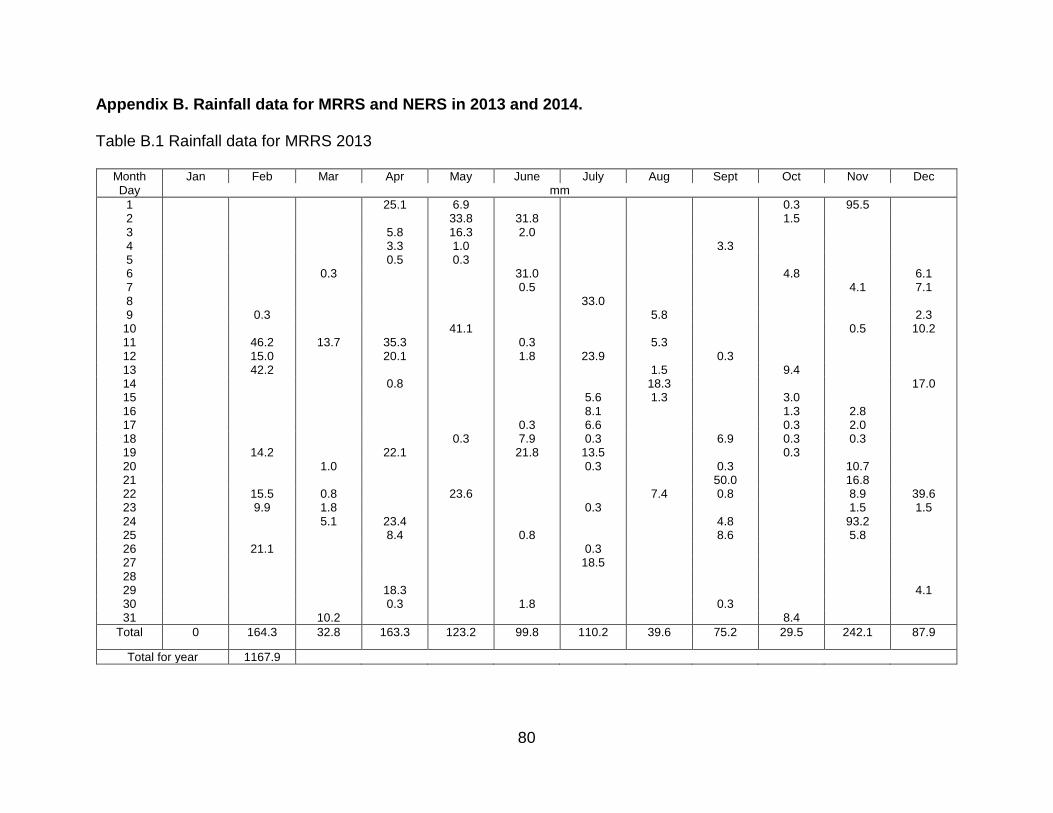
80
Appendix B. Rainfall data for MRRS and NERS in 2013 and 2014. Table B.1 Rainfall data for MRRS 2013
Month Jan Feb Mar Apr May June July Aug Sept Oct Nov Dec Day mm
1
25.1 6.9
0.3 95.5
2
33.8 31.8
1.5
3
5.8 16.3 2.0
4
3.3 1.0
3.3
5
0.5 0.3
6
0.3
31.0
4.8
6.1 7
0.5
4.1 7.1
8
33.0
9
0.3
5.8
2.3 10
41.1
0.5 10.2
11
46.2 13.7 35.3
0.3
5.3
12
15.0
20.1
1.8 23.9
0.3
13
42.2
1.5
9.4
14
0.8
18.3
17.0 15
5.6 1.3
3.0
16
8.1
1.3 2.8
17
0.3 6.6
0.3 2.0
18
0.3 7.9 0.3
6.9 0.3 0.3
19
14.2
22.1
21.8 13.5
0.3
20
1.0
0.3
0.3
10.7
21
50.0
16.8
22
15.5 0.8
23.6
7.4 0.8
8.9 39.6
23
9.9 1.8
0.3
1.5 1.5 24
5.1 23.4
4.8
93.2
25
8.4
0.8
8.6
5.8
26
21.1
0.3
27
18.5
28
29
18.3
4.1
30
0.3
1.8
0.3
31
10.2
8.4
Total 0 164.3 32.8 163.3 123.2 99.8 110.2 39.6 75.2 29.5 242.1 87.9
Total for year 1167.9
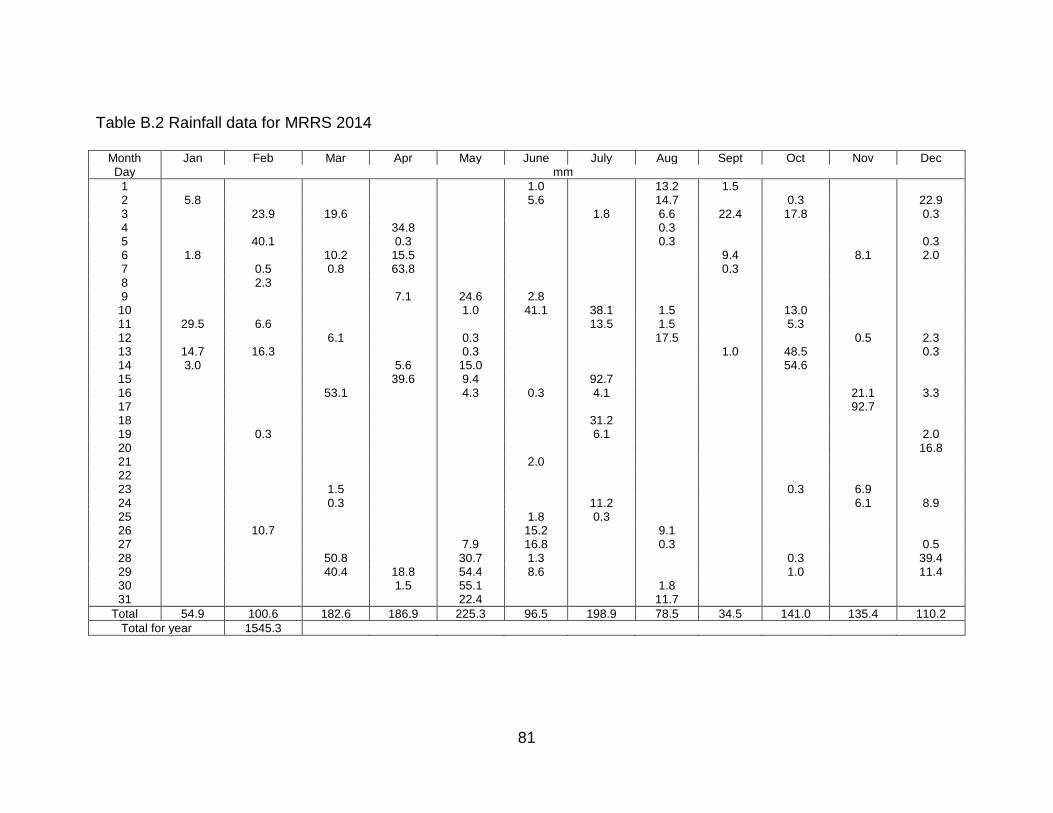
81
Table B.2 Rainfall data for MRRS 2014
Month Jan Feb Mar Apr May June July Aug Sept Oct Nov Dec Day mm
1
1.0
13.2 1.5
2 5.8
5.6
14.7
0.3
22.9 3
23.9 19.6
1.8 6.6 22.4 17.8
0.3
4
34.8
0.3
5
40.1
0.3
0.3
0.3 6 1.8
10.2 15.5
9.4
8.1 2.0
7
0.5 0.8 63.8
0.3
8
2.3
9
7.1 24.6 2.8
10
1.0 41.1 38.1 1.5
13.0
11 29.5 6.6
13.5 1.5
5.3
12
6.1
0.3
17.5
0.5 2.3 13 14.7 16.3
0.3
1.0 48.5
0.3
14 3.0
5.6 15.0
54.6
15
39.6 9.4
92.7
16
53.1
4.3 0.3 4.1
21.1 3.3 17
92.7
18
31.2
19
0.3
6.1
2.0
20
16.8 21
2.0
22
23
1.5
0.3 6.9
24
0.3
11.2
6.1 8.9
25
1.8 0.3
26
10.7
15.2
9.1
27
7.9 16.8
0.3
0.5 28
50.8
30.7 1.3
0.3
39.4
29
40.4 18.8 54.4 8.6
1.0
11.4 30
1.5 55.1
1.8
31
22.4
11.7
Total 54.9 100.6 182.6 186.9 225.3 96.5 198.9 78.5 34.5 141.0 135.4 110.2
Total for year 1545.3
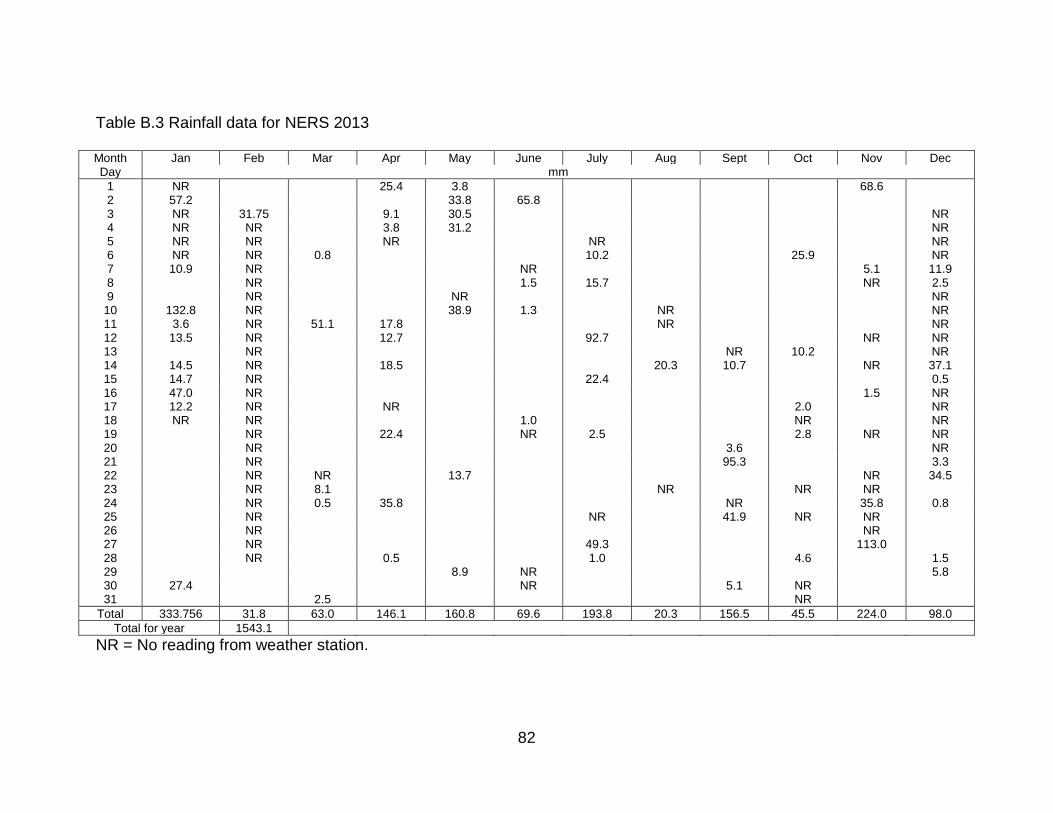
82
Table B.3 Rainfall data for NERS 2013
Month Jan Feb Mar Apr May June July Aug Sept Oct Nov Dec Day mm
1 NR
25.4 3.8
68.6
2 57.2
33.8 65.8
3 NR 31.75
9.1 30.5
NR 4 NR NR
3.8 31.2
NR
5 NR NR
NR
NR
NR 6 NR NR 0.8
10.2
25.9
NR
7 10.9 NR
NR
5.1 11.9 8
NR
1.5 15.7
NR 2.5
9
NR
NR
NR 10 132.8 NR
38.9 1.3
NR
NR
11 3.6 NR 51.1 17.8
NR
NR 12 13.5 NR
12.7
92.7
NR NR
13
NR
NR 10.2
NR 14 14.5 NR
18.5
20.3 10.7
NR 37.1
15 14.7 NR
22.4
0.5 16 47.0 NR
1.5 NR
17 12.2 NR
NR
2.0
NR 18 NR NR
1.0
NR
NR
19
NR
22.4
NR 2.5
2.8 NR NR 20
NR
3.6
NR
21
NR
95.3
3.3 22
NR NR
13.7
NR 34.5
23
NR 8.1
NR
NR NR
24
NR 0.5 35.8
NR
35.8 0.8 25
NR
NR
41.9 NR NR
26
NR
NR
27
NR
49.3
113.0
28
NR
0.5
1.0
4.6
1.5
29
8.9 NR
5.8 30 27.4
NR
5.1 NR
31
2.5
NR
Total 333.756 31.8 63.0 146.1 160.8 69.6 193.8 20.3 156.5 45.5 224.0 98.0
Total for year 1543.1
NR = No reading from weather station.
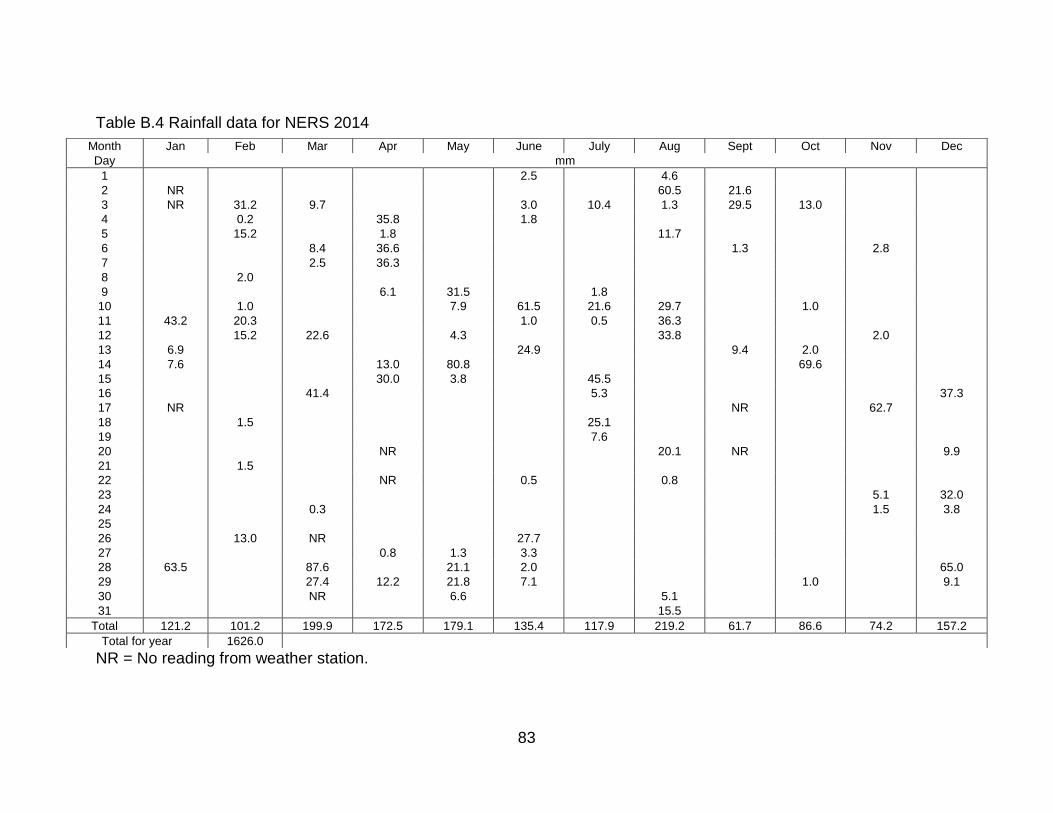
83
Table B.4 Rainfall data for NERS 2014
NR = No reading from weather station.
Month Jan Feb Mar Apr May June July Aug Sept Oct Nov Dec
Day mm
1
2.5
4.6
2 NR
60.5 21.6
3 NR 31.2 9.7
3.0 10.4 1.3 29.5 13.0
4
0.2
35.8
1.8
5
15.2
1.8
11.7
6
8.4 36.6
1.3
2.8
7
2.5 36.3
8
2.0
9
6.1 31.5
1.8
10
1.0
7.9 61.5 21.6 29.7
1.0
11 43.2 20.3
1.0 0.5 36.3
12
15.2 22.6
4.3
33.8
2.0
13 6.9
24.9
9.4 2.0
14 7.6
13.0 80.8
69.6
15
30.0 3.8
45.5
16
41.4
5.3
37.3
17 NR
NR
62.7
18
1.5
25.1
19
7.6
20
NR
20.1 NR
9.9
21
1.5
22
NR
0.5
0.8
23
5.1 32.0
24
0.3
1.5 3.8
25
26
13.0 NR
27.7
27
0.8 1.3 3.3
28 63.5
87.6
21.1 2.0
65.0
29
27.4 12.2 21.8 7.1
1.0
9.1
30
NR
6.6
5.1
31
15.5
Total 121.2 101.2 199.9 172.5 179.1 135.4 117.9 219.2 61.7 86.6 74.2 157.2
Total for year 1626.0

84
Vita
Payton Paul Dupree was born in White Castle, Louisiana in 1987. He attended
the University of Louisiana at Lafayette and graduated with a Bachelor of
Science in Environmental Sustainability with a concentration in Natural
Resources and Environmental Quality in December of 2011. In August of 2012
he was hired as a Research Associate by Dr. Brenda Tubana. After working for a
year he was offered the opportunity to pursue a Master of Science degree under
the guidance of Dr. Brenda Tubana in the School of Plant, Environmental, and
Soil Science and began in August of 2013. He graduated in August of 2015 and
accepted the position of Health, Safety, and Environmental Specialist offered by
Chicago Bridge & Iron.
Copyright © 2022 FDOKUMEN