copper-nickel mining, smelting and refining
285
This document is made available electronically by the Minnesota Legislative Reference Library as part of an ongoing digital archiving project. http://www.leg.state.mn.us/lrl/lrl.asp j.l' r" COPPER-NICKEL MINING, SMELTING AND REFINING AS AN ENVIRONMENTAL HAZARD TO HUMAN HEALTH September, 1977
-
Upload
khangminh22 -
Category
Documents
-
view
6 -
download
0
Transcript of copper-nickel mining, smelting and refining

This document is made available electronically by the Minnesota Legislative Reference Library as part of an ongoing digital archiving project. http://www.leg.state.mn.us/lrl/lrl.asp
j.l'
r"
COPPER-NICKEL MINING, SMELTING AND REFININGAS AN ENVIRONMENTAL HAZARD TO HUMAN HEALTH
September, 1977
Copper-Nickel Mining, Smelting and Refiningas an Environmental Hazard to Human Health
A Review of Epidemiologic Literature and StudyRec.Olmnendations on Sulfur Dioxide and Particulates
Performed Under Contract from theMinnesota Regional Copper-Nickel Study
Environmental Impact Task Force
by
Leonard M. Schuman, M.D.Jack S. Mandel, M.P.H.Hargot Hanson, B.S.Janet Nelms, M.P.H.
of
The Division of EpidemiologySchool of Public HealthUniversity of Ninnesota
September, 1977

TABLE OF CONTENTS
Sill'IMARY
I. INTRODUCTION
II. ATMOSPHERIC CONSIDERATIONS
A. Sulfur Oxides
B. Particulates
III. EXPERlt-'IENTAL STUDIES
A. Sulfur Dioxide1. Introduction2. Animal Studies
a) Acute Exposureb) Long Term Exposurec) Pulmonary Functiond) Mucociliary Clearancee) Absorption and Distribution
3. Human Studies
B. Sulfuric Acid and Sulfates1. Introduction2. Animal Studies
a) Acute Exposureb) Pulmonary Function
3. Human Studies
Co Sulfites1. Introduction2. Animal Studies3. Human Studies
D. Particulates1. Introduction2. Animal Studies
a) Introductionb) Pulmonary Function
E. Sulfur Oxides and Particulates1. Introduction2. Animal Studies3. Human Studies
Page
'i-vi
1
3
3
10
19
191920202126293133
383838384045
53535354
5656595962
646Lt
6470

IV. EPIDEHIOLOGIC STUDIES
Page
73
A. Introduction 73
B. Prob~erns in Interpretation 731. Meteorologic Effects 732. Aerometric Effects 74
C. Acute Exposures 78
D. Chronic Exposures 861. Mortality Studies 862. Morbidity Studies 126
E. Health Effects of S02 and Particulates on Children 1881. Mortality Studies 1892. Morbidity Studies 191
F. Occupationally Exposed Groups 2231. Sulfur Dioxide 2232. Sulfuric Acid 2353. Particulates 239
V. DOSE-RESPONSE ~ SETTING THE STANDARDS
VI. BIBLIOGRAPHY
".,',.
244
250

TABLE NUr-mER
LIST OF TABLES
TITLE PAGE
61
2
3
4
5
6
7
8
9
10
11
12;."
','
13
ESTI.HATED Sill..JFUR DIOXIDE OXIDATION RATES INTHE LOHER ATr1OSPHERE: TABULATION OF SELECTEDSTUDIES
MAJOR INDUSTRIAL SOURCES OF PARTICULATE 11POLLUTANTS
}~IN S02 &~D PARTICULATES STfu~DARDS PRESENTLY 18IN USE
IRRITANT POTENCY OF SUIJFURIC ACID 46
IRRITill~T POTENCY OF SULFATE SALTS 47
I{ANKING OF SULFATES FOR IRRIT}u~T POTENCY 48
INTERACTION OF SUl,FATES AND S02 49
EPIDEMIOLOGIC STUDIES ON THE EFFECT OF ACUTE 83POLLUTION EPISODES ON }IORTALITY
EPIDEMIOLOGIC STUDIES ON THE EFFECTS OF S02 104AND PARTICULATES ON HORTALITY
EPIDEMIOLOGIC STUDIES ON THE EFFECTS OF S02 154AND PARTICULATES ON HORBIDITY
SU}lliARY OF CHESS STUDIES 181
EPIDEMIOLOGIC STUDIES ON THE EFFECTS OF S02 192AND PARTICULATES ON CHILDREN AS ~rnASURED
BY HORTALITY
EPIDEMIOLOGIC STUDIES ON THE EFFECTS OF S02 206AND PARTICULATES ON CHILDREN AS MEl\.SUREDBY HORBIDITY
14
15
16
17
EPIDEMIOLOGIC STUDIES CONDUCTED BY CHESSINVESTIGATING THE EFFECTS OF S02 AND PARTICULATES ON CHILDREN
EPIDEMIOLOGIC STUDIES ON THE EFFECTS OF S02ON OCCUPATIONALLY EXPOSED GROUPS
EPIDEMIOLOGIC STUDIES INVESTIGATING THEEFFECT OF ATHOSPHERIC SULFURIC ACID ON OCCUPATIONALLY EXPOSED GROUPS
RANGE OF POLLUTAL\IT EXPOSURES ASSOCIATED \<lITHEXCESS CHRONIC BRONCHITIS
217
231
237
246

TAf)LE: NU1"!TIER
18
19
2.0
LIST OF 1'ABLES
TITLE
BEST JUDGMENT ESTI~~TES OF POLLUTANTTHRESHOLDS FOR ADVERSE EFFECTS OF LONGTERN EXPOSURES
BEST JUDGHENT ESTD·IATES OF POLLUTANTTHRESHOLDS FOR ADVERSE E'FFECTS OF SHORT-TERN EXPOSURES
SUrfr~RY OF DOSE-ill~SPONSE RELATIONSHIPSFOR EFFECTS OF PARTICLES fu~D S02 ON HEALTH
PAGE
249

FIGURE NUHBER
1
2
3
4
5
LIST OF FIGIJRES
TITLE
8IZE RAl.\1GES OF SOME COrvI["[ON PARTICLES
DIF:FERENT PATHS TAKEN BY 802
AFTER ITSREHOVAL :FRON INSPIRED AIR
FRACTION OF PARTICLES DEPOSITED IN THETHREE RESPIRATORY TRACT CONPARTHENTS ASA :FUNCTION OF PARTICLE DIAHETER
SCHEHATIC PROTRAYAL OF DUST DEPOSITIONSITES AND CLEARANCE PROCESSES
(A) EFFECT OF IRRITfu~TS IN MAJOR BRONCHI;(B) EfFECTS OF IRRITANTS IN TERJ"lINJlJ-IBRONCHIOLES; (C) EFFECT OF IRRIT}u~TS INJlJ..VEOLI
PAGE
15
34
57
60
69

:i
SUHrvfARY
Sulfur oxides compri~;e a vas t group of compounds, a fc\v of \vhich
are found in the atmospl1elc as a result of man's industrial processes.
These include sulfur dioxide (S02)' Sulfur trioxide (S03)' sulfuric acid
(H2
S04
) and various sulfates (XS04
). Ninety-eight percent of all emitted
sulfur oxides consist of sulfur dioxide. This fact, coupled with sulfur
dioxide 1 s well known irritant properties, has implicated sulfur dioxide
as the pollutant associated with air pollution most likely to cause
disease.
A complex series of reactions are associated with sulfur dioxide
in the atmosphere. In polluted air, sulfur dioxide is oxidized in
appreciable amounts to sulfuric acid and sulfates by photochemical and
catalytic processes. Chenlical reaction studies within copper smelters
have indicated that the presence of sulfates and sulfites are important
considerations in the study of health effects of sulfur oxides.
Meteorological factors play an important role in determining which
pollutant will be present and in what concentrations. Wind velocity
and direction, temperature and rainfall can be directly related to the
"'rate of chemical reactions and the dispersal of the end products of
such reactions. Particle sizes of sulfuric acid and sulfates are also
affected by the relative humidity \vhich may be important in the
consideration of the effect these compounds have on health.
Particulates is an all encompassing term use for all dispersed
solid or liquid material in the atmosphere. With this definition, all
the various sulfur oxides can be considered also to be particulates.
These particulates are of varying size and are capable of being carried
over long distances. Some particles are emitted directly from chemical
or industrial sources ~lile others are formed by chemical reactions
in the atmosphere (as is the case with most sulfuric acid and sulfates
found in the atmosphere). The U.S. primary standards for particulates
for 24 hours are 75 mLcrogms/m3
annual geometric mean and 260 microgms/m3
annual maximum.

Sulfur dioxide is a mild respiratory irritant when administered
alone. In order to produce death or serious pathological changes in
experimental animals, levels far in excess of ambient levels are
necessary. Upon inlLllation of S02' animals have demons trated an increase
in the number of goblet cells found in the lung on autopsy. The lung
has been shown to be the major organ of response, but evidence indicates
that the stomach and the blood system are also affected. Lesions in the
nasomaxillary turbinates have also been demonstrated. At this time there
is no evidence. to support the carcinogenicity of S02 in mammals. At
levels far in excess of ambient levels, 802 has been shmvn to reduce
ciliary activity and thereby decrease mucociliary clearance. Since
this leads to increased residence time of foreign particles Hithin the
lungs, this has been proposed as the cause of increased illness during
exposure to pollution. The combination of increase numbers of goblet
cells and slowed ciliary activity results in excess fluid in the alveoli.
It has been suggested that alveolar macrophages are responsible for
riddance of the excess mucus, but more study is required. The mode of
breathing has been shov.m to be important in determining the amount of
802 reaching the lmver ainvays. Both animal and human studies have
shmvn that more than 99% of all inhaled 802 is absorbed in the nose.
Hucus flmv has also been sh\Von to be reduced in the nose especially in
its anterior part \vhere 802 concentrations ,,,ere the highest. The maj or
physiological mechanism acting to reduce maximum expiratory flow is
thought to be a nasobronchial reflex causing bronchoconstriction.
The fate of absorbed 802 is still speculative. Results from
animal studies have ShO\~1 that some 802 is reabsorbed, some is briefly
stored Hithin the body's tissues and some is excreted in the urine.
It undergoes chemical reactions within the blood stream to form sulfite
and bisulfite. The action of these substances is still unknOhlTl.
From animal experiments, sulfuric acid and certain sulfates have
been shown to have greater irritant properties than 802 alone.
Particle size appears to be the determining fac tor in \vha t ef f ec t these
substances will have on the health of these animals. At 5 mg/m3
sulfuric
acid mist is detectable by practically all humans, but human responses
are quite varied depending on individual susceptibility. Like 502' th~
I I ~...L ..L ..l
l1la-Ln physiologicCJl mechanism involved in the inhalation of H2S0L~ appears
to be bronchoconstriction. Tllere exists the possibility of two different
mecl'~iGms of action depending on the size of the particle involved.
Larger particles deposit in the major bronchi where increased swelling
and exudiation of fluid leads to complete obstruction of the airways.
Smaller particles act by narrmving ainvays.
Not all sulfates have been found to potentiate the effect of S02'
Zinc ammonium sulfate has been found to increase flO\'7 resistance the
most of all sulfates tested. The physiological response again parallels
that produced by histamine. The cations associated with sulfation
appears to be related to the amount of histamine released.
A synergistic action exists bet"\veen S02 and H2
SOLf
and zinc ammonium
sulfate.
Important in studying health effects of particles is an understanding
of where they are deposited and how they are cleared from the lungs.
Deposition is dependent on size, shape and density of the particles.
The nose is the major site of particle deposition. Deposition in the
alveolae has been found to be maximum with particles between 1 and 2
microns. Clearance from the lung depends on where the particle is
deposited. Clearance from the alveolar surface is the slo\vest of all
areas.
Studies have shown that respirable particulates may be intrinsically
toxic, interfere with clearance of other particles from the lung, or act
as carriers of other toxic TIlaterials. Animal studies using smoke or
carbon black as pollutants have sho"\Vl1 that these pollutants by themselves
produce little major damage to the respiratory systems at levels even
greater than those found in the atmosphere. Studies have found that
increased pulmonary flow resistance, the dominant physiological alteration
produced by irritant particles is further augmented by small particle
size.
Numerous authors have concluded that small particles play an
important role in either a synergistic or additive manner on health
effects when various gases and particles are mixed.

Exposure of human subjects to S02 and NaCl aerosol has not
consistently s110wn the synergistic effect seen in guinea pigs.
Synergistic action between S02 and dust and S02 and ozone has been
demonstrated. However, no other studies have investigated the effects
of these combined pollutants on man. There is a lack of data on the
possible synergistic effects of S02 with other substances commonly
found in polluted atmDspheres such as nitrogen oxides, or hydrocarbons.
A vareity of techniques have been used to measure S02 and particulates
in the atmosphere. This has made comparison of pollution levels between
epidemiological studies difficult. ~vo comnlon methods for the measurement
of S02 in the United States has been the West-Gacke method and the
conductometric method. European studies have mostly used the hydrogen
peroxide method. In the United States, particulates have been measured
mostly by the high-volume sampler and in Europe by a method which
measures material collected on filter paper. In measuring specific
particulates such as sulfates and sulfuric acid, a great deal of work
is needed.
Some of the earliest studied on air pollution have centered around
a~~te episodes of high pollution. The majority of these studies utilized
'~ortality data. Results have indicated that excessively high levesl of
S02 and particulates increased mortality and morbidity, especially among
elderly persons and those \~ith chronic lung and respiratory disease.
Attempts have been made to correlate various pollutants \vith a \vide
variety of causes of death including arteriosclerosis, rheumatic heart
disease and bladder cancer. The causes of death that have received the
most attention have been the chronic respiratory diseases (in particular
bronchitis) and lung cancer. Most of these studies have adjusted for
age and sex differences, but only some have taken into consideration
other important confounding variables such as differences in smoking,
occupation and socioeconomic class. Few of the studies considered
weather and influenza epidemics as possible sources of variation.
The combination of different approaches to data collection and
interpretation, different statistical analyses and various factors
under consideration make any b\lt the most broad conclusions unjustifiable.
In general, very high levels of 802 and particulates do increase tIle
Jj
)1
the death rate for all cau~-;es of dC~Clth. Bronchitis Inort<1liL~y h'::lS been
related to Clir pollution. ~lile the association of lung cancer deaths
with air pollution seems to be more related to smoking and some
unidentified "urban" factor. Exactly "7hat pollutants are responsible
for increased deaths can not be determined by these studies.
Morbidity studies have been concerned mostly with respiratory
illness such as chronic bronchitis, emphysema and asthma and with non
disease effects such as decreased lung function. The effects of air
pollution have been measured by questionnaire, daily diary reporting,
emergency room visits, hospitalization rates, clinic visits, work
absences and pulmonary function tests. Some studies deal with well
individuals while others look at these already ill with a respiratory
disease. It can be concluded that an association exists bet\veen the
prevalence and incidence of respiratory illness and S02 and particulates.
Those already affected \I!ith disease such as bronchitis have been shmm
to have exacerbations of their disease upon exposure to these air
pollutants. These associations do not necessarily imply a causal
relationship. Many authors have also noted a synergistic effect or additive
effect between smoking and air pollution, with smoking having a much
,greater effect than the pollution.
Mortality and morbidity patterns have also been studied during
childhood ( 15 years) because children are relatively free from the
confounding effects resulting from cigarette smoking and occupational
exposure and because of the concern over \"hat effect early respiratory
disease has on the development of chronic disease later in life.
TIle studies seem to be in agreement that sulfur dioxide and particulates
contribute to increased frequency and severity of acute respiratory
disease in children. Children appear to be at increased risk to the
effects of these air pollutants. Peak expiratory flow and forced
expiratory flo\" in 0.75 second also appear to be influenced by ambient
air pollution levels. Exposure to elevated levels of sulfur dioxide
has occurred among workers in various industries such as refrigeration
and pulp mills. Elevated levels of sulfur dioxide (20-l00ppm) promote
fits of coughing, sneezing and other discomforts. Recent studies have
shown that exposure to levels of S02 below the standard foY occupational

vi
settings (Sppm TWA) do produce a reduction in forced expiratory volume
in 1 second and forced vital capacity and an increase in respiratory
symptoms. These effects have been demonstrated after smoking habits
have been controlled for. Interaction betHeen S02 and respirable
particulates apparently is not significant Hithin copper smelters.
However, this observation rests solely on one study'S findings and
should be replicated.
Exposure to elevated levels of sulfuric acid mist is most common
in industries producing sulfuric acid or storage batteries. At present
the recommended exposure limit of 1.0 mg/m3
of air as a time \veighted
average appears to be sufficient to prevent excess respiratory disease.
However, no conclusion concerning the prevention of tooth erosion
resulting from sulfuric acid mist exposure can be reached.
Most occupational studies on particulates have dealt with a
specific kind of particulate such as silica, aluminum or barium dust.
A few relevant articles on coal dust exposure and dusty occupation in
general were reviewed. Much of the data collected have been either
negative or not statistically significant, in regards to pollution
effects on health. However, a recent review article concluded that
inhalation of most minerals and vegetable dust could lead to increased
prevalence of cough and sputum and that some workers show a slight
decrease in lung function after prolonged exposure to these materials.
In reviewing all the epidemiological studies, it is difficult to
state \vith any confidence which levels of pollutants cause the effects
recorded or even \vhich pollutants are responsible for these effects.
Even \vith these problems, attempts have been made in a number of studies
to determine dose-response effects. These authors support the existing
primary ambient air quality standards for S02 and particulates. Levels
of S02 at 92-95 microgms/m3
with 15 microgms/m3
suspended sulfates were
found to be associated ,{ith excess bronchitis in the CHESS studies.
CHESS studies noted other associations with sulfate levels. Suspended
sulfates at 24 hour levels of 8-10 mi~rogms/m3 significantly aggravated
cardiopulmonary symptoms in those already afflicted with the disease.
No national standards have been set for suspended sulfates and it is
conc.luded that more data are needed in this area.

1
I. INTRODUCTION
Sulfur oxides from natural sources have al\vays been present in the
atmosphere to some extent. However, industrialization and urbanization
have concentrated sulfur oxides emitted from man's industrial processes
to levels which have become a threat to human health. Many of the
adverse health effects of air pollution have been attributed to sulfur
dioxide because of its irritating action upon the nose and eyes. Other
sulfur oxides have recently become of great concern as possible etiologic
agents.
Sulfur dioxide hasn't al\vays been considered a threat to human health.
In fact, sulfur dioxide was used therapeutically in Homer's time and as
recently as 1920 (Greenwald, 1954). Dermatoses of dogs and cats were
apparently treated \vith sulfur dioxide in France in the 1920's and the
1930's. It \vas used for treatment of various ailments in man such as:
chronic keratitis of the cornea, diphtheria, tuberculosis and the common
cold with varying degrees of success.
Apparently the first report of adverse effects from sulfur dioxide
stems from an industrial exposure in 1821. Animal experiments to
,. determine the effects of "10\'1" concentrations of sulfur dioxide \"ere first
conducted in 1884 by Ogata who also made the first observations about
man's greater sensitivity to sulfur dioxide (Greenwald, 1954). Sulfuric
acid became a topic of human studies in 1913 and in animals in 1950.
Interest in sulfates and sulfites has been more recent. Likewise,
epidemiological studies have concentrated on the effects of sulfur
dioxide and particulates \vith but recent interest in sulfates.
Numerous papers have been published on the effects of sulfur oxides
on humans, plants, animals, and materials. This review of the literature
\vill confine itself to human health effects primarily. To understand the
effects of various sulfur oxides on man, however, their atmospheric
chemistry along with results of experimental exposure of animals and
humans must be considered. These latter topics are reviewed fairly
briefly here. The major portion of the paper will be concerned with the
epidemiologic studies which are the basis for setting national air quality
standards for permissible levels of these pollutants in the atmosphere
and in occupational settings.
...l ..
'!"Jost of tl1(~~.se (:lpidcrniologic studies investigatjng the effeels of
sulfur' oxJclc~; ([;ulfur dioxide) have concurrently lookc>d at the effects
of particulates (also called smoke, dust, or fog). TIle definition of
particulate matter overlaps with the various substances considered to be
sulfur • 1
OXlClCS. That is, sulfates, sulfites, sulfuric acid and even
sulfur dioxide are considered to be particulates. For these reasons
sulfur oxides and particulates are considered together in this revie\\T.

'-\
Av Sulfuc Oxides
The cla::.;sificatJon of sulfur o:i:ides includes a number of different
compounds. Junong these) sulfur dioxide (802)' sulfur trioxide (S03)
and the corresponding acids, sulfurous acid (H2
S03
) and sulfuric acid
(H2
S04
) and the salts of these acids constitute the major atmospheric
pollutants.
Salts of sulfurous acid (H2
S03
) are known as sulfites and
bisulfites. These generally are not looked for in the atmosphere as
it is believed that essentially all sulphur dioxide is eventually
oxidized to sulfates the salts of sulfuric acid (H2
S04),
Inorganic sulfates are believed to be the product of the reaction
of sulfuric acid with cations or of the oxidation of sulfites.
Other sulfur oxides such as SO, S203' S207 and S04 have not been
found in the atmosphere although they are \vell knmvn in laboratory
studies (Air Quality Criteria -S02' 1975).
The major source of sulfur oxides in the atmosphere (other than
those occurring naturally) is the combustion of fossil fuels such as
_,petroleum and coal. Other sources include the refining of petroleum,
smelting of ores containing sulfur, the manufacture of sulfuric acid,
burning of refuse, paper making and the burning or smoldering of coal
refuse banks. Approximately 98% of all industrial sulfur released in
to the air is in the form of sulfur dioxide, 2 - 5% is sulfuric acid
(Air Quality and Stationary Emission Control, 1975)
Although almost all sulfur dioxide is believed to be converted
eventually to sulfates, not all atmospheric sulfates are a result of
industrial pollution. Naturally occurring sulfur dioxide and hydrogen
sulfide (H2
S) can also be oxidized to sulfates. In fact it has been
estimated that only one-third of the sulfur in the entire global
atmosphere is derived from pollution sources (~all, 1973).
However, this observation does not pertain to local respirable
ground levels of sulfur oxides which, in urban areas, is almost entirely
due to fossil fuel combusti.on.
The meteorological and chemica.l behClvior of these sulfur oxides
are inflllC[lCc~c1 grcdtly by the \V.:J.y they arc introduced into the

atmosphere. In other words such factors as the type of emitters, whether
large or small, and \vhether they are dispersed or pojnt sources have a
role in determininghD'i1! these pollutants wjJl be found in the
atmosphere. The Air Quality Criteria Document for SuJ.fur Oxides has
reported that the trend has been towards large point sources. These
contain lower concentrations of polynuclear hydrocarbons and higher
concentrations of nitrogen oxides and sulfuric acid. Particulate
matter from these large point sources can be better controlled which,
therefore, minimizes interaction with sulfur oxides.
A complex series of reactions are associated \vith sulfur dioxide
in the atmosphere. A simplified scheme abstracted from Air Quality
and Stationary source emission control is presented belo\'1:
S02+ (0) --- S03 (la)
SO + H 0 ----- H SO (lb)3 2+-1- 24 +
H SO + X ----- XSO + 2H (2)2 4 4 + _.
H 0 + SO --------H SO --- H + HSO2 2 2 3 2H + + SO; (3)
In reaction (la) sulfur dioxide is oxidizied to sulfur trioxide
'which reacts almost immediately with \vater vapor to form sulfuric.r'
acid aerosol (lb). Therefore reactions (la)and(lb)can be considered
one reaction in which sulfur dioxide is oxidized to sulfuric acid.
This process occurs in clean air in the presence of sunlight at the
low rate of 0.1% per hour.
However, in the presence of other air contaminants the rate is.greatly increased by t\vO general mechanisms: 1) Photochemical oxidation
which is initiated by light, and 2) catalysis by trace-air ions.
Photochemical oxidation is enhanced by increased sunlight,
nitrogen oxides and hydrocarbons. A complex series of reactions involving
03 atoms and hydrogen leads to the formation of the well knO\ffi photo
chemical smog. However, the oxidants responsible for the oxidation of
S02 in this system are not well established (Cox and Pennett, 1971).
Even rates of oxidation vary greatly from study to study; the highest
rate reported being 18% an hour (Ral], 1973). Even CIt 0.65~; per hour Coy and
Pennet t f 0 und t hat s i g n i fie ant qua n t. it i e s 0 f s u 1phat cae r 0 sol \V i 11 be

formed (Coy and Pennett, 1971). One possible factor involved here
is that the formation of sulfuric acid aerosol may decrease the amount
of sunlight and thereby S10H clO~vTl the rc::CJ c t ion ra te at "lhich fur ther
sulfuric acid may be formed.
Catalytic oxidation of sulfur dioxide occurs in the absence of
sunlight. A great deal of interest has been shmvn in the catalytic
role of metal ions in aerosols. Several have been implicated in this
process such as manganese, iron, vanadium, aluminum, lead and copper,
Judeikis has reviewed briefly the particle-catalyzed oxidation of 802'
Chemical composition and catalytic reactivity of particles seem to be
very important but too little is knm.J[j about the extent to Hhich
natural airborne particles exhibit catalytic activity (Judeikis, 1973).
The reactions are very complex with m~DY interrelated variables such
as the absorption rate of sulphur dioxide, the size and pH of the aerosol,
efficiency of the catalyst, rate of diffusion of reactants within the
aerosol and relative humidity (RaIl, 1973). Relat~ve humidity seems to be a
major consideration as the reaction occurs in water droplets containing
absorbed 8°2
,
.. ,HcKay found that the conversion of sulfur dioxid2. and ammonia.,"
,'~o ammonium sulfate in Hater droplets in the atmosphere is rather
rapid and is highly positively correlated with pH (McKay, 1971).
There ,,,as a tendency for the reaction to slow do'\Vn as it progressed
even ,,,hen there ,,,as no depletion of the gases involved, This Has
attributed to the steady fall in pH. Alkaline metal compounds and
ammonia, therefore, apparently enhance reaction rates by decreasing
droplet acidity.
A great deal of research has been conducted on the oxidation rates
of 8°2
, A summary of these studies abstracted from RaIl is presented
in Table 1.
Once the sulfuric acid is formed) by one of these mechanisms, it
may react further to produce sulphates. Thi.s is shmvn in reaction(2)
Hith X representing metals or ammonium.
Reaction (3) shmvs the formation of \\1eckly acidi.c sulfurous
acid (H2
803
) and its disassocation protluct~) the bisulfite (HSO;) and
sulfite ion (S03 ). These reactions might also be important to

6
Table 1
ESTIHi\TED SULFUR DIOXIDE OXIDATION RATES IN TIlE] Lm-lER ATJ'10SPlIERE:TABULA'lION OF SELECTED STUDIES
Experimentalconditions
Sunlight; HighS02 concentrationsno·other impuritiespresent
Sunlamp in smogchamber; h~gh S?2concentratlons lnpure air
Sunlight; 200-2000 SO; traceimpurities
Smog chamber; lightS02 NOx ' olefins
Photochemicalreactants S02 inppm concentrations
UV-irradiated gasmixtures· NO, x'hydrocarbons, S02'high levels
Catalyst dropletexposed to'high concentrationso~ S02 in humidall'
Metallic aerosolparticles on Teflonbeads in flmV'reactor; S02; watervapor
Artificial fog insmog chamber; veryhigh levels; S02and metal sulfates
~H?SOL formation in~ ~
water dropletsexposed to ~H,
and S02
Presumedatmospheric conditions
S?2; sunlight; cleanall'
S02; sunlight; clean air(r~action unaffected byhumidity)
Assuming 300 /m3s02
;bright sunlight for10 hours would produce30 of sulfate
3S02' 260 g/ ; ozone 3100 olefin, 33 g/mbright sunlight
Sunlight; S02' 260 g/m3
ozone, 200 g/m3 ,01efin3.3 g/nB L~O%RH
Noon sun
Natural fog containing19 crys tals of l'1nSOL indroplets; 2600 g/m3 ~S02
Natural fog (0.2 gH20/m3 ) in industri3larea; S02' 260 g/m,MnS0
4, 50
(Levels in smogchamber) 0.6 mg/m.3S02' 2 mg/m4 Mn S04
3100 g/r:J S02'10 g/m NH
3, cloud
droplet radlus of10
Extrapol~ted S02consurnptlon rate
O.5%/hour
0.1-0.2%/hour
O. 65 ~~ / h0 u r
(high rate maybe due to traceimpurities)
3%/hour forpentene; 0.4%/hour for propene
3%/hour
l-3%/hour
l%/min
2%/hour
O. Ol~~/min at77% RH2 .1iUmin at 95~!'
RH
2.5%/min in droplets
Reference
Hall, (citedby Urone andSchroeder
Gerhard andJohnstone
Cox and Penkett
Cox and Penkett
Cox and Penket.t
Urone et 31
Johnstone andCoughanmvr
Cheng et a1
Johnstone andMoll
Van Den Heuveland tIason

j
'11.::1 ble 1(continued)
-------_._--------_._-----_._---.---_ .._---------_..---_.
Experimentalconditions
Presumedatmosplleric conditions
Extrapol~ted S02consumpl:Jon rate
Reference
Atmosphericstudy of pollutedareas in Japan
Atmospheric studyof Canadian smeltingarea
lSO- Lf 200S02
3g/m
11.7%/min
0,03S%/min
Shirai et al
Katz
Study of S02oxidation in plumeof coal-burningpower plant
Atmospheric studyof Rouen (industrialcity) in \vinter
Found moi~Jture
level in plumeimpor§ant, S026 g/m
368-2L}2 g/m S02
O.l%/min at 70%RHO.S%/min at 100%RH
6-2S%/hour
Gartrell et al
Benarie et al
1Source: RaIl, D.P. Review of the health effects of sulfur oxid~s, Env. Health
Persp. 8: 97-121, 197 LI

the biochem:Lcal r.eClctions occurring in those exposed to SO .2
Obviously, weather hC1s a marked effect on the atmospheric
chi . al processes. Inversions allO\-l for Cl builchJp of sulfur oxides
and other contaminants and provide tjme for cbell1icul reaction to occur.
Hind influences the rate, direction and dispen:>ClI of sulfur oxides.
Temperature affects the reactivity and solubility of gases (RaIl, 1973).
Rain is capable of clearing the air of pollutants. }[eterological
conditions also affect the rate of reactions that these oxides of
sulfur undergo. Cloud cover will tend to reduce photochemical
oxidation, while high relative humidity and high te~peratures will
increase photochemical activity. Increased relative humidity will
also increase ~atalytic activity.
The deposition of sulfur dioxide and its oxidation products varies
greatly. This can be seen in surveys of these pollutants in the
atmosphere. Altshuller,as quoted by RaIl, has reported a general build
up of ground level sulfates stretching for many hundreds of miles in
the Northeastern United States (Rall,1973). Rural areas often have high
levels of suspended particulate sulfate in spite of having relatively
ne~ligible sulfur dioxide levels.iI'
Exact residence times have not been established for any of the
sulfur oxides but evidence seems to indicate that fine particulate
sulfates reside the longest in the atmosphere. However, even
particle size and density depend for a large part on weather
conditions. These characteristics will in turn affect the rate that
particles settle out of the atmosphere. Of particular interest is
a recent report by Smith et alan the chemistry of sulfur and arsenic
airborne copper smelter particulates (Smith, 1976). A large copper
smelter near Salt Lake City, Utah was the source of a series of air
samples. Seven particula te samples collec ted at thl~(:'e points \\Tcre
analyzed by two methods. It was found that hot water extraction pro
duced higher values for sulfate concentrations than hydrocloric acid
extraction. Apparently hot water extraction oxidizes all sulfur
compounds so there is an overestimation of sulfates.
Airborne concentrations of sulfate (includes <:Iny particulate-

absorbed S02 or H2
S04
~s well as soluble sulfates) and sulfite
(includes any particulate absorbed S02 as well as sulfites) averaged
109j::?3 ugso: lIT? and 53±39 ugSO;/m3
respectively :in the six samples
where all data were available. Whereas 85% of all sulfates were found
to be respirable, only 43% of the sulfites were found to be. The
different size distribution between these two compunds suggest that
they are formed by different mechanisms in the smelter environment.
Hansen has postulated that S02 is stabilized by chemisorption
on metal oxide (ie Fe2
04
CuD) to form stable sulfite complexes in
the smelter environment (Hansen, 1974). Other evidence is cited to
support this hypothesis. The uniform sulfite content with particle
size also seems to suggest a mass reaction betHeen S02 gas and airborne
particulates (Smith, 1976).
However, in the smelter environm~nt the source of sulfate is unknown.
It seems likely that it is produced by oxidation of sulfur dioxide
within the reverberatory furnaces or convertors. Apparently, the same
metals which stabilize S02 as sulfite can also catalyze the oxidation
of S02 to sulfate. Hansen has determined that the t\vO competing processes
ar~ controlled by a number of different factors (Smith, 1976). Relative
'humidity, ambient temperatures, the oxidation potential in the particles,
the activities of sulfite complexing metal ions and rates of various
reactions producing sulfite or removing it as sulfate are all important
in determining which process will predominate. High temperature, high
concentration of sulfates, SO? and particulates all exist in the
smelter environment.
It must be e,mphasized that the oxidation of sulfur dioxide results
in'the formation of sulfuric acid and sulfates, \vhich in turn comprise
about 5 - 20% of the total suspended particulate matter in urban air.
Of these sulfates, 80% are less than 2 microgms in diameter and, therefore, are
largely in the respirable fraction of particulate matter (Wagman, 1967).
Sulfates themselves comprise a large group of compounds which,
evidently, have different toxicological effects. AccorcJingly there
needs to be not only measurements made on these sulfur oxides but
accurate determin8tion of their chemical composition.

10
B. Particulates
Particulates are any dispersed solid or liquid material in the
atmosphere ranging in size from 0.005 to about 500 microns
(Fennelly,1976). Particles in this size range have a suspended
state varying from seconds to several months. Particulates can
be classified as either primary or secondary. Primary particles
are usually 1 to 20),,4,,\\.. in size and are inj ected directly into the
atmosphere by chemical reactions in the atmosphere. They are
relatively smaller and classified as sulfates, nitrates and hydro
carbons.
Primary particles are emitted from industrial sources and from
natural processes such as forest fires or ocean sprays. Particulate
emissions from stationary sources in the U.S. approximate 18 x 106
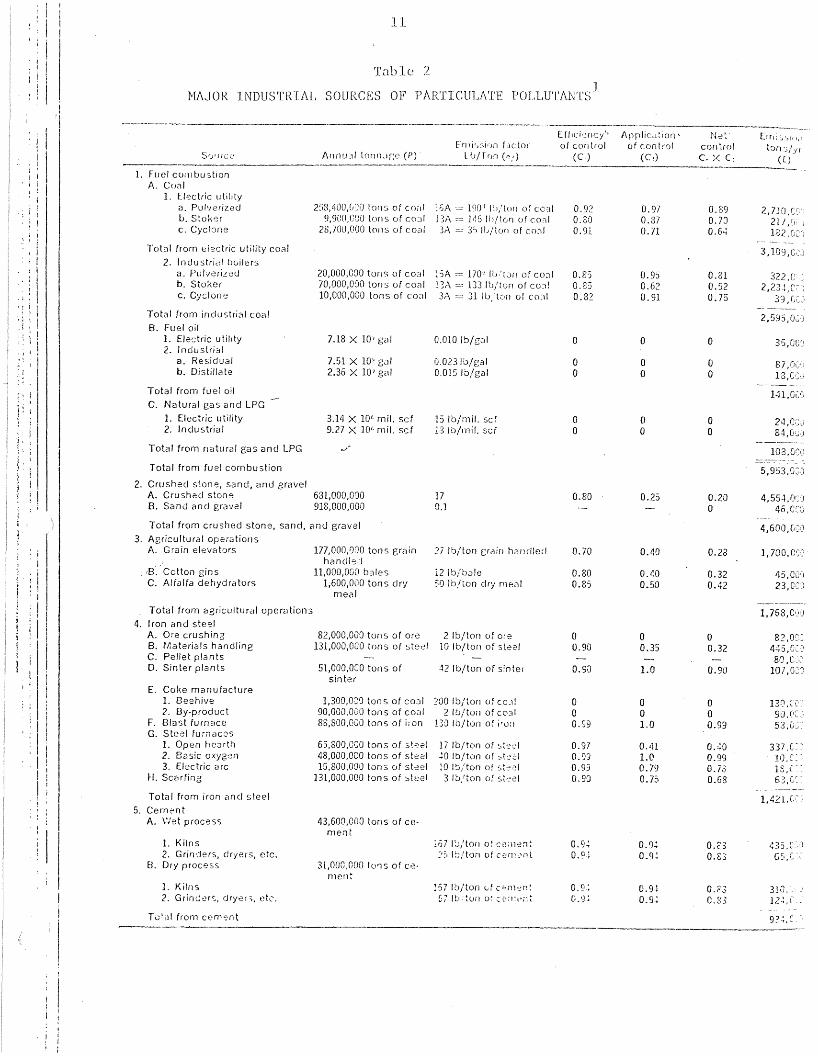
tons/year (Vandegrift, 1971) . Table 2 shmY's the maj or industrial
sources of particulate material.
Particle size is an important factor in any study of particulates.
Problems arise in this area because of the many different methods of
measuring the size and the fact that size can refer to either the
diameter or the radius. Some interpret it to mean the physical or
,.' geometrical size, '<lhereas others refer to equivalent sizes based on
optical, electrical or aerodynamic properties of the particles
(Fennelly,1976, Air Quality Criterion For Particulates,1969).
Most recent data has sho\vn a bimodal rather than normal dis-
tribution of size (diameter) for atmospheric particulates, with a
peak between 0.1 and 1.0 microns and another peak between 1.0 and
10 microns.
Evidence supporting this has shown that particles larger than 2.0
~rI~ are mostly primary particulates and those smaller than 1.0)1.(Y\ are
mostly secondary particulates. Figure 1 sho\vs some primary particles
and their sizes, based on geometric diameter of equivalent spheres.
Particles do not necessarily remain in the area where they are
emitted, but can be carried over long distances. Evidence is avail-
able showing that particulates produced in an urban area can be
carried hundreds of miles to rural areas. Lead particles thought to
be from the U.S. have been found in glacial ice in Greenland
(Fennelly, 1976).
Secolldary particulates are the major source of Aitken nuclei or
condensation centers necessary for the condensations that take place
) \
11
Table 2
NAJOR INDUSTRIAL SOURCES OF PAR'fICULATE POLl,UT'ANTS1
EftlCir~r1CY" ApplicdtlO'l ' Ne~ Erni-s',j( \,1E01 i '>~~i'jn fJetor' of control of control control tan "'/YI
SC..l!JrC2 Annu 31 tonn,lf:e (P) L '-'/TrJrJ ("'/) (C) «(I) ex c~ (E)------ ---...,~--
I 1. Fuel COIll bu stloni i A. Coal
L Electric utilitya. Pul'/er;z.ed 2:i8,tJOO,cIJO tons of co,d :6A -.= 190 I I'_l/ton of ceed 0.92 0.97 0.89 2,710,CC:b. Stoker 9,900,COO tons of ceul 13;\ = IllS Ih/toll of cO'll 0.80 0.87 0.70 21/,t) )c. Cyclone 28,700,000 tons of coal 3;\ = 35 ItJ/ton of cn.:-lf 0.91 0.71 0.64 122,CCIi II
I, 1'ot01I from electric utility coal 3,109,C,.';JI 2. Industrial boilersI a. Pulverized 20,000,COO tons of coal ~':;A = 170~ Ib:tJiI of cOJI 0.8S 0.95 0.31 322,C
Ib. Stoker 70,000,000 tons of cOed 13..\ = 133 Ill/ton of CO:1! 0.83 0.62 0.52 2,23-:,C:! c. Cyclone 10,000,000 tons of coal 3..\ = 31 Ib;'ton of cO::l1 0.82 0.91 0.75 39 ,C:~,.
I I\ I Total from industrial coal
2,595,0~,j, ~ : I B. Fuel oil
\ I 1. Electric utility 7.18 X 10' gal 0.010 Ib/gol ° 0 ° 35 ,OG~I\ iI 2. Industridl
I a. Residual 7.51 X 10'-' gal O_0231b/gal 0 0 a 87,OC:'1I b. Distillate 2.36 X 101 gal 0.0151b/gal 0 0 0 18,C'=C,I Tota I from fu el oil 14l,GC:J
IC. Natural gas and LPG
1. Electric utility 3.14 X 10'; mil. scf 15 lo/mil. scf a 0 0 24,OCj
I 2. Industrial 9.27 X 10'; mil. scf 13 lo/mil. scf 0 0 0 8-1,c!~j-----._~-
Total from natural gas and LPG ~. 103,GC')_.- ---~-
Total from fuel combustion 5,9:53.0:)2. Crushed stone, sand, and gravel
A. Crushed stone 631,000,000 17 0.80 0.25 0.20 4,55-1.01:)
B. Sand and gravel 918,000,000 0.1 a 46,CCC:-----
Total from crushed stone, sand, and gravel 4,600,G:J:}3. Agricultural operations
A. Grain elevators 177,000,000 tons grClin 27 lb/ton grain hClml:ed 0.70 0.40 0.28 1,700,0'=0I hanel/::.:!; .,B~ .Cotton gins 11.000,000 bales 12lb/bale 0.80 0.40 0.32 45,0(1':1
I C. Alfalfa dehydrators 1,600,000 tons dry 50 Ib/ton dry me,,1 0.85 0.50 0.,12 23,CC:)mealI -_._---I Total from agricultural operations l,758,e,:,)J
I4. Iron and steel
A. Ore crushin~ 82,000,000 tons of are 2 lblton of ore ° ° 0 82,00:: I B. Materials handlinB 131,000,000 tons of steel 10 lb/ton of steel 0.90 0.35 0.32 4~5,G,:J
i I C. Pellet plants 80,L~'O. Sinter plants 51,OOO,OCO tons of ~2 Ib/ton of s:nter O.SO 1.0 0.90 107,02J! I sinter
i
IE. Coke manufacture
1. Beehive 1,300,0,;0 tons of C031 200 Ib/ton of (0_11 ° 0 ° 130,~;Y:'
I 2. By-prOduct gO,OOO,OClO tons of COed 2 fb/ton of c031 a 0 0 gll,(e
I F. Blast furmlce 88,800,000 tons of i,on 130 la/ton of j'on 0.S9 1.0 0.99 53 I G'~,~
IG. Steel furnaces
1. Open hearth 65,SOO,OCO ton:; of steel 17 lo/ton of st-:,:?I 0.97 0.41 0.';0 337 .C::2. Basic oxyg2n 48,000,000 tons of steel ';0 Ib/t,)n of ",t~21 0.93 1.0 0.99 10,C: .I 3. Electric arc IS,800,OCiO tons of steel ],0 1!J;'ton of st~?1 0.93 0.79 O.h~ 1S, c
I H. Scarfing 131,000,000 tons of ~teef 3 la/ton of :.t.-,c:I 0.90 0.7S 0.68 631C~, -----_.-Total from iron anel steel 1,421,(/ :'
I5. Cement
A. \'/et process 43,600,000 tons of ee-
II rnent
1. Kilns ~67 I;;/tofl of c,;;l1en~ o C' 0.9'; 0.23 ~35,C~,J
I2. Grinjers, dryers, etc. :,~, ItJ/ton of c:::m·.'nt 0.91 0.9'; 0.83 G5,C:
8. Dry process 31,000,000 10'lS of ce-ment
I I 1. Kilns 157 lo/ton vi C;:'n1-:::nt 0.9-: O. 9~ 0.r3 310,I 2. Grind~rs, rJryer:;, etc. !i7 Ib:tun 07 C~:l;t~i1~ 0.9': 0.9~ C.~:3 12·;, (
I TO'ill from cement 9:'·;, C
I

12
-_--....-.~--_.... __"'_.______.___..._~__,~____. _""~.__·_,_•."._·_~"=_••_,L'.~.__·.~~_ '__.''''''-'-'_~'''''_''____'_-'''_-''.________..~.~,.".---..-_~_..--.-.= __~.,__..,.~_,__
[1 [ICil'ncyh r\ppllc.~tion' N.-:,l'- Ernis<,;onsEmission r.::ctor of cOldrol of control control tons yr
Source Annuc.d 10nnrlgc (r) Lll Ton krJ (Cc,l (e l ) ex C t (E)--~~'--~-----'.~-'--'-~"" ........-_._._.,-._------~_--...-.",-~._-- .."."..."~~----..--,, .........~-
G. Foresl proc:uc~s
A. WI!;;warn burners 27,500,000 tons of 10 Ib/lon of wasle 0 0 0 137,000waste
B. Sr:lwmills No est.C. Pulp mills 37,900,000 tOilS of pulp
l. Hecovery furnace 1:;0 Ib/ton of pulp 0.92 0.99 0.91 256,0002. Lime kilns ~5 Ib/ton of pulp 0.95 0.99 0.94 51,COO3. Dissolving tanks Sib/ton of pulp 0.90 0.33 0.30 66,000A P2rk boilers 82 ,OOO~.,.
D. Particleboard, etc. 74,000"_.-------
Total from forest products 666,000
7. LimeA. CrushIng, screening 28,0:0,000 tons of lock ?~ Ib/lon of rock 0.80 0.25 0.20 26·1,0008. Rotary kilns 16,200,000 tons af lime 120 Ib/ton of iime 0.93 0.87 0.81 29~,OOO
C. Verticle kilns 1,800,000 tons of lime 7 lb/tan of lime 0.97 0.40 0.39 4,000D. Materials handling 18,000,000 tons of li,ne 5 Ib/ton of lime 0.95 0.80 0.76 11,000
------Total from lime 573,000
8. ClayA. Ceramic
1. Grinding 4,722,000 tons 76lb/ton 0.80 0.75 0.60 72,0002. Drying 7,870,000 tons 70 Ib/ton 0.80 0.75 0.60 110,000
B. Refractoriesl. Kiln·fired
a. Calcining 688,000 tons 200 Ib/ton O.SO 0.80 0.64 25,000b. Drying 1,032,000 ton 5 i'0 Ib/ton 0.80 O.SO 0.64 13,000c. Grinding 3,440,000 tons 76lb/ton 0.80 0.80 0.64 47,000
2. Castable 550,000 tons 225 Ib/ton 0.90 0.85 0.77 14,OGO3. Magnesite 120,000 tons 250 Ib/ton O,FJO 0.70 0.56 7,0004. Mortars
a. Grinding 120,000 tons 76 Ib/ton 0.80 0.75 0.60 2,000b. Drying 120,000 tons 70lb/ton 0.80 0.75 0.60 2,OCO
5. Mixes 249,000 tons 76 lb/ton 0.80 0.75 0.60 4,000C. Heavy clay products
1. Grinding 4,740,000 tons 76lb/ton 0.80 0.75 0.60 72,0002. Drying 7,110,000 tons 70lb/ton 0.80 0.75 0.60 100,000
.~
Total from clay 458,0009. Primary non ferroL/S
A. Aluminum1. Grinding of bauxite 13,000,000 tons ot 6 Ib/ton of bauxite 0.80 8,000
bauxite2. Calcining of hydroxide 5,840,000 tons of 200 Ib/ton of alurnina 0.90 58,000
alumina3. Reduction cells
a. H. S. Soderberg 800,000 ton s of 1~4 Ib/lon of alurllinulll 0.':;0 La 0.40 35,000aluminum
b. V. S. Soder berg 700,000 tons of alullIi· 84 Ib/ton of aluminum O.G~ 1.0 0.64 10,000num
c. Prebake 1,755,000 tons of clUllli· 63 Ib/lon of c:lurninuill 0.64 1.0 0.64 20,000nurn
4. Materials handling 3,300,000 tons of dlullli- 10 Ib/ton uf alu;ninurll 0.90 0.35 0.32 11,000num
--- ----Total from primary aluminum 142,0008. Copper
1. Ore crushing 170,000,000 tons of ole 2 Ill/lOr! of ()[r>. a 0 0 ]70,0002. ROdsting 575,ODO tells of coppr:r n:,:3 Ib/ton of Cu 0.85 1.0 0.85 7,0003. Reverb. furnace 1,437,000 tons of :06 Ib/ton of Cu 0.95 0.S5 0.81 28,000
copper4. Converters 1,437,000 tons of 235 Ib/lnn I)f Cu 0.95 0.8:) 0.81 32,000
copper5. Me:lerials handling 1,437,000 tOilS of 10 Ih/toll of Cu 0.90 o "1' 0.32 5,000.JJ
copp.::r
nIdi f,orn primary copper .:>~2 ,ceo~----~--~~.-_.~".--- ..-.-

II I
: I13
ErfIC;·:".IICY" Application' NE:tc Emission.frn;:;sIon factur of corltrol of cOrJtrof con:rol tons ''if
Source Anl/lldl IOilllcq:£:: (P) Lb Ton (c;J (Cc) (Cd Co X C: (E)_••"'~_'_---_ ••-'~'_-~_' __ ', •• -.,~..---._~._." .•.._-".-'--'~-'-~'--~'-"-'---"""--"-~--------'--"----._---~--_._ .._-----_..~-"-------C. Zinc
1. Ore crushing2. Roasting
a. Fluid-b::!db, Ropp, multi-hearth
3. Sintering4, Distillalion5. Materials handling
Total from prirnary zinc
D. Lead1. Ore crushing2. Sintering3. Blast furnace4. Dross (,:,verb. furnace5. Material3 h,lfldling
Total from primary lead
Total from primary nonferrolls
10. Fertilizer and phosphate rockA. Phosphate rockB. Fertilizers
1. Ammonium nitrate
2. Urea3. Phosphates
a. Acid manufactureb. Granulation
4. Ammonium sulfate
18,000,000 ton.> of ore
76'.J,OOO tOils of zincl~i3,OO(l tons of zinc612,000 tons of zincG12,OOO tons of zinc
1,020.00U tons of zinc
4,500,000 tons of ore467,000 tons of le::ld467,000 tons of le:'leJ467,000 tons of lead467,000 tons (If I~;acf
38,000,000 tons of rock
2,800,000 tons of ammonitrate
1,000,000 tons of urea
4,370,000 tons of p."Oj13,000,000 tons of gran.
matI.2,700,000 tons '1mm.
sulfate
2 Ib/ton of are
2.000 I~J/t(Jn of Zn333 Ibjton of Zn130 Ibjt()[1 of Zn
7 lo/ton of Zn
2 Ib/ton of are:.20 Illjton of 19ad250 Ibjton of 1221(1
20 lojton of I:::ao5 Ib/ton of le'ad
o
0.930.350.95
0.90
a0.950.85
0.90
o
1.01.01.0
0.36
o0.900.93
0.35
o
0.980.850.95
0.32
o0.B50.830.500.32
18,000
15,OC:O4,nw)3,GGO
Ei,C:;O2,GC10
57,oeo
4,OCF'J17,G\)1)10,COr]
2,CI].J·I,OC r]
34,000----~"'_.--_ .._~--
475,OCO
53,000 .
28,GCO'
10,000 .
19,000190,000
27,00C"
251,000,000 tons of mat'I
6,264,000 tons ofasphalt
Total from fertilizers and phosphate rock
11. AsphaltA. P2ving material
L Dryers.", 2. Secondary sources
B. Roofing material
1. Blowing2. Snturator
32 Ib/ton of 111'1:'18 Ibj,on of m::1t'l
4 lbjton of asphalt
0.970.97
0.990.99
0.950.90
0.50
327,ceo
161,00040,000
3,00014,OO,J'
: J
Total from asphalt
12. FerroalloysA. Blast furnace
8. Electric furnace
C. Materials handling
Total from ferroalloys
13. Iron foundriesA. FurnacesB. Materials Handling
1. Coke, limeston::, etc,2. Sand
Total from iron foundrie<;
H. St'condary nonferrousA. Copper
1. Material prep;:mdluna. Wire burning
591,000 tons of ferro- ·110 lbjton ferro,IIlo/alloy
2,119,000 tons of ferro- 2.:10 fb/ton ferr03110yalloy
2,710,000 tons of ferro· 10 Ib/ton ferro.:llln:;alloy
18,000,000 tons of metal 16 Ibjton of llleLl!
5 lbjto~ of ille!:t!10,500,000 tons of sand 0.3 In/ton of S~)ntl
300,000 tons if1sLJldt~J ?IS la/ton of ,'/1;,"\'iire
0.99
0.80
0.90
o.so
o.soa
o
1.00
0.50
0.35
0.33
0.25a
o
0.99
0.40
0.32
0.27
0.20o
o
218,000
1,000
150,000
9,0)0
160,OJO
I05,OCO
37,C:;01,OIJiJ
I-B,OI)I:
~l,CGJ

________~___•__~___~_>___~..E_'...___~ .._____~__ _..........__, .. _ ..-_...
Efflelelley" Applic;:;,lion' Nf!t' E:'!li~ ',lOriS
Ernis~ion faeter c.f control of oKl!rol control ~ons yrSource Annu,"' lonnd,.;c (f') Lb Ton (c.') (e. ) (C,) c,: X C( (E)
b. S'tlei1llng furni1ces 6~.(;GO Ions ~;errlp 15 Ibllnn of SCfc:;=i 0.95 O.liO 0.19c. B!,:;st fUlnaces 287,OCO lOlls scrap ~IO Ib/lon of scrap 0.90 0.75 0.63 2,000
2. Smelting & refining ] ,liO,COO tons SC(<lP 70 Ib/tol1 of 50;:";') 0.91 0.60 0.57 ]7,OCO-----~~. __.,,-.
Tetal from secondary copper 60,000
8. Aluminum1. Sweating furnaces ~IOO,OOI) lons suap 32 Ih/loll of sClap 0.95 0.20 0.19 6,0002. Refi'1ing furni'lces l,OJ5.000 tOilS sdri1p 4 Ib/ton of SUep 0.95 0.60 0.57 1,0003. CIl/cnne Fluxing 136,000 Ions Cl used 1,000 Ib/ton CI us·~j 0.25 51,000
---------_.Tot21 from secondary aluminum 53,000
C. Load1. Pct ~u rnaces 53,000 tons scri1p 0.8 Iblton of scrap 0.95 0.95 0.902. Blast furnaces 119,000 tons scrap 190 Ib/ton of scrap 0.95 0.95 0.90 1,0003. Reverb. furnaces 554,000 tons scrap 100 Ib/ton of scrap 0.95 0.95 0.90 3,000
-----Total from secondary lead 4,000
O. Zinc1. Sweating furnaces
a. Metallic scrap 52,000 tons of scrap 12 'blton of scr2p 0.95 0.20 0.19b. Residual scrap 210,000 tons of scrap 30 Ib/ton of scrap 0.95 0.20 0.19 3,000
2. Distillation furnace 233,000 tons Zn reo 45 Ib/ton of zinc 0.95 0.60 0.57 2,000covered
-----Total from secondary zinc 5,000
------_._-Total from secondary nonferrous 127,000
15. Coal cleaningA. Thermel dryers 73,000,000 tons dried 1.0 94,000"
1'" Carbon Bleck,Channel process 71,000 2,300lb/ton 0 0 0 82.000
). Furnace process1. Gas 156,000 1.00 5,000*2. Oil 1,180,000 1.00 6,000·
Total from carbon black'"
-------93,000
17. Petroleum,A. FCC units 1.19 X 10⁹ bbJ. of feed 1.0 45,000 *
18. AcidsA. Sulfuric
1. New Acid3. Chamber 1,000,000 tons of 100% 5 Ib/ton of 100% H!SO: 0 0 2,000
H~SOlb. Contact 27,000,000 tons of 100% 2 Ib/tan of 100,% H!SO~ 0.95 0.90 0.85 4,000
H~SO~
2. Spent-acid concentrators 11,200,000 tons of spent 30 'blton of spent acid 0.95 0.35 0.80 8,000acid
B. Phosphoric1. Thermal process 1,020,000 tons of P~O, 134 Iblton of P~O.i 0.97 1.0 0.97 2,000
-----Total from acids 16,000
- "_.. ~ .. ____ ._w
TOTAL FROM MAJOR INDUSTRIAL SOURCES :. ~ ,081 ,000
'S",e specific industry section of Final Report (Contract CPA 22·59-104) for method of c'l:cula:;'lS quantity emitted., t..pplJcatlon of Con~rol is defined as that fraction of the total pr0duclion which has cG:trols.
~fllcie:lcy o~ Control is defined as the avera:se fractional efficlPncy of the contlol e(;'~';:JmAnt. prorated on the b.:>sis of production c3;:.:::c.ily .. r,(,t Contrails de:med as the overall level of cur.tlol, and is the product of the appilcc::,on c: control multiplied by the efficiency of co,-.rol.,,' Averc.fJ"; Ash Content of Carll UStjd, determined by phone sUf\,ey:
(d) (e)Type Boiler EIAc. Util. Indl1strial.. - -- -----_. ------- -------PulvE'ri;,;ed 11.9% 10.6%':S~c~er 11.2% 10.2%Cyclone 11.5% 10.3%
1Source: Vandegrift, A.E. et a1., J. Air Pollution Control
Assoc., 21, 321-328, 1971

J)
Figure T
1.0 nt
sea saJ nuclei
\
fly:ash/!....+ ._~ . l . . . '\, /
k
./1"-
carbon black
-+-~-p-a-i.~t 'pigment I pollens
I(~ _··_--t·--- ------> I~·---------~tobacco sHloke I I
~ -1:Aitken I cement dustnuclJi < I -..---·-T·-------------------;·~
~~ II
milled flour-(:..-/-----~t-_·-----)I, coal iclus_ t .__ '-
: I \. / -- ----"I!~-----7 i\ ii oil smoke .! I! ' ~(--I!----~----)I I
metallurgical dust and fumes II
----.--.--- ------... ------------ --. _I" .-------- -. -. --.---- ._ .. l .__ .--
Ismog I
-l- --·---1-> ;I . insecticid~
/1 dusts'
\II :;;!
rIIii
cbmbustion! nuclei
III
I'-E· ."
I
Source: Fennely, P.F. The orIgIn and influence of airbornepar ticu1ates . Am . Sci., 6LI, 46- 56, 19 7().

16
in the atmosphere. The formation of these particulates 1S tile result
of sunlight and atmospheric chemicals such <-1[:; 8° 2 , NH4' NO, H20 and
hydrocarbons (fennelly,1976). Some specific reactions in the formation
ot secondary particulates Here discllssed in the previous sec.tion.
Air pollution control regulations on particulates are most often
directed toward smoke, dustfall and suspended particulates (faith,1968).
Smoke is defined as a gas-born partic.le from incomplete combustion
and consisting mostly of carbon particles. Dusts are solid particles
of natural or industrial origin formed by disintegration processes.
Fumes are also solid particles resulting from sublimation, distillation,
calcination or chemical reaction processes. Mists are liquid particles.
Suspended particulates consist of any of the above Hhen they are
of such a size and density that they remain suspended in the atmos
phere. Dustfal1 refers to particulate matter \vhich settles out of
the air in a specific length of time (Faith,1968).
The standards set for S02 and particulates vary from country to
country as sho\Vl1 in Table 3 (Biersteker,1976~ U.S. primary standards
for particulates for 24 hours are 75~1/m3 annual geometric @ean,(median, year) and 260fl1/m3 annual maximum (highest day in year) .
I'" ,Secondary standards for 24 hours are 60)~~/m3.',,1'
There' are difficulties in setting ambient air standards because
two or three pollutants may be present at the same time and concen
trations vary widely due to meteorological and topographical conditions.
Also reactions may take place betHeen the various pollutants (Biersteker, 1976
In 1973 Hemeon published a critical review of the regulations
established for particulate metter (Hemeon, 1973). He criticized the
usage of the term "particulate matter" in that it Has too broad to
be defined as an air pollutant causing adverse health effects. To be
a health hazard an agent should be identified by its chemical compo-
sition. Particulate matter is a general designation Hith no chemical
identity and is therefore, a nonentity (Hemeon, 197~.
Also, instead of separate standards for S02 and particulate matter,
he suggested.terms such as "concentrations of soluble sulfate" as a
. substitute.
Another important area in reviewing atmospheric particles is
polycyclic organic matter (PO~O. This consists of the subcategories:
polynuclear aromatic hydrocarbons and polynuclear Ileterocyclic
compounds. pm·! represents only a very small part of total p.:trticuL,Le

"f,t'
.L,
matter but it is of importance because of its kno\Vn health hazard
to DIan and animals. PON is formed in any combustion process
~'vo1ving fossil fuels. It is uncertain \vhether PO(.{ cond(~~nses
out as discrete particles after cooling or condenses on surfaces
of existing particles after formation. According to most inves
tigators PON is bound to particles such as soot. PON is associatc.=:d
largely with particles less than 5 microgms in diameter. These
compounds are highly reactive and are degraded in the atmosphere by
photooxidation and reactions with S02 and other oxidants.
Benzo(a)pyrene (B(a)P) is an important constituent of POM and
is usually used to measure the presence of airborne organic
pollutants.

TABLE 3
NAIN S02 AND Pl\RTICULL\TES STANDARDS PRESENTLY IN USE
USA1974
USSR1973
S\veden1965
SO2
particulates
smoke
80),.l~3/m3 (mec.m, year), 36S}l'j/m3 (highestday i.n 3e.ar)
l300}tj/m (3 hour maximum, secondarystandard to protect against plant damage)
75 }{~ / m3 ( me dian, yea r), 26 0}(11m3 (h i ghe s tday ll1 year)
50.Jtg/m3 (24 hrs), 500)~?J/m3 (20 minutes)
50,.Lts/m3 (2 l f hrs), l50}l~/m3 (20 minutes)
15()..Jtg / m3 (highest month), 300J-f.S 1m3
(highest day in a month), 750)l5/m3(30 minutes)
Netherlands S02 75}{o/m3 (median, year), 250ft'3 /m31970 proposed (98 percentile)
smoke ft . 3 (median, year), 90/l{tj/m330 ~~/m(98 percentile)
West Germany S02 140){j/m3 (24 hrs) , 400)..t,/m3 (30 minutes)1~.74
100)'t~/m3 200}-l1/m3,.. ' particulates (24 hrs), (30 minutes)
Japan S02 120}{!) 1m3 (24 hrs), 300}ts/m3 (1 hr)
particulates 100)l:j/m3 ( 2l~ hrs), 200}{1 /m3 (1 hr)
Source: Biersteker, K. Sulfur Dioxide and suspended particulatematter. Where do we stand. Env. Res., 11, 287-304, 1976.

III. Experimental Studies
A~ Sulfur Dioxide
1. Introduction
Sulfur dioxide is ~ weak acid anhydride that is highly
soluble in aqueous solution. Absorption of sulfur dioxide
into the blood stream leads to the formation of sulfite
S03 and bisulfite HS03
ions at the low pH normally present.
These ions are then rapidly oxidized to sulfates by
sulfite oxidase. The biochemical mechClnism of sulfur
dioxide, therefore, can be considered in terms of its
weak acidity, the action of sulfite-bisulfite ions; or
by the effects of sulfate ions.
An excellent section on the biochemical reactions of
',"1. 1 '
inhaled sulfur oxides within the body was presented in Air
Quality and Stationary Source Emission Control, 1975. The
reader is referred to that publication for greater detail.
The author stated that the biochemical mechanisms by
which sulfur oxides produce effects in the lung \vere still
unkno\,m. The major physiological response to sulfur
dioxide inhalation is bronchoconstriction. Possibly these
effects are totally explainable by a decrease in pH.
Like\vise hyperplasia of mucous secreting cells, which often
result from prolonged exposure to sulfur dioxide, may
also be due to acidity. The author summits that this
explanation is probably an overs implication of sulfur
oxide toxicity. The toxicity of specific sulfur oxides
will be discussed in separate sections.
Sulfur dioxide has been implicated as the primary
contributing agent in pollution-related diseases. For
this reason the effects of sulfur dioxide alone Hill be
discussed in terms of its acute effects, its affect on
pulmonary func t ion, h:i.s tology, and pulmonary def ellse
systems in animals; :1nd its irritative and pulmonary function
effects in humans experimentally exposed.

',,1.. "
20
2. Animal Studies
a) Acute EXPOSlll"C
According t.o Air QU;Jl:Lty Criteria for Sulfur
Dioxide the response to sulfur dioxide has been tested
in a variety of species including guinea pigs, mice,
grasshoppers, anel cockroaches. Continuous exposure to
802 concentrations of 150 ppm required 847 hours to
kill 50% of the mice, while only 154 hours at 130 ppm
was required to kill 50% of the guinea pigs (1970).
From these data it appeared that mice were more resistant
fo the effects of 802 than \'1cre guinea pigs. Ho\Vever,
at concentrations of 300 ppm to 1,000 ppm 802' guinea
pigs were found to be more resistant than mice. At
l,OOO ppm 8°2
, 50% of the mice died in four hours \'1hile
it took 20 hours for 50% of the guinea pigs to die.
Thus, extrapolations from high to lower concentrations
in species sensitivity can be unreliable.
Colucci summarized t.he available data on acute
toxicity of 802 as fol10\\7s: "No significant mortality
was observed in animals at 802 concentrations ranging
from 250 ppm (650 mg/m3
) administered for 40 ~inutes,
to 1180 ppm (3,092 mg/m3) administered for 90 hours."
However, due to great variation among species and
among studies this summary statement seems unjustified.
Effects that were observed under this exposure (1180 ppm)
included "slight eye irritation, excess salivation,
coughing, some moderate dyspnea, rhinitis, lachrymation,
conjunctivitis, abdominal distention, lethargy, weakness,
and paralysis of the hind limbs" (Colucci, 1976).
Studies of this type have varied greatly in the
species used, the concentrations of 802' and duration
of exposure. In spite of these differences, often the
same response has been elicited. Therefore, the
pathological examination ·of these acutely exposed
animals
I' J
intercst. Cenerally thfC' lungs have
been f 0 un c1 to be t ] ICC r i ti Cell 0 y g a n of res p (l n s e
(EPRI).
Leong luac1e his tologic:al examinations of mice,
ra ts, and guinea pigs \'1hie 11 he had exposed to a
single lethal exposure of S02 ranging from 600 to
5,000 ppm (Leong, 1961). Each species "I.'7.:J.S exposed
to three different concentrations of the gas. Several
pretreatment procedures were used in order to increase
the animals sensitivity to 802' These included
injection of histamine, injections of albumin, and
adrenalectomy. T\'70 mechanisms of death Here observed
in guinea pigs. Occlusion of the bronchioles and
venous congestion with little or no fluid in the
alveoli "I.\Tere the distinctive features in those animals
which died quickly either after S02 exposure or
histamine injection. Those that died after 2-3 hours
of exposure experienced thickened alveolar walls with
20-30% of the alveoli filled with fluid. The
bronchioles were greatly distended. The observations
made on" these animals were apparently consistent with
the hypothesis that animals 'ivith brief survival times
die of asphyxia produced by the occlusion of the upper
respiratory passages. Death after prolonged survival
periods resulted from pulmonary failure associated
,·lith extensive edema. Leong's study suggested that
histamine is involved in the pathological effects
brought about by exposure to S02'
b) Long Term Exposure
Attempts have been made to assess the tissue damage
induced by the inhalation of 802 in lower concentrations
than those eliciting acute responses.
Alaire has reported minimal Alteration of the liver
(increased hepatocyte vacuolation) in guinen pigs
exposed to 5.72 ppm S00 for 52 weeks (A13ire, 1970).L

22
,,,ere Jos t D. nel t here \-fa s basal cc LI hyp crp las La cHld
transitional hyperplnsia; 2-/f Heek~3 of (':-:.por311re
to 200 ppm S02 produced squclrnolls metaplasia of the
cpi thelium. Doses of (fOO ppm 302 for 1 to 2 \-leeks
produced squamous metaplasia. Expo~~ur(' to 50'1L.
concentra tion of (fO T):)[[l for 6 ",eeks produced no
observable changes (P,smunc1ssoTI, 1973). In order
,,"
to produce hypersecretion, rats initially received
doses of (fO ppm 3°2 for 5 hr/day> .s dclys ~J "leek.G
Doses \Vere subsequently raised to 300--400 ppm \vhen no
great change was seen in the lungs (Reid, 1963). At
this larger dose an increase in the number of mucous
secreting cells (goblet cells) were observed both in
the main bronchi and in the peripheral airways (which
normally Jack goblet cells). An excess of mucous cells
in man is indicative of chronic bronchitis. The excess
goblet cells were still observable 3 months after
cessation of exposure; however, the cessation of
exposure did seem to end the increase in cells.
An. attempt \Vas made to produce chronic bronchitj s
in male beagles by using an exposure of 500-600 ppm
802 for 2-hour periods twice a week for 4-5 months
(Chakin, 1974). Upon histological examination of the
lungs, the proportion of goblet cells to ciliated
cells were found to be decreased at the beginning of
the segmental bronchi, \"hile goblets cell SHere
increased at the end of these bronchi and in the
bronchioles. Hyperplasia of the bronchial glands
occurred. The overall result was excess mucopurulent
exudate in the bronchial tree. Since alterations in
the quality or quantity of the respiratory mucus is
often a major characteristic of obstructive lung
diseases in llUm,l11s these his toJ ogical clwnges \'lere
significant I I t \1,7as not s uggestedthat the 1 e s ions

23
This some group showed a lower incidence and severity
of spontaneous disease upon examination of the lung
and trachea.
Goldring found ouly minor irritative responses
(in the form of focal bronchialization of the alveoli,
acute congestion of pulmonary parenchyma, focal emphysema,
and epithelial cushioning in the bronchus with the
suggestion of hyperplasia) in the lungs of hamsters
exposed to 650 ppm S02 plus 1% NaCl aerosol for q2 to
63 daily exposures (Goldring, 1967). Goldring also
found slight histopathological changes in the lungs of
hamsters exposed to 802 alone. In animals that were
first treated with papain (in order to induce emphysema)
and then challenged with chronic exposure to 802'
a significant number developed a mild form of
bronchitis (Goldring, 1970).
Minimal lesions were also observed in rats exposed
to 10 ppm 802 for up to 3 days. After 24 hours of 802
exposure, lesions in the nasomaxillary turbinates
,vere observed. These lesions consisted of edema, necrosis,
and desquamation of the respiratory and olfactory
epithelium. More severe injury occurred in the nasomax
illary turbinates than in the rest of the respiratory
tract. Mice with mild upper-respiratory tract infection
had more severe lesions after 802 exposure than those
mice ~hat were free from disease.
Epithelial changes were observed in the trachea
and large bronchi of Syrian hamsters exposed to 100,
200, and 400 ppm 802 for periods up to 6 weeks. The
sequence of changes were as follows; dilation, vacuo
lation, and extrusion or exfoliation of ciliated and
goblet cells within a few hours of exposure; replace
ment of ciliated cells by goblet cells 3 or 4 days
later; 6-8 days after continuing exposure goblet cells

induced were a precise counterpart of these found
in humans, bu t they \vcrc found to be more closely
related to t:hose in lnl1llCJl1S than those lesions pro-
duced in rats.
Laskin exposed rnts to 10, 51, 105, and 566 ppm
S02 for various time periods (Colucci, 1976). Pulmonary
damage and death occurred at concentrations of 566 ppm
SOr, but no effects were seen at lower exposure levels.L
It has been suggested that excess fluid in the
alveoli is removed by alveolar macrophages (Barry, 1970).
The comparative activity of our lysosomal hydrolytic
enzymes ·were studied histochemically in adult rats
exposed to S02 to induce hypersecretion of mucus and
thereby increase the amount of mucus reaching the
alveoli. A marked increase in acid phosphatase was
observed throughout the lung parenchyma. Barry
suggested that acid phosphatase in alveolar macrophages
increased in response to increased mucus reaching the
alveoli after respiratory irritation with 802 and
that it was connected 'I.-lith the break do\m and removal
of the mucupolysaccharide.
Peacock examined three comparable groups of LX
mice of both sexes for primary tumors and other lesions
after one group was exposed to free radicals and
another group was exposed to 802 (Peacock, 1967).
Incidence of primary lung tumors doubled in those mice
(male and female) exposed to 500 ppm 802 (only those
mice that survived over 300 days were considered)
as compared to controls. In females only those
exposed to 802 experienced any carcinoma of the lung.
A slight increase Has seen among mice exposed to free
radicals. The dist.ribution of tumors could have been
a matter of chance as \\';]s shO\.;rn by independent
statistical analysis, however, the possibility remains
tha t rcpca tc~c1 expos ur e to S02 accelerated the unknO\VI1

studies reviC'\ved: "Evidence' appears to bE.' clTlcl:"ging
to support the pathogenic effecls of S02 on tIle nasal
mucosa. However, as is characteristic of most C1nimal
studies, the levels required to produce these: effects
are high in relation to tha t observed in mnbie:nt
air. II Apparently sulfur dioxide does produce epithelial
,',,1'
changes in lungs of various animals. The overall results
appear to be an excess of mucous exudate in the bronchial
tree, due to an hyperplasia of goblet cells. Two
studies have implied that 802 may act as a carcinogen,
but no substantial evidence has been provided to
support that hypothesis.
c) Pulmonary Function
For detecing pulmonary irritation, alteration in
flow resistance is one of the more sensitive physiological
tests.
Increase pulmonary resistance resulted from the
administration of 802 into the upper and lower airways
of anesthetized, paralyzed, artificially ventilated
cats. This was prevented by a complete cold block of
the cervical vagosympathetic nerves or by injection
of atropine intravenously before 802 was inhaled.
These results seem to establish the reflex nature
of bronchoconstrictionduring inhalation of 802 (Nadel,
1965).
Anesthetized dogs ,,,ere exposed to 802 by nose or
by tracheal cannula (Frank, 1963). 802
ranged from
7 to 230 ppm for 15-20 minutes. Breathing through the
nose increased nasal flow resistance roughly in
proportion to the concentration of 802' Nasal flow
resistance reverted to control levels 15-40 minutes
after exposure ceased. Pulmonary flow resistance
undenvent smaller chang during exposure to 802
through the nose than did nasal flow resistance.

,,!'
27
When S02 was administered by trachea cannula pulmonary
flow resistance rose quickly to a peak in a few minutes
and decreased the-reaftcr. The changes in nasal f1.mY
resistance ",ere possibly due to mucosal swelling or
increased mucus secretions.
Alarie found no adverse changes in pulmonary
functions of guinea pigs at exposures of 0.1 to
5 ppm S02 for up to one year (Alaire, 1970).
Pulmonary function tests included tidal volume,
respiratory rate, minute volume, dynamic compliance,
pulmonary flo", resist2nce, and carbon monoxide uptake.
Body weight, growth, and survival were apparently not
adversely affected by exposure to S02' Hemotologic
variables and clinical measurements were normal.
Lewis found increased pulmonary flow resistance
and decreased lung compliance in beagles exposed to
5 ppm S02 continuously for 225 days (Lewis, 1968).
However, these results ",ere not demonstrated at 650
days in the same ani~als (Lewis, 1973).
Salem studied the bronchiolar and pulmonary
vascular smooth muscles in a group of anesthetized
dogs (Salem, 1961). S02 concentrations ranging from
200 to 850 ppm administered from 1 to 4 minutes
resulted in pulmonary vasoconstriction, bronchoconstriction,
with bronchodilation before and after increased pulmonary
arterial blood pressure, bradycardia and systemic shock.
Pulmonary vessels \\Tere determined to be more sensitive
than bronchioles to sulfur dioxide exposure. The
constriction of these vessles reduced the amount of
S02 absorbed by the pulmonary circulation and carried
to the systemic circulation.
Along slightly different lines, Lee conducted
experiments to establish the minimal S02 exposure
that \'lOuld consistently affect the re.spiral~ion and

biochemistry of guinea pigs (Lee, 1966). Exposure
to 19 ppm S02 [or one hour caused an increase in
tidal volume, decrease in reE;pitatory rate, along \vith
irregular effects on minute volume. A general decrense
in tidal volume and an increase in respiratory rate
was observed for S02 concentrations of 7 to 17 ppm.
Apparently the effect of 502 on the tidal volume was
dependent on the concentration of SOr administered.:I-
Below 18 ppm S02 tidal volume decreased while above
18 ppm 802 tidal volume increased.
802 concentrations of 0.14, 0.64, and 1.28 ppm
had no effect on the mechanical properties of the
lung, distribtuion of pulmonary ventilation, diffusing
capacity, and arterial blood oxygen tension of
cynomolgus monkeys exposed continuously for 78 days
(Alaire, 1972). A group exposed to 4.69 ppm 802
for 30 weeks did s11m'l a definite decrease in pulmonary
function after an accidental overexposure to concen-
trations of 802 in the range of 200--1,000 ppm for one
hour. The lungs and liver were found to be affected
upon histological examination.
Alaire conducted a follow-up study exposing
cynomolgous monkeys to 5 ppm S02 24 hours a day for
78 days (Alaire, 1975). No effects on pulmonary function
'\vere observed.
Amdur reported that exposure to as little as
0.15 ppm 802 for one hour can induce small reversible
increases in pulmonary resistance in guinea pigs (Colucci,
1976).
Apparently some anim;Jl species \<7ill exhibit a
response to low levels of 802' but these increases in
flow resistance reverse after cessation of exposure.

r l"
d) }~cociliary Clearance
Nucociliory clenrance is an important pulmonary
defense against toxic materials and pathogenic bacteria.
Three approaches have been generally undertaken in the
study of this mechanism: direct observation of cilia,
the clearance of foreign particles,and altered susceptibility
to infectious agents.
One of the first studies on mucus flow and ciliary
activity in rats \vas conducted in Scandinavia (Da1hamn,
1956). Two groups of rats were exposed to S02' 1 group
for 18 days at 11.4 ppm, the other for 67 days at 11.5
ppm. Each group was divided into two subgroups and
examined at t\VO different times, immediately af ter
cessation of exposure and 33 days later. A third group
comprised of 6 rats were exposed to a continuous stream
of air for 62 days. Retardation of the mucus flow was
demonstrated in all 4 groups exposed to S02' Ciliary
activity was significantly reduced in the rats exposed
to S02 for 18 days, but not in the rats exposed for a
longer period. This study indicated that mucus f10\<1 can
be slowed without a decrease in ciliary activity.
Da1hamn also studied the acute effects of sulfur
dioxide on ciliary activity on thd trachea of rabbits in
vivo and in vitro (Dalhamn, 1961, 1963). A 5 minute
exposure to 20-30 mg/l or 10 ppm S02 was required for
cessation of the ciliary beat in rabbits during in vitro
exposure (S02 blO\vn directly over tracheal mucosa). In
rabbits spontaneiously breathing through the nose 200-250
ppm S02 was required before ciliary beating ceased. The
apparent contradiction was explained by absorption of S02
in the nasal passages during nose breathing. Hh.en 200 ppm
S02 was inhaled, 6-8 ppm S02 was all that was recovered
in the trachea.

30
The ef fcc ts 0 f .Lllh::'lla t ion of S02 for 30 minutes on the
bronchial clearance in thn~e minaturc donkeys \Vas studied
by Spiezelrnan by means of rodioactive lilonodisperse ferric
oxide particles (Spiczelman, ]968). The donkeys exhibited
·discornfort during all levels of exposure from 0.26 to 713
ppm S02' but impai.red clearance occurred only at higher
concentrations of S02 ( ppm). These concentrations
also produced coughing and mucous discharge from the nose.
Tracheal mucus velocity was studied in 8 purebred
beagle dogs exposed to 1 ppm S02 intermittently for 12
months as opposed to 3 dogs not exposed at all (Hirsch,
1975). Teflon discs were used to monitor velocity.
Significant slOl,ling of mucus flmv as found among S02
exposed dogs. Apparently breathing and pulmonary gas
exchange were not affected. Long-germ exposure produced
impairment of ciliary activity \vith no alteration in
pulmonary function. Slowed mucociliary activity may be
one of the first signs of pulmonary dysfunctions.
Four hundred and twenty Long-Evans male rats were
exposed to S02 concentrations of 0.1, l,and 20 ppm, for
7 hours a day, 5 days a week for 10 to 25 days (Ferin,
1973). After exposure to 802' animals were exposed to
Ti02 aerosol at 15 mg/m3
for 7 hours (diameter 1.48 microgms).
S02 \'1<:1S sho\AlTl to effect the clearance of these "inert"
particles. Interestingly, it was observed that short term
exposures at higher concentration (20 ppm) were tolerated
better than longer lasting exposure to 10\ver levels of S02
(1 ppm).
Bacterial elimination in guinea pigs was not impaired
by exposure to 10 ppm 802 for 4 weeks (Rylander, 1969).
Killed, radioactive, and viable E. coli were the organisms
lIsed.
The effect of S02 alone on the pathogenesis of murine
influenza \·:as investigi..l ted by Fairchild in male albi.no
micE' (Fcdrchilc1, 1972). The mean S02 concentration ranged

""
31
fro m 2, 9 t () 3Lf PPTIl • He i gh t los S \<1;] S U ::; e c1 a san
indicator of response. At low levels of S02 exposure no
effect on weight was seen but at 34 ppm) mice lost 15
percent of their weight during the 7 day exposure. At
lower S02 concentrations the amount of pneumonia that was
observed was slightly reduced on the seventh day, IIowever,
at 7-10 ppm an increase in pneumonia began to be observed.
The underlying mechanisms were not clear. One possible
explanation offered was that S02 produced inflammatory
changes and pulmonary clearance mechanisms were therefore
slmved. Possibly alveolar macrophages were impaired. The
author pointed out that the concentration of S02 that
promoted pneumonia in mice was approximately 100 times the
concentration commonly observed in New York.
e) Absorption and Distribution
Several animal studies have focused on the amount of
absorption that occurs during the breathing of S02'
Because a large percentage of inhaled sulfur dioxide is
absorbed, the fate of this sulfur dioxide is also of
interest ..
Frank administered 35 S02 to anesthetizied dogs by
means of a mask with separate connections for the nose
and mouth (Frank, 1969). Ninety-nine percent of the gas
(1-50 ppm) breathed through the nose was absorbed at a
flm" of 3.5 liters per minute. Hhen flu\v Has increased
10 fold, the percent absorbed fell several percent. More
than 95 percent of all sulfur dioxide (1.10 ppm) inhaled
by mouth was absorped at a flow rate of 3.5 liters per
minute. Hmvever, \o,7hen flmV' increased 10 fold, abosrption
fell to belm'1 50 percent. The nose was 8hO\vn to be more
effective at removing 35 S02 from the airstre~m. The rate
of administration appeared to be quite important in terms
of penetration of the upper airways. The mode of breathing,
nasal or oral, SIOH or fast, seems to be more important
than the concentration ofS02
in the environment in
determining hO\\1 much 802 reaches the l<1rynx and the lQl.n~r
ain,rays. To related this finding to m;1Il, one ~'ioulc1 e}~lh\cl

32
exercise and heavy labor to result in increased exposure
of the lower airways to S02' Another important finding
was the continuous release of S02 from the mucus after
S02 exposure ceased.
The absorption of S02 in the respiratory tract of
rabbits breathing through the nose has been investigated
by Strandberg (Strandberg, 1964). According to Strandberg,
several authors have already studied this phenomenon.
Gadaskina found that absorption was 63 percent (range 46
percent to 81 percent) rabbits were exposed to 200-2,000
ppm S02 Dalhamn and Strandberg found 90-95 percent
absorption where rabbits were exposed to 100, 200,3nd 300
ppm S02. In this experiment, rabbits were exposed to
concentrations of S02 from approximately 0.05 ppm to
700 ppm. Expsure to high concentrations (100 ppm) of S02
resulted in absorption in the respiratory tract of
approximately 95 percent at inspriation and 98 percent at
expiration. However, exposure to low concentrations of
S02 (.1 ppm) less absorption occurred, approximately L~O
percent at inspiration and 80 percent at expiration.
Higher concentrations of excess mucus 'vere proposed to
occur during higher concentrations of S02 thereby increasing
absorption.
Amdur using Strandberg's data explained the fact that
the presence of a tracheal cannula does not lead to greater
response at low concentrations while it does lead to a
greater response at high concentrations (Amdur, 1963).
Since upper respiratory tract absorption is minimal at
low concentrations, it followed that a by pass of the upper
respiratory tract with the cannula would not significantly
increase the amount of S02 reaching the lung.
The absorption and distribution of S02 inhaled through
the nose and mouth Has studied in t'ivelve dogs (Ralchum, 1959).
A significantly lO\ver percentage of retained 35S
concentration
was found in the organs of the dogs breathing throuzh the

33
nose and mouth than in those breathing via a tracheostomy.
Those organs include.d the trachea, lungs, hilar lymph nodes,
liver and spleen. 35S
was found to be excreted in urine.
Blood levels of 35S
and pulmonary resistance were also
10\ver in dogs breathing through their nose and mouth.
The various measures seemed to indicate a protective
effect of the upper airways in that less sulfur dioxide
reached the lungs when breathed through the nose. Labelled
35S02 was only slowly removed from the trachea and lung,
being detected in these tissues a week after exposure
(Balchum, 1960). According to Balchum, Bystrova found
radioactive sulfur in the tissues of mice three weeks after
exposure.
35Yokayama exposed 5 mongrel dogs to 22± 2 ppm SOn
L
while they were anesthetized (Yokayama, 1971). Expsosures35
lasted from 30-60 minutes. Blood S levels rose
progressively during exposure and decreased slightly hours35
after exposure. More S was found in the plasma than in
the red blood cells. Of the 35S associated 'vith red blood
cells, two thirds appeared to be intracellular. 'That
affect the sulfur that enters the RBC may have is not
k . 35S f d b d"nO\ffi. Agaln, was oun to e excrete In urlne.
Figure 2 presents the possible paths that 802 follows
after its removal from inspired air (Frank, 1969).
At high exposure levels the upper airway absorbs a
large percentage of inhaled sulfur dioxide and thereby
minimize exposure of the lungs and lower ainvays. The
absorption of S02 is not a rapidly reversible process,
but rather leads to biochemical reactions \vithin the body
such as the formation of sulfi te \vhich apparently is
reversible.
3. Human Studies
Sulfur dioxide is a mild respiratory irritant that can
cause irritCltion Clnd inflammation of the eye conjunctiva.
According to Sax, 0.3-1 ppm can be detected by taste rather
than smell in the average individual (Sax, 1963). Sax has

34
Figure 2. Different Paths Taken by 802After its Removal fromInspired Air l
Tissues
vUrin2
( ? feces)
I'\V
l'III
.J- Alveoli
-~ Trachea 1 Bronch;II
E>',pircd
5°2
'\ desorption
Naso -j Oropharynx
I 7 '-I . '" ,. miCjrot!or. 'oy ~'": repea:"d desorption. ". '.
reabsorptionI -~ Blood (ce;;~ 7 plasma)\
\
1Source: Frank) N.R. et aI, Arch. Environ.
Health, 18, 315-322, 1969

35
also sta teel that 3 ppm has ,.'In easi.ly dc::tecLCJble odor, although
other studies have found \Vide variability in the level at \\lh.i.ch
S02 is detected. T\Venty ppm is the level at which S02 becomes
irritating to the eyes and 10,000 ppm is irritating to moist
areas of the skin within minutes of exposure. The upper
respiratory tract and the bronchi are the organs primarily
affec.ted by S02 inhalation. Edema of the lung or glottis
may result with possible respiratory paralysis at very high
concentrations. Conc.entrations of 400-500 ppm is immediately
dangerous to life. These findings have come mostly from
industrial exposures to S02' The toxicity of S02 at much lower
concentrations has also been studied under controlled conditions
with healthy human volunteers.
}Ielvilie compared the effects of S02 inhaled by mouth and
nose in 49 healthy volunteers (~lelville, 1970). Specific
airway conductance (SO ) decreased after inhalation of S02at;v
in low concentrations (below 5 ppm) during both nose and
mouth breathing. However, the decrease was greater with
.. ,. mouth breathing. No difference in SO bet~\7een nose and moutha\V
breathing \vas observed after inhalation of 5 ppm S02' No
further decreases in SO could be found after exposure toa"t;v
5 ppm S02 for 5 minutes even \vhen exposure lasted up to 1
hour. The authors suggested that this indicated acclimatization
Speizer and Frank using 7 human subjects found that with
exposures up to 25 ppm for 30 minutes less than 1 percent of
S02 entering the nose reaches the oropharynx. It \Vas implied
that these low concentrations were sufficient to initiate
reflex changes in bronchomotor tone (Speizer and Frank, 1966).
Anderson confirmed this finding in testing pharyngeal air
samples in 15 young healthy men during 6-hour exposures to 1.5
and 25 ppm S02 (Anderson, 1974). Significant decreases in
nasal mucus flow rates were observed during the 5 and 25 ppm
exposure particularly in the anterior nose and in subjects
with initially slow mucus flow rates. Increased nasal airflow
resistance and decreased forced expiratory volume in 1 second
"t·
(FEV'l ) and forced cxpirat-ory Elm,; clur Llle miClcllc balf. sec .expired volume vIas found at.: ;:111 cxpo:~;\nt' leveLs. 1'111.8 study
seemed to indicate that nosohronchi.:Jl reflex bT'onchoconstriction
was occurring.
According to Colucci, W ir failed to find any dose-related
changes in males exposed to 0.3-1.0 ppm S02 for 120 hours.
At 3 ppm significant but minimal reversible decreases in
small airway conductance occurred.
It has been concluded from this and other evidence that
"the experi~ental threshold concentrations for the demonstration
of the bronchoconstrictor effects of S02 for brief expsosure
is something close to 1. ppm (c~ 2.5 mg/m3
) in healthy adults"
(Colucci, 1976).
Pulmonary resistance was measured in 10 healthy males in3
Kmvaski after inhalation of about 10 mg/m of dust ·Hi th deep
breaths (Toyama, 1964). The mean diameter of the dust was
2 microgms. The degree of increased airway resistance depended
mostly on individual sensitivity. The results suggested that
fine particles produce increased flow resistance by phsical
rather than chemical means.
Wolff failed to find any changes in tracheobronchial
clearance in 9 healthy adults exposed to 5 ppm S02 (Wolff,
1975). He suggested that clearance results from the local
action of absorbed gas. The observed decreases in ~~ffiP appeared
to be caused by reflex bronchoconstriction.
A series of experiments all a total of 25 healthy human
volunteers extending over a period of 4 years found a great
deal of individual variation both bet\veen and \vithin subjects
(Lawther, 1975). However, increases in airway resistance
were seen at low concentrations (1-3 ppm) of 302 when inhaled
deeply. Higher concentrations (5-30 ppm) of S02 caused changes
in resistance \~'hen inhaled normally.
Stokinger after reviewing several papers on the affect
of pure 302 on man concluded that concentrations above 1 ppm
,.. '
37
pure 802 were required before serious or even significant
effects would be expected on the health of healthy individuals
(8tokinger, 1968).
The effect of 802 on individuals with impaired respiratory
systems would be expected to be greater, but no such studies
would be conducted for ethical considerations.

3B
B. Sulfuric Acid and Sulfates
1. Introduction
Since sulfuric acid and acid sul£o.tcs may he responsible
for much of the aggravation of respiratory illness associated
'vi th S02 levels im many epidemiologic studies, toxicologic
effects of these compounds are of great interest (Utidjian,
1975).
2. Animal Studies
a. Acute Exposure
Exposure of various animals to high concentrations
of sulfuric acid has been used to esta1ish its relative
toxicity and its affect on tissues in the respiratory
tract. Sulphates seemingly have not been studied in this
manner.
In 1948 Mather and Olmstead first established that
sulfuric acid aerosol was highly toxic (Bushtueva, 1961c).
Treon et. al. established that guinea pigs were the
most sensitive to H2
S04 aerosol, dying after 2.75 hours
inhalation of 22 ppm sulfuric acid (Treon, 1954).
Amdur determined that the eight hour lethal concentration
50 percent probable (LC SO ) of sulfuric acid having a mass median3
diameter (l~ID) of microgms l8mg/m for guinea pigs 1-2
months old and 50 mg/mJ
for guinea pigs 18 months old
(Amdur, 1971).
PattIe et. al. also determined an eight hour LC SO for
guinea pigs. Exposure was with sulfuric acid with a ~0ID
of 2.7 microgms and 0.8 microgms. Le rO for the 2.7 microgmsJ
particles was 27 mg/mJ
while the LC SO for the 0.8 microgms3
particles \-las 60 mg/m (Amdur, ,1971). An important findi.ng
showed that the presence of amnonium carbonate in quantities
sufficient to provide an excess of ammonia gave protection
from levels of sulfuric acid Hhicl! in the absence of
ammonia \'JQu} c1 have caused 50 percent mortali. ty. FroIn this
study it appcored that sulfuric acid H,lS morl~ toxic than
ammOni1..1m suI f d te.

Amdur and PattIe both reported patllologica] findings that
suggested that animals dying after exposures of less thun
2 hours to H2
SO died of asphyxia caused by bronchostenosis
and laryngeal spasm (Amdur, 1971). Those that died after
longer exposure also exhibited ci.-lp:Ll1ary engorgement and
hemorrhage. These changes might be related to the combined
effects of anoxia and increased intrathoracid pressure
caused by bronchostenosis and laryngeal spasm. This
action seems to be related to concentration and to
individual sensitivity. Apparently sulfuric acid can
also produce parenchymal lung damge depending on total
dosage received.
Bushteuva exposed guinea pigs continuously for 5 days
to S02 and sulfuric acid alone and in combination
(Bushteuva, 1960). Edema and thickening of alveolar \valls
/3
occurred in animals exposed to 2 rug ill of H2
S04
,
Pathomorphological changes in the lungs and upper respiratory
tract \Vere evident in those exposed to 3 rug/m3
S02 and
1 mg/m3
H2
S04
, Combined concentrations of S02 at 1 TIlg/m3
and H2
S04
at 0.5 mg/m3
produced similar but only slight
changes.
Three groups of 15 male albino rats were exposed to
703 ppm of "fuming" sulfuric acid; one group for 5 hours,
one group for 5 hours/day for 6 days and the last group
for 5 hours/day for 5 \veeks, in order to study the affects
it had on lung surfactant (Krishman, 1974). The rats
showed an increase in response with increasing length of
exposure. The first group Has comparable to the control
while the group exposed for 5 \'leeks shO\vec1 a defini te
decrease in surfactant activity. This was determined
by the increased minimum and maximum surface tension and
decreased phospholipid content. Histopathological changes
in this group were indicative of emphysema in 10 out of
the 15 rats. The effects of H?SOl were likened to the'-' f
effects of alcohol in the stomach, with small amounts
tending to increClse secretion and large amounts jnhibit:i.ng

'I!'
•• I ~
proc1uc t ion. Po::::::dbJy p lolong(~d expo,; ure to HZ ~;O! fumes. ~
can ;:lIter surfactant in the lung and lead to emphysema.
In a study with beagles exposed to SOZ (0.5 ppm) and]
H2
S04
(0.9 rng/m ) alone Clnd in combination for 620 clays
of continuous exposure, S02 alone produced no specific
effects (Lewis, 1973). H2S04
decreased the animals' lung
and heart weights, along with a decrease in lung capacity.
Lung parenchyma \Vas also seriously affected.
Regardless of particle size , 1 microgms, 1 microgms
4 microgms, concentrations of sulfuric acid beteen 0.1 and31 rng/m \.;rere usually able to produce slight but definite
histopathological changes in cynomoJ.gus monkeys (Alaire, 1975).3Concentrations above 1 mg/m induced definite histopathological
3changes, \'1hile concentrations above 2.5 mg/m also induced
pulmonary function impairment. The authors concluded that
deleterious effects detected froDl exposure to mixtures of
S02' fly ash,and H2S04 mist were attributable to the acid
mist alone.
b. Pulmonary Function
Pulmonary function tests are useful in studying effects
of exposure to levels of pollutants that do not end in
death or do not tend to produce pathological effects.
The studies that have been done on the health effects of
sulfates in animals fall mostly into this category.
Amdur exposed guinea pigs for 1 hour to concentrations3
of sulfuric acid mist ranging from 2-l,0 mg/m (Amdur, 1958).
The size of the particles seemed important in determining
the response. Particles of 7 microgms did not penetrate
beyond the upper respiratory tract and produced only a
slight (though signific8nt) response in flow resistance.
The effects caused by the 2.5 microgr;ls particles and the
0.8 microgms particles were dependent upon concentration.
At higher concentrations (40 mg/m3
) the 2.5 microgms
particles produced a greater effect. At lower lcve].s of
2 mg/m], which seem to he a more rea]istic concentration,

the. 0.8 microgrns particle.s caused a greater response.
BrOnchial c.onstrict:ion \,m.'.3 suggested as tile' physiological
m~c.hanism involved. Interestingly, this is the same
manner in which irritant acid gases behave (Amdur, 1958).
The response to 0.8 microgms particles was immediate
Vlhile the initial response to larger particles \vas quite
slow. Due to differences of response time, different
mechanisms of action between the sizes of partic.les has
been suggested (Amdur, 1971). Pathological findings
seemingly bear this out. Lungs in the rats exposed to
2.5 microgms were edematous with extensive areas of
atelectasis. This suggested that larger particles were
deposited in the major bronchi. Local irritation then
caused swelling and increased exudation of fluid, leading
to complete obstruction. Smaller particles seemed to be
responsible for narrowing the airways rather than complete
obstruction. Once exposure had ceased, these animals
demonstrated a slow return to normal. Apparently particles
deposited in the respiratory tract continue to exert their
effect after cessation of exposure \'7hile \\Thole irritant
gases are cleared from the lung as soon as exposure ceases.
According to Lee, there was an increase in mucus
production in rats exposed to H2S0L~ for 14 days (Lee, 1977).
The ability of donkeys to clear radiolabelled Fe2
03
particles upon exposure to H2
S04
was studied at the New York
University Institure for Environmental Medicine. One hour
exposures to H2
S04
significantly slowed clearance, but
(NH4)2S04 had not such effect. Apparently some of the
animals developed a persistent slo\ving of clearance after
repeated short-term exposures. Normal clearance did not
return for several months.
The Environmental Protection Agency conducted studies
on the effects of H?SOL on the immune. system and certain,- ~
hematological parameters (Lee, 1977). Rabbits exposed
for 4 hOllrs on two successive days exhibited an increRse
in thymidine incorporation of lymphocytes \,dth or \vithout
".,-
T cell nitro8en. Immunized mice exposc:d to 112S04 shmvecl
no change in number of antibody producing spleen cells.
A significant reduction in hematocrit, an increase in
polymorphonuclear leucocytes and a decrease in lymphocytes
were observed in rabbits exposed to H2S04 for 2 hours.
A study at the University of Washington has addressed
the question of Hhether or not HZS04
may be neutralized in
the lung by NH 3 which is naturally secreted by the body
(Lee, 1977). Enough ammonia is present to convert 13 to
5Z0 m1crogms/m3
of inhaled HZS04 to (~nI42So4 or (NH4)ZHS03.
The s1 te of reac tion or ~.;rhen this reaction takes place is
unknm·m.
Amdur and Corn studied the irritant effect of zinc
ammonium sulfate, zinc sulfate,and aw~onium sulfate in
guinea pigs (Amdur and Corn, 1963). At first, concentrations3
of approximately 1 mg/m and size of 0.29 microgms \Vere used.
Zinc ammonium sulfate ~vas determined to be the most irritant
in terms of increased £lmy' resistance. Armnoniurn sulfate
was the least irritant producing one-third to one-fourth
the response looked by zinc ammonium sulfate. Particle
sizes 0.28 microgms, 0.51 rnicrogms, 0.74 microgms and
1.4 microgms at concentrations of 0.25-3.6 mg/m3
for
1 hour were then investigated as far as the irritation
potential of zinc ammonium sulfate was concerned. As
particle size decreased, the response to a given concen
tration increased and the dose-response curves became
steeper. A small increase in concentration produced a
greater effect at smaller particles sizes. Particle size
and particle concentration appear intrinsically related.
\f.hen zinc ammonium sulfate and S02 \Vere administered
together, the effect was more than additive.
The effect of zinc ammoniwn sulfate was also examined
by Nadel, in anesthetized artificially ventilated cats
(Amdur, 1971). At a concentr.ation of LI O-50 mg/mJ
the
effect of zinc ammoniuT:1 sulfate 1,vas found to be similar
to the physiological response produced by llistar.tine, but

,.1'
to a lesser c.xt.ent. This finding is particularly
interesting in light of Chnrles' study of guinea pig
lungs subjected to 10-200 mm concentrations of ammonium
and various anions (Charles, 1975). His study suggests
that the inhalation irritation associated with certain
sulfates may be rel~ted to their ability to rplease
histamine in the presence of ammonium ion.
The affects of various aerosols on the respiratory
response of guinea pigs exposed to 802 and several sulfates
,.;rere investigated (Amdur and Underhill} 1968). Ferric
sulfate was classified as an irritant, b~t ferrous sulfate
and menganous sulfate produced no detectable changes in
flow resistance. This study determined that all sulfates
did not potentiate the effect of S02' These experiements
indicated that the key to the role of 802 in air pollution
toxicity lie not in 802 itself but in its atmospheric
chemistry.
3In the presence of 1.3 mg/m , S02 flow resistance
was increased by 15 percent. If atmospheric reactions
completely oxidized this S02 to 7 microgms H2
S04
, then
flow resistance would be increased 60 percent. A complete
conversion to 0.30 microgrns zinc ammonium sulfate \'lould
increase flow resistance 300 percent. Since complete
conversion is highly unlikely, Amdur chose a 10 percent
conversion rate, ,,,hich is very likely. Even with this
conversion rate, 0.3 microgms zinc ammonium sulfate
produced would increase flow resistance 45 percent.
Cations associated with sulfates can increase
susceptibility to infection (Coffin and Knelson, 1976).
Charles found that "there was a gradation of histamine
release according to the specific salt and the concentra-
tions.'1 Sulfate removal from the lung was also found to
be associated with specific cations. It would appear that
the action by the cntions occurs on the cell membrane and
leclCls to penetration or absorption of the anion into the
cell. The anion then binds to mast cell granules and

, Iqq
histclIIdne is relcosed. The hi~;tcltnLnc onc1 related subsume
initi<lte the bronchoconstrLc.tive reac.tion. \,J-j th the incl
evidence that sulfates and their a.'3soc:I.otecl cat.ions ore
important in health effects, more attention should be veu
to cationic substances polluting the air.
Combinations of sulfur dioxide with sulfuric acid or
with various sulfates, might increase pulmonary flow
resistance more than the expected from the addition of the
two compounds alone. Amdur presented evidence that the
effect may be more than additive with H2S04
at submicron
particle size (Amdur, 1953). Particles of 2.5 microgms
did not show that effect. The combined effect or zinc
ammonium sulfate and sulfur dioxide ,vas also found to be
more than additive (Amdur, 1963).
Amdur executed a series of studies with guinea pigs
to test the validity of the proposed threshold value of31 mg/m for sulfuric acid (Colucci, 1976). Percent change
in pulmonary resistance was studied as a function of H2S04concentra tion and particle size and as a func tion of pas t·
exposure time. The results showed that:
1) The percent changes in resistance increased with
increasing H2S04
concentration from 0.07 to 0.86
microgms/m3
at a particle size of I microgm,
but it is not a strictly linear relationship;
2) There was a five-fold increase in irritant potency
between H2
S04 aerosol particle sizes ranging from
2.5 to 0.1 microgms, all \vithin the If-respirable
range, II 'vith Amdur further stating that the. 3
concentrations of S04/m utilized in the study
fell \"i thin the range of hourly maximum values in
urban con~unities;
3) The irritant potency of sulfuric acid, based on
percent increase in resistance, far exceeds the
i rri tan t po t cncy of eigh t a the r com,non 1y occurri n:;,:
sulfates;
sing
4) Sulfuric acid concentrations of 0.1 and 1.0 mg/m3
inc1 u c e Cl n increa ~-)("' in r e :.:; is tanc e t hat doe s not
return to zero 30 minutes post-exposure;
5) In generaJ., resistance and compliance values
did not return to control levels by the end of
the exposure period \"hen the exposure to3
H2S04
had exceeded 0.4 to 0.6 mg/m. (~ote:
equivalent resistance and compliance values
would have returned to control values if S02
had been administered instead of H2
S04);
6) The effects of sulfuric acid administered with
S02 are more than additive at very high concentrations,
but not at those likely to occur in the ambient
air.
Tables 4-7 provide information on the irritant potency
of sulfuric acid (4) and sulfates (5), the ranking of
sulfates for irritant potency (6) and the interaction of
sulfates and S02 (7).
3. Human Studies
Little information exists on the effects of sulfuric
acid in man. No data exist on the affect of various
sulfates on human health. It is knmvn that direct contact·
with sulfuric acid results in the rapid destruction of
tissue with severe burning. Effects of inhalation of
sulfuric acid mist are a bit more difficult to quantify.
Sulfuric acid mist in concentrations of 0.125-0.5 ppm is
mildly annoying, 1.5-2.5 ppm is unpleasant, \·lhile 10-20 ppm
is unbearable with severe coughing and irritation of mucous
membranes of the eyes and nose. These concentrations occur
only in occupational settings (Sax, 1963). The exposures
that humans are subjected to under experimental conditions
are much 10\\7er.
Amdur exposed 15 normal human subjects to concentrations
of sulphuric acid mist from 0.35 to 5 mg/m3
for 5 to 15
minutes (Amdur, 1952). Percent retention of sulfuric

Table 5
1IRRITANT POTENCY OF SULFATE SALTS
Number of 3 % Increase % Increase ResistanceCompound 11M Animals JIg ~OA/m Resistance 11g S04/m3
_.._..._~-_ ...~.__._~--_._--
Zn (NH4)2(S04)2 + 0.29 12 163 221< 0.135
II 0.51 9 981 43"~ 0.044II 0.74 10 914 2l'~ 0.023
" 1.4 6 718 5 0.007
(~n4) 2 S04 + 0.19 10 363 23"< 0.063f"--.
~ -4 -0.003Y1 0.20 10 155311 0.29 6 729 28''< 0.038
II 0.81 10 6926 0 a
NHl.t. liSO, 0.13 19 775 15''< 0.019. '+
11 0.52 10 2168 28'~ 0.013II 0.77 10 9157 23"< 0.002
CuSO! 0.11 23 257 9 0.035.:..j-
0.13 30 1232 25,'< 0.020
0.33 35 1448 141< 0.009
+ Data from Amdur and Corn
* Change statistically significant
lSource: -Co1ucci,A. V.- Sulfur -'Dxides~ Current -status--of knowledgeEP~I EA-316 Prepared for Elect ~ower ResearchInstitute, December, 1970

Table 6
1RANKING OF SULFATES FOR IRRITANT POTENCY
1. 1 '
Compound
HZS04
Zn(NH4) Z (SOLf) Z
FeZ (S04)3
ZnS04
(N114)ZS04
11:-14HSO4
CUS04
% Increase/Resistanceg S04/mJ
0.410
0.135
0.106
. 0.079
0.038
0.013
0.009
0.003
-0.004
1Source: Colucci, A.V. Sulfur oxides: Current status of knowledge
EPRI FA-316 prepared foY Electric Power Research Institute,December, 1976

Table 7
1INTERACTION OF SULfATES ~l\m 502
More than Additive
No
FeS04
MnS04
Combination of S02 and CUS04
Yes
Not tested
Not tested
No
Yes
No
Yes
Yes
TotalS02 CUS04
Number of % Increase Sulfur3 3PPH gS04!m Animals Resistance :.-g!m _._-"---
0.5 18 13 1310257 23 9 86
0.4 333 10 59 1159
lSource: Colucci, A.,', Sulfur Oxides: Current status of knmvledgeEPRI EA-316 Prepared for Electric Power Research InstituteDecember, 1976

acid \vclS c1cternd.ned by ltlc'nsllcLn[~ total voluflw of air
breathed, the concentration in tile mixing chau;lber and the
concentration in the exhaled air. An average of 71 percent
of the sulfuric acid \-Jas retained, The mist particle size
averaged I microgul. The jnhalation of sulfuric acid
caused changes in respiration at aJ.l concentrations, with
shallower and more rapid breathing. The subjects could
not detect the acid by odor, taste or irritation below
1 mg/m3
(the maximum allowable range). At 5 mg/m3
the
acid mist ~las detectable to all subjects, but the response
was quite varied among the subj .=-'ct8. The main response
was a decrease in minute volume.
Sim and PattIe studied the response to sulfuric acid
mist during different relative humidities in healthy males
(Sim and PattIe, 1957). Concentrations of 20.8 rug/m3
for
30 minutes during high humidity produced "intense coughing."
Exposure to 39 mg/ill3
for 60 minutes at low humidity was
'\olell-tolerated. 11 They found that exposure to sulfuric
acid under high humidity increased mean particle size and
produced more irritation. The addition of aII1.IIlonia gas
abolished the irritant effects of acid. Two of the subjects
exposed to sulfuric acid developed long-lasting bronchitis
symptoms.
The sensitivity to light on exposure to sulfuric acid
was tested in 2 human subjects for time periods of 60, 90,
120 minutes by (Bushtueva, 1957). Determinations of
sensitivity were made every 5 minutes the first half hour
and every 10 minutes thereafter. The normal curve of dark
adaptation for both subjects was used as a control.3
Sulfuric acid aerosol at a concentration of 2.4 mg/m caused
a sharp reduction in light sensitivity. However, concentrations3
of 0.7-0.96 mg/m produced a rise in optical sensitivity.
Concentrations of 1.1-1.3 mg/m] first brought some increase,
then a reduction. The significance of these findings is
difficult to interpret. Tllrec;hold irritation effects of
H2
S04
aerosol were determined by questioning 10 subjects

51
exponecl to d1fferent levels of H2
SO{f' The range of
concentra t i OilS \Vas from 0.6-,0. 86 Iilg/m3
. }[ ighly sens i tive3
individuals had an average threshold value of 0.55 rug/m
(Bushteuva, 1957).
The Environmental Protection Agency plans to study the'~
effects on human health of exposure of 100 Dicrogws/m.J H2
S04
(Lee, 1977). Particle sizes of 0.3-0.09 microgms diameter
will be considered initially. The first set of experiments
should have begun in the Spring of 1977.
The toxicology of sulfuric acid may be summarized, in
part, as follows (Colucci, 1976):
1) "particle size is an essential determinant of the
irri tant potency of H2
SO if I'
2) "sulfuric acid elicits the greatest irritant
response among all sulfur oxides tested."
This appears to be true in animals and possibly in
humans. Colucci draws two more conclusions which require
some comment; the first being that "H2
S04
induced increase
in pulmonary resistance does not return to normal 30 minutes
post-exposure, which sugge.8ts that exposure to sulfuric
acid can induce irreversible deleterious effects at3
concentrations less than 1 mg/m ,11
This conclusion is inconsistent with that of Amdur,
who found that a slO\'1 return to normal has been a consistent
feature of exposure to irritant aerosols. No mention has
been made that this latter effect is indicative of
"irreversible deleterious effects." The second conclusion
which Colucci draws from these studies and which requires
comment is that "Under ambient circumstances, the mechanics
of emitted H2
S04
make it an infeasbile component of the
group of harmful air pollutants," Though it is true that
H2
S04
seems to be rapidly neutralized in ambient air) the
fact that its distribution and concentration in ambient
air is unl:nmvn coupled \<lith the fact that it is so toxic
warrants its consideration as a potentially dangerous component
of ambient <Jir.

The role of particle size and concentration of
sulfuric acid and particularly various sulfates seem to
warrant further animal and human study.

1'/'
C. Sulfites
1. Introduction
Typically, sulfi tes have not been c.onsidercd a maj or con-
stituent of sulfur oxide pollution, mainly because it was
believed that sulfites were rapidly oxidized to sulfates
under ambient atmospheric conditions. Therefore, fevI
experiernental and human studies have been perfonned in
this area and no epidemiologic study to date has assessed
sulfites specifically.
It has recently been postulated by Eatough that sul£ites
and bisulfites "Hay be an important component in the initiation
or exacerbation of respiratory disease by sulfur oxides"
(Colucci, 1976).
In a study conducted by Eatough and Colucci, appreciable
levels of sulfites were detected dmvnl'lind from and in the
vicinity of a copper smelter (Colucci~ 1976). The large
volumes of sulfite species collected suggested that sulfite
does not deteriorate rapidly in the atmosphere as was
believed. It has been postulated that "Upon contact Hith
metal oxides in particulates, SO forms sulfite complexes.. 2
Furthermore our data suggest that these complexes are stable
against air oxidation of the sulfite moiety. II
Metal sulfites may be involved in causing adverse health
effects in exposed individuals. The mechanism hypothesized
involves the release of sulfite, stored in the metal complex,
upon contact \vith the moist surfaces of the respiratory tract.
This released sulfite could then cause damage to surrounding
tissue.
The formation of sulfite within blood has been associated
,\.,i th exposure to sulfur dioxide and migh t play a role in
biochemical mechanisms of 802 toxicity.
2. Animal Studies
Gunnison investigated the reactivity of sulfite or bi-
sulfite Hithin mammalian plasma in vitro and vivo (Gunnison, 1971).

"I"
Sulff te added to serum was monitored by de terTnina t ions of
sulfite concentration in the reaction mixture. The evidence
provided seemed to indicate that sulfite reacts with disulfide
bonds found in plasma to fonn S-sulfonates. This reaction was
supposedly reversible. It i;vas proposed that the react ivity of
sulfite Hith plasma might also facilitate the maintenance of
low concentrations of sulfites in the body during very low
level exposure to sulfftes. Four rabbits were exposed to
Z3±S ppm SOZ and their plasma Has analyzed for the presence
of cyanalytic sulfite before and after exposure. No free
sulfite was detected, but plasma and serum S-sulfonate content
seemed to increase substantially. Unfortunately very few
studies have been conducted on the inhalation of various
sulfites.
Mice were exposed to sulfur dioxide, sodium sulfite,and
sodium metabisulfate (Alarie 1973). At 1 ppm metabisulfate had
a greater effect than SOZ on the respiratory rate. Alarie
concluded that "bisulfite anion was responsible for respiratory
irritation."
Exposure of guinea pigs to SOZ plus sodium bisulfite aerosol
increased their pulmonary flow resistance at 80% relative
humidity. Chemical analysis of that aerosol revealed the
presence of SOZ and bisulfite (Mcli1ton 1973).
Alarie exposed animals to mixtures of transition metal
sulfite aerosols similar to those found in amibent air
(Colucci, 1976).' The results of these studies should be
informative as to vhether sulfites in the ambient air do
pose a potential threat to human health.
3. Human Studies
Gunnison and Palmes measured the plasma S-sulfonate in
human subjects exposed to 0.3, 1.0, 3.0, 4.2 and 6.0ppm SO2
for periods up to 120 hours (Gunnison and Palmes, 1974).
Plasma levels of S-sulfonate Here positively correlated with
atmospheric sulfur dioxide. From the regression line an
estimated increase of 1.1 n moles of S-sulfonate per mI. of

. I! ~
.5.5
plasma resulted from each pplll of S02 increase within t.he
eXpOSUl(~ chambe:c. 'Tbebcal th effects of these S-sulfonates
within the. blood stream arc apparently still unknm..;rn.
However, these changes in protein structure may be irrever
sible, and may result in tissue damage. Until the effects of
S-sulfonates can be de te'nnined, metal sulfi tes should be classi
fied as a potential respiratory irritant.
Recently there has been some concern over the health
effects of sulfur dioxide and dietary sulfites in sulfite
oxidase·-deficient indjviduals all the grounds that these
individuals might be unusually vulnerable to mutagenic and
other effects of sulfites and bisulfates (Hickey 197fi).
However, this concern does not seem to be well founded at this
time. As AlariE~ pointed out in his rebuttal of that paper,
"there is no evidence for wide-spread sulfite-oxidase
deficiency in humans. II Possibly the sulfite oxidizing
capability in human populations should be surveyed to
determine whether a significant susceptible population exists.
According to Alarie i.f a large susceptible population existed,
the dangers of sulfites are not sufficiently well-documented
to be of too much concern (Alarie 1973).
More work in the area of sulfite toxicity is needed before
definitive conclusions can be reached.

56
D. Particulates
1. Introduction
Particles, OD entering tile respiratory tract, follow the
moving airstreams but particles also have a mobility of their
milD independent of air flm1. This can cause them to corne
into contact with the walls of the airway. The motion of
the par ticles ,V'hich resul ts in depositions is dependent on
their size, shape,and density (Muir 1972).
Three mechanisms are important in the deposition of
particulate matter. These are gravitational settling,
diffusion,and inertia. The gravitational settling of
particles is important in the deposition of large particles
or particles of high density such as dusts of heavy metals
on the lov7er surface of the ainvays or alveoli.
Diffusion or Brmvnian movement is the result of the
random bobardment of the particles by air molecules. This
may be a major mechanism for the deposition of small particles
( O.lmicrogms) in the lower pulmonary tract.
The third mechanism, inertia is important 'vhen the direction
of the airflow changes and the particles continue to mrrve in the
original direction for a short period. Inertia is of greatest
importante in the deposition of particles ~~ich are large and
of high density at points in the respiratory systems where the
direction of airflow changes (Air Quality Criteria, 1969)
Flow rates and gas mixing also need to be considered in the
deposition of particles. Some studies have found that the
inhalation of particulate matter such as sulfuric acid mist
can cause a decrease in expiratory flow rates in humans
Gas mixing is the exchange of new air inhaled with the residual
air left in the lungs. Aitshuia found that nondiffusible
particles greater than 0.5 microgms will move only to the depth
of the new air, but smaller particles will move independently
into the static lung air (Air Quality Criteria, 1969).
Figure 2 shows the relationship between particles of
various mass diameters and the percent deposi~ed in various
sections of the respiratory tract.

Figure 3. Fraction of Particles Deposited in the ThreeRespiratory Tract Comnartments as a Function
f P . J' ]). , 1o , artlC .. e lame Ler.
0.9
0.8 -
--....-~O,\C,jIALJZL~-·-~:~<,~tit;~~%$£~
10,2 10" 100 10' 102
r-,1ASS t.1EOli\N DIf\:'.~cTEn,[L
r-..--rTPm,-r-rrpnr,-r-TOf' '
1.0
owt:::(f)
oowozo......o«0:LL
1~Source: Air 0uaLLty CriteriCl, 1969

r n..)0
Landahl found tha t the nose is the maj or si tc of p<ll-ti cle
deposition. During breathing few particles greater than 20 microgms
in diameter and only 50% of those 5 microgms in diameter are able
to penetrate the nose (Muir, 1972). Even particles as small as
one micron have been found deposited in the nose.
A very important aspect of deposition is the pToportion of
particles which reach the alveoli. This portion, called
respirable dust, is associated with the development of pneumo
coniosis. Although there has been wide disagreement on the
size of particles at which alveolar deposition is at a maximum,
the most frequently quoted size h~s been 1 micron. Some
investigators have calculated the size as between 2 and 4
microns (~uir 1972). In general, particles between 1 and 2
micron have maximum efficiency of deposition ,ihereas particles
of 0.1 micron have a minimal efficiency. Hmvever if a large
number of particles of this size are present they may be as
important as smaller or larger particles intenns of toxicity.
Furthermore, the percentage of deposition of particles less than
0.1 micron is as great as for sizes more than 1 micron. Since
different clearance mechanisms of particles from the lung
operate in the different areas of the respiratory tract, the
area of deposition affects the rate of clearance.
Substances \vhich are soluble are rapidly absorbed from
all' areas of the tract. Insoluble subs tances on cilia ted
epithelium are moved to the pharnyx and then swallowed or
expectorated.
In the tracheobronchial system ciliary transport rates seem
to be unaffected by the size, weight or shape of the particles.
Studies of clearance in the human lung have shmvn that the
healthy mucosa is essentially cleared in less than 24 hours.
Some studies have used aerosols tagged with a dye to
follow the course of the clearance. Brieger and LaBelle showed
that 24 hours after exposure 50% of the total dye in the body
was found in the intestinal tract. This indicates the possible
consequences of air pollutants on organs other than the lungs.

1. 1 '
59
Clearance of particles from the alveolar surface is slow.
After a few hours of deposition, particles are encased by
macrophages. Non-toxic dusts are carried in this way to the
ciliated epithelium. Experiments on humans have shm.;n that
alveolar clearance is exponential with respect to time and
has a 60-120 day half life (Muir 1972).
Figure 4 presents a schematic diagram of all deposition
sites and clearance processes.
The three main areas of the respiratory system are' shmm.
D1 refers to inhaled particulate matter, DZ to material in the
exhaled air and D3 , Dl~' and DS
are particles deposited at the
three sites. The other letters refer to the follo\ving: a.)
the uptake of material from the nasopharynx directly into the
bloodstream, b.) rapid movement of particulate matter from
the nasopharynx by ciliary transport of mucus, co) the rapid
absorption of particles from the tracheobronchial system into
the blood stream, d.) the rapid ciliary movement of tracheo
bronchial mucus with particles being carried to the gastro
intestinal tract, e.) movement of material from the pulmonary
region to the circulatory system, f.) the rapid movement of
particles again dependent on macrophages and ciliary movement,
g.) a second slower movement dependent on ciliary movement
and phagocytic action but rate limited by the nature of the
particles, h) the slmv removal of part icles by the lymphatic
systems, i.) a continuation of pathway \vhere particles are
carried into the blood stream and j.) the absorbtion of material
from the gastrointestinal tract into the blood. The models
presented by the Task Group on Lung Dynamics have been shown to
yield predictions \vhich have been substantiated by experimental_
findings.
2. Ani~al Studies
a. Introduction
A vast amount of data is available from animal studies
on the pathological and physiological effects of various
kinds of particulates. Most of these studies centered
around one specific kind of particulate such as lead)
arsenic or asbestos.

(b)
Fj,gure 4.
(a)
GO
Schematic Portrayal of Dust DepositionSites and Clearance Processes1
NASOPHARYNGEAL ~COMPARTr'1ENT ------------,
GASTRO-"INTESTINi~L
TRACTBLOOD ~_ (c)
(e)
TRACHEOBRONCHIALCOHPARTHENT
-----------
PUL'10NARYCaMPARTJ\1ENT
(j)
(~) -- \[_., ~~
I I -----;--
(f) I I (g)
I II I
I
j
-----------------------_._------------
lSource: Air 0uality Criteria, 1969

6J
Toxicological s tuc1i.es have slim-Tn tha t par ticles may
be int.rinsically toxic (such as lead, beryl1ium,anc1
ashestos) their pre~~ence may interfere \'lith clearance
of other particles from the lungs, or they may act as a
carrier of toxic materials.
Carbon, a common particulate, is an efficient adsorber
of many organic and inorganic compounds. The deposition
of a particle carrying a high concentration of a chemical
may be more highly toxic than the absorbed chemical alone.
Some studies have dealt with the pathological effects
of smoke and carbon alone on animals.
Schnurer exposed rabbits and rats to bituminous coal
smoke for 80 days (Schnurer, 1937). The smoke contained
an average of 125 million particles per cubic foot, a.tt
million of these were free sulfur dioxide. All the lungs
examined were deeply pigmented.
These animals were shm\m to have developed fibrous
reactions about the carbon deposits with the formation of
collagen fibers. These lung changes were analagous to
those found in a mild grade of bituminous pneumoconiosis
of soft coal miners.
Vintinnes studied the effects of bituminous coal dust
and coal smoke on the resistance of rats to lobar pneumonia
(Vintinnes, 1951). The concentration of coal dust in the
exposure chambers varied between [100 and 850 million dust
particles per cubic foot of air. Duration of exposure to
dust or smoke before injection of pneumococcus culture
varied from 5 to 165 days for dust and from 2 to 154 for
smoke.
The coal dust exposed animals were found to have a
significantly lmver infection and mortality rate than
controls. In the smoke exposed group there was no
consistent difference in mortality. It was concluded that
the exposure to coal dust or smoke did not increase
susceptibility to lobar pneumonia.

"I'
Nmv s tuc1iec1 inhallation of carbon black dus t in hams ters,
mice, guinea pigs, and monkeys (N;:l\v, 1962). No significant
effects ,,,ere found other than the accumulation of dust in
the pulmonary system.
Mice and guinea pigs exposed to smoke from a kerosene
lamp survived exposures as high as 664 rng/m3 of smoke for
six hours (Salem and Cullumbine, 1961). Autopsy studies
revealed no obvious damage to the lungs of these animals.
A similar study but at a lower exposure (50mg/m3) found
no signs of edema, hemorrhage or emphysema (PattIe and
Burgess, 1963). However, pathological examination of the
lungs showed soot particles spread over the lining of
the bronchiolis and alveoli.
From these st~dies it appears that smoke or carbon
black by itself produces little major damage to the
respiratory system of animals at levels even greater than
those found in the atmosphere.
b. Pulmonary Function
A pattern of pulmonary impairment consistent with
peripheral ainvay obstruction was found in monkeys exposed
to bituminous coal dust (Me orman , 1975). Some reduction
in forced eXFiratory volume and maximum expiratory flow \vere
also observed. Specific lung volumes did not differ sig
nificantly from the controls.
Aerosols of zinc ammonium sulfate caused an increase
in pulmonary flo\<7 resistance in guinea pigs (Amdur and Corn,
1963) . This aerosol \vas knmvn to have been present at the
Donora fog episode of 1948. Smaller particles were found
to have greater irritant action at any given mass concentration.
Incubation of lung fragments of guinea pigs \vith 10 to
200 nun concentrations of armnoniurn ion produced the release
of substantial amounts of histamine (Charles and Menzel,
1975). Sulfate ions \o7hen tested with ammonium Here found
most potent. An osmotic effect was discounted. The studies
suggested that the irritation associated with inhalation
of certain sulfate and other salts may be a function of their

6 ').)
ability to releaE;e his tEllld ne \vhen <llllJflonium iOllS <Ire
present.
Amdur and Underhill observed the effects of various
aerosols (Na3UOLfNn02NaCL, KCL, NnCL) NH Lf SCN, Fe 2°3' carbon,
and open hearths dust) on pubnonary flow reslstance in
guinea pigs (i'Dndur and Underhill, 1968). All the aerosolE;
studied \vhen administered alone produced no al te.Dltion
in pulmonary flm" resistance. A "fly ash" mixture from
an oil burner was also tested and proved to be inert.
Ferric sulfate was found to be an irritant, however.
A concentration of 1 rug/m3 produced a 77% increase in
flmv resistance in 15 animals \vhich \vas statistically
significant.
In contrast to these findings Dautrebande found in
creased ainvay resis tance in guinea. pigs and humans
with exposure to many different "inert" particulate
matter (Fir Quality Criteria,1969).The differences betHeen
the studies have been attributed to the much higher con
centration used by Dautrebande.
Particle size may have an important role in determining
the toxic effects of an irritant. In the study by Amdur
and Corn as the particle size decreased from 1.4 to 0.29
microns the response to an equal mass concentration increased.3A concentration of 1.4 mg./m of zinc ammonium sulfate
0.74 microns in size resulted in a 21% increase in
resistance. A concentration of 1.8 mg/m3 at particle
size of 0.3 microns produced a resistance increase of 130%,
The Air Quality Criteria for Particulate matter
concluded that the main physiological effect of irritants
is to increase pulmonary flow resistance, and that this
response may be increased with a decrease in particle size.
Furthermore, it appears that heavy amounts of inert particles
can cause an increase in flow resistance.

','
E. Sulfur Oxides and Particulates
1. Introduction
Of importance in the toxicology of particulates is their
relationship to mixtures of irritant gases. T\vo major faclors,
particle size and their inherent chemical nature, are important
in determining the health effects of observed gases and partic
ulates (Severs, 1975). Many studies have been conducted on the
influence of particulate material on the toxicity of gases.
2. Animal Studies
The first experiment relating such an effect of particulates
was in 1939 \Vhen it \Vas found that mustard gas alone \.;ras harmless
to rats, but could produce pulmonary edema and death 'when admin
istered along with sodium chloride.
Studies since then have observed particulates \-lith ammonia,
formaldehyde, and oxides of nitrogen to mention a few. Probably
the most work has been done with mixtures of particulates and
The effect of a mixture of S02 and smoke on mice and guinea
pigs 'vas found to be greater than the effect of S02 alone (PattIe
and Burgess, 1957) . This \'laS felt to be the result of an addic-
tive effect rather than absorption of the gas on the smoke.
Salem and Cullumbine studied the effect of kerosene smoke on
the toxicity of sulfuric acid, S02' acrolein,and acetaldehyde in
guinea pigs, mice, and rabbits (Salem and Cullembine, 1961). In
guinea pigs smoke was found to increase the toxicity of sulfuric
acid. The toxicity of acetaldehyde and 802 was decreased. In
mice the toxicity of 802 was increased. The experiment indi
cated that guinea pigs were more susceptible to sulfuric acid
mist and that mice and rats had a higher resistance to it.
S02 was readily absorbed when active carbon was exposed to
a concentration of 3% of tile gas, thus demonstrating the physi
cochemical basis for a synergistic effect between 802 and carbon
particles (Dalhamn, 196~.

,,('
In rubblts , carbon alone was not found to effect ciliary
movements but the velocity of movement was significantly lower
\vhen exposure was to carbon and S02 at 100 ppm. This reduction
was, however, similar to that found after exposure to the same
concentration of S02 alone. A conclusion was reached that no
gas-aerosol synergistic effect on ciliary movement could be
demonstrated for 802 and aerosols at levels approximately those
in urban atmospheres.
Animals exposed to 10\01 concentration of S02 and high con
centrations of inert dust showed no difference in ciliary
frequency of the tracheal mucosa when compared to control ani
mals exposed to dust alone or clean air (Fraser, 1968).
Amdur found that NaCl, KCl,and NH4
SCN (ammonium thiocyanate)
\vith S02 potentiated an increase in air flm'1 resistance (Amdur,
1968). Insoluble aerosols were ineffective in potentiating a
response. It was proposed that the potentiation effect of S02
was mediated by the solubility of the gas in a liquid and its
oxidation to sulfuric acid. Aerosols of NaCl and of KCl would ab-
sorb water to become liquid droplets. Dry particles of carbon
fly ash or manganese dioxide sho\'1ed no potentiating effect.
In a study of combinations of S02 and open hearth dust in
guinea pigs, open hearth dust alone produced no respiratory3
effects \-lith concentrations as high as 7 mg/m (Amdur, 1970
SO at several concentrations also did not have an j~creased2
effect \vhen combined \vith the dus t or iron oxide fume. These
results are consistent with the proposed mechanism explained
above.
Alarie studied monkeys and giunea pigs exposed to mixtures
of S02' fly ash and sulfuric acid mist (Alarie, 1973, 1975).
Pulmonary function tests and hematologic and chemical analysis
Herc also conducted. No detrimental effects could be found for
long time exposures to 0.1 to 5 ppm of SO alone or to 0.1 to3
20.5 mg/m exposures to fly ash. Also no detrimental effect.s
\<lcrc found \-lith mixtures of S02 and fly ash. Exposure to

sulfuric aci(~ mist at conccnt~raLion::) abovI:' 1 iIlf)m3 regardless
of particle size resulted in clcfjnt_tt:' histopathological effects
'1 A .• --)] 11 /3 11-":tIl mon\.E~Ys. t COllcelltratJons 01 L. [InC ._ 109 111 (ClnJ.te
chctngcs \,,'ere found but to a lesE:er dcgrC'l~. The effects, E10stl)7'
changes in the bronchial lliUC.OS<-!, noticed i·/ith e:<posurc to mix
tures of S02' fly ash and E~ulfuLiC'. acid mist \·7ere attributed to
the acid mist alone.
Hamsters exposed to 40 ppm 802 for four hours per day for
six weeks produced no histopathological changes (Asrnundsson,
1973). A four hour exposure to 40 ppm 502 along with 0.74 g/m3
of carbon dust produced neutrophils in the airway epithelium.
The author suggested that the synergistic effect is due to the
S02 being absorbed on carbon particles and later released,
attracting leukocytes to the area,
Beagle dogs were used in an experiment to test pulmonary
function after exposure to N02
(Lewis, 1969,1973). A 1967 study
related N02
and particulate matter (iron oxide) to pulmonary
function. A lung exposed previously to an irritant was more
difficult to alter physiologically than one never exposed to
toxic concentrations of pollutants. Also relatively low levels
of H2
S04
aerosol) H2
SOLI
had the greatest toxic implications in
human health. Also dogs exposed to N02
and iron oxide partic
ulates were found to have significant increase in total pulmon
ary resistance from a control value of 1.6 to 4.0 cm ll20/liter/
second.
A study of the effects of S02 and dust on the microflora
of the respiratory system used rats exposed to 1 ppm S02 and
1 mg/m3
of dust for 12 hours a day for four consecutive months
(Battigelli, 1969). A second gl'OUp \,taS exposed to graphite
dust alone. Monitoring of the surface microflora from the
turbinates, stem bronchi and from lung l!Cll!1ogenates \,ms carried
out. No meaningful differences could be distinguished between
the two exposed groups and the control group. Tbc~re \<Jere no
trends which were consistent with nn effect of SU2
,

b/
Mice exposed to carbon alone (500 - 600 mg/m3
) or with SO~l..
were found to have a decrease in the antibody formation ability
(Zarhower, 1972). Exposure to 2.00 ppm S02 for 192 days was
associated ,-lith decreased antibody formation.
At 135 days of exposure an inrease in antibody prbduction
occurred in the spleen after exposure to S02 alone. This ac
tivity decreased by 192 days but it supported the idea that S02
under certain exposure conditions can have an adjuvant effect.
In a study of the effects of corn dust, c~rn starch,and S02
on swine, no clinical or pathological changes were found in
piglets exposed to corn starch alone (Martin, 1973). However,
the combination of the dust 'vith S02 produced symptoms similar
to those found lyith S02 alone. Clinical changes included ocular
or nasal irritation and increased salivation. Histologically
the changes in the epithelium of the turbinates and bronchi
included loss of cilia, disappearance of goblet cells and al
teration of cell type. There were no changes in the respira
tory area of the lung attributable to S02 or dust.
}lcFilton conducted an experiment on the role of relative
humidity on the synergistic effect of S02 and aerosols (}lcFilton,
1973 ). Relative humidity Ivas found to be an important variable
for aerosols capable of absorbing water at relative humidities
belO\v 95%.
The various animal studies have sho\ffi that there is a wide
variation of response in different animals of the same species.
This therefore is an important factor in interpreting the
various studies.
From the animal studies cited it can be concluded that
small particles probably do play an important part in either a
synergistic or additive manner on the effects noted from
various mixtures of gases and particles.
The role of POY in producing human skin cancer from occu
pational expO~>tlre is well established. Hm.,ever, PO:'1 do not
appear to significantly influence the pathogenesis of

non"-neoplas tic lung cl:L~;c;-, :::;0:-; Like crltp llysCm:l and ell [onic
bronchitis.
Stenb<lch observed the care ic effects on hamstcr~; of
benzo(a)pyrene <llone 01- in combillation \,Jith dusts of titanilJTTI
dioxide, aluminum oxide, carbon or ferric oxide (Stenback, 1976).
Dusts administered alone resulted in inLcI'stitial cell proli
feration, bronchial epithelial alterations, and [J £e\'7 grclnulo
matous changes but no tumors. B(a)P alone induced two tracheal
papillomas but in combination with dusts a number of tumors
were induced depending on the dust.
Asahima injected mice with suspensions of an organic ex-
tract of particulate atmospheric pollutants as well as
oxyneutral subfraction and acidic, basic, neutral, aliphatic,
aromatic, and insoluble fractions (Asahima, 1972). Results
showed wide variations in carcinogenicity and the incidence of
tumors in various organs in different test groups.
Saffiotti produced malignant tumors in hamsters by intra
tracheal instillation of a suspension of B(a)P with hematite
as a carrier. These lung tumors were similar to those found
in human cancers. (Air Quality Criteria, 1969)
There was an increase in the action of the carcinogen
\vhich resulted from its adherence to fine particulate matter.
In this form it is carried deep into the lung and released.
A study by Kuschner demonstrated that inhalation of B(a)P
in the presence of S02 caused the development of bronchogenic
squamous cell carcinoma. However neither B(a)P or 802 alone
caused the development of tumors. (Air Quality Criteria, 1969)
The effects of various gases and particles on major lung
areas are shown in Figure 5 .

69
Figure 5. (A) E£ feet of irri tD-nts in major l1ronchi; (B)
effects of irritants in terminal bronchioles;
irritants in alveoli.
(C) effect of
[--p,)niCI~
2.0-~.O)J_._--_._..~--~-'
B
~~:~:::,,_JParal'/sis of cili~
Hyperwere tion
MIICUl gland hypertrophyand C~ len lion
Su~cPlibilily 10 infeclion
Chronic prodUClive cough
,.J'
L-__O_.~_~_:I_~~_:~_0=k,.---------..,
P",,,,;,,;oo" bo'h Iprescnl ---.J
LOSI of nor"",) Odence1
EflecI on Surfxlanl
Goblel Cell Metaplasia
Inflarrmallon and Ol:>lilcraloon
Premature Clowre
c
Eflee II on:
Collaleral
Venlilation
Gal E~ch"n9'!
Sires> of LlIn9
Release of Proloolytic Enlymei
0.01,,-0.511

/0
Fe\v CXPC~l' illlcn t s h.-lve lH?Cll. cond LIe ted on the e f f ec t 0 f
combined pollut':-In ts on m'J.n.
TOy':Jma in Cl stuely of 13 healthy male Cldults exposed to 802
and NaC1 sepGrately and in combination found that NaCl aerosol
had no effect on pulmonary flow resistance '~len administered
for five minutes (Yoyama, 196~). 802 alone caused changes in
resistance proportional to the exposure concentration. Resis-
tance increased 5% at 1.6-5 ppm 802 and 50% at 56 ppm S02.
S02 and NaCl were administered together five minutes after
pulmonary flow returned to control values. Pulmonary flow
resistance was found to increase 20% above that observed for
Healthy males in Japan inhaled S02 and dust in order to
measure airway resistance. Recovery times were quite variable
ranging from 30 minutes to two hours. Upon recovery, subjects
were exposed to 3-40 ppm S02 for five minutes. Finally, upon
recovery from that exposure, subj ects ,vere exposed to a mix
ture of the two pollutants in the same concentrations for an
unspecified amount of time. Results indicated that bronchial
response was largely dependent on individual susceptibility.
However, synergistic action between the dust and sulfur dioxide
increased resistance.
Snell exposed nine subjects to S02' NaCl aerosol, distilled
'vater aerosol, and to 802 aerosol mixtures (Snell, 1969). \fuen
subjects received S02 and saline aerosol no significant de
creases in flow rates occurred at any of the levels of S02' A
combinatiun of S02 and distilled water aerosol significantly
decreased flow rates only at 5 ppm S02' Examination of the
particle sizes revealed that sonic generation of the distilled
\Vater produced particles in the area of 0.3 mm. Saline aerosol
on the other h[mcl had tlle grea tes t number of par t icles bet'i.veen
6 and 8 mm, This \-lould apparently account for the disc.repency
be tween this s t ltdy and l\:nd ur IS, \vhere a synergis tic ef f ec t of

/ J
SOL ctnc1 sC:1I-Ll1c Qcn)~;ol VlelS found at a particle size of 0.01\ mrn
but not at. 2.5 1I1n:,
The C:lbil:Lty of thc~ t\,;O oerosols to produce chan8(~s in pul-
monary resjstance Heemed to he related more to particle size
than to chemica.l l.-cac I.:. ion , A comparison of nasal clnd mouth
inhalation of S02 ~;h()T.ved that a drop in HEr:' 50% VC occurred
virtually only du inh3lotion of the dry gas through the
mouth. The inhalation of SOZ water aerosol combination through
the nose, resulted in an increase in total respirtory conduct-
ance and a drop in flow rates only slightly less than that
observed during inb.alation through the mouth.
Burton, studied 10 healthy male volunteers ages 25-34 with
no previous history of significant cardiopulmonary disease
(Burton, 1969.) })ulmonary flo\v resistance, ainqay resistance
and thoracic gas voluTIe were measured. The subjects were used
as their o~m controls by obtaining baseline data after breath-
ing warmed, humidified, medical grade air. The subjects were
exposed to S02 - NaCl aerosol mixture. The concentration of
S02 was 3.0 ppm. No significant increases were found for the'
measured pulmonary function factors after exposure to S02 alone
or SO 2 aero sol mix tur e.s ,·;hen compared to ind i vidual or mean
group controls. These findings confirmed those of Frank.
Toyama I s use of industria.l dusts Play have been l:l.Ore irritant
than the KaCl aerosol accounting for the response found between
802 and dust in that study. No gas-aerosol synergism could be
demonstra ted for S02 and I';2Cl aerosol at levels approximating
those in urban atmospheres. These findings are in contrast to
those in animal studies (Amdur, 1968, 1970.)
Hazucha studied the effect of S02' 03' and a 802 _ 03 mix
ture on light 18 - 25 year old normal l1on-sr~lOking males during
light exercise (Hazllcha, 1975). Pulmonary function tests Ivere·
made at 30 minute intervals, consisting of 15 minute exercise
periods on a bicycle ergomeLer and 15 minutes of rest, over a
t\Vo hour period. A concE'nLl-otion of 0.37 ppm ozone produced
a barely ~:;igniEic~lnl: decr(~(l~:;l-' :in mn;zLl!lzl1 micl--expir3tory flo\>1
rate (H~lFR) at the end of t\vO hours. 502 alone at a concen
tration of 0.37 ppm produced no significant effect on pulmonary
function. The S02 - ozone mixture produced a greater decrease
in pulmon(n~y function than eitller gas alone.
In an at temp t to discover thc::~ source of eye irri tation
caused by Los Angeles smog, CadJe exposed 25 staff members of
the Stanford Research Institute to an artificial smog contain
ing all the major constituents of that smog (Cadle, 1951). It
was found that removal of all the gaseous components eliminated
the eye irritating action of the artificial smog, while removal
of all particulate constitutents had no such effect. No single
constituent of the artificial smog was found to be responsible
for all irritating action. These results are only suggestive
of Hhat might be true in the smog of Los Angeles.

73
Epidemiologic Studies
A. Introduction
Epidemiologic studies have been used to set the primary air
standards for levels of sulfur dioxide and particulates permissible
in the atmosphere and within occupational settings. Unfortunately
these studies are often difficult to interpret due to differences
in aerometric measurements and meteorological aspects that have
not been considered. The main difficulties are briefly outlined
in the next two sections.
B. Problems in Interpretation
1. Meteorologic Effects
The relationship between pollutants and health may be confounded
by various meteorologic factors. Goldstein in a review paper
emphasized the significant effect of \veather on health (Goldstein,
1972). Oechi and Buechley demonstrated that periods of hot \veather
can have a marked effect on mortality in the absence of high levels
of pollution (Goldstein, 1972). Tromp separated the effects of \veather
and pollution (allergens) and found that strong atmospheric cooling
was the major triggering factor in the causation of asthma attacks.
(Tromp, 1968).
Because of the strong correlation between air pollution and
meteorologic factors it is difficult to separate their effects.
The level of pollution depends on the amount of pollutants eTnitted and
the rate of dissemination of these pollutants through the atmosphere.
Both of these are greatly influenced by weather. In nonindustrial
areas the weather influences the need for coal consumption for heating
homes and businesses. Thus, in a rather complex way the amount
emitted depends to some extent on the prevailing \veo.ther. The rate
of dissemination of pollutants is more readily apparent' since \veather
influences atmospheric reactions. In addition, wind velocity, barometric
pressure, precipitation, and atmospheric stability affect the length of
time pollutants remain in an area.
There is great need to consider meteorologic factors in epidemiologi
studies investig:l.ting the heZllth effects of Zlie pollution. Unfortunate}
fe\'7 studies have considered these factors and those trwt have generally
had a d iff i cuI t time s e p .:1 rat ing the e f f e c t S 0 [ \',r eat 11 e r fro m air po 11u t j 0 I:' .

2. Aerometric Effects
Reliable interpretation of eptdc!nJolu~:',ic studies i~3 impeded by
__ he fact that fe\v of these are bnsec1 on accurate aerometric data.
Often they rely on pClramet.ers such as dustfall) sl1Jol::e shade, coal
consumption or, at best, simply sulfur dioxide and particulates.
Only in fairly recent studies conducted by CHESS has any attempt
been made to measure sulfates (CUESS, 1974). Since other pollutants
are often associated with sulfur dioxide in the atmosphere, it is possible
that health effects attributed to 802 may be due to exposure to some
other agents. Particulate matter has often been considered in regard
to interaction that may occur with sulfur dioxide. However, particulate
matter is not a single entity, but rather a potpourri of several agents
including sulfur oxides such as sulfates and sulfuric acid; Sulfates
alone can comprise 5 to 20 per cent of suspended particulate matter.
In addition, different cations are associated vlith the "sulfate"
complex. Another factor that must be considered is that S02 is a precur
sor io these chemical substances that contribute to the particulate
loading of the atmosphere. Therefore, it is important in epidemiologic
studies to measure carefully these various sulfur o}\ides.
In epidemiologic studies investigating the effects of air pollution
on health some determination of pollutant exposure is always made.
In earlier studies a simple indez of liclean vs. dirty" was often all
that was given. As measurement of specific pollutants became more
important, a variety of techniques "Jere implemented. The pollutants
that first became of any interest were sulfur dioxide and smoke.
Accordingly these were the only pollutants for which measuring techniques
were developed. Recent concern for other sulfur oxides has sparked
interest in developing more accurate techniques for the measurement of other
sulfur oxides and particulates. Since the technique used affects the
concentration of pollutant obtained, the measurement techniques that
have been employed will be discllssed briefly in te.Clns of those commonly
used and their comparative reliability.
The measurement of sulfur oxides in the atmosphere <:1ppears to
be almost as challenging as atmospheric cllem:Lstry it~~el£. Of the three
sulfur oxides generally implicated in producing effects on health (sulfur
dioxide) sulfates and sulfuric Clcicl) only sulfur dioxide seems to be
measured \vith very relinbl e methocJ~.c;. An in-depth cli~;cuss.lon of various

1,1' .
75
methuds used can be fOllncl in Air Quality Criteria for Sulfur Oxides
(1968) . Since different methods (lye used \vith various sampling
techn1.que~~; (lmong t11C countries and some times "tithin countries,
comparisons of actual sulfur dioxide levels are virtually impossible.
In the United Sta tes the t\VO me thods mos t commonly used to
measure 802 are the Hest-Gaeke (colormetric: pererosaniline) and
the c.oncluct.ometric methods. The fonner method is specific for sulfur
dioxide and sulfite salts. This method has also been reported to be
the mOE::t satisfactoTy for intermittent and c.ontinuous sampling (Air
Quality Criteria 1975). Apparently, conductometric methods are
affected by other pollutants present in the atmosphere; therefore,
the results are sometimes very approximate.
In Europe, the method most often used in the hydrogen peroxide
approach; hO';\Tever, the presence of other gases in the sample may
give erroneous results.
A widely used technique, called the lead peroxide candle, measures
"sulfation rate." The measurements are given in milligrams of sulfur
trioxide per 100 cm2 of exposed lead peroxide candle surface per day
(rug 8°2/100 cm2/day). This method has a great many difficulties
associated \vith it and, therefore, is only a rough indication of sulfur
dioxide concentration.
Other techniques for measuring sulfur dioxide are being devised
and warrant careful consideration.
}Iost epidemiologic studies on the health effects of air pollution
have used one of t\vO methods to measure particulates. In the United
States a high-'volurne sampler has been the preferred method. Europeans,
on the other band, have generally used a procedure which depends on the
darkness of the material on the filter paper, referred to as smoke.
Although both are reported in micrograms per cubic meter (~g/m3) of air,
total suspended particle concentrations tend to be about 1.5 - 2.5 times
higher th<Jn smoke shade conc.entrations \vhen the same air is tested (Coillrnin.:
and Weller, 1967).
Of the t\·;o methods, measurement of the total-suspended particles
appears to be more accurate as it does not depend on the color of the
partlc.les. In terms of detcnnirLLng he.:1lth effects, both methods have
serious limitations. These methods measure all particulates, while

il)
only tlJOse about 1 - 2 It in diameter can pene.trate. cle(-,pl~y into the.
lUJlg (Air Quality Particulates 1969). Furthermore, exact composition of the
particles might he. important in the production of respiratory tract
damage but these methods fall to give any indication of these possible
effects. Basically, these procedures only indirectly measure particles
in polluted air which a~e injurious to health.
The method of measuring particulates often determines how
particle size is reported. At the present time there are no standard-
ized techniques for sizing and sampling of particulates, so that much
data on particulate size j.s difficult to assess (Fennell~, 1976). In
the Air Quality Criteria for Particulate Matter (1969) size refers to particulat
diameter or Stokes diameter.
One important group of particulates (sulfates) provides a good example
of the difficulties 'vhich arise in measuring specific compounds. First
of all, there is the possibility that a portion of the sulfates
detected in particle traps actually result from the reaction of sulfur
dioxide with the trapping material. The concentration of sulfates
obtained also may depend on the sampling volume.
The operational definition of sulfates is "material collected
on a high volume sample fil ter and analyzed as \Vater soluble sulfates".
Measurement of sulfates with this method not only may be inaccurate,
but factors that appear important in the biological activity of sulfates
such as chemical structure, acidity, and particle size cannot beI
measured by this method. Although sulfates are principally derived
from sulfur dioxide, the sulfate concentration is not always correlated
·Hith sulfur dioxide. Othe.r factors such as long range transport seem to
be involved and need to be considered. There appears to be considerable
controversy on "'lhether '\la ter soluble sulfa tes" is even a \'70rthhThile
group of compounds to measure. The Environmental Prdtection Agency
is in the process of finalizing a 5 year research plan on sulfates,
investigating the health effects, ecological effects, a.tmospheric
chemistry and transport, and measurement methodology and instrumentation.
The primary objective of this research \ViII be to determine Hhether
regula tory action on selcc t eel sul fates is \,;a rran ted (Lee, 1976).

"'"
77
A great deal of work needs to be done in the area of standard
izing sulfate measurements. This is particularly true now that
sulfates are believed to play an important role in effects on
health once attributed only to sulfur dioxide.
As far as communitity studies on air pollution are concerned,
sulfuTic acid has never been measured. As RaIl stated, "sampling
and analysis of atmospheric sulfuric acid can most optimistically
be desc.ribed as in the development stage" (RaIl, 1974).
To sum up briefly \vhat needs to be done in the area of
determining the concentration of various sulfur oxides in the
at.mosphere for epidemiologic studies, 3 areas require attention of
researchers: 1) standardization of sulfate measurements, 2) analysis
of various sulfates present, and 3) analysis of atmospheric sulfuric
acid. In order to understand fully the relationship of ambient
sulfate levels to health effects, the processes by ~nlich they are
produced and their relationship to sulfur dioxide sources also need
consideration (RaIl, .1974).
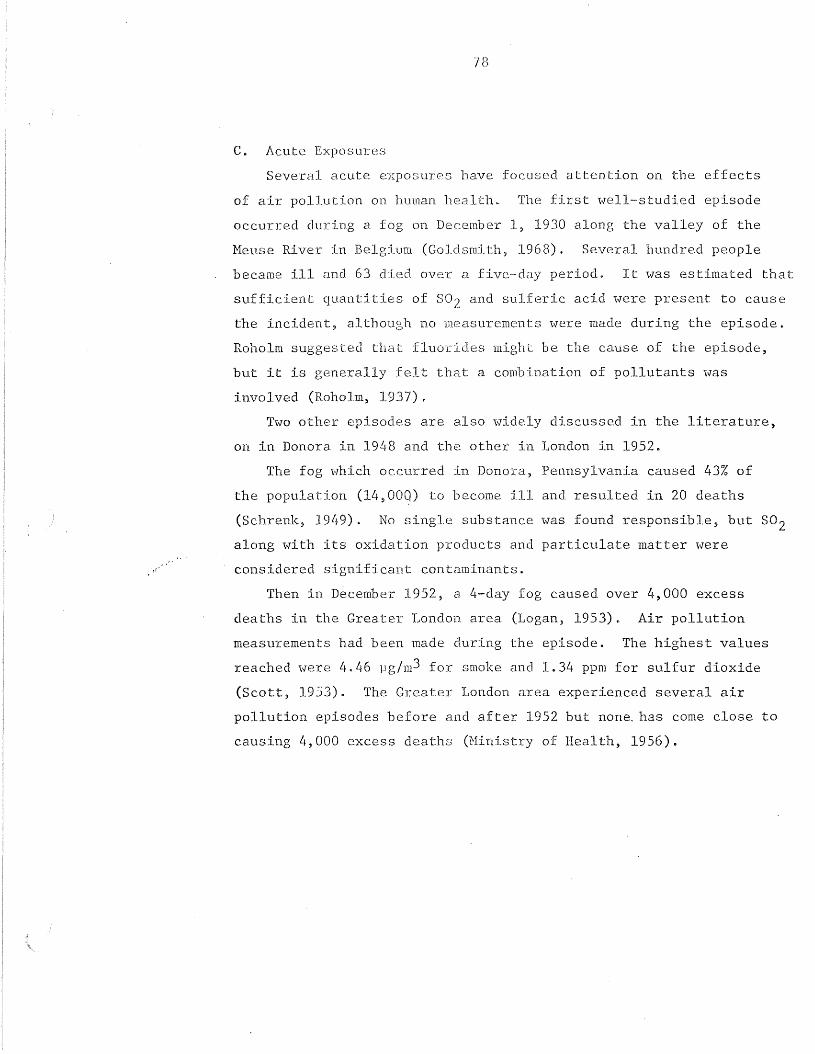
78
c. Acute Exposures
Several acute exposures have focused attention on the effects
of air pollution on human health~ The first well-studied episode
occurred during a fog on December 1, 1930 along the valley of the
Meuse River in Belgium (Gold~)mith, 1968). Several hundred people
became ill and 63 died over a five-day period. It was estimated that
sufficient quantities of S02 and sulferic acid were present to cause
the incident, although no measurements were made during the episode.
Roholrn suggested that fluorides might be the cause of the episode,
but it is genera.lly felt that a combinati.on of pollutants \vas
involved CRoholm, 1937).
~vo other episodes are also widely discussed in the literature,
on in Donora in 1948 and the other in London in 1952.
The fog which occurred in Donora, Pennsylvania caused 43% of
the population (14,OOg> to become ill and resulted in 20 deaths
(Schrenk, 1949). No single substance was found responsible, but S02
along with its oxidation products and particulate matter ,vere
considered significant contaminants.
Then in December 1952, a 4-day fog caused over 4,000 excess
deaths in the Greater I)ondon area (Logan, 1953). Air pollution
measurements had been made during the episode. The highest values
reached ,,,ere 4.46 pg/m3 for smoke and 1.34 ppm for sulfur dioxide
(Scott, 1953). The Greater London area experienced several air
pollution episodes before and after 1952 but nona has come close to
causing 4,000 excess deaths (Ministry of Health, 1956).

,,'
These three episodes h;lve c.er tcLLn eh'::l rae tc ri :::; Lies in common" Each
occurred during anticyclonic weather accompanied by fog and a tem
perature inversion, which led to a buildup of pollutants (particulate ,
mostly carbon and iron dust, and various gases) and an increase in
morbidity and mortality particularly from cardiac and respiratory
causes.
Ashe compared these three episodes and also considered episodes in
Cincinnati (1949), Poza Rica, Mexico (1950), Gallipolis Ferry, West
Virginia (1955-56), and Los Angeles smogs (Ashe, 1959). He concluded
that the weather made air pollution particularl.y hazardous.
Before 1952, other fogs in London: 1873, 1880, 1882, 1891, and
1892, had been associated with increases in mortality (Ministry of
Health, 1954). These were all associated with cool temperatures,
but no pollution measurements had been made. It was the episode in
1952 that stimulated the interest in looking at air pollution and its
possible effects on health. Therefo~e, during subsequent though less
severe episodes, pollution data were collected for analysis. Gore
and Shaddick and Burgess and Shaddick described investigations
using daily mortality figures for the county of London for a series
of "fogs" episodes during 19 54-~1957 (Gore and Shac1dick) 1958; Burgess
and Shaddick, 1959). To reduce the effects of chance fluctuations,
seven-day moving averages of the number of deaths \Vere used. Seven
recording stations furnished the necessary pollution data. Critical
levels of 2,000}{~/m3 of smoke and 0.4 ppm (l,144),z1/m3) 802 or about
4 times the customary \vinter level of pollution Here determined above
which a marked number of excess deaths \'70uld occur. Scott observed
a similar relationship during subsequent fogs in London (Scott, 1958,
1959, 1963).
Waller noted that patients with chronic bronchitis and emphysema
in London Here adversely affected by high levels of pollution during
a fog episode in the winter of 1954-55 (Waller, 1955; 1957). No
specific pollutant was held responsible.
Bradley, e t. ale inves tigated a fog in December, 1957 \vhich \-las
estimated to have caused betHeen 800 and 1,000 deaths (Bradley, 1958).
They noticed increases in deaths and cases of sickness before the
atmospheric pollution llad reached levels considered to be seriously
high. These results seemed to indicate that lower levels of pollution
were causing deaths.

)."'"I'
80
In an attempt to determine to \Vhat degree relatively minor fog
incidents were accompanied by increases in mortality, Martin and
Bradley investigated the fogs during the winter of 1958-1959 (Martin
and Bradley, 1960). A considerable number of fogs occurre.d ',vhere
small increases in pollution were found to be accompanied by increases
in daily deaths. A significant positive association bet\veen black
suspended matter and daily number of deaths \Vas found. A slightly
less significant association was found between S02 concentrations
and deaths. This was in keeping \Vith evidence that black suspended
matter had played a more prominent role in inCre8Sillg mortality
(Scott, 1958, 1959; Burgess and Shaddick, 1959).
t-lhen these data vIere considered along \vith data from the \vinter
of 1959-1960, Martin concluded that it would be too difficult to
determine a "threshold value below which levels of air pollution
would be considered safe" (Martin, 1966). The lowest levels con
sidered \Vere 500}!~/m3 of smoke and 409)..{~J1m3 of S02'
Greenburg studied mortality during an episode in New York City
in November, 1953, in which excess deaths were related to concentra~
tions of sulfer dioxide and suspended particulates (Greenburg, 1962a).
An analysis of clinic visits of children and adults during this
episode revealed an increase in upper respiratory illness and cardiac
visits. Hmvever, no effects of air pollution on the number of
asthma clinic visits were observed in the 4 hospitals studied (Green-
burg, 1962b).
During a later episode in 1962, Greenburg did not detect any
excess deaths or increases in visits to emergency clinics for upper
respiratory complaints, asthma, or cardiac conditions (Greenburg, 1963) <
A significant increase in visits for upper respiratory infections
did occur at four homes for the aged during this period.
However, in McCarroll and Bradley's study of this same episode,
a comparison of 24-hour average levels of pollutants \vith NeH York
City mortality figures (using a l5-day moving average) shmved excess
deaths occurring on December 1 (HcCarroll and Bradley, 1966). These
deaths followed-a daily average sulfer dioxide concentration of 0.72
ppm and smoke shade in excess of 6coh units during a period of atmos
pheric inversion and low ground-wind speed.

'f!'
81
.NcCarroll follcnved daily dea th2.l in Nel,v York Ci ty for a three
year period and found ped.odic peaks in mortality associated \vith
periods of high pollution (McCarroll, 1966, 1967a). Characteristically
these episodes had an effect on death rates in ages 45-64 and in those
over 65. HcCarroll concluded, "If these excess deaths are related to
air pollution the mechanism is probably protean and pervasive,
affecting the course of a variety of different diseases through a
basic physiologic effect" (NcCarroll, 1967b).
In 1967 Glasser published a study on the New York City air
pollution episode of Novembe.r 23---25) 1966 (Glasser, 1967). Unusually
high levels of 802 and smoke vlere present during this period. The
highest level of S02 (1.02 ppm) and smoke (8.2 CLHS/lOOO ft.) were
found on the third day of the episode. Four different control periods
were used to compare mortality data: 1) the 2~ \.,reeks preceding the
episode, 2) the five day period following the episode, 3) the previous
five years corresponding to the period preceding the episode and
4) the previous five years corresponding to the week of the episode.
For the control periods the average number of daily deaths ranged
from 233.9 to 238.3 with the episode week having a range of 257.3
to 266.0. The average number of daily deaths during the week of the
episode for those under LIS years was 3.9 more than all control periods
combined. For ages 45-64 and 65 and over the excess \Vas 5.0 and 15.2
respectively. The temperature during the episode was lSoF above
normal but it was concluded that \vi th the exception of mortality due
to vascular lesions of the central nervous system temperature could
not account for the increased deaths. Emergency visits to ho~pitals
for bronchitis and asthma were increased on the third day of the
episode in three of seven hospitals studied.
Greenburg studied another acute air pollution incident in New
York City from January 29 to February 12, 1963 (Greenburg, 1967).
On 73% of these days the 802 level was 0.40 ppm or higher with an
average hourly reading on one day of 1.50 ppm which remained for four
hours. During January and February 1963 there was widespread in
fection of the population with Asian influenza. This time period
was also among the coldest of tIle decade. Eight hundred and nine

excess deaths occurred during the study period compared to control
periods. Chi square calculation revealed a statistically signifi
cant increase (p{O.OI) in deaths due to influenza-pneumonia,
vascular lesions of the central nervous system, diseases of the
heart, and "all others" in age groups 45-64 and over 65 compared
to control years. Three estimates were obtained of the number of
excess deaths due to air pollution alone after controlling for
temperatures and the effects of influenza. These were 195, 345 and
405 and were obtained by using three different control periods in
the comparison.
Other acute episodes have been studied in terms of mortality
and morbidity. These are reviewed by Goldberg and the Air Quality
Criteria Reports (Goldberg, 1962; Air Quality Criteria, 1969).
Overall there appears to be ample evidence to conclude that
usually high levels of pollution increases mortality and morbidity,
especially among the elderly and those people with obstructive lung
disease or cardiac disease.
A summary of these studies is presented in Table 8.
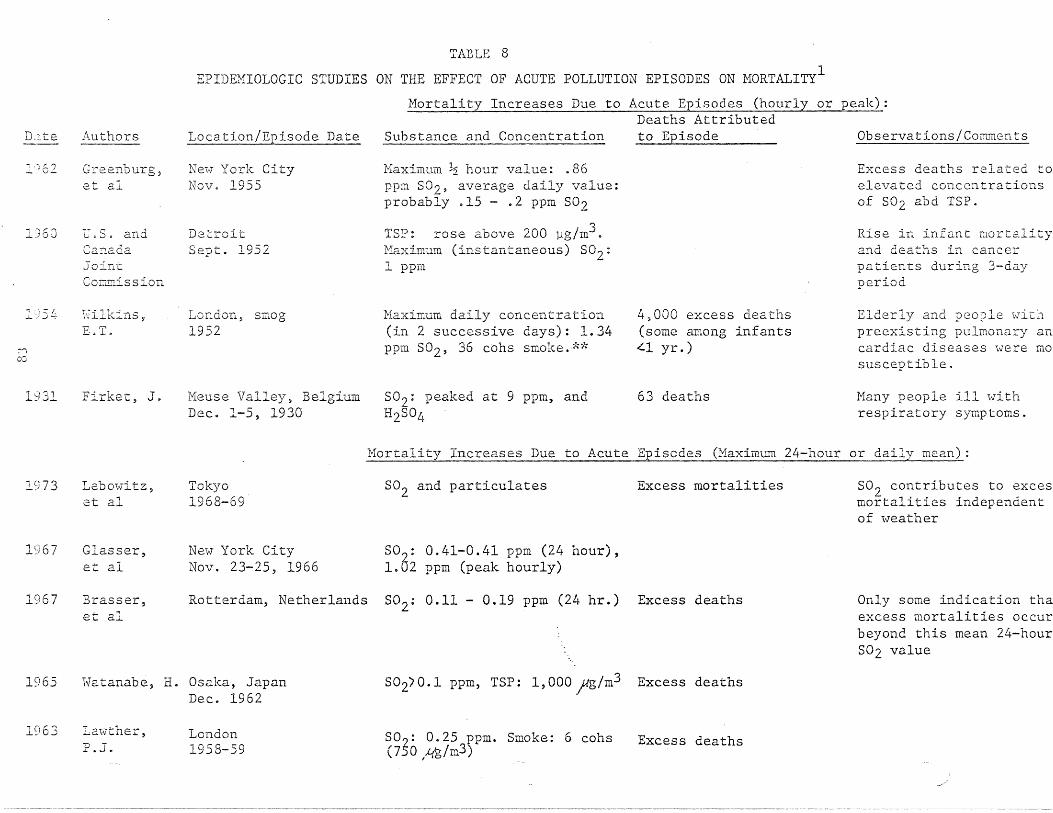
TABLE 8
EPIDEMIOLOGIC STUDIES ON THE EFFECT OF ACUTE POLLUTION EPISODES ON MORTALITY1
Mortality Increases Due to Acute Episodes (hourly or peak):
D,lte
1)62
,,~:, t' ''''''\
J...:JOv
Authors
Gree.nburg~
et al
U.S. andCar:aaaJointCOI:lITLission
Location/Episode Date
Ne-ev York CityNov. 1955
DetroitSept. 1952
Deaths AttributedSubstance and Concentration to Episode
Maximum ~ hour value: .86ppm SO), average daily value:probably .15 - .2 ppm S02
TSP: rose above 200 ~g/m3.tffiximum (instantaneous) S02:1 ppm
Observations/Comments
Excess deaths related toelevated concentrationsof S02 abd TSP.
Rise in infant mortalityand deaths in cancerpatients during 3-dayperiod
1 54
':--1co
1931
\~7illc.ill.s ,E.T.
Firke-c, J.
London, smog1952
Meuse Valley, BelgiumDec. 1-5, 1930
Maximum daily concentration(in 2 successive days): 1.34ppm S02' 36 cohs smoke ."d~
S02: peaked at 9 ppm, andH2S04
4,000 excess deaths(some among infants"-I yr.)
63 deaths
Elderly and people wlthpreexisting pulmonary ancardiac diseases were IDa
susceptible.
Many people ill withrespiratory symptoms.
Mortality Increases Due to Acute Episcdes (Maximum 24-hour or daily mean):
1973
1967
Lebmvitz,et al
Glasser,et a1
Tokyo1968-69
NeW" York CityNov. 23-25, 1966
802 and particulates
502: 0.41-0.41 ppm (24 hour),1.02 ppm (peak hourly)
Excess mortalities S02 contributes to excesmortalities independentof \-leather
1967 Brasser,et al
Rotterdam, Netherlands S02: 0.11 - 0.19 ppm (24 hr.) Excess deaths Only some indication thaexcess mortalities occurbeyond this mean 24-hourS02 value
1965 Watanabe, H. Osaka, JapanDec. 1962
502)0.1 ppm, TSP: 1,000 ;g/m3 Excess deaths
1963 La"(vther,P.J.
London1958-59
S02: .0.25 ppm. Smoke: 6 cohs(750 ~/m3)
I .
Excess deaths

1963
1963
1962
1960
u:
Greenburg,et a1
Greenburg,et a1
Greenburg,et 0.1
l'1artin,Bradley
Ne\v York CityDec. 1, 1962
New York CityJan 7, 1963
New York City1953
London1958-60
S02: 0.72 ppm. Heavy smoke
SO~: 0.6 ppm. Heavy smoke
802: 0.15 - 0.2 ppm. Heavysmoke
so?: 0.14 ppm, Smoke: 4 cons(500 lJg/m3)
Excess mortalities
No increased mortality
Assumed a 3-dtiy time Iebetween pollution cpis(and observed increasedmortality. Was a stat:tica11y significantrelationship betweenincreased air pollutio!and mortality
Lowest SO?, and smokelevels \vhich elicited E
response
1958, Gore,1959, Burgess,1963 Shaddick;
Scott
London, acute fog1954-59
802: 4 ppm. Black suspended Excess mortalitiesmatter: 16 cohs (2,000 lJg/m3).(100) Smoke (1956, 1959): 9.6cons (1,200 lJg/m3). S02(1959): 0.3 ppm
(120) For London incid~
S02 concentrations carrlate with excess mortalties
*~<125 llg/m3 1 coh (coefficient of haze)
LSource: Colucci, A.V., Sulfur Oxides: Current Status of Knowledge, EPRI EA-3l6, Dec. 1976

ADDITIONAL EPIDEMIOLOGIC STUDIES ON THE EFFECTS OF ACUTE POLLUTION EPISODES ON MORTALITY
, .,.,. .'c Susp~nded S02 ~ _.,ource ~opularlon HerDod Partlculates Smoke Otnpr Concluslons
.--.-----~-~-._._,.. ..,,'.,.-...-._---------
Noneaas;::er.967
If"'\00
Avg. dailymortalityall D.ges, maleand femaleControl periods233.9-238.3/dayvleek of episode257.3-266.0/day
Examined both not statedmortality andmorbidity inrelation to airpollution episodein New York CityNov. 23-25, 1966Also used as controls:1) 2~ week periodbefore episode2) 5 day periodfollowing episode3) 5 year periodprevious to episodecorresponding tovleek of episode4) previous 5 yearscorresponding tovle.~l~.~_~iorE_e.12<:Ls_~__._.
Range ofmean levels1.3-6.1 COHS
1000 ft.min. levelrange0.5-400COlIS 1000 ft.max. levelRange2.3-8.2 COHS
1000 ft.measuredbi-hourly
Range of meanlevels 0.100.51 ppm min.level range0.02-0.30 ppmmax. level range0.28-1.02 ppmhourly measurements
Mortality increased tohigher than expected leveand remD.incd for sevendays. Average of 24 morEdeaths per day found incomparison to controlpe:::-iods ~,lith 3 total of168 excess deaths. Theexcess mortality increas(with increasing age.Morbidity was measuredby clinic emergency visitfor bronchitis and asthm~
There was an increasednumber of visits on the3rd day of the episodein patients age 45 andover in three of the seVEhosoitals checked.
;reen-)urgL967
4,596 deathsduring periodstudied(306 per day)All causes
Jan. - Feb. 1963 not statedHigh air pollu-tion episode Ne'i'vYork City reviewedand compared withcontrol yearsprior and follow-ing episode inrelation tomortality. Otherstresses such ascold and epidemicdiseases alsopresent. Controlsused 'i'ilere:1) days berore &after episode2) similar periodduring 19583) days prior &S 111) .s e q \1 C 11 t t ()
JJn. 29Feb. 1247% of dayshad levelof 4COHunits ormore
daily avg.
Jan. 29 Feb. 1273% ofdailylevels were0.40 ppmor higher
daily avg.
none An estimated 200 - 400 excessdeaths attributed to air pollution alone after controllingfor temperature and influenza.
Increase in mortality for 01de1age groups (45 and over) and fethe causes influenza - pneumonjvascular lesions, cardiac &lIall others ll
•
No significant increase indeatof early infancy (<28 days)and no excess deaths in childrE

\.1'
B6
D Chronic. Exposures
1. Mortality Studies
Mortality studies have most frequently been utilized in
examining the effects of air pollution on human populations.
As previously mentj.oned, it was the observation that
increased numbers of deaths occurred during air pollution
episodes that brought attention to the fact that air
pollution posed a threat to health. The continued use of
mortality data is due, in part, to their easy accessibility.
Mortality studies also tend to be relatively inexpensive
and less time consuming than morbidity studies.
Along with these advantages corne certain problems inherent
in all mortality studies. First and foremost is the fact
that mortality data provide rather crude measurements as
they represent the final results of ill health. Furthermore,
certifications of death, upon which most mortality studies
are based, are not al\vays reliable particularly for selected
entities and may not reflect the contribution of air pollution.
The extent to \\Thich chronic respiratory diseases are listed
as the cause of death, or as an underlying cause, depends
to some extent on the familiarity of the physician \vith
the patient's medical history and the local medical usage.
Death certificates may also be filed in the place \\There the
person lived at the time of his death rather than the place
he lived most of his life, thus making comparisons between
mortality and local pollution levels misleading.
In using mortality data to assess effects of pollution
levels exact exposure levels are impossible to obtain.
Investigators have often used measurements of pollutants,
typically sulfur dioxide and smoke, over one year to
detennine the rela. t i ve exposure levels of several groups
under study. Since areas ~lich are high in air pollution
usually remain high due to the stability of pollution
sources, this method appears to be an adequate means of

H7
determining gradients of exposure among population groups.
Hmvever) caution mus t be used in interpr0'ting these studies
as air pollution measurements are not likely to be
representative of the true lifetimE' eXpOE:lUre, Furthermore,
dose relationships derived from them may not be tenable.
Therefore, in evaluating studies in this particular area,
it seems best to look at general trends that have been
verified by repeated studies. H~chter has addressed a
number of the problems encountered in the use of mortality
data for studying air pollution effects (Hechter, 1961).
He found that various environmental factoTs exhibited
distinct seasonal patterns plus irregular oscillations
in his study of daily cardiac and respiratory deaths in
Los Angeles County from 1956 to 1958. The seasonal
component was removed by a technique knm,m as harmonic
analysis. No influence of daily air pollution levels as
measured by oxidant levels and carbon monoxide on day to
day mortality could be found when correlation analyses were
performed.
For the years 1950-1952, Pemberton and Goldberg found
significant correlations between sulfur dioxide, as measured
by sulfation rates and deaths from bronchitis in men age
45 and over in the county boroughs of England and Wales
(Pemberton and Goldberg, 1957). A similar association
was noted in women in two of the six sets of data. Using
pollution exposure based on domestic coal consumption over
the same time period in England and Wales, Daly found that
the same positive correlation existed between exposure to
high pollution levels and death from bronchitis in men aged
45 to 64 years (Daly, 1959). After adjustment for differences
in social class and overcrowding the correlation still existed
but was lower than before. Daly found that deaths from
pneumonia and bronchitis in women also correlated with
pollution as measured by domf'stic coal consurnpt.ion. Hhen
mortality rates for bronchitis were compared with total

88
coal consumption, the correlation was very weak (r
No explanation was offered.
.24).
Bronchitis mortaJ.ity has also been associated with
deposit and smoke in the country boroughs of England and
Wales even after adjustment for population density (Stocks,
1959). In an evaluation of a smaller area, Stocks found
bronchitis mortality to be significantly correlated with
dust deposit but not with smoke. The opposite was true for
lung cancer.
The pH of winter precipitation has been found to be
strongly inversely related to bronchitis mortality in England,
Scotland, and Wales (Gorham, 1958, 1959). The winter sulfation
rate was also significantly correlated with bronchitis
mortality, but the correlation was smaller than that found
with pH of winter precipitation.
A IS-fold excess of mortality from bronchitis was recorded
in England and Wales when compared with that in Denmark.
Both countries used the same classification system (leD) for
causes of death on certification. When cigarette smoking ~vas
considered, it accounted for approximately half of the
difference. Apparently age distribution, social class,
climate and pollution ~vere not important factors. According
to Christenson, there is a real difference in mortality that
requires further study (Christenson, 1958).
In their study of postal workers in ·the United Kingdom,
Fairbairn and Reid found that bronchitis mortality and
morbidity \vere related to the frequency of fog as measured
by percent of occasions on which an object at 1,000 yards
was invisible (Fairburn and Reid, 1958). No relationship
of lung cancer deaths to fog or to domestic crowding was
found. A strong relationship between lung cancer and
population density was noted, however.

"I'
Higher lung cancer rates found in migrants from the United
Kingdom to New Zealand and to South Africa compared to the
British population born in those countries, point to a
possible effect of air pollution (Eastcott, 1956; Dean, 1959) ,but Jdequate. comparative data on smoking were not available.
According to Goldsmith, many studies have found that lung
cancer deaths are more frequent in cities than in rural
areas (Goldsmith, 1969). A 20% excess mortality-in urban
areas has been observed even ·i,vhen only non-·smokers· are
considered.
Haenszel found that the effects of residence and smoking
were synergistic with respect to lung cancer (Haenszel, 1962).
Smokers residing in urban areas had a greater rate of lung
cancer than would be expected from simply adding the
individual effects of residence and smoking.
Few studies relating lung cancer mortality to measured
ai.r pollution levels have been attempted. Buck and BrO"\ffi
compared standardized mortality ratios for the years 1955-59
with smoke and 302 measured in March 1962 for 219 areas of
the United Kil1gdoID. (Buck and Brown, 1964·). In general, they
found no association of lung cancer mortality with smoke and
802 levels.
Lung cancer mortality has been correlated with various
indices of air pollution such as smoke deposit, 1:12 benzpery1ene,
3:4 benzopyrenel domestic pollution based on fuel consumption
and areas considereel more polluted due to high levels of smoke
and sulfur dioxide (Stocks, 1958, 1959, 1960; Daly, 1959;
Pemberton, 1961; Burn a.nd Pemberton, 1963). Several investigators
have also found a positive association between lung cancer
mortality aad population density (Fairbairn and Reid, 1958;
Stocks, 1958; Buck and BrOtnl, 1964). In none of these was there
control on tobacco use. In an earlier study conducted with
nonsmokers, Doll found no such effec.t on lung c.ancer mortality
(Doll, 1953). At this time there is not suffic.ient evidenc.e

90
to link lung cancer mortality to air pollution. HOHever, ail
urban factor still remains important in lung cancer mortality.
l-n1en assessing the effects of clir pollution by means of
variation in weekly mortality, it is particularly important
to consider other factors, such as meteorological conditions
and influenza epidemics that may be contributing to changes
in mortality. Boyd took ,this into consideration in his study
over a period of 7 winters in Great Britain. Boyd attempted
to investigate the associations bet"Heen mortality, meteorological
conditions as measured by temperature and absolute humidity,
and air pollution as measured by sulphur dioxide, smoke, and
fog (Boyd, 1960). Low temperatures were found to be highly
correlated ~vith deaths ~vhich occurred t\.;ro \-leeks later. Among
the pollution factors studied, 802 was most highly correlated
with mortality, particularly from respiratory causes. However,
correlations with mortality were lower for pollution factors
than for temperature and humidi ty. The TClorta1i ty trends
seemed to suggest that the effects of pollution were more
serious \\Then accompanied by 101,7 temperatures.
According to the report on Air Quality and Stationary
Source Emission Control published in 1975, there has been
an increase in the combined mortality from bronchitis,
emphysema, and asthma in the United States from 6.9 to 12.1
per 100,000 during the period 1958 to 1967. However, there
has been a decline in deaths due to asthma. Hhile asthma
once accounted for 60 percent of all chronic respiratory
disease deaths, by 1967 it accounted for only 10 percent.
Therefore, the increase in chronic respiratory disease
deaths has been due to bronchitis and emphysema. Furthermore,
it has been more noticeable among white males. During this
period, death rates from influenza and pneumonia combined
have remained fairly constant.
An interesting follmQ-up study of 4,092 survivors of the
Donora, Penn. episode in 1948 was conduced by Ciocca in 1957,
eight and one half years after the episode (Ciocco, 1961).

91
By means of mailed que~;tionnaires Llnd personal intervie\vs over
. 99 percent of the Lf , 092 persons \vere traced to 1957. People
who reported acute illness at the time of the smog episode
had higher slilisequent mortality and prevalence of illness
than 0 t:her people in the cOlmnuni ty.
A series of mortality and air pollution studies conducted
by the Public Health Service has been reported by Rumford
(Rumford, 1961). In one such study, health districts in
Philadelphia were used to compare mortality and pollution
for the years 1954-1956. Significant correlations were
found bet\veen dustfal1 and tuberculosis, pneumonia, chronic
rheumatic heart disease, other diseases of the heart and
arteriosclerotic heart disease. }lultip1e correlation analysis
suggested that only chronic rheumatic heart disease was more
strongly correlated to dustfall than to indices of socio
economic conditions used (income, crowding, education, race).
In another study, mortality variations were comapred among
whi te female residents \vho lived in manufacturing versus non
manufacturing areas of Chicago. The results suggested that
residents of the manufacturing areas experienced higher
mortality, particularly in deaths due to cancer of the
respiratory tract and heart diseases. A second approach
compared mortality bet'iveen residents who lived less than
one mile and one to two miles from a large integrated primary
metals plant. \\Then mortality by census tracts, with comparable
socioeconomic levels were compared, the mortality among
residents of tracts less than one mile from the plant was over
30 percent higher than mortality in tracts one to two miles
from the plant. Unfortunately, no air pollution measurements
were made.
Pneumonia deaths have also been linked to air pollution.
/rom a comparison of death rates in 1932-35 in Pittsburgh
OV'3Y a period of decreasing air pollution, it \Vas shmV11 that
c1e;l ths from pneumonia also decreased
Lik.e\vise, fInIs found e:xccc.;c; pnc.uITloLda mortality in the
mas t: polluted c:nea of CltieC::lgo \\rhen COll1pa red to the cleanes t
area as determined by Bootfn11 and 802
levels (lrills, 1952).
Hinkelstein conducted a nUEtber of studies relating
mortality froln specific causes to air pollution. From death
certificate data collected between 1959 and 1961 in Buffalo
and Erie counties in New York, a positive association was
found between chronic respiratory disease mortality and
suspended particulates for yvhite men aged 50--69 (Hinkelstein,
1967). The standardized mortality ratios for chronic
respiratory diseases were 76 at pollution level I (lowest,
suspended particulates less than 80 microgms/m3,98 at level
II, 112 at level III,and 137 at level IV (highest, suspended
particulates over 135 microgms/m3). No association was found
between pollution and cancer of the bronchus, trachea, and
lung. An inverse relationship was found betyveen mortality
and economic levels. Five different economic groupings were
used in this study. There was a paucity of cases in the high
economic-high pollution group and the low economic-low
pollution group. Only economic level II (Level I-lowest level)
had cases in each of the four air pollution levels. For this
level, mortality from all causes in men aged 50-69 was 50 per
cent higher in the highest air pollution level compared to
the lowest. For chronic respiratory disease mortality the
rate was 64 percent higher in the highest pollution area
compared to lowest in men aged 50-69. No data were available
on past smoking habits of the cas(~s or on occupation.
A second study by Winkelstein compared total mortality
with oxides of sulfur (Winkelstein, 1968). A positive
association was found between chronic respiratory disease
mortality and sulfation in the two lowest economic levels in
white men 50-69 years. The high and low sulfation areas
together accounted for only 37 percent of the population of
\vhite men aged 50 years and over. ·hTinkelstein emphasized
tha t these assoe iel. tions ·h1(~re only i ndi rec: t and no de fini te
causal conclusions could be made. Other associations were

93
found between suspended particulates and mortality from
pros tate cancer) s Lomach cancer, 2nd cirrhosis of the liver
(Winke1stein, 1969b, 1969c, 1971). In the prostate cancer
study Winkelstein alluded to the possible association of
cadmium oxide dust in the air and prostate cancer. This
association has been reviewed by other investigators in
rela tion to occupa tional studies. In all of 1vinkels tein f s
studies presented here, air pollution was measured in 1961-63
and mortality data WBS collected for 1959-61.
An association of prostatic cancer and suspended particulates
measured by soiling index \Vas also found by Hagstrom in a study
conducted as part of the Nashville Air Pollution Study
(Hagstrom, 1967). This study also reviewed other malignant
neoplasms. During the twelve years studied (1949-1960) 2,912
deaths from cancer occurred. The relationship between cancer
and air pollution \Vas compared in a population of middle
socioeconomic status. The four pollution variables measured
were soiling index, S02' dustfall and sulfation rate. A
positive association was found bet\veen stomach cancer and
dustfall and between esophageal cancer and soiling index.
Mortality from cancer of the bladder was higher in higher
air pollution areas for all four pollutants measured. Total
mortality from cancer by age showed a direct relationship
to the level of soiling for ages 34 and over and an inverse
relationship for ages 25-34. No data were available on
smoking habits or occupation. As part of the Nashville Air
Pollution Study, Zeidberg reviewed respiratory disease
lilortality and its relationship to soiling index, S02'
sulfation rate and dustfall (Zeidberg, 196n. Three
socioeconomic strata \Vere designated. Total respiratory
disease death rates were found to be inversely related to
socioeconomic class. To control for socioeconomic effects,
the middle class was used in assessing the effects of pollution
since all three levels of pollution were represented in this
group. Sulfation rates and dustfa1l Here based on 123 sampling
areas where soiling index and 802 were measured at only 36

stations. rlortality r<:'ltcs for influenza, pneumonia, and
tubcrculosif3 in the hi gIlly polluted area, especially in
relation to sulfation rate and soiling index, were significantly
higher than in moderately polluted areas. This study has been
criticized on the basis that the middle socioeconomic level
used for controlling on this factor was very broadly defined
and the removal of the socioeconomic effect may have been
incomplete.
Zeidberg also looked at cardiovascular disease mortality
including total cardiovascular disease, general arteriosclerosis,
rheumatic heart disease, myocardial degeneration and hypertensive
heart disease (Zeidberg, 1967). A significant relationship
was found between soiling index and mortality from total cardio
vascular disease, hypertensive heart disease,and other myocardial
degeneration. Among females, mortality for all cardiovascular
disease categories decreased with decreasing levels of
pollution as measured by soiling index. The pattern for males
was generally irregular with arteriosclerotic heart disease
mortality inversely related to pollution levels. Mortality
for total and specific cardiovascular diseases \Vas higher at
all pollution levels among non-\vhites.
Hodgson, in a statistical study on mortality and air
pollution in New York City, November 1962-May 1965 utilizing
multiple regression analysis, noted levels of respiratory and
heart disease mortality to be significantly related to
environmental variables, especially particulate matter and
temperature. However, only one monitoring station was used
to measure pollutant concentrations (Hodgson, 1970). An
increase of one unit in the average daily concentration of
suspended particulates during a month resulted in an increase
of 13.25 in expected daily mortality from respiratory and
heart disease during the same month. The definition of
pollutant units was not clear. The author concluded by pointing
out that seerningly harmless increases in concentrations of
pollutants from day to day resulted in significant increases
in mortCllity.
95
Glasser investigated daily deaths from 1960 through 196/1
(particularly October through Hatch) in Ne\V York CiLy in
relation to 802' smoke shade, temperature, windspeed, sky
cove~ and rainfall (Glasser, 1971). Daily mortality was
valued in terms of deviation from normal and deviation from
a moving average. S02 and smoke shade were measured from
one sampling station and expressed as daily means.
Since the relationship between S02 and mortality was
stronger than that of smoke shade and mortality, S02 was
consi.dered the main pollutant. Days \vi th 302 levels of
0.22 ppm or less in comparison to days with S02 levels of
0.40 ppm showed a difference of 10-20 mean deaths per day.
Regression coefficients were calculated between daily mortality
and S02 and weather factors. This analysis showed that the
relationship of S02 to mortality \vas stronger than for any
weather variable.
Jacobs studied the relationship between cardiovascular
disease mortality and suspended particulates in Charleston,
s.c. (Jacobs, 1972). During the time period 1968-1972 air
pollution decreased in this area due to the control of
industrial emissions. Mortality rates were observed before
and during the reduction of air pollution. The population
from the industrial area of Charleston was found to have a
significantly higher risk of heart disease mortality than the
total county population in 1968 but not in 1970. This was
felt to be due to the reduction of suspended particulates
from a range of 74.4-227.6 microgms/m3
in 1968 to 55.3-120.5
microgms/ln3
in 1970. Jacobs suggested that the decreased
mortality might also be the result of fewer temperature
inversions in 1970 which exposed the population dangerous
concentration of pollutants less frequently. There appeared
to be no controls on economic status or smoking habits in
this study.
Schimmel estimated excess mortality due to air pollution
by examining daily mortality rates and air pollution for

',,1'
96
January, 1963 throllLih DecE'.rnber) 196B in NevJ '{ode Cily (Schimmel, 1972).
Air pollution measurements \Vere made for S02 and smoke shade.
Seven daily weather variables were also examined. The estimated
average daily excess mortality ranged from ]8.12-36.74, with an
intennediate estimate of 28.63. This is equal to about 10,000
deaths a year. Eighty percent of the excess was calculated to be
due to smoke shade and 20 percent due to 3°2 , This excess
represented approximately 12 pereent of the deaths \'lhieh occurred
during the six years of study.
Buechley in a study of the metropolitan New York-New Jersey
area, attempted to detect a relationship bet\Veen air pollution
(primarily S02) and mortality (Buechley, 1973). This \Vas part
of a larger analysis of daily mortality in 422 places in the
U.S. during 1962-1966. In addition to S02' other factors
considered were seasonal influences, extreme heat waves,
influenza epidemics, warm and cold weather, holidays, and day of
the week influences. Only one monitoring station was used to
measure air pollution levels.
Results indicated that Hith 802 levels belmv 30 microgms/m3
,
mortality was 1.5 percent less than expected and with S02 levels
above 500 microgms/m3 , mortality was 2 percent greater than
expected. Coefficient of haze was found to be as good as S02 in
predicting mortality. The estimated mortality resulting from
the study is much Imver than than predicted from Schimmel's study
which included only New York City. The discrepancy may be due to
more intensive adjustment for temperature variables and the
inclusion of the effects of influenza in BuechleyY s study. The
higher estimates in Schimmel's study may hCive resulted from
using pollution concentrations on days preceding the day of
death.
A comparison study of the relationship between mortality from
respiratory cancers and pollutants (smoke) during 1940-1969 wa~
studied in both the U.S.A. and England and Wales (Higgins, 1974).
For the U.S. males, age specific respiratory cancer mortality
rates have increased from 1940-1969 Dnd for females, the rates
have increased since 1955.

In England and'Wales, men aged 25-34 have experJcllce declining
death rates since 1943. In men aged 35-44, the rates have increased
to 195~ then decreased to original level. For the 45-54 year age
group there was an increase to 1950 then a leveling off
1955-65, with a decline 1965-69. The 55-64 year group experienced
increased deaths with a leveling off at 1960. The 65-75 year
group still experienced increasing death rates. In the U.S.
1955-1970 the number of men who never smoked increased for those
under 45 but decreased in those over 45 years of age. For England
and Wales 1955-70 there was a greater proportion of cigarette
smokers than in the U.s. Even with differences in smoking
controlled, respiratory cancer mortality rates have been leveling
off for men in England and Wales. A slightly greater decline for
lung cancer \Vas found in the Greater London area. This \vas found
to parallel a dramatic decrease that has occurred in Greater
London in smoke pollution levels, a decrease far greater than
in many U.S. cities or even other areas of England.
Henderson published a study on lung cancer mortality for
1968-1970 and lung cancer incidence in 1972 for southcentral
Los Angeles County, California, where an excess of lung cancer
had been previously reported (Henderson, 1975). Air pollution
data 'vere collected for suspended particulates and polynuclear
aromatic hydrocarbons on alternate weeks, June 13 through August
1, 1973. The polynuclear aromatic hydrocarbons specifically of
interest were benzo (e) pyrene (BEP) , benzo (a) pyrene (BAP) ,
benzo (ghi) perylene (GEE), and coronene (COR). The excess lung
cancer mortality in males \Vas 33 percent or 87 deaths per year.
Fourty-six of these deaths occurred in the under 65 year age group.
No excess of oral cavity, pancreatic, laryngeal or bladder cancer
was found. From observing the wind patterns of the study area,
it was found that air pollution could remain in the study area
for long periods of time after it was generated. A correlation
between the distribution of the lung cancer cases and the location
of the industries responsible for the pollution was found.
In relating air pollution and cancer mortality data from the same
time period, questions about the validity of the results ari~;e

"I'
",
98
because of the long 1a tcncy period:::> assoc ia ted vlL tll many' cancers.
The author in this case, however, points out.: tlwL the industrial
plants have been located in the same place within the study area
for the last 30 years and that the carcinogenic factors in the
air were probably at even higher concentrations 30 years ago.
Therefore, the author concluded that the excess of lung cancer
in southcentral Los Angeles was probably due to an excess of,
carcinogenic particles in the air.
Carnmv revieHed a number of studies on airborne benzo (a)
pyrene and pulmonary cancer which compared urban and rural
populations, migrant populations and different demographic units
(Carnow, 1973). From urban-rural studies, he associated a 100
percent increase in mortality with a 6.2 unit rise in benzo (a)
pyrenel (concentration of benzo (a) pyrene of 6.6 TIlicrogms/lOOOm3
for urban areas and 0.4 microgms/lOOOm3
rural areas). From the
migration studies, Carnow found that death rates for pulmonary
cancer followed closely the levels for air pollution with benzo (a)
pyrene. Carnow reviewed a study by Hitosagi in 1968 carried out
in Japan involving family intervieHs of 259 pulmonary cancer cases
and a random sampling of an adult population 35-74 years old.
Data on smoking, occupation, residence, and previous medical
histories were collected. Pollutants collected included benzo (a)
pyrene, S02' dust,and particulate matter. Increases in mortality
rate were found to be associated with higher pollution levels for
the most part. Carnow summarized his paper by theorizing that
from the epidemiologic studies conducted, a 5 percent increase
in pulmonary cancer mortality per unit increase in benzo (a) pyrene
can be estimated.
A study of t\VO communities in Pennsylvania, one 'Hith higher
pollution than the other \Vas published by Harris (Horris, 1976).
Because of a coal pmvered elec tric plan t, the more highly polluted
area of Seward had 9 times the 302' 6.2 times the sulfation rate,
3.2 times the dust fall, and 1.4 times the suspelld~d particulates
of Ne\v Florence.

Mortality data were collected from 1960-1972 for sample
populations in the two communities. Age and sex adjusted
mortality rates for Seward exceeded those for New Florence for
10 of the 11 years of the study (P< 0.05). The excess was not
in heart and respiratory disease categories as expected but in
cancers.
The original sample population studied consisted of volunteers.IDlfferences between nonrespondents and respondents were not explored.
No occupational data were collected, but Seward was believed to
have a higher percentage of coal miners and steel workers. Using
standard mortality ratios, no difference in mortality was found
between the male population, but females in Seward had higher
mortality ratios than females in New' Florence. When smoking and
length of residency'were adjusted fo~ a pattern of increased
mortality ,vas observed in each smoking and sex category for those
'vith more than 20 years of exposure to Seward I s air. Those 'ivho
resided for 20 years in Se'ivard were found to have a higher relative
risk than those with shorter residencies. A pattern consistent
Hith this was not found in New Florence. Among males smoking more
than one pack of cigarettes per day, those in Seward exposed to
20 years of air pollution had a slightly higher mortality than
those in New Florence. The data were found to be consistent 'ivith
an hypothesis that the effects of air pollution and smoking are
additive.
Mahoney tested the hypothesis that no differences existed
bet'iveen different levels of pollution and respiratory mortality
rates in Los Angeles in 1961 (Nahoney, 1976). Ozone, S02' and
suspended particulate levels 'vere measured in 1961. Temperature
data were also collected. There was an increase in mortality
'ivith increasing levels of ozone from 41.8/100,000 to 65.2/100,000
(p( 0.025). No increase in mortality was noted for S02' but the
author found tha the ozone levels and 802 levels were inversely
proportional so that an effect produced by 802 would have to be
quite large in order to be detected. 802 was well controlled at
this time also.

,.t'/,1'
lOU
A trend of incrcasintl, mortality HJth inc.reasing level of
suspended partic.ulatcs was statisticaJly significant. A problem
c)(istecl \vith this Cl~)sociation in th;:lt the high concentrations of
suspended particulates were concentrated downtown around the skid
rmv area. This increase could, therefore, be clue to the special
subgroup exposed.
Stocks published a three. part study on lung cancer and
bronchitis mortality in Great Britain (Stocks, 1966). Part one
involved mortality data collected from eight cities in England
and Wales from 1955. Population surveys we.re also conducted to
ascertain smoking habits, occupation, and residency histories.
In four of the cities previously collected data from other studies
,,,ere used. Air pollution measurements were made for total smoke,
polycyclic hydrocarbons, and trace elements. These meaSurements
were made at the time that mortality data were collected.
Correlations \Vere found bet\veen the average number of cigarettes
smoked per day, the proportion of the population smoking 20 or
more cigarettes dailY,and lung cancer mortality. Correlations
were also found bet\veen lung cancer mortality and total smoke,
3,4-benzopyrene, 1,12-benzopyrene, and trace elements.
In Part II, Stocks collected data on mortality from lung
cancer and bronchitis in 19 different countries apparently from
1958-59. Data on fuel consumption 1951-52. and 1955-58 \Vere also
collected along with the annual consumption of cigarettes from
1921. Using fuel consumption rates 7 yegrs prior to mortality
data, the partial coefficients after correction for differences
in cigarette consumption were 0.68 at age 35-44, 0.47 age 45-54,
0.45 at age 55-64, and 0.41 at age 65-74 for men. These were
apparently significant relationships.
Stocks repeated this study with 20 cOlmtries during the years
1962-63 for lung cancer and 1960-61 for bronchitis mortality
(Stock, 1967). He found a significant correlation of 0.446
between lung cancer mortality, males age 55-64,and solid fuel
consumption measured 6 years before. Adjustments were made for
cigarette consumption.

101
In Part three, Stock studied urban/rural differences for stomach
cancer, lung cancer,and bronchitis mortality from 1921 in different
regions of England. After adjustments were made for social factors
and smoking, an urban excess of lung cancer was found. This excess
was attributed to air pollution from coal smoke. Stocks concluded
his study with the hypothesis that smoking and air pollution
could act on lung cancer mortality by accelerating the latent
stages of an already initiated disease process.
Lung cancer and bronchitis mortality were studied by Ashley
in 84 county boroughs in England and \vales 1958-63 (Ashley, 1967).
Air pollution measurements for smoke and S02 \Vere measured at the
same time that cancer mortality dataw"ere collected.
T\venty four counties specializing in coal and textile industries
were found to have high ratios of bronchitis to cancer of the lung.
Fifty three of the 84 counties had air pollution data available.
Of these, 24 had smoke concentrations greater than 130 microgms/m3
with 11 of these being from the coal and textile industrial areas.
In comparing the towns with high pollution without textile or coal
industries to areas having coal and textile industries, the latter
still sho'ived a decreased lung cancer mortality rate. Ashley
hypothesized that the inhalation of dust provides the lung
protection against carcinogenic substances. This would be
indicated by the high bronchitis lung cancer mortality ratio.
The protection theory may involve a mechanism in \~lich the lung,
laden with dust, is in a better immunological state to attack
abnormal cells \vhen they are produced. Ashley also found support
for an hypothesis that air pollution is not correlated \vith lung
cancer but is correlated with bronchitis.
'In 1971, Hatanabe conducted a study in Osaka, Japan (Hatanabe,
1971). An excess of deaths found in the city over the suburban
areas was thought to be the result of increased air pollution
with cold temperature.
Lebo\vitz utilized a stimulus-response method to determine the
relationship between environ~ental stimuli (suspended particulates
and 802) and mortality (Lebowitz, 1973a). Using mortality data

102
from Tokyo, H multiple stepwise regression analysis was applied
first to delineate the importance of specific variables and to
designate the direction of the relationship. The correlation
coefficients between excess mortality (response) and the
environmental variables (stimuli) were found to be high in
,,,inter, 10Her in the summer, and, overall, high for the entire
period. The theory that air pollutants contribute to increased
mortality independent of temperature was supported in this study.
Lebo\"itz conducted similar studies in New York, Philadelphia,
and Los Angeles (Lebo\"itz, 1973b). Hortality \Vas found to be
related in time to pollution and weather variables. The stimuli
response method showed a significant relationship between the
magnitude of the abnormal environmental event (stimulus) and the
mortality response~
In Dublin, Ireland Kevany analyzed data on mortality and
morbidity from cardiovascular disease and respiratory diseases.
Ischaemic heart disease, the main component of the cardiovascular
disease category, was found to be significantly correlated ,,,ith
S02 ,,,ith a lag time equal to zero. Different lag times ranging
from 0-3 days wer~ applied to the data to allow for effects
that did not derive as i~nediate responses. At lag of one day,
the correlation became insignificant, except for valvular heart
disease and this was not sustained for a lag of t\Vo days. Three
and seven day averages were also used. Smoke at levels of 100
microgms/m3
showed a significant correlation with a seven day
moving average for ischaemic heart disease (r=0.74 p=0.004) and
valvular heart disease. It was concluded that smoke may have a
more gradual effect on increasing mortality over a longer period,
502 and over
death from acute respiratory
. / 3 1 .mlcrogms m , a strong carre a tlonWith levels of S02 at 150
there was a strong correlation with
disease.
with S02 having a more immediate effect. The mortality for
respiratory disease showed a less consistent association with air
pollution. For 802 levels up to 75 microgms/m3
, no significant
response in mortality \vas seen. At 100 microgms/m3
\"ith mortality from chrordc bronchitis, emphysema,and asthma \\Tas
seen with both three and seven day moving averages. No significant
correlation existed for smoke.

'i l
I'"
103
Occupational and socioeconomic levels were not considered and no
mention was made of the ages of the population studied, the
proportion of males and females, and the total nw~er of people.
A reference was made to smoking in that it was thought to remain
constant in the total population over the short periods which
were studied.
Many of these mortality studies were faced with problems
in the collection of pollution data. The pollution data often
were collected at the time of the study and were related to
mortality from a preceding time. Also some diseases under study,
such as cancer, have a long latent period and comparisons bet':veen
these mortality rates and present pollution measurements may not
at all be appropriate.
One of the problems relating to any study of air pollution
involves controlling for other factors ,,,hich may be related to
the variables studied. These include meteorologic factors,
the presence of epidemics such as influenza at the time of the
study,and seasonal influences. Some of the studies presented
have taken these into account, others have not.
All of the studies reviewed above have found some relation
between an air pollutant and increased mortality. No conclusion
can be made as to which specific pollutant, if any, is responsible
for the increase in mortality. Furthermore, it is difficult,
based on available studies, to determine the specific causes
of death attributable to air pollution.
A summary of these mortality studies is presented in Table 9.

EPIDElvIIOLOGIC STUDIES ON THE EFFECTS OF S02 AND rARTICULATES ON HORTALITY
clean.1 ppm
"cleaner vs. dirtiest"communitydirty
Not Not .40 ppmstated stated
Source
UNITED STATESHills
1952
Population
30-75 yr andover'1:1 & F2 communitiesin Chicago
Nethod
Mortality
ParticulatesExposure
Smoke SO'") Other
160tons/mi2/mo
20tonsl
.2/ml. rna
Results
1) death rates forpneumonia higher irpolluted area
2) respiratory tractcancer death ratesamong males rise afull decadeearlier in pollutecareas
Ciocca1961
,..::;-
o';-""'i
follow-upof 4,092.residentssurveyedin 1948Donora,Penn.
1) personalinterview
2) mailedquestionnaire
3) mortality8 1/2 yrfol10\vingepisode
exposed to pollution episode in1948
1) person who reparteeacute illness attime or smog episochave had subsequenthigher mortalityand prevalence ofillness than otherpeople in thecommunity
2) persons with severEcomplaints in 1948demonstrated highcJmortality andmorbidity than tho~
with mild complainl.._-.--....__..._ ...--...__....."''''."......._._.~,"'_·-._.:"""~-,.~""""c~...~·""~7·'P.'7' ..;·~~""'~"""'".....4~""'""""r!:'". ,~'l, .......,,~"!iooO~, •
Win~el- Males andstein Females Age1967 SO and over
Death certificatedata 1959-1961Buffalo and ErieCount~j, N. Y •
4 levels
1<('. 80II 80 - 100III 100 - 135IV~ 1351Jg/m3 per24 hours
No.tstated
Notstated
Positive association betweenpollution level & total mort:l'ity in vlhite men and Homen agl
50 - 69.
Positive association found wichronic respiratory dise~se
mortality white men aged 50-6years. No association foundbetween pollution and cancer I
the bronchus, trachea or lung

urce Population Hethod ParticulatesExpo.sure
Smoke S02 Other Results
nkel- Males andein Females68
Death CertificateData 1959 - 1961Buffalo - ErieCounty
Oxides ofSulfur 3levelsI <0.30 mg/sq emII <0.30 .45 mg/sqem111>0.45 mg/sq.cmper 30 days
No association found betweensulfation & total mortalityor mortality from cancer of thebronchus, trachea & lung inwhite men 50 years and over.Positive association found between chronic respiratory diseasEmortality & sulfCition in thetwo lowest economic levels inwhite m~n 50 - 69 years.No synergistic effect w~s foundbetween sulfation rate andsuspended particulates
nkel-.c:.i~__ --...lL.
69
i.Jlo,....,
nlcel-ein69
198 Hhitemale prostatic cancercases Age 50and over
95 \·Jhi te:nale and 36>;·7hi t e f emal eStomachcancer casesage 50-69
Death CertificateData 1959 - 1961Buffalo - ErieCounty New York
Death CertificateData 1959 - 1961Buffalo - Erie'County New York
4 LevelsI < 80II 80-100III 100-135IV 135+lJg/m3 per24 hours
~. LevelsI <- 80II 80-100III 100-135IV 135+llg/m3 per24 hours
Notstated
Notstated
--
Notstated
Notstated
Suspended particulates positively associated with prostaticcancer in age 50 anJ over group.In age 50 - 69 years mortalityrate in the highest pollutionarea 2.7 times the rate in thelowest area. For the 70and over group 1.7 times.
Found positive associationbetween suspended particulatesand stomach cancer mortalitymen and women aged 50-69 yearsNortality rates t\,-,o tiTi1es higherin high pollution areas than lo~
pollution area. No associationfor ages 70+ over with suspendedparticulates and stomach cancermortality

Exposure
;ource Population Method Particulates Smoke S02 Other Result......s'-- _
!inkE.;l-,t:elD.
_971
:eid-)erg_967~ash-
!illE~
~ir
Jolltl
~ion
;tudy)
IU::C
224 Hhite menand 78 whitefem.ales age50 and overcirrhosis ofthe liver cases
32,067 malesand females\~~hite and non\vhi te mortalityall causesrespiratorymortalityused specifically in thestudy
Death certificateData 1959 - 1961Buffalo-ErieCounty, New York
Death certificateData 1949 - 1960
4 LevelsI <80II 80-100III 100-135IV 135+11 g 1m3J/et 24 hours
Notstated·
Notstated
SoilingIndexCORS per1,000 linearft.High': 1.1J:I'IOD 0.3511.099Low _< 0.350
Notstated
High>-.0.013 ppm
HOD 0.0060.012 ppmLow ~O.005
ppmper 24 hours
Found positive associationbetween suspended particulates& cirrhosis mortality in malesaged 50 & older, in a lowereconomic level. ELlS gradientincrease in m.ortality rate fro~
28/100,000 in lowest pollutionarea to 173/100,000 highestpollution area. The fcmales11/100,000 in lowest populatioIto 47/100,000 highest.
Dustfalltonsj Respiratory disease mortalitymi 2 /rna in high pollution area wasHigh ~ 12 significantly higher thanMOD 5.01- moderate pollution area,11.99 except for bronchics c.J.ncer.l::o~ ~5__ SO~ and soiling indc}: had theSulfation most direct relationship to(S03) mg/ mortality. The direct rela100 cm2 / tionship between total res-day piratory disease m.ortality andHigh ~.400S03 levels was found at ageMOD .151- 25-75 years .. 399Low -S..150

Sou:,:"ce P.opula tion Method Particulates
Exposure
Smoke S02 Other Results
Dustfalltons/sq.mi/mohigh~12
HOD 5.0111.99Low~ 5
Dustfalltons/sq.mi/mohigh:::121:-'1OD 5.0111.99Low:S:5
Zeidberg196 7
(~~ash-
villeairpollu-!: io:l.study)
<=:J-:
strc::n196 -~
as11-viL~"e
airpo l~_u
tiO:lstudy)
32,067 malesand females""hite andnom·;rhiteTilortalityall casesCardiovascularrr.ortalityspecifically usedin study
All deaths dueto malignantneoplasms
Death certificatedata 1949-1960
Death certificatedata 1949-1960
Not stated
Not stated
SoilingindexCaRS perl~OOO
linearft.High ~ 1.1MOD 0 .. 35"11.099Low::: 0.350
SoilingindexCOHS per1,000linearft. ".High z: 1.1HOD 0.3511.099Low~O. 350
Higb~O.013
ppmMOD 0.0060.012 ppmLow~O. 005ppmper 24 hours
High2: 0.013ppmMOD 0.006-
0.012 ppmLow~0.005
ppmper 24 hours
Statistically signific2ntinverse associa tion fOlmd between socia-economic class &total cardiovascular diseasemortality, hypertensive heartdisease & other myocardialdegeneration mortality.
S If ~' Significant relationship foundu aLlon b "1"" d(SO) / etween SOl lng In ex &
1003 mg mortality from total cardio-
Id vascular disease, hypertensivesq cm ay .h ' h 7 400heart dlsease & other myo-
19 _. d' 1 d "MOD :151- car:a egeneratlon .. 399 For tema:es.a regular patt:rn
L-( 150 of assoclatlon betvleen pol.Lu
ow - . " d 1" f 1tlon an marta lty or a 1
cardiovascular diseases wasfound.
Mortality for all cancershigher (p 0.05) in highpollution area than moderatepollution area for suspendedparticulates measured bysoiling index. Stomach cancermortality had significant
fdifferences by dust fall level.
SuI a tion F d d' 1" 1 "'oun lrect re~at~onS11p
(OS
003) mg/ between soiling index level &
1 I" f r
dmorta lty or cancer or
sq cm/ ay h & b'" "d•• h:;-O 400 esop agus, pros tate . .Lac erhlg.l.! -. . 1" "_ no conslstent re~atlonsnlp
MOD .1.)1- f d' ]. r"oun between morta .lty trom.399 all cancers & sulfation orLow:;'. 150 S02'

;ource
ioc.gson-970
;lasser.971
coG
aco'ts.972
Population
Hales andFemales
Male.s andfe.males
In 1968; 1,958deaths malesand ferea1es.In 1970; 1,718deaths Dalesand females.
(All causes.)Study specifically deals "\vi thcardiovasculardeaths
Nethod
Hortality DataNovember 1962Hay 1965Ne~v York City
Daily mortality1960-1964(April-Sept.omitted)New York City
1968-1970Death certifi-catesCharleston,South Carolina
Particulates
No specificvalues given
Not measured
196874.4-227.6llg/m3
196957.9-170.7llg/m3
197055.3-120.5~g/m3
ExposureSmoke
Notmeasured
Range<1.0 -
6.0COIlSdailymeans
Not measured
S02
No specificvalues given
Range <."0.10~.60 ppmdailymeans
Not measured
Other
Notmeasured
Notmeasured
Notmeasured
Results
Significant relationship foundfor ages 65 and over and 64 aneunder between respiratory &heart disease mortality andenvironmental variablesespecially particulate matter& temperature. Deaths fromother causes were not significantly related to pollutants.
Mortality increased withincreased level of S02. Adifference of 10-20 deathsper day found between the meannumber of daily deaths ondays with mean S02 levels of~O.20 ppm comparea to dayswith~O.40 ppm S02 levels
Population from industrialarea was at significantlyhigher risk of heart diseasedeath than total county in1968 but not 1970. Believedue to a reduction in airpollution 1968-19701968: p = O. 0011970: p = 0.23

Exposure
ResultsOtherS02SmokeParticulatesHethodPopulationSou:::.-ce._----'------~::..:...:..:..._--_:::....::::..::~:.=..::::..::.~~~:...--_---=----~~-~~~------
Sch:i.m::nel }lale and female1972 deaths for ten
mort:alityvariates
Death certificatedata for 19631968Ne-c'l York City2,192 days ofstudy
Not measured Daily dataJan.l, 1963December 31,1968mean 21.63COR unitsx10
Daily dataJan.l, 1963Dec. 31, 1968mean 17.25ppm. 100
Notmeasured
Estimated ave. daily excessmortality in range of 18.12J6.74?Intermcdiate estimate 2863. This equals about 10,000deaths a year.80% of excess mortality believed due to smoke shade & 20% toS02
197
0\o;-\
~'fa1e and femaledeaths allcauses
Daily mortality Not measureddata collected forNew York-Nc::':v Jer-sey area 1962-1966
Not measured Mean valuesyearly range228.91- 3297.09 Jlg/m
Seasonalran~
157.1363.2Jlg/m3Day of theHeek range217.6 395.1 Jlg/m3
Notmeasured
Found days with SO) levelsbelow 30f~b/mJ bad ;;orto.lity1.5% less than expected anddays~with S02 levels above 500lJg/m.) had mortality 2% greaterthan expected.
Hig~~;irlS
197..;.1'1ales and f emales. Studydeals specifically Hithcancer of therespiratorysystem
U.S.,England& TvJalesmortalitycompared.1940-1969
Not measured Decreased1959:z: 302
.Jlg/mto 196765 Jl g/m3
Not measured Notmeasured
Found respiratory cancermortality rates have leveledoff in United Kingdom whereasin U.S. rates have continuedto rise. This found eventhough cigarette smoking highein United Kingdom. Gre~ter
London area found to haveslightly greater decrease inlung cancer possibly attributeto the dramatic decrease insmoke pollution which hadoccurred in this area.

Sou--ce Population
Hender- 5841 male andson 1881 female1973 lung cancer
mortalityCClses Clnd
incidentcases from1972combined
c;-1
Hethod
. Lung cancermortality data1968-1970 &incidentcases 1972Los Angeles
Particulates
Hean value98.7
3llg/mRange allstations83.7 116.4l-lg/m3
Exposure
Smoke S02 Other
Not measured Not measured Polynucleararomatichydrocarbonsin suspendedparticularmattercomponents:BEP 0.44ng/m3
BAP 2. 24ng/mGEE 1.7ng/m3
COR 0.98ng/m3
all meanstationvalues
Results
Excess risk of lung cancerin south central Los Angelesmales believed . duc toan excess of carcinogenicair pollution

Sou;:~ce Population Method ParticulatesExposure
Smoke SOl")L
Other Results
2'for:cis197
116 male andfemale deathsSe'\vard. 137 maleand femaledeaths Ne'\vFlorence.
Hortality datasample populationtwo communitiesSe1;·mrd (s) andNevl Florence(N. F.) Pennsylvania 1960-72
(N. F.) 109ll-g/m3
(S) 151 mg/m3
values areaverages
Notmeasured
Notmeasured'
Dustfall(N.F.) 26 tonsmi 2/mo(S) 83 tons/mi2/moSulfation(N.F'1 0.6mg/SO IlOOcm2
per day(S) 3. 7mg/SO 3/l00cm2
per dayvalues givenare average
Males with 20+ years ofresidency in Seward hadabout one-tenth the exces:mortality of those smokinlmore than one pack ofcigarettes per day in NewFlorence ar..d one-fifth thEexcess mortality of moder~
smokers in New Florence.Data consistent with anadditive effect of smokin~
and pollution.
I~r.:l-
1976
r-1
M
1,046 respiratorydeaths'";vhite malesand females
Death certificates 1961Los Angeles
Deficient indata forsome areas90 - 120Km units x 10
Notmeasured
Range 4 25 pphm
Ozone17.5pphm
27.5Increase in mortalIty witlincrease in level of ozonENo association found betwES03 and mortality. Foundincrease in mortalityparallel to increasinglevels of suspended particulates, statisticallysignificant (p< 0.01).

Exposure
1) significantcorrelation betweensulphur dioxide clnddeath from bronchitis in men aRe 45and over; similarassociation noted i'wo~en in 2 of the 6sets of data
2) no significantassociation betweenaver<1ZC sulphurdioxide and numherof person/room andincome classification
3) association betweenbronchitis unci soliemacter not asconsistent as withS02
totalsolids
Not stated approx.5-40 mg50')/1,000
J
cm2 leadperoxidecandle
Not statednumber ofdeaths fromRegistrarGeneral;Annual Revie'\v1950-1952
countyboroughsof Englandand Hales
1'1 & F
-:,'-1
C~ .
2 I1C
FOREIGNSO"LTCe Po p..ulation Method Particulates Smoke SO? Other Results
STuDIES45-64 yr65+ yr
Goldberg1954
""!""'I, ..,. •
r' e:T,D erL:on
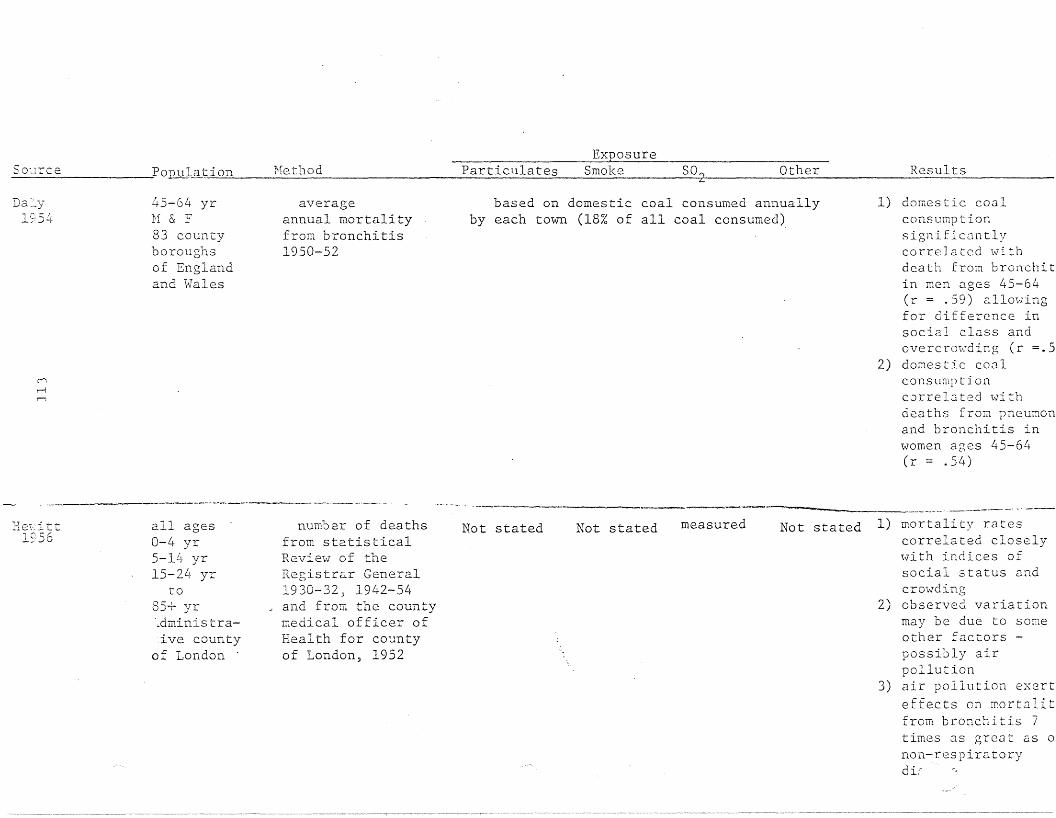
SO'cIrceExposure
PoJ2J!J-ation Hethod Particulates Smoke S02 Other Results
Da:'..y1954
("'i
,....-i
r-;
45-64 yrH & F83 countyboroughsor Englandand l>lales
averageannual mortalityfrom bronchitis1950-52
based on domestic coal consumed annuallyby each town (18% of all coal consumed>
-- .->--_._----_._--~---
1) domestic coalconsumptionsignificantlycorreIa ted \.;ri thdeath from bronchitin men ages 45-64(r = .59) allowingfor difference insocial class andovercrowding (r =.5
2) domestic cO.:1lconsumptioncorre 13 ted \..;'i thdeaths from pneumonand bronchitis inwomen ages 45-64(r = .54)
---~-- ----_.__ . -' -,--He'i:itt
1956all ages0-4 yr5-1Lr yr15-2~> yr
to
85+ yr,dminis traive county
of London .
number of deathsfrom statisticalRevie\v of theRegistrar General1930-32, 1942-54
J and from the countymedical officer ofHealth for countyof London, 1952
Not stated Not stated measured Not stated 1) mortality ratescorrelated closely\vith indices ofsocial status andcrOl,vding
2) observed variationmay be due to someother factors possibly airpollution
3) air pollution exerteffects on mortalitfrom bronchitis 7times as great as 0
non-respiratorydi:
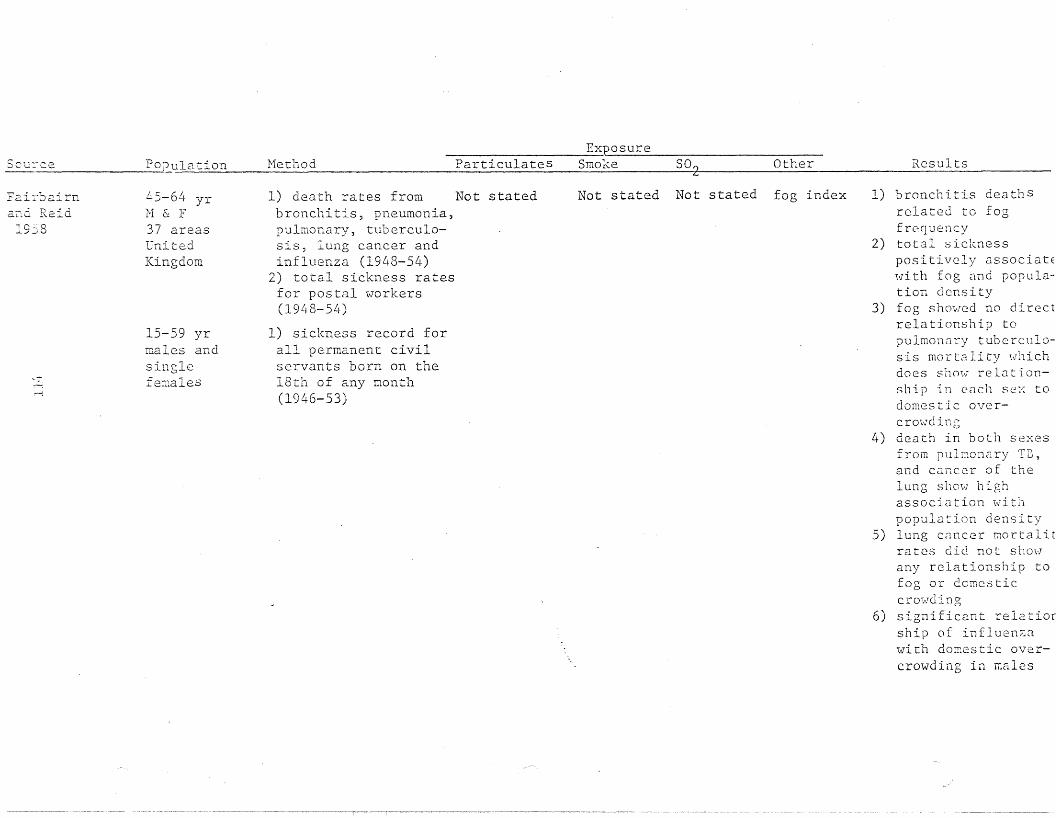
Sou~ce Population Nethod ParticulatesExposure
Smoke SO~ Other Results
Fai:cbairn... ...... ~ ~
and. KelG19j8
..~-:
45-64 yr1'1 & :F37 areasUnitedKingdom
15-59 yrma18s andsinglefe:r~a1es
1) death rates from Not statedbronchitis, pneumonia,pulmonary, tub8rculo-sis, lung cancer andinfluenza (1948-54)
2) total sickness ratesfor postal workers(1948-54)
1) sickness record forall permanent civilservants born on the18th of any month(1946-53)
Not stated Not stated fog index 1) bronchitis deathSrelated to fogfrequency
2) total sicknesspositively associatEwith fog and population density
3) fog showed no directrelationship topulmonClry tuberculosis mortality whichdoes show relationship in each se:-: todomestic overcrmvdin.:-"o
4) death in both sexesfrom pulmonary T13,and cancer of thelung show highassociation withpopulation density
5) lung cancer mortalitrates did not showany relationship tofog or domesticcrm'lding
6) significant relatiorship of influen~a
with domestic overcrowding in lliales
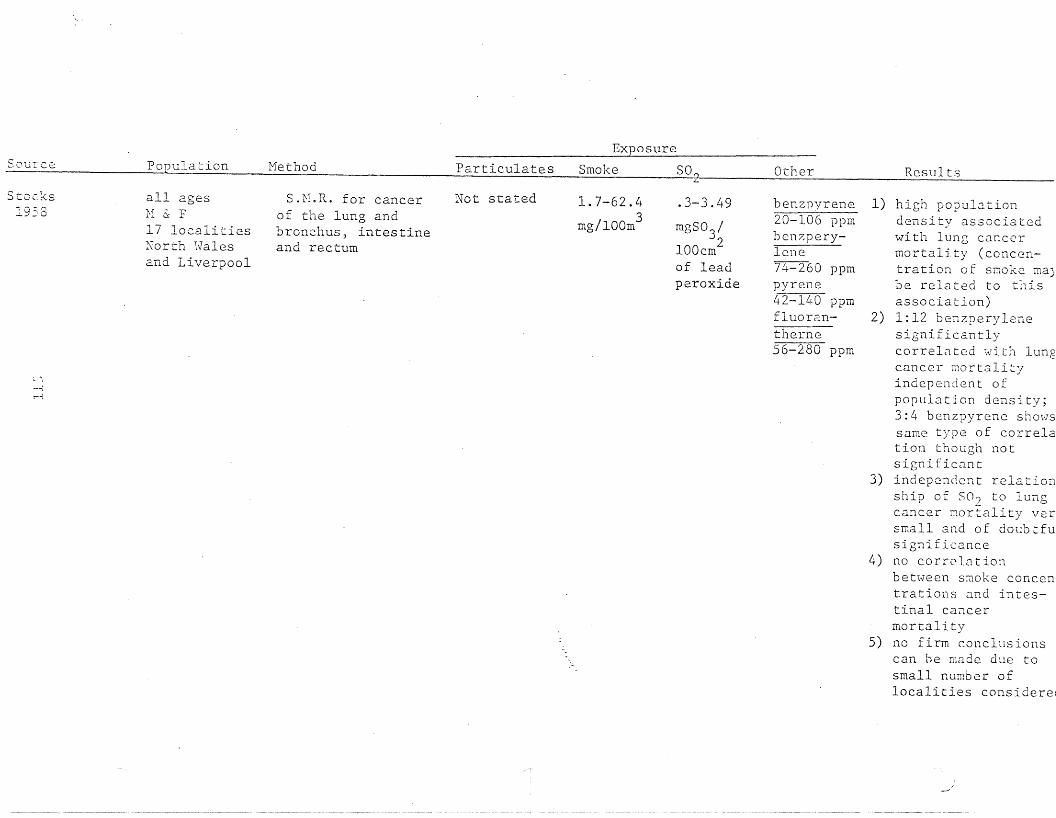
Exposure
Source Population Method Particulates Smoke SO? Other Results
Stoc:Zs1958
~ ""i
-'-j
!""""-l
all agesH & F17 localitiesNorth \\1alesand Liverpool
S.M.R. for cancerof the lung andbronchus, intestineand rectum
Not stated 1.7-62.43
mg/lOOm
.3-3.49
mgS03
/2
lOOcmof leadperoxide
benzpyrene20-106 ppmben?:perylcne74-260 ppmpyrene42-140 ppmfluoran-ti.1ern-;56-280 ppm
1) high populationdensity associatedwith lung cancermortality (concentration of smoke rna)be related to thisassociation)
2) 1:12 benzperylenesignificantlycorrelated with lungcancer wortalityindependent ofpopulation density;3:4 benzpyrene showssame type of correIation though notsignificant
3) independent relationship of SO? to lungcancer mortality versmall and of doubtfusignificance
4) no corrc1.<1tionbetween smoke concentrations and intestinal cancermortality
5) no firm c.onclusionscan he made due tosmall number oflocalities cons ide rei

ExposureSour2e Population Method Particulates Smoke SOn Other Results
--- 7
Stoc\:s1959
\.I:.
all ages1-1 & F1) countyboroughs
Englandand Hales
2) administrativeareas ofLancashireand \\TestRiding ofYorkshire
3) all urbanareas ofLancashire
deaths from cancer Not statedof the lung (1950-54)and deaths from cancerof stomach, intestinewith rectum and breastand from bronchitis(1950-53)
8-44mg/100
2cm
Not stated deposit96-731
2g/lOOm /mo
1) bronchitis and lungcancer mortality waspositively correlatewith deposit andsmoke
2) breast cancer showsnegative correlationwith pollution
3) stomach cancersignificantlyrelated to smoke anddeposit
1) bronchitis mortalitysignificantlycorreIa ted "vi thdeposit but notsmoke. Lung cancercorrelated '::Jithsmoke but notdeposit
2) stomach-cancermortalitysi~nifican~ly
related to smoke anddeposit only infemales
3) breast cancer showsno association withpollution
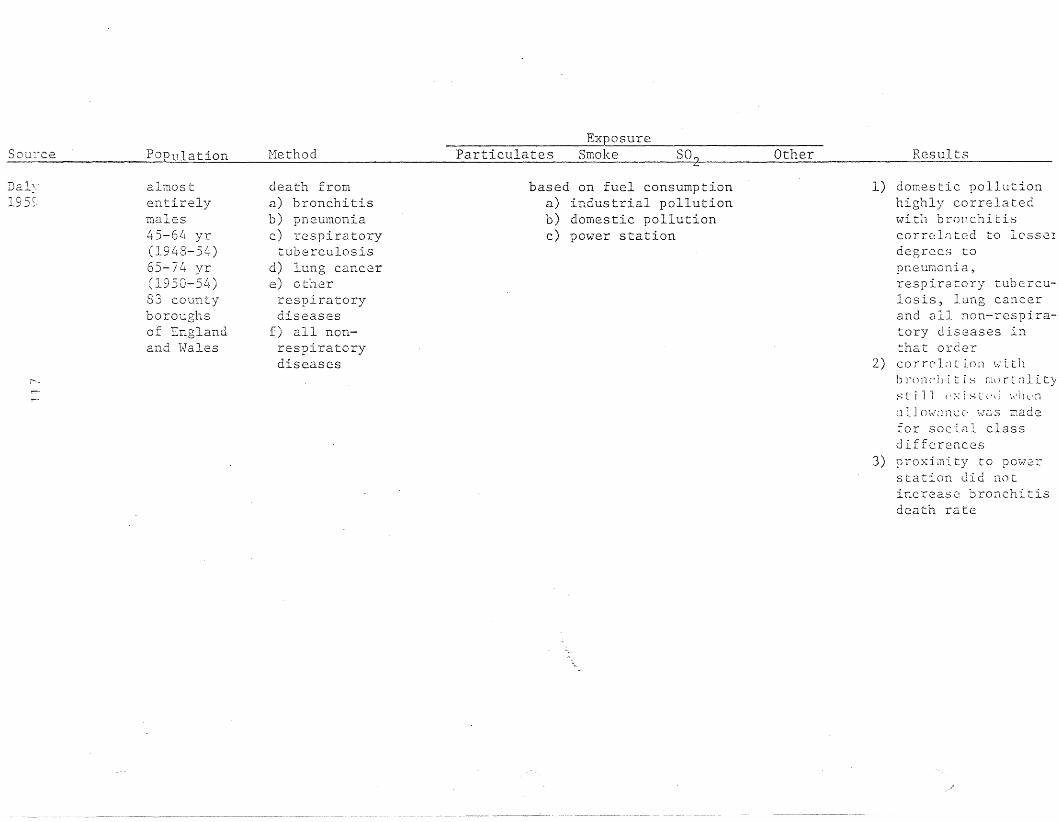
SourceExposure
POPulation Method Particulates Smoke SO~ Other Results
Daly19S~,
/"',,-
almostentirelymales45-64 yr(1948-54)65-74 yr(1950-54)83 countyboroughsof Englandand Hales
death froma) bronchitisb) pneumoniac) respiratorytuberculosis
d) lung cancere) otherrespiratorydiseases
f) all non-respiratorydiseases
based on fuel consumptiona) industrial pollutionb) domestic pollutionc) power station
1) domestic pollutionhighly correlatedwith bronchitiscorrelnted to lesse!degrees topneuT;1onia,respiratory tuberculosis, lung cancerand all non-respiratory diseases inthat order
2) cor r (' L 1 L i () n \.,;' Lt 11brOrlC']l it i:-; murl~lity
s !: ill ('x i s t (,tl h'11 l' n
a 11o,,\rZlncc' \,\TOS Dadefor social classdifferences
3) proximity to powerstation did notincrease: bronchitisdeath rate

SmokeExposure
SO~lrc2 PODulation tvIethod 'Particulat e Q----- so?
.....Other Results
S t,.Jcl-:s
1960
0:'
r-l
all ages1-1 & F53 countyboroughs74 administrative areasin Lancashireand HestRiding ofYorkshire
mortality fromcancers of thelung, stomach,intestine and thebreast
Not stated measuredrange15-562 2mg/lGGOm
Notstated
polycyclichydrocarbontraceelements
1) lung cancer mortaland' bronchitiscorrelated \-lithsmoke density
2) pneumonia in malesstronp,ly correlate,\-lith smoke density
3) cancers of thestomach and intestine are relatedsignificantly withsmoke LI1 lllc count:boroughts in Q~les
4) in fcm~les, cancerof the breast andother organs showno association \V'it1smoke
5) for lung C8.ncer anibronchitis 3:4benzopyrene is thesubstance of primeimportance but isapparently not imptant in pneumonia

ExposureSour ~e Pop_ul:at~Qn Method Particula te s Smoke 802 Other Resul ts
1960
v·
Llyr2:. 4S yrLondon,Eo.stAnglia( control)
1) weekly mortalityfrom broncllitis,pneumonia andheart disease
2) daily metero1ogicalreadings1947-1954Vlinters
~.25 mg/m3
Not stated3
.25-.40 mg/m3;7.4 mg/m
weekly fOE_ ~~de~
averageof meandailyconcentra-tionL .10 ppm.10-.15 ppm>.15 ppm
1) mortality increasedwith decreasingtemper<J.ture andincreasing humidity
2) among pollutionfactors, S02 showedhighest correlationswith mortality. SO?more closely associ a ted \vi tIlrespiratory Dortalit:than \,ri th heClrtdisease mort~lity
3) trends suggest thatincrease in mortalit:associated with fogoccur only when fogis accompanied byvery low temperature(belmv 36°F)

SOl.:rce
F'eT:"htJ ertonIS,61
C'-J
PopulD.tion
1) populationo f Shef f i e.1 d ,England30 stationsin Sheffield,England
2) 90 men "7i thchronicbronchitis
3) male workingclass
Hethod
1) lung cancermortality(ILN 162-163)Bronchitismortality(ILN 500-502)
2) diary3) number of menwith new attacksof bronchitisfrom certificatesof incapacity
not stated
ExposureSmoke
meanwinterrange9-88mg/lOOm3
S02
measuredin pphmno numbersgiven
Other Results
not stated 1) bronchitis and lun~
cancer are morecommon in morepolluted parts ofthe city
2) rise in number ofmen with bronchiti~
who became more ilJ'vi th rise inpollution
3) number of new attacof bronchLtis in\\Torking male population increased withperiods of highpollution

Sou::-ce Population Method ParticulatesExposure
Smoke so..., Other Results
n,ur:l andP e:n') erton
1953
-{
'""-l
men45-64 yr5 wards inSalforddefined bypollution
1) bronchitismorbiditydetermined byl1inis try ofNational Insurancecertificates for2 years
2) mortalitya) bronchitis
(lCD: 500-502)b) lung cancer
(lCD: 162-163)c) arterio
sclerotic heartdisease (lCD: 420)d) cerebrovascularaccidents (lCD:330-334)e) all causes1956-1959
Not stated dailywinteraverage45-77 3mg/lOOm
daily winter Notaverage stated6-25 pphm
1) bronchitis ratestended to be higherin more pollutedarea
2) excess number ofdeaths from !fallcauses ll
, bronchitisand lung cancer alsfound in highpollution area

Exposure
ouree Population Method Particulates Smoke S02 Other Resll1.ts ---------
toc1~s
966
('.:;
C'-..
:-fale and femalelung cancer andbronchitisdeaths
i'iale lungcancer deathrat:es
Hale and femalebronchitis,lung and stomach cancerdeaths age25-75+
I. Mortality datacollected andsurvey of airpollution andsmoking made inrour citiesData collectedalso from otherstudiesEngland andWales
II. Death rates19 countries1958 - 1959
III. 1921 - 1946Death rates compared bet~veen
urban areas andsurroundingregions. Englandand Wales
Not measured
Not measured
Not measured
7 areasRange 51312 mg!1000 m32 differentmethods ofmeasurementencompassthis rangeSomemeasuredby weightothers byreflection ....
Notmeasured
Notmeasured
Notmeasured
Notmeasured
Notmeasured
7 areas- --3,4 Benz012.:yren]3-48 J-lg!lOOO ill
1,12B8nzperylene5-45 pg/lOOOm3Arsenic EerylliumNolybdenum(Trace elements)
Solid fuelconsumptionRange239-4;} 212(yrs. 19511952) 232-4,129(yr. 1955)mean annual kgper head
Not measured
Correlation found betweeIlung cancer mortalityand total smoke, 3,4benzopyrene, 1,12benzperylcne & elements(arsenic, beryllium,molybdenum) for malesand females
Partial coefficents foun~
for bot solid fuel consumptic~ and cigarettesmoking. with mortaliryindeper·dently.
After differences made irsocial class and otherfactors an urban excessof lung cancer existedand was attributed to airpollution.

;OU"I: c.e Population Hethod Particulates
Exposure
Smoke SO 2 Other ReS"ults
;~oclcs
_96 7Lung cancerdeaths males age35-44 and 55-64bronchitis deathsage 55-64
Death rates 1960 1961 20 countries(repeat of studynoted in sectionII above)
Not measured Notmeasured
Notmeasured
Solid fuel----consumptionRange 1384129 kg/capita1955 - 1958
Found significant correIation betHeen mortality frclung cancer in males 55-6years and solid fuelconsumption 6 years beforThe coefficient whencigarette consumptionheld constant was +0.446.Lung cancer death rates imales aged 35-44 moreclosely related tocigarette c.onsumption thasolid fuel consumption.
i.s~ley
-96~~Nr-i
:1ale andfemale deathsfrom lung cancerand bronchitis
Hortality data1958 - 19 63~ 8lj·major urban areasof England andWales
Not measured Range 23261~g!m3Median124 llg!m3
Range33-227
3lJg!mMedianl24 1lg/m3
Not measured Significant correlationbetween smoke and S02and bronchitis. A ndtsignificant negativecorrelation Has foundbetween smoke and SO? witlung cancer. £~excess ofbronc.hitis with a deficielcy in lung cancer wasfound in mining and texti:to\VllS compared to otherregions. This believeddue to a protection inferlby inhalation of dust.

-urce Population Hethod Particulates
Exposure
Smoke SO 2 Other Results
van]75
,-"
t3.ll.S,u2
71
~-lale and Female deathscardiovascularand respiratorydise.ase
l';ot stated
Death certificates1970-1973Dublin, Ireland
Mortality dataNov. 1962 - Oct.1967 Osaka, Japan
Not measured
<.49 mg/m3).50 mg/m3
Notmeasured
Notmeasured
1970 - 1973Daily me~n
150 1Jg/mincrease.1970 - 1973in sg - 100llg!m level
<.09 ppm)-.10 ppm
Not measured
Not measured
Mortality for cardiovascular significantlycorrelated with S02 atincreasing thresholdlevels withr = 0.821 at 150 ~g/m3.SO; appears to have animmediate rather than la Eeffect on cardiovascular~o~t~l~tL' _
Strong correlation of SOrat 100 llg/m3 with acute ~respiratory mortality aneat 150 llg/m3 \-li th chronicbronchitis, emphysema aueasthma mortality.
Excess deaths found incity vs suburban area.These appear to resultfrom increased pollutionon cold days.Mortality found moreaffected by SO? than suspended particulates. S02level of'> O.lpprn deemedunhealthy.

;ourc:.e Population Hethod ParticulatesExposure
Smoke S02 Other Results
_ebo\,,"i tz_973
N
Hinter averagenumber dailydeaths 123 +11.7 surr:meraverage numberdaily deaths107.7 + 6.5
Death certificatedata April 1966 toMarch 1969Tokyo, Japanstimulus-responsestudy
Range30 (+ 11.6) 41.1-(+ 13.9)flg/m3 SUll1J.uer-winterrange
Notmeasured
Range Not measured4.4 (± 0.9)5.7 (± 1.3)pphmSummer-winterrange
Air pollutants havecontributed to increase,mortality independent 0
temperature. Correlatio'coefficents between exc,mortality (response) aniabnormal environmentevents (stimuli) are hi:in winter (r = 0.65)lower in surnrner(r = .48'and considered high fortotal period (r = .57)

126
2. Morbidity Studies
A summary of the morhidity studies revie.vled in this section
is presented in Table 10.
Morbidity studies are usually preferred over mortality
studies since they are more representative of the effects
of a factor acting on a population. However, presently
there is no single method of measuring respiratory morbidity
shmm to be very effec tive. In fact, evidence of an
association of relatively low pollution levels with respiratory
tract infections, for example, is only slightly better than
that provided by mortality data.
A number of different methods have been used to measure
the effects of air pollution. These include questionnaires
(such as the HRC) , daily diary report~ng, absence from work
or school, hospitalization rates, clinic visits, and lung
function tests. In addition, the populations studied have
varied from well individuals to panels or groups of
bronchitis and asthma patients.
Each type of study has problems that may possibly be
obscuring the time associations bet\veen air pollution and
morbidity. Even within each basic type of study, different
definitions, methods or instruments preclude any easy
comparison of results. As with air pollution confounding
variables, such as meteorologic condition~ could have a
greater effect on morbidity than on mortality. Such variables
need careful consideration in these studies. However, this
has not been done in the majority of studies. Even among
those studies that do consider meteorologic conditions,
often only temperature is used. Complete meteorologic
data would greatly clarify the associations between air
pollution and morbidity found by epidemiologic studies.
Norbidity studies in relation to air pollution have been
concerned primarily \vith respiratory illnesses such as chronic
bronchitis, ernphysema,and asthma. However, many authors,
rather than looking at specific disease entities, included

respiratory symptoms such as increased cough, sptum production
or dyspnea. This can obviate problems of comparability of
diagnoses and inclusivei1ess \,dthin such diagnoses.
Goldsmith pointed out that non-disease effects should
also be considered in epidemiologic studies (Goldsmith, 1969).
These effects included sensory irritation, odor and reactions
to odor, central nervous system reactions, psychomotor test
performance, temporal discrimination, biochemical changes,
and hematocrit changes.
Prindle compared tHO neighboring communities in Hest
central Pennsylvania with widely differing air pollution
levels utilizing a questionnaire, lung function test~ and
x-rays (Prindle, 1963). A greater proportion of males in
the more polluted community (Seward) had pneumoconiosis as
revealed by the x-rays. There were more males with emphysema
in the less polluted community of New Florence. One possible
interpretation is that selective migration had occurred
bet\veen the tmvns (Anderson, 1964).
In a preliminary report on the prevalence of chronic
respiratory disease in Berlin, Ne\v Hampshire in 1961, Ferris
and Anderson demonstrated that cigarette smoking and aging
were the major determinants of chronic respiratory disease
(Ferris and Anderson, 1962). An approximate tHo-fold
increase in the prevalence in each disease category in non
smoking men in the most polluted area did suggest an effect
by air pollution, but the difference was not statistically
significant. The possible influences of ethnic, economic,
and social differences could not be determined.
A later paper by Anderson suggested that the occurrence
of selective migration may explain these results (Anderson, 1964).
This was based on a review of residence 10 years prior to the
study of a subsample of the diseased persons, and on the
prevalence of respiratory disease in females Hho had never
smoked. The results indicated that disease persons did move
but concurrent migration of well people was not considered.
12r>
Ferris and Anderson suggested that this failure to
demonstrate any significant association between air pollution
and rosp I'U e .Ill, I;' have been due to the low levels
of air pollution exposure or to the similarity of exposure
actually experienced in contrast to that measured (Ferris and
Anderson, 1964). In order to determine the health effects of
pollution, they chose to compare the health status of people
in Berlin, New Hampshire to people living in Chilliwack,
Bri t:L~;}l a with practically no air pollution.
Methods used to survey the residents of Chilliwack were
comparable to those used in Berlin. Hore respiratory symptoms
and lowered lung function were observed in Berlin. The
decreased pulmonary function in Berlin could not be explained
entirely by increased cigarette smoking. The findings seem
to point to possible air pollution effects, but the authors
suggested that ethnic differences or other variables might
also explain this difference.
In r :'3,000 households in Nashville, Tennessee,
morbidity was' must consistently related to soiling index and
2L~ hour levels £or individuals 55 year or older in the
middle socioeconomic class (Zeidberg, 1964). Morbidity
rates tended to be higher in females. This might possibly
have been due to the fact that the adult female was usually
the respondent and she might have reported more illness for
herself than for other members of the household. Observations
showed that employed females experienced less morbidity than
housekeeping females. Several speculations are offered to
explain this difference, but further data are needed such as
the specific occupational exposure. Problems which have
been pointed out in a previous review include the absence of
cigarette-smoking information, the lack of a relationship
of air pollution to respiratory illnes~ and the broad definition
of the middle clas$. It has also been emphasized that Nashville
experie:(:h~:tt.·.:1: 1:S of pollution during the study
period.

129
Fairbairn and Reid collected sickness absence data on
outdoor postmen and indoor clerical and executive staff (males
and single females) during 1946-53 (Fairbairn and Reid, 1958).
Absences due to bronchitis and pneumonia \Vere associated ~vith
fog, but the association \Vas barely significant. Total sickness
rates for postmen, grouped according to their place of work
from 1948-54, showed significant associations with both fog
and population density.
Marked and consistent differences in respiratory illness
absences lasting more than seven days were noted among women
employees of the Radio Corporation of America in eight different
cities during 1955, 195h and 1958 (Dohan, 1960, 1961). The
incidence of respiratory disease was significantly correlated
with mean suspended particulate sulfate concentrations (r = 0.964)
w·ithin the· city in \vhich the \,millen \<lorked. An association
between sulfate concentrations and bronchitis and influenza,
but not pneumonia \vas noted \'1hen the data ,,,ere evaluated by
types of respiratory disease. Interestingly, in the year of
a major influenza epidemic, the areas with the higher sulfate
concentrations had greater increases in respiratory illness
absence rates. The four areas experiencing the highest illness
absence rates had mean annual suspended sulfate concentration
of 13.2 - 19.8 microgms/m3
. Sulfate data were only available
for one other city (7.4 microgms/m3
) which experienced lower
illness absences. Although total suspended particulates were
generally unrelated to respiratory illness, the cities \<lith
the t\VO highest illness absence rates also had the highest
concentrations of particulates (173 and 188 microgms/m3).
The mean concentrations of nickel and vanadium (for 4 cities
in \<lhich measurements were made) were found to be greater with
higher rates of respiratory illness. Apparently age distribution,
number of children in the household, local \veather and clima te,
or occupational exposure do not account for the 5-fold intercity
variation in incidence of respiratory disease. Mean annual
sulfate concentrations, however, were based on but 21-25
determinr-ttions in L1 of the S cities for \vhLch data \Vere

available which is a shortcoming of the study 0ir Qual. Stat.
Emm. Cont., 1975). HO\'lever, the ob~)ervecl correlation of 0.964
\\1<1S unusually high and strongly suggested an effect of suspended sulLn
A similar relationship was noted among employees at a
Radio Corporation plant in Camden, New Jersey and a publishing company
in Philadelphia, using visits to company dispensaries as an
index of respiratory disease (Respiratory Disease Incidence
Index), over a period of 15 months (Dohan, 1962). Weekly
mean suspended particulate sulfate concentrations ranged from
12.7 - 36 microgms/m3
. The author suggested that several
years of observation are needed to determine if there \.vas a
temporal relationship bet\veen fluctuation in incidence of
respiratory disease and fluctuations in air pollutants.
Records of absences of 4 to 182 days attributed to
bronchitis were used as an index of morbidity among nearby
60,000 London Transport employees during the years 1952-56.
The occurrence of prolonged fogs was ~ssociated with an
increase in sickness absence due to bronchitis. The lmver
morbidity in the county divisions tended to support the
hypothesis of pollution as a factor in bronchitis. Some
20-25 percent of the overall sickness absence rate could be
ascribed to air pollution according to a comparison of overall
absences with those for a southern county division considered
relatively pollution free due to prevailing winds. No
measurements of pollution were made, hGHever (Corn\val1, 1961 ).
One hundred and fifty patients with chronic obstructive
pulmonary disease were examined daily for 21 weeks (Spicer,
1962). Sputum analysis and lung function tests \vere included
in the daily visit. Patients all became better or worse
together, suggesting that some environmental factor was the
cause. However, no consistent relationship between the
patients' condition and atmospheric pollutants could be
established.
In Cincinnati, a city with air pollution well controlled,
Carey studied cardiorespiratory " cr ipples" by means of diary

.., q 0._l j-,_
sheets and various lung function tests (Carey, 1958). The
preliminary results revealed a prolonged fall in carbon monoxide
uptake about 5 days following a peak in air pollution. Six
of the ten patients also shmved an increase in symptoms 5 days
after the first peak of smoke in their house. The number of
patients studied was too small to draw any definite conclusions.
Becker reproted on an episode from November 23 to 25, 1966
on the eastern seaboard, with increased level of smoke and
S02 (Becker, 1968). The subjects studied were workers at
an insurance company in metropolitan New York City between
the ages of 16 and 64. The subjects were divided into two
groups: those without and those with prior respiratory disease,
on the basis of employee physicals given to all employees at
various intervals.. A further subdivision was also made between
smokers and nonsmokers.
During the episode period, a questionnaire was used to
collect data on symptomatology. The response to symptoms
such as cough, sputum production, eye irritatio~ and general
",. discomfort increased \>lith increases in pollution levels.
Eye irritation was the single most common complaint. Persons
with a previous history of respiratory diaase were significantly
more affected by increased pollution than the normal participants.
No statistically significant differences in symptom
response \vere observed bet\"een smokers and nonsmokers. Those
smoking less than 10 or more than 20 cigarettes per day were
found to have significantly greater symtom response compared
to those smoking 10-20 cigarettes per day.
Heimann studied the November 1966 air stagnation period
in the Boston metropolitan area and a period of less stagnation
in October of the same year (Heimann, 1970). Data were
collected on general population mortality, mortality and
morbidity in nursing home residents, condition of neonates
born to mothers pregnant during the episode, morbidity of a
group of patients with chronic nonspecific respiratory disease,
and data on the number of emergency room visits for heart
disease and respiratory dise3se. Of the five different

measurements of health listed above, only one group shO~vecl
adverse effects due to air pollution, This \Vas in the group
of patients having chronic nonspecific respiratory disease.
In this group the number of visits to the clinic rose during
the time interval after the air pollution episode and was
especially incre.ased in those living in the heaviest areas of
pollution.
The levels of air pollution reached during the episode
were not exceedingly high. The highest level for suspended
particulates during the study was 222 microgms!m3
and for
S02' 12 - 40 ppm.
Cohen studied the presence of symptoms (eye irritation,
throat irritation, cough, shortness of breath, chest pain
or burning in the chest) during publicized and unpublicized
air pollution episodes (Cohen, 1976). One hundred families
from each of three cOTInuunities with different pollution
levels were interviewed by telephone. No significant difference
'vas found in the incidence of symptoms bet"\veen publicized and
unpublici7,ed episodes. Significant increases in eye and
throat irritation, chest discomfor~ and shortness of breath
were noted in adults during the high pollution periods.
It was concluded that S02 levels above 0.11 ppm and
suspended particulate levels above 145 mirogms!m3
for a
number of days could significantly increase irritative
symptoms.
Holland reviewed pulmonary function, sputum production)
and respiratory disease symptoms in male post office employees
in Central London and three peripheral tOHns (Holland, 1965a).
The over age 50 group in London had more respiratory symptoms,
produced more sputu~ and had significantly lower lung function
test results. Corrections were made for smoking differences.
Socioeconomic factoYs were presumed to be the same in the
study areas. Occupational exposures were homogeneous. No
quantitative air pollution measurements were presented, but
it was concluded Lhat the differences in respiratory morbidity

133
between the areas were related to differences in air pollution.
Holland also published a study on the prevalence of
respiratory disease in iJOst office workers in London compared
with telephone company drivers in the u.s. (Holland, 1965b).
A downward gradient was noticed in the prevalence of
persistent cough and phlegm, and persistent cough and phlegm and
chest illness from London to surrounding country areas to the
U.S. The differences were most striking in the age group
50-59. In London, the results of the pulmonary function
test (FEVI
. O) were lowest, with the higest value in the U.S.
The differences between the countries were attributed
to the higher levels of pollution in England, although no
quantitative measurements of air pollution were given. It
'vas noted, however, that suspended particulates and smoke
were at higher levels in London and the country to\VllS than
in the U.S. Examination of smoking habits revealed that this
factor alone could not account for the differences.
Petrill reported the results of studies conducted in
Genoa, Italy (Petrill, 1966), The frequency of respiratory
disease symtoms were assessed by use of a modified British
}ledical Research Council questionnaire. Females age 65 and
over who 'vere nonsmokers and nonfactory workers were studied
as 'veIl as an indigent population receiving free medical care.
Air pollution \Vas monitored on a large scale in Genoa for
10 years. For these studies, air pollution data from 1954-1964
were used and indices of morbidity calculated for 1961 and 1962.
The mean temperature 'vas some\vhat lmver in the more polluted
area.
A significant correlation was found between bronchitis
and the mean annual S02 levels (r = 0.98). A nonsignificant
correlation was found with suspended particulates (r = 0.82)
and dustfall (r 0.66) .
In Rotterdam, Netherlands a study of male muncipal employees
was conduced in 1966 (Biersteker, 1969). Information on
13 L,
bronchitis symptoms was gathered through a questionnaire and
peak expiratory flow rates were determined.
One hllndred and eighty-one of 1,000 employees interviewed
had chronic morning cough. The peak expit-atory rates of males
reporting symptoms were significantly different from the
control group without symptoms. A significant difference
was also found in the number of heavy smokers between those
with bronchitis symptoms and the control group.
Exposure to air pollution \vas measured by the number of
years of residency in Rotterdam, the number of years in a
non-urban area, and the postal districts in 1Vhich the subject
resided. No differences were found between the bronchitis
symptom group and the control group with respect to these
variables. The authors concluded that the tool to measure
the effect of air pollution may have been inadequate.
HcCarroll published results of a study on the daily
illness records of 1,090 \vell adults over the ages of 15 in
New York City (McCarroll, 1965, 1967). The daily illness
records were obtained by weekly interviews. The average
length of participation for each person was 48 weeks.
The population studied was from a restricted geographic
area in Ne\v York City and was a mixture of "Hhi te, black, and
Puerto Ricans. Their housing ranged from middle income private
homes to tenement slums.
THO main symptoms \Vere assessed, cough and eye irritation.
The population was analyzed in three groups, heavy smokers,
moderate smokers, and nonsmokers. 802 and particulate density
were used as indications of pollution. The data Here analyzed
by time-series analysis and the results were plotted in
corregrams. 802 had an immediate effect in producing eye
symptoms and a delayed effect in the production of cough.
It was concluded that 802 was not the sale cause of cough
and eye irritation, but was a contributing factor. Particulate
density appeared to mak~ no contribution to eye symptoms but
did contribute to cough.

l\vo other studies helve used clato collected from the same
New York population. Cassel attempted to clarify interrelationships
between various errvironmental factors (Cassell, 1969). Seven
meteorologic factors were considered along with particulate
1. 1 '
matter, hydrocarbons, cq and 5°2
, Using principle component
analysis, five factors \Vere derived. These factors shmved
the relationships among environmental variables and those
bet\Veen the environmental variables and reported symptoms.
The difficulties in demonstrating a one to one relationship
bet\Veen an environmental factor and health were apparent.
Thompson using stepwise regression, attempted to relate
the incidence and prevalence rates of the "common cold" to
environmental variables such as 5°2
, CO, particulate matter,
temperature, humidity, \Vind velocity, barometric pressure, and
solar radiation (Thompson, 1970). Results sho\ved that metero10gic
variables appeared to be related more to common cold rates than
did the pollutant variables.
Fletcher found a decrease in sputum production in a group
of men followed between 1961-1966 (Fletcher, 1968). This
decline was thought to be related to a decrease in particulate
pollution in central London.
Using a random sample of white females in Buffalo, New
York, Winkelstein studied the relationship between air pollution,
respiratory symptornatolog~ and a history of bronchitis
(Winkelstein, 1969). On repeat interviews to evaluate the
reproducibility of anwers, it was found that questions relating
to the persistence of cough and the history of bronchitis
had low reproducibili ty. These charac teristics '\\Tere, therefore,
excluded from the analysis. Air pollution data were collected
from 21 sample stations. Isopleths were constructed showing
four areas of differing concentrations of suspended particulates
and three areas of varying S02 levels.
A nonsignificant positive association was found between
cough with phelgm production and sllspended particulates in
nonsmokers age 45 and over. No association was found with
oxides of sulfur,

j';'
136
\\Then re.sic1cnti8l mobility of the. populcltion ,vas conside.red,
it was found that smoke.rs with stable residential histories
had a positive association between suspended particulates
and cough Hith phlegm. Those having recently moved had an
inverse relationship.
It is noted that the division of the area into four levels
of graded ambient air quality \-Jas arbitrary and that a classi
fication using the average values at each sampling site might
have better delineated any real associations. Furthermore,
the method of measuring S02 (lead peroxide candle) \vas rather
crude and the range of values was narrow. The areas of high
and low sulfation together accounted for only 39 percent of
the total study population.
Using the British Medical Research Council questionnaire,
a postal survey study of the prevalence of respiratory
symptoms in England was conducted on a large sample of the
population (Lambert, 1970). Although the sampling \vas .not
completely representative, the bias was considered to be
minimal.
Only 30 percent of the sample lived in areas convered by
the National Air Pollution Survey and even in these areas
S02 measurements \Vere not completely reported. All but 12
percent of the area had data on coal consumption. No
reference was made to the monitoring devices used to measure
the pollutants.
An increase in respiratory symptoms ,"ith aging and
cigarette consumption \Vas ound. Urban/rural gradients could
not be explained by smoking differences alone. The results
shmved that increased cough and phlegm production in early
adult life resulted from cigarette smoking. The cumulative
effect of long time exposure to air pollution resulted in
more serious bronchitic: disease among the elderly.
It \-Jas found that air pollution exposure without prior
cigarette smoking produced only a slight increase in chronic
bronchitis in the over 55 age group. Occupational exposore
to vario us poll utan t s \vas no t cons iderecl.
In 1971, results uer(: published of a follcl\v-up study of
data collected in 1961 in Berliu, Nc'iv l[ampshirc~ (Ferris, 1971).
The reason for follow-up was to ascertain whether changes in
respiratory disease prevalence had occurred and if these
were related to changes in air pollution levels.
A new random sample of the population was used in addition
to the original sample. Data were collected through interviews
and pulmonary function tests.
Due to the closing of some factories and stricter controls,
pollution values were slightly less in 1966-67 than in 1961.
The least change was noted for dustfall.
The results, after controlling for smoking, age, and sex,
sho\ved slightly lower levels of respiratory disease prevalence
in 1967 than 1961. The forced vital capacity (EVC) in both
men and women was significantly greater in 1967 than 1961.
The forced expiratory volume in one second (FEVl
) had a less
consistent pattern and the peak expiratory flo,v rate was
slightly greater in 1967 than 1961. The failure of the FEVItest to sho,v a consistent pattern similar to the FVC made the
data from the FVC measurements less meaningful.
The small differences in disease prevalence noted from
1961 to 1967 \vcre not felt to be due to observer differences
between studies, the increased use of filter tip cigarettes
or to normal random variations. It was concluded that the
decrease in air pollution resulted in the changes.
In a later paper, Ferris noted that because of changes
in smoking habits, the same kind of individuals were not
being compared at both time periods (Ferris, 1973). An
examination of those ,~1ho had not changed their smoking habits
over the study period, however, revealed again a slight decrease
in respiratory symptoms.
A further follow-up study was published in 1976 dealing
with the 1967 sample population. This group was felt to
represent the healthier portion of the population (Ferris, 1976).

,,>
From 1967 to 1973 there was an increase in sulfation rate
and a decrease in the concentration of particulates, these
values being close to the Federal Primary Standard. In 1973-74
the mass respirable fraction made up 43 percent by weight
of the total amount of suspended particulates. No data were
available on particle size distribution in Berlin in the past.
No differences were found in respiratory disease prevalence
or in the respiratory symptoms themselves when they were reviewed
individually or in clusters between 1967 and 1973. It was
concluded that the changes in levels of air pollution (1967-1973)
had no associated beneficial effect on health and that present
federal standards for S02 and particulates 'vere adequate to
protect public health.
Reichel conducted a survey of respiratory symptoms in
three areas of West Germany, Duisburg, Bocholt, and Borken
(Reichel, 1971). Dusisberg is a center for steel production
and coal mining, Bocholt and Borken are rural areas.
No differences were found among the three areas in the
prevalence of cough, sputum production or in lung function
,,,hen the groups ,,,ere standardized for age, sex, smoking, and
social status. It appeared that possible occupational
differences were not considered.
The 802 levels in the three areas ranged between 0.03 and
0.3 ppm 'vith suspended particulates ranging from 0.01 to 0.39 ppm.
The prevalence of respira tory symptoms \Vas ascertained
by self administered questionnaires from 36,374 residents from
seven areas with different pollution levels in Osaka, Japan
(Tsunentoshi, 1971).
The prevalence of chronic bronchitis was found to be
greater with the increasing levels of pollution. Based on
these data, an increase of 2 percent would be expected in the
prevalence of chronic bronchitis with an increase of the2
observed S02 of Img/lOOcm /day. 802 levels under 1.0 mg/day
were found to have no effect on prevalence rates.

A random sample of men and \vornen selected from both a
rural unpolluted and n. polluted tmvn \'13S studied by
questIonnaire, lung function tests, intracutaneous allergy
tests, sputum productio~ and chest x-ray (VanderLende, 1973).
No data were provided on the number of people involved in
the study or on the levels of pollutants. In addition,
, .meterologic factors were not considered.
The prevalence of persistent phlegm was higher in the
polluted area than the rural area although no such disparity
was evident for dyspnea. For those aged 15-39 an association
between sm6king and dyspnea was found in the polluted area.
No significant relationship \vas found between smoking or
pollution and FEV results.
The relationship of chronic respiratory symptoms and
residence-associated air pollution were evaluated in a study
of 4,377 male twins age 41-51 from the U.S.A. (Bruber, 1973).
The advantages of twins in such a study include their similar
characteristics, such as age and sex an~ for many, their
genetic equivalence.
Information on smoking, alcohol consumptio~ and socio
economic status was obtained by a mailed questionnaire. Air
pollution exposure was measured by residence histories and
by estimates based on emission and meterologic parameters.
These estimates \vere obtained for 802' particulates and co. No
significant differences \Vere found for respiratory symptoms
bet\veen members of pairs \\lhen one t\,lin lived in a more urban
area than the other, or if one twin was exposed to higher
measurements of air pollution. These comparisons were based
on the twin pair having comparable smoking habits.
Neri conducted a study in two cities in Canada with
different levels of air pollution. Sudbury, Ontario with a
large nickel and copper smelter plant ",hich emits considerably
more S02 than the comparison city of Ottawa (Neri, 1975). Data
on respiratory symptoms were collected by a questionnaire and
meaSllrcments of forced vital capacity (rVC) and forced expiratory
volume in one second (FEV1
. O) were made.

For both males and femals a significant difference was
found between FEVI/J"VC ratios, Hith Sudbury having lmvBr mean
ratios than at ten,]':l. A higher prevalence of chronic bronchitis
,vas found in Sudbury than Ottmva (97/1000 vs 77/1000) for both
sexes combined. Males accounted for the greater share of the
difference. No significant interaction was detected between
air pollution and smoking.
A similar study impairing a polluted and unpolluted town
was conducted in Hungary (Racaveanu, 1975).
A questionnaire was used to collect data on respiratory
disease symptoms. Pulmonary function tests were also performed
but the results of these were apparently not ready for
publication. Subjects exposed to dusts, gases, or other
irritating vapors were excluded from the study.
No values were given for levels of air pollution. The
two cities were similar in climate, urbanizatio~ and living
conditions.
The prevalence of respiratory symptoms was found to be
about t"10 times higher in the polluted vs. the control town.
Cough and sputum production was higher in both to\ms 'l;vith
higher proportions smoking. For these symptoms as well as
wheezing and intercurrent chest diseases, smoking 'l;vas a major
risk faction; the risk for these symptoms being 3.5 - 6 times
highers in smokers than non-smokers.
Grade III dsypnea 'l;vas found to be almost three times more
frequent in the polluted vs. control to\ms (p <:0.001) for both
smokers and non-smokers and appeared to be more related to
air pollution. It appeared that smoking ~nd pollution had a
synergistic effect.
In a study of the health effects of air pollution, Sterling
used hospital data from the Blue Cross Association of Los
Angeles (Sterling, 1966). All hospitals included in the study
had at least 100 beds and Here less than five miles from a
pollution sampling station.
Four main disease categories \verp assembled to classify
admissions: highly relevant diseases (allergic disorders,
inflammatory diseases of the eye, acute upper respiratory
infections, influenza,and bronchitis), relevant diseases
(diseases of the heart, rheumatic fever, vascular diseases,
and other diseases of the respiratory system), total relevant
diseases (all of the above), and irrelevant diseases (all
other diseases).
Suspended particulates, S02' CO2 , oxidant precursers,
oxides of nitroge~ and ozone were measured.
A significant correlation was found bet\veen daily pollutant
levels and admission rates for diseases grouped as highly
relevant. Relevant diseases had fe\ver significant correlations
with the most signficant correlation being with S02' \Vhen S02
was considered by itself, it was found that the number of
admissions on days with high levels was greater than lower
level days. For specific diseases the highest correlations
were found for infectious diseases, acute upper respiratory
infections, and bronchitis. Significant correlations were
found between the length of hospitalization with highly
relevant diseases, heart and central nervous system diseases
and SOZ' NO Z' total oxides of nitrogen, and particulate matter.
Since the day of the week was related to hospital admissions
independent of other factors and since length of hospitalization
was effected by the day of the week appropriate adjustments
were made to the data. However, no consideration was given to
seasonal fluctuations in hospitalization or pollution levels.
A study conducted by the British Ministry of Social Insurance
used illness related absenteeism to assess the effects of
pollution on health (}linistry of Pensions, 1965). Incapacity to
work due to bronchitis was found significantly correlated with
smoke and SOZ" The winter average concentrations ranged from
between 100 and 200 microgms/m3
to about 400 microgms/m3
.
Also of interest in this study was that incapacity from
arthritis and rheumatism was greater in the areas with heavy
smoke pollution.
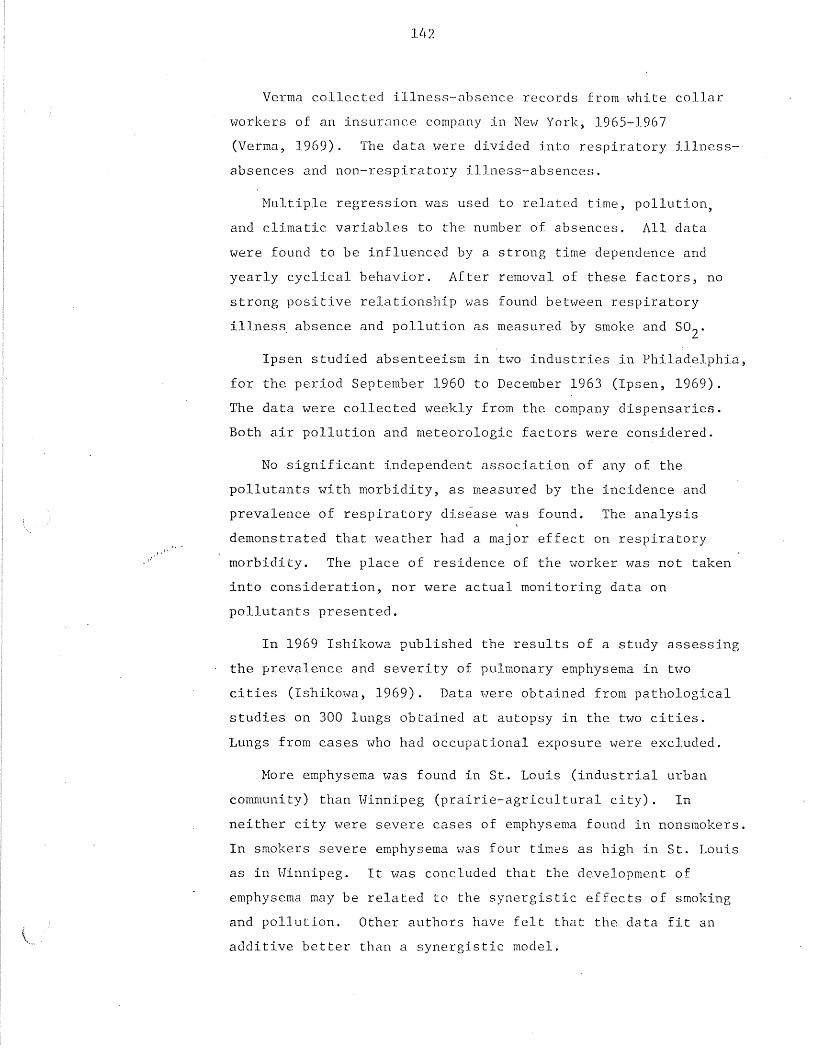
)."
Verma collected illness-absence records from white collar
workers of an insurance company in New York, 1965-1967
(Verma, 1969). The data were divided into respiratory illness
absences and non-respiratory illness-absences.
Multiple regression was used to related time, pollution,
and climatic variables to the number of absences. All data
were found to be influenced by a strong time dependence and
yearly cyclical behavior. After removal of these factors, no
strong positive relationship was found between respiratory
illnes~ absence and pollution as measured by smoke and S02.
Ipsen studied absenteeism in two industries in Phila~elphia,
for the period September 1960 to December 1963 (Ipsen, 1969).
The data were collected weekly from the company dispensaries.
Both air pollution and meteorologic factors \Vere considered.
No significant independent association of any of the
pollutants with morbidity, as measured by the incidence and
prevalence of respiratory dis~ase was found. The analysis
demonstrated that \veather had a major effect on respiratory
morbidity. The place of residence of the worker was not taken
into consideration, nor were actual monitoring data on
pollutants presented.
In 1969 Ishikmva published the resul ts of a study assessing
the prevalence and severity of pulmonary emphysema in two
cities (Ishikowa, 1969). Data \Vere obtained from pathological
studies on 300 lungs obtained at autopsy in the two cities.
Lungs from cases who had occupational exposure were excluded.
More emphysema was found in St. Louis (industrial urban
community) than Hinnipeg (prairie-agricultural city). In
neither city were severe cases of emphysema found in nonsmokers.
In smokers severe emphysema was four times as high in St. Louis
as in Winnipeg. It was concluded that the development of
emphysema may be related to the synergistic effects of smoking
and pollution. Other authors have felt that the data fit an
additive better than a synergistic model.

143
Some studies used a population already affected with
respiratory diseases to assess air pollution effects. Angel
in London studied respiratory symptoms in 85 men, tIle majority
with some evidence of chronic bronchitis (Angel, 1965). The
85 were selected from a group of 1,000 men aged 30-59 who were
factory and office workers. These men were seen by a physician
at least once every three weeks from Octobe~ 1962 to May, 1963.
Air pollution) temperature and humidity data were collected.
The smoke and 802 data were obtained from 12 sites. However,
exact methods of monitoring these measurements were not
presented in the paper.
Smoke appeared more strongly associated \vith the prevalence
of respiratory illness than either 802 or temperature. Smoke
and S02 were equally strongly associated with the attack rate
of respiratory illness.
In another study in Chicago, 115 patients with the
emphysema-bronchitis syndrome completed daily diary forms
on the severity of cough, sputum production and dyspnea
(Burrows, 1968). Marked seasonal fluctuations in the severity
of symptoms \vere found. No significant correlation was found
bet\veen air pollution measured by CO, S02' N02
nitrous oxide
and hydrocarbons and the severity of symptoms. Even with
these findings, the author does not deny that prolonged
exposure to pollutants may aggravate or induce chronic
bronchitis.
Carno~ using cardiopulmonary patients who recorded their
daily health status, studied the dose-effect relationship
between 802 and morbidity from respiratory disease in Chicago
(Carnow, 1969). Each patient was classified into one of seven
levels of exposure to 802' For those aged 55 years and older
with Grade 3 or 4 bronchitis, the rate of acute illness with
exposure to 0.25 ppm 802 was 50 percent greater than the rate
at levels of 0.04 ppm or less. The differences in illness
rates were even greater when illness occurring the day after
exposure was considered. Those under age 55 did not have
constantly greater illness rate with increasing S02"

Using patients as their own controls, significantly
higher levels of S02 were found on the days preceding the
illness than days preceding no illness. It was concluded that
exposure to high levels of S02 was associated with the
occurrence of acute respiratory illness in elder chronic
bronchopulmonary disease patients.
In England, Gregory surveyed exacerbations of disease in
340 cases of chronic bronchitis in male employees at a
Sheffield steel works (Gregory, 1970). Data were collected
through sickness absence records. Smoke, S02' relative
humidit~ and temperature were measured.
Analysis of the data by monthly averages revealed a
positive correlation bet\veen smoke and S02 with monthly
illness rates. A negative correlation was found with
temperature. The correlations with air pollution were assumed
to be influenced by a dependence on temperatures \vhich appeared
to be the dominant factor.
A separate analysis was made of weekly averages of
temperatures in the winter of 1957-1958. Temperature was
found to correlated inversely with the prevalence rate of
illness in the following wee~ and maximum and mean smoke
pollution correlated with the incidence rate of the succeeding
week. Both for monthly and weekly calculations temperature
was associated with the prevalence rate. These low
temperature correlations were considered to reflect the delay
in returning to work of those already absent because of illnes.
Smoke pollution was concluded to be a causative factor in
exacerbations of bronchitis.
Lawther in London, observed daily changes in the conditon
of bronchitis patients and pollution levels (Lawther, 1970):
Data were collected through diaries completed by the patients.
His paper presented results from a number of studies conducted
in this manner. Studies carried out in 1955-1958 showed a
correlation between pollution episodes and illness.
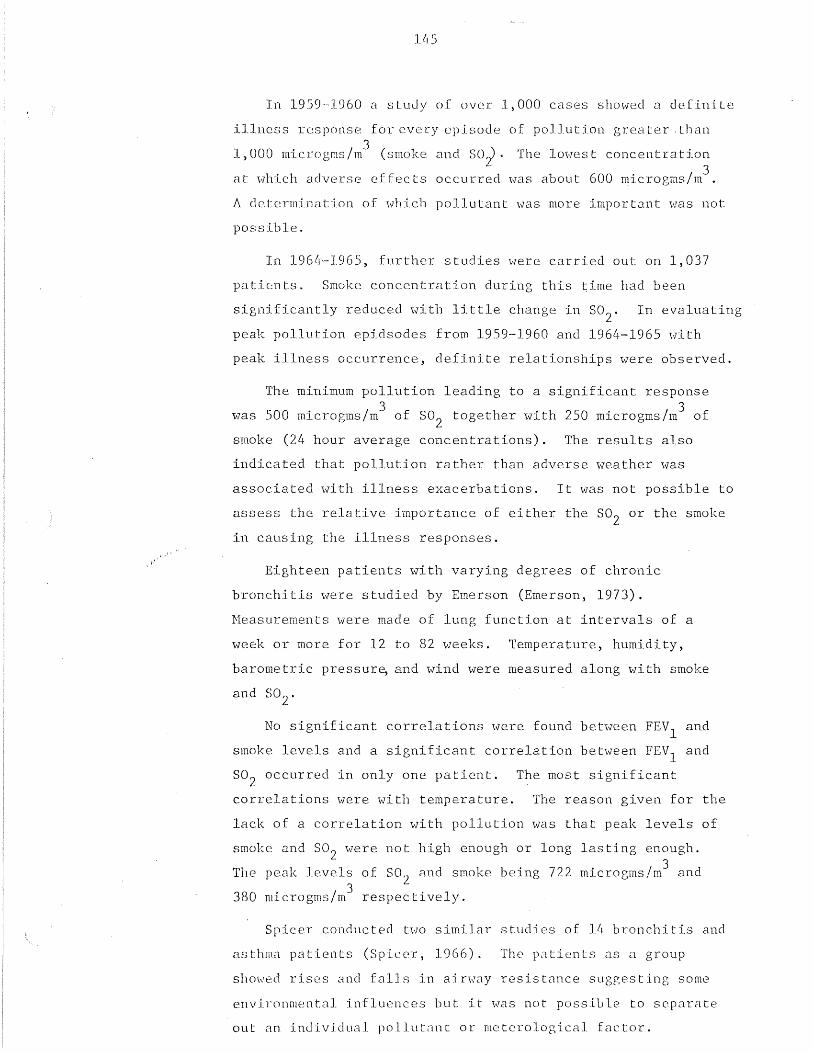
In 1959-1960 a study of over 1,000 cases showed a definite
illlle~)s response for eveLy episode of pollution greater .than
1,000 microgms/m3
(sIl101(e and SOt· The 10Hest concentration
at which adverse effects occurred Has about 600 microgms/m3
.
A determination of which pollutant was more important was not
possible.
In 1964-1965, further studies were carried out on 1,037
patients. Smoke concentration during this time had been
significantly reduced with little change in S02. In evaluating
peak pollution epidsodes from 1959-1960 and 1964-1965 with
peak illness occurrence, definite relationships were observed.
The minimum pollution leading to a significant response
was 500 microgms/m3
of S02 together \vith 250 microgms/m3
of
smoke (24 hour average concentrations). The results also
indicated that pollution rather than adverse weather was
associated with illness exacerbations. It was not possible to
assess the relative importance of either the S02 or the smoke
in causing the illness responses.
Eighteen patients with varying degrees of chronic
bronchitis were studied by Emerson (Emerson, 1973).
Measurements were made of lung function at intervals of a
week or more for 12 to 82 weeks. Temperature, humidity,
barometric pressur~ and wind were measured along with smoke
No significant correlations \vere found between FEVI
and
smoke levels and a significant correlation between FEV1
and
S02 occurred in only one patient. The most significant
correlations were with temperature. The reason given for the
lack of a correlation \·lith pollution \>las that peak levels of
smoke and S02 were not high enough or long lasting enough.
The peak levels of S02 and smoke being 722 microgms/m3
and
380 ' / 3 . 1nllcrogms m respectlve y.
Spicer conducted two similar studies of 14 bronchitis and
asthma patients (Spicer, 1966). The patients as a group
shO\\1ed rises and fC111s in ain'Jay resistC1nce suggesting some
environmental influences but it \-las not possible to separate
out an inJividual pollutant or meterological factor.

A further study in 1970 on healthy subjects revealed little
correlation of respiratory function and air pollution
(Spicer, 1970). Subjects \-lith a history of asthma had
significantly higher ainvay resistance levels even though
asymptomatic at the time of the study.
Howard studied 178 patients (158 men and 20 women) with
obstructive airway disease in Sheffield, England (Howard, 1974).
Using questionnaire and pulmonary measurements for FEV. 0.75
and FVC, a compariosn was made with similar patients from an
earlier study. The present group had less productive cough,
fewer winter illnesses, less severe dyspnea,and only one-third
the rate of decrease in FEV. The findings were attributed to
decreases in pollution levels which supposedly occurred between
the study periods.
A study by Kalpazanov observed the effects of air pollution
on the influenza epidemic 1974-1975 in Sofia, Bulgaria
(Kalpazanov, 1976). S02 levels on the day of illness and the
day before illness \vere found to be significantly correlated
'vith the number of influenza cases. The range of S02 observed3
was .798 - .913 mg/m. Nitric oxides, oxidant~ and formaldehyde
'were also shmVD to have an effect on the number of cases.
The author made note of the fact that these data were valid
only for the city of Sofia or other cities 'vith similar climate,
geographic and social conditions.
Another respiratory disease \Vhich has been the focus of
air pollution studies is bronchial asthma. This is a disease
characterized by attacks of marked hyperconstriction of the
bronchioles resulting in a \~eezing and gasping for breath.
As \vith other respiratory disease, it is difficult to provide
a clearcut definition of the disorder.
Many factors have been implicated as causes for bronchial
asthma, particularly a wide variety of allergens. Meteorologic
factors such as rapid decline in temperature have also been
associated \vith promoting attacks. Among children emotional
factors are thought to be of importance (Zeidburg, 1961).

1. 1 '',,1-
With so many variables, it becomes difficult to establish
adequate controls. Possibly due to this problem, investigators
have often used "panels" of asthmatic patients for study,
relying on the patients' reporting of ast~natic attacks.
HO'l,vever, a great deal of error is introduced by this means.
Each individual's definLi.on of an "as thma tic at tack" varies
to some degree according to the amount of 'I,vheezing or discomfort
they are accustomed to. Hhen using self reporting by patients,
errors inherent in subjective evaluation cannot be avoided.
In a study of 49 adults and 35 children with bronchial
asthma in Nashville, Tennessee, Zeidberg used a self-reporting
technique to determine \vhen asthmatic attacks \V'ere occ.urring
(Zeidberg, 1961) .. He found that of all the meteorologic
factors measured - temperature, humidity, barometric pressure,
and \vind veloci ty - only wind velocity sho\ved any relationship
\1ith the attack rate. Wind velocity was inversely related to
attack rates, as would be expected if air pollutant were related
to asthmatic attacks. Sulfation levels were directly related
to attack rates in adults but not in children. "men attack
rates on days 'l;vi th high and 10\'7 S02 levels \·7ere compared,
there were significant differences between them.
To determine \~lether asthmatic attacks were related to
air pollution levels, a group of 157 patients with bronchial
asthma was requested to mail reports of the onset of every
attack experienced from September 3 to December 9, 1956, to
their physician (Schoettlin, 1961). These reports \Vere mailed
weekly by 137 patients. Low positive correlations \Vere found
bet\veen oxidant levels and the number of persons having attacks.
'Then oxidant levels \Vere high enough to cause eye irri tation
(25 ppm), significantly greater number of persons had attacks.
Temperature, relative humiditY,and water vapor pressure also
showed low correlations with the number of attacks occ.urring.
Severe outbreaks of asthma have occurred in New Orleans.
From studies of the outbreaks occurring in 1955 and 1958,
Lewis indicated th3t these outbreaks were associated with point
sources of air pollution C"!eill, 1966). The point source
implicated was spontaneous underground buring in city dumps.
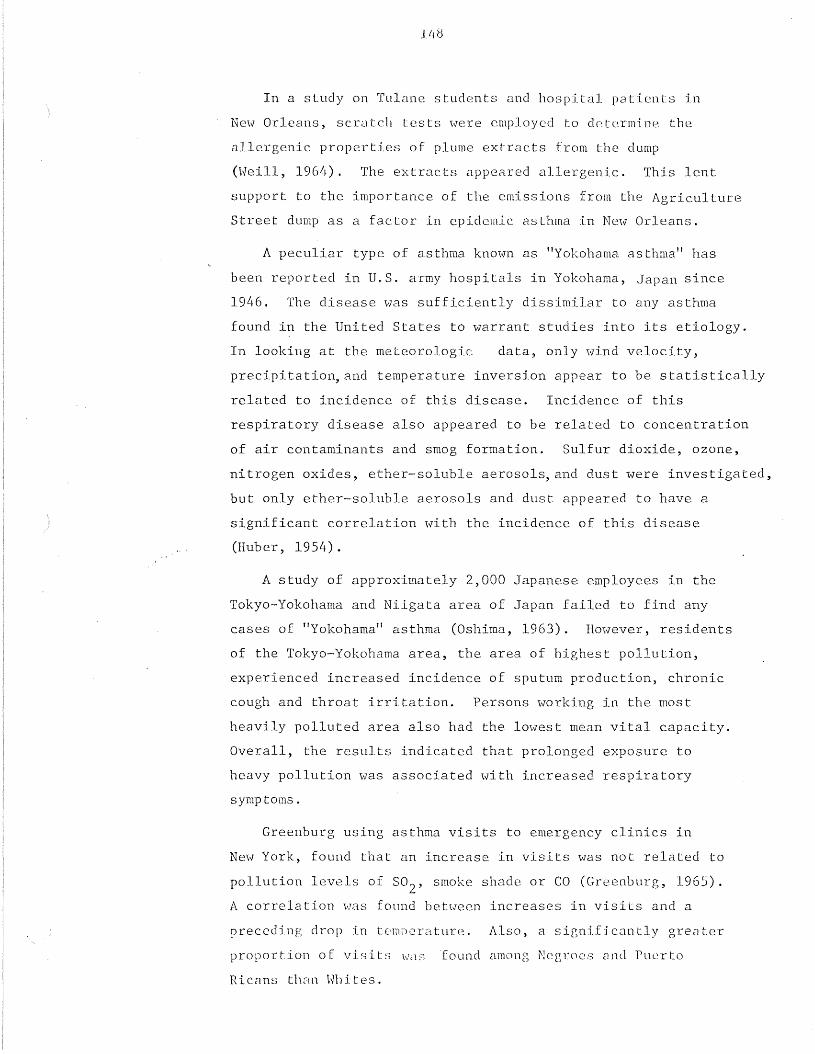
In a study on Tulane students and hospital patients in
New Orleans, scr~tcll tests were employed to determine the
allergenic properties of plume extracts from the dump
(Weill, 1964). The extracts appeared allergenic. This lent
support to the importance of the emissions from the Agriculture
Street dump as a factor in epidemic asthma in New Orleans.
A peculiar type of asthma known as "Yokohama asthma" has
been reported in U.S. army hospitals in Yokohama, Japan since
1946. The disease \vas sufficiently dissimilar to any asthma
found in the United States to warrant studies into its etiology.
In looking at the meteorologic data, only wind velocity,
precipitation,and temperature inversion appear to be statistically
related to incidence of this disease. Incidence of this
respiratory disease also appeared to be related to concentration
of air contaminants and smog formation. Sulfur dioxide, ozone,
nitrogen oxides, ether-soluble aerosols,and dust were investigated,
but only ether-soluble aerosols and dust appeared to have a
significant correlation with the incidence of this disease
(Huber, 1954).
A study of approximately 2,000 Japanese employees in the
Tokyo-Yokohama and Niigata area of Japan failed to find any
cases of "Yokohama" asthma (Oshima, 1963). Hmvever, residents
of the Tokyo-Yokohama area, the area of highest pollution,
experienced increased incidence of sputum production, chronic
cough and throat irritation. Persons working in the most
heavily polluted area also had the lowest mean vital capacity.
Overall, the results indicated that prolonged exposure to
heavy pollution was associated with increased respiratory
symptoms.
Greenburg using asthma visits to emergency clinics in
New York, found that an increase in visits was not related to
pollution levels of 802' smoke shade or co (Greenburg, 1965).
A correlation \.,ras found bett,yTeen increases in visits and a
9receding drop in temperature. Also, a significantly greater
proportion of visits was found among Negroes anJ Puerto
Ric C1 n s t h [m t~h i t e s .

Brmvn s tudiecl 3]/-{ persons vvith allergic rhini ti asthma
or both in an effort to measure the severity of symptoms in
relation to pollution (Brown, 1968). Mesurernents \Vere made
of S02' particulates and smoke. Meteorologic measurements
were also collected. The air pollutants were found to have
no significant effect on the severity of symptoms. A trend,
however, was noted for patients with non-ragweed allergic
rhinitis to have increased symptoms with more particulate
matter in the air.
Smoke measurements were obtained and an index of acute
asthma was provided by visits to the emergency room of a
Brisbane hospital (Derrick, 1970). Asthmatics in Brisbane
showed a characteristic seasonal pattern of attacks. No
significant association was found between smoke density and
the number of weekly hospital visits. It was concluded that
pollution measured by smoke did not contribute to seasonal
or short term increases in asthma attacks. The levels of
smoke observed in Brisbane were lower than those related to
smog illness episodes.
Variation in frequency and severity of attack was observed
in relation to air pollutants in a study of 84 cases of
b~onchial asthma (Landan, 1971). The subjects recorded daily
the time and place of any attacks and any medications used.
Heteorologic as well as pollution data were collected.
The most important variable of association was found to
be "day from beginning of study", a variable obviously composed
of a number of factors and of little predictive value \",ithout
delineation of the contributory components. The next most
important variable 'vas the level of S02' No specific levels
of S02 were reported in the study. The author concluded that
the study suffered from a lack of pollen measurements.
Another problem noted was that some asthmatics had no attacks
at all during the study.

150
Cohen evaluated air pollution from a coal-fueled power
plant and its relation to the frequency of asthma episodes
in 20 patients (Cohen, 1972). Questionnaires were administered
and daily reports on attacks Here kept by the subjects.
Suspended particulates, SO~ and soiling index were measured.
Significant correlations were found between asthmatic
attack rates and temperature (I' = 0.422), S02 (I' = 0.32), and
soiling index (r = 0.387). Significant differences in attack
rates were found between high and low pollution days and high
and low temperature, humidity and windspeed days .
After the effects of temperature \vere removed, significant
correlations remained between pollution levels and attack rates.
A single pollutant could not be singled out as the prime cause
of the asthma attacks. The levels of pollution involved \Vere
levels frequently found in large cities.
Sixty-eight colleges and universities reported on the number
of cases of spontaneous pneumathorax found and the type of
heating fuel used on the campus (~Iarienfeld, 1974). A
significant association was found between oil and coal fueled
power plants and the incidence of spontaneous pne~mathor in
college students.
The mechanism beyond the association may involve the
absorption of acids on carbon particulates which are inhaled
and result in chemical cauterization of the pulmonary epithelium.
Since no measurements \Vere taken of the amount of air pollution
around the universities, the relationship was based solely on
the type of fuel used. Also, the incidence of spontaneous
pneumothorax was found to be more than twice as high in
metropolitan colleges and universities than in such institutions
in non-metropolitan areas.
A number of epidemiologic studies dealing with air
pollution and health effects have been published under the
acronym of CHESS (Community Health and Environmental
Surveillance Systems), This is a national program of studies,
the purpose of which is to evaluate existing pollution standards.

15J
Studies \vC'rc conducted in Los Angels, Salt Lake Bnsin,
~;t Louis, Nc\v York/Nc\v Jersey, Chat tanooga, and Birmingham/
Charlotte "lyeas. The follen.ling studies are all part of this
program. House, in a Salt Lake Basin study observed the effect
of 802 and suspended sulfate on the prevalence of chronic
respiratory disease symptoms. The four communities studied
\,7(, re near a large copper sruel tel', \vi th the closes t community
5 miles f:rom the smelter and the farthest 38 miles. Data' 'vere
collected by a self administered questionnaire on respiratory
symptoms.
A significant increase in the prevalence of chronic
bronchitis was found in,smokers and non-smokers after an
exposure of 4 to 7 years to eleva ted levels of 802 of 92-·95
microgms/mJ
and suspended sulfates of 15 microgms/m3
, this
being accompanied by low levels of suspended particulates
(53 to 70 microgms/m3). The effects of smoking and air
polllition appeared to be additive. Occupational exposure to
various pollutants was found to be a strong determinant of
illness after age 40, having twice the effect of pollution
and over half the effect of cigarettes. Hayes selected
five communities in the Rocky Nountain Area, three 'vith smelters
and two without a smelter and no major air pollution sources.
Data \vere collected by self-administered questionnaires.
Those with occupational exposure to pollutants were excluded
from the study.
Results showed that the smelter-exposed communities had
a significantly greater prevalence of chronic bronchitis than
non-exposed communities. Prevalence rates were 2.4 to 2.8
tinles greClter in non-smokers in the smelter communities than
non-smokers in the 10\01 exposure cOlTITIlunities. Bronchitis \Vas
not found to be more severe in the high exposure areas.
Smoking and pollution were again found to be additive. The
effect of smoking on chronic bronchitis ~as found to be seven
times stronger than that of air pollution.

1
The concentrations of pollutants leading to excess bronchitis
were estimated at 177 to 374 mjcrogms/m3
for S02 lind 7.2 to 19.9
microgms/m3
for suspended sulfates.
A study of military re.cruits Has conducted by Finklea as
part of the Chicago-Northwest Indiana Studies. Self administered
questionnaires were used to examine chronic respiratory symptoms.
Chronic bronchitis rates were found to be higher in recruits
from more polluted urban areas than recruits from rural areas.
The excess in bronchitis rates was much smaller than found in
other CHESS areas. Exposure for 12 years or more to levels of
S02 of 96 to 217 microgms/m3
, suspended particulates of levels
of 103 to 155 microgms/m3
and suspended sulfates of 14 microgms/m3
\V'as found related to greater prevalence of respiratory sYmptoms.
Goldberg in New York again reviewed the prevalence of
chronic respiratory disease symptoms. Three areas with
different pollution levels were examined. Exposure up to 203
years to S02 levels of 144 to 404 microgms/m and suspended
sulfate levels of 9 to 24 microgms/m3
Here found related to
greater prevalence of chronic bronchitis. This was found to
be true for both sexes of ages 20 to 50 among smokers and non
smokers. In all the above studies, age, race, sex, socioeconomic
status and occupational exposure Here controlled. From the
above data it was concluded that excess bronchitis appears,
associated \vith S02 levels of 92 to 95 microgms/m3
and 15 microgms/m3
suspended sulfates. These data are in support of the National
Primary Ambient Air Quality Standards.
Another study by Goldberg, in New York, dealt with elderly
subjects who were divided into four groups: the well, with
heart disease, with lung diseas~and with lung and heart
disease. Diaries were used to collect daily data on ~yrnptoms
present. Temperature and suspended particulates were measured.
In heart disease panelists' elevations in temperature were
related to Horsening of symptoms. DecreafJr.?s in tcrnper8tures
\V'ere rela ted to indue t ion or aggrava tion of syml't.orns ina11
other groups. Findings suggested that short term exposure to

153
802' suspended par.ticulates, clnd suspended sulfates may adversely
effect health in thc~ elderly even after current air quality
goals are reached.
Suspended sulfates were found to have the most consistent
and strongest association \vith aggravation of symptoms. The
threshold level of suspended sulfates was estimated as 10. / 3mlcrogms In •
Stebbings using daily diaries studied panels of sick and
well elderly in New York City (Stebbings, 1976). Increasing
temperatures Here found to aggravate symptoms in heart disease
panels. No clear consistent relationship was found for the
other panels. The well elderly panel had exacerbations of
symptoms with elevat.ions in the levels of suspended nitrates,
suspended sulfates, S02
,and suspended particulates. A \Yeakel'
pattern was noted in the lung disease panel. Heart disease
symptoms \Vere found related only to suspended nitrate and
totai suspended particulates. No thresholds of effects for
the pollritants were established. Finklea studied panelists of
asthmatics in t\VO different areas, Salt Lake City Basin and
New York. In both studies patients recorded daily attacks
of asthma in diaries.
The Salt Lake Basin study found total suspended particulate
and suspended sulfates had significant effects on attack rates
at minimum temperatures greater than 300
F. Suspended sulfate
had the greatest effect. Temperatures alone were found to
have a more constant correlation than any Ineasured pollutant.
The threshold level for suspended particulates was 107 microgms/m3
and 17 .l~ microgms/m3
for suspended sulfates at temperatures
of 30° to SOoF.
In New York) asthmR attacks were linked to suspended
particulates and suspended sulfates. Also temperatures of a
more moderate degree were related to attacks rather tllan colder
temperatures such as was found for the Salt Lake region.
The estimated t~~~:-:-~~;llolcl for suspended particulates I.17GS
56 microgms/m3
and 12 microgms/m3
for suspended sulfates.
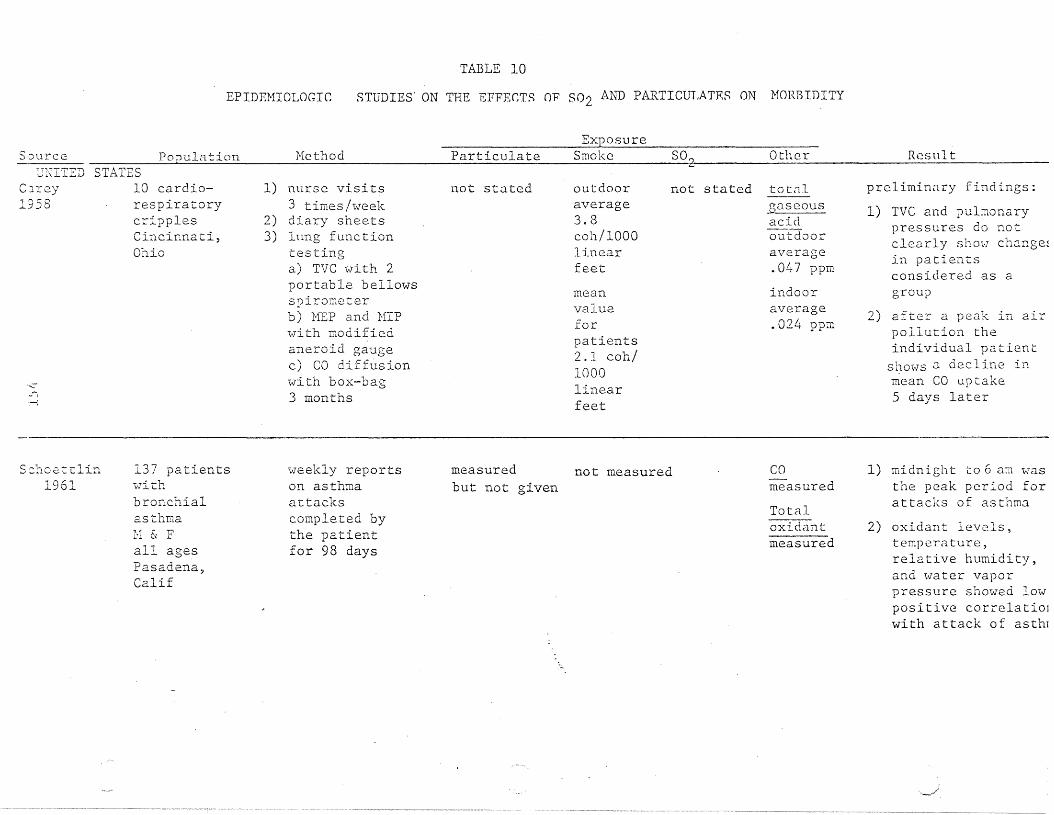
EPIDEMIOIJOGIC
TABLE 10
STUDIES' ON THE EFFEr;TS O'P S02 AND PARTICUT,ATF.S ON MORBIDITY
S':JurceExposure
Population Method Particulate Smoke SO~ Other ResultUNITED STATES
Carey 10 cardio-1958 respiratory
cripplesrt .. • ~ •vlnClnnaLl,Ohio
.,~i
,......)
1) nurse visits3 times/week
2) diary sheets3) lnng function
testinga) TVC with 2portable bellowsspirometerb) }1EP and NIPwith modifiedaneroid gaugec) CO diffusion\-7i th box-bag3 months
not stated outdooraverage3.8coh/1000linearfeet
meanvalueforpatients2.1 coh/1000linearfeet
not stated totnlgaseousacidoutdooraverage.047 ppm
indooraverage.024 ppm
preliminary findings:
1) TVC and pulmonarypressures do notclearly ShOl:7 change~
in patientsconsj_dered as agroup
2) after a peak in airpollution theindividual patient
shmoJs 0. dec 1 ine inmean CO uptake5 days later
S:::hoetI:lin1961
137 patientswithbronchialasthmaH & Fall agesPasadena,Calif
\veekly reportson asthmaattackscompleted bythe patientfor 98 days
measured not measuredbut not given
COmeasured
TotalOXIdantmeasured
1) midnight to 6 am vIasthe peak period forattacks of asthmo.
2) oxidant levels,temperature,relative humidity,and 1;oJater vaporpressure showed lowpositive correlatioJ'with attack of asthr

ResultOtherExposure
Smoke S02ParticulatesHethodSource"----------"---------------
I)Ot-i 3.:1
1961
~l
.r;,-l
femaleemployeesof the
RadioCorporationof America5 u.s.cities
illnessabsence lastingmore than 7days. Followedfor 3 years.
range101-188llg/m3
not measured sulfates7.4-19.8
3llg /m
copper.16-1.18
3l1g!m
nickel.013-.025
3llg/m
1) incidence ofrespiratory diseasesignificantlycorrelated with memsulfate concentrate~
(r =0.96)2) no correlation foun(
between respiratorydisease rates andconcentrations ofzinc, copp~r,
nitrates, benzene,soluble org.cmicmatter or suspendedparticulate matter
3) respiratory diseaserates increased witlincreasing nickeland vanadiumconcentrations (4cities)
--

Exposureour-c:e PODlll_~tjon Hethod Particulates Smoke S02 Other Resul t
sulfatesc;-rl2',-l
-L.~) G.':"
'-f::u;
e.mploye2sat 5locations
Total number ofindividualsvisiting thedispensaries'i7here they\vorked ,veekly(RDII)(61 weeks)
not stated not stated not stated - vlccklymeanrange12.7-36
3flg/m
1) weekly respiratoryd · .. ,lsensc lnClaC~c.e
index (RDll) foremployees inadjacent cities sho~
a high correlationwhich suggests thatan environmentalfactor is playing arole
2) sulfate concentration possiblyrelated to RDII
BellTelephoneCompanyemployeesH & FPittsburgh,Pennsylvania
absence forillness lastingmore than sevendays.July 1, 1935 toJune, 30, 1958
not stated decline not statedI005-LIGOhours ofsmoke
not stated 1) data suggestimprovement in illness rates inPittsburgh is aresult of markeddecrease in airpollution

SOU~C2 Popu10tion Hettod ParticulatesExposure
Smoke SOr Other 1(c~sul ti:
III. ~ 350and over?
mg/IOO cm-/day
ZI2i.iD2~rg., ............ -J-:iol
r-.:..I)
,..--:
49 adultsand 35e:.hildr2.D'\.;rithbronchialas rr1.Ti1a;\\;rj.ite ar~d
nOD\vhi te;Yi: & Fl~ash\lille:>
Tenn.
1) self recordingof att2cksmailsd in\vecJ<.ly
2) pulmonaryf-c:.nction testson 34 adults,22 children
Total110.96195.73
/~,./ 3\,:' m
.331 2.45cons!1,000 ft
o - .042ppm
Sulfation·
I. a - .lLt9II. .150 - .349
1) in adults, cheasthmatic attackrate varied directlyi;oJi th the level ofsulfation in theresidcDcial environment.
2) wind velocity showedinverse relationshipwith attack rate.Temperature, humiditand barometricpressure apparentlyhad no influence.
3) attack rates on dayswith highest S02
value weresignificantly higherthan on days withlowest S02 values
1) only G of the 31showed correlationwith pollution level
2) in 4 patients CO waspossibly involved
3) analysis did notindicate a strongrelationship betweenpulmonary perforoancand the vmy thepatient evaluated hifeelings about hisrespir~tory disease
Rok3.\J
196231 chronicrespiratorypatientsLos Angeleshos ital
1) preliminaryevaluation
2) pulmonaryfunctiona) VC, timedVC 3 sec, FRCmeasured withCollins 9-1iterspirometerb) airf1mvveloc.ity (FEVand c.ough)Silvermanpneumotachograph
measuredbut notgiven
not stated not stated NONO?CO~
°2measured
at L ;: lcs [

Source
Rc\ka\\!1962
Population Method
3) end-tiol and" rebreathings"CO 2 tension
4) airflow velocitySilverman pneumotachograph
ParticulatesExposure
Smoke S02 Other Result
4) 1 patient showedsignificant decay irpulmonary functionprior to death
All measured 2 hr sampling but not'presented in form that can be quoted
icer 150 patients 1) clinical exam=.962 Kith obs·truc- daily
tive ain·;ray a) Radisease b) MEFR
C)L:j 20-65 yr c) lung volumesr-l
Baltimore.body plethysmographror 21 weeks
not stated notstated
measured NO?dirtmeasured
1) patients becamcbet tcr and ,;.;ors2.at the same tiDesuggesting that thechange is due to
• 1.. ., .cenVlrOnQenLa~ £2C-
tors, possiblypollutants.
2) W2S not possible to
find o~e pollutantthat was responsiblE

Source
Exposure
Population Method -Particulates Smoke 502 Other Result
Prindle1963
c~:
FE-rris andALderson
1964
462 male and486 female;2: 30 yrt"\'l0 communities in westcentralPennsylvania
553 adults25-74 yrChilliwack,British-'"'! 1 ....l.O..LUmDla
1963comparedv,:i t~l
Berlin"Ne'lv I-Iampshire1960
1) lung functiontests
2) chest x-ray3) questionnaire
1) questionnaireinterviewer(Nay-June f63)
2) pulmonaryfunc.tiona) FVCb) FEV1 . 0wi-ch \<Jrightfspeak flov] meter
109 II g/m3
151 llg/m3
not stated
not stated
NEW FLORENCE1.5COHS/l,OOOft.
SEHARD
2.3 COHS?1,000 ft.
CHILLItV"ACK.(.5 cons/
1,000 ft
BERLIN
~5 COHS/1,000 £t
.01 ppm
.09 ppm
averageIppb
not stated
su1fation6 mg S03/100 cm2/day
dust fall26 tons/mi 2 /mo
dustfa1183 tonsmi?/mo
sulfntion37 mg S03/100 cro2 /day
sulfationrate50.3 S03mg/IOO cm2/day
dustrall10. i t tons/mi2/30 dCLy
sulfationL:26 mg S03/100 cru2/day
1) average ain1ayresistance and airway resistance Xvolume statisticallydifferent betweenthe 2 communitiesafter differences inheight and guagewere accounted for.May reflect difference in air pollution level
2) more males withpneumoconiosis inSeward, more maleswith emphysema inNew Florence
1) more respiratorysymptoms andlowered lungfunction observed inBerlin (morepolluted area)
2) difference cannotbe entirely cxplaineby smoking diff02rencc but mightbe explained byethnic differences
dustfall34.9 ton/mi2/30 day

ResultOtherS02
ExposureSmokeParticulatesMethodPop.iourc:e------------"-------------------
2)
1)indt2::-son19 \)l.,
c-...:
1,26125-74 yr3 residentialareasBerlin, NewHampshire
1) questionnairesimiliar to oneused by theBritish generalpractitionerssurvey
2) pulmonaryfunctiona) FVCb) FEV1.0
'Collins 61rf~h9rdingVJ..Ldill2Le.l..
c) PEFRWright peak.flOl'J meter
Not stated Not stated range5-17 ppb
dustfa111.
ton/mi /30 daysa) Total20.5-46.7b) insoluble11.9-25.4c) soluble5.6-21 . .3d) sulfate2.3-10.6
prevalence ofrespiratory diseaseand pulmonaryfunctionabnormalities wasnot clearly orconsister:tlyrelated topollution.previous .:Jll,tlysisof tIl(: claL,l
indicated thatcigarette smoking"t.Jas a moresignificant factorthan air pollution.
ieil196
1) 118students
of TulaneUniversity
2) hospitalpatients
Ne,;v Orleans
1) questionnaire2) ventilatory test
a) lung volumeb) expiratory
flmv3) scratch tests
No measurements made 1) plume cxtr~cts
probably allergenic2) higher reaction in
those currently';vith symptomaticasthma

Result
soiling index andS02 level in those·S S5 '..7';: in tI12middle socio~cono~ic
classin those over 55 yrClir pollutioncor reIa t: c ci ':'/ i t:hcardiovasculardisease but not with
1) morbidityconsistentlycorreia ted Ivi th
mo
Other
sulfationa) ~-:l5 r.
b) ~151-. 35 L)
C ')- 3 r.:: 1) ._. J-2mg/lOOcm !day
dustfalla):,:, 5b) 5.01-15c):; 15 'I
tons!mi<-!
24 hra):::. 005b) .0051-
.01c) ~.0101
ppm
_" ..~ ,~~ SO"Exposure
24 hra) ~100b) 101-199c) ~ 200
]Jg/ cm3
Partieula te.-:.s__~_m_Il_1,..-.:r-> :..-.;,J.- _
geometric mean ~
24 hrsoilingindexa) .'5:. .330b) .331-.83c)~.831
COL-lSi 1, 000ft
1) intervie\:veradministeredquestionnaire
HethodPopu13tion
2,833households'iVhite andnom,;rhite~N·ashvj_lle,Tennesse.e
our ~ce~ K.Qj[2lL@...!:~~_~~~:...::..- _
.e.icc>erg196:+
respiratory dise2se3) direct corrc10t~on
between morbid~cy
and white femalesHho keep house andall nonwhite females
--

ParticulatesSou~ce Population HethodExposure
Smoke S02 Other Results
)lL:nd)65
Xur;;.ber of menavailab Ie forsurvey: London2SI} countryarea 455, USA708
Post office vandrivers in Londonand three Englishcoun t ry to'VJnscompared to telephone companydrivers in U.S.Completed questionnaire for respiratory symptoms.Given lung function test (FEV 1.0)and sputum samplecollected
Both of these pollutants are athigher levels inLondon and Englishcountry towns thanUSA cities.
..r~·.·~.~_~.~~,.=.=.,-,-.,,-,.-,-,,---,,__
Found a British excessin the prevalence ofrespiratory disease, alsa lower FEV1 . O andincreased sputum inBritain over USA. Attributed possibly to thehigher levels of pollution in England vs. USA.
Graphs onlyof distributionpattern by dayof the i;veek
::erJ_irlg~ 66,:"
\.C.
Males and femalesLos Angeles
Hospital admissions data obtained from BlueCross AssociationLos Angeles27 disease categories looked at.223 days analyzed3-17-61 to 10-26-61
Notstated
Graphs onlyof distribution patternby day ofthe week
Graphs onlyCOZ, N02'oxidant precursors, oxidesof nitrogen,ozone, nitrogenoxidants
Significant correlationbct\\~een pollutants 0ndadmission rates fordiseases grouped ashighly relevant. Relevant discas2s hadfewer number of significant correlations, oneconsistent correlationwas with 5° 2 " Concludedair pollutJnts exert aconsiderable effect onhospital admissions forcertain diseases.
:erling~67
Males ane femalesLos Angeles
Length of hospital- Sameization. Data ob-tained from the BlueCross, Los Angeles223 days analyzed3-17-61 - 10-26-61
as above Same as above Same as above Significant correlationfound with diseasesgrouped as highly relevant, relevant and heartand central nervoussystem dise2se categoriefor length Ilospi tal stayand S02, NOZ, total oxidof nitr( '~ .....md iJartic-t: 1.:1 t!' j',

_.' \..- ........ _. I.... ~ .lo. \...... • "-~ •.l.. .....~ '- -l- '_ ... .1.
:Ca~roll 1,090 nor~al
;67 adults overage 15:::Ze-S} York City
Daily illnessrecords obtainedby vleekly intervie\v
Graphs onlyof frequencydistribution
'_j"'iJ.U.l\"'~
Notstated
w,j L
Graphs onlyof frequc.ncydistribution
\.....iL... ... J.~l.
Notstated
.L ". '- .~j u J.. ,- .. j
Correlograr:1s sllO'.·n::d S02having an iffi~Qdi3.tc
effect on eye irritationsympto~s and a delc £ f c. c t on co p r (, c\lJ ction. ParticulJtc density appeared to notcontribute to symptomsof eye irritation ~ut tocontribute to productionof cough .
.__.~ ~_, -=~c..:..;::.---,--,-..:..........;...;._
':-':"':':.'~._'-'-'~'--'"-;- .- ...... .;::. ...-~_ .. -...
co~\"r:..
368
r"'-.,:r-~";
1r=c'~'.·JS
68
314 patientsHltn asthma,rhinitis orboth. 86pe. rs OilS ';-Jereu;lder age 15.Philadelphia
lIS patientsChicago, 'Illinois1963-1964
Nc.asurements ofchanges in severity of symptomsrecorded dailyin diariesAugust I-November1, 1963
Patients with emphysema -bronchitis syndrome recorded dailyin a diaryseverity of symptoms(cough, sputum production & dyspnea)
No specific measurements given.Data presented in graph form.
No specific measurements given
Calculation of correlat ion c () e f f i c i en t s s 11 O\,'}e dno significJnt rel~tion
of the three pollutantsto severity of sym~toms.
A trend was noted fornon-rag\vecd allergicrhinitis cases to haveincreased symptoms withincreasing levels ofparticulate matter.
Found no correlation between air pollution andseverity of symptoms; ye<:luthor cor~tends it cannobe denied that long timeexposure to air pollutanmay lead to an aggravation or initiation ofchronic bronchitis
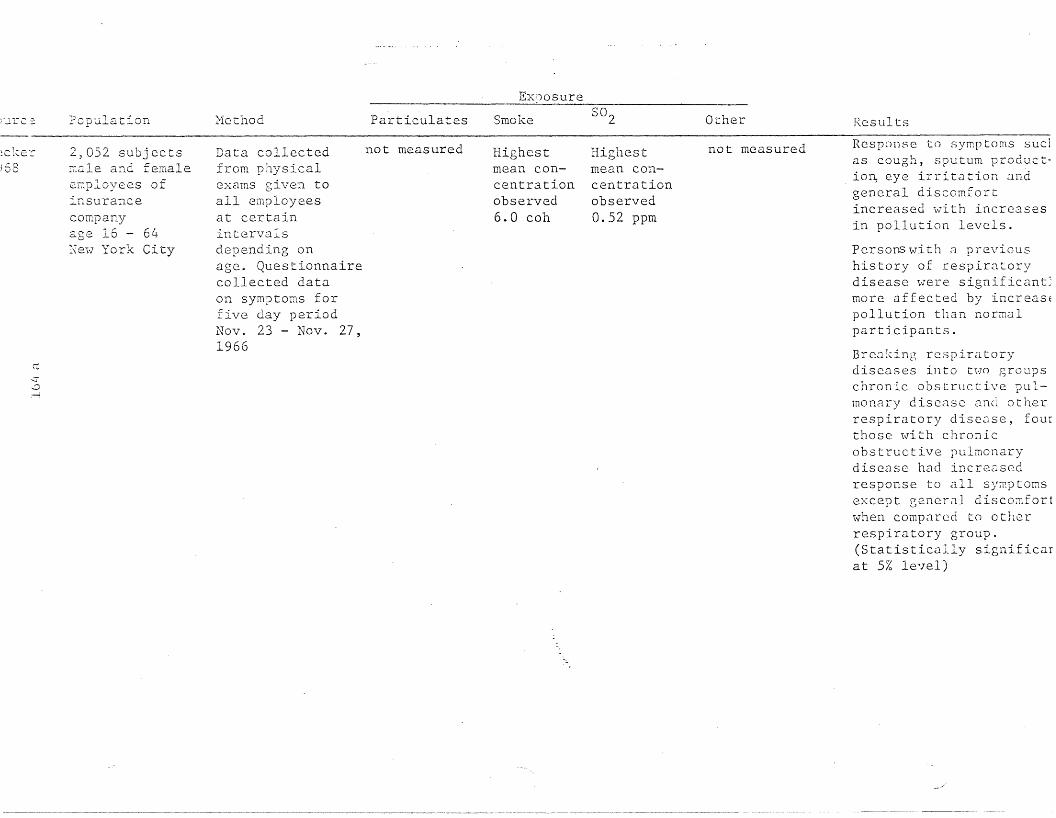
Jure::::.
1:Cl(.er
68
ec.::r..::;~
Population
2,052 subjectsIT,ale and femalee.r::ployees ofinsurancecompanyage 16 - 64Xe,\·l York City
Hethod Particulates
Data collected not measuredfrom physicaleXClms given toall employeesat certainintervalsdepending onage. Questionnairecollected dataon symptoms forfive day periodNov. 23 - Nov. 27,1966
Exposure
Smoke
Highestmean concentrationobserved6.0 coh
502
Highestmean concentrationobserved0.52 ppm
Other
not measured
Results
Response to symptoms suc1as cough, sputum productio~ eye irritation andgeneral discomfortincreased with increasesin pollution levels.
Persons \\7i th ;:l previoushistory of respiratorydisease were significant~
more affected by increasEpollution than normalparticipants.
Breaking respiratorydiseases into two groupschronic obstructive pulmonClry disease 2nd otherrespiratory disease, fourthose with chronicobstructive pulmonarydisease had incre3sedresponse to all sy~ptoms
except general discoillfortwhen compared to otherrespiratory group.(Statistically significarat 5% level)
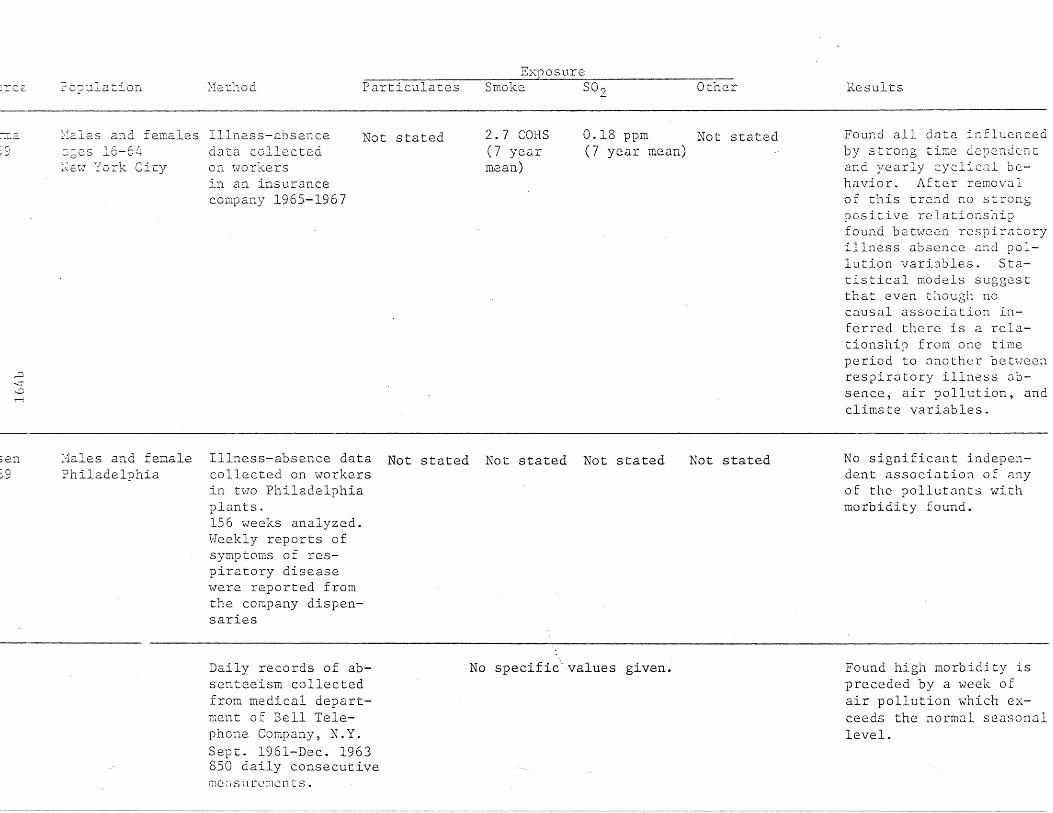
lrce. ?opulation. :'1e thod ParticulatesExposure
Smoke S02 Other Results
:'fales a:ld females Illness-absence_~L.o.
:c,I ~
,:::)
-...:r~
ecges 16-64:;;E:IY York City
data collec.tedon. I-Jorkersin an insurancecompany 1965-1967
Not stated 2.7 COES(7 yearmean)
0.18 ppm Not stated(7 year mean)
Found all data influencedby strong time dep2ndcDcand yearly cyc.lical behavior. After removalof this trend no strongpositive relationshipfound between respiratoryillness absence and pollution variables. Statistical models suggestthat even though nocausal association inferred there is a relationship from one timeperiod to another betweenrespiratory illness absence, air pollution, andclimate variables.
;erL~o).-/
Males and femalePhiladelphia
Illness-absence data Not stated Not stated Not statedcollected on workersin two Philadelphiaplants.156 weeks analyzed.Weekly reports ofsymptoms of respiratory diseasewere reported fromthe company dispensaries
Not stated No significant independent association of anyof the pollutants withmorbidity found.
Daily records of absenteeism collectedfrom medical department of Bell Telephone Company, N.Y.Sept. 1961-Dec. 1963850 daily consecutiveme:isurcmcn ts.
No specific"'values given. Found high morbidity ispreceded by a week ofair pollution which exceeds the normal seasonallevel.

ource
ctrDJ'VJ
.969
,')Ie"::;
Population
561 patientsvJi th chronicbroncho-pulmonary diseaser' .""illcago
Nethod
Patients reportedon dates of duration of respiratory illnesses.October, 1966January, 1968
ParticulatesExposure
Smoke S02 Other Results
In cases 55 years andolder, with grade 3 & 4chronic bronchitis, therate of illness occ~rrin
with exposure to 0.25 ppor more S02 was 50%greater than rate foundwith exposure to 0.04 PIor less. Differences iTrate of illness betweenthese levels was evengreater when illness occurringday after exposu1was used. Ages under SLgrade 3 & 4 did not haVEsteady incrCdse in illness rate with increasirS02 but rates at S02levels of 0.30 ppm O~
more were higher LhJG
rates associated withlevels of S02 0.04 ppmor less. l~':::ingP.J.ticnt a;:own con t r,) L found Slevels sign. higher forthe day preceding theillness than day preceding no illness.

',-,~:>u.~ "- __ Population Me.thod Partic.ulates
ExposureSmoke S02 Other Results
842 i>lhite females 1961-19631ke=_-::in:;0..)-1
\...C\.C.
age 25 a:ld overBuffalo, N.Y.
Questionnaire andintervie\-l regarding respiratorysymptomatology
4 levelsI (80II 80-100III 100-135IV)135llg/cu m/24 hrs
Notstated
Notstated
Oxides of sulfur3 levelsI <0.30II 0.30-0.45111)0.45mg/ sq cm/30days
Non-smokers 45-64 and a65 and over h~d positivassociation between prevalence of cough withphlegm and the level ofsuspended particulates(0.25)p)0.10) not foundamong smokers. For oxiof sulfur no such association found. h'hen residential mobility considered found smokers \"hohad not recently ~ovcd
had positive associatio:with suspended particulate pollution for coug)v7it:h phlegm. ;\.n inversiassociation found forsmokers who had moved(p(O.OI).
ldau 84 cases of bron- July 14, 1958-July Not statedi chial asthma 12, 1959 weekly
;l'..ville -""hite and non~\Thite reports of time~ Pcl- children and of onset, end of:i02 adults attacks, place oflOy apparently occurrence and
Nashville medication recordeddaily by subjectsand mailed weekly
-------------------- - -
Notstated
Notstated
Notstated
Most important independent variable associate,with asthmatic attackwas found to be "day inbeginning of study".The next important variable was found to be SO'it being less significarin its contribution.
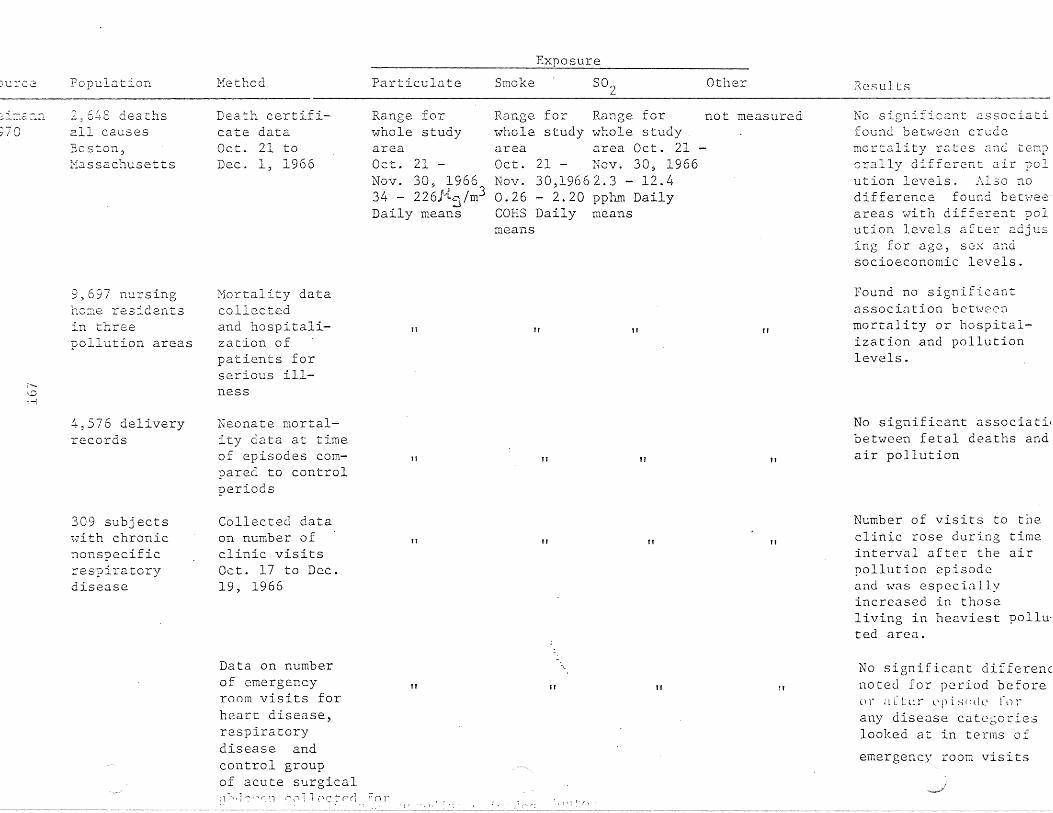
)Ul"C2 Population Hethod Particulate Smoke
Exposure
S02 Other Results
:-:i~:E:::r.L
~70
2 6!J.·S deathsall causesBoston,l'1a s sach use t t s
Death certificate dataOct. 21 toDec. 1, 1966
Range forwhole studyareaOct. 21 -Nov. 30, 196634 - 226}{5/m3Daily means
Range for Range for not measuredwhole study whole studyarea area Oct. 21Oct. 21 - Nov. 30, 1966Nov. 30,19662.3 - 12.40.26 - 2.20 pphm DailyCORS Daily meansmeans
No significant associatifound between crudemortality rates and temporally different air polution levels. Also nodifference found betwe~
areas with different polution levels after adjusing for age, sex andsocioeconomic levels.
r"v,-{
9,697 nursingh08e residentsin threepollution areas
4,576 deliveryrecords
309 subjects1vith chronicnonspecificrespiratorydisease
Mortality datacollectedand hospitalization ofpatients forserious illness
Neonate mortality data at timeof episodes compared to controlperiods
Collected dataon number ofclinic. visitsOct. 17 to Dec.19, 1966
TT
II
II
II
II
II
TT
Ii
TT
II
TT
TT
Found no significantassociation betweenmortality or hospitalization and pollutionlevels.
No significant associatilbetween fetal deaths andair pollution
Number of visits to theclinic rose during timeinterval after the airpollution episodeand was espcciallyincreased in thoseliving in heaviest polluted area.
Data on numberof emergencyroom visits forheart disease,respiratorydisease andcontrol groupof acute surgical
1 r n " .:" 1 1 (' c t p r1 f n r
tI It
: i· (;
11 !t
No significant differencnoted for period before() r ;[ CLc r l' p i. s (~ll (' r(I rany disease catcborieslooked at in terms of
emergency room visits

SOLrce Population Hethod ParticulatesExposure
Smoke S02 Other Results
Old and new sam- Re-examined sam-ple combined pIe from 1961699 males study and also829 females ne'hT random
FeTris1971
:;:::;
age 25 to 74and overBerlin N.H.1967
sample.Questionnaire'\vi th intervievJ'and FVC, FEV1.0and PEFmeasurementsmade.
1961mean 180 ~g/m3 Not statedrange 55-308~g/m3
1966mean 123. 7 ~g/m3range 26-288~g/m3
1967mean 139.2 ~g/m3
range 17-314 ~/m3
Not stated Dustfallg/mL /30 daysmean values(1961) 18.4(1966-67 samestations as1961) 14.3(1966-67 allstations) 9.7
S03
mg/lOO cm2/day1961 range0.373-1.101966-67same stationsas 1961range 0.0840.9801966-67all stationsrange 0.010-.98
Results after controllin~
for smoking, age, andsex showed slightlylower levels of respiratory disease prevalencein 1967 than 1961.
FVC in men and womenwere significantlygreater in 1967 than in1961.
FEVI had a less consistent pattern.
PEP slightly greater in1967 than 1961.
Ferris1~76
521 men and 680'Homen re-intervie~1ed
Berlin N.H.1973
Re-examined sample from 1967study used healthquest.ionnaire.FVe, FEllI. 0'PEF measurementswere made.
1973 80 ± 62~g/m3
Hass respirable particulates 197334 ~ 22 ~g/m3
Not stated 1973S02equivalents25 ± 8ppbSO? 10 ±6.5 ppn
~ ~g/lOO cm2
per day1973901 ± 287
No differences werefound for respiratorydisease prevalence whensy~ptoms reviewedindividually or inclusters between 1967and 1973.
No pattern was foundbetween air pollutionand FVC, FEV1' and PEF.

)ure2- Population Method ParticulatesExposure
Smoke 802 Other Results
)hen72
c~
Panel of 20 asthmatics, 30%adults. white.males & fe~ales.
Ne-:-; CUTr,berland,Hest Virginia
Questionnaire administered andsubjects completeddaily reports ontime of attack,place, durationand severity.New Cumberland,Hest Virginia
Demarcatingpoint betweenhigh and 10vJ
days.150 ].lg/m3
high volumesampler
Not stated Demarcating Soiling indexpoint bet"tveen measured by AISIhigh and low tape samplesdays - .07 ppmcouiometricmethod
All pollutants and temperature' correlated significantly with asthmarate. [Temperature(r=.422) 802 (r=.J2) andsoiling index (r=.J87).]SigniCicanL diffl?rcnccswere found between highlow pollution days ~nd
high-low days of temrerature, humidity and \·:indspeed with attack rate.After the effects oftemperature were rC80vedsignificant correlationsremained between pollution level and attacKrate.
·:--l~:,e<:
-.,! ..)
4377 Dale L\'lin
?2.irsu.s~
tior:..naire 0"""
respiratory symptoms, smoking andalcohol consump~
"Cion
Not stated As indivi~uals a rela-tionship £0und betweenrespirato~y sympto~s andurban residency but notwith more specificmeasurements of air pollution. Also in co~par
ing twin pairs ex~osQd
to different levels ofair pollution no significant differences werenotc~ for respiratorysymptoms.

;o~rce Population Hethod ParticulateExposure
Smoke S02 Other Results
:ohenL97 L,
Cr---
1121 wale andfemale. adultsand childrenin three areasNe'iv York City
Telephone interviews about presence of symptomsin any familymember duringpublicized andunpublicizedair pollutionepisodes andcontrol periodsin three areaswith differentlevels ofpollution
RiverheadPublicized26 ",i(,''t,j/m3
;)
Unpublicized44 /~t';t/m3
Aper L4 hours
QueensPublicized145 Jtq/m3
Unpublicized165}{c/m3
~
BronxPublicized;6.0 ~~ 1~,,3-. ,t,c'i.1 J.ll
Unpublicizedl80){c~ /m3
~
notmeasured
Riverhead not measuredPublicized0.03 ppm
Unpublicized0.01 ppm
QueensPublicized0.12 ppm
Unpublicized
0.11 ppm
BronxPublicized0.14 ppm
Unpub1icized0.15 ppm
Significant increase foeye and throat irritatichest discomfort and sheness of breath noted inadults during highpollution episode
Comparing publicized aniunpublicizcd episodes ill
significant differencesin symptoms found.
Concluded SO? level abo'0.11 ppm and~suspended
particul~te levels abovi- U f .:; ,...14) ..1""\6 ill ror a number (
d :J . "f" 1ays may slgnl lccnt yincrease irritativeS)'1Ilp toms

SOl.:_rce Population Hethod ParticulatesExposure
Smoke SO') Other Results
Respirablesuspendedparticulatesrange overthree areas26.3-44.4 llg/m3
Exacerbation of symptoms was found in thewell panel with increaselevels of suspendednitrates, suspended sulfates, 502 and respirable suspended particulates. Found similarbut weaker associationfor lung panel. Suspended nitrate and totalsuspended particulatelevel appeared to berelated to symptomsof heart disease.
Suspended sulfates11.1-13. 7 ~g/m3
areas Suspended nitrates30.3-67.7 2.5-4.2 ~g/m3~g/m3
Rangeoverthree
Notstated
Each subject had Mean dailyinterview with valuesquestions on range oversymptoms, hist.ory three areasof disease, occupa-34.9-98.3 ~g/m3tion, smoking, andsocioeconomicexposure, subjectsdivided into oneof four panels.Heekly diariescontaining information on dailysyrnp toms v-lerecompleted bypanelists.
342 subjectsage 60 or overNevl York
,.....,
Stet-Dings1976

Source Population Method ParticulateExposure
Smoke SO" Other ResultIO~(EIGN STUDIES
::rUDer
1954
C..Jr......r-i
:orm'7all1961
all ages",,>lith casesof llYokohama"asthmaYokohama,Japan
approx.60,000transportemployeesmale<: 65 yrLondon
incidencedetermined byvisits to U.S.Army hospital
sid<.nessabsence dueto bronchitis(4-182 daysin length)1952-1956
Not stated smog formation days.172 '5'1liter
no measurements made
ether:soIU.h1eaerosols.081 3mg/mdustindex~
O7.one .17t(,/liternitrogenoxides-:52a'/liter
1) of air contaminantsstudied only ethersoluble aerosol anddust appear to besignificantlycorreI ate d ,,v i t hincidence ofllYokoh<:lma" asthn.:l
2) incidence of asthmaalso correlated witlsmog formation.
1) support observation:that incidence ofbronchitis is close~
associated ".,rithoccurrence of denseand prolonged fogs
2) differences betweengeographic<:ll areassupport conclusionthat pollution fromdomestic fires andindustry arcresponsible forexcess mortalityinvaliding rates anesickness absence dUE
to bronchitis

;our::c P_oy"~lation
:crn'dall1951
Method ParticulatesExposure
Smoke SO~ Other Result
3) English climatemore conducive tobronchitis thanmost other countries
'1o:-k~962
r,r-
1) 40-64 yrmalesmunicipaltransportsystemworkers inBergen,Norrday
2) transportHarkers inpost officeservice inLondon,England
1) interview2) exam PRF
blood pressure\'Jeightsitting height
3) sicknessabsence data
4) morning sputumspecimens
no measure or comparison 1) higher prevalenceof most respiratorysymptoms found inLondon
2) PRF lower in London3) differences could
not be explained bysocioeconomicfactors or anthropometric measurements
4) smoking differencesdo"not explainsevere symptoms orlung capacitydifference

ResultOtherExposure
Smoke S02ParticulateNethodPopulation::: ou r~..:c:..:::2:...- -=-=-.c...:=-=..=..:=-=..::..::=- -:...---:- _
)shi:'J21963
....:::...-:-....
889";'lOrkersfrom acastingcompa.nyin TokyoYokohamaarea and.1,463 froman oilc.oepany\.Ji th branchesin Kashi\vasakii>~iig2.ta,Yokohas.a andKa\...~asaki
IS-58 yr olds
1) questionnaire2) physical exam3) chest
roentgenogram4) pulmonaryfunction tests
a) FVCb) Velsec .
no measurements made
low - high pollution
1) residents of highair pollution areahad a) increasedincidence of sputumproduction, chroniccough, and throatirritation, b) lowermean ve.c) increased numberof patients over 45yr. Hi th ai n.,.,2Yobstruction
2) cigarette smokers2nd persons with ahistory of 2llergieshad most respiratorydifficulty in highlypolluted area

.-:eCE.:' Population Method Particulates
ExposureSmoke S02 Other Results
__________---.;;=====::;;:..:.""'-"-':..;:".:c======-=-=-=-==--'~__=n_ - ---- --- -- ----- - - - --',~_~~_"_ _
11&:J.dh ......'...J~;
.,~-;
l'--
1ge165
293 :T:8.le mail-'Ian drivers and:Tlain cenance menCentral London
477 IT..3.1e mail-van dri'.-ers oreng ine.:2.riI1g'>lOrkc::rs in and2:coUnc. threeC.'JiJ.fJ. L. r)T townsin South England
85 males\T01un t e. e r s
...... .0 "'i •mos L \vlcn pYlOrnistory ofchronic b ron-chitisLondon, England
QuestionnairePulDonary function tests andcollected sputum from participants fromsimilar occupations but different areas
Respiratory symptoms o-e;servedduring \Jintermonths 1962-1963
No rneasuremen~s made at location of study but differences between levels in London and surroundingcountry noted
Graph only Graph onlyno specificmeasurementsgiven
Over age 50 male postoffice workers in Londohad more and severerrespiratory symptoms,produced more sputum Zinchad significancly lowerlung function test results. Concillded different levels of 2ir pollution was most likelyC8.use of difference:: inrespiratory morbiditybetween areas studied.
---------
Prevalence of respiratoryillness found to be relatsd in time morcclosely to increasedlevels of smoke than toS02. Also rel~tion intime found between incidence of respiratorydisease and S02 and smokENo significant association found between disease and low temperature,
2trilli966
-- ,... -- --~- -_ ....- -- ~--_.~---~ -,...-' •..-,.-
Females age 65and over nonsmokers andnon-factoryvlOrke rs
Heasured respiratory morbidityby questionnaire1961-1962
1954-64Range residential to industrialized19 sample sites0.08-0.88 rng/m3
Notstated
1954-64 Sulfation rates Found significant correRange residen- 1954-64 lation betweeri bronchititia1 to indus- Range residential and mean nnnuni S02tria1ized to industrialized levels (r=O.98). A non19 sample sites 19 sample sites significant correlatioil.020-.152 ppm 0.18-2.16 mg S03/was found with suspende
100 sq cm/day matter .82) anddus t [;1'\ r=O. 6G) .

tion 1:-12 G Particulates Smoke: S02 OLilc.r
e.tcher 1,000 men aged6S 30-59
London, England
Self-administeredquestionnaire, intervieHs aboutchest illness,FEV,~measurements
made and sputumcollected
l4G llg/m3 200 ~g/m3declining decliningto 60 ~g/m3 to 160 ~g/m3(source: air (source: airquality cri- quality cri-teria for teria forparticular particularmatter) matter)
Decline in sputum production observed 196166. Possibly associatedwith decline in particulate pollution in centra]London.
--~.~ -~- - - ----. -_.--- - .-~ .~ 0- ~_~P_~_-'::~~ ~~ __
~erstekerl,OOO male muni-69 cipal employees
Rotterdam, Netherlands
r-~
r-l
Bronchitis questionnaire and PEF measurements takenOctober 1966
Notstated
60 1:rg!m3 200 1-lg/m3winter daily winter dailyaverage average
Not stated Found no difference between bronchitis groupand a control group inrespect to vari~hles
relating to chronic cx-.posure to air pollution.A signigicant differencewas noted for the percentage of heavy smokersbetween the two groups.
L"ego ::y97C)
.3~0 cases OI
c1-~ror..ic bron-chitisSheffieldEI1g1and
July, 1955 toJune, 1961 collected sicknessabsence recordsfor all casesof chronic bron-chiLis in maleemployees of asteel works company
Hot stated RangeJuly, 1955June, 19616.9-81.3:mg 100m 3average permonth
RangeJuly, 1955June, 19613.6-19.7parts per100 ml partsair averageper month
Statistically sigcificanlinverse rclatio~ship between the incidence rateand prevalence rnte ofchronic bronchitis withtemperature. A significant correlationfound between incidencerat:::~ (lnd both moan f1ndmaximum smoke pollutionlevels of previous week.No corrcJation found between rdtcs .:lud factorsfor the same week. Concluded smoke pollutionwas a causation factor i'exacerbations of bronchitis.

Notstated
~ce
~ick
Population
Hales and femalesBrisbane, Australia
Method
Index of acuteasthma providedby visits tohospital atnight (10 p.m.to 6 a.m.)1960-62
Particulates
Not stated
ExposureSmoke S02
1960-19622 suburbsChermside0-1.7mean 0.49COR/lOOO ft.TOO':-Jong0-2.8mean 0.73COR/lOOO ft.
Other
Not stated
Results
No significant association between smoke pollution and hospitalvisits for asthma found
chel
r-r-M
8162 males andfemales from arandom sampleHe.st Germany
1963-1968survey of respiratory symptomsand lung functionin 3 areas ofHest Germany,Duisburg, BochaIt and ruralBorken.
Duisburgaverage0.085 ppmrange 0.010.39 ppmBocholtaverage0.047 ppmrange 0.010.07 ppmBorkenaverage0.035 ppmrange 0.020.06 ppm
Notstated
Notstated
SettleableParticulates
Duisburg2,780Bocholt390.4 g/100m2 /30 days
Oxides of Sulfur
Duisbur&220 averagerange 60-400Bocholtaverage 67range 29-159
Found no difference between the three areaswith different pollutionlevels and the prevalenceof cough and sputum production in males andfemales when the groupswere standardized forage, sex, smoking habitsand social status
·;:rle.:::"v
1071 patier :s'"-"Ii th symp tomsof chronicbronchitis, emphysema orasthma returneddiariesL,ondon
October, 1959- Not statedHareh, 1960Patients eom-'pIe ted diarieson changes intheir day to daycondition
1959-1960. 1959-1960 Not statedrange of means range of264-435 ~g/m3 means
254-365llg/m3
Found consistent response to pollution. Concentrations of smoke orSO~ ~renter th~n 1000llg/m3 resulted in asharp increase in thepercen tage of p:l tientsrecording their conditionLm.;rest cor 1tration1C C1. d 1.n t~ t ( . v C' f fcc t \} C1 S
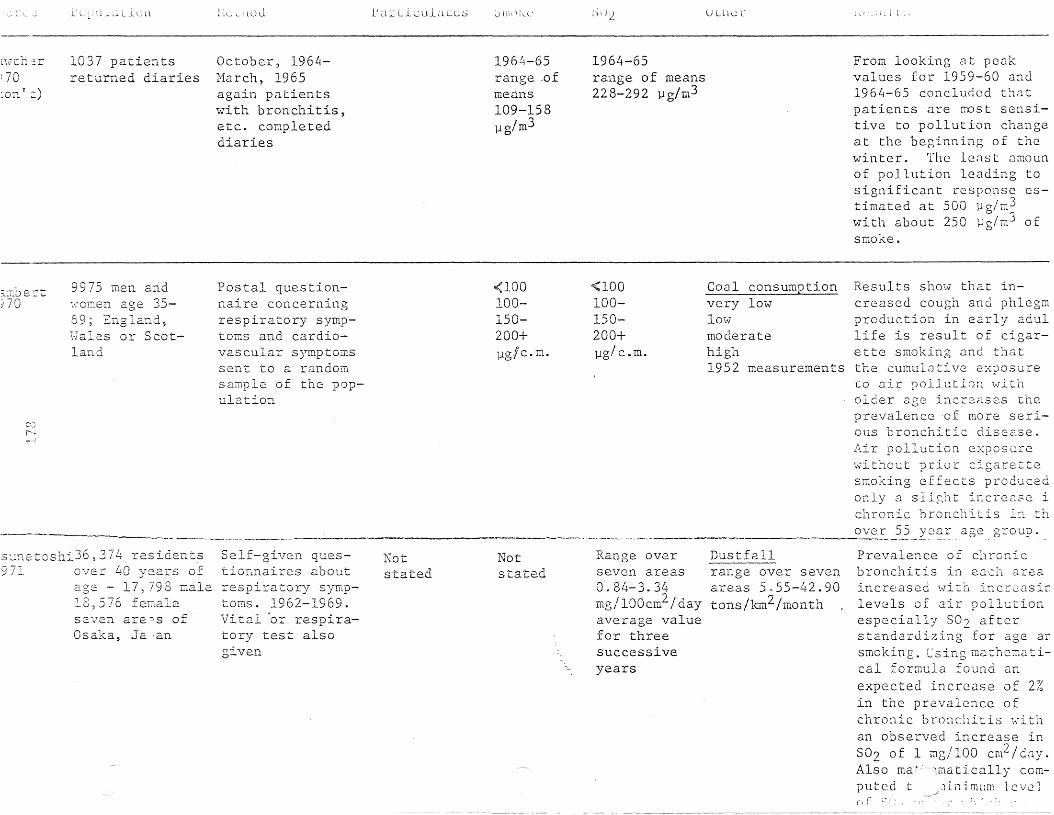
'--llud tar lculaLcs ,-) U Lll"": hi
l~\lth :;-:;.r
70:on v:)
1037 paI:.ientsreturned diaries
October, 1964Harch, 1965again patientswith bronchitis,etc. completeddiaries
1964-65range .ofmeans109-158llg /m3
1964-65range of means228-292 llg/m3
From looking at peakvalues for 1959-60 and1964-65 concluded thatpatients are ~Dst sensitive to pollution changeat the beginning of thewinter. The lenst amounof pollution leading tosignificant response estimated at 500 llg/m3with about 250 ll g /m 3 ofsmoke.
.--------~. ------'- ,._..._-_ ...• -----...---.
Results show that increased cough and phlegmproduction in early aciullife is result of cigar-ette smoking and thatthe cumulative exposureto air pollution witholder age increases theprevalence 'of more serious bronchitic disease.Air pollution exposurewithout prior cigarettesmoking effects producedonly a sli~ht increase ichronic bronchitis in th
.~_~ve~__?5 __xc:~~_age group ..
Coal consumptionvery low1mV'moderatehigh1952 measurements
<100100150200+llg /c •m•
<100100150200+
1/llg7 c . m.
Postal questionnaire concerningrespiratory symptoms and cardiovascular symptomssent to a randomsample of the population
9975 men and\·;OE:.en age 3569' England~
Hales or Scotland
r-~
v,.-'
f'-..-,,~
e-rt:
sunetoshi36,374 residents971 over 40 years of
age - 17,798 male18 576 fenaleseven are'""s ofOsaka, Ja 'an
Self-given questionnaires aboutrespiratory symptoms. 1962-1969.Vital 'or respiratory test alsogiven
Notstated
Notstated
Range overseven areas0.84-3.34mg/100cm2/dayaverage valuefor threesuccessiveyears
Dustfallrange over sevenareas 5055-42.90tons/km2 /month
Prevalence of chronicbronchitis in each areaincreased ~ith increasir.levels of air pollutionespecially 802 afterstandardi~ing for age arsmoking. Csing illClthematical formula found anexpected increase of 2%in the prevalence ofchronic bronchitis ,;-:ithan observed increase in802 of 1 mg/IOO cm2 /cay.Also ma~ 1matically computed t iillmi.lm lcvcin r i..' : ;.' ; • .-

)ou;::-ce Population Method ParticulatesExposure
Smoke S02 Other Results
Eme:son1973
18 patients >;-lithvarying degreesof chronic bronchitis and asthma14 nales, 4 femalesLondon
Lung function te~ts
given at approximately weekly intervals. Period ofstudy varied from12-82 weeks
Notstated
Mean 45 mg/eli m airrange overone year5.5-380 mg/eli m air
Mean 193 mg/cu TIl airrange overone year38.5-722 mg/eu m air
Not stated Found no significnntcorrelations b~twecn Fland smoke levels and asignificant correlatioIbe t\Veen FEV1.0 and S02occurred in only onepatient. Host significant correlations werewith temperature wheresix cases'showed suchcorrelations.
H.o'\va..rd197--t
C"'.r---~I
178 patients with Questionnaire on resobstructive air- piratory symptomsways disease given and also FEVO. 75 .158 men, 20 women and FVC measure-nean age 59.6+ ments made at inter-9.0 yr. val of one to threeSheffield, England months. 1966-72
1966-1972: A fall Not statedoccurred in levelsof air pollutants.
Not stated Compared to a similargroup of patients froma previous study foundrecent group had lessproductive cough, £2WCJ
winter illnesses, lesssevere breathlessness cabout one-third the ratof decrc2se of FEV.
Xer:~
197.5ot ta;;-la3280 ITlales auawales, 1969-71
Sudbury2208 :Eales andmales, 1972-73
Spirometric testsfe- (FEV1 and FVC)
and questionnaire onrespiratory symptomscompared betvleen
fe- two cities inCanada
Ottawa90.5 l1g/m3
Sudbury 352.1 ].lg/m
Geometricmean of annual geometmic means
Notstated
Otta\'7a16.1 ppb
Sudbury32.5 ppb
Arithmeticmean of annual arithmetic means
Not stated Significant differencefound bet\-J2en FE\'l/FVCratios ~ith Sudbury ha\ing lO\-ler mean ratiosthan Ott~wa for both ~c
and ICillale. Foundprevalence of chronicbronchitis in Sudbury \Ott m<J a ( 97/ 1000v s . 7 7/ 1(for both sexes cocJinec}1a1es ra th2r than £2~21
account [or diffcrcnc{-' l
the margIn of diff renefor males being 40 loce±18, .Jnd fC:'l;llcs 0 loce+19.

Particulatesource Population HethodExposure
Smoke S02 Other Results
Ie.elst fiveyearstm,m A
544 ?:lale.s
died for atleast fiveyears ,_\,110 Herenot previouslyexposed todusts, gas,eec. for at
Prevalence of respiratosymptoms found to beabout t\V'o times higherpolluted town VS. nonpolluted town. Grade IIdyspnea and over wasfound to 1)(: almost thretimes more frequent inpolluted vs. non-pollutt m'ln ( p <. 0 . 000 1) £0 rboth smokers and nonsmokers.
No values givenExamination of subjects by physiciansand two assistants,obtaining height,and \veight,pulmonary function tests and aquestionnaire onrespiratory symptoms. Resultscompared bet\veena polluted tm\il.iand a controltown.
agedlivedthestu-t\;<lO to\<1ns
All males40-60 \vho• +=ln one OJ...
aco";eanu975
~O':'.T1. B
753 Dale.sBt:crLare.st
'" -r I".~i j 0
?\uz.ber of d2.ilyillness casesSofia
Statistical correlation bet>:veennumber of dailyillness frominfluenza epidemic12-27-74 to 2-1275 and meteorological and pollution factors
Notstated
Notstated
Range .798.913 mg/m3
Dustrange .452-.473mg/m3
Nitric oxidesrange .020-.024mg/ill3
O:xidantsrange .0172-.022mg/m3
StatisticCllly signlIlcarelationship fOlmd between illGcss Gn one daand formaldehyde andnitric oxides levels cwodays before. S02 levelson day of illness andday before illness significantly correlatedwith illness from influenz~.

TABLE 11SUMMARY OF CHESS STUDIES
Exposure
)~rce
JUS<;'
974
~
co;-,
Population
7,635 parents ofelesenLary junioraEd senior highschool studentsf rc:-:: :four COTI"'.l--;:U-
Tl=- tics \·.~i tl-ldif fc:re.T~ expo-Sl1.reS to 2..lr
P°.l.J..utlon.Utah
Bethod
Self administered questionnaires onsy:nptomsFall 1970
Particulates
Range1940 - 1971bycommunity
LOld
78 - 108. 3
lJg/r.:1
Intermediate I81 - 151lJg/m3
Intermediate I.L45 lJg/m3
High53 - 70]1g/m3"
Smoke
Notstated
S02
"Range1940 - 1971by community
LO\.J' 3~g/m
Intcrme-diCltc I, C.L...J - 28llg/m3
IntermediClte II22 - 50]1g/m3
High62 - 234llg/m3
Other
Range1940 - 1971 bycommunity
_ SuspendedSulL:ite
Lmv3.7 - 5.8,..,]1g/m.)
Irrtermedia te I4.7 - 11
?1Jg/m...J
Intermediate II7.8 - 10llg/ m3
High12.4 - 28llg/m3
Results
A significant increasein the prevalence ofchronic bronchitis wasfound to occur in beth
k " .smo ers and nonsmokersof hoth sex ;tttc.r 4 - 7years of rcsidc~cc i~ a:area of elevated SO,.., (995 j..:g/m3 ) and sus~'cAdedsulfates (IS j..:g/m~)
The effects of air poll·ution and smoking appeaed to be additive
ocell rat ion '-11 C' ;.;: P () S U T (; t (dus t, gases, [urnes or a,osols was found to havetwice the effect ofpollution on chronicbronchitis prcvDlencefor over age 40 groups.

Exposure
>-..lrc2 Popu12tion NcthoJ Particulates Smoke S02 Other Results
r2~~ exposures LO completed~ Par-air Dollution. ticipants kept
211 total partici-A panel of asthmapants with asthma tics were interfrow four COIT'illlUn- vie';'lecl and quesiries with diffe- rionnaires
Suspended sulfate with tcmperature·~
and levels of 107
High 39-71 llg!m
m3
m3
S tl S P l' n dcds \II 1:! t L' i L' vel S
o [ 1. 4 ~JL";/ I1l '3 \.,1 i l11tempera turc~ /" SOu F and17.4 Wg/m3 with temperature 30-S0°F wererelated to incre~ses inasthma attack rates.
For S02 asthma atcacksinc rcaseJ \.;i th lcve1sof 23-54 ]J:~/m3 \vhc:ntemperc: ture ~40'-.1 F.
Increases in asthnaattacks related tosuspended particulateiTI.J.tter levels of 71
I.vith teIDDcLltures ofo •30-50 F.
Range: over fourseasons bycommunities
Lm'l4-7 llg/m3
LO\-7
4-101-1g/ m3
Range overfour seasonsby communities
IntermediateII High4-19 ~[g/m3 7-13 llg!m3
IntermediateI Intermediate 1&117-14 pg/m3 5-9 llg/m3
Notstated
Range overfour seasonsby communities
Lmv~...;b-70llg/m3
Intermediate II36-44 llg/mJ
High / 347-66 1-1g m
Intermediate I58-86 llg/m;--
daily diaries onasthmatic attacksThese diaries werere turned \veek1yHarcn 7-Sept.4,1971.
Utah
CJi'-\
i ~
~:-.. L::.J. 22.
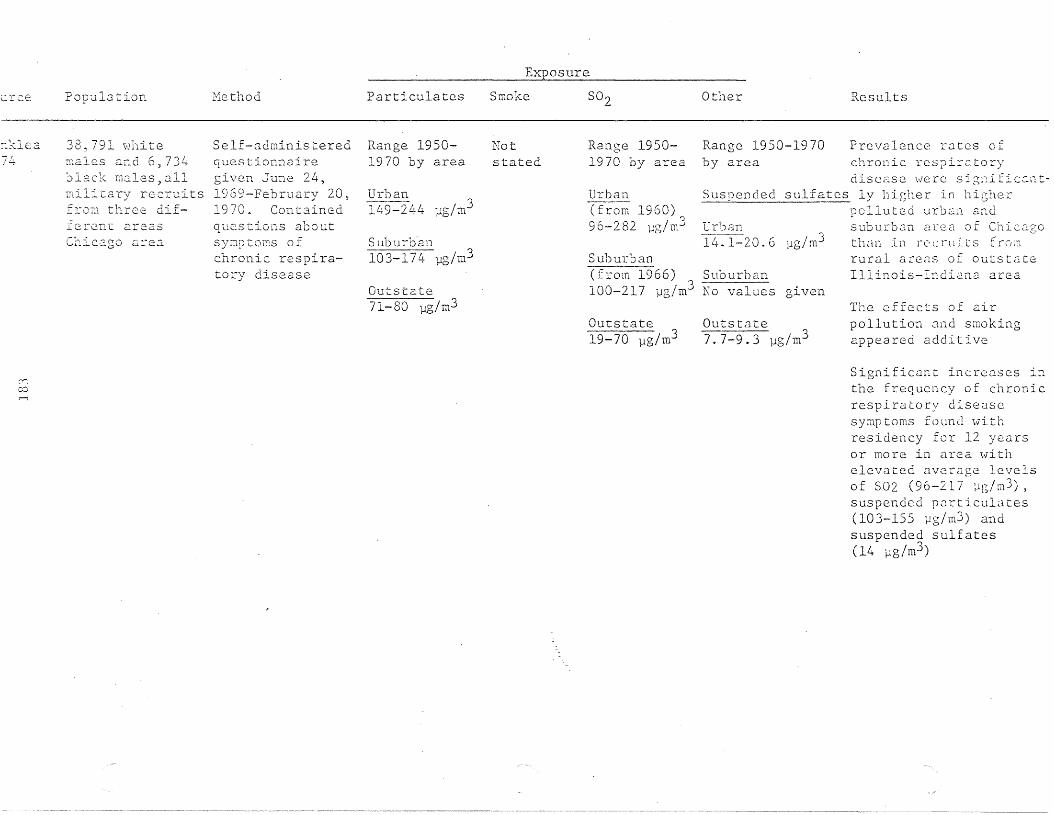
Exposure
Suburban(from 1966) Suburban100-217 ua /m3 No values·0
urce
:1~lea...."
/"'+
(Yj
co
Population
38, 791 vl11 i t emales and 6,734~lack ITl3.les,allmilir.ary recreits:r.::)"['.1 thre.e dif-::.::c::rc.nr. areasChi c?.go Cll.-ea
Hethod
Self-administeredquestionnairegiven June 24,1969-February 20,1970. Containedque.stions aboutsymp tOi::S 0 fchronic respiratory disease
Particulates
Range 19501970 by area
Urban~/o 2'4 /3.l.'-l-:;I- Lj. llg ill
Suburhan103-174· llg/mJ
Outs tate71-80 llg/mJ
Smoke
Notstated
S02
Range 19501970 by area
lJrban---(from 1960)96-282 llg/m3
Outs tate19-70 llg/m3
Other
Range 1950-1970by area
Urban14.1-20.6 llg/m3
given
Guts tate7• 7- 9 • 3 llg / m3
Results
subur03n area of Chicagothan in l-C c ru L l s f rOi:1
rural areas of outstateIllinois-Indiana area
The effc.cts of airpollution and smokingappeared additive
Significant increases inthe frequency of chronicrespiratory diseasesymptoms found \:lithresidency for 12 yearsor mo re in area '\"i thelevated average. levelsof S02 (96-217 ~g/m3),
suspended pnrticulates(103-155 llg/m3) andsuspended sulfates(14 flg/m3 )

Exposure
ur C:<2 Population Nethod Particulates Smoke 502 Other Results
Intermediate II57-78 llg/m3
Predicted thClt: suspcnJccs u 1 fat e s ,1 t 1eve 1 () f J 511g/TIl3 ,,·muld be relatedt 0 :1 L, I. i II C n:c' ;1:-; c i n
attack rtltc on cuo} Jay:::
and u 577 incr~asc on'Vlarrr;er dlly:::;
Lmv
An excess of asthmaattacks was found related to an estimatedlevel of suspendedparticulates of 56 llg/m~
Suspended sulfates (Tm1"n=30 to 50°F) andj,l 3
levels of 12 ~lg/rn forsuspended sulfates(Tmin=30 to 50°F)
Nedian dailylevels range overall seasons bycommunity
Lmv8-18 llg/m3
6-11 11g/m3Intermediate I29-56 ].lg/m~Intermediate I
9-14 11g/mjIntermediate II19-64 ].lg/m3 Intermediate II
10-14 l1g/mJ
l1edian dailylevels rangeover allseasons bycommunity
Notstated
Low29-34 ].lg/m3
Intermediate I55-60 ].lg/m3
Nedian dailylevels rangeover allseasons bycommunity
All prospectivepanelists intervie\-Jed andquestioned abouttheir asthma.Panelists selectedmailed in vleeklydiaries containing daily information on attackr3.tes
148 subj ec ts \.Ji thasthma from threecOIT.:.rI1uni ties'0112\\' Yo rk
"
7!.+:11::.1 c:. a
A 22% increase in aschm~
Clttack rates could beexp2ct~d with incrC2sesof suspended particuL1uto once a year allowablElevel of 260 ~g/m3
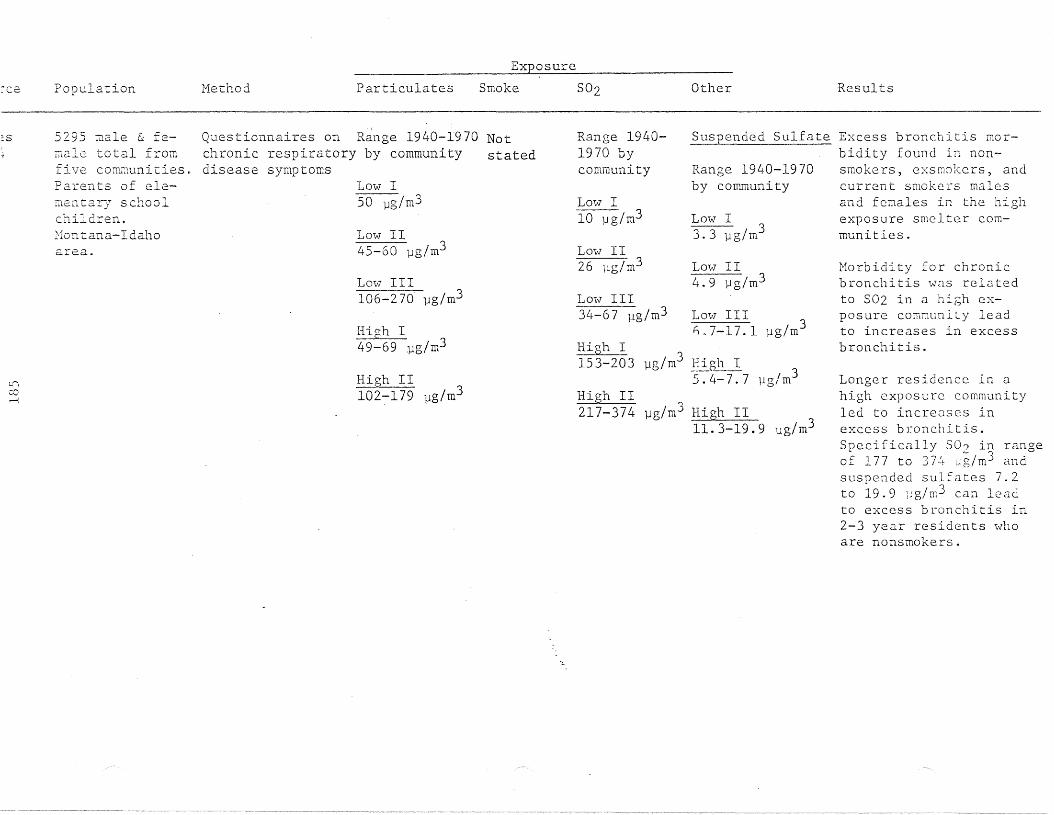
Exposure
~ce Population Hethod Particulates Smoke S02 Other Results
High I153-203 j..lg/m3 High I 3
5.4-7.7 j..lg/mHigh II
217-374 j..lg/m3 High II 311.3-19.9 j..lg/m
Morbidity for chronicbronchitis was relatedto 502 in a high exposure community leadto increases in excessbronchitis.
Longer residence in ahigh exposcrc communityled to increases inexcess bronchitis.Specifically 502 in rangeof 177 to 374 wg/m3 andsuspended sulfates 7.2to 19.9 11g/m3 can leadto excess bronchitis in2-3 year residen ts \'1£10
are nonsmokers.
Lmv III 3i;,7-l7.l j..lg/m
Suspended Sulfate Excess bronchitis morbidity found in nonsmokers, exsmokcrs, andcurrent smokers malesand females in the highexposure smelter communities.
Range 1940-1970by community
Lmv II4.9 1Jg/m3
Low I3.31Jg/ rn3
Lmv III34-67 11g/m3
Low II26 ~lg/m3
Low I10 fJg/m3
Range 19401970 bycommunity
Lo\;·] III106-270 1Jg/m3
High I49-69 .flg/rnJ
Low II45-60 1Jg/m3
Low I50 1Jg/m3
High II102-179 pg/m3
Questionnaires on R~nge 1940-1970 Notchronic respiratory by community stateddisease symptoms
]2-fontana-Idahoarea.
5295 male & feT;'Lale total fromfive cow~unities.
Parents of elementary schoolchildren.
L-j
cor-i
:s

Exposure
.rce. Population Method Particulates Smoke S02 Other ?\.esults
Citywide210-443 llg/rn3 Citywide
20-26 ]Jg/rn3Queens144-404 l1g/m3 Queens
9-24 l1g/m3Bronx210-395 l1g/m3 Bronx
16-22 ]J.g/m3
oberg4
~
:;)
4,764 parents ofele~entary schoolchildre.n in threecOP."Dunities.50%betwe.en 31-40year-old agegroup.Nevl York
Self-administeredquestionnaire onchronic bronchitis1970
Range 1949-1970' Notby community stated
Citywide101-203 l1g/m3
Queens80-173 1Jg/m3
Bronx104-166 llg/m3
Range 19491970 bycommunity
Range 1949-1970by community
Suspended sulfate
Increases in chronicbronchitis prcvnlenccfound among smokers,exsmokers and nonsmokersof both sexes with longterm exposures (up to20 years) to SO" levelsof 144-404 ~q;/m'1 Clndsuspended sulfate levelsof 9-24 llg/m3.
Chronic respiratorydisease frequency foundsignificantly higher incom1i1Unit i c oS \:l i t h in t c rmcdL.lte to high pollutionexposures than in len'Iexposure coxmunity.Could not be; nccount(2Jfor by age, occupation,smoking or race difference.
Again Clir pollution andsn~king effects ~PP(2ar
to be <Jdditive.

lrCE': Population Nethod Particulates
Exposure
Smoke S02 Other Results
Intermediate II5 7-78 ~g/m3
Ldb~rg
74
reoM
797 elderly sub- Personal interview Median dailyjects divided into used to distribute levels rangeone of four panels cases between over all1) well 2)heart three disease ca- seasons by3) lung 4)heart tegories and a co~~unity
and lung on bases category ofof physicians' healthy partici- Lowdiagnosis pants. Panelists 29-34 ~g/m3
~2W York given diaries torecord daily any Intermediate Isymptoms or changes 55-60 ~g/m3in condition.Study carried onfor 32 weeks
Notstated
Median dailylevels rangeover allseasons bycommunity
LOv]8-18 lJg/m3
Intermediate29-56 ~g/m3
Intermediate19-64 ~g/mj
l1edian dailylevels range overall seasons bycommunity
Sllspended
Lm'l6-11 pg/m3
IIntermediate I9-14 ~g/m3
IIIntermediate II10-14 ~g/mr--
country
Annual average suspendedsulfate rates of 10 to20 flg/m3 '\Vould res ul t ,
it was estimated,in a 6% morbidity excesson colder days and a32% morbidity excess onwarmer days

E. Health Effects of S02 (lnd Pat: l~Jcul(lLcs on Children
A prubJcrn inherent in all epidemiologic studies investi-
g<Jting the health effects of air pollution involves the
ascertainment of the t\.;ro groups similar in all factors (except
for air pollution exposnre) \\711ich might affect prevalence of
disease. Among the [actors \'1hic11 need to be considered are sex,
age, socio-economic class, ethnic origin, occupational exposure,
and smokinlj habits.
In order to reduce the number of variables under consideration,
many investigators have chosen to study children in whom smoking
and occupational exposure would be minimized as they are less
likely to be engaged in such activities than are adults. Children
also experience fewer changes of residence. Due to this lesser
mobility, it is felt that they have a more homogenous exposure
to air pollution over relatively long periods of time.
Not only are children considered a more convenient group to
study but they appear to be at greater risk of respiratory problems
that might result from air pollution exposure. Presumably this is
due to a greater degree of mouth-breathing, relatively greater
total volume, and a higher frequency of respiratory tract infections
than in adults.
Probably the most important reason children have been studied
so extensively recently is the ever increasing concern about
\\7hether early childhood respiratory illness increases the likli
hood of respiratory disease.
A major study giving substance to this concern was conducted
on respiratory disease in National Servicemen from the United
Kingdom (Rosenbaum, 1961). It was found that the incidence of
respiratory disease in these men was correlated with their home
localitjes before cilJ.l-up. Serviccment from indu.:;trial areas
appeared more susceptible to respiratory diseases than those
from rural areas. Other studies suggest that environment in the
carly yeClrs o[ life can contribute to the development of chronic
respir~tory disease in lat0r liCe (Eastcart) 1956; Dean, 1964;
Bolland, ] 9CJ9)

19~)
Hemy ,J II tho r s it Ll vee 0 n tencl e c1 t hat Cl C 11 i 1d 'IV i t 11 f r e que n t
rcspirCltury disease episodes will outgrow this condition in
tilDe. Hanlett and 1'1air in their study of "catarrhal" children
reached no conclusions due to small sample sizes, but the trend
did point to a positi.ve correlation between the "catarrhal"
child and the adult \,lith bronchitis (Harnett and Nair, 1963).
Although Lhe association be.t\·leen the "catarrhal" child in the
adult with chronic respiratory disease has not been established,
the evidence thus far has greatly increased the interest in any
factors increasing the incidence of respiratory illness in
children.
Over one hundred publication on the effects of air
pollutants on children have been reviewed by the American
Academy of Pediatrics (1970). The subject has also been reviewed
more recently (\{ehile and Hammer, 197 Lf). It is interesting to
note that the major pollutant incriminated in the mining of
copper was arsenic, although no clinical findings were associated
with its presence. Clinical and laboratory findings associated
with 502 and particulates included as increase in respiratory
infections, headaches, nausea, impaired ventilatory function,
anemia and related acute episodes of asthma.
1. Mortality Studies
Acute episodes of air pollution have long been associated
with increased numbers of deaths within the affected population.
In the past it \vas thought that these excess deaths occurred
mostly in the older aged component of the population. However,
in the four day London fag of 1952, Logan demonstrated that
excess deaths do occur in children when exposed to high levels
of pollution (Logan, 1953). He found that the mortality of
new-born infants almost doubled, infant deaths more than
doubled and deaths of children rose by one third during that
four day fog.
~lore re.cently, Greenburg investigatE:\d an BCllre episode in
0: l::VI Yo r k CJ t Y d urin g, J (J nLl.:J r y 29 - Feb r u a r >T 12, 196] ( Gr e e n bur g ,
1967). He found no significant excess of de.:lths of neh'-born
in :f ant s (c 2() dayso] d) \.,r h c· nco[II pCl n'd \-7 i t h t h (= same per10din
thE' con l r 0 1 y C ~l r S 0 f "[ 9 6 J-- 1 9 65 )
Hort.ality has also be::CTI used a;~ <111 indicator of air
pollution effects bc.L\\!Ccn and \'11thin cities over periods of
"nonnal" pollution lc.vel s,
Sprague and Hagstrom studied fetal and infant mortality in
Nashville, Tennessee for five years (Sprague and Hagstrom, 1969).
Dustfall alone or as an interaction variable \'7as most frequently
associated with white fetal and infant mortality. Sulfation
was correlated positively (r=+0.704) and socio-economic class
negatively (r=--0.5) '1ith \'.7hite but not with non--white infant
mortality.
These findings were confirmed by Collins in his study of
child mortality in England and Wales (Collins, 1971). Infant
mortality (0-1 years) was associated with domestic and
industrial pollution as measured by fuel consumption. Low
socio-economic class, low education and high population density
were also correlated with infant mortality. The ages, 1-4 years
showed this same correlation but the association was much weaker.
Children age 5-14 years showed no correlation between mortality
and these variables.
In order to examine the relationship between sudden infant
death syndrome (SIDS), a cause of dealth in children 1 week to
1 year of age and SOZ' Greenberg studied 942 deaths from SIDS
over a four year period in Chicago (Greenberg, 1973). Autopsy
reports, records describing the nature of death and data on
the death certificates were reviewed to determine all sudden
and unexpected deaths that occurred among infants 7 days to 1
year of age. The relationship between S02 concentration and
SIDS \'7as determined by cornpcu-jng tb(~ estimated SOZ levels in
the community \vhere the. death occurred \Vith SOZ levels 7 days
and 14 days, before and after the dealth, within the same
community. Further co~parisons were made in order to determine
\vheLher S02 levels Ivere higher one or t\W days prior to the

,_ii/
191
occurenc c of l he dea t h~;. No reIn l ionshi p be t\'Il'C:'1l SO 2 level s
and SIDS \-/cIS found. An inverse relationship bel\vecn tc.::mperattlre
and SIDS \'/Cl s found in thr ee of the yeCl u::; of study. Thc~ Clll thor
pointed out the possihlility that other pollutants, such ClS
oxides of nitrogen, carhon monoxidc,and suspended particulates,
\vhich \'7ere not meClsurec1, might be correlated \-lith SIDS.
In 1974, Hunt and Cross studied 66 infants \,/110 died before
they reached 1 year of age (Hunt and Cross, 1974). A live
infant, born in the same hospital as the one \-1ho died \.;ras
chosen as a control subject, matched for sex, race> and mother's
age group. The two groups of infants were found to have
experienced similar disadvantageous conditions of pregnancy and
delivery whi~h contribute to the increased risk of death for
the neHborn. Among the infants that died, more ,;{ere born during
three months of high p~llution (53-80 tons/mi/mo-dustfall, 1.5
6.5 microgms/so 2/rn 2/clay-Sulfation rate) than the other nine months
combined. The authors proposed that exposure of the pregnant
mothers to high levels of pollutants was possibly related to
fetal death. Important information was omitted such as
occupational history of the mother, educational attainment,
nutritional assessment,.2.nd, more importantly) the mother's
~moking habits.A summary is presented in Table 12.
2. Morbidity Studies
One of earliest community studies specifically considering
children took place in an industrial center in the USSR
(Yangsheva, 1957). High pollution levels were associated with
an increased frequency of disease of the respiratory organs,
the nervous system, skin, and lowered resistance to infectious
disease. High pollution levels were associated with low
hemoglobin levels in children. Kaplin confirmed. this finding
in Czechoslovakia (Kaplin, 1963).
Also in the USSR, ~lanzhen1:o associated bigh pollution~ 3
levels (s~:okc--] .87-6.!~ :~·,;~/l::..J; SO::tO.1 L--l.99 mg/PI ) \\-ith inet-cased
ll)('idcII\'c' l)] upjl('r rt-,:,pi::(,t'--'l1_-~' tLll't illfL't'til1n:=; c~nd a higher
incidence of pulmol1c1ry condition:::; Ul.:JIl%ht)l1ku, 19(6).

TABLE 12
EPIDEl,HOLOGIC STUDIES ON THE EFFECTS OF S02 AND PllliTICULATES ON CHILDREN AS HEASURED BY MORTALITY
E:~osure
ResultsOtherS02ParticulatesHc=thod.AreaPopulation)ur;~:e .l..
) r a~;U21d::.gst~roIJ.
j 69
C';c'r-"';
~l year olds NashvilleTenn.
1) mortality (5 yr)2) census tracts
Not stated 24 hr.0075 ppmSulfation.224 mg so,d100 sq ern/day
Dustfall7.305/sq mi/moSoilin0;-=s94COHS/1,000 ft
1) white infant (1-11 rno) deathpositively correlated withS03 (r = 0.704)ncgatjvely \olith socioeconomicclass (r = 0.52)
2) white neonatal (~28 days) deathpositively correlated withdustfnll (r = 0.491) negativelywith socioeconomic class (r =0.455)
3) neonatal (~'l day) deaLh is result of interaction of dustfalland socioeconomic class(r = 0.648)
4) no significant rclntionship ofnon-white mortality withvariables measured
cecLburg 1 '\vk - Cook 1) mortality from)7~ 1 yr County SIDS (L~ years),Ii ...J
942 Illinois 2) meterologicalchildren data
~r.t 66 Dauphin 1) monthly reports:-058 Latched County of mortality 1970)74 p2.il~s of Penn. 2) climatological
children and census data.( 1 year old 3) clinical records
1) domestic pollution2) industrial pollution3) power stations (supposedly
correlated with S02 level)
more deaths occurred during JulyAugust, Sept. - high pollutionmonths
2) geographic location associatedwith increased risk of death
3) exposure of pregnant mother tohigh pollutants 'sialy xe12Lc'c! Cn ll'[ 11 ,I
0-1 year deaths correlated with1) high domestic pollution (r =
0.583)2) high industrial pollution (r
0.448)3) low social class (r = 0.510)4) high population density (r
.404)5) low education (r = 0.494)1-4 year much weaker correlation5-14 year no correlation
Not stated 1) inverse relationship betweenSIDS and temp.
2) do not show that SO? levelsaffect SIDS -
Dustfall 1)18-28 tons/m2 /mo60-80%insoluble
Range duringJuly-Sept.sulfation1.5 - 2.61Jg/ S02!m2/ .day
Heasured butno data given
Suspendedparticulates24 hours33-1401J2;/m2
Not measured
1) mortality1958-1964
2) social data1951 census'
83 countyboroughsin Englandand 1>Ja1es
aIds0-14 year)llins
j7l

"
193
The sc:nlle y C.:1 r, a Br it ish s t uc1y was puhI is hed \<Jhich lws
become one of the most cited studies in the literature on
air polltltion and respiratory disease in children (Douglas
and Weller, 1966). In this study, a group of children were
followed from birtll in the first week of March, 1946 to
their leaving school in 1961. Information on upper and
lower respiratory illness was obtained by health visitors
during interviews with mothers when the children were 2 and
4 years of age. School doctors obtained further information
on illness during special examinations of the children at
8, 7, IJ, and 15 years of age. Assessment of the air pollution
levels (very low to high) was made on the basis of domestic
coal consumption in 1952. These estimates were later compared
with the levels measured during the year, 1962-1963. The
concentration of pollutants showed the same increases from
area to area as was predicted from coal comsuption data. Air
polution estimation from coal consumption would appear to be
adequate, at least for establishing a gradient of air pollution
exposure. The results of the Douglas and Waller study showed
that the frequency and severity of lower respiratory tract
infections increased with increasing levels of pollution.
These results were later confirmed in another British
study examining 5 year-old Sheffield school children in four
areas of varying pollution (Lunn, 1967). However, Lunn also
found a relationship between upper respiratory tract infection
and increasing pollution, as did }lazhenko. This conflicting
result may be due to the fact that in Lunn's study actual
pollution data were gathered while Douglas and Waller estimated
pollution levels from coal consumption.
A follQ1.\T-up study of these Sheffield children '\vas done
four years later (Lunn, 1970). Data on 11 year-old children
examined at the same time as the 5 year-olds in the original
study \\'ere included here for comparison. At the time of the
c:---igin:ll study it \\TClS found that the 11 ye.1r-olc1s had a 10\ver
p~cv~l~ncc of respiratory illness than tIle 5 year-olds.

.,1'
H0 \''1 ever, L11esc S ;] 1lI Q 5 YC<"l r _. 0 1. dsse e L1 f 0 uryea r s 1 Cl t e r, \vhen
they 'ii/ere nine, h,\(J less respiratory illness than the 11
year-olcls had in the original study. This Clppeared to
correspond to the decre~sing levels of air pollution over
this period. Smoke decreased from 30 microgms to 169 rnicrogms
and S02 decreased from 275 microgms to 253 microgms in the
heavily polluted area. However, the differences in respiratory
illnesses may well be due to recall problems as 48.4% of the
5 year-olds in the original study ,vith history of pneumonia or
bronchitis disclaimed these diseases four years later.
A follow-up study of the same cohort of children involved
in the Douglas and Waller study supported the hypothesis that
exposure to air pollution and adverse social class conditions
increase the risk of having 10'iver respiratory tract infection
in early childhood (Colley and Reid, 1973). However, at age
20 smoking was shown to be the dominant risk factor with air
pollution exerting a non-significant influence when other
factors were accollnted for. Like the Douglas and Waller study,
domestic coal consumption was used as an estimator of air
pollution levels.
In a pilot study conducted in three to\ffi in British
Columbia, Anderson used school absenteeism and lung function
tests in order to measure possible health effects of emissions
from a large kraft pulp mill (Anderson, 1966). There I-ias a
reduction in peak expiratory flow rate among the 1st-grade
students in the more polluted areas. These children also
experienced more frequent and longer lasting respiratory
illnesses along with certain other illnesses such as inflamed
eyes, headache, feverishness,and nausea. The association
between these symptoms and air pollution could not be
established as the tontrol town fell between the two polluted
t O\l1nsin the inc idenee 0 f the secand i t ion s . Et h n i c d ifferen c e s ,
living conditions, 2nd family size may explain the differences
b(-'t\vccn to\vns.

l':'
Fillklca conducted proE;pcctive surveys of respiratory
diE3C'tlse in volunteer [~1m:i.lics \'lith nursery school children
age 2--5 years in Chicago. The fC:llnilies \\Tere called once every
two weeks and asked about the presence of illness, fever,
respiratory symptoms, restricted activity, and otitis media
diagnosed by a physician, and other physician consultation
visits. Standard questionnaires were used by trained
interviewers to obtain the information. No information was
given about those who did not volunteer. Individuals living
for more than 3 years in areas of high pollution (802=107 to
250 microgms/m3
; total suspended particulates=137 to 165
microgms/m3
) showed significantly higher rates of acute
respiratory illness over those living in less polluted areas
(802=109 to 130 microgms/m3
; total suspended particulates- 121
to 123 microgms/m3). Restricted activity and otitis media were
also significantly higher among individuals in high pollution
areas. Cigarette smoking among mothers seemed to be related
to increased susceptibility in the youngest preschool children.
A similiar study \vas conducted in Ne\v York CHE8S communities
using volunteer families \vith at least one child twelve years
or younger who resided withing 1 to 1.5 miles of an air
monitoring station (Love, 1974). Acute lower respiratory
tract illnesses \.;rere significantly increased among families
exposed to elevated levels of air pollutants (802=256 to 321
microgms/m3
; total suspended particulates=97 to 123 microgms/rn3
;
suspended sulfates=lO to 15 microgms/m3
) for two to three years.
Residential mobility, socio-economic status, cigarette smoking
in the horne, and family history of chronic bronchitis all ~ere
found to be determinants of respiratory disease in children;
but these did not account for the total differences in illness
rates associated with differences in air pollution exposure.
Effects of nitrogen dioxide and elevated suspended
particulate exposure on respiratory illness were examined among
f,'lnili.c's \,:ith SC:,,'l)!l(\ gr.:lde children in 2 study conducted in
Chatt':lnoog;J. (Sh~', 1970). Respjratory ilJ ness rates \'7e1'e

cOl1:cds t :111 tly higher in t: he exposed arca~;. ILL f [crcncQs could
not be explClineci by economic level, fcunily composition, or
prevalence of chronic conditions. Therefore, nitrogen
dioxide exposure alone or exposure to elevated suspended
particulates alone was proposed as being related to
increased respiratory illness. Parental smoking habits did
not appear to affect tile illness rates in the second grade
children.
Of particular interest are two studies conducted in four
CHESS. communities in the Salt Lake Basin and in five comnn:nities
of the Rocky Mountain area (Nelson, 1974, Finklea, 1974).
In the Salt Lake Basin, the communities exhibited sirnilar
particulate and S02 exposures but varying S02 and suspended
sulfate exposures. The primary source of S02 was a large
smelter located five miles northwest of the high exposure
community. Past pollution levels were estimated from
monitoring and emmission data vtith consideration of meteol."O-
logic factors. Although these estimates are not precise
;1"
they are useful for determining annual average exposures to
pollution. Information on respiratory illness was obtained
through questionnaires sent home with elementary school
children and mailed to the parents of junior and senior high
school children. The response to the qllestionnaires was 67%.
Samples of nonrespondents seemed to indicate no difference
between the two groups, but this may not have been sufficient
to rule out bias. Frequency of single or repeated episodes
of acute lower respiratory illness, bronchitis,and croup
increased (40 to 50%) after exposure to elevated levels of
502 (91 microgms/m3) and suspended sulfates (15 microgms/nl3
) for
over three years. These levels Ivere found only in t11e high
exposure communitv near the smelter. PClrental s;;;oking \-las
found to increase in incidence of bronchitis and pneumonia
among their children. The tlllO most pO\,J(~rfLll det(>rm:Lnanls of
illness I~rere age and history of asthma ,,;hi.ch I'Jere controlled
for 1. II :1 S S l' S sin g the c f f e c t S 0 f air poll II t ion.

),1'
J. ':J I
In D. very simi l.-u" ~; tllc1 y, five communi t ie's in the Rocky
Hountain tlrea \V"cre selected and ranked as high or 10\>7 on thCJ.
basis of their estimated exposure to S02 during the study
period 1967-1970 (Finklea, 1974). Anaconda, one high
exposure community, has been the site of a large copper
smelter since the end of the Jast century. Kellogg, the
other high exposure community, has been the site of a
lead smelter for over 76 years. Questionnaires were sent
home wi th the school children \vith ins tructions for their
mothers to give respiratory disease information on all
children 12 years of age or younger. Information was
requested for the previous 3 years. This study found
significantly greater incidences of acute lower respiratory
disease among asthmatic and non-asthmatic children who were
exposed to estimated annual S02 levels of 177 microgms!m3
and suspended sulfates 7.2 microgms/m3
, accompanied by low
estimated annual average levels of particulates (65 microgms/m3
)
for three or more years. The t\vO high pollution communities
studied were definitely less well educated, experienced more
household crowding, and the parents were more likely to be
cigarette smokers than those from the 10\~7-exposure communities.
Socio-economic adjustment l\las made bet'·Ieen communities, but
no adjustment was made for smoking differences.
Despite the problems inherent in this second study,
duplication of results tends to give validity to these studies.
Other studies have confirmed the association between increased
respiratory disease with increasing levels of air pollution
(Paccagnell, 1969,~Zeidberg, 1964, Mountain 1968, Yoshida, 1974).
Hountain found a positive C1ssociation bet\\leen the prevalence
of respiratory symptoms and of particulate matter and CO
among children under 8 years of age in the east side of New
Your City. The prevalence rate of bronchial asthma has been
positively correlated with concentrations of S02 in Japan
( Yo s hida, 1 S'7 L. ) •
Paccagnella performed daily examinations on school
children, ages 7-12, in Ferrara, Italy and found that acute
respiratory disease \\'.:1S related to smoke and S02 and to
198
temperature and humidity (Paccagnel1a, 1969). He felt that
the influence of climatic factors was greater than that of
a:lr pollution factors.
Along slightly different lines, several studies have
focused on the affect of air pollution on emergency room
visits and hospital admissions for respiratory disease.
These studies deal not so much with the incidence of
respiratory disease as with the severity of the disease.
In order for these cases to be detected, respiratory symptoms
had to be sufficiently bothersome to require a hospital visit.
Another important consideration is the affect of weather in
precipitating an attack of asthma which often brings a child
to the emergency room. It is knolVTI that sudden changes of
temperature and barometric pressure cause more attacts than
a slow drop over several days.
A three-fold greater incidence of asthma as measured by
vi~its to a particular emergency room has been associated with
high levels of air pollution (particulates, approximately 130
220 microgms/m3
(Girsh 1967). In this same study a four-fold
increase in incidence of bronchial asthma occurred during
days of high barometric pressure. On days of high pollution
and high barometric pressure a nine-fold increase in bronchial
asthma attacks occurred.
Emergency room visits for all respiratory symptoms \Vere
compared lvith ambient 802 levels during a week includent three
days of an acute pollution episode in New York, the week
before and the lveek aftenvards (Chiarmante, 1970). There lvas
a significant rise in obstructive symptoms associated lvith
a rise in 802
levels. This increase in respiratory symptoms
\vas most marked 72 hr. after the peak 802
level (0.8 ppm).
This may be due to a lag between 802
levels and respiratory
symptoms or may just reflect a reluctance of the patients to
seek medical attention over a holiday (the day of heaviest
pollution fell on Thanksgiving). No data lvere given on
weather or on other pollutants.

1 CjC)
Smoke shade and sulfur diuxide levels were compared to
patient vis its [ 0 r 8 s t hmCl to an e ITl c: r g enc y roomin Bra 0 k1y n )
New York (Rao, 1973). The number of patient visits did not
vary with 502 levels and they actually decreased with
increasing levels of smoke shade. The lack of association
with S02 may well he due to the low levels of S02 (.099 ppm)
recorded during this study period in contrast with Chiarmonte's
study where S02 levels were rather high (0.8 ppm). Only
changes in pollution levels and in number of visits were
analyzed. Actual levels of pollution were apparently not
considered. Another shortcoming with this study was the lack
of temperature data.
In a comparison of two areas of contracting air quality,
a strong correlation existed between the number of daily
visits for asthma and daily levels of 502 in the area of
supposed lower pollution levels but not in the area of
higher pollution levels (Goldstein, 1974). No data on the
actual levels of S02 and particulates were given, only ratios
between the two areas. A strong relationship between asthm~
visitis and the first cold spells of fall were noted in both
cities. Similiar results were obtained by Ribbon who found
change in temperature to be related to changes in asthma
visits to a New York Hospital (Ribbon, 1972), The authors
felt that S02 itself was not the causative agent of increased
asthma attacks but 'ivas. associated \-lith some other confounding
variable. The conclusion was based on the fact that S02 was
not consistantly associated with the increased attacks of
asthma.
Greater hospitalizations for 8sthma, eczema,and croup
syndrome have been associated with increased air pollution
(Sultz, 1970; Emmerich, 1972). Sultz found no relationship
between hospitalization for astllma and eczema and socio
economic class. Tllere was a consistRnt relationship between
higher hospit.alization rat.es and higher levels of air
polJution \vithin each social class. Emmerich noted an

20(1
increase in croup cases, maiuly in infants, ~len the S02
concentrations were 110-80 pP]1, \Vhile levels over 80 ppb
appeared to be promoting the onset of disease.
A number of studies have used lung function measurements
to determine impaired health. In a \ve11 knmvn study by
Toyama, 10-11 year-old school children in Kawasaki and Tokyo
were found to have lower mean peak flow rates in areas of
high pollution than in areas of low pollution' (Toyama, 1964).
Holland studied 10,971 children in four areas of Kent
using a questionnaire on past respiratory illness and an
examina tion \vhich included measurement of the peak
expiratory flo\v rate (Holland, 1969). Peak expiratory flow
was affected by the level of pollution (as categorized by
place of residence), the social class, the family size,and
a past history of pneumonia, bronchitis or asthma. These
four factors were found to act independently and additively.
H00ever, these factors only accounted for 10-15% of the
total variation. This may mean that host factors playa
greater role in air pollution effects.
No relationships between lung function values (mean Raw)
and environmental factors were found in the 14 year-old school
children from three districts ~f Budapest (Mandi, 1974).
Based on the homogeneity of Raw values and questionnaire
results for the three school classes, it \Vas concluded that
respiratory function values, respiratory complaints,and
respiratory s)~ptoms were not affected by the prevailing
level of air pollution. It l1lust be noted that the levels of
air pollution \Vere low (802=0.1-0.9 rnicrogms/m3
, dustfall
38 g/m2
/mo.) compared with other studies.
In a survey of 1,000 children from two areas of Rotterdam,
one \veal thy and unpollu ted and the a ther poor and poIlu ted,
differences in the peak flow rates were primarily due to
differences in height and \veight bet'i'leen the t\·;o communities
(Bierstaker, 1970).

201
School absences and lung function as measured by FVC
an c1 FE V1 \,f(~ r c used to study p (> 11uti0 11 e f fee t son fir s t
and second grade children in seven schools in Berlin,
New Hampshire (Ferris, 1970). School absences and
respiratory illness \,Jere apparently not affected by air
pollution. This may have been due to the fact that some
of the children did not live close to their school and had
been assumed. Pulmonary function tended to be lower in
those children living in an area of high S02 (491 microgms
S03/l00 cm2
/day) and particulate pollution (43.2 ton/m2/30
days). The study suggests that the main contribution to
this effect of the pollution is the amount of particulates
in the air.
Mostardi compared 42 male high school students from an
urban industrialized area with 50 male students from a rural
area in Ohio on the basis of measurements of vital capacity
(Ve), one-second forced expiratory volume (FEVl
) maximal
midexpiratory flow (}ffiF) , and maximal indirect oxygen
consumption (V02max) (~~stardi, 1974). These students had
been studied three years previously on the basis of ve and
FEVO
.7s
' Over the 3 years, air pollution levels decreased.
During that time the FEV values improved, but ve did not.
HEF rates shO\ved no significant differences betHeen the t\VO
areas. ve ~nd VOx max values were significantly lower in
the more polluted area indicating that there could be some
permanent impairment of cardiopulmonary function as a result
of concentrations of S02 and particulates that were slightly
above then current U.S. standards. This study is of interest
because of the use of the measurement of V02
max which is
not usually considered. It has been suggested that the
differences in V02
max may have been influenced by the lack of
routine exercise in the urban group although participation in
orgainized sports seemed to be similar between the two groups
in the study. Potential criticisms of the study included
the relatively small numbers studied, the lack of analysis of
data on cig~1rt:.'ttl:' sffit.king ell.though such data \·,rere apparently
collected, and the conceivable difference in urban-rural us~
,,'
202
of non-tobacco cigarettes (Air Quality Statistics).
During emergency levels of particulates in Pittsburgh,
Stebbings investigated the effects pollution had on lung
function values (FEVO
.75
and FVC) among fourth to sixth
graders (Stebbings, 1976). As pollution levels dropped,
lung function values would be expected to improve in those
areas that had experienced high pollution while remaining
the same in the control: areas. This did not occur. In
fact, pulmonary function values declined slightly over
the 7 day test period. Small peTIlanent effects on lung
function could not be detected in this manner; to do so
would require measurements before the episode. There is
also the possibility that a longer period of study is
required in order to observe improvements in lung function.
This study was also unable to detect effects that reversed
in less than 48 hr.
As a part of the CHESS program, Shy conducted ventilatory
function tests (FEVO
.75
) on 2,364 New York schoo~ children
four times during the 1970-71 school year (Shy, 1974). Age,
height, socia-economic status, ethnic factors, migration
history, temperature, exposure to indoor air pollutants and
to pollutants not monitored, and concurrent respiratory
disease were factors that were taken into consideration.
Shy observed that children 9-13 years of age exposed to
estimated annual average sulfur dioxide levels of 131 to
435 microgms/m3
, levels of suspended particulates estimated
at 75 to 200 microgms/m3
, and suspended sufates estimated at
5 to 25 rnicrogrns/rn3
for a period of eight or more years showed
significant decreases in FEV.7S
' This was not observed in
younger children age 5 to 8 years.
Ventilatory function as measured by FEVO
.7S
was also
determined for children attending 12 different schools in
Cincinnati (Shy, 1974). Sulfue Dioxide levels were low in
all arCQS studied with an arit~netic mean of 52 microgms~

2cn
The 0 b s e r v t~ cI a [" e J d:i f f (l r l-' nc c:' S \ 'I ere d E' C UH:~ d [l s pro b a b 1 y
due t.o differences _in i3u~;pcndC'c1 particulClt:es suspended
suf a tes or susp end ed n j t Gl tes . Since yen t i1a tory
performance varied st with variation in suspended
sufates in all racial and socia-economic groups, the
differences in FEVO 7 c were attributed to suspended. -)
sulfate concentrations.
Riggins and Ferris criticized both the New York and
Cincinnati ventilatory function studies conducted by Shy
as providing unconvinc evidence that differences in
pulmonary function in school children were due to
differences in exposure to air pollution (Higgins and
Ferris, 1974). Various inconsistencies in these studies
\Vere pointed out and they concluded that "random scatter
seems to be a much more likely explanation than air
polution for these differences in lung function."
In another CHESS study conducted in Charlotte, North
Carolina and Birmingham, Alabama, ventilatory lung function
was used to compare the effects of air pollution on childre~
(Chapman, 1974). FEV O.75
was found to be lower among children
from Birmingham which had higher levels of RSP (35% higher),
TSP (34% higher), and suspended sulfates (25% higher).
However, S02 levels \'7ere lOvler in Birmingham than in
Charlotte. This finding led Chap~an to attribute the lower
lung function values to exposure to particulate pollution.
Of particular interest is a study conducted in a
southern Arizona copper-smelting and mining tO~ffi and Tucson,
Arizona, ~\Thich investigated the' effect of air pollution and
excercise on lung function (Lebowitz, 1974). Three groups
were chosen: a group of 60 male and female white middle class
fifth grad st.udents h81f of ~.;ho;-:: ~vere to excercise outdoors
in Tucson; a group of 30 r.lalc~ SI.X to t'.,:elve year-old \vhite
10~'7er and midd 1(' c lass ~lex ican-,,\mer iea ns to excerc ise
indoors in TucE;on; clnd a grOL!p of 17 six to t\\7C'lve yE'ar--old

"I'
white lower and middle class Mexican-Americans to exercise
outdoors in the mining to\vI1. The oLltdoor exercise group
in the mining town and the indoor group in Tucson were
engaged in the same activities while the outdoor group in
Tucson I·~as divided into control (no excercise) and
exercise (played as they usually did). In general, type
or degree of exercise, eating lunch,and ethnic or social
status was found to have no effect on lung function values.
It was assumed that air conditions indoors reduced pollution
to a level where it would have no effect on the children.
The actual levels of pollution indoors were not measured.
Healthy children in the mining tOlVTI experienced decreased
lung function values on the 2 days of high pollution before
exercise. These values decreased even more after exercise.
Values of FEVI
.O
and FVC showed consistant decreases after
the lunch-exercise period on high pollution day. No
differences were found between subjects with or without a
history of respiratory disease. No statistically different
results were found between the light and heavy exercise gro~ps.
Unfortunately no monitoring data on air pollution level ",olere
given.
One concern mentioned in several studies has been the
contribution of indoor air pollution to a person's overall
pollution load. Love suggested that indoor air pollution
caused by the domestic use of gas for cooking might be
important in acute respiratory disease in children because
of the association of cooking gas with nitrogen dioxide,
a pollutant that supposedly alters susceptibility to
respiratory disease (Love, 1974).
The importance of the indoor environment in air pollution
exposure has been investigated (Binder, 1976). Portable
personal air pollution samplers were used to measure the
exposure of twenty male children to respirable particulates,
sulfur dioxide, and nitrogen dioxide. over a 2Lr hour period.
Half had respiratory disease and half were normal controls.
Of P tl r tic u 1 i1 r s i g n if i canc e 1\"a s the f c.l C t Lh.:1 t 311 c h :L 1d r en
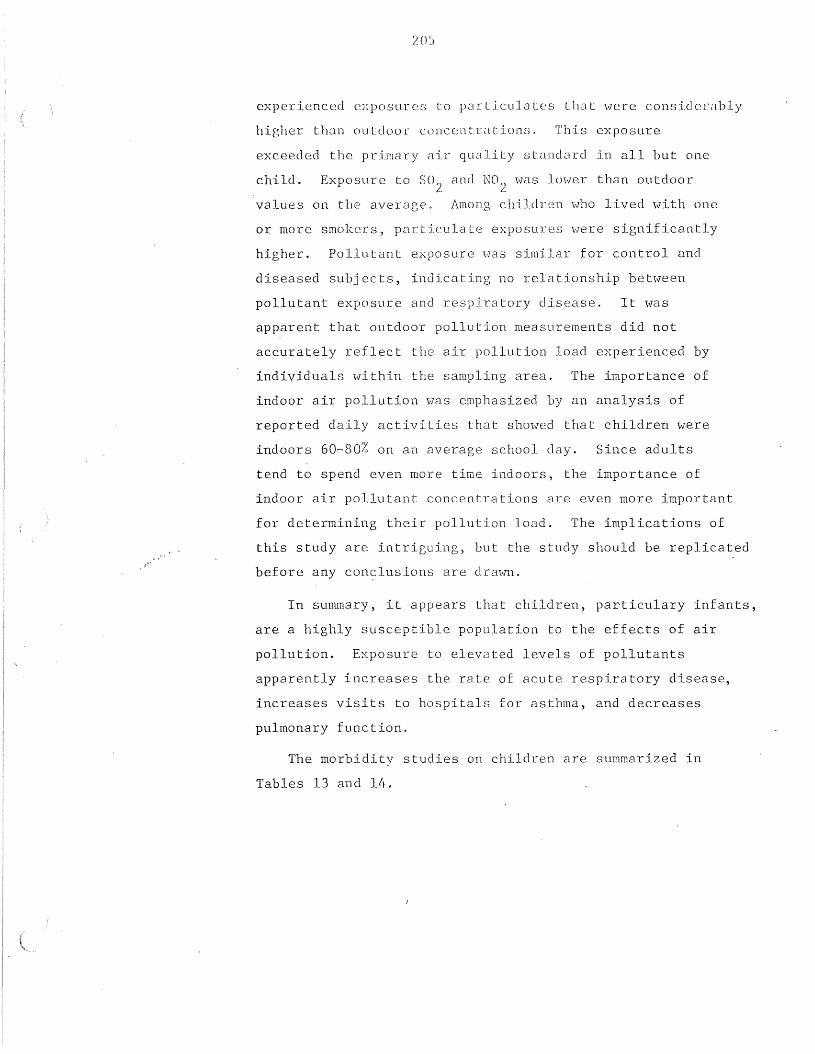
,OJ!'
205
experienced exposures to p;:lrticula tes that Here considerably
higher thun outdoor concentrations. This exposure
exceeded the primary air quality standard in all but one
child. Exposure to S02 and N02
was lower than outdoor
valu e son the a v e r Cl g e . Amo n g c 11 i 1 cl r en IVhoI i v e cl \\Ji thon e
or more smokers, particulate exposures were significClntly
higher. Pollutant exposure was similar for control and
diseased subjects, indicating no relationship between
pollutant exposure and respiratory disease. It was
apparent that outdoor pollution measurements did not
accurately reflect the air pollution load experienced by
individuals within the sampling area. The importance of
indoor air pollution was emphasized by an analysis of
reported daily activities that showed that children were
indoors 60-80% on an average school day. Since adults
tend to spend even more time indoors, the importance of
indoor air pollutant concentrations are even more important
for determining their pollution load. The implications of
this study are intriguing, but the study should be replicated
before any conclusions are c1ra\Vl1.
In summary, it appears that children, particulary infants,
are a highly susceptible population to the effects of air
pollution. Exposure to elevated levels of pollutants
apparently increases the rate of acute respiratory disease,
increases visits to hospitals for asthma, and decreases
pulmonary function.
The morbidity studies on children are summarized in
Tables 13 and 14.

Table 13
. -
EPIDEHIOLOGIC STUDIES ON THE EFFECTS OF S02 AND PARTICULATES ON CHILDREN AS HEASURED BY HORBIDITY
Exposure
ResultsOtherS02ParticulatesMethodour =2~e=-_~~:.£~~~~~-.l.~~~ 1i~~~~ .J~~~~~~~~__--...:=- ~~~=- -.::..~~~::;:::..- _UNITED STATES
Nitrogenoxide, COoxidantsSettleddustHeavypollution50-75 tons/sq rni/mo
irS~1
9671,346asthmaticchildren
St. Chris- 1)topher 1 sHospitalPhiladelphia
total number ofasthmatic patientscoming to hospitaloutpatient dispensary July-May1963-1965
Suspendeddust heavypollutionarea130-220 mg/melight pollution area70-120 mg/mc
Measured butnot stated
1) increased frequency of asthmaassociated with 1) highbarometric pressure 2) increaseair pollution
2) 9-fold increase in asthma ~·rith
high barometric pressure andheavy air pollution
fll2.::-
:7iOri ~ e,......,,;'j "
c'-l
3 TUO-
IS yearaIds83 c.hil-Grerl.
same.cohc1rt
LongIslandCollegeHospitalNe'i] York
1) ilis its to theemergency roomfor respiratoryproblems (3v7eeks)
2) allergy evaluations
Not stated Nov. 23-29episode.06-.8 ppmNov. 16-22.07-.26 ppmNov. 30-Dec. 6.07-.33 ppm
1) rise in obstructive symtomsassociated with rise in S02levels
2) rise more evident 72 hoursfollowing peak S02. level
9'0 c}lil-dreri

Exposure
ResultsOtherS02ParticulatesHethodAreaPODulation
SuL:z1970
ChildrenL:.lS yr old
4 areasdivided byair pollution, ErieCountyBuffalo
1) hospitalizationwith asthma oreczema
~80 - >135·lJg/m3
Not measured Not stated 1) consistent increase in hospita:ized asthma cases \.Jith increasing air pollution withinsocial class
2) incidence in asthma and eczemain boys.z:..S yr shOl.-7 greaterassociation with air pollu[ion
3) no relationship between socialclass and hospitalization
4) 3 times more hospitalized casel<5 yrs than 5-16 yrs.
tendedchangeasthma
1) the change in number of asthm~
tic visits appeared to be unrelated to change in level ofsmokeshade S02 or relativehumidity.
smoke shadet::...2. 0-)2.6COHS/l,OOOft. AlsoCO and oxidant measured
2)a change in temperatureto be associated with ain number of visits ror
<:..07 - ) .11ppm
Not statedvisits to theemergency room forbronchial asthma
2) hospital admissionsfor bronchial asthma
tal, NewYork
l'1etropoli- 1)tan Hospi-children
.L.!.;..;..S ttlmatic
;--CN
3.ibon1972
no change in patient visits toemergency room with varying SO,levels
2) number of patient visits decreased with increasing smokelevel
3) correlation between smoke shad,and S02 level (r = 0.46)
soiling 1)0-2.99 CORSi1,000 ft.
°- .099 ppm1) daily records of Not statednumber of patientsvisiting emergencyroom diagnosed asacute asthma attackcases Oct. 1970-March 1971
KingsCountyHedicalCenterBrooklyn,New York
1,742childrenmostlyblack orPuertoRican,101,' socioeconomicclass
Rao1973
Golj-stein197~
children<13 yearsold andadults
Harlem andBrooklyn,New York
1) number of visitsto emergency roomfor asthma Sept.Dec. 1970
no consistent relationship betweenareas seen inferred S02 levels werehigher in H~rlem (only comparisonbetween the two cities given).
1) increased asthma with coldweather
2) in Harlem no rise in asthmavisits vlith S07
3) high correlation between dailyS02 levels and daily visits tohospitals in Brooklyn (r = 0.51
4) more males than females withasthma (1.7x)

urce Population Area MethodExposure
Particulates S02 Other Results
uatain68
L:. 8 yr oldand adults(1,820)
lmver eastside ofNew York
1) interviewer ques- <1.50->2.01tionnaire (once COR unitsa 1;veek) 46weeks
<...10 -)2.01ppm
CO<3.0-)4.01ppmTotalhydrocarbons4.0 -5.01 ppm
1) prevalence of respiratorysymptoms in children directlyrelated to increasing levels ofparticulate matter and CO.In the summer not related toS02 and hydrocarbons
2) respiratory symptoms moreprevalent in young childrenthan in adults but headacheand eye irritation more prevalent in older group
:/70
co.....-C';
968 2nd 4 areas in 1) bDveekly post-grade chil- greater cards inquiringdren and Chatta- about illnesstheir nooga followed upi2~ilies by telephone(~043 interview forindivi- 24 weeksdual)
one area hadelevatedparticulatelevels
two otherareas vJ(:recontrolsno datagiven
one areaelevatedN02 levels
1) excessive acute respiratoryillness among families of thehigh N02 area
2) illness rates peaked duringA
2/Hong Kong influenz~ epi
demic and influenza B epidemic.A consistent excess in respiratory illness was reported inthe two exposed areas
3) parental smoking habits did notappear to influence respiratoryillness rates of 2nd gradechildren
rris70
716 1st and2nd gradersJan-June1966692 1st and2nd gradersSept.-June1967all white
7 schoolsin BerlinNew Hampshire
1) absences fromschool fol1owup \vith aquestionnaire
2) lung functiona) FVC Hright's
peak flowmeter
b) FEVI SteadWells
spirometer
4.86-22,55tons/mi 2/30 days/per24 hours
206-619llg/lOO cm2
dustfall13.4-43.2tons/mi2 /30 days
1) pulmonary function could beassociated with pollution
2) particulate concentration mightbe as important as S02 concentration
3) school absences might not bea sufficiently sensitive indexof the effects of air pollution

Exposure
Sou::-ce Population Area Nethod Particulates SOz Other Results
l-fos ~.:ardi j r. high1971,c school
students1970
Barbertonand RevereOhio
1) pulmonarytion test
a) VCb) FEVO. 751970
func- TSPlow - high76.85 - 109.34llg/m3/24 hours
low - high.809 - 1.046llg/SOZ100 sq em/day
dustfall10'"" - high5.4 - 30.9tons/sq. milmo.
1) VC and FEVO. 75 lower in highpollution area
dustfalllow - high10.3 - 18.3tons/sq. milmo.
\...-1 ~
oN
same cohort92 16 yr.old males1973
subsample of30
1) interviewZ) pulmonary func
tion Collins 9liter spirometer
a) VCb) FEV1.Oc) MHF
1973
VOZ lyfAX1973
TSPIm.;r - high70.9 - 77.3J1.g/m3/24 hours
method formeasuringSOZ changedfor 1973and couldnot be usedcomparatively
1) VC lower in high pollution area2) FEVI.O can improve over a perioc
when air pollutants are reduced,
1) VOZ lower in high pollution are~
30 6-1Z yr TucsonH i>;rhite and indoors
air-conditioned building pollutants considered to be muchlower than outside valves
LeD Ciwitz197
60 5thgradersNand FHhiteniddleclass
i-lex. -fuller.lower andmiddleclass
Tucsonoutdoors
1) portable pneumotachygrapha) FVCb) FEV
I 1.0'-t conSeCUl:lVeThursdays in spring
1) Collins 13.5 1spirometera) FVCb) FEVl 0c) IvlMEF"
Monday and Friday for5 weeks in summer
85 - 107llg/m3
Not stated Sulfate2.9 - 3.9
llg/m3
1) FEVI 0 and FVC sign decreasedafter exercise on high pollutiordays
2) lung function decreased to agreater degree when temp. andpollution greater
1) external air pollution and temp,did not affect lung functionwith exercise
2) ethnic group, soci~l status,and respiratory history did notappear to affect lung function
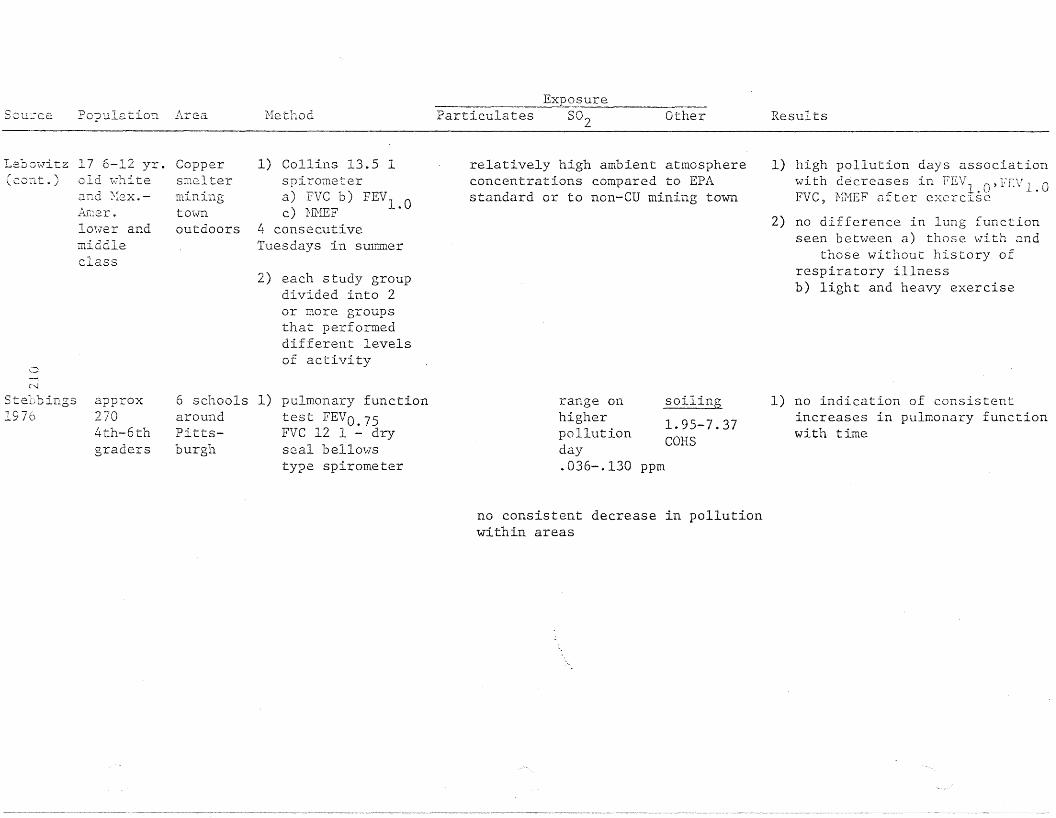
Sou:ce Population Arc:.a rlethodExposure
Particulates S02 Other Results
17 6-12 yr. Copperold ~hite smelter
Leomvitz(CO::lt. )
o~i
and Nex.-fu-:1er.
10l.;er andmiddleclass
miningtOlro
outdoors
1) Collins 13.5 1spirometera) PVC b) FEV1 .Oc) l-frillF
4 consecutiveTuesdays in summer
2) each study groupdivided into 2or more groupsthat perfoT1Ileddifferent levelsof activity
relatively high ambient atmosphereconcentrations compared to EPAstandard or to non-CD mining town
1) high pollution days associationwith d~crcases in FEV1 n,fEVl 0. \.) .FVC, Hl1EF after excrClSC
2) no difference in lung functionseen between a) those with and
those without history ofrespiratory illnessb) light and heavy exercise
C"-l
Stebbings1970
approx2704th-6thgraders
6 schools 1)aroundPittsburgh
pulmonary functiontest FEVO.75FVC 12 1 - dryseal bello"\vstype spirometer
range onhigherpollutionday.036-.130
soiling
1.95-7.37CORS
ppm
1) no indication of consistentincreases in pulmonary functionwith time
no consistent decrease in pollutionwithin areas
Particul~tes S02~OUI~'c.e Population Area MethodExposure
Other Results
T~D KI:~GJ02'1
estimated levels frommeasurements in 1962
predicted fromdomestic coal consumption
low - high Im-l - high
\ ,_,_" ,-. -r __. r •...J,,--"' ~~ .-:...0.':;
~::,:J.
72.11.er-96E
r; oCr'..),0UO
childrenborn~\larch 1946
!J.- areasIn.Gre.atBritain
1) intervie\'ls withmothers ;;vhen child2 and 4 yr
2) medical exam at6, 7, 11, and15 yrs .of age
91 - j42l1g/m
148 - 249l1g/m3
Not stated 1) upper respiratory tractinfection not related to airpollution
2) frequency and severity oflower respiratory tract infection increased with amount ofair pollution
Sheffield 2)3)
~l.1n7"_
19 67
r--{
r-.~
~J
819 5 yrold children
4 areasof
1) parental questionnaireexamFEV FVC.75with Poultonspirometerover a periodof 3 summers
range mean daily levels 1964
97 - 301 l1g/m3 to 123-275 l1g/m3
1) upper and lower respiratoryillness associated \-lith areawhich reflected pollutionlevel (increasing withincreasing pollution)
2) social class, number o[ children in house (Ind sharing roomshad little influence on disease
3) FEV 7S FVC decreased in heavypoliution area only
4) past history of respiratorydisease associated with reducedFEV.75
:io11and 10,9711969 5-16 yr
aIds
4 areasof Kent
1) parentalquestionnaire
2) medical exam3) PEFR with
Hrights peakflow meter
winter months similar to1966-67 smoke levels(daily average)high pollutionarea 28-96l1g/mm3low pollutionarea 12-50llg/mm3
1) peak expiratory flow ratedecreases ""itha) increasing family sizeb) lower social classc) past history of respiratory
diseased) residence in areas of higher
pollutionthese factors act independentlyand additively

Jure·2- Population Area HethodExposure
Particulates 802 Other Results
lO~887
ud R2id 6-10 yr970 olds
urban and 1) questionnaire Not statedrural 2) examareas of 3) PEFR, Wright peakEngland flow meterand Wales
winter mean Not stated40 - 140llg/m3
1) respiratory disease showsgradient (increasing) with1) lower social class2) increasing air pollution
most evident in children of semiskilled and unskilled workers
2) upper respiratory illness notassociated with increasinglevels of pollution
3) ventilatory function notaffected by pollution
llT'1..TI
970N~
N
500 9 J~r
olds samecohortstudied in1967
1,049 11yr oldsas studied1967
4 areasof Sheffield
1) questionnaire2) exam3) FEV 75 FVC with
Poultonspirometer overa period of3 summers
range mean daily level 1968
48 - 169 llg/m3 to 94 - 253 llg/m3
1) 11 yr olds had less frequenthistory of 3 or more colds,cough and colds going to thechest, lower respiratory tractillnesses, pneumonia andbronchitis than 5 yr olds inoriginal study,
2) decrease in morbidity associatedwith decrease in pollution
3) FEVO 7-' PVC showed no association'with air pollution
4) insignificant increase inFEVO,75 with respiratory illness
Jlle~I
~73
20 yr olds Greatsame cohort Britainstudied byDouglas andHaller 1966(3,899)
1) questionnaire estimates made 7 occasionsfrom 1948 to 1957, very low,low, moderate, high
1) smoking is the dominant factorin developing respiratorydisease
2) air pollution, social class,early respiratory disQaseshowed insignificant effectson respiratory disease

SOUTCe.
JAPPuv.
Population Area MethodExposure
Particulates S02 Other Results
207 10-11 2 areasyr olds in
Kawasaki
Toy;;'~ma
196L~
approx.1200 lOII yr aIds
1) exam2) peak flow rate
and TVe
6 schools 1) examin Tokyo 2) peak flow rate
and TVC
Hot stated
Not stated
sulfation dustfall 1) mean peak flow varied inversely.48-1.7 15.7-70 with level of pollutionS03 mg~d/ monthly 2) TVC not affected100 cm / ton/sq km/Pb02 mo
Not Not stated 1) mean peak flow varied inverselystated with level of pollution
pollutants measured but nonumbers given
Kag::n'la1974
c,"--Ic"~
Yoshida1974
20 HandF 11 yralds
163 schoolchildren\'lithbronchialasthma
Tokyo 1) body plethys-mograph
a) rawb) GcHv/vtg.c) FRCd) FVC
1) questionnaire2) intervievl of
parents3) pulmonary, function FEVl . o
4) immunoglobulinassay
suspendedparticulate
Not stated
measured
averageannual.07-.05ppm
ozoneNONOxN02
Not stated
1) raw values increased withincreasing temperature
2) during high temp. NOx ' N02, 502SPM may affect upper and lowerainvays
3) low temp - NO Z' NOx , S02 SPMmay affect lmver ainvay 03affect upper airway
4) 5 subjects showed significantcorrelation of their pulmonarytests with more than 3 environmental factors
1) prevalence rate of bronchialasthma higher in polluted areas
2) prevalence rate of bronchialasthma positively correlatedwith concentrations of 502(r = 0.705)
3) many children 1;,Jith branch Lllasthma have high E globulinlevels

Souc:ce Population Area Hethod
Exposure
Particulates S02 Other Results
C':L-.-IER FOEE lGi\)"
-'7_
she]a195
613 children ofL::r;.,7t2.rs Cf1001 a.\~e
8 years orolder
2 areasin theUSSR
1) morbidity databased on medicalrecords (2 yr)
2) clinical exam
24.9 - 66.3. 3mg/m
13.3 - 33mg/m3
HS6 - 1",6
I .:5mgJm
more polluted area associated with1) low hemoglobin2) increased frequency of disease
of respiratory orga~s, nervoussystem~ vision and skin
3) lowered resistance to infectious disease
4) induced susceptibility to
rickets and anemia and broughtearly manifestations of diffusepneumosclerosis
~'f&-:-t-
zl~2:11cc,
196
MC--J
3,009 2 districts 1) school records12 yr aIds in Irkutsk 2) preliminary exam
and living conditions and parent'sincome
3) x-ray
pollutedarea1.87 - 6.4
wg/m3
pollutedarea.11 - 1.99mg/m3
tarrysubstances.07 - 1.48mg/m3
more polluted area associated with1) increased incidence of upper
respiratory tract condition(1.9 times higher)
2) higher incidence of pulmonaryconditions
Kapalin1963
3,500 several3-14 yr areas inold males Czechoand females slovakia
1) clinical exam Not stated2) blood tests3) investigation of
home situation(nutrition andliving conditions)
low - high high dustfallout
1) high 302 positively associatedwith relative hypochromicanemia microcytosis and polyglobulia
2) red cell values are dependent orquality of nutrition andphysical activity

Exposure
ource Population Area Hethod Particulates 5°2 Other Results
nde~son 752 children 3 towns.966 in 1st grade in
BritishColumbia
1) enquiry of schoolabsences withquestionnaire
2) peak eApiratoryflow with Hrightpeak flow meter
"polluted vs. clean area"1) tonsillectomy, inflamed eyes,
headache, feverishness, nausea,more frequent in polluted areas
2) peak expiratory flow reducedin boys in more polluted areas
3) overall results nonconclusive
)acc.3.g~
lelIa369
'~("'i
--I::"'-J
335 7-12yr aIds
3 districts 1)in Ferrara,Italy
daily determination of child'shealth by medicalassistantsNov.-April
carbonaceousparticles.206-.399mg/mc
range.065-.278ppm
Not stated 1) association between temperaturehumidity, and air pollution
2) incidence of acute respiratorydisease correlated negativelywith temperature and positivelywith humidity
3) smoke and S02 levels significantly related to illness rateonly in low socioeconomic areawith low pollution
differences in peak flowexplained by age, height, andweight
low - high200 - 300
fJ-g/cm3
low - high50 - 75
fJ-g/cm3
peak flow over15 days HyssHadorn pneumometer
2) questionnaire
2 districts 1)in Rotterd.::lm, Netherlands
1,000elementaryschoolchildren
~9' 703t21c,erjier-
~r::ITlerich
L972534infantsvlithcroup
Germany 1) hospital admission levelssimilar toS02 lowerat high S02
o20 4060 -
\. >80
20 ppb40 ppb60 ppb80 ppbppb
Not stated 1) promotion of croup cases whenS02 780 ppb
2) increase in croup cases whenS02 concentrations between40 and 80 ppb
3) S02 just one factor involved

Exposure
SClu~-~~ce Population Area Hethod Particulates S02 Other Results
III chil- Most 1) FVC calculateddren 10-11 Czecho- from FEV withyr old who slovakia water spirometer~lad Ii~\Ted
in. ar2ar 0 r Y.'.O rE:than 5 yr
.15 - .52. ')
rug/m...}.15- .52 Not statedmg/m3
.15 - .67 Not statedmg/m3
1) maximum expiratory flow volumeappeared most valu~ble instudying e=fccts of air pollutic
2) because no past history ofrespiratory disease was revealecthe detected abnormality inlung function might be relatedto air pollution
'-.0
N
danCl
197L;
selec.ted Prague 1) special testinggroup of a) static lung volume19 b) FEV
c) Rawd) MEl"e) CLstatf) CLdyng) Pst (1)
86 14 yr 3 1) ques1:ionnaireolds districts 2) monthly exams
in 7 monthsBudapest, 3) vol. constantHungary body
plethysmographa) ITGV(5) Rawc) VCd) Tee) RV£) SGaw
38 g/m2/mo 0.1 - 9mg/m3
Not stated 1) respiratory function neitheraffected permanently norperiodically by air pollutionbased on Raw
2) no connection between air pollution anua) respiratory comp18intsb) clinical conditionsc) absences caused by respirator
illness

T1\BLE 14
EPIDEMIOLOGIC STUDIES CONDUCTED BY CHESS INVESTIGATING THE EFFECTSOF S02 AND PARTICULATES ON CHILDREN
Source
Sh)T197(..
,-
Population
5-13 year aIds2364 \vhitechildren
Area
3 areasof NewYork
Hethad
Nat'l. Cylinder Gaspulmonary functionindicator - FEVO: 75(4 testing periodsover 1 year)
Particulate(fJg/m3)
75-200
S02(lJg/m3)
131-145
SuspendedSulfate
(lJg/ m3)
5.25
Results
Na difference in 5-8year olds who had beenexposed less than 5 ye;
9-13 year aIds in morepolluted areas had decreased ventilatoryfunction - significantonly in boys
FEV O.75 of children-i~
all gr2des - lowest inwinter
N
19 7 ~.~
7-8 year- olds360 black and"\ihi te children
6 schools Stead Wells spirometerCincinnati FEVO.75 one weekly
interview with questionnaire - 3 monthsNovember, February,March
76-131nitrate 3.1
3.1
<:.52 9.5 Low FEV O. 75 values associ aLe cJ .../ i t h :
a) residence in polluted area
b) bl<lcksc) month of February
Suspended sulfate exer·ted greatest effect onFEV O. 75 v<llue
Ventil<ltory performanCEnot affected by pollutants on day of test
FEVO.75 of black andwhite children lowestin winter

high pollution area
3 areas Telephone interview once During studyof Chicago every two weeks, 11-69- TSP 111-151 51-106
11-70
)urce
Lr:klj,~2.
174
v....
('..
Population
2-5 year-aIdsand theirfamilies
Area Method Particulate(l1g/m3 )
TSP 137-165
S02( l1g/m3 )
107-250
SuspendedSulfate
(Vg/ m3 )
Not stated
Not stated
Results
Individuals living morethan 3 years in highpollution area had increased rates of:
a) acute respiratoryillness
b) restricted activityc) otitis media
Children in high exposure community hadhigher attack rates ofrespiratory disease inthe first ] ye0rs oflife
Cigarette smoking by themother seemed to be related to increased susceptability among youngest preschool children
256-321
5 year estimated annual average
)~~7e
'174·
children~ 12 years andtheir families(;;'Jhi te) (3000)
3 commun- Telephone interview onceities in every two weeks, 9-70NeT,v York 5-71
Range during studyTSP 34-104 23-63Nltrate 1.9-4.1
97-123
10.2-14.3
10-15
Illness frequency increased \-lith:
a) inCrl':lsing ::>ocioeconomic cl.-:lsS
b) recent family migration
c) cigarette smokingin the home
d) parental history ofbronchitis
Exposure to these levelsof air pollution (estimated from Lhc pns t 5 .years) for 2-3 years\v(lS 1 ij~' lo excessivef 11:'

,urC,2 Population Area Hethod Particulate(lJg/m3)
S02(lJg/m3 )
Suspended Sulfate(lJg/m3)
Results
~nklea 1 - 12 yr. oidsn4 (5,773)
5 communities inthe Rocky Mountains
questionnaire 99 - 115filled out bya parent
65
67
177 7.2
acute respiratorymorbidity inasthmatic childrenincrcased withexposure to theselevels
excess in acute lO"'lErespire! tory illnessespecially croup,among asthamtic andnonnsthmatic exposeto this level formorc than J ye.:lrs
lill:T,Er
j7 4~~C"'-l
1 - 12 yr olds New York questionnairefilled out by 60 - 185a parent
38 - 425 9 - 20 excess .:lcute Im.Jcrrespiratory diseaseassociatcJ withthese levels ofpollution
morbidity patternssimilar for blacksand whites exceptpneumonia was morefrequent .1.ncIhroncldtis \-las lessfrequent in blacks
pneumoni<:l Clnd
hospitalization'idere lli~~her in 1m..]expos\! YC '.;Illitechildren

urc(; Population Area Method Particulate(jJg/m3)
S02( jJr-\ 11113)
Suspended Sulfate(jJg/m3)
Results
ISOI"L
74
r--)
c-.~
(',)
9,0001 - 12 yrolds\\"hitemiddle class
4 communitiesin the SaltLake Basin
questionnairefilled out bya parent
highest estimated level
62 91 15nitrate
2.0
--
significant increasein acute lowerrespiratorymorbidity attribute!to exposure to theslleveL.; of pollutionfor more thdn 2 yrs
asthmatic history,age, socioeconomicstatus, and cigarctlsmoking in the home;also had sip-,nificanleffect on frc~ucncy
of illness
morbidity excessesohserved with 5 - 9yr exposure to annUiavcr~gc 12vcls of9 pg/m3 sulf.:Jte intl1e :1hsencc 0 i
c.lcv':Jtcd lev~"ls ofother po .1.1 u tell'. t s
hospitaliz:1tion &pnl-:umon i<1 no trelated to airpollution levels

30urc:e
:r~2~,':nan
197L:
-;
~
,"l
Population
5-13 yr olds3, 705 \,7hi teand blackchildren
Area
Charlotte
Birmingham
Method
1) NeGspirometer"RET.i... \ 0.75
2) selfquestionnaire
1) CPI12 1spirometer
2) selfquestionnaire
Particulate(1Jg/m3)
RSP32 - 4·0.9TSP67.9 - 85.9
RSP39.9 - 49.4TSP104.5 - 119.8
so')(flg/m3 )
16
11
SuspendedSulfate Results(1Jg/m3)
8.6 - 11.1 1) fEV O. 75 10\·.'crin pollutedcity strongly indicates thatexposure to particulatepollution decreases pulmonaryfunction
1.8 - 13.7 2) intercity differenc2s inFEVo .75 were smallest inFall and greatest in Spring.Particulate pollutiondifferences paralleledthese findings

223
F. Occupationally Exposed Groups
1. Sulfur Dioxide
Elevated levels of sulfur dioxide have been suspected in
causing urticaria (Pirila, 1954, 1963), asthma (Romanoff, 1939~
and even death (Galea, 1964) among groups occupationally
exposed.
Upon exposure to sulfur dioxide, the usual reaction con
sisted of fits of coughing, sneezing,and a running nose. No
measure of 802 exposure was given in these particular case
reports. The association of S02 exposure with the subsequent
reactions was made on the basis of exposure to unusually
large concentration of 502 fumes several days before the onset
of the symptoms.
In order to acquire accurate information on the health
effects of occupational exposure to 502' Kehoe studied 200
refrigeration workers in Dayton, Ohio (Kehoe, 1932). One
hundred men who were exposed to high levels of 502 (forty
seven of whom had been exposed for 4-12 years) \Vere compared
to 100 men who were not exposed to detectable levels of 502
within the same plant. The two groups were comparable in
age) height) "Height, number of years they had \vorked in the
plant, systolic and pulse pressures, erythocyte and leukocyte
count, and hemoglobin level. A significantly higher incidence
of nasopharyngitis, of alteration in the sense of smell and
sense of taste and of increased sensitivity to other irritants
was found in the group of \Vorkers exposed to 502' Abnormal
urinary acidity, tendency to increased fatigue, shortness of
breath on exertion,and abnormal reflexes were also all
significantly increased in the exposed group. Of the exposed
group, 80 percent became acclimatized to the 502 exposure
\Vithin approximately 3.±2 months. Acclimatization I;,,'as defined
as the ability to withstand the basic exposure to 502 without
experiencing a notable intensity of 1) hemoptysis, 2) chest
constrict:ion, 3) epi:=;taxis, !.r) cough and 5) irt-itation of the
respiratory tract. In other words, those who were considered

224
acclimatized still experienced these symptoms, but to a lesser
degree than \\Then first exposed to 802. In spite of these
findings, the author concluded "that there is no appreciable
danger to health" in a more or less continuous exposure to
endurable concentrations of 802 and that exposure to unendurable
concentrations is negligible under conditions which allow for
escape. A positive relationship existed between frequency of
heavy exposure and increased fatigability and shortness of
breath on exertion. No relationship was found between frequency
of heavy exposure and the frequency of severity of initial
symptoms. Colds lasted 2-3 times longer in the exposed group
although incidence was not increased.
A possibly long-term effect of 802 exposure was also
investigated by Anderson among oil refinery workers from the
Anglo-Iranian Oil Co. in South Persia (Anderson, 1950).
Two areas were chosen for study: the refining plant and the
special products plant. Within each area, two groups of
\vorkers \V'ere chosen, those \.,ho were exposed to 802 and those
who had no record of exposure to 802. Clinical exams were
performed on each man including an estimation of vital
capacity and a radiograph of the chest. The group exposed to
S02 in the refining plant showed a significantly better mean
vital capacity than the control group. The x-rays did not
show any uneven distribution of abnormalities among the four
groups. There was no evidence of an adverse effect on health
with sulfur dioxide exposure.
In Norway, a group of 54 pulp mill workers exposed to 2-36
ppm S02 Here compared to 56 paper industry \vorkers not exposed
to any "objectionable" gases (Skalpe, 1967). The tHO groups
were comparable as to age and smoking habits and were assumed
to be of similar social class due to the similarity of the
two jobs. A higher frequency of cough, expectoration and
dyspnea on exertion was evident in the exposed group. The
maximum expiratory flmy rate \vas 10Hcr in those under 50 in
the exposed group. No differences were found between the
mC'11 over 50 ill the t\yO groups. Tlw c::wthor porposed that this

,,"
/1.)
j s due to rospira to ry eli ~;('[l~-; e bEing rare in younger age groups
so that a small change: i~; easier to detect than in older age
groups wl1ere respiratory disease is more common.
Pulp mill \-vorkers \ycre also comp3rec1 '.vith' paper mill
\vorkers in Derlin, N.H. (Ferris, 1967). The pulp mill workers
were exposed to approxirnate_ly 1.71-2.06 ppm 802 and .001 ppm
C12
at the time of tIle survey. No difference in respiratory
disease or lung function was found between the two groups.
Men exposed to C12
did experience poorer lung function and
more shortness of breath than those ~xposed to 802 but the
difference was not statistically significant. The'fact that
these two groups exhibited a lower prevalence of respiratory
disease than the general population suggests that they were
not representative of the population. Upon further examination
of the data) self-selection was noticed among the paper mill
workers. Those who found S02 exposure disagreeable tended to
work for the paper mill) \·lhere S02 levels were undete.ctable.
In this way, those \~o were more sensitive to S02 exposure
were more likely to Hark in the paper mill, thereby reducing
the differences in respiratory illness between the two
occupational groups.
In a study designed to investigate the relationship of
respiratory cancer mortality with occupational exposure to
arsenic, sulfur dioxide, silica, lead fumes,and ferromanganese,
8,047 Hhite male smelter '.vorkers '.vere compared \>lith the Hhite
male population of the same states during 1938-1963 (Lee and
Fraumeni, 1969). Smelter workers experienced an excess total
mortality, mainly due to malignant neoplasms of the respiratory
system, diseases of the heart\and cirrhosis of the liver.
A three-fold increase in mortality from respiratory cancer
was observed among smelter workers with a gradient related
to exposure to arsenic, S02 and length of employment. The
highest rate of cancer was found among men with heavy arsenic
exposure and medium to heavy S02 exposure. Smoking histories
were not available on these men bllt according to the authors
it seemed unlikel\' tb3t sl1\l)king 8lono could dCc.ount for these

226
gr0at diffcr~llccs. Greater excess mortality was noted for
fared gn-- bo rn than na t i ve-o born rcsidcIJ ts of the U. S. This
difference might be explained, in part, by the fact that they
generally had longer periods of employment than native-born
workers. An inverse relationship existed between excess
respiratory cancer and silica exposure. This may just reflect
the fac t tha t vlOrk (] reas \,Ii th high arsenic or high S02
exposure provide a light silica exposure.
Of those lTH2n "\Vho HeTe exposed to iron in the fonn of
ferromanganese dust, a significant number died of lung cancer
(5 out of 3].7 exposed). Two of these deaths occurred among
persons with high S02 exposure and 1 death occurred in a
person with high silica exposure.
This study was unable to distinguish bet\veen the influences
of arsenic and S02' but was consistent in its association of
heavy arseni.c exposure, possibly in interaction with S02'
with excess numbers of death from respiratory cancer among
smelter workers. Since S02 has never been implicated as a
carcinogen in man, the author proposed that S02 possibly
enhances the carcinogenic effect of arsenic.
Archer cited several studies that were designed primarily
to give data on cancer among copper smelter Harkers (Archer,
1977). One of these, by Milby and Hine, indicated that 10
percent of deaths were due to non-malignant respiratory
disease in a smelter having relatively high levels of S02
vs. 5.1 percent for one with lower levels of S02' Apparently
no aie adjustment was made so these differences may not be
meaningful. Rencher and Carter are quoted by Archer as having
found a rate of 77.3/10,000 deaths from circulatory disease
among smelter workers compared to 71.9/10,000 among open pit
\vork.E:'.rs. By using a relative mortality method, they also
examined non-malignant respiratory deaths, finding 12.3
percent of such dC!flths among smelter \\rorkers as compared to
11.9 percent among mine \\j'orkcys. Of these deaths, 3.4 percent
\\?e rl:' chw to eli1phy~)('mel and 7 pc reen t to pneuITloni a among smel t c t'
\vol'kc1.S a!:.; Cl)lnp.:n:l'd tu 2.2 p~rct)nt and 6.8 respectively among

22/
mine: \vorlu.:Ts. Althuugh l1Jc'~-;e d:Lffc~r('nces \.]('rc not statistically
s 19nLf j call l:, the'y ~; \J ggc~-; t t ha t exc css dCCl thf; cl lie to chronic
respiratory c1iscns(-' do occur among those occupationally
exposed to S02'
Lee and Fraumeni reported an SMR (standardized mortality
ratio) of 141 for tuberculosis, 329 for malignant neoplasms
of the respiratory system, 118 for diseases of the hear~ and
79 for influenza and pneumonia among workers exposed to high
levels of S02' rinto and Bennett reported 150 deaths from
cardiovascular disease as compared to 134 deaths expected
among smelter \\Jorkers exposed to high levels of S02.
In a recent study by Archer, a copper smelter and the
open pit mine which supplied it with are were chosen to study
the chronic effects of low level occupational exposure to
S02 (Archer~ 1977). Questionnaire interviews provided
information on occupational history, respiratory symptoms,
tobacco, smoking habits, past illnesses, and social factors.
Pulmonary function tests \Vere performed Hith a spirometer
computer. FVC and FEVl
. O were inversely related to smoking
and to time spen t in the smelter. Among those \vho smoked
cigarettes and were exposed to S02' there was a clear trend
for S02 exposure to be associated with a decrease in FVC
and FEVl
, than was heavy cigarette smoking. The effects of
these two agents were found to be additive.
Problems \'lhich arose in the conduc t of this study included
representative sampling, use of the data backup system (more
frequently used among controls), selective withdrawal of
persons with respiratory disease from the study population,
possible differences due to prior work exposures, physical
fitness, influences of we8ther, differences in the time of
day of examinations, altitude differences, contaminating dust
or gases (other than S02),anc1 ethnic and socioeconomic
cJifference~J in pulmonaTy function. ~one of these factors
a pp E' are c1 tone g <.1 t e t 11 e l' C' s ul t s, but in fa c t prob a b 1y
artificially decred~;ed the actual differcnct2s both'een the

r") r) ().- ,( J
Chronic CqiOSUTC' to S02 in thc~ B-'llOltl" time-'\,;eightecl ;lVer.1gC?
(TWA) range of 1-5 mg/ln] (.4-2 ppm) accompanied by small .1ffiounLs
of s ul f 1J r 0 x Ld e [~ and 0 the I' p (l I' t :L c u J (1 t C S \'ld S f 0 un d to be
associated \Vith significant -reductions of FVC cHld FEVl ,
increase in some syrup toms of respiratory disease and days
off for illness.
This study indicated a nC2d for reconsideration of the
present T\\7A standard for S02 \'Jhic11 is 5 ppm. It also \varned
those exposed to significant levels of S02 of the extra risk
of cigarette smoking.
Smith has assessed the exposure of workers at a smelter
located in Garfield, Utah from 1940-1974 (Smith, 1977a).
The reverberatory furnace area was found to have the highest
levels of sulfur dioxide. In 1974 the time-weighted average3
\vas approximately 30 mg/m \'7i th brief "puffs ll approaching
520 'mg/m3 (Smith, 1976). Sulfate compounds averaged 0.11 mg/m3
3and sulfites averaged 0.046 mg/m. Similar, but slightly
higher levels \vere found in the converter area. Various
protective measures that have been installed in the smelter
were discussed with respect to subsequent changes that have
occurred in sulfur dioxide concentrations. Total particulate3
levels were described as highly variable (0.41 rug/m to 2.033mg/m throughout the plant. Sulfate compounds in all areas
of the plant were found to be largely in the respirable
fraction (approximately 80 percent). Sulfite compounds
consisted of various particle sizes with a fairly uniform
spread.
Personal monitoring devices were implemented in 1973 to
measure actual exposure of certain workers (Smith, 1977a).
A comparison of smelter area and personal samples indicated
that area measurements in high exposure jobs overpredicted
worker exposure. For example, an average of 3.5 mg/m3
502
T~\;rA \vas detc'rrninec1 for reverberatory furnace feeders, 'vhile
s2rnples from that area aver2gecl 16.77 mg/m 3 during an eight
hour shift. The re3son [or this discrepancy can be attributed

to the fact that \Jorkcrs spent approximately only 2 hours per
s 11 i f ton t 11 c fee cl 0 c k \'] i t han a vcrage 0 f O. 95 h 0 u r s 0 f rna s k
use Vlhile on the clock.
Pulmonary function as measured by forced vital capacity
and forced expiratory volume in one second were recorded for
113 0 f the s e \vo r k e r s durin g 19 73 an d 19 7!f ( Smit h , 19 77b) .
The \Vorkers exposure \Vas determined by personal air monitoring
devices previously mentioned. Respiratory symptoms, smoking
history,and occupational history Here also recorded. After
controlling for smoking, an excessive loss of forced expiratory
volume in one second (70 ml per year as compared with 25-30 ml
normally lost), and an increase in respiratory symptoms Has
found \Vith exposure to 1.0-2.5 ppm B02
• The study also
suggested that a differential sensitivity to S02 exists.
Thirty percent· of the total \vorkers examined \vere determined
to have acute responses to S02' This group experienced even
greater losses of pululonary function. No significant inter
action between S02 and respirable particulates seemed to
occur in relation to an effect on pulmonary function.
It is interesting that in the 7 epidemiologic studies
investigating occupational exposures to S02 and its possible
health effects, only the three most recent studies have
concluded that S02 is a potential hazard to the exposed \vorker.
The S02 levels in one of these later studies (Smith) was
below the recommended TWA (.4-2 ppm) but Here still associated
with increased respiratory symptoms. T\'1O of the early studies
did show significant differences in respiratory symptoms among
exposed workers--but the authors did not feel it Has of
importance.
S02 has been associated with increaied respiratory illness
among workers exposed to elevated levels over the eight-hour
work-day. Exactly what levels constitute a threshold value
belo\v \vhich no health effects are demonstrable still needs to
be evaluatc·d further \vith consideration of concurrent community
expo[.; lire. The' expOSLl rc to S02 it sel f mus t also be cons ide re.el

230
in vjew of oLller sulfur oxides and particulates that might
accompany it within the occupational setting and within the
neighboring communities.
The U.S. Department of Labor, occupational Safety and
H~alth Administration (OSHA) recently held liearings to determine
if tIle occupational exposure levels should be changed from
the current 5 ppm TWA to a lower level as has been suggested
by recent epidemiologic findings (Archer, 1977;" Smith, 1977).
A summary of these studies is presented in Table 15.
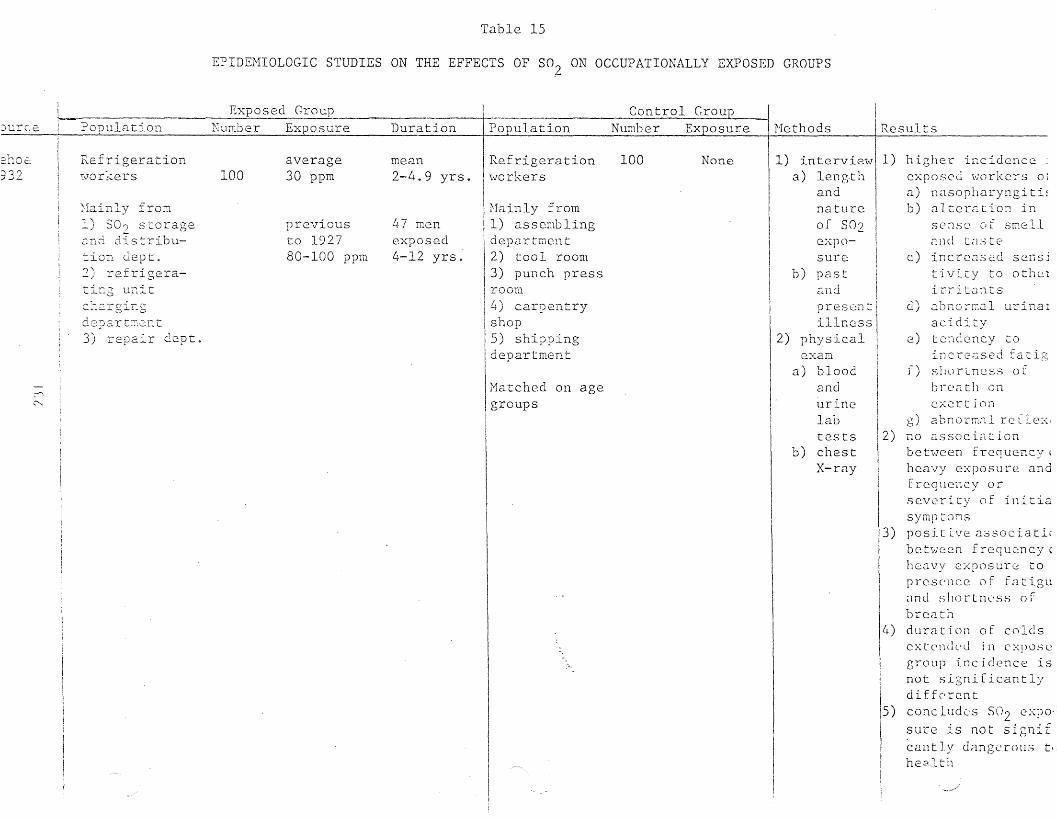
Table 15
EPIDEMIOLOGIC STUDIES ON THE EFFECTS OF S02 ON OCCUPATIONALLY EXPOSED GROUPS
: Exposed Group Control Crou+-Jurce ~I~PoPuJ.atio11__ Number Exposure Duration Population Number Exposure Hethods
IResults
1) interview! 1)a) length I
andnatureof S02
exertion
c) incrco.sed scnsjt :Lvi ty to othelirritonts
d) 2. bna rr...:J.I u:ci na 1
aciditye) t er-lclcncy co
incrC'used Eatigf) shortness of
bree-ttll on
higher incidence: :exposed workers ol
a) nasopharyngiti!b) alter;:tion in
sense of srr:ell(lJ1c! In:.., te
3)
g) a bn orm.'1l rc f 1e:·:,no associationbetween frequency,heavy e:,posure andfrequency orseverity of initiasymptomspositive ()::;sociati(between frequQncy(heavy exposure topresence of fatigu<mel s]1Ortnl'Ss ofbrc<:lthduration of coldsext en ell'din c :.: p \.) S cgroup incidence isnot significantlydifferent
5) concludes S02 expo·sure is not signifcan t 1)' clcmgc rOllS tl
health
14)
X-ray
sureb) past
a.nd
cxpo
prese:ntillness
2) physicalexam
a) bloodandurinelabtests 2)
b) chest
None100Refrigerationworkers
Mainly from1) assemblingdepartTi1cnt2) tool room3) punch press
I room4) carpentryshop5) shippingdepartment
\
Matched on agegroups
47 menexposed4-12 yrs"
mean2-4.9 yrs.
pre·viousto 192780-100 ppm
average30 ppm100
c.:-l.::.r gir:gde?artm,.:::ut3) repair dept.
-:. on dept.:2 refrigera-: r:g unit
Refrigeration\vorkers
Hainly from-, \ "'0.i) :::; 2 storage,:'i.ltd dis tribu-
~I
~
2no€:'"\?')":J.J ....

1) Clinicalexam
a) VCb) XR
Hethods IResult- s---+1---------+-1J) Exposed group inI
re fin ing plCln t shm·.rc~d
better HVC than control2)no evidence of adverse
effects of S02 on healt
35
no recorded100 exposure
no recordedexposure
1) refiningplant2) specialproductsplant
Oil refineryworkers
1-19 yr.
I
Exposed Group I Control Group INumber Exposure Duration IPopulation Nllmher Exposure
1 '\ refining mean-J
plant 97 0-25 ppm 8.15 yr.2) special Occasion- meanproducts ally 100 2.91 yr.plant 36 ppm
Oil refinery\,;orkers
?c:pulation
i2rson;(1Jv'
tHO groupsHorking popul~tion ofboth mills had lowerprevalence of respiratory disease thangeneral population
3) Hen exposed to CL., had. L
poorer reSplratoryfunction and shortnessof breath than thoseexposed to S02
II
11 ) 11.i. g lJ l' l r r- c q lll' 11 i·:-r 0 f
I co 1..: g}:) C' x Ii C c t ( J r Cl t ion :r '"'l'Q dYCDT'''~ o~ ',-' -'-; o~
I~l. i .. ) 1 1 ..... ~ , ~ 1 l.. t.... ,£'\. \.:.': L L -"- i. i
:in cxpos~d ~;rour,
I g r 0.;1 t c. r in L h 0 S c LS 0 Y r12) l'rEFR Jm.Jor in those .<:5CI! yr T.7-t· "'11':n "";--0- .).1! '-... L • .1. l::b.• J . ;:, c u
I gro""h) ~ 0 ~; ~ f f e L- (' nee in VC
~ between two groups
I/1) No difference in discas(I or lung function betl:,;c::c1
12)I
1) Interviewer questionnaire
a) occup.history
b) smokinghistory
c) respiratorysymptoms
2) Pulmonaryfunction
a) FVC
b) F~Vl'HlthHright 1 speak £lovJmeter
1) E)(;lm
.:1) symptomsb) VC \·Ji th
lk1 [.:}1
Clppnratus
c) MEFR
withHrigh t 1 S
peakflO\o1meter
not stated
no objectionablegases
56
124paper millworkers
p.:lpcrindustryworkers
S02 1.71-2.06 ppmbefore 195813.2 ppme12 = L.....001 ppm
2-J() ppmmeasure.nents allmQQe onsingleday
pl.ants
2) 3.2id to'~'Jers
-b j diges ter
Pulp mill 147l"<Jorkers
\<Torkers
Pulp mill 54
""
(;
~
-ris)7
)4

? (1 ;) u J ~1 t ion NU T:1 her Ex DOS U reDu r Cl t ionCIS cd Cro u p
2XTJOSc:.
C3.11CCr
grOl:p.o = 1,877E = 1, GJ~t
respirZ1tory Cl::1CCrposilvcly rcLlted toa) arscni~ exposureb) S02 cxpo,Surc'highes t risk ('tssoc.ia tc.(
with heavy Z1rscnic, modto heavy SO~ exposure
5) excess dcat~ in thoseexposed to ferro~an
ganeseE - 1.2 l t
0-5
i
IResultsI ------------11) Exco:ss death in
I
I[2) respir<ltory! significantly l1'1 CXC2SI vii t h g r 0. dien t ass 0 cia t cI with length of ernploy-I mentJ)
:4)
d I -) - .not state I 1 mortalityby deathcertificate
Control Croup----Number Exposure ---I Hi?thods .Population
l>Tnite m<11c:populationof the san:.estate
10-14 yr.5-9 yr.1-4 yr.
215 yr.before1938
215 yr.medium -
t -
e) ferro-
t -
manganese
mc.dium -
heavyb) 802
heavyc) silicad) leadfurnes
8,047 a) arsenics-=-..2.~ter
\"J0 r 1"(e r s
HI'""'.i te. male
\Jt'i(''-.I
cO,:}
'",-_1:- C :.:
'e 2::1(:'
.':-::"--:2 211l
che::77
Coppersmelter;;vorkers
953 0.4-2 ppm(THA)
.1-9.9yr.10-19.9>20 yr.
mine shopworkers
252 not stated I 1) Questionnaire 1) Chronic exposure to SOrinterview associated with ~
a) occup. a) reducti.on in fEV, ani
history FVCb) respiratory b) incre'l.c;e in respira-
symptoms tory symptoms and daysc) past i11- off from work
ness 2) The effects of S02 andd) smoking smoking both incrc.:lsed
history with incrc~sing length, 2) Pulmonary of exposure
functiona) FVCb) FEV
1
spirometercomputer

:..::rC2
EXPOSL~cl Group I J2.~ntrol Grouption Number Exposure Duration Population Number Exposure Hethods Results
ith77
'"~C'
-Coppersmeltervlorkers
113 variedaccordingto Horkarea respirabledust,totalsulfur,copper
not stated None
I
1) In tervie\va) respiratory
symptomsb) smoking
historyc) occur.
historyd) history
of disease2) Pulmonary
function
1) 1.0-2.5 ppm SOZassocia tcd tvi thexc0ssivc Joss of FEV_
d . . 1an an lncrcasc lnrespiratory sympto~s
even after controllingfor smoking
2) Those Hith an acuteresponse to SO?experienced cv~n
grc~tcr loss of lungfunction.

2. Sulfuric Acid
~[assive exposure to sulfuric clcJcl hc:u:; b(~en associated \d.tb
pulmonary fibrosis, bronchiectosis, and emphysema (Goldman and
Hill, 1953). According to HilLLams, sulfuric acid has pos::dbly
been involved in death from eder.l.:l or spasm of the larynx
(Williams, 1970).
Apparently feH studies on long term exposure to sulfuLlc
acid have been made, except in r~en occupat.ionally exposed.
Malcolm and Paul studied the effects of sulfuric acid on the
teeth of exposed and nonexposed workers in the storage battery
industry and found that considerable erosion of incisor teeth
occurred only in men exposed to acid mist in the forming
department. The amount of acid in the air varied from 3 mg3to 16.6 mg/rll on one day (Halcolm and Paul, 1961). According
to Williams, dental erosion in forming workers was also found
by Ten Bruggen Cate (Williams, 1968).
l;Jilliams investigated the certified sickness cd)sentee:i.sra
and ventilatory capacity of men exposed to sulphuric acid in
the forming department studied by Malcolm and Paul in 1961 and
of men in other departments of the same factory who were not
exposed. A slight excess of absences due to respiratory disease,
particularly bronchitis, was found among men exposed to sulphuric
acid mist as compared with controls. The excess of respiratory
disease was attributed to the increased number of episodes in ~en
attacked rather than to an increase in number of men attacked. lio
marked excess was seen in lower respiratory tract disease. Williams
suggested that this latter Bight be due to the large particle
size of the sulfuric acid mist. In another forming department,
"lilliams has stated that the filaSS median diameter has been ShO~ffi to
be 14 microg~s with only 4% being less than 4 micro8ffis in diameter.
Tests of ventilatory capacity showed no significant differences
bet\'ieen groups.
El-Sadik compared 33 workers involved in battery ma~ufacture
in two factories with 20 Qen never exposed to any checicals, who
\,;o-rked in th::. same factories (El-Sadik) 1972). The concentrations
of sulfuric acid ranged fran 26.12 to 35.02 mg/m3
in one plant and

12.55 to 13.51 rug/m3
in the other. No significant difference in
chroni.c. bronchiti[J or chronic asthmatic bronchitis \,;as found
bet\veen the exposed and control group. There \Vas a decrease in
FEV in the exposed group that perhaps might be due to1.0
inhalation of sulfuric acid fumes. Dental infections apparently
increased with duration of work.
According to Utidjian, it has not been possible to identify
a threshold value of sulfuric acid mist concentration belm" which
no detectable dental erosion occurs (Utidjian, 1975). At present
the recommended occupational exposure limit of 1.0 rug/ru3
of air
as a time-weighted average seems to be sufficient to prevent
excess in respiratory disease but no conclusions can be reached
on prevention of tooth erosion.
A summary of these studies is presented in Table 16.

EPIDEMIOLOGIC
J
STUDIES I1~ESTIGATING THE EFFECT
OF ATHORPHERIC.SULFURIC ACID ON OCCUPATIONALLY EXPOSED GROUPS
Exposed Group Control GroupI'o?u12,tion Nurr:.be.r Exposure Duration Population Number Exposure. Hcthod Res~lts
:<al'colm 6.? 2.-L.1
1961
;-
:::--...
\'·;orke.rs in aSL:.orageb Ci ·C ·C e r)T
indtlstr)}
a) forming 160dept.
b) chargingdept.
,., 0 16 r'3. ,-3 .0
mg/TIl
.8-2.5mg/m3
varied
v.70rlcers ina storagebatteryindustry
a) inspectiondept.
b) packers
117
free fromacid mistor anyotherdentalhazard
1) dental 1) only men exposed toexarr.ination acid T;,ist. clL~pl;:.~,'ed
erosion of i~cisor
teeth.
2) factors influer:cingthe dc~ree oferosion sce~rd to bethe length ofexposure) lip level:& concentr~tion ofthe acid in th2 2ir,
l)slight excess ofepisodes ofrespiratory diseaseparticularybronchitis aBongexposed group.
\·Ji.l.li2I:2S1.970
\'70rkers &2.}::,:::,orkers inar.. ele.ctricaccur:mlatorfactory
a) formingdept.
(SaT:"'!2 asstudie.d byNalcolm(1961)
notmeasured
few daysto morethan 40years
'l;·;rorke.rs E,e2>.vlOrkers inan electricaccumulatorfactory
a) assemblydept.
b) pastingdept.
(workers only)
c) plate cuttingdept.
(used forventilatorycompanions)
noexposure
1) certifiedsicknessabsense
2) ventilatorycapCicity
a)FEVl sec.b)FVC
measuredbefore &aftershift onNonday &Friday
2)increascd number ofspells i~ attackedmen rather tha~ anincreased nU2ber ofllien havin?, spells.
3)no siznificantdiff erence i:1ventilatory capacit~

Exposed Group Control GroupPopulation NUI:lber Exposure __Duration Population _}lurnber__~xposure Hethod Results
El-Sadik \'70rl::.e:::s in 33 1) 26.12- varied \·lOr'i.<.ers 2072 T:1anufacturing 35.02 never
dept. of tHO mg/m3 exposed tostorage any chemicalsbattery 2) 12.55- in same tHOfactories 13.51 factories.
mg/m3
XC""'.N
None 1) exama)occupationalhistory
1) exposure to sulfuricacid does not cause
(a) chronicbronchitis orchronic asthillaticbronchi tis, (b)reduction in vitalcapacity.
2) FEV1 decreased82 mI. in exposedgroup.
3) saliva pH averaged7 before ·Hork &
6.95 after work incontrols, 6.9 before'evork D 6. 7 after\'lOrk "\7as found inexposed.
4) de~tal infectionsincreased with workduration.

? '1 ()
3. Particulates
Detennining the occupational effects of part:i.culates is
difficult because of the wide range of airborne material
included under the classification of particulates. In most
air pollution studies of ambient air the composition of the
measured particulate is not determined. Host occupational
studies on the other hand deal with high exposure to one
particular kind of dust or irritant such as coal, silica,
aluminum or barium in miners or even flour dust exposure in
bakers. The literature is voluminous in regard to the health
effects of these many different materials and a complete
review of all the literature would not be possible. A few
relevant studies relating occupational exposure to dust and
summary articles, specifically on coal dust exposure~ have
been reviewed and are presented here.
Lowe studied the employees of two steel works in South
Wales (Lm'le, 1970). Data on respiratory s;mptoms and
measurements of lung function 'V;ere collected from 10, 4L}9 nen
'Vlho '.Jorked in one of 114· w'orking 2re.:lS of different pollution
levels. 802 and respirable dust were measured although the
actual levels in different areas \Vere not given. Analysi.s
demonstrated the importance of smoking in the etiology of
bronchitis with its prevalence increasing with the 8QOllnt
smoked. For air pollution it was concluded that if a relationship
exists \yith respiratory symptoms it was very slight and not
detectable by the methods used in this study. Lowe noted that
the failure of a relationship with airborne dust was not
surprising because the mean level never exceeded 2mg/m3
, The
lack of an association with SO~ was more surprising because the~-
level s measured HeTe five times the \-1in ter mear. in London.
LO\'7e noted that attempts by other authors (Paul 1961; Brinkman 1962;
8ka1pe 1964; Ferris 1967) to demonstrate relationships between
exposure to dust and SO" and respiratory symptOT;1~; in particular,(...
occupatJor.al groups have been either ne[,Lltive or unconvincing,

"
2/,0
Paul studied 3,536 African copper miners and 1,815 non~
fainers (Paul, 1961). A very 1m·.] :Lncidc:.nce of chronic bronchitis
was found to exist in the populations studied. No evidence
was found that silica dust predisposes to the development of
this disease. It was hypothesized that the low levels of
chronic bronchitis ""ere due to the moderate smoking habits of
the population.
Brinkman studied 1,317 men in Detroit aged If 0 to 65
(Brinkman, 1961). They were divided into four groups on the
bases of exposure to silica dust. Cigarette smoking was found
to be the most important factor in the cause of chronic bronchitis.
Doll reviewed mortality of selected group~ of gasworkers in
England for eight years (Doll, 1965). The men studied were
between 40 and 65 years of age and had been employed in the {ndustry
for more than 5 years. Three broad occupational classes were
defined; those \vith heavy exposure to products of coal carboniz2tion,
those with intermittent exposur~ and those with no exposure. Results
showed that the annual death rate was highest in the high exposure
group and lO\·7est in the lov: exposure. groups. THO diseases, lung
cancer and bronchitis, accounted for the largest amount of the
difference,along \vith cancer of the bladder, cancer of the scrotum,
and pneunoconiosis. Differences in mortality were not attributable
to differences in smoking. No specific measurements on air
pollution levels were made, the results being based on the four
classes of postulated exposure.
Higgins published two studies on chronic respiratory disease
in miners, foundr~~orkers, and other occupations in Derbyshire,
England (Higgins, 1959, 1968). In the first study, 776 men, ages
25 to 34 and 55 to 64, were divided into four groups, nondusty
workers, miners and ex-miners, foundry and ex-foundry and other
dusty job groups. A questionnaire ~as used to collect data on
symptomatology and ventilatory capacity (indirect maximum breathing
caraci ty, EEe) was measul:ed.
s were alGo examined. Findings suggested
j.l'
that wives whose husbands worked in dusty occupations had a
higher prevalc~nce rEltc for cough and sputum and chest illness
over a three year period compared to wives of those in dust
free areas.
A follow-up study on this group was conducted after nine
years. Results indicated that the nine-year mortality of
miners and ex-miners was insignificantly higher than mortality
for non-du~ty occupations.
The average annual decline in forced expiratory volume was
slightly greater in older men but the decline did not appear to
be closely related to occupation. The decline was greater in
smokers than non-smokers, suggesting that smoking was a more
important factor in the developI~ent of respiratory problems than
occupation.
Rogan studied the Tole of respirable dust particles in the
development of chronic bronchitis in coal miners in Great Britain
(Rogan, 1973). The study involved 3,581 coalface employees who
\'70rked in the most dust.y part of the mine. The cumulative
exposures to dust were calculated from sampling during a 10-year
period and from data on earlier exposures. 10'',-;' exposure levels
were 0 - 99 gram-hours per cubic meter with high exposure levels3
being greater than 200 gram-hours/m .
A statistically significant reduction in FEV1 .O
was found with
increasing cumulative exposure to dust. Miners and ex-biners were
found to have a higher prevalence of respiratory symptOGS and 1m'7er
mean M.B.e. than men working in dust-free occupations. In the older
age group these differences were not significant, in the younger
group the differences in N.B.C. were significan
Th(~ importa.tlce of coal dust ,;las assessed by 8easuring the
number of years on the, coal--geLtin8 shift. Elderly miners 'Hithout
pneumoconioses had a significant increase in the prevalence of

','
L" /, '!'-tL
of brea thle.ssness 'i\7i th increasinii year s spen t on thp. cOc1l-
getting shift.
A loss of FEVl
. O greater than expected from the combined
effects of dust exposure, smoking land age was associated with
i.ncreasfng severity of bronchitis symptoms. It is possible that
factors contributing to the development of the disease were
not involved in the progression of the disease or the further
deterioration of ventilatory capacity.
Smidt studied chronic nonspecific lung disease in 13,000
workers \Y'ith and \'lithout occupational dust exposure in Germany
(Smidt, 1976). Occupations included ceramic, asbestos, foundry,
coal mining, machine factory workers)and cement workers. Dust
exposed non-smokers age 20 - 35 had a prevalence of bronchitis
similar to the moderate smoker. For a middle age group the effect
of dust exposure \v2s less than that of smoking. The conclusion
reached was that the effects of smoking and dust exposure were
additive. The authors stated that because the data on s~oking
habits 'ivere more nearly exact than the data on dust exposure,
the chances of proof of an effect of smoking were better than for
dust exposure. Therefore, they would not conclude that sooking is
a greater hazard in chronic bronchitis than occupational dust
exposure.
Morgan, in a review article, stated that most studies have
sho\·m a greater prevalence of cough and sputum and a slightly
lower ventilatory capacity among the local miners than among
control groups (Morgan, 1976). It was pointed out that in 1965
the Hedical Research Council of Great Britain reported that the
intensity of dust exposure did not playa significant role. in
the determination of the prevalence of chronic bronchitis and
ainvay obstruction in those with occupational exposure. to dust.
Nore recent studies have demonstrated that bronchitis becomes
more prevalent as exposure to coal dust increases.
Horgan concluded that, based on recent evicence, the
inhalation of most minerals and vegetable dusts can lead to
an increased prevalence of cough and sputum. Also, prolonged

'1,1,1,1'
exposure to these Naterials con rCSlllt in a slight decrease
in lung function among some exposed workers.

V. DOSE-H.ESPONSE·- SETTING 'I'll I': STANDAr:DS
I' ;.
In rcvic\·/ing dosc--rcspousc relat:ionships bet'l'lcen air pollu
tants and respiratory disezlsc, CHESS sumrn;:l1~izec1 their most current
information. Table:' 16 sho\o1s the levels of pollutant associated
with excess chronic bronchitis witli current exposure and past
exposure in the four study areas. From the data it appears that
'when a community is exposed to sulfur oxides alone, S02 levels of
92 to 95 ~g/m3 and suspended sulfates of 15 ~g/m3 are associated
with excess bronchitis. \\Then higher levels of particulate
matter are present ,such as 120 ~g/m3, S02 at levels of 100 ~g/m3
and suspended sulfates at 14 Vg/m3 are associated with excess
bronchitis. In none of the CHESS areas was elevated exposure to
total suspended particulates found without concomitant increases
in sulfur oxide levels. Finlea concluded that these data support
existing primary ambient air quality standards of 80 annual mean
(arithmetic) ~g/m3 for S02 and 75 ~g/m3 annual mean (geometric) for
total suspended particulates (Finklea, 1974).
Tables 18 and 19 from the CHESS studies sumnlarize the threshold
levels for long and short term pollution exposures for the several
health effects. Adverse effects which have been noted with parti
culates and S02 at levels below the national primary air quality
standard have been attributed to suspended sulfate concentrates
rather than S02 and particulates. Significant aggravation of
cardiopulmonary symptoms was attributed to 24 hour suspended
sulfate levels as low as 8 to 10 wg/m3. No national standards
have been set for stlsp0ndecl sulfates.

245
Higgins summarized the dose--response relationships found in
a number of studies (Higgins, 1973), Levels bet\'leen 80 and 100
~g/m3 for particulates and 802 were found to be reasonable stan
dards. It was concluded that maximum daily averages should not
exceed 250 llg/m3 for smoke and 500 ltg/m3 for 8°2 , Higgins
pointed out that the nature of particulate differs from place to
place and other pollutants not even being measured may be more
important. In fact, uniform standards for particulates for the
entire country may not be justifiable. It \Vas concluded that mOl:e
research is needed in the area of air pollutants and health
es.pecially in the area of sulfuric acid and sulfates.
Table 20 presents a summary of the study results \vhich led to
the original air quality standards (RaIl, 1974). RaIl agrees that
the current ambient air standards for sulfur oxides are reasonable
and in a proper range.

. TABLE 17
~~~GE OF POLLUTANT EXPOSURES ASSOCIATED WITH EXCESS CHRONIC BRONCHITIS1
Current exposures
Cl~ic.ago
Neiil York
Rocky Hountain
Exposures within past 10')
years (annual average)a, ~g/m~
S02 I TSP I SS(80)b
I(25)b
I(no standard)
I II
92-95 I 53-70 I 15.0-15.3
177-37L} I 62-179 6.9-19.9
100-282 J 118-177 14.1-17.3
144-404 I 80-173 9-19
14.5
7.2-11.3
13.2-14.3
65-102
63.1-104.0
103-155
(annual average), ~g/m3
51-62.9
96-217
177-374
Lake',,'-,1 r>....10.-0.-'-
'-C.......-:;
'"'"
dEstimated from emissions data and pollutant trends
bNational Primary Air Quality Standard. The particulate standard is a geometric mean; the equivalentarithmetic mean would be about 85 ~g/m3.
1Source: Finklea, 1974

n f-J,-'.il,
TABLE 18
BEST JUDGHENT ESTH·1ATES OF POLLUTANT THEESHOLDS FOR ADVERSE, EFFECTS OF LONG···TERl,[ EXPOSUHES 1
Threshold (annual ave~age), ~g/m3---_•.~------------
--------------------_._---Effect
Increased prevalence of chronicbronchitis in adults
Increased acute lower respiratorydisease in children
Increased =~equency of acuterespiratq~y disease in families
Decreased lung function ofchildren
Sulfurdioxide
(80)a
95
95
106
200
Total suspendedparticulates (75)a
100
102
151
100
Suspendedsulfates(no 'standard)a
15
15
15
13
a~ational Primary Air Quality Standard. The particulate standard is a geometricmean; the equivalent arithmetic mean wuuld be about 85 ~g/m3.
1Source: Chess

TABLE 19
BEST JUDGt-'IENT ESTIl'IATES OF POLLUTANT THRESHOLDSFOR ADVERSE EFFECTS OF SHORT-TEl~I EXPOSURES 1
8-10
8-10
spendedsulfatesstandard)a
Threshold, lJg/ m3
TotalSulfur suspended Sudioxide particulate
Effect (365)a (260)2 (no
Aggravation of cardiopulmonary'symptoms in elderly )365 80-100
Aggravation. of asthma 180-250 70
a""National ?rimary Air Quality Standard.
1Source: Chess

SUt'IHARY OF DOSE-RESPC)N;:;E RELA'fJONSUIPS FOR EfFECTSOF PARTICLES AND S02 ON lIEALTfJ1
Averaging timefor Pollution1'1easurement s Place
Approximate Levels of PollutionParticles S02
llg/m3 fJg/m 3 Effect
2~ hr.
24 hr.
2l~ hr.
Heekly mean
24 hr.
Winter mean
fiual
"
London
London
London
London
Ne\v York
Britain
Britain
Britain
2000 1144
750 700
300 600
200 400
6b
1500
100-200 100-200
70 90
100 100
Mortality
Mortality
Deterioration ofpatients
Prevalence or incidenceof respiratory illness
Nortality
Incapacity for workfrom bronchitis
Lower respiratory infections in children
Upper and lower respiratory infections in
. children
Britain
Britain
Buffalo
Berlin, N.H.
100
100
lOa
180
100
100
Bronchitis prevalence
Prevalence of symptoms
Respiratory mortality
Increased respiratorysymptoms--decreasedpulmonary function
alIOld" results, leading to original standards
1J In coefficient of haze units (COBS)
.1r c c : Ra11, D.?, Envir 0 n. II ca 1. t h Per ::; p " 3, 9 7- 1. 21, 197[I

?5()
BJ BIJI0GJZi\PfIY
Air Quality nnd Stationary Emission Control. A Report by theCommission on Natural ReE;ources) National /\cade.my of Engineering,National Rl~seClrch Coun.cil, Hashington, D.C., ~[arch 1975
Air Quality Criteria for Sulfur Oxides. U.S. Department of H.E.N.,Public Health Service, Environmental Health Service. National AirPollution Control Administration, 1'~ashington, D.C., Pub. ~;o. AP-50, 1970
Air Quality Criteria for Particulate ~fCltter. U.S. Department ofH.E.W.) Public Health Service, Environmental Health Service. NationalAir Pollution Control Administration, Washington, D.C., Pub. No.AP-49, Jan. 1969
Alarie, Y., Ulrich, C.E., Busey, W.H., Swann, H.E. and MacFarland,H.N. Long term continuous exposure of guinea pigs to S02' Arch.Environ. Health 21: 769-777, 1970
Alarie, Y., Ulrich, C.E., Busey, H.;[" Krumm, A.A. and MacFarland,H.N. Long term continuous exposure to S02 in cynamologus monkeys,Arch. Environ. Health 24: 114-128, 1972
Alarie, Y., qakisaka, I., and Oka, S. Sensory irritation by sulfiteaerosols, Environ. Physiol. Biochem. 3: l82-i84, 1973
Alarie,· Y., Kantz, R.J., Ulrich, C.E., Krumm, A.A. and Busey, H.M.Long term continuous exposure to sulfur dioxide and fly ashmixtures, Arch. Environ. Health 27(4): 251-253, 1973
Alarie, Y., Krumm, A.A., Busey, H.H., Ulrich, C.E. and Kantz, R.J .. 'Long term exposure to sulfur dioxide, sulfuric acid, fly ash andtheir mixtures, Arch. Environ. Health 30: 254-262, 1975
Amdur, rLO., Silverman, L. and Drinker,~. Inhalation of sulfuricacid mist by human subjects, Arch. Ind. Hyg. Occup. Med. 6: 305313, 1952
Amdur, H.O. The respiratory response of guinea pigs to sulfuricacid mist, Arch. Ind. Health 18: 407-414, 1958
Amdur, M.O. and Corn, ~1. The irritant potency of zinc ammoniumsulfate of different particle sizes, Am. Ind. Hyg. Assoc. J.24: 326-333, 1963
fu~dur, 01.0. Respiratory absorption data and S02 dose-responsecurve, Arch. Environ. Health 12: 729-732, 1966
kndur, H.a. Clncl L'nclerhill, D.I\'. The effect of various aerosolson the response of guinea pigs to sulfur dioxide, Arch. Environ.Health 16: !}h()-468, 1968
Amdur, H.O. and Cnderhill, D.\\'. Response of guinea pigs to combinationof S()" ':Hld opC::t hearth dust, J. Air Pollut. Control Assoc. 20: 31--·34,191'0 -

Amdur, 1'LO. Aerosols formed by oxLd:'ltjon of sulfur dio:-:icle - revic\vof their toxicology, I\rch. Environ. Health 23: Li 59- L,68, 1971
AIJj('~~-i (' an 1\c ad emy 0 f P edia t ric s, Comm j t te e on Env Lronmen talHazards. P(~cl:Latric aspects of air pollution, Pediatrics46: 637-639, 1970
Anderson, A.dioxide, Br.
Possible long term effects of exposure to sulfurJ. Ind. Ned. 7: 82-86, 1950
Anderson, D.O., Ferns, B.G. and Zickmantel, R. Levels of airpollutfon and respiratory disease in Berlin New Hampshire,Am. Rev. Resp. Dis. 90: 877-887, 1964
Anderson, D.O. and Larson, A.A. The incidence of illness amongyoung children in two communities of different air quality:A pilot study, Can. Ned. Assoc. J. 95: 893-904, 1966
Anderson, I., Lundquist, G.R., Jensen, A.L. and Proctor, D.F.Human response to controlled levels of sulfur dioxide, Arch. Environ.Health 28: 31-39, 1974
Angel, J.H., Fletcher, C.1I., Hill, I.D. and Tinker, C.M.Respiratory illness in factory and office workers: A studyof minor respiratory illness in relation to changes in ventilatorycapacity, sputum characterisitcs and atmospheric pollution,Brit. J. Dis. Chest 59: 66-80, 1965
A;:~er, V.E. and Gillan, J.D. Chronic sulfur dioxide exposure in aj~~21ter I. Indices of chest disease, submitted to Journal ofOccupational Medicine, 1977
Asahiwa, S., Andrea, J.,Carmel, A.,Arnold, E., Bishop, V.,Joshi,S., Coffin, D. and Epstein, S.S. Carcinogenicity of organic fractionsof particulate pollutants collected in New York City and administeredsubcutaneously in infant mice, Cancer Res. 32: 2263-2268, 1972
Ashe, W.F. Exposure to high concentrations of air pollution (1)health effects of acute exposure, In: Proceedings of the ~ational
Conference on Air Pollution. U.S. Public Health Service, ~ash.
pp. 188-195, 1959
Ashley, D.J.B. The distribution of lung cancer and bronchitis inEngland and l'Iales, Brit. J. Cancer 21: 243-259, 1967
Asmundsson, T., Kilburn, K.H. and ~cKenzie,~. Injury andmetaplasia of airway cells due to S02' Lab. Invest. 29: 41-53,1973
nalchum, O.J., Dybickl, J. and Nene-ely, G.R. Absorption and distributionof S350 ? inhaleJ through the nose and mouth by dogs, Am. J. Physiology197: 1317-1321, 1959

Balchum, O. L., Dybicld, J. and 1'1on8c1 y, C. R. The dynamics of suI furdioxide inhalation, I\rch. Indust:. Health 21: 564-569, 1960
Barry,D.H. and Mawdesley-Thonns, L.E. Effect of sulphur dioxide onthe enzyme activity of the alveolar macrophage of rats, Thorax 25:61 2- 61 Lf , 197°Bates, D.V. Air pollutants and the human lung: The James Waringmemorial lecture, Am. Rev. of Resp. Disease 105: 1-13, 1972
Battigelli, M.C., Cole, H.M., Fraser, D.A. and Mah, R.A. Longterm effects of sulfur dioxide and graphite dust on rats,Arch. Environ. Health 18: 602-608, 1969
Becker, W.H., Schilling, F.J. and Verma, M.P. The effect on healthof the 1966 eastern seaboard air pollution episode, Arch. Environ.Health 16: 414-419, 1968
Biersteker, K. Air pollution and smoking as cause of bronchitisamong 1,000 male municipal employees in Rotterdam, Arch. Environ.Health 18: 531-535, 1969
Biersteker, K. and vanLeeuwen, P. Air pollution and peak flowrates of school children, Arch. Environ. Health 20: 382-384, 1970
Biersteker, K. Sulfur dioxide and suspended particulate matter wheredo we stand?, Env. Res. 11:287-304, 1976
Bi:-/':'er, R.E., Nitchell, C.A., Hosen, n.R. anel Bouhuys, A. Importance,,0':' :he indoor environment in air pollution exposure, Arch. Environ.Health 31(6): 277-279, 1976
Biological Effects of Atmospheric Pollutants Particulate PolycyclicOrganic Hatter, Committee on Biological Effects of AtmosphericPollutants Division of }ledical SClences National Research Council,National Academy of Sciences, Washington, D.C. 1972
Boyd, J.T. Climate, air pollution and mortality, Br. J. PrevoSoc. Heel. 14: 123-135, 1960
Bradley, W.H., Logan, W.P.D. and Martin, A.E. The London fog ofDecember 2-5, 1957, Honthly Bul. Nin. Health, London 17: 156-166,1958
Brinkman, G.L. and Coates, E.O. The prevalence of chronic bronchitisin an industrial population, Am. Rev. Resp. Disease 86: 47-54, 1962
BrOlvn, E. B. and Ipsen, J. Changes in the severity of symptomsof asthma and allergic rl1initis due to air pollutants, J. Allergy41: 254-268, 1968

253
Huck, s.r. nnd Brown, D.A. Mortality from lung cancer and bronchitisin relation to smoke and S02 concentration, population density,and social index, Tobacco lZe.~}earcb Council, London Research Paper7, 196tf
Buechley, R.W., Riggins, W.B., Hasselblad, V. and VanBruggen, J.B.S02 levels and perturbations in mortality. A study in New YorkNew Jersey metropolis, Arch. Environ. Health 27: 134, 1973
Burgess, S.C. and Shaddick, C.H. Bronchitis and air pollution,Roy. Soc. Health 1: 10-24, 1959
Burn, J.L. and Pemberton, J. Air pollution, bronchitis and lungcancer in Salford, Int. J. Air Wat. Pollute 7: 5-16, 1963
Burrows, B., Kellogg, A.L. and Buskey, J. Relationship of symptomsof chronic bronchitis and emphysema to weather and air pollution,Arch. Environ. Health 16: 406-413, 1968
Burton, e.G., Corn, M., Gee, J.B.L., Vasallo, C. and Thomas, A.P.Response of healthy men to inhaled low concentrations of gasaerosol mi~tures, Arch. Enviorn. Helath 18: 681-692, 1969
Bushtueva, K.A. The determination of the limi~ of allowable concentrationof sulfuric acid in atmospheric air, In: ~imits of Allowable ConcentrationsQ.t.......t\tr,l'2-~pheric Pol~~tall~~, Book 3, Ryazahov, V. A. (ed) U. S. Dept. ofCommerce, pp.20-36, 1957
Bl,lshtuev3., K.A. Toxicity of H S04 aerosol, In: Levine B.S. (trans)'~.S.S.R. Literature on Air Pol~utlon and Related Occupational Diseases:A Survey, U.S. Dept. of Commerce, Office of Technical Services, Vol. 1pp. 63-66, 1960
Bushtueva, K.A. Threshold reflex effect of S02 and sulfuric acidaerosals siP.1ul taneously present in the air, In: 1i:JIlJ~~_g_L~J-_:tC?~'!~1?_1~_
~~nce~~~ati~~~__of Atmospheric Pollutants, Book 4, Ryzaznov, V.A. (ed)U. S .. Public He.al th Service pp. 72-79, 1961
Cadle, R.D. and NaGill, P.L. Study of eye irritation caused by LosAngeles smog, Arch. Ind. Hygie.ne and Occup. Ned. 4: 74-84, 1951
Carey, G.C.R., Phair, J.J., Shephard, R.I. and Thomson, M.L. Theeffects of air pollution on human health, Am. Indust. Hyg. A.J. 19:363-370, 1958
Carnow, B.~., Lepper, ~.H., Shekelle, R.B. and Stamler, J. TheChicGgo air polllition study: S02 levels and acute illness in patientswith chronic bronchopulmonary disease, Arcll. Environ. Health 18:768-·776, 1969

25'1
DohCll1, F.e., Everts, C.S. and Smith, R. Variation in clir pollutionand the incidence of respiratory disease, J. Air Poll. Control Assoc.12: [I 18 -.II 22, 1 9 6 2
Doll, R. Mortality [rom lung cancer among non-smokers, Brit. J.Cancer 7: 303-312, 1953
Doll, R., Fisher, R.E.\.J., Gammon, E.J., Gunn, H., Hughes, G.O.,Tyrer, F.B. and Hilson, H. Hortality of gas\.lOrkers Hith special referenceto cancers of the lung and bladder, chronic bronchitis and pneumoconiosis, Brit. J. Industr. Med. 22: 1-12, 1965
Douglas, J.W.B. and Waller, R.E. Air pollution and respiratoryinfection in children, Brit. J. Prevo Soc. Med. 20: 1-8, 1966
Eastcott, D.F. Epidemiology of lung cancer in New Zealand, Lancet 270:37-39, 1956
ElSadik, Y.}!., Osman, B.A. and El-Gazzar, R.B. Exposure to sulfuricacid in manufacture of storage batteries, J. Occup. Med. 14: 224226, 1972
Emerson, P. Air pollution atmospheric conditions and chronicairways obstruction, J. Occup. Med. 15: 635-638, 1973
Emmerich, H., Bender, S.W., Jakin, R.H. and Emmerich, W. The effect~~_at~os~~~ric ~02 on_ ~roup syndrome: Computer analysis, Zeit.K-,-~jerhellk 113. I11-L~.. 1, 1972
,I'Fairbairn, A.S. and Reid, D.D. Air pollution and other local factorsin respiratory disease, Brit. J. Prevo Soc. Med. 12: 94-103, 1958
Fairchild, G.A., Roan, J. and }lcCarro1l, J. Atmospheric pollutantsand the pathogenesis of viral respiratory infection: Sulfur dioxideand influenza infection in mice, Arch. Environ. Health 25: 174-182,1972
Faith, H.L. Inert particulates - nuisance effects, J. of OccupationalNed. 10: 539-541, 1968
Fennelly, p.r. The origin and influence of airborne particulates,Am. Sci. 6[I: 46- 56, 197 6
Ferin, J. and Leach, L.J. The effect of SO? on lung clearance ofTiO') particles in rats, Am. Ind. Hygiene Assoc. 34: 260-263, 1973
L
Ferris, B.C. and Anderson, D.O.disease in a Ne\~' Hartlpshire Tm.rn,1962
The prevalence of chronic respiratoryAm. Rev. Resp. Dis. 86: 165-177,

255
Carnow, B.W. and Meier, P. Air Pollution and pulmonary cancer, Arch.Environ. Health 27: 207--218, 1973
Cassell, E.J., LebO\v'itz, M.D., Nountain, I.H., Lee, H.T., Thompson,D.J., Walter, D.W. and McCarroll, J.R. Air pollutio~weather, andillness in a New York populatjon, Arch. Environ. Health 18: 523530, 1969
Chakrin, L.W. and Saunders, L.Z. Experimental chronic bronchitispathology in the dog, Lab. Invest. 30: 145-154, 1974
Chapman, R., Hasselblad, V., Hayes, C., Williams, J., Simon, J. andWhite, R. Air pollution and childhood ventilatory functionI. Exposure to particulate matter in two southeastern cities, In:Clinical Implications of Air Pollution Research Finkel, A.J. and Duel,W.E. (ed) A.M.A., Air Pollution Medical Research Conference,December 5-6, San Francisco, California, 1974, pp. 285-304, 1976
Charles, J.1'1. and Nenzel, D.B. Ammonium and sulfate ion releaseof histamine from lung fragments, Arch. Environ. Health 30: 314-316,1975
Chiaramonte, L.T., Bongiorno, J .R., Brmm, R. and Laano, H.E.Air pollution and obstructive respiratory disease in children,. N.Y.State J. Ned. 70: 394-398, 1970
Christensen, D.W. and Wood, C.H. Bronchitis mortality rates inEngland, Wales, and in Denmark, Brit. Ned. J. 1: 620-622, 1958
"Ciocco, A. 'and Thompson, D.J. A follmv-up of Denora ten yearsafter: Hethodology and findings, Amer. J. Public Health 51: 155-164,1961
Coffin, D.L. and Knelson, J.H. Acid Precipitation effects of sulfurdioxide and sulfate aerosol particles on human health, i'u,llbio. 5:239-242, 1976
Cohen, A., Bromberg, S., Buechley, R.W., Heiderscheit, L.T. and Shy,C. ~I. Asthma and air pollution from a coal fueled pO'wer plant, Am.J. Public Health 62: 1181-88, 1972
Cohen, A.,Leone, G.publicized449,197 ft
Nelson, C.J., Bromberg, S.~I., Prauda, H., Ferrand, E.Symptoms reporting during recent publicized and unair pollution episodes, Am. J. Public Health 64: 442-
and
Colley, J;R.T. and Reid, D.D. Urban and social orlglns of chilhoodbronchitis in England and hTales, Brit. ~led. J. 2: 213-217,1970
Collins, J.J., Kasap, B.S. and Holland, W.W. Environmental factorsinch i 1d mo r t a lityin Eng1a nc1 and \\1ale s Am. J. Epi. 93: 10- 22, 197 1

Colley, J.E.T., Douglas, J.H.13. and Fc:ic1, D.D.in young adults: In[lucncc of (,inly chiJdl100dtract illnl'ss, sucia.l class, cdr pollution andJ. I' 195-198, 1973
Rc~;P11".'1 tory dis eDse
101',1c1' rcspircltorysmoking, Brit. Ned.
Colucci, A.V. SuJfur oxides: Current status of knowledge.ErRI EA-3l6 Prepared for Electric Power Research Institute, Decenilier1976
Cornwall, C.J. and Raffle, P.A.B. Bronchitis-sickness absence in Londontransp?rt, Brit. J. Ind. Ned. 18: 24-32, 1961
Cox, R.A. and Penkett, S.A. Photo-oxidation of atmospheric S02'Nature 229: 486-488, 1971
Dalhamn, T. Mucous flow and ciliary activity in the trachea of healthyrats and rats exposed to respiratory irritant gases (S02' H
3N, HCHO)
Acta. Physiol. Scand. 36 Suppl. 123: 1-83, 1956
Dalhamn, T. Studies on the effect of sulfur dioxide on ciliaryactivity in rabbit trachea in vivo and in vitro and on theresorptional capacity of the nasal cavity, Am. Res. Disease 83:566-567, 1961
Dalhamn, T. and Strandberg, L. Synergism between sulphur dioxide andcaLbon particles. Studies on absorptioil and on ciliary movementsin the rabbit trachea in vivo, Int. J. Air and Water Pollution7: 517-529, 1963
."D2_.iilelmn, T. and Sjoholr'1, J. Studies on S02,NO,/,and t,TH; effect onciliary activity in rabbit trachea of single in vitro exposure andresorption in rabbit nelsal cavitiy, Acta. Physiol. Scan. 58: 287291, 1963
Delly, C. Air pollution and causes of death, Brit. J. Prevo Soc.Ned. 13: 14-27, 1959
Dean, C.Rov Soc.
Lung cancer in South Africans and British irnQigrants, Proc.Ned. 57: 984-987, 1964
Derrick, E.H. A comparison between the density of smoke in theBrisbane air and the prevalence of asthma, Ned. J. Australia2: 670-675, 1970
Dohan, f.C. and Taylor, E.W. Air pollution and respiratorydisease. /-\ preliminary report, .:'1;:ner. J. rled. Sci. 2!fO: 337-339,1960
Dohan, F.C. Air polluL<1nts and incidence. of respir<1tory dise..:lse,Arch. Envirun. He3.1th 3: 23-31, 1961

257
Fink1ctl, J.F., Goldberg, J., lfasselb1aJ, V., Shy, C.N. andl-byes, e.G.PrevcI1ence of chronic respiratory disease symptoms in military recruits:Chicago indue tion center, 1969-1970, pp. Lf -23 t.o !f~36. In: U. S. EPA,Office of Research and Development,Health Consequences of SulfurOxides, A Report From CHESS 1970-1971, EPA-650/1-74-004, WashingtonD. C., Government Prin t ing Of f ice, 197 {f
Finklea, J.F., Calafiore, D.C., Nelson, C.J., Risr.an, H.B. andHayes, C.G. Aggravation of asthma by air pollutants: 1971 SaltLake Basin Studies, pp. 2-75 to 2-91. In: U.S. EPA, Office of Researchand Development, Health Consequences of Sulfur Oxides, A Report FromCHESS 1970-1971, EPA-650/1-7 Lf-·OO Lf, Hashington, D.C., GovernmentPrinting Office, 1974
Finklea, J.F., Farmer, J.H., Love, G.J., Calafiore, D.C. andSovocool, G.W. Aggravation of ast~la by air pollutants: 1970-1971N.Y. studies, pp. 5-71 to 5-84. In: U.S. EPA, Office of Researchand Development, Health Consequences of Sulfur Oxides, A ReportFrom CHESS 1970-1971, EPA-650/1-74-004, \vashington, D.C., Government Printing Office, 1974
Finklea, J.F., Shy, C.lL, Love, G.J., Hayes, C.G., Nelson, W.C.,Chapman, R.S. and House, D.E. Health consequences of sulfuroxides: Summary and conclusions based upon CHESS studies of 19701971, pp. 7-3 to 7-24. In: U.S. EPA, Office of Research andDevelopment, Health Consequences of Sulfur Oxides: A Report FromCHESS 1970-1971, EPA-650/1-·74-004, Hashington, D.C., GovernmentPrinting Office, 1974·
<Fletcher, C. ~.I., Tinker, C. N., Hall, I. D. and Speizer, F. E. Afive-year prospective field study of early obstructive airlvay disease,pp. 249-252. In: L.S. Department of H.E.~~., Public HealthService, Publication No. 1879, Current Reserach in ChronicRespiratory Disease. Proceedings 11th (Aspen, Emphysema) Conference,Aspen, Colorado, June 12-15, 1968, 1';ashington, D.C., GovernmentPrinting Office
35Frank, N.R., Yoder, R.E., Brain, J.D. and Yokoyama, E. S02 ( S labeled)absorption by the nose and mouth under conditions of varying concentration and flo\v, Arch. Environ. Health 18= 315-322, 1968
Frank, N.R. and Speizer, F.E. S02 effects on the respiratory systemin dogs, Arch. Environ. Health 11: 624-634, 1965
Fraswe, D.A., Battigelli, M.C. and Cole, H.ll. Ciliary activityand pulmonary retention of inhaled dust in rats exposed to sulfurdioxide, J. Air Poll. Control Assoc. 18: 821-823
Galen, ~L fatal sulfur" dioxide inhalation, Can. Ned. Assoc. J.91: 345-347, 1964
Giclclens, T{.E., Jr. and FAirchild, C. Histopathologic effects on S02on lhe nasal Ducosa of mice froPl defined flora and conventionalcoloniC's, /\rch. Environ. Health 25: 166-173, 1972
(;irsl1, L.S., Shubin, E., Dick, C. and Schulaner, F.A. A study onthe C'pidL)miol()~t,y of '::lsthrna in children in PhiladC'.lpllL1, ,J. Allergy39= 3Lj7--'157, 1967
FC'.rr:L~)) B.C.) Jr. and Anderson, D.O. Epic1cmiologicaJ studies relatedto air pollution: A comparison of Herlin, N.IL nnd ChillJ\-!C!ck,Br i tis h Co IIImbi a , Pro c. I\0 y. S(1 c. i·recl. 57: 97 9- 983, 19 6!t
Ferris, B.G., Jr., Burgess, \-l.A. (]nd Horcbester, J. Prevalence ofchronic respiratory disease in a pulp m:Lll and a paper mill in theUnited States, Br. J. Ind. Ned. 24: 26-37, 1967
Ferris, B.G. Chronic lcnv level air pollution lise of general mortalityand chronic disease morhidity and mortality to estimate effects,Env. Res. 2: 79-87, 1969
Ferris, B.G. Effects of air pollution on school absences and differencesin lung function in first and second graders in Berlin, New Hampshire,January 1966 to June 1967, Amer. Rev. Resp. Dis. 102: 591-606, 1970
Ferris, B.G., Higgins, I.T.T., Higgins, M.W., Peters, J.N., VanGanse, W.F. and Goldman, M.D. Chronic nonspecific respiratory diseaseBerlin, New Hampshire, 1961-1967: A cross sectional study,Am. Rev. Resp. Dis. 10Lf: 232-2Lf4, 1971
Ferris, B.G., Higgins, I.T.T., Higgins, M.W. and Peters, J.M.Sulfur oxides and suspended particulates possible effects of chronicexposure, Arch. Env. Health 27: 179-182, 1973
Ferris, B.G., Chen, H., Puleo, S. and }lurphy, R.L.H. Chronic nonspecificrespiratory disease in Berlin, Ne"\v Hampshire 1967 to 1973, Am. Rev.R2~?iratory Disease 113: 475-485, 1976
<ferris, G.B., Speizer, R.P., Spengler, J.D., Dockery, D., Bishop, V.,~volfson, M. and Humble, C. A study of the effects of sulfur oxidesand respirable particulates on the health of human beings. I. Methodologyand preliminary results, personal cORuunication, 1977
Finklea, J.r., Hammer, D.I., HO"\'7e, D.E., Sharp, C.R.) Nelson, \·J.C.,and Lawnmore, G.R. Frequency of acute lower respiratory disease inchildren: Retrospective survey of 5 Rocky ~rountain cOl1lmunities,1967-1970 pp. 3-55 to 3-56. In: U.S. EPA Office of Research &Development Health Consequences of Sulfur Oxides: A report fromCHESS, 1970-1971 EPA-650/l-74-004, Washington, D.C., U.S.Government Printing Office, 1974
Finklea, J.r., French, J.G., Lowrimore, G.R., Goldberg, J., Shy,C.M. and ~elson, W.C. Prospective surveys of acute respiratorydisease in volunteer families: Chicago nursery school study, 19691970, pp. 4-37 to 4-55. In: U.S. EPA, Research and Development HealthConsequences of Sulfur Oxides: A Report from CHESS 1970-1971,EPA-650/l-74-004, Washington, D.C., U.S. Government Printing Office,197 Lf

2':)1)
Glns~;er', H., Greenburg, L. and Field, F. NortaLLty and morbidityduring a period of high levels of nil' pollution, Nc\v York, November23-25,1966, Arch. Environ. Health 15: 6g Lf-69 L+, 1967
Glasser, M. and Greenburg, L. Air pollution, mortality and weather,New York City, 1960-1964, Arch. Environ. Health 22: 334-343, 1971
Goldberg, H.E., Cohen, A.A., Finklea, J.F., Farmer, J.R., Benson, F.B.and Love, G.J. Frequency and severity of cardiopulmonary symptoms inadult panels: 1970-1971 New York studies, pp. 5-85 to 5-103. In:U.S. ERA, Office of Research and Development, Health Consequences ofSulfur Oxides: A Report from CHESS 1970-1971, EPA-650/1-74-004,Washington, D.C., Government Printing Office, 1974
Goldberg, H.E., Finklea, J.F., Nelson, C.J., Steen, W.B., Chapman, R.S.,Swanson, D.H. and Cohen, A.A. Prevalence of chronic respiratorydisease symptoms in adults: 1970 survey of New York com~unities,
pp. 5-33 to 5-48. In: U.S. EPA, Health Consequences of SulfurOxides: A report from CHESS 1970-1971, EPA-650/l-74-004, Washington,D.C., U.S. Goverrnnent Printing Office, 1974
Goldring, I.P., Copper, P., Ratner, I.M. and Greenburg, L. Pulmonaryeffects of sulfur dioxide exposure in the Syrian hamster. T. Combinedwith viral respiratory disease, Arch. Environ. Health 15: 167-176,1967
Goldring, I.P., Greenburg, L., Park, S. and Ratrrer, I.M. Pulmonaryef:ects of sulfur dioxide exposure in the Syrian hamster, II. Combinedpith emphysema, Arch. Environ. Health 21: 32-37, 1970
Goldsmith, J.R. Effects of air pollution on human health. In: AirPollution, Stern, A.C. (ed), New York Academic Press
Goldsmith, J.R. Nondisease effects of air pollution, Env. Res.2: 93-101, 1969
Goldstein, I.F. Interaction of air pollution and weather in theireffects on health, Hs~rnA Hlth. Report 87(1): 50-55, 1972
Goldstein, I.F. and Block, G. Asthma and air pollution in t~vo innercity areas in New York City, J. Air Pollution Control Association24: 665-670, 1974
Gore, A.T. and Shaddick, C.W. Atmospheric pollution and mortalityin the county of London, Brit. J. Prevo Soc. Hed. 12: 104-113,1958
Gorham, E. Bronchitis and the acidity of urhan prec.ipitation,Lan~~t 2: 691, 1958
Go L"lldr.l) E. Pneumonia and a tmospher ic sulp ba te depos i. t, Lance t
2: 287--283, 1959

260
Greenburg, L., Jacob, N,B.:. Drolett.e,B.l''L Field, F. andBrallcrmnn, N.N. Ecport oJ [In '::11r pollut:ion inc-idcnt in NC\'l Yorl\City, Novellib e r 1953, PII b1. 11 C cl I t h RC' P0 r t 77: 7-- 16, .1 962
Greenburg, L., Field, F., Reed, J.1, and Erbrlrc1t, C.L. A-LXpollution and morbidity in New York City, J. A.M.A. 182: 1fi1-164,1962
Greenburg1l, L., Erhardt, C., Field, R., Reed, J.1. and Seriff, N.S.,Intermittent air pollution episodes in New York City, 1962, Pub. HealthReports 78: 1061-1064, 1963
Greenburg, L., Erhardt, C.L., Field, F. and Reed, J.I. Airpollution incidents and morbidity studies, Arch. Env. Health10: 351-356, 1965
Greenburg, L., Field, F., Erhardt, C.L., Glasser, M. and Reed,J. Air pollution influenza and mortality in New York City Januarythrough February 1963, Arch. Environ Health 15: 430-438, 1967
Greenburg, M.A., Nelson, K.E. and Carnow, B.W. A study of t~e
relationship between sudden infant death syndrome and environmentalfac tors, Am. J. Epidemiology 98: 4l2-Lf 22, 1973
Greenwald, I. Effects of inhalation of low concentrations of sulfurdioxide upon man and other maMnals, Arch. Industr. Hyg. 10: 455-475,1954
~~2gory, J. The influence of clireate and atmospheric pollution on,I! e~acerbations of chronic bronchitis, Atmos. Env. 4: 453- Lf68, 1970
Gunnison, A.F. and Benton, A.W. Sulfur dioxide: Sulfite-interaction\.;rith mammalian serum and plasma, Arch. Environ. Health 22: 381-388,1971
Gunnison, A.F. and Palmes, E.D. S-Sulfonates in human plasma followinginhalation of sulfur dioxide, Am. Ind. Hyg. Assoc. 35: 288-291, 1974
Haenszel, W., Loveland, D.B. and Sirken, M.G. Lung cancer mortalityrelated to residence and smoking habits, U.S. National CancerInstitute Journal 28: 947-1001, 1962
Hagstrom, R.c-I., Sprague, H.A. and Landau, E. The 0;ashville AirPollution Study. VII. Mortality from cancer in relation to airpollution, Arch. Environ. Health 15: 237-248, 1967
Hammer, D.I., ~[iller, Y.l., Stead, A.G. and Hayes, C.G. Air pollutionand childhooll 1m'o'er respiratory disease: Expc)sure to sulfur oxidesand p.:lrtlculate m3.tter in NeH York. In: Clinical InplicCltions of Air~ollllt_ion R~~~arch, Asher, J., Finkel and'Du-~-:L:~~ (eel), A.~I.:\.Air Pollution ~'[ed. Res. Conf. December 5-·6,197[1, S3D Francisco,C31ifornia pp. 321-338, 1976

761
_')
Hansen, L. D. Transition metol -- SO; complexes; A postulated mechanismfor the synergistic effects of aerosols and S02 on the respiratorytract. Tn: TrC1cc Sub.c;lances in Environmental 11eaJ th D.D. Hemphill(ed) Univers at Co , 1974
Harnett, R.W.F. and }~ir, A. Chronic bronchitis in the cattarrhalchild, Scot. Med. J. 8: 175-184, 1963
Hayes, C.G., Hammer, D.T., Shy, C..N., Hasse1blad, V., Sharp, C.R.,Creason, J.P. and McClain, K.E. Prevalence of chronic respiratorydisease symptoms in adul ts: 1970 survey of five Rocky ?[ountaincommunities. In: U.S. E.r.A., Office of Resc.arch and Development,Health Consequences of Sulfur Oxides: A Report from CHESS 1970-1971EPA -650/1-74-004 HClshington, D.C.; U.S. Government Printing Office,pp. 2-41 - 2-54, 1974
Hazucha, l1. and Bates, D.V. Combined effect of ozone and sulfur dioxideon human pulmonary function, Nature 257: 50-51, 1975
Hechter, H.B. and Goldsmith, J.R. Air pollution and daily mortality,Am. J. Med. Sci. 241: 581-588, 1961
Heiman, H. Episodic air pollution in metropolitan Boston, Arch. Environ.Health 20: 230-251, 1970
Hemeon, W.C. A critical review of regulations for the control ofparticulate emissions, J. Air Pollution Control Assoc. 23: 376-387,1973-
,R2:"derson, B.E., Gordon, R.J., Henck, H., Soohoo, J., Hartin, S.P.aDd Pike, ~1.C. Lung cancer and air pollution in southcentralLos Angeles county, Am. J. Epid. 101: 477-488, 1975
Hickey, R.J., Clelland, R.e., Bo\vers, E.J. and Boyce, D.E. Healtheffects of atmospheric sulfur dioxide and dietary sulfites, Arch.Env. Health 31: 108-112, 1976
Higgins, I.T.T., Cochrane, A.L., Gilson, J.e. and Wood, C.H.Population studies of chronic respiratory diseases: A comparisonof miners, foundry workers and others in Stave1ey, Derbyshire,Br. J. Ind. Med. 16: 255-268, 1959
Higgins, I.T.T., Gilson, J.e., Ferris, B.G., Waters, E., Campbell, H.and Higgins, tl. H. Chronic respiratory disease in an industrial to;;·m:A nine year follO\\7-up study, Am. J. Public Health 58~ 1667-1676, 1968
Higgins, I.T.T. and Ferris, B.G. Epidemiology of sulphur oxides andparticles, Proceedings of the Conference on Health EEfects of AirPollutants,National Academy of Sciences,National Research Council,October 3-5, 1973

",l ( r)'-_U,_
Higginr:, T.T.T. Trendr; in respiratory c.;tIlcer mortality in the U.S.anel in Eng]and and Hales, Arch. Environ. Health 28: 121-129, 1974
Higgins, I.T.T., ferris, B.G. Air pol1ut:ion effc::cts of the ventilatoryfunc tion, Arch. Environ. Hea 1 th 28: 23 LI, 197 Lf
lIir sch, J. A., S'\'7('n800, E. \L and Hanner, A. Tracheal mucous transpor tin beagles after long-term exposure to lppm sulfur dioxide, Arch.Environ. Health 30: 249-253, 1975
Hodgson, T.A., Jr. Short-term effects of air pollution on mortalityin New York City, Environ. Sci. Technol. 4: 589-597, 1970
Holland, H.IJ. and Reid, D.D. The urban factor in chronic bronchitis,Lancet 1: 445-448, 1965
Holland, W.W., Reid, D.D., Seltser, R., and Stone, R.W. Respiratorydisease in England and the U.S. studies of comparative prevalence,Arch. Environ. Health 10: 338-345, 1965
Holland, W.IV. Factors influencing the onset of chronic respiratorydisease, Brit. Hed. J. 2: 205-208, 1969
House, D.E., Finklea, J.f. Shy, C.M., Calafiore, D.C., Riggan, W.B.,Southwick, J.W. and Olsen, L. Prevalence of chronic respiratorydisease s}11lptoms in adults: 1970 survey of Salt Lake Basin communities,pp. 2-14 to 2-5Lf • In: U.S. E.P.A. Health Consequences of SulfurOxides: A report from CHESS, 1970-1971. EPA-650/l-74-004. Washington,D,~!=' U.S. Government Printing Office, 1974
Howard, P. The changing face of chronic bronchitis with airwaysobstruction, Brit. Med. J. 2: 89-93, 1974
Hrubec, Z., Cederlof, R., Friberg, L., Horton, R. and Ozolins, G.Respiratory symptoms in twins: Effects of residence-associatedair pollution,tobacco, and alcohol use and other factors, Arch.Environ. Health 27: 189-195, 1973
Huber, T.E., Joseph, S.H., Knoblocl:, E., Redfearn, P.L. andKarakm.;ra, J. A. Ne..,.' environmental respiratory disease (YokohamaAsthma), Arch. Ind. Hyg. Occup. ~led. 10: 399-408, 1954
Hunt, V.R. and Cross, ILL. Infant mortality and the environment ofa lesser metropolitan county: A study based on births in one calendaryear, Environ. Res. 9(2): 135-151, 1975
Ipsen, J., Deane, ~[. and Ingenito, r.E. Relationships of acuterespiratory disease to atmospheric pollution and meteorologicalcondition 1 Arch. Environ. Health 18: 462-472, 1969

Ishikcl\va) S.) Bm,qden, D.lI., Fisher, V. and Hyatt, J.P.The emphysema profile In t'i,.vO mich·]estern cities in North America, Arch.Environ. Health 18: 660-666, 1969
Jacobs, C.F. and Langdor, B.A. Cardiovascular deaths and airpollution in Charleston, South Carolina, Health Servo 87: 623-632,1972
Judeikis, H.S. and Siegel, A.J. Particle-catalyzed oxidation of atmospheric pollutants, Atmos. Environ. 7: 619-631, 1973
Kagawa, J., Toyama, T. and Nakaza, M. Pulmonary function tests forchildren exposed to air pollution. In: Clinical Implications of AirPollution Research, Finkel, A.J. and Duel, W.C. (ed), A.M.A., AirPollution Med. Research Conference, December 5-6, San Francisco,California, 1974 pp: 305-320, 1976
Kalpazanor, Y., Stamenova, }1. and Kurchatova, G. Air pollution and the1974-1975 influenza epidemic in Sofia, Env. Research 12: 1-8,1976
Kapalin, V.L.environments,
The red blood picture in children from differentRev. Czech. Hed. 9: 65-87, 1963
Kehoe, R.A., Machle, W.F., Kitzmiller, K. and LeBlanc, T.J.On the effects of prolonged exposure to sulphur dioxide, J. Ind.Hyg. 14: 158-173, 1932
KE.,\'.3ny, J., Rooney, N. and Kennedy, J. Health effects of air pollution,<In 0ublin, In. J. Hed. Sci. 144(3): 102-115, 1975
Krishnan, B., Nambinarayanan, T.K., Sivasankaran, V.P. The effectof sulfuric acid fumes on lung surfactant, Indian Journal of Experimental Biology 12: 524-527, 1974
Lambert, P.M. and Reid, D.D. Smoking, air pollution and bronchitisin Britian, Lancet 1: 853-857, 1970
Landau, E., Prindle, R.A. and Ziedberg, L.D. The Nashville air pollutionstudy: S02 and bronchial astl@a - a miltivariate analysis, Int. JournalEnviron. Studies 2(1): 41-46, 1971
Lawther, P.J., Waller, R.E. and Henderson, ~[. Air pollution and exacerbations of bronchitis, Thorax 25: 525-539, 1970
Lawther, P.J., ~acFarlane, A.J., Waller, R.E. and Brooks, A.G.F.Pulmonary function and sulphur dioxide: some preliminary findings,Environ. Res. 10: 355-367, 1975

Lebmdt7., N.D., Toyamo, T. and 1:'fcCarroll, J. The relationshipbet\'lcen [tir pollution ~lnc1 HeClthcr as stimuli "mel daily mortal:i tyas responfC;es in Tokyo, Japan, \vith comparisons vith other cities,Environ. Res. 6: 327-333, 1973
LeboHllz, H.D. A comparative analysis of stimulus response relationshipbetHeen mortality and air pollution-weather, Environ. Res. 6: 106-118,1973
Lebo\vitz, ~I.D. Bendheim, P., Cristea, G., Narkovitz, D., Nisiaszek,J., Staniec, H. and VanHyck, D. The. effect of air pollution andHeather on lung function in exercising children and adolescents,Amer. Rev. Resp. Dis. 109: 262-273, 1974
Lee, S.D. and Danner, R.M. Biological effects of S02 exposure on guineapigs, Arch. Environ. Health 12: 583-587, 1966
Lee, S.D. and Danner, R.M. Biological effects of S02 exposure on guineapigs, Arch. Environ. Health 12: 583-587, 1966
Lee, A.M. and Fraurnen~ J.F., Jr. Arsenic and respiratory cancer in man:An occupational study, J. Natl. Cancer Inst. 42: 1045-1052, 1969
Lee, R.E., Jr. and Duffield, F.V. EPA's Catalyst Research Prograrn=Environmental Impact of Sulfuric Acid Emission, U.S. EnvironmentalProtection Agency Health Effects Research Laboratory, Research TrianglePark, North Carolina, Ha.rch 1977
L~~~g, K.H, ~acFarland, B.A. and Sellers, E.A. Acute 802 toxicity:;[r:ects of histamine liberation, Arch. Environ. Health 3: 668-675,1961
Lewis, T.R, Campbell, D.E. and Vaught, T.R., Jr. Effects on caninepulmonary function via induced ~02 impairment particulate interactionand subsequent SO~, Arch. Environ. Health 18: 596-601, 1969
.:...
Lewis} T.R., ~[oorman, W.]. and Campbell, K.I. Toxicity of long termexposure to oxides of sulfur, Arch. Environ. Health 26: 16-21, 1973
Logan, H.P.D. :!ortality in London fog incident, 1952, Lancet 1:336-338, 1953
Love, G.J., Cohen, A.A., Finklea, J.F., French, J.G. ,Lawrimore, C.R.,Kelson, W.C. and R~~sey, P.B. Prospective surveys of acute respiratorydisease in volunteer families: 1970-1971 New York Studies, pp. 5-48 to5-69. In: U.S. EPA, Office of Research and Development, HealthConsequences of Sulfur Oxides: A Report from CHESS, 1970-1971,EPA-650/l-74-00~., ~ashington, D.C., C.S. ~overnment Printing Office1974

LO\\1e, C.R., C~lrllpbe.ll, It. and Khosln, T. Bronchitis in t-.;vC) inl:egro.tedsteel works. III. Respiratory symptoms ;::mel vClltiLltory cnpncityrelated to atmospheric pollution, Brit. J. InLlustri;::d Heel. 27: 12J129, 1970
Lunn, J.E., Knowelden, J. anel Handyside, A.J. Patterns of respiratoryillness in Sheffield infant school children, Brit. J. Prevo Soc.Ned. 21: 7-16, 1967
Lunn, J.E., Knowelden, J. and Roe, J.W. Patterns of illness inSheffield junior school children, Brit. J. Prevo Soc. Med. 24: 223228, 1970
MaHoney, L.E. Air pollution and respiratory mortality in Los Angeles,West J. Med. 124: 159-166, 1976
Malcolm, D. and Paul, E. Erosion of the teeth due to sulfuric acid inthe battery industry, Brit. J. Ind. Hed. 18: 63-69, 1961
Mandi, A. Galambos, E., Galgoczy, G., Szabo, H. and Kollar, K. Relation-~
ship bet\veen lung function valves and air pollution data in Budapestschool children, Pneumonologic 150: 217-225, 197Lf
~ Manzhenko, E.G. The effect of atmospheric pollution on the health ofchildren, Hyg. and Sanit. (Eng. trans.) 31(10-12): 126-128, 1966
Marienfeld, C.J., Galeota, W.R. and Halbert, R.R. Spontaneousneumothorax and fossil fuels, Arch. Environ. Health 29: 195-202, 1974
.i.·[·f:i:-tin, A.E. and Bradley, W.B. Hortality, fog, and atmospheric pollution,Great Britain Ministry of Health 19: 56-70, 1960
Martin, A.E. Mortality and morbidity statistics and air pollution,Proc. Roy. Soc. Hed. 57 (suppl): 969-975, 1964
Martin, S. and Willoughby, R.A. Organic dusts, sulfur dioxide and therespiratory tract of swine, Arch. Env. Healtll 25: 158-165, 1972
McCarroll, J.R., Cassell, E.J., Ingram, W. and Wolter, D. Health andthe urban environment air pollution and family illness, I. Design forStudy, Arch. Environ. Health 10: 357-363, 1965
McCarroll, J.R. and Bradley, W. Excess mortality as an indicator ofhealth effects of air pollution, ArneI'. J. Pub. Health 56: 1933-1943,1966
McCarroll, J., Cassell,J.R. and ~Iountain, 1.~L
and illness in a normall78-~18!~, 1967
E.J., Wolter, D.W., ~ountain, J.D., Diamond,Health and urban environment. V. Air pollution
urban population, Arch. Environ. Health 14:
266
Hc.C(] [Toll, J .l~. llc;:-Isurcments of morbidity and mortcl1ity related toair poLL It t ion, J. Air Po 11. C(] n t r 01 1\s ::; 0 c. 17: 203 - 20<), 1967
Hc.Jilton, E. E., Frank, N. R. and Charlson Roles of relative. humidityin the synergistic effect of a sulfur dioxide-aerosol mixture ill thelun8, Science 182: 503-504, 1973
HcKay, H.A.C, Tbe atmospheric oxidation of sulphur dioxide in Haterdroplets in presence of ammonia, Atmos. Environ. 5: 7-14, 1971
Melville, G.N. Changes in specific airway conductance in healthyvolunteers following nasal and oral inhalation of S02' W. Ind. Ned.J. i9: 231-235, 1970
Ministry of Health l~rtality and morbidity during the London Fogof December 1952, Rep. Public Health :fed. Subj. No. 95 London:Her Majestyls Stationary Office, 1954
Ministry of Pensions and National Insurance Report on an inquiry inSothe incidence of incapacity for work, London. Her Majesty'sStationary Office, 1965
Moorman, W.J., Lewis, T.R. and Wagner, W.D. Maximum expiratory flowvolume studies on monkeys exposed to bituminous coal dust, J. ofApplied Physiol. 39: 444-448, 1975
Morgan, W.K.C. and Lapp, N.L. Respiratory disease in coal miners,Au. Rev. of Respir. Disease l13~ 531-559, 1976
i'1o.:-ris, S.C., Shapiro, N.A. and Haller, J.R. Adult mortality in,2' communities "lith \\Tidely different air pollution levels, Arch.Env. Health 31: 248-254, 1976
Mostardi, R.A. and Leonard, D. Air pollution and cardiopulmonaryfunctions, Arch. Environ. Health 29: 325-328, 1974
Mountain, I.M., Cassell, E.J., Walter, D.W., Mountain, J.D., Diamond,J. R. and j\kCarroll, J. R. Heal th and the urban environment. VII. Airpollution and disease symptoms in a ','noTIn:i1 11 population, Arch.Environ. Health 17: 343-352, 1968
Huri, D.C.F. Clinical Aspects of Inhaled Particles \~illiam HeinemannMedical Books Limited, London, 1972
Nadel, J.A., Salem, H., Tamplin, B. and Toki\;.n1, Y. ?'fechanismofbronchoconstriction during inhalation of sulfur dioxide, J. App1.Physiol. 20: 164-167, 1965

267
National Institute for Occupational Safety and Health: Criteria fora Recommended Standard ... Occupat~on;11_E~xposure to SO/., Rockville,Haryland 197 ft) U.S. Department of llealth, Education, ,inc! HcJfal-c,Hashington, D.C. 197 Lf
Nau, C.A., Neal, J., Stembridge, V.A., Cooley, R.N. Physiologicaleffects of carbon black. IV. Inhalation, Arch. Environ. Health 4:Lf 15-431, 1962
Nelson, W.C., Finklea, J.F., House, D.E., Calafiore, D.C., Hertz,M.B. and Swanson, D.H. Frequency of acute lower respiratory diseasein chi.ldren: Retrospective survey of Salt Lake Basin communities,1967-1970 pp. 2-55 to 2-73. In: U.S. Environmental ProtectionAgency, Office of Research and Development. Health consequences ofsulfur oxides: A Report from CHESS, 1970-1971, EPA650/1-74-004Washington, D.C., U.S. Government Printing Office, 1974
Neri, L.C., Mandel, J.S., Hewitt, D. and Jurkowski, D. Chronicobstructive pulmonary disease in t\VO cities of contrasting airquality, Can. Med. Assoc. J. 113(11-12): 1043-1046, 1975
Oshima, Y., Ishizaki, T., Miyamoto~ T., Shimizu, T., Shida, T. andKabe, J. Air pollution and respiratory disease in the TokyoYokohama area, Am. Rev. of Resp. Dis. 90: 572-581, 1964
Paccagnel1a, B., Pavanello, R. and Pesarin, F. Immediate effects ofair pollution on health of school children in some districts ofFerrara, Arch. Environ. Health 18: 495-502, 1969
PattIe, R.E. and Burgess, F. Toxic effects of mixtures of S02 and'~moke with air, J. Pathol. Bacterol. 73: 411-419, 1957
Paul, R. Chronic bronchitis in African miners and non-miners inNorthern Rhodesia, Brit. J. Dis. Chest 55: 30-34, 1961
Peacock, P.R. and Spence, J.B. Incidence of lung tumors in LXmice exposed to (1) free radicals (2) S02' Brit. J. Cancer 21: 606618, 1967
Pemberton, J. and Goldberg, C. Air pollution and bronchitis,Brit. Hed. J. 2(1): 567-570, 1954
Pemberton, J. Air pollution as a possible cause of bronchitis andlun8 cancer, J. Hyg. Epidem. 5: 189-194, 1961
Petrilli, r.L., Agnese, G. and Kanitz, S. Epidemiologic studiesof air pollution effects in Genoa, Italy, Arch. Environ. Health12: 733-740, 1966
Pinto, S.S. L1nd Bennett, B.H. Effect of arsenic trioxide eXpJSllreon mortality, Arch. Environ. Health 7: 583-591, 1963
I
Pirila, V. Ski.n o11crgy to simplQ ga~.;eous ~.;ulfur compounds, Acta.Allergol. 7: 397-402, 1954
Pir j 1a, V., K;:I j Cl nne, 11 . and Sal0, O. P . Inha 1a t: ion of suI fur cl i ox :leI eas a CclllS e of skin rE:;~ac t ion resernbli ng c1 rug eru p t: ion, J. Occup.Hed. 5: 4 tf3- tt!i5, 1963
Prindle, E..A., "'right, G.H., HcCaldin, R.O., Harcus, S.C., Lloyd, T.C.and Bye, W.E. Comparison of pulmonary function and other parametersin t\vO communities \\dth \videly different air pollution levels, Arner. J.Pub. Health 53: 200-217, 1963
Racoveanu, C.L., Cretescu, R.P., Manicatide, M.A. and Nico1aescu,V. V. Prevalence of respi ra tory symptoms in to'i'Tl1S \vith diff erentair pollutiorl, Rev. Roum. Hed. (Ned. Intern.) 13(2): 105-113,1975
Rao, N., Steiner, P" Qazi, Q., Padre, R., Allen, J.E. and Steiner, M.Relationship of air pollution to attack rate of asthma in children,J. Asthma Res. 11: 23-26, 1973
RaIl, D.P. Review of the health effects of sulfur oxides,Environ. Health Persp. 8: 97-121, 1974
Reichel, G. Effect of air pollution on the" prevalence of respiratorydiseases in ~est Germany. In: Proceedings of the 2nd InternationalClean Air Congress pp. 186-191, December 6-11, 1970
Reid, D.D. Environmental factors in respiratory disease, Lancet 1:,1'289-1294, 1958
Reid, L. An experimental study of hypersecretion of mucous in thebronchial tree, Br. J. Exp. Pathol. 44: 437-445, 1963
Ribbon, A., Glasser, M. and Sudhivoraseth N. Bronchial asthma inchildren and its occurrence in relation to weather and air pollution,Annals of Allergy 30: 276-281, 1972
Rogan, J.N., Attfield, H.D., Jacobsen, N., Rae, S., Ha1ker, D.D.and Walton, '{.H. Role of dust in the working environment in developmentof chronic bronchitis in British coal miners, Br. J. Ind. Hed. 30:217-226, 1973
Roholm, K. The fog disaster in the :-lesa Valley, 1930, a fluorineintoxication, J. Indust. Hyg. 19: 126-137, 1937
Romanoff, A. Sulfur dioxide poisoning as a cause of asthma, J.Allergy 10: 166-169, 1939

Rosenbaum, S.disease, Brit.
26~
Home localiLj C~; of n:ltional servicemen \'lith respiratoryJ. Prevo Soc. Ned. 15: 61-67, 1961
\
Roth, R.P. and Tansey, M.r. Effects of gaseous air pollutants ongastric secreta-motor activities in the rat, J. Air Pollution Cant.Association 22: 706-709, 1972
Rumford, J. Mortality studies in relation to air pollution, Am. J.Pub. Health 51: 165-173, 1961
Rylander, R. Alterations of lung defense mechanisms againstairborne bacteria, Arch. Environ. Health 18: 551-555, 1969
Salem, H. and Aviado, D.H. Inhalation of sulfur dioxide, Arch.Environ. Health 2: 56-62, 1961
Salem, H. and Cullumbine, H. Kerosene smoke and atmospheric pollutants,Arch. Environ. Health 2: 641-647, 1961
Sax, N.I. Dangerous Properties of Industrial Materials ReinholdPublishing Corporation, 1963
Schimmel, H. and Greenburg, L. A study of the relation of pollutionto mortality, New York City 1963-1968, J. Air Poll. Control Assoc.22: 607-616, 1972
Schnuker, L. and Haythorn, S.R. The effects of coal smoke of kno\VTIcomposition on the lungs of animals, L~n. J. Pathol. 13: 799-810, 1937
?,choettlin, C. and Landau, E. Air pollution and asthmatic attacks·'in the Los Angeles area, Pub. H. Reports 76: 545-548, 1961
Schrenk, H.n., Heimam, H., Clayton, C.D. and Wexler, H. Air pollutionin Donora, Pennsylvania, Pub. Health Bull. 1'\0. 306, 1949
Scott, J.A. Fogs and deaths in London December 1952, Pub. HealthRep. 68: 474-478, 1953
Scott, J.A. The London fog of December, Med. Off. 99: 367-368, 1958
Scott, J.A. Fog and atmospheric pollution in London, \vinter 19581959, }led. Officier (London) 102: 191-193, 1959
Scott, J.A. The London 'fog of Dece~ber 1962, M. Officier (London)109: 250-252, 1963
Severs, K. Air pollution and health, Texas Rep. BioI. ~[ed. 33: 45-83,1975

270
Shy, C.1'1., Creason, J.P., Pearlman, H.E., 1"~cCIClin, 1<.1':., Benson, F.B.and Young, N.n. The ChatLll1oo[',a school chilc1rl'll stuely: Effectsof community exposure to nitrogen dioxide. II. TncidcIll'C 0 1 aculerespiratory disease, J. kn. Poll. Cont. Assoc. 20: 582-588, 1970
Shy, C.N., Hasselb1ac1, \") Burton, R.N., Nelson, C.J. and Cohen, A.A.Air pollution effects on ventilatory function of United States schoolchildren. Results of studies in Cincinnati, Chatanooga, andNe\'l York, Arch. Environ. Health 27: ]24-133, 1973
Shy, C. H., Hasselb1ad, V., Finklea, J. F., Burton, R. H., Pravda, N.,ChapmaN, R.S. and Cohen, A.A. Ventilatory function in school children:1970-1971, New York Studies, PP' 4-109 to 5-119. In: r.s. EPA, Officeof Research and Dev. Health Consequences of Sulfur Oxides: A Reportfrom CHESS 1970-1971, EPA 650/1-7 Lf---00
271
Speizer, F.E. and Frank) N.R. The uptake and release of S02 bythe human nose', Arch. Environ. Health 12: 725~728> 1966
Spicer, \V.S., Storey, P.lL, I'1organ, l\l.K.C., Kerr> H.D. and Standiford,N 'lC' ,,'aT i at ion in yes pi r (} tor y fun c t ion inse1ec t e c1 pat i en t sand itsrelation to air pollution, Am. Rev. lZesp. Dis. 86: 705-712, 1962
Spicer, S., Reinke, B.A. and Kerr, H.D. Effects of envirorunent uponrespiratory function II. Daily studies in patients with chronicobstructive lung disease, Arch. Environ. Health 13: 753-762, 1966
Spicer:, S. and Kerr, H. D. Eff ec ts of environment on respira toryfunction III. Weekly studies on young male adults, Arch. Environ.Health 21: 635-642, 1970
Spiegelman, J.R., Hanson, G.D., Lazarus, A., Bennett, R.J., Lippmann,M. and Albert, R.E. Effect of acute sulfur dioxide exposure onbronchial clearance in the donkey, Arch. Environ. Health 17: 321-326,-1968
Sprague, H.A. and Hagstrom, R. The Nashville air pollution study:Mortality multiple regression, Arch. Environ. Health 18: 503-507, 1969
Stebbings, J.R., Fogleman, D.G., McClain, K.E. and Towsend, r!.C. Effectof the Pittsburgh air pollution episode upon pulmonary function inschool children, Air Pollution Control Assoc. 26(6): 547-553, 1976
Stebbings, J.B. and Hayes, C.G. Panel studies of acute health effectsci: air pollution I. Cardiopulmonary symptoms in adults,1'\e\\J York,1971-1972, Environ. Res. 11: 89-111, 1976
,'1,1'
Stenback, F. Rowland, J. and Sellakuman, A. Carcinogenicity of benzopyrene and dusts in hamster lung, Oncology 33: 29-34, 1976
Sterling, T.D., Phair, J.J., Pollack, S.lT., Schumsky, D.A. and DeGroot,I. Urban morbidity and air pollution; a first report, Arch. Environ.Health 13: 158-170, 1966
Sterling, T.D., Pollack, S.V. and Phair, J.J. Urban hospital morbidityand air pollution; 2nd report, Arch. Environ. Health 15: 362-374,1967
Stocks, P. Air pollution and cancer mortality in Liverpool HospitalRegion and North Wales, Intern. J. Air. Poll. 1: 1-13, 1958
Stocks, P. Cancer and bronchitis mortality in relation to atmosphericdeposit and smoke, Brit. Ned. J. 1: 74-79, 1959

Stocks, P. On thc-' r(,]tltjon~; bet\'Il'en atmospl1cTic pollution in urban andrural localities and IrIortrllity from canccr~ bronc.hitis, ond pneumonia\vith pclrticular reference to 3:4 benzopyl:CllC:, beryllium, molybolenum,vanadium, and arsenic, Brit. J. Cancer 14: 397-~18, 1960
Stocks, P. Recent epidemiological studies of lung cancer mortality,cigarette smoking, and cdr pollution \-J:U:h c1iscusE:don of a nC\.1 hypothesisof causation, Br. J. Cancer 20: 595-623, 1966
Stocks. P. Lung cancer and bronchitis in relation to cigarettesmoking and fuel comsumption in 20 countries, Hr. J. Prevo Soc.Med. 21: 181-185, 1967
Stokinger, H.E. and Coffin, D.L. Biologic effects of air pollutionIn: Stern A.C. (ed) Air Pollution, pp. [\!16--5116, N.Y. Academic Press,1968
Str~ndberg, L.G. S02 absorption in the respiratory tract, Arch.Envlron. Health 9: llSO-166, 196[1
Sultz, H.A., Feldman, J.G., Schlesinger, E.R. and Noshen, H.E.An effect of continued exposure to air pollution on the incidence ofchronic childhood allergic diseases, Am. J. Pub. Health 60(5): 891900, 1970
Thompson, J.) Lebo\vi tz, rL, Cassell, E. J " Hal ter and HcCarroll, J.Health and the urban environment. VIIL Air pollution, \'7eather,a r.:: the c. omm0 nco1d, PJll. J. Pub. Hea 1 t h 60: 731- 73 9, 197 0
Toyama, T. Air pollution and its health effects in Japan, Arch.Environ. Health 8: 153-173, 1964
Treon, J.F., Durra, F.R., Capel, J., Sigmon, H. and Younker, W.Toxicity of sulfuric acid mist, Arch. Ind. Hyg. 2: 716-734, 1950
Tromp, S. Influence of weather and climate on asthma andbronchitis, Review Allerg. 22: 1027-1044, 1968
Tsunetushi, Y., Shimizu, T., Takahashi, H., Ichinosawa, A., Ueda, N.,Nakayama, N. and Yamagata, Y. Epidemiological study of chronic bronchitiswith special reference to effects of air pollution, Int. Arch.Arbeitsmed. 29: 1-27, 1971
Utidjian, H.~I.D. Criteria documents I. Recommendations for a sulfuricacid standard, J. Occup. Med. 17: 725-729, 1975
VanderLende, R., Visser, B.F., ~ever-Hess, J., Tammeling, G.J., deVries,K. and Orie, ~.G.~I. Epidemiological investigation in the ~etherlands
into the influence of smoking and atr.lospheric pollution on respiratorysymptor.ls and lung function disturb3nces, Pnernfionologic 149: 119-126, 1973

273
Vandergrift, A.E., Slio.nnon, 1..J., Sn.llce, E.E., Gorman, P.G. and J'ark,\\I • R. Par L -[ c \J 1;] ten i r po] 1uti 0 n :Ln t: 11cU. S ., J. Air Pol Jut ion Cont r 0 1Assoc. 21: 321-328, 19J1
Verma, tl.P., Schilling, F.J. and Becker, W.H. Epidemiological studyof illness absences in relation to air pollution, Arch. Environ.Health 18: 536-543, 1969
Vintinner, F.J. and Baetjer, A.M. Effects of bituminous coal dustand smoke on the lungs - animal experiments, Arch. Ind. Hyg. 4:206-216, 1951
Waller, R.E. and Lawther, P.J. Some observations on London fog,Brit. Med. J. 2: 1356-1358, 1955
Waller, R.E. and Lawther, P.J. Further observations on Londonfog, Brit. i'led. J. 2: 1473-1475, 1957
Watanab, E.H. and Kaneko, F. Excess death study of air pollution.In: Proceedings of the 2nd International Clean Air Congress, December6-11, 1970, pp. 199-201
Wagman, J., Lee, R.E. and Axt, C.J. Influence of some atmosphericvariables on the concentration and particle size distribution ofsulphate in urban air, Atmos. Environ. 1: 479-489, 1967
\vehrle, P. F. and Harr-mer, D. I. Summary Report: Illnesses of children.In: Clinic~_Imp1icationsof Air Pollution Research, Finkel, A.J. andD;j~l, H. C. (ed), presented at A.H.A. Air Pollution :ledical Research
"'C~nference, December 5-6, San Francisco, California, 1974, pp. 273284, 1976
Weill, H., Ziskind, :LN., Derbes, V., Le'ivis, R., Horton, R.J.N.and ~·kCaldin, R.O. Further observations on Ne'i-:r Orleans asthma,Arch. Environ. Health 8: 184-187, 1964
Williams, M.R. Sickness absence and ventilatory capacity of workersexposed to sulfuric acid mist, Brit. J. Ind. tIed. 27: 61-66, 1970
Hinkelstein, \iI., Kantor, S., Davis, E.\-1., }Ianeri, C.S. and Hosher,W.E. The relationship of air pollution and economic status to totalmortality and selected respiratory system mortality in men. r.· Suspended particulates, Arch. Environ. Health 14: 162-171, 1967
l-linkelstein, \\:., Kantor, S., Davis, "E.P., '(aneri, C. and Hosher, H.E.The relationship of air pollution and economic status to total mortalityand selected respiratory systems 80rtality in men. II. Oxides ofsulfur, Arch. Environ. Health 16: 401-405
\\finkelstein, \.!. and Kantor, S. Respiratol:y symptoms and air pollutionin an urban population of Northeastern [nited States, Arch. Environ.Health 18: 760-767, 1969

Hinkclstein, IY. and Kantor, S. Pro~::;tclte CanCel";suspended particulate air pollution, A.J.P.H. 59:
relationship to1134-1138, 1969
Hinkelstpl.n, 1,7. c1nc1 ]C::lntOl', S. Stomach cancer: positive associationwith suspended particulate air pollution, Arch. Env. Health 18: 544547, 1.969
Winkelstein, W. and Gay, M.H. Suspended particulate air pollutionrelationship to mortality from cirrhosis of the liver, Arch. Environ.Health 22: 174-177, 1971
Holf£, R.K., Dolovich, H., Eng. P., Rossman, C.H. and Ne\'7house, H.T.Sulfur dioxide and trachea-bronchial clearance in man, Arch. Environ.Health 30: 521-527, 1975
Yanysheva, N.Y. Air pollution by discharges from electric power plRntsand chemical combines on the health of nearby inhabitants, Gig: Sanit8: 15-29, 1957 In: U.S.S.R. I.iterature on Air Pollution and RelatedOccupational Diseases, B.S. Levne (trans) 1: 98-104, 1960
Yokoyama, E., Yoder, R.E. and Frank, N.R. Distribut}gn of 35 8 in theblood and its excretion in urine of dogs exposed to .SO?, Arch. Environ.'Health 22: 388-395, 1971 ~
Yoshida, R., Motomiya, K., Sairo, H. and Funabashi, S. Clinical andepidemiological studies of chilhood asthma in air polluted areas inJapan. In: Clinical Implications of Air Pollutio~ Research,Fi~ke1 A.J. and Duel, U.C. (ed) pp. 165-176,1976 Presented at theA.~;.A. Air rollution ~fedicCll Research Conference, December 5-6,,S~~ Francisco, California, 1974
Zapletal, A. Pulmonary function studies in children living in anair polluted area, Am. Rev. Respir. Dis. 107: 400--409, 1973
Zarkower, A. Alterations in antibody response induced by chronicinhalation of sulfur dioxide and carbon, Arch. Environ. Health 25:L} 5- 5 0 , I 97 2
Zeidberg, L.D., Prindle, R.A. and Landau, E. The Nashville air pollution study. I. Sulfur dioxide and bronchial asthma, a preliminaryreport. Alner. Rev. Resp. Dis. 8Lf: 489-503, 1961
Zeidberg, L.D., Prindle, R.A. and Landau, E. The Nashville airpollution study" III. ~forbidity in relation to air pollution,Arner. J. Pub. Health 54: 85-97, 1964
Zeidberg, L.D., Horton, R.J.~[. and Landau, E. The ~ashville airpo1lutin study. V. ~ortality from diseClses of the respiratorysystem in relation to air pollution, Arch. Environ. Health 15:214-224, 1967
Zeiclberg, L.D., Horton, R.J.~L and Land~lu, E. The )Jashville air pollu-t ion s t II c1 y . \'1. Car cl i 0 \'as c u 1a r dis e a s e. ni 0 r t d lityin r e 1 (1 t iont 0 a:i r po lill t i on, Ar (' h . En \' i r () n. fI e a 1 t h l): 225- 23 (). 1 9 67