Refining as-cast structures of novel SixTiVCrZr high-entropy ...
15
This is a repository copy of Refining as-cast structures of novel SixTiVCrZr high-entropy alloys using estimated effective solidification temperature obtained using Chvorinov’s rule . White Rose Research Online URL for this paper: http://eprints.whiterose.ac.uk/160675/ Version: Published Version Article: Leong, Z., Huang, Y., Bloomfield, M. et al. (7 more authors) (2020) Refining as-cast structures of novel SixTiVCrZr high-entropy alloys using estimated effective solidification temperature obtained using Chvorinov’s rule. Metals, 10 (3). 317. https://doi.org/10.3390/met10030317 [email protected] https://eprints.whiterose.ac.uk/ Reuse This article is distributed under the terms of the Creative Commons Attribution (CC BY) licence. This licence allows you to distribute, remix, tweak, and build upon the work, even commercially, as long as you credit the authors for the original work. More information and the full terms of the licence here: https://creativecommons.org/licenses/ Takedown If you consider content in White Rose Research Online to be in breach of UK law, please notify us by emailing [email protected] including the URL of the record and the reason for the withdrawal request.
-
Upload
khangminh22 -
Category
Documents
-
view
1 -
download
0
Transcript of Refining as-cast structures of novel SixTiVCrZr high-entropy ...
This is a repository copy of Refining as-cast structures of novel SixTiVCrZr high-entropy alloys using estimated effective solidification temperature obtained using Chvorinov’s rule.
White Rose Research Online URL for this paper:http://eprints.whiterose.ac.uk/160675/
Version: Published Version
Article:
Leong, Z., Huang, Y., Bloomfield, M. et al. (7 more authors) (2020) Refining as-cast structures of novel SixTiVCrZr high-entropy alloys using estimated effective solidification temperature obtained using Chvorinov’s rule. Metals, 10 (3). 317.
https://doi.org/10.3390/met10030317
[email protected]://eprints.whiterose.ac.uk/
Reuse
This article is distributed under the terms of the Creative Commons Attribution (CC BY) licence. This licence allows you to distribute, remix, tweak, and build upon the work, even commercially, as long as you credit the authors for the original work. More information and the full terms of the licence here: https://creativecommons.org/licenses/
Takedown
If you consider content in White Rose Research Online to be in breach of UK law, please notify us by emailing [email protected] including the URL of the record and the reason for the withdrawal request.
metals
Article
Refining As-Cast Structures of Novel SixTiVCrZrHigh-Entropy Alloys Using Estimated EffectiveSolidification Temperature Obtained UsingChvorinov’s Rule
Zhaoyuan Leong, Yuhe Huang, Maximillian Bloomfield , Bethany Jim , George Kerridge,
Jem Pitcairn, Michael Schobitz, Lorna Sinclair, Silvija Zilinskaite and Russell Goodall *
Dept. Materials Science & Engineering, The University of Sheffield, Sir Robert Hadfield Building, Portobello St,Sheffield S1 3JD, UK; [email protected] (Z.L.); [email protected] (Y.H.); [email protected] (M.B.);[email protected] (B.J.); [email protected] (G.K.); [email protected] (J.P.);[email protected] (M.S.); [email protected] (L.S.); [email protected] (S.Z.)* Correspondence: [email protected]; Tel.: +44(0)-114-222-5977
Received: 29 January 2020; Accepted: 26 February 2020; Published: 28 February 2020
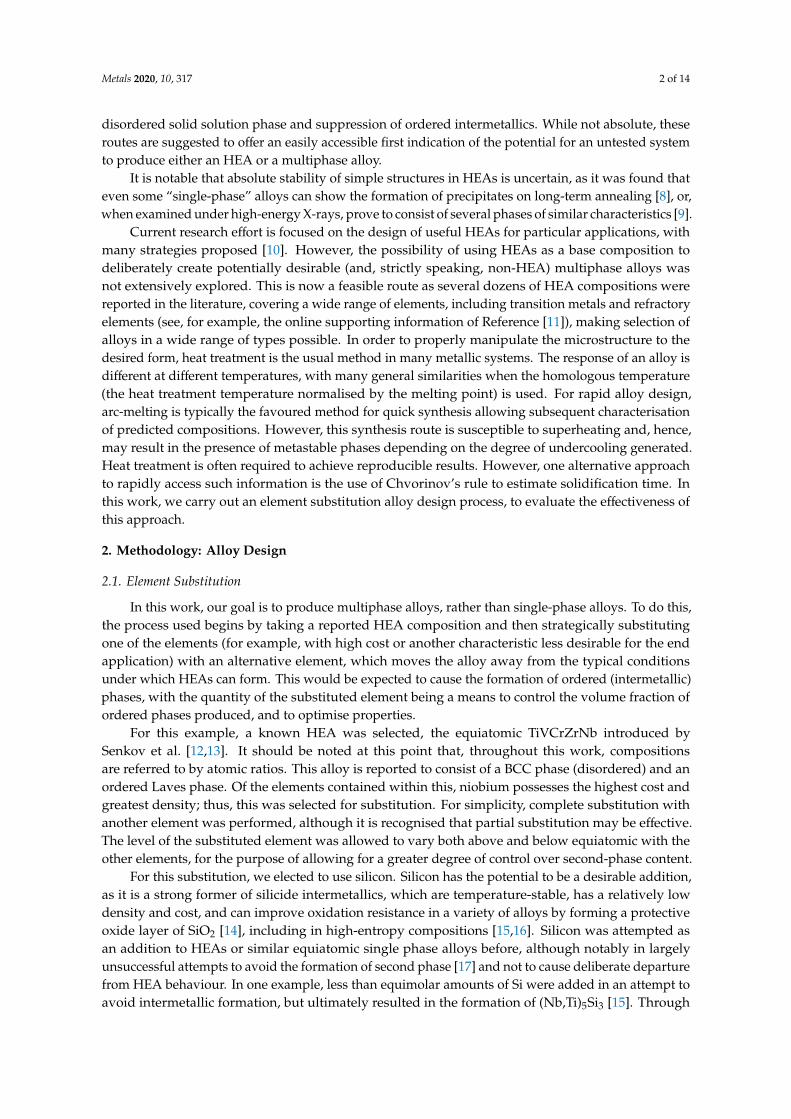
Abstract: High-entropy alloys (HEAs), i.e., multicomponent alloys where (typically five or more)elements are combined in equal, or roughly equal, quantities, are of great current interest, due to theirformation of single, simple structured phases, and the unusual properties they can potentially exhibit.Phase presence may be predicted using semi-empirical methods, but deviations from predictions maybe seen during the course of alloy synthesis, with the formation of unexpected phases. The generationof such phases may be controlled with knowledge of the effective solidification temperature; in thisfull article, Chvorinov’s rule for solidification time is used to estimate this temperature as part ofthe design of a new multiphase alloy system, TiVCrZr-Six. Further heat treatment of the TiVCrZr-Sisystem confirms the applicability of this approach. The new compositions demonstrate mechanicalproperties that suggest potential for optimization for high-temperature applications.
Keywords: alloy design; high-entropy alloys (HEAs); complex concentrated alloys (CCAs) silicide;arc-melting
1. Introduction
High-entropy alloys (HEAs) are alloys with multiple elements and no clear solvent (sometimes thecompositional range is taken to be 5–35 at.% of each [1]), where, for certain combinations, the resultantalloy displays few phases (possibly single phase), often of simple structures such as face-centred cubic(FCC) or body-centred cubic (BCC). As a relatively new class of metallic materials, they are the subjectof much current interest, understanding their structure, properties, and potential applications [2–4].While there are many definitions, here, we are exploring the wider range of alloy types which areclassified by Miracle and Senkov in their review [5] as multi-principal element alloys, without animplication for the phase makeup encountered, and more particularly the class identified by theseauthors as complex concentrated alloys (CCAs) defined compositionally as above, but allowingmultiphase microstructures (which may be desired for the purposes of property refinement, such asimprovement of the mechanical properties).
Much work focused on the prediction of HEA formation in new alloys. While there are manyapproaches, from electronic structure-based [6] to selection-based approaches on thermodynamicallyderived parameters [7], some of the widest used are empirical limits set on certain atomic andthermodynamic parameters, attempting to predict conditions that will lead to stabilisation of the
Metals 2020, 10, 317; doi:10.3390/met10030317 www.mdpi.com/journal/metals
Metals 2020, 10, 317 2 of 14
disordered solid solution phase and suppression of ordered intermetallics. While not absolute, theseroutes are suggested to offer an easily accessible first indication of the potential for an untested systemto produce either an HEA or a multiphase alloy.
It is notable that absolute stability of simple structures in HEAs is uncertain, as it was found thateven some “single-phase” alloys can show the formation of precipitates on long-term annealing [8], or,when examined under high-energy X-rays, prove to consist of several phases of similar characteristics [9].
Current research effort is focused on the design of useful HEAs for particular applications, withmany strategies proposed [10]. However, the possibility of using HEAs as a base composition todeliberately create potentially desirable (and, strictly speaking, non-HEA) multiphase alloys wasnot extensively explored. This is now a feasible route as several dozens of HEA compositions werereported in the literature, covering a wide range of elements, including transition metals and refractoryelements (see, for example, the online supporting information of Reference [11]), making selection ofalloys in a wide range of types possible. In order to properly manipulate the microstructure to thedesired form, heat treatment is the usual method in many metallic systems. The response of an alloy isdifferent at different temperatures, with many general similarities when the homologous temperature(the heat treatment temperature normalised by the melting point) is used. For rapid alloy design,arc-melting is typically the favoured method for quick synthesis allowing subsequent characterisationof predicted compositions. However, this synthesis route is susceptible to superheating and, hence,may result in the presence of metastable phases depending on the degree of undercooling generated.Heat treatment is often required to achieve reproducible results. However, one alternative approachto rapidly access such information is the use of Chvorinov’s rule to estimate solidification time. Inthis work, we carry out an element substitution alloy design process, to evaluate the effectiveness ofthis approach.
2. Methodology: Alloy Design
2.1. Element Substitution
In this work, our goal is to produce multiphase alloys, rather than single-phase alloys. To do this,the process used begins by taking a reported HEA composition and then strategically substitutingone of the elements (for example, with high cost or another characteristic less desirable for the endapplication) with an alternative element, which moves the alloy away from the typical conditionsunder which HEAs can form. This would be expected to cause the formation of ordered (intermetallic)phases, with the quantity of the substituted element being a means to control the volume fraction ofordered phases produced, and to optimise properties.
For this example, a known HEA was selected, the equiatomic TiVCrZrNb introduced bySenkov et al. [12,13]. It should be noted at this point that, throughout this work, compositionsare referred to by atomic ratios. This alloy is reported to consist of a BCC phase (disordered) and anordered Laves phase. Of the elements contained within this, niobium possesses the highest cost andgreatest density; thus, this was selected for substitution. For simplicity, complete substitution withanother element was performed, although it is recognised that partial substitution may be effective.The level of the substituted element was allowed to vary both above and below equiatomic with theother elements, for the purpose of allowing for a greater degree of control over second-phase content.
For this substitution, we elected to use silicon. Silicon has the potential to be a desirable addition,as it is a strong former of silicide intermetallics, which are temperature-stable, has a relatively lowdensity and cost, and can improve oxidation resistance in a variety of alloys by forming a protectiveoxide layer of SiO2 [14], including in high-entropy compositions [15,16]. Silicon was attempted asan addition to HEAs or similar equiatomic single phase alloys before, although notably in largelyunsuccessful attempts to avoid the formation of second phase [17] and not to cause deliberate departurefrom HEA behaviour. In one example, less than equimolar amounts of Si were added in an attempt toavoid intermetallic formation, but ultimately resulted in the formation of (Nb,Ti)5Si3 [15]. Through
Metals 2020, 10, 317 3 of 14
thermodynamic analysis, this was attributed to a highly negative enthalpy of mixing between Si andNb and Ti. In the alloy (FeCoNiCrAl)99Si1 [18], the small addition of Si was found, on heat treatment,to produce additional phases in the alloy. Evidence does, however, exist of successful tailoring of the Siaddition to avoid intermetallics; in the system AlCoCrFeNiSix with values of x from 0 to 1, only smallamounts of the intermetallic delta phase were observed, even under equiatomic conditions, with theconclusion that the silicon was largely accommodated in solid solution [19].
The approach used here results in initial consideration being given to SixTiVCrZr (x = 0, 0.5, 1, 1.5),to ensure a range of silicon contents are evaluated. Following Yang and Zhang’s approach for HEAprediction, parameters δ and Ω (Ω = Tm/Tc) can be evaluated for these new alloys. The calculationmethod of Ω and δ is detailed fully in Reference [20]. In this study, ∆Hmix is calculated from ∆HABmix
values obtained by Takeuchi and Inoue [21]. Both of the parameters Ω and δ are significant in theprediction of solid solution formation, with greater values of Ω and smaller values of δ making solidsolution formation more likely. The empirical criteria for obtaining a solid solution in HEAs proposedby Yang and Zhang are Ω ≥ 1.1 and δ ≤ 6.6%; for equiatomic version of the new alloy, the values arecalculated to be Ω = 0.65 and δ = 18.6%, clearly predicting that the simple disordered solid solutionstructure characteristic of HEAs is not expected to occur.
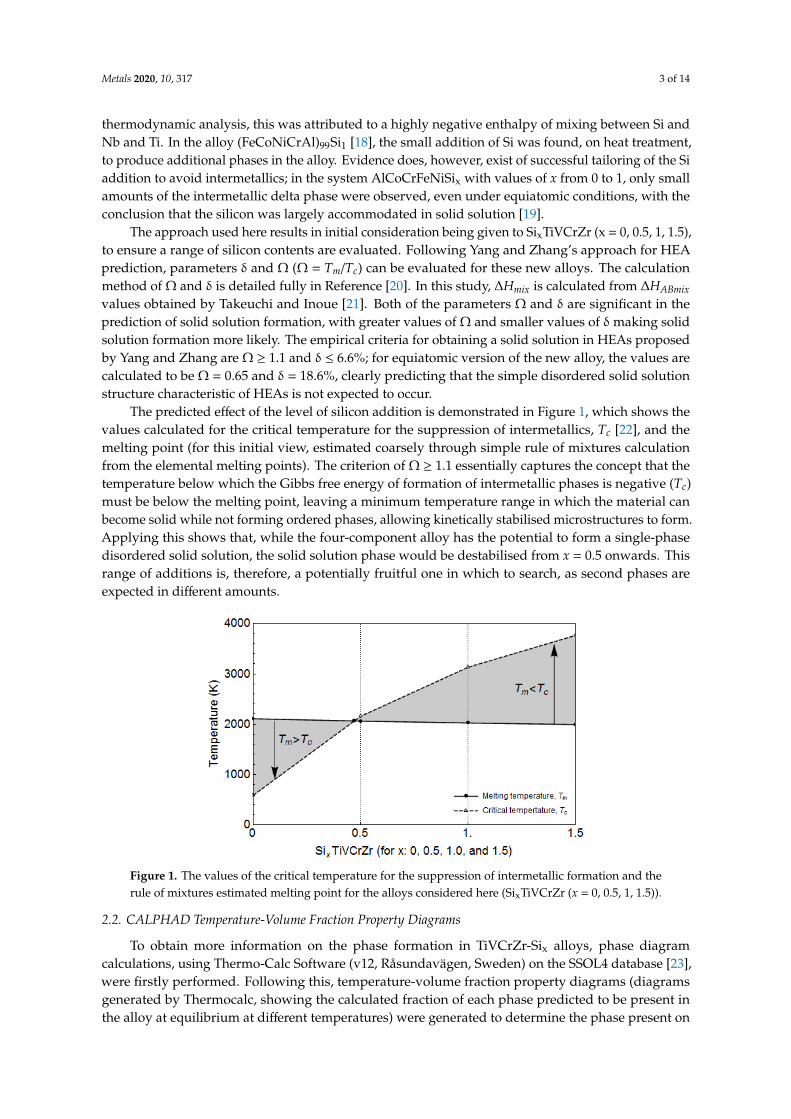
The predicted effect of the level of silicon addition is demonstrated in Figure 1, which shows thevalues calculated for the critical temperature for the suppression of intermetallics, Tc [22], and themelting point (for this initial view, estimated coarsely through simple rule of mixtures calculationfrom the elemental melting points). The criterion of Ω ≥ 1.1 essentially captures the concept that thetemperature below which the Gibbs free energy of formation of intermetallic phases is negative (Tc)must be below the melting point, leaving a minimum temperature range in which the material canbecome solid while not forming ordered phases, allowing kinetically stabilised microstructures to form.Applying this shows that, while the four-component alloy has the potential to form a single-phasedisordered solid solution, the solid solution phase would be destabilised from x = 0.5 onwards. Thisrange of additions is, therefore, a potentially fruitful one in which to search, as second phases areexpected in different amounts.
ȱ ȱ ȱ ȱ ȱ ȱ ȱ
ȱ ȱ ȱ ȱ ȱ ȱ ȱ ȱ ȱ ȱ ȱ ȱ ȱ ȱȱ ȱ ȱ ȱ ȱ ȱ ȱ ȱ ȱ ȱ ȱ ȱ ȱ ȱ ȱ ȱ ȱ ȱ ȱ
ȱ ȱ ȱ ȱ ȱ ȱ ȱ ȱ ȱ ȱ ȱ ȱ ȱ ȱ ȱȱ ȱ ȱ ȱ ȱ ȱ ȱ ȱ ȱ ȱ ȱ ȱ ȱ ȱ ȱ ȱ ȱ
ȱ ȱ ȱ ȱ ȱ ȱ ȱ ȱ ȱ ȱ ȱ ȱ ȱ ȱ ȱ ȱȱ ȱ ȱ ȱ ȱ ȱ ȱ ȱ ȱ ȱ ȱ ȱ ȱ ȱ
ȱ ȱ ȱ ȱ ȱ ȱ ȱ ȱ ȱ ȱ ȱ ȱ ȱ ȱ ȱ ȱ ȱȱ ȱ ȱ ȱ ȱ ȱ ȱ ȱ ȱ ȱ ȱ ȱ ȱ ȱ ȱ ȱȱ ȱ ȱΈȱ ȱ ȱ ȱ ȱ ȱ ȱ ȱ ȱ ȱ ȱ ȱ ȱ ȱ ȱ
ȱ ȱȱ ȱΈȱ ȱ ȱ ȱ ȱ ȱ ȱ ȱ ȱ ȱ茎兼件捲ȱ ȱ ȱ ȱ茎畦稽兼件捲ȱȱ ȱ ȱ ȱ ȱ ȱ ȱ ȱ ȱ ȱ ȱȱ ȱΈȱ ȱ ȱ ȱ ȱ
ȱ ȱ ȱ ȱ ȱ ȱ ȱ ȱ ȱȱ ȱ ȱ ȱ ȱΈȱ ȱ ȱȱ ȱ ȱ ȱ ȱ ȱ ȱ ȱ ȱ ȱ ȱ ȱ ȱ ȱ ȱ
ȱ ȱ ȱ ȱ ȱȱǃȱ ȱ ȱΈȱǂȱ ȱ ȱ ȱ ȱ ȱ ȱ ȱ ȱ ȱ ȱ ȱȱ ȱ ȱȱ ȱ ȱ ȱΈȱ ȱ ȱ ȱ ȱ ȱ ȱ ȱ ȱ ȱ ȱȱ ȱ ȱ ȱ ȱ ȱ ȱ ȱ ȱȱ ȱ ȱ ȱ ȱ ȱ ȱ ȱ ȱ ȱ ȱ ȱ ȱ ȱ ȱ ȱ ȱ
ȱ ȱ ȱ ȱ ȱ ȱ ȱ ȱ ȱ ȱ ȱ ȱ ȱ ȱ ȱȱ ȱ ȱ ȱ ȱ ȱ ȱ ȱ ȱ ȱ ȱ ȱ ȱ ȱ
ȱ ȱ ȱ ȱ ȱ ȱ ȱ ȱȱǃȱ ȱ ȱ ȱ ȱ ȱ ȱ ȱȱ ȱ ȱ ȱ ȱ ȱ ȱ ȱ ȱ ȱ ȱ ȱ ȱ ȱ ȱ
ȱ ȱ ȱ ȱ ȱ ȱ ȱ ȱ ȱ ȱ ȱ ȱ ȱ ȱ ȱ ȱȱ ȱ ȱ ȱ ȱ ȱ ȱ ȱ ȱ ȱ ȱ ȱ
ȱ ȱ ȱ ȱ ȱ ȱ ȱ Ȭ ȱ ȱ ȱ ȱ ȱ ȱ ȱ ȱ Ȭȱ ȱ ȱ ȱ ȱ ȱ ȱ ȱ ȱ ȱ ȱ ȱ ȱ ȱ ȱ ȱ
ȱ ȱ ȱ ȱ ȱ ȱ ȱ ȱ ȱ ȱ ȱ ȱ ȱ ȱ ȱ ȱ ȱȱ ȱ ȱ ȱ ȱ
ȱ
ȱ ȱ ȱ ȱ ȱ ȱ ȱ ȱ ȱ ȱ ȱ ȱ ȱ ȱ ȱ ȱȱ ȱ ȱ ȱ ȱ ȱ ȱ ȱ ȱ ȱ ȱ ȱ ȱ ȱ ȱ ȱ ȱ ȱ
ȱ ȱ Ȭ ȱ ȱ ȱ ȱ
ȱ ȱ ȱ ȱ ȱ ȱ ȱ ȱ ȱ Ȭ ȱ ȱ ȱ ȱȱ ȱ Ȭ ȱ ȱ ȱ ȱ ȱ ȱ ȱ ȱ ȱ ȱ
ȱ ȱ ȱ ȱ ȱ Ȭ ȱ ȱ ȱ ȱ ȱȱ ȱ ȱ ȱ ȱ ȱ ȱ ȱ ȱ ȱ ȱ ȱ ȱ ȱ ȱ
ȱ ȱ ȱ ȱ ȱ ȱ ȱ ȱ ȱ ȱ ȱ ȱ ȱ ȱ ȱ
Figure 1. The values of the critical temperature for the suppression of intermetallic formation and therule of mixtures estimated melting point for the alloys considered here (SixTiVCrZr (x = 0, 0.5, 1, 1.5)).
2.2. CALPHAD Temperature-Volume Fraction Property Diagrams
To obtain more information on the phase formation in TiVCrZr-Six alloys, phase diagramcalculations, using Thermo-Calc Software (v12, Råsundavägen, Sweden) on the SSOL4 database [23],were firstly performed. Following this, temperature-volume fraction property diagrams (diagramsgenerated by Thermocalc, showing the calculated fraction of each phase predicted to be present inthe alloy at equilibrium at different temperatures) were generated to determine the phase present on
Metals 2020, 10, 317 4 of 14
solidification, and to understand how this would change if the system were to be able to adjust itself toremain at equilibrium.
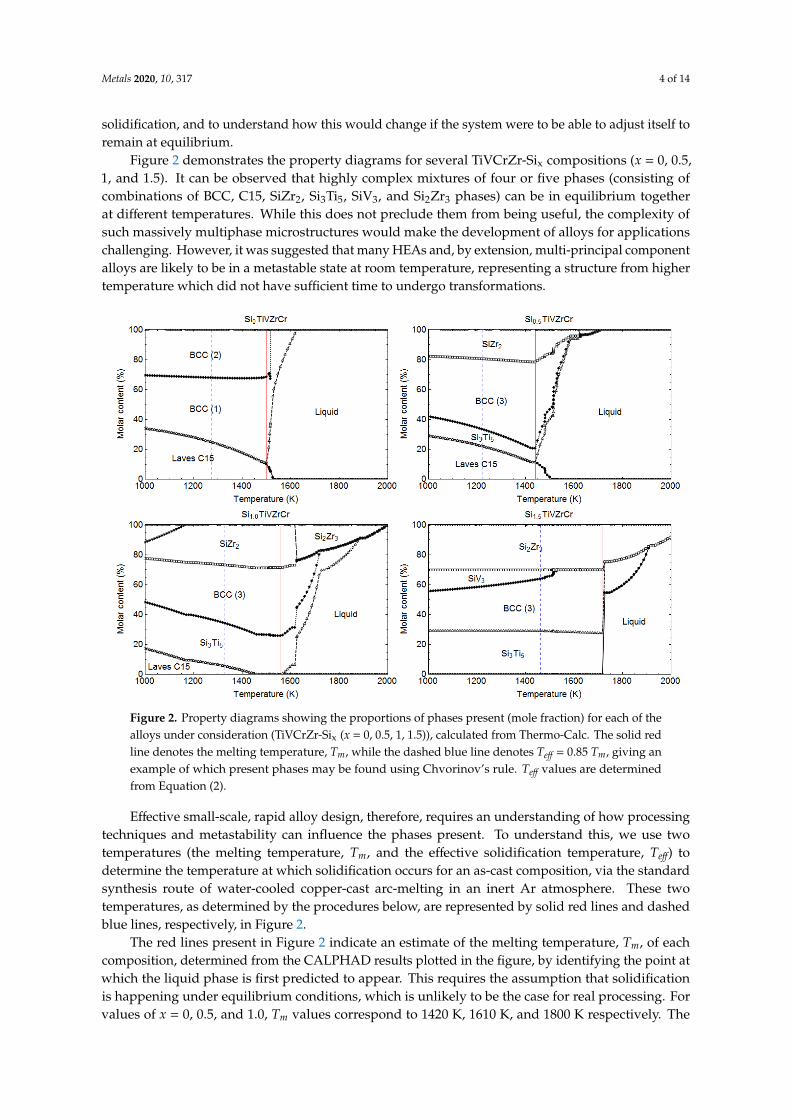
Figure 2 demonstrates the property diagrams for several TiVCrZr-Six compositions (x = 0, 0.5,1, and 1.5). It can be observed that highly complex mixtures of four or five phases (consisting ofcombinations of BCC, C15, SiZr2, Si3Ti5, SiV3, and Si2Zr3 phases) can be in equilibrium togetherat different temperatures. While this does not preclude them from being useful, the complexity ofsuch massively multiphase microstructures would make the development of alloys for applicationschallenging. However, it was suggested that many HEAs and, by extension, multi-principal componentalloys are likely to be in a metastable state at room temperature, representing a structure from highertemperature which did not have sufficient time to undergo transformations.
ȱ ȱ ȱ ȱ ȱ ȱ ȱ
ȱ ȱ ȱ ȱ ȱ ȱ ȱ ȱ ȱ ȱ ȱ ȱ ȱ ȱ ȱ ȱ ȱ ȱȱ ȱ ȱ ȱ
ȱ ȱ ȱ ȱ ȱ ȱ ȱ ȱ Ȭ ȱ ȱ ȱ ȱ ȱ ȱ ȱȱ ȱ ȱ ȱ ȱ ȱ ȱ ȱ ȱ ȱ ȱ ȱ ȱ ȱ ȱ ȱ ȱ
ȱ ȱ ȱ ȱ ȱ ȱ ȱ ȱ ȱ ȱ ȱ ȱ ȱ ȱ ȱ ȱȱ ȱ ȱ ȱ ȱ ȱ ȱ ȱ ȱ ȱ ȱ ȱ ȱ ȱ ȱȱ ȱ ȱ ȱ ȱ ȱ ȱ ȱ ȱ ȱ ȱȱ ȱ ȱ ȱ ȱ ȱ ȱ ȱ ȱ ȱ ȱ Ȭ ȱȱ ȱ ȱ ȱ ȱ ȱ ȱ ȱ ȱ ȱ ȱ ȱ ȱ ȱ ȱ ȱ
ȱ ȱ ȱ ȱ ȱ ȱ ȱ ȱ ȱ ȱ ȱ ȱ ȱ
ȱ
ȱȱ ȱ ȱ ȱ ȱ ȱ ȱ ȱ ȱ ȱ ȱ ȱ ȱ ȱ ȱ ȱȱ ȱ ȱ Ȭ ȱ ȱ ȱ ȱ ȱ ȱ ȱ ȱ ȱ Ȭ ȱ ȱ ȱ
ȱ ȱ ȱ ȱ ȱ ȱ ȱ ȱ ȱ ȱ ȱ ȱ ȱ ȱ ȱ ȱ ȱ ȱȱ ȱ ȱ ȱ ȱ ȱ ȱ ȱ ȱ ȱ ȇ ȱ ȱ ȱ ȱ ȱ ȱ
ȱ ȱ ȱ
ȱ Ȭ ȱ ȱ ȱ ȱ ȱ ȱ ȱ ȱ ȱ ȱ ȱȱ ȱ ȱ ȱ ȱ ȱ ȱ ȱ ȱ ȱ ȱ ȱ ȱ ȱ
ȱ ȱ ȱ ȱ ȱ ȱ ȱ ȱ ȱ ȱ ȱ ȱȱ ȱ ȱ ȱ ȱ ȱ ȱ ȱ ȱ Ȭ ȱ ȱ ȱ ȱ ȱȱ ȱ ȱ Ȭ ȱ Ȭ ȱ Ȭ ȱ ȱ ȱ ȱ ȱ ȱ ȱ ȱ
ȱ ȱ ȱ ȱ ȱ ȱ ȱ ȱ ȱ ȱ ȱ ȱ ȱ ȱ ȱȱ ȱ ȱ ȱ ȱ ȱ
ȱ ȱ ȱ ȱ ȱ ȱ ȱ ȱ ȱ ȱ ȱ ȱ ȱ ȱ ȱ ȱ ȱȱ ȱ ȱ ȱ ȱ ȱ ȱ ȱ ȱ ȱ ȱ ȱ ȱ ȱ
ȱ ȱ ȱ ȱ ȱ ȱ ȱ ȱ ȱ ȱ ȱ ȱ ȱ ȱ ȱ ȱȱ ȱ ȱ ȱ ȱ ȱ ȱ ȱ ȱ ȱ ȱ ȱ ȱ ȱ ȱ ȱ
ȱ ȱ ȱ ȱ ȱ ȱ ȱ ȱ ȱ ȱ ȱ ȱ ȱ ȱ ȱ ȱ ȱ ȱ ȱ ȱ ȱ ȱȱ ȱ ȱ ȱ ȱ ȱ ȱ ȱ ȱ ȱ ȱ ȱ ȱ ȱ ȱ ȱ ȱ ȱ
ȱ ȱ ȱ ȱ ȱ ȱ ȱ ȱ ȱ ȱ ȱ ȱ ȱ ȱ ȱ ȱ ȱ ȱ ȱ ȱ ȱ ȱ
Figure 2. Property diagrams showing the proportions of phases present (mole fraction) for each of thealloys under consideration (TiVCrZr-Six (x = 0, 0.5, 1, 1.5)), calculated from Thermo-Calc. The solid redline denotes the melting temperature, Tm, while the dashed blue line denotes Teff = 0.85 Tm, giving anexample of which present phases may be found using Chvorinov’s rule. Teff values are determinedfrom Equation (2).
Effective small-scale, rapid alloy design, therefore, requires an understanding of how processingtechniques and metastability can influence the phases present. To understand this, we use twotemperatures (the melting temperature, Tm, and the effective solidification temperature, Teff) todetermine the temperature at which solidification occurs for an as-cast composition, via the standardsynthesis route of water-cooled copper-cast arc-melting in an inert Ar atmosphere. These twotemperatures, as determined by the procedures below, are represented by solid red lines and dashedblue lines, respectively, in Figure 2.
The red lines present in Figure 2 indicate an estimate of the melting temperature, Tm, of eachcomposition, determined from the CALPHAD results plotted in the figure, by identifying the point atwhich the liquid phase is first predicted to appear. This requires the assumption that solidificationis happening under equilibrium conditions, which is unlikely to be the case for real processing. Forvalues of x = 0, 0.5, and 1.0, Tm values correspond to 1420 K, 1610 K, and 1800 K respectively. The
Metals 2020, 10, 317 5 of 14
rule of mixtures Tm previously calculated and used for the analysis shown in Figure 1 appears to behigher (2108 K, 2061 K, 2023 K, and 1993 K for x = 0, 0.5, 1.0, and 1.5, respectively) than those predictedfrom Figure 2 (1500 K, 1440 K, 1560 K, and 1720 K for x = 0, 0.5, 1.0, and 1.5, respectively); the valuespredicted from Figure 2 are 71%, 70%, 77%, and 86% for x = 0, 0.5, 1.0, and 1.5, respectively, of thevalues predicted from the rule of mixtures. One possible explanation for this gradual increase is thatthe simple rule of mixtures approach ignores any possible interactions between the elements, leadingto suppression of the melting point.
The blue lines in Figure 2 indicate an effective solidification temperature estimated usingChvorinov’s rule. This formulation relates solidification time to the volume and surface area of theas-cast composition.
t =
(
pm × L
Tm − T0
)2
×
(
π
4 k× p× c
)
×
(
1 +(
cm × ∆Ts
L
)2)
×
(
V
A
)n
, (1)
where Tm is the melting temperature of the liquid, T0 is the initial temperature of the mould, ∆Ts is thesuperheating temperature, L is the latent heat of fusion, k is the thermal conductivity of the mould, p isthe density of the mould, c is the specific heat of the mould, pm is the density of the melt, and cm isthe specific heat of the melt. The exponent n is here taken to be 1.75, following DeGarmo et al. [24].The mould used during arc-melting is copper, and its thermal conductivity, density, and specific heatsare known and are substituted into the equation. The melting temperature of the liquid is obtainedfrom Figure 2 as discussed previously. The initial temperature of the mould and the superheatingtemperature can be estimated by
∆Ts = Th − Tm =P× nE
m× cm− Tm, (2)
where Th is the temperature to which the melt is heated to, which may be estimated by using theprinciple of conservation of energy, P is the power supplied to the arc (taken from the manufacturer’sdata), nE is the efficiency, which we assume here to be 90% as the process is carried out in vacuum,and m is the mass (5 g) of the melt. Using rule of mixtures estimated values for the density, thermalconductivity, and specific heat of the metal, the solidification time can be found. From this, theeffective solidification temperature, Teff is determined from Teff = Tm − t·δT/dt. The cooling rate δT/dt forarc-melting is estimated as 1 × 10⁴ K·s−1. Calculated Teff values are determined to be 1064 K, 1069 K,1377 K, and 1640 K for x = 0, 0.5, 1, and 1.5, with these values corresponding to 0.71 Tm, 0.74 Tm, 0.88 Tm,and 0.95 Tm, respectively. The increased change in these fractions is correlated to the increase in thespecific heat of the melt due to increasing Si addition.
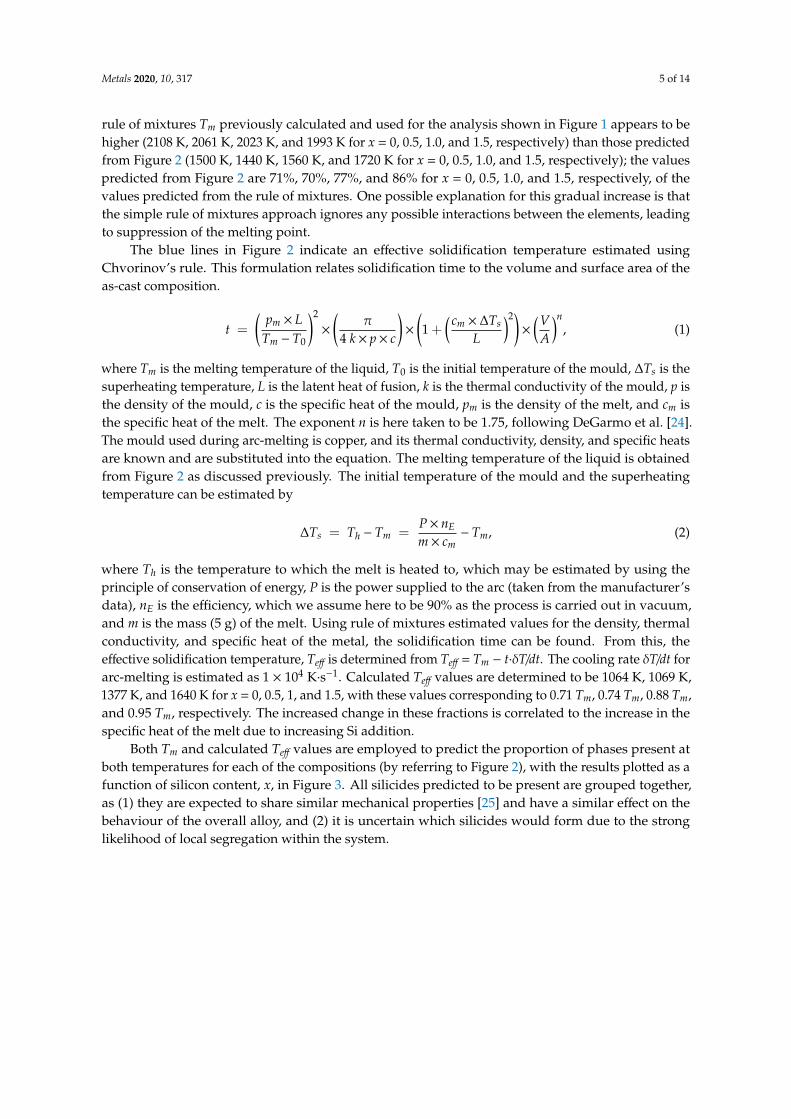
Both Tm and calculated Teff values are employed to predict the proportion of phases present atboth temperatures for each of the compositions (by referring to Figure 2), with the results plotted as afunction of silicon content, x, in Figure 3. All silicides predicted to be present are grouped together,as (1) they are expected to share similar mechanical properties [25] and have a similar effect on thebehaviour of the overall alloy, and (2) it is uncertain which silicides would form due to the stronglikelihood of local segregation within the system.
Metals 2020, 10, 317 6 of 14
ȱ ȱ ȱ ȱ ȱ ȱ ȱ
ȱ ȱ ȱ ȱ ȱ ȱ ȱ ȱ ȱ ȱ ȱ ȱ ȱ ȱ ȱ ȱ ȱ ȱ ȱ ȱ ȱ ȱȱ ȱ ȱ ȱ ȱ ȱ ȱ ȱ ȱ ȱ ȱ ȱ ȱ ȱ ȱ ȱ ȱ ȱ ȱ ȱ ȱ
ȱ ȱ ȱ ȱ ȱ ȱ ȱ ȱ ȱ ȱ ȱ ȱ ȱ ȱ ȱ ȱȱ ȱ ȱ ȱ ȱ ȱ ȱ ȱ ȱ ȱ ȱ ȱ ȱ ȱȱ ȱ ȱ ȱ ȱ ȱ ȱ
ȱ ȱ ȱ ȱ ȱ ȱ ȱ ȱ ȱ ȱ ȱ ȱ ȱȇ ȱ ȱ ȱ ȱ ȱ ȱ ȱ ȱ ȱ ȱ ȱ ȱ ȱ ȱ ȱ
Ȭ ȱ ȱ 建 噺 岾 椎尿抜挑脹尿貸脹任峇態 抜 岾 訂替 賃抜椎抜頂峇 抜 磐な 髪 岾頂尿抜ッ脹濡挑 峇態卑 抜 岾蝶凋峇津ȱ ȱ
ȱ ȱ ȱ ȱ ȱ ȱ ȱ ȱ ȱ ȱ ȱ ȱ ȱ ȱ ȱ ȱ ȱ ȱ ȱȱ ȱ ȱ ȱ ȱ ȱ ȱ ȱ ȱ ȱ ȱ ȱ ȱ ȱ ȱ ȱ ȱ ȱ
ȱ ȱ ȱ ȱ ȱ ȱ ȱ ȱ ȱ ȱ ȱ ȱ ȱ ȱ ȱ ȱ ȱ ȱ ȱ ȱ ȱ ȱ ȱ ȱȱ ȱ ȱ ȱ ȱ ȱ ȱ ȱ ȱ ȱ ȱ ȱ ȱ ȱ ȱ ȱ ȱ ȱ ȱ ȱ ȱȱ ȱ ȱ ȱ Ȭ ȱ ȱ ȱ ȱ ȱ ȱ ȱ ȱ ȱ ȱȱ ȱ ȱ ȱ ȱ ȱ ȱ ȱ ȱ ȱ ȱ ȱ ȱ ȱ ȱ ȱ
ȱ ȱ ȱ ȱ ȱ ȱ ȱ ȱ ȱ ȱ ȱ ȱ ȱ ȱ ȱȱ ȱ ȱ ȱ ȱ ȱッ劇鎚 噺 劇朕 伐 劇陳 噺 牒抜津曇陳抜頂尿 伐 劇陳 ȱ ȱ
ȱ ȱ ȱ ȱ ȱ ȱ ȱ ȱ ȱ ȱ ȱ ȱ ȱ ȱ ȱ ȱ ȱ ȱ ȱȱ ȱ ȱ ȱ ȱ ȱ ȱ ȱ ȱ ȱ ȱ ȱ ȱ ȱ ȱ ȱ ȱ
ȱ ȱ ȱ ȱ ȱ ȱ ȱ ȱ ȱ ȱ ȱ ȱ ȱ ȱ ȱ ȱ ȱ ȱ ȱ ȱȱ ȱ ȱ ȱ ȱ ȱ ȱ ȱ ȱ ȱ ȱ ȱ ȱ ȱ ȱ ȱ ȱ ȱ ȱ ȱ
ȱ ȱ ȱ ȱ ȱ ȱ ȱ ȱ ȱ ȱ ȱ ȱ ȱ ȱ ȱ ȱȱ ȱ ȱ ȱ ȱ ȱ ȱ ȱ ȱ ȱƺȱ ȉΈ ȱ ȱ ȱ ȱΈ ȱ
ȱ Ȭ ȱ ȱ ȱ ȱ ȱ ȱ ȱ ȉ ƺ ȱ ȱ ȱ ȱ ȱ ȱ ȱ ȱ ȱ ȱ ȱȱ ȱ ȱ ȱ ȱ ȱ ȱ ȱ ȱ ȱ ȱ ȱ ȱ ȱ ȱ ȱ ȱ ȱ ȱ ȱ ȱ ȱ ȱȱ ȱ ȱ ȱ ȱ ȱ ȱ ȱ ȱ ȱ ȱ ȱ ȱ ȱ ȱ ȱ ȱ
ȱ ȱ ȱ ȱ ȱ ȱ ȱ ȱ ȱ ȱ ȱ ȱ ȱȱ ȱ ȱ ȱ ȱ ȱ ȱ ȱ ȱ ȱ ȱ ȱ ȱ ȱ ȱ ȱ
ȱ ȱ ȱ ȱ ȱ ȱ ȱ ȱ ȱ ȱ ȱ ȱ ȱ ȱ ȱ ȱ ȱȱ ȱ ȱ ȱ ȱ ȱ ȱ ȱ ȱ ȱ ȱ ȱ ȱ ȱ ȱ ȱ ȱ ȱȱ ȱ ȱ ȱ ȱ ȱ ȱ ȱ ȱ ȱ ȱ ȱ ȱ ȱ ȱ ȱ ȱ ȱ
ȱ ȱ ȱ ȱ ȱ ȱ ȱ ȱ ȱ ȱ ȱ ȱ ȱ ȱ ȱ ȱ ȱ ȱȱ ȱ ȱ ȱ ȱ ȱ ȱ
ȱ
ȱ ȱ ȱ ȱ ȱ ȱ ȱ ȱ ȱ ȱ ȱ ȱ ȱ ȱ ȱ ȱȱ ȱ ȱ ȱ ȱ ȱ ȱ ȱ ȱ ȱ ȱ ȱ ȱ ȱ ȱ ȱ ȱ ȱ
ȱ ȱ ȱ ȱ ȱ ȱ ȱ ȱ ȱ ȱ ȱ ȱ ȱ ȱ ȱ ȱ ȱȱ ȱ ȱ ȱ ȱ ȱ ȱ
Figure 3. Predicted mole fractions of phases present in the alloys with different amounts of Si,determined from the property diagrams shown in Figure 2 at T = Tm. All silicide phases are groupedtogether for the plot; Predicted mole fractions of phases present in the alloys are shown with differentamounts of Si at T = Teff.
Figure 3 shows that, in both figures, none of the modified versions of the alloy examined wouldbe HEAs, due to the presence of multiple phases including significant amounts of ordered phases;this is unsurprising as the original alloy, TiVCrZr-Nb, contained a Laves phase. However, as pointedout by Miracle and Senkov [5], this does not preclude their usefulness. As expected, the calculationsindicate that increasing alloying additions of Si to TiVCrZr forms several silicide phases. In comparison,the Laves C15 phase (predicted to be ZrCr2) appears to be diminished by the addition of Si to thecomposition. This may be attributed to Zr2Si formation, which is a more stable phase (since ∆H =−10.67and −74.67 for ZrCr2 and Zr2Si, respectively). These results appear to be in relatively close agreementwith the predictions of Ω values.
Comparing the two graphs in Figure 3, the stability of the BCC phases appears to be enhancedif it is assumed that solidification takes place at T = Tm (the condition shown on the left in Figure 3).In this case, it is not predicted that the Laves C15 phase will form for the TiVCrZr-Si1 composition,whereas it is predicted to be present if it is assumed solidification takes place at T = Teff. Additionally,although the molar contents of the silicides are also reduced at T = Tm, the reduction is not large, withthe change in content primarily due to competition between the BCC and Laves C15 structure. The keydifference between the results when using each temperature value is the rapid reduction of the C15fraction when utilising T = Teff.
The theoretical assessment of the effect of the removal of Nb from the known equiatomicTiVCrZr-Nb and the inclusion of silicon indicates that various silicide phases can be formed (withthe amount controlled by the level of Si addition), at the expense of the disordered BCC phase, and,to a high proportion, the C15 Laves phase. It would be expected, therefore, that the strength wouldbe increased at the expense of ductility (with low ductility being expected for the higher levels ofaddition), although the removal of the low-ductility Laves phase may offset this for additions up toaround the equiatomic level. At the same time, the substitution will benefit both the alloy cost andthe density. For example, comparing equiatomic TiVCrZr-Nb and equiatomic TiVCrZr-Si, the rule ofmixtures estimates for density of each (6.83 g/cm3 vs. 5.77 g/cm3) would suggest a reduction of 16%.Although the multi-phase nature of the alloy will mean this is not fully accurate, it is indicative of abeneficial effect.
In order to confirm the predictions made here and to determine if utilising the effective temperatureas determined through Chvorinov’s rule is a useful tool in predicting the phases occurring inexperimental processing, the alloys were synthesised and characterised.
Metals 2020, 10, 317 7 of 14
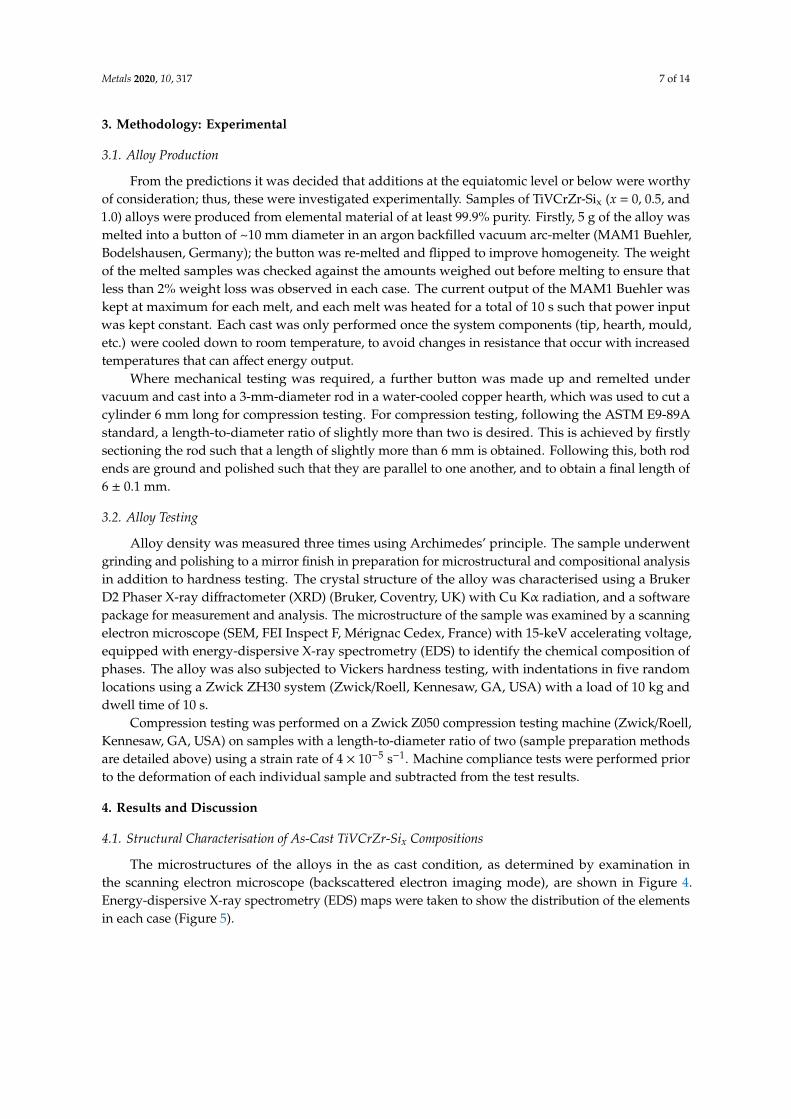
3. Methodology: Experimental
3.1. Alloy Production
From the predictions it was decided that additions at the equiatomic level or below were worthyof consideration; thus, these were investigated experimentally. Samples of TiVCrZr-Six (x = 0, 0.5, and1.0) alloys were produced from elemental material of at least 99.9% purity. Firstly, 5 g of the alloy wasmelted into a button of ~10 mm diameter in an argon backfilled vacuum arc-melter (MAM1 Buehler,Bodelshausen, Germany); the button was re-melted and flipped to improve homogeneity. The weightof the melted samples was checked against the amounts weighed out before melting to ensure thatless than 2% weight loss was observed in each case. The current output of the MAM1 Buehler waskept at maximum for each melt, and each melt was heated for a total of 10 s such that power inputwas kept constant. Each cast was only performed once the system components (tip, hearth, mould,etc.) were cooled down to room temperature, to avoid changes in resistance that occur with increasedtemperatures that can affect energy output.
Where mechanical testing was required, a further button was made up and remelted undervacuum and cast into a 3-mm-diameter rod in a water-cooled copper hearth, which was used to cut acylinder 6 mm long for compression testing. For compression testing, following the ASTM E9-89Astandard, a length-to-diameter ratio of slightly more than two is desired. This is achieved by firstlysectioning the rod such that a length of slightly more than 6 mm is obtained. Following this, both rodends are ground and polished such that they are parallel to one another, and to obtain a final length of6 ± 0.1 mm.
3.2. Alloy Testing
Alloy density was measured three times using Archimedes’ principle. The sample underwentgrinding and polishing to a mirror finish in preparation for microstructural and compositional analysisin addition to hardness testing. The crystal structure of the alloy was characterised using a BrukerD2 Phaser X-ray diffractometer (XRD) (Bruker, Coventry, UK) with Cu Kα radiation, and a softwarepackage for measurement and analysis. The microstructure of the sample was examined by a scanningelectron microscope (SEM, FEI Inspect F, Mérignac Cedex, France) with 15-keV accelerating voltage,equipped with energy-dispersive X-ray spectrometry (EDS) to identify the chemical composition ofphases. The alloy was also subjected to Vickers hardness testing, with indentations in five randomlocations using a Zwick ZH30 system (Zwick/Roell, Kennesaw, GA, USA) with a load of 10 kg anddwell time of 10 s.
Compression testing was performed on a Zwick Z050 compression testing machine (Zwick/Roell,Kennesaw, GA, USA) on samples with a length-to-diameter ratio of two (sample preparation methodsare detailed above) using a strain rate of 4 × 10⁻⁵ s−1. Machine compliance tests were performed priorto the deformation of each individual sample and subtracted from the test results.
4. Results and Discussion
4.1. Structural Characterisation of As-Cast TiVCrZr-Six Compositions
The microstructures of the alloys in the as cast condition, as determined by examination inthe scanning electron microscope (backscattered electron imaging mode), are shown in Figure 4.Energy-dispersive X-ray spectrometry (EDS) maps were taken to show the distribution of the elementsin each case (Figure 5).
Metals 2020, 10, 317 8 of 14ȱ ȱ ȱ ȱ ȱ ȱ ȱ
ȱȱ ȱ ȱ ȱ ȱ ȱ ȱ ȱ ȱ ȱ ȱ Ȭ ȱ ȱ
ȱ ȱ ȱ ȱ ȱ ȱ ȱ ȱ ȱ ȱ ȱ ȱ ȱ ȱ ȱ ȱ ȱ ȱ ȱ ȱ ȱ ȱȱ ȱ ȱ ȱ ȱ ȱ ȱ ȱ ȱ ȱ ȱ ȱ ȱ ȱ ȱ ȱ ȱ ȱ ȱ ȱ ȱȱ ȱ ȱ ȱ ȱ ȱ ȱ ȱ ȱ ȱ ȱ ȱ ȱ ȱ
ȱ ȱ ȱ ȱ ȱ ȱ ȱ ȱ ȱ ȱ ȱ ȱ ȱ ȱ ȱ ȱ
ȱ ȱ ȱ ȱ ȱ ȱ ȱ ȱ ȱ ȱ ȱ ȱ ȱ ȱ ȱ ȱȱ ȱ ȱ ȱ ȱ ȱ ȱ ȱ ȱ ȱ ȱ ȱ ȱ ȱ ȱ ȱ
ȱ ȱ ȱ ȱ ȱ ȱ ȱ ȱ ȱ ȱ ȱ ȱ ȱ ȱ ȱ ȱ ȱ ȱ ȱȱ ȱ ȱ ȱ ȱ ȱ ȱ ȱ ȱ ȱ ȱ ȱ ȱ ȱ Ȭ ȱ ȱȱ ȱ ȱ ȱ ȱ Ȭ ȱ ȱ ȱ ȱ ȱ ȱ ȱ ȱ ȱ ȱ
ȱ ȱ ȱ Ȭ ȱ ȱ ȱ ȱ ȱ ȱ ȱ ȱ ȱ ȱ ȱ ȱȱ ȱ ȱ ȱ ȱ ȱ ȱ ȱ ȱ Ȭ ȱ ȱ Ȭ ȱ ȱ Ȭ ȱ ȱ
ȱ ȱ ȱ ȱ ȱ ȱ ȱ ȱ ȱ ȱ ȱ ȱ ȱ ȱ ȱ ȱ ȱ ȱ ȱ ȱȱ ȱ ȱ ȱ ȱ ȱ ȱ ȱ ȱ ȱ ȱ ȱ ȱ ȱ ȱ ȱ ȱ
ȱ ȱ ȱ ȱ ȱ ȱ ȱ ȱ ȱ ȱ ȱ ȱ ȱ ȱ ȱ ȱ ȱ Ȭ ȱȱ ȱ Ȭ ȱ ȱ ȱ ȱ ȱ ȱ ȱ ȱ ȱ ȱ ȱ ȱ ȱȱ ȱ ȱ ȱ ȱ Ȭ ȱ ȱ ȱ ȱ ȱ ȱ ȱ ȱ ȱ ȱ ȱ Ȭȱ ȱ ȱ ȱ ȱ ȱ ȱ ȱ ȱ ȱ ȱ ȱ ȱ ȱ ȱ ȱ ȱ ȱ
ȱ ȱ ȱ ȱ ȱ ȱ ȱ ȱ ȱ ȱ ȱ ȱ ȱ ȱ ȱ ȱ ȱȱ ȱ ȱ ȱ ȱ ȱ ȱ ȱ ȱ ȱ ȱ ȱ ȱ ȱ ȱ ȱ
ȱ ȱ ȱ ȱ ȱ ȱ ȱ ȱ ȱ ȱ ȱ Ȭ ȱ ȱ ȱ ȱ ȱ ȱ ȱ Ȭ ȱȱ ȱ ȱ ȱ ȱ Ȭ ȱ ȱ ȱ ȱ ȱ ȱ ȱ ȱ ȱ
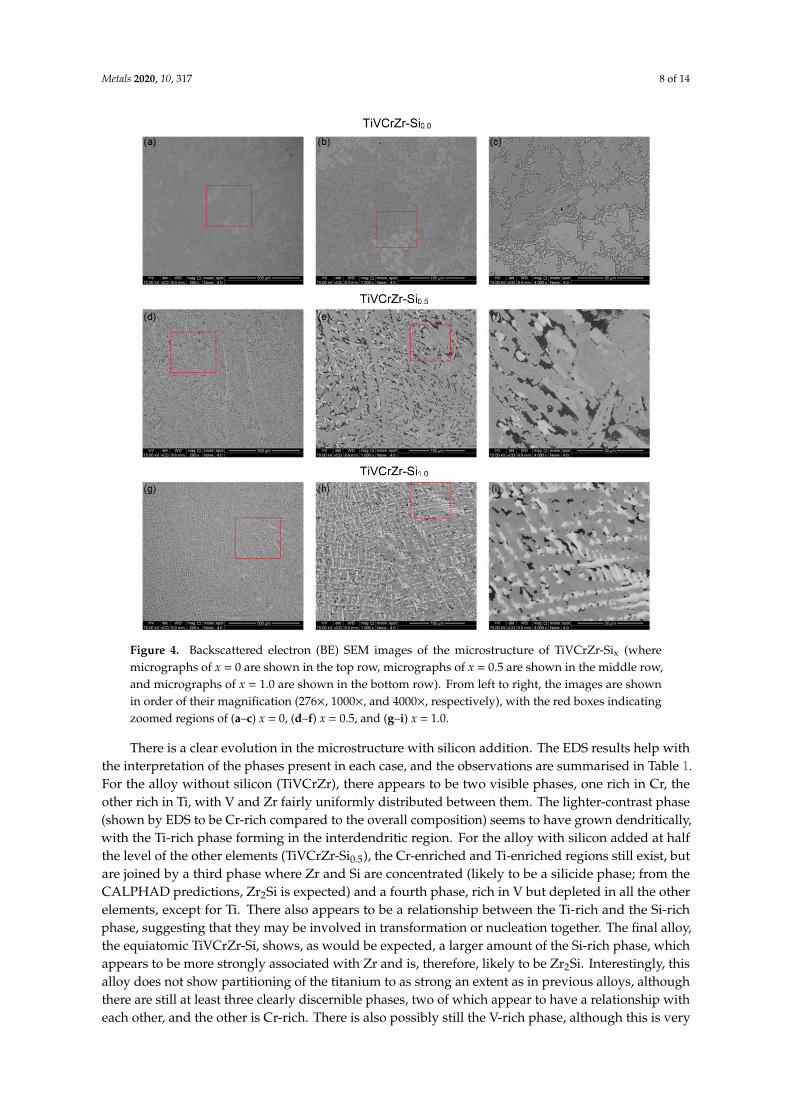
Figure 4. Backscattered electron (BE) SEM images of the microstructure of TiVCrZr-Six (wheremicrographs of x = 0 are shown in the top row, micrographs of x = 0.5 are shown in the middle row,and micrographs of x = 1.0 are shown in the bottom row). From left to right, the images are shownin order of their magnification (276×, 1000×, and 4000×, respectively), with the red boxes indicatingzoomed regions of (a–c) x = 0, (d–f) x = 0.5, and (g–i) x = 1.0.
There is a clear evolution in the microstructure with silicon addition. The EDS results help withthe interpretation of the phases present in each case, and the observations are summarised in Table 1.For the alloy without silicon (TiVCrZr), there appears to be two visible phases, one rich in Cr, theother rich in Ti, with V and Zr fairly uniformly distributed between them. The lighter-contrast phase(shown by EDS to be Cr-rich compared to the overall composition) seems to have grown dendritically,with the Ti-rich phase forming in the interdendritic region. For the alloy with silicon added at halfthe level of the other elements (TiVCrZr-Si0.5), the Cr-enriched and Ti-enriched regions still exist, butare joined by a third phase where Zr and Si are concentrated (likely to be a silicide phase; from theCALPHAD predictions, Zr2Si is expected) and a fourth phase, rich in V but depleted in all the otherelements, except for Ti. There also appears to be a relationship between the Ti-rich and the Si-richphase, suggesting that they may be involved in transformation or nucleation together. The final alloy,the equiatomic TiVCrZr-Si, shows, as would be expected, a larger amount of the Si-rich phase, whichappears to be more strongly associated with Zr and is, therefore, likely to be Zr2Si. Interestingly, thisalloy does not show partitioning of the titanium to as strong an extent as in previous alloys, althoughthere are still at least three clearly discernible phases, two of which appear to have a relationship witheach other, and the other is Cr-rich. There is also possibly still the V-rich phase, although this is very
Metals 2020, 10, 317 9 of 14
fine-scale. Predictions from the property diagram indicate that, at equilibrium under room temperatureconditions, the equiatomic alloy should consist of Ti5Si3, a Laves (C15) phase, Zr2Si, V3Si, and adisordered BCC solid solution phase. This could be in agreement with the observed microstructure ifthe silicides occur together and are hard to resolve in the imaging used.
ȱ ȱ ȱ ȱ ȱ ȱ ȱ
ȱ ȱ ȱ ȱ ȱ ȱ ȱ ȱ ȱ ȱ ȱ ȱ ȱ ȱȱ ȱ ȱ ȱ ȱ ȱ ȱ ȱ ȱ ȱ ȱ ȱ ȱ ȱ ȱ ȱ ȱ
ȱ ȱ ȱ ȱ ȱ ȱ ȱ ȱ ȱ ȱ ȱ ȱ ȱ ȱ ȱ ȱȱ
ȱȱ ȱ Ȭ ȱ Ȭ ȱ ȱ ȱ ȱ ȱ Ȭ ȱ ȱ ȱ ȱ
ȱ ȱ ȱ ȱ ȱ ȱ ȱ ȱ ȱ ȱ ȱ ȱ ȱ ȱ ȱ ȱ ȱ ȱ ȱ ȱ ȱȱ ȱ ȱ ȱ ȱ ȱ ȱ ȱ ȱ ȱ ȱ
ȱ ȱ ȱ ȱ ȱ ȱ ȱ ȱ ȱ ȱ ȱ ȱ ȱ ȱ ȱ ƺ ȱ ȱ ȱȱ ȱ ȱ ȱ ȱ ȱ ȱ ȱ ȱ ȱ ȱ ȱ ȱ ȱ ȱ ȱ ȱ ȱ
ȱ ȱ ȱ ȱ ȱ
ȱ ȱ ȱ ȱ ȱ ȱ ȱ
ȱȱ ȱ ȱ ƺȱ ȱ ȱȱ ƺȱ ȱ ȱ ȱ ȱ
ȱ
Ȭ ȱ ȱ ƺȱ ƺȱ ȱ ƺȱȬ ȱ ȱ ȱ ȱ ƺȱ ƺȱ
ȱ ƺȱ ƺȱ ƺȱ ȱ ȱȬ ȱ ƺȱ ȱ ȱ ƺȱ ƺȱ
ȱȬ ȱ ȱ ȱ ȱ ȱ ƺȱ
ȱ ƺȱ ƺȱ ȱ ȱ ȱȬ ȱ ȱ ȱ ȱ ƺȱ ƺȱ
ȱ ȱ ȱ Ȭ ȱ Ȭ ȱ ȱ
ȱ ȱ ȱ ȱ ȱ ȱ ȱ ȱ ȱ ȱ ȱ ȱ ȱ ȱ ȱ ȱȱ ȱ ȱ ȱ ȱ ȱ ȱ ȱ ȱ ȱ ȱ ȱ ȱ ȱ ȱ
ȱ ȱ ȱ ȱ ȱ Ȭ ȱ ȱ ȱ ȱ ȱ ȱ ȱ ȱ ȱ ȱ ȱ ȱȱ ȱ ȱ ȱ ȱ ȱ ȱ ȱ ȱ ȱ ȱ ȱ ȱ ȱ ȱ ȱȱ ȱ ȱ ȱ ȱ ȱ ȱ ȱ ȱ ȱ ȱ ȱ ȱ ȱ ȱ ȱ ȱ
ȱ ȱ ȱ ȱ ȱ ȱ ȱ ȱ ȱ ȱ ȱ ȱ ȱ ȱȱ
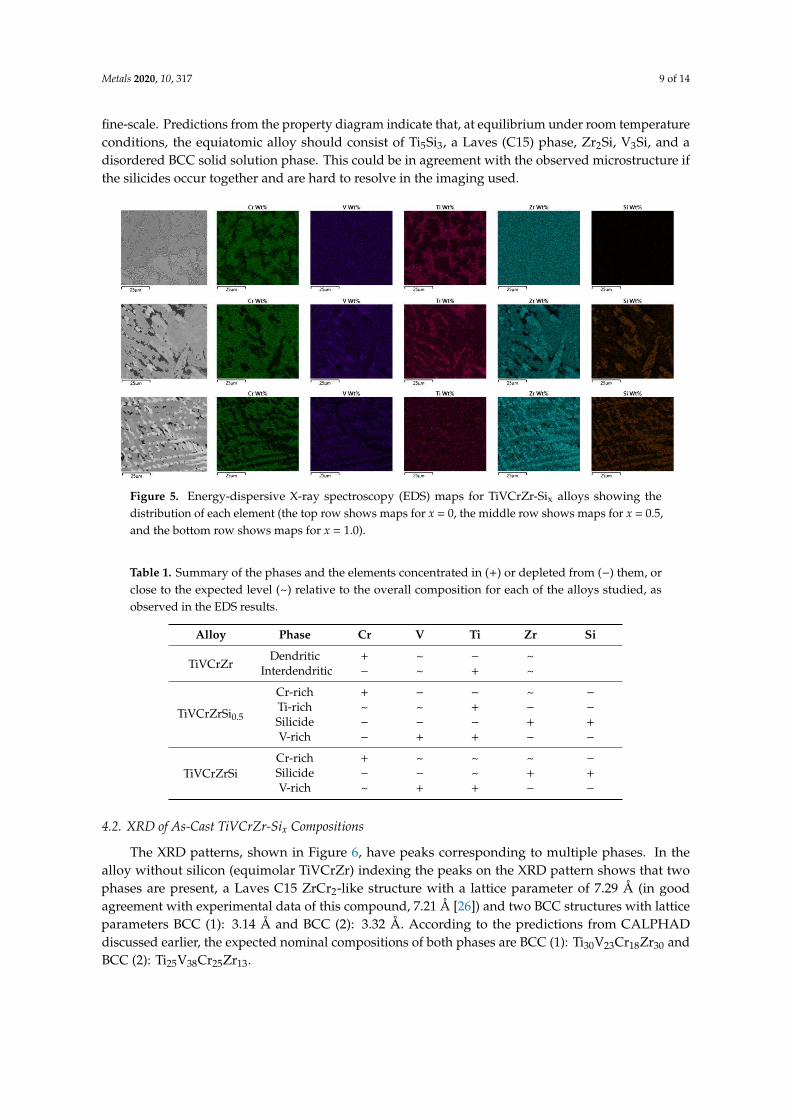
Figure 5. Energy-dispersive X-ray spectroscopy (EDS) maps for TiVCrZr-Six alloys showing thedistribution of each element (the top row shows maps for x = 0, the middle row shows maps for x = 0.5,and the bottom row shows maps for x = 1.0).
Table 1. Summary of the phases and the elements concentrated in (+) or depleted from (−) them, orclose to the expected level (~) relative to the overall composition for each of the alloys studied, asobserved in the EDS results.
Alloy Phase Cr V Ti Zr Si
TiVCrZrDendritic + ~ − ~
Interdendritic − ~ + ~
TiVCrZrSi0.5
Cr-rich + − − ~ −
Ti-rich ~ ~ + − −
Silicide − − − + +
V-rich − + + − −
TiVCrZrSiCr-rich + ~ ~ ~ −
Silicide − − ~ + +
V-rich ~ + + − −
4.2. XRD of As-Cast TiVCrZr-Six Compositions
The XRD patterns, shown in Figure 6, have peaks corresponding to multiple phases. In thealloy without silicon (equimolar TiVCrZr) indexing the peaks on the XRD pattern shows that twophases are present, a Laves C15 ZrCr2-like structure with a lattice parameter of 7.29 Å (in goodagreement with experimental data of this compound, 7.21 Å [26]) and two BCC structures with latticeparameters BCC (1): 3.14 Å and BCC (2): 3.32 Å. According to the predictions from CALPHADdiscussed earlier, the expected nominal compositions of both phases are BCC (1): Ti30V23Cr18Zr30 andBCC (2): Ti25V38Cr25Zr13.
Metals 2020, 10, 317 10 of 14ȱ ȱ ȱ ȱ ȱ ȱ ȱ
ȱȱ ȱ ȱ Ȭ ȱ ȱ ȱ ȱ ȱ ȱ Ȭ ȱ ȱ ȱ ȱ ȱ ȱ ȱ ȱ Ȭ ȱ
ȱ ȱ ȱ ȱ ȱ ȱ ȱ ȱ ȱ ȱ ȱ ȱ ȱ ȱȱ ȱ ȱ ȱ Ȭ ȱ ȱ ȱ ȱ ȱ ȱ ȱ ȱ ȱ ȱ
ȱ Ȭ ȱ
ȱ ȱ ȱ ȱ ȱ ȱ ȱ ȱ ȱ ȱ ȱ ȱ ȱ ȱ ȱȱ ȱ ȱ Ȭ ȱ ȱ ȱ ȱ Ȭ ȱ ȱ ȱ ȱ ȱ ȱ ȱ ȱ ȱȱ ȱ ȱ ȱ ȱ ȱ ȱ ȱ ȱ ȱ ȱ ȱ ȱ ȱ ȱ ȱ ȱ
ȱ ȱ ȱ ȱ ȱ ȱ ȱ ȱ ȱ ȱ ȱ ȱ ȱ ȱ ȱ ȱ ȱ ȱȱ ȱ ȱ ȱ ȱ ȱ ȱ ȱ ȱ ȱ ȱ ȱ ȱ ȱ ȱ ȱ ȱ
ȱ ȱ ȱ ȱ ȱ ȱ ȱ ȱ ȱ ȱ ȱ ȱ ȱ ȱ ȱ ȱȱ ȱ ȱ ȱ ȱ ȱ ȱ ȱ ȱ ȱ Ȭ ȱ ȱ Ȭ ȱ ȱȱ ȱ ȱ ȱ ȱ ȱ ȱ ȱ ȱ ȱ ȱ ȱ ȱ ȱ
ȱ ȱ ȱ ȱ ȱ ȱ Ȭ ȱ ȱ ȱƺ ȱ ȱ Ȭ ȱ ȱ ȱƺ ȱ ȱ Ȭ ȱ ȱ ȱƺ ȱȱ ȱ Ȭ ȱ ȱ ȱƺ ȱ ȱ ȱ ȱ ȱ ȱ ȱ ȱ ȱ ȱ ȱ ȱ ȱ
ȱ ȱ ȱ ȱ ȱ ȱ ȱ ȱ ȱ ȱȱ ȱ ȱ ȱ ȱ ȱ ȱ ȱ ȱ ȱ ȱ ȱ ȱ ȱ ȱ ȱ ȱ ȱȱ ȱ ȱ Ȭ ȱ ȱ ȱ ȱ ȱ ȱ ȱ ȱ ȱ ȱ ȱ ȱ ȱ ȱȱ ȱ ȱ ȱ ȱ ȱ ȱ ȱ ȱ ȱ ȱ ȱ ȱ ȱ ȱ ȱ ȱ ȱȱ ȱ ȱ ȱ ȱ ȱ ȱ ȱ ȱ ȱ ȱ ȱ ȱ ȱ ȱ
ȱ ȱ ȱ ȱ ȱ ȱ ȱ ȱ ȱ ȱ ȱ Ȭ ȱ ȱ ȱƺ ȱ ȱ ȱ Ȭȱ ȱ ȱƺ ȱ ȱ ȱ ȱ ȱ ȱ ȱ ȱ ȱ ȱ ȱ ȱ ȱ ȱ ȱ ȱ ȱ ȱȱ ȱ ȱ ȱ ȱ ȱ ȱ ȱ ȱ ȱ ȱ ȱ ȱ ȱ Ȭ ȱ ȱ ȱ ȱ ȱȱ ȱ ȱ ȱ ȱ ȱ ȱ ȱ ȱ ȱ ȱ ȱ ȱ ȱ ȱ ȱ ȱ ȱ
ȱ ȱ ȱ ȱ ȱ ȱ ȱ ȱ ȱ ȱ ȱȱ ȱ ȱ ȱ ȱ ȱ ȱ ȱ ȱ ȱ ȱ ȱ ȱ ȱ ȱ ȱ
ȱ ȱ ȱ ȱ ȱ ȱ ȱ Ȭ ȱ ȱ ȱ ȱ ȱ ȱ Ȭ ȱ ȱ ȱ ȱ ȱȱ ȱ ȱ ȱ ȱ ȱ ȱ ȱ ȱ ȱ ȱ ȱ ȱ ȱ ȱ ȱ ȱȱ ȱ Ȭ ȱ ȱ ȱ ȱ ȱ ȱ Ȭ ȱ ȱ ȱ ȱ ȱ ȱ ȱ ȱ ȱ ȱȱ ȱ Ȭ ȱ ȱ ȱ ȱ ȱ ȱ ȱ ȱ ȱ ȱ ȱ ȱ ȱ
ȱ ȱ ȱ ȱ ȱ ȱ ȱ ȱ ȱ ȱ ȱ ȱ ȱ ȱȱ ȱ ȱ ȱ ȱ ȱ ȱ Ȭ Ȭ ȱ ȱ ȱ ȱ ȱ ȱ ȱ ȱ ȱȱ ȱ ȱ ȱ ȱ ȱ ȱ
ȱ ȱ ȱ ȱ ȱ ȱ ȱ ȱ ȱ ȱ ȱ ȱ Ȭ ȱ ȱ ȱ ȱ ȱ ȱȱ ȱ ȱ ȱ ȱ ȱ ȱ ȱ ȱ ȱ ȱ ȱ ȱ ȱ ȱ ȱ ȱ ȱ
ȱ ȱ ȱ ȱ ȱ ȱ ȱ ȱ ȱ ȱ ȱ ȱ ȱ ȱ ȱ ȱ ȱ ȱ ȱ ȱ ȱ ȱ ȱȱ ȱ ȱ ȱ ȱ ȱ ȱ ȱ ȱ ȱ ȱ ȱ ȱ ȱ
ȱ ȱ ȱ ȱ ȱ ȱ ȱ ȱ ȱ ȱ ȱ ȱ ȱ ȱ ȱ ȱ ȱ ȱ ȱȱ ȱ ȱ ȱ ȱ ȇ ȱ ȱ ȱ ȱ ȱ ȱ ȱ ȱ ȱ ȱ ȱ ȱ
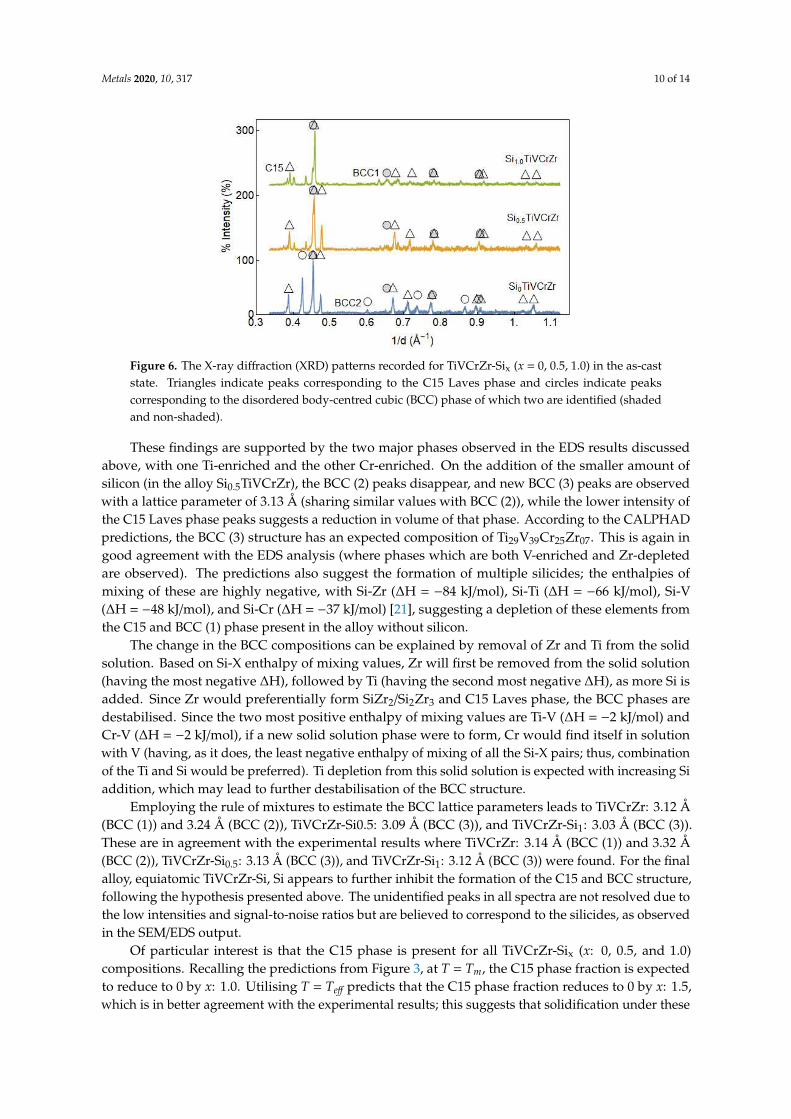
Figure 6. The X-ray diffraction (XRD) patterns recorded for TiVCrZr-Six (x = 0, 0.5, 1.0) in the as-caststate. Triangles indicate peaks corresponding to the C15 Laves phase and circles indicate peakscorresponding to the disordered body-centred cubic (BCC) phase of which two are identified (shadedand non-shaded).
These findings are supported by the two major phases observed in the EDS results discussedabove, with one Ti-enriched and the other Cr-enriched. On the addition of the smaller amount ofsilicon (in the alloy Si0.5TiVCrZr), the BCC (2) peaks disappear, and new BCC (3) peaks are observedwith a lattice parameter of 3.13 Å (sharing similar values with BCC (2)), while the lower intensity ofthe C15 Laves phase peaks suggests a reduction in volume of that phase. According to the CALPHADpredictions, the BCC (3) structure has an expected composition of Ti29V39Cr25Zr07. This is again ingood agreement with the EDS analysis (where phases which are both V-enriched and Zr-depletedare observed). The predictions also suggest the formation of multiple silicides; the enthalpies ofmixing of these are highly negative, with Si-Zr (∆H = −84 kJ/mol), Si-Ti (∆H = −66 kJ/mol), Si-V(∆H = −48 kJ/mol), and Si-Cr (∆H = −37 kJ/mol) [21], suggesting a depletion of these elements fromthe C15 and BCC (1) phase present in the alloy without silicon.
The change in the BCC compositions can be explained by removal of Zr and Ti from the solidsolution. Based on Si-X enthalpy of mixing values, Zr will first be removed from the solid solution(having the most negative ∆H), followed by Ti (having the second most negative ∆H), as more Si isadded. Since Zr would preferentially form SiZr2/Si2Zr3 and C15 Laves phase, the BCC phases aredestabilised. Since the two most positive enthalpy of mixing values are Ti-V (∆H = −2 kJ/mol) andCr-V (∆H = −2 kJ/mol), if a new solid solution phase were to form, Cr would find itself in solutionwith V (having, as it does, the least negative enthalpy of mixing of all the Si-X pairs; thus, combinationof the Ti and Si would be preferred). Ti depletion from this solid solution is expected with increasing Siaddition, which may lead to further destabilisation of the BCC structure.
Employing the rule of mixtures to estimate the BCC lattice parameters leads to TiVCrZr: 3.12 Å(BCC (1)) and 3.24 Å (BCC (2)), TiVCrZr-Si0.5: 3.09 Å (BCC (3)), and TiVCrZr-Si1: 3.03 Å (BCC (3)).These are in agreement with the experimental results where TiVCrZr: 3.14 Å (BCC (1)) and 3.32 Å(BCC (2)), TiVCrZr-Si0.5: 3.13 Å (BCC (3)), and TiVCrZr-Si1: 3.12 Å (BCC (3)) were found. For the finalalloy, equiatomic TiVCrZr-Si, Si appears to further inhibit the formation of the C15 and BCC structure,following the hypothesis presented above. The unidentified peaks in all spectra are not resolved due tothe low intensities and signal-to-noise ratios but are believed to correspond to the silicides, as observedin the SEM/EDS output.
Of particular interest is that the C15 phase is present for all TiVCrZr-Six (x: 0, 0.5, and 1.0)compositions. Recalling the predictions from Figure 3, at T = Tm, the C15 phase fraction is expectedto reduce to 0 by x: 1.0. Utilising T = Teff predicts that the C15 phase fraction reduces to 0 by x: 1.5,which is in better agreement with the experimental results; this suggests that solidification under these
Metals 2020, 10, 317 11 of 14
conditions in this system is not taking place at T = Tm, but that there is some undercooling present and,as a result, that Chvorinov’s rule is a good estimate for determining what phases might be expectedfrom CALPHAD methods (although it must be noted that the CALPHAD results may be inaccurateas this is quite a novel system). The large presence of C15 phases implies that the solidification timeis larger than anticipated in our calculations, which is attributed to the treatment of the mould as asimple copper mould. Increased model complexity would be required to obtain more accurate results,but the work done here demonstrates how a relatively low-fidelity method can result in guidance foruseful predictions that can be refined at a later time on just the compositions of greatest interest. Itmay, therefore, be concluded that the effective temperature as determined through Chvorinov’s rule isa useful tool in predicting the phases occurring in experimental processing.
From this, it may be also inferred that arc-melting synthesis and the resulting testing of as-castsamples can return unexpected results due to this phenomenon, and care must be taken during alloydesign if using arc-melting as a synthesis route.
4.3. Mechanical Properties of TiVCrZr-Six Compositions
The hardness of equiatomic TiVCrZr-Si was 684 HV10 (standard deviation 31), or 6.7 GPa, andthe density was measured as 5.41 g/cm3 (standard deviation 0.07), confirming an elevated hardnessand a low density (slightly lower than that of the simple rule of mixtures estimate) for the alloy. Asthe variable level of silicon was expected to have a significant impact on the material properties, allsamples (x = 0, 0.5, and 1.0) were cast as cylinders and tested in compression.
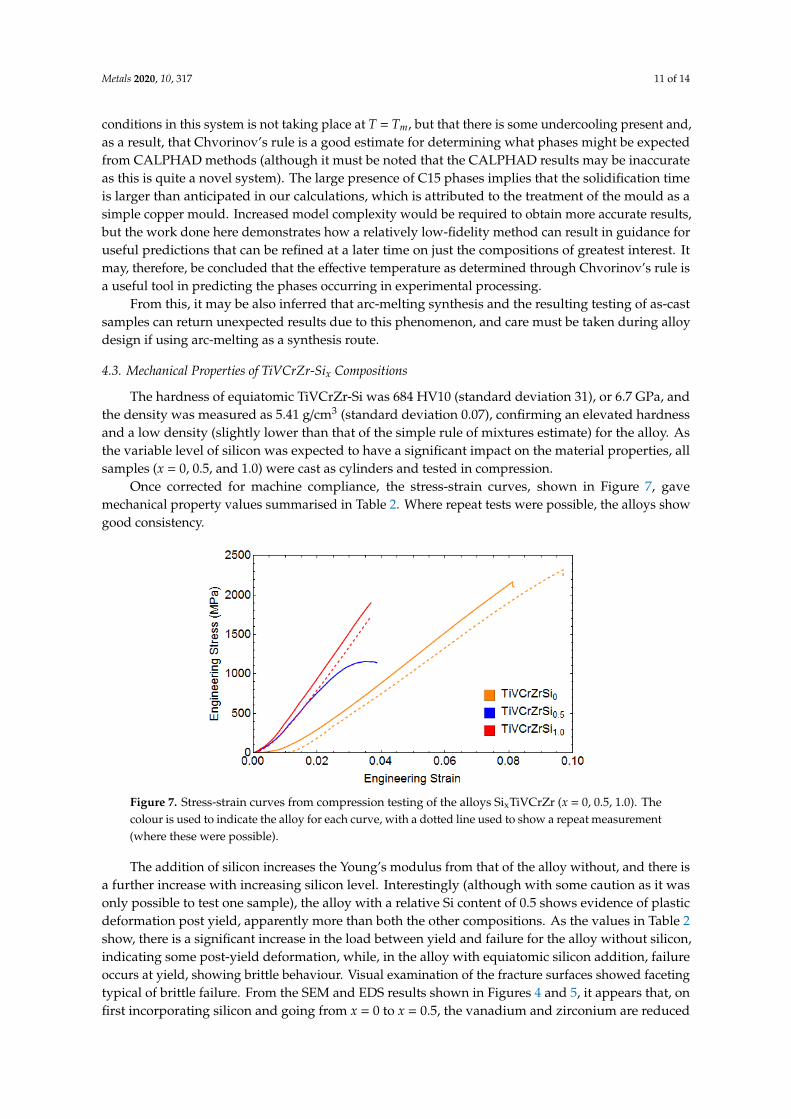
Once corrected for machine compliance, the stress-strain curves, shown in Figure 7, gavemechanical property values summarised in Table 2. Where repeat tests were possible, the alloys showgood consistency.
ȱ ȱ ȱ ȱ ȱ ȱ ȱ
ȱ ȱ ȱ ȱ ȱ ȱ ȱ ȱ ȱ ȱ ȱ ȱ ȱ ȱ ȱȱ ȱ ȱ ȱ ȱ ȱ ȱ ȱ ȱ ȱ ȱ ȱ ȱ ȱ ȱ ȱ ȱ
ȱ ȱ ȱ ȱ ȱ ȱ ȱ ȱ ȱ ȱ ȱ ȱ ȱ ȱ ȱȱ ȱ ȱ ȱ ȱ ȱ ȱ ȱ ȱ ȱ ȱ ȱ ȱ ȱ ȱ ȱ
ȱ ȱ ȱ ȱ ȱ ȱ ȱ ȱ ȱ ȱ ȱ ȱ Ȭ ȱ ȱ ȱȱ ȱ ȱ ȱ ȱ ȱ ȱ ȱ ȱ ȱ ȱ ȱ ȱ ȱ ȱ ȱ ȱ ȱ ȱȱ ȱ ȱ ȱ ȱ ȱ ȱ ȱ ȱ ȱ ȱ ȱ ȱ ȱ
ȇ ȱ ȱ ȱ ȱ ȱ ȱ ȱ ȱ ȱ ȱ ȱ ȱ ȱ ȱȱ ȱ ȱ ȱ ȱ ȱ ȱ ȱ Ȭ ȱ ȱ ȱ ȱ ȱ ȱ ȱ Ȭ ȱ
ȱ ȱ ȱ ȱ ȱ ȱ ȱ ȱ ȱ ȱ ȱ ȱ ȱ ȱ ȱ ȱȱ ȱ ȱ Ȭ ȱ ȱ ȱ ȱ ȱ
ȱ ȱ ȱ ȱ Ȭ ȱ ȱ
ȱ ȱ ȱ ȱ Ȭ ȱ ȱ ȱ ȱ ȱ ȱ ȱ ȱ ȱ ȱ ȱȱ ȱ ȱ ȱ ȱ ȱ ȱ ȱ ȱ ȱ ȱ ȱ ȱ ȱȱ ȱ ȱ ȱ ȱ ȱ ȱ ȱ ȱ ȱ ȱ ȱ ȱ ȱ ȱ ȱ ȱ ȱ ȱȱ ȱ ȱ ȱ ȱ ȱ ȱ ȱ ȱ ȱ ȱ ȱ ȱ ȱ ȱ ȱ ȱ
ȱ ȱ ȱ ȱ ȱ ȱ ȱ ȱ ȱ ȱ ȱ ȱ ȱ ȱ ȱȱ ȱ ȱ ȱ ȱ ȱ Ȭ ȱ ȱ ȱ ȱ ȱ ȱ ȱȱ ȱ ȱ ȱ ȱ ȱ ȱ ȱ ȱ ȱ ȱ ȱ ȱ ȱ ȱ
ȱ ȱ
ȱ ȱ ȱ ȱ ȱ ȱ ȱ ȱ ȱ ȱ ȱ ȱ ȱ ȱ ȱ ȱȱ ȱ
ȱȬ ȱ
ȱ ȱ
ȱ ȱ ȱȱȱ
Η ȱȱ ȱ ȱ ȱ
ȱȱ
Η ȱȱ ȱ ȱ ȱ
ȱȱ ȱ ȱ
ȱ ȱ ȱȱ ȱ ȱ
ȱ ȱ ȱ ȱ ȱ ȱ ȱ
ȱȱ ȱ ȱ
ȱ ȱ ȱȱ ȱ ȱ
ȱȱ ȱ Ȭ ȱ ȱ ȱ ȱ ȱ ȱ ȱ ȱ ȱ ȱ ȱ ȱ ȱ ȱ ȱȱ ȱ ȱ ȱ ȱ ȱ ȱ ȱ ȱ ȱ ȱ ȱ ȱ ȱ ȱ ȱ ȱ ȱ ȱ
ȱ ȱ ȱ ȱ ȱ
Figure 7. Stress-strain curves from compression testing of the alloys SixTiVCrZr (x = 0, 0.5, 1.0). Thecolour is used to indicate the alloy for each curve, with a dotted line used to show a repeat measurement(where these were possible).
The addition of silicon increases the Young’s modulus from that of the alloy without, and there isa further increase with increasing silicon level. Interestingly (although with some caution as it wasonly possible to test one sample), the alloy with a relative Si content of 0.5 shows evidence of plasticdeformation post yield, apparently more than both the other compositions. As the values in Table 2show, there is a significant increase in the load between yield and failure for the alloy without silicon,indicating some post-yield deformation, while, in the alloy with equiatomic silicon addition, failureoccurs at yield, showing brittle behaviour. Visual examination of the fracture surfaces showed facetingtypical of brittle failure. From the SEM and EDS results shown in Figures 4 and 5, it appears that, onfirst incorporating silicon and going from x = 0 to x = 0.5, the vanadium and zirconium are reduced

Metals 2020, 10, 317 12 of 14
in the Cr-rich main phase (likely to be the disordered BCC phase) as they are incorporated in thesilicides formed.
Table 2. The mechanical properties derived from compression testing of the alloys SixTiVCrZr (x = 0,0.5, 1.0).
AlloyTiVCrZr-Six
x =
Individual Samples Averages
E(GPa)
σy
(GPa)Failure
Stress (GPa)E
(GPa)σy
(GPa)Failure
Stress (GPa)
030 1.82 2.15
30 1.76 2.2329 1.70 2.31
0.5 45 0.97 1.14 45 0.97 1.14
1.055 1.97 1.97
56 1.87 1.8757 1.77 1.77
This reduction in solid solution strengthening of the matrix could allow for greater plasticdeformation, and the decreased strength and increased ductility observed. With further siliconaddition, up to the equiatomic level, this process is not reversed; rather, the fraction of silicide phases(which are expected to be relatively high hardness and low ductility [25]) is increased to the pointwhere the material cannot accommodate any plastic deformation before failure. In comparison, withregard to ductility, the optimum molar amount of Si to obtain a high plastic strain in a AlCoCrFeNiSixHEA was found to be 0.4, with plastic fracture observed at x = 0.2 and x = 0.4 [19], and the indicationsfrom this work is that a similar level of addition is the limit here, albeit in a largely different system.
The alloy with silicon at the 0.5 relative level still contains an appreciable quantity of silicides andC15 Laves phase, but is able to display some level of ductility (around 1% plastic deformation). This,coupled with the high yield strength of almost 1 GPa and the reduced density and raw material costover the parent TiVCrZr-Nb alloy, makes this composition the most interesting of those studied in thissystem from a structural point of view. It is possible that, with detailed examination of the mechanismof deformation and optimization of the microstructure, these properties could be increased further.
5. Conclusions
This work demonstrated an approach to the design of new multiphase, multicomponent alloys,using a known high-entropy alloy as a base. From this, a strategic substitution of an element, in thiscase silicon, was made, which should impart favourable properties. At the same time, this also createsan alloy which is incapable of satisfying the common requirements for the effects (such as the formationof a single phase from multiple components) ascribed to HEAs. The multiphase alloys that result,while not HEAs under the strictest definitions, have the potential to be tailored to be suitable for arange of different applications, especially those with mechanical requirements.
Here, the alloys TiVCrZr, TiVCrZr-Si0.5, and TiVCrZr-Si were designed and their phasecompositions predicted through CALPHAD, interpreted for realistic processing through use ofChvorinov’s Rule. On experimental processing, these alloys do indeed adopt multiphase structures,consisting of disordered BCC solid solution phases and ordered Laves and silicide intermetallic phasesin different quantities. The properties of the alloys show that, along with the expected reductionin density, the strength (as measured in compression) can be very high, while, for an addition ofSi at half the atomic fraction of the other elements, a degree of ductility can be preserved. Whilefurther investigation of the alloys and the effect of the many potential conditions for processing andservice would have to be performed to assess if this formulation can show suitable microstructureand properties to be of use, these experiments serve to show how this simple approach can rapidlyfind interesting alloys where the behaviour can be tuned to attempt to meet the requirements ofan application.

Metals 2020, 10, 317 13 of 14
Author Contributions: Conceptualisation, Z.L. and R.G.; investigation, Z.L., Y.H., M.B., B.J., G.K., J.P., M.S., L.S.,and S.Z.; supervision, R.G.; writing—original draft, Z.L. and Y.H.; writing—review and editing, Z.L., M.B., B.J.,G.K., J.P., M.S., L.S., S.Z., and R.G. All authors have read and agreed to the published version of the manuscript.
Funding: R.G. would like to acknowledge a fellowship supported by the Royal Academy of Engineering underthe RAEng/Leverhulme Trust Senior Research Fellowships scheme.
Acknowledgments: The authors would like to acknowledge the participation of Christopher Roger in theexperimental work.
Conflicts of Interest: The authors declare no conflicts of interest.
References
1. Yeh, J.-W.; Chen, S.-K.; Lin, S.-J.; Gan, J.-Y.; Shun, T.-S.; Tsau, C.-H.; Chang, S.-Y. Nanostructured high-entropyalloys with multiple principal elements: Novel alloy design concepts and outcomes. Adv. Eng. Mater. 2004,6, 299–303. [CrossRef]
2. Zhang, Y.; Zuo, T.T.; Tang, Z.; Gao, M.C.; Dahmen, K.A.; Liaw, P.K.; Lu, Z.P. Microstructures and propertiesof high-entropy alloys. Prog. Mater. Sci. 2014, 61, 1–93. [CrossRef]
3. Pickering, E.J.; Jones, N.G. High-entropy alloys: A critical assessment of their founding principles and futureprospects. Int. Mater. Rev. 2016, 63, 183–202. [CrossRef]
4. Tsai, M.; Yeh, J. High-entropy alloys: A critical review. Mater. Res. Lett. 2014, 2, 107–123. [CrossRef]5. Miracle, D.B.; Senkov, O.N. A critical review of high entropy alloys and related concepts. Acta Mater. 2017,
122, 448–511. [CrossRef]6. Leong, Z.; Wróbel, J.S.; Dudarev, S.L.; Goodall, R.; Todd, I.; Nguyen-Manh, D. The effect of electronic structure
on the phases present in high entropy alloys. Nat. Sci. Rep. 2017, 7, 39803. [CrossRef]7. Tancret, F.; Toda-Caraballo, I.; Menou, E.; Díaz-Del-Castillo, P.E.J.R. Designing high entropy alloys employing
thermodynamics and Gaussian process statistical analysis. Mater. Des. 2017, 115, 486–497. [CrossRef]8. Pickering, E.J.; Muñoz-Moreno, R.; Stone, H.J.; Jones, N.G. Precipitation in the equiatomic high-entropy alloy
CrMnFeCoNi. Scr. Mater. 2016, 113, 106–109. [CrossRef]9. Dahlborg, U.; Cornide, J.; Calvo-Dahlborg, M.; Hansen, T.C.; Leong, Z.; Dominguez, L.A.; Chambreland, S.;
Cunliffe, A.; Goodall, R.; Todd, I. Crystalline structures of some high entropy alloys obtained by Neutronand X-ray diffraction. Acta Phys. Pol. 2015, 128, 552–556. [CrossRef]
10. Tsai, M.-H. Three strategies for the design of advanced high-entropy alloys. Entropy 2016, 18, 252. [CrossRef]11. Asensio-Domınguez, L.; Goodall, R.; Todd, I. Prediction and validation of quaternary high entropy alloys
using statistical approaches. Mater. Sci. Technol. 2015, 31, 1201–1206. [CrossRef]12. Senkov, O.N.; Senkova, S.V.; Miracle, D.B.; Woodward, C. Mechanical properties of low-density, refractory
multi-principal element alloys of the Cr–Nb–Ti–V–Zr system. Mater. Sci. Eng. A 2013, 565, 51–62. [CrossRef]13. Senkov, O.N.; Senkova, S.V.; Woodward, C.; Miracle, D.B. Low-density, refractory multi-principal element
alloys of the Cr–Nb–Ti–V–Zr system: Microstructure and phase analysis. Acta Mater. 2013, 61, 1545–1557.[CrossRef]
14. Kim, B.G.; Kim, G.M.; Kim, C.J. Oxidation behavior of TiAl-X (X = Cr, V, Si, Mo or Nb) intermetallics atelevated temperature. Scr. Metall. Mater. 1995, 33, 1117–1125. [CrossRef]
15. Liu, C.M.; Wang, H.M.; Zhang, S.Q.; Tang, H.B.; Zhang, A.L. Microstructure and oxidation behavior of newrefractory high entropy alloys. J. Alloys Compd. 2014, 583, 162–169. [CrossRef]
16. Gorr, B.; Mueller, F.; Christ, H.-J.; Mueller, T.; Chen, H.; Kauffmann, A.; Heilmaier, M. High temperatureoxidation behavior of an equimolar refractory metal-based alloy 20Nbe20Moe20Cre20Tie20Al with andwithout Si addition. J. Alloys Compd. 2016, 688, 468–477. [CrossRef]
17. Zuo, T.T.; Li, R.B.; Ren, X.J.; Zhang, Y. Effects of Al and Si addition on the structure and properties of CoFeNiequal atomic ratio alloy. J. Magn. Magn. Mater. 2014, 371, 60–68. [CrossRef]
18. Liu, W.H.; Wu, Y.; He, J.Y.; Zhang, Y.; Liu, C.T.; Lu, Z.P. The phase competition and stability of high-entropyalloys. JOM 2014, 66, 1973–1983. [CrossRef]
19. Zhu, J.M.; Fu, H.M.; Zhang, H.F.; Wang, A.M.; Li, H.; Hu, Z.Q. Synthesis and properties of multiprincipalcomponent AlCoCrFeNiSix alloys. Mater. Sci. Eng. A 2010, 527, 7210–7214. [CrossRef]
20. Yang, X.; Zhang, Y. Prediction of high-entropy stabilized solid-solution in multi-component alloys. Mater.
Chem. Phys. 2012, 132, 233–238. [CrossRef]

Metals 2020, 10, 317 14 of 14
21. Takeuchi, A.; Inoue, A. Metallic glasses by atomic size difference, heat of mixing and period of constituentelements and its application to characterization of the main alloying element. Mater. Trans. 2005, 46,2817–2829. [CrossRef]
22. Cunliffe, A.; Plummer, J.; Figueroa, I.; Todd, I. Glass formation in a high entropy alloy system by design.Intermetallics 2012, 23, 204–207. [CrossRef]
23. Thermo-Calc Software SSOL4/SGTE Solutions Database Version 4. Available online: https://www.sgte.net/en/sgte-solution-database-sgsol (accessed on 14 April 2016).
24. DeGarmo, E.P.; Black, J.T.; Kohser, R.A. Materials and Processes in Manufacturing, 9th ed.; Wiley: Hoboken, NJ,USA, 2003.
25. Ostling, M.; Zaring, C. Mechanical properties of TM silicides. In Properties of Metal Silicides; Maex, K.,Rossum, M.V., Eds.; INSPEC, The Institution of Electrical Engineers: London, UK, 1995; pp. 15–30.
26. Soubeyroux, J.L.; Bououdina, M.; Fruchart, D.; de Rango, P. Phase stability and neutron diffraction studies ofLaves phases Zr(Cr1−xMx)2 with M = (Cu0.5Ni0.5) and 0 < x < 0.2 and their hydrides. J. Alloys Compd. 1995,231, 760–765.
© 2020 by the authors. Licensee MDPI, Basel, Switzerland. This article is an open accessarticle distributed under the terms and conditions of the Creative Commons Attribution(CC BY) license (http://creativecommons.org/licenses/by/4.0/).