Entropy of electromyography time series
10
Physica A 386 (2007) 698–707 Entropy of electromyography time series Miron Kaufman a, , Ulrich Zurcher a , Paul S. Sung b a Physics Department, Cleveland State University, Cleveland, OH 44115, USA b Health Sciences Department, Cleveland State University, Cleveland, OH 44115, USA Available online 31 July 2007 Abstract A nonlinear analysis based on Renyi entropy is applied to electromyography (EMG) time series from back muscles. The time dependence of the entropy of the EMG signal exhibits a crossover from a subdiffusive regime at short times to a plateau at longer times. We argue that this behavior characterizes complex biological systems. The plateau value of the entropy can be used to differentiate between healthy and low back pain individuals. r 2007 Elsevier B.V. All rights reserved. PACS: 87.19.Ff; 89.75.k; 87.15.Vv; 87.19Xx Keywords: Entropy; Complex system; Emg time series; Clinical diagnosis; Low back pain 1. Introduction Entropy has many interdisciplinary applications as for example in aging psychology [1,2] or macromolecular engineering [3]. In this paper, we focus on time series applications. Generically, biological time series are complex data that need to be distilled to useful information for example to assess an illness. Nonlinear analysis using fractal geometry and random walks theory proved to be useful in the analysis of a variety of time series such as correlations between global temperatures and solar activity [4], earthquakes statistics [5], human heartbeat [6] and shapes of red cells under flow stress [7]. We studied [8] time series generated by the electrical activity of back muscles of healthy and low back pain (LBP) individuals, motivated by the need to develop an evaluation tool for LBP. Using random walks concepts, Collins and De Luca [9,10] have studied the erratic motion of the center of pressure of a standing human body. They found a crossover from superdiffusive random walk for short times to subdiffusive random walks for longer times. Similar results were obtained by Wu et al. [11] and by Davis and collaborators [12]. In our entropic analysis of electromyography (EMG) time series from back muscle, we observe a crossover from subdiffusive, Hurst exponent Hp0.5, to self-organization, Hurst exponent HE0. In this paper, we compare the muscle activity of an individual with LBP to that of a healthy individual. Using the entropy of the electromyography time series, we also compare the performance of different muscles: thoracic right, thoracic left, lumbar right and lumbar left. Our general findings are consistent with the ideas of ARTICLE IN PRESS www.elsevier.com/locate/physa 0378-4371/$ - see front matter r 2007 Elsevier B.V. All rights reserved. doi:10.1016/j.physa.2007.07.045 Corresponding author. E-mail addresses: [email protected] (M. Kaufman), [email protected] (U. Zurcher), [email protected] (P.S. Sung).
Transcript of Entropy of electromyography time series
ARTICLE IN PRESS
0378-4371/$ - se
doi:10.1016/j.ph
�CorrespondE-mail addr
Physica A 386 (2007) 698–707
www.elsevier.com/locate/physa
Entropy of electromyography time series
Miron Kaufmana,�, Ulrich Zurchera, Paul S. Sungb
aPhysics Department, Cleveland State University, Cleveland, OH 44115, USAbHealth Sciences Department, Cleveland State University, Cleveland, OH 44115, USA
Available online 31 July 2007
Abstract
A nonlinear analysis based on Renyi entropy is applied to electromyography (EMG) time series from back muscles. The
time dependence of the entropy of the EMG signal exhibits a crossover from a subdiffusive regime at short times to a
plateau at longer times. We argue that this behavior characterizes complex biological systems. The plateau value of the
entropy can be used to differentiate between healthy and low back pain individuals.
r 2007 Elsevier B.V. All rights reserved.
PACS: 87.19.Ff; 89.75.�k; 87.15.Vv; 87.19Xx
Keywords: Entropy; Complex system; Emg time series; Clinical diagnosis; Low back pain
1. Introduction
Entropy has many interdisciplinary applications as for example in aging psychology [1,2] ormacromolecular engineering [3]. In this paper, we focus on time series applications. Generically, biologicaltime series are complex data that need to be distilled to useful information for example to assess an illness.Nonlinear analysis using fractal geometry and random walks theory proved to be useful in the analysis of avariety of time series such as correlations between global temperatures and solar activity [4], earthquakesstatistics [5], human heartbeat [6] and shapes of red cells under flow stress [7]. We studied [8] time seriesgenerated by the electrical activity of back muscles of healthy and low back pain (LBP) individuals, motivatedby the need to develop an evaluation tool for LBP.
Using random walks concepts, Collins and De Luca [9,10] have studied the erratic motion of the center ofpressure of a standing human body. They found a crossover from superdiffusive random walk for short timesto subdiffusive random walks for longer times. Similar results were obtained by Wu et al. [11] and by Davisand collaborators [12]. In our entropic analysis of electromyography (EMG) time series from back muscle, weobserve a crossover from subdiffusive, Hurst exponent Hp0.5, to self-organization, Hurst exponent HE0.
In this paper, we compare the muscle activity of an individual with LBP to that of a healthy individual.Using the entropy of the electromyography time series, we also compare the performance of different muscles:thoracic right, thoracic left, lumbar right and lumbar left. Our general findings are consistent with the ideas of
e front matter r 2007 Elsevier B.V. All rights reserved.
ysa.2007.07.045
ing author.
esses: [email protected] (M. Kaufman), [email protected] (U. Zurcher), [email protected] (P.S. Sung).
ARTICLE IN PRESSM. Kaufman et al. / Physica A 386 (2007) 698–707 699
Goldberger and his collaborators based on heart beat time series studies [13,14] that, when compared topathologies, a healthier biological system exhibits higher entropy. Indeed we find higher entropy levels for theerector spinae muscles in a healthy individual compared to a LBP individual and for the stronger thoracicerector spinae muscle (left for a right-handed person) than for the other side (right for a right-handed person)thoracic erector spinae muscle.
The balance of the paper is organized as follows. In Section 2 we present background information about theShannon and Renyi entropies. We also demonstrate that the Renyi entropy associated with diffusive processesgrows linearly with the logarithm of time, and the rate of growth is independent of the Renyi parameter. InSection 3 we describe the experimental method for measuring the electrical signal from back muscles. InSection 4 we describe how to generate walks from time series. The results of the study are in: Section 5, wherewe present the crossover from subdiffusion to self-organization; Section 6, where we compare healthy andLBP muscle activity; Section 7, where we compare the dominant and nondominant muscle activity. Section 8contains our conclusions.
2. Shannon and Renyi entropies
The entropy is the rigorous measure of lack of information. The information, or Shannon, entropy [15] for aparticular experimental condition with a set of M possible outcomes is
Sinformation ¼ �XMj¼1
pj lnðpjÞ; (1)
where pj is the relative frequency of outcome #j. It is uniquely determined from the Khinchin [16] axioms: (I) itdepends on the probabilities p only; (II) the lowest entropy (S ¼ 0) corresponds to one of the p’s being 1 andthe rest being zero (i.e., total information); (III) the largest value for the entropy is ln M and is achieved whenall p’s are equal to each other (i.e., the absence of any information); and (IV) S is additive over partitions ofthe outcomes. If the last axiom is relaxed to consider only statistically independent partitions, Renyi [17] foundthat the information entropy is replaced by a one-variable function:
SðbÞ ¼1
1� bln
XMj¼1
pbj
!. (2)
For b ¼ 1 the Renyi entropy equals the Shannon entropy. The Renyi entropy is related to the Tsallis entropywhich is central to the current massive research effort [18] in nonextensive statistical mechanics.
In the continuum limit: pj � rðx; tÞDx, where x is the random variable, e.g. displacement for random walker,and r is the probability distribution function. We consider Brownian and anomalous diffusive processescharacterized by a probability distribution function that satisfies the following scaling equation:
rðx; tÞ ¼ t�Hf ðx=tH Þ. (3)
H is the Hurst exponent [19]. The normalization of probabilities implies:R
f ðxÞ dx ¼ 1. A Brownian processis characterized by the lack of time correlations and has the probability distribution function:rðx; tÞ ¼ 1=
ffiffiffiffiffiffiffiffiffiffiffi4pDtp
e�ðx2=4DtÞ, where D is the diffusion constant. This probability distribution function satisfies
the scaling Eq. (3) with the Hurst exponent H ¼ 12. Random walks on fractals (e. g. percolation backbone)
exhibit anomalous diffusion. In the subdiffusive regime, 0oHo12, there are negative correlations or anti-
persistence, while in the superdiffusive regime (Levy flights), 12oHo1, there are positive time correlations or
persistence.The time dependence of entropy [20,21] for anomalous diffusion processes is obtained by substituting
pj � rðx; tÞDx into Eq. (2), replacing the sum by an integral and using Eq. (3):
Sðb; tÞ ¼ � lnðDxÞ �1
b� 1lnð
Z½f ðuÞ�bduÞ þH ln t. (4)
Hence S(b,t) ¼ a(b) ln(t)+b(b), with a(b) ¼ H independent of the Renyi parameter b. Interestingly enough theentropy associated with the spatial distribution of tracers advected by laminar flow in extruders [21] also
ARTICLE IN PRESSM. Kaufman et al. / Physica A 386 (2007) 698–707700
exhibits the logarithmic increase with time. Unlike diffusion processes, in that case the logarithmic coefficienta(b) varies significantly with the Renyi parameter X, as seen in Fig. 12 of Ref. [21]. In Section 5, we use thislogarithmic time dependence of entropy to analyze time series.
3. EMG signal
Surface EMG is a noninvasive tool that is used to assess LBP. Four channels of EMG were recorded usingbipolar, Ag–AgCl, surface electrodes. The EMG signals were pre-amplified at the skin (gain 35x) and furtheramplified downstream (bandwidth 20–4000Hz; model D-100 pre-amplifier and model ENG 55 driveramplifier, Therapeutics Unlimited, Iowa City, Iowa) with the entire system adjusted for each subject to allowmaximal amplification without saturation of the analogue-to-digital converter. The EMG signal was fedthrough a low-pass filter (cutoff frequency 480Hz at 6 dB per octave) and subsequently passed to a BNCconnector board (BNC 2080, National Instruments, Austin, Texas). The signal was interfaced with a 12-bitanalogue-to-digital converter (AT-MIO-16E-10; National Instruments) that amplified (100x) and sampledeach channel.
The endurance of the low back muscles (erector spinae) was determined using a modified version of theisometric fatigue test. During this test, subjects lay prone and lifted their trunks off the table. EMG electrodesattached to both sides of the erector spinae muscles on the low back collected 1024 data per second during a1minute time interval. Further information about the EMG experimental technique can be found in Ref. [22]and in references therein.
The time series analyzed in this paper are from two 29-year-old males, both right-handed, one healthy andthe other with chronic LBP. Both individuals are part of an ongoing clinical study at Cleveland StateUniversity. The participants included in the study received information regarding the purpose and methods ofthe study and a copy of the Institutional Review Board approved consent form that required their signature.Standard procedures for human subject studies were followed.
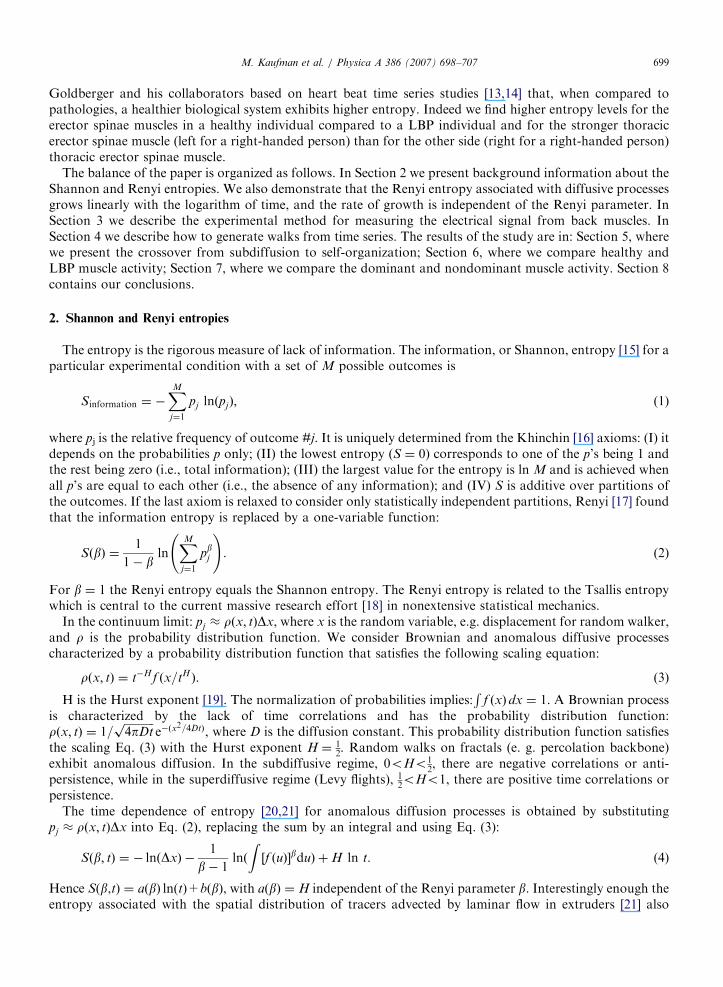
In Fig. 1, we show the EMG time series from the right thoracic muscle of the two individuals.
Fig. 1. EMG from thoracic right muscle: (a) healthy and (b) LBP.
ARTICLE IN PRESSM. Kaufman et al. / Physica A 386 (2007) 698–707 701
4. Time series and random walks
Consider a time series xt. Following Scafetta and Grigolini [20], we interpret the signal xn as a jump at
time n. We then generate all walks of time length t:X m;t ¼Pt�1
j¼0xjþm. For a given time t, we consider the
ensemble of all the walks of time length t, distinguished one from the other by the initial time m. We divide therange of X in M equal bins and estimate the probability of finding a walker at that location by using thefraction of all X that fall in the bin. The results shown in Section 5 are obtained for M ¼ 500 bins. Wecompute entropies using Eqs. (1) and (2). Motivated by Eq. (4) above, we analyze the numerical time seriessearching for a logarithmic dependence of the entropy.
5. Random walk to self-organization crossover
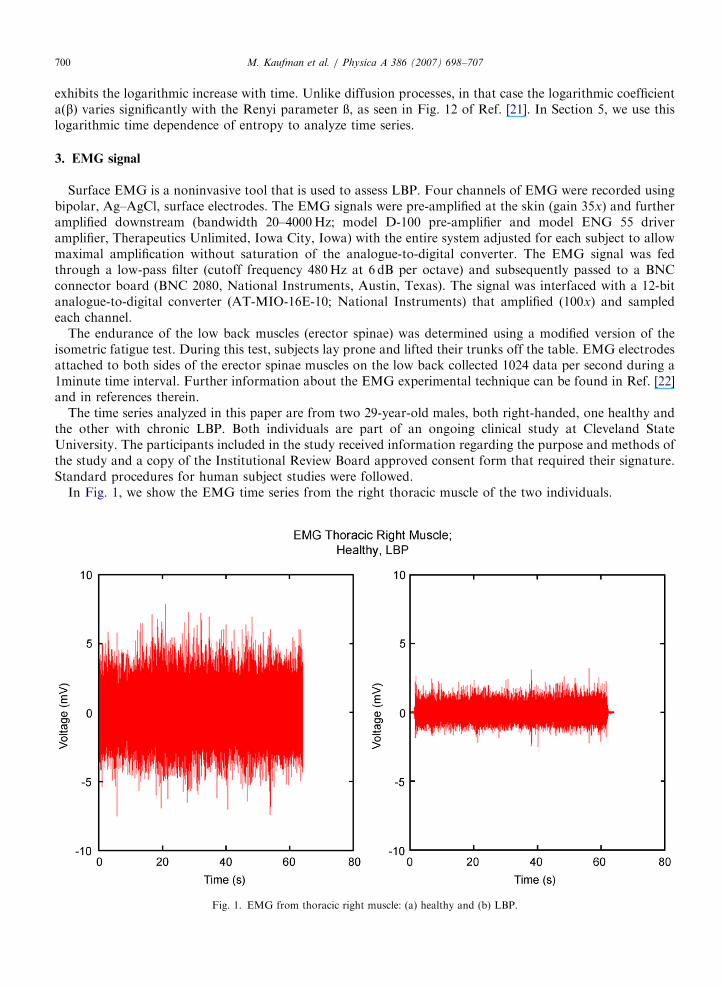
We show in Fig. 2 the entropy associated with walks generated from the healthy right thoracic muscle EMGtime series as a function of the logarithm of time. At short times, to0.01 s, the slope is 0.26, 0.32, 0.34 for theRenyi parameter b ¼ 0, 1, 5, respectively. Since the fit was done on only 10 data points, there is a largeuncertainty on those values. Similar slope values were extracted from the EMG data from all the muscles(thoracic right and left, lumbar right and left) for both individuals (Healthy, LBP). At longer times,0.01 soto1 s, the entropies exhibit a plateau. The plateau occurs at an entropy value well below the maximumpossible entropy value ln M. Hence it is not an artifact of the way we estimate the entropy, but it is an intrinsicproperty of the time series.
RANDOM NUMBER GENERATOR
1 10 100 1.103 1.104
1
2
3
4
5
6
7
8HEALTHY, Thoracic Right Muscle
TIME (ms)
1 10 100 1.103 1.104
TIME (ms)
RE
NY
I E
NT
RO
PIE
S, b
eta
= 0
, 1, 5
1
2
3
4
5
6
7
8
RE
NY
I E
NT
RO
PIE
S, b
eta
= 0
, 1, 5
ln(M) ln(M)
Fig. 2. Entropy vs. lnt. Top curve b ¼ 0, middle curve b ¼ 1, bottom curve b ¼ 5: (a) healthy thoracic right muscle; and (b) random
number generator.
ARTICLE IN PRESSM. Kaufman et al. / Physica A 386 (2007) 698–707702
The entropy plateau corresponds to the Hurst exponent HE0. Since the power spectrum P(f) �f�a, with anexponent a ¼ 2H+E1, it follows P(f)�1/f. Self-organization is generally associated with 1/f noise [23] andthis is the reason why the entropy plateau can be interpreted as a manifestation of self-organization.
Qualitatively similar dependences were observed [9–12] in the analysis of the erratic motion of the center ofpressure of the human body. Though the details are not identical, e.g crossover time and slopes are different,
1 10 100 1.103 1.104
0.1
0.2
0.3
0.4
0.5
0.6
0.7
0.8
0.9
1 HEALTHY, Thoracic Right Muscle
TIME (ms)1 10 100 1.103 1.104
TIME (ms)
1 10 100 1.103 1.104
TIME (ms)1 10 100 1.103 1.104
TIME (ms)
rela
tive
RE
NY
I E
NT
RO
PIE
S, b
eta
= 0
, 1, 5
0.1
0.2
0.3
0.4
0.5
0.6
0.7
0.8
0.9
rela
tive
RE
NY
I E
NT
RO
PIE
S, b
eta
= 0
, 1, 5
0.1
0.2
0.3
0.4
0.5
0.6
0.7
0.8
0.9
rela
tive
RE
NY
I E
NT
RO
PIE
S, b
eta
= 0
, 1, 5
0.1
0.2
0.3
0.4
0.5
0.6
0.7
0.8
0.9
rela
tive
RE
NY
I E
NT
RO
PIE
S, b
eta
= 0
, 1, 5
2 LBP, Thoracic Right Muscle
1 HEALTHY, Thoracic Left Muscle 2 LBP, Thoracic Left Muscle
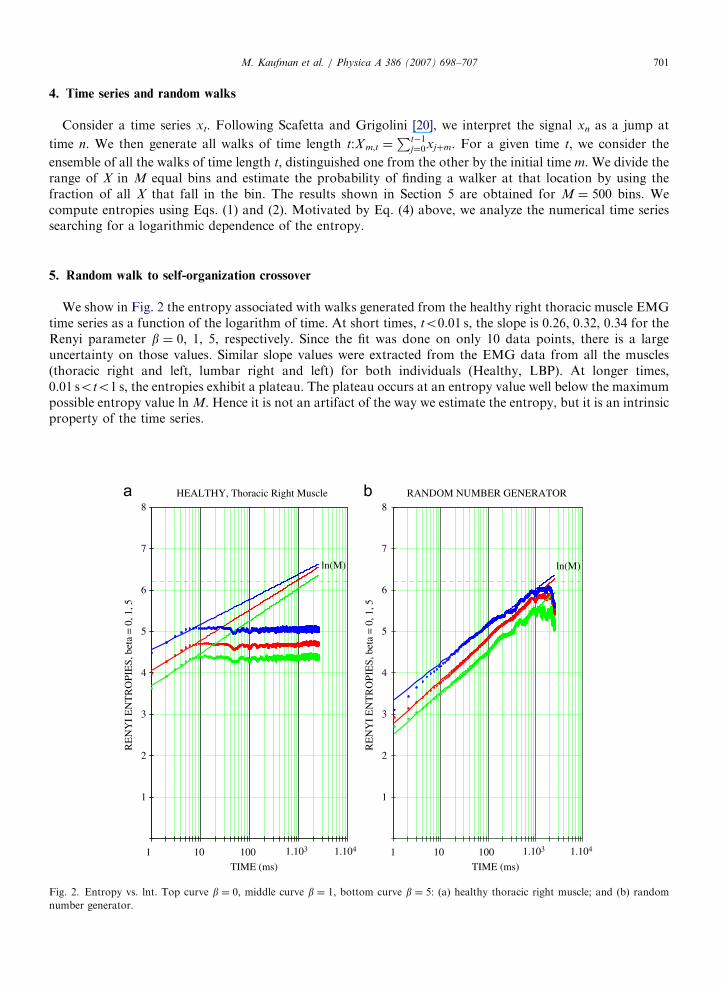
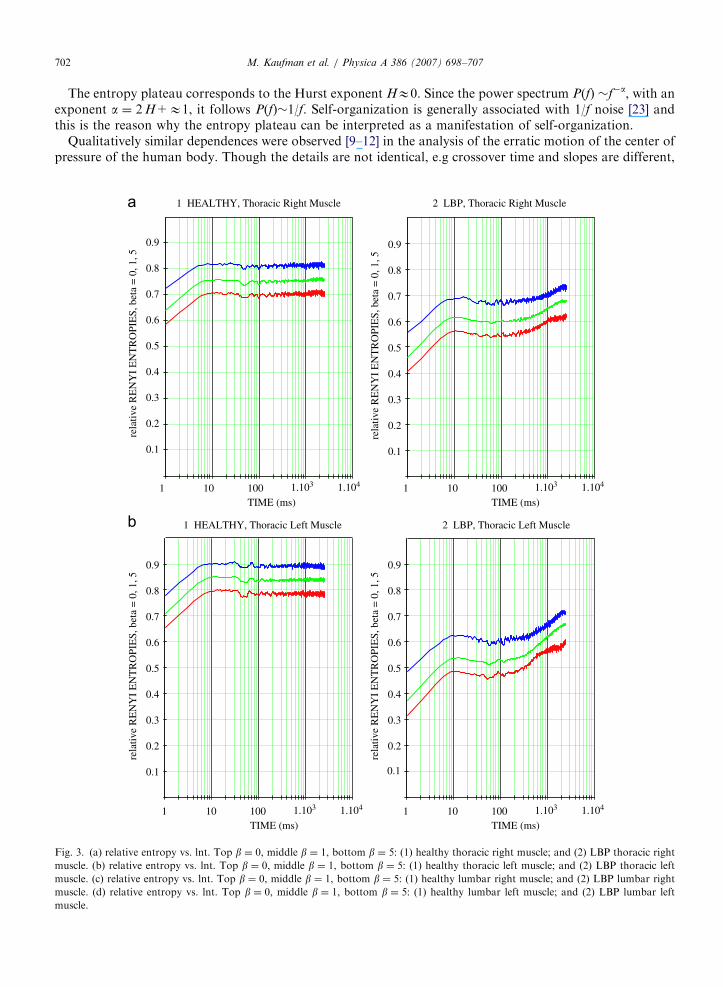
Fig. 3. (a) relative entropy vs. lnt. Top b ¼ 0, middle b ¼ 1, bottom b ¼ 5: (1) healthy thoracic right muscle; and (2) LBP thoracic right
muscle. (b) relative entropy vs. lnt. Top b ¼ 0, middle b ¼ 1, bottom b ¼ 5: (1) healthy thoracic left muscle; and (2) LBP thoracic left
muscle. (c) relative entropy vs. lnt. Top b ¼ 0, middle b ¼ 1, bottom b ¼ 5: (1) healthy lumbar right muscle; and (2) LBP lumbar right
muscle. (d) relative entropy vs. lnt. Top b ¼ 0, middle b ¼ 1, bottom b ¼ 5: (1) healthy lumbar left muscle; and (2) LBP lumbar left
muscle.

ARTICLE IN PRESS
1 10 100 1.103 1.104
0.1
0.2
0.3
0.4
0.5
0.6
0.7
0.8
0.9
1 HEALTHY, Lumbar Right Muscle
TIME (ms)
1 10 100 1.103 1.104
TIME (ms)
1 10 100 1.103 1.104
TIME (ms)
1 10 100 1.103 1.104
TIME (ms)
rela
tive
RE
NY
I E
NT
RO
PIE
S, b
eta
= 0
, 1, 5
0.1
0.2
0.3
0.4
0.5
0.6
0.7
0.8
0.9
rela
tive
RE
NY
I E
NT
RO
PIE
S, b
eta
= 0
, 1, 5
0.1
0.2
0.3
0.4
0.5
0.6
0.7
0.8
0.9
rela
tive
RE
NY
I E
NT
RO
PIE
S, b
eta
= 0
, 1, 5
0.1
0.2
0.3
0.4
0.5
0.6
0.7
0.8
0.9
rela
tive
RE
NY
I E
NT
RO
PIE
S, b
eta
= 0
, 1, 5
2 LBP, Lumbar Right Muscle
1 HEALTHY, Lumbar Left Muscle 2 LBP, Lumbar Left Muscle
Fig. 3. (Continued)
M. Kaufman et al. / Physica A 386 (2007) 698–707 703
we suspect that this type of crossover from large Hurst exponent random walks at short times to small Hurstexponent random walks at long times characterize organized complex systems. To support this point, we alsoshow in Fig. 2b below the qualitatively different dependence of entropy on time exhibited by time seriesgenerated with a commercial random number generator. The slopes of S versus ln t for the random numbergenerator data are 0.38, 0.45, 0.44 for b ¼ 0, 1, 5, respectively. These values are quite close to the Browniandiffusion value H ¼ 1
2. There is no plateau in the random number time series.
This comparison between the EMG data on one hand and random data on the other hand supports the ideathat the system responsible for the back muscle signal is complex as opposed to noisy. The time evolution ofentropy for EMG data also differs qualitatively from the time dependence of the entropy of chaotically
ARTICLE IN PRESSM. Kaufman et al. / Physica A 386 (2007) 698–707704
advected tracers [21]: the latter does not exhibit a crossover in time to self-organization, but it exhibits asubstantial dependence of the logarithmic amplitude on the Renyi parameter.
6. Comparison of healthy and LBP muscles
The entropy dependence on time constitutes a potential tool for differentiating between healthy and LBPindividuals. We show in Fig. 3 above, side by side, graphs of the relative entropy S/ln(M) versus ln t from fourerector spinae muscles (right and left thoracic and right and left lumbar) of a healthy male and a LBP male ofthe same age. In each case, we computed the entropy using M ¼ 500 bins.
The plateau entropy is consistently higher for the healthy individual than for the LBP individual. Weconfirm [22] this finding in a pilot study involving ten healthy and ten LBP individuals, who were matched bygender, but not by age. The question of whether the plateau entropy constitutes a useful diagnostic tool forLBP needs further investigation with large groups of individuals matched by age, gender, body mass index,etc. It is worth emphasizing that Costa et al. [13] and Chialvo [14] argued based on heart time series thatpathology is associated with less variability (lower entropy). Our findings support this idea.
-10 -5 0 5 10
0.01
0.02
0.03
0.04
LBP, Thoracic Left Muscle
X
-10 -5 0 5 10
X
prob
abili
ty, t
= 1
,000
ms
0.01
0.02
0.03
0.04
LBP, Thoracic Left Muscle
prob
abili
ty, t
= 1
,000
ms
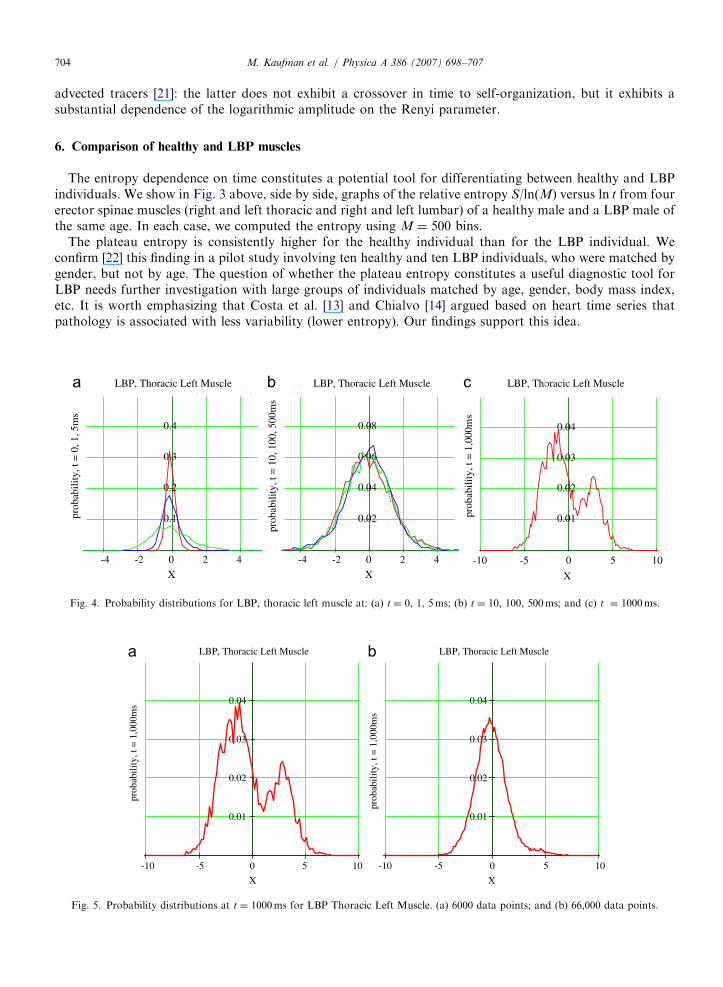
Fig. 5. Probability distributions at t ¼ 1000ms for LBP Thoracic Left Muscle. (a) 6000 data points; and (b) 66,000 data points.
-4 -2 0 2 4
0.1
0.2
0.3
0.4
LBP, Thoracic Left Muscle
X
-4 -2 0 2 4
X
prob
abili
ty, t
= 0
, 1, 5
ms
0.02
0.04
0.06
0.08
LBP, Thoracic Left Muscle
prob
abili
ty, t
= 1
0, 1
00, 5
00m
s
-10 -5 0 5 10
X
0.01
0.02
0.03
0.04
LBP, Thoracic Left Muscle
prob
abili
ty, t
= 1
,000
ms
Fig. 4. Probability distributions for LBP, thoracic left muscle at: (a) t ¼ 0, 1, 5ms; (b) t ¼ 10, 100, 500ms; and (c) t ¼ 1000ms.
ARTICLE IN PRESSM. Kaufman et al. / Physica A 386 (2007) 698–707 705
To better understand the entropy time evolution, we show in Fig. 4 the histograms used to determine theentropy for the LBP left thoracic muscle (Fig. 3b). In Fig. 4a, we see the widening of the probabilitydistribution with time corresponding to the entropy increase at short times to10ms. In Fig. 4b, theprobability distribution is practically stationary corresponding to the entropy plateau at longer times10msoto500ms. In Fig. 4c, we show the probability distribution at t ¼ 1000ms, attempting to understandthe increase in entropy apparent for t 4 500ms. We observe the occurrence of two peaks which maycorrespond to some sort of phase transition. In order to check this hypothesis, we computed the histogram
1 10 100 1.103 1.104
0.1
0.2
0.3
0.4
0.5
0.6
0.7
0.8
0.9
1 HEALTHY, Thoracic Right Muscle
TIME (ms) 1 10 100 1.103 1.104
TIME (ms)
1 10 100 1.103 1.104
TIME (ms) 1 10 100 1.103 1.104
TIME (ms)
rela
tive
RE
NY
I E
NT
RO
PIE
S, b
eta
= 0
, 1, 5
0.1
0.2
0.3
0.4
0.5
0.6
0.7
0.8
0.9
rela
tive
RE
NY
I E
NT
RO
PIE
S, b
eta
= 0
, 1, 5
0.1
0.2
0.3
0.4
0.5
0.6
0.7
0.8
0.9
rela
tive
RE
NY
I E
NT
RO
PIE
S, b
eta
= 0
, 1, 5
0.1
0.2
0.3
0.4
0.5
0.6
0.7
0.8
0.9
rela
tive
RE
NY
I E
NT
RO
PIE
S, b
eta
= 0
, 1, 5
2 HEALTHY, Thoracic Left Muscle
1 HEALTHY, Lumbar Right Muscle 2 HEALTHY, Lumbar Left Muscle
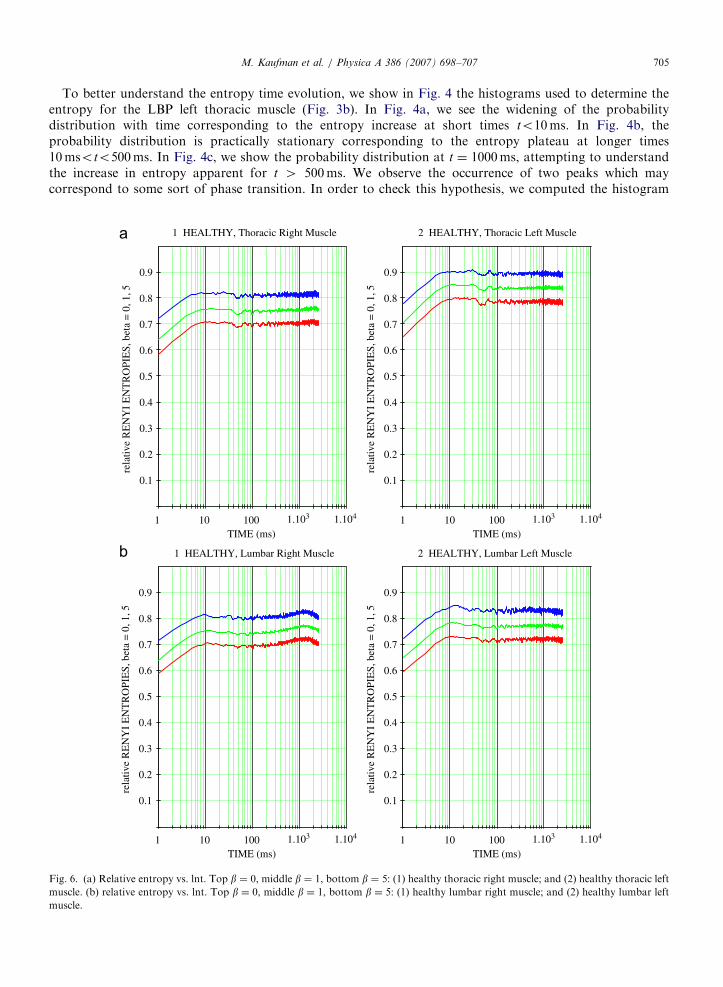
Fig. 6. (a) Relative entropy vs. lnt. Top b ¼ 0, middle b ¼ 1, bottom b ¼ 5: (1) healthy thoracic right muscle; and (2) healthy thoracic left
muscle. (b) relative entropy vs. lnt. Top b ¼ 0, middle b ¼ 1, bottom b ¼ 5: (1) healthy lumbar right muscle; and (2) healthy lumbar left
muscle.
ARTICLE IN PRESSM. Kaufman et al. / Physica A 386 (2007) 698–707706
using 66,000 data points rather than the 6000 points window used in all other computations. As shown in Fig.5, the two-peak structure disappears which leads us to believe that this is a manifestation of the finite numberof data points considered.
7. Comparison of right and left muscles
The effect of hand dominance has to be factored in Ref. [24] when evaluating the performance of backmuscles. The entropy measure can then be used to quantify the difference in performance between the rightand left sides of the back musculature for right- and left-handed individuals.
In Fig. 6 below, we show side by side the relative entropy S/lnM for the healthy individual’s right and leftthoracic erector spinae muscles and right and left lumbar erector spinae muscles. For the thoracic muscles, theplateau entropy of the left muscle is clearly higher than for the right side muscle. This is consistent with thefact that the individual is right-handed.
8. Conclusions
We have shown that a nonlinear analysis of time series based on entropy can discriminate between complexbiological sources and random sources of the data. While the EMG signal from an erector spinae muscleexhibits an entropy time dependence with a crossover from subdiffusive regime at short times to a self-organization regime (plateau) at longer time scales, time series generated with random number generators donot exhibit the plateau. The Renyi entropy time evolution also differentiates between this complex biologicalsystem and deterministic processes, e.g. tracers advection in polymer flows [21].
The presence of the plateau points to the existence of anti-correlations of EMG signals separated in time byat least 0.01 s. We believe that it is a manifestation of a complex self-organizing system [25] in which individualunits interact in a nonlinear fashion such that feedback loops operate over long temporal ranges. Wehypothesize that this self-regulation, needed for maintaining physiological control of biological systems, leadsto steady-state variability, i.e. the plateau in entropy versus time dependence.
The entropy plateau value can be used to differentiate between LBP and healthy individuals and betweendominant and nondominant muscles. This approach holds the potential for using the entropy of EMG signalsto diagnose LBP.
Acknowledgments
This research was supported by the State of Ohio through a faculty research grant at Cleveland StateUniversity. One of us (UZ) was supported by a Research Corporation grant. MK would like to thank theorganizers of the Pan-American Advanced Studies Institute ‘‘From Disordered Systems to Complex Systems’’,Professors Braunstein, Buldyrev, Cwilich, and Zypman, for inviting him to present this research in Mar delPlata.
References
[1] P.A. Allen, M. Kaufman, F. Smith, R.E. Propper, A molar entropy model of age differences in spatial memory, Psychol. Aging 13
(1998) 501–518.
[2] P.A. Allen, M.D. Murphy, M. Kaufman, K.E. Groth, A. Begovic, Age differences in central (semantic) and peripheral processing: the
importance of considering both response times and errors, J. Gerontol. B Psychol. Sci. Soc. Sci. 59 (2004) 210–219.
[3] M. Camesasca, M. Kaufman, I. Manas-Zloczower, Quantifying fluid mixing with the Shannon entropy, Macromol. Theory Simul. 15
(2006) 595–607.
[4] N. Scaffeta, B.J. West, Solar flare intermittency and the earth’ temperature anomalies, Phys. Rev. Lett 90 (2003) 248701.
[5] N. Scaffeta, B.J. West, Multiscale comparative analysis of time series and a discussion on ‘‘earthquake conversations’’ in California,
Phys. Rev. Lett. 92 (2004) 138501.
[6] P.Ch. Ivanov, L.A. Nunez Amaral, A.l. Goldberger, S. Havlin, M.G. Rosenblum, Z.R. Struzik, H.E. Stanley, Multifractality in
human heartbeat dynamics, Nature 399 (1999) 461–465.
[7] A.M. Korol, R. Rasia, Signatures of deterministic chaos in dyslipidemic erytrocytes under shear stress, Chaos 13 (2003) 87–93.
ARTICLE IN PRESSM. Kaufman et al. / Physica A 386 (2007) 698–707 707
[8] P. Sung, U. Zurcher, M. Kaufman, Nonlinear analysis of electromyography time series as a diagnostic tool for low back pain, Med.
Sci. Monit. 11 (1) (2005) CS1–CS5.
[9] J.J. Collins, C.J. De Luca, Random walking during quiet standing, Phys. Rev. Lett. 73 (1994) 764–767.
[10] J.J. Collins, C.J. De Luca, Upright correlated random walks: A statistical-biomechanics approach to the human postural control
system, Chaos 5 (1995) 57–63.
[11] J. Wu, N. Pan, K.R. Williams, Fractal dynamics of human stabilogram in quiet stance, International Society of Biomechanics XX
Congress Proceedings, Cleveland, 2005. p. 589.
[12] Z. Li, L. Keller, M. Luciano, B.L. Davis, H.J. Sommer, Postural Stability Measurement in Normal Pressure Hydrocephalus (NPH)
by Dual Axial Cranial Accelerometry, American Association of Neurological Surgeons, Chicago, 2002.
[13] M. Costa, A. Goldberger, C.-K. Peng, Multiscale entropy analysis of complex physiologic time series, Phys. Rev. Lett. 89 (2002)
068102.
[14] D.R. Chialvo, Unhealthy Surprises, Nature 419 (2002) 263.
[15] C.E. Shannon, W. Weaver, The Mathematical Theory of Communication, University of Illinois Press, Urbana, 1948.
[16] A.I. Khinchin, Mathematical Foundations of Information Theory, Dover, New York, 1957.
[17] A. Renyi, Theory of Probability, North-Holland, Amsterdam, 1960.
[18] See the special issue of Europhysics News, 36/6, 2005, J.P. Boon, C. Tsallis, (Eds.) dedicated to nonextensive statistical mechanics.
[19] B.B. Mandelbrot, The Fractal Geometry of Nature, Freeman, New York, 1983.
[20] N. Scafetta, P. Grigolini, Scaling detection in time series: diffusion entropy analysis, Phys. Rev. E 66 (2002) 036130.
[21] W. Wang, I. Manas-Zloczower, M. Kaufman, Entropy time evolution in a twin-flight single-screw extruder and its relationship to
chaos, Chem. Eng. Commun. 192 (2005) 405–423.
[22] P.S. Sung, U. Zurcher, M. Kaufman, Comparison of spectral and entropic measures for surface EMG time series: pilot study, J. of
Rehab. Res. and Dev. 44 (2007) 599–610.
[23] S.V. Buldyrev, J. Ferrante, F.R. Zypman, Dry friction avalanches: experiment and theory, Phys. Rev. E 74 (2006) 066110.
[24] P.S. Sung, K.F. Spratt, D.G. Wilder, A possible methodological flaw in comparing dominant and nondominant sided lumbar spine
muscle responses without simultaneously considering hand dominance, Spine 29 (17) (2004) 1914–1922.
[25] A.L. Goldberger, L.A.N. Amaral, J.M. Hausdorff, P.Ch. Ivanov, C.-K. Peng, H.E. Stanley, Fractal dynamics in physiology:
alterations with disease and aging, PNAS 99 (suppl.1) (2002) 2466–2472.