Characteristics of Combustion Flame Sprayed Nickel ...
92
Utah State University Utah State University DigitalCommons@USU DigitalCommons@USU All Graduate Theses and Dissertations Graduate Studies 5-2011 Characteristics of Combustion Flame Sprayed Nickel Aluminum Characteristics of Combustion Flame Sprayed Nickel Aluminum Using a Coanda Assisted Spray Manipulation Collar for Off- Using a Coanda Assisted Spray Manipulation Collar for Off- Normal Deposits Normal Deposits Reid S. Archibald Utah State University Follow this and additional works at: https://digitalcommons.usu.edu/etd Part of the Mechanical Engineering Commons Recommended Citation Recommended Citation Archibald, Reid S., "Characteristics of Combustion Flame Sprayed Nickel Aluminum Using a Coanda Assisted Spray Manipulation Collar for Off-Normal Deposits" (2011). All Graduate Theses and Dissertations. 964. https://digitalcommons.usu.edu/etd/964 This Thesis is brought to you for free and open access by the Graduate Studies at DigitalCommons@USU. It has been accepted for inclusion in All Graduate Theses and Dissertations by an authorized administrator of DigitalCommons@USU. For more information, please contact [email protected].
-
Upload
khangminh22 -
Category
Documents
-
view
0 -
download
0
Transcript of Characteristics of Combustion Flame Sprayed Nickel ...

Utah State University Utah State University
DigitalCommons@USU DigitalCommons@USU
All Graduate Theses and Dissertations Graduate Studies
5-2011
Characteristics of Combustion Flame Sprayed Nickel Aluminum Characteristics of Combustion Flame Sprayed Nickel Aluminum
Using a Coanda Assisted Spray Manipulation Collar for Off-Using a Coanda Assisted Spray Manipulation Collar for Off-
Normal Deposits Normal Deposits
Reid S. Archibald Utah State University
Follow this and additional works at: https://digitalcommons.usu.edu/etd
Part of the Mechanical Engineering Commons
Recommended Citation Recommended Citation Archibald, Reid S., "Characteristics of Combustion Flame Sprayed Nickel Aluminum Using a Coanda Assisted Spray Manipulation Collar for Off-Normal Deposits" (2011). All Graduate Theses and Dissertations. 964. https://digitalcommons.usu.edu/etd/964
This Thesis is brought to you for free and open access by the Graduate Studies at DigitalCommons@USU. It has been accepted for inclusion in All Graduate Theses and Dissertations by an authorized administrator of DigitalCommons@USU. For more information, please contact [email protected].
CHARACTERISTICS OF COMBUSTION FLAME SPRAYED NICKEL
ALUMINUM USING A COANDA ASSISTED
SPRAY MANIPULATION COLLAR FOR
OFF-NORMAL DEPOSITS
by
Reid S. Archibald
A thesis submitted in partial fulfillment
of the requirements for the degree
of
MASTER OF SCIENCE
in
Mechanical Engineering
Approved:
_________________________ _________________________
Dr. Leijun Li Dr. Barton Smith
Major Professor Committee Member
_________________________ _________________________
Dr. Thomas Fronk Dr. Byron Burnham
Major Professor Dean of Graduate Studies
UTAH STATE UNIVERSITY
Logan, Utah
2011

!
!
""
Copyright © Reid S. Archibald 2011
All rights Reserved

!
!
"""!
ABSTRACT
Characteristics of Combustion Flame Sprayed Nickel Aluminum Using a Coanda
Assisted Spray Manipulation Collar for Off-Normal Deposits
by
Reid S. Archibald, Master of Science
Utah State University, 2011
Major Professor: Dr. Leijun Li
Department: Mechanical and Aerospace Engineering
A novel flame spray collar called the Coanda Assisted Spray Manipulation collar
(CSM) has been tested for use on the Sulzer Metco 5P II combustion flame spray gun. A
comparison study of the stock nozzle and the CSM has been performed by evaluating the
porosity, surface roughness, microhardness, tensile strength and microscopy of normal
and off-normal sprayed NiAl deposits. The use of the CSM collar resulted in the need to
position the sprayed coupons closer to the gun, which in turn affected the particle impact
energy and particle temperatures of the NiAl powder. For the CSM, porosities had a
larger scatterband, surface roughness was comparably the same, microhardness was
lower, and tensile strength was higher. The microscopy analysis revealed a greater
presence of unmelted particles and steeper intersplat boundaries for the CSM. For both
processes, the porosity and surface roughness increased and the microhardness decreased
as the spray angle decreased.
(91 Pages)

!
!
"#
ACKNOWLEDGMENTS
I would like to express my deepest love and appreciation to my eternal
companion, Stefani, who has been my devoted companion through this thesis. This thesis
belongs to her as much as it belongs to me. I would also like to thank Dr. Li who has
supported this project both monetarily and academically even though he never had any
obligation to do so. Finally, I would like to thank Dr. Smith for providing the beginnings
for this entire adventure.
Reid Archibald

!
!
"!
TABLE OF CONTENTS
ABSTRACT ....................................................................................................................... iii!
ACKNOWLEDGMENTS ................................................................................................. iv!
TABLE OF CONTENTS .................................................................................................... v!
LIST OF TABLES ............................................................................................................ vii!
LIST OF FIGURES ......................................................................................................... viii!
INTRODUCTION TO THERMAL SPRAY ...................................................................... 1!
Motivation for Research ................................................................................................ 4!
LITERATURE REVIEW ................................................................................................... 7!
Splat Formation Characteristics ..................................................................................... 7!#$$%&'("%!)(*+%'%,!-----------------------------------------------------------------------------------------------------------------------!.!/(,&01*,('2!----------------------------------------------------------------------------------------------------------------------------------------!.!341*56(78!----------------------------------------------------------------------------------------------------------------------------------------!9:!
Deposit Characteristics ................................................................................................ 13!;<,<5('2!------------------------------------------------------------------------------------------------------------------------------------------!9=!30,$*&%!><0867%55!---------------------------------------------------------------------------------------------------------------------!?9!@*,A7%55!----------------------------------------------------------------------------------------------------------------------------------------!?B!C%75(1%!3',%78'6!--------------------------------------------------------------------------------------------------------------------------!?D!
OBJECTIVES ................................................................................................................... 32!
Statement of Problem ................................................................................................... 32!
Statement of Purpose ................................................................................................... 32!
Statement of Need ........................................................................................................ 32!
METHODOLOGY ........................................................................................................... 34!
Statement of Conditions ............................................................................................... 34!
Statement of Limitations .............................................................................................. 34!
Statement of Hypothesis .............................................................................................. 34!
Setup and Preliminary Calculations ............................................................................. 34!34,*2!E781%!3%'04!----------------------------------------------------------------------------------------------------------------------!F:!/<75'*7'!C%+4%,*'0,%!3%'04!------------------------------------------------------------------------------------------------!F=!C(+%!)%4%7A%7'!C%+4%,*'0,%!;,<$(1%!*7A!G+4*&'!#7%,82!/*1&01*'(<75!------------!F=!
Testing Procedures ....................................................................................................... 47!;<,<5('2!H%*50,%+%7'!-------------------------------------------------------------------------------------------------------------!FB!30,$*&%!><0867%55!*7A!;,<$(1%!H%*50,%+%7'5!-------------------------------------------------------------!F.!H(&,<6*,A7%55!H%*50,%+%7'!-----------------------------------------------------------------------------------------------!FD!C%75(1%!3',%78'6!H%*50,%+%7'!--------------------------------------------------------------------------------------------!FD!
RESULTS AND DISCUSSION ....................................................................................... 50!
Porosity Measurement ................................................................................................. 50!

!
!
"#
Surface Roughness Measurement ................................................................................ 53!
Microhardness Measurement ....................................................................................... 55!
Tensile Strength Measurement..................................................................................... 59!
Microscopy .................................................................................................................. 64!
CONCLUSION ................................................................................................................. 69!
REFERENCES ................................................................................................................. 70!
APPENDIX ....................................................................................................................... 72!

!
!
"##
LIST OF TABLES
$%&'(! ! ! ! ! ! ! ! ! ! ! !!!!)%*(!
!1 Distributions For the Deposited Mass, Direction Angle, and Droplet Size [7]. ............ 23!
2 Powder Diameters .......................................................................................................... 26!
3 Flame Spray Parameters ................................................................................................ 35!
4 Test Design Matrix ........................................................................................................ 36!
5 Assumed Parameters Used to Calculate the Time Dependent Temperature Profile. .... 44
!6 Estimated Kinetic Energies ............................................................................................ 47!
7 Porosity Methods ........................................................................................................... 73!
8 Surface Roughness Methods .......................................................................................... 74!
9 Hardness Methods .......................................................................................................... 75!
10 Tensile Strength Methods ............................................................................................ 76!

!
!
"###
LIST OF FIGURES
$#%&'(!! ! ! ! ! ! ! ! ! ! !!!!)*%(!
!
1 The 5P Metco II combustion flame spray gun.. .......................................................... 2!
2 A general cross-section of a flame sprayed coating. ................................................... 3!
3 A complex surface inhibiting thermal spraying.. ........................................................ 4!
4 A CAD model of the CSM collar. .............................................................................. 6!
5 A demonstration of how the CSM collar works. ........................................................ 6!
6 A splat impact schematic. ......................................................................................... 10!
7 Individual splat formations sprayed at various angles. ............................................. 11!
8 Surface roughness influence on splashing. ............................................................... 12!
9 Porosity data plots [3,11,12]. .................................................................................... 14!
10 Porosity data plots (Continued) [10]. ........................................................................ 15!
11 A typical thermal spray cone zshematic. .................................................................. 16!
12 Momentum in splat formations. ................................................................................ 17!
13 The shadow effect. .................................................................................................... 18!
14 Polished and etched molybdenum sprayed at 30 degrees. ........................................ 19!
15 Typical microstructure of plasma sprayed ceramic deposits. ................................... 20!
16 An image showing the over spray region. ................................................................ 22!
17 The surface roughness of the spray in reference to their zones. ............................... 23!
18 Surface roughness data plots[3,11]. .......................................................................... 24!
19 Surface roughness data plots (continued)[10]. .......................................................... 24!
20 Surface roughness data plots (continued) [14]. ......................................................... 25!
21 Surface roughness of small diameter powders [11]. ................................................. 26!
!
!
"#
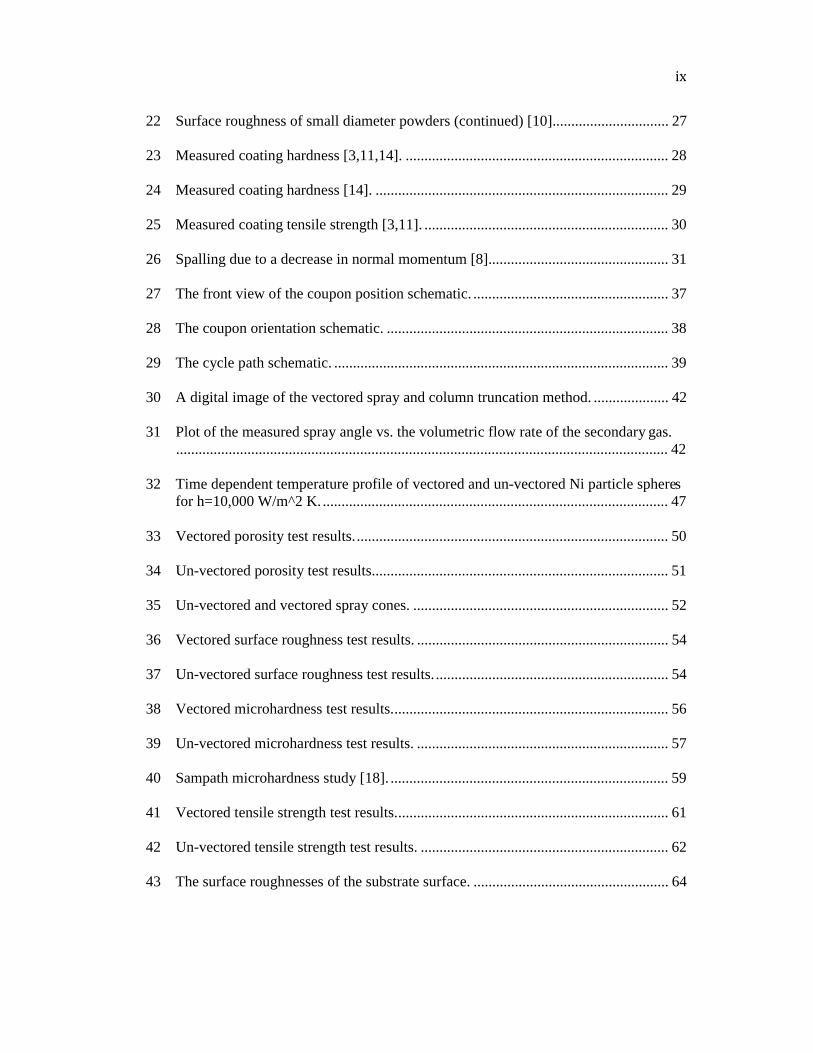
22 Surface roughness of small diameter powders (continued) [10]............................... 27!
23 Measured coating hardness [3,11,14]. ...................................................................... 28!
24 Measured coating hardness [14]. .............................................................................. 29!
25 Measured coating tensile strength [3,11]. ................................................................. 30!
26 Spalling due to a decrease in normal momentum [8]................................................ 31!
27 The front view of the coupon position schematic. .................................................... 37!
28 The coupon orientation schematic. ........................................................................... 38!
29 The cycle path schematic. ......................................................................................... 39!
30 A digital image of the vectored spray and column truncation method. .................... 42!
31 Plot of the measured spray angle vs. the volumetric flow rate of the secondary gas.
................................................................................................................................... 42
!
32 Time dependent temperature profile of vectored and un-vectored Ni particle spheres
for h=10,000 W/m^2 K. ............................................................................................ 47
!
33 Vectored porosity test results. ................................................................................... 50!
34 Un-vectored porosity test results............................................................................... 51!
35 Un-vectored and vectored spray cones. .................................................................... 52!
36 Vectored surface roughness test results. ................................................................... 54!
37 Un-vectored surface roughness test results. .............................................................. 54!
38 Vectored microhardness test results. ......................................................................... 56!
39 Un-vectored microhardness test results. ................................................................... 57!
40 Sampath microhardness study [18]. .......................................................................... 59!
41 Vectored tensile strength test results. ........................................................................ 61!
42 Un-vectored tensile strength test results. .................................................................. 62!
43 The surface roughnesses of the substrate surface. .................................................... 64!

!
!
"!
44 Microscopy images showing the splat formations for the vectored a) and un-vectored
b) processes for the 90º spray angle. ......................................................................... 65!
45 Microscopy images showing the splat formations for the vectored a) and un-vectored
b) processes for the 75º spray angle. ......................................................................... 65
!
46 Microscopy images showing the splat formations for the vectored a) and un-vectored
b) processes for the 60º spray angle. ......................................................................... 66
!
47 Microscopy images showing the splat formations for the vectored a) and un-vectored
b) processes for the 45º spray angle. ......................................................................... 66
!
48 Coupon dimensions. .................................................................................................. 77!
49 Partial circumference collar dimensions. .................................................................. 78!
50 Partial circumference control panel dimensions. ...................................................... 79!
51 Insert dimensions. ..................................................................................................... 80!
52 Thread attachment dimensions. ................................................................................ 81!

!
!
"!
CHAPTER 1
INTRODUCTION TO THERMAL SPRAY
The flame spray process is similar to the spray paint process except that molten
metallic or ceramic material is sprayed instead of a liquid paint. A typical thermal spray
gun setup consists of a gas source, a material feed source, a heat source and a nozzle
(#$%&'(! "). The gun can either be hand held or mounted to the arm of a programmable
robot. The operator of the gun usually moves the gun back and forth over the surface of
the sprayed object until the desired thickness is obtained. Once the desired thickness is
reached the part is ready for any post processing such as heat treatment, machining, etc.
Thermal sprayed coatings are used in a variety of industries for a variety of
purposes with the main driving purpose of minimizing production cost during
manufacturing. Thermal spray is used to coat surfaces for industries such as automotive,
defense, food processing, healthcare, and nuclear, to name just a few. These coatings are
used for wear resistance, heat resistance, clearance and dimensional control, corrosion
and oxidation resistance and electrical properties. Sprayed surfaces are employed to help
the base part last longer and perform better [1].
Thermal sprayed coatings bond to the substrate of the object being sprayed
primarily through a mechanical bonding (#$%&'(! )). Very little if any chemical bonding
must occur for the deposit to adhere. This feature allows non-similar materials to bond
together such as ceramics to metals or different metals such as steel to aluminum.
Another advantage is that thermal spray coatings have an extremely high cooling rate.
Therefore, heat sensitive materials can be sprayed with coatings that have extremely high
melting points without damaging the substrate. Thermal spray's high material deposit rate

!
!
"!
(up to 23 kg/h) can also be used to create near net shapes. Such shapes can then be more
precisely machined down to meet specified dimensions. These advantages combine to
provide protection and cost savings for manufacturers of many products.
Figure 1 The 5P Metco II combustion flame spray gun. This gun was used for this
experiment. Like all powder flame spray guns it has a gas source, powder feed source, a
nozzle and a heat source.

!
!
"!
Figure 2 A general cross-section of a flame sprayed coating. It includes areas of voids,
oxide inclusions, unmelted particles and the substrate [2].
!
!
One disadvantage of all thermal spray processes today is that the
must be applied nearly perpendicular to the surface being coated. Obstacles such as
overhanging features and small interior dimensions can prohibit thermal spray guns and
their robotic arms from accessing certain part features at an o
it is not possible to spray at a perpendicular angle to the surface the quality of the deposit
begins to decrease in many characteristics such as porosity, surface roughness, density
and tensile strength.
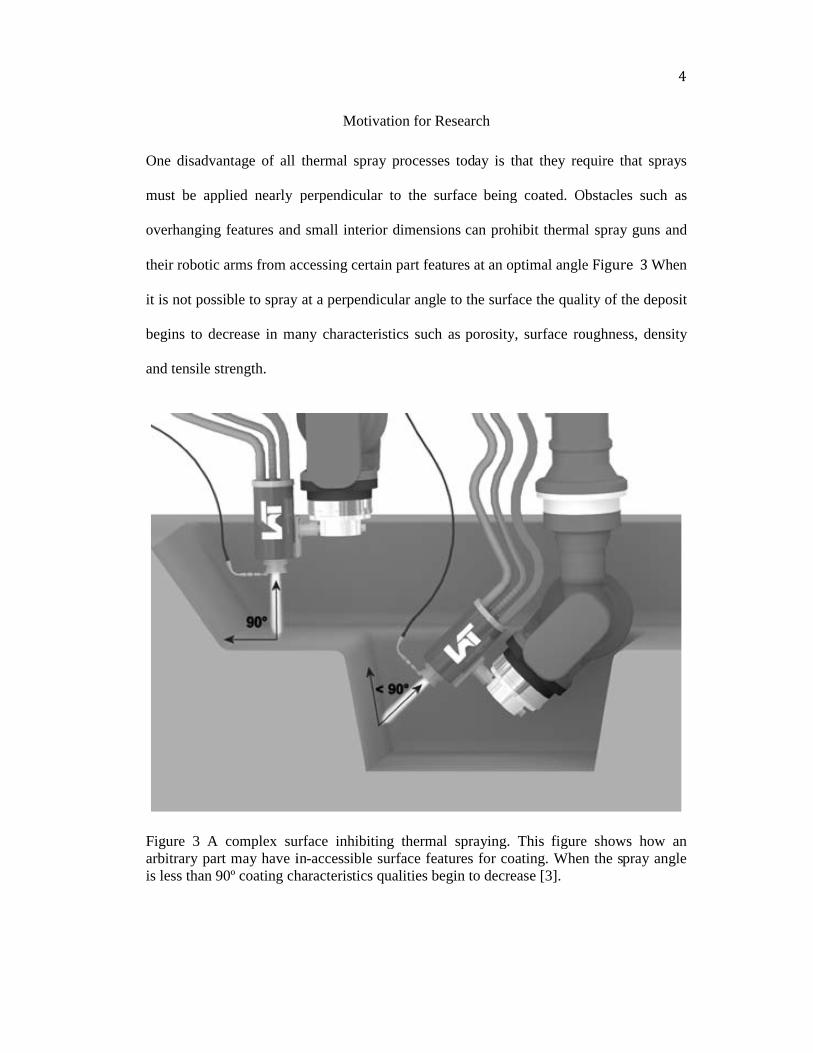
Figure 3 A complex surface inhibiting thermal spraying. This figure shows how an
arbitrary part may have in
is less than 90º coating characteris
Motivation for Research
One disadvantage of all thermal spray processes today is that they require that sprays
must be applied nearly perpendicular to the surface being coated. Obstacles such as
overhanging features and small interior dimensions can prohibit thermal spray guns and
their robotic arms from accessing certain part features at an optimal angle
it is not possible to spray at a perpendicular angle to the surface the quality of the deposit
begins to decrease in many characteristics such as porosity, surface roughness, density
A complex surface inhibiting thermal spraying. This figure shows how an
arbitrary part may have in-accessible surface features for coating. When the spray angle
90º coating characteristics qualities begin to decrease [3].
"!
y require that sprays
must be applied nearly perpendicular to the surface being coated. Obstacles such as
overhanging features and small interior dimensions can prohibit thermal spray guns and
ptimal angle #$%&'(! ) When
it is not possible to spray at a perpendicular angle to the surface the quality of the deposit
begins to decrease in many characteristics such as porosity, surface roughness, density
A complex surface inhibiting thermal spraying. This figure shows how an
accessible surface features for coating. When the spray angle

!
!
"!
The Coanda-Assisted Spray Manipulation (CSM) collar, a new thermal spray gun nozzle
attachment, has been developed to allow thermal sprays to be vectored #$%&'(! ). The
CSM uses a secondary gas flow situated parallel to the primary flow of the thermal spray
gun which entrains the primary flow into the secondary flow and then vectors the primary
flow using the Coanda effect (the natural tendency of a fluid to wrap around the surface
of an object it is flowing next to, like water on the convex surface of a spoon). As
illustrated in #$%&'(! " the primary flow of the thermal spray then wraps around the
convex surface of the CSM. By adjusting the mass flow rate of the secondary gas flow
the angle of the primary flow can be changed. Therefore the axis of the gun can be
pointed off-normal from the surface needing to be sprayed, but the primary flow could be
sprayed perpendicularly to the surface. This would allow for coatings to be sprayed
where it would otherwise be impossible to align the axis of the gun due to dimensional
constraints. For further detail on the development and testing of the CSM the author
encourages the reader to refer to [4].
The purpose of this thesis is to test and measure the deposition properties of !
a NiAl alloy powder deposited to off-angle substrates in order to prove the capability of
the CSM collar for the combustion flame spray process.

!
!
Figure 4 A CAD model of the CSM collar. This can be attached to the existing nozzle of
a flame spray gun to allow for vectoring of the flame spray.
Figure 5 A demonstration of how the CSM collar works. The primary flow becomes
entrained in the secondary flow. The Coanda effect causes the secondary flow to wrap
along the curved surface of the CSM. The result is a vectoring of the primary flow or the
flame spray.
A CAD model of the CSM collar. This can be attached to the existing nozzle of
a flame spray gun to allow for vectoring of the flame spray.
A demonstration of how the CSM collar works. The primary flow becomes
in the secondary flow. The Coanda effect causes the secondary flow to wrap
along the curved surface of the CSM. The result is a vectoring of the primary flow or the
"!
A CAD model of the CSM collar. This can be attached to the existing nozzle of
A demonstration of how the CSM collar works. The primary flow becomes
in the secondary flow. The Coanda effect causes the secondary flow to wrap
along the curved surface of the CSM. The result is a vectoring of the primary flow or the

!
!
"!
CHAPTER 2
LITERATURE REVIEW
A great deal of research has been conducted on thermal spray with the main
objective being to prove a particular gun technology, a particular spray method and/or a
particular powder. In the case of this study, attention will be focused on proving a new
gun technology: the CSM collar. Particular attention will be payed to the quality and
efficiency of the sprayed NiAl deposit while using the CSM. Although it is expected that
vectored spray depositions will resemble normal spray depositions, an extensive review
of off normal spray studies has been performed as a reference for comparison. This
section will present and discuss the discovered characteristics of several off normal
thermal sprays studies. It has been broken into two main chapters: Splat Formation
Characteristics and Deposit Characteristics. The first chapter will focus on the micro
scale characteristics of single splats while the latter chapter will focus on the macro
characteristics of the sprayed deposits. Within each chapter are sections and within each
section are descriptions of what specific researchers have found about a particular deposit
characteristic. This method has been used to provide easy reference to a particular study
for a particular deposit characteristic.
Splat Formation Characteristics
Coatings are created by the continual addition of individual molten splats. The
properties of these individual splats can be influenced by the spray angle parameter as
well by gun parameters, surface parameters and atmospheric parameters. In this study the
influence of changing the spray angle parameter will be considered. The main

!
!
"!
characteristics of individual splats that are influenced by the spray angle are the effective
diameter, circularity and splashing. Variances in these characteristics are often associated
with changes in the coating characteristics. For instance the degree of splashing can
influence the coating surface roughness. Most off-normal splat formation research has
been performed to aid in the development of numerical spray simulations to optimize
robotic mapping. The following sections will discuss some of the research and results that
have been published.
Effective Diameter
When particles are sprayed they are usually nearly spherical as they fly through
the atmosphere. However, when they impact onto the substrate surface they almost never
impact as a perfect circle. One way of physically describing these splats is by their
Equivalent Diameter:
!" # $%&' ((( ( ( ( ( )*+(
where A is the splat area. Montavon et al. [5] found through optical observation and
Gaussian analysis that the ED of vacuum plasma sprayed (VPS) Astroloy particles does
not change as the spray angle changes.
Circularity
Due to the momentum of the sprayed particle and the relative angle of the
substrate to the axis of the gun the circularity of the splat may deform into a more
elliptical shape. One physical description of this is the Elongation Factor:
!, # '-.%& (( ( ( ( ( )/+(

!
!
"!
where L is the longest dimension across the splat. Montavon et al. [5] found in the same
way for ED that EF does change as spray angle changes.
Based upon Madejski's [6] results Kanouff et al. [7] defined the fraction of splat
material upstream from the impact point as:
! "#
$%&'( ( ( ( ( )*+(
Kanouff et al. [7] developed f for a numerical model using the string method to predict
surface roughness. The results over predicted the coating thickness, but accurately
portrayed the amount of roughness.
Kang and Ng [8] through optical SEM observations concluded that the impact
point of the particle could be found through a backtracking method as accurately as
employing a geometric formula. Through the backtracking method they traced back
several of the finger-like protrusions of the splats (#$%&'(! )). Where these lines
intersected was the impact location. However, tracing these lines back to their
intersection point was noticeably tedious and time consuming. The geometric formula
method found the impact location by calculating the foci locations of the splat's elliptical
shape. Upon comparing the two methods they found them to be within about 7% of each
other. Both of these methods showed that the distance between the impact point and the
center of the ellipse increased as the spray angle decreased.

!
!
Figure 6 A splat impact schematic
by backtracking the finger like protrusions to a focal point. Alternatively the location of
the impact location can be found mathematically b
Bussman et al. [9]
the particle's material spreads downstream from the point of impact for spray angles less
than 45°.
Splashing
As the particles impact the surface they splash sending finger like protrusions
outward from the point of impact. Montavon et al.
by the following equation:
where P is the perimeter of the splat formation
much based upon spray angle in the same manner as they did for measuring the
EF. Kang et al. [8] through op
more unidirectional due to the particle's momentum as the spray angle decreased as
shown in "#$%&'! ( (a)-(g) whe
A splat impact schematic. The impact points in these splats can be traced back
by backtracking the finger like protrusions to a focal point. Alternatively the location of
the impact location can be found mathematically by calculating the foci locations
[9] found by using a 3D numerical model that more than 90% of
the particle's material spreads downstream from the point of impact for spray angles less
As the particles impact the surface they splash sending finger like protrusions
outward from the point of impact. Montavon et al. [5] described the degree of splashing
by the following equation:
! ! ! !
is the perimeter of the splat formation. They found that the DS
much based upon spray angle in the same manner as they did for measuring the
through optical SEM observation found that the splashing becomes
more unidirectional due to the particle's momentum as the spray angle decreased as
(g) where Figure [fig:Individual-splat-formations] (a) is the splat
)*
. The impact points in these splats can be traced back
by backtracking the finger like protrusions to a focal point. Alternatively the location of
y calculating the foci locations [8].
found by using a 3D numerical model that more than 90% of
the particle's material spreads downstream from the point of impact for spray angles less
As the particles impact the surface they splash sending finger like protrusions
described the degree of splashing
! ! "#$!
DS does not change
much based upon spray angle in the same manner as they did for measuring the ED and
tical SEM observation found that the splashing becomes
more unidirectional due to the particle's momentum as the spray angle decreased as
formations] (a) is the splat

!
!
""
formation of a perpendicularly sprayed particle and (b)-(g) are splats formations sprayed
at off-normal angles. Smith et al. [10] through optical observation found that the degree
of splashing increased dramatically as substrate surfaces became rougher (#$%&'(!))
Figure 7 Individual splat formations sprayed at various angles. Figures (a)-(g) show the
change in splat formation as the spray angle decreases from 90º. The fingerlike
protrusions become more unidirectional as the spray angle decreases and the splats
themselves become more elliptical [8].

!
!
Figure 8 Surface roughness
surface roughness on the degree of splat spl
the distinct differences in splat formation. The image on the bottom left is a splat
formation on a rough substrate whereas the image on the bottom right is a splat formation
on a smooth surface. The degree of spl
roughness increases [10].
oughness influence on splashing. These two images show the effect of
surface roughness on the degree of splat splashing. The bottom image is zoomed to show
the distinct differences in splat formation. The image on the bottom left is a splat
formation on a rough substrate whereas the image on the bottom right is a splat formation
on a smooth surface. The degree of splashing increases when the substrate surface
.
"#
plashing. These two images show the effect of
ashing. The bottom image is zoomed to show
the distinct differences in splat formation. The image on the bottom left is a splat
formation on a rough substrate whereas the image on the bottom right is a splat formation
ashing increases when the substrate surface

!
!
"#
Deposit Characteristics
As splats begin to build, a coating begins to form. These coatings tend to range
from a few micrometers in thickness to a few millimeters. The coatings have important
“macro” properties that can be different than the properties of the individual splats and
the properties of the original bulk material. These “macro” properties are what primarily
characterize the deposit. The following sections present and discuss common material
properties that have been researched in off-angle spray studies.
Porosity
Tiny pores in the coating begin to form when splats do not completely form to the
substrate. It is usually desirable to minimize the number of pores in the deposit because
the presence of pores is associated with a decrease in density, an increase in surface
roughness Smith et al. [10], a decrease in surface hardness and a decrease in tensile
strength [8,11]. When spray angles are decreased, a resultant increase in porosity
percentage occurs. Studies performed by Montavon et al. [5], Smith et al Smith et al.
[10], Ilavsky et al. [12], Leigh and Berndt [11] and Tillmann et al. [3] have all shown that
the percentage of porosity increases as the spray angle decreases. By contrast, a few
recent studies by Strock et al. [13] and Houdkova et al. [14], have reported results that
demonstrated porosity did not change significantly as the spray angle diminished. The
key difference between these two different results was the velocity of the sprayed
particles with the former studies using Plasma Spray guns and the latter studies using
HVOF spray guns. The findings by these studies are shown in $%&'()!* and $%&'()!"+.

!
!
"#
Figure 9 Porosity data plots [3,11,12].

!
!
"#
Figure 10 Porosity data plots (Continued) [10].
The momentum of a sprayed particle is critical to how well a particle will form to
the sublayer. When a particle is sprayed perpendicular to the surface of the substrate all
of that particle's momentum contributes to the impacting and spreading of the particle
across the sublayer forming a splat. When the normal momentum is sufficient the splat
can fill in the tiny cracks and crevices of the sublayer. Most thermal spray guns spray in a
cone shape, so inevitably some of the particles sprayed will be sprayed off-normal. Thus
those particles will have a lower normal momentum $%&'()!"".

!
!
"#
Figure 11 A typical thermal spray cone zshematic. A typical spray cone shape of a
thermal spray gun.
When the spray angle begins to decrease, the momentum of the particle begins to
be spread between two directions, the x and the y, where x is parallel to the surface of the
substrate and y is perpendicular to the substrate. The momentum in the two directions are
defined as Px and Py $%&'()! "*. When the particle is sprayed perpendicular to the surface,
Px=0, a relatively symmetric splat forms. As the spray angle decreases the magnitude of
Px begins to increase and the magnitude of Py decreases. When the magnitude of Px
increases, the momentum of the particle causes the splat to spread. This has a tendency to
thin the splat formation and inhibit the filling of sublayer pores and cracks.

!
!
Figure 12 Momentum in s
directional momentum between the perpendicular and off
angle decreases more momentum begins to transfer to the transverse x
increase in the P_{x} causes the splat formations t
this figure [11].
In addition, as the spray angle is decreased another major obstacle to limi
formation appears: the shadow effect. The shadow effect can easily be seen in
It occurs as rough peak like features begin to form. These peaks wor
particles from the backside of their surfaces. The shaded areas of these peaks soon
become voids as more and more particles are sprayed
Momentum in splat formations. This figure showcases the change in
directional momentum between the perpendicular and off-normal cases. As the spray
angle decreases more momentum begins to transfer to the transverse x
increase in the P_{x} causes the splat formations to become uneven as shown in case 2 in
In addition, as the spray angle is decreased another major obstacle to limi
formation appears: the shadow effect. The shadow effect can easily be seen in
It occurs as rough peak like features begin to form. These peaks work to block incoming
particles from the backside of their surfaces. The shaded areas of these peaks soon
become voids as more and more particles are sprayed [10,11].
"#
. This figure showcases the change in
normal cases. As the spray
angle decreases more momentum begins to transfer to the transverse x-direction. This
o become uneven as shown in case 2 in
In addition, as the spray angle is decreased another major obstacle to limiting pore
formation appears: the shadow effect. The shadow effect can easily be seen in $%&'()! "*.
k to block incoming
particles from the backside of their surfaces. The shaded areas of these peaks soon

!
!
Figure 13 The shadow effect. The shaded region is a result of the shadow effect caused
by the decreased spray angle. The shaded region becomes a potential void when off
normal splats follow the dashed line trajectory. These voids result in increased porosity
levels [7].
As these coatings continue to build up they begin to take on characteristics
associated with the spray angle. Smith et al
when molybdenum powders were sprayed at certain angles that column like formations in
the deposit would build up at about the same angle as the spray angle
Similarly, Ilavsky et al.
zirconia deposits that two types of pores formed: interlamellar pores and intralamellar
cracks. The interlamellar pores were mo
change with spray angle. However, the intralamellar cracks did change and were oriented
towards the spray direction. This study suggested that this was
crystallographic orientation of
cooling direction associated with the spray orientation
ffect. The shaded region is a result of the shadow effect caused
by the decreased spray angle. The shaded region becomes a potential void when off
normal splats follow the dashed line trajectory. These voids result in increased porosity
As these coatings continue to build up they begin to take on characteristics
associated with the spray angle. Smith et al. [10] found through optical observations that
when molybdenum powders were sprayed at certain angles that column like formations in
the deposit would build up at about the same angle as the spray angle
avsky et al. [12] found through optical observations of yttria
zirconia deposits that two types of pores formed: interlamellar pores and intralamellar
cracks. The interlamellar pores were mostly oriented parallel to the substrate and did not
change with spray angle. However, the intralamellar cracks did change and were oriented
towards the spray direction. This study suggested that this was due to
crystallographic orientation of the grains within the splats. This was likely caused by the
cooling direction associated with the spray orientation ("#$%&'!()).
(*
ffect. The shaded region is a result of the shadow effect caused
by the decreased spray angle. The shaded region becomes a potential void when off-
normal splats follow the dashed line trajectory. These voids result in increased porosity
As these coatings continue to build up they begin to take on characteristics
found through optical observations that
when molybdenum powders were sprayed at certain angles that column like formations in
the deposit would build up at about the same angle as the spray angle ("#$%&'! (+).
found through optical observations of yttria-stabilized-
zirconia deposits that two types of pores formed: interlamellar pores and intralamellar
stly oriented parallel to the substrate and did not
change with spray angle. However, the intralamellar cracks did change and were oriented
due to the preferred
the grains within the splats. This was likely caused by the

!
!
"#
Figure 14 Polished and etched molybdenum sprayed at 30 degrees. This figure shows the
tendency of the splats to form in a direction in correlation to the particle spray angle. This
is a likely result of the preferred crystallographic orientation [10].

!
!
"#
Figure 15 Typical microstructure of plasma sprayed ceramic deposits. These micrographs
show the two types of cracks found in an yttria-stabilized-zirconia deposit. a)
interlamellar pores and b)intralamellar cracks [12].

!
!
"#
Dramatic increases in porosity as well as most of the other deposit properties start
to occur when the spray angle reaches the 45° mark [3]. At the 45° mark the magnitude
of Px equals the magnitude of Py and any decrease in the spray angle causes Px>Py. At
this point more of the particle's energy is spent moving the particle downstream on the
surface than into the surface. Theoretically, when the spray angle reaches 0 the particles
will never impact onto the surface. Note: Strock et al. [13] and Houdkova et al. [14] did
not report any of their porosity measurements in their HVOF studies.
Surface Roughness
In some applications, such as the coating of cylinder bores, it is desirable to
minimize the surface roughness of the deposit in order to reduce post-processing costs
[7]. Studies by Kanouff et al. [7], Leigh and Berndt [11], Smith et al. [10] and Tillmann
et al. [3] have all found that the surface roughness of sprayed deposits increase as the
spray angle decreases. Other parameters that affect surface roughness include initial
particle momentum, substrate roughness and particle size.
Effect of Particle Momentum on Surface Roughness
When a splat hits a surface it begins to spread out. The direction of this spreading
is dependent on the direction of its momentum relative to the surface ($%&'()! #"). As
discussed above the momentum parallel to the substrate surface begins to increase as the
spray angle decreases. This increase in the parallel momentum aids in the spreading of
the splats causing the splats to shoot out smaller particles downstream called “overspray”
($%&'()! #*). The overspray particles re-impact onto the surface at angles much less than
the original spray angle and usually adhere to the higher asperities downstream. This
!
!
action increases the surface roughness of the deposit
roughness is already high then the spray angle and surface roug
together to increase surface roughness.
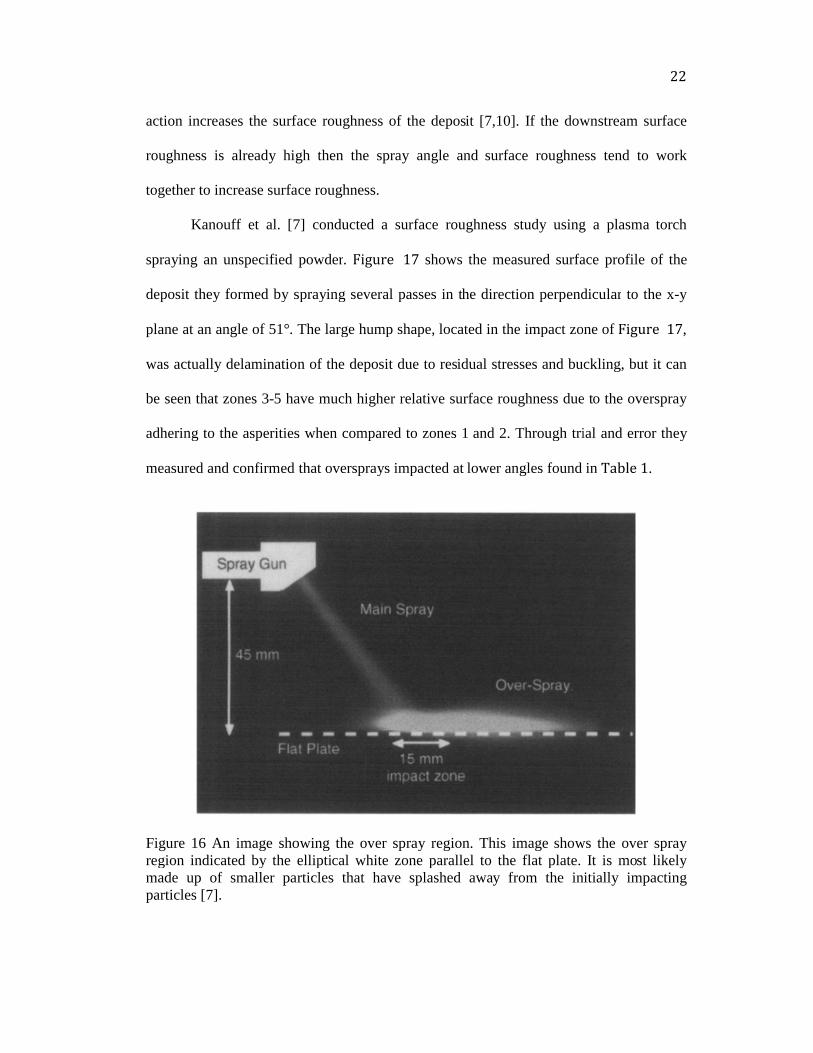
Kanouff et al. [7]
spraying an unspecified powder
deposit they formed by spraying several passes in the direction perpendicular
plane at an angle of 51°. The large hump shape,
was actually delamination of the deposit due to residual stresses
be seen that zones 3-5 have much higher relative surface roughness due to the overspray
adhering to the asperities when compared to zones 1 and 2. Through trial and error they
measured and confirmed that oversprays impacted at lowe
Figure 16 An image showing the over spray region. This image shows the over spray
region indicated by the ellipti
made up of smaller particles that have splashed away from the initially impacting
particles [7].
action increases the surface roughness of the deposit [7,10]. If the downstream surface
roughness is already high then the spray angle and surface roughness tend to work
together to increase surface roughness.
[7] conducted a surface roughness study using a plasma
spraying an unspecified powder. "#$%&'! () shows the measured surface profile of the
deposit they formed by spraying several passes in the direction perpendicular
. The large hump shape, located in the impact zone of
was actually delamination of the deposit due to residual stresses and buckling, but it can
5 have much higher relative surface roughness due to the overspray
adhering to the asperities when compared to zones 1 and 2. Through trial and error they
measured and confirmed that oversprays impacted at lower angles found in
An image showing the over spray region. This image shows the over spray
region indicated by the elliptical white zone parallel to the flat plate. It is most likely
made up of smaller particles that have splashed away from the initially impacting
**
. If the downstream surface
hness tend to work
conducted a surface roughness study using a plasma torch
shows the measured surface profile of the
deposit they formed by spraying several passes in the direction perpendicular to the x-y
located in the impact zone of "#$%&'! (),
and buckling, but it can
5 have much higher relative surface roughness due to the overspray
adhering to the asperities when compared to zones 1 and 2. Through trial and error they
r angles found in +,-.'!(.
An image showing the over spray region. This image shows the over spray
cal white zone parallel to the flat plate. It is most likely
made up of smaller particles that have splashed away from the initially impacting

!
!
"#
Figure 17 The surface roughness of the spray in reference to their zones. Zones 3-5 have
much higher surface roughness in comparison to zone 2. This is likely due to the
overspray splashing and the particles adhering to surface asperities [7].
Table 1 Distributions For the Deposited Mass, Direction Angle, and Droplet Size [7].
Zone
No. Description
Thermal spray
direction angle (!),
degrees
Droplet size
(D), "m
Deposited mass
(w), %
1 Overspray 178 5 1
2 Mainspray 51 40 76.6
3 Overspray 7.5 15 14.4
4 Overspray 5 15 4
5 Overspray 3 10 2
6 Overspray 2 5 2
Houdkova et al. [14], Strock et al. [13] and Bach et al. [15] all performed off-
normal thermal spray studies using HVOF guns which spray materials at supersonic
velocities. They all actually found that the surface roughness of the coatings went down
as the spray angle decreased. They suggested that at lower angles the impacting particles
were becoming more elongated instead of spiked and were likely breaking off asperities
thus making the surfaces smoother. However, for lower velocity processes, the surface
roughness usually increases as the spray angle decreases. The findings for the surface
roughness for all of the studies discussed are shown in $%&'()!*+-$%&'()!",.

!
!
"#
Figure 18 Surface roughness data plots[3,11].
Figure 19 Surface roughness data plots (continued)[10].

!
!
"#
Figure 20 Surface roughness data plots (continued) [14].
Effect of Particle Size on Surface Roughness
If the powder size is sufficiently small then the spray angle tends to have little
effect. Essentially, what happens is the smaller size of particle is better suited for filling
in the cracks and crevices of the substrate. Leigh and Berndt [11] and Smith et al. [10]
conducted studies using different plasma sprayed powders each with different average
diameters ($%&'(! "). They both found that for the smaller sized powders the overall
roughness tended to be less than the larger powders. In the study by Leigh and Berndt
[11] it was the Cr_{3}C_{2}-NiCr powder and in the study by Smith et al. [10] it was the
Aluminum Oxide powder that showed the least amount of surface roughness. Their
specific findings for the surface roughness of small diameter powders can be found in
)*+,-(!". & )*+,-(!"".

!
!
"#
Table 2 Powder Diameters
Powder Average Powder
Cr3C2-NiCr [11] 24.6 µm
NiAl [11] 58.4 µm
Aluminum [10] !80 µm
Copper [10] !70 µm
95 Ni/5 Al [10] !80 µm
Molybdenum [10] !70 µm
Aluminum Oxide [10] !50 µm
Figure 21 Surface roughness of small diameter powders [11].

!
!
"#
Figure 22 Surface roughness of small diameter powders (continued) [10].
Hardness
The hardness of sprayed coatings can be quite different than the hardness of the
original bulk material or even the hardness of individual splats due to the inclusion of
pores within the coatings. It is no surprise that the hardness of coatings tends to decrease
because pores tend to be more prevalent as spray angles decrease. Leigh and Berndt [11],
Strock et al. [13] and Houdkova et al. [14] all reported decreases in microhardness of the
materials that they tested, using the Vickers Hardness Test method, as the spray angles
decreased. Houdkova et al. [14] also reported a decrease in hardness using the HR15N
method. Interestingly, these studies combined used HVOF and plasma spray guns
showing that the hardness decrease was not dependent on either spray process. However,
Montavon et al. [5] and Tillmann et al. [3] (both using the Vickers Hardens Test Method)

!
!
"#
found that their hardness results showed no conclusive correlation to the spray angle.
Montavon et al. [5] concluded that the variations measured were due to the heterogeneous
nature of the material. The findings of each hardness study are shown in $%&'()! "* &
$%&'()!"+.
Figure 23 Measured coating hardness [3,11,14].

!
!
"#
Figure 24 Measured coating hardness [14].
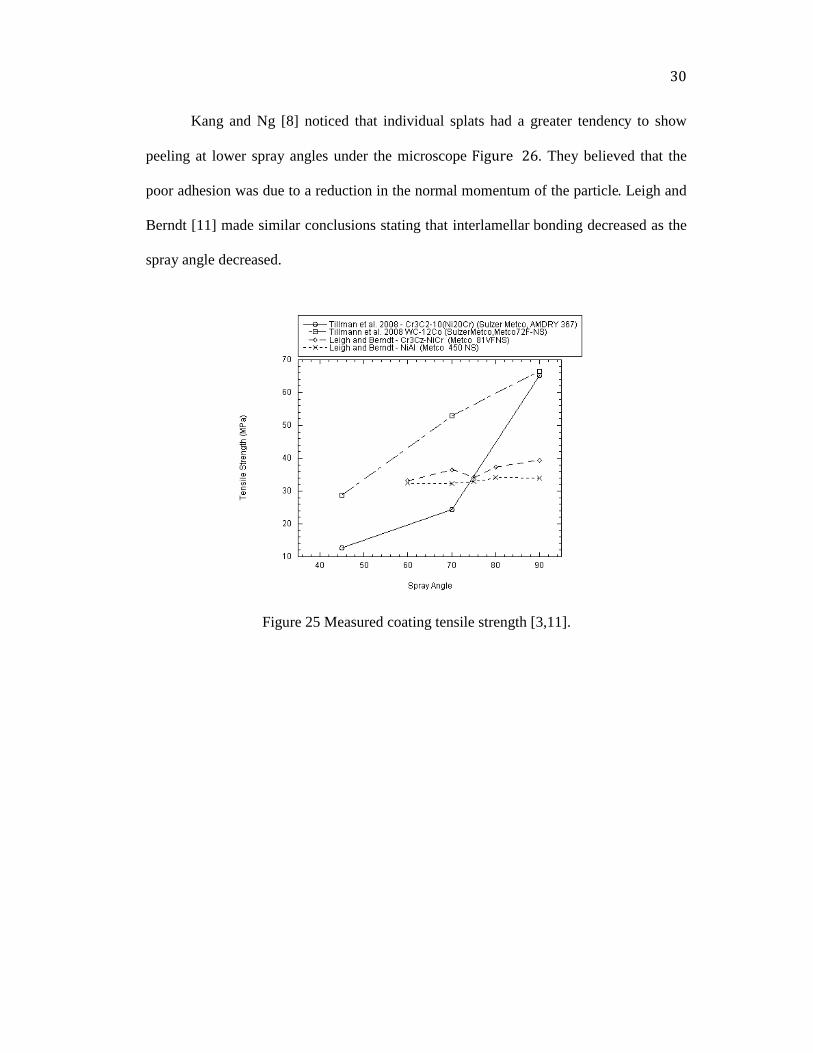
Tensile Strength
The tensile strength, !, is represented by: ! "#
$, where F is the maximum axially
applied force and A is the cross sectional area perpendicular to the applied force. Any
given material has an ultimate tensile strength, !%&', at which that material carries the
maximum load. Coatings tend to have more voids within a cross section than a cross
section of the same material in cast form. These voids decrease the overall cross sectional
area and in turn decrease the effective tensile strength. From the previous section it is
known that the overall porosity for sprayed coatings increases as the spray angle
decreases, which in turn affects the tensile strength. Leigh and Berndt [11], using the
ASTM C 633 testing method, and Tillmann et al. [3], using the DIN EN582 testing
method, both found this to be the case in their studies. Their findings are shown in $%&'()!
"*.
!
!
"#
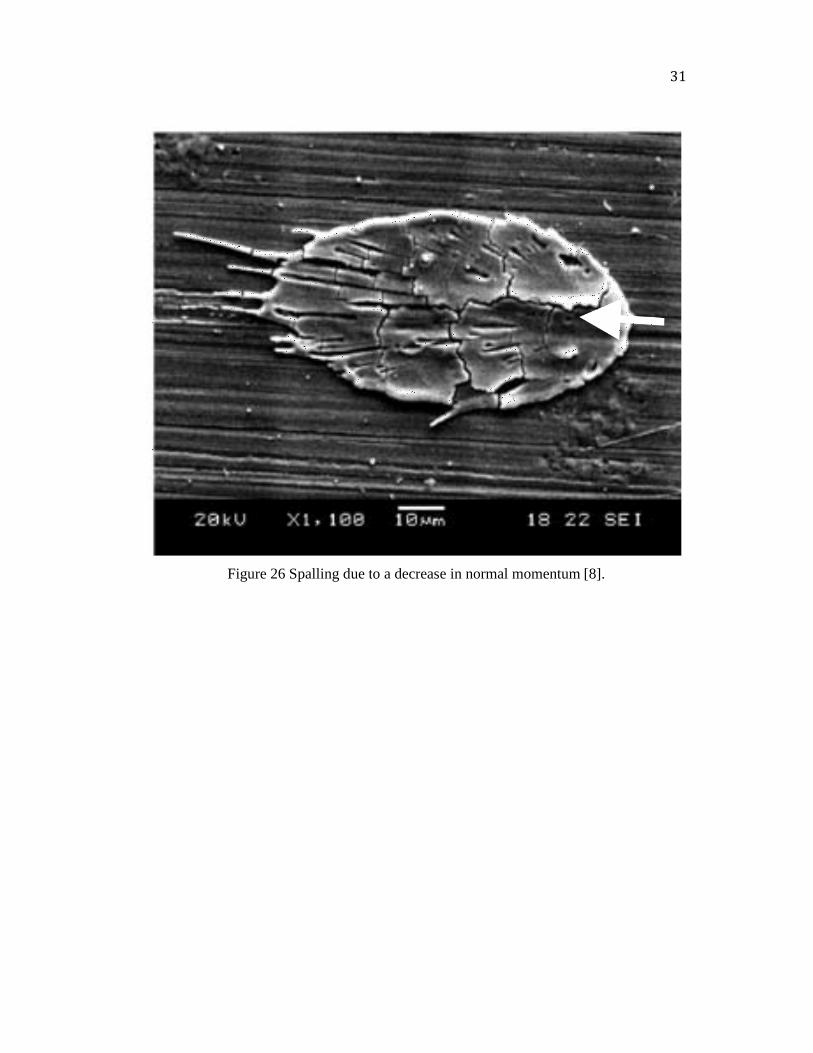
Kang and Ng [8] noticed that individual splats had a greater tendency to show
peeling at lower spray angles under the microscope $%&'()! *+. They believed that the
poor adhesion was due to a reduction in the normal momentum of the particle. Leigh and
Berndt [11] made similar conclusions stating that interlamellar bonding decreased as the
spray angle decreased.
Figure 25 Measured coating tensile strength [3,11].
!
!
Figure 26 Spalling due t
Spalling due to a decrease in normal momentum
"#
o a decrease in normal momentum [8].

!
!
"#
CHAPTER 3
OBJECTIVES
Statement of Problem
The problem of this project is to determine basic materials properties of off angle
thermally sprayed NiAl coatings using a novel spray manipulation nozzle attachment
called the Coanda-Assisted Spray Manipulation. This project will focus on measuring the
porosity, surface roughness, microhardness, and tensile strength of the sprayed material.
Coatings will be sprayed using a Metco 5P II Thermal Spray gun, which is a combustion
flame thermal spray gun, with and without a CSM collar. The measurable properties will
be compared for un-vectored and vectored coatings. The project will determine if and
how much the spray is affected by the CSM and vectoring the direction of the spray.
It is already understood that the optimal impingement angle of thermal sprays is
90º for most, if not all applications. Therefore, the coupon surface will be situated
perpendicular to the spray angle of the CSM for testing purposes.
Statement of Purpose
1. To compare the properties of vectored and un-vectored thermally sprayed deposits
of NiAl powder.
2. To provide substantial evidence for or against the use of the CSM collar.
Statement of Need
Thermal spray is used in a variety of industries such as aerospace, automotive, nuclear
and more. Each industry uses it for a variety of barrier applications such as corrosion
resistance, ablative material, thermal resistance, electromagnetic resistance and more.

!
!
""
Thermal spray applications are costly, inefficient and/or impossible because the spray
cannot be applied due to surface orientation constraints. The CSM can help to minimize
the thermal spray cost by increasing efficiency and cutting operation time therefore its
effectiveness needs to be proven.

!
!
"#
CHAPTER 4
METHODOLOGY
Statement of Conditions
1. Test will be conducted at room temperature in open atmosphere.
2. Temperature of substrate surface will be the same for spray in the un-vectored
process as it was in the vectored process.
3. Exit flow velocity of primary and secondary gases will remain constant.
Statement of Limitations
1. The test will be conducted with only a Metco 5P Type II flame spray gun.
2. The test will be conducted with only one powder: NiAl.
Statement of Hypothesis
The goal of the test is to compare the spray material properties of vectored and un-
vectored Nickel Aluminum powder. The properties of the vectored deposits will show
results comparable to un-vectored deposits.
Setup and Preliminary Calculations
Each 2.54 cm diameter x 3.81 cm long 1018 steel coupon was placed in an
ultrasonic bath with mild dish soap to wash off grease for 12 minutes and finally post
wiped with ethyl alcohol to remove any remaining water before processing. Three sample
coatings of Metco 450NS (NiAl) powder were created using a Metco 5P II gun for each
test as shown in $%&'(! # where the coupons are identified by the numbers 001-072. The

!
!
"#
coupons for the vectored and un-vectored processes were positioned as shown in $%&'()!
*+ at impingement angles of 90° (perpendicular), 75°, 60° and 45° to the respective spray
angle shown in $%&'()! *,. Figure 29 indicates the movement path of the spray gun for
both processes. The gases used were oxygen and acetylene, which were set at the same
flow rate of 35 CFH as indicated in -./0)! 1. Filtered, compressed air set between 4-5
CFM was used as the gas for the secondary flow.
Table 3 Flame Spray Parameters
Parameter Type Flow Rate Composition
Primary Flow Gas Oxy/Acetelyne Oxygen-35CFH /
Acetelyne-35 CFH -
Secondary Flow
Gas Compressed Air 4-5 CFM -
Powder Metco 450NS
Powder (NiAl) -
Al-4.99 (wt %), Ni-
93.41 (wt %),
T.A.O-0.3 (wt%),
Org Solids-1.18
(wt%), Moisture-
0.12 (wt%)
Each coupon was preheated at the #4 position for three cycles as shown in the
bottom left corner of $%&'()! *+. A cycle was defined as one back and forth motion. Next,
the coupons were sprayed for a half cycle at each incremental height starting at the #1
position and ending at the #7 position followed by a post heating cycle at the #4 position.
The deposition process was repeated 6 times for all coupons except for the tensile test
coupons. Coupon samples 004-006, 010-012, 016-018 and 022-024 had an additional 6
passes sprayed in order to provide a thickness comparison. All of the finished coupons
were left to air cool at room temperature.

! !
"#
!
Tab
le 4
Tes
t D
esig
n M
atri
x
Testi
ng
Pro
ced
ure M
atrix
Sp
ra
y
Pro
cess
Sp
ra
y
An
gle
(deg
)
Po
ro
sit
y
Mea
su
rem
en
t
Su
rfa
ce
Ro
ug
hn
ess
Mea
su
rem
en
t
Pro
fil
e
Mea
su
rem
en
t
Mic
ro
-ha
rd
ness
Mea
su
rem
en
t
Ten
sil
e T
est
T1
Th
ick
ness
Ten
sil
e T
est
T2
Th
ick
ness
Vecto
red
9
0
04
9 0
50
05
1
04
9 0
50
05
1
04
9 0
50
05
1
04
9 0
50
05
1
00
1 0
02
00
3
00
4 0
05
00
6
Un
-
Vecto
red
9
0
06
1 0
62
06
3
06
1 0
62
06
3
06
1 0
62
06
3
06
1 0
62
06
3
02
5 0
26
02
7
02
8 0
29
03
0
Vecto
red
7
5
05
2 0
53
05
4
05
2 0
53
05
4
05
2 0
53
05
4
05
2 0
53
05
4
00
7 0
08
00
9
01
0 0
11
01
2
Un
-
Vecto
red
7
5
06
4 0
65
06
6
06
4 0
65
06
6
06
4 0
65
06
6
06
4 0
65
06
6
03
1 0
32
03
3
03
4 0
35
03
6
Vecto
red
6
0
05
5 0
56
05
7
05
5 0
56
05
7
05
5 0
56
05
7
05
5 0
56
05
7
01
3 0
14
01
5
01
6 0
17
01
8
Un
-
Vecto
red
6
0
06
7 0
68
06
9
06
7 0
68
06
9
06
7 0
68
06
9
06
7 0
68
06
9
03
7 0
38
03
9
04
0 0
41
04
2
Vecto
red
4
5
05
8 0
59
06
0
05
8 0
59
06
0
05
8 0
59
06
0
05
8 0
59
06
0
01
9 0
20
02
1
02
2 0
23
02
4
Un
-
Vecto
red
4
5
07
0 0
71
07
2
07
0 0
71
07
2
07
0 0
71
07
2
07
0 0
71
07
2
04
3 0
44
04
5
04
6 0
47
04
8
"#!

! !
"#
!
Fig
ure
27
Th
e fr
on
t v
iew
of
the
cou
po
n p
osi
tio
n s
chem
atic
. T
his
sch
emat
ic s
ho
ws
the
spra
y g
un
an
d c
ou
po
n s
et u
p.
Th
e un
-vec
tore
d
cou
po
ns
wer
e p
osi
tio
ned
in
lin
e w
ith
th
e u
n-v
ecto
red
sp
ray 2
0.3
2 c
m a
way
. T
he
vec
tore
d c
ou
po
ns
wer
e p
osi
tio
ned
in
lin
e w
ith
th
e
spra
y 9
cm
in
th
e x
-dir
ecti
on
an
d 2
.2 c
m i
n t
he
z-d
irec
tio
n.
20
.32
cm
(8
in
.)
CS
M
No
zzle
Exit
Un-
Vecto
red
Coup
on
Vecto
red
Coupon
CS
M
Sp
ray G
un
No
zzle
Exit
9 c
m (
4 in
.)
Fro
nt
Vie
w
Z
X
2.1
59
cm
(.8
5 in
.)
Sp
ray P
ath
"#!

! !
"#
!
Fig
ure
28
Th
e co
up
on
ori
enta
tio
n s
chem
atic
. T
his
sch
emat
ic s
ho
ws
the
fro
nt
vie
w c
ou
po
n o
rien
tati
on
wit
h r
esp
ect
to t
he
spra
y p
ath
. !
var
ies
fro
m 9
0º
- 4
5º
for
bo
th p
roce
sses
.
"#!

! !
"#
!
Fig
ure
29
Th
e cycl
e p
ath
sch
emat
ic.
Th
is s
chem
atic
in
dic
ates
th
e sp
ray p
ath
use
d t
o c
oat
th
e su
rfac
e o
f ea
ch c
ou
po
n.
A p
re-h
eat
cycl
e
of
thre
e b
ack
an
d f
ort
h s
wee
ps
was
per
form
ed a
t p
osi
tio
n h
eigh
t 4
fo
llo
wed
by a
sp
ray c
ycl
e (V
iew
A)
star
tin
g a
t h
eigh
t 1
an
d
pro
ceed
ing t
o h
eigh
t 7
. T
his
was
fo
llo
wed
by a
po
st h
eati
ng c
ycl
e o
f o
ne
bac
k a
nd
fo
rth
sw
eep
at
po
siti
on
hei
gh
t 4
fo
llo
wed
by t
hen
nex
t sp
ray c
ycl
e. S
ix s
pra
y c
ycl
es w
ere
per
form
ed f
or
each
sam
ple
ex
cep
t fo
r th
e T
2 s
amp
les
for
the
ten
sile
tes
t w
hic
h w
ere
do
ne
wit
h
12
sp
ray c
ycl
es.
"#!

!
!
"#
Spray Angle Setup
No data was available concerning the parameters affecting the spray angle for the
vectored flame spray process prior to this study. It was assumed that the spray angle was
a function of primary flow rates, secondary flow rates, powder feed rate and CSM collar
geometry. The spray angle was experimentally found by varying the secondary flow rate
from 4 CFM to 9 CFM while keeping all other parameters constant. The method for
measuring the spray angle consisted of taking 10 digital images of the vectored spray
particles at an incremental secondary flow rate. The images were then analyzed using a
“center of light intensity” method and geometric principles to measure the spray angle.
The “center of light intensity” method was based off of a similar method one would use
for calculating the center of mass. Two parallel columns of pixels were chosen from the
image at a set width of 200 pixels apart far enough away from the nozzle exit to only
show light from the molten particles. These columns were then truncated down to the
rows that only represented the cross section of the sprayed particles while keeping the
same row labels. Then the center of intensity, CI, was calculated for each column using
Equation 5:
!"#$ !"% &' ()*+,-+.,/
' *+,-+.,/
0 0 0 0 1230
where ri is the initial row number location, rf is the final row number location and In is the
intensity level at that particular row. This was repeated for both columns. The result was
an estimated row location for the center of intensity. The number of rows between the

!
!
"#
two centers of intensity was calculated and then used in Equation 6 to calculate the spray
angle.
!"#$%&'()*+ , & -./01 23450346788 9& & & :;<&
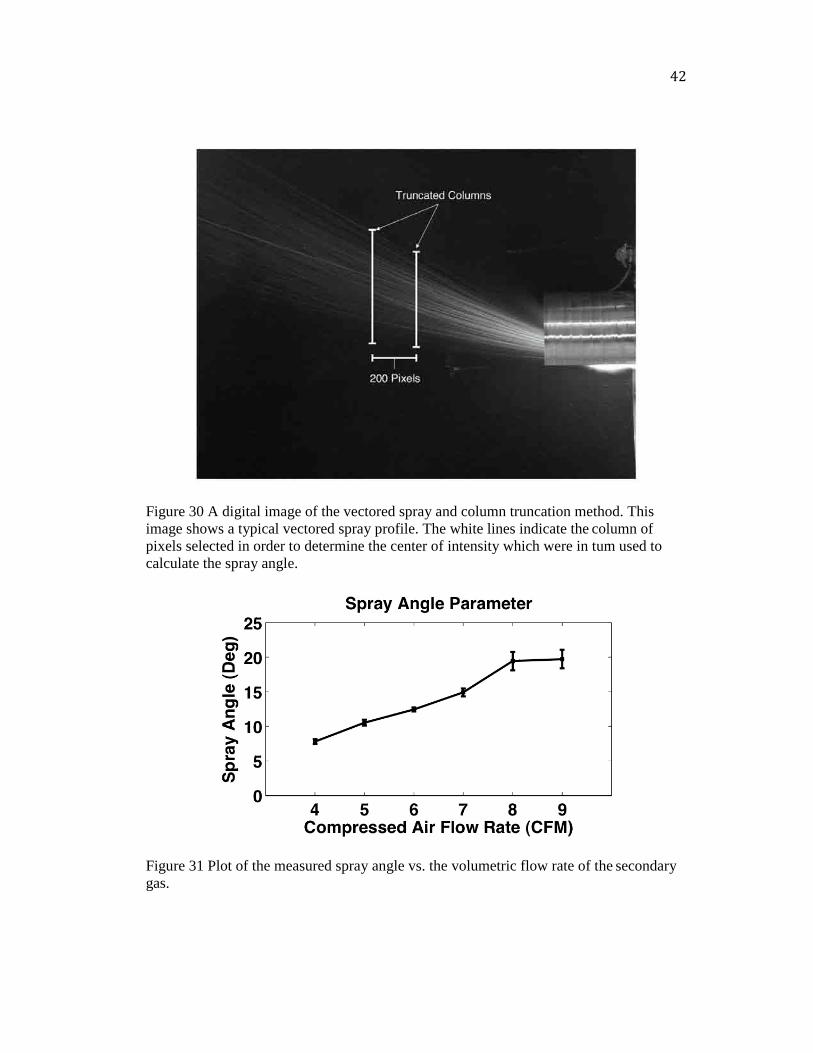
The two white lines in Figure 30 indicate the basic location of where the columns'
pixels were chosen from the digital images. $%&'(! " lists the parameter settings for the
spray angle measurements. The table indicates that the only parameter that was varied
during the measurement was the flow rate of the secondary gas. The spray angle
measurements are shown in Figure 31. Based upon the measurements indicated in Figure
31 the secondary gas flow rate was set between 4 and 5 CFM for an average spray angle
of 9° which is an average of the angles measured at 4 and 5 CFM. The error bars
represent the variance of the spray angle with 95% confidence level for ten samples.
!
!
"#
Figure 30 A digital image of the vectored spray and column truncation method. This
image shows a typical vectored spray profile. The white lines indicate the column of
pixels selected in order to determine the center of intensity which were in turn used to
calculate the spray angle.
Figure 31 Plot of the measured spray angle vs. the volumetric flow rate of the secondary
gas.

!
!
"#
Constant Temperature Setup
An isothermal comparison was desired between the vectored and un-vectored
spray process. In order to achieve this a type K thermal couple was mounted at the
substrate surface to measure the peak temperature for an un-vectored coupon during the
preheat cycle. Each measurement started at room temperature and was conducted 17
times. The average measured peak temperature was 339.1 C (642.4 F) with a 95%
confidence error of ±6.6 C (±11.9 F). Next, the temperature was measured the same way
along the vectored spray angle path until a similar temperature was measured. The
location as indicated in $%&'()! *+ measured an average temperature of 335.8 C (636.4 F)
with a 85% confidence error of ±12.4 C (±22.4 F). Moving the coupon distance will have
an effect upon the sprayed particles' impact kinetic energies and time dependent
temperature distribution.
Time Dependent Temperature Profile and Impact Energy Calculations
In association with the microhardness and tensile strength measurements an
estimation of the time dependent temperature profile and kinetic energy was performed
for the Ni particles in the spray to understand the thermal and impact energy differences
of the sprayed particles during the two different spray processes. This was done to help
explain differences between the two processes for their material properties. These
calculations were based upon the assumption that the particle's velocity in relation to the
surrounding gases was very low (Re < 1) and that the heat transfer coefficient was very
high (h = 10,000 W/m2K) due to the presence of phase change. ,-./)! 0 shows the
parameters used for these calculations which were based upon the previously mentioned
assumptions, reported material properties, and test setup. The results from these

!
!
""
calculations do not represent accurate energies and temperatures because of the arbitrary
parameters used. However, the estimated differences between the energies and
temperatures for the two processes were useful for explaining the different material
properties between the two.
Table 5 Assumed Parameters Used to Calculate the Time Dependent Temperature
Profile.
Assumed Parameters
Temperature 1700C
Initial Particle Temperature 30C
Heat Transfer Coefficient 10000 W/m^2 K
Thermal Conductivity For Ni 60.7 W/m K
Radius of Particle 2.25 E-2 mm
Exit Velocity of Particle 30 m/s
Dynamic viscosity of air at 1700C 4.549 E-5 Ns/m^2
Flight time of vectored particle 3.7 E-3 s
Flight time of un-vectored particle 8.1 E-3 s
Vectored Particle Travel Distance 10.32 cm
Un-Vectored Particle Travel Distance 20.32 cm
The following governing equation for energy transfer in a sphere [16] was used to
estimate the temperature distribution a Ni particle
!"!# $
%&' (
(!!& ()
*&'
!"!&+(((( (((( (((( (((( ,-.(
where / $ 01,23. is the thermal diffusivity of the particle, k is the thermal conductivity,
! is the density and c is the specific heat. The assumptions for using this equation is that
the particle is immersed in a large enough bath so that the energy transfer has minimal
effect on the temperature of the bath. The boundary condition for the surface of the
sphere was

!
!
"#
! "#
"$%&'&( ) *+,- . ,/01 1 1 1 +201
where h is the heat transfer coefficient, T_{\infty} is the temperature of the surrounding
gas and Ts is the surface temperature of the particle. The initial condition was
,+34 50 ) ,61 1 1 1 1 +701
where Ti is the initial uniform temperature of the particle.
An analytical solution to the governing equation for temperature distribution that
was provided by the Fundamentals of Heat and Mass Transfer [16] textbook is the
following infinite series:
89 ) : ;<=>?@ABCDE F
@A&9GHI+J<390-
<'F 1 1 1 +K501
;< )LMNOP+@A0?@A QDN+@A0R
S@A?NOP+S@A01 1 1 1 +KK01
The J<TU are the positive roots of
K . J< VWX+J<0 ) YH1 1 1 1 1111111+KZ01
The dimensionless terms are defined as
89 ) #?#[#\?#[
41111111111139 ) &
&(41111111111]W ) ^$
&(B41111111111YH )
_&(`1 1 +Ka01
where ro is the radius of the particle, Fo is the Fourier number and Bi is the Biot number.
The equation for the estimated flight times for the vectored and unvectored
processes were derived from the following equation of motion for a sphere undergoing
drag.
!
!
"#
!"# $ %"& ' () ) ) ) ) *+,-)
The estimated flight times were calculated from the following equation
. ' /01 23 4 5
56 7890:;
<) ) ) ) )))))*+=-)
where mp is the average mass of a particle of Ni based upon material specifications,
% ' >?@AB is the drag coefficient for a sphere with very low velocity *CD E +- according
to Stoke's law, @ is the dynamic viscosity at the assumed average gas temperature, x is the
distance traveled by the particle and vo is the assumed initial particle velocity. A Matlab
solver written by Recktenwald [17] was used to find the roots of Equation 12 and
calculate the temperature profile of a sphere immersed in a surrounding fluid of uniform
temperature. 397 positive roots *FG- were found for Equation 12.
The kinetic energy of a Ni particle was calculated using Equation 16.
HIJG ' 5K!L MNB O 1
/0"P
K (16))
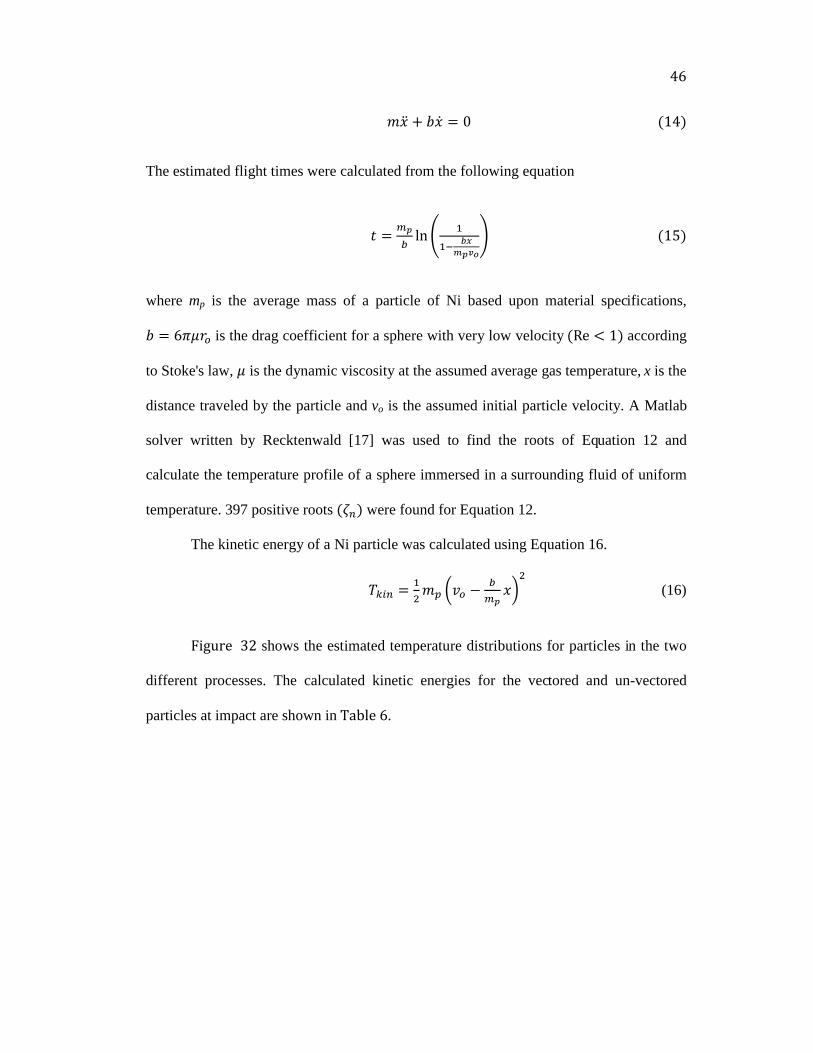
$%&'()! *+ shows the estimated temperature distributions for particles in the two
different processes. The calculated kinetic energies for the vectored and un-vectored
particles at impact are shown in ,-./)!#.

!
!
"#
Figure 32 Time dependent temperature profile of vectored and un-vectored Ni particle
spheres for h=10,000 W/m^2 K.
Table 6 Estimated Kinetic Energies
Estimated Kinetic Energy of the Particles at Impact
Vectored Un-Vectored
1.365 E-7 J 9.119 E-8 J
Testing Procedures
Porosity Measurement
Porosity measurements were conducted on samples 049-072. The measurement of
porosity was based upon the Archimedes Principle Equation:
!" # $ %! & '( ( ( ( )*+,(

!
!
"#
! " #$%&'( )* )+) * ),) ) ) ) )))-./0)
where Wa is the apparent weight of the coating in water, B is the buoyancy force acting
on the coating, W is the actual weight of the coating. #$%&'( is the density of water, V is
the volume of the coating and g is the gravitational acceleration. The density of the
coating was calculated from Equation 19
#12%&345 "6789
6789:6;7<=9)*)#$%&'() ) ) -.>0)
where ?%3( is the mass of the coating in air and ?$%&'( is the apparent mass of the
coating in water. The percentage of porosity was found by calculating the percent of the
difference between the density of cast Ni, #@3, and the density of the coating, #12%&345, as
shown in Equation 20.
AB8:ACD7<8EF
AB8* ).GG " H)IJ)KILIMNOP) ) ) -QG0)
The temperature of the water was approximately 23 C.
Surface Roughness and Profile Measurements
Surface roughness measurements were conducted on samples 049-072. Surface
profile measurements were conducted on samples 050, 058, 061 and 072. The surface
height was measured with the initial height set to zero for each sample. Three parallel
measurements, 2.54 mm (0.1 in.) long and 6.35 mm (0.25 in.) apart, were measured for
each sample in the Y direction of the coating surface. The travel speed was 0.102 mm/s
(0.004 in/s). From these measurements the average surface roughness was calculated
using Equation 21

!
!
"#
!" #$
%& '()'%)*$ + + + + ,-./+
where () is the measured deviation from the ideal surface at the ith
point.
Microhardness Measurement
Microhardness measurements were conducted on samples 049-072. A Vickers
hardness test was used to measure the microhardness at five locations per sample. The
applied loading was 1 kgf for 10 seconds. Equation 22 was used to calculate the
microhardness
01 #$23455+6+$789
:;+ + + + ,--/+
where d was the average length of the two diagonals measured and had units of mm.
Tensile Strength Measurement
Tensile strength measurements were conducted on samples 001-048.Tensile
strength measurements were performed according to ASTM C633 standard.

!
!
"#
CHAPTER 5
RESULTS AND DISCUSSION
Porosity Measurement
$%&'()! ** and $%&'()! *+ display the results of the porosity measurements for the
vectored and un-vectored processes at spray angles ranging from 90° - 45° for samples
049-072. In $%&'()! ** the trend line of the data has a general upward slope for spray
angles from 90° - 60° and then jumps down at 45°. In $%&'()! *+ the trend line of the data
has a general downward slope for spray angles from 90° - 45°. The size of the scatter-
band from one spray angle to the next is relatively similar within the same spray process.
However, the size of the scatter-band is consistently higher for the samples from the
vectored spray process.
Figure 33 Vectored porosity test results.

!
!
"#
Figure 34 Un-vectored porosity test results.
The upward trend agreed well with previous results found by Montavon et al. [5],
Smith et al. [10], Ilavsky et al. [12], Leigh et al. [11] and Tillman et al. [3] where the
porosity was attributed to the shadow effect introduced by Kanouff et al. [7]. However,
the downward jump at the 45° spray angle in the vectored process had not been seen
before. The existence of this jump might indicate a unique feature of the vectored spray
process. A possible cause for the jump in porosity could have been due to particles
breaking asperities off. This in turn would have reduced the shadow effect, which likely
decreased the chances for pore development. To support this idea, the kinetic energy of a
Ni particle at impact for the vectored and un-vectored processes was calculated. The
findings indicated a 33% increase in kinetic energy at impact for the particles of the
vectored spray process. It was therefore likely that the particles sprayed at 45° for the
vectored process surpassed a critical energy impact level that would break the asperity
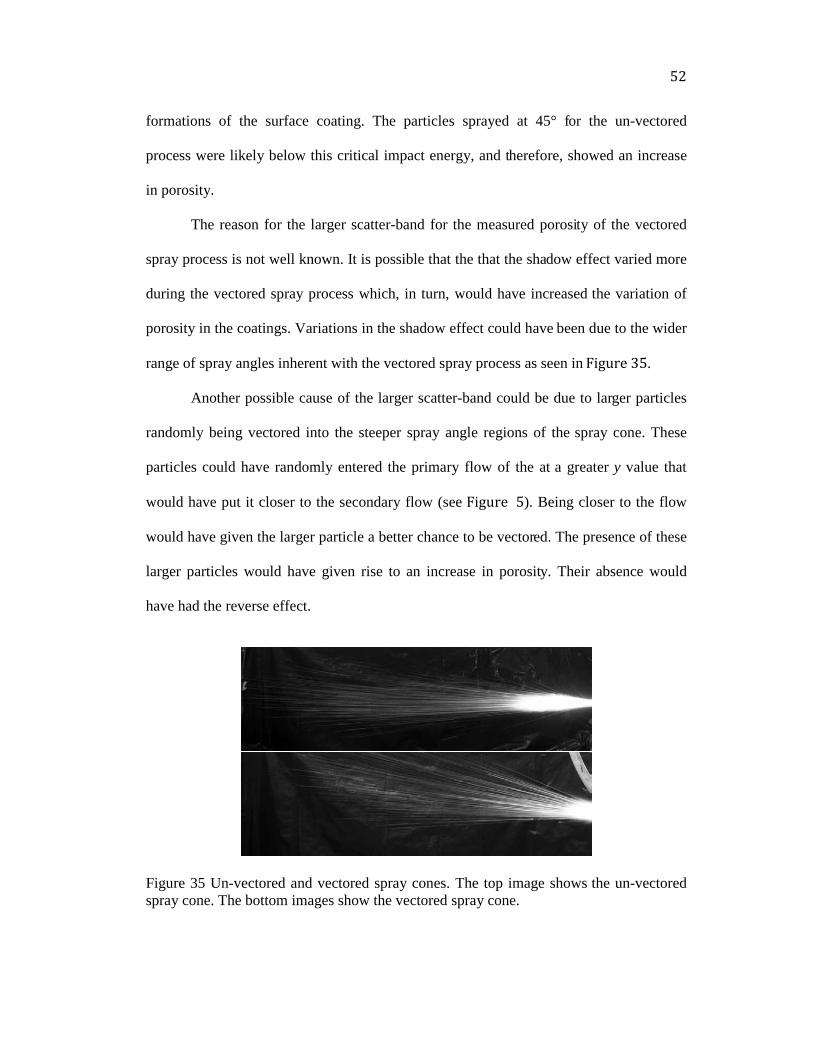
!
!
"#
formations of the surface coating. The particles sprayed at 45° for the un-vectored
process were likely below this critical impact energy, and therefore, showed an increase
in porosity.
The reason for the larger scatter-band for the measured porosity of the vectored
spray process is not well known. It is possible that the that the shadow effect varied more
during the vectored spray process which, in turn, would have increased the variation of
porosity in the coatings. Variations in the shadow effect could have been due to the wider
range of spray angles inherent with the vectored spray process as seen in $%&'()!*".
Another possible cause of the larger scatter-band could be due to larger particles
randomly being vectored into the steeper spray angle regions of the spray cone. These
particles could have randomly entered the primary flow of the at a greater y value that
would have put it closer to the secondary flow (see $%&'()! "). Being closer to the flow
would have given the larger particle a better chance to be vectored. The presence of these
larger particles would have given rise to an increase in porosity. Their absence would
have had the reverse effect.
Figure 35 Un-vectored and vectored spray cones. The top image shows the un-vectored
spray cone. The bottom images show the vectored spray cone.

!
!
"#
Surface Roughness Measurement
The surface roughness for sprayed particles using the vectored and un-vectored
spray processes for spray angles of 90° - 45° can be seen in $%&'()! #* and $%&'()! #+.
The trend line for the vectored surface roughness test in $%&'()! #* indicates an increase
in surface roughness for spray angles from 90° - 60° and then jumps down at 45°. The
trend line for the un-vectored surface roughness test in $%&'()! #+ indicates an increase in
surface roughness from 90° to 75°, but a leveling off of the surface roughness for spray
angles from 75° - 45°. $%&'()! #* and $%&'()! #+ both show similar uncertainty levels for
each of the spray angles for both processes. A correlation can be seen between the surface
roughness and the material porosity for the vectored spray processes shown in $%&'()! #*
and $%&'()! #+, particularly for the 45° spray angle. A similarly strong correlation is not
found for the un-vectored process.

!
!
"#
Figure 36 Vectored surface roughness test results.
Figure 37 Un-vectored surface roughness test results.

!
!
""
The increase in surface roughness for the vectored spray process for the spray
angles of 90° - 60° and the un-vectored spray process for the angles of 90° - 75° is similar
to the increases in surface roughness measured by Kanouff et al. [7], Leigh and Berndt
[11], Smith et al. [10], and Tillmann et al. [3]. The most likely cause for this increase in
surface roughness was due to the particles impacting primarily on the asperity formations
on the coating surface. The lack of a distinct upward trend for the un-vectored spray
process for the spray angles of 75° - 45° is not unprecedented (see Figures [fig:Surface-
Roughness-Data-Plots-01]-[fig:Surface-Roughness-Data-Plots-03]). Some of the
materials tested in these studies did not show a significant upward trend in surface
roughness until after the 45°. This indicates that the surface roughness was more sensitive
to the spray angle for the vectored spray process.
Like the porosity measurements, the reduction in surface roughness for the
vectored spray process for the 45° spray angle is likely due to the energy of the particle
being high enough at the time of impact to sheer the asperities being impacted. Similarly,
a study performed by Houdkova et al. [14] found a distinct downward trend in surface
roughness as the spray angle decreased for some materials (see Figure [fig:Surface-
Roughness-Data-Plots-03]). They attributed this reverse correlation to the possibility that
the low angled particles were actually shearing off the asperities forming on the coating
surface.
Microhardness Measurement
#$%&'(! )* and #$%&'(! )+ display the results of the microhardness measurements
against the spray angle for both the vectored and un-vectored processes. It can be seen
from the figures that in both processes the microhardness decreased as the spray angle

!
!
"#
decreased. By comparison, it can also be seen that the average microhardness for the
vectored sprays for each spray angle in $%&'()! *+ was less than that of the average
microhardness of the un-vectored sprays for the same angles in $%&'()!*,.
Figure 38 Vectored microhardness test results.

!
!
"#
Figure 39 Un-vectored microhardness test results.
The decrease in microhardness as the spray angle decreased has been seen before
by Leigh and Berndt [11], Strock et al. [13], and Houdkova et al. [14]. It was believed in
their studies that the likely decrease in microhardness was due to an increase of porosity.
Since hardness testing is a measurement of a material's ability to resist plastic
indentation, it is likely that the hardness can be correlated to the material's porosity. This
study also found that correlation between hardness and porosity.
The higher average microhardness for the un-vectored spray process could have
been due to higher particle temperatures. $%&'()! *+ displays the calculated time
dependent temperature profiles versus the radius of a spherical particle at the estimated
end time of flight for both the vectored and un-vectored spray processes. The heat
transfer coefficient was unknown but estimated to be in the range between 2000-20,000
W/m^2 K. Other assumptions are recorded in ,-./)! ". The resulting temperatures

!
!
"#
appeared to be uniform throughout the entire radius of the particles. This was likely due
to the high surface-to-volume ratio of the particle and the high thermal conductivity of
Nickel even though the heating times are on the magnitude of milliseconds.
$%&'()! *+ shows that the higher uniform temperature is that of the un-vectored
particle. It should be noted here that the melting point of Ni is 15 C, which would
indicate in this case that un-vectored particles would likely be in a liquid state whereas
the vectored particles would likely be in a semi-liquidous state. The uniform temperature
of the vectored Ni particle always remains substantially less than the un-vectored Ni
particle for the range of heat transfer coefficients used. The findings from the time
dependent temperature profile calculations indicate that the temperature of the un-
vectored particles were higher than the vectored particles upon impact. This would have
lead to better metallurgical bonding for the un-vectored coatings. Therefore, the higher
densities found in $%&'()! *, are most likely due to a greater amount of metallurgical
bonding between splats.
Sampath et al. [18] performed a study using three different coating techniques:
wire arc, APS, HVOF and cold spray. In their experiment, the microhardness was
measured against the particle's kinetic energy for each spray technique. Their results can
be seen in $%&'()! -. which plots the average microhardness of NiAl coating against the
kinetic energy/mole for each spray technique. The HVOF process achieved the highest
hardness, which was the highest kinetic energy/mole process of the three thermal spray
processes. Although the cold spray process sprayed particles had the highest energy of all
four processes its microhardness performance was lower than that of HVOF. It was
believed that the lower hardness was due to the non-metallurgical bonding associated

!
!
"#
Figure 40 Sampath microhardness study [18].
with the cold spray process. Similarly, the particles of the vectored process had a higher
kinetic energy at impact, but showcased a lower microhardness. This comparison also
supports the theory that the higher microhardness of the un-vectored coatings was due to
metallurgical bonding.
Tensile Strength Measurement
The tensile strength test was performed to showcase the tensile strength of the
NiAl coating material. Two different thicknesses, T1 and T2, were sprayed for the
vectored and un-vectored spray processes for spray angles of 90° - 45°. However, each of
the samples failed at the bonding location of the coating/substrate interface between the
NiAl coatings and the 1018 steel coupons. Therefore, $%&'()! *+ and $%&'()! *, showcase

!
!
"#
the tensile strength of the bond at the coating/substrate interface for the vectored and un-
vectored processes for the spray angles of 90° - 45° for both thicknesses. $%&'()! *+
shows that the bonding strength trend increased for the vectored process for spray angles
of 90° - 45° for both thicknesses. $%&'()! *, shows that the bonding strength trend
increased for the un-vectored process for spray angles of 90° - 45° for only the T2
thickness, but did not show any trend for the T1 thickness. $%&'()! *, shows that the
overall average bond strength of the vectored process for both thicknesses was higher
than the average bond strength of the un-vectored process for both thicknesses. The bond
strengths decreased 37% and 43% from the vectored process to the un-vectored process
for thicknesses T1 and T2, respectively.

!
!
"#
Figure 41 Vectored tensile strength test results.

!
!
"#
Figure 42 Un-vectored tensile strength test results.

!
!
"#
Because the tensile test showcased bond failure at the coating/substrate interface
these results could not be compared to the discussion of coating tensile strengths found
earlier in this paper. However, an explanation of the measured results will be discussed.
One reason for the change in the average bond strength between the two thicknesses
could be due to the difference in kinetic energy of the initially sprayed particles at the
time of substrate impact. The impact kinetic energies of the initially sprayed particles
were different because the samples for the vectored spray process had to be moved closer
to the gun in order to keep isothermic uniformity at the substrate surface. The
approximate energies were calculated under the assumptions provided in $%&'(! ). The
calculated energy for the particles sprayed in the vectored process was approximately
33% higher than the particles sprayed in the un-vectored process, which corresponds with
the change in the average tensile strengths between the two processes. It is therefore
likely that the higher energy at impact allowed for better mechanical bonding at the
coating/substrate interface dispute the higher viscosity of the vectored particles.
The increase in tensile strength measured as the spray angle decreased for both
thicknesses of the vectored process and for the T2 thickness of the un-vectored process is
surprising. No study has shown this type of trend before. One possible reason for this
phenomenon could be that the substrate surfaces were in fact not uniform in surface
roughness. If this were the case, then the coupons for the lower spray angles would have
to have been randomly selected with increasingly rougher surfaces to produce the
measured results. *+,-.(! /# displays the surface profiles of three different 1018 steel
coupons taken at random locations. These samples were machined using a lathe at the
same cutting speed and depth. *+,-.(! /# showcases that different areas of the profile of
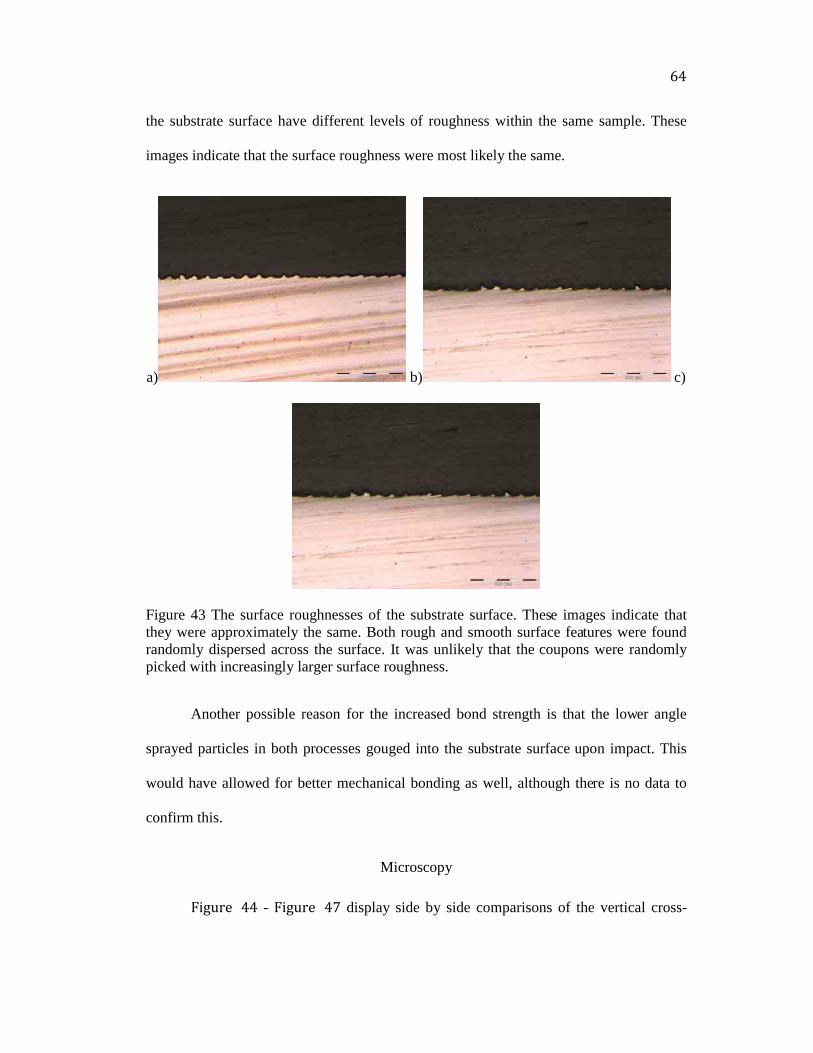
!
!
"#
the substrate surface have different levels of roughness within the same sample. These
images indicate that the surface roughness were most likely the same.
a) b) c)
Figure 43 The surface roughnesses of the substrate surface. These images indicate that
they were approximately the same. Both rough and smooth surface features were found
randomly dispersed across the surface. It was unlikely that the coupons were randomly
picked with increasingly larger surface roughness.
Another possible reason for the increased bond strength is that the lower angle
sprayed particles in both processes gouged into the substrate surface upon impact. This
would have allowed for better mechanical bonding as well, although there is no data to
confirm this.
Microscopy
$%&'()! ## - $%&'()! #* display side by side comparisons of the vertical cross-

!
!
"#
sections for the vectored and un-vectored process for spray angles from 90° - 45°. The
following observations were made from the figures between the vectored and un-vectored
processes. $%&'()!** - $%&'()!*+
! Show that for all spray angles the vectored splats appeared to be more spherical
than the un-vectored splats. The spherical feature shows the un-melted particle
shape.
! Show that the intersplat boundaries appear to be at a steeper angle for the vectored
splats at 45º than for the un-vectored splats.
a) b)
Figure 44 Microscopy images showing the splat formations for the vectored a) and un-
vectored b) processes for the 90º spray angle.
a) b)
Figure 45 Microscopy images showing the splat formations for the vectored a) and un-
vectored b) processes for the 75º spray angle.
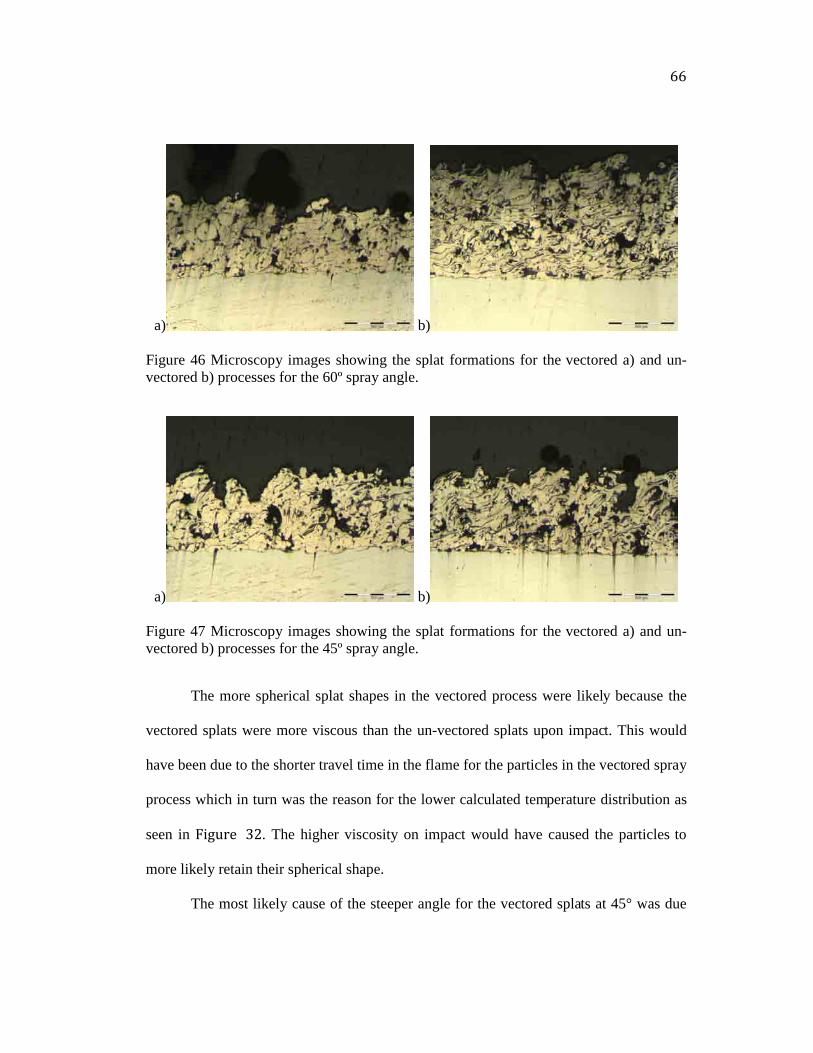
!
!
""
a) b)
Figure 46 Microscopy images showing the splat formations for the vectored a) and un-
vectored b) processes for the 60º spray angle.
a) b)
Figure 47 Microscopy images showing the splat formations for the vectored a) and un-
vectored b) processes for the 45º spray angle.
The more spherical splat shapes in the vectored process were likely because the
vectored splats were more viscous than the un-vectored splats upon impact. This would
have been due to the shorter travel time in the flame for the particles in the vectored spray
process which in turn was the reason for the lower calculated temperature distribution as
seen in #$%&'(! )*. The higher viscosity on impact would have caused the particles to
more likely retain their spherical shape.
The most likely cause of the steeper angle for the vectored splats at 45° was due

!
!
"#
to the particles impacting at a steeper angle than the intended 45°. The spray of the
vectored particles had an inherently larger spread than the un-vectored spray as seen in
$%&'()! *+. It is therefore likely that a greater percentage of particles would have
impacted at a lower angle than the average angle of 45°.
The microscopy images also show several similarities between the vectored and
un-vectored processes. $%&'()!,, - $%&'()!,#
! Show that the intersplat boundaries for each spray angle tend to be perpendicular
to the spray angle direction.
! Show that the intersplat boundaries are more jagged than the splat/substrate
boundaries.
! Do not show a distinguishable difference in porosity by visual inspection.
The tendency of the intersplat boundaries to be perpendicular to the spray angle found
in $%&'()! ,, were likely due to the angle of impact of the sprayed particles and the
resultant surface angle of the formed surface asperities. As the spray process continued
these asperities would continue to build up in the direction perpendicular to their surface.
In addition, this was probably the preferred crystallographic direction in the splat grains
as suggested by Smith et al. [10].
The greater jaggedness between the intersplat boundaries than between the
splat/substrate was probably due to the splashing and spreading of the particles upon
impact. This splashing and spreading is evidenced by the flat splat formations found in
$%&'()! ,, - $%&'()! ,#. The splashing and spreading would have in turn allowed for
greater mechanical bonding between the splats than between the initial splats and the
substrate. This is evidence supporting the idea that the intersplat tensile strength was

!
!
"#
much greater than the splat/substrate tensile strength and therefore the reason why the
samples failed at the splat/substrate interface instead of in the intersplat interface.
The darkest spots in $%&'()!** - $%&'()!*+ indicate places of porosity.
!
!
"#
CHAPTER 6
CONCLUSION
The effect of using a Coanda-Assisted Spray Manipulation collar on a combustion
flame spray gun using NiAl powder has been studied. The use of the CSM collar resulted
in the need to position the specimen approximately 50% closer to the gun. It also resulted
in an approximately 33% decrease of the surface coating microhardness. The effect of
moving the samples closer to the gun resulted in approximately 37% and 43% higher
coating/substrate bond strength for the T1 and T2 thickness, respectively. No noticeable
effect was made on the surface roughness, densities, or profiles by using the CSM. The
results confirmed previous conclusions that density decreases, surface roughness
increases and microhardness decreases as the spray angle decreases.
Future tests could be performed using different powder material and different
types of flame spray guns. Further studies of the tensile strength of the coating should be
done on coupons with rougher substrate surfaces to ensure that the mechanical bonding
strength is higher than the intersplat bonding strength. This would ensure that measured
tensile strengths indicated the tensile strength of just the coating material.
The use of the CSM collar can be used in the combustion flame spray process, but
requires the gun to be positioned closer to the substrate surface. Use of the collar is also
likely to decrease the microhardness of the material, but not significantly affect the
material's porosity and surface roughness.

!
!
"#
REFERENCES
[1] Davis, J., 2005, Handbook of Thermal Spray Technology, ASM International.,
Materials Park, OH, Chap. 1.
[2] England, G., 2010, “Thermal Spray Coatings,” Surface Engineering Forum
www.gordonengland.co.uk/xtsc.htm.
[3] Tillmann, W., Vogli, E., and Krebs, B., 2008, “Influence of Spray Angle on the
Characteristics of Atmospheric Plasma Sprayed Hard Material Based Coatings,”
Journal of Thermal Spray, 17 (5-6), pp. 948-955.
[4] Allen, D., 2008, “Axisymmetric Coanda-Assisted Vectoring,” thesis, Utah State
University, Logan, UT.
[5] Montavon, G., Coddet, C., Sampath, S., Herman, H., and Berndt, C., 1994,
"Vacuum Plasma Spray Forming of Astroloy: An Investigation of Processing
Parameters", "Proceedings of the 7th
National Thermal Spray Conference", ASM
International, Boston, MA., pp. 469-475.
[6] Madejski, J., 1976, “Solidification of Droplets on a Cold Surface,” International
Journal of Heat and Mass Transfer, 19, pp. 1009-1013.
[7] Kanouff, M., Neiser, R., and Roemer, T., 1998, “Surface Roughness of Thermal
Spray Coatings Made with Off-Normal Spray Angles,” Journal of Thermal Spray
Technology, 7(5), pp. 219-228.
[8] Kang, C., and Ng, H., 2006, “Splat Morphology and Spreading Behaivor Due to
Oblique Impact of Droplets Onto Substrates in Plasma Spray Coating Process,”
Surface and Coatings Technology, 200, pp. 5462-5477.
[9] Bussmann, S., Chandra, S., and Mostaghimi, J., 2000, “Numerical Results of Off-
Angle Thermal Spray Particle Impact”, University of Toronto, Toronto, ON
[10] Smith, M., Neiser, R., and Dykhuizen, R.C., 1994, "An Investigation of the Effects
of Droplet Impact Angle in Thermal Spray Deposition", "Proceedings of the 7th
National Thermal Spray Conference", ASM International, Boston, MA., pp. 603-
608.
[11] Leigh, S. H., and Berndt, C. C., 1997, “Evaluation of Off-Angle Thermal Spray,”
Surface and Coatings Technology, 89, pp. 213-224.

!
!
"#
[12] Ilavsky, J., Allen, A. J., Long, G. G., Krueger, S., Berndt, C. C., and Herman, H.,
1997, “Influence of Spray Angle on the Pore and Crack Microstructure of Plasma-
Sprayed Deposits,” Journal of the American Ceramic Society, 80(3), pp. 733-742.
[13] Strock, E., Ruggiero, P., and Reynolds, D., 2001, “The Effect of Off-Angle
Spraying on the Structure and Properties of HVOF WC/CoCr Coatings,” Engelhard
Corporation, East Windsor, CT.
[14] Houdkova, S., Kasparova, M., and Zahalka, F., 2010, “The Influence of Spraying
Angle on Properties of HVOF Sprayed Hardmetal Coatings,” Journal of Thermal
Spray Technology, 19(5), pp. 893-901.
[15] Bach, F., Mohwald, K., and Engl, L., 2006, “Rougness Enhancement of HVOF
Spray MCrAlY Bond Coatings for Adhesion Improvement of Ceramic Top Layers,”
"Proceedings of the 2006 International Thermal Spray Conference: Science,
Innovation, and Application", B. Marple and C. Moreau, eds., ASM International,
Seattle, WA, pp. 649-654.
[16] Incropera, F. P., Dewitt, D. P., Bergman, T. L., and Lavine, A. S., 2007,
Fundamentals of Heat and Mass Transfer, John Wiley and Sons, Hoboken, NJ.
[17] Recktenwald, G., 2006, “Transient, One-Dimensional Heat Conduction in a
Convectively Cooled Sphere,” Portland State University, Portland, OR.
[18] Sampath, S., Jiang, X., Matejicek, J., Prchlik, L., Kulkarni, A., and Vaidya, A.,
2004, “Role of Thermal Spray Processing Method on the Microstructure, Residual
Stress and Properties of Coatings: an Integrated Study for Ni–5 wt.% Al Bond
Coats,” Materials Science and Engineering, A364, pp. 216-231.

!
!
"#
APPENDIX

! !
"#
!
Tab
le 7
Po
rosi
ty M
eth
od
s
Au
tho
r
Meth
od
E
qu
ipm
en
t A
dd
itio
na
l N
ote
s
Mo
nta
vo
n e
t al
. 1
99
7
Un
kn
ow
n
Sm
ith
et
al.
19
94
Qu
anti
tati
ve
Imag
e an
alysi
s o
f
po
lish
ed m
etal
lag
rap
hic
cro
ss
sect
ion
s
Lec
o 3
00
met
alla
gra
ph
ic/
Mac
into
sh
Qu
adra
80
0/
Dap
ple
Im
age
An
alysi
s
So
ftw
are
Ilav
sky e
t al
. 1
99
7
Mer
cury
- In
tru
sio
n P
oro
sim
etry
(MIP
) an
d A
rch
imed
ean
(w
ater
dis
pla
cem
ent)
Po
rosi
met
ry
NIS
T C
old
Neu
tro
n R
esea
rch
Fac
ilit
y
at t
he
Nat
ion
al I
nst
itu
te o
f S
tan
dar
ds
and
Tec
hn
olo
gy i
n G
aith
ersb
urg
, M
D
Lei
gh
an
d B
ern
dt
19
97
O
pti
cal
Imag
e A
nal
ysi
s O
mn
imet
® l
, B
ueh
ler
Ltd
., L
ake
Blu
ff,
Illi
no
is
Th
e sa
mp
les
wer
e fi
rst
po
lish
ed.
10
fra
mes
wer
e
mea
sure
d a
nd
th
en
aver
aged
fo
r ea
ch s
amp
le
Str
ock
et
al.
20
01
U
nk
no
wn
Til
lman
n e
t al
. 2
00
8
Op
tica
l Im
age
An
alysi
s Z
eiss
, A
xio
vis
ion
4.6
Im
age
Pro
cess
ing S
oft
war
e
Ho
ud
ko
va
et a
l. 2
00
9
Arc
him
edea
n (
wat
er d
isp
lace
men
t)
Den
sity
Mea
sure
men
t U
nk
no
wn
"#!

! !
"#
!
Tab
le 8
Su
rfac
e R
ou
gh
nes
s M
eth
od
s
Au
tho
r
Meth
od
E
qu
ipm
en
t A
dd
itio
na
l N
ote
s
Sm
ith
et
al.
19
94
Sty
lus
Pro
filo
met
er
Det
ak 8
00
0 w
/2.5
µm
sty
lus
rad
ius
Sty
lus
Fo
rce:
30
mg;
Tra
ver
se R
ate:
74
0
µm
/min
; F
ou
r 1
.0 c
m l
ong s
can
s w
ere
per
form
ed i
n f
ou
r d
iffe
ren
t lo
cati
on
s fo
r ea
ch
sam
ple
. S
can
was
cen
tere
d o
n t
he
ver
tica
l m
id
pla
ne
slig
htl
y a
bo
ve
or
bel
ow
th
e h
ori
zon
tal
mid
pla
ne.
Lei
gh
an
d B
ern
dt
19
97
S
tylu
s P
rofi
lom
eter
S
urf
test
III
(M
itu
toyo
MF
G.
Co
. L
td.)
Cu
t-o
ff V
alu
e: 0
.8 m
m;
Tra
nsv
erse
Sp
eed
: 6
mm
/s.
Mea
sure
men
t ra
ng
e w
as 3
0 µ
m f
or
NiA
l
and
10
µm
fo
r C
r_{2
}C
_{2
}-N
iCr.
Kan
ou
ff e
t al
. 1
99
8
Dig
itiz
ed C
ross
Sec
tio
n
Un
kn
ow
n
Th
e sa
mp
les
wer
e cu
t, t
hen
po
lish
ed a
nd
th
en
dig
itiz
ed.
Str
ock
et
al.
20
01
Til
lman
n e
t al
. 2
00
8
3D
Su
rfac
e
Pro
filo
met
er
Ali
con
a, m
od
el I
nfi
nit
e
Fo
cus
Ho
ud
ko
va
et a
l. 2
00
9
"#!

! !
"#
!
Tab
le 9
Har
dn
ess
Met
ho
ds
Au
tho
r
Meth
od
L
oa
din
g
Eq
uip
men
t A
dd
itio
na
l
In
fo
rm
ati
on
Lei
gh
an
d B
ern
dt
Vic
ker
s H
ard
nes
s T
est
30
0 g
f (N
iA1
) &
50
0 g
f
(Cr_
{3
}C
_{2
}N
iCr)
Mic
rom
et I
I (B
ueh
ler
Ltd
., L
ake
Blu
ff,
Illi
no
is)
har
dn
ess
test
er.
Lo
ad h
eld
fo
r 1
5 s
.
Ind
enta
tio
ns
wer
e o
n
cen
ter
lin
e. I
nd
enta
tio
ns
wer
e se
par
ated
a
dis
tan
ce a
t le
ast
thre
e
tim
es t
he
ind
enta
tio
n
dia
go
nal
.
Mo
nta
vo
n e
t al
. V
ick
ers
Har
dn
ess
Tes
t 3
00
g
Un
kn
ow
n
Un
kn
ow
n
Str
ock
et
al.
Vic
ker
s H
ard
nes
s T
est
30
0 g
U
nk
no
wn
U
nk
no
wn
Til
lman
n e
t al
.
Vic
ker
s H
ard
nes
s T
est
0.1
kp
(0
.98
1 N
) L
eco
,mo
del
M-4
00
L
oad
was
hel
d f
or
15
s
Ho
ud
ko
va
et a
l.
HR
15
N &
Vic
ker
s
Har
dn
ess
Tes
t 3
00
g (
VH
N)
Un
kn
ow
n
Th
e R
ock
wel
l H
R1
5N
met
ho
d w
as u
sed
acco
rdin
g t
o
spec
ific
atio
ns
EN
ISO
65
08
-1.
"#!

! !
"#
!
Tab
le 1
0 T
ensi
le S
tren
gth
Met
ho
ds
Au
tho
r
Meth
od
E
qu
ipm
en
t A
dd
itio
na
l In
fo
rm
ati
on
Lei
gh
an
d B
ern
dt
19
97
T
ensi
le T
est
Un
kn
ow
n
AS
TM
C 6
33
tes
tin
g m
eth
od
; T
he
pu
ll-o
ff b
ar h
ad a
n 8
(5
/16
) m
m h
ole
inst
ead
of
a ta
pp
ed h
ole
. T
he
pu
ll-o
ff
bar
was
sli
gh
tly l
on
ger
(3
0.4
8 m
m
(1.2
in
))
Til
lman
n e
t al
. 2
00
8
Ten
sile
Tes
t M
oh
r &
Fed
erh
off
D
IN E
N5
82
tes
tin
g m
eth
od
"#!

! !
""
!
Fig
ure
48
Co
up
on
dim
ensi
on
s.
""!

! !
"#
!
Fig
ure
49
Par
tial
cir
cum
fere
nce
co
llar
dim
ensi
on
s.
"#!

! !
"#
!
Fig
ure
50
Par
tial
cir
cum
fere
nce
co
ntr
ol
pan
el d
imen
sio
ns.
"#!

! !
"#
!
Fig
ure
51
In
sert
dim
ensi
on
s.
"#!
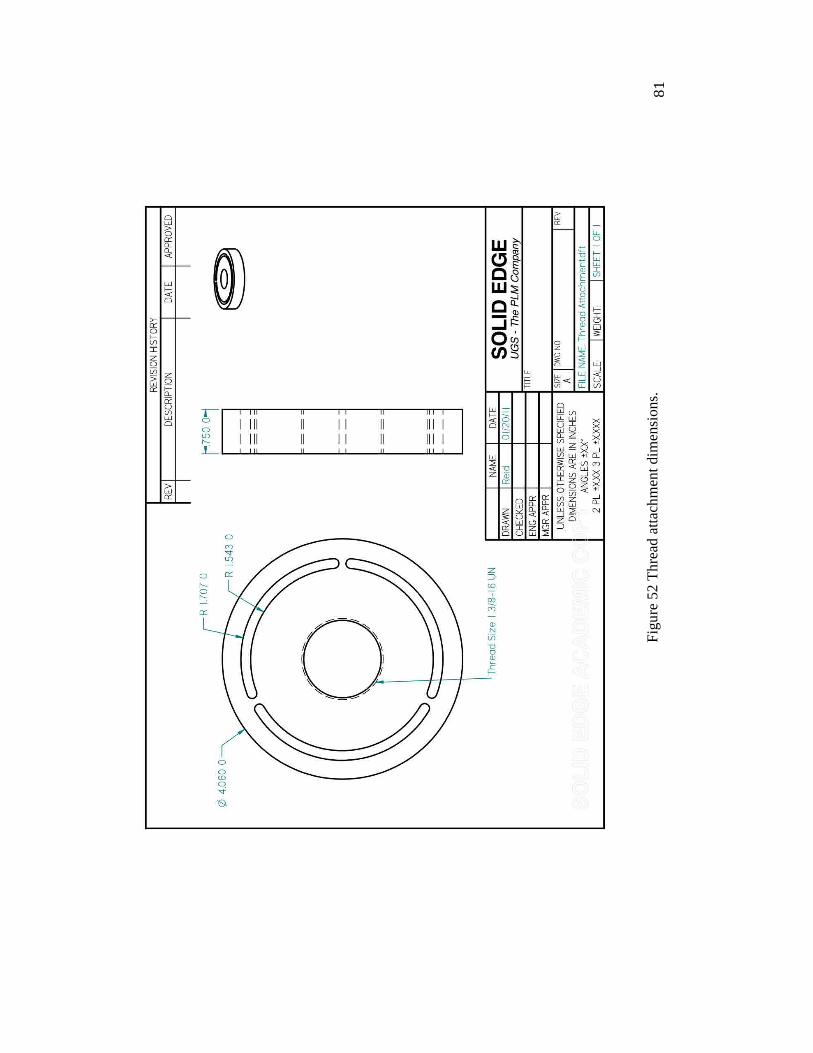
! !
"#
!
Fig
ure
52
Th
read
att
ach
men
t d
imen
sio
ns.
"#!