NITRATE REDUCTION AND HEAVY METAL REMOVAL
289
INVESTIGATIONS OF SUPPORTED BI- AND TRI-METALLIC nZVI: NITRATE REDUCTION AND HEAVY METAL REMOVAL BY TRAN THI LOC A thesis submitted to the Victoria University of Wellington in fulfilment of the requirements for the degree of Doctor of Philosophy Victoria University of Wellington 2020
-
Upload
khangminh22 -
Category
Documents
-
view
2 -
download
0
Transcript of NITRATE REDUCTION AND HEAVY METAL REMOVAL

INVESTIGATIONS OF SUPPORTED
BI- AND TRI-METALLIC nZVI:
NITRATE REDUCTION AND
HEAVY METAL REMOVAL
BY
TRAN THI LOC
A thesis
submitted to the Victoria University of Wellington
in fulfilment of the requirements for the degree of
Doctor of Philosophy
Victoria University of Wellington
2020


i
Attestation of Authorship
I hereby declare that this thesis entitled
INVESTIGATIONS OF SUPPORTED BI- AND TRI-METALLIC nZVI: NITRATE REDUCTION AND
HEAVY METAL REMOVAL
is my own work and that, to the best of my knowledge and belief. It contains no materials
previously published by another person except that which appears in the references and
acknowledgements. I further declare that this thesis has not been submitted for any degree,
diploma, or other qualification in any other institution.
Signed:______________________________________________________________
Date:_________________________________________________________________
Tran Thi Loc
Victoria University of Wellington

ii
Abstract
nZVI has been well documented as an effective reagent to remove contaminants, including
organic and inorganic substances. However, the drawbacks of nZVI are agglomeration and
bioaccumulation due to its magnetic property and nanosize. One of the solutions for these
problems is putting nZVI on non-toxic support. Microsilicate600 (Misi), a silicate from a
geothermal deposit in Rotorua, New Zealand, has been established to be useful in adsorbing
nZVI. Doping nZVI with other metals to generate bimetallic and trimetallic materials is a
method to increase its reactivity. These dopant metals function as catalysts in enhancing the
electron transfer from Fe(0) core to contaminants. In this research project, the effect of
doping metals on nZVI to generate bimetallic or trimetallic nZVI particles and effect of
adsorbing these resulting particles on Misi were investigated. The reactivity of these materials
towards the removal of different contaminants such as nitrate and toxic heavy metals was
examined.
Supported bimetallic nZVI@Misi were synthesised using different dopant metals, including
Ni, Cu, Zn, and Pd. Supported trimetallic nZVI@Misi was synthesised by doping Pd and Cu on
the surface of nZVI@Misi. Both supported bimetallic and trimetallic materials were prepared
using different Misi preparations, contents of dopants, and synthetic methods. All these
doped materials had higher reactivity than non-doped nZVI@Misi in removing nitrate. Misi
that was calcined and FeOOH-coated is the most optimised-prepared support. Moreover,
materials prepared via deposition method had higher reactivity in reducing nitrate than those
prepared via co-reduction method. This is due to the distribution of dopant metals on nZVI,
which was observed in TEM analysis. Of these materials, Ni-doped, Cu-doped, and Pd-Cu-
doped nZVI@Misi were the most promising materials. They not only reduced nitrate
effectively but also were not significantly affected by naturally occurring factors such as
oxygen, chloride, sulfate, carbonate, and phosphate. During nitrate reduction, the generation
of metal by-products was minimal. Interestingly, their reactivity in natural water was
relatively similar to that in lab-prepared samples.
The representative materials including supported Ni-doped, Cu-doped, and non-doped
nZVI@Misi, were used for heavy metal removal. These materials effectively removed
cadmium, lead, and chromium in both lab-prepared samples and natural water.

iii
Acknowledgements
There are a great many people who I would like to acknowledge for their help and support.
This thesis would not have been far from completion without their valuable contributions.
Above all else, I would like to express my thankfulness to my primary supervisor Associate
Professor Robin Fulton throughout this research project. Her guidance and support have been
incredibly valuable. I am very grateful for her dedicated supervision, generosity, patience, and
understanding.
I am extremely grateful to Dr. Robert Keyzers, my secondary supervisor. He has given me
advice and encouragement.
Similarly, my deepest gratitude goes to Dr. Putri Fraser. Her knowledge of nZVI materials and
willingness to answer questions was incredibly helpful in the early stages of my research on
nanomaterials.
I specially thank to Vietnam International Education Development (VIED) and Victoria
University of Wellington for providing me grant throughout my doctoral study. Without their
kindness assistance, this thesis would not have been done.
Thanks also to everyone in the School of Chemical and Physical Sciences. Specific mention
must go to David Flynn for his tireless help for training me on the electron microscopes. This
thesis would have been impossible without his contribution. I am extremely grateful to Dr.
Mathew Cairns for training me AAS. Without his significant support, it would have been
challenging for me to come to the end of my PhD journey. Thank you to all staffs at school for
their support and encouragement.
I would like to thank Water Research Group and Fulton/Coles group, especially Professor
Martyn Coles who has given insightful feedback throughout my project. Many thanks to
people in the group for all the help and assistance.
Thank you to my officemates who supported and encouraged me a lot.
A big thank you to my friends who helped me in writing and grammar and friends who
encouraged me during my journey. Without their friendship and support, I would have been
lonelier.
I am so grateful to all my family members. I am deeply appreciative of their love,
encouragement and constant loving support. None of this would have been possible without
you. This thesis is the only valuable present for my Mum.
Last but not least, I really appreciate members in the examination committee including
Professor Jim Johnston (Victoria University of Wellington - New Zealand), Dr Adam Hartland
(University of Waikato - New Zealand), Professor Subhasis Ghoshal (McGill University -
Canada) for their feedback and recommendations.
To you all, my love and thankfulness.

iii
Table of Contents
1. Introduction ........................................................................................................................................ 1
1.1. Nitrate .......................................................................................................................................... 2
1.1.1. Background of nitrate ........................................................................................................... 2
1.1.2. Methods for nitrate remediation .......................................................................................... 4
1.2. Heavy metals ................................................................................................................................ 5
1.2.1. Background of heavy metals ................................................................................................. 5
1.2.2. Methods for heavy metal removal ....................................................................................... 7
1.3. nZVI .............................................................................................................................................. 9
1.3.1. Background of nZVI ............................................................................................................... 9
1.3.2. Applications of nZVI ............................................................................................................ 12
1.3.2. Reduction of nitrate by nZVI ............................................................................................... 13
1.3.3. Removal of heavy metals by nZVI ....................................................................................... 14
1.4. Bimetallic nZVI and trimetallic (n)ZVI ........................................................................................ 15
1.4.1. Bimetallic Ni-nZVI ................................................................................................................ 16
1.4.2. Bimetallic Cu-nZVI ............................................................................................................... 19
1.4.3. Bimetallic nZVI of other metals ........................................................................................... 20
1.4.4. Trimetallic ZVI and trimetallic nZVI ..................................................................................... 21
1.5. Supported bimetallic nZVI .......................................................................................................... 23
1.5.1. Supported bimetallic Ni-nZVI .............................................................................................. 24
1.5.2. Supported bimetallic Pd-nZVI ............................................................................................. 26
1.5.3. Supported bimetallic of other metals ................................................................................. 27
1.6. Background of nZVI@Misi .......................................................................................................... 29
1.6.1. Properties of Misi600 .......................................................................................................... 29
1.6.2. Effect of Misi treatment on nZVI adsorption ...................................................................... 30
1.6.3. Effect of Misi treatment on nZVI reactivity towards nitrate reduction .............................. 31
1.7. Overview of thesis ...................................................................................................................... 31
1.7.1. Aim of the thesis ................................................................................................................. 31
1.7.2 Structure of the thesis ......................................................................................................... 33
2. Methods and instruments ................................................................................................................ 35
2.1. Methods ..................................................................................................................................... 35
2.1.1. Surface preparation ............................................................................................................ 35
2.1.2. Synthesis of bimetallic particles on Misi support ............................................................... 35
2.1.3. Synthesis of trimetallic particles on Misi support ............................................................... 40
2.1.4. Nitrate reduction ................................................................................................................ 44

iv
2.1.5. Elemental composition in materials ................................................................................... 46
2.1.6. Heavy metal removal .......................................................................................................... 46
2.1.7. Contaminant removal from lake water............................................................................... 47
2.1.8. Chemical analysis ................................................................................................................ 47
2.1.9. Characterisation of material method.................................................................................. 50
2.2. Instruments ................................................................................................................................ 51
2.2.1. Scanning electron microscopy ............................................................................................ 51
2.2.2. Transmission electron microscopy ..................................................................................... 53
2.2.3. X-ray diffraction .................................................................................................................. 54
2.2.4. Ion chromatography ........................................................................................................... 55
2.2.5. Atomic absorption spectroscopy ........................................................................................ 57
3. Determining the optimal dopant metals on nZVI@Misi in nitrate reduction .................................. 59
3.1. Introduction ............................................................................................................................... 59
3.2. Nitrate reduction using nZVI@Misi............................................................................................ 60
3.3. Bimetallic Ni-nZVI@Misi ............................................................................................................ 61
3.3.1. Variations on Misi preparation ........................................................................................... 62
3.3.2. Variations on Ni loading ...................................................................................................... 66
3.3.3. Variations on synthetic methods ........................................................................................ 68
3.3.4. Conclusion ........................................................................................................................... 85
3.4. Bimetallic Cu-nZVI@Misi ............................................................................................................ 85
3.4.1. Variations on Cu loading ..................................................................................................... 86
3.4.2. Variations on synthetic methods ........................................................................................ 88
3.4.3. Conclusion ......................................................................................................................... 101
3.5. Bimetallic Zn-nZVI@Misi .......................................................................................................... 101
3.5.1. Characterisation of Zn-nZVI@Misi .................................................................................... 102
3.5.2. Variations on Zn loading ................................................................................................... 103
3.5.3. Conclusion ......................................................................................................................... 106
3.6. Bimetallic Pd-nZVI@Misi .......................................................................................................... 106
3.6.1. Variations on Pd loading ................................................................................................... 107
3.6.2. Variations on synthetic methods ...................................................................................... 110
3.6.3. Conclusion ......................................................................................................................... 112
3.7. Trimetallic Pd-Cu-nZVI@Misi ................................................................................................... 113
3.7.1. Variations on Pd loading ................................................................................................... 113
3.7.2. Variations on synthetic methods ...................................................................................... 115
3.7.3. Conclusion ......................................................................................................................... 124
3.8. Conclusion ................................................................................................................................ 124

v
4. Nitrate reduction with optimised-doped nZVI@Misi ..................................................................... 125
4.1. Introduction ............................................................................................................................. 125
4.2. Nitrate reduction with bimetallic Ni-nZVI@Misi under anaerobic conditions ........................ 128
4.3. Nitrate reduction with bimetallic Cu-nZVI@Misi under anaerobic conditions ....................... 148
4.4. Nitrate reduction with trimetallic Pd-Cu-nZVI@Misi under anaerobic conditions ................. 158
4.5. Effect of reaction time and initial nitrate amount on nitrate reduction under anaerobic
conditions........................................................................................................................................ 166
4.5.1. Effect of reaction time ...................................................................................................... 166
4.5.2. Effect of initial nitrate amount.......................................................................................... 167
4.6. Conclusion ................................................................................................................................ 169
5. Effect of reaction conditions on nitrate reduction ......................................................................... 170
5.1. Introduction ............................................................................................................................. 170
5.2. Nitrate reduction under aerobic conditions ............................................................................ 172
5.3. Comparison of the reactivity of materials under anaerobic and aerobic conditions .............. 175
5.4. Determination of soluble metals during nitrate reduction ..................................................... 179
5.5. Effect of coexisting anions on nitrate reduction ...................................................................... 182
5.5.1. Effect of chloride on nitrate reduction ............................................................................. 183
5.5.2. Effect of sulfate on nitrate reduction ............................................................................... 185
5.5.3. Effect of carbonate on nitrate reduction .......................................................................... 188
5.5.4. Effect of phosphate on nitrate reduction ......................................................................... 191
5.5.5. Simultaneous effect of coexisting anions on nitrate reduction ........................................ 194
5.6. Conclusion ................................................................................................................................ 197
6. Nitrate reduction from lake water .................................................................................................. 199
6.1. Introduction ............................................................................................................................. 199
6.2. Lake Horowhenua .................................................................................................................... 200
6.3. Preliminary results of nitrate reduction from lake water ........................................................ 201
6.3.1. Nitrate reduction from lake water .................................................................................... 202
6.3.2. Nitrate reduction from lake water spiked with 10 ppm nitrate-N ................................... 203
6.4. Nitrate reduction from lake water ........................................................................................... 211
6.4.1. Nitrate reduction from lake water spiked with 10 ppm nitrate-N ................................... 211
6.4.2. Nitrate reduction from lake water spiked with 50 ppm nitrate-N ................................... 215
6.5. Determination of soluble iron during nitrate reduction from lake water ............................... 219
6.6. Conclusion ................................................................................................................................ 221
7. Heavy metal removal ...................................................................................................................... 222
7.1. Introduction ............................................................................................................................. 222
7.2. Cadmium removal by doped and non-doped nZVI@Misi ....................................................... 224

vi
7.2.1. Reactivity of doped and non-doped nZVI@Misi towards cadmium removal ................... 225
7.2.2. Determination of soluble metals in cadmium removal .................................................... 227
7.2.3. Elemental distribution of material after cadmium removal ............................................. 229
7.2.4. Conclusion ......................................................................................................................... 232
7.3. Lead removal by doped and non-doped nZVI@Misi ............................................................... 232
7.3.1. Reactivity of doped and non-doped nZVI@Misi towards lead removal ........................... 232
7.3.2. Determination of soluble metals in lead removal ............................................................. 234
7.3.3. Elemental distribution of nZVI@MisiCFeOOH after lead removal ................................... 237
7.3.4. Conclusion ......................................................................................................................... 238
7.4. Chromium removal by doped and non-doped nZVI supported on Misi .................................. 238
7.4.1. Reactivity of materials towards chromium removal ......................................................... 239
7.4.2. Determination of soluble metals in chromium removal ................................................... 241
7.4.3. Conclusion ......................................................................................................................... 242
7.5. Heavy metal removal from lake water .................................................................................... 242
7.5.1. Cadmium removal from lake water .................................................................................. 243
7.5.2. Lead removal from lake water .......................................................................................... 246
7.6. Conclusion ................................................................................................................................ 248
8. Summary and future work .............................................................................................................. 249
8.1. Summary .................................................................................................................................. 249
8.2. Future work .............................................................................................................................. 251
9. References ...................................................................................................................................... 252

vii
List of Tables
Table 1.1. Redox couples and E0 of nitrogen compounds in acidic and basic conditions 14
Table 1.2. Ni-nZVI systems reported 19
Table 1.3. Cu-nZVI systems reported 20
Table 1.4. Other systems reported 21
Table 1.5. Trimetallic ZVI and nZVI systems reported 23
Table 1.6. Supported Ni-nZVI reported 26
Table 1.7. Supported Pd-nZVI systems 27
Table 1.8. Supported bimetallic nZVI of other metals 28
Table 1.9. Chemical analysis of Misi 29
Table 1.10. Particle size analysis 29
Table 2.1. Material names and corresponding amount of metals salts added in M-nZVI@Misi
37
Table 2.2. Material names and corresponding amount of metals salts added in M1-M2-
nZVI@Misi 40
Table 2.3. Nitrate reduction under anaerobic and aerobic conditions 44
Table 2.4. Nitrate reduction in the presence of other ions 46
Table 2.5. Heavy metal removal 47
Table 3.1. List of Ni-nZVI@Misi systems synthesised 62
Table 3.2. Analysis of Ni-doped materials 80
Table 3.3. List of Cu-nZVI@Misi systems synthesised 86
Table 3.4. Analysis of Cu-doped materials 96
Table 3.5. List of Zn-nZVI@Misi systems synthesised 102
Table 3.6. List of Pd-nZVI@Misi systems synthesised 107
Table 3.7. List of Pd-nZVI@Misi systems synthesised 113
Table 3.8. Analysis of Pd-Cu-doped materials 119
Table 5.1. Phosphate concentrations during nitrate reduction in the presence of phosphate
194
Table 5.2. Phosphate concentrations during nitrate reduction in the presence of coexisting
anions 197
Table 6.1. The components of the sample collected from Lake Horowhenua 201

viii
Table. 6.2. Nitrite accumulation in nitrate reduction from lake water spiked with 10 ppm
nitrate-N under anaerobic conditions 213
Table. 6.3. Nitrite accumulation in nitrate reduction from lake water spiked with 10 ppm
nitrate-N under aerobic conditions 214
Table. 6.4. Nitrite accumulation in nitrate reduction from lake water spiked with 50 ppm
nitrate-N under anaerobic conditions 217
Table. 6.5. Nitrite accumulation in nitrate reduction from lake water spiked with 50 ppm
nitrate-N under aerobic conditions 218
Table 7.1. Nickel concentration in Cd(II) removal 228
Table 7.2. Lead concentration using MisiCFeOOH 234
Table 7.3. Nickel concentration in the removal of Pb(II) 20 ppm 235
Table 7.4. Nickel concentration in the removal of Pb(II) 40 ppm 236
Table 7.5. Chromium concentration using MisiCFeOOH 241
Table 7.6. Nickel concentration in Cr(VI) removal 242

ix
List of Figures
Figure 1.1. The structure of nZVI 11
Figure 1.2. Pathway of heavy metal removal by nZVI 15 Figure 2.1. Diagram showing the distribution of signals in SEM 52
Figure 2.2. Diagram showing the signals used for TEM 54
Figure 2.3. Diagram showing the interaction of X-rays with layers of atoms in a crystal 55
Figure 2.4. Diagram showing suppressed anion chromatography 56
Figure 2.5. Diagram showing atomic absorption experiment 58
Figure 3.1. Reduction characterisation of nZVI@Misi towards nitrate-N 10 ppm 61
Figure 3.2. COMPO images of 5%Ni-nZVI on: (a) MisiU, (b) MisiC, (c) MisiC-B and (d)
MisiCFeOOH synthesised via co-reduction method (MA) 63-64
Figure 3.3. COMPO images of (a) 5%Ni-nZVI and (b) nZVI 65
Figure 3.4. Reduction characterisation of Ni-nZVI on different preparations of Misi 66
Figure 3.5. COMPO images of (a) 2%Ni-nZVI@MisiC-MA and (b) 5%Ni-nZVI@MisiC-MA 67
Figure 3.6. Reduction characterisation of Ni-nZVI@MisiC on different Ni concentrations 68
Figure 3.7. COMPO images of (a) 5%Ni-nZVI@MisiC-MA, (b) 5%Ni-nZVI@MisiCFeOOH-MA, (c)
5%Ni-nZVI@MisiC-MB1, (d) 5%Ni-nZVI@MisiCFeOOH-MB1, (e) 5%Ni-nZVI@MisiC-MB2, (f)
5%Ni-nZVI@MisiCFeOOH-MB2 70
Figure 3.8. SEM-EDS mapping of 5%Ni-nZVI@MisiCFeOOH-MA 71
Figure 3.9. SEM-EDS mapping of nZVI@MisiCFeOOH 71
Figure 3.10. XRD spectrum of 5%Ni-nZVI@MisiCFeOOH-MA 72
Figure 3.11. TEM images in different magnifications of (a) and (d) 5%Ni-nZVI@MisiCFeOOH-
MA; (b) and (e) 5%Ni-nZVI@MisiCFeOOH-MB1; (c) and (f) 5%Ni-nZVI@MisiCFeOOH-MB2 73
Figure. 3.12. TEM-EDS spectrum of 5%Ni-nZVI@MisiCFeOOH-MA 74
Figure 3.13. TEM-EDS spectrum of 5%Ni-nZVI@MisiCFeOOH-MB1 74
Figure 3.14. TEM-EDS spectrum of 5%Ni-nZVI@MisiCFeOOH-MB2 75
Figure 3.15. TEM-EDS mapping of 5%Ni-nZVI@MisiCFeOOH-MA 76
Figure 3.16. TEM-EDS mapping of 5%Ni-nZVI@MisiCFeOOH MB1 77-78
Figure 3.17. TEM-EDS mapping of 5%Ni-nZVI@MisiCFeOOH-MB2 79

x
Figure 3.18. Reduction characterisation of 5%Ni-nZVI@MisiCFeOOH prepared via different
methods 82
Figure 3.19. Reduction characterisation of 5%Ni-nZVI@MisiC prepared via different methods
82
Figure 3.20. Nitrate reduction, ammonium production and mass balance by 5%Ni-nZVI@Misi
84
Figure 3.21. Nitrate reduction on different Cu loading contents 87
Figure 3.22. COMPO images of (a) 5%Cu-nZVI@MisiC-MA, (b) 5%Cu-nZVI@MisiCFeOOH-MA,
(c) 5%Cu-nZVI@MisiC-MB1, (d) 5%Cu-nZVI@MisiCFeOOH-MB1 88-89
Figure 3.23. TEM-EDS spectra of 5%Cu-nZVI@MisiCFeOOH-MA in different areas 90-91
Figure 3.24. TEM-EDS mapping of 5%Cu-nZVI@MisiCFeOOH-MA with low magnification 92
Figure 3.25. TEM-EDS mapping of 5%Cu-nZVI@MisiCFeOOH-MA with high magnification 93
Figure 3.26. TEM-EDS spectrum of 5%Cu-nZVI@MisiCFeOOH-MB1 94
Figure 3.27. TEM-EDS mapping of 5%Cu-nZVI@MisiCFeOOH-MB1 95
Figure 3.28. Reduction characterisation of 5%Cu-nZVI@MisiC prepared via different methods
97
Figure 3.29. Reduction characterisation of 5%Cu-nZVI@MisiCFeOOH prepared via different
methods 98
Figure 3.30. Nitrate reduction, ammonium production and mass balance by 5%Cu-nZVI@Misi
100
Figure 3.31. COMPO images of (a) 5% Zn-nZVI@MisiC and (b) 5% Zn-nZVI@MisiCFeOOH 103
Figure 3.32. Reduction characterisation of 5%Zn-nZVI@Misi on different Zn loadings 104
Figure 3.33. Nitrate reduction, ammonium production and mass balance by Zn-nZVI@Misi
105
Figure 3.34. COMPO images of (a) 0.5%Pd-nZVI@MisiCFeOOH-MA, (b) 1%Pd-
nZVI@MisiCFeOOH-MA, (c) 0.5%Pd-nZVI@MisiCFeOOH-MB1, (d) 1%Pd-nZVI@MisiCFeOOH-
MB1 108
Figure 3.35. Reduction characterisation of Pd-nZVI@MisiC-MA on different Pd contents 109
Figure 3.36. Reduction characterisation of Pd-nZVI@MisiCFeOOH-MA on different Pd
contents 110
Figure 3.37. Reduction characterisation of Pd-nZVI@Misi prepared via different methods
111

xi
Figure 3.38. Nitrate reduction, ammonium production and mass balance by 1%Pd-nZVI@Misi
112
Figure 3.39. COMPO images of (a) 0.5%Pd-nZVI@MisiCFeOOH-MC1 and (b) 1%Pd-
nZVI@MisiCFeOOH-MC1 114
Figure 3.40. Reduction characterisation of Pd-Cu-nZVI@MisiC-MC1 on different Pd loadings
115
Figure 3.41. COMPO images of 0.5%Pd-5%Cu-nZVI@MisiCFeOOH synthesised via different
methods (a) MAtri, (b) MC1, (c) MC2 and (d) MD 116
Figure 3.42. TEM-EDS spectrum of 0.5%Pd-5%Cu-nZVI@MisiCFeOOH-MC1 117
Figure 3.43. TEM-EDS mapping of 0.5%Pd-5%Cu-nZVI@MisiCFeOOH-MC1 118
Figure 3.44. Reduction characterisation of Pd-Cu-nZVI@MisiC prepared via different methods
120
Figure 3.45. Reduction characterisation of Pd-Cu-nZVI@MisiCFeOOH prepared via different
methods 121
Figure 3.46. Nitrate reduction, ammonium production and mass balance by 0.5%Pd-5%Cu-
nZVI@MisiC 123
Figure 4.1. Reduction characterisation of 5%Ni-nZVI@Misi towards nitrate- N 10 ppm under
anaerobic conditions 129
Figure 4.2. Reduction characterisation of 5%Ni-nZVI@Misi towards nitrate-N 10 ppm under
anaerobic conditions with high uncertainty after 5 minutes 130
Figure 4.3. Nitrite accumulation using 5%Ni-nZVI@Misi towards nitrate-N 10 ppm reduction
under anaerobic conditions 131
Figure 4.4. Nitrite accumulation using 5%Ni-nZVI@Misi towards nitrate-N 10 ppm reduction
under anaerobic conditions with high uncertainty after 5 minutes 132
Figure 4.5. Reduction characterisation of 5%Ni-nZVI@Misi towards nitrate-N 50 ppm under
anaerobic conditions 133
Figure 4.6. Nitrite accumulation using 5%Ni-nZVI@Misi towards nitrate-N reduction of 50
ppm under anaerobic conditions 135
Figure 4.7. Kinetics of nitrate reduction using 5%Ni-nZVI@MisiCFeOOH-MB1 under anaerobic
conditions 138
Figure 4.8. Kinetics of nitrate reduction using 5%Ni-nZVI@MisiCFeOOH-MB1 under anaerobic
conditions in different stages 139
xii
Figure 4.9. COMPO images of 5%Ni-nZVI@MisiCFeOOH-MB1 after nitrate-N reduction of: (a)
10 ppm and (b) 50 ppm 140
Figure 4.10. TEM images of 5%Ni-nZVI@MisiCFeOOH-MB1 after nitrate-N reduction of (a), (b)
10 ppm for 15 minutes and (c), (d) 50 ppm for 120 minutes 141
Figure 4.11. TEM-EDS spectrum of 5%Ni-nZVI@MisiCFeOOH-MB1 after reduction of 10 ppm
nitrate-N 142
Figure 4.12. TEM-EDS mapping of 5%Ni-nZVI@MisiCFeOOH-MB1 after reduction of 10 ppm
nitrate-N 144
Figure 4.13. TEM-EDS spectrum of 5%Ni-nZVI@MisiCFeOOH-MB1 after reduction of 50 ppm
nitrate-N 145
Figure 4.14. TEM-EDS mapping of 5%Ni-nZVI@MisiCFeOOH-MB1 after reduction of 50 ppm
nitrate-N 147
Figure 4.15. Reduction characterisation of 5%Cu-nZVI@Misi towards nitrate-N 10 ppm under
anaerobic conditions 148
Figure 4.16. Reduction characterisation of 5%Cu-nZVI@Misi towards nitrate-N 10 ppm under
anaerobic conditions with high uncertainty after 5 minutes 149
Figure 4.17. Nitrite accumulation using 5%Cu-nZVI@Misi towards nitrate-N 50 ppm reduction
under anaerobic conditions 150
Figure 4.18. Nitrite accumulation using 5%Cu-nZVI@Misi towards nitrate-N 10 ppm reduction
under anaerobic conditions with high uncertainty 151
Figure 4.19. Reduction characterisation of 5%Cu-nZVI@Misi towards nitrate-N 50 ppm under
anaerobic conditions 152
Figure 4.20 Nitrite accumulation using 5%Cu-nZVI@Misi towards nitrate-N 50 ppm reduction
under anaerobic conditions 156
Figure 4.21. COMPO images of 5%Cu-nZVI@MisiCFeOOH-MB1 after nitrate reduction of (a)
10 ppm and (b) 50 ppm 157
Figure 4.22. Reduction characterisation of 0.5%Pd-5%Cu-nZVI@Misi towards nitrate-N 10
ppm under anaerobic conditions with high uncertainty after 5 minutes 159
Figure 4.23. Nitrite accumulation using 0.5%Pd-5%Cu-nZVI@Misi towards nitrate-N 10 ppm
reduction under anaerobic conditions 160
Figure 4.24. Reduction characterisation of 0.5%Pd-5%Cu-nZVI@Misi towards nitrate-N 50
ppm under anaerobic conditions 161

xiii
Figure 4.25. Nitrite accumulation using 0.5%Pd-5%Cu-nZVI@Misi towards nitrate-N 50 ppm
reduction under anaerobic conditions 163
Figure 4.26. Reduction characterisation of 5%Cu-nZVI@MisiCFeOOH-MB1 and 0.5%Pd-5%Cu-
nZVI@MisiCFeOOH-MC1 towards nitrite-N 20 ppm under anaerobic conditions 164
Figure 4.27. COMPO images of 0.5%Pd-5%Cu-nZVI@MisiCFeOOH-MC1 after nitrate-N
reduction of (a) 10 ppm and (b) 50 ppm 166
Figure 4.28. Effect of reaction time on nitrate reduction under anaerobic conditions 167
Figure 4.29. Reduction characterisation of representative materials towards nitrate-N 100
ppm under anaerobic conditions 168
Figure 4.30. Nitrite accumulation using representative materials towards nitrate-N 100 ppm
reduction under anaerobic conditions 169
Figure 5.1. Nitrate reduction of 10 ppm nitrate-N under aerobic conditions 173
Figure 5.2. Nitrate reduction of 50 ppm nitrate-N under aerobic conditions 174
Figure 5.3. Nitrite accumulation in the reduction of 50 ppm nitrate-N under aerobic conditions
175
Figure 5.4. Nitrate reduction of 50 ppm nitrate-N under anaerobic and aerobic conditions
176
Figure 5.5. Nitrite accumulation in the reduction of 50 ppm nitrate-N under anaerobic and
aerobic conditions 178
Figure 5.6. Iron concentration in nitrate reduction of 10 ppm nitrate-N under aerobic
conditions 180
Figure 5.7. Iron concentration in nitrate reduction of 50 ppm nitrate-N under aerobic
conditions 180
Figure 5.8. Corrosion of materials under aerobic conditions 182
Figure 5.9. Effect of chloride on nitrate reduction and nitrate reduction in the absence of ions
under anaerobic conditions 184
Figure 5.10. Effect of chloride on nitrate reduction and nitrate reduction in the absence of
ions under aerobic conditions 184
Figure 5.11. Effect of sulfate on nitrate reduction and nitrate reduction in the absence of ions
under anaerobic conditions 186
Figure 5.12. Effect of sulfate on nitrate reduction and nitrate reduction in the absence of ions
under aerobic conditions 187

xiv
Figure 5.13. Effect of carbonate on nitrate reduction and nitrate reduction in the absence of
ions under anaerobic conditions 189
Figure 5.14. Effect of carbonate on nitrate reduction and nitrate reduction in the absence of
ions under aerobic conditions 190
Figure 5.15. Effect of phosphate on nitrate reduction and nitrate reduction in the absence of
ions under anaerobic conditions 192
Figure 5.16. Effect of phosphate on nitrate reduction and nitrate reduction in the absence of
ions under aerobic conditions 193
Figure 5.17. Effect of coexisting anions on nitrate reduction and nitrate reduction in the
absence of ions under anaerobic conditions 195
Figure 5.18. Effect of coexisting anions on nitrate reduction and nitrate reduction in the
absence of ions under aerobic conditions 196
Figure 6.1. Water sample in Lake Horowhenua 201
Figure 6.2. Nitrate reduction in lake water under anaerobic conditions 203
Figure 6.3. Nitrate reduction in lake water under aerobic conditions 203
Figure 6.4. Nitrate reduction in lake water spiked with 10 ppm nitrate-N without pH
adjustment under anaerobic conditions 204
Figure 6.5. Nitrite accumulation in nitrate reduction from lake water spiked with 10 ppm
without pH adjustment under anaerobic conditions 205
Figure 6.6. pH change in nitrate reduction from lake water spiked with 10 ppm without pH
adjustment under anaerobic conditions 206
Figure 6.7. Nitrate reduction in lake water spiked with 10 ppm nitrate-N without pH
adjustment under aerobic conditions 207
Figure 6.8. Nitrite accumulation in nitrate reduction from lake water spiked with 10 ppm
without pH adjustment under aerobic conditions 207
Figure 6.9. pH change in nitrate reduction from lake water spiked with 10 ppm without pH
adjustment under aerobic conditions 208
Figure 6.10. Nitrate reduction in lake water spiked with 10 ppm at initial pH 3 under anaerobic
conditions 209
Figure 6.11. Nitrate reduction in lake water spiked with 10 ppm at initial pH 3 under aerobic
conditions 209

xv
Figure 6.12. pH change in nitrate reduction from lake water spiked with 10 ppm at initial pH
3 under anaerobic conditions 210
Figure 6.13. pH change in nitrate reduction from lake water spiked with 10 ppm at initial pH
3 under aerobic conditions 211
Figure 6.14. Nitrate reduction in lake water spiked with 10 ppm under anaerobic conditions
212
Figure 6.15. Nitrate reduction in lake water spiked with 10 ppm under aerobic conditions
214
Figure 6.16. Nitrate reduction in lake water spiked with 50 ppm under anaerobic conditions
216
Figure 6.17. Nitrate reduction in lake water spiked with 50 ppm under aerobic conditions
218
Figure 6.18. Iron concentration in nitrate reduction from lake water spiked with 10 ppm under
aerobic conditions 220
Figure 6.19. Iron concentration in nitrate reduction from lake water spiked with 50 ppm under
aerobic conditions 221
Figure 7.1. Removal characterisation towards Cd(II) 226
Figure 7.2. Iron concentration in the removal of Cd(II) 20 ppm 228
Figure 7.3. Cadmium and iron concentrations using 5%Ni-nZVI@MisiCFeOOH-MA 229
Figure 7.4. TEM-EDS spectrum of nZVI@MisiCFeOOH after Cd(II) removal 230
Figure 7.5. TEM-EDS mapping of nZVI@MisiCFeOOH after Cd(II) removal 231
Figure 7.6. Iron concentration in the removal of 20 ppm Pb(II) 235
Figure 7.7. Iron concentration in the removal of 40 ppm Pb(II) 236
Figure 7.8. TEM-EDS spectrum of nZVI@MisiCFeOOH after Pb(II) removal 237
Figure 7.9. TEM-EDS mapping of nZVI@MisiCFeOOH after Pb(II) removal. 238
Figure 7.10. Removal characterisation towards Cr(VI) 240
Figure 7.11. Cadmium concentration in the removal of Cd(II) in lake water spiked with 20 ppm
under anaerobic conditions 243
Figure 7.12. Iron concentration in the removal of Cd(II) in lake water spiked 20 ppm under
anaerobic conditions 244
Figure 7.13. Cadmium concentration in the removal of Cd(II) in lake water spiked with 20 ppm
under aerobic conditions 245

xvi
Figure 7.14. Iron concentration in the removal of Cd(II) in lake water spiked 20 ppm under
aerobic conditions 246
Figure 7.15. Iron concentration in the removal of Pb(II) in lake water spiked with 20 ppm under
anaerobic conditions 247
Figure 7.16. Iron concentration in the removal of Pb(II) in lake water spiked with 20 ppm under
aerobic conditions 247

xvii
List of Abbreviations
AAS Atomic Absorption Spectroscopy
ADF Annular Dark-Field
BF Bright-Field
COMPO Composite image
EDS Energy Dispersive X-ray Spectroscopy
EPA Environmental Protection Agency
HEPES 4-(2-hydroxyethyl)-1-piperazineethanesulfonic acid
IC Ion Chromatography
Misi Microsilicate600
MisiC Calcined Misi
MisiCFeOOH Calcined/FeOOH-coated Misi
MO Methyl Orange
ND No detection
nZVI Nano Zero-Valent Iron
PCBs Polychlorinated biphenyls
ppm parts per million
SEM Scanning Electron Microscope
SS Starch and Sodium citrate
STEM Scanning Transmission Electron Microscope
TCE Trichloroethylene
TEM Transmission Electron Microscope
UV-Vis Ultraviolet/Visible Spectroscopy
WHO World Health Organisation
w/w weight/weight
XPS X-ray photoelectron spectrometer
XRD X-ray diffraction
ZVI Zero-valent iron

1
1. Introduction
The pollution of nitrate and heavy metals is a significant concern. Due to their toxicity, heavy
metals and high nitrate concentration damage human health, organisms, and ecosystems. As
such, several methods have been developed to remediate these compounds from the
environment. Each method has both advantages and disadvantages, depending on the
concentrations of contaminants and reaction conditions.
Nano zero-valent iron (nZVI) has been considered an effective agent to reduce nitrate and
heavy metals. nZVI provides more active sites and high reactivity than bulk or micro size
materials. Unfortunately, due to its nano size, nZVI causes bio-accumulation and
agglomeration. In order to minimise the environmental issue and maximise the activity of
nZVI, it is crucial to adsorb nZVI onto non-toxic supports. These non-toxic supports optimise
the distribution of nZVI particles, which helps maintain a large surface area, and minimise
bioaccumulation. One of the best-documented supports is silicates which are low-cost and
environmentally friendly. Research in the Fulton group has shown that microsilicate600
(Misi), a by-product of geothermal generation, can be used to support nZVI.1 This material is
capable of removing nitrate from water.
An efficient way to increase the reactivity of nZVI is doping it with other metals to generate
bimetallic2-3 and trimetallic materials.4-5 These materials are more reactive due to the catalytic
role of dopant metals.2, 6 In the current research project, a variety of metals were used to
dope on nZVI@Misi, forming supported bimetallic (M-nZVI@Misi) and trimetallic (Pd-Cu-
nZVI@Misi) materials. Variables in these studies included different dopant metals, dopant
concentrations, and synthetic methods. The morphology, shape, composition, and elemental
distribution of the resulting materials were examined. Additionally, the capacity of these
materials towards nitrate reduction and heavy metal removal was investigated.

2
1.1. Nitrate
1.1.1. Background of nitrate
Nitrate is one of the most common inorganic ions in groundwaters and surface waters. In
groundwaters, nitrate persists for decades, increasing in concentration due to the increasing
application of nitrogen on land.7 Due largely to its high solubility, nitrate is easily transported
into groundwaters. Nitrate comes from a number of different sources. These include
agricultural activities,8 industrial wastewater, food processing, decomposition of dairy and
meat products,9 septic tanks,9-10 refuse dump, erosion of natural deposits,11 discharge from
treatment systems of domestic sewage,12 and decomposition of organic matter.9, 12 Of these,
the main source of nitrate is from agriculture such as irrigation and runoffs from farmlands.
The abundant use of chemical fertilizers, uncontrolled discharge of wastewater, concentrated
animal feeding, and animal waste is a major contributor of residual nitrate in the
environment. For example, in a report about nitrate pollution in California’s agricultural areas
(2012), 96% of nitrate is from agriculture, only 4% of nitrate comes from other sources such
as water treatment plants, food processing, and septic systems.13
Nitrate can also be produced by the process of decomposition of wastes from the food
industry or household use which contain inorganic and organic nitrogen substances. In
addition, as an essential part of the natural nitrogen cycle, nitrate is always found in soil and
water as the final product of nitrification processes.14 Although fertilisers might not always be
nitrate-based, ammonia/ammonium is readily converted into nitrite and then nitrate by
nitrosomas bacteria and nitrobactor bacteria in the ground.15
As far as human health is concerned, nitrate at elevated concentrations causes skin rashes
and hair loss.13 It can also cause abdominal pains, diarrhea and vomiting.12 High levels of
nitrate compete with iodine uptake, leading to an increase in thyroid volume and the
possibility of thyroid disorders.16-18 In the human body, oral bacteria convert nitrate into
nitrite, which causes more severe health problems. For instance, nitrite reacts with Fe(II) in
hemoglobin to form methhemoglobin which cannot bind to oxygen. This leads to low oxygen
levels in the blood and causes methemoglobinemia (blue baby syndrome), especially in
infants under six months.11 Nitrite also reacts with stomach acid and amine/amide functional
groups in protein to form nitrosamine compounds that are known to be carcinogenic,

3
teratogenic, and mutagenic.9 Thereby, nitrate is one of the health concerns that need to be
remediated to the guideline value of safe waters proposed by the United States
Environmental Protection Agency (U.S. EPA) and the World Health Organization (WHO).
According to U.S. EPA, the maximum contaminant level of nitrate for drinking water is 45 mg/L
NO3- (10 ppm nitrate-N).11 This amount is 50 mg/L NO3
- (11.3 ppm nitrate-N), as set by WHO.19
Nitrate and phosphate are necessary nutrients for algae. However, if the amount of these two
substances is high, it causes eutrophication, endangering aquatic life.20-21 The eutrophication
accompanied by extensive algal blooms causes the deterioration of the water quality which
represents a serious threat to the ecosystems.22-23 Algal blooms not only limit light
penetration but also increase the concentration of suspended particles. The lack of sunlight
decreases the quality of photosynthetic processes, along with the destruction of benthic
habitat. When the algae die, the decomposition of dead algae consumes oxygen, thus
reducing the amount of dissolved oxygen in water. The water is then unable to support fish
and shellfish. In addition, some algal blooms have toxins or harmful metabolites that may
poison and/or kill aqueous wildlife, and other animals drinking these water sources.23
Nitrate pollution has become an environmental problem in many countries given that it is a
widespread contaminant to both groundwaters and surface waters. In Europe, the water in
some regions does not meet the Europe standards of nitrate despite the implementation of
legislation to prevent nitrates leaching from agriculture. For example, a report in 2010 shows
that 15% of groundwater monitoring stations and 3% of surface stations still had nitrate
concentrations above the WHO limit for the drinking water quality standard.24 In Asian
countries, the problem of nitrate pollution in Asia is even worse. In the Philippines and
Thailand, 30% of the groundwater wells were reported to have higher nitrate levels than the
WHO nitrate standard for drinking water, and up to three times greater in some areas.25

4
New Zealand is an agricultural country in which forestry, produce, and cattle and poultry
products are the most popular. Thus, fertilizers and livestock waste are the primary sources
of nitrogen leaching. From 1990 to 2012, the amount of nitrogen leached from agriculture
has increased by 28.6%.26 In 1990, sheep farming accounted for more than 50% of nitrogen
leaching, followed by dairy cattle (24%), beef cattle (21%), and fertilizers (4%). By 2012, dairy
cattle were the main source of nitrogen leaching with a contribution of 36%, followed by
sheep (27%), fertilizers (19%), and beef cattle (15%). In a report (2019) about nitrate-N
leached from livestock, from 1990 to 2017, the amount of nitrate-N leaching increased by
10,000 tonnes (5.3%).27 By 2017, dairy cattle contributed 65% nitrate-N leaching, followed by
beef (19%) and sheep (15%). Fortunately, although there has been an increase in algae
blooms across New Zealand, such nitrogen leaching has limited effect on New Zealand
drinking water as a separate report (2017) showed that only 13% of the sites monitored have
nitrate levels above the WHO limit for drinking water standard.28
1.1.2. Methods for nitrate remediation
Given the problem of excess nitrate on the environment and living creatures, several common
techniques have been developed to remove nitrate from soil and waters. These include ion
exchange, reverse osmosis, adsorption, biological denitrification, and chemical reduction. In
ion exchange, a column that is modified from macro-porous structure resin is used to
exchange nitrate.9, 29-30 Nitrate is absorbed on the column and then NaCl solution as the
regenerant is applied to elute nitrate from the column. Ion exchange is technically simple and
cost-effective.31 However, this method produces water with high total dissolved solids and
the treatment of excess regenerant is potentially necessary.
In reverse osmosis, nitrate is removed by reversing the normal water flow under pressure
through membranes.32 This method is effective to apply for water desalination. However, one
particular drawback of this method is that the membranes used in reverse osmosis easily get
damaged by organic matter, both suspended and colloidal particles in samples.33 Thus, pre-
treatment of samples is necessary prior to nitrate removal.
In the adsorption method, nitrate is removed by adsorbents that are derived from bio-
bamboo powder charcoal or activated carbon in the form of micrometer scale.34 The removal
efficiency can be increased by heating the adsorbent materials before use and conducting

5
process at low temperature. The adsorption method is cost-effective, convenient,35 and
feasible to apply for in situ treatment of underground and surface waters.34
In biological denitrification method, carbon sources are used to supply energy for bacteria to
convert nitrate into final product of nitrogen gas. This process may undergo four steps, during
which intermediates are generated. These intermediates can be nitrite, nitric oxide, and
nitrous oxide or a combination of more than one. There have been numerous studies on bio-
denitrification using different carbon supplying sources such as woodchip,36 natural organic
solid substrates,37-38 newspaper,39 and sugar, or glucose syrup.40 The major benefit of the
denitrification method is that under optimal conditions, the final product is non-toxic nitrogen
gas.36, 39 Unfortunately, bacteria and organic sources remaining during this removal process
are dangerous to drinking water.41 It is also difficult to maintain the biological process at
optimum conditions.34 Another drawback of the denitrification method is that it can be
sensitive to temperature and oxygen levels.36
In chemical reduction method, zero valent metals have been used as reducing reagents, such
as bulk Fe(0),42 microsized Fe (ZVI),10, 43-45 Cd(0),46 and Mg(0)47. The introduction of nano-sized
particles increases the efficiency significantly due to the increase in surface area; as the
particle size decreases, the ratio of surface to volume increases.48 One of the most prominent
examples with considerable potential benefits due to more active sites and higher reactivity
is nanoscale zero-valent iron (nZVI).49-50 This will be discussed in detail in 1.3.
1.2. Heavy metals
1.2.1. Background of heavy metals
There is no chemically complete definition of heavy metals. Heavy metals are typically defined
as any elements with a density of greater than 5 g/cm3, although this is a rough guideline.51
Heavy metals include toxic heavy elements such as cadmium, lead and mercury, but also
biologically important metals such as zinc. Heavy metal contamination can be from either
natural sources or industrial and agricultural waste sources. The erosion of natural deposits
release heavy metals.11 In industry, heavy metals are released from factories that
manufacture metal products, glass, electronic products, batteries, and paints, etc.11 In
agriculture, heavy metals are from runoffs from landfills and croplands as well as the use of
commercial fertilizers.52 In New Zealand, the application of superphosphate, which contains

6
cadmium impurities, has resulted in increasing cadmium levels in soils.53 Every 20 kg
phosphorus/ha is applied, an application of 8.87 g cadmium/ha is assumed in the top of 2.5
cm soil. This would result that the concentration of cadmium increases by 0.04 ppm/year.
Heavy metals, particularly lead, can also come from the corrosion of household plumbing
systems.11 In New Zealand, the use of lead in household paints was only started to be phased
out in the 1960’s.54
Heavy metals are toxic and persistent in the environment.55 In contrast to organic substances
or other inorganic ions, heavy metals are non-biodegradable to form harmless end products.
In living organisms, heavy metals are unlikely to be completely consumed or removed by any
biological processes in the organisms. Thereby, heavy metals accumulate up to the food
chain.56
Some heavy metals are crucial for biological functions. A number of enzymes or bioactive
complexes contain heavy metals such as zinc, manganese, nickel, copper, and iron, and thus
the presence of heavy metals is important in maintaining biochemical processes.51 For
example, zinc is found in several enzymes, including carbonic anhydrase which is responsible
for the interconversion of carbon dioxide and biocarbonate.57 Copper is found in redox
proteins which are responsible for transportation of electron or oxygen or in enzymes which
act as oxidases to catalyse the reactions of oxidation-reduction.58 Iron plays a role of carrying
oxygen to the tissues from the lungs.59 Many of these biologically important heavy metals
cause problems at higher concentrations.55 For instance, a high concentration of zinc results
in some health issues such as stomach problems, skin irritations, vomiting, anaemia, the
disorder of metabolism, depression, and malaise.60 Too much copper results in accumulation
in the kidneys, brains, and eyes. Wilson disease is a condition in which the body cannot
regulate copper; as such, it results in a build-up of copper.11
In contrast to zinc, iron, and copper, lead does not play any functions in biological systems.51
It accumulates progressively and has multi-toxicity pathways. It can damage the nervous and
reproductive systems and kidney.61-62 It can also cause many problems to other organs such
as liver and brain.62 One of the molecular targets of lead is the Amino Levulinic Acid
Dehydratase (ALAD) protein, which is involved in the biosynthetic pathway of hemoglobin;63
hence, anaemia is one of the symptoms of lead poisoning. In addition, the presence of lead
limits the amount of antioxidants, damaging living cells and causing oxidative stress.55

7
Cadmium is another toxic heavy metal, although the targets of cadmium are different to that
of lead. Exposure to cadmium results in damage to kidneys,11, 60 livers,60-61 and lungs60 as well
as bone degradation and renal dysfunction.61
With regards to chromium, the oxidation state is important. At low levels, Cr(III) is an essential
nutrient, potentiating the action of insulin.64 In contrast, Cr(VI) is highly toxic to humans and
animals and known as a potential carcinogenic factor.65-66 Cr(VI) also causes allergic
dermatitis.11
Heavy metals can damage human and livestock drinking water and irrigation water.67 In
addition, heavy metals in polluted irrigation water can be transferred to agricultural fields and
then accumulate in the soil. Due to their non-degradability, mobility and toxicity, heavy
metals need addressing urgently by using methods with high efficiency and environmental
friendliness.
1.2.2. Methods for heavy metal removal
Numerous investigations on heavy metal removal have been reported. They include chemical
precipitation, ion exchange, adsorption, membrane filtration, and nanotechnology. Of these,
chemical precipitation is the method that has been most commonly used in industry due to
its effectiveness and low-cost operation.68 In this method, heavy metals react with chemicals
to form insoluble substances. The resulting precipitates are then discarded from the solutions
by sedimentation or filtration processes. Typically, the chemicals used include alkaline
solutions such as Ca(OH)269-70, NaOH,70 and sulfide solutions.71 However, the use of Ca(OH)2
causes either numerous secondary precipitates or stable complexes, which leads to a
significant de-stabilisation of the primary heavy metal precipitates.69 In order to enhance the
precipitation, fly ash is sometimes used as seed material to increase the size of hydroxide
precipitates.72 Another way to enhance the precipitation is using coagulants such as
aluminum sulfate, polyalumium chloride, and magnesium chloride.73 Heavy metals are also
removed by chelating precipitation. Many chelates, including dipropyl dithiophosphate74 and
potassium ethyl xanthate,75 were used to form insoluble chelating complexes. This method is
simple and inexpensive, but it is only suitable for the removal of high concentrations of heavy
metals such as lead, cadmium, copper, and mercury.

8
In the ion exchange method, cations in the resin exchange with heavy metals in wastewaters.
The cation exchange resin is made of synthetic or natural solid. The synthetic cation exchange
resins typically contain a sulfonic acid group that can exchange protons and metals.76-78 A
common natural resin is a zeolite which can exchange cations such as Na(I), K(I) and Ca(II) and
heavy metals.79-81 Ion exchange is selective given that using this method, all ions can be
removed or substances are separated.82 However, ion exchange has drawbacks such as high
operational cost and the disposal of the residual metal sludge.83
In the adsorption method, carbon is usually used as an adsorbent to remove heavy metals.
Adsorption is considered an effective and low-cost method.84 It can operate with flexibility in
design and adsorbents can be regenerated. Yet, this method is only effective when the
concentrations of heavy metals in wastewater are low. In this method, carbon materials such
as activated carbon,85-86 or carbon nanotubes87-88 can be used as adsorbents. Due to the high
cost of activated carbon, natural substances, and metallurgical waste have alternatively been
used as adsorbents such as kaolin,89 kaolinite90-92 montmorillonite, goethite, humic acid,92-94
bentonite,95 bauxite,96 fly ash,97 diatomite98, and zeolite.99 Bio-adsorbents have also been
considered promising materials. These can be derived from algal biomass100-101 or microbial
biomass such as bacteria102-103 and fungi.104-105 Theoretically, using bio-sorbents is a cost-
effective and rapid way to treat heavy metals, but it is difficult to remove bio-sorbents and
desorb heavy metals afterward.
Membrane filtration is a method in which heavy metals are removed by the formation of
metal-polymer complexes directly in the membrane. The polymers in the membranes are
made of high-molecular-weight substances with carboxylic or amine groups, which bind to
metal ions.106 These polymers can be used in several different processes including
ultrafiltration,106 reverse osmosis,107 and nanofiltration.108-110 The membrane filtration is
effective, but expensive and complicated to operate.
ZVI is a versatile substance that can act in different roles.111 It can be a reductant via Fe(0) and
Fe(II) on the surface. It can be an adsorbent via FeOOH layer or a coagulant via the dissolution
of Fe(0) on the surface to form Fe(II). Therefore, ZVI has been used to remove heavy metals.65,
112-113 Although using ZVI is an effective way, the removal of ZVI is significantly improved when
it is in nano scale. For example, when the removal of Pb(II) was carried out in the same
conditions, nZVI removed Pb(II) 12 times faster than macro size Fe(0).114

9
Nanotechnology has been used to remove heavy metals. In this method, nanosized
substances are used as the adsorbent or reductant to remove heavy metals. This includes
nanostructured graphite oxide, silica/graphite oxide composites, and silica nanoparticles.115
Zero-valent iron nanoparticles (nZVI) are widely used as reductants.116-117
1.3. nZVI
1.3.1. Background of nZVI
Zerovalent iron Fe(0) is a mild reducing agent that can reduce oxidative contaminants
effectively. The surface area of Fe(0) particles has an important effect on their reactivity
because the higher the surface area is, the more reactive these particles get.14, 118 For
example, when the surface area of Fe increased from 1.8 m2/g to 4.9 m2/g, the removal
capacity of Fe towards trichloroethylene (TCE) increased from 0.311 mg/g to 0.887 mg/g.14 In
order to increase the number of the active site of Fe, several methods have been used,
including hydrogen reduction,14, 119 acid washing,14, 120 and ultrasound.121 The goal of these
methods is to destroy the deactivated layers and prevent the formation of oxide layers on the
surface of ZVI. For example, at the same reaction conditions, the nitrate reduction increased
from 45% to 99% when the ultrasonic bath was used.121 However, even though one or more
than one of these methods were applied to treat ZVI, the surface area of ZVI (<1 m2/g) was
significantly smaller than that of commercially available nanosized Fe (7 - 60 m2/g).122
Over the past decades, nanosize Fe(0), referred to as nano zero valent iron (nZVI), has gained
much attention due to its promising approach in environmental remediation. nZVI was firstly
introduced in contaminant remediation in the late 20th century.49, 123 It has widely been used
to remove both organic and inorganic substances. The increasing application of nZVI is due to
the nanoscale properties such as size and surface area that contribute to higher adsorption
capacity and reactivity. The majority of nZVI particles are in the size 50 - 100 nm.124 Compared
to the micro size Fe(0), nZVI maximises surface area and provides more active sites for
contaminants adsorbing or forming complexes.41 This results in increasing the reaction rate
of contaminant removal.49, 124-125 For example, the surface area of nZVI and commercial iron
powder was 33.5 m2/g and 0.9 m2/g; thus, the rate constant of TCE removal or polychlorinated
biphenyls (PCBs) using nZVI was 10 - 100 times greater than using Fe powder.49 In another

10
study, the surface area for nZVI and ZVI was 16.67 m2/g and 0.56 m2/g, respectively;
therefore, nZVI reduced nitrate 40 times faster than ZVI.126
Typically, nZVI has a spherical shape and tends to aggregate to form clusters due to its
magnetic nature.127 nZVI has a core-shell structure with a Fe(0) core surrounded by an iron
oxide/hydroxide shell (Figure 1).48, 124, 128 The core acts as the electron donor and provides
reducing power for reactions while the shell maintains sites for the adsorption of
contaminants. Reported literature on the composition of the shell has been complicated. Li
et al. reported that the shell consisted of the mixed valence iron oxides and that the shell
composition depends on the fabrication processes and surrounding media.48 For example,
when nZVI was produced by supersaturated metal vapour in a hollow cathode, the
nanocrystalline oxide shell consisted of either maghaemite (γ-Fe2O3) or magnetite (Fe3O4).129
When nZVI was generated using the hydrogen reduction of goethite, only magnetite (Fe3O4)
was observed in the shell.130 For the nZVI prepared using the reduction of sodium borohydride
with iron ions, there have been several investigations of the composition of the shell. For
example, in Liu et al.‘s study, the shell contained magnetite (Fe3O4).131 However, Sun et al.
reported that wustite (FeO) was the component in the shell.132 In other studies, the shell was
the combination of iron oxide and hydroxide.124, 128 As such, the nature of the shell is still not
well-understood.
A study by Kim et al., investigated how modified nZVI ages when it was exposed to air and
water.133 In this study, modified nZVI was initially prepared by exposing nZVI to air (4 - 50
ml/minute) for 24 hours or to the atmosphere in 5 minutes to form shell-modified nZVI and
rapid-oxidised nZVI. Shell-modified nZVI comprised around 60% Fe(0) and around 40%
magnetite (Fe3O4). A small amount of goethite (1 - 3%) was observed when shell-modified
nZVI was produced at high contact rate of air (from 20 mL/minute). However, rapid-oxidised
nZVI had lower Fe(0) and there were three iron oxides, consisting of 20% Fe(0), 21% wustite
(FeO), 20% hematite (α-Fe2O3), and 19% maghaemite (γ-Fe2O3). When shell-modified nZVI
was aged in water (one day), goethite (α-FeOOH) was newly formed. When shell-modified
nZVI was aged in ambient air (one month), both hematite (α-Fe2O3) and maghemite (γ-Fe2O3)
were newly formed.

11
Figure 1.1. The structure of nZVI.48, 134
The oxide/hydroxide shell of nZVI has both advantages and disadvantages. The function of
the shell was reported although the mechanism of the interaction between the shell and
contaminants was not clear. In the removal of contaminants via adsorption, the shell supplies
the reactive sites for contaminants to adsorb on its surface.135 136-137 In the removal of
contaminants via reduction, the shell functions as the sites for the initial adsorption and then
contaminants are reduced by the Fe(0) core.134 In contrast, the surface of the shell is a layer
that can interfere with electron transfer as the shell encapsulates nZVI core.134 Among
compositions of the shell, magnetite (Fe3O4) did not affect electron migration due to its
conductive property whereas lepidocrocite (-FeOOH) limited the electron transfer.138
However, in the presence of Fe(II), lepidocrocite (-FeOOH) can be transformed to magnetite
(Fe3O4) (eq. 1.1).
There are two major routes to prepare nZVI. The first route is to transform Fe substances into
nZVI using hydrogen reduction, electrochemical method, and arc discharge. In the hydrogen
reduction method, a stable flow of hydrogen is used to reduce goethite (FeOOH) at high
temperature (250 - 650⁰C) for 6 hours.139 The electrochemical method is a combination of
electrochemistry and ultrasonic methods in which nZVI is formed by the reduction of Fe(III) in
the cathode with the support of the stabiliser (platinum).140 In the arc discharge method, a
current of electricity goes through water-submerged iron electrodes and then the electrodes
are evaporated.141 The cooled metal vapor forms nZVI.
In the second route, iron ions are reduced using chemical reagents. In the green synthetic
method, nZVI is formed by polyphenolic extracts from leaves reacting with iron ions.142 A
Fe(0)
iron oxides/hydroxides shell

12
common way that has been used to synthesise nZVI in many laboratories involves the
reduction of iron ions with borohydride salts.49, 143 Although borohydride compounds are
costly, their use for synthesising nZVI is less time-consuming. Under an atmosphere of
nitrogen gas or argon, ferrous or ferric are typically reduced by either sodium borohydride or
potassium borohydride to form nZVI, boric acid and hydrogen gas (eq. 1.2 and eq. 1.3).144-146
The reaction can be carried out in deionised water or a mixture of ethanol and deionised
water.
The size and surface area of nZVI particles synthesised is strongly influenced by many factors
such as precursor concentrations of iron solutions, solvents and dispersion agent in iron
solutions, and the addition rate of reducing agents. Low concentrations of iron solutions
produce small nZVI. For instance, when the same amount of FeCl3 in different concentrations
of 0.01 M or 0.5 M were used, the average size of nZVI was 9.5 nm and 45 nm, respectively.145
The surface area of nZVI is also affected by solvent and dispersion agent. The presence of
ethanol as a co-solvent and polyethylene glycol (PEG) as a dispersant reduced the
agglomeration147-148 and produced particles with uniform size and shape distribution.148
Hwang et al. reported that an increase in the addition rate of BH4- produces smaller
nanoparticles. For example, when the reductant delivery rates went from 2 mL/minute and
20 mL/minute, the particle size decreased from 87.4 nm to 9.5 nm.149 This was explained that
in case of high injection of BH4-, nZVI nuclei had fewer opportunities to form and grow due to
the fast reduction. The rate of reductant addition also affects the shape of nZVI. For example,
spherical particles were formed under slow injection of the reductant (2 mL/minute) while
particles were non-spherical and scattered under fast injection (20 mL/minute).149
1.3.2. Applications of nZVI
Over the past 20 years, nZVI has been considered as a new tool for treating contaminants in
water and soil. Given that nZVI is available, easy to synthesise, and environmentally friendly,
it can be applied to remove both organic and inorganic substances. Typically, nZVI has been
used for dechlorination of substances such as TCE,49, 150 PCBs,49, 151 polybrominated diphenyl
ethers,151 tetrachloroethene,152 and chlorinated methanes.153 In addition, nZVI has been also
used for heavy metal remediation.154-155 The first report of nZVI for nitrate reduction was

13
published in 2000.156 Since then, several more studies on the reactivity, kinetics, and
pathways of nitrate reduction using nZVI have been carried out.41, 157-158
Despite its numerous applications, nZVI has potential drawbacks. nZVI can be hazardous to
organisms,159 and might cause environmental risks. The cytotoxicity of nZVI with organisms
proceeds via two pathways, including physical damage and biochemical destruction.160 The
former includes the destruction of the cell membrane integrity and enhancement of the
permeability of membranes. The latter consists of the decomposition of protein functional
groups, competition with respiration as well as damage of DNA and protein due to the
production of reactive oxygen species from the nZVI corrosion. Moreover, when nZVI adsorbs
and accumulates on the root surface of plants, it can influence the water and nutrient uptake,
inhibiting the growth of plants.161 nZVI can persist in biological systems and cause long-term
effect due to its low solubility.122 Other concerns of nZVI are its stability and storability. Due
to the magnetic and electrostatic forces of nZVI particles, they tend to agglomerate to forms
larger particles.127, 162 This results in a decrease in surface areas (active sites) for contaminant
adsorption and reduction. In addition, given its high reactivity, nZVI is also oxidised by non-
target compounds to form a thicker layer of oxides and hydroxides on the surface.134
1.3.2. Reduction of nitrate by nZVI
The standard reduction potential of iron (Fe(II)/Fe) is E0 = -0.44 V.48 The reduction potential
values of nitrate/N-products are different and more significantly positive than the reduction
potential of Fe(0) (Table 1.1).163-164 Fe(0) can reduce nitrate to potentially form a variety of
products, depending on reaction conditions. Of these, four main N-containing products,
including nitrite (NO2-), nitrous oxide gas (N2O), nitrogen gas (N2), and ammonium (NH4
+) can
be formed (Scheme 1.1). Nitrite is toxic to humans while nitrous oxide is a greenhouse gas
which contributes to global warming. Dinitrogen gas is non-toxic and the ideal product.
Ammonium is less mobile than nitrate due to its adsorption capacity in the soil but it can
undergo nitrification back to nitrite and then nitrate. As such, if ammonium is not trapped, its
formation only temporarily removes nitrogen from the water. Typically, ammonium is
reported as the predominant final product in the nZVI reduction of nitrate.145, 165-167

14
Scheme 1.1. Common nitrate reduction products and their oxidation states.
Table 1.1. Redox couples and E0 of nitrogen compounds in acidic and basic conditions.
Redox couple Condition E0 (V)
NO3−/NO2
- acidic +0.49
NO3−/N2 acidic +1.25
NO3−/NH4
+ acidic +0.88
NO3−/N2 basic +0.43
NO3−/NH3
basic -0.01
1.3.3. Removal of heavy metals by nZVI
nZVI removes heavy metals via different pathways, depending on their reduction potential.
These pathways include adsorption, complex formation, reduction, or a combination of these
(Figure 1.2).116 Typically, metals that have reduction potential close to that of iron adsorb on
the surface of the iron or form complexes with iron. In aquatic systems, the adsorption
depends on solution chemistry such as pH due to its effect on the charge of iron oxides. For
example, at high pH, iron oxides are negatively charged, resulting in complexes with cations
such as Zn(II) and Cd(II).116, 154 nZVI is also used to remove AsO2- via the adsorption even
though the reduction potential of HAsO2/As (E0 = +0.24 V) is more positive than that of Fe.168
Metals that have considerably more positive reduction potential than Fe such as Ag(I)/Ag (E0
= +0.80 V) , Cu(II)/Cu (E0 = +0.34 V), Hg(II)/Hg (E0 = +0.85 V) are reduced by Fe(0).116 Metals
with slightly more positive reduction potential can be removed by reduction or a combination
of reduction, adsorption and co-precipitation. For example, Ni(II)/Ni (E0 = -0.23 V) was
removed by nZVI via both reduction and adsorption.116 Although the reduction potential of
Pb(II)/Pb (E0 = -0.13 V) is more positive than that of Fe(II)/Fe, Pb(II) is removed via different
pathways such as reduction,117 both reduction and adsorption,116, 154 or a combination of

15
reduction, adsorption and co-precipitation.169 Antimony, SbC4H4O7- and H2Sb2O7
2-, is removed
via co-precipitation170 and Cr2O72- is removed via reduction117 or a combination of reduction
and precipitation.171
Figure 1.2. Pathway of heavy metal removal by nZVI.116-117, 154
1.4. Bimetallic nZVI and trimetallic (n)ZVI
In order to increase the chemical reactivity of nZVI, a secondary metal (M) can be added to
generate bimetallic nZVI systems (M-nZVI). The secondary metal acts as a catalyst for
contaminant reduction by lowering the activation barrier for this reaction.2-3, 6 Additionally,
the introduction of secondary metal also slows down the corrosion of iron on the surface of
nZVI, which leads to remain the number of nZVI active sites.172-173 Thus, bimetallic nZVI can
enhance the reaction rate and degradation yield.
Several studies on bimetallic nZVI (M-nZVI) with different secondary metals have been
reported. nZVI was formed from the precursor salts of either FeSO4 or FeCl3. The secondary
metals (M) are Ni, Cu, Pd, Ag, Au, Bi, and Pt that are from their salts of chloride, sulfate and
acetate. Bimetallic M-nZVI can be synthesised by two different methods.2, 126, 167, 174-175 The
co-reduction method (MA) is a one-step procedure in which both iron and the dopant ions
are simultaneously reduced (Scheme 1.2).2 The deposition method (MB) is a two-step process
in which nZVI is initially synthesised, followed by the secondary metal being deposited on the
surface of nZVI (Scheme 1.3).126, 167, 174-175
n: oxidation state of iron (n = 2, 3); m: oxidation state of secondary metals (m = 1, 2, and 3)
Scheme 1.2. Bimetallic M-nZVI@Misi synthesised using co-reduction method (MA).
Fen+
Mm+
NaBH4M-nZVI
Adsorption: Zn(II), Cd(II), Ba(II)
Adsorption + reduction: Ni(II), Pb(II) Reduction: Ag(I), Cu(II), Hg(II) Fe(0)
-0.44V

16
n: oxidation state of iron (n = 2, 3); m: oxidation state of secondary metals (m = 1, 2, and 3)
Scheme 1.3. Bimetallic M-nZVI@Misi synthesised using deposition method (MB).
1.4.1. Bimetallic Ni-nZVI
One of the common bimetallic systems is Ni-nZVI, which is synthesised from a variety of
precursor salts, such as NiSO4, NiCl2, and Ni(CH3COO)2,176 and a range of Ni:Fe ratios. The mass
ratio of Ni to Fe was from 0.2% to 30% that was abbreviated from 0.2:100 to 30:100. 2, 167, 172,
175-177 For example, 30%Ni-nZVI means that the mass ratio of Ni to Fe is 30:100. These
materials were synthesised using both co-reduction (MA) and deposition methods (MB). The
resulting Ni-nZVI systems were used for removing organic and inorganic substances. The
addition of Ni has been reported to enhance the reduction rate of contaminants.
A study by Wang et al. showed that 20%Ni-nZVI synthesised using the deposition method
(MB) effectively reduced trichloroethylene (TCE). After 36 hours, this Ni-nZVI system
removed TCE faster than non-doped nZVI. However, after 504 hours, the same yield was
achieved with or without the presence of Ni.3 This indicated that dopant Ni only had function
in increasing the reaction rate but did not have higher yield when the reaction was examined
in prolonged time.
Ni-nZVI systems have received a lot attention in nitrate reduction. Several studies on the
reactivity of Ni-nZVI towards nitrate reduction in terms of Ni contents, synthetic methods,
and reaction conditions were carried out. For instance, Kang et al. examined Ni-nZVI systems
with various Ni amounts (1%, 5%, 10%, 20%).2 The reactivity of materials was a function of
the amount of Ni, synthetic method, and solution pH. Of these materials, 5%Ni-nZVI was the
most effective material because this optimal Ni amount was ideal for maximising the number
of active sites. In addition, Ni-nZVI materials prepared via the co-reduction method (MA) had
higher reactivity than those prepared via the deposition method (MB). When the initial
concentration was 80 ppm nitrate-N and nZVI dosage was 1.5 g/L, all nitrate was reduced
using materials prepared via the co-reduction method (MA) after 40 minutes. Approximately
70% of nitrate was reduced using materials prepared via the deposition method (MB) after
120 minutes. Furthermore, at a neutral pH of 6.5, Ni-nZVI reduced nitrate more quickly than
under either acidic (pH 2.0 and 4.0) or basic (pH 9.0) conditions. The nitrate removal was
Fen+ NaBH4nZVI M-nZVI
Mm+

17
100%, 91%, and 50% at pH 6.5, pH 4, and pH 9, respectively. In contrast, another study on Ni-
nZVI with the Ni content of 5% to 30% showed that 10%Ni-nZVI was the highest performing
material when these materials were prepared via the deposition method (MB).175 The
reactivity of Ni-nZVI was also affected by pH, but acidic conditions (pH ≤ 3) were more
favourable for nitrate reduction. When the nitrate concentration of 100 ppm (22.6 ppm
nitrate-N), pH 2, and 0.4 g/L of particles, all nitrate was removed after 20 minutes.
In a separate study, three types of 0.2% Ni-nZVI synthesised via the deposition method (MB)
were examined towards nitrate reduction, including fresh (F-Ni-nZVI), dried (D-Ni-nZVI) and
dried-sonicated (DS-Ni-nZVI). The material dosage was 10 g/L and the initial nitrate
concentrations were from 10 ppm to 10,000 ppm. The highest performing material was F-Ni-
nZVI while the lowest performing material was D-Ni-nZVI.167 The difference in reactivity was
attributed to the levels in agglomeration of materials. This is because the fresh material had
the lowest level of agglomeration while more aggregates were formed during the drying
process. Sonication broke large aggregates in dried material into smaller ones. D-Ni-nZVI and
DS-Ni-nZVI reduced nitrate faster than D-nZVI and DS-nZVI, respectively due to the presence
of Ni catalyst. In contrast, F-Ni-nZVI and F-nZVI had the same nitrate reduction rate even
though the initial nitrate concentration was up to 10,000 ppm. Ryu et al. postulated that the
influence of agglomeration was more significant than that of catalyst Ni and that the role of
the catalyst was minimal when the level of the agglomeration was low.
Ni-nZVI materials were also used for heavy metal removal. They were prepared using both
co-reduction (MA) and deposition methods (MB) with the mass concentrations of Ni of 20% -
30%.172, 177 The heavy metals examined concluded Pb(II) and Cr(VI). The removal of heavy
metals was investigated against variables such as the concentration of heavy metals, solution
pH, and material dosage. In Saberi’s study, Ni-nZVI with the molar ratio of Ni to Fe was 1:3.5
(mass ratio 0.3:1) prepared via the co-reduction method (MA) was examined towards Pb(II)
removal.177 With an increase of the initial pH of the solution (1 - 5), particles dosage and
contact time, the Pb(II) removal increased using both either Ni-nZVI and nZVI. In contrast,
when initial Pb(II) concentration increased, the Pb(II) removal decreased. The maximum
removal efficiency (100%) was achieved at a pH of 5, Pb(II) concentration at 500 ppm and
material dosage at 3.75 g/L in 4 hours. Interestingly, more Ni-nZVI particles than nZVI was

18
required in the same volume of Pb(II) solution. The mechanism of Pb(II) removal was
adsorption, in which both Ni-nZVI and nZVI were used as the adsorbents.
Bimetallic Ni-nZVI was also used for Cr(VI) removal. In this study, Ni-nZVI with the mass ratio
of Ni to Fe of 0.2:1 was prepared via the deposition method (MB).172 The removal of Cr(VI)
depended on the solution pH. When the initial Cr(VI) concentration was 25 ppm and material
dosage was 1 g/L, Cr(VI) was removed faster at pH 2 (96.33%) than at pH 7 (60.31%). Ni-nZVI
removed Cr(VI) faster than nZVI, regardless of solution pH. The mechanism of Cr(VI) removal
was proposed via both adsorption and reduction. Cr(VI) adsorbed on the surface of nZVI and
then was reduced by nZVI with the catalysis of Ni to form Cr(III). Cr(III) was then captured on
the surface of nZVI via adsorption, precipitation of Cr(OH)3, and co-precipitation of CrxFe1-
x(OH)3.
In summary, the best Ni content in Ni-nZVI systems was not clear, depending on the reaction
conditions. In many cases, the Ni concentration chosen was not explained. In the nitrate
reduction, there was an argument in the effect of the solution pH. The material dosages were
different, from 0.4 g/L to 10 g/L and different initial nitrate concentrations were used, from
10 ppm to 10,000 ppm. Even though Ni was used in different reaction conditions, the
introduction of Ni was effective at increasing reaction rate in most of the cases compared to
nZVI. In the removal of heavy metals, the material dosage was from 1 g/L and 3.75 g/L. The
acid media was favourable for removing heavy metals, regardless of the mechanism of metal
removal.

19
Table 1.2. Ni-nZVI systems reported. Note: 0.2%Ni means the mass ratio of Ni to Fe is 0.2:100.
Ni content Method
Contaminant
co-reduction deposition
0.2% X nitrate
1% X X nitrate
2% X X nitrate
5% X X nitrate
10% X X nitrate
20% X X TCE, Pb(II) and Cr(VI)
30% X X Pb(II) and Cr(VI)
1.4.2. Bimetallic Cu-nZVI
Numerous studies have investigated bimetallic Cu-nZVI systems with the Cu concentration
from 1% to 20%. Similar to Ni-nZVI systems, 1%Cu-nZVI means the mass ratio of Cu to nZVI
was 1:100. All of the materials were synthesised using the deposition method (MB) with
either CuCl2 or CuSO4 as the Cu source.41, 178-181 The resulting Cu-nZVI was used for nitrate
reduction under neutral and acidic conditions. The introduction of Cu enhanced the reactivity
of nZVI, leading to a higher amount of nitrate reduced. For example, the reactivity of materials
depended on Cu levels (1% - 20%), with 5%Cu-nZVI found to be the highest efficiency material
in increasing the reaction rate.179 When the initial nitrate concentration was 80 ppm (18 ppm
nitrate-N) and the bimetallic dosage was 1.4 g/L, all nitrate was reduced within 20 minutes
under neutral pH’s. Muradova et al. also investigated nitrate reduction of 57.5 ppm (13 ppm
of nitrate-N) and the mass ratio of Fe to nitrate of 15:1.182 All nitrate was reduced after 60
minutes using 5%Cu-nZVI while 98% of nitrate was removed after 150 minutes using nZVI.
The pH increased from 5 to a level between 8 and 9 as the final pH values. In a separate study,
Krasae et al.’s study showed that 2.5%Cu-nZVI reduced nitrate under either acidic or neutral
conditions.178 After 30 minutes, when 10 ppm nitrate-N was used, the reduction yields were
50% and 42% at pH 3 and pH 7, respectively. In contrast, the nitrate removal was 14% and
11% when nZVI was used, respectively.

20
In summary, Cu-nZVI has been examined; however, the investigation of different methods to
synthesise Cu-nZVI systems and the optimal Cu concentration was not examined in detail. In
comparison with nZVI, the presence of Cu enhanced reactivity but this difference was not
much.181 The generation of nitrite during nitrate reduction has not monitored. Hence, more
studies need to be done to examine the effectiveness of Cu as well as to optimise the Cu
concentration.
Table 1.3. Cu-nZVI systems reported. Note: all systems were synthesised using the
deposition method and 1%Cu-nZVI means the mass ratio of Cu to Fe is 1:100.
Material Contaminant
1%Cu-nZVI nitrate
2.5% Cu-nZVI nitrate
5% Cu-nZVI nitrate
20% Cu-nZVI nitrate
1.4.3. Bimetallic nZVI of other metals
Studies have also investigated the degradation of contaminants using Pd-nZVI systems
prepared via the deposition method (MB). The Pd contents were examined from 0.054% to
50% with either Pd(CH3COO)2 or K2PdCl6 as the palladium source.49, 183-186 Pd-nZVI systems
were commonly used for reducing halogenated organic compounds. A Pd-nZVI system
(unpublished ratio) was used to reduce TCE and PCBs.49 Separate studies also examined the
reactivity of TCE using either 5%Pd-nZVI3 or Pd-nZVI (1% - 50%).183 Other studies used 0.054%
Pd-nZVI for reducing PCP in the presence of some ions such as sulfate, Cu(II), Ni(II) and
Fe(III),184 0.2%Pd-nZVI for removing chlorinated methanes,185 and 0.5%Pd-nZVI for
dechlorinating chlorophenols.186 In addition, Bi-nZVI systems with different Bi:Fe ratios (0% <
Bi/Fe ≤ 7%) were prepared via the co-reduction method (MA) to reduce hexahydro-1,3,5-
trinitro-1,3,5-triazine (RDX).187 Degradation of RDX was significantly dependent on the Bi
concentrations and the highest degradation rate was achieved at 4%Bi-nZVI. All Pd-nZVI and
Bi-nZVI were reported to only remove organic substances via reduction.

21
nZVI systems doped with 1%Ag or 1%Au prepared via the deposition method (MB) were
examined for simultaneously removing Cd(II) and nitrate.188 The rates of nitrate reduction
using these systems were higher than that of nondoped nZVI. Au-nZVI exhibited the highest
rate and lowest nitrite build-up. When the initial nitrate-N concentration was 45 ppm, over
77% nitrate was reduced and only 6% nitrite accumulation was observed in the presence of
30 ppm of Cd(II). Bimetallic Pt-nZVI using PtCl4 as the Pt source synthesised via the co-
reduction method (MA) was also examined.189 In this reported system, the molar ratio of Pt
to Fe was 1:1. When the initial nitrate concentration was 200 ppm (45 ppm nitrate-N) and
nanoparticle dosage was 0.25 g/L, 97% of nitrate was reduced at pH 7 after 120 minutes. This
Pt-nZVI was dramatically reactive compared to using anion exchange resins. However, due to
the very high concentration of Pt (molar ratio of Pt to Fe was 1:1) and the cost of Pt, this
material will not be applicable in nitrate reduction on a large scale.
Table 1.4. Other systems reported.
Material Method
Contaminant Co-reduction Deposition
0.054% Pd-nZVI X PCP
0.2%Pd-nZVI X chlorinated methanes
0.5%Pd-nZVI X chlorophenols
Pd-nZVI
(1% - 50%)
X TCE
Bi-nZVI
0% < Bi/Fe ≤ 7% X
RDX
1.4.4. Trimetallic ZVI and trimetallic nZVI
Trimetallic ZVI (micro size) has been synthesised by doping bimetallic on the surface of ZVI
particles via the co-reduction (MAtri) and the deposition method (MC).190 The co-reduction
process is a one-step procedure in which iron and two dopants are simultaneously reduced
(Scheme 1.4). The deposition method is a three-step process in which ZVI is synthesised and
then successively deposited of M2 and M1 on its surface (Scheme 1.5).

22
Scheme 1.4. Trimetallic M1-M2-ZVI@Misi synthesised using co-reduction method (MAtri).
Scheme 1.5. Trimetallic M1-M2-ZVI@Misi synthesised using deposition method (MC).
In Liou et al.’s study, the reactivity of microsized Pd-Cu-ZVI, Pt-Cu-ZVI, and Au-Cu-ZVI in
reducing 40 ppm nitrate-N in 4-(2-hydroxyethyl)-1-piperazineethanesulfonic acid (HEPES)
buffered solution was examined.190 These materials were prepared via the co-reduction
method (MAtri) and the deposition method (MC). The results showed that Pt-Cu-ZVI or Au-Cu-
ZVI both had higher reactivity than Pd-Cu-ZVI and that the presence of Pd increased N2
selectivity. Additionally, the 0.3%Pd-0.5%Cu-ZVI prepared via the deposition method (MC)
reduced nitrate faster and produced more nitrogen gas than that prepared via the co-
reduction method (MAtri). After 360 minutes, when the optimal conditions of pH were 8 - 8.5,
the nitrate conversion and nitrogen gas selectivity of the material prepared via the deposition
method (MC) were 91% and 30%, respectively. However, for the materials prepared via the
co-reduction method (MAtri), the nitrate conversion and nitrogen gas selectivity were 50%
and 8.8%, respectively.
Other studies have also investigated nitrate reduction using two types of trimetallic nZVI,
including Cu-Pd-nZVI and Pd-Cu-nZVI prepared via the deposition method (MC).4-5 Even
though trimetallic systems had a slightly lower reduction rate than bimetallic and
monometallic systems, they resulted in higher nitrogen gas selectivity. For instance, Lubphoo
et al.’s study showed that nitrate reduction using Pd-Cu-nZVI depended on initial nitrate
concentrations, pH, temperature, and the presence of hydrogen gas.4 In this study, the initial
nitrate concentration was 100 ppm (22.6 ppm of nitrate-N), the solution pH was 7 at 50°C and
in the presence of hydrogen gas. After 60 minutes, 90% of nitrate was removed and nitrogen
gas selectivity was highest at 60.5%. Lubphoo et al.’s also investigated the effect of Pd and Cu
contents and the order of the deposition on nitrate reduction.5 Pd-Cu-nZVI which contains
10% of deposited metals and a mass ratio of Pd to Cu at 2:1 had the highest reactivity and
nitrogen gas selectivity. When the initial nitrate concentration was 100 ppm (22.6 ppm of

23
nitrate-N), the particles dosage was 0.25 g/L, the nitrate removal was 63% and the ratio of
nitrogen gas to ammonium was 41:51 after 60 minutes.
In summary, trimetallic materials of ZVI and nZVI have been reported to promote the
production of nitrogen gas. However, only unsupported trimetallic was investigated. In
addition, the difference in the reactivity of these materials prepared using different methods
as well as different versions of the deposition methods has not been investigated.
Table 1.5. Trimetallic ZVI and nZVI systems reported. Note: all systems were used for nitrate
reduction.
Material Method
Co-reduction Deposition
0.3%Pd-0.5%Cu-ZVI X X
0.3%Pt-0.5%Cu-ZVI X X
0.3%Au-0.5%Cu-ZVI X X
Cu-Pd-nZVI
Pd:Cu = 2:1; (Pd + Cu) = 10% X
Pd-Cu-nZVI
Pd:Cu = 2:1; (Pd + Cu) = 10% X
1.5. Supported bimetallic nZVI
The addition of metal(s) to nZVI enhanced the reactivity of bimetallic and trimetallic materials.
However, these systems still have agglomeration problem.191 One possible solution is to place
the nanoparticles onto some types of support that will increase the distribution of particles
and minimise agglomeration.191-192 In addition, depositing nanoparticles on a support slows
down their oxidation with surroundings.191, 193 These supported materials have been
postulated to enhance their surface area193-194 and reactivity.191-195 Typically, silica, silicates,
and activated carbon are used as supports. The resulting materials have been used to examine
the property and reactivity in removing contaminants.

24
1.5.1. Supported bimetallic Ni-nZVI
Several studies examined supported bimetallic Ni-nZVI materials. They were prepared by
doping Ni-nZVI on different supports using both the co-reduction method (MA) and
deposition method (MB). The resulting materials were used for removing organic and
inorganic substances. For example, bimetallic Ni-nZVI on cellulose acetate was synthesised by
initially preparing Ni-nZVI using either the co-reduction method (MA) or the deposition
method (MB).196 Then, the Ni-nZVI was mixed with cellulose acetate in the solvent to form Ni-
nZVI@cellulose acetate. The reactivity of these systems towards TCE removal was examined.
The highest TCE removal rate was achieved when the Ni content was between 14.3% and
21.4%. Materials prepared using Ni-nZVI synthesised via the deposition method (MB) had
higher reactivity than those prepared using Ni-nZVI synthesised via the co-reduction method
(MA). The mechanism for the TCE removal was sorption of TCE on cellulose acetate and
reduction of TCE by nanoparticles in which Ni was a catalyst and Fe was a reducing agent.
In addition, Ni-nZVI on silica/silicates systems have been reported in nitrate reduction. They
were also synthesised using either the co-reduction method (MA) or the deposition method
(MB). Typically, natural silicates such as kaolinite and zeolite have been used. He et al.’s study
examined Ni-nZVI@zeolite prepared via the co-reduction method (MA) with the mass ratio of
Ni:nZVI:zeolite at 1:10:20.193 The reactivity of Ni-nZVI@zeolite was slightly sensitive to the
initial solution pH. When the solution pH increased from 3 to 8, the nitrate removal decreased
from 85% to 72.5%, respectively using the initial nitrate-N concentration of 20 ppm, the Ni-
nZVI dosage of 0.5 g/L, and reaction time of 4 hours. He et al. also reported that the presence
of phosphate diminished the nitrate reduction while nitrate enhanced phosphate removal.
Based on this study, supported Ni-nZVI was effective in nitrate reduction. However, the
reaction time was long, up to 4 hours and solution pH was adjusted. As such, the aim of the
investigation of supported Ni-nZVI@Misi in this study is to experience reactions without pH
adjustment in shorter reaction time but a higher nZVI dosage of 0.6 g. After that, the
effectiveness of Ni-nZVI@Misi will be compared and evaluated.
Supported Ni-nZVI systems have also been used for heavy metal removal, usually Cr(VI)
removal. Lu et al. examined Ni-nZVI on montmorillonite prepared via the co-reduction
method (MA).197 Ni-nZVI@montmorillonite with the mass ratio of Ni to nZVI at 1:10 was used
to remove Cr(VI). The removal increased when the dosage of the material increased from 0.4

25
g/L to 0.8 g/L. At the optimum dosage of 0.8 g/L, pH of 3, and Cr(VI) concentration of 50 ppm,
all Cr(VI) was removed after 180 minutes. In a separate study, Wang et al. doped Ni-nZVI on
starch and sodium citrate (SS) using the co-reduction method (MA).198 The removal of Cr(VI)
decreased when the solution pH increased. When the initial Cr(VI) concentration was 1 ppm,
the solution pH was 2 and material dosage was 10 g/L, 95.70% of Cr(VI) was removed after
120 minutes. Wang et al. also concluded that Cr(VI) was removed via two different pathways,
adsorption and reduction. This is consistent with the results examining the removal of Cr(VI)
using Ni-nZVI reported by Zhou et al..172 However, in the reduction pathway, both Fe and Ni
served as reductants to convert Cr(VI) into Cr(III). After the reaction, an oxide/hydroxide alloy
containing Fe(II), Fe(III), Ni(II), and Cr(III) was formed. These supported Ni-nZVI materials were
reactive in Cr(VI) removal; however, the material dosages were large and all these reactions
were in acidic conditions. The attempt using lower dosage, pH without adjustment and
reducing reaction time will be examined to test Ni-nZVI@Misi.
Supported Ni-nZVI materials have the ability to simultaneously remove nitrate and heavy
metals. In these studies, Ni:Fe:kaolinite was prepared via the co-reduction method (MA) and
the mass ratio of Ni:Fe:kaolinite was 1:10:20.192, 199 Ni-nZVI@kaolinite was used for reducing
the solutions containing both nitrate (180 ppm) and Pb(II) (300 ppm).192 When the nZVI
dosage was 0.5 g/L, pH was at 4 and temperature was 35°C, the nitrate and Pb(II) removal of
Ni-nZVI@kaolinite after 16 minutes was 86.3% and 79.0%, respectively. In contrast, under the
same conditions, the nitrate and Pb(II) removal of nZVI@kaolinite was 73.6% and 67.9%,
respectively. This indicated that Ni promoted the removal of both nitrate and Pb(II). Nitrate
was removed via the reduction while Pb(II) was removed via the combination of adsorption,
reduction, and co-precipitation.
In Cai et al.’s study, Ni-nZVI@kaolinite was used to simultaneously remove nitrate and
Cu(II).199 The presence of Cu(II) significantly increased nitrate reduction while nitrate slightly
inhibited Cu(II) removal. Specifically, when the initial nitrate concentration was 40 ppm and
the nZVI dosage was 2.48 g/L, the nitrate removal was 26.9% and 40.4% in the absence and
presence of Cu(II) (200 ppm), respectively. When the initial Cu(II) concentration was 200 ppm,
the Cu(II) removal was 99.7% and 96.5% in the absence and the presence of nitrate (100 ppm).
Cai et al. explained that during the reaction, Cu(II) was reduced to form Cu(0) on the surface
of bimetallic material. In this form, Cu(0) was considered as an addition catalyst that helped

26
increase the rate of nitrate reduction. In contrast, the reduction of nitrate produced
hydroxide ions, which prevents electron transfer from Fe core to Cu(II). As such, the reduction
of Cu(II) by nZVI decreased. This is inconsistent with the result examining the simultaneous
removal of nitrate and Pb(II).192
Table 1.6. Supported Ni-nZVI reported.
Material Method
Contaminant co-reduction deposition
Ni-nZVI@cellulose acetate
0% < Ni ≤ 21.4% X X TCE
Ni-nZVI@zeolite
1:10:20 X X nitrate
Ni-nZVI@montmorillonite
Ni:Fe = 1:10 X Cr(VI)
Ni-nZVI on starch and sodium citrate (SS)
X Cr(VI)
Ni-nZVI@kaolinite
1:10:20 X X
Both nitrate and Pb(II)
Both nitrate and Cu(II)
1.5.2. Supported bimetallic Pd-nZVI
Supported Pd-nZVI systems have been investigated and their reactivity was examined
towards organic substance removal. These supports included synthetic silica, natural silicate,
activated carbon, and green agents. All these supported Pd-nZVI systems were prepared via
the deposition method (MB). The mass ratio of Fe to support ranged from 10% to 50% and
the mass ratio of Pd to Fe was from 0.1% to 75%.151, 191, 200-202 For instance, Doong et al.
examined Pd-nZVI@mesoporous silica systems in which Fe content was from 10% to 50% and
Pd content was from 0.1% to 3%.200 The results showed that materials with the ratio of Fe to
silica at 30% and Pd ranging from 0.5% to 3% had the highest reactivity in the dechlorination
of tetrachloroethylene. In a separate study, Pd-nZVI@bentonite with the ratio of
Pd:Fe:bentonite at 0.75:1:1 was used to remove organic substances such as methyl orange
(MO)191 and p-chlorophenol.201 In addition, supported bimetallic Pd-nZVI on granular

27
activated carbon was used for removing polybrominated diphenyl ethers (PBDEs) and PCBs.151
In Wang et al.’s study, supported bimetallic Pd-nZVI on green agents such as polyethylene
glycol, starch, and guar gum was examined.202 These materials reduced 2,4-dichlorophenol
effectively and their removal was highest with the addition of 0.1% Pd. In all these studies,
organic substances were removed via reduction in which nZVI was a reductant and Pd served
as a catalyst promoting the electron flow from nZVI.
Table 1.7. Supported Pd-nZVI systems. Note: all these systems were synthesised using the
deposition method.
Material Contaminant
Pd-nZVI@mesoporous silica
Fe 10% - 50%
Pd 0.1% - 3%
tetrachloroethylene
Pd-nZVI@bentonite
0.75:1:1
methyl orange
p-chlorophenol
Pd-nZVI@granular activated carbon PBDEs and PCBs
Pd-nZVI@ polyethylene glycol 2,4-dichlorophenol
Pd-nZVI@starch 2,4-dichlorophenol
Pd-nZVI@ guar gum 2,4-dichlorophenol
1.5.3. Supported bimetallic of other metals
Supported nZVI doped with other metals such as Co, Cu, and Mn was also examined. For
example, Bragança et al. used two types of synthetic silica, hexagonal mesoporous silica and
Santa Barbara Amorphous silica to synthesise Co-nZVI@silica materials.203 In these materials,
the total content of Co and Fe was 25%. Although their surface area, volume, and diameter
of these materials were examined, their reactivity was not examined in this study.
Zeng et al. investigated the reactivity of bimetallic Cu-nZVI and Mn-nZVI on zeolite in nitrate
reduction.194 Two these systems were synthesised using the deposition method (MB). The
mass ratio of total metals to zeolite was 1:1. The mass percentage of Cu was 20% in Cu-
nZVI@zeolite and Mn was 4% in Mn-nZVI@zeolite. Both Cu-doped and Mn-doped materials

28
had higher surface area than unsupported nZVI, leading to higher reactivity in nitrate
reduction. Additionally, when the reduction was carried out in pH 3 - 9, the supported
bimetallic materials and nZVI@zeolite were not affected by the initial pH. In contrast,
unsupported nZVI was strongly dependent on pH. The initial nitrate-N concentration was 22.6
ppm (100 ppm nitrate), material dosage was 4 g/L and pH was 9. In this reported system,
after 6 hours, more than 94% of nitrate was removed using either Cu-doped, Mn-doped or
non-doped nZVI@zeolite while nitrate removal was 70% using unsupported nZVI.
There were also supported bimetallic M-nZVI being used for heavy metal removal. For
instance, Kakavandi et al. used Ag-nZVI on activated carbon powder prepared via the
deposition method (MB) to examine Cr(VI) removal.204 The predominant mechanism of Cr(VI)
removal was adsorption. The solution pH also strongly affected Cr(VI) removal. The reactivity
of Ag-nZVI@activated carbon powder in acidic conditions was higher than that observed in
more basic conditions. When the initial Cr(VI) concentration was 4 ppm and the dosage of the
material was 0.3 g/L (nZVI dosage of 0.06 g/L), 91.95% of Cr(VI) was removed at pH 3 after 60
minutes. Kakavandi et al. explained that at low pH, the surface of Fe was positively charged
and Fe(0) was easily oxidised to form Fe(II), which promoted the adsorption of Cr(VI).
Table 1.8. Supported bimetallic nZVI of other metals.
Material Method
Contaminant Co-reduction Deposition
Co-nZVI@silica
(Co + Fe) = 25% X
Not examine
Cu-nZVI@zeolite
%Cu = 20%
Metals:zeolite = 1:1
X nitrate
Mn-nZVI@zeolite
%Mn = 4%
Metals:zeolite = 1:1
X nitrate
Ag-nZVI@activated carbon powder X Cr(VI)

29
1.6. Background of nZVI@Misi
Research in Fulton group investigated the effectiveness of different silicates such as Misi600
(referred to as Misi), rice husk ash, Western Australia silica fume, and fly ash, on supporting
nZVI. Of these, Misi was considered the most effective support. In addition, different pre-
treatments of Misi prior adsorption of nZVI were examined. In this section, an overview of
Misi and a summary of the results of this study will be included.
1.6.1. Properties of Misi600
Misi600 (referred to as Misi) is an amorphous silica from a geothermal deposit.205 It was
supplied by Golden Bay Cement, a company based in Rotorua, New Zealand. Misi is produced
from ignimbrite and pumice breccia during the hydrothermal alterations over 10,000 years.206
Although this alteration forms a variety of silicification, Misi in the Rotorua area is unique
because it is formed due to the migration of hydrothermal fluids with rich silica under
pressure. Despite the majority of silica in Misi, it consists of impurities such as clay, ironsand,
alunite, and sulfur. Misi is a natural highly-reactive pozzolan.205 Due to its pozzolan property,
Misi reacts with Ca(OH)2 solution to form hydrates of calcium silicate or calcium silicate
aluminate known as cementitious hydration products.207 According to Golden Bay Cement,
the main composition of Misi is Si with 87.99% of SiO2, followed by Al with 4.31% of Al2O3
(Table 1.9).205 Misi also has a small amount of Ti, Fe, K, Ca, Na, S, and so on. All Misi particles
have the size below 100 µm, in which more than 90% of particles are below 5 µm (Table 1.10).
Table 1.9. Chemical analysis of Misi.
Composition SiO2 Al2O3 TiO2 Fe2O3 K2O CaO Na2O SO3 P2O2 MnO MgO
Mass (%) 87.99 4.31 1.16 0.59 0.49 0.32 0.14 0.13 0.05 0.03 < 0.02
Table 1.10. Particle size analysis.
µm 100 50 20 10 5 2 1 0.4
Passing (%) 100 99.6 97.9 94.5 84.6 55.6 35.0 12.2
Fraser investigated the morphology, elemental distribution, surface structure, surface area
and zeta potential of Misi.1 Scanning Electron Microscope (SEM) images showed that both the
size and shape of Misi were heterogeneous. In SEM-EDS mapping, there was an even

30
distribution of Si and Al. Ti was observed and it unevenly dispersed on Si. Other elements such
as Fe, S were also observed but the signals corresponding to these elements are weak. X-ray
diffraction (XRD) analysis was used to examine the elemental distribution. The peaks
corresponding to crystalline silica such as cristobalite (2θ = 22°) and quartz (2θ = 27°) were
observed. Some peaks with 2θ in a range of 20° - 30° corresponding to the amorphous silicate
phase were also observed. Numerous unassigned peaks were also present due to the natural
origin of Misi composite. The infrared spectrum of Misi600 showed a very strong peak at 1096
cm-1 corresponding to siloxane Si-O-Si. As this peak overlaps with Si-O-metal stretches (900 -
950 cm-1), thus the presence of Si-O-metal was not confirmed. A band at 791 - 698 cm-1 was
observed, which was consistent with the Si-O band of cristobalite. In addition, there was also
a broadband at 3000 - 3750 cm-1, corresponding to hydroxyl groups. Fraser also used
Brunauer-Emmett-Teller to determine the surface area (17.53 ± 0.04 m2/g) and pore size of
Misi (161 Å). The pH of the dispersion of Misi in deionised water was 6.27.
1.6.2. Effect of Misi treatment on nZVI adsorption
Misi was subjected to numerous treatments before coating with nZVI.1 These included
calcination, acid washing, boiling, and FeOOH coating. In the calcination method, two
different temperatures, 400 °C and 600 °C, were trialled. In the acid washing method,
different concentrations of HCl (5.6 M, 2.8 M, and 1.1 M) were applied. The order of
calcination and acid washing was also examined. The morphology of the resulting materials
was examined. The results from SEM image analysis showed that calcination was the most
important step in improving the dispersion of nZVI on the surface of Misi, followed by acid
washing. As acid washing only was used, the higher the acid concentration was, the more
Misi’s surfaces were promoted, enhancing nZVI adsorption. The difference in calcination
temperature did not affect nZVI adsorption.
In order to deposit FeOOH on the surface of Misi, Misi was soaked in FeSO4 and then the
resulting Misi was dried in air.208-209 In Fraser’s thesis, 0.5 g of FeSO4.7H2O was added to 1 g
of Misi (FeSO4.7H2O/Misi = 1:2 w/w).1 This was equivalent to the ratio of iron added to Misi
of 10:100. After MisiCFeOOH generation, the material was digested, and the amount of iron
was measured using Atomic Absorption Spectroscopy (AAS). The results showed that the final
ratio of iron to MisiCFeOOH was 0.7:100 and 7% of iron in solution was adsorbed on the
surface of Misi. In contrast, only 0.06% of iron was found in MisiC. However, the presence of

31
the crystalline material of FeOOH was not ascertained due to the small percentage of iron in
MisiCFeOOH and the heterogeneity of Misi. For example, there was no additional crystalline
peak in MisiCFeOOH compared to MisiC when the XRD spectra of these materials were
examined. Moreover, the peak confirming iron as goethite (-FeOOH) was not found in all
samples examined when Raman spectroscopy was used. In terms of nZVI adsorption, the
effect of FeOOH coating was not clear.
1.6.3. Effect of Misi treatment on nZVI reactivity towards nitrate reduction
The calcination temperature of Misi affected the reactivity of [email protected] Specifically,
nZVI@Misi prepared using Misi calcined at 600 °C reduced nitrate faster than that prepared
using Misi calcined at 400 °C. When nitrate-N concentration was 10 ppm, the molar ratio of
Fe to nitrate was 50:1, nitrate removal was 39 ± 5% and 62 ± 9% after 60 minutes, respectively.
Although coating with FeOOH did not change nZVI adsorption, it significantly enhanced
nitrate reduction. For example, when either 5-C600-AnF-nZVI (Misi which was acid washed,
calcined, and boiled) or 5-C600-AF-nZVI (Misi which was acid washed, calcined, boiled, and
coated with FeOOH) was used to reduce nitrate, nitrate removal was 65% and 90% after 60
minutes, respectively. In contrast, although acid washing increased nZVI adsorption, it did not
significantly affect nitrate reduction. For example, when either 5-C600-nAF-nZVI (Misi which
was acid washed, calcined, and coated with FeOOH) or C600-nAF-nZVI (Misi which was
calcined and coated with FeOOH) was used to reduced nitrate, nitrate removal was 74% and
70%, respectively.
1.7. Overview of thesis
1.7.1. Aim of the thesis
In previous research within the Fulton group, numerous systems of non-doped nZVI@Misi
with different preparations of Misi were examined. However, the maximum nitrate removal
was only 70% after 30 minutes using 10 ppm of nitrate-N and the molar ratio of iron to nitrate
of 25:1. Therefore, the research reported in this thesis was undertaken with the objective of
making more effective materials that are capacity of removing nitrate faster than nZVI@Misi
by doping nZVI@Misi with a variety of different metals. In addition, we wanted to expand the
chemistry of our doped nZVI@Misi to the removal of other contaminants. The aims are listed
below.

32
Firstly, doping metal(s) on unsupported nZVI lowered activation barrier and increased the
reactivity of the resulting materials.2 In addition, dopant in bimetallic M-nZVI could slow down
the oxidation of nZVI.172 Therefore, we postulated that the addition of other metals on
supported nZVI@Misi can increase the nitrate removal rate and stability of the materials.
Secondly, the introduction of two simultaneous dopants not only increased nitrate reduction
but also supported the conversion of nitrate into nitrogen gas. Consequently, the selectivity
of nitrogen gas in trimetallic systems was higher than in non-doped nZVI.5 In this study, the
effect of dopant(s) in supported bimetallic and trimetallic nZVI@Misi on the formation of final
nitrogen products is examined.
Thirdly, most reported systems have only focused on examining their reactivity in removing
nitrate from lab-prepared water under anaerobic conditions such as nitrogen or argon
atmospheres. In this study, the synthesised materials are used for removing nitrate from lab-
prepared water in the presence of oxygen and other co-existing ions. Moreover, the reactivity
of these materials is examined in nitrate removal from “real water”, for example, lake water.
Finally, heavy metals were usually removed using adsorbents such as silicates90-92 and
activated carbon.85-86 They were also removed using doped nZVI172 and doped nZVI coated on
supports.197-198 However, in reported systems, the high dosage of materials were used and
the reaction conditions were monitored; for example, in pH control. In this study, the
reactivity of these materials towards heavy metal removal of using supported non-doped
nZVI@Misi and doped nZVI@Misi is carried out in neutral conditions.
From the above aims, in this current research, supported bimetallic and trimetallic nZVI on
Misi systems are investigated. Bimetallic systems include Ni-nZVI@Misi, Cu-nZVI@Misi, Zn-
nZVI@Misi, and Pd-nZVI@Misi. The trimetallic system is Pd-Cu-nZVI@Misi. In all systems, the
three variables examined are Misi preparation, dopant metal concentration, and synthetic
method. Four different preparations of Misi, including uncalcined Misi, calcined Misi,
calcined-boiled Misi, and calcined/FeOOH-coated Misi, were used. Different concentrations
of dopant metals, from 0.1% to 10%, were also tested. Moreover, different synthetic
methods, co-reduction and deposition with various versions, were also examined.
After screening the reactivity of these systems towards nitrate reduction, the most promising
materials were used to investigate further in their ability to both reduce nitrate, along with

33
their activity in the presence of oxygen and coexisting ions. The best optimal materials were
also used to reduce nitrate in natural water taken from Lake Horowhenua. Additionally, the
reactivity of some representative materials towards heavy metals (Cd(II), Pb(II), and Cr(VI))
was examined.
1.7.2 Structure of the thesis
The thesis includes 8 chapters. Chapter 1 has generally introduced the topic and addresses
previous studies. This includes the scope of nitrate, heavy metals, and methods for the
removal of these contaminants. This also consists of the scope of non-doped, bimetallic and
trimetallic nZVI as well as supported bimetallic nZVI in removing contaminants.
Chapter 2 describes methods and instruments used to conduct the current research. It
describes the methods for preparing Misi support, synthesising supported bimetallic and
trimetallic nZVI@Misi materials. It then describes the methods for characterising and
analysing materials. Additionally, the methods for nitrate reduction, heavy metals removal,
and determination of soluble by-products are also discussed in this chapter. Finally, it
describes the instruments used to characterise the materials and to examine their reactivity.
Chapter 3 determines the most promising doped nZVI@Misi towards nitrate reduction. In this
chapter, all the materials were characterised and their reactivity towards nitrate reduction
was screened. Materials included supported bimetallic, Ni-nZVI@Misi, Cu-nZVI@Misi, Zn-
nZVI@Misi, and Pd-nZVI@Misi, as well as trimetallic Pd-Cu-nZVI@Misi. The morphology,
composition and elemental distribution of each system towards several variables including
Misi preparation, dopant concentration, and synthetic method, were examined.
Chapter 4 focusses in greater detail on the most promising materials described in Chapter 3.
The efficiency of these materials was examined through nitrate conversion and nitrite
accumulation. After nitrate reduction, the change in the morphology and elemental
distribution of these materials was also investigated.
Chapter 5 examines the effect of reaction conditions on nitrate reduction. The reactivity of
the most promising materials in the presence of oxygen and coexisting ions towards nitrate
reduction was examined. During nitrate reduction, the generation of soluble metal by-
products such as iron, nickel, and copper was also determined.

34
Chapter 6 investigates the reactivity of the most promising materials in nitrate reduction from
lake water taken from Lake Horowhenua. It included the investigations of these materials
towards nitrate reduction from lake water and lake water spiked. The effect of pH adjustment
in nitrate reduction from lake water was also investigated. During the reaction, the
concentrations of soluble iron were monitored.
Chapter 7 explores the reactivity of the representative materials towards heavy metal
removal. It included the investigations of their reactivity in removing Cd(II), Pb(II), and Cr(VI).
During heavy metal removal, the determination of soluble iron, nickel, and copper as by-
products was also monitored. Additionally, the elemental distribution of the resultant
material was examined.
Chapter 8 summaries all the findings and suggests future work.

35
2. Methods and instruments
In this research project, nZVI was generated in an inert atmosphere utilising Schlenk
techniques. Misi was generously donated by Golden Bay Cement in 2015. Prior to use, Misi
was kept in a black plastic bag away from moisture. Unless noted, all water used was
deionised (18 , Ultrapure (Type1) water). A complete list of chemical sources can be found
in the list of chemicals used.
2.1. Methods
2.1.1. Surface preparation
The ability of micro silicate (Misi) in supporting nanoparticles is influenced by pre-treatment
methods. Four different preparations of Misi were generated based on previous results in our
group: uncalcined Misi (MisiU), calcined Misi (MisiC), calcined and boiled Misi (MisiC-B) and
calcined/FeOOH-coated Misi (MisiCFeOOH).1 MisiU was prepared by heating Misi at 120 C
for 5 hours. MisiC was prepared by heating Misi in the oven at 600 C for 6 hours. MisiC-B was
produced by boiling MisiC in deionised water for 2 hours and then separated from the liquid
using a centrifuge (5,000 rpm, 5 minutes) and left in the oven (120 C) to dry for 5 hours. For
MisiCFeOOH, FeSO4.7H2O was added to MisiC (Fe: MisiC ratio of 1:2 w/w) in 200 mL deionised
water and boiled for 2 hours. The solid was separated by centrifugation (5,000 rpm, 5
minutes) and then sonicated in ethanol. The solid was again separated by centrifugation
(5,000 rpm, 5 minutes) and left in the oven (120 C) to dry for 5 hours.
2.1.2. Synthesis of bimetallic particles on Misi support
Several different methods were investigated to coat the silicate. For consistency, the names
of the resulting materials were listed in Table 2.1 and 2.2. These tables detail the amount of
added dopants, both in terms of total metal salt added as well as the mass of added dopant
compared to Misi and iron. Note: for all experiments, the amount of Misi used was 1.00 g and
the amount of FeSO4.7H2O added was 0.500 g or 0.100 g iron.
Two chemical methods were employed to adsorb nanoparticles (M-nZVI) onto the Misi
surface. These methods were a one-step co-reduction method (MA) and a two-step
deposition method (MB) that was modified from Kang et al. for synthesising unsupported Ni-
nZVI.2 The amount of chemicals used for the synthesis is listed in Table 2.1. Due to the use of

36
small amount of dopants including nickel, copper, zinc, and palladium in the material,
solutions containing these elements were prepared. The solution containing 2.5 x 10⁻³ g
nickel/mL by adding 0.5520 g NiCl2 to deionised water to make up 100.0 mL solution. The
solution containing 2.5 x 10⁻³ g copper/mL by adding 0.5290 g CuCl2 to deionised water to
make up 100.0 mL solution. The solution containing 2.5 x 10⁻³ g zinc/mL by adding 0.5211 g
ZnCl2 to deionised water to make up 100.0 mL solution. The solution containing 2 x 10⁻⁴ g
palladium/mL was prepared by adding 0.0422 g Pd(CH3COO)2 to deionised water to make up
100.0 mL solution. The name used for each material corresponds to the relative amount
added and is not necessarily a reflection of the exact composition of the material.

37
Table 2.1. Material names and corresponding amount of metals salts added in M-
nZVI@Misi. Note, for all examples, the amount of Misi is 1.00 g and the amount of
FeSO4.5H2O added is 0.500 g, or 0.100 g iron.
Name
NiCl2
2.5 x 10⁻³ g nickel/mL
(mL)
nickel (g)
CuCl2
2.5 x 10⁻³ g
copper/mL
(mL)
copper (g)
ZnCl2
2.5 x 10⁻³ g
zinc/mL
(mL)
zinc (g)
Pd(CH3COO)2
2 x 10⁻⁴ g
palladium/mL
(mL)
palladium (g)
2%Ni-nZVI@Misi 0.8 mL
2.0 x 10⁻³ g
5%Ni-nZVI@Misi 2.0 mL
5.0 x 10⁻³ g
10%Ni-nZVI@Misi 4.0 mL
1.0 x 10⁻² g
2%Cu-nZVI@Misi 0.8 mL
2.0 x 10⁻³ g
5%Cu-nZVI@Misi 2.0 mL
5.0 x 10⁻³ g
10%Cu-nZVI@Misi 4.0 mL
1.0 x 10⁻² g
5%Zn-nZVI@Misi 2.0 mL
5.0 x 10⁻³ g
10%Zn-nZVI@Misi 4.0 mL
1.0 x 10⁻² g
0.1%Pd-nZVI@Misi 0.5 mL
1.0 x 10⁻⁴ g
0.5%Pd-nZVI@Misi 2.5 mL
5.0 x 10⁻⁴ g
1%Pd-nZVI@Misi 5.0 mL
1.0 x 10⁻³ g

38
2.1.2.1. Co-reduction method (MA)
The co-reduction method involved the simultaneous reduction of both iron and dopant metal
in the presence of Misi (Scheme 2.1). The reduction potential of both iron (E0 = -0.44 V) and
dopant (M) is more positive than that of borohydride (E0 = -2.23 V). Therefore, iron and
dopant are reduced by borohydride (eq. 2.1 and eq. 2.2).
Scheme 2.1. M-nZVI@Misi synthesised using co-reduction method (MA). Green dots
attribute to bimetallic nZVI particles.
M = Ni (E0 = -0.26 V); Cu (E0 = +0.34 V); Pd (E0 = +0.92 V); Zn (E0 = -0.76 V).
In a typical experiment, a Schlenk flask was charged with 1.00 g Misi, 0.5000 g (1.8 x 10⁻³ mol)
of FeSO4.7H2O and doping metal (e.g. 2.0 mL of 2.5 x 10⁻³ g nickel/mL NiCl2 solution, 8.5 x 10-
5 mol of NiCl2) in 30 mL of deoxygenated deionised water under nitrogen atmosphere. The
resulting suspension was vigorously stirred with a glass-coated magnetic stir bar for 15
minutes. To this suspension, 0.37 g (9.8 x 10⁻³ mol) NaBH4 in 30 mL deoxygenated deionised
water was added dropwise (0.5 mL/min) via a syringe pump. The suspension was kept stirring
until gas evolution stopped (approximately 90 minutes). The resulting particles were isolated
with a strong magnet and the solvent was removed via a cannula. The material was washed
with 2 x 30 mL deoxygenated deionised water, followed by 2 x 30 mL deoxygenated ethanol.
The particles were then isolated and dried at 60 C under vacuum for 15 hours.
2.1.2.2. Deposition method
The deposition method was a two-step sequential procedure (Scheme 2.2). nZVI on Misi
particles were synthesised (eq. 2.1). After that, due to the more negative reduction potential

39
of nZVI, it oxidises dopant ion (M(II)) to form M on the surface of nZVI) (eq. 2.3). In method
MB1, wet nZVI@Misi particles were used while dry nZVI@Misi particles were used in method
MB2.
Scheme 2.2. M-nZVI@Misi synthesised using deposition method (MB). Blue dots attribute to
nZVI particles and green dots attribute to bimetallic nZVI particles.
M = Ni (E0 = -0.26 V); Cu (E0 = +0.34 V); Pd (E0 = +0.92 V).
a. Method MB1
nZVI@Misi synthesis: Under nitrogen atmosphere, a Schlenk flask was charged with 1.00 g of
Misi and 0.500 g (1.8 x 10⁻³ mol) of FeSO4.7H2O in 30 mL of deoxygenated deionised water.
The resulting suspension was vigorously stirred with a glass-coated magnetic stir bar for 15
minutes. To this suspension, 0.37 g (9.8 x 10⁻³ mol) of NaBH4 in 30 mL deoxygenated deionised
water was added dropwise (0.5 mL/min) via a syringe pump to generate nZVI@Misi. The
mixture was kept stirring until gas evolution stopped (approximately 90 minutes). The
nZVI@Misi particles were isolated by a strong magnet and the solvent was removed via a
cannula. The nZVI@Misi particles were washed with 2 x 30 mL deoxygenated deionised water.
Doping metal: A solution containing dopant metal M (e.g. 2.0 mL of 2.5 x 10⁻³ g nickel/mL NiCl2
solution, 8.5 x 10⁻⁵ mol of NiCl2) in 30 mL of deoxygenated deionised water was added to
nZVI@Misi via cannula. The mixture was stirred continuously for 30 minutes so that nZVI
reacts with M(II) to form M-nZVI@Misi. After that, the generated M-nZVI@Misi particles were
isolated with a strong magnet and solvent was removed via a cannula. The particles were
isolated and washed with 2 x 30 mL deoxygenated deionised water and 2 x 30 mL
deoxygenated ethanol. The particles were then dried at 60 C under vacuum for 15 hours.

40
b. Method MB2
After synthesising nZVI@Misi, the particles were washed with 2 x 30 mL deoxygenated
deionised water, followed by 2 x 30 mL deoxygenated ethanol, and then dried at 60 C under
vacuum for 15 hours. Dry nZVI@Misi was used for depositing secondary metal. The procedure
for doping metal was similar to method MB1.
2.1.3. Synthesis of trimetallic particles on Misi support
Two methods were employed to adsorb nanoparticles (M1-M2-nZVI) on Misi. These methods
include co-reduction (MAtri) and deposition that have three versions: MC1, MC2, and MD.
Table 2.2. Material names and corresponding amount of metals salts added in M1-M2-
nZVI@Misi. Note: for all examples, the amount of Misi is 1.00 g and the amount of
FeSO4.5H2O added is 0.500 g, or 0.100 g iron.
Name
CuCl2
2.5 x 10⁻³ g copper/mL
(mL)
copper (g)
Pd(CH3COO)2
2 x 10⁻⁴ g palladium/mL
(mL)
palladium (g)
0.5%Pd-5%Cu-nZVI@Misi 2.0 mL
5.0 x 10⁻³ g
2.5 mL
5.0 x 10⁻⁴g
1%Pd-5%Cu-nZVI@Misi 2.0 mL
5.0 x 10⁻³ g
5.0 mL
1.0 x 10⁻³ g
2%Pd-5%Cu-nZVI@Misi 2.0 mL
5.0 x 10⁻³ g
10.0 mL
2.0 x 10⁻³ g
2.1.3.1. Co-reduction method (MAtri)
The co-reduction method used to generate trimetallic particles is similar to that used to
generate bimetallic particles except for two dopant metals were used instead of one. In this
method, iron and the two dopant metals are reduced simultaneously in the presence of Misi
(Scheme 3.3).

41
Scheme 2.3. M1-M2-nZVI@Misi synthesised using co-reduction method (MAtri). Green dots
with orange attribute to trimetallic nZVI particles.
Under nitrogen atmosphere, a Schlenk flask was charged with 1.00 g of Misi, 0.500 g (1.8 x
10-3 mol) of FeSO4.7H2O and two dopants (M1, M2) (eg. 2.0 mL of 2.5 x 10⁻³ g copper/mL CuCl2
solution, 8.1 x 10⁻⁵ mol of CuCl2 and 2.5 mL of 2.0 x 10⁻⁴ g palladium/mL Pd(CH3COO)2 solution
(4.7 x 10⁻⁶ mol of Pd(CH3COO)2) in 30 mL of deoxygenated deionised water. The resulting
suspension was vigorously stirred with a glass-coated magnetic stir bar for 15 minutes. To this
suspension, 0.37 g (9.8 x 10⁻³ mol) of NaBH4 in 30 mL deoxygenated deionised water was
added dropwise (0.5 mL/min) via a syringe pump and stirred continuously until gas evolution
stopped (approximately 30 minutes) (eq. 2.1, eq. 2.4 and eq. 2.5). The M1-M2-nZVI@Misi
particles were isolated with a strong magnet and the solvent was removed via a cannula. The
material was washed with 2 x 30 mL deoxygenated deionised water, followed by 2 x 30 mL
deoxygenated ethanol. The particles were then isolated and dried at 60 C under vacuum for
15 hours.
2.1.3.2. Deposition method
In the deposition method, nZVI@Misi particles are initially synthesised and then two dopants
(M1, M2) were sequentially deposited on nZVI@Misi in three different methods: MC1, MC2,
and MD.
a. Method MC1
Method MC1 was a three-step procedure, similar to method MB1 (Section 2.1.2.2). In MC1,
each dopant was sequentially deposited on nZVI@Misi and only FeSO4 was subjected to
NaBH4 (Scheme 2.4).4

42
Scheme 2.4. M1-M2-nZVI@Misi synthesised using deposition method (MC1). Blue dots
attribute to nZVI particles, green dots attribute to bimetallic nZVI particles and green dots
with orange attribute to trimetallic nZVI particles.
nZVI@Misi was synthesised by the reduction of FeSO4 by NaBH4 (Section 2.1.2.2). nZVI
particles were washed with 2 x 30 mL deoxygenated deionised water. A solution containing
dopant metal M2 (e.g, 2.0 mL of 2.5 x 10⁻³ g copper/mL CuCl2 solution, 8.1 x 10⁻⁵ mol of CuCl2)
in 30 mL of deoxygenated deionised water was added to these particles via cannula. The
resulting suspension was stirred continuously for 30 minutes to generate bimetallic M2-
nZVI@Misi (Cu-nZVI@Misi) (eq. 2.6). M2-nZVI@Misi was washed with 2 x 30 mL deoxygenated
deionised water. A solution containing dopant metal M1, (e.g, 2.5 mL of 2.0 x 10⁻⁴ g
palladium/mL Pd(CH3COO)2 solution, 4.7 x 10⁻⁶ mol Pd(CH3COO)2) in 30 mL of deoxygenated
deionised water was added to these particles. The suspension was stirred continuously for 30
minutes to generate trimetallic M1-M2-nZVI@Misi (Pd-Cu-nZVI@Misi) (eq. 2.7 and possibly
eq. 2.8). M1-M2-nZVI@Misi was washed with 2 x 30 mL deoxygenated deionised water,
followed by 2 x 30 mL deoxygenated ethanol. The particles were then isolated and dried at
60 C under vacuum for 15 hours.
b. Method MC2
Method MC2 was a three-step procedure, similar to method MC1. However, after each
addition of doping metal and mixing, a solution of NaBH4 was added to the suspension. This
was modified from the method for synthesising unsupported Pd-Cu-nZVI and Cu-Pd-nZVI
reported by Lubphoo et al.5 (Scheme 2.5).

43
Scheme 2.5. M1-M2-nZVI@Misi synthesised using deposition method (MC2). Blue dots
attribute to nZVI particles, green dots attribute to bimetallic nZVI particles and green dots
with orange attribute to trimetallic nZVI particles.
nZVI@Misi was synthesised by the reduction of FeSO4 by NaBH4 (Section 2.2.2.2). A solution
containing M2 (e.g, 2.0 mL of 2.5 x 10⁻³ g copper/mL CuCl2 solution, 8.1 x 10⁻⁵ mol of CuCl2) in
30 mL of deoxygenated deionised water was added to these particles and the suspension was
stirred in 10 minutes. To this suspension, a solution of 0.10 g (2.6 x 10⁻³ mol) of NaBH4 in 10
mL deoxygenated deionised water was added dropwise (0.5 mL/min) and the suspension was
vigorously stirred until no gas bubbles evolved (approximately 20 minutes). The M2-
nZVI@Misi particles were separated and washed with 2 x 30 mL deoxygenated deionised
water. A solution containing M1 (e.g, 2.5 mL of 2.0 x 10⁻⁴ g palladium/mL Pd(CH3COO)2
solution, 4.7 x 10⁻⁶ mol Pd(CH3COO)2) in 30 mL deoxygenated deionised water was added to
these particles and the suspension was stirred in 10 minutes. A solution of 0.10 g (2.6 x 10⁻³
mol) of NaBH4 in 10 mL deoxygenated deionised water was added dropwise (0.5 mL/min) and
the suspension was vigorously stirred until no gas bubbles evolved (approximately 20
minutes), resulting in trimetallic M1-M2-nZVI@Misi. These particles were isolated, washed
with 2 x 30 mL deoxygenated deionised water, followed by 2 x 30 mL deoxygenated ethanol.
The particles were isolated and dried at 60 C under vacuum for 15 hours.
c. Method MD
Method D was a two-step procedure in which two dopant metals were simultaneously
deposited on nZVI@Misi. nZVI@Misi was initially synthesised by the reduction of FeSO4 by
NaBH4 (Section 2.2.2.2). A solution containing both dopant M1 and dopant M2 (e.g, 2.0 mL of
2.5 x 10⁻³ g copper/mL CuCl2 solution, 8.1 x 10⁻⁵ mol of CuCl2 and 2.5 mL of 2.0 x 10⁻⁴ g
palladium/mL Pd(CH3COO)2 solution, 4.7 x 10⁻⁶ mol of Pd(CH3COO)2) in 30 mL deoxygenated
deionised water was added to the particles. The suspension was vigorously stirred in 30
minutes to generate trimetallic M1-M2-nZVI @Misi (Scheme 2.6). The particles were isolated

44
and washed with 2 x 30 mL deoxygenated deionised water and 2 x 30 mL deoxygenated
ethanol. The particles were then isolated and dried at 60 C under vacuum for 15 hours.
Scheme 2.6. M1-M2-nZVI@Misi synthesised using deposition method (MD). Blue dots
attribute to nZVI particles and green dots with orange attribute to trimetallic nZVI particles.
2.1.4. Nitrate reduction
Nitrate reduction by doped and non-doped nZVI@Misi particles was examined under both
anaerobic and aerobic conditions. The effect of other coexisting ions was also examined.
Additionally, the reactivity of doped and non-doped nZVI@Misi towards nitrate reduction
from lake water was investigated.
A stock solution of 1,000 ppm nitrate-N was prepared from dehydrated KNO3 (105 C, 24
hours) in deionised water (0.7218 g KNO3 in 1.00 L). Working nitrate-N solutions, including 10
ppm, 50 ppm and 100 ppm were diluted from the stock solution with deionised water. For
each experiment, 0.150 g of material was added to 25.0 mL of nitrate solution. Under
anaerobic conditions, nitrate concentrations of 10 ppm, 50 ppm, and 100 ppm were used.
Under aerobic conditions, nitrate concentrations of 10 ppm and 50 ppm were used (Table
2.3).
Table 2.3. Nitrate reduction under anaerobic and aerobic conditions.
Condition Mass of material (g) Nitrate-N concentration (ppm)
Anaerobic conditions 0.150 10 50 100
Aerobic conditions 0.150 10 50
2.1.4.1. Anaerobic conditions
Prior to reduction, 25.0 mL of nitrate solution in a Schlenk flask was bubbled with nitrogen
gas for at least 20 minutes. Supported nanoparticles (0.150 g) were quickly added to this

45
solution and the suspension was stirred vigorously with a glass-coated magnetic stir bar.
Aliquots of 3 - 5 mL samples were withdrawn using a syringe at set time intervals such as 5
minutes, 15 minutes, 20 minutes, and 30 minutes and filtered through 0.22 μm cellulose
acetate syringe filter.
2.1.4.2. Aerobic conditions
In the aerobic conditions, 0.150 g of material was quickly added to 25.0 mL of nitrate solution.
The suspension was stirred vigorously with a glass-coated magnetic stir bar. Aliquots (5 mL)
were withdrawn using a syringe at set time intervals (5 minutes, 15 minutes, and 30 minutes)
and filtered through 0.22 μm cellulose acetate syringe filter.
2.1.4.3. Interfering ions
Four different ions (chloride, sulfate, carbonate, and phosphate) were used in the
investigation. Stock solutions of coexisting ions including chloride (1,000 ppm), sulfate-S
(1,000 ppm), carbonate-C (100 ppm) and phosphate-P (100 ppm) were prepared separately
by adding KCl (2.110 g), K2SO4 (5.440 g), K2CO3 (1.150 g), or KH2PO4 (0.440 g) to a 1.00 L
volumetric flask and adding deionised water to make up a 1.00 L solution.
The procedures for investigating the effect of coexisting ions on nitrate reduction were similar
to that of nitrate reduction. However, materials were added to the solution containing nitrate
and these ions. The influence of these ions on nitrate reduction was examined under both
anaerobic and aerobic conditions (Table 2.4). For example, in the experiment of chloride
influence, a 25 mL solution containing 10 ppm nitrate-N and 100 ppm chloride was prepared
by adding 2.5 mL of nitrate-N solution of 100 ppm and 2.5 mL of chloride solution of 1,000
ppm to deionised water to make up a 25.0 mL solution.

46
Table 2.4. Nitrate reduction in the presence of other ions. Note: for all experiments, the
amount of materials is 0.150 g, 2.5 mL of 100 ppm nitrate-N solution and the volume of
other ions are added to deionised water to make up a 25.0 mL solution.
Chloride 1,000
ppm (mL)
Sulfate-S 1,000
ppm (mL)
Carbonate-C
100 ppm (mL)
Phosphate-P
100 ppm (mL)
Deionised
water (mL)
2.5 2.5 5.0 2.5 up to 25.0 mL
2.1.5. Elemental composition in materials
In order to quantify their elemental composition, materials were digested using strong and
oxidising acid. Concentrated HNO3 (68 - 70%, 5.0 mL) was added in a plastic centrifuge tube
containing 0.250 g each material. Materials investigated were 5%Ni-nZVI@MisiCFeOOH-MA,
5%Ni-nZVI@MisiCFeOOH-MB1, 5%Cu-nZVI@MisiCFeOOH-MA, 5%Cu-nZVI@MisiCFeOOH-
MB1, 0.5%Pd-5%Cu-nZVI@MisiCFeOOH-MAtri, 0.5%Pd-5%Cu-nZVI@MisiCFeOOH-MC1,
nZVI@MisiCFeOOH and MisiCFeOOH. These suspensions were shaken, sonicated until no
brown gas (NO2) released. Deionised water (40 mL) was then added to this suspension. These
resulting suspensions were sonicated, centrifuged and separated to remove solid and diluted
to the final volume of 50.0 mL. The concentrations of metal loading were measured using
Atomic Absorption Spectroscopy (AAS).
2.1.6. Heavy metal removal
Stock solutions of cadmium (1,000 ppm), lead (1,000 ppm), and chromium (VI) (1,000 ppm)
were prepared by adding CdCl2 (0.163 g), Pb(NO3)2 (0.160 g), and K2Cr2O7 (0.283 g) to a 100.0
mL volumetric flask and adding deionised water to make up a 100.0 mL solution, respectively.
Due to the low solubility of PbCl2, stock solution of Pb (200 ppm) was prepared by adding
PbCl2 (0.027 g) to a 100.0 mL volumetric flask and adding deionised water to make up a 100.0
mL solution. Pb(NO3)2, PbCl2, K2Cr2O7, and CdCl2 were provided by Sigma-Aldrich. CdCl2 was
stored and weighed in an inert atmosphere glove box to minimise hydrolysis. The working
solutions of heavy metals (20 ppm and 40 ppm) were prepared from these stock solutions.
Prior to reaction, 25.0 mL of heavy metal solution was bubbled with nitrogen gas in a Schlenk
flask for at least 20 minutes. Supported nanoparticles (0.100 g) were quickly added to this
solution (e.g, 25.0 mL of cadmium 20 ppm) and the suspension was stirred vigorously with a

47
glass-coated magnetic stir bar. Aliquots (7 mL) were withdrawn using a syringe at set time
intervals (5 minutes, 15 minutes, and 30 minutes) and filtered through 0.22 μm cellulose
acetate syringe filter into a polyethylene test tube and then loaded into autosampler of the
atomic absorption spectroscopy (AAS). Sets of known standards with appropriate
concentrations were conducted for each metal measurement.
Table 2.5. Heavy metal removal. Note: for all experiments, the amount of materials is 0.100
g and 25.0 mL of heavy metal solutions with concentrations as listed.
Cadmium 20 ppm
(mL)
Lead 20 ppm
(mL)
Lead 40 ppm
(mL)
Chromium 20 ppm
(mL)
25.0 25.0 25.0 25.0
2.1.7. Contaminant removal from lake water
Natural water samples were from Lake Horowhenua, North Island, New Zealand. Samples
were taken near the lake’s edge and contained in clean polyethylene bottles. Samples were
collected on April 27, 2017 and on April 23, 2018. Samples were transported to the laboratory
and kept at 4 °C.
2.1.7.1. Nitrate reduction from lake water
Nitrate reduction from lake water samples was carried out under anaerobic (Section 2.1.4.1)
and aerobic conditions (Section 2.1.4.2). For the investigation on lake water spiked, nitrate
solution was added to the samples prior to use. Lake water spiked with 10 ppm of nitrate-N
was prepared by adding 10.0 mL of 1,000 ppm nitrate-N to a 1.00 L volumetric flask and
adding lake water to make up a 1.00 L solution. Lake water spiked with 50 ppm of nitrate-N
was prepared by adding 50.0 mL of 1,000 ppm nitrate-N to a 1.00 L volumetric flask and
adding lake water to make up a 1.00 L solution.
2.1.7.2. Heavy metal removal from lake water
Prior to use, lake water spiked with 20 ppm heavy metal was prepared by adding 20.00 mL of
1,000 ppm heavy metal to a 1.00 L volumetric flask and adding lake water to make up a 1.00
L solution. Heavy metal removal from lake water spiked under anaerobic was carried out as
mentioned in Section 2.1.6. Heavy metal removal from lake water spiked under aerobic

48
conditions was carried out as mentioned in Section 2.1.6; however, neither conduction under
nitrogen gas nor deoxygenation was needed.
2.1.8. Chemical analysis
2.1.8.1. Determination of nitrate
In this research, two methods were used to determine nitrate concentrations: ultraviolet-
visible (UV- Vis) spectrophotometry210 and ion chromatography (IC).211
a. Ultraviolet-visible spectroscopy
Nitrate concentrations were quantified at 220 nm using a Carry Bio-50 spectrophotometer.
Approximately 3 mL of sample in a quartz cuvette was placed in the sample holder. The
nitrate-N concentration was calculated from a known standard curve from 0.2 ppm to 10 ppm
nitrate-N.
b. Ion chromatography
Nitrate, nitrite, and phosphate standard solutions were prepared from commercial ion
chromatography (IC) standards (1,000 ppm, Sigma Aldrich and Fluka). The standards for
chloride (1,000 ppm) and sulfate (1,000 ppm) were prepared by adding KCl (2.110 g) and
K2SO4 (1.812 g) provided by Sigma-Aldrich to a 1.00 L volumetric flask and adding lake water
to make up a 1.00 L solution, respectively.
A PolyVialTM was filled with approximately 5 mL of sample and capped. The samples were
loaded into an autosampler with at least 5 known standard solutions. These standards were
in different nitrate concentration ranges, depending on the estimated nitrate concentrations
of the samples. In this study, the standard curves were from 0.5 - 50 ppm nitrate and 25 - 450
ppm nitrate. Concentrations of nitrate, nitrite, chloride, sulfate, and phosphate were
determined using the Thermofisher IC 1100 with Dionex IonPac AS14 column, Dionex IonPac
AG 14 column guard and Dionex AERS 500 suppressor. The IC mobile phase was a mixture of
Na2CO3 4.5 mM and NaHCO3 1.4mM that was diluted from Dionex AS23 Eluent concentrated
in deionised water. The flow rate was 1.2 mL/min and the injection volume was 25 µL.
2.1.8.2. Determination of ammonium
Ammonium was measured using the Nessler method. The Nessler reagent was prepared as
followed: in a beaker, HgI2 (10.00 g) and KI (7.00 g) were dissolved in deionised water (40.0

49
mL) (solution A). In another beaker, NaOH (16.00 g) was dissolved in deionised water (40.0
mL) (solution B). Solution A was added to solution B. The resulting solution was stirred
continuously and then diluted with deionised water to a final volume of 100.0 mL of Nessler
reagent. A stock ammonium-N solution (100 ppm) was prepared by adding NH4Cl (0.382 g) to
a 1.00 L volumetric flask and adding deionised water to make up a 1.00 L solution. Standards
and samples of ammonium were diluted from stock solutions with deionised water. HgI2, KI
and NH4Cl were provided Sigma-Aldrich. NaOH was provided by Vickers laboratories limited.
To determine the amount of ammonium, 0.1 mL of Nessler reagent was added to a 5.0 mL
volumetric flask and enough ammonia solution was added to the line. The resulting solution
was left in 20 minutes to form maximum complex. The ammonium concentrations were
measured using the Carry Bio-50 spectrophotometer at 425 nm.
2.1.8.3. Determination of dopant metal and iron after nitrate reduction
Working standards of elements including iron, nickel, and copper were prepared by diluting
their standards for the AAS (1,000 ppm) provided by Sigma-Aldrich. The standard curves were
from 0.1 - 5 ppm for both iron and nickel and from 0.5 - 5 ppm for copper.
After nitrate reduction, the remaining solutions were filtered via 0.22 µm cellulose acetate
syringe filter into polyethylene test tubes and then loaded into the AAS autosampler. The
absorption signals of iron, nickel, and copper were measured with the ThermoFisher iCE 3500
with SOLAAR™ software using an acetylene and air flame. The concentrations of these ions
were then calculated from the standard curves consisting of five known standards.
2.1.8.4. Determination of element composition in materials
For nickel and copper determination, the digested solutions were adjusted with an alkaline
solution (NaOH 10 N) to achieve pH from 1 to 2. For iron determination, the digested solutions
were quantitatively diluted 100 times with deionised water. The absorption signals of iron,
nickel, and copper were measured with the ThermoFisher iCE 3500 with SOLAAR™ software
using an acetylene and air flame. The metal concentrations were quantified from the
calibration curve consisting of five known standards. The standard curves were from 0.1 - 5
ppm for either iron or nickel and from 0.5 - 5 ppm for copper.

50
2.1.8.5. Determination of heavy metal concentration
Standard solutions of heavy metals were prepared by diluting AAS standards (1,000 ppm,
Sigma-Aldrich) with deionised water to appropriate concentrations. The standard curves of
cadmium, lead, and chromium was from 0.1 - 5 ppm.
Approximately 7 mL of sample was filtered into a polyethylene test tube and then loaded into
autosampler of the AAS. The absorption signals of cadmium, lead, and chromium as well as
metals after heavy metal removal such as iron, nickel, and copper were measured by the
ThermoFisher iCE 3500 with SOLAAR™ software using an acetylene and air flame except for
chromium where nitrous oxide and acetylene flame were used. The concentrations of these
ions were then calculated from the standard curves.
2.1.8.6. Determination of detection limit
The detection limit of analytes was determined using the standard deviation of the
measurement and the slope of the linear calibration curve.212 The results showed that the
detection limit of nitrate-N and nitrite-N using IC are 0.06 ppm and 0.04 ppm, respectively.
The detection limits of metals using AAS were also calculated, iron (0.09 ppm), nickel (0.04
ppm), copper (0.66 ppm), and lead (0.05 ppm).
2.1.9. Characterisation of material method
The morphology of materials was characterised using a scanning electron microscope (SEM)
and transmission electron microscope (TEM).161 The elemental composition was examined
using energy dispersive X-ray spectroscopy in SEM (SEM-EDS) and in TEM (TEM-EDS). The
crystalline composition of materials was examined using X-ray diffraction (XRD).
2.1.9.1. Method for scanning electron microscope
Samples were loaded on a carbon tape that had been placed on a 1 cm Al sample holder.
Samples were then coated with a 7 - 9 nm carbon layer using a Quorum Q150T E carbon coater
and dried under vacuum for at least 6 hours prior to use. All SEM images were taken using a
JEOL 6500F SEM instrument. The probe current was 13 kV, 15 kV, or 20 kV. The working
distance was from 8.3 mm to 10.3 mm.

51
2.1.9.2. Method for transmission electron microscope
Samples were dispersed in ethanol. A drop of dispersion was loaded on a grid and dried. The
Cu-containing materials were loaded on a gold grid while others were loaded on copper grids.
All TEM images and TEM-EDS information were generated using a JEOL TEM 2100F instrument
with 200 kV probe current.
2.1.9.3. Method for X-ray diffraction
Samples were loaded on a stainless-steel holder and compacted to achieve a smooth surface.
All XRD patterns were taken using PANalytical X’Pert Pro diffractometer. The X-ray source is
a CuKα tube in which the current is 40 mA and the voltage was 45 kV. Scans were determined
in the region from 5 - 90° with 0.013° step.
2.2. Instruments
2.2.1. Scanning electron microscopy
Scanning electron microscopy is the technique that is used for observing microscopic objects
in a stereographic image with high magnifications.213 Objects can be magnified in a wide
range, from 10 to 1,000,000 times. In SEM, when an electron beam irradiates the surface of
the sample, the beam interacts with atoms in different areas or depths of the sample.
Consequently, a variety of information is produced, depending on the areas that are analysed
(Figure 2.1).
There are three prevalent types of signals generated by the interaction of electrons with
samples, including secondary electrons, backscattered electrons, and X-rays. Secondary
electrons are used for morphological observation. When an electron beam irradiates a
sample, secondary electrons of the surface atoms are scattered. The number of electrons
emitted is a function of the incident angle of the electron beam to the sample. Due to the low
energy of secondary electrons, they only escape from a thin layer on the surface of the
sample, so their signals are suitable for the investigation of the morphology of the surface.
Images collected from secondary electrons is called Secondary Electron Images (SEI).
Backscattered electrons give information about the elemental distribution. Backscattered
electrons are scattered at deeper areas of the sample’s surface. The number and scattering
direction of backscattered electrons depend on the elemental composition of the sample and

52
the incident angle of the electron beam to the sample. The combination of surface
morphology and backscattered electrons gives a composition image (COMPO) when a
backscattered electron detector is used. In the COMPO image, there is a contrast in which
heavier elements have a brighter color than lighter elements.
X-rays analysis provides both qualitative and quantitative information about the sample. It
can identify the elemental composition of the sample and the weight concentration of
elements at the specified areas. When the incident beam irradiates the sample to create
secondary electrons, it leaves holes in the electron shells. If these holes are in inner electronic
shells, electrons from the outer shell will transfer into the inner shell to stabilise the atom.
The excess energy of this movement generates X-rays. There are two methods to analyse
characteristic X-rays, including wavelength dispersive X-ray spectroscopy (WDS) and energy
dispersive X-ray spectroscopy (EDS) but EDS is more common. EDS is a method in which a Si
(Li) semiconductor detector is used to detect the energy of the characteristic X-rays. In EDS,
the location of peaks attributed to the energy of identified elements and the intensities or
areas of peaks are proportional with the percentage mass of elements.
Figure 2.1. Diagram showing the distribution of signals in SEM.213
Incident electron beam
Secondary electrons
Backscattered electrons
Characteristic X-rays Continuous X-rays
Fluorescent X-rays
Auger electrons
Sample

53
2.2.2. Transmission electron microscopy
Transmission electron microscopy is a technique in which an electron beam interacts with a
specimen to provide information about morphology, composition, and crystallography.214 The
sample can be magnified to 5,000,000 times. In TEM, when an electron beam enters a thin
sample (less than 100 nm), electrons can go through the sample to form a transmitted beam.
The interactions between high energy electrons and atoms of the sample produce a variety
of signals (Figure 2.2).
Two common signals are TEM imaging and scanning transmission electron microscope
(STEM). TEM image contrast is formed due to the interaction of the incident electron beam
with the sample. Electrons go through the sample as a wave, yielding a change in amplitude
and phase. The contrast of amplitude and phase results in TEM imaging. In TEM images, the
darker areas response regions with greater absorption of the electron while regions with
fewer absorbed electrons are represented in lighter areas. Compared to SEM images, TEM
images give higher magnification and resolution.
STEM is formed when the electron beam scans over the sample in a raster. There are two
different detectors to collect the transmitted beam of scattered electrons. Scattered
electrons with low-angle (< 10 mrad) are collected using either bright-field (BF) detection to
form STEM-BF image while scattered electrons with the angle less than 50 mrad are collected
using annular dark-field (ADF) detector to form STEM-ADF image. In this study, the STEM-BF
image was used.
When a sample interacts with an electron beam, some of the electrons scatter inelastically
and lose energy. The lost energy is transferred to atoms and generates characteristic X-rays.
The number and the energy of characteristic X-rays are recorded when an energy-dispersive
X-ray spectrometer (EDS) is used. EDS provides elemental information of the sample.

54
Figure 2.2. Diagram showing the signals used for TEM.214
2.2.3. X-ray diffraction
X-ray diffraction (XRD) analysis uses X-ray sources to study the arrangement of atoms in
crystalline or polycrystalline materials.215 XRD is based on diffraction of monochromatic X-
rays and atoms within a sample. The type and arrangement of atoms in materials are obtained
via diffraction patterns, including the scattered intensity and the diffraction angle. There are
two standard uses of XRD: single crystal XRD and X-ray powder diffraction. The latter was
utilised in this research.
X-ray powder diffraction spectroscopy analyses polycrystalline powder samples. It gives
information about phase identification of crystalline materials and the average composition
of materials. An X-ray powder diffractometer consists of a goniometer, an X-ray tube, incident
beam optics, diffracted beam optics, and a detector.216-217 Monochromatic X-ray radiation
irradiates sample and the X-rays are scattered by the electrons of atoms in the lattice planes.
As the sample and the detector are rotated, the intensity of the reflected X-rays is recorded.
The sample rotates in the path of the X-ray beam at an angle θ while the X-ray detector
collects the diffracted X-rays and rotates at an angle of 2θ (Figure 2.3). The diffraction angle
Incident electron beam
Incoherent beam
Characteristic X-rays
Diffracted beam
Transmitted beam
Sample

55
can reveal information about the composition of the material. For instance, the diffraction
angle of Fe(0) 2θ is 45°.218
Figure 2.3. Diagram showing the interaction of X-rays with layers of atoms in a crystal.215
2.2.4. Ion chromatography
Ion chromatography (IC) is a form of liquid chromatography. It is commonly used in the
environmental, clinical, and industrial analysis. IC is considered a reliable and sensitive
method to analyse inorganic ions.219 It is also used for the analysis of charged organic
substances, such as acids, bases, amino acids, and carbohydrates.
In IC, there is a stationary phase and a mobile phase that both play a role in separating ions.
A stationary phase is a solid support coated with different functional groups, depending on
types of ions undergoing separation. In cation separation, the cation-exchange column is
coated with sulfonic or carboxylic acid groups. In anion separation, the anion-exchange
column is modified with quaternary ammonium functional groups. The mobile phase must
contain ionic eluents in both cation and anion analysis. Ions are measured by conductivity or
UV detectors.220
The procedure of the ion analysis by using IC consists of equilibration, adsorption, elution and
desorption.221 Analytes are injected and adsorbed on the active sites of the separator column.
Ions in eluent solution compete with analytes and then analytes are eluted. Analytes are
detected and quantified by the detector.
The ion identity is determined by its retention time. The areas of peaks correspond to the
concentration of analyte ions. The retention time is influenced by the nature of ions such as
valence, size, and polarization of ions, concentration of the mobile phase, and temperature
of the separator column.212 A high concentration of the eluent decreases retention time but
also yields poor separation. A higher column temperature decreases the viscosity of the
mobile phase, leading to an increase in chromatography efficiency.220
θ θ
d θ
Scattered X-rays
Lattice plane
Lattice plane

56
There are two kinds of IC: suppressed and non-suppressed. Suppressed IC is used widely to
determine common inorganic ions, such as iodide, nitrate, or bromide in water222 as well as
pharmaceuticals.223 The sample separated from the column contains analyte ions and an
eluent. This eluent has high conductivity, leading to a low signal to noise ratio. To deal with
this drawback, the suppressor plays a role in replacing cations from the separated solution
with hydronium ions for anion analysis and hydroxide ions for cation analysis by using an ion
exchange membrane. It decreases eluent conductivity to nearly zero and increases the
selectivity, performance, and resolution of the method.212 Bicarbonate, a mixture of
bicarbonate and carbonate, hydroxide219 or borate224 are often used as eluents in suppressed
IC (Figure 2.4).
Figure 2.4. Diagram showing suppressed anion chromatography.212
In the non-suppressed IC, the separator column is a resin which has a low ion-exchange
capacity. Eluents are dilute solutions, such as KOH for anion separation and HCl for cation
separation. The matrix of the sample does not affect the signal of analyses. The conductivity
increases when analytes emerge from the column. Ions are characterized by the difference
between the conductivity of the analyte and eluent.212 Nitrate can be determined by IC using
Anion
separator
column
Sample
nitrate
Eluent
Na2CO3/
NaHCO3 Suppressor
Conductivity
Detector
Cation
exchange
membrane nitrate
H+
Na+

57
a conductivity detector225 or a UV detector226-229 at 225 nm or 210 nm. In this project,
suppressed anion chromatography in which the mixture solution of Na2CO3 and NaHCO3 was
the eluent and a conductivity detector was used.
2.2.5. Atomic absorption spectroscopy
Atomic spectroscopy is a spectroscopic method in which the absorption of ultraviolet and
visible radiation depends on transitions between electronic energy levels.230 When an atom
absorbs energy, an electron is promoted from the ground state to the excited state in higher
orbitals. The atomic spectroscopy method has high sensitivity and hence, it is possible to
distinguish and measure one element from other elements in a complex matrix with high
reliability. It is used to measure analytes at ppm or ppb level.
There are two popular types of atomic spectrometry, including atomic emission spectrometry
(AES) and atomic absorption spectrometry (AAS). Both rely on the atomising process that ions
in solution are vaporised and atomised to form gaseous ions by heat from the flame or
furnace. The intensity of emission or absorption at a particular wavelength is proportional to
the number of atoms. Thus, it is utilised to measure the concentrations of ions in solution. In
this study, AAS as a method for measuring the concentrations of metal ions was used.
Under thermal excitation, atoms absorb energy as photons to promote electrons from the
ground state to the excited state. The sample is only irradiated with the wavelengths that
match the transitions between the energy levels of elements to escape the ground state. Each
element absorbs at specific wavelengths; as such, a specific radiation source is used for a
particular element. The radiation source is a hollow cathode lamp.
In flame AAS, depending on the elements analysed, either acetylene/air or acetylene/nitrous
oxide flame is used. The combustion of acetylene and air is commonly used as it typically
produces a flame temperature of 2,400 - 2,700 °K (e.g, iron, nickel, copper, cadmium, and
lead analysis in this study). When a hotter flame is required, acetylene and nitrous oxide are
used (e.g, chromium measurement.)

58
Figure 2.5. Diagram showing atomic absorption experiment.212
Hollow- Cathode
lamp Monochromator Detector Amplifier
Readout device
Fuel Air
Flame
Analyte sample
P0 P

59
3. Determining the optimal dopant metals on nZVI@Misi in nitrate
reduction
3.1. Introduction
In this chapter, investigations into different types of supported bimetallic and trimetallic nZVI
are discussed. The goal is to determine the best nZVI dopant in terms of both adsorbing onto
Misi and reactivity towards nitrate reduction. These studies included investigations on the
types of doping metals, Misi preparations and different synthetic methods for adding the
dopant. The doped metals to generate supported bimetallic nZVI and trimetallic nZVI were
Ni, Cu, Zn, and Pd. Bimetallic and trimetallic nZVI on Misi were synthesised using different
methods including co-reduction (MA) and deposition (MB). Four different preparations of
Misi were used to examine the effect of Misi pre-treatment on absorption and reactivity. For
each material synthesised, the morphology, composition and elemental distribution were
characterised and the reactivity towards nitrate reduction was examined.
The Misi silicate was prepared using procedures to that has been reported previously by our
group.1 Initially, four different preparations of Misi were examined. This included heating raw
Misi to 120 °C (MisiU), calcining Misi at 600 °C for 6 hours (MisiC), boiling MisiC in deionised
water for 2 hours (MisiC-B) and coating MisiC with iron oxyhydroxide (MisiCFeOOH). These
procedures were shown to affect not only the amount of nZVI adsorbed onto the silicate
surface but also the reactivity of supported nZVI towards nitrate reduction. Misi that had
undergone calcination (MisiC) exhibited better dispersion of adsorbed nZVI particles and the
MisiCFeOOH supported nZVI reduced nitrate faster than other materials.
Three different synthetic methods were trialled to generate supported bimetallic M-
nZVI@Misi, named method A (MA), method B1 (MB1) and method B2 (MB2). Four different
synthetic methods were used to generate supported trimetallic M-nZVI@Misi, named
method A (MAtri), MC1, MC2, and MD. The morphology of the resulting materials was
examined using SEM and TEM. The elemental composition was examined using SEM-EDS and
TEM-EDS. It was also determined by subjecting to nitric acid and the concentration of metals
in the resultant solutions was measured using AAS. Additionally, the crystalline composition
was investigated using XRD.

60
In Fraser’s study, when the molar ratio of iron to nitrate of 25:1 was used, the maximum of
70% nitrate was reduced using non-doped nZVI@Misi under anaerobic conditions.1 However,
when this ratio was applied using doped systems, no difference in the reactivity of these
materials was found due to the quick nitrate reduction. Therefore, in order to compare the
reactivity of doped nZVI materials, the nitrate reduction was conducted with the molar ratio
of iron to nitrate at 15:1 (10 ppm nitrate-N). All of the reactivity studies reported in Chapter
3 were carried out without pH control. The ability of each of the materials towards nitrate
reduction was screened using UV-Vis to monitor the disappearance of nitrate. The
uncertainties of the results in this chapter were calculated using linear least-squares
analysis.212 The average and standard deviation of nitrate concentrations were calculated
based on standard curve. The most efficient systems are examined in greater detail in Chapter
4, including IC analysis of the reaction mixtures as well as determining the reproducibility of
each system.
The Nessler method was utilised to measure the ammonium concentration in solutions after
nitrate reduction.231 In this method, ammonium reacts with HgI2 and KI in an alkaline
condition to form a yellow complex. The concentrations of this complex were measured using
UV-Vis. Other potential N-containing products such as N2, N2O, and NO2 were not measured.
Name of materials: In the synthesis of the doped materials, the ratio of dopant to iron was
always tightly controlled; however, as we discovered, the ratio of the dopant to iron did not
always exactly reflect the ratio of species in the reaction mixture. However, due to brevity
and consistency throughout the thesis as well as with other reported bimetallic and trimetallic
nZVI, the materials will be named by the initial amounts used in full recognition that the
absolute ratio might be slightly different. For example, 5%Ni-nZVI@Misi means that the mass
ratio of Ni to Fe is 5:100 and the mass ratio of Fe to Misi is 10:100. In another way, the ratio
of Ni:Fe:Misi is 0.5:10:100.
3.2. Nitrate reduction using nZVI@Misi
As the control materials, the reactivity of nZVI@Misi that was synthesised using the same
amount of Fe and Misi with supported bimetallic and trimetallic nZVI@Misi was examined.
Two different materials, nZVI on calcined Misi (nZVI@MisiC) and nZVI on calcined/FeOOH-
coated Misi (nZVI@MisiCFeOOH), were used. The molar ratio of iron to nitrate was 15:1 (10

61
ppm nitrate-N). The results showed that nZVI@MisiCFeOOH has a slightly higher reactivity
than nZVI@MisiC but the difference was minimal (Figure 3.1). After 5 minutes, nitrate-N
concentrations were more than 9 ppm for either material. After 30 minutes, nitrate-N
concentrations were 5.5 0.6 ppm (45% nitrate conversion) and 4.5 0.6 ppm (55% nitrate
conversion) when either nZVI@MisiC or nZVI@MisiCFeOOH was used, respectively.
Figure 3.1. Reduction characterisation of nZVI@Misi towards nitrate-N 10 ppm (0.150 g of
material, 25.0 mL of solution, under anaerobic conditions).
3.3. Bimetallic Ni-nZVI@Misi
Several studies on doping Ni on the surface of nZVI were published. In unsupported Ni-nZVI
systems, the effect of Ni concentrations (from 0.2% to 30%) on the reactivity of materials was
examined.2, 167, 175 However, in supported Ni-nZVI, for example Ni-nZVI@zeolite,193 Ni-
nZVI@kaolinite,192, 199 systems with the ratio of Ni:Fe:support (0.1:1:2) were reported. In this
section, the synthesis, characterisation, and reactivity towards nitrate reduction of bimetallic
Ni-nZVI@Misi systems were investigated. Ni-nZVI@Misi was synthesised using all three
synthetic methods, MA, MB1, and MB2. In these experiments, the mass ratio of Fe to Misi
was 1:10 and the mass ratios of Ni to Fe were varied from 2:100 to 10:100 with NiCl2 as the
nickel source. Since then, three different variables were examined. They included variations
on Misi preparations (MisiU, MisiC, MisiC-B, and MisiC-FeOOH) using 5%Ni and co-reduction
method (MA), variations on Ni loading using MisiC and co-reduction method (MA) and
variations regarding dopant addition, including co-reduction method (MA) and deposition
0
2
4
6
8
10
12
0 5 10 15 20 25 30 35
Nit
rate
-N (
pp
m)
Time (m)
nZVI@MisiC nZVI@MisiCFeOOH

62
method (MB1 and MB2). The systems investigated are listed in Table 3.1. They include 2%Ni-
nZVI coated on MisiC using co-reduction method (MA), 5%Ni-nZVI coated on four different
types of Misi using the co-reduction method (MA), 5%Ni-nZVI coated both MisiC and
MisiCFeOOH using the deposition method (MB1 and MB2), and 10%Ni-nZVI coated on MisiC
using the co-reduction method (MA).
Table 3.1. List of Ni-nZVI@Misi systems synthesised.
Materials Misi preparation
Method MisiU MisiC MisiC-B MisiCFeOOH
2%Ni-nZVI@ X Co-reduction (MA)
5% Ni-nZVI@
X X X X Co-reduction (MA)
X X Deposition (MB1)
X X Deposition (MB2)
10% Ni-nZVI@ X Co-reduction (MA)
3.3.1. Variations on Misi preparation
The importance of silicate preparation on supporting Ni-nZVI on Misi was examined by
characterising the morphology of the materials with SEM (Figure 3.2). In the COMPO images,
higher atomic number (higher density) elements are shown as a brighter signal, thereby, the
Ni-nZVI is observed as the lighter components and the silicate is grey. The COMPO images
revealed an uneven dispersion of nanoparticles on the surface of the Misi particles. In some
areas (red circle), good adsorption is observed. However, in other areas (blue circle), the
nanoparticles are observed in the form of chains, indicating agglomeration due to magnetic
and electrostatic forces of Fe.162 The disordered distribution of nanoparticles on support Misi
is similar to that observed by Shi et al.192 However, in their SEM images, a higher degree of
agglomeration was observed on kaolinite, potentially due to the higher ratio of Fe to silicate
(1:2).
Agglomeration was visibly observed to be more significant on Misi that had not undergone
calcination (MisiU) (Figure 3.2 a) than that of any other preparations (Figure 3.2 b, c, d). This
is consistent with previous investigations in our group with non-doped nZVI on Misi.

63
Calcination was concluded to be an important step in Misi treatment for adsorbing
nanoparticles.1 In materials from calcined Misi, including MisiC, MisiC-B, and MisiCFeOOH,
the difference in the dispersion of Ni-nZVI was not visibly observed in SEM.
Figure 3.2. COMPO images of 5%Ni-nZVI on: (a) MisiU, (b) MisiC, (c) MisiC-B and (d)
MisiCFeOOH synthesised via co-reduction method (MA) in two different magnifications. The
lighter component is attributed to Ni-nZVI and silicate is grey. Figure c and d is in the next
page.
a
b

64
Figure 3.2. COMPO images of 5%Ni-nZVI on: (a) MisiU, (b) MisiC, (c) MisiC-B and (d)
MisiCFeOOH synthesised via co-reduction method (MA) in two different magnifications. The
lighter component is attributed to Ni-nZVI and silicate is grey. Figure a and b are in the
previous page.
The morphology of Ni-nZVI@Misi was compared to that of unsupported materials. COMPO
images showed that unsupported Ni-nZVI and nZVI particles are more aggregated and stacked
together to form long chains (Figure 3.3). In contrast, in the presence of Misi, the
electromagnetic attraction of nZVI particles is reduced, preventing nanoparticles from
clustering.191 Therefore, using Misi as the support is one of the key requirements to spread
out nanoparticles.
c
d

65
Figure 3.3. COMPO images of (a) 5%Ni-nZVI and (b) nZVI.
In studies on non-doped nZVI@Misi, the adsorption of nZVI on Misi was quantified using
Picasa and FIJI software.1 As discussed by Fraser, both particle size of nZVI and the distribution
of nanoparticles on Misi was difficult to determine. These variables were not reproducible
due to the heterogeneity of Misi when different bathes of materials were used. Therefore, in
this current study, the size and distribution of bimetallic particles have not been investigated.
Nitrate reduction of the Ni-nZVI on different preparations of Misi was examined. In these
studies, four materials, including 5%Ni-nZVI@MisiU, 5%Ni-nZVI@MisiC, 5%Ni-nZVI@MisiC-B
and 5%Ni-nZVI@MisiCFeOOH prepared via co-reduction method (MA) were used. The molar
ratio of Fe to nitrate was 15:1. Nitrate was reduced more slowly using 5%Ni-nZVI@MisiU than
that of any materials on Misi that involved a calcination step. After 5 minutes, nitrate-N
concentrations were 9.9 ppm (5%Ni-nZVI@MisiU) and less than 8 ppm (either 5%Ni-
nZVI@MisiC, 5%Ni-nZVI@MisiC-B or 5%Ni-nZVI@MisiCFeOOH). After 20 minutes, the nitrate-
N level was 4 ppm and above 1 ppm, respectively (Figure 3.4). A minimal difference in the
nitrate reduction of 5%Ni-nZVI@MisiC, 5%Ni-nZVI@MisiC-B and 5%Ni-nZVI@MisiC-FeOOH
was observed. Based on the distribution of nanoparticles on Misi, there appears to be a
correlation between the dispersion and the reactivity. The better the particles adsorbed on
Misi, the faster the materials reduced nitrate.
Accordingly, two preparations of Misi, including calcined Misi (MisiC) and calcined/FeOOH-
coated Misi (MisiCFeOOH) were used for future work because of three reasons. Calcination is
useful for adsorbing nanoparticles on the surface of silicate, resulting in higher nitrate
removal. Generating MisiC is more timesaving than MisiC-B and their resulting materials had
a b

66
similar reactivity towards nitrate reduction. Furthermore, preliminary results showed that
materials with the FeOOH coating layer are less impacted by potentially inhibitory ions such
as carbonate and phosphate.
Figure 3.4. Reduction characterisation of Ni-nZVI on different preparations of Misi (0.150 g
of materials synthesised by co-reduction method (MA), 25.0 mL of 10 ppm nitrate-N solution,
under anaerobic conditions).
3.3.2. Variations on Ni loading
In the investigations into the effect of Ni loading on the nitrate reducing capacity of Ni-nZVI,
other authors reported that 5%Ni2 or 10%Ni175 in Ni-nZVI contributed to the highest
reactivity. In addition, in studies on Ni-nZVI@support, 10%Ni was chosen to test.192-193, 199
Therefore, in this study, three different Ni concentrations, 2%, 5%, and 10%, were used to
generate Ni-nZVI on calcined Misi (MisiC) via co-reduction method (MA). The effect of Ni
loading on both the adsorption of Ni-nZVI onto MisiC and the subsequent reactivity towards
nitrate were examined.
To investigate the effect of Ni loading on the adsorption, the morphology of two
representative materials including 2%Ni-nZVI@MisiC and 5%Ni-nZVI@MisiC was
characterised via SEM. A good dispersion of nanoparticles across the silicate support is
observed for both dopant contents, although some agglomeration is observed (Figure 3.5).
No difference in the dispersion of Ni-nZVI with different Ni contents (2% and 5%) on MisiC is
0
2
4
6
8
10
12
0 5 10 15 20 25
Nit
rate
-N
(p
pm
)
Time (m)
5%Ni-nZVI@MisiU 5%Ni-nZVI@MisiC
5%Ni-nZVI@MisiC-B 5%Ni-nZVI@MisiCFeOOH

67
visibly observed. Therefore, other supported doped nZVI@Misi systems do not need to be
examined their morphology. Although the effect of Ni loading on nZVI towards contaminant
reduction was examined by other authors, the difference in the morphology of these reported
materials was not examined.2, 175
Figure 3.5. COMPO images of (a) 2%Ni-nZVI@MisiC-MA and (b) 5%Ni-nZVI@MisiC-MA. The
lighter component is attributed to Ni-nZVI and silicate is grey.
The relative reactivity of materials as a function of Ni loading was investigated. In these
studies, three materials, 2%Ni-nZVI@MisiC, 5%Ni-nZVI@MisiC and 10%Ni-nZVI@MisiC
prepared via co-reduction method (MA), were used. The molar ratio of Fe to nitrate was 15:1.
The results showed that these materials reduced nitrate faster than non-doped nZVI@MisiC
(Section 3.2). Nitrate removal increased with increasing Ni concentration. The material with
2%Ni had the lowest reactivity while 10%Ni-nZVI@MisiC was the best performing material.
After 5 minutes, nitrate-N concentrations were 9.0 ppm, 7.9 ppm, and 6.9 ppm when either
2%Ni-nZVI@MisiC, 5%Ni-nZVI@MisiC or 10%Ni-nZVI@MisiC was used, respectively (Figure
3.6). Nevertheless, after 20 minutes, the nitrate-N level was 1.7 ppm using 2%Ni-nZVI@MisiC
while the nitrate-N levels were below 1 ppm for either 5%Ni-nZVI@MisiC or 10%Ni-
nZVI@MisiC, indicating a minimal difference in the reactivity of 5% and 10% Ni.
In Kang et al.’s study, 5%Ni-nZVI showed the fastest reduction rate while the reactivity with
1%Ni-nZVI, 10%Ni-nZVI or 20%Ni-nZVI was significantly slower in reducing nitrate.2 In another
study, Tehrani et al. reported that 10%Ni-nZVI exhibited the fastest nitrate conversion
compared to Ni-nZVI with Ni concentration from 5% to 30%.175 In the different understanding,
the reactivity of unsupported Ni-nZVI increased to reach the peak and then decreased when
a b

68
the Ni content increased. Kang et al. postulated that the highest reactivity was due to the
optimum level of doped metal, resulting in the greatest number of nZVI active sites. When
there was too much secondary metal (Ni) on the surface of nZVI, the electron transfer from
the Fe core to contaminants is hindered, leading to a slower reaction rate. In our work, Fe
adsorbed on the surface of Misi with the Fe:Misi ratio of 10:100. This caused much better
dispersion of Fe, therefore, the increase in Ni concentration to 10% (Ni:Fe = 10:100) could not
be enough to deactivate the active sites of Fe particles. However, as there was a minimal
difference in the reactivity of 5%Ni and 10%Ni on nZVI@Misi, the 5%Ni-nZVI@Misi was
chosen for further work to minimise the amount of nickel used while still maintaining high
activity.
Figure 3.6. Reduction characterisation of Ni-nZVI@MisiC on different Ni concentrations
(0.150 g of materials synthesised via co-reduction method (MA), 25.0 mL of 10 ppm nitrate-
N solution, under anaerobic conditions).
3.3.3. Variations on synthetic methods
In previously reported studies, Ni-nZVI was synthesised using both co-reduction (MA)2 and
deposition methods (MB),2, 167, 175 although all of the Ni-nZVI@support systems including Ni-
nZVI@kaolinite, Ni-nZVI@zeolite and Ni-nZVI@cellulose acetate reported were synthesised
via co-reduction (MA).192-193, 199 Regarding to deposition method, wet nZVI was typically used
for the deposition step. In our study, the effect of different methodologies for doping
nZVI@Misi with Ni was examined. For this, 5%Ni-nZVI on two preparations of Misi (calcined
Misi (MisiC) as well as calcined/FeOOH-coated Misi (MisiCFeOOH)), were synthesised using
-2
0
2
4
6
8
10
0 5 10 15 20 25
Nit
rate
-N
(p
pm
)
Time (m)
2% Ni-nZVI@MisiC 5% Ni-nZVI@MisiC 10% Ni-nZVI@MisiC

69
three different methods (MA, MB1, and MB2). The morphology of these resulting materials
was examined using SEM, TEM, and XRD. The reactivity of these materials towards nitrate
reduction was also examined.
SEM images revealed a good dispersion of Ni-nZVI on Misi for each material (Figure 3.7). In
most of the areas, nanoparticles evenly adsorb on the surface of Misi although a low degree
of agglomeration is observed in some areas. The appearance of 5%Ni-nZVI@Misi synthesised
using these different methods are similar and are not visibly distinguished via SEM.

70
Figure 3.7. COMPO images of (a) 5%Ni-nZVI@MisiC-MA, (b) 5%Ni-nZVI@MisiCFeOOH-MA,
(c) 5%Ni-nZVI@MisiC-MB1, (d) 5%Ni-nZVI@MisiCFeOOH-MB1, (e) 5%Ni-nZVI@MisiC-MB2,
(f) 5%Ni-nZVI@MisiCFeOOH-MB2. The lighter component is attributed to Ni-nZVI and silicate
is grey.
d c
a b
f e

71
The elemental distribution of 5%Ni-nZVI@MisiCFeOOH-MA was examined by using SEM- EDS
(Figure 3.8). The signals corresponding to Si, O, and Al are very strong, indicating the main
components of silicate (Misi). Signals corresponding to S and K are also detected with low
density. This is due to impurities within the naturally occurring silicate. The signal
corresponding to Fe is observed throughout and several high-density regions are observed,
presumably corresponding to the nanoparticles. Signals corresponding to Ni observed in
5%Ni-nZVI@MisiCFeOOH-MA is not clear and relatively similar to Ni signal examined in non-
doped nZVI@MisiCFeOOH (Figure 3.9). There looks to be some correlation between Ni and
Fe in 5%Ni-nZVI@MisiCFeOOH-MA but mainly, Ni signal does not follow Fe distribution. This
is due to the low resolution of the Ni signal; as such, the technique with higher resolution will
be needed, for example, TEM-EDS.
Figure 3.8. SEM-EDS mapping of 5%Ni-nZVI@MisiCFeOOH-MA.
Figure 3.9. SEM-EDS mapping of nZVI@MisiCFeOOH.
Si O
Al
S K Fe Ni

72
The crystalline composition of 5%Ni-nZVI@MisiCFeOOH-MA was examined using XRD
analysis (Figures 3.10). The main peaks are attributed to silicate, corresponding to cristobalite
(2 = 22) and quartz (2 = 27).232 The broad peak at 2 = 45 can tentatively be assigned to
Fe(0). In studies on M-nZVI on other silicates such as kaolinite and bentonite, a strong peak
corresponding to Fe(0) was found, indicating the presence of nZVI.192, 233 In these studies, a
higher mass ratio of Fe to silicate was reported, 1:2 and 1:1 for kaolinite and bentonite
materials, respectively, in contrast to our 1:10 ratio. In contrast, Fe(0) was never confirmed
in previous studies on non-doped [email protected] As such, the XRD analysis of other
materials will be in appendix and no further discussion on XRD will be done.
Figure 3.10. XRD spectrum of 5%Ni-nZVI@MisiCFeOOH-MA.
The shape of Ni-nZVI particles in 5%Ni-nZVI@MisiCFeOOH synthesised via co-reduction
method (MA) and deposition (MB1 and MB2) was examined by TEM (Figure 3.11). The images
revealed that the nanoparticles have core-shell structure and are in the form of agglomerates.
The core is presumably Fe or Fe-Ni alloy and the shell is presumably iron oxides or iron-nickel
oxides. The structure of Ni-nZVI on MisiCFeOOH is similar to that of non-doped nZVI reported
in the previous paper.143 In nZVI particles, the core is Fe(0) and the shell is an iron oxide layer
coming from the oxidation of nZVI during synthesis.

73
Figure 3.11. TEM images in different magnifications of (a) and (d) 5%Ni-nZVI@MisiCFeOOH-
MA; (b) and (e) 5%Ni-nZVI@MisiCFeOOH-MB1; (c) and (f) 5%Ni-nZVI@MisiCFeOOH-MB2.
The composition of Ni-nZVI supported on MisiCFeOOH prepared via co-reduction method
(MA) and deposition method (MB1 and MB2) was analysed. TEM-EDS was taken in different
areas and magnifications in each sample. However, in order to examine the elemental
composition of nanoparticles and compare the difference in the elemental distribution of
particles that were synthesised via different methods, TEM-EDS in small specific areas was
chosen to discuss (Figures 3.12, 3.13 and 3.14). High-intensity peaks corresponding to O, Si,
Al, and S are observed in all three samples, which are attributed to the natural silicate. A peak
corresponding to Fe is strong while a peak corresponding to Ni is weak, consistent with the
percentage of these elements in the samples. Based on the quantitative results of elements
in TEM-EDS spectra, the percentages of these two elements in examined areas each sample
are different. In 5%Ni-nZVI@MisiCFeOOH-MA, the mass percentage for Fe and Ni was 26.0%
and 0.8% and the atom percentage was 10.4% and 0.3%, respectively. In 5%Ni-
nZVI@MisiCFeOOH-MB1, the mass percentage for Fe and Ni was 40.4% and 1.8% and the
atom percentage was 16.7% and 0.7%, respectively. In 5%Ni-nZVI@MisiCFeOOH-MB2, the
mass percentage for Fe and Ni was 69.4% and 3.2% and the atom percentage was 38.9% and
1.7%, respectively. A strong peak corresponding to Cu (at 8 keV) is also observed due to the
Cu grid that supports the samples during TEM analysis.

74
Figure 3.12. TEM-EDS spectrum of 5%Ni-nZVI@MisiCFeOOH-MA. Note: labels have been
modified to highlight peaks relevant to this research. Please see appendix B.1 for complete
spectrum.
Figure 3.13. TEM-EDS spectrum of 5%Ni-nZVI@MisiCFeOOH-MB1. Note: labels have been
modified to highlight peaks relevant to this research. Please see appendix B.2 for complete
spectrum.

75
Figure 3.14. TEM-EDS spectrum of 5%Ni-nZVI@MisiCFeOOH-MB2. Note: labels have been
modified to highlight peaks relevant to this research. Please see appendix B.3 for complete
spectrum.
In the TEM-EDS mapping of 5%Ni-nZVI@MisiCFeOOH-MA, signals corresponding to Si, O and
Al are strong, consistent with the presence of Misi. In addition, signal corresponding to S was
also found due to the property of the geothermal waste (Figure 3.15). The signals of these
elements in Misi are in correlation. A signal corresponding to Fe is also strong, indicating the
Fe in bimetallic Ni-nZVI. A signal corresponding to Ni is also observed although the Ni peak is
relatively weak in the TEM-EDS spectrum. When the signals of Fe and Ni are overlaid, there is
a good overlap observed. In addition, there is also Ni signal on the surface of Fe, but its density
is weak (Figure 3.15a). The elemental distribution is due to the formation of a Fe-Ni alloy that
was generated by the simultaneous reduction of Fe(II) and Ni(II) by using NaBH4. In addition,
the signals of O and Fe do not significantly overlap each other (Figure 3.15b). Similarly, O and
Ni signals do not overlap (Figure 3.15c). This data is also consistent with an Fe-Ni alloy.

76
Figure 3.15. TEM-EDS mapping of 5%Ni-nZVI@MisiCFeOOH-MA.
Si O Al
S Fe Ni
Fe- Ni O- Fe
O- Ni O- Fe- Ni
a b
c d
30 nm
30 nm

77
In TEM-EDS mapping of 5%Ni-nZVI@MisiCFeOOH-MB1 (Figure 3.16), there are strong signals
corresponding to Si, O, Al, and S, confirming the presence of Misi. In addition to common
elements, the signals corresponding to other elements, including Cl, Ti, Na, and Mg are also
observed. This can be explained due to the heterogeneity of Misi as these elements are in the
region corresponding to Misi.
The signals corresponding to Fe and Ni are strong and there is a good correlation of these two
elements. Interestingly, a significant amount of Ni is observed on the surface of Fe (Figure
3.16a). This can be explained by the sequential method to synthesise this material. In this
method, Ni is deposited on the surface of nZVI by the reduction of Ni(II) by nZVI. This leads to
the adsorption of Ni(0) on the surface of nZVI. The signal of O correlates with the signals of Si,
Fe and Ni with higher density in the region where Si is. When the signals of O and Fe were
overlaid, there is an overlap and an O layer is observed on the surface of Fe (Figure 3.16b).
Moreover, when the signals of O and Ni were overlaid, there is an overlap of Ni and O,
although the signal for Ni is significantly stronger than that of O (Figure 3.16c). These results
suggested that bimetallic Ni-nZVI particles in 5%Ni-nZVI@MisiCFeOOH-MB1 have a spherical
shape with a core of Fe(0) and an outer layer, consisting of Ni(0) and potentially nickel oxides
and iron oxides (Figure 3.16d). This finding is consistent with that reported when unsupported
2%Ni-nZVI prepared via deposition method (MB1) was examined via XPS analysis.167 In this
reported material, Ni was found in the form of both Ni(0) and Ni(II) in Ni(OH)2 on the surface
of nZVI as determined by their binding energy.
Si O Al
S Fe Ni Cl
50 nm

78
Figure 3.16. TEM-EDS mapping of 5%Ni-nZVI@MisiCFeOOH-MB1.
The TEM-EDS mapping of 5%Ni-nZVI@MisiCFeOOH-MB2 was examined. Signals
corresponding to Si and O are observed, consistent with the presence of Misi in the material
(Figure 3.17). Signals corresponding to both Fe and Ni are strong. When signals of Fe and Ni
were overlaid, a denser layer of Ni surrounding the surface of Fe is observed (Figure 3.17a).
The similarity is also observed when signals of Fe and O were overlaid, an O layer covers the
surface of Fe (Figure 3.17b). Additionally, there is an overlap when signals of Ni and O were
overlaid (Figure 3.17c). Based on these results, 5%Ni-nZVI@MisiCFeOOH-MB2 particles have
K Ti Na Mg
Fe- Ni O- Fe
O- Ni O- Fe- Ni
a b
c d
50 nm
50 nm

79
spherical shape with an Fe(0) core covered by a layer consisting of Ni(0) and potentially nickel
oxides and iron oxides (Figure 3.17d). This is similar to the structure of 5%Ni-
nZVI@MisiCFeOOH-MB1.
Figure 3.17. TEM-EDS mapping of 5%Ni-nZVI@MisiCFeOOH-MB2.
Si O Fe
Ni
Fe- Ni O- Fe
O- Ni O- Fe- Ni
a b
c d
100 nm
100 nm

80
There have been investigations on the structure of bimetallic Ni-nZVI. However, no elemental
distribution of secondary metal on nZVI was characterised by TEM-EDS. Thus, these new
findings may provide reasonable reasons to explain the facile reactivity of bimetallic nZVI.
The elemental composition of bimetallic Ni-nZVI in supported bimetallic nZVI@Misi was
quantified by AAS. For this, 5%Ni-nZVI on calcined/FeOOH-coated Misi (MisiCFeOOH)
prepared via co-reduction method (MA) and deposition method (MB1) were digested in
concentrated nitric acid and the resulting solutions were used to measure the concentrations
of nickel and iron. The amount of nickel and iron was then calculated from their
concentrations and the mass of MisiCFeOOH was subtracted from the initial amount of
material with the assumption that the only digested material is iron and nickel. The result
shows that the mass ratio of Ni:Fe:MisiCFeOOH is 0.56:12.77:100 (molar ratio Ni:Fe = 1:24.03)
and 0.52:11.63:100 (molar ratio Ni:Fe = 1:23.56) for 5%Ni-nZVI@MisiCFeOOH-MA and 5%Ni-
nZVI@MisiCFeOOH-MB1, respectively (Table 3.2).
Table 3.2. Analysis of Ni-doped materials (0.250 g of material, 5.0 mL of concentrated
HNO3). Note: Misi = MisiCFeOOH.
Material Ni (mg) Fe (mg) Misi (mg) Mass ratio of
Ni:Fe:Misi
5%Ni-nZVI@MisiCFeOOH-MA 1.2330.005 28.20.1 220.60.1 0.56:12.77:100
5%Ni-nZVI@MisiCFeOOH-MB1 1.1540.005 25.90.1 222.90.1 0.52:11.63:100
MisiCFeOOH 0 2.32 247.68 0:0.94:100
The ratio of Fe to Misi in both samples is higher compared to the ratio of Fe:MisiCFeOOH
(10:100) used in the synthesis of these materials. A couple of reasons can be used to explained
this. Firstly, in the support MisiCFeOOH, the ratio of Fe to Misi was 0.94:100, thus the
expected ratio from this would be 11:100. In addition, the isolating steps to make the
materials involved using a strong magnet; as such, any free Misi that did not adsorb
nanoparticles was not attracted to this magnet and was discharged into the waste solutions.
This leads to the loss of Misi, resulting in a higher concentration of nanoparticles. The

81
Ni:MisiFeOOH ratio between two samples is similar; however, the real amount of Fe in 5%Ni-
nZVI@MisiCFeOOH-MA was higher than that of 5%Ni-nZVI@MisiCFeOOH-MB1. This could be
due to the loss of Fe in the deposition step that nZVI reduced Ni(II) to form Ni(0) and Fe(II).
In order to investigate the influence of synthetic methods on the reactivity of bimetallic
materials, nitrate reduction was examined using materials prepared via co-reduction method
(MA) and deposition method (MB1 and MB2). In these studies, two different preparations of
Misi, including calcined Misi (MisiC) and calcined/FeOOH-coated Misi (MisiFeOOH), were
used to synthesise Ni-nZVI@Misi. The results show that all these Ni-doped materials reduced
nitrate faster than non-doped nZVI@Misi (Section 3.2) and that nitrate reduction was
dependent upon the synthetic method to generate materials. When MisiCFeOOH was used
as the support, 5%Ni-nZVI@MisiCFeOOH-MB1 had the highest reactivity while 5%Ni-
nZVI@MisiCFeOOH-MB2 was the lowest performing material. The 5%Ni-nZVI@MisiCFeOOH-
MA exhibited the medium performing activity. For instance, after 5 minutes, the nitrate-N
concentrations were 3.8 ppm, 6.9 ppm, and 8.8 ppm when either 5%Ni-nZVI@MisiCFeOOH-
MB1, 5%Ni-nZVI@MisiCFeOOH-MA or 5%Ni-nZVI@MisiCFeOOH-MB2 was used (Figure 3.18).
In contrast, after 30 minutes, nitrate-N levels were not detected for all materials examined.
When MisiC was used as the support, 5%Ni-nZVI@MisiC-MB1 reduced nitrate faster than
both 5%Ni-nZVI@MisiC-MA and 5%Ni-nZVI@MisiC-MB2 in the first 5 minutes. The nitrate-N
concentration was below 1 ppm when 5%Ni-nZVI@MisiC-MB1 was used while the nitrate-N
concentrations were 2.9 ppm and 7.9 ppm when 5%Ni-nZVI@MisiC-MB2 and 5%Ni-
nZVI@MisiC-MA were used, respectively (Figure 3.19). However, after 15 minutes, the
difference in their reactivity was not found.

82
Figure 3.18. Reduction characterisation of 5%Ni-nZVI@MsiCFeOOH prepared via different
methods (0.150 g of materials, 25.0 mL of 10 ppm nitrate-N solution, under anaerobic
conditions).
Figure 3.19. Reduction characterisation of 5%Ni-nZVI@MisiC prepared via different methods
(0.150 g of materials, 25.0 mL of 10 ppm nitrate-N solution, under anaerobic conditions).
In the deposition method (MB), the reactivity of 5%Ni-nZVI@Misi synthesised using MB1 was
higher than that of 5%Ni-nZVI@Misi synthesised using MB2, regardless of Misi preparation.
However, the difference is minimal. Although the reason is uncertain, this can be explained
due to the loss in the number of active sites of Fe prior to the deposition step. During the
drying procedure of nZVI@Misi, the surface of the particles might be oxidised to form a
-2
0
2
4
6
8
10
0 5 10 15 20 25 30 35
Nit
rate
-N (
pp
m)
Time (m)
5%Ni-nZVI@MisiCFeOOH-MA 5%Ni-nZVI@MisiCFeOOH-MB1
5%Ni-nZVI@MisiCFeOOH-MB2
-2
0
2
4
6
8
10
0 5 10 15 20 25 30 35
Nit
rate
-N (
pp
m)
Time (m)
5%Ni-nZVI@MisiC-MA 5%Ni-nZVI@MisiC-MB1 5%Ni-nZVI@MisiC-MB2

83
protective oxide layer. This was evident by a yellow layer observed on the wall of Schlenk.
This layer can block the electron transfer from nZVI to contaminants such as nitrate. In
comparisons between method MA and MB1, materials prepared via MB1 had higher
reactivity towards nitrate reduction than those prepared via MA. This is inconsistent with a
previous study on unsupported Ni-nZVI reported by H. Kang et al..2 In their report, the
unsupported Ni-nZVI generated by method MA reduced nitrate much faster than that
prepared via method MB1. In our study, the presence of Misi might change the distribution
of nanoparticles. This results in the change in the reactivity of particles prepared via different
synthetic methods. However, our results are consistent with Wu et al.’s study in which Ni-
nZVI@cellulose acetate was used to remove TCE.196 Materials prepared via method MB had
higher reactivity than those prepared via method MA. Based on these results, the co-
reduction (MA) and deposition method using wet nZVI@Misi (MB1) were chosen for future
work due to their easier synthesis and slightly higher reactivity.
In order to examine final N-containing products, nitrate reduction was carried out and
ammonium concentrations in the resulting solutions were determined using the Nessler
method. For this, 5%Ni-nZVI on MisiC and MisiCFeOOH, synthesised by both co-reduction
method (MA) and deposition method (MB1), were used. Ammonium was generated fast
when all four materials were used (Figure 3.20). After 5 minutes, ammonium-N
concentrations were more than 8.3 ppm using all types of Ni-doped materials except for
5%Ni-nZVI@MisiCFeOOH-MA where the ammonium-N concentration was 5.5 ppm. After 30
minutes, ammonium-N concentrations were about 9 ppm (90% ammonium production) when
these four materials were used. Ammonium is the prominent final product in nitrate
reduction. This is consistent with previously reported work. In these studies, ammonium is
known as the main final product in nitrate reduction when either nZVI165 or ZVI234 were used.
In terms of nitrogen mass balance, after 5 minutes, the total nitrogen was higher than the
initial nitrogen. For example, after 5 minutes, nitrate-N, ammonium-N concentrations and
total nitrogen were 7.9 ± 0.7 ppm, 8.3 ± 0.2 ppm, and 16.2 ppm, respectively when 5%Ni-
nZVI@MisiC-MA was used. Since the samples for ammonium and nitrate determination were
not run from the same experiment, the 5-minute mass balance concentration is not reliable.
The most reliable nitrogen balance that can be examined is at the end (after 30 minutes) after
the reaction has gone to completion. After 30 minutes, the total nitrogen was around 9 ppm

84
(90% recovery). The loss of nitrogen could be in other gas products that need to be examined
in further study using the instruments for gas analysis.
Figure 3.20. Nitrate reduction, ammonium production and mass balance by 5%Ni-nZVI@Misi
(0.150 g of materials, 25.0 mL of 10 ppm nitrate-N solution, under anaerobic conditions).
-202468
1012141618
0 5 10 15 20 25 30 35
N (
pp
m)
Time (m)
5%Ni-nZVI@MisiC-MA
ammonium nitrate mass balance
-2
0
2
4
6
8
10
12
14
0 5 10 15 20 25 30 35
N (
pp
m)
Time (m)
5%Ni-nZVI@MisiCFeOOH-MA
ammonium nitrate mass balance
-2
0
2
4
6
8
10
12
0 5 10 15 20 25 30 35
N (
pp
m)
Time (m)
5%Ni-nZVI@MisiC-MB1
ammonium nitrate mass balance
-2
0
2
4
6
8
10
12
14
0 5 10 15 20 25 30 35
N (
pp
m)
Time (m)
5%Ni-nZVI@MisiCFeOOH-MB1
ammonium nitrate mass balance
-2
0
2
4
6
8
10
0 5 10 15 20 25 30 35
N (
pp
m)
Time (m)5%Ni-nZVI@MisiC-MA 5%Ni-nZVI@MisiCFeOOH-MA 5%Ni-nZVI@MisiC-MB1
5%Ni-nZVI@MisiCFeOOH-MB1 5%Ni-nZVI@MisiC-MA 5%Ni-nZVI@MisiC-MB1
Nitrate-N
Ammonium-N

85
3.3.4. Conclusion
In conclusion, all systems with dopant nickel had higher reactivity than non-doped nZVI@Misi,
regardless of nickel concentration or synthetic method. The presence of nickel could play the
role of the catalyst. Nitrate adsorbs onto the nickel surface, which promotes the reaction of
nitrate and electrons from nZVI. The reduction potential of nickel (E0 = -0.26 V) is more
negative than those of nitrate to any nitrogen products including nitrite, nitrogen gas, and
ammonium (Table 1.1); therefore, Ni(0) could be an additional reductant that produces
electrons to reduce nitrate. In addition, the distribution of nickel in Ni-nZVI@Misi is
dependent on synthetic methods. An alloy Ni-Fe was formed in materials prepared via the co-
reduction method (MA) while nickel in form of Ni(0) and nickel oxides covered on the surface
of nZVI in materials prepared via the deposition method (MB). Due to the core-shell structure
of Ni-nZVI@Misi (MB), these systems were more reactive than Ni-nZVI@Misi (MA).
3.4. Bimetallic Cu-nZVI@Misi
In addition to Ni, dopant Cu has been received a lot attention in increasing the reactivity of
nZVI materials. Most of studies have examined unsupported Cu-nZVI with the Cu
concentrations ranging from 0.5% to 20%.41, 126, 178, 181, 235 Cu-nZVI@zeolite is the only
reported supported Cu-nZVI; however, the mass percentage of Cu and Fe in material was 20%
and 41%, respectively.194 In this current study, bimetallic Cu-nZVI@Misi materials were
synthesised using two different synthetic methods, co-reduction (MA) and deposition (MB1)
(Section 3.1). In all these experiments, the mass ratio of Fe to Misi is 1:10 and the mass ratios
of Cu to Fe were varied from 2:100 (2%) to 10:100 (10%) with CuCl2 as the copper source.
Table 3.3 summaries Cu-nZVI systems that were examined. They include 2%Cu-nZVI coated
on MisiC using co-reduction method (MA), 5%Cu-nZVI coated on both MisiC and MisiCFeOOH
using both co-reduction method (MA) and deposition method (MB1), and 10%Cu-nZVI coated
on MisiC using co-reduction method (MA).
The morphology and reactivity towards nitrate reduction of these materials were
investigated. A morphology comparison was done on the samples prepared using the
different synthetic methods. However, due to the similarity of the morphology of these
samples with the Ni-containing and the lack of information obtained when comparing the

86
morphology of different Ni loadings, the morphology differences between the different Cu
concentrations were not examined.
Table 3.3. List of Cu-nZVI@Misi systems synthesised.
Materials Misi preparation
Method MisiC MisiCFeOOH
2%Cu-nZVI@ X Co-reduction (MA)
5%Cu-nZVI@ X X Co-reduction (MA)
X X Deposition (MB1)
10%Cu-nZVI@ X Co-reduction (MA)
3.4.1. Variations on Cu loading
The effect of Cu loading on the reactivity of Cu-nZVI@Misi towards nitrate reduction was
examined. Based on previously reported papers and considered the toxicity of Cu, Cu-nZVI on
calcined Misi (MisiC) synthesised via co-reduction method (MA) with different ratios of Cu to
Fe, such as 2%, 5%, and 10% was used for nitrate reduction. In these reactions, the molar ratio
of Fe to nitrate is 15:1. The results showed that Cu-doped materials had higher reactivity than
non-doped nZVI@Misi (Section 3.2), regardless of Cu concentration. The difference in the
reactivity of copper systems with different copper contents was minimal. For example, in the
first minutes of the reaction (5 minutes) and in the end of the reaction (30 minutes), the
nitrate-N concentrations were similar using any Cu-nZVI@MisiC systems. After 15 minutes,
5%Cu-nZVI@MisiC had slightly higher reactivity than both 2%Cu-nZVI@MisiC and 10%Cu-
nZVI@MisiC. The nitrate-N concentrations were 4.6 0.6 ppm, 3.1 0.6 ppm and 3.9 0.6
ppm using either 2%Cu-nZVI@MisiC, 5%Cu-nZVI@MisiC or 10%Cu-nZVI@MisiC, respectively
(Figure 3.21). Based on these results, the 5%Cu-nZVI on Misi was chosen for future work due
to the negative environmental implications of copper.

87
Figure 3.21. Nitrate reduction on different Cu loading contents (0.150 g of materials, 25.0 mL
of 10 ppm nitrate-N solution, under anaerobic conditions).
In several reported systems on unsupported Cu-nZVI, the dependence of the reactivity of
these materials on the copper concentration was not clear. In some reports, the reactivity
reached a peak at an optimum Cu concentration and then decreased with the increasing Cu
concentrations. The 5%Cu-nZVI exhibited the maximum reactivity when Cu-nZVI (0.5% - 20%)
systems were examined towards nitrate reduction.126, 235 For example, in Liou et al.’s study,
Cu-nZVI (0.5% - 20%) systems were investigated to reduce nitrate 40 ppm nitrate-N and the
molar ratio of Fe to nitrate was 2.2:1.126 After 120 minutes, nitrate removal was 92%, 100%,
86%, and 78% for 0.5%, 5%, 10%, and 20% Cu deposited. In Hosseini et al.’s study, Cu-nZVI
(2.5%) had the highest reactivity when nZVI was added Cu with the mass percentage of Cu to
Fe from 2.5% to 10%.181 In their study, Cu-nZVI and nZVI was used to remove nitrate in a
packed column. Nitrate conversion was 82% using nZVI and it increased to 89% using 2.5%Cu-
nZVI while Cu-nZVI (5% and 10%) reduced nitrate more slowly than nZVI (62% and 60%,
respectively. They explained that when the surplus amount of Cu was used, it has led to the
agglomeration of Cu, which inhibited the activity of nZVI. Another explanation for the
decrease in the reactivity of Cu-ZVI when Cu exceeds the optimum amount is that Cu may
block the electron transfer from Fe core to nitrate.236
-2
0
2
4
6
8
10
12
0 5 10 15 20 25 30 35
Nit
rate
-N (
pp
m)
Time (m)
2%Cu-nZVI@MisiC-MA 5%Cu-nZVI@MisiC-MA 10%Cu-nZVI@MisiC-MA

88
3.4.2. Variations on synthetic methods
All types of Cu-doped materials, unsupported Cu-nZVI and supported Cu-nZVI, published were
synthesised using the deposition method (MB).41, 126, 178, 181, 236 In this current study, the effect
of different synthetic methods to generate Cu-nZVI@Misi on both the adsorption of Cu-nZVI
on Misi and the reactivity towards nitrate reduction was examined. For this, 5%Cu-nZVI on
calcined Misi (MisiC) and calcined/FeOOH-coated Misi (MisiCFeOOH) was synthesised using
two different methods, MA and MB1. The morphology of resultant materials was
characterised using SEM. The elemental composition of these materials was examined using
TEM-EDS and their quantitative compositions were determined using AAS. The reactivity of
these materials towards nitrate reduction was also examined.
COMPO images of the materials revealed that there is a good dispersion of nanoparticles on
the surface of Misi although some agglomeration is observed (Figure 3.22). For examples, in
some areas (red circle), iron nanoparticles evenly adsorb on Misi while there is a disordered
arrangement of nanoparticles in the form of chains in other areas (blue circle). A higher level
of agglomeration is visibly observed in materials prepared via co-reduction method (MA) than
materials prepared via deposition method (MB1), regardless of Misi preparation but the
difference is minimal.
Figure 3.22. COMPO images of (a) 5%Cu-nZVI@MisiC-MA, (b) 5%Cu-nZVI@MisiCFeOOH-MA,
(c) 5%Cu-nZVI@MisiC-MB1, (d) 5%Cu-nZVI@MisiCFeOOH-MB1. The lighter component is
attributed to Cu-nZVI and silicate is grey. Figure b,c, and d are in the next page.
a

89
Figure 3.22. COMPO images of (a) 5%Cu-nZVI@MisiC-MA, (b) 5%Cu-nZVI@MisiCFeOOH-MA,
(c) 5%Cu-nZVI@MisiC-MB1, (d) 5%Cu-nZVI@MisiCFeOOH-MB1. The lighter component is
attributed to Cu-nZVI and silicate is grey. Figure a is in the previous page.
The composition of 5%Cu-nZVI on Misi was also examined via TEM-EDS analysis. For this,
5%Cu-nZVI@MisiCFeOOH-MA and 5%Cu-nZVI@MisiCFeOOH-MB1 were used. In both
d
b
c

90
samples, several peaks corresponding to O, Si, and Al are observed, indicating the presence
of silicate (Figure 3.23 and Figure 3.26). Regarding 5%Cu-nZVI@MisiCFeOOH-MA, an intense
peak corresponding to Fe is also observed while no peak corresponding to Cu is observed. The
absence of Cu peak is confirmed when different areas of 5%Cu-nZVI@MisiCFeOOH-MA were
examined (Figure 3.23). In the three specific areas examined, the mass percentage of Cu is
less than 0.15%. Specifically, in area 1, the mass percentage and the atom percentage for Fe
are 37.2% and 12.0% respectively while no Cu was quantified. In area 2, the mass percentage
for Fe and Cu was 16.0% and 0.15% and the atom percentage was 6.0% and 0.05%,
respectively. In area 3, the mass percentage for Fe and Cu was 7.6% and 0.15% and the atom
percentage was 2.13% and 0.04%, respectively. The very low concentration of Cu in TEM
spectra was confirmed as TEM-EDS of this material was examined (Figure 3.27). A signal
corresponding to Cu only localises in small areas while the signals corresponding to Si, O, Al,
Ti, S and Fe are strong.
Figure 3.23. TEM-EDS spectra of 5%Cu-nZVI@MisiCFeOOH-MA in different areas a, b and c.
Area b and c are in the next page. Note: labels have been modified to highlight peaks
relevant to this research. Please see appendix B.4 for complete spectrum.
a

91
Figure 3.23. TEM-EDS spectra of 5%Cu-nZVI@MisiCFeOOH-MA in different areas a, b and c.
Area a is in the previous page. Note: labels have been modified to highlight peaks relevant to
this research. Please see appendix B.4 for complete spectrum.
Si O Al
b
c

92
Figure 3.24. TEM-EDS mapping of 5%Cu-nZVI@MisiCFeOOH-MA with low magnification.
In order to examine the distribution of Fe and Cu in 5%Cu-nZVI@MisiCFeOOH-MA, one small
area was examined under higher magnification. In this area, the signals corresponding to Si,
Al, K, and Ti are not observed (Figure 3.25). This indicated that signals corresponding to silicate
depend on the specific area examined, potentially due to the heterogeneous nature of Misi.
However, the Fe signal is strong and its density in the core of the nanoparticles is greater than
on the surface. The O signal is observed in all areas Fe presents but it is weaker than that of
Fe. When signals of Fe and O are overlaid, there is an overlap with the denser Fe in the core
(Figure 3.25b), indicating an Fe(0) core surrounded by a layer of iron oxide. Regarding Cu, it
is only present as a small island on Fe and is not distinguished from the noise in the other
areas (Figure 3.25a). When the signals of O and Cu were overlaid, Cu is also observed in a
small island on O (Figure 3.25c).
Si O Al
Cu Fe S Ti
50 nm

93
Figure 3.25. TEM-EDS mapping of 5%Cu-nZVI@MisiCFeOOH-MA with high magnification.
Si O Al
Cu
Fe Ti K
O- Fe Fe- Cu
O- Cu O- Fe- Cu
a b
c d
10 nm
10 nm

94
In TEM spectrum of 5%Cu-nZVI@MisiCFeOOH-MB1 (Figure 3.26), a strong peak
corresponding to Fe is observed. A peak corresponding to Cu is observed, different from Cu
signal in 5%Cu-nZVI@MisiCFeOOH-MA. In this specific area examined, the mass percentage
for Fe and Cu was 77.7% and 5.1% and the atom percentage was 52.8% and 3.0%,
respectively.
Figure 3.26. TEM-EDS spectrum of 5%Cu-nZVI@MisiCFeOOH-MB1. Note: labels have been
modified to highlight peaks relevant to this research. Please see appendix B.5 for complete
spectrum.
The TEM-EDS mapping of 5%Cu-nZVI@MisiCFeOOH-MB1 showed that the signals
corresponding to Si, O, Al, S, K, and Ti are strong and correlate to each other, indicating the
presence of Misi (Figure 3.27). The signals corresponding to Fe and Cu are strong, present Cu-
Fe nanoparticles and consistent with TEM spectrum (Figure 3.26). When the signal of Fe and
Cu were overlaid, a significantly higher amount of Cu is observed on the surface of Fe than in
the core (Figure 3.27a), presumably due to the deposition method to synthesise material.
During this process, Cu(II) is reduced to Cu(0) by nZVI and then Cu(0) dopes on the surface of
nZVI. When the signals of Fe and O are overlaid, there is an O layer encapsulating Fe core
(Figure 3.27b). As such, Cu-nZVI particles have a core-shell structure, consisting of an Fe(0)
core and a shell that is a combination of Cu(0) and potentially copper oxides (Figure 3.27d).

95
Figure 3.27. TEM-EDS mapping of 5%Cu-nZVI@MisiCFeOOH-MB1.
Si O Al
Fe Ti S
O- Fe Fe- Cu
Cu
O- Cu O- Fe- Cu
a b
c d
50 nm
50 nm

96
The elemental composition of 5%Cu-nZVI@Misi was also determined using AAS. The 5%Cu-
nZVI@MisiCFeOOH-MA and 5%Cu-nZVI@MisiCFeOOH-MB1 were digested in concentrated
nitric acid and the resulting solutions were used to measure the concentrations of iron and
copper. The amount of Fe and Cu was calculated and the mass of MisiCFeOOH was subtracted
from the initial amount of material. The Cu:Fe:MisiCFeOOH mass ratio is 0.52:12.01: 100
(molar ratio of Cu:Fe is 1:26.40) and 0.55: 12.54: 100 (molar ratio of Cu:Fe is 1:26.06) for either
5%Cu-nZVI@MisiCFeOOH-MA or 5%Cu-nZVI@MisiCFeOOH-MB1, respectively (Table 3.4).
The ratio of Fe to MisiCFeOOH is higher than the theoretical ratio of Fe to MisiCFeOOH
(10:100). This is similar to that found in Ni systems. A possible reason for the higher ratio of
Fe to MisiCFeOOH is the contribution of Fe in Misi when Misi had been prepared by coating
an FeOOH layer. Iron attributes to 0.9% in MisiCFeOOH. The Cu:Fe ratio in 5%Cu-
nZVI@MisiCFeOOH-MB1 is slightly higher than that of 5%Cu-nZVI@MisiCFeOOH-MA but the
difference is minimal.
Table 3.4. Analysis of Cu-doped materials (0.250 g of material, 5.0 mL of concentrated
HNO3). Note: Misi = MisiCFeOOH.
Material Cu (mg) Fe (mg) Misi (mg) Mass ratio of
Cu:Fe:Misi
5%Cu-nZVI@MisiCFeOOH-MA 1.150.01 26.70.2 222.20.1 0.52:12.01:100
5%Cu-nZVI@MisiCFeOOH-MB1 1.220.04 27.70.1 221.10.1 0.55:12.54:100
MisiCFeOOH 0 2.32 247.68 0:0.94:100
TEM-EDS only showed traces of Cu within the samples, this must be because the Cu is evenly
distributed through the Fe, with only small amount of Cu concentrated on the surface. In
contrast, AAS analysis showed the concentration of elements when the material was
digested. Therefore, the difference in Cu results in TEM-EDS and AAS of 5%Cu-
nZVI@MisiCFeOOH-MA was observed. Regarding the real amount of Fe, the mass of Fe in
5%Cu-nZVI@MisiFeOOH-MB1 was slightly less than that of 5%Cu-nZVI@MisiFeOOH-MA. This
could be due to the loss of nZVI in the reaction of nZVI with Cu(II) in the deposition step to
form Cu(0).
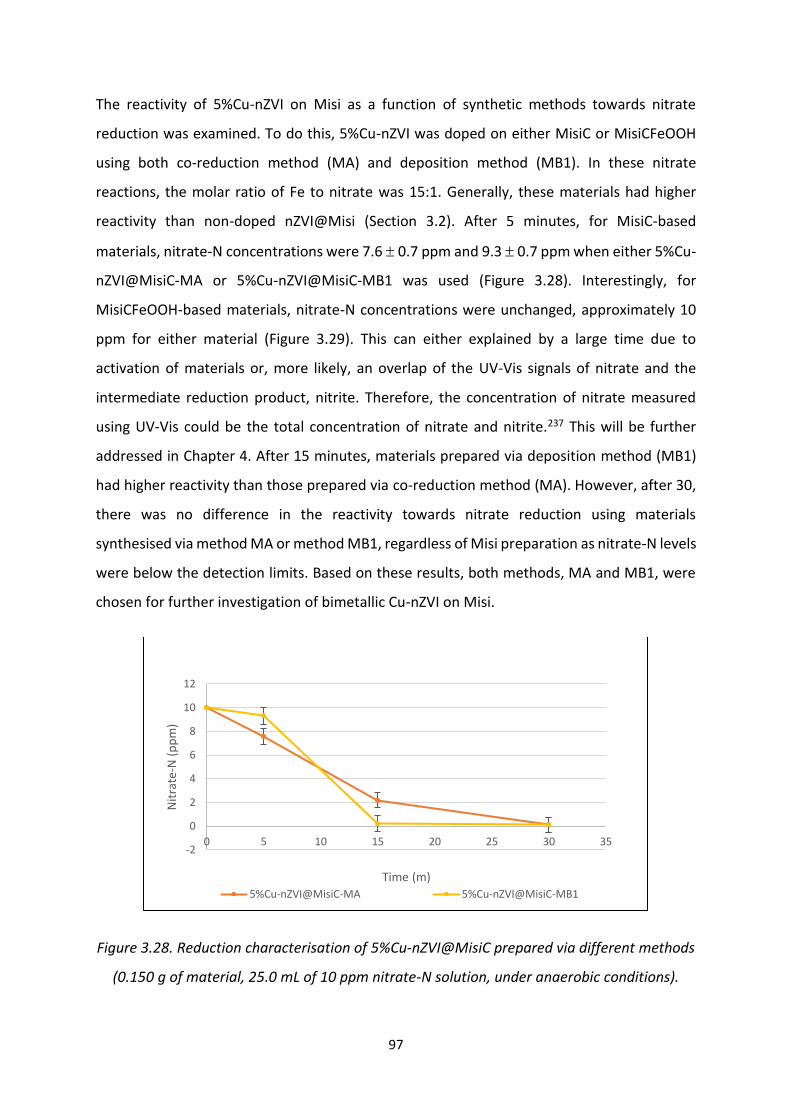
97
The reactivity of 5%Cu-nZVI on Misi as a function of synthetic methods towards nitrate
reduction was examined. To do this, 5%Cu-nZVI was doped on either MisiC or MisiCFeOOH
using both co-reduction method (MA) and deposition method (MB1). In these nitrate
reactions, the molar ratio of Fe to nitrate was 15:1. Generally, these materials had higher
reactivity than non-doped nZVI@Misi (Section 3.2). After 5 minutes, for MisiC-based
materials, nitrate-N concentrations were 7.6 0.7 ppm and 9.3 0.7 ppm when either 5%Cu-
nZVI@MisiC-MA or 5%Cu-nZVI@MisiC-MB1 was used (Figure 3.28). Interestingly, for
MisiCFeOOH-based materials, nitrate-N concentrations were unchanged, approximately 10
ppm for either material (Figure 3.29). This can either explained by a large time due to
activation of materials or, more likely, an overlap of the UV-Vis signals of nitrate and the
intermediate reduction product, nitrite. Therefore, the concentration of nitrate measured
using UV-Vis could be the total concentration of nitrate and nitrite.237 This will be further
addressed in Chapter 4. After 15 minutes, materials prepared via deposition method (MB1)
had higher reactivity than those prepared via co-reduction method (MA). However, after 30,
there was no difference in the reactivity towards nitrate reduction using materials
synthesised via method MA or method MB1, regardless of Misi preparation as nitrate-N levels
were below the detection limits. Based on these results, both methods, MA and MB1, were
chosen for further investigation of bimetallic Cu-nZVI on Misi.
Figure 3.28. Reduction characterisation of 5%Cu-nZVI@MisiC prepared via different methods
(0.150 g of material, 25.0 mL of 10 ppm nitrate-N solution, under anaerobic conditions).
-2
0
2
4
6
8
10
12
0 5 10 15 20 25 30 35
Nit
rate
-N (
pp
m)
Time (m)
5%Cu-nZVI@MisiC-MA 5%Cu-nZVI@MisiC-MB1

98
Figure 3.29. Reduction characterisation of 5%Cu-nZVI@MisiCFeOOH prepared via different
methods (0.150 g of material, 25.0 mL of 10 ppm nitrate-N solution, under anaerobic
conditions).
To examine the final N-containing product, 5%Cu-nZVI@Misi was used for nitrate reduction
and ammonium concentrations in resulting solutions was determined using the Nessler
method. In these experiments, 5%Cu-nZVI on either Misi or MisiCFeOOH was prepared via co-
reduction method (MA) and deposition method (MB1). The conversion of nitrate to
ammonium using Cu-doped systems was slower than using Ni-doped systems. After 5
minutes, ammonium-N levels were less than 3.5 ppm using any types of Cu-doped systems
(Figure 3.30) compared to more than 5.5 ppm ammonium-N was generated using any types
of Ni-doped systems (Figure 3.20). In nitrate reduction using Cu-doped systems, the
conversion of nitrate into nitrite was fast but the step from nitrite to ammonium was slow.
Therefore, nitrite accumulation was high (more detail in Chapter 4). However, after 30
minutes, the ammonium production was greater than 86% using all types of Cu-doped
materials, similar to Ni-doped systems. In addition, ammonium levels using either material
prepared via the deposition method (MB1) were slightly higher than those observed in either
material prepared via co-reduction method (MA). Ammonium-N levels were 9.8 ppm (98%
ammonium production) and 8.6 ppm (86% ammonium production), respectively. In summary,
ammonium is also the prominent N-containing product. This was consistent with the findings
reported by Liou et al..126 In their study, the initial nitrate-N concentration was 40 ppm and
-2
0
2
4
6
8
10
12
0 5 10 15 20 25 30 35
Nit
rate
-N (
pp
m)
Time (m)
5%Cu-nZVI@MisiCFeOOH-MA 5%Cu-nZVI@MisiCFeOOH-MB1

99
the molar ratio of Fe to nitrate was 2.2:1 using 5%Cu-nZVI. However, supported Cu-
nZVI@Misi in this current study converted nitrate to ammonium faster. Around 60% of the
initial nitrate was converted into ammonium after 15 minutes compared to 120 minutes in
their report.
In terms of nitrogen mass balance, after 5 minutes, the total nitrogen was higher than the
initial nitrogen, especially in materials prepared via the deposition method (MB1). This is
similar to the results from Ni-doped nZVI@Misi systems. For example, after 5 minutes,
nitrate-N, ammonium-N concentrations, and total nitrogen were 3.5 ± 0.3 ppm, 9.3 ± 0.7 ppm,
and 12.8 ppm, respectively when 5%Cu-nZVI@MisiC-MB1 was used. However, after 30
minutes, the total nitrogen was from 8.7 ppm to 9.0 ppm, which was more reliable. The mass
balance using materials prepared via co-reduction method (MA) was lower than that of
materials prepared via deposition method (MB1). It could be due to the lower reactivity of
materials prepared via co-reduction method (MA) or the generation of other nitrogen
products that should be examined using instruments for gas analysis.

100
Figure 3.30. Nitrate reduction, ammonium production and mass balance by 5%Cu-nZVI@Misi
(0.150 g of materials, 25.0 mL of 10 ppm nitrate-N solution, under anaerobic conditions).
-2
0
2
4
6
8
10
12
0 5 10 15 20 25 30 35
N (
pp
m)
Time (m)
5%Cu-nZVI@MisiC-MA
ammonium nitrate mass balance
-2
0
2
4
6
8
10
12
0 5 10 15 20 25 30 35
N (
pp
m)
Time (m)
5%Cu-nZVI@MisiCFeOOH-MA
ammonium nitrate mass balance
-2
2
6
10
14
0 5 10 15 20 25 30 35
N (
pp
m)
Time (m)
5%Cu-nZVI@MisiC-MB1
ammonium nitrate mass balance
-2
0
2
4
6
8
10
12
0 5 10 15 20 25 30 35
N (
pp
m)
Time (m)
5%Cu-nZVI@MisiCFeOOH-MB1
ammonium nitrate mass balance
-2
0
2
4
6
8
10
12
0 5 10 15 20 25 30 35
N (
pp
m)
Time (m)
5%Cu-nZVI@MisiC-MA 5%Cu-nZVI@MisiCFeOOH-MA
5%Cu-nZVI@MisiC-MB1 5%Cu-nZVI@MisiCFeOOH-MB1
Nitrate-N
Ammonium-N

101
3.4.3. Conclusion
In conclusion, all systems with dopant copper had higher reactivity than non-doped
nZVI@Misi, regardless of copper concentration and synthetic method. Similar to nickel, the
presence of copper could play the role of a catalyst. Nitrate adsorbs on the copper surface,
enhancing the reaction of nitrate and nZVI. Different from nickel, the reduction potential of
copper (E0 = +0.34 V) is slightly lower than that of nitrate/nitrite in acid condition (E0 = +0.49
V); therefore, copper might not be a reductant that reduces nitrate to nitrite. In addition, the
distribution of copper in Cu-nZVI@Misi is dependent on synthetic methods. Copper is
distributed in specific areas in materials prepared via co-reduction method (MA) while copper
in form of Cu(0) and copper oxides on the surface of nZVI in materials prepared via deposition
method (MB). Due to the difference in the distribution of copper on iron, Cu-nZVI@Misi (MB1)
systems were more reactive than Cu-nZVI@Misi (MA).
3.5. Bimetallic Zn-nZVI@Misi
Typically, dopant metals that have more positive reduction potential than Fe(II)/Fe have been
chosen due to their catalytic properties towards nitrate reduction. In a research reported, Zn
(E0 = -0.76 V) was used to generate Zn-nZVI using the deposition method and the resulting
material was examined towards dye removal.174 Although the physicochemical properties of
Zn-nZVI were characterised, there was no information about the presence of Zn(0) on nZVI.
However, in nitrate removal, dopant metal (0) is essential to improve the number of electrons
available for the reduction. Therefore, bimetallic Zn-nZVI on Misi was synthesised using co-
reduction method (MA) with an expectation of adding more reducing agent on nZVI@Misi. In
the synthetic procedure, the mass ratio of Fe to Misi is 1:10. Two different preparations of
Misi were used, including calcined Misi (MisiC) and calcined/FeOOH-coated Misi
(MisiCFeOOH). The mass ratios of Zn to Fe were 5% and 10% with ZnCl2 as the zinc source.
Table 3.5 summarises Zn-nZVI@Misi systems examined. They include 5%Zn-nZVI coated on
MisiC and MisiCFeOOH and 10%Zn-nZVI coated on MisiC and MisiCFeOOH. All these systems
were prepared using co-reduction method (MA). After making materials, the morphology of
5%Zn-nZVI@Misi was characterised via SEM and the variations of Zn loading on the reactivity
of Zn-nZVI@Misi towards nitrate reduction were examined.

102
Table 3.5. List of Zn-nZVI@Misi systems synthesised.
Materials Misi preparation
Method MisiC MisiCFeOOH
5%Zn-nZVI@ X X Co-reduction (MA)
10%Cu-nZVI@
3.5.1. Characterisation of Zn-nZVI@Misi
The morphology of bimetallic Zn-nZVI on different preparations of Misi, 5%Zn-nZVI@MisiC
and 5%Zn-nZVI@MisiCMisiCFeOOH, was examined via SEM. The COMPO images revealed
that there is an uneven distribution of nanoparticles on the surface of Misi in both materials
even though a low degree of agglomeration is observed (Figure 3.31). In some areas,
nanoparticles evenly adsorb on Misi (red circle) whereas a minimal amount of particles are
observed on Misi in other areas (blue circle). The distribution of Zn-nZVI particles is not as
good as that visibly observed in either Ni-nZVI (Section 3.3) or Cu-nZVI particles (Section 3.4)
when the morphology of these materials was characterised via SEM. Fewer Zn-nZVI particles
are observed on the surface of Misi.

103
Figure 3.31. COMPO images of (a) 5% Zn-nZVI@MisiC and (b) 5% Zn-nZVI@MisiCFeOOH. The
lighter component is attributed to Zn-nZVI and silicate is grey.
3.5.2. Variations on Zn loading
The effect of Zn loading on bimetallic Zn-nZVI on Misi was examined. For this, 5% and 10% Zn
on nZVI was synthesised on either MisiC or MisiCFeOOH. Due to the similarity of the
morphology of materials with Ni-containing as different nickel concentrations were used, the
morphology difference between different Zn loadings was not examined. The reactivity of Zn-
doped materials as a function of Zn concentration towards nitrate reduction was investigated.
In nitrate reduction, the molar ratio of Fe to nitrate is 15:1. All these Zn-doped materials had
higher reactivity than non-doped nZVI@Misi, except for 5%Zn-nZVI@MisiCFeOOH. The
reason for this inhibition was unclear but it could be the limitation in the number of active
sites.
a
b

104
After 5 minutes, the nitrate concentration was insignificantly reduced using all types of Zn-
doped materials except for 10%Zn-nZVI@MisiCFeOOH where the nitrate-N concentration
was 7.9 ppm (Figure 3.32). After 30 minutes, both materials with 10% of Zn reduced nitrate
faster than materials with 5% of Zn, regardless of Misi preparation. For MisiC-based materials,
nitrate-N concentrations were 4.6 ± 0.6 ppm (54% nitrate conversion) and 2.9 ± 0.6 ppm (71%
nitrate conversion) using either 5%Zn-nZVI@MisiC or 10%Zn-nZVI@MisiC, respectively. For
MisiCFeOOH-based materials, nitrate-N concentrations were 6.4 ± 0.7 ppm (36% nitrate
conversion) and 1.2 ± 0.7 ppm (88% nitrate conversion) using either 5%Zn-nZVI@MisiCFeOOH
or 10%Zn-nZVI@MisiCFeOOH, respectively.
Figure 3.32. Reduction characterisation of Zn-nZVI@Misi on different Zn loadings (0.150 g of
Zn-nZVI@Misi, 25.0 mL of 10 ppm nitrate-N solution, under anaerobic conditions).
The ammonium concentrations were measured in the resulting solutions using the Nessler
method. The ammonium concentration increased gradually over the course of 30 minutes
(Figure 3.33). After 5 minutes, ammonium-N concentrations were approximately 0.8 ppm
using all types of Zn-doped systems except for 10%Zn-nZVI@MisiCFeOOH where the
ammonium-N level was 3.2 ± 0.2 ppm. After 30 minutes, ammonium-N concentrations were
4.8 ppm ± 0.3 (48% ammonium production), 3.5 ± 0.2 ppm (35% ammonium production), 6 ±
0.3 ppm (60% ammonium production), and 8.6 ± 0.4 ppm (86% ammonium production) when
either 5%Zn-nZVI@MisiC, 5%Zn-nZVI@MisiCFeOOH, 10%Zn-nZVI@MisiC or 10%Zn-
nZVI@MisiCFeOOH was used, respectively.
0
2
4
6
8
10
12
0 5 10 15 20 25 30 35
Nit
rate
-N (
pp
m)
Time (m)
5%Zn-nZVI@MisiC 10%Zn-nZVI@MisiC
5%Zn-nZVI@MisiCFeOOH 10%Zn-nZVI@MisiCFeOOH

105
Figure 3.33. Nitrate reduction, ammonium production and mass balance by Zn-nZVI@Misi
(0.150 g of materials, 25.0 mL of 10 ppm nitrate-N solution, under anaerobic conditions).
0
2
4
6
8
10
12
0 5 10 15 20 25 30 35
N (
pp
m)
Time (m)
5%Zn-nZVI@MisiC
amonium nitrate mass balance
0
2
4
6
8
10
12
0 5 10 15 20 25 30 35
N (
pp
m)
Time (m)
5%Zn-nZVI@MisiCFeOOH
amonium nitrate mass balance
0
2
4
6
8
10
12
0 5 10 15 20 25 30 35
N (
pp
m)
Time (m)
10%Zn-nZVI@MisiC
amonium nitrate mass balance
0
2
4
6
8
10
12
0 5 10 15 20 25 30 35
N (
pp
m)
Time (m)
10%Zn-nZVI@MisiCFeOOH
amonium nitrate mass balance
0
2
4
6
8
10
12
0 5 10 15 20 25 30 35
N (
pp
m)
Time (m)
5%Zn-nZVI@MisiC 5%Zn-nZVI@MisiCFeOOH10%Zn-nZVI@MisiC 10%Zn-nZVI@MisiCFeOOH

106
3.5.3. Conclusion
Even though the standard reduction potential of Zn(II)/Zn is more negative than that of either
Fe, Ni or Cu, Zn-doped materials were less active than both Ni-doped nZVI@Misi and Cu-
doped nZVI@Misi. This can be explained by the catalytic role of Ni and Cu. The presence of Ni
and Cu promotes the electron transfer from nZVI to nitrate. In contrast, Zn only plays the role
of another reducing agent accompanied with nZVI. As such, supported bimetallic Zn-
nZVI@Misi were not investigated in further work.
3.6. Bimetallic Pd-nZVI@Misi
Several studies on doping Pd on nZVI have been reported. The Pd concentration used ranged
from 0.054% to 50%.3, 49, 183, 185-186 In addition, Pd-nZVI on supports have also been examined.
In these systems, the mass ratio of Fe to support and the mass ratio of Pd to Fe were 10:50
and from 0.1% to 75%, respectively.151, 191, 200-202 However, all unsupported and supported Pd-
nZVI were used for removing organic substances. In this study, bimetallic Pd-nZVI@Misi was
synthesised using two different methods, including co-reduction method (MA) and deposition
method (MB1). In all experiments, the mass ratio of Fe to Misi is 1:10 and the mass ratios of
Pd to Fe were varied from 0.1% to 1% with Pd(CH3COO)2 as palladium source. Two different
preparations of Misi, including calcined Misi (MisiC) and calcined/FeOOH-coated Misi
(MisiCFeOOH) were used as support. Table 3.6 summarises Pd-nZVI@Misi systems examined.
They include 0.1%Pd-nZVI coated on MisiC and MisiCFeOOH using the co-reduction method
(MA) and deposition method (MB1), 0.5%Pd-nZVI coated on MisiC and MisiCFeOOH using the
co-reduction method (MA) and deposition method (MB1), and 1%Pd-nZVI coated on MisiC
using the co-reduction method (MA). In these palladium studies, two different variables were
examined: variations on Pd loading and variations on synthetic method.

107
Table 3.6. List of Pd-nZVI@Misi systems synthesised.
Materials Misi preparation
Method MisiC MisiCFeOOH
0.1%Pd-nZVI@ X X Co-reduction (MA)
Deposition (MB1)
0.5%Pd-nZVI@ X X Co-reduction (MA)
Deposition (MB1)
1%Pd-nZVI@ X X Co-reduction (MA)
X Deposition (MB1)
3.6.1. Variations on Pd loading
The role of Pd as a function of Pd loading on both morphology and reactivity was examined.
The morphology of 0.5%Pd-nZVI and 1%Pd-nZVI on MisiCFeOOH was investigated using SEM.
COMPO images revealed that nanoparticles evenly adsorb on Misi with small amount of
agglomeration (Figure 3.34). In the majority of areas (red circle), there is a good dispersion of
nZVI on the surface of Misi although, in some areas (blue circle), nZVI agglomerates are
observed. The difference in the degree of agglomeration in these materials was not
quantified. The distribution of elements in our materials is similar to that of materials
previously reported but less agglomeration was observed. In these studies, Pd-nZVI was
doped on bentonite with the ratio of Fe to bentonite is 1:1191, 201 which is higher than that
used in our materials (1:10).

108
Figure 3.34. COMPO images of (a) 0.5%Pd-nZVI@MisiCFeOOH-MA, (b) 1%Pd-
nZVI@MisiCFeOOH-MA, (c) 0.5%Pd-nZVI@MisiCFeOOH-MB1, (d) 1%Pd-nZVI@MisiCFeOOH-
MB1. The lighter component is attributed to Pd-nZVI and silicate is grey.
The effect of Pd loading on the reactivity of Pd-nZVI on Misi towards nitrate reduction was
examined. These materials were produced by using co-reduction method (MA) on both MisiC
and MisiCFeOOH and three different Pd contents, 0.1%, 0.5%, and 1%. In nitrate reduction,
the molar ratio of Fe to nitrate is 15:1. All Pd-doped materials reduced nitrate faster than non-
doped nZVI@Misi (Section 3.2), except for 0.5%Pd-nZVI@MisiCFeOOH-MA. After 30 minutes,
the nitrate-N concentrations were 6.5 ± 0.7 ppm and 4.5 ± 0.6 ppm when 0.5%Pd-
nZVI@MisiCFeOOH-MA and nZVI@MisiCFeOOH were used, respectively. The higher reactivity
of some of Pd-doped nZVI@Misi systems can be explained by the catalytic role of Pd. Nitrate
adsorbs on the surface of Pd, leading to catalysing the reaction of nitrate with nZVI.
For MisiC-based materials, the nitrate reduction using 0.1%Pd-nZVI@MisiC-MA was slower
than that of both 0.5%Pd-nZVI@MisiC-MA and 1%Pd-nZVI@MisiC-MA but the difference was
a b
c d

109
insignificant (Figure 3.35). After 5 minutes, nitrate-N concentrations were approximately 9
ppm for all types of Pd-doped nZVI@Misi materials prepared via the co-reduction method
(MA). After 30 minutes, nitrate-N concentrations were 4.5 ± 0.6 ppm (55% nitrate conversion)
for 0.1%Pd-nZVI@MisiC-MA, 3.3 ± 0.6 ppm (67% nitrate conversion) for 0.5%Pd-nZVI@MisiC-
MA, and 3.1 ± 0.6 ppm (69% nitrate conversion) for 1%Pd-nZVI@MisiC-MA.
Figure 3.35. Reduction characterisation of Pd-nZVI@MisiC-MA on different Pd contents
(0.150 g of material, 25.0 mL of 10 ppm nitrate-N solution, under anaerobic conditions).
For MisiCFeOOH-based materials, the amount of Pd loading influenced on nitrate reduction.
After 5 minutes, nitrate-N concentrations were approximately 10 ppm using all materials
(Figure 3.36). However, after 30 minutes, 1%Pd-doped material reduced nitrate fastest while
the reactivity of 0.1%Pd-doped material was lowest. Nitrate-N concentrations were 1.9 ± 0.6
ppm (81% nitrate conversion), 6.5 ± 0.7 ppm (35% nitrate conversion) and 4.5 ± 0.6 ppm (55%
nitrate conversion) when either 1%Pd-nZVI@MisiCFeOOH-MA, 0.5%Pd-nZVI@MisiCFeOOH-
MA or 0.1%Pd-nZVI@MisiCFeOOH-MA, respectively. The higher reactivity of 1%Pd-doped
materials could be explained by the larger amount of Pd on the surface, resulting in more
catalytic sites. The presence of 1%Pd might start activating the catalytic function of palladium
while both 0.1%Pd and 0.5%Pd was not enough. In some cases (e.g. 0.5%Pd-
nZVI@MisiCFeOOH-MA), the nitrate reduction was not fast as nondoped nZVI@Misi. This
could be due to the random errors during the experimental process.
0
2
4
6
8
10
12
0 5 10 15 20 25 30 35
Nit
rate
-N (
pp
m)
Time (m)
0.1%Pd-nZVI@MisiC-MA 0.5%Pd-nZVI@MisiC-MA 1%Pd-nZVI@MisiC-MA

110
Figure 3.36. Reduction characterisation of Pd-nZVI@MisiCFeOOH- MA on different Pd
contents (0.150 g of material, 25.0 mL of 10 ppm nitrate-N solution, under anaerobic
conditions).
3.6.2. Variations on synthetic methods
The effect of synthetic methods on the reactivity of Pd-nZVI on Misi was examined. For this,
0.5%Pd-nZVI was doped on two different preparations of Misi, including calcined Misi (MisiC)
and calcined/FeOOH-coated Misi (MisiCFeOOH), using two different methods, MA and MB1.
The results showed that after 5 minutes, nitrate-N concentrations were more than 9 ppm for
all materials examined. After 30 minutes, materials synthesised using deposition method
(MB1) had higher reactivity than those synthesised using co-reduction method (MA) and the
difference between these materials is dependent upon preparations of Misi (Figure 3.37). For
MisiC, the difference in the reactivity of materials prepared via co-reduction method (MA)
and deposition method (MB1) was minimal. Nitrate-N concentrations were 2.7 ± 0.6 ppm
(73% nitrate conversion) and 3.3 ± 0.6 ppm (67% nitrate conversion) using either 0.5%Pd-
nZVI@MisiC-MB1 or 0.5%Pd-nZVI@MisiC-MA. For MisiCFeOOH, 0.5%Pd-nZVI@MisiCFeOOH-
MB1 reduced nitrate two times faster than 0.5%Pd-nZVI@MisiCFeOOH-MA. Nitrate-N
concentrations were 3.1 ± 0.6 ppm (69% nitrate conversion) and 6.5 ± 0.7 ppm (35% nitrate
conversion), respectively.
0
2
4
6
8
10
12
0 5 10 15 20 25 30 35
Nit
rate
-N (
pp
m)
Time (m)
0.1%Pd-nZVI@MisiCFeOOH-MA 0.5%Pd-nZVI@MisiCFeOOH-MA
1%Pd-nZVI@MisiCFeOOH-MA

111
Figure 3.37. Reduction characterisation of Pd-nZVI@Misi prepared via different methods
(0.150 g of material, 25.0 mL of 10 ppm nitrate-N solution, under anaerobic conditions).
In order to examine the products, two best materials, including 1%Pd-nZVI@MisiCFeOOH-MA
and 1%Pd-nZVI@MisiCFeOOH-MB1 were used to do nitrate reduction and the ammonium
concentrations of the resultant solutions were determined using the Nessler method. After 5
minutes, ammonium-N concentrations were 2.2 ± 0.2 ppm and 3.3 ± 0.2 ppm using either
1%Pd-nZVI@MisiCFeOOH-MA or 1%Pd-nZVI@MisiCFeOOH-MB1 (Figure 3.38). After 30
minutes, ammonium-N concentrations were 8.0 ± 0.2 ppm (80% ammonium production) and
7.8 ± 0.2 ppm, respectively. This indicated that ammonium was also the predominant final
product in the nitrate reduction using Pd-doped nZVI@Misi.
0
2
4
6
8
10
12
0 5 10 15 20 25 30 35
Nit
rate
-N (
pp
m)
Time (m)0.5%Pd-nZVI@MisiC-MA 0.5%Pd-nZVI@MisiCFeOOH-MA
0.5%Pd-nZVI@MisiC-MB1 0.5%Pd-nZVI@MisiCFeOOH-MB1

112
Figure 3.38. Nitrate reduction, ammonium production and mass balance by 1%Pd-nZVI@Misi
(0.150 g of materials, 25.0 mL of 10 ppm nitrate-N solution, under anaerobic conditions).
3.6.3. Conclusion
In comparison with Ni-doped and Cu-doped nZVI@Misi, Pd-doped nZVI@Misi had lower
reactivity towards nitrate reduction. After 30 minutes, no nitrate was found when either Ni-
nZVI@Misi or Cu-nZVI@Misi was used whereas more than 2 ppm nitrate-N was obtained for
all types of Pd-nZVI@Misi systems. The higher Pd levels are, the more reactive these materials
are. However, due to the cost of palladium source and the attempt finding the efficient
materials for environmental application, bimetallic Pd-nZVI@Misi was not chosen for further
study.
0
2
4
6
8
10
12
14
0 5 10 15 20 25 30 35
N (
pp
m)
Time (m)
1%Pd-nZVI@MisiCFeOOH-MA
amonium nitrate mass balance
0
2
4
6
8
10
12
14
0 5 10 15 20 25 30 35
N (
pp
m)
Time (m)
1%Pd-nZVI@MisiCFeOOH-MB1
amonium nitrate mass balance
0
2
4
6
8
10
12
0 5 10 15 20 25 30 35
N (
pp
m)
Time (m)
1%Pd-nZVI@MisiCFeOOH-MA 1%Pd-nZVI@MisiCFeOOH-MB1
Ammonium-N
Nitrate-N

113
3.7. Trimetallic Pd-Cu-nZVI@Misi
Unsupported trimetallic Pd-Cu-nZVI has previously been examined to reduce nitrate.4-5 In
these studies, trimetallic systems were synthesised using three-step procedures. The
investigation of supported Pd-nZVI has not been reported yet. In this current study, trimetallic
Pd-Cu-nZVI on Misi systems were synthesised using four synthetic methods, including MAtri,
MC1, MC2, and MD (Section 3.1). Two different preparations of Misi were used, including
calcined Misi (MisiC) and calcined/FeOOH-coated Misi (MisiFeOOH). In all synthetic
experiments, the mass ratio of Fe to Misi is 1:10, the mass ratio of Cu to nZVI is 0.05:1 and
the mass ratio of Pd to nZVI were varied from 0.5% to 2% with CuCl2 and Pd(CH3COO)2 as the
copper and palladium sources. Table 3.7 summarises Pd-Cu-nZVI@Misi examined. They
include 0.5%Pd-5%Cu-nZVI coated on MisiC and MisiCFeOOH using four different methods
(co-reduction (MAtri), deposition (MC1, MC2, and MD)), 1%Pd-5%Cu-nZVI coated on MisiC
using co-reduction (MAtri), and 2%Pd-5%Cu-nZVI coated on MisiC using co-reduction (MAtri).
In these trimetallic systems, two variables were examined: variations on Pd loading and
variations on synthetic method.
Table 3.7. List of Pd-nZVI@Misi systems synthesised
Materials Misi preparation
Method MisiC MisiCFeOOH
0.5%Pd-5%Cu-nZVI@
X
X
Co-reduction (MAtri)
Deposition (MC1)
Deposition (MC2)
Deposition (MD)
1%Pd-5%Cu-nZVI@ X Co-reduction (MAtri)
2%Pd-5%Cu-nZVI@ X Co-reduction (MAtri)
3.7.1. Variations on Pd loading
The effect of Pd loading on both the adsorption of Pd-Cu-nZVI onto Misi and the subsequent
reactivity towards nitrate was examined. To investigate the effect of Pd loading on the

114
morphology, Pd-nZVI was synthesised on MisiCFeOOH using method MC1 with two different
Pd concentrations, including 0.5% and 1%. COMPO images revealed that nZVI particles
disperse on the surface of Misi with a relatively high degree of agglomeration (Figure 3.39).
In some areas (red circle), the dispersion of nanoparticles on Misi is even whereas
nanoparticles are observed in the form of aggregates in other areas (blue circle). There is no
difference in the degree of agglomeration when 0.5%Pd and 1%Pd were deposited on Cu-
nZVI@MisiCFeOOH (Figure 3.39a and 3.39b)
Figure 3.39. COMPO images of (a) 0.5%Pd-nZVI@MisiCFeOOH-MC1 and (b) 1%Pd-
nZVI@MisiCFeOOH-MC1. The lighter component is attributed to Pd-Cu-nZVI and silicate is grey.
The reactivity of Pd-Cu-nZVI towards nitrate reduction on different Pd loadings was
investigated. For this, Pd-Cu-nZVI was prepared on MisiC using method MC1 with different Pd
loadings, including 0.5%, 1%, and 2%. The nitrate reaction was carried out with the molar ratio
of Fe to nitrate at 15:1. After 5 minutes, the nitrate conversion increased with the increasing
Pd contents, nitrate-N concentrations were 4.2 0.7 ppm, 2.8 0.7 ppm, and 2.1 0.7 ppm
when either 0.5%Pd-5%Cu-nZVI@MisiC, 1%Pd-5%Cu-nZVI@MisiC or 2%Pd-5%Cu-
nZVI@MisiC was used, respectively (Figure 3.40). However, after 15 minutes, nitrate was not
detected for all materials examined. As such, 0.5%Pd was chosen for further investigations
due to the cost of Pd.
a b

115
Figure 3.40. Reduction characterisation of Pd-Cu-nZVI@MisiC-MC1 on different Pd loadings
(0.150 g of material, 25.0 mL of 10 ppm nitrate-N solution, under anaerobic conditions).
3.7.2. Variations on synthetic methods
There have been two reported methods for synthesising trimetallic Pd-Cu-nZVI.4-5 They were
three step process with and without addition of NaBH4 after depositing Cu and Pd. In this
study, the effect of synthetic methods on both the distribution of nanoparticles on Misi and
reactivity of Pd-Cu-nZVI@Misi was examined. For this, trimetallic Pd-Cu-nZVI@Misi was
synthesised using four different methods, including MAtri, MC1, MC2, and MD (Section 2.1.3).
Two different preparations of Misi, including calcined Misi (MisiC) and calcined/FeOOH-
coated Misi (MisiCFeOOH), were used. The mass ratios of Fe to Misi, Cu to nZVI and Pd to nZVI
were 1:10, 0.05:1 and 0.005:1, respectively.
The morphology of the resultant materials was characterised via SEM. COMPO images
revealed that the dispersion of nZVI on the surface of Misi is dependent upon synthetic
methods. Materials prepared via method MAtri has a good dispersion of nanoparticles on Misi
with the lowest degree of agglomeration (Figure 3.41a). However, more agglomeration is
observed in materials that had been prepared via method MC1, MC2, and MD (Figure 3.41b,
3.41c, and 3.41d). The difference in the distribution of particles prepared via MC1, MC2, and
MD is minimal and cannot be distinguished via SEM.
0
2
4
6
8
10
0 5 10 15 20 25 30
Nit
rate
-N (
pp
m)
Time (m)0.5%Pd-5%Cu-nZVI@MisiC-MC1 1%Pd-5%Cu-nZVI@MisiC-MC1
2%Pd-5%Cu-nZVI@MisiC-MC1
a

116
Figure 3.41. COMPO images of 0.5%Pd-5%Cu-nZVI@MisiCFeOOH synthesised via different
methods (a) MAtri, (b) MC1, (c) MC2 and (d) MD. The lighter component is attributed to Pd-
Cu-nZVI and silicate is grey.
The composition and distribution of elements in trimetallic Pd-Cu-nZVI on Misi was
investigated using TEM. The 0.5%Pd-5%Cu-nZVI@MisiCFeOOH-MC1 was initially examined.
In TEM-EDS spectrum, a significant peak corresponding to Fe is observed while peaks
corresponding to Cu and Pd are not detected. Other areas of this sample were also
undertaken EDS spectra and the same results were obtained. For example, in this examined
area (Figure 3.42), the mass percentage for Fe, Cu, and Pd was 84.7%, 0.4% and 0.04% and
the atom percentage was 59.2%, 0.2% and 0.02%, respectively. There is a difference in the Cu
signal between trimetallic 0.5%Pd-5%Cu-nZVI@MisiCFeOOH-MC1 and bimetallic 5%Cu-
nZVI@MisiCFeOOH-MB1. No Cu peak is found in trimetallic material while the strong peak of
Cu is observed in bimetallic material (Figure 3.26) even though the same method and the
same amount of Cu was used.
b
c d
a

117
Figure 3.42. TEM-EDS spectrum of 0.5%Pd-5%Cu-nZVI@MisiCFeOOH-MC1. Note: labels have
been modified to highlight peaks relevant to this research. Please see appendix B.6 for
complete spectrum.
The TEM-EDS mapping revealed the presence and distribution of elements in this material.
Strong signals corresponding to the elements found in Misi (Si, O, Al, and Na) are observed
(Figure 3.43). The Fe signal is also significant, consistent with the strong peak found in the
TEM-EDS spectrum. Even though the signals of Cu and Pd are observed, they are not reliable,
especially Pd due to the lack of Pd signal in the TEM-EDS spectrum. When the signals of Fe
and Cu are overlaid (Figure 3.43a), the density of Cu on the surface of Fe is slightly greater
than in the core but the difference is not as great as that of 5%Cu-nZVI@MisiCFeOOH-MB1
(Figure 3.27a). This can be explained in that the Pd deposition step may remove the Cu layer
from 5%Cu-nZVI@MisiCFeOOH-MB1 due to the reaction of Cu (E0= +0.34) with Pd(II) (E0=
+0.92). There is also an overlap of Fe and O with the O layer on the surface of Fe, similar to
bimetallic Ni-nZVI@Misi and Cu-nZVI@Misi. There have been some studies investigating on
unsupported trimetallic Pd-Cu-nZVI.4-5 In these studies, only SEM-EDS spectra was reported
and the information about the distribution of these elements was unclear. Due to the lack of

118
information about the elemental distribution in trimetallic Pd-Cu-nZVI@MisiCFeOOH-MC1,
the TEM examination of other trimetallic materials was not undertaken.
Figure 3.43. TEM-EDS mapping of 0.5%Pd-5%Cu-nZVI@MisiCFeOOH-MC1.
The elemental composition of trimetallic Pd-Cu-nZVI@Misi was also quantified using AAS. For
this, trimetallic materials prepared via co-reduction method (MAtri) and deposition method
(MC1) were digested in the concentrated nitric acid and the concentrations of copper and
iron in the resultant solutions were measured. The mass of MisiCFeOOH was subtracted from
the initial amount of material. The results showed that the Cu:Fe:MisiCFeOOH mass ratio is
0.53:12.65:100 (molar ratio Cu:Fe is 1:27.28) and 0.54:11.52:100 (molar ratio Cu:Fe is 1:24.38)
for 0.5%Pd-5%Cu-nZVI@MisiCFeOOH-MAtri and 0.5%Pd-5%Cu-nZVI@MisiCFeOOH-MC1,
respectively (Table 3.8). The mass ratios of Cu to MisiCFeOOH between two samples are
Si O Al
Fe Cu Pd
Fe- Cu
Na
a O-Fe b
25 nm
25 nm

119
similar and similar to the ratio of amount of chemicals used (Cu:MisiCFeOOH is 0.5:100). In
contrast but consistent with other doped materials, the mass ratios of Fe to MisiCFeOOH are
higher than the theoretical ratio (Fe:MisiCFeOOH is 10:100). The higher amount of Fe in these
materials may be explained by the existence of Fe in Misi that had been coated by a FeOOH
layer during Misi pre-treatment. Fe accounts for 0.94% in MisiCFeOOH.
In addition, the mass ratio of Fe to Misi in material prepared via deposition method (MC1) is
lower than that of in material prepared via co-reduction method (MAtri). One of the possible
reasons is the loss of Fe during the three-step procedure (MC1). In method MC1, nZVI reacts
with Cu(II) and possibly with Pd(II) to form deposition layers. Another reason is that the
number of washing steps in deposition method (MC1) is greater than that of co-reduction
method (MAtri). This leads to more Fe removed from the suspension during the synthesis. In
terms of palladium, it was not detected using AAS due to the low palladium concentration in
solutions that resulted from these materials. Its detection should be done by an instrument
with lower detection limit such as inductively coupled plasma or inductively coupled plasma
mass spectrometry.
Table 3.8. Analysis of Pd-Cu-doped materials (0.250 g material, 5.0 mL concentrated HNO3).
Note: Misi = MisiCFeOOH.
Material Cu (mg) Fe (mg) Misi (mg) Mass ratio of
Cu:Fe:Misi
0.5%Pd-5%Cu-nZVI@MisiCFeOOH-MAtri 1.160.02 28.00.1 220.90.1 0.53:12.65:100
0.5%Pd-5%Cu-nZVI@MisiCFeOOH-MC1 1.200.02 25.70.1 223.10.1 0.54:11.52:100
MisiCFeOOH 0 2.32 247.68 0:0.94:100
The reactivity of the supported 0.5%Pd-5%Cu-nZVI on Misi prepared via different methods
towards nitrate reduction was examined. In these studies, the molar ratio of Fe to nitrate is
15:1. All Pd-Cu-doped materials had higher reactivity than non-doped nZVI@Misi (Section
3.2). After 5 minutes, materials prepared via co-reduction method (MAtri) had the lowest
reactivity while materials prepared via deposition method (MC1) reduced nitrate fastest,
regardless of Misi preparation. For MisiC-based materials, nitrate-N concentrations were 9.5
± 0.7 ppm and 4.2 ± 0.6 ppm when either 0.5%Pd-5%Cu-nZVI@MisiC-MAtri (MAtri referred as

120
MA in figures) or 0.5%Pd-5%Cu-nZVI@MisiC-MC1 was used, respectively (Figure 3.44). For
MisiCFeOOH-based materials, nitrate-N concentrations were 7.5 ± 0.7 ppm and 1.1 ± 0.7 ppm
when either 0.5%Pd-5%Cu-nZVI@MisiCFeOOH-MAtri or 0.5%Pd-5%Cu-nZVI@MisiCFeOOH-
MC1 was used, respectively (Figure 3.45).
These results are similar to supported bimetallic nZVI@Misi. Materials prepared using
sequential method were more reactive than those prepared using one step method. After 30
minutes, nitrate-N concentration was 2.9 ± 0.6 ppm (71% nitrate conversion) using 0.5%Pd-
5%Cu-nZVI@MisiC-MAtri while nitrate-N levels were below the detection limit using either
other material, regardless Misi preparation and synthetic method. Based on these results,
materials synthesised via deposition methods including MC1 and MD had higher reactivity
than those synthesised via co-reduction method. Of these, materials synthesised via
deposition method (MC1) had the highest reactivity. Furthermore, MisiCFeOOH was the
better support than MisiC, regardless the synthetic method. For example, nitrate-N
concentrations were 4.2 ± 0.6 ppm and 1.1 ± 0.7 ppm when either 0.5%Pd-5%Cu-nZVI@MisiC-
MC1 or 0.5%Pd-5%Cu-nZVI@MisiCFeOOH-MC1 was used. Therefore, trimetallic Pd-Cu-
nZVI@MisiCFeOOH prepared using deposition method (MC1) was chosen for further
investigations. In addition, although trimetallic Pd-Cu-nZVI@MisiCFeOOH prepared using co-
reduction method (MAtri) is slightly less reactive, it will also be examined and compared due
to the ease of synthesis.
Figure 3.44. Reduction characterisation of Pd-Cu-nZVI@MisiC prepared via different methods
(0.150 g of material, 25.0 mL of 10 ppm nitrate-N solution, under anaerobic conditions).
-2
0
2
4
6
8
10
12
0 5 10 15 20 25 30 35
Nit
rate
-N (
pp
m)
Time (m)0.5%Pd-5%Cu-nZVI@MisiC-MA 0.5%Pd-5%Cu-nZVI@MisiC-MC1
0.5%Pd-5%Cu-nZVI@MisiC-MC2 0.5%Pd-5%Cu-nZVI@MisiC-MD

121
Figure 3.45. Reduction characterisation of Pd-Cu-nZVI@MisiCFeOOH prepared via different
methods (0.150 g of material, 25.0 mL of 10 ppm nitrate-N solution, under anaerobic
conditions).
It was reported that the introduction of Pd in unsupported trimetallic Pd-Cu-nZVI increased
the nitrogen gas selectivity in nitrate reduction and decreased ammonium generation.4-5 To
examine final N-containing products, trimetallic Pd-Cu-nZVI on Misi was used for nitrate
reduction and ammonium concentration in the resulting solutions was measured using the
Nessler method. The 0.5%Pd-5%Cu-nZVI on two different preparations of Misi, MisiC and
MisiCFeOOH, were synthesised using two different synthetic methods, including MAtri and
MC1. For MisiC-based materials (Figure 3.46), after 5 minutes, ammonium-N concentrations
were 2.6 ± 0.2 ppm and 5.2 ± 0.2 ppm when either 0.5%Pd-5%Cu-nZVI@MisiC-MAtri or
0.5%Pd-5%Cu-nZVI@MisiC-MC1 was used. After 30 minutes, ammonium-N concentrations
were 8.8 ± 0.3 ppm (88% ammonium production) and 9.8 ± 0.3 ppm (98% ammonium
production). For MisiCFeOOH-based materials, after 5 minutes, ammonium-N concentrations
were 3.0 ± 0.2 ppm and 9.8 ± 0.3 ppm when either 0.5%Pd-5%Cu-nZVI@MisiCFeOOH-MAtri or
0.5%Pd-5%Cu-nZVI@MisiCFeOOH-MC1 was used. After 30 minutes, ammonium-N
concentrations were approximately 10 ppm (100% ammonium production). Interestingly, the
ammonium generation using 0.5%Pd-5%Cu-nZVI@MisiCFeOOH-MC1 was fastest, maximum
ammonium was formed after only 5 minutes. This is consistent with the fastest nitrate
removal of this material. These observations suggested that ammonium is the prominent final
product in nitrate reduction using trimetallic Pd-Cu-nZVI@Misi, which is inconsistent with
-2
0
2
4
6
8
10
0 5 10 15 20 25 30 35
Nit
rate
-N (
pp
m)
Time (m)0.5%Pd-5%Cu-nZVI@MisiCFeOOH-MA 0.5%Pd-5%Cu-nZVI@MisiCFeOOH-MC1
0.5%Pd-5%Cu-nZVI@MisiCFeOOH-MC2 0.5%Pd-5%Cu-nZVI@MisiCFeOOH-MD

122
reported research on unsupported Pd-Cu-nZVI. The presence of Pd-Cu increased the
selectivity of nitrogen gas and the nitrogen gas generation was up to 50%.4-5 However, in
these reported studies, the percentage of the total mass of Cu and Pd was 10% and the mass
ratio of Pd to Cu was 2:1.
In terms of nitrogen mass balance, total nitrate-N and ammonium-N was generally equal to
the initial nitrogen used. In somes points, the mass balance values were higher. This can be
explained by the errors during the measurement of nitrate and ammonium. Nitrate and
ammonium were not always determined in the same batches and the same time. However,
the aim of this chapter is to screen the reactivity of the materials synthesised as well as the
main final products. Therefore, the exact concentrations of nitrate and ammonium should be
done as the recovery of nitrogen is investigated.
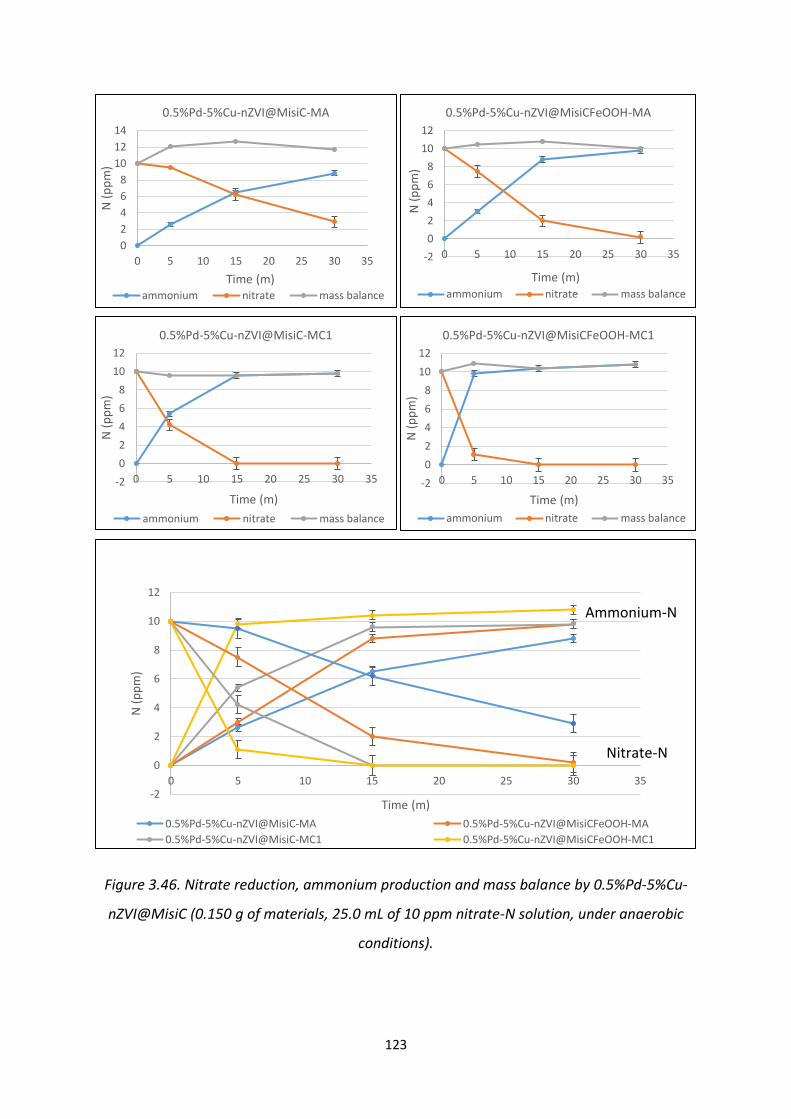
123
Figure 3.46. Nitrate reduction, ammonium production and mass balance by 0.5%Pd-5%Cu-
nZVI@MisiC (0.150 g of materials, 25.0 mL of 10 ppm nitrate-N solution, under anaerobic
conditions).
0
2
4
6
8
10
12
14
0 5 10 15 20 25 30 35
N (
pp
m)
Time (m)
0.5%Pd-5%Cu-nZVI@MisiC-MA
ammonium nitrate mass balance
-2
0
2
4
6
8
10
12
0 5 10 15 20 25 30 35
N (
pp
m)
Time (m)
0.5%Pd-5%Cu-nZVI@MisiCFeOOH-MA
ammonium nitrate mass balance
-2
0
2
4
6
8
10
12
0 5 10 15 20 25 30 35
N (
pp
m)
Time (m)
0.5%Pd-5%Cu-nZVI@MisiC-MC1
ammonium nitrate mass balance
-2
0
2
4
6
8
10
12
0 5 10 15 20 25 30 35
N (
pp
m)
Time (m)
0.5%Pd-5%Cu-nZVI@MisiCFeOOH-MC1
ammonium nitrate mass balance
-2
0
2
4
6
8
10
12
0 5 10 15 20 25 30 35
N (
pp
m)
Time (m)
0.5%Pd-5%Cu-nZVI@MisiC-MA 0.5%Pd-5%Cu-nZVI@MisiCFeOOH-MA
0.5%Pd-5%Cu-nZVI@MisiC-MC1 0.5%Pd-5%Cu-nZVI@MisiCFeOOH-MC1
Nitrate-N
Ammonium-N

124
3.7.3. Conclusion
Trimetallic Pd-Cu-nZVI@Misi had higher reactivity than non-doped nZVI@Misi due to the
potentially catalytic function of both copper and palladium. The difference in the reactivity of
trimetallic Pd-Cu-nZVI@Misi and bimetallic Cu-nZVI@Misi was not evident. Trimetallic
material was less reactive than bimetallic Cu-nZVI@Misi when they were prepared via the co-
reduction method. However, in this chapter, the nitrate concentration was measured using
the UV-Vis; hence, the impact of nitrite on nitrate concentration might occur. The influence
of palladium in greater detail will be discussed in Chapter 4 where nitrite analysis is examined
using the IC.
3.8. Conclusion
In Chapter 3, several materials were examined their reactivity towards nitrate reduction with
different doping metals. The addition of another metal or other metals had a positive effect
on increasing the reduction. All bimetallic nZVI on Misi doped with Ni, Cu, Zn, and Pd as well
as trimetallic Pd-Cu-nZVI on Misi reduced nitrate faster than non-doped nZVI on Misi. After
30 minutes, nitrate conversion was more than 55% and 35% for any doped nZVI@Misi
materials prepared using MisiC and MisiCFeOOH, respectively regardless of synthetic method.
In contrast, after 30 minutes, nitrate conversion was 45% and 21% using either nZVI@MisiC
or nZVI@MisiCFeOOH, respectively. This is consistent with previously reported papers about
the catalytic role of the secondary metal.2, 167 In these studies, the secondary metal gained
the number of active sites, leading more interactions of nitrate and electrons. Moreover, the
addition of the metal with the more negative reduction potential than Fe (for example, Zn)
may provide another reducing agent, accompanied with nZVI. As such, doping metal(s) on
nZVI@Misi is an effective way to enhance the reactivity nZVI@Misi.
The differences in the amount of nitrate reduced were dependent upon dopant metals. Ni-
doped, Cu-doped, and Pd-Cu-doped materials reduced the most nitrate. After 30 minutes,
more than 90% of nitrate was reduced using either bimetallic nZVI@Misi. Bimetallic Zn-
nZVI@Misi and Pd-nZVI@Misi increased nitrate reduction compared to non-doped
nZVI@Misi but the increase was minimal. Therefore, we chose bimetallic Ni-doped nZVI@Misi
and Cu-doped nZVI@Misi as well as trimetallic Pd-Cu-nZVI on Misi for further investigation.

125
4. Nitrate reduction with optimised-doped nZVI@Misi
4.1. Introduction
The aim of this chapter is to examine the reactivity towards nitrate reduction in greater detail
using the most promising materials described in Chapter 3. The efficiency of these materials,
nitrate conversion and nitrite accumulation, is investigated under anaerobic conditions. The
change in the morphology and elemental distribution of these materials after nitrate
reduction is also examined. In addition, how the preparation of the nZVI nanoparticles
influencing the resultant reactivity was examined. For instance, as there is significant
difference in the surface the nanoparticles prepared via co-reduction method (MA) and
deposition method (MB), the change in the surface properties that might influence the overall
reactivity of the nanoparticles was examined to ascertain. To date, this type of analysis has
never been performed.
Fe(0) typically reacts with nitrate in a two-step process. The first step is the conversion of
nitrate to nitrite, a two-electron reduction (eq. 4.1). The second step is the reaction of further
Fe with nitrite to form ammonium, a six-electron process (eq. 4.2). As such, from nitrate to
ammonium, requires eight electrons with nitrite, an intermediate product (eq. 4.3). To
prevent the building of nitrite, the conversion of nitrite into other final products must be
faster than the conversion of nitrate to nitrite.
Other gaseous N-containing products such as NO2, NO, N2O and N2 are also possible products
in the reduction of nitrate, but only the production of nitrogen gas has been examined. A
popular method for nitrogen gas estimation is N-mass balance in which nitrogen gas is
calculated by the subtraction of the remaining nitrate, nitrite, and ammonium from initial
nitrate concentration.4-5, 190 The reports of nitrogen gas selectivity are not highly reliable due
to the different sensitivity for nitrate, nitrite and ammonium determination; in addition, these
calculations assume that nitrogen gas is the only gaseous N-containing product. Directly
determining the amount of nitrogen gas produced has been conducted using residual gas

126
analysis, which is a method used for testing the variation of gas components as a function of
time in vacuum systems.238 In order to measure nitrogen gas, the reaction of nitrate with
material was carried out in the reactor to form gaseous compounds.190 These gases then were
employed in high vacuum systems and detected by quadrupole mass spectrometer in residual
gas analyser. The results of this study showed that the amount of nitrogen gas that is directly
measured is comparable to that being estimated by N-mass balance; as such, estimating the
N-mass balance is semi-reliable.
The reaction between Fe(0) and nitrate occurs under a range of pH, from slightly alkaline to
acidic media, depending on the size of particles. Several studies have shown that Fe(0)
powder only removes nitrate in acidic conditions where the reactivity of iron is not inhibited
in the presence of an Fe oxide layer. For example, nitrate is readily removed at low pH (pH <
3) and only negligible nitrate is reduced at a pH higher than 4.239 When the initial
concentration was 32.9 ppm nitrate-N (2.35 mM/L), all nitrate was reduced at pH < 3 after 15
minutes and at pH of 3 after 25 minutes. Less than 15% of nitrate was reduced at a pH of 4.5
after 45 minutes. In a separate study, when the initial nitrate-N concentration was 11.3 ppm
(0.81 mM/L), 95% of nitrate was reduced at pH of 2 after 30 minutes and a small amount of
nitrate was removed at pH > 4.10 In contrast, Zhang et al. showed that Fe(0) powder can react
with nitrate at neutral pH although the amount nitrate removed is minimal.240 For instance,
when the initial nitrate-N concentration was 30 ppm (2.14 mM/L), 98% of nitrate was reduced
at a pH of 2.3 after 16 hours and less than 10% of nitrate was removed at a pH of 7.1 after 48
hours.
Nanosize Fe(0) (nZVI) is more reactive than Fe(0) powder, thus it can react with nitrate at
higher pH. For example, when the initial nitrate-N concentration was 100 ppm and the molar
ratio of Fe to nitrate was 3:1 (nZVI dosage was 1.25 g/L), all nitrate was removed at pH of 7
after 90 minutes.41 The effect of the initial pH of the solution on nitrate reduction has also
been investigated in several studies. Zang et al. showed that the nitrate reduction decreased
with increasing pH.241 In their study, the initial nitrate-N concentration was 18 ppm (80 ppm
nitrate) and the molar ratio of Fe to nitrate was 23:1 (nZVI dosage was 1.67 g/L) using
nZVI@graphite. All nitrate was reduced at a pH of 3 after 15 minutes, at a pH of 4 after 30
minutes and at either pH of 5 or pH of 6.7 after 50 minutes. A similar result has been reported
in Kim et al.’s study on nZVI.242 Nitrate reduction slightly decreased when pH was from 3 to 7

127
but the decrease was significant at pH 9 - 11. In their study, the initial nitrate-N concentration
was 50 ppm, the molar ratio of Fe to nitrate was 2.5:1 (nZVI dosage of 0.5 g/L). Using this
system, the rate constant decreased from 7.5 x 10⁻²/minute (pH of 3) to 4.7 x 10⁻²/minute (pH
of 7) while the rate constant was 6.7 x 10⁻³/minute at pH of 11.
In this chapter, the reactivity of bimetallic Ni-nZVI@Misi and Cu-nZVI@Misi as well as
trimetallic Pd-Cu-nZVI@Misi systems towards nitrate reduction was examined under
anaerobic conditions. Bimetallic materials were synthesised via co-reduction method (MA)
(Section 2.1.2.1) and deposition method (MB1) (Section 2.1.2.2). Trimetallic materials were
prepared via co-reduction method (MAtri) (Section 2.1.3.1) and deposition method (MC1)
(Section 2.1.3.2). The mass ratio of elements added in bimetallic materials M:Fe:Misi is
0.5:10:100 and the mass ratio of element added in trimetallic materials Pd:Cu:Fe:Misi is
0.05:0.5:10:100. Two different preparations of Misi were utilised, including calcined Misi
(MisiC) and calcined/FeOOH-coated Misi (MisiCFeOOH).
Three different molar ratios of Fe to nitrate were used in these studies, including 15:1 (10
ppm nitrate-N), 3:1 (50 ppm nitrate-N) and 1.5:1 (100 ppm nitrate-N). We initially focused on
10 ppm nitrate-N as it is the maximum contaminant level in drinking water. As the nitrate
concentrations were less than 1 ppm after reduction when 10 ppm of nitrate-N was reduced
using many of our materials, the nitrate-N levels were increased to 50 ppm and 100 ppm in
order to help differentiate any differences in reactivity for our doped nZVI@Misi materials.
The pH of the solutions was not specifically altered as we wanted to ensure that our materials
could work under “real-world” conditions. Initial attempts at using buffers (for example,
HEPES) were carried out. However, the addition of HEPES buffer resulted in yellow solutions.
Although the origin of the colour was not determined, concerns were raised that the buffers
could damage the column of the IC. As such, the original plan of not specifically controlling
the pH of the solutions was followed.
The concentrations of nitrate and nitrite were measured using IC. The concentrations of
soluble metal ions, such as ion and dopant metals, were determined using AAS. The
morphology of materials after nitrate reduction was also characterised via SEM and TEM.

128
4.2. Nitrate reduction with bimetallic Ni-nZVI@Misi under anaerobic conditions
Based on preliminary results from the activity of Ni-nZVI@Misi, 5%Ni was chosen as the
optimal concentration. Both calcined Misi (MisiC) and calcined/FeOOH-coated Misi
(MisiCFeOOH) were well-behaved in adsorbing nanoparticles and the resulting materials
reduced nitrate quickly. However, nitrate was measured using UV-Vis and nitrite was not
monitored (Section 3.3), which did not give accurate results about reducing capacity of 5%Ni-
nZVI@Misi. In this section, the reactivity of supported Ni-nZVI on Misi towards nitrate
reduction, as determined by nitrate conversion and nitrite accumulation, was examined. Four
materials, including 5%Ni-nZVI@MisiC-MA, 5%Ni-nZVI@MisiCFeOOH-MA, 5%Ni-
nZVI@MisiC-MB1 and 5%Ni-nZVI@MisiCFeOOH-MB1, were used. Two nitrate-N
concentrations, 10 ppm and 50 ppm, were examined under anaerobic conditions.
The removal of 10 ppm of nitrate-N with Ni-nZVI@Misi was rapid, regardless of either Misi
preparation or doping method. Within 5 minutes, the nitrate-N levels were below 3 ppm, and
after 15 minutes, the nitrate-N levels were below the detection limit of the IC (0.06 ppm)
(Figure 4.1). The material, 5%Ni-nZVI@MisiC-MB1, performed particularly well, removing
more than 90% of nitrate after 5 minutes. As a control, the reactivity of the Ni-doped systems
was compared to that of non-doped nZVI@Misi. After 5 minutes, the nitrate-N levels were
around 7 ppm and after 15 minutes, the nitrate-N levels were more than 4 ppm for both types
of non-doped materials. After 30 minutes, the nitrate-N levels were 6 ppm (40% nitrate
conversion) and 2.6 ppm (74% nitrate conversion) when either nZVI@MisiC or
nZVI@MisiCFeOOH was used, respectively. These results suggested that nickel plays a
catalytic role in nitrate reduction. However, the difference in the reactivity among Ni-
nZVI@Misi systems is minimal and cannot be distinguished due to the rapid nitrate reduction,
especially when the uncertainties of these values are considered.

129
Figure 4.1. Reduction characterisation of 5%Ni-nZVI@Misi towards nitrate- N 10 ppm under
anaerobic conditions (0.150 g of materials and 25.0 mL of solution).
The problem of investigating the reduction using 10 ppm of nitrate-N solution is the
inconsistency in the nitrate concentrations when nitrate removal using samples of either the
same batch or different batches of materials was examined in triplicate. Thus, high
uncertainties in the results were observed (Figure 4.2). For example, after 5 minutes, nitrate-
N concentrations were 0.93 ppm, 2.88 ppm, and 4.15 ppm when samples of three different
batches of 5%Ni-nZVI@MisiC-MA were utilised. Combining these results would give an
average nitrate-N concentration of 3 ± 2 ppm (3 ppm ± 66%). Similarly, average nitrate-N
concentrations were 1.7 ± 0.8 ppm (1.7 ppm ± 47%), 0.8 ± 0.8 ppm (0.8 ppm ± 100%) and 1 ±
1 ppm (1 ppm ± 100%) using either 5%Ni-nZVI@MisiCFeOOH-MA, 5%Ni-nZVI@MisiC-MB1 or
5%Ni-nZVI@MisiCFeOOH-MB1, respectively. These high uncertainties do not allow for
correlation between materials used and nitrate-removal capacity.
0
2
4
6
8
10
12
0 5 10 15 20 25 30 35
Nit
rate
-N (
pp
m)
Time (m)5%Ni-nZVI@MisiC-MA 5%Ni-nZVI@MisiCFeOOH-MA
5%Ni-nZVI@MisiC-MB1 5%Ni-nZVI@MisiCFeOOH-MB1
nZVI@MisiC nZVI@MisiCFeOOH

130
Figure 4.2. Reduction characterisation of 5%Ni-nZVI@Misi towards nitrate-N 10 ppm under
anaerobic conditions with high uncertainty after 5 minutes (0.150 g of materials and 25.0 mL
of solution).
The reaction intermediate nitrite was detected in these solutions, but the levels were very
low when using Ni-nZVI@Misi materials. For instance, after 5 minutes, the nitrite-N
concentrations were below 0.5 ppm and after 15 minutes, the nitrite-N levels were below the
detection limit of the IC (0.04 ppm) (Figure 4.3). Nitrite was also detected using non-doped
nZVI@Misi as a control material. After 5 minutes, nitrite-N levels were about 0.3 ppm, a
minimal difference compared to Ni-doped systems. From 15 minutes, the nitrite-N level was
still 0.2 ppm when either nZVI@MisiC or nZVI@MisiCFeOOH was used. Based on these results,
the proposed mechanism of nitrate reduction is that nZVI reacts with nitrate to form nitrite
and then nitrite is reduced to form ammonium as the main final product, regardless of Ni-
doped or non-doped nZVI@Misi. However, Ni-doped nZVI@Misi converted nitrate to nitrite
as well as nitrite to final products faster than non-doped nZVI@Misi. Interestingly, after 5
minutes, the concentrations of nitrate and nitrite using 5%Ni-nZVI@MisiC-MA were higher
than those using any other types of Ni-doped nZVI@Misi, highlighting this material was less
reactive than the other Ni-doped materials.
-2
0
2
4
6
8
10
12
5
Nit
rate
-N (
pp
m)
Time (m)5%Ni-nZVI@MisiC-MA 5%Ni-nZVI@MisiCFeOOH-MA
5%Ni-nZVI@MisiC-MB1 5%Ni-nZVI@MisiCFeOOH-MB1
nZVI@MisiC nZVI@MisiCFeOOH

131
Figure 4.3. Nitrite accumulation in 5%Ni-nZVI@Misi towards nitrate-N 10 ppm reduction
under anaerobic conditions (0.150 g of materials and 25.0 mL of solution).
The nitrite concentrations were also inconsistent when samples of different batches were
used for the reduction of 10 ppm nitrate-N after 5 minutes (Figure 4.4). However, this
inconsistency was less than in nitrate concentrations. For example, nitrite-N levels were 0.6
ppm, 0.34 ppm, and 0.42 ppm when samples of 5%Ni-nZVI@MisiC-MA were used. Combining
these values, the average nitrite-N concentration was 0.5 ± 0.1 ppm (0.5 ppm ± 20%).
Similarly, the average nitrite-N concentrations were 0.3 ± 0.1 (0.3 ppm ± 33%) and 0.2 ± 0.1
(0.2 ppm ± 50%) for 5%Ni-nZVI@MisiCFeOOH-MA and 5%Ni-nZVI@MisiC-MB1, respectively.
0
0.2
0.4
0.6
0 5 10 15 20 25 30 35
Nit
rite
-N (
pp
m)
Time (m)5%Ni-nZVI@MisiC-MA 5%Ni-nZVI@MisiCFeOOH -MA
5%Ni-nZVI@MisiC-MB1 5%Ni-nZVI@MisiCFeOOH-MB1
nZVI@MisiC nZVI@MisiCFeOOH

132
Figure 4.4. Nitrite accumulation in 5%Ni-nZVI@Misi towards nitrate-N 10 ppm reduction
under anaerobic conditions with high uncertainty after 5 minutes (0.150 g of materials and
25.0 mL of solution).
The high levels of uncertainty did not allow for correlation between materials used and their
ability to reduce nitrate. There are some possible reasons for these results. The first and most
important reason is from the preparation of the aliquots for the IC. Samples were manually
withdrawn using syringes and then filtered, the number of particles in suspension that were
taken may be slightly different at every set time interval. As such, during the filtration process,
nitrate is still reacting, but now with an unknown quantity of nanoparticles. Secondly, the
heterogeneous composition of Misi may cause the different adsorption capacity of
nanoparticles on the surface of Misi, leading to the difference in the number of active sites in
each batch. These reasons lead to the high uncertainty in the average nitrate concentrations;
as such, we decided to examine higher nitrate concentrations to determine if the reactivity of
the materials could be differential.
Increasing the concentration of nitrate-N to 50 ppm allowed us to examine the differences in
the reactivity of the materials with greater accuracy. The 50 ppm of nitrate solution exceeded
the reducing capacity of our materials (molar ratio of Fe to nitrate at 3:1 instead of the
idealised 4:1 (eq. 4.3)); as such, we did not expect to see all the nitrate removed from the
solutions. However, it did allow us to obtain more reliable data, especially with regards to
the first time point. For all Ni-doped nZVI@Misi examined, more than 40% of nitrate was
reduced after 5 minutes. (Figure 4.5). After 5 minutes, the nitrate levels decreased gradually,
0
0.2
0.4
0.6
5
Nit
rite
-N (
pp
m)
Time (m)
5%Ni-nZVI@MisiC-MA 5%Ni-nZVI@MisiCFeOOH-MA
5%Ni-nZVI@MisiC-MB1 5%Ni-nZVI@MisiCFeOOH MB1
nZVI@MisiC nZVI@MisiCFeOOH

133
with only nominal nitrate decrease between 15 and 30 minutes. For example, the nitrate-N
concentrations were 32 ± 4 ppm, 24 ± 3 ppm, and 22 ± 3 ppm after 5 minutes, 15 minutes and
30 minutes, respectively when 5%Ni-nZVI@MisiC-MA was utilised.
After 30 minutes, materials prepared using MisiC had lower nitrate conversion than those
using MisiCFeOOH. Nitrate-N levels were 22 ± 3 ppm (56% nitrate conversion) and 18 ± 4 ppm
(64% nitrate conversion) when either 5%Ni-nZVI@MisiC-MA or 5%Ni-nZVI@MisiCFeOOH-MA
was used, respectively. Nitrate-N levels were 20 ± 1 ppm (60% nitrate conversion) and 14 ± 1
ppm (72% nitrate conversion) when either 5%Ni-nZVI@MisiC-MB1 or 5%Ni-
nZVI@MisiCFeOOH-MB1 was used, respectively.
Figure 4.5. Reduction characterisation of 5%Ni-nZVI@Misi towards nitrate-N 50 ppm under
anaerobic conditions (0.15 g of materials and 25 mL of solution).
The reactivity of materials prepared via co-reduction method (MA) was relatively similar to
that of materials prepared via deposition method (MB1) over the course of 30 minutes. For
example, after 30 minutes, nitrate-N levels were 18 ± 4 ppm and 20 ± 1 ppm when either
5%Ni-nZVI@MisiCFeOOH-MA or 5%Ni-nZVI@MisiC-MB1 was used, respectively. However, of
these Ni-doped materials, 5%Ni-nZVI@MisiCFeOOH-MB1 is the best performing material in
terms of nitrate conversion from 15 minutes. This can be explained by the distribution of Ni
and Fe in the nanoparticles. In 5%Ni-nZVI@MisiCFeOOH-MB1, Ni is located on the surface of
Fe (Figure 3.16), resulting in a higher number of catalytic sites for both nitrate adsorption and
conversion into nitrite.
0
10
20
30
40
50
5 15 30
Nit
rate
-N (
pp
m)
Time (m)5%Ni-nZVI@MisiC-MA 5%Ni-nZVI@MisiCFeOOH-MA
5%Ni-nZVI@MisiC-MB1 5%Ni-nZVI@MisiCFeOOH-MB1
nZVI@MisiC nZVI@MisiCFeOOH

134
The relative uncertainty of nitrate concentration was in a range of 5% - 22% for the reactions
with an initial nitrate-N concentration of 50 ppm. These uncertainties were much smaller than
those being observed in the reaction of 10 ppm nitrate-N. Thus, a better correlation between
materials and their reactivity towards nitrate reduction was observed when higher nitrate
concentrations were used.
The results of nitrate reduction using Ni-doped nZVI@Misi were compared with those
observed when the reactivity of non-doped nZVI on Misi was examined as the control. Ni-
doped nZVI@Misi reduced nitrate faster than non-doped nZVI@Misi. After 5 minutes, nitrate-
N levels were 46.7 ± 0.4 ppm and 43 ± 1 ppm when either nZVI@MisC or nZVI@MisiCFeOOH
was used, respectively. After 30 minutes, nitrate-N concentrations were 38 ± 1 ppm nitrate
(24% nitrate conversion) and 28 ± 4 ppm (44% nitrate conversion), respectively.
The enhancement in the reactivity of Ni-doped systems is consistent with a report by Shi et
at. on the investigation of supported Ni-nZVI on kaolinite192 and a report by Li et al. on the
enhancement of Ni in supported Ni-nZVI on biochar.243 Supported doped Ni-nZVI reduced
nitrate faster than supported nZVI, indicating the significant catalytic role of Ni in improving
the reduction rate of nZVI. The total nitrate conversions using Ni-nZVI@kaolinite (86.3%), and
Ni-nZVI@biochar (over 93%) were higher than observed with our materials. This difference in
nitrate conversion is due to the different reaction conditions. In these studies, the reactions
were in optimised conditions, including initial nitrate concentration, nZVI dosage, medium,
and temperature. In the study on Ni-nZVI@kaolinite, the initial nitrate-N concentration was
41 ppm (180 ppm nitrate), molar ratio of Fe to nitrate was 3:1 (nZVI dosage of 0.5 g/L), initial
pH of solution was 4, and reaction was were run at 35C. Possibly, the lower initial nitrate
concentration was the main reason for the high nitrate removal. In the study on Ni-
nZVI@biochar, the initial nitrate-N concentration was less than 50 ppm, and the molar ratio
of Fe to nitrate was more than 8.6:1 (Ni-nZVI@biochar dosage was 4 g/L with 42.8% nZVI).
Additionally, Ni-nZVI@biochar was found to remove nitrate via two different pathways,
including the oxidation of nanoparticles with nitrate and the adsorption of approximately
about 7% of nitrate on the surface of biochar.
However, Ni-doped nZVI@Misi materials had higher reactivity compared to Ni-nZVI@zeolite
with mass ratio at 1:10:20 reported by He et al..193 The mass ratio of Ni:Fe:silicates in these
materials was 1:10:20 and the initial nitrate-N was 50 ppm. He et al. reported that when the

135
molar ratio of Fe of nitrate was 2.5:1 (Ni-nZVI dosage of 0.5 g/L) and pH was 5, the nitrate-N
level was 35 ppm (30% nitrate conversion) after 30 minutes. In contrast, in our study, when
the molar ratio of Fe of nitrate of 3:1 (nZVI dosage of 0.6 g/L), more than 56% nitrate
conversion was observed using any types of Ni-nZVI@Misi. Additionally, the reaction of Ni-
doped nZVI@Misi with nitrate were occurred under neutral conditions without pH
adjustment.
In addition to nitrate, the concentration of nitrite was monitored for our systems. The nitrite
levels initially increased dramatically and then decreased gradually (Figure 4.6). These results
were consistent with the two-step process of nitrate reduction in which nitrate is reduced to
nitrite and then nitrite is converted into other products. When materials prepared via co-
reduction method (MA) were used, the nitrite accumulation in these two systems were similar
for the duration of the reaction. After 5 minutes, nitrite-N levels were 4.2 ± 0.8 ppm and 3.7
± 0.6 ppm and after 30 minutes, nitrite-N concentrations were 4 ± 1 ppm (8.0% nitrite
accumulation) and 2.8 ± 0.9 ppm (5.6% nitrite accumulation) when either 5%Ni-nZVI@MisiC-
MA or 5%Ni-nZVI@MisiCFeOOH-MA was used, respectively. In Ni-doped materials, the rate
of nitrate and nitrite conversion correlated; that is, when nitrate conversion was fast, nitrite
conversion was also fast; however, when nitrate conversion was slow, nitrite accumulation
was observed due to concurrent slow nitrite conversion.
Figure 4.6. Nitrite accumulation in 5%Ni-nZVI@Misi towards nitrate-N reduction of 50 ppm
under anaerobic conditions (0.150 g of materials and 25.0 mL solution).
0
1
2
3
4
5
6
5 15 30
Nit
rite
-N (
pp
m)
Time (m)5%Ni-nZVI@MisiC-MA 5%Ni-nZVI@MisiCFeOOH-MA
5%Ni-nZVI@MisiC-MB1 5%Ni-nZVI@MisiCFeOOH-MB1
nZVI@MisiC nZVI@MisiCFeOOH

136
When materials synthesised via deposition method (MB1) was used, the role of Misi
preparation in supporting nanoparticles was more significant. The 5%Ni-nZVI@MisiC-MB1
resulted in more nitrite build-up than 5%Ni-nZVI@MisiCFeOOH-MB1. After 5 minutes, nitrite-
N levels were 5.6 ± 0.2 ppm and 4.5 ± 0.7 ppm using 5%Ni-nZVI@MisiC-MB1 and 5%Ni-
nZVI@MisiCFeOOH-MB1. After 30 minutes, nitrite-N concentrations were 4.8 ± 0.1 ppm
(9.6% nitrite accumulation) and 2.4 ± 0.8 ppm (4.8% nitrite accumulation), respectively.
Nitrite levels produced by all types of Ni-doped materials were higher than those generated
using non-doped nZVI@Misi. After 5 minutes, nitrite-N levels were 0.97 ± 0.04 ppm and 1.9 ±
0.5 ppm, after 30 minutes, nitrite-N levels were 1.9 ± 0.2 ppm (3.8% nitrite accumulation) and
1.7 ± 0.3 ppm (3.4% nitrite accumulation) when either nZVI@MisiC or nZVI@MisiCFeOOH was
used, respectively.
The formation of nitrite in the nitrate reduction using supported Ni-doped nZVI has not
received much attention, with the nitrite levels either not reported or, if the levels were
reported, the evidence was not always solid. For instance, in investigations of either Ni-
nZVI@kaolinite or Ni-nZVI@kaolin particles on the simultaneous removal of nitrate and
heavy metal ions, no information about nitrite was published.192, 199 In other studies, the
authors used what was described as UV-Vis methodologies to determine the concentrations
of nitrate, nitrite, and ammonium. One of the studies determined that nitrite was not formed
in the nitrate reduction with bimetallic Ni-nZVI even though the initial nitrate-N concentration
was 50 ppm.244 In another study, when the reduction of 20 ppm nitrate-N was reduced using
Ni-nZVI@biochar, the nitrite level was only 0.024 ppm.243 However, their UV-Vis
methodologies were based on China EPA standards that we are unable to access in order to
understand their methodologies.
The nitrite concentrations monitored using IC have only been reported in some studies using
unsupported bimetallic Ni-nZVI. The amount of nitrite accumulated depended on reaction
conditions. In a study, the initial nitrate-N concentration was 80 ppm (354 ppm nitrate), molar
ratio of Fe to nitrate was 4.7:1 (nZVI dosage was 1.5 g/L) and the initial pH of the solution was
6.5.2 After 5 minutes, only 2.9 ppm nitrite-N was found and after 40 minutes, no nitrite was
detected. In a separate study, when the initial nitrate-N concentration was 22.6 ppm (100
ppm nitrate) and molar ratio of Fe to nitrate was 6.6:1 (nZVI dosage of 0.6 g/L), nitrite-N was
3 ppm after 60 minutes.245

137
In summary, the introduction of Ni promoted nitrate reduction. The role of Ni was highlighted
in several studies on both supported and unsupported Ni-doped nZVI. Similar to the
conclusion by Ryu et al. that Ni catalyses for the formation of hydrogen in the nitrate
reduction using Ni-nZVI,167 the mechanism in which nitrate reacts with Ni-nZVI@Misi can be
postulated. Nitrate is reduced by electrons that are directly transferred from Fe to the Ni
surface. Simultaneously, Fe reacts with water on the surface of Ni to form an adsorbed
hydride (Ni-Hads). After adsorption of nitrate onto the Ni surface (Ni-NO3-ads), the adsorbed
hydrides will react with the adsorbed nitrate, forming nitrite and then final products.
Kinetics of nitrate reduction:
The kinetics of nitrate reduction was reported in several studies. However, they were unclear
and inconsistent. Nitrate was reduced by iron via different kinetic coefficients such as zero-
order, first-order, pseudo-first order, and pseudo-second order.2, 140, 167, 190, 236, 242, 246 For
example, Chen et al. reported nitrate was reduced by nZVI via first-order reaction140 but Kim
et al. reported that both pseudo-first order and pseudo-second order were a good fit for this
reaction.242 Regarding bimetallic materials, nitrate was reduced by Ni-nZVI via zero-order2 or
pseudo-first order reaction.167, 246 In the investigation of trimetallic materials, nitrate
reduction followed pseudo-first order when either Pd-Cu-ZVI, Au-Cu-nZVI or Pt-Cu-nZVI was
used.190 In this study, the kinetics of nitrate reduction using 5%Ni-nZVI@MisiCFeOOH-MB1
was examined. In the first 8 minutes, a significant amount of nitrate was removed, from 50
ppm to 24.6 ppm nitrate-N. After the initial 8 minutes, the amount of nitrate increased to
around 28.6 ppm. This indicated that nitrate de-adsorbed into solution from the surface of
the materials. It should be noted that this behaviour has been observed, not commented on,
in another study of nitrate reduction by unsupported Ni-nZVI.167 After 10 minutes, the rate
of nitrate removal was significantly slower than the initial 8 minutes. The data was examined

138
to determine if it fitted either standard first order (Figure 4.7b) or second order (Figure 4.7c)
kinetics, but no linear relationship was observed. Therefore, the kinetics of nitrate reduction
using 5%Ni-nZVI@MisiCFeOOH-MB1 did not follow either zero-order, first-order or second-
order reaction. These studies were performed in duplicate to ensure reproducibility.
Figure 4.7. Kinetics of nitrate reduction using 5%Ni-nZVI@MisiCFeOOH-MB1 under anaerobic
conditions (0.150 g of materials and 25.0 mL of solution).
The kinetics of nitrate reduction was investigated for both two different stages. In the first 8
minutes, it follows either a first-order process with k = 0.08 minute-1 and R2 = 0.88 or a second-
order kinetics with k = 0.02 ppm-1minute-1 and R2 = 0.95 (Figure 4.8a and 4.8b). unfortunately,
the data does not allow us to confirm either process. After 10 minutes, the change in nitrate
concentration was too small to be able to determine the reaction order. As such, the rate of
nitrate reduction cannot be determined; however, it does follow a two-stage process
presumably due to the change in the nature of the iron nanoparticle over time (see next
section).
20
30
40
50
0 5 10 15 20 25 30 35 40 45
Nit
rate
-N (
pp
m)
Time (m)
zero-order fit
3
3.2
3.4
3.6
3.8
4
0 5 10 15 20 25 30 35 40 45
ln[n
itra
te]
Time (m)
first-order fit
0.02
0.03
0.04
0.05
0 5 10 15 20 25 30 35 40 45
1/[
nit
rate
]
Time (m)
second-order fit
a b
c

139
Figure 4.8. Kinetics of nitrate reduction using 5%Ni-nZVI@MisiCFeOOH-MB1 under anaerobic
conditions in different stages (0.150 g of materials and 25.0 mL of solution).
The change in the morphology and elemental distribution of materials during the reduction
of nitrate was investigated via SEM and TEM analyses. We focused on 5%Ni-
nZVI@MisiCFeOOH prepared via deposition method (MB1) and monitored changes in its
morphology under two different reaction conditions: after reduction of 10 ppm nitrate-N for
15 minutes and after reduction of 50 ppm nitrate-N for 120 minutes. After nitrate reduction,
each material was washed with deoxygenated deionised water, followed by deoxygenated
ethanol, and then dried under vacuum. COMPO images showed the presence of silicate and
y = -0.0811x + 3.7578R² = 0.8817
3.0
3.2
3.4
3.6
3.8
4.0
0 2 4 6 8
ln[n
itra
te]
Time (m)
first-order fit
y = 0.0024x + 0.0228R² = 0.9503
0.02
0.02
0.03
0.03
0.04
0.04
0.05
0 2 4 6 8
1/[
nit
rate
] (p
pm
-1)
Time (m)
second-order fit
y = -0.1316x + 28.949R² = 0.9647
22
24
26
28
0 5 10 15 20 25 30 35 40 45
Nit
rate
-N (
pp
m)
Time (m)
zero-order fit
y = -0.0052x + 3.3916R² = 0.9727
3.15
3.2
3.25
3.3
3.35
0 5 10 15 20 25 30 35 40 45
ln[n
itra
te]
Time (m)
first-order fit
y = 0.0002x + 0.0341R² = 0.9789
0.030
0.035
0.040
0.045
0 5 10 15 20 25 30 35 40 45
1/[
nit
rate
] (p
pm
-1)
Time (m)
second-order fit
a b
c d
e

140
nanoparticles in both samples with some nanoparticles unevenly dispersed on the surface of
silicate. The composition of materials after nitrate reduction is primarily silicate with
significantly fewer nanoparticles (Figure 4.9) than prior to the reaction (Figure 3.7d). The
decrease in the number of nanoparticles is presumably due to the loss of nZVI over the course
of the reaction. This observation was consistent with Shi et al.’s finding that the chain
structure disappeared.192 However, the difference in the number of nanoparticles after
between 10 ppm nitrate reduction and 50 ppm nitrate reduction was not determined via SEM.
Figure 4.9. COMPO images of 5%Ni-nZVI@MisiCFeOOH-MB1 after nitrate-N reduction of: (a)
10 ppm and (b) 50 ppm.
TEM analysis showed a significant change in the shape of materials before and after nitrate
reduction. Before nitrate reduction, the Ni-nZVI particles of 5%Ni-nZVI@MisiCFeOOH-MB1
(Figure 3.16b) comprises of a spherical core with an encompassing shell of Ni(0) and iron
nickel oxides. These particles are aggregated into clusters. After reducing either 10 ppm
nitrate-N for 15 minutes (Figure 4.10a and 4.10b) or 50 ppm nitrate-N for 120 minutes (Figure
4.10c and 4.10d), the core-shell structure is diminished. This is consistent with Kang et al.’s
report in which the shape of iron changed from spherule to sheet after nitrate reduction using
Ni-nZVI.2
a
b

141
Figure 4.10. TEM images of 5%Ni-nZVI@MisiCFeOOH-MB1 after nitrate-N reduction of (a),
(b) 10 ppm for 15 minutes and (c), (d) 50 ppm for 120 minutes.
There have been studies on the structure of Ni-nZVI before and after reaction using TEM.2, 167
However, these investigations focused on TEM images that reveal the shape of particles and
the change in agglomeration. In this study, based on TEM images, only ill-defined materials
are observed; as such, we performed TEM-EDS analysis to determine further information
about the composition of the material. Figure 4.11 revealed the elemental composition of
5%Ni-nZVI@MisiCFeOOH-MB1 via TEM-EDS spectrum after reducing 10 ppm nitrate-N for 15
minutes. Peaks corresponding to Si, O, S, and Al are observed, indicating the presence of Misi.
Peaks corresponding to Fe and Ni are also observed, confirming the existence of Fe and Ni
after nitrate reduction. The mass percentage for Fe and Ni was 48.3% and 2.6% and the atom
percentage was 23.2% and 1.2%, respectively. This Fe:Ni mass ratio (19:1) was lower than
that of before nitrate reduction (22:1) (Section 3.3.3, mass percentage for Fe and Ni was
40.4% and 1.8%). This indicated that iron was removed from the material due to its reaction
with nitrate.
a
b
c
d

142
Figure 4.11. TEM-EDS spectrum of 5%Ni-nZVI@MisiCFeOOH-MB1 after reduction of 10 ppm
nitrate-N (0.150 g of material, 25.0 mL of solution, under anaerobic conditions, 15 minutes).
Note: labels have been modified to highlight peaks relevant to this research. Please see
appendix B.7 for complete spectrum.
In addition to the TEM-EDS spectra, TEM-EDS mapping of 5%Ni-nZVI@MisiCFeOOH-MB1 after
reducing 10 ppm nitrate for 15 minutes confirmed the presence of both Misi and Ni-nZVI
particles. Signals corresponding to elements such as Si, O, Al, S, and Ti are observed,
consistent with the presence of Misi (Figure 4.11). The signals corresponding to Fe and Ni take
the form of agglomerated nanoparticles. When the signals of Fe and Ni are overlaid, the
significant difference in the elemental distribution between 5%Ni-nZVI@MisiCFeOOH-MB1
before and after nitrate reduction is observed. Before reaction, there are core-shell particles
with a well-dispersed layer of Ni(0) and iron nickel oxides on the surface of the Fe(0) core
(Figure 3.16). After reduction, the Ni signal appears slightly enhanced on the surface of Fe
than on Fe(0) core; however, the defined core-shell structure is no longer present (Figure
4.12a). Regarding to the signals of O, Fe and Ni, there is also a significant change in the
distribution of these elements. Before reaction, a layer containing O and Ni encapsulates Fe
(Figure 3.16). After reaction, little O presents in the Fe and Ni (Figure 4.12b, 4.12c and 4.12d).

143
Interestingly, the agglomeration of nanoparticles appears to have increased. This could be
due to the migration and agglomeration of the remaining Fe(0), although we are unable to
determine the origin of the remaining Fe(0); for example, whether it is from unreacted
nanoparticles, or from the migration of Fe(0) from partially reacted nanoparticles to form new
Fe nanoparticles.

144
Figure 4.12. TEM-EDS mapping of 5%Ni-nZVI@MisiCFeOOH-MB1 after reduction of 10 ppm
nitrate-N (0.150 g of material, 25.0 mL of solution, under anaerobic conditions, 15 minutes).
Fe
Fe- Ni O- Fe
O- Ni O- Fe- Ni
a b
c d
Si O Al
S Ti Ni 50 nm
50 nm

145
TEM-EDS spectrum the material generated after reduction of 50 ppm nitrate-N for 120
minutes revealed peaks corresponding to Si, O, S, and Al, indicating the presence of Misi.
Peaks corresponding to Fe and Ni are also observed (Figure 4.13), confirming the presence of
Fe and Ni. Ni percentage was significantly lower than Fe. The mass percentage for Fe and Ni
was 40.31% and 2.67% and the atom percentage was 22.14% and 1.44%, respectively. The
mass ratio of Fe to Ni in this specific area of 15:1 that was lower than those of this material
before the nitrate reduction (22:1) and after reduction of 10 ppm of nitrate (19:1). This
confirmed that the higher nitrate concentration removed more iron from the material.
Figure 4.13. TEM-EDS spectrum of 5%Ni-nZVI@MisiCFeOOH-MB1 after reduction of 50 ppm
nitrate-N (0.150 g of material, 25.0 mL of solution, under anaerobic conditions, 120
minutes). Note: labels have been modified to highlight peaks relevant to this research.
Please see appendix B.8 for complete spectrum.
Similar to TEM-EDS spectrum, in TEM-EDS mapping of 5%Ni-nZVI@MisiCFeOOH-MB1 after
reduction of 50 ppm nitrate-N for 120 minutes, signals corresponding to Si, O, Al, S, and Ti are
observed, consistent with the presence of Misi (Figure 4.14). A few nanoparticles are also
found, and they do not appear to be adsorbed directly onto the silicate. In these particles, the
Fe and Ni signals are strong, and an overlap between these two elements is observed (Figure
4.14a). Additionally, the O signal does not relate to signals of Fe or Ni, it is only observed

146
overlaid with Si (Figure 4.14b, 4.14c, and 4.14d). These results indicate that the core-shell
structure of Ni-nZVI particles in which the combination of Ni(0) and potentially iron nickel
oxides deposited on the surface of Fe(0) core before reaction has been properly destroyed.
The remaining nanoparticles appear to be the mixture of Fe and Ni (Fe-Ni alloy). Interestingly,
the presence of Fe(0) and potentially Ni(0) is noted, even though all of the zero-valent metal
centers should have reacted with the excess nitrate added. The used ratio of Fe to nitrate is
3:1 compared to the theoretically idealised ratio of 4:1 (Section 4.1).

147
Figure 4.14. TEM-EDS mapping of 5%Ni-nZVI@MisiCFeOOH-MB1 after reduction of 50 ppm
nitrate-N (0.150 g material, 25.0 mL of solution, under anaerobic conditions, 120 minutes).
Si O Al
Fe- Ni O- Fe
O- Ni O- Fe- Ni
a b
c d
S Ti Fe Ni
100 nm
100 nm

148
4.3. Nitrate reduction with bimetallic Cu-nZVI@Misi under anaerobic conditions
Several studies reported that the deposition of Cu on nZVI enhanced nitrate reduction.41, 126,
178, 181 In addition, Cu-nZVI also produces much more nitrite than non-doped nZVI.126 However,
most of these studies have focused on unsupported Cu-nZVI. In this chapter, the reactivity of
supported Cu-nZVI on Misi towards nitrate, as determined by nitrate conversion and nitrite
accumulation, were examined under anaerobic conditions. Four materials, including 5%Cu-
nZVI@MisiC-MA, 5%Cu-nZVI@MisiCFeOOH-MA, 5%Cu-nZVI@MisiC-MB1 and 5%Cu-
nZVI@MisiCFeOOH-MB1 were used. Two different nitrate-N concentrations, including 10
ppm and 50 ppm, were examined.
The removal of 10 ppm of nitrate-N using Cu-nZVI@Misi was rapid, regardless of either Misi
preparation or synthetic method. Within 5 minutes, nitrate-N levels were below 6.5 ppm and
after 15 minutes, nitrate-N levels were below 1 ppm (Figure 4.15). Compared to non-doped
nZVI@Misi as a control, all Cu-doped nZVI@Misi systems had higher reactivity. These results
highlighted the role of copper as a catalyst in improving nitrate conversion. However, the
difference in the reactivity among Cu-nZVI@Misi systems is minimal and cannot be
distinguished due to the rapid nitrate reduction, especially when the uncertainties of these
values are considered.
Figure 4.15. Reduction characterisation of 5%Cu-nZVI@Misi towards nitrate-N 10 ppm under
anaerobic conditions (0.150 g of materials, 25.0 mL of solution).
-2
0
2
4
6
8
10
12
0 5 10 15 20 25 30 35
Nit
rate
-N (
pp
m)
Time (m)5%Cu-nZVI@MisiC-MA 5%Cu-nZVI@MisiCFeOOH-MA
5%Cu-nZVI@MisiC-MB1 5%Cu-nZVI@MisiCFeOOH-MB1
nZVI@MisiC nZVI@MisiCFeOOH

149
The inconsistency in the results of nitrate concentrations was observed for the reduction with
an initial nitrate-N concentration of 10 ppm when nitrate reduction using samples of either
the same batch and or different batches of materials were examined in triplicate, particularly
after 5 minutes (Figure 4.16). For example, after 5 minutes, the nitrate-N concentrations were
1.46 ppm, 6.76 ppm, and 7.20 ppm when samples of three different batches of 5%Cu-
nZVI@MisiC-MA were used. Combining these results would give an average nitrate-N
concentration of 5 3 ppm (5 ppm 60%). Similarly, the average nitrate-N concentrations
were 7 3 ppm (7 ppm 43%), 3 2 ppm (3 ppm 67%) and 3 3 ppm (3 ppm 100%) when
either 5%Cu-nZVI@MisiCFeOOH-MA, 5%Cu-nZVI@MisiC-MB1 or 5%Cu-nZVI@MisiCFeOOH-
MB1 was used, respectively. The high levels of uncertainty did not allow for correlation
between materials used and their ability to reduce nitrate. As such, higher nitrate
concentrations were examined to determine if the reactivity of the materials could be
differential.
Figure 4.16. Reduction characterisation of 5%Cu-nZVI@Misi towards nitrate-N 10 ppm
under anaerobic conditions with high uncertainty after 5 minutes (0.150 g of materials, 25.0
mL of solution).
The reaction intermediate nitrite was also examined in the reduction of 10 ppm nitrate-N.
The nitrite-N concentration initially increased (up to 4 ppm after 5 minutes) and then
decreased after 30 minutes (Figure 4.17). The amount of nitrite build-up depended on doping
method for synthesising materials. After 5 minutes, materials prepared via deposition
0
2
4
6
8
10
12
5
Nit
rate
-N (
pp
m)
Time (m)5%Cu-nZVI@MisiC-MA 5%Cu-nZVI@MisiCFeOOH-MA
5%Cu-nZVI@MisiC-MB1 5%Cu-nZVI@MisiCFeOOH-MB1
nZVI@MisiC nZVI@MisiCFeOOH

150
method (MB1) accumulated much more nitrite than materials prepared via co-reduction
method (MA). Nitrite-N concentrations were 3 - 4 ppm when either 5%Cu-nZVI@MisiC-MB1
or 5%Cu-nZVI@MisiFeOOH-MB1 was used while nitrite-N concentration was around 1 ppm
using either 5%Cu-nZVI@MisiC-MA or 5%Cu-nZVI@MisiCFeOOH-MA. However, after 15
minutes, nitrite-N concentrations were below 1 ppm and after 30 minutes, nitrite-N
concentrations were below the detection limit of the IC (0.04 ppm) when any Cu-doped
nZVI@Misi systems were used. As a control, nitrite production in Cu-doped nZVI@Misi was
compared to that of non-doped nZVI@Misi. After 5 minutes, nitrite levels using Cu-doped
systems were higher than those using non-doped systems. In contrast, after 30 minutes,
nitrite levels using Cu-doped systems were lower than those using non-doped systems, but
the difference was minimal.
In Cu-doped materials, after 5 minutes, the faster nitrate conversion was, the more nitrite
accumulated. For example, Cu-doped materials prepared via deposition method (MB1)
reduced nitrate faster than Cu-doped materials prepared via co-reduction method (MA),
therefore, more nitrite was present in Cu-doped materials prepared via deposition method
(MB1). This is different from Ni-doped systems in which the nitrate concentrations were
directly proportional to nitrite concentrations.
Figure 4.17. Nitrite accumulation using 5%Cu-nZVI@Misi towards nitrate-N 10 ppm
reduction under anaerobic conditions (0.15 g of materials, 25 mL of solution).
-1
0
1
2
3
4
5
0 5 10 15 20 25 30
Nit
rite
-N (
pp
m)
Time (m)5%Cu-nZVI@MisiC-MA 5%Cu-nZVI@MisiCFeOOH-MA
5%Cu-nZVI@MisiC-MB1 5%Cu-nZVI@MisiCFeOOH-MB1
nZVI@MisiC nZVI@MisiCFeOOH

151
Nitrite levels were also inconsistent when nitrate reduction of 10 ppm was triplicated using
samples of either the same batch or different batches. After 5 minutes, the average nitrite
levels were 0.9 ± 0.2 ppm (0.9 ppm ± 22%), 0.8 ± 0.7 ppm (0.8 ppm ± 88%), 3 ± 2 ppm (3 ppm
± 67%) and 3.1 ± 0.9 ppm (3.1 ppm ± 29%) when either 5%Cu-nZVI@MisiC-MA, 5%Cu-
nZVI@MisiCFeOOH-MA, 5%Cu-nZVI@MisiC-MB1 or 5%Cu-nZVI@MisiCFeOOH-MB1 was
used, respectively (Figure 4.18). The low nitrite levels and the high uncertainties did not allow
for the correlation between materials used and their ability in nitrate reduction. Therefore,
more information about nitrite generation needs examining, for example, in the reduction of
higher initial nitrate concentration.
Figure 4.18. Nitrite accumulation using 5%Cu-nZVI@Misi towards nitrate-N 10 ppm
reduction under anaerobic conditions with high uncertainty (0.150 g of materials, 25.0 mL of
solution).
The capacity of nitrate removal and the difference in the reactivity of Cu-doped nZVI@Misi
systems were examined when these materials were tested in a higher initial concentration.
Similar to the results from Ni-doped nZVI@Misi systems, the 50 ppm of nitrate-N exceeds the
reducing capacity of our Cu-nZVI@Misi materials (molar ratio of Fe to nitrate at 3:1 instead
of the idealised ratio at 4:1); hence, all nitrate was not expected to be removed from the
solutions. However, more reliable data can be collected, especially with regards to the initial
time point as well as to compare the reactivity of these materials.
0
1
2
3
4
5
5
Nit
rite
-N (
pp
m)
Time (m)5%Cu-nZVI@MisiC-MA 5%Cu-nZVI@MisiCFeOOH-MA
5%Cu-nZVI@MisiC-MB1 5%Cu-nZVI@MisiCFeOOH-MB1
nZVI@MisiC nZVI@MisiCFeOOH

152
The effect of synthetic methods on the reactivity of Cu-doped nZVI@Misi materials was
evident. Cu-doped nZVI@Misi prepared via deposition method (MB1) exhibited significantly
greater reactivity than those prepared via co-reduction method (MA), regardless of Misi
preparation (Figure 4.19). For example, after 5 minutes, nitrate-N levels were 40 ± 2 ppm and
28 ± 2 ppm when either 5%Cu-nZVI@MisiC-MA or 5%Cu-nZVI@MisiC-MB1 was used. Nitrate-
N levels were 34 ± 2 ppm and 17 ± 2 ppm when either 5%Cu-nZVI@MisiCFeOOH-MA or 5%Cu-
nZVI@MisiCFeOOH-MB1 was used. After 30 minutes, nitrate-N levels in both Cu-doped
materials prepared via deposition method (MB1) were three times lower than those in both
Cu-doped materials prepared via co-reduction method (MA). The nitrate-N concentrations
were 27 2 ppm (46% nitrate conversion) and 10.0 0.7 ppm (80% nitrate conversion) when
either 5%Cu-nZVI@MisiC-MA or 5%Cu-nZVI@MisiC-MB1 was used, respectively. The nitrate-
N concentrations were 17 1 ppm (66% nitrate conversion) and 5 1 ppm (90% nitrate
conversion) when either 5%Cu-nZVI@MisiCFeOOH-MA or 5%Cu-nZVI@MisiCFeOOH-MB1
was used, respectively. These results confirmed the important role of the copper layer on the
surface of nZVI particles that was generated via deposition method (MB1). There is a Cu layer
on the surface of nZVI in 5%Cu-nZVI@MisiCFeOOH-MB1 while Cu is only present as a small
island on Fe in 5%Cu-nZVI@MisiCFeOOH-MA (Section 3.4.2).
Figure 4.19. Reduction characterisation of 5%Cu-nZVI@Misi towards nitrate-N 50 ppm under
anaerobic conditions (0.150 g of materials, 25.0 mL solution).
Interestingly, the relative uncertainty levels of nitrate concentrations were in a range of 6% -
20% for the reaction with an initial nitrate-N concentration of 50 ppm. These values were
0
10
20
30
40
50
5 15 30
Nit
rate
-N (
pp
m)
Time (m)5%Cu-nZVI@MisiC-MA 5%Cu-nZVI@MisiCFeOOH-MA
5%Cu-nZVI@MisiC-MB1 5%Cu-nZVI@MisiCFeOOH-MB1
nZVI@MisiC nZVI@MisiCFeOOH

153
much smaller than the uncertainties for the reaction with an initial nitrate-N concentration of
10 ppm. As such, there is a better correlation of materials used and their reactivity towards
nitrate reduction of 50 ppm.
The Misi preparation effected the reactivity of Cu-doped nZVI@Misi materials as MisiCFeOOH
was more successful than MisiC, regardless of synthetic method (Figure 4.19). After 5
minutes, materials using MisiCFeOOH reduced nitrate faster than those using MisiC. For
example, nitrate-N levels were 34 2 ppm and 40 2 when either 5%Cu-nZVI@MisiCFeOOH-
MA or 5%Cu-nZVI@MisiC-MA was used, respectively. Moreover, nitrate conversions in
materials prepared using MisiCFeOOH were higher than those in materials prepared using
MisiC. For example, after 30 minutes, the nitrate conversions were 66% and 46% when either
5%Cu-nZVI@MisiCFeOOH-MA or 5%Cu-nZVI@MisiC-MA was used, respectively. Although the
difference in the distribution of nanoparticles on the surface of different preparations of Misi
was not visually observed via SEM analysis, the importance of coating FeOOH layer in
enhancing the reactivity of nanoparticles was indicated. This finding is consistent to that
observed by Fraser in which the support preparation of non-doped nZVI@Misi had a
significant effect on the reactivity of the nanoparticles.1 Although factors behind this were
not determined, this does have implications on understanding the reactivity of nanoparticles
in different media and how the chemistry of the surrounding media (eg. soils, etc) might affect
the reactivity of the nanoparticles.
Compared to non-doped nZVI@Misi, bimetallic 5%Cu-nZVI on either MisiC or MisiCFeOOH
had greater reactivity towards nitrate reduction. Cu-doped material that had the lowest
reactivity (5%Cu-nZVI@MisiC-MA) still reduced nitrate much faster than non-doped
nZVI@Misi that had the higher reactivity (nZVI@MisiCFeOOH). For example, after 30 minutes,
the nitrate conversion values were 66% and 44% when either 5%Cu-nZVI@MisiC-MA or
nZVI@MisiCFeOOH was used, respectively. These results suggested that Cu is catalysing the
reduction of nitrate by nZVI. This has been noted by other researchers. The reactivity of Cu-
nZVI was significantly increased when nitrate was reduced from solutions. For instance, Cu
promoted nitrate reduction when 2.5%Cu-nZVI was used either acidic or neutral
conditions.178 Nitrate removal increased by 37% and 36% when Cu-nZVI was used as pH of 3
and pH of 7 compared to nZVI. In Hwang et al.’s study, nitrate conversion was 98% using Cu-
nZVI (5% mol/mol) compared to 50% using non-doped nZVI.41 Moreover, in Liou et al.’s study,

154
the same finding was observed when Cu-nZVI (0.5% - 20% w/w) was used to remove
nitrate.126 Using 5%Cu-nZVI, nitrate conversion increased 3.6 times compared to nZVI. The
reactivity of Cu-nZVI also increased when nitrate was reduced through a packed sand column.
Hosseini et al. reported that the reducing performance of Cu-nZVI (2.5% Cu w/w) was higher
than that of nZVI but the increase was minimal (only 7%).181 Nitrate conversion was 82% and
89% using either nZVI or 2.5%Cu-nZVI, respectively. In contrast, this is inconsistent with the
study in which Cu-nZVI@zeolite and nZVI@zeolite were examined. The researchers reported
that there was no difference in the reactivity between using Cu-nZVI@zeolite and
nZVI@zeolite in nitrate reduction, 100% of nitrate (100 ppm) was reduced using both
materials after 6 hours.194
However, supported Cu-nZVI@Misi materials were more active than reported unsupported
Cu-nZVI. For example, when the same mass ratio of Fe and nitrate (15:1) was used, all nitrate-
N (13 ppm) was removed at pH 5 after 60 minutes using 5%Cu-nZVI180 compared to all nitrate-
N (10 ppm) was removed at neutral pH after less than 30 minutes using 5%Cu-nZVI@Misi. In
comparison with reported supported Cu-nZVI, Cu-nZVI@Misi materials were more active.
When the initial nitrate-N concentration was 50 ppm, the molar ratio of Fe to nitrate was 3:1
and the reaction was conducted in unadjusted pH, nitrate conversion was from 46% to 90%
after 30 minutes. In contrast, in the investigation of Cu-nZVI@zeolite, the initial nitrate-N
concentration was 22.6 ppm (100 ppm nitrate), molar ratio of Fe to nitrate was 27:1 (nZVI
dosage of 2.46 g/L), the initial solution pH was 5.7, nitrate removal took 6 hours.194 As such,
these supported 5%Cu-nZVI@Misi systems, especially 5%Cu-nZVI@MisiCFeOOH-MB1 will
attribute to the new list of effective materials towards nitrate reduction.
Liou et al. proposed the mechanism of nitrate reduction using bimetallic Cu-ZVI.236 In this
study, Fe donates electrons (E0 = -0.44 V) to the catalytic Cu and water. Water accepts
electrons (E0 = -0.41 V) to produce Hads that adsorbs on the surface of Cu in the form of Cu-
Hads. Nitrate also adsorbs on the surface of Cu in the form of Cu-NO3-ads. After that, nitrate
reacts with Hads on the Cu surface to generate nitrite and then final products such as
ammonium. In materials prepared via deposition method (MB1), Cu is well-dispersed on the
surface of nZVI particles (Figure 3.27), which offers more Cu sites for nitrate to adsorb on the
surface. This is beneficial for the conversion step from nitrate into nitrite because Cu surfaces
are the ideal substrate for nitrate adsorption and then reduction to nitrite.190

155
In addition to nitrate, the nitrite concentrations were also monitored for our Cu-doped nZVI
systems. The accumulation of nitrite was dependent upon synthetic methods to prepare
materials. Nitrite levels were 2 - 5 times greater when materials prepared via deposition
method (MB1) rather than co-reduction method (MA) were used (Figure 4.20). After 5
minutes, nitrite-N concentrations were 14.6 ± 0.8 ppm and 18 ± 3 ppm using either 5%Cu-
nZVI@MisiC-MB1 or 5%Cu-nZVI@MisiCFeOOH-MB1. After 30 minutes, nitrite-N
concentrations decreased, 15.84 ± 0.09 ppm (32% nitrite accumulation) and 9 ± 1 ppm (18%
nitrite accumulation) using either 5%Cu-nZVI@MisiC-MB1 or 5%Cu-nZVI@MisiCFeOOH-MB1,
respectively. In contrast, nitrite-N levels were about 3 - 4 ppm when either 5%Cu-
nZVI@MisiC-MA or 5%Cu-nZVI@MisiCFeOOH-MA was used. The higher nitrite concentrations
observed in Cu-doped nZVI@Misi-MB1 systems can be explained by the faster nitrate
reduction and potentially slower nitrite reduction of these materials compared to those using
materials prepared via co-reduction method (MA). Furthermore, in Cu-doped materials, the
conversion of nitrate and nitrite had different behaviour. The faster nitrate reduction was,
the slower nitrite conversion was, which results in the higher nitrite accumulation. This is
inconsistent with Ni-doped materials.

156
Figure 4.20. Nitrite accumulation using 5%Cu-nZVI@Misi towards nitrate-N 50 ppm
reduction under anaerobic conditions (0.150 g of materials, 25.0 mL of solution).
There is also a difference in the nitrite accumulation when different preparations of Misi were
used, with nitrite concentrations observed in materials using MisiCFeOOH were less than
those using MisiC. The difference was minimal, regarding materials prepared via co-reduction
method (MA) while it was more significant with regards to materials prepared via deposition
method (MB1).
Nitrite accumulated in Cu-doped systems was higher than that of non-doped
nZVI@MisiCFeOOH. Particularly, nitrite in Cu-doped systems prepared via method deposition
(MB1) was up to eight times greater than that of non-doped systems. This can be partially
explained by the difference in the nitrate conversion and then nitrite reduction. Cu-doped
nZVI@Misi reduced nitrate significantly faster than non-doped nZVI@Misi, therefore much
more nitrite was formed and accumulated. The higher nitrite build-up in Cu-doped systems
was consistent with that reported by Liou et al..126 However, in their study, nitrite
accumulation was significantly higher than that observed in our systems. When the initial
nitrate-N concentration was 40 ppm and the molar ratio of Fe to nitrate was 2.1:1 using Cu-
nZVI, after 120 minutes, nitrite level-N was around 16 ppm (40% nitrite accumulation).
Therefore, a new finding observed in supported 5%Cu-nZVI@Misi is that the presence of Misi
helped speed up nitrite conversion, potentially due to the higher reactivity of supported
materials.
0
5
10
15
20
25
5 15 30
Nit
rite
-N (
pp
m)
Time (m)
5%Cu-nZVI@MisiC-MA 5%Cu-nZVI@MisiCFeOOH -MA
5%Cu-nZVI@MisiC-MB1 5%Cu-nZVI@MisiCFeOOH- MB1
nZVI@MisiC nZVI@MisiCFeOOH

157
In summary, coating a FeOOH layer in the pre-treatment procedure of Misi plays an important
role in enhancing the reactivity of Cu-nZVI nanoparticles as well as minimising the build-up of
nitrite. Using the deposition method (MB1) is successful in doping a secondary metal on the
surface of nZVI. Consequently, the materials prepared via deposition method (MB1) are more
active than those prepared via co-reduction method (MA) towards nitrate reduction.
The change in the morphology of materials during the reduction of nitrate was investigated
via SEM. We focused on 5%Cu-nZVI@MisiCFeOOH prepared via deposition method (MB1)
and monitored changes in its morphology under two different reaction conditions: after
reduction of 10 ppm nitrate for 15 minutes and after reduction of 50 ppm nitrate for 120
minutes. After nitrate reduction, each material was washed with deoxygenated deionised
water, followed by deoxygenated ethanol, and then dried under vacuum. COMPO images
revealed the presence of silicate and nanoparticles in both samples, with some nanoparticles
unevenly dispersed on the surface of the silicate. After nitrate reduction, the composition of
materials is primarily silicate with significantly fewer nanoparticles (Figure 4.21) than prior to
reaction (Figure 3.23d). Additionally, there is a significant level of agglomeration of
nanoparticles in 5%Cu-nZVI@MisiCFeOOH-MB1 after reduction of 10 ppm nitrate for 15
minutes whereas only a few islands of particles are observed in the material after reduction
of 50 ppm nitrate for 120 minutes.
Figure 4.21. COMPO images of 5%Cu-nZVI@MisiCFeOOH-MB1 after nitrate reduction of (a)
10 ppm and (b) 50 ppm.
a b

158
4.4. Nitrate reduction with trimetallic Pd-Cu-nZVI@Misi under anaerobic conditions
There have several investigations on the effect of both Pd and Cu on the reactivity of nZVI
materials. However, these trimetallic Pd-Cu-nZVI were unsupported materials with high
concentration of total dopant metals (around 9% - 10%) and high ratio of Pd to Cu (2:1). 4-5,
247 In this study, the reactivity of 0.5%Pd-5%Cu-nZVI supported on Misi towards nitrate, as
determined by nitrate conversion and nitrite accumulation, was examined. To do this, four
different materials, including 0.5%Pd-5%Cu-nZVI@MisiC-MAtri, 0.5%Pd-5%Cu-
nZVI@MisiCFeOOH-MAtri, 0.5%Pd-5%Cu-nZVI@MisiC-MC1 and 0.5%Pd-5%Cu-
nZVI@MisiCFeOOH-MC1 were used. Two different nitrate-N concentrations, including 10
ppm and 50 ppm, were examined.
The reactivity of trimetallic Pd-Cu-doped materials was a function of the synthetic method
when 10 ppm nitrate-N was used. Materials prepared via deposition method (MC1) reduced
nitrate much faster than materials prepared via co-reduction method (MAtri) (Figure 4.22). In
addition, materials on MisiCFeOOH were more reactive than those on MisiC, regardless of the
synthetic method. After 5 minutes, nitrate-N concentrations were more than 7.5 ppm and
after 15 minutes, nitrate-N concentrations were more than 2 ppm when either material
prepared via method co-reduction (MA) was used. In contrast, after 5 minutes, nitrate-N
concentrations were below 1.3 ppm and after 15 minutes, nitrate-N concentrations were
below the detection limit of the IC (0.06 ppm) when either material prepared via deposition
method (MC1) was used. However, after 30 minutes, nitrate levels were below the detection
limit for all types of trimetallic Pd-Cu-nZVI@Misi systems except for 0.5%Pd-5%Cu-
nZVI@MisiC-MAtri, where the nitrate-N concentration was about 2.6 ppm. These results
suggested that 0.5%Pd-5%Cu-nZVI@MisiCFeOOH-MC1 was the best trimetallic material. The
effectiveness of coating FeOOH layer on Misi and using the deposition method was
highlighted in improving the reactivity of trimetallic systems.

159
Figure 4.22. Reduction characterisation of 0.5%Pd-5%Cu-nZVI@Misi towards nitrate-N 10
ppm under anaerobic conditions (0.150 g of materials, 25.0 mL of solution).
The reactivity of Pd-Cu-nZVI@Misi was compared to that of non-doped nZVI@Misi as the
control material. Pd-Cu-doped materials prepared via deposition method (MC1) reduced
nitrate faster than non-doped nZVI@Misi, regarless of Misi preparation over the course of 30
minutes. However, Pd-Cu-doped materials prepared via co-reduction method (MA) reduced
nitrate more slowly than non-doped nZVI@Misi after 5 minutes and the contrast was
observed after 15 minutes.
Nitrite was also detected in the reduction of 10 ppm nitrate-N (Figure 4.23). After 5 minutes,
nitrite-N concentrations were about 1 ppm using either 0.5%Pd-5%Cu-nZVI@MisiC-MAtri,
0.5%Pd-5%Cu-nZVI@MisiCFeOOH-MAtri or 0.5%Pd-5%Cu-nZVI@MisiC-MC1. In contrast,
nitrite-N concentration was 3 ppm when 0.5%Pd-5%Cu-nZVI@MisiCFeOOH-MC1 was used.
However, after 15 minutes, nitrite-N was only detected in materials prepared via co-reduction
method (MAtri), where the nitrite-N concentrations were less than 1 ppm. The conversion of
nitrite depended on Misi preparation. Materials based on MisiCFeOOH reduced nitrite more
slowly than materials based on MisiC, leading to the lower nitrite accumulation. Combining
with the results of nitrate reduction, it can be concluded that Pd-Cu-doped
nZVI@MisiCFeOOH had higher reactivity in both nitrate and nitrite conversion.
0
2
4
6
8
10
12
0 5 10 15 20 25 30 35
Nit
rate
-N (
pp
m)
Time (m)0.5%Pd-5%Cu-nZVI@MisiC-MA 0.5%Pd-5%Cu-nZVI@MisiCFeOOH-MA
0.5%Pd-5%Cu-nZVI@MisiC-MC1 0.5%Pd-5%Cu-nZVI@MisiCFeOOH-MC1
nZVI@MisiC nZVI@MisiCFeOOH

160
Figure 4.23. Nitrite accumulation using 0.5%Pd-5%Cu-nZVI@Misi towards nitrate-N 10 ppm
reduction under anaerobic conditions (0.150 g of materials, 25.0 mL of solution).
As a control material, the nitrite production using Pd-Cu-doped materials was compared to
that of non-doped nZVI@Misi. After 5 minutes, nitrite levels accumulated by Pd-Cu-doped
materials were higher than that produced by non-doped nZVI@Misi, especially 0.5%Pd-5%Cu-
nZVI@MisiC-MC1 where nitrite level was three times greater. After 15 minutes, 0.5%Pd-
5%Cu-nZVI@Misi prepared via co-reduction method (MAtri) accumulated more nitrite while
0.5%Pd-5%Cu-nZVI@Misi prepared via deposition method (MC1) accumulated less nitrite
than non-doped nZVI@Misi; however, this difference was minimal.
The difference in the reactivity of trimetallic materials was exemplified when 50 ppm nitrate-
N was used. Materials prepared via deposition method (MC1) had significantly greater
reactivity than those prepared via co-reduction method (MAtri) (Figure 4.24). When either
MisiC or MisiCFeOOH was used as a support, materials prepared via deposition method (MC1)
reduced nitrate 2 - 4 times faster than materials prepared co-reduction method (MAtri). For
example, after 5 minutes, nitrate-N levels were 39 2 ppm and 17 3 ppm using either
0.5%Pd-5%Cu-nZVI@MisiCFeOOH-MA or 0.5%Pd-5%Cu-nZVI@MisiCFeOOH-MC1,
respectively. After 30 minutes, nitrate-N levels were 19.3 0.8 ppm (61% nitrate conversion)
and 5 2 ppm (90% nitrate conversion), respectively.
-0.5
0.5
1.5
2.5
3.5
0 5 10 15 20 25 30 35
Nit
rite
-N (
pp
m)
Time (m)
0.5%Pd-5%Cu-nZVI@MisiC-MA 0.5%Pd-5%Cu-nZVI@MisiCFeOOH-MA
0.5%Pd-5%Cu-nZVI@MisiC-MC1 0.5%Pd-5%Cu-nZVI@MisiCFeOOH-MC1
nZVI@MisiC nZVI@MisiCFeOOH

161
Figure 4.24. Reduction characterisation of 0.5%Pd-5%Cu-nZVI@Misi towards nitrate-N 50
ppm under anaerobic conditions (0.150 g of materials, 25.0 mL of solution).
Moreover, materials on MisiCFeOOH were more active than those on MisiC, regardless of
synthetic method. The nitrate reduction using Pd-Cu-nZVI on MisiCFeOOH was up to 3 times
faster than Pd-Cu-nZVI on MisiC. For example, after 5 minutes, nitrate-N levels were 24.9
0.5 ppm and 17 3 ppm when either 0.5%Pd-5%Cu-nZVI@MisiC-MC1 or 0.5%Pd-5%Cu-
nZVI@MisiCFeOOH-MC1 was used. After 30 minutes, nitrate-N levels were 12.8 0.2 ppm
(74% nitrate conversion), and 5 2 ppm (90% nitrate conversion), respectively. Based on
these results, 0.5%Pd-5%Cu-nZVI@MisiCFeOOH-MC1 performed the highest reactivity while
the lowest nitrate conversion was obtained by 0.5%Pd-5%Cu-nZVI@MisiC-MAtri.
In comparison with non-doped nZVI@Misi, the reactivity of all types of Pd-Cu-doped systems
was higher, regardless of the synthetic method and Misi preparation. After 5 minutes, nitrate
levels using non-doped nZVI@Misi were up to three times greater than that observed in Pd-
Cu-nZVI@Misi systems. After 30 minutes, nitrate conversion observed in Pd-Cu-doped
systems was 2 - 3 times greater than that observed in non-doped nZVI@Misi. The difference
in the reactivity between Pd-Cu-doped materials prepared via co-reduction method (MAtri)
and non-doped nZVI@Misi in nitrate reduction of 50 ppm was inconsistent with that in nitrate
reduction of 10 ppm. The reason for this phenomenon is not certain but it could be due to
the low concentration of nitrate (10 ppm), resulting in data that were less reliable than data
collected when a higher concentration of nitrate-N (50 ppm) was used.
0
10
20
30
40
50
5 15 30
Nit
rate
-N (
pp
m)
Time (m)0.5%Pd-5%Cu-nZVI@MisiC-MA 0.5%Pd-5%Cu-nZVI@MisiCFeOOH-MA
0.5%Pd-5%Cu-nZVI@MisiC-MC1 0.5%Pd5%Cu-nZVI@MisiCFeOOH-MC1
nZVI@MisiC nZVI@MisiCFeOOH

162
In the reduction of 50 ppm nitrate, the catalytic role of Pd-Cu was evident. Our results are
partly consistent with an investigation that was reported by Lubphoo et al..4-5 In these studies,
unsupported trimetallic Pd-Cu-nZVI was synthesised by the deposition method (MC1). The
ratio of Pd to Cu was either 1:1 or 2:1 and the total mass ratio of dopant metals to Fe was
1:10. In nitrate reduction, the initial nitrate-N concentration was 22.6 ppm and molar ratio of
Fe to nitrate was 2.8:1. Using this system, nitrate reduction was higher than nZVI after 30
minutes. The postulated reason for the improvement in reactivity was due to Cu and Pd acting
as the catalysts and helping facilitate electron transfer. However, in their studies, the
introduction of Pd increased the selectivity of nitrogen gas that was not found in our study.
In contrast, our results are also inconsistent with their results as nZVI reduced nitrate faster
than trimetallic systems after 20 minutes. They postulated that nZVI reacted with nitrate via
direct electron transfer from Fe while trimetallic materials reduced nitrate via H atom that
was generated from Fe corrosion with water and then adsorbed on the surface of Cu after
which, nitrate and Hads reacts on the surface of Cu.
In addition to nitrate, the nitrite accumulated in Pd-Cu-doped materials was also monitored.
Nitrite accumulation depended on the synthetic methods. Materials prepared via co-
reduction method (MAtri) accumulated less nitrite than those being prepared via deposition
method (MC1) (Figure 4.25). For materials prepared via co-reduction method (MAtri), nitrite-
N levels were approximately 4 ppm over the course of 30 minutes. These levels were slightly
higher than those observed in non-doped nZVI@Misi. In contrast, for materials prepared via
deposition method (MC1), nitrite-N concentrations were in a range of 8 - 16 ppm. These levels
were up to 9 times greater than those observed in non-doped nZVI@Misi. Specifically, after
5 minutes, nitrite-N concentration was around 15 ppm for both types of Pd-Cu-doped
prepared via deposition method (MC1). After 30 minutes, nitrite-N concentrations were 16.3
± 0.7 ppm (33% nitrite accumulation) and 8 ± 2 ppm (16% nitrite accumulation) when either
0.5%Pd-5%Cu-nZVI@MisiC-MC1 or 0.5%Pd-5%Cu-nZVI@MisiCFeOOH-MC1 was used,
respectively. Combining the results of nitrate conversion and nitrite build-up, 0.5%Pd-5%Cu-
nZVI@MisiCFeOOH-MC1 is the most effective trimetallic material in reducing nitrate and
minimising the toxic nitrite formation.

163
Figure 4.25. Nitrite accumulation using 0.5%Pd-5%Cu-nZVI@Misi towards nitrate-N 50 ppm
reduction under anaerobic conditions (0.150 g of materials, 25.0 mL of solution).
The nitrate conversion and nitrite accumulation using supported trimetallic materials had
opposite behaviours. The faster nitrate was converted, the more nitrite was built up. For
example, 0.5%Pd-5%Cu-nZVI@Misi prepared via deposition method (MC1) removed nitrate
faster than 0.5%Pd-5%Cu-nZVI@Misi prepared via co-reduction method (MAtri). Therefore,
the higher nitrite accumulation was observed in 0.5%Pd-5%Cu-nZVI@Misi prepared via
deposition method (MC1). This relation was similar to that of Cu-doped nZVI@Misi.
To determine the effect of Pd in Pd-Cu-doped materials towards nitrate reduction, the
reactivity of Pd-Cu-doped and Cu-doped materials was compared. When materials were
synthesised via co-reduction method (MA), regardless Misi preparation, Pd-Cu-doped
materials had similar reactivity to Cu-doped materials. For example, after 30 minutes, the
nitrate-N concentrations were 27 ± 2 ppm and 27.8 ± 0.4 ppm using either 5%Cu-nZVI@MisiC-
MA tri or 0.5%Pd-5%Cu-nZVI@MisiC-MA tri, respectively. When materials were prepared via
the deposition method (MB1 and MC1), the effectiveness of the introduction of Pd was
unclear. For example, after 5 minutes, 0.5%Pd-5%Cu-nZVI@MisiC-MB1 was more reactive
than 5%Cu-nZVI@MisiC-MB1, the nitrate-N concentrations were 24.9 ± 0.5 ppm and 28 ± 1
ppm, respectively. In contrast, after 30 minutes, 5%Cu-nZVI@MisiC-MB1 was more reactive
than 0.5%Pd-5%Cu-nZVI@MisiC-MB1, the nitrate-N concentrations were 10.0 ± 0.7 ppm and
12.8 ± 0.2 ppm, respectively. In systems prepared using MisiCFeOOH, the reactivity of
bimetallic Cu-doped and trimetallic Pd-Cu-doped was similar. For example, after 30 minutes,
0
5
10
15
20
5 15 30
Nit
rite
-N (
pp
m)
Time (m)0.5%Pd-5%Cu-nZVI@MisiC-MA 0.5%Pd-5%Cu-nZVI@MisiCFeOOH-MA
0.5%Pd-5%Cu-nZVI@MisiC-MC1 0.5%Pd5%Cu-nZVI@MisiCFeOOH-MC1
nZVI@MisiC nZVI@MisiCFeOOH

164
the nitrate-N concentrations were 5 ± 1 ppm and 5 ± 2 ppm using either 5%Cu-
nZVI@MisiCFeOOH-MB1 or 0.5%Pd-5%Cu-nZVI@MisiCFeOOH-MC1, respectively. As such,
the addition of Pd was not significantly effective in the step converting nitrate to nitrite. This
can be explained by the small amount of Pd in material (mass ratio of Pd to Misi is 0.5:100),
presumably is not enough to activate its catalytic role. In addition, the Pd deposition changed
the elemental distribution of Cu-doped material. In 5%Cu-nZVI@MisiFeOOH-MB1, there is a
good dispersion of Cu on the surface of nZVI (Section 3.5). However, the addition of Pd
decreases the Cu signal on the surface of nZVI (Section 3.7).
Other authors reported that Pd is a place for nitrite adsorption prior to being reduced5 or a
catalyst for nitrite reduction to final products.248 In order to examine the effect of Pd, the
reactivity of 5%Cu-nZVI@MisiCFeOOH-MB1 and 0.5%Pd-5%Cu-nZVI@MisiCFeOOH-MC1 in
reducing 20 ppm of nitrite-N was tested. The results showed that the presence of Pd increased
the nitrite conversion to final products (Figure 4.26) but the increase was minimal. After 5
minutes, the nitrite-N levels were 5.7 ± 0.6 ppm and 3.7 ± 0.4 ppm and after 15 minutes, the
nitrite-N levels were 0.75 ± 0.08 ppm and 0.18 ± 0.02 ppm when either 5%Cu-
nZVI@MisiCFeOOH-MB1 or 0.5%Pd-5%Cu-nZVI@MisiCFeOOH-MC1 was used. After 30
minutes, nitrite-N levels were less than 0.1 ppm for both materials.
Figure 4.26. Reduction characterisation of 5%Cu-nZVI@MisiCFeOOH-MB1 and 0.5%Pd-
5%Cu-nZVI@MisiCFeOOH-MC1 towards nitrite-N 20 ppm under anaerobic conditions (0.150
g of materials, 25.0 mL of solution).
0
5
10
15
20
0 5 10 15 20 25 30 35
Nit
rite
-N (
pp
m)
Time (m)
5%Cu-nZVI@MisiCFeOOH-MB1 0.5%Pd-5%Cu-nZVI@MisiCFeOOH-MC1

165
According to Lubphoo et al., the mechanism of nitrate removal proceeds via both reduction
of nitrate by electrons, directly transferred from Fe and by an adsorbed hydride, formed from
the reduction of Fe with water.5 Fe plays a role of donating electrons to catalytic metals (Cu
and Pd) and then these electrons react with nitrate. In addition, Fe also donates electrons to
water to produce Hads attaching on the surface of Cu and Pd in the form of Cu-Hads and Pd-
Hads, respectively. Nitrate in the solution adsorbs on the surface of Cu and then Cu-NO3-ads
reacts with Cu-Hads to form nitrite that adsorbs on the surface of Pd. Afterwards, nitrite is
reduced by Pd-Hads to form final products.
There has been no investigation on the morphology of trimetallic nZVI after nitrate reduction.
In this study, the change in morphology of Pd-Cu-doped materials was examined via SEM
analysis. We focused on 0.5%Pd-5%Cu-nZVI@MisiCFeOOH-MC1 and monitored changes in its
morphology under two different reaction conditions: after reduction of 10 ppm nitrate-N at
15 minutes and after reduction of 50 ppm nitrate-N at 120 minutes. After nitrate reduction,
each material was washed with deoxygenated deionised water, followed by deoxygenated
ethanol and then dried under vacuum to get resulting material. COMPO images also revealed
the presence of silicate and nanoparticles in both samples but the density of nanoparticles
changes. Significantly fewer nanoparticles are observed (Figure 4.27) than prior to reaction
(Figure 3.42b). After reduction of 10 ppm nitrate-N at 15 minutes, Fe particles are observed
on Misi and they are still in the form of agglomeration. In contrast, after reduction of 50 ppm
nitrate-N at 120 minutes, there are few agglomerates on some islands of Misi.
Fe Fe2+ + 2e-
2 Cu + H2 2 Cu-Hads
Cu-NO3- + Cu-Hads + e- 2 Cu + NO2
- + OH-
Pd-NO2- + 5 Pd-Hads + e- 6 Pd + NH3 + 2 OH-
Pd + NO2-(aq)
Pd-NO2-ads
Cu + NO3-(aq)
Cu-NO3-ads
NH3 + H2O NH4+ + OH-
Fe + 2 H2O Fe2+ + H2 + 2 OH-
2 Pd + H2 2 Pd-Hads

166
Figure 4.27. COMPO images of 0.5%Pd-5%Cu-nZVI@MisiCFeOOH-MC1 after nitrate-N
reduction of (a) 10 ppm and (b) 50 ppm.
4.5. Effect of reaction time and initial nitrate amount on nitrate reduction under
anaerobic conditions
4.5.1. Effect of reaction time
For the above examples, the maximum reaction time was 30 minutes. This arbitrary time limit
was chosen to allow us to screen more materials. For the three most promising materials in
each class, 5%Ni-nZVI@MisiCFeOOH-MB1, 5%Cu-nZVI@MisiCFeOOH-MB1 and 0.5%Pd-
5%Cu-nZVI@MisiCFeOOH-MC1, as well as non-doped nZVI@MisiCFeOOH, longer reaction
periods were examined in order to determine the maximum nitrate removal capacity for each
of these systems. To do this, the materials were added to 50 ppm nitrate-N solution and the
reactions were monitored in 180 minutes.
The nitrate removal was initially fast (in 30 minutes) and then gradually to the end of the test
period (Figure 4.28) when either M-doped material or Pd-Cu-doped material was used. For
example, when 5%Ni-nZVI@MisiCFeOOH-MB1 was used, nitrate conversion was 72% and
87% after 30 minutes and 180 minutes, respectively. The similar tendency was observed using
either Cu-doped material or Pd-Cu-doped material. The nitrate conversion was 91% and 97%
when 5%Cu-nZVI@MisiCFeOOH-MB1 was used, respectively. The nitrate conversion was 94%
and 99% when 0.5%Pd-5%Cu-nZVI@MisiCFeOOH-MC1 was used, respectively. Considering
the difference of nitrate conversion between 30 minutes and 180 minutes in each material,
choosing 30 minutes as the course of the reaction in our research is reasonable because less
than 14% of nitrate was reduced during a prolonged time of 150 minutes.
a b

167
In contrast, nZVI@MisiCFeOOH reduced nitrate gradually during the course of reaction time
(180 minutes). After 30 minutes, nitrate conversion was 51% and after 180 minutes, nitrate
conversion was 86%. Despite the same total nitrate conversion when either 5%Ni-
nZVI@MisiCFeOOH-MB1 or nZVI@MisiCFeOOH was used, Ni-doped system reduced nitrate
faster than the non-doped system in short-time period. These results confirmed the catalytic
role of Ni as well as Cu in enhancing the reactivity of doped nZVI on Misi.
Figure 4.28. Effect of reaction time on nitrate reduction under anaerobic conditions (0.150 g
of materials, 25.0 mL of 50 ppm nitrate-N solution).
4.5.2. Effect of initial nitrate amount
The difference in the reactivity of metal-doped nZVI@ Misi and non-dop nZVI@Misi materials
towards nitrate reduction was again observed when 100 ppm of nitrate-N was used. For this,
the four representative materials, including 5%Ni-nZVI@MisiCFeOOH-MB1, 5%Cu-
nZVI@MisiCFeOOH-MB1, 0.5%Pd-5%Cu-nZVI@MisiCFeOOH-MC1 and nZVI@MisiCFeOOH
were used. Doped nZVI@Misi had higher reactivity than non-doped nZVI@Misi and the
significant catalytic role towards nitrate conversion was observed in materials containing Cu
(Figure 4.29). In addition, both Cu-doped and Pd-Cu-doped materials had the same reactivity
in nitrate conversion. After 5 minutes, half of the initial nitrate (50 ppm) was removed using
either Cu-doped material or Pd-Cu-doped material and 32 ppm nitrate-N was reduced using
5%Ni-nZVI@MisiCFeOOH-MB1. In contrast, only 6 ppm of nitrate was reduced using
nZVI@MisiCFeOOH. After 30 minutes, the nitrate conversion was 65% for either Cu-doped
material or Pd-Cu-doped material and 43% for 5%Ni-nZVI@MisiCFeOOH-MB1 while only 35%
0
10
20
30
40
50
0 30 60 90 120 150 180
Nit
rate
-N (
pp
m)
Time (m)5%Ni-nZVI@MisiCFeOOH-MB1 5%Cu-nZVI@MisiCFeOOH-MB1
0.5Pd-5%Cu-nZVI@MisiCFeOOH-MC1 nZVI@MisiCFeOOH

168
was observed in nZVI@MisiCFeOOH. These results confirmed the important role of metal-
doped in promoting nitrate reduction.
Comparing with the reduction of the 50-ppm nitrate-N solution, a higher rate of nitrate
removal was observed. For example, when 5%Ni-nZVI@MisiCFeOOH-MB1 was used, after 5
minutes, nitrate-N concentration was from 100 ppm to 68 ppm (32 ppm nitrate-N removed)
while nitrate-N concentration decreased from 50 ppm to 27 ppm (23 ppm nitrate-N removed)
in the reduction of 100 ppm and 50 ppm, respectively.
Figure 4.29. Reduction characterisation of representative materials towards nitrate-N 100
ppm under anaerobic conditions (0.150 g of materials and 25.0 mL of solution).
In terms of nitrite production, non-doped nZVI@MisiCFeOOH accumulated nitrite with the
lowest level although it reduced nitrate the most slowly (Figure 4.30). Over the course of 30
minutes, nitrite levels were around 3.5 ppm. In contrast, both Cu-doped and Pd-Cu-doped
materials reduced nitrate fastest, but they accumulated a significant amount of nitrite of
around 25 ppm. In addition, after 5 minutes, significant amount of nitrite remained in solution
(Figure 4.30). This could be due to the lack of the reductants. Potentially, most of the Fe(0)
was consumed in the first step from nitrate to nitrite leading to less Fe participating the
second step from nitrite to final products. As such, the nitrite concentrations were constant.
0
20
40
60
80
100
0 5 10 15 20 25 30 35
Nit
rate
-N (
pp
m)
Time (m)
5%Ni-nZVI@MisiCFeOOH-MB1 5%Cu-nZVI@MisiCFeOOH-MB1
0.5Pd-5%Cu-nZVI@MisiCFeOOH-MC1 nZVI@MisiCFeOOH

169
Figure 4.30. Nitrite accumulation using representative materials towards nitrate-N 100 ppm
reduction under anaerobic conditions (0.150 g of materials and 25.0 mL of solution).
4.6. Conclusion
Doping metals on the surface of nZVI@Misi to generate supported bimetallic and trimetallic
systems was an effective method in improving nitrate reduction. Misi that was calcined and
coated with FeOOH was an efficient support in enhancing the reactivity of bimetallic
nanoparticles. Additionally, doping metals on the surface of nZVI@Misi using deposition
method (MB1 or MC1) increased the reactivity of the materials more significantly than using
co-reduction method (MA or MAtri). As such, 5%Ni-nZVI@MisiCFeOOH-MB1, 5%Cu-
nZVI@MisiCFeOOH-MB1, and 0.5%Pd-5%Ni-nZVI@MisiCFeOOH-MC1 have potential to be
used in nitrate remediation of “real” waters.
Among these doped materials, both 5%Cu-nZVI@MisiCFeOOH-MB1 and 0.5%Pd-5%Cu-
nZVI@MisiCFeOOH-MC1 had a higher reactivity in nitrate conversion than 5%Ni-
nZVI@MisiCFeOOH-MB1. However, Ni-doped material reduced nitrite to final products faster
than Cu-doped and Pd-Cu-doped materials. As such, less nitrite was accumulated in 5%Ni-
nZVI@MisiCFeOOH-MB1. Although the catalytic role of Pd in nitrate conversion was
insignificant, the presence of Pd slightly increased nitrite reduction to final products relative
to 5%Cu-nZVI@MisiCFeOOH-MB1.
0
10
20
30
0 5 10 15 20 25 30 35
Nit
rite
-N (
pp
m)
Time (m)5%Ni-nZVI@MisiCFeOOH-MB1 5%Cu-nZVI@MisiCFeOOH-MB1
0.5Pd-5%Cu-nZVI@MisiCFeOOH-MC1 nZVI@MisiCFeOOH

170
5. Effect of reaction conditions on nitrate reduction
5.1. Introduction
The aim of this chapter is to examine the reactivity of our doped nZVI@Misi materials towards
nitrate reduction when they are exposed to oxygen and naturally available ions. This
examination undertakes two variables: (1) the efficiency of doped nZVI@Misi materials as
determined by nitrate conversion and nitrite accumulation under aerobic conditions, and (2)
the effect of coexisting ions on nitrate reduction using these materials under both anaerobic
and aerobic conditions. In addition, the generation of soluble iron and other dopant metals is
also examined.
There have been numerous studies on nitrate reduction using nZVI,156, 165 Ni-doped nZVI, Cu-
doped nZVI, nZVI@chitosan, nZVI@sodium oleate,244 or [email protected] However, these
reactions are commonly carried out in anaerobic conditions such as in a sealed reaction vessel
or under a flow of inert gas (nitrogen or argon). Therefore, the reactivity of nZVI particles was
not affected by any oxidising factors in the open environment.
The synthetic methods used to generate nZVI results in it having a core-shell structure.48 The
composition and the thickness of shell vary, depending on the synthetic methods and
conditions (vide infra).48, 249 In addition, the longer the particles are in contact with oxidising
media, the thicker the oxide/hydroxide layer becomes, which slows down electron transfer
from the Fe(0) core to the surface.250 As such, when materials containing nZVI are exposed to
aerobic conditions, the presence of oxygen might affect the reactivity of these materials.
In “real” waters, there are numerous available ions which have an impact on nitrate
reduction. Some ions can speed up nitrate reduction while other ions inhibit the reactivity of
nZVI towards nitrate reduction. For example, nitrate reduction is significantly increased in
the presence of either Cd(II),251 Cu(II),199 or Pb(II).192 In contrast, some ions can compete with
nitrate in the adsorption onto the nZVI surface, and essentially inhibit nitrate reduction. For
instance, at pH’s less than 8, the surface of the iron nanoparticles becomes positively charged,
and anions, such as sulfate or phosphate, adsorb onto this positively charged surface of nZVI
which decreases the number of available nZVI active sites for nitrate reduction.48, 252
There have been some studies in which the effect of chloride, sulfate, bicarbonate, carbonate,
and phosphate were investigated. Chloride is reported to passivate nZVI when nZVI was used

171
to remove TCE.150 This was attributed to the formation of complexes on the surface of nZVI.
Sulfate also had negative effect on the reactivity of both nZVI and bimetallic nZVI. For
example, the removal of TCE using nZVI decreased in the presence of sulfate.150 In addition,
sulfate decreased both the removal rate and degradation yield when Pd-nZVI was used to
remove pentachlorophenol.184 The inhibition of sulfate was due to the formation of
complexes on the surface of nZVI, leading to the blockage of the active sites on the surface of
nanoparticles.150, 184 Bicarbonate and carbonate also affected the reactivity of nZVI
composites. For example, bicarbonate decreased the removal of TCE.150 Carbonate inhibited
the decolourisation of MO by [email protected] The negative effect of carbonate/
bicarbonate was reported due to the formation of complexes or precipitation of substances
such as siderite (FeCO3)150, 191 and iron-carbonate hydroxides (Fe(OH)CO3)191 on the surface
of nanoparticles. Similar to other ions, phosphate inhibited nZVI in removing TCE due to the
precipitation of vivianite (Fe3(PO4)2.8H2O).150
In this study, three representative materials which are described in Chapter 4 are used to
study the effect of both aerobic conditions as well as the effect of coexisting ions. These are
5%Ni-nZVI@MisiCFeOOH-MB1, 5%Cu-nZVI@MisiCFeOOH-MB1, and 0.5%Pd-5%Cu-
nZVI@MisiCFeOOH-MC1. These materials were chosen as they not only readily reduce nitrate
but also span the range of the different types of materials examined. Non-doped
nZVI@MisiCFeOOH was used as a control material. Two different molar ratios of Fe to nitrate
15:1 (10 ppm nitrate-N) and 3:1 (50 ppm nitrate-N) were used to investigate nitrate reduction
under anaerobic conditions (see Chapter 4) versus aerobic conditions. During nitrate
reduction, the concentrations of soluble metals such as iron and doped metal ions were also
measured.
Decisions on the appropriate concentrations of potential inhibitory ions were based on
preliminary studies on the reduction of 10 ppm nitrate-N using 5%Ni-nZVI@MisiCFeOOH-
MB1. The amount of chloride, sulfate, carbonate, and phosphate was increased stepwise until
either an inhibitory effect was observed, or 100 ppm of the ion was reached. The
concentration ranges included chloride and sulfate-S (10 - 100 ppm each), carbonate (5 - 20
ppm), and phosphate (1 - 10 ppm). Neither chloride nor sulfate significantly influenced nitrate
reduction when their concentrations were up to 100 ppm. Nitrate conversion started being
inhibited when the concentrations of carbonate-C and phosphate-P were 20 ppm and 10 ppm,

172
respectively. As such, we decided to examine the effect of these ions, chloride (100 ppm),
sulfate-S (100 ppm), carbonate-C (20 ppm) and phosphate-P (10 ppm) on nitrate reduction of
10 ppm. The concentrations of nitrate, nitrite, and phosphate were measured using IC. The
concentrations of metal ions, such as iron and doped metal ions, were determined using AAS.
5.2. Nitrate reduction under aerobic conditions
nZVI rapidly reacts with oxygen, water, and natural occurring constituents in the
environment. The aging of nZVI can be oxidation and transformation of the shell composition.
Sarathy et al. reported that when nZVI is exposed to deionised water and dissolved oxygen,
the original shell of nZVI was broken down and the oxide shell was transformed to a more
protective layer.253 In another study, when nZVI was exposed to an oxygen atmosphere, the
ageing was due to the recovery and recrystallisation of amorphous structure to the crystalline
phase.254 Regardless of mechanism, ageing nZVI results in the loss of the active Fe(0) sites
available, decreasing its reactivity towards TCE.131, 255 Another study examined the effect of
reused bimetallic Pd-nZVI on the removal of chlorobenzenes.256 The reactivity of aged
particles decreased due to Pd dislodgment from Pd-nZVI and the encapsulation of Pd islets by
the iron oxides. However, the effect of ageing due to exposure to atmosphere has not been
investigated. In this current study, the reactivity of doped and non-doped nZVI@Misi towards
nitrate reduction was examined in the presence of oxygen gas.
The nitrate removal of 10 ppm nitrate in aerobic conditions was rapid when doped nZVI@Misi
materials were used (Figure 5.1). After 5 minutes, both 5%Ni-nZVI@MisiCFeOOH-MB1 and
5%Cu-nZVI@MisiCFeOOH-MB1 reduced nitrate to the detection limit of the IC (0.06 ppm).
The trimetallic material, 0.5%Pd-5%Cu-nZVI@MisiCFeOOH-MC1, reduced nitrate more slowly
than bimetallic materials with the nitrate-N level at 1.8 ppm after 5 minutes. However, after
15 minutes, nitrate-N concentrations were below the detection limit for all types of doped
materials. Thus, the reactivity of these materials was not significantly different.

173
Figure 5.1. Nitrate reduction of 10 ppm nitrate-N under aerobic conditions (0.150 g of
materials, 25.0 mL of solution).
Although the difference in the reactivity of doped nZVI@Misi was minimal, the role of doping
metal(s) on nZVI@Misi was evident. Doped materials were much better in nitrate reduction
than non-doped nZVI@Misi. After 5 minutes, the nitrate-N level was 9.6 ppm and after 15
minutes, the nitrate-N level was 4.0 ppm when nZVI@MisiCFeOOH was used.
Nitrite was not detected using Ni-doped material while nitrite accumulation was observed
using Cu-doped, Pd-Cu-doped, and nZVI@MisiCFeOOH materials during the reaction. After 5
minutes, nitrite-N concentration was the most significant at 2.4 ppm using 0.5%Pd-5%Cu-
nZVI@MisiCFeOOH-MC1 whereas nitrite-N concentration was 0.3 ppm for either 5%Cu-
nZVI@MisiCFeOOH-MB1 or nZVI@MisiCFeOOH-MC1. After 15 minutes, nitrite-N
concentrations were below the detection limit of the IC (0.04 ppm) for all materials examined.
As the reactivity difference between the doped materials was minimal when 10 ppm nitrate-
N was examined, more concentrated nitrate solutions were investigated to help magnify any
differences. A significant amount of nitrate was reduced by doped materials when 50 ppm of
nitrate-N was used under aerobic conditions. After 5 minutes, about 50% of nitrate was
removed by Ni-doped material and approximately two-thirds of nitrate was removed by
either Cu-doped or Pd-Cu-doped material (Figure 5.2). The nitrate-N levels were 27 ± 4 ppm,
14 ± 2 ppm, and 19 ± 2 ppm when either 5%Ni-nZVI@MisiCFeOOH-MB1, 5%Cu-
nZVI@MisiCFeOOH-MB1 or 0.5%Pd-5%Cu-nZVI@MisiCFeOOH-MC1 was used, respectively.
0
2
4
6
8
10
12
0 5 10 15 20 25 30 35
Nit
rate
-N (
pp
m)
un
der
aer
ob
ic
con
dit
ion
s
Time (m)5%Ni-nZVI@MisiCFeOOH MB1 5%Cu-nZVI@MisiCFeOOH MB1
0.5%Pd-5%Cu-nZVI@MisiCFeOOH MB1 nZVI@MisiCFeOOH

174
After 30 minutes, the nitrate-N levels were 18 ± 4 ppm (64% nitrate conversion), 6.9 ± 0.5
ppm (86% nitrate conversion), and 10 ± 4 ppm (80% nitrate conversion), respectively.
Interestingly, 5%Cu-nZVI@MisiCFeOOH-MB1 had slightly higher reactivity than 0.5%Pd-
5%Cu-nZVI@MisiCFeOOH-MC1 during the course of the reaction. The difference in the
reactivity of Cu-doped and Pd-Cu-doped materials towards nitrate conversion under aerobic
conditions is different from that observed in anaerobic conditions (Section 4.3 and 4.4).
Figure 5.2. Nitrate reduction of 50 ppm nitrate-N under aerobic conditions (0.150 g of
materials, 25.0 mL of solution).
As a control material, the reactivity of non-doped nZVI@MisiCFeOOH was also examined.
nZVI@MisiCFeOOH reduced nitrate much more slowly than doped materials. After 5 minutes,
the nitrate-N level was 37.6 ± 0.7 ppm and after 30 minutes, the nitrate-N concentration was
21.8 ± 0.5 ppm (56% nitrate conversion).
Both Cu-doped and Pd-Cu-doped produced more nitrite compared to Ni-doped and non-
doped nZVI@Misi (Figure 5.3). After 5 minutes, the nitrite-N levels were 16 ± 2 ppm and 12.2
± 0.8 ppm using Cu-doped or Pd-Cu-doped material while nitrite-N levels were 3.6 ± 0.9 ppm
and 1.72 ± 0.06 ppm using Ni-doped material and non-doped nZVI@MisiCFeOOH,
respectively. After 30 minutes, the nitrite levels in all materials decreased but these decreases
were minimal. Nitrite-N levels were 2.6 ± 0.8 ppm (5% nitrite accumulation), 14 ± 2 ppm (28%
nitrite accumulation), 11 ± 1 ppm (22% nitrite accumulation) and 1.0 ± 0.1 ppm (2% nitrite
accumulation) when either 5%Ni-nZVI@MisiCFeOOH-MB1, 5%Cu-nZVI@MisiCFeOOH-MB1,
0
10
20
30
40
50
5 15 30
Nit
rate
-N (
pp
m)
un
der
aer
ob
ic
con
dit
ion
s
Time (m)
5%Ni-nZVI@MisiCFeOOH-MB1 5%Cu-nZVI@MisiCFeOOH-MB1
0.5%Pd-5%Cu-nZVI@MisiCFeOOH-MC1 nZVI@MisiCFeOOH

175
0.5%Pd-5%Cu-nZVI@MisiCFeOOH-MC1 or nZVI@MisiCFeOOH was used, respectively.
Although 5%Cu-nZVI@MisiCFeOOH-MB1 reduced nitrate faster than 0.5%Pd-5%Cu-
nZVI@MisiCFeOOH-MC1, the nitrite conversion in the presence of Pd in the material was
faster, leading to a lower nitrite accumulation using Pd-Cu-doped material. This is similar to
the mechanism of nitrate reduction using these materials under anaerobic condition. Pd
catalysed the nitrite reduction step due to the supply of the surface for nitrite adsorption
before nitrite was reduced to final products.
Figure 5.3. Nitrite accumulation in the reduction of 50 ppm nitrate-N under aerobic
conditions (0.150 g of materials, 25.0 mL of solution).
5.3. Comparison of the reactivity of materials under anaerobic and aerobic conditions
The reactivity of doped nZVI@Misi materials under aerobic conditions was lower than that
observed under anaerobic conditions. Oxygen affected the reactivity of trimetallic materials
while its effect on bimetallic materials was insignificant. The decrease in their reactivity in the
presence of oxygen could be due to the passivation of the outer layer of nanoparticles which
diminishes electron transfer from the Fe(0) core to nitrate.253, 255 For example, after 30
minutes, the nitrate-N concentrations were 14 ± 1 ppm and 18 ± 4 ppm when 5%Ni-
nZVI@MisiCFeOOH-MB1 was used either under anaerobic or aerobic condition, respectively
(Figure 5.4). As such, these doped systems are promising materials for nitrate removal.
0
5
10
15
20
5 15 30
Nit
rite
-N (
pp
m)
un
der
aer
ob
ic c
on
dit
ion
s
Time (m)
5%Ni-nZVI@MisiCFeOOH-MB1 5%Cu-nZVI@MisiCFeOOH-MB1
0.5%Pd-5%Cu-nZVI@MisiCFeOOH-MC1 nZVI@MisiCFeOOH

176
Column: anaerobic conditions; Line: aerobic conditions
Figure 5.4. Nitrate reduction of 50 ppm nitrate-N under anaerobic and aerobic conditions
(0.150 g of materials, 25.0 mL of solution).
The effect of oxygen on the reactivity of doped nZVI materials has not received much
attention. However, the insignificant decrease in the reactivity of 0.5%Pd-5%Cu-
nZVI@MisiCFeOOH-MC1 is inconsistent with Liu et al.’s report.247 In their study, 3%Cu-6%Pd-
nZVI was synthesised by simultaneous deposition of both Pd and Cu on nZVI. The initial
nitrate-N concentration was 22.6 ppm and the molar ratio of Fe to nitrate was 2.8:1. In this
reported system, the reactivity of trimetallic significantly decreased with increasing dissolved
oxygen. After 60 minutes, nitrate conversion was 82.3%, 38.1%, and 20.4% in the presence of
0.42 mg/L, 6.05 mg/L, and 10.41 mg/L of dissolved oxygen. Although dissolved oxygen was
never measured for our systems, as the reactions were performed in air, a maximum
dissolved oxygen level of 9 mg/L can be assumed at 20 °C.257
In related research investigating the removal of nitrate with ZVI under aerobic conditions,
nitrate was only reduced in buffered conditions.45 In our study, nZVI@MisiCFeOOH reduced
nitrate under aerobic conditions without pH control. This can be explained by the important
role of both nanosized Fe and Misi support. Nanosized Fe increases the reducing capacity of
Fe as well as the introduction of Misi decreases agglomeration. Therefore, the reactivity of
nZVI@Misi increases. Additionally, nZVI@MisiCFeOOH under aerobic conditions was more
0
10
20
30
40
50
5 15 30
Nit
rate
-N (
pp
m)
un
der
tw
o c
on
dit
ion
s
Time (m)5%Ni-nZVI@MisiCFeOOH-MB1 5%Cu-nZVI@MisiCFeOOH-MB1
0.5%Pd-5%Cu-nZVI@MisiCFeOOH-MC1 nZVI@MisiCFeOOH

177
active than under anaerobic conditions. After 30 minutes, the nitrate-N levels were 28 ± 4
ppm (44% nitrate conversion) and 21.8 ± 0.5 ppm (56% nitrate conversion) when
nZVI@MisiCFeOOH was used either under anaerobic or aerobic conditions, respectively. This
is inconsistent with a study in which the chemical transformation of nZVI was examined when
nZVI was exposed in oxygen-saturated water for 24 hours.258 Both the reducing capacity and
reactive lifetime of nZVI decreased. Thus, more nZVI was required to treat a similar mass of
contaminants than when used under anaerobic conditions.
In our study, the reactivity of nZVI@MisiCFeOOH is higher under aerobic conditions than
under aerobic conditions. This can be explained by the formation of oxidants when nZVI is
exposed to oxygen. Fe reacted with water in the presence of oxygen to form Fe(II) and H2O2.246
Subsequently, Fe reacted with H2O2 to form Fe(II). These oxidants can be Fe(II), H2O2, O2•- (eq.
5.1 - 5.4) which may provide active components for nitrate reduction.
Nitrite accumulation under the two conditions was also compared. When 5%Ni-
nZVI@MisiCFeOOH-MB1 was used, the nitrite build-up under anaerobic and aerobic
conditions was similar (Figure 5.5). After 30 minutes, the nitrite-N levels were 2.4 ± 0.8 ppm
and 2.6 ± 0.8 ppm when 5%Ni-nZVI@MisiCFeOOH-MB1 was used under either anaerobic
conditions or aerobic conditions, respectively. This indicated that Ni-doped material (5%Ni-
nZVI@MisiCFeOOH-MB1) was not affected by oxygen gas in both steps of nitrate reduction
including nitrate conversion and nitrite reduction. When Cu-doped and Pd-Cu-doped systems
were used, the difference in nitrite accumulation in two reaction conditions was dependent
upon the reaction time (Figure 5.5). After 5 minutes, nitrite accumulation under anaerobic
conditions was more than that aerobic conditions. For instance, nitrite-N levels were 18 ± 2
ppm and 16 ± 2 ppm when 5%Cu-nZVI@MisiCFeOOH-MB1 was used, respectively. This
suggested that the step from nitrate to nitrite under anaerobic conditions was faster than

178
that under aerobic condition. In contrast, after 30 minutes, nitrite accumulation under
anaerobic conditions was less than that under aerobic conditions. For instance, nitrite-N
levels were 9 ± 1 ppm and 14 ± 2 ppm when 5%Cu-nZVI@MisiCFeOOH-MB1 was used,
respectively. This meant that nitrite reduction under anaerobic conditions was faster than
under aerobic conditions. In other words, during the course of the reaction, these materials
were more reactive under anaerobic conditions than under aerobic conditions.
Column: anaerobic conditions; Line: aerobic conditions
Figure 5.5. Nitrite accumulation in the reduction of 50 ppm nitrate-N under anaerobic and
aerobic conditions (0.15 g of materials, 25 mL of solution).
Due to the slightly lower reactivity and higher accumulation of nitrite of doped materials
when the nitrate reduction was conducted under aerobic conditions, we examined whether
nitrite as the intermediate might react with oxygen gas or dissolved oxygen to form nitrate.
For this, the reduction of 10 ppm nitrite-N was examined under anaerobic and aerobic
conditions. Two materials, 5%Ni-nZVI@MisiCFeOOH-MB1 and 0.5%Pd-5%Cu-
nZVI@MisiCFeOOH-MC1 were used. The results showed that the decrease in the reactivity is
not due to the re-formation of nitrate. Using 0.5%Pd-5%Cu-nZVI@MisiCFeOOH-MC1, nitrate-
N levels were below the detection limit of the IC (0.06 ppm) during the course of the reaction
in both conditions. Using 5%Ni-nZVI@MisiCFeOOH-MB1, only a small amount of nitrate was
detected after 5 minutes, 0.13 ppm and 0.09 ppm under either anaerobic condition or aerobic
conditions, respectively. In addition, the higher nitrite accumulation under aerobic conditions
0
4
8
12
16
20
24
5 15 30Nit
rite
-N (
pp
m)
un
der
tw
o c
on
dit
ion
s
Time (m)
5%Ni-nZVI@MisiCFeOOH-MB1 5%Cu-nZVI@MisiCFeOOH-MB1
0.5%Pd-5%Cu-nZVI@MisiCFeOOH-MC1 nZVI@MisiCFeOOH

179
is due to the slower nitrite conversion. For example, after 5 minutes, nitrite-N concentrations
were 0.43 ppm and 2.15 ppm using 0.5%Pd-5%Cu-nZVI@MisiCFeOOH-MC1 either under
anaerobic conditions or aerobic conditions, respectively.
5.4. Determination of soluble metals during nitrate reduction
One of the concerns of the real-life application of our materials is the generation of the by-
products after the reaction. In nitrate reduction using doped and non-doped nZVI@Misi, by-
products are not only N-containing substances but also metal ions. We aimed to examine if
the metal ions could accumulate during the reaction. The mobility and transport of iron and
other metal ions after nitrate removal using materials containing these metals have not
received much attention. In order to determine the generation of the metal ions during the
course of the reaction, we first examined the stability of our system under aerobic conditions.
For this, we examined the conversion of Fe and other doped metals by measuring the
concentrations of metal ions including soluble iron, nickel, and copper in the solutions during
the reduction of 10 ppm and 50 ppm nitrate-N. Our four standard materials, 5%Ni-
nZVI@MisiCFeOOH-MB1, 5%Cu-nZVI@MisiCFeOOH-MB1, 0.5%Pd-5%Cu-
nZVI@MisiCFeOOH-MC1, and nZVI@MisiCFeOOH were utilised.
The formation of soluble iron was a function of reaction time and initial nitrate
concentrations. In the reduction of 10 ppm nitrate-N using doped materials, the soluble iron
levels gradually increased over the course of the reaction (Figure 5.6). After 30 minutes, the
iron levels were 1.75 ppm using the Ni-doped system and around 1 ppm using Cu-doped and
Pd-Cu-doped materials. In contrast, for the non-doped nZVI@MisiCFeOOH, the iron level
reached its maximum after 5 minutes (1.0 ppm) and then decreased back down to below 0.5
ppm at both the 15- and 30-minute marks. The difference in the trend generating iron using
nZVI@MisiCFeOOH can be explained by the very slow nitrate removal. In the first 5 minutes,
very little nitrate was reduced (Figure 5.1). There might be a process of nitrate adsorption on
the active sites and the corrosion of Fe(0) to form Fe(II), leading to the higher level of iron.
After 15 minutes, a significant amount of nitrate was reduced, indicating the production of
hydroxide. This resulted in the decrease in iron concentration.

180
Figure 5.6. Iron concentration in nitrate reduction of 10 ppm nitrate-N under aerobic
conditions (0.150 g of materials, 25.0 mL of solution).
Interestingly, the levels of soluble iron after reducing 50 ppm nitrate-N were less than those
observed after reducing 10 ppm nitrate-N. After 5 minutes, iron concentrations were less than
0.5 ppm (Figure 5.7) and after 30 minutes, iron concentrations were around the detection
limit of the AAS (0.09 pm) for all types of doped materials. For nZVI@MisiCFeOOH, the iron
level was slightly higher at 0.2 ppm.
Figure 5.7. Iron concentration in nitrate reduction of 50 ppm nitrate-N under aerobic
conditions (0.150 g of materials, 25.0 mL of solution).
0
0.5
1
1.5
2
0 5 10 15 20 25 30 35
Iro
n (
pp
m)
un
der
aer
ob
ic c
on
dit
ion
s
Time (m)
5%Ni-nZVI@MisiCFeOOH-MB1 5%Cu-nZVI@MisiCFeOOH-MB1
0.5%Pd-5%Cu-nZVI@MisiCFeOOH-MC1 nZVI@MisiCFeOOH
0
0.5
1
1.5
2
0 5 10 15 20 25 30 35Iro
n (
pp
m)
un
der
aer
ob
ic c
on
dit
ion
s
Time (m)5%Ni-nZVI@MisiCFeOOH-MB1 5%Cu-nZVI@MisiCFeOOH-MB1
0.5%Pd-5%Cu-nZVI@MisiCFeOOH-MC1 nZVI@MisiCFeOOH

181
The iron generation is inconsistent with a study in which nitrate was reduced using Ni-
nZVI@zeolite with the mass ratio of Ni:Fe:zeolite at 1:10:20 reported by He al et..193 In the
supporting information of this study, iron concentrations increased with increasing nitrate
concentrations and were significantly higher than those observed in our research. The molar
ratio of Fe to nitrate was 2.5 and the initial pH was 5 without pH control in the presence of
phosphate-P 10 ppm. In this reported system, after 30 minutes, iron levels increased from 8
ppm to more than 20 ppm with increasing nitrate-N concentration from 20 ppm to 100 ppm
but after 180 minutes, iron levels were around 2 ppm. They explained that the higher the
nitrate concentration, the higher the concentration of soluble iron. However, they also
postulated that the generation of soluble iron was faster than the formation of Fe(OH)2 and
Fe(OH)3, thus more soluble iron were found.
According to Cheng et al., the solution pH was 8.8 after reduction of 175 ppm of nitrate-N
using ZVI in pH neither control nor buffer. At this pH, Fe(OH)3 and a complex of Fe(II), Fe(III)
(from iron corrosion) with hydroxide was formed.45 In our studies, after nitrate reduction, the
concentrations of the metal ions were low. A possible reason for this phenomenon is the
removal of insoluble by-products. The reduction of nitrate generates hydroxide ions, leading
to an increase in the solution pH. The high pH results in the precipitation of oxides/hydroxides
of iron, nickel, and copper.143 Therefore, as a consequence of no pH control, the production
of hydroxide ions is the key requirement for the removal of metal ions as the by-products.
In our study, the reasons for the lower iron concentration in the reduction of 50 ppm nitrate-
N are unclear. During the reactions, the difference in the pH of solutions between 10 ppm
and 50 ppm studies are insignificant. Unfortunately, pH values are not consistent in different
batches of experiments, ranging from 8.9 to 9.5 after 30 minutes. However, a possible reason
for lower ion concentrations is due to the corrosion of nanoparticles with water after finishing
nitrate reduction. For the 10 ppm nitrate-N samples, the iron levels continued to increase
after all nitrate was removed from solution. Therefore, despite no nitrate reduction, iron still
reacted with water to form soluble iron that was observed. This theory is supported when the
corrosion of these materials with deionised water was examined. After 30 minutes, soluble
iron concentrations were more than 7 ppm using doped materials (Figure 5.8). Additionally,
in the reaction of 10 ppm nitrate-N, after 30 minutes, the iron concentration was lower using

182
nZVI@MisiCFeOOH than using doped materials potentially due to the gradual nitrate
reduction over the course of 30 minutes.
Figure 5.8. Corrosion of materials under aerobic conditions (0.150 g of materials, 25.0 mL of
deionised water).
Soluble nickel was also observed during the reaction between Ni-doped material and nitrate
when both 10 ppm and 50 ppm nitrate-N were used. In 10 ppm nitrate reduction, nickel level
reached a maximum of 0.1 ppm after 30 minutes. In 50 ppm nitrate reduction, nickel levels
were around the detection limit of the AAS (0.04 ppm) during the course of 30 minutes. In
nitrate reduction using Cu-doped material, soluble copper concentrations were below the
detection limit of the AAS (0.66 ppm). Therefore, the leaching of nickel was insignificant while
the leaching of Cu needs further examination using instruments with higher sensitivity.
5.5. Effect of coexisting anions on nitrate reduction
The reactivity of doped and non-doped materials towards nitrate reduction in the presence
of common ions was examined. Three representative doped materials, 5%Ni-
nZVI@MisiCFeOOH-MB1, 5%Cu-nZVI@MisiCFeOOH-MB1, and 0.5%Pd-5%Cu-
nZVI@MisiCFeOOH-MC1 and nZVI@MisiCFeOOH as a control material were used. Ions,
chloride (100 ppm), sulfate-S (100ppm), carbonate-C (20 ppm), and phosphate-P (10 ppm),
were used to examine their influence on nitrate reduction of reducing 10 ppm nitrate-N. The
molar ratio of Fe to nitrate was 15:1 and the reactions were conducted under both anaerobic
and aerobic conditions.
-2
0
2
4
6
8
10
12
14
0 5 10 15 20 25 30 35
Iro
n (
pp
m)
un
der
aer
ob
ic c
on
dit
ion
s
Time (m)5%Ni-nZVI@MisiCFeOOH-MB1 5%Cu-nZVI@MisiCFeOOH-MB1
0.5%Pd-5%Cu-nZVI@MisiCFeOOH-MC1 nZVI@MisiCFeOOH

183
5.5.1. Effect of chloride on nitrate reduction
Chloride is one of the most common inorganic anions in waters and wastewaters. It is non-
toxic to aquatic life. According to EPA, the criterion of continuous chloride concentration is
up to 230 ppm in freshwater and unlimited in saltwater.259 In chemistry, it is assumed to be
an inert anion in that it is unable to be reduced by Fe(0).150 However, chloride could affect
contaminant removal in the adsorbing step. Although there have been some studies on
nitrate reduction, most of them have focused on the importance of H+ in changing the
solution pH.43, 234, 239 Chloride was introduced to solution by adding HCl as a pH controllable
agent. In Hwang et al.’s study, the effect of chloride on nitrate reduction was examined;
however, they investigated simple nZVI.260 In our study, we used chloride in the form of KCl
to examine if this anion could affect nitrate reduction using doped and non-doped
nZVI@MisiCFeOOH.
Chloride did not inhibit nitrate reduction when either Cu-doped or Pd-Cu-doped material was
used under both anaerobic and aerobic conditions (Figure 5.9 and 5.10). After 5 minutes,
nitrate-N concentration was below the detection limit of the IC (0.06 ppm) using either Cu-
doped or Pd-Cu-doped. In contrast, chloride inhibited nitrate reduction using Ni-doped
material. After 5 minutes, nitrate-N levels were 5.7 pm and 3.2 ppm either under anaerobic
conditions or aerobic conditions, respectively. These nitrate levels were significantly higher
than when in the absence of chloride. However, after 30 minutes, nitrate-N concentrations
were below the detection limit for all types of doped materials.

184
Figure 5.9. Effect of chloride on nitrate reduction and nitrate reduction in the absence of ions
under anaerobic conditions (0.150 g of material, 25.0 mL of a solution containing 10 ppm
nitrate-N and 100 ppm chloride).
Figure 5.10. Effect of chloride on nitrate reduction and nitrate reduction in the absence of
ions under aerobic conditions (0.150 g of material, 25.0 mL of a solution containing 10 ppm
nitrate-N and 100 ppm chloride).
Nitrite levels after 5 minutes were slightly higher under anaerobic conditions compared to
aerobic conditions. After 30 minutes, no nitrite was detected for all types of materials under
either condition. The nitrite levels were insignificantly different from those observed when
0
2
4
6
8
10
12
14
0 5 10 15 20 25 30 35
Nit
rate
-N (
pp
m)
Time (m)
presence of chloride
5%Ni-nZVI@MisiCFeOOH-MB15%[email protected]%Pd-5%Cu-nZVI@MisiCFeOOH-MC1nZVI@MisiCFeOOH
0
2
4
6
8
10
0 5 10 15 20 25 30 35
Nit
rate
-N (
pp
m)
Time (m)
nitrate only
5%Ni-nZVI@MisiCFeOOH-MB15%[email protected]%Pd-5%Cu-nZVI@MisiCFeOOH-MC1nZVI@MisiCFeOOH
0
2
4
6
8
10
12
0 5 10 15 20 25 30 35
Nit
rate
-N (
pp
m)
Time (m)
presence of chloride
5%Ni-nZVI@MisiCFeOOH-MB15%[email protected]%Pd-5%Cu-nZVI@MisiCFeOOH-MC1nZVI@MisiCFeOOH
0
2
4
6
8
10
0 5 10 15 20 25 30 35
Nit
rate
-N (
pp
m)
Time (m)
5%Ni-nZVI@MisiCFeOOH MB15%Cu-nZVI@MisiCFeOOH MB10.5%Pd-5%Cu-nZVI@MisiCFeOOH MB1nZVI@MisiCFeOOH
nitrate only

185
chloride is absent. Thus, chloride did not inhibit nitrate reduction using doped materials
except for the Ni-doped system with minimal inhibition.
In contrast to the doped systems, the non-doped system was significantly inhibited by
chloride, with no nitrate removed after 5 minutes and the nitrate-N levels at 3.7 ppm after 30
minutes under both anaerobic and aerobic conditions, higher than the 2.6 ppm and 1.5 ppm
observed in the absence of chloride. The effect is consistent with Hwang et al.’s study in which
nZVI was used to remove nitrate.260 The initial nitrate-N was 100 ppm, the molar ratio of Fe
to nitrate was 3.1:1 and an initial pH of the unbuffered solution was 7. In this reported system,
nitrate removal decreased in the presence of 1,800 ppm chloride. Hwang et al.’s explained
that at low concentration of chloride, nZVI was completely oxidised to form magnetite as the
main product of nZVI corrosion. In contrast, at a high concentration of chloride, amorphous
iron hydroxide was observed. Therefore, chloride could be a competitive anion with nitrate
onto the surface of nZVI particles.
In our doped materials, iron nanoparticles are protected by an outer layer which is potentially
a combination of either Ni(0) and iron-nickel oxides in Ni-doped material or Cu(0) and copper
oxides in Cu-doped material (Section 3.3 and 3.4). This layer limits the corrosion of nZVI.
Additionally, dopant metals function as the catalyst, enhancing electron transfer from Fe core
to nitrate. As such, the reactivity of the doped materials in nitrate reduction was maintained
in the presence of chloride (100 ppm).
5.5.2. Effect of sulfate on nitrate reduction
Similar to chloride, sulfate is considered to be an inert anion because it is unable to be reduced
by Fe(0).150 However, sulfate is able to be a ligand and form complexes with iron,48 which can
prevent contaminants from adsorbing on the surface of composites. Typically, sulfate is
introduced to nitrate reaction when H2SO4 was added as a pH controllable agent. In Liou et
al.’s study, sulfate in Na2SO4 inhibited nitrate reduction using nZVI and Cu-nZVI.252 In this
study, we investigated the reactivity of materials in removing nitrate in the presence of sulfate
using K2SO4.
The removal of 10 ppm nitrate-N in the presence of sulfate was rapid when any of the doped
nZVI@MisiCFeOOH materials were used under both anaerobic and aerobic conditions (Figure
5.11 and 5.12). The levels of nitrate and nitrite when sulfate was present were not significantly

186
different from those observed when sulfate is absent. Therefore, sulfate did not inhibit the
reactivity of doped nZVI@MisiCFeOOH materials. This finding is inconsistent with a study in
which nitrate was removed by Cu-nZVI in the presence of sulfate.252 When the initial nitrate-
N concentration was 20 ppm and the molar ratio of Fe to nitrate was 4.7:1, nitrate removal
was slower and more nitrite accumulated in the presence of 3.2 ppm sulfate-S. The lack of
the inhibition of sulfate using our doped materials could be due to the high reactivity of doped
nZVI nanoparticles when these particles were adsorbed on the surface of Misi and higher
Fe:nitrate ratio.
Figure 5.11. Effect of sulfate on nitrate reduction and nitrate reduction in the absence of ions
under anaerobic conditions (0.150 g of material, 25.0 mL of a solution containing 10 ppm
nitrate-N and 100 ppm sulfate-S).
0
2
4
6
8
10
12
0 10 20 30
Nit
rate
-N (
pp
m)
Time (m)
presence of sulfate
5%Ni-nZVI@MisiCFeOOH-MB15%[email protected]%Pd-5%Cu-nZVI@MisiCFeOOH-MC1nZVI@MisiCFeOOH
0
2
4
6
8
10
0 5 10 15 20 25 30 35
Nit
rate
-N (
pp
m)
Time (m)
nitrate only
5%Ni-nZVI@MisiCFeOOH-MB15%[email protected]%Pd-5%Cu-nZVI@MisiCFeOOH-MC1nZVI@MisiCFeOOH

187
Figure 5.12. Effect of sulfate on nitrate reduction and nitrate reduction in the absence of ions
under aerobic conditions (0.150 g of material, 25.0 mL of a solution containing 10 ppm
nitrate-N and 100 ppm sulfate-S).
In contrast, sulfate affected nitrate reduction using nZVI@MisiCFeOOH (Figure 5.11 and 5.12).
After 5 minutes, nitrate-N concentrations were greater than 9.3 ppm under either condition.
After 30 minutes, nitrate-N levels were 6.7 ppm and 5.9 ppm under either anaerobic or
aerobic conditions, significantly higher than the 2.6 ppm and 1.5 ppm observed in the absence
of sulfate. The deactivation of sulfate on nZVI@MisiCFeOOH is consistent with that found by
Liou et al..252 In their study, the initial nitrate-N concentration was 20 ppm and the molar ratio
of Fe to nitrate was 4.7:1. Using this system, nitrate removal was slower in the presence of
sulfate-S (3.2 ppm). The decrease in nitrate conversion in the presence of sulfate can be
explained by the adsorption of sulfate on the surface layer FeOOH261 and the formation of
iron-sulfate complexes.234 These substances may block active Fe(0) sites, preventing electron
transfer from Fe(0) to nitrate.
In summary, similar to chloride, sulfate is a friendly anion in nitrate reduction when doped
nZVI@MisiCFeOOH was used. It did not influence the reactivity of doped nZVI@MisiCFeOOH
materials due to the protection of an outer layer (Ni(0) and iron-nickel oxides in Ni-doped
material or Cu(0) and copper oxides in Cu-doped material) and the catalytic role of the
dopants. In contrast, sulfate lowered the reactivity of nZVI@MisiCFeOOH. Thus, doped
materials are promising materials for nitrate reduction in the presence of sulfate under both
anaerobic and aerobic conditions.
0
2
4
6
8
10
0 10 20 30
Nit
rate
-N (
pp
m)
Time (m)
presence of sulfate
5%Ni-nZVI@MisiCFeOOH-MB1
5%Cu-nZVI@MisiCFeOOH-MB1
0.5%Pd-5%Cu-nZVI@MisiCFeOOH-MC1nZVI@MisiCFeOOH
0
2
4
6
8
10
12
0 5 10 15 20 25 30 35
Nit
rate
-N (
pp
m)
Time (m)
5%Ni-nZVI@MisiCFeOOH MB15%Cu-nZVI@MisiCFeOOH MB10.5%Pd-5%Cu-nZVI@MisiCFeOOH MB1nZVI@MisiCFeOOH
nitrate only

188
5.5.3. Effect of carbonate on nitrate reduction
Natural waters contain a variety of weak acid and bases that are the main sources of buffering.
One of them is a carbon source in the form of carbonic, bicarbonate, and carbonate that
always occurs together in equilibrium. Both carbonate and bicarbonate are considered to be
inhibitory ions towards contaminant removal using nZVI composites. For example,
bicarbonate affects the reactivity of nZVI in removing TCE150 or uranium ions.262 Carbonate
also inhibited the removal of MO when Pd-nZVI@bentonite was used.191 In another study,
both bicarbonate and carbonate decreased Cr(VI) removal when Ni-nZVI was used, with
carbonate having more significant inhibition than bicarbonate.263 In a study on the effect of
carbonate on nitrate reduction, carbonate interfered with the reactivity of both nZVI and Cu-
nZVI.252 In our study, the influence of carbonate in K2CO3 on nitrate reduction was examined
to determine whether carbonate affects doped and non-doped nZVI@Misi materials.
5.5.3.1. Effect of carbonate on nitrate reduction in anaerobic conditions
Carbonate affected the reactivity of all doped nZVI@Misi materials examined under
anaerobic conditions. After 5 minutes, nitrate-N concentrations were significantly higher in
the presence of carbonate than in the absence of carbonate in anaerobic conditions (Figure
5.13). After 30 minutes, when 5%Ni-nZVI@MisiCFeOOH-MB1 was used, nitrate-N
concentration was higher than when carbonate was absent. In contrast, when either Cu-
doped or Pd-Cu-doped nZVI@MisiCFeOOH was used, the nitrate concentrations were similar
to those found in the absence of carbonate. Nitrite build-up was also monitored in these
reactions. The nitrite levels were relatively similar in the presence or absence of carbonate
when any of doped materials were used.

189
Figure 5.13. Effect of carbonate on nitrate reduction and nitrate reduction in the absence of
ions under anaerobic conditions (0.150 g of material, 25.0 mL of a solution containing 10
ppm nitrate-N and 20 ppm carbonate-C).
In contrast, carbonate deactivated nZVI@MisiCFeOOH in removing nitrate under anaerobic
conditions. After 30 minutes, the nitrate-N concentrations were unchanged compared to the
initial concentration of 10 ppm nitrate-N. At some points over the course of the reaction, the
nitrate-N levels were slightly greater than 10 ppm. This can be explained by the random errors
that have made in the preparation step of the initial solutions. Additionally, the eluent for
running the IC is a mixture of carbonate and bicarbonate. Thus, this may introduce uncertainty
in nitrate concentrations.
Our results of the effect of carbonate are consistent with those found by Liou et al..252 In their
study, the effect of carbonate on nitrate reduction using nZVI or Cu-nZVI was examined. The
initial nitrate-N concentration was 20 ppm and the initial molar ratio of Fe to nitrate was 4.7:1.
In this reported system, the nitrate reduction was slower in the presence of carbonate (1.2
ppm).
5.5.3.2. Effect of carbonate on nitrate reduction in aerobic conditions
Carbonate also affected the reactivity of doped nZVI@Misi materials under aerobic conditions
although the effect was not as strong as under anaerobic. For instance, after 5 minutes,
nitrate levels were significantly higher than in the absence of added carbonate (Figure 5.14).
However, after 30 minutes, the nitrate concentrations were similar to those found in the
0
2
4
6
8
10
12
14
0 5 10 15 20 25 30 35
Nit
rate
-N (
pp
m)
Time (m)
presence of carbonate
5%Ni-nZVI@MisiCFeOOH-MB15%[email protected]%Pd-5%Cu-nZVI@MisiCFeOOH-MC1nZVI@MisiCFeOOH
0
2
4
6
8
10
0 5 10 15 20 25 30 35
Nit
rate
-N (
pp
m)
Time (m)
nitrate only
5%Ni-nZVI@MisiCFeOOH-MB15%[email protected]%Pd-5%Cu-nZVI@MisiCFeOOH-MC1nZVI@MisiCFeOOH

190
absence of carbonate. Nitrite build-up was dependent upon the nature of materials. After 5
minutes, when either Ni-doped or Pd-Cu-doped material was used, nitrite concentrations
were similar to those observed in the absence of carbonate. In contrast, when Cu-doped
material was used, the nitrite level was significantly higher than in the absence of carbonate.
However, after 30 minutes, nitrite levels were slightly higher than when carbonate was absent
for all types of doped materials.
Figure 5.14. Effect of carbonate on nitrate reduction and nitrate reduction in the absence of
ions under aerobic conditions (0.150 g of material, 25.0 mL of a solution containing 10 ppm
nitrate-N and 20 ppm carbonate-C).
In contrast to doped materials but similar to under anaerobic conditions, carbonate
deactivated nZVI@MisiCFeOOH in removing nitrate. After 30 minutes, the nitrate-N
concentrations remained at 10 ppm. Therefore, nZVI@MisiCFeOOH should not be used in
nitrate removal in the presence of carbonate regardless of either condition.
The inhibition of carbonate on nitrate reduction could be due to the corrosion of iron with a
carbonate solution, resulting in the formation of complexes and precipitates.191 For example,
carbonate may generate precipitate FeCO3150 or both FeCO3 and Fe(OH)2 on the surface of
particles.252 In addition, carbonate can form a combination of magnetite/maghemite and
carbonate green rust (Fe(II)4Fe(III)
2(OH)12.CO3).262 The production of these substances onto the
surface of particles prevents the electron transfer from Fe(0) core to nitrate using doped
materials and deactivates using non-doped nZVI@MisiCFeOOH. Moreover, carbonate with
0
2
4
6
8
10
12
14
0 10 20 30
Nit
rate
-N (
pp
m)
Time(m)
presence of carbonate
5%Ni-nZVI@MisiCFeOOH-MB15%[email protected]%Pd-5%Cu-nZVI@MisiCFeOOH-MC1nZVI@MisiCFeOOH
0
2
4
6
8
10
12
0 5 10 15 20 25 30 35
Nit
rate
-N (
pp
m)
Time (m)
5%Ni-nZVI@MisiCFeOOH MB15%Cu-nZVI@MisiCFeOOH MB10.5%Pd-5%Cu-nZVI@MisiCFeOOH MB1nZVI@MisiCFeOOH
nitrate only

191
negatively charged can adsorb on the surface of nZVI particles, which competes with nitrate.
As a result, a decrease in nitrate reduction was observed.
In summary, carbonate inhibits nitrate reduction using doped materials. The inhibition is
under aerobic conditions less significant than under anaerobic conditions. As such, doped
materials are able to remove nitrate from “real” waters in the presence of carbonate,
especially under aerobic conditions.
5.5.4. Effect of phosphate on nitrate reduction
Phosphate has been reported as an inhibitory ion towards Fe reactivity. At pH less than 8,
phosphate combines with positively charged components on the surface of Fe to form
complexes.48 In several studies, phosphate affects the removal of contaminants. For example,
hydrogen phosphate (HPO42-) decreased the removal of TCE when nZVI was used.150
Dihydrogen phosphate (H2PO4-) inhibited the removal of tetracycline when nZVI on
polyvinylpyrrolidone was used.264 Phosphate (PO43-) also affected nitrate reduction when nZVI
or Cu-nZVI was used and it had the most significant passivation compared to sulfate or
carbonate.252 In this study, the effect of phosphate (KH2PO4) on nitrate reduction was
examined to investigate if phosphate could inhibit doped and non-doped nZVI@Misi.
5.5.4.1. Effect of phosphate on nitrate reduction in anaerobic conditions
Phosphate passivated doped nZVI@MisiCFeOOH in reducing nitrate under anaerobic
conditions. Both nitrate and nitrite concentrations were higher in the presence of phosphate
(Figure 5.15). These differences were significant when all types of doped materials were used.
Of these materials examined, Cu-doped reduced nitrate with the slowest rate while both Ni-
doped and Pd-Cu-doped materials had the same nitrate conversion. In contrast, phosphate
deactivated nitrate reduction when nZVI@MisiCFeOOH was used. The nitrate level not only
did not decrease but also was higher than the initial concentration over the course of 30
minutes. The reason for this result was not evident; however, this could be due to the impact
of phosphate on the determination of nitrate using the IC, leading to positive errors in nitrate
concentrations.

192
Figure 5.15. Effect of phosphate on nitrate reduction and nitrate reduction in the absence of
ions under anaerobic conditions (0.150 g of material, 25.0 mL of a solution containing 10
ppm nitrate-N and 10 ppm phosphate-P).
The inhibition of phosphate under anaerobic conditions is consistent with some studies in
which the influence of phosphate on nitrate reduction was examined. Liou et al. investigated
the effect of phosphate (PO43-) in nitrate reduction using Cu-nZVI or [email protected] The
initial nitrate-N concentration was 20 ppm and the molar ratio of Fe to nitrate was 4.7:1. In
this reported system, nitrate removal was slower in the presence of PO43- at 3.1 ppm
phosphate-P. In He et al.’s study, phosphate inhibited nitrate removal using supported Ni-
nZVI@zeolite (the mass ratio is 1:10:20).193 The nitrate-N concentration was 20 ppm, the
molar ratio of Fe to nitrate was 6.3:1 and the solution pH was 5. Nitrate reduction was
inhibited in the presence of 5 ppm phosphate-P.
5.5.4.2. Effect of phosphate on nitrate reduction in aerobic conditions
Phosphate also affected the reactivity of doped nZVI@Misi materials under aerobic
conditions although the effect was not as strong as under anaerobic conditions (Figure 5.16).
Additionally, nitrite build-up was higher in the presence of phosphate, but the difference was
insignificant. The less significant influence of phosphate under aerobic conditions leaves open
the possibility of using these doped materials to remove nitrate from “real” waters in the
presence of phosphate. Similar to those under anaerobic conditions, Cu-doped materials had
the highest level of inhibition.
0
2
4
6
8
10
12
14
0 5 10 15 20 25 30 35
Nit
rate
-N (
pp
m)
Time (m)
presence of phosphate
5%Ni-nZVI@MisiCFeOOH-MB15%[email protected]%Pd-5%Cu-nZVI@MisiCFeOOH-MC1nZVI@MisiCFeOOH
0
2
4
6
8
10
0 5 10 15 20 25 30 35
Nit
rate
-N (
pp
m)
Time (m)
nitrate only
5%Ni-nZVI@MisiCFeOOH-MB15%[email protected]%Pd-5%Cu-nZVI@MisiCFeOOH-MC1nZVI@MisiCFeOOH

193
Figure 5.16. Effect of phosphate on nitrate reduction and nitrate reduction in the absence of
ions under aerobic conditions (0.150 g of material, 25.0 mL of a solution containing 10 ppm
nitrate-N and 10 ppm phosphate-P).
Interestingly, all materials, 5%Ni-nZVI@MisiCFeOOH-MB1, 5%Cu-nZVI@MisiCFeOOH-MB1,
0.5%Pd-5%Cu-nZVI@MisiCFeOOH-MC1, and nZVI@MisiCFeOOH, had high capacity in
removing phosphate in the presence of nitrate under both anaerobic and aerobic conditions
(Table 5.1). Under anaerobic conditions, after 5 minutes, phosphate-P levels decreased from
10 ppm to less than 2 ppm and after 30 minutes, phosphate-P levels were less than 0.5 ppm
(95% phosphate removal). Phosphate removal was faster under aerobic conditions. After 5
minutes, phosphate-P levels were less than 0.2 ppm (98% phosphate removal). Thereby,
supported doped nZVI on MisiCFeOOH can simultaneously remove nitrate and phosphate
effectively. These findings are consistent with a previous investigation on simultaneous
removal of nitrate and phosphate using [email protected]
0
2
4
6
8
10
12
14
0 5 10 15 20 25 30 35
Nit
rate
-N (
pp
m)
Time (m)
presence of phosphate
5%Ni-nZVI@MisiCFeOOH-MB15%[email protected]%Pd-5%Cu-nZVI@MisiCFeOOH-MC1nZVI@MisiCFeOOH
0
2
4
6
8
10
12
0 5 10 15 20 25 30 35
Nit
rate
-N (
pp
m)
Time (m)
5%Ni-nZVI@MisiCFeOOH MB15%Cu-nZVI@MisiCFeOOH MB10.5%Pd-5%Cu-nZVI@MisiCFeOOH MB1nZVI@MisiCFeOOH
nitrate only

194
Table 5.1. Phosphate concentrations during nitrate reduction in the presence of phosphate
(10 ppm as the initial phosphate-P).
Phosphate-P (ppm)/ Time 5 minutes 15 minutes 30 minutes
Conditions N2 Air N2 Air N2 Air
5%Ni-nZVI@MisiCFeOOH-MB1 0.98 0.05 0.87 0.08 0.23 0.23
5%Cu-nZVI@MisiCFeOOH-MB1 0.67 0.12 0.30 0.07 0.31 0.15
0.5%Pd-5%Cu-nZVI@MisiCFeOOH-MC1 0.10 0.09 0.17 0.10 0.19 0.10
nZVI@MisiCFeOOH 2.02 0.18 0.96 0.07 0.54 0.04
MisiCFeOOH 2.06 0.79 0.45
MisiC 10.05 9.86 9.71
N2: anaerobic conditions; Air: aerobic conditions
The inhibition of phosphate on nitrate reduction as well as the removal of phosphate by our
materials can be explained via three reasons. Firstly, the initial pH of the solution containing
nitrate and phosphate (H2PO4-) was less than 6.3 at which phosphate may directly adsorb on
the positively charged surface of nZVI.48, 264 Secondly, phosphate may form complexes with
products from iron corrosion, for example, the complexes of phosphate on iron oxides,265 the
complexes of phosphate and Fe(II)/Fe(III) on the surface of materials252 or iron-phosphate
(vivianite-Fe3(PO4)2.8H2O).150 Finally, during the nitrate reduction, hydroxide is produced,
therefore, phosphate may be removed from the solutions by co-precipitation.193 As such,
these forms of phosphate diminish the active sites for the adsorption and then removal of
contaminants.
5.5.5. Simultaneous effect of coexisting anions on nitrate reduction
In the previous sections, the effect of individual ions was examined. Natural water typically
contains all these ions. The effect on nitrate reduction may be accumulative, or independent
in the presence of all ions. There have been several studies on the effect of anions on the
reactivity of iron materials. However, typically, contaminants were examined in the presence

195
of individual ion. In this study, the simultaneous effect of all four coexisting ions on nitrate
reduction was examined.
5.5.5.1. Simultaneous effect of coexisting anions on nitrate reduction under anaerobic
conditions
The presence of these four ions affected nitrate reduction using doped materials under
anaerobic conditions. Nitrate reduction was significantly slower than that observed in both
the absence of ions and the presence of individual ion (Figure 5.17). The positive effect of Pd
in trimetallic nZVI@MisiCFeOOH was observed. Among doped materials, 5%Ni-
nZVI@MisiCFeOOH-MB1 reduced nitrate fastest (65% nitrate conversion) with the lowest
nitrite accumulation. As such, Ni-doped material was selected as the most effective material
for nitrate removal in the presence of chloride, sulfate, carbonate, and phosphate under
anaerobic conditions. In contrast, the presence of four coexisting ions deactivated
nZVI@MisiCFeOOH. No nitrate was reduced over the course of 30 minutes.
Figure 5.17. Effect of coexisting anions on nitrate reduction and nitrate reduction in the
absence of ions under anaerobic conditions (0.150 g of material, 25.0 mL of a solution
containing 10 ppm nitrate-N, 100 ppm chloride, 100 ppm sulfate-S, 20 ppm carbonate-C and
10 ppm phosphate-P).
5.5.5.2. Simultaneous effect of coexisting anions on nitrate reduction under aerobic conditions
These ions simultaneously affected nitrate reduction using doped materials under aerobic
conditions, but the effect was not as strong as under anaerobic conditions. Nitrate reduction
0
2
4
6
8
10
12
14
0 5 10 15 20 25 30 35
Nit
rate
-N (
pp
m)
Time (m)
presence of coexisting anions
5%Ni-nZVI@MisiCFeOOH-MB15%[email protected]%Pd-5%Cu-nZVI@MisiCFeOOH-MC1nZVI@MisiCFeOOH
0
2
4
6
8
10
0 5 10 15 20 25 30 35
Nit
rate
-N (
pp
m)
Time (m)
nitrate only
5%Ni-nZVI@MisiCFeOOH-MB15%[email protected]%Pd-5%Cu-nZVI@MisiCFeOOH-MC1nZVI@MisiCFeOOH

196
was significantly slower than that observed in both the absence of ions and the presence of
individual ion (Figure 5.18). Although the nitrate reduction was slightly slower using Ni-doped
material (75% nitrate conversion) than that using Pd-Cu-doped systems (84% nitrate
conversion), no nitrite was detected using Ni-doped system. In contrast, but similar to the
results under anaerobic conditions, four anions deactivated nZVI@MisiCFeOOH. No nitrate
was reduced over the course of 30 minutes.
Figure 5.18. Effect of coexisting anions on nitrate reduction and nitrate reduction in the
absence of ions under aerobic conditions (0.150 g of material, 25.0 mL of a solution
containing 10 ppm nitrate-N, 100 ppm chloride, 100 ppm sulfate-S, 20 ppm carbonate-C and
10 ppm phosphate-P).
Doped nZVI@MisiCFeOOH and non-doped nZVI@MisiCFeOOH materials had the capacity of
removing phosphate in the presence of nitrate-N (10 ppm), chloride (100 ppm), sulfate-S (100
ppm), and carbonate-C (20 ppm) under both anaerobic and aerobic conditions (Table 5.2). In
anaerobic, after 30 minutes, phosphate-P levels were approximately 2 ppm (80% of
phosphate removal). In aerobic conditions, phosphate was removed faster. After 30 minutes,
phosphate-P were below 0.5 ppm (95% phosphate removal).
0
2
4
6
8
10
12
0 5 10 15 20 25 30 35
Nit
rate
-N (
pp
m)
Time (m)
presence of coexisting anions
5%Ni-nZVI@MisiCFeOOH MB15%Cu-nZVI@MisiCFeOOH MB10.5%Pd-5%Cu-nZVI@MisiCFeOOH MB1nZVI@MisiCFeOOH
0
2
4
6
8
10
12
0 5 10 15 20 25 30 35
Nit
rate
-N (
pp
m)
Time (m)
5%Ni-nZVI@MisiCFeOOH MB15%Cu-nZVI@MisiCFeOOH MB10.5%Pd-5%Cu-nZVI@MisiCFeOOH MB1nZVI@MisiCFeOOH
nitrate only

197
Table 5.2. Phosphate concentrations during nitrate reduction in the presence of coexisting
anions (10 ppm as the initial phosphate-P).
Phosphate-P (ppm)/ Time 5 minutes 15 minutes 30 minutes
Conditions N2 Air N2 Air N2 Air
5%Ni-nZVI@MisiCFeOOH-MB1 1.94 1.14 1.47 0.54 1.56 0.52
5%Cu-nZVI@MisiCFeOOH-MB1 4.28 1.95 2.35 0.40 1.89 0.42
0.5%Pd-5%Cu-nZVI@MisiCFeOOH-MC1 1.96 0.09 1.19 0.10 1.12 0.10
nZVI@MisiCFeOOH 4.60 3.94 3.14 0.66 2.42 0.43
N2: anaerobic conditions; Air: aerobic conditions
In nitrate reduction without other ions, the reactivity of doped materials in removing 10 ppm
nitrate-N was not distinguishable due to the very fast reaction. However, with higher nitrate-
N concentrations (50 ppm), Cu-doped material converted nitrate to nitrite faster than the
other materials. The reduction produced Fe(II) that could possibly combine with phosphate
to form solid substances including Fe3(PO4)2 in anaerobic conditions or FePO4 in aerobic
conditions. These substances might deposit on the surface of nZVI fastest, leading to the
prevention of electron transfer from the Fe core to nitrate.
In summary, all doped materials had high reactivity in co-decontamination of nitrate and
phosphate when coexisting anions are present, especially in aerobic conditions. Of these,
5%Ni-nZVI@MisiCFeOOH-MB1 not only reduced contaminants effectively but also eliminated
nitrite build-up. As such, it will be a promising material to apply in natural waters.
5.6. Conclusion
Doped materials, including Ni-doped, Cu-doped, and Pd-Cu-doped on Misi, had high reactivity
towards nitrate reduction under aerobic conditions. Although these materials were affected
by the presence of oxygen, the inhibition was minimal. In addition, during reactions, the
generation of soluble iron and dopant metals was insignificant. Interestingly, both chloride
and sulfate did not interfere with nitrate reduction. In contrast, carbonate and phosphate

198
were inhibitory coexisting ions towards nitrate reduction. This could be due to the
competition and formation of precipitates that prevent the electron transfer. The inhibition
was less under aerobic conditions than anaerobic conditions. The reason for this
phenomenon was not fully understood. However, it can be partly explained by the formation
of radical ions, similar to that when nZVI@MisiCFeOOH was exposed to oxygen (eq.5.1 - 5.4).
Compared to previously reported materials, our doped materials were passivated less
significantly when they were exposed to aerobic conditions. The reactivity of our doped
materials maintained in the presence of chloride and sulfate. In addition, although
interference was observed with both carbonate and phosphate, the interference of these ions
only occurs at concentrations that are typically not observed in ecosystems. Encouragingly,
the concentrations in which we did observe an inhibitory effect were significantly higher than
that observed with other reported systems. For instance, both nZVI and Cu-nZVI were
inhibited when they were used to remove nitrate in the presence of either carbonate-C (1.2
ppm) or phosphate-P (3.1 ppm).252 As such, these doped material in this current study,
especially, 5%Ni-nZVI@MisiCFeOOH is the ideal material to apply to “real” environments.

199
6. Nitrate reduction from lake water
6.1. Introduction
In this chapter, the investigations of doped nZVI@Misi materials towards nitrate reduction
from lake water are discussed. This includes both the reactivity of doped nZVI@Misi and the
generation of soluble metal by-products. The reactivity of these materials was examined
through nitrate conversion and nitrite accumulation.
Natural waters consist of numerous elements, including not only contaminants that need
removing but also common ions that often inhibit the materials designed to remove
contaminants. For example, phosphate can influence nZVI when nZVI was used for nitrate
reduction.48 Carbonate passivates both nZVI and Cu-nZVI when these materials were used to
reduce nitrate.252 Humic acid, a common natural organic substance, can activate and
passivate the nitrate reduction using nZVI, depending on its state266 or its concentration.267
When humic acid is in bulk phase, it serves as an electron transfer mediator, consequently,
accelerating nitrate reduction. However, when humic acid absorbs on the surface of nZVI, it
acts as an inhibitory factor, decreasing nitrate reduction. In contrast to inhibitory ions, several
ions are promoting factors that speed up nitrate removal. Metal ions such as Cd(II), Cu(II), and
Pb(II) were useful in enhancing nitrate reduction when either nZVI,251 Ni-nZVI@kaoline,199 or
Ni-nZVI@kaolinite192 was used, respectively. Finally, some major ions do not significantly
interact with the materials; for instance, Na(I) had a slightly inhibitory effect towards nitrate
reduction when ZVI was used in the presence of CO2.268 Similarly, chloride also did not
significantly affect nitrate reduction when nZVI@MisiCFeOOH was used.1
Due to the variety of components and their interactions, natural waters are the best place to
evaluate the effectiveness of materials in removing contaminant or co-contaminants. In this
research, the reactivity of our most promising materials towards nitrate reduction from Lake
Horowhenua (New Zealand) was examined. Firstly, the reactivity of doped materials towards
nitrate reduction was screened using samples collected on April 27, 2017. The investigations
included nitrate reduction from lake water and lake water that was spiked with 10 ppm
nitrate-N with and without pH adjustment. Secondly, the reactivity was studied in greater
details with water collected on April 23, 2018. The investigations included nitrate reduction
from lake water spiked with 10 ppm and 50 ppm nitrate-N in order to examine the reactivity

200
of these materials under more extreme conditions as well as the determination of the soluble
iron. The iron was measured to not only to monitor its production during the reaction, but to
also ascertain the viability of our materials for environmental remediation. That is, if the
amount of soluble iron is greater than the maximum allowable in drinking water, then these
materials might not be viable. All investigations were conducted under both anaerobic and
aerobic conditions.
6.2. Lake Horowhenua
Lake Horowhenua is a small shallow lake with the surface area of 2.9 km2 and the mean depth
of 1.3 m.269 It is located in Horowhenua district, Southern Manawatu-Wanganui, the west
coast of the North Island of New Zealand. It currently receives the runoffs from intensive
agriculture and received the treated sewage water from the town of Levin for 25 years,
between 1962 and 1987.269-270 Nutrients from sewage discharge have accumulated in the
sediment and are the predominant reason for the current hypertrophic condition.270 Lake
Horowhenua has high nitrogen and low phosphorus in winter while low nitrogen and high
phosphorus in summer. The source of nitrogen is fertilizer leaching from the horticulture,
market gardening, and intensive dairy farming with the most nitrogen arriving via the inflow
of the Arawhata Stream. From 1989 to 2008, the total nitrogen concentration in this inflow
increased from 10.5 ppm to 13.6 ppm. In contrast, the main source of phosphorus is from
sediment.
The water quality of Lake Horowhenua has decreased since 1997 and it was ranked as one of
the most polluted lakes in New Zealand.271 Considering the trophic level index that concludes
water clarity, chlorophyll content, total phosphorous and nitrogen, Lake Horowhenua is
considered to be super trophic. Due to the poor quality, the lake is only suitable for some
activities such as boating, rowing, and sailing. However, in summer, these activities are not
allowed due to toxic algal blooms containing cyanobacteria.
The lake water that was collected has a yellowish colour. It has sediments and green
components that is assumed algae (Figure 6.1). pH value of lake water was around 7. The
concentrations of anions in these samples were measured using IC (Table 6.1). The nitrate-N
concentrations were approximately 1 ppm. The levels of nitrite and phosphate were not
detected using the IC. The levels of chloride and sulfate were detected, approximately 19 ppm

201
and 4 ppm, respectively. However, they were not high enough to influence the nitrate
reduction (see Chapter 5).
Figure 6.1. Water sample in Lake Horowhenua.
Table 6.1. The components of the sample collected from Lake Horowhenua.
Sample pH chloride Nitrite-N Nitrate-N Sulfate-S Phosphate-P
April 27, 2017 6.8 19.2 ND 0.7 4.2 ND
April 23, 2018 7.1 19.7 ND 1.3 3.4 ND
ND*: no detection
6.3. Preliminary results of nitrate reduction from lake water
There have been numerous studies on the effect of coexisting ions on the reactivity of nZVI
materials. The effect of these ions was discussed in Section 5.5. In addition to inorganic ions,
naturally organic substances, typically humic acid, are always present in natural waters. In
most of the studies, the influence of humic acid on the reactivity of nZVI and doped nZVI were
examined towards organic compound removal. For example, when chloroform was
dechlorinated by nZVI, humic acid at the concentration of less than 100 ppm promoted
electron transfer.272 However, humic acid was commonly reported to inhibit nZVI even
though its concentration was low (less than 50 ppm). For instance, humic acid slowed down
the removal of carbon tetrachloride,272 decabromodiphenyl273 using nZVI. Moreover, humic
acid affected Ni-nZVI274 and Pd-nZVI186 when they were used to remove 2,4-dichlorophenol.

202
The effect of humic acid on nitrate reduction was also reported by Kim et al..266-267 In their
study, nitrate removal using nZVI decreased when humic acid exceeded 50 ppm.266
In this research, the ability of materials in removing nitrate from lake water was screened.
The initial nitrate-N concentration taken on April 27, 2017 was 0.7 ppm. This lake water and
this lake water spiked with 10 ppm nitrate-N were investigated. The effect of pH adjustment
on nitrate reduction was also examined. Three representative materials, 5%Ni-
nZVI@MisiCFeOOH-MB1, 5%Cu-nZVI@MisiCFeOOH-MB1, and 0.5%Pd-5%Cu-
nZVI@MisiCFeOOH-MC1 were used. nZVI@MisiCFeOOH was also used as a control material.
6.3.1. Nitrate reduction from lake water
Doped materials had the capacity of reducing nitrate from lake water under both anaerobic
and aerobic conditions. After 30 minutes, nitrate-N levels were below the detection limit of
the IC (0.06 ppm) for all types of doped materials (Figure 6.2 and 6.3). Moreover, nitrite was
only observed at less than 0.1 ppm when Cu-doped system was used under anaerobic
conditions. In contrast, nZVI@MisiCFeOOH reduced nitrate from lake water very slowly.
Nitrate-N levels were 0.7 ppm and 0.6 ppm when nZVI@MisiCFeOOH was used under either
anaerobic or aerobic conditions, respectively. As such, doped nZVI@MisiCFeOOH reduces
nitrate significantly faster than non-doped nZVI@MisiCFeOOH. Of these doped materials,
trimetallic nZVI@MisiCFeOOH reduced nitrate with the fastest rate while Ni-doped material
appeared to have lowest activity. However, the small level of initial nitrate in lake water (0.7
ppm nitrate-N) was not enough to differentiate the reactivity of these doped materials.
Therefore, further investigations were carried out using lake water spiked with nitrate.

203
Figure 6.2. Nitrate reduction in lake water under anaerobic conditions (0.150 g of material,
25.0 mL of sample).
Figure 6.3. Nitrate reduction in lake water under aerobic conditions (0.150 g of material,
25.0 mL of sample).
6.3.2. Nitrate reduction from lake water spiked with 10 ppm nitrate-N
6.3.2.1. Nitrate reduction from lake water spiked with 10 ppm nitrate-N at neutral pH
In order to examine the reactivity of doped materials in “real” water, the lake water was
spiked with 10 ppm nitrate-N to give a final nitrate-N concentration of 10.7 ppm. The resulting
solution was used for nitrate reduction to determine if these materials could reduce nitrate
in the presence of numerous factors in natural water. In addition, nitrite accumulation and
0
0.2
0.4
0.6
0.8
1
0 5 10 15 20 25 30 35
Nit
rate
-N (
pp
m)
un
der
an
aero
bic
co
nd
itio
ns
Time (m)5%Ni-nZVI@MisiCFeOOH-MB1 5%Cu-nZVI@MisiCFeOOH-MB1
0.5Pd-5%Cu-nZVI@MisiCFeOOH-MC1 nZVI@MisiCFeOOH
0
0.2
0.4
0.6
0.8
0 5 10 15 20 25 30 35Nit
rate
-N (
pp
m)
un
der
aer
ob
ic
con
dit
ion
s
Time (m)5%Ni-nZVI@MisiCFeOOH-MB1 5%Cu-nZVI@MisiCFeOOH-MB1
0.5Pd-5%Cu-nZVI@MisiCFeOOH-MC1 nZVI@MisiCFeOOH

204
the change in the pH of the solutions were also monitored. These experiments were carried
out without pH adjustment in anaerobic and aerobic conditions.
a. Nitrate reduction from lake water spiked with 10 ppm nitrate-N without pH adjustement
under anaerobic conditions
Three representative materials reduced nitrate from lake water spiked with 10 ppm nitrate-
N under anaerobic conditions, the degree of which was dependent upon the nature of
materials. Ni-doped system reduced nitrate fastest while Cu-doped system had the lowest
reactivity (Figure 6.4). However, the difference in their reactivity was minimal. After 30
minutes, the nitrate conversion was 99%, 94%, and 97% when either 5%Ni-
nZVI@MisiCFeOOH-MB1, 5%Cu-nZVI@MisiCFeOOH-MB1 or 0.5%Pd-5%Cu-
nZVI@MisiCFeOOH-MC1 was used. In contrast to doped materials, nZVI@MisiCFeOOH as a
control material reduced nitrate very slowly. After 30 minutes, only 7% of the initial nitrate
was reduced.
Figure 6.4. Nitrate reduction in lake water spiked with 10 ppm nitrate-N without pH
adjustment under anaerobic conditions (0.150 g of material, 25.0 mL of sample).
Nitrite was also monitored during the nitrate reduction from lake water (Figure 6.5). Nitrite
build-up using Ni-doped and non-doped materials was lower than both Cu-doped and Pd-Cu-
doped systems. After 30 minutes, nitrite build-up was less than 2% for 5%Ni-
nZVI@MisiCFeOOH-MB1, 5%Cu-nZVI@MisiCFeOOH-MB1, and nZVI@MisiCFeOOH. In
contrast, the nitrite accumulation was 12% when 5%Cu-nZVI@MisiCFeOOH-MB1 was utilised.
0
2
4
6
8
10
12
0 5 10 15 20 25 30 35
Nit
rate
-N (
pp
m)
un
der
an
aero
bic
co
nd
itio
ns
Time (m)5%Ni-nZVI@MisiCFeOOH-MB1 5%Cu-nZVI@MisiCFeOOH-MB1
0.5Pd-5%Cu-nZVI@MisiCFeOOH-MC1 nZVI@MisiCFeOOH

205
The accumulation of nitrite in lake water was consistent with the nitrite generation in lab-
prepared samples using the same materials.
Figure 6.5. Nitrite accumulation in nitrate reduction from lake water spiked with 10 ppm
without pH adjustment under anaerobic conditions (0.150 g of materials, 25.0 mL of
sample).
The reduction of iron with nitrate generates hydroxide ions that may affect the generation of
by-products. To investigate the change in hydroxide production, the pH of the solutions was
monitored during the reaction (Figure 6.6). After 5 minutes, the pH notably increased to more
than 8.3 using both doped and non-doped materials. Of these, the pH was highest when Ni-
doped material was used, which is consistent with the faster nitrate reduction. Between 15
minutes and 30 minutes, the pH slightly increased to 9.5 with the doped materials while it
decreased to 7.6 with the non-doped nZVI@MisiCFeOOH. The change in the pH in doped
systems can be explained by the reduction of nitrate over the course of 30 minutes. In
contrast, the pH changes of nZVI@MisiCFeOOH can be attributed to the corrosion of iron in
solution.
0
0.5
1
1.5
2
2.5
3
0 5 10 15 20 25 30 35
Nit
rite
-N (
pp
m)
un
der
an
aero
bic
co
nd
itio
ns
Time (m)5%Ni-nZVI@MisiCFeOOH-MB1 5%Cu-nZVI@MisiCFeOOH-MB1
0.5Pd-5%Cu-nZVI@MisiCFeOOH-MC1 nZVI@MisiCFeOOH

206
Figure 6.6. pH change in nitrate reduction from lake water spiked with 10 ppm without pH
adjustment under anaerobic conditions (0.150 g material, 25.0 mL of sample).
From these preliminary experiments of nitrate reduction from lake water, it is noted that
these doped materials were not significantly inhibited by undetermined factors in natural
water under anaerobic conditions. These doped materials were still active even though they
reduced nitrate from lake water more slowly than lab-prepared samples. In contrast, non-
doped nZVI@Misi was almost deactivated. More details about the activity of these materials
as well as the difference in their reactivity undergone further examination.
b. Nitrate reduction from lake water spiked with 10 ppm nitrate-N at neutral pH under aerobic
conditions
The ability of the materials to reduce nitrate under aerobic conditions was examined. Doped
materials reduced nitrate from lake water spiked with 10 ppm under aerobic conditions
(Figure 6.7) and the reduction amount was similar to anaerobic conditions. The difference in
the reactivity of these doped materials under aerobic conditions was insignificant. After 30
minutes, the nitrate conversion was 99%, 97%, and 96% when either 5%Ni-
nZVI@MisiCFeOOH-MB1, 5%Cu-nZVI@MisiCFeOOH-MB1 or 0.5Pd-5%Cu-
nZVI@MisiCFeOOH-MC1 was used, respectively. In contrast, the non-doped material reduced
nitrate slowly; after 30 minutes, only 13% of the initial nitrate was removed.
0
2
4
6
8
10
0 5 10 15 20 25 30pH
un
der
an
aero
bic
co
nd
itio
ns
Time(m)
5%Ni-nZVI@MisiCFeOOH-MB1 5%Cu-nZVI@MisiCFeOOH-MB1
0.5Pd-5%Cu-nZVI@MisiCFeOOH-MC1 nZVI@MisiCFeOOH

207
Figure 6.7. Nitrate reduction in lake water spiked with 10 ppm nitrate-N without pH
adjustment under aerobic conditions (0.150 g of material, 25.0 mL of sample).
Nitrite was also monitored during the reaction. The degree of the nitrite accumulation
depended on the nature of materials, which was similar to anaerobic conditions (Figure 6.8).
Interestingly, nitrite accumulation in Cu-doped materials was only 3% compared to 12% under
anaerobic conditions.
Figure 6.8. Nitrite accumulation in nitrate reduction from lake water spiked with 10 ppm
without pH adjustment under aerobic conditions (0.150 g of materials, 25.0 mL of sample).
The change in the solution pH under aerobic conditions was similar to that under anaerobic
conditions (Figure 6.9). This confirmed the similarity of nitrate reduction under two
0
2
4
6
8
10
12
0 5 10 15 20 25 30 35
Nit
rate
-N (
pp
m)
un
der
aer
ob
ic
con
dit
ion
Time (m)5%Ni-nZVI@MisiCFeOOH-MB1 5%Cu-nZVI@MisiCFeOOH-MB1
0.5Pd-5%Cu-nZVI@MisiCFeOOH-MC1 nZVI@MisiCFeOOH
0
0.5
1
1.5
2
2.5
3
0 5 10 15 20 25 30 35
Nit
rite
-N (
pp
m)
un
der
aer
ob
ic
con
dit
ion
s
Time (m)5%Ni-nZVI@MisiCFeOOH-MB1 5%Cu-nZVI@MisiCFeOOH-MB1
0.5Pd-5%Cu-nZVI@MisiCFeOOH-MC1 nZVI@MisiCFeOOH

208
conditions. It was encouraging that nitrate reduction should be examined under both
anaerobic and aerobic conditions.
Figure 6.9. pH change in nitrate reduction from lake water spiked with 10 ppm without pH
adjustment under aerobic conditions (0.150 g materials, 25.0 mL of sample).
In conclusion, doped materials had high reactivity in nitrate reduction from lake water spiked
with 10 ppm nitrate-N without pH adjustment under anaerobic and aerobic conditions. There
was no difference in their reactivity between these two conditions. Of these, Ni-doped system
reduced nitrate fastest with no nitrite accumulation. After the reaction, the pH in doped
materials was greater than non-doped material. This can be explained by the hydroxide
generation from the interaction of doped materials with nitrate.
6.3.2.2. Nitrate reduction from lake water spiked with 10 ppm nitrate-N at pH of 3
Acidic conditions are favourable for the reaction of nZVI with nitrate. For instance, a
significant rate enhancement was observed at pH’s less than 3 when nZVI@graphite reacts
with nitrate.241 In another study, when nitrate was reduced using nZVI, the reaction was faster
at pH’s less than 7; however, at pH’s between 3 and 7, this effect was insignificant.242 At pH’s
higher than 9, nitrate reduction was significantly decreased. Acidic conditions also affected
the reactivity of bimetallic nZVI. For example, nitrate removal using Ni-nZVI@biochar
decreased when the initial pH increased from 3 to 9 but the decrease was minimal.243
However, these investigations were conducted in lab samples. In this current study, the effect
of acidic conditions on the activity of these representative materials in removing nitrate from
0
2
4
6
8
10
0 5 10 15 20 25 30
pH
un
der
aer
ob
ic c
on
dit
ion
s
Time (m)5%Ni-nZVI@MisiCFeOOH-MB1 5%Cu-nZVI@MisiCFeOOH-MB1
0.5Pd-5%Cu-nZVI@MisiCFeOOH-MC1 nZVI@MisiCFeOOH

209
lake water was examined. For this, lake water was spiked with 10 ppm nitrate-N (final nitrate-
N concentration of 10.7 ppm) and the pH was adjusted to 3 prior to the addition of our
materials.
At pH 3, nitrate reduction was rapid when all types of doped materials were used under both
anaerobic and aerobic conditions. After 30 minutes, nitrate-N levels were around the
detection limit of the IC (0.06 ppm) (Figure 6.10 and 6.11). Interestingly, there was no
difference in their reactivity under two conditions. Nitrite was only observed in both Cu-
doped nZVI@Misi and Pd-Cu-doped nZVI@Misi at 1.4%.
Figure 6.10. Nitrate reduction in lake water spiked with 10 ppm at initial pH 3 under
anaerobic conditions (0.150 g of material, 25.0 mL of sample).
Figure 6.11. Nitrate reduction in lake water spiked with 10 ppm at initial pH 3 under aerobic
conditions (0.150 g of material, 25.0 mL of sample).
0
2
4
6
8
10
12
0 5 10 15 20 25 30 35Nit
rate
-N (
pp
m)
un
der
an
aero
bic
co
nd
itio
ns
Time (m)5%Ni-nZVI@MisiCFeOOH-MB1 5%Cu-nZVI@MisiCFeOOH-MB1
0.5Pd-5%Cu-nZVI@MisiCFeOOH-MC1 nZVI@MisiCFeOOH
0
2
4
6
8
10
12
0 5 10 15 20 25 30 35
Nit
rate
-N (
pp
m)
un
der
aer
ob
ic
con
dit
ion
s
Time (m)5%Ni-nZVI@MisiCFeOOH-MB1 5%Cu-nZVI@MisiCFeOOH-MB1
0.5Pd-5%Cu-nZVI@MisiCFeOOH-MC1 nZVI@MisiCFeOOH

210
The initial pH significantly influenced the reactivity of nZVI@MisiCFeOOH. After 30 minutes,
at neutral pH, nitrate conversion was 7% and 13% under anaerobic and aerobic conditions,
respectively. In contrast, at low initial pH, nitrate conversion was 39% and 56%, respectively.
The faster nitrate reduction at pH of 3 can be explained by the elevation of Fe corrosion. H+
ions may dissolve the protective layer (ion oxides) on the surface of nZVI,263 leading to more
Fe active sites to react with nitrate. These results were inconsistent to those reported by Kim
et al., who studied the effect of pH on nitrate reduction using nZVI.242 At initial pH’s between
3 and 7, only a small change in the rate of nitrate reduction was observed, presumably due to
a rapid rise of pH to 10, regardless of the initial pH of the solution. However, in their study, a
higher concentration (50 ppm) of nitrate-N was used.
The solution pH was monitored over the course of our reactions. After 5 minutes, the pH
increased significantly to range from 5.3 to 6.0 and stabilised at a pH of 6 between 15 minutes
and 30 minutes under both anaerobic and aerobic conditions, (Figure 6.12 and 6.13). Of
particular interest is that pH in nZVI@MisiCFeOOH was similar to doped materials even
though nZVI@MisiCFeOOH reduced nitrate significantly more slowly.
Figure 6.12. pH change in nitrate reduction from lake water spiked with 10 ppm at initial pH
3 under anaerobic conditions (0.150 g of material, 25.0 mL of sample).
0
2
4
6
0 5 10 15 20 25 30pH
un
der
an
aero
bic
co
nd
itio
ns
Time (m)
5%Ni-nZVI@MisiCFeOOH-MB1 5%Cu-nZVI@MisiCFeOOH-MB1
0.5Pd-5%Cu-nZVI@MisiCFeOOH-MC1 nZVI@MisiCFeOOH

211
Figure 6.13. pH change in nitrate reduction from lake water spiked with 10 ppm at initial pH
3 under aerobic conditions (0.150 g of material, 25.0 mL of sample).
These results show the significance of pH adjustment on nitrate conversion. Although these
are important observations, it is encouraging that doped materials in this current study are
still reactive at higher pH’s in contrast to the non-doped system. This confirms that these
doped systems are more applicable to “normal” conditions. As such, the reactivity of doped
materials will be examined in greater detail at only neutral pH.
6.4. Nitrate reduction from lake water
The reactivity of doped materials towards nitrate reduction from lake water was examined in
greater detail using lake water collected on April 23, 2018. The initial nitrate-N concentration
was 1.3 ppm. To understand the reactivity of our materials in greater detail, and to ascertain
any differences in their reactivity, the lake water was spiked with 10 ppm and 50 ppm nitrate-
N to give the solutions with the final nitrate-N concentrations of 11.3 ppm and 51.3 ppm,
respectively. The nitrate reactions were conducted under both anaerobic and aerobic
conditions. Four different materials, including 5%Ni-nZVI@MisiCFeOOH-MB1, 5%Cu-
nZVI@MisiCFeOOH-MB1, 0.5%Pd-5%Cu-nZVI@MisiCFeOOH-MC1, and nZVI@MisiCFeOOH,
were used.
6.4.1. Nitrate reduction from lake water spiked with 10 ppm nitrate-N
The addition of 10 ppm of nitrate-N to the lake water was chosen in order to compare the
activity of these representative materials in removing this amount of nitrate from lake water
0
2
4
6
0 5 10 15 20 25 30
pH
un
der
aer
ob
ic c
on
dit
ion
s
Time (m)5%Ni-nZVI@MisiCFeOOH-MB1 5%Cu-nZVI@MisiCFeOOH-MB1
0.5Pd-5%Cu-nZVI@MisiCFeOOH-MC1 nZVI@MisiCFeOOH

212
and lab samples. In the lab sample, when nitrate was reduced using doped materials, all
nitrate was reduced to below the detection limit and no nitrite accumulation was observed
in less than 15 minutes under both anaerobic and aerobic conditions. nZVI@MisiCFeOOH had
lower activity; however, after 30 minutes, nitrate conversion was 74% and 85% under
anaerobic and aerobic conditions, respectively.
6.4.1.1. Nitrate reduction from lake water spiked with 10 ppm nitrate-N under anaerobic
conditions
All doped materials had the capacity of reducing nitrate from lake water spiked with 10 ppm
under anaerobic conditions (Figure 6.14). The difference in their reactivity was insignificant.
After 30 minutes, nitrate-N levels were 4.9 ± 0.1 ppm (57% nitrate conversion), 4 ± 2 ppm
(65% nitrate conversion), and 3.9 ± 0.4 ppm (65% nitrate conversion) when either 5%Ni-
nZVI@MisiCFeOOH-MB1, 5%Cu-nZVI@MisiCFeOOH-MB1 or 0.5%Pd-5%Cu-
nZVI@MisiCFeOOH-MC1 was used, respectively. As a control material, nitrate reduction using
nZVI@MisiCFeOOH was also investigated. Nitrate-N levels were 10.3 ± 0.3 ppm (9% nitrate
conversion). Comparing to the results from the lab sample, nitrate reduction was significantly
slower.
Figure 6.14. Nitrate reduction in lake water spiked with 10 ppm under anaerobic conditions
(0.150 g of material, 25.0 mL of sample).
Nitrite was also monitored in nitrate reduction from lake water. Over the course of 30
minutes, no nitrite was detected using either Ni-doped or non-doped materials (Table 6.2). In
0
2
4
6
8
10
12
5 15 30Nit
rate
-N (
pp
m)
un
der
an
aero
bic
co
nd
itio
ns
Time (m)
5%Ni-nZVI@MisiCFeOOH-MB1 5%Cu-nZVI@MisiCFeOOH-MB1
0.5%Pd-5%Cu-nZVI@MisiCFeOOH-MC1 nZVI@MisiCFeOOH

213
contrast, after 30 minutes, nitrite-N concentrations were 3 ± 1 ppm (27% nitrite
accumulation) and 2.3 ± 0.2 (20% nitrite accumulation) using either 5%Cu-
nZVI@MisiCFeOOH-MB1 or 0.5%Pd-5%Cu-nZVI@MisiCFeOOH-MC1, respectively. The nitrite
accumulation in both Cu-doped and Pd-Cu-doped materials was significantly higher than that
observed in the lab samples. These results indicated that both nitrate and nitrite conversion
were affected by coexisting substances in lake water under anaerobic conditions.
Table. 6.2. Nitrite accumulation in nitrate reduction from lake water spiked with 10 ppm
nitrate-N under anaerobic conditions (0.150 g of material, 25.0 mL of sample).
Nitrite-N (ppm)/ Time 5 minutes 15 minutes 30 minutes
5%Ni-nZVI@MisiCFeOOH-MB1 ND ND ND
5%Cu-nZVI@MisiCFeOOH-MB1 1 ± 1 2 ± 1 3 ± 1
0.5%Pd-5%Cu-nZVI@MisiCFeOOH-MC1 1.44 ± 0.09 2.3 ± 0.2 2.3 ± 0.2
nZVI@MisiCFeOOH ND ND ND
6.4.1.2. Nitrate reduction from lake water spiked with 10 ppm nitrate-N under aerobic
conditions
Doped materials removed nitrate from lake water spiked with 10 ppm of nitrate-N faster
under aerobic conditions than anaerobic conditions (Figure 6.15). The difference in the
reactivity of the doped materials under aerobic conditions was minimal. After 30 minutes,
nitrate-N levels were 1.6 ± 0.5 ppm (86% nitrate conversion), 2 ± 2 ppm (82% nitrate
conversion), and 2.1 ± 0.9 ppm (81% nitrate conversion) when either 5%Ni-
nZVI@MisiCFeOOH-MB1, 5%Cu-nZVI@MisiCFeOOH-MB1 or 0.5%Pd-5%Cu-
nZVI@MisiCFeOOH-MC1 was used, respectively. In contrast, only 12% of the initial nitrate
was removed using non-doped nZVI@MisiCFeOOH. Similar to under anaerobic conditions, the
nitrate reduction was considerably slower than that observed in the lab samples. However,
these doped materials had higher reactivity under aerobic conditions than under anaerobic
conditions.

214
Figure 6.15. Nitrate reduction in lake water spiked with 10 ppm under aerobic conditions
(0.150 g of material, 25.0 mL of sample).
The nitrite-N concentrations using Ni-doped and non-doped materials were below the
detection limit over the course of 30 minutes (Table 6.3). Although nitrite was detected using
both Cu-doped and Pd-Cu-doped materials after 5 minutes and 15 minutes, no nitrite was
detected after 30 minutes. Nitrite accumulation was lower than that observed under
anaerobic conditions. This indicated that oxygen elevated both nitrate and nitrite conversion.
Although the reasons for this phenomenon are unknown, these results would be helpful in
applying these materials to “real” conditions. In addition, nitrite accumulation was relatively
similar to that in the lab sample. These results suggested that coexisting substances in lake
water significantly affected nitrate conversion whereas their effect on nitrite conversion was
minimal under aerobic conditions.
Table. 6.3. Nitrite accumulation in nitrate reduction from lake water spiked with 10 ppm
nitrate-N under aerobic conditions (0.150 g of material, 25.0 mL of sample).
Nitrite-N (ppm)/ Time 5 minutes 15 minutes 30 minutes
5%Ni-nZVI@MisiCFeOOH-MB1 ND ND ND
5%Cu-nZVI@MisiCFeOOH-MB1 1 ± 1 2 ± 2 ND
0.5%Pd-5%Cu-nZVI@MisiCFeOOH-MC1 1.6 ± 0.3 1.3 ± 0.3 ND
nZVI@MisiCFeOOH ND ND ND
0
2
4
6
8
10
12
5 15 30
Nit
rate
-N (
pp
m)
un
der
aer
ob
ic
con
dit
ion
s
Time (m)5%Ni-nZVI@MisiCFeOOH-MB1 5%Cu-nZVI@MisiCFeOOH-MB1
0.5%Pd-5%Cu-nZVI@MisiCFeOOH-MC1 nZVI@MisiCFeOOH

215
In conclusion, doped materials were able to reduce nitrate from lake water spiked with 10
ppm nitrate-N under both anaerobic and aerobic conditions. Both nitrate and nitrite
conversion were faster under aerobic conditions than under anaerobic conditions. In
contrast, non-doped nZVI@MisiCFeOOH only reduced a small amount of nitrate (less than
12%) under both conditions.
6.4.2. Nitrate reduction from lake water spiked with 50 ppm nitrate-N
Although these representative materials did not reduce all nitrate in lake water spiked with
10 ppm, the difference in their reactivity was not really clear. We decided to carry out nitrate
reduction from lake water spiked with 50 ppm nitrate-N. Results from lake water were also
compared with those in lab samples to determine if naturally occurring ions could affect the
reduction of high nitrate concentration.
6.4.2.1. Nitrate reduction from lake water spiked with 50 ppm nitrate-N under anaerobic
conditions
In anaerobic conditions, all types of doped materials reduced nitrate from lake water spiked
with 50 ppm nitrate-N but nitrate removal was significantly slower than in lab samples (Figure
6.16). After 30 minutes, Ni-doped and Cu-doped materials reduced nitrate faster than
trimetallic Pd-Cu-doped material. Nitrate-N concentrations were 24.4 ± 0.7 ppm (52% nitrate
conversion), 24 ± 1 ppm (53% nitrate conversion) and 28 ± 3 ppm (45% nitrate conversion)
when either 5%Ni-nZVI@MisiCFeOOH-MB1, 5%Cu-nZVI@MisiCFeOOH-MB1 or 0.5%Pd-
5%Cu-nZVI@MisiCFeOOH-MC1 was used, respectively. In contrast, nitrate-N concentrations
were 47.3 ± 0.5 ppm (8% nitrate conversion) when nZVI@MisiCFeOOH was used as a control
material.

216
Figure 6.16. Nitrate reduction in lake water spiked with 50 ppm under anaerobic conditions
(0.150 g of material, 25.0 mL of sample).
Nitrite was also monitored in these reactions (Table 6.4). Nitrite accumulation using Ni-doped
material was significantly lower than both Cu-doped and Pd-Cu-doped materials. After 30
minutes, the nitrite-N levels were 1.4 ± 0.2 ppm (3% nitrite accumulation), 15 ± 2 ppm (29%
nitrite accumulation) and 9.9 ± 0.9 ppm (19% nitrite accumulation) when either 5%Ni-
nZVI@MisiCFeOOH-MB1, 5%Cu-nZVI@MisiCFeOOH-MB1 or 0.5%Pd-5%Cu-
nZVI@MisiCFeOOH-MC1 was used, respectively. Nitrite accumulation in both Cu-doped and
Pd-Cu-doped materials was higher in lake water than in lab samples. In contrast, Ni-doped
material accumulated was less nitrite in lake water. The presence of Pd in Pd-Cu doped
material promoted the nitrite reduction, which is similar to nitrite accumulation in nitrate
reduction from lab-prepared samples. In contrast to doped materials but consistent with
nitrate reduction, nitrite-N concentrations using non-doped nZVI@MisiCFeOOH were below
the detection of the IC over the course of 30 minutes.
0
10
20
30
40
50
5 15 30Nit
rate
-N (
pp
m)
un
der
an
aero
bic
co
nd
itio
ns
Time (m)
5%Ni-nZVI@MisiCFeOOH-MB1 5%Cu-nZVI@MisiCFeOOH-MB1
0.5%Pd-5%Cu-nZVI@MisiCFeOOH-MC1 nZVI@MisiCFeOOH

217
Table. 6.4. Nitrite accumulation in nitrate reduction from lake water spiked with 50 ppm
nitrate-N under anaerobic conditions (0.150 g of material, 25.0 mL of sample).
Nitrite-N (ppm)/ Time 5 minutes 15 minutes 30 minutes
5%Ni-nZVI@MisiCFeOOH-MB1 ND 1.8 ± 0.2 1.4 ± 0.2
5%Cu-nZVI@MisiCFeOOH-MB1 6 ± 1 11 ± 1 15 ± 2
0.5%Pd-5%Cu-nZVI@MisiCFeOOH-MC1 4.5 ± 0.2 8.2 ± 0.3 9.9 ± 0.9
nZVI@MisiCFeOOH ND ND ND
In anaerobic conditions, the difference in reactivity of these materials towards nitrate
reduction from lab-prepared samples against lake water is the outstanding reducing capacity
of Ni-doped material. Using this material resulted in the fastest nitrate conversion and no
nitrite build-up. As such, 5%Ni-nZVI@MisiCFeOOH-MB1 is the most promising material.
6.4.2.2. Nitrate reduction from lake water spiked with 50 ppm nitrate-N under aerobic
conditions
As with the 10 ppm samples, doped materials reduced nitrate from lake water spiked with 50
ppm faster under aerobic conditions than under anaerobic conditions. The reactivity of these
three materials was similar over the course of 30 minutes (Figure 6.17). For example, after 30
minutes, the nitrate-N concentrations were 20 ± 4 ppm (61% nitrate conversion), 19 ± 3 ppm
(63% nitrate conversion), and 22 ± 2 ppm (57% nitrate conversion) when either 5%Ni-
nZVI@MisiCFeOOH-MB1, 5%Cu-nZVI@MisiCFeOOH-MB1 or 0.5%Pd-5%Cu-
nZVI@MisiCFeOOH-MC1 was used, respectively. The difference in the reactivity of these
materials was minimal, which is inconsistent with that was observed in lab-prepared samples.
In contrast, but consistent with our other results, nitrate-N concentration was 46 ± 2 ppm
(10% nitrate conversion) when nZVI@MisiCFeOOH was used.

218
Figure 6.17. Nitrate reduction in lake water spiked with 50 ppm under aerobic conditions
(0.150 g of material, 25.0 mL of sample).
Nitrite was not detected in Ni-doped system while nitrite levels were significant in either Cu-
doped or Pd-Cu-doped system during the course of the reaction (Table 6.5). However, nitrite
accumulation was lower than that observed under anaerobic conditions. After 30 minutes,
nitrite-N levels were 13 ± 1 ppm (25% nitrite accumulation) and 9 ± 2 ppm (18% nitrite
accumulation) when either 5%Cu-nZVI@MisiCFeOOH-MB1 or 0.5%Pd-5%Cu-
nZVI@MisiCFeOOH-MC1 was used, respectively. Nitrite accumulation using these three
materials was lower in lake water than in lab samples under aerobic conditions. Although Pd-
Cu-doped nZVI@Misi did not reduce nitrate faster than Cu-doped nZVI@Misi, the
introduction of Pd increased the nitrite reduction, leading to less nitrite build-up.
Table. 6.5. Nitrite accumulation in nitrate reduction from lake water spiked with 50 ppm
nitrate-N under aerobic conditions (0.150 g of material, 25.0 mL of sample).
Nitrite-N (ppm)/ Time 5 minutes 15 minutes 30 minutes
5%Ni-nZVI@MisiCFeOOH-MB1 ND ND ND
5%Cu-nZVI@MisiCFeOOH-MB1 6.6 ± 0.9 12.4 ± 0.4 13 ± 1
0.5%Pd-5%Cu-nZVI@MisiCFeOOH-MC1 5.4 ± 0.4 8 ± 1 9 ± 2
nZVI@MisiCFeOOH ND ND ND
0
10
20
30
40
50
5 15 30
Nit
rate
-N (
pp
m)
un
der
aer
ob
ic
con
dit
ion
s
Time (m)
5%Ni-nZVI@MisiCFeOOH-MB1 5%Cu-nZVI@MisiCFeOOH-MB1
0.5%Pd-5%Cu-nZVI@MisiCFeOOH-MC1 nZVI@MisiCFeOOH

219
In summary, nitrate reduction from lake water spiked was considerably slower when both
doped and non-doped materials were used under both anaerobic and aerobic conditions. It
could be due to the presence of organic matters in natural water, which was investigated in
several studies about the effect of humic acid on iron composite. For example, humic acid
passivated nZVI,272-273 Ni-nZVI274 or Pd-nZVI186 when these particles were used to remove
organic substances. The inhibition of these substances was explained by the competition on
the surface of active sites.186, 272-274 In a separate study, humic acid inhibited Ni-nZVI in Cr(VI)
removal due to the formation of chelate Fe-humic acid and Ni-humic acid in which both iron
and nickel acted as coordination centers.263 As a result, the number of active sites of both iron
and nickel decreased. Another possible reason for the lower reducing performance of these
materials in lake water is the effect of ionic strength. The higher ionic strength, the slower
reduction of nZVI with nitrate.242 In this case, lake water consists of numerous ions, potentially
resulting in higher ionic strength compared to lab samples.
In lake water, all types of doped materials reduced nitrate faster under aerobic conditions
than under anaerobic conditions. This is inconsistent with the results when these materials
were examined in lab samples. Although the reason for the differences under both conditions
is unclear, it could be due to the interaction between coexisting factors in lake water with the
surface of nanoparticles in the presence of oxygen. In addition, nitrite accumulation was
lower in lake water than in lab samples, except lake water spiked with 10 ppm under aerobic
conditions.
6.5. Determination of soluble iron during nitrate reduction from lake water
During the nitrate reduction from lab samples (10 ppm and 50 ppm) under aerobic conditions,
the concentrations of soluble iron were less than 2 ppm and 0.5 ppm, respectively. In this
study, the generation of soluble iron from lake water was also examined in order to determine
if the amount of iron could change. For this, after removing nitrate from lake water spiked 10
ppm nitrate-N and 50 ppm nitrate-N, solutions were filtered via syringe filter 0.22 µm and
then measured iron concentrations using the AAS. The initial iron level in lake water before
the reaction was 0.3 ppm.
For lake water spiked with 10 ppm nitrate-N, after 5 minutes, the soluble iron concentrations
were around 4 ppm for all doped systems tested (Figure 6.18). These were more than eight

220
times greater than those observed in the lab sample. However, after 30 minutes, the iron
levels were around 0.5 ppm. The decrease in the soluble iron concentrations at 30 minutes
can be explained by the formation of insoluble substances (iron oxides/hydroxides).143
Figure 6.18. Iron concentration in nitrate reduction from lake water spiked with 10 ppm
under aerobic conditions (0.150 g of material, 25.0 mL of sample).
Iron concentrations were lower than those in the lab samples after 30 minutes. This could be
due to the slow nitrate reduction in lake water. As discussed in Section 5.4, our materials
released a significant amount of iron into solution due to the dissolution of the particles.
However, significantly less iron was produced upon reaction with nitrate. This is attributed to
the rise in pH of the solution which results in the precipitation of soluble iron. In the lake
samples, nitrate reduction was gradual, the increased iron levels at 5 minutes could be due
to the corrosion of nanoparticles. Another possible reason for lower iron concentration in
lake water is that soluble iron can be taken by components in lake water such as microalgae275
and phytoplankton.276
For lake water spiked with 50 ppm nitrate-N, after 5 minutes, the iron levels ranged from 1.6
ppm to 3.9 ppm for all doped materials examined (Figure 6.19). The iron concentration using
Ni-doped was lowest while 0.5%Pd-5%Cu-nZVI@MisiCFeOOH-MC1 produced iron with the
highest level. These iron concentrations were more than three times greater than in lab
samples. However, after 30 minutes, the iron levels were around the detection limit of the
AAS (0.09 ppm) using Ni-doped material. Iron levels were 0.4 ppm and 0.2 ppm when either
0
1
2
3
4
5
0 5 10 15 20 25 30
Iro
n (
pp
m)
un
der
aer
ob
ic c
on
dit
ion
Time (m)5%Ni-nZVI@MisiCFeOOH-MB1 5%Cu-nZVI@MisiCFeOOH-MB1
0.5Pd-5%Cu-nZVI@MisiCFeOOH-MC1
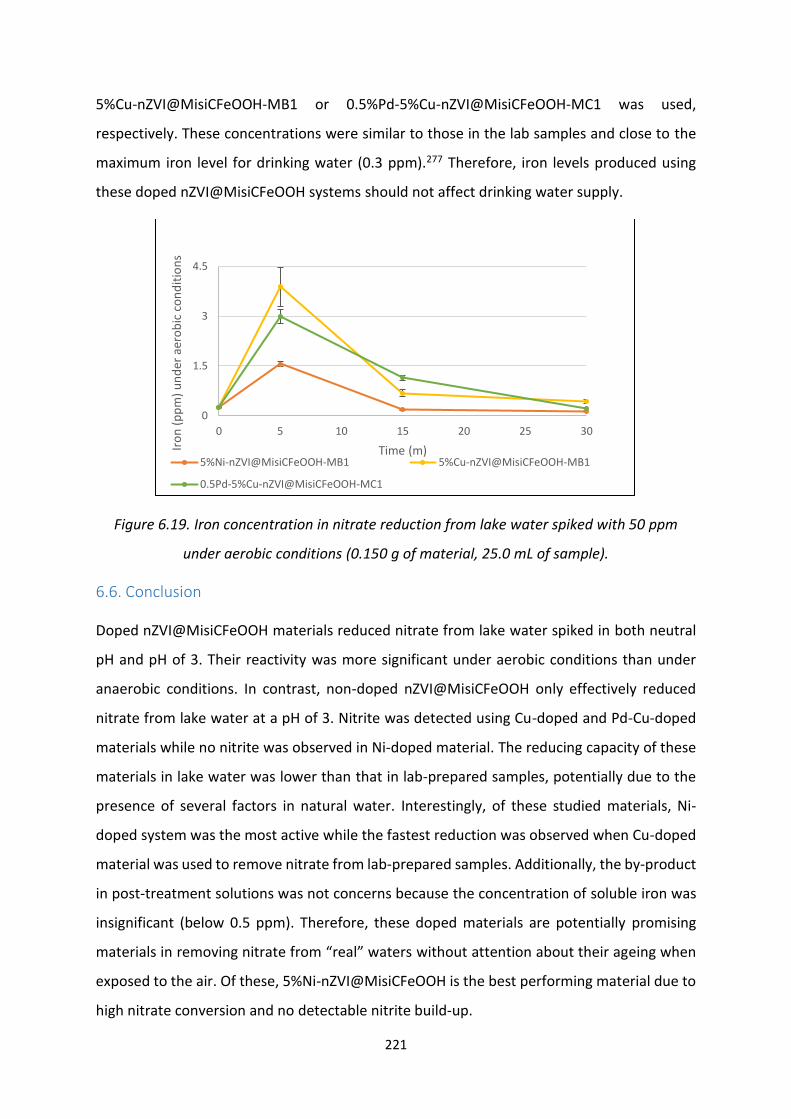
221
5%Cu-nZVI@MisiCFeOOH-MB1 or 0.5%Pd-5%Cu-nZVI@MisiCFeOOH-MC1 was used,
respectively. These concentrations were similar to those in the lab samples and close to the
maximum iron level for drinking water (0.3 ppm).277 Therefore, iron levels produced using
these doped nZVI@MisiCFeOOH systems should not affect drinking water supply.
Figure 6.19. Iron concentration in nitrate reduction from lake water spiked with 50 ppm
under aerobic conditions (0.150 g of material, 25.0 mL of sample).
6.6. Conclusion
Doped nZVI@MisiCFeOOH materials reduced nitrate from lake water spiked in both neutral
pH and pH of 3. Their reactivity was more significant under aerobic conditions than under
anaerobic conditions. In contrast, non-doped nZVI@MisiCFeOOH only effectively reduced
nitrate from lake water at a pH of 3. Nitrite was detected using Cu-doped and Pd-Cu-doped
materials while no nitrite was observed in Ni-doped material. The reducing capacity of these
materials in lake water was lower than that in lab-prepared samples, potentially due to the
presence of several factors in natural water. Interestingly, of these studied materials, Ni-
doped system was the most active while the fastest reduction was observed when Cu-doped
material was used to remove nitrate from lab-prepared samples. Additionally, the by-product
in post-treatment solutions was not concerns because the concentration of soluble iron was
insignificant (below 0.5 ppm). Therefore, these doped materials are potentially promising
materials in removing nitrate from “real” waters without attention about their ageing when
exposed to the air. Of these, 5%Ni-nZVI@MisiCFeOOH is the best performing material due to
high nitrate conversion and no detectable nitrite build-up.
0
1.5
3
4.5
0 5 10 15 20 25 30
Iro
n (
pp
m)
un
der
aer
ob
ic c
on
dit
ion
s
Time (m)5%Ni-nZVI@MisiCFeOOH-MB1 5%Cu-nZVI@MisiCFeOOH-MB1
0.5Pd-5%Cu-nZVI@MisiCFeOOH-MC1

222
7. Heavy metal removal
7.1. Introduction
In this chapter, investigations on the reactivity of doped and non-doped materials towards
toxic heavy metals are discussed. This includes the removal of heavy metals, generation of
soluble metal by-products and elemental distribution on the materials after removal. In
addition, the removal of toxic heavy metals from natural water is also examined.
Toxic heavy metals such as cadmium, lead, chromium (VI), mercury, to name a few can be
persistent and non-biodegradable. They damage human health and are harmful to other
organisms. Due to their danger, several methods have been used to remove them. Of these,
nZVI has widely been used as an effective method.
Heavy metals are removed from waters by nZVI in different pathways, depending on their
standard reduction potential and their ability to form oxides. The pathways include
adsorption, complex formation, co-precipitation, reduction, or a combination of these.116 The
adsorption, complex formation, and co-precipitation are caused by electrostatic interaction
and surface bonding without electron transfer. These are main pathways of the removal of
metals with standard reduction potential close or more negative than that of iron. In the
reduction pathway, metals with standard reduction potential more positive than that of iron
are reduced by iron. However, typically, the removal of metal ions involves more than one
pathway. For example, the reduction potential of Cd(II)/Cd is -0.40 V, very close to that of
Fe(II)/Fe (-0.44 V), so Cd(II) can be removed by nZVI via adsorption136, 154, 278-280 or complex
formation of Cd(II) on the surface of nZVI with no apparent reduction.116, 279-280 Techniques
including X-ray photoelectron spectroscopy (XPS), energy dispersive X-ray pectroscopy in
conjunction with scanning electron microscope (SEM-EDS) and energy dispersive X-ray
spectroscopy in conjunction with transmission electron microscopy (TEM-EDS) have provided
evidence of the presence of Cd(II) on the surface of nZVI. For example, the peak corresponding
to Cd(II) in XPS116, 136, 154, 280 or in SEM-EDS278 confirmed the presence of Cd(II) on the surface
of nZVI when Cd(II) was removed by nZVI. TEM-EDS analysis of nZVI after Cd(II) removal
showed the formation of nanofiber which consists of iron oxides and cadmium ferrite
(CdFe2O4).279 However, in Liu et al.’s study, the mechanism of the Cd(II) removal was via a
combination of adsorption (predominant) and reduction (auxiliary) when Cd(II) was removed

223
using nZVI@chitosan beads.281 In this study, both Cd(II) and Cd(0) peaks were observed in
XPS.
Although the reduction potential of Pb(II)/Pb (-0.13 V) is more positive than that of Fe(II)/Fe,
Fe(0) has removed Pb(II) via different pathways. For example, Huang et al. reported that Pb(II)
was removed by nZVI via both adsorption and reduction (eq. 7.1).154 In their study, both peaks
of Pb(II) and Pb(0) were observed in XPS analysis. In Zhang et al.’s study, Pb(II) was removed
by nZVI by the combination of adsorption, co-precipitation, and reduction (small part).169 In
this study, XPS showed peaks of Pb(II) (high intensity) and Pb(0) (low intensity). In addition,
XPS also showed a decrease in the percentage of OH- and an increase in the percentage of O2-
after removal, confirming the presence of Pb(OH)2 that bonded with Fe(OH)2 and Fe(OH)3. In
contrast, in Ponder et al.’s study, Pb(II) was removed using nZVI@PolyFlo resin via reduction
and potentially adsorption.117 In their study, both Pb(0) and Pb(II) were detected in XPS
analysis but they were not sure about the origin of Pb(II) which can be from the direct
adsorption or the oxidation during the reaction.
The reduction potential of Cr2O72-/Cr(II) (+1.33 V) is significantly more positive than Fe. The
fully oxidised chromium, dichromate (Cr2O72-) referred to in this thesis as Cr(VI). Cr(VI) is
removed via reduction,117 or a combination of reduction and precipitation.154 In Huang et al.’s
study, Cr(VI) was removed via a combination of reduction and precipitation (eq. 7.2 - 7.5).154
In this study, signals corresponding to Cr2O3 and FeCr2O4 was observed using XPS. However,
in a separate study, Li et al. reported that Cr(VI) was removed by nZVI via reduction to form
Cr(III) and then Cr(III) incorporated into FeOOH of the shell to form hydroxide of iron and
chromium.171 XPS analysis suggested the presence of Cr2O3 and Cr(OH)3.

224
We wanted to investigate the ability of our materials to remove heavy metals from solution.
As the surface of the material might be a key in the removal of heavy metals, we decided to
investigate if the method of preparation of the doped-nZVI could have an effect. For instance,
materials prepared via co-reduction method (MA) typically have the dopant metals found
within the nZVI, whereas materials prepared via deposition method (MB1) have the dopant
metals on the surface of the nZVI. In this study, supported materials including Ni-doped, Cu-
doped and non-doped nZVI@Misi were used. Bimetallic materials were prepared via both co-
reduction (MA) and deposition (MB1). Misi that had been calcined and then coated with
FeOOH layer was used as the support. Three toxic heavy metals, Cd(II), Pb(II), and Cr(VI), were
investigated. The reactivity of these materials towards heavy metals was examined in both
lab samples and lake water spiked with the heavy metals. The concentrations of soluble heavy
metals including iron, nickel, and copper were measured using AAS. The elemental
distribution of nZVI@Misi after heavy metal removal was also characterised via TEM.
7.2. Cadmium removal by doped and non-doped nZVI supported on Misi
Cadmium is a potential carcinogen. If an area is contaminated with cadmium, then some type
remediation is necessary, depending upon if it is a waterway or soil. The WHO has set the
maximum allowable concentration for cadmium at 0.003 ppm in drinking water.19 Various
methods have been used to remove it from waters. Of these, nZVI is considered as an effective
agent, which was reported in numerous studies.136, 154-155, 278-279 Supported nZVI was also used
to remove Cd(II). For example, nZVI@fly ash removed Cd(II) effectively282 or nZVI@bentonite
removed Cd(II) faster than bentonite.283 In addition, bimetallic nZVI was investigated. For
example, Su et al. used Au-nZVI for simultaneous removal of nitrate and Cd(II); however, Au
did not increase the removal of Cd(II).251 Therefore, in this current study, the effectiveness of
dopant metals and synthetic methods on the reactivity of supported nZVI materials towards
Cd(II) removal were examined.
In cadmium studies, the molar ratio of Fe to Cd(II) was 40:1 (20 ppm Cd(II)). The reactions
were carried out under anaerobic conditions. The concentrations of cadmium, iron, nickel,
and copper were measured over the course of the reaction. In addition, the elemental
distribution of nZVI@MisiCFeOOH after Cd(II) removal was also examined if cadmium could
precipitate on the surface of nZVI.

225
7.2.1. Reactivity of doped and non-doped nZVI@Misi towards cadmium removal
More than 10 ppm of Cd(II) was removed by all types of materials examined after 5 minutes,
(Figure 7.1). The Ni-doped material prepared via co-reduction method (MA) removed Cd(II)
fastest, with the other materials showing similar reactivity. The cadmium concentration was
3 ppm for 5%Ni-nZVI@MisiCFeOOH-MA while more than 6 ppm was observed for other
materials. However, after 30 minutes, the difference in their reactivity was more obvious. Ni-
doped materials reduced Cd(II) fastest while non-doped nZVI@MisiCFeOOH was the slowest
performing material. For example, the cadmium concentrations were 0.50 ± 0.09 ppm (98%
Cd(II) removal) and 4.7 ± 0.3 ppm (77% Cd(II) removal) when either 5%Ni-nZVI@MisiCFeOOH-
MA or nZVI@MisiCFeOOH was used, respectively. These results suggested that the
introduction of dopant metals (Ni, Cu) helped catalyse the removal of Cd(II). This was
inconsistent with a report by Su et al. in which the removal of Cd(II) using Au-nZVI was similar
to that observed using nZVI.251 However, in their study, unsupported nZVI was used, the molar
ratio of Fe to Cd(II) ranged from 10:1 to 100:1 and the solution contained both Cd(II) (10 - 100
ppm) and nitrate-N (15 ppm). In a separate study, the initial Cd(II) concentration was 20 ppm
and the molar ratio of Fe to Cd(II) was 50:1 using nZVI@fly ash.282 After 5 minutes, all Cd(II)
was removed, indicating that their material removed Cd(II) faster than our materials.
However, in their study, a higher ratio of Fe to Cd(II) was used compared to our ratio (40:1).

226
Figure 7.1. Removal characterisation towards Cd(II) (0.10 g of material, 25.0 mL of 20 ppm
solution).
In addition, Ni-doped material prepared via co-reduction method (MA) had significantly
higher reactivity in 15 minutes than that prepared via deposition method (MB1). However,
the difference in their reactivity was minimal after 30 minutes. For example, after 5 minutes,
cadmium concentrations were 2.9 ± 0.5 ppm and 7 ± 2 ppm using either 5%Ni-
nZVI@MisiCFeOOH-MA or 5%Ni-nZVI@MisiCFeOOH-MB1, respectively. After 30 minutes,
cadmium concentrations were 0.50 ± 0.09 ppm and 1.4 ± 0.6 ppm for 5%Ni-
nZVI@MisiCFeOOH-MA and 5%Ni-nZVI@MisiCFeOOH-MB1, respectively. The difference in
the kinetics of Cd(II) removal using materials prepared via co-reduction and deposition
methods is in contrast to that of nitrate reduction. The higher reactivity of Ni-doped material
prepared via co-reduction method (MA) could be due to its surface properties in which might
promote the removal of Cd(II) via adsorption in which Cd(II) adsorbed on the surface of nZVI
by combining with the iron oxides layer to form CdFeO4.279 In 5%Ni-nZVI@MisiCFeOOH-MA,
Ni is found inside nZVI particles; as such, it would not affect the oxidation of iron during the
synthesis (Section 3.3). In contrast, in 5%Ni-nZVI@MisiCFeOOH-MB1, Ni is on the surface of
nZVI (Section 3.3), slowing down iron not only from oxidising at the surface, but also
minimising the surface area of the iron oxide shell.172 As such, the number of iron oxide sites
for Cd(II) adsorption decreases.
Regarding Cu-doped materials, within 15 minutes, Cu-doped material prepared via deposition
method (MB1) removed Cd(II) faster than that prepared via co-reduction method (MA). For
0
5
10
15
20
5 15 30
Cad
miu
m (
pp
m)
Time (m)5%Ni-nZVI@MisiCFeOOH-MA 5%Ni-nZVI@MisiCFeOOH-MB1
5%Cu-nZVI@MisiCFeOOH-MA 5%Cu-nZVI@MisiCFeOOH-MB1
nZVI@MisiCFeOOH

227
example, after 5 minutes, cadmium concentrations were 8 ± 1 ppm and 6 ± 1 ppm using either
5%Cu-nZVI@MisiCFeOOH-MA or 5%Cu-nZVI@MisiCFeOOH-MB1, respectively. The reason for
this was unclear, but there might be reduction of Cd(II) accompanied with adsorption of Cd(II)
at the start of removal process. Surface Cu of nZVI (5%Cu-nZVI@MisiCFeOOH-MB1) promotes
the electron transfer more effectively than Cu within the nZVI (5%Cu-nZVI@MisiCFeOOH-
MA). However, after 30 minutes, there was no difference in these Cu-doped materials.
Although the mechanism of the Cd(II) removal using supported doped and non-doped
nZVI@Misi was not determined, its removal was due to nanoparticles, including original nZVI
and other substances produced by nZVI. Control experiments to investigate the role of the
support (MisiCFeOOH) in removing Cd(II) were performed and showed no decrease in the
amount of Cd(II) upon addition of a 20 ppm. This indicated that Cd(II) is not adsorbed by Misi.
These results are in contrast to previously reported supports such as kaolinite89-90, 92 and
goethite.92, 94
7.2.2. Determination of soluble metals in cadmium removal
Several investigations on Cd(II) removal using supported nZVI composites have been
reported. However, there was no discussion about the soluble iron, including leaching. In this
current study, the concentrations of iron, nickel, and copper were monitored during the
reaction. The results showed that a significant amount of iron was produced when all types
of the materials were used. Iron levels ranged from 6 ppm to 11 ppm over the course of the
monitored reaction (Figure 7.2). Of these, non-doped nZVI@MisiCFeOOH produced the least
amount of iron. Materials prepared via co-reduction method (MA) generated less soluble iron
than those prepared via deposition method (MB1). For example, after 30 minutes, iron levels
were 8.8 ± 0.1 ppm, 11.2 ± 0.4 ppm when either 5%Ni-nZVI@MisiCFeOOH-MA or 5%Ni-
nZVI@MisiCFeOOH-MB1 was used, respectively. The iron detected in the solutions could be
due to the reduction of nZVI with Cd(II) or the corrosion of nZVI with water. After 30 minutes,
the corrosion of iron with water produced more than 4 ppm soluble iron (Section 5.4).

228
Figure 7.2. Iron concentration in the removal of Cd(II) 20 ppm (0.10 g material, 25.0 mL of
solution).
In a related study, Cd(II) was removed using unsupported nZVI.251 The initial Cd(II)
concentration was 20 ppm and the molar ratio of Fe to Cd(II) was 50:1. After 90 minutes, 60%
of Cd(II) was removed and the iron concentration was more than 9 ppm. Comparing to our
results, nZVI@MisiCFeOOH removed Cd(II) faster, more effectively and produced less soluble
iron.
Nickel was also measured during the reaction between Ni-doped nZVI@Misi and Cd(II) (Table
7.1). Nickel concentrations using 5%Ni-nZVI@MisiCFeOOH-MB1 were higher than those using
5%Ni-nZVI@MisiCFeOOH-MA. In contrast, in the removal of Cd(II) using Cu-doped nZVI@Misi,
the concentration of Cu(II) never exceeded the detection limit of the AAS (0.66 ppm).
Table 7.1. Nickel concentration in Cd(II) removal.
Nickel (ppm)/ time 5 minutes 15 minutes 30 minutes
5%Ni-nZVI@MisiCFeOOH-MA 0.60 ± 0.03 0.34 ± 0.03 0.21 ± 0.02
5%Ni-nZVI@MisiCFeOOH-MB1 1.0 ± 0.2 0.8 ± 0.1 0.51 ± 0.07
The predominant mechanism of Cd(II) removal has been reported as adsorption or complex
formation of Cd(II) on the surface of nZVI.116, 154, 278-279 Our findings indicated that the
mechanism of Cd(II) removal might be adsorption/complexation and potentially reduction.
0
2
4
6
8
10
12
14
5 15 30
Iro
n (
pp
m)
Time (m)5%Ni-nZVI@MisiCFeOOH-MA 5%Ni-nZVI@MisiCFeOOH-MB1
5%Cu-nZVI@MisiCFeOOH-MA 5%Cu-nZVI@MisiCFeOOH-MB1
nZVI@MisiCFeOOH

229
The adsorption/complexation is caused by the relative similarity of the reduction potential of
iron (-0.44 V) and cadmium (-0.40 V). An example for these pathways is obtained when the
concentrations of cadmium and iron were calculated in mM using the most effective material
(5%Ni-nZVI@MisiCFeOOH-MA) (Figure 7.3). The ratio of cadmium concentration removed
(174 mM) to iron concentration produced (157 mM) was 1.1:1 that was higher than expected
ratio 1:1 (eq 7.1). The cadmium reduction might occur due to the presence of soluble Fe(II) in
solutions. If only adsorption/complexation occurred, consistent with the removal of Cd(II) by
nZVI,116, 136, 154, 278-280 the reactivity of doped materials, especially those prepared via
deposition method (MB1), would be lower than non-doped nZVI@MisiCFeOOH due to the
limit of adsorption sites. If Cd(II) removal is resulted by a combination of
adsorption/complexation as well as reduction, this is consistent with a report in which Cd(II)
was removed using nZVI@chitosan beads.281
Figure 7.3. Cadmium and iron concentrations using 5%Ni-nZVI@MisiCFeOOH-MA.
7.2.3. Elemental distribution of material after cadmium removal
In order to examine the fate of cadmium after removal, the elemental distribution of
nZVI@MisiCFeOOH after 30-minute reaction was examined via TEM. The spectra of this
specific area showed peaks corresponding to Si, O, and Al, consistent with the presence of
Misi (Figure 7.4). A strong Fe signal and a weak Cd signal are observed, indicating the presence
of both iron and cadmium in the material.
130
140
150
160
170
180
5 15 30
Met
als
(mM
)
Time (m)
5%Ni-nZVI@MisiCFeOOH-MA
Fe produced Cd removed

230
Figure 7.4. TEM-EDS spectrum of nZVI@MisiCFeOOH after Cd(II) removal (0.10 g of material,
25.0 mL of 20 ppm solution).
EDS mapping of nZVI@MisiCFeOOH after Cd(II) removal confirmed the presence of both Misi
and nZVI particles. The overlay of Si, O, Al, S, and Ti corresponds to Misi (Figure 7.5). When
the signals of Fe and Cd were overlaid, Cd is observed on wherever Fe is present; however, it
appears as if there is a layer of Cd on top of Fe (Figure 7.5a). The signals of O and Cd appear
to overlap on the nZVI particles (Figure 7.5c). When the signals of Fe, O, and Cd are combined
(Figure 7.5b and 7.5d), it becomes evident that there is a core-shell structure in which there
is a Cd(0) or CdO shell encapsulating an Fe(0) core, although we cannot distinguish between
the two oxidation states. Cd(II) can be present from the direct adsorption of Cd(II) on the
surface of material whereas Cd(0) can be generated from the reduction of Cd(II) with Fe
nanoparticles, which then adsorbs on the surface of nZVI.

231
Figure 7.5. TEM-EDS mapping of nZVI@MisiCFeOOH after Cd(II) removal (0.10 g material,
25.0 mL solution of 20 ppm).
O Si
Fe
Al
S Ti Cd
Fe- O b Fe- Cd a
O- Cd c Fe- O- Cd d
50 nm
50 nm
232
7.2.4. Conclusion
In summary, all of the materials examined removed Cd(II) from aqueous solution. Cd(II) was
removed via adsorption/complexation and potentially reduction. The addition of dopant
metals such as Ni and Cu increased the reactivity of these materials. During the reaction, iron
and nickel were detected in solutions while copper concentrations were below the detection
limit of the AAS. Cadmium was observed on the surface of Fe nanoparticles, but its form was
not determined. Among the doped nZVI@Misi, materials prepared via co-reduction method
(MA) were more effective than those via deposition method (MB1) due to their higher or
similar reactivity but lower iron production. Therefore, 5%Ni-nZVI@MisiCFeOOH-MA and
5%Cu-nZVI@MisiCFeOOH-MA were chosen for Cd(II) removal from lake water.
7.3. Lead removal by doped and non-doped nZVI supported on Misi
Lead is a highly poisonous metal, with multiple pathways in biological systems, including
interfering with heme biosynthesis and causing neurological problem.63 The WHO has set the
maximum allowable concentration for lead at 0.01 ppm in drinking water.19 Due to its toxicity
to human health, the removal of lead is a significant concern. There have been several
methods for Pb(II) removal, including nZVI composites such as unsupported nZVI116, 154, 169 as
well as supported nZVI such as nZVI@PolyFlo resin,117 nZVI@bentonite,283 nZVI@chitosan
beads,281 and [email protected] In addition, bimetallic and supported bimetallic Ni-nZVI were
also examined. However, conflicting results have been reported with regards to the catalytic
role of Ni. For example, in a study, the addition of Ni as a dopant did not influence the
reactivity of nZVI when Ni-nZVI was used to remove Pb(II).177 In contrast, in another study,
more Pb(II) was removed using Ni-nZVI@kaolinite than [email protected]
In this study, the reactivity of doped and non-doped nZVI@Misi towards Pb(II) removal was
examined. The molar ratios of Fe to Pb(II) of 74:1 (20 ppm Pb(II)) and 37:1 (40 ppm Pb(II))
were tested. The reactions were carried out under anaerobic conditions. During the reactions,
the concentrations of soluble metals in solutions were also monitored. After the reaction, the
elemental distribution of nZVI@MisiCFeOOH was also examined via TEM.
7.3.1. Reactivity of doped and non-doped nZVI@Misi towards lead removal
The reactivity of these materials towards Pb(II) was initially examined when Pb(NO3)2 (20
ppm) was used. After 5 minutes, the lead levels were around the detection limit of the AAS

233
(0.05 ppm) for all materials used. The rapid removal of Pb(II) might be partly due to the
presence of nitrate as nitrate reduction would result in an elevation of pH, thus promoting
Pb(II) removal by precipitation. This is consistent with a study in which Pb(II) removal
increased when the solution pH increased from 5 to 9.285
The removal of Pb(II) (40 ppm) using PbCl2 was examined in order to examine to remove any
influence of nitrate. Only three representative materials, 5%Ni-nZVI@MisiCFeOOH-MA,
5%Ni-nZVI@MisiCFeOOH-MB1 and nZVI@MisiCFeOOH were trialled. Consistent with the 20
ppm study, the removal of Pb(II) was rapid and the lead concentrations were below the
detection limit of the AAS (0.05 ppm) after 5 minutes when any of the doped and non-doped
materials were used. These results indicated that the presence of nitrate did not help enhance
Pb(II) removal.
There has been a report in which Pb(II) was removed using [email protected] However, in
this study, the Pb(II) removal was investigated in the presence of nitrate. In addition, the initial
concentrations of Pb(II) (300 ppm) and nitrate (180 ppm) were significantly higher than levels
we examined. Although this system was able to remove, the conditions are comparable with
ours.
Fu et al. reported a similar study in which Pb(II) was removed using [email protected] In their
study, the molar ratio of Fe to Pb(II) was 15:1 (nZVI dosage was 0.16 g/L) and pH of solution
was 4 - 6. All Pb(II) (40 ppm) was removed after 5 minutes; however, the removal of Pb(II)
decreased at Pb(II) concentration higher than 50 ppm. Although their ratio of Fe to Pb(II) was
lower, acidic condition is favourable for Fe corrosion.241
There have been several supports such as bentonite,283, 286 graphene oxide,286 zeolite287 that
can adsorb Pb(II). To evaluate if MisiCFeOOH can absorb Pb(II), a control experiment was
carried out. The results showed that Pb(II) concentration was 18.4 ± 0.4 (8% Pb(II) removal)
after 30 minutes (Table 7.2). This indicated that the contribution of MisiCFeOOH in removing
Pb(II) was insignificant and the majority of Pb(II) removal was due to the interaction between
Pb(II) and nanoparticles. These results are in contrast to an investigation in which Pb(II) was
removed using nZVI@bentonite. In this study, the Pb(II) removal using bentonite was greater
than one-half of that using [email protected]

234
Table 7.2. Lead concentration using MisiCFeOOH.
Lead (ppm)/ time 0 minute 5 minutes 15 minutes 30 minutes
MisiCFeOOH 20 19.1 ± 0.8 18.9 ± 0.2 18.4 ± 0.4
7.3.2. Determination of soluble metals in lead removal
7.3.2.1. Determination of soluble metals in the removal of lead 20 ppm
During the studies involving the removal of 20 ppm of Pb(II) in Pb(NO3)2, the concentrations
of iron, nickel, and copper were measured. The iron concentrations decreased over the course
of the reaction (Figure 7.6). This can be explained by the positive effect of nitrate. The co-
removal of nitrate by iron produced hydroxides, leading to the decrease in iron in the form of
iron hydroxides. A significant decrease in iron concentration was not observed for Ni-doped
systems whereas iron concentrations significantly decreased with the use of Cu-doped and
non-doped nZVI@Misi. This phenomenon could be due to the higher reactivity of Ni-doped
towards Pb(NO3)2 over other materials. The Ni-doped material prepared via co-reduction
method (MA) produced less iron than the Ni-doped material prepared via deposition method
(MB1) although the reverse was observed in Cu-doped systems. For example, after 5 minutes,
the iron concentrations were 2.7 ± 0.4 ppm and 4 ± 1 ppm for 5%Ni- nZVI@MisiCFeOOH-MA
and 5%Ni- nZVI@MisiCFeOOH-MB1, respectively. The 5%Cu-nZVI@MisiCFeOOH-MA and
5%Cu-nZVI@MisiCFeOOH-MB1 produced 6.7 ± 0.7 ppm and 3.9 ± 0.6 ppm, respectively. The
reason for this difference should be examined in further studies. Interestingly, after 5
minutes, the iron concentrations using both 5%Cu-nZVI@MisiCFeOOH-MB1 (6.7 ± 0.7 ppm)
and nZVI@MisiCFeOOH (5.9 ± 0.4 ppm) were higher than 5.4 ppm that is expected iron
concentration if all Pb(II) is removed via reduction. This indicates the corrosion of iron during
Pb(II) removal. However, after 30 minutes, the soluble iron levels were relatively similar,
ranging from 1.9 to 3.0 ppm for all materials examined.

235
Figure 7.6. Iron concentration in the removal of 20 ppm Pb(II) ( 0.10 g of material, 25.0 mL of
solution).
Nickel was also detected during the reaction between Ni-doped nZVI@MisiCFeOOH and Pb(II)
(Table 7.3). After 30 minutes, nickel levels were less than 0.14 ppm. In contrast, in the removal
of Pb(II) using Cu-doped nZVI@MisiCFeOOH, the concentrations of copper were below the
detection limit of the AAS (0.66 ppm).
Table 7.3. Nickel concentration in the removal of Pb(II) 20 ppm.
Nickel (ppm)/ time 5 minutes 15 minutes 30 minutes
5%Ni-nZVI@MisiCFeOOH-MA 0.23 ± 0.02 0.17 ± 0.03 0.14 ± 0.04
5%Ni-nZVI@MisiCFeOOH-MB1 0.29 ± 0.07 0.3 ± 0.1 0.13 ± 0.02
7.3.2.1. Determination of soluble metals in the removal of lead 40 ppm
A significant amount of iron was generated during the removal of 40 ppm Pb(II). After 30
minutes, the iron concentrations ranged from 5.7 ppm to 14.1 ppm for all types of materials
used (Figure 7.7). Despite no difference in the reactivity of these materials in removing 40
ppm Pb(II), the generation of iron was significantly different. The amount of iron that
nZVI@MisiCFeOOH produced was lower than other materials. Additionally, 5%Ni-
nZVI@MisiCFeOOH-MB1 produced considerably more iron than 5%Ni-nZVI@MisiCFeOOH-
MA.
0
2
4
6
8
5 15 30
Iro
n (
pp
m)
Time (m)5%Ni-nZVI@MisiCFeOOH-MA 5%Ni-nZVI@MisiCFeOOH-MB1
5%Cu-nZVI@MisiCFeOOH-MA 5%Cu-nZVI@MisiCFeOOH-MB1
nZVI@MisiCFeOOH

236
Figure 7.7. Iron concentration in the removal of 40 ppm Pb(II) (0.10 g of material, 25.0 mL of
solution).
Although the initial Pb(II) concentrations doubled, from 20 ppm to 40 ppm, the iron levels
increased more than three times. This might be due to the difference in Pb(II) sources. When
Pb(II) (20 ppm) using Pb(NO3)2 was used, nitrate-N (2.7 ppm) was also reduced, leading to an
increase in the pH of the solution. This may enhance the precipitation of iron to form iron
hydroxides.
During the removal of 40 ppm Pb(II) using Ni-doped nZVI@MisiCFeOOH, nickel was also
detected (Table 7.4). These nickel levels were higher than those being produced in the
removal of 20 ppm Pb(II). After 30 minutes, nickel levels were 0.3 ppm. The copper
concentrations were still below the detection limit (0.66 ppm) during the reaction between
Cu-doped nZVI@MisiCFeOOH and Pb(II). This is consistent with the copper results in the
removal of 20 ppm Pb(II).
Table 7.4. Nickel concentration in the removal of Pb(II) 40 ppm.
Nickel (ppm)/ time 5 minutes 15 minutes 30 minutes
5%Ni-nZVI@MisiCFeOOH-MA 0.7 ± 0.2 0.47 ± 0.2 0.35 ± 0.04
5%Ni-nZVI@MisiCFeOOH-MB1 1.03 ± 0.07 0.48 ± 0.07 0.30 ± 0.04
0
4
8
12
16
5 15 30
Iro
n (
pp
m)
Time (m)
5%Ni-nZVI@MisiCFeOOH-MA 5%Ni-nZVI@MisiCFeOOH-MB1 nZVI@MisiCFeOOH

237
There are two possible reasons for the formation of iron. Firstly, iron can be generated in the
oxidation of nZVI by Pb(II) because Pb(II) is removed via reduction.116, 154, 169 Secondly, iron can
be produced from the corrosion of nZVI with water (Section 5.4) after nZVI reacts with Pb(II)
completely. This can be evident if the soluble iron concentrations are higher than that
estimated when all Pb(II) was reduced by nZVI, in this case 10.8 ppm of iron for the removal
of 40 ppm Pb(II).
7.3.3. Elemental distribution of nZVI@MisiCFeOOH after lead removal
The elemental distribution of nZVI@MisiCFeOOH after removing 20 ppm Pb(II) for 30 minutes
was examined via TEM. In the TEM-EDS spectrum, peaks corresponding to Si, O, and Al were
observed, consistent with the presence of Misi (Figure 7.8). A peak corresponding to Fe was
strong. The mass percentage and atom percentage of Fe were 83.67% or 54.89%, respectively.
The peak corresponding to Pb is coincidental with the peak corresponding to S. As S is present
in Misi, we could not determine if this signal is due to either Pb or S.
Figure 7.8. TEM-EDS spectrum of nZVI@MisiCFeOOH after Pb(II) removal (0.1 g of material,
25 mL of Pb(II) 20 ppm solution).

238
The EDS mapping of this material was unable to confirm the fate of lead as the signals of Si,
O, Al, attributed to Misi, overlaid those of Fe, S and Pb (Figure 7.9). Thus, although the STEM
image appeared to be a core-shell structure, it is unable to comment further on this material.
Figure 7.9. TEM-EDS mapping of nZVI@MisiCFeOOH after the removal of Pb(II) (0.10 g
material, 25.0 mL of 20 ppm Pb(II) solution).
7.3.4. Conclusion
In summary, the role of dopant metals could not be evaluated in the Pb(II) removal due to the
rapid reaction of both supported doped and non-doped nZVI@MisiCFeOOH. During the
reaction, iron and nickel were detected in solutions whereas copper concentrations were
below the detection limit of the AAS. There was no clear evidence for the presence of Pb on
the surface of nZVI particles due to the weak signal and the overlap of Pb and S.
7.4. Chromium removal by doped and non-doped nZVI supported on Misi
Chromium (VI) is a potential carcinogen and highly toxic to humans, animals and plants.65-66
The WHO has set the maximum allowable concentration for chromium total at 0.05 ppm in
drinking water.19 Due to its toxicity, the removal of chromium has received a lot of attention.
Typically, Cr(VI) is reduced into Cr(III) that precipitates with other ions. Several studies have
reported the use of nZVI to remove Cr(VI).117, 154, 288 Supported nZVI have been also used to
remove Cr(VI). For example, nZVI@PolyFlo resin,117 nZVI@graphene,289 nZVI@SS,198
nZVI@sepiolite,284 and nZVI@multiwalled carbon nanotubes have all been examined for their
Fee
Si O Al
S Pb

239
ability to remove Cr(VI).290 In addition, supported bimetallic systems were also used to
remove Cr(VI). For instance, Ag-nZVI@activated carbon was used to remove Cr(VI); however,
the effect of Ag was not examined.204 In other studies, both Ni-nZVI@SS198 and Ni-
nZVI@montmorillonite291 removed Cr(VI) faster and more effectively than nZVI@SS and
nZVI@montmorillonite, respectively. In this current research, the reactivity of doped and
non-doped materials towards Cr(VI) was examined. Five representative materials, 5%Ni-
nZVI@MisiCFeOOH-MA, 5%Ni-nZVI@MisiCFeOOH-MB1, 5%Cu-nZVI@MisiCFeOOH-MA,
5%Cu-nZVI@MisiCFeOOH-MB1, and nZVI@MisiCFeOOH were used. The molar ratio of Fe to
Cr(VI) was 19:1 (20 ppm Cr(VI)). The reactions were carried out under anaerobic conditions.
During the reaction, the concentrations of total chromium, soluble by-products such as iron,
nickel, and copper, were measured.
7.4.1. Reactivity of materials towards chromium removal
Both doped and non-doped materials removed Cr(VI), the degree of which was dependent
upon dopant metals (Figure 7.10). Ni-doped and Cu-doped materials removed Cr(VI) faster
than non-doped nZVI@MisiCFeOOH, confirming the role of dopant metals. For example, after
30 minutes, more than 40% of initial Cr(VI) was removed while 30% of Cr(VI) was removed
using non-doped nZVI@MisiCFeOOH. Moreover, both types of Ni-doped materials had higher
reactivity than both types of Cu-doped materials. After 30 minutes, Cr(VI) removal was greater
than 60% using both types of Ni-doped materials while less than 45% was observed using both
types of Cu-doped materials. The enhancement in the rate of Cr(VI) removal using both Ni-
doped and Cu-doped could be potentially due to the catalytic role of Ni and Cu. These dopants
could promote the electron transfer from nZVI, leading to a faster removal of Cr(VI) compared
to non-doped nZVI@Misi. Additionally, Ni-doped materials had higher reactivity than Cu-
doped systems, potentially due to the more negative reduction potential of nickel compared
to copper.

240
Figure 7.10. Removal characterisation towards Cr(VI) (0.10 g of material, 25.0 mL of 20 ppm
solution).
Ni-doped material prepared via co-reduction method (MA) removed Cr(VI) significantly faster
than that prepared via deposition method (MB1). For example, after 30 minutes, the
concentrations of chromium were 0.69 ± 0.03 (97% Cr(VI) removal) and 8 ± 1 (60% Cr(VI)
removal) when either 5%Ni-nZVI@MisiCFeOOH-MA or 5%Ni-nZVI@MisiCFeOOH-MB1 was
used, respectively. In contrast, there was no difference in the reactivity of Cu-doped
materials. For example, after 30 minutes, the concentration of chromium was 11 ± 1 (45%
Cr(VI) removal) and 12 ± 4 (40% Cr(VI) removal) when either 5%Cu-nZVI@MisiCFeOOH-MA or
5%Cu-nZVI@MisiCFeOOH-MB1 was used, respectively. The reason for the difference in the
reactivity of these materials were uncertain and will need further investigation.
The enhancement in the reactivity of doped materials was consistent with Lu et al.’s study in
which Ni-nZVI@montmorillonite was used to remove Cr(VI).291 In this study, the initial Cr(VI)
was 50 ppm, the material dosage was 0.8 g/L (unpublished percentage of Fe) and pH was 3.
The presence of Ni significantly increased the amount of Cr(VI) removed. After 60 minutes, all
Cr(VI) was removed using Ni-nZVI@montmorillonite whereas 70% Cr(VI) was removed using
nZVI@montmorillonite. Our results are also consistent with a study in which Ni-nZVI@SS was
used to remove Cr(VI) (0.2 ppm - 1 ppm) at pH 2.198 After 120 minutes, the amount of Cr(VI)
removed using Ni-nZVI@SS doubled that being removed by nZVI@SS. However, Ni-nZVI
0
3
6
9
12
15
18
21
5 15 30
Ch
rom
ium
(p
pm
)
Time (m)
5%Ni-nZVI@MisiCFeOOH-MA 5%Ni-nZVI@MisiCFeOOH-MB1
5%Cu-nZVI@MisiCFeOOH-MA 5%Cu-nZVI@MisiCFeOOH-MB1
nZVI@MisiCFeOOH

241
coated on Misi systems exhibited faster reactivity as they reacted with Cr(VI) without pH
adjustment and resulted in higher Cr(VI) removal.
One of the methods for chromium removal reported is adsorption using kaolinite and its
modified forms,292-293 or bentonite as absorbents.294 We investigated if MisiCFeOOH can
remove any Cr(VI). After 30 minutes, only 3.5% of Cr(VI) was removed (Table 7.5); as such,
the removal of Cr(VI) in our systems is primarily due to its interactions with nanoparticles.
Table 7.5. Chromium concentration using MisiCFeOOH.
Chromium (ppm)/ time 0 minute 5 minutes 15 minutes 30 minutes
MisiCFeOOH 20 19.3 ± 0.2 19.3 ± 0.3 19.3 ± 0.4
7.4.2. Determination of soluble metals in chromium removal
The determination of ions during Cr(VI) removal has been not received much attention. In this
current study, the concentrations of soluble by-products were monitored during the reaction.
The results showed that iron concentrations were below the detection limit of the AAS (0.09
ppm) over the course of 30 minutes when all types of doped and non-doped materials were
used. The low iron could be due to the formation of insoluble iron compounds. In Cr(VI)
removal, Cr(VI) is converted into Cr(III) and then Cr(III) combines with Fe(III) to form CrxFe1-
x(OH)3 and/or CrxFe1-x(OOH) (eq. 7.4 and eq. 7.5)171, 295 or Cr0.67Fe0.33(OH)3.117 These insoluble
substances could either precipitate out on the surface of the nanoparticles ot Misi, or as their
own separated entity; however, in any case, these would be discarded during filtration.
Nickel was formed during the reduction of Ni-doped nZVI@MisiCFeOOH with Cr(VI). Nickel
levels were 0.2 ppm and 0.4 ppm when either 5%Ni-nZVI@MisiCFeOOH-MA or 5%Ni-
nZVI@MisiCFeOOH-MB1 was used, respectively (Table 7.6). In contrast, the copper
concentrations never exceeded the detection limit of the AAS (0.66 ppm) when Cu-doped
materials reacted with Cr(VI). Although there have been studies in which supported Ni-nZVI
were used to remove Cr(VI), the determination of soluble ions, including iron and nickel, was
not published.198, 291

242
Table 7.6. Nickel concentration in Cr(VI) removal.
Nickel (ppm)/ time 5 minutes 15 minutes 30 minutes
5%Ni-nZVI@MisiCFeOOH-MA 0.22 ± 0.08 0.2 ± 0.2 0.2 ± 0.2
5%Ni-nZVI@MisiCFeOOH-MB1 0.4 ± 0.3 0.4 ± 0.2 0.4 ± 0.2
The decrease of chromium concentration and the generation of by-products suggested a
mechanism of Cr(VI) removal in which Cr(VI) is removed via a combination of reduction and
adsorption.117, 171 171, 204, 289 The former is caused by reducing Cr(VI) to form Cr(III) by nZVI as
suggested by the difference in the reduction potential of Fe(II)/Fe (-0.44 V) and Cr(VI)/Cr(III)
(+1.33 V). The latter is due to the adsorption or co-precipitation of Cr(III) with other ions such
as OH- and Fe(III) on the surface of materials. Evidence for this mechanism is from the lack of
iron detected in solution.
7.4.3. Conclusion
In summary, doped and non-doped materials removed Cr(VI) from aqueous solution. The
introduction of dopant metals (Ni and Cu) increased the reactivity of doped
nZVI@MisiCFeOOH and the catalytic role of Ni was more significant than Cu. Among these
materials, 5%Ni-nZVI@MisiCFeOOH-MA was the best performing. In addition, during the
reaction, the concentrations of both iron and copper were below the detection limit while
nickel was detected but nickel concentrations were less than 0.4 ppm. Based on Cr(VI)
removal and iron generation, it can be concluded that Cr(VI) was removed from the solution
via both adsorption and reduction mechanisms.
7.5. Heavy metal removal from lake water
The reactivity of our doped and non-doped materials towards heavy metal removal from lake
water was examined to determine if coexisting ions could affect the removal or if these
materials could deactivate as exposed to the air. Lake water sample collected on 23 April 2018
was used to test Cd(II) and Pb(II). As these ions were not detected in the lake water, we spiked
the water with 20 ppm of each ion. Three representative materials, 5%Ni-nZVI@MisiCFeOOH-
MA, 5%Cu-nZVI@MisiCFeOOH-MA and nZVI@MisiCFeOOH, were used to investigate their
reactivity as well as the generation of soluble by-product during the reaction. All experiments
were conducted under both anaerobic conditions and aerobic conditions.

243
7.5.1. Cadmium removal from lake water
7.5.1.1. Cadmium removal from lake water spiked with 20 ppm under anaerobic conditions
The removal of Cd(II) from lake water spiked with 20 ppm was faster than from the lab
samples. After 30 minutes, more than 90% of Cd(II) was removed (Figure 7.11). Specifically,
the soluble cadmium levels were 0.15 ± 0.07 ppm (99% Cd(II) removal), 1 ± 1 ppm (95% Cd(II)
removal) and 2 ± 1 ppm (90% Cd(II) removal) when 5%Ni-nZVI@MisiCFeOOH-MA, 5%Cu-
nZVI@MisiCFeOOH-MA and nZVI@MisiCFeOOH were used, respectively. This indicated that
the Cd(II) removal was not inhibited by any coexisting factors in lake water. In contrast, these
factors enhanced Cd(II) removal. This enhancement can be explained by the presence of
biomass, for example, algae that can absorb Cd(II).61, 296-297 This was evident in a controlling
experiment. After spiking lake water with 20 ppm Cd2+ and stirring, the concentration of Cd(II)
in the resulting solution was 15.7 ppm.
Figure 7.11. Cadmium concentration in the removal of Cd(II) in lake water spiked with 20
ppm under anaerobic conditions (0.10 g of material, 25.0 mL of sample).
During the Cd(II) removal from lake water under anaerobic conditions, the production of
soluble metals was monitored. After 30 minutes, soluble iron levels were 1.6 ± 0.7 ppm, 3 ± 1
ppm, and 2.8 ± 0.5 ppm when 5%Ni-nZVI@MisiCFeOOH-MA, 5%Cu-nZVI@MisiCFeOOH-MA,
and nZVI@MisiCFeOOH were used, respectively (Figure 7.12). These iron concentrations were
significantly lower than those observed in the study of lab samples. The lower levels of soluble
iron may be explained by the absorption of iron ions by organic substances in lake water such
0
5
10
15
20
5 15 30
Cad
miu
m (
pp
m)
un
der
an
aero
bic
co
nd
itio
ns
Time (m)
5%Ni-nZVI@MisiCFeOOH-MA 5%Cu-nZVI@MisiCFeOOH-MA nZVI@MisiCFeOOH

244
as algae.275, 298 The soluble nickel levels at 0.2 ppm and copper levels at below the detection
limit were similar to those observed in the study of lab samples.
Figure 7.12. Iron concentration in the removal of Cd(II) in lake water spiked 20 ppm Cd(II)
under anaerobic conditions (0.10 g of material, 25.0 mL of the sample).
7.5.1.2. Cadmium removal from lake water spiked with 20 ppm under aerobic conditions
The aging of nZVI is known to decrease the reactivity of materials.131, 255 In this study, the
removal of Cd(II) was examined when these materials are exposed to oxidising media. For
this, the removal was conducted under aerobic conditions. When Ni-doped or Cu-doped
materials was used, the Cd(II) removal was similar to that observed under anaerobic
conditions (Figure 7.13). After 30 minutes, more than 93% of Cd(II) was removed. In contrast,
non-doped nZVI@MisiCFeOOH was slightly more active under aerobic conditions, which
could be due to the change in the surface properties. When non-doped material interacts
with the oxidising agents, there could be a change or formation of iron oxides/hydroxides on
the surface of nZVI, potentially promoting the adsorption of Cd(II). For example, in Wang et
al.’s study, in fresh nZVI, there was a peak of Fe(0) in XPS analysis; however, when nZVI was
aged in atmosphere, the oxidation caused a thicker shell, leading to no peak of Fe(0) detected
by XPS.254
0
2
4
6
8
5 15 30Iro
n (
pp
m)
un
der
an
aero
bic
co
nd
itio
ns
Time (m)
5%Ni-nZVI@MisiCFeOOH-MA 5%Cu-nZVI@MisiCFeOOH-MA nZVI@MisiCFeOOH

245
Figure 7.13. Cadmium concentration in the removal of Cd(II) in lake water spiked with 20
ppm under aerobic conditions (0.10 g of material, 25.0 mL of sample).
When both Ni-doped and Cu-doped materials were used, more iron was produced under
aerobic conditions than under anaerobic conditions over the course of 30 minutes; however,
these differences were minimal (Figure 7.14). When non-doped nZVI@MisiCFeOOH was used,
iron levels were higher under aerobic conditions than that observed under anaerobic
conditions within 15 minutes. The opposite trend was observed after 30 minutes. Nickel levels
were also measured, ranging from 0.2 ppm to 0.4 ppm during the reaction of 5%Ni-
nZVI@MisiCFeOOH-MA with Cd(II) while no copper was detected during the reaction of
5%Cu-nZVI@MisiCFeOOH-MA with Cd(II).
0
5
10
15
20
5 15 30
Cad
miu
m (
pp
m)
un
der
aer
ob
ic
con
dit
ion
s
Time(m)
5%Ni-nZVI@MisiCFeOOH-MA 5%Cu-nZVI@MisiCFeOOH-MA nZVI@MisiCFeOOH

246
Figure 7.14. Iron concentration in the removal of Cd(II) in lake water spiked 20 ppm under
aerobic conditions (0.10 g of material, 25.0 mL of sample).
In summary, these representative doped and non-doped materials effectively removed Cd(II)
from lake water spiked under both anaerobic and aerobic conditions. The Cd(II) removal from
lake water was more effective than from lab samples, although the amount of Cd(II) absorbed
by biomass was significant (22%). The presence of oxygen did not affect Cd(II) removal; in
contrast, enhanced the reactivity of non-doped material. Therefore, these materials have
potential to be used in removing Cd(II) from “real” waters.
7.5.2. Lead removal from lake water
To determine if naturally occurring factors could affect, the removal of Pb(II) from lake water
spiked with 20 ppm was examined under both anaerobic and aerobic conditions. After 5
minutes, lead concentrations were below 0.3 ppm and after 15 minutes, lead levels were
below the detection limit of the AAS (0.05 ppm). This indicated that the effect of coexisting
ions in lake water was not observed in the removal of 20 ppm Pb(II).
During the reactions under both anaerobic and aerobic conditions, the concentrations of iron
and dopant metals were examined. The iron concentrations under aerobic conditions were
relatively similar to those observed under anaerobic conditions (Figure 7.15 and 7.16).
Additionally, these iron concentrations were similar to those observed in the lab samples.
Nickel concentrations were less than 0.2 ppm under anaerobic conditions, which is consistent
with those in the lab samples while nickel concentrations were around 0.4 ppm, slightly higher
0
2
4
6
8
10
5 15 30
Iro
n (
pp
m)
un
der
aer
ob
ic c
on
dit
ion
s
Time (m)
5%Ni-nZVI@MisiCFeOOH-MA 5%Cu-nZVI@MisiCFeOOH-MA nZVI@MisiCFeOOH

247
under aerobic conditions. In summary, Pb(II) removal and iron generation were not affected
by the coexisting ions in lake water under both anaerobic and aerobic conditions. Therefore,
these materials have potential to remove Pb(II) from “real” waters.
Figure 7.15. Iron concentration in the removal of Pb(II) in lake water spiked with 20 ppm
under anaerobic conditions (0.10 g of material, 25.0 mL of sample).
Figure 7.16. Iron concentration in the removal of Pb(II) in lake water spiked with 20 ppm
under aerobic conditions (0.10 g of material, 25.0 mL of sample).
0
2
4
6
8
5 15 30Iro
n (
pp
m)
un
der
an
aero
bic
co
nd
itio
ns
Time(m)
5%Ni-nZVI@MisiCFeOOH-MA 5%Cu-nZVI@MisiCFeOOH-MA nZVI@MisiCFeOOH
0
2
4
6
8
5 15 30Iro
n (
pp
m)
un
der
aer
ob
ic c
on
dit
ion
s
Time (m)
5%Ni-nZVI@MisiCFeOOH-MA 5%Cu-nZVI@MisiCFeOOH-MA nZVI@MisiCFeOOH

248
7.6. Conclusion
Our materials, including doped and non-doped nZVI@MisiCFeOOH, have the ability to
remove toxic heavy metals. The dopant metals enhanced the removal of Cd(II) and Cr(VI)
whereas the effect of these dopants on Pb(II) removal needs further examination, potentially
using higher Pb(II) concentrations. Iron was found during removal of both Cd(II) and Pb(II)
while iron concentrations were below the detection limit during the removal of Cr(VI). In
addition, these materials were not influenced by coexisting ions in natural water. Therefore,
using these systems to remove heavy metals from “real” waters is promising.

249
8. Summary and future work
8.1. Summary
In this thesis, the reactivity of supported bimetallic and trimetallic nZVI@Misi towards nitrate
and heavy metal removal had been studied.
Numerous dopant metals, Ni, Cu, Zn, and Pd, were used to synthesise supported bimetallic
nZVI@Misi and Pd and Cu were used to generate supported trimetallic Pd-Cu-nZVI@Misi.
These materials were prepared using different preparations of Misi and synthetic methods.
All these materials had higher reactivity than non-doped nZVI@Misi, indicating that the
dopant metals have catalytic role in terms of reactivity enhancement. Of these, Ni, Cu, and
Pd-Cu were the most promising dopants. In addition, Misi that was calcined and coated with
MisiCFeOOH was the most efficient support in improving the reactivity of bimetallic and
trimetallic nanoparticles. Moreover, the two-step synthesis in which the dopant metal was
deposited on the top of pre-formed nZVI@Misi (deposition method) was significantly more
effective than co-reduction method in which the dopant and iron ions were simultaneously
reduced to produce M-nZVI@Misi. The materials produced using the deposition method were
more reactive regards to nitrate reduction.
The bimetallic nanoparticles Ni-nZVI@MisiCFeOOH or Cu-nZVI@MisiCFeOOH prepared via
deposition method had a core-shell structure in which Fe(0) serves as a core and a
combination of either Ni(0) and iron-nickel oxides or Cu(0) and copper oxides as a shell. Due
to the elemental distribution of the main reducing agent (Fe) and catalyst (Ni, Cu), the
reducing capacity of supported bimetallic materials increased significantly. In contrast, in
trimetallic Pd-Cu-nZVI@MisiCFeOOH prepared via deposition method, the Cu signal was
slightly greater on the surface of Fe and Pd signal was not reliable. Due to this elemental
distribution and the tiny amount of Pd in materials, the effectiveness of Pd addition was
minimal. However, Pd slightly accelerated nitrite conversion, leading to less nitrite
accumulation compared to bimetallic Cu-nZVI@Misi.
The reactivity of supported bimetallic and trimetallic nZVI@MisiCFeOOH was not significantly
affected when these materials were exposed to oxygen. Even though the amount of iron used
was less than that needed to remove all nitrate in the solutions, the nitrate removal was
relatively similar under anaerobic and aerobic conditions. Additionally, chloride and sulfate

250
did not influence their reactivity. Although carbonate and phosphate inhibited these
materials, the interference of these ions only occurs at high concentrations. Interestingly, in
the presence of inhibitory coexisting ions, the reactivity of these materials was higher under
aerobic conditions than under anaerobic conditions. Moreover, during the reduction, the
concentrations of soluble iron, nickel, and copper were low, which is beneficial for the
application in terms of environmental remediation. As such, these new materials show
promising in treating nitrate.
Supported bimetallic and trimetallic nZVI@MisiCFeOOH effectively reduced nitrate from
natural water collected in Lake Horowhenua. The reactivity was diminished compared to lab
samples. Encouragingly, their reactivity under aerobic conditions was higher than under
anaerobic conditions. After nitrate removal, the concentrations of soluble iron were minimal,
and were around the maximum allowable level for drinking water. It should be noted that the
non-doped nZVI@Misi was unable to reduce a significant amount of nitrate from lake water.
Supported bimetallic materials had the capacity of removing toxic heavy metals such as
cadmium, lead, and chromium (VI) both from lab-prepared and lake water. Their reactivity
was not affected by coexisting factors in lake water. During the removal of cadmium and lead,
soluble iron was detected. In contrast, the concentrations of soluble iron were below the
detection limit in the removal of chromium (VI).
In summary, this research synthesised new materials that easily dispersed in water and
efficiently removed contaminants. Of the supported bimetallic and trimetallic
nZVI@MisiCFeOOH, the one prepared by doping 5%Ni-nZVI on Misi that was calcined and
then coated with FeOOH (5%Ni-nZVI@MisiCFeOOH) was the best towards nitrate reduction
and heavy metal removal. In particular, the 5%Ni-nZVI@MisiCFeOOH prepared using
deposition method is evaluated as the most effective material in reducing nitrate. Even
though it relatively reduced nitrate more slowly than both Cu-doped and Pd-Cu-doped, the
generation of by-product (nitrite) was observed with the lowest levels. The new findings of
the elemental distribution of Ni dopant and iron are useful in explaining the catalytic
effectiveness of the dopant as well as the interaction between these two metals. The 5%Ni-
nZVI@MisiCFeOOH prepared using co-reduction method is an outstanding material in
removing heavy metals. For instance, the 5%Ni-nZVI@MisiCFeOOH-MA reduced both Cd(II)
and Cr(VI) faster than other materials. Unfortunately, due to the time constraints, we were

251
unable to determine why this material showed such significantly higher activity. As such,
5%Ni-nZVI@MisiCFeOOH will be a promising material that should be scaled for the
remediation contaminants from the “real” environment.
8.2. Future work
As a result of this work presented, there are some directions for future work.
Bimetallic nZVI@Misi: Firstly, the capacity of these materials should be examined towards
other heavy metals (mercury, arsenic) and organic substances. In addition, the reactivity of
these materials in simultaneously removing contaminants should be investigated. After that,
we can apply these materials in natural waters containing numerous pollutants. Secondly,
these materials should be scaled with attention about optimising the ratio of Fe to
borohydride to remain their reactivity but minimise the cost. Thirdly, other supports should
be trialled to adsorb bimetallic nanoparticles to evaluate their supporting effectiveness.
Trimetallic Pd-Cu-nZVI@Misi: Previous studies reported the introduction of Pd increased
nitrogen selectivity; however, this was not observed in our materials, potentially, due to the
low concentration of Pd. Therefore, an increase in Pd concentration and an alternation in the
ratio of Cu to Pd should be examined in order to determine the usefulness of these dopants.
Doped materials prepared via deposition method (MB1) reduced nitrate faster than those
prepared via co-reduction method (MA). However, the contrast was observed in the removal
of cadmium and chromium. Therefore, the effect of synthetic method on the reactivity of
materials towards heavy metals need further examination.
The non-doped nZVI@Misi was shut down whereas the doped systems remained active in
removing nitrate from natural water. The factors might be due to humics and sediments
which might form complexes with iron oxides on surface of nZVI. In contrast, bimetallic
nanoparticles might be protected by a dopant layer, maintaining the number of electrons
transferring from the Fe(0) core. This should be a further study area.
In contrast to the reactivity observed with nitrate, the non-doped nZVI@Misi was still active
when it was used to remove cadmium and lead in lake water. This could be due to the removal
mechanism of these metals by nZVI. One of the pathways of the removal of these ions is
adsorption that depends on the surface property. Therefore, the removal of chromium and
other metals that have significantly higher reduction potential than iron should be further
examined.

252
9. References
1. Fraser, H. P. Methods to improve nZVI adsorbance on silicates surface for nitrate reduction. Victoria University of Wellington, Library of Victoria University of Wellington, 2018. 2. Kang, H.; Xiu, Z.; Chen, J.; Cao, W.; Guo, Y.; Li, T.; Jin, Z., Environ Technol 2012, 33 (16-18), 2185-92. 3. Wang, Q.; Jeong, S. W.; Choi, H., Hazard Mater 2012, 213-214, 299-310. 4. Lubphoo, Y.; Chyan, J.-M.; Grisdanurak, N.; Liao, C.-H., Taiwan Institute of Chemical Engineers 2015, 57, 143-153. 5. Lubphoo, Y.; Chyan, J. M.; Grisdanurak, N.; Liao, C. H., Taiwan Institute of Chemical Engineers 2016, 59, 285-294. 6. Schrick, B.; Blough, J. L.; Jones, A. D.; Mallouk, T. E., Chemistry of Materials 2002, 14 (12), 5140-5147. 7. Nolan, B. T.; Ruddy, B. C.; Hitt, K. J.; Helsel, D. R., Environ. Sci. Technol. 1997, 31, 2229-2236. 8. Shrimali, M.; Singh, K. P., Environmental Pollution 2001, 112, 351- 359. 9. Samatya, S.; Kabay, N.; Yüksel, Ü.; Arda, M.; Yüksel, M., Reactive and Functional Polymers 2006, 66 (11), 1206-1214. 10. Huang, C.-P.; Wang, H.-W.; Chiu, P.-C., Water Res 1998, 32, 2257-2264. 11. Pan, J. R.; Huang, C.; Hsieh, W.-P.; Wu, B.-J., Separation and Purification Technology 2012, 84, 52-55. 12. Lohumi, N.; Gosain, S.; Jain, A.; Gupta, V. K.; Verma, K. K., Analytica Chimica Acta 2004, 505 (2), 231-237. 13. Holbrook, S. Farming communities face crisis over nitrate pollution, study says. https://thefern.org/2012/03/farming-communities-facing-crisis-over-nitrate-pollution-study-says/ (accessed May 2, 2019). 14. J Lin, C.; Lo, S. L., Water Res 2005, 39 (6), 1037-46. 15. Esmail, M. Y.; Astrofsky, K. M.; Lawrence, C.; Serluca, F. C., Chapter 20 - The Biology and Management of the Zebrafish. In Laboratory Animal Medicine (Third Edition), Fox, J. G.; Anderson, L. C.; Otto, G. M.; Pritchett-Corning, K. R.; Whary, M. T., Eds. Academic Press: Boston, 2015; pp 1015-1062. 16. Drozd, V. M.; Branovan, I.; Shiglik, N.; Lushchyk, M. L.; Platonova, T. Y.; Pashkevich, V. I.; Kudelsky, A. V.; Shimanskaya, I.; Danilova, L. I.; Biko, J.; Reiners, C., Cytology and Genetics 2016, 50 (6), 372-376. 17. Tajtakova, M.; Semanova, Z.; Tomkova, Z.; Szokeova, E.; Majoros, J.; Radikova, Z.; Sebokova, E.; Klimes, I.; Langer, P., Chemosphere 2006, 62 (4), 559-64. 18. Ward, M. H., Reviews on Environmental Health 2009, 24 (4), 357-363. 19. WHO A global overview of national regulations and standards for drinking-water quality. https://apps.who.int/iris/bitstream/handle/10665/272345/9789241513760-eng.pdf?ua=1 (accessed April 11, 2019). 20. Khan, F. A.; Ansari, A. A., The Botanical Review 2005, 71 (4), 449-482. 21. Khan, M. N.; Mohammad, F., Eutrophication: Challenges and Solutions. In Eutrophication: Causes, Consequences and Control, Ansari, A. A.; Gill, S. S., Eds. Springer, Dordrecht: 2014; Vol. 2, pp 1-15. 22. Dorgham, M. M., Effects of Eutrophication. In Eutrophication: Causes, Consequences and Control, Ansari, A. A.; Gill, S. S., Eds. Springer, Dordrecht: 2014; Vol. 2, pp 29-44. 23. Anderson, D. M.; Glibert, P. M.; M., B. J., Estuaries 2002, 25, 704-726. 24. European Commission: Nitrate pollution falling, but greater efforts still needed to meet water quality standards across the EU; European Commision, 2010. 25. Tirado, R. Nitrates in drinking water in the Philippines and Thailand; Greenpeace Research Laboratories, 2007.

253
26. Trends in nitrogen leaching from agriculture; Statistics New Zealand, 2017. 27. Nitrate leaching from livestock; Statistics New Zealand, 2019. 28. Our fresh water; Statistics New Zealand, 2017; p 55. 29. Baea, B.-U.; Junga, Y.-H.; Hana, W.-W.; Shin, H.-S., Water Research 2002, 36, 3330–3340. 30. Boumediene, M.; Achour, D., Desalination 2004, 168, 187-194. 31. Clifford, D.; Lin, C.-C.; Horng, L.-L.; Boegel, J. Nitrate removal from drinking water in Glendale, Arizona; United States Environmental Protection Agency: 1987. 32. Schoeman, J. J.; Steyn, A., Desalination 2003, 155, 15-26. 33. Archna; Sharma, S. K.; Sobti, R. C., E-Journal of Chemistry 2012, 9 (4), 1667-1675. 34. Mizuta, K.; Matsumoto, T.; Hatate, Y.; Nishihara, K.; Nakanishi, T., Bioresour Technol 2004, 95 (3), 255-7. 35. Mohsenipour, M.; Shahid, S.; Ebrahimi, K., Asian Journal of Chemistry 2014, 26 (23), 7881-7886. 36. Warneke, S.; Schipper, L. A.; Bruesewitz, D. A.; McDonald, I.; Cameron, S., Ecological Engineering 2011, 37 (3), 511-522. 37. Aslan, S.; Türkman, A., Water Science and Technology 2003, 48 (11-12), 489–495. 38. Hashemi, S. E.; Heidarpour, M.; Mostafazadeh-Fard, B., Water Science and Technology 2011, 63 (11), 2700-2706. 39. Volokita, M.; Belkin, S.; Abeliovich, A.; Soares, M. I. M., Water Research 1996, 30 (4), 965-971. 40. Nurizzo, C.; Mezzanotte, V., Wal. Sci. Tech. Vol. 26 1992, 26 (3-4), 827-834. 41. Hwang, Y. H.; Kim, D. G.; Shin, H. S., Hazard Mater 2011, 185 (2-3), 1513-1521. 42. Alowitz, M. J.; Scherer, M. M., Environmental Science & Technology 2002, 36 (3), 299-306. 43. Su, C.; Puls, R. W., Environ. Sci. Technol 2004, 38, 2715-2720. 44. Westerhoff, P.; James, J., Water Research 2003, 37 (8), 1818-1830. 45. Cheng, I. F.; Muftikian, R.; Fernando, Q.; Korte, N., Chemosphere, 1997, 35 (11), 2689-2695. 46. Jones, M. N., Water Res 1984, 18 (5), 643-646. 47. Kumar, M.; Chakraborty, S., Hazard Mater 2006, 135 (1-3), 112-21. 48. Li, X.-Q.; Elliott, D. W.; Zhang, W.-X., Critical Reviews in Solid State and Materials Sciences 2006, 31 (4), 111-122. 49. Wang, C.-B.; Zhang, W.-X., Environmental Science & Technology 1997, 31, 2154-2156. 50. Sohn, K.; Kang, S. W.; Ahn, S.; Woo, M.; Yan, S.-K., Environ. Sci. Technol 2006, 40, 5514-5519. 51. Savic-Gajic, I.; Savic, I.; Gajic, D., The role and health risk of heavy metals in human organism. In Heavy metals and health, Castillo, L., Ed. Nova Science: 2016; pp 47-89. 52. Nacke, H.; Goncalves, A. C., Jr.; Schwantes, D.; Nava, I. A.; Strey, L.; Coelho, G. F., Arch Environ Contam Toxicol 2013, 64 (4), 537-44. 53. Bramley, R. G. V., New Zealand Journal of Agricultural Research 2012, 33 (4), 505-519. 54. Removing lead-based paint. https://www.health.govt.nz/your-health/healthy-living/environmental-health/hazardous-substances/removing-lead-based-paint (accessed June 25th, 2019). 55. Jaishankar, M.; Tseten, T.; Anbalagan, N.; Mathew, B. B.; Beeregowda, K. N., Interdiscip Toxicol 2014, 7 (2), 60-72. 56. Kouba, A.; Buřič, M.; Kozák, P., Water, Air, & Soil Pollution 2009, 211 (1-4), 5-16. 57. Lindskog, S., Pharmacology & Therapeutics 1997, 74 (1), 1-20. 58. Messerschmidt, A., 8.14 - Copper Metalloenzymes. In Comprehensive Natural Products II, Liu, H.-W.; Mander, L., Eds. Elsevier: Oxford, 2010; pp 489-545. 59. Gupta, C. P., Applied Chemistry 2014, 7 (11), 38-46. 60. Oyaro, N.; Juddy, O.; Murago, E. N. M.; Gitonga, E., Food, Agriculture & Environment 2007, 5 (3-4), 119-121. 61. Sheng, P. X.; Ting, Y. P.; Chen, J. P.; Hong, L., J Colloid Interface Sci 2004, 275 (1), 131-41. 62. Goel, J.; Kadirvelu, K.; Rajagopal, C.; Kumar Garg, V., Hazard Mater 2005, 125 (1-3), 211-20.

254
63. Moore, M.; Goldberg, A.; Yeung, A., Lead Effects on the Heme Biosynthetic Pathway Relationship to Toxicity. 2006; Vol. 514, p 191-203. 64. Lewicki, S.; Zdanowski, R.; Krzyzowska, M.; Lewicka, A.; Debski, B.; Niemcewicz, M.; Goniewicz, M., Ann Agric Environ Med 2014, 21 (2), 331-5. 65. Gheju, M., Water, Air, & Soil Pollution 2011, 222 (1-4), 103-148. 66. Cohen, M. D.; Kargacin, B.; Klein, C. B.; Costa, M., Crit Rev Toxicol 1993, 23 (3), 255-81. 67. Kibria, G. Trace/heavy Metals and Its Impact on the Environment, Biodiversity and Human Health- A Short Review; 2016. 68. Ku, Y.; Jung, I.-L., Wat. Res. 2001, 35 (1), 135-142. 69. Baltpurvins, K. A.; Burns, R. C.; Lawrance, G. A.; Stuart, A. D., Wat. Res. 1997, 31 (5), 973-980. 70. Mirbagheri, S. A.; Hosseini, S. N., Desalination 2005, 171 (1), 85-93. 71. Ozverdi, A.; Erdem, M., Hazard Mater 2006, 137 (1), 626-32. 72. Chen, Q.; Luo, Z.; Hills, C.; Xue, G.; Tyrer, M., Water Res 2009, 43 (10), 2605-14. 73. Pang, F. M.; Kumar, P.; Teng, T. T.; Mohd Omar, A. K.; Wasewar, K. L., Taiwan Institute of Chemical Engineers 2011, 42 (5), 809-815. 74. Ying, X.; Fang, Z., Hazard Mater 2006, 137 (3), 1636-42. 75. Chang, Y.-K.; Chang, J.-E.; Lin, T.-T.; Hsu, Y.-M., Hazardous Materials 2002, B94, 89–99. 76. Abo-Farha, S. A.; Abdel-Aal, A. Y.; Ashour, I. A.; Garamon, S. E., J Hazard Mater 2009, 169 (1-3), 190-4. 77. Alyuz, B.; Veli, S., Hazard Mater 2009, 167 (1-3), 482-8. 78. Kang, S. Y.; Lee, J. U.; Moon, S. H.; Kim, K. W., Chemosphere 2004, 56 (2), 141-7. 79. Motsi, T.; Rowson, N. A.; Simmons, M. J. H., International Journal of Mineral Processing 2009, 92 (1-2), 42-48. 80. Ostroski, I. C.; Barros, M. A.; Silva, E. A.; Dantas, J. H.; Arroyo, P. A.; Lima, O. C., J Hazard Mater 2009, 161 (2-3), 1404-12. 81. Taffarel, S. R.; Rubio, J., Minerals Engineering 2009, 22 (4), 336-343. 82. Dabrowski, A.; Hubicki, Z.; Podkościelny, P.; Robens, E., Chemosphere 2004, 56 (2), 91-106. 83. Shrivastava, P. K.; Gupta, S. K., Chemical Sciences and Applications 2015, 6 (1). 84. Fu, F.; Wang, Q., Environ Manage 2011, 92 (3), 407-18. 85. Jusoh, A.; Su Shiung, L.; Ali, N. a.; Noor, M. J. M. M., Desalination 2007, 206 (1-3), 9-16. 86. Kang, K. C.; Kim, S. S.; Choi, J. W.; Kwon, S. H., Industrial and Engineering Chemistry 2008, 14 (1), 131-135. 87. Wang, H.; Zhou, A.; Peng, F.; Yu, H.; Yang, J., Colloid Interface Sci 2007, 316 (2), 277-83. 88. Kabbashi, N. A.; Atieh, M. A.; Al-Mamun, A.; Mirghami, M. E. S.; Alam, M. D. Z.; Yahya, N., Environmental Sciences 2009, 21 (4), 539-544. 89. Arias, M.; Barral, M. T.; Mejuto, J. C., Chemosphere 2002, 48, 1081–1088. 90. Suraj, G.; Iyer, C. S. P.; Lalithambika, M., Applied Clay Science 1998, 13, 293–306. 91. Yavuza, O.; Altunkaynak, Y.; Guzel, F., Water Research 2003, 37, 948–952. 92. Angove, M. J.; Wells, J. D.; Johnson, B. B., Colloids and Surfaces 1999, 146, 243–251. 93. Wu, Z.; Gu, Z.; Wang, X.; Evans, L.; Guo, H., Environmental Pollution 2003, 121, 469–475. 94. Collins, C. R.; Ragnarsdottir, K. V.; Sherman, D. M., Geochimica et Cosmochimica Acta 1999, 63 (19/20), 2989–3002. 95. Naseem, R.; Tahir, S. S., Wat. Res. 2001, 35 (16), 3982–3986. 96. Erdem, M.; Altundoğan, H. S.; Tümen, F., Minerals Engineering 2004, 17 (9-10), 1045-1052. 97. Bayat, B., Hazardous Materials 2002, B95, 275–290. 98. Sheng, G.; Wang, S.; Hu, J.; Lu, Y.; Li, J.; Dong, Y.; Wang, X., Colloids and Surfaces A: Physicochemical and Engineering Aspects 2009, 339 (1-3), 159-166. 99. Apiratikul, R.; Pavasant, P., Chemical Engineering Journal 2008, 144 (2), 245-258. 100. Apiratikul, R.; Pavasant, P., Bioresour Technol 2008, 99 (8), 2766-77. 101. Ajjabi, L. C.; Chouba, L., Environ Manage 2009, 90 (11), 3485-9. 102. Pan, J.-h.; Liu, R.-x.; Tang, H.-x., Environmental Sciences 2007, 19 (4), 403-408.

255
103. Quintelas, C.; Rocha, Z.; Silva, B.; Fonseca, B.; Figueiredo, H.; Tavares, T., Chemical Engineering Journal 2009, 152 (1), 110-115. 104. Amini, M.; Younesi, H.; Bahramifar, N., Colloids and Surfaces A: Physicochemical and Engineering Aspects 2009, 337 (1-3), 67-73. 105. Tsekova, K.; Todorova, D.; Dencheva, V.; Ganeva, S., Bioresour Technol 2010, 101 (6), 1727-31. 106. Labanda, J.; Khaidar, M. S.; Llorens, J., Desalination 2009, 249 (2), 577-581. 107. Mohsen-Nia, M.; Montazeri, P.; Modarress, H., Desalination 2007, 217 (1-3), 276-281. 108. Murthy, Z. V.; Chaudhari, L. B., Hazard Mater 2008, 160 (1), 70-7. 109. Murthy, Z. V. P.; Chaudhari, L. B., Chemical Engineering Journal 2009, 150 (1), 181-187. 110. Figoli, A.; Cassano, A.; Criscuoli, A.; Mozumder, M. S.; Uddin, M. T.; Islam, M. A.; Drioli, E., Water Res 2010, 44 (1), 97-104. 111. Sun, Y.; Li, J.; Huang, T.; Guan, X., Water Research 2016, 100, 277-295. 112. Rangsivek, R.; Jekel, M. R., Water Research 2005, 39 (17), 4153-4163. 113. Feng, P.; Guan, X.; Sun, Y.; Choi, W.; Qin, H.; Wang, J.; Qiao, J.; Li, L., Journal of Environmental Sciences 2015, 31, 175-183. 114. Jassam, S. H.; Nasir, M. J., Kerbala University 2013, 11 (3). 115. Sheet, I.; Kabbani, A.; Holail, H., Energy Procedia 2014, 50, 130-138. 116. Li, X.-Q.; Zhang, W.-X., Phys. Chem. C 2007, 111, 6939-6946. 117. Ponder, S. M.; Darab, J. G.; Mallouk, T. E., Environ. Sci. Technol. 2000, 34, 2564-2569. 118. Agrawal, A.; Tratnyek, P. G., Environ. Sci. Technol. 1996, 30, 153-160. 119. Liou, Y. H.; Lo, S.-L.; Lin, C.-J.; Kuan, W. H.; Weng, S. C., Journal of Hazardous Materials 2005, 126 (1), 189-194. 120. Agrawal, A.; Ferguson, W. J.; Gardner, B. O.; Christ, J. A.; Bandstra, J. Z.; Tratnyek, P. G., Environmental Science & Technology 2002, 36 (20), 4326-4333. 121. Tsai, Y. J.; Chou, F. C.; Cheng, T. C., Hazard Mater 2009, 163 (2-3), 743-7. 122. Stefaniuk, M.; Oleszczuk, P.; Ok, Y. S., Chemical Engineering Journal 2016, 287, 618-632. 123. Zhang, W.-x.; Wang, C.-B.; Lien, H.-L., Catalysis Today 1998, 40, 387-395. 124. Martin, J. E.; Herzing, A. A.; Yan, W.; Li, X.-q.; Koel, B. E.; Kiely, C. J.; Zhang, W.-x., Langmuir 2008, 24 (8), 4329–4334. 125. Tratnyek, P. G.; Johnson, R. L., Nano Today 2006, 1 (2), 44-48. 126. Liou, Y. H.; Lo, S. L.; Lin, C. J.; Kuan, W. H.; Weng, S. C., Hazard Mater 2005, 127 (1-3), 102-10. 127. Rosická, D.; Šembera, J., Nanoscale Research Letters 2011, 6 (1), 527. 128. O’Carroll, D.; Sleep, B.; Krol, M.; Boparai, H.; Kocur, C., Advances in Water Resources 2013, 51, 104-122. 129. Kuhn, L. T.; Bojesen, A.; Timmermann, L.; Nielsen, M. M.; Mørup, S., Journal of Physics: Condensed Matter 2002, 14 (49), 13551-13567. 130. Nurmi, J. T.; Tratnyek, P. G.; Sarathy, V.; Baer, D. R.; Amonette, J. E.; Pecher, K.; Wang, C.; Linehan, J. C.; Matson, D. W.; Penn, R. L.; Driessen, M. D., Environmental Science & Technology 2005, 39 (5), 1221-1230. 131. Liu, Y.; Majetich, S. A.; Tilton, R. D.; Sholl, D. S.; Lowry, G. V., Environmental Science & Technology 2005, 39 (5), 1338-1345. 132. Sun, Y.-P.; Li, X.-q.; Cao, J.; Zhang, W.-x.; Wang, H. P., Advances in Colloid and Interface Science 2006, 120 (1), 47-56. 133. Kim, H.-S.; Ahn, J.-Y.; Hwang, K.-Y.; Kim, I.-K.; Hwang, S., Environ. Sci. Technol. 2010, 44, 1760–1766. 134. Mu, Y.; Jia, F.; Ai, Z.; Zhang, L., Environ. Sci.: Nano 2017, 4, 27–45. 135. Olegario, J. T.; Yee, N.; Miller, M.; Sczepaniak, J.; Manning, B., Journal of Nanoparticle Research 2010, 12 (6), 2057-2068. 136. Boparai, H. K.; Joseph, M.; O'Carroll, D. M., Environ Sci Pollut Res Int 2013, 20 (9), 6210-21.

256
137. Kržišnik, N.; Mladenovič, A.; Škapin, A. S.; Škrlep, L.; Ščančar, J.; Milačič, R., Science of The Total Environment 2014, 476-477, 20-28. 138. Suzuki, T.; Moribe, M.; Oyama, Y.; Niinae, M., Chemical Engineering Journal 2012, 183, 271-277. 139. Liu, H. B.; Chen, T. H.; Chang, D. Y.; Chen, D.; Liu, Y.; He, H. P.; Yuan, P.; Frost, R., Materials Chemistry and Physics 2012, 133 (1), 205-211. 140. Chen, S.-S.; Hsu, H.-D.; Li, C.-W., Nanoparticle Research 2004, 6 (6), 639-647. 141. Kassaee, M. Z.; Motamedi, E.; Mikhak, A.; Rahnemaie, R., Chemical Engineering Journal 2011, 166 (2), 490-495. 142. Machado, S.; Pinto, S. L.; Grosso, J. P.; Nouws, H. P.; Albergaria, J. T.; Delerue-Matos, C., Sci Total Environ 2013, 445-446, 1-8. 143. Sohn, K.; Kang, S. W.; Ahn, S.; Woo, M.; Yang, S.-K., Environ. Sci. Technol. 2006, 40, 5514-5519. 144. Li, X.-q.; Zhang, W.-x., Langmuir 2006, 22, 4638-4642. 145. Liou, Y. H.; Lo, S. L.; Kuan, W. H.; Lin, C. J.; Weng, S. C., Water Res 2006, 40 (13), 2485-92. 146. G. N. Glavee; K. J. Klabunde; Sorensen, C. M.; Hadjipanayis, G. C., Inorg. Chem 1995, 34, 28-35. 147. Park, H.; Park, Y. M.; Oh, S. K.; You, K. M.; Lee, S. H., Environ Technol 2009, 30 (3), 261-7. 148. Wang, W.; Jin, Z. H.; Li, T. L.; Zhang, H.; Gao, S., Chemosphere 2006, 65 (8), 1396-404. 149. Hwang, Y.-H.; Kim, D.-G.; Shin, H.-S., Applied Catalysis B: Environmental 2011, 105 (1-2), 144-150. 150. Liu, Y.; Phenrat, T.; Lowry, G. V., Environmental Science & Technology 2007, 41 (22), 7881-7887. 151. Zhuang, Y.; Ahn, S.; Seyfferth, A. L.; Masue-Slowey, Y.; Fendorf, S.; Luthy, R. G., Environ Sci Technol 2011, 45 (11), 4896-903. 152. Fagerlund, F.; Illangasekare, T. H.; Phenrat, T.; Kim, H. J.; Lowry, G. V., Contam Hydrol 2012, 131 (1-4), 9-28. 153. Lien, H.-L.; Zhang, W.-x., Environmental Engineering 1999, 125 (11), 1042-1047. 154. Huang, P.; Ye, Z.; Xie, W.; Chen, Q.; Li, J.; Xu, Z.; Yao, M., Water Res 2013, 47 (12), 4050-8. 155. Calderon, B.; Fullana, A., Water Res 2015, 83, 1-9. 156. Choe, S.; Chang, Y.-Y.; Hwang, K.-Y.; Khim, J., Chemosphere 2000, 41, 1307-1311. 157. Yang, G. C.; Lee, H. L., Water Res 2005, 39 (5), 884-94. 158. Khalil, A. M. E.; Eljamal, O.; Jribi, S.; Matsunaga, N., Chemical Engineering Journal 2016, 287, 367–380. 159. Grieger, K. D.; Fjordboge, A.; Hartmann, N. B.; Eriksson, E.; Bjerg, P. L.; Baun, A., Contam Hydrol 2010, 118 (3-4), 165-83. 160. Xie, Y.; Dong, H.; Zeng, G.; Tang, L.; Jiang, Z.; Zhang, C.; Deng, J.; Zhang, L.; Zhang, Y., J Hazard Mater 2017, 321, 390-407. 161. El-Temsah, Y. S.; Joner, E. J., Environmental Toxicology 2012, 27 (1), 42-49. 162. Yan, W.; Herzing, A. A.; Kiely, C. J.; Zhang, W. X., Contam Hydrol 2010, 118 (3-4), 96-104. 163. Shand, M.; Anderson, J. A., Catalysis Science & Technology 2013, 3 (4), 879-899. 164. Fanning, J. C., Coordination Chemistry Reviews 2000, 199, 159–179. 165. An, Y.; Li, T.; Jin, Z.; Dong, M.; Li, Q., Desalination 2010, 252 (1-3), 71-74. 166. Sohn, K.; Kang, S. W.; Ahn, S.; Woo, M.; Yang, S.-K., Environ Sci Technol 2006, 40 ( 17), 5514–5519. 167. Ryu, A.; Jeong, S.-W.; Jang, A.; Choi, H., Applied Catalysis B: Environmental 2011, 105 (1-2), 128-135. 168. Kanel, S.; Manning, B.; Charlet, L.; Choi, H., Environ Sci Technol 2005, 39 (5), 1291-1298. 169. Zhang, Y.; Su, Y.; Zhou, X.; Dai, C.; Keller, A. A., Hazard Mater 2013, 263 Pt 2, 685-93. 170. Dai, C.; Zhou, Z.; Zhou, X.; Zhang, Y., Water, Air, & Soil Pollution 2013, 225 (1). 171. Li, X.-Q.; Cao, J.; Zhang, W.-X., Ind. Eng. Chem. Res. 2008, 47, 2131-2139. 172. Zhou, S.; Li, Y.; Chen, J.; Liu, Z.; Wang, Z.; Na, P., RSC Advances 2014, 4 (92), 50699-50707.

257
173. Lin, Y.; Chen, Z.; Megharaj, M.; Naidu, R., Journal of Colloid and Interface Science 2012, 381 (1), 30-35. 174. Gautam, R. K.; Rawat, V.; Banerjee, S.; Sanroman, M. A.; Soni, S.; Singh, S. K.; Chattopadhyaya, M. C., Journal of Molecular Liquids 2015, 212, 227-236. 175. Tehrani, M. R. F.; Vossoughi, M.; Shamsai, A., Environment Protection Engineering 2014, 40, 75-86. 176. Han, Y.; Yan, W., Water Res 2014, 66, 149-59. 177. Saberi, A., Iranica Journal of Energy & Environment 2012, 3 (2), 189-196. 178. Krasae, N.; Wantala, K.; Tantriratna, P.; Grisdanurak, N., App. Envi. Res. 2014, 36 (2), 15-23. 179. Guo, J.; Guo, P.; Yu, M.; Sun, Z.; Li, P.; Yang, T.; Liu, J.; Zhang, L., Polish Journal of Environmental Studies 2018, 27 (5), 2023-2028. 180. Muradova, G. G.; Gadjieva, S. R.; Palma, L. D.; Vilardi, G., Chemical Engineering Transactions 2016, 47. 181. Hosseini, S. M.; Ataie-Ashtiani, B.; Kholghi, M., Nitrate reduction by nano-Fe/Cu particles in packed column. 2011; Vol. 276, p 214-221. 182. Muradova, G. G.; Gadjieva, S. R.; Palma, L. D.; Vilardi, G., Chemical Engineering Transactions 2016, 47, 205-210. 183. Lien, H.-L.; Zhang, W.-X., Applied Catalysis B: Environmental 2007, 77 (1-2), 110-116. 184. Shih, Y.-h.; Chen, M.-Y.; Su, Y.-F., Applied Catalysis B: Environmental 2011, 105 (1-2), 24-29. 185. Wang, X.; Chen, C.; Chang, Y.; Liu, H., Hazard Mater 2009, 161 (2-3), 815-23. 186. Zhang, Z.; Shen, Q.; Cissoko, N.; Wo, J.; Xu, X., J Hazard Mater 2010, 182 (1-3), 252-8. 187. Gong, J.; Lee, C.-S.; Chang, Y.-Y.; Chang, Y.-S., Journal of hazardous materials 2015, 286, 107-117. 188. Su, Y.; Adeleye, A. S.; Huang, Y.; Sun, X.; Dai, C.; Zhou, X.; Zhang, Y.; Keller, A. A., Water research 2014, 63, 102-111. 189. Daud, M.; Khan, Z.; Ashgar, A.; Danish, M. I.; Qazi, I. A., Nanotechnology 2015, 2015, 1-7. 190. Liou, Y. H.; Lin, C. J.; Weng, S. C.; Ou, H. H.; Lo, S. L., Environ. Sci. Technol. 2009, 43, 2482–2488. 191. Wang, T.; Su, J.; Jin, X.; Chen, Z.; Megharaj, M.; Naidu, R., Hazard Mater 2013, 262, 819-25. 192. Shi, L.; Du, J.; Chen, Z.; Megharaj, M.; Naidu, R., Colloid Interface Sci 2014, 428, 302-307. 193. He, Y.; Lin, H.; Dong, Y.; Li, B.; Wang, L.; Chu, S.; Luo, M.; Liu, J., Chemical Engineering Journal 2018, 347, 669-681. 194. Zeng, Y.; Walker, H.; Zhu, Q., Hazard Mater 2017, 324 (Pt B), 605-616. 195. Zhang, Y.; Li, Y.; Li, J.; Hu, L.; Zheng, X., Chemical Engineering Journal 2011, 171 (2), 526-531. 196. Wu, L.; Ritchie, S. M., Chemosphere 2006, 63 (2), 285-92. 197. Lu H., T. B., Wang J., Hao H., Chemical Engineering Transactions 2017, 60, 169-174. 198. Wang, J.; Ji, B.; Shu, Y.; Chen, W.; Zhu, L.; Chen, F., Polish Journal of Environmental Studies 2018, 27 (6), 2785-2792. 199. Cai, X.; Gao, Y.; Sun, Q.; Chen, Z.; Megharaj, M.; Naidu, R., Chemical Engineering 2014, 244, 19-26. 200. Doong, R.-A.; Saha, S.; Lee, C.-H.; Lin, H.-P., RSC Advances 2015, 5 (110), 90797-90805. 201. Zhou, Y.; Kuang, Y.; Li, W.; Chen, Z.; Megharaj, M.; Naidu, R., Chemical Engineering Journal 2013, 223, 68-75. 202. Wang, X.; Le, L.; Alvarez, P. J. J.; Li, F.; Liu, K., Taiwan Institute of Chemical Engineers 2015, 50, 297-305. 203. Bragança, L. F. F. P. G.; Avillez, R. R.; Moreira, C. R.; Pais da Silva, M. I., Materials Chemistry and Physics 2013, 138 (1), 17-28. 204. Kakavandi, B.; Kalantary, R. R.; Farzadkia, M.; Mahvi, A. H.; Esrafili, A.; Azari, A.; Yari, A. R.; Javid, A. B., Environmental Health Science & Engineering 2014, 12. 205. General guide to Microsilica; Auckland. 206. Chisholm, D. H., Performance characteristics of concrete incorporating a natural amorphous silica. In The third CANMET/ACI International conference, Auckland, New Zealand, 1997.

258
207. Walker, R.; Pavía, S., Materials and Structures 2010, 44 (6), 1139-1150. 208. Qiu, X.; Fang, Z.; Liang, B.; Gu, F.; Xu, Z., Hazard Mater 2011, 193, 70-81. 209. Ensie, B.; Samad, S., Desalination 2014, 347, 1-9. 210. American Public Health Association, A. W. W. A., Water Environment Federation, Standard Methods for the Examination of Water and Wastewater. In Nitrogen (nitrate), 1999. 211. American Public Health Association, A. W. W. A., Water Environment Federation, Standard Methods for the Examination of Water and Wastewater. In Determination of anions by ion chromatography, 1999. 212. Harris, D. C., Quantitative chemical analysis. 6 th ed.; New York, 2003. 213. Jeol, Invitation to the SEM World. Japan. 214. Wen, J. G., Transmission Electron Microscopy. In Practical Materials Characterization, Sardela, M., Ed. Springer: New York, 2014; pp 189-229. 215. Font-Bardia, M.; Alcobé, X., X-ray single crystal and powder difraction: posibilities and applications. Spain. 216. Dinnebier, R. E.; Billinge, S. J. L., Principles of Powder Diffraction. Royal Society of Chemistry, 2008. 217. Housecroft, C. E.; Sharpe, A. G., Inorganic Chemistry. Italy, 2012; p 121-124. 218. Liu, J.; Wang, C.; Shi, J.; Liu, H.; Tong, Y., Hazard Mater 2009, 163 (1), 370-5. 219. Haddad, P. R., Anal Bioanal Chem 2004, 379 (3), 341-3. 220. Weiss, J., Handbook of Ion Chromatography. 4th ed.; Wiley-VCH: 2016. 221. Khan, H. U., The Role of Ion Exchange Chromatography in Purification and Characterization of Molecules. In Ion Exchange Technologies, Kilislioglu, A., Ed. IntechOpen, 2012. 222. Elkin, K.; Riviello, J.; Small, H., Journal of Chromatography A 2015, 1403, 63-69. 223. Karu, N.; Hutchinson, J. P.; Dicinoski, G. W.; Hanna-Brown, M.; Srinivasan, K.; Pohl, C. A.; Haddad, P. R., Journal of Chromatography A 2012, 1253, 44-51. 224. Wahab, M. F.; Anderson, J. K.; Abdelrady, M.; Lucy, C. A., Analytical chemistry 2014, 86 (1), 559-66. 225. Kapinus, E. N.; Revelsky, I. A.; Ulogov, V. O.; Lyalikov, Y. A., Journal of Chromatography B 2004, 800 (1-2), 321-323. 226. Ito, K.; Nomura, R.; Fujii, T.; Tanaka, M.; Tsumura, T.; Shibata, H.; Hirokawa, T., Analytical and bioanalytical chemistry 2012, 404 (8), 2513-7. 227. Tirumalesh, K., Talanta 2008, 74 (5), 1428-1434. 228. Connolly, D.; Paull, B., Analytica Chimica Acta 2001, 441 (1), 53-62. 229. Hu, W.; Haddad, P. R.; Hasebe, K.; Tanaka, K.; Tong, P.; Khoo, C., Analytical chemistry 1999, 71 (8), 1617-1620. 230. Burrows, A.; Holman, J.; Parsons, A.; Pilling, G.; Price, G., Chemistry3 introducing inorganic, organic and physical chemistry. Oxford University Press: New York, 2009. 231. Krug, F. J.; Růžička, J.; Hansen, E. H., Analyst 1979, 104, 47-54. 232. Elzea, J. M.; Rice, S. B., Clays and Clay Minerals 1996, 44 (4), 492-500. 233. Su, J.; Lin, S.; Chen, Z.; Megharaj, M.; Naidu, R., Desalination 2011, 280 (1-3), 167-173. 234. Choe, S.; Liljestrand, H. M.; Khim, J., Applied Geochemistry 2004, 19 (3), 335-342. 235. Sparis, D.; Mystrioti, C.; Xenidis, A.; Papassiopi, N., Desalination and Water Treatment 2013, 51 (13-15), 2926-2933. 236. Liou, Y. H.; Lo, S. L.; Lin, C. J.; Hu, C. Y.; Kuan, W. H.; Weng, S. C., Environ. Sci. Technol. 2005, 39, 9643-9648. 237. Keen, O. S.; Love, N. G.; Linden, K. G., 10 - Nitrate Photochemistry in the Context of Water Reclamation. 2014; p 229-246. 238. Liu, J.; Lei, D.; Li, Q., Renewable Energy 2016, 86, 949-954. 239. Huang, Y. H.; Zhang, T. C., Water Res 2004, 38 (11), 2631-2642. 240. Zhang, T. C.; Huang, Y. H., Environmental Engineering 2005, 131 (3), 461-470.

259
241. Zhang, H.; Jin, Z.-H.; Han, L.; Qin, C.-H., Transactions of Nonferrous Metals Society of China 2006, 16, 345-349. 242. Kim, D.-G.; Hwang, Y.-H.; Shin, H.-S.; Ko, S.-O., KSCE Journal of Civil Engineering 2015, 20 (1), 175-187. 243. Li, P.; Lin, K.; Fang, Z.; Wang, K., Cleaner Production 2017, 151, 21-33. 244. An, Y.; Li, T.; Jin, Z.; Dong, M.; Xia, H.; Wang, X., Bioresour Technol 2010, 101 (24), 9825-8. 245. Bae, S.; Hamid, S.; Jung, J.; Sihn, Y.; Lee, W., Environmental Technology 2016, 37 (9), 1077-1087. 246. Lee, C.; Sedlak, D. L., Environmental Science & Technology 2008, 42 (22), 8528-8533. 247. Liu, H.; Guo, M.; Zhang, Y., Environmental Technology 2014, 35 (7), 917-924. 248. Jung, J.; Bae, S.; Lee, W., Applied Catalysis B: Environmental 2012, 127, 148-158. 249. John E. Martin; Andrew A. Herzing; Weile Yan; Xiao-Qin Li; Bruce E. Koel; Christopher J. Kiely; Zhang, W.-X., Langmuir 2008, 24, 4329-4334. 250. Wang, C. M.; Baer, D. R.; Thomas, L. E.; Amonette, J. E.; Antony, J.; Qiang, Y.; Duscher, G., Applied Physics 2005, 98 (9), 094308. 251. Su, Y.; Adeleye, A. S.; Huang, Y.; Sun, X.; Dai, C.; Zhou, X.; Zhang, Y.; Keller, A. A., Water Res 2014, 63, 102-111. 252. Liou, Y.-H.; Lo, S.-L.; Weng, S.-C., Western Pacific Earth Sciences 2010, 10, 41-56. 253. Sarathy, V.; Tratnyek, P. G.; Nurmi, J. T.; Baer, D. R.; Amonette, J. E.; Chun, C. L.; Penn, R. L.; Reardon, E. J., The Journal of Physical Chemistry C 2008, 112 (7), 2286-2293. 254. Wang, Q.; Lee, S.; Choi, H., The Journal of Physical Chemistry C 2010, 114 (5), 2027-2033. 255. Liu, Y.; Lowry, G. V., Environmental Science & Technology 2006, 40 (19), 6085-6090. 256. Zhu, B.-W.; Lim, T.-T., Environmental Science & Technology 2007, 41 (21), 7523-7529. 257. American Public Health Association, A. W. W. A., Water Environment Federation, Standard Methods for the Examination of Water and Wastewater. In 4500-O Oxygen (dissolved), 1999. 258. Reinsch, B. C.; Forsberg, B.; Penn, R. L.; Kim, C. S.; Lowry, G. V., Environ. Sci. Technol. 2010, 44, 3455–3461. 259. . 260. Hwang, Y.; Kim, D.; Shin, H. S., Environ Technol 2015, 36 (9-12), 1178-87. 261. Ostergren, J. D.; Brown, G. E., Jr.; Parks, G. A.; Persson, P., Colloid Interface Sci 2000, 225 (2), 483-493. 262. Hua, Y.; Wang, W.; Huang, X.; Gu, T.; Ding, D.; Ling, L.; Zhang, W. X., Chemosphere 2018, 201, 603-611. 263. Zhu, F.; Li, L.; Ren, W.; Deng, X.; Liu, T., Environ Pollut 2017, 227, 444-450. 264. Chen, H.; Luo, H.; Lan, Y.; Dong, T.; Hu, B.; Wang, Y., J Hazard Mater 2011, 192 (1), 44-53. 265. Stumm, W.; Morgan, J. J., Aquatic Chemistry: Chemical Equilibria and Rates in Natural Waters. 3rd ed.; John Wiley & Sons: New York, Chichester, Brisbane, Toronto, Singapore, 1996; Vol. 126. 266. Kim, D.-G.; Hwang, Y.-H.; Shin, H.-S.; Ko, S.-O., Environmental Technology 2013, 34 (12), 1625-1635. 267. Kim, D.-G.; Hwang, Y.-H.; Shin, H.-S.; Ko, S.-O., Desalination and Water Treatment 2012, 49 (1-3), 147-156. 268. Ruangchainikom, C.; Liao, C. H.; Anotai, J.; Lee, M. T., Chemosphere 2006, 63 (2), 335-43. 269. Gibbs, M. M.; White, E., Hydrobiologia 1994, 275 (1), 467-477. 270. Gibbs, M. Lake Horowhenua Review: Assessment of Opportunities to Address Water Quality Issues in Lake Horowhenua; NIWA, 2011. 271. https://www.horizons.govt.nz/HRC/media/Media/Water/Lake-Horowhenua-Report-122017.pdf?ext=.pdf (accessed 25 March, 2019). 272. Feng, J.; Zhu, B.-w.; Lim, T.-T., Chemosphere 2008, 73 (11), 1817-1823. 273. Tan, L.; Liang, B.; Fang, Z.; Xie, Y.; Tsang, E. P., Journal of Nanoparticle Research 2014, 16 (12), 2786. 274. Zhang, Z.; Cissoko, N.; Wo, J.; Xu, X., J Hazard Mater 2009, 165 (1-3), 78-86.

260
275. Sutak, R.; Botebol, H.; Blaiseau, P. L.; Leger, T.; Bouget, F. Y.; Camadro, J. M.; Lesuisse, E., Plant Physiol 2012, 160 (4), 2271-84. 276. Sunda, W. G.; Huntsman, S. A., Marine Chemistry 1995, 50 (1), 189-206. 277. Iron in Drinking-water, Background document for development of WHO Guidelines for Drinking-water Quality; WHO, 1996. 278. Boparai, H. K.; Joseph, M.; O'Carroll, D. M., J Hazard Mater 2011, 186 (1), 458-65. 279. Soto Hidalgo, K. T.; Guzmán-Blas, R.; Ortiz-Quiles, E. O.; Fachini, E. R.; Corchado-García, J.; Larios, E.; Zayas, B.; José-Yacamán, M.; Cabrera, C. R., RSC Advances 2015, 5 (4), 2777-2784. 280. Zhang, Y.; Li, Y.; Dai, C.; Zhou, X.; Zhang, W., Chemical Engineering Journal 2014, 244, 218-226. 281. Liu, T.; Yang, X.; Wang, Z. L.; Yan, X., Water Res 2013, 47 (17), 6691-700. 282. Ma, L.; Wei, Q.; Chen, Y.; Song, Q.; Sun, C.; Wang, Z.; Wu, G., R Soc Open Sci 2018, 5 (2), 171051. 283. Zarime, N. A.; Yaacob, W. Z. W.; Jamil, H., 2018, 1940, 020029. 284. Fu, R.; Yang, Y.; Xu, Z.; Zhang, X.; Guo, X.; Bi, D., Chemosphere 2015, 138, 726-34. 285. Moazeni, M.; Ebrahimi, A.; Rafiei, N.; Pourzamani, H. R., Health Scope 2016, 6 (2). 286. Yu, C.; Shao, J.; Sun, W.; Yu, X., Arabian Journal of Chemistry 2018. 287. Dawagreh, A. K.; Hailat, M.; Hussam Alkhasawneh, A., Evaluation of natural zeolite as sorbent material for the removal of lead from waste water. 2017; Vol. 36, p 67-74. 288. Rahmani, A. R.; Samadi, M. T.; Noroozi, R., Environmental and Ecological Engineering 2011, 5 (2). 289. Jabeen, H.; Chandra, V.; Jung, S.; Lee, J. W.; Kim, K. S.; Kim, S. B., Nanoscale 2011, 3 (9), 3583-5. 290. Lv, X.; Xu, J.; Jiang, G.; Xu, X., Chemosphere 2011, 85 (7), 1204-9. 291. Lu, H.; Tian, B.; Wang, J.; Hao, H., Chemical Engineering Transactions 2017, 60. 292. Bhattacharyya, K. G.; Sen Gupta, S., Industrial & Engineering Chemistry Research 2006, 45 (21), 7232-7240. 293. Li, Y.; Yue, Q.-Y.; Gao, B.-Y., Applied Clay Science 2010, 48 (3), 481-484. 294. Tewari, N.; Guha, B. K.; Vasudevan, P., Adsorption study of hexavalent chromium by bentonite clay. 2005; Vol. 17, p 2184-2190. 295. Fan, Z.; Zhang, Q.; Gao, B.; Li, M.; Liu, C.; Qiu, Y., Chemosphere 2019, 217, 85-94. 296. Imani, S.; Rezaei-Zarchi, S.; Hashemi, M.; Borna, H.; Javid, A.; Zand, A. m.; Abarghouei, H. B., Medicinal Plants Research 2011, 5 (13), 2775-2780. 297. Figueira, M. M., Biotechnology and Bioengineering 1997, 54 (4), 344-350. 298. Garcia-Casal, M. N.; Pereira, A. C.; Leets, I.; Ramirez, J.; Quiroga, M. F., The Journal of Nutrition 2007, 137 (12), 2691-2695.

261
Appendix
A. XRD spectra
A.1. XRD spectrum of 5%Ni-nZVI@MisiCFeOOH-MB1.
A.2. XRD spectrum of 5%Cu-nZVI@MisiCFeOOH-MA.

262
A.3. XRD spectrum of 5%Cu-nZVI@MisiCFeOOH-MB1.
A.4. XRD spectrum of 0.5%Pd-5%Cu-nZVI@MisiCFeOOH-MAtri.

263
A.5. XRD spectrum of 0.5%Pd-5%Cu-nZVI@MisiCFeOOH-MC1.
B. Complete TEM-EDS spectra
B.1. TEM-EDS spectrum of 5%Ni-nZVI@MisiCFeOOH-MA.

264
B.2. TEM-EDS spectrum of 5%Ni-nZVI@MisiCFeOOH-MB1.
B.3. TEM-EDS spectrum of 5%Ni-nZVI@MisiCFeOOH-MB2.

265
B.4. TEM-EDS spectra of 5%Cu-nZVI@MisiCFeOOH-MA in different areas a, b, and c. Area c is
in the next page.
a
b

266
B.4. TEM-EDS spectra of 5%Cu-nZVI@MisiCFeOOH-MA in different areas a, b, and c. Areas a
and b are in the previous page.
.
B.5. TEM-EDS spectrum of 5%Cu-nZVI@MisiCFeOOH-MB1.
c

267
B.6. TEM-EDS spectrum of 0.5%Pd-5%Cu-nZVI@MisiCFeOOH-MC1.
B.7. TEM-EDS spectrum of 5%Ni-nZVI@MisiCFeOOH-MB1 after reduction of 10 ppm nitrate-
N (0.150 g material, 25 mL of solution, under anaerobic conditions, 15 minutes).

268
B.8. TEM-EDS spectrum of 5%Ni-nZVI@MisiCFeOOH-MB1 after reduction of 50 ppm nitrate-
N (0.150 g material, 25 mL of solution, under anaerobic conditions, 120 minutes).

269
C. List of chemicals used
Name Source Purity
Cadmium standard for AAS Sigma Aldrich
CdCl2 Sigma Aldrich 99.99%
Chromium standard for AAS Sigma Aldrich
Copper standard for AAS Sigma Aldrich
Ethanol (absolute) Fisher Chemical AR Grade
FeSO4·7H2O Riedel-deHaën 99.5%
HNO3 Sigma Aldrich 68 - 70%
HgI2 Sigma Aldrich 99.0%
Iron standard for AAS Sigma Aldrich
KCl Sigma-Aldrich 99.0%
K2Cr2O7 Sigma-Aldrich 99.0%
K2SO4 Sigma-Aldrich 99.0%
K2CO3 Sigma-Aldrich 99.0%
KH2PO4 Sigma-Aldrich 99.0%
KI Sigma Aldrich 99%
KNO3 Vickers Lab Ltd 99.5%
Lead standard for AAS Fluka
Microsilica 600 Golden Bay Cement
NaBH4 (powder) Sigma Aldrich 96%
NaNO2 Sigma Aldrich 97%
NaOH Pure Science 90%
NH4Cl Sigma Aldrich 99.5%
Nickel standard for AAS Sigma Aldrich
Nitrate standard for IC Sigma-Aldrich
Nitrite standard for IC Sigma-Aldrich
Pb(NO3)2 Sigma Aldrich 99.0%
PbCl2 Sigma Aldrich 98%
Pd(CH3COO)2 Sigma Aldrich
Phosphate standard for IC Fluka
ZnCl2 Sigma Aldrich > 97%