Global simulations of nitrate and ammonium aerosols and ...
26
Atmos. Chem. Phys., 12, 9479–9504, 2012 www.atmos-chem-phys.net/12/9479/2012/ doi:10.5194/acp-12-9479-2012 © Author(s) 2012. CC Attribution 3.0 License. Atmospheric Chemistry and Physics Global simulations of nitrate and ammonium aerosols and their radiative effects L. Xu and J. E. Penner Department of Atmospheric, Oceanic and Space Science, University of Michigan, Ann Arbor, Michigan, USA Correspondence to: L. Xu ([email protected]) Received: 26 March 2012 – Published in Atmos. Chem. Phys. Discuss.: 19 April 2012 Revised: 14 September 2012 – Accepted: 24 September 2012 – Published: 22 October 2012 Abstract. We examine the formation of nitrate and ammo- nium on five types of externally mixed pre-existing aerosols using the hybrid dynamic method in a global chemistry trans- port model. The model developed here predicts a similar spa- tial pattern of total aerosol nitrate and ammonium to that of several pioneering studies, but separates the effects of nitrate and ammonium on pure sulfate, biomass burning, fossil fuel, dust and sea salt aerosols. Nitrate and ammonium boost the scattering efficiency of sulfate and organic matter but lower the extinction of sea salt particles since the hygroscopicity of a mixed nitrate-ammonium-sea salt particle is less than that of pure sea salt. The direct anthropogenic forcing of par- ticulate nitrate and ammonium at the top of the atmosphere (TOA) is estimated to be -0.12 W m -2 . Nitrate, ammonium and nitric acid gas also affect aerosol activation and the re- flectivity of clouds. The first aerosol indirect forcing by an- thropogenic nitrate (gas plus aerosol) and ammonium is esti- mated to be -0.09 W m -2 at the TOA, almost all of which is due to condensation of nitric acid gas onto growing droplets (-0.08 W m -2 ). 1 Introduction Aerosols, especially those from anthropogenic sources, play an important role in changing the Earth’s climate. Substantial progress has been made towards understanding how aerosols, such as sulfate, carbonaceous particles, mineral dust and sea salt, can impact the Earth’s climate (Penner et al., 2001; Tex- tor et al., 2006; Forster et al., 2007). However, little has been done to quantify the direct and indirect effects of aerosol ni- trate and ammonium in spite of the fact that nitrate and am- monium are known to be significant anthropogenic sources of aerosols (Intergovernmental Panel on Climate Change (IPCC), 1994; van Dorland et al., 1997; Adams et al., 1999). A limited number of global models have been used to pre- dict nitrate and ammonium aerosol concentrations (Adams et al., 1999; Metzger et al., 2002; Liao et al., 2003; Ro- driguez and Dabdub, 2004; Bauer et al., 2007; Feng and Penner, 2007; Pringle et al., 2010) and their direct radia- tive effects (van Dorland et al., 1997; Adams et al., 2001; Jacobson, 2001; Liao et al., 2004; Liao and Seinfeld 2005; Bauer et al., 2007; Myhre et al., 2009), but no one has eval- uated their indirect forcing. Most global aerosol models in- cluded in the AeroCom exercise exclude ammonium and ni- trate aerosols (Schulz et al., 2006; Textor et al., 2006; Kinne et al., 2006), and, of those that do, most treat these aerosols in thermodynamic equilibrium, which, for global average con- ditions, overestimates the portion in coarse aerosols (Feng and Penner, 2007). Major nitrate salts (e.g. ammonium ni- trate, sodium nitrate) have lower deliquescence relative hu- midity (DRH) than their corresponding sulfate salts (e.g. ammonium sulfate, sodium sulfate) and are highly hygro- scopic. This normally would be expected to increase aerosol scattering properties and increase both their direct and in- direct radiative forcing. The Fourth Assessment Report (i.e. AR4) from the IPCC (Forster et al., 2007) estimates the di- rect radiative forcing for nitrate to be -0.10 ± 0.10 W m -2 at the top of atmosphere (TOA). However, the relatively small number of studies is not sufficient to accurately character- ize the magnitude and the uncertainties in the direct radiative forcing associated with aerosol nitrate (Forster et al., 2007). Studies (Adams et al., 2001; Liao et al., 2006; Liao and Sein- feld, 2005) using global models have also suggested that the decreased radiative forcing of sulfate aerosols due to their reduced emissions in the future could be partially offset by Published by Copernicus Publications on behalf of the European Geosciences Union.
-
Upload
khangminh22 -
Category
Documents
-
view
0 -
download
0
Transcript of Global simulations of nitrate and ammonium aerosols and ...

Atmos. Chem. Phys., 12, 9479–9504, 2012www.atmos-chem-phys.net/12/9479/2012/doi:10.5194/acp-12-9479-2012© Author(s) 2012. CC Attribution 3.0 License.
AtmosphericChemistry
and Physics
Global simulations of nitrate and ammonium aerosols and theirradiative effects
L. Xu and J. E. Penner
Department of Atmospheric, Oceanic and Space Science, University of Michigan, Ann Arbor, Michigan, USA
Correspondence to:L. Xu ([email protected])
Received: 26 March 2012 – Published in Atmos. Chem. Phys. Discuss.: 19 April 2012Revised: 14 September 2012 – Accepted: 24 September 2012 – Published: 22 October 2012
Abstract. We examine the formation of nitrate and ammo-nium on five types of externally mixed pre-existing aerosolsusing the hybrid dynamic method in a global chemistry trans-port model. The model developed here predicts a similar spa-tial pattern of total aerosol nitrate and ammonium to that ofseveral pioneering studies, but separates the effects of nitrateand ammonium on pure sulfate, biomass burning, fossil fuel,dust and sea salt aerosols. Nitrate and ammonium boost thescattering efficiency of sulfate and organic matter but lowerthe extinction of sea salt particles since the hygroscopicityof a mixed nitrate-ammonium-sea salt particle is less thanthat of pure sea salt. The direct anthropogenic forcing of par-ticulate nitrate and ammonium at the top of the atmosphere(TOA) is estimated to be−0.12 W m−2. Nitrate, ammoniumand nitric acid gas also affect aerosol activation and the re-flectivity of clouds. The first aerosol indirect forcing by an-thropogenic nitrate (gas plus aerosol) and ammonium is esti-mated to be−0.09 W m−2 at the TOA, almost all of which isdue to condensation of nitric acid gas onto growing droplets(−0.08 W m−2).
1 Introduction
Aerosols, especially those from anthropogenic sources, playan important role in changing the Earth’s climate. Substantialprogress has been made towards understanding how aerosols,such as sulfate, carbonaceous particles, mineral dust and seasalt, can impact the Earth’s climate (Penner et al., 2001; Tex-tor et al., 2006; Forster et al., 2007). However, little has beendone to quantify the direct and indirect effects of aerosol ni-trate and ammonium in spite of the fact that nitrate and am-monium are known to be significant anthropogenic sources
of aerosols (Intergovernmental Panel on Climate Change(IPCC), 1994; van Dorland et al., 1997; Adams et al., 1999).A limited number of global models have been used to pre-dict nitrate and ammonium aerosol concentrations (Adamset al., 1999; Metzger et al., 2002; Liao et al., 2003; Ro-driguez and Dabdub, 2004; Bauer et al., 2007; Feng andPenner, 2007; Pringle et al., 2010) and their direct radia-tive effects (van Dorland et al., 1997; Adams et al., 2001;Jacobson, 2001; Liao et al., 2004; Liao and Seinfeld 2005;Bauer et al., 2007; Myhre et al., 2009), but no one has eval-uated their indirect forcing. Most global aerosol models in-cluded in the AeroCom exercise exclude ammonium and ni-trate aerosols (Schulz et al., 2006; Textor et al., 2006; Kinneet al., 2006), and, of those that do, most treat these aerosols inthermodynamic equilibrium, which, for global average con-ditions, overestimates the portion in coarse aerosols (Fengand Penner, 2007). Major nitrate salts (e.g. ammonium ni-trate, sodium nitrate) have lower deliquescence relative hu-midity (DRH) than their corresponding sulfate salts (e.g.ammonium sulfate, sodium sulfate) and are highly hygro-scopic. This normally would be expected to increase aerosolscattering properties and increase both their direct and in-direct radiative forcing. The Fourth Assessment Report (i.e.AR4) from the IPCC (Forster et al., 2007) estimates the di-rect radiative forcing for nitrate to be−0.10 ± 0.10 W m−2 atthe top of atmosphere (TOA). However, the relatively smallnumber of studies is not sufficient to accurately character-ize the magnitude and the uncertainties in the direct radiativeforcing associated with aerosol nitrate (Forster et al., 2007).Studies (Adams et al., 2001; Liao et al., 2006; Liao and Sein-feld, 2005) using global models have also suggested that thedecreased radiative forcing of sulfate aerosols due to theirreduced emissions in the future could be partially offset by
Published by Copernicus Publications on behalf of the European Geosciences Union.

9480 L. Xu and J. E. Penner: Global simulations of nitrate and ammonium aerosols
increases in the radiative forcing of nitrate aerosols. Reduc-tion of sulfate in aerosols results in an increase of NH3 in theatmosphere, which allows a larger formation of ammoniumnitrate.
As noted above, none of the existing studies has estimatedthe indirect forcing by ammonium and nitrate aerosols. Fur-thermore, a number of studies (Kulmala et al., 1993, 1998;Goodman et al., 2000) show that the condensation of nitricacid onto growing cloud droplets contributes soluble materialto the droplet and enhances their water uptake and growth,leading to increased droplet number concentrations. There-fore, a full consideration of both HNO3(g) and aerosol am-monium and nitrate is needed to properly estimate indirectforcing by aerosols and HNO3 gas.
The formation of nitrate aerosols strongly depends on theavailability of its precursor gases and on the ambient condi-tions. Nitrate aerosols form if sulfate aerosols are irreversiblyneutralized and atmospheric ammonia is in excess. Nitrate ispredominantly present in the submicron mode at continentalsites (ten Brink et al., 1997; Heintzenberg et al., 1998; Putaudet al., 2003) in the form of ammonium nitrate (NH4NO3).Nitrate aerosols have been found to be at least as impor-tant as sulfate in some regions of Europe (ten Brink et al.,1996; Schaap et al., 2004) and some urban areas (Malm et al.,2004). Nitrate is internally mixed with sulfate, ammonium,elemental and organic carbon in western Europe (Dall’Ostoet al., 2009) and in the Amazon basin (Trebs et al., 2005).However, aerosol nitrate is not just associated with ammo-nium in the accumulation mode. Coarse mode aerosol nitratecan be produced by adsorption of nitric acid on sea salt par-ticles (Savoie and Prospero, 1982) and soil particles (Wolff,1984). Lefer and Talbot (2001) found that 86 % of nitratemass was associated with water-soluble super-micron soil-derived Ca2+ in an acid environment. Other metal specieslike Mg2+, Na+ and K+ can also be associated with nitrate.In addition, aerosol nitrate is formed through heterogeneousreactions of nitrogen radicals such as gaseous NO3, N2O5and HNO3 dissolved into wet aerosol (Ehhalt and Drum-mond, 1982; Parrish et al., 1986; Li et al., 1993). Ammoniumhelps to retain nitrate in the aerosol phase by neutralizingthe aerosol acidity during heterogeneous formation processes(Adams et al., 1999). Liao and Seinfeld (2005) demonstratethat the heterogeneous chemistry reactions on particles canincrease the direct radiative forcing due to nitrate by 25 %.
The partitioning of nitrate and ammonium between the gasand aerosol phases has been done using three different ap-proaches. The first approach assumes instantaneous chemicaland thermodynamic equilibrium (Pilinis and Seinfeld, 1987;Russell et al., 1988; Binkowski and Shankar, 1995; Lurmannet al., 1997) between the gas and aerosol phase (hereafter re-ferred to as EQ). Instantaneous thermodynamic equilibriummay be assumed for the fine mode aerosols (particle diameterless than 1 µm) since small particles achieve equilibrium withthe gas phase within a few minutes (Wexler and Seinfeld,1990; Dassios and Pandis, 1999). However, assuming ther-
modynamic equilibrium between the gas and aerosol phaseis not likely to be valid for coarse particles, such as sea saltand mineral dust because it takes from several hours to up toa week to reach equilibrium (Meng and Seinfeld, 1996; Se-infeld and Pandis, 1998) and this time is longer than the timestep typically used in chemical transport models (e.g. about1 h). Observations also show that gas phase concentrationsand coarse aerosol particles are not in equilibrium (John etal., 1989). A more accurate representation of the partitioningof semi-volatile species called the “dynamic method” (here-after referred to as DYN) has been developed (Meng and Se-infeld, 1996; Meng et al., 1998; Jacobson et al., 1996; Ja-cobson, 1997a, b; Sun and Wexler, 1998a, b; Pilinis et al.,2000). In this approach, a fully dynamic mass transfer cal-culation is applied to each aerosol size bin. Although thedynamic method is most accurate, its use in large-scale airquality models as well as global chemical transport modelshas been limited due to its high computation cost. The hy-brid dynamic method (hereafter referred to as HDYN) wasproposed by Capaldo et al. (2000). In this method, the equi-librium method is employed to determine the composition ofaerosol particles with diameters less than a threshold diam-eter (around 1 µm) while the dynamic method developed byPilinis et al. (2000) is used to calculate the mass transfer-limited concentrations in larger particles.
Here, we apply the hybrid dynamic method, first applied ina global model by Feng and Penner (2007, hereafter referredto as FP07), which follows the methods outlined in Capaldoet al. (2000) to calculate the burden of nitrate and ammoniumin aerosols. FP07 presented the differences between the pre-dicted nitrate and ammonium in aerosols using the HDYNmethod and several other methods. Most importantly, theyfound that the thermodynamic equilibrium assumption un-derestimates the fine-mode nitrate aerosol burden by 25 %.Nitrate and ammonium can also be approximated using afirst-order removal approximation based on uptake coeffi-cients. FP07 found that this method overestimates both fineand coarse mode nitrate aerosols, while a simplified formof HDYN (Liao et al., 2003, 2004) overestimates the coarsemode nitrate. These differences would be expected to lead tosignificant differences in the predicted forcing from nitrateand ammonium.
We updated the FP07 global simulation of nitrate and am-monium aerosols based on the HDYN method but also ac-count for the dynamics of sulfate aerosol and its interactionwith non-sulfate aerosol components (Herzog et al., 2004;Liu et al., 2005; Wang et al., 2009). FP07 only simulatedaerosol mass and so did not account for the nucleation ofnew sulfate aerosols and their growth as well as the coatingby sulfate on other aerosol types. Since aerosol nitrate is onlyallowed to form after sulfate is fully neutralized, an accuraterepresentation of sulfate is key to determining the amount ofaerosol nitrate that can form.
The three-dimensional global aerosol and chemistry trans-port model used in this study is described in the Sect. 2.
Atmos. Chem. Phys., 12, 9479–9504, 2012 www.atmos-chem-phys.net/12/9479/2012/

L. Xu and J. E. Penner: Global simulations of nitrate and ammonium aerosols 9481
Section 3 presents the present-day global distribution of pre-dicted sulfate, nitric acid and nitrate, ammonia and ammo-nium. In addition, the global budgets of gaseous nitric acidand nitrate as well as ammonia and ammonium are discussed.The comparisons of aerosol concentrations (i.e. sulfate, ni-trate and ammonium) with ground-based observations arealso included in this section. The calculated aerosol opticalproperties are presented in Sect. 4, and estimates of directand indirect radiative forcing of nitrate and ammonium aswell as their anthropogenic contribution are in Sect. 5. Thesummary and conclusions are presented in Sect. 6.
2 Model description
2.1 Global aerosol and chemistry transport model
We used the version of the IMPACT global aerosol andchemistry model that treats the microphysics of sulfateaerosol (i.e. nucleation, condensation of gas phase sulfate,and coagulation) and its interaction with non-sulfate aerosols(Liu et al., 2005; Wang et al., 2009). Similar to FP07,modeled transport was driven by assimilated meteorologi-cal fields from the NASA Goddard Data Assimilation Of-fice (DAO) general circulation model (GCM) for the year1997 with a 6-h time interval. The DAO meteorological fieldswere interpolated to a 1-h time interval for the tracer ad-vection time step in IMPACT. The spatial resolution of themodel was 2◦ latitude by 2.5◦ longitude in the horizontalwith 26 vertical layers ranging from the surface to 2.5 hPa.The model uses the flux form semi-Lagrangian (FFSL) ad-vection scheme (Lin and Rood, 1996) while vertical diffu-sion is based on an implicit scheme described in Walton etal. (1988) using vertical diffusion coefficients provided bythe DAO meteorological fields.
We used two modes to treat the mass and number ofsulfate aerosol and its microphysical interactions (Herzoget al., 2004; Liu et al., 2005): a nucleation/Aitken mode(r <0.05 µm) and an accumulation mode (r >0.05 µm). Non-sulfate aerosols are assumed to follow prescribed backgroundsize distributions based on observations (Table 1). Carbona-ceous aerosols (OM and BC) are represented by a single sub-micron size bin but separate tracers are carried for biomassburning, natural and fossil fuel particles based on their sourceorigins. Sea salt and mineral dust aerosols are representedin four bins with radii varying from 0.05–0.63 µm, 0.63–1.26 µm, 1.26–2.5 µm, and 2.5–10 µm to account for varyingremoval rates and thermodynamics. These size distributionsare also used for the radiative properties of the separate sizebins as well as the varying cloud condensation nuclei activa-tion spectrum.
Binary homogeneous nucleation of H2SO4 (gas) is usedto determine the nucleation of sulfate aerosols (Vehkamakiet al., 2002). In addition, 2 % of the anthropogenic sulfuremissions are assumed to be emitted as primary aerosols
Table 1.Size distribution parameters for non-sulfate aerosols.
Aerosol Component Nai
ri , µm σi
Fossil fuel OM/BCb 0.428571 0.005 1.50.571428 0.08 1.71.×10−6 2.5 1.65
Biomass OM/BC and natural OMc 0.9987 0.0774 1.4021.306×10−3 0.3360 1.3832.830×10−3 0.9577 1.425
Sea saltd 0.965 0.035 1.920.035 0.41 1.70
Duste 0.854240 0.05 1.650.145687 0.27 2.67
7.3×10⁻⁵ 4.0 2.40
a Ni is normalized fraction by total number concentration in a given size range and isdimensionless.b Penner et al. (1998). Note although the size distribution of OM/BC for pollution isadopted from an observation from a Hardiman forest fire (Radke et al., 1988), themedian diameter of the mass distribution (i.e. 0.16 µm) is close to that measured(0.18 µm) by Schwarz et al. (2010).c Anderson et al. (1996).d Quinn and Coffman (1998).e d’Almeida et al. (1991).
with a specified size distribution to mimic the effects ofsub-grid scale processes leading to aerosol nucleation. Thehydrophilic and hydrophobic properties and correspondingscavenging efficiency of non-sulfate aerosols are determinedby the amount of sulfate coating that is produced throughcoagulation and condensation and the amount of nitrate andammonium on each aerosol type. Condensational growth iskinetically limited by the diffusion of sulfuric acid gas to theparticle surface. Coagulation is allowed to occur between sul-fate particles of the same size and between particles of dif-ferent sizes as well as with non-sulfate particles. Sulfate pro-duced within cloud droplets is equally distributed among thehygroscopic aerosol particles that are larger than 0.05 µm inradius.
Dry deposition rates for gaseous species are calculatedbased on the work of Jacob and Wofsy (1990), Wesely (1989)and Walcek et al. (1996). Dry deposition of aerosol parti-cles uses a resistance-in-series parameterization followingZhang et al. (2001). Gravitational settling is also taken intoaccount. Wet deposition is calculated by using the wet scav-enging model described in Mari et al. (2000) and Liu etal. (2001). Two types of scavenging are included: (1) scav-enging in wet convective updrafts, and (2) first-order rainoutand washout in precipitating columns. For scavenging in con-vective updrafts, the fraction of tracer scavenged depends onthe rate constant for conversion of cloud condensate to pre-cipitation (assumed to be 0.005 s−1) as well as the fractionof tracer present in the condensatefi (i.e. the scavengingefficiency). The fraction of highly soluble gaseous speciessuch as HNO3(g) and H2SO4(g) in the cloud condensatephase is assumed to be 100 % while scavenging efficienciesof less soluble gaseous species are calculated based on their
www.atmos-chem-phys.net/12/9479/2012/ Atmos. Chem. Phys., 12, 9479–9504, 2012

9482 L. Xu and J. E. Penner: Global simulations of nitrate and ammonium aerosols
Henry’s law coefficients. Scavenging efficiencies of aerosolspecies are either prescribed to be constant for pure sulfateaerosol and sea salt withfi = 1 or (for BC/OM and mineraldust) are calculated based on the amount of sulfate, ammo-nium and nitrate associated with the particles (0< fi < 1).For the latter effects, we updated the scavenging efficienciesfor sulfate-coated aerosols described in Liu et al. (2005), toaccount for the amount of coverage by internally mixed sul-fate, ammonium and nitrate molecules. Thus, the fractionalarea coverage of a single non-sulfate-ammonium-nitrate par-ticle surface by internally mixed sulfate, ammonium and ni-trate molecules (e.g. for carbonaceous aerosols) was calcu-lated from
xSO4+NO3+NH4BC+OM =
r2avgNavg
4(rBC+OM + ravg)2, (1)
whererBC+OM is the mass-weighted average radius for car-bonaceous particles;ravg is the average radius of internallymixed sulfate, ammonium and nitrate molecules; andNavgis the total number of molecules of internally mixed sulfate,ammonium and nitrate on the particle surface. Following Liuet al. (2005), whenf SO4+NO3+NH4
BC+OM = 10 (layers), the parti-cle becomes fully hygroscopic so thatfi = 1 and is linearlyinterpolated between 0 and 1 for less than 10 monolayers. Inaddition, wet scavenging efficiencies for accumulation modesulfate and sea salt mixed with nitrate and ammonium are as-sumed to be 1.0 while the nucleation/Aitken mode aerosolsare only scavenged as a result of their Brownian coagulationwith cloud droplets.
Table 2 summarizes the emissions used for present day(PD) and pre-industrial (PI) scenarios. Ammonia emissionsfor the present-day were taken from the global inventory ofBouwman et al. (1997). The total ammonia source specifiedin this inventory is estimated to be 53.6 Tg N per year andTable 2 lists the contributions of each source type to the totalemission. Among nine sources, domestic animals contributethe largest fraction, 34 %, followed by synthetic fertiliz-ers, oceans, biomass burning, soils under natural vegetation,wild animals and other sources. The ammonia emissions forpre-industrial conditions include the emission sources fromoceans, soils under vegetation and wild animals. We assumethat all other sources have anthropogenic origins and werenear zero in the year 1850. The total ammonia emission inthe PI scenario is 10.7 Tg N per year.
The emissions of NOx from industrial activities, fossil fuelcombustion as well as soil process are from van Aardenne etal. (2001) for 1990, while those from biomass burning andlightning are based on the year 1990 (Ito et al., 2007, 2009).The largest fraction of NOx emissions are associated withindustrial activity and fossil fuel combustion, 22.7 Tg N peryear, out of a total NOx emission 41.0 Tg N per year. The nextlargest sources are biomass burning, soil processes, lightningand aircraft emissions, in that order. The total NOx emissionfor PI conditions, representative of 1890, is 11.7 Tg N per
Table 2.Global annual emission for pre-industrial and present-dayscenarios.
Scenario
Species Pre-industrial Present-Day1850 2000
NH3, Tg N yr−1
Domesticated animals – 21.6Synthetic fertilizers – 9.0Oceans 8.2 8.2Biomass burning – 5.9Crops – 3.6Humans – 2.6Soils under natural vegetation 2.4 2.4Wild animals 0.1 0.1Others – 0.3Totala 10.7 53.6
NOx, Tg N yr−1
Industrial activities/Fossil fuel combustion 1.0b 22.7b
Biomass burning 4.8c 9.3c
Soil processes 2.9b 5.5b
Lightning 3.0d 3.0d
Aircraft – 0.5Total 11.7 41.0
SO2, Tg S yr−1
Anthropogenic emission 1.5 60.1Volcanic emission 4.8 4.8Biomass burning – –DMS oxidation 34.6 34.6Total 40.9 99.5
DMS, Tg S yr−1
Oceanic source 26.1 26.1
OM, Tg yr−1
Fossil fuel emission 5.1 15.8Biomass burning emission 17.8 47.4Photochemistry from terpenes 14.5 14.5Total 37.4 77.6
BC, Tg yr−1
Fossil/biofuel fuel emission 0.8 5.8Biomass burning emission 1.7 4.7Total 2.5 10.5
a Bouwman et al. (1997);b From van Aardenne et al. (2001);c From Ito et al. (2007);d From Ito et al. (2009).
year which is dominated by biomass burning and lightningsources.
Anthropogenic sulfur emission as well as volcanic SO2emission, marine DMS fluxes, OM and BC fluxes are sameas that used in Wang et al. (2009). Sea salt emissions inthe model were estimated off-line and provided by Gong etal. (1997). The algorithm of Monahan et al. (1986) was usedin order to interpolate the total mass flux into our 4 size bins(0.05–0.63 µm, 0.63–1.26 µm, 1.26–2.5 µm, and 2.5–10 µm).The total sea salt emissions are 3768 Tg yr−1. The dust emis-sion fluxes at each 6 h interval were from Ginoux et al. (2001)based on observed 10 m wind speed and soil wetness. The
Atmos. Chem. Phys., 12, 9479–9504, 2012 www.atmos-chem-phys.net/12/9479/2012/

L. Xu and J. E. Penner: Global simulations of nitrate and ammonium aerosols 9483
Table 3.Constituent composition simulated for each aerosol type.
Constituent composition Size bin(s) applied
Pure sulfate with NO−3 , NH+
4 and H2O(aq) Bin 1 (D<1.25 µm)
FF OM/BC and associated SO2−
4 , NO−
3 , NH+
4 and H2O(aq) Bin 1 (D<1.25 µm)
BB OM/BC and associated SO2−
4 , NO−
3 , NH+
4 and H2O(aq) Bin 1 (D<1.25 µm)
Dust and associated SO2−
4 , NO−
3 , NH+
4 and H2O(aq) Bin 1, 2, 3, 4
Sea salt and associated SO2−
4 , NO−
3 , NH+
4 and H2O(aq) Bin 1, 2, 3, 4
dust emissions fluxes are represented by the same 4 size binsas the sea salt aerosols and are described in detail in Liu etal. (2005). Similar to biomass burning aerosols, mineral dustemissions are uniformly injected in the boundary layer.
The simple nitrogen chemistry treatment described byFeng and Penner (2007) was adopted. This treatment calcu-lates the gas phase concentrations of NO, NO2, NO3, N2O5and HNO3. In the simple chemistry, the three dimensionalconcentration fields of OH and O3 are fixed monthly aver-ages, taken from a 1-yr simulation of the chemistry transportmodel GRANTOUR using the climate model CCM1 mete-orological fields (Penner et al., 1994). The diurnal cycle ofOH and HO2 is approximated by scaling the monthly av-erage fields using the cosine of the solar zenith angle. Themodel was run for four different months (i.e. January, April,July and October) with a 1 month spin-up for each month toobtain an annual average aerosol concentration field.
2.2 Treatment of nitrate and ammonium
Following FP07, we used the EQUISOLV II thermodynamicequilibrium model (Jacobson, 1999) to calculate the nitrateand ammonium within aerosols with diameters less than1.25 µm (i.e. bin 1, hereafter referred to as the fine mode) andsolved the mass transfer equations for particles with aerosoldiameters larger than 1.25 µm (i.e. the 3 larger size bins, here-after referred to as the coarse mode). The equilibrium as-sumption is well justified for fine mode aerosols in our globalaerosol transport model since a transport time step of onehour is used. Accommodation coefficients of 0.193, 0.092and 0.1 were used for HNO3, NH3 and N2O5 (Feng and Pen-ner, 2007) when solving mass transfer equations.
Although aerosol particles are often found as partiallyor completely internally mixed with multiple components(Zhang et al., 2003), particles near their sources are gener-ally externally mixed. Therefore, the assumption of a com-plete internal mixture can distort the predicted particle chem-ical composition (Kleeman et al., 1997), as well as possiblyradiative effects. Whereas FP07 made this assumption of ne-cessity, here nitric acid and ammonia interact with each of theother pre-existing externally mixed aerosol populations for atotal of 11 populations, i.e. pure sulfate, sulfate-associatedwith carbonaceous particles, sea salt and dust (see Table 3),which provides a more realistic representation than fully in-
ternally mixed aerosols as in FP07. We apply thermodynamicequilibrium (Jacobson, 1999) for the five aerosols types con-secutively (i.e. pure sulfate, carbonaceous aerosols from fos-sil fuel, carbonaceous aerosols from biomass burning, dustand sea salt) in size bin 1, followed by solving the mass trans-fer equations for nitrate and ammonium in the 3 larger sizebins (D>1.25 µm) for dust and sea salt. Sulfate is first neu-tralized by ammonia and then nitric acid is allowed to re-act with ammonia and the other aerosol particles. Changingthe reaction order that we used for dust and sea salt changesthe nitrate and ammonium concentrations by less than 10 %for high concentrations of both dust and sea salt. In orderto eliminate differences introduced by the reaction sequence,we switched the order of the reactions (i.e. by solving the re-actions with dust first at odd time steps and with sea salt firstat even time steps). While we thought the introduction ofexternally mixed populations might make an important dif-ference to the burden of nitrate and ammonium, the globalaverage results from this model are similar to those in FP07.Nevertheless, we present the burdens associated with eachaerosol field below, since this is the first model that has sep-arately calculated these effects. The disinterested reader canskip to Sect. 4.
3 Present-day global aerosol concentration fields
3.1 Sulfate
Simulated results for the sulfur model used in this workwere presented and compared with observations in Liu etal. (2005). Results presented here are only shown in orderto understand the behavior of the other aerosol components.Figure 1 shows the predicted annual averaged mixing ratios(pptv) of pure sulfate and sulfate coated on other aerosol par-ticles at the surface (i.e. the first model level) for the PDscenario. The highest pure sulfate concentrations are mainlylocated in the industrialized regions of the Northern Hemi-sphere where they typically exceed 1 ppbv (1 µg m−3SO2−
4 =
258 pptv at 298 K and 1000 mb). The sulfate associated withother aerosol types is highest near the source regions of thecorresponding pre-existing aerosols.
www.atmos-chem-phys.net/12/9479/2012/ Atmos. Chem. Phys., 12, 9479–9504, 2012

9484 L. Xu and J. E. Penner: Global simulations of nitrate and ammonium aerosols
Figure 1: Predicted annual average mixing ratios (pptv) of pure sulfate and coated sulfate as well
as the total sulfate aerosols (bottom right) in the surface layer. The pressure level of
the surface layer together with the average mixing ratio for that layer is indicated
above each panel.
Fig. 1. Predicted annual average mixing ratios (pptv) of pure sulfate and coated sulfate as well as the total sulfate aerosols (bottom right) inthe surface layer. The pressure level of the surface layer together with the average mixing ratio for that layer is indicated above each panel.
Figure 2: Predicted annual average mixing ratios (pptv) of gaseous HNO3 (left) and NH3 (right)
in the surface layer. The pressure level of the surface layer together with the average
mixing ratio for that layer is indicated above each panel.
Fig. 2. Predicted annual average mixing ratios (pptv) of gaseous HNO3 (left) and NH3 (right) in the surface layer. The pressure level of thesurface layer together with the average mixing ratio for that layer is indicated above each panel.
3.2 Nitric acid and nitrate
The predicted annual average gas-phase HNO3 at the surfaceis given in Fig. 2 (left panel). In general, the HNO3 mixingratios in the Northern Hemisphere are higher in January thanin July because the loss of HNO3 by photolysis and its reac-tion with OH is comparably smaller in winter (see FP07) dueto weaker sunlight. The winter–summer contrast also appliesto its accompanying aerosol component, aerosol nitrate. Thepredicted HNO3 mixing ratio, generally exceeds 1 ppbv inthe industrialized areas of Europe, central and eastern Asia,North America as well as over open biomass burning regionsin the tropics. The simulated nitric acid is close to that inthe previous study (Feng and Penner, 2007) since similarNOx emissions were used as well as the same simple nitro-
gen chemistry mechanism. Comparing the nitric acid mix-ing ratio near surface with two other global model studies(Adams et al., 1999, hereafter A99; Liao et al., 2003, here-after L03), the nitric acid gas in the present study shares asimilar spatial pattern as these two studies though the globalannual average nitric acid gas is about 60 % and 36 % lowerthan A99 and L03, respectively. In addition, the annual av-erage tropospheric burden of nitric acid (0.30 Tg N, see Ta-ble 4) is about a factor of 3 and 2 smaller than that in Bauer etal. (2007) (0.86 Tg N) and Pringle et al. (2010) (0.55 Tg N),respectively.
The predicted present day mixing ratios (pptv) of nitrateaerosols formed on the five types of pre-existing aerosols andtotal nitrate aerosols at the surface are shown in Fig. 3. Thelocations of the peaks in the aerosol nitrate mixing ratio are
Atmos. Chem. Phys., 12, 9479–9504, 2012 www.atmos-chem-phys.net/12/9479/2012/

L. Xu and J. E. Penner: Global simulations of nitrate and ammonium aerosols 9485
Table 4.Global annual budgets of HNO3(g) and nitrate (NO−3 ) for present-day and pre-industrial scenarios.
Scenario
Present-Day Pre-industrial
HNO3(g)
Sources (Tg N yr−1) 42.30 14.72NO2+OH 24.38 11.20N2O5+ aerosol 17.92 3.52
Loss (Tg N yr−1) 42.30 14.72HNO3+OH and HNO3+hν 4.31 3.39Loss to nitrate 15.92 4.68Dry deposition 7.79 2.08Wet deposition 14.48 4.67
Burden (Tg N)a 0.30 0.15Above 5 km (%) 80.46 91.57In polar (%)b 1.91 2.06
Lifetime 4.76 4.80Removal rate (day−1) 0.21 0.13
Wet 0.13 0.09Dry 0.07 0.04Wet (%) 65.00 69.11
NO−
3
Sources (Tg N yr−1) 15.92 4.68Gas-to-aerosol (D<1.25 µm) 8.76 2.49Gas-to-aerosol (D>1.25µm) 7.16 2.19
Loss (Tg N yr−1) 15.92 4.48Dry deposition 3.96 0.72Wet deposition 11.96 3.96
Burden (Tg N) 0.17 0.08On pure sulfate (%) 23.17 19.96On carbonaceous aerosols (%) 2.10 2.18On dust bins 1–4 (%) 12.28, 15.96, 27.09, 2.52 24.72, 15.93, 23.70, 1.29On sea salt bins 1–4 (%) 14.73, 1.14, 0.84, 0.16 11.24, 0.53, 0.40, 0.05Fine-mode (D<1.25 µm) 52.29 58.10Coarse-mode (D>1.25 µm) 47.71 41.90Above 5 km (%) 24.43 38.37In polar (%) 1.25 1.92
Lifetime 3.92 6.26Removal rate (day−1) 0.25 0.16
Wet 0.19 0.13Dry 0.06 0.03Wet (%) 75.37 84.39
a The tropospheric HNO3 burden was calculated by the summation of HNO3 concentrations over the model levelsbelow 200 hPa in this work.b South of 80° S and north of 80° S.
consistent with those from previous studies (Feng and Pen-ner, 2007; Liao et al., 2003; Adams et al., 1999). Note that1 µg m−3 NO−
3 = 400 pptv at 298 K and 1000 mb. The nitratemixing ratios condensed on pure sulfate generally exceed1 ppbv over eastern United States, Europe, India, and easternAsia. The nitrate associated with fossil fuel/biofuel OM/BCmaximizes in eastern Asia with an average value of about100 to 300 pptv while that associated with biomass burning
aerosols is highest over major burning regions. The locationof the peak in the aerosol nitrate predicted on dust and seasalt aerosols occurs over the Sahara desert for dust and overcoastal regions close to the continents for sea salt. Most con-tinental areas in the Northern Hemisphere have nitrate mix-ing ratios exceeding 300 pptv. In the Southern Hemisphere,a value as large as this only occurs in highly localized areassuch as part of South America, South Africa and Australia.
www.atmos-chem-phys.net/12/9479/2012/ Atmos. Chem. Phys., 12, 9479–9504, 2012

9486 L. Xu and J. E. Penner: Global simulations of nitrate and ammonium aerosols
Figure 3: Predicted annual average mixing ratios (pptv) of nitrate associated with each aerosol
type and for total nitrate in aerosols (bottom right) in the surface layer. The pressure
level of the surface layer together with the average mixing ratio for that layer is
indicated above each panel.
Fig. 3. Predicted annual average mixing ratios (pptv) of nitrate associated with each aerosol type and for total nitrate in aerosols (bottomright) in the surface layer. The pressure level of the surface layer together with the average mixing ratio for that layer is indicated above eachpanel.
Figure 4: Annual average molar ratio of total ammonium to total sulfate (top) and gas ratio
(bottom) in the the surface layer. See text for the definition of the gas ratio.
Fig. 4. Annual average molar ratio of total ammonium to total sul-fate (top) and gas ratio (bottom) in the the surface layer. See text forthe definition of the gas ratio.
Marine mixing ratios of nitrate aerosols are generally in therange of 1–100 pptv except in coastal regions. Zonal averagemixing ratios are very similar to those shown by FP07, so arenot discussed here.
As noted earlier, the formation of nitrate depends on theabundance of ammonia. The molar ratio of total ammo-nium to total sulfate (shown in Fig. 4, top panel) is gen-erally larger than 2 over continents and less than 2 overoceans, indicating that the excess ammonia over continentsis available to react with nitrate while ammonia is limit-ing in most ocean areas. Figure 4 (bottom panel) showsannual average gas ratio (Ansari and Pandis, 1998) nearthe surface. The gas ratio is defined as the free ammonia([NH3] + [NH+
4 ] − 2× [SO2−
4 ]
)divided by the total nitrate(
[HNO3] + [NO−
3 ])
expressed in molar concentration units.The gas ratio is useful for indicating which reactant, ammo-nia or nitric acid, limits the formation of ammonium nitrate.If the gas ratio is greater than 1, it indicates that nitric acid islimiting. A gas ratio with the value between 0 and 1 indicatesthat ammonia is limiting even though some ammonia is avail-able for reaction with nitric acid. If the gas ratio is less than 0,it indicates that that ammonia is significantly limited. Thenno free ammonia is available and the formation of ammo-nium nitrate is not possible because all of the ammonia willpreferentially react with sulfate. On an annual average basis,free ammonia exists in most populated areas of the globe. Ahigh gas ratio is also found in Brazil, Patagonia, India as wellas the southern Atlantic and Indian oceans. The high gas ratioover oceans is expected in accordance with the ocean sourcesof ammonia and the absence of HNO3 sources. On the other
Atmos. Chem. Phys., 12, 9479–9504, 2012 www.atmos-chem-phys.net/12/9479/2012/

L. Xu and J. E. Penner: Global simulations of nitrate and ammonium aerosols 9487
hand, ammonia is limited in remote continental and marineareas.
3.3 Ammonia and ammonium
The present day annual average mixing ratios of gas phaseammonia at the surface are shown in Fig. 2 (right panel).The highest surface mixing ratios, in excess of 1 ppbv withsome peaks more than 10 ppbv (1 µg m−3
= 1457 pptv NH3at 298 K and 1000 mb), are found in China, India, Europe,eastern United States, Brazil and South Africa. Continentalmixing ratios exceed 300 pptv everywhere except the Arctic,Sahara, and southwestern Australia. Marine mixing ratios ofgas phase ammonia are highest near the equator and over theSouthern ocean as a result of high ammonia emissions in thatpart of the ocean; otherwise, they are less than 100 pptv. Am-monia mixing ratios are negligibly small (less than 1 pptv)over most of Antarctica. Ammonia surface mixing ratios aremainly determined by both the emissions of ammonia and itsuptake by sulfate and nitrate.
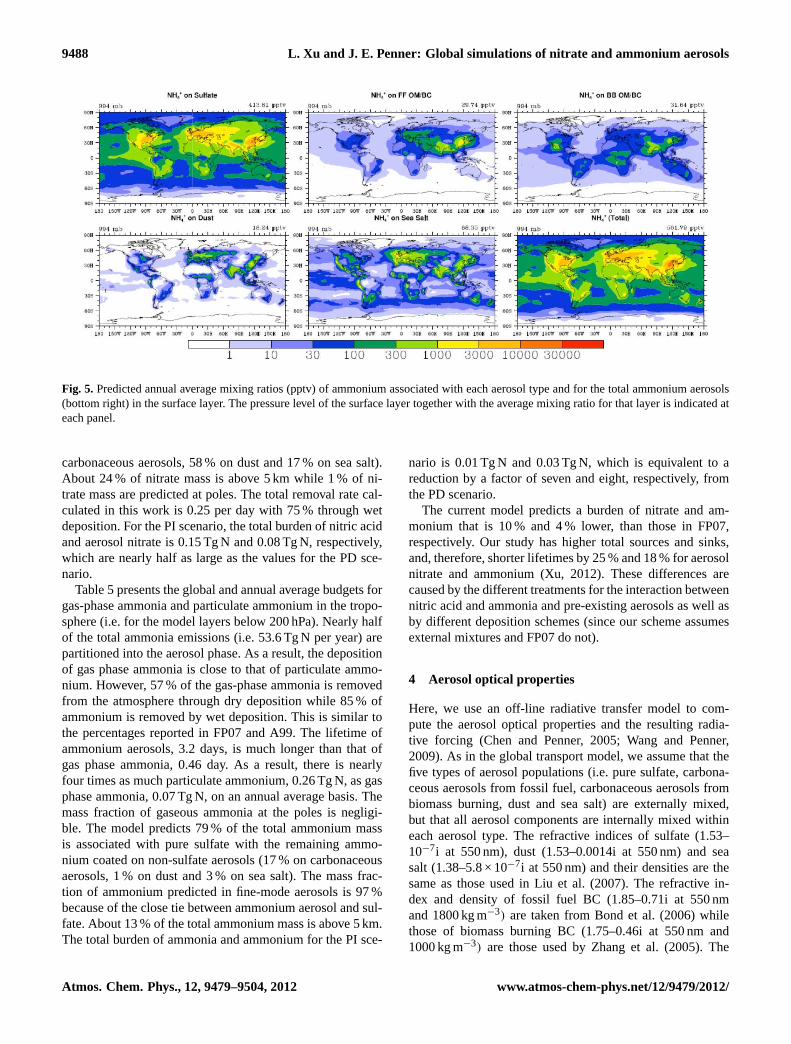
The annual average mixing ratios of ammonium aerosolson each aerosol type as well as the total at the surface areshown in Fig. 5. The total ammonium concentrations pre-dicted here are similar to those of Adams et al. (1999) andFeng and Penner (2007), including locations and magnitudesof the peaks. Because ammonium is preferentially associatedwith sulfate, the peaks in the ammonium mixing ratios areclosely tied with those of sulfate. As expected, ammonium onpure sulfate is the largest among the five aerosol types. Thehighest total ammonium mixing ratios exceed 3 ppbv and arefound in industrialized regions, (1 µg m−3
= 1377 pptv NH+4at 298 K and 1000 mb). Continental mixing ratios exceed300 pptv almost everywhere while marine mixing ratios ofammonium are in the range of 100–300 pptv except for re-mote oceans. The alkaline compounds (i.e. Ca2+, Na+, K+,Mg2+) in dust and the cation Na+ tied to sea salt make it dif-ficult for ammonia to partition into dust and sea salt particles.The anion (e.g. Cl−) in sea salt may be associated with am-monium when both sulfate and nitrate are in poor abundance.Zonal average mixing ratios are very similar to those shownby FP07, so are not discussed here.
3.4 Comparisons of aerosol concentrations withground-based measurements
Aerosol concentrations (sulfate, ammonium and nitrate) arecompared with two ground-based measurement data sets,EMEFS and EMEP, representing polluted continental con-ditions. We adopted the EMEFS (Eulerian Model EvaluationField Study) data set presented in A99, which includes an-nual average sulfate, ammonium and nitrate concentrationsfor 75 sites spread throughout eastern North America. TheEMEP (European Monitoring and Evaluation Programme)reported annual averages from 1986 to 2009 in Europe. Fol-lowing A99 and FP07, the year of 1995 data is taken to facil-
itate the comparison of ammonium and nitrate aerosol sincethe simulated sulfate concentrations most closely match withreported observations. In general, modeled aerosol concen-trations for sulfate, ammonium and nitrate agree well withthe observed values, similar to the comparison conducted inFP07 and A99. A detailed discussion may be found in FP07and is not repeated here. The comparison results are pre-sented in Appendix A. We note that as in FP07 and A99,nitrate over North America is overpredicted in the model incomparison with measurements, possibly as a result of evap-oration from the filter packs resulting in values that are bi-ased low in the measurements (Adams et al., 1999; Pakkanenet al., 1999), although neglect of the formation of organic ni-trates in our simple treatment of gas phase nitrogen chemistrymay also play a role (up to 50 % in some areas according tothe model of Lin et al., 2012).
3.5 Global budgets
Tables 4 and 5 summarize the global budgets of gas phasenitric acid and aerosol nitrate as well as gas phase ammoniaand aerosol ammonium for the PD and PI scenarios calcu-lated by the hybrid dynamic method on the five externallymixed pre-existing aerosol types. Here we chose a character-istic height of 5 km following Textor et al. (2006) and dis-cuss the mass fraction above this height as an indicator ofvertical transport. Stronger vertical transport corresponds toslower wet removal rate coefficients in the models (Textor etal., 2006). We also calculate the mass fraction in polar re-gions which serves as an indicator of horizontal transport.In general, long-range transport is most significant for smallparticles, which have longer lifetimes.
The total chemical production of gas phase HNO3 is42.3 Tg N per year with 24.4 Tg N per year from reaction ofNO2 with OH and 17.9 Tg N per year through the heteroge-neous conversion of N2O5 on aerosols, respectively. 38 % ofthe gaseous HNO3 removal is due to the formation of par-ticulate nitrate including 8.8 Tg N per year in the fine-modeand 7.2 Tg N per year in the coarse-mode while 10 % of thegas-phase HNO3 loss (i.e. 4.3 Tg N per year) is through thephotolysis of HNO3 and its reaction with OH. The gaseousHNO3 burden in the troposphere (i.e. for the model layersbelow 200 hPa) is calculated to be 0.3 Tg N with a lifetimeof 4.8 days. In contrast, the estimated lifetime of aerosol ni-trate is about 4 days. The average rate coefficient for wetremoval of nitric acid is about 0.21 per day and this pro-cess contributes 65 % of the total removal. As shown in Ta-ble 4, about 81 % of the nitric acid burden is above 5 km. Themass fraction of gaseous nitric acid at the poles is 2 %, closeto that predicted for sulfate aerosol as reported in Wang etal. (2009). Our predicted total nitrate burden, 0.17 Tg N, isclose to the 0.19 Tg N predicted using the internal mixtureapproach in FP07. However, in this model 23 % of the ni-trate mass is associated with pure sulfate with the remainingnitrate mass associated with sulfate-coated aerosols (2 % on
www.atmos-chem-phys.net/12/9479/2012/ Atmos. Chem. Phys., 12, 9479–9504, 2012
9488 L. Xu and J. E. Penner: Global simulations of nitrate and ammonium aerosols
Figure 5: Predicted annual average mixing ratios (pptv) of ammonium associated with each
aerosol type and for the total ammonium aerosols (bottom right) in the surface layer.
The pressure level of the surface layer together with the average mixing ratio for that
layer is indicated at each panel.
Fig. 5. Predicted annual average mixing ratios (pptv) of ammonium associated with each aerosol type and for the total ammonium aerosols(bottom right) in the surface layer. The pressure level of the surface layer together with the average mixing ratio for that layer is indicated ateach panel.
carbonaceous aerosols, 58 % on dust and 17 % on sea salt).About 24 % of nitrate mass is above 5 km while 1 % of ni-trate mass are predicted at poles. The total removal rate cal-culated in this work is 0.25 per day with 75 % through wetdeposition. For the PI scenario, the total burden of nitric acidand aerosol nitrate is 0.15 Tg N and 0.08 Tg N, respectively,which are nearly half as large as the values for the PD sce-nario.
Table 5 presents the global and annual average budgets forgas-phase ammonia and particulate ammonium in the tropo-sphere (i.e. for the model layers below 200 hPa). Nearly halfof the total ammonia emissions (i.e. 53.6 Tg N per year) arepartitioned into the aerosol phase. As a result, the depositionof gas phase ammonia is close to that of particulate ammo-nium. However, 57 % of the gas-phase ammonia is removedfrom the atmosphere through dry deposition while 85 % ofammonium is removed by wet deposition. This is similar tothe percentages reported in FP07 and A99. The lifetime ofammonium aerosols, 3.2 days, is much longer than that ofgas phase ammonia, 0.46 day. As a result, there is nearlyfour times as much particulate ammonium, 0.26 Tg N, as gasphase ammonia, 0.07 Tg N, on an annual average basis. Themass fraction of gaseous ammonia at the poles is negligi-ble. The model predicts 79 % of the total ammonium massis associated with pure sulfate with the remaining ammo-nium coated on non-sulfate aerosols (17 % on carbonaceousaerosols, 1 % on dust and 3 % on sea salt). The mass frac-tion of ammonium predicted in fine-mode aerosols is 97 %because of the close tie between ammonium aerosol and sul-fate. About 13 % of the total ammonium mass is above 5 km.The total burden of ammonia and ammonium for the PI sce-
nario is 0.01 Tg N and 0.03 Tg N, which is equivalent to areduction by a factor of seven and eight, respectively, fromthe PD scenario.
The current model predicts a burden of nitrate and am-monium that is 10 % and 4 % lower, than those in FP07,respectively. Our study has higher total sources and sinks,and, therefore, shorter lifetimes by 25 % and 18 % for aerosolnitrate and ammonium (Xu, 2012). These differences arecaused by the different treatments for the interaction betweennitric acid and ammonia and pre-existing aerosols as well asby different deposition schemes (since our scheme assumesexternal mixtures and FP07 do not).
4 Aerosol optical properties
Here, we use an off-line radiative transfer model to com-pute the aerosol optical properties and the resulting radia-tive forcing (Chen and Penner, 2005; Wang and Penner,2009). As in the global transport model, we assume that thefive types of aerosol populations (i.e. pure sulfate, carbona-ceous aerosols from fossil fuel, carbonaceous aerosols frombiomass burning, dust and sea salt) are externally mixed,but that all aerosol components are internally mixed withineach aerosol type. The refractive indices of sulfate (1.53–10−7i at 550 nm), dust (1.53–0.0014i at 550 nm) and seasalt (1.38–5.8 × 10⁻⁷i at 550 nm) and their densities are thesame as those used in Liu et al. (2007). The refractive in-dex and density of fossil fuel BC (1.85–0.71i at 550 nmand 1800 kg m−3) are taken from Bond et al. (2006) whilethose of biomass burning BC (1.75–0.46i at 550 nm and1000 kg m−3) are those used by Zhang et al. (2005). The
Atmos. Chem. Phys., 12, 9479–9504, 2012 www.atmos-chem-phys.net/12/9479/2012/

L. Xu and J. E. Penner: Global simulations of nitrate and ammonium aerosols 9489
Table 5.Global Annual budgets of NH3(g) and ammonium (NH+4 ) for present-day and pre-industrial scenarios.
Scenario
Present-Day Pre-industrial
NH3(g)
Emission (Tg N yr−1) 53.60 10.71Loss (Tg N yr−1) 53.60 10.71
Loss to ammonium 30.52 5.87Dry deposition 12.71 2.33Wet deposition 9.63 2.36
Burden (Tg N) 0.07 0.01Above 5 km (%) 0.76 0.51In polar (%) 0.003 0.05
Lifetime 0.46 0.73Removal rate (day−1) 0.90 1.37
Wet 0.39 0.69Dry 0.51 0.68Wet (%) 43.04 50.28
NH+
4
Sources (Tg N yr−1) 30.52 5.87Gas-to-aerosol (D<1.25µm) 27.46 5.32Gas-to-aerosol (D>1.25µm) 3.06 0.55
Loss (Tg N yr−1) 30.44 5.93Dry deposition 4.51 0.74Wet deposition 25.93 5.19
Burden (Tg N) 0.26 0.03On pure sulfate (%) 79.12 80.95On carbonaceous aerosols (%) 17.05 14.53On dust bins 1–4 (%) 0.07, 0.88, 0.18, 0.03 0.01, 0.14, 0.04, 0.05On sea salt bins 1–4 (%) 1.03, 1.00, 0.55, 0.09 1.09, 2.01, 1.02, 0.17Fine-mode (D<1.25 µm) 97.26 96.57Coarse-mode (D>1.25 µm) 2.74 3.43Above 5 km (%) 13.00 11.32In polar (%) 0.54 0.54
Lifetime 3.23 2.19Removal rate (day−1) 0.31 0.46
Wet 0.26 0.40Dry 0.05 0.07Wet (%) 85.14 87.48
refractive index of organic matter (OM) in biomass burningwas that of Kirchstetter et al. (2004) (1.53–0.03i at 550 nm),while 50 % of organic matter originating from fossil fuelcombustion also used this refractive index, to account for thefact that some of this material is absorbing. The rest of theorganic matter used the same refractive index as that of am-monium sulfate throughout the spectrum. Refractive indicesof ammonium sulfate are used for ammonium. Refractive in-dices of nitrate at the 19 wavelengths used for the radiativeforcing calculation are taken from the Global Aerosol Clima-tology Project database (http://gacp.giss.nasa.gov/datasets).The refractive indices of each internal mixture are calculated
by volume-weighting the refractive indices of each individ-ual aerosol species including its associated water.
The nitrate and ammonium for each aerosol type (Table 3)is output for use in the off-line radiation model, but thesecomponents must be distributed within each size bin andtype in order to accurately calculate the radiative properties.Therefore, we calculate the size distribution of pure sulfateusing the predicted mass and number and the assumed geo-metric standard deviation (i.e. 1.514 and 1.776, respectively,for the nuclei and accumulation modes) for a log-normal dis-tribution at each grid (Liu et al., 2005) while the other fourtypes of aerosols use the prescribed size distributions givenin Table 1. We assumed that two ammonium cations are first
www.atmos-chem-phys.net/12/9479/2012/ Atmos. Chem. Phys., 12, 9479–9504, 2012

9490 L. Xu and J. E. Penner: Global simulations of nitrate and ammonium aerosols
Figure 6: Global annual mean distribution (left) and scatter plot (right) of modeled aerosol
optical depth and observational data from AERONET at 550 nm. Observational data
were provided by S. Kinne and included all available level 2 data from 1996 to 2010.
The geometric mean ratio (GMR) beteween modeled and observed values is given.
Fig. 6.Global annual mean distribution (left) and scatter plot (right) of modeled aerosol optical depth and observational data from AERONETat 550 nm. Observational data were provided by S. Kinne and included all available level 2 data from 1996 to 2010. The geometric meanratio (GMR) between modeled and observed values is given.
associated with one sulfate anion to form ammonium sulfatebefore they are allowed to be associated with nitrate to formammonium nitrate. This assumption is valid over most con-tinental areas since the gas ratio is generally higher than 1(Fig. 4, bottom panel). For pure sulfate, nitrate is allocated toeach sulfate size bin in the accumulation mode according tothe surface area fraction of that size bin to the total surfacearea. For the other four aerosol types, sulfate, ammoniumand nitrate are distributed into each size bin proportional tothe surface area of that type. We use Kohler theory togetherwith the soluble fraction present on each type of aerosols topredict the amount of water on each aerosol type. The hy-groscopicity or Kappa value of nitrate is assumed to be 0.67(Petters and Kreidenweis, 2007), higher than that for ammo-nium sulfate, 0.51. The hygroscopicity of the other aerosolsis 1.16, 0.14, 0.14, and 5× 10⁻⁷ for sea salt, organic matter,dust and black carbon, respectively (see Ghan et al., 2001).The organic value we use here, 0.14, is somewhat higher thanthe average Kappa value reported in Jimenez et al. (2009)but seems reasonable for the more oxidized compounds thatrepresent the organics in aerosols at longer time scales (Linet al., 2012). Note that sea salt is the most hygroscopic ofall the aerosols. The hygroscopicity of the internal mixturewithin each aerosol type is calculated by volume-weightingthe hygroscopicity of each of the individual aerosol species.Aerosol optical depth (AOD) was calculated using a threedimensional lookup table that included the optical propertiesfrom a Mie scattering calculation, whose independent vari-ables were the real and imaginary refractive indices and thesize parameter (x = 2πr/λ, wherer andλ are the aerosolradius and wavelength, respectively), so that arbitrary inter-nal mixtures and sizes of aerosols could be included. In thepresent study, we used monthly averaged aerosol concentra-tions in the radiative transfer model. Sensitivity tests usingdaily and hourly aerosol concentrations were examined in Xu
(2012) and the results were within 5 % for the direct effectand 10 % for the indirect effect. The relative humidity dataused the 4-hourly meteorology field that was used to drivethe off-line radiation transfer model described in Wang andPenner (2009).
Predicted annual average aerosol optical depth is com-pared with the annual averaged observational data derivedfrom the AERONET provided by S. Kinne (Max PlanckInstitute for Meteorology) in Fig. 6. The modeled highestAODs are found over Europe, eastern Asia and over the Sa-hara desert and range from 0.4 to 0.6. The highest AODsin Eastern North America are around 0.1 to 0.3. In general,the modeled AOD is within a factor of 2 of the observeddata from the AERONET. However, the geometric mean ra-tio between modeled and observed AOD is 0.71 indicatingthat the model underestimates AOD. The modeled AOD overthe ocean can be lower than that observed if sea salt emis-sions are too low. Over continents, the modeled AOD cap-tures the general spatial pattern of AOD although the magni-tude is smaller than the observations, especially over SouthAmerica. Low values in these regions may be due to lowbiomass burning emissions. Modeled optical depths in theArabian Sea (0.1–0.4) and Indian Ocean (0.1–0.2) are withinthe range of values observed during the Indian Ocean Experi-ment (INDOEX) by Jayaraman et al. (1998) (i.e. 0.2–0.4 andabout 0.1, respectively).
Figure 7 shows a comparison between the modeled annualmean global distribution of single scattering albedo (SSA)at 550 nm and observation sites from the AERONET. Themodeled SSA over the North America generally ranges from0.75 to 0.96. The simulated SSA ranges from 0.9 to 0.96over Eastern Europe and 0.85–0.9 in Western Europe. TheSSA over regions with biomass burning aerosols and mineraldust are generally lower than 0.9 and 0.93, respectively. Themodeled SSA generally agrees with the observations from
Atmos. Chem. Phys., 12, 9479–9504, 2012 www.atmos-chem-phys.net/12/9479/2012/

L. Xu and J. E. Penner: Global simulations of nitrate and ammonium aerosols 9491
Figure 7: Global annual mean distribution (left) and scatter plot (right) of modeled aerosol single
scattering albedo and observational data from AERONET at 550 nm. The geometric
mean ratio (GMR) beteween modeled and observed values is given.
Fig. 7.Global annual mean distribution (left) and scatter plot (right) of modeled aerosol single scattering albedo and observational data fromAERONET at 550 nm. The geometric mean ratio (GMR) beteween modeled and observed values is given.
Figure 8: Annual mean distribution of the simulated radiative effects of nitrate and ammonium at
the top of atmosphere (TOA) for the all-sky condition for the PD simulation (left) and
global annual mean distribution of the difference in aerosol optical depth at 550 nm
( AOD) between the simulations with and without ammonium and nitrate aerosols for
the PD scenario (right).
Fig. 8. Annual mean distribution of the simulated radiative effects of nitrate and ammonium at the top of atmosphere (TOA) for the all-skycondition for the PD simulation (left) and global annual mean distribution of the difference in aerosol optical depth at 550 nm (1AOD)between the simulations with and without ammonium and nitrate aerosols for the PD scenario (right).
AERONET with a geometric mean ratio between modeledand observed values of 1.01 although we slightly underes-timate the SSA over biomass burning regions (e.g. SouthAmerica).
5 Radiative forcing of nitrate and ammonium
The direct and indirect radiative effects of nitrate and am-monium aerosols were calculated for both present-day andpreindustrial emissions. Note that the same meteorology field(i.e. cloud fields, relative humidity) is used for both PI andPD simulations. The radiative effect, here, is defined as thedifference in the net incoming radiative flux with and withoutboth nitrate and ammonium aerosols for both the PD and thePI scenarios. As in IPCC, the total direct or indirect anthro-pogenic forcing by nitrate and ammonium aerosols is definedas the difference in the net radiative flux between the PD andPI scenarios due to the change in anthropogenic emissions ofnitrate and ammonium precursors. The global annual mean
forcing is assessed based on the average of the four-monthsimulated results (i.e. January, April, July and October).
5.1 Direct forcing of nitrate and ammonium
Figure 8 (left panel) shows the annual mean distribution ofthe simulated direct radiative effect of nitrate and ammoniumat the top of atmosphere (TOA) for all-sky conditions for thePD simulation. The inclusion of nitrate and ammonium con-tributes to cooling of up to−3 W m−2 over continents but aslight warming (0.2 W m−2) over the oceans in regions withhigh sea salt concentrations. The warming effect over oceanis expected since nitrate and ammonium lowers the abilityof sea salt aerosols to take up water, which then decreasesthe extinction characteristics of sea salt aerosols shown inFig. 8 (right panel). Figure 8 (right panel) shows global an-nual mean distribution of the difference in aerosol opticaldepth at 550 nm between the simulations with and withoutammonium and nitrate aerosols for the PD simulation. A de-crease in the aerosol optical depth at 550 nm including nitrate
www.atmos-chem-phys.net/12/9479/2012/ Atmos. Chem. Phys., 12, 9479–9504, 2012

9492 L. Xu and J. E. Penner: Global simulations of nitrate and ammonium aerosols
Table 6.Comparison of direct radiative effect and anthropogenic forcing (W m−2) of nitrate and ammonium in this work with other studies.
Direct effect (PD) Direct effect (PI) Anthropogenic forcing Total direct effectg
TOA Surface TOA Surface TOA Surface
This work −0.14 −0.18 −0.02 −0.02 −0.12 −0.16 −0.3 (−0.1∼−0.9)M09a
−0.023B07b
−0.11 −0.05 −0.06L04c
−0.14 −0.17L05d
−0.22 −0.21 −0.06 −0.06 −0.16 −0.15J01e −0.07 −0.07A01f
−0.30 −0.11 −0.19
a Myhre et al. (2009);b Bauer et al. (2007);c Liao et al. (2004);d Liao and Seinfeld (2005);e Jacobson et al. (2001);f Adams et al.(2001);g the value outside and inside of the parentheses represent the total direct whole sky forcing from all aerosol components andthe total aerosol direct effect summarized in AR4, respectively.
and ammonium is found over the Southern Oceans and partof North Pacific Ocean.
Table 6 shows a comparison of direct effect and anthro-pogenic forcing of nitrate and ammonium estimated in thiswork with other studies. The direct effect of nitrate and am-monium at TOA for the present-day in this work is estimatedto be −0.14 W m−2. Other models have estimated signifi-cantly lower forcing (−0.07 W m−2 estimated by Jacobsonet al., 2001) and higher forcing (−0.30 W m−2 by Adams etal., 2001). As noted by FP07, the equilibrium treatment of Ja-cobson et al. (2001) would be expected to have far too muchnitrate in larger aerosols, while that by Adams et al. (2001)might have higher forcing, because the formation of nitrateand ammonium on dust and sea salt particles was neglectedentirely. The direct effect of nitrate and ammonium at the sur-face estimated in this work,−0.18 W m−2, is comparable tothat by Liao et al. (2004).
Figure 9 shows annual average direct anthropogenic forc-ing of nitrate and ammonium at TOA for all-sky condi-tions. The nitrate and ammonium forcing is estimated to be−0.12 W m−2, much larger than the value of−0.023 W m−2
in M09 and somewhat smaller than the−0.19 W m−2 in A01.Again, A01 neglected the effects of dust and sea salt, butit is not clear why the results in M09 are so much smaller.There is a cooling of up to−3 W m−2 over Eastern Asia,North America and Europe, which is consistent with the ar-eas where nitrate and ammonium aerosols are highest. Theanthropogenic nitrate and ammonium direct forcing at thesurface given in Table 6 is−0.16 W m−2, which is compa-rable to the−0.15 W m−2 estimated by Liao et al. (2005).Note that this work predicts a smaller nitrate burden for bothPD and PI simulation compared with the values reportedin Liao et al. (2005) but the change of the nitrate burdenfrom the PI scenario to the PD scenario (i.e. roughly an in-crease of a factor of 2) is close between these two studies,which results in a similar anthropogenic forcing of nitrateand ammonium. Figure 10 shows the annual average totaldirect anthropogenic forcing of all aerosol components at
Figure 9: Annual mean direct anthropogenic forcing of nitrate and ammonium from the PI to PD
scenario for all-sky conditions.
Fig. 9.Annual mean direct anthropogenic forcing of nitrate and am-monium from the PI to PD scenario for all-sky conditions.
the TOA for all-sky conditions (left panel) and for clear-sky conditions (right panel). At the top of atmosphere, thetotal global annual anthropogenic forcing for all-sky con-ditions is estimated to be−0.3 W m−2, which is within therange of−0.1∼ −0.9 W m−2 reported by AR4 (Forster etal., 2007) and, somewhat by accident, close to the sug-
gested global annual mean radiative forcing of−0.3 W m−2
by Myhre (2009) (since our nitrate/ammonium forcing is sodifferent). The all-sky direct forcing shows a strong coolingover industrial regions with moderate heating occurring overbiomass burning regions. The total cooling by anthropogenicaerosols would be significantly larger, but it is masked bythe shortwave cloud forcing (i.e. the clear sky forcing is−0.91 W m−2 at the top of atmosphere while the all-sky forc-ing is −0.3 W m−2). For clear-sky conditions, aerosols gen-erally exert negative forcing at TOA with a strong cooling ofup to−10 W m−2 over East Asia, Europe and North Amer-ica in which anthropogenic aerosols are highest. Note that theinclusion of absorbing aerosols (BC and/or OM) in biomassburning regions can cause heating when the aerosol is abovea cloud or above a reflecting surface (Haywood and Shine,1995). In clear skies, aerosols would only heat if the surfacealbedo is large and the proportion of absorbing material islarge enough. Although we use a refractive index for OM in
Atmos. Chem. Phys., 12, 9479–9504, 2012 www.atmos-chem-phys.net/12/9479/2012/

L. Xu and J. E. Penner: Global simulations of nitrate and ammonium aerosols 9493
Figure 10: Annual mean total direct anthropogenic forcing of all aerosols at the top of
atmosphere from the PI to PD scenario for all-sky conditions (left) and for clear-sky
conditions (right).
Fig. 10. Annual mean total direct anthropogenic forcing of all aerosols at the top of atmosphere from the PI to PD scenario for all-skyconditions (left) and for clear-sky conditions (right).
biomass aerosols that represents the absorption seen in mea-surements (Kirchstetter et al., 2004), we do not find that thisabsorption leads to a positive forcing in clear skies (whereasChuang et al. (2012) do find a positive forcing). The contri-bution of aerosol nitrate and ammonium to the global averagetotal clear sky direct anthropogenic forcing is approximately13 %.
5.2 Indirect forcing of nitrate and ammonium
Here, we investigate the aerosol indirect effect of nitrate andammonium and its accompanying gaseous HNO3 in the at-mosphere. The treatment for gas phase HNO3 is based onthe substitution method proposed in a previous study (Chen,2006). Chen (2006) used a cloud parcel model to investi-gate the use of different assumptions for the treatment ofnitrate in the gas phase and aerosol phase to calculate thecloud droplet number concentrations for different represen-tative sites on the Earth. In keeping with the results of Kul-mala et al. (1993), he found that both nitrate in the aerosolphase and HNO3 in gas phase can have an effect on aerosolactivation. Kulmala et al. (1993) showed that in the presenceof HNO3 gas, the supersaturation needed to activate aerosolparticles is suppressed. As a result, smaller particles can beactivated more easily at high concentrations of HNO3. Sincethe droplet number is mainly determined by the fine-modeaerosol number, Chen (2006) proposed to re-distribute thegas-phase HNO3 to the fine-mode aerosol phase and to usethis together with the Abdul-Razzak and Ghan (2002) pa-rameterization scheme to approximate the effect of gaseousHNO3 on cloud droplet number concentrations in globalmodels. Chen (2006) used an adiabatic parcel model andshowed that the substitution method used in a parcel modelcaptures the increase of cloud droplets due to the condensa-tion of nitric acid gas to within a root-mean-square (RMS) of5 %. The Abdul-Razzak and Ghan (2002) scheme, however,has additional approximations that cause additional errors(RMS difference of 20 %) between the parcel model and theirparameterization with the substitution method. In this work,we implemented this treatment in the off-line calculation of
forcing developed by Wang and Penner (2009). Thus, we ac-count for the influence of both gaseous HNO3 and aerosolnitrate and ammonium on the estimated cloud droplet num-ber concentrations. In order to calculate these effects, first,we calculated the cloud droplet number from the five indi-vidual aerosol types (Nd,j , wherej is aerosol type) and the
total cloud droplet number (i.e.Nd =
5∑j=1
Nd,j ) without con-
sidering the effect of nitric acid gas. Thus, we only considerthe influence of particulate phase nitrate and ammonium oncloud droplet activation in this step. Then, we distribute themass of nitric acid gas to each aerosol type in the fine mode(i.e. size bin 1) proportional to the fraction of cloud dropletsformed on this aerosol type (i.e.fj = Nd,j/Nd). Last, we up-dated the cloud droplet number with this new nitrate aerosoldistribution.
Generally speaking, HNO3 gas and aerosol ni-trate/ammonium have two counteracting effects in modifyingcloud droplet number concentrations. First, the addition oftotal nitrate (gas plus aerosol) and ammonium increasesthe size and the solute concentration in the aerosol par-ticles, which increases the hygroscopicity and leads to adecrease in the critical supersaturation (Sc) due to Raoulteffect (or “solute effect”). This solute effect is closely tiedwith the soluble fraction in pre-existing aerosols. If thepre-existing aerosol is soluble, the effect of aerosol-phaseammonium and nitrate and gas-phase nitric acid may notbe of great importance. If the pre-existing aerosol is mainlynon-soluble, the addition of soluble aerosol and gas speciescan increase the uptake of water, thereby causing an increasein the number of cloud droplets. Second, the effect of totalnitrate on cloud droplets is also related to the total mass ofnitrate and HNO3 gas. An increase in the total mass of theaerosol particle population due to the presence of nitrateand ammonium aerosols and HNO3 gas tends to decreasethe ambient maximum supersaturation (Smax). In this case,nitrate lowers the saturation water vapor associated withaerosol particles, leading to a decrease in the size of particlesthat activate at a given supersaturation. Based on the theory
www.atmos-chem-phys.net/12/9479/2012/ Atmos. Chem. Phys., 12, 9479–9504, 2012

9494 L. Xu and J. E. Penner: Global simulations of nitrate and ammonium aerosols
Table 7. Descriptions of experiments for the radiative calculationsof the first aerosol indirect forcing.
Case Description
PN The calculation with all aerosols including particulateNO−
3 and NH+
4 .
TN The calculation including particulate NO−3 and
NH+
4 and gaseous HNO3.
NN The calculation without NO−3 and NH+
4 but includingsulfate, carbonaceous aerosols from both fossil fuel andbiomass burning, dust and sea salt.
of activation, aerosol particles withSc<Smax are activatedto become cloud droplets and will grow spontaneously if theambient supersaturation remains at or above the respectivecritical value. Hence, the number of droplets depends onthe competition between the increasing effect of the lowercritical supersaturations and the decreasing effect of thelower ambient maximum supersaturations within the parcel.In addition, the number of cloud droplets that form is relatedto how the soluble gases are distributed among the particleswith different sizes. If small particles collect comparablymore gases than larger particles, this favors the increasingaerosol activation while the number of cloud drops maydecrease if larger particles take up gases more easily.
Table 7 outlines the experiment designs for the radiativecalculations of the first aerosol indirect forcing. We ran tworadiative calculations for the three cases listed in Table 7:one with the PD aerosol concentrations and one with the PIaerosol concentrations. The difference in the radiative fluxbetween the total nitrate case (TN) and particulate nitrate(PN) cases (i.e. TN-PN) is the net effect of HNO3 gas whilethe difference between TN and NN (no nitrate) is the totalnitrate (NO−
3 + HNO3 gas) and ammonium effect.Figure 11 shows the present day annual average cloud top
droplet number (CDN) concentration for the three cases. Asexpected, the influence of nitrate and ammonium aerosols onthe cloud droplet activation mainly occurs over the North-ern Hemisphere since the major aerosol nitrate and ammo-nium occurs in the Northern Hemisphere. Because nitrateand ammonium decrease rapidly with altitude (not shown),the largest effects of adding these aerosols are seen close tothe surface. There is some modification of cloud droplets be-tween 0–30◦ S in the Southern Hemisphere with the addi-tion of nitric acid gas (i.e. the TN case) due to higher gasphase HNO3 mixing ratios over these areas. The addition ofnitrate and ammonium aerosols increases the cloud dropletnumber concentration by about 3 % on a global average ba-sis. With the further addition of nitric acid gas, the increasein cloud droplets is more than 10 %. Local enhancements areeven larger. The spatial pattern of the modeled CDN con-centration in this study is similar to that predicted in other
Figure 11: Present day annual average cloud top droplet number (CDN) concentration for the
NN, PN, and TN cases near 930 mb (the third model layer).
Fig. 11. Present day annual average cloud top droplet number(CDN) concentration for the NN, PN, and TN cases near 930 mb(the third model layer).
global studies (e.g. Merikanto et al., 2010; Karydis et al.,2011). However, the CDN are slightly lower over the pol-luted regions (less than 500 cm−3) than those in Merikantoet al. (2010) and Karydis et al. (2011). Differences in pre-dicted CDN can arise if the assumed in-cloud updraft ve-locities differ. This study used the updraft velocities chosenin Wang and Penner (2010) which are less than 0.3 m s−1
over the land whereas Merikanto et al. (2010) and Kary-dis et al. (2011) used values of 0.4 m s−1 and 0.3 m s−1, re-spectively. Figure 12 shows the absolute difference of presentday annual average cloud droplet number near 930 mb (thethird model level, near the top of the boundary layer) betweenthe PN and NN cases for each aerosol type. The addition ofaerosol nitrate and ammonium increases the number of to-tal cloud droplets almost everywhere except for some areasover oceans. The activated pure sulfate is inhibited with addi-tional nitrate and ammonium except for sulfate concentrationpeak regions. The reduction of activated pure sulfate resultsfrom the increase in the activation of carbonaceous aerosolsand dust due to the significant enhancement of their capabil-ity to uptake water by more soluble coatings of nitrate and
Atmos. Chem. Phys., 12, 9479–9504, 2012 www.atmos-chem-phys.net/12/9479/2012/

L. Xu and J. E. Penner: Global simulations of nitrate and ammonium aerosols 9495
Figure 12: The absolute difference of present day annual average cloud droplet number
concentration activated from each aerosol type and the total cloud droplet number
near 930 mb (the third model layer) between the case PN and NN. The mean value
is given above each panel.
Fig. 12.The absolute difference of present day annual average cloud droplet number concentration activated from each aerosol type and thetotal cloud droplet number near 930 mb (the third model layer) between the case PN and NN. The mean value is given above each panel.
ammonium besides sulfate. Ghan et al. (1998) showed thatthe competition between sulfate and sea salt can decreasethe influence of sulfate on cloud droplet number concentra-tions for typical marine cloud conditions. They found thatthe additional sea salt increases the total number of activatedcloud drops for low sulfate concentrations while the numberof activated droplets decreases significantly with the addi-tional sea salt for high sulfate concentrations. They explainedthat the presence of large cloud condensation nuclei (CCN)with larger surface area will enhance condensation, reducethe maximum supersaturation and hence prevent the activa-tion of enough of smaller CCN, eventually resulting in thedecrease of the total number of activated drops. This exampledemonstrates the non-linear dynamical effects that exist in asimple two-component aerosol system (i.e. the effect of in-creasing the availability of aerosol populations does not nec-essarily causes an increase in cloud droplet concentration).Here, the decrease in drop numbers formed on sulfate is dueto the competition for water vapor in the multi-componentsystem. Figure 13 shows a similar figure for the difference
between the TN case and the NN case. The additional HNO3gas in the TN case further enhances the activation of sulfateand carbonaceous aerosols but it does not change the activa-tion of dust and sea salt by a significant amount. This is prob-ably because HNO3 gas is small in regions with abundantdust and sea salt so that the additional HNO3 gas effect is notpronounced on these two types of aerosols. We also see someareas over remote oceans with decreases in cloud drops whenHNO3 gas and nitrate and ammonium particles are added,which again might be due to the competition between differ-ent aerosol types discussed above (and in Ghan et al., 1998).The negative response of sulfate in Northern America is alsodue to the dynamic competition for water vapor in the com-plex multi-component system, which is partly a result of thepositive response of fossil fuel and biomass burning aerosolsto the additional HNO3 gas (compare Figs. 12 and 13). Over-all, the addition of nitrate aerosols increases the number ofcloud droplets in eastern Asia while the further addition ofnitric acid increases the cloud droplets even more over east-ern Asia, Europe, eastern United Sates, South America and
www.atmos-chem-phys.net/12/9479/2012/ Atmos. Chem. Phys., 12, 9479–9504, 2012

9496 L. Xu and J. E. Penner: Global simulations of nitrate and ammonium aerosols
Figure 13: The absolute difference of present day annual average cloud droplet number
concentration activated from each aerosol type and the total cloud droplet number
near 930 mb (the third model layer) between the case TN and NN. The mean value
is given above each panel.
Fig. 13.The absolute difference of present day annual average cloud droplet number concentration activated from each aerosol type and thetotal cloud droplet number near 930 mb (the third model layer) between the case TN and NN. The mean value is given above each panel.
Figure 14: The percentage change in zonal annual-average cloud droplet number for the case PN
and the case TN compared to the NN case near 930 mb (the third model layer).
Fig. 14. The percentage change in zonal annual-average clouddroplet number for the case PN and the case TN compared to theNN case near 930 mb (the third model layer).
South Africa. The added mass of soluble gases facilitatesthe activation of smaller particles by causing a lower criticalsuper-saturation and a higher hygroscopicity. Figure 14 sum-marizes the percentage change in zonal annual-average clouddroplet number for the PN and TN cases with respect to theNN case near 930 mb. There is a large peak in the changeof cloud droplets near 30◦ N and 60◦ N corresponding to thelocations of the highest nitrate aerosol and nitric acid con-centrations.
Figure 15 shows the spatial distribution of the change indroplet effect radius and the first aerosol indirect forcingfor the TN case. The aerosol indirect forcing in this caseis −1.48 W m−2. The spatial distribution of the first indirectforcing is not only determined by the change in the cloud topeffective radius but also by the cloud distribution. The maxi-mum in the first aerosol indirect forcing occurs in the stormtrack region over the north Pacific. This is consistent withthe pattern shown in Wang and Penner (2009). This peakis caused by both the strong decrease in the cloud droplet
Atmos. Chem. Phys., 12, 9479–9504, 2012 www.atmos-chem-phys.net/12/9479/2012/

L. Xu and J. E. Penner: Global simulations of nitrate and ammonium aerosols 9497
Figure 15: The spatial distribution of the change in droplet effect radius (left) and the first
aerosol indirect forcing between the PD and PI simulations (right) for the TN case.
Fig. 15. The spatial distribution of the change in droplet effect radius (left) and the first aerosol indirect forcing between the PD and PIsimulations (right) for the TN case.
Table 8. Global annual-average cloud droplet number concentration at cloud top in the PD (PI) simulation, cloud top effective radius inthe PD (PI) simulation, cloud optical thickness in the PD (PI) simulationa, absolute (percentageb) change in cloud top droplet numberconcentration, cloud top effective radius and cloud optical thickness from anthropogenic emission, and 1st AIE for all three cases and thedifference of the case NN and TN at the top of atmosphere.
Case Nd (#/cm3) Re (µm) τc Change inNd (#/cm3) Change inRe (µm) Change inτc 1st AIE (W m−2)
NN 112.47 (74.03) 10.44 (11.32) 29.85 (27.34) 38.44 (51.92 %)−0.88 (−7.77 %) 2.51 (9.18 %) −1.39PN 115.11 (71.29) 10.43 (11.31) 29.89 (27.36) 43.82 (61.47 %)−0.88 (−7.78 %) 2.53 (9.25 %) −1.40TN 125.38 (74.75) 10.31 (11.23) 30.15 (27.51) 50.63 (67.73 %)−0.92 (−8.19 %) 2.64 (9.60 %) −1.48Netc −0.09 (−0.08)
a The values outside and inside the parenthesis in column 2–4 represent the results from the PD and PI scenario.b The percentage values inside the parenthesis in column 5–7 is calculated as the difference from the PI to the PD divided by the values in the PI scenario.c “net” represents the first aerosol indirect forcing of anthropogenic HNO3 and nitrate and ammonium aerosol and the forcing due to anthropogenic HNO3 gas only (i.e., valueinsidethe parenthesis).
effective radius and the large cloud forcing over this region.Figure 16 shows the first aerosol indirect effect of total ni-trate (gas plus aerosol) and ammonium (TN case minus NNcase) for the PD (top), PI (middle) simulation and the PD-PI anthropogenic indirect forcing of total nitrate and ammo-nium (bottom) at the TOA. The indirect effect of total nitrateand ammonium for the PD and PI simulations is estimatedto be−0.23 W m−2 and−0.15 W m−2, which results in ananthropogenic indirect forcing of−0.09 W m−2, equivalentto a 6 % enhancement compared to the total first aerosol in-direct forcing without nitrate and ammonium. The local ef-fects of total nitrate and ammonium for the PD simulationis even larger, up to−1.5∼ −2 W m−2 over Europe, easternAsia, eastern United States and the coastal area close to cen-tral Africa. Our present-day indirect effect of total nitrate andammonium is only half that estimated for the present-day in-direct effect of nitric acid gas by Makkonen et al. (2012) (i.e.−0.23 W m−2 vs.−0.32 W m−2). This large difference couldresult from the different parameterizations of the effect of ni-tric acid gas on aerosol activation (i.e. we used the substi-tution method of Chen, 2006 while Makkonen et al., 2012used the parameterization of Romakkaniemi et al., 2005).But the simulated nitric acid mass concentrations betweenthese two studies might also differ. It has been documented
that there is factor of two or larger variation in the calculationof tropospheric NO2 column densities for different regions(i.e. Eastern US, Europe, East Asia, Africa, South America)(van Noije et al., 2006), although HNO3 variations mightbe smaller or larger than those for NO2. Since the study ofMakkonen et al. (2012) did not provide a global budget andburden of nitric acid gas, we can not precisely understand thecause of the differences at this stage.
Table 8 gives a summary of global annual-average clouddroplet number concentration at the cloud top as deducedusing the ISCCP cloud simulator similar as Wang and Pen-ner (2009), cloud top effective radius, cloud optical thicknessin the PD and PI (i.e. values in parentheses) simulations, andthe absolute change and relative percentage change (i.e. val-ues in parentheses) in cloud top droplet number concentra-tion, cloud top effective radius and cloud optical thicknessfrom anthropogenic emissions (i.e. PD-PI values). The lastcolumn provides the PD-PI 1st AIE for the NN, PN, andTN cases at the top of atmosphere. In general, the cloud topdroplet number and cloud optical thickness increase from theNN case to the TN case for both the PD and PI scenarioswhile the cloud top effective radius decreases. The cloud topdroplet number concentration for the NN, PN and TN casesincreases by 52 %, 61 % and 68 %, respectively, between the
www.atmos-chem-phys.net/12/9479/2012/ Atmos. Chem. Phys., 12, 9479–9504, 2012

9498 L. Xu and J. E. Penner: Global simulations of nitrate and ammonium aerosols
Figure 16: The first aerosol indirect effect of total nitrate (gas plus aerosol) and ammonium for
the PD (top), PI (middle) simulation and the PD – PI anthropogenic aerosol indirect
forcing (bottom) at the top of atmosphere (TOA). The mean forcing value is indicated
in each panel.
Fig. 16. The first aerosol indirect effect of total nitrate (gas plusaerosol) and ammonium for the PD (top), PI (middle) simulationand the PD – PI anthropogenic aerosol indirect forcing (bottom) atthe top of atmosphere (TOA). The mean forcing value is indicatedin each panel.
PD and PI simulations. The relative changes in cloud top ef-fective radius and cloud optical depth are smaller, only about8–10 %. The addition of total nitrate and ammonium con-tributes to the increase of cloud droplet number concentra-tion by 16 % (comparing the NN case and the TN case inthe 5th column) while it only decreases the cloud top ef-fective radius by 0.04 µm (comparing the NN case and theTN case in the 6th column), equivalent to a 0.4 % in the rel-ative change consistent with the latter only scaling as theinverse of droplet number to the 1/3 power. The total (gasplus aerosol) first aerosol indirect forcing of anthropogenicnitrate and ammonium is dominated by the nitric acid gaseffect, which is−0.08 W m−2 out of total−0.09 W m−2 ona global average basis. Figure 17 shows the first aerosol in-direct forcing of anthropogenic nitrate and ammonium over
Figure 17: The first aerosol indirect anthropogenic forcing at the top of atmosphere over five
areas for the three cases (AER: PN-NN; GAS: TN-PN; TOT: TN-NN). GLB, NH,
SH, LND and OCN stand for the global average, average over the northern and
southern hemisphere, average over the land and ocean, respectively.
Fig. 17.The first aerosol indirect anthropogenic forcing at the top ofatmosphere over five areas for the three cases (AER: PN-NN; GAS:TN-PN; TOT: TN-NN). GLB, NH, SH, LND and OCN stand forthe global average, average over the Northern and Southern Hemi-sphere, average over the land and ocean, respectively.
5 areas to differentiate the forcing from HNO3 gas and par-ticulate nitrate and ammonium. Anthropogenic total nitrate(gas plus aerosol) and ammonium aerosols have a higher in-fluence on clouds in the Northern Hemisphere than in theSouthern Hemisphere and higher effects over land than overthe ocean. The aerosol nitrate and ammonium exert a higherinfluence over land than over the oceans, which is consistentwith their larger concentrations over continents. In contrast,nitric acid gas exerts a higher influence over the ocean thanover land, which is consistent with the significant effect ofnitric acid gas in modifying clouds over the coastal regionsclose to continents (see Fig. 16). The large anthropogenic in-direct forcing of nitric acid gas over the coastal regions is dueto the amount of clouds seen in these regions together withthe increase in the number of cloud droplets associated withsulfate, fossil fuel carbonaceous aerosols, and biomass burn-ing aerosols when nitric acid gas is added (compare Figs. 12and 13).
6 Summary and discussion
This work presents a global modeling study that simulatesthe heterogeneous formation of nitrate and ammonium byupdating the previous model framework presented in Fengand Penner (2007). In this work, the University of Michiganversion of the IMPACT aerosol model which includes sulfurdynamics (Liu et al., 2005) is used to generate the chemical-and size-resolved aerosol global distribution. We account forthe interaction between nitric acid and ammonia with allfive types of pre-existing aerosols (i.e. sulfate, carbonaceousaerosols from fossil fuel combustion, carbonaceous aerosolsfrom biomass burning, dust and sea salt) which differs fromthe study by Feng and Penner (2007) who assumed that allaerosol components were internally mixed in each size bin.Our major goal was to explore the aerosol direct and indirectradiative forcing induced by HNO3 gas as well as aerosol am-monium and nitrate. For this purpose, two global simulations
Atmos. Chem. Phys., 12, 9479–9504, 2012 www.atmos-chem-phys.net/12/9479/2012/

L. Xu and J. E. Penner: Global simulations of nitrate and ammonium aerosols 9499
effect of total nitrate and ammonium for the PD and PI simulation is estimated to be -0.23 W m-2
and -0.15 W m-2
at TOA, leading to a first aerosol indirect anthropogenic forcing of -0.09 W m-2
at TOA induced by anthropogenic HNO3 gas, nitrate and ammonium. This is mainly determined
by the nitric acid gas effect, which is -0.08 W m-2
on a global basis with higher effects over
oceans. This is the first estimate that we know of for the anthropogenic nitric acid gas indirect
effect.
Appendix A:
Figure A1: Modeled and observed annual average concentrations for sulfate, ammonium and
nitrate aerosols from the EMEFS (North America) network.
Figure A2: Modeled and observed annual average concentrations for sulfate, ammonium and
nitrate aerosols from the EMEP (Europe) network.
Acknowledgement
Fig. A1. Modeled and observed annual average concentrations for sulfate, ammonium and nitrate aerosols from the EMEFS (NorthAmerica) network.
effect of total nitrate and ammonium for the PD and PI simulation is estimated to be -0.23 W m-2
and -0.15 W m-2
at TOA, leading to a first aerosol indirect anthropogenic forcing of -0.09 W m-2
at TOA induced by anthropogenic HNO3 gas, nitrate and ammonium. This is mainly determined
by the nitric acid gas effect, which is -0.08 W m-2
on a global basis with higher effects over
oceans. This is the first estimate that we know of for the anthropogenic nitric acid gas indirect
effect.
Appendix A:
Figure A1: Modeled and observed annual average concentrations for sulfate, ammonium and
nitrate aerosols from the EMEFS (North America) network.
Figure A2: Modeled and observed annual average concentrations for sulfate, ammonium and
nitrate aerosols from the EMEP (Europe) network.
Acknowledgement
Fig. A2. Modeled and observed annual average concentrations for sulfate, ammonium and nitrate aerosols from the EMEP (Europe)network.
using the hybrid dynamic method with present day (PD) andpreindustrial (PI) emissions were conducted. An offline- ra-diation transfer model was then used to assess both the directand indirect forcing of HNO3, nitrate and ammonium usingthe PD and PI concentration fields.
The model developed here predicts a similar spatial dis-tribution for total nitrate and ammonium as the pioneeringstudies (Feng and Penner, 2007; Liao et al., 2003; Adamset al., 1999) for the PD scenario. The predicted aerosol op-tical depth in the present day captures the general spatialpattern of AERONET-observed AOD (e.g. peaks in easternAsia, Europe and the Sahara) but with smaller magnitude.The modeled AOD is underestimated, especially over theSouth America biomass burning region, which possibly in-dicates that the biomass burning emissions in this region aretoo low. The modeled single scattering albedo at 550 nm is ingeneral agreement with observations but shows some under-estimation over South America.
Nitrate and ammonium are found to exhibit two counter-acting effects with respect to the direct effect of the pre-existing (non nitrate and ammonium) aerosols in this work.
The inclusion of ammonium and nitrate can boost the scat-tering efficiency of scattering aerosols such as sulfate andbiomass burning organic matter since ammonium nitrate isgenerally more hygroscopic than ammonium sulfate and or-ganic matter in terms of the Kappa parameter (Petters andKreidenweis, 2007) and this increases their size and hencetheir cooling effect. Additionally, nitrate and ammoniumlowers the ability of sea salt aerosols to take up water dueto the lower hygroscopicity of nitrate and ammonium thanthat of sea salt. The direct effect of nitrate and ammonium atthe TOA for the present-day is estimated to be−0.14 W m−2,within the range published for other models, but the more ac-curate methods used here place our result in contrast withthese models. Smaller forcing is estimated for the PI sce-nario due to the smaller burden of ammonium and nitrate.The direct anthropogenic (PD-PI) forcing of nitrate and am-monium is estimated to be−0.12 W m−2 at the TOA and−0.16 W m−2 at the surface. The total global annual averagedirect anthropogenic forcing from all aerosol components isestimated to be−0.3 W m−2, which is within the range of−0.1∼ −0.9 W m−2 reported in AR4 (Forster et al., 2007).
www.atmos-chem-phys.net/12/9479/2012/ Atmos. Chem. Phys., 12, 9479–9504, 2012

9500 L. Xu and J. E. Penner: Global simulations of nitrate and ammonium aerosols
The contribution of aerosol nitrate and ammonium to the to-tal clear sky direct anthropogenic forcing is approximately13 % on a global basis, indicating that the nitrate and ammo-nium should not be ignored in the future assessment.
The indirect effect induced by total nitrate (gas and par-ticle phase) and ammonium was also examined based onthe parameterization proposed by Chen (2006). The firstaerosol indirect effect of total nitrate and ammonium forthe PD and PI simulation is estimated to be−0.23 W m−2
and −0.15 W m−2 at TOA, leading to a first aerosol indi-rect anthropogenic forcing of−0.09 W m−2 at TOA inducedby anthropogenic HNO3 gas, nitrate and ammonium. Thisis mainly determined by the nitric acid gas effect, whichis −0.08 W m−2 on a global basis with higher effects overoceans. This is the first estimate that we know of for the an-thropogenic nitric acid gas indirect effect.
Acknowledgements.LX and JEP are grateful to the DOEAtmospheric Science Research Program (grant number DOE-DE-FG02-97-ER62370) and to the DOE Climate Program (grantnumber DOE-FG02-01-ER63248) for partial support of this work.Some of this work took place while LX was supported as a studentat the Max Planck Institute for Chemistry. LX and JEP thankX. Huang (University of Michigan) who provided useful commentson a draft of this paper. LX and JEP are grateful for S. Kinne (MaxPlanck Institute for Meteorology) who provided the observationaldata for aerosol optical properties derived from the AERONET.
Edited by: M. Kopacz
References
Abdul-Razzak, H. and Ghan, S. J.: A parameterization of aerosolactivation – 3. Sectional representation, J. Geophys. Res., 107,4026,doi:10.1029/2001JD000483, 2002.
Adams, P. J., Seinfeld, J. H., and Koch, D. M.: Global concen-tration of tropospheric sulphate, nitrate and ammonium aerosolsimulated in a general circulation model, J. Geophys. Res., 104,13791–13823, 1999.
Adams, P. J., Seinfeld, J. H., Koch, D. M, Mickley, L., and Jacob,D.: General circulation model assessment of direct radiative forc-ing by the sulphate-nitrate-ammonium-water inorganic aerosolsystem, J. Geophys. Res., 106, 1097–1111, 2001.
Anderson Jr., B. E., Sachse, G. W., Bagwell, D. R., Hudgins, C.H., Blake, D. R., and Blake, N. J.: Aerosols from biomass burn-ing over the tropical South Atlantic region: Distributions and im-pacts, J. Geophys. Res., 101, 24117–24138, 1996.
Ansari, A. S. and S. N. Pandis: Response of inorganic PM to precur-sor concentrations, Environ. Sci. Technol., 32, 2706–2714, 1998.
Bauer, S. E., Koch, D., Unger, N., Metzger, S. M., Shindell, D.T., and Streets, D. G.: Nitrate aerosols today and in 2030: aglobal simulation including aerosols and tropospheric ozone, At-mos. Chem. Phys., 7, 5043–5059,doi:10.5194/acp-7-5043-2007,2007.
Binkowski, F. S. and Shankar, U.: The regional particulate mattermodel, 1. mode desription and preliminary results, J. Geophys.Res., 100, 26191–26209, 1995.
Bond, T. C., Habib, G., and Bergstrom, R. W.: Limitations in theenhancement of visible light absorption due to mixing state, J.Geophys. Res., 111, D20211,doi:10.1029/2006JD007315, 2006.
Bouwman, A. F., Lee, D. S., Asman, W. A. H., Dentener, F. J., VanDer Hoek, K. W., and Olivier, J. G. J.: A global high-resolutionemission inventory for ammonia, Global Biogeochem. Cy., 11,561–588, 1997.
Capaldo, K., Pilinis, C., and Pandis, S. N.: A computationally ef-ficient hybrid approach for dynamic gas/aerosol transfer in airquality models, Atmos. Environ., 34, 3617–3627, 2000.
Chen, Y.: Aerosol indirect effects on clouds and global climate,PhD, Department of Atmospheric, Oceanic, and Space Sciences,University of Michigan, Ann Arbor, MI, 218 pp., 2006.
Chen, Y. and Penner, J. E.: Uncertainty analysis for estimates of thefirst indirect aerosol effect, Atmos. Chem. Phys., 5, 2935–2948,doi:10.5194/acp-5-2935-2005, 2005.
Chuang, C. E., Ramanathan V., and Decremer, D.: Observa-tionally constrained estimates of carbonaceous aerosol radia-tive forcing, P. Natl. Acad. Sci. USA, 109, 11624–11629,doi:10.1073/pnas.1203707109, 2012.
Dall’Osto, M., Harrison, R. M., Coe, H., Williams, P. I., and Al-lan, J. D.: Real time chemical characterization of local andregional nitrate aerosols, Atmos. Chem. Phys., 9, 3709–3720,doi:10.5194/acp-9-3709-2009, 2009.
d’Almeida, G. A., Koepke, P., and Shettle, E. P.: AtmosphericAerosols: Global Climatology and Radiative Characteristics, A.Deepak, Hampton, Va, 1991.
Dassios, K. G. and Pandis, S. N.: The mass accommodation coeffi-cient of ammonium nitrate aerosol, Atmos. Environ., 33, 2999–3003, 1999.
Ehhalt, D. and Drummond, J. W.: The tropospheric cycle of NOx:chemistry of the unpolluted and polluted troposphere, edited by:Georgii, W. J., Proc. NATO Adv. Study Inst.,Corfu, Greece, 28September–10 Octtober 1981 Reidel, Dordrecht, 219–251, 1982.
Feng, Y. and Penner, J. E.: Global modeling of nitrate and ammo-nium: Interaction of aerosols and tropospheric chemistry, J. Geo-phys. Res., 112, D01304,doi:10.1029/2005JD006404, 2007.
Forster, P., Ramaswamy, V., Artaxo, P., Berntsen, T., Betts, R., Fa-hey, D. W., Haywood, J., Lean, J., Lowe, D. C., Myhre, G.,Nganga, J., Prinn, R., Raga, G., Schulz, M., and Van Dorland,R.: Changes in Atmospheric Constituents and in Radiative Forc-ing, in: Climate Change 2007:The Physical Science Basis. Con-tribution of Working Group I to the Fourth Assessment Reportof the Intergovernmental Panel on Climate Change, edited by:Solomon, S., Qin, D., Manning, M., Chen, Z., Marquis, M., Av-eryt, K. B., Tignor, M., and Miller, H. L., Cambridge UniversityPress, Cambridge, United Kingdom and New York, NY, USA,2007.
Ghan, S. J., Guzman, G., and Abdul-Razzak, H.: Competition be-tween sea salt and sulfate particles as cloud condensation nuclei,J. Atmos. Sci., 55, 3340–3347, 1998.
Ghan, S., Laulainen, N., Easter, R., Wagener, R., Nemesure, S.,Chapman, E., Zhang, Y., and Leung, R.: Evaluation of aerosol di-rect radiative forcing in MIRAGE, J. Geophys. Res., 106, 5295–5316,doi:10.1029/2000JD900502, 2001.
Ginoux, P., Chin, M., Tegen, I., Prospero, J. M., Holben, B.,Dubovik, O., and Lin, S. J.: Sources and distributions of dustaerosols simulated with the GOCART model, J. Geophys. Res.,106, 20255–20273, 2001.
Atmos. Chem. Phys., 12, 9479–9504, 2012 www.atmos-chem-phys.net/12/9479/2012/

L. Xu and J. E. Penner: Global simulations of nitrate and ammonium aerosols 9501
Gong, S. L., Barrie, L. A., and Blanchet, J. P.: Modeling sea-saltaerosols in the atmosphere .1. Model development, J. Geophys.Res., 102, 3805–3818, 1997.
Goodman, A. L., Underwood, G. M., and Grassian, V. H.: A labora-tory study of the heterogeneous reaction of nitric acid on calciumcarbonate particles, J. Geophys. Res., 105, 29053–29064, 2000.
Haywood, J. M. and Shine, K. P.: The effect of anthropogenic sul-fate and soot aerosol on the clear sky planetary radiation budget,Geophys. Res. Lett., 22, 603–606, 1995.
Heintzenberg, J., Wendisch, M., Yuskiewicz, B., Orsini, D.,Wiedensohler, A., Stratmann, F., Frank, G. P., Martinsson, B. G.,Schell, D., Fuzzi, S., and Orsi, G.: Characteristics of haze, mistand fog, Contrib. Atmos. Phys., 71, 21–31, 1998.
Herzog, M., Weisenstein, D. K., and Penner, J. E.: A dy-namic aerosol module for global chemical transport mod-els: Model description, J. Geophys. Res., 109, D18202,doi:10.1029/2003JD004405, 2004.
Intergovernmental Panel on Climate Change (IPCC), Climatechange 1994: Radiative Forcing of Climate Change and anEvaluation of the IPCC IS92 Emission Scenarios, edited by:Houghton, J. T., Meria Filho, L. G., Bruce, J., Lee, H., Callan-der, B. A., Haites, E. F., Harris, N., and Maskell, K., CambridgeUniv. Press, Cambridge, United Kingdom and New York, NY,USA, 1994.
Ito, A. and Akimoto, H.: Seasonal and interannual variations inCO and BC emissions from open biomass burning in SouthernAfrica during 1998–2005, Global Biogeochem Cy., 21, GB2011,doi:10.1029/2006GB002848, 2007.
Ito, A., Sillman, S., and Penner, J. E.: Global chemical trans-port model study of ozone response to changes in chemicalkinetics and biogenic volatile organic compounds emissionsdue to increasing temperatures: Sensitivities to isoprene nitratechemistry and grid resolution, J. Geophys. Res., 114, D09301,doi:10.1029/2008JD011254, 2009.
Jacob, D. J. and Wofsy, S. C.: Budgets of reactive nitrogen, hy-drocarbons, and ozone over the Amazon forest during the wetseason, J. Geophys. Res., 95, 16737–16754, 1990.
Jacobson, M. Z.: Development and application of a new air pollu-tion modeling system-II: Aerosol module structure and design,Atmos. Environ., 31A, 131–144, 1997a.
Jacobson, M. Z.: Numerical techniques to solve condensational anddissolutional growth equations when growth is coupled to re-versible reactions, Aerosol Sci. Techinol., 27, 491–498, 1997b.
Jacobson, M. Z.: Studying the effects of calcium and magnesiumon size-distributed nitrate and ammonium with EQUISOLV II,Atmos. Environ., 33, 3635–3649, 1999.
Jacobson, M. Z.: Global direct radiative forcing due to multicompo-nent anthropogenic and natural aerosols, J. Geophys. Res., 106,1551–1568, 2001.
Jacobson, M. Z., Tabazadeh, A., and Turco, R.: Simulating equi-librium within aerosols and nonequilibrium between gases andaerosols, J. Geophys. Res., 101, 9079–9091, 1996.
Jayaraman, A., Lubin, D., Ramachandran, S., Ramanathan, V.,Woodbridge, E., Collins, W. D., and Zalpuri, K. S.: Direct ob-servations of aerosol radiative forcing over the tropical IndianOcean during the January–February 1996 pre-INDOEX cruise,J. Geophys. Res., 103, 13827–13836,doi:10.1029/98JD00559,1998.
Jimenez, J. L., Canagaratna, M. R., Donahue, N. M., et al.: Evolu-tion of organic aerosols in the atmosphere, Science, 326, 1525—1529,doi:10.1126/science.1180353, 2009.
John, W., Wall, S. M., Ondo, J. L., and Winklmayr, W.: Acidic-aerosol size distributions during SCAQS (Southern CaliforniaAir Quality Study), final report, Rep. CA/DOH/AIHL/SP-51,Calif. Air Resour. Board, Sacramento, 1989.
Karydis, V. A., Kumar, P., Barahona, D., Sokolik,I. N., and Nenes,A.: On the effect of dust particles on global cloud condensationnuclei and cloud droplet number, J. Geophys. Res., 116, D23204,doi:10.1029/2011JD016283, 2011.
Kinne, S., Schulz, M., Textor, C., Guibert, S., Balkanski, Y., Bauer,S. E., Berntsen, T., Berglen, T. F., Boucher, O., Chin, M., Collins,W., Dentener, F., Diehl, T., Easter, R., Feichter, J., Fillmore, D.,Ghan, S., Ginoux, P., Gong, S., Grini, A., Hendricks, J., Herzog,M., Horowitz, L., Isaksen, I., Iversen, T., Kirkevag, A., Kloster,S., Koch, D., Kristjansson, J. E., Krol, M., Lauer, A., Lamarque,J. F., Lesins, G., Liu, X., Lohmann, U., Montanaro, V., Myhre,G., Penner, J., Pitari, G., Reddy, S., Seland, O., Stier, P., Take-mura, T., and Tie, X.: An AeroCom initial assessment – opticalproperties in aerosol component modules of global models, At-mos. Chem. Phys., 6, 1815–1834,doi:10.5194/acp-6-1815-2006,2006.
Kirchstetter, T. W., Novakov, T., and Hobbs, P. V.: Evidence that thespectral dependence of light absorption by aerosols is affectedby organic carbon, J. Geophys. Res.-Atmos., 109, D21208,doi:10.1029/2004JD004999, 2004.
Kleeman, M. K., Cass, G. R., and Elderin, A.: Modeling the air-borne particle complex as a source-oriented external mixture, J.Geophys. Res., 102, 21355–21372, 1997.
Kulmala, M., Laaksonen, A., Korhonen, P., Vesala, T., Ahonen, T.,and Barrett, J. C.: The Effect of Atmospheric Nitric-Acid Vaporon Cloud Condensation Nucleus Activation, J. Geophys. Res.-Atmos., 98, 22949–22958, 1993.
Kulmala, M., Toivonen, A., Mattila, T., and Korhonen, P.: Varia-tions of cloud droplet concentrations and the optical properties ofclouds due to changing hygroscopicity: A model study, J. Geo-phys. Res.-Atmos., 103, 16183–16195, 1998.
Lefer, B. L. and Talbot, R. W.: Summertime measurements ofaerosol nitrate and ammonium at a northeastern U.S. site, J.Geophys. Res., 106, 20365–20378,doi:10.1029/2000JD900693,2001.
Li, X., Larson, D. E., Gliberic, M., and Oaks, A.: Effects of nitro-gen metabolites on the induction of maize nitrate reductase, PlantPhysiol., 102, Supplement, 37, 1993.
Liao, H. and Seinfeld, J. H.: Global impacts of gas-phase chem-istry aerosol interactions on direct radiative forcing by anthro-pogenic aerosols and ozone, J. Geophys. Res., 110, D18208,doi:10.1029/2005JD005907, 2005.
Liao, H., Adams, P. J., Chung, S. H., Seinfeld, J. H., Mickley, L.J., and Jacob, D. J.: Interactions between tropospheric chemistryand aerosols in a unified general circulation model, J. Geophys.Res., 108, 4001,doi:10.1029/2001JD001260, 2003.
Liao, H., Seinfeld, J. H., Adams, P. J., and Mickley, L. J.: Globalradiative forcing of coupled tropospheric ozone and aerosolsin a unified general circulation model, J. Geophys. Res., 109,D16207,doi:10.1029/2003JD004456, 2004.
www.atmos-chem-phys.net/12/9479/2012/ Atmos. Chem. Phys., 12, 9479–9504, 2012

9502 L. Xu and J. E. Penner: Global simulations of nitrate and ammonium aerosols
Liao, H., Chen, W.-T., and Seinfeld, J. H.: Role of climate change inglobal predictions of future tropospheric ozone and aerosols, J.Geophys. Res., 111, D12304,doi:10.1029/2005JD006852, 2006.
Lin, G., Penner, J. E., Sillman, S., Taraborrelli, D., and Lelieveld, J.:Global modeling of SOA formation from dicarbonyls, epoxides,organic nitrates and peroxides, Atmos. Chem. Phys., 12, 4743–4774,doi:10.5194/acp-12-4743-2012, 2012.
Lin, S.-J. and R. B. Rood: Multidimensional flux-form semi-Lagrangian transport schemes, Mon. Weather Rev., 124, 2046–2070, 1996.
Liu, H. Y., Jacob, D. J., Bey, I., and Yantosca, R. M.: Constraintsfrom pb-210 and be-7 on wet deposition and transport in aglobal three-dimensional chemical tracer model driven by as-similated meteorological fields, J. Geophys. Res., 106, 12109–12128, 2001.
Liu, X. H., Penner, J. E., and Herzog, M.: Global modeling ofaerosol dynamics: Model description, evaluation, and interac-tions between sulfate and nonsulfate aerosols, J. Geophys. Res.,110, D18206,doi:10.1029/2004JD005674, 2005.
Liu, X., Penner, J., Ghan, S., and Wang, M.: Inclusion of ice micro-physics in the NCAR Community Atmospheric Model Verision3 (CAM3), J. Clim., 20, 4526–4547, 2007.
Lurmann, F. W., Wexler, A. S., Pandis, S. N., Musarra, S., Kumar,N., and Seinfeld, J. H.: Modeling urban and regional aerosols,Atmos. Environ., 31A, 2695–2715, 1997.
Makkonen, R., Romakkaniemi, S., Kokkola, H., Stier, P., Raisanen,P., Rast, S., Feichter, J., Kulmala, M., and Laaksonen, A.: Bright-ening of the global cloud field by nitric acid and the asso-ciated radiative forcing, Atmos. Chem. Phys., 12, 7625–7633,doi:10.5194/acp-12-7625-2012, 2012.
Malm, W. C., Schichtel, B. A., Pitchford, M. L., Ashbaugh, L. L.,and Eldred, R. A.: Spatial and monthly trends in speciated fineparticle concentration in the United States, J. Geophys. Res., 109,D03306,doi:10.1029/2003JD003739, 2004.
Mari, C., Jacob, D. J., and Bechtold, P.: Transport and scavengingof soluble gases in a deep convective cloud, J. Geophys. Res.,105, 22255–22267, 2000.
Meng, Z. and Seinfeld, J. H.: Time Scales to Achieve AtmosphericGas-Aerosol Equilibrium for Volatile Species, Atmos. Environ.,30, 2889–2900, 1996.
Meng, Z., Dabdub, D., and Seinfeld, J. H.: Size-resolved and chem-ically resolved model of atmospheric aerosol dynamics, J. Geo-phys. Res., 103, 3419–3435, 1998.
Merikanto, J., Spracklen, D. V., Pringle, K. J., and Carslaw, K. S.:Effects of boundary layer particle formation on cloud dropletnumber and changes in cloud albedo from 1850 to 2000, Atmos.Chem. Phys., 10, 695–705,doi:10.5194/acp-10-695-2010, 2010.
Metzger, S., Dentener, F., Krol, M., Jeuken, A., and Lelieveld, J.:Gas/aerosol partitioning: 2. Global modeling results, J. Geophys.Res., 107, 4313,doi:10.1029/2001JD001103, 2002.
Monahan, E. C., Spiel, D. E., and Davidson, K. L.: A model ofmarine aerosol generation via whitecaps and wave disruption, in:Oceanic Whitecaps and Their Role in Air-Sea Exchange, editedby: Monahan, E. C. and MacNiocail, G., 167–174, Springer, NewYork, 1986.
Myhre G.: Consistency Between Satellite-Derived and ModeledEstimates of the Direct Aerosol Effect, Science, 325, 187,doi:10.1126/science.1174461, 2009.
Myhre, G., Berglen, T. F., Johnsrud, M., Hoyle, C. R., Berntsen, T.K., Christopher, S. A., Fahey, D. W., Isaksen, I. S. A., Jones, T.A., Kahn, R. A., Loeb, N., Quinn, P., Remer, L., Schwarz, J. P.,and Yttri, K. E.: Modelled radiative forcing of the direct aerosoleffect with multi-observation evaluation, Atmos. Chem. Phys., 9,1365–1392,doi:10.5194/acp-9-1365-2009, 2009.
Pakkanen, T. A., Hillamo, R. E., Aurela, M., Andersen, H. V.,Grundahl, L., Ferm, M., Persson, K., Karlsson, V., Reissell, A.,Røyset, O., Fløisand, I., and Oyola, P.: Nordic intercompari-son for measurement of major atmospheric nitrogen species, J.Aerosol Sci., 30, 247–263, 1999.
Parrish, D., Norton,R., Bollinger, M., Liu, S., Murphy, P., Albritton,D., and Fehsenfeld, F.: Measurements of’HNO3 and NO−
3 par-ticulates at a rural site in the Colorado mountains, J. Geophys.Res., 91, 5379–5393, 1986.
Penner, J. E., Atherton, C. A., and Graedel, T. E.: Global emissionsand models of photochemically active compounds, in: GlobalAtmospheric-Biospheric Chemistry, edited by: Prinn, R., 223–248, Springer, New York, 1994.
Penner, J. E., Chuang, C. C., and Grant, K.: Climate forcing by car-bonaceous and sulfate aerosols, Clim. Dyn., 14, 839–851, 1998.
Penner, J. E., Andreae, M., Annegarn, H., Barrie, L., Feichter, J.,Hegg, D., Jayaraman, A., Leaitch, R., Murphy, D., Nganga, J.,and Pitari, G.: Aerosols, their direct and indirect effects, in: Cli-mate Change 2001: The Scientific Basis, edited by: Houghton,J. T., Ding, Y., Griggs, D. J., Noguer, M., Van der Linden, P. J.,Dai, X., Maskell, K., and Johnson, C. A., Cambridge Univ. Press,289–348, 2001.
Petters, M. D. and Kreidenweis, S. M.: A single parameter repre-sentation of hygroscopic growth and cloud condensation nucleusactivity, Atmos. Chem. Phys., 7, 1961–1971,doi:10.5194/acp-7-1961-2007, 2007.
Pilinis, C. and Seinfeld, J.H.: Continued development of a generalequilibrium model for inorganic multicomponent atmosphericaerosols, Atmos. Environ., 32, 2453–2466, 1987.
Pilinis, C., Capaldo, K. P., Nenes, A., and Pandis, S. N.: MADM-A new multicomponent aerosol dynamics model, Aerosol Sci.Technol., 32, 482, 2000.
Pringle, K. J., Tost, H., Message, S., Steil, B., Giannadaki, D.,Nenes, A., Fountoukis, C., Stier, P., Vignati, E., and Lelieveld, J.:Description and evaluation of GMXe: a new aerosol submodelfor global simulations (v1), Geosci. Model Dev., 3, 391–412,doi:10.5194/gmd-3-391-2010, 2010.
Putaud, J., van Dingenen, R., Baltensperger, U., Bruggemann, E.,Charron, A., Facchini, M., Decesari, S., Fuzzi, S., Gehrig, R.,Hansson, H.-C., Harrison, R. M., Jones, A. M., Laj, P., Lorbeer,G., Maen-haut, W., Mihalopoulos, N., Muller, K., Palmgren, F.,Querol, X., Rodriguez, S., Schneider, J., Spindler, G., ten Brink,H., Tunved, P., Torseth, K.,Wehner, B.,Weingartner, E., Wieden-sohler, A., Wahlin, P., and Raes, F.: A European aerosol phe-nomenology; physical and chemical characteristics of particulatematter at kerbside, urban, rural and background sites in Europe,European Commission, Report nr. EUR 20411 EN, 2003.
Quinn, P. K. and Coffman, D. J.: Local closure during the FirstAerosol Characterization Experiment (ACE 1): Aerosol massconcentration and scattering and backscattering coefficients, J.Geophys. Res., 103, 16575–16596, 1998.
Radke, L. F., Hegg, D. A., Lyons, J. H., Brock, C. A., Hobbs, P.V., Weiss, R., and Rasmussen, R.: Airborne measurements on
Atmos. Chem. Phys., 12, 9479–9504, 2012 www.atmos-chem-phys.net/12/9479/2012/
L. Xu and J. E. Penner: Global simulations of nitrate and ammonium aerosols 9503
smokes from biomass burning, in: Aerosols and Climate, editedby: Hobbs, P. V. and McCormick, M. P., 411–422, A Deepak,Hampton, Va, 1988.
Rodriguez, M. A. and Dabdub, D.: IMAGES-SCAPE2: A model-ing study of size- and chemically resolved aerosol thermodynam-ics in a global chemical transport model, J. Geophys. Res., 109,D02203,doi:10.1029/2003JD003639, 2004.
Romakkaniemi, S., Kokkola, H., and Laaksonen, A.: Parameteriza-tion of the nitric acid effect on CCN activation, Atmos. Chem.Phys., 5, 879–885,doi:10.5194/acp-5-879-2005, 2005.
Russell, A. G., McCue, K. F., and Cass, G. R.: Mathematical mod-eling of the formation of nitrogen-containing air pollutants. 1.Evaluation of an Eulerian photochemical model, Environ. Sci.Technol., 22, 263–271, 1988.
Savoie, D. L. and Prospero, J. M.: Particle size distribution of ni-trate and sulfate in the marine atmosphere, Geophys. Res. Lett.,9, 1207–1210,doi:10.1029/GL009i010p01207, 1982.
Schaap, M., van Loon, M., ten Brink, H. M., Dentener, F. J., andBuiltjes, P. J. H.: Secondary inorganic aerosol simulations forEurope with special attention to nitrate, Atmos. Chem. Phys., 4,857–874,doi:10.5194/acp-4-857-2004, 2004.
Schulz, M., Textor, C., Kinne, S., Balkanski, Y., Bauer, S., Berntsen,T., Berglen, T., Boucher, O., Dentener, F., Guibert, S., Isaksen,I. S. A., Iversen, T., Koch, D., Kirkevag, A., Liu, X., Monta-naro, V., Myhre, G., Penner, J. E., Pitari, G., Reddy, S., Seland,Ø., Stier, P., and Takemura, T.: Radiative forcing by aerosols asderived from the AeroCom present-day and pre-industrial simu-lations, Atmos. Chem. Phys., 6, 5225–5246,doi:10.5194/acp-6-5225-2006, 2006.
Schwarz, J. P., Spackman, J. R., Gao, R. S., Watts, L. A., Stier,P., Schulz, M., Davis, S. M., Wofsy, S. C., and Fahey, D. W.:Global-scale black carbon profiles observed in the remote at-mosphere and compared to models, Geophys. Res. Lett., 37,L18812,doi:10.1029/2010GL044372, 2010.
Seinfeld, J. H. and Pandis, S. N.: Atmospheric Chemistry andPhysics: From Air Pollution to Climate Change, John, Wiley &Sons, Inc., 1998.
Sun, Q. and Wexler, A. S.: Modeling urban and regional aerosolsnear acid neutrality application to the 24-25 June SCAQSepisode, Atmos. Environ., 32, 3533–3545, 1998a.
Sun, Q. and Wexler, A. S.: Modeling urban and regional aerosol-condensation and evaporation near acid neutrality, Atmos. Envi-ron., 32, 3527–3531, 1998b.
ten Brink, H. M., Veefkind, J. P., Waijers-Ijpelaan, A., and van derHage, J. C.: Aerosol light-scattering in the Netherlands, Atmos.Environ., 30, 4251–4261, 1996.
ten Brink, H. M., Kruisz, C., Kos, G. P. A., and Berner, A.: Com-position/size of the light-scattering aerosol in the Netherlands,Atmos. Environ., 31, 3955–3962, 1997.
Textor, C., Schulz, M., Guibert, S., Kinne, S., Balkanski, Y., Bauer,S., Berntsen, T., Berglen, T., Boucher, O., Chin, M., Dentener, F.,Diehl, T., Easter, R., Feichter, H., Fillmore, D., Ghan, S., Ginoux,P., Gong, S., Grini, A., Hendricks, J., Horowitz, L., Huang, P.,Isaksen, I., Iversen, I., Kloster, S., Koch, D., Kirkevag, A., Krist-jansson, J. E., Krol, M., Lauer, A., Lamarque, J. F., Liu, X., Mon-tanaro, V., Myhre, G., Penner, J., Pitari, G., Reddy, S., Seland,Ø., Stier, P., Takemura, T., and Tie, X.: Analysis and quantifica-tion of the diversities of aerosol life cycles within AeroCom, At-mos. Chem. Phys., 6, 1777–1813,doi:10.5194/acp-6-1777-2006,
2006.Trebs, I., Metzger, S., Meixner, F., Helas, G., Hoffer, A.,
Rudich, Y., Falkovich, A., Moura, M., Da Silva, R., Artaxo,P., Slanina, J., and Andreae, M.: The NH4+-NO3-Cl-SO42-H2O aerosol system and its gas phase precursors at a pasturesite in the Amazon Basin: How relevant are mineral cationsand soluble organic acids?, J. Geophys. Res., 110, D07303,doi:10.1029/2004JD005478, 2005.
van Aardenne, J. A., Dentener, F. J., Olivier, J. G. J., Klein Gold-ewijk, C. G. M., and Lelieveld, J.: A 1× 1 degree resolutiondataset of historical anthropogenic trace gas emissions for theperiod 1890–1990. Global Biogeochem. Cy., 15, 909–928, 2001.
van Dorland, R., Dentener, F. J., and Lelieveld, J.: Radiative forc-ing due to tropospheric ozone and sulphate aerosols, J. Geophys.Res., 102, 28079–28100, 1997.
van Noije, T. P. C., Eskes, H. J., Dentener, F. J., Stevenson, D. S.,Ellingsen, K., Schultz, M. G., Wild, O., Amann, M., Atherton,C. S., Bergmann, D. J., Bey, I., Boersma, K. F., Butler, T., Co-fala, J., Drevet, J., Fiore, A. M., Gauss, M., Hauglustaine, D.A., Horowitz, L. W., Isaksen, I. S. A., Krol, M. C., Lamarque,J.-F., Lawrence, M. G., Martin, R. V., Montanaro, V., Muller, J.-F., Pitari, G., Prather, M. J., Pyle, J. A., Richter, A., Rodriguez,J. M., Savage, N. H., Strahan, S. E., Sudo, K., Szopa, S., andvan Roozendael, M.: Multi-model ensemble simulations of tro-pospheric NO2 compared with GOME retrievals for the year2000, Atmos. Chem. Phys., 6, 2943–2979,doi:10.5194/acp-6-2943-2006, 2006.
Vehkamaki, H., Kulmala, M., Napari, I., Lehtinen, K. E. J., Timm-reck, C., Noppel, M., and Laaksonen, A.: An improved pa-rameterization for sulfuric acid-water nucleation rates for tro-pospheric and stratospheric conditions, J. Geophys. Res., 107,4622,doi:10.1029/2002JD002184, 2002.
Walcek, C. J., Brost, R. A., and Chang, J. S.: SO2, sulfate and HNO3deposition velocities computed using regional land use and me-teorological data, Atmos. Environ., 20, 949–964, 1996.
Walton, J. J., Maccracken, M. C., and Ghan, S. J.: A global-scalelagrangian trace species model of transport, transformation, andremoval processes, J. Geophys. Res., 93, 8339–8354, 1988.
Wang, M. and Penner, J. E.: Aerosol indirect forcing in a globalmodel with particle nucleation, Atmos. Chem. Phys., 9, 239–260,doi:10.5194/acp-9-239-2009, 2009.
Wang, M., Penner, J. E., and Liu, X.: Coupled IMPACT aerosoland NCAR CAM3 model: Evaluation of predicted aerosolnumber and size distribution, J. Geophys. Res., 114, D06302,doi:10.1029/2008JD010459, 2009.
Wesely, M. L.: Parameterization of surface resistances to gaseousdry deposition in regional-scale numerical models, Atmos. Env-iron., 23, 1293–1304, 1989.
Wexler, A. S. and Seinfeld, J. H.: The distribution of ammoniumsalts among a size and composition dispersed aerosol, Atmos.Environ., 24A, 1231–1246, 1990.
Wolff, G. T.: On the nature of nitrate in coarse continental aerosols,Atmos. Environ., 18, 977–987, 1984.
Xu, L.: Global simulation of nitrate and ammonium aerosols andtheir radiative effects and comparison of satellite-based and mod-eled aerosol indirect forcing, Ph.D. thesis, Department of Atmo-spheric, Oceanic and Space Sciences, University of Michigan,Ann Arbor, 306 pp., 2012.
www.atmos-chem-phys.net/12/9479/2012/ Atmos. Chem. Phys., 12, 9479–9504, 2012

9504 L. Xu and J. E. Penner: Global simulations of nitrate and ammonium aerosols
Zhang, D., Iwasaka, Y., Shi, G., Zang, J., Matsuki, A., andTrochkine, D.: Mixture state and size of Asian dust particles col-lected at southwestern Japan in spring 2000, J. Geophys. Res.,108, 4760,doi:10.1029/2003JD003869, 2003.
Zhang, L., Gong, S. L., Padro, J., and Barrie, L.: A size-segregatedparticle dry deposition scheme for an atmospheric aerosol mod-ule, Atmos. Environ., 35, 549–560, 2001.
Zhang, S., Penner, J. E., and Torres, O.: Inverse modeling ofbiomass burning emissions using total ozone mapping spectrom-eter aerosol index for 1997, J. Geophys. Res., 110, D21306,doi:10.1029/2004JD005738, 2005.
Atmos. Chem. Phys., 12, 9479–9504, 2012 www.atmos-chem-phys.net/12/9479/2012/